Mobile Based Solution for Pest and Disease Management in ...
144
-
Upload
khangminh22 -
Category
Documents
-
view
0 -
download
0
Transcript of Mobile Based Solution for Pest and Disease Management in ...


I
Mobile Based Solution for Pest and Disease Management in Paddy
Cultivation
Lessons Learnt from Deployment
Rifana Buhary
Renuka Weerakkody Thushara Dharmawardhana
Amal Dissanayaka Virajith Kuruppu
Dinusha Rathnayake
Research Report No: 239 August 2021
Hector Kobbekaduwa Agrarian Research and Training Institute 114, Wijerama Mawatha
Colombo 7 Sri Lanka

II
© 2021, Hector Kobbekaduwa Agrarian Research and Training Institute
First Published: August 2021
ISBN: 978-624-5973-00-2
National Library and Documentation Services Board - Cataloguing-In- Publication Data Hector Kobbekaduwa Agrarab Rsearch and Training Institute 114, Wijerama Mawatha, Colombo 07 Sri Lanka Final typesetting and lay-out by: Dilanthi Hewavitharana Tel. Phone : +94112696981 +94112696437 Fax : +94112692423 Email : [email protected] Web page : www.harti.gov.lk
Rifana Buhary
Mobile Based Solution for Pest and Disease Management in Paddy Cultivation: Lessons
Learnt from Development/ Rifana Buhary ...[et al.] - Colombo: Hector Kobbekaduwa
Agrarian Research and Training Institute, 2021. - 132 p. ; 30 cm.
x,125p.; 28 cm. (Reserch Report: No. 239)
ISBN 978-624-5973-00-2
i. 633.18095493 DDC23 ii. Buhary, Rifana (Co. author)
1. Rice - Sri Lanka
2. Rice - Disease and pests - Sri Lanka

i
A Collaborative Research Project by
Hector Kobbekaduwa Agrarian Research and Training Institute (HARTI) Western Sydney University (WSU)
University of Colombo School of Computing (UCSC) Department of Agriculture (DOA)
Contributors:
Mr. Janagan Sivagnanasundaram Researcher, WSU
Prof. Athula Ginige Professor in IT, WSU
Dr. Jeevani Goonathilake Senior Lecturer, UCSC
Ms. G.D.S.N. Chandrasena Director (Agri. Technology) – Acting, State Ministry of Paddy and Grains, Organic Food, Vegetables, Fruits, Chillies, Onion and Potato Cultivation Promotion, Seed Production and Advance Technology Agriculture
Ms. K.R.D. Gunapala Assistant Director of Agriculture (Research), Rice Research and Development Institute, Bathalagoda
Dr. S.J. Arasakesary Additional Director, Regional Agriculture Research and Development Centre, Killinochchi
Ms. K.N.C. Gunawardena Director, Field Crop Research and Development Institute, Mahailluppallama
Ms. W.M.K. Fernando Assistant Director of Agriculture (Research), Field Crop Research and Development Institute, Mahailluppallama
Ms. H.A.S.N. Hettiarachchi Assistant Director of Agriculture (Research), Agricultural Research Station, Seetha Eliya
ii
FOREWORD
Extension is one of the key pieces of the puzzle in the matter of developing the agriculture sector. Indeed, it could be argued that a well-oiled extension service replete with personnel empowered with knowledge and possessing excellent communication skills is a non-negotiable for meaningful engagement with all stakeholders and especially the farmers themselves. For numerous reasons, including erroneous policy decisions which unfortunately haven't been rectified as well as legislative enactments that essentially compromised the existing institutional arrangement, extension work has been extremely challenging. This situation has naturally posed obstacles to efforts aimed at modernizing the agriculture sector. For example, whereas there has been progress in the development of appropriate technology, these have barely manifested themselves on the ground. Ladybird, a mobile application, was developed with a view to address some of these issues, especially that of knowledge dissemination in ways that are practically useful to the farmer. Most importantly, it is a tool that recognizes existing realities and seeks delivery even within the relevant limitations. This study describes the entire process, notes the limitations as derived from information provided by intended beneficiaries and proposes recommendations for improvement. In addition to the obvious project evaluation, this report is also an excellent example of methodologies necessary for systemic intervention in the sector. There are no heroic solutions. There are only intelligently formulated strategies whose efficacy must necessarily be tested in practice before amendment and general application. The study, moreover, gives insights into relevant economic, social, cultural and technological factors that need to be considered prior to any and all interventions in this sector. This study, then, will no doubt offer direction for further research which, hopefully, will lead to fine-tuning the application itself and thereafter more systematic and comprehensive deployment. Malinda Seneviratne Director/CEO
iii
ACKNOWLEDGEMENTS This project was made possible through the contribution of many individuals and organizations. The HARTI research team would like to express its sincere gratitude to the former Director of HARTI Mr. Karunadasa Udage and the former Additional Director of HARTI Mr. R.L.N. Jayatissa for their direction and guidance in initiating the project. We are also grateful to Dr. W.M.W. Weerakoon, Director General of Agriculture, for making available crop expertise from the Department of Agriculture for the study and his unstinted assistance on several occasions for the development and deployment of the mobile application whose introduction and performance is discussed in this report. Farmers in Matara, Kurunegala and Polonnaruwa districts who were involved in the deployment of the mobile application and participated in the baseline survey and the post evaluation assessment were fully supportive in sharing opinions and experiences. We are extremely appreciative of their invaluable contributions. We also wish to thank Mr. I.U. Hettiwatta and Mr. K.A.K.N. Karunarathna, Hingurakgoda, Mr. M.R.G. Thusitha Kumara Ekanayaka, Medirigiriya, Mr. W.W.G.M. Wijayaraja, Nikaweratiya, Mr. D.M.G.R. Kumara, Kumbukgate, Mr. Dimuthu Rubasinghe, Kamburupitiya and Mr. J.G.I. Ruwan Kumara, Akuressa, all extension officials of the Department of Agriculture for their encouragement and support. We also thank Mr. S.S.J. Rosa, Statistical Officer and Mr. N.T.S. Thushantha, Statistical Assistant for the assistance extended to conduct the field survey and data analysis. We wish to place on record our thanks to all the graduates and graduate trainees who were involved in the study. Ms. Pradeepa Liyanage facilitated our work by offering administrative assistance throughout. We are grateful to her. We wish to acknowledge Mrs. W.D.P. Weerasinghe, Rice Breeder, Act. Deputy Director (Research), Regional Rice Research and Development Centre, Bombuwela for her valuable comments on the draft report. A special thank-you to Ms. Chandrika Dahanayake, Assistant Registrar (Programme) who supported the study in numerous ways. We also thank the publication unit for putting the elegant final touches. We are also grateful to the present director of the institute, Mr Malinda Seneviratne, for encouraging us in the final lap and urging us to get it done. Last but not least, many thanks go to all the HARTI staff for their extended support until this publication. Rifana Buhary Renuka Weerakkody Thushara Dharmawardhana Amal Dissanayaka Virajith Kuruppu Dinusha Rathnayake

iv
EXECUTIVE SUMMARY Crop loss due to pests and diseases (P&D) is one of the major problems faced by farmers, especially during the pre-harvest stage. One key reason for this is that the flow of P&D management information often gets interrupted due to failed coordination. As a result, farmers have limited access to accurate and useful information when they need it the most, especially in a comprehensible format and in language that they understand. This is crucial in order to mitigate P&D occurrence, determine whether they have or could develop into outbreaks and what prevention and/or control measures could be taken. Taken together, this lack of real-time information is what necessitated the exploration of developing a mobile-based information system aimed at strengthening farmer-extension linkage through a user-centric flow of real-time information to optimize P&D management in food crops through a collaborative effort. The main objective of this pilot project was to test the feasibility of the mobile-based solution developed. Named Ladybird, it was a community-based approach to minimize crop damage via early detection of P&D through smart computing, participatory sensing and event detection. The pilot project was implemented in the Kurunegala, Matara and Polonnaruwa districts among a purposive sample of 180 paddy farmers who had or had access to smartphones. The baseline survey, conducted among 180 farmers, revealed many weaknesses related to P&D management in paddy cultivation. These included poor adoption of preventive measures, poor diagnosis of P&D events, and insufficient knowledge on P&D management, heavy dependence on unconfirmed sources for assistance, prioritizing chemical control methods, improper selection, overuse and misuse of mineral pesticides, and poor access to extension agents when P&D are observed. Ladybird was developed as an all-inclusive tool to address these multiple issues and was perceived as such by the farmers themselves. Section 2 of this report details the baseline situation of P&D management in paddy cultivation in the study locations. The mobile application was successfully deployed among 116 farmers in three districts. Section 3 of this report provides details of the deployment stage with difficulties encountered i.e. in relation to the farmer, technology and extension services. The post evaluation was undertaken via phone interviews due to constraints imposed by the pandemic situation and the sample was reduced to 68 farmers from Polonnaruwa and Kurunegala. It was learned that the mobile application had been useful and attractive to the sample farmers in many ways. The key contribution of Ladybird is seen as the strengthening of real-time linkages between the farmer and the Agricultural Instructor (AI) as the latter diagnoses the P&D and recommends control measures leading to minimized diagnosis errors and misuse of agrochemicals by the majority in the post-evaluation sample farmers (85%). Other benefits included the following: enhanced ability to use knowledge practically in the correct context (76%), the user-friendly nature of the application (72%), an effective guide to choose

v
the right pesticides (53%) and being compliant with pesticide recommendations (49%). The post implementation evaluation further revealed that 90 per cent of the farmers identified P&Ds through the mobile solution with 45 per cent of them seeking solutions by reporting P&D occurrences.
The study found a number of limiting factors in the use of Ladybird. Despite the high prevalence of mobile phones among the country's population, most of the paddy farmers use versions incompatible with advanced mobile solutions. Poor signal strength in farming areas and lack of internet facilities also constituted major obstacles. Therefore, it was concluded that improved connectivity in the farming areas is a prerequisite in the effort to digitize agriculture.
The study emphasizes further the importance of capacitating farmers to use technological tools, transforming ASCs into resourceful e-landscapes to fulfil farmer information needs both on a regular and real-time basis, assisting farmers’ organizations to address farming-related issues at the community level, the need to pick the right set of farmers when deploying mobile solutions, close monitoring of users to solve issues that may arise, understand further opportunities and potential areas of development, and streamlining and accelerating the digitization of agriculture.

vi
LIST OF CONTENTS Page
No. FOREWORD ii ACKNOWLEDGEMENTS iii EXECUTIVE SUMMARY iv LIST OF CONTENTS vi LIST OF TABLES xi LIST OF FIGURES xii LIST OF BOXES xiii ABBREVIATIONS xiv
SECTION ONE
Introduction and Methodology 1
CHAPTER ONE Introduction 3 1.1 Background to the Pilot Project 3 1.2 Significance of the Project 3 1.3 Objectives of the Pilot Project 5
1.3.1 Specific Objectives of the Baseline Survey 5 1.3.2 Specific Objective of the Development and Deployment of
Mobile Solution 5
1.3.3 Specific Objective of the Post Evaluation 5 1.4 Limitations of the Study 5 1.5 Organization of the Report 6 CHAPTER TWO Methodology 7 2.1 Introduction 7 2.2 Project Collaborators 7
2.2.1 Western Sydney University and University of Colombo School of Computing
7
2.2.2 Department of Agriculture 7 2.2.3 Hector Kobbekaduwa Agrarian Research and Training
Institute 8
2.3 The Mobile Application: Ladybird 8 2.3.1 Ladybird Farmer Version 8 2.3.2 Ladybird Staff Version 10 2.3.3 Ladybird Admin Portal 11
2.4 Selection of Study Locations and Sample Beneficiaries 11 2.5 Data Collection Methods 11
2.5.1 Field Survey 11 2.5.2 Focus Group Discussions 12

vii
2.5.3 Key Informant Interviews 13 2.5.4 Over the Phone Interviews 13
2.6 Data Analysis 13
SECTION TWO
Baseline Survey Findings 17
CHAPTER THREE Socio-economic Profile of Project Beneficiaries 19 3.1 Introduction 19 3.2 Socio-economic and Demographic Characteristics of Project
Beneficiaries 19
3.3 Farmers’ Participation in Community Based Organizations 20 3.4 Use of Land by Sample Paddy Farmers 22 3.5 Summary 24 CHAPTER FOUR Current Status of Paddy Cultivation by the Sample Farmers 25 4.1 Introduction 25 4.2 Cultivation Methods and Practices 25
4.2.1 Source of Water for Paddy Cultivation 25 4.2.2 Field Establishment and Nursery Methods 26 4.2.3 Use of Seed Paddy Variety 27 4.2.4 Sources of Seed Paddy Obtained 28 4.2.5 Seed Rate 29
4.3 Yield Derived from Paddy Cultivation 30 4.3.1 Yield Loss in Polonnaruwa 32 4.3.2 Yield Loss in Kurunegala 33 4.3.3 Yield Loss in Matara 33
4.4 Purpose of Production and Paddy Marketing 33 4.5 Main Constraints Faced by Sample Paddy Farmers 34
4.5.1 Main Constraints in Polonnaruwa 35 4.5.2 Main Constraints in Kurunegala 36 4.5.3 Main Constraints in Matara 37
4.6 Summary 38 CHAPTER FIVE Current Status of Pest and Disease Management in Paddy Cultivation 39 5.1 Introduction 39 5.2 Application of Recommended Cultural Practices by Farmers 39
5.2.1 Awareness and Adoption of Recommended Practices by Farmers
40
5.3 Weed Management in Paddy Cultivation 42 5.3.1 Application of Herbicides 42 5.3.2 Time of Application of Herbicides 44 5.3.3 Rate of Application of Herbicides 46
viii
5.4 Disease Management in Paddy Cultivation 46 5.4.1 Occurrence of Rice Diseases 47 5.4.2 Diagnosis of Rice Diseases 48 5.4.3 Degree of Rice Disease Infestation 50 5.4.4 Farmers’ Perception on Need for Rice Disease Control 50 5.4.5 Sources of Information for Rice Disease Management 51 5.4.6 Application of Various Control Methods for Rice Disease
Management 52
5.4.7 Rice Disease Management using Chemical Control Methods 53 5.5 Management of Insect Pests, Nematodes and Rats in Paddy
Cultivation 54
5.5.1 Occurrence of Rice Pests 54 5.5.2 Diagnosis of Rice Pests by Farmers 55 5.5.3 Degree of Rice Pests Infestation 57 5.5.4 Farmers’ Perception on Need for Rice Pest Control 57 5.5.5 Sources of Information for Rice Pest Management 58 5.5.6 Rice Pest Management Methods 59 5.5.7 Management of Rice Pests using Chemical Control Methods 60
5.6 Summary 62 CHAPTER SIX Access to and Use of Mobile-based Tools in Agriculture 65 6.1 Introduction 65 6.2 Telephone Usage in Sample Households 65
6.2.1 Types of Telephones Used 65 6.2.2 Types of Service Providers for Cellular Mobile Phones 66 6.2.3 Household Expenditure on Telephone Use 68
6.3 Use of Smart Mobile Phones by Sample Farmers 68 6.3.1 Exposure to Mobile Technology by Sample Farmers 69 6.3.2 Types of Cellular Phone Used by Individuals 69 6.3.3 Purpose of Using Smart Mobile Phones 70 6.3.4 Use of Internet by Sample Farmers 71
6.4 Awareness and Use of Mobile Phones for Agricultural Purposes 73 6.4.1 Awareness and Use of Agriculture Related Mobile Calls 73 6.4.2 Awareness and Use of Farming Related Mobile Applications 76 6.4.3 Awareness and Use of Mobile Websites 78
6.5 Summary 80
SECTION THREE
Deployment of Ladybird 81
CHAPTER SEVEN Deployment Status of Ladybird Mobile Application 83 7.1 Introduction 83 7.2 Adjusted Sample 83 7.3 Installation of Ladybird 83

ix
7.4 Use of Ladybird for P&D Reporting in 2019/2020 Maha Season 86 7.5 Challenges of Deployment 89
7.5.1 Mobile Application Related Issues 89 7.5.2 Farmer Related Issues 89 7.5.3 Issues Related to Extension Officials 90
7.6 Summary 90
SECTION FOUR
Post Evaluation 91
CHAPTER EIGHT Post Evaluation on Ladybird Mobile Application 93 8.1 Introduction 93 8.2 Response towards P&D Reporting 93 8.3 Benefits Derived through Ladybird 94 8.4 Constraints Encountered in using Ladybird Mobile Application 94 8.5 Overall Assessment on Ladybird Mobile Application 95 8.6 Summary 98
SECTION FIVE
Concluding Remarks 101
CHAPTER NINE Conclusions and Recommendations 103 9.1 Conclusions 103 9.2 Recommendations 107 9.3 Potential Areas for Further Research 108 REFERENCES 109 APPENDICES Appendix 3.1 Distribution of Farmers by Extent and Type of Land
Accessible 111
Appendix 4.1 Field Establishment Methods and Nursery Practices Employed across Districts and Cultivation Seasons
112
Appendix 4.2 List of Paddy Varieties Cultivated by Farmers 112 Appendix 4.3 Percentage Distribution of Sample Farmers by Source of
Seed Paddy 113
Appendix 4.4 Average, Maximum and Minimum Unit Price of Paddy Sold by Sample Farmers
113
Appendix 5.1 Percentage Distribution of Farmers by Awareness and Adoption of Recommended Practices in Paddy Cultivation
114
Appendix 5.2 Reasons for Non-adoption of Recommendations in Paddy Cultivation
115

x
Appendix 5.3 Number of Farmers by Types of Herbicides Used across Districts by Seasons
118
Appendix 5.4 Symptom Identification Chart of Major Rice Diseases 119 Appendix 5.5 Number of Farmers Reporting Level of Infestation of
Rice Diseases across Districts by Seasons 120
Appendix 5.6 Degree of Success of Control Method Employed to Control Rice Diseases
121
Appendix 5.7 Number of Farmers Reporting Pests in Paddy across Districts by Seasons
122
Appendix 5.8 Symptom Identification Chart of Major Rice Pests 123 Appendix 5.9 Level of Success of Control Method Employed to Control
Pests 124
Appendix 5.10 Insecticide Usage to Control Pest Damages 125 Appendix 6.1 Telephone Service Providers in Sri Lanka as at December
2019 126
Appendix 6.2 Statistics of Telephone Expenditure of Farm Families by Districts
127

xi
LIST OF TABLES Page No.
Table 2.1 Variables Measured to Achieve Specific Objectives of Baseline Survey
14
Table 2.2 Variables Measured to Achieve Specific Objectives of Post Evaluation
15
Table 3.1 Distribution of Farmers by Ownership of Land Plots 23 Table 4.1 Field Establishment Method and Nursery Types Practiced 27 Table 4.2 Distribution of Farmers by Source of Seed Paddy Obtained 29 Table 4.3 Recommended Paddy Seed Rate and Average Seed Rates
Used 30
Table 4.4 Distribution of Farmers by Farm Gate Price Received for Paddy
34
Table 5.1 Average Frequency of Herbicide Application 43 Table 5.2 Distribution of Farmers Reporting Frequency of Herbicide
Application in Maha Season 44
Table 5.3 Distribution of Farmers Reporting Frequency of Herbicide Application in Yala Season
44
Table 5.4 Distribution of Farmers by Number of Diseases Occurred 47 Table 5.5 Distribution of Farmers Reporting Diseases in Paddy 48 Table 5.6 Number of Farmers Identified Diseases through Defined
Symptoms 49
Table 5.7 Number of Farmers Reported the Level of Infestation of Rice Diseases
50
Table 5.8 Distribution of Farmers by Perception held on Control of Rice Diseases
51
Table 5.9 Distribution of Farmers Reporting Sources of Information for Disease Management
52
Table 5.10 Number of Farmers by Degree of Disease Management by Management Methods
53
Table 5.11 Distribution of Farmers by Reported Number of Pest Occurrences
54
Table 5.12 Number of Farmers Identified Pests through Defined Symptoms
56
Table 5.13 Distribution of Farmers Reported Degree of Pest Infestation 57 Table 5.14 Distribution of Farmers by Perception held on Need for
Control of Rice Pests 58
Table 5.15 Distribution of Farmers by Number of Sources of Information Used for Pest Management in Paddy
59
Table 5.16 Distribution of Farmers by Degree of Pest Control and Control Methods
60
Table 6.1 Distribution of Individuals across Districts by Types of Telephones Used
66
Table 7.1 Distribution of Sample Farmers at Different Stages of Project Implementation
83

xii
LIST OF FIGURES Page
No. Figure 2.1 Homepage of the Ladybird Mobile Application 9 Figure 2.2 Map of Selected ASCs for the Study 12 Figure 3.1 Distribution of Farmers by Membership in CBOs 21 Figure 3.2 Distribution of Farmers holding Key Positions in CBOs 22 Figure 4.1 Distribution of Farmers by Source of Water for Paddy
Cultivation 26
Figure 4.2 Distribution of Farmers by Grain Types Cultivated 28 Figure 4.3 Distribution of Farmers by Yield Obtained 31 Figure 4.4 Distribution of Farmers in Polonnaruwa by Major Constraints
Faced in Paddy Cultivation 35
Figure 4.5 Distribution of Farmers in Kurunegala by Major Constraints Faced in Paddy Cultivation
36
Figure 4.6 Distribution of Farmers in Matara by Major Constraints Faced in Paddy Cultivation
37
Figure 5.1 Distribution of Farmers by Awareness and Adoption of Recommended Practices in Paddy Cultivation - A
40
Figure 5.2 Distribution of Farmers by Awareness and Adoption of Recommended Practices in Paddy Cultivation - B
41
Figure 5.3 Distribution of Farmers Use of Herbicides 43 Figure 5.4 Distribution of Farmers Complying with Recommendations in
Herbicide Application 45
Figure 5.5 Percentage of Applications of Sofit Herbicide by Time of Application in Polonnaruwa and Kurunegala Districts
45
Figure 5.6 Percentage of Sofit Applications by Level of Sofit Usage in Polonnaruwa and Kurunegala Districts
46
Figure 5.7 Number of Diseases Reported by Control Methods 52 Figure 5.8 Distribution of Farmers Reported Prominent Pest
Occurrences 55
Figure 5.9 Number of Pests Reported by Control Methods 60 Figure 6.1 Distribution of Subscribers by Cellular Service Providers 67 Figure 6.2 Distribution of Subscribers Reporting Reasons for Choosing
Cellular Service Providers 67
Figure 6.3 Distribution of Farm Households by Total Expenditure on Telephones
68
Figure 6.4 Percentage Distribution of Farmers by Years of Exposure to Mobile Phones
69
Figure 6.5 Distribution of Farmers across Districts by User Type 70 Figure 6.6 Distribution of Farmers by Purpose of Using Smart Phones 71 Figure 6.7 Distribution of Farmers by Frequency of Internet Use 72 Figure 6.8 Distribution of Farmers by Awareness and Use of Agriculture
Related Mobile Calls 73

xiii
Figure 6.9 Distribution of Farmers by Reasons for Using Agriculture Related Mobile Calls
74
Figure 6.10 Distribution of Farmers Awareness and Use of Agriculture Related Mobile Applications
76
Figure 6.11 Distribution of Farmers by Awareness and Use of Agriculture Related Mobile Applications
77
Figure 6.12 Distribution of Farmers by Reasons for Using Agriculture Related Mobile Applications
78
Figure 6.13 Distribution of Farmers by Awareness and Use of Agriculture Related Websites
79
Figure 6.14 Reasons for Using Agriculture Related Mobile Websites 80 Figure 7.1 Number of Installation of Ladybird over Week since
Deployment 84
Figure 7.2 Distribution of Farmers by Reasons for Installation Failure 85 Figure 7.3 Steps in Reporting P&D Events in Ladybird 87 Figure 8.1 Farmers’ Opinions about the Constraints of Ladybird 95
LIST OF BOXES
Page No.
Box 6.1 Experience of Using Mobile Phone by a Farmer from
Kamburupitiya 72
Box 6.2 Experience of Farming Related Mobile Calls by a Farmer from Medirigiriya
75
Box 8.1 Experience of a Farmer using the Ladybird Mobile Application
97

xiv
ABBREVIATIONS AI - Agriculture Instructor AIMS - Agricultural Information Management System ARPA - Agriculture Research and Production Assistant ASC - Agrarian Service Centre BPH - Brown Plant Hopper CBO - Community-based Organization CF - Carbon Footprint DCS - Department of Census and Statistics DOA - Department of Agriculture FGD - Focus Group Discussion GN - Grama Niladhari HARTI - Hector Kobbekaduwa Agrarian Research and Training Institute HH - Household HIES - Household Income and Expenditure Survey ICT - Information and Communication Technology IPM - Integrated Pest Management KII - Key Informant Interview OS - Operating System P&D - Pests and Diseases PeTAC - Pesticide Technical Advisory Committee RO - Research Officer ROP - Registrar of Pesticides RRDI - Rice Research and Development Institute SMS - Short Message Service TCRSL - Telecommunication Regulatory Commission of Sri Lanka UCSC - University of Colombo School of Computing WBPH - White Back Plant Hopper WSU - Western Sydney University
1
SECTION ONE
Introduction and Methodology

2

3
CHAPTER ONE
Introduction 1.1 Background to the Pilot Project Food crops are damaged due to various factors1, biotic and abiotic. Among them, pests and diseases (P&D) caused by biotic factors are of great concern to the farming community as they can severely damage the crop if not properly controlled. Although the Department of Agriculture (DOA) has developed and introduced a variety of P&D control measures including Integrated Pest Management (IPM) for food crops (Jayasooriya & Aheeyar, 2015; Piyasena, 2009), farmers have been experiencing various adverse consequences by failing to optimize the P&D control. The main reason for this is that even though the knowledge and training have been imparted to the farming community through the Agricultural Extension Service, farmers are not successful in managing that knowledge to ensure correct diagnosis of P&D as well as the choice of and use appropriate control methods. Therefore, they need expert assistance with real-time information when the P&D are observed in the field. However, there is no consistent coordination between the farming community and the experts. This weakness referred to as ‘coordination failure’, negatively affects the P&D control in food crop production. As a result, farmers receiving the right information fall short. Coordination failure is exacerbated by the current shortage of extension staff and the high number of farm families that need to be served (De Silva, 2011). Nevertheless, misdiagnosis and mismanagement, as well as delays, can turn P&D incidence into an outbreak resulting in a reduction in farm income with negative effects on food production/security. Therefore, alternatives to mitigate pest control related coordination failure should be explored. Against this background, this project aimed at developing and piloting a mobile-based information package as an alternative with a view to optimizing the P&D control of paddy cultivation. This mobile solution was termed “Ladybird’. This report deals with the baseline situation amongst the participants of the pilot project and the deployment experience of Ladybird followed by a post-project evaluation. 1.2 Significance of the Project Advice on P&D management is conveyed through the formal extension service by field-level agents and the Agricultural Instructor (AI). This is the predominant extension approach prevalent in the current context. These services are essentially limited to farmer group training with only sporadic visits possible to farms and farmers 1 The paddy crop is frequently exposed to a wide variety of biotic factors both pests and pathogens and
abiotic stresses such as iron toxicity, salinity and acidity. This project focus only on biotic factors however it involves sufficient room for upgrading to an all-inclusive tool that include abiotic stresses too.

4
due to the higher number of farm families that need to be served by a single officer, in addition to other inefficiencies. Farmers have difficulty in reaching the officials at the required time of their information needs. Weak coordination between the relevant scientists, extension staff and the farming community is the characteristic drawback of the conventional extension system. P&D control in food crop production creates many detrimental effects arising due to this coordination failure. In general, the farming community is reluctant to move away from the long-held practice of using chemical pesticides for any reason or course of action which they do not believe effective in P&D management. Furthermore, deviation from recommended P&D control methods is the root of several serious problems (Munaweera & Jayasinghe, 2017). For example, the use of chemical control methods at the first appearance of P&D symptoms, the frequent use of chemical pesticides and overdose, and the use of ‘cocktails’ where farmers mix several pesticides, add a huge cost to the farm budget and finally paves the way for an environmental catastrophe. In the local context, there is a growing concern about chemical contamination of food from pesticides, toxic heavy metals and mycotoxins (Vidanapathirana et al., 2018). Moreover, extreme weather conditions stimulate the occurrence of P&D and their transformation into outbreaks (Rosenzweig et al., 2011). This ultimately impedes optimal control of P&D while placing food safety, security, and sovereignty in danger. The adverse impacts of pesticide use on the ecological balance have also been observed (Pimentel et al., 1993). The gap of information also varies from farm to farm and so too the decisions that need to be made by one farmer and another. As a result, coordination failure is a problem that needs to be addressed individually. This cannot be accomplished through the time consuming conventional extension approaches. Therefore, it has become mandatory that P&D management is optimized through the delivery of real-time information via fast and innovative approaches that derive the benefits of modern Information and Communication Technology (ICT). Such ICT alternatives would ensure ‘successful coordination’ in P&D management in food crop production. Providing real time P&D control information confirmed by the experts to the farming community, as piloted through this project, is a rapid and reliable strategy to optimize P&D control in food crop production. The Ladybird mobile application carries a greater potential in reaching every farmer during P&D incidences with appropriate real-time actionable information on P&D control. Ladybird also provides the opportunity for the prediction of P&D based on feedback from the selected communities with the potential for scaling up to ensure accessibility to all who are interested. The mechanism delivers timely actionable information for those affected and therefore they can make better decisions in managing crop losses due to P&D with varied positive effects. Minimized dependence on pesticide dealers, reducing the cost of production owing to timely identification and management of P&D, increasing the yield and thereby farmer incomes and improving supply chains are some noticeable effects. Moreover, developing and implementing such smart computing-based solutions will lead to reaping greater
5
benefits to a developing country like Sri Lanka in her struggle to ensure sustainability in agriculture. 1.3 Objectives of the Pilot Project The main objective of this pilot project is to test the validity of a community-based approach to optimize P&D management in food crop production using social computing techniques. The project was implemented in three stages: (a). Initial survey of project beneficiaries to obtain the baseline situation against which the relative progress could be measured after project implementation, (b). Development and deployment of the mobile-based solution and (c). Post evaluation. 1.3.1 Specific Objectives of the Baseline Survey
1. To keep records on the socio-demographic characteristics of the project beneficiaries.
2. To ascertain the current status of paddy cultivation by the beneficiaries. 3. To discover how they control P&D in paddy cultivation. 4. To explore the extent to which they have access to and use of mobile tools
in agriculture.
1.3.2 Specific Objective of the Development and Deployment of Mobile Solution 1. To ensure that the farming community is able to manage P&D optimally
with the use of actionable information provided through this mobile-based solution.
1.3.3 Specific Objectives of the Post Evaluation
1. To identify the factors influencing the deployment of mobile based solutions including attitudinal and behavioral responses of the farming community.
2. To validate the effectiveness of the solution for wider popularization. 3. To provide policy directives towards promoting user-centric extension
methods for agricultural activities including the management of P&D.
1.4 Limitations of the Study This project was designed to ensure optimal control of P&D in the food crop sector through the introduction of a mobile based application. Although the project was well designed through the hard work of the project collaborators and planned to be launched with respect to a few selected food crops, it was restricted to paddy cultivation due to the pandemic situation. Even among paddy farmers, only the baseline survey was successfully completed. Since then the deployment, providing the technical assistance for the use of the application by the farmers and obtaining their feed-back were all done in this confined environment.

6
Therefore, it is correct to say that the opportunity to take advantage of the keen interest of the farming community in this regard has been lost. Most of the farmers dropped out of the project due to travel restrictions. It was not easy to popularize such a technological tool by contacting the rest over the phone. The post-evaluation was also done over the phone so it was not detailed or complete. As a result, the opportunity to test the significance of this valuable technological tool created with great effort was lost. However, it is important to document all the interventions made and the lessons learnt in the effort to popularize this mobile-based application for future reference. 1.5 Organization of the Report The report is organized into five sections with nine chapters. Section One includes this introductory chapter which presents the study background, significance and objectives as well as the second chapter which details the methodology. Section Two deals with the findings of the baseline survey and is organized into four chapters related to the four specific objectives of the baseline survey stage of the pilot project. Accordingly, Chapter Three presents the socio-economic profile of the project beneficiaries whilst Chapter Four discusses the current status of paddy cultivation including the yield losses and problems in paddy cultivation from the project beneficiaries’ view point. Chapter Five details the current status of P&D management in paddy by the beneficiaries and Chapter Six reports the extent to which the beneficiaries have access to and use mobile phones in farming. Section Three highlights the deployment status of mobile application under Chapter Seven. Chapter Eight describes the post-evaluation situation. Finally, Section Five concludes the report with recommendations, which are presented in Chapter Nine.

7
CHAPTER TWO
Methodology 2.1 Introduction This chapter describes the methods employed in achieving the study objectives and describes the selection of study locations, the sample, data collection methods and data analysis. The chapter begins with a description of how the project was conceived and evolved as a collaborative effort among research institutes and universities. 2.2 Project Collaborators This pilot project is a collaborative exercise between the Hector Kobbekaduwa Agrarian Research and Training Institute (HARTI), Department of Agriculture (DOA), Western Sydney University (WSU), Australia and University of Colombo School of Computing (UCSC). A multi-disciplinary team comprising ICT scientists from the WSU and UCSC, entomologists and pathologists from the DOA and socio-economists from the HARTI joined this effort and finally developed a community-based approach that sought to optimize P&D control in paddy using social computing techniques. The role of the various institutions and responsibilities of the team are discussed below. 2.2.1 Western Sydney University and University of Colombo School of Computing WSU and UCSC were involved in the development of the mobile based solution which was eventually named ‘Ladybird’. The ultimate goal of the mobile application is for the prediction of P&D outbreaks using smart computing techniques, participatory sensing and event detection. All the evolving technological expertise were provided by these two institutions which were responsible for monitoring the information system, response evaluation and providing actionable information based on the context information. Initially, the agriculture instructors (AIs) were to be responsible for the confirmation of P&D information generated through the system based on farmer reports. Ultimately, it was expected that the mobile solution would be developed to a stage where the system automatically responds to the farmers based on the experience and lessons from the pilot project. 2.2.2 Department of Agriculture The initial contribution of the DOA was in the processing and compilation of both published and unpublished knowledge on P&D management to develop the mobile solution. The information gathered on paddy included crop variety information, package of practices, P&D information, favorable climatic and soil conditions for crop growth and P&D symptoms, and remedial actions. The AIs of the DOA were responsible for the confirmation of P&D information by studying farmers’ reports. The most vital contribution of the scientists at the research institutes was to verify for the

8
prediction of P&D for which they undertook the overall monitoring of the reporting of diseases by farmers as well as the subsequent responses. 2.2.3 Hector Kobbekaduwa Agrarian Research and Training Institute HARTI was responsible for overall coordination between collaborative institutes, relevant officials and beneficiary farmers. While developing the mobile solution, the HARTI research team assisted through the translation of contents into local languages incorporating colloquial terms when and where appropriate. Based on its field experience and the continuous interaction with the farmers and the officials, the HARTI team provided suggestions to WSU and UCSC teams for the improvement of the mobile application. Furthermore, HARTI conducted the baseline survey of beneficiary farmers, provided training and deployed the mobile application. It also undertook weekly monitoring via telephone conversations, periodic site visits and post evaluation. 2.3 The Mobile Application: Ladybird Ladybird has two separate mobile applications; (a). Ladybird farmer version and (b). Ladybird staff version. The staff version can also be accessed through Ladybird admin portal, which further contains a dashboard to monitor overall situation. 2.3.1 Ladybird Farmer Version Ladybird is almost all-inclusive as it is not only targets P&D management but also includes all the crop production advice that help ensure vigorous crop growth and maximization of yield. It contains six modules: farmer profile, information of farms and crops, cultivation practices from land preparation to harvesting, real-time reporting of P&D events, crop-specific IPM practices and regular reminders to the farmers about cultivation practices (Figure 2.1).

9
Source: The Pilot Project on Ladybird Mobile Application, 2019
Figure 2.1: Homepage of the Ladybird Mobile Application Module 1: The Farmer Profile Module contains the farmer’s personal information along with the Agrarian Service Centre (ASC) the relevant farmer belongs to. Therefore, it eventually becomes a farmers’ database at the Grama Niladhari (GN) Division level with contact details for any subsequent decision making. Module 2: The module for farms and crop information allows the farmer to register any number of farms with the location, extent available and water source. The growing season, variety and the extent growing with the date of planting can be added thereafter. Thus the registered information is farmer-centric and constitutes a database containing farm management information and crop production data. Module 3: This module takes account of cultivation practices from land preparation to harvesting based on the information provided in the previous module and displays a calendar of events throughout the life cycle. Classified into different activities, all the relevant and recommended management practices are included in this section. The farmer can
Module 1: Farmer profile
Module 2: Farms and crop information
Module 3: Cultivation practices
Module 4: Reporting P&D events
Module 5: Integrated pest management practices
Module 6: Notifications
10
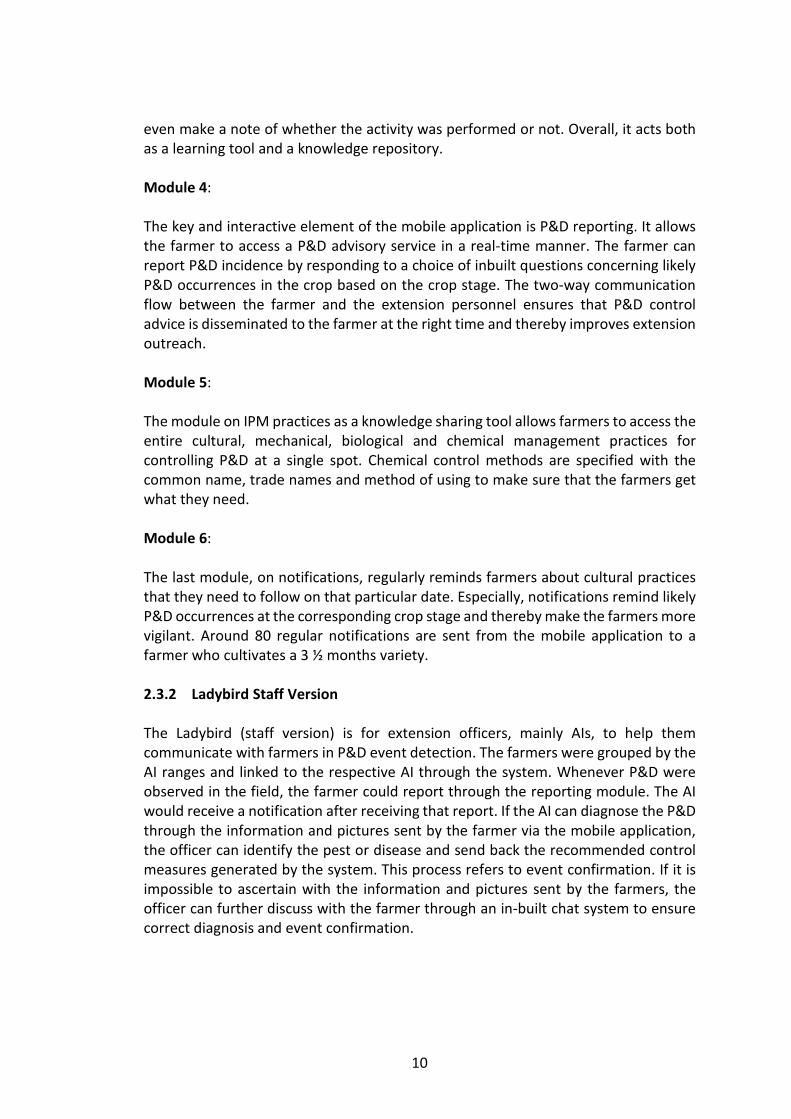
even make a note of whether the activity was performed or not. Overall, it acts both as a learning tool and a knowledge repository. Module 4: The key and interactive element of the mobile application is P&D reporting. It allows the farmer to access a P&D advisory service in a real-time manner. The farmer can report P&D incidence by responding to a choice of inbuilt questions concerning likely P&D occurrences in the crop based on the crop stage. The two-way communication flow between the farmer and the extension personnel ensures that P&D control advice is disseminated to the farmer at the right time and thereby improves extension outreach. Module 5: The module on IPM practices as a knowledge sharing tool allows farmers to access the entire cultural, mechanical, biological and chemical management practices for controlling P&D at a single spot. Chemical control methods are specified with the common name, trade names and method of using to make sure that the farmers get what they need. Module 6: The last module, on notifications, regularly reminds farmers about cultural practices that they need to follow on that particular date. Especially, notifications remind likely P&D occurrences at the corresponding crop stage and thereby make the farmers more vigilant. Around 80 regular notifications are sent from the mobile application to a farmer who cultivates a 3 ½ months variety. 2.3.2 Ladybird Staff Version The Ladybird (staff version) is for extension officers, mainly AIs, to help them communicate with farmers in P&D event detection. The farmers were grouped by the AI ranges and linked to the respective AI through the system. Whenever P&D were observed in the field, the farmer could report through the reporting module. The AI would receive a notification after receiving that report. If the AI can diagnose the P&D through the information and pictures sent by the farmer via the mobile application, the officer can identify the pest or disease and send back the recommended control measures generated by the system. This process refers to event confirmation. If it is impossible to ascertain with the information and pictures sent by the farmers, the officer can further discuss with the farmer through an in-built chat system to ensure correct diagnosis and event confirmation.

11
2.3.3 Ladybird Admin Portal The Ladybird website provides the links to download both the farmer and officer versions of Ladybird. As an admin portal, it manages the farmer registration and contains the dashboard for regular monitoring. Further, the Ladybird staff version can be accessed through the website by the officer to respond to the farmer reports. Personalized alerts can also be sent to all registered farmers simultaneously. 2.4 Selection of Study Locations and Sample Beneficiaries Study Location: Climate vulnerability, the cost for pest control out of the total cost of production and the extent of cultivation were considered for the selection of study locations. Three districts, namely Polonnaruwa, Kurunegala and Matara, representing dry, intermediate and wet zones respectively were selected as study locations for the deployment of Ladybird among paddy farmers. In consultation with scientists and higher-level regional agriculture officials, two ASCs were selected from each district as study sites based on the extent of paddy production as indicated in Figure 2.2. Selection of Sample Beneficiaries: It was necessary to select farmers who own smart mobile phones compatible with Ladybird and willingly support this exercise. Accordingly, the sampling frame was unknown. Hence, non-probability sampling methods such as convenient and snowball sampling techniques were employed. A group of 60 paddy farmers were selected from two ASCs from each district. A total of 180 paddy farmers comprised the sample. 2.5 Data Collection Methods 2.5.1 Field Survey Initially, the baseline survey was conducted among the sample farmers to establish the baseline situation. The results of the baseline survey served as the benchmark for comparison and monitoring of the project activities to evaluate the project achievements. Data required to set the benchmark was gathered from paddy farmers by administering a pre-tested structured questionnaire by the research team and the statistical staff of the HARTI.

12
Source: Authors’ illustration based on Sri Lanka Survey Department, 2018
Figure 2.2: Map of Selected ASCs for the Study 2.5.2 Focus Group Discussions Before deployment of the proposed solution, Focus Group Discussions (FGDs) with a group of farmers were carried out to disseminate relevant information and to obtain the initial response of the farming community. Further, FGDs were conducted to deploy the mobile application through training as to how the proposed technology is
13
used with the aid of a video demonstration. The farmer or any other family member capable of using the ICT solution was invited to the training programme. In addition to the research team, respective extension personnel also participated in the FGDs.
2.5.3 Key Informant Interviews Key informants of this study were the directors of agriculture, agricultural instructors, divisional officers, Rice Research and Development Institute (RRDI) scientists, subject matter specialists, farmer leaders and pesticide dealers in the respective locations. Data were gathered through Key Informant Interviews (KIIs) in respect of three important aspects; (a) understanding of the historical perspectives of P&D occurrence, outbreaks and control measures for each crop, (b) potential challenges for the deployment of ICT solution, and (c) possible behavioural responses from the farming community towards the intervention. Such information was highly useful for the development and the deployment of the solution in a manner in which increased acceptance of the solution by the farming community is increasingly ensured. 2.5.4 Over the Phone Interviews Initially, it was planned to conduct the post evaluation survey by using a structured questionnaire. However, with the prevailing Covid 19 pandemic situation in the country, a post evaluation became a simplified version of interviewing farmers over the telephone.
2.6 Data Analysis Data was analyzed using both descriptive and inferential statistical tools, MS-Excel and SPSS software version 20 where applicable. The data collected with respect to specific objectives and the analytical methods employed are detailed in Table 2.1 and Table 2.2.

14
Table 2.1: Variables Measured to Achieve Specific Objectives of Baseline Survey
Variables Data Collection
Methods
Specific Objective 1: To keep records on the socio-demographic characteristics of the project beneficiaries.
Age; Educational status; Employment; Number of income-generating family members; Monthly income; Monthly household expenditure; Participation in community-based organizations (CBOs); Membership and holding key positions in CBOs; Land use pattern and types and ownership
Field Survey
Specific Objective 2: To disclose the current status of paddy cultivation by project beneficiaries.
Paddy cultivation methods and practices; Methods of irrigating paddy crop; Crop establishment methods and Nursery practices; Seed paddy varieties used; Sources of seed paddy and seed rates; Paddy yield obtained and yield loss; Purpose of paddy production; Farmgate price for paddy; Main constraints faced in paddy cultivation
Field Survey FGDs KIIs
Specific Objective 3: To reveal how they control P&D in paddy cultivation.
Application of recommended cultural practices; Awareness and adoption of recommended practices; Application of herbicides; Types and rates of herbicides applied; Occurrence and diagnosis of P&D in paddy; Degree of P&D infestation; Farmers’ perception on need for P&D control; Sources of information for P&D management; P&D management methods; P&D management using chemical control methods
Field Survey FGDs
Specific Objective 4: To explore the extent to which they have access to and use of mobile tools in agriculture.
Types of telephones used; Types of service providers; Household expenditure on telephone; Exposure to mobile technology; Types of cellular phones used; Purpose of using smart mobile phones; Use of internet; Awareness and use of farming-related mobile calls, mobile applications and websites
Field Survey FGDs
The specific objective linked to the development and deployment of Ladybird was the action part of this project.

15
Table 2.2: Variables Measured to Achieve Specific Objectives of Post Evaluation
Variables Data Collection
Methods
Specific Objective 1: To identify the factors influencing the deployment of the mobile-based solutions including attitudinal and behavioural responses of the farming community.
Status of installation of Ladybird mobile application; Reasons for installation failure; P&D reporting in 2019/2020 Maha season; Challenges faced during deployment stage; Observation and reporting of pests and diseases by farmers; Benefits derived and constraints encountered in using the Ladybird; Overall evaluation of the Ladybird mobile application
FGDs; Over the phone conversations based on an interview guide
Due to the Covid-19 pandemic situation, further validation of the effectiveness of Ladybird in P&D management in paddy cultivation was constrained and the study provides policy directives towards promoting user-centric extension methods for agricultural activities including the management of P&D based on the experience gathered through the deployment of Ladybird.

16

17
SECTION TWO
Baseline Survey Findings

18

19
CHAPTER THREE
Socio-economic Profile of Project Beneficiaries
3.1 Introduction This chapter offers an overview of the socio-economic and demographic characteristics of the sample paddy farmers, who were chosen to introduce the Ladybird mobile application in Polonnaruwa, Kurunegala and Matara districts. Additionally, their wealth of land and cultivating pattern are described using the type of land, availability of land, land ownership and cultivated land extent during the 2018/19 Maha and 2019 Yala seasons. These seasons will be henceforth referred to as Maha and Yala for purposes of convenience. 3.2 Socio-economic and Demographic Characteristics of Project Beneficiaries The Polonnaruwa, Kurunegala and Matara districts represent major paddy growing areas in the dry, intermediate and wet zones respectively. The sample was purposively selected based on involvement in paddy cultivation and direct use or immediate access of smart phones in view of the need to introduce the Ladybird mobile application. As youth representation in the agriculture sector is declining in the country, the sample reflects only five per cent involvement of young paddy farmers. It accommodates 50 per cent of the farmers who are over 30 and below 50 years from all three districts (Polonnaruwa – 58%, Kurunegala – 52% and Matara – 42%). However, the age of farmers who are 50 or above in the total sample was 44 per cent, with the largest percentage being from Matara district (58%). It must be kept in mind that most farmers in the Matara district are engaged in paddy cultivation for consumption rather than for commercial purposes. Amongst the chosen paddy farmers, the majority (52%) had educational attainment below or up to G.C.E. O/L whilst 43 per cent had either G.C.E. O/L or G.C.E. A/L qualification. It is important to note that five per cent of paddy farmers possess tertiary educational qualifications (degree/postgraduate-diploma/postgraduate-degree) in the sample. Relatively young or middle-aged farmers with better educational qualifications, who comprised the majority of the sample, was expected to be an added advantage for the successful deployment and popularization of mobile-based solutions amongst the farming community. Close to three fourths (73%) of the paddy farmers in the total sample are engaged in farming as a primary livelihood. Despite the higher potential of full-time farmers being selected to the sample, a considerable portion (33%) from Matara are employed in

20
the state sector and paddy cultivation is merely for their household consumption. Additionally, farmers are also self-employed. The proportion of farmers engaged in self-employment opportunities as a secondary source of income confirms the same (Polonnaruwa – 62% and Kurunegala – 46%). The average number of income-generating family members in the total sample is two which is mostly represented by the heads of the household head and their spouses. The mean monthly income of the total sample is Rs. 79,562. According to the Household Income and Expenditure Survey (HIES) of the Department of Census and Statistics (DCS) (2018), the mean monthly household income for Polonnaruwa, Kurunegala and Matara districts were Rs.64,525, Rs.59,661 and Rs.54,019 respectively. There was no statistical evidence to prove any significant variation between Kurunegala and Matara districts data as per the HIES (Kurunegala t59=0.670; p>0.05 Matara t58=1.315; p>0.05). Nevertheless, the mean monthly income of Polonnaruwa (t59=4.653; p<0.05) is significantly higher than the value obtained from the HIES data (2018). The mean monthly household expenditure for the total sample is Rs.27,433. The mean monthly household expenditure calculated for Polonnaruwa, Kurunegala and Matara are Rs.26,083, Rs.23,900 and Rs.32,316 respectively. According to HIES (2018), the mean monthly household expenditure for Polonnaruwa, Kurunegala and Matara districts were Rs.47,910, Rs.55,718 and Rs.47,322 respectively. Comparison of sample values with corresponding HIES data shows that the mean monthly household expenditure is significantly lower in the sample chosen for the study (Polonnaruwa t59=-12.296; p<0.05, Kurunegala t59=-20.924; p<0.05 and Matara t59=-7.873; p<0.05). 3.3 Farmer’s Participation in Community based Organizations There are many community-based organizations (CBOs) at the village level. The farming community also participates in various CBOs for instance, farmers’ organizations, death benevolence societies, welfare societies, rural development societies, elderly societies and youth societies. In the sample selected for the study, 92 per cent of farmers have membership in such CBOs. In Sri Lanka, it is obvious that being a member of a farmer organization is a prominent characteristic of a paddy farmer as they need assistance for cultivation, interacting with relevant government officers and fellow farmers via farmers’ organizations for input, marketing and training assistance.

21
Source: HARTI Survey Data, 2019
Figure 3.1: Distribution of Farmers by Membership in CBOs Figure 3.1 illustrates the membership in CBOs of sample farmers in the districts and shows the highest participation in farmers’ organizations (Polonnaruwa - 77%, Kurunegala - 80% and Matara - 85%). Death benevolence societies are the second prioritized. Such CBOs are self-help organizations formed voluntarily by the community to cater to funeral needs. There are also farmers in Polonnaruwa (12%) Kurunegala (7%) and Matara (7%), without membership in any CBOs. Nearly half the sample (53%) holds positions in CBOs such as president, vice president, secretary, assistant secretary and treasurer etc. (Figure 3.2). Working as leaders in CBOs enhances social recognition and is a means of securing reputation. The elderly farmers have more experience in society and are more likely to hold key positions in CBOs. Apparently, ability to work, lead, assist others and have interpersonal relationships are the decisive factors to be elected to these positions.
77%70%
80% 77%85%
35%
0
25
50
75
100
Farmers' organization Death benevolence society
Pe
rce
nta
ge o
f Fa
rme
rs
Membership in CBOs by Districts
Polonnaruwa Kurunegala Matara

22
Source: HARTI Survey Data, 2019
Figure 3.2: Distribution of Farmers Holding Key Positions in CBOs
3.4 Use of Land by Sample Paddy Farmers Farmers possess both uplands and lowlands, where the uplands are mostly utilized for the construction of their houses with home gardens with or without paddy or any other field crops. The latter, however, are almost exclusively used for paddy cultivation. This is a general situation in the three districts. Most of the paddy farmers in the Polonnaruwa District are large scale commercial farmers while in Matara cultivation is mostly for consumption. In Kurunegala, there is a mix, cultivation targeting both sale and consumption. This is even reflected by the greater extent of land plots possessed by paddy farmers in the above districts (Appendix 3.1). The smallest and the largest extent of a low land plot register as 0.5 acres from Matara district and 15 acres from Polonnaruwa district respectively. Further, from the total of 826.08 acres of land possess by the total sample paddy farmers, 36 per cent is lowland which is mostly used for paddy cultivation. Both the average extent of the lowland plots across districts (Polonnaruwa – 6.33 ac; Kurunegala – 4.52 ac; Matara – 3.23 ac) and the total lowland area owned by the sample farmers (Polonnaruwa – 55%; Kurunegala – 33%; Matara - 12%) reconfirms the large scale operation of paddy cultivation in Polonnaruwa district compared to the other two districts. Land ownership is not a crucial factor for most of the land plots possessed by paddy farmers in all three districts as they have some kind of legal ownership such as deeds with free holding rights and land grants (Swarna Bhoomi, Jaya Bhoomi and Ranbima). Deeds with free holding rights and land grants are the most prominent land ownership
25%
10%
27%
8%7%
22%
18%
15%
8%
0
10
20
30
Polonnaruwa Kurunegala Matara
Pe
rce
nta
ge o
f Fa
rme
rs
Key positions in CBOs by Districts
President Secretary Treasurer
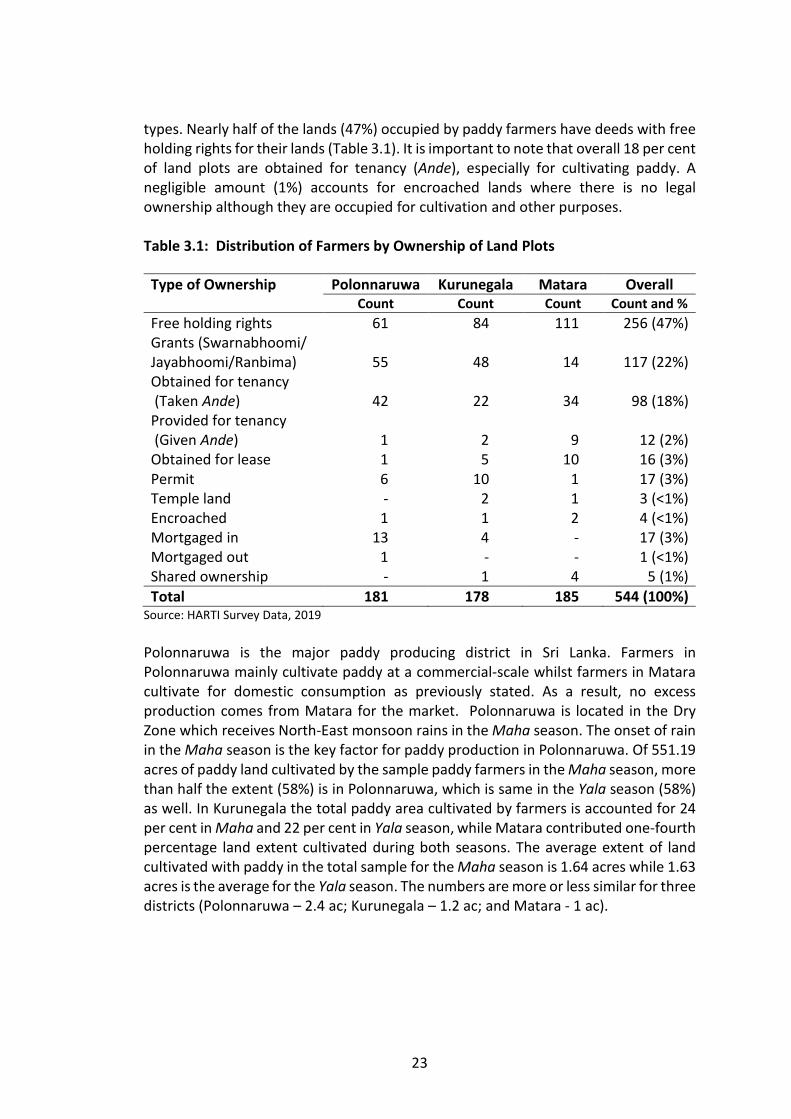
23
types. Nearly half of the lands (47%) occupied by paddy farmers have deeds with free holding rights for their lands (Table 3.1). It is important to note that overall 18 per cent of land plots are obtained for tenancy (Ande), especially for cultivating paddy. A negligible amount (1%) accounts for encroached lands where there is no legal ownership although they are occupied for cultivation and other purposes. Table 3.1: Distribution of Farmers by Ownership of Land Plots
Type of Ownership Polonnaruwa Kurunegala Matara Overall Count Count Count Count and %
Free holding rights 61 84 111 256 (47%) Grants (Swarnabhoomi/ Jayabhoomi/Ranbima) 55 48 14 117 (22%) Obtained for tenancy (Taken Ande) 42 22 34 98 (18%) Provided for tenancy (Given Ande) 1 2 9 12 (2%) Obtained for lease 1 5 10 16 (3%) Permit 6 10 1 17 (3%) Temple land - 2 1 3 (<1%) Encroached 1 1 2 4 (<1%) Mortgaged in 13 4 - 17 (3%) Mortgaged out 1 - - 1 (<1%) Shared ownership - 1 4 5 (1%)
Total 181 178 185 544 (100%) Source: HARTI Survey Data, 2019
Polonnaruwa is the major paddy producing district in Sri Lanka. Farmers in Polonnaruwa mainly cultivate paddy at a commercial-scale whilst farmers in Matara cultivate for domestic consumption as previously stated. As a result, no excess production comes from Matara for the market. Polonnaruwa is located in the Dry Zone which receives North-East monsoon rains in the Maha season. The onset of rain in the Maha season is the key factor for paddy production in Polonnaruwa. Of 551.19 acres of paddy land cultivated by the sample paddy farmers in the Maha season, more than half the extent (58%) is in Polonnaruwa, which is same in the Yala season (58%) as well. In Kurunegala the total paddy area cultivated by farmers is accounted for 24 per cent in Maha and 22 per cent in Yala season, while Matara contributed one-fourth percentage land extent cultivated during both seasons. The average extent of land cultivated with paddy in the total sample for the Maha season is 1.64 acres while 1.63 acres is the average for the Yala season. The numbers are more or less similar for three districts (Polonnaruwa – 2.4 ac; Kurunegala – 1.2 ac; and Matara - 1 ac).

24
3.5 Summary
Forty three per cent of sample farmers under 50 years of age had either G.C.E. O/L or G.C.E. A/L qualifications. Relatively young or middle-aged farmers who comprised the majority of the sample had better educational attainments, which is a promising situation for the successful deployment and popularization of mobile-based solutions amongst the farming community.
The primary livelihood of the majority of the sample is paddy farming.
Statistical analysis of the mean monthly household income of farmers revealed that the sample has an average level of income corresponding to HIES data in Kurunegala and Matara while it was significantly higher income in Polonnaruwa. Contrastingly, the mean monthly household expenditure values are significantly lower than the corresponding values of HIES.
More than 90 per cent of farmers had membership in CBOs indicating that there is a high level of social engagement. Farmers’ organizations and death benevolence societies are the two main CBOs. Almost half of the sample farmers held positions in CBOs, which makes for greater social recognition and reputation.
Most of the paddy farmers in Polonnaruwa are large scale commercial farmers while in Matara, paddy cultivation is mostly done for self-consumption while Kurunegala, has a mixed target of both commercial and self-consumption.
Nearly half of the sample held legal ownership with free holding rights to their lands whilst the rest had access to lands through grants or through tenure arrangement (Ande).

25
CHAPTER FOUR
Current Status of Paddy Cultivation by the Sample Farmers 4.1 Introduction This chapter describes the current status of paddy cultivation in the study locations. Data required for the analysis was gathered through a questionnaire survey conducted among the sample farmers concerning 2018/19 Maha and 2019 Yala. The chapter particularly sheds light on the cultivation methods and practices, expected and obtained yield with the reason for the yield differences as well as constraints faced by the farmers during paddy cultivation. 4.2 Cultivation Methods and Practices Among the sample farmers selected for the study, 99 per cent had grown paddy in the Maha season and 94 per cent had grown paddy in the Yala season. A single land plot of the total extent under paddy cultivated by a chosen farmer during the respective seasons was considered for the analysis in this chapter. Overall, the average land plot size accounted for 1.7 acres in both seasons and on a district basis, the average plot size was 2.3 acres in Polonnaruwa, 1.3 acres in Kurunegala and one acre in Matara. The paddy farmers in Polonnaruwa are involved in large scale cultivation in general, as mentioned before. The forthcoming section describes various cultural practices relevant to Maha and Yala seasons across districts.
4.2.1 Source of Water for Paddy Cultivation In the study areas, paddy cultivation is carried out under various water supply methods which largely vary across districts but only slightly between Maha and Yala seasons (Figure 4.1). The main factors are as follows:
In Polonnaruwa, the paddy cultivation by over 92 per cent farmers is fed by major irrigation while the rest depend on minor irrigation schemes.
In Kurunegala, over 55 per cent farmers grow paddy under major irrigation schemes; around 1/3rd of paddy farms are fed by minor irrigation schemes with the rest is rain-fed.
In Matara, rain-fed paddy is the prominent feature followed by cultivation under minor irrigation schemes. However, around 19 per cent of farmers grow paddy under major irrigation schemes.

26
Source: HARTI Survey Data, 2019
Figure 4.1: Distribution of Farmers by Source of Water for Paddy Cultivation
4.2.2 Field Establishment and Nursery Methods The sample farmers use major field establishment methods, broadcasting and transplanting, and four types of nurseries (Table 4.1). As elaborated in Appendix 4.1, similarities and variations across districts are as follows:
Broadcasting is the prominent crop establishment method (around 80%) employed irrespective of locations and the seasons with Polonnaruwa showing a 97 per cent prevalence.
Matara and Kurunegala demonstrate a moderate tendency to go for transplanting as well.
Dapog nursery and seedling boxes for mechanical transplanting are popular among Matara farmers while the parachute method is prominent in Kurunegala.
13%8%
42%40%
18% 16%
8% 7%
32% 33%
40%41%
26% 27%
92% 93%
55%60%
19%20%
55% 57%
0
25
50
75
100
Polonnaruwa Kurunegala Matara Overall
Pe
rce
nta
ge o
f Fa
rme
rs
Source of Water by Season and District
Rainfed Minor irrigation Major irrigation

27
Table 4.1: Field Establishment Method and Nursery Types Practiced
Season Field Establishment Method Nursery Type
Broadcasting Transplanting Lowland Dapog Machine
Transplanting Parachute
Count and Percentage
Maha 143 (80%)
36 (20%)
4 (11%)
10 (28%)
8 (22%)
14 (39%)
Yala 140 (83%)
29 (17%)
1 (3%)
11 (38%)
8 (28%)
9 (31%)
Source: HARTI Survey Data, 2019
4.2.3 Use of Seed Paddy Variety Seed paddy is the basic input in paddy farming. The seed paddy variety, age group, source and seed rate are important aspects that farmers consider before cultivation. The varieties can be categorized by different age groups based on the duration of crops such as 80-85 days, 3 months, 3 ½ months, 4 months, 4 ½ months and 5-6 months. Most farmers grow a single variety in a plot with few exceptions; 10 per cent of farmers in Maha and 12 per cent in Yala had sown two varieties belonging to different age groups in the same plot. This occurs in Polonnaruwa and Kurunegala where the plot size is relatively larger. The paddy varieties sown during both seasons are listed out in Appendix 4.2. The following are some salient features in relation to the use of varieties:
The majority (over 85%) had cultivated 3 ½ months varieties irrespective of location and season.
The rest had cultivated varieties of distinct life span i.e. 3 months, 4 months and 4 ½ months.
The varieties mostly grown in Polonnaruwa and Kurunegala are Bg 366, Bg 360 (Keeri Samba) and Bg 352 i.e 3 ½ months varieties.
Varieties prominent in Matara are At 362 and Bg 366 (3 ½ months varieties) and Bg 379-2 (4 ½ months variety).
Based on the grain type, paddy varieties can be classified into Nadu (long grain) and Samba (short grain). The majority (80%) grow Nadu during both seasons.
Figure 4.2 shows how grain types vary across districts. Matara is predominantly a Nadu growing area, whereas Samba had been grown in the other two districts to a certain extent although Nadu is the key variety.
Statistical evidence also confirms an association between the grain type and the districts during both seasons (Maha - χ2 (2, N=162) = 12.444, p <0.05; Yala - χ2 (2, N=159) = 9.253, p <0.05).
28
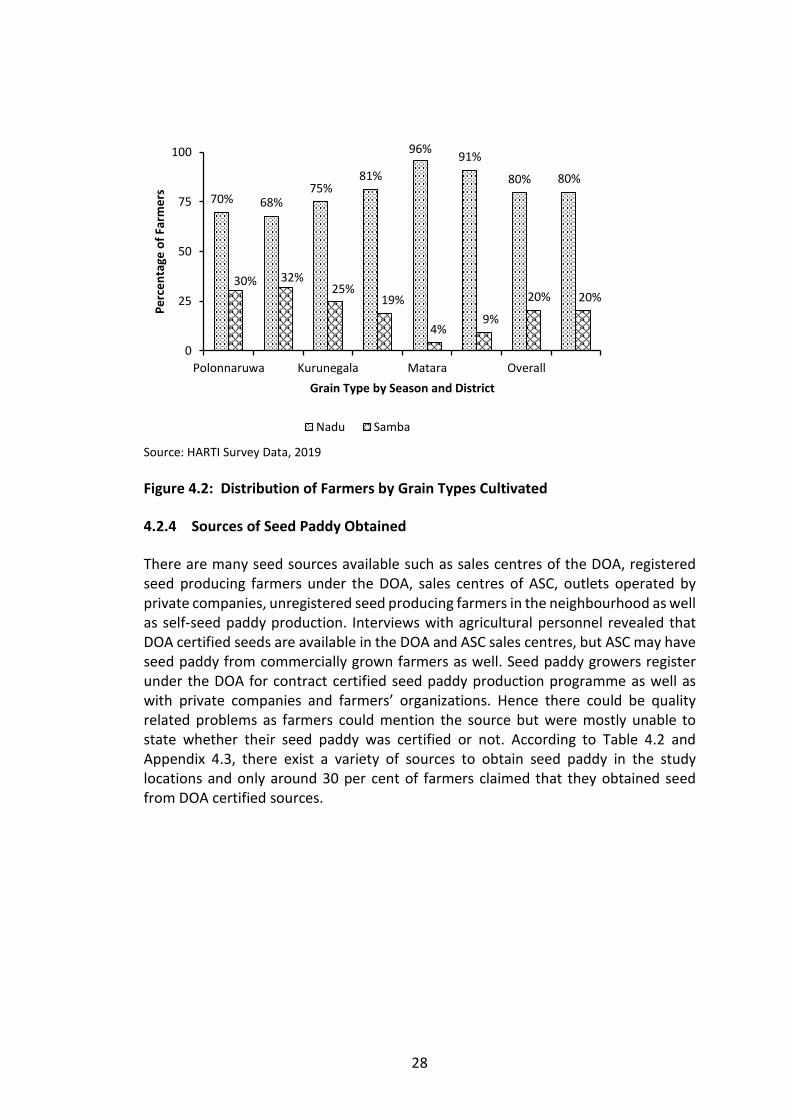
Source: HARTI Survey Data, 2019
Figure 4.2: Distribution of Farmers by Grain Types Cultivated
4.2.4 Sources of Seed Paddy Obtained
There are many seed sources available such as sales centres of the DOA, registered seed producing farmers under the DOA, sales centres of ASC, outlets operated by private companies, unregistered seed producing farmers in the neighbourhood as well as self-seed paddy production. Interviews with agricultural personnel revealed that DOA certified seeds are available in the DOA and ASC sales centres, but ASC may have seed paddy from commercially grown farmers as well. Seed paddy growers register under the DOA for contract certified seed paddy production programme as well as with private companies and farmers’ organizations. Hence there could be quality related problems as farmers could mention the source but were mostly unable to state whether their seed paddy was certified or not. According to Table 4.2 and Appendix 4.3, there exist a variety of sources to obtain seed paddy in the study locations and only around 30 per cent of farmers claimed that they obtained seed from DOA certified sources.
70% 68%75%
81%
96%91%
80% 80%
30% 32%25%
19%
4%9%
20% 20%
0
25
50
75
100
Polonnaruwa Kurunegala Matara Overall
Pe
rce
nta
ge o
f Fa
rme
rs
Grain Type by Season and District
Nadu Samba

29
Table 4.2: Distribution of Farmers by Source of Seed Paddy Obtained
Source of Seed Paddy Obtained Maha Season Yala Season Count and Percentage
DOA 61 (30%) 52 (26%) Private outlets 35 (17%) 35 (18%) Self-produced seeds 35 (17%) 41 (21%) ASCs 28 (14%) 33 (17%) Registered farmers 27 (13%) 27 (14%) Unregistered farmers 15 (7%) 10 (5%)
Total 201 (100%) 198 (100%) Source: HARTI Survey Data, 2019
The key features relating to seed paddy sources are as follows:
Farmers had accessed either single or multiple sources for seed paddy.
Most of the farmers obtained seeds only from a single source within a particular season while the rest use multiple channels.
The prominent source in Polonnaruwa is self-produced seeds during both Maha and Yala, followed by registered seed producers, DOA sales centres and private outlets in the area.
Nearly half the farmers in Kurunegala sourced seed paddy from sales centres of the DOA in both seasons. The second seed source preference was the particular sales centres of the ASCs in the region.
In Matara, priority was given to private outlets, sales centres of DOA and ASCs in both seasons. Self-seed production was less evident in the area. Overall it confirms that there are differences among districts for sourcing the seed paddy.
Statistically, there is an association between the source of seed paddy and the districts (Maha - χ2 (10, N=179) = 51.346, p <0.05; Yala - χ2 (10, N=169) = 45.961, p <0.05).
4.2.5 Seed Rate The seed rate varies by field establishment method and thus DOA recommendation2 is available based on the grain types such as Samba or Nadu (Department of Agriculture, 2017). Table 4.3 records the average seed rates per acre recommended
2 According to Department of Agriculture (2017) recommendation, 100kg per hectare for lowland field and 200kg per hectare for the upland field (Kekulan or Manawari method) is required if Nadu type seed paddy is cultivated by broadcasting, in case of Samba 75-80kg for lowland and 200kg for upland seed paddy is required for a hectare. If transplanting is the type of field establishment method, seed requirement per hectare for lowland nursery is 50kg for Nadu and 40kg for Samba; the upland nursery is 75kg for Nadu and 50kg for Samba; Dapog nursery is 50kg for Nadu and 40kg for Samba. Nursery for mechanical transplanter and Parachute method, 25-40kg and 20-30kg of seed paddy is required respectively to get plants needed for a hectare.

30
and used by the sample farmers as they practice different field establishment methods and use different grain types. Nadu was cultivated by the majority of farmers using broadcasting in lowlands, with the average seed rate used showing no significant difference from that of the recommended rate in both seasons (t89 = 1.060, p =0.292 for Maha season and t85 = -0.402; p =0.689 for Yala season). Samba was also mainly cultivated by the broadcasting method in lowlands and again the average seed rate used showed no significant difference from that of the recommended rate in both seasons (t24 = -0.762, p =0.453 for Maha season and t25 = -0.166; p =0.870 for Yala season). Thus, the analysis shows that the majority of farmers adhere to DOA recommendations. However, Table 4.3 shows even though few farmers adopted transplanting and different types of nursery types, the average seed rate used was marginally higher, implying overuse. Table 4.3: Recommended Paddy Seed Rate and Average Seed Rates Used
Establishment Method
Nadu Seed Rate (kg/ac) Samba Seed Rate (kg/ac)
DOA Recommendation
Rate Used DOA
Recommendation Rate Used
Upland broadcasting 80 41 80 19
Lowland broadcasting 40 41 30-32 30
Lowland nursery 20 24 16 25
Dapog 20 29 16 -
Mechanical transplanting 10-16 34 10-16
-
Parachute 8-12 28 8-12 39 Source: HARTI Survey Data, 2019; Department of Agriculture, 2017
4.3 Yield Derived from Paddy Cultivation Accomplishment of a better yield is the ultimate target of any farmer, but it depends mainly on the crop establishment method, variety used and cultural practices followed by the farmers. External factors also play a crucial role in achieving the potential yield including climate variation, P&D and wildlife damage. The baseline survey records the highest average yield of 2,254 kg/acre in Polonnaruwa in Maha. The respective figures for Kurunegala and Matara are 1,796 kg/acre and 1,169 kg/acre. In Yala, the average yield records as 2,576 kg/ac in Polonnaruwa, 1,700 kg/acre in Kurunegala and 951 kg/acre in Matara. Obviously, the yield variation is statistically significant (Maha – F (2, 166) = 31.137, p <0.05; Yala – F(2, 156) = 71.831, p <0.05).
31
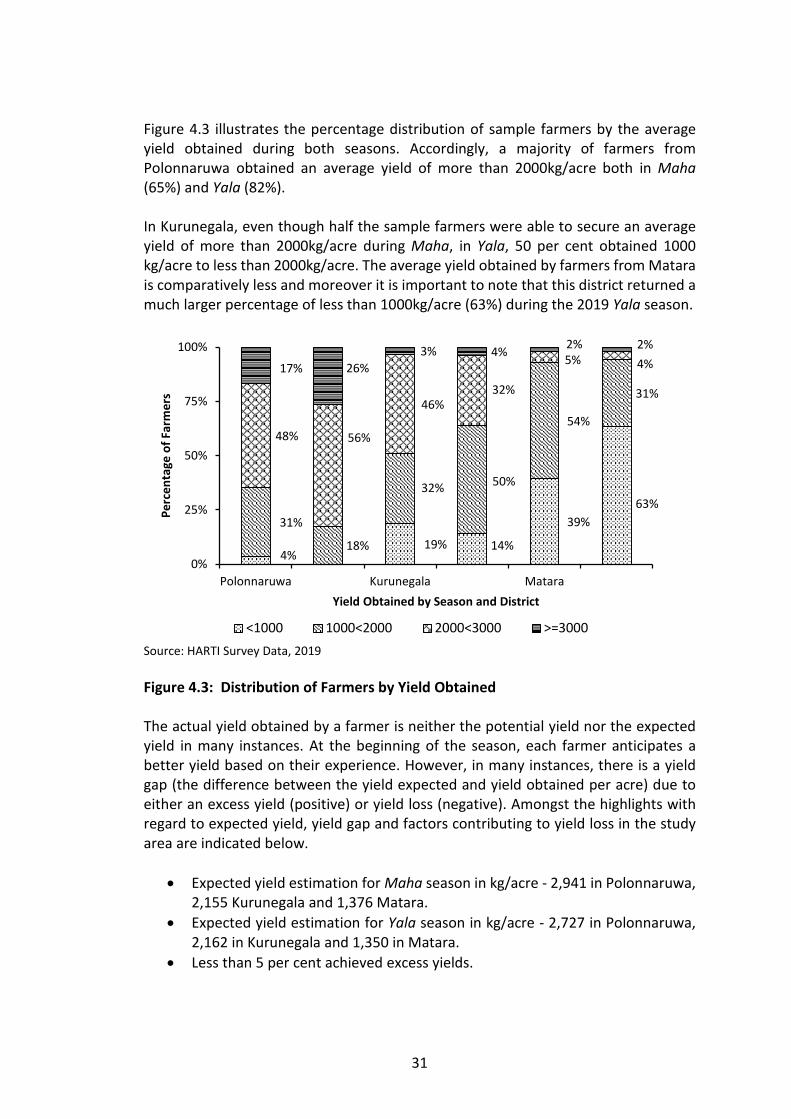
Figure 4.3 illustrates the percentage distribution of sample farmers by the average yield obtained during both seasons. Accordingly, a majority of farmers from Polonnaruwa obtained an average yield of more than 2000kg/acre both in Maha (65%) and Yala (82%). In Kurunegala, even though half the sample farmers were able to secure an average yield of more than 2000kg/acre during Maha, in Yala, 50 per cent obtained 1000 kg/acre to less than 2000kg/acre. The average yield obtained by farmers from Matara is comparatively less and moreover it is important to note that this district returned a much larger percentage of less than 1000kg/acre (63%) during the 2019 Yala season.
Source: HARTI Survey Data, 2019
Figure 4.3: Distribution of Farmers by Yield Obtained The actual yield obtained by a farmer is neither the potential yield nor the expected yield in many instances. At the beginning of the season, each farmer anticipates a better yield based on their experience. However, in many instances, there is a yield gap (the difference between the yield expected and yield obtained per acre) due to either an excess yield (positive) or yield loss (negative). Amongst the highlights with regard to expected yield, yield gap and factors contributing to yield loss in the study area are indicated below.
Expected yield estimation for Maha season in kg/acre - 2,941 in Polonnaruwa, 2,155 Kurunegala and 1,376 Matara.
Expected yield estimation for Yala season in kg/acre - 2,727 in Polonnaruwa, 2,162 in Kurunegala and 1,350 in Matara.
Less than 5 per cent achieved excess yields.
4%19% 14%
39%
63%
31%
18%
32% 50%
54%
31%
48% 56%
46%32%
5% 4%17% 26%
3% 4%2% 2%
0%
25%
50%
75%
100%
Polonnaruwa Kurunegala Matara
Pe
rce
nta
ge o
f Fa
rme
rs
Yield Obtained by Season and District
<1000 1000<2000 2000<3000 >=3000

32
Excess yield is a result of marginal climatic variations and thereby lack of natural disasters, good quality seeds, better cultural practices and minimal P&D damages.
Around 31 per cent of farmers experienced no excess or loss during Maha. The respective figure for the Yala season is 18 per cent.
Sixty six percent experienced yield loss during Maha while the corresponding figure for Yala was 77 per cent.
In general:
Damage due to P&D is the key contributor to yield loss during Maha, accounting for 58 per cent of the loss.
In Yala, 47 per cent of yield loss is due to climatic variations both drought and heavy rain.
Losses due to wildlife, especially from elephants, peacocks, wild boars and birds, account for 5-6 per cent.
Other factors leading to yield loss are weeds, poor soil condition, low-quality seed paddy, chemical damages and practical issues like damage due to use of machinery, issues associated with seeding and transplanting, and post-harvest losses.
Yield loss between districts is not statistically significant in either season (Maha – F (2, 113) = 3.042, p>0.05; Yala – F (2, 121) = 2.088, p>0.05).
4.3.1 Yield Loss in Polonnaruwa Maha 2018/19
Average yield loss is 651 kg/acre.
The main reason for the yield loss is pest damage (60%) while diseases accounted for 8 per cent.
Rainy weather intensified both P&D damage. Hence, minimization of P&D is a prerequisite to attain higher yields during Maha.
Post-harvest losses register 7 per cent mainly due to non-optimization of machinery used for harvesting.
Yala 2019
Average yield loss is 479 kg/acre which is less than in Maha.
The yield loss is mainly due to weed growth (29%).
The second most influential factor is prolonged drought (21%) which prevailed in the area during the season. Continuous dryness is unfavorable for paddy cultivation as it affects all stages of the crop ultimately resulting in poor yield.
Yield loss due to pest damage is less in Yala (11%).
33
4.3.2 Yield Loss in Kurunegala Maha 2018/19
Average yield loss was 513 kg/ac.
Like in Polonnaruwa, the main reason for the yield loss is pest damage (40%).
Both prolonged drought condition and heavy showers (26%) caused yield losses.
Wildlife damage are slightly prominent (12%) whilst diseases account for 7 per cent of the yield loss.
Yala 2019
Average yield loss was 631kg/ac, which is higher than in Maha.
Categorized in the intermediate zone, the prevalence of both heavy rain (35%) and prolonged drought conditions (33%) are common reasons for yield losses in Kurunegala. This was very evident during Yala.
Adverse climatic conditions intensify the effect of other factors such as pests (accounting for 16% of yield loss) and diseases.
Kurunegala requires a suitable mechanism to mitigate P&D damages during both seasons.
4.3.3 Yield Loss in Matara Maha 2018/19
Average yield loss was 415 kg/ac.
Heavy rain caused 35 per cent yield loss.
Both wildlife damage (20%) and pest damage (18%) contribute to considerable yield losses.
Yala 2019
Average yield loss was 496 kg/ac which is higher than in Maha.
Heavy rain causes severe yield loss (62%).
Both P&D equally contribute to yield loss (12% each).
4.4 Purpose of Production and Paddy Marketing The paddy harvest is utilized for self-consumption and sale with a small portion used as seed paddy by farmers. There is also a share of payment in the case of tenant farmers. The survey revealed that while consumption and sale are among the key purposes of paddy cultivation (>80%), almost half of the sample farmers from

34
Polonnaruwa has produced paddy for sale. They have also prioritized consumption and seed production. Nevertheless, Matara and Kurunegala farmers mainly produced for consumption while selling a proportion of harvest. Setting aside part of the harvest as seed paddy was minimal. The purpose of cultivation varies among farmers, but farming is the main livelihood of many. The income depends on production, farm gate price, quality and other factors including post-harvest losses. Paddy prices are impacted by demand and supply issues. Average selling price during both seasons was Rs. 44/kg in Polonnaruwa and Rs. 46/kg in Kurunegala (Appendix 4.4). It is evident that the maximum price went up to as high as Rs. 83/kg, while the minimum price was Rs. 22/kg. Table 4.4 reports that the majority of farmers had sold their produce above Rs. 35/kg, but particularly in Yala, many farmers in Matara sold their paddy below Rs. 35/kg, which is low compare to the other two districts, implying there were many who produced for consumption and sold for a lower price if necessary. Statistical evidence also proves that the price difference between districts during Maha season was not significant as, χ2 (4, N=118) = 8.017, p >0.05, however, was significant during Yala season, χ2 (4, N=78) = 14.495, p <0.05.
Table 4.4: Distribution of Farmers by Farm Gate Price Received for Paddy
Unit price (Rs./kg)
Polonnaruwa Kurunegala Matara Overall
Maha Yala Maha Yala Maha Yala Maha Yala
Count Count and %
<35 14 1 8 2 6 4 28
(24%) 7
(9%)
35<45 29 21 14 9 7 2 50
(42%) 32
(41%)
>=45 12 13 15 14 13 12 40
(34%) 39
(50%)
Total 55 35 37 25 26 18 118 (100%)
78 (100%)
Source: HARTI Survey Data, 2019
4.5 Main Constraints Faced by Sample Paddy Farmers The constraints faced by the farmers in paddy cultivation are many and varied. As such, they were requested during the baseline survey to state the constraint they faced during Maha and Yala. The results are presented below.

35
4.5.1 Main Constraints in Polannaruwa Maha 2018/19
The main constraint is P&D damage (65%) followed by lack of machinery due to unavailability or prohibitive costs (32%) (Figure 4.4). Water scarcity (18%) due to inability of obtaining adequate amounts at the correct time and decline in farm gate prices mainly due to selling of wet paddy during the peak harvesting period (17%) were also identified as major constraints.
Other constraints include high cost of production (13%), weed growth (13%), labour shortage (12%), the threat of wild animals (8%), and natural disasters (7%).
Yala 2019
Main constraint for many farmers was water scarcity (47%), weed growth (30%), lack of machinery due to unavailability of prohibitive costs (25%), and P&D damage (22%).
Other constraints were also identified by farmers in the case of both seasons.
Source: HARTI Survey Data, 2019
Figure 4.4: Distribution of Farmers in Polonnaruwa by Major Constraints Faced in Paddy Cultivation
7%
10%
10%
30%
12%
10%
47%
25%.
22%
7%
8%
12%
13%
13%
17%
18%
32%
65%
0 18 35 53 70
Natural disasters
Wild-life damages
Labour shortage
Weed
High cost of production
No promising price
Water scarcity
Machinery not available or expensive
Pest and diseases
Percentage of Farmers
Maj
or
Co
nst
rain
ts
Yala Maha

36
4.5.2 Main Constraints in Kurunegala Maha 2018/19
Constraints identified: P&D damages (68%), water shortage (28%) and wild-life damage (27%) particularly by wild boars, elephants and birds (Figure 4.5).
Labour shortage (17%) for field activities and the inability to obtain a fair farm-gate price (13%) were also mentioned by the considerable number of farmers in the area.
Yala 2019
Inadequate water for cultivation purposes (45%), P&D damage (37%) and wildlife threat (23%), especially by wild boar, were the main constraints.
Source: HARTI Survey Data, 2019
Figure 4.5: Distribution of Farmers in Kurunegala by Major Constraints Faced in Paddy Cultivation
5%
18%
7%
8%
15%
23%
45%
37%
3%
5%
7%
13%
17%
27%
28%
68%
0 18 35 53 70 88
Weed
Natural disasters
Machinery not available or expensive
No promising price
Labour shortage
Wild-life damages
Water scarcity
Pest and diseases
Percentage of Farmers
Maj
or
Co
nst
rain
ts
Yala Maha

37
4.5.3 Main Constraints in Matara Maha 2018/19
Main constrain for half of the sample was the threat from wildlife (52%) especially peacocks and wild boar (Figure 4.6). P&D damages (37%) and natural disasters (30%) such as flood and heavy wind were also identified by the considerable number of farmers.
Farmers’ need for machinery (3%) and low farm-gate price (2%) were identified as the main problem by a few who were mostly small scale, self-consumption oriented farmers.
Yala 2019
As in the cast of Maha, the main constraint in Yala was also wildlife threats (57%). P&D and natural disasters were also identified by 48% of farmers, a figure higher than that corresponding to Maha.
Inadequate water for cultivation (20%) and labour shortage (13%) were also mentioned by a considerable number of farmers.
Source: HARTI Survey Data, 2019
Figure 4.6: Distribution of Farmers in Matara by Major Constraints Faced in Paddy Cultivation
52
37
30
17
10
10
3
2
2
57
48
48
20
10
13
3
2
5
0 20 40 60
Wild-life damages
Pest and diseases
Natural disasters
Water scarcity
High cost of production
Labour shortage
Machinery not available or expensive
No promising price
Weed
Percentage of Farmers
Maj
or
Co
nst
rain
ts
Yala Maha
38
4.6 Summary
Almost all the farmers selected for the study had grown paddy in Maha while only 94 per cent cultivated in Yala.
The source of water for over 92 per cent of farmers in Polonnaruwa was major irrigation while the rest depended on minor irrigation schemes. Over 55 per cent of farmers from Kurunegala grow paddy under major irrigation schemes while the rest depending on minor irrigation schemes and rain-fed conditions. In Matara, paddy is cultivated mainly under rain-fed conditions; some cultivate under minor irrigation schemes with 19 per cent of farmers cultivating under major irrigation schemes.
About 80 per cent of the farmers used broadcasting as an establishment method.
The majority had cultivated short-duration varieties of 3 ½ months, especially Nadu grain type.
Seed paddy is obtained from a variety of sources and farmers had used either single or multiple sources to meet the requirement. Only around 30 per cent of farmers stated that they obtained seed paddy from DOA certified sources. Self-produced seeds are popular in Polonnaruwa while in Kurunegala sales centres of the DOA and in Matara private outlets, sales centres of DOA and ASCs are preferred by farmers.
Analysis also revealed that the average seed rate used by the majority of farmers adhere to DOA recommendations, but that they overuse for nurseries.
Polonnaruwa has the highest and Matara has the lowest average yield per acre. Only less than five per cent achieved excess yield and yield losses were experienced by 66 per cent of farmers in Maha and 77 per cent in Yala.
Reasons for yield loss vary by location and seasons. In Polonnaruwa, the main reason was pest damage during Maha and weed growth in Yala season. In Kurunegala pest damage was the main cause of yield loss in Maha and both heavy showers of rain and prolonged drought were factors in Yala. Heavy rain caused heavy yield loss in Matara in both seasons.
Sale and consumption are the main purposes of paddy production. In addition, farmers use the harvest as seed paddy and payment for tenancy.
Farm gate prices varied by location and the prices did not fluctuate heavily between seasons. The majority in all three districts had sold the produce above Rs. 35/kg, i.e. 76 per cent in Maha and 9 per cent in Yala.
The constraints faced by the farmers in paddy cultivation are many and varied. P&D, water shortage, wildlife damages and natural disasters are prominent issues faced by the sample farmers while there are many minor issues including cost of machinery, weeds and price of the produce.

39
CHAPTER FIVE
Current Status of Pest and Disease Management in Paddy Cultivation
5.1 Introduction P&D management in paddy cultivation is crucial not only to improve yield by quantity but also to enhance its quality. The IPM approach which recommends employing the most appropriate pest control technique or a combination of techniques from a variety of options i.e. cultural, mechanical, biological and chemical practices to control P&D, is promoted by the DOA to achieve a sustainable solution for the issue. All the farmers start cultivation simultaneously over a period of a week or less in Yaya3. This is one among many cultural practices that prevent P&D occurrences. The practice of timely planting while refraining from staggered cultivation is therefore time-tested. Although IPM is the best solution, control through chemical is still popular among farmers due to economic gain (Munaweera and Jayasinghe, 2017). Chemicals such as herbicides, insecticides and fungicides are used to control weeds, insects and diseases respectively. The legal authority for registration and regulation of pesticides in Sri Lanka lies with Registrar of Pesticides (ROP), who is appointed under the Pesticides Act4. However, decisions related to the pesticides recommendations are made by the Pesticide Technical Advisory Committee (PeTAC) of the DOA. Against this background, this chapter sheds light on the awareness of and adoption of recommended cultural practices by the sample farmers to prevent P&D in paddy cultivation. Subsequently, the status of weed, P&D management by sample farmers over 2018/19 Maha and 2019 Yala are considered. 5.2 Application of Recommended Cultural Practices by Farmers The current status of P&D management by sample farmers was assessed based on their response towards adhering to the following 12 cultural practices which have been recommended for paddy cultivation by the DOA.
1. All the farmers in ‘Yaya’ begin cultivation activities simultaneously - Yaya cultivation
3 Yaya (tract) is referred to as the whole paddy land typically supplied irrigated water in one handover
point. 4 According to the Pesticides Act No. 33 of 1980, as amended by the Act No. 06 of 1994 and the Act No.
31 of 2011, ROP is the authorized official to regulate pesticides imported to, and manufactured in Sri Lanka, and to assure their quality and safe use, and to assess and to declare maximum residue limits in agricultural produce (DOA, 2019).
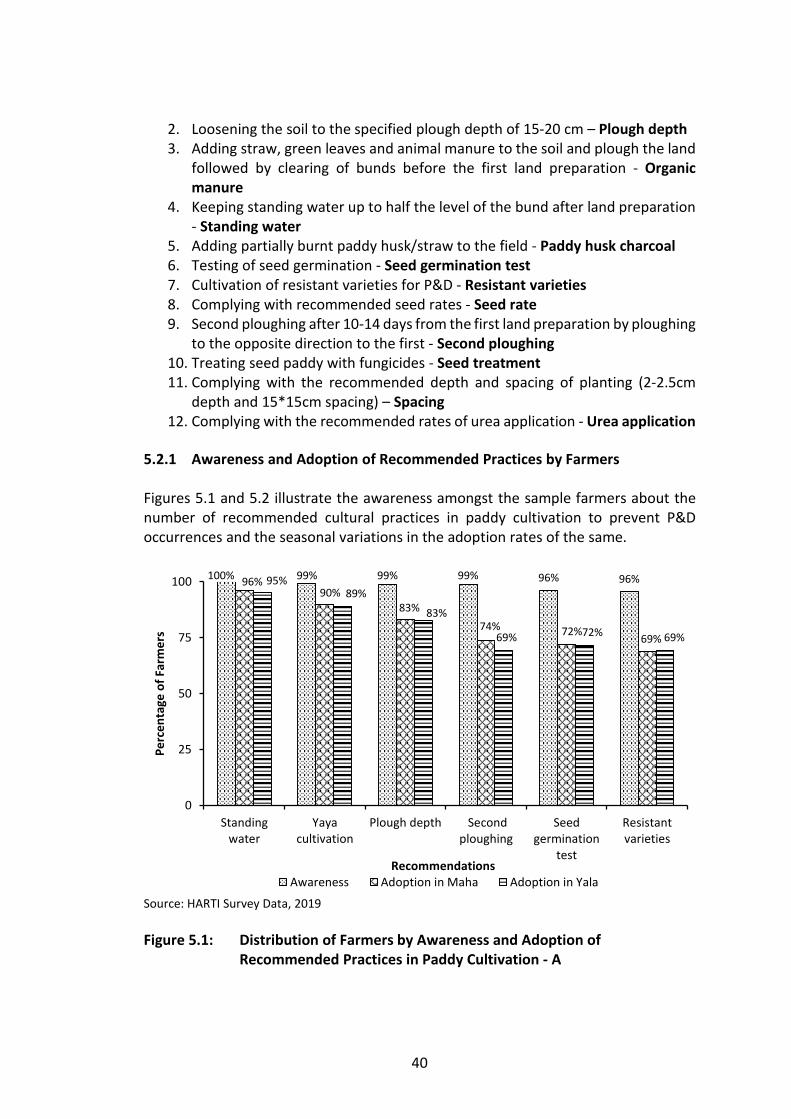
40
2. Loosening the soil to the specified plough depth of 15-20 cm – Plough depth 3. Adding straw, green leaves and animal manure to the soil and plough the land
followed by clearing of bunds before the first land preparation - Organic manure
4. Keeping standing water up to half the level of the bund after land preparation - Standing water
5. Adding partially burnt paddy husk/straw to the field - Paddy husk charcoal 6. Testing of seed germination - Seed germination test 7. Cultivation of resistant varieties for P&D - Resistant varieties 8. Complying with recommended seed rates - Seed rate 9. Second ploughing after 10-14 days from the first land preparation by ploughing
to the opposite direction to the first - Second ploughing 10. Treating seed paddy with fungicides - Seed treatment 11. Complying with the recommended depth and spacing of planting (2-2.5cm
depth and 15*15cm spacing) – Spacing 12. Complying with the recommended rates of urea application - Urea application
5.2.1 Awareness and Adoption of Recommended Practices by Farmers Figures 5.1 and 5.2 illustrate the awareness amongst the sample farmers about the number of recommended cultural practices in paddy cultivation to prevent P&D occurrences and the seasonal variations in the adoption rates of the same.
Source: HARTI Survey Data, 2019
Figure 5.1: Distribution of Farmers by Awareness and Adoption of Recommended Practices in Paddy Cultivation - A
100% 99% 99% 99% 96% 96%96%90%
83%
74% 72%69%
95%89%
83%
69% 72% 69%
0
25
50
75
100
Standingwater
Yayacultivation
Plough depth Secondploughing
Seedgermination
test
Resistantvarieties
Pe
rce
nta
ge o
f Fa
rme
rs
RecommendationsAwareness Adoption in Maha Adoption in Yala

41
Figure 5.1 is particularly about the recommendations about which farmers have considerable awareness (over 95%) with over 65 per cent adoption rates during both seasons. Those practices include keeping standing water in the field after land preparation, cultivation of the entire Yaya by all the farmers simultaneously, loosening the soil to the specified plough depth of 15-20 cm, second ploughing after 10-14 days by ploughing to the opposite direction, undertaking seed germination test and cultivation of resistant varieties. The results are suggestive of the greater achievements of the extension service of the DOA.
Source: HARTI Survey Data, 2019
Figure 5.2: Distribution of Farmers by Awareness and Adoption of Recommended Practices in Paddy Cultivation - B
Figure 5.2 indicates that though farmers are well aware of certain recommendations (over 80% farmers), the rates of adoption remain between 45-60 per cent. These recommendations including the adding of organic manure, straw and green leaves followed by the clearing of bunds before the first land preparation, complying with recommended rates of seeds and urea application and undertaking seed treatment. Figure 5.2 also indicates that the application of partially burnt paddy husks/straw into the paddy field registers the lowest rate of adoption despite its increased awareness amongst over 80 per cent of the sample farmers. Spacing and planting depth is a recommendation where there is the least awareness as evident in Figure 5.2. Slight variations can be observed across districts for the adoption of recommended practices (Appendix 5.1). In Polonnaruwa, 94 per cent of farmers adhere to Yaya cultivation whilst the rest do not due to large scale cultivation, cultivation of different varieties and problems in water availability.
99% 99% 96%92%
84%
18%
61%56% 54%
49%
9%15%
62%56% 55%
46%
8%14%
0
25
50
75
100
Organicmanure
Ureaapplication
Seed rate Seedtreatment
Paddy huskcharcoal
Spacing
Pe
rce
nta
ge o
f Fa
rme
rs
RecommendationsAwareness Adoption in Maha Adoption in Yala

42
Around 13 per cent of farmers from Matara and Kurunegala do not begin simultaneous cultivation due to water issuance problems, lack of paddy fields in the Yaya or the rain-fed nature of paddy cultivation. In addition, unorganized farmers in Matara and those cultivating different varieties in Kurunegala have failed to undertake cultivation together with the rest of the farmers. The data indicates how best the ‘Yaya’ concept has been put into practice by the paddy farmers irrespective of agro-ecological variations across study locations. Appendix 5.2 also summarizes the location-specific reasons underpinning the non-adoption of recommended practices in paddy cultivation. That information helps to derive important lessons that could lead to further improvement in the extension service on paddy cultivation. 5.3 Weed Management in Paddy Cultivation Use of herbicides to control weed is common in paddy cultivation island-wide. According to Taylor and Clampett (2002), good management of the weed involves not only the application of herbicides as appropriate but practising cultural methods including water management in the field to control the weed. Post planting herbicides available for rice in Sri Lanka can be categorized into three kinds based on selectivity i.e. non-selective herbicides for grasses, sedges and broad-leaf weeds; selective grass killers; selective broad-leaf and sedge killers. It is important to note that rotation of herbicides according to their mode of action is required to avoid the development of herbicide resistant weeds, which may occur due to repeated use of the same or similar mode of action herbicides (Department of Agriculture, 2015). 5.3.1 Application of Herbicides The survey revealed that relatively a higher number of farmers used herbicides to control weed in Maha compared to Yala except for Polonnaruwa, which shows no seasonal difference (Figure 5.3).
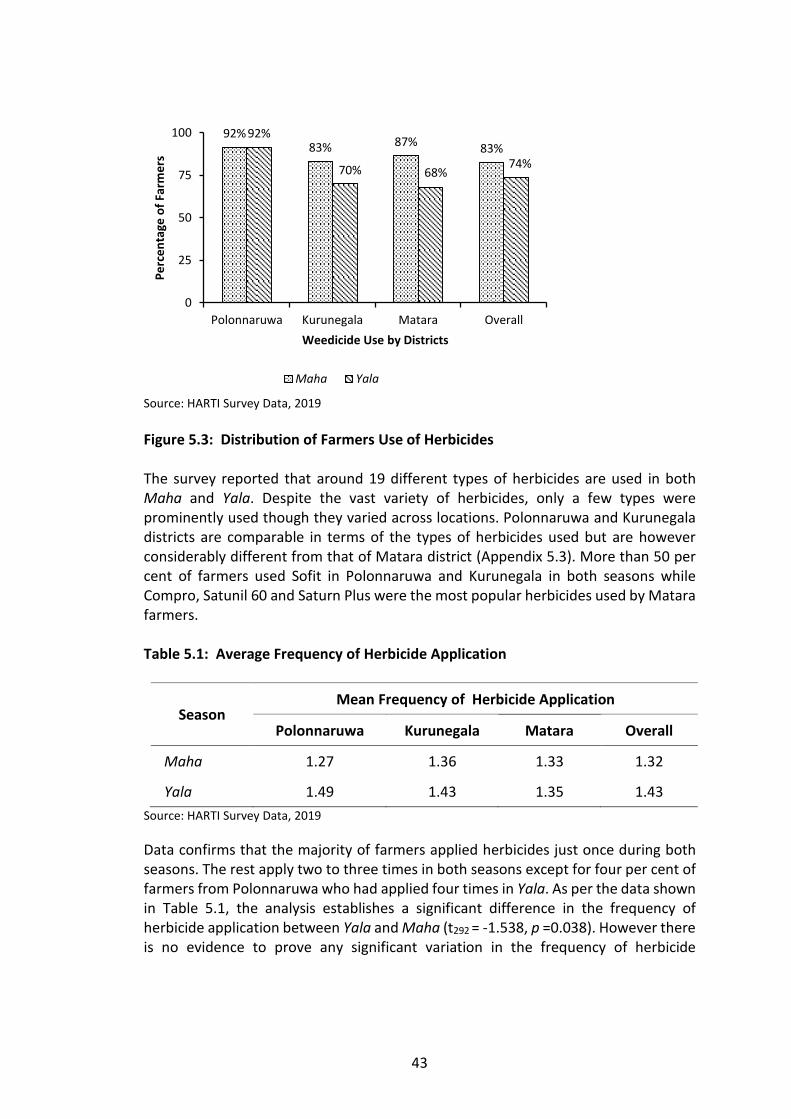
43
Source: HARTI Survey Data, 2019
Figure 5.3: Distribution of Farmers Use of Herbicides The survey reported that around 19 different types of herbicides are used in both Maha and Yala. Despite the vast variety of herbicides, only a few types were prominently used though they varied across locations. Polonnaruwa and Kurunegala districts are comparable in terms of the types of herbicides used but are however considerably different from that of Matara district (Appendix 5.3). More than 50 per cent of farmers used Sofit in Polonnaruwa and Kurunegala in both seasons while Compro, Satunil 60 and Saturn Plus were the most popular herbicides used by Matara farmers. Table 5.1: Average Frequency of Herbicide Application
Season Mean Frequency of Herbicide Application
Polonnaruwa Kurunegala Matara Overall
Maha 1.27 1.36 1.33 1.32
Yala 1.49 1.43 1.35 1.43
Source: HARTI Survey Data, 2019
Data confirms that the majority of farmers applied herbicides just once during both seasons. The rest apply two to three times in both seasons except for four per cent of farmers from Polonnaruwa who had applied four times in Yala. As per the data shown in Table 5.1, the analysis establishes a significant difference in the frequency of herbicide application between Yala and Maha (t292 = -1.538, p =0.038). However there is no evidence to prove any significant variation in the frequency of herbicide
92%83% 87% 83%
92%
70% 68%74%
0
25
50
75
100
Polonnaruwa Kurunegala Matara Overall
Pe
rce
nta
ge o
f Fa
rme
rs
Weedicide Use by Districts
Maha Yala
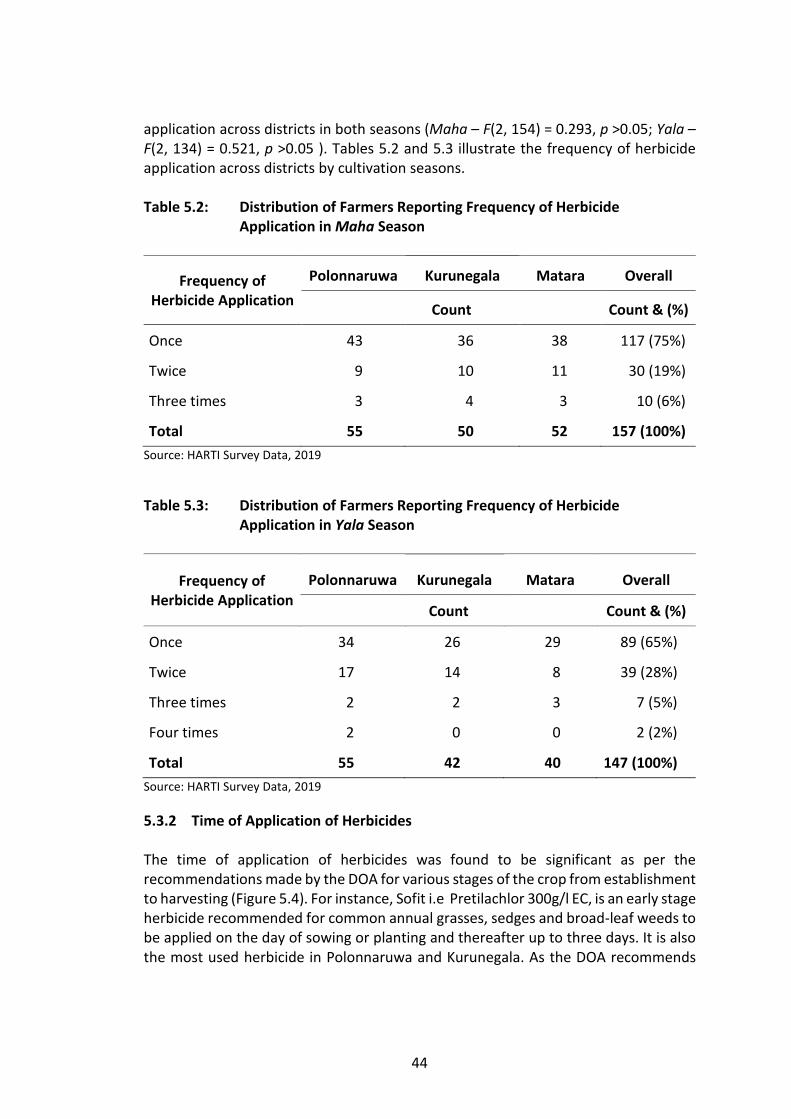
44
application across districts in both seasons (Maha – F(2, 154) = 0.293, p >0.05; Yala – F(2, 134) = 0.521, p >0.05 ). Tables 5.2 and 5.3 illustrate the frequency of herbicide application across districts by cultivation seasons. Table 5.2: Distribution of Farmers Reporting Frequency of Herbicide
Application in Maha Season
Frequency of Herbicide Application
Polonnaruwa Kurunegala Matara Overall
Count Count & (%)
Once 43 36 38 117 (75%)
Twice 9 10 11 30 (19%)
Three times 3 4 3 10 (6%)
Total 55 50 52 157 (100%)
Source: HARTI Survey Data, 2019
Table 5.3: Distribution of Farmers Reporting Frequency of Herbicide Application in Yala Season
Frequency of Herbicide Application
Polonnaruwa Kurunegala Matara Overall
Count Count & (%)
Once 34 26 29 89 (65%)
Twice 17 14 8 39 (28%)
Three times 2 2 3 7 (5%)
Four times 2 0 0 2 (2%)
Total 55 42 40 147 (100%)
Source: HARTI Survey Data, 2019
5.3.2 Time of Application of Herbicides The time of application of herbicides was found to be significant as per the recommendations made by the DOA for various stages of the crop from establishment to harvesting (Figure 5.4). For instance, Sofit i.e Pretilachlor 300g/l EC, is an early stage herbicide recommended for common annual grasses, sedges and broad-leaf weeds to be applied on the day of sowing or planting and thereafter up to three days. It is also the most used herbicide in Polonnaruwa and Kurunegala. As the DOA recommends

45
using Sofit from the first day of crop establishment to three days, the data also indicates that 93 per cent applications in Kurunegala and 97 per cent of applications in Polonnaruwa comply with this recommendation. The rest apply it until the 10th day from crop establishment (Figure 5.5). In Matara district the most used herbicide in both seasons is Compro and it was applied as per the recommendation or close to it.
Source: HARTI Survey Data, 2019
Figure 5.4: Distribution of Farmers Complying with Recommendations in Herbicide Application
Source: HARTI Survey Data, 2019
Figure 5.5: Percentage of Applications of Sofit Herbicide by Time of Application in Polonnaruwa and Kurunegala Districts
180
14 13
207
162
199
190
0
55
110
165
220
Applied as perrecommendation
Deviated fromrecommendation
Not mentioned Overall
Nu
mb
er
of
Farm
ers
Maha Yala
0%
20%
40%
60%
80%
100%
0 3 5 8 10 13
Ap
plic
atio
n (
%)
Days from Establishment by Districts
Polonnaruwa Kurunegala
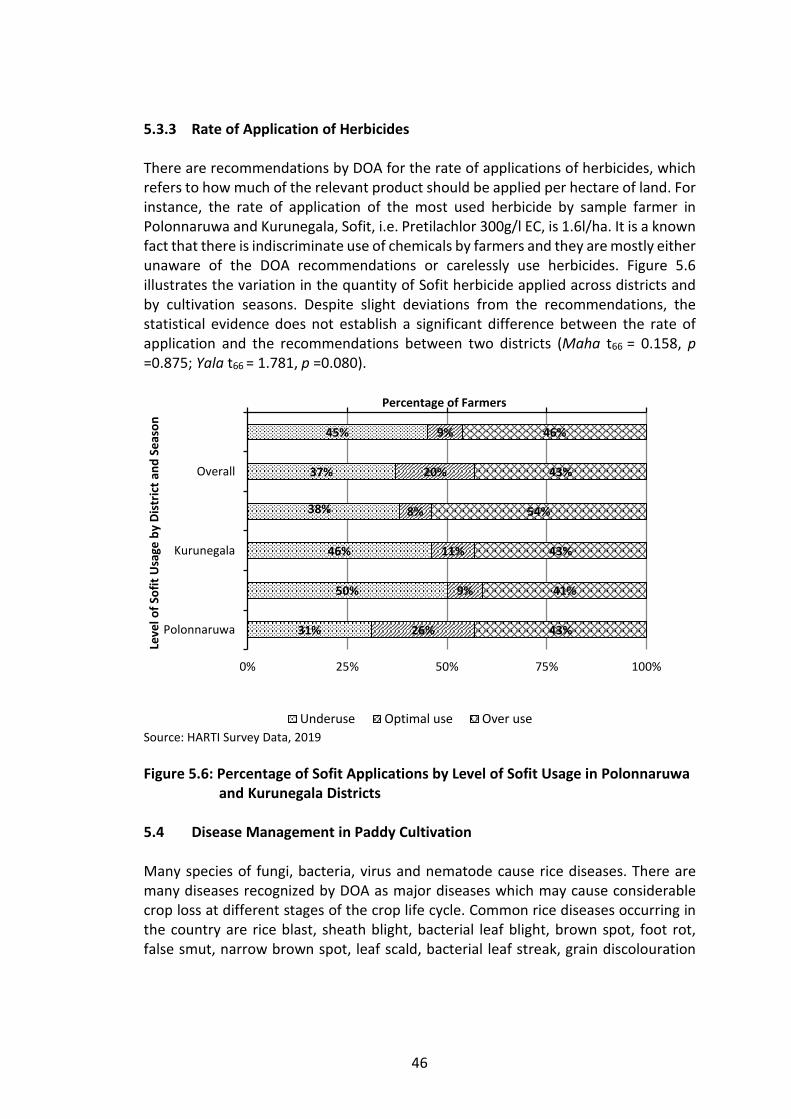
46
5.3.3 Rate of Application of Herbicides There are recommendations by DOA for the rate of applications of herbicides, which refers to how much of the relevant product should be applied per hectare of land. For instance, the rate of application of the most used herbicide by sample farmer in Polonnaruwa and Kurunegala, Sofit, i.e. Pretilachlor 300g/l EC, is 1.6l/ha. It is a known fact that there is indiscriminate use of chemicals by farmers and they are mostly either unaware of the DOA recommendations or carelessly use herbicides. Figure 5.6 illustrates the variation in the quantity of Sofit herbicide applied across districts and by cultivation seasons. Despite slight deviations from the recommendations, the statistical evidence does not establish a significant difference between the rate of application and the recommendations between two districts (Maha t66 = 0.158, p =0.875; Yala t66 = 1.781, p =0.080).
Source: HARTI Survey Data, 2019
Figure 5.6: Percentage of Sofit Applications by Level of Sofit Usage in Polonnaruwa and Kurunegala Districts
5.4 Disease Management in Paddy Cultivation Many species of fungi, bacteria, virus and nematode cause rice diseases. There are many diseases recognized by DOA as major diseases which may cause considerable crop loss at different stages of the crop life cycle. Common rice diseases occurring in the country are rice blast, sheath blight, bacterial leaf blight, brown spot, foot rot, false smut, narrow brown spot, leaf scald, bacterial leaf streak, grain discolouration
45%
37%
38%
46%
50%
31%
9%
20%
8%
11%
9%
26%
46%
43%
54%
43%
41%
43%
0% 25% 50% 75% 100%
Overall
Kurunegala
Polonnaruwa
Percentage of Farmers
Leve
l of
Sofi
t U
sage
by
Dis
tric
t an
d S
eas
on
Underuse Optimal use Over use

47
and sheath rot. The DOA recommends a variety of methods to control rice pests such as cultural, physical, biological, chemical techniques and the IPM system.
5.4.1 Occurrence of Rice Diseases At least one disease occurrence reported by farmers in Maha season is relatively higher in Polonnaruwa than in the other two districts. It is alarming that around 27 per cent of paddy farmers stated that the crop was affected by at least one disease in Maha while 18 per cent reported that there was such occurrence in Yala (Table 5.4). Two rice diseases in a single season is a rare occurrence (Polonnaruwa - 5%; Kurunegala - 3%) in Maha as well. Table 5.4: Distribution of Farmers by Number of Diseases Occurred
Number of Disease
Occurrence
Polonnaruwa Kurunegala Matara Overall
Count Count & (%)
Maha
One 21 16 11 48 (27%)
Two 3 2 0 5 (3%)
Yala
One 5 9 16 30 (18%)
Two - 1 1 2 (1%)
Source: HARTI Survey Data, 2019
Table 5.5 illustrates the occurrence of rice diseases during both seasons in study locations. Rice blast and bacterial leaf blight are predominant diseases amongst those reported.

48
Table 5.5: Distribution of Farmers Reporting Diseases in Paddy
Disease
Polonnaruwa Kurunegala Matara Overall
Maha Yala Maha Yala Maha Yala Maha Yala
Rice blast 5 1 6 3 3 5 14 (8%) 9 (5%)
Bacterial leaf blight 6 - 3 3 1 3 10 (6%) 6 (4%)
Browns spot 1 1 3 2 3 3 7 (4%) 6 (4%)
Sheath blight 6 2 - - 1 2 7 (4%) 4 (2%)
False smut - - 3 1 2 2 5 (3%) 3 (2%)
Narrow browns spot 3 - - - - - 3 (2%) -
Sheath rot - - 1 1 - - 1 (1%) 1 (1%)
Grain discolouration - - 1 - - - 1 (1%) -
Unspecified* 3 1 1 - 1 2 5 (3%) 3 (2%)
Note: * Farmers were unable to specify exact disease occurred Source: HARTI Survey Data, 2019
5.4.2 Diagnosis of Rice Diseases Precise diagnosis of diseases is a prerequisite for the employment of appropriate control measures. However, it is difficult to differentiate diseases from pest damages and deficiencies without having a thorough understanding of the symptoms of each type of disorder. Thus it is necessary to diagnose the diseases precisely for appropriate field management. Sample farmers were questioned regarding how they diagnose rice diseases from the symptoms listed by DOA (Appendix 5.4). Table 5.6 illustrates the pattern of identification of mainly occurring rice diseases through symptoms. The following is an assessment of the level of knowledge of the farmers about disease identification based on four main diseases. Rice Blast
All the affected farmers have responded concerning the symptoms of rice blast.
Among 32 reported, 60 per cent identification were based on abnormal leaf colour and necrotic lesions/streak.
Six identifications were through empty grains during the reproductive stage.
Fungal growth, sheath discolouration, dead plants and wilting are recorded as other symptoms of blast though they are not considered as the key symptoms or the symptoms of secondary infestations of rice blast in paddy.

49
Table 5.6: Number of Farmers Identified Diseases through Defined Symptoms
Symptoms
Rice Diseases
Rice blast Bacterial leaf blight
Brown spot
Sheath blight
Abnormal colour 13 6 2 1
Abnormal growth 1 2 2
Fungal growth 1
Necrotic lesions/streak 6 8 8 5
Dead plants 1 2 4 1
Grain discolouration 1
Sheath discolouration 2 4
Empty grains 6 1 1
Wilting 3 2
Total 32 17 19 15
Note: DOA listed symptoms for relevant diseases are shaded in grey colour (See Appendix 5.4). Source: HARTI Survey Data, 2019
Bacterial Leaf Blight
Among 17 reported cases, the large majority (94%) of disease identifications are based on DOA listed symptoms such as necrotic lesions/streaks, abnormal colour and dead plants.
No farmer reported the wilting symptom in identifying bacterial leaf blight.
Brown Spot
Among 19 reported, 8 disease identifications were based on necrotic lesions.
Rest of the identifications was based on symptoms which were not listed by DOA for brown spot disease.
Sheath Blight
Among 15 reported, more than half of (60%) the identification was by using either necrotic lesions/streak or grain discolouration.
Farmers’ identification was also based on the variety of symptoms which were not listed by the DOA, for example, sheath discolouration.
These findings show that disease identification in paddy cultivation is rather complex and require thorough knowledge which farmers lack. Therefore, they have been

50
misled in the identification of diseases that occur due to diverse pathogens; mainly bacteria and fungus. As evident from the analysis disease identification knowledge among paddy farmers is insufficient and need to be improved; otherwise poor disease identification may result in misuse of pesticides and ineffective control of diseases in paddy cultivation. 5.4.3 Degree of Rice Disease Infestation Overall, the level of infestation of rice diseases reported in both Maha and Yala are moderate to mild infestations with less severe infestations reported only among less than 30 per cent of farmers (Table 5.7). As reported, damage due to rice diseases are negligible and are under the control of the farmers. As refer to Appendix 5.5, in Polonnaruwa severe infestation of major diseases like rice blast, bacterial leaf blight and sheath blight was reported only with respect to Maha. Particularly, a severe infestation of the brown spot was noticed by many in Kurunegala while false smut was evident in Matara. Table 5.7: Number of Farmers Reported the Level of Infestation of Rice Diseases
District
Level of Infestation in Maha Level of Infestation in Yala
Severe Moderate Mild Severe Moderate Mild
Polonnaruwa 3 8 15 - 1 6
Kurunegala 7 12 5 6 6 4
Matara 8 5 3 7 9 6
Total 18
(27%) 25
(38%) 23
(35%) 13
(29%) 16
(36%) 16
(36%)
Source: HARTI Survey Data, 2019
5.4.4 Farmers’ Perception on Need for Rice Disease Control Farmers are very keen about the application of control measures, regardless of the level of infestations which in most cases are moderate to mild, according to Table 5.7. Table 5.8 is indicative of the farmers increased interest in the control of prominent rice diseases which occur in their paddy fields. Farmers had sought control measures irrespective of cultivation season too.

51
Table 5.8: Distribution of Farmers by Perception Held on Control of Rice Diseases
Disease
Control Requirement Maha
Control Requirement Yala
Required Not required Required Not required
Rice blast 16 4 10 3
Bacterial leaf blight 13 2 7 1
Sheath blight 10 - 5 1
Brown spot 9 1 7 2
Narrow brown spot 1 2 - -
Sheath rot 4 - 4 -
Grain discolouration 1 - - -
False smut 7 - 6 -
Unspecified* 8 - 5 -
Total 57 (86%) 9 (14%) 38 (84%) 7 (16%)
Note: * Farmers were unable to specify exact disease that occurred Source: HARTI Survey Data, 2019
5.4.5 Sources of Information for Rice Disease Management Even though the DOA fulfills the extension needs of the farming communities, farmers, in general, rely on unconfirmed sources for extension information especially from pesticide dealers when there is an issue related to P&D. Table 5.9 presents the extent to which farmers depend on confirmed and unconfirmed sources for information needs related to rice diseases by study sites. Among confirmed sources, AIs predominate while pesticide dealers, own knowledge and fellow farmers were considered unconfirmed sources of information. Accordingly, Polonnaruwa leads the way with the highest percentage of farmers (61%) obtaining information from confirmed sources. The situation in other study sites is worse, which is a matter of concern in terms of the crop, the farmer’s economy and the environment.

52
Table 5.9: Distribution of Farmers Reporting Sources of Information for Disease Management
Information Sources Polonnaruwa Kurunegala Matara Overall
Confirmed Sources
AIs 12 10 9 31 ARPAs - 3 4 7 ROs 2 1 3
Total 14 (61%) 14 (47%) 13 (52%) 41 (53%)
Unconfirmed Sources
Pesticide dealers 5 4 6 15 Own knowledge 10 5 15 Fellow farmers 4 2 1 7
Total 9 (39%) 16 (53%) 12 (48%) 37 (47%) Source: HARTI Survey Data, 2019
5.4.6 Application of Various Control Methods for Rice Disease Management Figure 5.7 reveals that there are various disease management methods employed by farmers i.e. cultural, physical, biological and chemical and among which chemical methods are used by the large majority of diseases. It is important to note that either cultural or biological methods have also been used in Polonnaruwa (23%) and Matara (4%).
Source: HARTI Survey Data, 2019
Figure 5.7: Number of Diseases Reported by Control Methods
41
1
1724 23
0
8
15
23
30
Polonnaruwa Kurunegala Matara
Nu
mb
er o
f D
isea
ses
Control Method by District
Cultural Biological Chemical

53
The analysis also reveals that chemical methods are the predominant disease control method in use have helped 64 per cent of farmers to achieve complete control in disease incidents with a partial control for another 31 per cent of farmers (Table 5.10). Appendix 5.6 further indicates the use of distinct disease control methods in terms of disease.
Table 5.10: Number of Farmers by Degree of Disease Management by Management Methods
Disease Control Method
Degree of Disease Control
Not at all To some extent Completely
Cultural Methods - 1 5
Biological Methods - - 1
Chemical Methods 5 (5%) 32 (31%) 65 (64%)
Total 5 (5%) 33 (30%) 71 (65%)
Source: HARTI Survey Data, 2019
5.4.7 Rice Disease Management using Chemical Control Methods Poor awareness among farmers about chemicals that suit distinct disease conditions is a common weakness observed across all study locations. A number of insecticides were found to be used incorrectly, for instance, Fipronil 5% SC, Etofenprox 10% EC (Trebon), Diazinon 50%EW (Basudin), Thiamethoxam 25%WG (Actara) to control certain diseases such as sheath blight, rice blast, sheath rot, grain discolouration and brown spot diseases. Except for rice blast and sheath blight, the rest of the diseases have no chemical recommendations in Sri Lanka, and yet farmers use various chemicals to control those diseases. Farmers applied Tebuconazole 250g/l EW (Folicur and Lankem), to control rice blast, bacterial leaf blight, sheath blight and brown spot, but it is recommended specifically for rice blast. Similarly, Hexaconazole 50g/l EC (Eraser) was found to have been used for rice blast, bacterial leaf blight, sheath blight and false smut, although it is recommended only to control sheath blight. Among all the chemical applications for disease management, only five per cent of applications have been done accurately. For instance, Hexaconazole 50g/l EC (Eraser) to control sheath blight and Tebuconazole 250g/l EW (Folicur) to control rice blast. These findings are suggestive of the indiscriminate use of insecticides and fungicides not recommended for certain diseases.

54
The analysis further reveals that irrespective of study locations, the majority of farmers (68%) tend to apply chemicals at the first appearance of symptoms even though no serious damage to the crop is evident. Another 29 per cent of farmers use chemicals when they understand that there is a potential for further spread of diseases. Only a few (2%) apply chemicals before observing symptoms. 5.5 Management of Insect Pests, Nematodes and Rats in Paddy Cultivation Rice is affected by several insect pests, nematodes and rats which are henceforth referred to as pests as appropriate. Damage due to pests is more severe than diseases in paddy cultivation. The pests are categorized as major and minor based on the extent and severity of the damage. Nematodes and rats are considered major pests whereas the major insect pests found in paddy cultivation are brown planthopper, stem borer, gall midge, thrips, leaf folder, rice bug, sheath mite, white back plant hopper and leaf mite as well as occasional pests are mole cricket, black bugs and rice hispa. The DOA recommends a wide range of cultural, physical, biological, chemical and IPM methods for pest management in paddy. 5.5.1 Occurrence of Rice Pests As per the survey results, the percentage of farmers who reported at least one pest occurrence in Maha is almost double in Polonnaruwa (78%) and Kurunegala (77%) compared to Matara (37%) with more than three-quarters of farmers in the first two districts having encountered pest problems (Table 5.11). When comparing the two seasons, pest prevalence is greater in Maha. The number of farmers reporting pest occurrence was also high during this season. In the overall sample, two or more pest incidents were reported by 23% of farmers in Maha season and 14% in the Yala season.
Table 5.11: Distribution of Farmers by Reported Number of Pest Occurrences
Pest Occurrence
Polonnaruwa Kurunegala Matara Overall
Count Count & (%)
Maha
One 47 46 22 115 (64%) Two 16 16 10 42 (23%) Three 5 6 5 16 (9%) Four 1 0 0 1 (1%)
Yala
One 21 24 26 71 (42%) Two 6 7 11 24 (14%) Three 1 1 7 9 (5%)
Source: HARTI Survey Data, 2019

55
The rice pest incidences reported in study locations during both seasons are detailed in Appendix 5.7 and prominent pests illustrated in Figure 5.8. Brown plant hopper (BPH) found to be the most frequent in all three districts, but BPH is more prominent during Maha in Polonnaruwa and Kurunegala than in Matara. Certain pest occurrences are location-specific, for instance, stem borer in Polonnaruwa and white back plant hopper in Kurunegala affected over 20 per cent of farmers in Maha.
Source: HARTI Survey Data, 2019
Figure 5.8: Distribution of Farmers Reported Prominent Pest Occurrences 5.5.2 Diagnosis of Rice Pests by Farmers There are instances where pest attacks, disease infestations and nutrient deficiencies show more or less similar symptoms making it difficult to differentiate. As such, the symptom identification chart (Appendix 5.8) for major pests prepared by Chandrasena and Gunapala (2019) was used as a guideline to facilitate the identification of pest damage by the farmers.
4116
3814 14 8
93
38
0
35
70
105
140
175
Polonnaruwa Kurunegala Matara Overall
Nu
mb
er o
f P
est
Occ
urr
ence
Type of Pest by District and Season
Brown plant hopper Stem borer White back plant hopper
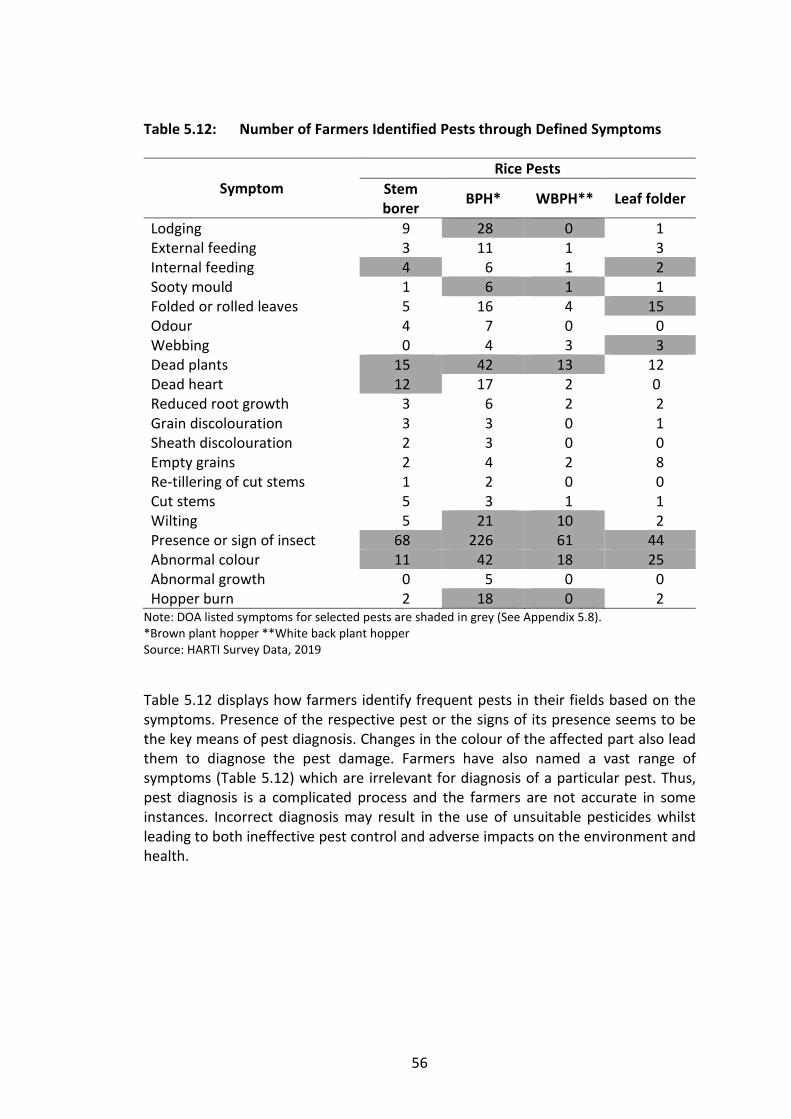
56
Table 5.12: Number of Farmers Identified Pests through Defined Symptoms
Symptom Rice Pests
Stem borer
BPH* WBPH** Leaf folder
Lodging 9 28 0 1 External feeding 3 11 1 3 Internal feeding 4 6 1 2 Sooty mould 1 6 1 1 Folded or rolled leaves 5 16 4 15 Odour 4 7 0 0 Webbing 0 4 3 3 Dead plants 15 42 13 12 Dead heart 12 17 2 0 Reduced root growth 3 6 2 2 Grain discolouration 3 3 0 1 Sheath discolouration 2 3 0 0 Empty grains 2 4 2 8 Re-tillering of cut stems 1 2 0 0 Cut stems 5 3 1 1 Wilting 5 21 10 2 Presence or sign of insect 68 226 61 44 Abnormal colour 11 42 18 25 Abnormal growth 0 5 0 0 Hopper burn 2 18 0 2
Note: DOA listed symptoms for selected pests are shaded in grey (See Appendix 5.8). *Brown plant hopper **White back plant hopper Source: HARTI Survey Data, 2019
Table 5.12 displays how farmers identify frequent pests in their fields based on the symptoms. Presence of the respective pest or the signs of its presence seems to be the key means of pest diagnosis. Changes in the colour of the affected part also lead them to diagnose the pest damage. Farmers have also named a vast range of symptoms (Table 5.12) which are irrelevant for diagnosis of a particular pest. Thus, pest diagnosis is a complicated process and the farmers are not accurate in some instances. Incorrect diagnosis may result in the use of unsuitable pesticides whilst leading to both ineffective pest control and adverse impacts on the environment and health.

57
5.5.3 Degree of Rice Pests Infestation Table 5.13: Distribution of Farmers Reported Degree of Pest Infestation
District
Degree of Pest Infestation Maha
Degree of Pest Infestation Yala
Severe Moderate Mild Severe Moderate Mild
Polonnaruwa 21 46 95 9 20 57
Kurunegala 94 43 26 52 19 17
Matara 40 69 19 45 73 27
Total 155
(34%) 158
(35% 140
(31%) 106
(33%) 112
(35%) 101
(32%)
Source: HARTI Survey Data, 2019
Among the pest incidence reported by the farmers, there was no considerable difference between the degrees of infestation i.e. severe, moderate and mild by seasons (Table 5.13). The pattern of severity and prominent pests by districts follows. District Prominent Severity Prominent Pest Infestations Polonnaruwa Mild Brown plant hopper, stem borer,
white back plant hopper, rice bug and gall midge
Kurunegala Severe Brown plant hopper, leaf folder, white back plant hopper and stem borer
Matara Moderate Brown plant hopper, gall midge, stem borer and rat The above findings are suggestive of relatively higher pest incidences in all three districts. 5.5.4 Farmers’ Perception on Need for Rice Pest Control As for the diseases, farmers’ decision making on pest control seems to be high during both seasons (Maha - 72% and Yala - 68%) as shown in Table 5.14. Brown plant hopper, white back plant hopper, stem borer, leaf folder, gall midge and rat created a

58
perception of high requirement of control methods and it was more than double as the ‘not required’ response. Table 5.14: Distribution of Farmers by Perception Held on Need for Control of Rice
Pests
Pest
No. of Farmers Reporting Control Requirement
Maha Yala
Required Not required Required Not required
BPH* 148 48 82 29
WBPH** 37 9 18 7
Stem borer 47 21 22 14
Leaf folder 28 13 19 11
Gall midge 18 7 16 0
Rat 17 2 16 5
Thrips 10 2 6 5
Rice bug 7 8 11 12
Leaf mite 2 4 6 9
Mole cricket 4 2 5 3
Sheath mite 0 0 7 2
Case worm 0 4 0 0
Whorl maggot 2 2 1 0
Nematode 1 0 0 0
Total 321 (72%) 122 (28%) 209 (68%) 97 (32%)
Note: * Brown plant hopper ** White back plant hopper Source: HARTI Survey Data, 2019
5.5.5 Sources of Information for Rice Pest Management According to Table 5.15, AIs were the main source of information sought by farmers to control pests, characterizing the importance of the existing extension service. A considerable number of reports were made to the Agriculture Research and Production Assistants (ARPAs) as well. However, the issue of farmers’ approaching

59
pesticide dealers cannot be neglected since the numbers reported in all parts of the country implies a trend towards unconfirmed sources for information. Further, farmer use of either own or fellow farmers’ knowledge to get information is also relatively high. Table 5.15: Distribution of Farmers by Number of Sources of Information Used for
Pest Management in Paddy
Description Number of Farmers
Overall Polonnaruwa Kurunegala Matara
Confirmed sources
AIs 32 45 21 98 ARPAs 5 14 19 ROs 2 1 5 8 Field officers of private companies 2 1 3
Total 34 (43%) 53 (52%) 41 (59%) 128 (51%)
Unconfirmed sources
Pesticide stores 13 22 12 47 Own knowledge 19 20 6 45 Fellow farmers 14 6 10 30 Farmers' organizations 1 1
Total 46 (58%) 49 (48%) 28 (41%) 123 (49%) Source: HARTI Survey Data, 2019
5.5.6 Rice Pest Management Methods Similar to disease management, pest management also largely depends on chemical methods. Figure 5.9 illustrates that Kurunegala farmers entirely depend on chemical methods while in other districts over 75 per cent of farmers employ chemical control methods. Cultural practices and biological control methods are employed by the rest of the farmers depicting the willingness for chemical-free practices for pest management.
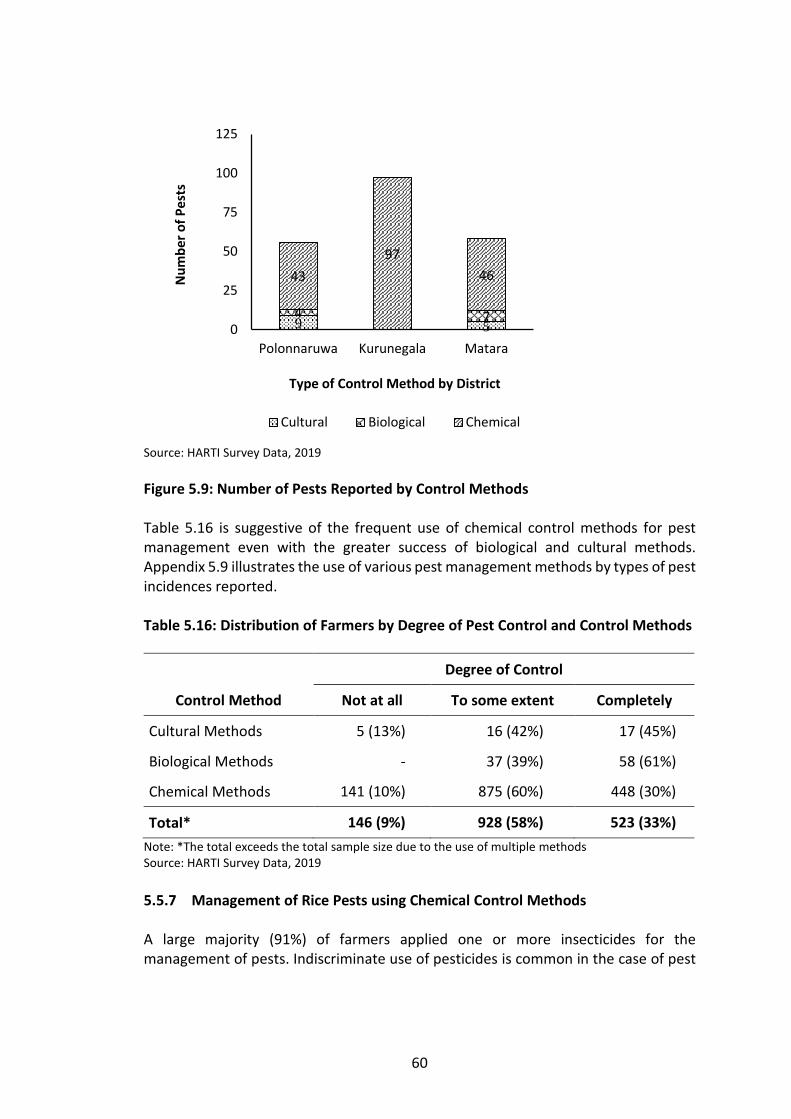
60
Source: HARTI Survey Data, 2019
Figure 5.9: Number of Pests Reported by Control Methods Table 5.16 is suggestive of the frequent use of chemical control methods for pest management even with the greater success of biological and cultural methods. Appendix 5.9 illustrates the use of various pest management methods by types of pest incidences reported. Table 5.16: Distribution of Farmers by Degree of Pest Control and Control Methods
Control Method
Degree of Control
Not at all To some extent Completely
Cultural Methods 5 (13%) 16 (42%) 17 (45%)
Biological Methods - 37 (39%) 58 (61%)
Chemical Methods 141 (10%) 875 (60%) 448 (30%)
Total* 146 (9%) 928 (58%) 523 (33%)
Note: *The total exceeds the total sample size due to the use of multiple methods Source: HARTI Survey Data, 2019
5.5.7 Management of Rice Pests using Chemical Control Methods A large majority (91%) of farmers applied one or more insecticides for the management of pests. Indiscriminate use of pesticides is common in the case of pest
9 54 7
43
97
46
0
25
50
75
100
125
Polonnaruwa Kurunegala Matara
Nu
mb
er o
f P
est
s
Type of Control Method by District
Cultural Biological Chemical

61
management too as certain farmers had used chemicals beyond the recommendations of the DOA as listed in Appendix 5.10. In order to control brown plant hopper and white back plant hopper, farmers mostly used Fenobucarb 500g/l EC (BPMC, Bassa, Dozerr), Imidacloprid 70% WG (Admire), Thiamethoxam 25% WG (Actara), Carbosulfan 20% SC (Marshal), Etofenprox 10% EC (Trebon) and Chlorantraniliprole 20% + Thiomethoxam 20% (Virtako). Further, many used Carbosulfan 20% SC (Marshal) to control brown plant hopper and white back plant hopper, thrips, stem borer and rice bug as per the recommendation. It is important to note that Sulphur 80% WP was also correctly applied to control leaf mite damage. Nevertheless, many had misused insecticides as previously mentioned. For instance, Thiocyclam hydrogen oxalate 50% SP (Evisect) is recommended for plant hopper damage and Thiocyclam 4G (Thiocyclam hydrogen oxalate) is recommended for stem borer damage, but farmers used the Evisect for stem borer damage too. Imidacloprid 70% WG (Admire) was also used by several farmers to control stem borer, although it is not listed in the DOA recommendation (Department of Agriculture, 2015). Further, the economic threshold level of gall midge is 5 per cent damage to the crop. However, farmers consider it is too late for effective control when damage symptoms appear. In disease prevalent areas, it is recommended to treat nurseries 5 days after seeding at 15-20g/10m2 by broadcasting Fipronil 0.3% GR (ATL, Fipronil granules, Diligent 0.3 GR) or Diazinon 5% GR (Basudin, Diazinon) granules on wet mud or into 1cm of standing water 1-2 weeks after transplanting or 1-3 weeks after sowing (Department of Agriculture, 2015). The survey revealed that farmers used a variety of insecticides that are not recommended to control gall midge. Difenacoum 0.005% RB, Coumatetralyl 0.0375% RB, Brodifacoum 0.005% RB, Difethialone 0.0025% RB and Flocoumafen 0.005% RB are recommended by the DOA to control rats in the field from establishment to maturity stage. It is evident that in addition to Difenacoum 0.005% RB (Ratkill), few farmers used different insecticides, which are not recommended to control rats while the same chemical was used to control different pests, which are not recommended by the DOA (Appendix 5.10). The pattern of pesticide application is no exception from the observed pattern in disease management as the majority (68%) applies pesticides followed by the first observation of symptoms without severe damage. Another 29 per cent of farmers wait until the damage develops to a degree beyond which the crop may experience severe damage. Only three per cent apply chemicals before they observe symptoms of pest infestation.
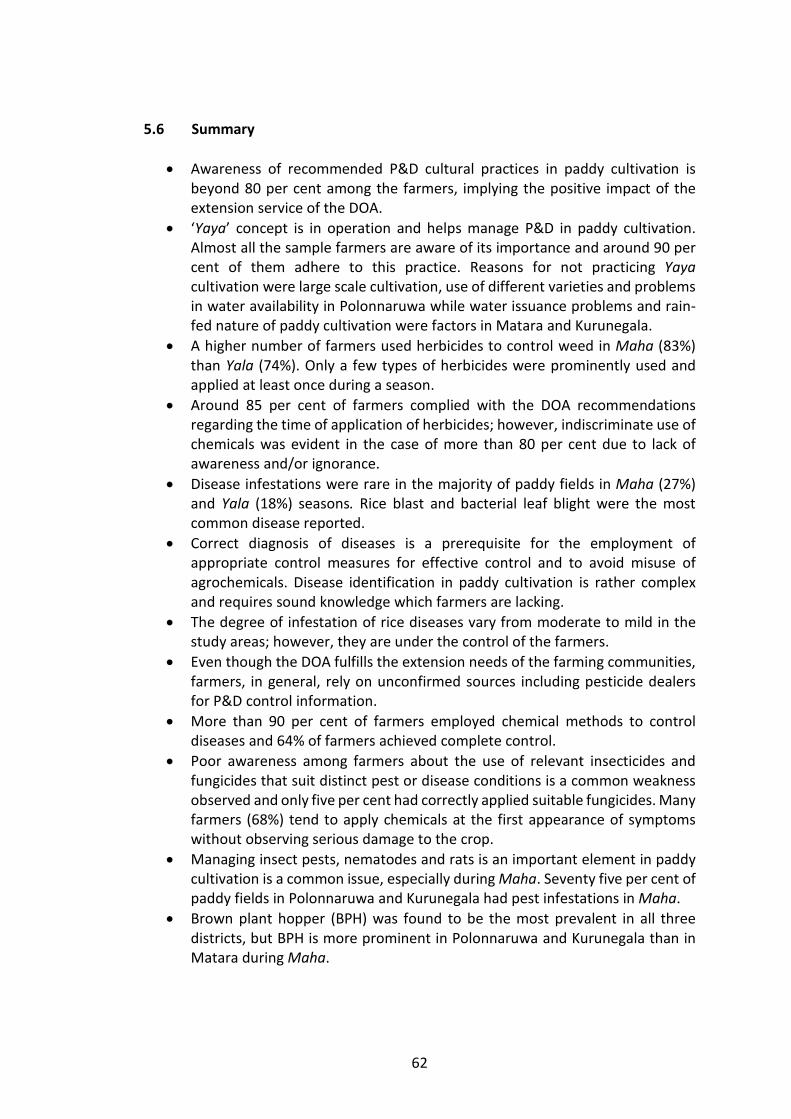
62
5.6 Summary
Awareness of recommended P&D cultural practices in paddy cultivation is beyond 80 per cent among the farmers, implying the positive impact of the extension service of the DOA.
‘Yaya’ concept is in operation and helps manage P&D in paddy cultivation. Almost all the sample farmers are aware of its importance and around 90 per cent of them adhere to this practice. Reasons for not practicing Yaya cultivation were large scale cultivation, use of different varieties and problems in water availability in Polonnaruwa while water issuance problems and rain-fed nature of paddy cultivation were factors in Matara and Kurunegala.
A higher number of farmers used herbicides to control weed in Maha (83%) than Yala (74%). Only a few types of herbicides were prominently used and applied at least once during a season.
Around 85 per cent of farmers complied with the DOA recommendations regarding the time of application of herbicides; however, indiscriminate use of chemicals was evident in the case of more than 80 per cent due to lack of awareness and/or ignorance.
Disease infestations were rare in the majority of paddy fields in Maha (27%) and Yala (18%) seasons. Rice blast and bacterial leaf blight were the most common disease reported.
Correct diagnosis of diseases is a prerequisite for the employment of appropriate control measures for effective control and to avoid misuse of agrochemicals. Disease identification in paddy cultivation is rather complex and requires sound knowledge which farmers are lacking.
The degree of infestation of rice diseases vary from moderate to mild in the study areas; however, they are under the control of the farmers.
Even though the DOA fulfills the extension needs of the farming communities, farmers, in general, rely on unconfirmed sources including pesticide dealers for P&D control information.
More than 90 per cent of farmers employed chemical methods to control diseases and 64% of farmers achieved complete control.
Poor awareness among farmers about the use of relevant insecticides and fungicides that suit distinct pest or disease conditions is a common weakness observed and only five per cent had correctly applied suitable fungicides. Many farmers (68%) tend to apply chemicals at the first appearance of symptoms without observing serious damage to the crop.
Managing insect pests, nematodes and rats is an important element in paddy cultivation is a common issue, especially during Maha. Seventy five per cent of paddy fields in Polonnaruwa and Kurunegala had pest infestations in Maha.
Brown plant hopper (BPH) was found to be the most prevalent in all three districts, but BPH is more prominent in Polonnaruwa and Kurunegala than in Matara during Maha.

63
There are instances where pest attacks, disease infestations and nutrient deficiencies show more or less similar symptoms making it difficult to differentiate from one another. The study also revealed that pest diagnosis is a complicated process and farmers do not diagnose accurately pest events and finally use pesticides indiscriminately to manage the situation.
Application of pest control methods reported by around 70 per cent of farmers was mainly to control brown plant hopper, white back plant hopper, stem borer, leaf folder, gall midge and rat.
AIs were the main source of information sought by farmers to control pests, characterizing the importance of the existing extension service. However, pesticide dealers are the second main source of information.
In pest management, farmers largely depend on chemical control methods. However, the use of cultural and biological control methods, even though to a lesser extent, shows their interest towards chemical-free practices.
More than 90 per cent of farmers applied one or more insecticides to control pests and many had misused insecticides, i.e. without complying with recommendations.
With respect to disease control, 68 per cent of farmers applied pesticides followed by the first observation of symptoms without severe damage by pests.

64

65
CHAPTER SIX
Access to and Use of Mobile-based Tools in Agriculture 6.1 Introduction The mobile phone is a device that’s almost every individual owns. Emerging mobile phone-based applications with recent advancement in ICT play a significant role towards enhancing the knowledge base of the farming communities in many developing countries. Furthermore, this has effected changes in the agricultural communication process recently (Saravanan, 2010). Mobile phone-based applications have contributed to increasing the awareness of farmers, more so than face-to-face interaction with instructors (Ashraf et al., 2018). The traditional way of communication between farmers and AIs is less cost effective and less successful due to a large number of farm families to be served by an AI (Hiriburegama et al., 2013). Accordingly, bridging this information gap using advances in ICT especially through mobile-based applications is a timely need. However, before such interventions can be made available to farmers, their affordability needs to be studied. Therefore, it is a prerequisite to have a thorough understanding of the ground situation concerning the access to and use of mobile phones by the target farming communities. The baseline survey undertaken to fulfill this need gathered information on the use of mobile phones by the sample farmers, the type of mobile network in use, smart phone usage, use of farming-related smart technologies with special emphasis on mobile applications and challenges faced by them while employing those interventions. This chapter presents the above information and related findings. 6.2 Telephone Usage in Sample Households
6.2.1 Types of Telephones Used There are different types of telephones used by individuals at the household level, mainly classified as fixed access telephones and cellular mobile phones. Fixed access telephones are of two types; wireline and wireless phones whereas cellular mobile phones basically feature phones and smart phones. According to the Central Bank of Sri Lanka (2019), there are over 35 million telephone subscribers in Sri Lanka of which 93 per cent are cellular mobile subscribers. When the penetration of mobile phones in the total population is considered, there are 150 mobile subscribers per 100 persons due to multiple phones and/or multiple connections used by a single user. The baseline survey revealed that only 29 per cent of the households (HHs) of the sample had fixed access telephones whilst the large majority of the members of

66
sample HHs (90%) use cellular mobile phones either smart or feature phones. Descriptive responses are suggestive of poor acceptability of fixed access telephones due to difficulties in timely settlement of bills. Even though some smart phones are two or three times more expensive than the installation cost of a fixed access phone, they were hardly seen among the farming communities, probably due to attractive features available in cellular phones such as touch screen, camera, video, radio, sounds for music and a wide range of social media applications. Table 6.1 shows that the number of smart phones used by sample HHs surpasses the number of feature phones irrespective of location. This is partially or totally the result of purposive sampling of HHs with either the farmer or a HH member using smart phones. Data shows that each HH possesses at least one smart phone and a maximum of four. Table 6.1: Distribution of Individuals across Districts by Types of Telephones Used
Types of Telephones Number of Individuals
Polonnaruwa Kurunegala Matara Overall
Fixed access Telephones
Wire-line phones 5 5 8 18 (3%) Wireless phones 12 12 10 34 (7%)
Sub total 17 (9%) 17 (9%) 18 (11%) 52 (10%)
Cellular Mobile Phones
Smart phones 98 88 82 268 (50%) Feature phones 67 78 68 213 (40%)
Sub total 165 (91%) 166 (91%) 150 (89%) 481 (90%) Source: HARTI Survey Data, 2019
6.2.2 Types of Service Providers for Cellular Mobile Phones According to the Telecommunication Regulatory Commission of Sri Lanka (TCRSL) (2019), there are three fixed access telephone service providers and four cellular mobile telephone service providers in Sri Lanka at present (Appendix 6.1), Dialog, Mobitel, Hutch and Airtel. Although Hutch announced that Etisalat was acquired on the 30th of November 2018, Etisalat was listed in TCRSL statistics until September 2019. Survey data also reveals that there were many Etisalat users at the time of field survey, although Dialog and Mobitel were predominant (Figure 6.1). The selection of service providers by the clients depends on several factors. Figure 6.2 depicts the key determinant in choosing the respective brands of cellular mobile phones and that signal strength or the extent to which the network coverage is strong in the area was the prominent reason. Dialog and Mobitel had been chosen because of the undoubted brand popularity. Mobile phone costs and the services provided by

67
each service provider are the next important factors. Furthermore, service quality, early adoption, internet-friendly usage had also been considered while choosing the service provider.
Source: HARTI Survey Data, 2019
Figure 6.1: Distribution of Subscribers by Cellular Service Providers
Source: HARTI Survey Data, 2019
Figure 6.2: Distribution of Subscribers Reporting Reasons for Choosing Cellular Service Providers
48 5144 48
2930 44 34
0%
20%
40%
60%
80%
100%
Polonnaruwa Kurunegala Matara Overall
Pe
rce
nta
ge o
f Su
bsc
rib
ers
Types of Cellular Service Providers by District
Dialog Mobitel Hutch Airtel Etisalat
54
44
56
38
64
25
26
17
18
11
9
12
18
19
14
8
14
4
23
1
4
4
5
2
10
0% 20% 40% 60% 80% 100%
Dialog
Mobitel
Hutch
Airtel
Etisalat
Percentage of Responses by Reasons
Typ
e o
f Se
rvic
e P
rovi
de
r
Signal strength Popular among community Low cost Many network services Other

68
6.2.3 Household Expenditure on Telephone Use Average monthly telephone expenditure of a farm HH is estimated to be Rs.1681. The corresponding mean monthly expenditure values are not significantly different across districts (F (2, 165) = 0.434, p > 0.05) (Appendix 6.2). Figure 6.3 is suggestive of monthly expenditure exceeding Rs. 1500 by around 50 per cent of farm HHs as telephone charges. The analysis further establishes a significant association between monthly telephone expenditure and the number of telephones used by a sample HH (r (166) = 0.362, p<0.001). Moreover, statistics reveal that mean monthly telephone expenditure is eight per cent of the monthly expenditure of a farm HH whereas it is six per cent concerning over 50 per cent of sample HHs.
Source: HARTI Survey Data, 2019
Figure 6.3: Distribution of Farm Households by Total Expenditure on Telephones The average internet cost of a farm HH is around Rs. 500 (Rs.504) and there exists a significant difference in average internet cost across districts due to relatively high cost reported (Rs. 701) from Polonnaruwa district (F (2, 165) = 7.080, p < 0.05). Pearson correlation test further reveals a strong correlation between call charges and internet charges in farm HHs (r (166) = 0.888, p<0.001). It implies that those who spend more on phone calls tend to spend more on the internet as well. 6.3 Use of Smart Mobile Phones by Sample Farmers The intervention by this project is a mobile application named Ladybird and it is accessible only via smart phones. Hence, the discussion below categorically focuses on mobile phones related to the exposure of sample farmers.
6 7 5 6
40 43 47 43
40 38 29 36
13 13 19 15
0%
25%
50%
75%
100%
Polonnaruwa(n=52)
Kurunegala(n=56)
Matara(n=58)
Overall(n=52)
Pe
rce
nta
ge o
f Fa
rm F
amili
es
Total Expenditure on Telephone Use by District
<500 500<1500 1500<3000 >=3000
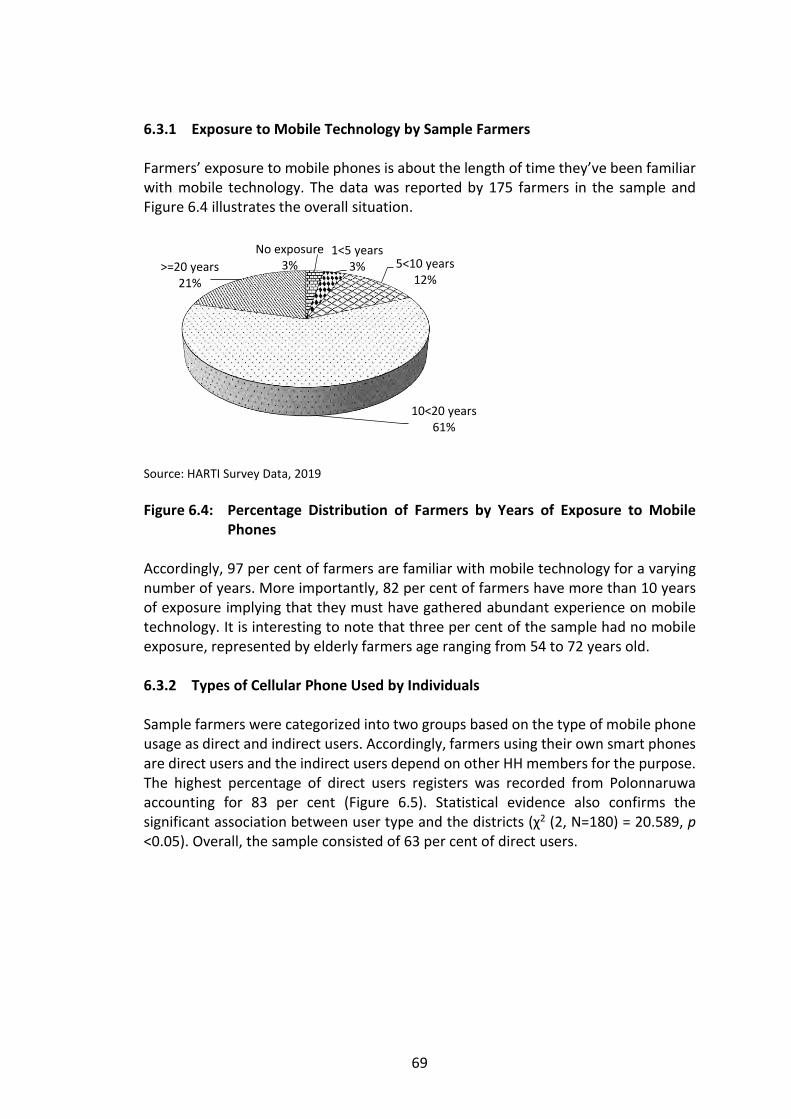
69
6.3.1 Exposure to Mobile Technology by Sample Farmers Farmers’ exposure to mobile phones is about the length of time they’ve been familiar with mobile technology. The data was reported by 175 farmers in the sample and Figure 6.4 illustrates the overall situation.
Source: HARTI Survey Data, 2019
Figure 6.4: Percentage Distribution of Farmers by Years of Exposure to Mobile Phones
Accordingly, 97 per cent of farmers are familiar with mobile technology for a varying number of years. More importantly, 82 per cent of farmers have more than 10 years of exposure implying that they must have gathered abundant experience on mobile technology. It is interesting to note that three per cent of the sample had no mobile exposure, represented by elderly farmers age ranging from 54 to 72 years old. 6.3.2 Types of Cellular Phone Used by Individuals Sample farmers were categorized into two groups based on the type of mobile phone usage as direct and indirect users. Accordingly, farmers using their own smart phones are direct users and the indirect users depend on other HH members for the purpose. The highest percentage of direct users registers was recorded from Polonnaruwa accounting for 83 per cent (Figure 6.5). Statistical evidence also confirms the significant association between user type and the districts (χ2 (2, N=180) = 20.589, p <0.05). Overall, the sample consisted of 63 per cent of direct users.
No exposure3%
1<5 years3% 5<10 years
12%
10<20 years61%
>=20 years21%

70
Source: HARTI Survey Data, 2019
Figure 6.5: Distribution of Farmers across Districts by User Type 6.3.3 Purpose of Using Smart Mobile Phones The telephone was historically invented to communicate with each other, but technology has improved and has provided unimaginable options to cater to the diverse needs of the people. Smart phone technology is one of the cutting-edge inventions of the current era providing a vast range of opportunities. Even though this study aimed to introduce a mobile application through smart mobile phones, there still exists a considerable gap between options available in smart phones and the purpose of use by the farmers. The sample survey also reveals that the majority of direct users (94%) (n=113) use smart phones for conversation purposes (for in and out calls) (Figure 6.6).
83%
62%
43%
63%
17%
38%
57%
37%
0
23
45
68
90
Polonnaruwa Kurunegala Matara Overall
Pe
rce
nta
ge o
f Fa
rme
rs
Mobile Phone User Type by District
Direct user Indirect user

71
Source: HARTI Survey Data, 2019
Figure 6.6: Distribution of Farmers by Purpose of Using Smart Phones In addition, short message service (SMS), news services, Google map as well as social media platforms such as Facebook, YouTube and WhatsApp are popular among more than 50 per cent of smart phone users in the sample. They have utilized the phones as an entertainment and education tool too. Latest trends such as mobile banking, online shopping and online reservation including e-channeling, hotel and travel booking are still the least used mobile services by the sample farmers. The data reported leads to presume that there is potential for poor adoption of the latest technology such as mobile applications similar to Ladybird. 6.3.4 Use of Internet by Sample Farmers Internet access is essential for the use of the mobile application introduced under this project and therefore farmers, who possess smart phones, were inquired during the baseline survey about the frequency of internet use. It is remarkable to note that 96 per cent smart phone user farmers from Polonnaruwa use the internet. However, a considerable portion in the other two districts has no access to the internet (19% in Kurunegala and 31% in Matara) as illustrated in Figure 6.7.
4%
6%
7%
30%
46%
54%
50%
67%
71%
94%
0 25 50 75 100
Online shopping
Mobile banking
Online Reservation
Education
Entertainment
News or information
Google map
Social media
SMS
Call
Percentage of Farmers
Pu
rpo
se o
f U
sin
g Sm
art
Ph
on
e

72
Source: HARTI Survey Data, 2019
Figure 6.7: Distribution of Farmers by Frequency of Internet Use The difference in internet use across districts is statistically significant too (χ2 (4, N=113) = 15.883, p<0.05). The corresponding mean monthly internet expenditure across districts (Rs.442 in Polonnaruwa; Rs.200 in Kurunegala and Rs.230 in Matara) also establishes a significant difference (F (2, 106) = 10.427, p < 0.05) owing to relatively increased expenditure among farmers in Polonnaruwa. The location-specific difference reported is a challenging situation towards achieving the project objectives.
Box 6.1: Experience of Using Mobile Phone by a Farmer from Kamburupitiya
Source: HARTI Survey Data, 2019
4227
829
5454
61
56
419
3115
0%
20%
40%
60%
80%
100%
Polonnaruwa(n=50)
Kurunegala(n=37)
Matara(n=26)
Overall(n=113)
Pe
rce
nta
ge o
f Fa
rme
rs
Frequency of Internet Use by District
Frequent use Infrequent use Zero use
I started cultivating paddy at age 16. Initially, I had a feature phone and used it for a long period. If I remember correctly, in the year 2017 my elder son gave me his second-hand smart phone, so I gave my feature phone to my wife. Using a smart phone is an interesting experience with many features such as camera, video and radio. However, I faced many difficulties in handling the smart phone in various occasions. As I usually wear a sarong, it is difficult to carry the phone safely while undertaking farming activities. There are many unforgettable incidences related to using smart phones. Once when I was attending a farmer organization’s meeting, the phone started to ring loudly, and I was unable to make it silent. Again, on the day of land preparation, I missed a very important call from the Divisional Secretariat because I kept the phone far away from the paddy field, concerned about its safety. Then, I decided to take the smart phone wherever I go but it ended up falling into the mud. With this incident, I was again inclined to use a feature phone. Now when I work in the paddy field, I cover the phone in polythene to make sure that it is safe.

73
6.4 Awareness and Use of Mobile Phones for Agricultural Purposes There are many telephone-based novel extension approaches introduced by the government and private entities especially targeting farming communities. Mobile phones act as a key mode of disseminating information due to the availability of evolving technologies and tools. Those tools can be broadly categorized as mobile calls, mobile applications and mobile websites as described in the forthcoming sections.
6.4.1 Awareness and Use of Agriculture Related Mobile Calls Sample farmers were inquired about their knowledge and use of agriculture-related mobile call services such as the 1920 call centre of the Department of Agriculture (DOA), 6666 Mobitel agri-price information index of HARTI and 616 Dialog Govi Mithuru service. Figure 5.8 illustrates the percentage distribution of farmers by awareness and use of the above mobile call advisory services.
Source: HARTI Survey Data, 2019
Figure 6.8: Distribution of Farmers by Awareness and Use of Agriculture Related Mobile Calls
As evident in Figure 6.8, the 1920 call centre of the DOA is the most known mobile advisory service accounting for 73 per cent of the sample farmers who are predominantly paddy farmers. Out of them, around 27 per cent have sought the assistance of the service at least once. The Dialog Govi Mithuru advisory service is also popular among 36 per cent with approximately one-third of them using the service at least once. HARTI 6666 daily price index is both the least known and least used. The DOA has its regional offices all over the country, and its key focus is on food crop
73%
11%
36%
27%
1%
13%
0
20
40
60
80
DOA 1920 HARTI 6666 Dialog Govi Mithuru616
Pe
rce
nta
ge o
f Fa
rme
rs
Awareness and Use of Agriculture Related Mobile Calls
Awareness Use

74
production and well-being of the farmers. Therefore, the intervention implemented through the department has wider outreach than any other call services owing to popularization by extension officials. It includes several favorable features such as personal assistance with live contact, toll-free service, the possibility of repeated conversations with previously contacted officials and wider accessibility from all networks. The study showed that paddy farmers are eager to get technical assistance through such services. However, the Dialog Govi Mithuru is a relatively new intervention and HARTI 6666 call service provides only price-related information. The above information is further supported by the data in Figure 6.9, since many farmers (64%) had sought information on P&D management and technical support for crop cultivation (58%). The provision of the above information is mandatory to the DOA and is thus provided through 1920 call centre. Market and weather information is supposed to be less important to paddy farmers whereas land-related information is an important priority. Farmers are not adequately aware of the call services (46%), consider such services to be non-essential (16%) and have the insufficient technical knowledge to use them (14%). All these constitute challenges to be overcome before employing advanced IT applications in agriculture.
Source: HARTI Survey Data, 2019
Figure 6.9: Distribution of Farmers by Reasons for using Agriculture related Mobile Calls
2%
6%
11%
20%
58%
64%
0 18 35 53 70
Knowledge enhancement
Weather information
Price and marketing information
Land related issues
Technical information on crop cultivation
Pest and disease information
Percentage of Farmers
Re
aso
ns
for
usi
ng
Agr
icu
ltu
ral
Re
late
d M
ob
ile C
alls

75
Box 6.2: Experience of Farming Related Mobile Calls by a Farmer from Medirigiriya Source: HARTI Survey Data, 2019
The case teaches few lessons; farmers do prioritize advisory services based on the farming needs; seek for cost-effective means; ground-level affairs and transactions are decisive in the use of advisory services, advisory services with a live touch are rather effective and trustworthy and there is a long way to use highly automated systems by the farming communities.
We are aware of the DOA 1920, HARTI 6666 and Dialog Govi Mithuru services. On the one hand we as paddy farmers know the prevailing paddy prices very well and therefore aren’t very much interested in HARTI 6666 to get price information. On the other hand, many farmers have to sell their harvest to the agreed buyers from whom we obtain seed paddy, agrochemicals and credit to manage the cultivation. Most of us have no real choice whereas a few farmers store paddy and bargain for prices. Therefore, we do not consider price details too much. In addition, HARTI 6666 and Dialog 616 services are automated and difficult to follow. However, with regard to the DOA 1920 service, we can personally communicate with the officer to convey our concerns and get solutions. Moreover, we can ask the name of the advisor and contact them again if the same issue arises. This service is also free of charge. Therefore, it is easier and more cost-effective than the automated systems with advanced technology which we are not very familiar with. Indeed, I was 41 when I had the first telephone and by 49 had the first smart phone. The situation of using mobile phones is almost similar among the rest of the farmers in this area.

76
6.4.2 Awareness and Use of Farming Related Mobile Applications
Source: HARTI Survey Data, 2019
Figure 6.10: Distribution of Farmers Awareness and Use of Agriculture Related Mobile Applications
A number of locally initiated mobile applications by the government and private entities are currently available while plenty of international mobile applications are also accessible to the local farming communities. Whilst the DOA predominates in developing agriculture-related mobile applications, there were around eight applications in operation at the time of field survey. Hela Bojun and Govi Vedaduru were comparatively popular among sample farmers but none of them knew about plant treater and AIMS (Agricultural Information Management System) Sinhala mobile applications which have been introduced by the DOA. However, farmers were poorly aware of all those applications and the usage was even less as indicated in Figure 6.10. The awareness of mobile applications developed by private entities such as Dialog Govi Mithuru and Govipola are known by the farmers to a certain extent, but their usage was low. Globally accessible mobile applications such as Agrio, Sowing calendar, Land area and CF (Carbon Footprint) calculator are popular among less than one per cent of sample farmers. Figure 6.11 displays awareness and use of popular agriculture-related mobile applications by a number of farmers in the sample districts. A relatively higher number of Polonnaruwa farmers were aware of Govi Mithuru, Govipola, Hela Bojun and Govi Vedaduru applications but the number of users remains
119
2 2 1 1
21
11
3 2 1 1 0 0
5
1
0
5
10
15
20
25
Hel
a B
oju
n
Go
vi V
ed
adu
ru
Kru
shi A
dvi
sor
SL G
AP
Bo
ga P
uro
kath
anay
a
Hel
a N
utr
itio
n
Go
vi M
ith
uru
Go
vip
ola
Government apps Private apps
Pe
rce
nta
ge o
f Fa
rme
rs
Awareness and Use of Agriculture Related Mobile Applications
Awareness Use

77
very low in all districts. It is also important to note that according to extension officials, the Dialog - Govi Mithuru application was trialed among farmers in Polonnaruwa and DOA - Govi Vedaduru was trialed in Kurunegala.
Source: HARTI Survey Data, 2019
Figure 6.11: Distribution of Farmers by Awareness and Use of Agriculture Related Mobile Applications
Moreover, Figure 6.12 shows that farmers use mobile applications mainly to obtain crop production-related technical information (79%) and P&D information (43%). As challenges exist while using mobile calls, major problems for mobile application use includes lack of awareness of available mobile applications (55%), poor technical knowledge on using mobile technology (33%) and the perception that it is not essential need for their farming activity (14%).
19
13
10
15
3 32
1
9
0
35
20 0 0
10
7
34 4
31 1
0
5
10
15
20
Govimithuru
Helabojun
Govivedaduru
Govipola Govimithuru
Helabojun
Govivedaduru
Govipola
Awareness Use
Nu
mb
er
of
Farm
ers
Awareness and Use of Agriculture Related Mobile Applications by District
Polonnaruwa Kurunegala Matara

78
Source: HARTI Survey Data, 2019
Figure 6.12: Distribution of Farmers by Reasons for Using Agriculture Related Mobile Applications
6.4.3 Awareness and Use of Mobile Websites Despite a low percentage of farmers being aware of and browsing farming-related mobile websites, it can be observed that they do access several distinct websites. The official DOA website is the most browsed website by the sample farmers accounting for 31 per cent of awareness and 11 per cent of use (Figure 6.13). Use of agriculture-related YouTube channels (9%) and Facebook pages (3%) was also reported. Further, the DOA initiated Wikigoviya website that consists of Agripedia and Agri forum as well as the Croplook website providing early warnings for paddy and vegetable producers have also received attention from the farming community recently.
79
43
29
14
7
7
0 20 40 60 80 100
Technical information on crop cultivation
Pest and disease information
Land related issues
Price and marketing information
Home gardening information
Knowledge enhancement
Percentage of Farmers
Re
aso
ns
for
Usi
ng
Mo
bile
Ap
plic
atio
ns

79
Source: HARTI Survey Data, 2019
Figure 6.13: Distribution of Farmers by Awareness and Use of Agriculture related Websites
Most of the above-mentioned websites are rich in agricultural knowledge and act as a learning tool for many interested parties. According to Figure 6.14, the large majority of farmers (94%) browse websites to reach technical information relating to crop cultivation while 34 per cent reported that P&D information was accessed. As indicated under both the above tools, mobile calls and mobile applications, farmers face similar issues with mobile websites too, with 54 per cent being unaware of the websites, 33 per cent having technical knowledge of browsing websites and 13 per cent who consider knowledge from mobile websites was not essential for their farming activities.
31
10
3 3 2
119
3 2 1
0
10
20
30
40
DOA officialwebsite
Youtubechannels
Facebookpages
Wikigoviya Croplook
Pe
rce
nta
ge o
f Fa
rme
rs
Awareness and Use of Agriculture Related Mobile Websites
Awareness Use
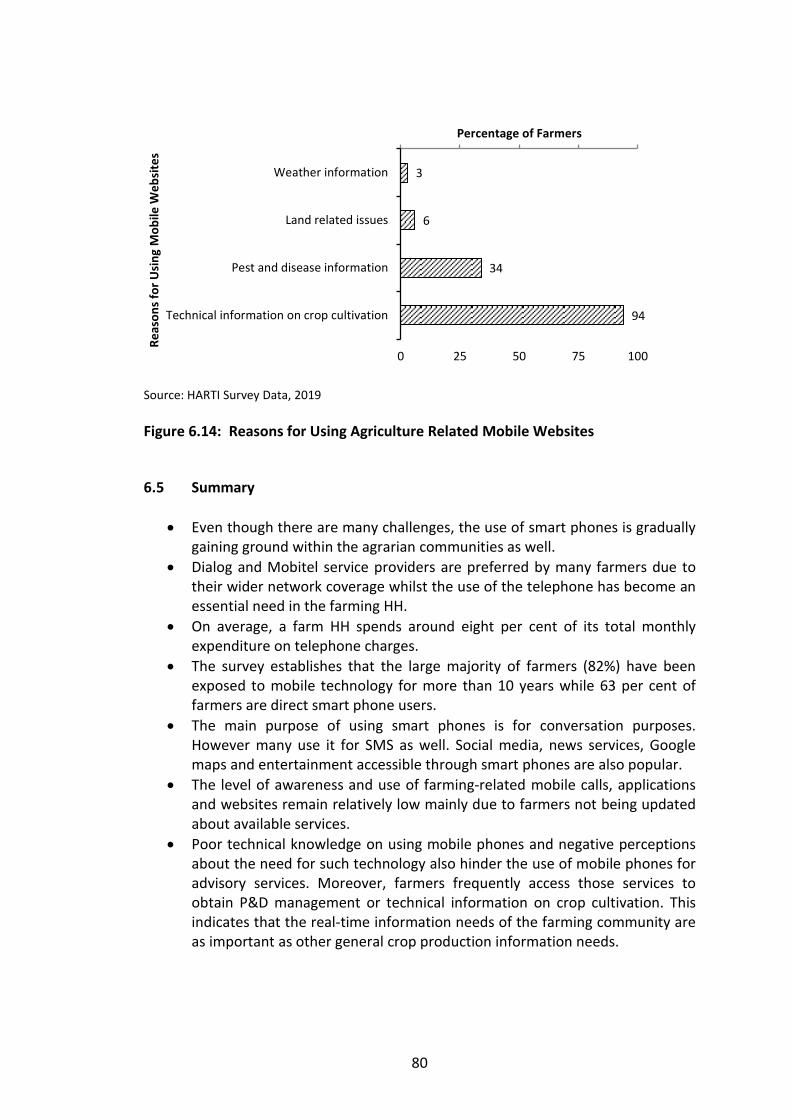
80
Source: HARTI Survey Data, 2019
Figure 6.14: Reasons for Using Agriculture Related Mobile Websites
6.5 Summary
Even though there are many challenges, the use of smart phones is gradually gaining ground within the agrarian communities as well.
Dialog and Mobitel service providers are preferred by many farmers due to their wider network coverage whilst the use of the telephone has become an essential need in the farming HH.
On average, a farm HH spends around eight per cent of its total monthly expenditure on telephone charges.
The survey establishes that the large majority of farmers (82%) have been exposed to mobile technology for more than 10 years while 63 per cent of farmers are direct smart phone users.
The main purpose of using smart phones is for conversation purposes. However many use it for SMS as well. Social media, news services, Google maps and entertainment accessible through smart phones are also popular.
The level of awareness and use of farming-related mobile calls, applications and websites remain relatively low mainly due to farmers not being updated about available services.
Poor technical knowledge on using mobile phones and negative perceptions about the need for such technology also hinder the use of mobile phones for advisory services. Moreover, farmers frequently access those services to obtain P&D management or technical information on crop cultivation. This indicates that the real-time information needs of the farming community are as important as other general crop production information needs.
3
6
34
94
0 25 50 75 100
Weather information
Land related issues
Pest and disease information
Technical information on crop cultivation
Percentage of Farmers
Re
aso
ns
for
Usi
ng
Mo
bile
We
bsi
tes

81
SECTION THREE
Deployment of Ladybird

82

83
CHAPTER SEVEN
Deployment Status of Ladybird Mobile Application 7.1 Introduction Initially, it was envisaged that Ladybird would be deployed among 180 farmers from Polonnaruwa, Kurunegala and Matara during the 2019/2020 Maha season. However, the sample size was adjusted owing to practical issues faced during the field deployment. This chapter is about the deployment and use of Ladybird by the beneficiaries for P&D reporting with practical issues associated with the mobile solution. 7.2 Adjusted Sample Data in Table 7.1 shows an increase from the baseline situation to deployment with a post-deployment decline. Initial interest among farmers to join the project declined due to practical difficulties, especially limited access to smart phones. Installation of Ladybird was constrained due to incompatible versions of mobile phones and usage being restricted due to weak signals as further discussed in the forthcoming sections. As such, the post-deployment sample comprised of the farmers who had successfully installed Ladybird. Table 7.1: Distribution of Sample Farmers at Different Stages of Project
Implementation
District Sample Size by Stage of Project Implementation
Baseline Deployment Post-Deployment Post-Evaluation
Polonnaruwa 60 71 37 32
Kurunegala 60 74 39 36
Matara 60 61 40 -
Total 180 206 116 68
Source: HARTI Survey Data, 2019/2020 Maha
7.3 Installation of Ladybird Several methods were used during the deployment of Ladybird from group sessions and individual physical contact to over the phone contact. Initially, Ladybird was deployed among the farmers in Matara, followed by Kurunegala and finally in Polonnaruwa. The installation continued for almost nine weeks from 02.12.2019 to

84
02.02.2020 (Figure 7.1). It is worth mentioning that it took almost seven weeks to deploy among half of the deployed sample however, the rest completed within two weeks. Experience and lessons learnt from the installation methods employed in Matara and Kurunegla districts helped rapid deployment in Polonnaruwa.
Source: HARTI Survey Data, 2019/2020 Maha
Figure 7.1: Number of Installation of Ladybird over Week since Deployment Figure 7.2 illustrates the reasons for installation failure across districts. The key reason is the inaccessibility of farmers. Overall 41 per cent of farmers were inaccessible due to not attending the group sessions, moving out from the area, unavailability at the time the team visited the home, and inability to reach them via given contact details. In Matara, Ladybird was initially introduced to farmer groups in the Kamburupitiya ASC area. Those who did not attend group sessions were approached individually. The individual approach employed in the Akuressa ASC in Matara district helped reduce the rate of inaccessibility to five per cent of the sample farmers.
21 25 25
44 44 48
62
99
116
0
30
60
90
120
1 2 3 4 5 6 7 8 9
Nu
mb
er
of
Inst
alla
tio
n
Week from Deployment Started
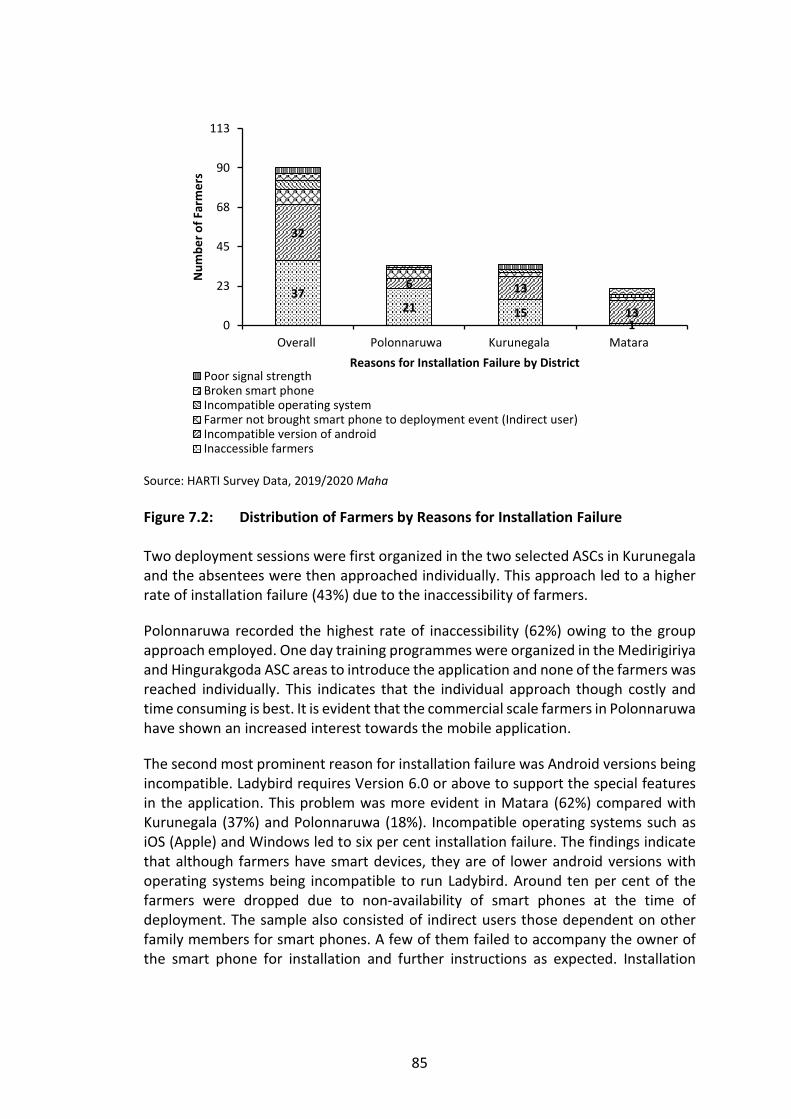
85
Source: HARTI Survey Data, 2019/2020 Maha
Figure 7.2: Distribution of Farmers by Reasons for Installation Failure Two deployment sessions were first organized in the two selected ASCs in Kurunegala and the absentees were then approached individually. This approach led to a higher rate of installation failure (43%) due to the inaccessibility of farmers.
Polonnaruwa recorded the highest rate of inaccessibility (62%) owing to the group approach employed. One day training programmes were organized in the Medirigiriya and Hingurakgoda ASC areas to introduce the application and none of the farmers was reached individually. This indicates that the individual approach though costly and time consuming is best. It is evident that the commercial scale farmers in Polonnaruwa have shown an increased interest towards the mobile application.
The second most prominent reason for installation failure was Android versions being incompatible. Ladybird requires Version 6.0 or above to support the special features in the application. This problem was more evident in Matara (62%) compared with Kurunegala (37%) and Polonnaruwa (18%). Incompatible operating systems such as iOS (Apple) and Windows led to six per cent installation failure. The findings indicate that although farmers have smart devices, they are of lower android versions with operating systems being incompatible to run Ladybird. Around ten per cent of the farmers were dropped due to non-availability of smart phones at the time of deployment. The sample also consisted of indirect users those dependent on other family members for smart phones. A few of them failed to accompany the owner of the smart phone for installation and further instructions as expected. Installation
3721 15
1
32
6 13
130
23
45
68
90
113
Overall Polonnaruwa Kurunegala Matara
Nu
mb
er
of
Farm
ers
Reasons for Installation Failure by DistrictPoor signal strengthBroken smart phoneIncompatible operating systemFarmer not brought smart phone to deployment event (Indirect user)Incompatible version of androidInaccessible farmers

86
failed among four per cent of the farmers due to broken smart phones and three per cent due to poor signal strength. 7.4 Use of Ladybird for P&D Reporting in 2019/2020 Maha Season The module for P&D reporting plays a pivotal role in Ladybird. Despite the above challenges, farmers in the sample made a conscious effort to learn and exercise the P&D reporting module. The reporting process included five specific steps with several options for the farmer to choose as indicated in the images in Figure 7.3. These make it more convenient for the farmer when it comes to selecting the matching options for the P&D observed in the field and facilitating the relevant AI to get a clear and consistent depiction of the P&D reported.
Step 1: To provide information of the growth stage of the crop i.e. seedling stage, tillering stage or reproductive stage.
Step 2: To provide information on the affected part i.e. leaves, stem, whole plant,
roots. Step 3: To provide information on symptoms observed i.e. if the leaves are chosen in
Step 2, Step 3 would include a list of possible symptoms to choose such as spindle-shaped lesions with whitish to gray centres and red to brownish margin; curled from the margin to the middle with silvery streaks or yellowish patches; white or transparent patches with pinholes and distorted leaves; silvery white hollow tube or onion leaf or silver shoot; white streaks parallel to the midrib with irregular translucent white patches; transparent whitish streaks with tubular folded leaves; water-soaked to yellow-orange stripes on leaf with a wavy margin and progress toward the leaf base; small, water-soaked, linear lesions between leaf veins starts from dark green and later become light brown; small, circular, yellow brown or brown lesions; irregular lesions with gray-white centres and brown margins; zonate lesions of alternating light tan and dark brown starting from leaf tips or edges.
Step 4: To provide information on the distribution of symptoms i.e. random single
plant, random group of plants, uniformity over distribution, marginal, strip, circular distribution.
Step 5: Upload images with notes.

87
Source: Ladybird Mobile Application, 2020
Figure 7.3: Steps in Reporting P&D Events in Ladybird
Step I: Growth stage Step II: Affected part Step III: Symptoms
observed
Step III: (Continued.) Step IV: Symptoms
distribution Step V: Upload images
with notes

88
Of the post deployment sample, reporting trend was varied among districts. Polonnaruwa farmers predominate in P&D reporting. Crop losses due to heavy rains and upgrading of the application resulted in less reporting in Matara. In Kurunegala, the reason was mid-season deployment. Overall, the use of Ladybird by the farmers was largely restricted due to lack of technical assistance to run the application. Moreover, the research team was unable to make field visits as planned due to the pandemic situation. Even though, technical instructions were provided over the phone, a few farmers were possible to use Ladybird for reporting P&D events. Both direct and indirect users were involved in P&D reporting. Therefore, not owning a smart phone is not a matter of concern; a community approach is possible and can be encouraged for the popularization of mobile applications similar to Ladybird. Relatively young farmers in the age category of less than 40 years showed greater interest in P&D reporting. Furthermore, many P&D reports were about the vegetative growth stage. In many instances the choice on the affected part was leaves. The rest was about the stem and the panicle. Most P&D reports were not confirmed by the AIs by looking at the images and information. The confirmation was based on further communication between the AI and the farmer. This means that the discussion element in the application was important. Even though the P&D identification system was developed with the involvement of rice scientists, farmers failed to report accurately based on the five-step reporting process mentioned above. The P&D report sent by the farmer is the input for the AI to choose the particular P&D issue from the staff application as the system automatically sends the information on P&D diagnosis and the corresponding IPM practices. The report containing this information is called ‘Confirmed reports’. The message appears as ‘Pending reports’ until final confirmation. There were many pending reports because some farmers give up responding to AIs in the middle of reporting due to lack of interest and in other instances because minor P&D occurrences did not require further action. The number of reports varied by distinct P&D occurrences; brown plant hopper, leaf folder, whorl maggot, stem borer and thrips were the frequently reported pests. The number of reports confirmed on diseases also varied; bacteria leaf blight, rice blast, and sheath blight were the commonly reported diseases.

89
7.5 Challenges of Deployment
Deployment challenges could be traced to three sources; mobile application, farmer and the extension officers. 7.5.1 Mobile Application-Related Issues
Operating System of Mobile Phones: Ladybird was only compliant with android operating systems (OS) which are the common OSs of the smart mobile phones use by the majority of project beneficiaries. However, there are phones with other OSs such as iOS (Apple) and Windows which Ladybird is not compatible with. Therefore, developing mobile applications that can operate with multi OSs is essential for wider popularization of Ladybird type mobile applications among farmers.
Android Version of Mobile Phones: Ladybird is compatible only with android versions above 6.0 due to the interactive features of the application. Many mobile phones used by farming community are older versions.
Mobile Networks: Availability of different service providers with varying degrees of signal strength severely affected the smooth use of Ladybird.
Internet Facilities: Internet facilities are essential for the interactive elements of Ladybird. However, farmers are not used to regular use of internet due to cost and unfamiliarity. Therefore, application should be developed to have offline access at least with already stored information.
Upgrading the Application: Even after deployment among farmers, Ladybird needed upgrading several times in order to meet farmers’ requirements. However, the majority of farmers weren’t too familiar with the technology and therefore they faced difficulties in upgrading the mobile solution and gave up when there is no external assistance.
Usability: The advanced knowledge repository available in the application apparently did not appeal to farmers. Content should be easy and simple to enable farmers to easily understand.
Missing Information: Minor P&D like black beetle and hispa are omitted from the P&D reporting system and farmers were curious regarding such information as well. Therefore, the content should be further enriched with the information of minor P&Ds to make the application perfect.
7.5.2 Farmer Related Issues
Reporting P&D: P&D reporting showed certain shortcomings due to lack of images attached, poor capturing of images and submission of complicated images, trying to solve several issues through a single reporting and giving up the process if further discussion is necessary.
Internet Facility: Use of internet is not a common due to the high cost of internet charges.

90
7.5.3 Issues Related to Extension Officials Extension officials are overworked: Busy schedules of extension officers do not
permit them to responding to P&D reports sent by farmers. Unfamiliarity of application: Extension officers feel more comfortable with
telephone conversations rather than mobile application; therefore, there was a tendency to contact the farmer to solve the issue instead of responding through the mobile application.
Farmers dislike further communication: Farmers dislike lengthy discussions over vague questions generated by the system such as ‘provide more explanation’. This makes farmers reluctant to continue the discussion. Therefore, proper training is essential for the officers to deal with the situation and how to be specific in asking questions.
English version of staff application: Ladybird staff application is only available in English which makes it difficult to grab the information at once (for some officers). Therefore, multi-language content is necessary.
7.6 Summary
The individual approach to install the application is the most successful method compared to group and over the phone techniques even though it is not effective in terms of time and cost. Out of the total sample, 56 per cent of farmers were able to install the application successfully.
Among the accessible farmers, incompatible version of the android, being indirect user, incompatible operating system and poor signal were the major issues. Among them, most of the issues were related to the individual, but the signal or network connectivity cannot be solved without the support of the firms which deal with the mobile networking. Furthermore, individual issues indicate that there is a need for support to use of smart mobile phones by farmers.
It was evident in Polonnaruwa that commercial farmers were more interested about the application than the rest of the farmers and their engagement in reporting P&D was also higher (41%).
Even though P&D reporting was higher by direct smart phone users, statistical tests confirmed that being a direct or indirect user was not significant.
Relatively young farmers, i.e farmers below 40 years, reported higher than the rest of the farmers indicating the importance of introducing the technology to the youth.
Farmers encountered P&D issues mainly during the seedling or vegetative growth stage accounting for 83 per cent of reports where leaf was the main affected part indicated by farmers in identifying the symptoms of P&D.
In addition, detecting the P&D using the system was not easy, considering that 71 per cent of reports were submitted subsequent to discussions with the AI to determine the issue. Only 36 per cent of reports included correct diagnosis of the symptoms by the farmers, indicating that there is a high probability of misdiagnosis by farmers at the reporting stage.
Finally, resolved reports either directly or via discussion confirmed that the success rate of the application was 52 per cent.
91
SECTION FOUR
Post Evaluation

92
93
CHAPTER EIGHT
Post Evaluation on Ladybird Mobile Application 8.1 Introduction Post-deployment evaluation of the Ladybird application was conducted with respect to 2019/2020 Maha, but only in Kurunegala and Polonnaruwa since the majority of the sample farmers in Matara district were not engaged in paddy cultivation during due to adverse weather condition. Furthermore, field visits were restricted on account of the Covid-19 pandemic situation and therefore it had to be a simplified version of the exercise and was limited to over-the-phone interviews. The post deployment sample in the two districts comprised 76 farmers but only 68 were contactable via phone. Hence post evaluation sample was eventually limited to 36 farmers from Kurunegala and 32 from Polonnaruwa. The information gathered covered farmers’ experience and opinions of P&D incidence and reporting, benefits derived through and the problems faced while using Ladybird and finally the overall assessment of the mobile application. 8.2 Response towards P&D Reporting Throughout the cultivation season, only 55 (83%) farmers noted P&D incidence. Polonnaruwa farmers were severely affected by Brown Plant Hopper infestation which led to a huge loss of farm income. Further, an outbreak of stem borer occurred during the same period. The majority of farmers who experienced P&D in their fields were of the opinion that the P&D reporting module of the mobile application and regular notifications sent by the system helped them immensely in accurate diagnosis. However, only 29 paddy farmers (45%) had used Ladybird for P&D reporting. It is remarkable to note that reporting is significantly associated with the location and the age of the respondent, the younger being more responsive. Farmers needed to understand and be familiar with reporting module, choosing answers from several options related to stage of the crop, symptoms and distribution. Also, it is necessary to upload clear images of symptoms to minimize the discussion with the AI at the other end of the line. In this manner, the paddy farmers are likely to improve their knowledge as well. Once a farmer reports the P&D event, the respective AI had the responsibility to respond immediately to solve the problem before it escalates. It is noteworthy to highlight that 28 out of 29 paddy farmers who reported their problem received a response. Enhancing connectivity between the farmer and the AI in this manner can certainly strengthen the agricultural extension service. Out of 29 reporting farmers, the majority (93%) were satisfied with the responses given by the
94
respective AI regarding the pesticides and chemicals that need to be applied as remedies. The respective AI could communicate with the farmer asking several more questions and photographs to verify the exact pest or disease before giving his/her response. This is a two-way communication process and farmers were highly impressed on this element which was executed through the staff version of the mobile application. 8.3 Benefits Derived through Ladybird The prime objective of Ladybird is to optimize P&D management in paddy cultivation through an integrated approach which incorporates all favorable cultural practices, biological control methods and finally chemical control methods only as a last resort. Around 75 per cent of the farmers (43) believe that Ladybird refreshed and improved their knowledge on the accurate diagnosis of P&D since they were able to identify symptoms correctly and instantaneously through the mobile application. However, 53 per cent of the farmers (24) stated that Ladybird helped them to select pesticides by reading the information uploaded according to DOA recommendations though paddy farmers are used to applying pesticides based on experience and as instructed by pesticide dealer. Of the total post evaluation sample of 68, 22 farmers (49%) had followed recommendations regarding pesticides indicated in the mobile application. Another adverse effect of the influence of pesticide dealers who promote and encourage the application of pesticides is that farmer has to pay the prices they set for chemicals. Sixteen farmers (36%) had used the information given in the mobile application to minimize the use of chemicals and thereby to cut down the cost of pest control. Furthermore, it was evident that although several inexpensive pesticides are recommended in the mobile application, farmers had chosen the ones they were more familiar with albeit at a higher cost. Meanwhile, 17 paddy farmers (37%) had been able to lessen the frequency of pesticide application. 8.4 Constraints Encountered in Using Ladybird Mobile Application Knowledge dissemination was simple enough to attract both young and older farmers. Nevertheless, it is clear that adult farmers should have a certain extent of knowledge to deal with mobile technology. It is the farmers’ opinion that Ladybird is easy to deal with and to become familiar with. Hence, the majority of the paddy farmers (72%) did not encounter any complexity in managing Ladybird (Figure 8.1). Farmers, as the ground level actors, were of the view that there should be a simple and easily understood way of grasping P&D management information. Thus each and every module was presented in a simple and understandable manner with no

95
language barriers. Around 80 per cent of the farmers stated that they did not encounter difficulty in understanding the information.
Source: HARTI Survey Data, 2019/2020 Maha
Figure 8.1: Farmers’ Opinions about the Constraints of Ladybird The majority (90%) perceived that there was quick and timely response from the relevant AI. The staff version of Ladybird ensured continuous contact with the farmers and helped avoid frequent field visits by AIs. They saved time and avoided unnecessary details in the case of responding to cases where farmers lived a considerable distance away from them. Thus, the application shows excellent potential to be strengthening the agricultural extension system. The information on cultivation practices and advice given through Ladybird was highly appreciated by 76 per cent of paddy farmers who said that they attempted to apply them practically. The consideration of a wide variety of remedies for P&D management including cultural practices, biological control methods, IPM practices along with all the agronomic practices in paddy cultivation was considered to be highly advantageous. It ensured a wide array of choices for the farmers when selecting among possible alternative. They could make choices, in other words, to suit available resources, maximizing benefits at a lower cost. 8.5 Overall Assessment on Ladybird Mobile Application Ninety seven percent of the farmers in the evaluation sample opined that Ladybird was very useful for paddy cultivation especially in P&D management. The overall assessment was based on three parameters; the simple way of information presented; ease of use and ease in become familiar with it. Young farmers in the sample perceived
8 12 3 7
7280 90 76
208 7
17
0%
20%
40%
60%
80%
100%
Complexity ofmethodology of
using the LadybirdApp.
Difficulty inundesrtanding of theinformation includedin the Ladybird App.
Not on timeresponsing for thepest and disesase
reports
Difficulty in practicaluse of given advices
and cultivationpractices
Pe
rce
nta
ge o
f Fa
rme
rs
Opinion about Constraints
Yes No Uncertain
96
that Ladybird would help them to acquire the spirit of paddy farming which runs with modern technology. Regular notification, P&D identification information and IPM practices were the most popular features of Ladybird, they stated. Only three per cent stated that it is not useful since they already knew the cultivation practices with their gathered knowledge and life time experience. The majority, however, had engaged with Ladybird on a daily basis and applied useful information from daily notifications. Even though P&D outbreaks were less during the 2019/2020 Maha season, 85 per cent of paddy farmers preferred to have a mobile application for P&D management information. They were also keen on gathering information of new P&D occurrences through a mobile application. They believed that this would enable timely intervention in protecting their paddy fields against P&D outbreaks and reduce the cost of pesticides since there are many cultural, biological and physical remedies as opposed to chemical methods. At present the number of mobile applications available for paddy in Sri Lanka is negligible. They are not operating well under the current context and confined to certain localities. Like in other countries, paddy farmers are willing to move forward with technological innovation and in this context a mobile application like Ladybird has immense significance. This need has been confirmed by the majority (87%) of the post evaluation sample. They need, however, to have a proper training and hands on experience on similar mobile applications, especially in the case of elderly paddy farmers.

97
Box 8.1: Experience of a Farmer Using the Ladybird Mobile Application
Source: HARTI Survey Data, 2019/2020
A commercial scale, 59 years old farmer from Hingurakgoda, started using a mobile phone at the age of 45. He had passed the GCE A/L examination and his primary source of livelihood is paddy farming. He is also engaged in non-farm income-earning activities as well. He represents several community based organizations at the village level such as Farmers’ Organization, Death Benevolence Society and Civil Defense Committee while being the current president of the Farmers’ Organization of his village. He had experienced a considerable loss in harvest and income during the past several seasons. Incomes in general had fallen due to the BPH outbreak, but the farmers had not realized that a fungal infestation accompanied the BPH attack. At the time of harvesting they realized that fungus has destroyed the entire Yaya, but were not visible until the end. He believes that BPH, the fungal attack and climatic influence caused the yield reduction which was experienced throughout the district. He stated, ‘Ladybird mobile application is a life saver in such circumstances’. Satisfied with the responses he received through the mobile application for his P&D reporting with images, the way the discussion has been organized and the regular reminders, he acknowledged the effort made to introduce Ladybird. He said’ ‘the notifications alert me about tasks that had slipped my mind’. He further said it was a magical moment when he went through the specific information with respect to his different farm plots and admitted that he played around the mobile application during the early stage of crop and gathered vast knowledge on farming practices of which he hadn’t been aware of even though he had engaged in farming since childhood. Usually farmers consult an AI to find out what some of the diseases are, he said. Otherwise, when they go to the market and look at the information and immediately find the details. However, with Ladybird, they do not need to go anywhere but can get farm specific information with one finger tap. He also observed that the application lists out all possible chemicals with trade names and recommended dosages. This was very valuable, he stated. He further confirmed that the use of pesticide was reduced to a large extent thanks to the application, as they had previously predicted and applied chemical at first sight. He was satisfied overall with the content, features and orientation of the application and anticipated diversification of the application to cover other crops as well.

98
8.6 Summary
During the 2019/2020 Maha season, 83 per cent of sample paddy farmers observed at least one pest or one disease, in particular brown plant hopper and stem borer outbreaks were evident in Polonnaruwa.
A positive outcome of this exercise is that 90 per cent of the sample had used it to identify P&Ds. Forty five per cent of the farmers sent P&D reports by uploading photographs of the symptoms and answering several questions appearing in the P&D module. This feature helped the farmer improve knowledge on P&D identification.
The evidence of the responses received reveals the importance of creating a platform shared by the farmer and the agriculture instructor (AI) as a means of strengthening the conventional extension service and improving it. The two-way communication process was encouraged to identify P&Ds using the module in the Ladybird mobile application.
This Ladybird mobile application enhanced the knowledge of the paddy farmers (75%) in terms of P&D identification and persuaded them to practice physical and biological control methods rather applying several chemicals. This module is most popular among the young farmers since they can grasp the new knowledge and update the current knowledge on P&D management.
With respect to choosing pesticides, this mobile application was found to be useful to more than the half of the sample paddy farmers (53%). Of the total sample, 49 per cent followed pesticide recommendations disseminated through this mobile application. This helped reverse the trend of overusing pesticides and also pesticide cocktails.
Of the total sample, 36 per cent followed the information given on measures to reduce pesticide cost and 37 per cent reduced the frequency of pesticide application.
No issues were encountered by the majority (72%) since this mobile application is user-friendly. Presentation of information in a simple and understandable way made it equally accessible to everyone. Language was not a major constraint since the information was uploaded in Sinhala.
Older farmers needed some kind of assistance in operating the smart phones as they weren’t adept at embracing new technological devices such as smart phones.
On time responses for the P&D reports was important since it facilitates the two-way communication. The staff version of this mobile application speeded up the responding, avoided frequent field visits, and reduced time consumption and difficulty in visiting far away fields.
Seventy six per cent of the sample paddy farmers appreciated the practicability and the provision of information, particularly the agronomic practices, cultural, physical, biological and chemical control methods and integrate pest management (IPM) practices.

99
The Ladybird mobile application is an important and useful mobile application for paddy cultivation particularly for P&D management in paddy according to 97 per cent of the respondents. Other reasons for the popularity, as stated by respondents, are that information was given in a simple manner and easy to use.
It was more popular among young paddy farmers since they believe that they could enhance their knowledge with current updates and use advanced modern technology.
Of the total sample, 85 per cent preferred to have a mobile application like Ladybird to obtain information since they are eager to know about on new outbreaks of pests and diseases in order to protect their fields. They were of the view that such tools were useful when using cultural, biological and physical control methods to reduce pesticide application and cost of pesticides.
Despite many mobile applications for paddy being confined to particular areas, 87 per cent of respondents were willing to have a mobile application which provides information on paddy cultivation. For such a mechanism to be successful, however, they need to be properly trained.

100
101
SECTION FIVE
Concluding Remarks

102

103
CHAPTER NINE
Conclusions and Recommendations 9.1 Conclusions In general, the diagnosis of P&D in paddy is rather complex as similar symptoms appear in pest attacks, disease infestations and nutrient deficiencies. This makes it difficult to differentiate one from the other and therefore it requires a thorough knowledge which farmers lack. Thus there is a knowledge gap among the farmers, as revealed by the baseline survey reveals. Given this background, the primary objective of this project was to develop the capacity of farmers to fill the knowledge gaps in P&D management with the dissemination and adoption of mobile based technology developed through a collaborative effort. Even though it was challenging to successfully deploy mobile solution named ‘Ladybird’ and for the comprehensive post-evaluation due to COVID-19 pandemic situation prevailed in the country, the baseline situation outlined below points to the fact that P&D management in paddy is inefficient to the extent that a rapid solution is required.
‘Over 80 per cent farmers are aware of the recommended cultural practices to prevent P&D occurrences and around 90 per cent of farmers adhere to ‘Yaya’ practice knowing its importance in managing P&D. Undesirably, the large majority of paddy farmers apply herbicides in both seasons (80% in Maha and 74% in Yala) at least once. Though timing of herbicide application is on par with DOA recommendations, over 80 per cent of the farmers exceed recommended rates.’
‘The risk of diseases in paddy is relatively low however. Over 90 per cent of the affected farmers employ chemical methods and achieve a 64 per cent rate of control. These are obvious indications farmers prioritize and are satisfied with chemical methods for disease control. The fact that only five per cent of farmers are successful in applying the correct fungicide and use the correct dosage leads to conclude that farmers are lacking in appropriate knowledge regarding the correct use of inputs for disease control. In such a situation, more than two-thirds of farmers (68%) tend to apply chemicals at the first appearance of the symptoms with another two per cent applying them even before symptoms become apparent.
‘The pest problem is a common issue in paddy cultivation especially during the Maha season. Reportedly, 75 per cent of paddy fields are infested. Pest management also depends largely on chemical control methods and over 90 per cent of farmers apply one or more insecticides including non- recommended ones. Here too it is common for the majority of farmers

104
(68%) to apply pesticides upon observing symptoms even in cases where there isn’t severe damage.’
Even though the DOA is mandated to serve the knowledge needs of the farming community, there are clear gaps in optimizing P&D management. A significant number of farmers (49% and 47% farmers respectively for pest and disease management information) depend on unconfirmed sources for P&D management information. Pesticide dealers are the frontline actors typically. The dealer knows that the farmer prefers the best remedy, regardless of price. It is perceived that the better the remedy, the higher the cost. This pleases the farmer and promotes the pesticide trade. One key reason for this state of affairs is that the farmer does to receive the right information and necessary support with respect to P&D related problems; in other words, the lack of swift access to formal extension service or the failed extension coordination at the field level. Every piece of this information tells the tragedy of local paddy cultivation relying on toxic mineral pesticides. Ladybird, which ensures swift access to real-time P&D management information by affected farmers, is proven to be a better alternative to solve the problem of failed coordination relating to P&D management not only in paddy cultivation but within the entire food crop sector as well. Ladybird technology is ideal to strengthen the link between farmers and the extension service. In the midst of great difficulties, Ladybird was deployed amongst the farmers and the lessons learnt can be listed as answers to four major questions; (a). How well does Ladybird adapt to local field conditions? (b). Does the farming community have the capacity necessary to embrace the technology? (c). How do extension personnel respond to it? and (d). What is the status of Ladybird from the end user angle? (a) How well does Ladybird adapt to local field conditions? Ladybird is equipped with an interactive module for P&D management on a real-time basis and requires strong signal strength to make it work properly. However, the field situation is far below the expected level. It is a prerequisite for the deployment of Ladybird that each farm household has smart phones to enable farmers to access the service. It was a great advantage that the selected farm households met this requirement by having one to four smart phones which are accessible to the farmer either directly (63%) or indirectly (37%). Another vital necessity for the successful deployment is signal strength. The choice between two popular services providers in the study locations was largely based on signal strength but not necessary brand popularity, cost factor, service quality, early adoption, and internet-friendly usage.

105
Despite the high prevalence of mobile telephones among the country's population as a whole, poor signal strength in certain pockets remained a major obstacle for successful deployment. Therefore, introducing mobile solutions in such a restrictive environment is ineffective and outweighs many of the strengths typical of mobile solutions. The responsibility lies with the state to encourage public and private enterprises, individually or jointly, to establish communication infrastructure in the rural setting to cover the entire farming community. The pandemic has also taught the world that developing a country's communications infrastructure is more important than ever. (b) Does the farming community have sufficient capacity to embrace the
technology? The availability of smart phones alone is insufficient to make use of the mobile application. It requires a certain degree of technical knowhow and willingness to use. Conventionally, most farmers were using their mobile phones for simple tasks including in and outcalls, short messages, browsing social media and news alerts. Due to high cost, the use of internet was limited in general. But internet usage was also high among those who made more calls. Of the three main types of agriculture related mobile solutions released, the use of mobile applications has been largely use to glance through technical information on crop cultivation (79%) with relatively less interest (43%) in P&D management information. Restricted use of mobile calls and accessing websites were due to poor awareness of such e-solutions, poor knowledge on using mobile technology and attitudinal constraints. These factors hindered the success of Ladybird. Under all these circumstances, the ability to instantly derive benefits from an interactive tool such as Ladybird was found to be low. Therefore, it must be noted that most of the paddy sector farmers are not competent enough to take advantage of an interactive ICT tool like Ladybird. As such, the failures ascertained through the responses obtained from the post-deployment sample could not only be attributed to the unfavorable conditions prevailed in the country but may also have been due to negative attitudes concerning the necessity of those solutions for farming activities. The solution lies with the technical empowerment of farmers to take advantage of a digitized system. The agricultural extension service can help familiarizing the farming community about e-solutions as prioritized by the present government. Furthermore, the environment of the agrarian service centres (ASC) is not conducive to adding a reasonable value to the farm household through mobile applications. Therefore, a shift in the prototype of the ASCs is a prerequisite. The ASC needs to be transformed into an e-landscape which facilitates farming in a real-time manner. Nevertheless, the purposive sample revealed some favorable features too. It comprised of youth and middle-aged mostly full-time farmers who grow paddy in both

106
seasons with relatively higher education. Moreover a large majority (82%) had been exposed to mobile technology for over ten years. A marked involvement in CBOs (92%) was a sign of their greater capacity to influence the community about the mobile solution or, put another way, facilitate horizontal diffusion among neighbouring farmers. Farmers’ land ownership and high income levels indicate their ability use the internet without interruption as well as the ability to purchase mobile phones that are compatible with the mobile solution. More importantly, they showed a greater interest on Ladybird, especially the large scale paddy farmers from Polonnaruwa who secure higher production revealed a greater attentiveness. All these are favorable signs for a vitality of interactive mobile solutions like Ladybird in the future. (c) How do extension personnel respond to it? The general perception of the extension personnel is that the real-time link between the farmer and the AI coupled with the participatory diagnosis process would ensure correct diagnosis of P&D events leading to minimized diagnostic errors. The recommendations of control measures generated by the system would lead to optimize P&D control through the right choice of agrochemicals, applying them at the right time based on recommendations leading to minimize both the misuse of agrochemicals and dependence on inappropriate sources of information for P&D management. Though the number of end users of Ladybird was limited, on time responses for the P&D reports was an important milestone as it demonstrated the ability to facilitate two-way communication between farmers and extension agents through swift response to reports via the staff version without field visits whilst saving time and other resources. AIs believe that all of the above were accomplished with the limited opportunities available. (d) Ladybird from the end user angle? In the early stages of the project, the farming community had high hopes and was excited about the interactive feature of Ladybird for P&D management. The message about Ladybird was horizontally diffused among the farming community and farmers were keen about the wealth of information it contained from seed rates for different establishment methods and a range of cultural practices for P&D management. Farmers believed that P&D is one of the causes of crop loss in paddy cultivation where the vital contribution of Ladybird with real-time information in managing P&D was considered to have great potential. They were convinced that the crop information module would act as a tool for environmental regulation as it guides farmers to first prevent P&D occurrences in the existing crop and then in future events and finally to minimize the use and misuse of mineral pesticides as reported in the baseline survey.
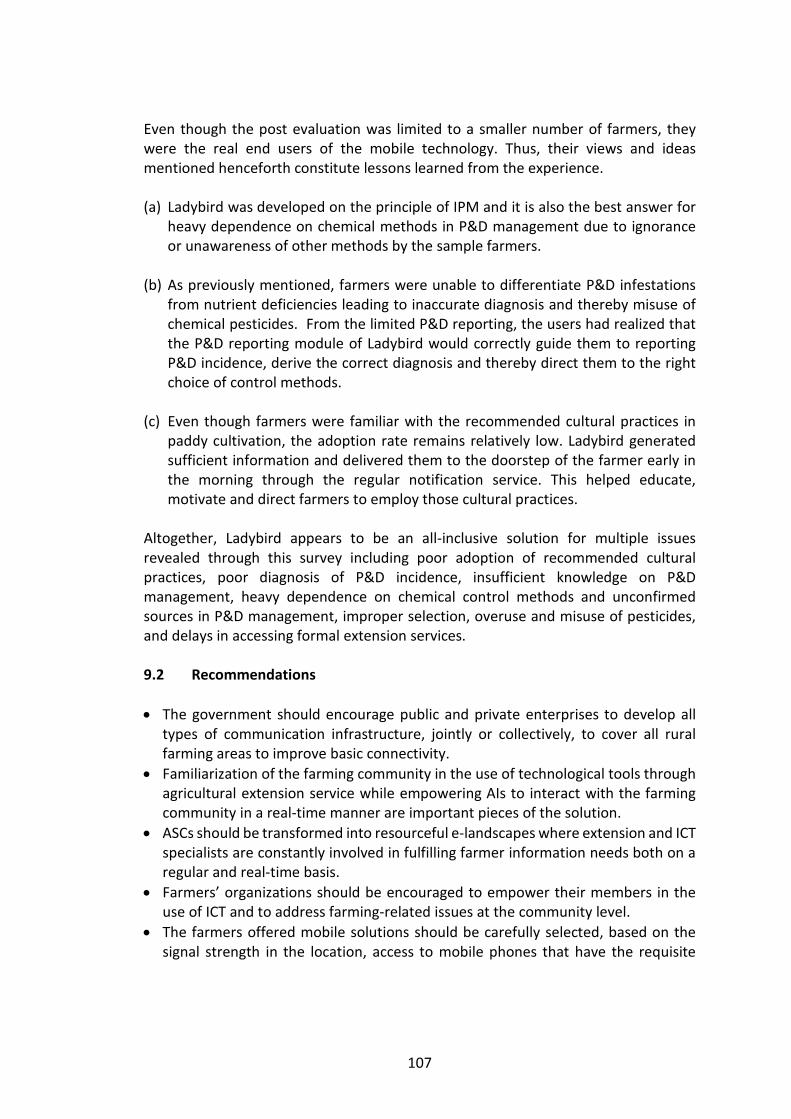
107
Even though the post evaluation was limited to a smaller number of farmers, they were the real end users of the mobile technology. Thus, their views and ideas mentioned henceforth constitute lessons learned from the experience. (a) Ladybird was developed on the principle of IPM and it is also the best answer for
heavy dependence on chemical methods in P&D management due to ignorance or unawareness of other methods by the sample farmers.
(b) As previously mentioned, farmers were unable to differentiate P&D infestations
from nutrient deficiencies leading to inaccurate diagnosis and thereby misuse of chemical pesticides. From the limited P&D reporting, the users had realized that the P&D reporting module of Ladybird would correctly guide them to reporting P&D incidence, derive the correct diagnosis and thereby direct them to the right choice of control methods.
(c) Even though farmers were familiar with the recommended cultural practices in
paddy cultivation, the adoption rate remains relatively low. Ladybird generated sufficient information and delivered them to the doorstep of the farmer early in the morning through the regular notification service. This helped educate, motivate and direct farmers to employ those cultural practices.
Altogether, Ladybird appears to be an all-inclusive solution for multiple issues revealed through this survey including poor adoption of recommended cultural practices, poor diagnosis of P&D incidence, insufficient knowledge on P&D management, heavy dependence on chemical control methods and unconfirmed sources in P&D management, improper selection, overuse and misuse of pesticides, and delays in accessing formal extension services.
9.2 Recommendations
The government should encourage public and private enterprises to develop all types of communication infrastructure, jointly or collectively, to cover all rural farming areas to improve basic connectivity.
Familiarization of the farming community in the use of technological tools through agricultural extension service while empowering AIs to interact with the farming community in a real-time manner are important pieces of the solution.
ASCs should be transformed into resourceful e-landscapes where extension and ICT specialists are constantly involved in fulfilling farmer information needs both on a regular and real-time basis.
Farmers’ organizations should be encouraged to empower their members in the use of ICT and to address farming-related issues at the community level.
The farmers offered mobile solutions should be carefully selected, based on the signal strength in the location, access to mobile phones that have the requisite

108
features, affordability of internet facilities, and competence in using/adopting mobile technology and deployment, followed by intensive training on running the applications.
Mobile app users need to be monitored closely to resolve possible problems and to understand further opportunities and potential areas of development, for instance the improvement of the notifications module to address farming related problems that require immediate attention/solutions.
The government should take steps towards an uncompromising effort to streamline and accelerate the development of a digital platform to link even the most remote farming areas with extension services through a single, all-inclusive application for farmers and relevant stakeholders.
9.3 Potential Areas for Further Research Given the above information and analysis, it is clear that Ladybird has a promising future and can be further strengthened by incorporating information on inputs, produce and markets with respect to all crops. It is, according to Ginige et al. (2016) a digital knowledge eco system, an all-inclusive single mobile app that manage the entire value chain of crops. The Government should initiate a similar attempt to cater to diverse needs of the farmers as well as consumers especially under the confined environment due to the pandemic situation worldwide.
The above conclusions indicate that the importance of interlinking policy, technology and institutions. Therefore, these basic necessities should be addressed in advance for wider popularization of mobile applications and in general towards a move towards a digital system of agriculture as envisaged in stated policy priorities.

109
REFERENCES Ashraf, E., Shurjeel, H.K. and Iqbal, M. (2018) ‘Creating Awareness Among Farmers for
the Use of Mobile Phone Cellular Technology for Dissemination of Information Regarding Aphid (Macrosiphum Miscanthi, Hemiptera, Aphididae) Attack on Wheat Crop’. Sarhad Journal of Agriculture, 34(4), pp. 724-728.
Central Bank of Sri Lanka (2019) Annual Report 2018. Colombo: Central Bank of Sri Lanka.
Chandrasena, S. and Gunapala, R. (2019) Pest and Disease Identification Flow for Ladybird Mobile Application. Minutes of study meeting 26 March 2019, Hector Kobbekaduwa Agrarain Research and Training Institute, Colombo, Sri Lanka.
De Silva, P.C.J. (2011) Agricultural Extension in Domestic Sector: Problems, Weaknesses and Suggestions for Improvement. Agrarian Journal. 15 (1).
Department of Agriculture (2015) Pest Management Recommendations. Peradeniya: Department of Agriculture.
Department of Agriculture (2017) Paddy Cultivation. Peradeniya: Department of Agriculture.
Department of Agriculture (2019) Performance Report 2018. Peradeniya: Department of Agriculture.
Department of Census and Statistics (2018) Household Income and Expenditure Survey - 2016. Colombo: Department of Census and Statistics. Available at: http://www.statistics.gov.lk/[Accessed 08 January 2020].
Ginige, A., Walisadeera, A.I., Ginige, T., De Silva, L., Di Giovanni, P., Mathai, M., et al., (2016) Digital Knowledge Ecosystem for Achieving Sustainable Production: A Case Study from Sri Lanka. In: 2016 IEEE International Conference on Data Science and Advanced Analytics (DSAA). IEEE. pp. 602–11.
Hiriburegama, K., Vidanapathirana, N.P., Ho, K.J. and Hiriburegama, W.K. (2013) ‘E-tools for developing nations for lifelong learning: A social responsibility of higher education institutes – A case ctudy in Sri Lanka’, (Ed) Hitchcock, J., Hitchcock, L & Kaskenpalo, P. (2013) FICAP-1 Proceedings Collaborative Academic Programme as a Contribution to Developing Nations, pp. 46-55, Universal Publishers, USA.
http://www.harti.gov.lk/images/download/reasearch_report//217.pdf
Jayasooriya, H.J.C. and Aheeyar, M.M.M. (2015) Application of Integrated Pest Management (IPM) in Vegetable Cultivation: Past Experiences and Suggestions for Promotion. Colombo: Hector Kobbekaduwa Agrarian Research and Training Institute.

110
Munaweera, T.P. and Jayasinghe, J.A.U.P. (2017) Farmer Perception and Demand for Pesticide in Rice Cultivation of Sri Lanka. Colombo: Hector Kobbekaduwa Agrarian Research and Training Institute.
Pimentel, D., Acquay, H., Biltonen, M., Rice, P., Silva, M., Nelson, J., Lipner, V., Giordano, S., Horowitz, A. and D’Amore, M. (1993) ‘Assessment of environmental and economic impacts of pesticide use’. In: Pimentel D., Lehman H. (eds) The Pesticide Question. Springer, Boston, MA.
Piyasena, K., (2009) ‘Integrated pest management activities in Sri Lanka’. In: Alam, S. and Ahmed, A., editors. Integrated Pest Management in SAARC countries. Dhaka: SAARC Agriculture Centre. pp. 199-221.
Rosenzweig, C., Iglesias, A., Yang, X. B., Epstein, P.R. and Chivian, E. (2001) ‘Climate Change and Extreme Weather Events’. Global Change & Human Health, 2(2), 90–104.
Saravanan, R., (2010) (Ed.) ICTs for Agricultural Extension: Global Experiments, Innovations and Experiences. New Delhi: New India Publishing Agency (NIPA).
Taylor, M.C. and Clampett, W.S. (2002) ‘Developing weed management strategies to achieve effective weed control in rice in New South Wales, Australia’. In J.E. Hill, & B. Hardy (Eds.), Proceedings of the Second Temperate Rice Conference. pp. 603-614.
Telecommunications Regulatory Commission of Sri Lanka (2019) Statistics – ‘Cumulative Number of Licenses granted under Section 17 of the Sri Lanka Telecommunications Act No 25 of 1991 as amended’ Colombo: Telecommunications Regulatory Commission of Sri Lanka. Available at: http://www.trc.gov.lk/images/pdf/statis_q4_03032020.pdf.
Vidanapathirana R., Champika J., Rambukwella R. and Wijesooriya N. (2018) Quality and Safety Issues in Fruit and Vegetable Supply Chains in Sri Lanka: A Review. Colombo: Hector Kobbekaduwa Agrarian Research and Training Institute.
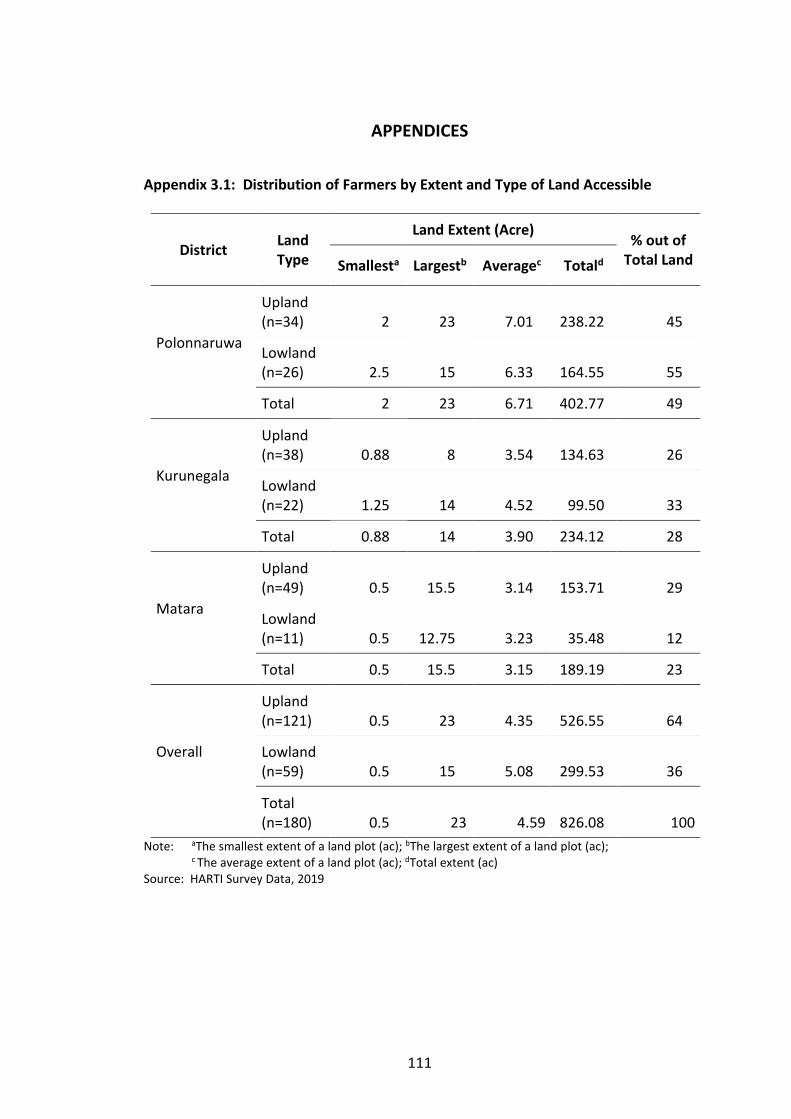
111
APPENDICES
Appendix 3.1: Distribution of Farmers by Extent and Type of Land Accessible
District Land Type
Land Extent (Acre) % out of
Total Land Smallesta Largestb Averagec Totald
Polonnaruwa
Upland (n=34) 2 23 7.01 238.22 45
Lowland (n=26) 2.5 15 6.33 164.55 55
Total 2 23 6.71 402.77 49
Kurunegala
Upland (n=38) 0.88 8 3.54 134.63 26
Lowland (n=22) 1.25 14 4.52 99.50 33
Total 0.88 14 3.90 234.12 28
Matara
Upland (n=49) 0.5 15.5 3.14 153.71 29
Lowland (n=11) 0.5 12.75 3.23 35.48 12
Total 0.5 15.5 3.15 189.19 23
Overall
Upland (n=121) 0.5 23 4.35 526.55 64
Lowland (n=59) 0.5 15 5.08 299.53 36
Total (n=180) 0.5 23 4.59 826.08 100
Note: aThe smallest extent of a land plot (ac); bThe largest extent of a land plot (ac); c The average extent of a land plot (ac); dTotal extent (ac)
Source: HARTI Survey Data, 2019

112
Appendix 4.1: Field Establishment Methods and Nursery Practices Employed across Districts and Cultivation Seasons
Establishment method
Polonnaruwa Kurunegala Matara Total
Maha Yala Maha Yala Maha Yala Maha Yala
Broadcasting 58 57 46 44 39 39 143 (80%)
140 (83%)
Transplanting 2 2 14 8 20 19 36 (20%)
29 (17%)
Nursery type
Lowland nursery
0 0 1 0 3 1 4 1
Dapog nursery 0 1 0 0 10 10 10 11
Machine transplanting
0 0 1 1 7 7 8 8
Parachute 2 1 12 7 0 1 14 9
Source: HARTI Survey Data, 2019
Appendix 4.2: List of Paddy Varieties Cultivated by Farmers
Duration Variety Name
3 months Bg 300, Bg 350, Bg 310, At 308, At 307
3 ½ months Bg 94-1, Bg 358, Bg 359, Bg 360 (Keeri Samba), Bg 366, At 373, At 362, Bw 363, Bw 364, Bw 367, Bw 372, Ld 368
4 months Bg 403 (Mahasen), Ld 408
4 ½ months Bg 379-2, Bg 450
Source: HARTI Survey Data, 2019
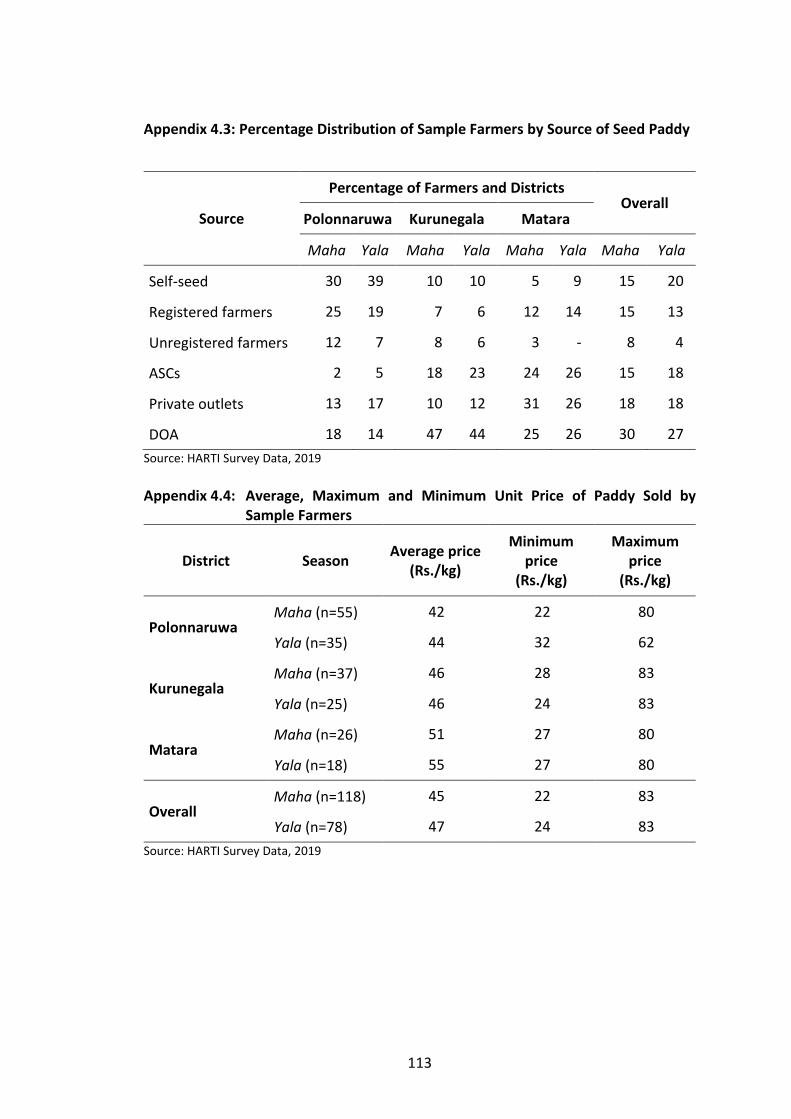
113
Appendix 4.3: Percentage Distribution of Sample Farmers by Source of Seed Paddy
Source
Percentage of Farmers and Districts Overall
Polonnaruwa Kurunegala Matara
Maha Yala Maha Yala Maha Yala Maha Yala
Self-seed 30 39 10 10 5 9 15 20
Registered farmers 25 19 7 6 12 14 15 13
Unregistered farmers 12 7 8 6 3 - 8 4
ASCs 2 5 18 23 24 26 15 18
Private outlets 13 17 10 12 31 26 18 18
DOA 18 14 47 44 25 26 30 27
Source: HARTI Survey Data, 2019
Appendix 4.4: Average, Maximum and Minimum Unit Price of Paddy Sold by
Sample Farmers
District Season Average price
(Rs./kg)
Minimum price
(Rs./kg)
Maximum price
(Rs./kg)
Polonnaruwa Maha (n=55) 42 22 80
Yala (n=35) 44 32 62
Kurunegala Maha (n=37) 46 28 83
Yala (n=25) 46 24 83
Matara Maha (n=26) 51 27 80
Yala (n=18) 55 27 80
Overall Maha (n=118) 45 22 83
Yala (n=78) 47 24 83
Source: HARTI Survey Data, 2019

114
Appendix 5.1: Percentage Distribution of Farmers by Awareness and Adoption of Recommended Practices in Paddy Cultivation
Source: HARTI Survey Data, 2019
Recommendation
Polonnaruwa (% of Farmers)
Kurunegala (% of Farmers)
Matara (% of Farmers)
Awareness (n=60)
Adoption in Maha (n=60)
Adoption in Yala (n=60)
Awareness (n=60)
Adoption in Maha (n=60)
Adoption in Yala (n=56)
Awareness (n=59)
Adoption in Maha (n=59)
Adoption in Yala (n=57)
Standing water 100 93 92 100 100 100 100 95 95
Yaya cultivation 100 95 93 100 87 88 98 88 86
Plough depth 98 83 85 100 88 86 98 78 77
Second ploughing 100 58 50 97 78 77 100 85 82
Seed germination test
95 82 80 95 72 73 98 63 61
Resistant varieties 97 68 68 97 75 77 93 63 63
Organic manure 98 27 30 100 80 79 100 78 81
Urea application 100 52 52 100 50 50 98 68 67
Seed rate 97 35 38 97 63 64 93 64 63
Seed treatment 90 43 32 95 55 59 92 49 49
Paddy husk charcoal 90 8 8 80 12 9 81 7 7
Spacing 5 5 5 18 10 9 31 31 30
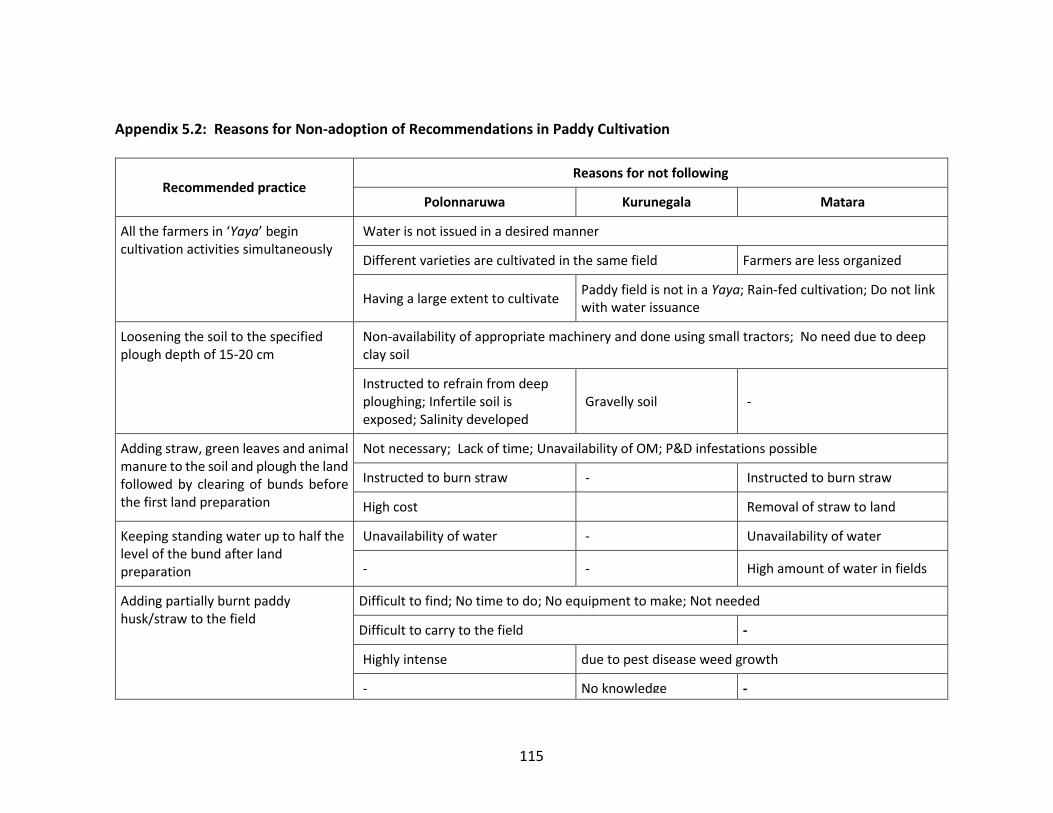
115
Appendix 5.2: Reasons for Non-adoption of Recommendations in Paddy Cultivation
Recommended practice Reasons for not following
Polonnaruwa Kurunegala Matara
All the farmers in ‘Yaya’ begin cultivation activities simultaneously
Water is not issued in a desired manner
Different varieties are cultivated in the same field Farmers are less organized
Having a large extent to cultivate Paddy field is not in a Yaya; Rain-fed cultivation; Do not link with water issuance
Loosening the soil to the specified plough depth of 15-20 cm
Non-availability of appropriate machinery and done using small tractors; No need due to deep clay soil
Instructed to refrain from deep ploughing; Infertile soil is exposed; Salinity developed
Gravelly soil -
Adding straw, green leaves and animal manure to the soil and plough the land followed by clearing of bunds before the first land preparation
Not necessary; Lack of time; Unavailability of OM; P&D infestations possible
Instructed to burn straw - Instructed to burn straw
High cost Removal of straw to land
Keeping standing water up to half the level of the bund after land preparation
Unavailability of water - Unavailability of water
- - High amount of water in fields
Adding partially burnt paddy husk/straw to the field
Difficult to find; No time to do; No equipment to make; Not needed
Difficult to carry to the field -
Highly intense due to pest disease weed growth
- No knowledge -

116
Appendix 5.2: Reasons for Non-adoption of Recommendations in Paddy Cultivation (Continued)
Recommended practice Reasons for not following
Polonnaruwa Kurunegala Matara
Testing of seed germination Trust in germination
Difficult to do practically Cultivating for seed paddy
Cultivation of resistant varieties Using suitable variety for the
area; Not needed
Using variety that gives high income
Using variety that is preferred for consumption
Not receiving resistant varieties using by experience
Doing cultivation for seed paddy Trust Doing cultivation for seed
paddy
Complying with recommended seed
rates
Use by experience; To compensate damages
Low fertile soil; to gain high yield -
High tillering; Deciding by the
variety using
No knowledge about
the fact; Transplanting
Second ploughing after 10-14 days
from the first land preparation by
ploughing to the opposite direction to
the first
Issue in giving water
Using big tractor; Not having
suitable equipment on time; Had
to cultivate all lands together;
Difficult because muddy soil
Busy schedule; Not
necessary; Crop
activities late
Using big tractor; Not having
suitable equipment on time;
High cost; Difficult because
muddy soil

117
Appendix 5.2: Reasons for Non-adoption of Recommendations in Paddy Cultivation (Continued)
Recommended practice
Reasons for not following
Polonnaruwa Kururenagala Matara
Treating seed paddy with fungicides Already done when purchasing; Not necessary/not used in area
No knowledge of treatment method -
Busy schedule; Low in diseases in
Maha/Yala season; Using only
when cultivated late
- Busy schedule; Low in diseases in
Maha/Yala season; Using only
when cultivated late; Highly
reactive Difficulty in finding; Fear of
hopper damage
Not using chemicals; Trust
Complying with the recommended
depth and spacing of planting (2-2.5cm
depth and 15*15cm spacing)
- Cannot decide because
using parachute method
Cannot decide because using
seed sowing
Complying with the recommended
rates of urea application Decide by experience; Deciding by the green colour in leaves; To increase yield
Decide by the rainfall; Low fertile soil Not using chemicals
To control P&D specially
in Yala; high fertility in
soil
Using organic/chemicals To control P&D specially in Yala;
high fertility in soil
Source: HARTI Survey Data, 2019

118
Appendix 5.3: Number of Farmers by Types of Herbicides Used across Districts by Seasons
Common Name Trade Name Polonnaruwa Kurunegala Matara Overall
Maha Yala Maha Yala Maha Yala Maha Yala
Pretilachlor
Sofit 42 42 38 31 3 3 83 76
Set - 1 - - - - - 1
Pretilachlor 1 - 2 2 - - 3 2
Propanil + Clomazone Compro 60 EC 2 3 2 1 2- 21 24 25
Thiobencarb + Propanil Satunil 60
- - - - 14 7 14 7 Saturn plus
Propanil + Pretilachlor Profit 50 EC 5 12 2 2 1 1 8 15
Pretilachlor + Pyribenzoxim Solito 1 - 3 3 8 5 12 8
MCPA 40% SL* M 50 5 3 4 4 1 1 9 8
MCPA 60% SL
M 60 - - 7 9 - - 7 9
MCPA 60 1 - - - 3 2 4 2
Hedonal 60 - - - - 1 1 1 1
Bispyribacsodium + metamifop Kiseki 4 4 3 4 - 1 7 9
Bispyribacsodium 100 g/l SC Nominee 1 - 1 1 6 3 8 4
Bispyribac sodium 20% WP Kensolo 4 9 - - - - 4 9
Propanil 3-4 DPA 1 1 - - 3 3 4 4
Azimsulfuron Gulliver - - - - 4 4 4 4
Metamifop Matari - 2 - - 1 1 1 3
Florpyrauxifen-benzyl Loyant** 1 - - - - - 1 -
Oxyfluorfen Goal 1 - - - - - 1 -
Kitto - - 1 - - - 1 -
Quinclorac Facet - 3 - - - - - 3
Cyhalofop-butyl Clincher - 1 - - - - - 1
Unknown*** 1 1 5 3 4 1 10 5
Total 70 82 68 60 69 54 207 196 Notes: * Herbicide MCPA 40% SL has been removed from the list of recommended herbicides for rice cultivation in Sri Lanka by October 2018
** Until an acceptable field implementation package is introduced to the farmer, all stocks of Loyant herbicide available in the market was recalled by December 2018 due to field complaints (Department of Agriculture, 2019)
*** Farmers were unable to remember the herbicides they have applied Source: HARTI Survey Data, 2019

119
Appendix 5.4: Symptom Identification Chart of Major Rice Diseases
Disease Symptoms Disease Symptoms
Rice blast - Necrotic lesions
- Empty grains
Narrow brown spot
- Necrotic lesions/ streaks
Bacteria leaf blight
- Abnormal colour
- Necrotic lesions
- Odour - Dead plants - Wilting
Sheath rot
- Necrotic lesions
- Discolouration on seeds
- Discolouration on sheath
- Empty grains
Sheath blight - Necrotic lesion - Fungal growth - Discolouration
on seeds
Bacteria leaf streak
- Abnormal colour
- Necrotic streaks
- Odour
Brown spot - Necrotic lesions
- Discolouration on seeds
Foot rot - Abnormal colour
- Odour - Dead plants
False smut - Abnormal growth
- Fungal growth
Leaf scald
- Abnormal colour
- Necrotic lesions
Grain discolouration
- Discolouration on seeds
- Empty grains
Source: Chandrasena and Gunapala (2019)
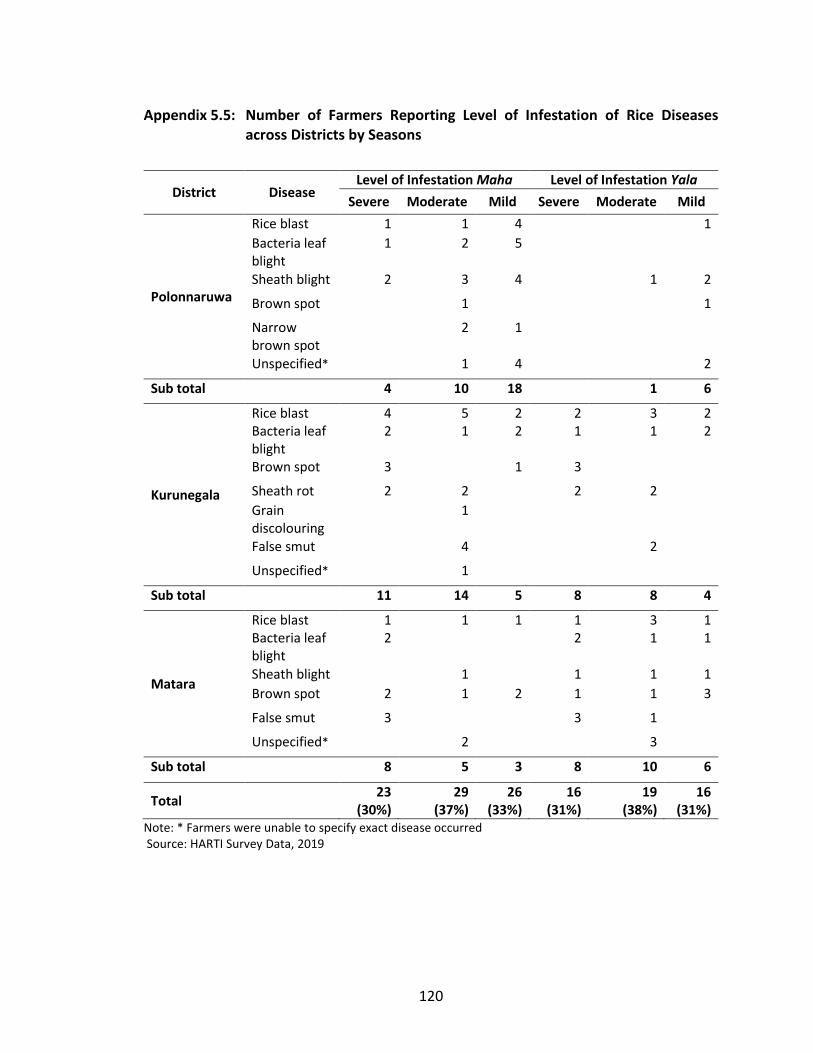
120
Appendix 5.5: Number of Farmers Reporting Level of Infestation of Rice Diseases across Districts by Seasons
Note: * Farmers were unable to specify exact disease occurred Source: HARTI Survey Data, 2019
District Disease Level of Infestation Maha Level of Infestation Yala
Severe Moderate Mild Severe Moderate Mild
Polonnaruwa
Rice blast 1 1 4 1 Bacteria leaf blight
1 2 5
Sheath blight 2 3 4 1 2
Brown spot 1 1
Narrow brown spot
2 1
Unspecified* 1 4 2
Sub total 4 10 18 1 6
Kurunegala
Rice blast 4 5 2 2 3 2 Bacteria leaf blight
2 1 2 1 1 2
Brown spot 3 1 3
Sheath rot 2 2 2 2 Grain discolouring
1
False smut 4 2
Unspecified* 1 Sub total 11 14 5 8 8 4
Matara
Rice blast 1 1 1 1 3 1 Bacteria leaf blight
2 2 1 1
Sheath blight 1 1 1 1 Brown spot 2 1 2 1 1 3
False smut 3 3 1
Unspecified* 2 3
Sub total 8 5 3 8 10 6
Total 23
(30%) 29
(37%) 26
(33%) 16
(31%) 19
(38%) 16
(31%)

121
Appendix 5.6: Degree of Success of Control Method Employed to Control Rice Diseases
Control Method Disease
Degree of success
Not control at all
Controlled to some extent
Completely controlled
Cultural
Rice blast 2
Bacteria leaf blight 2
Sheath blight 2
Brown spot 1
Unspecified* 1
Sub total 1 7
Biological Narrow brown spot 1
Sub total 1
Chemical
Rice blast 2 8 42
Sheath blight 2 2 18
Brown spot 11 11
Narrow brown spot 1
Sheath rot 0 32
Grain discolouration 1
False smut 2 11 8
Unspecified* 3 17 34
Sub total 9 (4%) 51 (25%) 145 (71%)
Total 9 (4%) 52 (24%) 153 (72%)
Note: * Farmers were unable to specify exact disease occurred Source: HARTI Survey Data, 2019

122
Appendix 5.7: Number of Farmers Reporting Pests in Paddy across Districts by Seasons
Pest
Polonnaruwa Kurunegala Matara Overall
Maha Yala Maha Yala Maha Yala Maha Yala
(n=60) (n=59) (n=60) (n=52) (n=59) (n=58) (n=179) (n=169)
Brown plant hopper 41 16 38 14 14 8 93 38
Stem borer 15 5 6 4 5 5 26 14
White back plant hopper 2 1 13 5 1 2 16 8
Leaf folder 1 - 7 5 5 6 13 11
Gall midge 2 - 1 1 5 4 8 5
Rice bug 2 3 - 1 2 2 4 6
Rat 2 - 1 1 2 4 5 5
Thrips 1 1 2 - - 3 3 4
Leaf mite 1 1 - - 1 4 2 5
Sheath mite - - - 1 - 4 - 5
Mole cricket - - - - 1 2 1 2
Whorl maggot - 1 - - 1 - 1 1
Case worm 1 - - - - - 1 -
Nematode 1 - - - - - 1 -
Source: HARTI Survey Data, 2019
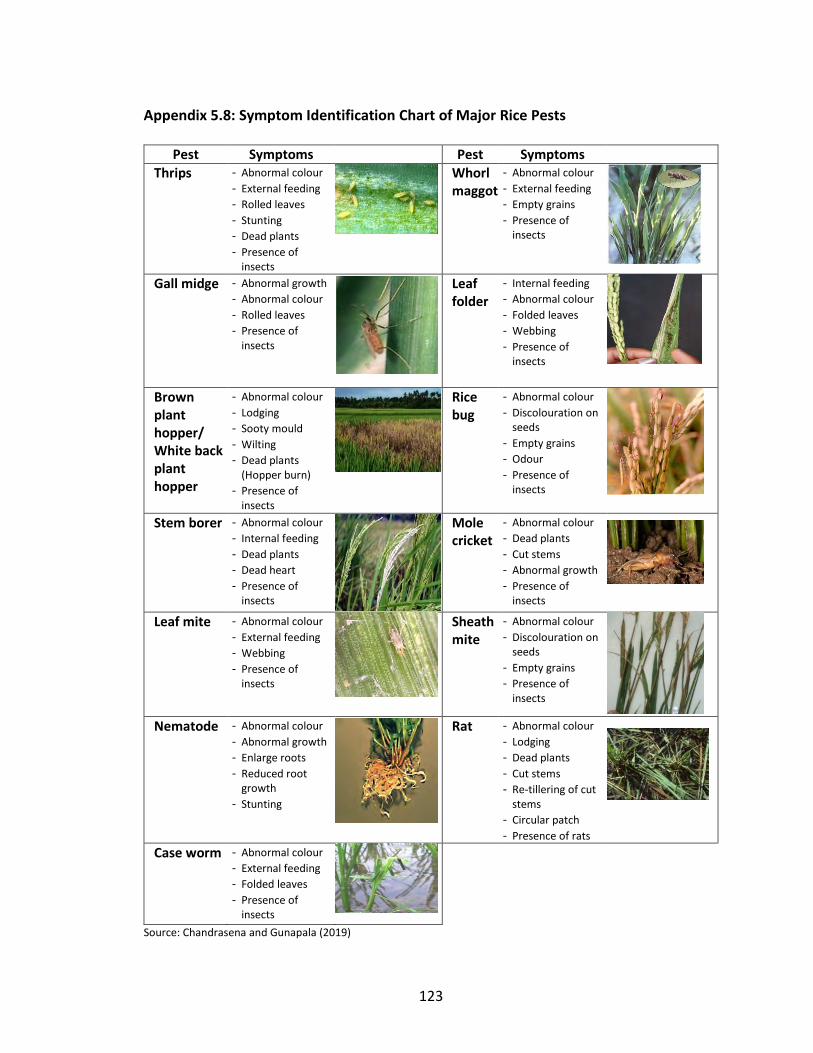
123
Appendix 5.8: Symptom Identification Chart of Major Rice Pests
Source: Chandrasena and Gunapala (2019)
Pest Symptoms Pest Symptoms
Thrips
- Abnormal colour
- External feeding
- Rolled leaves
- Stunting
- Dead plants
- Presence of insects
Whorl maggot
- Abnormal colour
- External feeding
- Empty grains
- Presence of insects
Gall midge - Abnormal growth
- Abnormal colour
- Rolled leaves
- Presence of insects
Leaf folder
- Internal feeding
- Abnormal colour
- Folded leaves
- Webbing
- Presence of insects
Brown plant hopper/ White back plant hopper
- Abnormal colour
- Lodging
- Sooty mould
- Wilting
- Dead plants (Hopper burn)
- Presence of insects
Rice bug
- Abnormal colour
- Discolouration on seeds
- Empty grains
- Odour
- Presence of insects
Stem borer - Abnormal colour
- Internal feeding
- Dead plants
- Dead heart
- Presence of insects
Mole cricket
- Abnormal colour
- Dead plants
- Cut stems
- Abnormal growth
- Presence of insects
Leaf mite - Abnormal colour
- External feeding
- Webbing
- Presence of insects
Sheath mite
- Abnormal colour
- Discolouration on seeds
- Empty grains
- Presence of insects
Nematode - Abnormal colour
- Abnormal growth
- Enlarge roots
- Reduced root growth
- Stunting
Rat - Abnormal colour
- Lodging
- Dead plants
- Cut stems
- Re-tillering of cut stems
- Circular patch
- Presence of rats
Case worm - Abnormal colour
- External feeding
- Folded leaves
- Presence of insects

124
Appendix 5.9: Level of Success of Control Method Employed to Control Pests
Control
method Pest
Level of success
Not control
at all
Controlled to
some extent
Completely
controlled
Cultural
1
Stem borer 1 4 4
BPH* 3 8 7
Leaf folder 4 2
Rice bug 1
Rat 1 2
Sub total 5 16 17
Biological
Thrips 3
Stem borer 19
Gall midge 8 8
BPH* 13 7
WBPH** 1
Leaf folder 5 1
Rice bug 2 19
Rat 8
Sheath mite 1
Sub total 37 58
Chemical
Whorl maggot 1
Thrips 21 27
Stem borer 33 65 79
Gall midge 6 90 2
BPH* 59 349 199
WBPH** 31 113 55
Leaf folder 4 98 50
Rice bug 2 2 14
Mole cricket 33
Rat 4 99 4
Sheath mite 2 4
Leaf mite 1 13
Nematode 2 2
Sub total 141 875 448
Total*** 146 (9%) 928 (58%) 523 (33%)
Note: * Brown plant hopper **White back plant hopper ***The total exceeds the total sample size due to use of multiple methods Source: HARTI Survey Data, 2019

125
Appendix 5.10: Insecticide Usage to Control Pest Damages
Common name Trade name
Wh
orl
mag
got
Thri
ps
Ste
m
bo
rer
Gal
l
mid
ge
BP
H
WB
PH
Leaf
fold
er
Ric
e
bu
g
Mo
le
cric
ket
Rat
She
ath
mit
e
Leaf
mit
e
Tota
l
Fenobucarb 500g/l EC
BPMC - - 10 - 33 5 2 - - 2 - - 52
Bassa - - - - 9 - - 4 - - - 2 15
Dozerr - 2 - - 1 4 2 - - - - - 9
Beepa - - 1 - - - - - - - - - 1
Imidacloprid 70% WG
Admire - - 13 - 26 12 1 - - - - - 52
Provado - - - - 1 - - - - - - - 1
Imidacloprid - 1 1 - 2 - - 1 - - - - 5
Thiamethoxam 25% WG Actara - - 1 1 21 8 2 - 4 6 - - 43
Carbosulfan 20% SC Marshal - 3 3 1 12 4 2 2 - - 1 - 28
Etofenprox 10% EC Trebon - 1 3 - 8 1 - - - 2 - - 15
Chlorantraniliprole 20%+ Thiomethoxam 20% Virtako - - 1 1 10 2 1 - - - - - 15
Thiocyclam hydrogen oxalate 50% SP Evisect - - 3 - 4 - - - - - - - 7
Difenacoum 0.005%RB Ratkill - - - - 2 - 2 - - 4 - - 8
Ethiprole 10% SC Curbix - - 2 - 4 - - - - - - - 6
Fipronil 5% SC Regent - - 1 - 3 - 1 - - - - - 5
Sulfphur 80% WP Sulphur - - - - - - - - - - - 4 4
Mightee Gate - - - - 1 - - - - - - - 1
Chlorantraniliprole 20% SC Coragen - - 1 - 2 - - - - - - - 3
Tebufenozide 20% SC Mimic - - - - 1 1 1 - - - - - 3
Abamactin 1.8% EC Mig - - - - 1 - - - - - - - 1
Soro 1 - - - - - - - - - - - 1
Pymetrozine 50% WG Chess - - - - 1 - - - - - - - 1
Unspecified*** - - 1 5 11 6 5 - - - - - 28
Total 1 7 41 8 153 43 19 7 4 14 1 6 304
Note: * Brown plant hopper; **White back plant hopper; *** Reported trade names used to control pests were either herbicides or not listed out in the DOA recommendations. Source: HARTI Survey Data, 2019
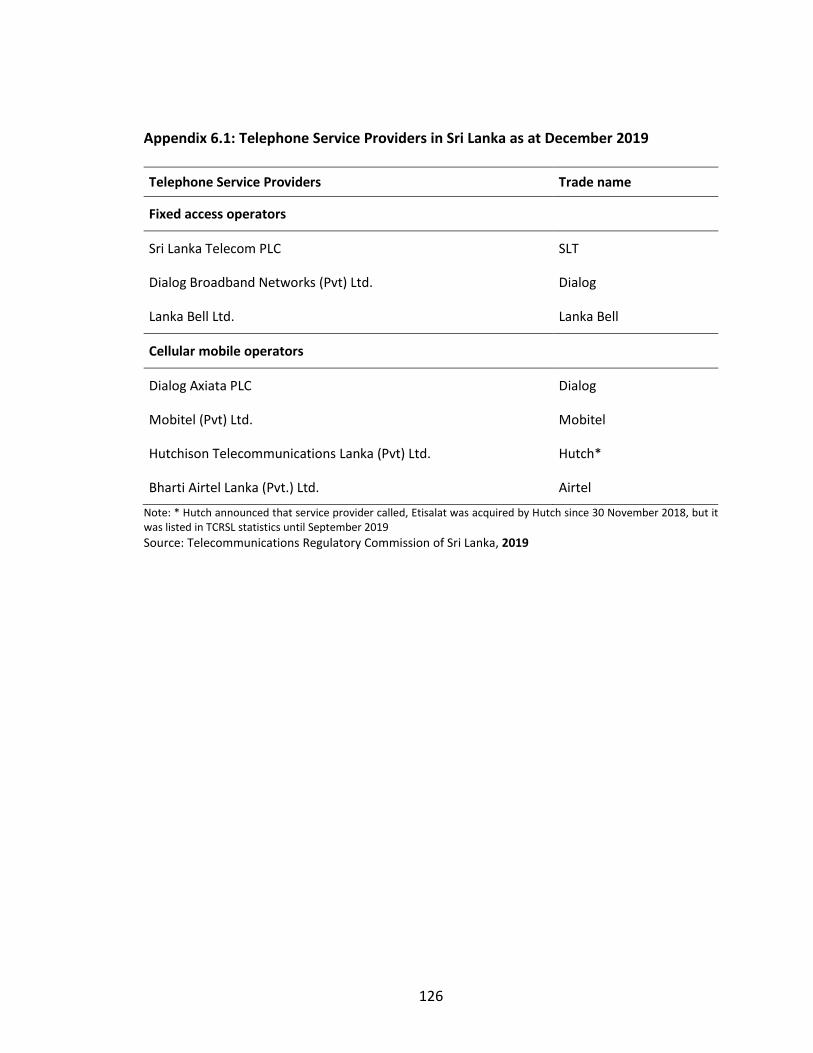
126
Appendix 6.1: Telephone Service Providers in Sri Lanka as at December 2019
Telephone Service Providers Trade name
Fixed access operators
Sri Lanka Telecom PLC SLT
Dialog Broadband Networks (Pvt) Ltd. Dialog
Lanka Bell Ltd. Lanka Bell
Cellular mobile operators
Dialog Axiata PLC Dialog
Mobitel (Pvt) Ltd. Mobitel
Hutchison Telecommunications Lanka (Pvt) Ltd. Hutch*
Bharti Airtel Lanka (Pvt.) Ltd. Airtel
Note: * Hutch announced that service provider called, Etisalat was acquired by Hutch since 30 November 2018, but it was listed in TCRSL statistics until September 2019
Source: Telecommunications Regulatory Commission of Sri Lanka, 2019

127
Appendix 6.2: Statistics of Telephone Expenditure of Farm Families by Districts
Description Polonnaruwa
(n=52) Kurunegala
(n=56) Matara (n=58)
Overall (n=166)
Call cost (Rs.)
Mean 1060 1136 1385 1201
Minimum 50 100 150 50
Maximum 3000 3470 4700 4700
Internet cost (Rs.)
Mean 701 444 387 504
Minimum 100 0 0 0
Maximum 3000 1500 2000 3000
Total telephone cost (Rs.)
Mean 1761 1580 1705 1681
Minimum 150 300 200 150
Maximum 4500 4200 4100 4500 Source: HARTI Survey Data, 2019