Mitsubishi Steel Mfg. Co., Ltd. Financial Results for the First ...
34
Mitsubishi Steel Mfg. Co., Ltd. Financial Results for the First Half of the Fiscal Year Ending March 2017 November 18, 2016
-
Upload
khangminh22 -
Category
Documents
-
view
0 -
download
0
Transcript of Mitsubishi Steel Mfg. Co., Ltd. Financial Results for the First ...

Mitsubishi Steel Mfg. Co., Ltd. Financial Results for the First Half of the Fiscal Year Ending March 2017
November 18, 2016
1
Ⅰ. Opening Remarks
Ⅱ. H1 FY2016 Results
Ⅲ. Full-year Earnings Forecasts for FY2016
Ⅳ. Progress with the 2016 Mid-term Business Plan
Ⅰ. Opening Remarks
2
II. H1 FY2016 Results
Ⅰ. Opening Remarks
Ⅱ. H1 FY2016 Results
Ⅲ. Full-year Earnings Forecasts for FY2016
Ⅳ. Progress with the 2016 Mid-term Business Plan
3
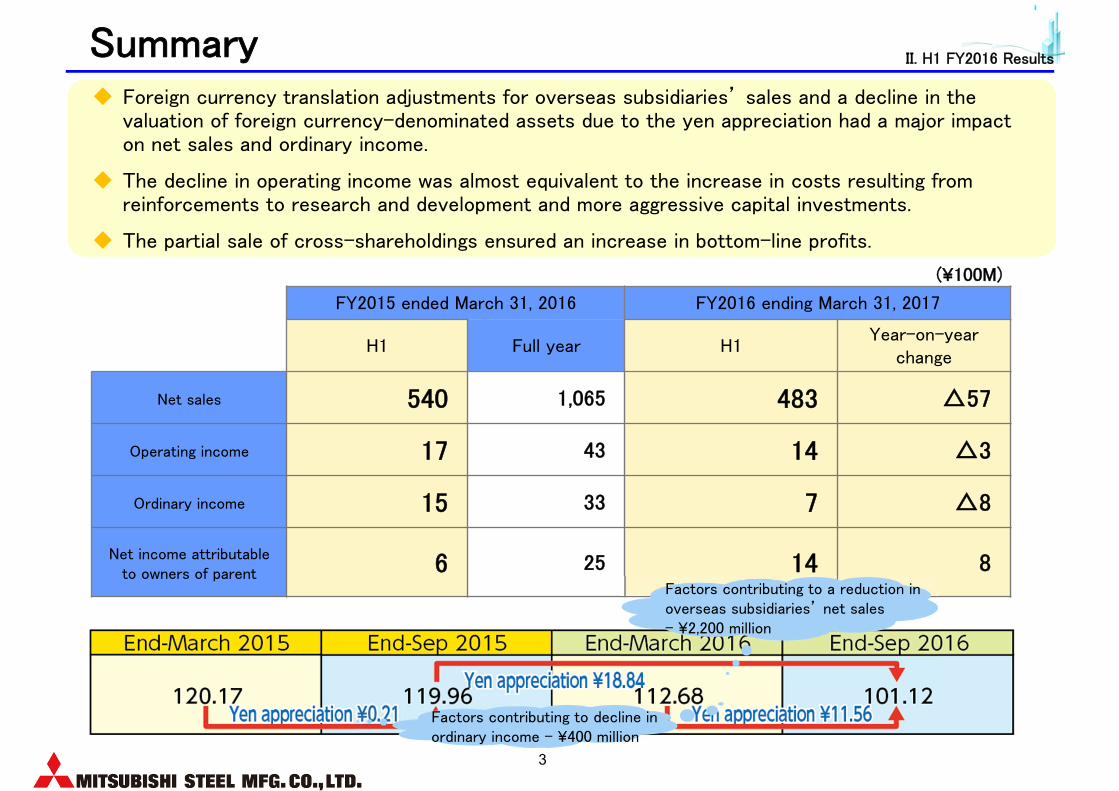
Summary
FY2015 ended March 31, 2016 FY2016 ending March 31, 2017
H1 Full year H1Year-on-year
change
Net sales 540 1,065 483 △57
Operating income 17 43 14 △3
Ordinary income 15 33 7 △8
Net income attributable to owners of parent 6 25 14 8
Foreign currency translation adjustments for overseas subsidiaries’ sales and a decline in the valuation of foreign currency-denominated assets due to the yen appreciation had a major impact on net sales and ordinary income.
The decline in operating income was almost equivalent to the increase in costs resulting from reinforcements to research and development and more aggressive capital investments.
The partial sale of cross-shareholdings ensured an increase in bottom-line profits.
(¥100M)
Factors contributing to a reduction in overseas subsidiaries’ net sales- ¥2,200 million
Factors contributing to decline in ordinary income - ¥400 million
II. H1 FY2016 Results
4
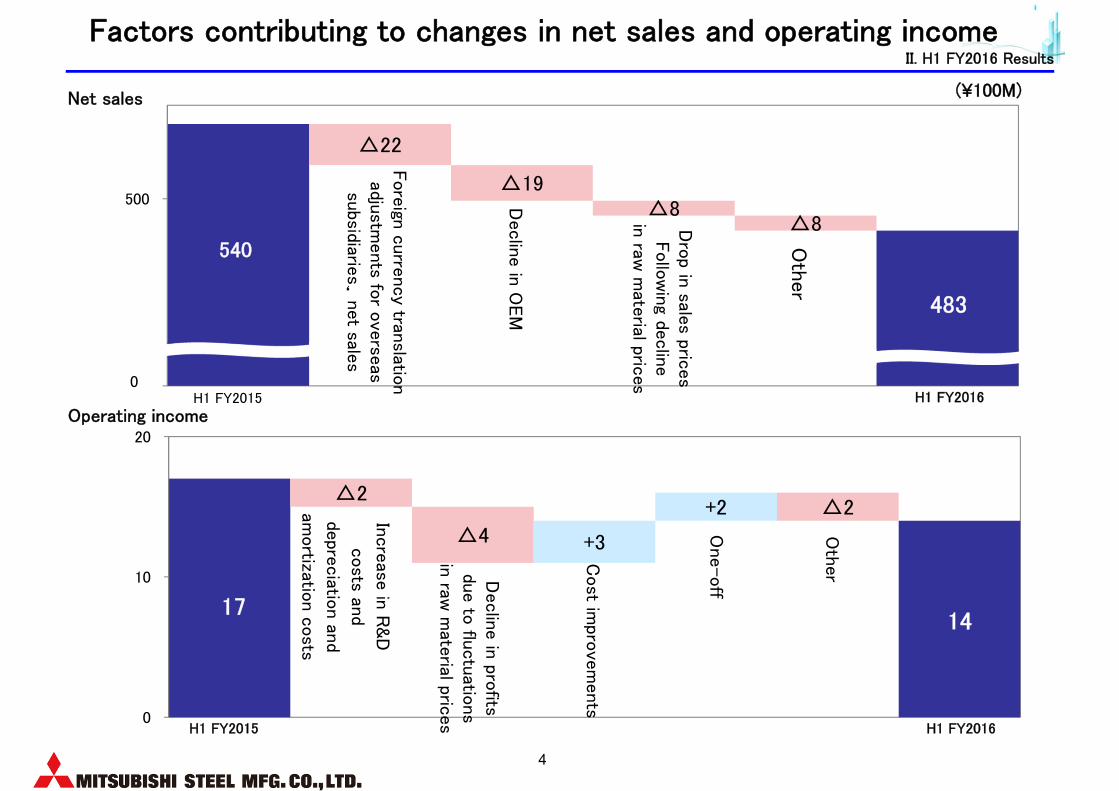
Factors contributing to changes in net sales and operating income
17
Incre
ase in
R&D
costs an
d
depre
ciatio
n an
d
amortizatio
n c
osts
△2
△4 +3
+2 △2
0
10
20
Cost im
prove
ments
Declin
e in
profits
due to
fluctu
ations
in raw
mate
rial prices
One-off
14
Oth
er
H1 FY2015 H1 FY2016
(¥100M)
540 Oth
er
△22
△19△8
△8
400
500
Dro
p in sale
s prices
Follo
win
g declin
e
in raw
mate
rialpric
es
483
Fore
ign c
urre
ncy tran
slation
adjustm
ents fo
r ove
rseas
subsidiarie
s
’ net sale
s
Declin
e in
OEM
H1 FY2015 H1 FY20160
Operating income
Net sales
II. H1 FY2016 Results
5
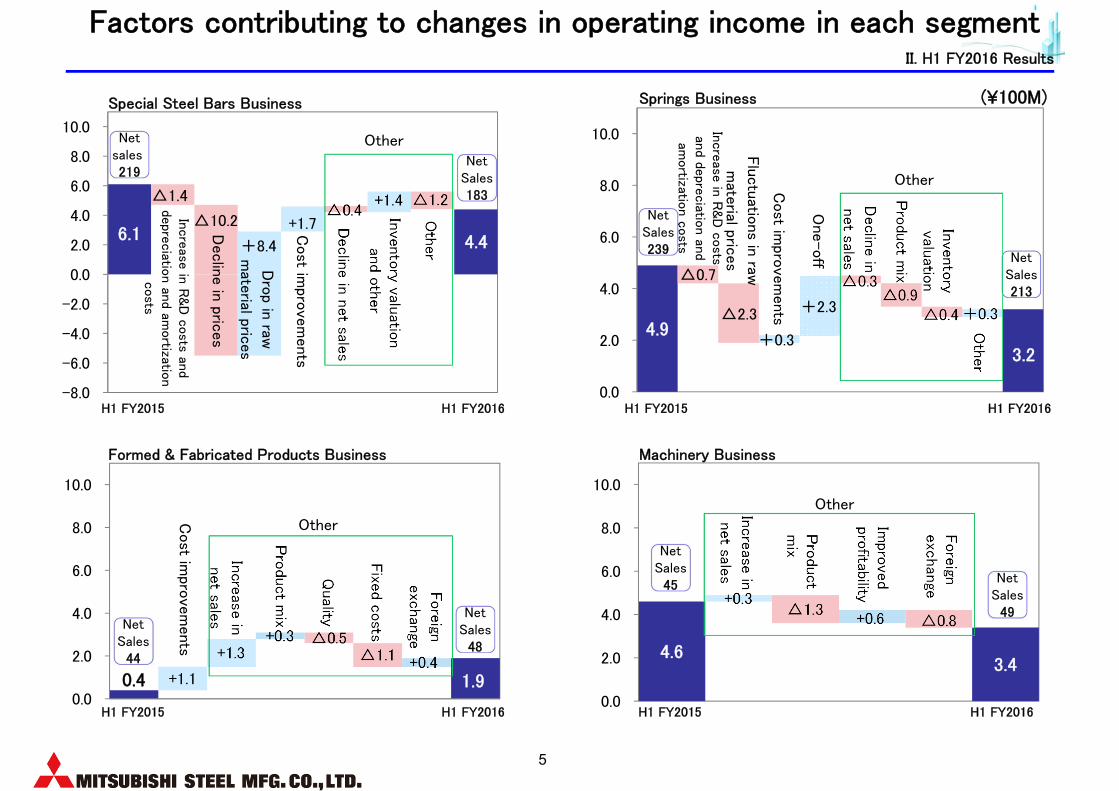
4.9
Declin
e in
net sale
s
Cost im
prove
ments
Flu
ctu
ations in
raw
mate
rial prices
Pro
duct m
ix
Oth
er
△0.7
+0.3
+0.3△2.3 +2.3△0.9
△0.3
△0.4
0.0
2.0
4.0
6.0
8.0
10.0
One-off
Inve
nto
ry valu
ation
Incre
ase in
R&D
costs
and de
preciatio
n an
d am
ortizatio
n c
osts
3.2
0.4
Incre
ase in
net sale
s
Fore
ign
exc
han
ge
Cost im
prove
ments
Pro
duct m
ix 為替
+1.1
+1.3+0.3 △0.5
△1.1 +0.4
0.0
2.0
4.0
6.0
8.0
10.0
Fixe
d costs
Quality
Other
6.1
Declin
e in
net sale
s
Dro
p in raw
mate
rial prices
Declin
e in
prices
Cost im
prove
ments
+8.4
△1.4
△10.2 +1.7
△1.2△0.4
+1.4
-8.0
-6.0
-4.0
-2.0
0.0
2.0
4.0
6.0
8.0
10.0
Inve
nto
ry valuatio
nan
d oth
er
Oth
er
Incre
ase in
R&D
costs an
d de
preciatio
n an
d amortizatio
n
costs
Other
H1 FY2015 H1 FY2016
4.6
Incre
ase in
net sale
s
3.4
+0.3△1.3
+0.6 △0.8
0.0
2.0
4.0
6.0
8.0
10.0
Impro
ved
profitability
Special Steel Bars Business (¥100M)Springs Business
Formed & Fabricated Products Business Machinery Business
H1 FY2015 H1 FY2016
H1 FY2015 H1 FY2016 H1 FY2015 H1 FY2016
NetSales183
Netsales219
NetSales
49
NetSales
45
NetSales
48
NetSales
44
NetSales239
NetSales213
1.9
Pro
duct
mix
Fore
ign
exc
han
geOther
Other
4.4
II. H1 FY2016 Results
Factors contributing to changes in operating income in each segment
6
(¥100M)
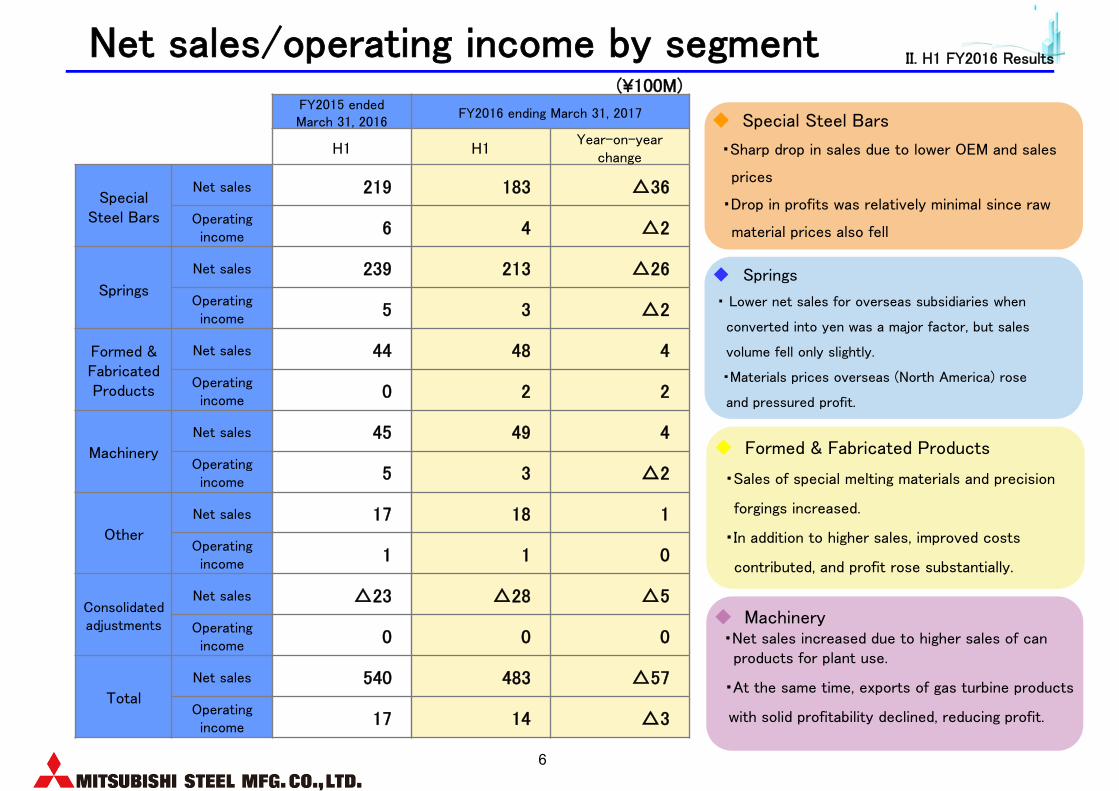
Net sales/operating income by segmentFY2015 ended March 31, 2016
FY2016 ending March 31, 2017
H1 H1Year-on-year
change
Special Steel Bars
Net sales 219 183 △36
Operating income 6 4 △2
Springs
Net sales 239 213 △26
Operating income 5 3 △2
Formed & Fabricated Products
Net sales 44 48 4
Operating income 0 2 2
Machinery
Net sales 45 49 4
Operating income 5 3 △2
Other
Net sales 17 18 1
Operating income 1 1 0
Consolidated adjustments
Net sales △23 △28 △5
Operating income 0 0 0
Total
Net sales 540 483 △57
Operating income 17 14 △3
Special Steel Bars
・Sharp drop in sales due to lower OEM and sales
prices
・Drop in profits was relatively minimal since raw
material prices also fell
Springs
・ Lower net sales for overseas subsidiaries when
converted into yen was a major factor, but sales
volume fell only slightly.
・Materials prices overseas (North America) rose
and pressured profit.
Formed & Fabricated Products
・Sales of special melting materials and precision
forgings increased.
・In addition to higher sales, improved costs
contributed, and profit rose substantially.
Machinery・Net sales increased due to higher sales of can products for plant use.
・At the same time, exports of gas turbine products
with solid profitability declined, reducing profit.
II. H1 FY2016 Results

7
(¥100M)
Due in part to the liquidation of some cross-shareholdings, bottom-line profits (net income for the quarter) rose significantly.
FY2015 ended March 31, 2016
FY2016 ending March 31, 2017
H1 results H1 resultsChange over previous
period
Operating income 17 14 △3
Non-operating income △2 △7 △5
Translation (exchange profit & loss) 0 △4 △4
Other △2 △3 △1
Ordinary income 15 7 △8
Gains on sale of stocks ‐ 18 18
Other extraordinary income/loss 0 △2 △2
Income before income taxes 15 23 8
Tax expenses △8 △8 0
Net income attributable to owners of parent 6 14 8
Impact of non-operating income/loss and extraordinary income/lossII. H1 FY2016 Results
8
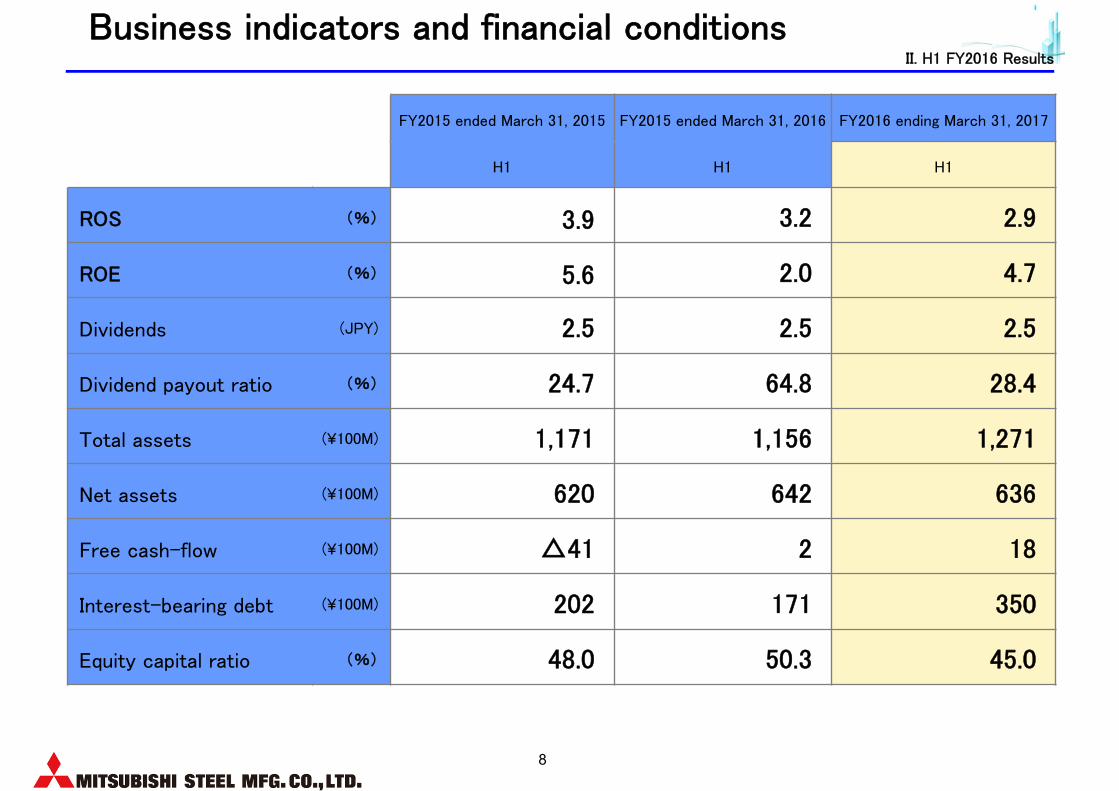
Business indicators and financial conditions
FY2015 ended March 31, 2015 FY2015 ended March 31, 2016 FY2016 ending March 31, 2017
H1 H1 H1
ROS (%) 3.9 3.2 2.9
ROE (%) 5.6 2.0 4.7
Dividends (JPY) 2.5 2.5 2.5
Dividend payout ratio (%) 24.7 64.8 28.4
Total assets (¥100M) 1,171 1,156 1,271
Net assets (¥100M) 620 642 636
Free cash-flow (¥100M) △41 2 18
Interest-bearing debt (¥100M) 202 171 350
Equity capital ratio (%) 48.0 50.3 45.0
II. H1 FY2016 Results

9
III. Full-year Earnings Forecasts for FY2016
Ⅰ. Opening Remarks
Ⅱ. H1 FY2016 Results
Ⅲ. Full-year Earnings Forecasts for FY2016
Ⅳ. Progress with the 2016 Mid-term Business Plan

10
(¥100M)
Forecast for full-year results
FY2015 ended March 31, 2016
FY2016 ending March 31, 2017
Results
(A)Current forecast (B)
Change over previous period
(B)-(A)
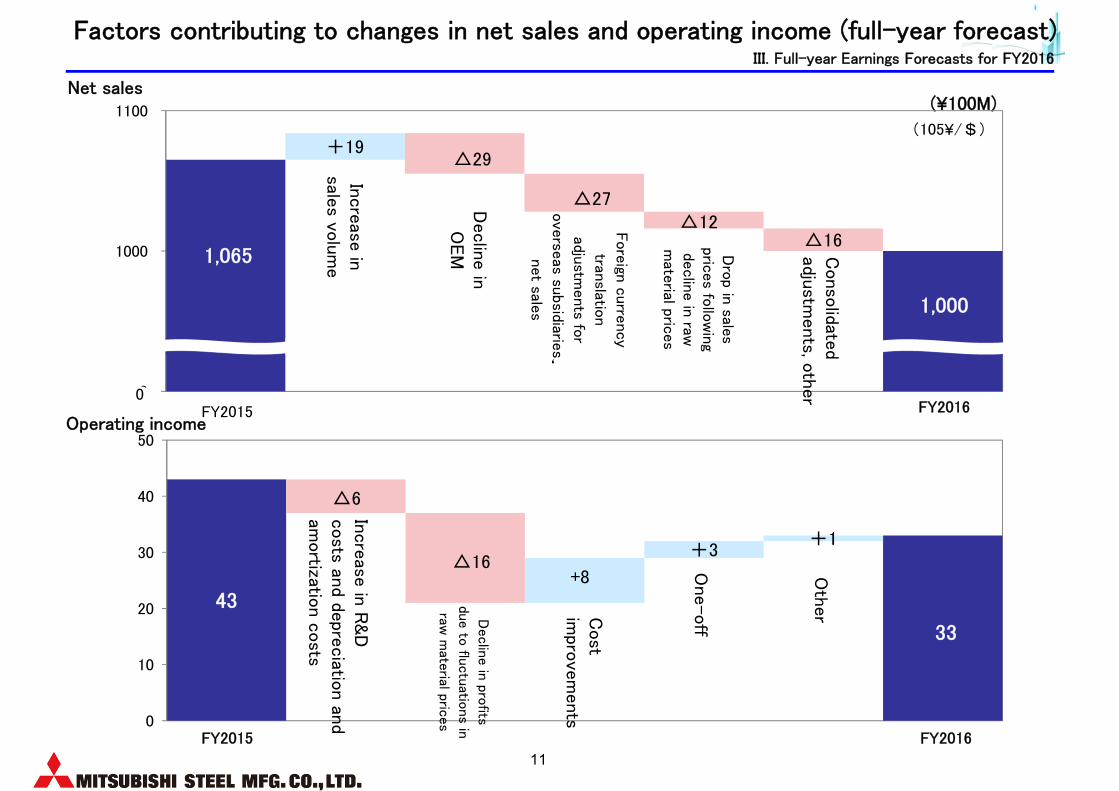
Net sales 1,065 1,000 △65
Operating income 43 33 △10
Ordinary income 33 24 △9
Net income attributable to owners of parent 25 30 5
We expect sales to be down in the fiscal year as a whole due to the impact of foreign exchange rates and lower OEM and sales prices in the second half as well.
Higher costs will pressure sales due to the recent steep rise in coking coal prices.
The sale of cross-shareholdings will contribute to bottom-line profits, ensuring higher profit for the full year.
III. Full-year Earnings Forecasts for FY2016
11
Factors contributing to changes in net sales and operating income (full-year forecast)
43
Oth
erD
eclin
e in
profits
due to
fluctu
ations in
raw m
aterial pric
es
+8
△6
△16+3
+1
0
10
20
30
40
50
Incre
ase in
R&D
costs an
d depre
ciatio
n an
d am
ortizatio
n c
osts
Cost
impro
vem
ents
One-off
FY2015 FY2016
(¥100M)
33
1,065
Fore
ign c
urre
ncy
translatio
n
adjustm
ents fo
r
ove
rseas su
bsidiaries
’
net sale
s
+19
△12
△29
△27
△16
900
1000
1100
Dro
p in sale
s pric
es fo
llow
ing
declin
e in
raw
mate
rial prices
1,000C
onso
lidated
adjustm
ents, o
ther0
Incre
ase in
sale
s volu
me
Declin
e in
O
EM
FY2015 FY2016
(105¥/$)
Operating income
Net sales
III. Full-year Earnings Forecasts for FY2016
12
11
Sale
s mix
Incre
ase in
R&D
costs an
d
depre
ciatio
n an
d amortizatio
n
costs S
teep rise
in
cokin
g coal pric
es
Dro
p in sale
s prices
+12
△3
△16
+3
△8+4
+2
-10
-5
0
5
10
15
20
Cost
impro
vem
ents
Dro
p in raw
m
aterial pric
es
Oth
er
5
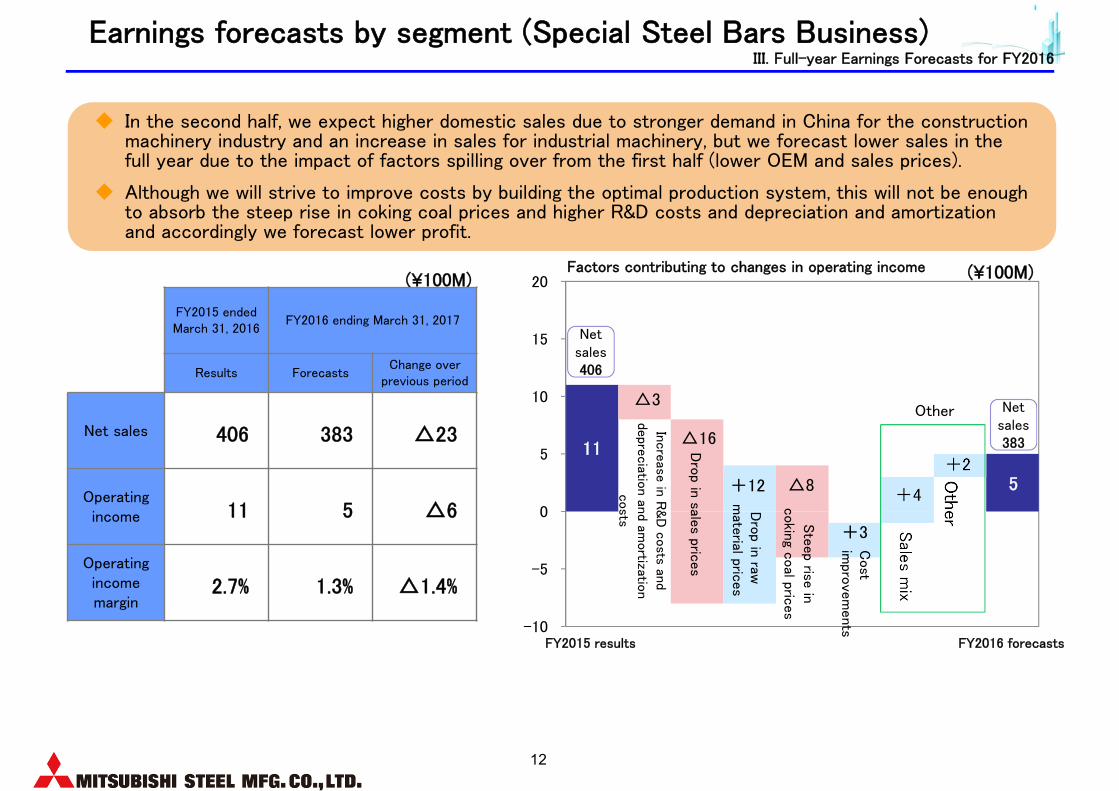
In the second half, we expect higher domestic sales due to stronger demand in China for the construction machinery industry and an increase in sales for industrial machinery, but we forecast lower sales in the full year due to the impact of factors spilling over from the first half (lower OEM and sales prices).
Although we will strive to improve costs by building the optimal production system, this will not be enough to absorb the steep rise in coking coal prices and higher R&D costs and depreciation and amortization and accordingly we forecast lower profit.
Earnings forecasts by segment (Special Steel Bars Business)
(¥100M) (¥100M)Factors contributing to changes in operating income
Netsales406
FY2015 ended March 31, 2016
FY2016 ending March 31, 2017
Results ForecastsChange over
previous period
Net sales 406 383 △23
Operating income 11 5 △6
Operating income margin
2.7% 1.3% △1.4%
FY2015 results FY2016 forecasts
Netsales383
Other
III. Full-year Earnings Forecasts for FY2016

13
Iron ore and coal markets and fluctuations in sales prices in Special Steel Bars Business
100
80
90
100
110
120
130
140
150
上期
下期
上期
下期
上期
下期
上期
下期
上期
下期
上期
下期
上期
下期
上期
下期
上期
下期
上期
下期
上推
定
8/3期 9/3期 10/3期 11/3期 12/3期 13/3期 14/3期 15/3期 16/3期 17/3期 18/3
Ave
rage
sal
es
price: I
ndex Average sales price: Index
0
40
80
120
160
200
240
280
320
360
0
20
40
60
80
100
120
140
160
180
上期
下期
上期
下期
上期
下期
上期
下期
上期
下期
上期
下期
上期
下期
上期
下期
上期
下期
上期
下期
上推
定
8/3期 9/3期 10/3期 11/3期 12/3期 13/3期 14/3期 15/3期 16/3期 17/3期 18/3
Coki
ng
coal
mar
ket
conditio
ns;
FO
B U
SD
/to
n
Iron o
re m
arke
t conditio
ns;
FO
B U
SD
/to
n
鉄鉱石-市況 $/㌧
原料炭-市況 $/㌧
◆ Conditions will be harsh in H2 due to the sharp rise in coking coal, and negotiations over sales prices for the Company’s products are underway with customers.
III. Full-year Earnings Forecasts for FY2016
H1 H2 H1 H2 H1 H2 H1 H2 H1 H2 H1 H2 H1 H2 H1 H2 H1 H2 H1 H2 H1 FY2017 estimates
FY2007 FY2008 FY2009 FY2010 FY2011 FY2012 FY2013 FY2014 FY2015 FY2016
Iron ore – market conditions USD/ton
Coking coal – market conditions USD/ton
14
15
Cost im
prove
ments
△3
+4△3
+3△1
0
5
10
15
20
25
15
FY2016forecasts
FY2015results
Incre
ase in
R&D
costs an
d depre
ciatio
n an
d am
ortizatio
n c
osts
One-off
Oth
er
Decre
ases in
profit du
e to
flu
ctu
ations in
raw m
aterial pric
es
Other
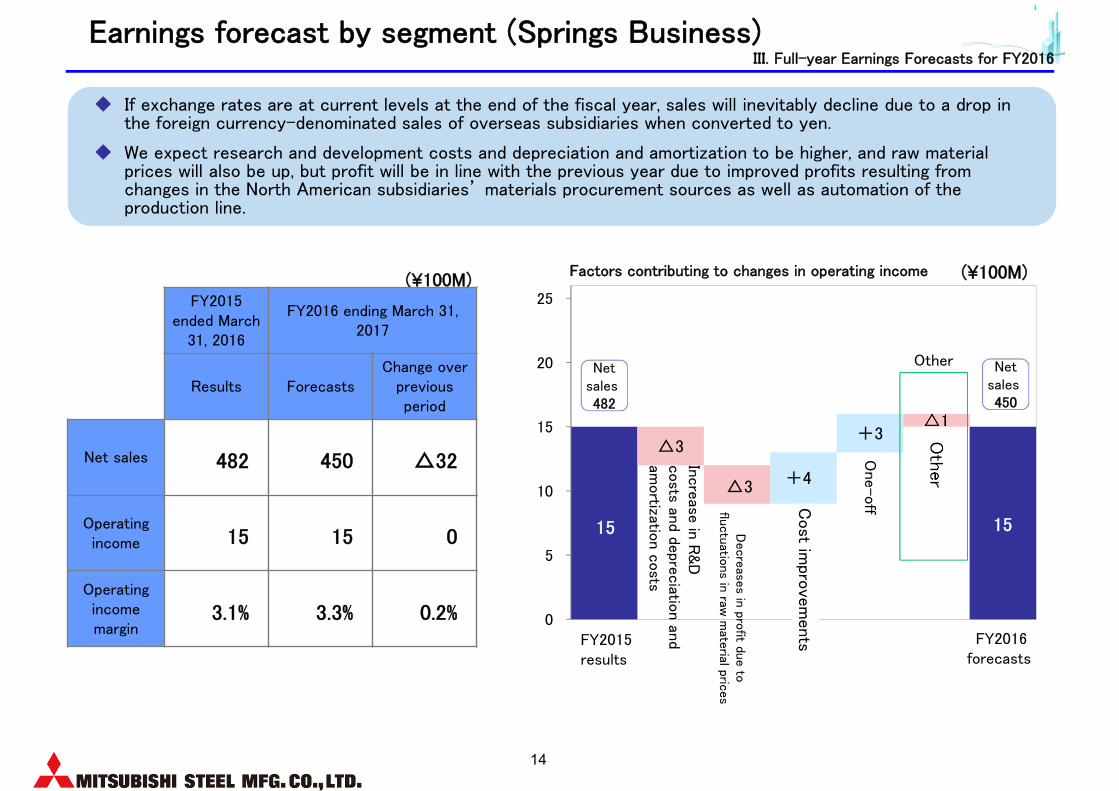
Earnings forecast by segment (Springs Business)
If exchange rates are at current levels at the end of the fiscal year, sales will inevitably decline due to a drop in the foreign currency-denominated sales of overseas subsidiaries when converted to yen.
We expect research and development costs and depreciation and amortization to be higher, and raw material prices will also be up, but profit will be in line with the previous year due to improved profits resulting from changes in the North American subsidiaries’ materials procurement sources as well as automation of the production line.
Factors contributing to changes in operating income(¥100M) (¥100M)
Netsales482
Netsales450
FY2015 ended March
31, 2016
FY2016 ending March 31, 2017
Results ForecastsChange over
previous period
Net sales 482 450 △32
Operating income 15 15 0
Operating income margin
3.1% 3.3% 0.2%
III. Full-year Earnings Forecasts for FY2016
15
5
Oth
er
Cost im
prove
ments
Flu
ctu
ations in
raw
mate
rial prices
Sale
s mix
+1△1△1+1
0
5
10
15
20
25
5
Other
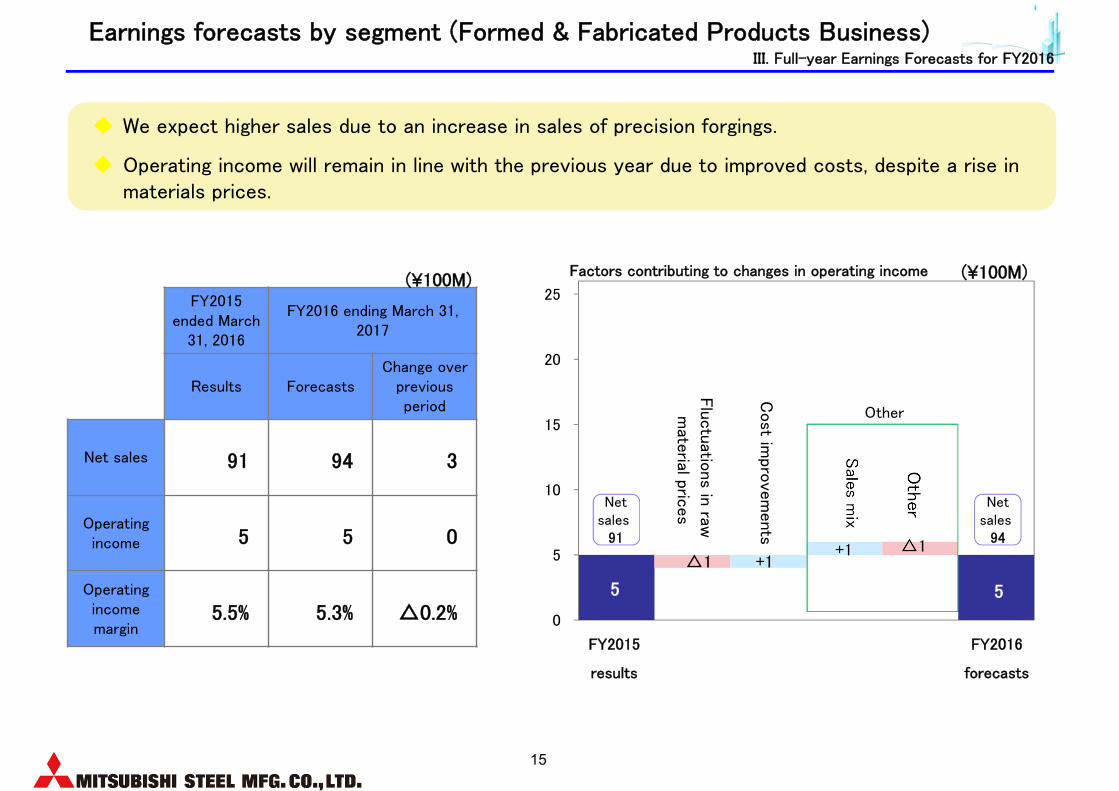
Earnings forecasts by segment (Formed & Fabricated Products Business)
We expect higher sales due to an increase in sales of precision forgings.
Operating income will remain in line with the previous year due to improved costs, despite a rise in materials prices.
FY2015 ended March
31, 2016
FY2016 ending March 31, 2017
Results ForecastsChange over
previous period
Net sales 91 94 3
Operating income 5 5 0
Operating income margin
5.5% 5.3% △0.2%
(¥100M) (¥100M)
FY2015
results
FY2016
forecasts
Netsales
91
Netsales
94
III. Full-year Earnings Forecasts for FY2016
Factors contributing to changes in operating income
16
10
Sale
s mix
Fore
ign
exc
han
ge
△2△1
0
5
10
15
20
25
7
Other
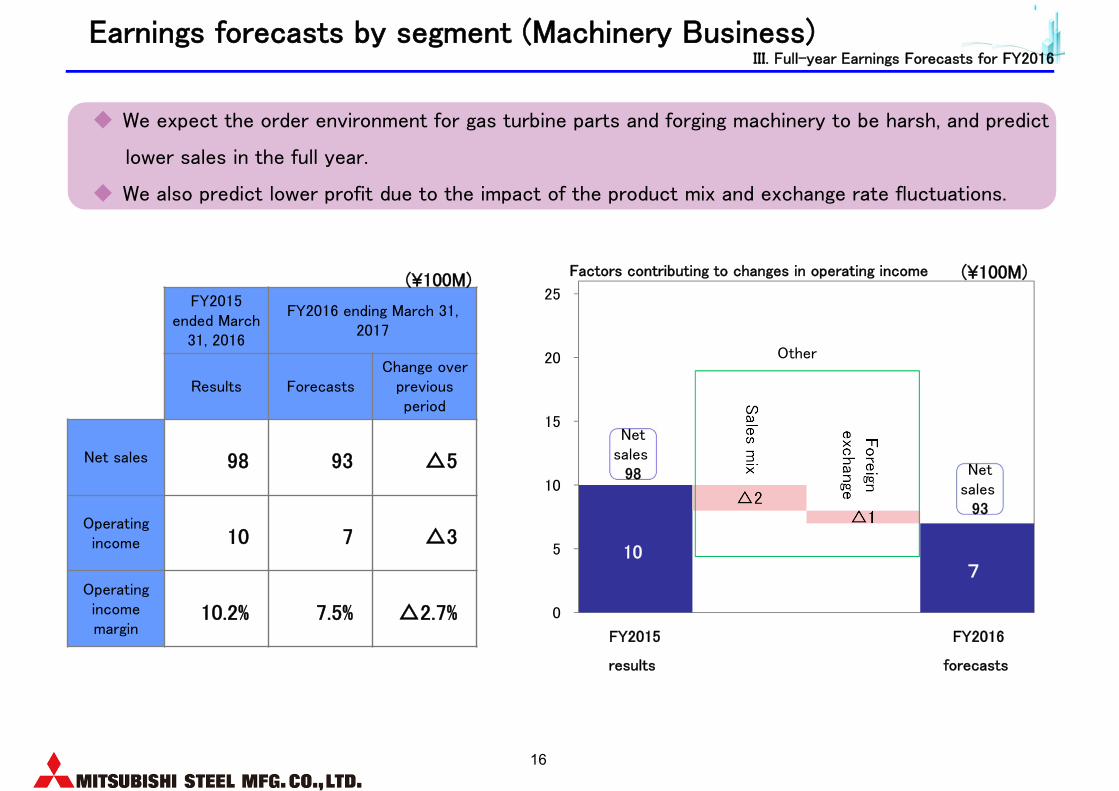
Earnings forecasts by segment (Machinery Business)
We expect the order environment for gas turbine parts and forging machinery to be harsh, and predict
lower sales in the full year.
We also predict lower profit due to the impact of the product mix and exchange rate fluctuations.
FY2015 ended March
31, 2016
FY2016 ending March 31, 2017
Results ForecastsChange over
previous period
Net sales 98 93 △5
Operating income 10 7 △3
Operating income margin
10.2% 7.5% △2.7%
(¥100M) (¥100M)
FY2015
results
FY2016
forecasts
Netsales
98 Netsales
93
III. Full-year Earnings Forecasts for FY2016
Factors contributing to changes in operating income
17
(¥100M)
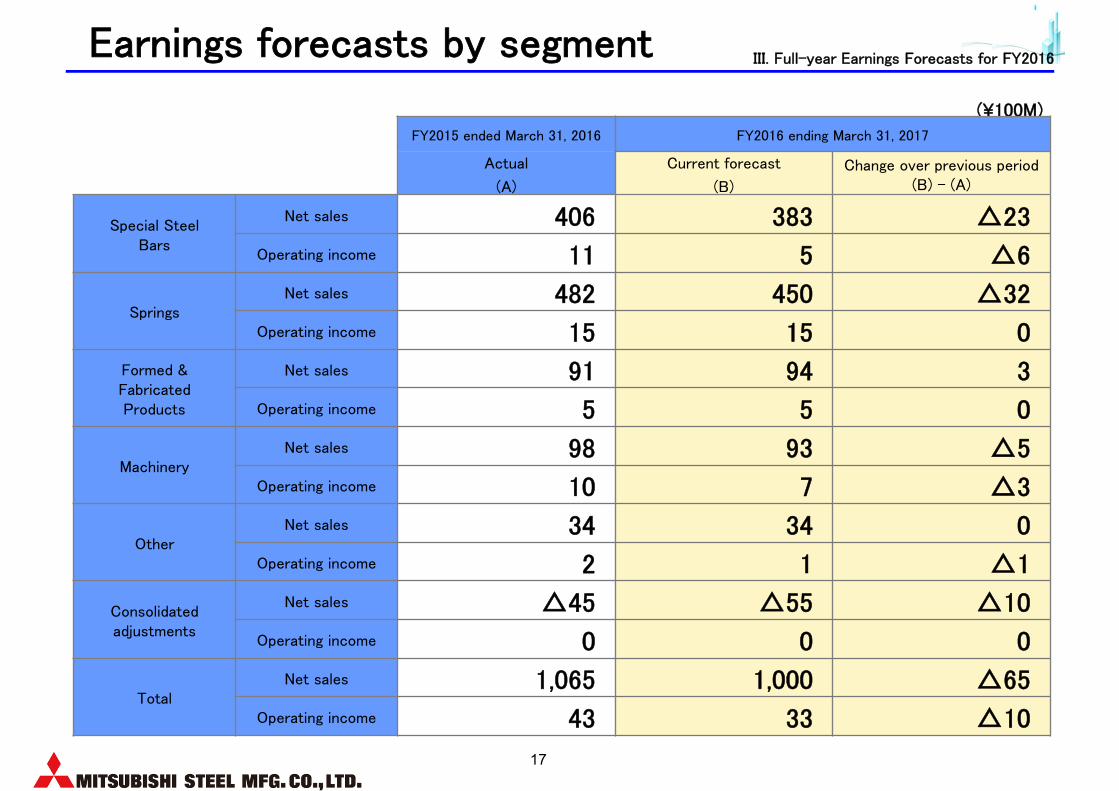
Earnings forecasts by segment
FY2015 ended March 31, 2016 FY2016 ending March 31, 2017
Actual
(A)
Current forecast
(B)
Change over previous period (B) - (A)
Special Steel Bars
Net sales 406 383 △23Operating income 11 5 △6
SpringsNet sales 482 450 △32
Operating income 15 15 0Formed & Fabricated Products
Net sales 91 94 3Operating income 5 5 0
MachineryNet sales 98 93 △5
Operating income 10 7 △3
OtherNet sales 34 34 0
Operating income 2 1 △1
Consolidated adjustments
Net sales △45 △55 △10Operating income 0 0 0
TotalNet sales 1,065 1,000 △65
Operating income 43 33 △10
III. Full-year Earnings Forecasts for FY2016

18
Full-year earnings forecast (impact of non-operating income/loss and extraordinary income/loss) In addition to temporary special factors such as investment losses on equity method and extraordinary losses in the
previous fiscal year, the addition of gains on the sale of stocks will increase income before income taxes by 1.5 times over the previous year.
Nevertheless, tax expenses will return to regular levels, and thus we expect after-tax income to increase only about 20%.
FY2015 ended March 31, 2016 FY2016 ending March 31, 2017
Results Forecast Change over previous period
Operating income 43 33 △10
Non-operating income/loss △10 △9 1
Translation (exchange profit & loss) △2 △5 △3
Investment gains & losses on equity method △11 △6 5
Other 3 2 △1
Ordinary income 33 24 △9
Gains on sale of stocks 3 24 21
Other extraordinary income/loss △8 △2 6
Income before income taxes 28 45 17
Tax expenses △1 △14 △13
Net income attributable to owners of parent 25 30 5
(¥100M)
III. Full-year Earnings Forecasts for FY2016
19
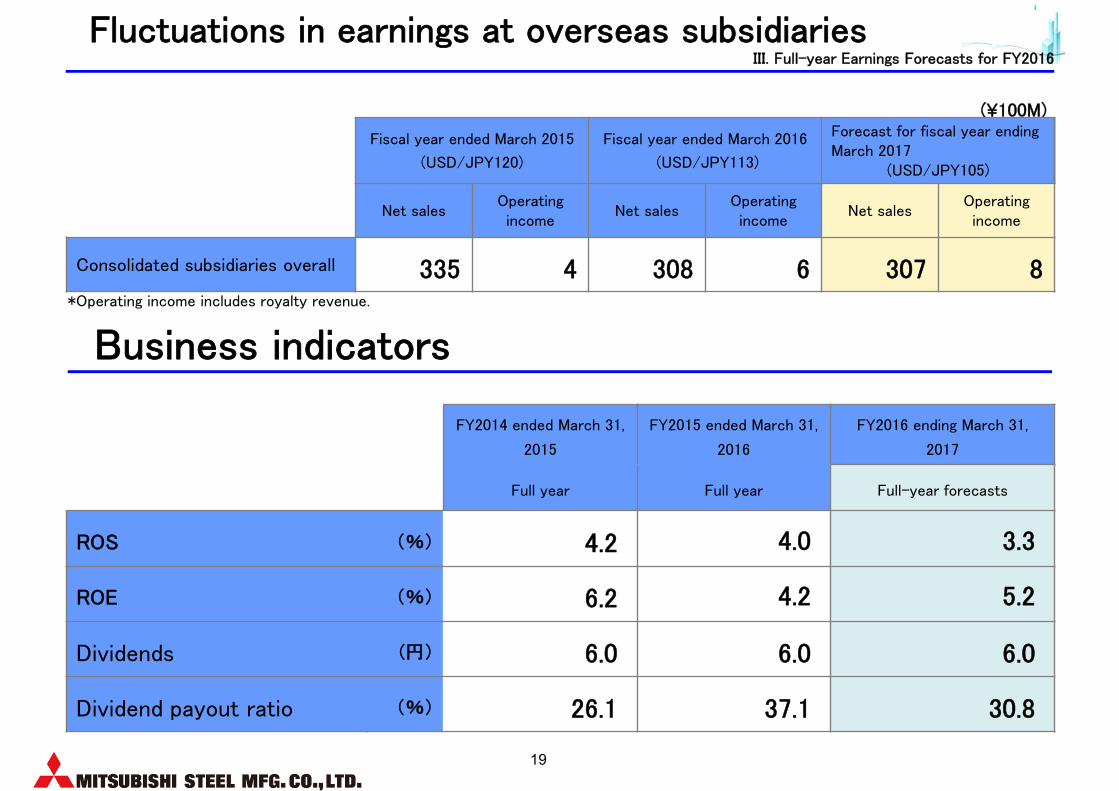
Fluctuations in earnings at overseas subsidiaries
FY2014 ended March 31,
2015
FY2015 ended March 31,
2016
FY2016 ending March 31,
2017
Full year Full year Full-year forecasts
ROS (%) 4.2 4.0 3.3
ROE (%) 6.2 4.2 5.2
Dividends (円) 6.0 6.0 6.0
Dividend payout ratio (%) 26.1 37.1 30.8
(¥100M)
Fiscal year ended March 2015
(USD/JPY120)
Fiscal year ended March 2016
(USD/JPY113)
Forecast for fiscal year ending March 2017
(USD/JPY105)
Net salesOperating income
Net salesOperating income
Net salesOperating income
Consolidated subsidiaries overall 335 4 308 6 307 8
Business indicators*Operating income includes royalty revenue.
III. Full-year Earnings Forecasts for FY2016
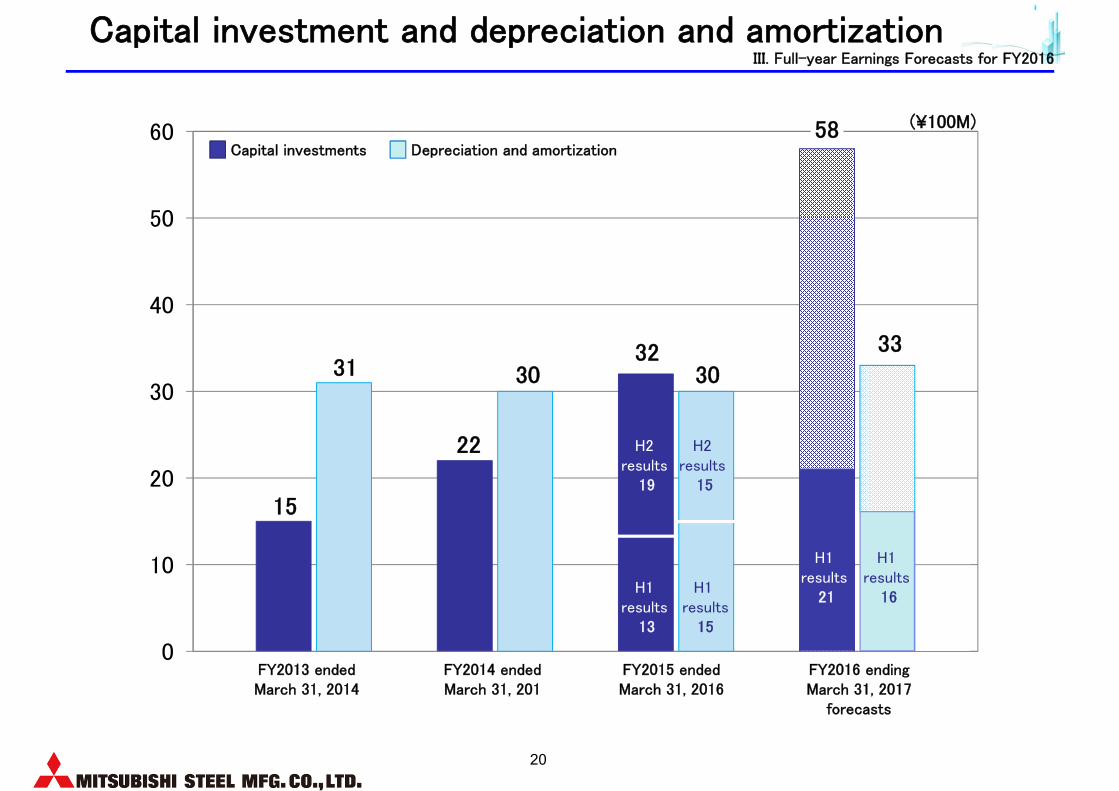
20
Capital investment and depreciation and amortization
15
31
22
3032
30
58
33
0
10
20
30
40
50
60
H2 results
19
H1 results
13
H2 results
15
H1 results
15
Depreciation and amortization
FY2014 ended March 31, 201
FY2013 ended March 31, 2014
Capital investments
FY2015 ended March 31, 2016
FY2016 ending March 31, 2017
forecasts
H1 results
21
H1 results
16
(¥100M)
III. Full-year Earnings Forecasts for FY2016
21
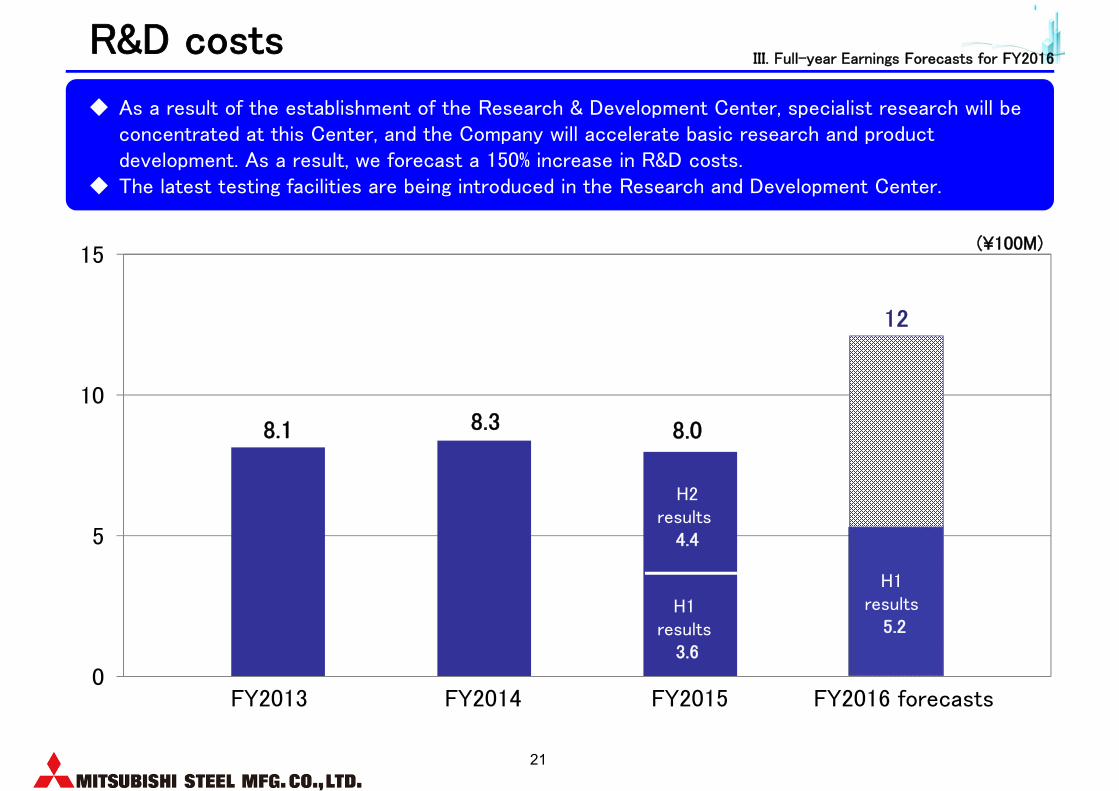
R&D costs
8.1 8.3 8.0
12
0
5
10
15
FY2013 FY2014 FY2015 FY2016 forecasts
H1 results
3.6
H2results
4.4
(¥100M)
As a result of the establishment of the Research & Development Center, specialist research will be concentrated at this Center, and the Company will accelerate basic research and product development. As a result, we forecast a 150% increase in R&D costs.
The latest testing facilities are being introduced in the Research and Development Center.
H1 results
5.2
III. Full-year Earnings Forecasts for FY2016
22
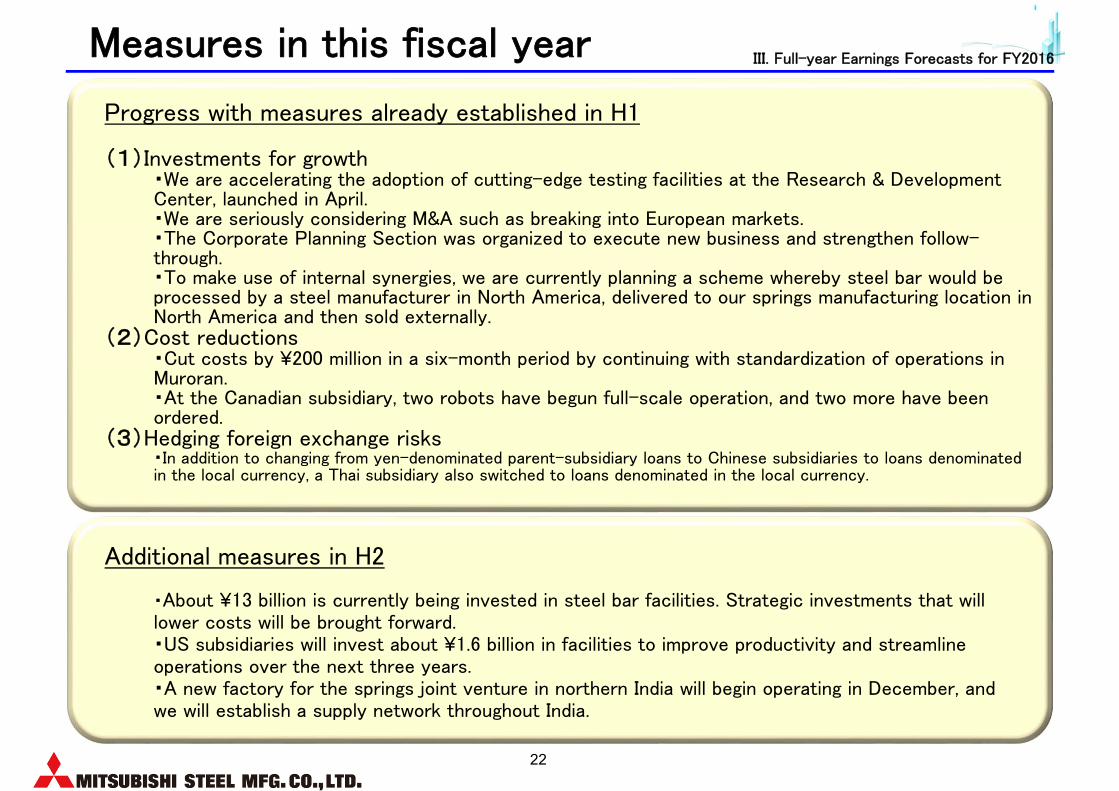
Measures in this fiscal year
Additional measures in H2
・About ¥13 billion is currently being invested in steel bar facilities. Strategic investments that will lower costs will be brought forward.・US subsidiaries will invest about ¥1.6 billion in facilities to improve productivity and streamline operations over the next three years.・A new factory for the springs joint venture in northern India will begin operating in December, and we will establish a supply network throughout India.
Progress with measures already established in H1
(1)Investments for growth・We are accelerating the adoption of cutting-edge testing facilities at the Research & Development Center, launched in April.・We are seriously considering M&A such as breaking into European markets.・The Corporate Planning Section was organized to execute new business and strengthen follow-through.・To make use of internal synergies, we are currently planning a scheme whereby steel bar would be processed by a steel manufacturer in North America, delivered to our springs manufacturing location in North America and then sold externally.
(2)Cost reductions・Cut costs by ¥200 million in a six-month period by continuing with standardization of operations in Muroran.・At the Canadian subsidiary, two robots have begun full-scale operation, and two more have been ordered.
(3)Hedging foreign exchange risks・In addition to changing from yen-denominated parent-subsidiary loans to Chinese subsidiaries to loans denominated in the local currency, a Thai subsidiary also switched to loans denominated in the local currency.
III. Full-year Earnings Forecasts for FY2016

23
IV. Progress with the 2016 Mid-term Business Plan
Ⅰ. Opening Remarks
Ⅱ. H1 FY2016 Results
Ⅲ. Full-year Earnings Forecasts for FY2016
Ⅳ. Progress with the 2016 Mid-term Business Plan
24
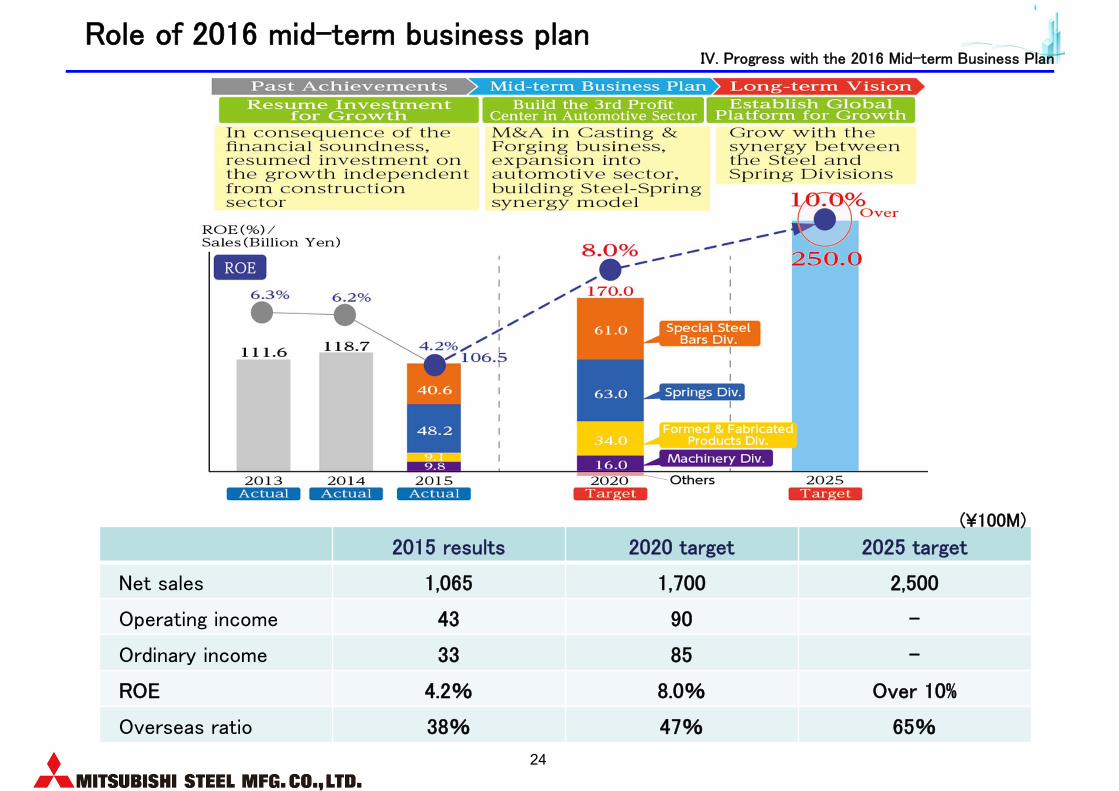
Role of 2016 mid-term business plan
2015 results 2020 target 2025 target
Net sales 1,065 1,700 2,500
Operating income 43 90 -
Ordinary income 33 85 -
ROE 4.2% 8.0% Over 10%
Overseas ratio 38% 47% 65%
(¥100M)
IV. Progress with the 2016 Mid-term Business Plan
25
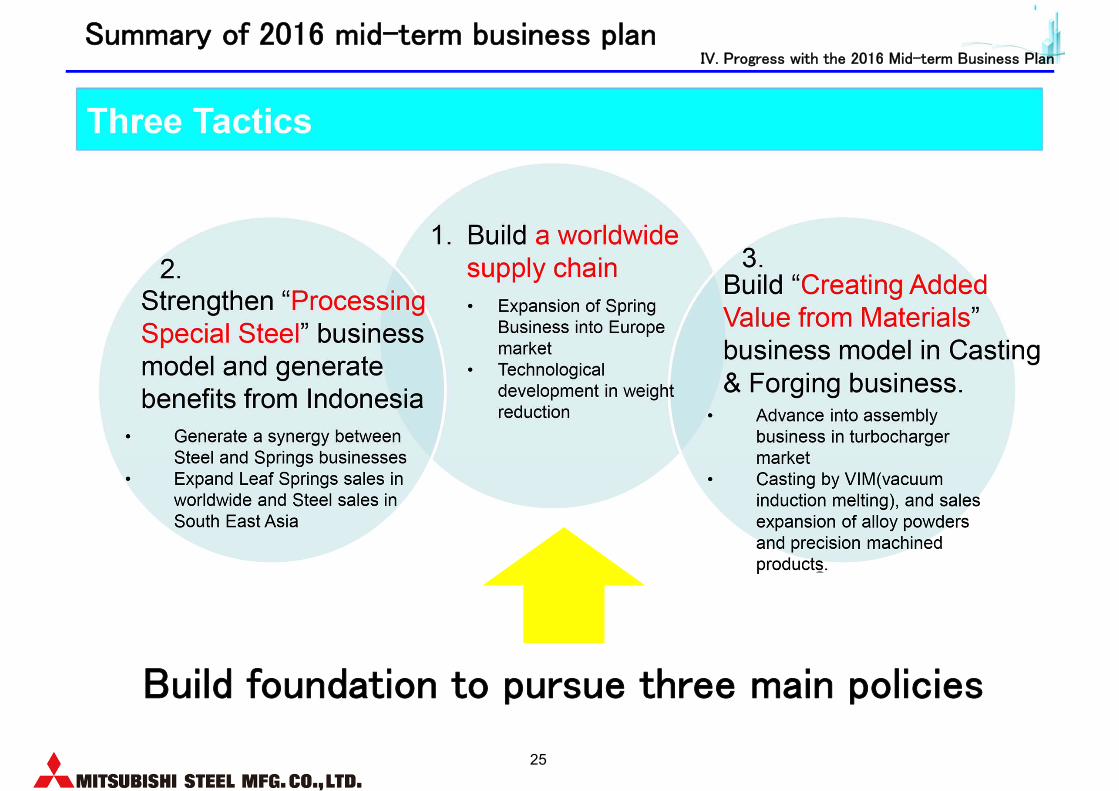
Summary of 2016 mid-term business planIV. Progress with the 2016 Mid-term Business Plan
Build foundation to pursue three main policies
26
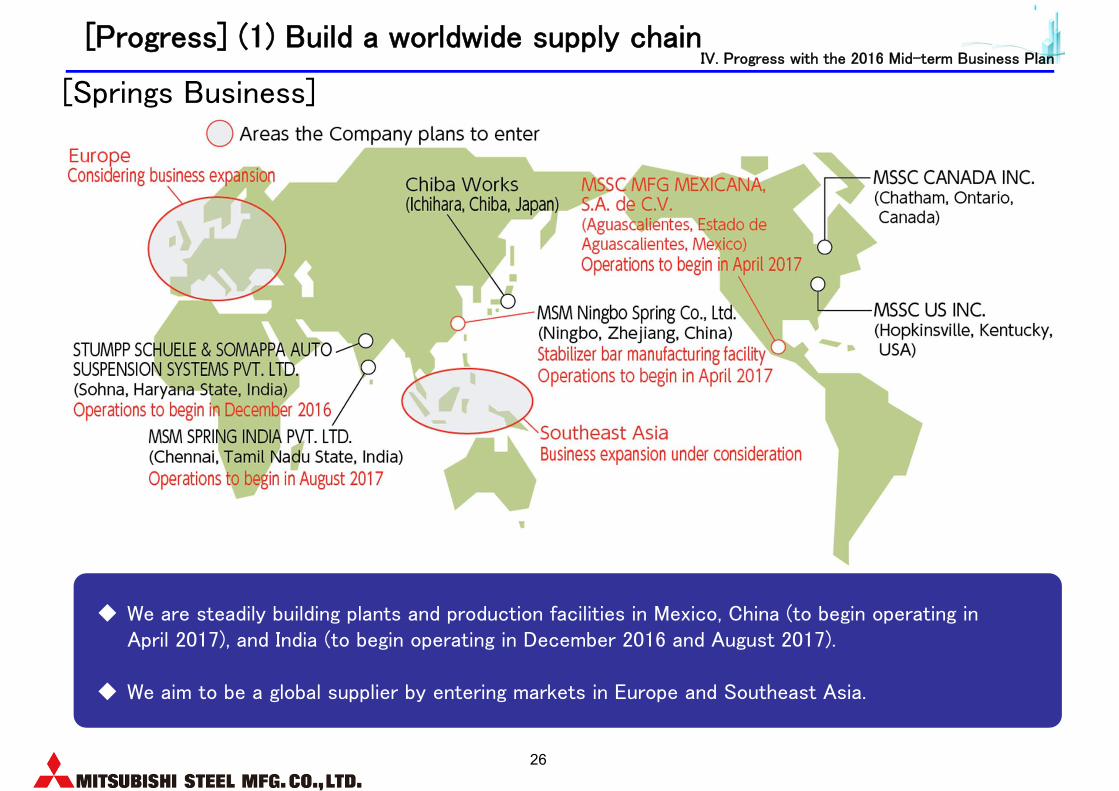
[Progress] (1) Build a worldwide supply chain
We are steadily building plants and production facilities in Mexico, China (to begin operating in April 2017), and India (to begin operating in December 2016 and August 2017).
We aim to be a global supplier by entering markets in Europe and Southeast Asia.
[Springs Business]IV. Progress with the 2016 Mid-term Business Plan
27
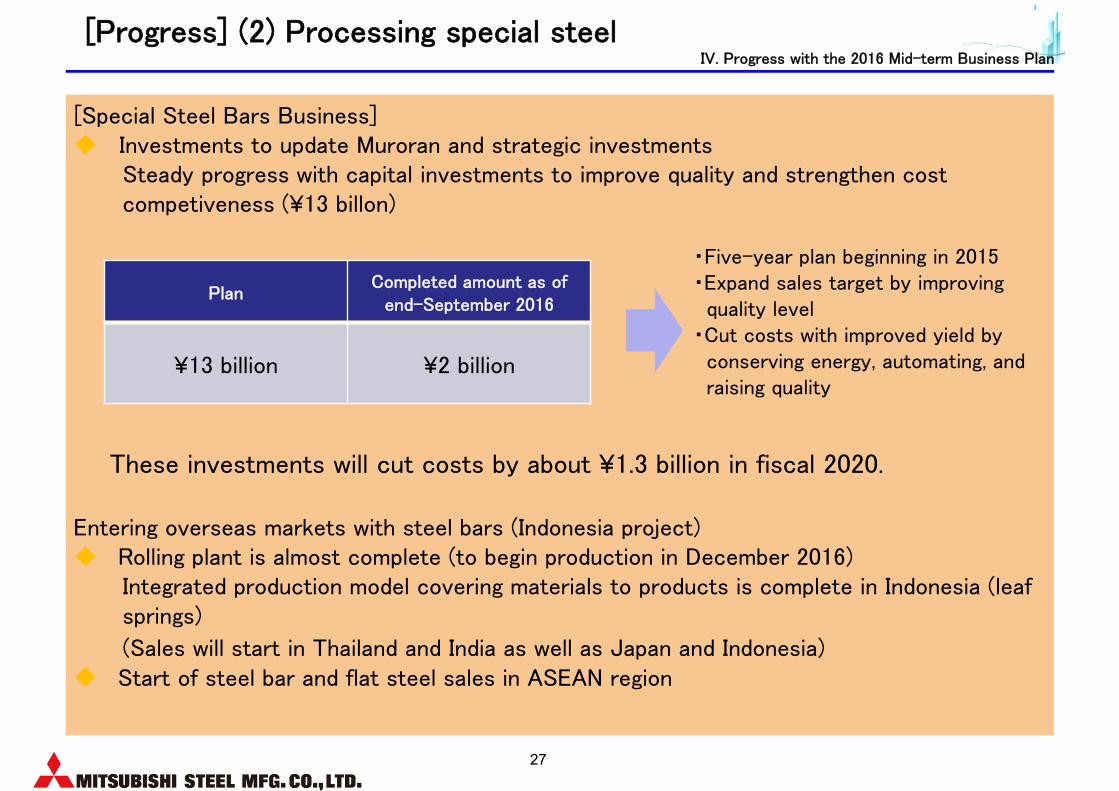
[Special Steel Bars Business] Investments to update Muroran and strategic investments
Steady progress with capital investments to improve quality and strengthen cost competiveness (¥13 billon)
These investments will cut costs by about ¥1.3 billion in fiscal 2020.
Entering overseas markets with steel bars (Indonesia project) Rolling plant is almost complete (to begin production in December 2016)
Integrated production model covering materials to products is complete in Indonesia (leaf springs)
(Sales will start in Thailand and India as well as Japan and Indonesia) Start of steel bar and flat steel sales in ASEAN region
[Progress] (2) Processing special steel
PlanCompleted amount as of
end-September 2016
¥13 billion ¥2 billion
・Five-year plan beginning in 2015・Expand sales target by improving quality level
・Cut costs with improved yield by conserving energy, automating, and raising quality
IV. Progress with the 2016 Mid-term Business Plan
28
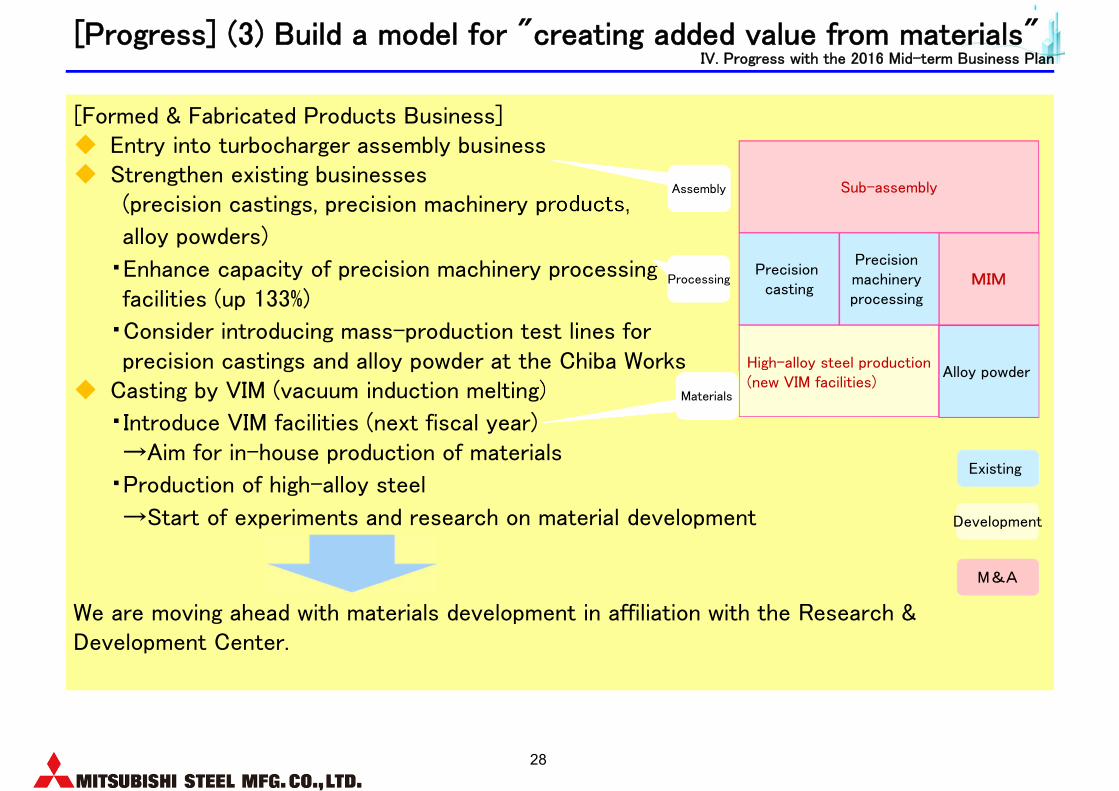
[Progress] (3) Build a model for "creating added value from materials"
[Formed & Fabricated Products Business] Entry into turbocharger assembly business Strengthen existing businesses
(precision castings, precision machinery products,
alloy powders)
・Enhance capacity of precision machinery processingfacilities (up 133%)
・Consider introducing mass-production test lines forprecision castings and alloy powder at the Chiba Works
Casting by VIM (vacuum induction melting)
・Introduce VIM facilities (next fiscal year) →Aim for in-house production of materials
・Production of high-alloy steel
→Start of experiments and research on material development
We are moving ahead with materials development in affiliation with the Research & Development Center.
Sub-assembly
High-alloy steel production(new VIM facilities)
Precision casting
Alloy powder
Precision machinery processing
MIM
Existing
Development
M&A
Assembly
Processing
Materials
IV. Progress with the 2016 Mid-term Business Plan
29
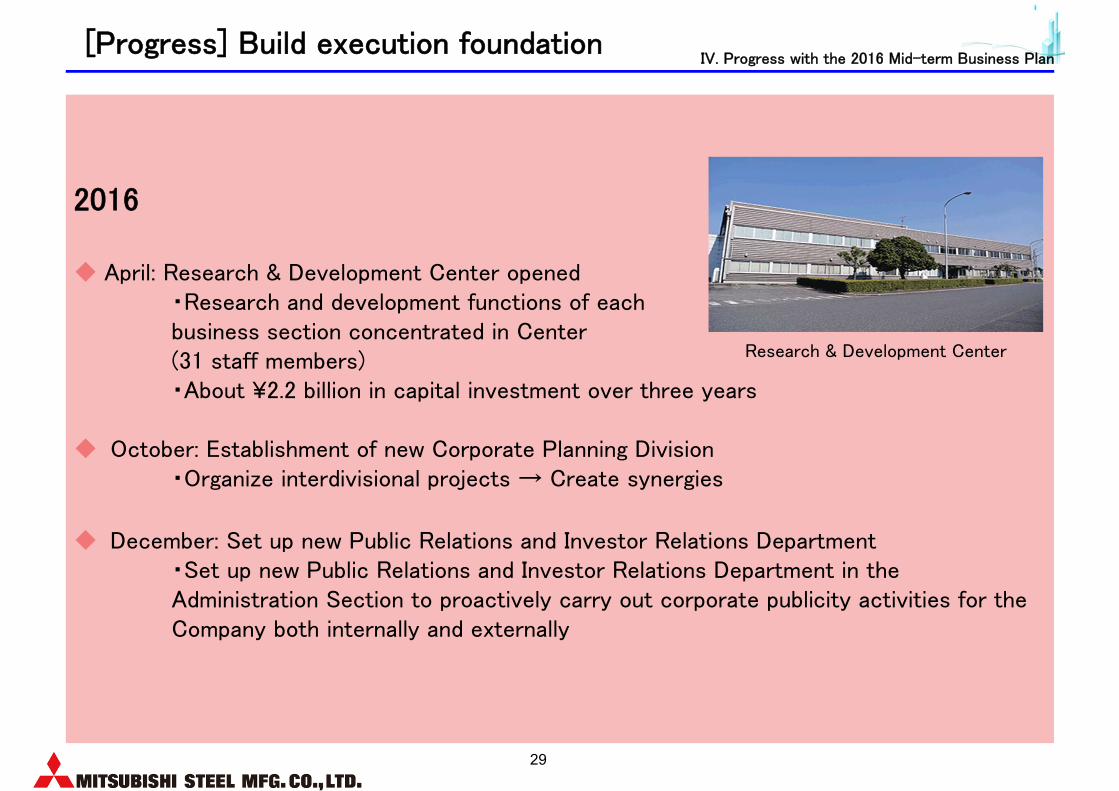
2016
April: Research & Development Center opened・Research and development functions of each business section concentrated in Center (31 staff members)・About ¥2.2 billion in capital investment over three years
October: Establishment of new Corporate Planning Division・Organize interdivisional projects → Create synergies
December: Set up new Public Relations and Investor Relations Department・Set up new Public Relations and Investor Relations Department in the Administration Section to proactively carry out corporate publicity activities for the Company both internally and externally
[Progress] Build execution foundation
Research & Development Center
IV. Progress with the 2016 Mid-term Business Plan

30
Section Research and development items 2016 2017 2018 2019 2020
Springs
Make springs lighter in weightAdapt to autonomous vehicle technologyAddress electric vehicles
Develop high-stress spring steel
Evaluation tests for local procurement of spring material
Steel bar Development of high-purity steel
Materials development and mass production with VIM(VIM: vacuum induction melting)
Formed & Fabricate
d Products
Development of heat-resistant steel (for turbochargers)Improvements to high-frequency characteristics of soft magnetic powder
Company-wide
IoT: Development of high value-added productsIoT: Greater efficiency of production line
Research & Development Center (development plan)
Move ahead with systematic development looking to the future
India, North America
Mexico, otherEurope, other; Evaluation
tests
High-stress spring steelSTEP 2
High-stress spring steelSTEP 1
Development of high-stress spring steelSTEP 3
High-temperature compatibility STEP 1 High-temperature compatibility STEP 2
Improvements to high-frequency characteristics STEP 1
Improvements to high-frequency characteristics STEP 2
Steel bar prototypes
Utilization of IoT technology
Compliance with increase in foundation brake weight
Bearing steel, spring steel, steel for gears, etc.
High-alloy steel for precision casting; master heat
Adaptation for global expansion, support for new business, etc.
High stress and hollowed, crystal grain fined, resin spring
IV. Progress with the 2016 Mid-term Business Plan
31
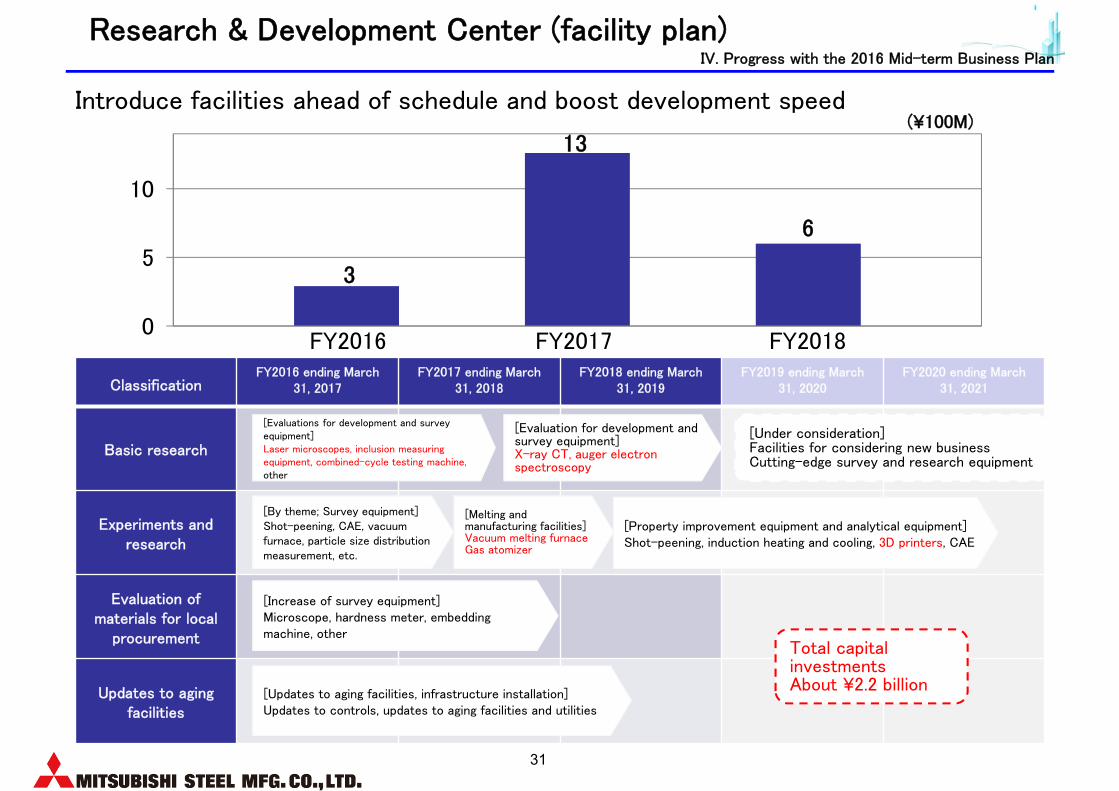
ClassificationFY2016 ending March
31, 2017FY2017 ending March
31, 2018FY2018 ending March
31, 2019FY2019 ending March
31, 2020FY2020 ending March
31, 2021
Basic research
Experiments and research
Evaluation of materials for local
procurement
Updates to aging facilities
[Evaluations for development and survey equipment]Laser microscopes, inclusion measuring equipment, combined-cycle testing machine, other
[Updates to aging facilities, infrastructure installation]Updates to controls, updates to aging facilities and utilities
[Increase of survey equipment]Microscope, hardness meter, embedding machine, other
[By theme; Survey equipment]Shot-peening, CAE, vacuum furnace, particle size distribution measurement, etc.
[Melting and manufacturing facilities]Vacuum melting furnaceGas atomizer
[Property improvement equipment and analytical equipment]Shot-peening, induction heating and cooling, 3D printers, CAE
[Evaluation for development and survey equipment]X-ray CT, auger electron spectroscopy
[Under consideration]Facilities for considering new businessCutting-edge survey and research equipment
Total capital investmentsAbout ¥2.2 billion
Research & Development Center (facility plan)
Introduce facilities ahead of schedule and boost development speed
3
13
6
0
5
10
FY2017FY2016 FY2018
(¥100M)
IV. Progress with the 2016 Mid-term Business Plan
32
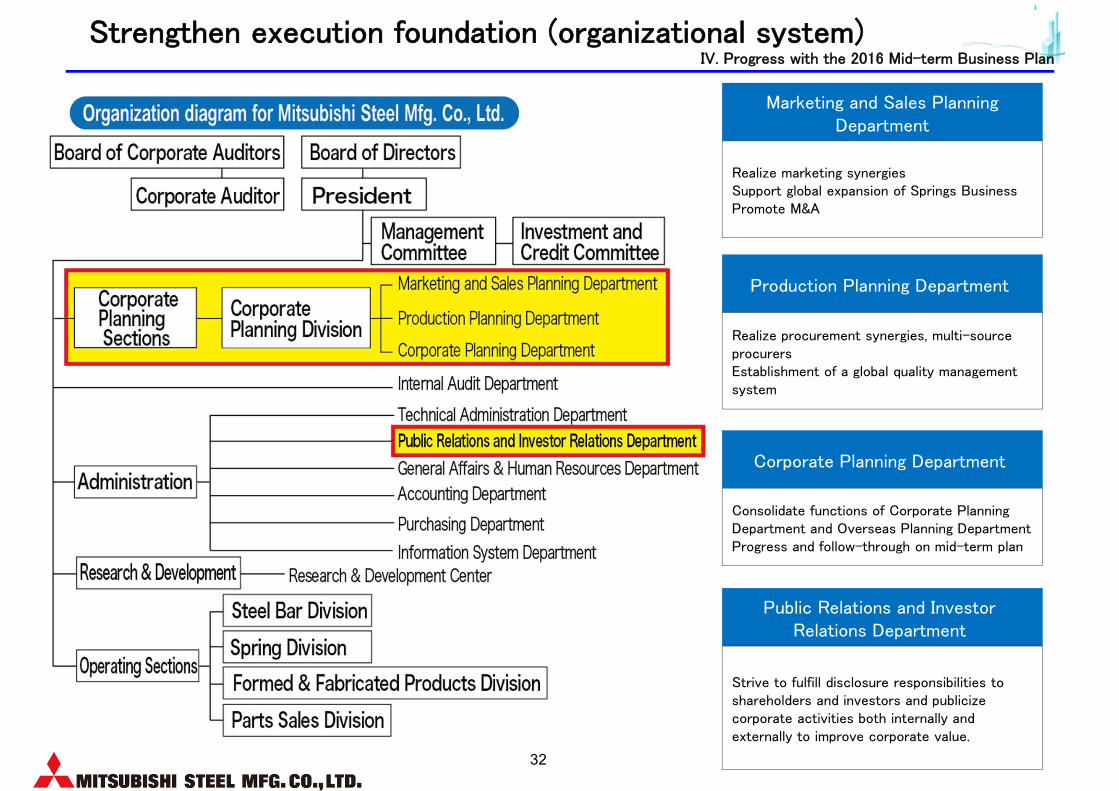
Strengthen execution foundation (organizational system)
Marketing and Sales Planning Department
Realize marketing synergiesSupport global expansion of Springs BusinessPromote M&A
Production Planning Department
Corporate Planning Department
Realize procurement synergies, multi-source procurers Establishment of a global quality management system
Consolidate functions of Corporate Planning Department and Overseas Planning DepartmentProgress and follow-through on mid-term plan
Public Relations and Investor Relations Department
Strive to fulfill disclosure responsibilities to shareholders and investors and publicize corporate activities both internally and externally to improve corporate value.
IV. Progress with the 2016 Mid-term Business Plan

<Notes on Forecasts>
These materials are meant solely to provide investors with information, and are not intended to solicit trades. The
forecasts provided in these materials are based on targets and projections and the Company does not promise or
guarantee future performance. Please use this information with the understanding that the Company’s future
performance may differ from this business outlook. Although these earnings materials were prepared based on
data believed to be reliable, we cannot guarantee their accuracy and safety. Regardless of the purpose of these
materials, the Company bears no responsibility and we encourage all investors to make final investment decisions
based on their own judgment.