Mitochondrial genetic variability of Didelphis albiventris (Didelphimorphia, Didelphidae) in...
8
Mitochondrial genetic variability of Didelphis albiventris (Didelphimorphia, Didelphidae) in Brazilian localities Luciene C.C. Sousa 1 , Célia M.F. Gontijo 2 , Helbert A. Botelho 2 and Cleusa G. Fonseca 1 1 Departamento de Biologia Geral, Instituto de Ciências Biológicas, Universidade Federal de Minas Gerais, Belo Horizonte, MG, Brazil. 2 Laboratório de Leishmanioses, Centro de Pesquisas René Rachou, Fundação Oswaldo Cruz, Belo Horizonte, MG, Brazil. Abstract Didelphis albiventris is a well- known and common marsupial. Due to its high adaptability, this very widespread gen- eralist species occurs under various environmental conditions, this even including protected regions and disturbed urban areas. We studied a 653 bp fragment of cytochrome oxidase c (COI) from 93 biological samples from seven Brazilian localities, with linear distances ranging between 58 and about 1800 km to analyze the effects of geographic distances on variability and genetic differentiation. The haplotype network presented nine haplotypes and two ge- netic clusters compatible with the two most distant geographic areas of the states of Minas Gerais, in the southeast, and Rio Grande do Sul, in the extreme south. As each cluster was characterized by low nucleotide and high haplotype diversities, their populations were obviously composed of closely related haplotypes. Surprisingly, moder- ate to high F ST differentiation values and a very weak phylogeographic signal characterizes interpopulation compari- sons within Minas Gerais interdemes, these being correlated with the presence of privative haplotypes. On a larger geographic scale, a comparison between demes from Minas Gerais and Rio Grande do Sul presented high F ST val- ues and a robust phylogeographic pattern. This unexpected scenario implies that mtDNA gene flow was insufficient to maintain population cohesion, reflected by the observed high differentiation. Key words: Didelphis albiventris, marsupial, variability, COI, genetic differentiation. Received: November 27, 2011; Accepted: February 28, 2012. Introduction The white-eared opossum Didelphis albiventris Lund, 1840 (Didelphimorphia, Didelphidae) is widely dis- tributed throughout Brazil, Paraguay, Uruguay, Argentina, Bolivia (Gardner, 2008; Costa et al., 2008), Ecuador, Peru and Colombia (Wilson and Reeder, 2005). The species is listed as “Least Concern” in the IUCN Red List Category (Costa et al., 2008). Through their presence in a wide vari- ety of habitats, and adaptability to disturbed areas, such as large towns and other urban habitats, D. albiventris mani- fests the capacity of coexisting with environmental impacts caused by human exploitation of natural spaces. Another characteristic is their importance as parasite reservoirs, highly relevant in populated urban areas (Schallig et al., 2007). One of the most important factors affecting mammals in small fragments is the lack of food resources. Little is known on Neotropical forest mammal movement between forest-patches. Even so, anecdotal evidence indicates facile mobility in some species, especially habitat generalists, as opossums (Chiarello, 2000). This was apparent in a south- eastern Brazilian Atlantic Forest region, where D. aurita manifested interfragment movement in 19.4% of recap- tures, the highest, when compared to seven other small mammals (Pires et al., 2002). Didelphis are polygynous, the females presenting more stable home ranges and the males migrating more, hence the differences among sexes in the use of space (Loretto and Vieira, 2005), as verified for D. marsupialis in Venezuela, where, on using radiote- lemetry methodology, a mean home range 10 times greater for males (122.7 ha) than for females (12 ha) was observed (Sunquist et al., 1987). In this context, white-eared opos- sums, as seed dispersers, make an important contribution to the maintenance of diverse ecosystems, mainly where spe- cialist frugivores are frequently absent, as in urban forest fragments (Cantor et al., 2010). In the present survey, four Brazilian biomes in the wide D. albiventris distribution were sampled, viz., Atlan- tic Forest, Cerrado, Caatinga and Pampa. The Atlantic For- Genetics and Molecular Biology, 35, 2, 522-529 (2012) Copyright © 2012, Sociedade Brasileira de Genética. Printed in Brazil www.sbg.org.br Send correspondence to Luciene C.C. Sousa. Departamento de Biologia Geral, Instituto de Ciências Biológicas, Universidade Fed- eral de Minas Gerais, Avenida Antônio Carlos 6627, Pampulha, 31270-901 Belo Horizonte, MG, Brazil. E-mail: [email protected]. Research Article
Transcript of Mitochondrial genetic variability of Didelphis albiventris (Didelphimorphia, Didelphidae) in...
Mitochondrial genetic variability of Didelphis albiventris(Didelphimorphia, Didelphidae) in Brazilian localities
Luciene C.C. Sousa1, Célia M.F. Gontijo2, Helbert A. Botelho2 and Cleusa G. Fonseca1
1Departamento de Biologia Geral, Instituto de Ciências Biológicas,
Universidade Federal de Minas Gerais, Belo Horizonte, MG, Brazil.2Laboratório de Leishmanioses, Centro de Pesquisas René Rachou, Fundação Oswaldo Cruz,
Belo Horizonte, MG, Brazil.
Abstract
Didelphis albiventris is a well- known and common marsupial. Due to its high adaptability, this very widespread gen-eralist species occurs under various environmental conditions, this even including protected regions and disturbedurban areas. We studied a 653 bp fragment of cytochrome oxidase c (COI) from 93 biological samples from sevenBrazilian localities, with linear distances ranging between 58 and about 1800 km to analyze the effects of geographicdistances on variability and genetic differentiation. The haplotype network presented nine haplotypes and two ge-netic clusters compatible with the two most distant geographic areas of the states of Minas Gerais, in the southeast,and Rio Grande do Sul, in the extreme south. As each cluster was characterized by low nucleotide and highhaplotype diversities, their populations were obviously composed of closely related haplotypes. Surprisingly, moder-ate to high FST differentiation values and a very weak phylogeographic signal characterizes interpopulation compari-sons within Minas Gerais interdemes, these being correlated with the presence of privative haplotypes. On a largergeographic scale, a comparison between demes from Minas Gerais and Rio Grande do Sul presented high FST val-ues and a robust phylogeographic pattern. This unexpected scenario implies that mtDNA gene flow was insufficientto maintain population cohesion, reflected by the observed high differentiation.
Key words: Didelphis albiventris, marsupial, variability, COI, genetic differentiation.
Received: November 27, 2011; Accepted: February 28, 2012.
Introduction
The white-eared opossum Didelphis albiventris
Lund, 1840 (Didelphimorphia, Didelphidae) is widely dis-
tributed throughout Brazil, Paraguay, Uruguay, Argentina,
Bolivia (Gardner, 2008; Costa et al., 2008), Ecuador, Peru
and Colombia (Wilson and Reeder, 2005). The species is
listed as “Least Concern” in the IUCN Red List Category
(Costa et al., 2008). Through their presence in a wide vari-
ety of habitats, and adaptability to disturbed areas, such as
large towns and other urban habitats, D. albiventris mani-
fests the capacity of coexisting with environmental impacts
caused by human exploitation of natural spaces. Another
characteristic is their importance as parasite reservoirs,
highly relevant in populated urban areas (Schallig et al.,
2007).
One of the most important factors affecting mammals
in small fragments is the lack of food resources. Little is
known on Neotropical forest mammal movement between
forest-patches. Even so, anecdotal evidence indicates facile
mobility in some species, especially habitat generalists, as
opossums (Chiarello, 2000). This was apparent in a south-
eastern Brazilian Atlantic Forest region, where D. aurita
manifested interfragment movement in 19.4% of recap-
tures, the highest, when compared to seven other small
mammals (Pires et al., 2002). Didelphis are polygynous,
the females presenting more stable home ranges and the
males migrating more, hence the differences among sexes
in the use of space (Loretto and Vieira, 2005), as verified
for D. marsupialis in Venezuela, where, on using radiote-
lemetry methodology, a mean home range 10 times greater
for males (122.7 ha) than for females (12 ha) was observed
(Sunquist et al., 1987). In this context, white-eared opos-
sums, as seed dispersers, make an important contribution to
the maintenance of diverse ecosystems, mainly where spe-
cialist frugivores are frequently absent, as in urban forest
fragments (Cantor et al., 2010).
In the present survey, four Brazilian biomes in the
wide D. albiventris distribution were sampled, viz., Atlan-
tic Forest, Cerrado, Caatinga and Pampa. The Atlantic For-
Genetics and Molecular Biology, 35, 2, 522-529 (2012)
Copyright © 2012, Sociedade Brasileira de Genética. Printed in Brazil
www.sbg.org.br
Send correspondence to Luciene C.C. Sousa. Departamento deBiologia Geral, Instituto de Ciências Biológicas, Universidade Fed-eral de Minas Gerais, Avenida Antônio Carlos 6627, Pampulha,31270-901 Belo Horizonte, MG, Brazil. E-mail:[email protected].
Research Article
est and Cerrado appear on the biodiversity hotspots list,
which highlights 24 priority conservation areas (Mitter-
meier et al., 1998). Biodiversity hotspots, occupying only
1.4% of the Earth’s surface, concentrate more than 60%
of terrestrial species (Mesquita, 2004), and mainly con-
sist of heavily exploited and often highly fragmented
ecosystems, greatly reduced in extent, and with less than
25% of the original vegetation remaining (Mittermeier et
al., 1998). Several vegetal formations are observed in the
Brazilian Atlantic Forest, such as the Seasonal Forest
(semi-deciduous and deciduous, the latter occurring on a
reduced scale) and the Rain Forest (dense and moist).
The seasonal semi-deciduous forest is under extreme
risk, formerly caused by sugar cane and coffee planta-
tions, and currently by growing urbanization, especially
around the major cities (IBGE, 2011; Fundação SOS
Mata Atlântica, 2011). The Araucaria Moist Forest, an
endangered ecosystem (only 12.6% remaining) of the
Atlantic Rain Forest, is mostly distributed among small
fragments surrounded by anthropogenic habitats, such as
cattle pasture, farming and exotic-tree monoculture
(Ribeiro et al., 2009; Emer and Fonseca, 2011). The
Cerrado, Caatinga and Pampa biomes are characterized
by open grassland vegetation. The Cerrado biome, with
savanna vegetation, predominates in central Brazil, the
Caatinga, with savanna-steppe vegetation, is typical of
the semiarid northeast, and the Pampa, restricted to the
extreme south, is characterized by steppe vegetation
(IBGE, 2011).
Mitochondrial DNA, the most used molecular
marker for tracing the geographic distribution of genea-
logical lineages, even at the intraspecific level, has been
consolidated by such characteristics as maternal inheri-
tance and high rates of nucleotide substitution (Avise et
al., 1987). Molecular DNA techniques, besides forming
the basic tool in population genetics studies for defining
taxonomic units (Wilson-Wilde et al., 2010), have also
been widely used in mammal diversity surveys when ana-
lyzing variability characteristics and distribution, as in the
genetic structure analyses of the Atlantic Forest
sigmodontine rodents Oligoryzomys nigripes and
Euryoryzomys russatus (Gonçalves et al., 2009) and the
short-tailed bats Carollia brevicauda, C. perspicillata, C.
sowelli and C. castanea (Hoffmann et al., 2003). COI, the
marker of choice for species discrimination by the
Barcode of Life Database (BOLD), is useful for species
identification, and the study of differentiation in
large-scale structure assaying (Wilson-Wilde et al., 2010;
Sousa et al., 2012).
Knowledge on species population genetics is impor-
tant for a better understanding of species biology, including
ecological correlations. The aim here was to study
Didelphis albiventris population genetic patterns, by focus-
ing on the geographic distance effect on both variability
and genetic differentiation among demes.
Materials and Methods
Sampling
This research was developed under a license for sci-
entific purposes granted by IBAMA/SISBIO, number
20170-2, renewed in February, 2011. The institutions that
collaborated with sample donations also have their own sci-
entific licenses.
Didelphis albiventris samples from two distant geo-
graphic areas in Brazil, herein considered as two geo-
graphic clusters, were studied, viz., Minas Gerais (MG), a
southeastern state, and Rio Grande do Sul (RS), the south-
ernmost. Linear distances between the studied localities
range from 58 to 1795 km (Table 1). In MG, six localities
were sampled (Figure 1). Piracema (Pir) and Almenara
(Alm), both in the Atlantic Forest, and Bambuí (Bam), in
the Cerrado, were poorly sampled (Figure 1). As the Belo
Horizonte Metropolitan Region (BH, 40 samples), Divi-
nópolis (Div, 18 samples) and the Reserva Indígena Xa-
criabá (RIX, 18 samples) were well-sampled, the
hypothesis of separate demes was tested here. Although BH
and Div are geographically situated in transitional regions
between the Cerrado and Atlantic Forest, both sampled ar-
eas present characteristics of the Atlantic Forest biome.
RIX, a transitional area connecting the Cerrado and Caa-
tinga biomes, presents ecotone characteristics. The RS geo-
graphic cluster (Figure 1) comprised samples collected in
two localities in the Araucaria Moist-Rain Forest, a domain
of the Atlantic Forest (Machadinho and Caxias do Sul),
four collected in the Pampa biome (Porto Alegre and Triun-
fo) and three from road killed animals from RS, but without
exact locality information. For Rio Grande do Sul, dis-
tances correspond to the average among known state col-
lection localities (Table 1).
In the entire analysis, and due to the small size of the
samples obtained from each location, as a whole, the RS
sample group was treated as one single study area.
DNA extraction, amplification and sequencing
The tissue samples used were mostly obtained from the
liver, and in a few cases, the spleen, muscle and blood.
Sousa et al. 523
Table 1 - Matrix with linear geographic distances (km) between sampling
areas. The meanings of abbreviations are cited in the topic ‘sampling’ in
“Material and Methods”.
Demes BH Div RIX Bam Pir Alm RS
BH
Div 111
RIX 548 590
Bam 221 115 600
Pir 94 58 621 164
Alm 523 622 393 700 620
RS 1256 1180 1725 1130 1170 1795
Ear-tissue fragments were collected from road killed ani-
mals. Tissue samples were preserved in 95% ethanol and
stored at -20 °C. Most of the samples were kindly donated by
researchers from the Centro de Pesquisa René Rachou/FIO-
CRUZ, Museu de Ciências Naturais da Pontifícia Univers-
idade Católica de Minas Gerais, Fundação Zoo-Botânica do
Rio Grande do Sul, and the Pontifícia Universidade Católica
do Rio Grande do Sul. DNA from macerated tissue frag-
ments was extracted according to standard phenol-chloro-
form protocols, as described by Sambrook et al. (2001).
DNA sequences of the mitochondrial cytochrome
oxidase I gene (COI) were amplified using the universal
primers LCO 1490: 5’ GGT CAA CAA ATC ATA AAG
ATA TTG G 3’ and HCO 2198: 5’ TAA ACT TCA GGG
TGA CCA AAA AAT CA 3’ (Folmer et al., 1994). Each
PCR was carried out in a 20 �L final volume, containing
50 ng of genomic DNA, 10x Buffer III B (Phoneutria:
100 mM (NH4)2SO4, 100 mM KCl, 100 mM Tris-HCl pH
8,4, 1% Triton-X, 15 mM MgCl2 10x), 0.8 �M of dNTPs,
0.5 �M of each primer, 1% bovine serum albumin (BSA),
and 1 unit of Taq DNA polymerase (Phoneutria). After an
initial denaturing step of 3 min at 94 °C, the PCR conditions
followed a standard three-step protocol, with 30 cycles of
1 min at 94 °C, 45 s at 47 °C and 30 s at 72 °C, followed by a
final extension step for 5 min at 72 °C. Satisfactory amplifi-
cations were visualized in 6% polyacrylamide gels. Am-
plified DNA products were purified using 20%
polyethylene-glycol (PEG 8000) and 2.5 M NaCl, accord-
ing to Sambrook et al. (2001).
PCR products were sequenced in both directions with
the same primers, LCO 1490 or HCO 2198 (Folmer et al.,
1994) on an ABI3100 automated sequencer using a BigDye
Terminator Kit v3 (Applied Biosystems). Alternatively,
some sequences were obtained on a MegaBACE automated
capillary sequencer, using an ET dye terminator kit (GE
Healthcare).
Statistical data analysis
Sequences were base-called with Phred software
(Ewing et al., 1998; Ewing and Green, 1998), and checked
for quality with Phrap software (Green, 1994), whereas the
assembled chromatograms were checked and edited in
Consed (Gordon et al., 1998). Chromatogram peaks for
each sequence were visually verified to ensure consensus
fidelity. Sequence groups were aligned using the Clustal W
algorithm implemented in MEGA 4.1 (Tamura et al.,
2007), with a 653 bp fragment showing high levels of se-
quence quality for all individuals. The studied sequences
were deposited in GenBank (accession numbers JN638891
to JN 638983).
MEGA 4.1 (Tamura et al., 2007), DNAsp v. 5 (Li-
brado and Rozas, 2009) and Arlequin v. 3.1 (Excoffier et
al., 2005) were used for analyzing intrapopulation genetic
diversity and estimating standard indices of genetic varia-
tion, such as haplotype (Hd) and nucleotide (�) diversities.
Arlequin v. 3.1 (Excoffier et al., 2005) was also used for
calculating differentiation indices and analyzing molecular
variance (AMOVA), with the Tamura & Nei distance
method and 10,100 permutations. This software was also
used for calculating Mismatch Distribution, Tajima’s D
and Fu’s Fs tests of neutrality, thereby assaying demo-
graphic expansion, and whether mutations were neutral or
under the influence of selection.
The haplotype network was constructed based on sta-
tistical parsimony. The maximum number of steps parsi-
moniously connecting two haplotypes was informed by
TCS v. 1.21, which estimates genealogical relationships
among sequences (Clement et al., 2000).
Alleles in Space (AIS) (Miller, 2005) was used for an-
alyzing the relationship between inter-individual spatial
and genetic information, and Mantel testing and spatial
autocorrelation analysis for predicting patterns, such as
correlations between genetic and geographical distances.
The best evolutionary model was determined with
Modeltest v. 3.7 (Posada and Crandall, 1998). Phylogeo-
graphic inference using Maximum Parsimony, Maximum
Likelihood and Bayesian analyses were carried out with
PAUP* 4.0 (Swofford, 2002), PHY ML 3.0 (Guindon and
Gascuel, 2003) and MrBayes (Huelsenbeck and Ronquist,
2001), respectively.
Results
Molecular characterization of mtDNA COI fragments
The analysis of 93 mtDNA COI sequences revealed
24 polymorphic sites, all of which corresponding to synon-
524 Genetic diversity of D. albiventris
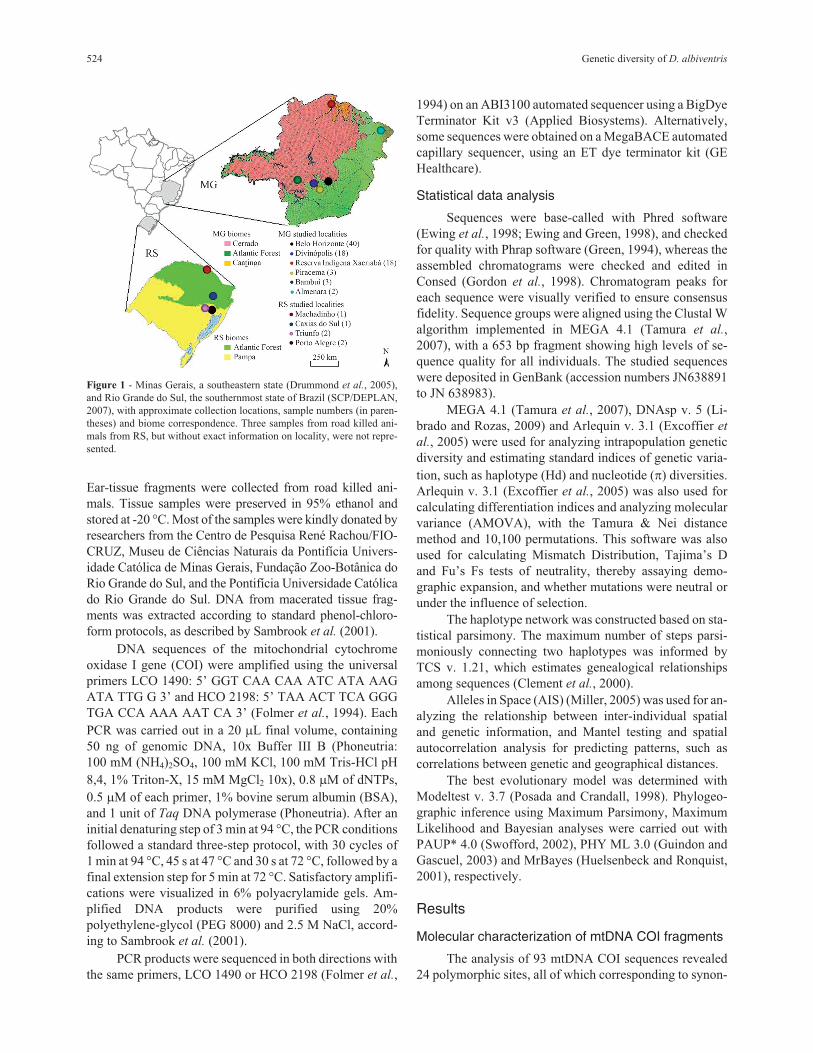
Figure 1 - Minas Gerais, a southeastern state (Drummond et al., 2005),
and Rio Grande do Sul, the southernmost state of Brazil (SCP/DEPLAN,
2007), with approximate collection locations, sample numbers (in paren-
theses) and biome correspondence. Three samples from road killed ani-
mals from RS, but without exact information on locality, were not repre-
sented.
ymous transitions. Nucleotide composition was 34.1% thy-
mine, 22.4% cytosine, 28.2% adenine and 15.3% guanine.
Nine haplotypes (H = 9), all with three or more recordings
of occurrence, were observed. Haplotype 1 occurred
throughout all the areas studied in MG, whereas seven were
private to just one analyzed area, viz., haplotypes 2 and 3 to
Belo Horizonte (BH), 4 and 5 to Reserva Indígena Xacriabá
(RIX), 7 to Divinópolis (Div), and 9 and 10 to Rio Grande
do Sul State (RS) (Table 2).
Haplotype diversity (Hd) of 0.7235 (with a standard
deviation of 0.044) and nucleotide diversity (�) of 0.0065,
characterized the analyzed data set (Table 3). Hd and � for
each population can be seen in Table 3.
When RS sequences were excluded, and only the six
MG localities analyzed, nine polymorphic sites were
found, these corresponding to seven haplotypes (H = 7),
haplotype diversity (Hd) of 66.52%, and nucleotide diver-
sity (�) of 0.23%.
Genetic differentiation among populations
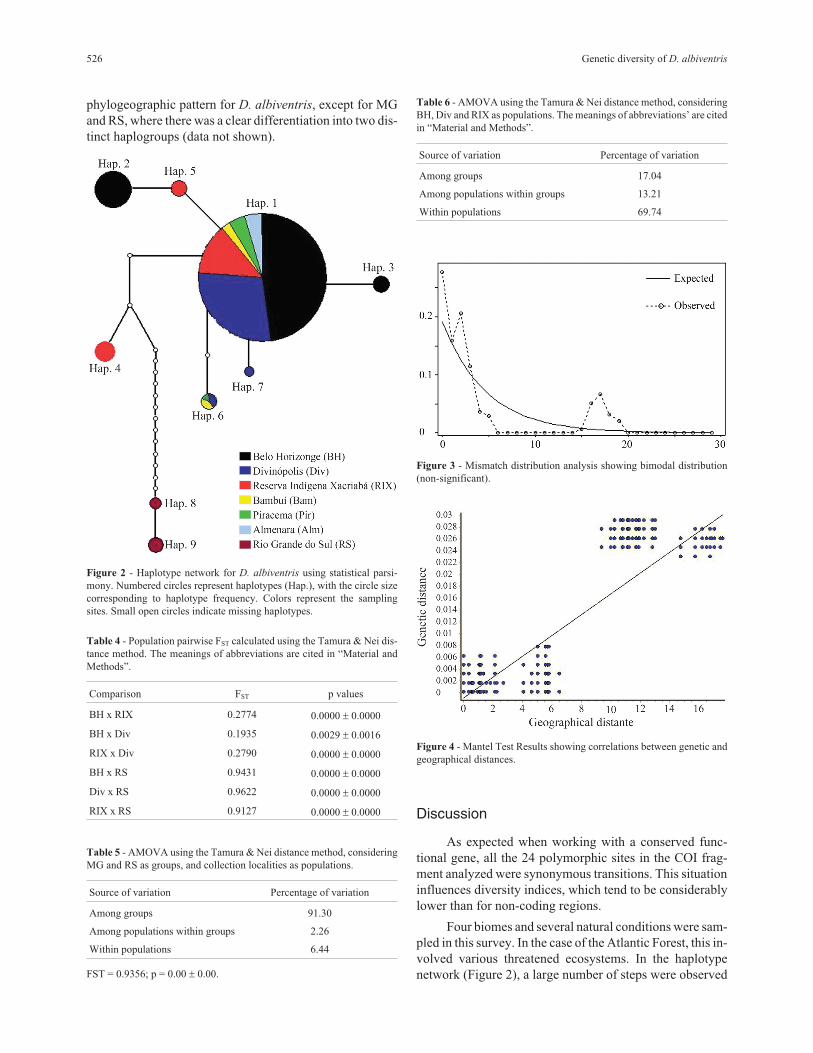
The haplotype network produced with the 93 D.
albiventris specimens using statistical parsimony, and with
a 91% connection limit, showed two distant genetic clusters
compatible with the MG and RS geographic clusters (Fig-
ure 2).
Highly significant population pairwise differentiation
values were observed (Table 4). On comparing demes be-
tween geographic clusters (RS x MG), obtained values
proved to be higher than 91%, the smallest FST being ob-
served in the comparison RIX x RS (the meanings of abbre-
viations are cited in “Materials and Methods”).
AMOVA indicated genetic structuring (FST = 93.6%,
p = 0.000). According to the Tamura & Nei distance me-
thod, and on comparing the two geographic clusters (MG
and RS), intergroup differences contributed with 91.3% of
the total genetic variance (Table 5), whereas interpopu-
lation variance, within the groups was 2.26%, and within
the populations themselves, 6.44%. All the results were sig-
nificant.
By way of analysis using the Tamura & Nei distance
method, and with BH and Divinópolis as a first group and
RIX as a second, variation partitioning revealed 17.04% of
intergroup variance, 13.21% of interpopulation within
groups, and 69.74% of intrapopulation, with FST = 30.26%
(p = 0.000) (Table 6).
Two groups were formed, the first comprising BH
and Divinópolis samples and the second RIX (the meanings
of abbreviations are cited in “Material and Methods”).
Tajima’s D (p > 0.35) and Fu’s FS statistics (p > 0.51)
neutrality tests were non-significant. As a test of recent
population expansion, applied mismatch distribution anal-
ysis indicated non-significant bimodal distribution (Figu-
re 3).
On compiling a complete dataset, Mantel test analysis
revealed two geographical clusters corresponding to ge-
netic clusters (Figure 4). Although, on analyzing MG and
RS populations, genetic and geographical distances were
highly correlated (r = 0.8901; P of a correlation greater than
or equal to that observed = 0.001), they were considerably
less so (r = 0.2216; P of a correlation greater than or equal to
that observed = 0.002), when analyzing only MG.
The HKY 85 evolutionary model of nucleotide sub-
stitution, together with the Akaike informative criterion in
Modeltest 3.7 (Posada and Crandall, 1998), was found to be
the most appropriate for dataset analysis. As a whole, phy-
logeographic analysis with Maximum Parsimony, Maxi-
mum Likelihood and Bayesian analysis revealed a weak
Sousa et al. 525
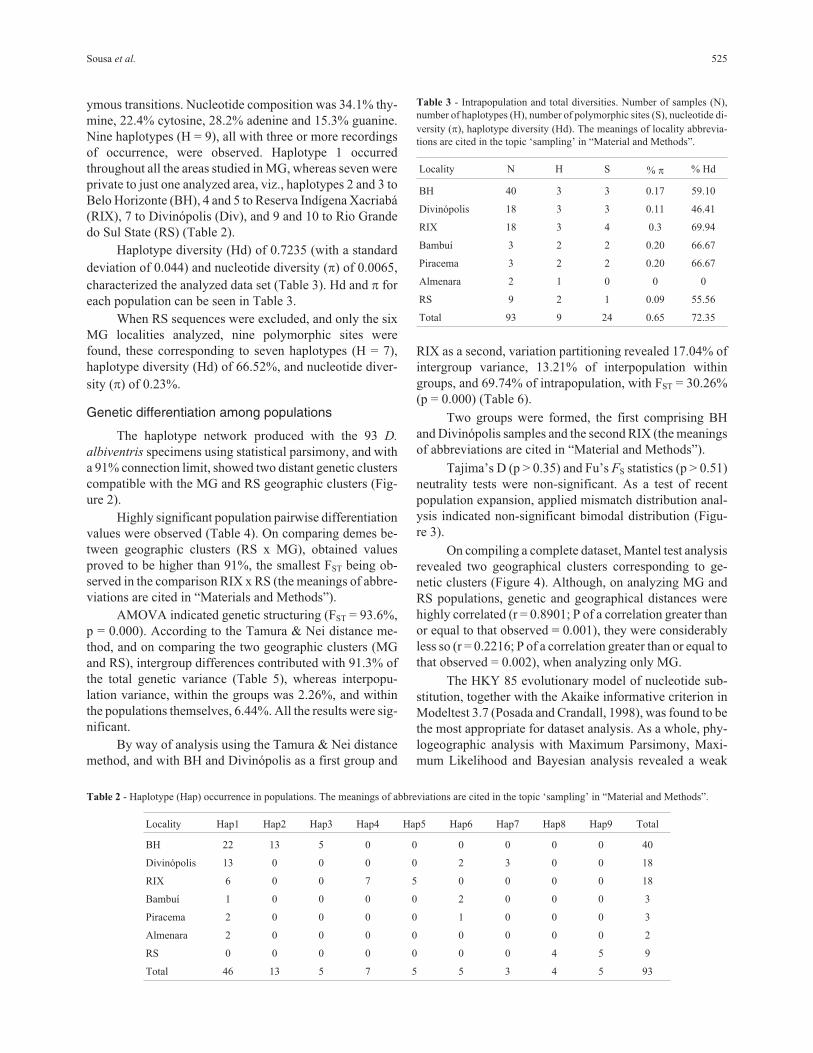
Table 2 - Haplotype (Hap) occurrence in populations. The meanings of abbreviations are cited in the topic ‘sampling’ in “Material and Methods”.
Locality Hap1 Hap2 Hap3 Hap4 Hap5 Hap6 Hap7 Hap8 Hap9 Total
BH 22 13 5 0 0 0 0 0 0 40
Divinópolis 13 0 0 0 0 2 3 0 0 18
RIX 6 0 0 7 5 0 0 0 0 18
Bambuí 1 0 0 0 0 2 0 0 0 3
Piracema 2 0 0 0 0 1 0 0 0 3
Almenara 2 0 0 0 0 0 0 0 0 2
RS 0 0 0 0 0 0 0 4 5 9
Total 46 13 5 7 5 5 3 4 5 93
Table 3 - Intrapopulation and total diversities. Number of samples (N),
number of haplotypes (H), number of polymorphic sites (S), nucleotide di-
versity (�), haplotype diversity (Hd). The meanings of locality abbrevia-
tions are cited in the topic ‘sampling’ in “Material and Methods”.
Locality N H S % � % Hd
BH 40 3 3 0.17 59.10
Divinópolis 18 3 3 0.11 46.41
RIX 18 3 4 0.3 69.94
Bambuí 3 2 2 0.20 66.67
Piracema 3 2 2 0.20 66.67
Almenara 2 1 0 0 0
RS 9 2 1 0.09 55.56
Total 93 9 24 0.65 72.35
phylogeographic pattern for D. albiventris, except for MG
and RS, where there was a clear differentiation into two dis-
tinct haplogroups (data not shown).
Discussion
As expected when working with a conserved func-
tional gene, all the 24 polymorphic sites in the COI frag-
ment analyzed were synonymous transitions. This situation
influences diversity indices, which tend to be considerably
lower than for non-coding regions.
Four biomes and several natural conditions were sam-
pled in this survey. In the case of the Atlantic Forest, this in-
volved various threatened ecosystems. In the haplotype
network (Figure 2), a large number of steps were observed
526 Genetic diversity of D. albiventris
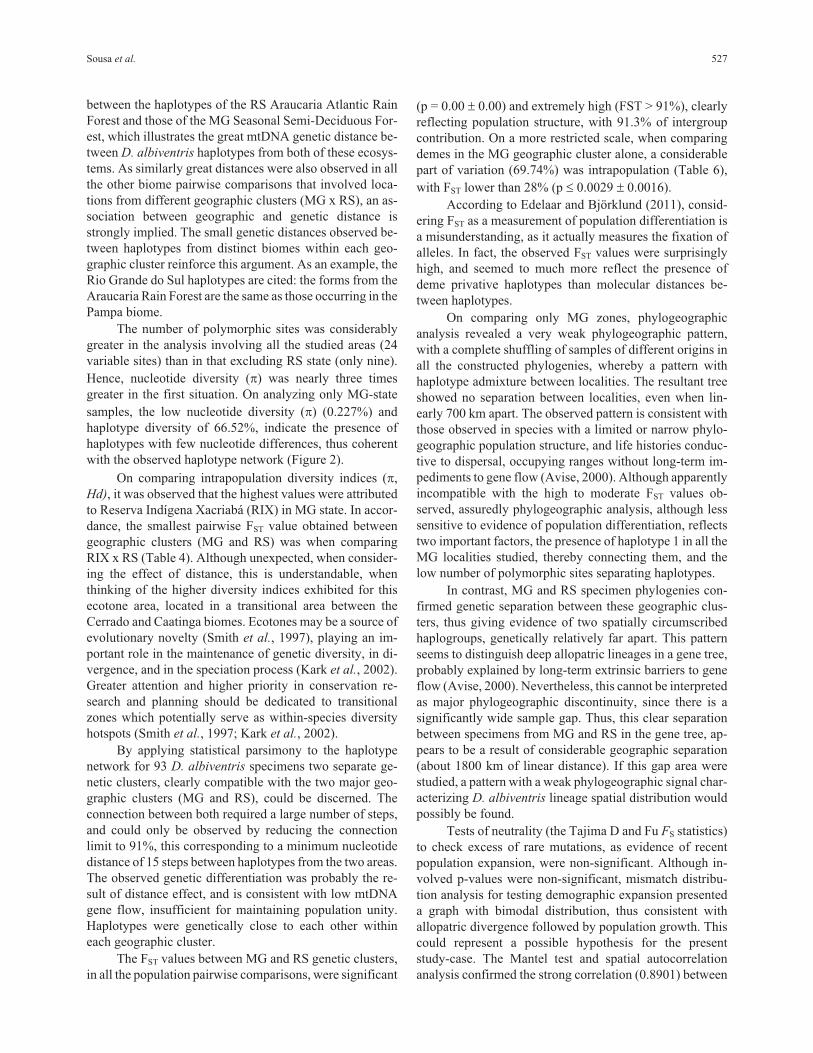
Table 4 - Population pairwise FST calculated using the Tamura & Nei dis-
tance method. The meanings of abbreviations are cited in “Material and
Methods”.
Comparison FST p values
BH x RIX 0.2774 0.0000 � 0.0000
BH x Div 0.1935 0.0029 � 0.0016
RIX x Div 0.2790 0.0000 � 0.0000
BH x RS 0.9431 0.0000 � 0.0000
Div x RS 0.9622 0.0000 � 0.0000
RIX x RS 0.9127 0.0000 � 0.0000
Table 5 - AMOVA using the Tamura & Nei distance method, considering
MG and RS as groups, and collection localities as populations.
Source of variation Percentage of variation
Among groups 91.30
Among populations within groups 2.26
Within populations 6.44
FST = 0.9356; p = 0.00 � 0.00.
Table 6 - AMOVA using the Tamura & Nei distance method, considering
BH, Div and RIX as populations. The meanings of abbreviations’ are cited
in “Material and Methods”.
Source of variation Percentage of variation
Among groups 17.04
Among populations within groups 13.21
Within populations 69.74
Figure 3 - Mismatch distribution analysis showing bimodal distribution
(non-significant).
Figure 4 - Mantel Test Results showing correlations between genetic and
geographical distances.
Figure 2 - Haplotype network for D. albiventris using statistical parsi-
mony. Numbered circles represent haplotypes (Hap.), with the circle size
corresponding to haplotype frequency. Colors represent the sampling
sites. Small open circles indicate missing haplotypes.
between the haplotypes of the RS Araucaria Atlantic Rain
Forest and those of the MG Seasonal Semi-Deciduous For-
est, which illustrates the great mtDNA genetic distance be-
tween D. albiventris haplotypes from both of these ecosys-
tems. As similarly great distances were also observed in all
the other biome pairwise comparisons that involved loca-
tions from different geographic clusters (MG x RS), an as-
sociation between geographic and genetic distance is
strongly implied. The small genetic distances observed be-
tween haplotypes from distinct biomes within each geo-
graphic cluster reinforce this argument. As an example, the
Rio Grande do Sul haplotypes are cited: the forms from the
Araucaria Rain Forest are the same as those occurring in the
Pampa biome.
The number of polymorphic sites was considerably
greater in the analysis involving all the studied areas (24
variable sites) than in that excluding RS state (only nine).
Hence, nucleotide diversity (�) was nearly three times
greater in the first situation. On analyzing only MG-state
samples, the low nucleotide diversity (�) (0.227%) and
haplotype diversity of 66.52%, indicate the presence of
haplotypes with few nucleotide differences, thus coherent
with the observed haplotype network (Figure 2).
On comparing intrapopulation diversity indices (�,
Hd), it was observed that the highest values were attributed
to Reserva Indígena Xacriabá (RIX) in MG state. In accor-
dance, the smallest pairwise FST value obtained between
geographic clusters (MG and RS) was when comparing
RIX x RS (Table 4). Although unexpected, when consider-
ing the effect of distance, this is understandable, when
thinking of the higher diversity indices exhibited for this
ecotone area, located in a transitional area between the
Cerrado and Caatinga biomes. Ecotones may be a source of
evolutionary novelty (Smith et al., 1997), playing an im-
portant role in the maintenance of genetic diversity, in di-
vergence, and in the speciation process (Kark et al., 2002).
Greater attention and higher priority in conservation re-
search and planning should be dedicated to transitional
zones which potentially serve as within-species diversity
hotspots (Smith et al., 1997; Kark et al., 2002).
By applying statistical parsimony to the haplotype
network for 93 D. albiventris specimens two separate ge-
netic clusters, clearly compatible with the two major geo-
graphic clusters (MG and RS), could be discerned. The
connection between both required a large number of steps,
and could only be observed by reducing the connection
limit to 91%, this corresponding to a minimum nucleotide
distance of 15 steps between haplotypes from the two areas.
The observed genetic differentiation was probably the re-
sult of distance effect, and is consistent with low mtDNA
gene flow, insufficient for maintaining population unity.
Haplotypes were genetically close to each other within
each geographic cluster.
The FST values between MG and RS genetic clusters,
in all the population pairwise comparisons, were significant
(p = 0.00 � 0.00) and extremely high (FST > 91%), clearly
reflecting population structure, with 91.3% of intergroup
contribution. On a more restricted scale, when comparing
demes in the MG geographic cluster alone, a considerable
part of variation (69.74%) was intrapopulation (Table 6),
with FST lower than 28% (p � 0.0029 � 0.0016).
According to Edelaar and Björklund (2011), consid-
ering FST as a measurement of population differentiation is
a misunderstanding, as it actually measures the fixation of
alleles. In fact, the observed FST values were surprisingly
high, and seemed to much more reflect the presence of
deme privative haplotypes than molecular distances be-
tween haplotypes.
On comparing only MG zones, phylogeographic
analysis revealed a very weak phylogeographic pattern,
with a complete shuffling of samples of different origins in
all the constructed phylogenies, whereby a pattern with
haplotype admixture between localities. The resultant tree
showed no separation between localities, even when lin-
early 700 km apart. The observed pattern is consistent with
those observed in species with a limited or narrow phylo-
geographic population structure, and life histories conduc-
tive to dispersal, occupying ranges without long-term im-
pediments to gene flow (Avise, 2000). Although apparently
incompatible with the high to moderate FST values ob-
served, assuredly phylogeographic analysis, although less
sensitive to evidence of population differentiation, reflects
two important factors, the presence of haplotype 1 in all the
MG localities studied, thereby connecting them, and the
low number of polymorphic sites separating haplotypes.
In contrast, MG and RS specimen phylogenies con-
firmed genetic separation between these geographic clus-
ters, thus giving evidence of two spatially circumscribed
haplogroups, genetically relatively far apart. This pattern
seems to distinguish deep allopatric lineages in a gene tree,
probably explained by long-term extrinsic barriers to gene
flow (Avise, 2000). Nevertheless, this cannot be interpreted
as major phylogeographic discontinuity, since there is a
significantly wide sample gap. Thus, this clear separation
between specimens from MG and RS in the gene tree, ap-
pears to be a result of considerable geographic separation
(about 1800 km of linear distance). If this gap area were
studied, a pattern with a weak phylogeographic signal char-
acterizing D. albiventris lineage spatial distribution would
possibly be found.
Tests of neutrality (the Tajima D and Fu FS statistics)
to check excess of rare mutations, as evidence of recent
population expansion, were non-significant. Although in-
volved p-values were non-significant, mismatch distribu-
tion analysis for testing demographic expansion presented
a graph with bimodal distribution, thus consistent with
allopatric divergence followed by population growth. This
could represent a possible hypothesis for the present
study-case. The Mantel test and spatial autocorrelation
analysis confirmed the strong correlation (0.8901) between
Sousa et al. 527
geographic and genetic distances, when analyzing the MG
and RS clusters. Differentiation probably reflects both the
great distance between localities, and the existence of barri-
ers in the wide range of species distribution. As only gene
flow can genetically connect populations, the maintenance
of COI gene differentiation implies the presence of barriers
to mtDNA gene flow, although other important factors
seem to be closely related to the observed differentiation re-
sults, viz., the bridge between a methodology based on a
haplotypic mtDNA system, and ecological characteristics,
especially D. albiventris sex-biased dispersion.
Due to its wide distribution, generalist habits, high
adaptability, capacity to move long distances (Gentile and
Cerqueira, 1995; Chiarello, 2000; Pires et al., 2002), and
outstanding mobility, when compared to other small mam-
mals (Pires et al., 2002), D. albiventris populations are pre-
sumed to be genetically connected. The unexpectedly high
differentiation among MG demes seems to be totally un-
aligned with the above cited ecological characteristics,
whence the importance of considering an alternative. A
mean home range ten times greater for males (122.7 ha)
than for females (12 ha) has been observed for D.
marsupialis (Sunquist et al., 1987). Although dispersion
competence is relevant to promoting genetic approximation
between populations, it is in no way a guarantee of gene
flow. Even so, as Didelphis dispersion is recognizably
greater in males, this probably does indeed contribute
more. Working with a maternally inherited genetic marker,
it was impossible to discuss complete D. albiventris diver-
sity history, since mtDNA analysis told nothing about the
male’s effective contribution to connecting demes. Hence,
our results furnished data only on the mutational history
corresponding to maternal lineage genealogical informa-
tion. The observed mtDNA COI genetic differentiation was
consistent with mtDNA gene flow insufficiency in main-
taining population unity, or to effectively approximate sep-
arated demes in the large geographic scenario studied.
Additional research with nuclear markers (microsatellites
and/or sequences) could complete our findings, thereby
providing a better understanding of species population ge-
netics. As to the female contribution to D. albiventris popu-
lation structure, the haplotype network and differentiation
values strongly suggest that female gene flow is insuffi-
cient in connecting and effectively approximating the pop-
ulations under study. The contact with this widespread and
important species emphasized the need for additional sur-
veys towards a better understanding of its interesting biol-
ogy.
Acknowledgments
We are grateful to the Centro de Pesquisa René Ra-
chou – Fundação Oswaldo Cruz, Célia Gontijo, Helbert
Botelho and José Eloy dos Santos Júnior; to the Pontifícia
Universidade Católica de Minas Gerais – Museu de Ciên-
cias Naturais, Edeltrudes Câmara, Cláudia Costa and Da-
nilo Saraiva; to the Fundação Zoo-Botânica do Rio Grande
do Sul, Daniela Sanfelice; to the Pontifícia Universidade
Católica do Rio Grande do Sul, Eduardo Eizirick and Ma-
noel Rodrigues for specimen donations made for this re-
search. Financial support was provided by the Fundação de
Amparo à Pesquisa de Minas Gerais and Programa Eco-
lógico de Longa Duração.
ReferencesAvise JC, Arnold J, Ball RM, Bermingham E, Lamb T, Neigel JE,
Reeb CA and Saunders NC (1987) Intraspecific phylogeo-
graphy: The mitochondrial DNA bridge between population
genetics and systematics. Annu Rev Ecol Syst 18:489-522.
Avise JC (2000) Phylogeography the History and Formation of
Species. Harvard University Press, London, 447 pp.
Cantor M, Ferreira LA, Silva WR and Setz EZF (2010) Potential
seed dispersal by Didelphis albiventris (Marsupialia, Didel-
phidae) in highly disturbed environment. Biota Neotrop
10:45-51.
Chiarello AG (2000) Density and population size of mammals in
remnants of Brazilian Atlantic Forest. Conserv Biol
14:1649-1657.
Clement M, Posada D and Crandall KA (2000) TCS: A computer
program to estimate gene genealogies. Mol Ecol 9:1657-
1659.
Drummond GM, Martins CS, Machado ABM, Sebaio FA and
Antonini Y (2005) Biodiversidade em Minas Gerais: Um
Atlas para sua Conservação. 2nd edition. Fundação Bio-
diversitas, Belo Horizonte, 222 pp.
Edelaar P and Björklund M (2011) If FST does not measure neutral
genetic differentiation, then comparing it with QST is mis-
leading. Or is it? Mol Ecol 20:1805-1812.
Emer C and Fonseca CR (2011) Araucaria Forest conservation:
Mechanisms providing resistance to invasion by exotic tim-
ber trees. Biol Invasions 13:189-202.
Ewing B and Green P (1998) Base-calling of automated sequencer
traces using Phred. II. Error probabilities. Genome Res
8:186-194.
Ewing B, Hillier LD, Wendl MC and Green P (1998) Base-calling
of automated sequencer traces using Phred. I. Accuracy as-
sessment. Genome Res 8:175-185.
Excoffier L, Laval G and Schneider S (2005) Arlequin ver. 3.0:
An integrated software package for population genetics data
analysis. Evol Bioinform Online 1:47-50.
Folmer O, Black M, Hoeh W, Lutz R and Vrijenhoek R (1994)
DNA primers for the amplification of mitochondrial cyto-
chrome c oxidase subunit I from diverse metazoan inverte-
brates. Mol Mar Biol Biotech 3:294-299.
Gardner AL (2008) Mammals of South America vol. 1: Marsu-
pials, Xenarthrans, Shrews and Bats. The University of Chi-
cago Press, Chicago, 690 pp.
Gentile R and Cerqueira R (1995) Movement patterns of five spe-
cies of small mammals in a Brazilian restinga. J Trop Ecol
11:671-677.
Gonçalves GL, Marinho JR and Freitas TRO (2009) Genetic
structure of Sigmodontine rodents (Cricetidae) along an
altitudinal gradient of the Atlantic Rain Forest in southern
Brazil. Genet Mol Biol 32:882-885.
Gordon D, Abajian C and Green P (1998) Consed: A graphical
tool for sequence finishing. Genome Res 8:195-202.
528 Genetic diversity of D. albiventris
Guindon S and Gascuel O (2003) A simple, fast, and accurate al-
gorithm to estimate large phylogenies by maximum likeli-
hood. Syst Biol 52:696-704.
Hoffmann FG and Baker RJ (2003) Comparative phylogeography
of short-tailed bats (Carollia, Phyllostomidae). Mol Ecol
12:3403-3414.
Huelsenbeck JP and Ronquist F (2001) MRBAYES: Bayesian in-
ference of phylogeny. Bioinformatics 17:754-755.
Kark S, Mukerji T, Safriel UN, Noy-Meir I, Nissani R and Darvasi
A (2002) Peak morphological diversity in an ecotone un-
veiled in the chukar partridge by a novel Estimator in a De-
pendent Sample (EDS). J Anim Ecol 71:1015-1029.
Librado P and Rozas J (2009) DnaSP ver. 5: A software for com-
prehensive analysis of DNA polymorphism data. Bioin-
formatics 25:1451-1452.
Loretto D and Vieira MV (2005) The effects of reproductive and
climatic seasons on movements in the black-eared opossum
(Didelphis aurita Wied-Neuwied, 1826). J Mammal
86:287-293.
Mesquita CAB (2004) RPPN da Mata Atlântica: Um Olhar Sobre
as Reservas Particulares dos Corredores de Biodiversidade
Central e da Serra do Mar. Conservação Internacional, Belo
Horizonte, 48 pp.
Miller MP (2005) Alleles in Space Computer software for the
joint analysis of inter-individual spatial and genetic informa-
tion ver. 1.0. J Hered 96:722-724.
Mittermeier RA, Myers N, Thomsen JB, Fonseca GAB and Oli-
vieri S (1998) Biodiversity hotspots and major tropical wil-
derness areas: Approaches to setting conservation priorities.
Conserv Biol 12:516-520.
Pires AS, Lira PK, Fernandez FAS, Schittini GM and Oliveira LC
(2002) Frequency of movements of small mammals among
Atlantic Coastal Forest fragments in Brazil. Biol Conserv
108:229-237.
Posada D and Crandall A (1998) MODELTEST: Testing the
model of DNA substitution. Bioinformatics 14:817-818.
Ribeiro MC, Metzger JP, Martensen AC, Ponzoni F and Hirota M
(2009) Brazilian Atlantic forest: How much is left and how
is the remaining forest distributed? Implications for conser-
vation. Biol Conserv 142:1141-1153.
Sambrook J, Russel DW and Sambrook J (2001) Molecular Clon-
ing: A Laboratory Manual. CHSL Press, New York.
Schallig HDFH, Silva ES, Van Der Meide WF, Schoone GJ and
Gontijo CMF (2007) Didelphis marsupialis (Common
Opossum): A potential reservoir host for zoonotic
Leishmaniasis in the metropolitan region of Belo Horizonte
(Minas Gerais, Brazil). Vector-Borne Zoonotic Dis
7:387-393.
Smith TB, Wayne RK, Girman DJ and Bruford MW (1997) A role
for ecotones in generating rainforest biodiversity. Science
276:1855-1857.
Sousa LCC, Gontijo CMF, Lacorte GA, Meireles SN, Silva AP
and Fonseca CG (2012) Molecular characterization of an
opossum Didelphis albiventris (Marsupialia, Didelphidae)
population in an urban fragment of Brazilian Atlantic Rain
Forest and support to species barcode identification. Genet
Mol Res (in press).
Sunquist ME, Austad N and Sunquist F (1987) Movement pat-
terns and home range in the common opossum (Didelphis
marsupialis). J Mammal 68:173-176.
Swofford DL (2002) PAUP*: Phylogenetic analysis using parsi-
mony (and other methods) ver. 4. Sinauer Associates,
Sunderland.
Tamura K, Dudley J, Nei M and Kumar S (2007) MEGA4: Molec-
ular evolutionary genetics analysis software ver. 4.0. Mol
Biol Evol 24:1596-1599.
Wilson DE and Reeder DAM (2005) Mammal Species of the
World: A Taxonomic and Geographic Reference. 3rd edi-
tion. The Johns Hopkins University Press, Baltimore,
743 pp.
Wilson-Wilde L, Norman J, Robertson J, Sarre S and Georges A
(2010) Current issues in species identification for forensic
science and the validity of using the cytochrome oxidase I
(COI) gene. Forensic Sci Med Pathol 6:233-241.
Internet ResourcesArlequin Software, http://cmpg.unibe.ch/software/arlequin3/
(July 31, 2011).
DNAsp Software, http://www.ub.edu/dnasp/ (July 31, 2011).
Costa L, Astúa de Moraes D, Brito D, Soriano P, Lew D and
Delgado C (2008) Didelphis albiventris. IUCN Red List of
Threatened Species ver. 2011.1,
http://www.iucnredlist.org/apps/redlist/details/40489/0
(July 31, 2011).
MEGA 4 Software, http://www.megasoftware.net/ (July 31,
2011).
MrBayes Software, http://mrbayes.sourceforge.net/down-
load.php (July 31, 2011).
National Center for Biotechnology Information – GenBank,
http://www.ncbi.nlm.nih.gov/genbank/ (July 31, 2011).
Phred, Phrap and Consed Software, http://www.phrap.
org/phredphrapconsed.html (July 31, 2011).
Green P (1994) Phrap. Genome Sciences Department, University
of Washington, Laboratory of Phil Green, http://www.ge-
nome.washington.edu/UWGC/analysistools/phrap.htm
(July 31, 2011).
PhyML, http://www.atgc-montpellier.fr/phyml/versions.php
(July 31, 2011).
SCP/DEPLAN Secretaria do Planejamento Governo do Rio
Grande do Sul, http://www.scp.rs.gov.br (July 31, 2011).
Associate Editor: Louis Bernard Klackzo
License information: This is an open-access article distributed under the terms of theCreative Commons Attribution License, which permits unrestricted use, distribution, andreproduction in any medium, provided the original work is properly cited.
Sousa et al. 529