MINISTRY OF HEALTH AND SOCIAL SERVICES
74
MINISTRY OF HEALTH AND SOCIAL SERVICES REVISED COSTING OF NAMIBIA’S 3RD HIV/AIDS MEDIUM TERM PLAN (MTP III) TECHNICAL REPORT _________________________________________________________________________ October 2007
-
Upload
khangminh22 -
Category
Documents
-
view
0 -
download
0
Transcript of MINISTRY OF HEALTH AND SOCIAL SERVICES

�
MINISTRY OF HEALTH AND SOCIAL SERVICES
REVISED COSTING OF NAMIBIA’S 3RD HIV/AIDS MEDIUM TERM PLAN (MTP III)
TECHNICAL REPORT
_________________________________________________________________________
October 2007

��
Publ�shed by:The M�n�stry of Health and Soc�al Serv�ces, D�rectorate for Spec�al Programmes
A Technical Report on the Revised Costing of Namibia’s Third Medium Term Plan
Comm�ss�oned by:The M�n�stry of Health and Soc�al Serv�ces
Funded by:European Comm�ss�on (HIV/AIDS Response Capac�ty Development Programme) and Pres�dent’s Emergency Plan for AIDS Rel�ef
F�rst publ�shed 2007
Copyr�ght © 2007D�rectorate for Spec�al ProgrammesM�n�stry of Health and Soc�al Serv�cesPO Box 13198, W�ndhoek
All r�ghts reserved.
The report was wr�tten to ass�st Nam�b�a w�th the management of the Nat�onal HIV/AIDS response. It may be quoted prov�ded the source �s acknowledged. The document may not be used for commerc�al purposes or for profit.
For add�t�onal cop�es contact the D�rectorate for Spec�al Programmes, MoHSS
Layout and Pr�nt�ng: John Me�nert Pr�nt�ng
ACKNOWLEDGEMENTS
We gratefully acknowledge the support of the M�n�stry of Gender and Ch�ld Welfare, M�n�stry of Reg�onal and Local Government, M�n�stry of Labour and Soc�al Welfare, M�n�stry of Educat�on, M�n�stry of Informat�on and Broadcast�ng, the Office of the Pr�me M�n�ster, the Nat�onal Plann�ng Comm�ss�on, NIP, NABCOA, NANASO, L�ronga Eparu, Nawal�fe Trust, Soc�al Market�ng Assoc�at�on and many other stakeholders who contr�buted to th�s exerc�se (see also Append�x III). We also want to thank the Pr�mary Health Care, Pol�cy Plann�ng & Human Resources Development, Human Resource Management, Pharmaceut�cal Serv�ces and the F�nance D�rectorates w�th�n the M�n�stry of Health and Soc�al Serv�ces for collaborat�ng and support�ng the Resource Needs Est�mat�on. F�nally, we want to thank those who part�c�pated �n the consensus consultat�on meet�ng on 14 & 15 February 2007 and/or �n one of the many other consultat�ons, and we w�sh to express our s�ncere grat�tude for the valuable contr�but�ons and gu�dance prov�ded.
Thanks are also to the staff �n the EC funded Nam�b�a HIV/AIDS Response Capac�ty Development Programme (HRCDP) and PEPFAR for the�r techn�cal �nput and fund�ng support.

���
FOREWORD
HIV/AIDS rema�ns a major developmental challenge all over the world and �s a lead�ng cause of death �n Nam�b�a. The HIV/AIDS pandem�c has been w�th us for many years and follow�ng the stat�st�cs we hope we have reached the peak of the ep�dem�c. Unfortunately, the prevalence rate �s st�ll unacceptably h�gh and Nam�b�a has made strong comm�tment to Un�versal Access �n the UNGASS 2006 pol�t�cal declarat�on and the Afr�can Un�on M�n�sters’ of Health meet�ng �n 2007.
Th�s rev�sed MTP III Resource Needs Est�mat�on has been a very useful exerc�se for the nat�onal response plann�ng. The �nvestment needed to combat the d�sease and to ensure un�versal access coverage �s h�gh. In 2007, we seem to reach 70% coverage of the people l�v�ng w�th HIV/AIDS who are el�g�ble for ant�-retrov�ral treatment (ART). The number of Orphans and Vulnerable Ch�ldren �s expected to stab�l�ze �f we manage to reach 80% coverage of the ART programme �n 2009. However, we st�ll face challenges �n br�ng�ng serv�ces closer to the commun�t�es and related to male �nvolvement.
It �s common knowledge that prov�d�ng treatment for l�fe and m�t�gat�ng the �mpact of HIV/AIDS �s very costly and d�fficult to susta�n. Therefore we need to redouble our efforts �n prevent�on and Nam�b�a �s faced w�th a huge challenge �n chang�ng behav�our to reduce HIV transm�ss�on. The nat�onal HIV campa�gn on ‘Be There to Care’, that focuses on healthy relat�ons, and l�nked campa�gns on ‘Cons�stent Condom Use’, ‘Proud to be tested’, and ‘Stop TB’, carry h�ghly relevant messages to the people of Nam�b�a and we all need to �nternal�ze those messages.
Th�s cost�ng report also clearly �nd�cates that for the com�ng years �ncreased resources are needed to reduce the HIV prevalence and that �t �s pert�nent that the GRN scales up resources to the overall mult�-sectoral response for susta�nab�l�ty. However, external support rema�ns needed. The Nat�onal AIDS Execut�ve Comm�ttee adv�sed to update th�s Resource Needs Est�mat�on (RNE) every two years and I would h�ghly recommend th�s, as th�s w�ll be a necessary tool �n support of the overall health and development plann�ng.
I w�sh to express my s�ncere grat�tude to the cost�ng work�ng group that d�d an excellent job �n comp�l�ng the �nformat�on and came up w�th th�s report. I want to thank Dr. Norbert Forster, Deputy Permanent Secretary (MoHSS) and Abner Xoagub, Head ENARS, D�rectorate for Spec�al Programmes (MoHSS) for the�r strateg�c leadersh�p �n th�s exerc�se. I thank Ella Sh�hepo, D�rector Spec�al Programmes for fac�l�tat�ng and Ambros�us Uakurama RM&DC, D�rectorate for Spec�al Programmes (MoHSS) for lead�ng the coord�nat�on of the overall process, the consultants Gayle Mart�n and F�l�p Meheus for develop�ng the RNE model and scenar�os, Cla�re D�llavou (Strateg�c Informat�on Officer, CDC) for her valuable comments, and Jeanette de Putter (Sen�or Techn�cal Adv�sor, DSP, MoHSS) for her techn�cal �nput and pull�ng the whole exerc�se together.

�v
TABLE OF CONTENTS
Executive Summary .................................................................................................................... v��
Introduct�on ....................................................................................................................................................................1A. Purpose of the Report .......................................................................................................................................2B. HIV/AIDS S�tuat�on and Econom�c Context ................................................................................................2C. Process...................................................................................................................................................................4D. Methodology ........................................................................................................................................................5E. Data Collect�on and Ver�ficat�on .....................................................................................................................7F. L�m�tat�ons, General Informat�on and Spec�fic Assumpt�ons .....................................................................8G. Key results of Resource Needs Est�mat�on and Scenar�o Modell�ng .....................................................20H. Resource Gap Analys�s .....................................................................................................................................24I. Conclus�on and Impl�cat�ons ............................................................................................................................26
Append�x I. Summary RNE sheets ............................................................................................................................30Append�x II. MTP-III Components, programme areas .........................................................................................44Append�x III. Consultat�ve Meet�ng Attendance L�st ............................................................................................46Append�x IV. C�rcumc�s�on: What do we know to date? ....................................................................................56Append�x V. Data Sources and other ......................................................................................................................59
Table of FiguresF�gure 1: Bas�c Approach to the Resource Est�mat�on Model .........................................................................5F�gure 2: Flow Chart of Data Inputs and Approach of Resource Needs Model ........................................6F�gure 3: Bas�c cost�ng pr�nc�ples ............................................................................................................................9F�gure 4: Total Resource Needs by Cost Area for all scenar�o’s ..................................................................10F�gure 5: Resources Requ�red for H�gh, Med�um and Low Scenar�os ..........................................................21F�gure 6: Breakdown of Resource Requ�rement for the H�gh, Med�um, and Low scenar�os .................21F�gure 7: Share of Resources Requ�red for Prevent�on, Care and Treatment ...........................................22F�gure 8: Prel�m�nary Resource Gap Analys�s (2007–2012). ...........................................................................25F�gure 9: MTP III Nat�onal Programme Goals ....................................................................................................44F�gure 10: Relat�onsh�p between HIV prevalence and reduct�on �n HIV �nc�dence .....................................56F�gure 11: Relat�onsh�p between male c�rcumc�s�on prevalence and reduct�on �n HIV �nc�dence ...........................................................................................................................................56
List of TablesTable 1. Summary programme areas �ncluded �n the Resource Est�mat�on ................................................8Table 2. Share of MTP III Component for H�gh, Med�um and Low Scenar�os ......................................... 22 Table 3. Compar�son of Resource Needs Est�mates w�th Selected Econom�c Ind�cators (�n m�ll�ons) ....................................................................................... 23Table 4. Compar�son of per cap�ta Resource Needs Est�mates w�th Health Expend�ture (�n m�ll�ons) ......................................................................................................... 24Table 5. Comm�tted Resources for HIV/AIDS (2005) ................................................................................... 24Table 6. Summary H�gh Scenar�o ........................................................................................................................ 30Table 7. Summary Med�um Scenar�o .................................................................................................................. 33Table 8. Summary Low Scenar�o ......................................................................................................................... 36Table 9. Summary Scenar�o Compar�son .......................................................................................................... 39Table 10. Ma�n Sectors �n the Mult�-Sectoral Response .................................................................................. 45

v
ABBREVIATIONS & ACRONYMS
AIDS Acqu�red Immuno-Defic�ency SyndromeANC Ante-Natal CareART Ant�-Retrov�ral TherapyARV Ant�-Retrov�ral BCC Behav�our Change Commun�cat�onBCI Behav�our Change Intervent�onBSS Behav�oural Surve�llance SurveyCAA Cathol�c A�ds Act�onCACOC Const�tuency AIDS Co-ord�nat�ng Comm�tteeCBO Commun�ty Based Organ�sat�onCPT Co- tr�moxazole Prevent�ve TherapyC&T Counsell�ng and Test�ngDACOC D�str�ct AIDS Coord�nat�ng Comm�tteeDHS Demograph�c Health SurveyGDP Gross Domest�c ProductGF Global FundGRN Government of the Republ�c of Nam�b�aHAART H�ghly Act�ve Ant�-Retrov�ral TreatmentHBC Home Based CareHIS Health Informat�on SystemHIV Human Immuno-defic�ency V�rusHR Human ResourcesIEC Informat�on, Educat�on, Commun�cat�onIGAs Income Generat�ng Act�v�t�esIPT Ison�az�d Prevent�ve TherapyMAWF M�n�stry of Agr�culture, Water and F�sher�esMFMR M�n�stry of F�sher�es and Mar�ne ResourcesMoE M�n�stry of Educat�onMIB M�n�stry of Informat�on and Broadcast�ngMoHSS M�n�stry of Health and Soc�al Serv�cesMTEF Med�um Term Expend�ture FrameworkMTP II Second Med�um Term Plan [1999-2004]MGECW M�n�stry of Gender Equal�ty and Ch�ld WelfareMRLGHRD M�n�stry of Reg�onal and Local Government, Hous�ng and Rural
DevelopmentMYFC My Future My Cho�ceNABCOA Nat�onal Bus�ness Coal�t�on on HIV/AIDSNACOP Nat�onal A�ds Co-ord�nat�on Programme NAEC Nat�onal A�ds Execut�ve Comm�tteeNGO Non-Governmental Organ�zat�onNANASO Nam�b�an Network for AIDS Serv�ce Organ�sat�onsOPM Office of the Pr�me M�n�sterOMAs Organ�sat�ons, M�n�str�es and Agenc�esOVC Orphans and Vulnerable Ch�ldrenPCR Polymerase Cha�n React�onPEP Post-Exposure Prophylax�sPEMP Performance and Effic�ency Management ProgrammePHC Pr�mary Health Care

v�
PLWHA People l�v�ng w�th HIV/AIDSPMTCT+ Prevent�on of Mother to Ch�ld Transm�ss�on (plus on-go�ng treatment)RACOC Reg�onal AIDS Co-ord�nat�ng Comm�tteeRNE Resource Needs Est�mat�onRNM Resource Needs MethodologySSC Sector Steer�ng Comm�tteeSTI Sexually transm�tted Infect�onUN Un�ted Nat�onsUNAIDS Un�ted Nat�ons Jo�nt Programme on HIV/AIDSUNGASS Un�ted Nat�ons General Assembly Spec�al Sess�on on HIV/AIDSUSAID Un�ted States Agency for Internat�onal DevelopmentVCT Voluntary Counsell�ng and Test�ngWFP World Food Programme

v��
EXECUTIVE SUMMARY
The Nam�b�an Nat�onal Strateg�c Plan on HIV/AIDS (2004 - 2009): Th�rd Med�um -Term Plan, (MTP III) prov�des an all-�nclus�ve strategy for effect�ve management and control of the HIV/AIDS ep�dem�c. The MTP III has been �mplemented for almost four years now and a m�d-term rev�ew took place �n June/July 2007. The need for a rev�sed resource est�mat�on exerc�se was �dent�fied based on current ach�evements, roll-out process and address�ng constra�nts �n HIV/AIDS programmes. The ma�n object�ve of the Resource Needs Est�mat�on (RNE) was to develop a deta�led cost�ng of the nat�onal HIV/AIDS response andbr�ng �n var�ous scenar�os to ass�st dec�s�on makers �n pol�cy mak�ng and strateg�c plann�ng.
Nam�b�a’s HIV prevalence �n pregnant women peaked �n 2002 at 22.3%, and subsequently showed a decl�ne to 19.7% �n 2004 and then rose aga�n to 19.9% �n 2006. These figures suggest that: (1) The prevent�on efforts have to be consol�dated and �ntens�fied; and (2) Care and treatment as well as �mpact m�t�gat�on st�ll need to be further expanded to adequately
cover the�r target populat�ons.
Nam�b�a, be�ng a h�gh prevalence country, st�ll needs substant�al resources to finance the nat�onal HIV/AIDS response. However, the mob�l�sat�on of external resources �s often compl�cated as a result of Nam�b�a’s class�ficat�on as a low-m�ddle �ncome country. The country �s expected to be able to finance a substant�al part of the HIV/AIDS response. But the country has one of the h�ghest �ncome d�spar�t�es of the world and 56% of the populat�on l�ves below US$ 2 per day and therefore more challenges ahead �n terms of resource allocat�on.
The overall RNE process took s�x months. Extens�ve consultat�ons w�th all relevant stakeholders took place to collect and ver�fy data, to develop the RNE model, and to reach consensus on cost�ng sheets and scenar�o model�ng. Data collect�on, ver�ficat�on and consensus bu�ld�ng was the most challeng�ng part of the exerc�se. However, the longer programmes are be�ng �mplemented, the better the data. The scenar�os were set to help �n the roll-out and/or sett�ng up of nat�onal HIV/AIDS programmes, and also help to fac�l�tate strateg�c dec�s�on mak�ng. The RNE est�mates the financ�al resources requ�red to �mplement the nat�onal HIV/AIDS response through to 2012.
The Resource Needs Est�mat�on (RNE) methodology, endorsed globally by UNAIDS was custom�zed for Nam�b�a reflect�ng the spec�fic features of the Nam�b�an ep�dem�c and the HIV response. The bas�c approach of the RNE �s to use four bas�c cr�ter�a; the s�ze of the populat�on be�ng targeted by the �ntervent�on or serv�ce, the coverage of that target populat�on be�ng reached by the �ntervent�on (2005/06), the target sett�ng up to 2012/13, and the un�t cost to prov�de that �ntervent�on or serv�ce. Us�ng th�s approach, h�gh, med�um, and low scenar�os were est�mated for each serv�ce prov�ded to the Nam�b�an people around HIV/AIDS. In the major�ty of cases, the h�gh scenar�o a�ms towards the standards of Un�versal Access, wh�le the low scenar�o reflects the current capac�ty and resource constra�nts, and the med�um scenar�o �s an alternat�ve opt�on �n between.
The RNE 2007, however, has some limitations. It covers 19 extens�ve programmes areas but the follow�ng programme areas are e�ther not �ncluded or could not be adequately costed due to t�me constra�nts and/or data constra�nts:a) - Informat�on, Educat�on and Commun�cat�on; Soc�al Mob�l�zat�on and Behav�or Change
Commun�cat�on;b) - Opportun�st�c Infect�ons;c) - HIV related �n-pat�ent costs;d) - Pall�at�ve Care;e) - Male c�rcumc�s�on; and f) - the MTP III component on Enabl�ng Env�ronment (although some elements are �ntegrated �nto the var�ous programme areas).

v���
Espec�ally, the �npat�ent cost �s expected to be qu�te large. Therefore, the low scenar�o w�ll not be real�st�c for Nam�b�a as parts of the above-ment�oned programme costs are not �ncluded. The HIV �n-pat�ent cost, for example, �s a substant�al amount �n add�t�on to the current calculated cost. The February 2007 Cathol�c AIDS Act�on �npat�ent census data �nd�cated that 43% of the pat�ents adm�tted �n the Cathol�c Health Serv�ce hosp�tals were HIV related. Extrapolat�ng th�s percentage nat�on-w�de w�ll br�ng Nam�b�a to an add�t�onal annual cost of N$ 244 m�ll�on, wh�ch can be translated �nto an add�t�onal 16% or 13% on top of the respect�vely med�um and h�gh scenar�o average annual cost.
The report descr�bes �n deta�l the general assumpt�ons made for the RNE. Further �t also elaborates on the spec�fic assumpt�ons w�th regard to the n�neteen programme areas covered. Across all programme areas, the total average annual cost of mon�tor�ng and evaluat�on �s est�mated to be between 3% (h�gh) and 4% (med�um) and the management cost var�es from 9% (h�gh) to 10% (med�um). The human resources cost accounts for �s between 8% (h�gh) and 11% (med�um).
The total resources requ�red for the h�gh scenar�o are �ncreased from N$1,445 m�ll�on (US$203 m�ll�on) �n 2007 to N$2,418 m�ll�on (US$340 m�ll�on) �n 2012 (F�gure 5). The resources requ�red for the med�um and low scenar�os �n 2012 are N$1,878 m�ll�on (US$ 264 m�ll�on) and N$1,514 m�ll�on (US$213 m�ll�on) respect�vely (F�gure 5). The programme areas that account for the largest share of the total resource needs are: Ant�-retrov�ral Therapy (ART), OVC support, Workplace programmes, Food Ass�stance, Home Based Care, Pall�at�ve Care and Psycho-Soc�al Support, as well as Human Resources Management as �llustrated �n F�gure 6. More �nformat�on about the amounts �n N$ are �llustrated �n Append�x I.
Figure 5. Resources Required for High, Medium and Low ScenariosTotal Resources Required by Scenario
(2007-2012, current N$ and US$)
N$ 0
N$ 500
N$ 1,000
N$ 1,500
N$ 2,000
N$ 2,500
2007 2008 2009 2010 2011 2012
N$ (million)
US$0
US$50
US$100
US$150
US$200
US$250
US$300
US$350
US$ (million)
High scenario
Medium scenario
Low scenario

�x
Figure 6. Breakdown of Resource Requirement for the High, Medium and Low Scenarios (annual average)
In the h�gh scenar�o the �mpact m�t�gat�on component of MTP III was the h�ghest (33%), followed by treatment, care and support (32%) and prevent�on (24%) (F�gure ���, Table �). In the med�um and low scenar�o, treatment accounts for the largest shares — 37% and 33% respect�vely. The share allocated for prevent�on under th�s scenar�o �s just over a fourth (25%) (F�gure 7, Table 2).
Total Resource Needs by Programme Area for all Scenarios (average annnual, 2007-2012, current N$ and US$)
N$0
N$200
N$400
N$600
N$800
N$1,000
N$1,200
N$1,400
N$1,600
N$1,800
N$2,000
High Medium Low
N$ (millions)
US$0
US$50
US$100
US$150
US$200
US$250
US$ (millions)
Management/Coord., M&E
Regional support
Infrastructure
HR
PLHA support
Food assistance & Nutrition
OVC
TB
HBC, Palliative Care, Psychosocial support
Workplace & Mainstreaming
IEC, BCC,SM & youth skills
Safe medical injection
PEP
Blood safety
STI
Condoms
C&T
ART (incl TB/HIV - IPT/CPT)
PMTCT
Figure 7. Share of Resources Required for Prevention, Care and Treatment
Total Resource Needs by MTP III Component for all Scenarios (average annual, 2007-2012, current N$ and US$)
N$0
N$200
N$400
N$600
N$800
N$1,000
N$1,200
N$1,400
N$1,600
N$1,800
N$2,000
High Medium Low
N$ (millions)
US$0
US$50
US$100
US$150
US$200
US$250
US$ (millions)
Policy, Mgt, Coordination,M&E
Infrastructure
HR
Treatment
Mitigation
Prevention

x
Table 2. Share of MTP III Component for High, Medium and Low Scenarios.
H�gh Scenar�o Med�um Scenar�o Low Scenar�o
Prevent�on 24% 26% 29%
Impact M�t�gat�on 33% 24% 22%
Treatment 32% 37% 33%
HR 6% 8% 9%
Infrastructure 2% 2% 2%
Pol�cy, Management, Coord�nat�on, Mon�tor�ng and Evaluat�on
3% 4% 4%
TOTAL 100% 100% 100%
The MTP III �s cons�stent w�th broader development plann�ng tak�ng place �n Nam�b�a. The Th�rd Nat�onal Development Plan (NDP III) for 2007-2012 �s currently be�ng developed and the med�um case scenar�o cost has been used for the NDP III resource est�mates. The med�um and h�gh scenar�os account for four percent and five percent respect�vely of the 2005 GDP and 12% and 15% respect�vely of the 2005 Government expend�ture figures. The per cap�ta average annual resource needs est�mate for the health sector programme areas accounts for 47% (med�um) and 49% (h�gh) of the Total Health Expend�ture (THE). However, as the latest nat�onal health accounts data are from 1999/00, the percentages are est�mated sl�ghtly lower as the THE �s expected to have �ncreased. The share of the non-health sector programmes cost on the total cost �s 44% (med�um) and 52% (h�gh).
G�ven the ex�st�ng �nformat�on on resources based on pledges and comm�tments from donors, both external and domest�c (for 2005 the est�mate was N$692 m�ll�on/US$97 m�ll�on), the resource gap was assessed. As Nam�b�a at the t�me that the cost�ng was conducted d�d not have accurate data on fund�ng d�sbursements, th�s report does not �ntend to draw ev�dence based conclus�ons on the N$ amounts for the resource gap. At the end of 2007, more accurate data w�ll be ava�lable �n the MoHSS/DSP fund�ng database.
It �s also �mportant to real�ze that fund�ng comm�tments beyond two years are hardly ava�lable, and therefore one needs to be careful w�th fund�ng project�ons over a per�od of five years. Further, �t �s assumed that the resources are currently ava�lable �n-country could be allocated to other programme areas as well. Th�s �s however not always the case and currently some of the MTP III areas are grossly under-funded. Resources ava�lable are often t�ed to project and programme proposals and donor rules and regulat�ons. Most flex�ble financ�ng mechan�sms, �f �mplementat�on mechan�sms and accountab�l�ty structures allow, may be useful for Nam�b�a �n the longer run. In 2005, the external fund�ng comm�tments accounted for 63% of the total nat�onal HIV/AIDS response resources.
However, �t �s clear for both the med�um as well as the h�gh scenar�os that resource mob�l�zat�on from both nat�onal and external resources st�ll needs to �ncrease. The share of GRN fund�ng needs to �ncrease �n order to allow health programmes to become less dependent on external fund�ng and for the overall susta�nab�l�ty of the nat�onal HIV/AIDS response. The un�t cost can become a useful tool to mon�tor cost-effect�veness of programmes and therefore an add�t�onal tool for strateg�c plann�ng. Above that beyond two years, the resource gap �s worr�some.

x�
Resource Gap Analysis for all Scenarios(2007-2012, current N$ and US$)
N$2,500-
N$2,000-
N$1,500-
N$1,000-
N$500-
N$0
N$500
N$1,000
N$1,500
N$2,000
N$2,500
2007 2008 2009 2010 2011 2012N$ (millions)
US$351-
US$251-
US$151-
US$51-
US$49
US$149
US$249
US$349
US$ (millions)
High scenario Medium scenario Low scenario Resources available
Resource requirement
Resource gap
Conclusion
The government of Nam�b�a has comm�tted �tself to Un�versal Access targets �n the AU meet�ng of health m�n�sters (2007) and the UN H�gh-level meet�ng on HIV/AIDS/UNGASS II (2006). These comm�tments are �nstrumental �n develop�ng and/or roll�ng out the nat�onal HIV/AIDS response. Th�s also results �n the fact that cont�nuous efforts are needed for mob�l�z�ng and reallocat�ng �nternal and external resources for HIV/AIDS. The class�ficat�on of Nam�b�a as a low-m�ddle �ncome country, the h�gh HIV/AIDS prevalence, as well as the h�gh �ncome d�spar�ty and poverty among a large part of the populat�on, need to be taken �nto account �n mob�l�z�ng and allocat�ng resources.
The med�um and h�gh scenar�os seem to be more real�st�c for Nam�b�a. They take �nto account the �nternat�onal and nat�onal pol�cy comm�tments and the current progress. The scenar�o model�ng �s �mportant to clar�fy the resource �mpl�cat�ons of scal�ng up programmes to cover a larger target group or make other add�t�onal �nvestments. The scenar�os also helped w�th the strateg�c assessment of how to roll out programmes w�th a focus on susta�nab�l�ty, effic�ency and effect�veness.
Figure 8. Preliminary Resource gap analysis (2007–2012).
The approach of cost�ng three scenar�os was thought to be the most effect�ve �n fac�l�tat�ng the strateg�c plann�ng process as well as advocacy for resource mob�l�zat�on.
Nam�b�a w�ll need an annual average of N$ 1.6 b�ll�on or N$ 1.9 b�ll�on for the med�um respect�vely the h�gh case scenar�o, wh�ch accounts for 12% and 15% of the GRN expend�ture (2005). The health sector programe areas cost almost 50% of the total health expend�ture, wh�ch cannot be neglected. It was apparent that the health programme areas seemed relat�vely well establ�shed, but the challenge �s �n extend�ng the�r reach to d�str�cts and const�tuenc�es and tackl�ng the �nfrastructure and human resource constra�nts. However, many of the health sector programmes are essent�ally externally funded, wh�ch causes concern �n terms of susta�nab�l�ty. Some of the mult�-sectoral programmes, for example food ass�stance, are under funded.

x��
Implications
In terms of susta�nab�l�ty, the Government of Nam�b�a (GRN) needs to �nvest more funds �nto the nat�onal HIV/AIDS response to replace external fund�ng. Currently the M�n�stry of F�nance (MoF) makes substant�al allocat�ons to the M�n�stry of Health and Soc�al Serv�ces (health systems cost for the prov�s�on of HIV/AIDS serv�ces), M�n�stry of Gender, Equal�ty and Soc�al Welfare (MGECW - OVC grants), and M�n�stry of Labour and Soc�al Welfare (d�sab�l�ty grants for PLWHAs), but th�s �s by far not enough to cover the cost of the Nat�onal HIV/AIDS response. External fund�ng rema�ns essent�al for the susta�nab�l�ty of the response.
Thus, the susta�nab�l�ty of the nat�onal HIV/AIDS response w�ll depend on the follow�ng factors: a) Adequate resource mob�l�zat�on and resource allocat�on; b) Increas�ng programme effic�ency and effect�veness; c) Tackl�ng constra�nts (e.g. human resources for health sectors and expanded response); and d) Strengthen�ng �mplementat�on capac�ty.
Adequate resource mob�l�zat�on and allocat�on �s d�rectly l�nked to strengthen�ng the current mon�tor�ng and evaluat�on, �nclud�ng accountab�l�ty and resource track�ng. Nam�b�a needs to �ncrease �nvestment w�th a more �n-depth focus on prevent�on, �n part�cular related to behav�our change �ntervent�ons. The GRN needs to re-allocate more resources to HIV/AIDS and �n collaborat�on w�th development partner look �nto fund�ng mechan�sms that �mprove the pred�ctab�l�ty of fund�ng beyond two years and a more flex�ble use for allocat�ng fund�ng towards the HIV/AIDS programme areas. Mon�tor�ng of un�t cost �s a useful tool to look �nto cost-effect�veness and the effic�ency of programmes.
In order to scale up programmes, �t �s h�ghly relevant to tackle the ma�n constra�nt now, wh�ch �s tra�n�ng of add�t�onal health and other profess�onals to �mprove the �mplementat�on capac�ty. It �s also of utter �mportance to speed up the decentral�zat�on process �n order to allocat�on more resources to the reg�ons and const�tuenc�es.

1
INTRODUCTION
The Nam�b�an Nat�onal Strateg�c Plan on HIV/AIDS 2004-2009, Th�rd Med�um Term Plan (MTP III) has fulfilled many of �ts targets �n the four years of �ts �mplementat�on. Therefore, the cost�ng done at the onset of the MTP III �s outdated and need arose for a rev�sed resource est�mat�on exerc�se. Follow�ng the �nd�cators, �nformat�on needed to be updated and new targets to be set.
The resource est�mat�on presented �n th�s report bu�lds on the �n�t�al cost�ng done �n 2003, as well as a rap�d cost�ng exerc�se that was carr�ed out for the development of Nam�b�a’s Global Fund Round S�x Proposal �n 2006. In add�t�on, the 2006 UNGASS Pol�t�cal Declarat�on on HIV/AIDS has been taken �nto account and espec�ally the strong consensus on Un�versal Access �s reflected �n the rev�sed est�mat�on. The rev�sed cost est�mat�on also fed �nto the MTP III m�d-term rev�ew process conducted �n June 2007, tak�ng �nto account the most current data.
The ma�n object�ve of the resource needs est�mat�on was to develop a deta�led cost�ng of the nat�onal HIV/AIDS response follow�ng the defined targets for Nam�b�a by focus�ng on un�t costs and br�ng�ng �n var�ous scenar�os to ass�st dec�s�on makers �n pol�cy mak�ng and strateg�c plann�ng.
Thus the spec�fic object�ves of th�s RNE act�v�ty were to: 1. Develop a country ta�lored resource est�mat�on methodology and analyze, develop and agree
upon un�t costs and target sett�ngs; 2. Est�mate the resource requ�rements of Nam�b�a’s Th�rd Med�um Term Plan accord�ng to the
var�ous chosen scenar�os and make the resource requ�rements expl�c�t; 3. Assess the resource gap based on current resource ava�lab�l�ty and the Resource Needs
Est�mat�on; 4. Contr�bute to an ev�dence base that w�ll form an object�ve source for pr�or�t�zat�on of �n�t�at�ves,
advocacy and dec�s�on mak�ng �dent�fied under the strateg�c plan, and 5. Bu�ld nat�onal capac�ty �n the var�ous programmes on resource est�mat�on and develop a
model composed of uncompl�cated spread sheets for the mult�-sectoral HIV/AIDS response programmes.
The MTP III �s also cons�stent w�th broader development plann�ng tak�ng place �n Nam�b�a. The Th�rd Nat�onal Development Plan (NDP III) prov�des an �mportant development context for the MTP III. In order to ensure that th�s updated cost�ng would cover the full NDP III �mplementat�on per�od, �t covers the t�me frame 2007-2012. The resource est�mat�on follows the five components of the MTP III and the subsequent 19 programme areas (see F�gure 9 �n Append�x II). Table 10 �n append�x II shows how these 19 programme areas l�nk to var�ous sectors and the ma�n umbrella organ�sat�ons for People L�v�ng w�th HIV/AIDS (PLWHAs), c�v�l soc�ety organ�sat�ons and the pr�vate sector.
The M�n�stry of Health and Soc�al Serv�ces (MoHSS) was supported �n the exerc�se by two �nternat�onal econom�sts: Constella Futures’ Dr. Gayle Mart�n and Mr. F�l�p Meheus from the Royal Trop�cal Inst�tute (KIT). F�nanc�al and techn�cal support was prov�ded through the European Un�on‘s HIV/AIDS Response Capac�ty Development Programme (HRCDP) and the Pres�dents Emergency Plan for AIDS Rel�ef (PEPFAR)/USAID.

2
A. PURPOSE OF THE REPORT
Th�s report �ntends to:(1) descr�be the �ntens�ve process to collect �nformat�on and consensus bu�ld�ng on the
methodology & results; (2) expla�n the methodology that has been used to ach�eve the above-ment�oned object�ves; (3) document the ma�n data �nputs and data sources; (4) prov�de �ns�ght �nto the general and spec�fic assumpt�ons w�th regard to the resource est�mat�on
results; (5) share key results of the scenar�o modell�ng; (6) prov�de �nformat�on on the resource gap analys�s; and (7) d�scuss some of the �mpl�cat�ons and conclus�ons of the Resource Needs Est�mat�on (RNE).
Before proceed�ng, �t �s �mportant to make a few comments about Resource Est�mat�on Modell�ng. There are mult�ple purposes of modell�ng:
(1) to clar�fy the �mpl�cat�ons of d�fferent approaches �n order to ass�st w�th plann�ng; (2) to deal w�th uncerta�nty1; (3) to expla�n why resources should be allocated for HIV by show�ng what may happen �n the
absence of the �nvestments; and (4) to �nform pr�or�t�zat�on �f total resource needs are not met. Note that modell�ng cannot pred�ct the future, but �t allows planners and pol�cy-makers to
cons�der opt�ons relevant to strateg�c plann�ng and pol�cy mak�ng.
B. HIV/AIDS SITUATION AND ECONOMIC CONTEXT
Nam�b�a has a general�sed HIV/AIDS ep�dem�c w�th HIV pr�mar�ly spread through heterosexual transm�ss�on. From the 1992 est�mate of 4.2%, prevalence rose rap�dly over the follow�ng four years to 15.4% �n 1996. Prevalence cont�nued to r�se, although less rap�dly for the next s�x years to a peak of 22.3% �n 2002.
Nat�onal prevalence showed a marg�nal decl�ne to 19.7% �n 2004 and then rose sl�ghtly to 19.9% �n 2006. Th�s suggests two �mportant challenges:
(1) Prevent�on efforts need to be consol�dated and �ntens�fied; and (2) Care and treatment, as well as �mpact m�t�gat�on serv�ces need to be scaled up towards
un�versal access coverage of the target populat�ons.
S�nce the launch of MTP III �n 2004, a number of �nternat�onally gu�ded �n�t�at�ves have �mpacted on Nam�b�a’s expanded response. The first two years of �mplementat�on have seen an unprecedented �mprovement �n roll-out of serv�ces to the commun�t�es on prevent�on, treatment, care and support serv�ces. As a result, the response to the HIV/AIDS ep�dem�c �n Nam�b�a has seen many changes. These �nclude:
a) Cons�derably �ncreased fund�ng comm�tments;b) The engagement of grow�ng numbers of organ�zat�ons from the publ�c, pr�vate and c�v�l soc�ety
sectors; andc) Expans�on of geograph�c coverage of serv�ces and programmes.
1There are several sources of uncerta�nty: (1) Ep�dem�c determ�nants (e.g., the effect�veness of prevent�on programs), the HIV/ response (human resource ava�lab�l�ty; pace of �mplementat�on; changes �n �mplementat�on approaches over t�me; F�nanc�al resource ava�lab�l�ty); Macroeconom�c and Market �nd�cators (changes �n commod�ty pr�ces, �nflat�on rates, �nterest rates).

3
Nam�b�a �s class�fied as a low m�ddle-�ncome country because �t �s endowed w�th r�ch natural resources, wh�ch has led to a relat�vely h�gh per-cap�ta �ncome (US$2,380 per cap�ta �n 2004 - World Bank 2006). However, the 2005 Human Development Report shows that the Nam�b�an Human Development Index dropped from 0.693 �n 1995 to 0.648 �n 2000 and stood at 0.627 �n 2003 (UNDP 2003). The report also g�ves a G�n�-�ndex of 70.7 �n 2003 wh�le th�s same coeffic�ent was 67 �n 1998. There �s no other country �n the world that has a h�gher value related to �ncome d�spar�ty.
Accord�ng to the Nat�onal Household Income and Expend�ture Survey (NHIES) of 1993/1994, the r�chest 20% of the populat�on share 78.7% of �ncome or consumpt�on, wh�le the poorest 20% share 1.4% of the �ncome and consumpt�on �n Nam�b�a. The report also states that 34.9% of the Nam�b�an populat�on l�ves below US$1 a day and 55.8% below US$2 a day. Nam�b�a has a Human Poverty Index of 33 and ranks number 60 among 103 develop�ng countr�es. More fund�ng �s needed to make the HIV/AIDS response susta�nable through local �n�t�at�ves, but external resources rema�n necessary tak�ng �nto account the poverty challenges �n Nam�b�a.
Thus, Nam�b�a’s development and HIV/AIDS s�tuat�on �nd�cates a strong need to advocate for more comm�tment and resources both nat�onally and �nternat�onally to effect�vely address the HIV/AIDS pandem�c. The Resource Needs Est�mat�on tr�es to prov�de the most current calculat�ons to th�s effect.

4
C. PROCESS
The MoHSS started the rev�s�on exerc�se of the resource est�mat�on �n November 2006. A cost analys�s work�ng group2 was �nstalled to rev�ew the former cost�ng and prov�de overall gu�dance throughout the process and techn�cal �nput �nto the cost�ng �tself. W�th the ass�stance of the EC/HRCDP project w�th�n the M�n�stry and the USAID/Health Pol�cy In�t�at�ve, the consultants from Futures Group and the Royal Trop�cal Inst�tute (KIT) were recru�ted to ass�st w�th the un�t cost�ng and scenar�o sett�ng.
The Resource Mob�l�zat�on and Development Coord�nat�on (RM&DC) Un�t �n the D�rectorate of Spec�al Programmes �n the MoHSS worked w�th key m�n�str�es and stakeholders to ensure good �nformat�on flow and ownersh�p. RM&DC staff were tra�ned on the job �n the RNE process and �ntroduced to the cost�ng methodology together w�th programme managers. The �dea was that programme managers and RM&DC staff could use the RNE model for future exerc�ses. Tra�n�ng was ach�eved w�th several consultat�on sess�ons on the des�gn, data �nput and results w�th the programme managers of the Government of Nam�b�a as well as w�th other relevant stakeholders.
The first round of consultat�ons began �n the first two weeks of December 2006. Dur�ng these weeks, meet�ngs were held w�th techn�cal staff. The development of the cost�ng sheets, calculat�on of un�t costs and further data requ�rements were d�scussed. The techn�cal staff were requested to prov�de relevant gu�del�nes, stat�st�cs, strateg�c and operat�onal plans (�nclud�ng budgets and expend�ture sheets), and other �nformat�on that could ass�st �n the RNE. Data collect�on and ver�ficat�on took cons�derable t�me and several meet�ngs w�th programmes were needed to reach consensus. The larger part of the data collect�on took place dur�ng a second round of meet�ngs �n the per�od January-February 2007.
In the second tranche of consultat�ons done �n February 2007, the consultants v�s�ted Nam�b�a from 29 January unt�l 23 February 2007 and overlapped one week to conclude the work. The consultant from Constella Futures Group worked on elaborat�ng d�fferent scenar�o sett�ngs and l�nked the RNE results to the MTEF and nat�onal and �nternat�onal fund�ng flow �nformat�on. The complet�on of the cost�ng sheets was delayed as a result of the large number of stakeholders that had to be consulted as well as the data collect�on. Therefore a re-ass�gnment of tasks was needed between the consultants and DSP/MoHSS staff to �ncrease the number of add�t�onal consultancy days.
A two-day Consensus Bu�ld�ng and Scenar�o Sett�ng Workshop of the Cost�ng for the MTP III Rev�ew was organ�zed from 14 to 15 February, 2007 for techn�cal and manager�al staff to rev�ew and comment on the draft cost�ng sheets. All relevant HIV/AIDS stakeholders from the Government, pr�vate sector, c�v�l soc�ety and donor agenc�es were �nv�ted and attendance spanned across the d�fferent programme sess�ons that were conducted �n a parallel manner.
The object�ve of the workshop was to rev�ew and bu�ld consensus on the data used �n the cost�ng sheets and on the target sett�ng of the 19 areas of the MTP III as well as contr�but�ng �nput to the var�ous scenar�os that would be used for plann�ng purposes. Dur�ng the workshop, the object�ves and overv�ew of the cost�ng process, as well as the Resource Needs Est�mat�on Methodology and scenar�o sett�ng were presented to the part�c�pants. The members of the cost�ng work�ng group and consultants fac�l�tated the sess�ons dur�ng the workshop.
2 Dr. Norbert Forster, Under Secretary MoHSS (Cha�r); Mr. Abner Xoagub, Head Expanded Nat�onal HIV/AIDS Response Support /DSP/MoHSS (Co-Cha�r); Mr. Ambros�us Uakurama, CHPA Resource Mob�l�zat�on and Donor Coord�nat�on(RM&DC)/DSP/MoHSS; Ms. Annemar�e N�tschke, Head RM&DC, DSP/MoHSS; Ms. Jul�eth Kar�rao, CHPA/ENARS/DSP/MoHSS; Ms. Cla�re D�llavou, Strateg�c Informat�on L�a�son & Deputy PEPFAR Coord�nator; Mr. Denn�s Weeks, PEPFAR Coord�nator; and Ms. Jeanette de Putter, Sen�or Techn�cal Adv�sor, EC project/MoHSS. Other relevant people l�ke Mr. Perry Mwangala, TA M&E Global Fund Programme Management Un�t, DSP/MoHSS were consulted on an ad hoc bas�s when needed.

5
In the week of 19 to 23 February 2007, da�ly meet�ngs were held w�th sen�or management of var�ous relevant m�n�str�es (the Permanent Secretary (PS), Deputy PS, D�rectors, Deputy D�rectors and HIV/AIDS focal persons/po�nts). The purpose was to br�ef sen�or management on the outcomes of the RNE, and also to exam�ne the proposed scenar�os, as cost�ng outcomes were necessary for gu�dance �n future plann�ng. Due to a lack of t�me, some of the meet�ngs were postponed to a later stage.
Dur�ng the Nat�onal A�ds Execut�ve Comm�ttee (NAEC) meet�ng on 21 February, 2007, �t was adv�sed that the cost�ng exerc�se be updated every two years, and that the current RNE Model comp�l�ng the d�fferent programme cost�ng sheets should be used and updated as deemed necessary. Th�s would ensure the use of up-to-date �nd�cators and targets, un�t costs, exchange rate, and pol�cy and programme changes. The resource est�mat�on results would be used as a strateg�c plann�ng tool. The overall process took s�x months. The exerc�se consumed 60 consultancy days and qu�te substant�al nat�onal staff t�me. Overall the process was judged as very pos�t�ve related to extens�ve consultat�ons, consensus bu�ld�ng and ownersh�p.
D. METHODOLOGY
To est�mate the costs of the var�ous programmes �dent�fied �n the MTP III, a Resource Needs Model was developed. The model was spec�fically ta�lored to the Nam�b�an s�tuat�on �n collaborat�on w�th the var�ous stakeholders us�ng the data �nput style descr�bed �n Append�x 11.
Var�ous scenar�os were exam�ned as seen �n Append�x I. The Model �s a spreadsheet that has been des�gned to fac�l�tate the est�mat�on of costs of �nd�v�dual programmes.
The bas�c method of resource est�mat�on �s first to est�mate the number of people �n need of HIV/AIDS-related serv�ces �n the target group. A coverage target �s then establ�shed to est�mate the populat�on that would actually use the serv�ce. The next step �s to est�mate the un�t cost of prov�d�ng the �ntervent�on or serv�ce and th�s �s used to calculate the total cost of the �ntervent�on. Th�s �s �llustrated �n F�gure 1.
Figure 1: Basic Approach to the Resource Estimation Model
# People �n target populat�on % coverage of target populat�on to be ach�eved
# of people to be reached w�th the �ntervent�on
Cost of �ntervent�on per person reached
Cost of �ntervent�on

6
A flow chart of the structure of the Resource Needs Model �s p�ctured �n F�gure 2. As �llustrated, the model rel�es on three types of �nputs _ target populat�on s�ze, coverage and future target sett�ng and un�t costs.
• Target populat�on s�ze: For each HIV/AIDS prevent�on serv�ce, the model requ�res the s�ze of populat�on that w�ll be targeted. Th�s �s the populat�on that could potent�ally have access to those serv�ces g�ven the ex�st�ng �nfrastructure.
The est�mated populat�on s�zes were based on the Central Bureau of Stat�st�cs’ populat�on project�ons (2006) and der�ved from 2004/05 and 2005/06 programme data.
• Coverage: Coverage �s the percentage of the target populat�on that �s reached by a spec�fic prevent�on serv�ce �n any g�ven year. Coverage rates are �ntended to �nd�cate what �s feas�ble and necessary.
• Target sett�ng was dec�ded upon by programme experts through us�ng current coverage based on �nd�cators from the 2004/05, 2005/06 and 2006/07 fiscal years and the pace of roll�ng out programme act�v�t�es. Target sett�ng was chosen tak�ng �nto account the var�ous factors as the target populat�on and the ma�n capac�ty constra�nts depend�ng on scenar�os.
• Un�t costs: They are defined as the costs requ�red to reach one person �n the target populat�on w�th a part�cular serv�ce. Un�t costs are used to calculate total costs of the serv�ce through mult�ply�ng the number of people reached by the un�t cost.
Figure 2: Flow chart of Data Inputs and Approach of Resource Needs Model
X XGoals, Object�ves and Intervent�ons
90% of h�gh r�sk groups targeted w�th IEC
50% of d�str�cts develop Counsell�ng and Support Centres
50% of HIV+pregnant women w�th access to PMTCT; 95% �n 2012
Targetpopulat�on
Coverageand targetsett�ng
Un�tCost
Requ�red Resources
N$/US$
N$/US$
N$/US$

7
E. DATA COLLECTION AND VERIFICATION
A w�de range of �nformat�on sources were consulted. Generally, the data requ�rements can be d�v�ded �nto the follow�ng categor�es: • Demograph�c data • Ep�dem�olog�cal and Behav�oural data• Program and Serv�ce del�very data• Econom�c and F�nanc�al data• Other sectors and Programmes data
Demograph�c data: Th�s was obta�ned from the Nat�onal Plann�ng Comm�ss�on’s populat�on project�ons produced �n 2006 and based on the 2001 census. The MoHSS model (Spectrum), on Demograph�c Outcomes of HIV/AIDS prov�ded useful data on PLWHAs and those el�g�ble for ART, as well as on Orphans and Vulnerable Ch�ldren (OVC).
Ep�dem�olog�cal and Behav�oral data: It was prov�ded by the MTP III draft Progress Report cover�ng 2004-2006, DHS, and the Sent�nel Survey. There was strong rel�ance on the MoHSS for these data �nputs.
Programme and Serv�ce Del�very data: W�th the perm�ss�on of the M�n�str�es of Health and Soc�al Serv�ces, Gender and Ch�ld Welfare, Labour and Soc�al Welfare, MRLGHRD, Educat�on, and the Office of the Pr�me M�n�ster, data �nputs were obta�ned from offic�als and experts who were �dent�fied �n the relevant m�n�str�es.
Econom�c & F�nanc�al data (�nclud�ng expend�ture and un�t cost data): Th�s category of data �ncludes two types: (1) Fund�ng pledges & comm�tments data, and (2) Un�t cost data for each �ntervent�on.
Data on fund�ng comm�tments was comp�led by the MoHSS from the matr�x of the Partnersh�p Forum, and PEPFAR and Global Fund financ�al managers, as well as est�mates from NABCOA for the pr�vate sector and NANASO3 for the c�v�l soc�ety sector. Fund�ng data was not d�saggregated by programme. Un�t costs were seldom collected but some were ava�lable from the Global Fund programme management un�t �n the MoHSS. The latest Nat�onal Health Accounts survey had only 1999/2000 fiscal year data, and a new survey �s scheduled for 2007. Household HIV/AIDS expend�ture �s notor�ously hard to capture, but future data collect�on efforts should not om�t th�s source of HIV/AIDS spend�ng – espec�ally spend�ng on care and treatment.
Other data: A separate model was des�gned to est�mate the human resource needs. In add�t�on, programme plans and reports prov�ded add�t�onal data, as well as group d�scuss�ons w�th relevant stakeholders. Annual budgets of programmes that were be�ng rolled out for several years conta�ned relat�vely good data on un�t costs, programme costs, etc. The cost�ng exerc�ses undertaken for OVC and the nat�onal HIV/AIDS Mon�tor�ng and Evaluat�on (M&E) plan were �nformat�ve. These were done �n 2003 and 2006 respect�vely and �nformat�on was extracted from these exerc�ses. Also, GTZ/NABCOA conducted a cost benefit analys�s wh�ch was useful for the work place programme management un�t costs.
Data Ver�ficat�on: Several consultat�ve meet�ngs were conducted �n order to get feedback from experts �n var�ous fields and to generate consensus bu�ld�ng. In add�t�on, �nformal consultat�ons were done w�th experts to complement lack�ng �nformat�on.
3 NANASO prov�ded est�mates based on the 2006 Cadre Exerc�se. Est�mates of nat�onal fund�ng of the organ�zat�ons rev�ewed was extra-polated nat�on-w�de.

8
F. LIMITATIONS, GENERAL INFORMATION AND SPECIFIC ASSUMPTIONS
F.1. MTP III Programme Areas
The resource est�mat�on �s based on the MTP III �ntervent�on and programme categor�es and 19 programme areas were �dent�fied for the Resource Needs Est�mat�on (see Table 1). The t�me-frame for the est�mat�on �s 2007-2012.
The follow�ng programmes are not �ncluded or could not be adequately costed e�ther due to t�me constra�nts, data constra�nts, or both factors:�) - Informat�on, Educat�on and Commun�cat�on, Behav�or Change Commun�cat�on and Soc�al
Mob�l�zat�on (IEC, BCC & SM) (t�me constra�nt – l�m�ted cost�ng);���) - Opportun�st�c Infect�ons (data constra�nt – not �ncluded);�v) - HIV related �n-pat�ent costs (data constra�nt – not �ncluded);v) - Pall�at�ve Care (data constra�nt – l�m�ted cost�ng);v�) - Male c�rcumc�s�on (data constra�nt); and v��) - the MTP III component on Enabl�ng Env�ronment (t�me constra�nt – l�m�ted cost�ng, although
some elements are �ntegrated �nto the var�ous programme areas).
Est�mat�on of resources for the IEC, BCC & SM programme areas was l�m�ted due to the complex�ty of th�s area. Numerous stakeholders are act�ve �n th�s field and a complete cost�ng requ�res more t�me �n order to �dent�fy all act�v�t�es, and mob�l�ze and obta�n the data from all stakeholders. As th�s �s a pr�or�ty area there �s also need for more �n-depth cost�ng and analys�s. Male c�rcumc�s�on �s a newly focused prevent�on method that �s currently rece�v�ng cons�derable attent�on �n v�ew of sc�ent�fic advances but was not �ncluded �n th�s analys�s. Some d�scuss�on on male c�rcumc�s�on �s prov�ded (see Append�x V for more �nformat�on).
The �mportant conclus�on to be drawn based on the results of the Resource Needs Est�mat�on �s that the low scenar�o w�ll not be real�st�c for Nam�b�a because part of the costs are not �ncluded. HIV �npat�ent costs, �nclud�ng opportun�st�c �nfect�ons and pall�at�ve care accounts for a substant�al amount of resources that have not been captured. The February 2007 Cathol�c AIDS Act�on �npat�ent census �nd�cated that 43%
4 of the pat�ents adm�tted to Cathol�c Health Serv�ces hosp�tals are HIV related. Extrapolat�ng th�s data
nat�on-w�de w�ll br�ng Nam�b�a to an add�t�onal annual cost of N$ 244 m�ll�on , or �n other words 16% of the total average annual RNE cost for the med�um case scenar�o or 13% for the h�gh case scenar�o. Therefore the med�um and h�gh scenar�os seem more real�st�c for Nam�b�a.
Table 1. Summary programme areas included in the resource estimation
MTP III Components Programme Areas Comments
Enabl�ng Env�ronment Th�s MTP III component was not costed. Some of the act�v�t�es have been �ncorporated �nto the other programme areas below.
Prevent�on 1. Counsel�ng and Test�ng (�nclud�ng rout�ne and voluntary test�ng)
2. Condom prov�s�on3. Sexually Transm�tted Infect�ons (STI)4. Blood safety5. Post-Exposure Prophylax�s (PEP)6. Inject�on safety7. IEC, BCC, and Soc�al Mob�l�sat�on8. Work Place Programmes and Ma�nstream�ng
4 Est�mat�on based on 43% of the �npat�ent cost for ma�nly �nternal med�c�ne and ped�atr�c wards follow�ng the 2006/07 MoHSS
publ�c health expend�ture for referral hosp�tals and reg�onal/d�str�ct hosp�tals.

9
Treatment, Care & Support 9. ART, �nclud�ng TB/HIV and TB10. PMTCT11. Home Based Care, Pall�at�ve care, Psychosoc�al support
IEC,SM,BCC l�m�ted cost�ngMale c�rcumc�s�on not covered
Impact M�t�gat�on 12. PLWHAs13. Orphans and Vulnerable Ch�ldren14. Food secur�ty & IGAs
Other than tuberculos�s, the treatments of opportun�st�c �nfect�ons have not been costed due to data l�m�tat�ons, Ne�ther �npat�ent costs.
Programme Management 15. Human Resources16. Infrastructure 17. Management & Coord�nat�on of Nat�onal response18. Reg�onal support19. Mon�tor�ng and Evaluat�on
The Resource Needs Est�mat�on �s based on general and spec�fic assumpt�ons that are �mportant to take �nto account when �nterpret�ng the results of the cost analys�s.
F.2. General Assumptions
In th�s sect�on the general approach and assumpt�ons wh�ch have been used �n the sett�ng up of the Resource Needs Est�mat�on Model, cost�ng tools, as well as the assumpt�ons underly�ng each scenar�o are l�sted. • Fiscal year: The fiscal year �n Nam�b�a �s Apr�l 1 – March 31. Unless otherw�se �nd�cated, the fiscal year
2007, for example, refers to the t�me per�od Apr�l 1, 2007 to March 31, 2008.• Population projections: Project�ons were taken from the 2005 Nat�onal Plann�ng Comm�ss�on
populat�on project�ons that were based on the 2000/01 census. These project�ons m�ght be adapted when more recent data becomes ava�lable, �nclud�ng more accurate v�tal reg�strat�on.
• Perspective of the provider is considered: In any cost analys�s the types of costs cons�dered depend on whose perspect�ve �s adopted. The purpose of th�s analys�s �s to �nform resource mob�l�zat�on and resource allocat�on dec�s�ons. Therefore, the costs to the consumer of serv�ces are not expl�c�tly taken �nto account. However, that does not mean that demand-s�de costs are not �mportant or that they are not cons�dered �n the analys�s. For example, one of the pr�mary mot�vat�ons for government or donor subs�d�zat�on of costs of ART or condoms or expand�ng geograph�c access to var�ous programs �s dr�ven by the des�re to reduce the costs to the consumer and remove financ�al barr�ers that could prevent access to or ut�l�zat�on of goods or serv�ces by commun�t�es.
• Constant unit costs assumed over the projection period: There are several reasons why one would expect un�t costs to vary over t�me. One �s the econom�c reasons (var�at�on �n exchange rate, �nflat�on rate and �nterest rates). The pr�ce fluctuat�ons assoc�ated w�th drugs are very hard to pred�ct and therefore the RNE model was des�gned �n such a way that updated pr�ces can be �nserted eas�ly.
One m�ght also expect un�t costs to vary as programs are scaled up as a result of econom�es of scale. Un�t costs are defined as average total costs (as opposed to marg�nal costs).
Figure 3: basic costing principles
F�gure 3 shows that �n�t�ally average costs may be h�gh (p1) as the output �s small (q1), and average cost then reaches a m�n�mum (p2 at q2) and beyond that may �ncrease as the program �ncreases beyond the opt�mal output (p3 at q3). As �n most cost�ng for strateg�c country plans, the cost data for each program does not ex�st to support var�at�on �n cost by level of output �n Nam�b�a.
does not mean that demand-side costs are not important or that they are not considered in the analysis. For example, one of the primary motivations for government or donor subsidization of costs of ART or condoms or expanding geographic access to various programs is driven by the desire to reduce the costs to the consumer and remove financial barriers that could prevent access to or utilization of goods or services by communities. Constant unit costs assumed over the projection period. There are several reasons why one would expect unit costs to vary over time. One is the economic reasons (variation in exchange rate, inflation rate and interest rates). The price fluctuations associated with drugs are very hard to predict and therefore the RNE model was designed in such a way that updated prices can be inserted easily. One might also expect unit costs to vary as programs are scaled up as a result of
economies of scale. Unit costs are defined as average total costs (as opposed to marginal costs).
Figure 3 shows that initially average
costs may be high (p1) as the output is small (q1), and average cost then reaches a minimum (p2 at q2) and beyond that may increase as the program increases beyond the optimal output (p3 at q3). As in most costing for strategic country plans, the cost data for each program does not exist to support variation in cost by level of output in Namibia
Figure 3: Basic costing principles
p1
p3
p2
q1 q2
P
Qq3
.Scaling-up: Some costs associated with scaling-up are explicitly taken into account when new programs are introduced.
E.G. coordination and management at the national and regional level, and training of doctors and nurses to supervise and manage ART. Therefore a variation was used in the management cost percentage to cater for initial investment. Exchange rate: The projections are generally made for the period 2007-2012. A constant exchange rate is assumed over the projection period. The exchange rate used is the Interbank Exchange Rate on 1 January, 2007, namely US$1 = Namibian $7.12550 (www.oanda.com). In order to keep the model and scenarios relatively simple, exchange rate fluctuations were not taken into account. Inflation rate and Discount rate: At this stage, neither the resources required nor the resources available have been inflation adjusted or discounted. These adjustments are not always easy to interpret to non-economists, and this report includes mostly unadjusted financial results, though summary tables reflecting the adjustments have been included. Consistent programme categories: The costing for each intervention contains the following programme categories: specific programme activities, training, IEC, management and M&E. Programme management and monitoring and evaluation costs were estimated as a percentage of the activity cost. This percentage and outcomes were checked against the current overall budgets and expenditure at the national and in some cases at the regional level. Note that the costs do not include management cost of, for example, the health service delivery level. The resource estimation for the high and low case scenario resulted in respectively three percent and four percent for monitoring and evaluation which includes the national HIV/AIDS monitoring and evaluation as well as specific programme monitoring and evaluation. The overall management cost for national and regional came to nine percent and ten percent of total costs for the high and low case scenario respectively (see Appendix I, Comparison by Cost Area). The resource estimation takes into account the leveling off of these programme management costs because during initiation of the
21

10
• Scaling-up: Some costs assoc�ated w�th scal�ng-up are expl�c�tly taken �nto account when new programs are �ntroduced. E.G. coord�nat�on and management at the nat�onal and reg�onal level, and tra�n�ng of doctors and nurses to superv�se and manage ART. Therefore a var�at�on was used �n the management cost percentage to cater for �n�t�al �nvestment.
• Exchange rate: The project�ons are generally made for the per�od 2007-2012. A constant exchange rate �s assumed over the project�on per�od. The exchange rate used �s the Interbank Exchange Rate on 1 January, 2007, namely US$1 = Nam�b�an $7.12550 (www.oanda.com). In order to keep the model and scenar�os relat�vely s�mple, exchange rate fluctuat�ons were not taken �nto account.
• Inflation rate and Discount rate: At th�s stage, ne�ther the resources requ�red nor the resources ava�lable have been �nflat�on adjusted or d�scounted. These adjustments are not always easy to �nterpret to non-econom�sts, and th�s report �ncludes mostly unadjusted financ�al results, though summary tables reflect�ng the adjustments have been �ncluded.
• Consistent programme categories: The cost�ng for each �ntervent�on conta�ns the follow�ng programme categor�es: spec�fic programme act�v�t�es, tra�n�ng, IEC, management and M&E.
• Programme management and monitoring and evaluation costs were est�mated as a percentage of the act�v�ty cost. Th�s percentage and outcomes were checked aga�nst the current overall budgets and expend�ture at the nat�onal and �n some cases at the reg�onal level. Note that the costs do not �nclude management cost of, for example, the health serv�ce del�very level. The resource est�mat�on for the h�gh and low case scenar�o resulted �n respect�vely three percent and four percent for mon�tor�ng and evaluat�on wh�ch �ncludes the nat�onal HIV/AIDS mon�tor�ng and evaluat�on as well as spec�fic programme mon�tor�ng and evaluat�on. The overall management cost for nat�onal and reg�onal came to n�ne percent and ten percent of total costs for the h�gh and low case scenar�o respect�vely (see Append�x I, Compar�son by Cost Area). The resource est�mat�on takes �nto account the level�ng off of these programme management costs because dur�ng �n�t�at�on of the programme the costs are relat�vely h�gher compared to five years later as there are less �nvestment costs �n �nfrastructure and staffing. In the absence of spec�fic data for some programmes, percentages or flat rates were used for tra�n�ng and IEC.
Figure 4: Total Resource Needs by Cost Area for all Scenarios
Total Resource Needs by Cost Area for all Scenarios(annual average, 2007-2012, current N$ and US$)
N$0
N$200
N$400
N$600
N$800
N$1,000
N$1,200
N$1,400
N$1,600
N$1,800
N$2,000
High Medium Low
N$ (millions)
US$0
US$50
US$100
US$150
US$200
US$250
US$ (millions)
HR (incl training)
M&E
Management
Activities

11
• Human Resources: Human resources are �ncluded as a separate category. For calculat�ng human resource cost, full salar�es (�nclud�ng benefits, pens�on etc.) were used and the number of necessary staff was calculated based on rat�os of pat�ent v�s�ts. Formal degree or curr�culum tra�n�ng costs were also �ncluded as part of the human resource costs. On salary costs, although �t was pred�cted that there would be a salary �ncrease dur�ng the subsequent years, �t was not taken �nto account. Therefore the updat�ng of the cost�ng every two years would ensure that the most current data was used.
• Training cost: Due to the spec�fic post-aparthe�d context �n Nam�b�a, tra�n�ng costs are relat�vely h�gh for 2005-08. Currently, there �s substant�al donor support go�ng �nto tra�n�ng. It �s assumed that th�s w�ll decrease over t�me and extra-curr�culum tra�n�ng should �n future be concentrated on new staff recru�tment. The human resource sheets �n the RNE model conta�n the est�mat�ons for curr�culum tra�n�ng. As Nam�b�a �s l�m�ted �n tra�n�ng �nst�tutes, med�cal personnel �nclud�ng doctors, pharmac�sts, nutr�t�on�sts, psycholog�sts, etc, need to be tra�ned outs�de the country. The costs were est�mated based on full scholarsh�ps.
F.3. Specific Assumptions
The sect�on below descr�bes the spec�fic assumpt�ons underly�ng the programme and scenar�o cost�ng.
Counseling and Testing
The cost�ng was based on the UNAIDS Reference Group on AIDS Econom�cs’ recommendat�on that the number of people �n need of counsel�ng and test�ng be est�mated at two t�mes the populat�on HIV prevalence rate. In 2007 the target populat�on �s est�mated to be 424,444 people wh�le for 2012 �t �s 455,723 people based on the 2004 prevalence rate. The coverage �n 2005/06 was 25% of the target populat�on. The target sett�ng for the future �s based on the scal�ng-up of rap�d test�ng - and the decrease of ELISA test�ng, recru�tment and tra�n�ng of commun�ty volunteers to conduct the test�ng and the roll-out of publ�c sector counsel�ng and test�ng s�tes to 319 from the 250 �n 2006.
In add�t�on to the publ�c prov�s�ons, the Soc�al Market�ng Assoc�at�on (SMA) �s operat�ng 17 New Start centers and th�s number �s expected to rema�n stable. The major�ty of counsel�ng and test�ng �s done by the publ�c sector (about 85%).
The un�t costs used are the cost per person counseled for the New Start Centers as well as number of publ�c counsel�ng and test�ng s�tes. Deta�led un�t costs were obta�ned for the var�ous tra�n�ngs conducted by the publ�c sector and SMA, costs of ELISA and rap�d tests, and monthly remunerat�on to commun�ty counselors.
The resource est�mat�on was done for the follow�ng: counsel�ng, tests, tra�n�ng, IEC, mon�tor�ng and evaluat�on (five percent of program costs), and programme management (10% of programme costs).
High scenario The coverage rate for 2012 �s set at 95% of the number of people need�ng tests (est�mated accord�ng to the UNAIDS approach).The pace of �ncrease between 2007 and 2012 projected a nearly logar�thm�c path r�s�ng fast �n�t�ally and then slow�ng �n the latter years.
Medium scenario The coverage rate for 2012 �s set at 95% of the number of people need�ng tests, (est�mated accord�ng to the UNAIDS approach). The average annual rate of �ncrease was assumed to be constant between 2007 and 2012, y�eld�ng a l�near path.
Low scenario The coverage rate �s set at 80% of those need�ng test�ng (est�mated accord�ng to the UNAIDS approach). The pace of �ncrease between 2007 and 2012 was assumed to be constant.

12
Treatment of Sexually Transmitted Infections (STIs)
The ma�n object�ve of the STI programme �s to tra�n and superv�se correct case management follow�ng the syndrom�c approach. The target populat�ons are males (474,446) and females (492,461) �n the reproduct�ve age group (2007), mult�pl�ed by the STI �nc�dence rate wh�ch prov�des the expected number of STIs per year.
Un�t costs were est�mated to be N$40 per STI ep�sode wh�ch �ncludes drugs (about N$10), laboratory costs, partner not�ficat�on, etc.
The resource est�mat�on was done for the follow�ng: d�agnos�s and treatment costs, tra�n�ng, IEC, mon�tor�ng and evaluat�on (five percent of program costs) and programme management (20% of program costs).
High scenario The ma�n bas�s for the scenar�o model�ng �s the assumpt�ons perta�n�ng to reduct�on �n STIs treated between 2007 and 2012 for the publ�c sector. In the h�gh scenar�o analys�s the costs were est�mated on the bas�s of the STI �nc�dence be�ng reduced from 10% to five percent.
Medium scenario Based on an STI �nc�dence reduct�on from 10% to 6.5%.
Low scenario Based on an STI �nc�dence reduct�on from 10% to 7.8%.
Workplace Programmes and Mainstreaming
The resource est�mat�on for the publ�c sector workplace programmes and ma�nstream�ng was based on data from the Office of the Pr�me M�n�ster (OPM). The data for the pr�vate sector workplace programmes (WPPs) came from NABCOA.
The est�mat�ons for ma�nstream�ng (MS) were based on the 28 OMAs. Un�t costs were developed for small, med�um and large s�ze workplace programmes and ma�nstream�ng programmes tak�ng �nto account m�n�mum staffing and act�v�ty fund�ng requ�rements. Nat�onal management costs �nclude tra�n�ng, mon�tor�ng and evaluat�on, and �mpact and WPP surveys, etc.
The ma�n WPP target populat�ons are the workers �n both publ�c and pr�vate sectors. The publ�c sector has 99,166 employees or 79,927 (exclud�ng parastatals) �n 28 Organ�zat�ons, M�n�str�es, and Agenc�es (OMAs). In 2006/07, OPM est�mated that 28,470 employees were reached by WPPs. The number of pr�vate sector employees �s not prec�sely known. It �s est�mated that 130,000 employees are formally employed �n the sector. There are 24,073 employers of wh�ch 10,000 are reg�stered w�th the MTI. NABCOA est�mated that about 55% of those employers have more than 20 employees of wh�ch 4,500 have between 20-50 employees and 1000 more than 50 employees. Th�s seems to be the target group wh�ch �s cons�derable �n s�ze �n the pr�vate sector for work place programmes based on cost and benefits. In 2006/07 fiscal year, NABCOA est�mated that 25,666 employees were reached. Target sett�ng for future years was developed based on the roll-out of WPPs and �nformat�on prov�ded by key experts. An alternate un�t pr�ce calculat�on was done for workplace programmes (N$720 per person per year), but both un�t pr�ce calculat�ons ended up w�th s�m�lar total cost.
The bulk of the cost for WPPs, however, �s generated by the �nvestment of both publ�c (PSEMAS) and pr�vate health �nsurance. Est�mat�ons of NABCOA and OPM are that about 6.5% of the �nvestment �s related to HIV, wh�ch �s accounts roughly for N$ 41.6 m�ll�on and N$ 32.5 m�ll�on respect�vely. As part of the cost �s �ncluded under the ART drugs and laboratory cost�ng for human resources �n the publ�c sector, �t was adv�sed to �nclude two percent for PSEMAS and four percent for pr�vate health �nsurance (due to h�gher consultat�on fees) under th�s cost�ng sheet, and a five percent growth of these �nvestments was �ncluded over the years.

13
The loss �s �n pens�on funds, and salary �ncreases are not yet �ncorporated. As these programmes are �n the �n�t�al roll out phase, the next cost�ng m�ght be able to prov�de more accurate �nformat�on �f data becomes ava�lable.
H�gh scenar�o The h�gh scenar�o follows the low scenar�o calculat�on but �ncluded �ncreased �nvestment �n the health �nsurance for publ�c (4%), and pr�vate (6%) (Cost for publ�c sector Med�cal A�d (PSEMAS) as well as �nvestment �n pr�vate health �nsurance, and �nsurance for those that cannot afford).
Med�um scenar�o The scenar�o �s based on the alternate calculat�on for WPP (N$720/pp). However, the number of employees �n the pr�vate sector �s a rough est�mate, wh�ch could be sl�ghtly m�slead�ng.
Low scenar�o Th�s scenar�o �s calculated based on a fixed budget amount for WPP and MS for small, med�um and large OMAs and pr�vate compan�es. It also �ncludes �nvestment cost �n publ�c health �nsurance (2%) and pr�vate health �nsurance (4%).
Information, Education and Communication; Behaviour Change Communication; Social Mobilisation; and Youth Skills
The target populat�on for mass med�a and targeted campa�gns �s the reproduct�ve age populat�on, wh�ch �s roughly over one m�ll�on. Then there are d�fferent target groups such as vulnerable populat�ons l�ke the youth, sex workers (600-7000 (2007-2012)), truck dr�vers (600 -100,000), pr�soners and deta�nees (1855-3711) etc.
The un�t costs were obta�ned for mass med�a campa�gns, targeted campa�gns, soc�al mob�l�sat�on cost per s�te, and My Future My Cho�ce and W�ndows of Hope programmes for pr�mary and secondary schools. Un�t costs for My Future My Cho�ce and W�ndows of Hope programmes were der�ved from the 2006/07 M�n�stry of Educat�on budget for l�fe sk�lls programmes (N$23/pup�l). The cost�ng for out-of-school youth was based on rough est�mates and the un�t cost of N$30/person as the group �s harder to reach.
Due to lack of data on outreach to spec�fic target groups, a flat rate was �ntroduced by the experts �n order not to lose �mportant cost est�mat�ons. As stated earl�er �n the report, th�s latter area w�ll need add�t�onal attent�on for more �n-depth cost�ng as the overall cost seems underest�mated.
The management cost for youth sk�lls was est�mated to be 10% of the total programme cost and the mon�tor�ng and evaluat�on component 5% of the programme cost. The management cost for IEC, BCC, and SM �s h�gher due to the fact that there are many c�v�l soc�ety actors �mplement�ng act�v�t�es and therefore the percentage was est�mated to be 35%. The M&E component was kept at 5% and the tra�n�ng component was est�mated to be 20%.
Mass med�a campa�gns Targeted campa�gns Number of s�tes for soc�al mob�l�zat�on
% of r�sk groups reached w�th targeted campa�gns
H�gh scenar�o
1/yr (cost of campa�gn one m�ll�on N$ h�gher)
Reach�ng 47%-80% pr�mary and secondary schools and out of school youth from 50,000 – 200,000
6-8/yr 55 10% �ncreas�ng to 80% �n 2012
Med�um scenar�o
1/yr
Reach�ng 43%-60% pr�mary and secondary schools and no out of school youth
One �n 2007 �ncreas�ng to 8 �n 2012
41 10% �ncreas�ng to 60% �n 2012
Low scenar�o
1/yr
Reach�ng 40%-40% pr�mary and secondary schools and no out of school youth
One �n 2007 �ncreas�ng to 5 �n 2012
28 10% �ncreas�ng to 40% �n 2012

14
Blood Safety
The var�ous blood products met 80% of the target populat�on needs �n 2005. Target sett�ng from 24,156 un�ts (93%) towards 25,881 (100%), therefore, can be gradually done over the years. The un�t cost or serv�ce fee ava�lable at the blood transfus�on serv�ces are two fold: a) Subs�d�zed serv�ce fee and b) An unsubs�d�zed one. The resource est�mat�on used the unsubs�d�zed one to adequately reflect the full cost to the consumer.
H�gh scenar�o The same assumpt�ons were used for all scenar�os.
Med�um scenar�o
Low scenar�o
Safe Medical Injection
The target populat�ons �n th�s case are publ�c hosp�tals, health centers and cl�n�cs (311 fac�l�t�es). The coverage and target sett�ng are based on the health fac�l�t�es served (287-311). The resource est�mat�on focused further on the number of safety boxes and protect�ve equ�pment per health fac�l�ty based on data from the URC.
H�gh scenar�o The same assumpt�ons were used for all scenar�os.
Med�um scenar�o
Low scenar�o
Post-Exposure Prophylaxis (PEP)
The est�mat�on of the need was based on the total populat�on s�ze �n Nam�b�a and the number of PEP k�ts per m�ll�on populat�ons of 500. It was assumed that �n 2007, 70% of the needed PEP k�ts would be prov�ded, and by 2012, 100% of the needed k�ts would be prov�ded. The cost est�mates �ncluded the cost per PEP k�t (N$1,311) and the cost of tra�n�ng. The tra�n�ng needs were est�mated at 80 people tra�ned annually �n a three-day tra�n�ng. The resource est�mat�on was done for the follow�ng: PEP k�ts costs, tra�n�ng, IEC, mon�tor�ng and evaluat�on (five percent of program costs), and programme management (50% of program costs, wh�ch �ncludes part of the cost for the Women and Ch�ld Protect�on Un�ts (WCPUs)).
H�gh scenar�o The same assumpt�ons were used for all scenar�os.
Med�um scenar�o
Low scenar�o

15
Condom Promotion and Provision
The target populat�on �s the reproduct�ve populat�on. Accord�ng to the 2000 DHS, cons�stent condom use �n mar�tal sex or steady relat�onsh�ps �s 17.9%. It �s assumed that th�s percentage w�ll double by 2012. Accord�ng to the DHS, condom use �n casual sex �s 67% and �t was assumed that th�s figure would also �ncrease to 80% by 2012.
Based on data from NASOMA, SMA, and MoHSS, there were 23,9 m�ll�on condoms d�str�buted and these are to be �ncreased to 39.5 m�ll�on. It �s est�mated that there �s 10% condom wastage dur�ng storage and d�str�but�on. Cost est�mat�on took �nto account var�at�on �n un�t costs of male and female condoms d�str�buted through publ�c d�str�but�on and soc�al market�ng. Allowance was also made for costs of condom transportat�on, storage and log�st�cs.
The resource est�mat�on was done for the follow�ng: male and female condoms d�str�buted publ�cly and through soc�al market�ng, tra�n�ng (three percent of program costs), IEC (three percent of program costs), mon�tor�ng and evaluat�on (five percent of program costs) and programme management (30% of program costs).The programme cost �ncludes the cost of the ma�n c�v�l soc�ety and pr�vate sector ent�t�es �nvolved �n the �mplementat�on of th�s programme area.
H�gh scenar�o The same assumpt�ons were used for all scenar�os.
Med�um scenar�o
Low scenar�o
Prevention of Mother-to-child Transmission (PMTCT)
The target populat�on �s pregnant women follow�ng the crude b�rth rate calculat�ons (DHS 2006, prel�m�nary data). The number of pregnant women �s est�mated to be 60,574 �n 2007 and 64,111 �n 2012. The ante-natal care serv�ce attendance �s est�mated to be 90% �n 2007 go�ng up to 95% �n 2012.The PMTCT coverage for the pregnant women attend�ng Ante Natal Cl�n�cs and rece�v�ng group/�nd�v�dual counsel�ng �s 87% �n 2007 and goes up to 95% �n 2012. In 2006/07 fiscal year, the women know�ng the�r status were almost 50% and scenar�o target sett�ng was done to �ncrease the coverage of women for PMTCT prophylax�s. Un�t costs were calculated for cost PCR, couple counsel�ng, tra�n�ng, TBA k�ts, and d�fferent scenar�os on prophylax�s (note scenar�o 1&2 [2007-2012] are women on HAART or that have met the cr�ter�a to be put on HAART accord�ng to the PMTCT gu�del�nes �ncorporated �n the ART cost�ng)
The resource est�mat�on takes �nto account both the PMTCT current gu�del�nes, as well as the proposed gu�del�nes that are not yet endorsed.
H�gh scenar�o The coverage rate for PMTCT prophylax�s for 2012 �s set at 85% for HIV+ pregnant women access�ng ANC serv�ces and rece�v�ng PMTCT (correspond�ng to un�versal access targets). The average annual rate of �ncrease was assumed to be constant between 2007 and 2012, y�eld�ng a l�near path.
Med�um scenar�o The coverage rate for PMTCT prophylax�s for 2012 �s set at 75% for HIV+ pregnant women access�ng ANC serv�ces. The average annual rate of �ncrease was assumed to be constant between 2007 and 2012, y�eld�ng a l�near path.
Low scenar�o The coverage rate for PMTCT prophylax�s for 2012 �s set at 65% for HIV+ pregnant women access�ng ANC serv�ces. The average annual rate of �ncrease was assumed to be constant between 2007 and 2012, y�eld�ng a l�near path.

16
Anti-Retroviral Therapy (ART) & TB
The target populat�ons are d�verse for the ART cost�ng and were der�ved from the Spectrum model. The est�mate for the HIV+ populat�on �s 207,216 people for 2007 go�ng up to 257,754 people �n 2012. The est�mated number of people el�g�ble for ART �n 2007 �s 65,941 go�ng up to 117,611 people (cumulat�ve) �n 2012.
The percentage of adults on ART �s est�mated to be 87%, (64% female) and for ch�ldren 0 -13 years old �s 14%, 0-3 are19%, and 4 -13 are 81%. There �s no breakdown for pregnant women yet.
About 93% of the adult populat�on �s on first l�ne treatment. The cost�ng �ncludes ARV med�c�ne, laboratory tests, IEC, tra�n�ng (10% �n 2007- 5% �n 2012), mon�tor�ng and evaluat�on (three percent), and programme management (15% �n 2007 – 10% �n 2012). It also �ncludes the pat�ents el�g�ble for HIV/TB, IPT and CPT med�c�ne (IPT covers 20% - 60% 2007 HIV+ populat�on and CPT 25% of the TB pat�ents).
Un�t costs were done for var�ous treatment reg�mes and related laboratory tests follow�ng both the current and new gu�del�nes and based on the number of people who could be on treatment. The TB programme cost was est�mated based on the cost per pat�ent treated (N$855) and based on a TB prevalence of 765/100,000 populat�on.
H�gh scenar�o The coverage �s set at 35,422 people �n 2006 (63%) and up to 93,158 �n 2012 (79%), and defined as the percentage of women, men and ch�ldren w�th advanced HIV �nfect�on rece�v�ng ARV treatment (corresponds to un�versal access targets).
Med�um scenar�o The coverage �s set at 35,422 people �n 2006 (63%) up to 86,818 �n 2012 (74%), and defined as the percentage of women, men and ch�ldren w�th advanced HIV �nfect�on rece�v�ng ARV treatment
Low scenar�o The coverage �s set at 35,422 people �n 2006 (63%) up to 83,376 �n 2012 (71%), and defined as the percentage of women, men and ch�ldren w�th advanced HIV �nfect�on rece�v�ng ARV treatment
Home-Based Care (HBC), Palliative Care and Psychosocial support
The target populat�on �s calculated d�fferently under the var�ous scenar�os (See scenar�o descr�pt�on below). HBC workers generally have three cl�ents and prov�de 12 hours volunteer work per week. The turn-over of HBC workers �s 15% wh�ch suggests an �ncreased need for tra�n�ng and/or �ncent�ves. Tra�n�ng of a HBC worker var�es and the average of three-week tra�n�ng t�me was taken.
Cost of HBC prov�der �ncent�ve payments was based on average monthly re�mbursement of cost and coord�nat�on fees wh�ch amounts to N$250/month for the low scenar�o. However, the ma�n HBC prov�ders exper�ence retent�on problems and w�sh to prov�de �n add�t�on to the re�mbursement of cost and coord�nat�on fees, a monetary remunerat�on of N$500 or even N$750 per month. The resource est�mat�on �ncluded the follow�ng costs: HBC prov�der �ncent�ve payments, HBC prov�der remunerat�on package (wh�ch �ncludes 2 T-sh�rts, 2 caps, un�form, to�letry pack, b�b, name tags and b�cycles), cost of HBC k�ts and replen�shment, tra�n�ng, cost of psychosoc�al counsel�ng by lay counselors and soc�al workers, programme management, and mon�tor�ng and evaluat�on costs. Management cost covers MoHSS/PHC, Soc�al Welfare & DSP/Pall�at�ve Care and seven ma�n HBC prov�ders (NGOs). For the psychosoc�al support and pall�at�ve care programmes only staff cost and tra�n�ng costs respect�vely were �ncluded as act�v�t�es.

17
H�gh scenar�o It �s assumed that the number of people need�ng home-based care �s 43,028 �n 2007 up to 47,274 people �n 2012. Th�s �s based on a rough est�mate, respect�vely 55% and 40% of the PLWHAs start�ng treatment and those �n the�r last year of l�fe. The number of HBC prov�ders �s expected to be 1.5 t�mes as h�gh as �n 2005. Incent�ve payments were calculated at N$9,000 per year per person (N$750 per month).
Med�um scenar�o It �s assumed that the number of people need�ng home-based care �s 58,675 �n 2007 up to 59,092 people �n 2012. Th�s �s based on a rough est�mate of respect�vely 75% and 50% of the PLWHAs start�ng treatment and those �n the�r last year of l�fe. The number of HBC prov�ders �s expected to be double the 2005 figure. Incent�ve payments were calculated at N$6,000 per year per person (N$500 per month).
Low scenar�o A d�fferent approach �s used to est�mate the number of people need�ng home-based pall�at�ve care. It �s assumed that the number of people need�ng HBC �s a comb�nat�on of the follow�ng: (1) the number of people on ART and are �n the�r last year of l�fe; (2) the number of PLWHAs who are el�g�ble for ART, but not start�ng on ART; and (3) the number of PLWHAs not el�g�ble for ART. It �s assumed that the number of people need�ng home-based care �s 22,314 �n 2007 up to 20,827 people �n 2012. The number of HBC prov�ders as per 2005 �s expected to be suffic�ent. Incent�ve payments are calculated at N$3,000 per year per person (N$250 per month).
Orphans and Vulnerable Children
Target populat�ons were taken from the updated Spectrum model and d�v�ded �nto pr�mary and secondary school age. The target populat�on �n 2007 �s 125,000 and th�s number rema�ns stable unt�l 2012 �f Nam�b�a reaches an 80% ART programme coverage5. The coverage of the target populat�on was based on the number of OVC access�ng some k�nd of grant wh�ch was almost 46% �n 2006 (ma�ntenance grants, foster care grants, ch�ldren home subs�d�es and place of safety allowances).
The cost�ng further �ncludes school books and un�forms, the school development fund, commun�ty development (Income Generat�ng Act�v�t�es (IGAs), mult�-purpose center support, etc.)), tra�n�ng, mon�tor�ng and evaluat�on and management costs. Un�t costs were based on grant amount per year per ch�ld, school development fund fee per learner, school un�form and books, support for mult�-purpose centers, commun�ty development and support to CBOs. The number of OVC of pr�mary and secondary school go�ng age �s est�mated to be 66,560 and 43,520 respect�vely �n 2007 and 70,720 and 46,240 respect�vely �n 2012.
5 The MoHSS Spectrum model of 2007 est�mates the number of OVCs based on an 80% ART programme coverage �n 2009. The number of OVC �s expected to stab�l�ze. However, �f the ART programme coverage �s less the number of OVCs w�ll �ncrease.
% of OVC access�ng grants
Ma�ntenance grant
Foster care grant
Ch�ld home subs�d�es
Place of Safety allowance
% of OVC benefit�ng from Educat�on Development Fund
Management cost
M & E cost
Secondary school
Pr�mary school
H�gh scenar�o
76% 61% 14% 3% 0.1% 80% 80% 15% 5%
Med�um scenar�o
60% 47% 11% 2% 0.1% 60% 60% 15% 5%
Low scenar�o
40% 31% 8% 1% 0.1% 40% 40% 10% 5%

18
Food Assistance and Nutrition
There are d�fferent target populat�ons such as PLWHAs, lactat�ng HIV+ women, OVCs and pr�mary school ch�ldren that are el�g�ble for food support. Food secur�ty �s an under-funded area and comprehens�ve programmes have not been establ�shed yet. Currently, there �s an OVC food support project cover�ng some reg�ons, a school feed�ng programme, a Food for Work programme, and a hort�culture project. Part of the cost�ng �ncludes �ncome generat�ng act�v�t�es (IGAs) to reduce dependency on food ass�stance. Un�t cost data was der�ved from the ment�oned projects and extra-polated to cover the nat�on.
The work�ng group composed of MoHSS/PHC, I-Tech, NANASO (nutr�t�on), MRLGHRD (Food for Work), MoE (school feed�ng), MAWF/FAO (Hort�culture project), MGECW/WFP (food support to 20% OVCs �n need), and MGECW (IGAs) came up w�th a comprehens�ve plan wh�ch has been used for the est�mat�ons.
The scenar�os below �nclude food gardens scal�ng up from 400 - 828 and small gardens 6,883 -14,107, and 230 IGAs per year.
# of PLWHAs el�g�ble for food support
# of OVC on food support
# of pr�mary school ch�ldren benefit�ng from School Feed�ng Program
# of el�g�ble Infants/mothers to be reached by targeted food ass�stance
H�gh scenar�o 8,945-27,182 25,468-43,353 125,190-180,206 4,517-8,918
Med�um scenar�o 8,071-16,474 22,979-26,275 113,938-109,216 4,517-8,918
Low scenar�o 8,071-16,474 11,490-13,137 112,953-109,216 3,613-7,134
PLWHA Support
Un�t costs were der�ved from d�sab�l�ty grants for s�x months for PLHWAs (N$2,220), the buddy system and the management and coord�nat�on costs of PLWHA networks such as L�ronga Eparu.
# of PLWHAs to be covered by d�sab�l�ty grants/yr
H�gh scenar�o 2,357 to 17,115
Med�um scenar�o 2,357 to 12,836
Low scenar�o 2,357 to 8,557

19
Human Resources (HR)
The HR cost�ng was done for the health sector tak�ng �nto account the number of med�cal doctors, nurses, pharmac�sts and pharmac�st ass�stants, and laboratory techn�c�ans and laboratory ass�stants needed for outpat�ent ART/PMTCT/C&T. The calculat�on �s based on profess�onal/pat�ent rat�o and the number of v�s�ts by pat�ents per year for ART, PMTCT and/or C&T.
The MoHSS model developed to calculate th�s also �ncluded HIV/TB. Un�t costs were full salar�es, �nclud�ng benefits. In add�t�on, as there �s a shortage of med�cal personnel, the profess�onal tra�n�ng for the above profess�ons was taken �nto account based on full scholarsh�ps. The HR cost�ng also �ncludes soc�al workers, record clerks and volunteers for the OVC programme; psycholog�sts and soc�al workers for psychosoc�al support; and nutr�t�on�sts for the food ass�stance and nutr�t�on programmes.
H�gh scenar�o The same assumpt�ons were used for all scenar�os.
Med�um scenar�o
Low scenar�o
Infrastructure
Target sett�ng was based on the number of health fac�l�t�es �n the publ�c sector only. Un�t costs for major and m�nor renovat�ons were der�ved from US gra�n fund exper�ences on renovat�ng hosp�tals and health centers/cl�n�cs.
Experts prov�ded �nformat�on on the number of m�nor or major renovat�ons/adaptat�ons for both ART/PMTCT/C&T as well as TB/HIV �n the current 34 hosp�tals and the 77 cl�n�cs/health centers for ART roll-out.
The renovat�on/adaptat�ons for ART/PMTCT/C&T targets are from 10 to 25 hosp�tals (2007-2012); one to 51 health centers and cl�n�cs; and for TB/HIV adaptat�ons 0 to 30 hosp�tals and one to 51 health centers and cl�n�cs �n 2007 and 2012 respect�vely.
H�gh scenar�o The same assumpt�ons were used for all scenar�os.
Med�um scenar�o
Low scenar�o
Regional Support
Targets are the RACOCs and CACOC management structures. Coverage �s based on whether the RACOC and CACOC structures have a plan and budget, wh�ch was h�gh �n 2006 for RACOCs but much less for CACOCs. Target sett�ng was done on three scenar�os by experts from MRLGHRD on the number of members to be tra�ned, staff costs and management costs (�nclud�ng mon�tor�ng and evaluat�on.
For RACOCs �t also �ncluded act�v�ty fund�ng/budget support. Un�t costs were developed for tra�n�ng, management and coord�nated staff and act�v�ty costs. Management and M&E costs of MRLGHRD and AMICAALL were �ncorporated as well.

20
H�gh scenar�o Tra�n�ng would target 210 (2007) to 170 (2012), RACOC members and 540 (2007) to 430 (2012), CACOC members; budget support for RACOCs ranges from N$2.7 to N$3.9 m�ll�on (2007/2012). Staff costs ranged from N$912,000 to N$2.6 m�ll�on for RACOCs and N$0-2 m�ll�on for CACOCs; management costs were from N$684,000 to N$2 m�ll�on for RACOCs and N$0-609,000 for CACOCs. The cost for nat�onal management was N$284,000 to N$862,000 (2007/2012).
Med�um scenar�o Tra�n�ng would target 100 -210 RACOC members and 350-380 CACOC members �n 2007 and 2012; budget support for RACOCs from N$2 m�ll�on to N$2,7 m�ll�on, staff costs from N$912,000 to N$2,6 m�ll�on for RACOCs and N$0 – 402,000 for CACOCs; and management costs from N$684,000 to N$2 m�ll�on for RACOCs and N$0-121,000 for CACOCs; The cost for nat�onal management was N$284,000 to N$562,000.
Low scenar�o Tra�n�ng would target 100 – 210 RACOC members and 380-350 CACOC members respect�vely �n 2007 and 2012; budget support for RACOCs ranged from N$2.7 to N$2.7 m�ll�on, staff costs from N$912,000 to N$912,000 for RACOCs and no fund�ng for CACOCs; and management costs from N$684,000 for RACOCs and no fund�ng for CACOCs; There was no fund�ng for nat�onal management as �s the current s�tuat�on.
Management and Monitoring and Evaluation (M&E)
Coord�nat�on and Mon�tor�ng and Evaluat�on costs were based on 2006/07 budgets that were �ncorporated for DSP/MoHSS and NANASO. Note that coord�nat�on and management costs for other ma�n players were �ncorporated under var�ous programmes (e.g. OPM, NPC and NABCOA under WPP & MS and L�ronga Eparu under PLWHAs, MGECW under OVC, etc.)
All programmes �ncorporate cost�ng for programme mon�tor�ng and under th�s head�ng nat�onal Mon�tor�ng and Evaluat�on costs were der�ved from the recent cost�ng exerc�se by MoHSS/DSP/ Mon�tor�ng and Evaluat�on The nat�onal HIV/AIDS Mon�tor�ng and Evaluat�on programme has major systems �nvestment costs �n the first two years. Further, the enabl�ng env�ronment component of the MTP III has not been properly costed and therefore the overall management cost �s assumed to be h�gher.
H�gh scenar�o The same assumpt�ons were used for all scenar�os.
Med�um scenar�o
Low scenar�o
G. KEY RESULTS OF THE RESOURCE NEEDS ESTIMATION AND SCENARIO MODELING
The requ�red resources were est�mated for each scenar�o based on the descr�bed methodology, data �nputs and scenar�o descr�pt�ons. F�gure 5 shows the Resource Needs Est�mat�on for the h�gh, med�um and low scenar�os. Follow�ng the fact that not all programme areas could be costed and due to the relat�vely h�gh est�mated HIV related �n-pat�ent cost (see Sect�on F1), the low case scenar�o �s not real�st�c for Nam�b�a.
The total annual resources requ�red for the h�gh scenar�o are N$1,445 m�ll�on (US$203 m�ll�on) �n 2007 to N$2,418 m�ll�on (US$340 m�ll�on) �n 2012 (F�gure 3, Append�x I). The resources requ�red for the med�um and low scenar�os �n 2012 are N$1,878 m�ll�on (US$264 m�ll�on) and N$1,514 m�ll�on (US$213 m�ll�on).

21
Total Resources Required by Scenario(2007-2012, current N$ and US$)
N$ 0
N$ 500
N$ 1,000
N$ 1,500
N$ 2,000
N$ 2,500
2007 2008 2009 2010 2011 2012
N$ (million)
US$0
US$50
US$100
US$150
US$200
US$250
US$300
US$350
US$ (million)
High scenario
Medium scenario
Low scenario
Figure 5: Resource Requirement for the High, Medium and Low Scenarios
F�gure 6 shows the breakdown by �ntervent�on and average annual cost on each programme area over the per�od of project�on (2007-2012) for the three scenar�os (see also Append�x I). The programme areas that account for the largest share of the total resource needs are: ART, OVC support, workplace and ma�nstream�ng �ntervent�ons, food ass�stance, home based care, pall�at�ve care and psycho-soc�al support, and human resources recru�tment and development. The shares vary sl�ghtly by scenar�o. The exact percentages are prov�ded �n the table below.
Total Resource Needs by Programme Area for all Scenarios (average annnual, 2007-2012, current N$ and US$)
N$0
N$200
N$400
N$600
N$800
N$1,000
N$1,200
N$1,400
N$1,600
N$1,800
N$2,000
High Medium Low
N$ (millions)
US$0
US$50
US$100
US$150
US$200
US$250
US$ (millions)
Management/Coord., M&E
Regional support
Infrastructure
HR
PLHA support
Food assistance & Nutrition
OVC
TB
HBC, Palliative Care, Psychosocial support
Workplace & Mainstreaming
IEC, BCC,SM & youth skills
Safe medical injection
PEP
Blood safety
STI
Condoms
C&T
ART (incl TB/HIV - IPT/CPT)
PMTCT
Figure 6: Total Resource Needs by Programme Area for all Scenarios

22
Figure 7: Total Resource Needs by MTP III Component for all Scenarios
Total Resource Needs by MTP III Component for all Scenarios (average annual, 2007-2012, current N$ and US$)
N$0
N$200
N$400
N$600
N$800
N$1,000
N$1,200
N$1,400
N$1,600
N$1,800
N$2,000
High Medium Low
N$ (millions)
US$0
US$50
US$100
US$150
US$200
US$250
US$ (millions)
Policy, Mgt, Coordination,M&E
Infrastructure
HR
Treatment
Mitigation
Prevention
In the h�gh scenar�o the share of the m�t�gat�on component of MTP III was the h�ghest (33%), followed by treatment, care and support (32%), and prevent�on (24%) - (Append�x 1, Scenar�o Compar�sons). Only s�x percent was requ�red for human resources. In the med�um scenar�o, prevent�on and treatment account for the largest shares — 26% and 37% respect�vely. The share allocated for m�t�gat�on under th�s scenar�o �s almost one quarter, �.e. 24%.
Table 2. Share of MTP III Component for High, Medium and Low Scenarios.
H�gh Scenar�o Med�um Scenar�o Low Scenar�o
Prevent�on 24% 26% 29%
Impact M�t�gat�on 33% 24% 23%
Treatment 32% 37% 33%
HR 6% 8% 9%
Infrastructure 2% 2% 2%
Pol�cy, Mgt, Coord�nat�on, Mon�tor�ng and Evaluat�on 3% 4% 4%
TOTAL 100% 100% 100%
How do these resource needs est�mates compare w�th ex�st�ng levels of expend�ture �n Nam�b�a? Table 2 shows the resource needs est�mates �n relat�on to total GDP and government expend�ture. The est�mated resources requ�red account for between four percent (med�um scenar�o) and five percent (h�gh scenar�o) of GDP (2005), and between 12% (med�um scenar�o) and 15% (h�gh scenar�o), of the total government expend�ture. The per cap�ta average annual resource needs are N$918 (129 US$) for the h�gh, N$744 (104US$) for the med�um, and N$625 (88 US$) for the low scenar�os. The per cap�ta average annual resources needs for the health sector programmes var�es from N$337 (low), N$406 (med�um), to N$423 (h�gh). The per cap�ta average annual resource needs as a percentage of the Total Health Expend�ture (THE) (source: NHA 1999/2000) ranges from 39% (low), 47% (med�um) and 49% (h�gh) but �s expected to be lower as the Total Health Expend�ture �s assumed to have �ncreased over the years. Unfortunately at the t�me of the RNE, more recent NHA data was not ava�lable. However, compared to the MoHSS publ�c health expend�ture for 2005/06, the per cap�ta share of the health sector RNE var�es from 55%, 66% to 68% respect�vely for the low, med�um and h�gh scenar�os (Append�x I), wh�ch �s a cons�derable burden for the overall health budget portfol�o.

23
However, we need to be careful w�th the �nterpretat�on as cost are �ncluded for c�v�l soc�ety (e.g. �n HBC prov�s�on) and pr�vate sector (condom product�on) as well. Nevertheless, the c�v�l soc�ety sector �s currently financed ma�nly by the donor commun�ty and publ�c sector prov�s�ons need to be made to take over some of these cost (outsourc�ng). Dur�ng the RNE �t was noted that most health sector programmes are heav�ly dependent on external fund�ng. From the susta�nab�l�ty po�nt of v�ew, �t would be useful to allocate more nat�onal resources towards these programmes. In conclus�on, the total cost for the nat�onal HIV/AIDS response �s substant�al but necessary to reduce the �mpact of HIV/AIDS on the overall development. When compar�ng the total annual average RNE for the MoHSS health sector programmes w�th the total RNE for the non-MoHSS programme areas, the med�um scenar�o attr�butes 56% of the cost to the health programmes and 44% for non-health. The h�gh scenar�o attr�butes 48% and 52% for health and non-health respect�vely. The costly programmes for the health sector are ART, HBC, and Human Resources, and for the non-health sector OVC, Work Place Programmes, Ma�nstream�ng, and Food Ass�stance.
6 These compar�sons are �ncomplete but are purely to benchmark the est�mated resources requ�red and to get a sense of the order of magn�tude of the resource needs. For example, not all RNE w�ll be financed from government expend�ture. However, th�s �s an �mportant benchmark to cons�der when cons�der�ng susta�nab�l�ty.
Table 3. Comparison of Resource Needs Estimates with selected economic indicators (in millions)6
H�gh scenar�o Med�um scenar�o Low scenar�o
Average Annual Resource Needs
N$1,920 N$1,554 N$1,306
Est�mate (2007-2012, m�ll�on) US$270 US$218 US$183
GDP (2005, m�ll�on) N$38,744
US$5,439
Average Annual Resource Needs Est�mate as % of GDP
5% 4% 3%
Government Expend�ture (2005, m�ll�on)
N$12,700
US$1,783
Average Annual Resource Needs Est�mate as percentage of Government Expend�ture
15% 12% 10%

24
H. RESOURCE GAP ANALYISIS
G�ven the ex�st�ng resource ava�lab�l�ty based on pledges and comm�tments from var�ous fund�ng partners, external and domest�c, the resource gap was assessed. The est�mates based on pledges and comm�tments are c�ted �n Table 4. Accord�ng to the data collected for 2005, 63% of the resources come from external or donor sources.
The resource gap for Nam�b�a at the t�me that the RNE was conducted was based on fund�ng pledges and comm�tments. There was no comp�led data on fund�ng d�sbursements �n-country, wh�ch �s more accurate to est�mate the resource gap. At the end of 2007, more accurate data w�ll be ava�lable through the MoHSS/DSP fund�ng database, and therefore the resource gap may �ncrease �n the future. It �s also �mportant to real�ze that fund�ng comm�tments beyond two years are hardly ava�lable, and therefore one needs to be careful w�th fund�ng project�ons over two years. For 2010 - 2012 the gap �s h�gh as there are no fund�ng comm�tments yet. In monetary terms, the cumulat�ve resource gaps over per�od 2007-2009 for the h�gh and med�um scenar�os are: N$485 m�ll�on (US$82 m�ll�on) and N$228 m�ll�on (US$54 m�ll�on).
Table 5. Committed resources for HIV/AIDS (2005)
N$ m�ll�ons US$ m�ll�ons
2005
Government N$249 US$35
External N$426 US$60
Total N$675 US$97
F�gure 8 shows the projected resource gap through 2012 tak�ng �nto account the est�mated resource needs for 2007 to 2012. The share of the resource needs est�mate for the h�gh scenar�o that can be funded w�th the ava�lable resources �n 2007 �s 76%. The med�um scenar�o appears more affordable and 88% of the resource needs seem covered. These percentages decrease to 66% and 80% �n 2009. It �s �mportant to note that th�s assumes that the resources prov�ded on paper are ava�lable for programmes and that these can be re-allocated where needed. Th�s �s however not always the case as fund�ng �s programmed and �t �s adm�n�strat�vely cumbersome to reallocate. Currently some of the MTP III areas are grossly under-funded.
Table 4. Comparison of per capita Resource Needs Estimates with Health Expenditure (in millions)
High scenario Medium scenario Low scenario
Per cap�ta Average Annual Resource Needs Est�mate (2007-2012)
N$918 N$744 N$625
US$129 US$104 US$88
Per cap�ta Average Annual Resource Needs Est�mate for Health Sector (2007-2012)
N$423 N$406 N$337
US$59 US$57 US$47
Per cap�ta Total Health Expend�ture (THE)(1999/00) N$858
US$141
Per cap�ta Average Annual Resource Needs Est�mate for Health Sector (2007-2012) as a % of THE
49% 47% 39%

25
Figure 8: Resource Gap Analysis for all Scenarios (2007–2012).
Resource Gap Analysis for all Scenarios(2007-2012, current N$ and US$)
N$2,500-
N$2,000-
N$1,500-
N$1,000-
N$500-
N$0
N$500
N$1,000
N$1,500
N$2,000
N$2,500
2007 2008 2009 2010 2011 2012N$ (millions)
US$351-
US$251-
US$151-
US$51-
US$49
US$149
US$249
US$349
US$ (millions)
High scenario Medium scenario Low scenario Resources available
Resource requirement
Resource gap
The Resource Gap Analys�s suggests that even for the med�um scenar�o add�t�onal resources need to be mob�l�zed for �mplementat�on. As Nam�b�a �s categor�zed as a low m�ddle �ncome country and therefore expected to contr�bute substant�al nat�onal fund�ng to HIV/AIDS, �t �s not always easy to advocate for more external resources. The Nam�b�an Government �s struggl�ng w�th one of the h�ghest �ncome d�spar�t�es �n the world and a large percentage of the populat�on �s l�v�ng below the poverty l�ne. Re-allocat�on �s not always that self-ev�dent. Nevertheless, resources from both donors and the Government of Nam�b�a need to be cont�nually mob�l�zed. The resources needed unt�l 2012 cont�nue to �ncrease �n efforts to honor nat�onal and �nternat�onal comm�tments. Further, resources need to become more effect�vely d�str�buted towards pr�or�ty areas and to reach the decentral�zed level (reg�ons and const�tuenc�es).
Cost-effect�veness arguments are now rout�nely part of assessments of the mer�t of HIV �ntervent�ons. Cost �s an �mportant determ�nant of the cost-effect�veness of an �ntervent�on. The cost var�at�on may be for leg�t�mate reasons (e.g. small scale g�ven the populat�on s�ze, or cons�der�ng geograph�c catchment areas). Nam�b�a has relat�vely h�gh factor costs for human resources, equ�pment and log�st�cs, transport, and phys�cal �nfrastructure. Yet, there may also be some �n-effic�enc�es that would need deta�led �nvest�gat�on and strateg�c reth�nk�ng of programme �mplementat�on. For example, mob�le test�ng m�ght be more cost-effect�ve for some scarcely populated areas. It �s therefore �mportant that the cost per person reached be mon�tored �n order to �dent�fy �neffic�enc�es and separate these from leg�t�mate causes of cost var�at�on.
If fewer resources become ava�lable follow�ng the RNE med�um scenar�o, some programmes w�ll rema�n �nadequately resourced and nat�onal and �nternat�onal comm�tments cannot be honored. At the same t�me, �t �s useful to look at the var�ous programmes �n more deta�l and see where effic�ency ga�ns can be accompl�shed through more focus on cost effect�ve �ntervent�ons, etc. Lack of clar�ty on fund�ng project�ons below two years �s hamper�ng financ�ng strateg�es for both external and �nternal donors.

26
1. CONCLUSIONS AND IMPLICATIONS
I.1 Conclusions
The MTP III has been �mplemented for almost four years and a m�d-term rev�ew was done �n June/July 2007. A rev�sed resource est�mat�on was needed based on the current ach�evements, the dynam�c nature of the ep�dem�c, and address�ng constra�nts �n HIV/AIDS programmes. Therefore the ma�n object�ve of the resource est�mat�on was to develop a deta�led cost�ng of the nat�onal HIV/AIDS response follow�ng the RNE methodology reflect�ng the target populat�on of an �ntervent�on, the current coverage (2005/06) and targets (2012/13) for Nam�b�a and the calculat�on of un�t costs. Var�ous scenarios (low, med�um and h�gh) were costed to ass�st dec�s�on makers �n pol�cy mak�ng and strateg�c plann�ng. The process �ncluded a w�de range of stakeholders. Several meet�ngs w�th programmes were conducted to collect and ver�fy data, and consensus bu�ld�ng through workshops. The overall exerc�se took s�x months.
Nam�b�a �s faced w�th �ts own HIV prevalence situation and development context. Nam�b�a rema�ns one of the h�ghest prevalence countr�es �n the world, and the 2006 sent�nel surve�llance d�d not �nd�cate any prom�ses regard�ng a decrease. At the same t�me �s Nam�b�a class�fied as a low m�ddle-�ncome country w�th one of the h�ghest �ncome d�spar�t�es �n the world. The �ncrease of nat�onal resources towards financ�ng the ep�dem�c should be poss�ble but w�ll consequences for the sectors where resources are re-allocated from.
The MTP III progress report, cover�ng the 2004 and 2005 fiscal years �nd�cates clearly that the health sector programmes are well under way to reach�ng the�r set targets. Therefore the data �nputs and target sett�ng was eas�er as �n other HIV/AIDS sector programmes that are lagg�ng beh�nd. The longer programmes are �mplemented the better the mon�tor�ng data could become and the eas�er the cost�ng. Dur�ng the cost�ng exerc�se �t also became apparent that these health programme are largely externally funded, creat�ng an �ssue around susta�nab�l�ty. Further, the challenge of extend�ng the�r coverage towards d�str�cts and const�tuenc�es �s d�rectly related to tackl�ng the �nfrastructure and human resource constra�nts. Other programme areas as, for example, food secur�ty and nutr�t�on and health systems �nfrastructure seem to have �nsuffic�ent resources and lack �nst�tut�onal capac�ty at the nat�onal and reg�onal level.
Nam�b�a �s ser�ous �s �n pol�t�cal commitments to �ncreas�ng coverage of HIV/AIDS programmes. The government of Nam�b�a has endorsed global and reg�onal comm�tments for HIV/AIDS �mply�ng universal access as �n the UNGASS II (2006) pol�t�cal declarat�on and most recently �n the AU summ�t (2007). These comm�tments have been �nstrumental �n roll�ng out the Nat�onal HIV/AIDS response, develop�ng programme strateg�es and mob�l�z�ng and reallocat�ng �nternal and external resources. The resource needs est�mat�on �ncorporated these comm�tments and the current s�tuat�ons on the ground �n the target sett�ng and scenar�os.
Tak�ng �nto account the �nternat�onal and nat�onal pol�cy comm�tments and the current nat�onal HIV/AIDS response progress, the resource est�mat�on was done w�th �ncorporat�ng scenario setting (low, medium and high). Th�s scenar�o sett�ng was �mportant to show the resource �mpl�cat�ons on scal�ng up programmes to cover a larger target group or �ncreas�ng �nvestment, as well as reth�nk�ng strateg�cally of how to roll out programmes w�th a focus on susta�nab�l�ty, effic�ency and effect�veness. The cost of the MTP III components of treatment, care and support, and m�t�gat�on �s substant�al and there �s a need to strateg�ze on financ�al susta�nab�l�ty. What �s needed for �mplementat�on plann�ng �s a strategic response — �.e., one that makes opt�mal use of ava�lable resources. In Nam�b�a’s case, �t was �dent�fied that cost�ng three scenar�os would be most effect�ve �n fac�l�tat�ng the strateg�c plann�ng process as well as advocacy for resource mob�l�zat�on over t�me.
Tak�ng �nto account the l�m�tat�ons �n the cost�ng, as not all costs were �ncluded, the low scenar�o seems not to be an opt�on for Nam�b�a.

27
Espec�ally the HIV related �npat�ent cost that �s expected to be a substant�al amount �n add�t�on to the current cost, wh�ch �s est�mated to be 13% or 16% of the total average annual cost �n respect�vely the h�gh and med�um scenar�o. W�th the med�um case scenar�o, Nam�b�a tr�ed to be as real�st�c as poss�ble g�ven the amount of fund�ng and capac�ty constra�nts. The h�gh scenar�o �s what comes closest to the Un�versal Access goals. The final results of the h�gh, med�um and low case scenar�os are h�ghl�ghted �n the report. The average annual resources requ�red for the med�um scenar�o �s 1,6 b�ll�on or 1,9 b�llon N$ for respect�vely the med�um and h�gh scenar�o. These average annual resources are est�mated to be around 4% (med�um) and 5% (h�gh) of the GDP (2005), or 12% (med�um) and 15% (h�gh) of the 2005 government expend�ture. The per cap�ta average annual RNE for health sector programmes as a percentage of the total health expend�ture �s expected to be around 47% (med�um) and 49% (h�gh) or sl�ghtly lower as we expect the total health expend�ture to have �ncreased s�nce 1999/2000.
The RNE report outl�nes �n deta�l the general and spec�fic underly�ng assumpt�ons for the �nd�v�dual programmes areas. The programmes need�ng substant�al resources are ART, OVC support, Workplace programmes, HBC, Food support, and Human resources management. When break�ng the programmes �nto the MTP III components, the shares of prevent�on, care and treatment, and m�t�gat�on are relat�vely balanced, w�th sl�ghtly more cost for the two latter ones. By look�ng down at the breakdown of the 19 programmes together, the share of mon�tor�ng and evaluat�on comes to 3% (h�gh) and 4%(med�um), and of management �s around 9% (h�gh/med�um). The share of human resources �s 11% for the med�um and 8% for the h�gh scenar�o.
The resource gap for Nam�b�a at the t�me that the cost�ng was conducted d�d not have accurate data on external fund�ng d�sbursements �n-country, th�s report �ntends to be modest �n draw�ng conclus�ons. At the end of 2007, more accurate data w�ll be ava�lable �n the MoHSS/DSP fund�ng database. Therefore, based on ongo�ng data collect�on for 2006/07 on d�sbursements, the gap analys�s and percentages may change �n the future.
However, �t �s clear that for both the med�um as well as the h�gh scenar�o add�t�onal resources are needed. Thus, th�s also means �f an �ncrease �n fund�ng from the GRN or other development partners �s not mob�l�zed, the scal�ng-up of the current programmes w�ll not be poss�ble. In 2005, almost 63% of the HIV/AIDS response seemed to be funded through external sources and some of the MTP III programme areas are heav�ly externally funded and some seem grossly under-funded. It seems ev�dent that the Government of Nam�b�a needs to contr�bute more to the overall response �n order to ensure susta�nab�l�ty. Cost-effect�veness through mon�tor�ng un�t cost w�ll enhance programme’s rate of effic�ency. The fact that the most comm�tments are made for two years of less, poses challenges for long-term plann�ng. Also the comm�tted resources are often relat�vely t�ed and cannot eas�ly made ava�lable for programmes areas that are under-funded. Th�s requ�res to look �nto more long-term and flex�ble fund�ng mechan�sms.
I.2 Implications
The sustainability of the nat�onal HIV/AIDS response w�ll depend on d�fferent factors: a) resource mob�l�zat�on and resource allocat�on; b) �ncreas�ng programme effic�ency and effect�veness through creat�ng econom�es of scale; c) tackl�ng constra�nts (e.g. human resources and human capac�ty development); and d) strengthen�ng �mplementat�on capac�ty.
To make the HIV/AIDS response susta�nable, �t �s �mportant to increase and/or maintain investments in prevention. As much emphas�s has been put on scal�ng up treatment serv�ces and much success has been ach�eved, the need to �nvest �n prevent�on �s apparent �n the data g�ven. A more deta�led cost�ng exerc�se for th�s part�cular area �s needed. The �mplementat�on of prevent�on �s done by a w�de range of stakeholders and the weak nat�onal coord�nat�on needs to be addressed structurally to reach effect�veness.

28
Focus on �nvest�ng �n nat�onal and reg�onal coord�nat�on, BCC and h�gh r�sk behav�ors, and secondary prevent�on.
An increased commitment of resources by the GRN is necessary to ensure a susta�nable response. Currently the M�n�stry of F�nance makes substant�al allocat�ons to the MoHSS (HIV/AIDS Health Sector Programmes and Health Systems), MGECW (OVC grants), MoLSW (d�sab�l�ty grants for PLWHAs), but th�s �s by far not enough. At the same t�me, the development partners w�ll need to strateg�ze co-fund�ng for the current rolled-out programmes and more effect�ve and effic�ent allocat�on of those resources. The partners need to follow-up on the Rome Declarat�on related to aid effectiveness. In collaborat�on w�th the Government of Nam�b�a they need to explore �mproved fund�ng mechan�sms for both central and reg�onal levels to fac�l�tate better �mplementat�on of serv�ce del�very. Funding mechanisms need to become more al�gned and eas�er to adm�n�ster. Basket fund�ng seems to be a best pract�ce to date, and poss�b�l�t�es around scal�ng th�s method up and �ncorporat�ng a larger proport�on of the donors needs to be addressed.
Cost-effectiveness arguments need to rout�nely part of assessments of the mer�t of HIV �ntervent�ons. Cost �s an �mportant determ�nant of the cost-effect�veness of an �ntervent�on. It lends �tself to susta�nab�l�ty and to programme effic�ency. The cost var�at�on may be for leg�t�mate reasons (e.g., small scale g�ven the populat�on s�ze, or �n large geograph�c catchment areas). Nam�b�a has a relat�vely h�gh cost factor �n terms of human resources and log�st�cs. But, there may also be some �neffic�enc�es that would need deta�led �nvest�gat�ons and strateg�c reth�nk�ng of programme �mplementat�on. For example w�ll mob�le test�ng be more cost-effect�ve for sparsely populated areas? It �s therefore �mportant that the cost per person reached/ un�t cost be mon�tored �n order to �dent�fy �nefficac�es and separate these from leg�t�mate causes of cost var�at�on.
Increased support for HIV/AIDS programm�ng w�ll depend on whether value for money �s demonstrated �n the way current resources are ut�l�zed and whether accountability �s guaranteed. It �s thus cr�t�cal that the current health management �nformat�on systems and mon�tor�ng and evaluat�on be strengthened, wh�ch includes resource tracking. The resource track�ng also needs to be closely l�nked to health �nd�cators. The M�n�stry of F�nance and NPC need to enforce the use of the MTEF cod�ng for more effect�ve track�ng of HIV resources. Adequate responses depend on managers and serv�ce prov�ders hav�ng the necessary �nformat�on to respond effect�vely.
Capacity-building w�ll rema�n a h�gh cost unt�l the root determ�nant of th�s problem �s addressed: the overall human capac�ty development of Nam�b�ans. An �nvestment �n bas�c secondary educat�on as well as bursar�es for tert�ary educat�on outs�de of the country needs to be pr�or�t�zed. Many students m�grate soon after graduat�on abroad or to the pr�vate sector, therefore a retention policy needs to be attached to scholarsh�ps and bursar�es subs�d�zed by both the GRN and development partners. Nam�b�a needs to be less dependent of fore�gn profess�onals. The human resource est�mates �n th�s Resource Needs Est�mat�on exerc�se are l�m�ted to the salary costs of add�t�onal posts that need to be created and the formal tra�n�ng requ�rements. Extra-curr�culum tra�n�ng accounts for more than five percent of total resource needs est�mate. Over the per�od of the project�on, there �s a slow�ng down on resources needed for tra�n�ng. However, extra-curr�culum tra�n�ng st�ll rema�ns a substant�al part of some programmes (more then 10% for IEC, BCC, and Soc�al Mob�l�sat�on; Home Based Care, Reg�onal Support and Management and Coord�nat�on), often due to h�gh rates of staff turnover.
Successful �mplementat�on of the response to HIV �s about more than just money. Inst�tut�onal capac�ty bu�ld�ng and �nvestments �n nat�onal level systems and �nfrastructure �s be�ng done but at reg�onal and d�str�ct level th�s �s st�ll needed. Wh�le th�s report pr�mar�ly stresses financ�al �ssues, tackl�ng the implementation capacity constra�nts �s cruc�al for the current programme roll-out as well as susta�nab�l�ty.

29
The overall cost w�ll st�ll �ncrease as some programmes need to be set up and rolled out, e.g. food ass�stance. Yet th�s �s expected to decrease over t�me after the �n�t�al �nvestment �s made. Implementat�on capac�ty must therefore grow at the same pace �n order to effect�vely ut�l�ze �ncreases �n financ�al resources and ensure coverage of serv�ces, at least �n the �n�t�al years. Due to the sparsely populated nature of Nam�b�a, scal�ng up effect�ve programmes that reach the ent�re populat�on �s necessary, but w�ll also have s�gn�ficant cost �mpl�cat�ons. Decentral�z�ng serv�ces and �ncreas�ng management capac�ty requ�res �nvestment. Yet the current ongo�ng decentralization process �n Nam�b�a �s slow. It �s needed to exped�te the current decentral�zat�on process �n order to learn and understand how the GRN can effect�vely contr�bute to the HIV/AIDS response �n terms of better management capac�ty, resource mob�l�zat�on & resource allocat�on, and mon�tor�ng and evaluat�on �n order to br�ng the serv�ces closer to the target groups at less cost. Currently, there are no fund�ng mechan�sms (e.g. reg�onal basket or pooled fund�ng) �n place to allocate resources closer to serv�ce del�very. In terms of cost and tackl�ng constra�nts, �t would seem decentral�zat�on may be a worthy �nvestment for the GRN to explore �n order to atta�n the max�mum level of programme effect�veness and coverage.

30
Ap
pen
dix
I: S
um
mar
y R
NE
Sh
eets
Tabl
e 6:
RN
E S
um
mar
y H
igh
Sce
nar
ioH
igh
Sce
nar
io (
tota
l co
st)
20
0720
0820
0920
1020
1120
12%
PMT
CT
11,5
19,9
22
13,0
59,2
91
13,9
31,5
34
14,7
37,1
10
15,8
79,6
82
17,1
28,8
22
0.75
%
AR
T (
�ncl
TB/
HIV
- IP
T/C
PT)
286,
453,
125
356,
210,
855
379,
743,
332
428,
175,
581
476,
271,
962
524,
770,
842
21.3
2%
C&
T51
,370
,376
59
,120
,737
65
,133
,982
70
,925
,618
71
,983
,262
73
,017
,852
3.
41%
Con
dom
s31
,188
,602
38
,056
,735
41
,619
,263
48
,147
,642
51
,160
,150
53
,458
,480
2.
29%
STI
4,54
6,39
6 4,
280,
768
3,95
9,42
5 3,
582,
367
3,14
9,59
3 2,
661,
105
0.19
%
Bloo
d sa
fety
19,3
24,6
67
20,7
05,0
00
20,7
05,0
00
20,7
05,0
00
20,7
05,0
00
20,7
05,0
00
1.07
%
PEP
3,34
1,17
3 3,
999,
476
4,40
8,75
4 4,
502,
868
4,59
4,82
9 4,
683,
795
0.22
%
Safe
med
�cal
�nje
ct�o
n1,
192,
011
1,14
3,11
5 1,
143,
115
1,19
2,01
1 1,
143,
115
1,14
3,11
5 0.
06%
IEC
, BC
C,S
M &
you
th s
k�lls
84,6
57,0
87
86,6
17,3
96
88,5
83,6
05
91,4
18,7
14
93,2
59,5
24
95,1
00,3
36
4.69
%
Wor
kpla
ce13
4,14
3,54
0 15
4,79
8,20
2 18
7,32
8,07
9 22
3,38
2,24
1 26
2,91
5,72
2 30
4,84
6,43
2 11
.02%
HBC
193,
426,
602
193,
771,
794
189,
599,
643
183,
418,
315
205,
138,
966
220,
250,
471
10.3
1%
TB
6,32
2,35
2 6,
494,
626
6,66
5,39
6 6,
833,
092
6,99
6,95
1 7,
155,
472
0.35
%
OV
C20
9,14
9,66
8 23
4,53
1,01
4 25
5,39
2,14
6 28
0,33
2,07
8 30
5,27
2,00
9 33
0,21
1,94
1 14
.02%
Food
ass
�sta
nce
201,
562,
295
256,
482,
826
309,
009,
642
362,
230,
079
420,
232,
848
481,
296,
733
17.6
6%
PLW
HA
sup
port
17,6
43,4
13
25,6
10,9
14
29,5
36,7
23
33,1
72,3
33
40,5
01,9
15
55,0
89,8
27
1.75
%
HR
87,3
40,9
02
109,
007,
766
117,
682,
478
128,
121,
653
125,
446,
078
135,
581,
453
6.12
%
Infr
astr
uctu
re29
,375
,000
30
,625
,000
32
,500
,000
32
,500
,000
30
,625
,000
30
,625
,000
1.
62%
Reg
�ona
l sup
port
6,17
8,37
6 15
,657
,028
12
,274
,898
13
,167
,768
13
,087
,768
17
,107
,768
0.
67%
Man
agem
ent/
Coo
rd.,
Mon
�tor�
ng
and
Eval
uat�o
n65
,864
,435
48
,540
,879
52
,954
,966
47
,710
,463
43
,210
,463
43
,210
,463
2.
62%
TO
TA
L (
N$)
1,44
4,59
9,94
2 1,
658,
713,
421
1,81
2,17
1,98
1 1,
994,
254,
933
2,19
1,57
4,83
8 2,
418,
044,
907
100.
00%
TO
TA
L (
US
$)$2
02,3
813,
207
$232
,873
,462
$254
,418
,127
$279
,981
,487
$307
,568
4,02
3$3
39,4
79,0
69

31
MT
P I
II c
om
po
nen
ts20
0720
0820
0920
1020
1120
12%
Pre
ven
tio
n34
1,28
3,77
4 38
1,78
0,71
9 42
6,81
2,75
7 47
8,59
3,57
1 52
4,79
0,87
8 57
2,74
4,93
6 23
.7%
$4
7,91
4,20
4$5
3,59
9,73
4$5
9,92
1,96
3$6
7,19
1,68
0$7
3,67
7,50
6$8
0,40
9,97
0
Mit
igat
ion
428,
355,
376
516,
624,
755
593,
938,
511
675,
734,
490
766,
006,
773
866,
598,
501
33.4
%
$6
0,13
8,37
6$7
2,53
1,03
1$8
3,38
5,42
1$9
4,86
9,08
8$1
07,0
06,7
73$1
21,6
55,2
56
Tre
atm
ent
486,
202,
079
556,
477,
275
576,
008,
371
618,
426,
988
688,
407,
879
752,
176,
786
32.0
%
$6
8,25
9,86
9$7
8,12
6,08
7$8
0,86
8,13
6$8
6,82
3,45
7$9
6,64
8,35
6$1
05,6
01,1
30
HR
87,3
40,9
02
109,
007,
766
117,
682,
478
128,
121,
653
125,
446,
078
135,
581,
453
6.1%
$1
2,26
2,14
1$1
5,30
4,04
0$1
6,52
1,91
7$1
7,98
7,51
5$1
7,61
1,88
0$1
9,03
4,82
7
Infr
astr
uct
ure
29,3
75,0
00
30,6
25,0
00
32,5
00,0
00
32,5
00,0
00
30,6
25,0
00
30,6
25,0
00
1.6%
$4
,124
,075
$4,2
99,5
67$4
,562
,806
$4,5
62,8
06$4
,299
,567
$4,2
99,5
67
Po
licy,
Mgt
, Co
ord
inat
ion
, M
on
ito
rin
g an
d E
valu
atio
n72
,042
,811
64
,197
,907
65
,229
,864
60
,878
,231
56
,298
,231
60
,318
,231
3.
3%
$1
0,11
4,38
1$9
,013
,003
$9,1
57,8
84$8
,546
,940
$7,9
03,9
36$8
,468
,320
TO
TA
L (
N$)
1,44
4,59
9,94
2 1,
658,
713,
421
1,81
2,17
1,98
1 1,
994,
254,
933
2,19
1,57
4,83
8 2,
418,
044,
907
100.
0%
TO
TA
L (
US
$)$2
02,8
13,2
07$2
32,8
73,4
62$2
54,4
18,1
27$2
79,9
81,4
87$3
07,6
84,0
23$3
39,4
79,0
69

32
Co
mp
aris
on
by
cost
are
a20
0720
0820
0920
1020
1120
12%
Act
ivit
ies
1,05
2,94
3,76
6 1,
245,
763,
788
1,40
1,66
1,07
7 1,
563,
945,
764
1,73
6,62
7,63
0 1,
928,
072,
346
80%
$1
47,8
27,0
18$1
74,8
97,7
98$1
96,7
84,8
47$2
19,5
68,6
48$2
43,8
12,1
51$2
70,6
89,8
47
Man
agem
ent
157,
539,
180
174,
355,
206
174,
512,
485
185,
461,
281
2001
,341
,904
21
8,71
3,49
6 9%
$2
2,11
7,56
0$2
4,47
8,43
0$2
4,50
0,51
1$2
6,03
7,65
7$2
8,26
7,20
1$3
0,70
6,06
9
Mo
nit
ori
ng
and
Eva
luat
ion
79,2
65,6
26
63,5
99,2
74
67,9
97,1
46
66,9
58,8
11
66,6
15,9
12
70,9
63,9
39
3%
$1
1,12
8,42
1$8
,928
,958
$9,5
46,3
93$9
,400
,617
$9,3
52,4
76$9
,962
,913
HR
(in
cl t
rain
ing)
154,
851,
370
174,
995,
154
168,
001,
272
177,
889,
077
186,
989,
392
200,
295,
126
8%
$2
1,74
0,20
8$2
4,56
8,27
5$2
3,58
6,37
6$2
4,97
4,56
4$2
6,25
2,19
4$2
8,12
0,24
0
HR
(ex
cl t
rain
ing)
57,1
89,5
86
72,3
94,4
71
83,5
31,9
92
95,3
59,0
00
106,
119,
254
116,
071,
419
5%
$8
,029
,076
$10,
163,
751
$11,
727,
393
$13,
387,
834
$14,
898,
510
$16,
295,
734
TO
TA
L (
N$)
1,44
4,59
9,94
2 1,
658,
713,
421
1,81
2,17
1,98
1 1,
994,
254,
933
2,19
1,57
4,83
8 2,
418,
044,
907
100%
TO
TA
L (
US
$)$2
02,8
13,2
07$2
32,8
73,4
62$2
54,4
18,1
27$2
79,9
81,4
87$3
07,6
84,0
23$3
39,4
79,0
69

33
Tab
le 7
: RN
E S
um
mar
y M
ediu
m S
cen
ario
Med
ium
Sce
nar
io (
tota
l co
st)
2007
2008
2009
2010
2011
2012
%
PMT
CT
11,3
44,0
02
12,6
90,5
32
13,3
54,0
94
13,9
37,9
77
14,8
47,0
52
15,8
45,4
91
0.88
%
AR
T (
�ncl
TB/
HIV
- IP
T/C
PT)
279,
061,
224
334,
420,
654
350,
782,
500
397,
477,
917
443,
009,
510
490,
722,
623
24.6
9%
C&
T57
,053
,119
59
,120
,737
63
,102
,106
67
,009
,564
70
,099
,774
73
,017
,852
4.
19%
Con
dom
s31
,188
,602
38
,056
,735
41
,619
,263
48
,147
,642
51
,160
,150
53
,458
,480
2.
84%
STI
5,12
7,81
0 4,
952,
883
4,73
1,52
7 4,
463,
741
4,14
9,52
6 3,
788,
881
0.29
%
Bloo
d sa
fety
19,3
24,6
67
20,7
05,0
00
20,7
05,0
00
20,7
05,0
00
20,7
05,0
00
20,7
05,0
00
1.32
%
PEP
3,34
1,17
3 3,
999,
476
4,40
8,75
4 4,
502,
868
4,59
4,82
9 4,
683,
795
0.27
%
Safe
med
�cal
�nje
ct�o
n1,
192,
011
1,14
3,11
5 1,
143,
115
1,19
2,01
1 1,
143,
115
1,14
3,11
5 0.
07%
IEC
, BC
C,S
M &
you
th s
k�lls
51,0
38,9
85
56,1
24,8
40
61,2
16,5
95
63,1
14,7
51
68,0
81,1
08
73,0
47,4
64
4.01
%
Wor
kpla
ce10
7,13
7,54
0 12
6,44
1,90
2 15
7,55
3,96
4 19
2,11
9,42
0 23
0,08
9,76
0 27
0,37
9,17
3 11
.65%
HBC
189,
880,
901
195,
213,
278
194,
446,
027
162,
440,
456
184,
615,
479
198,
094,
875
12.0
9%
TB
6,32
2,35
2 6,
494,
626
6,66
5,39
6 6,
833,
092
6,99
6,95
1 7,
155,
472
0.44
%
OV
C19
8,62
7,41
7 21
1,09
3,77
0 22
3,56
0,12
4 23
6,02
6,47
7 24
8,49
2,83
1 26
0,95
9,18
5 14
.79%
Food
ass
�sta
nce
88,6
88,9
32
100,
524,
300
109,
768,
477
118,
511,
204
127,
706,
408
137,
297,
252
7.34
%
PLW
HA
sup
port
17,6
43,4
13
24,0
77,5
16
26,6
51,6
11
28,7
77,2
66
34,4
47,1
76
45,5
91,0
68
1.91
%
HR
87,3
40,9
02
109,
007,
766
117,
682,
478
128,
121,
653
125,
446,
078
135,
581,
453
7.56
%
Infr
astr
uctu
re29
,375
,000
30
,625
,000
32
,500
,000
32
,500
,000
30
,625
,000
30
,625
,000
2.
00%
Reg
�ona
l sup
port
6,09
8,37
6 13
,596
,468
9,
279,
777
9,51
1,46
8 9,
196,
468
13,0
96,4
68
0.65
%
Man
agem
ent/
Coo
rd.,
Mon
�tor�
ng
and
Eval
uat�o
n65
,864
,435
48
,540
,879
52
,954
,966
47
,710
,463
43
,210
,463
43
,210
,463
3.
24%
TO
TA
L (
N$)
1,25
5,65
0,86
1 1,
396,
829,
476
1,49
2,12
5,77
6 1,
583,
102,
972
1,71
8,61
6,67
7 1,
878,
403,
111
100.
00%
TO
TA
L (
US
$)$1
76,2
85,8
84$1
96,1
06,5
19$2
09,4
85,5
51$2
22,2
58,2
06$2
41,2
83,5
21$2
63,7
16,5
82

34
MT
P I
II c
om
po
nen
ts20
0720
0820
0920
1020
1120
12%
Pre
ven
tio
n28
6,74
7,90
9 32
3,23
5,22
0 36
7,83
4,41
8 41
5,19
2,97
5 46
4,87
0,31
4 51
6,06
9,25
1 25
.5%
$4
0,25
7,69
5$4
5,38
0,29
5$5
1,64
1,75
6$5
8,29
0,61
5$6
5,26
5,01
7$7
2,45
3,04
2
Mit
igat
ion
304,
959,
762
335,
695,
586
359,
980,
212
383,
314,
948
410,
646,
415
443,
847,
505
24.0
%
$4
2,95
7,30
5$4
6,98
8,67
3$5
0,08
0,33
9$5
3,06
1,03
5$5
6,62
9,72
8$6
0,92
7,34
3
Tre
atm
ent
475,
264,
477
536,
128,
558
551,
893,
923
566,
751,
465
634,
621,
940
695,
972,
971
37.2
%
$6
6,72
4,29
5$7
5,26
9,24
9$7
7,48
2,61
2$7
9,56
8,52
2$8
9,09
7,13
2$9
7,71
0,45
0
HR
87,3
40,9
02
109,
007,
766
117,
682,
478
128,
121,
653
125,
446,
078
135,
581,
453
7.6%
$1
2,26
2,14
1$1
5,30
4,04
0$1
6,52
1,91
7$1
7,98
7,51
5$1
7,61
1,88
0$1
9,03
4,82
7
Infr
astr
uct
ure
29,3
75,0
00
30,6
25,0
00
32,5
00,0
00
32,5
00,0
00
30,6
25,0
00
30,6
25,0
00
2.0%
$4
,124
,075
$4,2
99,5
67$4
,562
,806
$4,5
62,8
06$4
,299
,567
$4,2
99,5
67
Po
licy,
Mgt
, Co
ord
inat
ion
, M
on
ito
rin
g an
d E
valu
atio
n71
,962
,811
62
,137
,347
62
,234
,744
57
,221
,931
52
,406
,931
56
,306
,931
3.
9%
$1
0,10
3,14
9$8
,723
,712
$8,7
37,3
86$8
,033
,617
$7,3
57,6
20$7
,905
,157
TO
TA
L (
N$)
1,25
5,65
0,86
1 1,
396,
829,
476
1,49
2,12
5,77
6 1,
583,
102,
972
1,71
8,61
6,67
7 1,
878,
403,
111
100.
0%
TO
TA
L (
US
$)$1
76,2
85,8
84$1
96,1
06,5
19$2
09,4
85,5
51$2
22,2
58,2
06$2
41,2
83,5
21$2
63,7
16,5
82
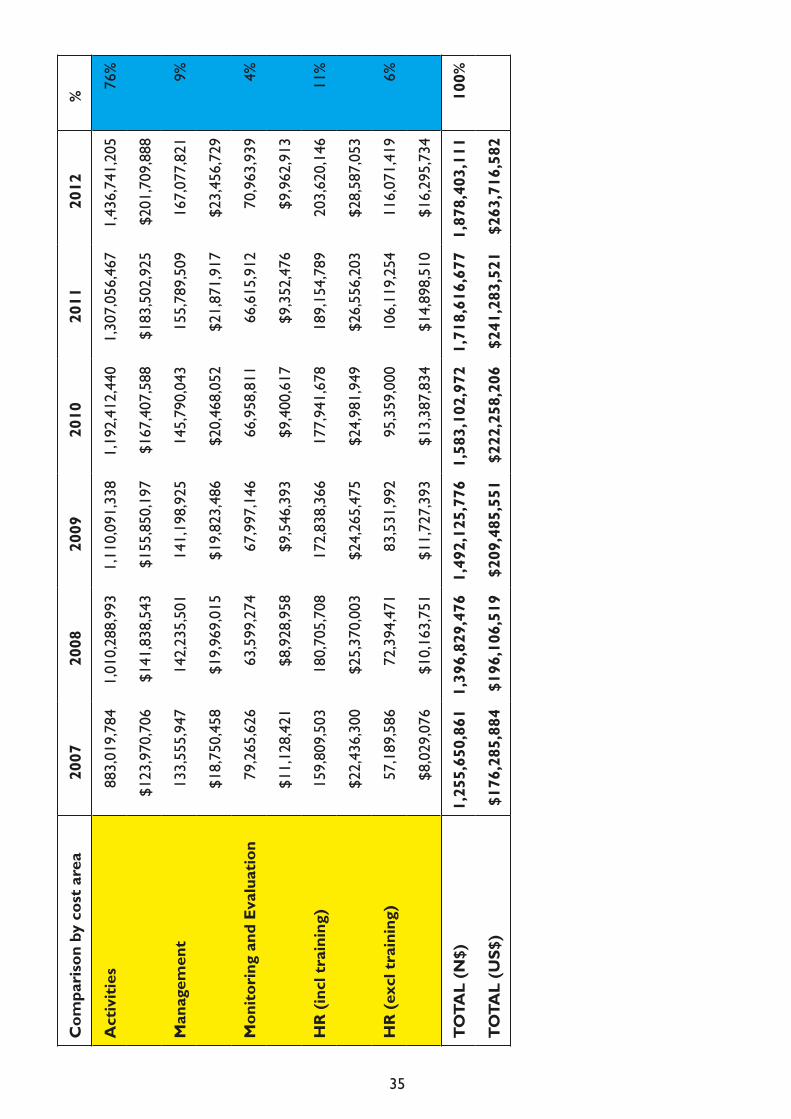
35
Co
mp
aris
on
by
cost
are
a20
0720
0820
0920
1020
1120
12%
Act
ivit
ies
883,
019,
784
1,01
0,28
8,99
3 1,
110,
091,
338
1,19
2,41
2,44
0 1,
307,
056,
467
1,43
6,74
1,20
5 76
%
$1
23,9
70,7
06$1
41,8
38,5
43$1
55,8
50,1
97$1
67,4
07,5
88$1
83,5
02,9
25$2
01,7
09,8
88
Man
agem
ent
133,
555,
947
142,
235,
501
141,
198,
925
145,
790,
043
155,
789,
509
167,
077,
821
9%
$1
8,75
0,45
8$1
9,96
9,01
5$1
9,82
3,48
6$2
0,46
8,05
2$2
1,87
1,91
7$2
3,45
6,72
9
Mo
nit
ori
ng
and
Eva
luat
ion
79,2
65,6
26
63,5
99,2
74
67,9
97,1
46
66,9
58,8
11
66,6
15,9
12
70,9
63,9
39
4%
$1
1,12
8,42
1$8
,928
,958
$9,5
46,3
93$9
,400
,617
$9,3
52,4
76$9
,962
,913
HR
(in
cl t
rain
ing)
159,
809,
503
180,
705,
708
172,
838,
366
177,
941,
678
189,
154,
789
203,
620,
146
11%
$2
2,43
6,30
0$2
5,37
0,00
3$2
4,26
5,47
5$2
4,98
1,94
9$2
6,55
6,20
3$2
8,58
7,05
3
HR
(ex
cl t
rain
ing)
57,1
89,5
86
72,3
94,4
71
83,5
31,9
92
95,3
59,0
00
106,
119,
254
116,
071,
419
6%
$8
,029
,076
$10,
163,
751
$11,
727,
393
$13,
387,
834
$14,
898,
510
$16,
295,
734
TO
TA
L (
N$)
1,25
5,65
0,86
1 1,
396,
829,
476
1,49
2,12
5,77
6 1,
583,
102,
972
1,71
8,61
6,67
7 1,
878,
403,
111
100%
TO
TA
L (
US
$)$1
76,2
85,8
84$1
96,1
06,5
19$2
09,4
85,5
51$2
22,2
58,2
06$2
41,2
83,5
21$2
63,7
16,5
82

36
Tab
le 8
: RN
E S
um
mar
y L
ow S
cen
ario
Low
Sce
nar
io (
tota
l co
st)
2007
2008
2009
2010
2011
2012
%
PMT
CT
11,1
68,0
82
12,3
21,7
74
12,7
76,6
54
13,1
38,8
45
13,8
14,4
22
14,5
62,1
61
0.99
%
AR
T (
�ncl
TB/
HIV
- IP
T/C
PT)
277,
115,
987
329,
661,
446
343,
656,
297
385,
627,
912
427,
253,
511
471,
465,
511
28.5
8%
C&
T54
,867
,449
54
,907
,811
57
,006
,478
59
,177
,456
60
,682
,335
62
,175
,986
4.
45%
Con
dom
s31
,188
,602
38
,056
,735
41
,619
,263
48
,147
,642
51
,160
,150
53
,458
,480
3.
36%
STI
5,20
9,22
5 5,
124,
998
5,00
3,62
8 4,
845,
115
4,64
9,45
8 4,
416,
658
0.37
%
Bloo
d sa
fety
19,3
24,6
67
20,7
05,0
00
20,7
05,0
00
20,7
05,0
00
20,7
05,0
00
20,7
05,0
00
1.57
%
PEP
3,34
1,17
3 3,
999,
476
4,40
8,75
4 4,
502,
868
4,59
4,82
9 4,
683,
795
0.33
%
Safe
med
�cal
�nje
ct�o
n1,
192,
011
1,14
3,11
5 1,
143,
115
1,19
2,01
1 1,
143,
115
1,14
3,11
5 0.
09%
IEC
, BC
C,S
M &
you
th s
k�lls
49,2
28,2
70
51,9
50,1
44
54,6
77,9
19
54,3
12,0
94
56,9
14,4
68
59,5
16,8
43
4.17
%
Wor
kpla
ce12
8,61
8,15
1 14
5,19
0,13
7 16
1,30
2,74
8 18
0,28
6,31
8 20
2,68
4,34
5 22
4,15
7,84
4 13
.30%
HBC
56,9
76,2
21
53,9
44,0
73
52,2
97,2
66
52,7
35,7
90
54,0
62,6
65
55,6
94,6
67
4.16
%
TB
6,32
2,35
2 6,
494,
626
6,66
5,39
6 6,
833,
092
6,99
6,95
1 7,
155,
472
0.52
%
OV
C18
4,73
3,43
4 18
3,30
5,80
6 18
1,87
8,17
7 18
0,45
0,54
8 17
9,02
2,91
9 17
7,59
5,29
0 13
.87%
Food
ass
�sta
nce
71,8
58,8
46
82,2
70,4
18
90,5
64,7
69
98,5
35,6
60
106,
774,
371
115,
343,
674
7.22
%
PLW
HA
sup
port
13,4
79,7
14
16,4
00,3
90
17,2
68,3
71
18,6
86,4
35
21,1
69,2
16
27,1
80,6
43
1.46
%
HR
87,3
40,9
02
109,
007,
766
117,
682,
478
128,
121,
653
125,
446,
078
135,
581,
453
8.98
%
Infr
astr
uctu
re29
,375
,000
30
,625
,000
32
,500
,000
32
,500
,000
30
,625
,000
30
,625
,000
2.
38%
Reg
�ona
l sup
port
5,81
4,68
5 5,
639,
685
5,43
4,68
5 5,
454,
685
5,13
9,68
5 5,
139,
685
0.42
%
Man
agem
ent/
Coo
rd.,
Mon
�tor�
ng
and
Eval
uat�o
n65
,864
,435
48
,540
,879
52
,954
,966
47
,710
,463
43
,210
,463
43
,210
,463
3.
85%
TO
TA
L (
N$)
1,10
3,01
9,20
5 1
,199
,289
,279
1,
259,
545,
966
1,34
2,96
3,58
6 1,
416,
048,
979
1,51
3,81
1,73
8 10
0.00
%
TO
TA
L (
US
$)$1
54,8
57,3
11$1
68,3
73,0
55$1
76,8
32,7
34$1
88,5
44,0
70$1
98,8
04,8
23$2
12,5
30,1
30

37
MT
P I
II c
om
po
nen
ts20
0720
0820
0920
1020
1120
12%
Pre
ven
tio
n30
4,13
7,62
9 33
3,39
9,18
9 35
8,64
3,56
0 38
6,30
7,34
9 41
6,34
8,12
1 44
4,81
9,88
0 28
.6%
$4
2,69
9,10
7$4
6,80
7,25
6$5
0,35
1,41
5$5
4,23
5,24
5$5
8,45
2,79
1$6
2,45
0,05
6
Mit
igat
ion
270,
071,
994
281,
976,
614
289,
711,
317
297,
672,
642
306,
966,
506
320,
119,
607
22.5
%
$3
7,91
6,49
6$3
9,58
7,83
3$4
0,67
3,73
9$4
1,79
1,46
2$4
3,09
6,26
5$4
4,94
2,88
2
Tre
atm
ent
340,
414,
560
390,
100,
146
402,
618,
960
445,
196,
794
488,
313,
126
534,
315,
650
33.2
%
$4
7,79
2,17
2$5
4,76
7,73
2$5
6,52
5,29
8$6
2,50
2,97
2$6
8,55
6,24
8$7
5,01
4,72
7
HR
87,3
40,9
02
109,
007,
766
117,
682,
478
128,
121,
653
125,
446,
078
135,
581,
453
9.0%
$1
2,26
2,14
1$1
5,30
4,04
0$1
6,52
1,91
7$1
7,98
7,51
5$1
7,61
1,88
0$1
9,03
4,82
7
Infr
astr
uct
ure
29,3
75,0
00
30,6
25,0
00
32,5
00,0
00
32,5
00,0
00
30,6
25,0
00
30,6
25,0
00
2.4%
$4
,124
,075
$4,2
99,5
67$4
,562
,806
$4,5
62,8
06$4
,299
,567
$4,2
99,5
67
Po
licy,
Mgt
, Co
ord
inat
ion
, M
on
ito
rin
g an
d E
valu
atio
n71
,679
,120
$1
0,06
3,32
154
,180
,564
$7,6
06,6
28
58,3
89,6
51$8
,197
,558
53
,165
,148
$7,4
64,0
69
48,3
50,1
48
$6,7
88,0
7248
,350
,148
$6,7
88,0
72
4.3%
TO
TA
L (
N$)
1,10
3,01
9,20
5 1,
199,
289,
279
1,25
9,54
5,96
6 1,
342,
963,
586
1,41
6,04
8,97
9 1,
513,
811,
738
100.
0%
TO
TA
L (
US
$)$1
54,8
57,3
11$1
68,3
73,0
55$1
76,8
32,7
34$1
88,5
44,0
70$1
98,8
04,8
23$2
12,5
30,1
30
Co
mp
aris
on
by
cost
are
a20
0720
0820
0920
1020
1120
12%
Act
ivit
ies
759,
386,
396
846,
844,
578
912,
516,
938
983,
571,
905
1,05
1,66
0,62
7 1,
125,
052,
386
74%
$1
06,6
13,3
16$1
18,8
91,9
23$1
28,1
11,9
30$1
38,0
87,6
23$1
47,6
46,8
73$1
57,9
50,6
38
Man
agem
ent
128,
145,
379
134,
100,
999
130,
971,
226
133,
247,
902
140,
890,
509
149,
859,
440
10%
$1
7,99
0,84
6$1
8,82
6,98
0$1
8,38
7,57
8$1
8,70
7,21
0$1
9,78
0,18
6$2
1,03
9,37
1
Mo
nit
ori
ng
and
Eva
luat
ion
74,8
64,1
80
57,8
14,5
44
61,4
14,8
56
61,0
70,7
76
58,8
13,0
53
61,7
84,2
74
4%
$1
0,51
0,48
4$8
,116
,817
$8,6
22,2
79$8
,573
,972
$8,2
57,0
02$8
,674
,143
HR
(in
cl t
rain
ing)
140,
623,
250
160,
529,
157
154,
642,
946
165,
073,
003
164,
684,
790
177,
115,
637
12%
$1
9,74
2,66
5$2
2,53
7,33
5$2
1,71
0,94
6$2
3,17
5,26
4$2
3,12
0,76
1$2
4,86
5,97
8
HR
(ex
cl t
rain
ing)
57,1
89,5
85
72,3
94,4
70
83,5
31,9
91
95,3
59,0
00
106,
119,
254
116,
071,
418
8%
$8
,029
,076
$10,
163,
751
$11,
727,
393
$13,
387,
834
$14,
898,
510
$16,
295,
734
TO
TA
L (
N$)
1,10
3,01
9,20
5 1,
199,
289,
279
1,25
9,54
5,96
6 1,
342,
963,
586
1,41
6,04
8,97
9 1,
513,
811,
738
100%
TO
TA
L (
US
$)$1
54,8
57,3
11$1
68,3
73,0
55$1
76,8
32,7
34$1
88,5
44,0
70$1
98,8
04,8
23$2
12,5
30,1
30

38
Sce
nari
o C
ompa
riso
nsA
vera
ge A
nnua
lC
umul
ativ
e
H
igh
Med
ium
Low
Hig
hM
ediu
mL
owH
igh
Med
ium
Low
PMT
CT
0.7%
0.9%
1.0%
14,3
76,0
60
13,6
69,8
58
12,9
63,6
56
86,2
56,3
62
82,0
19,1
50
77,7
81,9
38
AR
T (
�ncl
TB/
HIV
- IP
T/
CPT
)21
.3%
24.6
%28
.5%
408,
604,
283
382,
579,
071
372,
463,
444
2,45
1,62
5,69
7 2,
295,
474,
428
2,23
4,78
0,66
5
C&
T3.
4%4.
2%4.
5%65
,258
,638
64
,900
,526
58
,136
,253
39
1,55
1,82
8 38
9,40
3,15
3 34
8,81
7,51
5
Con
dom
s2.
3%2.
8%3.
4%43
,938
,479
43
,938
,479
43
,938
,479
26
3,63
0,87
3 26
3,63
0,87
3 26
3,63
0,87
3
STI
0.2%
0.3%
0.4%
3,69
6,60
9 4,
535,
728
4,87
4,84
7 22
,179
,653
27
,214
,367
29
,249
,082
Bloo
d sa
fety
1.1%
1.3%
1.6%
20,4
74,9
44
20,4
74,9
44
20,4
74,9
44
122,
849,
667
122,
849,
667
122,
849,
667
PEP
0.2%
0.3%
0.3%
4,25
5,14
9 4,
255,
149
4,25
5,14
9 25
,530
,894
25
,530
,894
25
,530
,894
Safe
med
�cal
�nje
ct�o
n0.
1%0.
1%0.
1%1,
159,
414
1,15
9,41
4 1,
159,
414
6,95
6,48
1 6,
956,
481
6,95
6,48
1
IEC
, BC
C,S
M &
you
th
sk�ll
s4.
7%4.
0%4.
2%89
,939
,444
62
,103
,957
54
,433
,290
53
9,63
6,66
2 37
2,62
3,74
3 32
6,59
9,73
7
Wor
kpla
ce &
M
a�ns
trea
m�n
g11
.0%
11.6
%13
.3%
211,
235,
703
180,
620,
293
173,
706,
590
1,26
7,41
4,21
5 1,
083,
721,
758
1,04
2,23
9,54
1
HBC
, Pal
l�at�v
e C
are,
Ps
ycho
soc�
al s
uppo
rt10
.3%
12.1
%4.
2%19
7,60
0,96
5 18
7,44
8,50
3 54
,285
,114
1,
185,
605,
791
1,12
4,69
1,01
6 32
5,71
0,68
2
TB
0.4%
0.4%
0.5%
6,74
4,64
8 6,
744,
648
6,74
4,64
8 40
,467
,890
40
,467
,890
40
,467
,890
OV
C14
.0%
14.8
%13
.9%
269,
148,
143
229,
793,
301
181,
164,
362
1,61
4,88
8,85
6 1,
378,
759,
804
1,08
6,98
6,17
2
Food
ass
�sta
nce
&
Nut
r�t�o
n17
.6%
7.3%
7.2%
338,
469,
071
113,
749,
429
94,2
24,6
23
2,03
0,81
4,42
4 68
2,49
6,57
5 56
5,34
7,73
8
PLH
A s
uppo
rt1.
7%1.
9%1.
5%33
,592
,521
29
,531
,342
19
,030
,795
20
1,55
5,12
4 17
7,18
8,04
9 11
4,18
4,77
0
HR
6.1%
7.5%
9.0%
117,
196,
722
117,
196,
722
117,
196,
722
703,
180,
330
703,
180,
330
703,
180,
330
Infr
astr
uctu
re1.
6%2.
0%2.
4%31
,041
,667
31
,041
,667
31
,041
,667
18
6,25
0,00
0 18
6,25
0,00
0 18
6,25
0,00
0
Reg
�ona
l sup
port
0.7%
0.7%
0.4%
12,9
12,2
68
10,1
29,8
38
5,43
7,18
5 77
,473
,606
60
,779
,025
32
,623
,110
Man
agem
ent/
Coo
rd.,
M&
E2.
6%3.
2%3.
8%50
,248
,611
50
,248
,611
50
,248
,611
30
1,49
1,66
9 30
1,49
1,66
9 30
1,49
1,66
9
TO
TAL
(N
$)10
0.0%
100.
0%10
0.0%
1,91
9,89
3,33
7 1,
554,
121,
479
1,30
5,77
9,79
2 11
,519
,360
,022
9,
324,
728,
872
7,83
4,67
8,75
3
TO
TAL
(U
S$)
$2
69,5
41,5
63$2
18,1
89,3
77$1
83,3
23,6
87$1
,617
,249
,375
$1,3
09,1
36,2
64$1
,099
,942
,123
Tab
le 9
: RN
E S
cen
ario
Co
mp
aris
on

39
MT
P I
II C
ompo
nent
sH
igh
Med
ium
Low
Hig
h M
ediu
m
Low
H
igh
Med
ium
L
ow
Pre
vent
ion
23.7
%25
.5%
28.6
%45
4,33
4,43
9 39
5,65
8,34
8 37
3,94
2,62
1 2,
726,
006,
635
2,37
3,95
0,08
6 2,
243,
655,
728
63,7
85,8
43
$55,
548,
070
52,4
99,3
12
382,
715,
057
$333
,288
,419
$382
,715
,057
Mit
igat
ion
33.4
%24
.0%
22.5
%64
1,20
9,73
4 37
3,07
4,07
1 29
4,41
9,78
0 3,
847,
258,
404
2,23
8,44
4,42
8 1,
766,
518,
680
90,0
22,0
19
$52,
377,
372
41,3
34,7
79
540,
132,
111
$314
,264
,234
$540
,132
,111
Trea
tmen
t31
.9%
37.1
%33
.2%
612,
949,
896
576,
772,
222
433,
493,
206
3,67
7,69
9,37
8 3,
460,
633,
334
2,60
0,95
9,23
6
86,0
54,5
06
$80,
975,
377
60,8
59,8
58
516,
327,
036
$485
,852
,260
$516
,327
,036
HR
6.1%
7.5%
9.0%
117,
196,
722
117,
196,
722
117,
196,
722
703,
180,
330
703,
180,
330
703,
180,
330
16,4
53,7
20
$16,
453,
720
16,4
53,7
20
98,7
22,3
20
$98,
722,
320
$98,
722,
320
Infr
astr
uctu
re1.
6%2.
0%2.
4%31
,041
,667
31
,041
,667
31
,041
,667
18
6,25
0,00
0 18
6,25
0,00
0 18
6,25
0,00
0
4,35
8,06
5 $4
,358
,065
4,35
8,06
5 26
,148
,388
$2
6,14
8,38
8$2
6,14
8,38
8
Polic
y, M
gt,
Coo
rdin
atio
n, M
&E
3.3%
3.9%
4.3%
63,1
60,8
79
60,3
78,4
49
55,6
85,7
96
378,
965,
275
362,
270,
694
334,
114,
779
8,86
7,41
0 8,
476,
774
7,81
7,95
3 53
,204
,462
50
,860
,643
53
,204
,462
TO
TAL
(N
$)10
0.0%
100.
0%10
0.0%
1,91
9,89
3,33
7 1,
554,
121,
479
1,30
5,77
9,79
2 11
,519
,360
,022
9,
324,
728,
872
7,83
4,67
8,75
3
TO
TAL
(U
S$)
26
9,54
1,56
3 21
8,18
9,37
7 18
3,32
3,68
7 1,
617,
249,
375
1,30
9,13
6,26
4 1,
099,
942,
123

40
Per
capi
ta A
IDS
RN
E
Hig
hM
ediu
mL
ow
per
cap�
ta t
otal
RN
E
N$9
18
N$7
44
N$6
25
$129
$104
$88
per
PLH
A t
otal
RN
E
N$8
,366
N
$6,7
86
N$5
,709
$1,1
75$9
53$8
02
per
cap�
ta h
ealth
sec
tor
tota
l RN
E
N$4
23
N$4
06
N$3
37
$59
$57
$47
per
PLH
A C
are
and
Tre
atm
ent
RN
E
N$5
,460
N
$4,1
49
N$3
,182
$767
$583
$447
Com
pari
son
by c
ost
area
Hig
hM
ediu
mL
ow H
igh
Med
ium
L
ow
Hig
h M
ediu
m
Low
Act
ivit
ies
79.7
%76
.5%
74.3
%1,
488,
169,
062
1,15
6,60
1,70
5 94
6,50
5,47
2 8,
929,
014,
371
6,93
9,61
0,22
7 5,
679,
032,
830
208,
930,
052
162,
379,
974
132,
883,
717
1,25
3,58
0,31
0 97
4,27
9,84
6 79
7,30
2,30
5
Man
agem
ent
9.0%
8.9%
9.9%
185,
320,
592
147,
607,
958
136,
202,
576
1,11
1,92
3,55
2 88
5,64
7,74
6 81
7,21
5,45
5
26,0
17,9
05
20,7
23,2
76
19,1
22,0
29
156,
107,
428
124,
339,
656
114,
732,
171
M&
E2.
9%3.
8%4.
1%69
,233
,451
69
,233
,451
62
,626
,947
41
5,40
0,70
9 41
5,40
0,70
9 37
5,76
1,68
3
9,71
9,96
3 9,
719,
963
8,79
2,44
9 58
,319
,780
58
,319
,780
52
,754
,697
HR
(in
cl t
rain
ing)
8.3%
10.8
%11
.7%
177,
170,
232
180,
678,
365
160,
444,
798
1,06
3,02
1,39
1 1,
084,
070,
190
962,
668,
786
24,8
73,6
43
25,3
66,1
64
22,5
25,4
92
149,
241,
857
152,
196,
983
135,
152,
950
HR
(ex
cl t
rain
ing)
4.8%
6.2%
7.7%
88,4
44,2
87
88,4
44,2
87
88,4
44,2
87
530,
665,
721
530,
665,
721
530,
665,
721
12,4
17,0
50
12,4
17,0
50
12,4
17,0
50
74,5
02,2
99
74,5
02,2
99
74,5
02,2
99
TO
TAL
(N
$)10
0.0%
100.
0%10
0.0%
1,91
9,89
3,33
7 1,
554,
121,
479
1,30
5,77
9,79
2 11
,519
,360
,022
9,
324,
728,
872
7,83
4,67
8,75
3
TO
TAL
(U
S$)
26
9,54
1,56
3 21
8,18
9,37
7 18
3,32
3,68
7 1,
617,
249,
375
1,30
9,13
6,26
4 1,
099,
942,
123

41
GD
P an
d G
over
nmen
t Ex
pend
�ture
% T
otal
RN
E pe
r G
DP
and
Gvt
exp
end�
ture
and
% H
ealth
se
ctor
RN
E/M
oHSS
exp
end�
ture
GD
P (m
�ll�o
n, 2
005)
N$3
8,74
4 N
$38,
744,
000,
000
5.0%
4.0%
3.4%
$5
,439
Gvt
exp
end�
ture
(m
�ll�o
n, 2
005)
N$1
2,70
0 N
$12,
700,
000,
000
15.1
%12
.2%
10.3
%
$1
,783
MoH
SS P
ubl�c
Hea
lth
Expe
nd�tu
re (
PHE)
(m
�ll�o
n, 2
005/
06)
N$1
,335
N
$1,3
34,8
58,6
37
68.5
%65
.8%
54.5
%
$1
87
Per
cap
ita
Hea
lth
E
xpen
dit
ure
Tot
al p
er c
ap�ta
N$1
,446
$2
03
Publ
�c p
er c
ap�ta
N$1
,007
$1
41
Per
capi
ta A
IDS
RN
E
Hig
hM
ediu
mL
ow

42
Per
cap
ita
Hea
lth
E
xpen
dit
ure
H
�gh
scen
ar�o
Med
�um
sc
enar
�oLo
w s
cena
r�o
Ave
rage
Ann
ual R
esou
rce
Nee
ds E
st�m
ate
(200
7-20
12, m
�ll�o
n)N
$1,9
20
N$1
,554
N
$1,3
06
$2
70$2
18$1
83
GD
P (2
005,
m�ll
�on)
N$3
8,74
4
$5
,439
Ave
rage
Ann
ual R
esou
rce
Nee
ds E
st�m
ate
as %
of
GD
P5.
0%4.
0%3.
4%
Gov
ernm
ent
expe
nd�tu
re
(200
5, m
�ll�o
n)N
$12,
700
$1
,783
Ave
rage
Ann
ual R
esou
rce
Nee
ds E
st�m
ate
as %
of
Gvt
exp
end�
ture
15%
12%
10%

43
Per
cap
ita
Hea
lth
E
xpen
dit
ure
H
�gh
scen
ar�o
Med
�um
sc
enar
�oLo
w s
cena
r�o
Per
cap�
ta A
vera
ge A
nnua
l R
esou
rce
Nee
ds E
st�m
ate
(200
7-20
12)
N$9
18
N$7
44
N$6
25
$1
29$1
04$8
8
Per
cap�
ta A
vera
ge A
nnua
l R
NE
for
heal
th s
ecto
r (2
007-
2012
)N
$423
N
$406
N
$337
$5
9$5
7$4
7
Per
cap�
ta T
otal
Hea
lth
Expe
nd�tu
re (
1999
-200
0)N
$858
$1
41
Per
cap�
ta A
vera
ge A
nnua
l R
NE
for
Hea
lth S
ecto
r (2
007-
12)
as %
of T
HE
49%
47%
39%
%
Ave
rage
Ann
ual R
NE
for
Hea
lth
Sect
or (
2007
-12)
as
% o
f MoH
SS P
HE
(200
5/06
)68
%66
%
55%

44
Ap
pen
dix
II. M
TP
-III
Co
mp
on
ents
, Pro
gra
mm
e A
reas
& M
ain
Sec
tors
Fig
ure
9: M
TP
III N
atio
nal
Pro
gra
mm
e G
oal
s
MTP
3 III
Na
tiona
l Pro
gra
mm
e G
oa
l
55
2Pr
eve
ntio
n1
Ena
blin
g E
nviro
nme
nt
5Pr
og
ram
me
Ma
nag
em
ent
3Tr
ea
tme
nt, C
are
, & S
upp
ort
1.1
C
ap
ac
ity d
eve
lop
me
nt:
Le
ad
ers
hip
1.1.
1 Su
sta
ine
d le
ad
ers
hip
c
om
mitm
en
t
1.3
Po
licy
& la
w re
form
1.3
1 N
atio
na
l po
licy
De
velo
pm
en
t &
law
re
form
1.3.
2 Se
cto
ral &
In
stitu
tion
alp
olic
ies
1.4
In
terv
en
tion
s to
red
uc
e s
tigm
a
disc
rimin
atio
n
1.4.
1 So
cia
l mo
bili
satio
n t
o
co
mb
at
dis
crim
ina
tion
1.4.
2 A
ctio
ns
to p
reve
nt
&
ad
dre
ss d
isc
rimin
atio
n
2.1
Ca
pa
city
de
velo
pm
en
t:
pre
ven
tion
2.2
Ta
rge
t vu
lne
rab
le p
op
ula
tion
s
2.1.
1 C
ap
ac
ity d
eve
lop
me
nt
2.3
Ta
rge
t yo
un
g p
eo
ple
2.2.
1 Ta
rge
t BC
I fo
r vu
lne
rab
le
po
pu
latio
ns
2.2.
2 P
reve
ntio
n o
f tra
nsm
issio
n
in h
ea
lth c
are
se
ttin
gs
2.4
Ta
rge
t th
e g
en
era
l po
pu
latio
n
2.4.
1 So
cia
l mo
bili
satio
n &
a
wa
ren
ess
2.
4.2
Wo
rkp
lac
e p
rog
ram
me
s 2.
4.3
Exp
an
d c
on
do
m
pro
visi
on
2.
4.4
Stre
ng
the
n S
TI
ma
na
ge
me
nt
2.4.
5 V
olu
nta
ry c
ou
nse
llin
g &
te
stin
g
2.4.
6 Sa
fety
of b
loo
d
tra
nsf
usi
on
pro
du
cts
3.1
Ca
pa
city
de
velo
pm
en
t: T
rea
tme
nt,
c
are
an
d s
up
po
rt
3.1.
1 C
ap
ac
ity
D
eve
lop
me
nt
3.1.
2 IE
C t
o s
up
po
rt e
xpa
nd
ed
tr
ea
tme
nt,
ca
re &
su
pp
ort
p
rog
ram
me
s
3.2.
1 La
bo
rato
ry s
erv
ice
s fo
r H
IV/A
IDS
ma
na
ge
me
nt
3.2.
2 D
rug
s &
su
pp
lies
sys
tem
s
3.2.
3 P
MTC
T+ s
erv
ice
s
3.2.
4 M
an
ag
em
en
t o
f
op
po
rtu
nis
tic in
fec
tion
s
3.2.
5 C
olla
bo
rativ
e T
B/H
IV/A
IDS
serv
ice
s
3.2.
6 P
rovi
sion
of H
AA
RT
3.2.
7 H
om
e-b
ase
d c
are
3.2.
8 A
cc
ess
to
ca
re fo
r vu
lne
rab
le
po
pu
latio
ns
4.3.
1Ad
dre
ssin
g p
ove
rty,
fo
od
se
cu
rity,
nu
triti
on
&
ho
usi
ng
5.1
De
velo
pin
g o
f HIV
/AID
S m
an
ag
em
en
t c
ap
ac
ity
5.1.
1 H
um
an
reso
urc
e p
lan
nin
g
5.1.
2 H
um
an
reso
urc
e
de
velo
pm
en
t 5.
1.3
Qu
alit
y a
ssu
ran
ce
5.1.
4 C
ap
ac
ity d
eve
lop
me
nt
of
serv
ice
pro
vid
ers
5.2.
1 M
an
ag
em
en
t st
ruc
ture
s
5.2
.2 R
eso
urc
e m
ob
ilisa
tion
& fl
ow
me
ch
an
ism
s 5
.2.3
Info
rma
tion
flo
ws
5.2
.4 M
ain
stre
am
ing
5.2
.5 M
an
ag
em
en
t p
roc
ess
es
5.3
Pro
gra
mm
e m
on
itorin
g &
e
valu
atio
n
5.4.
1 M
ult
i-se
cto
ral
HIV
/AID
S
rese
arch
co
ord
ina
tio
n
5.4.
2 Su
rve
illa
nc
e &
Re
sea
rch
5.2
Ma
na
ge
me
nt
& c
o-o
rdin
atio
n
5.3.
1 M
on
itorin
g &
eva
lua
tion
3.2
Tre
atm
en
t a
nd
Ca
re s
erv
ice
s
5.4
Surv
eill
an
ce
an
d o
pe
ratio
na
l re
sea
rch
2.3.
1 BC
I in
sc
ho
ols
2.3.
2 BC
I fo
r yo
uth
1.2
PL
WH
A in
volv
em
en
t
1.2.
1 In
cre
ase
p
art
icip
atio
n
2.5
Inte
rve
ntio
ns
to re
du
ce
V
uln
era
bili
ty
2.5
.1 A
dd
ress
ing
vu
lne
rab
ility
4.2
Serv
ice
s fo
r OV
C &
PL
WH
A
4.3
Ad
dre
ssin
g p
ove
rty
4Im
pa
ct M
itig
atio
n
4.1
Ca
pa
city
de
velo
pm
en
t:
Loc
al r
esp
on
ses

45
Tabl
e 10
. Mai
n S
ecto
rs in
th
e M
ult
i-S
ecto
ral R
esp
on
se
Min
istr
y o
r S
ecto
rEx
ampl
es o
f Pro
gram
s, A
ct�v
�t�es
and
Inte
rven
t�ons
All
Sec
tors
& O
ffice
of
the
Pri
me
Min
iste
r an
d N
atio
nal
Pla
nn
ing
Wor
kpla
ce �n
terv
ent�o
ns +
Ma�
nstr
eam
�ng
Ed
uca
tio
n
You
th L
�fe S
k�lls
Pro
gram
IEC
,BC
C,S
oc�a
l Mob
�l�sa
t�on
(ma�
nly
c�v�
l soc
�ety
)Sc
hool
Fee
Exe
mpt
�ons
for
OV
C L
earn
ers
(thr
ough
Sch
ool
Dev
elop
men
t Fu
nd)
Loan
s fo
r fo
rmal
tra
�n�n
g fo
r se
lect
ed h
ealth
pro
fess
�ona
lsSc
hool
Fee
d�ng
Pro
gram
for
OV
C L
earn
ers
Agr
icu
ltu
reFo
od S
uppo
rt fo
r PL
WH
As
Food
gar
dens
Gen
der
an
d S
oci
al W
elfa
reG
rant
s fo
r O
VC
(M
a�nt
enan
ce; F
oste
r C
are;
Ch�
ldre
n H
ome
Subs
�d�e
s; P
lace
of S
afet
y) a
nd O
VC
Foo
d Su
ppor
t
Reg
ion
al a
nd
Lo
cal G
over
nm
ent
Reg
�ona
l Sup
port
Lab
or
and
So
cial
Wel
fare
D�s
ab�l�
ty g
rant
s to
PLW
HA
s
Info
rmat
ion
an
d B
road
cast
ing
IEC
/BC
C/S
M: M
ass
Med
�a, T
arge
ted
Cam
pa�g
ns
Hea
lth
an
d S
oci
al S
ervi
ces
AR
T, C
&T
, PM
TC
T, H
BC, P
sych
osoc
�al s
uppo
rt, P
all�a
t�ve
Car
e, P
EP,
Inje
ct�o
n Sa
fety
, Blo
od S
afet
y, L
oans
for
form
al t
ra�n
�ng
for
heal
th
prof
ess�
onal
s
NA
BC
OA
Wor
k Pl
ace
prog
ram
mes
for
pr�v
ate
sect
or
NA
NA
SO
C�v
�l so
c�et
y co
ord�
nat�o
n (H
BC, N
utr�
t�on,
IEC
/BC
C/S
M &
OV
C
supp
ort)
, mon
�tor�
ng a
nd e
valu
at�o
n c�
v�l s
oc�e
ty,
LIR
ON
GA
EPA
RU
PLW
HA
s co
ord�
nat�o
n, b
uddy
sup
port

46
Ap
pen
dix
III
. Co
nsu
ltat
ive
Mee
tin
g A
tten
dan
ce L
ist
Att
end
ance
Lis
t o
f C
on
sen
sus
Bu
ildin
g an
d S
cen
ario
Set
tin
gT
he
Rev
ised
MT
P I
II C
ost
ing
Exe
rcis
e14
& 1
5 Fe
bru
ary
2007
at
GZ
Co
nfe
ren
ce C
entr
e
Org
an�z
at�o
n N
ame
T�tl
eW
ork
Phon
eC
ellp
hone
Ema�
l Nam
e
MoH
SSD
r. N
orbe
rt F
orst
erU
nder
secr
etar
y, N
AEC
Cha
�r20
3203
808
1128
4273
nfor
ster
@m
hss.
gov.
na
MoH
SSM
s. E
lla S
h�he
poD
�rec
tor,
DSP
2032
273
0811
2214
06sh
�hep
oe@
naco
p.ne
t
MoH
SSD
r. M
arcu
s G
oras
ebD
eput
y D
�rec
tor,
HSR
2032
272
0812
6912
05go
rase
bm@
naco
p.ne
t
MoH
SSM
s Be
rtha
Kat
j�ven
aD
ep. D
�rec
tor:
PP&
HR
D20
3250
208
1128
3491
bkat
j�ven
a@m
hss.
gov.
na
MR
LGH
RD
Fenn
�-F N
auya
laD
eput
y D
�rec
tor
2975
019
fnau
yala
@m
rlgh
.gov
.na
MG
ECW
Ms.
Hel
ena
And
jam
baD
eput
y D
�rec
tor-
Ch�
ld W
elfa
re28
3316
708
1252
6806
hand
jam
ba@
mge
cw.g
ov.n
a
MIB
R�th
a Jo
do
Med
�a O
ffice
r 28
3911
1�ld
efon
s�na
@ya
hoo.
com
MA
WF
Ms
Uae
ta M
uzum
aC
ha�r
AID
S C
omm
�ttee
2087
622
muz
umay
@m
awrd
.gov
.na
MoL
SWM
r. T
j�kuz
u T
j�rar
akan
ua
Insp
ecto
r In
dust
r�es
20
6611
1un
t@w
eb.c
om.n
a
MoL
SWM
r. K
ay S
trau
ssSy
stem
s A
dm�n
�str
ator
2066
310
0812
7192
95ks
trau
ss@
mol
.gov
.na
NA
NA
SOM
r. M
�cha
el M
ulon
doN
at�o
nal C
oord
�nat
or26
1122
0812
48 3
272
coor
d�na
tor@
nana
so.c
om
Nam
Red
Cro
ssM
s. D
�ana
E.Iy
ambo
O
VC
Nat
�ona
l Coo
rd�n
ator
23
5226
Nat
prog
-ovc
@re
dcro
ss.o
rg.n
a
NA
BCO
AM
r. P
eter
Van
Wyk
Pr
ogra
mm
e M
anag
er37
8750
0812
6327
03pj
vanw
yk@
afr�
caon
l�ne.
com
.na
MoH
SS/D
SP/E
CD
r. Je
anet
te D
e Pu
tter
EC S
en�o
r T
ech.
Adv
�sor
(K
IT)
2032
830
0812
0927
57de
putt
erj@
naco
p.ne
t
CD
CD
. Bro
ssar
d
Dep
uty
D�r
ecto
r22
4149
brou
ssar
dd@
naco
p.ne
t
MoH
SSM
r. A
bner
Xoa
gub
Ch�
ef H
ealth
Pro
gram
2032
825
0812
5248
13xo
agub
a@na
cop.
net
MoH
SSM
s Sa
ndra
Ow
oses
Ch�
ef H
ealth
Pro
gram
2032
289
0811
2728
01ow
oses
s@na
cop.
net
MoH
SS/D
SP/E
CM
r. H
erm
en O
rmel
Reg
�ona
l Tec
hn�c
al A
dv�s
or20
3228
208
1285
7250
orm
elh@
naco
p.ne
t
CD
CA
. Bla
ke22
4149
hbla
ke@
naco
p.ne
t
CD
CM
ark
Dam
esyn
TA
-HIS
2241
49
dam
esyn
m@
naco
p.ne
t
MoH
SS/G
FFl
oren
ce S
oros
esPr
ojec
t C
oord
�nat
or20
3273
1fs
oros
es@
glob
alfu
nd.c
om.n
a
Cap
ac�ty
Emad
Az�
zC
apac
�ty P
roje
ct30
3799
eaz�
z@�n
trah
ealth
.org
MoH
SS/F
HD
M.D
�erg
aard
tC
HPA
2032
725

47
Ap
pen
dix
III
. Co
nsu
ltat
ive
Mee
tin
g A
tten
dan
ce L
ist
- co
nti
nued
Att
end
ance
Lis
t o
f C
on
sen
sus
Bu
ildin
g an
d S
cen
ario
Set
tin
gT
he
Rev
ised
MT
P I
II C
ost
ing
Exe
rcis
e14
& 1
5 Fe
bru
ary
2007
at
GZ
Co
nfe
ren
ce C
entr
e
Org
an�z
at�o
n N
ame
T�tl
eW
ork
Phon
eC
ellp
hone
Ema�
l Nam
e
MoH
SS/D
SPD
alle
en W
�tboo
�M
EO22
4149
w�tb
oo�d
@na
cop.
net
MoH
SS/D
SPD
r.K
.Mas
upu
TA
– M
on�to
r�ng
and
Eva
luat
�on
2241
49m
asup
uk@
cdc.
gov
MoH
SS/D
SPD
umen
� Eph
ra�m
Stat
�st�c
�an
2241
49du
men
�e@
naco
p.ne
t
MoH
SS/D
SPA
nna
Jona
sC
HPA
2032
828
jona
sa@
naco
p.ne
t
Proj
ect
Hop
eA
�na
Ngh
�pan
gelw
aA
dm�n
Ass
�sta
nt37
7 85
4H
ope_
ovc_
pm@
�way
.na
MoH
SSIn
dong
o La
zaru
sPh
arm
ac�s
t23
818
l�ndo
ngo@
mhs
s.go
v.na
SMA
El�z
e B�
erm
ann
Coo
rd�n
ator
244
936
El�z
e.b�
erm
ann@
sma.
org.
na
Phar
m S
erv�
ces
Phar
m-I
dr�s
AR
T L
og�s
t�cs
Phar
mac
�st
2331
51r�
dr�s
@cm
s-na
m�b
�a.c
om
USA
IDT
.Kop
penh
aver
Mon
�tor�
ng a
nd E
valu
at�o
n A
dv�s
ortk
oppe
nhav
er@
usa�
d.or
g
NA
SOM
AR
.de
Kle
rkBo
okke
eper
2564
27R
oman
d�.d
ekle
rk@
naso
ma.
com
NA
SOM
AE.
Ne�
del
HR
,Adm
�n &
Sal
es M
anag
er25
6427
elm
ar�e
@na
som
a.co
m
UR
CL.
N�s
bet
Dep
uty
Coo
rd�n
ator
0811
2969
43ly
d�aN
@ur
c-na
.com
RPM
+M
SHD
av�d
Mab
�r�u
Sen�
or T
echn
�cal
Adv
�sor
2280
16dm
ab�r
�u@
msh
.org
.na
CH
SD
.M.K
angu
d�e
Ch�
ef M
ed�c
al O
ffice
r24
8365
kang
ud�e
@�w
ay.n
a
WH
OO
lufe
m� O
keH
IV/A
IDS
Cou
ntry
Offi
cer
2046
335
oke@
na.a
fro.
who
.�nt
NA
SOM
AO
t�l�e
Lam
bert
Proj
ect
Man
ager
2564
27ot
�l�e@
naso
ma.
com
MoH
SS/D
SPSa
ra F
ulle
rN
A V
CT
Pro
g C
oord
�nat
or20
3287
3fu
llers
@na
cop.
net
UN
ICEF
Ta�
m� A
maa
mbo
Proj
ect
Offi
cer
2046
208
tam
aam
bo@
un�c
ef.o
rg
MoH
SS/G
FW
.Hau
s�ku
Man
ager
--C
ondo
ms
2032
875
haus
�kuw
@na
cop.
net
MoH
SS/C
DC
Ed�n
gton
Dz�
noty
�wey
�T
A -
VC
T20
3287
4dz
�not
y�w
ey�e
@na
cop.
net
MoH
SS/D
SPFr
ans�
na T
j�tuk
aN
urs�
ng C
oord
�nat
or20
3286
9tj�
tuka
@na
cop.
net
Futu
res
Gro
upG
ayle
Mar
t�nSe
n�or
Eco
nom
�st
gmar
t�n@
futu
resg
roup
.com
KIT
Gro
upF�
ll�p
Meh
eus
Hea
lth E
cono
m�s
tf.m
eheu
s@k�
t.nl
MR
LGH
RD
Er�c
a N
d�ye
paD
PSen
d�ye
pa@
mrl
gh.g
ov.n
a
SMA
L�ez
el W
olm
aran
sR
esea
rch
Man
ager
2449
36L�
ezel
.wol
mar
ans@
sma.
org.
na
MoH
SSH
CR
Beu
kes
Dep
uty
D�r
ecto
r20
3222
0hb
euke
s@m
hss.
gov.
na
NA
SOM
ASa
b�na
Ngh
�yol
wa
Wor
kpla
ce25
6427
Sab�
na@
naso
ma.
com

48
Ap
pen
dix
III
. Co
nsu
ltat
ive
Mee
tin
g A
tten
dan
ce L
ist
- co
nti
nued
Att
end
ance
Lis
t o
f C
on
sen
sus
Bu
ildin
g an
d S
cen
ario
Set
tin
gT
he
Rev
ised
MT
P I
II C
ost
ing
Exe
rcis
e14
& 1
5 Fe
bru
ary
2007
at
GZ
Co
nfe
ren
ce C
entr
e
Org
an�z
at�o
n N
ame
T�tl
eW
ork
Phon
eC
ellp
hone
Ema�
l Nam
e
UR
CFr
antz
S�m
eon
Ch�
ef o
f Par
ty23
7022
fran
tzs@
urc-
nam
.com
SCM
SJo
seph
Ng�
dar�
Lead
Res
�den
t A
dv�s
or22
8016
jng�
dar�
@pf
scm
.org
MoH
SS/D
SPA
nnat
j�e T
ob�a
sC
HP
2032
277
tob�
asa@
naco
p.ne
tW
HO
Tuo
yo O
koro
sobo
Hea
lth E
cono
m�s
t20
4633
6ok
oros
obot
@na
.afr
o.w
ho.�n
tM
oHSS
/DSP
S.K
.Tob
�as
SHPA
2032
871
tob�
ass@
naco
p.ne
tM
oHSS
/DSP
I.C.P
�ete
rsen
Ass
VC
T C
oord
�nat
or20
3787
4p�
eter
sen�
@na
cop.
net
MoH
SSD
.J.T
j�ho
AG
D�r
TH
C+
CSS
2032
391
dtj�h
o@m
hss.
gov.
naW
HO
Jam
es C
h�ts
vaM
R T
ech
Offi
cer
2046
337
ch�ts
vaj@
na.a
fro.
who
.�nt
MoH
SS/D
SPW
�lhel
m�n
a K
afith
aSH
PA O
I & P
C20
3286
7ka
fitha
w@
naco
p.ne
tM
oHSS
/DSP
Patr
�ck
G�th
endu
Phar
mac
�st
2032
863
g�th
endu
p@na
cop.
net
NA
NA
SOEl
�eze
r H
ambu
ree
Offi
cer
2611
22e.
ham
bure
e@na
naso
.com
L�fe
L�ne
Sum
�tra
M.
D�r
ecto
r: F
�nan
ce &
Adm
�n22
6889
sum
�tra@
l�fel
�ne.
org.
naU
NIC
EFM
atth
ew D
ally
P.O
.OV
IS20
4611
1m
dall�
ng@
un�c
ef.o
rgO
PMA
. Kes
sler
PHR
M28
7315
4ak
essl
er@
opm
.gov
.na
GT
ZLa
uckn
er K
athr
�ne
Prog
ram
me
Man
ager
2032
761
Kat
hr�n
.lauc
kner
@gt
z.de
NA
NA
SOL.
Lars
dott
erN
utr�
t�on
Adv
�sor
2611
22nu
tr�t�
on@
nana
so.c
omM
oHSS
/DSP
L.N
.Indo
ngo
Phar
mac
�st
2032
348
l�ndo
ngo@
mhs
s.go
v.na
UN
DP
B.O
.Kor
ante
ngSe
n�or
Pol
�cy
Adv
�sor
2046
234
beya
m.a
fron
.kor
ante
ng@
undp
.org
MoH
SS/D
SPJu
l�et
Kar
�rao
CH
PA-M
a�ns
trea
m�n
g20
3227
6ka
r�ra
oj@
naco
p.ne
tM
GEC
WLu
c�a
E�se
sC
ontr
ol S
oc�a
l Wor
ker
2833
182
le�s
es@
mge
cw.g
ov.n
aW
FPM
all�k
a A
lulu
aPr
ogra
mm
e O
ffice
r20
4640
1M
all�k
a.ah
luw
al�a
@w
fp.o
rgPE
PFA
RC
la�r
e D
�lla
Sen�
or L
�a�s
on27
3753
cd�ll
vou@
usa�
d.go
vA
CT
Jul�a
Am
ukw
aya
Sen�
or C
ouns
elor
2595
90ja
muk
way
a@a�
dsca
re.c
omU
ND
PSa
rah
Mw
�l�m
aN
at�o
nal P
rogr
am O
ffice
r20
4632
6Sa
rah.
mw
�l�m
a@un
dp.o
rgO
PMEm
elda
Uch
amL�
a�so
n O
ffice
r28
7501
1eu
cham
@op
m.g
ov.n
aM
GEC
WBr
�g�tt
e N
sh�m
y�m
ana
Soc�
al W
orke
r28
3313
7br
�uza
@ya
hoo.
com
MoH
SS/D
SPG
ebha
rdt
T�m
othe
usC
HPA
2032
829
t�mot
heus
g@na
cop.
net
MoH
SS/P
HC
A�r
a Sh
�kua
mb�
CH
PA-C
BHC
2032
723
ash�
kuam
b�@
glob
alfu
nd.c
om.n
a

49
Ap
pen
dix
III
. Co
nsu
ltat
ive
Mee
tin
g A
tten
dan
ce L
ist
- co
nti
nued
Att
end
ance
Lis
t o
f C
on
sen
sus
Bu
ildin
g an
d S
cen
ario
Set
tin
gT
he
Rev
ised
MT
P I
II C
ost
ing
Exe
rcis
e14
& 1
5 Fe
bru
ary
2007
at
GZ
Co
nfe
ren
ce C
entr
e
Org
an�z
at�o
n N
ame
T�tl
eW
ork
Phon
eC
ellp
hone
Ema�
l Nam
eO
PMK
apen
da M
aren
gaPr
ojec
t M
anag
er28
7301
9km
aren
ga@
opm
.gov
.na
MoH
SS/D
SPU
akur
ama
K.A
mbr
os�u
sC
HPA
2032
276
0813
17 7
945
uaku
ram
aa@
naco
p.ne
tM
oHSS
/EC
Mar
l�na
Kus
chSe
n�or
Pro
ject
Sec
reta
ry20
3227
5ku
schm
@na
cop.
net

50
Wo
rkin
g G
rou
p M
emb
ers
NA
ME
DES
IGN
AT
ION
OFF
ICE
PHO
NE
OFF
ICE
FAX
MO
BILE
E-M
AIL
CO
ST
ING
WK
GR
OU
P
Mr.
Ab
ner
Xo
agu
bM
oHSS
/DSP
Ch�
ef: E
nars
2032
825
2241
5508
1 25
2 48
13xo
agub
a@na
cop.
net
Ms
Jean
ette
de
Pu
tter
Sen�
or T
A -
MoH
SS/D
SP/E
C20
3283
022
4155
081
209
2757
depu
tter
j@na
cop.
net
Mr.
Uak
ura
ma
Am
bro
siu
sM
oHSS
– D
SP -
RM
DC
2032
276
2241
5508
1 31
7 79
45ua
kura
maa
@na
cop.
net
Ms.
A. N
itsc
hke
MoH
SS/D
SP/R
MD
C20
3227
822
4155
081
1490
038
n�ts
chke
a@na
cop.
net
Dr.
No
rber
t Fo
rste
rU
nder
Sec
reta
ry: M
oHSS
2032
038
081
128
4273
nfor
ster
@m
hss.
gov.
na
Dill
avo
u C
lair
eD
eput
y PE
PFA
R C
oord
�nat
or27
3753
081
122
1844
cd�ll
avou
@us
a�d.
gov
Fein
ber
g M
adel
ein
eU
SAID
Nam
�b�a
M &
E A
dv�s
or27
3740
081
127
3023
Mfe
�nbe
rg@
usa�
d.go
v
Ms.
Ju
liet
Kar
irao
MoH
SS/D
SP M
a�ns
trea
m�n
g20
3227
622
4155
081
228
4714
kar�
raoj
@na
cop.
net
Ms.
E.S
hih
epo
MoH
SS/D
SP: D
�rec
tor
2032
273
2241
5508
1 12
2 14
06sh
�hep
oe@
naco
p.ne
t
Mr.
Meh
eus
Fili
pR
oyal
Tro
p�ca
l Ins
t�tut
e, A
mst
erda
m20
3283
022
4155
f.meh
eus@
k�t.n
l
Ms.
Gay
le M
arti
nFu
ture
s G
roup
2032
830
2241
55gm
art�n
@fu
ture
sgro
up.c
om
Mr.
Den
nis
Wee
ksU
SG P
EPFA
R C
oord
�nat
or27
3713
081
129
4082
wee
ksd@
stat
e.go
v
PM
TC
T W
ork
ing
Gro
up
Ms.
Flo
ren
ce S
oro
ses
PMT
CT
/Glo
bal F
und
2032
731
2349
5608
1 12
7 91
12fs
oros
es@
glob
alfu
nd.c
om.n
a
Mar
k N
eth
erd
aC
DC
2241
4922
6959
081
309
4457
neth
erda
m@
na.c
dc.g
ov
Dr.
Mag
ari
CD
C
M.D
ierg
aard
tM
oHSS
– P
HC
- F
HD
2032
725
Tuoy
o O
koro
sob
oW
HO
Hea
lth E
cono
m�s
t20
4633
6ok
oros
obot
@na
.afr
o.w
ho.�n
t
VC
T W
ork
ing
Gro
up
Ms.
Ism
eld
a P
iete
rsen
VC
T C
oord
�nat
or20
3287
230
0539
081
124
3688
p�
eter
sen�
@na
cop.
net
Ms.
Sar
a F
ulle
rV
CT
Coo
rd�n
ator
2032
873
3005
3908
1 24
3 40
32fu
llers
@na
cop.
net
Mr.
Ed
ingt
on
Dzi
no
tyiw
eyi
TA
-V
CT
2032
828
3005
3908
1 23
9 99
93dz
�not
y�w
ey�e
@na
.cdc
.gov
Ms.
Lie
zel W
olm
aran
sR
esea
rch
Man
ager
L�ez
el.w
olw
eran
s@sm
a.or
g.na

51
AR
T W
ork
ing
Gro
up
Dr.
Mar
cus
!Go
rase
bH
SR: D
eput
y D
�rec
tor
2032
868
3005
3908
1 26
9 12
05go
rase
bm@
naco
p.ne
t
Ms.
Ria
Bo
ckH
SR -
CH
PA -
HIV
-AID
S20
3286
730
0539
081
269
8392
bock
m@
naco
p.ne
t
Dr.
Nd
apew
a H
amu
nim
eSe
n�or
Med
�cal
Offi
cer
2032
864
3005
3908
1 12
4 87
35ha
mun
�meh
@na
cop.
net
Mr.
Pat
rick
Git
hen
du
Phar
mac
�st
2032
863
3005
3908
1 30
2 16
52g�
then
dup@
naco
p.ne
t
Ms.
Daw
n B
rou
ssar
dC
DC
: Dep
uty
D�r
ecto
r22
4149
brou
ssar
dd@
naco
p.ne
t
A. B
lake
CD
C22
4149
hbla
ke@
naco
p.ne
t
Em
ad A
ziz
Cap
ac�ty
Pro
ject
3037
99ea
z�z@
�ntr
ahea
lth.o
rg
Dav
id M
abir
iuR
PM+
MSH
Sen
�or
Tec
hn�c
al A
dv�s
or22
8016
dmab
�r�u
@m
sh.o
rg.n
a
D.M
.Kan
gud
ieC
HS:
Ch�
ef M
ed�c
al O
ffice
r24
8365
kang
ud�e
@�w
ay.n
a
H.C
.R.B
euke
sD
eput
y D
�rec
tor:
MoH
SS20
3222
0hb
euke
s@m
hss.
gov.
na
Po
licy
& P
lan
nin
g W
G
Ms.
Van
Zyl
Act
�ng
DD
: HR
D/P
P20
3253
527
2286
081
3044
789
vanz
yle@
mhs
s.go
v.na
Ms.
Ham
ana
Con
trol
Offi
cer
2032
511
2722
8608
1 24
81 4
73m
pham
ana@
mhs
s.go
v.na
Ms.
Ber
tha
Kat
jiven
aD
eput
y D
�rec
tor:
HR
D/P
P20
3250
227
2286
081
1283
491
bkat
j�ven
a@m
hss.
gov.
na
Ms.
D.J
.Tjih
oA
G D
�r -
TH
C +
CSS
2032
391
2722
86dt
j�ho@
mhs
s.go
v.na
Tra
inin
g &
Sch
ola
rsh
ips
WG
Ms.
Cel
ine
Usi
kuM
oHSS
/HR
D20
3257
327
2286
081
1222
202
9cu
s�ku
@m
hss.
gov.
na
Ms.
Kau
too
Mu
tiru
aM
oHSS
/HR
D20
3250
627
3286
kmut
�rua
@m
hss.
gov.
na
Mr.
Pro
tasi
us
Ngh
ilen
del
eM
oHSS
/HR
D20
3250
427
4286
wab
w�t�
@ya
hoo.
com
Ms.
Julia
Nan
gom
be
MoH
SS/H
RD
2032
515
2722
8608
1 12
44 9
48ju
l�ana
ngom
be@
yaho
o.co
m
Sal
arie
s &
Ben
efits
WG
Ms.
Lyd
ia N
ash
ixw
aM
oHSS
/HR
M20
3218
122
0462
081
124
0451
lnas
h�xw
a@m
hss.
gov.
na
Mr.
A.J
.Tjip
ura
MoH
SS/H
RM
2032
184
2204
6208
1 23
6 02
49at
j�pur
a@ya
hoo.
com
CM
S:P
har
mac
euti
cal W
G
Mr.
G.H
abim
ana
Cen
tral
Med
�cal
Sto
res
(CM
S)23
3151
2364
83gh
ab�m
ana@
cms-
nam
�b�a
.com
Ms.
Sh
eeh
ama
Dia
na
Cen
tral
Med
�cal
Sto
res
(CM
S)23
3151
2364
83ds
heeh
ama@
cms-
nam
�b�a
.com
Mr.
Ph
arm
-Id
ris,
R.A
AR
T L
og�s
t�cs
Phar
mac
�st
(CM
S)23
3151
2364
8308
1 21
2 89
19r�
dr�s
@cm
s-na
m�b
�a.c
om

52
Ms.
Lem
a H
arri
etC
entr
al M
ed�c
al S
tore
s (C
MS)
2331
5123
6483
hlem
a@cm
s-na
m�b
�a.c
om
Mr.
Ind
on
go L
azar
us
MoH
SS: P
harm
ac�s
t20
3818
l�ndo
ngo@
mhs
s.go
v.na
Jose
ph
Ngh
idar
iLe
ad R
es�d
ent
Adv
�sor
: SC
MS
2280
16jn
g�da
r�@
pfsc
m.o
rg
Dis
abili
ty G
ran
ts: M
oL
&S
W
Mr.
A.E
.Biw
aD
eput
y D
�rec
tor:
MoL
&SW
2066
111
2123
2308
1 12
2 8
162
eb�w
a@m
ol.g
ov.n
a
Mr.
K.S
trau
ssSy
stem
Adm
�n�s
trat
or: M
oLSW
2066
310
2123
2308
1 27
1 92
95ks
trau
ss@
mol
.gov
.na
Mr.
Tjik
uzu
Tjir
arak
anu
aIn
spec
tor
Indu
str�
es20
6611
121
2323
unt@
web
.com
.na
Tra
inin
g W
ork
ing
Gro
up
Ms.
Th
om
as A
lber
tin
aM
oHSS
/DSP
/ T
SC20
3227
822
4155
081
229
3664
thom
asa@
naco
p.ne
t
Mr.
Tub
aun
du
le G
od
frey
MoH
SS/D
SP /
TSC
2032
277
2241
5508
1 24
6 70
55tu
baun
dule
g@na
cop.
net
Ms.
Liz
Ste
ven
sI-
TEC
H C
ount
ry D
�rec
tor
2460
8522
1391
081
287
9002
l�zo@
u.w
ash�
ngto
n.ed
u
Ms.
An
nat
jie T
ob
ias
MoH
SS/D
SP: T
SC20
3227
722
4155
tob�
asa@
naco
p.ne
t
HB
C &
Pal
liati
ve C
are
WG
Ms.
Julia
Am
ukw
aya
AC
T25
9590
2186
7308
1 29
8 41
62ja
muk
way
a@a�
dsca
re.c
om
Ms.
Ver
ie K
asu
me
CA
A23
8169
2186
6508
1 20
8 41
01ca
aka@
mw
eb.c
om.n
a
Ms.
Ngh
ixu
lifw
a Tu
afiC
AA
2763
5827
6364
081
129
2433
tuafi
@ca
a.or
g.na
Ms.
Air
a S
hik
uam
bi
MoH
SS/P
HC
2032
723
2349
6808
1 26
9 96
24sh
�kua
mb�
a@na
cop.
net
Ms.
Wilh
elm
ina
M.K
afith
aM
oHSS
/DSP
2032
867
3005
3908
1 12
9 93
10ka
fitha
w@
naco
p.ne
t
Ms.
Dia
na
Iyam
bo
NR
CS
- O
VC
- N
at C
oord
�nat
or23
5226
Nat
prog
-ovc
@re
dcro
ss.o
rg.n
a
Ro
sem
ary
Nal
isa
Nam
�b�a
Red
Cro
ss S
oc�e
ty23
5226
h�v-
a�ds
cord
@re
dcro
ss.o
rg.n
a
Fra
nsi
na
Tjit
uka
MoH
SS/H
SR: N
urs�
ng C
oord
�nat
or20
3286
930
0539
tj�tu
ka@
naco
p.ne
t
Dr.
Olu
fen
i Oke
WH
O H
IV/A
IDS
Cou
ntry
Offi
cer
2046
335
oke@
na.a
fro.
who
.�nt
Elie
zer
Ham
bu
ree
NA
NA
SO: O
ffice
r26
1122
e.ha
mbu
ree@
nana
so.c
om
Mr.
Mic
hae
l Mu
lon
do
NA
NA
SO N
at�o
nal C
oord
�nat
or26
1122
081
248
3272
coor
d�na
tor@
nana
so.c
om
TB
Wo
rkin
g G
rou
p
Ms.
Ro
salia
In
do
ngo
MoH
SS/D
SP/ T
B20
3286
722
4155
081
257
9397
�ndo
ngor
@na
cop.
net

53
Co
nd
om
s &
ST
I WG
Dr.
Mar
cus
!Go
rase
bH
SR: D
eput
y D
�rec
tor
2032
868
3005
3908
1 26
9 12
05go
rase
bm@
naco
p.ne
tM
s.S
arah
To
bia
sH
SR -
SH
PA -
ST
I Con
dom
s20
3287
130
0539
081
255
2848
tob�
ass@
naco
p.ne
tF
arir
ayi N
yam
biy
aN
ASO
MA
: Man
ager
F�n
ance
2564
2725
6424
081
291
3804
fara
�@na
som
a.co
mE
lize
Bie
rman
nSM
A C
oord
�nat
or24
4936
el�z
e.b�
erm
ann@
sma.
org.
naR
. De
Kle
rkN
ASO
MA
: Boo
kkee
per
2564
27ro
man
d�.d
ekle
rk@
naso
ma.
com
E.N
eid
elN
ASO
MA
: HR
, Adm
�n &
Sal
es M
anag
er25
7427
elm
ar�e
@na
som
a.co
mO
tilie
Lam
ber
tN
ASO
MA
: Pro
ject
Man
ager
2564
27ot
�l�e@
naso
ma.
com
W.H
ausi
kuM
oHSS
/GF:
Man
ager
Con
dom
s20
3287
530
0539
haus
�kuw
@na
cop.
net
Lie
zel W
olm
aran
sSM
A: R
esea
rch
Man
ager
2449
36l�e
zel.w
olm
aran
s@sm
a.or
g.na
Ms.
Sar
ah T
ob
ias
MoH
SS/H
SR: C
ondo
ms
2032
871
3005
39to
b�as
s@na
cop.
net
WG
On
Psy
cho
soci
al S
up
po
rtM
s.L
aura
Cro
nje
MoH
SS20
3260
908
1 28
8 34
83lc
ronj
e@m
hss.
gov.
na
Sta
tist
ics
Wo
rkin
g G
rou
pM
ark
Dam
esyn
CD
C -
TA
HIS
2241
4922
6959
081
128
0159
dam
esyn
m@
na.c
dc.g
ovM
ark
Net
her
da
CD
C22
4149
2269
5908
1 30
9 44
57ne
ther
dam
@na
.cdc
.gov
Mr.
Ph
arm
-Id
ris,
R.A
Cen
tral
Med
�cal
Sto
res(
CM
S)23
3151
2364
8308
1 21
2 89
19r�
dr�s
@cm
s-na
m�b
�a.c
om
NIP
Wo
rkin
g G
rou
pH
aro
ld T
.Kau
raG
M (
Tec
hn�c
al O
pera
t�ons
)29
5420
025
5566
081
127
5945
haro
ld.k
aura
@n�
p.co
m.n
aE
segi
el G
aeb
Man
ager
: Cor
pora
te A
ffa�r
s29
5420
025
5566
081
127
5782
eseg
�el.g
aeb@
n�p.
com
.na
Mrs
.de
Waa
l-M
iller
2954
200
2555
66
Reg
ion
al S
up
po
rt W
ork
ing
Gro
up
An
dre
w H
arri
sA
dv�s
or: M
RLG
HR
D22
2860
2228
6408
1 21
0 62
06ah
arr�
s.le
p46@
lond
on.e
duH
erm
en O
rmel
Reg
�ona
l Tec
h A
dv�s
or: M
oHSS
/DSP
2032
282
2241
5508
1 28
5 72
50or
mel
h@na
cop.
net
E.K
.Nd
iyep
aM
RLG
HR
D: D
PS29
7518
825
8131
081
128
3721
end�
yepa
@m
rlgh
.gov
.na
Ms.
E.U
.Kam
utu
ezu
MR
LGH
RD
: Ch�
ef D
evel
opm
ent
Plan
ner
2975
037
2975
279
081
270
0185
ekam
utue
zu@
mrl
gh.g
ov.n
aM
s.A
.A.C
amp
bel
lA
ccou
ntan
t: M
RLG
HR
D29
7500
829
7 51
5908
1 29
5 57
05ac
ampb
ell@
mrl
gh.g
ov.n
aM
rs.T
.N.I
iten
geSH
RP:
MR
LGH
RD
2975
104
297
5096
T��t
enge
@m
rlgh
.gov
.na
Fen
ni-
F N
auya
laD
eput
y D
�rec
tor:
MR
LGH
RD
2975
019
2975
096
fnau
yala
@m
rlgh
.gov
.na
Eri
ca N
diy
epa
MR
LGH
RD
Dep
uty
PSen
d�ye
pa@
mrl
gh.g
ov.n
a
Wo
rkp
lace
& M
ain
stre
amin
g W
GM
s.Ju
liet
Kar
irao
MoH
SS/D
SP -
Ma�
nstr
eam
�ng
2032
276
2241
5508
1 22
8 47
14ka
r�ra
oj@
naco
p.ne
t

54
Mr.
Geb
har
dt T
imo
theu
sM
oHSS
/DSP
WPP
2032
829
2241
5508
1 24
0 70
24ge
bhar
dt@
naco
p.ne
t
Mr.
A.K
essl
erO
PM28
7315
422
5076
akes
sler
@op
m.g
ov.n
a
Ms.
Hei
ta A
ina
NA
BCO
A37
8756
3787
7708
1 30
0 48
74a�
nah@
nabc
oa.o
rg
Kap
end
a M
aren
gaO
PM28
7301
908
1 23
1 30
27km
aren
ga@
opm
.gov
.na
Mat
thew
An
dre
asO
PM28
7303
128
7302
8m
andr
eas@
opm
.gov
.na
Ale
xia
Kru
g vo
n N
idd
aD
ED20
3712
8al
ex�a
.ded
@�w
ay.n
a
Mr.
Jueg
en H
aas
DED
- H
IV A
IDS
Expe
rt20
3276
108
1 28
0 24
96ha
ag.d
ed@
�way
.na
Mr.
Ab
ner
Xo
agu
bM
oHSS
/DSP
Ch�
ef: E
nars
2032
825
2241
5508
1 25
2 48
13xo
agub
a@na
cop.
net
Mr.
Pet
er v
an W
ykN
ABC
OA
3787
5037
8777
081
263
2703
pete
rj@
nabc
oa.o
rg
Sab
ina
Ngh
iyo
lwa
NA
SOM
A: W
orkp
lace
2564
27sa
b�na
@na
som
a.co
m
Kat
her
ine
Lau
ckn
erG
TZ
: Pro
gram
me
Man
ager
2032
761
kath
r�n.
lauc
kner
@gt
z.de
B.O
.Ko
ran
ten
gU
ND
P Se
n�or
Pol
�cy
Adv
�sor
2046
234
beya
m.a
fron
.kor
ante
ng@
undp
.org
Sar
ah M
wili
ma
UN
DP
Nat
�ona
l Pro
gram
Offi
cer
2046
326
sara
h.m
w�l�
ma@
undp
.org
Em
eld
a U
cham
OPM
L�a
�son
Offi
cer
2875
011
euch
am@
opm
.gov
.na
Foo
d S
ecu
rity
& N
utr
itio
n W
G
Man
fred
Men
jen
gua
Dep
uty
D�r
ecto
r: M
RLG
HR
D29
7519
022
6049
081
127
3312
mm
enje
ngua
@m
rlgh
.gov
.na
Lin
da
Lar
sdo
tter
Nut
r�t�o
n A
dv�s
or: N
AN
ASO
2611
2226
1778
081
232
5791
nutr
�t�on
@na
naso
.com
Pau
lina
Sh
iyel
eken
iPr
ojec
t C
oord
�nat
or: M
AW
F H
ort�c
ultu
re20
8746
320
8778
608
1 21
6 40
73sh
�yel
eken
�p@
maw
rd.g
ov.n
a
Alb
ert
Foss
oPr
ojec
t C
oord
�nat
or: F
AO
2765
6327
6552
081
213
9240
albe
rt.fo
sso@
ho00
.hsw
.ch
Uae
ta M
uzu
ma
HIV
/AID
S Fo
cal P
erso
n -
MA
WF
2087
622
2087
594
081
253
9971
muz
umau
@m
awrd
.gov
.na
Bat
on
Osm
ani
UN
WFP
: Hea
d of
Pro
gram
me
2046
364
2047
065
081
303
6371
bato
n.os
man
�@w
fp.o
rg
Mal
lika
Alu
lua
WFP
: Pro
gram
me
Offi
cer
2046
401
mal
l�ka.
alul
ua@
wfp
.org
Inje
ctio
n S
afet
y &
PE
P C
ost
ing
WG
Fra
ntz
Sim
eon
UR
C23
7022
081
203
3814
Fran
tzS@
urc-
na.c
om
Ida
Bo
uw
erU
RC
2370
22Id
aB@
urc-
na.c
om
L.N
isb
etU
RC
: Dep
uty
Coo
rd�n
ator
081
129
6943
lyd�
an@
urc-
na.c
om
Jam
es C
hit
sva
WH
O: M
R T
echn
�cal
Offi
cer
2046
337
ch�ts
vaj@
na.a
fro.
who
.�nt
Bo
od
Tra
nsf
usi
on
Ser
vice
s (B
TS
) WG
Mrs
.C.J
.Go
uw
sA
dm�n
Man
ager
: NA
MBT
S22
5851
2258
54cg
ouw
s@bt
s.co
m.n
a
Mrs
.R.M
osi
ane
Lab
Man
ager
: NA
MBT
S22
5851
2258
54rk
mos
�ane
@bt
s.co
m.n
a

55
OV
C W
ork
ing
Gro
up
Mat
thew
Dal
lint
PO -
OV
Cs
- U
NIC
EF20
4611
120
4620
608
1 33
7 37
07m
dall�
ng@
un�c
ef.o
rgD
ori
s R
oo
sPO
- C
h�ld
Pro
tect
�on
- U
NIC
EF20
4625
220
4620
608
1 27
6 88
65dr
oos@
un�c
ef.o
rgB
rigi
tte
Nsh
imyi
man
aSo
c�al
Wor
ker
- M
GEC
W28
3313
722
9569
081
237
4468
br�g
uza@
yaho
o.co
mC
eles
te Z
aah
lC
ontr
ol S
oc�a
l Wor
ker
- M
GC
EW28
3317
922
9569
081
241
4165
cele
stez
@m
gecw
.gov
.na
Joyc
e N
aku
taC
ontr
ol S
oc�a
l Wor
ker
- M
GC
EW28
3316
422
9569
jnak
uta@
mge
cw.g
ov.n
aR
olle
tte
Bes
sin
ger
Prog
ram
Man
ager
- C
AFO
2695
7226
9574
081
290
2096
prog
ram
cafo
@�w
ay.n
aH
elen
a A
nd
jam
ba
Act
�ng
D�r
ecto
r -
MG
CEW
2833
167
2295
6908
1 12
9 52
19ha
ndja
mba
@m
gecw
.gov
.na
Lu
cia
Eis
esM
GC
EW -
Con
trol
Soc
�al W
orke
r28
3318
2le
�ses
@m
gecw
.gov
.na
Ms.
Ain
a N
ghip
ange
lwa
Adm
�n A
ss�s
tant
: Pro
ject
Hop
e37
7854
Hop
e_ov
c_pm
@�w
ay.n
aTa
imi A
maa
mb
oU
NIC
EF P
roje
ct O
ffice
r20
4620
8ta
maa
mbo
@un
�cef
.org
Su
mit
ra M
L�fe
L�ne
: D�r
ecto
r F�
nanc
e &
Adm
�n22
6889
sum
�tra@
l�fel
�ne.
org.
na
M &
E W
ork
ing
Gro
up
Dal
leen
Wit
bo
oi
MoH
SS/D
SP M
on�to
r�ng
and
Eva
luat
�on
Offi
cer
2241
4922
6959
081
129
5523
w�tb
oo�d
@na
cop.
net
Mar
y M
ahy
UN
AID
S M
on�to
r�ng
and
Eva
luat
�on
Adv
�sor
081
337
8181
mah
ym@
una�
ds.o
rgM
arel
ize
Go
rgen
s-A
lbin
oW
orld
Ban
km
arel
�ze.
gorg
ens@
gma�
l.com
Ms.
San
dra
Ow
ose
sM
oHSS
/DSP
CH
P M
on�to
r�ng
and
Eva
luat
�on
2032
289
2241
5508
1 12
7 28
01ow
oses
s@na
cop.
net
Dr.
K.M
asu
pu
MoH
SS/D
SP T
A M
on�to
r�ng
and
Eva
luat
�on
2241
4922
6959
mas
upuk
@cd
c.go
vM
r.E
frai
m D
um
eni
MoH
SS/D
SP S
tat�s
t�c�a
n22
4149
2269
59du
men
�e@
naco
p.ne
tM
s.A
nn
a Jo
nas
MoH
SS/D
SP20
3282
822
4155
jona
sa@
naco
p.ne
t
Todd
Ko
pp
enh
aver
USA
ID/N
am�b
�a M
on�to
r�ng
and
Eva
luat
�on
Adv
�sor
2737
40tk
oppe
nhav
er@
usa�
d.go
v
Man
agem
ent
and
Co
ord
inat
ion
Ms.
Ella
Sh
ihep
oD
�rec
tor
Spec
�al P
rogr
amm
es20
3227
322
4155
081
122
1406
sh�h
epoe
@na
cop.
net
Mr.
Mic
hae
l Mu
lon
do
Nat
�ona
l Coo
rd�n
ator
NA
NA
SOM
s. A
nn
a Jo
nas
M a
nd E
Offi
cer
MoH
SS/D
SPM
r.V
eko
nd
ja H
.Tjik
uzu
NPC
Dep
uty
D�r
ecto
r PR
P: N
HR
P28
3413
822
6501
081
122
8298
vtj�k
uzu@
npc.
gov.
na
IEC
,BC
C,S
OC
Bas
tian
Sch
war
tzN
awaL
�feFe
dn
ey K
abu
nga
MIB
Cla
ire
Dill
avo
uD
eput
y D
�rec
tor
PEPF
AR
Rit
ha
Jod
oM
IB: M
ed�a
Offi
cer
2839
111
�ldef
ons�
na@
yaho
o.co
m

56
Appendix IV. Circumcision: What do we know to date?
• Sc�ent�fic ev�dence. Ecolog�cal stud�es� and ep�dem�olog�cal stud�es��,���,�v,v,v� have h�ghl�ghted the potent�al protect�ve effect of male c�rcumc�s�on �n prevent�ng HIV transm�ss�on to un�nfected males hav�ng sex w�th womenv�� . The b�olog�cal plaus�b�l�ty of th�s protect�ve effect has been supported by laboratory stud�esv���,�x and cl�n�cal tr�als stud�es have now confirmed the efficacy of male c�rcumc�s�on aga�nst HIV transm�ss�on.x,x� Follow�ng the 60% efficacy (95% CI: 32% -76%), demonstrated �n the South Afr�can study, two cl�n�cal tr�als �n Uganda and Kenya recently revealed a protect�ve effect of 53% and 48% respect�vely of male c�rcumc�s�on on HIV transm�ss�on.
• Impact. Countr�es �n the Southern Afr�ca reg�on vary �n HIV prevalence, and �t �s uncerta�n whether male c�rcumc�s�on as an HIV �ntervent�on should be recommended �n all these countr�es. However, some ev�dence from mult�-country model�ng xx (W�ll�ams et al. (2006)) found that the largest benefit from male c�rcumc�s�on as an HIV prevent�on �ntervent�on (measured �n terms of reduct�on �n HIV �nc�dence) �s l�kely to occur �n countr�es w�th a h�gh HIV prevalence and moderate to low levels of male c�rcumc�s�on (F�gure 10, F�gure 11).
F�gure 10: Relat�onsh�p between HIV prevalence and reduct�on �n HIV �nc�dencex��
F�gure 11: Relat�onsh�p between male c�rcumc�s�on prevalence and reduct�on �n HIV �nc�dencex���
• Coverage. The cl�n�cal tr�als have focused on the �mpact of male c�rcumc�s�on on suscept�b�l�ty to HIV �nfect�on (�.e., the probab�l�ty of �nfect�on from an �nfected female partner to the c�rcumc�sed male), but have shed very l�ttle l�ght on the �mpact of male c�rcumc�s�on on HIV �nfect�ousness (�.e., the probab�l�ty of �nfect�on from an �nfected c�rcumc�sed male to a sexual partner)x�v . The magn�tude of the latter effect w�ll determ�ne the s�ze of the secondary effect of male c�rcumc�s�on. It �s therefore poss�ble that the relat�onsh�p between coverage and �mpact �s not l�near, but assoc�ated w�th a sharper decrease �n �nfect�ons averted as coverage �ncreases.
0.001
0.01
0.1
1
10
0 10 20 30 40 50
HIV prevalence (%)
Reduction in incidence
(percent per year - log scale)
Source: Adaptated from Williams et al. 2006
0.001
0.01
0.1
1
10
0 20 40 60 80 100
Prevalence of MC (%)
Reduction in incidence (log
scale)
Source: Adaptated from Williams et al. 2006

57
• Age at c�rcumc�s�on. Assum�ng �mplementat�on barr�ers l�m�t the ab�l�ty to roll out male c�rcumc�s�on to all men, what age group should be targeted to afford the greatest �mpact �n terms of new �nfect�ons averted? There �s no conclus�ve �nformat�on ava�lable concern�ng the relat�onsh�p between HIV r�sk and age at c�rcumc�s�on, and some stud�es have y�elded contrad�ct�ng results.xv
• R�sk compensat�on (or behav�oural d�s�nh�b�t�on). Th�s �s �ncrease �n HIV r�sk behav�our (e.g. lower condom use, �ncrease �n number of sex partners, �ncrease �n frequency of sex, etc.) �n response to perce�ved protect�on from c�rcumc�s�on. Th�s �s a vex�ng �ssue ra�sed �n relat�on to new HIV prevent�on technolog�es (e.g. vacc�nes, male c�rcumc�s�on, m�crob�c�des etc). xv� In add�t�on to cl�n�cal safety, r�sk compensat�on �s the most �mportant factor ra�sed �n debates about male c�rcumc�s�on.
• Mov�ng from sc�ence to plann�ng for �mplementat�on. The accumulat�ng sc�ent�fic ev�dence �s slowly be�ng supplemented w�th qual�tat�ve and quant�tat�ve pol�cy analys�s to ensure that the necessary �nformat�on �s ava�lable for dec�s�on-makers to make resource allocat�on and affordab�l�ty dec�s�ons. Examples are: acceptab�l�ty stud�esxv��,xv���,x�x �mpact stud�esxx, cost-effect�veness analysesxx�, expert consultat�onsxx��, as well as a deta�led cost analys�s and �mpact study currently be�ng undertaken by the Health Pol�cy In�t�at�ve.xx���
• Cost. Some cost data has been reported, although none of these stud�es are formal cost�ng stud�es. Orange Farm (South Afr�ca) $55; Raka� (Uganda) $69; K�sumu (Kenya) $25. It should be noted that these costs are not d�rectly comparable because �t �s unclear what �s �ncluded �n the stud�es.
• For example, �nd�rect costs are often not fully reflected; donat�ons (espec�ally cl�n�c�ans’ t�me), often not costed; and var�at�on by prov�der type and level of health fac�l�ty not reflected as well as the scale of serv�ce del�very �s unclear. A cost study of male c�rcumc�s�on �n three Southern Afr�can countr�es has found that uncompl�cated c�rcumc�s�ons usually requ�re four v�s�ts: pre-surg�cal exam�nat�on and IEC; surg�cal procedure; and two follow-up v�s�ts (2-3) and seven days post-surgery. A fifth v�s�t at 21 days post-surgery �s recommended but seldom occurs �n uncompl�cated cases. Male c�rcumc�s�on �s usually done under local anaesthes�a by all except pr�vate prov�ders who generally use general anaesthes�a. Wa�t�ng t�me between the first and second v�s�t ranges between one to e�ght weeks reflect�ng some capac�ty constra�nts. Ant�b�ot�cs are rout�nely prescr�bed by some prov�ders but not �n all cases. Dress�ngs are not reappl�ed by all prov�ders at post-operat�ve v�s�t. Costs to the pat�ent at non-pr�vate prov�ders range between US$4.8 to US$41.5. The un�t cost analyses are be�ng completed. The results of th�s study w�ll prov�de accurate un�t cost est�mates that are cr�t�cal for cost-effect�veness analys�s and affordab�l�ty assessment �n order to �nform resource allocat�on and resource mob�l�zat�on for Male C�rcumc�s�on as an HIV �ntervent�on.

58
� Auvert B, Buve A, Lagarde E, Kah�ndo M, Chege J, Rutenberg N, Musonda R, Laourou M, Akam E,We�ss HA. 2001. Male c�rcumc�s�on and HIV �nfect�on �n four c�t�es �n sub-Saharan Afr�ca. AIDS. Vol. 15, suppl. 4, pp. S31-S40.�� Gray R, K�wanuka N, Qu�nn T, Sewankambo N, Serwadda D, Mangen F, Lutalo T, Nalugoda F, Kelly R, Meehan M, Chen M, L� C and Wawer M, for the Raka� Project Team. 2000. Male c�rcumc�s�on and HIV acqu�s�t�on and transm�ss�on: cohort stud�es �n Raka�, Uganda. AIDS, 14:2371-2381.��� Mehendale SM, Shepherd ME, D�vekàr AD, et al. 1996. Ev�dence for h�gh prevalence and rap�d transm�ss�on of HIV among �nd�v�duals attend�ng STD cl�n�cs �n Pune, Ind�a. Ind�an J Med Res; 104:317-35.�v Cameron DW, D’Costa LJ, Ma�tha GM, Cheang M, P�ot P, S�monsen JN, Ronald AR, Gak�nya MN, Nd�nya-Achola JO, Brunham RC and Plummer FA. 1989. Female to male transm�ss�on of human �mmunodefic�ency v�rus type 1: r�sk factors for seroconvers�on �n men. Lancet, 334(8660): 403-407v We�ss HA. 2002. Update of current ep�dem�olog�cal ev�dence on male c�rcumc�s�on and HIV. In USAID/AIDSMark, 2003. Male C�rcumc�s�on: Current Ep�dem�olog�cal and F�eld Ev�dence; Program and Pol�cy Impl�cat�ons for HIV Prevent�on and Reproduct�ve Health, Conference Report, Wash�ngton DC. http://www.usa�d.gov/pop_health/a�ds/TechAreas/research/�ndex.html, pp 14-15.We�ss HA, Thomas SL, Munab� SK, and Hayes RJ. 2006. Male c�rcumc�s�on and r�sk of syph�l�s, chancro�d and gen�tal herpes: A systemat�c rev�ew and meta-analys�s. Sex. Transm. Inf., 82:101-110.v� S�egfr�ed N., Muller M., Deeks J., Volm�nk J., Egger M., Low N., We�ss H., Walker S. and W�ll�amson P.: HIV and male c�rcumc�s�on—A systemat�c rev�ew w�th assessment of the qual�ty of stud�es. Lancet Infect D�s. 2005; 5:165–173.S�egfr�ed N., Muller M., Deeks J., Volm�nk J., Egger M., Low N., We�ss H., Walker S. and W�ll�amson P.: Male c�rcumc�s�on for prevent�on of heterosexual acqu�s�t�on of HIV �n men, Cochrane Rev�ew, 2006.v�� The effect has not been demonstrated for homosexual sexual exposure.v��� Szabo R, Short RV. 2000. How does male c�rcumc�s�on protect aga�nst HIV �nfect�on? BMJ 320: 1592–1594.�x Patterson. BK. 2002. Recent research on the phys�ology and uptake of HIV �n the human foresk�n. Update of current ep�dem�olog�cal ev�dence on male c�rcumc�s�on and HIV. In USAID/AIDSMark, 2003. Male C�rcumc�s�on: Current Ep�dem�olog�cal and F�eld Ev�dence, Program and Pol�cy Impl�cat�ons for HIV Prevent�on and Reproduct�ve Health. September 18, 2002 Conference Report. Wash�ngton DC. http://www.usa�d.gov/pop_health/a�ds/TechAreas/res earch/�ndex.html, pp 16-17.x Auvert B, Taljaard D, Lagarde E, Sobngw�-Tambekou J, S�tta R, and Pure A, 2005.Random�zed, Controlled Intervent�on Tr�al of Male C�rcumc�s�on for Reduct�on of HIV Infect�on R�sk: The ANRS 1265 Tr�al. PLoS Med�c�ne, Vol. 2 (11):1112-1122 Onl�ne at: www.plosmed�c�ne.org.x� Nat�onal Inst�tutes of Health/Nat�onal Inst�tute of Allergy and Infect�ous D�seases: Quest�ons and Answers: NIAID-Sponsored Adult Male C�rcumc�s�on Tr�als �n Kenya and Uganda, Bethesda, 2006.Internat�onal AIDS Soc�ety: Statement on New Stud�es Show�ng that Male C�rcumc�s�on Substant�ally Reduces the R�sk of HIV Infect�on Among Men, 2006.x�� W�ll�ams, BG., James O. Lloyd-Sm�th, Eleanor Gouws, Cather�ne Hank�ns, Wayne M. Getz, John Hargrove, Isabelle de Zoysa, Chr�stopher Dye1, Bertran Auvert, The Potent�al Impact of Male C�rcumc�s�on on HIV �n Sub-Saharan Afr�ca, PLOS Med�c�ne, 3(7): 2006: 1032-1040. Onl�ne at: www.plosmed�c�ne.org. x��� Ib�d. x�v A Gates-funded study by Ron Gray that �s currently underway �n Raka� w�ll be able to measure the �mpact on �nfect�ousness (Personal Commun�cat�on, December 2006).xv Ba�ley RC, Plaummer FA. and Moses S.: Male c�rcumc�s�on and HIV prevent�on: current knowledge and future research d�rect�ons, Lancet Infect�ous D�seases 2001; 1: 223–231.xv� Cassell M.M., Halper�n D.T., Shelton J.D. and Stanton D.: R�sk compensat�on: the Ach�lles’ heel of �nnovat�ons �n HIV prevent�on? Br�t�sh Med�cal Journal, 332: 2006: 605-607. xv�� Halper�n DT, Fr�tz K, McFarland W, Woelk G. Acceptab�l�ty of Adult Male C�rcumc�s�on for Sexually Transm�tted D�sease and HIV Prevent�on �n Z�mbabwe. Sexually Transm�tted D�seases Apr�l 2005; 32:4:238-239.x��� Soor� N et al. Dynam�cs of male c�rcumc�s�on pract�ces �n Northwest Tanzan�a. STI 2001; 28:214-8. Ba�ley RC et al. The acceptab�l�ty of male c�rcumc�s�on to reduce HIV �nfect�ons �n Nyanza Prov�nce, Kenya. AIDS Care 2002; 14:27-40. x�x Kebaabetswe P et al. Male c�rcumc�s�on: An acceptable strategy for HIV prevent�on �n Botswana. Unpubl�shed manuscr�pt (Also Abstract accepted for 2002 Barcelona AIDS Conference.) Fr�tz K et al. The feas�b�l�ty of adult male c�rcumc�s�on for HIV prevent�on �n Z�mbabwe. (Subm�tted)xx W�ll�ams et al 2006xx� Kahn J.G., Marse�lle E., and Auvert B.: Cost-effect�veness of Male C�rcumc�s�on for HIV prevent�on �n a South Afr�ca sett�ng. PLoS Med�c�ne, 3(12):2349-2358. Onl�ne at: www.plosmed�c�ne.org.xx�� AIDSMark Project: Male C�rcumc�s�on: Current Ep�dem�olog�cal and F�eld Ev�dence, Program and Pol�cy Impl�cat�ons For HIV Prevent�on and Reproduct�ve Health; Conference Report, 2002, Populat�on Serv�ces Internat�onal, Wash�ngton DCxx��� Cost and Impact of Male C�rcumc�s�on �n Lesotho, Swaz�land and Zamb�a.
BIBLIOGRAPHY
59
Reference Materials collected from Technical and Financial staff contacted on indicators,targets and unit costs
Costing DSP Office Working Group: Ref Material1) Plan for Nat�onal Mult�sectoral Mon�tor�ng and Evaluat�on of HIV/AIDS 2006/7 - 2008/9 MoHSSSol�ta�re Press; Copyr�ght MOHSS/DSP2) Nat�onal Malar�a Pol�cy, Apr�l 2005 Rep of Nam�b�a: Copyr�ght MoHSS/DSP3) Nam�b�an HIV/AIDS S�tuat�on and Gap Analys�s Execut�ve Summary, July 2006 MoHSS/DSP - RME4) The GLOBAL FUND Round S�x Proposal Form, May 2006
PMTCT Working Group: Ref Material1) Gu�del�nes for PMTCT: Dec 20042) Rev�sed PMTCT - Plus Programme 2004 - 20133) Current ARV tender est�mates4) Food Secur�ty Worksheet5) Global Fund Round 66) Proposed Gu�del�nes for PMTCT, 2nd Ed�t�on, Nov 20067) Costs of Tests NIP8) Costs of Drugs CMS
VCT Working Group: Ref Material1) VCT current status & gap analys�s (2004-2013), Rev�sed 5/7/20062) VCT Centres Reports3) Government NPC,CBS, Populat�on Project�ons 2001 - 2031, Jan 20064) NIP, Jan 20075) CMS, Jan 2007
ART Working Group: Ref Material1) ART C�rcular of Lab Tests2) ART Prog: Current Status Report & Gap Analys�s3) ART Cost Est�mat�on Quest�onna�re4) Projected ARV Quant�ficat�on F�gures FY ‘07/085) Table 4: Info on Health Profess�onals �n Posts FY ‘05/06
Policy & Planning Group HRM/HRD: Ref Material1) Est�mates of Infrastructure Needs2) HSS Current Status & Project�ons3) Draft IMAI Roll-out Plan, June 20064) Fac�l�t�es Report 20045) A record of all fac�l�ty centers, hosp�tals & cl�n�cs.
Training & Scholarships HRM/HRD: Ref Material1) Info on Health Related Students under Tra�n�ng, 20062) HRD Act�on Plan for Support from CDC/I-tech, 2007
Appendix V. Source and other References

60
Salaries & Benefits HRM/HRD: Ref Material1) MoHSS Health Personnel Salary Scales for 1999 & 20062) Summary of Posts on Proposed staff Establ�shment MoHSS 2006 & 20073) C�rcular: Salary Budget Adjustment 2005/2006 MoHSS4) Package of Med�cal Officers, Nurses & Pharmac�sts 2005
Disability Grants: MoL&SW: Ref Material1) L�st of Reg�onal Pens�on Offices (MoL)2) D�sab�l�ty Grant3) MoL: Funeral Benefit Programme4) MoL: Re-reg�strat�on of Pens�oners5) MoL: Old Age Grant6) MoL: Customer Serv�ce Charter, D�v�s�on - Soc�al Welfare
HBC & Palliative Care WG: Ref Material1) Prepared by NEDICO Copyr�ght: MOHSS/PHC2) HBC: General Issues across all 13 Reg�ons3) HBC Volunteers & Cl�ents as per Const�tuency - CAA4) Commun�ty - Based Health Care - Report of an Assessment of Comm Volunteers, Dec 20065) Red Cross database6) NANASO database7) CAA database & �nfo 20068) HBC Work�ng Group9) HBC Worksheet10) HRM: Salary & Benefit Database
TB Working Group: Ref Material1) The Nat�onal Strateg�c Plan on TB2) Nat�onal Gu�del�nes for the Management of TB3) WHO TB database
Condoms & STI Working Group: Ref Material1) Gu�del�nes on STI2) Strategy on D�str�but�on of Condoms3) NASOMA,SMA,DHS databases4) F�ll�p’s Worksheet, STI workgroup on workshop5) Global Fund Round 6 cost�ng
Food & Security Working Group: Ref Material1) MGECW/WFP - out of school food d�str�but�on to OVC 20062) MoHSS/PHC - PMTCT data of 20063) MoHSS/PHC - PMTCT progress report(Jan-Dec 2006)4) MGECW & WFP est�mates5) C�v�l soc�ety Gu�del�nes
WPP & Mainstreaming Working Group: Ref Material1) The Nam�b�an Labour Market - workers exper�ences and percept�ons (LARRI), June 20042) The number of workers �n publ�c sector - source OPM 20063) The number of offices, m�n�str�es & agenc�es --source OPM 20064) The number of workers formally employed �n pr�vate sector --source NABCOA,2006

61
OVC Working Group: Ref Material1) The NPC Central stat�st�cs2) 2001 Census3) Spectrum Project�ons from OVC Cost�ng Study4) MGCEW brochure on SWG, 20035) MGCEW 2005 OVC Costed Plan
STI Working Group: Ref Material1) STI Status & Gaps2) Global Fund Round 6 Cost�ng

62