Microsoft Office 2000 - HAL INRAe
386
ÉCOLE DOCTORALE EDEG PHD SCHOOL OF SICIENCE – ÉCONOMIE ET GESTION DEPARTMENT OF FOOD AND RESOURCE ECONOMICS MONPELLIER SUPAGRO FACULTY OF SICIENCE UNIVERSITÉ DE MONTPELLIER UNIVERSITY OF COPENHAGEN PhD Thesis Presented by: Kimlong LY On 18 December 2018 Integration of Youth into Smallholding Agriculture: Challenges, Impacts and Prospects: Perspectives from Cambodia Supervisors: Betty WAMFLER, SUPAGRO Iben NATHAN, COPENHAGEN Submitted on: 15 October 2017 Dissertation Assessment Committee Mr. Andreas de Neergaard, Professor, Copenhagen University Chairman, Examiner Mr. François Doligez, Associate Professor, HDR, IRAM, Paris Evaluator Mr. Carsten Smith-Hall, Professor, IFRO, Copenhagen University Evaluator Mr. Christophe Déprés, Associate Professor, VetAgroSup Examiner Mrs. Betty WAMFLER, Professor, Montpellier SupAgro Thesis supervisor, Examiner This work was supported by the Agricultural Transformation by Innovation (AGTRAIN: http://agtrain.eu) Erasmus Mundus Joint Doctorate Programme, funded by the EACEA (Education, Audiovisual and Culture Executive Agency) of the European Commission under Grant AGTRAIN agreement number 2011-0019.
-
Upload
khangminh22 -
Category
Documents
-
view
0 -
download
0
Transcript of Microsoft Office 2000 - HAL INRAe

É C O L E D O C T O R A L E E D E G P H D S C H O O L O F S I C I E N C E
– É C O N O M I E E T G E S T I O N D E P A R T M E N T O F F O O D A N D R E S O U R C E E C O N O M I C S
M O N P E L L I E R S U P A G R O F A C U L T Y O F S I C I E N C E
U N I V E R S I T É D E M O N T P E L L I E R U N I V E R S I T Y O F C O P E N H A G E N
PhD Thesis
Presented by: Kimlong LY
On 18 December 2018
Integration of Youth into Smallholding Agriculture: Challenges,
Impacts and Prospects: Perspectives from Cambodia
Supervisors: Betty WAMFLER, SUPAGRO
Iben NATHAN, COPENHAGEN
Submitted on: 15 October 2017
Dissertation Assessment Committee
Mr. Andreas de Neergaard, Professor, Copenhagen University Chairman, Examiner
Mr. François Doligez, Associate Professor, HDR, IRAM, Paris Evaluator
Mr. Carsten Smith-Hall, Professor, IFRO, Copenhagen University Evaluator
Mr. Christophe Déprés, Associate Professor, VetAgroSup Examiner
Mrs. Betty WAMFLER, Professor, Montpellier SupAgro Thesis supervisor, Examiner
This work was supported by the Agricultural Transformation by Innovation (AGTRAIN: http://agtrain.eu) Erasmus Mundus
Joint Doctorate Programme, funded by the EACEA (Education, Audiovisual and Culture Executive Agency) of the European
Commission under Grant AGTRAIN agreement number 2011-0019.
THÈSE POUR OBTENIR LE GRADE DE DOCTEUR
DE MONTPELLIER SUPAGRO
En Sciences Economiques
École doctorale EDEG – Économie et Gestion
Portée par l’Université de Montpellier
Unité de recherche UMR 1110 MOISA
L'INSERTION DES JEUNES DANS LES AGRICULTURES
FAMILIALES: ENJEUX, IMPACTS ET PROSPECTIVE. LE
CAS DU CAMBODGE.
Rapport de gestion
2015
Présentée par Kimlong LY
Le 18 Décembre 2017
Sous la direction de Betty WAMFLER, SUPAGRO
Et Iben NATHAN, COPENHAGEN
Devant le jury composé de
Andreas de Neergaard, Professor, Associate Dean, University of Copenhagen
Carsten Smith-Hall, Professor, IFRO, University of Copenhagen
François Doligez, Professor, IRAM
Christophe Despres, Associate Professor, VetAgroSup
Betty WAMFLER, Professor, Montpellier SupAgro/MOISA
Président du jury,
Examinateur
Rapporteur
Rapporteur
Examinateur
Examinateur

Montpellier SupAgro n‟entend donner aucune approbation aux opinions émises dans
cette thèse ; ces opinions doivent être considérées comme propres à leur aute
i
ABSTRACT
The objective of this doctoral dissertation is to look at the factors that determine the
decisions of youth and their parents regarding youth occupation and thereby to understand the
conditions for integrating youth into family farming.
In the context of developing countries, there are increasing concerns that the younger
generations may lose interest in farming, since this is likely to threaten global food security in
the long-term. The increasing importance of migration and non-farm activities to rural
livelihoods in developing countries has raised a scholarly debate about whether smallholder
farming holds a potential for the youth in the future at all. However, especially in a Southeast
Asian context, there are only very few available studies concerned with understanding the
options for and the decisions of youth and their parents regarding youth occupation and farm
integration.
The present dissertation addresses this research gap by drawing on primary data from
a fieldwork in Cambodia. Cambodia is home of smallholder rice-based farming, and the
country experiences rapid population growth. There is therefore a huge need to ensure young
peoples‟ livelihoods and incomes either through their integration in the labour market, or in
smallholder farming.
The fieldwork took place in Cambodia‟s Otdar Meanchey low-density area and Takeo
high-density area in 2012 and 2013. Within these two provinces, the fieldwork covered five
districts (18 villages). The main purpose of the fieldwork was to understand the current and
potential future role of family farming in accommodating young people. The data collection
methods included questionnaire surveys, semi-structured and focus group interviews,
participant observation, and a case study of an NGO (CEDAC) driven youth-integration-in-
farming program. A typology of farming systems and strategies was developed for the survey
and discussion.
The dissertation shows that due to low levels of education, the rural youth in
Cambodia has few alternatives other than to rely on smallholder rice farming or migrate.
Though acknowledging that farming is hard work, rural youth and households do not
disregard farm work, and they actually do consider family farming as one of their main
options. However, when having engaged in farming even with support from CEDAC, many
of the young people experience that farming cannot sustain them and their families. It is
therefore common that they re-consider whether they should stay in and/or leave farming, or
diversify by seasonal migration.

ii
Further, the results indicate that integrating youth into farming is purely a family
decision. Settling in new pioneer areas is one of the household strategies to get access to new
land and thereby secure the children‟s future. Only in situations where plots of land are too
small to get sub-divided, households tend to invest in children‟s higher education. Given that
non-farm activities cannot accommodate the growing number of active workers and that land,
due to population increase, will have to be sub-divided for families even below the minimum
threshold of sustainable living, the study concludes that the future livelihood of children must
be secured under the motto of ―sharing the survival” or “Chék Khear Ros‖ i.e., by combining
both farming and non-farming activities.
The growth of the population in the rural areas of Cambodia, together with the slower
pace of job development in the secondary and tertiary sectors, suggest that in the future, more
land for cultivation will be needed most likely at the expense of forest and wetland. There
will, therefore, be a need for redefining the land tenure systems in the country. One option
could be to distribute land from cancelled economic concessions to rural families. There is
also a need for further studies of integration programs in Cambodia under social land
concessions, which is the existing legal framework for providing access to land for poor
people to see if they are still part of the solution.
While existing studies mainly explain ways in which people been quitted farming
based on push/pull factors and personal cost benefit, this study applied institutional change
theory as process of problem solving to explain this question: problems that Cambodian
smallholder agriculture face in their farming system become “a shared mental model “or “a
shared rule” among family member and its social group that motivate them to act
spontaneously or deliberately such as whether they should stay in and/or leave farming, or
diversify by seasonal migration. This study is the first exploration the question of youth and
family farming in Cambodia which could be interest for others country having similar
context.
Key words: Rural youth, rural livelihood, small holding farming, family farming, integration
in farming, Cambodia.

iii
RÉSUMÉ
L'objectif de cette thèse de doctorat est d'examiner les facteurs qui déterminent les
décisions des jeunes ruraux cambodgiens et de leurs parents concernant la profession des
jeunes. In fine, nous cherchons à comprendre les conditions d'intégration de la jeunesse
cambodgienne dans l'agriculture familiale.
Dans les pays en développement, le désintérêt croissant des jeunes générations pour
l'agriculture pose problème car cette tendance risque de menacer la sécurité alimentaire
mondiale à long terme. L'importance croissante que prennent la migration hors-village et les
activités non agricoles dans les stratégies de subsistance des ménages ruraux a soulevé un
débat sur le rôle que pouvait jouer l'agriculture familiale dans l'avenir des jeunes ruraux.
Pourtant, il existe très peu d'études traitant des décisions relatives à la profession des jeunes
dans le secteur agricole.
Cette thèse de doctorat contribue à combler cette lacune à partir de données primaires
issues d'un travail de terrain au Cambodge. Le secteur agricole cambodgien est composé
d‟exploitations familiales qui reposent sur des systèmes rizicoles et le pays connaît également
une croissance démographique rapide. De ce fait, assurer les moyens de subsistance et les
revenus des jeunes, par leur intégration dans le marché du travail ou dans l'agriculture
paysanne, représente un enjeu essentiel pour le pays.
La collecte de donnés a eu lieu en 2012 et 2013 dans deux zones distinctes du
Cambodge: la zone à faible densité de population d'Otdar Meanchey et la zone à forte densité
de Takeo. Dans ces deux provinces, le travail de terrain a couvert cinq districts (18 villages).
L'objectif principal du travail de terrain était de comprendre le rôle actuel et potentiel de
l'agriculture familiale pour l‟emploi des jeunes. Les méthodes de collecte de données
comprenaient des enquêtes, des entretiens semi-directifs, l'observation de participants et une
étude de cas portant sur un programme d'intégration de jeunes agriculteurs porté par une ONG
(CECAC). Une typologie des systèmes et stratégies agricoles a été développée pour l'enquête
et la discussion.
La thèse montre qu'en raison du faible niveau d'éducation, les jeunes ruraux au
Cambodge ont peu d'alternatives à la petite riziculture ou à la migration en dehors de leur
village d‟origine. Tout en reconnaissant le fait que l'agriculture est un travail difficile, les
jeunes ruraux et leurs ménages ne négligent pas le travail agricole et considèrent l'agriculture
familiale comme l'une de leurs principales options. Cependant, lorsqu'ils se sont engagés dans
l'agriculture, même avec le soutien du CECAC, de nombreux jeunes ont l'impression que
iv
l'agriculture ne leur permet pas de subvenir à leurs besoins et à ceux de leur famille. Il est
donc fréquent qu'ils se posent la question de savoir s‟ils doivent poursuivre une activité
agricole ou s‟ils doivent diversifier leurs sources de revenu par une migration saisonnière.
De plus, les résultats indiquent que l'intégration des jeunes dans l'agriculture est une
décision purement familiale. S'installer dans de nouvelles zones pionnières est l'une des
stratégies des ménages pour accéder à de nouvelles terres et ainsi garantir l'avenir de leurs
enfants. Ce n'est que dans des situations où les parcelles sont trop petites pour être subdivisées
que les ménages ont tendance à investir dans l‟éducation supérieure des enfants. Étant donné
que les activités non agricoles ne pourront pas accueillir le nombre croissant de travailleurs
actifs et que le foncier, en raison de l'augmentation de la population, tendra à être subdivisée
en parcelles de plus en plus petites qui ne pourront garantir un revenu durable, l'étude conclut
que les futurs stratégies de subsistance des ménages ruraux devront reposer sur le principe de
«partage de survie» ou «Chék Khear Ros», c'est-à-dire combiner des activités agricoles et non
agricoles.
La croissance de la population rurale cambodgienne et le ralentissement de la
croissance du marché du travail dans les secteurs secondaire et tertiaire, suggèrent qu'à
l'avenir, plus de terres seront nécessaires pour l‟agriculture et que ceci se fera au détriment des
forêts et des zones humides. Il serait donc nécessaire de redéfinir les régimes fonciers du pays.
Une option pourrait être de distribuer les terres des concessions économiques qui ont été
récemment annulées aux familles rurales. Il est également nécessaire de poursuivre
l‟évaluation des programmes de redistribution de terres entrepris dans le cadre des
concessions foncières sociales, politique qui constitue le cadre juridique existant pour
permettre aux pauvres d'accéder à la terre.
Alors que les études existantes cherchent principalement à expliquer l‟abandon
d‟activités agricoles à partir de facteurs push / pull et de calculs coûts/bénéfices individuels,
cette étude a mobilisé la théorie du changement institutionnel et la manière dont elle
conceptualise les processus de résolution de problèmes pour traiter cette question. Les
problèmes rencontrés par les petits agriculteurs cambodgiens sont alors conceptualisés comme
«des modèles mentaux partagés» ou «des règles partagées» entre les membres de la famille et
le groupe social. Ces règles influencent leurs décisions spontanées ou délibérées comme celle
de continuer ou quitter l'agriculture, ou de diversifier leurs stratégies de subsistance par une
migration saisonnière. Cette étude constitue une première tentative d‟analyser la question de
la jeunesse et de l'agriculture familiale au Cambodge et pourrait être répliquée dans d'autres
pays ayant un contexte similaire.

v
Mots clés : Jeunesse rurale, moyens de subsistance ruraux, petite exploitation agricole,
agriculture familiale, intégration dans l'agriculture, Cambodge.
vi
ACKNOWLEDGEMENT
This work was supported by the Agricultural Transformation by Innovation (AGTRAIN)
Erasmus Mundus Joint Doctorate Programme, funded by the EACEA (Education, Audiovisual and
Culture Executive Agency) of the European Commission under Grant AGTRAIN agreement number
2011-0019. This study (AGTRAIN) is a double degree study program between Montpellier SupAgro,
France (host institution) and University of Copenhagen (mobilty institution).
First and foremost, I would like to deeply thank my supervisors, Betty WAMPFLER1,
Professor at Institut des régions chaudes (IRC) of Montpellier SupAgro and Iben NATHAN2,
Associate Professor at Department of Food and Resource Economics (IFRO) of University of
Copenhagen, for input, guidance and fruitful discussion throughout my thesis work.
Special thanks to Didier PILLOT, Professor at IRC for his advisory on agrarian issue of
Cambodia and for seeking additional funding support this PhD study.
Deeply thank to my friend Rada KONG for assisting doing statistical analysis on farm
typology using PCA.
My extended thank to Royal University of Phnom Penh and Ministry of Education Youth and
Sport for the all supports and allow me to peruse this PhD study.
I would like to thank all my interviewees who gave up their valuable time for contributing to
my work. I also thank staffs of Children's Development Association (CDA) in Otdar Meanchey
province for providing guide and access to field for first data collection. I would like to thank also to
Cambodian Center for Study and Development in Agriculture (CEDAC3) for providing guide and
access to the field data collection for the second field work. My sincere thank is also extended to all
relevant institutions for providing administrative support for accessing to field such as Royal
University of Phnom Penh, provincial hall of Otdar Meanchey and Takeo and provincial department of
agriculture of both provinces.
Last but not least, thanks to all my friends in Phnom Penh who help proof-reading my thesis
and friends in Montpellier providing friendly environments and moral support during my stay in
France.
Thank you all!
Montpellier, 18 December 2017.
Kimlong LY
1 https://www.supagro.fr/web/irc/
2 http://ifro.ku.dk/english/staff/?pure=en/persons/227730
3 Centre d‟Etude et de Développement Agricole Cambodgien: http://www.cedac.org.kh
vii
TABLE OF CONTENTS
ABSTRACT ................................................................................................................................ i
RÉSUMÉ ................................................................................................................................... iii ACKNOWLEDGEMENT ......................................................................................................... vi TABLE OF CONTENTS ......................................................................................................... vii LIST OF ILLUSTRATION ...................................................................................................... xii LIST OF BOXES...................................................................................................................... xii
LIST OF TABLES.................................................................................................................... xii LIST OF FIGUES .................................................................................................................... xiv ABBREVIATIONS ................................................................................................................. xvi CHAPTER 1 IS FAMILY FARMING AN OPTION FOR FUTURE YOUTH
EMPLOYMENT IN CAMBODIA? ........................................................................................... 1
1.1 Problem of the study ......................................................................................................... 1 1.2 Farmer exclusion and job creation .................................................................................... 2 1.3 Smallholder farming: structural constraints ...................................................................... 3 1.4 Cambodia: demographic, employment and agrarian-nexus .............................................. 5
1.5 Research questions ............................................................................................................ 9 1.6 Youth definition applied in the study ................................................................................ 9 1.7 Structure of dissertation .................................................................................................. 10
CHAPTER 2 THEORETICAL BACKGROUND, RESEARCH FRAMEWORK, AND
METHODOLOGY ................................................................................................................... 11 PART I. Theoretical background .............................................................................................. 11
2.1 Institutional Economics: Theory of Institutional Change ............................................... 12
2.1.1 Concept of Institution ............................................................................................... 12 2.1.2 Institutional Change theory ....................................................................................... 14
2.2 Institutional change as process of problem solving ........................................................ 16 2.3 Family farm: as institution or organization ..................................................................... 17
PART II. Theoretical framework.............................................................................................. 18
2.4 Existing theories explaining the change of family farming ............................................ 18
2.5 Framework for successful and sustainable youth integration in farming ........................ 21
2.6 Framework for understanding the issue of integration youth in smallholding farming in
this PhD study ....................................................................................................................... 22
PART III. Methodology ........................................................................................................... 26 2.7 Research Design .............................................................................................................. 26
2.7.1 The study area for the first survey ............................................................................ 26 2.10.1.1 Site selection in Otdar Meanchey ................................................................... 28
2.10.1.2 Why three districts? ........................................................................................ 29 2.10.1.3 Site selection in Takeo province: why two districts? ..................................... 31
2.10.1.3.1 Tram Kak commune ................................................................................ 32 2.10.1.3.2 Prey Kabas commune ............................................................................. 34
2.10.1.4 Social economic survey sample ...................................................................... 36
2.10.1.5 Focus group discussion with youth ................................................................ 36 2.7.2 The case study on Young Agricultural Entrepreneur Project (YAE) ....................... 37
2.8 Economic calculation and data analysis .......................................................................... 38 2.9 Some Ethical Considerations .......................................................................................... 40
2.9.1 Youth perception on farming .................................................................................... 40 2.9.2 Economics data from YAE case study...................................................................... 40 2.9.3 Year of getting marriage ........................................................................................... 40
2.9.4 Typology of farm hosueholds ................................................................................... 41 2.10 Analytical Framework ................................................................................................... 41
CHAPTER 3 UNDERSTANDING RURAL LIVELIHOOD AND SMALLHOLDING
FARMING IN CAMBODIA .................................................................................................... 45
viii
3.1 Historical setting of Otdar Meanchey and Takeo province ................................................ 45 3.2 Socioeconomic diagnostics of rural households ................................................................. 51
3.2.1 Demographics ............................................................................................................... 51 3.2.2 Education ...................................................................................................................... 52
3.2.2.1 Youth education ..................................................................................................... 52 3.2.2.2 Children education (age below 14) ........................................................................ 54
3.2.2.3 Household head‟s education .................................................................................. 54 3.2.2.4 Youths currently studying ...................................................................................... 55
3.2.3 Migration and youth ..................................................................................................... 55 3.2.4 Consumption and household expenditure .................................................................... 58 3.2.5 Income sources ............................................................................................................. 60
3.2.6 Food security ................................................................................................................ 62 3.2.7 Access to credit ............................................................................................................ 62 3.2.8 Settlement in Otdar Meanchey and Takeo ................................................................... 65 3.2.9 Concluding remark ....................................................................................................... 71
3.3 Non-farm activities ............................................................................................................. 72
3.3.1 A short history of non-farm activities in Cambodia ..................................................... 72 3.3.2 The nature of non-farm activities in the three study areas ........................................... 74
3.3.2.1 Five main categories of non-farm activities........................................................... 74 3.3.2.2 Agricultural wage labour ....................................................................................... 76 3.3.2.3 Self-business .......................................................................................................... 77 3.3.2.4 Salaried employment ............................................................................................. 78
3.3.2.5 Labor-based work .................................................................................................. 79 3.3.2.6 Migration................................................................................................................ 83
3.3.2.7 Income-based category of non-farm activities ....................................................... 85 3.3.3 Migration and non-farm farm income .......................................................................... 86
3.3.3.1 Education of migrant .............................................................................................. 90
3.3.3.2 Migration as a temporal activity ............................................................................ 91 3.3.3.3 Non-farm and migration income per person .......................................................... 93
3.3.3.4 Reason for migration and the use of remittance .................................................... 94
3.3.4 View on non-farm activities ......................................................................................... 97
3.3.5 Concluding remarks ..................................................................................................... 99 3.4 Description of agricultural activities ................................................................................ 102
3.4.1 Biophysical environment in Otdar Meanchey and Takeo province ........................... 102 3.4.2 Rain-fed rice farming in Otdar Meanchey province .................................................. 103
3.4.2.1 Rice cultivation .................................................................................................... 104 3.4.2.2 Annual crops ........................................................................................................ 108 3.4.3.3 Vegetables ............................................................................................................ 109 3.4.2.4 Regrouping annual crops and vegetables in Otdar Meanchey ............................. 111 3.4.2.5 Animal production ............................................................................................... 112
3.4.2.6 Common resource (CR) ....................................................................................... 114 3.4.2.7 Fruit Tree ............................................................................................................. 115 3.4.2.8 Economic comparison of agricultural activities in Otdar Meanchey................... 115
3.4.3 Diversified rice farming system in Tram Kak ............................................................ 117 3.4.3.1 Rice cultivation .................................................................................................... 117 3.4.3.2 Annual crops ........................................................................................................ 119 3.4.3.3 Vegetables ............................................................................................................ 120
3.4.3.4 Regrouping Annual Crops and Vegetables in Tram Kak .................................... 121 3.4.3.5 Animal production ............................................................................................... 121 3.4.3.6 Common Resource in Tram Kak ......................................................................... 123
3.4.3.7 Fruit Trees in Tram Kak ...................................................................................... 124 3.4.3.8 Economic comparison of agricultural activities in Tram Kak ............................. 124
ix
3.4.4 Prey Kabas irrigated rice farming system .................................................................. 126 3.4.4.1 Intensified rice cropping in Prey Kabas ............................................................... 127
3.4.4.1.1 2R and 3R rice cropping .............................................................................. 127 3.3.4.1.2 DR: water receding rice ............................................................................... 129 3.3.4.1.3 HR: Late cycle rice or late season rice ........................................................ 130 3.3.4.1.4 Factors affecting the choice of 2R, 3R and HR ........................................... 130
3.4.4.2 Annual crops in Prey Kabas ................................................................................. 133 3.4.4.3 Vegetables in Prey Kabas .................................................................................... 133 3.4.4.4 Regrouping Annual Crops and Vegetables .......................................................... 133 3.4.4.5 Animal production ............................................................................................... 134 3.4.4.6 Common Resources in Prey Kabas (CR) ............................................................. 134
3.4.4.7 Fruit Trees in Prey Kabas .................................................................................... 135 3.4.4.8 Economic comparison of agricultural activities in Prey Kabas ........................... 136
3.4.5 Concluding remarks ................................................................................................... 138 3.5 Land Value Index ............................................................................................................. 140 3.6 Minimum Surface for Sustainable Integration in Family Farming (MSI)........................ 142
3.6.1 Calculating poverty line/minimum need per person per day or per year in USD ...... 142 3.6.2 Defining the Minimum Surface for Integration in Farming ....................................... 144
3.6.3 Land situation for possible youth integration ............................................................. 145 3.7 Diversity of household: A typology of farm households ................................................. 148
3.7.1 Principle component analysis and cluster analysis .................................................... 148 3.7.2 Farm type in Zone Tram Kak ..................................................................................... 151
3.7.2.1 Tram Kak PCA result and cluster analyses.......................................................... 151 3.7.2.2 Description of farm the typology in Tram Kak ................................................... 152
3.7.2.3 Economic performance and livelihood strategy of each farm type in Tram Kak 154 3.7.2.4 Economic sustainability of farm type in Tram Kak ............................................. 157 3.7.2.5 Farm capacity in comparison to poverty line in Tram Kak ................................. 158
3.7.3 Farm type in Prey Kabas ............................................................................................ 159 3.7.3.1 Prey Kabas PCA result and cluster analyses........................................................ 159
3.7.3.2 Description of farm the typology in Prey Kabas ................................................. 161
3.7.3.3 Economic performance and livelihood strategy of farm type in Prey Kabas ...... 164
3.7.3.4 Economic sustainability of farm type in Prey Kabas ........................................... 166 3.7.3.5 Farm capacity in comparison to the poverty line in Prey Kabas ......................... 166
3.7.4 Farm type in Zone Otdar Meanchey .......................................................................... 167 3.7.4.1 Otdar Meanchey PCA result and cluster analyses ............................................... 167
3.7.4.2 Description of farm typology in Otdar Meanchey ............................................... 169 3.7.4.3 Economic performance and livelihood strategy of each farm type in Otdar
Meanchey ......................................................................................................................... 171 3.7.4.4 Economic sustainability of farm type in Otdar Meanchey .................................. 174 3.7.4.5 Farm capacity in comparison to poverty line in Otdar Meanchey ....................... 175
3.7.5 Concluding remarks ................................................................................................... 176 3.8 Discussion ......................................................................................................................... 179
3.8.1 Socioeconomic conditions: farming have to accommodate more youth .................... 179
3.8.2 Difficulty in looking for non-farm jobs link to low level of education ...................... 180 3.8.3 The degradation of farm economies and rural poverty: Farming as a safety net ....... 181 3.8.4 Role of migration as a supplementary income to farming ......................................... 181
3.9 Conclusion ........................................................................................................................ 182
CHAPTER 4: YOUTH INTEGRATION IN FAMILY FARMING IN CAMBODIA .......... 188 4.1 Re-defining of youth in farming ....................................................................................... 188
4.1.1 Youth household ........................................................................................................ 189
4.1.2 Adult household ......................................................................................................... 190 4.2 Description of youth and adult household ........................................................................ 191
x
4.2.1 Distribution of youth and adult household in each zone and type ............................. 191 4.2.2 Youth and adult household: land shared at marriage and current land ...................... 192
4.2.3 Economics characterization of youth and adult household ........................................ 198 4.2.3.1 Tram Kak youth and adult ................................................................................... 198 4.2.3.2 Prey Kabas youth and adult ................................................................................. 200 4.2.3.3 Otdar Meanchey youth and adult ......................................................................... 202
4.3 Analysis youth integration capacity ................................................................................. 205 4.3.1 Defining youth integration capacity ........................................................................... 205 4.3.2 Youth integration capacity in each zone by farm type ............................................... 206
4.3.2.1 Capacity youth integration in Tram Kak ............................................................. 206 4.3.2.2 Capacity youth integration in Prey Kabas ........................................................... 210
4.3.2.3 Capacity youth integration in Otdar Meanchey ................................................... 214 4.3.3 Economic capacity of youth integration in each farm type ........................................ 219
4.3.3.1 Zone Tram Kak .................................................................................................... 219 4.3.3.2 Zone Prey Kabas .................................................................................................. 222 4.3.3.3 Zone Otdar Meanchey.......................................................................................... 223
4.4 Household strategy for future youth ................................................................................. 226 4.4.1 Investment in children education ............................................................................... 226
4.4.2 Integration into farming under the MSI ..................................................................... 228 4.4.3 Integration under the form of generation transfer ...................................................... 229 4.4.4 Migration to zone pioneer to seek for agricultural land ............................................. 230 4.4.5 Farm trajectory Tram Kak, Prey Kabas and Otdar Meanchey ................................... 231
4.5 Discussion ......................................................................................................................... 234 4.5.1 Factor of enable and unable ....................................................................................... 234
4.5.2 Land amortization of land/sub division of land ......................................................... 235 4.5.3 Land is main challenge for future youth integration .................................................. 236 4.5.4 Small holder farming is safety-net ............................................................................. 238
4.5.5 Sustainable integration in farming need a complementary from non-farm ............... 239 4.6 Conclusion ........................................................................................................................ 240
CHAPTER 5: INSTITUTIONAL DIMENSION FOR SUSTAINABLE YOUTH
INTEGRATION IN CAMBODIAN FAMILY FARMING .................................................. 242
5.1 Introduction ...................................................................................................................... 242 5.2 Perception on farming ...................................................................................................... 244
5.2.1 Theory explaining perception ..................................................................................... 244 5.2.2 Single youth perception and aspiration toward farming ............................................ 244
5.2.3 Family perception on agriculture ............................................................................... 252 5.2.3.1 General opinion on agriculture ............................................................................ 252 5.2.3.2 Is it easy to start farm work? ................................................................................ 254
4.2.3.1 It is not easy to get land clear in zone pioneer like Otdar Meanchey ............. 255 4.2.3.2 Traditional knowledge is no longer applicable when rice is more intensified256
4.2.3.3 Experience determines the view on the easiness of starting up farm work .... 257 5.2.3.3 Do you think agriculture is a good option for employment? ............................... 258 5.2.3.4 Do you intend to hand over your farm to children? ............................................. 258
5.3 Institutional dimension in support youth integration in farming ...................................... 260 5.3.1 Role of existing CBOs in the survey .......................................................................... 260 5.3.2 NGOs Intervention: Case study of CEDAC‟s YAE program .................................... 261
5.3.2.1 Very few attempts to test youth integration program in farming......................... 261
5.3.2.2 CEDAC and young agricultural entrepreneur program ....................................... 262 5.3.2.3 To leave or to stay: Lesson learnt from CEDAC ................................................. 264
5.3.2.3.1 A life story: Motivation to start up farming as experience from trial migration
.................................................................................................................................... 264 5.3.2.3.2 Motivation to quit farming after farming trail: A livelihood economy tell 264
xi
5.3.2.3.3 Those who stay combining active labor with family or non-farm activities267 5.3.2.3.4 Will they return back to farming?................................................................ 269
5.3.3.4 Youth‟s challenge in YAE: Lesson learnt ........................................................... 270 5.3.3.4.1 Youth‟s complex social characteristic: Development intervention
disappointment? .......................................................................................................... 270 4.3.3.4.2 There is no showcase that farming is high profitable .................................. 271
4.3.3.4.3 No financial support setting up farming: Is CEDAC rational? ................... 272 4.3.3.4.4 Access to market .......................................................................................... 273
5.3.4 Existing policy in supporting youth integration in farming ....................................... 273 5.4 Factors determine youth to settle in farming .................................................................... 276
5.4.1 Generation born and land access ................................................................................ 276
5.4.2 Political integration at different time impacted on different integration in farming .. 277 5.4.3 Low level of education determines young people’s choice of farming ..................... 278 5.4.4 Gender and way of household subdivide land to children ......................................... 278 5.4.5 Non-farm job is not easily accessible: Knowledge and skill demand but competition
............................................................................................................................................. 279
5.4.5 Couple strategy ........................................................................................................... 279 5.4.6 Investment in children education ............................................................................... 280
5.5 Discussion and conclusion................................................................................................ 280 CHAPTER 6: THE FUTURE PROSPECTS FOR YOUTH INTEGRATION IN FAMILY
FARMING IN CAMBODIA .................................................................................................. 288 SYNTHESIS OF STUDY RESULTS AND CONCLUSION ............................................... 288
6.1 Economic sustainability of farming need a complementary from non-farm activities . 289 6.2 Motivation, perception on farming: to leave or to stay ................................................. 291
6.3 Future prospect of youth and Cambodian family farming ............................................ 292 REFERENCE ......................................................................................................................... 294 APPENDIX ............................................................................................................................ 299
Appendix – 01 Land and labor productivity of cropping systems ...................................... 299 Appendix – 02 Access to credit ........................................................................................... 304
Appendix – 03 Income situation and income sources ......................................................... 307
Appendix – 04 Level of education of family member of 382 household surveyed ............ 308
Appendix – 05 Educational investment .............................................................................. 312 Appendix – 06 PCA and Cluster analysis inTram Kak, Prey Kabas and Otdar Meanchey 315 Appendix – 07 Couple strategy- land share at marriage by youth and adult household ..... 321 Appendix – 08 Household Economic by farm type with and without non-farm income per
farm active worker .............................................................................................................. 325 Appendix – 09 Youth integration capacity by zone by youth adult household .................. 328 Appendix – 10 Factors of production correlation ............................................................... 329 Appendix – 11 Perception on agriculture by type by youth adult by capacity ................... 331 Appendix – 12 Asset standard estimated value for asset conversion to monetary value .... 335
Appendix – 13 Detail activities in the main categories of non-farm activities ................... 336 Appendix – 14 Non-farm activities in the three study areas ............................................... 337 Appendix – 14 Questionnaire for household survey ........................................................... 349
Appendix – 15 Questionnaire survey on youth perception on agriculture .......................... 361 Appendix – 16 Interview guide for key informants ............................................................ 364 Appendix – 17 Guideline for youth focus group discussion ............................................... 366 Appendix – 18 Guideline for interview with YAE-CEDAC .............................................. 367
xii
LIST OF ILLUSTRATION
Illustration 1 Basic livelihood and migration framework (Ellis & Freeman, 2005) ................. 20 Illustration 2 Framework for sustainable youth integration in Farming ................................... 22 Illustration 3 Analytical framework of the PhD study ............................................................. 42 Illustration 4 The movement of settlement in Otdar Meanchey province .............................. 230 Illustration 5 Representation of farm trajectory in Tram Kak ................................................ 232
Illustration 6 Representation of farm trajectory in Prey Kabas .............................................. 233 Illustration 7 Representation of farm trajectory in Otdar Meanchey ...................................... 234 Illustration 8 Process of property right formalization under the land law 2001 ..................... 275
LIST OF BOXES
Box 1 Case 335 Story of parents supporting youth to accumulate assets-land for farming ... 193
Box 2 Case 280-TK-3-Adult-UH Household ......................................................................... 209
Box 3 Case 279-TK-1-Adult-UH household .......................................................................... 210 Box 4 Case 352-PB-3-Adult-AH household .......................................................................... 213
Box 5 Case 129-OMC-1-Adult-UH story of household settle in zone poineer ...................... 216 Box 6 Case 124-OMC-1-Adult-UH: Youth integration in Otdar Meanchey ......................... 217 Box 7 Case 106-OMC-2-Youth HH-AH ................................................................................ 218
LIST OF TABLES
Table 1 Sample selection in the study area ............................................................................... 36 Table 2 YAE Key informant interview .................................................................................... 38
Table 3 Educational level attained by youth (who no longer at school) .................................. 53 Table 4 Migration destination of rural youth............................................................................ 58
Table 5 Average debt per household in three zones ................................................................. 63
Table 6 Average debt per household by borrowing source ...................................................... 63
Table 7 Purpose of borrowing in the three zones ..................................................................... 64 Table 8 Reasons for settlement in Otdar Meanchey ................................................................. 66
Table 9 Year of settlement in Otdar Meanchey ........................................................................ 67 Table 10 Home province of new settler in Otdar Meanchey .................................................... 67 Table 11 Reason for settlement in Tram Kak ........................................................................... 68 Table 12 Year of settlement in Tram Kak by home province .................................................. 69
Table 13 Reasons for settlement in Prey Kabas ....................................................................... 69 Table 14 Year of settlement by home province in Prey Kabas ................................................ 70 Table 15 Year of settlement by home district in Prey Kabas ................................................... 70 Table 16 Non-farm off-farm activities in the three study areas ............................................... 75 Table 17 Comparison of non-farm activities in the three-study area ....................................... 76
Table 18 Garment worker income from the case 375 .............................................................. 82 Table 19 Activity calendar of youth engage in both farming and garment work ..................... 82
Table 20 Remittance per year per person by destination of migrant ........................................ 83 Table 21 Marital Status of HH member doing non-farm activities by age group .................... 90 Table 22 Educational level of migrant in the three areas ......................................................... 91 Table 23 People on migration and on pause from migration in the three zones ...................... 92 Table 24 Destination of migration by migrants for non-farm activities in the three zones ...... 92 Table 25 Average number of HH member doing non-farm per HH by class of non-farm
income per person ..................................................................................................................... 93 Table 26 Average number of migrant per HH by class of total migration income per migrant
.................................................................................................................................................. 94
xiii
Table 27 Usage of remittance ................................................................................................... 95 Table 28 Soil type in the studied area ..................................................................................... 103
Table 29 Cropping calendar in Otdar Meanchey .................................................................... 104 Table 30 Percentage of people who use fertilizer in OMC .................................................... 106 Table 31 Average land holding by village in OMC ............................................................... 106 Table 32 Percentage of those who sell rice by food security ................................................. 107
Table 33 Duration of lacking rice ........................................................................................... 108 Table 34 Number of people growing cassava in OMC .......................................................... 109 Table 35 Land proportion by combining cropping system (HR, AC, VG) ............................ 112 Table 36 Average economic value of common resource by type in OMC ............................ 115 Table 37 Economic of farm activity summary in Otdar Meanchey ....................................... 117
Table 38 Cropping calendar in Tram Kak .............................................................................. 118 Table 39 Average land by cropping system in Tram Kak ...................................................... 121 Table 40 Average economic value of common resources in Tram Kak ................................ 124 Table 41 Economic comparison of agricultural activities in Tram Kak ................................. 126 Table 42 Cropping calendar of rice-based cropping system in Prey Kabas ........................... 127
Table 43 Rice land proportion in Prey Kabas ......................................................................... 128 Table 44 Rice land allocation between 2R, 3R and HR ......................................................... 131
Table 45 Common resource economic value by type in Prey Kabas ..................................... 135 Table 46 Economic comparison of agricultural activities in Prey Kabas ............................... 137 Table 47 Land Value Index by three zones ............................................................................ 142 Table 48 Cambodian poverty line 2009 and 20013 ................................................................ 143
Table 49 Survey poverty line .................................................................................................. 144 Table 50 Minimum Surface for Integration in the three zones ............................................... 144
Table 51 Minimum Surface for Integration in irrigated area ................................................. 144 Table 52 Land and youth integration capacity in three zones ................................................ 145 Table 53 Land value index and actual youth in farming ........................................................ 147
Table 54 Variable description for PCA .................................................................................. 150 Table 55 Correlations between variables and factors in Tram Kak ....................................... 152
Table 56 Description of farm type in Tram Kak .................................................................... 154
Table 57 Income situation of household in Tram Kak: with and without non-farm activities
................................................................................................................................................ 158 Table 58 Correlations between variables and factors: Prey Kabas ........................................ 160 Table 59 Description of farm the typology in Prey Kabas ..................................................... 161 Table 60 Income situation of household in Prey Kabas: with and without non-farm ............ 166
Table 61 Correlations between variables and factors: Otdar Meanchey ................................ 168 Table 62 Description of farm the typology in Otdar Meanchey ............................................. 169 Table 63 Income situation of household in Otdar Meanchey: with and without non-farm .... 174 Table 64 Summary key livelihood strategies of households in each farm type ..................... 178 Table 65 Youth and adult household characteristic: age, education, and household size ...... 189
Table 66 Distribute youth and adult household among the type of farming .......................... 192 Table 67 Land share at marriage and the current land accumulation ..................................... 195 Table 68 Land price per hectare in the three zones ................................................................ 197
Table 69 Tram Kak: youth and adult household farm characteristics .................................... 199 Table 70 Prey Kabas: youth and adult household farm characteristics .................................. 201 Table 71 Otdar Meanchey: youth and adult household farm characteristics ......................... 203 Table 72 Tram Kak youth integration capacity ...................................................................... 208
Table 73 Prey Kabas youth integration capacity .................................................................... 212 Table 74 Otdar Meanchey youth integration capacity............................................................ 215 Table 75 Summary youth integration capacity in the three study areas ................................ 219
Table 76 The average cost of expense on education per child at different level by household
................................................................................................................................................ 227
xiv
Table 77 Land plan for sub-divided by household in Otdar Meanchey (case 103) ................ 229 Table 78 Youth aspirations: those who currently studying .................................................... 250
Table 79 Association between gender and willing to take over farm work ........................... 251 Table 80 General opinion on farming and reasons explained ................................................ 253 Table 81 Is it easy to start farm work? ................................................................................... 254 Table 82 Do you think that agriculture is a good option? ...................................................... 258
Table 83 Intention to hand over farm work to children .......................................................... 259 Table 84 Youth Graduated from CEDAC project .................................................................. 262 Table 85 Number of YAE who successful settle in farming .................................................. 266 Table 86 Estimation of land distribution by land tenure regimes ........................................... 276
LIST OF FIGUES
Figure 1 Study Area .................................................................................................................. 27 Figure 2 Map of the study area in Otdar Meanchey ................................................................. 30
Figure 3 Map of study area in Takeo province (Tram Kak and Prey Kabas) ........................... 32 Figure 4 Sketch of Tram Kak commune .................................................................................. 32 Figure 5 Sketch of Prey Kabas commune ................................................................................ 34
Figure 6 Population pyramid in the study areas by zone .......................................................... 52 Figure 7 Percentage of youth currently studying by zone ........................................................ 55
Figure 8 Youth situation in the study area ................................................................................ 57 Figure 9 Percentage of agricultural consumption ..................................................................... 59 Figure 10 Percentage of household non-agricultural consumption (expense) ......................... 59
Figure 11 Expense on food and non-food of rural household in percentage ............................ 60 Figure 12 Income sources in Tram Kak, Prey Kabas and Otdar Meanchey ............................ 61
Figure 13 Detailed income sources from both farm and non-farm work ................................. 62 Figure 14 Percentage of construction work by zone ................................................................ 79 Figure 15 Construction work by gender ................................................................................... 79
Figure 16 Construction work by location ................................................................................. 80 Figure 17 Relationship between non-farm work, migration and farming work ....................... 84
Figure 18 Non-farm income-based category ............................................................................ 86 Figure 19 Percentage of households non-farm activities .......................................................... 88
Figure 20 Percentage of households who have migrated family members .............................. 89 Figure 21 Percentage of non-farm and migration income to total non-farm income ............... 90 Figure 22 View on access to non-farm activities ..................................................................... 97 Figure 23 Climate in Takeo province Figure 24 Climate Otdar Meanchey province ...... 102
Figure 25 Histogram of land index in three zones .................................................................. 147 Figure 26 Cluster analysis in Tram Kak ................................................................................. 152 Figure 27 Economic performance of farm type in Tram Kak ................................................ 157 Figure 28 Household income per capita in Tram Kak............................................................ 159 Figure 29 Cluster analysis in Prey Kabas ............................................................................... 161
Figure 30 Economic performance of farm type in Prey Kabas .............................................. 164
Figure 31 Household income per capita in Prey Kabas.......................................................... 167
Figure 32 Cluster analysis in Otdar Meanchey ...................................................................... 169 Figure 33 Economic performance of farm type in Otdar Meanchey ...................................... 173 Figure 34 Household income per capita in Otdar Meanchey ................................................. 175 Figure 35 Respondent's view on accessible to land ................................................................ 195 Figure 36 Tram Kak: youth and adult household economic performance ............................. 200 Figure 37 Prey Kabas: youth and adult household economic performance ........................... 202 Figure 38 Otdar Meanchey: youth and adult household economic performance ................... 205

xv
Figure 39 TK-Income of youth and adult household by farm type and by integration capacity
................................................................................................................................................ 221
Figure 40 TK Non-farm incomes of youth and adult household by farm type and by
integration capacity ................................................................................................................. 221 Figure 41 PB-Income of youth and adult household by farm type and by integration capacity
................................................................................................................................................ 223
Figure 42 PB Non-farm incomes of youth and adult household by farm type and by
integration capacity ................................................................................................................. 223 Figure 43 OMC-Income of youth and adult household by farm type and by integration
capacity ................................................................................................................................... 224 Figure 44 OMC Non-farm incomes of youth and adult household by farm type and by
integration capacity ................................................................................................................. 224 Figure 45 Percentage of household having youth access to education by level of education 228
xvi
ABBREVIATIONS
2R 2 Cycle of IR rice, IR is name of rice variety
3R 3 Cycle of IR rice
AC Annual Crops
CEDAC Centre d'Etude et de Développement Agricole Cambodgien
CPP Cambodian‟s People Party
CR Common Resource
CS Cropping System
CT Cattle
DK Democratic Kampuchea
DR Water receding rice or dry season rice
ER Early season rice/short cycle rice
FT Fruit Tree
FUNCINPEC Front Uni National pour un Cambodge Indépendant, Neutre, Pacifique, et
Coopératif in French or National United Front for an Independent,
Neutral, Peaceful, and Cooperative Cambodia in English.
GLF Group Learning Facilitator
GO Gross output
GV Gross Value
GVA Gross value added
HR Heavy Season rice or late season rice
IC Intermediary Cost
IC Intermediate cost
KPNLF Khmer People's National Liberation Front
KR Khmer Rouge
LPV Land Potential Value
LVI Land Value Index
MOLINAKA Mouvement National de Libération du Kampuchea
MSI Minimum Surface land for sustainable Integration in farming
OMC Otdar Meanchey province
PB Prey Kabas, the studied district of Takeo province
PG Pig
PL Paid Labor
PL Paid labor cost
PRK The People‟s Republic of Kampuchea
PT Poultry
SRI System Rice Intensification
TK Takeo province, or Tram Kak district the study district
UNTAC United Nations Transitional Authority in Cambodia
VA Value Added
VG Vegetables
VN Viet Name/Vietnamese
YAE Young Agricultural Entrepreneur
1
CHAPTER 1 IS FAMILY FARMING AN OPTION FOR FUTURE
YOUTH EMPLOYMENT IN CAMBODIA?
1.1 Problem of the study
Youth unemployment and underemployment have become a major issue in most developing
countries (Bennell, 2007, p. 2). Given that 55% of youths reside in rural areas globally,
agricultural improvement by turning small farms into productive and profitable organizations
seems at least one of the possible solutions to youth employment issues (Dixon, Gulliver, &
Gibbon, 2001; The World Bank, 2007). However, smallholder farming has been neglected in
many of developing countries in terms of policy intervention and support especially since the
structural adjustment program (Ellis & Biggs, 2001)
The change in rural areas with respect to demography, diversity and globalization of
national economy has impacts on cultural values and ideologies of household economic
behavior Migration as a central part of rural livelihoods has implied that an increasing number
of rural households have no commitment to farming (Ellis & Freeman, 2005; Rigg, 2006).
This new tendency has opened up a debate on rural development policy, and whether it should
continue to center on agricultural development. Some scholars argue that policies need to be
completely rethought with a new focus on non-farm activities. (Ashley & Maxwell, 2001;
Chang, 2009; Rigg, 2006). Others, however, argue that there are still only limited
possibilities for supplying non-farm activities to the growing youth in the least developing
countries and that it is therefore still necessary to look at small-holder farming as a potential
solution when dealing with rural youth unemployment (Bennell, 2007).
Although smallholding agriculture currently is the biggest source of employment in
developing countries, evidence show that youth loses interest in farming (Hall, Hirsch, & Li,
2012; White, 2011, 2012). Recent studies from African countries show that youth view
agriculture as an hard, inferior, and dirty work (Bennell, 2007). The declining number of
youth who are willing to take up farming signifies a generational issue which should be of
global concern, since it can have grave adverse impact on regarding global food security
(Proctor & Lucchesi, 2012). But, to what extent is smallholder farming actually able to
accommodate young people if they want to settle in farming? What factors contribute to keep
them work on farm or move away from farm? And what kind of intervention to be considered
for youth integration project? This doctoral dissertation aims to explore answers to these
questions in the context of Cambodia.
2
1.2 Farmer exclusion and job creation
The new emerging problem is not just only the structural problem within farming sectors but
it is also about the farmer exclusion from job creation in farming resulted from the global
market integration. The more the countries integrate into the global market, the more farmers
are being distracted from the already degraded small-scale farming.
Macroeconomic development policy by the World Bank assumed full employment
and put it into equations. Agricultural sector is often considered as a primary sector that can
provide labor force for the development of secondary and tertiary sectors for economic
development processes (d‟Orfeuil, 2012). By doing so, we will get more land per people and
increase productivities per unit of land in order to overcome the challenging need for food of
9 billion human beings while maintaining environmental services as well as to provide job in
the field. However, such a policy seems to yield counterproductive consequences as it
encourages peasant evictions and apparently ignore the fact that agriculture is still the biggest
source of employment for developing countries where its industrial sectors are poorly
developed. Hence, the globalization via market integration would otherwise evict peasants in
the integration process and there could be about two billion peasants to be pushed out of
farming (d‟Orfeuil, 2012).
A relatively recent analysis by d‟Orfeuil (2012) has outlined a number of factors that
could contribute to maintaining 40% of global peasants in a poverty trap and exclude them
from the job market. One main factor is the disequilibrium of job demand and supply.
Globally, people working on agriculture accounts for about 40% of human jobs. This number
is varied and largely concentrated on poor countries as 93% in Bhutan and Burkina Faso, 64%
for China, 59% for Cambodia, 3% for France, and 1.7% for the United State of America. The
global market integration implies urbanization and transfer of labor forces from agricultural to
industrial sectors. But few poor countries have revolutionized their industrial sectors to such
an extent that these sectors can absorb the growing labor forces. A second main factor is the
eviction of peasants from farming due to limiting their access to resource i.e. land and market,
often a result from liberalized trade, integrated agricultural markets, real estate markets,
sanitary standards which create very unequal competition. Hence, the more the poor country
becomes integrated in globalization, the more people will be excluded to existing poverty trap
and to new exclusion from job market and eviction from the farms. This process is seriously
accumulated around the city of the south countries for example between 1993–2002, the poor
has been fell by 150 million in rural areas but been risen by 50 million in urban areas. Hence,
3
economic growth, urbanization helped reduce poverty globally (Ferreira & Ravallion, 2008;
Ravallion, Chen, & Sangraula, 2007).
There is a high risk of double exclusion. The first exclusion is the unbalanced labor
market and shortage of job which are the result of demographical growth. The second
exclusion is job destruction process which excludes peasant from their land and job markets
due to market integration and very unequal competition.
The doctoral study gives an overview on the experience from Cambodia in order to
see if Cambodia would be one of cases of the global problem as an Asian country which will
sooner or later be integrated into ASEAN regional economic community. The following
section will discuss the structural constraint of smallholding farming.
1.3 Smallholder farming: structural constraints
A global economic crisis is likely to increase youth unemployment and job creation recovery
would be a very challenging effort (ILO, 2011). That is why youth unemployment is
considered as one of the world major problems since the 1960s, however, youth development
remains a negligence in many developing countries (ILO, 2006).
While rural sectors of developing countries are dominated by smallholding
agriculture and plays a vital role in economy, the agricultural sector faces a number of serious
challenges (P. B. R. Hazell, 2005). In addition to technical constraints, such as declining
productivity, and structural constraints, such as limited investment on research and
dissemination, smallholding, poor institutional support and weak governance, farmers not
only have to face unfavorable markets and high competition, they also have to face the
complex social and economic issues arising from the growth of population to be
accommodated. Although there are high levels of urban unemployment and/or under-
employment, rural out-migration is still continuing because there is a greater per capita
earning in urban than in rural areas. One of the reason has been explained by Goldsmith,
Gunjal, and Ndarishikanye (2004) that it is because of the degrading economic conditions of
the rural sector (Goldsmith et al., 2004). Recent study by d‟Orfeuil (2012) has added another
glue for rural out migration that it is the outcome of global labor market exclusion of peasant
from farming.
Beside unemployment i.e. serious underemployment is also matter. Number of
unpaid family workers continue to increase in rural area (ILO, 2011, p. 21). Policy measures
which aim at targeting urban labor investments such as micro-credit measures could worsen
4
the situation in that it could create even greater incentives for rural out-migration and thereby
increase more unemployment and underemployment in urban areas (Goldsmith et al., 2004).
Dealing with unemployment alone is not enough. The unemployed youth are mainly better-
educated from urban area who can engage in job search. But rural youth are under the serious
underemployment in the low productivities particularly household-based activities. It is better
to focus on livelihood improvement of the most disadvantaged youth rather than focus solely
on unemployment (Bennell, 2007, p. 4).
Given that about half of the world‟s populations , whose livelihood depends on
smallholder farming, are poor and living in rural area, the key to move them out of poverty
must rely on the improving farming (Dixon et al., 2001). This can be done by turning small
farms into productive and profitable organization (The World Bank, 2007). It might increase
value added to agricultural product in the agricultural value chain and then create more on-
farm, off-farm and non-farm jobs in rural communities. Then, the pressure coming from the
rapid population growth could be reduced by those new job creations. This notion is known as
small farming led-growth model which is considered to potential to contribute to sustain
economic development and poverty reduction in developing countries.
The recent debate is centered on the rapid transformation in the rural south in terms
of household economic behavior, particularly changing cultural values and ideologies that call
for less emphasis on small-holding family farming but should rather focus on development of
non-farm activities (Rigg, 2006). The positive manner in terms of delivering higher incomes,
more resilient livelihoods and higher standards of living drive non-farm activities becoming
central to rural livelihoods and drive number of rural households to no longer have
commitment toward farming (Rigg, 2006). As earlier mentioned, it is found that rural youth
are now increasingly disinterested in smallholder farming and view that farm activities are
inferior and dirty work (Bennell, 2007, pp. 4-5). Therefore, one should not underestimate the
capacity of the global labor market that provides work and remittances to sustain rural life and
to cope with the crisis. With the suggestion to rethink the development approach, Rigg (2006)
concludes that we can no longer assume that small farmers are better off than landless
laborers, tenants are in a better position than owner-occupiers, agriculture and farming are the
desired default positions of rural households, parents desire a settled and farming life for their
children. And no longer should we assume that agricultural development is the best way to
promote rural development, and that rural development is the best means of raising rural
incomes and improving livelihoods (Rigg, 2006). This analysis show completely different
perspective from what d‟Orfeuil (2012) provocative call which has given me an impressive
5
spectrum of thinking to examine the case of Cambodia with regards to youth, employment
and family faming in Cambodia.
1.4 Cambodia: demographic, employment and agrarian-nexus
In Cambodia, about 80% of the country‟s 14 million people resides in rural areas. Their
predominant occupation is subsistence farming based on annual rice cropping plus other
natural resources dependence (McKenney & Prom Tola, 2002; Bhargavi Ramamurthy,
Boreak Sik, Per Ronnås, & Hach Sok, 2001a).
From the 1980s until the 2000s the population doubled at a growth rate of 2.5%.
Large numbers of young people enter the labor force as a result of a baby boom in the 1980s
(McKenney & Prom Tola, 2002).Existing research shows that people who are 24 years old or
younger accounts for 60 % of the entire population (CDRI 2007)4. Each year, about 275,000
young people enter the job market (ILO, 2007). If the pattern of employment in the
agricultural sector remains the same, which is approximately 59% of the total labor force
(Bhargavi Ramamurthy, Boreak Sik, Per Ronnås, & Hach Sok, 2001b; Theng, 2009), the
agricultural sector will have to accommodate more than 162,250 young people seeking for
land in order to make farming their livelihood by every year.
During the 2000s, Cambodia enjoyed the double digit economic growth which was
driven by the garment industry, construction and tourism. Agriculture accounted for a huge
59% of employment, compared with 13 % for industry and 27 % for services (Theng, 2009).
In 2006, 330,000 workers were employed in the garment industry. They came from the rural
areas. More than 90 % were young women. The construction sector offered about 260,000
jobs to young men, while hotels and restaurants together produced 61,000 jobs (CDRI, 2007).
Though employment data in Cambodia is poorly recorded in the country and
unreliable for making a complete picture to understand the employment issue of the countries,
it is obvious to observe that the current country growth rate of 7% will not be enough to create
job for the young growing labor force.
Demographical analysis suggested that Cambodia will have a very long way to go
through the job creation issues. Debouvry (2011) predicted that population will continue to
growth until year 2020 and stabilize for several years, the population structure will then
4 If the definition of Cambodian youth is applied, the 30 years old or below account for 65%
of the entire population in which 32% were the 15-29 years old labor force. The calculation
based on data from NIS (2009)

6
change to old age structure. According to (2011) by the year 2060, Cambodian population
will reach its peak about 18.788 million before its declining in the year afterward. Base on
this, we can say that Cambodia will have 8 years more to cope with the rise of population and
48 years for reaching post population transition. However, this is not a sound estimation.
Based on the most recent work of Diepart (2016) suggested that the Cambodian demography
is well-engage in the demographic transition process and by the year of 2030, the population
of Cambodia will reach 18,390,683 people. Based this, 3 million people will be added to rural
labor force by the year 2030 (Diepart, 2015a).
In Cambodia, most households are smallholders with less than 2 ha5 (RGC, WB, &
ACI, 2005b). The average marriage age is 24 years old (National Institute of Statistic, 2009).
Those whose parents are farmers often receive rice land as a wedding gift to begin their
livelihood. The average household size is 4.7 persons per family (NIS, 2009). This implies
that less land is available per household for sub-division making the available land capital
insufficient for subsistence. Consequently, an increasing number of rural Cambodians migrate
to the cities. An agrarian study in Kampong Thom province indicates that the out-migration
from the rural community is a result of labor surplus (2010). Those migrants are mainly
young and lack employability due to low education and limited training (ILO, 2007).
Cambodian agrarian structure study finds that smallholder agricultural production
systems absorb a significant amount of the rural labor force, while the large commercial
plantation systems often do not (RGC et al., 2005b). But it seems that the government
prioritizes in large scale plantation as evidenced in large scale of land concession (Ngo &
Chan, 2010b).
However, a study indicates the pressure on agrarian system of the country which
intervolves with migration and settlement in new area. The assessment on scenarios for rural
sector in Cambodia shows that the main farming system i.e. terrace farming system accounts
for about 70% of the total population. The system has now reached level of saturated density
which is no longer possible to support and accommodate more people (Pillot, 2007; Pillot,
Fusillier, Pouliquen, Morel, & Yang Saing, 2000). Pillot (2007) estimated that there will be
about 1.5 to 4.8 million of people will have to move out of the farm by the year 2020. This
figure is considerably high. The analysis of the 2008 population census data indicated two
5 The baseline survey in 1998 indicated that about 20-30% of total population had more land
than one ha/household and occupied nearly 70% the total agricultural land, leaving about 10%
for the majority who had less than 0.5ha/household (Ramamurthy et al., 2001b)

7
patterns of internal migration. First is migration from rural to rural area called “agricultural-
driven” migration. Second is migration from rural to urban area called” job-seeking
migration”. This confirms the scenario suggested by Pillot (2007). In addition, the prospects
of job creation in rural-non-farm industry seem to be very small though there is a sign of
nascent (Acharya, Kim, Chap, & Meach, 2003b). Pillot (2007), in his analysis, suggested that
given the fact that the country still enjoys high economic growth rates, agricultural policy
regulating employment would yield desirable results in coping with the growth of the young
labor force and with pressures on rice terrace farming systems compared to liberal policy.
In the meanwhile, there are not may studies related to rural-rural migration related to
agrarian issues. Only after 2010, scholars such as Pilgrim, Ngin, and Diepart (2012), Diepart
and Dupuis (2014) began to pay attention to rural-migration from agrarian perspectives. This
came from an alarming finding in the 2008 population census which indicates that rural-rural
migration accounts for 60 percent total migrants. Hence, this doctoral dissertation is one of
the initial scholarly attempts to explore and gather knowledge concerning youth employment
and small-holding farming in the country.
The issue of youth integration in Cambodian family farming is quite new to
Cambodian research. There is almost no knowledge and experience documented about the
county in this topic. First, question of making farming attractive is not systematically
researched and documented in the country especially way that Cambodian youth and their
family are motivated to do in farming and their perception toward farming apart from
traditional practices in the farming activities. In addition, there is insufficient knowledge
whether current small farming in Cambodia is profitable enough to bring attractiveness to
youth or not. Rural-rural migration is remarkably observed to be a natural dynamic rather than
a result from intervention policy. It is obvious that the movement are driven by the
agricultural land seeking to settle in new area. But knowledge on role of migration in family
farming is not much available. There is also no existing knowledge or study on rural youth
and farming. Even (rural-urban) migration are just emergent trend on the Cambodia research
arena due to rural out migration and rural in migration are remarkable as shown by National
Census in 2008 but what is happening to rural farm structure especially the sustainability of
farming in absorption youth is not available.
Acharya et al. (2003b) found that occupation outside of agriculture is emerging only
slowly in Cambodia. This is largely due to the country‟s history (Acharya et al., 2003b). Pillot
(2007) suggests that Cambodia should consider employment regulating agricultural policy is a

8
sound proposition. A study by Kydd and Dorward (2004) reveals that smallholder agricultural
based countries are often challenged by weaknesses of institutional environment6, and,
thereby, face serious coordination failure7. Hence, the countries require a continuous effort on
technical innovation. In this regards, Coordinated Market Economy (CME) approach would
be more appropriate than Liberal Market Economy (LME) (Kydd & Dorward, 2004).
However, it is very unlikely for Cambodia as so far, the country does not have even general
youth employment policy. It will be a very long way to go for regulating employment in
farming as Cambodia position itself in a free market economy. In addition, government is
more favor in large scale plantation than smallholding farming. This can be seen through large
scale economic land concession which is now become most controversial for political
discussion and land conflict in the country. Industrial sector remains only garment work,
tourism, and construction which are unlikely to create enough job for the growth of young
labor force especially the leading in garment industry which faces an uncertainty due to a
number of factors. This sector is largely dependent on external markets such as EU and US. If
those markets face problem i.e. global financial crisis, then Cambodia will face the problem of
cutting down the job in the sector too. Hence, it seems the lesson from this has taught
Cambodian government to value agricultural sector. But the lacks of regulating and
coordinating policy for agricultural transformation are showing the opposite attention of the
government especially in related to land policy. National youth employment policy has not
yet been developed but on the process of establishment of consultation and formulation. This
means that agricultural employment is not yet in the policy idea. This situation is favorable
for peasant exclusion when rural livelihood is not improved and the job creation has no
perspective especially when Cambodia has to integrate into labor and agricultural market in
ASEAN in the year 2015. Based on the factual analysis by Pillot (2007), growth of young
labor force, migration and shortage of employment in the secondary and third sector and
agrarian structure of the country suggest that Cambodia is one of the countries that fall into
new unheard and unidentified global problem pointed out by d‟Orfeuil (2012).
The issue of youth is even more complex when it was put in the regional context
integration. Rapid transformation in Cambodia since it becomes a member of ASEAN in term
of economic growth, infrastructure development and urbanization, integration into market
6 The institutional environment is the set of fundamental political, social, and legal ground rules that establishes
the basis for production, exchange, and distribution, institutional arrangement is an arrangement between
economic units that govern the ways in which these units can cooperate and/or compete. (Davis & North, 1971) 7 Coordination defined as effort or measures design to make players within the market system act into a common
or complementary way or towards a common goal.
9
liberalization, institutional improvement such as land law and natural resource management
regulation has contributed to the recent agrarian change in Cambodia. Many lands, about 1/5
of the country area, are devoted for economic land concession which is in favor of large scale
plantation (UN, 2007). Agricultural land price is rapidly increased due to land expansion, land
speculation and land scarcity. This results potential land conflict between local communities,
the local elites and the concession company. The investment in farming is become more and
more expensive due to high demand for more inputs both technical and managerial knowledge
(Dorward, Kydd, Morrison, & Urey, 2004; Wampfler, 2014).
This doctoral dissertation aims at breaking through this complexity to understand
conditions for integration Cambodian youth into smallholding-agriculture. By acknowledging
that addressing the complexity need multidisciplinary, the study examines the existing
theoretical framework explaining the cause of youth to move away from the farm and,
thereby, position its self on the institutional economic based on the application concept of
institutional change in relation to problem solving and livelihood framework to understand
youth integration matter in Cambodia.
1.5 Research questions
1. What lies behind youth and family „s decision not to take up the farming activities?
2. To what extend can smallholding farming accommodate youth if they wanted to settle
in farming?
3. What factors contribute to keep youth works on farm or move away from farm?
4. What kind of intervention to be considered for youth integration?
1.6 Youth definition applied in the study
According to national youth policy, Cambodia define “youth “as those age between 15 to 30
years old, while international youth definition defined by UNESCO define “youth as those
age between 15-24 years old (UNICEF, 2009). The study applies youth definition of
Cambodia. However, based on knowledge from the field survey, when taking about youth in
farming, this study defines youth or youth couple as people whose ages are between 14 to 35
years old. Adult or adult couple or adult household is defined as people whose ages are above
35 years old.
10
1.7 Structure of dissertation
This dissertation comprises of five main chapters. Chapter 1 proposes the problem of the
study, context of Cambodian and research questions. Chapter 2 consists of 3 parts. Part 1 is
reviewing theoretical background concept of institutional economic and institutional change
and how its relevant to this doctoral study. Part 2 is about the framework for understanding
the issue of successful youth integration in farming. Part 3 is about research methodology and
analytical framework.
Chapter 3: “Rural livelihood and smallholding farming: The farm and household
economy in rural Cambodia” analyzed the farm production system and its profitability. It was
followed by the analysis of household consumption and income sources. By doing this we
were able to see that whole picture of farming capacity in generating income for sustaining
youth family. The chapter addressed the following question: (1) what type of farming system
available in the study area? Does farming generate attractive income? Is the total earning from
farming enough to meet household need? What role of non-farm income and remittance from
migration?
Chapter 4: “Youth integration in family farming in Cambodia” is to explore the extent
to which different farm type and diversity of farm impact on accommodating youth in
farming.
Chapter 5: “Institutional dimensions for sustainable youth integration in Cambodian
family farming” is dealing with the following question: what are motivations for them to
decide to settle in farming? Even with strong support from the project, why youth still quit
farming after the project finish? What factors contribute to those who success and failure in
business farming initiated by youth with project support? What are role of family and relevant
institution facility youth access to farming. The chapter is written based on the interview with
CEDAC project staff, interview with youth who succeeded settling in farming, youth who
failed to settle, and their parents.
Chapter 6: “The future Prospect of youth integration in family farming in Cambodia”
is the synthesis of finding and conclusion of the dissertation.
11
CHAPTER 2 THEORETICAL BACKGROUND, RESEARCH
FRAMEWORK, AND METHODOLOGY
PART I. Theoretical background
The world has reached the conventional consensus on the idea that the economic development
should not be solely based on market regulation. Invisible hand of market alone is not enough
but it should be an institution that helps regulating and correcting the market to reach
efficiency as high as possible. This is because the disappointment of the previous economic
explanation i.e. neoclassical economic that is mainly based on the assumption that the
economics of exchange is costless and individual can maximize their choice of benefit under
the market and price regulation, then market could reach efficient level as the outcome of
interaction between market and choice be made by individual. However, in the real word, how
people making choice is very much depend on the information availability and their mental
capacity to process the information. The limitation of capacity of processing information and
the imperfect information drive individual to bear the cost associated with their choice making
before to transaction such as searching, monitoring, coordinating etc. When it is costly to
transact, it is, then, institution matter. Simply, institution is a human imposed rule of the game
to facilitate human interaction in the market economy (North, 1990). Major portion of
national economy8 are devoted to transaction cost. Developing countries are poor as because
the economics of exchange bear high transaction cost due to the absence of institution that
minimize those transaction costs (North, 1990). In addition, the previous neo-classical
economic approaches are frictionless, timeless and tend to be more static than dynamic in
explaining the complexity of issues (North, 1990, 2003). This, on the one hand, opens up the
gate for transaction cost paradigm in explaining economic development. On the other hand, it
requires a body of theory that integrates the three important dimensions of politic, economic
and social in explaining the economic development and, therefore, framework of institutional
analysis for understanding institutional change is introduced (North, 2003). When transaction
cost and roles of institution are widely recognized, it becomes more obvious that the previous
economic hypothesis of neoclassical theory is far from the reality. Two mainstreams of
economist try to bring economic theory to be more reality.
8 Taking example of the calculation of transaction costs of the U.S. national economy,
transaction cost account for up to more than 45 percent of the national income (Shin, 2005).
12
First there are the orthodox institutional economists tend to suggest that “economics
embedded in the imperfect market where the information is incomplete; thereby it requires
some basic necessary institutions to regulate the market”.
Second there are the heterodox institutional economists prefer to take into account
the complexity in which the economy is embedded. They argue that the neoclassical
economic assumption is far from the reality and, therefore, it should be completely change the
economic hypothesis. The suggested hypothesis is that “economic is embedded in social
institution”. Probably, it is in this economic hypothesis that North (1987, 1990) has developed
a theory of institutional change explaining how the economics of exchange is taking place and
functioning in the society. If the economic is place on the social institution, then, one may
understand that objective of economic is no longer individual maximization and equilibrium
but objective of economic embedded in social institution is to create an incentive behavior for
individual for the purpose of economic growth both productive and redistributive of one
society. Therefore, institutional change theory can be considered as a grand theory as it
provides a whole perspective of how society is evolved and construct the economics of
exchange.
2.1 Institutional Economics: Theory of Institutional Change
Addressing the complex issues of understanding reality, one cannot ignore that the issues are
multidisciplinary. This study employs institutional economic approach in addressing the
question of youth integration into smallholding farming, given that it permits the study to
combine economical and sociological discipline. Family farming can be either considered as
institution or organization. The institutional change theory is, hence, relevant family farming
embedded in social institution. This section, I am going to show that given family farming can
be considered as an institution and an organization, the institutional change based on ―the
shared mental model‖ is relevant in explaining the question of why smallholder farmer
quitted their farm.
2.1.1 Concept of Institution
Self-interested behavior embedded in human mind and ignorance, which individuals face
when they interact; generate the potential inter-individual conflicts and social interaction
issues. Inventing social rules and following the social rules are, hence, the devise for
restricting self-interest of all or some member of the society and to better mutual advantage in

13
exchange process (Mantzavinos, 2001). Therefore, enforcements are the characteristic of the
institution.
Motivations derive from self-interest seeking (economic aspect) arise social problem
and inter-individual conflict. Social rules and institutions exist as the mean of solving social
problem and overcoming the social conflict (Mantzavinos, 2001).
Due to the limits of human cognitive capacity plus the complexity of the
environment (social aspect), individuals mobilize their energy only when the new problems
arise. They, then, classify the new problems into situation where it is similar to the old
existing one that they used to solve. Then it follows the routine.
Institutions exist as rule of the game to stabilize expectation and to reduce
uncertainty of agents (Mantzavinos, 2001). Institutions are, therefore, defined as social rules
i.e. rules of the game that shape human interaction in the society through mechanism of social
control either formal or informal (North, 1990). They are patterns of behavior serving to solve
the problem of cooperation and providing the platform for conflict resolution (Mantzavinos,
2001).
Institution is generally referred to every kind of organization. It is necessary to
distinguish between institution as rules of the game and organization (or institution) as
corporate entity, for example, the bank (Ellis, 1988; Mantzavinos, 2001; North, 1990).
Organization as corporate entity is a group of individual so-called collective units
characterized by a set of procedural rules that define the coordination of individual members
to achieve the common objective or to solve a common problem. When organizations deal
with other organizations or with individuals, they are submitted to the general social rules
which are equally constrained by general rules of the game. That social rule is called “the
institutions” (Mantzavinos, 2001, pp. 83-84).
Mantzavinos (2001) distinguishes formal and informal institutions based on its
enforcement agency. Formal institution is enforced by law. Informal institution can be
classified into three categories: (1) conventions as self-policing institutions, (2) moral rules
with individual as the first party controller and (3) social norms which are enforced by the
member of the social group.
14
2.1.2 Institutional Change theory
Depending on the social-cultural context, individuals have different mental models and
capacities to process information. They therefore act differently when making their choice in
the economics of exchange (North, 1995; Williamson, 2000).
Because of the economic interest, people will try to maximize its own benefit which
is not necessary to add value to the economies at all such as rent seeking, free riding. This
could lead to tragedy of the common (Chang, 2010). The act in seeking such personal interest
with guile is called “opportunism” (Williamson, 1985, p. 30). Normally, people intended to
rationally economization orientation. But since they have limited capacity to make their
choice due to the limited “cognitive competence”, the situation of behavioral uncertainty
arisen. Williamson (1985) calls this “bounded rationality”. Based on this “behavioral
uncertainty”, Williamson views the emergence of institution as a contractual relation.
Contractual relation is never perfectly defined; contractual gap is, hence, occurred. Parties
involve the relation, devise machinery to “work thing out” that is to invest their specific assets
(asset specificity) in order to specialize in the governance structure. Objective is to minimize
the transaction cost9 as well as to safeguard the behavioral uncertainty; finally, alternative
mode of organization is defined. This is known as organizational theory.
Williamson„s organizational theory is oriented towards industrial firms especially
related to the aspect of organization management and contractual interrelation between
organization that is it evolves mainly at the institutional design and formal rule (Chavance,
2009, p. 79). In this case, transaction cost framework is often applied in which production
cost, governance cost and alternative mode organization are the theme of analysis
(Williamson, 1985, pp. 43-63). In addition, according to the four level of institutional
analysis, Williamson (2000, p. 597) distinguishes between the institutional environment and
institutional arrangements which correspond to informal and formal rules. Since it takes very
long time to change informal rules, it would be difficult to conduct a field study at this level.
Hence, Williamson tends to analyze the institutional only formal rules. However, Slangen,
Loucks, & Slangen (2008, p. 84) observe that there have been many types of cultural shifts
during the last one hundred years suggesting that institutional change at this level is not that
time dependent. In this regard, it is probably a limitation of Williamson organizational theory
9 Refer to the costs for running the economic system.

15
if the informal rule is taken into account. Instead, I will consider North‟s theory of
institutional change.
Due to socio-cultural factors, people are influenced by the system of belief, ideology
and other aspects of behavior such as a form of altruism and self-imposed standard of
conduct. This will influence their choices (North, 1990, pp. 20-25). Institutions are, hence,
defined as the rule of game in a society where human impose constraint to structure/shape the
human interaction that create the incentive systems10
for human exchange in either politic,
social or economics. It is about rules and norms both formal and informal with their
enforcement characteristics in the society. If institution is rules of the game, organizations
are, then, players in within society that can be individual or group who share common
purpose to achieve objectives such as political body (political parties, senate, …), economic
bodies (firms, trade unions, family farms, cooperatives), social bodies (churches, pagoda,
clubs, civil society …) and educational bodies (school, university, research center …) (North,
1990, 1995, 2003).
The institutional change is determined by the interaction between institution and
organization. Two main determinants shape institutional change. First is the opportunity
provided by the incentive structure of the institutions. Second is the feedback process that
humans perceive and react to the changes in the opportunity set. Organizations are created in
line with the institutional framework and will act to get the opportunity set from the incentive
structure of the institutional framework. The chance to gain the profitability depends on the
mental model in which entrepreneur of organization process the information. The cognitive
capacity of entrepreneur creates a kind of communication among member of the organization
so that every member possesses the same understanding-a shared mental model. This is
known as organization learning. Therefore, organizations will invest on seeking means that
permit them to be able to capture more opportunities i.e. knowledge11
. When the organization
evolves in taking advantage of the opportunities set, they will become more and more
specialized in knowledge, more efficient and more productive, more competitive and
gradually change the institutional framework (North, 1990, 1995, 2003).
10 The incentive system could yield both incentives and disincentives that behave in a certain way 11
Knowledge here refer to “all the human adaptations to environment in which the past experience has been
incorporated”(Hayek, 1960, p. 26) cited in (Mantzavinos, 2001, p. 78). North (1990) classified knowledge as (1)
communicable knowledge (can be transmitted through communications) and (2) tacit knowledge (can be
transmitted through practice and initiation). Mantzavinos (2001) classify knowledge as (1) Theoretical
knowledge or scientific knowledge-“know what” which can be transferred with aid of symbols, (2) Practical
knowledge-“know how” which can be transmitted by example and imitation, (3) Atomistic knowledge-
knowledge exist in individual brain experience reality: can be transmitted within small groups such as family
firms. It is everyday phenomena.
16
North „s theory of institutional change gives broader perspective to understand the
complexity of the society ranging from individual motivation to informal and formal
institutions. In addition, based on individual behavior, North employed the concept of shared
mental model which is result from process of learning. He emphasizes that the way in which
knowledge is developed could shape the individuals perceptions of the world around them and
those perceptions, in turn, shape the search for knowledge (North, 1990, p. 76). The
incentives that are built in the institutional framework play roles in shaping skill and
knowledge. Viewing the society is complex so-called “decipher environment”, North believes
it is individual that is the principle agent stimulating institutional change. The extent to which
agents willing to change the institution depend on their motivation where they perceive and
learn from the decipher environment. However, acknowledging that our understanding of
individual motivation is incomplete, it is, therefore, existence of existing institutions that
provide means for choice making and motivation of actors (self-interested seeking, altruism
and other no wealth-maximizing values) that helps shaping institutions (North, 1990, p. 25).
North „s theoretical framework of institutional change could be a basic theory for
understanding the perception and motivation of young people regarding agricultural work. In
this sense, we can simply say that the study of institutional economic is about the study of
formal and informal rules and its interaction with individual or group of individual members
of the society that could affect their economic behavior. The change will be either an
incentive or disincentive for economic activities.
2.2 Institutional change as process of problem solving
In line with North„s ideas concerning individual perception, motivation, knowledge and
learning process, Mantzavinos (2001) elaborates the theory of shared mental model as a
simple communication model and, thereby, explains institutional change as a process of
collective problem solving which individuals face. The main argument for this theory is that
institutional change is the outcome of changing agents‟ perceptions if their interests are better
served under the new institutional arrangements. The change will go through the evolutionary
process of learning (growth and transmit knowledge) i.e. trial and error by either collective or
individual. Once, everyone possesses the same cognitive structure (shared mental model),
they, then, initiate the change deliberately through collective action or spontaneously through
invisible hand.
When individuals meet a problem, they try to find ready-made solutions from the
environment they are living in. If new problems occur, individuals communicate. The effect
17
of communication (called insertion rule) permits introducing solutions to the problem into the
cognitive system of individual from the cognitive system of other individuals. Finally, both
sender and receiver possess the same cognitive rule(s) and finally arise the share rule(s)
between individuals called a “shared mental model”(Denzau & North, 1994; Mantzavinos,
2001, pp. 68-69).
Base on this problem-solving model, the institutions are, then, either changed
deliberately or spontaneously. Deliberate change happens when collectives encounter the
same problem and make a conscious choice to solve it. Spontaneous change happens when
individuals try out an innovative12
solution. If a given new solution solves the problem, other
individuals tend to react, to imitate and to adopt the new solution. The process, with aid of
invisible hand, constitutes the accumulative process through which new behavior or pattern of
action becomes more wildly adopted by those who expect to have better condition.
In this study I apply the problem-solving model (motivation and knowledge as learning
process) deriving from the theory of institutional change to understand conditions for
integration young into smallholding agriculture. Based on this model, individual and family
make choices based on the problems they face in their livelihood, knowledge of solutions they
have learnt from member of their social group, and what they perceive to be the best solution
conditioned by their resource constraints.
2.3 Family farm: as institution or organization
It is important to highlight meaning of family farm13
or farm household. The term „family‟
implies a range of sociological factors, such as interpersonal relationships, whereas
„household‟ implies notions of functional economic activity (Tipper, 2010).
Families are households and include kin, which refers to a blood-relationship
between individuals. Once notions of kinship are attached to family, it implies collective
responsibility, collective action rules, norms and decision making within family members
(Tipper, 2010). In this sense family may be considered as an „institution or informal
institution‟(Chia, Dugué, & Sakho-Jimbira, 2006; Mantzavinos, 2001).“Family” can be
considered as „organization‟ in the sense that it comprises governance structures for
coordination of economic activities to achieve common objectives, i.e. sustaining livelihood
12
The case of an individual perceiving something as new problem and trying out a solution that is new to him
but not to the others member of the social group does not constitute an innovation(Mantzavinos, 2001, p. 94). 13
There are many study define meaning of family farming or peasant farming such as (Ellis, 1988).
18
(Requier-Desjardins, 1994). It is a unit of production involving both production and
consumption. One of its important roles is as provider of insurance against economic adverse
events (Pollak, 1985). In this case family may incline to the notion of household suggested by
Tipper (2010) and organizational theory suggested by Williamson (Williamson, 1985).
PART II. Theoretical framework
2.4 Existing theories explaining the change of family farming
Lewis as early as in 1954 stated that all countries at some stage have to experience the
movement of a labor force from the agricultural sector to non-agricultural sectors especially in
societies with a fairly low level of economic development and rapid population growth. This
is because agricultural activities are subject to diminishing returns. When there is surplus
labor adding to the same plot of land, then labor productivity will decline up to the point
where it is equal to or below the subsistence level. Commercial farmers must reduce the
number of workers or reduce the wage rate. Family farm households must share the earning
from agriculture to more member of household working on the farm and the dependent. When
this share is below the household subsistent, farm household„s member will seek alternatives
which could result in higher earning such as out-migration. More often, this migration has
implied geographical movement of workers from rural to urban areas. The growth of urban
unemployment would drive this labor working in petty services which has usually low
productivity (Thirlwall, 2006).
In line with Lewis regarding to population growth, Dynson, (2010) argues that
population growth is the main factor for societal change. Considering mortality and fertility as
natural phenomena, demographical transition theory explains the path of transition as the
change of society from the high birth and death rate to lower birth and death rate and, thereby,
resulting population growth, people movement from rural to urban (urbanization) and change
from “young age structure” to “old age structure” society (Dyson, 2010). Theory stated that
traditional society will begin with declining in mortality which leads to rapid population
growth: urbanization, migration, gender differentiation i.e. changes in women‟s roles, child
bearing, family structure; these pose the stresses and strains on the society. As a consequence,
people reduce number of children implying the decline of fertility. The society will gradually
move to the structure of population aging14
(Dyson, 2010, pp. 216-225). However, even
though each country has to go through the process of transition, it does not mean that each
14 For detail framework please see Dyson (2010, p. 9)
19
country would achieve the same outcome of the transition. The concept of demographical
transition shares similar perspective with institutional economics. On the pathway of
institutional change, the outcome would vary even though the same policy and standard
institution was adopted. To understand the current challenge of the world, North (2003)
suggests taking into account-population growth and institutional structure. Hence, land and
labor of family are important aspects for addressing youth issue in family farming
General social and economic theories of migration are always popular when issues involve
people‟s decisions to migrate out of the farm. The theories emphasize numerous factors
influent decision of agent of the family farm. General social theory of migration suggested
that those factors are (1) original factors (push and pull forces), (2) destination factors, (3)
intervening obstacles (physical and sociocultural distance) and (4) personal factors
(perception in which individual learn from their environment) (Rhoda, 1983). The economic
migration theory focus on (5) the expected “profitability of the employment” at the
destination; that is, a personal cost-benefit analysis taking place in the prospective migrant‟s
mind and extended to income and intersectional linkage model (Rhoda, 1983; Todaro, 1969).
Sustainable livelihood theory suggests that migration has now become a central
feature of the livelihood of the majority of households in low income countries (Ellis &
Freeman, 2005). Illustration 1 shows the linkage between migration and the livelihood
framework15
as a way of moving out of poverty. The immediate connection migration to the
human and financial capital in livelihood framework could help family farming to accumulate
their wealth. Migration involves mobility of labor together with a person‟s experience, skills,
educational level and health status. This human capital will play multiple roles in both
reducing vulnerability and enabling asset accumulation of the household. Earnings obtained
from migrating and the remittances sent back by migrants to their resident families are to
maintain or raise the level of other assets such as saving, land, equipment, livestock,
education of children and so on. This could contribute to the increase of household asset and
reduction of the rural poverty (Ellis & Freeman, 2005).
15
For livelihood framework: see Sustainable Rural Livelihoods: A Framework for Analysis by Scoones (1998)
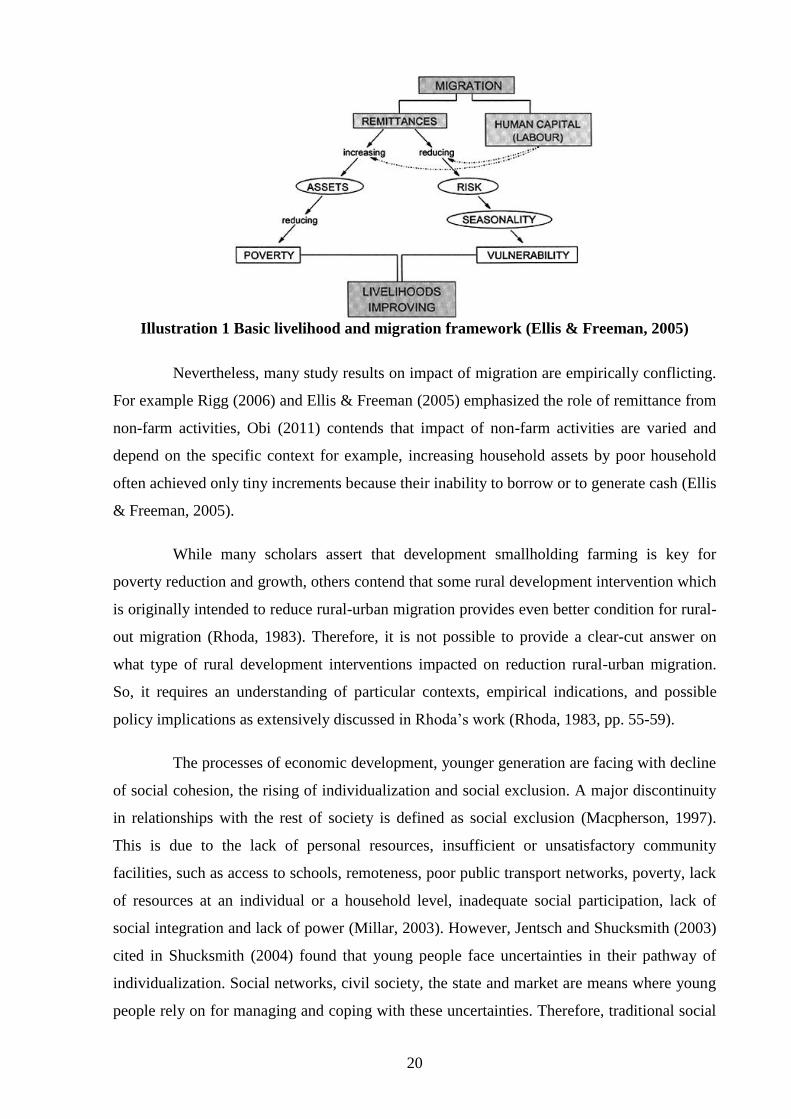
20
Illustration 1 Basic livelihood and migration framework (Ellis & Freeman, 2005)
Nevertheless, many study results on impact of migration are empirically conflicting.
For example Rigg (2006) and Ellis & Freeman (2005) emphasized the role of remittance from
non-farm activities, Obi (2011) contends that impact of non-farm activities are varied and
depend on the specific context for example, increasing household assets by poor household
often achieved only tiny increments because their inability to borrow or to generate cash (Ellis
& Freeman, 2005).
While many scholars assert that development smallholding farming is key for
poverty reduction and growth, others contend that some rural development intervention which
is originally intended to reduce rural-urban migration provides even better condition for rural-
out migration (Rhoda, 1983). Therefore, it is not possible to provide a clear-cut answer on
what type of rural development interventions impacted on reduction rural-urban migration.
So, it requires an understanding of particular contexts, empirical indications, and possible
policy implications as extensively discussed in Rhoda‟s work (Rhoda, 1983, pp. 55-59).
The processes of economic development, younger generation are facing with decline
of social cohesion, the rising of individualization and social exclusion. A major discontinuity
in relationships with the rest of society is defined as social exclusion (Macpherson, 1997).
This is due to the lack of personal resources, insufficient or unsatisfactory community
facilities, such as access to schools, remoteness, poor public transport networks, poverty, lack
of resources at an individual or a household level, inadequate social participation, lack of
social integration and lack of power (Millar, 2003). However, Jentsch and Shucksmith (2003)
cited in Shucksmith (2004) found that young people face uncertainties in their pathway of
individualization. Social networks, civil society, the state and market are means where young
people rely on for managing and coping with these uncertainties. Therefore, traditional social
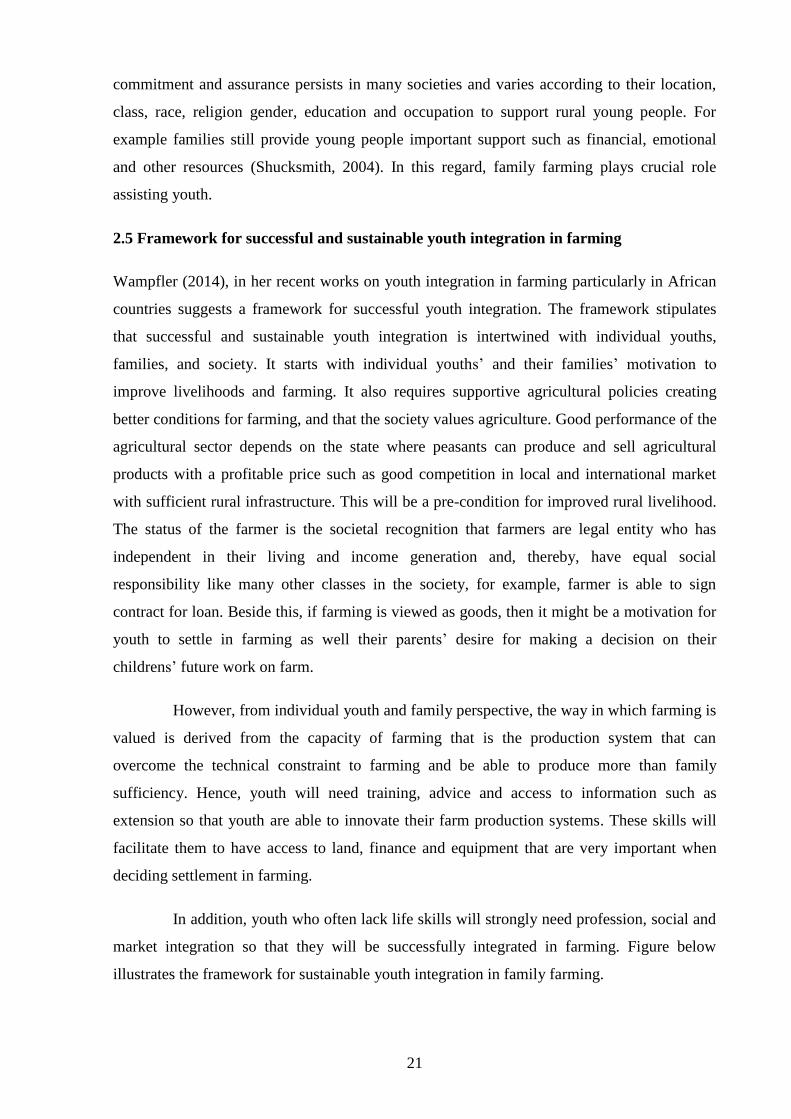
21
commitment and assurance persists in many societies and varies according to their location,
class, race, religion gender, education and occupation to support rural young people. For
example families still provide young people important support such as financial, emotional
and other resources (Shucksmith, 2004). In this regard, family farming plays crucial role
assisting youth.
2.5 Framework for successful and sustainable youth integration in farming
Wampfler (2014), in her recent works on youth integration in farming particularly in African
countries suggests a framework for successful youth integration. The framework stipulates
that successful and sustainable youth integration is intertwined with individual youths,
families, and society. It starts with individual youths‟ and their families‟ motivation to
improve livelihoods and farming. It also requires supportive agricultural policies creating
better conditions for farming, and that the society values agriculture. Good performance of the
agricultural sector depends on the state where peasants can produce and sell agricultural
products with a profitable price such as good competition in local and international market
with sufficient rural infrastructure. This will be a pre-condition for improved rural livelihood.
The status of the farmer is the societal recognition that farmers are legal entity who has
independent in their living and income generation and, thereby, have equal social
responsibility like many other classes in the society, for example, farmer is able to sign
contract for loan. Beside this, if farming is viewed as goods, then it might be a motivation for
youth to settle in farming as well their parents‟ desire for making a decision on their
childrens‟ future work on farm.
However, from individual youth and family perspective, the way in which farming is
valued is derived from the capacity of farming that is the production system that can
overcome the technical constraint to farming and be able to produce more than family
sufficiency. Hence, youth will need training, advice and access to information such as
extension so that youth are able to innovate their farm production systems. These skills will
facilitate them to have access to land, finance and equipment that are very important when
deciding settlement in farming.
In addition, youth who often lack life skills will strongly need profession, social and
market integration so that they will be successfully integrated in farming. Figure below
illustrates the framework for sustainable youth integration in family farming.
22
Source: (Wampfler, 2014)
2.6 Framework for understanding the issue of integration youth in smallholding farming
in this PhD study
At the policy level, institutional change theory draws the development thinkers‟ attention on
different paths and stages of development which requires careful adoption of economic policy
for example the influence of demographical transition and institutional structure. The case of
smallholder agricultural based countries, analysis suggested that due to weaknesses of
Family
Farm
production
system
Youth
Motivation to
improve the
livelihood and
farming
Performance of
agricultural sector
Condition of rural
livelihood
Status of agriculture
Perception on agriculture
Professional
integration
Social
integration
Market
integration
Information
Innovation
Training
Advising
Land
Financing
Equipment
Institutional environment
Institutional arrangement:
agricultural policies and public policies Imperfect market and
weak of institution
Illustration 2 Framework for sustainable youth integration in Farming

23
institutional environment16
, the countries would face serious coordination failure17
and, hence,
requires a continuous technical innovation. In this regards, Coordinated Market Economy
(CME) approach would be more appropriate than Liberal Market Economy (LME) (Kydd &
Dorward, 2004).
The issue of youth integration in family farming can be explained from different
theoretical points of view and share some interrelated points. Institutional economic theory
suggests to take into account the institutional environment and arrangements which condition
farm household behavior, individual choice, household decision making, information flow
and governance structure of the household but the theory seem less emphasis on rural
livelihood aspects such as migration and social structure when it comes to apply at the farm
level. While livelihood framework less taken into account market and different level of
institutional environments (individual, family, community and state), both social and
economic migration theory stress on individual personal economic cost benefit as incentive
for migration. These theories emphasize less incentives such as role of belief, ideology,
tradition, altruism, social norms, and cultural values which lead to bounded rationality (in
intuitional economic theory). However, when questions of youth integration are primarily
related to land, those theories do not take into account the social structures which would result
from the effort of rural development (Berger, 1992). While land access may generate different
agrarian class, failing to take into account social structure may contribute to failure in
development effort. Social capital theory is, hence; somehow contribute to understanding this
from the sociological point of view. When family farm is considered as an organization,
family farm may have to invest in specific assets (asset specificity) such as knowledge, skill,
and experience and network which are necessary to ensure the durability and sustainability of
the farm household in the market lock-in. In this sense asset specificity may incline to notion
of social capital, the aggregation of the actual or potential resources which are linked to
possession of a durable network of more or less institutionalized, socially instituted and
guaranteed under the common name of family (organization).
To understand the condition for integration young people in family farming the
study should understand young people‟s decisions to move away from the farm and migrate.
There are both push and pull factors, and personal cost benefit analyses drive households to
16
The institutional environment is the set of fundamental political, social, and legal ground rules that establishes
the basis for production, exchange, and distribution, institutional arrangement is an arrangement between
economic units that govern the ways in which these units can cooperate and/or compete (Davis & North, 1971). 17
Coordination defined as effort or measures design to make players within the market system act into a
common or complementary way or towards a common goal.

24
decide to migrate (Rhoda, 1983). Land and labor i.e. growth of family members whom family
farming has to accommodate are the problems that family farm face. Age, gender, marital
status and level of education influence the way the individual and family value the future and
choice of livelihood strategies (Obi, 2011).
This review suggests us to understand that youth integration can be operationalized
through, (1) understanding the socio-economic situation of family farms as this will condition
their motivation/commitment and livelihood strategy to farm work. (2) Both young peoples‟
and their families perception of work in agriculture should be examined as economic rational
aspects may not be enough to explain choice of farm work. This could be, for example, their
aspiration to enjoy city life. (3) Different levels of institutional environments and arrangement
ranching from family roles over community based organizations to state policy. (4) Access to
land and different type of farming systems will determine the different level of investment
and need for integration especially the capacity of farming in income generation to sustaining
the farm family, (5) Social systems such as community based organizations, and other
institutional support contributing to attract young people to agricultural work.
The present dissertation suggests that livelihood and migration share some points
with institutional economic theory and, thereby, an integrated theoretical framework can be
developed. This could reconcile between the orthodox and heterodox economic mainstreams
as well as harmonization between homo economicus and homo sociologicus. The study
proposes that conditions for youth integration into smallholding agriculture are
perception/motivation/desire of family farm/farm household to decide to utilize their assets to
make livelihood activities to sustain livelihood and to cope with livelihood constraints (shock,
trend, seasonality) based on economic rationales embedded in social institutions (formal,
informal, institutional environment/arrangement).
Literature review from different theories indicates that issue of youth integration in
family farming can be explained from different angles of theory such as institutional change
theory, organizational theory, migration theory, livelihood theory, and social capital theory.
Both past and recent empirical studies indicate the growing change of youth and family farm
commitment toward farming activities which contribute to the concern of global thread on
future food security (Proctor & Lucchesi, 2012). The question of making agriculture attractive
is still very challenging and whether it should be made attractive not easy to give answer
(Brüntrup, 2010). In such decipher environment of family farming, to understand the issue of
25
youth integration into small holder farming requires an integrated framework which lie
between institutional economic, livelihood, migration and social capital theory.
Many studies attempt to explain the reason why youth move out of the farm. Recent
research related to youth and family farming mainly focuses on the youths‟ own aspiration
and technical constraints toward farming but tends to neglect structural constraints. In
addition, roles of smallholder family farming in accommodating the growth of family
members and the extent to which agriculture generates income for sustaining livelihoods have
not been at attention of any recent research related to the issue of youth and family farming.
Hence, more empirical study needs to be carried out with an integrated framework.

26
PART III. Methodology
2.7 Research Design
My study combined household socio-economic survey, in-depth key informant interviews,
and focus group discussions with youth. Given that youth and households are inter-dependent,
to capture youth issues on farming, youth was selected from the household. Hence, the unit
analysis of this study are individuals (youth) and households.
The survey was designed to understand from the general sense on the situation of
farm family in Cambodia in order to see the economic activities generated from farming and
non-farming, social status, and family demography (age, gender, education, migration), access
to common resources, household daily consumption/expense and thereby triangulated this
data to see if farming could meet the household need.
The case study on youth integration project in Cambodia is to reinforce the
knowledge from the survey. It was intended to understand what would be reasons that
influence youth and family‟s decision to quit or to stay in farming. With general and specific
knowledge, the study would be able to discuss the real motivation of youth regarding farm
work and to discuss with appropriate consideration for future youth integration in Cambodian
farming.
Given that rural-rural migration is remarkable in Cambodia, the study is designed to
investigate in two areas-low and high-density areas to see inter-linkage of the areas especially
related to the issue of land availability. This study area is designed for the first socio-
economic survey. The second field work is dedicated to the case study of one youth
integration project of CEDAC project. Youth who were taking part in the project were
identified and selected from four provinces of Cambodia.
2.7.1 The study area for the first survey
After exploration, the study decided to choose (1) Otdar Meanchey representing low density
area and (2) Takeo province representing the high-density area. Otdar Meanchey is new
created province where large part forestlands were converted to agricultural land as a result of
population movement for new settlements. A common type of farming system is rain fed rice
farming with annual crop on the upland land. Some people migrate to Thailand as it is close to
the border. Takeo province is an old and stable area. People own small plots of agricultural
land and try to diversify agricultural activities through growing earlier rainy season rice and

27
vegetable. In some areas like in Prey Kabas commune, people intensify rice farming with
water supply from irrigation. The proximity to the capital Phnom Penh and the present of
garment factories makes it attractive for youth and adult to migrate to the city for educational
and non-farm occupational purpose.
Three districts (out of five) were selected from Otdar Meanchey province to see
historical linkages regarding to political integration, settlements, land acquisition, and
migration related to farming. Two districts (out of ten) were selected from Takeo province
based on agro-ecological zones of the province, poverty map, and migration. Tram Kak
district represents high migration district and agricultural diversification districts, whereas
Prey Kabas represents low migration and rice intensification district. One commune was
selected from Tram Kak district. Two villages represent agricultural diversification based on
limited source of storage water and other two villages represent agricultural diversification
with no access to water source.
Figure 1 Study Area
Source: General Population Census of Cambodia 2008 (National Institute of Statistic, 2009)

28
The study randomly selected respondents of 382 households from the two study areas.
The survey covered 25% of youth age between 15 and 3018
years old. The contents of the
questionnaire are mainly about household composition (age, sex, education, and marital
status), migration and occupation, agricultural and non-agricultural activities (land, labor
input, income, and expenditure), household consumption, and general views related to
agricultural occupation. One group discussion was conducted with youth who were currently
studying at secondary and high school to get their view regarding to occupation on farming.
Twenty key informants were interviewed including key farmers, village chief, chief of
community forestry NGOs staff and independent analysts to get knowledge on locality,
constraints regarding to youth occupation in farming and prospects. Qualitative interview was
also done with some selected youth who were engaged in farming and their parents to see
challenge in starting up farm work and extent of which family could support youth farmer.
2.10.1.1 Site selection in Otdar Meanchey
As I did not have background knowledge about the situation of Otdar Meanchey in
advance, and with the caution to political sensitiveness, I decided to identify the study area
through the development NGOs that was working in Otdar Meanchey and had good
relationship with local authorities. I contacted “NGOs forum” based in Phnom Penh whose
work is to coordinate the NGOs and INGOs in Cambodia. I finally got the name of two NGO-
Buddhists for Development (BfD) and Children Development Association (CDA). BfD
provided me with good general information regarding to legal document related to the
provinces, such as on the establishment of the province, and gave me suggestions regarding
how? to target the village. However, BfD‟s works were mainly related to education,
decentralization and de-concentration and they therefore, did not have good access to the
village. CDA was working closely with villager through development project such as
livelihood improvement, community forestry, and land issues. CDA had very good access to
the field and was willing to assist and guide me to the field. Moreover, all identified villages
from BfD were in the target area of CDA. I, therefore, decided to work with CDA for
accessing the field.
Samples were randomly selected in Otdar Meanchey. Initially I planned to choose 20
respondents per village from 10 identified villages representing 3 regions of the province.
18
According to national youth policy, Cambodia define “youth “as those age between 15 to 30 years old, while
international youth definition defined by UNESCO define “youth as those age between 15-24 years old. The
study applies youth definition of Cambodia.
29
Each region had a different history which was connected from one to another. I shall elaborate
this later in the context of the study area. However, due to scattered and geographical
distribution plus sensitiveness of the hot land issues, the interviews could not be conducted as
planned to cover 200 respondents especially in the last two villages where they were the
former Khmer rouge villages19
with high sensitivities to outsider. When the study took place
in the villages, villagers had been seriously involved in land conflicts with a private company
who owned economic land concession from the government. They showed anger to outsiders
and refused to participate in the survey. It was important to note that for access to the Khmer
Rouge villages, it was necessary for me to go through networks they trusted either
government or NGO networks. Otherwise, the data collection would be difficult. In my case, I
used Children Development Association (CDA) network, the only organization working on
forest and land issues in Otdar Meanchey and actively engaged in REDD project in
Cambodia.
“What is the network where are you coming from? Ah, you come from
CDA. No problem because CDA working very well with our
community forestry. If you work only within your topic, I can answer
some. If you working on something else (I presume that he means
something related to politics, KR history), then I cannot answer”
(Source: one village head chief, in former Khmer Rouge village, and
former KR commander of one brigade)
The quotation above made me realize that the advices which were given to me to be cautious
on data collection in former Khmer Region are serious.
2.10.1.2 Why three districts?
The agro-ecological system of the Otdar Meanchey province is mainly similar. Major
farming systems are rice based. The rice lands are from forest clearance. People cultivate
rainfed rice once a year. All people practice sowed-rice but not transplanted rice. But some
people whose land is higher elevated, tend to grow annual crops, particularly cassava.
However, people learnt how to grow cassava only in the last one or two years. On the new
occupied forest land where it is not yet cleared, people have to speed up the process of
19
Village that has been settle by former Khmer Rouge force fighting against the government between 1991 and
1998 and its final surrender was in 1998 and submitted to live under the administration of the government 1998
in Along Veng district of Otdar Meanchey province.
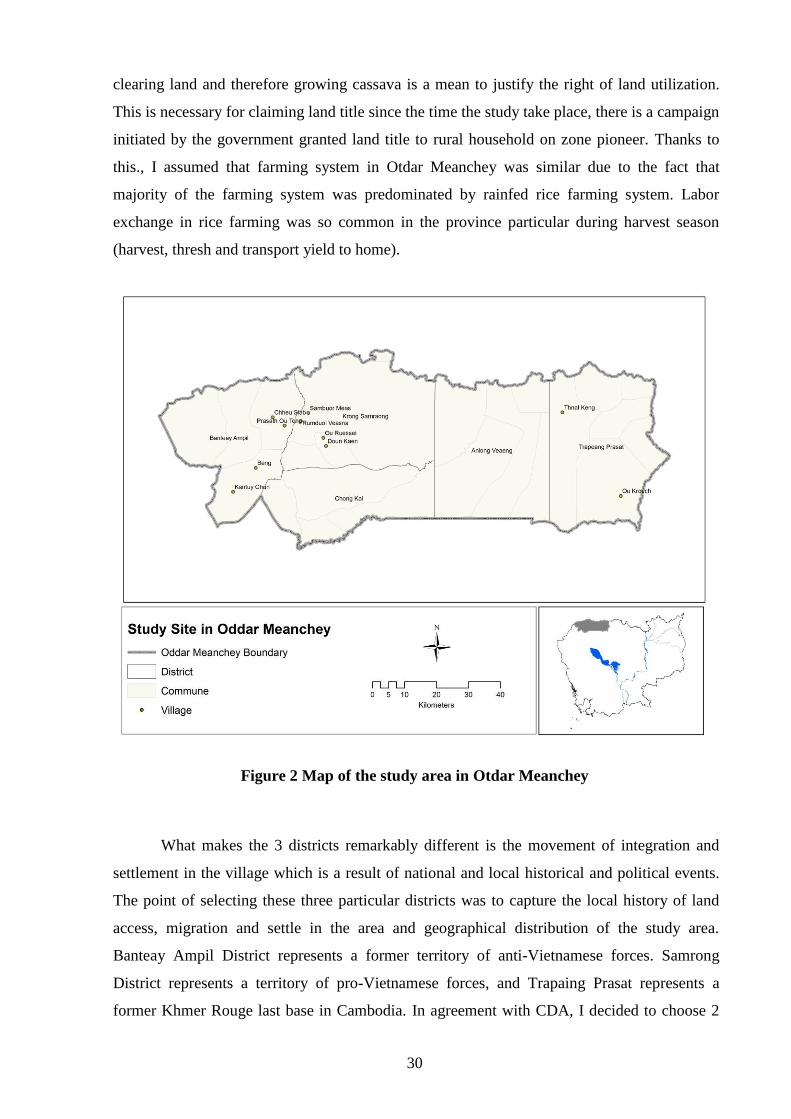
30
clearing land and therefore growing cassava is a mean to justify the right of land utilization.
This is necessary for claiming land title since the time the study take place, there is a campaign
initiated by the government granted land title to rural household on zone pioneer. Thanks to
this., I assumed that farming system in Otdar Meanchey was similar due to the fact that
majority of the farming system was predominated by rainfed rice farming system. Labor
exchange in rice farming was so common in the province particular during harvest season
(harvest, thresh and transport yield to home).
Figure 2 Map of the study area in Otdar Meanchey
What makes the 3 districts remarkably different is the movement of integration and
settlement in the village which is a result of national and local historical and political events.
The point of selecting these three particular districts was to capture the local history of land
access, migration and settle in the area and geographical distribution of the study area.
Banteay Ampil District represents a former territory of anti-Vietnamese forces. Samrong
District represents a territory of pro-Vietnamese forces, and Trapaing Prasat represents a
former Khmer Rouge last base in Cambodia. In agreement with CDA, I decided to choose 2
31
communes from each district, and two villages from each commune. In Trapaing Prasat
districtd only one village was selected from each commune. As mentioned earlier, my data
collection in Trapaing Prasat was not as smooth as in the other districts due to the sensitive
and “hot” land conflicts especially in Ou Kroch village. However, in terms of rice based
farming system, there was no difference between the three districts.
2.10.1.3 Site selection in Takeo province: why two districts?
Before deciding for the exact field sites, I talked to four institutions working in Takeo-
Agronomes et Vétérinaires Sans Frontières (AVSF), Provincial Department of Agriculture of
Takeo province (PDOA), district office of agriculture and CEDAC to discuss agro-ecological
system of the province. These talks pointed me to the district of Bati, Tram Kak and Traing as
having high migration, while Angkor Borey, Borey Cholasa, Koh Andet, Prey Kabas, Don
Keo, Kirivong are comparatively low in migration. After that I applied land use and natural
resource mapping taking into account poverty distribution and farming, I decided to choose
two districts Tram Kak and Prey Kabas district. Tram Kak district represents a high migration
zone, while Prey Kabas represents a low migration zone. I also talked to the district offices of
agriculture in both districts to get an impression of the different agro-ecological systems and
thereby to identify the communes. I learnt that Tram Kak district was more oriented to
agricultural diversification, which means that people used dug ponds to grow early rainy
season rice in certain areas, together with vegetable growing and poultry production. In Prey
Kabas district, people intensify rice farming up to three times a year with existing irrigation,
plus water receding rice during the dry season (dry season rice) once a year.
In Tram Kak district, I selected two communes: Tram Kak and Trapaing Kranhoung.
In Prey Kabas district, I selected Prey Kabas commune. I spent two days visiting each
commune, and I drove through them as well as observed the landscape. I found that Tram Kak
and, Trapaing Kranhoung communes have similar agro-ecological systems and a history of
land acquisition linking to the Khmer Rouge era. So, I finally decided to choose only one of
them, i.e. Tram Kak commune due to its accessibility.
I talked to the commune chief and commune council, who assisted me in identifying
villages in the two communes and provided me with maps of the communes I also discussed
my landscape observations with them based on these maps.
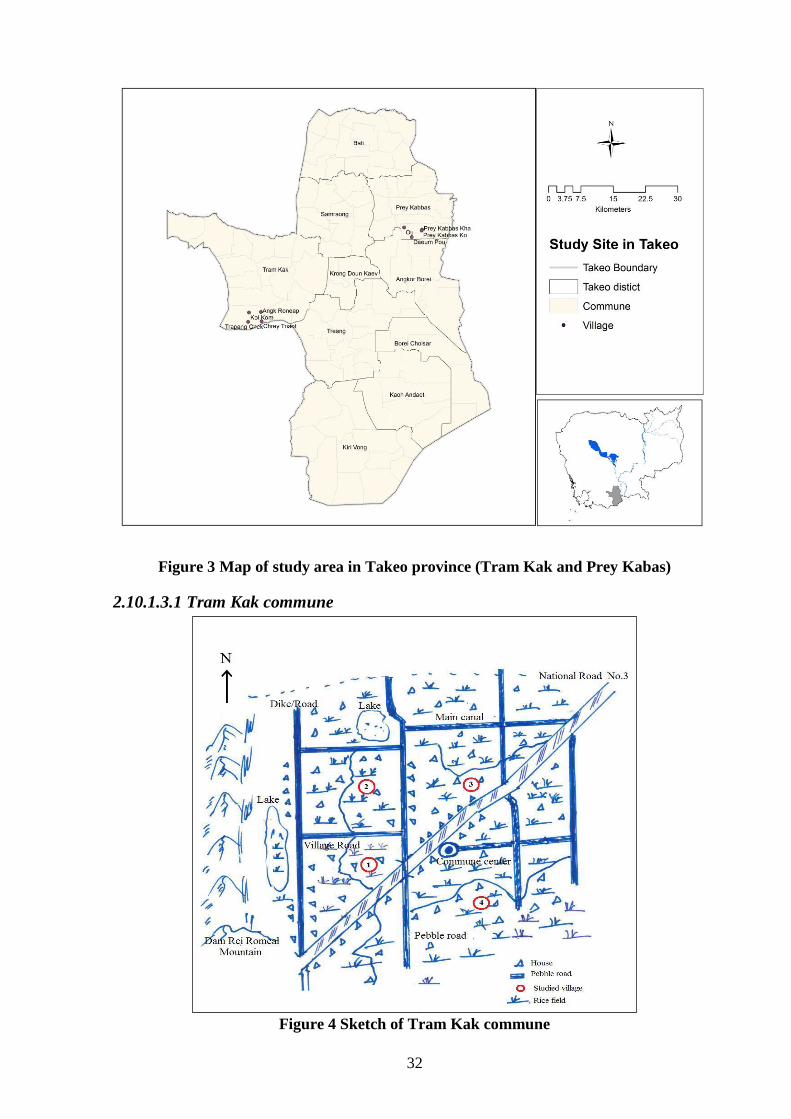
32
Figure 3 Map of study area in Takeo province (Tram Kak and Prey Kabas)
2.10.1.3.1 Tram Kak commune
Figure 4 Sketch of Tram Kak commune

33
The area is characterized by the limited access to water for agricultural production and small
plots of rice production. People tried to diversify agricultural production through digging
ponds to store water for home consumption, for growing early rainy season rice and for
growing vegetables, plus poultry production. However, such diversification could be done by
only few villagers, while many villagers kept cultivating one rainy season rice plus other non-
farm activities. This allowed me to select four representative villages where two villages had
access to a water reservoir in the village and two other villages who did not have access to
water at all.
The first of the two selected villages was Trapaing Chak. This village had access to
Trapaing Chak lake with a dike constructed to capture water from the Dam Rei Romeal
mountain. The dike also functioned as a pebble road leading to another village. With this
source of water, some families living around the lake could cultivate early rainy season rice
and grow vegetable. Other families, who did not have access to the water, used a dug pond to
irrigate their rice. The farmers only allocated some of their plots to cultivate early rain season
rice.
The second village was Kok Kom village. Kol Kom‟s dike was constructed to capture
water in the Kol Kom reservoir. The situation was exactly the same as in Trapaing Chak
village. Both reservoirs were constructed during the Pol Pot regime in 1975-1979. In 1980-81,
the state of Cambodia20
distributed rice land to families, 15a per person. In the west of the
Trapaing Chak dike, there was available forest land along the foot of Dam Rie Romeal
Mountain but this land was not distributed to the villagers. There were Khmer Rouge forces
residing in the mountain often came down and used guns against people in the commune. Not
so many people dared to encroach land over there. However, villagers, who dared came to
occupy the land to cultivate annual crops. These land holdings were not legalized as they had
not been officially distributed. At the time when the study took place, youth volunteers of the
prime minister surveyed these lands for granting land titles to the occupants. The upper foots
of the mountain were put under the control of community forestry.
The other two villages, Ang Roneab and Chrey Thnaot, which were located East of
Trapaing Chak and Kok Kom, did not have access to water source. There was a pond but it
20
From1979 to 1989 Cambodia was named: People's Republic of Kampuchea (PRK) and between 1989 to 1993
Cambodia was named: State of Cambodia (SOC), from 1993-present Cambodia is named the Kingdom of
Cambodia, and Royal Government of Cambodia.
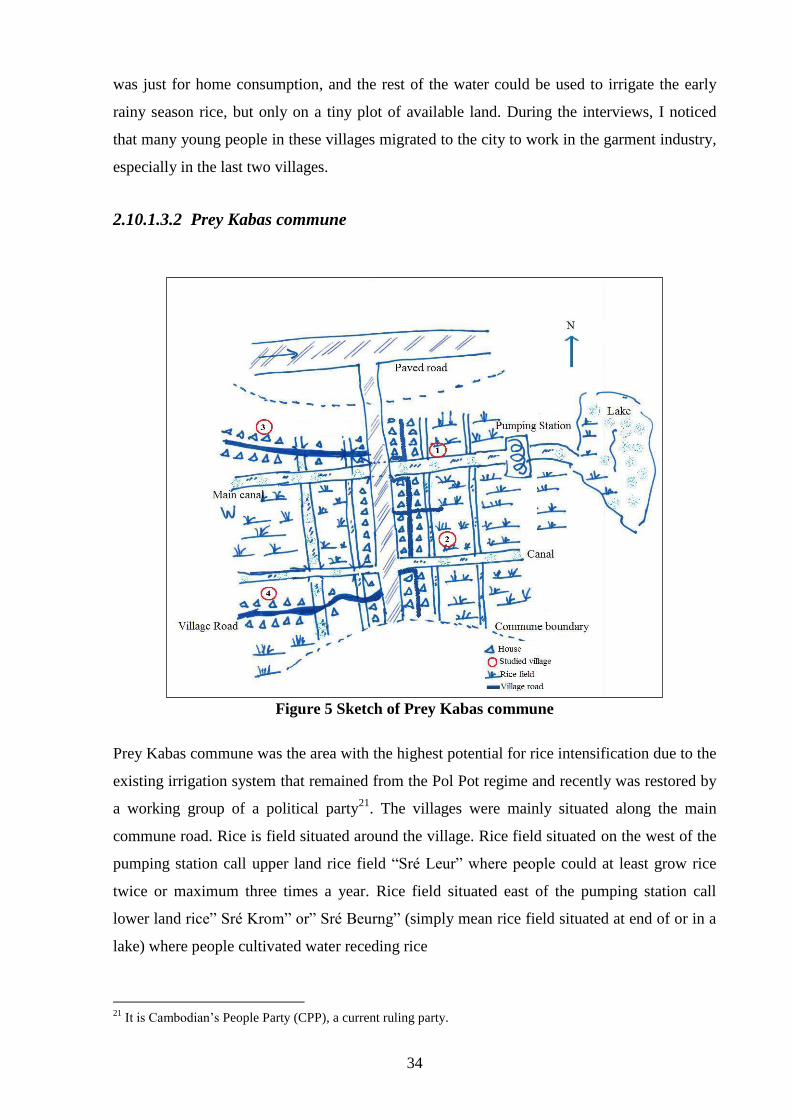
34
was just for home consumption, and the rest of the water could be used to irrigate the early
rainy season rice, but only on a tiny plot of available land. During the interviews, I noticed
that many young people in these villages migrated to the city to work in the garment industry,
especially in the last two villages.
2.10.1.3.2 Prey Kabas commune
Figure 5 Sketch of Prey Kabas commune
Prey Kabas commune was the area with the highest potential for rice intensification due to the
existing irrigation system that remained from the Pol Pot regime and recently was restored by
a working group of a political party21
. The villages were mainly situated along the main
commune road. Rice is field situated around the village. Rice field situated on the west of the
pumping station call upper land rice field “Sré Leur” where people could at least grow rice
twice or maximum three times a year. Rice field situated east of the pumping station call
lower land rice” Sré Krom” or” Sré Beurng” (simply mean rice field situated at end of or in a
lake) where people cultivated water receding rice
21
It is Cambodian‟s People Party (CPP), a current ruling party.
35
During 1980-81, both upper rice land and lower rice land were distributed to the villagers
with 18a of each land type per person.
Rice intensification requires heavy fertilizer and pesticide inputs. Therefore, the rice is
mainly for selling purpose. Some people grow organic rice for domestic consumption. Hence
people raise cows, besides selling purpose, to get manure fertilizing their organic rice field.
Many villagers complain that high utilization of agro-chemical inputs make their farm profits
shrink to a minimum. People in the village are busy all along the year with the cultivation.
Some villagers do not have time to raise poultry or other animals, others raise pigs and cows.
In 1995, people still grew rice through transplanting the seedling. The mechanization
by two-wheel tractors and other farm machinery like harvesting and threshing machines
began in 2000 when farming techniques completely transformed from transplanting seedlings
to sowing rice seed. It was at that time labor exchange in the village began to disappear.
People informed us that they rarely buy fertilizer in cash but in credit, and that the
price therefore often is higher than cash price. They also claimed that they prefer credits,
which they can repay at the end of the harvest season. My general observations indicated that
the socio-economic status of these villagers was relatively high. They had rather big houses.
Most of the houses had pumping wells and hygiene toilets, and many rice cultivators owned
two-wheel tractors and pumping machines. In the village, there were harvest machines
operated by wealthier families. Many households informed that they send their children to
study at universities in Phnom Penh.
The commune has a very strong connection with high ranking officers in Phnom Penh
as it is their home origin.

36
2.10.1.4 Social economic survey sample
The Table 1 below illustrates number of respondents selected for interview in Otdar Meanchey
and Takeo province.
Table 1 Sample selection in the study area
Province District Commune Village
Total
house
hold
Despondent Total
Male Female
Otdar Meanchey
Samrong
Bansay Reak Sambour Meas* 150 8 15 23
Romdoul Veasna* 94 4 10 14
Samrong Ou Ruessei 58 2 11 13
Doun Kaen 460 11 22 33
Banteay
Ampil
Kouk Khpos Ou Toung* 105 1 16 17
Chheur Slab 175 3 21 24
Beng Beng 130 10 11 21
Kantuy Choun*22
101 5 12 17
Trapaing
Prasat
Trapaing Prasat Ou Kroch**23
180 0 5 5
Ph'av Thnal Keng 105** 180 5 11 16
Total 183
Takeo
Tram Kak Tram Kak
Trapaing Chak 169 5 21 26
Kol Kom 200 8 15 23
Ang Roneab 285 11 13 24
Chrey Thnaot 289 9 15 24
Prey Kabas Prey Kabas
Prey Kabas Kha 187 20 6 26
Prey Kabas Ko 155 15 13 28
Ou 175 12 13 25
Daeum Pou 119 17 6 23
Total 199
Grand total 382
2.10.1.5 Focus group discussion with youth
After having carried out the questionnaire survey, I carried out focus group discussions with
young people in Takeo province on the general question “what do you think about agricultural
work?” After the discussion, they were asked to respond to a short questionnaire survey
regarding their opinion about agricultural work (see questionnaire in the appendix). The
challenge was that youth who were available to participate the discussion were those who
were studying and staying in the village. Only one of the participants was a drop out youth
and worked in a farm. This suggested for better design for group discussions in the further
22
New village created in 1997-98 23
New village created in 1991 Former Khmer Rouge village

37
study one characteristic should be considered that is drop out youth and youth who still
studying in the village. We could not include drop out youth who migrated away from village
and youth who migrated for studying purpose as they were not there for the study. This was
also a challenge for this kind of youth study in relation to farming, migration and settlement.
2.7.2 The case study on Young Agricultural Entrepreneur Project (YAE)
The purpose of this second field work was to strengthen the knowledge from the first field
work on the factors affecting the integration or disintegration of youth from farm work in
Cambodia by looking at the case of Young Agricultural Entrepreneur (YAE) project of Centre
d‟Etude et de Développement Agricole Cambodgien / Cambodian Center for Study and
Development in Agriculture (CEDAC) which was initiated since 2008 to help youth between
16-30 years old who dropped out at grade 9 to 12 to successfully run a profitable farming.
From 2008 to 2013, there were 267 youth taking part in the project in six provinces of
Cambodia. My interview with CEDAC „s YAE program director during the first field work in
2012 indicated that among 20 youth taking part in the 2 year support, there were only 2 who
had successfully run farm work. With such a big support, I wondered why only few youths
successfully ran farm business.
The objective of this field study was to strengthen the knowledge from the first
fieldwork in order to match knowledge from first field study with degree of reality of
intervention of NGO to integrate youth in farming.
I went to NGO forum database to check list of NGOs who had projects related to
agriculture and then checked their webpage to see if their program activities were related to
youth integration in farming. I found that many of them were just general rural development
projects that aimed at raising productivity, livelihood improvement such as distribution of
seed, training on agricultural techniques, etc. CEDAC informed me that they had substantial
scale of work in integrating youth in farming. Therefore, I decided to focus only on CEDAC.
My identification of key informant was based on snowball sampling. I asked local
project staff who knew the addresses of the participants in YAE. After that I asked the
interviewees if they knew other trainees. It was difficult to find YAE for an interview as many
of them had quitted farm work and migrated out of the villages. In the end I managed to
interview 29 youth of YAE project in four provinces-Preys Veng, Svay Rieng, Takeo and
Kampong Chhnag. Table 2 below illustrates number of person interviewed and their status.
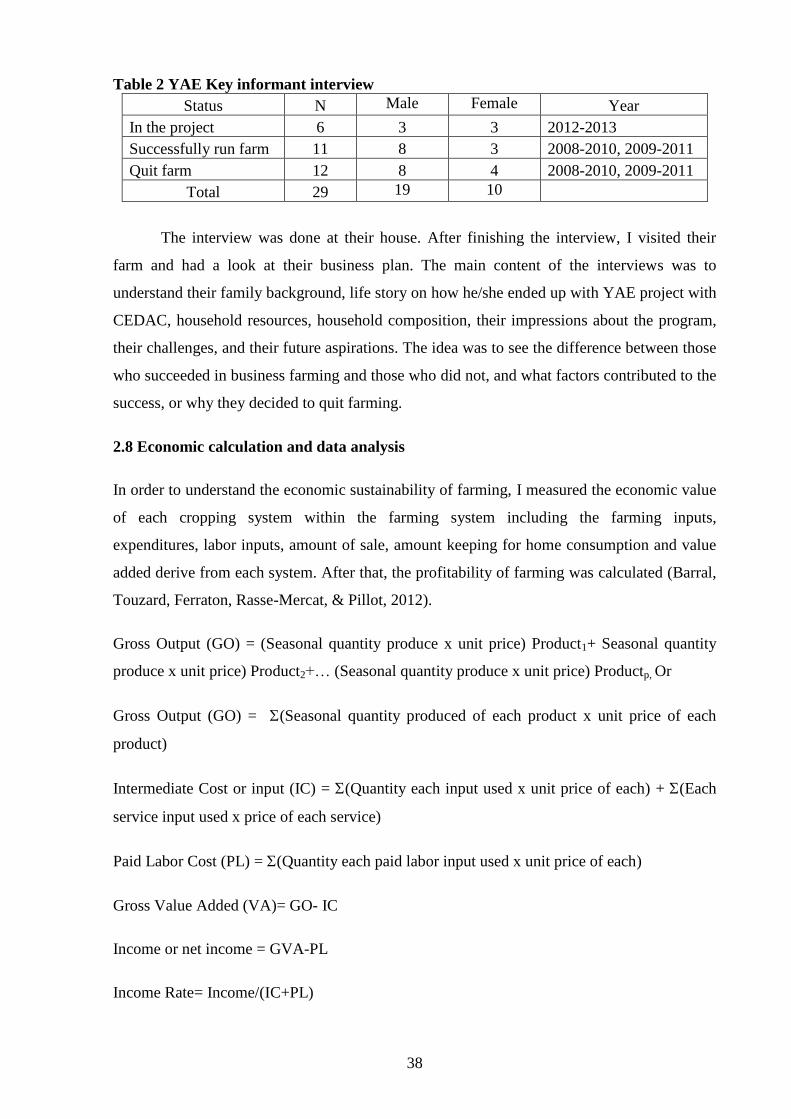
38
Table 2 YAE Key informant interview
Status N Male Female Year
In the project 6 3 3 2012-2013
Successfully run farm 11 8 3 2008-2010, 2009-2011
Quit farm 12 8 4 2008-2010, 2009-2011
Total 29 19 10
The interview was done at their house. After finishing the interview, I visited their
farm and had a look at their business plan. The main content of the interviews was to
understand their family background, life story on how he/she ended up with YAE project with
CEDAC, household resources, household composition, their impressions about the program,
their challenges, and their future aspirations. The idea was to see the difference between those
who succeeded in business farming and those who did not, and what factors contributed to the
success, or why they decided to quit farming.
2.8 Economic calculation and data analysis
In order to understand the economic sustainability of farming, I measured the economic value
of each cropping system within the farming system including the farming inputs,
expenditures, labor inputs, amount of sale, amount keeping for home consumption and value
added derive from each system. After that, the profitability of farming was calculated (Barral,
Touzard, Ferraton, Rasse-Mercat, & Pillot, 2012).
Gross Output (GO) = (Seasonal quantity produce x unit price) Product1+ Seasonal quantity
produce x unit price) Product2+… (Seasonal quantity produce x unit price) Productp, Or
Gross Output (GO) = (Seasonal quantity produced of each product x unit price of each
product)
Intermediate Cost or input (IC) = (Quantity each input used x unit price of each) + (Each
service input used x price of each service)
Paid Labor Cost (PL) = (Quantity each paid labor input used x unit price of each)
Gross Value Added (VA)= GO- IC
Income or net income = GVA-PL
Income Rate= Income/(IC+PL)

39
Value added per land unit “Land productivity”:
GVA per ha = Total VA by Cropping System (CS)/ surface under this Cropping System (CS)
Value Added per unit of labor “Labor productivity”:
GVA per working day = seasonal VA by CS on a given area/ number of working days require
per season for this CS on the given area.
While labor productivity was used to see the level of intensification of each crop, land
productivity would be used to calculate Land Value Index, Land Potential Value and the MIS.
Economic sustainability of household
After understanding the economics of each cropping activity, the economic sustainability of
farming system of the family was calculated to see if the earning generated from agricultural
activities and non-agricultural activities was enough to cover what was actually need by the
current family farming as illustrated in table below.
Household Sustainability Total household income - Total household expenditures
Negative (-)
Or
Positive (+)
-Rice (2R, 3R, HR, DR)
-Vegetables
-Annual crops
-Fruit trees
-Animal (Cattle, chicken,
poultry, aquatic culture
such as fish, frock
culture)
-Common resource
Buy more rice (kg)
Daily food (food ingredients)
Clothes
Medical
Electricity
Water
Cooking fuel (fuel wood, Charcoal,
gas...)
Land tax, Other tax
Wedding party
Social contribution
Children schooling
Telephone
Transportation
Entertainment (traveling …)
Other (community member fee…etc.)
+
Non-farm and off-farm
activities (earning and
remittance from
migration)

40
2.9 Some Ethical Considerations
The exploration of youth integration in family farming is quite new to Cambodia. It seems no
one has ever thought about this question. Therefore, having heard that I was doing this
research, everyone whom I met in Cambodia were surprised to hear that I had raised this
question.
2.9.1 Youth perception on farming
Designing a study to understand the question of youth integration in farming faced a
number of challenges. In many families the youth did not know much about resource
management of farming as this information was centrally managed by the household head.
Drop-out youth had often migrated and non-drop out youth was often students. To better
capture the different views, the interview had to be done with both household heads and
youth. However, when the interview took place, the youth was often not present. If youth was
available, they did not know much about farming work, which required me to go back to the
household head.
2.9.2 Economics data from YAE case study
The case study was not favorable for getting economic data for comparing with survey
data given that youth shared work with parents and the environment for interview was not
good to discuss in-depth on farm operational activities given that many of them were
household head, having children on hand, and some of them were just beginning of farm work
and therefore there was no good record keeping on farm work. Their works were ongoing trial
learning with the training. Therefore, the case study was mainly discussing life history, reason
to settle in farming, family support, future aspiration, factor of success and failure in
settlement in farming and their perception on farming.
2.9.3 Year of getting marriage
In the survey I did not expect to include the variable age of marriage but I had to as I
wanted to know if at the marriage they got land share from parents of both sides or not. But
by not include this variable; I mix the picture of land share of both old and new couple. If the
variable was included, it would give better picture. However, in the analysis we could still
distinguish both old and young couple by their age. And this distinguished land they got at
their marriage. I raised this question for a lesson learned for future study related to the
question of youth integration in farming.
41
2.9.4 Typology of farm hosueholds
Given this study employed socio-ecnomic survey, the farm typology based on statistical
approach using principle component analysis and cluster analysis require field revisit for
validation the farm types found in this study in order to verify if they are reflecting the real
situation. This study could not complete this process due to limitation of research budget and
time constraint. However, based on the field observation and qualitative information obtained,
the result of farm type is reflecting the situation. I acknowledge that due to the
methodological application, the representation of farm types mainly reflects structural farm
typology. While functional farm typology requires a closer look using agrarian diagnostic
approach. Initially, this study does not attempt and does not design to employ this agrarian
diagnostic approach given that youth situation in smallholding farming in Cambodia absent.
That is the reason why this study employed socio-economic survey as an exploratory stage of
getting general understanding youth situation in farming in Cambodia. Even the study
employed the socio-economic survey, the questionair is designed to capture all agricultural
activities raised in the agragrain diagnostic approach including, cropping systems, farming
systems and livelihood activities undertaken by household to respond to the agrarian
questions. The data was organized according to the cropping systems for making economic
calucation such as land and labor productivity. The good point of doing farmy typology based
on this socio-economic survey is that when the land is small, the agrarian diagnostic approach
may not find the significant of land holding between the farm types which the statatical
approach does.
2.10 Analytical Framework
The question of rural youth in relation to agriculture and rural-rural migration are not at the
attention of any study in Cambodia. In 2010, there was only one study on rural migration and
settlement done by IDRC, which indicates different waves of migration and settlement in
rural Cambodia (Pilgrim et al., 2012).
Illustration 3 below illustrates the coherence of analysis of this doctoral study.
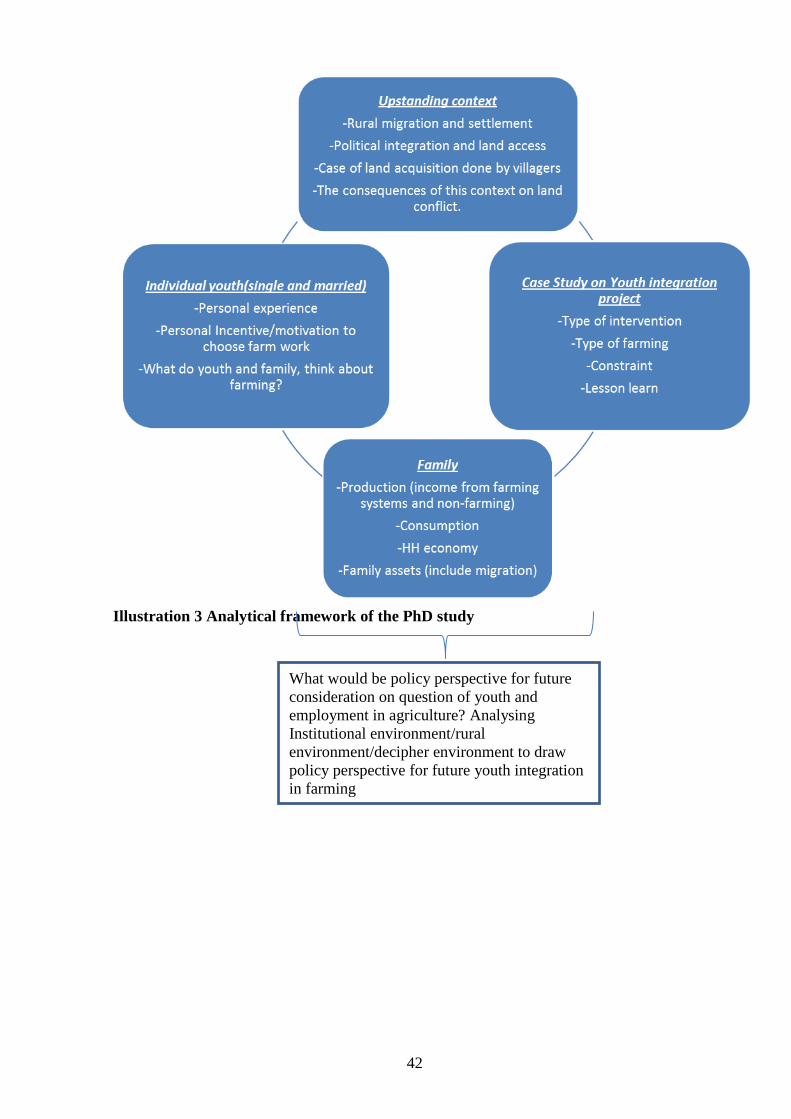
42
Illustration 3 Analytical framework of the PhD study
What would be policy perspective for future
consideration on question of youth and
employment in agriculture? Analysing
Institutional environment/rural
environment/decipher environment to draw
policy perspective for future youth integration
in farming
Small farm vs. large farm?

43
My study will begin by examining the contextual factors (rural settlement, migration,
history of agricultural land seeking, and motivation for rural migration) that can explain
different waves of rural migration and settlements.
After that, I will develop a typology of different farming systems and strategies, and
examine the economic profitability of the different types, and whether they can generate
enough income to meet farming families‟ livelihood needs. My study includes other income
sources such as off-farm and non-farm availability, natural resource exploitation in all
seasons. All these income sources will be used to compare with the daily consumption need
stated by each family to see the economic sustainability of farm family (chapter 3).
Next, based on the farm typology and drawing on youth and adult household
interviews, I will first examine the economic capacity of family farming and their youth
integration capacity. Then, I will explore the rural youth‟s rationale for choosing occupation,
the socio-economic background of the families, and their general perception of occupation in
agriculture (chapter 4).
In chapter 5, I will look at general perception of single youth, youth couple and adult
household to see the view on farming. After that, the case of CEDAC‟s Youth Agricultural
Entrepreneurs program (YAE) has been explored. YAE has supported youth settling in
farming for two years. My purpose is to see, under conditions of improved farming systems,
technical advice, and training, what factors cause youths to stay or move away from farms?
For this purpose, I have explored youth life histories to see how they decided to take part in
the project, and examine the existing environment that contribute to the success and the
constraint of youth integration efforts done by this NGO. By doing this, I will see the degree
of effectiveness of the intervention, and consider some future pathways for the youth
integration program (chapter 5).
Finally, I will draw on the combined knowledge from chapters 3-5 to analyses the
prospects for youth integration in farming. In particular, I will focus on the importance of the
institutional environment and national policies in the context of land scarcity. More
specifically, I will use the survey results on land, settlement, demographics, and migration, for
a discussion of the process of land occupation in the low and high density area-Takeo and
Otdar Meanchey and relate to the survey results on the general economics of farming, and
triangulate with the study on YAE. Lesson learn from this will be used a reflection on the
degree of reality of recent land distribution policy if it met the objective of sustainability of
44
farming and the future consideration for any youth integration project that might talk place in
the future for the solution of demographic growth and employment creation in within farming
sector (chapter conclusion).
45
CHAPTER 3 UNDERSTANDING RURAL LIVELIHOOD AND
SMALLHOLDING FARMING IN CAMBODIA
In Cambodia, rural youths find themselves seriously challenged when looking for non-farm
activities due to their low level of education and limited opportunities. Many non-farm
income jobs require a high-level of education and are very competitive. Young people also
need a strong social network. Hence, migrating is a strategy for the rural youth to accumulate
the financial capital to invest in their farm, such as enlarging the farm‟s size or buying a two-
wheel tractor, fertilizer, and other farm inputs to make their livelihood more secure.
Therefore, agriculture is viewed as more than just employment for rural youths: it is a source
of livelihood that plays a vital role in accommodating youth in terms of income generation,
food security, safety-net for a household and its migrant members, and source of basic
education. However, smallholding farming in Cambodia faces a number of challenges in
sustaining rural livelihood, especially when the profitability from farming is small due to
small land size, high production cost and low yield and prices.
The knowledge from the field survey data collection suggests there are three local
contextual factors which affect the options for youth integration in the three studied areas in
different ways. They are the historical setting, the different socio-economic status of the areas,
and the alternative employment options available. In the following, I will compare the three
study areas with regard to these factors.
3.1 Historical setting of Otdar Meanchey and Takeo province
Looking first at the historical setting of Otdar Meanchey, it can be noted that it is a newly
created province that was established in 1998. It was previously one of the districts of Siem
Reap province. It is also the last base of Khmer Rouge and FUNCINPEC.24
It is the last
province that was integrated into the government administration in 1998.
This province suffered badly during the civil war. The western part of the province,
which includes the district of Banteay Ampil and some parts of the Samrong district, was
formerly controlled by Para forces (a local given name to the movements that aimed to free
Cambodia from the Vietnam forces who occupied Cambodia between 1979 and 1989). The
24
FUNCINPEC stands for Front Uni National pour un Cambodge Indépendant, Neutre,
Pacifique, et Coopératif in French and National United Front for an Independent, Neutral,
Peaceful, and Cooperative Cambodia in English.
46
centre part of the province, the Samrong and Chong Kal district, was controlled by the
People‟s Republic of Kampuchea (PRK) who were backed up by the Vietnamese military.
The eastern part of the province, the Anlong Veng region, was controlled by Khmer Rouge up
to its final surrender in 1998, and was its last base.
After the liberation of Phnom Penh and central Cambodia by Vietnamese forces (VN)
in early January 1979, the Cambodian people were in extreme poverty, not even food. This
period was described as year zero. A serious drought during the following rainy season made
things worse, since the conditions for rice cultivation were not favourable. The newly created
government backed by the Vietnamese troops was under international embargo. Therefore,
thousands of Cambodians fled to the Cambodian–Thailand border to seek for food from the
United Nations (UN), who established refugee camps and distributed food to people along the
border. At that time, resistance groups formed to fight against the invasion by Vietnamese
troops.
During the time of resistance 1979-1990, these groups were based in the provinces
along the Cambodian–Thailand border so that they could stay connected to the refugee camps
situated in Thailand. In Otdar Meanchey, the Para force was stationed in the Kouk Khpos
commune in Prey Tran (Tran Forest), which is just about 500 meters from one of my study
villages, Chheur Slab25
. In Kouk Khpos, there is a centre point called Tonlé Sar. This was the
boundary/front line between Para forces and Vietnamese forces. From Kokpos to the West,
the land was controlled by Para-forces and eastwards it was controlled by the VN and the
PRK.
Some of the VN troops were stationed at the centre of the Samrong district, where the
Doun Kaen village is situated. They held back people who wanted to escape to the refugee
camps. The refugees then decided to settle in Ou Ruessei village because there were sources
of water nearby, and then became the permanent residents of Ou Ruessei village. Soon after,
the VN troops taught the new villagers how to grow vegetable from the VN troops, who then
bought the vegetables from the villagers to supply their troops. This is how people in Ou
Ruessei village began to grow vegetables.
It is important to explain briefly the history of the Para-forces in Cambodia, as this is
part of the explanation for land acquisition in the study area. The first force, called
FUNCINPEC, was led by King Norodom Sihanuk. The second force, called Khmer People's
25
Said interviewee in Chheur Slab village.
47
National Liberation Front (KPNLF), was led by Mr Son Sann, who was prime minister of
Cambodia during the 1960s. The third force, called MOLINAKA,26
was formed from five
resistance groups. Under the UN Paris Peace Accord, signed on 23 October 1991, these forces
were integrated into the government through the first national elections, managed by
UNTAC.27
Khmer Rouge forces declined to join the elections claiming that the Paris Peace
Agreements were not properly implemented. In particular, they accused the UN monitoring
system examining the withdrawal of Vietnamese troop of being weak.
At the end of 1991, the refugees in several camps along the border were repatriated all
over Cambodia. 138 households were repatriated to the Kam Norb village, located in
Samrong district, which would later become the city centre of the Otdar Meanchey province.
These households obtained residential land but not agricultural land. Together with other
landless citizens, they cleared forest and grew rice in the Bansay Reak commune under
shifting cultivation. Due to lack of dragged power and means of production, they could only
do rice cultivation on very small plots of land of between two and four acres. At that time, the
country‟s political situation was in chaos due to the presence of Khmer Rouge troops. The
interviewees in the studied villages said that at that time, land acquisition occurred just for the
purpose of survival. There were no clear land property rights. The original residents of Don
Ken had only small land properties inherited from their parents, and these properties were
scattered around the village. When the situation became more stable between 1996 and 1998,
people started to occupy more land and clear the nearby forests to cultivate rice due to the
increasing population in the area. There were also initiatives by the local authorities to
establish a new village and distribute land to landless people supported by local military
leaders. The overlap between these and the villagers‟ own initiatives resulted in chronic
conflicts for example in the Kantuy Choun village. These conflicts remained unsolved until
the complete shift of political power in 2003. Now, the resolution seems effective only in
villages who supported the ruling party.
In Anlong Veng, the Khmer Rouge government allowed its people to come down from
the mountains to settle in the area and seek agricultural land. People explained to me that
26
MOLINAKA stands for Mouvement National de Libération du Kampuchea. 27
UNTAC stand for United Nations Transitional Authority in Cambodia (February 1992 - September 1993).

48
they came to settle in the area (Tabun28
village), as early as in 1991, where in most other
places integration did not happen until 1997-98.
After the Paris peace agreements, these groups (FUNCINPEC, KPNLF, MOLINAKA)
transformed themselves into political parties to compete in the upcoming elections.
FUNCINPEC became the FUNCINPEC party; KPNLF become the Buddhist Liberal
Democratic Party (BLDP) and MOLINAKA become MOLINAKA Party. PRK was then
transformed to the State of Cambodia (SOC),29
which was represented by the Cambodian‟s
People Party (CPP). All parties participated in national elections on 23–28 May 1993 which
were run by UNTAC.30
The election results show that FUNCINPEC won 58 seats, CPP won
51 seats, BLDP won 10 seats, and MOLINAKA won 1 seat. However, CPP claimed
irregularity, demanded re-elections in several provinces and threatened to create an
autonomous area. King Norodom Sihanuk proposed a resolution of creating a coalition
government with two co-prime ministers, where power was shared between the two parties
(FUNCINPEC and CPP), which solved the immediate problem. However, the struggle among
the two parties led to the collapse of coalition through a coup d‟état run by CPP in July 1997.
This resulted in 1996 being known as the year of Khmer Rouge integration. Two factions of
Khmer Rouge forces in Samlot and Pailin (in the Battambang province) laid down arms and
submitted themselves to the government under the win-win policy31
initiated by the co-prime
minister Hun Sen. Impunity was given by the King to the leaders of these two groups. Due to
the coup d‟état in 1997, FUNCINPEC forces fled to Otdar Meanchey, its former resistance
base, and started the resistance again. At that time, the former Khmer Rouge in Samlot, who
had been disappointed with their leader due to the unfair benefit sharing of the incentives
given by the government right after the integration, decided to join FUNCINPEC and the
Khmer Rouge forces in Anlong Veng. People were gathered by force again to live in refugee
camps along the Cambodia–Thailand border in the Banteay Ampil and Anlong Veng districts,
which my respondents in the Kouk Khpos and Ph'av communes witnessed.
28
Tabun is the name of one of the leaders of KR force from Mondulkiri, he is Phnong ethnic minority in
Mondulkiri, later on the village was call Thnal Keng 105 meaning the corner road in T-shape, in which 105 is
number of brigade 105 of KR force from Mondolkiri province. 29
This name was given to the state during the transitional times from the withdrawal of Vietnamese troops from
Cambodia in 1989 until the restoration of the monarchy in 1993.
30 UNTAC: United Nations Transitional Authority in Cambodia. 31
This policy as three main strategies: guaranteed personal and family safety; assured career safety; and secured
safety of properties. The field knowledge allows me to interpret the last two to mean that that the former Khmer
Rouge have the right to control the area and manage their resources including land and forest under the
government administration. They can still have their leadership role over people in the area, who are governed
by them.

49
In 1998, the national reconciliation led to the election and integration of the Anlong
Veng FUNCINPEC and Khmer Rouge forces. Between 1998 and 2000, villagers rapidly
occupied the land to expand rice cultivation due to an increase of family members and the
improved stability of the area. The strong relocation movement was remarkable in 1998, when
people came to settle in this new area. Some of these migrations were organised by local
people and some under arrangements by local authorities. Later on, requests were done
spontaneously by village elders or deliberately by local authorities to register the village with
the Ministry of Interior.
In 2008, political chaos in Thailand resulted in the Thai government (the Yellow shirt
group, a Royalist Group) to fuel a border issue (case of Preah Vihea temple) with Cambodia.
The conflict escalated from small arms clash to a small war at the border of the Otdar
Meanchey and Preah Vihear provinces. Due to this, the government of Cambodia issued a
special policy for the north-west region of Cambodia, which was partly in response to military
needs and partly aimed at the long-term development of the newly established province.
Many roads were constructed, such as the Nation Road No. 6, connecting Banteay Meanchey
to Siem Reap; National Road No. 100, connecting the Kralanh district of the Siem Reap
province to the Otdar Meanchey province; and National Road No. 57, connecting Samrong
city to the Banteay Ampil district of Otdar Meanchey, the Banteay Chhmar district and the
city of the Banteay Meanchey province. The aims of the policy can briefly be summarised as
follows: to redistribute the labour force in the area, develop strong and permanent military
bases, and transform former conflict areas into agricultural development and tourism zones.
Due to the policy, villages along the border were newly joined with military bases. This led to
land conflicts between those who encroached land in 1998–2000, those who settled later in
2008, and private companies, who were granted economic land concessions. Before 2003,
provincial and district governors were from FUNCINPEC (particularly former military
leaders). After 2003, all were replaced by CPP. At this time, some of the land conflicts were
resolved, but the resolution did not meet the expectations of local people.
In the above historical description, the local timeline is connected with the national
political timeline. I call this the “institutional environment.” The institutional environment in
the studied area contributed to different waves of settlements and land acquisitions. Those
who came after 2000 did not get distributed land free of charge. They could, however,
purchasing land at a cheap price.

50
Takeo province is a much more politically stable area with a different history
compared to Otdar Meanchey. However, some parts of the area, particularly the Tram Kak
commune, were historically the stronghold of Khmer Rouge during the Pol Pot regime (1975–
1979), and a liberated zones were established since 1971 (Chandler, 1999). The Khmer
Rouge in Takeo was considered the strongest in the country. This force used to crackdown on
any rebelling forces within the KR itself. After 1979, many people from this force sought
refuge in the north-west (Battambang, Pailin and Samlot), the northern parts of Cambodia
(Otdar Meanchey and Preah Vihear) and the southern part of Cambodia (the Takeo and
Kampot provinces). After the integration in 1996, the Khmer Rouge who had been located in
the Takeo province became a network inviting their relatives in Takeo province to settle in the
new areas including the Pailin and Battambang provinces, or the Malay and Banteay
Meanchey districts of the Otdar Meanchey province.
As mentioned above, the history of land acquisition in Takeo, thus, also links to the
process of integrating Khmer Rouge, since this created the conditions for illegal land
acquisition along the Dam Rei Romeal Mountain. However, the situation is Tram Kak is not
as remarkable as in the Otdar Meanchey province.
At the time of writing, the Takeo province is the stronghold of the ruling party: the
Cambodian‟s People Party. It is the homeland of many of the high-ranking officers such as
the minister of agriculture, the deputy prime mister and some military generals. They often
come to visit the Takeo province and offer support to people there, such as supporting
infrastructural development like the irrigation scheme in Prey Kabas.
The above historical setting gives us the picture of situation of the two study provinces
impacted on access to land and how security and stability of the area impacted on youths
„access to education and thereby impacted their choice to settle in farming.

51
3.2 Socioeconomic diagnostics of rural households
This section, I am going to look at the general social economic of the household survey in
Tram Kak, Prey Kabas and Otdar Meanchey by looking at situation of youth and household
such as demography, education, migration, income sources, consumption, food security
access to credit and reasons of settlement of household. This will give the general picture of
the three study areas that will be the basis for further understanding the diversity of farm
household in each area.
3.2.1 Demographics
Cambodia‟s population has a young age structure. The annual population growth rate was
1.83 per cent from 2008 to 2013. The average household size was 4.6 persons per household
in 2013. The total gender ratio (the number of males per 100 females) is 94.3. The Takeo
province has a high population density of 200 to 499 persons per square kilometre, with a
population growth of 1.78 per cent, while the Otdar Meanchey province has a lower
population density of 20 to 49 person per square kilometre with a remarkably high population
growth rate of 4.49 per cent (NIS, 2013).
My survey on 383 households in both the Takeo and Otdar Meanchey provinces
shows the number of family members and their age, gender, education and migration profile
of 2,185 people. 40 per cent (874 persons) are youths (aged between 15 to 30 years old). The
average age is 27.14 years old (26.11 in Otdar Meanchey, 28.68 in Prey Kabas, and 27.82 in
Tram Kak). This implies that both provinces have a young population, which also can be seen
from the population pyramids in figure 1. The gender ratio is 98.54, which indicate there is
almost equal distribution between males and females among the population in the study area.
The average household size is 5.02 (5.4 in Otdar Meanchey, 4.83 in Takeo, 4.78 in Tram Kak
and 4.89 in Prey Kabas).
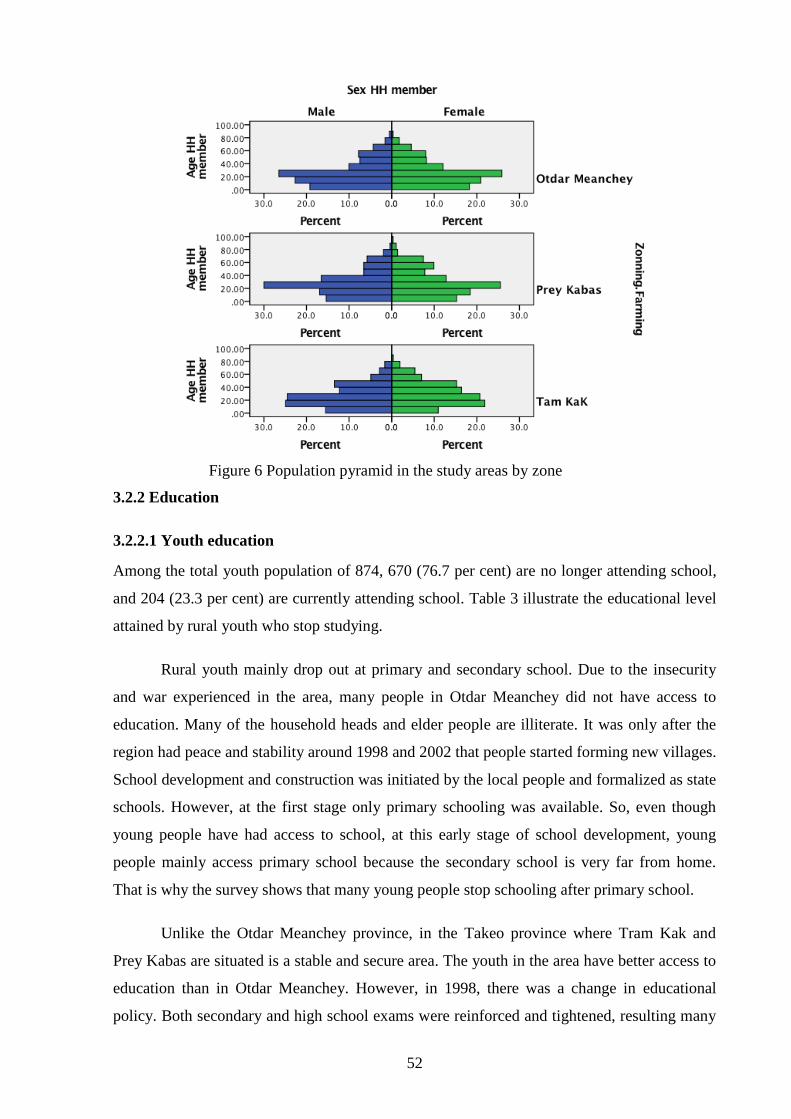
52
Figure 6 Population pyramid in the study areas by zone
3.2.2 Education
3.2.2.1 Youth education
Among the total youth population of 874, 670 (76.7 per cent) are no longer attending school,
and 204 (23.3 per cent) are currently attending school. Table 3 illustrate the educational level
attained by rural youth who stop studying.
Rural youth mainly drop out at primary and secondary school. Due to the insecurity
and war experienced in the area, many people in Otdar Meanchey did not have access to
education. Many of the household heads and elder people are illiterate. It was only after the
region had peace and stability around 1998 and 2002 that people started forming new villages.
School development and construction was initiated by the local people and formalized as state
schools. However, at the first stage only primary schooling was available. So, even though
young people have had access to school, at this early stage of school development, young
people mainly access primary school because the secondary school is very far from home.
That is why the survey shows that many young people stop schooling after primary school.
Unlike the Otdar Meanchey province, in the Takeo province where Tram Kak and
Prey Kabas are situated is a stable and secure area. The youth in the area have better access to
education than in Otdar Meanchey. However, in 1998, there was a change in educational
policy. Both secondary and high school exams were reinforced and tightened, resulting many

53
youths dropping out in 1998 and 1999. This policy had an impact all over the country. In Prey
Kabas people highlight that this matter had a strong impact on the decision of many youths in
the area in favour of settling in farming.
The survey shows that youths aged 15 to 30 years old who are no longer studying
report that they are access to mainly primary and secondary school. Tram Kak has lowest rate
of youth access to primary school at 18 per cent and the high rate of youth access to
secondary and high school at 47.5 per cent, while youths in Prey Kabas at the primary and
secondary school level are 37.2 and 37.9 per cent respectively. Otdar Meanchey has the
highest rate of youth drop out at primary school at 47.3 per cent, with 21.3 per cent dropping
out at secondary school. While the percentage of illiterate youth in Tram Kak and Prey Kabas
is 2.2 and 2.1 per cent respectively, Otdar Meanchey has the highest rate of illiterate youths at
19.2 per cent. Youths in Tram Kak have highest access to high school at 29.5 per cent,
followed by Prey Kabas with 19.3 per cent. Otdar Meanchey has the lowest rate of youth drop
out at high school with 9.4 per cent.
Very few youths finish their study at vocational training schools and university.
Although the figure is low, Prey Kabas have the highest percentage of youths finishing
education at university with 2.8 per cent, but the lowest rate of youths finishing vocational
training with 0.7 per cent. 1.4 per cent and 1.3 per cent of youths finished university in Tram
Kak and Otdar Meanchey respectively, while the percentage of youth finishing vocational
training were 1.4 per cent in Tram Kak and 1.6 in Otdar Meanchey.
In general, nearly 40 per cent of rural youth dropped out at primary school, 30.30 per
cent drop out at secondary school, 12 per cent are illiterate, 15.7 per cent drop out at high
school and 1.3 and 1.6 per cent finish vocational training and university. If illiterate youth,
primary and secondary school are count together, rural youth 81.31 per cent have access to
secondary. At the primary and secondary school level in Cambodia, youth possess only basic
knowledge of how to read, write, numerical calculations and basic life skills, but not
professional skills oriented for job seeking. Besides factors such as war and insecurity in rural
areas, particularly Otdar Meanchey, distance from secondary and high school is one of the
main reasons for rural youth to drop out from school (The World Bank, 2017, p. 74).
Table 3 Educational level attained by youth (who no longer at school)
Zone Educational level Frequency Per cent Cumulative
per cent
Tam Kak
Primary school 25 18.0 18.0
Secondary school 66 47.5 65.5
High school 41 29.5 95.0
Vocational training 2 1.4 96.4

54
Bachelor’s degree 2 1.4 97.8
Illiterate 3 2.2 100.0
Total 139 100.0
Prey Kabas
Primary school 54 37.2 37.2
Secondary school 55 37.9 75.2
High school 28 19.3 94.5
Vocational training 1 0.7 95.2
Bachelor’s degree 4 2.8 97.9
Illiterate 3 2.1 100.0
Total 145 100.0
Otdar
Meanchey
Primary school 182 47.3 47.3
Secondary school 82 21.3 68.6
High school 36 9.4 77.9
Vocational training 6 1.6 79.5
Bachelor’s degree 5 1.3 80.8
Illiterate 74 19.2 100.0
Total 385 100.0
Total
Primary school 261 39.0 39.0
Secondary school 203 30.3 69.4
High school 105 15.7 85.1
Vocational training 9 1.3 86.4
Bachelor’s degree 11 1.6 88.0
Illiterate 80 12.0 100.0
Total 669 100.0
3.2.2.2 Children education (age below 14)
Although primary school is now accessible in rural areas, still 4 per cent of children (age
below 14 years old) in Tram Kak, and 9 per cent in Otdar Meanchey did not attend the
primary school, while in Prey Kabas, all under-youths attend primary school (Please see
appendix 4 for detail dropout rate at different school age).
3.2.2.3 Household head’s education
The 383 household surveys show that 24.3 per cent of household heads are illiterate or did not
attend school, 47 per cent attended primary school, 25.2 per cent attended secondary school,
10.8 per cent attended high school and only 1 per cent attended upper high school. This
suggests that majority of household heads did not have much access to education. The main
grade that they can access to primary school is at grade 4, to secondary school is grade 8 and
to high school is grad 11. While the education level of the household heads in Tran Kak and
Prey Kabas household head is similar, Otdar Meanchey is remarkable because the household
heads had having no access to school 39 per cent and primary school 51 per cent. This is due
to the history in the area, which has due to war and political insecurity, people had no access
to school. Interviews with the key informants revealed that about 50 per cent of adults in the
area are illiterate. This figure is confirmed by the survey, which showed that among the adult
population in Otdar Meanchey, 47.1 per cent did not attend school or were illiterate while
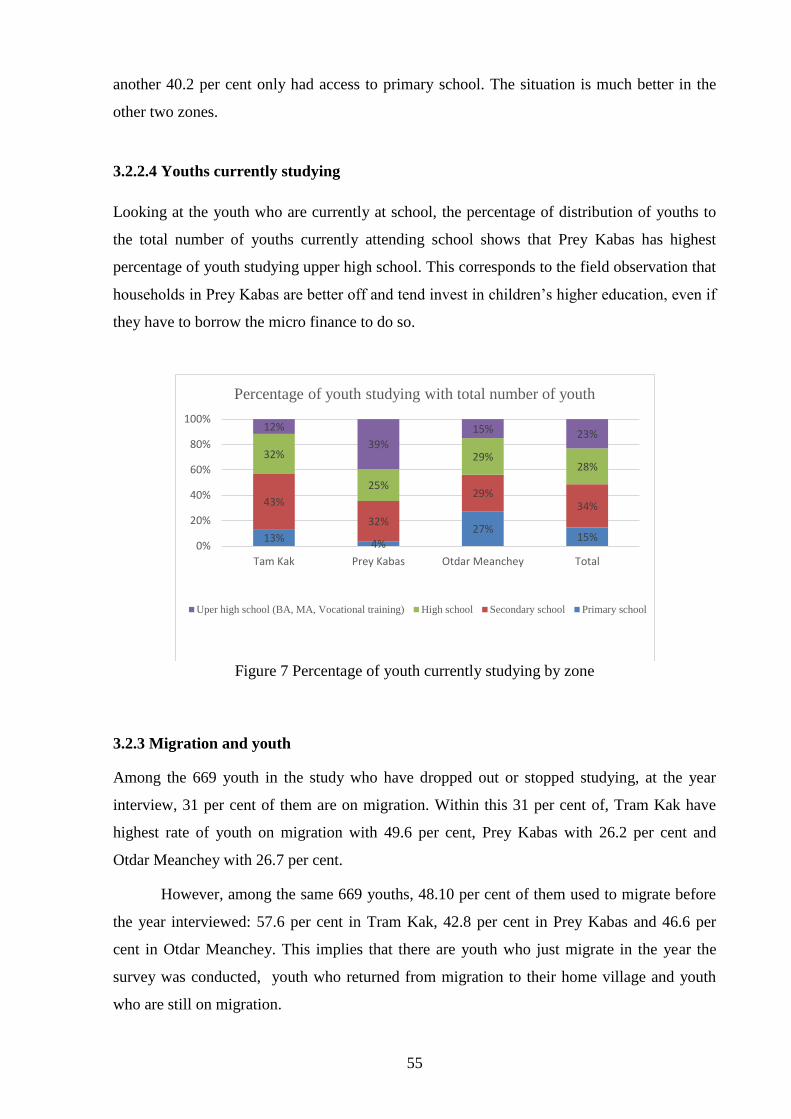
55
another 40.2 per cent only had access to primary school. The situation is much better in the
other two zones.
3.2.2.4 Youths currently studying
Looking at the youth who are currently at school, the percentage of distribution of youths to
the total number of youths currently attending school shows that Prey Kabas has highest
percentage of youth studying upper high school. This corresponds to the field observation that
households in Prey Kabas are better off and tend invest in children‟s higher education, even if
they have to borrow the micro finance to do so.
Figure 7 Percentage of youth currently studying by zone
3.2.3 Migration and youth
Among the 669 youth in the study who have dropped out or stopped studying, at the year
interview, 31 per cent of them are on migration. Within this 31 per cent of, Tram Kak have
highest rate of youth on migration with 49.6 per cent, Prey Kabas with 26.2 per cent and
Otdar Meanchey with 26.7 per cent.
However, among the same 669 youths, 48.10 per cent of them used to migrate before
the year interviewed: 57.6 per cent in Tram Kak, 42.8 per cent in Prey Kabas and 46.6 per
cent in Otdar Meanchey. This implies that there are youth who just migrate in the year the
survey was conducted, youth who returned from migration to their home village and youth
who are still on migration.
13% 4%
27% 15%
43%
32%
29% 34%
32%
25%
29% 28%
12%
39%
15% 23%
0%
20%
40%
60%
80%
100%
Tam Kak Prey Kabas Otdar Meanchey Total
Percentage of youth studying with total number of youth
Uper high school (BA, MA, Vocational training) High school Secondary school Primary school

56
Among the 31 per cent of youth who had migrated when the survey was conducted,
1.4 per cent in Tram Kak, 5.3 per cent in Prey Kabas and 17.5 per cent in Otdar Meanchey
had never migrated before. This gives the average of 10 per cent of youth who had migrated
in the three zones.
Among 69 per cent of youth who are residing in the village now, 17.1 per cent in Tram
Kak, 24.3 per cent in Prey Kabas, and 33.6 per cent in Otdar Meanchey had migrated before
the year interviewed. This gives the average of 28.9 per cent in all zones. These figures show
there is higher percentage of youth who have return from migration and reside in their home
village than youth who migrated for the first time in the year surveyed. This implies that rural
family farms are currently accommodating drop out youths and return migrant youths.
Taking into account the total youth population distribution among each household
including youth who currently study, youth doing non-farm work and youths doing farming
work, on average across the three zones, 55 per cent of youths are engaging in farming
activities, particularly rice farming, 5.7 per cent are doing non-farming activities, 15.4 per
cent are migrating and 23.52 per cent are studying (Figure 8). Tram Kak has highest
percentage of youth migration (25.23 per cent) and doing non-farm activities (6.42 per cent)
and the lowest in doing farming (40.83 per cent). Prey Kabas has a higher percentage of youth
doing farming than Tram Kak (52.76 per cent) but is lower than Tram Kak in youth migration
(9.45 per cent) and youth doing non-farm activities (3.94 per cent). Otdar Meanchey has
highest rate of youths doing farming, which account for 63.45 per cent of total youth in the
area, whereas the percentage of youths who have migrated is lower than Tram Kak and higher
than Prey Kabas. Prey Kabas has the highest percentage of youths studying, which
corresponds to the field observation that the households in this area are well off and have a
greater ability to invest in children‟s education than the other two study areas. Otdar
Meanchey have lowest rate of youth studying, due to the historical reasons outlined above.
According to the key informant interviews, the high migration in Otdar Meanchey is
due to drought in the interview year resulting a low rice yield. For example, in Sambou Meas,
the village‟s normal rice yield is 2 tons per hectare but the drought impacted on yield and it
dropped to 0.5 or 0.6 ton per hectare. In addition to the desire to earn additional income to
support daily expenses, migration in Otdar Meanchey is also driven by land lost due to land
conflict between the villagers, the military and concession companies; however, the
households who had lost their land had completely migrated so were not there to answer the
survey. Migration in this area is also strongly motivated by the aspiration to accumulate
capital to invest in farm machinery, particularly to buy a two-wheel tractor and to buy more

57
land and expand the agricultural area, especially for young couple who only possess a small
amount of land. In Tram Kak and Prey Kabas, the motivation for migration is to seek the
complementary income to farm activities when the farms do not produce enough to meet the
household‟s need.
Figure 8 Youth situation in the study area
22 per cent of the household heads (83 of 382) migrated in the previous year. At the time
when the interviews took place, only 12 household heads (approximately 3 per cent of the
total household heads) were on migration. This is due to the interview taking place during the
cultivation season when the household returns home. Migration is higher among household
heads who were youths in comparison to adult household head, with 49 per cent youth and 17
per cent of adult household heads had migrated in the previous year. The destination of
migration is mainly other provinces, Phnom Penh or Thailand. Otdar Meanchey has highest
rate of migration to Thailand out of the three zones.
The destination of migration for youths was mainly the capital of Phnom Penh, other
provinces of Cambodia and Thailand. In Tram Kak, 55 per cent of youth migrate to other
provinces of Cambodia, 32 per cent to the capital and 10 per cent to Thailand; in Prey Kabas,
youth migrating to other provinces accounts for 44.7 per cent, to Phnom Penh 31.6 per cent,
Thailand 5.2 per cent and South Korea 2.6 per cent. In Otdar Meanchey, local migration
within the province account for 10.1 per cent, migration to other provinces 23.3 per cent, to
Thailand 65 per cent and to Malaysia 1 per cent (Table 4).
40.83% 52.76%
63.45% 55.38%
6.42%
3.94%
6.30%
5.70% 25.23% 9.45%
14.08%
15.40%
27.52% 33.85%
16.17% 23.52%
Tram Kak Prey Kabas Otdar Meanchey Total
0.00%
10.00%
20.00%
30.00%
40.00%
50.00%
60.00%
70.00%
80.00%
90.00%
100.00%
Youth Situation
Youth doing farming Youth doing non-farming
Youth on migration Youth studying

58
Table 4 Migration destination of rural youth
Youth destination of migration Frequency Per cent Valid
percentage
Cumulative
percentage
In commune in the interview
commune 6 2.86 2.86 2.86
In a district in the interview district 3 1.43 1.43 4.29
In province in the interview province 10 4.76 4.76 9.05
In other provinces 79 37.62 37.62 46.67
Phnom Penh 34 16.19 16.19 100.00
Thailand 76 36.19 36.19 82.86
Malaysia 1 0.48 0.48 83.33
Korea 1 0.48 0.48 83.81
Total 210 100.00 100.00
3.2.4 Consumption and household expenditure
In addition to selling agricultural products for income, some of the agricultural product was
kept for home consumption. Looking at the total consumption from farming in the three
zones, rice consumption accounts for 75.83 per cent, poultry (chicken and duck) 15.07 per
cent, common resources 8.46 per cent, while the vegetable annual crop and aquaculture
contribute less than 1 per cent of the total consumption.
Tram Kak and Otdar Meanchey have similar percentages of rice consumption, with
72.3per cent and 73.41per cent respectively, while rice share highest percentage of rice
consumption, 84.33 per cent, in Prey Kabas. Poultry in Tram Kak contribute 20.76 per cent,
follow by Otdar Meanchey 15.36 per cent. The lowest consumption of poultry is in Prey
Kabas 10.01 per cent. In Otdar Meanchey, poultry raising is not done for income-generation
purpose but mainly for home consumption because chicken will be used as food to host the
exchange labour during the picking season. This is not the case in Tram Kak and Prey Kabas,
where poultry is used for family consumption
The proximity to community forestry provides access for the locals to common
resources, particularly non-timber forest products (NTFP). This constitute the highest
percentage of common resource consumption, with 10 per cent of the total agricultural
consumption in the area. In Tram Kak and Prey Kabas, the common resources are mainly the
collection of protein sources from the rice field (such as fish, crabs, snails and mice) which
contribute about 5.15 and 5.65 per cent of total agricultural consumption respectively.
However, due to the expansion of agricultural land and many people exploiting common
resource, the people in Otdar Meanchey share the view that common resources have
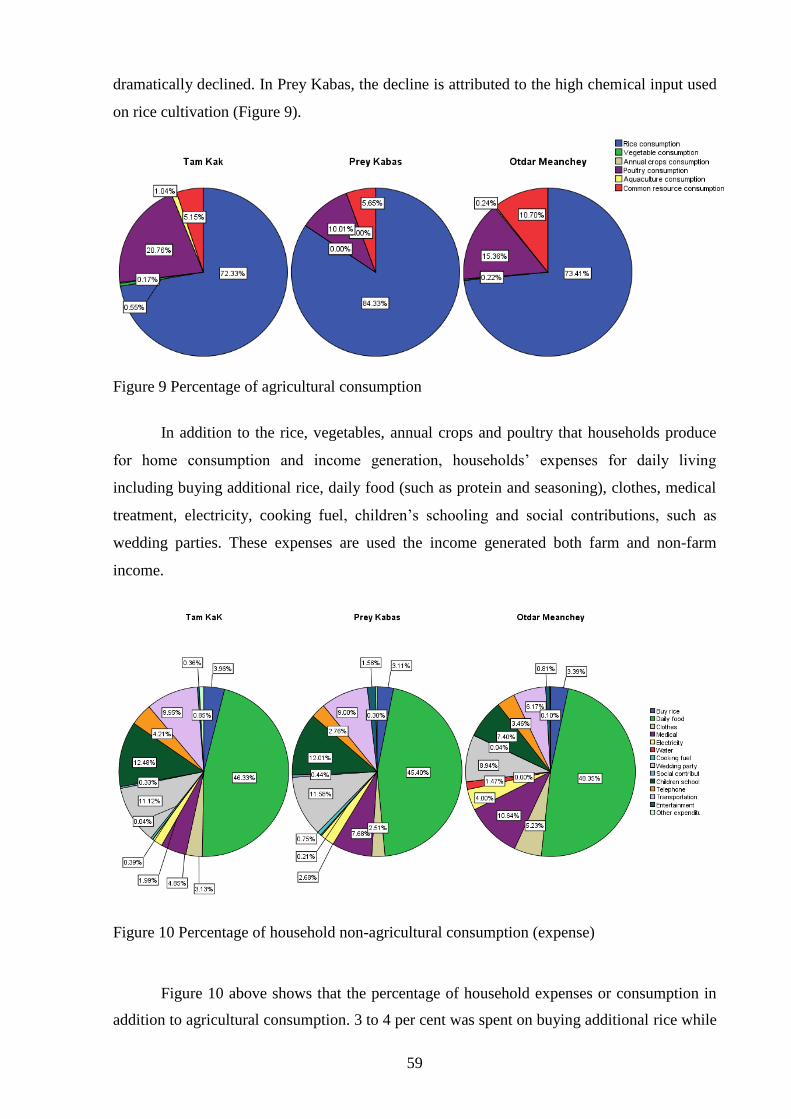
59
dramatically declined. In Prey Kabas, the decline is attributed to the high chemical input used
on rice cultivation (Figure 9).
Figure 9 Percentage of agricultural consumption
In addition to the rice, vegetables, annual crops and poultry that households produce
for home consumption and income generation, households‟ expenses for daily living
including buying additional rice, daily food (such as protein and seasoning), clothes, medical
treatment, electricity, cooking fuel, children‟s schooling and social contributions, such as
wedding parties. These expenses are used the income generated both farm and non-farm
income.
Figure 10 Percentage of household non-agricultural consumption (expense)
Figure 10 above shows that the percentage of household expenses or consumption in
addition to agricultural consumption. 3 to 4 per cent was spent on buying additional rice while

60
45 to 48 per cent on buying daily food. This implies that in each zone spends on food nearly
50 per cent or more of the non-agricultural consumption. Beside the expenditure on food,
according to field observation, expenses for contributing to wedding parties are considerable
and was raised as a concern by many households. For some household, this type of expense is
equal or even higher than the earnings from agriculture. Tram Kak and Prey Kabas share
more than 11 per cent of total non-agricultural consumption, while Otdar Meanchey shares
about 9 per cent. This share is just slightly lower than the expenditure on children‟s education,
which is 12 per cent in Tram Kak and Prey Kabas and 7.4 per cent in Otdar Meanchey.
By grouping the consumption of food (the sum of agricultural consumption is the
amount kept from the harvest and food expense is the amount that the household bought) and
non-food consumption, the contribution of agriculture to total household consumption on
average for the three zone is 33.29 per cent (30.56 per cent in Tram Kak, 26.83 per cent in
Prey Kabas and 38.23 per cent in Otdar Meanchey). This implies that rural household spend
on food an average of 65.35 per cent of total expenses, of which 33.29 per cent comes from
agriculture that the household do not need to buy and another 32.05 per cent is expense is on
non-food expenses, where the income from both farming and non-farm work is used to cover
the expenses on food. The average percentage of spending on food in Tram Kak is 60.79 per
cent, in Prey Kabas is 60.51 per cent and in Otdar Meanchey is 70.03 per cent (Figure 11).
Figure 11 Expense on food and non-food of rural household in percentage
3.2.5 Income sources
Income is the net monetary value the household generates from each economic activity, both
farming and non-farming, taking out intermediary cost for production and paid labor cost for
when households hire external labor to execute the economic activities. The survey results
show that in general, in the three studies sites agricultural income contributes approximately

61
69 per cent of the household‟s income, with 65 per cent in Tram Kak, 72 per cent in Prey
Kabas and 64 per cent in Otdar Meanchey. The remaining 31 per cent is non-farm income,
within which 22 per cent is non-farm activities and 9 per cent is from migration (Figure 12). It
is interesting to see that non-farm activities developed by rural household, although
contributing less than agricultural income, contribute twice as much as migration income in
three zones: 21 per cent, 19 per cent, and 25 per cent in Tam Kak, Prey Kabas, and Otdar
Meanchey respectively.
Figure 12 Income sources in Tram Kak, Prey Kabas and Otdar Meanchey
Looking at the agricultural income, rice is the predominant source of income and
constitutes 38 per cent of total income. Annual crops and vegetables contribute a small
amount, which is about 1.88 per cent and 2.38 per cent respectively, and income from raising
animals, which includes poultry, pig, and fish, contributes 10.45 per cent. The impression
from the field interviews suggests that cattle play an important role as supplementary income
to rural households and this was highlighted in the survey result that cattle contribute about 12
per cent of total household income. Fruit trees, in particular coconut fruit, contribute income
to a few households in Tram Kak and banana trees for a very small number of families in
Otdar Meanchey. However, fruit trees are just a supplementary income and not the key
livelihood activities of the people in the study area, as is the common resources (Figure 13).
Given the access to irrigation in Prey Kabas, rice contribute 50 per cent of household income
to people in Prey Kabas and cattle 15 per cent. Vegetables and annual crops is not the key
crops and key activities in this area, and only three households grow annual crops and two
households grow vegetables in the area. In Tram Kak vegetable and annual crops play role to
some villages situated near natural lack such as Trapaing Chak and Kol Kom village.
Vegetable is also common to households who is able to dig pond to store enough water for
growing vegetable. In Otdar Meanchey, there is scattering of household distributed across
each village that growing vegetables and annual crops, although there are not as many as
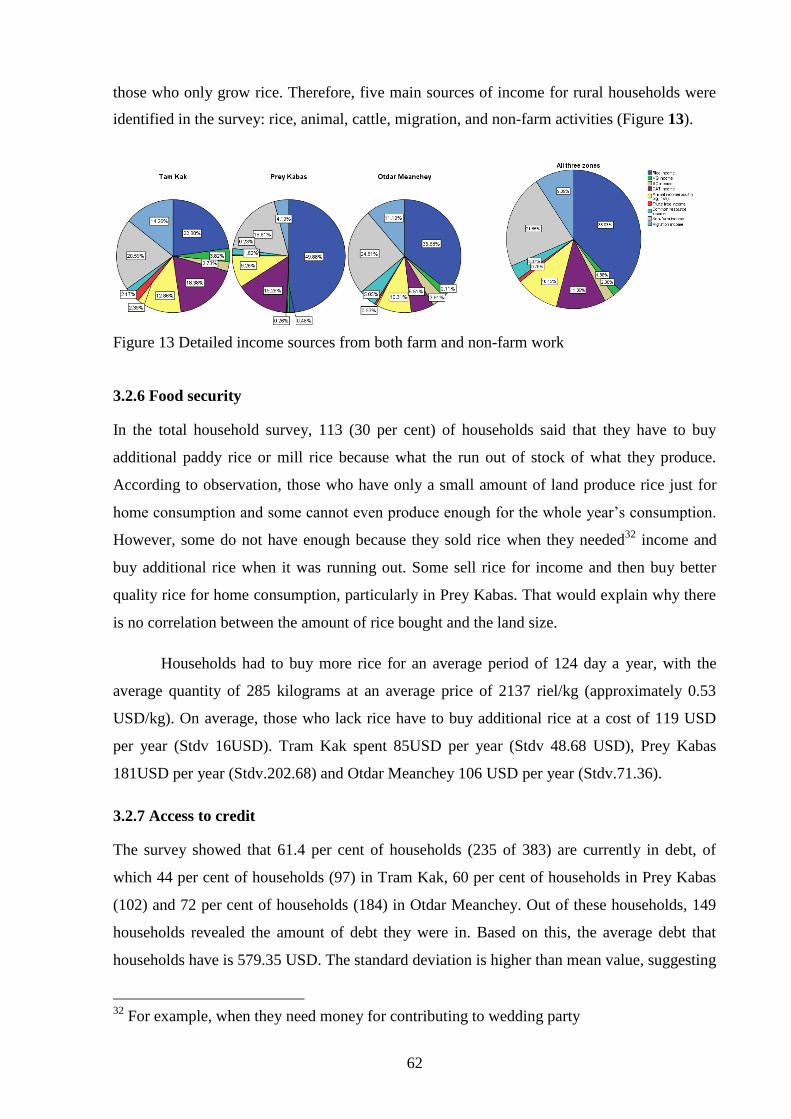
62
those who only grow rice. Therefore, five main sources of income for rural households were
identified in the survey: rice, animal, cattle, migration, and non-farm activities (Figure 13).
Figure 13 Detailed income sources from both farm and non-farm work
3.2.6 Food security
In the total household survey, 113 (30 per cent) of households said that they have to buy
additional paddy rice or mill rice because what the run out of stock of what they produce.
According to observation, those who have only a small amount of land produce rice just for
home consumption and some cannot even produce enough for the whole year‟s consumption.
However, some do not have enough because they sold rice when they needed32
income and
buy additional rice when it was running out. Some sell rice for income and then buy better
quality rice for home consumption, particularly in Prey Kabas. That would explain why there
is no correlation between the amount of rice bought and the land size.
Households had to buy more rice for an average period of 124 day a year, with the
average quantity of 285 kilograms at an average price of 2137 riel/kg (approximately 0.53
USD/kg). On average, those who lack rice have to buy additional rice at a cost of 119 USD
per year (Stdv 16USD). Tram Kak spent 85USD per year (Stdv 48.68 USD), Prey Kabas
181USD per year (Stdv.202.68) and Otdar Meanchey 106 USD per year (Stdv.71.36).
3.2.7 Access to credit
The survey showed that 61.4 per cent of households (235 of 383) are currently in debt, of
which 44 per cent of households (97) in Tram Kak, 60 per cent of households in Prey Kabas
(102) and 72 per cent of households (184) in Otdar Meanchey. Out of these households, 149
households revealed the amount of debt they were in. Based on this, the average debt that
households have is 579.35 USD. The standard deviation is higher than mean value, suggesting
32
For example, when they need money for contributing to wedding party

63
that there is high variation on the amount they borrow among households, ranging from 5
USD to 5000 USD.
Table 5 Average debt per household in three zones
Zone N Mean Std.
Deviation Minimum Maximum
Tam Kak 39 332.69 341.89 25 2000
Prey Kabas 61 894.88 944.82 25 5000
Otdar Meanchey 49 382.88 511.50 5 3000
Total 149 579.35 739.33 5 5000
Table 6 Average debt per household by borrowing source
Source of borrowing by household
N** Percentage Valid
percentage Cumulative percentage
Mean N* Std.
Deviation Min. Max. Sum
Percentage
of total
sum
Family/relatives 42 11 18 18 430 30 522 25 2000 12913 15
Your neighbor 35 9 15 33 290 18 259 5 1000 5218 6
NGOs 12 3 5 38 150 2 141 50 250 300 0
Trader/Employer/Agricultural
firm 6 2 3 41 100 2 35 75 125 200 0
MFI/Bank 103 27 44 85 806 76 906 25 5000 61263 71
Rice bank/village bank 22 6 9 94 281 9 302 50 1000 2525 3
Saving group 14 4 6 100 351 11 303 6 1000 3856 4
Total 235 61 100 583 148 741 5 5000 86274 100
Missing System 148 39
Total 383 100.0
*Among those who reveal their amount of debt
**Among those who currently borrowing
Households mainly borrow from family or relatives, which accounts for 18 per cent of
total household access to credit, 15 per cent borrowed from neighbors, 44 per cent from micro
finance institutions (MFI), 3 per cent from local traders, 9 per cent from rice banks and 6 per
cent from a saving group. However, the share percentage of amount of borrowing by the total
amount borrowed shows that 71 per cent of the cash is borrowed from an MFI, while 15 per
cent from family or relative, 6 per cent from neighbors, 3 per cent from a rice or village bank
and 4 per cent from a saving group. Among the three zones, Prey Kabas has highest
percentage of household borrowing from MFIs as well as the highest amount of cash
borrowed.
The survey showed that 76 per cent of households in Tram Kak, 64 per cent of
households in Prey Kabas, and 47 per cent of households in Otdar Meanchey have used their
land title as collateral for borrowing.
The main reason for households borrowing money is to do agricultural work such as
buying fertilizers, pesticides, repairing agricultural equipment, buying petroleum and other
64
relevant expend related to farming. This reason of borrowing accounts for 53 per cent of the
235 households who are in debt. 4.68 per cent said they borrow for investments related to
self-business. 7.23 per cent borrow to buy food and 7.23 per cent borrow to pay medical
treatment. 7.66 per cent borrow to buy land, the majority of them are in Prey Kabas (Table 7).
In Otdar Meanchey, interviewees reported wanting more land but none of this reason reported
in the purpose of borrowing. But people in the area has highest percentage borrow for doing
agricultural activities which account for 77.3 per cent while the other zone 17.1 per cent in
Tram Kak and 25.8 per cent in Prey Kabas (see appendix x for purpose of borrowing in each
zone)
Table 7 Purpose of borrowing in the three zones
Purpose of borrowing Frequency Percentage Valid
percentage
Cumulative
percentage
For agricultural work, buy agricultural tools/inputs 125 32.64 53.19 53.19
Investment 11 2.87 4.68 57.87
To feed the family (buy more food) 17 4.44 7.23 65.11
To pay for the medical treatment 17 4.44 7.23 72.34
To pay for children to go to school 9 2.35 3.83 76.17
To organize wedding/festival 10 2.61 4.26 80.43
For migration 3 0.78 1.28 81.70
To repay previous debt 2 0.52 0.85 82.55
To cope with crop failure 9 2.35 3.83 86.38
For young married couple starting business 3 0.78 1.28 87.66
To buy land 18 4.70 7.66 95.32
To buy motorcycle 4 1.04 1.70 97.02
To build household or part of the house 7 1.83 2.98 100.00
Total 235 61.36 100.00
Missing System 148 38.64
Total 383 100.00
Among the 148 household who did not borrow, 15.54 per cent said that they are not
able to borrow primarily because they are not sure if they are able to repay back the debt,
another 1.35 per cent shared the same reason but due to high interest rates, while 0.68 per cent
do not borrow because they have family support. The remaining 82.43 per cent do not borrow
simply because they do not need to. This was supported by the field observation, where it was
seen that there are some households that are in a situation of being too poor and therefore not
able to borrow, which is the reason why they are not borrowing because they are afraid that
they cannot afford to pay back the debt.
The net-income (the total gross value added minus the paid labor in production) of the
family show that there are 76.2 per cent of households (292) who are income positive, while
the remaining 23.8 per cent of households (99) are income negative. Among those who are
income positive, 58.6 per cent are in debt. Given their income is positive, this implies that
65
household will likely to repay the debt. However, among those 23.8 per cent of the income
negative households, 70.3 per cent are in debt (64 households). Given their income is
negative, these households will likely find it hard situation to pay back the debt. Those who
are income negative and do not borrow are likely to borrow in the future or have to take other
measures to compensate for the lack of household income.
3.2.8 Settlement in Otdar Meanchey and Takeo
In Otdar Meanchey, migration is more remarkable in new villages than old villages. Migration
to Thailand is common in the area. At first, people were not interested in working in Thailand
as they could not save much money, especially those who earn less than 300 bath (about 8
USD/day). Secondly, it is illegal migration. However, since then people have become more
interested in migrating to Thailand as they see others can earn high income from migration,
especially since 2010, when legal migration became open to everyone. This happens due to
the effort of the government promoting legal migration.
The qualitative interview with each village chief suggested that the movement of
people settling in the area is driven by the growing of family members in the originated area.
However, the reasons for settlement shown in the survey results are mainly related to land
seeking. The process of settlement in new area begins when the household head arrives to
investigate the area. After seeing the possibilities in the area, the household head sells their
assets in the original area and comes to buy land in the new area. Once everything is settled,
the whole family moves and settles in new village. The year of settlement determines the
amount of land they get. Those who came to settle later tend to get less land because there is
no more land available or land has become more expensive. This is confirmed in the
qualitative interviews with village chiefs and some households. The test of correlation
between the class of year settlement and the class of land show there is significantly negative
correlation between land and year of settlement. However, this is just the general pattern.
There some cases where newcomers have bigger areas of land as due to their financial
resources they can buy more land from the locals.
66
Case Summary
Valid Missing Total
N Per cent N Per cent N Per cent
115 62.50 per cent 69 37.50 per cent 184 100.00 per cent
Table 8 Reasons for settlement in Otdar Meanchey
Why do you come to settle in this area?
Responses Percentage
of cases N Per cent
Seeking non-farm opportunities 3 2.00 2.60
Seeking agricultural land 60 40.80 52.20
To work as wage labor in agriculture 3 2.00 2.60
To live with relatives 5 3.40 4.30
Agricultural land is small in the previous location 19 12.90 16.50
Did not have residential land in the previous location 20 13.60 17.40
Married a with resident here 10 6.80 8.70
To begin new livelihood as previous location is not favorable (for young
couple) 5 3.40 4.30
No land in the previous location 4 2.70 3.50
Others 18 12.20 15.70
Total 147 100.00 127.80
Among the 184 households interviewed, 115 responded to the question about the
reasons they came to settle in the village and those 115 people ticked 147 boxes, which is
about 1.3 boxes per person. This means that many of them have reported more than one
reason. We have two sets of percentages. One column uses the total number of responses
(147) as a base value for the percentages and the other column uses the number of cases (115)
as the base. 52.20 per cent of the respondents said the main reason for settling in the area is to
look for land in agriculture. That is 40.8 per cent of all the answers. 16.5 per cent said that
they have come here because the agricultural land is small in the previous location. This is
12.9 per cent of all the answers. Not having residential land in the previous location was
reported as a settlement reason for 17.4 per cent of respondents, which is about 13.6 of all the
answers. 3.5 per cent of respondents said the motivation to settle here was that they did not
have land in their previous location.
Many of the answers on the reason for settlement are primarily related to land. If the
percentage of case that are related to land are summed up, we can see that about 70.7 per cent
of respondents have mentioned reasons of settlement related to land, which take 89.6 per cent
of all the answers.
67
Looking at the distribution of years that people came to settle in the village, we can
see the movement of people comes into the area in an influx from 1997 to 2002. Considering
those who settled in 1979 and earlier the original residents in the area, we then see that 29 per
cent of them are old villagers. People who settle between 1980 and 1996 account for 27 per
cent. Those who come to settle later than 1996, there are 82 families, which is 45 per cent of
the total 184 households interviewed.
Table 9 Year of settlement in Otdar Meanchey
Year of settlement Frequency Percentage Valid
percentage
Cumulative
percentage
Home village 18 9.80 9.80 9.80
In 1979 and earlier 35 19.00 19.00 28.80
1980 - 1985 16 8.70 8.70 37.50
1986 - 1990 13 7.10 7.10 44.60
1991 - 1995 20 10.90 10.90 55.40
1996 - 2002 66 35.90 35.90 91.30
2003 - 2005 4 2.20 2.20 93.50
2006 - 2010 10 5.40 5.40 98.90
2011 and later 2 1.10 1.10 100.00
Total 184 100 100
To see where those 45 per cent of new settlers are coming from, I select those 45 per
cent and see their home province. 20 per cent of people coming from various provinces. 18
per cent are coming from Banteay Meanchey and 20 per cent coming from the Siem Reap
province. Both provinces are provinces near Otdar Meanchey. The other 43 per cent are
people from the Otdar Meanchey province who have moved from nearby districts or
communes to seek land due to have no land or a small amount of land in the previous
location. This result supports the qualitative interviews, that to be near family members and
having a small amount of land in their previous location drives people to move to Otdar
Meanchey, particularly those from Siem Reap and Banteay Meanchey.
Table 10 Home province of new settler in Otdar Meanchey
Home province* Number Percentage Cumulative
percentage
Kampong Thom 1 1 1
Kandal 1 1 2
Mondullkiri 1 1 4
Pursat 1 1 5
Battambang 2 2 7
Prey Veng 2 2 10
Takeo 2 2 12
Kampong Cham 3 4 16
Preah Vihear 3 4 20
Banteay Meanchey 15 18 38
Siem Reap 16 20 57
Otdar Meanchey 35 43 100
68
Total 82 100
*Year of settlement after 1996 - and later
Unlike in the Otdar Meanchey region, where the main reason for moving land seeking,
settlement in Tram Kak region is mainly driven by marriage to a resident in the region.
Among the 97 of respondents, 36 people responded to the question and ticking 38 boxes of
answers, which implies that most of them chose on only one answer. 86.1 per cent of people
reveal that the reason for settlement in the village is because they get married to a resident
there, taking 81.6 per cent of the answer.
Case Summary
Valid Missing Total
N Per cent N Per cent N Per cent
36 37.10 per cent 61 62.90 per cent 97 100.00 per cent
Table 11 Reason for settlement in Tram Kak
Why do you come to settle in this area? Responses Percentage of
cases N Percentage
To live with relatives 2 5.30 5.60
Marriage to a resident here 31 81.60 86.10
To begin new livelihood as previous location is not favorable (for
young couple) 1 2.60 2.80
Others 4 10.50 11.10
Total 38 100.00 105.60
There are 40 families (about 41 per cent of 97) report as old villager (birth village) and
did not report the year of their settlement in the village. By considering people who settle in
and before 1979 as old villagers, the classification year of settlement shows home villagers
account for 75 per cent of respondents. Those who moved in between 1980 and 2000 account
for about 15 per cent (15 families). Those who come to the area later than 2001 account for
about 9 per cent (9 families). This reveals that majority of people in Tram Kak are old
residents and that those who come to the area later did so because they married a resident in
the area. By checking their home district, I see that majority of original locations are from the
same district in Tram Kak or the same province, Takeo. There are very few from the Kampot
and Kandal provinces.
69
Table 12 Year of settlement in Tram Kak by home province
Year of settlement
Where is your home province?
Total Percentage Cumulative
percentage Kampot Kandal Phnom Penh Svay
Rieng Takeo
Home village 0 0 0 0 40 40 41 41
Before 1975 0 0 1 0 24 25 26 67
1975 - 1979 0 0 0 1 7 8 8 75
1980 - 1985 1 0 0 0 5 6 6 81
1986 - 1990 1 0 0 0 4 5 5 87
1991 - 1995 2 0 0 0 1 3 3 90
1996 - 2000 0 0 0 0 1 1 1 91
2001 - 2005 0 0 0 0 4 4 4 95
2006 - 2010 0 1 0 0 2 3 3 98
2011 and later 0 0 0 0 2 2 2 100
Total 4 1 1 1 90 97 100
Similar to the Tram Kak region, the main reason that people settle in the Prey Kabas
area is mainly driven by getting married to a resident in the area. Among the 102 households
interviewed, 29 peoples responded to the question about reasons for moving by ticking 29
boxes of answer, which implies that each of them has chosen only one answer. 62.10 per cent
of people reported that the reason for settling in the village is because they got married to a
resident of Prey Kabas. This accounts for 62.10 per cent of the total answers.
Case Summary
Valid Missing Total
N Per cent N Per cent N Per cent
29 28.40 per cent 73 71.60 per cent 102 100.00 per cent
Table 13 Reasons for settlement in Prey Kabas
Why do you come to settle in this area? Responses Percentage of
cases N Percentage
Seeking non-farm opportunities 1 3.40 3.40
Seeking land in agriculture 2 6.90 6.90
To guard others land 1 3.40 3.40
To live with relative 1 3.40 3.40
Did not have residential land in the previous location 1 3.40 3.40
Marriage a resident here 18 62.10 62.10
Other 5 17.20 17.20
Total 29 100 100
By checking the year of settlement in the village, I can see that there are only three
families that settled in the village. One family who were originally from the Kandal province
settled in 1990. The other two families are from Kampong Cham and Koh Kong and they
moved in 2002 and 2004 respectively. The rest of residents already lived within the Takeo
province. Regardless of those who settle before 1979, I can see that the Takeo people began

70
settle in Prey Kabas mainly between 1980 and 1990, which accounts for about 15 per cent.
There are about 20 per cent of families who arrived after 1990.
Table 14 Year of settlement by home province in Prey Kabas
Year of settlement
Where is your home province?
Total Percentage Cumulative
percentage Kampong Cham Kandal Koh
Kong Takeo
Home village 0 0 0 39 39 38 38
Before 1975 0 1 0 16 17 17 55
1975 - 1979 0 1 0 8 9 9 64
1980 - 1985 0 0 0 11 11 11 75
1986 - 1990 0 1 0 3 4 4 78
1991 - 1995 0 0 0 3 3 3 81
1996 - 2000 0 0 0 4 4 4 85
2001 - 2005 1 0 1 5 7 7 92
2006 - 2010 0 0 0 6 6 6 98
2011 and later 0 0 0 2 2 2 100
Total 1 3 1 97 102
Table 15 below shows the distribution of the district of origin from 97 families in the Takeo
province. 4 per cent come from Angkor Borey and 2 per cent from the Sam Rong district, but
the majority (92 per cent) come from the Prey Kabas district itself. This can include moving
from a different commune within the same district or a nearby village within the same
commune of Prey Kabas, mainly due to getting married, as indicated in the table of reasons
for settlement.
Table 15 Year of settlement by home district in Prey Kabas
Year of
settlement
Home district Total Percentage
Cumulative
percentage Angkor Borey Sam Rong Prey Kabas
Home village 0 0 63 63 65 65
1980 - 1985 1 0 10 11 11 76
1986 - 1990 0 0 3 3 3 79
1991 - 1995 0 0 3 3 3 82
1996 - 2000 0 0 4 4 4 87
2001 - 2005 1 0 4 5 5 92
2006 - 2010 1 1 4 6 6 98
2011 and later 1 0 1 2 2 100
Total 4 2 89 97 100
Total 4 2 92 100
Looking at the reported reasons for settling in the three-study area suggests that
movement to Otdar Meanchey is driven by agricultural land-seeking. Multiple migration from
rural to rural area is done by both outsiders from difference provinces and people within the
province. The qualitative interview showed that due to the children‟s limited access to
education and family members moving to the area, rural families in Otdar Meanchey are

71
motivated to settle in new areas where land is accessible in order to secure their livelihood as
well as secure the future for their children through preparing the land for sharing to their
children. In Tam Kak and Prey Kabas, the main reasons for settling are the same: the
newcomer comes to the village because they married a local resident and they mainly come
from the same province, a nearby district or within the same district.
3.2.9 Concluding remark
From looking at the socioeconomic demographics of rural households, we can see that in the
three study areas have a young population, with an average age of 27 years old and an average
household size of five persons per household. According to the Cambodian definition of
youth, youths account for about 40 per cent of the people living in the study area. The
majority of rural youth mainly finish schooling at either primary of secondary school. If a
youth drops out, there is apparently no alternative for work besides farming. Hence, the
percentage of youth who have dropped out and are currently working on farming is high at
about 55 per cent while, only 6 per cent work in non-farm labour and 15 per cent migrate.
Rural household spend 65.35 per cent of their income on food, of which 33.29 per cent is the
contribution from their own farming. Agriculture contributes 69 per cent of total household
income, suggesting that farming plays a significant role for rural households. Rice, vegetable,
annual crops, cattle and other animal-raising are the main sources of income from farming.
The majority of rural household (approximately 61 per cent) are in debt with an
average debt of 579.35 USD per household; however, there is a high variation in the amount
of debt between individual households. The main purpose of borrowing is to do agricultural
work and investments and to buy land. The main source of borrowing is from MFIs, with a
very small amount from a village bank or saving group. This implies that local initiatives such
as saving groups or village rice banks are not enough to meet the demand of capital for
farming investment, but rather help rural households with small shortages.
While new settlement in Tram Kak and Prey Kabas is mainly driven by marriages
with a local from a village in the area, in Otdar Meanchey migration is driven by multiple
reasons, such as agricultural land-seeking due to shortages of land in the previous location.
Due to the distance from school and past political insecurity of Otdar Meanchey, many youths
did not have access to school and are illiterate. Hence, seeking new land in Otdar Meanchey
can be a way not only to just secure the family‟s livelihood but also to secure the future of
children who apparently have no alternative for work other than farming.

72
3.3 Non-farm activities
In this section, I will look at non-farm activities and their roles in contributing to household
income. I will also discuss the views of respondent about non-farm activities that may lead to
them to view farming is a vital source for sustaining their livelihoods.
3.3.1 A short history of non-farm activities in Cambodia
Two main studies from CDRI provide extensive examination on the evolution of non-farming
activities in Cambodia. The first one is Acharya, Kim, Chap, and Meach (2003a) and the
second one is Acharya et al. (2003b). The authors link work to history and suggest that the
recent development of non-farming activities are just the beginning of the development.
In early of the Khmer history, the Khmer was believed to possess the knowledge of
astronomy, geometry and mathematics. This has been drawn from the big architecture of
Angkor Wat and the many other temples across the kingdom. However, it is unknown
whether the Khmer used this knowledge to create non-farm activities; rather, they used it to
develop means of transport, weapons for expanding the country and food processing.
After the Angkor period, there is little knowledge about Cambodian history between
the 14th
and 19th
century. However, in early mid-19th
century, Cambodia faced severe famine
and attacks from invading armies, that resulted in the country becoming less populous. The
Khmer predominantly resided in rural areas and earned a living based on subsistence farming,
leaving the non-farm sector to the hands of ethnic minorities such as the Chinese, the Sino-
Khmer and the Cham to manage marketing, non-rice garden farming, weaving and
commercial fisheries (Willmott, 1966). Technological knowledge was lost and remained
possibly only in the Kampong area (a port area situated on the water bank whose residents
engage in trade and transport) where the community still possess some skills such as in land
navigation, boat making, fish processing, food processing, spinning and weaving in addition
to rice growing (Acharya et al., 2003a).
During the French colonial period, cotton processing (ginning, weaving and spinning)
was introduced to Cambodia. This knowledge and method survives until this day; however,
people use imported yarn because the cotton production could not be revived. Commercial
fishing was also first observed a century ago (Acharya et al., 2003a). Since the French
colonised Cambodia in 1863, Cambodia‟s economy was integrated with the southern part of
Vietnam (Cochinsin). The export of rice, smoked fish, timber and other Cambodian products
were managed by Chinese and Vietnamese traders in Prey Nokor city (currently Hochinminh
city) (Chandler, 1999). Rubber farms were established in 1920 but centrally managed by the

73
French colonists. Between 1930–1940 Cambodia lived isolated from the Khmer-Shino
economic zone (Acharya et al., 2003a). By choice or by necessity, the majority of
Cambodians at that time started to work as civil servants, land tenants or become a monk in
the Buddhist religion, leaving the commercialization in the hands of Chinese and Vietnamese
traders. The immigration of Vietnamese was encouraged by French colonials, as they were
perceived to be enthusiastic workers and had greater French knowledge than the Khmer.
Thereby, the Vietnamese were given many positions in the colonial administration as well. In
the capital of Phnom Penh, there were 100,000 habitants in 1936. Half of them were
Vietnamese and Chinese immigrants who managed all of the trade and commercial activities.
45,000 people resided around the Royal Palace including monks, home gardeners, handicraft
makers, small traders, all of whom reside in different arrondissement in the south and west of
the place (Chandler, 1999). This period was remarkable due to the significant grow of
urbanization thanks to the establishment of transportation, telecommunication and
electrification, as well as the building of a railway in 1932. A number of Cambodian
intellectuals travelled to France for higher education. This provides the basis for
modernization in the city and subcities such as Battambang, Kampong Cham, Siem Reap and
Shihanukville. However, it is not that easy to explain the slow evolution of non-farm
activities. Unlike many societies, where non-farm activities emerge because of higher
productivities, Cambodian agriculture is very low as predominantly by extensive (Swiden).
The taxation to support the palace and the colonists during the colonial period did not permit
the growth of land and labor productivities. Along with the absence of agricultural
technology, these factors drove rural household communities to work on the land for a
subsistence basis only (Acharya et al., 2003a).
After Cambodia gained independence in 1953, the country became small industry-
based, with many small and medium industries operating in Cambodia. These included car
assembly facilities, scooter factories, soap factories, weaving factories, paper mills, sugar
mills, chemical plants and food caning factories. The private investment begins taking root in
this period and there was much human resource development, such the creation of higher
educational institutions like medical, engineering and other technical training schools.
However, these activities were taking place only in the capital and the majority of
Cambodians continued to live in rural areas and earn a living based on subsistence farming
(Acharya et al., 2003a). In the late 1960s, Cambodia entered the Indo-China War and from
1970 to 1990 the country experienced civil war, particularly the period from 1975 to 1979
where all infrastructures and much human capital was completely destroyed. People were
again separated from skill work and engaged only in farming activities. After 1980, some

74
activities under the Krom Samki cooperative such as rice milling and other food processing
were reintroduced. In 1985, street vending and petty marketing were widespread. Large-scale
industrialization only began in 1990s (Acharya et al., 2003a).
The study done in 2003 describes the common non-farm activities done in Cambodia,
which are mainly traditional ones such as brick-making, fish processing and weaving. The
recent integration of Cambodia into the ASEAN community after2000 and the improvement
of the investment environment done by the government offer new kinds of non-farming job,
particular in the garment sectors, construction work, entertainment industries, tourism and
financial and other services. These kinds of job are available mainly in the capital and the
main cities of Cambodia. However, some garment factories have recently moved to closer to
rural provinces such as Takeo, Kandal, Kampong Speur, Kampong Chhnang and Kampong
Cham.
3.3.2 The nature of non-farm activities in the three study areas
3.3.2.1 Five main categories of non-farm activities
The field observation suggests different situations are linked to the non-farm activities
available in each area. Otdar Meanchey is driven by land expansion, new settlement on new
land and migration to Thailand. Exchange labor and the tractorization of two-wheel-tractors is
notable in this area. In Tram Kak, due to its small land size and no access to irrigation, people
in this area try to seek non-farm alternatives to complement farming, such as working as a
trader, seller, garment worker, tailor or a salaried employee. The only different from Tram
Kak in Pray Kabas is that that area has access to irrigation, where people can intensify rice up
to three times a year. Farming is also assisted by mechanization, particularly through the use
of harvest machines. Weaving (handcrafting) is also common, but it is generally just optional
work. However, the situation of migration for non-farm jobs in Pray Kabas is quite similar to
the Tram Kak commune, given that both are in close proximity to the capital Phnom Penh.
Next, I will look at the survey in order to see more detail about each activity. Table 17
summarizes the main non-farm activities in the study areas based on the activity. The
percentage is measured among the total activities undertaken by family members in each zone
along with the estimated labor spend on activities and labor productivity.
Non-farm and off-farm activities in the study areas can be categorized into five main
categories: migration, agricultural wage labor, self-business, salary-based jobs and labor-
based job. Table 16 illustrates the percentage of each main activity to the total activities in
each study area. For detail on the activities in each main category, see Appendix 14.
75
Table 16 Non-farm off-farm activities in the three study areas
Zone
Case Summary of non-farm activitiesa Average
activity
per
household
Valid Missing Total
N Percentage N Percentage N Percentage
Tam Kak 80 82 17 18 97 100 1.35
Prey
Kabas
76 75 26 25 102 100 1.43
Otdar
Meanchey
159 86 25 14 184 100 1.37
a. Dichotomy group tabulated at value 1.
Zone Main category of non-farm activitiesa Responses Percentage
of cases N Percentage
Tam Kak Migration 32 30 40
Agricultural wage labor 15 14 19
Self-business 25 23 31
Salary-based job 7 6 9
Labor-based job 29 27 36
Total 108 100 135
Prey Kabas Migration 12 11 16
Agricultural wage labor 25 23 33
Self-business 29 27 38
Salary-based job 10 9 13
Labor-based job 33 30 43
Total 109 100 143
Otdar
Meanchey
Migration 39 18 25
Agricultural wage labor 86 39 54
Self-business 39 18 25
Salary-based job 27 12 17
Labor-based job 28 13 18
Total 219 100 138
a. Dichotomy group tabulated at value 1.
80 households, accounting for 82.5 per cent of the total 97 households in Tram Kak,
do non-farm activities. They undertake 108 main activities, of which 30 per cent are migration
activities, 14 per cent are agricultural wage labor, 23 per cent are self-business, 6 per cent are
salary-based jobs, and 27 per cent are labor-based jobs. At a household level, households with
migration accounted for 40 per cent of total households, while of the rest, 31 per cent do self-
business, 19 per cent do agricultural wage labor, 9 per cent have a salary-based job and 36 per
cent have a labor-based job. The total percentage of households who do non-farm activities is
135 per cent. This implies that some rural household have undertaken more than one non-farm
activity. 108 activities were done by 80 households, implying that each household has an
average of 1.35 non-farm activities.
In Prey Kabas, 76 of 102 households (75 per cent) do non-farm activities, of which
only 16 per cent are migration, 33 per cent do agricultural wage labor, 38 per cent has a self-
business, 13 per cent has a salary-based job and 43 per cent is labor-based jobs. On average, a
household conducts 1.43 non-farm activities.
76
In Otdar Meanchey 159 of 184 households (86 per cent) do non-farm activities, of
which 25 per cent is migration, 54 per cent is agricultural wage labor, 25 per cent is self-
business activities, 17 per cent is salary-based jobs and 18 per cent are labor-based jobs.
Households undertake on average 1.37 non-farm activities per household.
In general, Tram Kak and Otdar Meanchey, is notable by migration. Agricultural wage
labor is remarkable in zone Otdar Meanchey while in Prey Kabas is remarkable by labor
based. Self-business shares the same pattern across the three areas. Table 17 summary of the
labor productivities and labor input among the three areas. The percentage is count among the
detail activities.
Table 17 Comparison of non-farm activities in the three-study area
Non-farm activities
Tram Kak Prey Kabas Otdar Meanchey
N
Percentage
of all activities
Mean labor
productivity (USD/per/day)
Mean labor
input
(day)
N
Percentage
in all activities
Mean labor
productivity (USD/per./day)
Mean labor
input
(day)
N
Percentage
in all activities
Mean labor
productivity (USD/per./day)
Mean labor
input
(day)
Salaried
employment 8 6 2.4 245 11 8 2.4 245 28 10 5.7 261
Palm sugar
production 1 1 6.3 120 0 0 . . 1 0 0.8 27
Small business 28 21 2.0 295 28 21 3.2 290 41 14 2.9 273
Agricultural wage
labor 17 13 3.5 10 27 21 4.6 18 128 45 3.5 10
Construction work 19 14 4.1 87 4 3 4.3 109 11 4 3.9 85
Handicraft work 0 0 . . 34 26 1.4 181 0. 0 . .
Garment work 8 6 1.6 308 2 2 1.3 225 2 1 2.1 360
Moto taxi 2 2 3.1 365 1 1 2.5 350 3 1 3.9 184
Other non-farm
activities 4 3 6.5 14 9 7 4.7 60.56 10 4 3.7 32
Remittance USD
per year/person 46 35 236.3
15 11 251.5 60 21 461.0 .
Total people doing activities
133 100
131 100
284 100
3.3.2.2 Agricultural wage labour
From the survey as well as the qualitative interviews with farmers, it is suggested that
agricultural wage labor and construction wage labor are complementary activities. They are
not the key activities developed by a household like a small business. Agricultural wage labor
can be done by both men and women, while construction works are purely done by men and
mainly male household heads.
Given that Otdar Meanchey is driven by new land clearance, therefore the agricultural
wage labor activities available are land clearance, exchange labor, planting cassava, weeding
grass out of cassava plantations, ploughing, harvesting rice and cassava, and transporting
agricultural product. The land clearance is the reason why there is a higher percentage of
people doing this activity in Otdar Meanchey in comparison to the other two zones.

77
The rapid land expansion in the northern province of Cambodia, particularly in
Battambang and Banteay Meanchey, and development of annual crops such as maize and
cassava in those new areas provide opportunities for villagers in Otdar Meanchey to
seasonally migrate for work (Cham Kar) in those areas. Two cases were found in the survey
of this, while another two cases (case 94 and 174) migrated for agricultural work in a different
province for 100 and 96 days respectively. By excluding those statistically extreme values
(outliers), people in Otdar Meanchey do agricultural wage labor on average 10 days per year,
ranging from a minimum of two days to a maximum of 45 days per person per year.
In Tram Kak, agricultural wage labor is mainly rice transplanting and rice harvesting.
This is not surprising, as the area is a small rice land, therefore transplanting rice is widely
practiced here and the need for agricultural wage labor is mainly for transplanting and
harvesting. The average time people do this activity in the area is 10.47 days per year, ranging
from a minimum of two days to a maximum of 30 days.
In Prey Kabas, where rice farming is mostly done intensified inputs such as fertilizers
and pesticides, the agricultural wage labor available is mainly spraying pesticide and
harvesting and transporting the rice product. In this area, people do not transplant rice and
harvesting is done by machine. The average labor input for this activity is 18 days ranging
from three to 50 days. The average labor productivity in Prey Kabas is higher than in the two
other zones wat 4.63 USD per person per day.
When comparing the three zones, we can see that even though agricultural wage labor
productivity (3.65 USD/person/day) is higher than small business (2.67 USD/person/day), the
average availability is just 11 days per year. Small business, in contrast, is an ongoing activity
all throughout the year.
3.3.2.3 Self-business
A self-business or small business is a local self-business developed by rural households as a
complementary income to farm activities. The survey indicates that this kind of job is
predominantly done woman, particularly housewives, who is account for 68 per cent among
family member who have small business activities in the three areas. This activity is closely
linked to farm work, as wives manage and help farm work. Self-businesses are the strategical
activities developed by household for women as supplementary income to family, where
woman can look after children, sell products and help farming during the peak season. While
this type of activity is literally an off-farm activity and although the term non-farm activities
is employed in this study in the general sense, I refer to both off-farm or non-farm work in
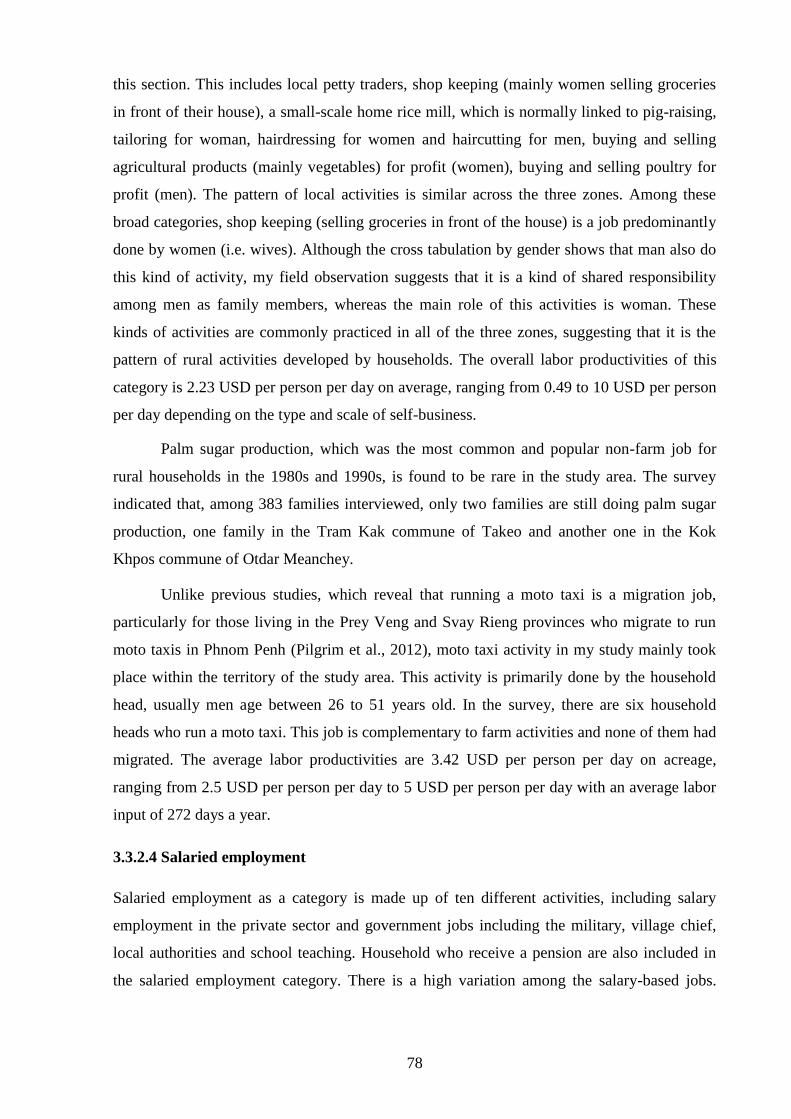
78
this section. This includes local petty traders, shop keeping (mainly women selling groceries
in front of their house), a small-scale home rice mill, which is normally linked to pig-raising,
tailoring for woman, hairdressing for women and haircutting for men, buying and selling
agricultural products (mainly vegetables) for profit (women), buying and selling poultry for
profit (men). The pattern of local activities is similar across the three zones. Among these
broad categories, shop keeping (selling groceries in front of the house) is a job predominantly
done by women (i.e. wives). Although the cross tabulation by gender shows that man also do
this kind of activity, my field observation suggests that it is a kind of shared responsibility
among men as family members, whereas the main role of this activities is woman. These
kinds of activities are commonly practiced in all of the three zones, suggesting that it is the
pattern of rural activities developed by households. The overall labor productivities of this
category is 2.23 USD per person per day on average, ranging from 0.49 to 10 USD per person
per day depending on the type and scale of self-business.
Palm sugar production, which was the most common and popular non-farm job for
rural households in the 1980s and 1990s, is found to be rare in the study area. The survey
indicated that, among 383 families interviewed, only two families are still doing palm sugar
production, one family in the Tram Kak commune of Takeo and another one in the Kok
Khpos commune of Otdar Meanchey.
Unlike previous studies, which reveal that running a moto taxi is a migration job,
particularly for those living in the Prey Veng and Svay Rieng provinces who migrate to run
moto taxis in Phnom Penh (Pilgrim et al., 2012), moto taxi activity in my study mainly took
place within the territory of the study area. This activity is primarily done by the household
head, usually men age between 26 to 51 years old. In the survey, there are six household
heads who run a moto taxi. This job is complementary to farm activities and none of them had
migrated. The average labor productivities are 3.42 USD per person per day on acreage,
ranging from 2.5 USD per person per day to 5 USD per person per day with an average labor
input of 272 days a year.
3.3.2.4 Salaried employment
Salaried employment as a category is made up of ten different activities, including salary
employment in the private sector and government jobs including the military, village chief,
local authorities and school teaching. Household who receive a pension are also included in
the salaried employment category. There is a high variation among the salary-based jobs.
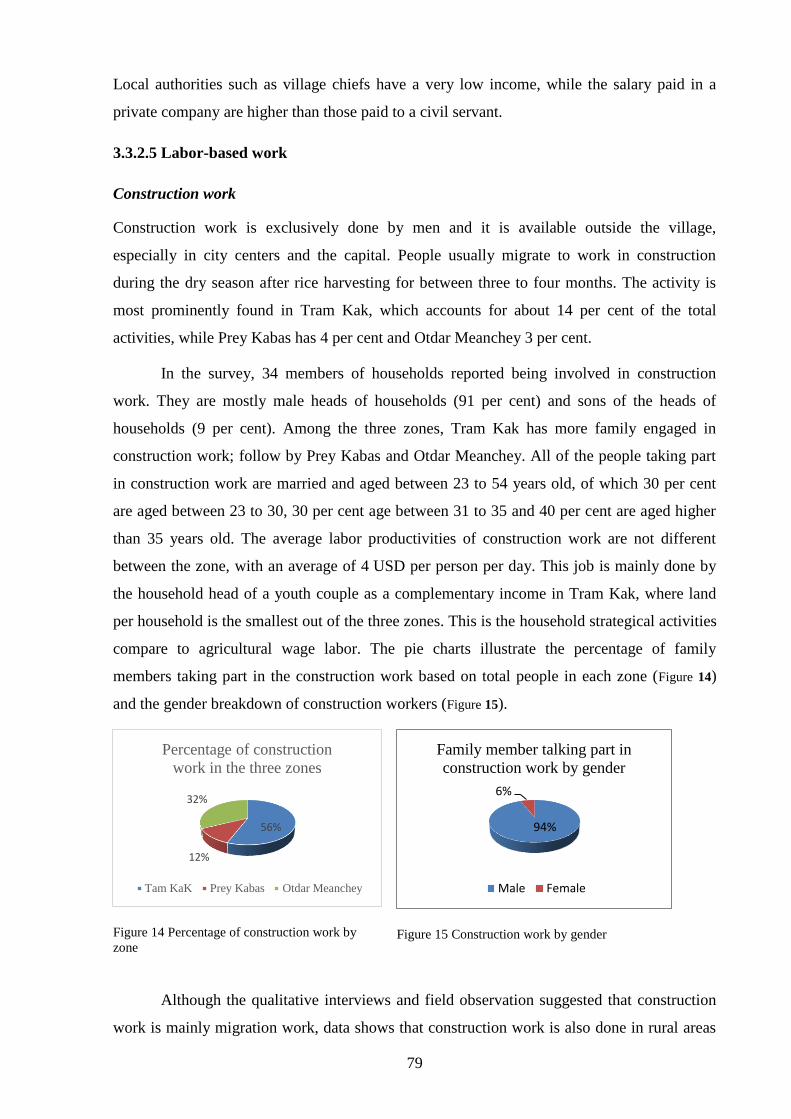
79
Local authorities such as village chiefs have a very low income, while the salary paid in a
private company are higher than those paid to a civil servant.
3.3.2.5 Labor-based work
Construction work
Construction work is exclusively done by men and it is available outside the village,
especially in city centers and the capital. People usually migrate to work in construction
during the dry season after rice harvesting for between three to four months. The activity is
most prominently found in Tram Kak, which accounts for about 14 per cent of the total
activities, while Prey Kabas has 4 per cent and Otdar Meanchey 3 per cent.
In the survey, 34 members of households reported being involved in construction
work. They are mostly male heads of households (91 per cent) and sons of the heads of
households (9 per cent). Among the three zones, Tram Kak has more family engaged in
construction work; follow by Prey Kabas and Otdar Meanchey. All of the people taking part
in construction work are married and aged between 23 to 54 years old, of which 30 per cent
are aged between 23 to 30, 30 per cent age between 31 to 35 and 40 per cent are aged higher
than 35 years old. The average labor productivities of construction work are not different
between the zone, with an average of 4 USD per person per day. This job is mainly done by
the household head of a youth couple as a complementary income in Tram Kak, where land
per household is the smallest out of the three zones. This is the household strategical activities
compare to agricultural wage labor. The pie charts illustrate the percentage of family
members taking part in the construction work based on total people in each zone (Figure 14)
and the gender breakdown of construction workers (Figure 15).
Figure 14 Percentage of construction work by
zone
Figure 15 Construction work by gender
Although the qualitative interviews and field observation suggested that construction
work is mainly migration work, data shows that construction work is also done in rural areas
56%
12%
32%
Percentage of construction
work in the three zones
Tam KaK Prey Kabas Otdar Meanchey
94%
6%
Family member talking part in
construction work by gender
Male Female
80
in within or nearby villages, which made up 58 per cent of total household members who
reported engaging in this activity. This suggests that rural house improvement provides
construction jobs to local people. Among the 34 household members who did construction
work, only two of them were a housewife. 20 of them (59 per cent) are doing construction
work within the village or nearby villages, whereas other 14 of them (41 per cent) do
construction work outside the village, of which 9 per cent worked in the interviewee‟s district,
6 per cent in the interviewee‟s province, 24 per cent in other provinces and 3 per cent in
Thailand (Figure 16).
Figure 16 Construction work by location
Handicraft work
Handicraft work is a category which includes weaving and any other handicraft work.
However, there is a special kind of handicraft work in Prey Kabas that locally called “Pak
Din,” which is a kind of activity where middle traders provide garment material and silver or
golden thread to stick on the garment‟s material, which is then used for fashion. This is purely
a woman‟s job, where a housewife does it as a complementary form of non-farm work. 34
family members in the survey reported doing this activity, including a female household head
as well as wives, sisters, daughters and daughters in law. Daughters also help doing this
activity in addition to attending school. They do this once they are free from farm work,
particularly in the afternoon or evening. From the field observation, this activity is the activity
59%
9%
6%
24%
3%
41%
Construction work by location
Interview village In a district in the interview district
In province in the interview province In other provinces
Thailand
81
that earns the smallest amount of income. It yields the lowest labor productivity in
comparison to other activities. It is just an optional complementary activity.
Garment work
Garment work is purely migration work and the observation of many cases in the survey show
that it plays a very important role for many rural families. Usually, it is a job for women who
have dropped out of school or for a family who cannot afford their children‟s education. This
activity is closely linked to the farm family and is complementary to small land household in
both Tram Kak and Prey Kabas, but particularly in the Tram Kak district. This kind of job is
the key strategy for a family who only have a small amount of land to earn a complementary
income to sustain their livelihood. A young family or a family with married or single (drop
out) youths often seek a complementary income from these activities by letting any family
member to do garment factory work. Even though garment work is obviously perceived to be
a woman job, this work is available for both men and women.
Among the 12 family members in the survey who were taking part in garment work,
10 are female (83 per cent). 11 of them are single (91 per cent). They are aged between 16 to
32 years old with an average age of 23 years old. Two of them (17 per cent) dropped out at
primary school, five of them (42 per cent) dropped out at secondary school, four of them (33
per cent) dropped out of high school and one of them is illiterate (8 per cent). Therefore,
garment work is the work for youth who have dropped out and are looking for non-farm work.
Youths can migrate to work in the garment industry, mainly in Phnom Penh. The job
is available all year long. However, youth can choose to work seasonally, for example for
three to six months per year starting from January to June and then come back home to help
with farm work (see Table 19). One case from the survey is a male from Tram Kak who does
garment work but comes back to do rice farming during the rainy season. In another example
(case 375), a 24 years old girl decided to drop out at the twelfth grade at high school so she
could be responsible for farm work and earning income to support her family. Usually, the
remittance from family members who do this garment factory work is about 50USD per
month. Table 18 below shows the income, expenses and remittance to support family from the
case 375 in the Prey Kabas commune.
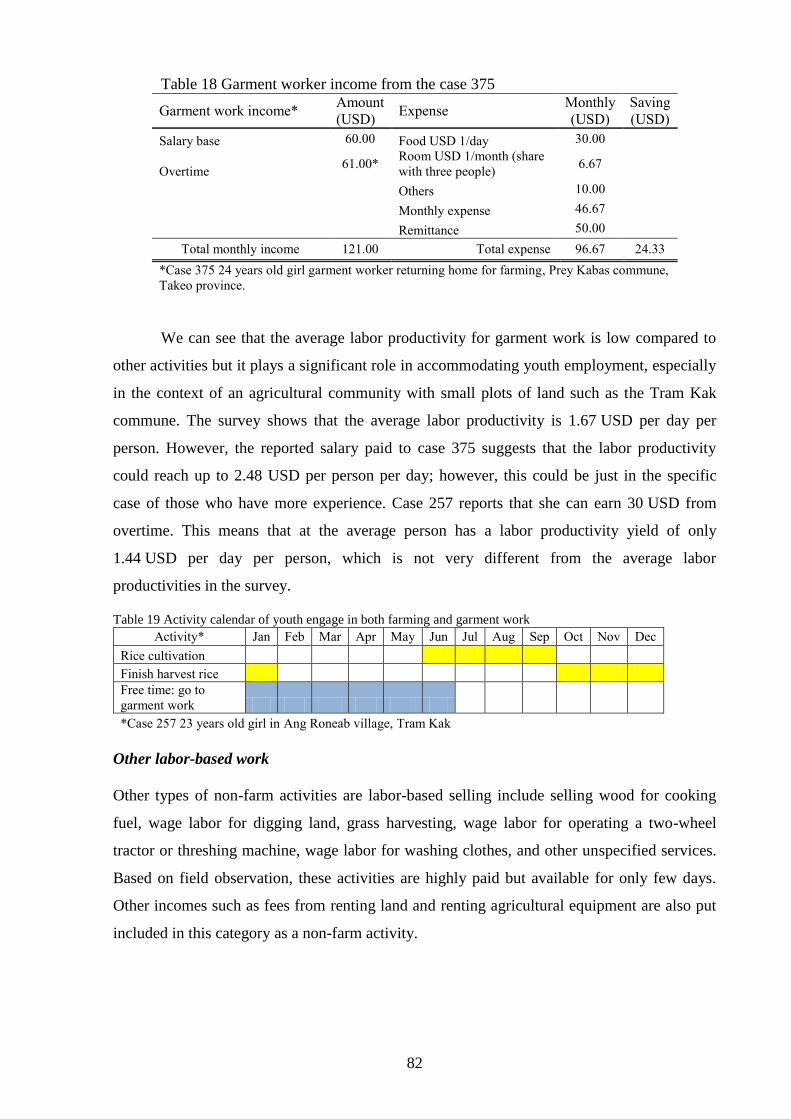
82
Table 18 Garment worker income from the case 375
Garment work income* Amount
(USD) Expense
Monthly
(USD)
Saving
(USD)
Salary base 60.00 Food USD 1/day 30.00
Overtime 61.00*
Room USD 1/month (share
with three people) 6.67
Others 10.00
Monthly expense 46.67
Remittance 50.00
Total monthly income 121.00 Total expense 96.67 24.33
*Case 375 24 years old girl garment worker returning home for farming, Prey Kabas commune,
Takeo province.
We can see that the average labor productivity for garment work is low compared to
other activities but it plays a significant role in accommodating youth employment, especially
in the context of an agricultural community with small plots of land such as the Tram Kak
commune. The survey shows that the average labor productivity is 1.67 USD per day per
person. However, the reported salary paid to case 375 suggests that the labor productivity
could reach up to 2.48 USD per person per day; however, this could be just in the specific
case of those who have more experience. Case 257 reports that she can earn 30 USD from
overtime. This means that at the average person has a labor productivity yield of only
1.44 USD per day per person, which is not very different from the average labor
productivities in the survey.
Table 19 Activity calendar of youth engage in both farming and garment work
Activity* Jan Feb Mar Apr May Jun Jul Aug Sep Oct Nov Dec
Rice cultivation
Finish harvest rice
Free time: go to
garment work
*Case 257 23 years old girl in Ang Roneab village, Tram Kak
Other labor-based work
Other types of non-farm activities are labor-based selling include selling wood for cooking
fuel, wage labor for digging land, grass harvesting, wage labor for operating a two-wheel
tractor or threshing machine, wage labor for washing clothes, and other unspecified services.
Based on field observation, these activities are highly paid but available for only few days.
Other incomes such as fees from renting land and renting agricultural equipment are also put
included in this category as a non-farm activity.
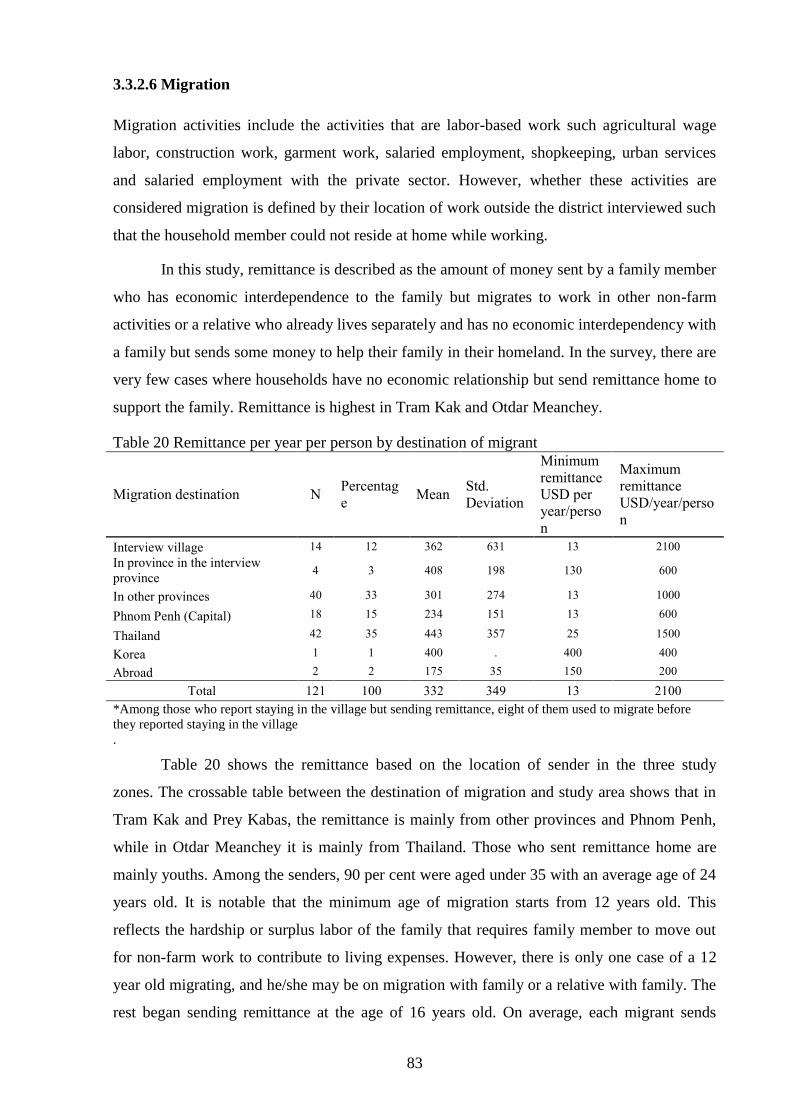
83
3.3.2.6 Migration
Migration activities include the activities that are labor-based work such agricultural wage
labor, construction work, garment work, salaried employment, shopkeeping, urban services
and salaried employment with the private sector. However, whether these activities are
considered migration is defined by their location of work outside the district interviewed such
that the household member could not reside at home while working.
In this study, remittance is described as the amount of money sent by a family member
who has economic interdependence to the family but migrates to work in other non-farm
activities or a relative who already lives separately and has no economic interdependency with
a family but sends some money to help their family in their homeland. In the survey, there are
very few cases where households have no economic relationship but send remittance home to
support the family. Remittance is highest in Tram Kak and Otdar Meanchey.
Table 20 Remittance per year per person by destination of migrant
Migration destination N Percentag
e Mean
Std.
Deviation
Minimum
remittance
USD per
year/perso
n
Maximum
remittance
USD/year/perso
n
Interview village 14 12 362 631 13 2100
In province in the interview
province 4 3 408 198 130 600
In other provinces 40 33 301 274 13 1000
Phnom Penh (Capital) 18 15 234 151 13 600
Thailand 42 35 443 357 25 1500
Korea 1 1 400 . 400 400
Abroad 2 2 175 35 150 200
Total 121 100 332 349 13 2100
*Among those who report staying in the village but sending remittance, eight of them used to migrate before
they reported staying in the village
.
Table 20 shows the remittance based on the location of sender in the three study
zones. The crossable table between the destination of migration and study area shows that in
Tram Kak and Prey Kabas, the remittance is mainly from other provinces and Phnom Penh,
while in Otdar Meanchey it is mainly from Thailand. Those who sent remittance home are
mainly youths. Among the senders, 90 per cent were aged under 35 with an average age of 24
years old. It is notable that the minimum age of migration starts from 12 years old. This
reflects the hardship or surplus labor of the family that requires family member to move out
for non-farm work to contribute to living expenses. However, there is only one case of a 12
year old migrating, and he/she may be on migration with family or a relative with family. The
rest began sending remittance at the age of 16 years old. On average, each migrant sends

84
remittance home about 332 USD per migrant per year. The amount is about the same for zone
Tram Kak and Prey Kabas but highest in Otdar Meanchey due to popularity of migrating to
Thailand where people can earn higher than migrating within Cambodia.
We can see that there is a diversity of activities that families tried to develop. Small
businesses are dominated by shopkeepers who are mainly woman. Although the average labor
productivity is low compared to other activities such as palm sugar production, agricultural
wage labor, construction work and other non-farm activities, at 285 days per year the
availability of this activity is far longer than the four mentioned above. The other activities,
especially agricultural wage labor, have very limited availability, with a labor input of 74, 11,
89 and 40 days respectively. The labor productivity varies according to the type of business.
Salaried employment (except for the village chief) and other activities such as working for a
private company, being a driver, teacher, civil servant, cooker, assistant shopkeeper and
casino worker have labor productivities that are higher than the average 3.3USD per person
per day. That is why both young people and parents want their children to work in salaried
employment, given it is more stable and secure income than farming. Garment work has the
lowest average labor productivities in comparison to other activities but plays a very
important role in accommodating youth employment, especially in situations where the family
has a small plot of land and many family members. Case 280 in the Chrey Thnaot village in
Tram Kak commune clearly reveals this situation (Figure 17). Four members of the family
have to migrate. Three of them doing garment factory work and one of them does
construction work. These four migrants send a remittance to their parents with a monthly
amount of 100 USD. This shows the significant role of garment work in supporting youths
and families in all three zones.
- 67 49
0m*0m 0
0.1ha 0 Grade:9 Grade: 8
Migration: Garment
work
Construction
work (PP)
Home:25m*40m 0
Rice :0.2ha 0.2ha Edu :6 6
- 29 26
26
16
15 Grade:9 Migration: Garment
work
Grade:6
Studying
Grade:8
Migration: Garment work
Figure 17 Relationship between non-farm work, migration and farming work
85
3.3.2.7 Income-based category of non-farm activities
Based on the quality of non-farm activities that has the capacity to generate a high or low
income for a household, except migration and agricultural wage labor, the main category of
self-business, salary based and labor based were classified into to sub-categories:
Self-business high income (SB-H): Are the self-business activities generating income
more than 2 USD per day or more than 730 USD per year.
Self-business low income (SB-L): Are the self-business activities generating income
less than 2 USD per day or less than 730 USD per year.
Salary high income (SL-H): Are the salary activities generating income more than 2
USD per day or more than 730 USD per year.
Salary low income: Are the salary activities generating income less than 2 USD per day
or less than 730 USD per year.
Labor-based high income (LB-H): Are the labor-based activities generating more
income than 1 USD per day or more than 365 USD per year.
Labor-based low income (LB-L): Are the labor-based activities generate more income
less than 1 USD per day or less than 365 USD per year.
Figure 18 shows the average non-farm income per household each study area. On
average, households in Tram Kak earn 498 USD per household, of which 40 per cent of
income comes from migration, 2 per cent from agricultural wage labor, 6 per cent from labor-
based high income, 8 per cent from labor-based low income, 23 per cent from self-business
high income, 13 per cent from self-business low income, 5 per cent from salary high income
and 3 per cent from salary low income.
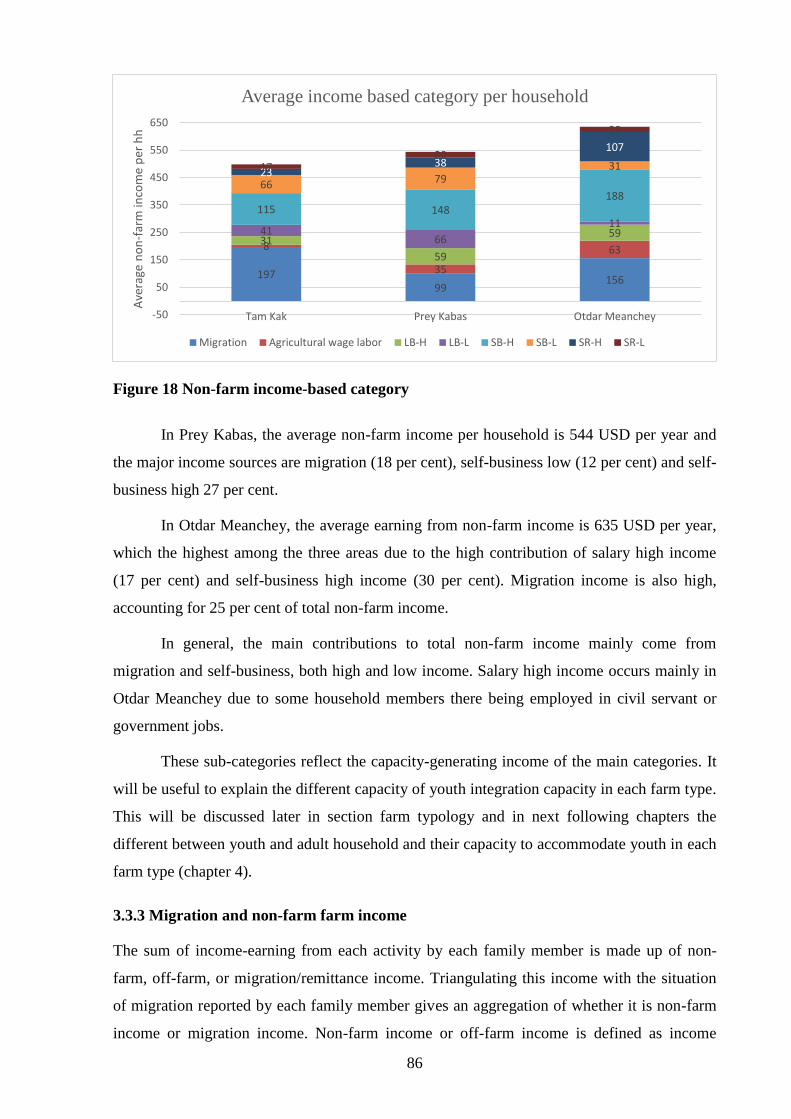
86
Figure 18 Non-farm income-based category
In Prey Kabas, the average non-farm income per household is 544 USD per year and
the major income sources are migration (18 per cent), self-business low (12 per cent) and self-
business high 27 per cent.
In Otdar Meanchey, the average earning from non-farm income is 635 USD per year,
which the highest among the three areas due to the high contribution of salary high income
(17 per cent) and self-business high income (30 per cent). Migration income is also high,
accounting for 25 per cent of total non-farm income.
In general, the main contributions to total non-farm income mainly come from
migration and self-business, both high and low income. Salary high income occurs mainly in
Otdar Meanchey due to some household members there being employed in civil servant or
government jobs.
These sub-categories reflect the capacity-generating income of the main categories. It
will be useful to explain the different capacity of youth integration capacity in each farm type.
This will be discussed later in section farm typology and in next following chapters the
different between youth and adult household and their capacity to accommodate youth in each
farm type (chapter 4).
3.3.3 Migration and non-farm farm income
The sum of income-earning from each activity by each family member is made up of non-
farm, off-farm, or migration/remittance income. Triangulating this income with the situation
of migration reported by each family member gives an aggregation of whether it is non-farm
income or migration income. Non-farm income or off-farm income is defined as income
197 99
156
8
35
63 31
59
59 41 66
11 115 148
188 66 79
31 23
38
107
17 20
20
-50
50
150
250
350
450
550
650
Tam Kak Prey Kabas Otdar Meanchey
Ave
rage
no
n-f
arm
inco
me
per
hh
Average income based category per household
Migration Agricultural wage labor LB-H LB-L SB-H SB-L SR-H SR-L

87
generated by any household member within the village, commune, or district where he/she
can come and reside in the village. Migration income is defined by an-income earning
destination of migration for people who migrate in within the same province, other provinces,
capital cities or abroad where he/she is not able to reside in the village.
Remittance, as explained in Section 3.3.2.6 Migration, is an amount of money sent by
a family member who has economic interdependence with the family migrates to work on
other non-farm activities or a relative who already lives separately and has no economic
interdependence with a family but helps by sending some money to help their family in their
home land.
The sum of non-farm/off-farm income, migration income and remittance is called total
non-farm income, which is the added value generated from activities besides farming. It
should be noted that this term is defined in a broad sense which does not attempt to
distinguish the nature of its relation to the farming system. For example, if small business
activities are developed by a housewife but she also uses her free time to raise pigs and help
farming, hence, income from small business by its nature should be the income from farming
system. But in this study, I would like to distinguish this into total non-farm income order to
see the contribution of non-farm activities to the faming income. At the end, there will be only
two main categories: non-farm income (non-farm and off-farm) and migration income
(migration income and remittance). The sum of the two is total non-farm income.
After aggregating the sum of the non-farm income of each family member into the
three main described categories above, I try to see how many households in the survey do
non-farm activities and migration and to what extent the earning from these contributes to the
household economy. Some family members generate a very small amount of non-farm
income per year, earning sums as little as 5 USD. The number household doing non-farm will
be high and not reflecting the significant of the activity if small amount of earning from non-
farm activities has to be count. In order to accurately reflect reality, my knowledge from the
survey suggests that the minimum account considered as a non-farm activity is 50 USD per
person per year. If observed local wage labor is 5 USD per person per year, then those who
are considered as doing non-farm activity are those whose spend at least 10 days in a year to
generate income within the district they are living.
Based on the criteria of non-farm activity outlined above, the survey shows that
among 383 households surveyed, 54.83 per cent conduct non-farm activities. Tram Kak and
Otdar Meanchey has similar figures of 51.55 per cent and 48.91 per cent respectively, but

88
Prey Kabas shows a higher figure of 67.6 per cent, due to the handcrafting activities (Pak Din)
which are available only in this district.
Figure 19 Percentage of households non-farm activities
Household that reported they have family members who have migrated are 123 among
383 households surveyed, which is about 32.38 per cent. In Otdar Meanchey, the percentage
of migration is about the same the overall percentage of migration of the three study zones at
31 per cent, while in Prey Kabas only 20.59 per cent of the 102 households have family
member who have migrated. In Tram Kak, the percentage is the highest, with 47.42 per cent
of the 97 households having a family member who has migrated. This very much corresponds
to the field observation, that due to small land holdings per family, farming alone is not
enough to support family members in Tram Kak. Therefore, migration is the compensatory
strategy of the people in the area. Garment work and construction work are the key
compensating strategies for households in Tram Kak.
51.55 68.63
48.91 54.83
48.45 31.37
51.09 45.17
0
20
40
60
80
100
Tram Kak Preykabas Otdar Mean
Chey
Total
Per
cen
tage
Percentage of households non-farm activity
Have Non-farm activities No Non-farm activities
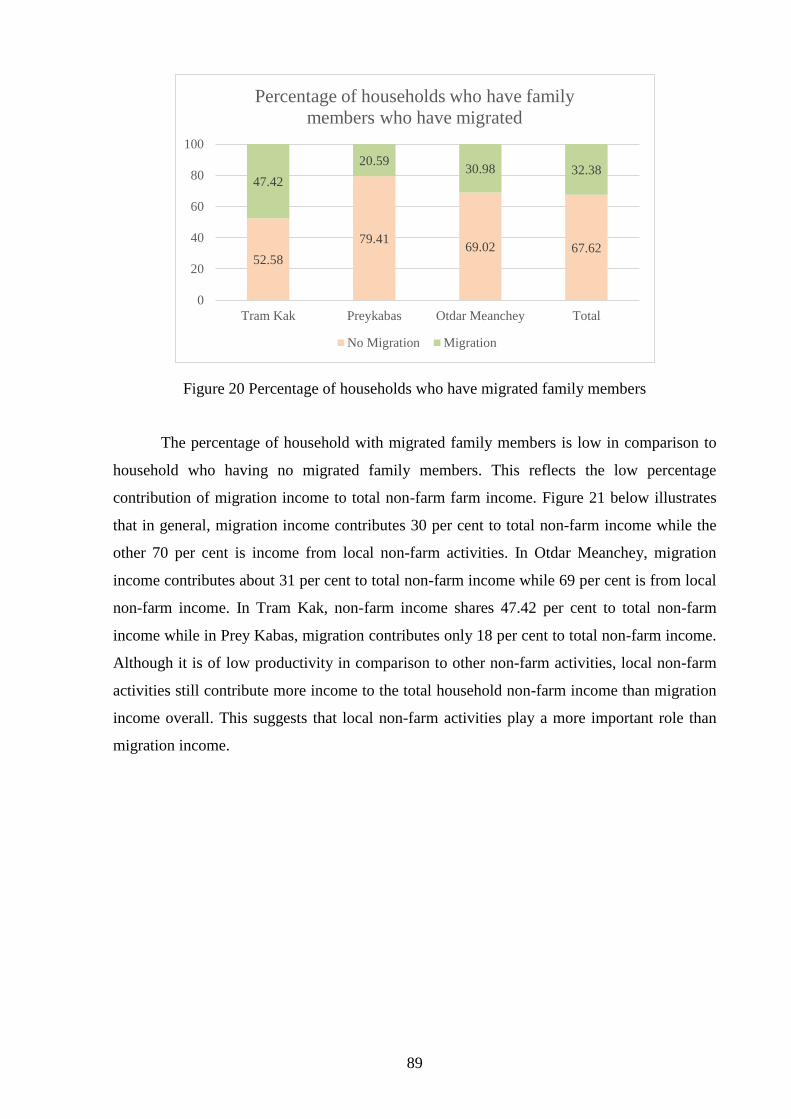
89
Figure 20 Percentage of households who have migrated family members
The percentage of household with migrated family members is low in comparison to
household who having no migrated family members. This reflects the low percentage
contribution of migration income to total non-farm farm income. Figure 21 below illustrates
that in general, migration income contributes 30 per cent to total non-farm income while the
other 70 per cent is income from local non-farm activities. In Otdar Meanchey, migration
income contributes about 31 per cent to total non-farm income while 69 per cent is from local
non-farm income. In Tram Kak, non-farm income shares 47.42 per cent to total non-farm
income while in Prey Kabas, migration contributes only 18 per cent to total non-farm income.
Although it is of low productivity in comparison to other non-farm activities, local non-farm
activities still contribute more income to the total household non-farm income than migration
income overall. This suggests that local non-farm activities play a more important role than
migration income.
52.58
79.41 69.02 67.62
47.42
20.59 30.98 32.38
0
20
40
60
80
100
Tram Kak Preykabas Otdar Meanchey Total
Percentage of households who have family
members who have migrated
No Migration Migration
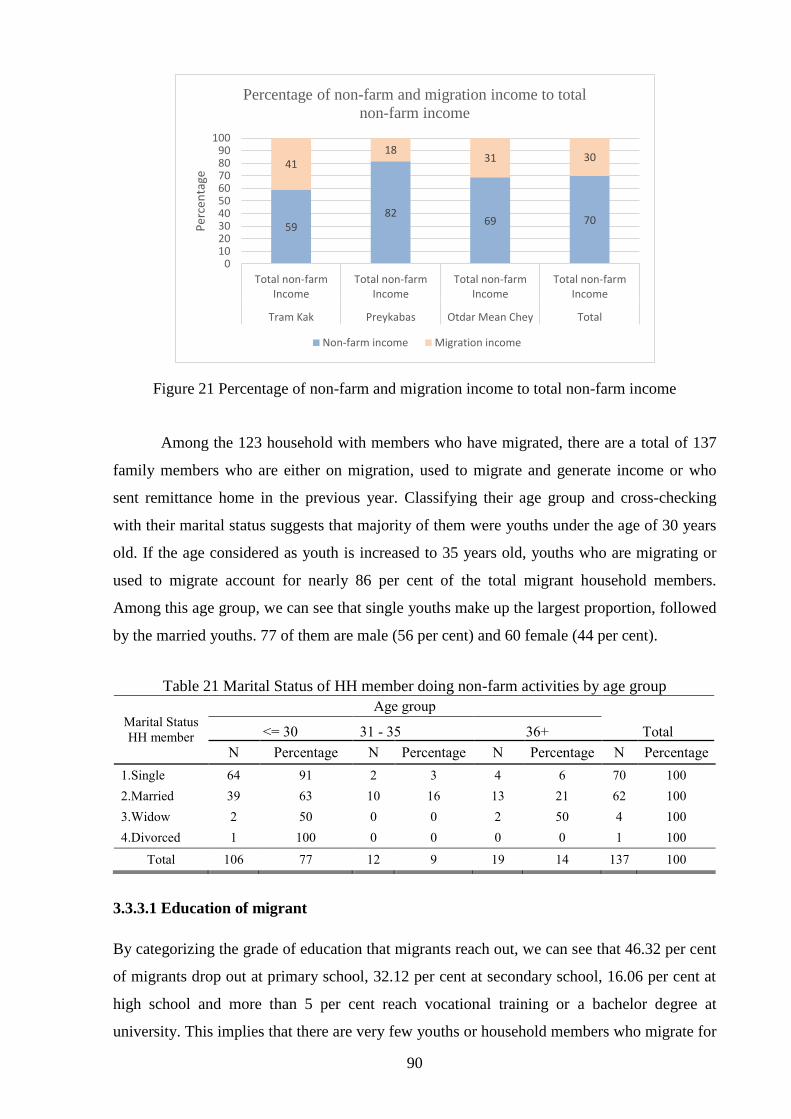
90
Figure 21 Percentage of non-farm and migration income to total non-farm income
Among the 123 household with members who have migrated, there are a total of 137
family members who are either on migration, used to migrate and generate income or who
sent remittance home in the previous year. Classifying their age group and cross-checking
with their marital status suggests that majority of them were youths under the age of 30 years
old. If the age considered as youth is increased to 35 years old, youths who are migrating or
used to migrate account for nearly 86 per cent of the total migrant household members.
Among this age group, we can see that single youths make up the largest proportion, followed
by the married youths. 77 of them are male (56 per cent) and 60 female (44 per cent).
Table 21 Marital Status of HH member doing non-farm activities by age group
Marital Status
HH member
Age group
Total <= 30 31 - 35 36+
N Percentage N Percentage N Percentage N Percentage
1.Single 64 91 2 3 4 6 70 100
2.Married 39 63 10 16 13 21 62 100
3.Widow 2 50 0 0 2 50 4 100
4.Divorced 1 100 0 0 0 0 1 100
Total 106 77 12 9 19 14 137 100
3.3.3.1 Education of migrant
By categorizing the grade of education that migrants reach out, we can see that 46.32 per cent
of migrants drop out at primary school, 32.12 per cent at secondary school, 16.06 per cent at
high school and more than 5 per cent reach vocational training or a bachelor degree at
university. This implies that there are very few youths or household members who migrate for
59 82
69 70
41 18
31 30
0102030405060708090
100
Total non-farmIncome
Total non-farmIncome
Total non-farmIncome
Total non-farmIncome
Tram Kak Preykabas Otdar Mean Chey Total
Per
cen
tage
Percentage of non-farm and migration income to total
non-farm income
Non-farm income Migration income
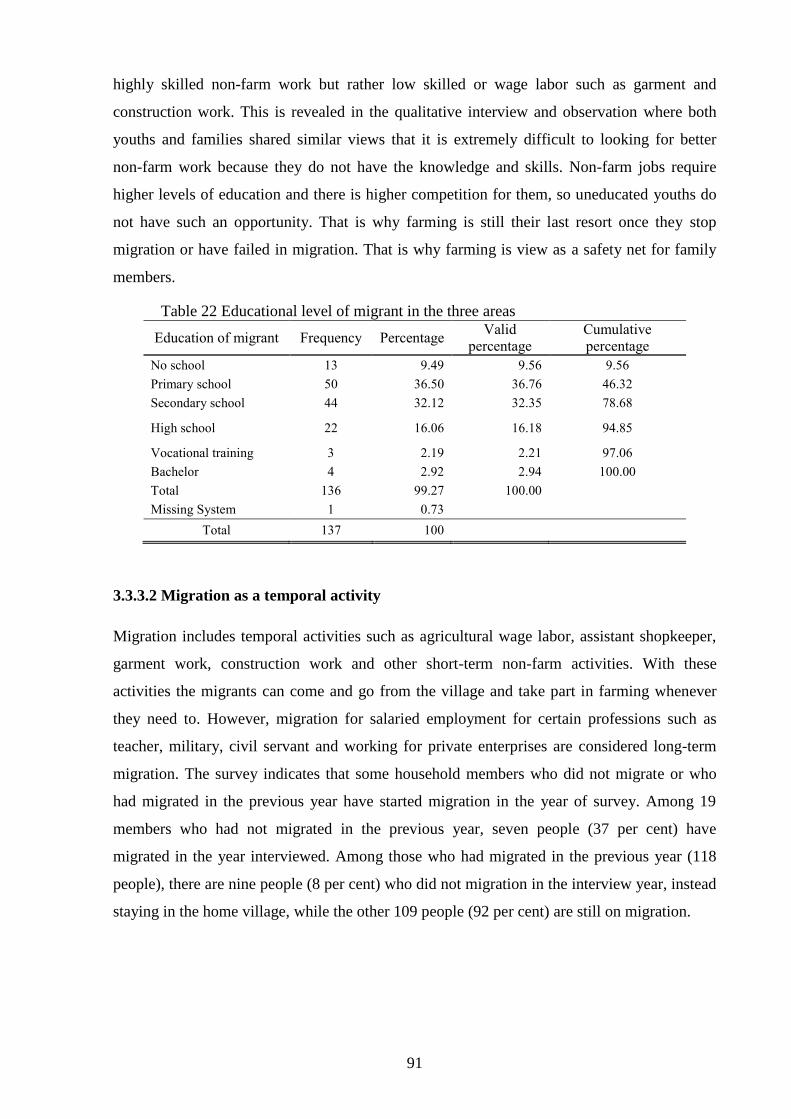
91
highly skilled non-farm work but rather low skilled or wage labor such as garment and
construction work. This is revealed in the qualitative interview and observation where both
youths and families shared similar views that it is extremely difficult to looking for better
non-farm work because they do not have the knowledge and skills. Non-farm jobs require
higher levels of education and there is higher competition for them, so uneducated youths do
not have such an opportunity. That is why farming is still their last resort once they stop
migration or have failed in migration. That is why farming is view as a safety net for family
members.
Table 22 Educational level of migrant in the three areas
Education of migrant Frequency Percentage Valid
percentage
Cumulative
percentage
No school 13 9.49 9.56 9.56
Primary school 50 36.50 36.76 46.32
Secondary school 44 32.12 32.35 78.68
High school 22 16.06 16.18 94.85
Vocational training 3 2.19 2.21 97.06
Bachelor 4 2.92 2.94 100.00
Total 136 99.27 100.00
Missing System 1 0.73
Total 137 100
3.3.3.2 Migration as a temporal activity
Migration includes temporal activities such as agricultural wage labor, assistant shopkeeper,
garment work, construction work and other short-term non-farm activities. With these
activities the migrants can come and go from the village and take part in farming whenever
they need to. However, migration for salaried employment for certain professions such as
teacher, military, civil servant and working for private enterprises are considered long-term
migration. The survey indicates that some household members who did not migrate or who
had migrated in the previous year have started migration in the year of survey. Among 19
members who had not migrated in the previous year, seven people (37 per cent) have
migrated in the year interviewed. Among those who had migrated in the previous year (118
people), there are nine people (8 per cent) who did not migration in the interview year, instead
staying in the home village, while the other 109 people (92 per cent) are still on migration.

92
Table 23 People on migration and on pause from migration in the three zones
Do you migrate now?
Do you migrate in the
previous year? No Yes Total
N Percentage N Percentage N Percentage
No 12 63 7 37 19 100
Yes 9 8 109 92 118 100
Total 21 15 116 85 137 100
There are only few cases of migration within the boundary of the province, which is 5
cases (3.65 per cent) of the total number of people on migration. Migration to other
destinations, including the capital city, account for 52.6 per cent, of which 21.2 per cent is
migration to Phnom Penh, and 31.39 per cent is migration to other provinces. Migration
abroad is predominantly to Thailand (27 per cent), with South Korea having 0.73 per cent and
other countries beside the two making 0.73 per cent. Therefore, migration abroad is nearly 29
per cent. However, migration to Thailand is mainly done by people in Otdar Meanchey due to
its proximity to Thailand. According to the qualitative interviews and field observation,
people tend to migrate to Thailand because it is less expensive than South Korea. This
tendency is likely to increase due to the efforts of the Cambodian government to facilitate
legal migration through providing better access to a Thailand border pass for migrants who
wish to seek non-farm or farm work in the provinces of Thailand that border Cambodia. The
investment on migration to South Korea is also found in the study even it is said the cost for
migration is very high. However, it is said the earning is very high compares to earnings from
migration to Thailand. Table 24 shows the destination of family members who were on
migration during the study period.
Table 24 Destination of migration by migrants for non-farm activities in the three zones
Where are they now? Frequency Percentage Valid
percentage
Cumulative
percentage
Interview village* 21 15.33 15.3 15.3
In province in the interview province 5 3.65 3.6 19
In other provinces 43 31.39 31.4 50.4
Thailand 37 27.01 27 77.4
South Korea 1 0.73 0.7 78.1
Phnom Penh 29 21.17 21.2 99.3
Abroad 1 0.73 0.7 100
Total 137 100 100
*This includes two cases where remittance was received from a relative. 19 cases included those who
migrated before the interview took place but currently reside in the village and contribute income or
remittance to the family.
93
3.3.3.3 Non-farm and migration income per person
Regardless the quality of non-farm activities, meaning the amount they have earned, by
considering any family member taking part in generating non-farm income at any particular
time during the year as having non-farm activity, then we can see that on average across all
zones 1.47 family members per family engage in non-farm work. With the standard deviation
of 0.71 (nearly 1), we can see that the average is nearly two household members per
household doing non-farm activity. Table 25 below classifies non-farm income per person
into class to see the significant contribution of income per family member. For detail
separation by zone, see appendix – 14. On average, each household member taking part in a
local non-farm activity contributes income of 416.6 USD per person per year. The standard
deviation is higher than the mean value, suggesting there is a high variation among the
amount of earning undertaken by each family member which is dependent on the type and
quality of activity.
Table 25 Average number of HH member doing non-farm per HH by class of non-farm income per person
Number of
household Non-farm income per person Number of people working on non-farm
Class of non-
farm income
per person
(USD)
N Percentage Mean Std.
Deviation Minimum Maximum Mean
Std.
Deviation Minimum Maximum
<= 50 60 22 25.91 13.16 5.00 50.00 1.65 0.92 1 5
50.01 - 100 30 11 79.23 17.97 37.50 125.00 1.27 0.45 1 2
100.01 - 300 59 22 193.86 91.63 7.50 450.00 1.53 0.75 1 4
300.01 - 500 43 16 392.53 176.45 55.00 912.50 1.53 0.70 1 4
500.01 - 1000 51 19 755.34 266.90 100.00 1800.00 1.29 0.50 1 3
1000.01+ 24 9 1685.91 505.25 1050.00 3150.00 1.38 0.58 1 3
Total 267 100 416.60 517.70 5.00 3150.00 1.47 0.71 1 5
Regardless of the amount of earning per migrant per household, the average migrant
per household is 1.52 migrants, ranging from one to five migrants per family. For a detailed
separation by zone, see appendix – 14. Table 22 shows the quality of migration income per
migrant. On average among a total of 92 migrants, each migrant contributes income of about
455.15 USD per year per migrant. There is high variation between migrant (standard
deviation higher than mean value) depending on the type of work, duration of work and
destination of migration.
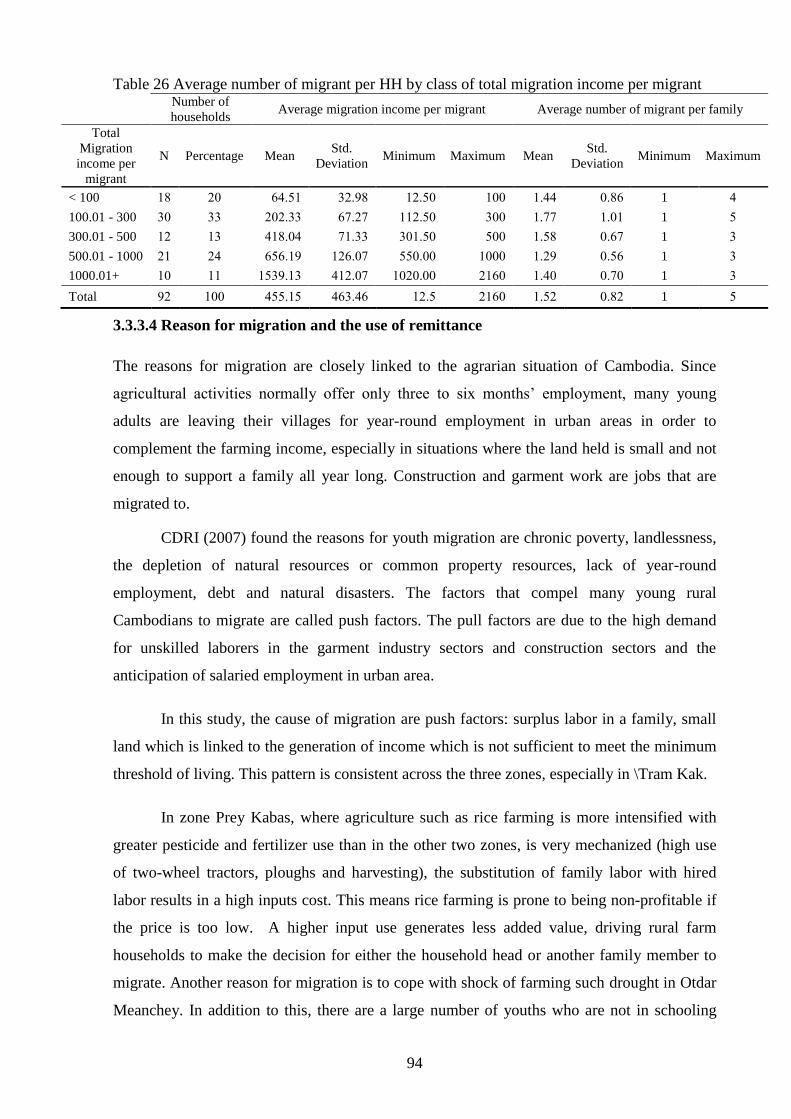
94
Table 26 Average number of migrant per HH by class of total migration income per migrant
Number of
households Average migration income per migrant Average number of migrant per family
Total
Migration
income per
migrant
N Percentage Mean Std.
Deviation Minimum Maximum Mean
Std.
Deviation Minimum Maximum
< 100 18 20 64.51 32.98 12.50 100 1.44 0.86 1 4
100.01 - 300 30 33 202.33 67.27 112.50 300 1.77 1.01 1 5
300.01 - 500 12 13 418.04 71.33 301.50 500 1.58 0.67 1 3
500.01 - 1000 21 24 656.19 126.07 550.00 1000 1.29 0.56 1 3
1000.01+ 10 11 1539.13 412.07 1020.00 2160 1.40 0.70 1 3
Total 92 100 455.15 463.46 12.5 2160 1.52 0.82 1 5
3.3.3.4 Reason for migration and the use of remittance
The reasons for migration are closely linked to the agrarian situation of Cambodia. Since
agricultural activities normally offer only three to six months‟ employment, many young
adults are leaving their villages for year-round employment in urban areas in order to
complement the farming income, especially in situations where the land held is small and not
enough to support a family all year long. Construction and garment work are jobs that are
migrated to.
CDRI (2007) found the reasons for youth migration are chronic poverty, landlessness,
the depletion of natural resources or common property resources, lack of year-round
employment, debt and natural disasters. The factors that compel many young rural
Cambodians to migrate are called push factors. The pull factors are due to the high demand
for unskilled laborers in the garment industry sectors and construction sectors and the
anticipation of salaried employment in urban area.
In this study, the cause of migration are push factors: surplus labor in a family, small
land which is linked to the generation of income which is not sufficient to meet the minimum
threshold of living. This pattern is consistent across the three zones, especially in \Tram Kak.
In zone Prey Kabas, where agriculture such as rice farming is more intensified with
greater pesticide and fertilizer use than in the other two zones, is very mechanized (high use
of two-wheel tractors, ploughs and harvesting), the substitution of family labor with hired
labor results in a high inputs cost. This means rice farming is prone to being non-profitable if
the price is too low. A higher input use generates less added value, driving rural farm
households to make the decision for either the household head or another family member to
migrate. Another reason for migration is to cope with shock of farming such drought in Otdar
Meanchey. In addition to this, there are a large number of youths who are not in schooling
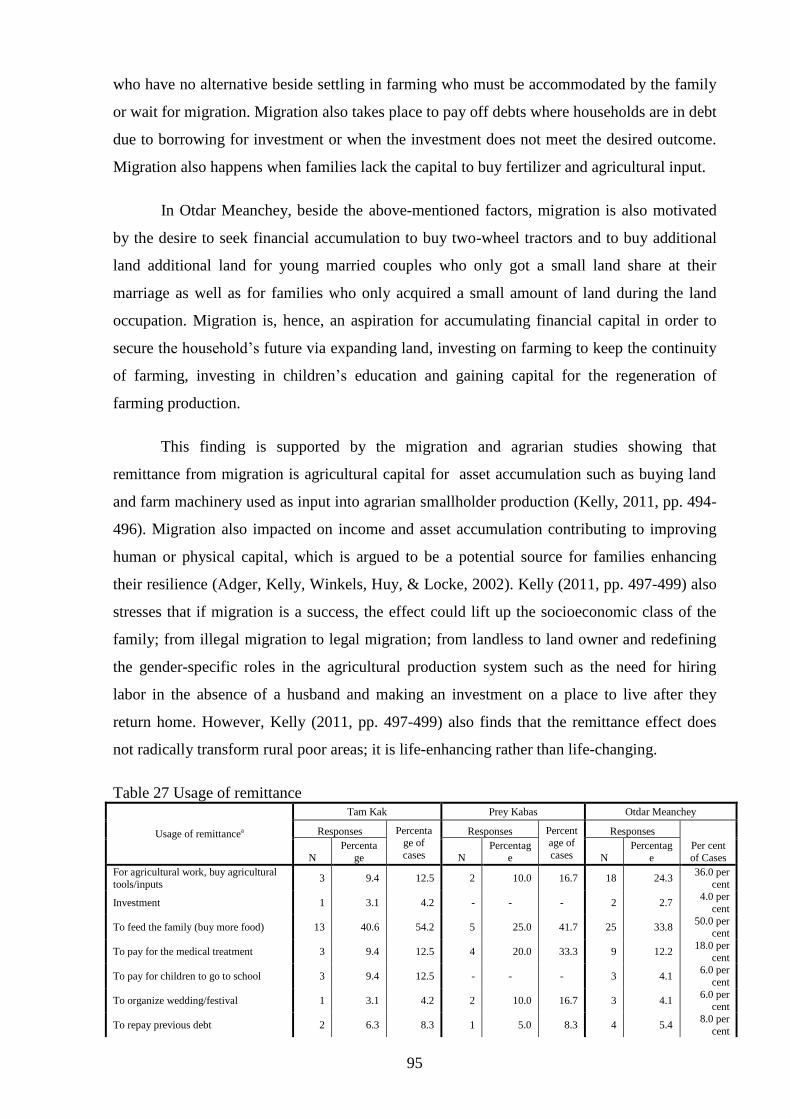
95
who have no alternative beside settling in farming who must be accommodated by the family
or wait for migration. Migration also takes place to pay off debts where households are in debt
due to borrowing for investment or when the investment does not meet the desired outcome.
Migration also happens when families lack the capital to buy fertilizer and agricultural input.
In Otdar Meanchey, beside the above-mentioned factors, migration is also motivated
by the desire to seek financial accumulation to buy two-wheel tractors and to buy additional
land additional land for young married couples who only got a small land share at their
marriage as well as for families who only acquired a small amount of land during the land
occupation. Migration is, hence, an aspiration for accumulating financial capital in order to
secure the household‟s future via expanding land, investing on farming to keep the continuity
of farming, investing in children‟s education and gaining capital for the regeneration of
farming production.
This finding is supported by the migration and agrarian studies showing that
remittance from migration is agricultural capital for asset accumulation such as buying land
and farm machinery used as input into agrarian smallholder production (Kelly, 2011, pp. 494-
496). Migration also impacted on income and asset accumulation contributing to improving
human or physical capital, which is argued to be a potential source for families enhancing
their resilience (Adger, Kelly, Winkels, Huy, & Locke, 2002). Kelly (2011, pp. 497-499) also
stresses that if migration is a success, the effect could lift up the socioeconomic class of the
family; from illegal migration to legal migration; from landless to land owner and redefining
the gender-specific roles in the agricultural production system such as the need for hiring
labor in the absence of a husband and making an investment on a place to live after they
return home. However, Kelly (2011, pp. 497-499) also finds that the remittance effect does
not radically transform rural poor areas; it is life-enhancing rather than life-changing.
Table 27 Usage of remittance
Usage of remittancea
Tam Kak Prey Kabas Otdar Meanchey
Responses Percentage of
cases
Responses Percentage of
cases
Responses
Per cent
of Cases N
Percenta
ge N
Percentag
e N
Percentag
e
For agricultural work, buy agricultural
tools/inputs 3 9.4 12.5 2 10.0 16.7 18 24.3
36.0 per
cent
Investment 1 3.1 4.2 - - - 2 2.7 4.0 per
cent
To feed the family (buy more food) 13 40.6 54.2 5 25.0 41.7 25 33.8 50.0 per
cent
To pay for the medical treatment 3 9.4 12.5 4 20.0 33.3 9 12.2 18.0 per
cent
To pay for children to go to school 3 9.4 12.5 - - - 3 4.1 6.0 per
cent
To organize wedding/festival 1 3.1 4.2 2 10.0 16.7 3 4.1 6.0 per
cent
To repay previous debt 2 6.3 8.3 1 5.0 8.3 4 5.4 8.0 per
cent

96
House building 2 6.3 8.3 2 10.0 16.7 7 9.5 14.0 per
cent
To cope with crop failure 1 3.1 4.2 1 5.0 8.3 1 1.4 2.0 per
cent
For help child to start agricultural work - - - 1 5.0 8.3 2 2.7 4.0 per
cent
For buying land 1 3.1 4.2 1 5.0 8.3 - - -
For buying motorbike 2 6.3 8.3 1 5.0 8.3 - - -
Total 32 100.0 133.3 20 100.0 166.7 74 100.0 148.0 per
cent
Case summary
N 24 24.7 12 11.8 50 27.2
Missing 73 75.3 90 88.2 134 72.8
Total 97 100.0 102 100.0 184 100.0
a. Dichotomy group tabulated at value 1.
Table 27 shows the usage of remittance by the household surveyed. The results show
that those who responded to the question mainly used remittance for buying food to feed
family, which accounts for 54.2 per cent of the total response. The rest is for investment in
farming, medical treatment and children‟s schooling, which account for 12.5 per cent equally.
Prey Kabas shares the same pattern of using remittance for buying food, which accounts for
about 41 per cent of total responses. Using remittance for medical treatment was 33.3 per cent
of the total response. In Otdar Meanchey, remittance is mainly used for operating agricultural
activities (24.3 per cent), for buying food to feed the family (33.8 per cent) and for medical
treatment (12.2 per cent).
Case 0083: This is the case of remittance usage of a household in Otdar
Meanchey. Mr. Do (invented name), 58 years old man, his wife is 54 years
old. They live in Cheur Slab village in the Kok Kpos commune of the Otdar
Meanchey province. They shared their story of how they used migration to
buy land. This family seems better off. He was a primary school teacher in
1979. However, since the livelihood was not improving, he left his job and
focused solely on farming. Because he is an old resident of the village, his
first land occupation is 10 hectares, which was expanded later. He has five
children. Three of them have married, settled in farming and live
independently. They received three hectares of land per couple. Now he
retains six hectares of rice land and 0.8 hectares of Cham Kar land. He still
has two more children. One is a single male (24 years old) who did not
attend school who is currently working with him and helping him take care
of the cattle. The youngest son is 20 years old. He did not attend school and
just got married to a 24 years old girl. The land was not shared with them.
Therefore, this young couple migrated to Thailand in order to earn money to
buy agricultural land. The migration to Thailand cost 3,000 bath (90USD).
The remittance sent home varied between 4,000 bath to 5,000 bath (120 to
150 USD), to a total of 20,000 to 30,000 bath (approximately 600 to 900
USD). This money has been used to buy three plots of rice land of size 30

97
metres by 60 metres. The land has already been cleared. In addition to the
land, the remittance has been used to a build house and a latrine for the
young couple. Now the couple return home and work on this land. He said
that farming is a good option for his children because he did not attend
school so he has no alternative beside farming. To settle in farming, the
young couple was supported by their parents in everything, including the
cost of migration, seeds, money, agricultural equipment, advice, labor and a
house for living.
3.3.4 View on non-farm activities
The survey asked respondents to share their general opinion on the possibility of finding non-
farm activities. The survey shows that the three study areas share almost the same response,
with more than 70 per cent of respondents reporting that it is not easy to seek an alternative to
farming. 23 per cent state that it is easy while the remaining 6 per cent have no idea
concerning the question (Figure 22). The main reason to support their view was explained in
the qualitative interview, where because they were farmers in a rural area, they have low
education and therefore no alternatives beside farming. Non-farm activities in the urban city
require a social network and high completion. In addition to this, some migration work such
as construction work, garment work and urban services such as being a security guard for a
private company receive a very low income and thus they can only save very little money.
Figure 22 View on access to non-farm activities
Some youths who had migrated to work on non-farm activities reported that the jobs
were hard they only earned a low income. This motivated them to come back and return to
farming. Although household members who have migration experience also shared the
opinion that non-farm job opportunities are not easily accessible and demand knowledge, skill
and a social network in the city. However, those who said that seeking non-farm jobs was
easy had a social network with their migration experience, for example they had a relative in
71
26
3
67
29
4
73
17 9
71
23
6
01020304050607080
No Yes No idea No Yes No idea No Yes No idea No Yes No idea
Tam Kak Prey Kabas Otdar Meanchey Total
Per
cen
tage
Do you think that now it is easy to find job beside agriculture?
View on access to non-farm activities

98
the city or another family member who was also on migration and, hence, this migrant is a
network or a footprint for facilitating the new family member who had dropped out from
school.
The below quotations are impression from interviewees in the three study areas on the
non-farm activities and farming:
Being a farmer in rural area, we have no knowledge and skill. Therefore,
we don‟t know what else besides farming that we can do. If we rely on
the off-farm activities which are available in the village or local area, we
would starve because it is not it is not enough to support living.
- Said 42 year old woman in the Kantouy Choun village, Beng
commune Otdar Meanchey province.
I have a friend who dropped out and migrated to Phnom Penh. I think
that it will be easy for me if I decide to migrate to Phnom Penh too. I can
just call him and I will share accommodation with him. He said he will
help me finding a job there.
- Said 19 years old boy in Chrey Thnaot village, Tram Kak commune,
Takeo province.”
A 24 year old girl who retired from garment work and got married last
year settled with her husband farming in the Deurm Po village, Prey
Kabas commune shared her migration experience with garment work.
After she married a guy in her village, she started working on her
grandparents‟ farm. They are getting old and will hand over their farm to
the new couple. She said: “I started working when I was 18 years old
until 24 years old in the garment industry in Phnom Penh but I could only
save 300 USD. This money was just enough to buy jewellery for my
wedding day. I think that if I was working in garment work, I would save
almost nothing. I am better to start a farm with my husband. Perhaps I
can save more because this year we can save 100 USD from farming.
The case study of youth who took part in a young agricultural entrepreneur project
(YAE) project reveal that except for the youths who had freshly graduated and were taking
part in the project, the rest of them had migrated to work to cities such as in Phnom Penh.
99
They share similar reason why they had decided to join the YAE project. That is because the
work available when migrating, such as as private security at a private company, garment
work and other low skill or labor-based job, is very hard work and that pays very little
income. Upon hearing the announcement of the CEDAC recruiting young people to start
farming, the youths decided to return home and starting a farm project with CEDA training
program.
Hard work, low income earning, being far away from home and family and having no
migration experience as well as a demand for knowledge and skill, high competition and
requiring a social network are the main reasons that many rural households had the
impression that it is not that easy to find an alternative to farming activities. Although some
non-farm work such as garment work provides a low income, garment work plays an
important role in helping families by providing temporary work for generating financial
capital to help support the farming, especially when there is a crop failure or the degradation
of farming activities, for example income lost from rice-farming and pig-raising.
A 35 year old man in the Tram Kak district experience lost income from
pig-raising and his rice cultivation is for just home consumption. This
year, he has to look after his four children and his wife must migrate for
garment factory work in Phnom Penh in order to earn 100 USD per
month.
3.3.5 Concluding remarks
The development of non-farm activities, particularly self-businesses such as selling groceries
in front of house (usually done by woman), migrating for garment, construction or other work
by the household head or a youth who has dropped out are strategic solutions to the situation
of insufficient income-generation from farming. This pattern is found in the three study areas.
Non-farm work and migration play a very important role in compensating for when
agriculture cannot provide enough to sustain the family. From the observation, households
who abstain from non-farm work tend to own large plots of land. Families with small land
area with no non-farm work are likely going to be living an unsustainable life and family
members are expected to migrate in the future. This also related to children dropping out from
school.
In addition to earning money as complementary to farming income, in Otdar
Meanchey migration to Thailand is common and the main purpose is to accumulate financial
100
capital in order to buy more land, to clear land, to buy a two-wheel tractor and to obtain
capital for farm investment to cope with crop failures such as drought. Migration in Tram Kak
and Prey Kabas is a coping strategy to support the family as complementary income source
farming activities when the land is small and especially for young couples who receive little
or no land at marriage integrating themselves into migration and non-farm activities.
Migration is also a complementary income source when there is a failure in farming.
Non-farm activities developed by the family are mainly working as a shopkeeper,
tailor, hairdresser/cutter, running a small-scale rice mill for home use and for servicing the
neighboring farms. Small scale rice mills are often linked to pig and poultry-raising.
Construction works is mainly done by the household head while migration work such as
garment work is mainly for young people. Garment work is also easy accessible for rural
youths with few skills. There is a development of local non-farm activities based on
knowledge and skill from migration work such as tailor are the skill learning from migration
to garment industry but this activity earns very little in rural area.
The migration study of (CDRI, 2007) found that migration has a significant impact on
poverty reduction. This study shares a similar conclusion that non-farm activities and
remittance from migration do have an impact on poverty reduction and sustaining the rural
livelihood. In some cases, remittance support a family all year round and contribute to
investing in children‟s education and land expansion and buying two-wheel tractor to enhance
farm production and agricultural transport.
The nature of non-farm and migration determine the quality of earning and remittance
sent home. The main sources of non-farm income are migration and self-business. However,
local non-farm activities contribute 70 per cent of total non-farm income, suggesting that the
role of local non-farm activities developed by rural households is important. Although
agricultural wage labor contributes a large percentage in the three areas, the numbers of day
of work available to rural households is on average 10 days, which contributes little to the
average total non-farm income. The view of respondents on the availability of non-farm
activities is confirmed by the small number of salaried jobs available and the percentage to
total non-farm income in both Tram Kak and Prey Kabas, except in Otdar Meanchey where
the survey found households who had a family member with salaried employment,
particularly as civil servants. The average contribution of labor-based work such as garment
and construction work to total income is low compared to other activities, it plays an
important role to rural households who have a small amount of. Those who migrate work to
help lower the burden of farming by accommodating surplus youth on one hand while on the
101
other hand the remittance from migration helps to enhance the home farming income through
providing the capital to investment to ensure the continuity of rural farm household.

102
3.4 Description of agricultural activities
3.4.1 Biophysical environment in Otdar Meanchey and Takeo province
There is no temperature data in both provinces of Otdar Meanchey and Takeo, this research
assumes that Otdar Meanchey shares a similar climate pattern with Banteay Meanchey, a
nearby province, and Takeo shares a similar temperature with the Svay Rieng province, a
nearby province. The average monthly temperature in the Banteay Meanchey province is
obtained over the three-year period of 2013 to 2015 while in Svay Rieng province, it is
obtained over a 30-year period from 1985 to 2015.
Figure 23 Climate in Takeo province Figure 24 Climate Otdar Meanchey province
Source: Ministry of Water Resources and Meteorology, Cambodia (2012)
In 2012, the total rainfall in Otdar Meanchey was approximately 1,169.9 mm with an
average monthly rainfall of 94 mm. The total rainy days in that year was is 99 days. In Takeo,
the total rainfall in 2012 was 1345.3 mm with an average monthly rainfall of 94mm. The total
annual rainy day in Takeo was 111 days.
According the soil classification of open development of Cambodia, tell the area of
soil type in the studied area and its fertility. Prey Kabas has the highest percentage of Alluvial
Lithosols (89 per cent) and Cultural hydromorphics soil (11 per cent). Both soil types are
categorized as medium fertility, while in Tram Kak red-yellow podzols (54 per cent) and Acid
Lithosols (10 per cent) are predominant. The soil in this area is categorized as low fertility
soil. Cultural hydromorphics (24 per cent) and Alluvial Lithosols (12 per cent) are considered
as medium fertility. Thank to this, Tram Kak consists of a majority of low fertility soil (54 per
cent), which is not the case of Prey Kabas. Unlike Takeo province, Otdar Meanchey is
predominant covered by low fertility soil, which accounts for 81 per cent, medium fertility
soil accounts for 17 per cent and high fertility soil only 2 per cent. According to the
25.9
27.1 27.55
29.95 29.8
29.1
27.2
28.2 28.3 28.25
27.1
25.25
4.0
19.5
34.7
7.6
12.6 12.5 10.7
11.7
14.3 12.0
9.1
3.5 3 1
3 4
12 12 13 12
21
15
12
3
22
23
24
25
26
27
28
29
30
31
0.0
5.0
10.0
15.0
20.0
25.0
30.0
35.0
40.0
Jan Feb Mar April May June July Aug Sept Oct Nov Dec
Month
Climate Takeo Province
Average Temperature(°C) Average Rainfall (mm) Rain days
25.5 27.7
29.9 30.6 31.5 31.0 29.9 29.8 29.4 28.0
28.1 26.9
0.0
12.2
0.0
7.8
12.6 12.4
10.1
7.9
13.5 17.5
0.0 0.0 0 1
0
5
11
16
11
23
18
14
0 0 0.0
5.0
10.0
15.0
20.0
25.0
30.0
35.0
0.0
5.0
10.0
15.0
20.0
25.0
Jan Feb Mar April May June July Aug Sept Oct Nov Dec
Month
Climate Otdar Meanchey Province
Average Temperature(°C) Average Rainfall (mm) Rain days
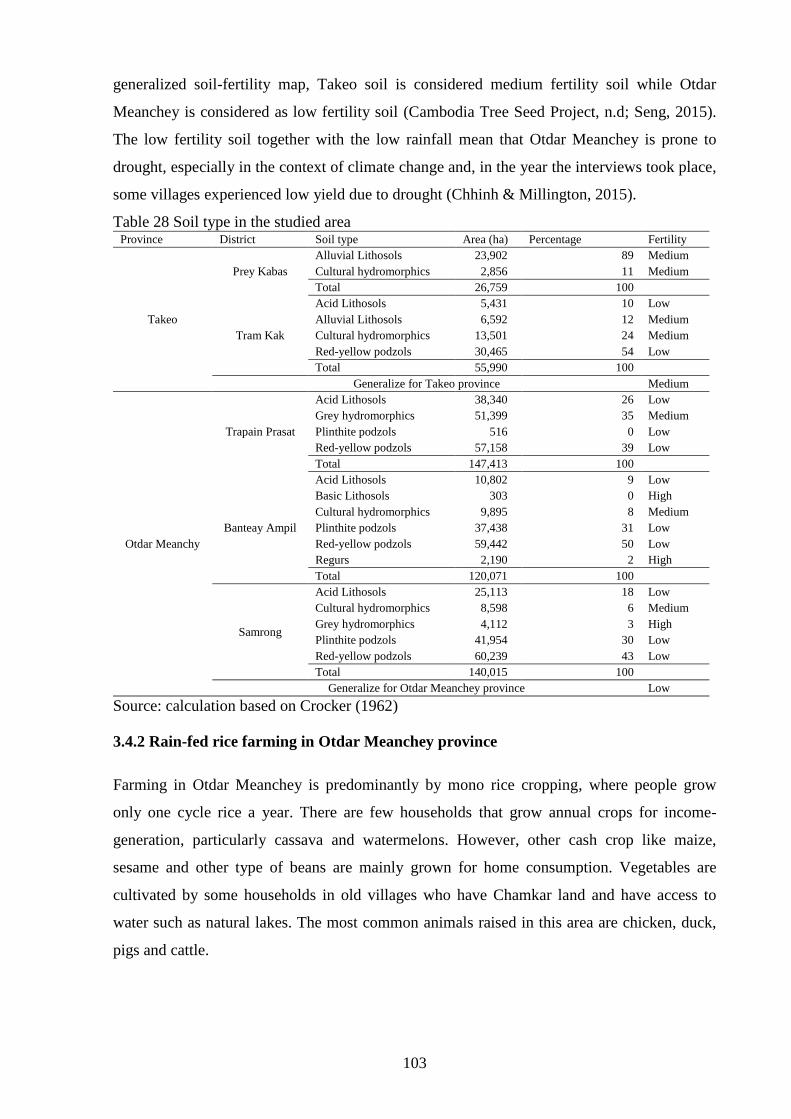
103
generalized soil-fertility map, Takeo soil is considered medium fertility soil while Otdar
Meanchey is considered as low fertility soil (Cambodia Tree Seed Project, n.d; Seng, 2015).
The low fertility soil together with the low rainfall mean that Otdar Meanchey is prone to
drought, especially in the context of climate change and, in the year the interviews took place,
some villages experienced low yield due to drought (Chhinh & Millington, 2015).
Table 28 Soil type in the studied area Province District Soil type Area (ha) Percentage Fertility
Takeo
Prey Kabas
Alluvial Lithosols 23,902 89 Medium
Cultural hydromorphics 2,856 11 Medium
Total 26,759 100
Tram Kak
Acid Lithosols 5,431 10 Low
Alluvial Lithosols 6,592 12 Medium
Cultural hydromorphics 13,501 24 Medium
Red-yellow podzols 30,465 54 Low
Total 55,990 100
Generalize for Takeo province Medium
Otdar Meanchy
Trapain Prasat
Acid Lithosols 38,340 26 Low
Grey hydromorphics 51,399 35 Medium
Plinthite podzols 516 0 Low
Red-yellow podzols 57,158 39 Low
Total 147,413 100
Banteay Ampil
Acid Lithosols 10,802 9 Low
Basic Lithosols 303 0 High
Cultural hydromorphics 9,895 8 Medium
Plinthite podzols 37,438 31 Low
Red-yellow podzols 59,442 50 Low
Regurs 2,190 2 High
Total 120,071 100
Samrong
Acid Lithosols 25,113 18 Low
Cultural hydromorphics 8,598 6 Medium
Grey hydromorphics 4,112 3 High
Plinthite podzols 41,954 30 Low
Red-yellow podzols 60,239 43 Low
Total 140,015 100
Generalize for Otdar Meanchey province Low
Source: calculation based on Crocker (1962)
3.4.2 Rain-fed rice farming in Otdar Meanchey province
Farming in Otdar Meanchey is predominantly by mono rice cropping, where people grow
only one cycle rice a year. There are few households that grow annual crops for income-
generation, particularly cassava and watermelons. However, other cash crop like maize,
sesame and other type of beans are mainly grown for home consumption. Vegetables are
cultivated by some households in old villages who have Chamkar land and have access to
water such as natural lakes. The most common animals raised in this area are chicken, duck,
pigs and cattle.

104
3.4.2.1 Rice cultivation
The main cropping activities in Otdar Meanchey are rice and annual cash crops, particularly
cassava and watermelon. Cassava was just grown in the previous year and this year 2012,
mostly as a means for justifying the land possession during the time of the land titling
campaign (just being launched by Prime Minister Hun Sen on 07 May 2012, Order 01).
Vegetables are mainly grown for home consumption and only a very few families have
particular plots for growing vegetables for the market with access to one natural pond. During
the dry season, the area has limited access to drinking water, especially when the natural lakes
dry out.
Table 29 Cropping calendar in Otdar Meanchey
Month Jan Feb Mar Apr May Jun Jul Aug Sep Oct Nov Dec Remark
Rice
Rainy season rice* Showing
Annual crops
Cassava
Maize
Sesame
Sugar can
Water melon
Ground nut
Soybean
Mungbean
Vegetables
Cucumber
Longbean
Egg plant
Watermelon
Other types of vegetables
(spinach, waterconvolvulus, chili
etc.)
*Note: The green colour indicates planting season, red colour indicates harvest season
Rice is extensively cultivated one time a year. Depending on whether the rain stars in
May or June, the rice is harvested in November or December. People do not transplant rice
like in many other regions in the central plain of Cambodia; rather, they sow rice directly on
the cultivated land. Since the end of the civil war, forest land has gradually been converted
into agricultural land. After the land is cleared, people grow rice without applying fertilizer for
the first or second year. After that, people started to apply fertilizers. In order to get new land,
people use their family labor to clear the forest step by step. Some families said that they still
have forest land or fallow land because the land is not yet clear for rice cultivation. For those
who have enough money but lack labor, they can hire a tractor to clear the land (Hek Dei,

105
local language), which costs 5,500 bath (people here prefer to state the value in the Thai
currency). This amount is equal to about 160 USD per hectare.
People use exchange labour in two main activities: harvesting and threshing rice. The
host family has to host lunch and pay back this amount of work accordingly. Therefore, their
chickens or ducks are rarely raised for the purpose of selling but for making food to host
exchange labourers during the peak labour period. Labour exchange is found to be common in
Otdar Meanchey in the three districts of the study area. However, in new areas such as in
Trapaing Prasat district, where a new settlement just started in 2008–2012, labour exchange is
also found in planting the annual crops. This give me the impression that labour exchange is
part of the culture of the people in Otdar Meanchey and also a coping strategy for starting the
farm works in cases where farm inputs such as capital and labour are lacking.
“It is difficult to hire labour to help farming in my village during the peak period
because everyone is busy with their farm work; therefore, we can only exchange
labour as it will be of mutual benefit.
- Ou Tong village chief.”
The proximity to rice field is on average about five kilometres from home. The
geographical and agro-ecological condition, i.e. the newly cleared land, require a two-wheel
tractor to transport the workforce and farming equipment. Additionally, a two-wheel tractor is
also meant for transport such as going to the market (collectively) to buy weekly food and to
transport agricultural products from the production area to home. Often, wood remains in the
newly cleared rice field which require “slashing and burning.” This requires a two-wheel
tractor to plough quickly to catch up with the rainfall. During my field study during the rice
cultivation season, I rarely saw people using a cow to plough the rice field but two-wheel
tractor instead.
The survey shows that among the 184 households interviewed in Otdar Meanchey, 13
per cent of households did not apply fertilizer in the interview year (2012). The cross-tab table
show the relationship between the application of fertilizer according to the village. It can be
seen that that the newly created villages like Sambour Meas, which have forest land not yet
cleared, tend to apply less fertilizer. Table 30 below shows the number of families that did not
apply fertilizer:
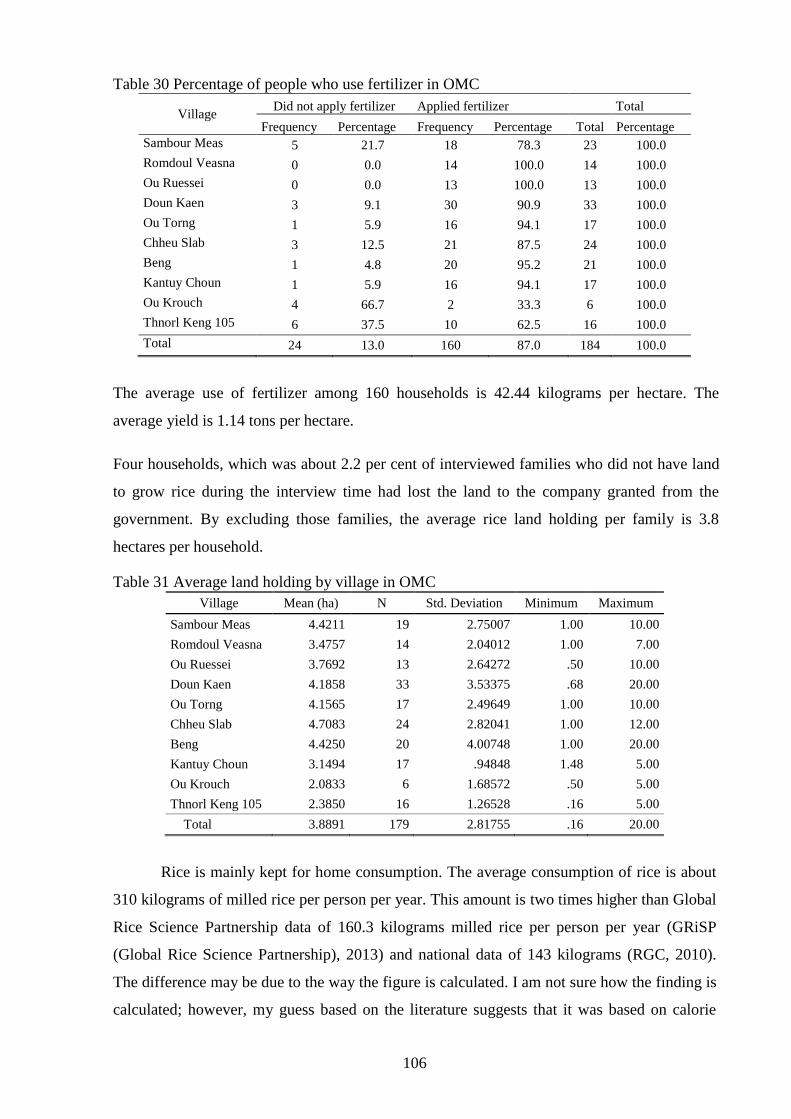
106
Table 30 Percentage of people who use fertilizer in OMC
Village Did not apply fertilizer Applied fertilizer Total
Frequency Percentage Frequency Percentage Total Percentage
Sambour Meas 5 21.7 18 78.3 23 100.0
Romdoul Veasna 0 0.0 14 100.0 14 100.0
Ou Ruessei 0 0.0 13 100.0 13 100.0
Doun Kaen 3 9.1 30 90.9 33 100.0
Ou Torng 1 5.9 16 94.1 17 100.0
Chheu Slab 3 12.5 21 87.5 24 100.0
Beng 1 4.8 20 95.2 21 100.0
Kantuy Choun 1 5.9 16 94.1 17 100.0
Ou Krouch 4 66.7 2 33.3 6 100.0
Thnorl Keng 105 6 37.5 10 62.5 16 100.0
Total 24 13.0 160 87.0 184 100.0
The average use of fertilizer among 160 households is 42.44 kilograms per hectare. The
average yield is 1.14 tons per hectare.
Four households, which was about 2.2 per cent of interviewed families who did not have land
to grow rice during the interview time had lost the land to the company granted from the
government. By excluding those families, the average rice land holding per family is 3.8
hectares per household.
Table 31 Average land holding by village in OMC
Village Mean (ha) N Std. Deviation Minimum Maximum
Sambour Meas 4.4211 19 2.75007 1.00 10.00
Romdoul Veasna 3.4757 14 2.04012 1.00 7.00
Ou Ruessei 3.7692 13 2.64272 .50 10.00
Doun Kaen 4.1858 33 3.53375 .68 20.00
Ou Torng 4.1565 17 2.49649 1.00 10.00
Chheu Slab 4.7083 24 2.82041 1.00 12.00
Beng 4.4250 20 4.00748 1.00 20.00
Kantuy Choun 3.1494 17 .94848 1.48 5.00
Ou Krouch 2.0833 6 1.68572 .50 5.00
Thnorl Keng 105 2.3850 16 1.26528 .16 5.00
Total 3.8891 179 2.81755 .16 20.00
Rice is mainly kept for home consumption. The average consumption of rice is about
310 kilograms of milled rice per person per year. This amount is two times higher than Global
Rice Science Partnership data of 160.3 kilograms milled rice per person per year (GRiSP
(Global Rice Science Partnership), 2013) and national data of 143 kilograms (RGC, 2010).
The difference may be due to the way the figure is calculated. I am not sure how the finding is
calculated; however, my guess based on the literature suggests that it was based on calorie
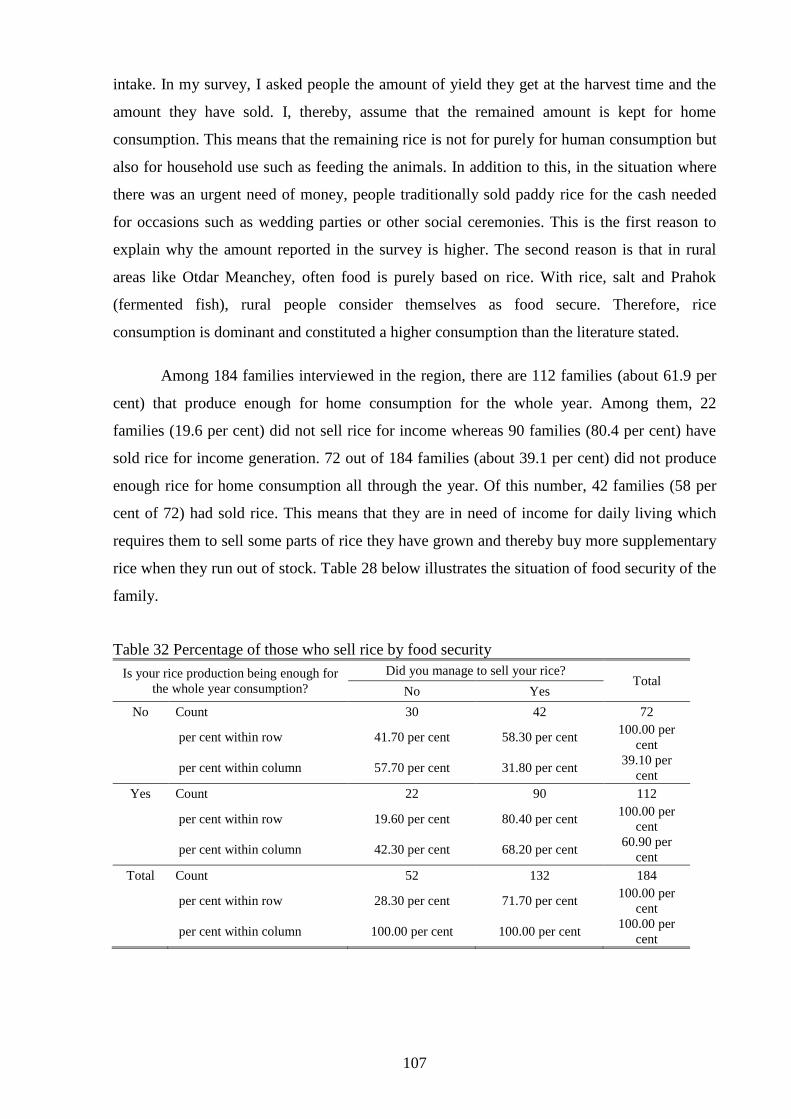
107
intake. In my survey, I asked people the amount of yield they get at the harvest time and the
amount they have sold. I, thereby, assume that the remained amount is kept for home
consumption. This means that the remaining rice is not for purely for human consumption but
also for household use such as feeding the animals. In addition to this, in the situation where
there was an urgent need of money, people traditionally sold paddy rice for the cash needed
for occasions such as wedding parties or other social ceremonies. This is the first reason to
explain why the amount reported in the survey is higher. The second reason is that in rural
areas like Otdar Meanchey, often food is purely based on rice. With rice, salt and Prahok
(fermented fish), rural people consider themselves as food secure. Therefore, rice
consumption is dominant and constituted a higher consumption than the literature stated.
Among 184 families interviewed in the region, there are 112 families (about 61.9 per
cent) that produce enough for home consumption for the whole year. Among them, 22
families (19.6 per cent) did not sell rice for income whereas 90 families (80.4 per cent) have
sold rice for income generation. 72 out of 184 families (about 39.1 per cent) did not produce
enough rice for home consumption all through the year. Of this number, 42 families (58 per
cent of 72) had sold rice. This means that they are in need of income for daily living which
requires them to sell some parts of rice they have grown and thereby buy more supplementary
rice when they run out of stock. Table 28 below illustrates the situation of food security of the
family.
Table 32 Percentage of those who sell rice by food security
Is your rice production being enough for
the whole year consumption?
Did you manage to sell your rice? Total
No Yes
No Count 30 42 72
per cent within row 41.70 per cent 58.30 per cent 100.00 per
cent
per cent within column 57.70 per cent 31.80 per cent 39.10 per
cent
Yes Count 22 90 112
per cent within row 19.60 per cent 80.40 per cent 100.00 per
cent
per cent within column 42.30 per cent 68.20 per cent 60.90 per
cent
Total Count 52 132 184
per cent within row 28.30 per cent 71.70 per cent 100.00 per
cent
per cent within column 100.00 per cent 100.00 per cent 100.00 per
cent

108
Of the 72 families that did not have enough rice for consumption through the year,
there are 67 families (93 per cent of 72) that bought rice and another five families (7 per cent)
had borrowed paddy rice from their neighbors.
With a paddy to rice conversion ratio of 64 per cent (RGC, 2010), the conversion of
milled rice that people bought more to paddy rice tells us that the average milled rice that
people bought is 213 kilograms per family per year, which is equal to 333.41 kilograms per
family per year. The average duration of lacking rice is about 94.2 days per year, ranging
from a minimum of 10 days up to a maximum of 240 days (Table 29).
Table 33 Duration of lacking rice
N Minimum Maximum Mean Std. Deviation
Days without rice 70 10 240 94.20 55.47
Average paddy rice bought in kg 70 46.88 843.75 333.41 217.63
Average milled rice bought in kg 70 30 540 213.38 139.28
3.4.2.2 Annual crops
The typical annual crops in this area are maize (13 families) and cassava (21 families). Other
crops grown are sesame (one family), sugarcane (two families) bean (groundnut four families,
soybeans (two families), mung beans (two families), another type of bean (one family) and
watermelon (12 families). Maize is mainly grown for home consumption but cassava mainly
for income-generation purpose. Cassava is mainly grown in April or May and harvested in
December or January (for other crops, please see the cropping calendar in Table 29).
There is a limited market in the area for cassava; however, in the interview year there
was a growing tendency for growing cassava due to two main reasons. First, there is rapid
growth in the other provinces which makes people believe that there will be good market for
cassava locally, especially as there is a middle trader who is building a warehouse for
stocking cassava in the city centre. Second, growing cassava is a means for justifying land
holdings. As mentioned in the context of the study area, these actions are in response to the
land titling campaign launched by the government. Table 30 shows the frequency of those
who grow cassava in the previous year and those who grew it in the study year. Among the
184 households interviewed, 77 per cent of households did not grow cassava, 11 per cent have
cultivated in previous years and 11 per cent have just grown this year. This also implies that
majority of households do not have the land for growing annual crop or that most of the land
is suitable for rice cultivation.

109
Table 34 Number of people growing cassava in OMC
Do you grow cassava? Frequency Percentage
No, do not grow cassava 142 77.2
Yes 21 11.4
Yes, just this year 21 11.4
Total 184 100
There are 13 families (7.1 per cent) out of 184 family that maize, out of which five
families (2.7 per cent of the total family) have sold some part of the maize and used the rest
for home consumption. The average yield is 1.423 ton per hectare, ranging from 0.31 tons per
hectare to 3.75 tons per hectare. Maize produces a gross value of 403 USD per hectare and
value added of 366 USD per hectare. This give an average land productivity of 403 USD per
hectare and labour productivities of USD5.6 per person per day. Because growing on small
plot of land and not intended for commercialization, people tend not to use any other input.
This gives a high value for the income rate but the local market is not well developed for
maize production.
3.4.3.3 Vegetables
Vegetables that are grown in the study area are cucumbers, long bean, eggplants and other
types of vegetables including spinach, water convolvulus and peppers.
Vegetable are mainly grown in old villages such as Chheu Slab, Ou Ruessei and Beng,
where some families have access land that is suitable for growing vegetables that close to a
natural lake. They are grown to sell locally in the market. NGOs see the potential to develop
vegetable cultivation in the area but efforts for people to grow vegetables meets two main
challenges. First, people do not have access to water. Second, a majority of them
(approximately 50 per cent according to the key informant interviews) are illiterate, which
makes it difficult for them to learn new techniques from NGOs.
One key informant who specializes in vegetable growing in Ou Ruessei tells the story
of vegetable growing in the village as well as in the city of Otdar Meanchey. Mrs. Kolab
(invented name), a 57 years old woman originally from the Takeo province who settled in the
village after liberation from the Pol Pot regime in 1979. In 1979, her family migrated from the
Battambang province and headed west in order to move to the refugee camp in Thailand but,
in that year, they faced a serious drought and had no water for consumption. Many people
who migrated were temporarily stationed in the Ou Ruessei village as the village has a natural
110
lake where there is water all year long. Meanwhile, Vietnamese troops were stationed in the
city centre of Samrong City, which is very close to the Ou Ruessei village. In order to feed the
troops, the Vietnamese army started growing vegetables. However, they could not grow
enough to meet their needs so they asked local villagers in Ou Ruessei the help them grow
vegetables in exchange for milled rice to complement what they produced themselves. The
case study reported that she learned how to grow vegetables from the Vietnamese troops.
Since then, people in the village have been growing vegetables and this village grows
vegetables to supply to the local market.
Among the nine families who grow long bean, they use on average 0.12 hectares,
ranging from 0.01 to 0.25 hectares per family. One family has a profit loss while the rest of
the generate income. The maximum value added from long beans is 147 USD per household,
with two families earning about 70 USD per house and the other three earning less than 30
USD. Although long beans have a high economic profit of 1450 USD per hectare and an
average net-income rate of 4.7, but long beans contribute an average gross value of only 80
US per household, ranging from 19 USD to 200 USD per household which gives an average
value added of 58.5 USD per household.
Among the five families that grow eggplant, only one family can grow eggplant with a
high profit and get a high income on 0.5 hectares of land, whereas the other four families
grow on a small plot of land (0.03 hectares) and mainly not for a commercial purpose. Those
four households did not expense on input in growing eggplants and therefore, no profit rate is
calculated compare to inputs cost. So, the net-income rate is from the one family who grow
eggplants for commercial purposes, who had a high profit rate of 37. The average gross value
per hectare is 1,919 USD, with a maximum value of 3,500 USD per hectare. The average
value added per hectare is 1885 while the average profit is 1,772 USD per hectare. Again, in
term of households, 10.3 per cent (19 out of 184 families) grow cucumbers on an average land
size of 0.11 hectares, ranging from a minimum 0.03 to a maximum 0. hectares. There are only
two families growing cucumber for income, with a high value added from 350 USD to 1,500
USD. The remaining families just grow cucumbers for home consumption that gives a value
added from 3 to 45 USD per household. This gives an average gross value of cucumbers of
1,327 USD per hectare and value added 1,103 USD per hectare with an income rate of 8.7.
However, in terms of value added per household, people can generate only 120 USD of gross
value and 106 USD of value added. This means that on the average land size of 0.11 hectares,
people can generate value added only 106 USD per family per year from cucumber
production.
111
One family grow watermelon on 0.01 hectares that has a high yield of 100 tons per
hectare and a gross value of 5,000 USD per hectare with value added of 3,080 USD per
hectare. With the price that people sell and earn at the local market, this give land
productivities of 30,800 USD per hectare. However, in term of labor productivities
watermelon generates only 2 USD per person per day, which is lower than any other type in
the vegetable category. At the household level, watermelons generate only 50 USD gross
value and value added 30 USD and profit about 28 USD.
For other type of vegetables, the calculation based on 25 families shows that only 18
families generate income from other types of vegetables and the other seven families just use
their home garden for home consumption. If we compare among the total 184 families, we
can see that only 14 per cent of families grow vegetable and 4 per cent (seven families) did
not generate income, 7 per cent (12 families) earn less than 100 USD per house, 2 per cent (4
families) earn less than 200 USD per year and 1 per cent (2 families) earn from 300 USD to
500 USD per household. This means that other type of vegetables can generate income for a
few families who is specialize in vegetable-growing who have land and water for vegetable
growing. This means vegetable growing is not well-developed in the area. That is why some
NGOs see the potential to promote vegetable-growing in the area. Table 31 belows show the
income classification of other type of vegetables, the number and percentage of families
growing vegetables and the mean value of income generation from this type of production.
3.4.2.4 Regrouping annual crops and vegetables in Otdar Meanchey
Based on the result of land and labor productivities, I group annual crops and vegetables into
two main group to simplify the category of crops: annual crop (AC) and vegetable (VG). AC
comprises maize, cassava, beans, cucumbers and sesame. VG comprises watermelon, long
bean, eggplant, vegetables, watermelon and sugarcane. The table below is a summary table
which combines several tables into a single one in order to make it easier to visualize the data.
However, by doing this, I have excluded the minimum, maximum and standard deviation.
These can be found in Appendix 1.
After regrouping, the average annual crop land of 0.27 hectares per family gives a
gross value of 189.48 USD and value added of 165.86 USD. Standard deviation is higher than
mean value. This mean that there is very high variation of value among households. This
implies that the quality of production is different than the cropping system cultivated by
households. This is the same in the case of vegetables.
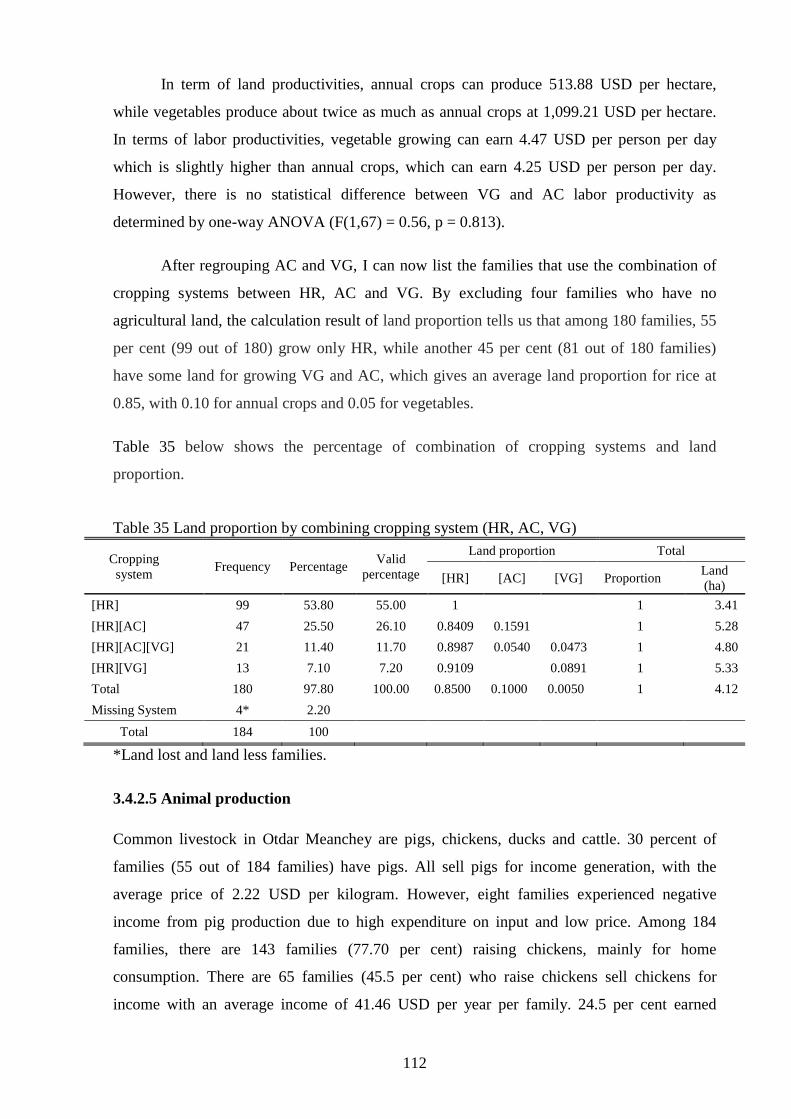
112
In term of land productivities, annual crops can produce 513.88 USD per hectare,
while vegetables produce about twice as much as annual crops at 1,099.21 USD per hectare.
In terms of labor productivities, vegetable growing can earn 4.47 USD per person per day
which is slightly higher than annual crops, which can earn 4.25 USD per person per day.
However, there is no statistical difference between VG and AC labor productivity as
determined by one-way ANOVA (F(1,67) = 0.56, p = 0.813).
After regrouping AC and VG, I can now list the families that use the combination of
cropping systems between HR, AC and VG. By excluding four families who have no
agricultural land, the calculation result of land proportion tells us that among 180 families, 55
per cent (99 out of 180) grow only HR, while another 45 per cent (81 out of 180 families)
have some land for growing VG and AC, which gives an average land proportion for rice at
0.85, with 0.10 for annual crops and 0.05 for vegetables.
Table 35 below shows the percentage of combination of cropping systems and land
proportion.
Table 35 Land proportion by combining cropping system (HR, AC, VG)
Cropping
system Frequency Percentage
Valid
percentage
Land proportion Total
[HR] [AC] [VG] Proportion Land
(ha)
[HR] 99 53.80 55.00 1
1 3.41
[HR][AC] 47 25.50 26.10 0.8409 0.1591
1 5.28
[HR][AC][VG] 21 11.40 11.70 0.8987 0.0540 0.0473 1 4.80
[HR][VG] 13 7.10 7.20 0.9109
0.0891 1 5.33
Total 180 97.80 100.00 0.8500 0.1000 0.0050 1 4.12
Missing System 4* 2.20
Total 184 100
*Land lost and land less families.
3.4.2.5 Animal production
Common livestock in Otdar Meanchey are pigs, chickens, ducks and cattle. 30 percent of
families (55 out of 184 families) have pigs. All sell pigs for income generation, with the
average price of 2.22 USD per kilogram. However, eight families experienced negative
income from pig production due to high expenditure on input and low price. Among 184
families, there are 143 families (77.70 per cent) raising chickens, mainly for home
consumption. There are 65 families (45.5 per cent) who raise chickens sell chickens for
income with an average income of 41.46 USD per year per family. 24.5 per cent earned

113
income of less than 30 USD per year with an average income of 15.26 USD per year per
family.
33.2 per cent of families (61 of 184) raise ducks, of which 52.5 per cent (32 of 61)
families had sell ducks for income. Five families raise fish from 150 to 800 head. All of them
generate income from selling fish, earning from 50 to 600 USD per year. For further
economic details of each animal, see appendix 1.
The impression from the interview suggests that the reason that families did not sell
chickens is because they mainly keep, them for consumption especially during the peak
labour demand. During this period, people mostly exchange labour. The host will need to host
the lunch or dinner, therefore, chicken or duck are mainly raised to serve this purpose.
The qualitative interview with one development NGO suggested there is the potential
to raise income from growing vegetables and raising poultry but the challenge is the low
education of the family who struggle to lean the better techniques taught by development
NGO.
70 of 184 families surveyed (38 per cent) raise cattle. Among those who have cattle,
36 families had sold cattle in the year interviewed, which is about 51 per cent of total families
who raise cattle, from which five families of them have sold their last cattle so they have no
more remaining cattle stock.
Each family who raises cattle has an average 3.2 heads per family and they sell on
average 1.94 heads per family. The qualitative interviews showed that people sold cattle every
one, two or three years, depending on the need of the family. According to the survey, the
price varies according to the age and quality of cow, ranging from 125 USD per head for a
small cow to 1,000 USD per head for a very good one. However, people reported that the
average price for an adult cow is 500 USD per head, while the survey reported an average
value of 324 USD per head. Using a value of 500 USD per head, the cattle stock value per
family is calculated to determine the household asset. I assume that people sell cattle every
three years for the purpose of calculating the economic value of the labor productivity of
cattle in order to avoid being misleading. The input cost is calculated on a three-year basis and
the input cost calculated per head for the duration of three years. This will be used to multiply
the number of cattle sold in the interview year. This cost deducted from the gross value in
order to see the value added. The given value added is, therefore, used to compute the labor
productivity.
114
3.4.2.6 Common resource (CR)
The area is characterized as new area, given that a lot of the agricultural land has just been
recently cleared from forest. In addition to this, there are several forest communities
surrounding the village that people can access to collect forest product. Therefore, firewood,
charcoal, wild vegetables, wild mushroom and wild fruit are available in the study area. That
is why two-wheel tractors are very important for the people in this area, because the rice fields
are a long distance from home and people need a two-wheel tractor to transport agricultural
products as well as to plough the new land, which often still has wood remaining wood from
recently felled trees. This land cannot be ploughed with cows. Two-wheel tractors have been
used to transport firewood from rice fields to home to make charcoal. The rapid expansion of
agricultural land has led people to believe that the common resources in the area are in
dramatic decline. People collect common resources mainly for home consumption. However,
some non-timber forest products (NTFPs) can be collected for income generation such as wild
potatoes, wild mushroom, fish and frogs.
Fish are harvested from common pools for home consumption. Traditionally, people
mainly keep fish for making prohok (fermented fish). People share view that as long as they
have prohok and rice, they feel secure all year long, because they can find vegetables in the
forest or in their home garden to consume with prohok and rice. That is why rice is very
meaningful to family; it is not just an economic output per hectare but food security. People
believe that the cost of buying rice from the others is higher than if they cultivate their own
rice.
93 of 184 families (50.5 per cent) have collected firewood; however, the amount
collected is not revealed in the survey. Only 3 of 93 families (1.6 per cent) sold firewood. The
rest is just kept for home consumption. On average, people collect 8.4 ox-carts of firewood,
ranging from two to 32 ox-carts per year. The local price of 30,000 riels per ox-cart (7.5 USD
per ox-cart) for the sale of firewood has been used as a standard price for calculating the gross
value and value added of firewood. Table 36 shows further detail about the common
resources.
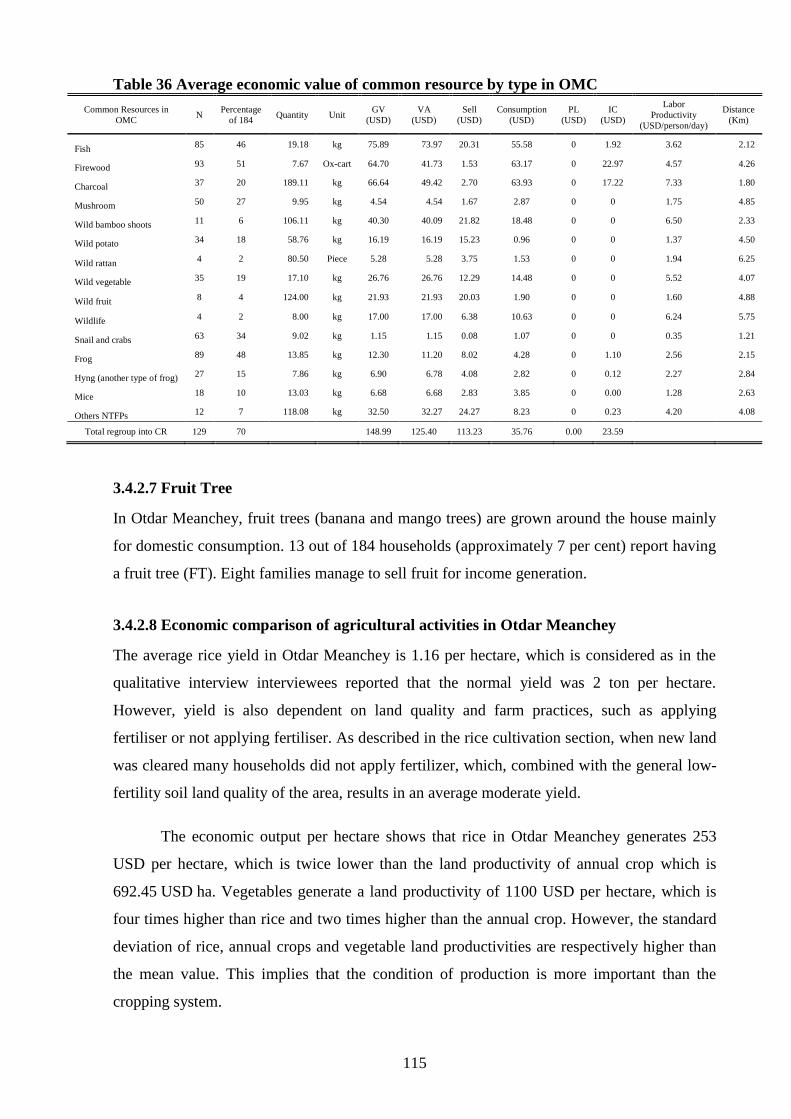
115
Table 36 Average economic value of common resource by type in OMC
Common Resources in
OMC N
Percentage
of 184 Quantity Unit
GV
(USD)
VA
(USD)
Sell
(USD)
Consumption
(USD)
PL
(USD)
IC
(USD)
Labor
Productivity
(USD/person/day)
Distance
(Km)
Fish 85 46 19.18 kg 75.89 73.97 20.31 55.58 0 1.92 3.62 2.12
Firewood 93 51 7.67 Ox-cart 64.70 41.73 1.53 63.17 0 22.97 4.57 4.26
Charcoal 37 20 189.11 kg 66.64 49.42 2.70 63.93 0 17.22 7.33 1.80
Mushroom 50 27 9.95 kg 4.54 4.54 1.67 2.87 0 0 1.75 4.85
Wild bamboo shoots 11 6 106.11 kg 40.30 40.09 21.82 18.48 0 0 6.50 2.33
Wild potato 34 18 58.76 kg 16.19 16.19 15.23 0.96 0 0 1.37 4.50
Wild rattan 4 2 80.50 Piece 5.28 5.28 3.75 1.53 0 0 1.94 6.25
Wild vegetable 35 19 17.10 kg 26.76 26.76 12.29 14.48 0 0 5.52 4.07
Wild fruit 8 4 124.00 kg 21.93 21.93 20.03 1.90 0 0 1.60 4.88
Wildlife 4 2 8.00 kg 17.00 17.00 6.38 10.63 0 0 6.24 5.75
Snail and crabs 63 34 9.02 kg 1.15 1.15 0.08 1.07 0 0 0.35 1.21
Frog 89 48 13.85 kg 12.30 11.20 8.02 4.28 0 1.10 2.56 2.15
Hyng (another type of frog) 27 15 7.86 kg 6.90 6.78 4.08 2.82 0 0.12 2.27 2.84
Mice 18 10 13.03 kg 6.68 6.68 2.83 3.85 0 0.00 1.28 2.63
Others NTFPs 12 7 118.08 kg 32.50 32.27 24.27 8.23 0 0.23 4.20 4.08
Total regroup into CR 129 70 148.99 125.40 113.23 35.76 0.00 23.59
3.4.2.7 Fruit Tree
In Otdar Meanchey, fruit trees (banana and mango trees) are grown around the house mainly
for domestic consumption. 13 out of 184 households (approximately 7 per cent) report having
a fruit tree (FT). Eight families manage to sell fruit for income generation.
3.4.2.8 Economic comparison of agricultural activities in Otdar Meanchey
The average rice yield in Otdar Meanchey is 1.16 per hectare, which is considered as in the
qualitative interview interviewees reported that the normal yield was 2 ton per hectare.
However, yield is also dependent on land quality and farm practices, such as applying
fertiliser or not applying fertiliser. As described in the rice cultivation section, when new land
was cleared many households did not apply fertilizer, which, combined with the general low-
fertility soil land quality of the area, results in an average moderate yield.
The economic output per hectare shows that rice in Otdar Meanchey generates 253
USD per hectare, which is twice lower than the land productivity of annual crop which is
692.45 USD ha. Vegetables generate a land productivity of 1100 USD per hectare, which is
four times higher than rice and two times higher than the annual crop. However, the standard
deviation of rice, annual crops and vegetable land productivities are respectively higher than
the mean value. This implies that the condition of production is more important than the
cropping system.
116
Rice capital investment per hectare is also half as much as the annual crop. However,
the annual crops require five times as much labor per hectare than rice but yields an average
labor productivity of almost the same as rice. That is why it is more economically interesting
to grow rice rather than an annual crop, even though the land productivities of annual crops is
twice as high as rice. It can be seen that rice requires less labour input per hectare than annual
crops and vegetables but offers highest land productivities. That is apparently the reason why
people prefer to grow rice even though land productivity is lower than with other crops and
people can save labor for doing other activities such as migration or off-farm work. Vegetable
investment per unit of land is slightly less than annual crops but labor input is seven time
higher than annual crops. Given vegetables are labor intensive, the low investment per unit of
land could be under-estimated or aggregated with the value per unit of land from the small-
scale production which some households produce for home consumption would impact the
cost actual cost of those produce for income generation.
Although the land productivity of vegetables and annual crops is higher than for rice,
in terms of labor productivities, rice generates the highest labor productivity, follow by
annuals crop and vegetables. The comparison mean test between the mean labor productivities
of rice, vegetables and annual crop shows no statistical difference between the three. For
animal production, pigs have the lowest labor productivity in comparison to poultry and
cattle.
In terms of the average contribution to household income, rice contributes the highest
cross output and added value among the crops. While rice contribute 630USD per household
per year, annual crops contribute 256 per household per year, about half as much as rice.
Vegetables, poultry, pigs, aquaculture, common resources and fruit trees contribute about the
same amount to households of between 125 and 180 USD per household per year. It is
interesting to see that cattle contribute a large amount of income to households in comparison
to rainy season rice, which contribut4es about 600 USD per year per family. Although cattle
labor productivity is low compared to other crops, people believe that it is a safety net for a
family that they can sell when they urgently need money. Households reported that cattle have
been sold to buy a two-wheel tractor. The environment is conducive for people raising cattle
in the area when there is grassland available where people can let the cattle go. However,
people admitted that it requires a lot of labor to take care of cattle, meaning that at least one
family member has to care for the cattle full time care or the responsibility is shared among
family members.

117
Comparing income from crop with non-farm income and migration income, the
average contribution to households from non-farm income is 575.53 USD per household per
year, while migration income is 807.69 USD per household per year. Therefore, the main
sources of income for people in Otdar Meanchey are predominantly rice, non-farm activities,
migration and cattle. The rest of the activities, such as annual crops, vegetables, poultry, pigs,
aquaculture, common resources and fruit trees, contribute small amounts where household
have tried to diversify based on resource availability such as annual crop land, vegetable land,
access to water and proximity to forest resources (see Table 37).
Table 37 Economic of farm activity summary in Otdar Meanchey
Economic comparison of farm activities Otdar Meanchey
HR AC VG CAT PT PIG AQ CR FT NF MIG
Land (ha) 3.82 0.71 0.27 - - - - - - - -
GO (USD/ha) 285.34 849.98 2708.21 - - - - - - - -
GVA (USD/ha) 245.21 664.47 2588.73 - - - - - - - -
Yield (t/ha) 1.16 - - - - - - - - - -
IC (USD/ha) 40.13 157.79 120.01 12.41 - - - - - - -
PL (USD/ha) 74.52 58.20 38.62 0.00 - - - - - - -
Labor (man-day/ha) 48.82 263.44 1859.07 121.00 - - - - - - -
Labor family (man-day/ha) 29.81 251.24 1849.16 121.00 - - - - - - -
Land productivity (USD/ha) 253.24 692.45 1099.21
- - - - - - -
Labor productivity (USD/man-day) 4.73 4.61 4.47 1.33 3.70 1.17 2.56 4.05 7.01 - -
Net income/Profit (USD/ha) 170.69 629.93 2550.11 586.90 - - - - - - -
Income rate (USD/1 USD invested) 1.65 2.72 3.09 - 5.11 1.89 1.81 - - - -
Number of household 184 53 35 36 149 55 5 129 13 140 45
GO per household (USD/hh) 1042.10 350.58 189.48 599.31 166.68 328.20 273.85 148.99 131.65 - -
GVA per household (USD/hh) 902.56 326.07 165.86 586.90 152.95 179.79 126.95 125.40 131.65 - -
Income per household (USD/hh) 630.17 255.99 157.50 586.90 152.95 179.79 126.95 125.40 131.65 575.53 807.69
IC (USD/hh) 139.54 29.78 23.89 12.41 16.85 148.41 146.90 23.59 0.00 - -
PL (USD/hh) 272.39 70.97 8.37 0.00 0.00 0.00 0.00 0.00 0.00 - -
Consumption (USD/hh) 544.87 2.38 8.46 - 140.67 0.00 64.85 113.23 11.35 - -
Labor (man-day/hh) - - - 121.00 44.13 91.39 51.00 29.36 13.23 - -
Labor family (man-day/hh) - - - 121.00 44.13 91.39 51.00 29.36 13.23 - -
Number of cattle per hh, number of pig per hh - - - 3.20 - - 512.00 - - - -
Number of cattle sold per hh, number of pig
per hh - - - 1.94 - - 512.00 - - - -
Cattle price per head, per kg for pig - - - 324.48 - - - - - - -
Cattle remain - - - 2.37 - - - - - - -
3.4.3 Diversified rice farming system in Tram Kak
3.4.3.1 Rice cultivation
In Tram Kak, land was distributed in 1980, „81 and „82. Due to the small rice landholdings
and lack of access to irrigation, people dug ponds for the purpose of growing rice and
vegetables as well as reserving water for home consumption. With water storage, people have
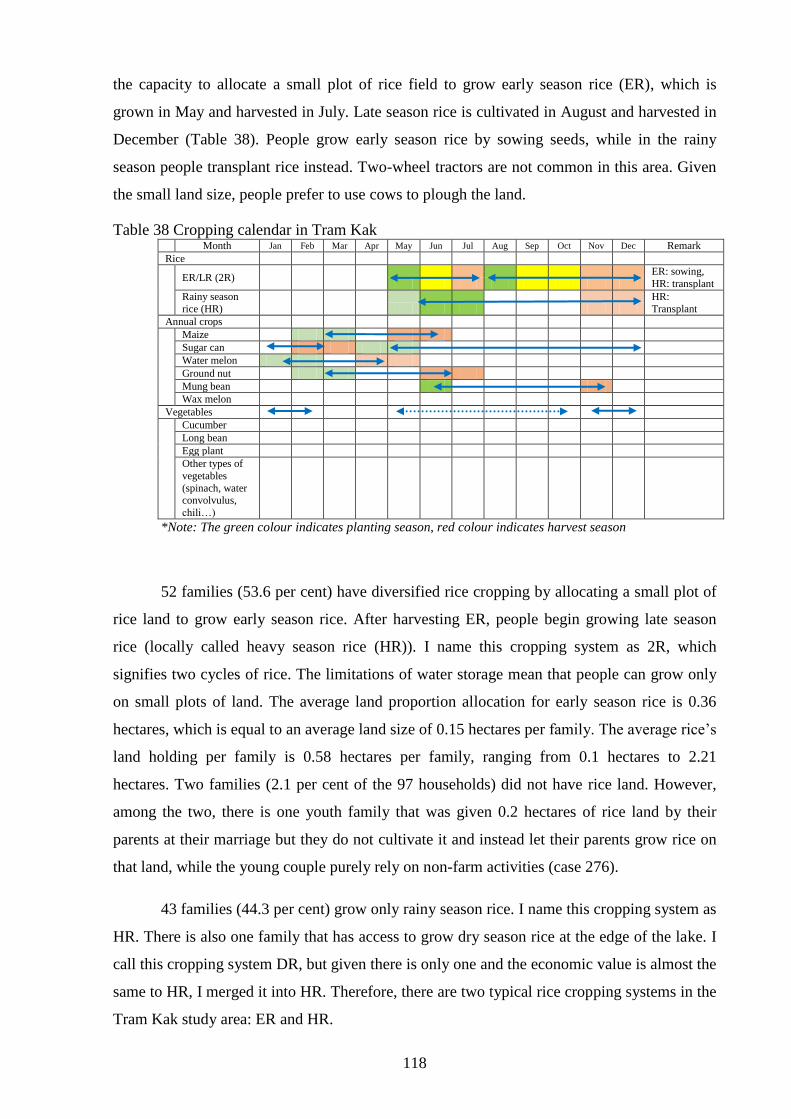
118
the capacity to allocate a small plot of rice field to grow early season rice (ER), which is
grown in May and harvested in July. Late season rice is cultivated in August and harvested in
December (Table 38). People grow early season rice by sowing seeds, while in the rainy
season people transplant rice instead. Two-wheel tractors are not common in this area. Given
the small land size, people prefer to use cows to plough the land.
Table 38 Cropping calendar in Tram Kak
Month Jan Feb Mar Apr May Jun Jul Aug Sep Oct Nov Dec Remark
Rice
ER/LR (2R)
ER: sowing,
HR: transplant
Rainy season
rice (HR)
HR:
Transplant
Annual crops
Maize
Sugar can
Water melon
Ground nut
Mung bean
Wax melon
Vegetables
Cucumber
Long bean
Egg plant
Other types of
vegetables
(spinach, water convolvulus,
chili…)
*Note: The green colour indicates planting season, red colour indicates harvest season
52 families (53.6 per cent) have diversified rice cropping by allocating a small plot of
rice land to grow early season rice. After harvesting ER, people begin growing late season
rice (locally called heavy season rice (HR)). I name this cropping system as 2R, which
signifies two cycles of rice. The limitations of water storage mean that people can grow only
on small plots of land. The average land proportion allocation for early season rice is 0.36
hectares, which is equal to an average land size of 0.15 hectares per family. The average rice‟s
land holding per family is 0.58 hectares per family, ranging from 0.1 hectares to 2.21
hectares. Two families (2.1 per cent of the 97 households) did not have rice land. However,
among the two, there is one youth family that was given 0.2 hectares of rice land by their
parents at their marriage but they do not cultivate it and instead let their parents grow rice on
that land, while the young couple purely rely on non-farm activities (case 276).
43 families (44.3 per cent) grow only rainy season rice. I name this cropping system as
HR. There is also one family that has access to grow dry season rice at the edge of the lake. I
call this cropping system DR, but given there is only one and the economic value is almost the
same to HR, I merged it into HR. Therefore, there are two typical rice cropping systems in the
Tram Kak study area: ER and HR.
119
This also most no significant difference between the average rice land of those who
grow early season rice plus rainy season rice (2R, 0.64 hectares) and the average land rice of
those who grow rainy season rice (HR) alone (0.51 hectares).
61 per cent of households (59 of 97) grow rice for just home consumption and do not
sell it for income generation. However, 20 per cent of total households have to buy additional
rice as they do produce enough for home consumption. Among those who did not sell rice for
income, 30.5 per cent (18 households) have to buy additional rice, meaning that even if the
entire amount of rice produced is kept for home consumption, it is not enough to feed the
household and they have to buy more rice.
3.4.3.2 Annual crops
The common annual cash crops, like maize, watermelon and beans, are cultivated mainly in
two villages: Trapaing Chak and Trapaing Chak, where annual crop land is situated at the end
of the village close to the foot of the Damrei Romeal mountain.
Maize is only grown in the Trapaing Chak and Trapaing Chak village. 6.2 per cent (six
of 97 families) grow maize on average 0.3 hectares. Five families are in the Trapaing Chak
village and the sixth one is in Kol Kom, a nearby village of Trapaing Chak. Given people sell
fresh maize as a snack for consumption, no proper and reliable yield was revealed during the
survey, but rather the overall income from maize production. Four families sold their maize
for an average income of 155 USD per household, ranging from 45 to 425 USD. One family
grow sugarcane on 0.02 hectares that provided an income of 50 USD with land productivities
of 5,625 USD per hectare.
21.6 per cent (21.6 per cent of 97) families grow watermelon. Watermelon is a high
risk for losing profit due to two main reasons. First, the market is limited as many others also
grow watermelons. Second, when there is a rain during the harvest season, the watermelon
yield will be ruined. There are two families that lost money from growing watermelon in the
year of the survey: 20.75 USD to 52.5 USD per family. By excluding those who made a loss,
watermelon provides average land productivity of 466 USD per hectare, which higher than
OMC.
14.4 per cent (14 of 97) families grow different types of beans, include groundnut and
mung beans. 11 families sold beans for income, while the other three families kept them for
home consumption. For detail of the annual crops‟ economic value generation, see appendix
1.
120
3.4.3.3 Vegetables
Vegetables are grown in Tram Kak mainly for income generation. The majority of households
who grow vegetables sell their production for income and very few of them grow for home
consumption. People try to diversify crops through vegetable growing by digging ponds to
store water. Long beans, cucumbers, eggplants and different type of leafy vegetables are
grown in the region. Among 97 families, there are three families that grows long beans. One
of them lost money from the production.
12 families grow cucumber (12.4 per cent). 10 families sold cucumbers for income.
Among the 10, three families were income negative from cucumber production. The
remaining two families grow cucumber for just home consumption. People allocate an
average 0.09 hectares, ranging between 0.02 hectares to 0.2 hectares, for growing cucumbers.
Cucumbers have land productivities of 354 USD per hectare and labor productivities 2.87
USD per person per day in Tram Kak, which is lower than cucumber production in Otdar
Meanchey.
33 families grow different types of vegetables in two villages, Trapaing Chak and Kol
Kom, a nearby village that has a natural lake. Those who grow vegetables are those who live
near the lake. Some dig ponds to store water for growing vegetables. Two villages, Ang
Roneab and Chrey Tnaot, do not have the same kind of access to water, which is why there no
households grow vegetables there. From the survey, there are three household that grow
vegetables for just home consumption and do not sell for income generation and five
households that produce a very low value of vegetables due to the high expense on
intermediary input cost and the low land productivities of vegetable. By include all those
extreme cases, the land productivity of vegetables is 2,255 USD per hectare. But when
remove those values, the land productivities of vegetables increase up to 2,600 USD per
hectare. The standard deviation is twice higher than mean, suggesting there is a very high
variation between the mean values. Three families have land productivities from 10,000 USD
to nearly 30,000 USD per hectare, while the majority of 14 households had land productivities
from 1,000 USD per hectare to 5,000 USD per hectare. Six families had land productivities
from 500 USD per hectare to 1,000 USD per ha. The remaining 11 families had less than 500
USD per hectare. This tells us that the quality of production is much more important than the
cropping system. Eggplant and leafy vegetables generate high land productivities and labor
productivities in comparison to long beans and cucumber. However, in terms of contributing
to the household, we can see that only leafy vegetables and eggplant contribute more than 130
USD per household per year.

121
3.4.3.4 Regrouping Annual Crops and Vegetables in Tram Kak
Based on one economic value – that is the land and labor productivities of each crop together
with investment on crops – maize, sugarcane and leafy vegetables can be grouped into a
single category as vegetable [VG] and watermelon, beans, long bean, eggplant and cucumber
as a single annual crop [AC]. We can see that nearly 30 per cent of the families grow rainy
season rice on an average land size of 0.38 hectares without the capacity to combine or
diversify with either vegetable nor annual crops (Table 39).
Table 39 Average land by cropping system in Tram Kak
Cropping system N Percentage Valid
percentage
Mean land (ha)
[HR] [2R]
[VG] [AC] Total [ER] [HR]
[HR][VG] 2 2.10 2.10 0.40
0.008
0.41
[HR][VG][AC] 4 4.10 4.20 0.63
0.18 0.24 1.05
[HR][AC] 10 10.30 10.50 0.86
0.32 1.18
[HR] 27 27.80 28.40 0.38
0.38
[2R][VG] 15 15.50 15.80
0.21 0.83 0.16
0.99
[2R][VG][AC] 13 13.40 13.70
0.26 0.70 0.23 0.25 1.18
[2R][AC] 11 11.30 11.60
0.14 0.55
0.18 0.74
[2R] 13 13.40 13.70
0.13 0.46
0.46
Total 95 97.90 100 0.75
Missing system 2 2.10
Total 97 100
3.4.3.5 Animal production
Like many other regions of Cambodia, the animals raised in Tram Kak are pigs, chickens,
ducks, geese, fish and cattle. There are 20 families out of 97 (20.6 per cent) in Tram Kak
raising pigs mainly for income generation. All producers can sell pigs for income and none of
them raise pigs for home consumption. People can raise pigs up to twice per year (two
cycles). The main expense is foraging. Due to the scarcity of local forage, people no long
produce their own pig forage. People prefer to buy ready-made or industry forage to feed pigs.
This constitutes a high of expense on input cost. The second expense is on buying a pig sow.
The income from pig can be either selling pig for meat or sell a pig sow or both, depending on
the specialization of the family. However, people mostly sell pigs for pork meat.
79 families raise chickens (81.40 per cent of 97), of which 45 families sold chicken
(46.40 per cent of 97). There are only three families that earned more than 250 USD income
from chicken-raising per year, 300 USD per year and 864 USD per year in each of the three
families. The rest earn an average of 54.74 USD per year, with a value added of 130 USD per
year and consumption 95 USD per year. From my field observation, I noticed that having
122
income from selling chicken of 100 USD per year is considered as an income diversification
strategy for families.
37 family raise ducks (38.1 per cent). Five families sell ducks, from which four
families have generate more than 85 USD per year, with an average income from those who
sell duck of 80.5 USD per year.
There are eight families (8.20 per cent) raising fish in Tram Kak. Among them, there
are four families (4.1 per cent) that sell fish for income. Among them there is one family who
specializes in fish raising that can earn an income of 1,000 USD per year from this
production. Excluding this specialized family gives an average profit that is equal to a value
added of 50 USD per family. The labour productivity is 1.72 USD per person per day. Besides
those who manage to generate income, the others raise fish for just home consumption as a
trial as part of an effort by NGOs to encourage people in the area to raise fish.
Among the 97 households interviewed in Tram Kak, 84 families (86.60 per cent) raise
cattle, out of which 41 families have sold their cattle for income, which is about 48.8 per cent
of those who have cattle and about 42 per cent of the total households surveyed in the area.
Only one family had sold all their cattle. The average cattle remaining is 2.44 head per
household. Each family sold cattle at the average of 1.5 head per household and an average
price is 433 USD per head. The typical cattle price in the area is 500 USD per head.
It is interesting to see that in the area with small agricultural land, almost every
household tried to raise cattle. This is partly because the land is so small, hence farmers do not
need two wheel-tractors as drought power: a cow is enough for ploughing and preparing the
land for other crops. Therefore, raising cattle provides supplementary income as well as safety
net for the family. The only challenge that the people complained about is that it is difficult to
find grazing land, given that in the rainy season all land is cultivated for rice, so the cattle
have to remain under or around the house. People also agree that cattle consume labor for
providing water, grazing and feeding. Similar to other regions, the labor productivities is 1.55
USD per person per day, which is just slightly higher than the Otdar Meanchey region, who
had 1.33 USD per person per day. Given there no much expenditure on cattle, the average
income is the gross value of the cattle sold. Cattle contribute more income than the land
productivities of one hectare of rice. Therefore, cattle play an important role in the household
income of rural families.
123
3.4.3.6 Common Resource in Tram Kak
The common resources in Tram Kak is collecting fish in the rice field, stream and natural
lakes. Among the 97 households surveyed, only 15 families collected fish (15 per cent of 97),
of which only two families (2.1 per cent of 97) sold fish for household income. There were
three families (case numbers 197, 211 and 215) that fished up to 700 kilograms and generated
income of 700 USD per year from fishing. The other two families could fish 120 kilograms
respectively but generated no income, using the fish just for domestic consumption. These
three cases are statistical outliers. By removing this extreme value, we can see that in average,
rural families collect about 17.7 kilograms of fish from common areas per family per year,
ranging from a minimum of 1.2 kilograms per family per year to 50 kilograms per family per
year. They usually collect fish in their rice field or in other rice fields. The maximum distance
that people went to collect common resources is two kilometres from the home village with an
average distance of 0.37 kilometres.
24.7 per cent of families (24 of 97) collected firewood for household cooking fuel.
None of them sell firewood. People collected an average of 4.67 ox-carts of fuel per year at a
maximum distance of four kilometres from their home village (0.75 kilometres on average).
Assuming a local price of 7.5 USD per ox-cart, the gross value and value added of firewood is
calculated.
2.1 per cent of families (2 out of 97) have collected wild bamboo shoots. One of them
can collect up to 1200 kilograms per year and generates an income from selling bamboo
shoots of 163 USD per year, while another family collected only 20kg for home consumption.
These two families having access to bamboo shoots because they live in close proximity to a
mountain.
14.4 percent of families (14 of 97) collected some kind of snails and crabs from the
rice fields as source of protein. By asking people to estimate the amount they have collected
in kilograms, the survey shows that on average people have collected seven kilograms of this
kind of common resource per household per year. This collection is usually for home
consumption only and it is rarely for income. It also has a low economic value. There is only
one family in the Prey Kabas district that can sell this kind of common resource, with a price
of 500 riels per kg (0.13 USD per kg). The survey used this local price to calculate the gross
value and value added of this common resource.
15.5 percent of families (15 of 97) catch frogs. One family catches up to 42 kilograms
per year, which is the extreme value. By excluding this, each household catches an average of

124
3.14 kilograms of frogs per year, ranging from one to six kilograms per year. Two families
sold frogs for a tiny income.
Table 40 Average economic value of common resources in Tram Kak
CR Tram Kak N
Percent
age of
97
Quantity Unit GV
(USD) VA
(USD) Sell
(USD) Consumption
(USD) PL
(USD) IC
(USD)
Labor
Productivity (USD per
person/day)
Distance (km)
Fish 15 15 17.73 Kg 135.05 132.22 48.17 86.88 0 2.83 3.39 0.37
Firewood 24 25 4.67 Ox-cart
36.98 30.00 0.00 36.98 0 6.98 4.26 0.75
Wild bamboo
shoot 2 2 520.00 Kg 84.25 84.25 81.25 3.00 0 0.00 6.02 1.00
Snail and crabs 14 14 6.96 Kg 0.87 0.87 0.00 0.87 0 0.43 0.26 0.62
Frog 15 15 3.14 Kg 7.71 7.28 3.53 4.18 0 0.00 2.10 0.40
Hyng (frog) 1 1 2.00 Kg 1.50 1.50 0.00 1.50 0 0.00 1.50 1.50
Total regroup into CR
41 42
78.44 73.16 22.88 55.56 0.00 5.28
In general, common resources are mainly used for home consumption and only one
family who specialized in catching fish can generate an income from fishing in the common
resources.
3.4.3.7 Fruit Trees in Tram Kak
32 families in Tram Kak generate income from fruit trees (FT), mainly from coconut and
mango trees. Fruit trees are grown around the home village. People do not spend labor on
taking care of the fruit trees, therefore the estimated labor is on the day they harvest the fruit
and sell it to traders who come to buy it at the village. Hence, the labor productivities is high
compared to the other crops thanks to this specific characteristic. The average labor
productivity is 15.2 USD 0 per person per day, ranging from 4 USD to 30 USD per person per
day. Banana and other fruit trees are included into a single category as fruit tree.
3.4.3.8 Economic comparison of agricultural activities in Tram Kak
Table 41 shows the economic comparison of agricultural activities in Tram Kak.
With the capacity to irrigate from ponds, the average yield of 2R rice in Tram Kak is 2.64
tons per hectare. This is higher than HR rice, which is 2.16 tons per hectare. The 2R
investment on intermediate cost is 196.5 USD per hectare, which is 62.19 USD higher than
HR but the land productivity of 3R is 717.874 per hectare, which is 272.54 USD per hectare
higher than the land productivity of HR, which 445.37 USD per hectare. The increased capital
of 62.19 to invest on 2R will bring the marginal growth of income from rice 4.38 time.
Therefore, it is more beneficial for people in Tram Kak to invest in digging ponds to grow 2R
rice. The labor input for 2R is 199 man-days per hectare, which 28 man-days per hectare
125
higher than HR, which requires 161 man-days per hectare. Given the marginal land
productivity of 272.54 USD per hectare and a marginal labour input of 28 man-days per
hectare, if people shift from HR to 2R, it would give the marginal labour productivities of
9.73 USD per man-day. Vegetables have the highest land productivities but also require the
highest labour input and investment per hectare. Vegetables generate labour productivities of
12.63 USD per man-day. The annual crop investment per hectare is about the same as
investing in 2R. However, in terms of land productivity, annual crops produce added value of
only 548.46 USD per hectare, while 2R can produce 717.874 USD per hectare, which is
169.28 USD lower than a 2R crop. In the situation that annual crop has to be grown on the
Chamkar land where not many people possess land, it is, therefore, economically attractive
that people diversify crops by digging ponds in which to grow 2R rice. In addition to this,
with the water available from ponds, people can grow vegetables and raise fish.
If converting HR to 2R by allocating 20 per cent of land for digging ponds, 20 per cent
of land for growing vegetables, and 60 per cent of land growing for 2R and raising fish, a
simulation on 0.5 hectares of land based on the given economic output shows that the total
added value increases three times and the growth of labor gives marginal labour productivities
two times higher than the conventional HR. Hence, the strategy to improve the cropping
system in Tram Kak is to diversify agricultural activities between 2R, vegetables and fish
culture.
For animals, raising pigs requires the highest labour input in comparison to
aquaculture (fish raising) and poultry. However, pig has labor productivities lower than
poultry and aquaculture, which require less labour input.
In term of average contribution of income to a household, 2R contributes 446.62 USD
per household per year, which is twice as high as HR, which contributed just 196.97 USD per
household per year. Vegetable land productivity is the highest in comparison to other crops
but it contributes an average of 151.83 USD per household per year, while annual crops
contribute less than other crops at 93.85 USD per household per year. For animals, poultry
contributes 145.83 USD per household per year, while pigs and aquaculture contribute 218.79
USD per household per year and 181.20 USD per household per year respectively. Again, like
in Otdar Meanchey, cattle contribute the highest income to households in comparison to other
crops, animal and even non-farm and migration income. As in Otdar Meanchey, non-farm and
migration income contribute an average income of a significant amount in comparison to
other crop and animal-raising activities.
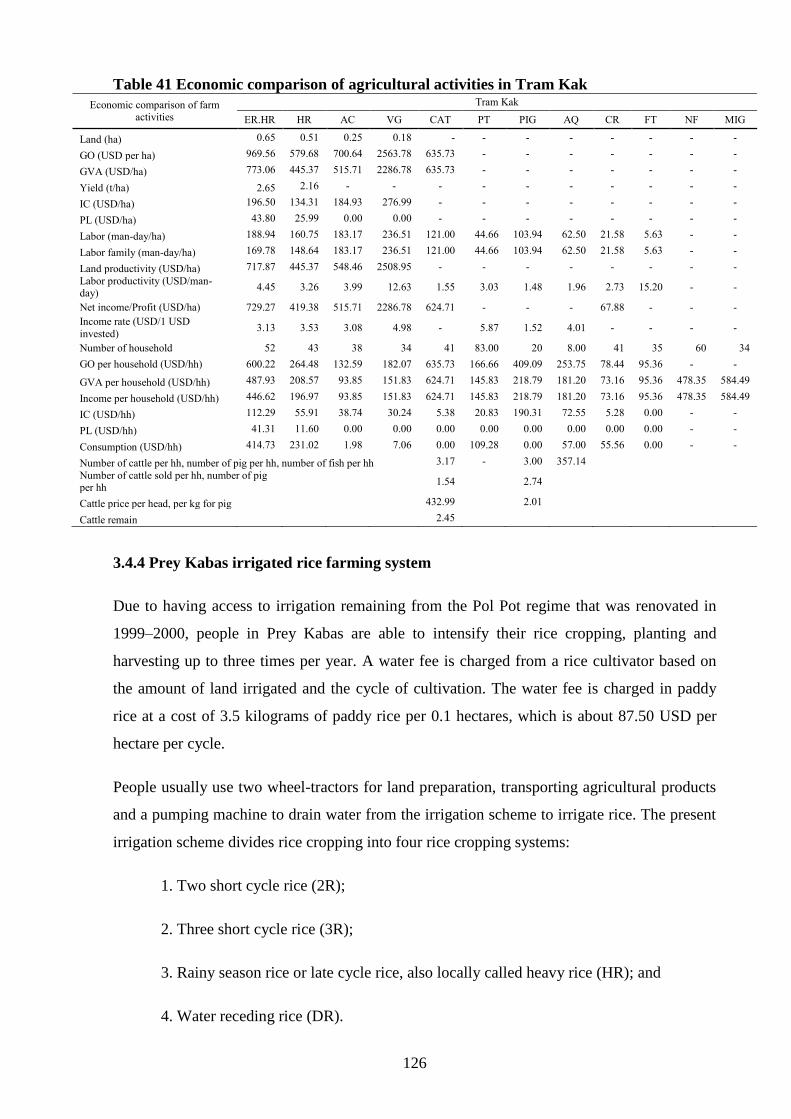
126
Table 41 Economic comparison of agricultural activities in Tram Kak
Economic comparison of farm activities
Tram Kak
ER.HR HR AC VG CAT PT PIG AQ CR FT NF MIG
Land (ha) 0.65 0.51 0.25 0.18 - - - - - - - -
GO (USD per ha) 969.56 579.68 700.64 2563.78 635.73 - - - - - - -
GVA (USD/ha) 773.06 445.37 515.71 2286.78 635.73 - - - - - - -
Yield (t/ha) 2.65 2.16 - - - - - - - - - -
IC (USD/ha) 196.50 134.31 184.93 276.99 - - - - - - - -
PL (USD/ha) 43.80 25.99 0.00 0.00 - - - - - - - -
Labor (man-day/ha) 188.94 160.75 183.17 236.51 121.00 44.66 103.94 62.50 21.58 5.63 - -
Labor family (man-day/ha) 169.78 148.64 183.17 236.51 121.00 44.66 103.94 62.50 21.58 5.63 - -
Land productivity (USD/ha) 717.87 445.37 548.46 2508.95 - - - - - - - -
Labor productivity (USD/man-day)
4.45 3.26 3.99 12.63 1.55 3.03 1.48 1.96 2.73 15.20 - -
Net income/Profit (USD/ha) 729.27 419.38 515.71 2286.78 624.71 - - - 67.88 - - -
Income rate (USD/1 USD
invested) 3.13 3.53 3.08 4.98 - 5.87 1.52 4.01 - - - -
Number of household 52 43 38 34 41 83.00 20 8.00 41 35 60 34
GO per household (USD/hh) 600.22 264.48 132.59 182.07 635.73 166.66 409.09 253.75 78.44 95.36 - -
GVA per household (USD/hh) 487.93 208.57 93.85 151.83 624.71 145.83 218.79 181.20 73.16 95.36 478.35 584.49
Income per household (USD/hh) 446.62 196.97 93.85 151.83 624.71 145.83 218.79 181.20 73.16 95.36 478.35 584.49
IC (USD/hh) 112.29 55.91 38.74 30.24 5.38 20.83 190.31 72.55 5.28 0.00 - -
PL (USD/hh) 41.31 11.60 0.00 0.00 0.00 0.00 0.00 0.00 0.00 0.00 - -
Consumption (USD/hh) 414.73 231.02 1.98 7.06 0.00 109.28 0.00 57.00 55.56 0.00 - -
Number of cattle per hh, number of pig per hh, number of fish per hh 3.17 - 3.00 357.14
Number of cattle sold per hh, number of pig per hh
1.54
2.74
Cattle price per head, per kg for pig
432.99
2.01
Cattle remain 2.45
3.4.4 Prey Kabas irrigated rice farming system
Due to having access to irrigation remaining from the Pol Pot regime that was renovated in
1999–2000, people in Prey Kabas are able to intensify their rice cropping, planting and
harvesting up to three times per year. A water fee is charged from a rice cultivator based on
the amount of land irrigated and the cycle of cultivation. The water fee is charged in paddy
rice at a cost of 3.5 kilograms of paddy rice per 0.1 hectares, which is about 87.50 USD per
hectare per cycle.
People usually use two wheel-tractors for land preparation, transporting agricultural products
and a pumping machine to drain water from the irrigation scheme to irrigate rice. The present
irrigation scheme divides rice cropping into four rice cropping systems:
1. Two short cycle rice (2R);
2. Three short cycle rice (3R);
3. Rainy season rice or late cycle rice, also locally called heavy rice (HR); and
4. Water receding rice (DR).
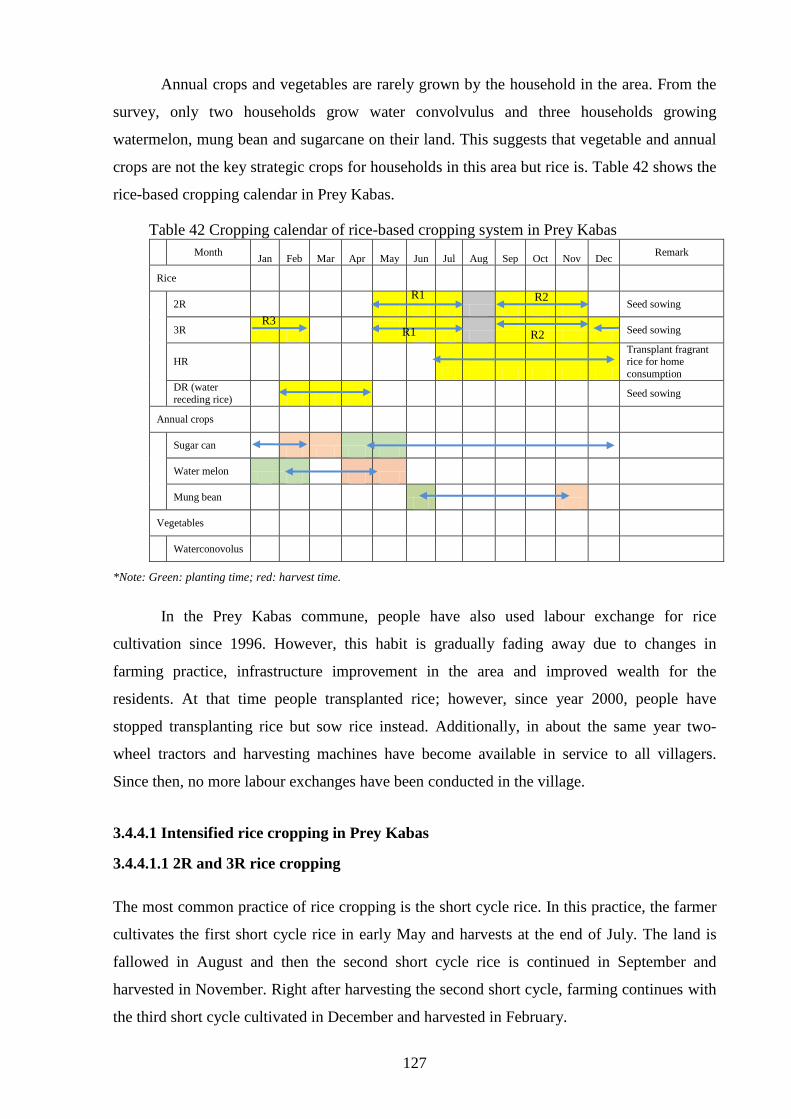
127
Annual crops and vegetables are rarely grown by the household in the area. From the
survey, only two households grow water convolvulus and three households growing
watermelon, mung bean and sugarcane on their land. This suggests that vegetable and annual
crops are not the key strategic crops for households in this area but rice is. Table 42 shows the
rice-based cropping calendar in Prey Kabas.
Table 42 Cropping calendar of rice-based cropping system in Prey Kabas
Month Jan Feb Mar Apr May Jun Jul Aug Sep Oct Nov Dec
Remark
Rice
2R
Seed sowing
3R
Seed sowing
HR
Transplant fragrant rice for home
consumption
DR (water
receding rice) Seed sowing
Annual crops
Sugar can
Water melon
Mung bean
Vegetables
Waterconovolus
*Note: Green: planting time; red: harvest time.
In the Prey Kabas commune, people have also used labour exchange for rice
cultivation since 1996. However, this habit is gradually fading away due to changes in
farming practice, infrastructure improvement in the area and improved wealth for the
residents. At that time people transplanted rice; however, since year 2000, people have
stopped transplanting rice but sow rice instead. Additionally, in about the same year two-
wheel tractors and harvesting machines have become available in service to all villagers.
Since then, no more labour exchanges have been conducted in the village.
3.4.4.1 Intensified rice cropping in Prey Kabas
3.4.4.1.1 2R and 3R rice cropping
The most common practice of rice cropping is the short cycle rice. In this practice, the farmer
cultivates the first short cycle rice in early May and harvests at the end of July. The land is
fallowed in August and then the second short cycle rice is continued in September and
harvested in November. Right after harvesting the second short cycle, farming continues with
the third short cycle cultivated in December and harvested in February.
R1 R2
R3 R1 R2

128
2R and 3R are exactly the same practice and used the same rice variety, IR66, which is
the recommended variety for irrigated rice. Whether households do two cycles (2R) or three
(3R) cycles is dependent on whether the household wishes to maximize production. Some
households reported that land that is situated at the end of irrigation scheme can only cultivate
twice a year due to the availability of water in the canal. However, according to the field
observation, people tend to grow 2R rather than 3R even though their land is fully accessible
to the water in the irrigation scheme and those who tend to grow 3R are those who have a
small amount of land and who therefore attempt to maximize their production.
The common practice is that each short cycle rice requires 306 kilograms of seed per
hectare and 280 kilograms of fertilizer per hectare, which is applied in two phases equally: in
the early growing stage and another at flowering stage. Farmers buy fertilizer on credit, with
the three months interest rate ranging from 17 per cent to 20 per cent. The price is often
higher than the market price due to interest. However, people prefer to buy on credit because
they cannot afford to pay in cash at the buying time.
Unlike the low-density area of Otdar Meanchey region, people do not use labour
exchange in transplanting and harvesting in Prey Kabas. Instead, people started changing
from transplanting to sowing rice and lately they have stopped harvesting by hand but instead
prefer to use a harvest machine at a price of 3,500 to 4,500 Riel per 0.1 hectare (0.88 to 1.13
USD per 0.1 hectare).
Table 43 show the combination of rice cropping systems practiced by households in
Prey Kabas.
Table 43 Rice land proportion in Prey Kabas
Cropping System N Percentage
Rice Land Proportion
[HR] [2R] [3R] [DR] Total Average rice
land (ha/hh)
SUM
Land
(ha)
[2R] 28 27.50
1
1 0.87 24.45
[2R]/[DR] 38 37.30
0.45
0.55 1 1.94 73.60
[3R] 7 6.90
1
1 0.62 4.35
[3R]/[DR] 8 7.80
0.48 0.52 1 1.14 9.14
[DR] 1 1.00
1.00 1 1.00 1.00
[HR] 4 3.90 1.00
1 0.71 2.84
[HR]/[2R] 4 3.90 0.55 0.45
1 0.65 2.59
[HR]/[2R]/[3R]/[DR] 1 1.00 0.13 0.26 0.23 0.38 1 2.62 2.62
[HR]/[2R]/[DR] 8 7.80 0.33 0.23
0.44 1 2.74 21.95
[HR]/[3R] 1 1.00 0.17
0.83
1 2.08 2.08
[HR]/[DR] 2 2.00 0.31
0.69 1 0.77 1.53
Total 102 100.00
1.43 146.15
129
* Due to outlier removed, some remain blank.
People mainly grow IR for 2R, 3R and DR to sell to Vietnamese traders. The
production utilizes high inputs i.e. pesticide and fertilizer. Walking through the rice fields
situated around the village, an outsider can smell the pesticide. The better-off people in the
area grow IR to sell and allocate a certain plot of land to grow fragrant rice with low input use
or even organic rice. Those who have small land plots and want to maximize production tend
to grow three short cycles of rice.
3.3.4.1.2 DR: water receding rice
People grow water receding rice at the lower part of the irrigation scheme by pumping the
water from the natural lake. People start sowing water receding rice in February when the
water has receded and harvest in April, which the hottest month in Cambodia. That is why
people prefer to call this dry season rice, which in the Khmer language is sré braing or srov
braing. The average amounts of fertilizer and seed used are 310 and 374 kilograms per
hectare respectively.
Observations from the field interview suggest that DR requires less labour in
comparison to other rice cropping methods because it is not necessary to prepare the land.
Farmers just spend one day preparing the dike with muddy soil, and then the land is ready to
sow the seed. The rest of the process just involves applying fertilizer two or three times,
spraying pesticide and pumping water. Harvesting is done using a harvesting machine and
then the product is transported to sell directly to Vietnamese traders right after harvesting. The
payments of input cost that the farmer bought on credit during the cultivated season can also
be made on about the same day.
People said that the high input used and low price paid for rice contributed to some
households only making a low profit. However, the analysis of survey data on the mean of the
net-income class per hectare shows that there is no statistically different between the IC and
PL per hectare. In the survey, people reported they sell rice at prices ranging from 700 riel per
kilogram to 1,200 riels per kilogram. People said that if the price paid is between 800 to 1,000
riel per kilogram, dry season rice brings profit. Otherwise, if the price is below or equal to 700
riel per kg, people will face negative income because of the high expenses for inputs. The
comparison means test proved this statement. The compare-mean and post hoc test show that
in terms of price, those have a net-income of less than 200 USD per hectare are not
statistically different that the first two groups who received prices of 770 to 790 riel per
kilogram. Nevertheless, the higher income per hectare is received by those that sell rice at a

130
price of between 859 riel per kilogram to 1,019 riel per kilogram. In terms of yield, those who
get a low profit per hectare in the first two groups got the same average yield of 3.79 to 3.89
tons per hectare in the same subset, while those who have a high profit per hectare had an
average yield of 5.32 to 7.2 tons per hectare. Therefore, it is the yield and price at harvesting
that determines whether a household has a high negative income for dry season rice. The
qualitative interviews suggest that dry season rice often generate a high income and plays an
important role in supporting young couples to accumulate wealth with which to buy rice land
through the cultivation of DR using land they have borrow from their parents for a certain
period of time.
3.3.4.1.3 HR: Late cycle rice or late season rice
Late cycle or late seasons rice (HR) is grown from August to December. There is no
combination of early season rice and late season rice, like in the Tram Kak region. I use the
term HR to reflect the common name the villagers call this rice, srov thgnon, which means
heavy rice (HR).
The economic value of HR shows that it is more profitable than 3R and 2R and less
intensive. The land productivity is also high if we distribute the mean value according to the
combination of the cropping system. HR requires less water to irrigate as well as less
pesticide and less fertilizer. Hence, growing HR is not just a labor-saving strategy in terms of
other activities but has a high economic return.
3.3.4.1.4 Factors affecting the choice of 2R, 3R and HR
In Prey Kabas, because IR rice (which includes 2R, 3R and DR) has a very high chemical
input (fertilizer and pesticide), people mainly grow 2R, 3R and DR to sell to Vietnamese rice
traders while they grow HR for home consumption, mainly fragrant jasmine rice. Due to the
high price, HR is also grown by some families and likely the labour-saving family. This group
grows HR for both home consumption and income generation. Therefore, the distribution of
land to grow 2R, 3R and HR depends on the choice of intensification level of the households.
By looking at the distribution of land proportion for each cropping, I can see how many
families that combine the three-rice cropping. I put aside water receding rice (DR) because the
separate land and system from the previous 3 rice cropping system.

131
Table 44 Rice land allocation between 2R, 3R and HR Land Allocation for Rice Cultivation in PB Frequency Percenta
ge
Valid
percentage
2R 66 64.70 65.30
[2R] more than 50 per cent and [HR] less
than 50 per cent 5 4.90 5.00
[2R] less than 50 per cent [HR] more than 50
per cent 7 6.90 6.90
[2R] 42 per cent [3R] 37 per cent [HR] 21 per
cent 1 1.00 1.00
3R 15 14.70 14.90
3R more than 80 per cent, HR less than 20
per cent 1 1.00 1.00
HR 6 5.90 5.90
Total 101 99.00 100.00
Missing System 1 1.00
Total 102 100.00
Table 44 shows that 40 per cent (79 families out of 102) grow 2R rice. Among them
83.5 per cent (66 families) distributed all their land to cultivate only 2R rice. 6.30 per cent
(five families) distribute more than 50 per cent of land to 2R and less than 50 per cent to HR.
8.90 per cent (seven families) distribute less than 50 per cent of land to 2R and more than 50
per cent to HR. One family of this 2R system allocates 42 per cent to 2R, 37 per cent to 3R
and 21 per cent to HR.
16.9 per cent (17 families) grow 3R, out of which 15 families allocate all land for 3R,
while one family allocates 0.83 land proportion to 3R and the rest for HR. And another one
allocated 42 per cent for 2R, 37 per cent for 3R and 21 per cent for HR.
58 families (57 per cent of 102) have water receding rice land with an average (and
mode) land size of 1.01 hectares per family ranging from 0.25 to 6 hectares.
There are total 19 families that allocate land to grow HR, with six families growing
only HR and the other 13 families combine HR with 2R and 3R.
Based on the distribution of land proportions among 2R, 3R and HR over the sum of
the three study areas, I group those who allocate all land to 3R as the “most intensified rice
cropping”, those who allocate all land to 2R as the “less intensified rice cropping” and those
who allocate all land to HR as the “least intensified rice cropping”. Those who allocate a
proportion among the three systems, I check the proportion of 3R over the sum of land for 2R
and 3R and compare HR over the sum of the three lands. The higher 3R over the sum of 2R
and 3R and the lower HR over the total land, I give weight to 3R as the most intensified
cropping system and vice versa, the lower 2R compare to 2R with low HR, I give weight to
2R as the less intensified system. The low 2R and 3R, and higher HR, I give weight to HR,

132
the least intensified system. Based on these I can see that 17 families (16.7 per cent) have the
most intensified cropping system, 72 families (70.6 per cent) have the less intensified system
and 12 families (11.80 per cent) have the least intensified cropping system. One family does
not have any land in the irrigated area but uses water receding rice.
By excluding those who do not have dry season rice land, I run a cross-tabulation to
test the relationship between the level of intensification and class of dry season rice land. I can
see that cultivating dry season rice does not affect the level of intensification of the rice
cropping in the irrigated area. The reason for this is that it uses separate land in a different
area and the cultivation season is also different. My impressions from the interview suggests
that the people intended to grow dry season rice if they had the land to do so.
My qualitative interview reveals that to some families grow rice three times per year
because they only have a small plot of land. This supports the common-sense idea that those
who have smaller land tend to maximize their production. However, when I check the
distribution of land that has been allocated from most to least intensive system, I see that
those who have the smaller land also grow HR. To see if it is case in this study area, I test the
relationship of Chi-square between the three levels of intensification and the five classes of
land in the irrigated area (excluding the DR land). The test shows no relationship between
these variables, X2 (9) = 7.718698, p = 0.46142033. With the three categories of
intensification, I run again the gross table with the total land size by choosing the Eta test.34
This tests whether there is no association if the Eta value is close to 0 or perfect association if
it is close to 1. The Eta value of the dependent variable total land is 0.138. This means that
there is very little association between the land size and the level of intensification. The
distribution of data shows that both with small and large plots of land are the most and least
intensified. The square value of Eta 0.019 (<2 per cent) tells the effect of the association is
small.35
This was confirmed again by the Partial Eta Squared to estimate the effect size
through Univariate Analysis of Variance. The F value of 2 degrees of freedom with an error
degree of freedom 98 is F (2, 98) = 3.104, p = 0.049, which gives the Partial Eta Squared of
0.06, indicating there is small effect size on the land and the level of intensification. The P
value of 0.049 tells us that there is a statistical difference between the mean lands within each
group level of intensification. This implies that the size of the land is not the only factor that
33 10 cells (66.7 per cent) have expected count less than 5. The minimum expected count is .24. This is violet
the assumption rule in which is only 20 per cent is allowed. This suggests that the result might not be valid.
34 Nominal and interval data, only Eta test is allowed. 35
0.02 Or 2 per cent: small effect, 0.13 or 13 per cent medium effect and 0.26 or 26 per cent large effect.
133
affects the choice of intensification, but the labor savings from that method of cropping can be
used for doing alternate activities such as non-farm work. Although some households told me
during the interview that their land cannot do 2R because it is at the end of the irrigation area,
by cross-checking the distribution in the village with the distance from irrigation, I can see
that those who are close to irrigation also do HR, which is the least intensified rice-cropping
method. This permits me to rule out the idea that it is the access to water in the irrigation
scheme that determines the intensity, suggesting that instead it is the choice of the family.
3.4.4.2 Annual crops in Prey Kabas
People in the Prey Kabas area do not have annual crop land; instead, all lf the land is
dedicated to growing rice. However, there are three families who do grow annual crops. One
family grows sugarcane on the 0.02 hectares of village land of 0.02ha, one family grows
watermelons on annual cropland of 0.45 hectares and the third grows mung beans on a 0.24
hectare of land on a hill near the village.
3.4.4.3 Vegetables in Prey Kabas
Like annual crops, growing vegetables is not a key activity undertaken by households in the
area. The common vegetables such long beans, eggplants, cucumbers and other leafy
vegetables that are cultivated by many households in Tram Kak and Otdar Meanchey are not
grown in the Prey Kabas commune. There are only two families that grow water convolvulus.
People harvest water convolvulus monthly. No specific yield was reported during the survey
but the income and expensed on the production. In terms of their contribution to household
income, water convolvulus generates on average 435 USD per household per year.
3.4.4.4 Regrouping Annual Crops and Vegetables
The labour productivity of watermelon and vegetables (in this case water convolvulus) is
higher than any other crops, so I merge the two into a single category of vegetable [VG]. I
also merge sugarcane and bean into a single category of annual crop [AC]. I can see that even
though only three families grow vegetables, this production contributes an income to the
households of between 250 USD to 600 USD per year. This amount is almost equal to selling
one cow. the contribution to households from annual crops ranges from 50 USD to 250 USD
per year. However, given so few families grow AC and VG, these crops are complementary
crops rather than strategic crops like rice.
134
3.4.4.5 Animal production
Like many other areas, the people in Prey Kabas raise pigs, poultry and cattle. There are 28
household (27.50 per cent of 102 families) who raise pigs. There are three factors that
determine the income from pig: the price of pigs at the time that the household sells the pig,
the age of the pig, the expense on the input used, particularly pig industrial forage, and the
degree of specialization of the family in raising pigs. Among those who raise pigs, more than
46.4 per cent that earn less than 200 USD per year from doing so. The income is very
different among households who raise pigs. The family that generates the highest income
from pig production makes nearly 2,000 USD per year in net income.
Chickens and ducks are raised by 55.90 per cent (57 families out of 102), out of which
33 families sold chickens for income. The rest is just keep them for home consumption. 19
families (18.6 per cent) raise ducks, out of which only four families had sold ducks for
income. The rest raise ducks for home consumption. There is one big commercial duck-
raising farm in the area.
The two families that raise ducks for commercial purposes on a large scale can
generate value from 2,137 USD to 3,818 USD, with high labour productivities of 10 to 16
USD per person per day respectively. But, if these two families are excluded, the average
value added is only 42 USD per family, ranging from 5 USD to 163 USD maximum with
average labour productivities of 1.7 USD per person per day. There is no family raising fish in
Prey Kabas.
Among the 102 household surveys, 89 said that they have raised cattle, which make up
87.3 per cent. Of those who have cattle, 54 (60.7 per cent) of them have sold the cattle at an
average of 1.54 heads per household with the average price of 433 USD per head. There is
one cow trader who buys and sells cows in the village.
3.4.4.6 Common Resources in Prey Kabas (CR)
People said that fish were more available between September to April than at other times in
the year. During this period, some families did not spend any money buying food as they
could catch the fish for food. However, they needed to buy daily food from April until
August, with the amount is varying according to the family‟s needs. Among 102 families, 22
families catching fish in the common pool, which makes up 21.6 per cent of the total families.
Nine families out of 22 (40.9 per cent) have sold some part of the collected fish in the past
year. The rest just keeping fish for home consumption. One family (case 360) fishes up to 600
135
kilograms per year and another family (case 293) fishes up to 250 kilograms per year.
However, these are statistical outliers. By excluding these values, the average amount of fish
caught by people in the area is 48 kilograms per family, ranging from three kilograms to 180
kilograms.
Firewood, 19 families (18.6 per cent of 102) collected firewood from the forest near
the water receding rice fields. Three families (cases 286, 294 and 309) collect up to 30, 20 and
15 ox-carts of firewood respectively. However, these are statistical outliers. By excluding
these extreme values, the average value of firewood collected by families was 2.88 ox-carts
per family, ranging from 2 to 6 ox-cart. None of them sold firewood for household income;
therefore, collecting firewood is just for home consumption only. One family produced an
estimated 600 kilograms of charcoal per year. There are 19 households collecting snail and
crabs, 21 household colleting frock, 1 household collecting Hyng, and 6 household hunting
mice. Table 45 outlines the common economic value by type.
Table 45 Common resource economic value by type in Prey Kabas
Common resources in
Prey Kabas N
Percent
age of
102
Quantity Unit GV
(USD)
VA
(USD)
Sell
(USD)
Consumption
(USD)
PL (
USD
)
IC (
USD
)
Labor
Productivity (
USD per person/day)
Distance
(Km)
Fish ( USD) 22 22 48.24 Kg 156.16 154.80 62.27 93.89 0 1.36 4.51 1.30
Firewood ( USD) 19 19 2.88 Ox-
cart 45.26 38.55 0.00 45.26 0 6.72 6.23 0.95
Charcoal ( USD) 1 1 600.00 Kg 120.00 30.00 0.00 120.00 0 90.00 6.00 -
Snail and crabs (
USD) 19 19 7.76 Kg 1.23 1.23 0.26 0.97 0 0.00 0.40 0.95
Frocks ( USD) 21 21 3.64 Kg 8.15 8.05 2.86 7.77 0 0.11 2.13 0.67
Hyng ( USD) 1 1 3.00 Kg 2.25 2.25 0.00 2.25 0 0.00 1.13 2.00
Mice ( USD) 6 6 7.67 Kg 11.17 11.17 8.75 2.42 0 0.00 2.03 4.50
Total regroup into CR 43 44 108.04 103.01 75.44 33.81 0.00 5.68
3.4.4.7 Fruit Trees in Prey Kabas
There are only three families in Prey Kabas who generates income from mango trees and
another kind of fruit tree locally named khvet. Two families reported they received an income
250 USD per year and 50 USD per year from their mango tree. One family got income 250
USD per year from their khvet three. They did not use any labour input for taking care of
those fruit tree. In the harvest season, traders come to village and buy the fruit from the tree
which they harvest themselves. The seller just collects the money following the harvesting
activity done by the trader. As there is no family labour input in the fruit tree production, no
labour productivity is calculated.
136
3.4.4.8 Economic comparison of agricultural activities in Prey Kabas
Among the 11 agricultural economic activities, there are seven main activities done by many
households in Prey Kabas. They are rice-based activities including rice (HR, 2R, 3R, DR) and
raising cattle, poultry and pigs. Rice is the most dominant activity, with 2R and DR cultivated
by the majority of the household.
With the capacity to irrigate, the average yield is almost equal between HR, 2R, 3R
and DR at between four to five tons per hectare. The 2R system give average yield of 4.75
tons per hectare, while the 3R system has a yield of 4.75 tons per hectare. The DR system has
a yield of 5.43 tons per hectare and the HR system yields 4.2 tons per hectare. Excluding the
paid labour, the investment per hectare (IC per hectare) of 2R is 2.29 time higher than HR. 3R
investment per hectare is 3.4 times higher than HR, while DR is 1.15 times higher than HR. If
both IC and PL are considered as investments per hectare, then 2R is 2.08 times higher than
HR, 3R is 3.02 times higher than HR and DR is 1.10 times higher than HR. Comparing the
gross output per hectare, the two times investment higher than HR generates a gross output
1.66 time higher than HR. 3.4 times investment give gross output of 3R 2.78 time higher than
HR, while DR with 1.1 investment higher than HR produces a gross output 0.96 times lower
than HR.
In terms of output per unit of labour, 2R produces 11.13 USD per man-day, which is
slightly lower than 2R and 3R, which produce an almost identical labour productivity of 12.11
USD per man-day and 12.13 USD per man-day respectively. Therefore, in terms of economic
output per unit of labour, HR, 2R and 3R are about the same. That is why it is also more
interesting for farmers who is want to save labor grow HR. This is because HR uses less
input, less water and less pesticide than other rice-cropping methods. Moreover, the price of
2R, 3R and DR fluctuates and is not stable, therefore, given the high input cost, these three
productions are prone to be income negative if the price is too low (below 700 riel per
kilogram); however, they can also bring in a high income if the yield is high and price is
above 900 or 1000 riel per kilogram. Hence, growing HR beside for home consumption36
and
labour saving, it is also a backup when other rice becomes income negative to grow. Usually,
HR price is stable, ranging from 1,100 to 1,300 Riels per kilogram. DR land productivity is
776.23 USD per hectare, which almost identical to HR whose land productivity is 797.16
USD per hectare. However, the economic output per unit of labour for DR is 2.21 times
36
Due to high input use such particularly pesticide, usually family in Prey Kabas did not consume IR rice.
Instead, they grow HR rice for home consumption.

137
higher than HR, 2.03 times higher than 2R and 2.02 times higher than 3R. Therefore, 2R and
3R are more interesting to those who are have a small amount of land and need to maximize
the economic output per unit of land. However, the economic output per unit of labour is also
most the same for HR, 2R and 3R. DR is more attractive since in produces the highest
economic output per unit of labour. Since humans are economically rational, then tend to
maximize production if they can, in this case if they have full access to irrigation. However,
the combination of HR, 2R, 3R shown by the survey could also the choice of household to
optimize the family‟s labour availability and for other non-economic reasons such as health
safety of consuming HR, which is produced using chemical-free input.
Table 46 Economic comparison of agricultural activities in Prey Kabas
Economic comparison of farm activities
Prey Kabas
HR 2R 3R DR VG AC CAT PT PIG CR FT NF MIG
Land (ha) 0.55 0.80 0.66 1.04 0.22 0.13 - - - - - - -
GO (USD/ha) 1260.77 2087.02 3510.85 1209.33 3064.81 1793.48
- - - - - -
GVA (USD/ha) 902.62 1280.00 2312.11 801.99 2637.96 1689.67 - - - - - - -
Yield (t/ha) 4.20 4.75 5.05 5.43 - - - - - - - - -
IC (USD/ha) 352.94 807.02 1198.74 407.34 426.85 103.80 - - - - - - -
PL (USD/ha) 180.07 301.38 410.42 176.49 0.00 25.00 - - - - - - -
Labor (man-day/ha) 71.82 114.67 148.35 54.70 86.67 152.17 121.00 50.69 115.91 22.34 1.06 - -
Labor family (man-day/ha)
29.63 49.97 63.79 10.63 86.67 152.17 121.00 50.69 115.91 22.34 1.06 - -
Land productivity
(USD/ha) 797.16 1279.47 2261.35 776.23 2637.96 1689.67 - - - - - - -
Labor productivity
(USD/man-day) 11.13 12.11 12.13 24.56 29.23 10.46 1.58 3.16 2.44 3.64 100.00
- -
Net income/Profit (USD/ha)
722.55 978.62 1901.69 625.51 2894.21 1664.67 - - - - - - -
Income rate (USD/1 USD
invested) 1.38 0.97 1.32 1.28 6.49 3.22 - - - 11.02 - - -
Number of household 20 79 17 57 3 2 54 58 28 43 3 73 13
GO per household
(USD/hh) 613.21 1594.77 2204.92 1194.68 450.00 150.00 635.73 291.77 622.42 108.04 183.33 621 784
GVA per household (USD/hh)
423.74 970.15 1379.76 780.23 388.75 126.13 624.71 228.88 330.64 102.36 183.33 621 784
Income per household
(USD/hh) 330.19 747.41 1214.12 624.05 414.38 120.38 624.71 228.88 330.64 102.36 183.33 621 784
IC (USD/hh) 184.66 624.62 825.16 414.45 61.25 23.88 5.38 62.90 291.78 5.68 0.00 - -
PL (USD/hh) 93.55 222.75 236.67 156.17 0.00 5.75 0.00 0.00 0.00 0.00 0.00 - -
Consumption (USD/hh) 263.76 406.40 357.99 77.32 0.00 0.00 0.00 193.61 0.00 75.44 0.00 - -
Number of cattle per hh, number of pig per hh - - - - 3.01 - 4.15 - - - -
Number of cattle sold per hh, number of pig per hh - - - 1.52 - 5.18 - - - -
Cattle price per head, per kg for pig - - - - 482.52 - 1.98 - - - -
Cattle remain - - - - 2.14 - - - - -
In terms of income per household (added value minus paid labour) HR contributes 330
USD per household per year. 2R contributes an average income 2.23 times higher than HR,
while 3R contributes nearly 3.67 times more than HR. The land productivities is almost the

138
same as DR but DR contributes twice as much income as HR. The average consumption of
HR is 263 USD per household, which is almost the equal to the HR net income of 330.19
USD per household. The qualitative interviews confirmed that HR is mainly grown for home
consumption. 2R and 3R also contribute to home consumption about the same amount per
household, at 406.4 USD per household and 358 USD per household respectively. In the
interviews, people reported that 2R and 3R are produced for income-generation. The
consumption of 2R and 3R implies that there some households that have a small amount of
land and therefore cannot allocate any land to grow HR for home consumption, so they need
to maximize production by growing 2R and 3R and their gross output will be kept for both
home consumption and selling for income generation. Usually, DR production is not for home
consumption. Consumption of DR occurs when a family has only DR land. Hence for rice
cropping, the main source of income is 2R, 3R and DR.
Again, the same as in Tram Kak and Otdar Meanchey, cattle contribute a significant
amount of income to households, of about the same as the 2R income. Poultry and pigs
contribute moderate income of 229 USD per household and 331 USD per household
respectively, which is about the same amount as HR. Non-farm and migration income are also
the sources of income (Table 46).
3.4.5 Concluding remarks
In this section, all agricultural activities have been examined and categorized into main
groups in order to make cross comparisons within zones and across zones. Among 13 main
economic activities, there are 10 main agricultural activities, in which six main activities are
crops, four main activities are animal-raising, one main activity is exploiting the common
resources and two main activities are non-farm work and migration. The economic
performance of each activity and its contribution to household income has been explored.
In all zones, the average income from cattle contributes a significant amount compared
to the average income from rice, annual crops and vegetables. Poultry, pigs and aquaculture
contribute moderate income to households but they are key elements for diversification. Fruit
trees and common resources play important roles to a few households but in general they
contribute just an optional and additional source of protein to rural households. Cattle stock in
each household is a source of income, providing a safety net for when people are in urgent
need of income, such as to buy a two-wheel tractor or pay for medical treatment or children‟s
weddings. Though cattle have lowest labour productivity and require labour look after, having

139
cattle can be an economic assurance to households that each rural household should take into
account.
In Otdar Meanchey, the economic activities of farming were characterized by rain-fed
mono rice cropping (HR) and annual crops (mainly cassava, watermelon, maize and beans;
the vegetables grown are cucumber, eggplant, watermelon and other leafy vegetables). In
Tram Kak, farm economic activities are a rice cropping system of early rainy season rice and
late rainy season rice (ER and HR), and rainy season rice (HR). Except for cassava, the other
annual crops and vegetables were cultivated the same as in Otdar Meanchey. Prey Kabas is
different from the previous two zones due to the access to irrigation in this area allows for
intensified rice cropping, include 2 short cycle rice (2R), 3 short cycle rice (3R), rainy season
rice (HR) and water receding rice (DR). Annual crops and vegetable are rarely found in this
area.
In Otdar Meanchey, HR has low economic output per unit of land but the highest
economic output per unit of labour in comparison to other activities. Hence, the key to
increase agricultural output is to expand HR land. That is why land size is much more
important for people in this area. This provides motivation for migration, which is done not
just to seek complementary income but to accumulate financial capital to expand rice land as
well as to buy the two-wheel tractors which are necessary for rice farming in the area.
Growing cassava is more economically attractive than HR but requires high labour input.
Cassava land productivity is 2.74 time higher than HR but yields almost identical labour
productivity, with 4.73 USD per man-day for HR and 4.61 USD per man-day for AC. The
qualitative interviews suggests that rather than anticipating a high economic return from
cassava, people who had just began growing cassava the year interviewed did so as a means to
justify the land used and to demonstrate they were owner of the land in order to get the land
title rather than the anticipation for high economic return. The local agricultural wage labour
is 3.47 USD per man-day, which is lower than HR, AC, VG and poultry-raising. While the
labour productivity of construction work is 3.86 USD per man-day, garment workers receive
2.08 USD per man-day, hence, it is if people have enough land, it is preferable to do HR and
AC rather than migration. However, wage labour in Thailand is 300 bath per man-day, which
is why many people in this area to migrate to Thailand.
In Tram Kak, a combined ER and HR system brings the highest economic per unit of
land and per unit of labour in comparison to other farm activities. Since the area has only a
small land size per household, people try to diversity through digging ponds to grow ER and

140
HR rice and vegetables. The key to increasing household income is to diversify rice via
digging ponds to store water. Poultry, pigs and fish are the key complementary elements for
households to combine with rice farming and non-farming activities. The observations during
the interview with all young couples in Tram Kak reveal that a husband or wife has to engage
with non-farm activities, for example husband have to work as garment worker or
construction worker, and then return to come back home to do rice in the cultivation season.
The rice cultivation is to secure the food for consumption and the non-farm income covers the
family‟s daily expenses.
In general, over the three zones, non-farm income and migration income per
household are notable in all zones. Both contribute even more than rice based in Otdar
Meanchey and Tram Kak.
Due to access to irrigation, bigger land size and access to water receding rice land,
households in Prey Kabas can intensify rice up to three times per years. The main source of
agricultural income in the area is 2R, 3R and DR Rice cropping. Though land productivities
of 2R and 3R is higher than HR, labour productivities are almost identical (2R:12.11 USD per
man-day, 3R:12.13 USD per man-day and HR: 11.13 USD per man-day). DR has highest
labour productivity at 24.56 USD per man-day with the lowest land productivity. The
additional sources of income are cattle and animal-raising, particularly pig and poultry.
Vegetable and annual crops are not key activities in this area.
In all zones, agricultural wage labour activities are available for only short periods of
time: on average 11 days per year. People therefore view it is just a supplementary income.
Rural households cannot solely rely on that income.
Based on land and labour productivities, in the next section we develop a land value
index from the household expenses and consumption presented in the section socioeconomic
diagnostics. This allows for the calculation of the poverty line in each zone and, therefore, the
minimum surface for sustainable integration in farming. Finally, farm household‟s economics
can be examined in a household farm typology that will be developed based on main
economic activities presented in this section.
3.5 Land Value Index
When there is a diversity of cropping systems within each of the areas, and even more
between the various areas, it increases the potential of each plot of land to generate added
value and income, independently of the capacity of the households to take advantage of this
141
potential. The mean land productivity ranges from 275 USD per hectare for HR in Otdar
Meanchey to 2,261 USD per hectare for three rice crops per year in the irrigated plots of Prey
Kabas, which corresponds to a range of 1 to 8. Being mean values, these data do not express
the individual capacities of the various households to generate added value and income, but
rather the agro-ecological potential of the land, mainly linked with the quality of the soil, the
local climatic conditions and the access to irrigation.
In order to allow comparisons between the holdings of the households within each of
the three areas, I calculate a land value index which compares the potential of each plot of
land – carrying a defined cropping system – to generate added value in comparison with a plot
of the only system that is common to all the three zones, heavy season rice. The Otdar
Meanchey index of cropping system A (LIA) is calculated by dividing the land productivities
of cropping system A (LPA) by the land productivity of heavy season rice (LPHR).
The higher the LVI is for one specific plot, the more the land will have the capacity to
generate a high income. The land potential value (LPV) of one specific household is then
calculated by multiplying the area cultivated in each cropping system by the LVI of this
cropping system.
The total land potential value (TLPV) for one specific household is then the sum of LPVs of
all the cropping systems A, B, C, D…Z that this household undertakes.
LPV of Household H = (Land cultivated in CS1) * + (Land cultivated in CS2)
* + ….
LPV of Household H = ∑ (Land cultivated in CSi) *
The LPV represents the holding (virtual number of hectares) that would give the same income
to the household as the one actually held if it was totally cultivated in heavy rice. The LPV
allows us to make comparisons between household‟s holdings while erasing the impact of the
various cultivation systems and their differences in land productivity.
142
Based on land productivity of each cropping in each zone, land value index is calculated and
shown in Table 47.
Table 47 Land Value Index by three zones
Land index of
cropping system
Takeo non-
irrigated zone
Takeo irrigated
zone
Otdar
Meanchey
HR 1 1 1
ER.HR 1.35 1.61 n. a
3R n. a 2.84 n. a
DR n. a 0.97 n. a
AC 1.16 2.12 2.161
VG 2.31 1.69 1.953
3.6 Minimum Surface for Sustainable Integration in Family Farming (MSI)
The Minimum Surface for Sustainable Integration in Family Farming (MSI) is the minimum
amount of land that, for one household in a given agro-ecological environment, can support
the creation of an added value equivalent to the income needed to ensure the sustainability
and continuity of rural livelihood. For any youth integration in farming, MSI is identified in
order to identify the minimum threshold in the land holding that can ensure the sustainability
of farming on a full-time basis (without requiring any off-farm or non-farm complement).
The calculation of the MSI, in each of the three areas, requires:
1. Calculating the minimum threshold of income susceptible to allow a sustainable
livelihood (poverty line); and
2. Calculating the amount of land that is susceptible to allow the production of such an
added value, given the land potential expressed in each of the areas
3.6.1 Calculating poverty line/minimum need per person per day or per year in USD
Option 1: My initial definition of need is defined by using the declaration of household
expense consumption and consumption on agriculture and common resources as an expense,
then I sum all incomes from the different sources of earning, including farming and non-
farming, to see the final balance of family. I will then consider those who have a positive
balance are those who meet sustained requirements and vice-versa. However, by doing so,
there is ethical question on the expense of family might be different according to the
preference of the family.
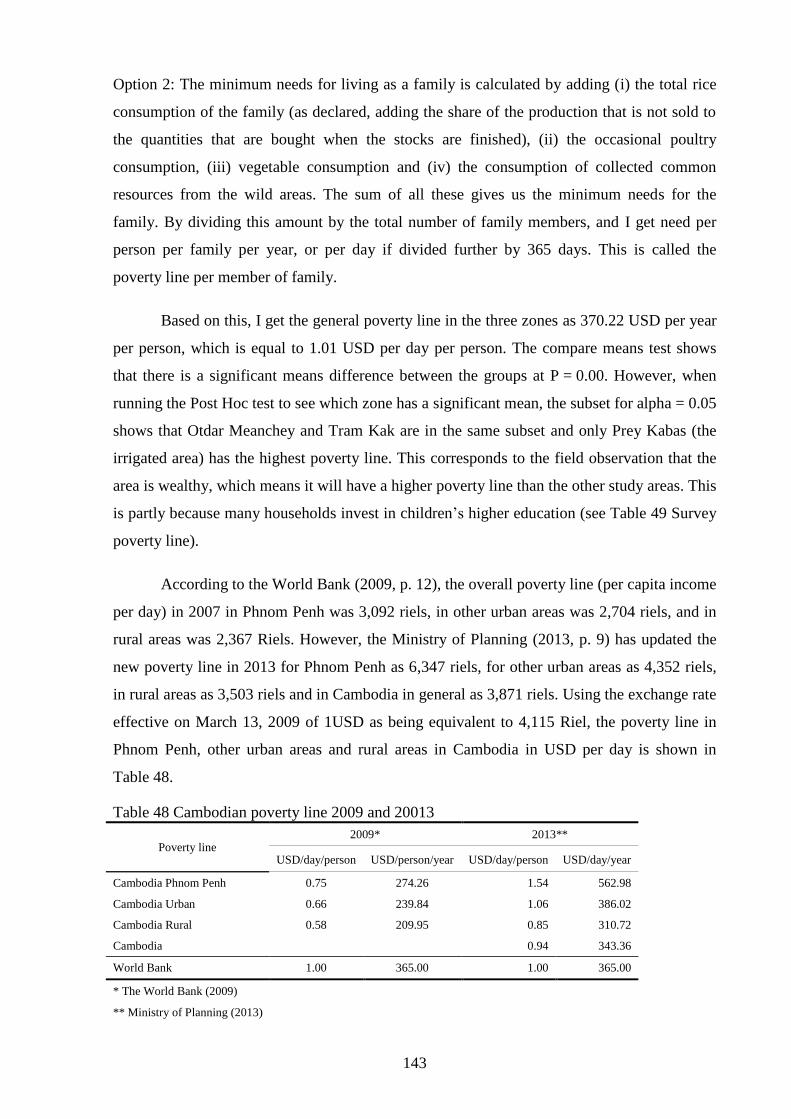
143
Option 2: The minimum needs for living as a family is calculated by adding (i) the total rice
consumption of the family (as declared, adding the share of the production that is not sold to
the quantities that are bought when the stocks are finished), (ii) the occasional poultry
consumption, (iii) vegetable consumption and (iv) the consumption of collected common
resources from the wild areas. The sum of all these gives us the minimum needs for the
family. By dividing this amount by the total number of family members, and I get need per
person per family per year, or per day if divided further by 365 days. This is called the
poverty line per member of family.
Based on this, I get the general poverty line in the three zones as 370.22 USD per year
per person, which is equal to 1.01 USD per day per person. The compare means test shows
that there is a significant means difference between the groups at P = 0.00. However, when
running the Post Hoc test to see which zone has a significant mean, the subset for alpha = 0.05
shows that Otdar Meanchey and Tram Kak are in the same subset and only Prey Kabas (the
irrigated area) has the highest poverty line. This corresponds to the field observation that the
area is wealthy, which means it will have a higher poverty line than the other study areas. This
is partly because many households invest in children‟s higher education (see Table 49 Survey
poverty line).
According to the World Bank (2009, p. 12), the overall poverty line (per capita income
per day) in 2007 in Phnom Penh was 3,092 riels, in other urban areas was 2,704 riels, and in
rural areas was 2,367 Riels. However, the Ministry of Planning (2013, p. 9) has updated the
new poverty line in 2013 for Phnom Penh as 6,347 riels, for other urban areas as 4,352 riels,
in rural areas as 3,503 riels and in Cambodia in general as 3,871 riels. Using the exchange rate
effective on March 13, 2009 of 1USD as being equivalent to 4,115 Riel, the poverty line in
Phnom Penh, other urban areas and rural areas in Cambodia in USD per day is shown in
Table 48.
Table 48 Cambodian poverty line 2009 and 20013
Poverty line 2009* 2013**
USD/day/person USD/person/year USD/day/person USD/day/year
Cambodia Phnom Penh 0.75 274.26 1.54 562.98
Cambodia Urban 0.66 239.84 1.06 386.02
Cambodia Rural 0.58 209.95 0.85 310.72
Cambodia
0.94 343.36
World Bank 1.00 365.00 1.00 365.00
* The World Bank (2009)
** Ministry of Planning (2013)
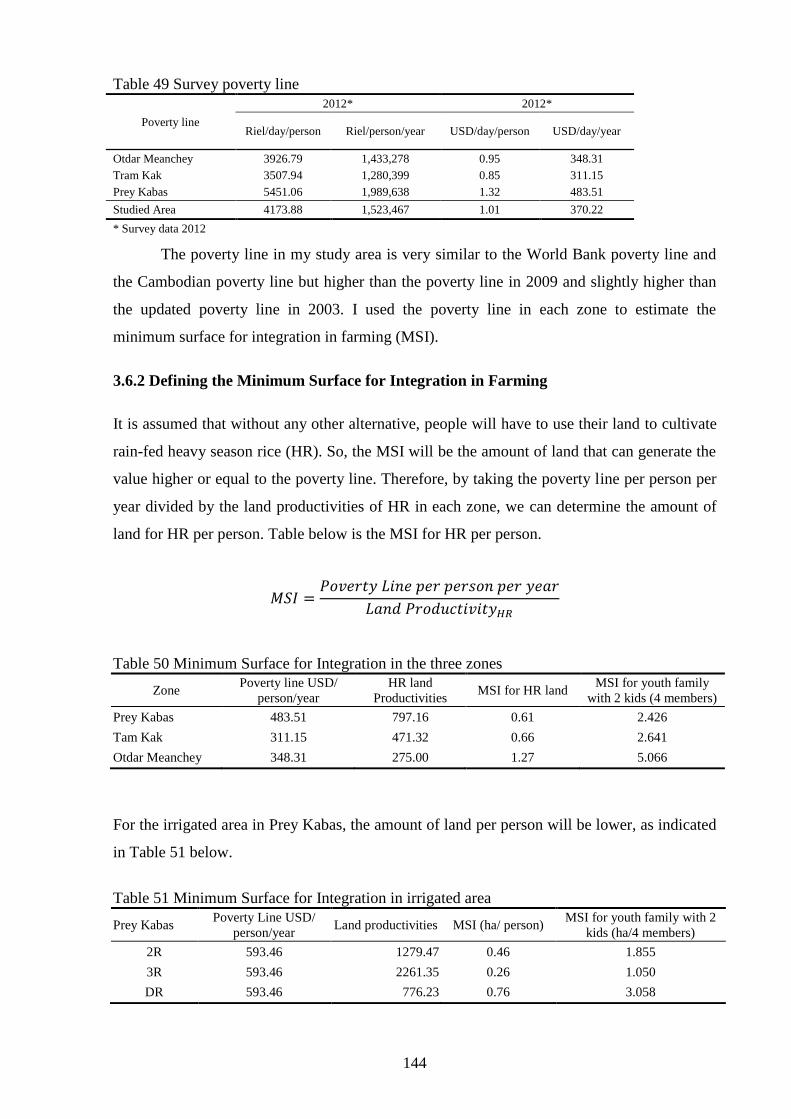
144
Table 49 Survey poverty line
Poverty line
2012* 2012*
Riel/day/person Riel/person/year USD/day/person USD/day/year
Otdar Meanchey 3926.79 1,433,278 0.95 348.31
Tram Kak 3507.94 1,280,399 0.85 311.15
Prey Kabas 5451.06 1,989,638 1.32 483.51
Studied Area 4173.88 1,523,467 1.01 370.22
* Survey data 2012
The poverty line in my study area is very similar to the World Bank poverty line and
the Cambodian poverty line but higher than the poverty line in 2009 and slightly higher than
the updated poverty line in 2003. I used the poverty line in each zone to estimate the
minimum surface for integration in farming (MSI).
3.6.2 Defining the Minimum Surface for Integration in Farming
It is assumed that without any other alternative, people will have to use their land to cultivate
rain-fed heavy season rice (HR). So, the MSI will be the amount of land that can generate the
value higher or equal to the poverty line. Therefore, by taking the poverty line per person per
year divided by the land productivities of HR in each zone, we can determine the amount of
land for HR per person. Table below is the MSI for HR per person.
Table 50 Minimum Surface for Integration in the three zones
Zone Poverty line USD/
person/year
HR land
Productivities MSI for HR land
MSI for youth family
with 2 kids (4 members)
Prey Kabas 483.51 797.16 0.61 2.426
Tam Kak 311.15 471.32 0.66 2.641
Otdar Meanchey 348.31 275.00 1.27 5.066
For the irrigated area in Prey Kabas, the amount of land per person will be lower, as indicated
in Table 51 below.
Table 51 Minimum Surface for Integration in irrigated area
Prey Kabas Poverty Line USD/
person/year Land productivities MSI (ha/ person)
MSI for youth family with 2
kids (ha/4 members)
2R 593.46 1279.47 0.46 1.855
3R 593.46 2261.35 0.26 1.050
DR 593.46 776.23 0.76 3.058
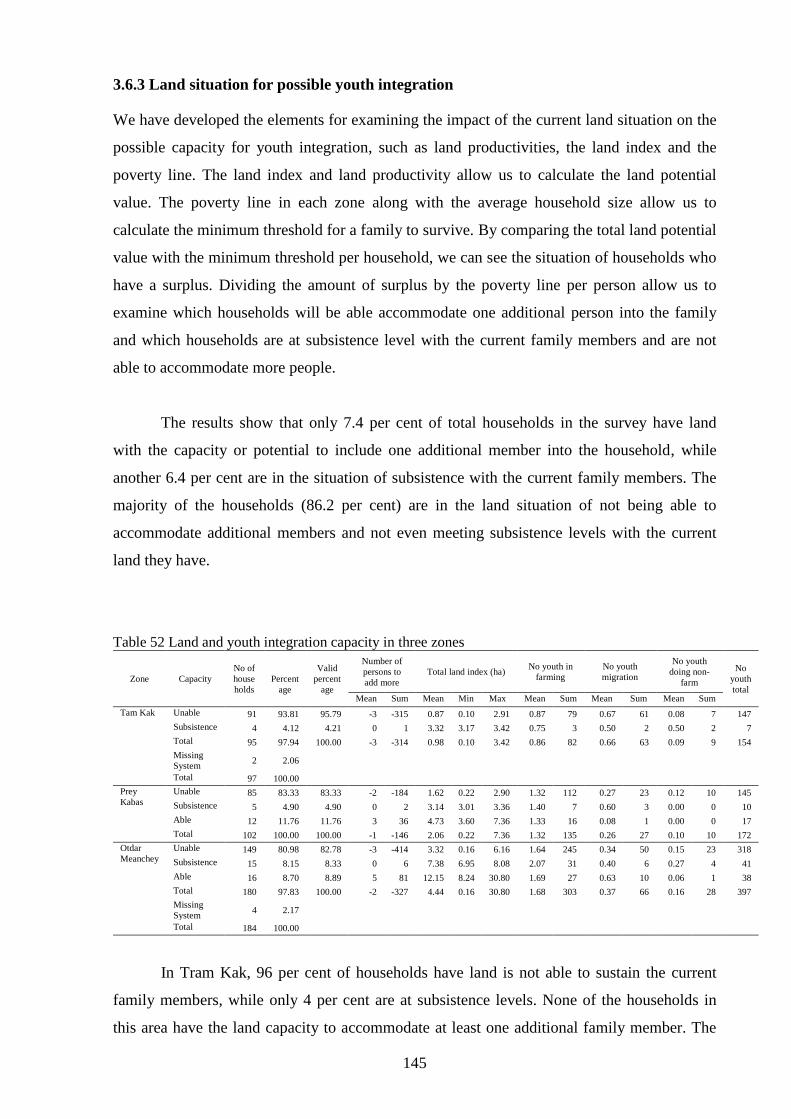
145
3.6.3 Land situation for possible youth integration
We have developed the elements for examining the impact of the current land situation on the
possible capacity for youth integration, such as land productivities, the land index and the
poverty line. The land index and land productivity allow us to calculate the land potential
value. The poverty line in each zone along with the average household size allow us to
calculate the minimum threshold for a family to survive. By comparing the total land potential
value with the minimum threshold per household, we can see the situation of households who
have a surplus. Dividing the amount of surplus by the poverty line per person allow us to
examine which households will be able accommodate one additional person into the family
and which households are at subsistence level with the current family members and are not
able to accommodate more people.
The results show that only 7.4 per cent of total households in the survey have land
with the capacity or potential to include one additional member into the household, while
another 6.4 per cent are in the situation of subsistence with the current family members. The
majority of the households (86.2 per cent) are in the land situation of not being able to
accommodate additional members and not even meeting subsistence levels with the current
land they have.
Table 52 Land and youth integration capacity in three zones
Zone Capacity
No of
house
holds
Percent
age
Valid
percent
age
Number of
persons to
add more
Total land index (ha) No youth in
farming
No youth
migration
No youth
doing non-
farm
No
youth
total Mean Sum Mean Min Max Mean Sum Mean Sum Mean Sum
Tam Kak Unable 91 93.81 95.79 -3 -315 0.87 0.10 2.91 0.87 79 0.67 61 0.08 7 147
Subsistence 4 4.12 4.21 0 1 3.32 3.17 3.42 0.75 3 0.50 2 0.50 2 7
Total 95 97.94 100.00 -3 -314 0.98 0.10 3.42 0.86 82 0.66 63 0.09 9 154
Missing
System 2 2.06
Total 97 100.00
Prey
Kabas
Unable 85 83.33 83.33 -2 -184 1.62 0.22 2.90 1.32 112 0.27 23 0.12 10 145
Subsistence 5 4.90 4.90 0 2 3.14 3.01 3.36 1.40 7 0.60 3 0.00 0 10
Able 12 11.76 11.76 3 36 4.73 3.60 7.36 1.33 16 0.08 1 0.00 0 17
Total 102 100.00 100.00 -1 -146 2.06 0.22 7.36 1.32 135 0.26 27 0.10 10 172
Otdar
Meanchey
Unable 149 80.98 82.78 -3 -414 3.32 0.16 6.16 1.64 245 0.34 50 0.15 23 318
Subsistence 15 8.15 8.33 0 6 7.38 6.95 8.08 2.07 31 0.40 6 0.27 4 41
Able 16 8.70 8.89 5 81 12.15 8.24 30.80 1.69 27 0.63 10 0.06 1 38
Total 180 97.83 100.00 -2 -327 4.44 0.16 30.80 1.68 303 0.37 66 0.16 28 397
Missing
System 4 2.17
Total 184 100.00
In Tram Kak, 96 per cent of households have land is not able to sustain the current
family members, while only 4 per cent are at subsistence levels. None of the households in
this area have the land capacity to accommodate at least one additional family member. The
146
average land value index of those who is not subsistence is 0.87 hectares, ranging from a
minimum of 0.1 hectares to a maximum of 2.91 hectares. The mean land value index of those
who are at subsistence is 3.32 hectares, ranging from 3.32 hectares to 3.42hectares.
In Prey Kabas, 83 per cent of households have land capacity below subsistence level,
with a mean land value index of 1.62 hectares, ranging from 0.22 to 2.90 hectares. 5 per cent
of households has land capacity for subsistence, with a mean land value index of 3.14 hectares
ranging from 3.01 to 3.36 hectares. However, 12 per cent of households have the land
capacity to add at least one additional member. Their mean land value index is 4.73 hectares,
ranging from 3.6 to 7.36 hectares.
In Otdar Meanchey, 83 per cent of households are in the situation where the land has
the capacity to produce below the subsistence levels. Their average land value index is 3.32,
ranging from 0.16 to 6.16 hectares. 8 per cent of households are at subsistence with a land
value index of 7.38 hectares, ranging from 6.95 to 8.08 hectares. 9 per cent of households
have the land capacity to add at least one additional member, given their average land value
index of 12.15 hectares ranging from 8.24 to 30.80 hectares.
Although the majority of households has a land value index below the subsistence
level, both households who are under-subsistence and at subsistence in Tram Kak are
currently keeping one youth working in farming (0.87 persons per household and 0.75 persons
per household), while in Prey Kabas these figures are 1.32 and 1.40 person per household
respectively. In Otdar Meanchey, households that have a land capacity below subsistence are
hosting 1.64 youths per household and households at subsistence are hosting youths at 2.07
persons per household.
Even though the percentage is not high, there are households that have the land ability
to add more youth in Prey Kabas where there is the capacity to irrigate the land. This is the
same in Otdar Meanchey, where some households have farms of a large size. The able
household has an average capacity to integrate three persons per household (standard
deviation 1.79) in Prey Kabas and five persons (standard deviation 8.3) in Otdar Meanchey.
The standard deviation of higher than the mean value suggests that there is a high variation
among the capacity of households, because some household have large land size with the high
capacity to add more people. This makes the average capacity per household high.

147
Although the analysis survey data suggest that 86.2 per cent of households have a land
value index below the subsistence level they are, in fact, currently accommodating youths in
farming (Table 53). Total sum number of youths within the below-subsistence households, at
subsistence households and households able to accommodate an additional member shows
that the households unable to support youths should be minus 913 persons but, in fact, 191
youths are currently working in this group of households (65 per cent), while 84 youths are on
migration (29 per cent) and 17 youths doing non-farm activities (6 per cent).
Table 53 Land value index and actual youth in farming Capacity youth integration No of
household
Land value
index capacity
to add in person
No youth
in farming
No youth
migration
No youth
doing non-
farm
Total youth
Unable 325 -913 191 84 17 292
per cent with total youth 65 per cent 29 per cent 6 per cent 100 per cent
Subsistence 24 9 10 5 2 17
per cent with total youth 59 per cent 29 per cent 12 per cent 100 per cent
Able 28 116 43 11 1 55
per cent with total youth 78 per cent 20 per cent 2 per cent 100 per cent
Total 377 -787 244 100 20 364
per cent with total youth 67 per cent 27 per cent 5 per cent 100 per cent
Looking at the distribution among the households in each zone (Figure 25) shows that
average land value index per household is 0.98 hectares in Tram Kak, 2.06 hectares in Prey
Kabas, and 4.34 hectares in Otdar Meanchey. The majority of households in the three areas
have a land value index below the subsistence level of 3.32, 3.14 and 7.38 hectares in each
zone respectively. This suggests that land alone should not be an assessment criterion for
youth integration in farming. The contribution of other factors such as the combination of
activities such as animal-raising, non-farm work and migration income would enhance the
household‟s capacity. Thus, the land result for youth integration capacity is apparently lower
than the current land index.
Figure 25 Histogram of land index in three zones
Therefore, a farm typology will be done in order to see the diversity and different
strategies of households needed to further examine the youth‟s integration capacity. The next
section discusses the farm typology in each zone, describing the farm types and their
148
economic capacity and comparing the minimum threshold of a household within each farm
type.
3.7 Diversity of household: A typology of farm households
Due to the heterogeneity of farming systems in tropical humid regions, it is challenging to
fully understand their variability. Therefore, various tools and methods have been developed
and used to comprehended as well as to deal with the farming systems‟ diversity such as
wealth rankings, farm typologies and distribution (Alvarez, Paas, Descheemaeker, Tittonell,
& Groot, 2014). Typologies are, then, often used to understand and capture smallholder
farming system‟s heterogeneity. This can be achieved by classifying farms into groups that
have common characteristics, i.e. farm types. Since this study employs a socioeconomic
survey to understand rural livelihoods, the principal component analysis (PCA) and cluster
analysis (CA) methods are used as they are suitable for analysing the socioeconomic
characteristics of typical farm households (Bidogeza, Berentsen, De Graaff, & Lansink,
2009). The objective of this section is to use the statistical methods PCA and CA in order to
typify farm households into main groups based on their common characteristics in the three
zones so that the farm economic capacity of each type can be assessed and the farm strategy
identified. The result concerning the farm types will be used to further examine the youth and
adult farm households and their integration capacity in the next chapter.
3.7.1 Principle component analysis and cluster analysis
Considering the different situations of the three zones that may impact on different household
strategies and different capacities for youth integration, the PCA has been done by zone. The
initial idea was to select only two provinces of Cambodia, which represent a high density area
(Takeo) and a low-density area (Otdar Meanchey), and the sample survey intended to collect
an equal proportion of 200 households from each province. In the actual data collection, we
received 199 household surveys in the high-density area and 183 in the low-density area.
However, in the high-density area (the Takeo zone), Tram Kak was characterized by small
land holdings per family and limited access to irrigation. Therefore, people tried to diversify
crops and more family members engaged in non-farm activities and migration, especially
garment work, due to the proximity to the capital city Phnom Penh. The Prey Kabas zone, in
contrast, , was located in the same province but had access to irrigation that allowed people to
intensify rice cropping up to three times per year. In addition to this, they had access to water
receding rice fields. The land holding per family in this area is also higher than Tram Kak.
Due to the substantial differentiation of characteristics, the study decided to do a farm
149
typology in each zone rather than general typology that includes the entire three zones
together. By excluding two families that were not suitable for data analysis due to insufficient
data collected and eight families who were statistical outliers, the study had 372 households
for the farm typology. In Tram Kak, there were 96 families, of which one household was
excluded. In Prey Kabas, there were 95 families in the zone, of which one family was
excluded and another six families were statistical outliers. In Otdar Meanchey, 181
households were included in the analysis, of which two families were excluded due to being
statistical outliers. These families are big land owners. Table 54 explains the attributes of the
variables and thee descriptions from the survey, including the PCA.
The survey data of farm households in each zone were constructed using the
multivariate statistical techniques of principal component analysis (PCA) to reduce the dataset
into non-correlated components. After that, hierarchical cluster analysis was used to partition
the PCA output into clusters. All analyses were executed in XLSTAT 2016.06.38277 (in
Microsoft Excel). The PCA condenses all information from the original interdependence
variable into a smaller set of variables. Variables that are strongly independent, correlate very
strongly or are double correlated, for example gross output and gross value added, have been
examined. Outlier cases were removed before reaching the final PCA analysis. The selected
variables were used to construct the factors using PCA. Factors were rotated using orthogonal
rotation (the Varimax method). Based on Kaiser‟s criterion, all factors exceeding an
eigenvalue of one were retained for future analysis. Factors retained from PCA were used in
cluster analysis using the agglomerative hierarchical clustering (AHC) tool, which is Ward‟s
hierarchical procedure. The numbers of cluster retained from Ward‟s method, a dendrogram,
were used to select the optimal clusters. After that, one-way analysis of variance was
performed to see the difference between the clusters.

150
Table 54 Variable description for PCA
Name of variable Description Unit Include in PCA
Zone Tram Kak
(N=96)
Zone Prey Kabas
(N=95)
Zone Otdar
Meanchey (N=181)
TK
(1)
PB
(2)
OMC
(2) Mean STDEV Mean STDEV Mean STDEV
Human resources
Total active workers Total number of active persons doing farm and non-farm activities person ✓
2.95 1.22 2.72 1.00 3.44 1.67
Active farm worker Number of active persons actually working on farm person ✓ ✓ ✓ 2.18 0.88 2.37 0.76 2.88 1.40
Per cent labor migration Percentage of migrants to total number of active workers of the family per cent
✓
19.02 24.62 6.79 14.77 9.97 18.11
Age of household head Farmer's age in years year ✓ ✓ ✓ 45.02 11.48 46.25 13.46 46.72 12.68
HH size Number of household members person
4.82 1.40 4.95 1.56 5.55 2.05
Land resources
Farm size
Total land size used for crops cultivation (rice, vegetable and annual
crop) in hectares Ha ✓ ✓ ✓ 0.74 0.56 1.41 0.84 3.80 2.29
Land labor ratio The division of total cultivated land to number of active farm workers ha/ person ✓ ✓ ✓ 0.37 0.33 0.65 0.45 1.52 1.16
per cent rice land Percentage of rice land to total land per cent ✓ ✓ ✓ 82.98 22.67 100.00 0.00 92.78 18.43
per cent AC land Percentage of annual crop land to total land per cent ✓ ✓ ✓ 10.13 16.98 0.00 0.00 4.32 11.54
per cent VG land Percentage of vegetable land to total land per cent ✓ ✓ ✓ 5.85 11.07 0.00 0.00 0.69 2.64
Financial resources
Total household assets
Sum of monetary value of home assets, agricultural asset and cattle
stock value USD ✓
2589.24 1670.19 3464.63 2291.09 2601.34 2093.79
Agricultural assets Sum of monetary value of agricultural equipment USD
✓ ✓ 716.77 724.60 1591.89 1826.90 1612.15 1592.38
HH expenditure
Household expenses for basic consumption such as food, clothes, and
medical needs USD ✓ ✓ ✓ 1033.05 495.77 1475.50 610.29 1177.57 552.29
Agricultural expenses
(IC+PL) Sum of expense all IC (Intermediary Cost) and PL (paid labor) USD
✓ 207.42 218.16 1338.25 797.01 499.38 368.45
Cattle stock value Value of cattle not yet sold for income USD
✓ 1057.29 787.63 915.79 621.65 417.13 712.03
Rice IC+PL Expense on rice include intermediary cost and paid labor cost USD
113.68 131.27 1212.24 749.68 389.23 290.79
AC IC+PL Expense on annual crop include intermediary cost and paid labor cost USD
13.69 29.83 0.00 0.00 24.62 76.11
HH income sources
Agricultural GVA
Total agricultural gross valued added (sum of all gross values added
from agricultural activities) USD ✓ ✓ ✓ 971.46 860.24 2108.12 1245.36 1296.35 785.81
Rice GVA
Total sum of gross value added from rice cropping system HR, 2R,3R
and DR USD ✓ ✓ ✓ 358.51 385.89 1492.20 977.53 813.78 545.32
AC GVA Gross value from vegetable productions USD ✓ ✓ ✓ 39.61 75.67 0.00 0.00 61.01 184.01
VG GVA Gross value added from annual crops USD ✓ ✓ ✓ 55.39 124.51 0.00 0.00 27.05 128.61
CAT GVA Gross value added from cattle mainly cow USD ✓
266.80 400.52 352.32 457.41 112.59 305.52
AN GVA
Gross value added from animal raising include pig, poultry, and
aquaculture (cattle is not included) USD
✓ ✓ 185.81 212.72 214.09 496.14 183.93 175.53
Total non-farm GVA The sum of non-farm income and migration income USD ✓ ✓
505.58 551.23 477.34 592.70 642.66 878.72
Non-farm GVA
Income from non-farm activities generate by non-migrant family
member USD
298.58 474.55 421.84 559.55 441.85 796.04
Migration GVA Income from migration including remittance send home by migrant
member USD
207.01 412.62 55.50 244.56 200.81 504.70
151
3.7.2 Farm type in Zone Tram Kak
3.7.2.1 Tram Kak PCA result and cluster analyses
From the 16 variables included in the PCA (Table 54), six components have eigenvalues
greater than 1 and are been retained for future analysis. These six variables (F1 to F6) explain
78.20 per cent of the total variability. Looking at each column of Table 55, it is possible to
define each component according to the variables which are the most strongly associated. To
make it easy to identify the largest loading, the highest value of squared cosines has been
highlighted in bold, which corresponds to the highest correlation between variable
components. The first component (F1), which explains 29.29 per cent of variance, is
positively correlated with farm size, total agricultural gross value added, rice gross value
added, cattle gross value added and household expenditure. The second component (F2),
which explains 13.90 per cent of variance, is positively correlated with per cent of annual
crop land and gross value added of annual crop while being negatively correlated with the
percentage of rice land. The third component, which explains 12.39 per cent of variance, is
positively correlated between total active working family, active farm workers and age of
household head.
We can see that the first two components are mostly related to farm size and land use,
while the third component is mostly related to family members; that is, the total number of
active workers and the educational level of the household head. The fourth component (F4),
which explains 9.02 per cent of variance, is positively correlated with the percentage of
vegetable land used and its gross value added. The fifth component, which explains 7.08 per
cent of variance, is positively correlated to land-labour ratio, while the sixth component,
which explains 6.58 per cent of variance, is related to total non-farm activities. Although
household assets is positive correlated in component F7, its eigenvalue is less than one, which
is below Kaiser‟s criterion.
The first two components have been used for running cluster analysis and three
clusters were automatically generated. Cluster 1 is denoted as TK-1, which signify zone Tram
Kak, farm type 1. The same is applied for TK-2 and TK-3.

152
Table 55 Correlations between variables and factors in Tram Kak
Name of variables Component
F1 F2 F3 F4 F5 F6 F7
Human resources
Total active workers 0.160 0.109 0.828 -0.048 0.079 0.366 0.018
Active farm worker 0.301 0.341 0.682 0.208 0.124 0.020 0.333
Age of household head 0.203 0.014 0.681 -0.053 -0.181 -0.070 -0.184
Land resources
Farm size 0.792 -0.094 0.001 -0.153 0.485 0.200 0.080
Land labor ratio 0.557 -0.221 -0.319 -0.323 0.558 0.215 -0.072
Percentage rice land -0.518 -0.676 0.273 0.006 0.305 -0.167 0.082
Percentage AC land 0.352 0.784 -0.109 -0.318 -0.068 -0.084 -0.103
Percentage VG land 0.580 0.171 -0.191 0.634 -0.115 0.229 -0.021
Financial resources
Total household assets 0.496 -0.022 -0.156 -0.116 -0.178 -0.290 0.686
HH expenditure 0.621 -0.392 -0.061 -0.204 -0.391 0.006 0.114
HH income sources
Agricultural GVA 0.858 -0.321 0.094 0.036 -0.124 -0.174 -0.166
Rice GVA 0.654 -0.501 0.135 -0.079 -0.067 -0.052 0.076
AC GVA 0.547 0.587 -0.052 -0.326 0.085 -0.083 -0.021
VG GVA 0.548 -0.051 -0.237 0.617 -0.015 0.287 -0.005
CAT GVA 0.668 -0.178 0.131 -0.027 -0.121 -0.318 -0.447
Total non-farm income -0.145 -0.220 -0.054 -0.463 -0.442 0.658 0.022
Eigenvalues 4.687 2.223 1.973 1.444 1.133 1.053 0.892
Cumulative explained variance 29.29 43.19 55.52 64.54 71.62 78.20 83.78
Figure 26 Cluster analysis in Tram Kak
3.7.2.2 Description of farm the typology in Tram Kak
The one-way analysis of variance has been done to find the similarity and the difference of
characteristics between the groups (Table 56).
Rice GVA
VG GVA
AC GVA
CAT GVA
Farm worker
per centRice land
per centAC land
per centVG land
HH EXP
Agricultural GVA
Land.labor.ratio
Active worker Total HH Assets
NF GVA
Age Land
-1
-0.75
-0.5
-0.25
0
0.25
0.5
0.75
1
-1 -0.75 -0.5 -0.25 0 0.25 0.5 0.75 1
F2 (
13
.89
pe
r ce
nt)
F1 (29.29 per cent)
Variables (axes F1 and F2: 43.19 per cent)
184
185
186
187
188 189
190
191 192 193
194
195
196
197
198
199
200
201
202
203
204
205
206
207
208
209
210
211 212
213
214 215 216 218
219 220
221
222
223 224
225
226 228
229
230 231
232
233 234
235
236
237 238 239
240
241
242
243 244
245 246
247
248
249
250
251 252
253 254
255 256 257
258 259 260
261 262
263 264 265
266 267
268
269
270 271
272
273
274
275 276
277
278
279 280
281
TK-1
TK-2
TK-3
-6
-4
-2
0
2
4
6
-4 -2 0 2 4 6 8
F2
(13.8
9 p
er
cen
t)
F1 (29.29 per cent)
Observations (axes F1 and F2: 43.19 per cent)

153
TK-1: This farm type is characterized by small land size and resource-poor
households. This cluster I account for 46 per cent of the famer households in Tram Kak. This
group differs from the other groups due the small agricultural land of average 0.37 hectares
and small household assets of 1,750 USD. This small land is mostly dedicated to rice
cropping given the average percentage of land shares uses very little for vegetables and
annual crop lands. This implies that the small land means households have less diversified
cropping than any other farm type. The income from cattle income is also small, implying that
in this group, not many people raise cattle. Given their few sources of income, this group also
spends less the other groups, even though the household size is very similar to the other the
groups. This group shares the highest percentage (60 per cent) of non-farm income (from both
non-farm work and migration income) of the groups.
TK-2: Farm type II is characterized by medium land size, medium resources and a
diversified household. This cluster accounts for 24 per cent of farm households. It is
characterized by the diversification of agricultural activities that can be seen through the
percentage of land use. Land is dedicated to growing annual crops and vegetables at the
highest rate out of all three groups. This group also relies on non-farm income, which
accounts for 26 per cent of the total average household income.
TK-3: Farm type III is characterized by medium land size, rich resources and is rice
based. This cluster accounts for 30 per cent of farm households. This group has the largest
farm size and the highest household assets and land per active family member from all the
three groups. Due to this resource endowment, this group generates the highest income of the
three groups. This type of farm also obtains 21 per cent supplementary income from non-farm
activities as well.
In summary, we can simply say that the first group (TK-1) is a resource-poor
household that relies on rice and non-farm income; the second group (TK-2) is resource-
medium household who diversify their agricultural activities (annual crops and vegetables)
with supplement these activities with non-farm income; and the third group (TK-3) is a
resource-rich household whose main activities is rice that is complemented by small vegetable
and annual crops plus non-farm income. Cattle contribute a significant amount of income to
farm types TK-2 and TK-3. Though farm TK-1 has the highest average total non-farm income
(from migration and non-farm income) from the three groups, it is not statistically different.
This suggests that non-farm income plays an important role in all farm types.
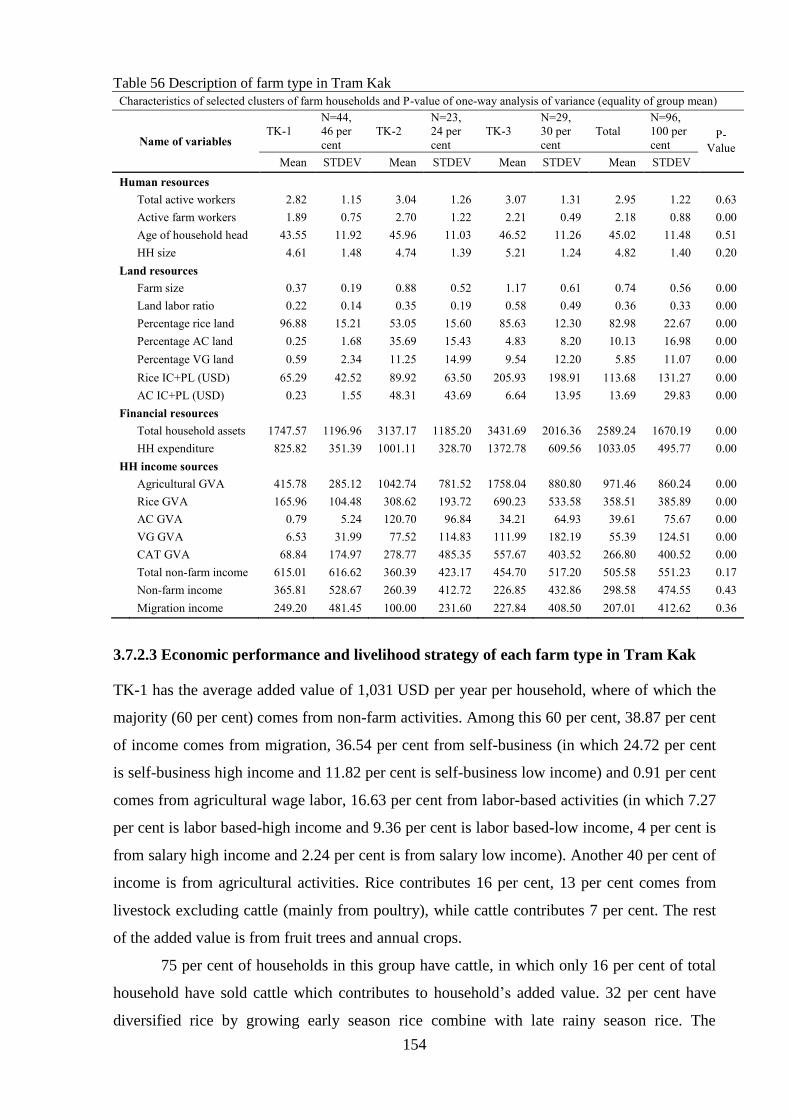
154
Table 56 Description of farm type in Tram Kak
Characteristics of selected clusters of farm households and P-value of one-way analysis of variance (equality of group mean)
Name of variables TK-1
N=44,
46 per
cent
TK-2
N=23,
24 per
cent
TK-3
N=29,
30 per
cent
Total
N=96,
100 per
cent P-
Value
Mean STDEV Mean STDEV Mean STDEV Mean STDEV
Human resources
Total active workers 2.82 1.15 3.04 1.26 3.07 1.31 2.95 1.22 0.63
Active farm workers 1.89 0.75 2.70 1.22 2.21 0.49 2.18 0.88 0.00
Age of household head 43.55 11.92 45.96 11.03 46.52 11.26 45.02 11.48 0.51
HH size 4.61 1.48 4.74 1.39 5.21 1.24 4.82 1.40 0.20
Land resources
Farm size 0.37 0.19 0.88 0.52 1.17 0.61 0.74 0.56 0.00
Land labor ratio 0.22 0.14 0.35 0.19 0.58 0.49 0.36 0.33 0.00
Percentage rice land 96.88 15.21 53.05 15.60 85.63 12.30 82.98 22.67 0.00
Percentage AC land 0.25 1.68 35.69 15.43 4.83 8.20 10.13 16.98 0.00
Percentage VG land 0.59 2.34 11.25 14.99 9.54 12.20 5.85 11.07 0.00
Rice IC+PL (USD) 65.29 42.52 89.92 63.50 205.93 198.91 113.68 131.27 0.00
AC IC+PL (USD) 0.23 1.55 48.31 43.69 6.64 13.95 13.69 29.83 0.00
Financial resources
Total household assets 1747.57 1196.96 3137.17 1185.20 3431.69 2016.36 2589.24 1670.19 0.00
HH expenditure 825.82 351.39 1001.11 328.70 1372.78 609.56 1033.05 495.77 0.00
HH income sources
Agricultural GVA 415.78 285.12 1042.74 781.52 1758.04 880.80 971.46 860.24 0.00
Rice GVA 165.96 104.48 308.62 193.72 690.23 533.58 358.51 385.89 0.00
AC GVA 0.79 5.24 120.70 96.84 34.21 64.93 39.61 75.67 0.00
VG GVA 6.53 31.99 77.52 114.83 111.99 182.19 55.39 124.51 0.00
CAT GVA 68.84 174.97 278.77 485.35 557.67 403.52 266.80 400.52 0.00
Total non-farm income 615.01 616.62 360.39 423.17 454.70 517.20 505.58 551.23 0.17
Non-farm income 365.81 528.67 260.39 412.72 226.85 432.86 298.58 474.55 0.43
Migration income 249.20 481.45 100.00 231.60 227.84 408.50 207.01 412.62 0.36
3.7.2.3 Economic performance and livelihood strategy of each farm type in Tram Kak
TK-1 has the average added value of 1,031 USD per year per household, where of which the
majority (60 per cent) comes from non-farm activities. Among this 60 per cent, 38.87 per cent
of income comes from migration, 36.54 per cent from self-business (in which 24.72 per cent
is self-business high income and 11.82 per cent is self-business low income) and 0.91 per cent
comes from agricultural wage labor, 16.63 per cent from labor-based activities (in which 7.27
per cent is labor based-high income and 9.36 per cent is labor based-low income, 4 per cent is
from salary high income and 2.24 per cent is from salary low income). Another 40 per cent of
income is from agricultural activities. Rice contributes 16 per cent, 13 per cent comes from
livestock excluding cattle (mainly from poultry), while cattle contributes 7 per cent. The rest
of the added value is from fruit trees and annual crops.
75 per cent of households in this group have cattle, in which only 16 per cent of total
household have sold cattle which contributes to household‟s added value. 32 per cent have
diversified rice by growing early season rice combine with late rainy season rice. The
155
remaining 68 per cent grow only rainy season rice. In this group, growing vegetables and
annual crops is not part of the diversified strategy of the household, with only one household
in this group growing an annual crop (bean) on 0.05 hectares which contributes only a small
amount of income to the household. 57 per cent of households in this farm type have a family
member on migration, while 68 per cent of households do non-farm activities. In this group,
four families account for 9 per cent who do not do either non-farm activities nor migration,
while 15 households (34 per cent) do both migration and non-farm activities, 10 households
(23 per cent) have a family member on migration, and 34 per cent do non-farm activities.
Therefore, the key livelihood strategy of this group is non-farm and migration-based
combined with rice-based animal-raising (mainly poultry and cattle).
Due to bigger land size (rice land) which provides the capacity to diversify cropping
activities with both annual crops and vegetables, TK-2 has the capacity to produce added
value of 1,403 USD per year per household, which is 36 per cent higher TK-1. 74 per cent of
total added value comes from agricultural activities, in which 22 per cent comes from rice, 20
per cent from cattle, 9 per cent from animal raising, 9 per cent from annual crops, 6 per cent
from vegetables, 4 per cent from fruit trees and 6 per cent from common resources. The other
26 per cent of added value comes from non-farm activities, in which 25 per cent comes from
migration, 42.73 per cent from self-business (22.02 per cent from SB-H, and 20.71 per cent
from SB-L), 10.86 per cent from SR-L, 6.65 per cent from agricultural wage labor, 7.24 per
cent from LB-H and from 7.19 per cent from LB-L.
This group diversifies agricultural activities, growing 2R rice, AC and VG. 57 per cent
of households in this farm type have diversified rice by growing early season rice combined
with later rainy season rice. Only one family in this farm type did not grow either vegetables
or annual crops, while the remaining 96 per cent have cultivated annual crops and vegetables.
Only one family (4 per cent) in this farm type does not have cattle, while the
remaining 96 per cent have cattle in stock, in which 48 per cent sold cattle which contributed
added value higher than group TK-1. Other than cattle, animal production is predominantly
poultry. 30 per cent of households in this type have a migrant family member and 65 per cent
of households do non-farm activities. Therefore, in farm type TK-2, the main livelihood
strategy is diversifying rice (2R), vegetables, annual crops and cattle, with poultry raising the
same as in TK-1. Migration and non-farm activities are also complementary to household
added value.

156
Farm TK-3 has the highest gross value added at 2,213 USD per year per household,
which is more than twice of the added value of TK-1 and 1.6 times higher than TK-2. 79 per
cent total of the household added value come from agricultural activities and 21 per cent from
non-farm activities. Among the 79 per cent of farm added value, 31 per cent comes from rice
production, 2 per cent from annual crops, 5 per cent from vegetables, 25 per cent from cattle,
14 per cent from livestock (predominantly poultry, pig and fish), 2 per cent from fruit trees
and 1 per cent from common resources. Non-farm activities contribute 21 per cent to total
household income, with 50 per cent from migration, 32.18 per cent from self-business (SB-
H:20.76 per cent, SB-L:11.42 per cent), 7.78 per cent from salaried activities (SL-H:6.83 per
cent, SL-L:0.95 per cent) and 9.86 per cent from labor-based activities (LB-H:3.79 per cent,
LB-L: 6.07 per cent).
86.2 per cent of households in this type have diversified rice by growing early season
rice with late season rice. 37.9 per cent of households grow both vegetables and annual crops.
45 per cent of households have a family member on migration while 48 per cent of
households do non-farm activities. It is notable that all households have cattle stock, in which
79 per cent have sold cattle. This is the reason why farm household in TK-3 have largest share
of income from cattle. Therefore, with a larger land size than the other groups, the key
livelihood strategy of this type of household is diversify rice, annual crops and vegetables but
largely rely on animal-raising, predominantly cattle and poultry. Pig is also more frequent in
this type in comparison to the other farm types. Migration contributes more than 50 per cent
of total non-farm income in this farm type.

157
Figure 27 Economic performance of farm type in Tram Kak
Examining the farm type capacity suggests that farm types that have more agricultural
resources, such as land, tend to have higher income added compare to non-farm activities,
while the absence or little income from farming means farm type TK-1 relies more on non-
farm or migration activities. However, the capacity to generate non-farm income is not
significantly different between the three groups, which means the group with the have bigger
land tend to have higher added value. In addition to this, the capacity to diversify agricultural
activities, which can be seen through the combination of activities and is reflected in the
composition of household income (Figure 27), tends to occur mostly in TK-2 and TK-3,
which have an average land size of 0.88and 1.17 hectares respectively and more household
resources (assets). The smallest landholders (TK-1, with an average of 0.37 hectares) have the
least capacity to diversify in all most all activities including rice, vegetables, poultry, pig and
cattle, but instead are more oriented to non-farm activities and migration.
3.7.2.4 Economic sustainability of farm type in Tram Kak
The sum of agricultural income (net), the value derived from the gross value added minus
paid labor of each agricultural activity, and total non-farm income (sum of income from both
non-farm and migration) gives the total household income. Subtracting the household
expenses from this total household income allows us to find out whether a household is
income positive or negative. Table 57 shows the situation of household income in each farm
type with and without non-farm income. With non-farm income, 59 per cent of households in
0
200
400
600
800
1000
1200
1400
1600
1800
2000
2200
TK-1 TK-2 TK-3
Ave
rage
inco
me
pe
r h
ou
seh
old
Farm type
Economic performance of farm type in Tram Kak
Rice GVA AC GVA VG GVA Fruite Tree GVA CR GVA Cattle GVA Animal GVA (exl.cattle) Non-farm GVA
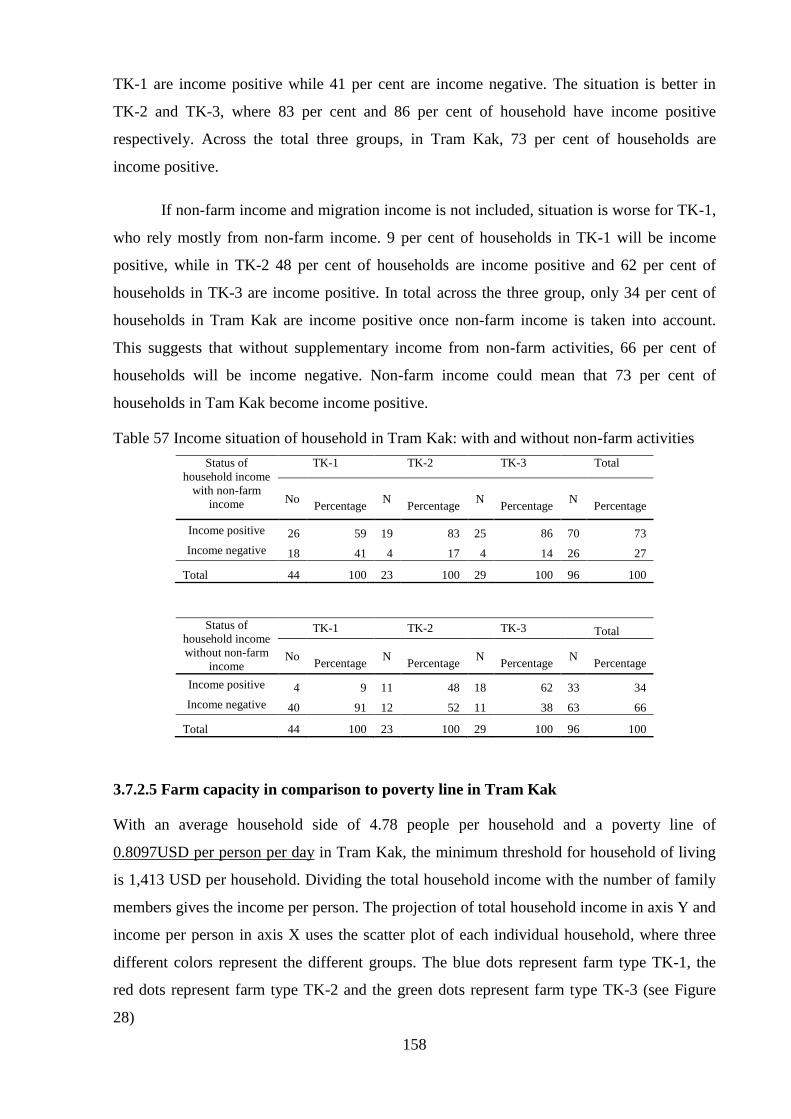
158
TK-1 are income positive while 41 per cent are income negative. The situation is better in
TK-2 and TK-3, where 83 per cent and 86 per cent of household have income positive
respectively. Across the total three groups, in Tram Kak, 73 per cent of households are
income positive.
If non-farm income and migration income is not included, situation is worse for TK-1,
who rely mostly from non-farm income. 9 per cent of households in TK-1 will be income
positive, while in TK-2 48 per cent of households are income positive and 62 per cent of
households in TK-3 are income positive. In total across the three group, only 34 per cent of
households in Tram Kak are income positive once non-farm income is taken into account.
This suggests that without supplementary income from non-farm activities, 66 per cent of
households will be income negative. Non-farm income could mean that 73 per cent of
households in Tam Kak become income positive.
Table 57 Income situation of household in Tram Kak: with and without non-farm activities
Status of
household income
with non-farm
income
TK-1 TK-2 TK-3 Total
No
Percentage N
Percentage N
Percentage N
Percentage
Income positive 26 59 19 83 25 86 70 73
Income negative 18 41 4 17 4 14 26 27
Total 44 100 23 100 29 100 96 100
Status of
household income
without non-farm
income
TK-1 TK-2 TK-3 Total
No
Percentage N
Percentage N
Percentage N
Percentage
Income positive 4 9 11 48 18 62 33 34
Income negative 40 91 12 52 11 38 63 66
Total 44 100 23 100 29 100 96 100
3.7.2.5 Farm capacity in comparison to poverty line in Tram Kak
With an average household side of 4.78 people per household and a poverty line of
0.8097USD per person per day in Tram Kak, the minimum threshold for household of living
is 1,413 USD per household. Dividing the total household income with the number of family
members gives the income per person. The projection of total household income in axis Y and
income per person in axis X uses the scatter plot of each individual household, where three
different colors represent the different groups. The blue dots represent farm type TK-1, the
red dots represent farm type TK-2 and the green dots represent farm type TK-3 (see Figure
28)
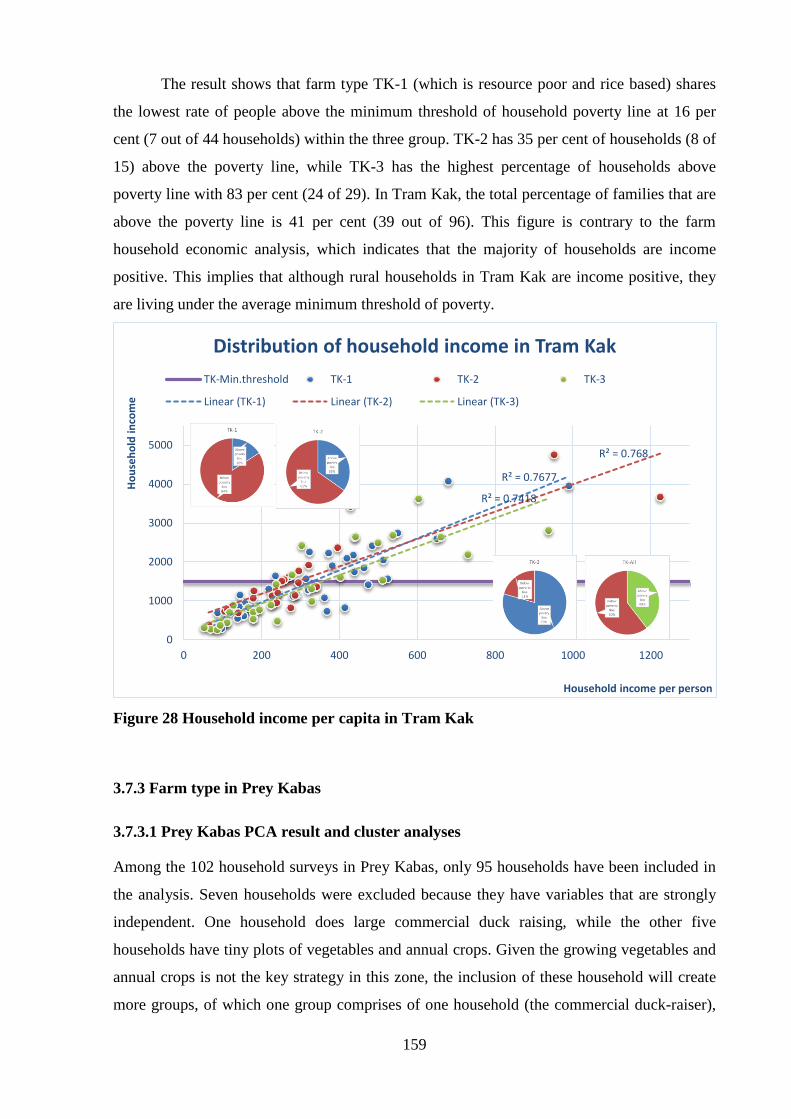
159
The result shows that farm type TK-1 (which is resource poor and rice based) shares
the lowest rate of people above the minimum threshold of household poverty line at 16 per
cent (7 out of 44 households) within the three group. TK-2 has 35 per cent of households (8 of
15) above the poverty line, while TK-3 has the highest percentage of households above
poverty line with 83 per cent (24 of 29). In Tram Kak, the total percentage of families that are
above the poverty line is 41 per cent (39 out of 96). This figure is contrary to the farm
household economic analysis, which indicates that the majority of households are income
positive. This implies that although rural households in Tram Kak are income positive, they
are living under the average minimum threshold of poverty.
Figure 28 Household income per capita in Tram Kak
3.7.3 Farm type in Prey Kabas
3.7.3.1 Prey Kabas PCA result and cluster analyses
Among the 102 household surveys in Prey Kabas, only 95 households have been included in
the analysis. Seven households were excluded because they have variables that are strongly
independent. One household does large commercial duck raising, while the other five
households have tiny plots of vegetables and annual crops. Given the growing vegetables and
annual crops is not the key strategy in this zone, the inclusion of these household will create
more groups, of which one group comprises of one household (the commercial duck-raiser),
R² = 0.7677
R² = 0.768
R² = 0.7418
0
1000
2000
3000
4000
5000
0 200 400 600 800 1000 1200
Ho
use
ho
ld in
com
e
Household income per person
Distribution of household income in Tram Kak
TK-Min.threshold TK-1 TK-2 TK-3
Linear (TK-1) Linear (TK-2) Linear (TK-3)

160
one group of vegetable growers comprises two households and another group of annual crop
growers comprises two households. In total, then there would be six groups, in which three
group have only very few households. One last household (case 307) was also excluded
because their situation is not applicable to include for analysis. This household is an old
widow who has 0.2 hectares of rice land which she is not able to cultivate. She hires someone
to cultivate the land and is living with a grandson who is studying at high school. Her living is
not based on agricultural activities but based remittance support from relatives.
Five components resulting from principal components analysis of 16 variables have
eigenvalues of greater than 1 and have been retain for further analysis. These five variables
(F1 to F5) percentage of cumulative variance explains 72.2 per cent of the total variability.
The first component (F1), which explain 27.7 per cent of variance, is positively
correlated with farm size, land labor ratio, total agricultural gross value added, rice gross
value added and household expenditure. Except for household expenditure, the first
component is more correlated with land, the added value produce by land, and land
availability per active farm worker. The second component (F2), which explains 16.35 per
cent of variance, has a positive correlation with the number of people actively working in
farming, the age of the household head and total non-farm income. This component mostly
explains the farm‟s human resources. The third component (F3), which explains 11.23 per
cent of variance, mostly represents the percentage of rice land, while the fourth component
(F4), which explain 9.79 per cent of variance, is positively correlated with animal gross value
added (excluding cattle GVA). The last component (F5), which explains 8.56 per cent of
variance, is positively correlated with the percentage of labor migration.
The first two components have been used for cluster analysis and three clusters were
automatically generated. Cluster 1 is denoted as PB-1, which signifies zone Prey Kabas farm
type 1. The same is applied to PB-2 and PB-3.
Table 58 Correlations between variables and factors: Prey Kabas
Name of variables Component
F1 F2 F3 F4 F5
Human resources
Active farm worker -0.046 0.693 -0.481 0.200 -0.250
Percentage of labor migration -0.098 0.401 0.221 -0.435 0.662
Age of household head -0.188 0.634 -0.283 -0.334 0.165
Land resources
Farm size 0.825 -0.227 -0.188 -0.257 -0.073
Land labor ratio 0.735 -0.501 -0.001 -0.269 0.009
Percentage rice land -0.095 0.014 0.683 -0.079 -0.288
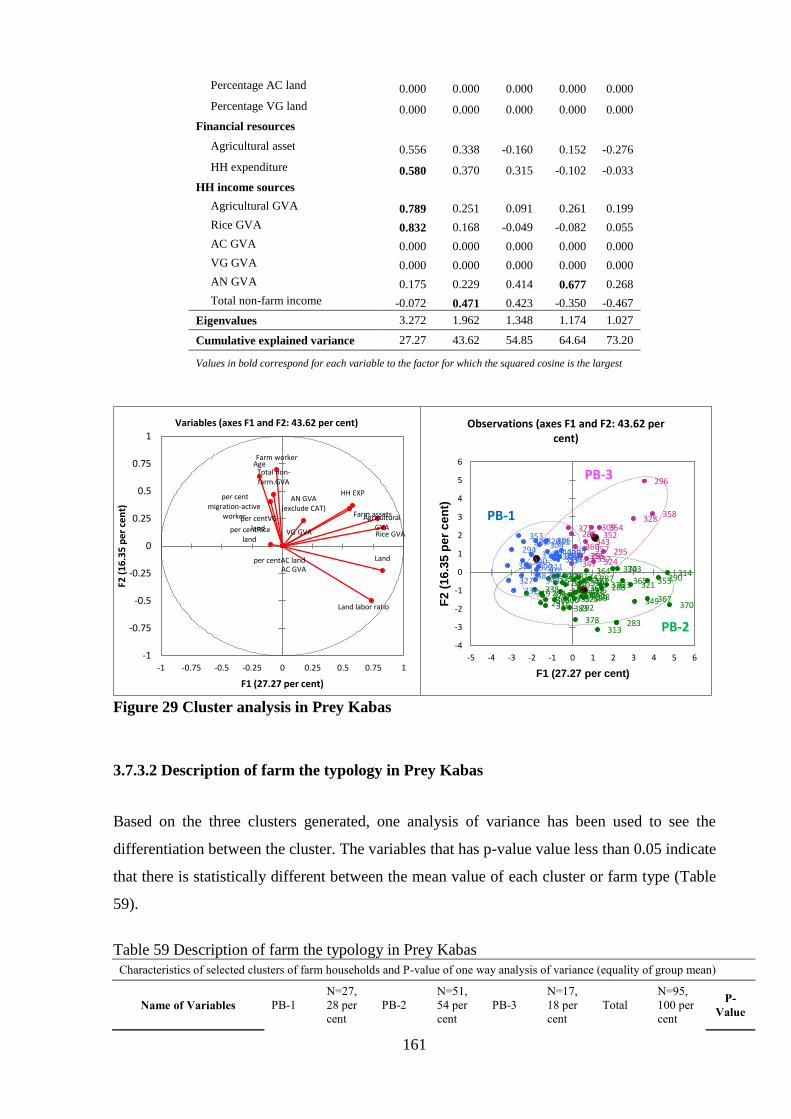
161
Percentage AC land 0.000 0.000 0.000 0.000 0.000
Percentage VG land 0.000 0.000 0.000 0.000 0.000
Financial resources
Agricultural asset 0.556 0.338 -0.160 0.152 -0.276
HH expenditure 0.580 0.370 0.315 -0.102 -0.033
HH income sources
Agricultural GVA 0.789 0.251 0.091 0.261 0.199
Rice GVA 0.832 0.168 -0.049 -0.082 0.055
AC GVA 0.000 0.000 0.000 0.000 0.000
VG GVA 0.000 0.000 0.000 0.000 0.000
AN GVA 0.175 0.229 0.414 0.677 0.268
Total non-farm income -0.072 0.471 0.423 -0.350 -0.467
Eigenvalues 3.272 1.962 1.348 1.174 1.027
Cumulative explained variance 27.27 43.62 54.85 64.64 73.20
Values in bold correspond for each variable to the factor for which the squared cosine is the largest
Figure 29 Cluster analysis in Prey Kabas
3.7.3.2 Description of farm the typology in Prey Kabas
Based on the three clusters generated, one analysis of variance has been used to see the
differentiation between the cluster. The variables that has p-value value less than 0.05 indicate
that there is statistically different between the mean value of each cluster or farm type (Table
59).
Table 59 Description of farm the typology in Prey Kabas
Characteristics of selected clusters of farm households and P-value of one way analysis of variance (equality of group mean)
Name of Variables PB-1
N=27,
28 per
cent
PB-2
N=51,
54 per
cent
PB-3
N=17,
18 per
cent
Total
N=95,
100 per
cent
P-
Value
Rice GVA VG GVA
AC GVA
Farm worker
per centRice land
per centAC land
per centVG land
HH EXP
Agricultural GVA
Land labor ratio
Total non-farm.GVA
per cent migration-active
worker Farm assets
AN GVA (exclude CAT)
Land
Age
-1
-0.75
-0.5
-0.25
0
0.25
0.5
0.75
1
-1 -0.75 -0.5 -0.25 0 0.25 0.5 0.75 1
F2 (
16
.35
pe
r ce
nt)
F1 (27.27 per cent)
Variables (axes F1 and F2: 43.62 per cent)
282
283
284
285
286
287 288
289
290
291 292
293
294 295
296
297 300
301 302
303
304 306
308
309
310
311
312
313
314
315
316
317
318 319 320 321
322
323
324
325
326
327
328
329 330
331
332
334
335
336 337
338
340
341 342
343
344 345
346 347
348
349
350 351
352 353 354
355
356 357
358
359 360
361 362
363
364 365
366 367 368
369
370
371 372 373 374
376
377
378
379
380 381 382
383
PB-1
PB-2
PB-3
-4
-3
-2
-1
0
1
2
3
4
5
6
-5 -4 -3 -2 -1 0 1 2 3 4 5 6
F2
(1
6.3
5 p
er
ce
nt)
F1 (27.27 per cent)
Observations (axes F1 and F2: 43.62 per cent)
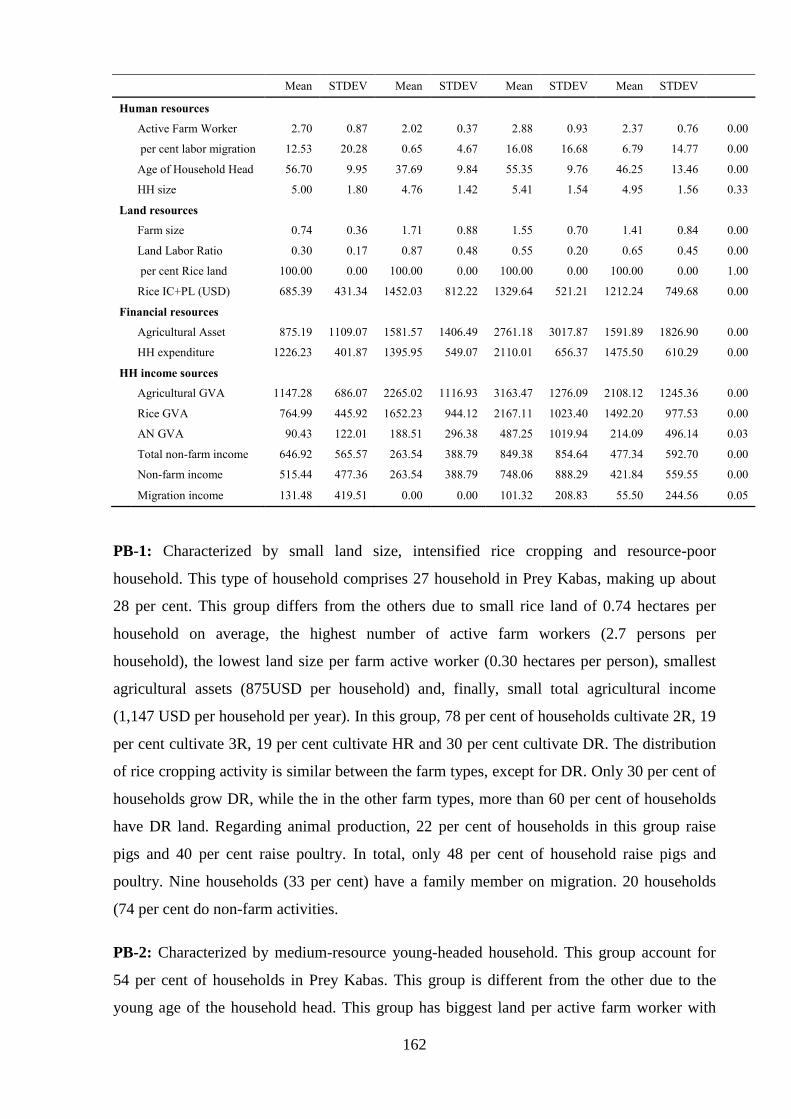
162
Mean STDEV Mean STDEV Mean STDEV Mean STDEV
Human resources
Active Farm Worker 2.70 0.87 2.02 0.37 2.88 0.93 2.37 0.76 0.00
per cent labor migration 12.53 20.28 0.65 4.67 16.08 16.68 6.79 14.77 0.00
Age of Household Head 56.70 9.95 37.69 9.84 55.35 9.76 46.25 13.46 0.00
HH size 5.00 1.80 4.76 1.42 5.41 1.54 4.95 1.56 0.33
Land resources
Farm size 0.74 0.36 1.71 0.88 1.55 0.70 1.41 0.84 0.00
Land Labor Ratio 0.30 0.17 0.87 0.48 0.55 0.20 0.65 0.45 0.00
per cent Rice land 100.00 0.00 100.00 0.00 100.00 0.00 100.00 0.00 1.00
Rice IC+PL (USD) 685.39 431.34 1452.03 812.22 1329.64 521.21 1212.24 749.68 0.00
Financial resources
Agricultural Asset 875.19 1109.07 1581.57 1406.49 2761.18 3017.87 1591.89 1826.90 0.00
HH expenditure 1226.23 401.87 1395.95 549.07 2110.01 656.37 1475.50 610.29 0.00
HH income sources
Agricultural GVA 1147.28 686.07 2265.02 1116.93 3163.47 1276.09 2108.12 1245.36 0.00
Rice GVA 764.99 445.92 1652.23 944.12 2167.11 1023.40 1492.20 977.53 0.00
AN GVA 90.43 122.01 188.51 296.38 487.25 1019.94 214.09 496.14 0.03
Total non-farm income 646.92 565.57 263.54 388.79 849.38 854.64 477.34 592.70 0.00
Non-farm income 515.44 477.36 263.54 388.79 748.06 888.29 421.84 559.55 0.00
Migration income 131.48 419.51 0.00 0.00 101.32 208.83 55.50 244.56 0.05
PB-1: Characterized by small land size, intensified rice cropping and resource-poor
household. This type of household comprises 27 household in Prey Kabas, making up about
28 per cent. This group differs from the others due to small rice land of 0.74 hectares per
household on average, the highest number of active farm workers (2.7 persons per
household), the lowest land size per farm active worker (0.30 hectares per person), smallest
agricultural assets (875USD per household) and, finally, small total agricultural income
(1,147 USD per household per year). In this group, 78 per cent of households cultivate 2R, 19
per cent cultivate 3R, 19 per cent cultivate HR and 30 per cent cultivate DR. The distribution
of rice cropping activity is similar between the farm types, except for DR. Only 30 per cent of
households grow DR, while the in the other farm types, more than 60 per cent of households
have DR land. Regarding animal production, 22 per cent of households in this group raise
pigs and 40 per cent raise poultry. In total, only 48 per cent of household raise pigs and
poultry. Nine households (33 per cent) have a family member on migration. 20 households
(74 per cent do non-farm activities.
PB-2: Characterized by medium-resource young-headed household. This group account for
54 per cent of households in Prey Kabas. This group is different from the other due to the
young age of the household head. This group has biggest land per active farm worker with
163
0.87 hectares per person. However, given this group also has the highest expenses for
farming, the larger land size does not add much to the total agricultural income. People in this
group plant dry season rice, resulting in this group have the biggest farm size per family. The
group has the lowest percentage of migration. Non-farm income is the also lowest in
comparison to the other groups, with an average contribution of only 11 per cent of the total
income. While the other groups have an average of three active farm workers, this group has
only two. This corresponds to the age of household head, which suggests that this group is
mainly young household-headed families. The group is also differentiated from the others due
to a high dependency ratio. 78 per cent of households in this group grow 2R, 14 per cent grow
3R, 66 per cent grow DR and 22 per cent grow HR. 32 per cent raise pigs, 60 per cent raise
poultry, 84 per cent raise cattle, in which 55 per cent sold cattle for income. 62 per cent do
non-farm activities and 2 per cent (one family) have a family member on migration.
PB-3: Characterized by rice-based resource rich families. This group accounts for 18 per cent
of households in Prey Kabas. This group has better resources than the other groups, including
big rice land size (even though it is smaller than type II), higher number of active farm
workers, the highest income from rice and animals, and the highest income from non-farm
activities. This group also has the highest farm asset value. The high percentage of labor
migration reflects the highest earning from non-farm income. This group has better farm
capacity in both farm and non-farm activities, which is why this group was named rice-based
resource-rich farm household. However, not many households fall into this rich group. The
group accounts for only 18 per cent of all households (17 out of 95). 83 per cent grow 2R, 11
per cent grow 3R, 61 per cent grow DR and 17 per cent grow HR. 22 per cent raise pigs, 67
per cent raise poultry. 95 per cent raise cattle, in which 56 per cent sold cattle. 50 per cent of
households have a family member on migration. 89 per cent of households do non-farm
activities.
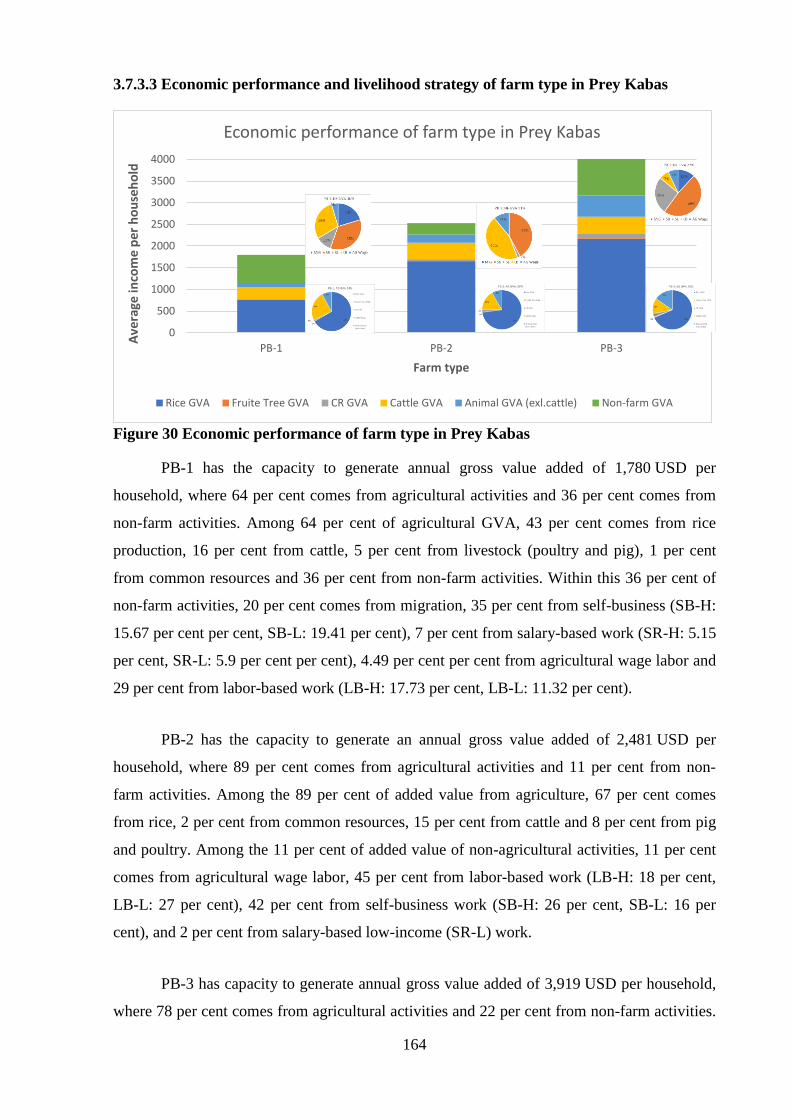
164
3.7.3.3 Economic performance and livelihood strategy of farm type in Prey Kabas
Figure 30 Economic performance of farm type in Prey Kabas
PB-1 has the capacity to generate annual gross value added of 1,780 USD per
household, where 64 per cent comes from agricultural activities and 36 per cent comes from
non-farm activities. Among 64 per cent of agricultural GVA, 43 per cent comes from rice
production, 16 per cent from cattle, 5 per cent from livestock (poultry and pig), 1 per cent
from common resources and 36 per cent from non-farm activities. Within this 36 per cent of
non-farm activities, 20 per cent comes from migration, 35 per cent from self-business (SB-H:
15.67 per cent per cent, SB-L: 19.41 per cent), 7 per cent from salary-based work (SR-H: 5.15
per cent, SR-L: 5.9 per cent per cent), 4.49 per cent per cent from agricultural wage labor and
29 per cent from labor-based work (LB-H: 17.73 per cent, LB-L: 11.32 per cent).
PB-2 has the capacity to generate an annual gross value added of 2,481 USD per
household, where 89 per cent comes from agricultural activities and 11 per cent from non-
farm activities. Among the 89 per cent of added value from agriculture, 67 per cent comes
from rice, 2 per cent from common resources, 15 per cent from cattle and 8 per cent from pig
and poultry. Among the 11 per cent of added value of non-agricultural activities, 11 per cent
comes from agricultural wage labor, 45 per cent from labor-based work (LB-H: 18 per cent,
LB-L: 27 per cent), 42 per cent from self-business work (SB-H: 26 per cent, SB-L: 16 per
cent), and 2 per cent from salary-based low-income (SR-L) work.
PB-3 has capacity to generate annual gross value added of 3,919 USD per household,
where 78 per cent comes from agricultural activities and 22 per cent from non-farm activities.
0
500
1000
1500
2000
2500
3000
3500
4000
PB-1 PB-2 PB-3
Ave
rage
inco
me
per
ho
use
ho
ld
Farm type
Economic performance of farm type in Prey Kabas
Rice GVA Fruite Tree GVA CR GVA Cattle GVA Animal GVA (exl.cattle) Non-farm GVA
165
Among the 78 per cent of added value from agriculture, 55 per cent comes from rice, 2 per
cent from common resources, 10 per cent from cattle and 12 per cent from pig and poultry. In
this group, 78 per cent of households grow 2R, 14 per cent grow 3R, 66 per cent grow DR and
22 per cent grow HR. From within the 22 per cent of non-farm activities, 12 per cent comes
from migration, 48 per cent from self-business activities (SB-H: 38 per cent, SB-L: 10 per
cent), 26 per cent from salary-based activities (20 per cent SR-H, 6 per cent SR-L), 7 per cent
from agricultural wage labor and 7 per cent from LB-L.
Youth migration is high in PB-1 and PB-3 which average youth migration fall into the
same subset when doing compare mean with post-hoc test. In PB-1, the average youth
migration is 0.5 persons, in PB-2 is it is 0.6 persons, while PB-2 is 0.02 persons. There is a
lower number of youth migration in PB-2 because 56 per cent of households in this group are
youth household.
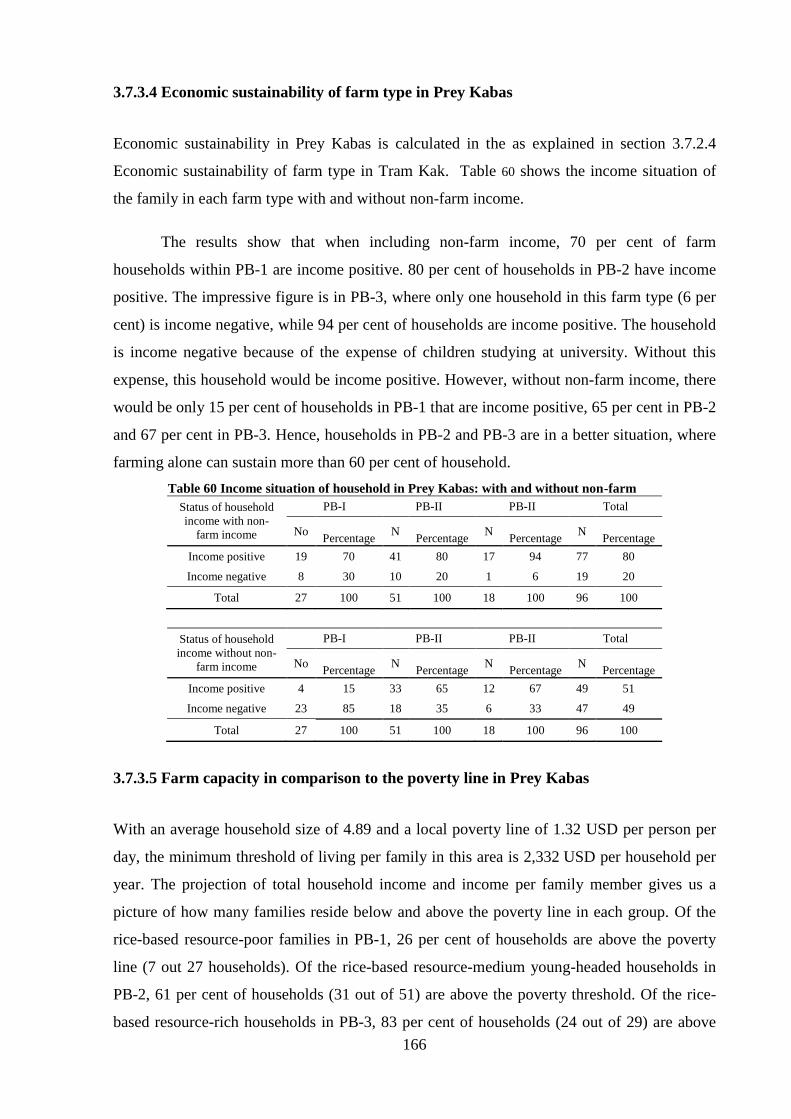
166
3.7.3.4 Economic sustainability of farm type in Prey Kabas
Economic sustainability in Prey Kabas is calculated in the as explained in section 3.7.2.4
Economic sustainability of farm type in Tram Kak. Table 60 shows the income situation of
the family in each farm type with and without non-farm income.
The results show that when including non-farm income, 70 per cent of farm
households within PB-1 are income positive. 80 per cent of households in PB-2 have income
positive. The impressive figure is in PB-3, where only one household in this farm type (6 per
cent) is income negative, while 94 per cent of households are income positive. The household
is income negative because of the expense of children studying at university. Without this
expense, this household would be income positive. However, without non-farm income, there
would be only 15 per cent of households in PB-1 that are income positive, 65 per cent in PB-2
and 67 per cent in PB-3. Hence, households in PB-2 and PB-3 are in a better situation, where
farming alone can sustain more than 60 per cent of household.
Table 60 Income situation of household in Prey Kabas: with and without non-farm
Status of household
income with non-
farm income
PB-I PB-II PB-II Total
No
Percentage N
Percentage N
Percentage N
Percentage
Income positive 19 70 41 80 17 94 77 80
Income negative 8 30 10 20 1 6 19 20
Total 27 100 51 100 18 100 96 100
Status of household
income without non-
farm income
PB-I PB-II PB-II Total
No
Percentage N
Percentage N
Percentage N
Percentage
Income positive 4 15 33 65 12 67 49 51
Income negative 23 85 18 35 6 33 47 49
Total 27 100 51 100 18 100 96 100
3.7.3.5 Farm capacity in comparison to the poverty line in Prey Kabas
With an average household size of 4.89 and a local poverty line of 1.32 USD per person per
day, the minimum threshold of living per family in this area is 2,332 USD per household per
year. The projection of total household income and income per family member gives us a
picture of how many families reside below and above the poverty line in each group. Of the
rice-based resource-poor families in PB-1, 26 per cent of households are above the poverty
line (7 out 27 households). Of the rice-based resource-medium young-headed households in
PB-2, 61 per cent of households (31 out of 51) are above the poverty threshold. Of the rice-
based resource-rich households in PB-3, 83 per cent of households (24 out of 29) are above

167
the poverty line, which is the highest rate among the three groups. In Prey Kabas in general,
56 per cent of households are above the minimum threshold of poverty line (53 out of 95 farm
households). In PB-2 and PB-3, the majority of households (more than 60 per cent) are above
the poverty threshold (Figure 31).
Figure 31 Household income per capita in Prey Kabas
3.7.4 Farm type in Zone Otdar Meanchey
3.7.4.1 Otdar Meanchey PCA result and cluster analyses
In Otdar Meanchey, from the 16 variables included in the PCA analysis, six components have
eigenvalues of greater than one. These six variables (F1 to F6) explain 74.57 per cent of the
total variability. Component F1, which explains 26.5 per cent of variance, is positively
correlated with farm size, land to labour ratio, agricultural investment (IC+PL) and the gross
value added of rice production. Component F2 is negatively correlated with the percentage of
rice land but positively correlated with the percentage of annual crop land. This variable also
positively correlates with the gross value added of annual crops. This implies the opposite
tendency between groups with rice land and groups with annual crop land. We can see that
the first two components are mainly explained by the land used, aspects related to land and
farm economic capacity. Component F3 positively correlates with the number of active farm
y = 4.0226x + 326.46 R² = 0.7613
R² = 0.7669
y = 3.1654x + 595.85 R² = 0.6687
0
1000
2000
3000
4000
5000
6000
7000
8000
0 200 400 600 800 1000 1200
Ho
use
ho
ld in
com
e
Household income per person
Distribution of household income in Prey Kabas
PB-Min.threshold PB-1 PB-2 PB-3
Linear (PB-1) Linear (PB-2) Linear (PB-3)

168
workers and the age of the household head. Component F4 positively correlates with the
percentage of vegetables and their gross value added. Household expenditure is explained in
component F5 and animal gross value added is explained in component F6.
The first two components have been used for cluster analysis. Result shows there are
four clusters: small land rice based cropping system: OMC-I, big land rice based groping
system: OMC-II. Annual crops based-rice with small: OMC-III, and Annual crops based-rice
with big land: OMC-IV.
Table 61 Correlations between variables and factors: Otdar Meanchey
Name of variables Component
F1 F2 F3 F4 F5 F6
Human resources
Active farm workers 0.049 -0.322 0.662 0.197 -0.464 0.057
Age of household head -0.072 -0.201 0.730 0.097 -0.003 -0.068
Land resources
Farm size 0.880 -0.142 0.062 -0.121 -0.246 -0.031
Land labor ratio 0.734 0.061 -0.437 -0.306 0.011 -0.114
Percentage rice land 0.159 -0.758 -0.191 0.036 0.132 0.060
Percentage AC land 0.031 0.858 0.261 -0.249 -0.095 -0.001
Percentage VG land 0.315 0.328 -0.193 0.675 -0.104 -0.074
Financial resources
Agricultural asset 0.447 -0.256 0.182 -0.308 0.034 -0.363
HH expenditure 0.401 0.051 0.112 0.103 0.705 -0.034
Agricultural expense (IC+PL) 0.782 0.071 -0.141 -0.175 -0.169 0.078
Cattle stock value 0.260 -0.036 0.487 0.154 0.443 -0.115
HH income sources
Agricultural GVA 0.870 0.108 0.201 0.141 0.044 0.118
Rice GVA 0.849 -0.233 0.092 -0.032 -0.092 -0.099
AC GVA 0.173 0.843 0.259 -0.173 0.033 0.002
VG GVA 0.323 0.242 -0.248 0.661 -0.096 -0.252
AN GVA (exclu.cattle) 0.376 0.000 0.024 0.086 0.078 0.862
Eigenvalues 4.240 2.496 1.789 1.329 1.062 1.014
Cumulative explained variance 26.50 42.10 53.28 61.59 68.23 74.57
Note: Values in bold correspond for each variable to the factor for which the squared cosine is the largest

169
Figure 32 Cluster analysis in Otdar Meanchey
3.7.4.2 Description of farm typology in Otdar Meanchey
Table 62 below is described the different attribute of farm type in Otdar Meanchey using the
analysis of variance. The variables that have p-value value less than 0.05 indicate that there is
statistically different between the mean value of each cluster or farm type.
Table 62 Description of farm the typology in Otdar Meanchey Characteristics of selected clusters of farm households and P-value of one-way analysis of variance (equality of group mean)
Name of Variables OMC-1
N=111,
61 per
cent OMC-2
N=49,
27 per
cent OMC-3
N=16, 9
per cent OMC4
N=5, 3
per cent Total
N=181,
100 per
cent P-
Value
Mean STDEV Mean STDEV Mean STDEV Mean STDEV Mean STDEV
Human resources
Active Farm Worker 3.03 1.53 2.86 1.14 2.25 1.18 2.00 0.00 2.88 1.40 0.09
Age of Household
Head 47.85 13.22 45.02 10.61 47.19 13.95 37.00 12.63 46.72 12.68 0.19
HH size 5.47 2.13 5.98 1.83 5.25 2.18 4.20 1.30 5.55 2.05 0.18
Land resources
Farm size 2.81 1.42 6.42 1.96 2.65 2.05 4.04 1.65 3.80 2.29 0.00
Land Labor Ratio 1.05 0.55 2.60 1.43 1.32 1.19 2.02 0.83 1.52 1.16 0.00
per cent Rice land 98.55 3.93 97.93 3.76 50.26 31.91 50.41 12.39 92.78 18.43 0.00
per cent AC land 1.29 3.89 1.15 3.24 23.12 19.22 42.37 21.56 4.32 11.54 0.00
per cent VG land 0.17 0.63 0.92 2.12 1.61 4.09 7.22 11.04 0.69 2.64 0.00
Rice IC+PL (USD) 279.43 164.02 685.16 299.44 274.81 337.99 292.65 299.32 389.23 290.79 0.00
AC IC+PL (USD) 6.78 29.74 17.91 57.57 81.43 91.52 304.70 211.63 24.62 76.11 0.00
Financial resources
Agricultural Asset 1298.92 1611.82 2626.73 1173.62 986.25 1271.09 626.00 1399.78 1612.15 1592.38 0.00
HH expenditure 1090.45 457.39 1406.36 603.14 919.48 507.73 1695.23 1089.85 1177.57 552.29 0.00
Agricultural
Expense (IC+PL) 341.41 204.50 853.13 396.41 428.61 388.40 766.32 415.68 499.38 368.45 0.00
Cattle Stock Value 319.82 645.94 663.27 862.34 375.00 562.73 300.00 447.21 417.13 712.03 0.04
HH income sources
Agricultural GVA 927.44 472.82 2089.65 738.68 1208.46 756.88 1993.27 905.14 1296.35 785.81 0.00
Rice GVA 587.55 259.63 1448.33 573.48 497.90 410.92 628.25 391.94 813.78 545.32 0.00
AC GVA 14.55 50.14 30.50 79.40 232.27 262.01 843.30 409.74 61.01 184.01 0.00
VG GVA 5.62 26.71 52.56 206.72 51.50 164.55 174.55 245.04 27.05 128.61 0.01
AN GVA 150.79 118.54 268.20 254.10 179.21 154.92 108.79 103.55 183.93 175.53 0.00
Non-farm income 430.84 809.48 442.34 723.02 390.38 753.23 846.25 1370.06 441.85 796.04 0.71
Migration income 268.85 529.65 107.70 523.54 76.66 172.72 0.00 0.00 200.81 504.70 0.14
Rice GVA
VG.VAUSD
AC GVA
Farm worker
per centRice land
per centAC land
per centVG land
HH EXP Agricultural GVA
Agricultural IC+PL
Land labor ratio
Farm assets
Cattle stock value
AN GVA (exclude CAT)
Land Age
-1
-0.75
-0.5
-0.25
0
0.25
0.5
0.75
1
-1 -0.75 -0.5 -0.25 0 0.25 0.5 0.75 1
F2
(15.3
2 p
er
cen
t)
F1 (27.45 per cent)
Variables (axes F1 and F2: 42.77 per cent)
1
2 3 4
5 6 7 8
9 10
11 12
13
14 15
16
17 18
19
20
21
22 23 24 25
26
27
28
29 30 31
32
33
34
36 37
38
39 40 41 42 43
44 45
46
47
49
50 51 52 53 54 55
56 57 58
59
60
61 62 63
64
65
66 67
68
69 70 71 72 73
74
75 76 77 78 79
80
81 82
83
84 85
86
87
88
89
90 91
92
93 94 95
96 98
99 100 101
102 103 104
105 106 107 108 109 110
111 112
113 114 115
116 117 118 119
120 121 122
123
124 125
126 127 128 129 130
131 132
133
134 135
136 137
138
139
140
141 142
143 144 145
146 147 148 149 150
151 152
153 154
155 156 157
158
159 160 161 162
163
164
165 166
167 168
169
170 171
172
173
174 175
176
177
178 179
180 181
182
183
384
OMC-1 OMC-2
OMC-3
OMC-4
-4
-2
0
2
4
6
8
10
-10 -8 -6 -4 -2 0 2 4 6 8 10
F2
(15.6
0 p
er
cen
t)
F1 (26.50 per cent)
Observations (axes F1 and F2: 42.10 per cent)

170
OMC-1: This small land size rice-based cropping group is the largest of the three,
making up of 61 per cent of the total households (111 out of 181 sample surveys). This group
has an average farm size of 2.81 hectares. It is called a rice-based cropping system because
the average percentage of land use proportion dedicated to rice cropping is 98.55 per cent,
which leaves minimal land for annual crops and vegetables. This group has high non-farm
income but small agricultural income in comparison to the other groups. In this group, 100
per cent of households grow rainy season rice and 14 per cent growing VG and AC. For
animal production, 23 per cent of households raise pigs, 80 per cent raise poultry and 32 per
cent raise cattle, of which 13.5 per cent of total households in this group sell cattle. 3 per cent
of households raise fish. Migration accounts for 37 per cent of household income. In this farm
type, 79 per cent of households do non-farm activities.
OMC-2: This big rice land-based cropping group is different from the others as it has
the highest farm size of 6.42 hectares. 97.93 per cent of average land use is dedicated to rice
cropping. The gross value added from rice production is an average of 1,448.33 USD, which
is the highest of the groups. This group is also different from the others due to the high gross
value added from animal raising. This group makes the highest total gross value added from
agriculture of 2,090 USD. It is also the highest for total agricultural value added. This group
also has the highest rice resources, which can be seen through the value of agricultural assets.
This group contains 49 households (27 per cent). Beside rice, 20 per cent of households in this
group grow AC and VG, 47 per cent of household raise pigs, 90 per cent of households raise
poultry and 4 per cent raise fish. 51 per cent households raise cattle, in which 31 per cent of
total households within the group sold cattle for income. In this group, 20 per cent of
households have one family member on migration and 76 per cent of household do non-farm
activities.
OMC-3: This annual crop-based rice farming group consist of 16 household (9 per
cent). This group has an average land size of 2.65 hectares, of which the average percentage
of land use is 50 per cent dedicated to rice and the rest is to annual crops and vegetables. This
group has smaller agricultural assets than the previous two rice-based groups. The total non-
farm income is also the smallest amount in comparison to other groups. In addition to
growing rice, 70 per cent of this group grow annual crops and vegetables. Pigs are raised by
31 per cent of households, while 75 per cent of households raise poultry. 51 per cent of
households have cattle, in which 30 per cent sell cattle. Migration is also notable in this farm
type, with 31 per cent of households having one family member on migration. 75 per cent of
household have non-farm activities.
171
OMC-4: This annual crop-based rice-farming low-asset group comprises five
households, which account for 3 per cent of total households in Otdar Meanchey. This group
is significantly different from the other group due to the farm size, of which the average
percentage of land use for annual crops is 50 per cent. It also has percentage of vegetable land
and the highest average income from annual crop and vegetable. This group therefore has a
high total agricultural gross value comparable to the OMC-II group. This group is also
different because the household head‟s age is younger than the other groups. This group has
the highest average non-farm income. Beside rice, 100 per cent of households in this group
grow annual crops (AC) and vegetable (VG). 20 per cent of households raise pigs (one
household), 60 per cent raise poultry (three households). 40 per cent (two households) raise
cattle, in which 20 per cent sell cattle (one household). 20 per cent have one family member
on migration (one household) and 60 per cent do non-farm activities (three households).
In general observation, it can be seen that OMC-1 and OMC-3 share similar total
agricultural values added, with 927.44 USD and 1208.46 USD respectively (Tukey and
Duncan post hoc test). Similarly, OMC-2 and OMC-4 share a similar total agricultural values
added, with 2,090 USD and 1,993 USD respectively. This is an obvious grouping of a poor
rice and rich rice-based group and a poor and rich annual crop-based group.
3.7.4.3 Economic performance and livelihood strategy of each farm type in Otdar
Meanchey
OMC-1: The average annual added value produced by this farm type is 1,549 USD per
household, with 65 per cent from agricultural activities, 38 per cent from rice, 1 per cent from
AC, 5 per cent from CR, 6 per cent from cattle and 10 per cent from pig and poultry. 45 per
cent of income comes from non-farm income, with 29 per cent from migration, 27 per cent
from self-business activities (SB-H: 23 per cent, SB-L:4 per cent), 19 per cent from salary-
based activities (SR-H:17 per cent, SR-L: 2 per cent), 11 per cent from agricultural wage
labor and 14 per cent from labor-based activities (LB-H: 13 per cent, LB-L: 2 per cent). This
group has many household with a family member on migration. As mentioned in farm type
description, 37 per cent of 111 households with a family member on migration.
OMC-2: This farm type has an average annual added value of 2,534 USD per
household. 78 per cent of GVA comes from farming and 22 per cent from non-farm activities.
The 78 per cent of added value from farming is derived from rice (57 per cent), AC (1 per
172
cent), VG (2 per cent), CR (4 per cent), cattle (7 per cent) and other livestock including pigs,
poultry and fish (11 per cent). Since OMC-2 has rice land that is twice as big as OMC-1, the
contribution of rice income is also nearly twice as high. If we break down the 22 per cent of
non-farm income, considering the source of contribution based on 100 per cent of total non-
farm income, we can see that migration contributes 20 per cent, self-business activities 53 per
cent (SB-H: 47 per cent, SB-L: 8 per cent), salary-based activities 18 per cent (SR-H:14 per
cent, SR-L: 4 per cent), agricultural wage labor 3 per cent and labor-based activities 5 per cent
(LB-H: 4 per cent, LB-L:1 per cent).
OMC-3: This group has the capacity to generate value added of 1,603 USD per
household, which is slightly higher than OMC-1. 71 per cent of this added value comes from
farming where, considering the percentage to total added value, 31 per cent comes from rice,
14 per cent from AC, 3 per cent from VG, 5 per cent from CR, 7 per cent from cattle and 11
per cent from pig and poultry. Among the 29 per cent non-farm income, considering
percentage of total non-farm income as 100 per cent, migration is 16 per cent, self-business
activities 11 per cent (SB-L: 11 per cent), salary-based activities 36 per cent (SL-H: 35 per
cent, SL-L:1 per cent) and agricultural wage labor 36 per cent.
OMC-4: This group has the highest capacity to generate added value. The average
annual added value produced by this farm type is 2,633 USD per household, where 68 per
cent comes from farming and 32 per cent from non-farming. 68 per cent of farm added value
comes from 24 per cent of rice GVA, 32 per cent from AC GVA, 7 per cent from VG GVA, 8
per cent from CR GCA, 1 per cent from cattle GVA and 4 per cent from poultry GVA.
32 per cent from non-farm income: 97 per cent from self-business activities (SB-H), 2
per cent from labor-based activities (LB-L: 2 per cent) and 1 per cent agricultural wage labor.

173
Figure 33 Economic performance of farm type in Otdar Meanchey
In all groups, the land has an impact on the total household added value in each type.
OMC-1 and OMC-3 share almost equal value added from farming, since both farm types have
about the same amount of farm land. The different is OMC-1 is less diversified with their
cropping activities, being purely based on rice, while OMC-2 diversifies rice, annual crops
and vegetables. The same observation is found in OMC-2 and OMC-4, where total household
added value is about the same. The difference is the combination of cropping activities and
non-farm activities. OMC-2 has bigger rice land and grows mostly rainy season rice while
OMC-4, although having smaller land than OMC-2, combines rice, annual crops and
vegetables. OMC-2 has diverse non-farm income sources, while OMC-4 income is mostly
from self-business activities.
The percentage of household with family members who have migrated is also
observed to be high in OMC-1 and OMC-2. In both farm types, more than 30 per cent of
households have family members on migration. In OMC-3 and OMC-4 migration is less at
about 20 per cent equally. This implies that the pattern of migration tends to be high in farm
types that have small land that generate little total household gross added value and migration
is less in farm types that have big land and generate high gross added value per household.
Although self-business activities are observed to play role in all farm types, self-
business activities also contribute a higher percentage to total non-farm income in farm types
that have a high capacity to generate added value from agriculture (more than 50 per cent in
OMC-2 and more than 90 per cent in OMC-4). Additionally, in these farm types, the
percentage share of self-business high income is also higher than self-business low income
0
500
1000
1500
2000
2500
3000
OMC-1 OMC-2 OMC-3 OMC-4Ave
rage
inco
me
per
ho
use
ho
ld
Farm type
Economic performance of farm type in Otdar Meanchey
Rice GVA AC GVA VG GVA Fruite Tree GVA CR GVA Cattle GVA Animal GVA (exl.cattle) Non-farm GVA

174
across farm types. This implies that household that perform well from farming tend to invest
in other non-farm activities, in this case more in self-businesses that have the capacity
generate a high income. The observation is also found in labor-based activities and
agricultural wage labor activities.
3.7.4.4 Economic sustainability of farm type in Otdar Meanchey
With farming, results show that in Otdar Meanchey, the majority of households (77 per cent)
were income positive, with 68 per cent of households in OMC-1, 96 per cent of households in
OMC-2, 88 per cent in OMC-3 and 60 per cent in OMC-4.
Without farming, there would be 39 per cent of households in Otdar Meanchey that
are income positive: i 27 per cent in OMC-1, 59 per cent in OMC-2, 56 per cent in OMC-3,
and 40 per cent in OMC-4. Therefore, non-farm activities including migration play an
important role in all farm types to ensure the economic sustainability of households in each
type where farming income alone cannot meet the household‟s need.
Table 63 Income situation of household in Otdar Meanchey: with and without non-farm
Status of household
income with non-
farm income
OMC-1 OMC-2 OMC- 3 OMC- 4 Total
No Percentag
e N
Percentag
e N
Percentag
e N
Percentag
e N
Percentag
e
Income positive 76 68 44 96 14 88 3 60 137 77
Income negative 35 32 2 4 2 13 2 40 41 23
Total 111 100 46 100 16 100 5 100 178 100
Status of household
income without
non-farm income
OMC- 1 OMC- 2 OMC- 3 OMC- 4 Total
No Percentag
e N
Percentag
e N
Percentag
e N Percentage N
Percentag
e
Income positive 30 27 29 59 9 56 2 40 68 39
Income negative 81 73 20 41 7 44 3 60 108 61
Total 111 100 49 100 16 100 5 100 176 100

175
3.7.4.5 Farm capacity in comparison to poverty line in Otdar Meanchey
Figure 34 Household income per capita in Otdar Meanchey
With an average household size of 5.1 people and a local poverty line of 0.95 USD per
person per day, this gives a minimum threshold of living per family in this area of
1,880.85 USD per household per year. The projection of total household income and income
per family member give us a picture of how many families reside below and above the
poverty line in each group.
OMC-1 has 28 per cent of households are above the minimum threshold of poverty
(31 out 111) households). OMC-2 has the highest rate of households above the minimum
threshold of poverty at 49 per cent (24 out of 49 households). OMC-3 has 31 per cent of
households above the minimum threshold of poverty (5 out of 16). OMC-4 has 60 per cent of
households above the minimum threshold of poverty (3 out of 5).
In general, 34 per cent of the households in Otdar Meanchey are above the minimum
threshold of poverty per household. This suggests that although the situation of landholding
per household in the area is remarkable high in comparison to other zones, given the low land
productivities of rice and the big household sizes and even though the majority of households
y = 4.2596x + 239.82 R² = 0.7545 y = 4.2814x + 508.79
R² = 0.6799
y = 3.6503x + 331.52 R² = 0.4925
y = 2.7152x + 585.99 R² = 0.9416
0
1000
2000
3000
4000
5000
6000
7000
0 200 400 600 800 1000 1200 1400
Ho
use
ho
ld in
com
e
Household income per person
Distribution of household income in Otdar Meanchey OMC-Min.threshold OMC-1 OMC-2OMC-3 OMC-4 Linear (OMC-1)Linear (OMC-2) Linear (OMC-3) Linear (OMC-4)
176
are income positive, the poverty threshold suggests people in this area are living in hard
conditions.
3.7.5 Concluding remarks
A multivariate analysis approach that combines PCA and CA allows this study to identify
farm types in the three studied areas with respect to socioeconomic factors comprising
factors: assets, humans, land, financial and income sources.
Data on 16 variables of 96 households in zone Tram Kak, 16 variables of 95 in zone
Prey Kabas, and 16 variables of 181 households in zone Otdar Meanchey were evaluated by
multivariate statistical methods. PCA identified six factors that explain 78.20 per cent of
variance of 16 variables in Tram Kak, 73.20 per cent of variance of 16 variables in Prey
Kabas, and 74.57 per cent of variance of 16 variables in Otdar Meanchey. Among these
factors, the first two factors (F1 and F2) were used in cluster analysis to classify the farm
types. Three farm types were identified in zone Tram Kak, three types in zone Prey Kabas,
and four farm types in zone Otdar Meanchey.
In Tram Kak, farm type TK-1 has small-sized land (an average of 0.37 hectare per
household) and poor resources. They tend to rely on non-farm activities, which account for 60
per cent of household income. This farm type has the highest rate of household migration,
which account for 57 per cent of households within farm type. This farm is least diversified in
agricultural activities. The farm type TK-2 that have medium-sized land (average 0.88
hectares per household) and medium resources, with the most diversify agricultural activities
(rice, vegetables and annual crops), where 74 per cent of household income is from
agriculture and 25 per cent is from non-farm activities. 30 per cent of households in this farm
type have a family member of migration. Farm type TK-3 has biggest agricultural land in
comparison to TK-1 and TK-2 and shares a similar diversification of agricultural activities to
TK-2. The difference is this farm type has a higher migration than TK-2 (45 per cent). Beside
migration, non-farm activities patterns emerge in Tram Kak, where the smaller the land the
household possesses, the more non-farm activities the household engages in. TK-1 has 68 per
cent of household conducting non-farm activities, TK-2 has 65 per cent of households
conducting non-farm activities and 48 per cent of household in TK-3 conduct non-farm
activities.
In Prey Kabas, all farm types share the same pattern of intensified rice-based cropping
(growing 2R, 3R and HR) but the difference is the availability of DR. PB-1 has smaller land
177
size and, because less DR is grown, has a high percentage of household members on
migration. PB-2 has the biggest land size and DR and has least migration, due to the young
age of the household heads. PB-3 share similar characteristic to PB-2 but has the highest
income due to a high income share from non-farm and migration.
In Otdar Meanchey, there are two distinct farm types: rice based and annual crops
based. OMC-1 is a small rice land-based resource-poor household characterized by small land
size and poor agricultural assets. Due to the small land size, only 55 per cent of income
generated from farming, which is complemented by another 45 per cent from non-farm
income. OMC-2 is a big rice-based agricultural resource-rich household. This group has the
biggest average land size among the other groups. The contribution of non-farm income is 22
per cent. OMC-3 is an annual crop-rice based agricultural resource-poor household with
complementary income from non-farming 29 per cent and 32 per cent respectively. While
poor rice-based and poor annual crop-based households have more than 30 per cent of
household migration, rich rice-based and rich annual crop-based households tend to have less
household migration (20 per cent ).
From the farm typology, we can see that in all cases, non-farm income, migration
income and remittance play a role in contributing to farm income. Farm types that have more
resources (land and assets) have the capacity to generate more income, thereby there is less
migration. Additionally, households with better farm types tend to develop and have more
high-income self-business. Households in the resource-poor farms tend to rely on low-income
small business, agricultural wage labor-based work and migration. The richer farm type has a
higher percentage of households above the poverty threshold.
Without non-farm income, agricultural income alone would not sustain the households
economically, and many households (59 per cent of 372 households) would experience
income negativity. In comparison, with non-farm income, 76 per cent of households are
income positive.
The results of a comparison between household income and the minimum poverty
threshold per household result shows that there are only 139 households out of 372 (37 per
cent) that are above the poverty threshold. This suggests that although majority of households
(76 per cent) are economically sustainability, they are in fact living in hard conditions with
the majority of them below the minimum threshold of poverty. Table 64 shows a summary of
key livelihood strategies of household in each farm type of the three study areas.

178
Table 64 Summary key livelihood strategies of households in each farm type
Farm type Main characteristics Livelihood strategy
TK-1 Small land 0.38ha per hh
Poor assets
Land too small to diversify agricultural activities: HR based cropping.
AG income 40 per cent, NF income: 60 per cent
NF: Labor based, self-business, salary > Migration.
Tendency: high migration 57 per cent
TK-2 Medium land 0.88ha/hh
Medium assets
Most diversify agricultural activities, 2R, HR, VG, AC and animal
AG income 74 per cent, NF income: 26 per cent
NF: labor based work, agricultural wage labor, self-business > Migration
Tendency: moderate migration 30 per cent
TK-3 Big land 1.17ha/hh
Rich assets
Most diversify agricultural activities, 2R, HR, VG, AC and animal
AG income 79 per cent, NF income: 21 per cent
NF: Self-business, salary low, labor based= Migration.
Tendency: high migration 45 per cent
PB-1 Small land 0.74 ha/hh
Poor agricultural assets
Intensify rice 2R, 3R and HR, less DR: 30 per cent
AG income 64 per cent, NF income: 26 per cent
NF: self-business, Labor based > Migration.
Tendency: moderate migration 33 per cent
PB-2 big land 1.71 ha/hh
Medium agricultural
assets
Young headed household
Intensify rice 2R, 3R and HR, More DR: 60 per cent
AG income 89 per cent, NF income: 11 per cent
NF: self-business, Labor based, agricultural wage labor
Tendency: No migration 2 per cent, youth household
PB-3 big land 1.55 ha/hh
Rich agricultural assets
Intensify rice 2R, 3R and HR, More DR: 61 per cent
AG income 64 per cent, NF income: 36 per cent
NF: Labor based, self-business> Migration.
Tendency: High migration 45 per cent, youth household
OMC-1 Small land 2.81ha/hh
Poor agricultural assets
Rice based HR 99 per cent
AG income 55 per cent, NF income: 45 per cent
NF: self-business, salary low, Labor based, agricultural wage labor > migration.
Tendency: High migration 37 per cent
OMC-2 Big land 6.42ha/hh
Rich agricultural assets
Rice based HR 98 per cent
AG income 78 per cent, NF income: 22 per cent
NF: self-business, salary low, Labor based > migration.
Tendency: low migration 20 per cent
OMC-3 Small land 2.65ha/hh
Poor agricultural assets
Rice based HR 50 per cent, AC 50 per cent
AG income 71 per cent, NF income: 29 per cent
NF: Salary low, agricultural wage labor, self-business> migration.
Tendency: High migration 31 per cent
OMC-4 Big land 4.04ha/hh
Poor agricultural assets
Rice based HR 50 per cent, AC 50 per cent
AG income 68 per cent, NF income: 32 per cent
NF: Self-business> migration.
Tendency: Low migration 20 per cent (small sample)
179
3.8 Discussion
3.8.1 Socioeconomic conditions: farming have to accommodate more youth
In the study area, on average 65 per cent of total household expenses are on food. Unlike a
recent study that claims that non-farm income contributes 60 per cent to total household
income (Rahut & Micevska Scharf, 2012), this study shows that that agriculture is still a
dominant source of income, with 69 per cent of household income coming from agriculture
and 31 per cent from non-farming sources. This implies that farming is the dominant source
of income. This is the reason why farming is important to rural households, both ensuring
food security and providing a safety net.
The socioeconomic diagnostics show that youths accounted for 40 per cent of total
population in the survey. Given the majority of rural youths frequently drop out of school,
rarely graduating from high school, there is often few employment options for them besides
being accommodated within the family‟s farm. Access to non-farm activities is perceived to
be difficult and competitive as well as requiring an existing social network.
The motivation for land seeking is clearly seen in the low-density zone of Otdar
Meanchey, where multiple migration and land seeking is common, as explained due to the
historical setting and reasons for settling in the area. Land seeking is done to both expand the
capacity to sustaining livelihood and to secure land for future of their children who have no
alternative beside farming. The political and historical events that occurred in Otdar
Meanchey together with demography (population growth) impacted on youth education (with
little or no access to education) and create condition of accessibility to land in the zone
pioneer. These conditions suggest there will be more youth who will settle in farming, even
though the land availability for parents to subdivided is getting smaller and smaller.
Migration, particularly to Thailand, is hence a strategy for supporting families as well as
helping to accumulate assets expand land and by agricultural assets, particularly two-wheel
tractors.
In Tram Kak, where the land availability is small per household, youth who have
dropped out of school have will have no alternative beside contributing their labor to their
family‟s farm or migrating to seek non-farm work. Garment work, construction and other
urban service jobs are common for youths in this area. Given the land e is distributed based on
family member born in during the land share period in the early 1980s, anyone who was born
later will have no land quota for subdivision. Parents, hence, have to motivate children to

180
perform well in education and mobilize their resources to invest in their children‟s education
if their farm capacity permits them to do so. Otherwise, youths will likely migrate for non-
farm work. The same situation occurs in Prey Kabas, but the area is better than Tram Kak as
the land holdings are bigger per family and they have the access to irrigation, which means
people can do double or triple rice cropping and have access to water receding rice fields,
which generate the maximum economic output per unit of labor. As in Tram Kak, youths in
Prey Kabas who were born in the late 1980s do not have land quota. Hence, parents in Prey
Kabas tend to invest in children‟s education, given there is no more land for them. However,
this is dependent on each individual youth‟s performance in education. If they fail in their
education, meaning they drop out before or at high school, they will have few alternatives
beside working on the current family farm or migrating.
61 per cent of total households are in debt. They borrowed money for investing in
farming, to buy additional food, to pay for medical treatment and to buy land and other assets.
The majority of households live below the poverty threshold, suggested that rural households
are living in hard conditions. Although farming seems not a favorable occupation for future
youth integration, the socioeconomic situations faced by the youths in the area suggest that
many rural youths will have to rely on the current farming given the limited availability of
non-farm activities. Migration is one exit strategy but it is only a temporary one. Farming
remains a shelter and a safety net for youths returning from migration.
3.8.2 Difficulty in looking for non-farm jobs link to low level of education
My study supports the observation that young people have difficulties in finding jobs outside
agriculture if they have a low level of education. Because of their limited education, rural
youths face uncertainty in seeking decent jobs beside agriculture, particularly in low-density
areas. One youth group leader in Otdar Meanchey stated that youth in rural areas lack
knowledge and skills, and hence often lack self-confidence. Therefore, they have difficulties
in finding jobs besides farming. Figure 21 shows how respondents from the survey feel about
the difficulty of finding non-farm jobs for youths. Our key informant in the Takeo province
argues that to get non-farm job requires a high level of education and very strong social
network, such as having a relative in the city. One youth group leader in Otdar Meanchey also
shares the view that rural youth are lacking knowledge and skill and thereby lack the self-
confidence to look for job beside farming.
181
Pursuing study at higher education, which is considered as an exit strategy to non-farm
sectors, is big investment for farmers. Only better-off farmers can afford to send their children
to secondary and high school, meaning the majority of youths drop out. It was observed that
some households sold land and borrowed micro finance in order to support their children who
perform well in education. For example, Case 350 in PB-1 sold 0.36 hectares of land at price
of 3,000 USD to support two daughters studying university in Phnom Penh. The cost of
investment on education per youth will be discussed in detail in the next chapter 4 (See 226).
3.8.3 The degradation of farm economies and rural poverty: Farming as a safety net
The situation of being below poverty line suggests rural farm households are living in difficult
conditions, even though the economic analysis suggests that majority of them are income
positive given the combination of both farm and non-farm activities. This implies that rural
household tend to adjust their expenses to what they have earn so that some household
expenses are less than the poverty line or minimum threshold per family. As indicated in the
socioeconomic diagnostic section of this chapter (3.2 Socioeconomic diagnostics of rural
household), rural households spend more than 65 per cent of their income on food. Though
non-farm income contributes to household‟s economic sustainability, agriculture still
contributes 79 per cent of total household income. This implies that agriculture is a vital
source of household income for many rural households. However, the tendency is found in
farm types that have small land sizes to rely more on non-farm activities to earn a
complementary income, such as in TK-1 and OMC-1 where non-farm income contributes 60
per cent and 45 per cent to household income respectively. With the other farm types,
although majority of income is from farming, they also require the complementary income
from non-farm activities or migration activities. To get more land in order to increase farm
income is seen as the motivation of households in Otdar Meanchey to move to a new area
where land is accessible via occupation or purchasing in order to expand land as well as to
secure the future of their children who do not have access to education and no employment
alternatives beside farming.
3.8.4 Role of migration as a supplementary income to farming
Although migration is one of the major sources of income in both low and high-density areas,
it cannot totally substitute for farming activities as it is just a temporary job. In many cases,
rural people migrate just to earn enough capital to invest in their farm, such as to buy more
land, a two-wheel tractor, fertilizer and to sustain their livelihood. One purpose is to earn
182
enough money to meet a shortage of income. Another purpose is to earn money to invest in
farming to maintain sustainability and the continuity of farming. Migrating to Thailand is
common in Otdar Meanchey, while having youth who have dropped out from school migrate
to do garment work or construction in Phnom Penh is common in Takeo in Tram Kak and
Prey Kabas. However, in comparison to other local non-farm activities, migration contributes
a lower percentage to total non-farm income. However, to households who have small plots of
land in Tram Kak, having a household member migrate for garment, construction work or
other labor or service work is a significant contribution to ensuring the sustainability of the
rural household.
Farm types that have a small land size and poor agricultural assets, such as TK-1, PB-
1, OMC-1, OMC-3, then, rely more on non-farm income and have a higher rate of migration.
Most of the households in all farm types try to develop non-farm activities, particularly self-
business. The poorer farm types tend to earn supplementary income from labor-based
activities, agricultural wage labor, low-income small businesses and migration, while the
richer farm types tend to develop high income small businesses and earning less from labor-
based activities and agricultural wage labor.
3.9 Conclusion
From a land perspective, based on the land availability possessed by households in the survey,
only a minority of households have big enough land to accommodate additional more youths.
However, given the socioeconomic condition of youths such as a low level of education and
limited job availability in non-farm sectors, they are apparently able to integrate into farming
once they get married on land which is even under the MSI. They, thereby, have to combine
with non-farm activities or migration activities. In order to integrate youth, households have
to consider non-farm activities developed by any household member.
Given that most of rural youth drop out at secondary school and high school and there
are not so many non-farm opportunities are available for them, it is likely that many youths
are going to take part in farming. However, given that farming alone cannot sustain
livelihood, youth will have to combine non-farm activities (as well as migration) with farming
in order to sustain livelihood. Although migration contributes less to total household income
than other non-farm activities, it plays important role to some households. Ellis and Freeman
(2005) and Rigg (2006) observe that migration is now becoming the central feature of rural
livelihood in developing countries, and thereby suggests that rural development should no
longer focus only on farming but also on creating more non-farm activities for youth.
183
Therefore, there is a need to develop skills related to farming to increase production to
generate more income and to reduce the need to buy additional food such as fish and other
meat. Many rural development projects have been trying to do this through distributing seed,
chickens and pig and providing some training on agricultural techniques. However, the
fieldwork experience and knowledge from field observation gave the impression that the
support is just for immediate relief and is temporary. After the project is over, farmers will go
back to the status quo. Hence, there should be stronger and systematic support for rural youths
and their family. It is likely that an integration of agricultural skills in secondary or high
school could be a part of solution. In addition to this, since rural youth often lack self-
confidence and life skills, personal and livelihood skill development should be included in the
training in order to inspire youths and their family to foresee the future challenges. This
suggestion is in line with the work of one NGO who has been trying to work on the
integration of youth in farming. The NGO-CEDAC claims that they are now working with
stakeholders to advocate the agricultural training to be included in high school.
As indicated in the household economy section, the majority of farming families
encounter hardship which is demonstrated by looking at households in relation to the poverty
line. This situation can be explained by institutional theory (derived from the mental model
theory of Mantzavinos (2001) and Mantzavinos, North, and Shariq (2004), which can explain
the rationale of youth and their family‟s decision to quit or to stay farming. In this case, the
problem people face in their livelihood, i.e. that the income from farming does not meet daily
consumption needs, becomes a learning process which later becomes shared knowledge
among family members and become a rule where either youth, household member or farm
household try to analog when they meet the similar problem. In this case, the degradation of
rural livelihood, that is when the farm‟s earnings are unable to meet the daily need and there
is a low profitability in farming, needs rules that youths and their parents have to figure out
solutions, such as dropping out from school and migrating to city to seek non-farm jobs in
order to sustain livelihoods and keep the continuity of farming, as it is their family‟s safety
net. And, vice versa, the experiences from migration, such as it is hard work and can pay a
very small income that is only enough for self-survival where other values (like working
independently, being one‟s own boss, personal freedom, enjoying time with family member
and available leisure time) is also motive for them to come back home and set up a farm,
especially when they are getting married. Migration, hence, can be considered as a temporary
strategy to overcome livelihood stress.

184
Cambodia has special circumstances – i.e. political integration, population pressure,
small holding farming challenges and limited opportunities for non-farm activities – which
provide challenges for youths and their family farms, as they need a combination of both farm
and non-farm activities. Acharya et al. (2003b) found that there are very few occupations
away from agriculture. The slow emergence of non-farm activities in the country is largely
due to historical fact (Acharya et al., 2003b). The suggestion of Pillot (2007) that Cambodia
should consider employment-regulating agricultural policy is a sound proposition. Kydd and
Dorward (2004) reveal that smallholder agricultural-based countries often face challenges due
to the weaknesses of the institutional environment37
and, thereby, face serious coordination
failure.38
Hence, countries require a continuous effort in regard to technical innovation.
Therefore, a coordinated market economy (CME) approach would be more appropriate than a
liberal market economy (LME) (Kydd & Dorward, 2004). However, this is very unlikely for
Cambodia, as the country does not even have a general youth employment policy. It will be
very long way to go before regulating employment in farming or Cambodia positioning itself
in a free market economy. In addition to this, the Cambodian government favors large-scale
plantations over smallholder farming. This can be seen through the large-scale economic land
concessions granted, which is now a controversial topic of for political discussion and a
source of land conflict in the country.
The question of the subdivision of land and land availability for children at their
marriage is become more and more challenging, especially in high-density areas in Tram Kak
and Prey Kabas. Even in low-density areas, people admit that land is now becoming more and
more scarce and expensive. All land has an owner and there is no more available land for
people to encroach as previously did. Education is expected to be an exit strategy for children
from family farming; hence, farmers try to mobilize resources including micro finance or
even selling agricultural land to fund their children‟s schooling.
One way to make farming attractive to youth is to make farming more profitable. The
program director of one NGO who work on youth integration in Cambodia said, “The biggest
challenge is that there is not so many examples that youth can get a higher income from
farming.” People tend to view farm work as a low-income job, but those who earn more from
37
The institutional environment is the set of fundamental political, social, and legal ground rules that establishes
the basis for production, exchange, and distribution, institutional arrangement is an arrangement between
economic units that govern the ways in which these units can cooperate and/or compete. (Davis & North, 1971) 38
Coordination defined as effort or measures design to make players within the market system act into a
common or complementary way or towards a common goal.

185
farming view it as good job. The study found that state of being one‟s own boss rather than
working for others is a benefit for many youths that respondents interviewed would like.
Although some studies indicate youth are growing disinterested in farming, the qualitative
interviews with youths and with parents and the group discussion with youths who are
currently studying give the impression that farming is one of their aspirations. They saw that
those who migrate out of their village did have not gains more than to those who stayed
working on farm. Those who migrate at some point will have to settle on farming, especially
after getting married.
The quotation below is an example of how rural youth experience with the hardship of
being earn and save very little from their migration for garment work:
I have been working for more than five years in garment work in
Phnom Penh but I have only saved 300 USD. This amount I used
to buy jewellery for my wedding. I think that if I can save almost
nothing working in garments, I better start farm work with my
husband. Perhaps I can save more, because this year we can save
100 USD from farming.”
- 24 years old woman in Prey Kabas commune in the year she
got married (2012).
Although, smallholding farming faces challenges, it is still the dominant source of
income and food in Cambodia. Given the global fact that smallholding family farming in
developing countries spend between 60 to 80 per cent of their income on food, agriculture still
plays a vital role as a safety net to family and migrant. In many cases, it was found that
parents send rice and food to migrants who work at the city (even if they have migrated for
study). Migration is a strategy to improve farming income. Earnings from migration and
remittance are used to invest in farming, such as enlarging farm size, buying input and
machinery and supporting daily need.
This chapter examines the rural youth situation in smallholding farming in Cambodia
by looking at socioeconomic background of youths and their family in low and high-density
areas to see to extent to which small-holding farming can accommodate a new generation of
youth and the factors that integrate and disintegrate youths from farming. The study concludes
that although smallholding farming faces challenge in sustaining livelihoods, many more
youth will settle in farming. This is partly due to the historical context (such as political
186
integration), population pressure due to a baby boom, limited non-farm opportunities and the
low educational level of rural youths, which means rural youth do not have many alternatives
besides farming. In addition to this, higher education is an expensive investment that not
many rural families can afford and opportunities for non-farm activities require a high level of
education and a social network and are highly competitive.
Cambodian youth are deeply engaged in smallholding farming, partly because there
are so few non-farm activities in rural areas and partly because rural youth lack assets and
skill, particularly the low level of education which means they have poor confidence about
seeking alternatives.
In such a context, though, migration contributes to some extent to household income
but, given the fact that the major expense of rural people is food, the study concludes that
agriculture is more than just employment/occupation to rural youth but it is a source of
livelihood which plays a vital role in accommodating youth in term of generating income,
food security, giving a safety net to households and migrant members, and providing a source
of basic education. However, traditional farming is challenged by the low profitability of
farming, which requires rural youth to rely on parents‟ resources and on migration as part of
the strategy to sustain their living and to invest more on their farm. Therefore, making
smallholding farming in Cambodia become more profitable remains the big challenge.
In this chapter, I have explained the institutional environment, farm production and its
economic capacity, discussed the capacity of youth integration and the extent to which family
farming in rural Cambodia can accommodate youth in farming and identified the role of non-
farm activities, including migration.
The majority of smallholding farms have on average a small land size of 0.7 hectares,
which is not enough to generate income to sustain the average family size of people. Non-
farm activities and migration play a very crucial role in sustaining livelihood. Without non-
farm income complementary, about 70 per cent of rural households would be income
negative, whole with non-farm incomes, 70 per cent are income positive. However, although
the economic result from farm families show that majority of household are income positive,
when this income is compared to the poverty line and the average minimum threshold for
sustainable living for a family, the result shows that the majority of rural households (60 per
cent) are living under the poverty line. This implies that rural households live in a difficult
situation.
187
The next chapter will discuss the capacity for youth integration and the factors that
contribute to choosing to settle in farming undertaken by youth and adult households based on
the farm typology developed in this chapter.

188
CHAPTER 4: YOUTH INTEGRATION IN FAMILY FARMING IN
CAMBODIA
4.1 Re-defining of youth in farming
Although the studies adopted Cambodian youth definition as those whose age between 14 and
30 years old (UNICEF, 2009), the closer look at the family history linking to migration and
settlement in farming of the families in the survey in the three zones suggests that in order for
one to able to see a better picture of the family farming, the age of youth should be extended
to 35 years old. As settlement in farming took place after getting married, some single male
tends to living a single life up to maximum 36 years old based on observed case from survey
in this study. Women tend to drop out of school earlier and therefore getting married at
younger age practically between 18 to 24 years based on the observed case from survey.
Therefore, the possible combination of youth family could be people between the age 18 to 36
years old. In this case, if Cambodian youth definition is applied, some youth families in the
survey may be theoretically excluded while actually they are new youth couple who also have
just settled in farming. I, therefore, re-define youth definition in this study for this chapter as
youth are people whose ages are between 14 to 35 years old.
Youth family is defined as couple who is either husband or wife aged between 14 to
35 years old or family that has household head age below and equal to 35 years old. However,
that is not the only criteria to call youth family. Some certain household even age of
household head is more than 35, this study categorizes as youth family given that the he/she
just get married and settle in farming and just have baby. This is due to man married to youth
woman age below 35 (age between 21 to 25 years old observed from the survey).
Adult family is defined as couple who both husband and wife aged above 35 years old.
Usually, adult family can have single youth or married couple residing within the household.
Young couple who just got married and are currently living with adult family can be
temporally in order to have enough couple experience to live independently from parent or
can be permanently because there is no land share to the young couple or can be the last son
or daughter (mostly daughter) who traditionally live and take care of parents when they are
getting old. They apparently inherited the farm land and household assets.
In this chapter, I am going to look at the socio and economic characteristic of youth
and adult family to see how many of them have settled in which farm type defined in the
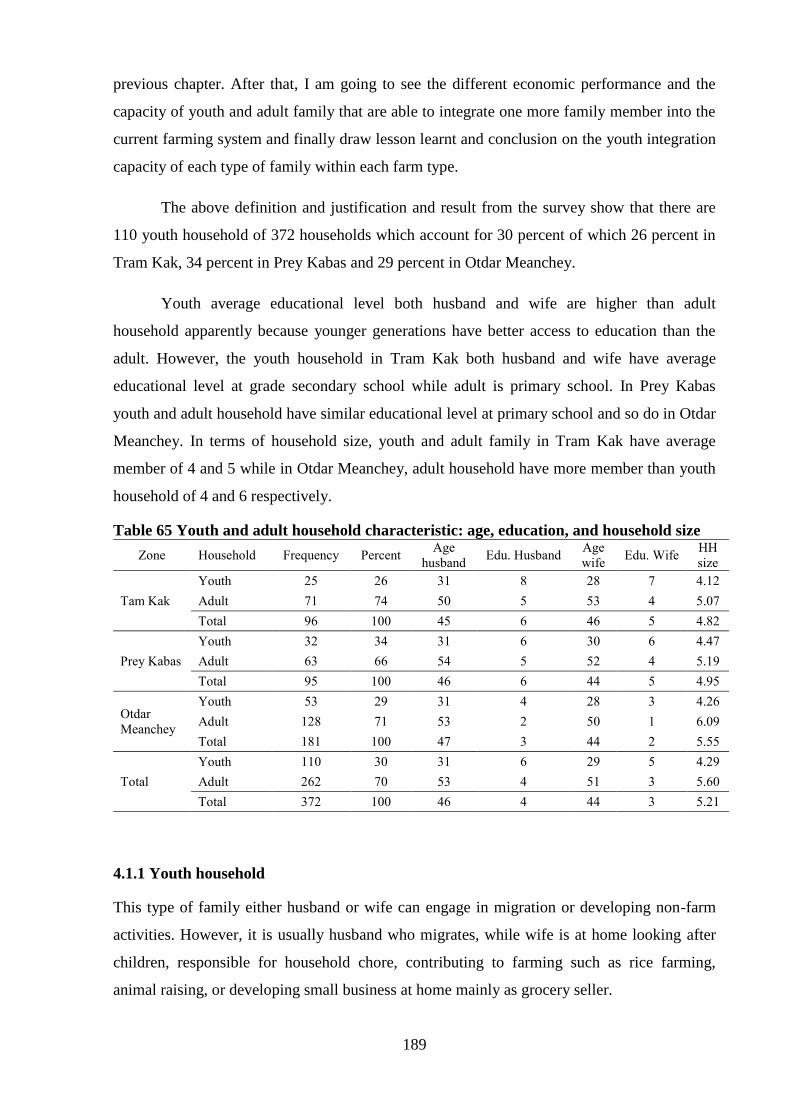
189
previous chapter. After that, I am going to see the different economic performance and the
capacity of youth and adult family that are able to integrate one more family member into the
current farming system and finally draw lesson learnt and conclusion on the youth integration
capacity of each type of family within each farm type.
The above definition and justification and result from the survey show that there are
110 youth household of 372 households which account for 30 percent of which 26 percent in
Tram Kak, 34 percent in Prey Kabas and 29 percent in Otdar Meanchey.
Youth average educational level both husband and wife are higher than adult
household apparently because younger generations have better access to education than the
adult. However, the youth household in Tram Kak both husband and wife have average
educational level at grade secondary school while adult is primary school. In Prey Kabas
youth and adult household have similar educational level at primary school and so do in Otdar
Meanchey. In terms of household size, youth and adult family in Tram Kak have average
member of 4 and 5 while in Otdar Meanchey, adult household have more member than youth
household of 4 and 6 respectively.
Table 65 Youth and adult household characteristic: age, education, and household size
Zone Household Frequency Percent Age
husband Edu. Husband
Age
wife Edu. Wife
HH
size
Tam Kak
Youth 25 26 31 8 28 7 4.12
Adult 71 74 50 5 53 4 5.07
Total 96 100 45 6 46 5 4.82
Prey Kabas
Youth 32 34 31 6 30 6 4.47
Adult 63 66 54 5 52 4 5.19
Total 95 100 46 6 44 5 4.95
Otdar
Meanchey
Youth 53 29 31 4 28 3 4.26
Adult 128 71 53 2 50 1 6.09
Total 181 100 47 3 44 2 5.55
Total
Youth 110 30 31 6 29 5 4.29
Adult 262 70 53 4 51 3 5.60
Total 372 100 46 4 44 3 5.21
4.1.1 Youth household
This type of family either husband or wife can engage in migration or developing non-farm
activities. However, it is usually husband who migrates, while wife is at home looking after
children, responsible for household chore, contributing to farming such as rice farming,
animal raising, or developing small business at home mainly as grocery seller.
190
The qualitative interview together with the examination of the household composition
in the survey give an impression that youth usually takes up farming at their point of
marriage. The observed cases tell that youth getting marriage after migration for a while by
both man and woman or any of them. At their marriage, they get land share such as village
land or agricultural land from one or both sides depending on the resource availability of the
both sides of the family. In case of marriage in to the village, traditionally groom comes to
live with the bride side; in this case if the groom is an outsider, land share is usually from the
bride side while the groom side contributes as dowry. Thanks to migration experience, any of
them can migrate again in case the farming is not sufficient supporting the livelihood. There
are 110 households which account for 30% of 372 households. Among 110 youth household,
there are 10 households who did not get land share at their marriage.
4.1.2 Adult household
Adult household is a family that has single youth or under youth children or youth family
(couple) age 14 (legally 18) to 35 years old) and currently living with parents. Any member of
youth family can be on migration or engage in non-farm activities or currently attending
school. This family can also have single youth age of 14 to 35 years old both male and female
who dropped out from school working at home or on migration or currently studying. Youth
couple wife lives with parent looking after children and engaging in non-farm work such as
small grocery, hair dresser, or help parent doing farm work. Husband can engage in farm
work in case of old age parent, or working on non-farm such as teacher, salaried employed in
local workhouse (for example husband doing iron smith, wife hairdresser case: 0068-OMC-3-
Adult-AH). Adult family with youth married mainly has daughter who mainly dropped out
and live with parents. It is a rare case for male because of tradition of Cambodia the married
couples are going to live with the bride side. Youth couple in this family is usually the last
child mostly daughter. However, adult family with youth couple may extend their stay with
the family longer apparently because their parents do not have land to share or any support for
them to start independent household. That is why young couple resides with parents and
thereby, surplus labor such as husband or wife engaging in migration or non-farm activities
such as construction work or garment work. Among 372 households, there are 262 adult
households which account for 70% of total household. Among 262 adult households, there are
66 households that have young married couple (between 1 to 4 couples) are living with which
account for 25% of total adult household. Among 262 (70%) adult household, there are 162
(60%) household have children getting married in the past 10 years. 74% of 162 households
have manage to give land to the married couple.
191
4.2 Description of youth and adult household
4.2.1 Distribution of youth and adult household in each zone and type
Among 372 households include in the analysis and making farm typology, there are 30%
youth households and 70% adult households. Youth household is distributed 26% of 96
households in Zone Tram Kak, 34% of 95 households in Zone Prey Kabas and 29% of 181
households in zone Otdar Meanchey. Table 66 illustrates the distribution of youth within each
type of farming where the percentage is calculated between youth and adult household within
total youth and adult.
In Tram Kak, majority of youth account for 60% of total youth in zone is in farm type
TK-1, the other 20% are in TK-2 and rest 20% are in TK-3. This suggests that majority of
youth settled in farming mainly on TK-1. Adult households 41% are in TK-1 while 25% are
in TK-2 and 34% are in TK-3.
In Prey Kabas, 2 youth households accounted for 6% in PB-1, 1 household accounted
for 1% are in PB-3 while the majority of youth 29 household accounted about 91% in PB-2.
That was why PB-2 was characterized by young headed household and less migration because
youth in this farm type, farm active worker was dedicated to rice farming. 25 adult
households accounted for 40% in PB-1 while 22 households accounted for 35% in PB-2 and
16 household accounted for 25%.
In Otdar Meanchey, among total 53 household youth, 30 household accounted for
57% in OMC-1, 16 household accounted for 30% in OMC-2, 4 households accounted for 8%
in OMC-3 and 3 household accounted for 6% are in OMC-4. The distribution shared similar
pattern for adult household. Among 128 household, 81 household accounted for 63% in
OMC-1, 33 household accounted for 26% in OMC-2, 12 household accounted for 9% in
OMC-3 and 2 household accounted for 2% in OMC-4.
In general, both youth and adult household distribute in all farm type in each zone but
the majority is obviously seen in small land and poor asset farm type that is TK-1 in Tram
Kak and OMC-1 in Otdar Meanchey except zone Prey Kabas where youth household is
remarkably seen in PB-2 where majority accounted for 91% in this farm type.
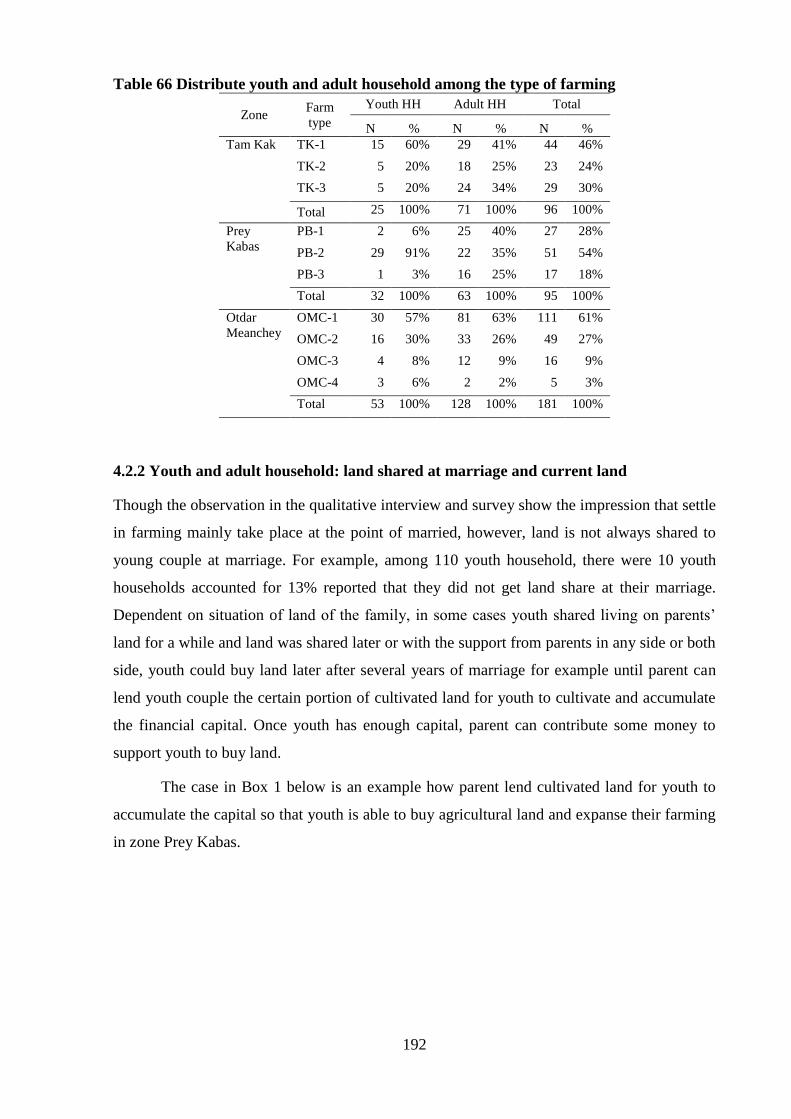
192
Table 66 Distribute youth and adult household among the type of farming
Zone Farm
type
Youth HH Adult HH Total
N % N % N %
Tam Kak TK-1 15 60% 29 41% 44 46%
TK-2 5 20% 18 25% 23 24%
TK-3 5 20% 24 34% 29 30%
Total 25 100% 71 100% 96 100%
Prey
Kabas
PB-1 2 6% 25 40% 27 28%
PB-2 29 91% 22 35% 51 54%
PB-3 1 3% 16 25% 17 18%
Total 32 100% 63 100% 95 100%
Otdar
Meanchey
OMC-1 30 57% 81 63% 111 61%
OMC-2 16 30% 33 26% 49 27%
OMC-3 4 8% 12 9% 16 9%
OMC-4 3 6% 2 2% 5 3%
Total 53 100% 128 100% 181 100%
4.2.2 Youth and adult household: land shared at marriage and current land
Though the observation in the qualitative interview and survey show the impression that settle
in farming mainly take place at the point of married, however, land is not always shared to
young couple at marriage. For example, among 110 youth household, there were 10 youth
households accounted for 13% reported that they did not get land share at their marriage.
Dependent on situation of land of the family, in some cases youth shared living on parents‟
land for a while and land was shared later or with the support from parents in any side or both
side, youth could buy land later after several years of marriage for example until parent can
lend youth couple the certain portion of cultivated land for youth to cultivate and accumulate
the financial capital. Once youth has enough capital, parent can contribute some money to
support youth to buy land.
The case in Box 1 below is an example how parent lend cultivated land for youth to
accumulate the capital so that youth is able to buy agricultural land and expanse their farming
in zone Prey Kabas.
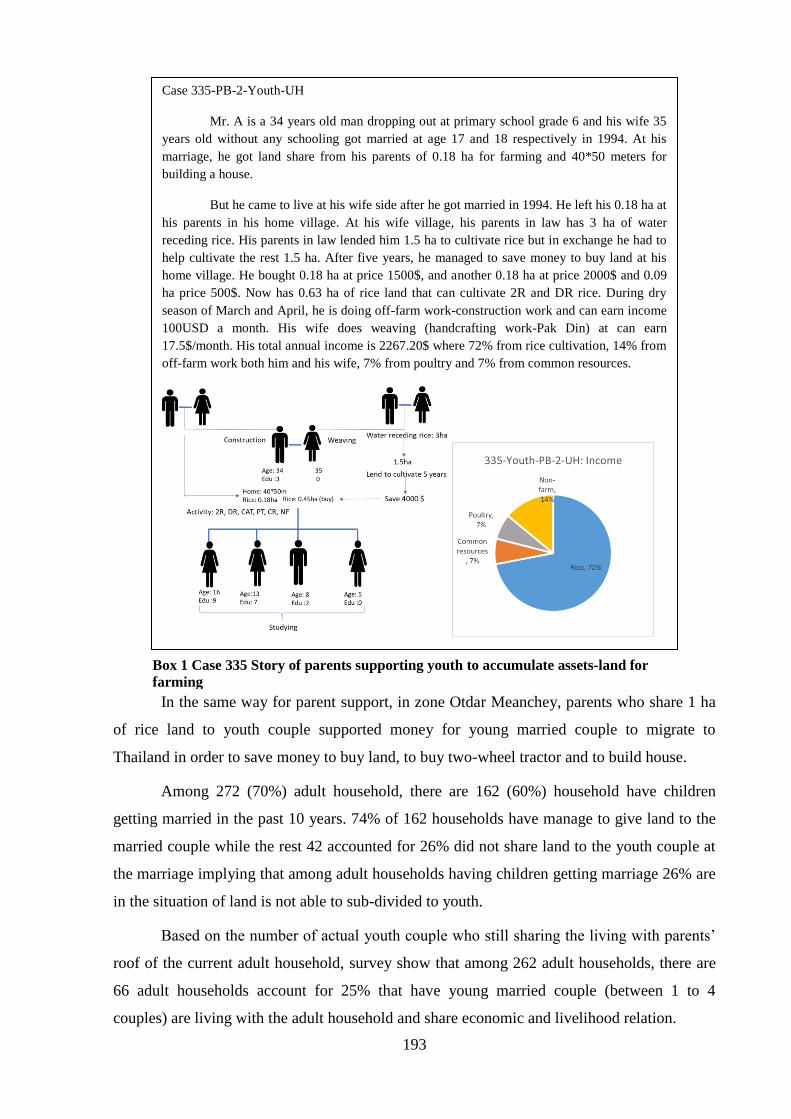
193
In the same way for parent support, in zone Otdar Meanchey, parents who share 1 ha
of rice land to youth couple supported money for young married couple to migrate to
Thailand in order to save money to buy land, to buy two-wheel tractor and to build house.
Among 272 (70%) adult household, there are 162 (60%) household have children
getting married in the past 10 years. 74% of 162 households have manage to give land to the
married couple while the rest 42 accounted for 26% did not share land to the youth couple at
the marriage implying that among adult households having children getting marriage 26% are
in the situation of land is not able to sub-divided to youth.
Based on the number of actual youth couple who still sharing the living with parents‟
roof of the current adult household, survey show that among 262 adult households, there are
66 adult households account for 25% that have young married couple (between 1 to 4
couples) are living with the adult household and share economic and livelihood relation.
Case 335-PB-2-Youth-UH
Mr. A is a 34 years old man dropping out at primary school grade 6 and his wife 35
years old without any schooling got married at age 17 and 18 respectively in 1994. At his
marriage, he got land share from his parents of 0.18 ha for farming and 40*50 meters for
building a house.
But he came to live at his wife side after he got married in 1994. He left his 0.18 ha at
his parents in his home village. At his wife village, his parents in law has 3 ha of water
receding rice. His parents in law lended him 1.5 ha to cultivate rice but in exchange he had to
help cultivate the rest 1.5 ha. After five years, he managed to save money to buy land at his
home village. He bought 0.18 ha at price 1500$, and another 0.18 ha at price 2000$ and 0.09
ha price 500$. Now has 0.63 ha of rice land that can cultivate 2R and DR rice. During dry
season of March and April, he is doing off-farm work-construction work and can earn income
100USD a month. His wife does weaving (handcrafting work-Pak Din) at can earn
17.5$/month. His total annual income is 2267.20$ where 72% from rice cultivation, 14% from
off-farm work both him and his wife, 7% from poultry and 7% from common resources.
Box 1 Case 335 Story of parents supporting youth to accumulate assets-land for
farming
194
Among 272 (70%) of adult household, there are 162 household accounted for 60%
said that they have marriage couple in the past ten years. 74% of 162 households said that
they have manage to share the land to youth couple while the other 42 adult household
accounted for 26% do not share. The reason is mainly land is too small to subdivide. Given
some youth couple already live separately, some adult household already help youth settle in
farming more than one couple already, therefore, adult household that still have couple living
with tend not to share land them because the land is already too small to subdivide or the
share is morally done but size is too small for example 0.1ha has been share to youth couple
in zone Tram Kak (case 280-TK-3-Adult-UH see Box 2). In this situation, youth can keep this
land with parent to cultivate and engage in migration or they manage to come to cultivate
during the rainy season. In this case, youth have to integrate themselves into nonfarm sectors
notably garment industry worker, construction worker or any urban services. In return,
remittance from migrant couple help contributing to enhance parent‟s household living whose
land generate values below the poverty threshold.
At the point of installation in farming survey show that there is a tendency that youth
got agricultural land share from parents at marriage less than the adult household. So do the
accumulation of land among youth and adult household. The current land ownership of youth
household tends to be smaller than the adult household. That is the reason why adult family
have rice gross value added higher than youth family in each farm type. The combination of
land share at marriage determines the amount of land at the point of installation. Looking at
the distribution of land share by both sides of parents in each farm type in the three zones,
result shows that usually those who got land share from both side of parent tend to have
bigger farm size than those who got only from one side of parents. Table 67 summaries the
average land share at marriage of youth and adult household in zone Tram Kak, Prey Kabas
and Otdar Meanchey where “F” denote bride side, “M” denote groom side and both “MF”
denote both groom and bride side. For detail distribution of land share at marriage of youth
and adult household in each farm type, please see appendix - 07.

195
Table 67 Land share at marriage and the current land accumulation
Zone Type of
household
Couple
strategy
Number of
household
Land share at
marriage Land ownership
Change
Mean Std.
Deviation Mean
Std.
Deviation
Tam Kak Youth
HH
[F] 6 0.48 0.61 0.73 0.60 0.25
[M] 5 0.26 0.08 0.71 1.18 0.45
[M][F] 13 0.44 0.17 0.58 0.35 0.14
Total 24 0.41 0.32 0.64 0.62 0.23
Adult HH [F] 12 0.34 0.20 0.62 0.51 0.29
[M] 3 0.11 0.08 0.28 0.14 0.16
[M][F] 27 0.50 0.32 0.96 0.65 0.46
Total 42 0.43 0.30 0.81 0.62 0.39
Prey Kabas Youth
HH
[F] 12 0.59 0.39 1.80 1.05 1.21
[M] 2 0.24 0.08 0.86 0.70 0.62
[M][F] 16 0.64 0.37 1.55 0.76 0.92
Total 30 0.59 0.37 1.60 0.89 1.01
Adult HH [F] 5 0.71 0.32 1.36 0.75 0.66
[M] 6 0.25 0.13 1.26 1.11 1.01
[M][F] 16 0.56 0.30 1.25 0.63 0.69
Total 27 0.52 0.31 1.27 0.75 0.76
Otdar
Meanchey
Youth
HH
[F] 13 2.10 1.60 4.20 2.48 2.10
[M] 12 2.67 1.81 3.81 2.50 1.14
[M][F] 15 3.67 1.72 3.34 1.31 -0.33
Total 40 2.86 1.80 3.76 2.10 0.90
Adult HH [F] 25 2.21 1.72 4.32 2.65 2.11
[M] 10 1.60 0.52 4.57 2.61 2.97
[M][F] 19 3.94 1.91 5.25 2.76 1.31
Total 54 2.71 1.88 4.70 2.67 1.99
Do you think that now it is become easy to get more land?
Figure 35 Respondent's view on accessible to land
People share view that land now become very scarce and expensive to buy. Land sell
in Tram Kak and Prey Kabas is very rare and very expensive. The situation in both area is that
it is very rare and there is no one is willing to sell the land.
196
―Land now is very expensive. Even if we have money, it is
difficult to find people who is willing to sell.‖ Said a 42 years old
woman in Chrey Thnoat village, Tram Kak commune (Case 279-
TK-1- Adult-UH).
―Land is so expensive and we don't have capital. I am thinking to
buy more land but I wait the remittance from my children who
migrate to Thailand.‖ Said 63 years old woman in Chrey Thnoat
village, Tram Kak commune (Case 278-TK-2-Adult-UH)‖
―Land now becomes very scared and expensive. The point is there
is no want willing to sell their land.‖ Said 63 years old woman, in
Prey Kabas ‗K‘ village, Prey Kabas commune, Take province
(Case 333-PB-Adult-HH).
―Land is very expensive. A 60m*60m land cost 4000 UDS
(11111$/ha), we cannot afford with such higher price.‖ Said a 51
years old man in Prey Kabas ‗Kha‘ village, Prey Kabas commune
(case 306-PB-1-Audult-UH).
―It is very expensive, 1a (0.01ha) price 300,000-400,000 Riel
(7500 to 10000$/ha), we cannot afford it.‖ Said 63 years old man
in Ou village, Prey Kabas commune (Case 357-PB-3-Youth-AH).
In Otdar Meanchey the land is still available for purchase although the majority of
people tend to view that the price is increase and they mostly can afford to buy it. My field
observation of some households shares to opposite view that land is available for sell though
the price is increasing but that is because the land is already cleared. The qualitative interview
shows that land is still available for villagers in Otdar Meanchey to buy because there are
some big land owners who wish to sell the land. But the land price is increase if compare to
what people used to occupy freely.
―It is difficult of get more agricultural land because there is no
more land for freely occupying. The rest of the land is belonged to
company, we cannot even buy from them.‖ Said a 46 years old
woman in Ou Krouch village, Trapaing Prasat commune and
district, Otdar Meanchey province (Case 183: OMC-3-Adult
HH).
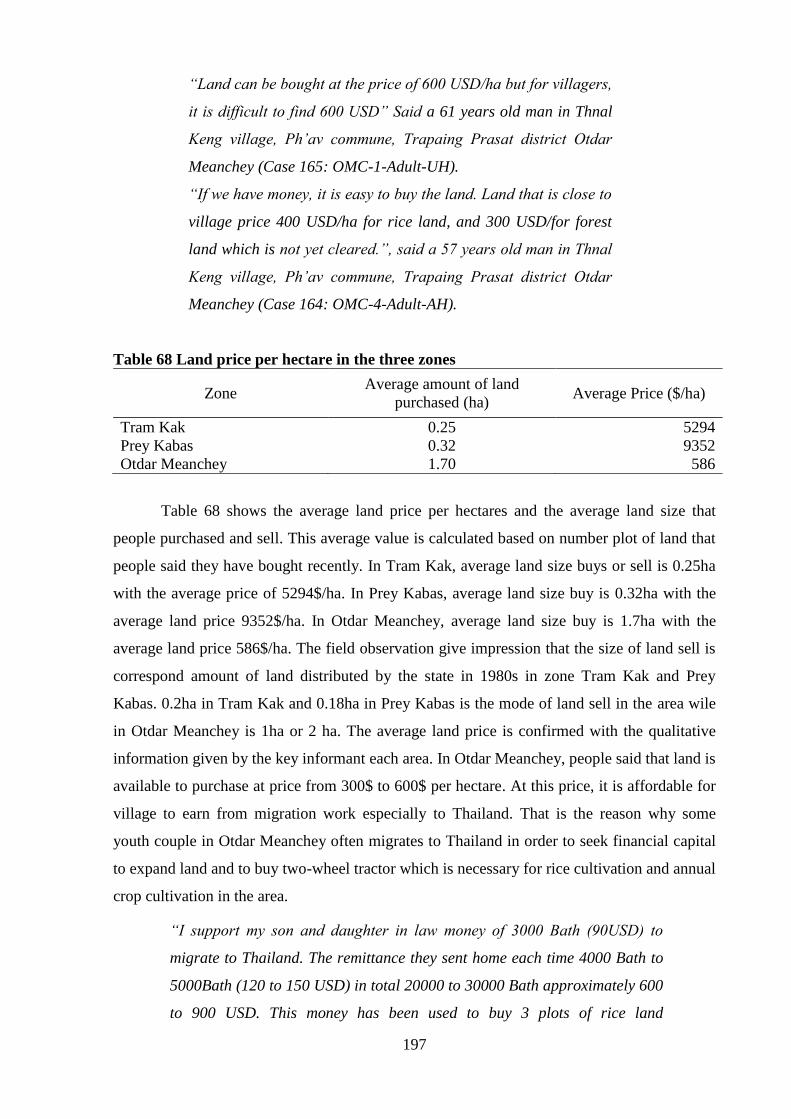
197
―Land can be bought at the price of 600 USD/ha but for villagers,
it is difficult to find 600 USD‖ Said a 61 years old man in Thnal
Keng village, Ph‘av commune, Trapaing Prasat district Otdar
Meanchey (Case 165: OMC-1-Adult-UH).
―If we have money, it is easy to buy the land. Land that is close to
village price 400 USD/ha for rice land, and 300 USD/for forest
land which is not yet cleared.‖, said a 57 years old man in Thnal
Keng village, Ph‘av commune, Trapaing Prasat district Otdar
Meanchey (Case 164: OMC-4-Adult-AH).
Table 68 Land price per hectare in the three zones
Zone Average amount of land
purchased (ha) Average Price ($/ha)
Tram Kak 0.25 5294
Prey Kabas 0.32 9352
Otdar Meanchey 1.70 586
Table 68 shows the average land price per hectares and the average land size that
people purchased and sell. This average value is calculated based on number plot of land that
people said they have bought recently. In Tram Kak, average land size buys or sell is 0.25ha
with the average price of 5294$/ha. In Prey Kabas, average land size buy is 0.32ha with the
average land price 9352$/ha. In Otdar Meanchey, average land size buy is 1.7ha with the
average land price 586$/ha. The field observation give impression that the size of land sell is
correspond amount of land distributed by the state in 1980s in zone Tram Kak and Prey
Kabas. 0.2ha in Tram Kak and 0.18ha in Prey Kabas is the mode of land sell in the area wile
in Otdar Meanchey is 1ha or 2 ha. The average land price is confirmed with the qualitative
information given by the key informant each area. In Otdar Meanchey, people said that land is
available to purchase at price from 300$ to 600$ per hectare. At this price, it is affordable for
village to earn from migration work especially to Thailand. That is the reason why some
youth couple in Otdar Meanchey often migrates to Thailand in order to seek financial capital
to expand land and to buy two-wheel tractor which is necessary for rice cultivation and annual
crop cultivation in the area.
―I support my son and daughter in law money of 3000 Bath (90USD) to
migrate to Thailand. The remittance they sent home each time 4000 Bath to
5000Bath (120 to 150 USD) in total 20000 to 30000 Bath approximately 600
to 900 USD. This money has been used to buy 3 plots of rice land
198
size:30m*60m. The land has been cleared already. Beside land, the
remittance has been used to build house for young couple and latrine.‖, Said
58 years old man, in Cheur Slab village, Kok Kpos commune of Otdar
Meanchey province (Case 0083-OMC-2-Adult-AH, see also in chapter 3).
4.2.3 Economics characterization of youth and adult household
As already explained in previous chapter on farm typology, there is diversity of household in
the three studied areas that can be categorized into 10 farm types. Though household in the
same farm type are supposed to share similar characteristic, however, there are also diversity
within the group. In this section will examine the key different between youth and adult
household in each farm type and their economic activities. After that their economic capacity
to add one more additional person into the system will be examined.
4.2.3.1 Tram Kak youth and adult
Usually, youth household have smaller farm size than adult household. Except youth
household in TK-3 where they have average farm size 1.63ha which is bigger than adult
household 1.10ha, youth in TK-1 and TK-2 have average farm size 0.35ha and 0.78ha which
smaller than 0.39h and 0.90ha of adult household in TK-1 and TK-2 respectively.
Adult and youth households in TK-1 have more labor migration than household in
other farm type accounted for an average 29% and 18% of percentage of labor migration total
labor respectively. Due to degree of diversification of farming, youth household in TK-2 and
TK-3 have no percentage of labor migration while adult and youth household in TK-1 have
29% and 18% of labor migration respectively. Adult household in TK-3 have average active
labor migration 22% while youth household do not have any migrant.
Beside land and labor migration, youth and adult in Tram Kak is remarkable different
in term of agricultural asset and household asset. Adult household tend to have more home
and agricultural asset than youth in TK-1 and TK-2 while it is opposite for youth TK-3 where
youth have similar household asset and higher agricultural assets (see Table 69 below).

199
Table 69 Tram Kak: youth and adult household farm characteristics
TK-1 TK-2 TK-3 Grand Total
Adult
HH
Youth
HH Total
Adult
HH
Youth
HH Total
Adult
HH
Youth
HH Total
Adult
HH
Youth
HH
Grand
Total
Number of HH 29 15 44 18 5 23 24 5 29 71 25 96
Human resources
Total Active Worker 3.13 2.08 2.82 3.26 2.00 3.04 3.24 2.00 3.07 3.20 2.05 2.95
Active Farm Worker 2.03 1.54 1.89 2.84 2.00 2.70 2.28 1.75 2.21 2.32 1.67 2.18
% labor migration 29.46 17.95 26.06 7.37 0.00 6.09 21.55 0.00 18.58 21.23 11.11 19.02
Age of Household Head 49.35 29.69 43.55 49.26 30.25 45.96 48.92 31.50 46.52 49.19 30.14 45.02
HH size 4.90 3.92 4.61 4.95 3.75 4.74 5.36 4.25 5.21 5.07 3.95 4.82
Land resources
Farm size 0.39 0.34 0.37 0.90 0.78 0.88 1.10 1.63 1.17 0.76 0.67 0.74
Land Labor Ratio 0.22 0.24 0.22 0.34 0.39 0.35 0.49 1.17 0.58 0.34 0.44 0.36
% Rice land 98.91 92.05 96.88 52.30 56.61 53.05 85.22 88.16 85.63 82.54 84.55 82.98
% AC land 0.36 0.00 0.25 36.89 30.03 35.69 4.59 6.33 4.83 11.02 6.93 10.13
% VG land 0.73 0.26 0.59 10.81 13.36 11.25 10.19 5.51 9.54 6.44 3.76 5.85
Financial resources
Agricultural Asset 582 482 553 768 705 757 866 1355 933 724 691 717
Total household assets 1828 1556 1748 3216 2761 3137 3430 3445 3432 2713 2145 2589
HH expenditure 769 962 826 1017 928 1001 1439 959 1373 1055 955 1033
Agricultural Expense
(IC+PL) 98 93 97 254 149 236 351 366 353 222 156 207
Agricultural PL 16 2 12 12 8 11 73 14 65 34 5 28
Rice IC+PL 67 60 65 89 95 90 221 110 206 124 76 114
AC IC+PL 0 0 0 53 25 48 5 16 7 15 8 14
Cattle stock value ($) 661 731 682 1526 1500 1522 1260 1250 1259 1080 976 1057
HH income sources
Agricultural income 404 402 404 1069 856 1032 1804 1006 1693 1039 604 944
Rice income 152 160 154 277 398 298 683 269 626 360 226 331
AC income 1 0 1 133 63 121 31 52 34 45 22 40
VG income 7 4 7 73 100 78 125 32 112 63 28 55
CAT income 75 55 69 306 149 279 594 333 558 306 126 267
AN (exclu. CAT) income 142 126 137 125 122 125 326 196 308 199 139 186
Total non-farm income 605 638 615 336 475 360 452 474 455 486 576 506
Non-farm income 362 376 366 215 475 260 187 474 227 266 413 299
Migration income 244 263 249 121 0 100 264 0 228 219 163 207
Total HH income 1010 1041 1019 1405 1331 1392 2255 1480 2148 1525 1180 1449
In terms of economic performance, Figure 36 shows that adult and youth household in
TK-1 have identical economic capacity of annual household income 1010USD and 1041USD
respectively. The composition to total average household income is also share the similarity.
In TK-2 adult household have economic capacity generate income 1405USD while youth
generate 1331USD per year. The annual income of youth and adult household in this farm
type is about the same, however, the key different is the contribution of animal income
(exclude cattle) and annual crop income the make adult household have higher agricultural
income. In addition, the labor migration of household active work in the adult household and
non-farm activities provide additional income to adult household to generate annual income
slightly higher than youth household. Thanks to the contribution of non-farm activities
approximately 36% to total income that contribute the youth household economic is identical
to adult household income. Adult household in TK-3 has the highest annual income of
2255USD while youth has only 1480USD. The high income of adult household is due to high
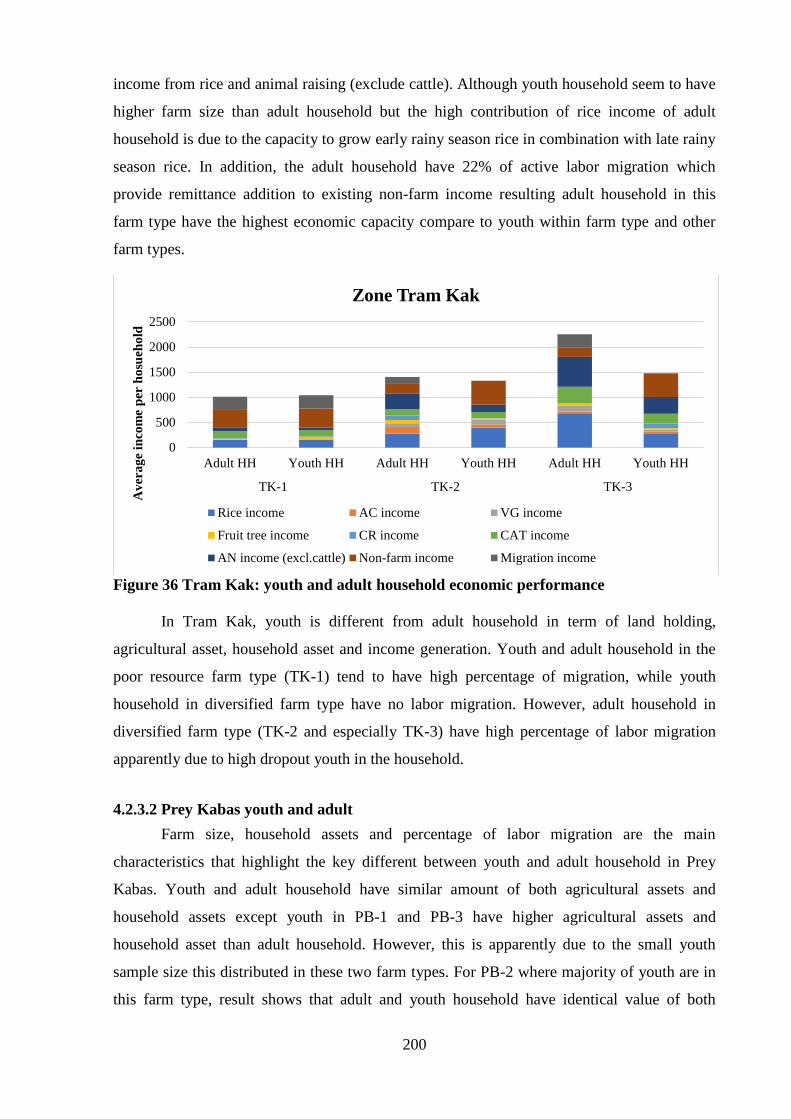
200
income from rice and animal raising (exclude cattle). Although youth household seem to have
higher farm size than adult household but the high contribution of rice income of adult
household is due to the capacity to grow early rainy season rice in combination with late rainy
season rice. In addition, the adult household have 22% of active labor migration which
provide remittance addition to existing non-farm income resulting adult household in this
farm type have the highest economic capacity compare to youth within farm type and other
farm types.
Figure 36 Tram Kak: youth and adult household economic performance
In Tram Kak, youth is different from adult household in term of land holding,
agricultural asset, household asset and income generation. Youth and adult household in the
poor resource farm type (TK-1) tend to have high percentage of migration, while youth
household in diversified farm type have no labor migration. However, adult household in
diversified farm type (TK-2 and especially TK-3) have high percentage of labor migration
apparently due to high dropout youth in the household.
4.2.3.2 Prey Kabas youth and adult
Farm size, household assets and percentage of labor migration are the main
characteristics that highlight the key different between youth and adult household in Prey
Kabas. Youth and adult household have similar amount of both agricultural assets and
household assets except youth in PB-1 and PB-3 have higher agricultural assets and
household asset than adult household. However, this is apparently due to the small youth
sample size this distributed in these two farm types. For PB-2 where majority of youth are in
this farm type, result shows that adult and youth household have identical value of both
0
500
1000
1500
2000
2500
Adult HH Youth HH Adult HH Youth HH Adult HH Youth HH
TK-1 TK-2 TK-3
Av
era
ge
inco
me
per
ho
sueh
old
Zone Tram Kak
Rice income AC income VG income
Fruit tree income CR income CAT income
AN income (excl.cattle) Non-farm income Migration income
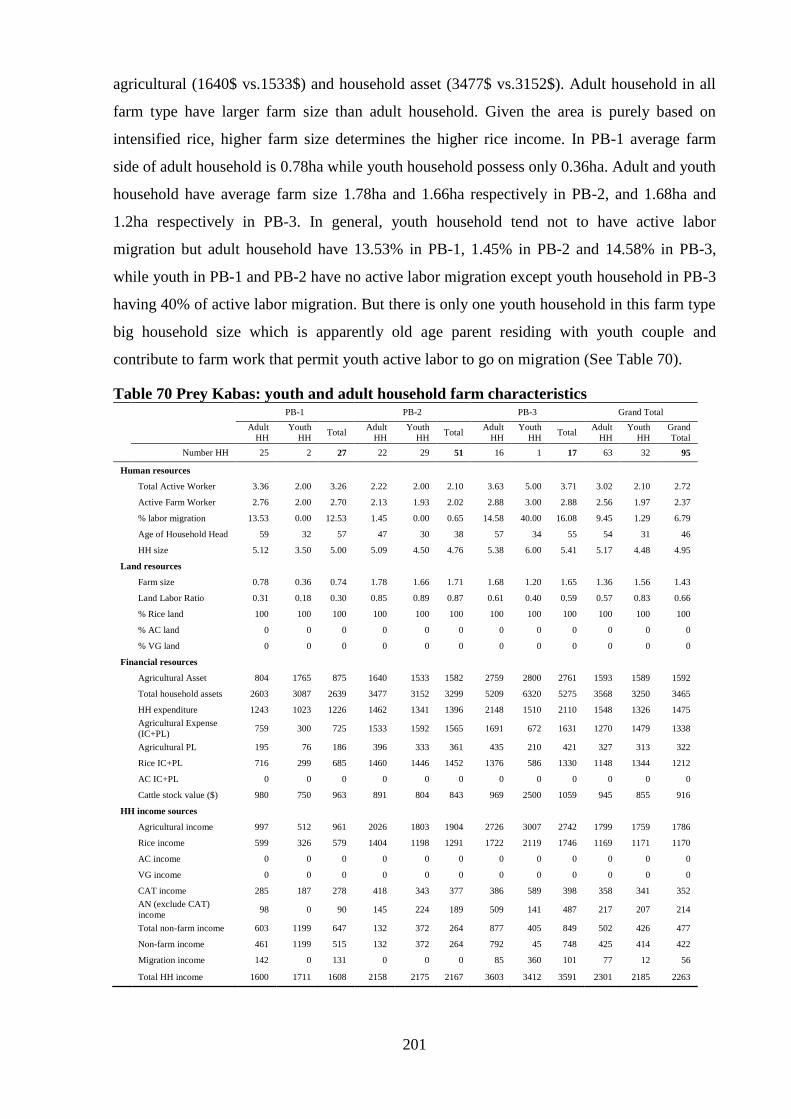
201
agricultural (1640$ vs.1533$) and household asset (3477$ vs.3152$). Adult household in all
farm type have larger farm size than adult household. Given the area is purely based on
intensified rice, higher farm size determines the higher rice income. In PB-1 average farm
side of adult household is 0.78ha while youth household possess only 0.36ha. Adult and youth
household have average farm size 1.78ha and 1.66ha respectively in PB-2, and 1.68ha and
1.2ha respectively in PB-3. In general, youth household tend not to have active labor
migration but adult household have 13.53% in PB-1, 1.45% in PB-2 and 14.58% in PB-3,
while youth in PB-1 and PB-2 have no active labor migration except youth household in PB-3
having 40% of active labor migration. But there is only one youth household in this farm type
big household size which is apparently old age parent residing with youth couple and
contribute to farm work that permit youth active labor to go on migration (See Table 70).
Table 70 Prey Kabas: youth and adult household farm characteristics
PB-1 PB-2 PB-3 Grand Total
Adult
HH
Youth
HH Total
Adult
HH
Youth
HH Total
Adult
HH
Youth
HH Total
Adult
HH
Youth
HH
Grand
Total
Number HH 25 2 27 22 29 51 16 1 17 63 32 95
Human resources
Total Active Worker 3.36 2.00 3.26 2.22 2.00 2.10 3.63 5.00 3.71 3.02 2.10 2.72
Active Farm Worker 2.76 2.00 2.70 2.13 1.93 2.02 2.88 3.00 2.88 2.56 1.97 2.37
% labor migration 13.53 0.00 12.53 1.45 0.00 0.65 14.58 40.00 16.08 9.45 1.29 6.79
Age of Household Head 59 32 57 47 30 38 57 34 55 54 31 46
HH size 5.12 3.50 5.00 5.09 4.50 4.76 5.38 6.00 5.41 5.17 4.48 4.95
Land resources
Farm size 0.78 0.36 0.74 1.78 1.66 1.71 1.68 1.20 1.65 1.36 1.56 1.43
Land Labor Ratio 0.31 0.18 0.30 0.85 0.89 0.87 0.61 0.40 0.59 0.57 0.83 0.66
% Rice land 100 100 100 100 100 100 100 100 100 100 100 100
% AC land 0 0 0 0 0 0 0 0 0 0 0 0
% VG land 0 0 0 0 0 0 0 0 0 0 0 0
Financial resources
Agricultural Asset 804 1765 875 1640 1533 1582 2759 2800 2761 1593 1589 1592
Total household assets 2603 3087 2639 3477 3152 3299 5209 6320 5275 3568 3250 3465
HH expenditure 1243 1023 1226 1462 1341 1396 2148 1510 2110 1548 1326 1475
Agricultural Expense
(IC+PL) 759 300 725 1533 1592 1565 1691 672 1631 1270 1479 1338
Agricultural PL 195 76 186 396 333 361 435 210 421 327 313 322
Rice IC+PL 716 299 685 1460 1446 1452 1376 586 1330 1148 1344 1212
AC IC+PL 0 0 0 0 0 0 0 0 0 0 0 0
Cattle stock value ($) 980 750 963 891 804 843 969 2500 1059 945 855 916
HH income sources
Agricultural income 997 512 961 2026 1803 1904 2726 3007 2742 1799 1759 1786
Rice income 599 326 579 1404 1198 1291 1722 2119 1746 1169 1171 1170
AC income 0 0 0 0 0 0 0 0 0 0 0 0
VG income 0 0 0 0 0 0 0 0 0 0 0 0
CAT income 285 187 278 418 343 377 386 589 398 358 341 352
AN (exclude CAT)
income 98 0 90 145 224 189 509 141 487 217 207 214
Total non-farm income 603 1199 647 132 372 264 877 405 849 502 426 477
Non-farm income 461 1199 515 132 372 264 792 45 748 425 414 422
Migration income 142 0 131 0 0 0 85 360 101 77 12 56
Total HH income 1600 1711 1608 2158 2175 2167 3603 3412 3591 2301 2185 2263

202
Result shows that youth and adult household share almost identical total annual
income household in each farm type. On average, in PB-1, adult household earn 1600$/year
while youth household earn 1711$/year. However, due to small land, youth household in PB-
1 have to combine 70% of total income from non-farm activities while adult household
combine 29% of non-farm activities and 9% from migration activities. In PB-2, adult
household earn 2158$ per year youth 2175$ per year. Adult household have higher
agricultural income than youth household due to the contribution of rice income (big farm
size) accounted for 65% compare 55%. In addition, 19% of income of adult household comes
from animal production while youth household has only 16% of income from animal
production. It is non-farm income that annual total income of youth household higher than
adult household (17.10% vs.6.12%). In PB-3, adult household generate 3603$ per year where
major contribution is from rice (49%), cattle (14%), non-farm income (22%), migration
(2.36%). Youth household annual income earning is 34012$ where major contribution is from
rice (62%), cattle (4%), animal production (17.27%), and migration (11%). The key different
between adult and youth household in PB-3 is adult household have high percentage of non-
farm income added to farm income that make adult household earn identical income to youth
household (See Figure 37).
Figure 37 Prey Kabas: youth and adult household economic performance
4.2.3.3 Otdar Meanchey youth and adult
In general, result shows that youth household tends to have smaller land, smaller agricultural
asset and smaller household assets than adult household. However, adult household tend to
have higher percentage of labor migration than youth household due to high farm active
worker and smaller land per active labor than youth household.
0
500
1000
1500
2000
2500
3000
3500
4000
Adult HH Youth HH Adult HH Youth HH Adult HH Youth HH
PB-1 PB-2 PB-3
Av
era
ge
inco
me
per
ho
sueh
old
Zone Prey Kabas
Rice income AC income VG income
Fruit tree income CR income CAT income
AN income (excl.cattle) Non-farm income Migration income

203
Youth in rice based small land poor resource farm type OMC-1 has smaller and asset
than adult household. It is opposite for youth in rice based big land and rich resource farm
type OMC-2. While adult household in OMC-1 has average agricultural assets 1501$, youth
has only 754$. Youth in OMC-2 has better situation in term of land and assets compare to
adult household for both agricultural assets and household assets. The average agricultural
assets for adult household is 2546$ and for youth household is 2793$. The average total
household assets for adult household is 2230$ and for youth household is 4252$.
OMC-3 and OMC-4 whose household combine rice and annual crops, youth has
average land bigger than adult household but then to have smaller agricultural assets and
household assets compare to adult household. Thank to this, youth in OMC-3 and OMC-4
tend to spend more paid labor in both rice and annual crops cultivation than adult household
having more agricultural assets (see Table 71). Labor exchange is found common in Otdar
Meanchey in both rice and annual crops cultivation.
Table 71 Otdar Meanchey: youth and adult household farm characteristics
OMC-1 OMC-2 OMC-3 OMC-4 Grand Total
Adult
HH
Youth
HH Total
Adult
HH
Youth
HH Total
Adult
HH
Youth
HH Total
Adult
HH
Youth
HH Total
Adult
HH
Youth
HH Grand
Total
Number HH 81 30 111 33 16 49 12 4 16 2 3 5 128 53 181
Human resources
Total Active Worker 4.12 2.13 3.59 4.06 2.06 3.41 3.33 2.00 3.00 2.00 2.00 2.00 4.00 2.09 3.44
Active Farm Worker 3.42 1.97 3.03 3.36 1.81 2.86 2.42 1.75 2.25 2.00 2.00 2.00 3.29 1.91 2.88
% labor migration 12.06 8.89 11.20 8.89 2.08 6.67 19.58 0.00 14.69 0.00 0.00 0.00 11.76 5.66 9.97
Age of Household Head 54 31 48 51 33 45 53 29 47 50 29 37 53 31 47
HH size 5.95 4.17 5.47 6.61 4.69 5.98 5.67 4 5.25 5.5 3.33 4.2 6.09 4.26 5.55
Land resources
Farm size 3.02 2.22 2.81 6.75 5.72 6.42 2.31 3.67 2.65 3.85 4.17 4.04 3.93 3.50 3.80
Land Labor Ratio 1.00 1.18 1.05 2.15 3.53 2.60 0.98 2.33 1.32 1.93 2.08 2.02 1.31 2.03 1.52
% Rice land 98.28 99.26 98.55 97.34 99.15 97.93 43.34 71.05 50.26 38.52 58.33 50.41 91.95 94.78 92.78
% AC land 1.53 0.64 1.29 1.61 0.21 1.15 21.94 26.66 23.12 61.48 29.63 42.37 4.40 4.12 4.32
% VG land 0.19 0.09 0.17 1.05 0.64 0.92 1.39 2.29 1.61 0.00 12.04 7.22 0.52 1.10 0.69
Financial resources
Agricultural Asset 1501 754 1299 2546 2793 2627 1315 0 986 1565 0 626 1754 1270 1612
Total household assets 2292 1366 2042 4230 4252 4237 2290 595 1866 2762 398 1344 2799 2124 2601
HH expenditure 1115 1025 1090 1506 1200 1406 968 773 919 1544 1796 1695 1209 1102 1178
Agricultural Expense
(IC+PL) 357 299 341 802 959 853 381 570 429 461 970 766 476 556 499
Agricultural PL 190 161 182 392 588 456 192 304 220 33 545 340 240 323 264
Rice IC+PL 299 226 279 632 796 685 278 266 275 90 428 293 380 413 389
AC IC+PL 9 1 7 26 2 18 61 144 81 371 260 305 24 27 25
Cattle stock value ($) 358 217 320 879 219 663 500 0 375 500 167 300 508 198 417
HH income sources
Agricultural income 770 678 745 1824 1239 1633 930 1162 988 1753 1587 1653 1072 935 1032
Rice income 423 367 408 1141 703 998 276 431 315 360 442 409 594 477 560
AC income 14 6 12 32 10 24 187 219 195 1121 490 742 52 50 52
VG income 6 3 6 24 111 52 14 164 52 0 258 155 11 62 26
CAT income 109 23 86 229 82 181 150 0 113 0 53 32 142 41 113
AN (exclu. CAT) income 156 135 151 284 235 268 139 299 179 114 105 109 187 176 184
Total non-farm income 776 494 700 577 495 550 536 260 467 50 1377 846 691 527 643
Non-farm income 453 371 431 417 495 442 434 260 390 50 1377 846 436 457 442
Migration income 323 123 269 160 0 108 102 0 77 0 0 0 255 70 201
Total HH income 1546 1172 1445 2401 1734 2183 1466 1423 1455 1803 2964 2500 1763 1462 1675
204
In OMC-1 adult household earn average 1546$ per year, youth household earn 1172$
per year. Though adult household has average farm size 3 ha which is 1 ha higher than youth
having only 2ha but rice income of adult household is just slightly higher than youth
household (423$ vs.367$). While the investment on farm is not significant different, the
different of rice income is apparently due to quality of production such yield or quality of
land. However, it is non-farm income and migration income that contribute to adult household
income higher than youth household. Non-farm income and migration income contribute
29.3% and 20.89% respectively to total adult household income, while these two income
source 31.67% and 10.5% to total youth household income.
In OMC-2 adult household has average income 2401$ per year while youth household
has 1734$ per year. Thank to bigger land size, rice is the key contribution to adult household
income which account for 47% of total income while adult is only 40.55%. Animal
production contributes 9.56% in adult household compare to 4.71% in youth household. Adult
household combine migration (6.66%) and non-farm income (17.36%) while youth have only
non-farm income (28.53%).
In OMC-3 youth and adult household have identical income 1466$ and 1423$
respectively. What makes youth and adult household different is contribution of income of
adult household is non-farm income (29.58%), migration income (6.97%), while youth
household is rice (30.32% vs.18.83%), animal income (21.05% vs.9.49%), and non-farm
income (18.3%).
In OMC-4, adult household has average annual income 1803$ while youth has
average income 2964$. Youth have higher income than adult thank to the non-farm activities
which contribute 46.46% of total non-farm income while non-farm income contributes 2.77%
to adult household income. Adult household have higher agricultural income due to the higher
proportion of land is growing annual crops which have higher land productivity compare to
rice. Annual contribute 60.19% to adult household while it is only 16.52% for youth
household.
In general, in rice based small land, poor resource, youth tend to have smaller income
compare to adult household due to small land. However, either youth or adult household in
this farm type have high percentage of migration compare to the rest of the group. Usually,
adult household have high percentage of labor migration compare to youth household thank to
availability of total active worker and in all most all farm type (except OMC-4, apparently
due to small sample size) adult household have labor migration. Youth household has big land
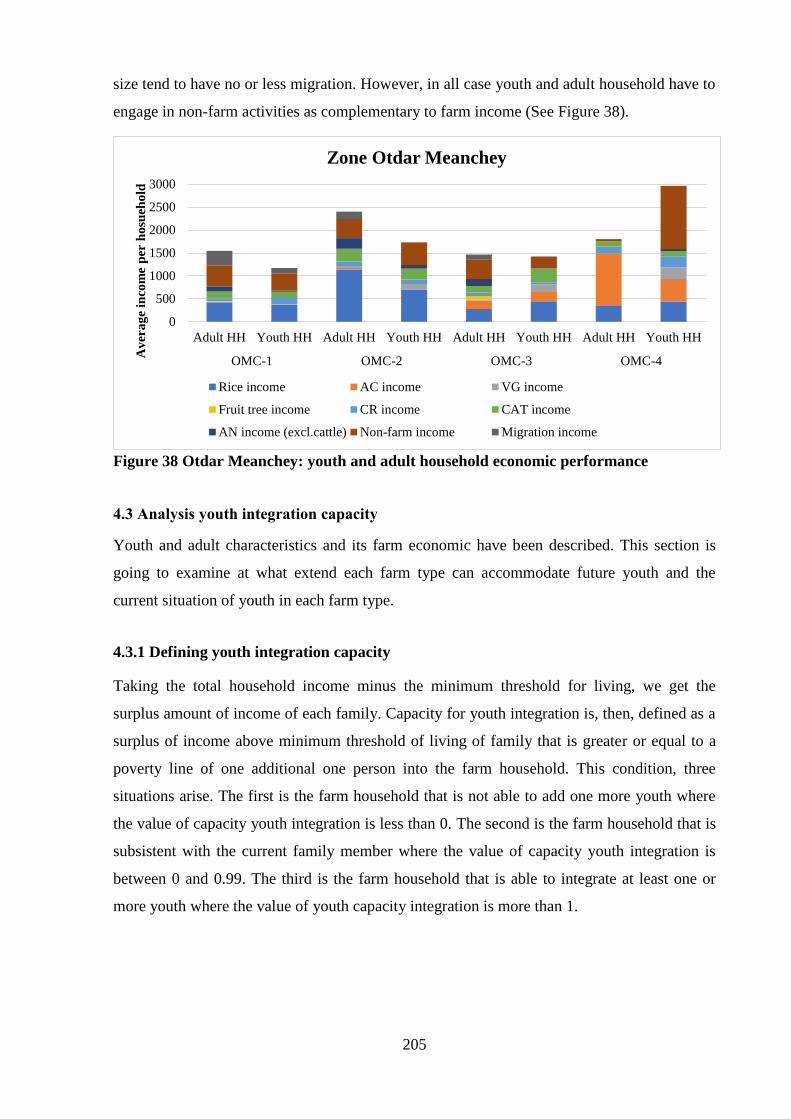
205
size tend to have no or less migration. However, in all case youth and adult household have to
engage in non-farm activities as complementary to farm income (See Figure 38).
Figure 38 Otdar Meanchey: youth and adult household economic performance
4.3 Analysis youth integration capacity
Youth and adult characteristics and its farm economic have been described. This section is
going to examine at what extend each farm type can accommodate future youth and the
current situation of youth in each farm type.
4.3.1 Defining youth integration capacity
Taking the total household income minus the minimum threshold for living, we get the
surplus amount of income of each family. Capacity for youth integration is, then, defined as a
surplus of income above minimum threshold of living of family that is greater or equal to a
poverty line of one additional one person into the farm household. This condition, three
situations arise. The first is the farm household that is not able to add one more youth where
the value of capacity youth integration is less than 0. The second is the farm household that is
subsistent with the current family member where the value of capacity youth integration is
between 0 and 0.99. The third is the farm household that is able to integrate at least one or
more youth where the value of youth capacity integration is more than 1.
0
500
1000
1500
2000
2500
3000
Adult HH Youth HH Adult HH Youth HH Adult HH Youth HH Adult HH Youth HH
OMC-1 OMC-2 OMC-3 OMC-4
Av
era
ge
inco
me
per
ho
sueh
old
Zone Otdar Meanchey
Rice income AC income VG income
Fruit tree income CR income CAT income
AN income (excl.cattle) Non-farm income Migration income

206
4.3.2 Youth integration capacity in each zone by farm type
4.3.2.1 Capacity youth integration in Tram Kak
Table 72 is the result explaining the farm capacity in Tram Kak by youth and adult
household in each farm type and it capacity denoted as “Unable” referring to household who
is unable to add at least one additional member, “Subsistence” referring to household whose
farm has capacity to maintain subsistent, and “Able” referring to household who are above the
subsistent level and able to add at least one additional member into the current family
farming. Number of person to be added is the sum of number of person each household within
the same farm capacity “Unable”, “Subsistence” and “Able”. In figure, “UH”, “SH” and
“AH” are the abbreviation using to denote “unable household”, “subsistent household” and
“able household” respectively.
In TK-1 majority of youth and adult household 87% and 83% respectively are in the
situation that is not able to accommodate more people. There are two youth household and
two adult household that farm economic capacity is able to add at least one more people while
3 adult household are subsistence. In TK-2, 60% of youth household and 67% of adult are
below subsistence level which is not able to add more people. In TK-3, 40% of youth
household and 63% of adult household are in the better situation that can add more people.
By looking at household unable household, result shows that in each farm type
especially adult household, they are in fact being accommodating youth in family farming.
For example, in 24 unable adult households in TK-1, number of people to be added is
supposed to be -53 persons (minus 53), but in fact 11 youth are working on parents „ farm, 29
youth are on migration, 18 youth are currently studying, and 20 persons is under youth. By
reading the same way in other adult household in the rest of the farm type, we can see the
same pattern that those unable household are currently accommodating youth in the system.
Based on the land share pattern to youth couple at marriage in the area is 0.18ha to
0.2ha, it is likely that though those household in TK-1 with average land size of 0.36ha even
they have capacity to add more youth but land situation does not permit to sub-divided. The
capacity to add is due to the present of non-farm and migration income of parents or
household member migration. But household in TK-2 or TK-3 under moral obligation to
share the survival apparently household may be able to share to land to youth couple even
though it is very small and far below the minimum threshold of living. The situation in Tram
Kak is that the youth integration must combine non-farm activities.
207
In general, in Tram Kak 60% of households is in the situation that economic capacity
below subsistence which is not favorable for to accommodate more people in the farm
system. However, these below subsistence farm far in fact being accommodated many rural
youths in Tram Kak. 13% of household are in situation of subsistence. There is only 27% of
household that are above subsistence level which is able to accommodate more youth into the
farm system. In all case, youth in a household are involving in migration and non-farm
activities which contribute to the economic capacity to accommodate more people.

208
Table 72 Tram Kak youth integration capacity
Farm
type HH Capacity
Capacity to add Actual youth currently in farming system
Number
of household
%
Number
of person
to be
added
Youth
Farming
Youth
Migration
Youth
Non-farming
Youth
Studying
Youth
total
Under
youth
TK-1
Youth
HH
Unable 13 87% -32 20 2 2 0 24 25
Able 2 13% 7 1 0 3 0 4 2
Total 15 100% -26 21 2 5 0 28 27
Adult
HH
Not able 24 83% -53 11 29 0 18 58 20
Subsistence 3 10% 1 2 3 0 2 7 3
Able 2 7% 11 0 2 0 1 3 2
Total 29 100% -40 13 34 0 21 68 25
Total
Unable 37 84% -85 31 31 2 18 82 45
Subsistence 3 7% 1 2 3 0 2 7 3
Able 4 9% 17 1 2 3 1 7 4
Total 44 100% -66 34 36 5 21 96 52
TK-2
Youth
HH
Unable 3 60% -5 6 0 0 0 6 4
Subsistence 1 20% 0 1 0 1 0 2 3
Able 1 20% 3 2 0 0 0 2 3
Total 5 100% -2 9 0 1 0 10 10
Adult
HH
Unable 12 67% -21 13 4 0 6 23 10
Subsistence 2 11% 1 2 1 2 0 5 1
Able 4 22% 15 6 0 0 6 12 1
Total 18 100% -5 21 5 2 12 40 12
Total
Unable 15 65% -26 19 4 0 6 29 14
Subsistence 3 13% 2 3 1 3 0 7 4
Able 5 22% 18 8 0 0 6 14 4
Total 23 100% -7 30 5 3 12 50 22
TK-3
Youth
HH
Unable 2 40% -2 4 0 0 0 4 4
Subsistence 1 20% 0 2 0 0 0 2 1
Able 2 40% 4 3 0 1 0 4 5
Total 5 100% 2 9 0 1 0 10 10
Adult
HH
Unable 4 17% -6 1 1 0 5 7 2
Subsistence 5 21% 2 3 5 1 4 13 5
Able 15 63% 64 5 16 1 18 40 9
Total 24 100% 60 9 22 2 27 60 16
Total
Unable 6 21% -8 5 1 0 5 11 6
Subsistence 6 21% 2 5 5 1 4 15 6
Able 17 59% 68 8 16 2 18 44 14
Total 29 100% 62 18 22 3 27 70 26
Tam
Kak
Youth
HH
No 18 72% -39.46 30 2 2 0 34 33
Subsistence 2 8% 0.47 3 0 1 0 4 4
Yes 5 20% 13.27 6 0 4 0 10 10
Total 25 100% -25.72 39 2 7 0 48 47
Adult
HH
No 40 56% -79.91 25 34 0 29 88 32
Subsistence 10 14% 4.36 7 9 3 6 25 9
Yes 21 30% 89.59 11 18 1 25 55 12
Total 71 100% 14.04 43 61 4 60 168 53
Total
No 58 60% -119.37 55 36 2 29 122 65
Subsistence 12 13% 4.83 10 9 4 6 29 13
Yes 26 27% 102.86 17 18 5 25 65 22
Total 96 100% -11.68 82 63 11 60 216 100
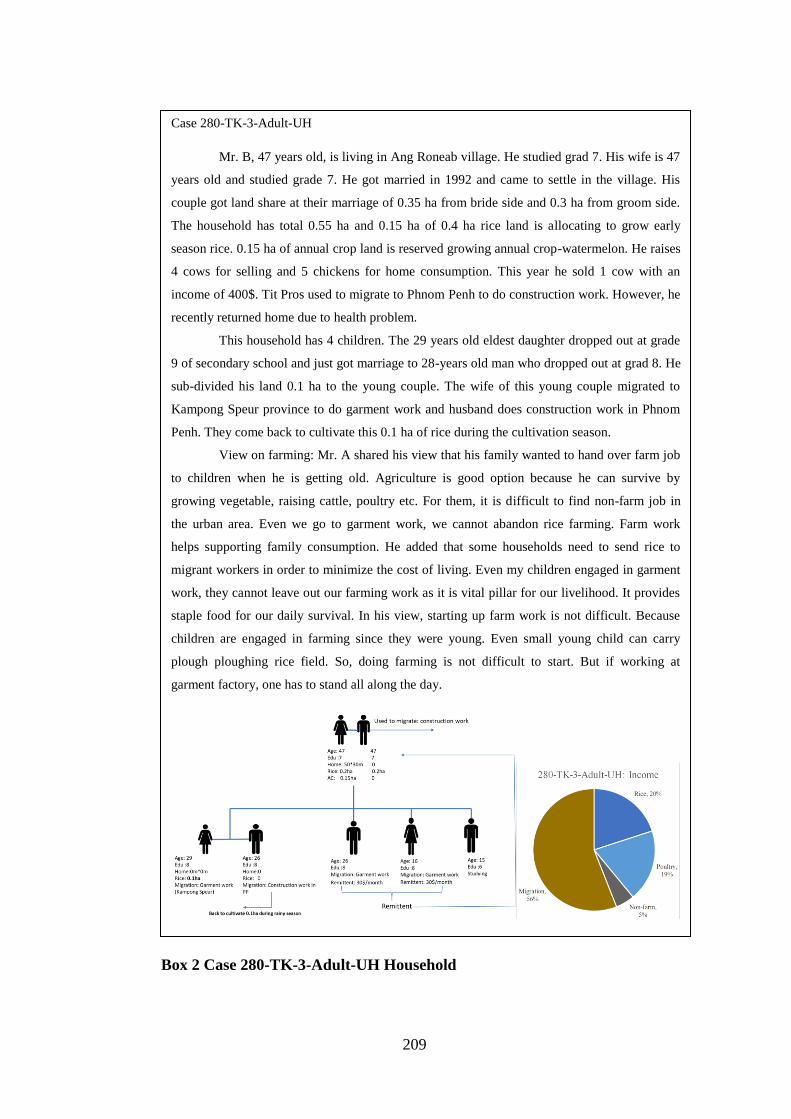
209
Box 2 Case 280-TK-3-Adult-UH Household
Case 280-TK-3-Adult-UH
Mr. B, 47 years old, is living in Ang Roneab village. He studied grad 7. His wife is 47
years old and studied grade 7. He got married in 1992 and came to settle in the village. His
couple got land share at their marriage of 0.35 ha from bride side and 0.3 ha from groom side.
The household has total 0.55 ha and 0.15 ha of 0.4 ha rice land is allocating to grow early
season rice. 0.15 ha of annual crop land is reserved growing annual crop-watermelon. He raises
4 cows for selling and 5 chickens for home consumption. This year he sold 1 cow with an
income of 400$. Tit Pros used to migrate to Phnom Penh to do construction work. However, he
recently returned home due to health problem.
This household has 4 children. The 29 years old eldest daughter dropped out at grade
9 of secondary school and just got marriage to 28-years old man who dropped out at grad 8. He
sub-divided his land 0.1 ha to the young couple. The wife of this young couple migrated to
Kampong Speur province to do garment work and husband does construction work in Phnom
Penh. They come back to cultivate this 0.1 ha of rice during the cultivation season.
View on farming: Mr. A shared his view that his family wanted to hand over farm job
to children when he is getting old. Agriculture is good option because he can survive by
growing vegetable, raising cattle, poultry etc. For them, it is difficult to find non-farm job in
the urban area. Even we go to garment work, we cannot abandon rice farming. Farm work
helps supporting family consumption. He added that some households need to send rice to
migrant workers in order to minimize the cost of living. Even my children engaged in garment
work, they cannot leave out our farming work as it is vital pillar for our livelihood. It provides
staple food for our daily survival. In his view, starting up farm work is not difficult. Because
children are engaged in farming since they were young. Even small young child can carry
plough ploughing rice field. So, doing farming is not difficult to start. But if working at
garment factory, one has to stand all along the day.

210
4.3.2.2 Capacity youth integration in Prey Kabas
Table 73 shows the economic capacity of farm household in youth and adult household in
each farm type in zone Prey Kabas whether they are able to accommodate more people into
the farm system. Result shows the same pattern as zone Tram Kak that household whose have
small land and poor resource i.e. PB-1 and PB-2 tend to have less capacity to add more young
people. Empirically, though small sample size of youth household in PB-1, 100% of youth
household in this farm type are in situation of below subsistence which is not able to
Case 279: TK-1: UH-adult household
Mrs. C, 42 years old woman, respondent. Her husband is 44 years old. Both
husband and wife used to migrate to Kampong Som province and Phnom Penh for
construction work. The work took place during the dry season for 6 months.
In 1983, land was distributed 20 a per person. She and her husband got total 40 a of
rice land. She has 5 children. All are single. 3 children dropped out and migrated to Lem
district of Battambang province before 2011. There, they work as agricultural wage laborers
there. And perhaps having experience in the province proximity to Thailand, those three
children are currently migrating to Thailand working as construction worker and factory
worker. Remittance from children is 1500(Thai) Bath/month which approximately
45$/month. Thank to this remittance, the household head currently no longer migrates to
work as construction worker but doing farming in the home village.
All though the land is already small, Mrs C is willing to share farming to children
because to her it is the share for the survival. There is no alternative of occupation. The only
occupation is farming. It is extremely difficult to find non-farm work. The land in her village
is not available for sale and if there is, it is very expensive and a household like her is not
able to manage to buy and expand the land.
Box 3 Case 279-TK-1-Adult-UH household

211
accommodate more young people into the system. The same way for adult household, 80% of
adult household in PB-1 is not able to add more youth, while 8% of household are subsistence
and 12% are able to add more youth. Although the majority of the unable households are not
supposed to add more people, they are in fact hosting many youths in farming. Result show
that total number of people to be added into this farm type is -43. In contrary, among 57 total
youth in adult household of PB-1, there are 26 youth working on farming, 11 youth on
migration, 1 youth doing non-farm activities and 19 youth studying. Reading the same way
for the rest of youth and adult household in PB-2 and PB-3, we can see the same pattern that
majority of household in each farm type are in situation of not able to accommodate
additional people (See Table 73).
In general, in zone Prey Kabas, among total 32 youth household, there are 59% of
youth household are not able to accommodate additional people, while 13% are subsistence,
and 28% are able to add at least one additional person into the farm system. Among total 63
adult household, there are 60% of adult household are not able to accommodate additional
people, while 14% are subsistent, and 25% are able are able to add at least one additional
person into the farm system. Considering both youth and adult household, among total 95
farm household din Prey Kabas, there are 60% are below subsistence and not able to add
more people, 14% are subsistence with the current farming system, and 26% are above
subsistence and able to add at least one additional youth into the current farming system. For
general summary of result by zone, by youth and adult and all studied area, please see
Appendix – 09 Youth integration capacity by zone by youth adult household.

212
Table 73 Prey Kabas youth integration capacity
Farm
type HH Capacity
Capacity to add Actual youth current in farming system
Number of
household %
Number of
person to
be added
Youth
Farming
Youth
Migration
Youth
Non-
farming
Youth
Studying
Youth
total
Under
youth
PB-1
Youth
HH
Unable 2 100% -3 4 0 0 0 4 3
Total 2 100% -3 4 0 0 0 4 3
Adult
HH
Unable 20 80% -43 26 11 1 19 57 14
Subsistence 2 8% 1 4 0 1 1 6 2
Able 3 12% 4 4 2 0 2 8 1
Total 25 100% -38 34 13 2 22 71 17
Total
Unable 22 81% -46 30 11 1 19 61 17
Subsistence 2 7% 1 4 0 1 1 6 2
Able 3 11% 4 4 2 0 2 8 1
Total 27 100% -40 38 13 2 22 75 20
PB-2
Youth
HH
Unable 17 59% -33 32 0 1 4 37 31
Subsistence 4 14% 2 8 0 0 1 9 7
Able 8 28% 23 15 0 1 1 17 19
Total 29 100% -8 55 0 2 6 63 57
Adult
HH
Unable 15 68% -20 8 1 0 19 28 13
Subsistence 3 14% 1 2 0 0 5 7 1
Able 4 18% 9 3 0 1 10 14 7
Total 22 100% -10 13 1 1 34 49 21
Total
Unable 32 63% -52 40 1 1 23 65 44
Subsistence 7 14% 4 10 0 0 6 16 8
Able 12 24% 31 18 0 2 11 31 26
Total 51 100% -17 68 1 3 40 112 78
PB-3
Youth
HH
Able 1 100% 2 2 2 0 1 5 0
Total 1 100% 2 2 2 0 1 5 0
Adult
HH
Unable 3 19% -4 6 2 0 2 10 2
Subsistence 4 25% 1 2 1 3 4 10 0
Able 9 56% 42 10 6 0 10 26 7
Total 16 100% 40 18 9 3 16 46 9
Total
Unable 3 18% -4 6 2 0 2 10 2
Subsistence 4 24% 1 2 1 3 4 10 0
Able 10 59% 44 12 8 0 11 31 7
Total 17 100% 42 20 11 3 17 51 9
Prey
Kabas
Youth
HH
No 19 59% -35.22 36 0 1 4 41 34
Subsistence 4 13% 2.43 8 0 0 1 9 7
Yes 9 28% 24.96 17 2 1 2 22 19
Total 32 100% -7.83 61 2 2 7 72 60
Adult
HH
No 38 60% -66.73 40 14 1 40 95 29
Subsistence 9 14% 4.16 8 1 4 10 23 3
Yes 16 25% 54.67 17 8 1 22 48 15
Total 63 100% -7.90 65 23 6 72 166 47
Total
No 57 60% -101.95 76 14 2 44 136 63
Subsistence 13 14% 6.59 16 1 4 11 32 10
Yes 25 26% 79.63 34 10 2 24 70 34
Total 95 100% -15.74 126 25 8 79 238 107
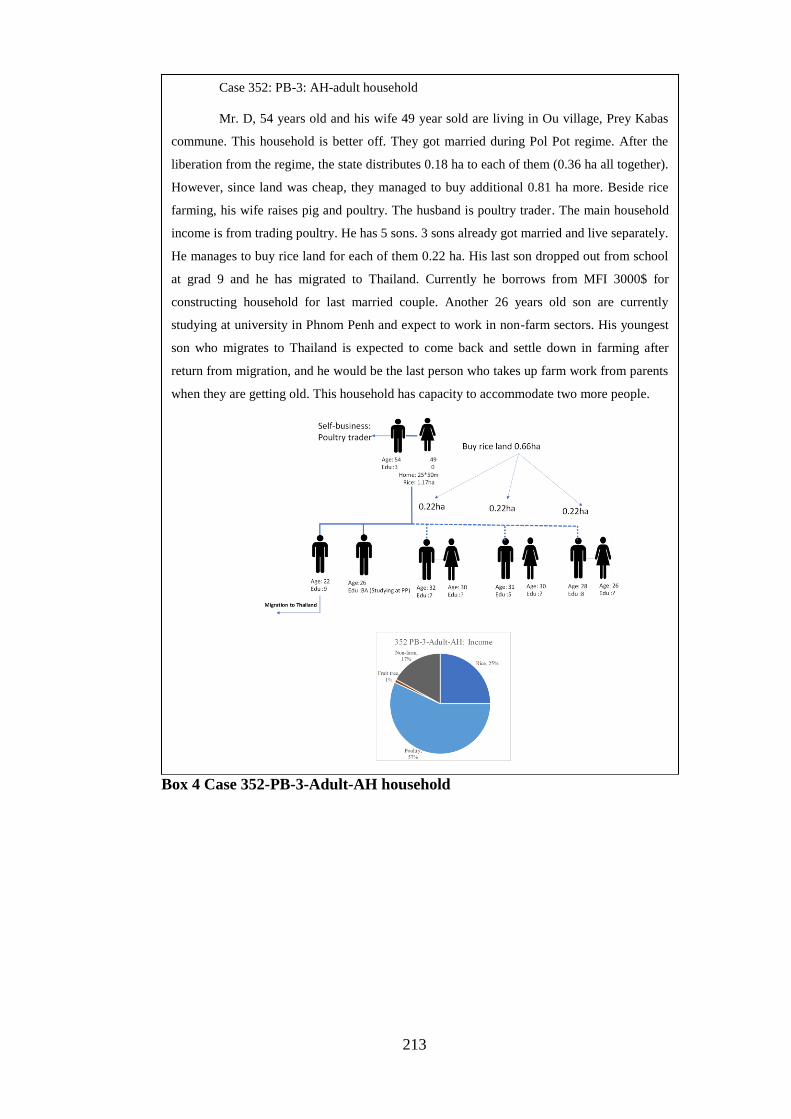
213
Case 352: PB-3: AH-adult household
Mr. D, 54 years old and his wife 49 year sold are living in Ou village, Prey Kabas
commune. This household is better off. They got married during Pol Pot regime. After the
liberation from the regime, the state distributes 0.18 ha to each of them (0.36 ha all together).
However, since land was cheap, they managed to buy additional 0.81 ha more. Beside rice
farming, his wife raises pig and poultry. The husband is poultry trader. The main household
income is from trading poultry. He has 5 sons. 3 sons already got married and live separately.
He manages to buy rice land for each of them 0.22 ha. His last son dropped out from school
at grad 9 and he has migrated to Thailand. Currently he borrows from MFI 3000$ for
constructing household for last married couple. Another 26 years old son are currently
studying at university in Phnom Penh and expect to work in non-farm sectors. His youngest
son who migrates to Thailand is expected to come back and settle down in farming after
return from migration, and he would be the last person who takes up farm work from parents
when they are getting old. This household has capacity to accommodate two more people.
Box 4 Case 352-PB-3-Adult-AH household

214
4.3.2.3 Capacity youth integration in Otdar Meanchey
Result shows the same pattern that both youth and adult household in the small land and poor
resource farm type tend to have less percentage of households that are able to accommodate
additional people in to the farm system and more percentage of household below subsistence
level.
80% of youth household in OMC-1, 69% of youth household in OMC-2, 75% in
OMC-3, and 50% of adult household in OMC-4 are not able to add more people in to the
current farming. While 10% in OMC-1, 13% in OMC-2, 14% in OMC-3 and 33% in OMC-4
(of youth household) are subsistence, there are 7% in OMC-1, 19% in OMC-2, 25% in OMC-
3 and 33% in OMC-4 are subsistent. 7% in OMC-1, 19% in OMC-2, 0% in OMC-3, and 33%
in OMC-4 are able to accommodate at least one more people.
68% of adult household in OMC-1, 42% of adult household in OMC-2, 75% in OMC-
3, and 33% of adult household in OMC-4 are not able to add more people in to the current
farming. While 9% in OMC-1, 15% in OMC-2, 8% in OMC-3 and 33% in OMC-4 (of adult
household) are subsistence, there are 7% in OMC-1, 19% in OMC-2, 25% in OMC-3 and
33% in OMC-4 are subsistent. 23% in OMC-1, 42% in OMC-2, 25% in OMC-3, and 50% in
OMC-4 are able to accommodate at least one more people.
In general, in zone Otdar Meanchey, among total 53 youth household, there are 75%
of youth household are not able to accommodate additional people, while 13% are
subsistence, and 11% are able to add at least one additional person into the farm system.
Among total 128 adult household, there are 61% of adult household are not able to
accommodate additional people, while 10% are subsistent, and 29% are able are able to add at
least one additional person into the farm system.
Considering both youth and adult household, among total 181 farm household in
Otdar Meanchey, there are 65% are below subsistence and not able to add more people, 11%
are subsistence with the current farming system, and 24% are above subsistence and able to
add at least one additional youth into the current farming system (See Table 74).

215
Table 74 Otdar Meanchey youth integration capacity
Farm type HH Capacity
Capacity to add Actual youth current in farming system
Number
of
household
%
Number
of person
to be
added
Youth
Farming
Youth
Migration
Youth
Non-
farming
Youth
Studying
Youth
total
Under
youth
OMC-1
Youth
HH
Unable 25 83% -71 49 4 0 2 55 42
Subsistence 3 10% 2 6 0 0 0 6 6
Able 2 7% 9 3 0 1 2 6 1
Total 30 100% -61 58 4 1 4 67 49
Adult
HH
Unable 55 68% -140 106 25 4 14 149 67
Subsistence 7 9% 4 11 5 1 2 19 6
Able 19 23% 58 23 13 9 17 62 25
Total 81 100% -78 140 43 14 33 230 98
Total
Unable 80 72% -211 155 29 4 16 204 109
Subsistence 10 9% 5 17 5 1 2 25 12
Able 21 19% 66 26 13 10 19 68 26
Total 111 100% -139 198 47 15 37 297 147
OMC-2
Youth
HH
Unable 11 69% -16 21 1 1 3 26 25
Subsistence 2 13% 1 3 0 1 0 4 3
Able 3 19% 8 5 0 1 0 6 7
Total 16 100% -7 29 1 3 3 36 35
Adult
HH
Unable 14 42% -18 18 7 1 10 36 23
Subsistence 5 15% 2 10 2 2 2 16 11
Able 14 42% 65 21 7 4 17 49 15
Total 33 100% 49 49 16 7 29 101 49
Total
Unable 25 51% -34 39 8 2 13 62 48
Subsistence 7 14% 3 13 2 3 2 20 14
Able 17 35% 73 26 7 5 17 55 22
Total 49 100% 43 78 17 10 32 137 84
OMC-3
Youth
HH
Unable 3 75% -6 5 0 1 0 6 4
Subsistence 1 25% 0 2 0 0 0 2 3
Total 4 100% -5 7 0 1 0 8 7
Adult
HH
Unable 8 67% -25 6 8 0 2 16 14
Subsistence 1 8% 1 0 0 0 0 0 3
Able 3 25% 10 3 1 2 0 6 8
Total 12 100% -14 9 9 2 2 22 25
Total
Unable 11 69% -30 11 8 1 2 22 18
Subsistence 2 13% 1 2 0 0 0 2 6
Able 3 19% 10 3 1 2 0 6 8
Total 16 100% -20 16 9 3 2 30 32
OMC-4
Youth
HH
Unable 1 33% -3 2 0 0 0 2 2
Subsistence 1 33% 0 2 0 0 0 2 1
Able 1 33% 12 2 0 0 0 2 1
Total 3 100% 9 6 0 0 0 6 4
Adult
HH
Unable 1 50% -3 1 0 0 0 1 3
Able 1 50% 2 0 0 0 2 2 2
Total 2 100% 0 1 0 0 2 3 5
Total
Unable 2 40% -6 3 0 0 0 3 5
Subsistence 1 20% 0 2 0 0 0 2 1
Able 2 40% 14 2 0 0 2 4 3
Total 5 100% 9 7 0 0 2 9 9
Otdar
Meanchey
Youth
HH
No 40 75% -95.51 77 5 2 5 89 73
Subsistence 7 13% 3.48 13 0 1 0 14 13
Yes 6 11% 28.30 10 0 2 2 14 9
Total 53 100% -63.73 100 5 5 7 117 95
Adult
HH
No 78 61% -185.27 131 40 5 26 202 107
Subsistence 13 10% 7.02 21 7 3 4 35 20
Yes 37 29% 134.91 47 21 15 36 119 50
Total 128 100% -43.34 199 68 23 66 356 177
Total
No 118 65% -280.78 208 45 7 31 291 180
Subsistence 20 11% 10.49 34 7 4 4 49 33
Yes 43 24% 163.21 57 21 17 38 133 59
Total 181 100% -107.07 299 73 28 73 473 272
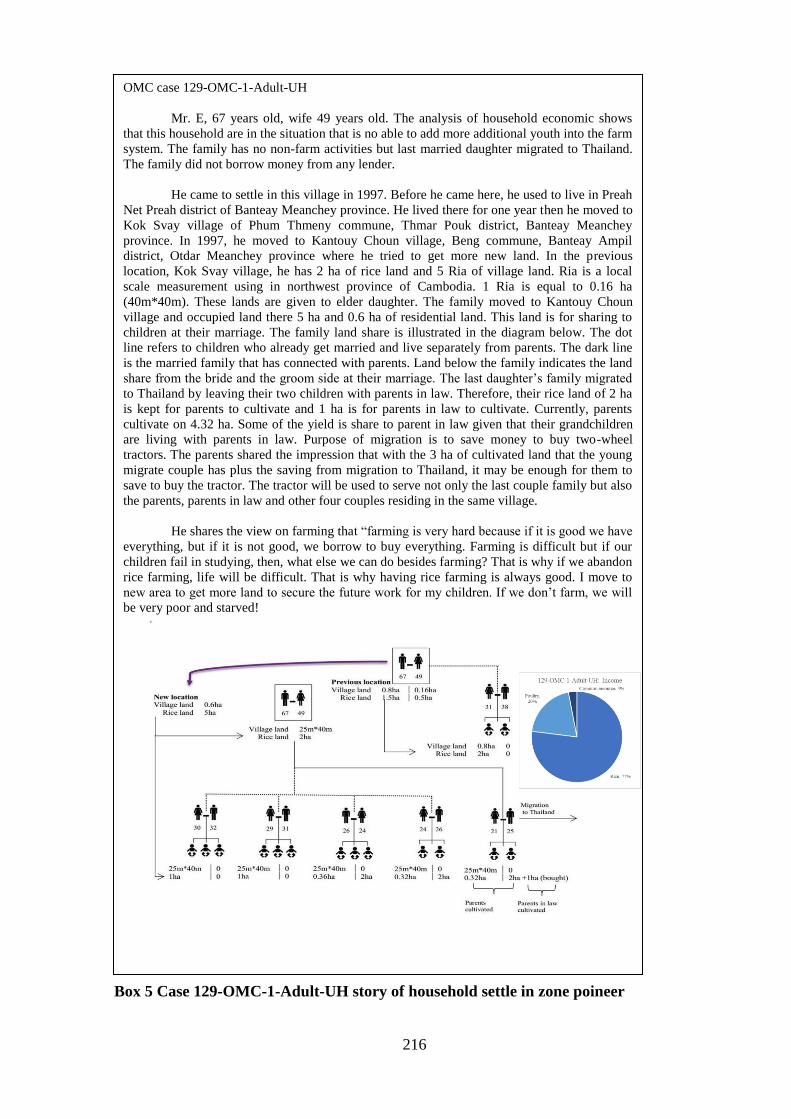
216
OMC case 129-OMC-1-Adult-UH
Mr. E, 67 years old, wife 49 years old. The analysis of household economic shows
that this household are in the situation that is no able to add more additional youth into the farm
system. The family has no non-farm activities but last married daughter migrated to Thailand.
The family did not borrow money from any lender.
He came to settle in this village in 1997. Before he came here, he used to live in Preah
Net Preah district of Banteay Meanchey province. He lived there for one year then he moved to
Kok Svay village of Phum Thmeny commune, Thmar Pouk district, Banteay Meanchey
province. In 1997, he moved to Kantouy Choun village, Beng commune, Banteay Ampil
district, Otdar Meanchey province where he tried to get more new land. In the previous
location, Kok Svay village, he has 2 ha of rice land and 5 Ria of village land. Ria is a local
scale measurement using in northwest province of Cambodia. 1 Ria is equal to 0.16 ha
(40m*40m). These lands are given to elder daughter. The family moved to Kantouy Choun
village and occupied land there 5 ha and 0.6 ha of residential land. This land is for sharing to
children at their marriage. The family land share is illustrated in the diagram below. The dot
line refers to children who already get married and live separately from parents. The dark line
is the married family that has connected with parents. Land below the family indicates the land
share from the bride and the groom side at their marriage. The last daughter‟s family migrated
to Thailand by leaving their two children with parents in law. Therefore, their rice land of 2 ha
is kept for parents to cultivate and 1 ha is for parents in law to cultivate. Currently, parents
cultivate on 4.32 ha. Some of the yield is share to parent in law given that their grandchildren
are living with parents in law. Purpose of migration is to save money to buy two-wheel
tractors. The parents shared the impression that with the 3 ha of cultivated land that the young
migrate couple has plus the saving from migration to Thailand, it may be enough for them to
save to buy the tractor. The tractor will be used to serve not only the last couple family but also
the parents, parents in law and other four couples residing in the same village.
He shares the view on farming that “farming is very hard because if it is good we have
everything, but if it is not good, we borrow to buy everything. Farming is difficult but if our
children fail in studying, then, what else we can do besides farming? That is why if we abandon
rice farming, life will be difficult. That is why having rice farming is always good. I move to
new area to get more land to secure the future work for my children. If we don‟t farm, we will
be very poor and starved!
Box 5 Case 129-OMC-1-Adult-UH story of household settle in zone poineer

217
OMC case 124: OMC-1-Adul-UH
Mrs. F, 54 years old woman and her husband 53 years old are living in Kantouy Choun village. Her
ancestor used to live in this village since 1962-63. During the Khmer Rouge regime, her family migrate to
live in Beng village. After liberation, the family moved to Prasat Bey village. At her marriage, she got 1ha
of rice land from the groom side and 0.32ha of village land from bride side in Thmar Pouk district, Kok
Svay village. The family has 5 children. However, both 1ha of rice land and 0.32ha village land were
distributed two eldest sons. The family, then, decided to bring the rest of the 3 children to settle in Kantouy
Choun village in 2001. There, the family occupied 4ha land for rice cultivation. About the same time, the
family also bought 1 ha of forest land for doing Chamkar, cassava. And she still has one more ha of forest
land which was distribute last year (in 2011) to the villager arrange by local authorities (village and
commune arrangement). The remained 1ha of land was just cleared this year by hiring tractor cost
5500Bath (155USD/ha) but not cultivated. Among 3 children, none of them have access to education. 27
years old daughter got married to 33 years old man but do not have children. They got 1ha of rice land from
parents and small village land about 0.1ha nearby parent‟s land. 24 years old daughter got married to 23
years old man and having baby girl of 2 months old. They also got 1ha of land from parents with 0.1ha
village land near by parents. However, both families have been migrated to Thailand last years and just
come back to village this year. The objective is the earn money to pay back debt that the parents borrowed
to buy new two-wheel tractor for serving agricultural purpose. The last 19 years old daughter who is single
is also get 1ha of rice land. Right now, the family has one old two wheel-tractor and new two wheel-
tractors, which have to be used and share among five families (2 son families, 2 young married families and
parent family). To get new two-wheel tractor parent‟s family have to sell 1 cow, using money getting from
dowry, sell rice product and borrow 30000 Bath (847UDS) from micro finance in order to buy new two
wheel-tractor cost 106000Bath (2990USD). The family said that the reason that family did not use all land
for cultivation because the family does not have enough capital to clear the land as well as to invest. In
order to get 1ha of forest-cleared land ready for cultivation, it is very, very hard and time consuming, Mrs.
F stressed.
The family also harvest common resources such as wild fruit, wild vegetable, mush room, wild
rhizome and frog for both income and household consumption but the family said that those common
resources are dramatically decline because the expansion of land clearance for growing rice and annual
crops particularly cassava. During April and May, the 3 family members buy fresh cassava from nearby
villages to dry out and sell for profit. In June, two family members spend total 7 days working as
agricultural wage labor with local rate of 14000Riel/person/day approximately 3.5USD/person/day. When
asking is it easy to find non-farm or off-farm job, Mrs. F reported that it is not that easy because the
opportunity is not available all the time but seasonal like her case, the family member can work only 7 days
per year. If one has to rely on this kind of job, one will be starved because one will not get enough to eat.
That is why the family view agriculture is good option. However, Mrs. F added that it is not easy to start
agricultural work drawing from her and others‟ experience of how hard it is to get 1 ha of cultivated land
clear from the forest.
Box 6 Case 124-OMC-1-Adult-UH: Youth integration in Otdar Meanchey

218
Box 7 Case 106-OMC-2-Youth HH-AH
In all three zones, result shows that among the total 372 households, there are 232
households account for 63 percent of farm household are not able to accommodate one more
youth while the other 45 households accounts for 12 percent are subsistence with the current
family. 25% of household that is able to add at least one addition al youth. Among those 63
percent unable household, they are actually accommodating 62% of total youth with the same
category while 17% of youth migration, 2% of youth engaging in non-farm activities and 19%
of youth studying. While total capacity of those unable household is -502 persons, the current
total youth is 549 persons in which 339 youth are working on farming, 95 persons on
migration 11 persons doing non-farm activities and 104 persons currently studying plus 308
under youth whom these households need to take care. This suggests that majority of rural
household are currently facing the challenge in accommodating youth and the growth family
member while their farm capacity is in critical situation of below the average poverty
Case 106-OMC-2-Youth HH-AH
This is the case of youth household having capacity to add more family member
in Otdar Meanchey.
Mr. G is 35 years old now. His wife is 30 years old selling grocery in front of
house. This couple got married in year 2000. At marriage, the couple got land share
amount 3.5ha of rice land from groom side and 1.5ha of rice land from bride side (see
figure household composition below). Mr. graduate high school. Thanks to his
knowledge, he used to work for NGO and current he is deputy chief of community
forestry in his village. He managed to buy additional agricultural land 7ha. Currently he
owns 12ha of rice land. He has three children. The eldest is 11 years old. He does not
want his children to do farm work because it is hard job. He wants his children to study
and get job in non-farm activities. However, he plans to share land 2ha to each child for
securing their future in case they do not do well in study and drop out.
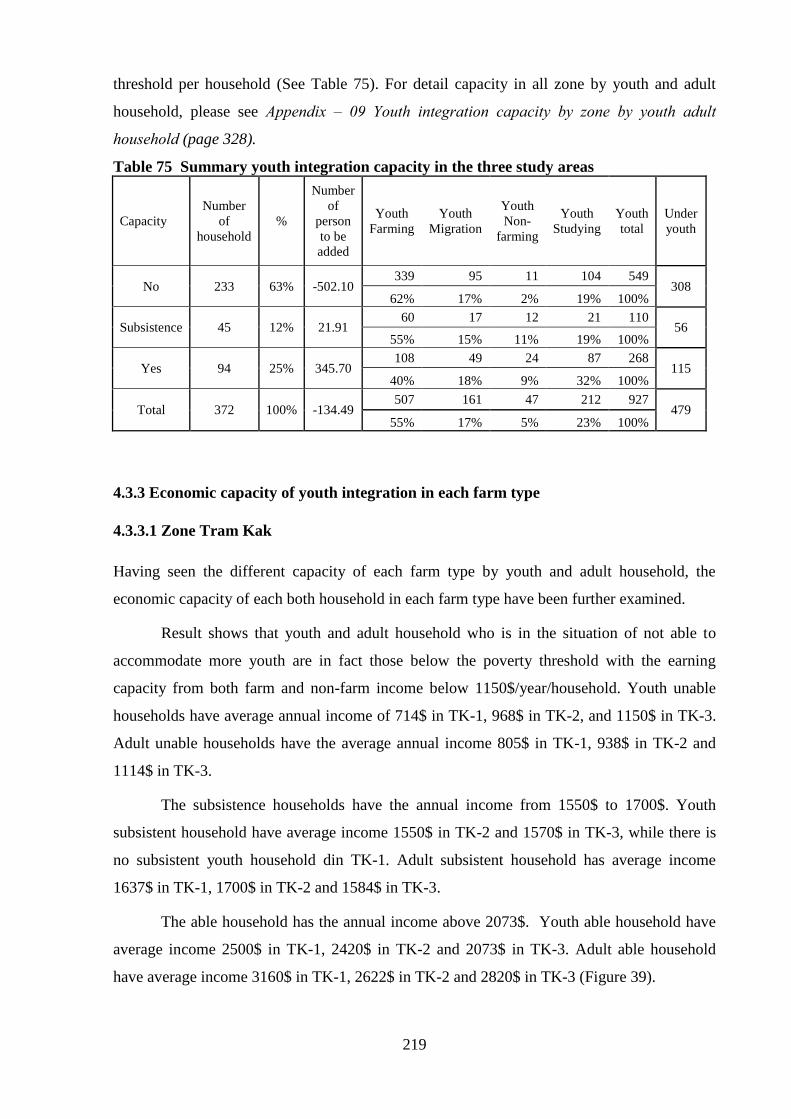
219
threshold per household (See Table 75). For detail capacity in all zone by youth and adult
household, please see Appendix – 09 Youth integration capacity by zone by youth adult
household (page 328).
Table 75 Summary youth integration capacity in the three study areas
Capacity
Number
of
household
%
Number
of
person
to be
added
Youth
Farming
Youth
Migration
Youth
Non-
farming
Youth
Studying
Youth
total
Under
youth
No 233 63% -502.10 339 95 11 104 549
308 62% 17% 2% 19% 100%
Subsistence 45 12% 21.91 60 17 12 21 110
56 55% 15% 11% 19% 100%
Yes 94 25% 345.70 108 49 24 87 268
115 40% 18% 9% 32% 100%
Total 372 100% -134.49 507 161 47 212 927
479 55% 17% 5% 23% 100%
4.3.3 Economic capacity of youth integration in each farm type
4.3.3.1 Zone Tram Kak
Having seen the different capacity of each farm type by youth and adult household, the
economic capacity of each both household in each farm type have been further examined.
Result shows that youth and adult household who is in the situation of not able to
accommodate more youth are in fact those below the poverty threshold with the earning
capacity from both farm and non-farm income below 1150$/year/household. Youth unable
households have average annual income of 714$ in TK-1, 968$ in TK-2, and 1150$ in TK-3.
Adult unable households have the average annual income 805$ in TK-1, 938$ in TK-2 and
1114$ in TK-3.
The subsistence households have the annual income from 1550$ to 1700$. Youth
subsistent household have average income 1550$ in TK-2 and 1570$ in TK-3, while there is
no subsistent youth household din TK-1. Adult subsistent household has average income
1637$ in TK-1, 1700$ in TK-2 and 1584$ in TK-3.
The able household has the annual income above 2073$. Youth able household have
average income 2500$ in TK-1, 2420$ in TK-2 and 2073$ in TK-3. Adult able household
have average income 3160$ in TK-1, 2622$ in TK-2 and 2820$ in TK-3 (Figure 39).

220
In all cases, non-farm income and migration income contribute to total household
income and determine the capacity of each household to accommodate additional people.
Usually household having high non-farm and migration has high capacity to add more people
except adult able household in TK-2 and TK-3 whose farm income alone is able to add more
people thank to the degree of diversification animal (pig, poultry, fish, cattle), vegetable,
annual crop.
Adult able household in TK-1 has 59% of non-farm income, and 7% of migration
income to total household income. Farming contributes only 34% to household income where
major source is from cattle and animal production. By looking at the source of non-farm
income (Figure 40), those 66% of non-farm income (59%+7%) are coming from self-business
high income 58%, 31% from salary high income and 10% from migration (consider of 100%
of non-farm income). Youth able household in the same TK-1 has 32% of income from non-
farm activities and 54% of income from migration contributed to total non-farm income.
Considering this 56% (32% plus 54%) as 100%, we can see that 63% of income from
migration, 32% from self-business high income and 5% from labor based work.
Adult able household in TK-2 is remarkable due to the contribution of farm income
alone is enough to add more people. Farming contribute 86% of total income where 17%
come from rice, 8% from annual crops, 6% from vegetable, 5% from fruit tree, 12% from
common resource, 7% from cattle, 31% from animal production. Non-farm income
contributes only 14% where 91% from self-business low income and salaried high income.
Youth able household in the same farm type has 16% income from rice, 8% from cattle and
75% from non-farm income in which 100% of this non-farm income is coming from self-
business high income.
Adult able household in TK-3 has the same pattern to adult able household in TK-2.
75% of income is coming from farming where 31% is from rice 1% from AC, 4% from VG,
2% from fruit free, 14% from cattle and 23% from animal production. Total non-farm income
contributes 25% in which 10% from nonfarm activities and 15% from migration. Youth
household in the same farm type have 75% of income from farming where 27% from rice,
11% from AC, 1% from VG, 6% from CR, 10% from cattle, 20% from animal production and
25% from non-farm income (86% from salary high and 14% self-business low).
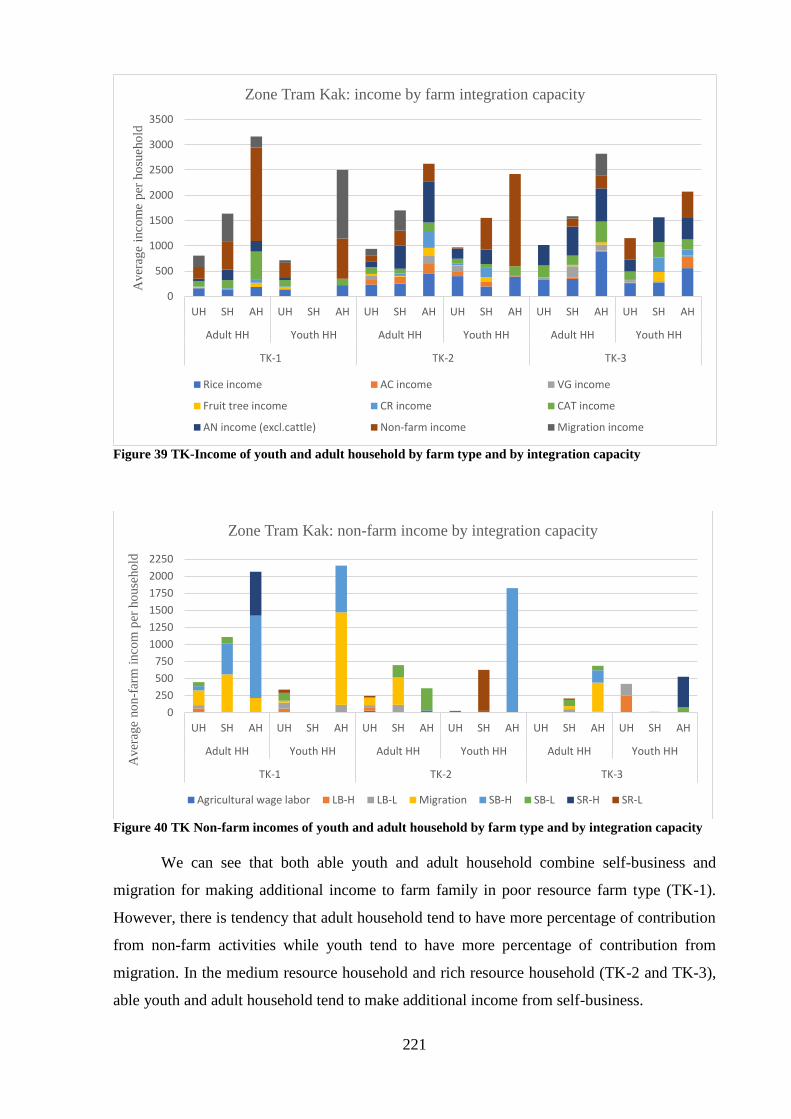
221
Figure 39 TK-Income of youth and adult household by farm type and by integration capacity
Figure 40 TK Non-farm incomes of youth and adult household by farm type and by integration capacity
We can see that both able youth and adult household combine self-business and
migration for making additional income to farm family in poor resource farm type (TK-1).
However, there is tendency that adult household tend to have more percentage of contribution
from non-farm activities while youth tend to have more percentage of contribution from
migration. In the medium resource household and rich resource household (TK-2 and TK-3),
able youth and adult household tend to make additional income from self-business.
0
500
1000
1500
2000
2500
3000
3500
UH SH AH UH SH AH UH SH AH UH SH AH UH SH AH UH SH AH
Adult HH Youth HH Adult HH Youth HH Adult HH Youth HH
TK-1 TK-2 TK-3
Aver
age
inco
me
per
ho
sueh
old
Zone Tram Kak: income by farm integration capacity
Rice income AC income VG income
Fruit tree income CR income CAT income
AN income (excl.cattle) Non-farm income Migration income
0
250
500
750
1000
1250
1500
1750
2000
2250
UH SH AH UH SH AH UH SH AH UH SH AH UH SH AH UH SH AH
Adult HH Youth HH Adult HH Youth HH Adult HH Youth HH
TK-1 TK-2 TK-3
Aver
age
no
n-f
arm
inco
m p
er h
ouse
ho
ld
Zone Tram Kak: non-farm income by integration capacity
Agricultural wage labor LB-H LB-L Migration SB-H SB-L SR-H SR-L
222
4.3.3.2 Zone Prey Kabas
Household who is in the situation of not able to add one additional person into farming
system has an average income below 1711$, while subsistent household have an average
income between 2502$ to 2663$. The able households have average income from 2951$.
In PB-1, adult able household have annual average income of 2951$ where 16% of
income from non-farm activities, 24% from migration, 30% from rice, 2% from common
resources, 7% from cattle and 23% from animal production.
Youth and adult able household in PB-2 and PB-3 have farm capacity to add one
additional people even without additional non-farm activities given that it agricultural income
alone is above the subsistence level. It is remarkable that this agricultural income beside rice,
the major contribution to this capacity is cattle income and the animal production (pig and
poultry).
Adult able household in PB-2 have average income of 3386$ where 55% of income is
from rice, 9% from cattle, 30% from animal production and 6% from non-farm income.
Youth able household in the same farm type have average income of 3706$ where 68% from
rice, 5% from cattle, 16% from animal production, and 11% from non-farm activities. This
11% of non-farm activities, are mainly come from self-business high (57%), self-business low
(19%) labor based low income (15%) and 10% from agricultural wage labor.
Adult able household in PB-3 have average income of 4728$ where 43% from rice,
1% from fruit tree, 18% from cattle 12% from animal production, 21% from non-farm income
and 1% from migration. The 22% of total non-farm income (21% plus 1%) is coming from
11% agricultural wage labor, 1% from labor base low income, 6% from migration, 11% from
self-business low income, 11% from self-business high income and 2% from salary low
income. Youth able household have average income of 3412$ where 62% come from rice, 5%
from common resource, 4% from cattle income, 17% from animal income, 1% from non-farm
activities and 11%from migration. The 12% of total non-farm income 4% from agricultural
wage labor, 89% from migration and 7% from self-business low income.
In term of land or farm size, there is not significant different between the subsistent
and able household. Farm size does not provide clear cut answer what which amount of land
that contributes to the capacity to add one additional people into the system. The farm
capacity to add one additional people is thank to the combination of farm size, cattle, animal
and non-farm activities (including migration) (See Figure 41 and Figure 42).
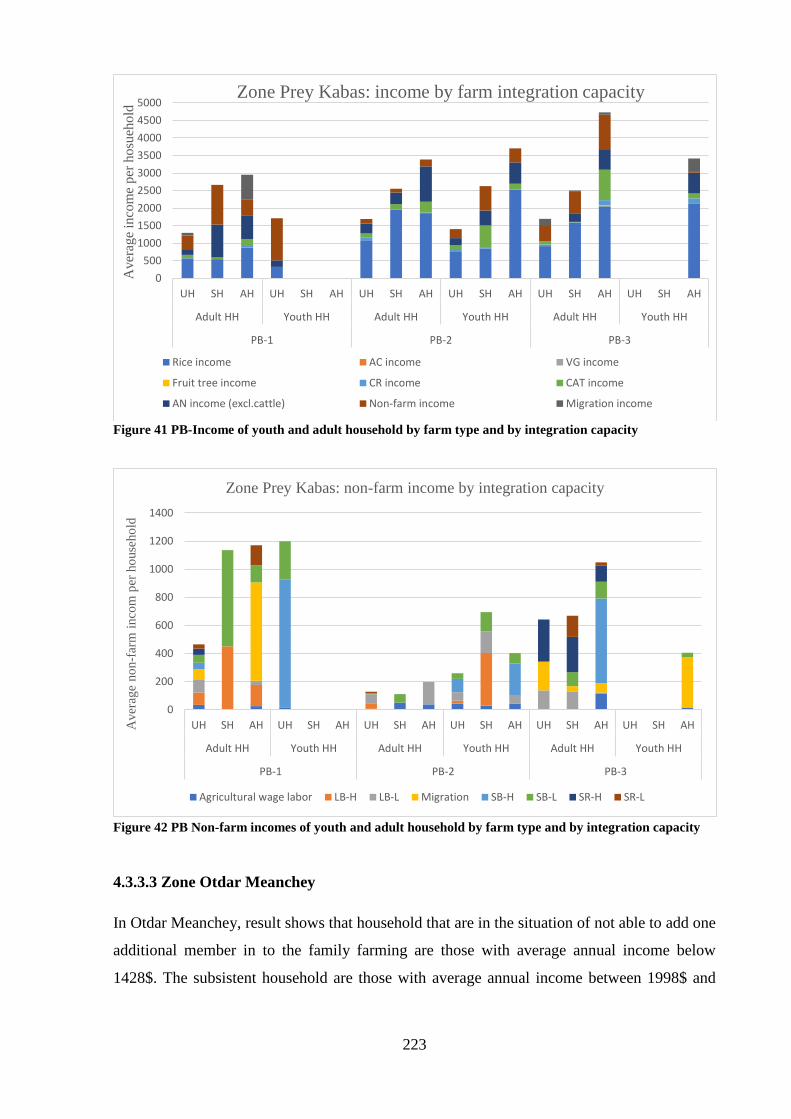
223
Figure 41 PB-Income of youth and adult household by farm type and by integration capacity
Figure 42 PB Non-farm incomes of youth and adult household by farm type and by integration capacity
4.3.3.3 Zone Otdar Meanchey
In Otdar Meanchey, result shows that household that are in the situation of not able to add one
additional member in to the family farming are those with average annual income below
1428$. The subsistent household are those with average annual income between 1998$ and
0
500
1000
1500
2000
2500
3000
3500
4000
4500
5000
UH SH AH UH SH AH UH SH AH UH SH AH UH SH AH UH SH AH
Adult HH Youth HH Adult HH Youth HH Adult HH Youth HH
PB-1 PB-2 PB-3
Aver
age
inco
me
per
hosu
ehold
Zone Prey Kabas: income by farm integration capacity
Rice income AC income VG income
Fruit tree income CR income CAT income
AN income (excl.cattle) Non-farm income Migration income
0
200
400
600
800
1000
1200
1400
UH SH AH UH SH AH UH SH AH UH SH AH UH SH AH UH SH AH
Adult HH Youth HH Adult HH Youth HH Adult HH Youth HH
PB-1 PB-2 PB-3
Aver
age
no
n-f
arm
inco
m p
er h
ouse
ho
ld
Zone Prey Kabas: non-farm income by integration capacity
Agricultural wage labor LB-H LB-L Migration SB-H SB-L SR-H SR-L
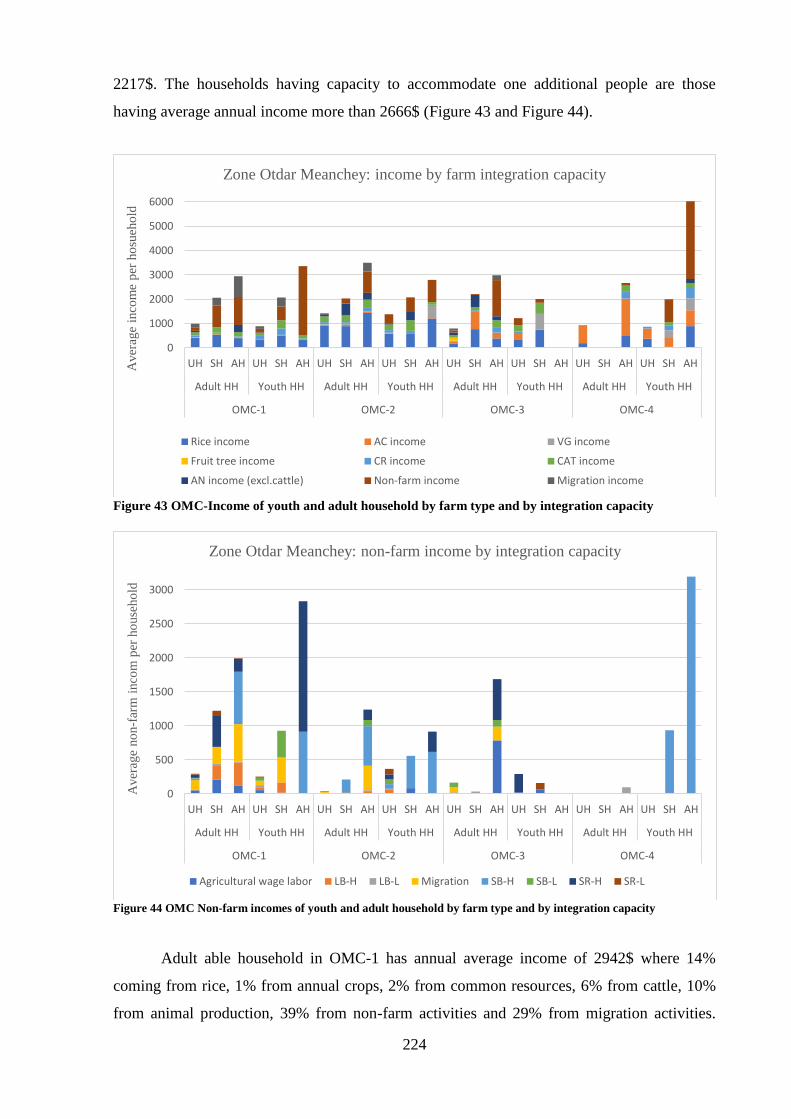
224
2217$. The households having capacity to accommodate one additional people are those
having average annual income more than 2666$ (Figure 43 and Figure 44).
Figure 43 OMC-Income of youth and adult household by farm type and by integration capacity
Figure 44 OMC Non-farm incomes of youth and adult household by farm type and by integration capacity
Adult able household in OMC-1 has annual average income of 2942$ where 14%
coming from rice, 1% from annual crops, 2% from common resources, 6% from cattle, 10%
from animal production, 39% from non-farm activities and 29% from migration activities.
0
1000
2000
3000
4000
5000
6000
UH SH AH UH SH AH UH SH AH UH SH AH UH SH AH UH SH AH UH SH AH UH SH AH
Adult HH Youth HH Adult HH Youth HH Adult HH Youth HH Adult HH Youth HH
OMC-1 OMC-2 OMC-3 OMC-4
Aver
age
inco
me
per
ho
sueh
old
Zone Otdar Meanchey: income by farm integration capacity
Rice income AC income VG income
Fruit tree income CR income CAT income
AN income (excl.cattle) Non-farm income Migration income
0
500
1000
1500
2000
2500
3000
UH SH AH UH SH AH UH SH AH UH SH AH UH SH AH UH SH AH UH SH AH UH SH AH
Adult HH Youth HH Adult HH Youth HH Adult HH Youth HH Adult HH Youth HH
OMC-1 OMC-2 OMC-3 OMC-4
Aver
age
no
n-f
arm
inco
m p
er h
ouse
ho
ld
Zone Otdar Meanchey: non-farm income by integration capacity
Agricultural wage labor LB-H LB-L Migration SB-H SB-L SR-H SR-L

225
Consider both non-farm and migration as total non-farm income; this 68% of non-farm
income is coming from agricultural wage labor (6%), Labor based high income (17%),
migration (28%), self-business high income (38%), and salary high income (10%). Youth able
household in the same farm type have average annual earning 3363$ where 14% from rice,
1% from common resource, 4% from cattle and 84% from non-farm income. This 84% of
total non-farm income is coming from self-business high income 32% and salary high income
68%.
Adult able household in OMC-2 has annual average income of 3503$ where 41% of
income come from rice, 1% from annual crops, 1% from vegetable, 4% from common
resources, 10% from cattle, 8% from animal production, 25% from non-farm activities and
10% from migration activities. Consider both non-farm and migration as total non-farm
activities, this 25% total non-farm income is coming from agricultural wage labor (1%),
labor-based work 4% (LB-H: 3%, LB-L:1%), migration (29%), self-business high income
(47%), labor base low income (7%) and salary high income (12%). Youth able household in
the same farm type have average annual income 2797$ where 43% of total income is from
rice, 2% from annual crops, 17% from vegetable, 2% from common resources, 4% from cattle
income and 33% from non-farm income. This 33% non-farm income is contributed from
agricultural wage labor 1%, self-business high income 66% and salary high income 33%.
Adult able household in OMC-3 has annual average income of 2989$ where 13%
come from rice, 7% from annual crops, 8% from common resource, 10% from cattle 5% from
animal production, 50% from non-farm income and 7% from migration income. Both non-
farm and migration income contribute total non-farm income 57% where 47% come from
agricultural wage labor, 12% from migration, 6% from self-business low income and 36%
from salary high. There is not youth able household in this farm type.
Adult able household in OMC-4 has annual average income of 2666$ where 20% of
income come from rice, 56% come from annual crops, 12% come from common resources,
9% from cattle, and 4% come from non-farm income. This 4% of non-farm income is
contributed by labor based work low income accounted 100% of total non-farm income.
Youth able household in the same farm type have average annual income of 6025$ where
15% of income is from rice, 11% from annual crops, 8% from vegetable, 8% from common
resources, 3% from cattle, 3% animal production, and 53% from non-farm income. This non-
farm income (53%), 100% is coming from self-business high income.
In general, household in poor resource and small land like OMC-1, the subsistence
and capacity to add more people is strongly depend on the degree of generation of income
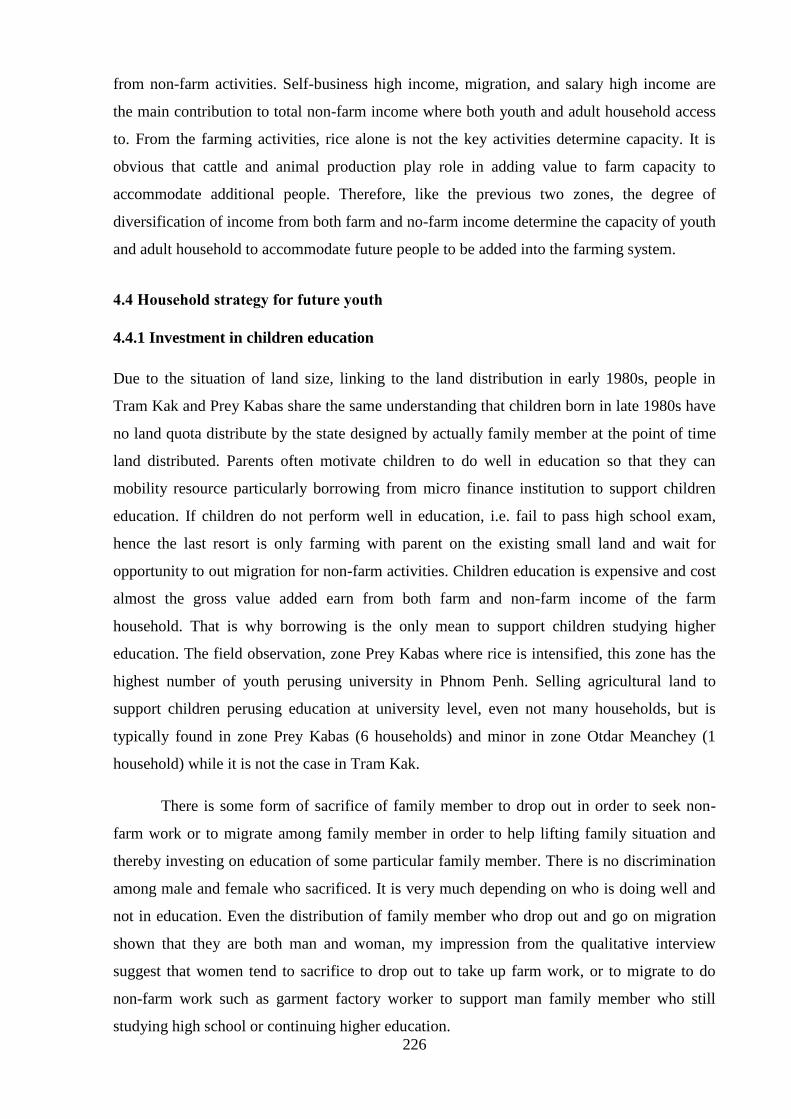
226
from non-farm activities. Self-business high income, migration, and salary high income are
the main contribution to total non-farm income where both youth and adult household access
to. From the farming activities, rice alone is not the key activities determine capacity. It is
obvious that cattle and animal production play role in adding value to farm capacity to
accommodate additional people. Therefore, like the previous two zones, the degree of
diversification of income from both farm and no-farm income determine the capacity of youth
and adult household to accommodate future people to be added into the farming system.
4.4 Household strategy for future youth
4.4.1 Investment in children education
Due to the situation of land size, linking to the land distribution in early 1980s, people in
Tram Kak and Prey Kabas share the same understanding that children born in late 1980s have
no land quota distribute by the state designed by actually family member at the point of time
land distributed. Parents often motivate children to do well in education so that they can
mobility resource particularly borrowing from micro finance institution to support children
education. If children do not perform well in education, i.e. fail to pass high school exam,
hence the last resort is only farming with parent on the existing small land and wait for
opportunity to out migration for non-farm activities. Children education is expensive and cost
almost the gross value added earn from both farm and non-farm income of the farm
household. That is why borrowing is the only mean to support children studying higher
education. The field observation, zone Prey Kabas where rice is intensified, this zone has the
highest number of youth perusing university in Phnom Penh. Selling agricultural land to
support children perusing education at university level, even not many households, but is
typically found in zone Prey Kabas (6 households) and minor in zone Otdar Meanchey (1
household) while it is not the case in Tram Kak.
There is some form of sacrifice of family member to drop out in order to seek non-
farm work or to migrate among family member in order to help lifting family situation and
thereby investing on education of some particular family member. There is no discrimination
among male and female who sacrificed. It is very much depending on who is doing well and
not in education. Even the distribution of family member who drop out and go on migration
shown that they are both man and woman, my impression from the qualitative interview
suggest that women tend to sacrifice to drop out to take up farm work, or to migrate to do
non-farm work such as garment factory worker to support man family member who still
studying high school or continuing higher education.

227
The investment in children education also take the form of borrowing from micro
finance institution especially when children need to pursue higher education at university such
as paying school fee (in case that children did not get scholarship), living costs and other cost
and sending rice and agricultural product from home village.
However, the cost investment is expensive to rural that not many of them could afford.
Based on the cost for education per children at university, it is cost more than the average
annual household income in of household in TK-1 115% of 1031USD/year, 85% of annual
income of TK-2 (1403USD/year), 54% of annual income of TK-3 (2213USD/year). In the
Prey Kabas, the cost for investment compare to annual average household income would 72%
of annual income of household in PB-1, 52% of PB-2 and 33% of PB-3. In Otdar Meanchey,
the cost of investment on children higher education will be 63% of annual income of OMC-1,
39% of OMC-2, 61% of OMC-3 and 37% of OMC-4.
Table 76 The average cost of expense on education per child at different level by household
Zone
University cost
High
school per
person
Secondary
school per
person
Primary
school per
person University living
allowance/year/person
University
fee/year/person
University
per person
Otdar Meanchey 502 480 982 170 128 33
Prey Kabas 851 437 1288 168 168 51
Tam Kak 840 350 1190 224 138 41
Grand Total 781 425 1206 187 147 37
If this amount of expense on education can be lower if children do well in education
and get the scholarship for university fee. Hence households need to expense on living
allowance for children. The cost will be reduced if there is social network such as relative or
previous migrant who live and work in the capital that can accommodate and support children
studying university.
Across comparison between the zone, among household having youth attending
school, only zone Prey Kabas having high percentage of household that have children
studying at university level. Among 69% of household having youth studying, 26% having
youth studying at university, 18% studying high school, 23% studying secondary school and
3% of youth studying primary school. In Tram Kak, among 36% household having youth at
school, there are only 4% having children studying university. In Otdar Meanchey among,
57% of household having children at school there is only 7% of household having children
studying at university. These household is distributing divers across farm type which provide
no clear-cut answer that which farm type have more children studying university.

228
Figure 45 Percentage of household having youth access to education by level of education
4.4.2 Integration into farming under the MSI
There will be more youth have to install in farming. It is very unlikely for household in the
poor farm type whose land is small particularly in TK-1, PB-1 and OMC-1. However, given
the pattern of land share is 0.18ha or 0.20 ha in Tram Kak and Prey Kabas, it is likely that
household in TK-2, TK-3, PB-2 and PB-3 whose land is more than 1 ha is going to sub-divide
for children who fail education under to moral obligation of ―sharing the survival‖.
In Otdar Meanchey many youths did not access to school or drop out at mainly
primary and secondary school. Parents are motivated to secure the future of their children by
preparing agricultural land for sub-division.
In many cases highlighted in the box as well as the observation from the qualitative
interview reveal that thought household currently have single youth, but some households
already facilitated integrating youth into farming already and the land is become smaller and
smaller. In Tram Kak, family give land to children between 0.1ha and 0.2 ha while in Prey
Kabas between 0.18 to 0.22 ha, while in Otdar Meanchey, youth settle farming between 1 and
5 ha dependent on the combination of bride and groom, notably 1 to 2 ha from each side. This
amount of land is far below the minimum surface for sustainable integration in farming.
Therefore, youths who start farming with this amount of land will have to strongly rely one
interaction between the parents support and the migration or combination of non-farm
activities. Given educational level of rural youth is low, it will be difficult for them to
integrate into high labor productivities non-farm sector but labor based work and low labor
productivities work such as garment factory, construction work and other urban services for
10 3 8
11 23 23
11
18 19
4
26 7
0
10
20
30
40
50
60
70
Otdar Meanchey Prey Kabas Tam Kak
Per
cen
tag
e o
f h
ou
seh
old
ha
vin
g
yo
uth
ed
uca
tio
n
% Youth's education per household
Youth in primary school Youth in secondary school Youth in high school Youth in university
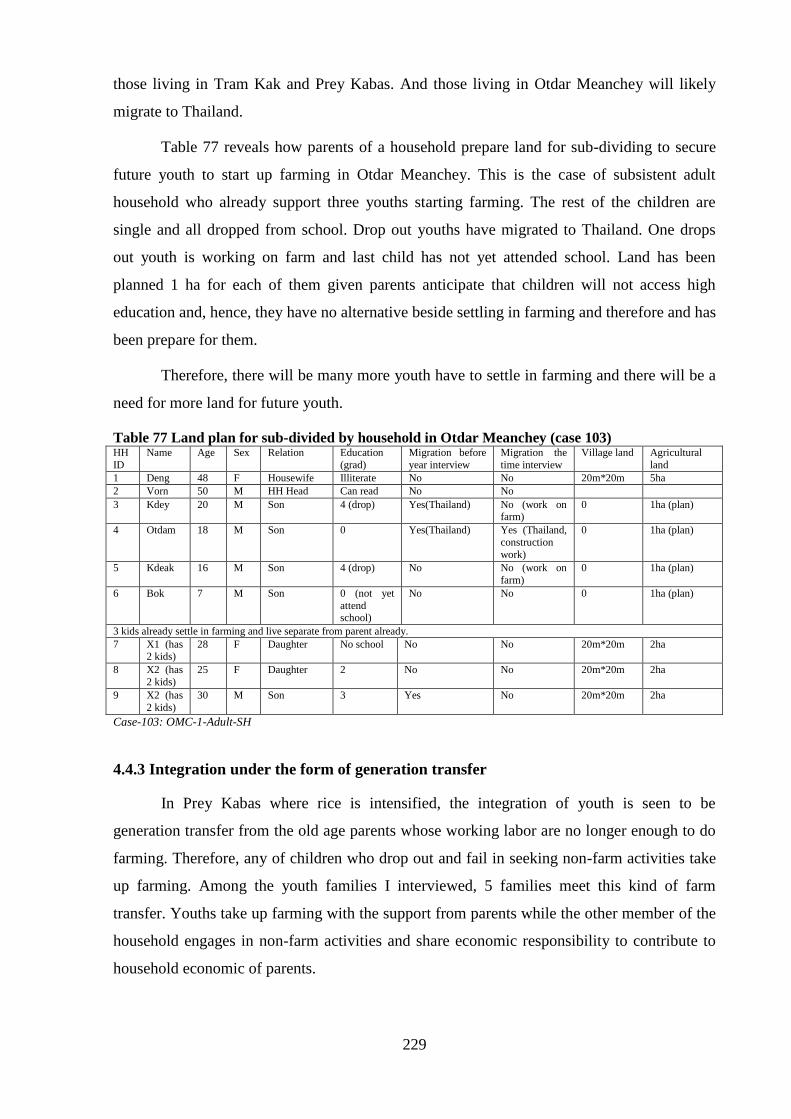
229
those living in Tram Kak and Prey Kabas. And those living in Otdar Meanchey will likely
migrate to Thailand.
Table 77 reveals how parents of a household prepare land for sub-dividing to secure
future youth to start up farming in Otdar Meanchey. This is the case of subsistent adult
household who already support three youths starting farming. The rest of the children are
single and all dropped from school. Drop out youths have migrated to Thailand. One drops
out youth is working on farm and last child has not yet attended school. Land has been
planned 1 ha for each of them given parents anticipate that children will not access high
education and, hence, they have no alternative beside settling in farming and therefore and has
been prepare for them.
Therefore, there will be many more youth have to settle in farming and there will be a
need for more land for future youth.
Table 77 Land plan for sub-divided by household in Otdar Meanchey (case 103) HH
ID
Name Age Sex Relation Education
(grad)
Migration before
year interview
Migration the
time interview
Village land Agricultural
land
1 Deng 48 F Housewife Illiterate No No 20m*20m 5ha
2 Vorn 50 M HH Head Can read No No
3 Kdey 20 M Son 4 (drop) Yes(Thailand) No (work on farm)
0 1ha (plan)
4 Otdam 18 M Son 0 Yes(Thailand) Yes (Thailand,
construction
work)
0 1ha (plan)
5 Kdeak 16 M Son 4 (drop) No No (work on
farm)
0 1ha (plan)
6 Bok 7 M Son 0 (not yet
attend school)
No No 0 1ha (plan)
3 kids already settle in farming and live separate from parent already.
7 X1 (has 2 kids)
28 F Daughter No school No No 20m*20m 2ha
8 X2 (has
2 kids)
25 F Daughter 2 No No 20m*20m 2ha
9 X2 (has
2 kids)
30 M Son 3 Yes No 20m*20m 2ha
Case-103: OMC-1-Adult-SH
4.4.3 Integration under the form of generation transfer
In Prey Kabas where rice is intensified, the integration of youth is seen to be
generation transfer from the old age parents whose working labor are no longer enough to do
farming. Therefore, any of children who drop out and fail in seeking non-farm activities take
up farming. Among the youth families I interviewed, 5 families meet this kind of farm
transfer. Youths take up farming with the support from parents while the other member of the
household engages in non-farm activities and share economic responsibility to contribute to
household economic of parents.
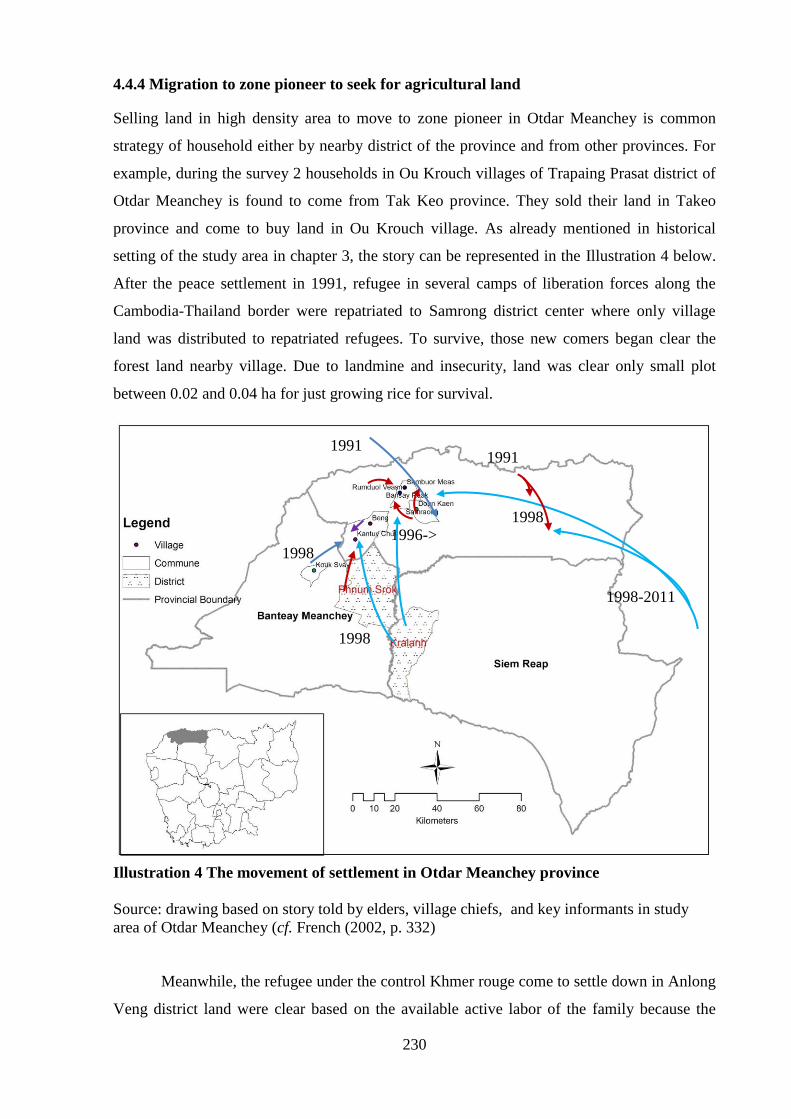
230
4.4.4 Migration to zone pioneer to seek for agricultural land
Selling land in high density area to move to zone pioneer in Otdar Meanchey is common
strategy of household either by nearby district of the province and from other provinces. For
example, during the survey 2 households in Ou Krouch villages of Trapaing Prasat district of
Otdar Meanchey is found to come from Tak Keo province. They sold their land in Takeo
province and come to buy land in Ou Krouch village. As already mentioned in historical
setting of the study area in chapter 3, the story can be represented in the Illustration 4 below.
After the peace settlement in 1991, refugee in several camps of liberation forces along the
Cambodia-Thailand border were repatriated to Samrong district center where only village
land was distributed to repatriated refugees. To survive, those new comers began clear the
forest land nearby village. Due to landmine and insecurity, land was clear only small plot
between 0.02 and 0.04 ha for just growing rice for survival.
Illustration 4 The movement of settlement in Otdar Meanchey province
Source: drawing based on story told by elders, village chiefs, and key informants in study
area of Otdar Meanchey (cf. French (2002, p. 332)
Meanwhile, the refugee under the control Khmer rouge come to settle down in Anlong
Veng district land were clear based on the available active labor of the family because the
1998-2011
1991
1998
1998
1991
1996->
1998

231
area is full controlled by the Khmer Rouge force. In 1996, the situation is little bit improved
and the growing population in Samrong district drive villager to begin clearing land and
expand village. For example, Ou Ruessei village were separated into two villages, and
villagers in Don Ken and Kam Nop village began to move to Bansay Reak commune which
later on Sambour Meas, Romdoul Veasna, Ou Tong village were created. In 1998, the last
force of Khmer Rouge in Anlong Veng were surrender and submit to the government, villager
in Along Veng began expand land to Trapaing Prasat district. The province was then
separated from Sieam Reap province. New city center and municipality were newly
constructed displacement and resettlement take place in Somrong district. The movement of
people to occupy land began rapidly. People from Kralanh district of Siem Reap province,
from Phnom Srok and Kok Svay of Banteay Meanchey moved to occupy land in Katuy
Choun village, Beng commune, Banteay Ampil district of Otdar Meanchey. Beng village
which is an old populated village began to expand village too. People here also move to
Kantuy Chun area under local initiative.
Settlement in new area requires a lot of effort especially forest land clearance ―Hék
Dey‖, the common expression in Khmer language. Thank the historical and institutional
setting to this area, usually, children did not have access to school due to poverty and,
thereby, engage in farming and migration to Thailand. Children migration in this area is
expected to accumulate the financial capital to invest in farming such as clearing the remained
forest land, buy two-wheel tractor, to buy land. People views that currently land is no longer
available for free occupy but land is only available on purchase. The qualitative interview
with key informants reveal that the motivation to move to new area is to seek agricultural land
in zone pioneer of Otdar Meanchey is for securing the future for the family and for children.
4.4.5 Farm trajectory Tram Kak, Prey Kabas and Otdar Meanchey
The triangulation of farm household economic situation, land situation, migration ,
education and household story on youth integration, a farm household trajectory in Tram Kak,
Prey Kabas and Otdar Meanchey can be summarized and represented in Illustration 5,
Illustration 6 and Illustration 7.
In Tram Kak, given the land is very scare, investment on children education is a must
for household in this area. If youth fail in education, the only option is migration to garment
work or other sectors. Once youth get married, in this case, under the motto of sharing for the
survival, parents may manage to share land 0.1 to 0.2 ha to young couple or do not share but

232
let couple to share household economic with parents but youth have to engage in non-farm or
migration activities. However, given the limited access to water and limited capacity to
diversify, youth couple with migration experience tend to abandon this mall land for parents
and more rely on non-farming or migration activities. Given the situation of poverty, single
youth may be forced to drop out and migrate in order to earn additional income to support
family. In return, remittance from migration become an investment for future youth‟s
education and as well as for keeping the continuity of rural livelihood. If youth perform well
in education and family is able to afford after high school investment, youth may attend
university and integrate themselves into salary high income in formal sectors. If youth
perform well but household has no financial capacity to support youth to continue higher
education, youth may follow the path of previous migrant and migrate for garment work or
other non-farm activities. Even though settlement in farming usually take place at point of
marriage, however, migrant may have high chance to integrate into non-farm sector and least
chance to return to farming. However, this also depend on the couple strategy and land
availability of each side of couple. Integration in farming could take place when the parents
are too old to farm. In this case, daughter or son who is going to live with parents they are
getting old likely to inherit land from parents. Illustration 5 shows the representation of farm
household trajectory in Tram Kak.
Illustration 5 Representation of farm trajectory in Tram Kak
In Prey Kabas, farm household share the same pattern of trajectory as Tram Kak.
However, the present of irrigation and the availability of water receding rice land, some farm
families manage to settle children who do not perform well and drop out from school into in
farming. Drop out youths help parent working on farming. After working for parent for a
while, single youth is likely to married with youth in the same situation in the same village or
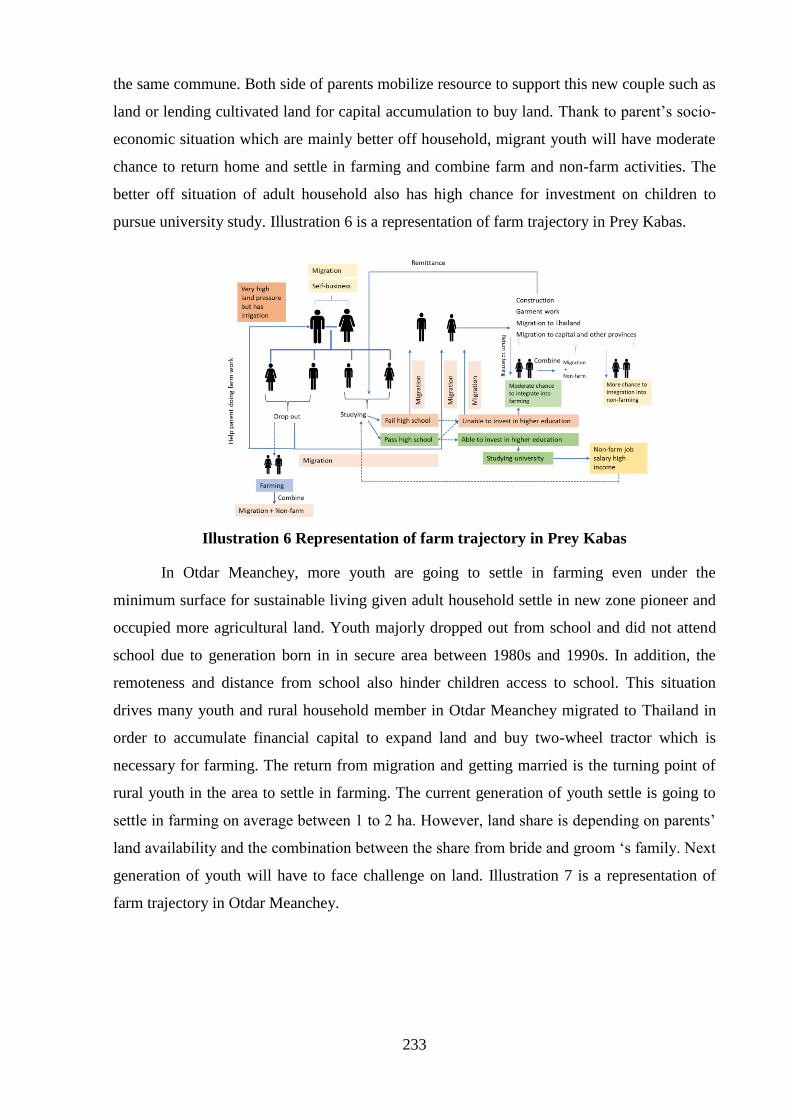
233
the same commune. Both side of parents mobilize resource to support this new couple such as
land or lending cultivated land for capital accumulation to buy land. Thank to parent‟s socio-
economic situation which are mainly better off household, migrant youth will have moderate
chance to return home and settle in farming and combine farm and non-farm activities. The
better off situation of adult household also has high chance for investment on children to
pursue university study. Illustration 6 is a representation of farm trajectory in Prey Kabas.
Illustration 6 Representation of farm trajectory in Prey Kabas
In Otdar Meanchey, more youth are going to settle in farming even under the
minimum surface for sustainable living given adult household settle in new zone pioneer and
occupied more agricultural land. Youth majorly dropped out from school and did not attend
school due to generation born in in secure area between 1980s and 1990s. In addition, the
remoteness and distance from school also hinder children access to school. This situation
drives many youth and rural household member in Otdar Meanchey migrated to Thailand in
order to accumulate financial capital to expand land and buy two-wheel tractor which is
necessary for farming. The return from migration and getting married is the turning point of
rural youth in the area to settle in farming. The current generation of youth settle is going to
settle in farming on average between 1 to 2 ha. However, land share is depending on parents‟
land availability and the combination between the share from bride and groom „s family. Next
generation of youth will have to face challenge on land. Illustration 7 is a representation of
farm trajectory in Otdar Meanchey.
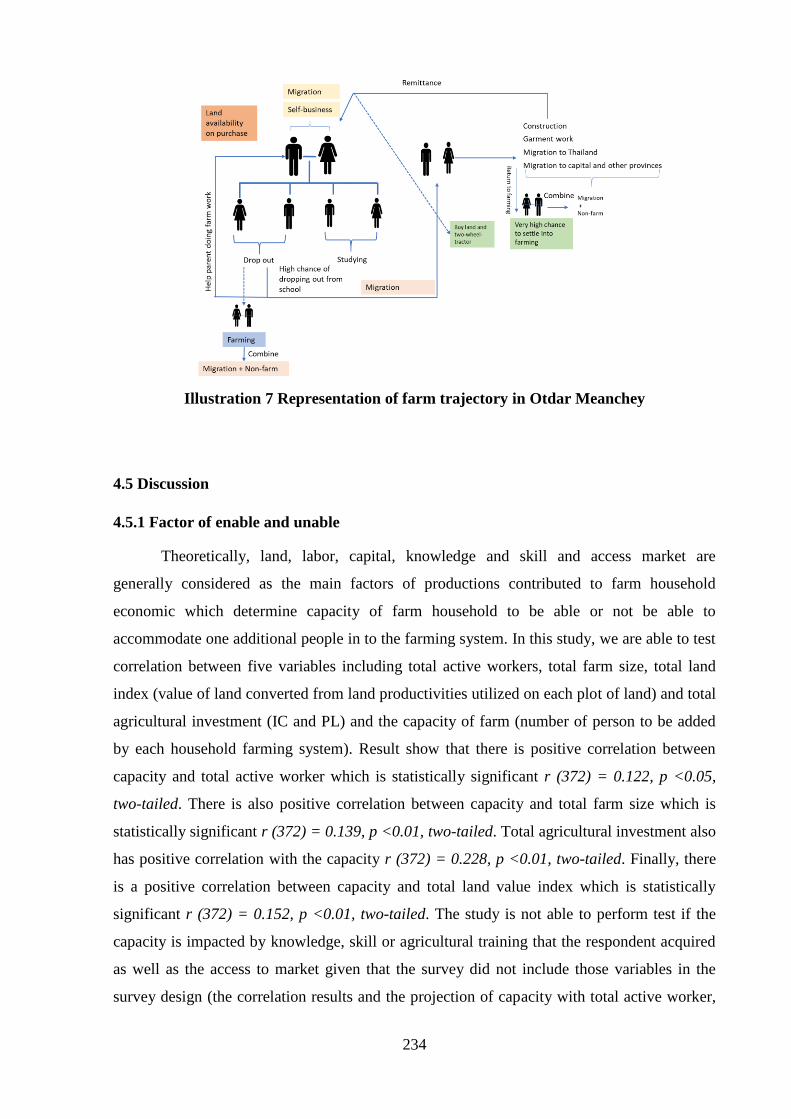
234
Illustration 7 Representation of farm trajectory in Otdar Meanchey
4.5 Discussion
4.5.1 Factor of enable and unable
Theoretically, land, labor, capital, knowledge and skill and access market are
generally considered as the main factors of productions contributed to farm household
economic which determine capacity of farm household to be able or not be able to
accommodate one additional people in to the farming system. In this study, we are able to test
correlation between five variables including total active workers, total farm size, total land
index (value of land converted from land productivities utilized on each plot of land) and total
agricultural investment (IC and PL) and the capacity of farm (number of person to be added
by each household farming system). Result show that there is positive correlation between
capacity and total active worker which is statistically significant r (372) = 0.122, p <0.05,
two-tailed. There is also positive correlation between capacity and total farm size which is
statistically significant r (372) = 0.139, p <0.01, two-tailed. Total agricultural investment also
has positive correlation with the capacity r (372) = 0.228, p <0.01, two-tailed. Finally, there
is a positive correlation between capacity and total land value index which is statistically
significant r (372) = 0.152, p <0.01, two-tailed. The study is not able to perform test if the
capacity is impacted by knowledge, skill or agricultural training that the respondent acquired
as well as the access to market given that the survey did not include those variables in the
survey design (the correlation results and the projection of capacity with total active worker,
235
farm size, agricultural investment and land index, see Appendix – 10 Factors of production
correlation page 329).
Although the household situation is unable to add more people, many rural households
will have to subdivide land for children at their marriage for sharing the survival. In cases
where land is too small to be sub-divided, young couple tend to live and share the living with
the current farming and thereby any member of couple have to get engaged in non-farm
activities or migration or both couple migrate. In Tram Kak, it is obvious that youth couple in
this situation have no choice but to seek garment work or construction work. The same
tendency is found in Prey Kabas for the poor resource households and small land holders.
However, in Otdar Meanchey, the migration to Thailand is obvious due to its proximity and
ease legal border crossing. Migrants are able to make higher income earning than local. Thank
to high income earning, migration to Thailand is become a mean for accumulation of capital
to buy land and two-wheel tractors which is necessarily needed for farming in the area.
Though local villagers admitted that the situation of land is increasingly scarce and expensive
with financial capital of 500 to 1000 USD, people can manage to buy one or two hectares of
land. The land sale and transfer are still available. Some owners own big land and some parts
are not cleared yet. They are likely to make smaller plots for sales. In contrast, land in Tram
Kak and Prey Kabas, is very scarce and expensive due to increase of population. Most
importantly is that there is no one is willing to sell its own land in these two areas.
4.5.2 Land amortization of land/sub division of land
There is a very strong tendency that youth is going to startup more on farming even in small
land with the size far below the MSI even in low density area such as Otdar Meanchey. Even
though the economic capacity of farming generating from land is far below the living
threshold, my study found that youths have to startup with farm work even in very tiny of
land and combine migration and non-farm work. Under to motto ―Chek Khnea Ros‖ in
Khmer which is mean ―share each other for the survival‖ drive parents more or less to
manage to share the land. Case 280-TK-3-UH in Box 2 is an example in zone Tram Kak and
OMC-1-Adult-SH in Table 77 is example of land amortization among family member in
Otdar Meanchey.
The institutional environment and arrangement explain that the open up new area in
Otdar Meanchey is driven by the national political integration becomes a driving force/access
for local people to solve the population pressure especially helping the integration of young
people into farming in the low-density area Otdar Meanchey. Due to the limitation of rural

236
non-farm activities and growing family member who mostly drop out, many more family
members are going to settle more on farming on the small plot of land between 1 and 2 ha.
However, due to degradation of farm household economic and small land, future youth
integration in Otdar Meanchey will rely on farming and migration to Thailand.
While in high density area such as Tram Kak and Prey Kabas, there will be no land to
share with future youth integration. Parents have small land and there is no land quota for
sharing to children born later than 1982 or 1983. Therefore, the handover of land is possible
when parents get old or among parents who have accumulated land over the years. But future
youth will be largely relying on non-farm work and parents will mobilize resource to invest
on children education. If they fail schooling, the only last resort is to stay with parents and
take on the same land for a while, until they have the possibility to make migration for non-
farm job.
Even the many families and youth have to settle in land below the MSI, people will
have to settle in farming due to lack of better alternatives. Therefore, farming is a basic safety
need to family. The future migration is anticipated to complement the family‟s source of
income from farming. This is often the case for families with children whose access to
education is long enough for them to build skills needed by non-farm sectors. Future youth
integration has to combine both farm and non-farm activities including migration of the
family member.
Like in Tram Kak, youth still have to work on farming even if they have small land
and combine with non-farm activity. So, do Prey Kabas. In Otdar Meanchey, people migrate
to Thailand in particular to see financial capital to clear more land, expand the land, to buy
two wheel-tractor and to compensate the degradation of farming economic that might occur
during the bad year period such as drought and crop failure.
All though farm economic demonstrated in the survey shows that only few families that
can make profit from farming and majority can profit only if they combine with non-farm
activity, still farming is consider as vital role in ensuring family safety and food security.
4.5.3 Land is main challenge for future youth integration
The farm household from the survey shows that even with the people trying to seek non-farm
activities and developing non-farm activities, still majority of family do not meet the need of
the family in a sustainable manner. For some families, farming can integrate youth. Still,
parents encourage children to seek the alternate job on non-farm in order to improve their
237
livelihood. However, this will be challenge, as the current system could not allocate MIS to
one more youth who married in the family or to live separately from parents. In many cases
that I encounter the family where the young married couple aged between 23 and 26 years
old, their parents are able to share not more than 1 ha of land. With such a small land, both
husband and wife are forced to migrate to Thailand leaving behind the children at
grandparents to look after. When asking what purpose of migration, they said to seek capital
to expand the land and to buy two-wheel tractor.
Case of Otdar Meanchey (case 124) reveals how family structure allocates land to
youth. Although few families have MIS to allocate to youth and the MIS should be met, the
study found that youth are already working on the small plot of land. In reality, in many cases
that I have encounter during the interview, rural youth in Otdar Meanchey have to startup in
agriculture on one ha of agricultural land. Case 124 is an example of how parents prepare and
distribute land to children and how they mobilize family member to expand the important
assets for agricultural purpose. We can see that in this family, the two eldest sons are already
making their living in farming. The two younger married daughters also installed in farming
though previously migrated. In addition, the last single daughter already has the land quota of
1ha land for future settlement. This family is not an isolated case but it is typical case that I
see it is the pattern of the people in Otdar Meanchey. The pattern is that people with limited
access to education is left with no other better alternative than farming. In this area, the school
was just built under the initiative of new settlement when the village was established and it
was available mainly at the primary school. Therefore, those children who were growing up
during the family settlement were very unlikely to have access to school beyond primary
level. This is the situation of the villagers in this area. Therefore, I can draw the main strategy
for youth integration in the area based on historical linking to settlement and political
integration, the socioeconomic condition of the family there. Pressure of big household size
over small plot of land and limitation of children accesses to education drive families in Otdar
Meanchey to find all means to expand agricultural land for the securing the future of their
children. Migration to Thailand that was revealed by some families during the interview is
just temporary. It is just to find the financial capital to buy land or two-wheel tractor for
serving agricultural purpose.
Small land and poor resource household such as TK-1, PB-1 and OMC-1 despite
economic capacity shows that some households have capacity to add one additional youth, but
qualitatively, these households are in the situation of no longer possibility of further
subdivision land. Hence, youth migration out is obvious in those farm types. The contribution
238
remittance from migrant or non-farm income to the household is adding to the farm capacity
and that capacity will be translated to investment on education of remaining child or children
or expand agricultural asset to secure the future return of migrant or when migrant getting
married. However, without capital from migration, it is very unlikely that current farming will
be able to accommodate grown up family members. Therefore, those migrants will likely to
have integrated into non-farm sectors rather than return home for farming. The takeover of the
land from parents could possibly happen under the form of generation transfer when parents
are getting old and not able to work on the land, then any migrants of the households may
return home and take care of parents and work on the land and combine activities with non-
farm or resume migration since they have experience already.
4.5.4 Small holder farming is safety-net
As there is not so many alternatives and limited capacity, knowledge and skill to get non-farm
job, this suggests more youth particularly those who dropped out or fail in education rely on
family farming and expect for future migration as a complement to existing parents‟ farm.
Although the situations of some farm households are under the minimum threshold of living,
still these farm households are currently accommodating youth more than any other type of
farming. This is strongly corresponded to the qualitative explanation by farm household that
farming is their safety net and the positive perception of youth and adult household on
farming (This will be elaborate later in chapter 5).
Non-farm activity plays significant role in increasing farm capacity to accommodate
youth. Hence, future integration will not purely rely on farming when the land is below the
MIS. Integration will take place under the forms of combination of farm and off-farm/non-
farm activities. This can be seen in the survey that either husband or wife tries to diversify
income source on non-farm activities notably motor-taxi, construction and agricultural wage
laborer by husband and handcrafting, shopkeeper, small business (family rice mill, sell
grocery in front of house) mainly by wife. Any households whose family members are
successfully integrated into non-farm activities or have non-farm activities such as salaried
employees (teachers, soldiers, civil servants) have higher capacity added to farm household to
sustain the living as well as to accommodate more young people on the small land.
Farm type TK-1, PB-1, OMC-1 and OMC-3 (poor resource group) has many
household are below the MSI. The capacity for youth integration strongly relies on non-farm
activities. Those who are in the position to accommodate youth are those who have higher
non-farm income from both migration and non-farm activities. Although this group is in the
239
position not to accommodate more youth and many youths are going to move out, the survey
result shows that in fact many youths are currently living and relying on this farm. The future
of youth in this farm type will have to invest on education. However, as investment in
education is expensive, this group of family will likely not able to invest in their children
education. The household in this type will have to accommodate more youth and wait for
opportunity to migrate out of the farm in order to maintain the sustainability of the household.
That is why household view farming as good option for them given that it plays a role
ensuring safety-net, without any alternative, they, at least, have food to consume. In rural
area, having enough rice to consume all along the year together with ―Pra Hok‖ or
―fermented fish‖ is considered by rural household as food secure. The additional non-farm
activities are added to complement what farm cannot generate and thereby, the migration
family member or seasonal migration of household head will offer additional opportunity or
capacity to invest on children education in the future where farming has no place for them.
4.5.5 Sustainable integration in farming need a complementary from non-farm
Jiao, Pouliot, and Walelign (2017) found that over 70% of rural household has been shifted
their livelihood strategy to more remunerative strategy. Rahut and Micevska Scharf (2012)
found that non-farm income contributes more 60 per cent of total household income and
emphasis that education plays a major role in accessing to more remunerative non-farm
employment. The poor and the less well-educated of people, the less their participation in the
non-farm sectors. This study shares similar finding that non-farm activities which include
local self-business, salary employment, and migration plays important roles in complementary
income to rural household and the less land the farm household has, the more non-farm
activities the household has to rely on farming. This is clearly seen in small land and poor
resource household TK-1, PB-1, OMC-1 and OMC-3. However, this study found that it is not
enumerative employment is found to be very rare for rural household such as military, local
authority, civil servant and teacher. The employment in private sectors such as garment
worker, construction worker is contributing to low income earning. Other urban services
which is high income earning is very rare except some household whose children finished
university high enumerative employment. Investment in education is expensive and not rural
household can afford this. Hence, it is not coincident that rural non-farm employment
particularly self-business initiated by rural household and migration play important role in
complementary income to farm household income particularly small land and land poor
household in this study.
240
Like many agrarian studies who find that small holder family farming still offers big
source of employment for youth, this study shares similar finding that majority of youth are
working on family farming but majority of youth are working on the small-land and poor
resource household and even below poverty threshold. Such a situation is not healthy for
future youth occupation. This situation requires the complementary income from non-farm
activities. The smaller land tends to rely more on non-farm activities and migration work and
therefore, farming on small plot of land will become source for food instead of buying rice.
4.6 Conclusion
This chapter examined the situation of youth and adult household in accommodating youth
integration in family farming, its strategy for future youth, and its economic capacity to add
one additional member in to the current farming system. The study found that youth
household accounted for 30% of the survey sample and they are mainly settling in the small
land and poor resource farm type TK-1, PB-1, OMC-1 and OMC-3, except PB-2 where
majority of youth settle in PB-2 thank to the strong support from parents who is mainly better
off household. Even though the pattern of settlement suggested youth normally settle in
farming at their marriage, however, not all youth couple get land share at marriage thank to
land situation of the parents‟ household. Youth can reside and depend on parents‟ household
for several years to accumulate capital to buy mean of productions such as land and
equipment in order to live independently from parents. The combination of land share of both
side of parents-groom and bride side could increase the amount of land and thereby facilitate
youth settlement in farming especially if youth get married within same village or nearby
village. The analysis economic capacity of farm household show that though majority of farm
household are in situation of below subsistent, they are in fact accommodating youth
especially within the adult household. Hence, beside food security, smallholder farming in the
study area is the safety-net in the absent of no alternative or less alternatives.
The study also found that rural youth often have poor access to school and many drop
out below secondary and high school. Situation is worse in low density area-Otdar Meanchey
where remoteness and the previous insecurity of province impacted the access to school of
many children in the area. While access to higher education require high capital for
investment, it is very unlikely that those small land and poor resource is able to invest in such
higher education. Thus, there will be more youth going settle in farming even small land.
Given the poverty situation linking to low level of education and the limited
availability of non-farm job, rural youth have few alternatives besides farming. In return, the
241
hardship in rural household economic becomes a pushing factor for rural household to
combine farm and non-farm activities such developing self-business and migration. The area
where land situation is highly pressure such as Tram Kak and Prey Kabas, household also
engage on non-farm activities but strong motivation to invest in children given there is no
more land to secure for their future. Unlike Otdar Meanchey where land is still available for
purchase, drop out youth still have more chance to get land share from parent to start up farm
work. In the future, smallholder farming will have to face more challenge in accommodating
the new growing family member. Therefore, combining non-farm activities, seasonal
migration of household head or family member long term migration to urban such as the
capital city or to Thailand become necessary to ensure keeping continuity and sustainability
of the current family farming.
The next following chapter will examine the institutional dimensions in supporting
youth settlement in farming by looking at the individual youth and household perception on
farming, role of local based community organization, the role of NGOs and policy impacted
on youth integration in farming in the study area.
242
CHAPTER 5: INSTITUTIONAL DIMENSION FOR SUSTAINABLE
YOUTH INTEGRATION IN CAMBODIAN FAMILY FARMING
5.1 Introduction
The situation of Cambodian rural youth regarding the settlement in farming is absent but
some indications from various studies in Southeast Asia state that youth is no longer
interested in farming (Hall et al., 2012). The finding is quite contradictory to the current
situation of Cambodia where majority of rural youth residing in rural area engage and depend
on their parents‟ family farming. However, the recent migration study indicates remarkable
migration from rural to rural and rural to urban area. Agricultural land seeking likely drives
these rural-rural migrations (Diepart, 2010; Pilgrim et al., 2012). We are not clear whether the
migrant population is the outcome of youth who is not interested in farming or other factors.
In addition, we do not know what is in youths‟ and their parents‟ minds about farming
activities.
The way of which they think about the possible employment in farming is totally
absent in this country. This chapter aims at exploring individual youth and their family
perspectives on farming activities and factors determining their choice of occupation.
As shown in the previous chapter, the economics and profitability of farming alone are
small and not enough to sustain the current family members of majority of household in the
survey. Majority of them have to earn the complementary incomes from non-farm activities
including local non-farm, off-farm and migration activities. In addition, the land holding per
family is far beyond MSI that drive majority of the family not able to allocate one MIS to one
additional youth.
In chapters 3 and 4, I have indicated that the economic result of farming and the
family and thereby draw the conclusion that such condition is likely not favorable for future
sustainable youth integration in farming within the current farming system due to the land
availability. However, I was wondering in such condition, how people perceive farming and
why. Last section of the survey questionnaire is dedicated perception questions in order to get
respondents‟ views on farming. This is not the general public view on farming but rather how
farmers themselves view on farming. As indicate in the framework of sustainable youth
integration, one of the factors for successful youth integration is firstly come from the
motivation of individual and family farm to improve the farming (Wampfer & Bergès, 2017;

243
Wampfler, 2014). Therefore, view on farming in this case indicates how they give value to
what they are doing.
This chapter is drawn from the socio-economic survey of 372 rural households in two
provinces of Cambodia, focus group discussion with 12 youth in Tram Kak, 13 youth
individual interview in Prey Kabas, 1 youth group leader in Otdar Meanchey and case of
study of YAE project of CEDAC to see
(1) The individual‟s and family‟s views on farming,
(2) Role of local based community in supporting youth
(3) Lesson learnt from youth integration program YAE done by CEDAC and
(4) Existing policies that may have been impacted on youth integration in family
farming.
Part 7 of the questionnaire dedicates to the perception of the youth from parents‟
perspectives asking how respondents give opinions about youth‟s perceptions on agriculture
and parents‟ own perceptions on agriculture and youth family‟s perceptions. Respondent in
group discussion, individual interview and the survey, has been asked to response yes/no to
the questions and thereby explain the reasons to support his/her argument in the open-ended
question. There are four main questions: first do they think that agriculture or farm work is
good option for their family? Is it easy to start farm work? Do they intend to hand over the
farm work to their children? Is it easy to find non-farm job? Focus group discussion and
individual interview with single youth are used to discuss their views on farming both youth
dropping out and currently studying. Survey data of youth and adult couple household is used
to discuss family‟s perceptions and role of community-based organization. After that study
examines the NGOs-case study of CEDAC-YAE, and policy framework impacted on youth
integration in farming.
This chapter discusses 1. What are youth, youth family, and adult family view about
farming? 2. What factors explain the choice of integration in farming? 3. What roles of
community-based organizations, NGOs and existing policy framework play roles in
supporting youth integration in farming?

244
5.2 Perception on farming
5.2.1 Theory explaining perception
When it comes to explain youth decision to move out-off the farm, many empirical
explanation are mainly derived from economic incentives (Rhoda, 1983). For example
economic migration theory explains rural out-migration based on the expected “profitability
of the employment” at the destination; that is, a personal cost-benefit analysis taking place in
the prospective migrant‟s mind (Todaro, 1969). Due to the fact that human economic rational
is incomplete and imperfect, ways in which people make decisions are not totally based on
economic reason but also based on other form of non-economic behavior such as norms, self-
imposed standard of conducts, altruism etc. which were shaped by the social structure of the
society (North, 1990). In addition, people may make decisions based on personal experience
or from what they have learnt from their social environment. Decision, in another word, is an
outcome of changing one or more agents‟ perceptions if his or their interests are better served
under the new institutional arrangement comparing to the previous one (Mantzavinos, 2001).
In the later sense, way in which people making decision is not totally dependent on economic
rational but they also rely on existing social institutions and social structures either family,
community or society (Bourdieu, 2005; Mantzavinos, 2001; North, 1990; Polyani, 1944).
Hence, youth decision to move out or stay working on the farm is based on economic
rationales embeded in social institutions.
5.2.2 Single youth perception and aspiration toward farming
One group discussion has been done with 12 single youth in Tram Kak commune. 1 youth
drops out and works on the farm. The rest are students currently studying at secondary and
high schools. In Prey Kabas, no group discussion is done but youth has been identified
through the survey with family and individual discussion is done with youth who are
available. 13 single youths have been interviewed aged between 16 and 23 years old. Among
them, 3 youths are female. 6 youths drop out. 7 youths are currently studying. Beside the
qualitative information, I manage to encode the responses from both group discussion and
individual discussion into small database comprise of 25 cases to see what we can learn from
youths‟ perspectives on their aspirations toward farming.
Both group discussion and individual interview with youth show that in all cases,
youth used to help parents do the farm work.
Youth focus group discussion reveals that youths are proud of what their parents have
especially when they have learnt that those who migrated do not do well comparing to what

245
their parents do i.e. farming. They also learnt that those who migrated return home and rely
on farm job. All the participants share the same views that farming is one of the good options.
They share the same views that they see those who migrated to seek non-farm job do not do
well and do not save much. They finally come back home and rely on the farms of their
parents. A drop out male youth who is currently working on their parents‟ farms reveals that
farming is not difficult job because he used to help and do it with their parents since he was
young. Other participants also share the same views; therefore, all participants think that they
can do farm work. However, when asking about what they want to be in the future, it appears
that only 2 youths (who currently study) said that they want to be farmers whereas the rest
they aspire to non-farm job. My impression during the group discussion suggests that female
youths tend to show their interests in farm work than male youths and give more positive
views on agriculture when they were asked this question: “Do you have any intention to take
over farm work from your parents?”. 10 participants out of 12 share positive views on
farming, whereas 2 participants said that their parents want them to peruse higher education
and work on non-farm activities.
Female participants:
―I have no problem with farm work. Some tasks are easy and some
tasks are difficult.‖
―Farming is important for family. When we need money, we can sell
the products.‖
―Farming is very important. If we do not do farm work, farmers like us
will have nothing to eat.‖
―It is the job for daily livelihood. We grow vegetables. We have to
grow more in order to get enough for supporting our study.‖
―Parents do not want children to do farm work. They want children
peruse higher education.‖
Male participants:
―Agriculture just only brings income for daily subsistence in the
family. If we cannot find others non-farm work, we can still work on the
farm and we can feed ourselves. Working on the farm is the work for
our own boss, can get food and income for daily consumption.
However, we need to find other non-farm job to supplement the farming

246
because we have small land. This is the reason why I partly love
agricultural job only 50%.‖
―I think farming is difficult job because it is just a subsistence job. It is
good only if we know how to develop the farming to be more than
subsistence. But in the future, I think that 80% of my feeling, I want to
work on farm whenever I am free from non-farm work.‖
―It is good as it is a kind of job that can sustain the living.‖
―Farming provides food and supports children‘s education‖
―My parents want me to work outside the farm as mechanic in
repairing motorbike. I finished the training already but do not have the
initial capital to start this job. That is why I want to start my work with
agriculture to earn more income in order to achieve my parents' goal. I
think that agriculture is good because I saw those who cultivate with
modern technique gain good yield and much easier than those
practicing traditional technique. So, I want to study agricultural
technique but I am not sure if I can peruse or not.‖
When asking the question: “Is it easy to start farm work?”, 7 out 12 participants
demonstrate that it is not that easy. All of them pointed out to the question of technical know-
how in doing farming. One participant shares the view that ―at the beginning, it is difficult as
we are not well aware of all farming techniques. So, my parents have to accompany me to do
the farm work.‖ Another participant agreed and added that ―it is very difficult at the
beginning but later on it becomes easy‖. Another participant shares the same view that
―Because we do not know how to do it. We can do it only if parents help us to do a long with
us‖. ―We do not have much technical knowledge. Moreover, working on the farm needs to
spend more time.‖, another participant added. The last participants raise their concern about
the constraints of agriculture that ―It is difficult due to natural factor, livelihood factor such
as lack of capital to buy fertilizer, sometimes lack of labor as it demands many labor inputs
such as labor to transport rice, seedling, watering and etc. Agricultural work also impacted
on health such as backache, and other consequences derive from applying agricultural
chemical inputs.‖ The last two participants positively indicate that it is easy to start farm work
and also raise the following concern that they are unsure about the outcome of the crops on
one hand and on the other hand, this farm work requires a lot of labor inputs and of course it
is a very tired and exhausted job.
247
When asking the question: “Is it easy to find non-farm job?” 4 participants said that it
is difficult to find by providing the reason that first there is a few jobs available and second,
the availability is hard job with low income such as garment factory job. 2 participants said
they have no ideas about this question. The other 6 participants share positive views that there
is possibility to find job beside farming but all of them stress on the same point that only if
they have true skill and knowledge plus foreign languages. The quotation below is the view
expressed by each participant.
―Only if we have true skill, then we can earn money besides rice
farming.‖
―It is easy only if we have higher education but my case, I drop out low
grade. So, cannot do any other job beside garment worker,
construction worker. If I compare between those jobs and farming job,
I think that working on the farm at home is better. Although it is
difficult but we can meet our daily need and support our family and
help them every day.‖
―It is easy to find like garment work but it is difficult job. This is
because people are not knowledgeable to get better job than garment
work.
―Non-farm work generates more income than farm work and use less
labor than rice farming but only if we have knowledge such foreign
language.‖
When asking “do you have any intention to take over farm work from your parents?”,
1 participant said he did not know, 2 said they are not interested in farm work, and 9
participants said they are willing to take farm work from their parents. Among them two
participants said they are willing to work on the farm only if their parents have land for them
to farm. The other four participants are willing to work on the farm but regard farm work as a
complementary work from non-farm activities such as school teacher.
―If parents keep the land for us, want or do not want we have
to do it.‖
―If we have opportunity to do other non-farm work, we rent
our agricultural land to others.‖
248
―Because I want to be a teacher. Being a teacher, I can partly
teach at school and partly work on agriculture.‖ ―Besides
being a teacher, I can do farm work.‖ ―I want to do farming
50% of my time, whenever, I am free from other jobs.‖
Two participants are willing to take over farm work from parents because their parents are
too old to do farm work. So, it is a kind of generation transfer from parents to children.
―Because my parents are too old to work, to prepare land, to
irrigate the vegetable.‖
―Because my parents are getting old and they want me to take
over their farm.‖
Another participant is willing to do farm work because he/she enjoys freedom of being
working for his/her own boss.
―It is the job that can generate income, doing work for
other is not as easy as doing our own work.‖
However, the last comment from the female participants is very interesting. It is
almost the same to the generation transfer from old age parents to children. She emphasized
on the role of woman that in Cambodia, man is traditionally going to live with bride side.
Therefore, old age parents are going to live with the last daughter and hand over their last
asset such as land and house to the last couple when they pass away.
―I am willing to take over the farm work because I am a girl
who will continue this work and who will live with parents.
Boy can leave after marriage.‖, said a girl participant.
We can see that youths share positive views and they are willing to take over the farm
if their parents keep land for them. Although there is an availability non-farm activity, youth
still would prefer to do farm work. Male and female share the same views on farming work.
Non-farm activities are perceived to be limited available and it require knowledge and skill.
This is the reason that youths show their intention to be school teachers (primary and
secondary schools) because they can partly do farm work beside the teaching. However, the
impression from the interview suggests that females give more positive views on farming than
males. Females tend to accept to stay with parents as moral obligation and accept farm work
once their parents are getting old. The group discussion, hence, tells that from individual
youth‟s perspective, there is no discrimination on farm work. Although acknowledging that it

249
is hard job, still youth view farming is also a good option given that it ensures the family
safety net. Drop out youth give their views that seeking low skill non-farm activities is even
more difficult and the earning is not far less than farming. Therefore, for them, there is limited
option besides farming. That is why drop out youth tend to give more positive views on
farming.
Individual interviews with 13 youths in Prey Kabas show that farming is not a good
option by referring to the fact that the family has small land and thereby aspire to non-farm
activities which are perceived to be easier.
“Because my parents have very small land size, and income from
rice cultivation is irregular. If I work in non-farm activity, I will have
regular earning than farming.”
“Doing business or working in non-farm sector is easier than
farming. If I go to find job in Phnom Penh, I have my relatives, they
can help me find job.”
“I have friend who can find job, so I think it is easy to find non-farm
job.”
Agriculture is a good option referring to the fact that it is an existing job and provides
foundation for family to invest in children education and sustain the living and safety net in
case of failure in job seeking after graduation.
“I am not interested in working in agriculture because we have
small land. So, I want to be a banker in the future.”
“Agriculture is a good option because we cannot afford to get the job
beside agriculture. I want to start farm work but I share my feeling
that 50 percent I want to work on the farm given that the earning
from farming allows us to peruse further education.”
“Farming is good. If I graduate and I cannot find job, I have farm
which can support my living.”
“Farming is a good option because we depend on farming”
“For peasant, it is the good choice because there is no any other
thing for them to do.”
“Farming is a good option because it is an existing job.”
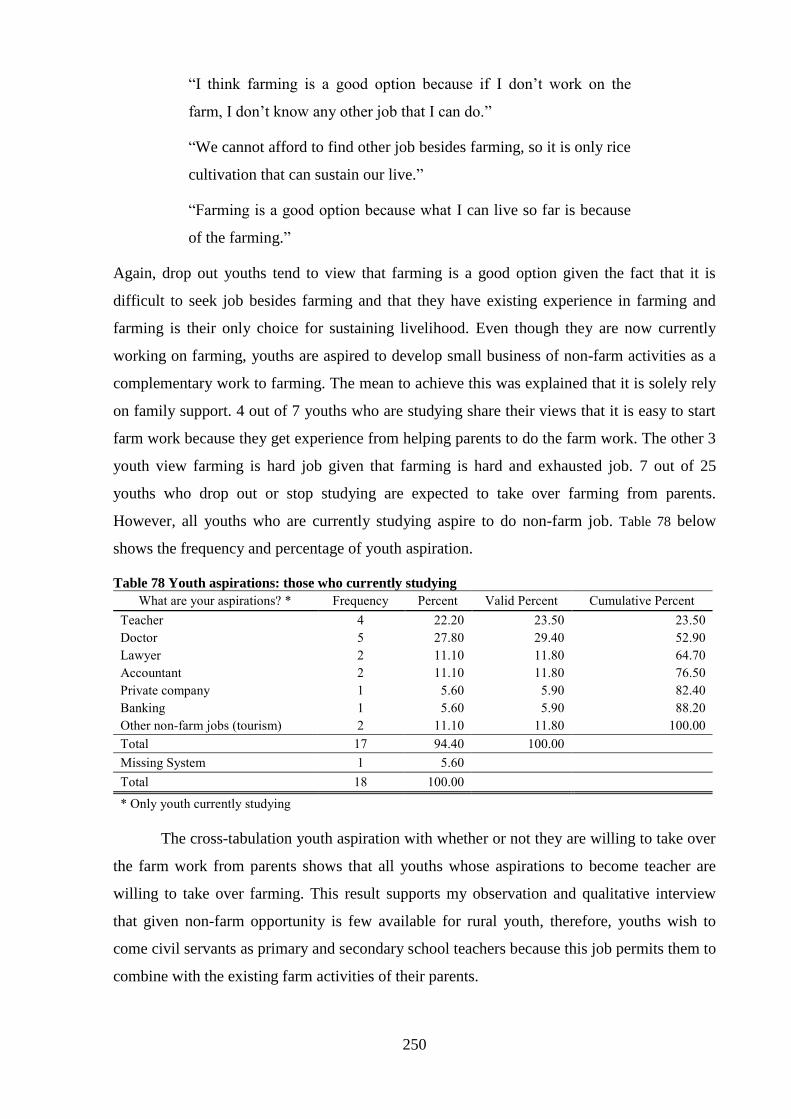
250
“I think farming is a good option because if I don‟t work on the
farm, I don‟t know any other job that I can do.”
“We cannot afford to find other job besides farming, so it is only rice
cultivation that can sustain our live.”
“Farming is a good option because what I can live so far is because
of the farming.”
Again, drop out youths tend to view that farming is a good option given the fact that it is
difficult to seek job besides farming and that they have existing experience in farming and
farming is their only choice for sustaining livelihood. Even though they are now currently
working on farming, youths are aspired to develop small business of non-farm activities as a
complementary work to farming. The mean to achieve this was explained that it is solely rely
on family support. 4 out of 7 youths who are studying share their views that it is easy to start
farm work because they get experience from helping parents to do the farm work. The other 3
youth view farming is hard job given that farming is hard and exhausted job. 7 out of 25
youths who drop out or stop studying are expected to take over farming from parents.
However, all youths who are currently studying aspire to do non-farm job. Table 78 below
shows the frequency and percentage of youth aspiration.
Table 78 Youth aspirations: those who currently studying
What are your aspirations? * Frequency Percent Valid Percent Cumulative Percent
Teacher 4 22.20 23.50 23.50
Doctor 5 27.80 29.40 52.90
Lawyer 2 11.10 11.80 64.70
Accountant 2 11.10 11.80 76.50
Private company 1 5.60 5.90 82.40
Banking 1 5.60 5.90 88.20
Other non-farm jobs (tourism) 2 11.10 11.80 100.00
Total 17 94.40 100.00
Missing System 1 5.60
Total 18 100.00
* Only youth currently studying
The cross-tabulation youth aspiration with whether or not they are willing to take over
the farm work from parents shows that all youths whose aspirations to become teacher are
willing to take over farming. This result supports my observation and qualitative interview
that given non-farm opportunity is few available for rural youth, therefore, youths wish to
come civil servants as primary and secondary school teachers because this job permits them to
combine with the existing farm activities of their parents.
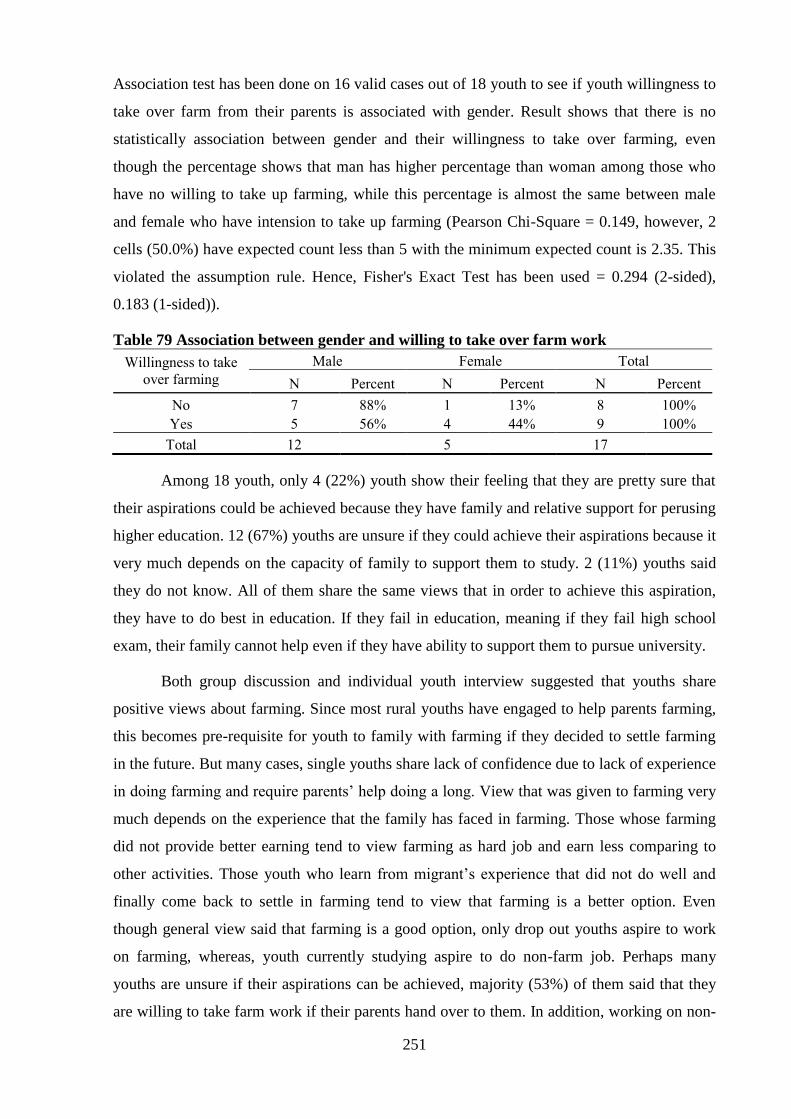
251
Association test has been done on 16 valid cases out of 18 youth to see if youth willingness to
take over farm from their parents is associated with gender. Result shows that there is no
statistically association between gender and their willingness to take over farming, even
though the percentage shows that man has higher percentage than woman among those who
have no willing to take up farming, while this percentage is almost the same between male
and female who have intension to take up farming (Pearson Chi-Square = 0.149, however, 2
cells (50.0%) have expected count less than 5 with the minimum expected count is 2.35. This
violated the assumption rule. Hence, Fisher's Exact Test has been used = 0.294 (2-sided),
0.183 (1-sided)).
Table 79 Association between gender and willing to take over farm work
Willingness to take
over farming
Male Female Total
N Percent N Percent N Percent
No 7 88% 1 13% 8 100%
Yes 5 56% 4 44% 9 100%
Total 12
5
17
Among 18 youth, only 4 (22%) youth show their feeling that they are pretty sure that
their aspirations could be achieved because they have family and relative support for perusing
higher education. 12 (67%) youths are unsure if they could achieve their aspirations because it
very much depends on the capacity of family to support them to study. 2 (11%) youths said
they do not know. All of them share the same views that in order to achieve this aspiration,
they have to do best in education. If they fail in education, meaning if they fail high school
exam, their family cannot help even if they have ability to support them to pursue university.
Both group discussion and individual youth interview suggested that youths share
positive views about farming. Since most rural youths have engaged to help parents farming,
this becomes pre-requisite for youth to family with farming if they decided to settle farming
in the future. But many cases, single youths share lack of confidence due to lack of experience
in doing farming and require parents‟ help doing a long. View that was given to farming very
much depends on the experience that the family has faced in farming. Those whose farming
did not provide better earning tend to view farming as hard job and earn less comparing to
other activities. Those youth who learn from migrant‟s experience that did not do well and
finally come back to settle in farming tend to view that farming is a better option. Even
though general view said that farming is a good option, only drop out youths aspire to work
on farming, whereas, youth currently studying aspire to do non-farm job. Perhaps many
youths are unsure if their aspirations can be achieved, majority (53%) of them said that they
are willing to take farm work if their parents hand over to them. In addition, working on non-

252
farm job also requires experience of migration such as being used to live far away from home,
have social network such as friends or relatives in the city to facilitate and accommodate the
migration.
Unlike many study which found that youths are growing disinterested in farming
(Hall et al., 2012), My individual discussion with single youth either they are currently
studying or dropping out show the opposite view that single youths in the study share
positive views on farming and have no discrimination between male and female youths.
Female youth tends to share more positive view on farming and willing to take over farming
than male as indicated in the group discussion.
5.2.3 Family perception on agriculture
5.2.3.1 General opinion on agriculture
General opinion on farming expressed by respondents in the survey have been categorized
into 6 main response based on their qualitative expression of their felling. The projection of
the responses to by farm type and by youth and adult household does not help much to
explain the difference in this general opinion. Hence, the result is presented in zone.
In general, 41.40% of respondents did not have ideas to comment on the question
while the rest 59.60% shared their opinions. Majority of household accounted for 34.5% share
general impression on agriculture that it is good (32.3% stated that it is good, 2.2% stated that
it is very good). The cross tabulation between farm type, farm capacity (below poverty
threshold, subsistence and above poverty threshold) show no clear cut or strong tendency that
those who are in hard situation or poor farm type tend to view farming is a good option or not.
But there is mixture of view among them. The point is that even household in the poor farm
type also gives positive view on farming and some households in the better farm type give
view that farming is hard work. Please see appendix for detail view presented by farm type
and farm capacity.
Households who view farming as not good because it is hard work and earn less profit.
They do not have alternative and the fact that they have small land. Those who view farming
as hard work share almost the same reason to the previous one but adding the fact that they
lack equipment, capital, and it is rain dependent work. There are households giving natural
view that farm is normal because it is culture and tradition and they do not have alternative
besides farming. For those who view farming is good, their major reason is refer to the fact

253
that they do not have to buy food. It is their safety net. They do not have alternatives. It is the
source for income that they can support children for education.
―Farming is better than migration to Thailand. Migration to
Thailand can earn money but it is very hard job. Farming
more relaxes and provides food for home consumption and
income generation.‖, 30 years old married woman with 3 kids
in Kouk Kpos commune, Otdar Meanchey province, whose
farm house hold is subsitence (Case 82, OMC, OMC-3-Youth
HH-Subsistence).
―Non-farm migration is even more difficult than farming
because I don‘t have migration and working experience‖
(Case 209-TK-3-Adult HH-Able)
―Farming demands less knowledge and skill, without farming
we must be very poor‖, ―No farm, no food.‖, ―Farming is only
good only if we have the supplementary income”, ―Farming is
good for the poor‖ Said the household in poor farm type.
Table 80 General opinion on farming and reasons explained
Zone
General
opinion on farming
Frequency Percent
General opinion
on
farming
Mean reasons explain the opinion Frequency Percent
Tram Kak No idea 37 36.6
No idea 159 100.0
Not good 7 6.9
Not good Hard work, less profit 12 50.0
Hard work 10 9.9
No alternatives, no knowledge and skill to do other job
6 25.0
Normal 3 3.0
Small land 6 25.0
Good 42 41.6
Total 24 100.0
Very good 2 2.0
Hard work
Hard work, less profit 24 42.9
Total 101 100.0
Lack of mean production (land, equipment, cow)
2 3.6
Prey Kabas No idea 29 32.2
No alternatives, no knowledge and skill to
do other job
18 32.1
Not good 10 11.1
Rain dependent work 7 12.5
Hard work 25 27.8
Small land 2 3.6
Normal 5 5.6
Work under sun no social status 3 5.4
Good 21 23.3
Total 56 100.0
Total 90 100.0
Normal It is culture and tradition 6 46.2
Otdar
Meanchey
No idea 88 48.6
No alternatives, no knowledge and skill to
do other job
7 53.8
Not good 4 2.2
Total 13 100.0
Hard work 21 11.6
Good Better than migration 1 0.8
Normal 5 2.8
Demand less knowledge and skill 1 0.8
Good 57 31.5
Don‟t need to buy food 32 26.2
Very good 6 3.3
Enjoy being own boss 10 8.2
Total 181 100.0
Farming can support children education 10 8.2
Total No idea 154 41.4
Income generation 3 2.5
Not good 21 5.6
It is culture and tradition 14 11.5
Hard work 56 15.1
Like farming 2 1.6

254
Normal 13 3.5
Safety net for living 26 21.3
Good 120 32.3
No alternatives, no knowledge and skill to do other job
23 18.9
Total 372 100.0
Total 122 100.0
Very good
Income generation 3 33.3
Mean of living 5 55.6
No alternatives, no knowledge and skill to
do other job
1 11.1
Total 9 100.0
5.2.3.2 Is it easy to start farm work?
Though many rural youths used to help parents to do the farm work when they were
young, majority of youth households accounted for 60% reveal that it is not that easy to start
farm work while adult households 52% share the same views. Lack of equipment (referring to
lack of two-wheel tractors and link to the response to lack of labor), lack of capital, lack of
technical knowledge, small land, difficult to clear land (in Otdar Meanchey), rain dependent
work, hard work are the main reasons for youth and adult households to view that it is
difficult to start farm work.
Table 81 Is it easy to start farm work? Is it easy to start farm work?
Is it easy to start farm work?
Zone Household Response Frequency Percent
Response Reasons Frequency Percent
Tram Kak
Youth HH
No 17 58.62
No
Difficult to clear land 14 6.90
Yes 12 41.38
Hard work 34 16.75
Total 29 100.00
Lack of capital 28 13.79
Adult HH
No 36 50.00
Lack of drought power 10 4.93
Yes 34 47.22
Lack of equipment 57 28.08
No idea 2 2.78
Lack of everything 3 1.48
Total 72 100.00
Lack of experience 4 1.97
Prey Kabas
Youth HH
No 19 67.86
Lack of labor 9 4.43
Yes 9 32.14
Lack of technical knowledge 9 4.43
Total 28 100.00
Rain dependent work 18 8.87
Adult HH
No 30 48.39
Small land 17 8.37
Yes 32 51.61
Total 203 100.00
Total 62 100.00
Yes
Availability of farm machinery services
4 2.65
Otdar
Meanchey
Youth HH
No 30 56.60
Better than migration 1 0.66
Yes 20 37.74
Have enough equipment 11 7.28
No idea 3 5.66
Have enough labor 2 1.32
Total 53 100.00
Have experience 70 46.36
Adult HH
No 70 54.69
Have free time to work on
other activities 4 2.65
Yes 45 35.16
Have land 2 1.32
No idea 13 10.16
Have parents‟ help 1 0.66
Total 128 100.00
Have two-wheel tractor 1 0.66
Total Youth HH
No 66 60.00
Independent work 2 1.32
Yes 41 37.27
Lack of market 1 0.66
No idea 3 2.73
Need small capital to start 1 0.66
Total 110 100.00
No alternative 3 1.99

255
Adult HH
No 136 51.91
No require much technical
knowledge 1 0.66
Yes 111 42.37
Only if we have land 1 0.66
No idea 15 5.73
Parent support 1 0.66
Total 262 100.0
Personal preference 4 2.65
Require less technical
knowledge 2 1.32
Tradition 39 25.83
Total 151 100.00
No idea 18 100.00
“Having experience” is linking to the reason of “tradition” or “habit of being farmer”
are main reasons that respondents view that it is not difficult to start farm work. In addition,
farming is view that easy to start is because respondents “having enough equipment”. While
categorizing the qualitative answer, this response is usually link to the answer of “having
enough labor”, “need small capital to start”, “require less technical knowledge”. However,
based the qualitative interview and field observation of the three-studied areas suggested that
in zone pioneer like Otdar Meanchey farming is difficult to start because it is difficult to get
the land clear given the land is former forest land. In irrigated area like Prey Kabas where rice
is intensified, experience and technical knowledge are required. Traditional knowledge is no
longer applied in this area which many youth households complain that is not easy when they
start farm work.
4.2.3.1 It is not easy to get land clear in zone pioneer like Otdar Meanchey
The view is given by the adult family who experience and involve in settlement in
new village and organize the land distribution such as those living in Kan Touy Choun
village, Ban Say Reak village and Som Rong village. Usually people who seek for land are
those who lack financial capital and rely solely on family active labor for land clearing slash
and burn. Therefore, people clear land step by step and piece by piece. That is the main reason
why some households still remain uncultivated land because it is not yet been cleared.
―To get land clear for one 1 ha requires a lot of labor and capital.
It is very hard because the base of the tree that have just fell down
and burn remain very difficult to get the land clear for cultivation‖
(Case 124-OMC-Adult-UH).
In addition, the process of getting land involved serious land conflict resulting some
households lost their land that have been cultivated several years. Due to land conflict, some
households got agricultural below their expectation. For example, to get land in Kan Touy
Choun village, people expect to get 5 ha unclear land for each family. However, due to
256
ongoing land dispute between concession company, military and villagers, only 5 household
get 5 ha of land and the rest get only 3 ha. The conflict takes place from nearly 10 years from
2000 until 2009. Those who come to settle latter receive only village land. That is why some
households migrate to Thailand with the expectations that they can manage to save some
money to buy land and two-wheel tractor which is the necessary mean for land clearance and
preparation.
4.2.3.2 Traditional knowledge is no longer applicable when rice is more intensified
Settlement in Otdar Meanchey is view to be usual as it follows the rational practice slash and
burn and apply no fertilizer for the first two or three years in the zone pointier new area and
receive low yields. The land clearance and rice cultivation are at the stage of claiming land
possession and secure tenure. Migration is also a mean to seek financial capital to buy mean
of production such as two-wheel tractor to facilitate rice cultivation, land clearance and
transport agricultural production from the far farm field. In new area like this, people follow
traditional practice slash and burn and sow rice. Labor exchange is commonly practice in this
area in both rice cultivation (land preparation, harvest, thresh, and transport agricultural
product) and annual crops cultivation. This is also applied for annual crop cultivation. In one
less intensified like Tram Kak where people grow mainly rice on small plot of land, farming
does not require much knowledge. Knowing only how to prepare seedling, transplant and
application fertilizer is considered as enough. However, in zone high intensified rice
cropping, youths who just settle in farming share view that it is not that easy to start farm
work. Traditional knowledge where youth used to learn from his parent is not applicable to
rice cultivation now in Prey Kabas. Either doing 2 or 3 cycle rice or dry season rice, require
more technical knowledge on choosing the right fertilizer at different stages of cultivation.
This is the same for application of pesticides that require different identification to the cause
on rice disease and insect. High application of pesticide also drives family to view that
farming is hard job due to the impact on health especially on those who spray pesticides by
themselves. To avoid the risk, farmers tend to hire someone else to do instead and this raises
the cost productions and thereby low value added and profit from farming.
27 years old male in Deoum Pou village, Prey Kabas commune tells the
story that: since the year 2000, the farming practice in Prey Kabas is
completely transformed from transplanting rice to sowing rice. The rice
variety of IR66 requires high technical knowledge to handle. We have
learnt from Vietnamese farmers who farm at the Cambodia-Vietnam

257
border and spread across Prey Kabas. In my parents‘ generation, they
just use transplant rice and apply fertilizer. This knowledge is not
applicable anymore in my generation because rice now is become more
intensified for the current moment.‖ (Case 383-Youth-PB-2-UH).
― growing rice is hard job because high input use and earn very few.
Sometimes the return is just equal to the investment which means we
make no profit. If the price is above 900 Riel, we could make profit but
otherwise, we will lose,‖ said by several households in Prey Kabas
commune.
4.2.3.3 Experience determines the view on the easiness of starting up farm work
Youth who first start up farm work said that it is not that easy to start up farming linking to
previous experience in farming. This view was expressed by the youth married couple who
have just settle in farming in Prey Kabas and single youth in Tram Kak. Those who have
experience view that it is easy since they used to help parents to do the farm work since they
were young. However, those who never engage in farming before view farming as very hard
job to start and require parents to work along with them at least one to two years.
“A 26 years old male youth in Prey Kabas “Kha” village, studied at a
Buddhist high school. He got married 2 months after he left the
monkhood in 2009. At his marriage, he got 40a of “Sré Leur”, which
can cultivate up to 3 times per year, from his parents (groom‟s side)
and 38a for “Sré Krom-water receding rice” from bride‟s side. At the
first starting up the farm work, it was physically and mentally hard
because he does not have previous experience in farming. Mentally,
he was so worry about his crops whether it yields good result or not.
He is afraid of crop failure and profit loss. Luckily, his parent in-law
helps him to work on the farm and give advice. Without help from
parents, his settlement in farming would be even more difficult. He
shares opinion that he would need capital of 250 USD to start farm
work in each crop season. To live better life, he would need 5 ha. He
would need parents to support them both to work on the farm and give
advice for at least 2 years to get accustom as today. Besides farming,
he is also a cow trader. He is the main farm active labor force in the
family.” Case 305-PB)

258
From the qualitative interview, several youths also share similar experience like the
above case. Therefore, having previous experience on farming such as helping parents to do
farm work when they were young does impact on how hard that youths have to face when
starting up the farm work. Besides experience, lack of access to irrigation, insufficient rain,
lack of capital, lack of labor in peak season, high input cost resulting low profitability are
mentioned in the reasons for how hard is it to start farm work. Youth who took over farming
from parents revealed they have difficulty in starting up farming due to lacking experience
and technical know-how.
5.2.3.3 Do you think agriculture is a good option for employment?
The main reasons that drive rural households to view that farming is a good option are
because the majority of rural households accounted 72% perceive that it is not easy to find job
besides farming thereby 87% of households tend to view that farming is a good option for
them. In addition, the qualitative interview shares the same perspective that they are farmers
who have low level of education, and they have no alternatives besides farming. The cross-
tabulation between the response of how easy it is to find job beside farming and is agriculture
a good option, the chi-square test shows that there is significant association between the
response.
Table 82 Do you think that agriculture is a good option?
Do you think that agriculture is a good option?
Zone Response Frequency Percent
Tram Kak
No 3 3.13
Yes 91 94.79
No idea 2 2.08
Total 96 100.00
Prey Kabas
No 10 10.53
Yes 83 87.37
No idea 2 2.11
Total 95 100.00
Otdar Meanchey
No 12 6.63
Yes 149 82.32
No idea 20 11.05
Total 181 100.00
Total
No 25 6.72
Yes 323 86.83
No idea 24 6.45
Total 372 100.0
5.2.3.4 Do you intend to hand over your farm to children?
The survey shows that in general, majority of both youth and adult household said
they are willing to hand over their farms to their children. However, the response of youth
household has less percentage comparing to adult household in zone Tram Kak. That is
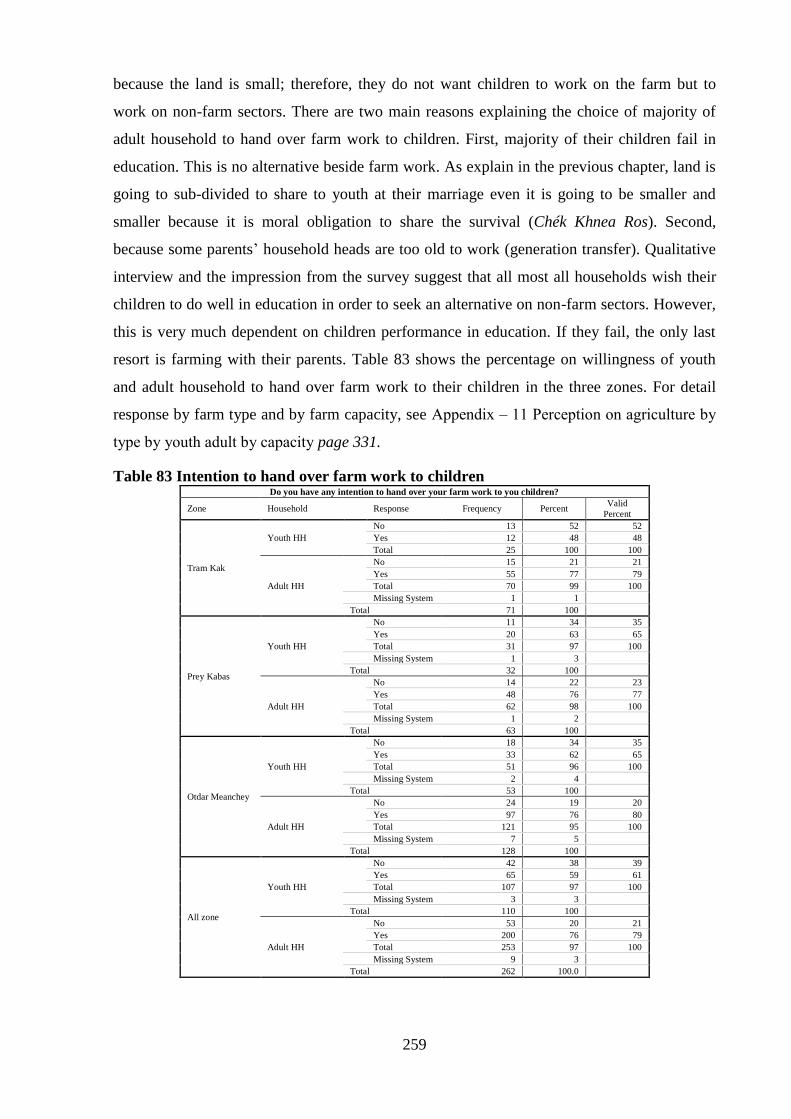
259
because the land is small; therefore, they do not want children to work on the farm but to
work on non-farm sectors. There are two main reasons explaining the choice of majority of
adult household to hand over farm work to children. First, majority of their children fail in
education. This is no alternative beside farm work. As explain in the previous chapter, land is
going to sub-divided to share to youth at their marriage even it is going to be smaller and
smaller because it is moral obligation to share the survival (Chék Khnea Ros). Second,
because some parents‟ household heads are too old to work (generation transfer). Qualitative
interview and the impression from the survey suggest that all most all households wish their
children to do well in education in order to seek an alternative on non-farm sectors. However,
this is very much dependent on children performance in education. If they fail, the only last
resort is farming with their parents. Table 83 shows the percentage on willingness of youth
and adult household to hand over farm work to their children in the three zones. For detail
response by farm type and by farm capacity, see Appendix – 11 Perception on agriculture by
type by youth adult by capacity page 331.
Table 83 Intention to hand over farm work to children Do you have any intention to hand over your farm work to you children?
Zone Household Response Frequency Percent Valid
Percent
Tram Kak
Youth HH
No 13 52 52
Yes 12 48 48
Total 25 100 100
Adult HH
No 15 21 21
Yes 55 77 79
Total 70 99 100
Missing System 1 1
Total 71 100
Prey Kabas
Youth HH
No 11 34 35
Yes 20 63 65
Total 31 97 100
Missing System 1 3
Total 32 100
Adult HH
No 14 22 23
Yes 48 76 77
Total 62 98 100
Missing System 1 2
Total 63 100
Otdar Meanchey
Youth HH
No 18 34 35
Yes 33 62 65
Total 51 96 100
Missing System 2 4
Total 53 100
Adult HH
No 24 19 20
Yes 97 76 80
Total 121 95 100
Missing System 7 5
Total 128 100
All zone
Youth HH
No 42 38 39
Yes 65 59 61
Total 107 97 100
Missing System 3 3
Total 110 100
Adult HH
No 53 20 21
Yes 200 76 79
Total 253 97 100
Missing System 9 3
Total 262 100.0
260
5.3 Institutional dimension in support youth integration in farming
5.3.1 Role of existing CBOs in the survey
Both survey and qualitative interview found that the existing traditional community based
organizations are mainly for religious purpose. Absence of institutional supports drives young
farmers to rely very strongly on family supports (subdivide land, know-how, motivation,
capital, equipment etc.). The livelihood condition of youth or young couple such as their
capacity in accumulating wealth is very much dependent on their parent‟s socio-economic
background. The better off of youth parents, the more assets are shared to youth at their
marriage for example land availability for sub-divide to youth, equipment such as two-wheel
tractors for utilizing in farming and especially financial support for youth starting farm work.
Youth integration in farming is purely done by family support both land and financial capital
to start up. As explained previously, youth settlement takes place at the point of marriage
where both side of parents make an effort to contribute asset to both couple such as land and
money. Looking at the distribution of list of CBOs in the survey and its nature together with
the impression from the qualitative interview, the study found that those community-based
organizations are mainly for religious and development purpose which play no role in
supporting youth to install in farming. Those CBOs are saving, self-help group that all
contribute to livelihood improvement under the development project of NGGs program.
In OMC, there are NGOs that people report to have activities in the province such as
Children‟s Development Association (CDA) who mainly work on livelihood improvement
and community forestry, Community-based Integrated Development Organization (CIDO),
and Investing in Children and their Societies (ICS) working education program to children.
There are other NGOs program reported by villagers that I could not trace the correct name
but reported by villager as SAKVAM, WC, SVAM, CHHR and MARISOR. They run
multiple programs ranking from livelihood improvement via increase productivities in rice,
vegetable, and animal raising to health care, education, saving group, village rice bank, and
cow bank. Beside livelihood program that encourages people to improve and diversify
agricultural activities raising animal and vegetable growing, there is community forestry.
However, this creation of community forestry resulting some land conflict over land
occupation previously by some villagers. Some villagers have been asked to move out of the
protected forest. That is why some few villagers give some negative views about community
forestry as nepotism and partism. It should be noted that community forestries in the Otdar
Meanchey are potentially accepting under the REDD Project. Recently people attempt to
raise fish on the plastic pond.

261
While inTram Kak, Takeo province, there is Sokapeak Krousa Yeurng (SKY) which
means our family health. It is health insurance scheme for the poor. CEDAC is also available
in the area working on saving group and agricultural development. There are nun association,
Old people association, Association of the poor, Saving Group, and majority is Sangkahak
Group. Sangkaha is partly linked to Buddhism religion where people contribute the small
amount of money. For example, 0.5 USD/month to secure if any member of group, primarily
the old one, get sick or die. The association would share a certain fund to help back or help
organize funeral ceremony. It is like a solidary association.
People share view that those institutional supports are not sufficient to what they need
for starting up the farm. Hence, the existing CBOs in Tram Kak, Prey Kabas and Otdar
Meanchey are mainly religion purpose, self-help group or development program-oriented
production improvement to motivate existing farmers to diversify agricultural activities
purposively for income generation. But none of them directly involve in integrating youth in
farming. Therefore, youth integration in farming is purely done with family support.
5.3.2 NGOs Intervention: Case study of CEDAC’s YAE program
5.3.2.1 Very few attempts to test youth integration program in farming
The opportunity of rural youth to find decent work besides farming is limited in developing
countries. When youth employment emerges at international policy agenda, the policy
intervention that focuses on the employment opportunity in the agriculture and agribusiness
sectors remain at low level of attention (Proctor & Lucchesi, 2012; White, 2012). Only very
recent studies have highlighted the critical role of youth in the informal labor force in their
family farm (SPC, 2010). Traditional farming with low profitability and less evolve in agri-
food chain may not be enough to match youth expectation. So, development practitioners try
their intervention programs which encourage young people to develop themselves as
agricultural entrepreneurs and to stay working in agriculture such as in some Pacific countries
(SPC, 2010) and some African countries (CEPIA, 2007). Given the issue is relatively new for
developing countries, there are not so many existing knowledges available regarding to issue
on youth installation in agriculture. However, literatures suggest that major challenges are
high level of youth education, young age (remarkably less than 30 years old), small land side,
proximity to the city and stress in livelihood which drive youth to have tendency to shift from
agriculture (Leavy & Smith, 2010; Sharma & Bhaduri, 2009).

262
In Cambodia, the exploration of NGOs working on youth integration in farming is
very few and CEDAC is found to be the most leading one in working with youth. Centre
d‟Etude et de Développement Agricole Cambodgien / Cambodian Center for Study and
Development in Agriculture (CEDAC) founded in August 1997, with initial support from the
French NGO GRET. CEDAC main activities are to provide training on Development
Oriented Research in Agriculture (DORA) and to develop agricultural techniques which are
practical for Cambodian farmers by collecting extensive successful experiences from farmers.
In addition, CEDAC facilitate organize farmers to create saving group and the latest program
is to train Young Community Leader (YCL) and Young Agricultural Entrepreneur (YAE). As
stated in its project document to donor, YAE project aims at creating farm job for youths who
do not have opportunity to pursue their study and to find other jobs beside farming by
accommodating them with technical and financial support to run a profitable farming. It is
also to test the approach in respond to employment creation in farming sector while there was
global economic crisis in 2008 when some migrant youths returned and being accommodated
by smallholder farming. So far, CEDAC has produced 267 YAE. Table below shows the
number of youths who have taken part in youth program of CEDAC.
Table 84 Youth Graduated from CEDAC project
Youth Development Program Number
Young Graduate 212
Young Community Leader 207
Young Agricultural Entrepreneur 267 Source: interview with program direct of Young Agriculture Entrepreneur project
5.3.2.2 CEDAC and young agricultural entrepreneur program
The project criteria are to select youths aged 16- 30 who have at least graduated high
school, who have parents as farmers with affordable land for farm development, who has
experience in farming and inspire to work in farming, who have capacity to write and basic
numeric calculation. He/she has to have willingness to contribute to their community and
young generation and does not affiliate with an ongoing study or workplace. Children of the
poor, women and those who got married are encourage to take part in the project but there
must be an accord from their parents and husband/wife. The project targeted 6 provinces:
Svay Rieng, Prey Veng, Kampong Chhnang, Kampong Speur, Kampot and Takeo. The
project planned to train 60 YAE from each province in which 20 YAE per promotions.
The project duration is two years. First year is dedicated to theory and technical
knowledge in agriculture. The first 6 months, the study focuses on theoretical part includes
agroecology, farming system, rice production, fish production, chicken production, pig

263
production, vegetable production and mushroom production. Research method, personal
development, value chain and farm business development are also included. Trainees are
obligated to develop their own farms such as chicken, SRI or pig based on their interest as
part of their practice with constant support and supervision from Group Learning Facilitators
in each province. They are encouraged to set up learning center39
in the farm to share
knowledge and experience gained from the project to share with other youths and villagers in
their villages. This is a part of their social responsibility and a part of their learning to
facilitate their community work. After that they have to choose their areas of specialization so
that they have to do internships with experience and successful farmers for 5 months. The last
month of the first year is dedicated to reflection and writing up their business plan for
implementation for the second year. They have to present their plans to the committee of the
project. The second year is dedicated to the farm practice. YAEs implement their farm
business according to their business plans. YAEs are invited to attend follow up meeting
which took place every three months to share the working experience.
YAE‟s experiences from his/her real implementation allow YAE to modify or to
adjust his/her business plan. Group Learning Facilitators (GLF) provided “on farm”
supervision to each YAE. Experience suggest that female GLF is easier to work with YAE
comparing to male GLF because first she understands female YAE situation and second male
YAE is encouraged to work harder as they feel embarrassed to female GLF. GLF has
extensive experience in agricultural techniques. GLF acted as facilitator, teacher and
counselor. They are selected from top graduates from Youth Community Leader (YCL)
project.
The announcement was done through radio broadcasting. However, the interview with
CEDAC program director reveals that it is difficult to find youth taking part in the project.
CEDAC later updates its approach by making loudspeaker announcement at some potential
communes and through identification from village chief and commune chief. Upon received
applications, candidates are invited to participate in an orientation seminar. There, they are
explained about the objectives of project, study program, requirements, assignment and the
supports from the program. The candidates who are interested are invited to take part in 4
assignments within one-month period. They have to write a minimum of 5 pages of (1)
personal life story and future aspiration, (2) plant inventory in their home village, (3)
inventory of village capital such infrastructure, and (4) resource flow in the village including
39
CEDAC contribute 100 USD to YAE who is willing to set up the learning

264
value chain. Those who take part in these assignments and submitted all assignments will be
reward 10 USD and they passed for the interview round. Those who passed the interview will
attend the YAE two years training. Candidates have two more months to decide. If they are
confident to take part in training, they are asked to sign a formal contract with the agreement
from parents witnessed by local authorities that they are committed to take part in the training.
The project would spend for each trainee amount 2000 USD including food, traveling, field
apprentice, and learning materials. However, CEDAC asked each participant to contribute
300 USD when they successfully run the business farming in order to keep sustainability of
the program and as part of their social responsibility for next generation of youth. The
interview with both CEDAC and YAE reveal that CEDAC so far did not ask for this
contribution fun.
5.3.2.3 To leave or to stay: Lesson learnt from CEDAC
5.3.2.3.1 A life story: Motivation to start up farming as experience from trial migration
Except those who fresh drop out of high school, fresh passing high school and taking part of
the project, the study found that many youths who decided to settle in farming are those who
experience migration to city. Experiencing difficulty from migration and the earning from
migration do not permit to save much after several months or years. Migration far from home
alone, low salary and difficult condition of living at destination of migration are the reasons
that motivate youth and parents decided to take part with CEDAC.
As mentioned earlier, youths have gone through various assignments to test their
commitment and willingness to work on the farm. Those who are accepted to enroll in the
program are those who already pass the commitment test and ready to work on the farm.
Some dropped out during the process. Therefore, the remaining youths taking part in the
integration project are those who committed to farming.
5.3.2.3.2 Motivation to quit farming after farming trail: A livelihood economy tell
The study was surprised by the fact that the interview with group learning facilitator (GLF)
reveals that only very few YAEs remain working on the farm. The question arises: with two
years support, why many youths who take part in project quit their business farms and seek
alternatives? Through the selection process and the criteria for selection, YAEs have
minimum assets such as land, parents‟ consent and support to start the farm business work.
Another question arises: why there are so many youths taking part in the project quit their
work and seek non-farm opportunities after the project finished one or several years later?
265
The on- farm visit and observation with those who are currently taking part in the project
show their significant outcome of farm demonstration which gave a good impression of
successful youth integration in farming project. However, it turns to interview with YAEs
who are no longer supported by project show the opposite result that many of them have
migrated to work on non-farm activities and, thereby, it is difficult to access them for an
interview. Those who remain in the village for the interview are the most outstanding YAEs.
Question on “how the significant of the project for YAE” has been tested with
respondents. All respondents admitted that the project plays a very important role in their
successful farm work. Without the project they cannot start farm work because they do not
master the agricultural technique. The project helps them overcome all technical matters.
Another question has been tested with YAE who is currently stay in farming in order to get
their perspective on those YAE who quitted farming: “With such significant support, why do
many YAEs in your promotion quit their farm work?”. The answer falls into the same pattern
is because of the ―livelihood factor ―or ―Kata Chi Veak Pheap‖ in Khmer language. This
livelihood factor was revealed by the case of the most successful YAE in Takeo province who
decided to quit their farm work last five months to work for private company for monthly
salary of 300 USD. Responding to the question why quitting farming, the straight, short and
concise answer is that the income earning from farming is not enough to meet their daily
consumption. Detail income and expense have been asked the same way in the question of
socio-economic survey and result proved that what it means by “livelihood factor-Kata Chi
Veak Pheap” mentioned by many respondents is valid.
Mr. Dara (invented name) 33 years old, is a village veterinary and the
most outstanding YAE in Takeo province specialized in chicken and pig
raising. He has to commit fulltime work on the farm to get profit from
this farm work. His production is far above the average farmer in
chicken and pig raiser but still the earning from this is not enough to
meet his daily need. He can earn profit 705 USD from chicken, 2707
USD from pig production, 125 USD from his veterinary services in a
year. So, in total his net earnings are 3537 USD but this cannot balance
his daily consumption of 3679 USD per year. This bases on detail
calculation of each farm activities and detail household consumption
within his family. Recently there is growing of competition on veterinary
services in the village so now he could earn less and less from his
service. The company offered him only 5 months‘ work with monthly

266
salary of 300 USD. Now he is staying at home look after his children
while his wife has just moved to Phnom Penh to start garment work with
monthly salary of 100 USD. I will soon resume my farm activities soon,
he added.
Facing the same challenge, some successful YAEs reveal their intention to migrate for
high income work including migration to South Korea and Thailand. A respondent in
Kampong Chhnang province just got information that his application to South Korea is
succeeded. Another successful YEA growing mushroom in Svay Rieng is on the process of
applying for job in Thailand. The main reason that he plans to migrate is because his current
mushroom farm is very labor intensive and the earning is not much comparing to what he
expects from the work in Thailand. Another 23 years old girl YAE in Teuk Pos district,
Kampong Chhnang province quitted mushroom farming for garment work in Phnom Penh.
Table 85 below is to give an impression on how few it is of successful YAE in operating farm
work.
Table 85 Number of YAE who successful settle in farming
Province Batch YAE Female Success Year Project
status
Prey Veng
Batch 1 21 ? 2 2008-2010 Finished
Batch 2 13 1 ? 2009-2011 Finished
Batch 3 34 17 On going
2012-2013
On
going
Svay Rieng Batch 1 20 ? 1 2008-2010
Batch 2 25 ? 2 2009-2011
Takeo
Batch 1 n.a n.a n.a
Batch 2 n.a n.a n.a
Batch 3 20 ? 3 Finished
Kampong
Chhnang
Batch 1 16 5 2 2008-2010 Finished
Batch 2 20 11 3 2009-2011 Finished
Batch 3 30 13 5 2011-2013 Finished
This finding which supported by the socio-economic survey indicates that among 372
rural household interviews, there are more than 70 of rural households have positive income
which implied that earning would likely be enough to sustain their daily consumption.
However, when comparing this figure with the minimum threshold for sustainable living, data
show opposite that 47% households in OMC, 56% in PB, and 41% in Tram Kak are above the
minimum threshold of living. This means that those positive incomes are living in the
minimal expend below the poverty line.

267
The main reasons that explain by the villagers why youths quit farming are because of
“livelihood factor”, “they imitate the others who migrate successfully” in such quotations:
“They saw other youths in village migrate then they follow”, “Young girls in the village
nowadays drop out at early high school, then go for garment work”, “Youths saw the other
young people in the village earn good money when migrated to city, the rest of youth in the
same village follow the footstep”. However, this imitation has their rational. YAEs who were
interviewed about training activities reveal that during training they were asked to do
economic calculation exercise on their current family farming and design the business project
for ameliorating their farming. They feel very upset when they applied economic principle to
analyze their farming, they see that their current farming is often profit lose, even they tried
with new anticipated project by including their labor cost and opportunity cost, still their
business farming do not yield much profitability. The experience that youth encounter in
current farm family and the profit lose in their trial business farming have becoming a
common knowledge/shared knowledge/shared rule that household and youth poses. Later on,
this shared knowledge on become an informal rule or pattern that other youth and family
facing the same problem to analog and to act alike (Mantzavinos, 2001).
The term “farm operational cost” was locally named “recycle capital”. Beside initial
investment cost, the case of Mr. Dara (invented name) suggests that he would need at least
1000$ more as an operational cost as well as to secure if any production cycle fails for
example chicken or pig died. He would have capital to restore the production. The
knowledge from the first field survey reveals that some family members who migrate to city
to seek non-farm work are to earn capital in order to invest on their rice farm such as buying
fertilizer, hiring labor, enlarging farm size. In this sense they actually try to recover farm
operational cost or recycle capital for future farm productions such as rice production, chicken
or pig production as this capital was degraded by farm shock or family health shock or by the
growing burden of daily consumption such as children schooling.
5.3.2.3.3 Those who stay combining active labor with family or non-farm activities
Youth who is currently keep on working in farming is considered as successful integration in
farming by the GLF and CEDAC staff. However, the study found that those who stay in
farming are in fact those single youth who combine their active labor with parent working in
farming. For example, youth involves in mushroom production. Mother involves in marketing
and feeding animals, and father involves in rice farming or help building chicken fence and
cage or mushroom storage house. Farther/mother can engage in non-farm activities such as

268
small business at home or motor taxi in the city and still manage to come back to help doing
farm work. In case youths have children, their parents can help looking after. Many of
successful YAE interview mainly fall into this category. The successful case is also found in
those marriage couples especially woman whose husband takes part in non-farm activities
such as a school teacher.
A single 24 years old woman in Takeo keeps running her fish farm because her farther
is a nurse who earns income from consulting medical service to local villagers. Her parents
support her to make big fish farm made of concrete. Her mother is responsible for selling fish
while she focuses on raising fish and breeding fish. Her parent is a better off family.
In all successful cases, the 2 successful cases in Svay Rieng, 1 successful case raising
fish in Takeo and 2 successful cases in Kampong Chnang raising chicken and 1 successful
case in Prey Veng are single youth who live with parents. The story of these household
reveals that the successful keeping youth in farming are strongly linked with family support
such as parents help youth doing farm work. A 31 years old married woman with two children
in Svay Rieng province shares the same reasons for her continuity in pig raising because her
parents are pig raisers and she wants to raise pig too. Participating in YAE project, she raises
pig along with her parents. After she got married to a local secondary school teacher, she
separates pig farm from her parents and continues to raise pig on her own but her farm is next
to her parents’ farm. They still help her some times. She said that she still works on the farm
because she has a husband who gets salary from teaching profession which is complementary
to her family and he manages to help her in rice farming. Without her husband salary, pig
raising alone would not be enough for her family.
A 24 years old single female youth in Kampong Chhnang whose parent socio-
economic status is poor quitted her mushroom farm and has gone to Phnom Penh to work as
garment worker. A discussion with her parents reveals that the need for income to sustain the
whole family requires her to quit her mushroom farm and go for garment work because
mushroom farm does not generate enough income to sustain her family.
This suggests that the successful of youth integration in farming beside YAE project
support, youth will need strong support from parents and social arrangement within family in
order to keep sustain in their farm work especially the combine income from both farming and
non-farming by any family member such as husband of youth couple or youth’s parents to
overcome daily consumption needed.
269
5.3.2.3.4 Will they return back to farming?
YAE youths share their views that farming is their backup strategy and as safety-net after they
get married and have children. Migration is their temporary strategy to earn more capital to
enlarge their farm capacity as well as for future investment. The interview with YAEs who
have opportunity to work in non-farm activities with NGOs reveals that the earnings from
farming are small and discrete unlike non-farm work where the income is liquid. they quit
farm job because they want to save and accumulate financial capital. They wish to resume
farm work after they save sufficient capital. The study found two cases of successful YAE
who decide to invest in higher education in the field of agricultural development. They wish
to seek for non-farm job. The rational is that they want to save more capital for future. They
share their aspiration to return to farm work in the future as they prefer to work
independently. With this earning, they can invest more in their farm work in larger scale and
secure the living when they get marriage and have no opportunity to do job in non-farm
sectors. In another way, after earning the recover capital, they may return from migration to
resume farm work which is their safety net for the future.
Miss. Kunthea (invented name), a single 23 years old is an outstanding
chicken raiser in Kampong Chhnang province. She was taking part in
CEDAC, YAE project in 2008 right after she graduated from high school.
She works closely with her father who is curious to learn from her
chicken raising technique. Later on, her farther becomes very
knowledgeable in chicken raising and raise chicken for remarkable
commercial purpose. With knowledge and experience from CEDAC, she
has an opportunity to work for a local NGO in the province with monthly
salary 260$. She said that if the job is secure, she is going to work for
about 10 years, and then she will come to settle back in her farming
again. Now she still goes back home every weekend to help her father
raise chicken. When asking why she considers coming back, she said that
she likes the work for her own boss. It is better than working for others
especially when the prospect of her current work is just temporary and
not secure. Agricultural job is the job when she gets married and gets
old.

270
5.3.3.4 Youth’s challenge in YAE: Lesson learnt
5.3.3.4.1 Youth’s complex social characteristic: Development intervention
disappointment?
The impression from some CEDAC staffs who work closely with YAE shows that they feel
disappointed with single youth who migrate after joining the project and draw lesson learnt
that the project should focus on marriage youth as they might have strong attachment to the
farm work. This study found that either single youth or marriage youth at any point of time,
they will have to face the same problem. Single youth at their marriage will have to adjust
livelihood strategy such as moving farm or previous abandon farm to live at the bride
(mostly) or groom side. The marriage couple also has to migrate after the experience
undesirable income earning to sustain their family members from their farm work. Single
youth also expect to migrate when their earnings from farm work in combination with their
parents‟ resources permit them to fund their higher education and expect to find higher non-
farm job. Also, single youth who has more experience in farming and related rural
development skills such as facilitation skill, reporting skill and so on, would likely have the
opportunity to find job in development work with NGOs or in other non-farm sectors. Thank
to agricultural technical knowledge acquired from two years training.
Some youths who aspire for higher education try to work in the informal sector to get
resource funding education such as English language and computer skills. But lack of
prospects in earning from this meager income job together with pressure from workload
drives youth to rethink about their alternatives. One of obvious alternatives is farming work.
Youth compare the value earning from informal sectors work with farming opportunities such
as being united with family, leisure time with family member; drive youth to decide to settle
on farming. For example, five YAE youths in Prey Veng and Svay Rieng provinces used to
migrate to work as garment work, security guard, construction and mechanical work in
Phnom Penh but they admitted that the income earning is very small and it is very hard job.
They feel disappointed with their jobs because the earning is not comparable to the effort they
put in. When they heard the announcement via radio and decide to go back home and take
part in the CEDAC project. In return, after experiencing in farming for a while, youth will
seek alternatives to improve their farming and earning sources such as migration to get non-
farm job. For example, among 20 YAEs in the second promotion in Kampong Chhnang
province, there are only three successful YAEs of which two of them have successfully got
an NGO job as community facilitators with monthly salary of 260$ per month. The 30 YAEs

271
in the third promotion, 5 of them continue their higher education at university at weekends
and they work on their farm on weekdays. 3 among 5 got non-farm job.
Marriage is turning point for youth to reorganize their livelihood activities such as
whether to live with bride or groom family. This depends on each side resources. Normally,
the groom has to live with the bride family after marriage. This would be the challenge for
male youth who take part in the project before marriage. Given that most of the youth take
part in CEDAC project when they were single. Their farming equipment was set up at their
parents‟ house. They have to rearrange all this again when they get married especially for
male youth. Generally, the groom will have to leave with bride‟s family. Some youths also
have to abandon farm work due to husband‟s or wife‟s non-farm job which requires his or her
to move to non-farm work place. For example, one female YAE in Svay Rieng abandon her
farm to live with her husband who works as security guard in one private company in Phnom
Penh.
4.3.3.4.2 There is no showcase that farming is high profitable
The question of how to make farming profitable and become attractive to youth meets a
challenge. Given that there is very few or almost no showcase to prove that youth taking part
in farming is successful and sustains their living from farming alone. With support from YAE
project, youth can overcome technical constraints of farming through increasing farm
production and generating higher profit. The increase farm profitability can be seen from
technical economic calculation in their business plans. However, household economy is
taking into account such an incremental of increase is apparently not enough to sustain
household consumption demand. This becomes a real experience and learning process for
youth to re-decide whether to move or to stay.
Discussions with YAE project coordinator and relevant staff reveal that since the
project has been started, one of the most challenging questions is: “there is no showcase to
prove that farming brings high profit”. The program has no strong argument to inspire youth
to work on farming. In the training, the participants were asked to reflect on their current
farming. Youth taking part in the training often disappointed when they share their reflection
in the big group discussion on the analysis of their economic calculation of the current
farming system. But their motivation to continue is after the comparison with the alternative
non-farm work and migration experience of the others. In such situation, youth have been
asked to think of the solution to improve their farming. Their proposed ideas would be used
272
to develop their business plans and to execute the plans with on-going supervision from
CEDAC, YAE facilitators.
4.3.3.4.3 No financial support setting up farming: Is CEDAC rational?
At the initial implementation of YAE project, CEDAC did not have budget to finance YAE
business plan. Their budget is just enough to run YAE project. Complaints have been raised
by many YAEs that there is no financial support such as micro lending for starting up the
business farm. For example, one YAE in Kampong Chhnang who wishes to raise fish but did
not have enough capital to start. Actually, CEDAC tries to respond to this critique by trying
to establish the business plan competition among the best YAE. The champion of the
competition would get the micro lending up to 2000 USD from the Federation of Saving. The
core value of CEDAC tom motivating farmer is „to start from what farmer has and to start
from what farmer can do”. However, when looking at different case of CEDAC and YAE,
many of them quit farm work. CEDAC tries to run the training in the form of social business
such as students who take part in the project in the form of borrowing. For example, the case
of YCL has to pay back their training 1000 USD once successfully get job. The CEDAC farm
integration project spends on each YAE amount of 2000 USD per participant. YAE has been
required to contribute back 320 USD if they successfully run the farm business. Neither
success nor failure, YAE did not contribute back yet because CEDAC did not ask for. They
are willing to pay back if demanded. On the point of keeping continuity of the program, a
question may be raised: What if the micro lending is given to an anticipated failed business,
then who pays back to CEDAC? Will the program be going to sustain? If one knows that
taking part in the project one will get financial support, then, many rural youths who do not
have options, would participate the projects with or without real motivation. In fact, micro
lending is important to start business farm. However, it is not that micro lending that
contributes to the success of farming but it is rather the capacity of farm generation of income
that contributes to success.
Giving the investment cost on education is expensive; some high school graduates
may just want to have opportunity to get access to two years training rather than the desire to
settle in farming. The training will be a bridge for them to get access to after-high school
education. Two years training is rather costly and they cannot even afford on their own. With
such training, they acquire strong technical knowledge to farming, which is quite attractive to
NGOs who need development workers.
273
4.3.3.4.4 Access to market
One of the factors that contributes to success and failure of YAE is access to market. In some
rural areas where youth choose to start new crops such as mushroom growing, there is no
market because people did not even know how mushroom should be consumed. Distance
from market is also a challenge.
In conclusion, CEDAC provides sufficient technical knowledge, self-motivation and
advice. However, things that YAE has to overcome are capital to start up, economic
profitability from ongoing farming and access to market.
5.3.4 Existing policy in supporting youth integration in farming
There is no direct and specific policy in Cambodia addressing the direct question of youth
integration in farming; though, some research indicated that agriculture offers a big source of
employment (RGC, WB, & ACI, 2005a). National Employment Policy 2015-2025 is on the
process of formulation in 2012 where I had a chance to attend the consultation workshop
during the field data collection. The impression is that there is no specific policy idea related
to employment creation in farming sectors. The policy is finalized and issued in 2015 (RGC,
2014a, 2015).
However, there are land policies such as land law 2001 and Sub-Degree on social
land concession 2003 (RGC, 2003) and economic land concessions 2005 (RGC, 2005) that
may indirect impact on rural youth and adult household access to land which is primary
source of settlement in farming. Though there is no clear and causal explanation to support
this hypothesis but national census 2008 clearly demonstrated that majority approximately
nearly 60% of rural households migrated from rural to rural area which is argued by Pilgrim
et al. (2012) and agricultural land seeking driven which is apparently a result from existing
intervention and legal framework that provide access to land as mentioned in the historical
setting of the studied area in the previous chapter 3. This flow of migration is unnoticed and
usually goes under the radar of most planners and researchers which is called by Maltoni
(2006a) cited by Diepart and Sem (2014) as “the invisible flow”.
Land law was promulgated in August 2001 in respond to turmoil of land tenure
management in early 2000s resulted from unclear land tenure, which the first land law (1992)
does not cover, and the concession system introduced in 1990s aiming generate state revenue
for postwar re-construction (Diepart, 2015a). Put aside the land speculation for an anticipated
earning from land market, population pressure is one of the driving forces for settlement and
274
land occupation in new pioneer area such as Otdar Meanchey. Integration in farming is purely
done on family initiated based. Therefore, household has to mobilize its own resource to start
up farm work. Since village settlement and land occupation have started in 1998-2000 in
Otdar Meanchey, I am not sure under what legal framework that local authority can organize
and distribute the land to people in Otdar Meanchey before 2003. Apparently, the measure
was taken under specific respond to new created provinces in 1998 when the Khmer Rouge
force integrated into the formal administration of the state. Among three specific measure
issues by Prime Minister Hun Sen of win-win policy for Khmer Rouge integration, one of the
measures is that former Khmer rouge leader can manage the land and distribute land to its
people and demobilize military (see also page in historical setting of the study area in chapter
3).
The Sub-Decree No.19 on Social Land Concessions (SLC) provides the ground for
local authorities to initiate the social land concession to the landless and land poor at local
level and the Ministry of Land Management, Urban Planning and Construction (MLMUPC)
to establish residences and/or generate income through agriculture. “Social land concession”
is a legal mechanism to transfer private state land for social purposes to the poor who lack
land for residential and/or family farming purposes to meet the basic needs. The purpose of
SLC are: to provide land for residential purposes to poor homeless families, to provide land
to poor families for family farming, to provide land to resettle families who have been
displaced resulting from public infrastructure development, to provide land to the families
suffering from natural disaster, to provide land to repatriated families, to provide land to
demobilized soldiers and families of soldiers who were disabled or died in the line of duty, to
facilitate economic development, to facilitate economic land concessions by providing land to
workers of large plantations (Chamkar) for residential purposes or family farming and to
develop areas that have not been appropriately developed. Under the SLC programme,
concession (Sampathian) rights would be granted as possession (Paukeas) if a Social Land
Concession recipient remains on the land for a period of five years and follows legal duties.
Then, he/she can apply to convert the concession rights to ownership (RGC, 2003). Sub-
Decree No.146 on Economic Land Concessions aims to stimulate investment to improve
productivity and agricultural diversity through large scale plantation in rural Cambodia and to
create jobs in the country side (RGC, 2005). We can see that within ELC, there can be a SLC.
Illustration 8 below illustrates the legal framework on land management in Cambodia.
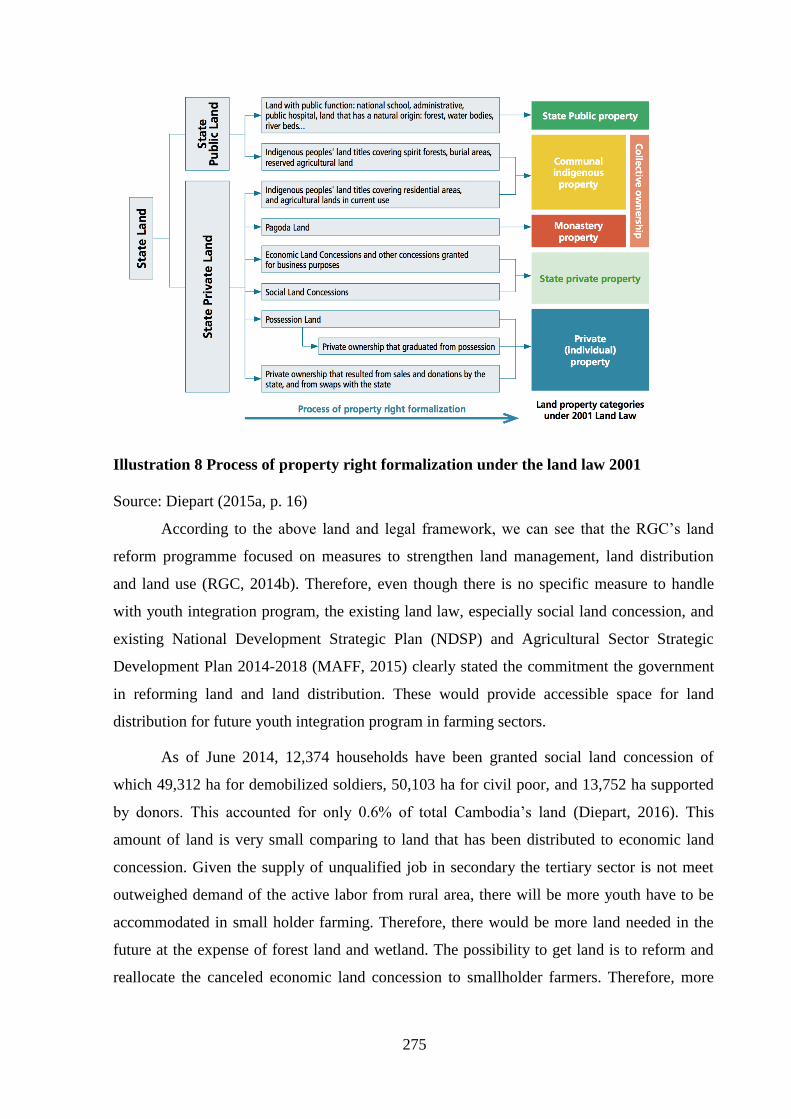
275
Illustration 8 Process of property right formalization under the land law 2001
Source: Diepart (2015a, p. 16)
According to the above land and legal framework, we can see that the RGC‟s land
reform programme focused on measures to strengthen land management, land distribution
and land use (RGC, 2014b). Therefore, even though there is no specific measure to handle
with youth integration program, the existing land law, especially social land concession, and
existing National Development Strategic Plan (NDSP) and Agricultural Sector Strategic
Development Plan 2014-2018 (MAFF, 2015) clearly stated the commitment the government
in reforming land and land distribution. These would provide accessible space for land
distribution for future youth integration program in farming sectors.
As of June 2014, 12,374 households have been granted social land concession of
which 49,312 ha for demobilized soldiers, 50,103 ha for civil poor, and 13,752 ha supported
by donors. This accounted for only 0.6% of total Cambodia‟s land (Diepart, 2016). This
amount of land is very small comparing to land that has been distributed to economic land
concession. Given the supply of unqualified job in secondary the tertiary sector is not meet
outweighed demand of the active labor from rural area, there will be more youth have to be
accommodated in small holder farming. Therefore, there would be more land needed in the
future at the expense of forest land and wetland. The possibility to get land is to reform and
reallocate the canceled economic land concession to smallholder farmers. Therefore, more
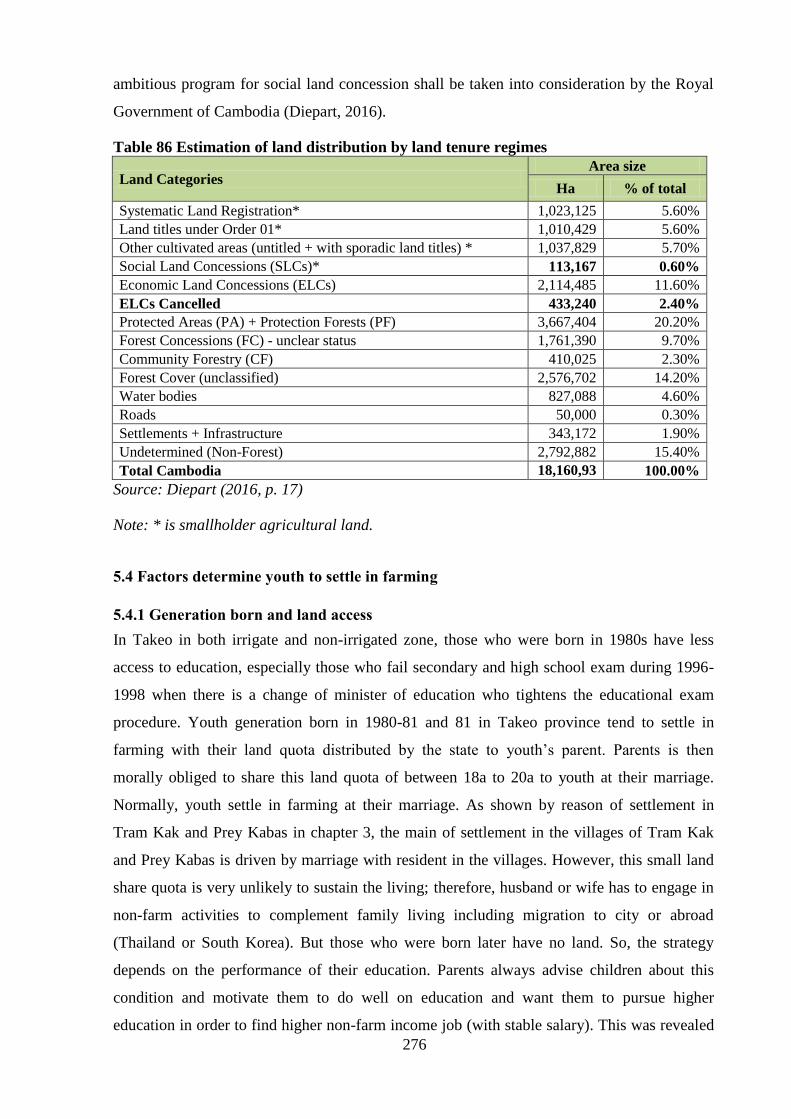
276
ambitious program for social land concession shall be taken into consideration by the Royal
Government of Cambodia (Diepart, 2016).
Table 86 Estimation of land distribution by land tenure regimes
Land Categories Area size
Ha % of total
Systematic Land Registration* 1,023,125 5.60%
Land titles under Order 01* 1,010,429 5.60%
Other cultivated areas (untitled + with sporadic land titles) * 1,037,829 5.70%
Social Land Concessions (SLCs)* 113,167 0.60%
Economic Land Concessions (ELCs) 2,114,485 11.60%
ELCs Cancelled 433,240 2.40%
Protected Areas (PA) + Protection Forests (PF) 3,667,404 20.20%
Forest Concessions (FC) - unclear status 1,761,390 9.70%
Community Forestry (CF) 410,025 2.30%
Forest Cover (unclassified) 2,576,702 14.20%
Water bodies 827,088 4.60%
Roads 50,000 0.30%
Settlements + Infrastructure 343,172 1.90%
Undetermined (Non-Forest) 2,792,882 15.40%
Total Cambodia 18,160,93
8 100.00%
Source: Diepart (2016, p. 17)
Note: * is smallholder agricultural land.
5.4 Factors determine youth to settle in farming
5.4.1 Generation born and land access
In Takeo in both irrigate and non-irrigated zone, those who were born in 1980s have less
access to education, especially those who fail secondary and high school exam during 1996-
1998 when there is a change of minister of education who tightens the educational exam
procedure. Youth generation born in 1980-81 and 81 in Takeo province tend to settle in
farming with their land quota distributed by the state to youth‟s parent. Parents is then
morally obliged to share this land quota of between 18a to 20a to youth at their marriage.
Normally, youth settle in farming at their marriage. As shown by reason of settlement in
Tram Kak and Prey Kabas in chapter 3, the main of settlement in the villages of Tram Kak
and Prey Kabas is driven by marriage with resident in the villages. However, this small land
share quota is very unlikely to sustain the living; therefore, husband or wife has to engage in
non-farm activities to complement family living including migration to city or abroad
(Thailand or South Korea). But those who were born later have no land. So, the strategy
depends on the performance of their education. Parents always advise children about this
condition and motivate them to do well on education and want them to pursue higher
education in order to find higher non-farm income job (with stable salary). This was revealed
277
by the qualitative interview with key informant. Being aware of their family situation of
having no more land, youth is aspired for non-farm job. Their only choice is doing best in
education. But they are unsure if their parents‟ situation is able to finance their study are not.
If not success in education, the last resort is only to work on farming and migration for labor
based work.
The situation is quite different from low density area zone. Those who were born in
late 1980s early 1990s have very limited or even no access to education due to instability and
security of the area. Together with the growing family members, with a gradual stability in
the area provided access to clear land, parents living within and nearby provinces decided to
move to low density and occupied more land for children. Those who get marriage between
years 1996-2002 and later tend to get land from parent between one to two hectares from both
bride or/and groom‟s side. Married couple tries to mobilize resource such as migration to
accumulate land. Some youth families get up to 5 ha or more due to the combination of land
share at their marriage and this land is to secure family living and children education. Youth
of the parents in the previous generation in late 1970s early 1980s tend to settle more in
farming due to low access to education. The school development starts once the new villages
were established in between year 1996-2002 when the new settlement took place. Youth
mainly drop out at primary school and secondary school. In later 2008, even though high
school is available but many youths drop out already. Therefore, children who born in late
1980s and early 1990s generation tend to settle in farming. The field observation suggests
that it takes up to 2 generations (children of those who born in late 1990s) of people in Otdar
Meanchey to get to high school and higher education given the poverty in the area. Those
who get land between 4 and 6 ha of agricultural land tend to secure living than those who get
less than this. Due to low land productivities, those who have land between 2 and 3 ha are
unlikely to sustain their living and there by migration is at typically strategy of youth family
in this area to accumulate capital to expand land and farm investment.
5.4.2 Political integration at different time impacted on different integration in
farming
As already mentioned in chapter 3, institutional environment, which refers to different stages
of different political integration, impacted on different waves of migration and settlement in
farming. The story of Otdar Meanchey shares similar story and link to Khmer Rouge
integration (Samaharenekam) impacted on different waves of settlement in new area in
Northwest Cambodia especially in Battambang province which has been described by Diepart
and Dupuis (2014), and Diepart (2015a). Otdar Meanchey has more stories to tell up to 2008

278
and 2011 where there is small arm clash between Cambodia and Thailand over territory of
Preah Vihear temple which impacted once again on the land acquisition and land conflict
between local people, military and the concession company. This political integration creates
a condition of open up zone pioneer that provides access to people to occupy the land in the
new area and clear forest for cultivation. The combination of growing family members,
around the zone pioneer, drives a family a local initiation to move and settle in new area.
5.4.3 Low level of education determines young people’s choice of farming
The study supports the observation that young people have difficulties in finding jobs outside
agriculture because they have no education. Rural youth have to face uncertainty in seeking
decent job beside agriculture due to the low level of education particularly in low density area
where the political integration and remoteness determine the access of people to mainly
primary school. One youth group leader in Otdar Meanchey reveals that youth in rural areas
lack knowledge and skills, and hence often also lack self-confidence. Therefore, they have
difficulties in finding jobs besides farming. One key informant in Takeo province argues that
to get non-farm job requires high level of education and very strong social network such as
having relative in the city. Pursuing higher education is big investment for farmers. Only few
farmers can afford to send their children and youth to secondary and high school while the
majority of youth drop out. Survey indicates that majority of youths aged 15-30 drop out at
secondary and high schools.
5.4.4 Gender and way of household subdivide land to children
Both quantitative and qualitative data show that in Cambodia the way in which family shares
land to children is no discrimination between boy and girl. This very much depends on family
land availability of both bride and groom. Parents tend to plan land for all children if they
have land. For example, case 103 in Otdar Meanchey where the land is planned equally
among children even they are single (See Table 77 in chapter 3, page 228). However, if land
situation is critical, families tend to follow the tradition that land shall be given to any son or
daughter, but mostly daughter, who decided to live with and take care of parents when they
get old. Nevertheless, parents give open choice to children. In many cases, parents leave the
choice to children by saying that ―this is very much dependent on children performance in
education. If children do well, family would like to mobilize resource to support their
education such as borrowing micro finance. However, if they fail, there is only one last resort
is to live and work in farming with parents or to leave or to migrate to find non-farm works
or agricultural wage labors.‖ Therefore, the study found no discrimination among children

279
whether boy or girl or even the rank of the children but rather the choice and situation of
individual youth who succeed in education in non-farm job or fail in education or in
migration.
5.4.5 Non-farm job is not easily accessible: Knowledge and skill demand but
competition
Both youth and adult family perceive that it is not easy to find non-farm job because they do
not have migration experience. Low level of educations is the main constraint for them to
integrate into high labour productivities non-farm job. The case study of YAE-CEDAC
clearly reveal that many youths decided to taking part in YAE program had experienced the
hardship from the previous migration such as working as private security, construction work,
garment factory work, private primary school teacher etc.
―I failed high school exam and I have no motivation to study for re-exam. I wish to become
primary school teacher. I seat for exam several times and did not pass. I decided to migrate
to Phnom Penh to find work. I worked as garment worker for a while, and then I worked for
private company. However, the works is very hard and I earn very little just enough for
survival in the city. I spent 4 years on those work and I did not save much. I then return home
and work on farm and then get marriage. I got 0.2ha from my parents and 0.2 ha from my
wife‘s parents. Farming is hard work and I never wish to do farm work but if I do not farm, I
will not have food to sustain living. Now I have to do construction work to earn extra income
to support my family.‖, Said 31 years old married youth in Chrey Thnoat village, Tram Kak
commune (Case 273-TK-1-Youth-UH).
5.4.5 Couple strategy
Any member of the youth couple has to engage in non-farm activities such as construction
work, wage labour sells or to migrate after working on the farm for a while. Adult household
is also dependent on remittance from young migrant to maintain its durability of livelihood in
case their farming does not meet the need. Youth have to leave behind their children with
parents and remittance is sending home to support baby and to support parents. The
combination of land share from both bride and groom also increase the land size and the
support from parents in both sides to strengthen the capacity of youth integration in farming.
Migration youth expect to have land share from parents, tend to return back and marriage in
home village (Yagura, 2012).
280
5.4.6 Investment in children education
Although parents‟ aspiration is to see children doing well in education, two factors determine
the children performance in education including children own performance in education and
family socio-economic status. Some family who have poor social economic status tend not to
afford children education and thereby, youth have to drop out and seek alternative activities
such as farming, migration or non-farm work. Children‟s performances in education also
determine the commitment of the family to invest with an expectation that they can finish
their study and seek non-farm job such as salaried employed that may contribute to family
economy in the future.
There is a form of sacrifice of family member to drop out to seek non-farm work or to
migrate among family members in order to help lifting family situation and thereby investing
on education of some particular family members. There is no discrimination among male and
female who sacrificed. It is very much dependent on who is doing well and not in education.
The distribution of family members who drop out and on migration shows both man and
woman. The impression from the qualitative interview suggests that women tend to sacrifice
to drop out and take up farm work or to migrate to do non-farm work such as garment factory
worker to support man family members who are still studying high school or continuing
higher education.
The investment in children education also takes the form of borrowing from micro
finance institution especially when children need to pursue higher education at university such
as paying school fee (in case that children did not get scholarship), living costs and other cost
and sending rice and agricultural product from home village. Selling agricultural land for
supporting children education is also done by household. This situation is impressively found
in Prey Kabas district where people seem better off than any other zones.
5.5 Discussion and conclusion
Analysis perception of single youth, youth household and adult household suggest that
there is no discrimination among them regarding the choice of occupation in farming. Rural
youth and household tend to give positive view on farming. It is also found the same among
the Malaysian youth (Abdullah, Samah, & Othman, 2012).
Cambodian single rural youths have been brought up in agricultural setting and learn
to farm since their childhood, thereby, they tend to view that it is not difficult if they start
farm work. However, youth households who already set up in and experience in farming share

281
their first experience that it is not easy especially referring to the fact of lacking technical
knowledge and experience. They, hence, need parents to support at least one to two years.
Adult households tend to view that it is easy referring to the fact that they have experience
and it is culture and tradition that they used to practice. However, the study found that in
irrigated area where rice is intensified, traditional knowledge is no longer applied; youth
would need more technical knowledge on rice farming.
While the perception studies on Indian youth in farming found poor income from
farming drive youth to lose faith in agriculture and dislike farming (Narain, Singh, & Singh,
2016), this study found no relation between economic situation and the perception on
farming. The triangulation between farm type, farm economic capacity situation in
comparison with the minimum threshold of poverty provide no clear-cut answer that situation
of farm household economic does influence the perception toward farming. However, the
qualitative interview suggests that learning the experience from unsuccessful migration, the
perception on the difficulty to seek non-farm activities beside farming drive the households to
perceive that farming is a good option for them and their safety-net. Hence, though wishing
their children to do well in education and seek alternatives beside farming, still majority of
rural households reveal intension to hand over the farm to children or subdivide land for
children under the moral obligation: ―sharing the survival‖. This is because children have
low level of education and hence they have very few alternatives beside farming.
The situation of farm economic such as low profit, small land that drive rural
household to motivate children to do well in education in order to seek alternatives outside the
farming sector. On the other hand, the limited offer of low skill job for rural youth who
mainly drop out at below high school become a learning experience for youth and some farm
families to view farming as one of the good option for rural youth. ―Farming is good for the
poor. Farming requires less technical knowledge. Farming is better than migration
(construction work and garment work). Farming is a source of livelihood. Without farming,
we will be poor. No farm, no food.‖ These quotations are expressed by respondents from the
social economic survey. Therefore, from individual youth and family perspective, there is a
strong motivation for choice of occupation in farming given that there is no alternative linking
their low level of education of rural youth.
Unlike Bylander (2013) who found that household increasingly perceive agriculture-
based livelihood strategies as unwise and risky due to the recurring of environmental shock.
This study found opposite that rural household who does not have alternative and poor access

282
to non-farm sector tend to view that farming is their safety-net and provides basic source of
living and support children basic education. Migration is, hence, on one hand a strategy to
recover the farm operational cost for keeping the continuity of rural farming and livelihood.
On the other hand, migration is to earn the complementary income added to the farm income
that cannot support the daily living due to small land as well as to accumulate household asset
such as land expansion, buying two-wheel tractor and to start up self-business.
The case study of YAE-CEDAC‟s youth integration in farming project shows that
youths taking part in the project have very strong commitment toward farming from both
youth and parents in supporting youths to start up farm work. However, as indicated by life
story of YAE, except those fresh high school graduates, all YAEs used to have migration
experience and unsuccessful migration. This is the reason that motivated them to go back and
settle in farm.
Given not so many alternatives available especially accessibility to non-farm job,
farming is one of the motivation for rural youth to decide for future job. This can be seen
through single youth view on farming and youth and adult household view on farming.
However, the quality of farming itself determines the view whether farming is good or not
good. That is the farm capacity of generating income to meet living.
The only last option is farming or migration if children fail in education. Given the
land is not available to subdivide in zone high density areas such as Tram Kak and Prey
Kabas. Tram Kak and Prey Kabas strongly motivate children to study well in order to
integrate themselves into non-farm sector, while in Otdar Meanchey access to school is still
limited for rural youths. More youths are going to drop out below high school and engage in
farm work or migrate to Thailand. Given the situation of land is still available from the
previous occupation by parents, youths would likely to settle more on farming at their
marriage in the area even on the small land about 1 to 2 hectares.
The aspirations of rural parents are to see children working on other non-farm jobs
which could generate higher income than farming. However, since their ability of supporting
children education is limited, mostly rural youth can afford up to only high school or less.
Some drop out because of their poor performance in school. Thank to this, they are living
with their parents either helping farming activities, seasonal off-farm activities such as harvest
corn, or bean in other area or migrating to Thailand.

283
The way people see agriculture is a good option or not may be different from parents‟
generations and children education, experience in farming and the context of land availability
at different location such as low-density area in Otdar Meanchey, high density area non-
irrigated area in Tram Kak and high-density area irrigated area in Prey Kabas.
In low density area, given high level of drop out both youth and adult family tend to
design future for their children by trying to expand land in order to secure the future of their
children. This can be seen through the initiative to occupy the land, to move from old village
to settle in new village and get more land or to migrate (by single drop-out youth, or married
youth, or household head), particularly to Thailand in order to accumulate capital to buy rice
land or residential land. In this area, many more youth are like to settle in farming even on the
small land between 1 and 2 ha which is the size below the minimum threshold of living. The
future of youth couple that are going to settle in farming is going to combine the farming and
migration particularly to Thailand and in within Cambodia. The facilitation of cross-border
pass currently done by the government would help facilitate migration of those rural
households and contribute to improve livelihood of smallholder farming. The improvement of
farming via the combination with both farm and non-farming would help the household able
to invest in future generation children‟s higher education so that they can integrate into non-
farm activities in the future.
In high density area like Prey Kabas and Tram Kak, situation of land does not permit
younger generation of youth to settle on farming provided that the youth‟s land quota shared
by the state in very early 1980s was already given to youth who, by now, are at the age of
more than 30 years old. Hence, youth couple who got their land quota in 1980s and adult
family who have children born in late 1980s have no alternatives but to motivate and invest in
children education so that they can integrate into non-farm sectors. The existing farming
would have to combine with non-farm activities either by migrant youth or by household
head. Therefore, the existing farming is safety net for them if they failed in migration or when
they pause from migration. Given investment of education is expensive and not many family
can afford. The last resort of drop out youth is going to be accommodated by the current
farming and wait for opportunity to migrate or seek non-farm activities. In this sense,
household in this area must have a complementary income either by self-business or salaried
employees.
Drop-out youths tend to see farming as good options because they do not have
alternatives besides farming especially in the situation of the limited availability of non-farm
activities. Farming is not the first aspiration for youth currently studying even though they

284
share positive view on farming and have no discrimination on farm work. Farming is
considered as their last resort when they failed in education. They aspire to work on non-farm
activities such as salaried employees or become civil servant such as teacher that they can
combine the non-farm activities with farming activities. However, this very much depends on
youth performance in education that drive parents‟ motivation to mobilize resource such as
borrowing relatives, and use relative network in the city to invest on those children.
In parents‟ perspectives, doing well in education and seeking non-farm job are their
first aspirations. If children could not do well in education, the last resort is to stay at home
and help working on the farm or migrating to seek non-farm job which contributing to family
if the existing farm has already met the labor demand. The land availability for subdivision is
the main problem. Those who were born in the time that land was distributed successful or
failure in education, parent is obliged to share his/her land quota but for those who were born
later, this land share is optional and parents have no moral obligation to share land. Then, land
subdivision is dependent on the capacity of the parents to accumulate the land after the period
of land distribution.
Drop out either take up farming or migrate for non-farm job has a form of sacrifice
and investment in order to invest and support any member of the family to do well education
and seek non-farm job. There is no discrimination on rank of children or gender. For example,
younger sister can take up farming to support older brother to study at university (Case of PB)
or older sister drops out and takes up farming to support younger sister and brother to attain
high school (case of Tram Kak) and vice versa. Those who succeed in study and get non-farm
work tend to help family and family member who currently studying at secondary or high
school. The previous migration could be a social network for youth either dropping out or
finishing high school to follow the path elders either university or non-farm work. That is why
the term investment in education is very vague in a broader sense.
A case study with YAE-CEDAC shows the same thing as survey that youth having
hard experience on migration views non-farm work is difficult job and earn less. That is their
first motivation to participate in YAE program. However, after few years of experience
farming, the degradation of farm economic drive some YAEs to quit farming and seek non-
farm job and they expect to resume farm work again when they do well in non-farm work and
regain their financial capital for continuing farm work.
Unlike many studies demonstrate that youth is growing more disinterested in farming.
Cambodian youth and family show no discrimination of farm work and regards farm work as
better option comparing to other low productivities non-farm work such as garment work.
285
Farm work is considered as safety net for rural Cambodian family. Migration is temporal job
of life trajectory and seeks financial capital to invest, to strengthen and to expand farming
activities when they get old and are unable to migrate anymore.
The assumption that family farm profitability or economic is the main factor to drive
youth or family member to decide to move or to stay in farming is partly correct when talking
about any discrete point of time. However, considering time span in the life cycle trajectory, I
can see that farming plays an important role in ensuring safety of the family and therefore,
migration is a temporary activity to seek financial capital to invest on their safety package
when they are no longer able to do non-farm work.
Although farming is not so profitable, low level education and limitation of
availability of non-farm job drive youth and family to perceive that farming is a good option.
Therefore, the initial assumption that degradation of farm economic is the factor that drives
people to perceive farm work is not a good option is not correct. So, do my initial hypothesis
to say that the capacity to generate profit of family farming do tell the prospect for future
integration is not favorable is also not correct. Because in reality, youth have to install in
farming even though the land is very small far below the MSI. Under moral obligation of
rural household ―sharing the survival‖ is atomized to youth even 0.1 ha at their marriage.
That is because of the institutional environment such as land distribution in 1980, 1981 and
1982, political integration in 1991, 1996, and 1998, exam tightening (academic lifted) policy
on education in 1998, the beginning stage development of non-farm activities and the event of
baby boom in 1980s. This gives us the prospect that youth would have to install more in
farming in the future and they are going to combine both farm and non-farm activities.
Therefore, more land would be needed.
Given that many rural youths often drop out at secondary and high schools and going
to settle in farming, the integration of agricultural skill in secondary or high school could be a
part of solution. In addition, due to the fact that rural youths often lack self-confidence and
life skill, personal development and livelihood skill should be included in the training in order
to aspire youth and their family to foresee the future challenges and initiate their aspirations
and choice for the proper response.
Role of CBOs in the survey and qualitative interview is mainly religious purpose and
poverty relieve such as saving group, rice bank, village bank but play no role in supporting
youth settle in farming. Therefore, youth integration is mainly done by family own initiative
to secure the future of their children. Very few attempts have been done by NGOs such as
CEDAC to integrate youth into farming. However, very few cases proved to be successful
286
thank to the strong family support and the combination of non-farm activities of family
member. The integration program of CEDAC can help youth overcome the technical
constraints related to farming but not the farm economic that meet the need of the rural
household. The limitation of financial support for youth to start farming is also one of the
challenges of the program.
This study based on the current situation of farming where many households in the
small land holder farm type and the situation of youth drop out mainly on secondary school
especially in low density area, the perception on availability of non-farm activities given by
respondents, the motivation indicate in the perception there is still a strong motivation of
smallholder family farmer to design future of their children in farming and single youth
perception who has no-discrimination on farm work if it is profitable, and role of farming as a
safety net for them, I concludes that many more youths would have to settle in farming.
Under the shared motor or shared rule as ―sharing the survival‖, land is going to subdivide
among the small holder farming to their children as observe in some cases in zone Tram Kak
and Prey Kabas and clearly indicate in zone Otdar Meanchey. This finding supported by the
recent work of Diepart (2016) who runs the demographic scenarios on active worker, job
offer in secondary and third sector with different required land scenarios updated from the
work of Pillot et al. (2000). Diepart (2016) shows that the grow of unqualified job would not
be enough responding to the growth of active workers supplied from rural area, and,
therefore, in all scenarios, smallholder farming in Cambodia would be definitely need more
land to accommodate those growth active workers. Even if the existing legal framework
under the social land concession provides ground for land distribution; however, the question
of youth occupation in farming is neither at the political will of the government nor at the
policy idea so far. Therefore, further research on this matter such as the work of Diepart
(2016), Pillot et al. (2000), Pillot (2007) and the study on youth integration in farming would
be necessary for informing the policy maker. Rural migration study, rural settlement and
youth integration in small holder farming are not at the attention of Cambodian‟s research
interest so far. Promoting this thematic in the research arena in Cambodia would help
informing the policy maker and political will of the Royal Government of Cambodia.
The study concludes that given the absence of institutional support, youth integration
in farming have been done on family institution. Local based community organization are
mainly for religion purpose and existing development program are mainly contribute to
enhance rural living condition which plays no role in supporting youth in farming. There are
very few youth integration programs which have been attempt to trial that can overcome the

287
technical constraint of farming such as YAE project of CEDAC. However, without the strong
policy support from the government such as facilitate access to land, credit for starting up
farm work and lack state coordination program regarding employment creation in farming,
youth integration in farming either done by family or NGO program would face the serious
challenge in term of maintaining economic sustainability of rural household and the
sustainability of the intervention program by NGOs.

288
CHAPTER 6: THE FUTURE PROSPECTS FOR YOUTH
INTEGRATION IN FAMILY FARMING IN CAMBODIA
SYNTHESIS OF STUDY RESULTS AND CONCLUSION
This dissertation contributes to the ongoing debates whether rural development should focus
on small farming or non-farm farm activities development (Rigg, 1997, pp. 165-198; 1998,
2006), and whether or not farming is attractive to the youth (White, 2011). The dissertation
contributes by examining the extent to which Cambodian family farming can accommodate
the youth; what is the role of non-farm activities; how youth and adults perceive of farming;
and what are the institutional dimensions of possible future youth integration in farming.
Youth in farming is defined as single or couple aged persons below or equal to 35 years old
engaging and exploiting livelihood from farming activities.
The present chapter summarizes the main findings from chapter three, four, and five in
order to reflect and to draw conclusions on the prospect of integrating youth in family farming
in Cambodia. In chapter three, I explored the general situation of family farming in the two
provinces of Cambodia-Takeo (high population density area) and Otdar Meanchey (a low
population density area) to understand the economic sustainability of farming in the two
areas, i.e. what earnings each activity in farming could generate in combination with non-
farms income sources. I concluded that, for most households, farming alone cannot meet the
families‟ actual subsistence needs. To see different livelihood strategy, based on their farming
activities, I grouped the households into different farm types, and found that a majority of
farm household had a financial surplus thanks to the combination of farm and non-farm
activities. However, when comparing this situation to the minimum threshold of poverty per
household (See page 144, 166, 175), the results show that a majority of the rural households
in fact live under the threshold which implies that they are living under hard situation. In
Chapter four, I investigate farm capacity for future youth integration in youth and adult
household respectively. It appears that, on the one hand, a majority of the households cannot
add even one additional member into their current farming systems. In spite of this, all types
of households actually host many young people, who have not been able to get employment in
other sectors. This situation drives rural household to secure the future for their children by
sub-dividing their land referring to the moral obligation of ―sharing the survival‖. In the
future, an increasing number of young people therefore must survive by doing farming on
even smaller plots of land below the minimum surface for sustainable integration in farming
289
(MSI). Therefore, young people will increasingly be forced to combining farm with non-farm
activities. In the current study, this is seen most clearly, in the low density area, where
households migrate into Otdar Meanchey province to acquire more land for their children.
In Chapter five, I examine how individual single youth, youth couple (youth household) and
adult household perceive of and value agricultural work. In the Chapter, moreover, I explore
the role of CBOs, NGOs, and policy in supporting youth integration in farming. I find that
youth integration has been done solely by family initiative. The CBOs that are active in the
study areas are mainly religious, aim at organizing saving groups, or are concerned with
development activities that play no role in supporting youth start-up in farming. Only
CEDAC has a small youth integration test program. The results show, moreover, that a
majority of the young people (YAE), who have taken part in the program for several years
have quit the program. They have learned that the outcome from farming cannot cover their
subsistence. The villagers call this ―the livelihood factor‖ or ―Kak Ta Chi Veak Pheap.‖
Through the CEDAC case study, I found that the program provides support to the youth in
terms of entrepreneurship, personal development, and technical knowledge. However, the
main challenge for the youth to start up farms are the lack of funds to help them access
markets, and the general problem of creating a livelihood surplus based on farming alone.
With regard to existing national policies related youth integration in farming, I found
that there are not yet such policies in place for the idea of creating youth employment in
farming. There are related land policies, particularly regarding social land concession, that
could provide access to land for youth integration in family farming. In practice, state and
donor supported programs have made some efforts to accommodate this need. However, there
has hardly been any implementation of land tenure reforms within the framework of social
land concessions. . For the same reason, I with Diepart (2016) suggest that the cancelled
economic land concessions should be reallocated to people and that the government should
ensure implementation of relevant programs under the existing social land concession
scheme.
6.1 Economic sustainability of farming need a complementary from non-
farm activities
In Rural Cambodia, due to the small farm size 59 percent of rural household will encounter
economic unsustainability unless they can complement their incomes with non-farm
activities. My study shows that non-farm income has contributed to ensuring incomes above

290
subsistence level for 76% of the rural households. However, comparing with the average
minimum threshold of poverty per household, my results also show that more than 60 per cent
of the household live below the threshold level (See page 158, 166, 175). The combined
picture shows that the prospects for future sustainability of family farming in the study areas
are not good.
This could explain why people decide to move away from farming and why it is not
attractive to youth. Scholars often observe that in Cambodia and other developing countries,
development projects aiming at raising rural agricultural productivities fail after the projects
finish one or two years. The most of the common answer lie upon the lack of ownership and
motivation of farmer. But I rarely see any study explain this situation from the sustainability
of economic of family farming linking to the obvious poverty situation. My study shows that
it is in fact not the lacking of ownership or motivation but rather that the families cannot meet
their own livelihood needs through farming alone. This creates the kind of trend and shock,
which is also explained in the sustainable livelihood framework (Ellis & Freeman, 2005). I
see this as a constant degradation of rural livelihoods. It naturally drives people to quit
farming or seek alternatives particularly in the form of long-term migration. While this is in
line with economic migration theory, which explains that the push and pull factor of
migration is personal calculations of costs versus benefit, where each individual compare
status quo to an anticipated destination. Economic migration theory, however, cannot explain
how the farming family as an organization or an institution makes decisions about migration.
However, there is also limited availability of non-farm activities. Migration to cities therefore
requires skill and strong social networks even for a job as unskilled garment worker. Rural
households therefore initiate and develop local non-farm activities, such as small scale
business as a complement to farm work.
The tendency is for small land poor resource households to rely more on non-farm
activities. For example, the households in TK-1 with average farm size 0.38 ha, 60 per cent of
income is from non-farm farming activities. However, for the farms with more than 0.78 ha,
farming contributes more than 64 per cent to total household income. In general, 68 per cent
of total income is from farming. Given that more than 65 per cent of total expenses are on
food, farming still play major role in contributing to household income as well as ensuring
food security to household.
291
The Government‟s most relevant recent effort is to facilitate legal migration. This is
expressed in the official labor employment policy. However, it is likely that this offer will not
be enough to accommodate the growing rural active labor force. The answer to the question
whether development should focus on small-farm or non-farm employment which Rigg
(2006) raised is not easy. Based on my study in Cambodia, I share the view of d‟Orfeuil
(2012) that governments in developing countries, including in Cambodia, lack capacity to
transform non-farm sectors to accommodate the growing labor forces. This puts pressure on
small holding farming and result in double exclusion. This double peasant exclusion should
be acknowledged as a global problem on line with poverty and hunger, climate change and
environmental degradation.
The historical demographic-economic transition processes of the European countries
that can keep transition without sustaining structural unemployment can no longer serve as a
model for developing countries in Africa and Asia with rapidly increasing numbers of young
people entering job market and seeking for jobs (d‟Orfeuil, 2012). As far as food security and
poverty of rural household is concerned, in my view from this doctoral study, the priority
should be given to small farming first. This view is supported by the P. Hazell, Poulton,
Wiggins, and Dorward (2006, p. 35); and Dorward et al. (2004, p. 17). Without an assertive
agenda towards small farm agriculture, poverty will likely increase, migrations to urban areas
could be overwhelming (P. Hazell et al., 2006).
6.2 Motivation, perception on farming: to leave or to stay
The present study shows that youth and households have positive views on farming. They
think that farming can provide them their basic subsistence needs and provide their children
with basic education. In addition, farming can allow them to diversify their incomes such as
being teacher (civil servants), have a small business (self-employed), or migrate.
The CEDAC case shows that rural households “hang in” agriculture if their assets and
activities are engaged to maintain their livelihood. Rural households “step up” if the current
assets are invested to expand activities, production and income will improve livelihood. Rural
households “ step out” if existing activities are engaged into the accumulation of assets that
can provide a base for moving out into different activities for example accumulation of
livestock as saving that can be sold to finance children‟s education (Dorward et al., 2009).
Unlike some African countries, such as Ethiopia, where studies suggest that policy
prescriptions aiming at integrating young literate farmers would be challenged by the parents,

292
who are strongly against the idea engaging in agriculture (Tadele & Ayalew, 2012, p. 22).
The present study concludes that smallholder farmers in Cambodia have a much more
positive attitude towards the role of agriculture. Unlike White (2011) who argue that
agriculture is unattractive to young people and Hall et al. (2012), who states that „there is
increasing evidence from across Southeast Asia that farmers would like to get out of
agriculture themselves and, even more, that they hope their children will not become farmers‟,
this study thus shows a different perspective (Diepart, 2015b; Maltoni, 2006a, 2006b, 2007;
Pilgrim et al., 2012). Having concluded so, I acknowledge that this is very much dependent
on the youth generation (cohort), I have studied, and that future atomization of land could
change the general view toward farming in rural Cambodia.
6.3 Future prospect of youth and Cambodian family farming
Given the low level of education of rural youth and limited job offered in urban area, rural
youth will face few alternatives and settlement in farming sound promising to them at their
marriage. Under to moral obligation of parents to share to the survival to children, will is
going to sub-divide or otherwise youth have to work and reside within the current small land
farming. This situation is very challenge for current farming in term of sustaining livelihood.
Non-farm activities will have to play even more important role in complementary to the farm
income. The smallholder farming will have to accommodate more youth in the future and
they will be in need of land.
On international Labor Day 1 May 2012, the Royal Government of Cambodia
announced that there is sign of labor shortage in garment industry, construction, and
agriculture and called for rural people to work within the country rather than to migrate
abroad (RFI, 2012). Kang and Siv (2013), however, conclude that withdrawal of labor force
from the agricultural sector would impact negatively on agricultural productivity. However,
this doctoral study concludes that since migration is due to scarcity of land, avoided migration
cannot increase productivity. On the contrary, the earning from non-farm activities and
remittance from migration is likely to be used for farm investment, investment on children
education, supporting daily food consumption, and expansion of household assets.
Where is the arable land that should meet the need of the growing young labor force?
As suggested by previous study such as Ngo and Chan (2010a), Ngo and Chan (2010b),
Hansen and Neth (2006) and Yoeu (2016) that investment on large scale plantation via
economic land concession (ELCs) have not led to increased agricultural productivity or
293
economic growth in Cambodia. Redefining Cambodian land tenure such as distribution of
cancelled ELCs to rural land less or land poor could be a solution to the future land demand.
In Cambodia, it is not a matter of like or dislike farming by youth or adult but it is a
matter of having enough land to meet employment in farming that meet the subsistence living
or not. So far, supporting youth integration in farming is solely done by family initiative.
Without enough institutional support for youth integration in farming, and without very strong
state desire to transform the agricultural sector and land tenure systems, the motivation from
youth and farm household alone, even with NGOs support, will yield no prospect of long term
sustainability of farming and rural livelihood (Wampfer & Bergès, 2017; Wampfler, 2014).
294
REFERENCE Abdullah, Farah Adila, Samah, Bahaman Abu, & Othman, Jamilah. (2012). Inclination towards Agriculture
among Rural Youth in Malaysia. Economic Planning, 11(773.3), 3.6.
Acharya, Sarthi, Kim, Sedara, Chap, Sotharith, & Meach, Yady. (2003a). Off-farm and Non-farm Activities and
Employment in Cambodia. In Off-farm and Non-farm Employment in Southeast Asian Transitional
Economies and Thailand. Phnom Penh: Cambodia Development Resource Institute (CDRI).
Acharya, Sarthi, Kim, Sedara, Chap, Sotharith, & Meach, Yady. (2003b). Off-farm and Non-farm Employment:
A Perspective on Job Creation in Cambodia. Retrieved from Phnom Penh:
Adger, W Neil, Kelly, P Mick, Winkels, Alexandra, Huy, Luong Quang, & Locke, Catherine. (2002). Migration,
remittances, livelihood trajectories, and social resilience. AMBIO: A Journal of the Human
Environment, 31(4), 358-366.
Alvarez, Stéphanie, Paas, Wim, Descheemaeker, Katrien, Tittonell, Pablo, & Groot, Jeroen. (2014). Typology
construction,a way of dealing with farm diversity General guidelines for Humidtropics. Retrieved from
The Netherlands:
Ashley, Caroline, & Maxwell, Simon. (2001). Rethinking Rural Development Development Policy Review,
19(4), 395-425.
Barral, Stéphanie, Touzard, Isabelle, Ferraton, Nicolas , Rasse-Mercat, Elisabeth , & Pillot, Didier. (2012).
Assessing Smallholder Farming: Diagnostic Analysis of Family-Based Agricultural Systems in a Small
Region: Illustrated with the Case Study of the Giham Pioneer Front, Sumatra, Indonesia. the
Philippines: the Southeast Asian Regional Center for Graduate Study and Research in Agriculture
(SEARCA).
Bennell, Paul. (2007). Promoting Livelihood Opportunities for Rural Youth. Retrieved from
Berger, Guy. (1992). Social Structure and Rural development in the Third World. New York: Cambridge
University Press.
Bidogeza, JC, Berentsen, PBM, De Graaff, J, & Lansink, AGJM Oude. (2009). A typology of farm households
for the Umutara Province in Rwanda. Food Security, 1(3), 321-335.
Bourdieu, Pierre. (2005). The Social Structure of the Economy (Chris Turner, Trans.). Cambirdge, UK: Polity
Press.
Brüntrup, Michael. (2010). Making Agriculture Attractive. Rural 21, 11-13.
Bylander, Maryann. (2013). Depending on the sky: Environmental distress, migration, and coping in Rural
Cambodia. International Migration.
Cambodia Tree Seed Project. (n.d). Description of Ecological Factors in Cambodia. Retrieved from
http://www.treeseedfa.org/doc/GeneEcologicalZonation/4DescriptionofEcological.pdf
CDRI. (2007). Youth Migration and Urbanisation in Cambodia. Retrieved from Phnom Penh:
CEPIA. (2007). Dimensions structurelles de la libéralisation pour l‘agriculture et le développent rural:
Programme RuralStruc Mali - Phase I. Ministère de l‟Agriculture, République du Mali Retrieved from
http://www.worldbank.org/afr/ruralstruc.
Chandler, David P. (1999). Brother Number One: A Political Biography of Pol Pot: Boulder: Westview.
Chang, Ha-Joon. (2009). Rethinking public policy in agriculture: lessons from history, distant and recent.
Journal of Peasant Studies, 36(3), 477-515.
Chang, Ha-Joon. (2010). Institutions and Economic Development: Theory, Policy and History. Journal of
Institutional Economics, 1-26.
Chavance, Bernard. (2009). Institutional Economics (Translated from the French by Francis Wells). New York
and Paris: Routledge and La Décourverte
Chhinh, Nyda, & Millington, Andrew. (2015). Drought Monitoring for Rice Production in Cambodia. Climate
Policy, 3, 792-811. doi:10.3390/cli3040792
Chia, Eduardo, Dugué, Patrick, & Sakho-Jimbira, Souadou. (2006). Can family farms be considered as
institutions? (Les exploitations agricoles familiales sont-elles des institutions?). Cahiers Agricultures,
16(6), 498-505.
Crocker, Charles D (Cartographer). (1962). The general soil map of the kingdom of Cambodia and the
exploratory survey of soils of Cambodia
d‟Orfeuil, Henri Rouillé. (2012). Exclusions paysannes et marché international du travail. Etudes Rurales,
190(2), 193-206.
Davis, Lance E., & North, Douglass C. (1971). Institutional Change and American Economic Growth.
Cambridge: Cambridge University Press.
Debouvry, Pierre (2011). [Cambodia Demographical Analysis].
Denzau, Arthur T., & North, Douglass C. (1994). Shared mental models: ideologies and institutions. Kyklos,
47(1), 3-31.
Diepart, Jean-Christophe. (2010). Cambodian peasant‟s contribution to rural development: a perspective from
Kampong Thom Province. Biotechnol. Agron. Soc. Environ, 14(2), 321-340.

295
Diepart, Jean-Christophe. (2015a). The fragmentation of land tenure systems in Cambodia: peasants and the
formalization of land rights. Retrieved from
https://orbi.ulg.ac.be/bitstream/2268/183306/1/DIEPART_2015_Fragmentation-Land-Tenure-Systems-
Cambodia.pdf
Diepart, Jean-Christophe. (2015b). Land tenure situation and future land allocation needs of smallholder
farmers in Cambodia. Retrieved from Vientiane:
http://orbi.ulg.ac.be/bitstream/2268/200771/3/DIEPART_2016_TheyWillNeedLand-FINAL.pdf
Diepart, Jean-Christophe. (2016). They will need land! The current land tenure situation and future land
allocation needs of smallholder farmers in Cambodia. Retrieved from Vientiane:
http://orbi.ulg.ac.be/bitstream/2268/200771/3/DIEPART_2016_TheyWillNeedLand-FINAL.pdf
Diepart, Jean-Christophe, & Dupuis, David (2014). The peasants in turmoil: Khmer Rouge, state formation and
the control of land in northwest Cambodia. The Journal of Peasant Studies, 41(4), 445-3468.
Diepart, Jean-Christophe, & Sem, Thol. (2014). The Cambodian peasantry and the formalisation of land rights:
historical overview and current issues. Retrieved from
http://www.gembloux.ulg.ac.be/eg/publicationseconomieagricole/doc_download/463-the-cambodian-
peasantry-and-the-formalisation-of-land-rights-historical-overview-and-current-issues
Dixon, J, Gulliver, A, & Gibbon, D. (2001). Farming Systems and Poverty: Improving Farmers‘Livelihoods in a
Changing World. Rome and Washington DC: FAO and World Bank.
Dorward, Andrew, Anderson, Simon, Bernal, Yolanda Nava, Vera, Ernesto Sánchez, Rushton, Jonathan,
Pattison, James, & Paz, Rodrigo. (2009). Hanging in, stepping up and stepping out: livelihood
aspirations and strategies of the poor. Development in Practice, 19(2), 240-247.
doi:10.1080/09614520802689535
Dorward, Andrew, Kydd, Jonathan, Morrison, Jamie, & Urey, Ian. (2004). A Policy Agenda for Pro-Poor
Agricultural Growth. World Development, 32(1), 73-89.
doi:http://dx.doi.org/10.1016/j.worlddev.2003.06.012
Dyson, Tim. (2010). Population and Development: the Demographic Transition. New York: Zed Books.
Ellis, Frank (Ed.) (1988). Peasant Economics: Farm Households and Agrarian Development (2 ed.). Cambridge:
Cambridge University Press.
Ellis, Frank, & Biggs, Stephen. (2001). Evolving Themes in Rural Development 1950s-2000s. Development
Policy Review, 19(4), 437-448.
Ellis, Frank, & Freeman, H.Ade (Eds.). (2005). Rural Livelihoods and Poverty Reduction Policies. London and
New York: Routledge.
Ferreira, Francisco H. G, & Ravallion, Martin. (2008). Global Poverty and Inequality: A Review of the
Evidence. World Bank Policy Research Working Paper Series.
French, Lindsay. (2002). From Politics to Economics at the Thai–Cambodian Border: Plus Ça Change.
International Journal of Politics, Culture, and Society, 15(3), 427-470.
Goldsmith, Peter D., Gunjal, Kisan, & Ndarishikanye, Barnabé. (2004). Rural-urban migration and agricultural
productivity: the case of Senegal. Agricultural Economics, 31(1), 33-45.
GRiSP (Global Rice Science Partnership) (Ed.) (2013). Rice Almanac (4 ed.). Los Ba os (Philippines):
International Rice Research Institute.
Hall, Derek, Hirsch, Philip, & Li, Tania Murray. (2012). Powers of exclusion: land dilemmas in Southeast Asia.
Asian Theatre Journal, 29(1).
Hansen, Kasper K., & Neth, Top. (2006). Natural Forest Benefits and Economic Analysis of Natural Forest
Conversion in Cambodia. Retrieved from Phnom Penh:
Hayek, Friedrich A. von. (1960). The Constitution of Liberty. London: Routledge and Kegan Paul.
Hazell, Peter B. R. (2005). Is there a future for small farms? Agricultural Economics, 32, 93-101.
doi:10.1111/j.0169-5150.2004.00016.x
Hazell, Peter, Poulton, Colin, Wiggins, Steve, & Dorward, Andrew. (2006). The future of small farms: synthesis
paper.
ILO. (2006). Global Employment Trends for Youth, 2006. Retrieved from Geneva:
ILO. (2007). ILO policy brief on youth employment in Cambodia. Retrieved from Phnom Penh:
ILO. (2011). Global Employment Trends for Youth, 2011. Retrieved from Geneva:
Jiao, Xi, Pouliot, Mariève, & Walelign, Solomon Zena. (2017). Livelihood Strategies and Dynamics in Rural
Cambodia. World Development, 97, 266-278. doi:http://dx.doi.org/10.1016/j.worlddev.2017.04.019
Kang, Chandararot, & Siv, Dannet. (2013). Rural development and employment opportunities in Cambodia:
How can a national employment policy contribute towards realization of decent work in rural areas?
Retrieved from
Kelly, Philip F. (2011). Migration, Agrarain Transition, and Rural Change in Souteast Asia. Critical Asian
Studies, 43(4), 479-506. doi:10.1080/14672715.2011.623516
Kydd, J., & Dorward, A. (2004). Implications of market and coordination failures for rural development in least
developed countries. Journal of International Development, 16(7), 951-970.

296
Leavy, Jennifer, & Smith, Sally. (2010). Future Farmers: Youth Aspirations, Expectations and Life Choices.
Retrieved from
Macpherson, Stewart. (1997). Social Exclusion. Journal of Social Policy, 26(04), 533-541.
doi:doi:10.1017/S0047279497005096
MAFF. (2015). Agricultural Sector Strategic Development Plan 2014-2018. Phnom Penh: Ministry of
Agriculture, Forestry and Fisheries (MAFF) Retrieved from http://www.maff.gov.kh/policies-
strategies/1288-2015-09-25-05-10-08.html.
Maltoni, Bruno. (2006a). The invisible flow. Rural to Rural Migration in Cambodia. A Case study in the
Provinces of Takeo and Prey Veng. Retrieved from Phnom Penh:
Maltoni, Bruno. (2006b). Review of Labor Migration Dynamics in Cambodia. Retrieved from Phnom Penh,
Cambodia:
Maltoni, Bruno. (2007). Migration in Cambodia: Internal vs. External Flows. Paper presented at the 8th
ARPMN Conference on “Migration, Development and Poverty Reduction”, 25-29 May 2007, Fuzhou
(China).
Mantzavinos, C. (Ed.) (2001). Individual, Institutions and Markets. New York: Cambridge University Press.
Mantzavinos, C., North, Douglass C., & Shariq, Syed. (2004). Learning, institutions, and economic performance.
Perspectives on Politics, 2(01), 75-84.
McKenney, Bruce, & Prom Tola. (2002). Natural Resources and Rural Livelihoods in Cambodia: A Baseline
Assessment. Retrieved from Phnom Penh:
Millar, Jane. (2003). Gender, Poverty and Social Exclusion. Social Policy and Society, 2(03), 181-188.
doi:doi:10.1017/S1474746403001246
Ministry of Planning. (2013). Poverty in Cambodia-New Approach Redefining the Poverty Line. Retrieved from
MORAM. (2012). Rainfall and Temperature data. Retrieved from http://www.mowram.gov.kh
Narain, Sarju, Singh, AK, & Singh, SRK. (2016). Perception of Farming Youth towards Farming. Indian
Research Journal of Extension Education, 15(2), 105-109.
National Institute of Statistic. (2009). General Population Census of Cambodia 2008: National Report on Final
Census Results. Retrieved from Phnom Penh:
Ngo, Sothath, & Chan, Sophal. (2010a). Agriculture Financing and Services for Smallholder Farmers. Retrieved
from Phnom Penh:
Ngo, Sothath, & Chan, Sophal. (2010b). Does Large Scale Agricultural Investment Benefit the Poor? Retrieved
from Phnom Penh:
NIS. (2009). General Population Census of Cambodia 2008: Nationa Report on Final Census Results. Phnom
Penh: Kingdom of Cambodia.
NIS. (2013). The Cambodia Inter-Censal Population Survey 2013. Retrieved from
http://www.stat.go.jp/info/meetings/cambodia/pdf/ci_pr02.pdf
North, Douglass C. (1987). Institutions, Transaction Cost and Economic Growth. Economic Inquiry, 25(3), 419-
428. doi:10.1111/j.1465-7295.1987.tb00750.x
North, Douglass C. (1990). Institutions, Institutional Change and Economic Performance (Political Economy of
Institutions and Decisions). the United States of America: Cambridge University Press.
North, Douglass C. (1995). The New Institutional Economics and the Third Word Development. In John Harriss,
Janet Hunter, & Colin M. Lewis (Eds.), The new institutional economics and third world development.
London and New York: Routledge.
North, Douglass C. (2003). The Role of Institution in Economic Development. Retrieved from Geneva,
Switzerland:
Obi, Ajuruchukwu (Ed.) (2011). Institutional Constraints to Small Farmer Development in Southern Africa.
Wageningen: Wageningen Academic.
Pilgrim, John, Ngin, Chanrith, & Diepart, Jean-Christophe. (2012). Multiple Migrations, Displacements and
Land Transfers at Ta Kream in Northwest Cambodia. In Susanna Hecht, Susan Kandel, & Abelardo
Morales (Eds.), Migration, Rural Livelihoods and Natural Resource Management: International
Development Research Centre (IDRC) of Canada, Ford Foundation, Fundación PRISMA.
Pillot, Didier. (2007). Jardins et Rizières du Cambodge : Les enjeux du développement agricole. Paris: Karthala
et GRET.
Pillot, Didier, Fusillier, Christian, Pouliquen, Anne, Morel, Niels, & Yang Saing, Koma. (2000). Scenarios for
the Rural Sector of Cambodia and the Agricultural Education System: Part 2-Farming Systems in
Cambodia and Their Evolution. (Report Nº2). Retrieved from Phnom Penh:
Pollak, Robert A. (1985). A Transaction Cost Approach to Families and Households. Journal of Economic
literature, 23(2), 581-608.
Polyani, Karl. (1944). The Great Transformation: The Political and Economic Origins of Our Time. The United
States of America: Beacon Press.
Proctor, Felicity, & Lucchesi, Valerio. (2012). Small-scale farming and youth in an era of rapid rural change.
Retrieved from London:
297
Rahut, Dil Bahadur, & Micevska Scharf, Maja. (2012). Non‐ farm employment and incomes in rural Cambodia.
Asian‐ Pacific Economic Literature, 26(2), 54-71.
Ramamurthy, Bhargavi, Sik, Boreak, Ronnås, Per, & Sok, Hach. (2001a). Cambodia 1999-2000: Land, Labour
and Rural Livelihood in Focus. Retrieved from Phnom Penh:
Ramamurthy, Bhargavi, Sik, Boreak, Ronnås, Per, & Sok, Hach (2001b). Cambodia 1999-2000: Land, Labour
and Rural Livelihood in Focus. Retrieved from Phnom Penh:
Ravallion, Martin, Chen, Shaohua, & Sangraula, Prem. (2007). New Evidence on the Urbanization of Global
Poverty. Population and Development Review, 33(4), 667-701. doi:10.1111/j.1728-4457.2007.00193.x
Requier-Desjardins, Denis. (1994). L'«économie des organisations» et l'analyse du comportement des unités
domestiques en Afrique sub-saharienne. Economie appliquée, 47(4), 105-131.
RFI. (2012). Cambodia announce labor shortage on international labor day 2012. Radio France International.
RGC. (2003). Sub Decree On Social Land Concessions. Phnom Penh: The Royal Government of Cambodia
Retrieved from http://www.cambodiainvestment.gov.kh/sub-decree-19-on-social-land-
concessions_030319.html.
RGC. (2005). Sub-Decree on Economic Land Concession. Phnom Penh: The Royal Government of Cambodia
Retrieved from http://www.cambodiainvestment.gov.kh/sub-decree-146-on-economic-land-
concessions_051227.html.
RGC. (2010). Policy Paper on The Promotion of Paddy Production and Rice Export. Retrieved from Phnom
Penh:
RGC. (2014a). Labor Migration Policy for Cambodia 2015-2018. Retrieved from Phnom Penh:
RGC. (2014b). National Strategic Development Plan 2014-2018. Phnom Penh: The Royal Government of
Cambodia (RGC) Retrieved from http://cdc-crdb.gov.kh/cdc/documents/NSDP_2014-2018.pdf.
RGC. (2015). National Employment Policy 2015-2025. Retrieved from Phnom Penh:
RGC, WB, & ACI. (2005a). Cambodian Agrarian Structure Study. Retrieved from Phnom Penh:
RGC, WB, & ACI. (2005b). Cambodian Agrarian Structure Study. Retrieved from Phnom Penh:
Rhoda, Richard. (1983). Rural Development and Urban Migration: Can We Keep Them down on the Farm?
International Migration Review, 17(1), 34-64.
Rigg, Jonathan. (1997). Southeast Asia: The human landscape of modernization and development. London and
New York: Routledge.
Rigg, Jonathan. (1998). Rural–urban interactions, agriculture and wealth: a southeast Asian perspective.
Progress in Human Geography, 22(4), 497-522.
Rigg, Jonathan. (2006). Land, Farming, Livelihoods, and Poverty: Rethinking the Links in the Rural South.
World Development, 34(1), 180–202.
Scoones, Ian. (1998). Sustainable Rural Livelihoods: A Framework for Analysis. Retrieved from
Seng, Vang. (2015). Cambodia-Soil Resources. Paper presented at the Asian Soil Partnership Consultation
Workshop on Sustainable Management and Protection of Soil Resources 13-15 May 2015, Bangkok,
Thailand, Bangkok, Thailand.
Sharma, Amrita, & Bhaduri, Anik. (2009). The „Tipping Point‟in Indian Agriculture: Understanding the
Withdrawal of Indian Rural Youth. Asian Journal of Agriculture and Development, 6(1), 83-98.
Shin, Jang-Sup. (2005). Institutional Transition and Transaction Cost: a Methodological Consideration. In
Fredrik Sjöholm & Jose Tongzon (Eds.), Institutional Change in Southeast Asia. London and New
York: RoutledgeCurzon and Taylor & Francis Group.
Shucksmith, Mark. (2004). Young People and Social Exclusion in Rural Areas. Sociologia Ruralis, 44(1), 43-59.
doi:10.1111/j.1467-9523.2004.00261.x
Slangen, Louis H.G., Loucks, Laura A., & Slangen, Arjen H.L. (2008). Instittutional Economics and Economic
Organization Theory: An Integrated Approach. The Netherlands: Wageningen Academic Publishers.
SPC. (2010). Pacific youth need family support to stay in agriculture. Retrieved from http://www.spc.int/en/our-
work/social/human-development/news/448-pacific-youth-need-family-support-to-stay-in-
agriculture.html
Tadele, Getnet, & Ayalew, Asrat. (2012). ―Last Resort and Often not an Option at All‖: Youth, Education and
Farming as Livelihood in Ethiopia. Paper presented at the The Young People, Farming and Food
Conference, Accra, Ghana.
The World Bank. (2007). World Development Report 2008: Agriculture for Development. Washington DC: The
International Bank for Reconstruction and Development / The World Bank.
The World Bank. (2009). Poverty profile and trend in Cambodia, 2007: Finding from the Cambodia Socio-
Economic Survey (CSES) (Report No. 48618‐ KH). Retrieved from Washington, DC:
The World Bank. (2017). Cambodia – Sustaining strong growth for the benefit of all : a systematic country
diagnostic. Retrieved from Washington, D.C. :
Theng, Vuthy. (2009). Managing through the Crisis—Strengthening Key Sectors for Cambodia‘s Future
Growth, Development and Poverty Reduction: Infrastructure and Energy to Support Cambodia‘s
Manufacturing Base. Retrieved from Phnom Penh:
298
Thirlwall, A.P. (2006). Growth and Development: With Special Reference to Developing Economies (8th ed.).
New York: Palgrave Macmillan.
Tipper, Adam. (2010). Economic models of the family and the relationship between economic status and health.
Social Science & Medicine, 70(10), 1567-1573. doi:10.1016/j.socscimed.2010.01.028
Todaro, Michael. (1969). A Model of Labor Migration and Urban Development in Less Developed Countries.
American Economic Review, 138-148.
UN. (2007). Economic land concessions in Cambodia A human rights perspective. Retrieved from Phnom Penh,
Cambodia:
http://cambodia.ohchr.org/~cambodiaohchr/sites/default/files/Economic%20Land%20Concession%20-
%20a%20human%20rights%20perspective%202007.pdf
UNICEF. (2009). Situation Analysis of Youth in Cambodia. Retrieved from Phnom Penh:
https://www.unicef.org/cambodia/FINAL_UN_Youth_SitAn__2009.pdf
Wampfer, Betty, & Bergès, Louise. (2017). Comprendre le processus d‘installation des jeunes en agriculture
pour mieux l‘accompagner: Grille d‘analyse et premiers résultats. Note Techniques N 27. Retrieved
from http://librairie.afd.fr/en/nt-27-afrique-agri-jeunes-accompagnement/
Wampfler, Betty. (2014). Framework for successfull youth integration in agriculture (powerpoint presentation).
Paper presented at the Accompagner l‟insertion des jeurns dans les agricultures familiales au Sud (4-5-6
June 2014), Montpellier SupAgro.
White, Ben. (2011). Who Will Own the Countryside? Dispossession, Rural Youth and the Future of Farming.
Valedictory Lecture. The Hague: Institute of Social Studies.
White, Ben. (2012). Agriculture and the generation problem: rural youth, employment and the future of farming.
Paper presented at the The Young People, Farming and Food Conference, Accra, Ghana.
Williamson, Oliver E. (1985). The Economic Institutions of Capitalism: The Free Press, a Division of
Macmillan.
Williamson, Oliver E. (2000). The New Institutional Economics: Taking Stock, Looking Ahead. Journal of
Economic literature, 38(3), 595-613.
Willmott, W. E. (1966). History and Sociology of the Chinese in Cambodia Prior to the French Protectorate.
Journal of Southeast Asian History, 7(1), 15-38. doi:10.1017/S0217781100003100
Yagura, Kenjiro. (2012). Does Labour Migration Offer Opportunities for Meeting Prospective Spouses? The
Case of Migrant Workers in Cambodia. Population, Space and Place, 18(3), 277-294.
doi:10.1002/psp.683
Yoeu, Asikin. (2016). Integrating Ecosystem Services into Agricultural Land Use Analysis and Planning in
Mondulkiri Province, Cambodia. (Doctor), Montpellier SupAgro, Montpellier.
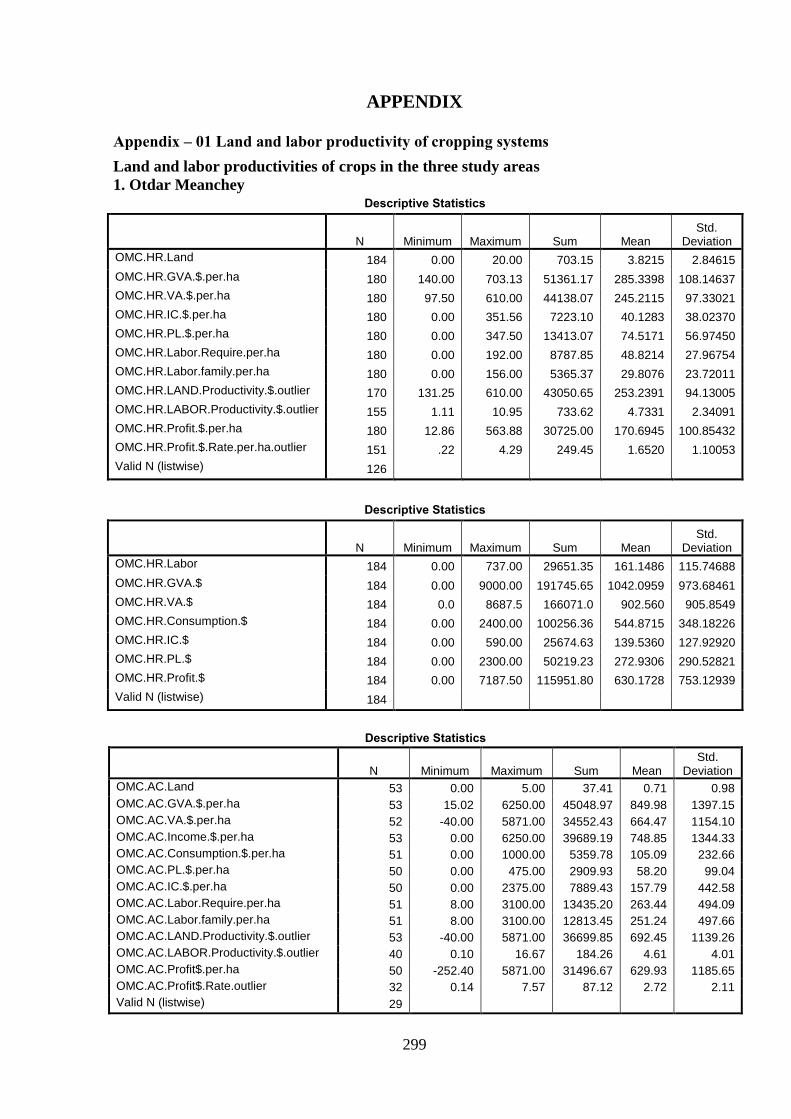
299
APPENDIX
Appendix – 01 Land and labor productivity of cropping systems
Land and labor productivities of crops in the three study areas
1. Otdar Meanchey Descriptive Statistics
N Minimum Maximum Sum Mean Std.
Deviation
OMC.HR.Land 184 0.00 20.00 703.15 3.8215 2.84615
OMC.HR.GVA.$.per.ha 180 140.00 703.13 51361.17 285.3398 108.14637
OMC.HR.VA.$.per.ha 180 97.50 610.00 44138.07 245.2115 97.33021
OMC.HR.IC.$.per.ha 180 0.00 351.56 7223.10 40.1283 38.02370
OMC.HR.PL.$.per.ha 180 0.00 347.50 13413.07 74.5171 56.97450
OMC.HR.Labor.Require.per.ha 180 0.00 192.00 8787.85 48.8214 27.96754
OMC.HR.Labor.family.per.ha 180 0.00 156.00 5365.37 29.8076 23.72011
OMC.HR.LAND.Productivity.$.outlier 170 131.25 610.00 43050.65 253.2391 94.13005
OMC.HR.LABOR.Productivity.$.outlier 155 1.11 10.95 733.62 4.7331 2.34091
OMC.HR.Profit.$.per.ha 180 12.86 563.88 30725.00 170.6945 100.85432
OMC.HR.Profit.$.Rate.per.ha.outlier 151 .22 4.29 249.45 1.6520 1.10053
Valid N (listwise) 126
Descriptive Statistics
N Minimum Maximum Sum Mean Std.
Deviation
OMC.HR.Labor 184 0.00 737.00 29651.35 161.1486 115.74688
OMC.HR.GVA.$ 184 0.00 9000.00 191745.65 1042.0959 973.68461
OMC.HR.VA.$ 184 0.0 8687.5 166071.0 902.560 905.8549
OMC.HR.Consumption.$ 184 0.00 2400.00 100256.36 544.8715 348.18226
OMC.HR.IC.$ 184 0.00 590.00 25674.63 139.5360 127.92920
OMC.HR.PL.$ 184 0.00 2300.00 50219.23 272.9306 290.52821
OMC.HR.Profit.$ 184 0.00 7187.50 115951.80 630.1728 753.12939
Valid N (listwise) 184
Descriptive Statistics
N Minimum Maximum Sum Mean Std.
Deviation
OMC.AC.Land 53 0.00 5.00 37.41 0.71 0.98
OMC.AC.GVA.$.per.ha 53 15.02 6250.00 45048.97 849.98 1397.15
OMC.AC.VA.$.per.ha 52 -40.00 5871.00 34552.43 664.47 1154.10
OMC.AC.Income.$.per.ha 53 0.00 6250.00 39689.19 748.85 1344.33
OMC.AC.Consumption.$.per.ha 51 0.00 1000.00 5359.78 105.09 232.66
OMC.AC.PL.$.per.ha 50 0.00 475.00 2909.93 58.20 99.04
OMC.AC.IC.$.per.ha 50 0.00 2375.00 7889.43 157.79 442.58
OMC.AC.Labor.Require.per.ha 51 8.00 3100.00 13435.20 263.44 494.09
OMC.AC.Labor.family.per.ha 51 8.00 3100.00 12813.45 251.24 497.66
OMC.AC.LAND.Productivity.$.outlier 53 -40.00 5871.00 36699.85 692.45 1139.26
OMC.AC.LABOR.Productivity.$.outlier 40 0.10 16.67 184.26 4.61 4.01
OMC.AC.Profit$.per.ha 50 -252.40 5871.00 31496.67 629.93 1185.65
OMC.AC.Profit$.Rate.outlier 32 0.14 7.57 87.12 2.72 2.11
Valid N (listwise) 29

300
Descriptive Statistics
N Minimum Maximum Sum Mean Std.
Deviation
OMC.VG.Land 35 0.00 1.50 9.45 0.27 0.37
OMC.VG.GVA.$.per.ha 35 50.00 50000.00 94787.26 2708.21 8376.52
OMC.VG.VA.$.per.ha 35 -37.50 50000.00 90605.50 2588.73 8389.41
OMC.VG.Income.$.per.ha 35 0.00 37500.00 68915.07 1969.00 6308.18
OMC.VG.Consumption.$.per.ha 35 -18.56 12500.00 25872.19 739.21 2206.55
OMC.VG.PL.$.per.ha 35 0.00 562.50 1351.62 38.62 116.11
OMC.VG.IC.$.per.ha 35 0.00 968.89 4200.33 120.01 231.00
OMC.VG.Labor.Require.per.ha 35 14.50 33333.33 65067.57 1859.07 5789.54
OMC.VG.Labor.family.per.ha 35 6.00 33333.33 64720.75 1849.16 5789.28
OMC.VG.LAND.Productivity.$.outlier 31 60.50 4375.00 34075.50 1099.21 1251.97
OMC.VG.LABOR.Productivity.$.outlier 29 0.54 14.83 129.77 4.47 4.07
OMC.VG.Profit$.per.ha 35 -95.00 50000.00 89253.88 2550.11 8399.28
OMC.VG.Profit$.Rate.outlier 20 -0.43 10.99 61.83 3.09 3.70
Valid N (listwise) 17
2 Prey Kabas Descriptive Statistics
N Minimu
m Maximum Sum Mean Std.
Deviation
Preykabas.HR.Land.total.ha 20 .06 1.30 11.06 .55 .31
R.HR.Yield.4calcul.outlier 17 1.67 6.20 71.44 4.20 1.27
Preykabas.HR.GVA$.per.ha 20 416.67 3375.00 25215.40 1260.77 735.57
Preykabas.HR.VA$.per.ha 20 296.20 2906.25 18052.34 902.62 625.01
Preykabas.HR.PL$.per.ha 20 0.00 493.75 3601.43 180.07 133.41
Preykabas.HR.IC$.per.ha 20 0.00 1166.67 7058.72 352.94 247.84
Preykabas.HR.Labor.Estimated.per.ha 20 29.69 211.25 1436.45 71.82 47.89
Preykabas.HR.Labor.Estimated.family.per.ha 20 1.22 112.50 592.61 29.63 31.84
Preykabas.HR.LAND.Productivity.outlier 19 296.20 1745.83 15146.09 797.16 421.40
Preykabas.HR.LABOR.Productivity.outlier.estimated
17 5.97 16.97 189.18 11.13 3.28
Preykabas.HR.Profit$.per.ha 20 184.50 2412.50 14450.90 722.55 551.70
Preykabas.HR.Profit$.Rate 19 .33 3.46 26.18 1.38 .85
Valid N (listwise) 14
Descriptive Statistics
N Minimu
m Maximum Sum Mean Std.
Deviation
Preykabas.HR.Land.total.ha 20 .06 1.30 11.06 .55 .31
Preykabas.HR.GVA$ 20 150.00 1750.00 12264.13 613.21 429.60
Preykabas.HR.VA$ 20 87.50 1251.75 8474.89 423.74 317.52
Preykabas.HR.Income$ 20 0.00 1625.00 6988.88 349.44 454.72
Preykabas.HR.Consumption$ 20 0.00 672.00 5275.25 263.76 187.35
Preykabas.HR.PL$ 20 0.00 348.75 1871.00 93.55 85.25
Preykabas.HR.IC$ 20 0.00 609.70 3693.24 184.66 164.14
Preykabas.HR.Profit$ 20 72.50 903.00 6603.89 330.19 254.48
Valid N (listwise) 20
Descriptive Statistics
N Minimum Maximum Sum Mean Std.
Deviation
Preykabas.2R.Land.total.ha 79 .09 2.65 63.58 .80 .45
R.2R.Yield.Average1.2.outlier 74 1.75 8.36 351.17 4.75 1.33
R.2R.Price.mean.1.2 78 635.00 1425.00 68928.00 883.69 142.58
Preykabas.2R.GVA$.per.ha 79 860.29 7887.23 231235.22 2927.03 1453.48
Preykabas.2R.VA$.per.ha 79 -28.13 3617.71 101119.96 1280.00 759.95
Preykabas.2R.PL$.per.ha 79 50.00 888.89 23809.30 301.38 170.77

301
Preykabas.2R.IC$.per.ha 79 210.38 3157.34 63754.35 807.02 414.82
Preykabas.2R.Labor.total.per.ha 79 35.47 537.78 10572.17 133.82 102.37
Preykabas.2R.Labor.family.per.ha 79 4.29 277.78 4559.04 57.71 59.59
Preykabas.2R.LAND.Productivity.outlier 76 309.92 3461.82 97239.46 1279.47 701.35
Preykabas.2R.LABOR.Productivity.outlier 66 3.72 24.73 799.10 12.11 5.53
Preykabas.2R.Profit$.per.ha 79 -318.13 3419.79 77310.66 978.62 725.03
Preykabas.2R.Profit$.Rate 79 -.20 3.62 76.79 .97 .77
Valid N (listwise) 60
Descriptive Statistics
N Minimum Maximum Sum Mean Std.
Deviation
Preykabas.2R.Land.total.ha 79 .09 2.65 63.58 .8048 .44744
Preykabas.2R.GVA$ 79 264.00 4837.50 125986.68 1594.7680 991.53374
Preykabas.2R.VA$ 79 -14.06 2912.50 76642.09 970.1531 693.56032
Preykabas.2R.Income$ 79 0.00 4597.50 93881.21 1188.3697 943.49846
Preykabas.2R.Consumption$ 79 0.00 1380.00 32105.47 406.3984 361.94770
Preykabas.2R.PL$ 79 30.00 781.25 17596.88 222.7453 145.77523
Preykabas.2R.IC$ 79 101.00 2904.75 49344.60 624.6152 459.50156
Preykabas.2R.Profit$ 79 -200.88 2593.75 59045.22 747.4078 643.87246
Valid N (listwise) 79
Descriptive Statistics
N Minimum Maximum Sum Mean Std.
Deviation
Preykabas.3R.Land.total.ha 17 .30 1.72 11.14 .66 .39
R.3R.Yield.Average1.2.3.outlier 17 2.83 7.56 85.87 5.05 1.40
Preykabas.3R.GVA$.per.ha 17 790.00 8604.17 59684.48 3510.85 1750.71
Preykabas.3R.VA$.per.ha 17 285.85 10538.96 42659.99 2312.11 2306.50
Preykabas.3R.PL$.per.ha 17 0.00 1143.75 6977.13 410.42 295.03
Preykabas.3R.IC$.per.ha 17 283.33 2066.20 20378.65 1198.74 442.79
Preykabas.3R.Labor.per.ha 17 40.57 382.12 2522.00 148.35 96.29
Preykabas.3R.Labor.family.per.ha 17 6.67 167.27 1084.42 63.79 57.50
Preykabas.3R.LAND.Productivity.outlier 10 1701.14 2710.03 22613.49 2261.35 320.15
Preykabas.3R.LABOR.Productivity.outlier 12 6.55 28.65 145.50 12.13 6.03
Preykabas.3R.Profit$.per.ha 17 144.34 9830.63 35682.86 1901.69 2225.67
Preykabas.3R.Profit$.Rate 17 .14 4.62 22.49 1.32 1.21
Valid N (listwise) 9
Descriptive Statistics
N Minimum Maximum Sum Mean Std.
Deviation
Preykabas.3R.Land.total.ha 17 .30 1.72 11.14 .66 .39
Preykabas.3R.GVA$ 17 474.00 7800.00 37483.68 2204.92 1706.83
Preykabas.3R.VA$ 17 231.63 4661.25 24663.39 1379.76 1218.60
Preykabas.3R.PL$ 17 0.00 675.00 4023.38 236.67 172.19
Preykabas.3R.IC$ 17 170.00 3138.75 14027.79 825.16 728.09
Preykabas.3R.Income$ 17 474.00 7800.00 31397.88 1846.93 1711.14
Preykabas.3R.Consumption$ 17 0.00 1662.50 6085.80 357.99 441.88
Preykabas.3R.Profit$ 17 153.00 4136.25 20640.02 1143.09 1140.33
Valid N (listwise) 17
Descriptive Statistics
N Minimum Maximum Sum Mean Std.
Deviation
Preykabas.DR.Land.total.ha 57 0.25 6.00 59.37 1.04 0.90
R.DR.Yield 57 1.31 11.92 307.93 5.40 1.63
R.DR.Yield.outlier 54 3.00 8.00 292.95 5.43 1.20
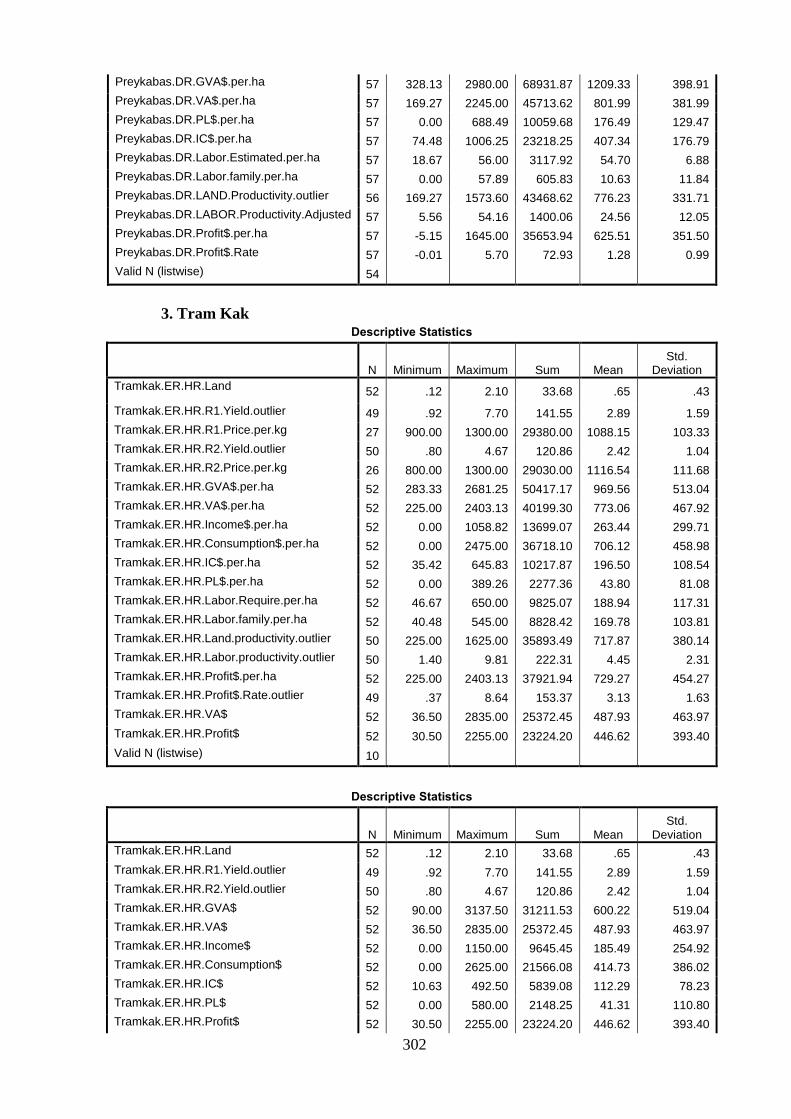
302
Preykabas.DR.GVA$.per.ha 57 328.13 2980.00 68931.87 1209.33 398.91
Preykabas.DR.VA$.per.ha 57 169.27 2245.00 45713.62 801.99 381.99
Preykabas.DR.PL$.per.ha 57 0.00 688.49 10059.68 176.49 129.47
Preykabas.DR.IC$.per.ha 57 74.48 1006.25 23218.25 407.34 176.79
Preykabas.DR.Labor.Estimated.per.ha 57 18.67 56.00 3117.92 54.70 6.88
Preykabas.DR.Labor.family.per.ha 57 0.00 57.89 605.83 10.63 11.84
Preykabas.DR.LAND.Productivity.outlier 56 169.27 1573.60 43468.62 776.23 331.71
Preykabas.DR.LABOR.Productivity.Adjusted 57 5.56 54.16 1400.06 24.56 12.05
Preykabas.DR.Profit$.per.ha 57 -5.15 1645.00 35653.94 625.51 351.50
Preykabas.DR.Profit$.Rate 57 -0.01 5.70 72.93 1.28 0.99
Valid N (listwise) 54
3. Tram Kak Descriptive Statistics
N Minimum Maximum Sum Mean Std.
Deviation
Tramkak.ER.HR.Land 52 .12 2.10 33.68 .65 .43
Tramkak.ER.HR.R1.Yield.outlier 49 .92 7.70 141.55 2.89 1.59
Tramkak.ER.HR.R1.Price.per.kg 27 900.00 1300.00 29380.00 1088.15 103.33
Tramkak.ER.HR.R2.Yield.outlier 50 .80 4.67 120.86 2.42 1.04
Tramkak.ER.HR.R2.Price.per.kg 26 800.00 1300.00 29030.00 1116.54 111.68
Tramkak.ER.HR.GVA$.per.ha 52 283.33 2681.25 50417.17 969.56 513.04
Tramkak.ER.HR.VA$.per.ha 52 225.00 2403.13 40199.30 773.06 467.92
Tramkak.ER.HR.Income$.per.ha 52 0.00 1058.82 13699.07 263.44 299.71
Tramkak.ER.HR.Consumption$.per.ha 52 0.00 2475.00 36718.10 706.12 458.98
Tramkak.ER.HR.IC$.per.ha 52 35.42 645.83 10217.87 196.50 108.54
Tramkak.ER.HR.PL$.per.ha 52 0.00 389.26 2277.36 43.80 81.08
Tramkak.ER.HR.Labor.Require.per.ha 52 46.67 650.00 9825.07 188.94 117.31
Tramkak.ER.HR.Labor.family.per.ha 52 40.48 545.00 8828.42 169.78 103.81
Tramkak.ER.HR.Land.productivity.outlier 50 225.00 1625.00 35893.49 717.87 380.14
Tramkak.ER.HR.Labor.productivity.outlier 50 1.40 9.81 222.31 4.45 2.31
Tramkak.ER.HR.Profit$.per.ha 52 225.00 2403.13 37921.94 729.27 454.27
Tramkak.ER.HR.Profit$.Rate.outlier 49 .37 8.64 153.37 3.13 1.63
Tramkak.ER.HR.VA$ 52 36.50 2835.00 25372.45 487.93 463.97
Tramkak.ER.HR.Profit$ 52 30.50 2255.00 23224.20 446.62 393.40
Valid N (listwise) 10
Descriptive Statistics
N Minimum Maximum Sum Mean Std.
Deviation
Tramkak.ER.HR.Land 52 .12 2.10 33.68 .65 .43
Tramkak.ER.HR.R1.Yield.outlier 49 .92 7.70 141.55 2.89 1.59
Tramkak.ER.HR.R2.Yield.outlier 50 .80 4.67 120.86 2.42 1.04
Tramkak.ER.HR.GVA$ 52 90.00 3137.50 31211.53 600.22 519.04
Tramkak.ER.HR.VA$ 52 36.50 2835.00 25372.45 487.93 463.97
Tramkak.ER.HR.Income$ 52 0.00 1150.00 9645.45 185.49 254.92
Tramkak.ER.HR.Consumption$ 52 0.00 2625.00 21566.08 414.73 386.02
Tramkak.ER.HR.IC$ 52 10.63 492.50 5839.08 112.29 78.23
Tramkak.ER.HR.PL$ 52 0.00 580.00 2148.25 41.31 110.80
Tramkak.ER.HR.Profit$ 52 30.50 2255.00 23224.20 446.62 393.40
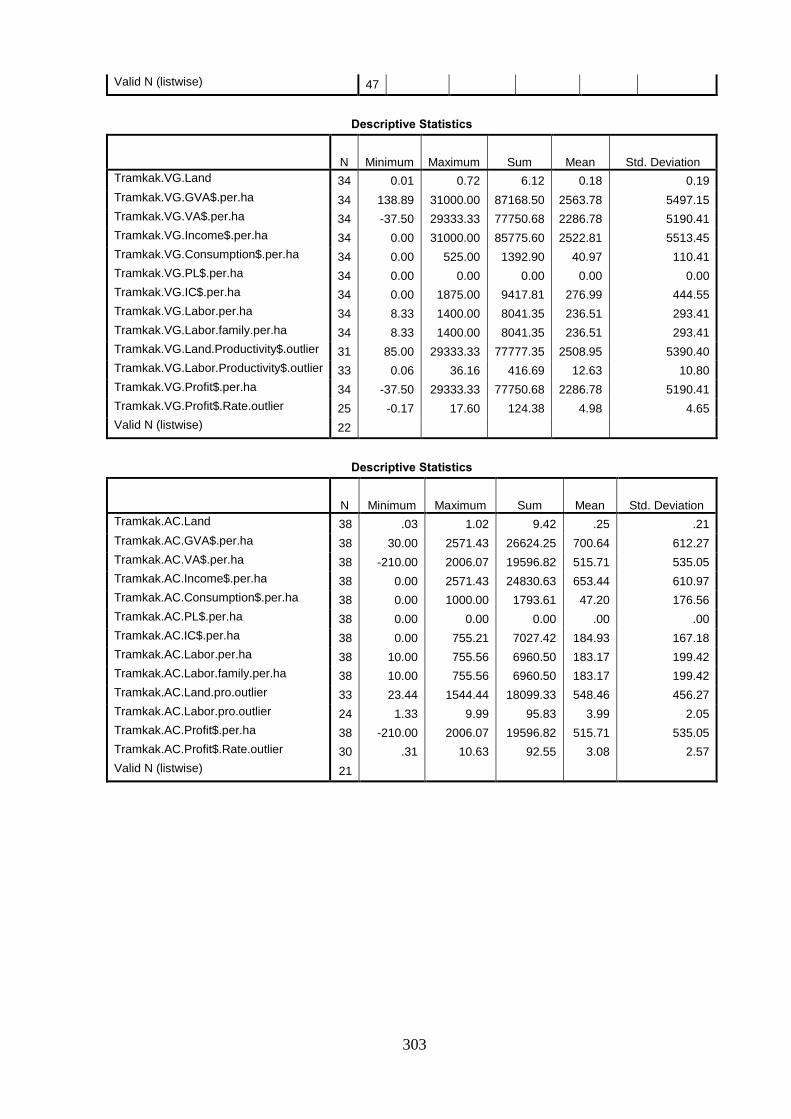
303
Valid N (listwise) 47
Descriptive Statistics
N Minimum Maximum Sum Mean Std. Deviation
Tramkak.VG.Land 34 0.01 0.72 6.12 0.18 0.19
Tramkak.VG.GVA$.per.ha 34 138.89 31000.00 87168.50 2563.78 5497.15
Tramkak.VG.VA$.per.ha 34 -37.50 29333.33 77750.68 2286.78 5190.41
Tramkak.VG.Income$.per.ha 34 0.00 31000.00 85775.60 2522.81 5513.45
Tramkak.VG.Consumption$.per.ha 34 0.00 525.00 1392.90 40.97 110.41
Tramkak.VG.PL$.per.ha 34 0.00 0.00 0.00 0.00 0.00
Tramkak.VG.IC$.per.ha 34 0.00 1875.00 9417.81 276.99 444.55
Tramkak.VG.Labor.per.ha 34 8.33 1400.00 8041.35 236.51 293.41
Tramkak.VG.Labor.family.per.ha 34 8.33 1400.00 8041.35 236.51 293.41
Tramkak.VG.Land.Productivity$.outlier 31 85.00 29333.33 77777.35 2508.95 5390.40
Tramkak.VG.Labor.Productivity$.outlier 33 0.06 36.16 416.69 12.63 10.80
Tramkak.VG.Profit$.per.ha 34 -37.50 29333.33 77750.68 2286.78 5190.41
Tramkak.VG.Profit$.Rate.outlier 25 -0.17 17.60 124.38 4.98 4.65
Valid N (listwise) 22
Descriptive Statistics
N Minimum Maximum Sum Mean Std. Deviation
Tramkak.AC.Land 38 .03 1.02 9.42 .25 .21
Tramkak.AC.GVA$.per.ha 38 30.00 2571.43 26624.25 700.64 612.27
Tramkak.AC.VA$.per.ha 38 -210.00 2006.07 19596.82 515.71 535.05
Tramkak.AC.Income$.per.ha 38 0.00 2571.43 24830.63 653.44 610.97
Tramkak.AC.Consumption$.per.ha 38 0.00 1000.00 1793.61 47.20 176.56
Tramkak.AC.PL$.per.ha 38 0.00 0.00 0.00 .00 .00
Tramkak.AC.IC$.per.ha 38 0.00 755.21 7027.42 184.93 167.18
Tramkak.AC.Labor.per.ha 38 10.00 755.56 6960.50 183.17 199.42
Tramkak.AC.Labor.family.per.ha 38 10.00 755.56 6960.50 183.17 199.42
Tramkak.AC.Land.pro.outlier 33 23.44 1544.44 18099.33 548.46 456.27
Tramkak.AC.Labor.pro.outlier 24 1.33 9.99 95.83 3.99 2.05
Tramkak.AC.Profit$.per.ha 38 -210.00 2006.07 19596.82 515.71 535.05
Tramkak.AC.Profit$.Rate.outlier 30 .31 10.63 92.55 3.08 2.57
Valid N (listwise) 21

304
Appendix – 02 Access to credit
Source of borrowing Zone Source of borrowing N % Mean
Std.
Deviation Minimum Maximum SUM
Tam Kak
Family/relatives 7 18% 163 136 25 375 1138
Your neighbor 1 3% 250
250 250 250
MFI/Bank 21 54% 371 403 25 2000 7788
Rice bank/village bank 1 3% 75
75 75 75
Saving group 9 23% 414 298 50 1000 3725
Total 39 100% 333 342 25 2000 12975
Prey Kabas
Family/relatives 15 25% 590 641 25 2000 8850
Your neighbor 4 7% 184 101 38 250 738
MFI/Bank 39 64% 1131 1039 100 5000 44125
Rice bank/village bank 2 3% 375 177 250 500 750
Saving group 1 2% 125
125 125 125
Total 61 100% 895 945 25 5000 54588
Otdar
Meanchey
Family/relatives 8 17% 366 400 25 1000 2925
Your neighbor 13 27% 325 296 5 1000 4230
NGOs 2 4% 150 141 50 250 300
Trader/Employer/Agricultural firm
2 4% 100 35 75 125 200
MFI/Bank 16 33% 584 751 125 3000 9350
Rice bank/village bank 6 13% 283 357 50 1000 1700
Saving group 2 4% 28 31 6 50 56
Total 48 100% 383 511 5 3000 18761
Total
Family/relatives 30 20% 430 522 25 2000 12913
Your neighbor 18 12% 290 259 5 1000 5218
NGOs 2 1% 150 141 50 250 300
Trader/Employer/Agricultural firm
2 1% 100 35 75 125 200
MFI/Bank 76 51% 806 906 25 5000 61263
Rice bank/village bank 9 6% 281 302 50 1000 2525
Saving group 12 8% 326 301 6 1000 3906
Total 148 100% 579 739 5 5000 86324
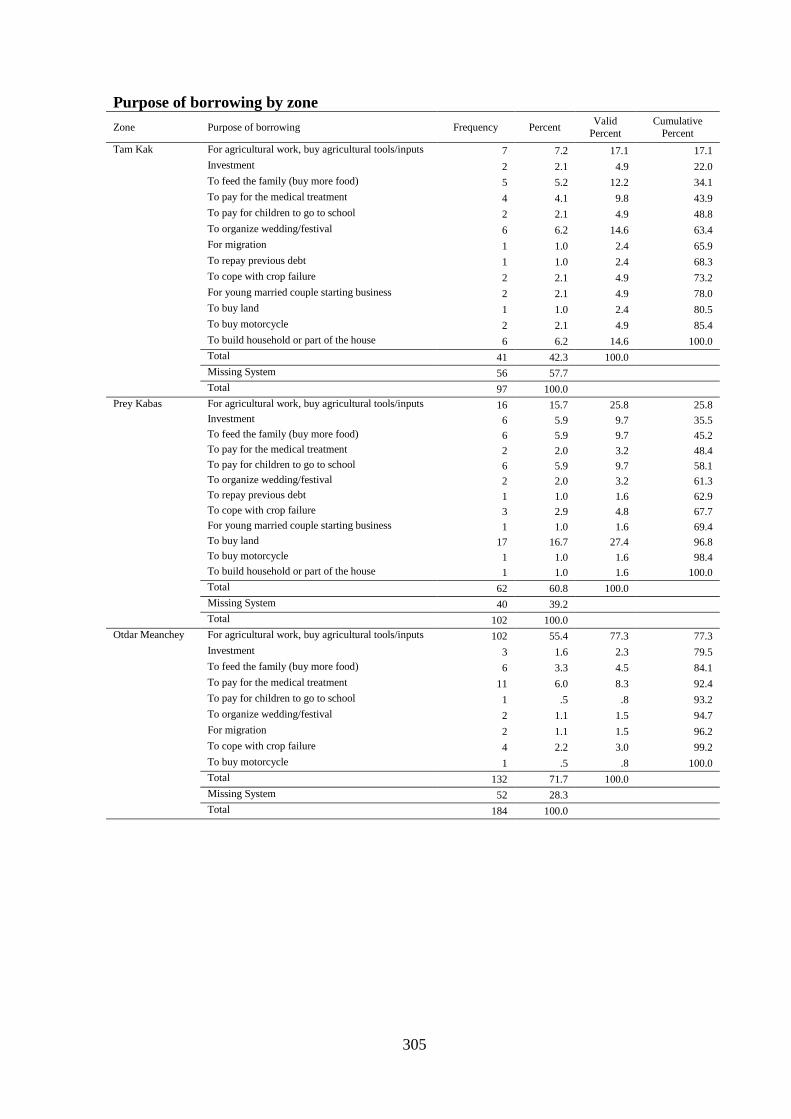
305
Purpose of borrowing by zone
Zone Purpose of borrowing Frequency Percent Valid
Percent
Cumulative
Percent
Tam Kak For agricultural work, buy agricultural tools/inputs 7 7.2 17.1 17.1
Investment 2 2.1 4.9 22.0
To feed the family (buy more food) 5 5.2 12.2 34.1
To pay for the medical treatment 4 4.1 9.8 43.9
To pay for children to go to school 2 2.1 4.9 48.8
To organize wedding/festival 6 6.2 14.6 63.4
For migration 1 1.0 2.4 65.9
To repay previous debt 1 1.0 2.4 68.3
To cope with crop failure 2 2.1 4.9 73.2
For young married couple starting business 2 2.1 4.9 78.0
To buy land 1 1.0 2.4 80.5
To buy motorcycle 2 2.1 4.9 85.4
To build household or part of the house 6 6.2 14.6 100.0
Total 41 42.3 100.0
Missing System 56 57.7
Total 97 100.0
Prey Kabas For agricultural work, buy agricultural tools/inputs 16 15.7 25.8 25.8
Investment 6 5.9 9.7 35.5
To feed the family (buy more food) 6 5.9 9.7 45.2
To pay for the medical treatment 2 2.0 3.2 48.4
To pay for children to go to school 6 5.9 9.7 58.1
To organize wedding/festival 2 2.0 3.2 61.3
To repay previous debt 1 1.0 1.6 62.9
To cope with crop failure 3 2.9 4.8 67.7
For young married couple starting business 1 1.0 1.6 69.4
To buy land 17 16.7 27.4 96.8
To buy motorcycle 1 1.0 1.6 98.4
To build household or part of the house 1 1.0 1.6 100.0
Total 62 60.8 100.0
Missing System 40 39.2
Total 102 100.0
Otdar Meanchey For agricultural work, buy agricultural tools/inputs 102 55.4 77.3 77.3
Investment 3 1.6 2.3 79.5
To feed the family (buy more food) 6 3.3 4.5 84.1
To pay for the medical treatment 11 6.0 8.3 92.4
To pay for children to go to school 1 .5 .8 93.2
To organize wedding/festival 2 1.1 1.5 94.7
For migration 2 1.1 1.5 96.2
To cope with crop failure 4 2.2 3.0 99.2
To buy motorcycle 1 .5 .8 100.0
Total 132 71.7 100.0
Missing System 52 28.3
Total 184 100.0
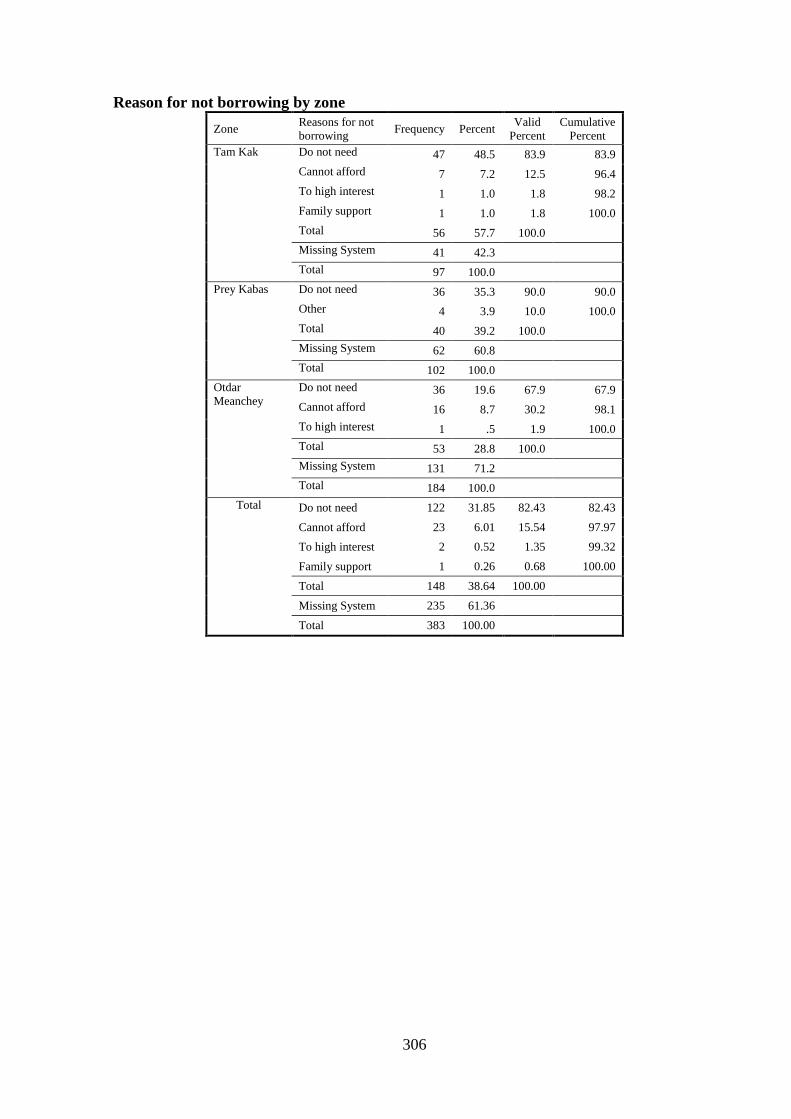
306
Reason for not borrowing by zone
Zone Reasons for not
borrowing Frequency Percent
Valid
Percent
Cumulative
Percent
Tam Kak Do not need 47 48.5 83.9 83.9
Cannot afford 7 7.2 12.5 96.4
To high interest 1 1.0 1.8 98.2
Family support 1 1.0 1.8 100.0
Total 56 57.7 100.0
Missing System 41 42.3
Total 97 100.0
Prey Kabas Do not need 36 35.3 90.0 90.0
Other 4 3.9 10.0 100.0
Total 40 39.2 100.0
Missing System 62 60.8
Total 102 100.0
Otdar
Meanchey
Do not need 36 19.6 67.9 67.9
Cannot afford 16 8.7 30.2 98.1
To high interest 1 .5 1.9 100.0
Total 53 28.8 100.0
Missing System 131 71.2
Total 184 100.0
Total Do not need 122 31.85 82.43 82.43
Cannot afford 23 6.01 15.54 97.97
To high interest 2 0.52 1.35 99.32
Family support 1 0.26 0.68 100.00
Total 148 38.64 100.00
Missing System 235 61.36
Total 383 100.00
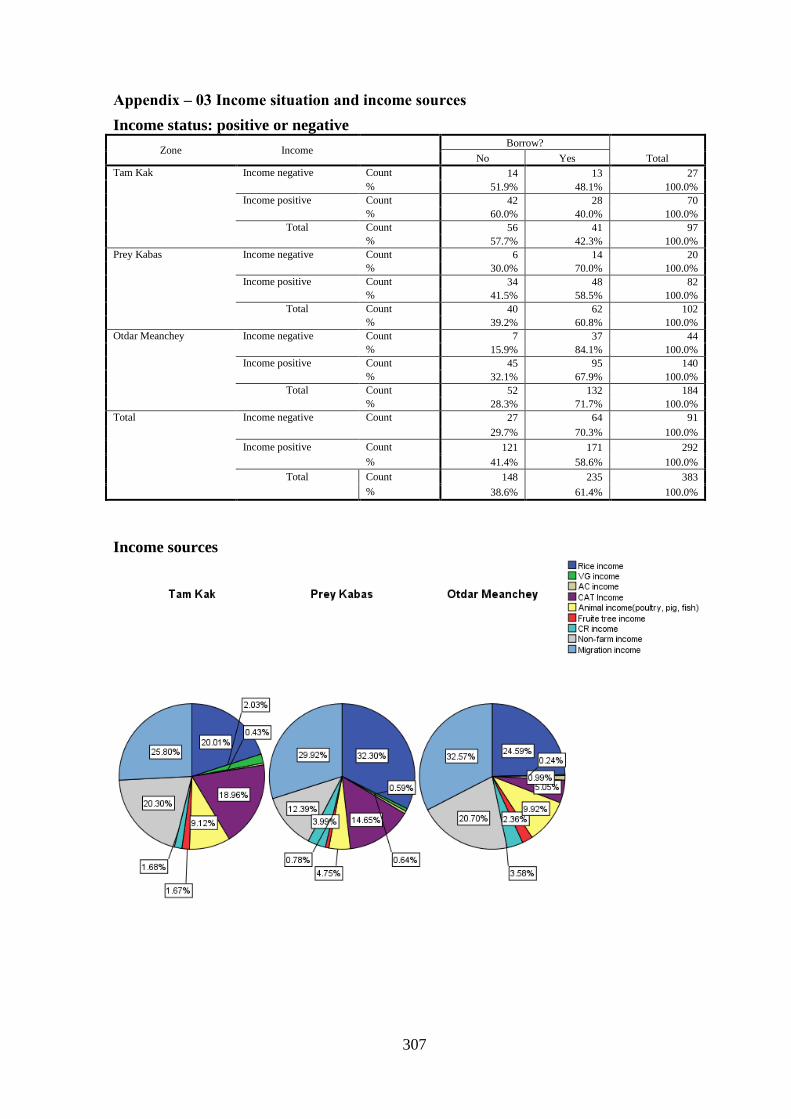
307
Appendix – 03 Income situation and income sources
Income status: positive or negative
Zone Income Borrow?
Total No Yes
Tam Kak Income negative Count 14 13 27
% 51.9% 48.1% 100.0%
Income positive Count 42 28 70
% 60.0% 40.0% 100.0%
Total Count 56 41 97
% 57.7% 42.3% 100.0%
Prey Kabas Income negative Count 6 14 20
% 30.0% 70.0% 100.0%
Income positive Count 34 48 82
% 41.5% 58.5% 100.0%
Total Count 40 62 102
% 39.2% 60.8% 100.0%
Otdar Meanchey Income negative Count 7 37 44
% 15.9% 84.1% 100.0%
Income positive Count 45 95 140
% 32.1% 67.9% 100.0%
Total Count 52 132 184
% 28.3% 71.7% 100.0%
Total Income negative Count 27 64 91
29.7% 70.3% 100.0%
Income positive Count 121 171 292
% 41.4% 58.6% 100.0%
Total Count 148 235 383
% 38.6% 61.4% 100.0%
Income sources

308
Appendix – 04 Level of education of family member of 382 household surveyed
Educational level of all family member of 382 household surveyed by zone
Zone School Age
Do they currently study?
No Yes Total
N Percent No Percent No Percent
Tam Kak Pre-school 0-6 41 89.13% 5 10.87% 46 100.00%
Primary school 7-12 2 3.77% 51 96.23% 53 100.00%
Secondary school 13-15 3 9.38% 29 90.63% 32 100.00%
High school 16-18 23 53.49% 20 46.51% 43 100.00%
University/vocational school 19-22 34 70.83% 14 29.17% 48 100.00%
Upper university 23-30 80 93.02% 6 6.98% 86 100.00%
Upper university 31-35 38 97.44% 1 2.56% 39 100.00%
36+ 154 100.00% 0 0.00% 154 100.00%
Total 375 74.85% 126 25.15% 501 100.00%
Prey Kabas Pre-school 0-6 55 87.30% 8 12.70% 63 100.00%
Primary school 7-12 0 0.00% 43 100.00% 43 100.00%
Secondary school 13-15 1 3.33% 29 96.67% 30 100.00%
High school 16-18 6 20.00% 24 80.00% 30 100.00%
University/vocational school 19-22 29 51.79% 27 48.21% 56 100.00%
Upper university 23-30 109 86.51% 17 13.49% 126 100.00%
Upper university 31-35 51 98.08% 1 1.92% 52 100.00%
36+ 142 100.00% 0 0.00% 142 100.00%
Total 393 72.51% 149 27.49% 542 100.00%
Otdar
Meanchey Pre-school 0-6 121 80.13% 30 19.87% 151 100.00%
Primary school 7-12 12 8.96% 122 91.04% 134 100.00%
Secondary school 13-15 13 17.57% 61 82.43% 74 100.00%
High school 16-18 57 69.51% 25 30.49% 82 100.00%
University/vocational school 19-22 104 85.95% 17 14.05% 121 100.00%
Upper university 23-30 217 93.53% 15 6.47% 232 100.00%
Upper university 31-35 67 100.00% 0 0.00% 67 100.00%
36+ 281 100.00% 0 0.00% 281 100.00%
Total 872 76.36% 270 23.64% 1142 100.00%
Total Pre-school 0-6 217 83.46% 43 16.54% 260 100.00%
Primary school 7-12 14 6.09% 216 93.91% 230 100.00%
Secondary school 13-15 17 12.50% 119 87.50% 136 100.00%
High school 16-18 86 55.48% 69 44.52% 155 100.00%
University/vocational school 19-22 167 74.22% 58 25.78% 225 100.00%
Upper university 23-30 406 91.44% 38 8.56% 444 100.00%
Upper university 31-35 156 98.73% 2 1.27% 158 100.00%
36+ 577 100.00% 0 0.00% 577 100.00%
Total 1640 75.06% 545 24.94% 2185 100.00%
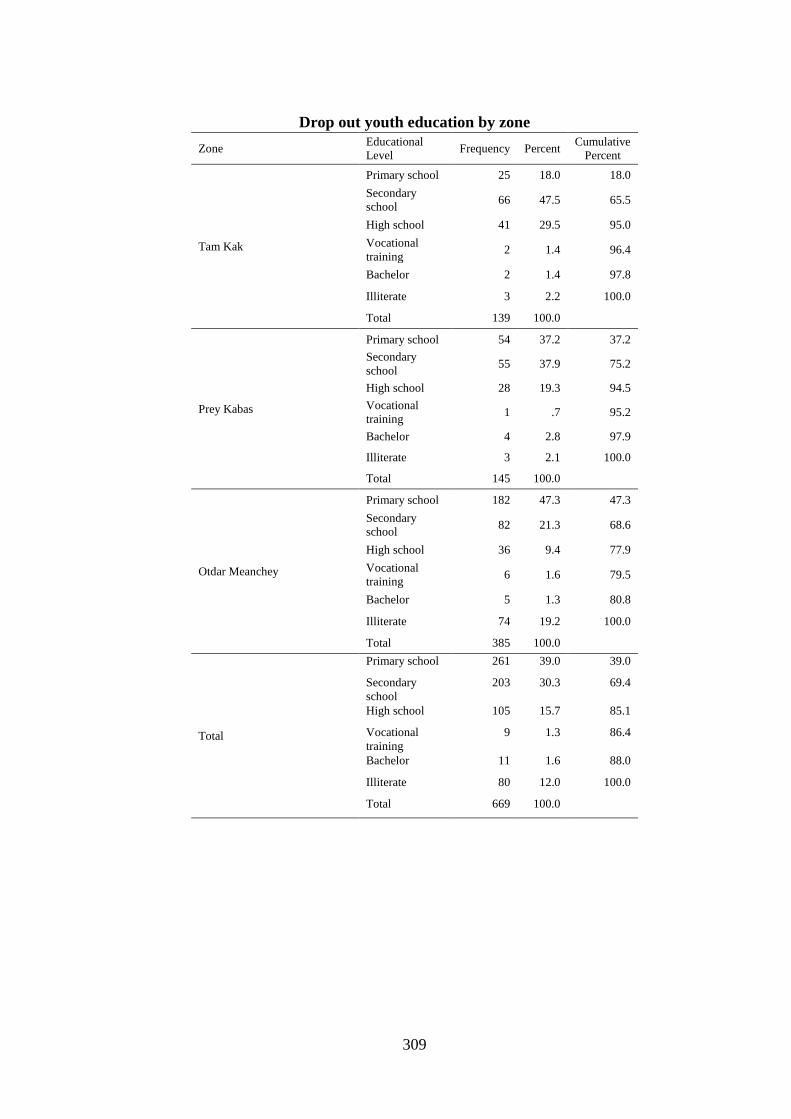
309
Drop out youth education by zone
Zone Educational
Level Frequency Percent
Cumulative
Percent
Tam Kak
Primary school 25 18.0 18.0
Secondary
school 66 47.5 65.5
High school 41 29.5 95.0
Vocational
training 2 1.4 96.4
Bachelor 2 1.4 97.8
Illiterate 3 2.2 100.0
Total 139 100.0
Prey Kabas
Primary school 54 37.2 37.2
Secondary
school 55 37.9 75.2
High school 28 19.3 94.5
Vocational
training 1 .7 95.2
Bachelor 4 2.8 97.9
Illiterate 3 2.1 100.0
Total 145 100.0
Otdar Meanchey
Primary school 182 47.3 47.3
Secondary
school 82 21.3 68.6
High school 36 9.4 77.9
Vocational
training 6 1.6 79.5
Bachelor 5 1.3 80.8
Illiterate 74 19.2 100.0
Total 385 100.0
Total
Primary school 261 39.0 39.0
Secondary
school
203 30.3 69.4
High school 105 15.7 85.1
Vocational
training
9 1.3 86.4
Bachelor 11 1.6 88.0
Illiterate 80 12.0 100.0
Total 669 100.0

310
Education of youth currently studying
Zone Educational
level Frequency Percent
Valid
Percent
Cumulative
Percent
Tam Kak
Primary school 2 3.8 3.8 3.8
Secondary
school 17 32.7 32.7 36.5
High school 28 53.8 53.8 90.4
Bachelor 5 9.6 9.6 100.0
Total 52 100.0 100.0
Prey Kabas
Primary school 3 3.8 3.8 3.8
Secondary
school 18 22.5 22.5 26.3
High school 30 37.5 37.5 63.8
Vocational
training 1 1.3 1.3 65.0
Bachelor 28 35.0 35.0 100.0
Total 80 100.0 100.0
Otdar Meanchey
Primary school 10 13.9 13.9 13.9
Secondary
school 27 37.5 37.5 51.4
High school 23 31.9 31.9 83.3
Vocational
training 2 2.8 2.8 86.1
Bachelor 10 13.9 13.9 100.0
Total 72 100.0 100.0
Total
Primary school 15 7.4 7.4 7.4
Secondary
school 62 30.4 30.4 37.7
High school 81 39.7 39.7 77.5
Vocational
training 3 1.5 1.5 78.9
Bachelor 43 21.1 21.1 100.0
Total 204 100.0 100.0
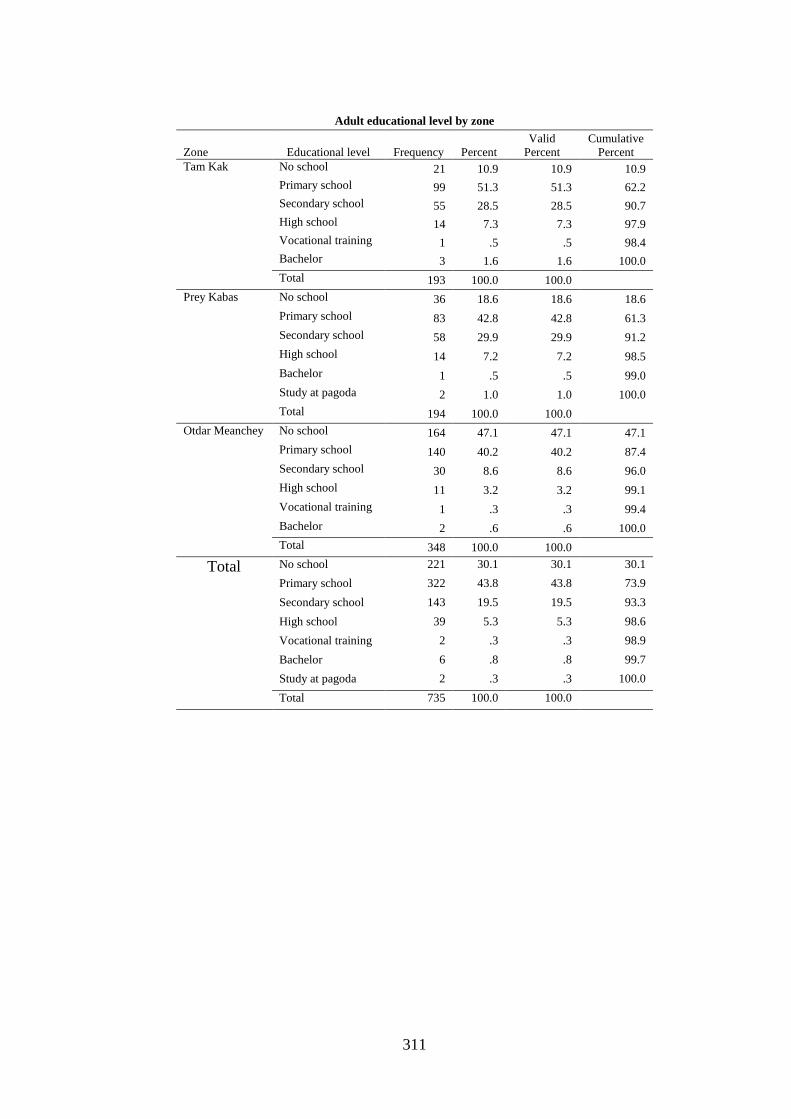
311
Adult educational level by zone
Zone Educational level Frequency Percent
Valid
Percent
Cumulative
Percent
Tam Kak No school 21 10.9 10.9 10.9
Primary school 99 51.3 51.3 62.2
Secondary school 55 28.5 28.5 90.7
High school 14 7.3 7.3 97.9
Vocational training 1 .5 .5 98.4
Bachelor 3 1.6 1.6 100.0
Total 193 100.0 100.0
Prey Kabas No school 36 18.6 18.6 18.6
Primary school 83 42.8 42.8 61.3
Secondary school 58 29.9 29.9 91.2
High school 14 7.2 7.2 98.5
Bachelor 1 .5 .5 99.0
Study at pagoda 2 1.0 1.0 100.0
Total 194 100.0 100.0
Otdar Meanchey No school 164 47.1 47.1 47.1
Primary school 140 40.2 40.2 87.4
Secondary school 30 8.6 8.6 96.0
High school 11 3.2 3.2 99.1
Vocational training 1 .3 .3 99.4
Bachelor 2 .6 .6 100.0
Total 348 100.0 100.0
Total No school 221 30.1 30.1 30.1
Primary school 322 43.8 43.8 73.9
Secondary school 143 19.5 19.5 93.3
High school 39 5.3 5.3 98.6
Vocational training 2 .3 .3 98.9
Bachelor 6 .8 .8 99.7
Study at pagoda 2 .3 .3 100.0
Total 735 100.0 100.0

312
Appendix – 05 Educational investment
1. The average cost of expenditure on education per child at different level
Zone
University cost High
school
per
person
Secondary
school per
person
Primary
school per
person University living
allowance/year/person
University
fee/year/person
University
per person
Otdar
Meanchey 502 480 982 170 128 33
Prey Kabas 851 437 1288 168 168 51
Tam Kak 840 350 1190 224 138 41
Grand Total 781 425 1206 187 147 37
2. Percentage of household having children studying at different level
3. Percentage of household having children studying at different level
Youth studying Type N %
Youth studying Type N %
Youth studying Type N %
University TK-1 3 43%
University PB-1 9 38%
University OMC-1 5 71%
7% TK-2 1 14%
26% PB-2 6 25%
4% OMC-2 2 29%
TK-3 3 43%
PB-3 9 38%
Total 7 100%
Total 7 100%
Total 24 100%
High school OMC-1 10 53%
High school TK-1 7 39%
High school PB-1 3 18%
11% OMC-2 9 47%
19% TK-2 1 6%
18% PB-2 12 71%
Total 19 100%
TK-3 10 56%
PB-3 2 12%
Secondary OMC-1 10 50%
Total 18 100%
Total 17 100%
11% OMC-2 8 40%
Secondary TK-1 6 27%
Secondary PB-1 5 25%
OMC-3 1 5%
23% TK-2 6 27%
23% PB-2 12 60%
OMC-4 1 5%
TK-3 10 45%
PB-3 3 15%
Total 20 100%
Total 22 100%
Total 20 100%
Primary OMC-1 10 53%
Primary TK-1 4 50%
Primary PB-1 1 33%
10% OMC-2 7 37%
8% TK-2 1 13%
3% PB-2 2 67%
OMC-3 1 5%
TK-3 3 38%
PB-3 0 0%
OMC-4 1 5%
Total 8 100%
Total 3 100%
Total 19 100%
10 3
8
11 23 23
11
18 19
4
26 7
0
10
20
30
40
50
60
70
Otdar Meanchey Prey Kabas Tam Kak
Per
cen
tage
of
ho
use
ho
ld h
avin
g y
ou
th e
du
cati
on
% Youth's education per household
Youth in primary school Youth in secondary school Youth in high school Youth in university

313
3. Household having children studying at different level by farm type by zone
Zone Type
HH Having
youth studying
primary school
HH Having
youth studying
secondary
school
HH Having
youth studying
high school
HH Having
youth studying
upper high
school or
university
Total
N % N % N % N % N %
Otdar
Meanchey
OMC-1 10 29% 10 29% 10 29% 5 14% 35 100%
OMC-2 7 27% 8 31% 9 35% 2 8% 26 100%
OMC-3 1 50% 1 50%
0%
0% 2 100%
OMC-4 1 50% 1 50%
0%
0% 2 100%
Total 19 29% 20 31% 19 29% 7 11% 65 100%
Prey Kabas
PB-1 1 6% 5 28% 3 17% 9 50% 18 100%
PB-2 2 6% 12 38% 12 38% 6 19% 32 100%
PB-3 0% 3 21% 2 14% 9 64% 14 100%
Total 3 5% 20 31% 17 27% 24 38% 64 100%
Tam Kak
TK-1 4 20% 6 30% 7 35% 3 15% 20 100%
TK-2 1 11% 6 67% 1 11% 1 11% 9 100%
TK-3 3 12% 10 38% 10 38% 3 12% 26 100%
Total 8 15% 22 40% 18 33% 7 13% 55 100%
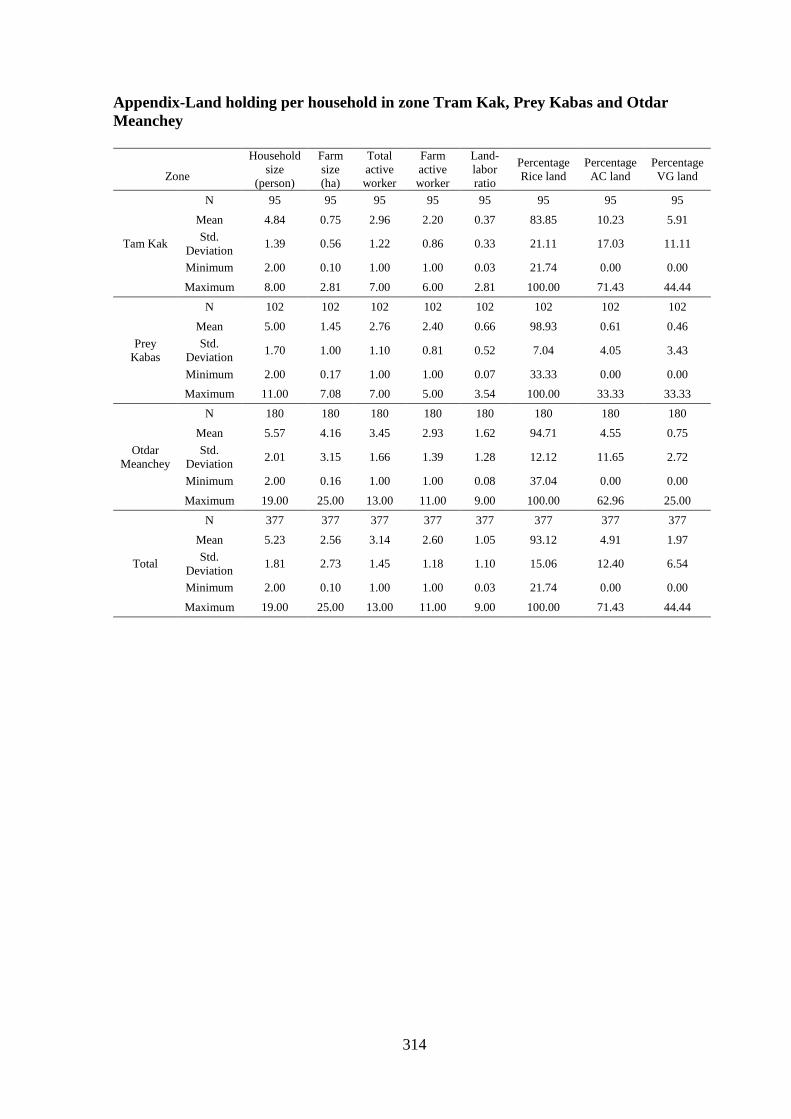
314
Appendix-Land holding per household in zone Tram Kak, Prey Kabas and Otdar
Meanchey
Zone
Household
size
(person)
Farm
size
(ha)
Total
active
worker
Farm
active
worker
Land-
labor
ratio
Percentage
Rice land
Percentage
AC land
Percentage
VG land
Tam Kak
N 95 95 95 95 95 95 95 95
Mean 4.84 0.75 2.96 2.20 0.37 83.85 10.23 5.91
Std.
Deviation 1.39 0.56 1.22 0.86 0.33 21.11 17.03 11.11
Minimum 2.00 0.10 1.00 1.00 0.03 21.74 0.00 0.00
Maximum 8.00 2.81 7.00 6.00 2.81 100.00 71.43 44.44
Prey
Kabas
N 102 102 102 102 102 102 102 102
Mean 5.00 1.45 2.76 2.40 0.66 98.93 0.61 0.46
Std.
Deviation 1.70 1.00 1.10 0.81 0.52 7.04 4.05 3.43
Minimum 2.00 0.17 1.00 1.00 0.07 33.33 0.00 0.00
Maximum 11.00 7.08 7.00 5.00 3.54 100.00 33.33 33.33
Otdar
Meanchey
N 180 180 180 180 180 180 180 180
Mean 5.57 4.16 3.45 2.93 1.62 94.71 4.55 0.75
Std.
Deviation 2.01 3.15 1.66 1.39 1.28 12.12 11.65 2.72
Minimum 2.00 0.16 1.00 1.00 0.08 37.04 0.00 0.00
Maximum 19.00 25.00 13.00 11.00 9.00 100.00 62.96 25.00
Total
N 377 377 377 377 377 377 377 377
Mean 5.23 2.56 3.14 2.60 1.05 93.12 4.91 1.97
Std.
Deviation 1.81 2.73 1.45 1.18 1.10 15.06 12.40 6.54
Minimum 2.00 0.10 1.00 1.00 0.03 21.74 0.00 0.00
Maximum 19.00 25.00 13.00 11.00 9.00 100.00 71.43 44.44
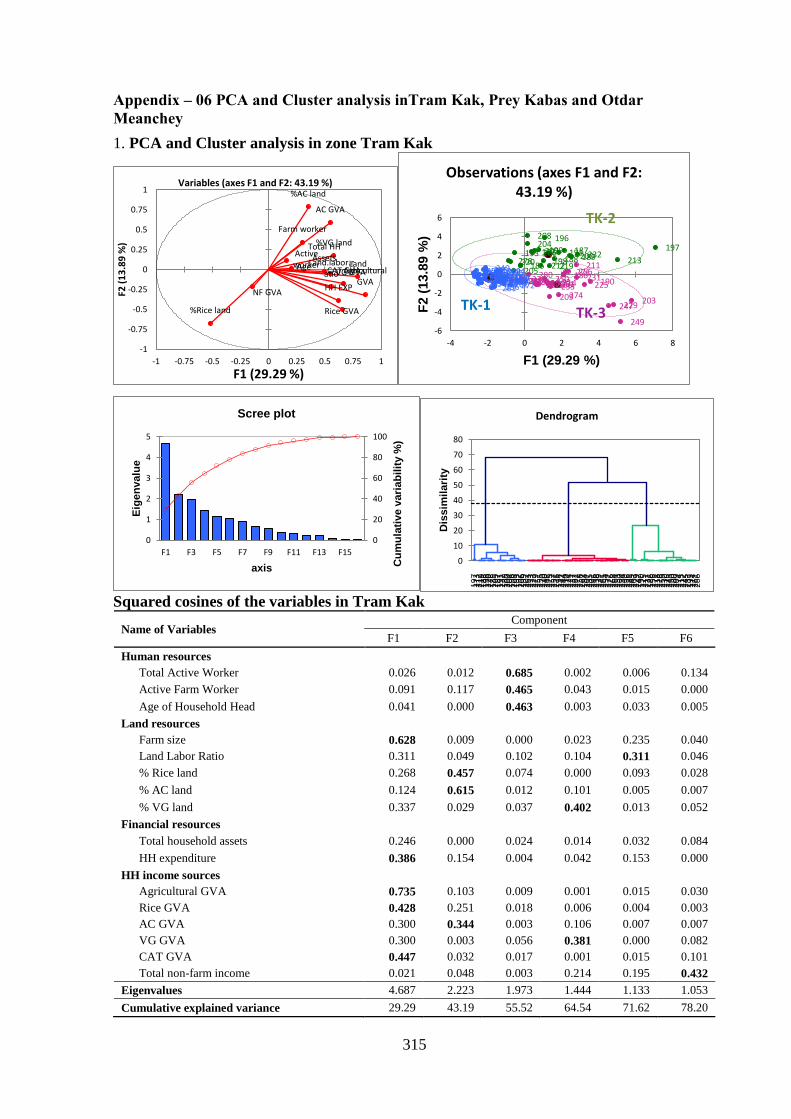
315
Appendix – 06 PCA and Cluster analysis inTram Kak, Prey Kabas and Otdar
Meanchey
1. PCA and Cluster analysis in zone Tram Kak
Squared cosines of the variables in Tram Kak
Name of Variables Component
F1 F2 F3 F4 F5 F6
Human resources
Total Active Worker 0.026 0.012 0.685 0.002 0.006 0.134
Active Farm Worker 0.091 0.117 0.465 0.043 0.015 0.000
Age of Household Head 0.041 0.000 0.463 0.003 0.033 0.005
Land resources
Farm size 0.628 0.009 0.000 0.023 0.235 0.040
Land Labor Ratio 0.311 0.049 0.102 0.104 0.311 0.046
% Rice land 0.268 0.457 0.074 0.000 0.093 0.028
% AC land 0.124 0.615 0.012 0.101 0.005 0.007
% VG land 0.337 0.029 0.037 0.402 0.013 0.052
Financial resources
Total household assets 0.246 0.000 0.024 0.014 0.032 0.084
HH expenditure 0.386 0.154 0.004 0.042 0.153 0.000
HH income sources
Agricultural GVA 0.735 0.103 0.009 0.001 0.015 0.030
Rice GVA 0.428 0.251 0.018 0.006 0.004 0.003
AC GVA 0.300 0.344 0.003 0.106 0.007 0.007
VG GVA 0.300 0.003 0.056 0.381 0.000 0.082
CAT GVA 0.447 0.032 0.017 0.001 0.015 0.101
Total non-farm income 0.021 0.048 0.003 0.214 0.195 0.432
Eigenvalues 4.687 2.223 1.973 1.444 1.133 1.053
Cumulative explained variance 29.29 43.19 55.52 64.54 71.62 78.20
Rice GVA
VG GVA
AC GVA
CAT GVA
Farm worker
%Rice land
%AC land
%VG land
HH EXP
Agricultural GVA
Land.labor.ratio
Active worker
Total HH Assets
NF GVA
Age Land
-1
-0.75
-0.5
-0.25
0
0.25
0.5
0.75
1
-1 -0.75 -0.5 -0.25 0 0.25 0.5 0.75 1
F2 (
13
.89
%)
F1 (29.29 %)
Variables (axes F1 and F2: 43.19 %)
184
185 186
187 188 189
190
191 192 193
194 195
196 197
198 199
200
201
202
203
204
205
206
207
208
209
210
211 212 213
214 215 216 218
219 220
221 222
223 224 225
226 228
229
230 231
232
233 234 235 236
237 238 239 240
241 242
243 244 245 246
247
248
249
250 251 252 253 254
255 256 257 258 259 260 261 262
263 264 265 266 267 268 269
270 271
272 273
274
275 276 277
278
279 280
281
TK-1
TK-2
TK-3 -6
-4
-2
0
2
4
6
-4 -2 0 2 4 6 8
F2 (
13.8
9 %
)
F1 (29.29 %)
Observations (axes F1 and F2: 43.19 %)
0
20
40
60
80
100
0
1
2
3
4
5
F1 F3 F5 F7 F9 F11 F13 F15
Cu
mu
lati
ve v
ari
ab
ilit
y %
)
Eig
en
valu
e
axis
Scree plot
197
213
212
219
188
198
220
278
185
205
187
191
232
189
200
204
196
208
193
192
206
199
202
263
273
223
279
251
255
270
240
248
275
252
257
276
194
242
244
210
224
221
237
262
272
258
267
184
207
235
201
246
238
239
241
265
254
277
226
268
264
253
260
234
269
236
281
249
203
229
247
190
225
211
231
186
256
271
218
228
259
230
216
243
250
280
209
274
215
222
245
233
195
214
261
266
0
10
20
30
40
50
60
70
80D
issim
ilari
ty
Dendrogram

316
Correlation Matrix variable PCA in Tram Kak
Correlation matrix (Pearson (n)): Tram Kak
Variables Rice
GVA
VG
GVA
AC
GVA
CAT
GVA
Active
Farm
Worker
% Rice
land
% AC
land
% VG
land
HH
expenditure
Agricultural
GVA
Land
Labor
Ratio
Total
Active
Worker
Total
household
assets
Total non-
farm
income
Age of
Household
Head
Farm
size
Rice GVA 1 0.314 0.089 0.392 0.110 0.008 -0.060 0.164 0.567 0.785 0.349 0.125 0.309 0.015 0.182 0.503
VG GVA 0.314 1 0.079 0.179 0.070 -0.330 0.018 0.692 0.259 0.419 0.253 -0.054 0.164 -0.166 0.003 0.371
AC GVA 0.089 0.079 1 0.254 0.261 -0.578 0.665 0.215 0.166 0.294 0.291 0.094 0.255 -0.130 0.067 0.402
CAT GVA 0.392 0.179 0.254 1 0.116 -0.205 0.117 0.304 0.439 0.785 0.278 0.097 0.194 -0.145 0.237 0.417
Active Farm Worker 0.110 0.070 0.261 0.116 1 -0.127 0.184 0.213 -0.020 0.186 -0.170 0.597 0.139 -0.231 0.296 0.272
% Rice land 0.008 -0.330 -0.578 -0.205 -0.127 1 -0.764 -0.529 -0.183 -0.214 -0.106 0.018 -0.238 -0.008 0.011 -0.249
% AC land -0.060 0.018 0.665 0.117 0.184 -0.764 1 0.088 -0.013 0.074 0.109 0.026 0.156 -0.122 0.072 0.193
% VG land 0.164 0.692 0.215 0.304 0.213 -0.529 0.088 1 0.198 0.420 0.154 -0.003 0.212 -0.178 -0.024 0.340
HH expenditure 0.567 0.259 0.166 0.439 -0.020 -0.183 -0.013 0.198 1 0.616 0.291 0.020 0.402 0.175 0.096 0.387
Agricultural GVA 0.785 0.419 0.294 0.785 0.186 -0.214 0.074 0.420 0.616 1 0.376 0.105 0.346 -0.106 0.199 0.581
Land Labor Ratio 0.349 0.253 0.291 0.278 -0.170 -0.106 0.109 0.154 0.291 0.376 1 -0.078 0.210 0.024 -0.078 0.803
Total Active Worker 0.125 -0.054 0.094 0.097 0.597 0.018 0.026 -0.003 0.020 0.105 -0.078 1 -0.132 0.089 0.453 0.218
Total household assets 0.309 0.164 0.255 0.194 0.139 -0.238 0.156 0.212 0.402 0.346 0.210 -0.132 1 -0.068 0.036 0.333
Total non-farm income 0.015 -0.166 -0.130 -0.145 -0.231 -0.008 -0.122 -0.178 0.175 -0.106 0.024 0.089 -0.068 1 -0.038 -0.100
Age of Household Head 0.182 0.003 0.067 0.237 0.296 0.011 0.072 -0.024 0.096 0.199 -0.078 0.453 0.036 -0.038 1 0.068
Farm size 0.503 0.371 0.402 0.417 0.272 -0.249 0.193 0.340 0.387 0.581 0.803 0.218 0.333 -0.100 0.068 1
Values in bold are different from 0 with a significance level alpha=0.05
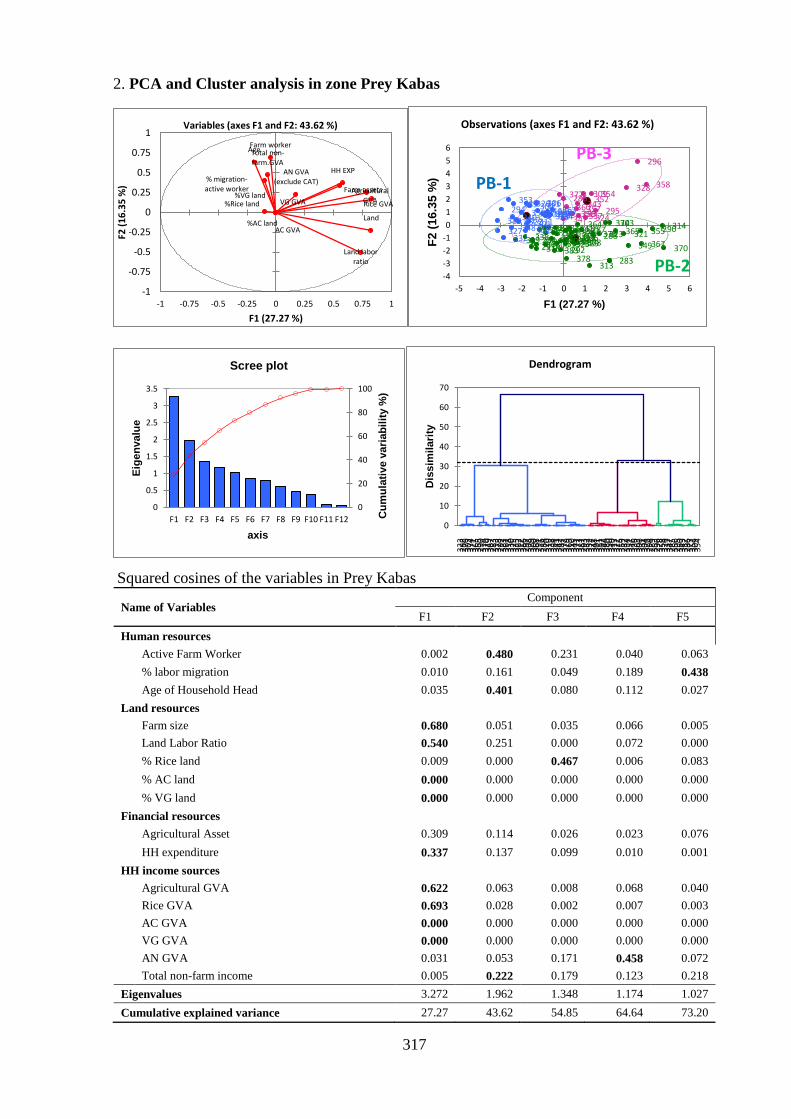
317
2. PCA and Cluster analysis in zone Prey Kabas
Squared cosines of the variables in Prey Kabas
Name of Variables Component
F1 F2 F3 F4 F5
Human resources
Active Farm Worker 0.002 0.480 0.231 0.040 0.063
% labor migration 0.010 0.161 0.049 0.189 0.438
Age of Household Head 0.035 0.401 0.080 0.112 0.027
Land resources
Farm size 0.680 0.051 0.035 0.066 0.005
Land Labor Ratio 0.540 0.251 0.000 0.072 0.000
% Rice land 0.009 0.000 0.467 0.006 0.083
% AC land 0.000 0.000 0.000 0.000 0.000
% VG land 0.000 0.000 0.000 0.000 0.000
Financial resources
Agricultural Asset 0.309 0.114 0.026 0.023 0.076
HH expenditure 0.337 0.137 0.099 0.010 0.001
HH income sources
Agricultural GVA 0.622 0.063 0.008 0.068 0.040
Rice GVA 0.693 0.028 0.002 0.007 0.003
AC GVA 0.000 0.000 0.000 0.000 0.000
VG GVA 0.000 0.000 0.000 0.000 0.000
AN GVA 0.031 0.053 0.171 0.458 0.072
Total non-farm income 0.005 0.222 0.179 0.123 0.218
Eigenvalues 3.272 1.962 1.348 1.174 1.027
Cumulative explained variance 27.27 43.62 54.85 64.64 73.20
Rice GVA VG GVA
AC GVA
Farm worker
%Rice land
%AC land
%VG land
HH EXP
Agricultural GVA
Land labor ratio
Total non-farm.GVA
% migration-active worker Farm assets
AN GVA (exclude CAT)
Land
Age
-1
-0.75
-0.5
-0.25
0
0.25
0.5
0.75
1
-1 -0.75 -0.5 -0.25 0 0.25 0.5 0.75 1
F2 (
16
.35
%)
F1 (27.27 %)
Variables (axes F1 and F2: 43.62 %)
282
283
284
285
286
287 288
289
290
291 292
293
294 295
296
297 300
301 302 303
304 306
308
309
310
311
312
313
314 315
316
317
318 319 320 321
322
323
324
325
326
327
328
329 330
331
332
334
335
336 337
338
340 341 342
343
344 345
346 347
348
349
350 351
352 353 354
355
356 357
358
359 360
361 362
363
364 365
366 367 368
369 370
371 372 373 374
376
377
378
379
380 381 382
383
PB-1
PB-2
PB-3
-4
-3
-2
-1
0
1
2
3
4
5
6
-5 -4 -3 -2 -1 0 1 2 3 4 5 6
F2
(1
6.3
5 %
)
F1 (27.27 %)
Observations (axes F1 and F2: 43.62 %)
0
20
40
60
80
100
0
0.5
1
1.5
2
2.5
3
3.5
F1 F2 F3 F4 F5 F6 F7 F8 F9 F10 F11 F12 Cu
mu
lati
ve v
ari
ab
ilit
y %
)
Eig
en
valu
e
axis
Scree plot
323
288
376
303
374
321
365
355
290
314
370
349
367
283
313
378
292
383
361
318
330
325
335
362
312
366
297
308
329
300
368
291
316
284
320
319
338
364
341
342
287
372
379
369
310
345
371
373
381
293
382
332
327
348
301
311
302
344
380
350
340
317
322
315
359
282
334
351
346
336
363
306
331
304
326
294
289
353
296
328
358
324
337
347
285
356
295
360
343
357
286
377
352
309
354
0
10
20
30
40
50
60
70
Dis
sim
ilari
ty
Dendrogram

318
Correlation Matrix variable PCA in Prey Kabas
Correlation matrix (Pearson (n)): Zone Prey Kabas
Variables Rice
GVA
VG
GVA
AC
GVA
Active
Farm
Worker
%
Rice
land
%
AC
land
%
VG
land
HH
expenditure
Agricultural
GVA
Land
Labor
Ratio
Total
non-
farm
income
% labor
migration
Agricultural
Asset
AN GVA
(exclu.cattle)
Farm
size
Age of
Household
Head
Rice GVA 1
0.065 -0.068
0.412 0.836 0.416 0.014 0.034 0.398 -0.037 0.554 -0.090
VG GVA
AC GVA
Active Farm Worker 0.065
1 -0.139
0.031 0.089 -0.398 0.127 -0.021 0.263 0.039 -0.044 0.419
% Rice land -0.068
-0.139 1
0.009 -0.054 -0.042 0.196 0.041 -0.042 0.096 -0.097 -0.045
% AC land
% VG land
HH expenditure 0.412
0.031 0.009
1 0.433 0.257 0.268 0.084 0.303 0.239 0.337 0.070
Agricultural GVA 0.836
0.089 -0.054
0.433 1 0.295 -0.048 0.028 0.373 0.330 0.413 -0.110
Land Labor Ratio 0.416
-0.398 -0.042
0.257 0.295 1 -0.190 -0.157 0.212 -0.018 0.881 -0.254
Total non-farm income 0.014
0.127 0.196
0.268 -0.048 -0.190 1 0.131 0.052 -0.034 -0.137 0.133
% labor migration 0.034
-0.021 0.041
0.084 0.028 -0.157 0.131 1 -0.052 0.025 -0.136 0.311
Agricultural Asset 0.398
0.263 -0.042
0.303 0.373 0.212 0.052 -0.052 1 0.138 0.358 0.035
AN GVA (exclu.cattle) -0.037
0.039 0.096
0.239 0.330 -0.018 -0.034 0.025 0.138 1 -0.039 -0.049
Farm size 0.554
-0.044 -0.097
0.337 0.413 0.881 -0.137 -0.136 0.358 -0.039 1 -0.092
Age of Household Head -0.090
0.419 -0.045
0.070 -0.110 -0.254 0.133 0.311 0.035 -0.049 -0.092 1
Values in bold are different from 0 with a significance level alpha=0.05

319
3. PCA and Cluster analysis in zone Otdar Meanchey
Squared cosines of the variables in Otdar Meanchey
Name of Variables Component
F1 F2 F3 F4 F5 F6
Human resources
Active Farm Worker 0.002 0.103 0.439 0.039 0.215 0.003
Age of Household Head 0.005 0.040 0.533 0.009 0.000 0.005
Land resources
Farm size 0.774 0.020 0.004 0.015 0.061 0.001
Land Labor Ratio 0.539 0.004 0.191 0.094 0.000 0.013
% Rice land 0.025 0.575 0.036 0.001 0.017 0.004
% AC land 0.001 0.736 0.068 0.062 0.009 0.000
% VG land 0.099 0.108 0.037 0.456 0.011 0.005
Financial resources
Agricultural Asset 0.200 0.065 0.033 0.095 0.001 0.132
HH expenditure 0.161 0.003 0.013 0.011 0.497 0.001
Agricultural Expense (IC+PL) 0.611 0.005 0.020 0.030 0.028 0.006
Cattle Stock Value 0.067 0.001 0.238 0.024 0.196 0.013
HH income sources
Agricultural GVA 0.758 0.012 0.041 0.020 0.002 0.014
Rice GVA 0.720 0.054 0.008 0.001 0.008 0.010
AC GVA 0.030 0.711 0.067 0.030 0.001 0.000
VG GVA 0.105 0.059 0.061 0.436 0.009 0.063
AN GVA 0.141 0.000 0.001 0.007 0.006 0.744
Eigenvalues 4.240 2.496 1.789 1.329 1.062 1.014
Cumulative explained variance 26.50 42.10 53.28 61.59 68.23 74.57
Rice GVA
VG.VA$
AC GVA
Farm worker
%Rice land
%AC land
%VG land
HH EXP Agricultural GVA
Agricultural IC+PL
Land labor ratio
Farm assets
Cattle stock value
AN GVA (exclude CAT)
Land Age
-1
-0.75
-0.5
-0.25
0
0.25
0.5
0.75
1
-1 -0.75 -0.5 -0.25 0 0.25 0.5 0.75 1
F2
(15.3
2 %
)
F1 (27.45 %)
Variables (axes F1 and F2: 42.77 %)
1 2
3 4 5 6 7 8
9 10
11 12
13
14 15 16
17 18
19
20
21
22 23 24 25
26
27
28
29 30 31 32
33 34
36 37 38
39 40 41 42 43 44 45
46
47
49 50 51 52 53 54 55 56
57 58 59
60
61 62 63 64 65
66 67
68
69 70 71 72 73
74 75 76 77 78 79
80
81 82
83
84 85 86
87
88
89
90 91
92 93 94
95 96 98
99 100 101 102 103 104 105 106 107 108 109 110
111 112 113 114 115
116 117 118 119 120 121 122 123
124 125 126 127 128 129 130 131
132 133
134 135 136 137
138
139
140
141 142 143 144 145
146 147 148 149 150 151 152
153 154 155 156 157
158 159 160 161
162
163
164
165 166 167 168 169
170 171
172
173
174 175
176 177
178 179
180 181
182
183
384
OMC-1 OMC-2
OMC-3 OMC-4
-4
-2
0
2
4
6
8
10
-10 -8 -6 -4 -2 0 2 4 6 8 10
F2
(15.6
0 %
)
F1 (26.50 %)
Observations (axes F1 and F2: 42.10 %)
0
20
40
60
80
100
0
0.5
1
1.5
2
2.5
3
3.5
4
4.5
F1 F3 F5 F7 F9 F11 F13 F15
Cu
mu
lati
ve v
ari
ab
ilit
y %
)
Eig
en
valu
e
axis
Scree plot
60
138
164
163
182 33
18
3 10
13
9 19
26
34
82
28
68
178
140
172 87
17
9 67
36
63
110
156 44
16
0 55
148 20
29
70
91
25
79
12
3 86
18
40
73
98
139
131
151
134
155
157 22
17
6 56
125
104
128 6
89
10
7 50
112
105
168 16
11
4 11
3 24
159 54
12
1 38
4 1
119 59
65
84
13
5 81
115
162 90
17
3 21
38
92
11
124
127
158 95
2 47
14
7 12
43
126
177
122
153
109
169
137 64
11
8 10
3 13
0 53
167 7
12
9 57
136 8
76
14
6 16
6 39
72
117
120 37
93
94
80
17
0 14
4 17
5 16
5 17
4 11
1 14
2 13
2 58
149 27
31
49
15
2 14
15
17
42
71
77
161 23
41
10
0 3
75
116
101
150
108
171
102 61
99
51
66
15
4 18
0 69
181
141
143 30
32
46
85
88
83
14
5 13
3 74
45
52
78
96
4 10
6 5
62
0
20
40
60
80
100
120
140
Dis
sim
ilari
ty
Dendrogram

Correlation Matrix variable PCA in Otdar Meanchey
Correlation matrix (Pearson (n)): Otdar Meanchey
Variables Rice GVA
VG GVA
AC GVA
Active
Farm
Worker
%
Rice
land
% AC land
% VG land
HH expenditure
Agricultural GVA
Agricultura
l Expense
(IC+PL)
Land
Labor
Ratio
Agricultural Asset
Cattle
Stock
Value
AN GVA (exclu.cattle)
Farm size
Age of
Househol
d Head
Rice GVA 1 0.147 -0.053 0.159 0.238 -0.125 0.139 0.243 0.793 0.561 0.550 0.352 0.254 0.161 0.809 0.016
VG GVA 0.147 1 0.109 -0.054 -0.056 0.021 0.473 0.138 0.309 0.187 0.181 -0.015
-0.004 0.019 0.174 -0.144
AC GVA -0.053 0.109 1 -0.084 -0.498 0.825 0.150 0.166 0.269 0.163 0.102 -0.023 0.082 0.047 0.054 -0.048
Active Farm Worker 0.159
-
0.054 -0.084 1 0.162 -0.058 -0.044 -0.084 0.105 -0.030 -0.362 0.180 0.105 0.053 0.201 0.387
% Rice land 0.238
-0.056 -0.498 0.162 1 -0.592 -0.158 0.119 0.016 0.074 0.121 0.150 0.014 0.068 0.191 -0.056
% AC land -0.125 0.021 0.825 -0.058 -0.592 1
0.074 0.027 0.111 0.088 0.026 -0.106 0.016 -0.025 -0.021 -0.054
% VG land 0.139 0.473 0.150 -0.044 -0.158 0.074 1 0.134 0.290 0.218 0.148 -0.068 0.031 0.102 0.155 -0.136
HH expenditure 0.243 0.138 0.166 -0.084 0.119 0.027 0.134 1 0.341 0.205 0.192 0.236 0.171 0.170 0.178 0.078
Agricultural GVA 0.793 0.309 0.269 0.105 0.016 0.111 0.290 0.341 1 0.551 0.474 0.254 0.370 0.409 0.705 0.027
Agricultural Expense (IC+PL)
0.561 0.187 0.163 -0.030 0.074 0.088 0.218 0.205 0.551 1 0.634 0.329 0.027 0.308 0.660 -0.115
Land Labor Ratio 0.550 0.181 0.102 -0.362 0.121 0.026 0.148 0.192 0.474 0.634 1 0.286
-0.008 0.148 0.683 -0.292
Agricultural Asset 0.352
-
0.015 -0.023 0.180 0.150 -0.106 -0.068 0.236 0.254 0.329 0.286 1 0.110 0.019 0.384 0.074
Cattle Stock Value 0.254
-
0.004 0.082 0.105 0.014 0.016 0.031 0.171 0.370 0.027 -0.008 0.110 1 0.041 0.159 0.205
AN GVA (exclu.cattle) 0.161 0.019 0.047 0.053 0.068 -0.025 0.102 0.170 0.409 0.308 0.148 0.019 0.041 1 0.255 -0.044
Farm size 0.809 0.174 0.054 0.201 0.191 -0.021 0.155 0.178 0.705 0.660 0.683 0.384 0.159 0.255 1 0.025
Age of Household Head 0.016
-
0.144 -0.048 0.387 -0.056 -0.054 -0.136 0.078 0.027 -0.115 -0.292 0.074 0.205 -0.044 0.025 1
Values in bold are different from 0 with a significance level alpha=0.05
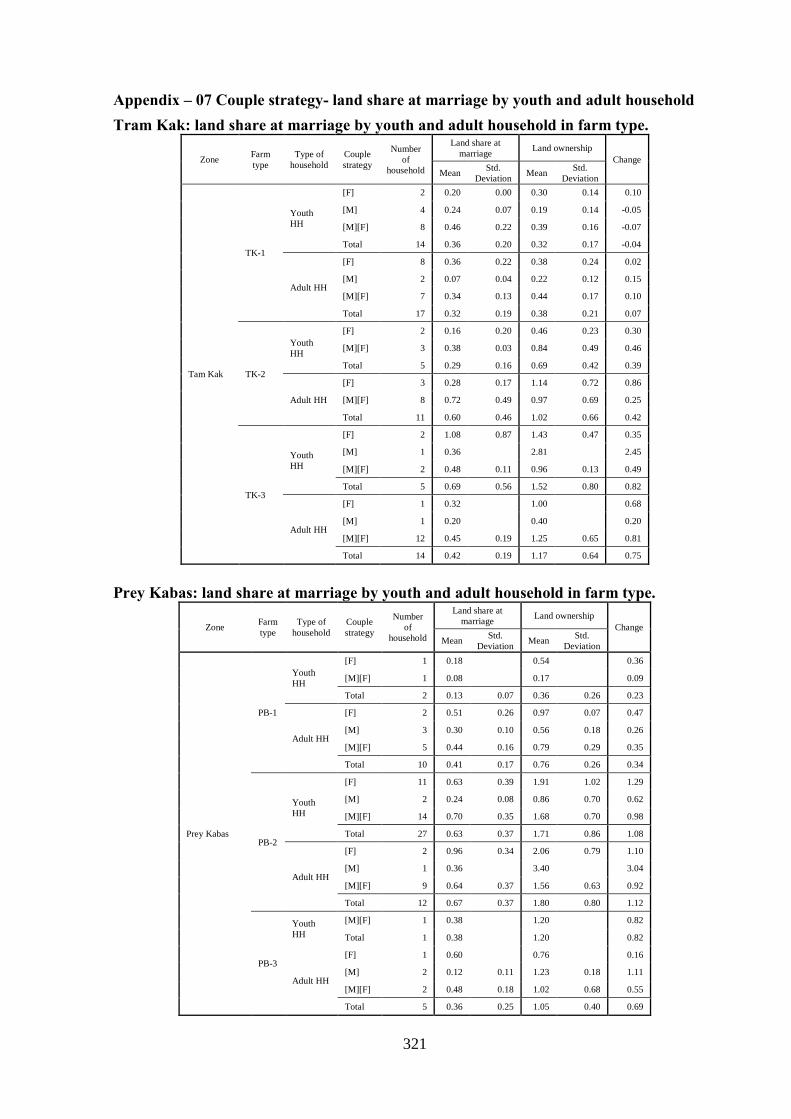
321
Appendix – 07 Couple strategy- land share at marriage by youth and adult household
Tram Kak: land share at marriage by youth and adult household in farm type.
Zone Farm
type
Type of
household
Couple
strategy
Number
of
household
Land share at
marriage Land ownership
Change
Mean Std.
Deviation Mean
Std.
Deviation
Tam Kak
TK-1
Youth
HH
[F] 2 0.20 0.00 0.30 0.14 0.10
[M] 4 0.24 0.07 0.19 0.14 -0.05
[M][F] 8 0.46 0.22 0.39 0.16 -0.07
Total 14 0.36 0.20 0.32 0.17 -0.04
Adult HH
[F] 8 0.36 0.22 0.38 0.24 0.02
[M] 2 0.07 0.04 0.22 0.12 0.15
[M][F] 7 0.34 0.13 0.44 0.17 0.10
Total 17 0.32 0.19 0.38 0.21 0.07
TK-2
Youth
HH
[F] 2 0.16 0.20 0.46 0.23 0.30
[M][F] 3 0.38 0.03 0.84 0.49 0.46
Total 5 0.29 0.16 0.69 0.42 0.39
Adult HH
[F] 3 0.28 0.17 1.14 0.72 0.86
[M][F] 8 0.72 0.49 0.97 0.69 0.25
Total 11 0.60 0.46 1.02 0.66 0.42
TK-3
Youth
HH
[F] 2 1.08 0.87 1.43 0.47 0.35
[M] 1 0.36 2.81 2.45
[M][F] 2 0.48 0.11 0.96 0.13 0.49
Total 5 0.69 0.56 1.52 0.80 0.82
Adult HH
[F] 1 0.32 1.00 0.68
[M] 1 0.20 0.40 0.20
[M][F] 12 0.45 0.19 1.25 0.65 0.81
Total 14 0.42 0.19 1.17 0.64 0.75
Prey Kabas: land share at marriage by youth and adult household in farm type.
Zone Farm
type
Type of
household
Couple
strategy
Number
of
household
Land share at
marriage Land ownership
Change
Mean Std.
Deviation Mean
Std.
Deviation
Prey Kabas
PB-1
Youth
HH
[F] 1 0.18 0.54 0.36
[M][F] 1 0.08 0.17 0.09
Total 2 0.13 0.07 0.36 0.26 0.23
Adult HH
[F] 2 0.51 0.26 0.97 0.07 0.47
[M] 3 0.30 0.10 0.56 0.18 0.26
[M][F] 5 0.44 0.16 0.79 0.29 0.35
Total 10 0.41 0.17 0.76 0.26 0.34
PB-2
Youth
HH
[F] 11 0.63 0.39 1.91 1.02 1.29
[M] 2 0.24 0.08 0.86 0.70 0.62
[M][F] 14 0.70 0.35 1.68 0.70 0.98
Total 27 0.63 0.37 1.71 0.86 1.08
Adult HH
[F] 2 0.96 0.34 2.06 0.79 1.10
[M] 1 0.36 3.40 3.04
[M][F] 9 0.64 0.37 1.56 0.63 0.92
Total 12 0.67 0.37 1.80 0.80 1.12
PB-3
Youth
HH
[M][F] 1 0.38 1.20 0.82
Total 1 0.38 1.20 0.82
Adult HH
[F] 1 0.60 0.76 0.16
[M] 2 0.12 0.11 1.23 0.18 1.11
[M][F] 2 0.48 0.18 1.02 0.68 0.55
Total 5 0.36 0.25 1.05 0.40 0.69
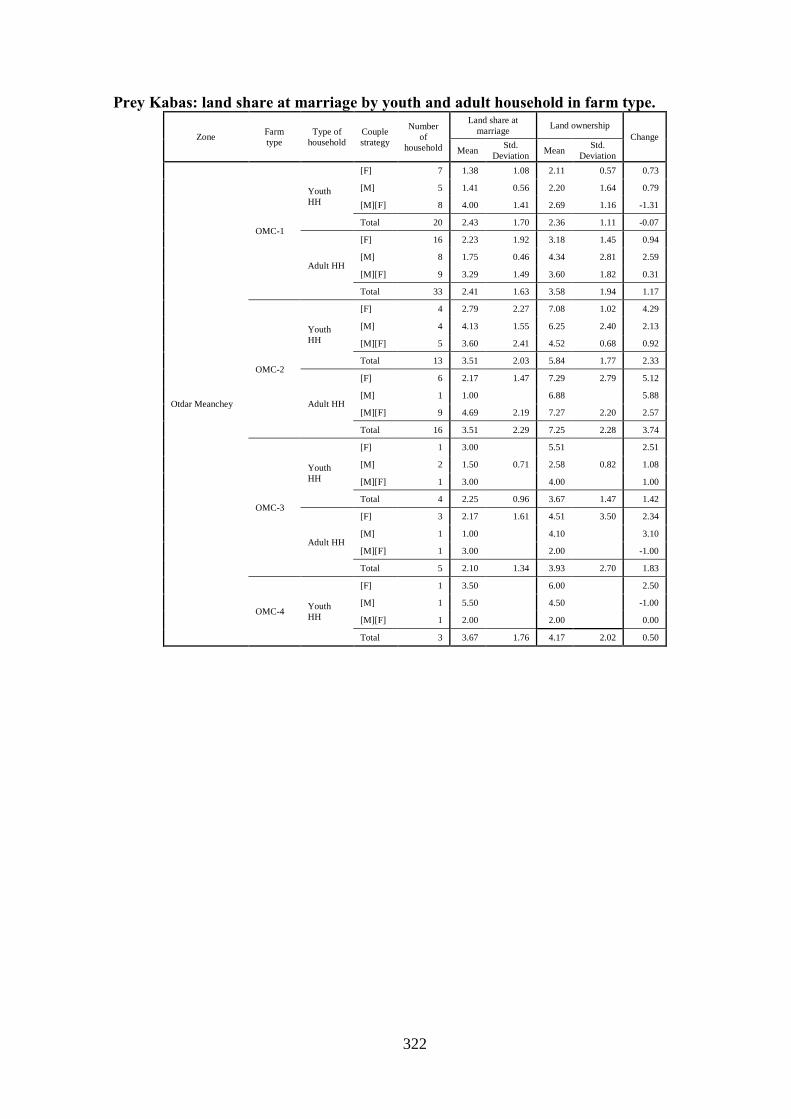
322
Prey Kabas: land share at marriage by youth and adult household in farm type.
Zone Farm
type
Type of
household
Couple
strategy
Number
of
household
Land share at
marriage Land ownership
Change
Mean Std.
Deviation Mean
Std.
Deviation
Otdar Meanchey
OMC-1
Youth
HH
[F] 7 1.38 1.08 2.11 0.57 0.73
[M] 5 1.41 0.56 2.20 1.64 0.79
[M][F] 8 4.00 1.41 2.69 1.16 -1.31
Total 20 2.43 1.70 2.36 1.11 -0.07
Adult HH
[F] 16 2.23 1.92 3.18 1.45 0.94
[M] 8 1.75 0.46 4.34 2.81 2.59
[M][F] 9 3.29 1.49 3.60 1.82 0.31
Total 33 2.41 1.63 3.58 1.94 1.17
OMC-2
Youth
HH
[F] 4 2.79 2.27 7.08 1.02 4.29
[M] 4 4.13 1.55 6.25 2.40 2.13
[M][F] 5 3.60 2.41 4.52 0.68 0.92
Total 13 3.51 2.03 5.84 1.77 2.33
Adult HH
[F] 6 2.17 1.47 7.29 2.79 5.12
[M] 1 1.00 6.88
5.88
[M][F] 9 4.69 2.19 7.27 2.20 2.57
Total 16 3.51 2.29 7.25 2.28 3.74
OMC-3
Youth
HH
[F] 1 3.00 5.51
2.51
[M] 2 1.50 0.71 2.58 0.82 1.08
[M][F] 1 3.00 4.00
1.00
Total 4 2.25 0.96 3.67 1.47 1.42
Adult HH
[F] 3 2.17 1.61 4.51 3.50 2.34
[M] 1 1.00 4.10
3.10
[M][F] 1 3.00 2.00
-1.00
Total 5 2.10 1.34 3.93 2.70 1.83
OMC-4 Youth
HH
[F] 1 3.50 6.00 2.50
[M] 1 5.50 4.50
-1.00
[M][F] 1 2.00 2.00 0.00
Total 3 3.67 1.76 4.17 2.02 0.50
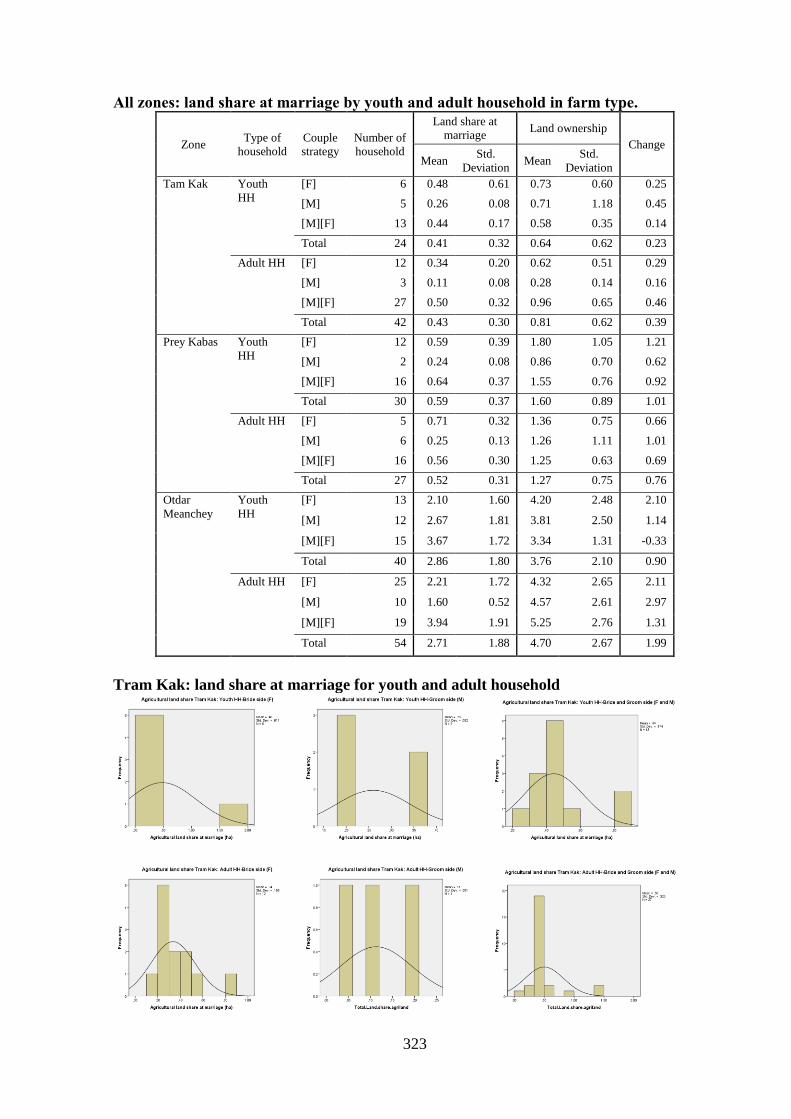
323
All zones: land share at marriage by youth and adult household in farm type.
Zone Type of
household
Couple
strategy
Number of
household
Land share at
marriage Land ownership
Change
Mean Std.
Deviation Mean
Std.
Deviation
Tam Kak Youth
HH
[F] 6 0.48 0.61 0.73 0.60 0.25
[M] 5 0.26 0.08 0.71 1.18 0.45
[M][F] 13 0.44 0.17 0.58 0.35 0.14
Total 24 0.41 0.32 0.64 0.62 0.23
Adult HH [F] 12 0.34 0.20 0.62 0.51 0.29
[M] 3 0.11 0.08 0.28 0.14 0.16
[M][F] 27 0.50 0.32 0.96 0.65 0.46
Total 42 0.43 0.30 0.81 0.62 0.39
Prey Kabas Youth
HH
[F] 12 0.59 0.39 1.80 1.05 1.21
[M] 2 0.24 0.08 0.86 0.70 0.62
[M][F] 16 0.64 0.37 1.55 0.76 0.92
Total 30 0.59 0.37 1.60 0.89 1.01
Adult HH [F] 5 0.71 0.32 1.36 0.75 0.66
[M] 6 0.25 0.13 1.26 1.11 1.01
[M][F] 16 0.56 0.30 1.25 0.63 0.69
Total 27 0.52 0.31 1.27 0.75 0.76
Otdar
Meanchey
Youth
HH
[F] 13 2.10 1.60 4.20 2.48 2.10
[M] 12 2.67 1.81 3.81 2.50 1.14
[M][F] 15 3.67 1.72 3.34 1.31 -0.33
Total 40 2.86 1.80 3.76 2.10 0.90
Adult HH [F] 25 2.21 1.72 4.32 2.65 2.11
[M] 10 1.60 0.52 4.57 2.61 2.97
[M][F] 19 3.94 1.91 5.25 2.76 1.31
Total 54 2.71 1.88 4.70 2.67 1.99
Tram Kak: land share at marriage for youth and adult household

324
Prey Kabas: land share at marriage for youth and adult household
Otdar Meanchey: land share at marriage for youth and adult household
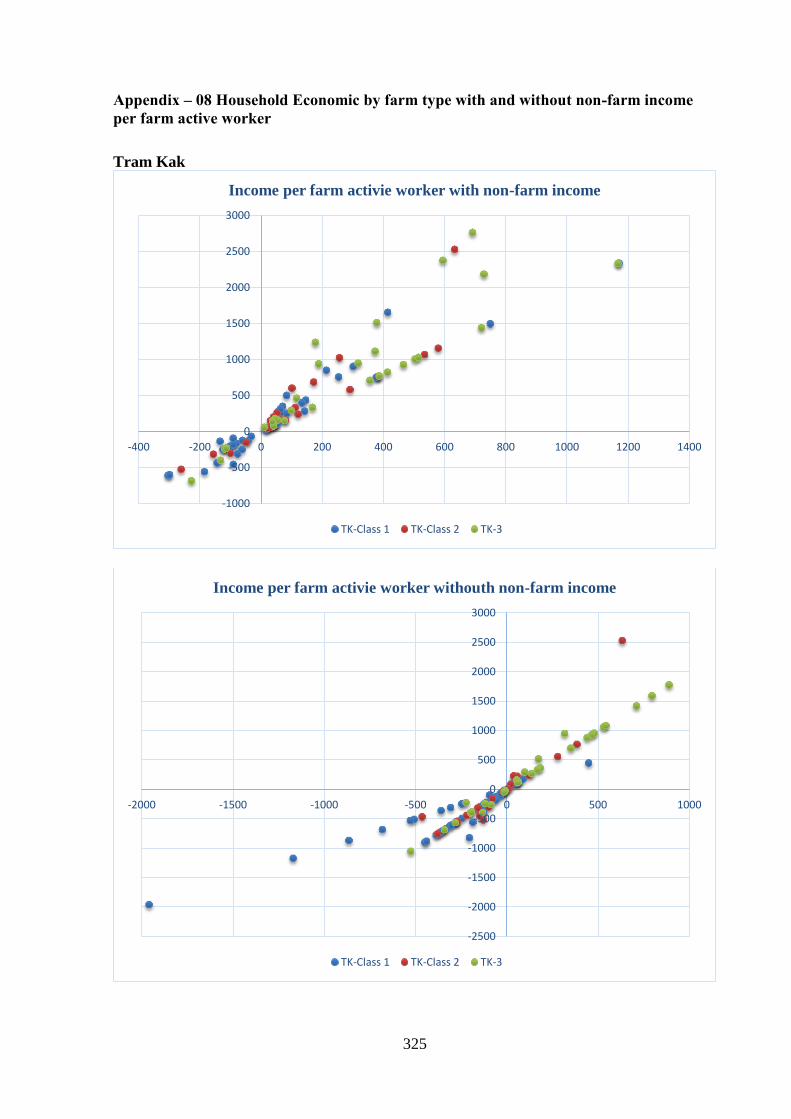
325
Appendix – 08 Household Economic by farm type with and without non-farm income
per farm active worker
Tram Kak
-1000
-500
0
500
1000
1500
2000
2500
3000
-400 -200 0 200 400 600 800 1000 1200 1400
Income per farm activie worker with non-farm income
TK-Class 1 TK-Class 2 TK-3
-2500
-2000
-1500
-1000
-500
0
500
1000
1500
2000
2500
3000
-2000 -1500 -1000 -500 0 500 1000
Income per farm activie worker withouth non-farm income
TK-Class 1 TK-Class 2 TK-3
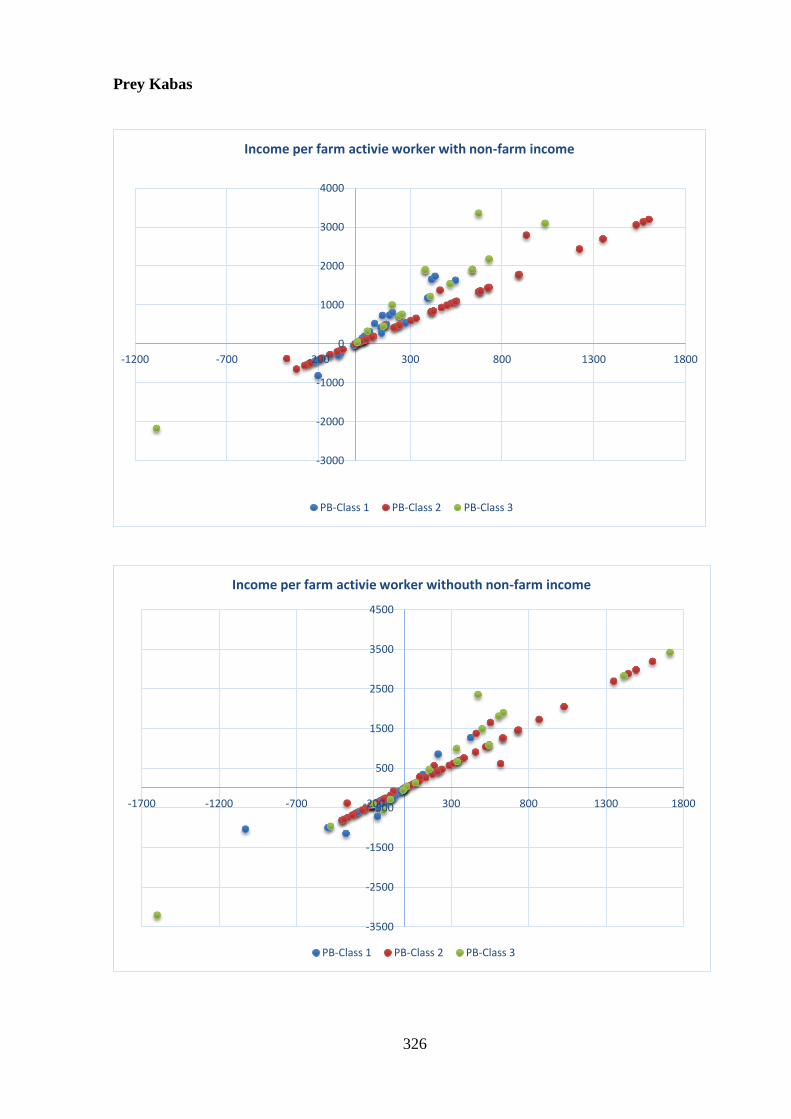
326
Prey Kabas
-3000
-2000
-1000
0
1000
2000
3000
4000
-1200 -700 -200 300 800 1300 1800
Income per farm activie worker with non-farm income
PB-Class 1 PB-Class 2 PB-Class 3
-3500
-2500
-1500
-500
500
1500
2500
3500
4500
-1700 -1200 -700 -200 300 800 1300 1800
Income per farm activie worker withouth non-farm income
PB-Class 1 PB-Class 2 PB-Class 3
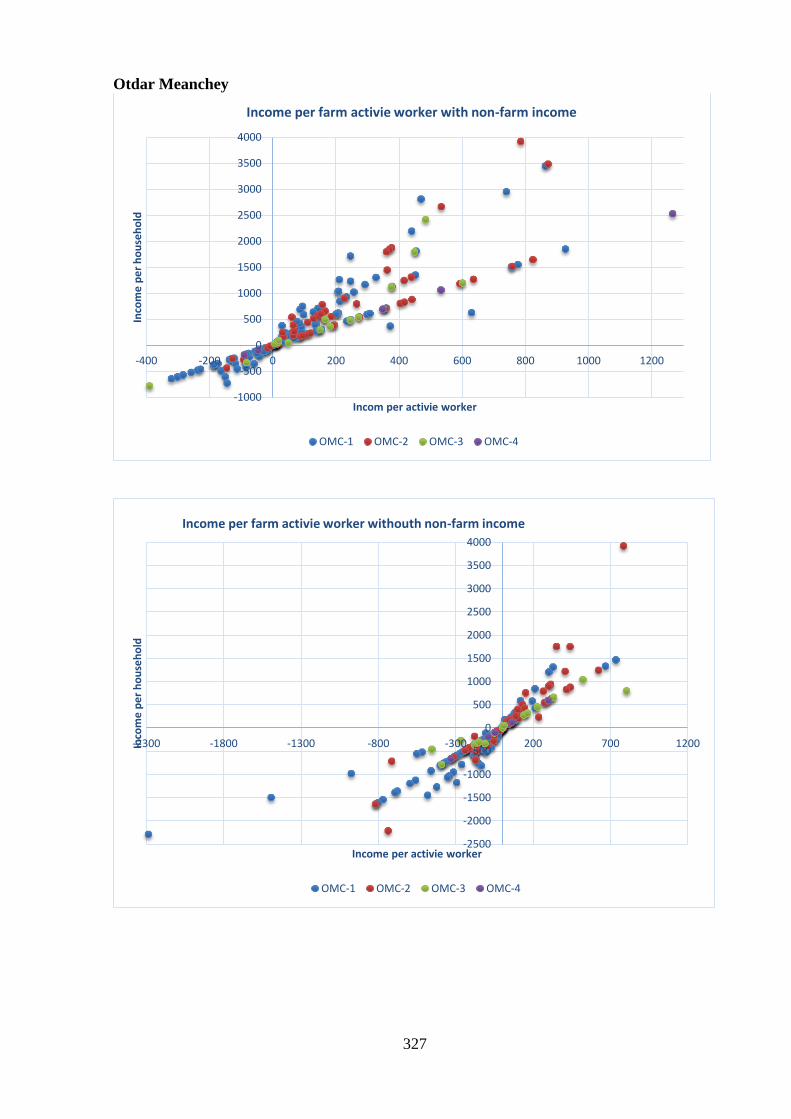
327
Otdar Meanchey
-1000
-500
0
500
1000
1500
2000
2500
3000
3500
4000
-400 -200 0 200 400 600 800 1000 1200
Inco
me
pe
r h
ou
seh
old
Incom per activie worker
Income per farm activie worker with non-farm income
OMC-1 OMC-2 OMC-3 OMC-4
-2500
-2000
-1500
-1000
-500
0
500
1000
1500
2000
2500
3000
3500
4000
-2300 -1800 -1300 -800 -300 200 700 1200Inco
me
pe
r h
ou
seh
old
Income per activie worker
Income per farm activie worker withouth non-farm income
OMC-1 OMC-2 OMC-3 OMC-4

328
Appendix – 09 Youth integration capacity by zone by youth adult household
Zone HH Capacity Number of
household %
Number of
person to
be added
Youth
Farming
Youth
Migration
Youth
Non-
farming
Youth
Studying
Youth
total
Under
youth
Tam Kak
Youth
HH
No 18 72% -39.46 30 2 2 0 34 33
Subsistence 2 8% 0.47 3 0 1 0 4 4
Yes 5 20% 13.27 6 0 4 0 10 10
Total 25 100% -25.72 39 2 7 0 48 47
Adult
HH
No 40 56% -79.91 25 34 0 29 88 32
Subsistence 10 14% 4.36 7 9 3 6 25 9
Yes 21 30% 89.59 11 18 1 25 55 12
Total 71 100% 14.04 43 61 4 60 168 53
Total
No 58 60% -119.37 55 36 2 29 122 65
Subsistence 12 13% 4.83 10 9 4 6 29 13
Yes 26 27% 102.86 17 18 5 25 65 22
Total 96 100% -11.68 82 63 11 60 216 100
Prey Kabas
Youth
HH
No 19 59% -35.22 36 0 1 4 41 34
Subsistence 4 13% 2.43 8 0 0 1 9 7
Yes 9 28% 24.96 17 2 1 2 22 19
Total 32 100% -7.83 61 2 2 7 72 60
Adult
HH
No 38 60% -66.73 40 14 1 40 95 29
Subsistence 9 14% 4.16 8 1 4 10 23 3
Yes 16 25% 54.67 17 8 1 22 48 15
Total 63 100% -7.90 65 23 6 72 166 47
Total
No 57 60% -101.95 76 14 2 44 136 63
Subsistence 13 14% 6.59 16 1 4 11 32 10
Yes 25 26% 79.63 34 10 2 24 70 34
Total 95 100% -15.74 126 25 8 79 238 107
Otdar
Meanchey
Youth
HH
No 40 75% -95.51 77 5 2 5 89 73
Subsistence 7 13% 3.48 13 0 1 0 14 13
Yes 6 11% 28.30 10 0 2 2 14 9
Total 53 100% -63.73 100 5 5 7 117 95
Adult
HH
No 78 61% -185.27 131 40 5 26 202 107
Subsistence 13 10% 7.02 21 7 3 4 35 20
Yes 37 29% 134.91 47 21 15 36 119 50
Total 128 100% -43.34 199 68 23 66 356 177
Total
No 118 65% -280.78 208 45 7 31 291 180
Subsistence 20 11% 10.49 34 7 4 4 49 33
Yes 43 24% 163.21 57 21 17 38 133 59
Total 181 100% -107.07 299 73 28 73 473 272
All zones
Youth
HH
No 77 70% -170.19 143 7 5 9 164 140
Subsistence 13 12% 6.37 24 0 2 1 27 24
Yes 20 18% 66.53 33 2 7 4 46 38
Total 110 100% -97.29 200 9 14 14 237 202
Adult
HH
No 156 60% -331.91 196 88 6 95 385 168
Subsistence 32 12% 15.54 36 17 10 20 83 32
Yes 74 28% 279.17 75 47 17 83 222 77
Total 262 100% -37.20 307 152 33 198 690 277
Total
No 233 63% -502.10 339 95 11 104 549 308
Subsistence 45 12% 21.91 60 17 12 21 110 56
Yes 94 25% 345.70 108 49 24 87 268 115
Total 372 100% -134.49 507 161 47 212 927 479

329
Appendix – 10 Factors of production correlation
y = 0.0589x + 3.1493 R² = 0.0149
0
2
4
6
8
10
12
14
-6 -4 -2 0 2 4 6 8 10 12 14
Tota
l act
ive
wo
rker
Capacity: number of person to be added
Total active worker
y = 0.1904x - 0.801 R² = 0.0192
-10
-5
0
5
10
15
0 2 4 6 8 10 12 14
Cap
acit
y: n
um
ber
of
per
son
to
be
add
ed
Farm size
Farm size
y = 0.2007x - 0.8882 R² = 0.0231
-6
-4
-2
0
2
4
6
8
10
12
14
0.00 2.00 4.00 6.00 8.00 10.00 12.00 14.00
Cap
acit
y: n
um
ber
of
per
son
to
be
add
ed
Land index
Land index

330
Descriptive Statistics
Mean Std. Deviation N
Number of additional feeding
person based on total HH VA -0.34 2.99 372
Total active worker 3.13 1.44 372
Land farm size (Rice, AC, VG) 2.40 2.18 372
Agricultural IC and PL 638.26 649.54 372
Land index 2.71 2.26 372
Correlations
Number of
additional feeding
person
Total
active
worker
Land farm
size (Rice,
AC, VG)
Agricultural
IC and PL
Land
index
Number of
additional feeding
person
Pearson Correlation 1 .122* .139** .228** .152**
Sig. (2-tailed) .019 .007 .000 .003
N 372 372 372 372 372
Total active
worker
Pearson Correlation .122* 1 .244** -.092 .214**
Sig. (2-tailed) .019 .000 .075 .000
N 372 372 372 372 372
Land farm size
(Rice, AC, VG)
Pearson Correlation .139** .244** 1 .226** .960**
Sig. (2-tailed) .007 .000 .000 .000
N 372 372 372 372 372
Agricultural IC
and PL
Pearson Correlation .228** -.092 .226** 1 .260**
Sig. (2-tailed) .000 .075 .000 .000
N 372 372 372 372 372
Land index Pearson Correlation .152** .214** .960** .260** 1
Sig. (2-tailed) .003 .000 .000 .000
N 372 372 372 372 372
*. Correlation is significant at the 0.05 level (2-tailed).
**. Correlation is significant at the 0.01 level (2-tailed).
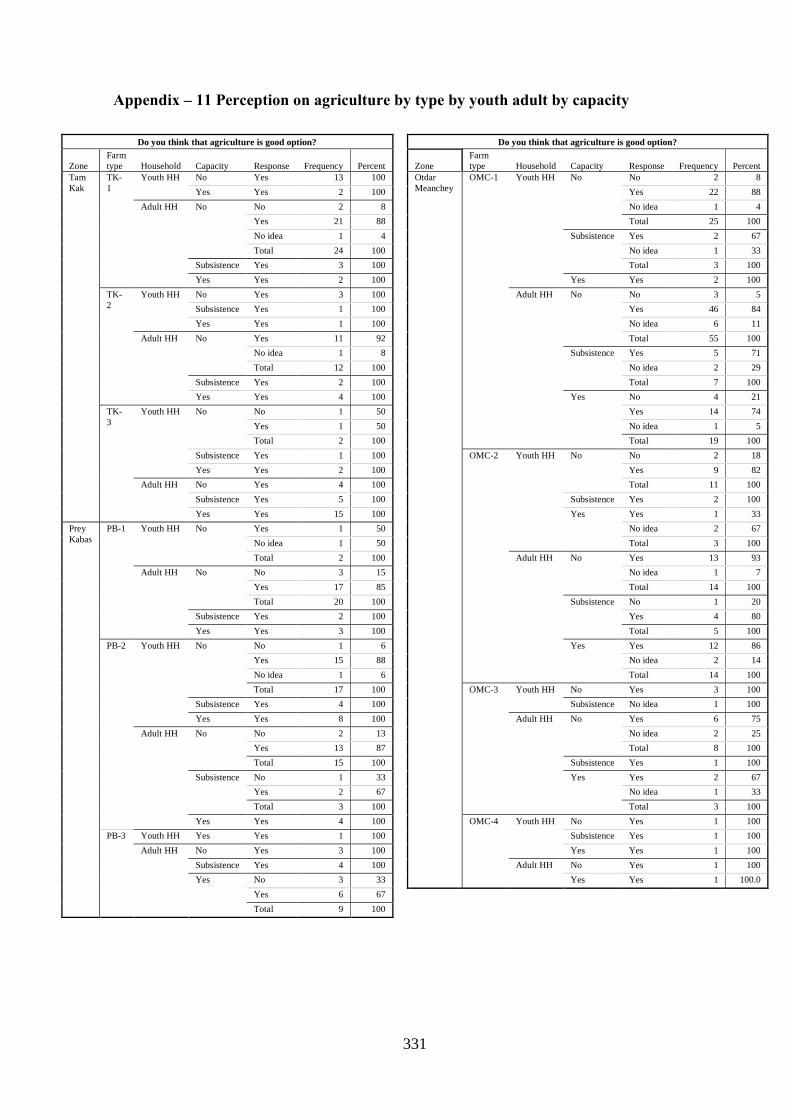
331
Appendix – 11 Perception on agriculture by type by youth adult by capacity
Do you think that agriculture is good option?
Do you think that agriculture is good option?
Zone
Farm
type Household Capacity Response Frequency Percent
Zone
Farm
type Household Capacity Response Frequency Percent
Tam
Kak
TK-
1
Youth HH No Yes 13 100
Otdar
Meanchey
OMC-1 Youth HH No No 2 8
Yes Yes 2 100
Yes 22 88
Adult HH No No 2 8
No idea 1 4
Yes 21 88
Total 25 100
No idea 1 4
Subsistence Yes 2 67
Total 24 100
No idea 1 33
Subsistence Yes 3 100
Total 3 100
Yes Yes 2 100
Yes Yes 2 100
TK-
2
Youth HH No Yes 3 100
Adult HH No No 3 5
Subsistence Yes 1 100
Yes 46 84
Yes Yes 1 100
No idea 6 11
Adult HH No Yes 11 92
Total 55 100
No idea 1 8
Subsistence Yes 5 71
Total 12 100
No idea 2 29
Subsistence Yes 2 100
Total 7 100
Yes Yes 4 100
Yes No 4 21
TK-
3
Youth HH No No 1 50
Yes 14 74
Yes 1 50
No idea 1 5
Total 2 100
Total 19 100
Subsistence Yes 1 100
OMC-2 Youth HH No No 2 18
Yes Yes 2 100
Yes 9 82
Adult HH No Yes 4 100
Total 11 100
Subsistence Yes 5 100
Subsistence Yes 2 100
Yes Yes 15 100
Yes Yes 1 33
Prey
Kabas
PB-1 Youth HH No Yes 1 50
No idea 2 67
No idea 1 50
Total 3 100
Total 2 100
Adult HH No Yes 13 93
Adult HH No No 3 15
No idea 1 7
Yes 17 85
Total 14 100
Total 20 100
Subsistence No 1 20
Subsistence Yes 2 100
Yes 4 80
Yes Yes 3 100
Total 5 100
PB-2 Youth HH No No 1 6
Yes Yes 12 86
Yes 15 88
No idea 2 14
No idea 1 6
Total 14 100
Total 17 100
OMC-3 Youth HH No Yes 3 100
Subsistence Yes 4 100
Subsistence No idea 1 100
Yes Yes 8 100
Adult HH No Yes 6 75
Adult HH No No 2 13
No idea 2 25
Yes 13 87
Total 8 100
Total 15 100
Subsistence Yes 1 100
Subsistence No 1 33
Yes Yes 2 67
Yes 2 67
No idea 1 33
Total 3 100
Total 3 100
Yes Yes 4 100
OMC-4 Youth HH No Yes 1 100
PB-3 Youth HH Yes Yes 1 100
Subsistence Yes 1 100
Adult HH No Yes 3 100
Yes Yes 1 100
Subsistence Yes 4 100
Adult HH No Yes 1 100
Yes No 3 33
Yes Yes 1 100.0
Yes 6 67
Total 9 100
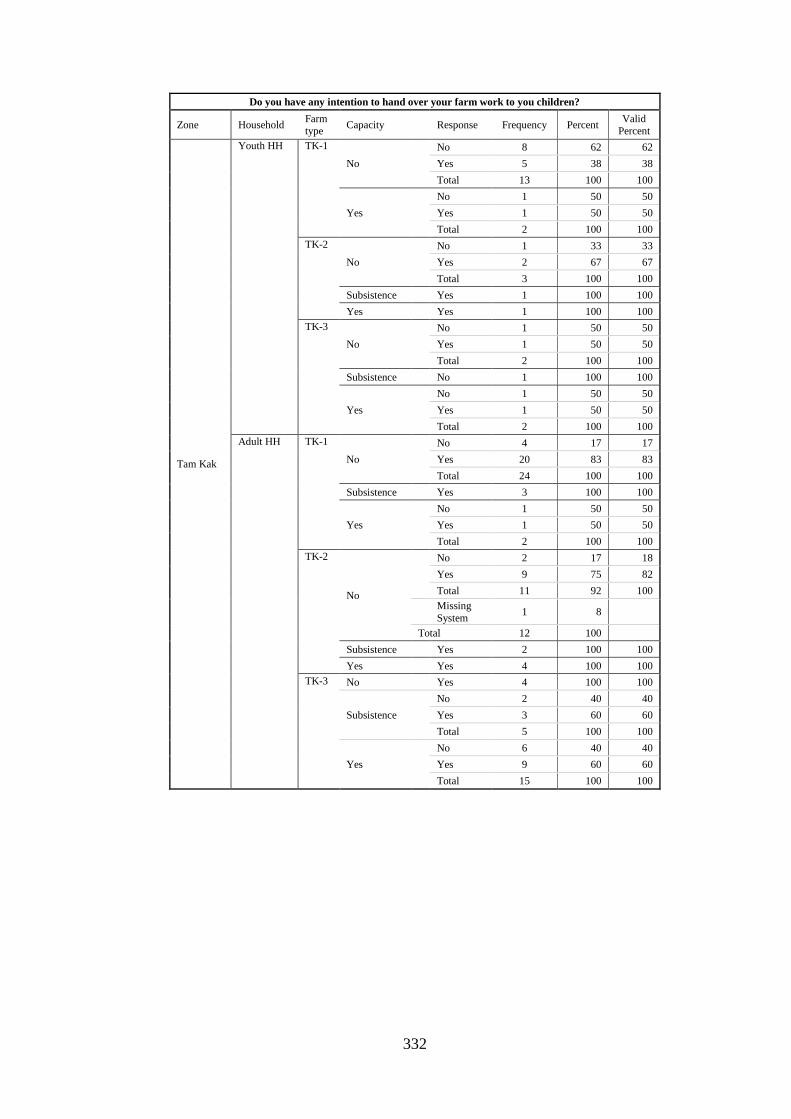
332
Do you have any intention to hand over your farm work to you children?
Zone Household Farm
type Capacity Response Frequency Percent
Valid
Percent
Tam Kak
Youth HH TK-1
No
No 8 62 62
Yes 5 38 38
Total 13 100 100
Yes
No 1 50 50
Yes 1 50 50
Total 2 100 100
TK-2
No
No 1 33 33
Yes 2 67 67
Total 3 100 100
Subsistence Yes 1 100 100
Yes Yes 1 100 100
TK-3
No
No 1 50 50
Yes 1 50 50
Total 2 100 100
Subsistence No 1 100 100
Yes
No 1 50 50
Yes 1 50 50
Total 2 100 100
Adult HH TK-1
No
No 4 17 17
Yes 20 83 83
Total 24 100 100
Subsistence Yes 3 100 100
Yes
No 1 50 50
Yes 1 50 50
Total 2 100 100
TK-2
No
No 2 17 18
Yes 9 75 82
Total 11 92 100
Missing
System 1 8
Total 12 100
Subsistence Yes 2 100 100
Yes Yes 4 100 100
TK-3 No Yes 4 100 100
Subsistence
No 2 40 40
Yes 3 60 60
Total 5 100 100
Yes
No 6 40 40
Yes 9 60 60
Total 15 100 100

333
Do you have any intention to hand over your farm work to you children?
Zone Household Farm
type Capacity Response Frequency Percent
Valid
Percent
Prey Kabas
Youth HH PB-1
No
No 1 50 100
Missing System 1 50
Total 2 100
PB-2
No
No 5 29 29
Yes 12 71 71
Total 17 100 100
Subsistence
No 1 25 25
Yes 3 75 75
Total 4 100 100
Yes
No 4 50 50
Yes 4 50 50
Total 8 100 100
PB-3 Yes
Yes 1 100 100
Adult HH PB-1
No
No 7 35 35
Yes 13 65 65
Total 20 100 100
Subsistence Yes 2 100 100
Yes Yes 3 100 100
PB-2
No
No 1 7 7
Yes 14 93 93
Total 15 100 100
Subsistence
No 1 33 33
Yes 2 67 67
Total 3 100 100
Yes
No 2 50 50
Yes 2 50 50
Total 4 100 100
PB-3 No Yes 3 100 100
Subsistence
No 1 25 25
Yes 3 75 75
Total 4 100 100
Yes
No 2 22 25
Yes 6 67 75
Total 8 89 100
Missing System 1 11
Total 9 100
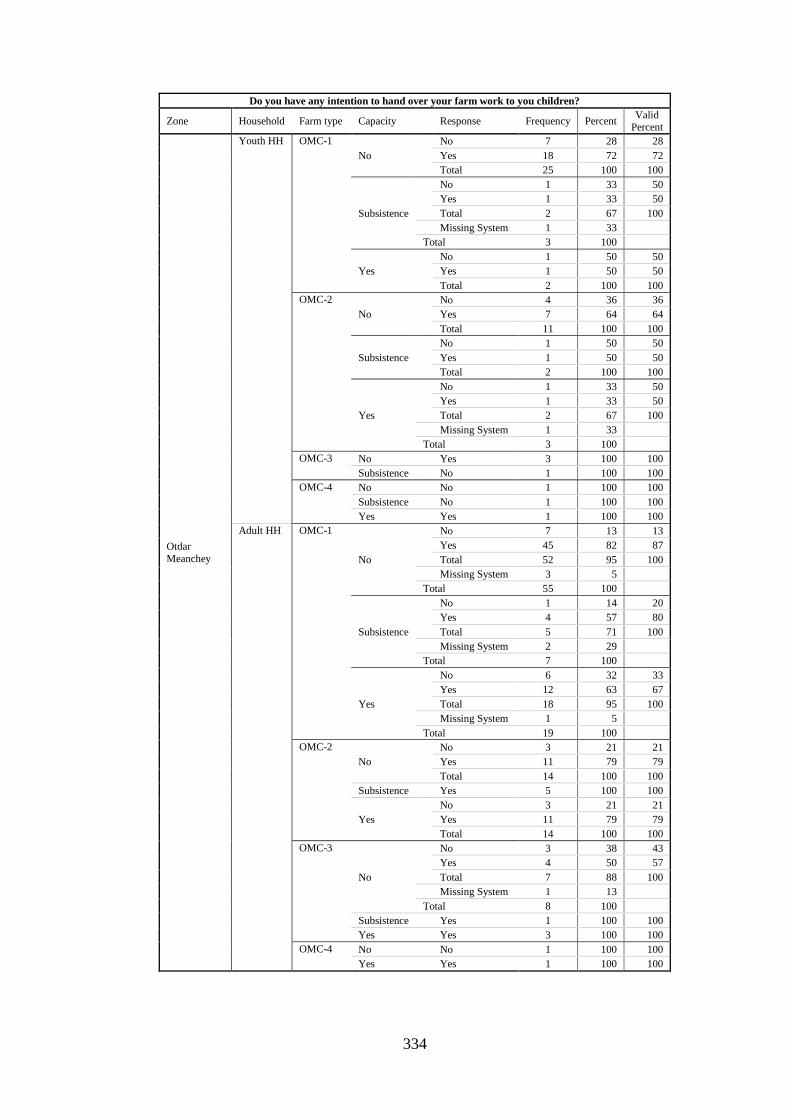
334
Do you have any intention to hand over your farm work to you children?
Zone Household Farm type Capacity Response Frequency Percent Valid
Percent
Otdar
Meanchey
Youth HH OMC-1
No
No 7 28 28
Yes 18 72 72
Total 25 100 100
Subsistence
No 1 33 50
Yes 1 33 50
Total 2 67 100
Missing System 1 33
Total 3 100
Yes
No 1 50 50
Yes 1 50 50
Total 2 100 100
OMC-2
No
No 4 36 36
Yes 7 64 64
Total 11 100 100
Subsistence
No 1 50 50
Yes 1 50 50
Total 2 100 100
Yes
No 1 33 50
Yes 1 33 50
Total 2 67 100
Missing System 1 33
Total 3 100
OMC-3 No Yes 3 100 100
Subsistence No 1 100 100
OMC-4 No No 1 100 100
Subsistence No 1 100 100
Yes Yes 1 100 100
Adult HH OMC-1
No
No 7 13 13
Yes 45 82 87
Total 52 95 100
Missing System 3 5
Total 55 100
Subsistence
No 1 14 20
Yes 4 57 80
Total 5 71 100
Missing System 2 29
Total 7 100
Yes
No 6 32 33
Yes 12 63 67
Total 18 95 100
Missing System 1 5
Total 19 100
OMC-2
No
No 3 21 21
Yes 11 79 79
Total 14 100 100
Subsistence Yes 5 100 100
Yes
No 3 21 21
Yes 11 79 79
Total 14 100 100
OMC-3
No
No 3 38 43
Yes 4 50 57
Total 7 88 100
Missing System 1 13
Total 8 100
Subsistence Yes 1 100 100
Yes Yes 3 100 100
OMC-4 No No 1 100 100
Yes Yes 1 100 100
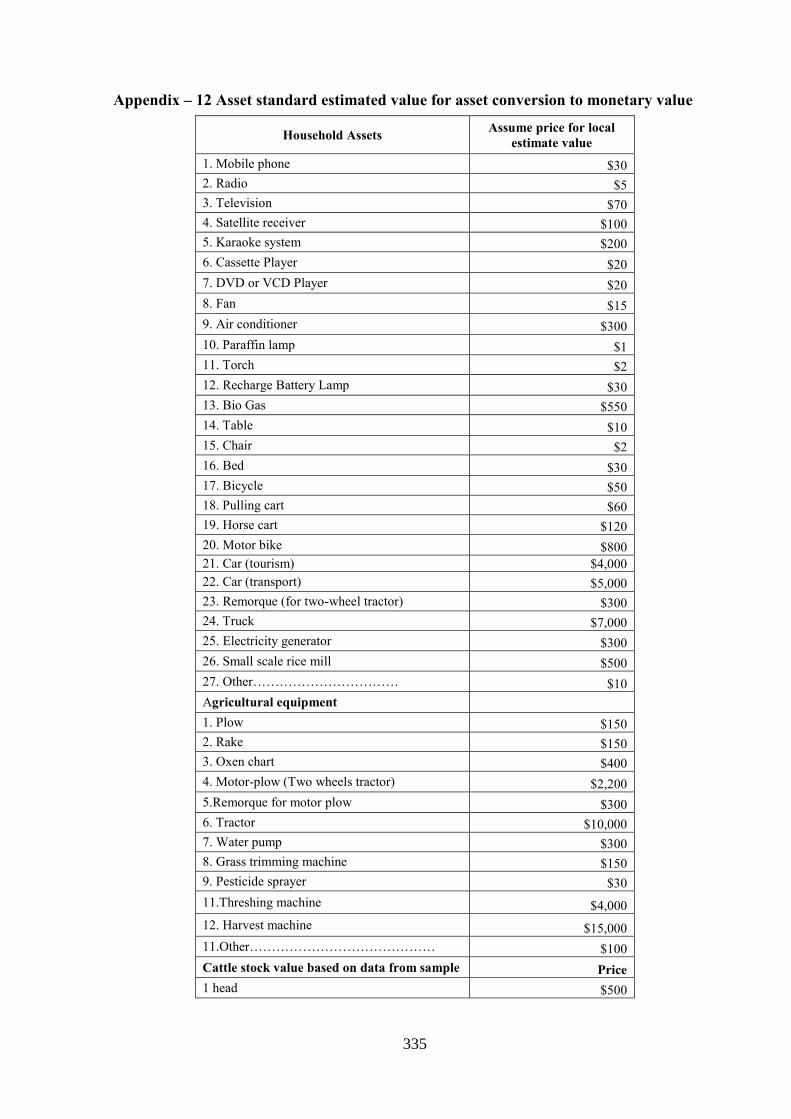
335
Appendix – 12 Asset standard estimated value for asset conversion to monetary value
Household Assets Assume price for local
estimate value
1. Mobile phone $30
2. Radio $5
3. Television $70
4. Satellite receiver $100
5. Karaoke system $200
6. Cassette Player $20
7. DVD or VCD Player $20
8. Fan $15
9. Air conditioner $300
10. Paraffin lamp $1
11. Torch $2
12. Recharge Battery Lamp $30
13. Bio Gas $550
14. Table $10
15. Chair $2
16. Bed $30
17. Bicycle $50
18. Pulling cart $60
19. Horse cart $120
20. Motor bike $800
21. Car (tourism) $4,000
22. Car (transport) $5,000
23. Remorque (for two-wheel tractor) $300
24. Truck $7,000
25. Electricity generator $300
26. Small scale rice mill $500
27. Other…………………………… $10
Agricultural equipment
1. Plow $150
2. Rake $150
3. Oxen chart $400
4. Motor-plow (Two wheels tractor) $2,200
5.Remorque for motor plow $300
6. Tractor $10,000
7. Water pump $300
8. Grass trimming machine $150
9. Pesticide sprayer $30
11.Threshing machine $4,000
12. Harvest machine $15,000
11.Other…………………………………… $100
Cattle stock value based on data from sample Price
1 head $500

336
Appendix – 13 Detail activities in the main categories of non-farm activities
No Self-Business No Salary based No Labor based No Migration No Agricultural wage labor
1 Businessman 1 Civil servant or LA 1 Carpenter (Cheang Cheur) 1 Agricultural wage labor 1 Transplant rice
2 Buy and Sell agricultural
product (trade) 2 Driver 2 Construction 2 Assistance of shop keeper 2 Harvest rice
3 Buy and sell poultry 3 Military 3 Garment worker (near
village) 3 Businessman 3 Transport rice
4 Food processing (including
small scale food processing) 4 Pension fund 4 Grass harvest 4
Buy and Sell agricultural product
(trade) 4 Spray pesticide
5 Hairdresser/hair cutter 5 Salaried employment
in private company 5 Handicraft 5 Casino work 5 Manual weeding
6 Hire two-wheel tractor for
plough 6 Teacher 6 Harvest Machine 6 Civil servant or LA 6 Land clearance
7 Junk collectors 7 Village chief 7 Land digger 7 Construction 7 Drive two-wheel tractor
8 Local petty trader (including
petroleum street seller)
8
Organize wedding party
food 8 Cooker 8 Harvest cassava
9 Mechanic
9 Other non-farm jobs 9 Driver 9 Other relevant wage labor
in agriculture
10 Moto taxi
10 Religious master ceremony 10 Garment worker (in city)
11 Renting two-wheel tractor to
transport rice product
11 Taxi driver (Pro Lan) 11 Remittance
12 Rice mill
12 Threshing machine worker 12 Salaried employment
14 Sell wood
13 Timber cutter 13 Shop keeper
15 Shop keeper
14 Washing clothes for others 14 Urban services
17 Palm sugar production
15 Remittance
18 Small industries
19 Tailor
21 Taxi
22 Threshing rice with own
machine

337
Appendix – 14 Non-farm activities in the three study areas
Small business detail activities by gender
Zone Detail small business activities Male Female Total
N % N % N %
TK
Local petty trader (including petroleum street
seller) 1 100% 0 0% 1 100%
Food processing (including small scale food
processing) 0 0% 3 100% 3 100%
Shop keeper 1 8% 11 92% 12 100%
Rice mill 2 50% 2 50% 4 100%
Businessman 1 100% 0 0% 1 100%
Small industries 1 100% 0 0% 1 100%
Tailor 0 0% 2 100% 2 100%
Hairdresser/hair cutter 1 100% 0 0% 1 100%
Buy and Sell agricultural product (trade) 0 0% 2 100% 2 100%
Buy and sell poultry 1 100% 0 0% 1 100%
Total 8 29% 20 71% 28 100%
PB
Fishing 1 100% 0 0% 1 100%
Local petty trader (including petroleum street
seller) 3 100% 0 0% 3 100%
Food processing (including small scale food
processing) 0 0% 2 100% 2 100%
Shop keeper 2 20% 8 80% 10 100%
Rice mill 0 0% 1 100% 1 100%
Businessman 2 40% 3 60% 5 100%
Mechanic 1 100% 0 0% 1 100%
Tailor 0 0% 1 100% 1 100%
Junk collectors 1 33% 2 67% 3 100%
Hairdresser/hair cutter 0 0% 1 100% 1 100%
Buy and sell poultry 1 100% 0 0% 1 100%
Total 11 38% 18 62% 29 100%
OMC
Local petty trader (including petroleum street
seller) 0 0% 2 100% 2 100%
Food processing (including small scale food
processing) 0 0% 2 100% 2 100%
Shop keeper 6 22% 21 78% 27 100%
Rice mill 0 0% 1 100% 1 100%
Small industries 1 100% 0 0% 1 100%
Hairdresser/hair cutter 1 50% 1 50% 2 100%
Other non-farm jobs 1 100% 0 0% 1 100%
Buy and Sell agricultural product (trade) 2 50% 2 50% 4 100%
Taxi 1 100% 0 0% 1 100%
Total 12 29.27% 29 70.73% 41 100%
Total Fishing 1 100% 0 0% 1 100%
Local petty trader (including petroleum street
seller) 4 67% 2 33% 6 100%

338
Food processing (including small scale food
processing) 0 0% 7 100% 7 100%
Shop keeper 9 18% 40 82% 49 100%
Rice mill 2 33% 4 67% 6 100%
Businessman 3 50% 3 50% 6 100%
Mechanic 1 100% 0 0% 1 100%
Small industries 2 100% 0 0% 2 100%
Tailor 0 0% 3 100% 3 100%
Junk collectors 1 100% 0 0% 1 100%
Hairdresser/hair cutter 2 40% 3 60% 5 100%
Other non-farm jobs 1 100% 0 0% 1 100%
Buy and Sell agricultural product (trade) 2 29% 5 71% 7 100%
Buy and sell poultry 2 100% 0 0% 2 100%
Taxi 1 100% 0 0% 1 100%
Total 31 32% 67 68% 98 100%
Relation to household head who do small business activities in the village in three zones
Relation to HH head Male Female Total
N % N % N %
HH head 25 81% 9 13% 34 35%
Husband/wife 0 0% 45 67% 45 46%
Son/Daughter 1 3% 12 18% 13 13%
Parents 0 0% 1 1% 1 1%
Son/daughter in law 5 16% 0 0% 5 5%
Total 31 100% 67 100% 98 100%
Relation to household head doing construction work
Relation to HH head Male Female Total
N % N % N %
HH head 29 91% 2 100% 30 91%
Son/Daughter 3 9% 0 0% 3 9%
Total 32 100% 2 100% 34 100%

339
Small business labor productivity and labor inputs by activity
Zone Small business labor input by activity N %
Mean
Labor
productivity
Mean
Labor
input
Labor productivity Labor input
Std. De Min Max Std. De Min Max
Tam KaK
Local petty trader (including petroleum
street seller) 1 3.57% 1.39 180 . 1.39 1.39 . 180 180
Food processing (including small scale
food processing) 3 10.71% 1.00 224 0.50 0.50 1.50 138 90 365
Shop keeper 12 42.86% 1.97 337 1.36 0.75 5.00 95 36 365
Rice mill 4 14.29% 2.21 365 2.06 0.50 5.00 92 180 365
Businessman 1 3.57% 5.00 360 . 5.00 5.00 . 360 360
Small industries 1 3.57% 2.00 360 . 2.00 2.00 . 360 360
Tailor 2 7.14% 1.27 180 1.075 0.51 2.03 0 180 180
Hairdresser/hair cutter 1 3.57% 2.00 365 . 2.00 2.00 . 365 365
Buy and Sell agricultural product (trade) 2 7.14% 2.50 365 0 2.50 2.50 0 365 365
Buy and sell poultry 1 3.57% 2.50 240 . 2.50 2.50 . 240 240
Total 28 100.00% 2.00 295 1.35 0.5 5.00 99 36 365
Prey Kabas
Fishing 1 3.57% 5.80 210 . 5.80 5.80 . 210 210
Local petty trader (including petroleum
street seller) 3 10.71% 2.98 301 1.85 1.37 5.00 103 183 365
Food processing (including small scale
food processing) 2 7.14% 1.88 365 0 1.88 1.88 0 365 365
Shop keeper 10 35.71% 2.31 321 1.75 0.49 5.00 91 120 365
Rice mill 1 3.57% 3.75 365 . 3.75 3.75 . 365 365
Businessman 5 17.86% 6.80 218 4.40 1.50 10.00 134 120 365
Mechanic 1 3.57% 1.67 360 . 1.67 1.67 . 360 360
Tailor 1 3.57% 1.00 180 . 1.00 1.00
180 180
Junk collectors 1 3.57% 1.83 300 . 1.83 1.83
300 300
Hairdresser/hair cutter 2 7.14% 1.25 365 0.59 0.83 1.67 173 120 365
Buy and sell poultry 1 3.57% 2.08 300 . 2.08 2.08 . 300 300
Total 28 100.00% 3.21 290 2.79 0.49 10 102 120 365
Otdar Mean
Chey
Local petty trader (including petroleum
street seller) 2 4.88% 2.98 195 3.50 0.50 5.45 191 60 330
Food processing (including small scale
food processing) 2 4.88% 3.38 261 2.30 1.75 5.00 148 156 365
Shop keeper 27 65.85% 2.74 282 2.23 0.50 8.63 97 60 365
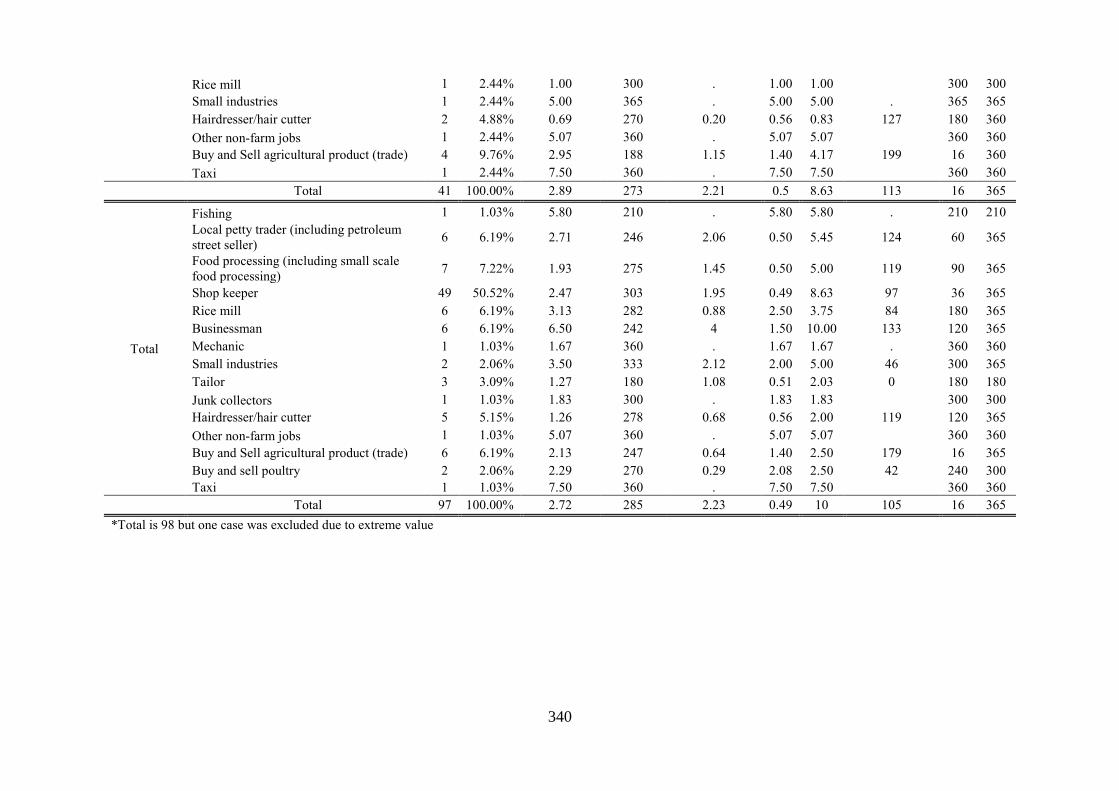
340
Rice mill 1 2.44% 1.00 300 . 1.00 1.00
300 300
Small industries 1 2.44% 5.00 365 . 5.00 5.00 . 365 365
Hairdresser/hair cutter 2 4.88% 0.69 270 0.20 0.56 0.83 127 180 360
Other non-farm jobs 1 2.44% 5.07 360 . 5.07 5.07
360 360
Buy and Sell agricultural product (trade) 4 9.76% 2.95 188 1.15 1.40 4.17 199 16 360
Taxi 1 2.44% 7.50 360 . 7.50 7.50
360 360
Total 41 100.00% 2.89 273 2.21 0.5 8.63 113 16 365
Total
Fishing 1 1.03% 5.80 210 . 5.80 5.80 . 210 210
Local petty trader (including petroleum
street seller) 6 6.19% 2.71 246 2.06 0.50 5.45 124 60 365
Food processing (including small scale
food processing) 7 7.22% 1.93 275 1.45 0.50 5.00 119 90 365
Shop keeper 49 50.52% 2.47 303 1.95 0.49 8.63 97 36 365
Rice mill 6 6.19% 3.13 282 0.88 2.50 3.75 84 180 365
Businessman 6 6.19% 6.50 242 4 1.50 10.00 133 120 365
Mechanic 1 1.03% 1.67 360 . 1.67 1.67 . 360 360
Small industries 2 2.06% 3.50 333 2.12 2.00 5.00 46 300 365
Tailor 3 3.09% 1.27 180 1.08 0.51 2.03 0 180 180
Junk collectors 1 1.03% 1.83 300 . 1.83 1.83
300 300
Hairdresser/hair cutter 5 5.15% 1.26 278 0.68 0.56 2.00 119 120 365
Other non-farm jobs 1 1.03% 5.07 360 . 5.07 5.07
360 360
Buy and Sell agricultural product (trade) 6 6.19% 2.13 247 0.64 1.40 2.50 179 16 365
Buy and sell poultry 2 2.06% 2.29 270 0.29 2.08 2.50 42 240 300
Taxi 1 1.03% 7.50 360 . 7.50 7.50
360 360
Total 97 100.00% 2.72 285 2.23 0.49 10 105 16 365
*Total is 98 but one case was excluded due to extreme value

341
Construction work labor productivity and labor inputs
Zone Migration destination N Construction Mean
Labor productivity
Construction Mean
Labor input
Labor productivity Labor input
Std. De Min Max Std. De Min Max
Tam KaK 1.Interview village 13 4.22 75 0.66 3.33 5 50.56 10 180
4.In province in the interview
province 2 4.38 165 0.88 3.75 5 190.92 30 300
5.In other provinces 4 3.65 90 0.21 3.33 3.75 64.81 30 180
Total 19 4.11 87 0.64 3.33 5 72.23 10 300
Prey Kabas 1.Interview village 3 4.10 45 0.31 3.85 4.44 20.00 25 65
6.Thailand 1 5.00 300 . 5 5 . 300 300
Total 4 4.32 109 0.52 3.85 5 128.54 25 300
Otdar
Meanchey 1.Interview village 4 4.99 77 1.75 3.75 7.46 29.02 60 120
3. In a district in the interview
district 3 2.92 143 0.72 2.5 3.75 187.71 30 360
5.In other provinces 4 3.44 48 0.31 3 3.75 68.79 3 150
Total 11 3.86 85 1.38 2.5 7.46 101.52 3 360
Total 1.Interview village 20 4.35 71 0.94 3.33 7.46 43.73 10 180
3. In a district in the interview
district 3 2.92 143 0.72 2.5 3.75 187.71 30 360
4.In province in the interview
province 2 4.38 165 0.88 3.75 5 190.92 30 300
5.In other provinces 8 3.54 69 0.27 3 3.75 65.77 3 180
6.Thailand 1 5.00 300 . 5 5 . 300 300
Total 34 4.0565 89 0.92 2.5 7.46 86.76 3 360
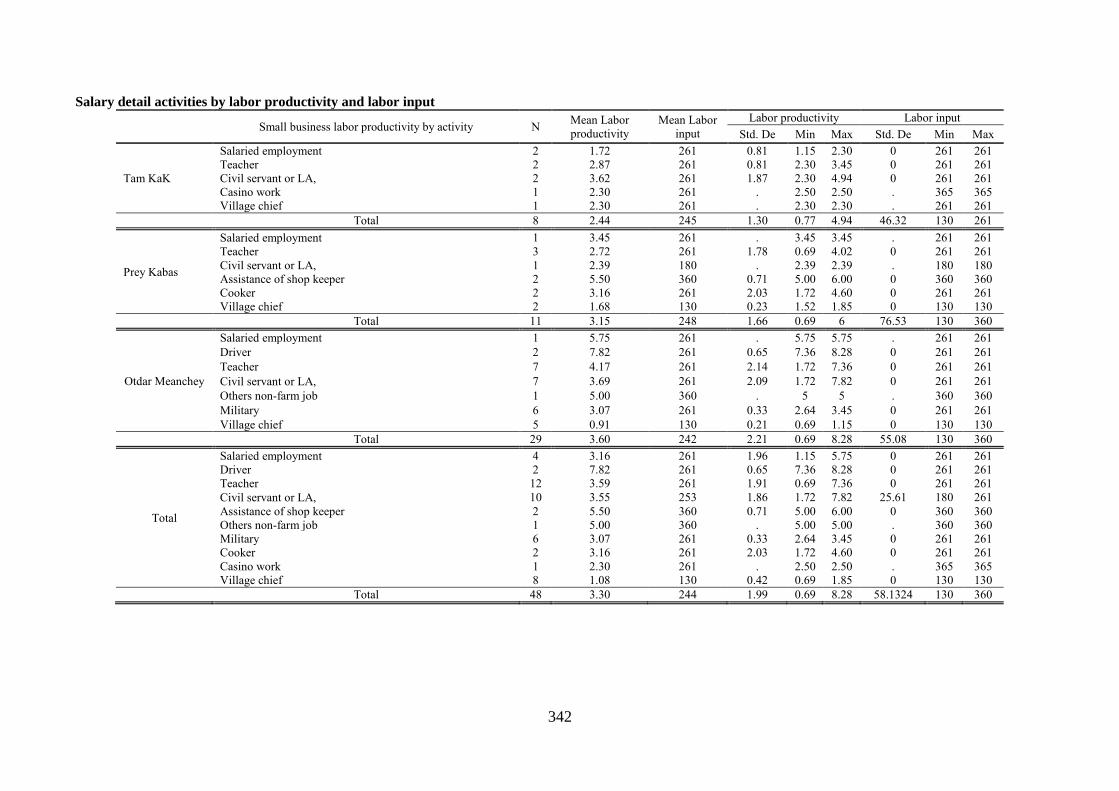
342
Salary detail activities by labor productivity and labor input
Small business labor productivity by activity N
Mean Labor
productivity
Mean Labor
input
Labor productivity Labor input
Std. De Min Max Std. De Min Max
Tam KaK
Salaried employment 2 1.72 261 0.81 1.15 2.30 0 261 261
Teacher 2 2.87 261 0.81 2.30 3.45 0 261 261
Civil servant or LA, 2 3.62 261 1.87 2.30 4.94 0 261 261
Casino work 1 2.30 261 . 2.50 2.50 . 365 365
Village chief 1 2.30 261 . 2.30 2.30 . 261 261
Total 8 2.44 245 1.30 0.77 4.94 46.32 130 261
Prey Kabas
Salaried employment 1 3.45 261 . 3.45 3.45 . 261 261
Teacher 3 2.72 261 1.78 0.69 4.02 0 261 261
Civil servant or LA, 1 2.39 180 . 2.39 2.39 . 180 180
Assistance of shop keeper 2 5.50 360 0.71 5.00 6.00 0 360 360
Cooker 2 3.16 261 2.03 1.72 4.60 0 261 261
Village chief 2 1.68 130 0.23 1.52 1.85 0 130 130
Total 11 3.15 248 1.66 0.69 6 76.53 130 360
Otdar Meanchey
Salaried employment 1 5.75 261 . 5.75 5.75 . 261 261
Driver 2 7.82 261 0.65 7.36 8.28 0 261 261
Teacher 7 4.17 261 2.14 1.72 7.36 0 261 261
Civil servant or LA, 7 3.69 261 2.09 1.72 7.82 0 261 261
Others non-farm job 1 5.00 360 . 5 5 . 360 360
Military 6 3.07 261 0.33 2.64 3.45 0 261 261
Village chief 5 0.91 130 0.21 0.69 1.15 0 130 130
Total 29 3.60 242 2.21 0.69 8.28 55.08 130 360
Total
Salaried employment 4 3.16 261 1.96 1.15 5.75 0 261 261
Driver 2 7.82 261 0.65 7.36 8.28 0 261 261
Teacher 12 3.59 261 1.91 0.69 7.36 0 261 261
Civil servant or LA, 10 3.55 253 1.86 1.72 7.82 25.61 180 261
Assistance of shop keeper 2 5.50 360 0.71 5.00 6.00 0 360 360
Others non-farm job 1 5.00 360 . 5.00 5.00 . 360 360
Military 6 3.07 261 0.33 2.64 3.45 0 261 261
Cooker 2 3.16 261 2.03 1.72 4.60 0 261 261
Casino work 1 2.30 261 . 2.50 2.50 . 365 365
Village chief 8 1.08 130 0.42 0.69 1.85 0 130 130
Total 48 3.30 244 1.99 0.69 8.28 58.1324 130 360

343
Average Non-farm income per person and average number of family member per family by zone
Number of
household Non-farm income per person Number of people working on non-farm
Zone Class of Non-farm income per person N % Mean Std. Deviation Minimum Maximum Mean Std. Deviation Minimum Maximum
Tam KaK <= 50.00 8 14% 27.34 15.89 5.00 50.00 1.25 0.46 1 2
50.01 - 100.00 5 9% 80.50 16.99 55.00 100.00 1.00 0.00 1 1
100.01 - 300.00 16 28% 187.97 71.78 107.00 300.00 1.13 0.34 1 2
300.01 - 500.00 13 23% 399.46 62.58 312.50 500.00 1.31 0.63 1 3
500.01 - 1000.00 9 16% 679.17 148.75 515.00 912.50 1.33 0.50 1 2
1000.01+ 6 11% 1388.96 279.48 1050.00 1825.00 1.17 0.41 1 2
Total 57 100% 408.21 414.07 5.00 1825.00 1.21 0.45 1 3
Prey Kabas <= 50.00 6 8% 37.92 13.46 22.50 50.00 1.33 0.52 1 2
50.01 - 100.00 7 10% 86.75 9.93 75.00 100.00 1.29 0.49 1 2
100.01 - 300.00 27 38% 210.37 55.55 107.50 300.00 1.78 0.93 1 4
300.01 - 500.00 7 10% 413.04 32.98 365.00 446.25 1.57 0.53 1 2
500.01 - 1000.00 19 26% 761.82 165.27 517.50 1000.00 1.21 0.42 1 2
1000.01+ 6 8% 1490.63 370.93 1050.00 1825.00 1.33 0.82 1 3
Total 72 100% 455.89 429.75 22.50 1825.00 1.49 0.73 1 4
Otdar Mean Chey <= 50.00 53 39% 23.69 12.17 7.50 50.00 1.72 0.95 1 5
50.01 - 100.00 20 15% 75.23 15.16 52.75 100.00 1.35 0.49 1 2
100.01 - 300.00 17 13% 191.50 65.58 125.00 300.00 1.41 0.51 1 2
300.01 - 500.00 12 9% 425.63 45.35 360.00 493.75 2.00 0.85 1 4
500.01 - 1000.00 20 15% 809.19 145.01 504.00 948.50 1.40 0.60 1 3
1000.01+ 14 10% 1876.74 533.13 1050.00 3150.00 1.43 0.51 1 2
Total 136 100% 393.98 598.97 7.50 3150.00 1.57 0.77 1 5
Total <= 50.00 67 25% 25.40 13.20 5.00 50.00 1.63 0.88 1 5
50.01 - 100.00 32 12% 78.57 14.84 52.75 100.00 1.28 0.46 1 2
100.01 - 300.00 60 23% 199.05 62.81 107.00 300.00 1.50 0.75 1 4
300.01 - 500.00 32 12% 412.24 50.93 312.50 500.00 1.63 0.75 1 4
500.01 - 1000.00 48 18% 766.06 158.03 504.00 1000.00 1.31 0.51 1 3
1000.01+ 26 10% 1675.07 491.45 1050.00 3150.00 1.35 0.56 1 3
Total 265 100% 413.86 519.80 5.00 3150.00 1.47 0.71 1 5

344
Average Migration income per migrant and average number of migrant per family by zone
Number of household Average migration income per migrant Average number of migrant per family
Zone Total Migration income per
migrant N % Mean Std. Deviation Minimum Maximum Mean Std. Deviation Minimum Maximum
Tam KaK <= 100.00 5 14% 79.25 26.60 38 100 1.80 1.30 1 4
100.01 - 300.00 15 43% 200.17 60.57 113 300 1.87 1.19 1 5
300.01 - 500.00 4 11% 402.50 66.52 360 500 1.50 0.58 1 2
500.01 - 1000.00 9 26% 661.11 145.30 550 1000 1.33 0.50 1 2
1000.01+ 2 6% 1428.13 101.65 1356 1500 1.50 0.71 1 2
Total 35 100% 394.71 346.70 38 1500 1.66 0.97 1 5
Prey Kabas <= 100.00 2 17% 36.25 33.59 13 60 1.00 0.00 1 1
100.01 - 300.00 3 25% 150.00 0.00 150 150 1.67 1.15 1 3
300.01 - 500.00 2 17% 380.00 28.28 360 400 1.00 0.00 1 1
500.01 - 1000.00 4 33% 625.00 50.00 600 700 1.50 1.00 1 3
1000.01+ 1 8% 1980.00 . 1980 1980 2.00 . 2 2
Total 12 100% 480.21 529.50 13 1980 1.42 0.79 1 3
Otdar Mean Chey <= 100.00 11 25% 62.95 34.38 13 100 1.45 0.93 1 4
100.01 - 300.00 13 30% 224.42 78.95 125 300 1.62 0.77 1 3
300.01 - 500.00 6 14% 441.08 83.49 302 500 1.83 0.75 1 3
500.01 - 1000.00 7 16% 655.71 147.41 600 990 1.14 0.38 1 2
1000.01+ 7 16% 1507.86 464.04 1020 2160 1.29 0.76 1 3
Total 44 100% 486.40 526.62 13 2160 1.48 0.76 1 4
Total <= 100.00 18 20% 64.51 32.98 13 100 1.50 0.99 1 4
100.01 - 300.00 31 34% 205.48 68.43 113 300 1.74 1.00 1 5
300.01 - 500.00 12 13% 418.04 71.33 302 500 1.58 0.67 1 3
500.01 - 1000.00 20 22% 652.00 127.84 550 1000 1.30 0.57 1 3
1000.01+ 10 11% 1539.13 412.07 1020 2160 1.40 0.70 1 3
Total 91 100% 450.32 462.75 13 2160 1.54 0.85 1 5

345
Detail of non-farm activities in three zones
Main non-farm activities all zone N
Percent of
all
activities
in zone
Percent Mean Labor
productivity
Mean
Labor
input
Labor productivity Labor input
Std. De Min Max Std. De Min Max
Salaried employment 48 9% 100.00% 3.30 244 1.99 0.69 8.28 58.132 130 360
Salaried employment 4
8.33% 3.16 261 1.96 1.15 5.75 0 261 261
Driver 2
4.17% 7.82 261 0.65 7.36 8.28 0 261 261
Teacher 12
25.00% 3.59 261 1.91 0.69 7.36 0 261 261
Civil servant or LA, 10
20.83% 3.55 253 1.86 1.72 7.82 25.61 180 261
Assistance of shop keeper 2
4.17% 5.50 360 0.71 5.00 6.00 0 360 360
Other non-farm jobs 1
2.08% 5.00 360 . 5.00 5.00 . 360 360
Military 6
12.50% 3.07 261 0.33 2.64 3.45 0 261 261
Cooker 2
4.17% 3.16 261 2.03 1.72 4.60 0 261 261
Casino work 1
2.08% 2.30 261 . 2.50 2.50 . 365 365
Village chief 8
16.67% 1.08 130 0.42 0.69 1.85 0 130 130
Palm sugar production 2 0.37% 3.50 74 3.89 0.75 6.25 65.76 27 120
Small business 97 18% 100.00% 2.72 285 2.23 0.49 10 105 16 365
Fishing 1
1.03% 5.80 210 . 5.80 5.80 . 210 210
Local petty trader (including petroleum street seller) 6
6.19% 2.71 246 2.06 0.50 5.45 124 60 365
Food processing (including small scale food processing) 7
7.22% 1.93 275 1.45 0.50 5.00 119 90 365
Shop keeper 49
50.52% 2.47 303 1.95 0.49 8.63 97 36 365
Rice mill 6
6.19% 3.13 282 0.88 2.50 3.75 84 180 365
Businessman 6
6.19% 6.50 242 4 1.50 10.00 133 120 365
Mechanic 1
1.03% 1.67 360 . 1.67 1.67 . 360 360
Small industries 2
2.06% 3.50 333 2.12 2.00 5.00 46 300 365
Tailor 3
3.09% 1.27 180 1.08 0.51 2.03 0 180 180
Junk collectors 1
1.03% 1.83 300 . 1.83 1.83
300 300
Hairdresser/hair cutter 5
5.15% 1.26 278 0.68 0.56 2.00 119 120 365
Other non-farm jobs 1
1.03% 5.07 360 . 5.07 5.07
360 360
Buy and Sell agricultural product (trade) 6
6.19% 2.13 247 0.64 1.40 2.50 179 16 365
Buy and sell poultry 2
2.06% 2.29 270 0.29 2.08 2.50 42 240 300
Taxi 1
1.03% 7.50 360 . 7.50 7.50
360 360
Agricultural wage labor 172 32% 3.65 11 1 2 8 10 2 50
Construction work 34 6% 4.06 89 0.92 2.5 7.46 86.76 3 360
Weaving or handicraft work 34 6% 1.38 181 0.72 0.50 3.50 81.65 50.00 365
Garment work 12 2% 1.67 302.50 0.32 1.00 2.50 95 90 360
Moto taxi 6 1% 3.42 272 0.96 2.50 5.00 150 4 365
Other non-farm activities 23 4% 4.59 40.09 2.38 0.50 10.00 56 1 180
Remittance USD/Year/person 109 20% 270 242 12.5 1020
Total people doing activities 537 100%
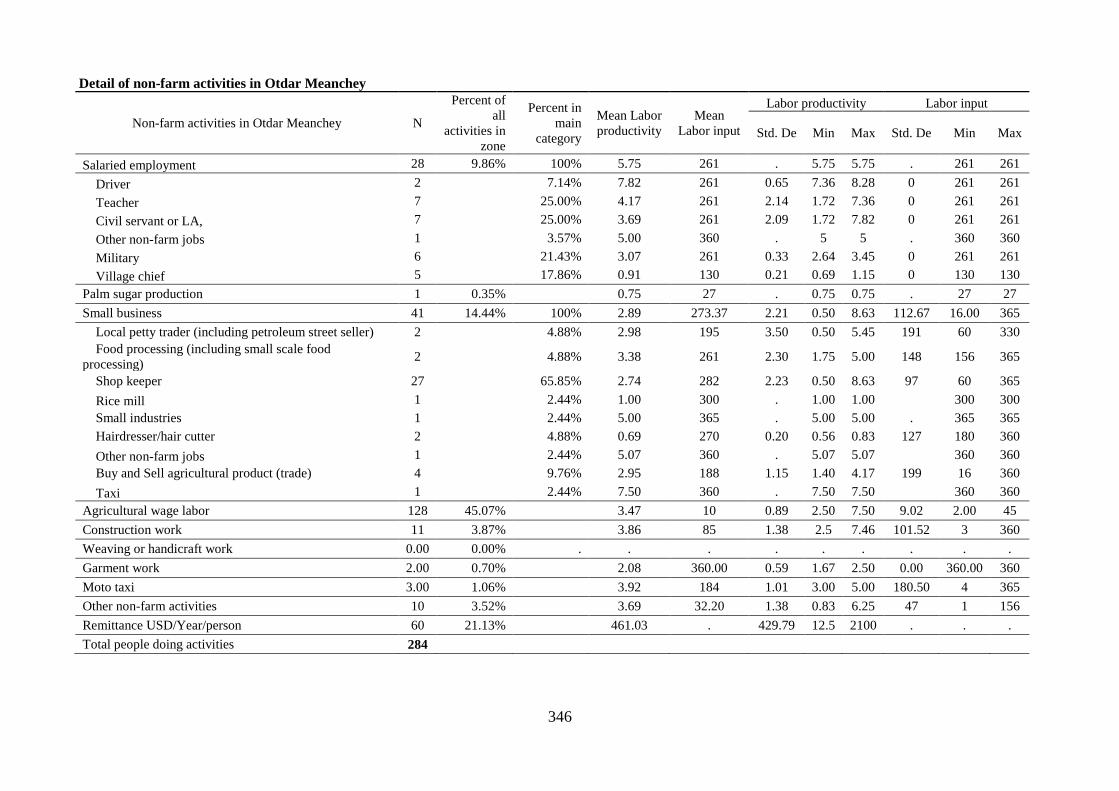
346
Detail of non-farm activities in Otdar Meanchey
Non-farm activities in Otdar Meanchey N
Percent of
all
activities in
zone
Percent in
main
category
Mean Labor
productivity
Mean
Labor input
Labor productivity Labor input
Std. De Min Max Std. De Min Max
Salaried employment 28 9.86% 100% 5.75 261 . 5.75 5.75 . 261 261
Driver 2
7.14% 7.82 261 0.65 7.36 8.28 0 261 261
Teacher 7
25.00% 4.17 261 2.14 1.72 7.36 0 261 261
Civil servant or LA, 7
25.00% 3.69 261 2.09 1.72 7.82 0 261 261
Other non-farm jobs 1
3.57% 5.00 360 . 5 5 . 360 360
Military 6
21.43% 3.07 261 0.33 2.64 3.45 0 261 261
Village chief 5
17.86% 0.91 130 0.21 0.69 1.15 0 130 130
Palm sugar production 1 0.35% 0.75 27 . 0.75 0.75 . 27 27
Small business 41 14.44% 100% 2.89 273.37 2.21 0.50 8.63 112.67 16.00 365
Local petty trader (including petroleum street seller) 2
4.88% 2.98 195 3.50 0.50 5.45 191 60 330
Food processing (including small scale food
processing) 2
4.88% 3.38 261 2.30 1.75 5.00 148 156 365
Shop keeper 27
65.85% 2.74 282 2.23 0.50 8.63 97 60 365
Rice mill 1
2.44% 1.00 300 . 1.00 1.00
300 300
Small industries 1
2.44% 5.00 365 . 5.00 5.00 . 365 365
Hairdresser/hair cutter 2
4.88% 0.69 270 0.20 0.56 0.83 127 180 360
Other non-farm jobs 1
2.44% 5.07 360 . 5.07 5.07
360 360
Buy and Sell agricultural product (trade) 4
9.76% 2.95 188 1.15 1.40 4.17 199 16 360
Taxi 1
2.44% 7.50 360 . 7.50 7.50
360 360
Agricultural wage labor 128 45.07% 3.47 10 0.89 2.50 7.50 9.02 2.00 45
Construction work 11 3.87% 3.86 85 1.38 2.5 7.46 101.52 3 360
Weaving or handicraft work 0.00 0.00% . . . . . . . . .
Garment work 2.00 0.70% 2.08 360.00 0.59 1.67 2.50 0.00 360.00 360
Moto taxi 3.00 1.06% 3.92 184 1.01 3.00 5.00 180.50 4 365
Other non-farm activities 10 3.52%
3.69 32.20 1.38 0.83 6.25 47 1 156
Remittance USD/Year/person 60 21.13% 461.03 . 429.79 12.5 2100 . . .
Total people doing activities 284

347
Summary of non-farm activities in Zone Tram Kak
Non-farm activities Tram Kak N
Percent
of all
activities
in zone
Percent Mean Labor
productivity
Mean
Labor
input
Labor productivity Labor input
Std.
De Min Max Std. De Min Max
Salaried employment 8 6% 100% 2.44 245 1.30 0.77 4.94 46.32 130 261
Salaried employment 2
25.00% 1.72 261 0.81 1.15 2.30 0 261 261
Teacher 2
25.00% 2.87 261 0.81 2.30 3.45 0 261 261
Civil servant or LA, 2
25.00% 3.62 261 1.87 2.30 4.94 0.00 261 261
Casino work 1
12.50% 2.30 261 . 2.50 2.50 . 365 365
Village chief 1
12.50% 2.30 261 . 2.30 2.30 . 261 261
Palm sugar production 0 0% 0 6.25 120 6.25 6.25 . 120 120
Small business 28 21% 100% 2.00 295 1.35 0.5 5.00 99 36 365
Local petty trader (including petroleum street seller) 1
3.57% 1.39 180 . 1.39 1.39 . 180 180
Food processing (including small scale food processing) 3
10.71% 1.00 224 0.50 0.50 1.50 138 90 365
Shop keeper 12
42.86% 1.97 337 1.36 0.75 5.00 95 36 365
Rice mill 4
14.29% 2.21 365 2.06 0.50 5.00 92 180 365
Businessman 1
3.57% 5.00 360 . 5.00 5.00 . 360 360
Small industries 1
3.57% 2.00 360 . 2.00 2.00 . 360 360
Tailor 2
7.14% 1.27 180 1.075 0.51 2.03 0 180 180
Hairdresser/hair cutter 1
3.57% 2.00 365 . 2.00 2.00 . 365 365
Buy and Sell agricultural product (trade) 2
7.14% 2.50 365 0 2.50 2.50 0 365 365
Buy and sell poultry 1
3.57% 2.50 240 . 2.50 2.50 . 240 240
Agricultural wage labor 17 13% 3.49 10 1.02 1.67 6.25 8.10 3 30
Construction work 19 14% 4.11 87 0.64 3.33 5 72.23 10 300
Weaving or handicraft work 0 0% . . . . . . . . .
Garment work 8 6% 1.65 308 0.05 1.52 1.67 80 180 360
Moto taxi 2 2% 3.13 365 0.88 2.50 3.75 0.00 365 365
Other non-farm activities 4 3% 6.52 14 2.07 3.75 8.57 12 4 30
Remittance USD/Year/person 46 35% 236.30 198.25 12.5 1000 . . .
Total people doing activities 132 100%

348
Summary of non-farm activities in Zone Prey Kabas
Non-farm activities Prey Kabas N
Percent of
all
activities
in zone
Percent Mean Labor
productivity
Mean
Labor input
Labor productivity Labor input
Std.
De Min Max Std. De Min Max
Salaried employment 11 8% 100% 2.44 245 1.30 0.77 4.94 46.32 130 261
Salaried employment 1
9.09% 3.45 261 . 3.45 3.45 . 261 261
Teacher 3
27.27% 2.72 261 1.78 0.69 4.02 0 261 261
Civil servant or LA, 1
9.09% 2.39 180 . 2.39 2.39 . 180 180
Assistance of shop keeper 2
18.18% 5.50 360 0.71 5.00 6.00 0 360 360
Cooker 2
18.18% 3.16 261 2.03 1.72 4.60 0 261 261
Village chief 2
18.18% 1.68 130 0.23 1.52 1.85 0 130 130
Palm sugar production 0 0% . . . . . . . . .
Small business 28 21% 467% 3.21 290 2.79 0.49 10 102 120 365
Fishing 1 16.67% 5.80 210 . 5.80 5.80 . 210 210
Local petty trader (including petroleum street seller) 3
50.00% 2.98 301 1.85 1.37 5.00 103 183 365
Food processing (including small scale food processing) 2
33.33% 1.88 365 0 1.88 1.88 0 365 365
Shop keeper 10
166.67% 2.31 321 1.75 0.49 5.00 91 120 365
Rice mill 1
16.67% 3.75 365 . 3.75 3.75 . 365 365
Businessman 5
83.33% 6.80 218 4.40 1.50 10.00 134 120 365
Mechanic 1
16.67% 1.67 360 . 1.67 1.67 . 360 360
Tailor 1
16.67% 1.00 180 . 1.00 1.00
180 180
Junk collectors 1
16.67% 1.83 300 . 1.83 1.83
300 300
Hairdresser/hair cutter 2
33.33% 1.25 365 0.59 0.83 1.67 173 120 365
Buy and sell poultry 1
16.67% 2.08 300 . 2.08 2.08 . 300 300
Agricultural wage labor 27 21% 4.63 18 0.90 2.50 6.25 13.88 3 50
Construction work 4 3% 4.32 109 0.52 3.85 5 128.54 25 300
Weaving or handicraft work 34 26% 1.38 181 0.72 0.50 3.50 81.65 50.00 365
Garment work 2 2% 1.33 225 0.47 1.00 1.67 191 90 360
Moto taxi 1 1% 2.50 350 . 2.50 2.50 . 350 350
Other non-farm activities 9 7% 4.74 60.56 2.99 0.50 10.00 73 2 180
Remittance USD/Year/person 15 11% 251.50 179.78 12.5 600
Total people doing activities 131 100%
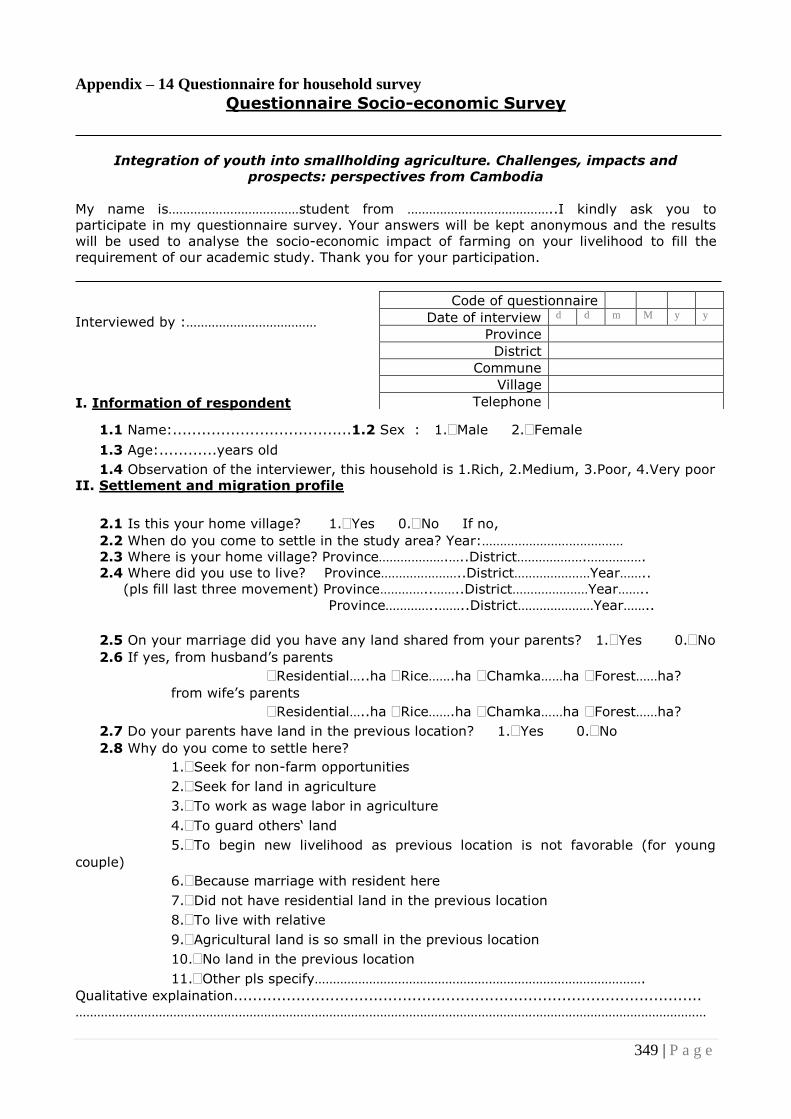
349 | P a g e
Appendix – 14 Questionnaire for household survey
Questionnaire Socio-economic Survey
Integration of youth into smallholding agriculture. Challenges, impacts and
prospects: perspectives from Cambodia
My name is………………………………student from …………………………………..I kindly ask you to
participate in my questionnaire survey. Your answers will be kept anonymous and the results
will be used to analyse the socio-economic impact of farming on your livelihood to fill the
requirement of our academic study. Thank you for your participation.
Interviewed by :………………………………
I. Information of respondent
1.1 Name:.....................................1.2 Sex : 1.Male 2.Female
1.3 Age:............years old
1.4 Observation of the interviewer, this household is 1.Rich, 2.Medium, 3.Poor, 4.Very poor
II. Settlement and migration profile
2.1 Is this your home village? 1.Yes 0.No If no,
2.2 When do you come to settle in the study area? Year:…………………………………
2.3 Where is your home village? Province……………….…..District……………….…………….
2.4 Where did you use to live? Province…………………..District…………………Year……..
(pls fill last three movement) Province…………..……..District…………………Year……..
Province…………..……..District…………………Year……..
2.5 On your marriage did you have any land shared from your parents? 1.Yes 0.No
2.6 If yes, from husband’s parents
Residential…..ha Rice…….ha Chamka……ha Forest……ha?
from wife’s parents
Residential…..ha Rice…….ha Chamka……ha Forest……ha?
2.7 Do your parents have land in the previous location? 1.Yes 0.No
2.8 Why do you come to settle here?
1.Seek for non-farm opportunities
2.Seek for land in agriculture
3.To work as wage labor in agriculture
4.To guard others‘ land
5.To begin new livelihood as previous location is not favorable (for young
couple)
6.Because marriage with resident here
7.Did not have residential land in the previous location
8.To live with relative
9.Agricultural land is so small in the previous location
10.No land in the previous location
11.Other pls specify……………………………………………………………………………….
Qualitative explaination.................................................................................................
…………………………………………………………………………………………………………………………………………………………
Code of questionnaire
Date of interview d d m M y y
Province
District
Commune
Village
Telephone

350 | P a g e
III. Household membership and migration
3.1 All members of household normally resident, including those away temporarily40 at work or school/university
HH mem. ID
Name Relation to HH
Marital status
Age Sex Ethnic Level of
Edu Current Study?
Where? Has migrated 2000-2011?
Where are they now?
(1) (2) (3) (4) (5) (6) (7) (8) (9) (10) (11)
Yes/No
(12)
Where?
(13) Where, now? (14) What they are doing?
1
2
3
4
5
6
7
8
9
10
11
12
3.2 In this household, how many married couples are there? ………………….Couples
Code: (3): 1.HH head, 2.Husban/wife, 3.Son/Daughter, 4.Stepson, 5.Adopted son/daughter, 6.Father/mother, 7.Brother/sister, 8.Grandson/Granddaughter, 9.Niece/Nephew, 10.Son/daughter in law,
11.Brother/sister in law, 12.Father/mother in law, 13.Other relative, 14.Servant, 15.Other (please specified…………)
(4): 1.Single, 2.Married, 3. Widow, 4.Divorce, 5.Seperate
(6): 1.Male, 2.Female
(7): 1.Khmer, 2.Cham, 3.Chinese, 4.Vietnames, 5.Ethnic minority
(9): 0.No, 1.Yes
(10), (12) & (13): 1. Interview village, 2.In interview commune, 3. In interview district 4. In interview province, 5. In other province, 6. Abroad (Thailand, Korea, Malaysia) (11): 0.no, 1. Seasonal, 2.short term, 3. long term, 4.permanant (14) Agricultural work: 1. Rice farming, 2. Plantation (Chamcar), 3. Gardening, 4. Forestry/NTFP, 5. Forest workers, 6. Cattles care giver, 7. Fishing, 8. Processing fish product , 9. Aquaculture,
Non Agricultural work: 10. Fish trading, 11. Carpenter, 12. Construction worker, 13. Housewife, 14. Salaried employment, 15. Agricultural wage laborer, 16. Construction wage laborer, 17. Local petty trader(including petroleum street seller), 18. Food processing (including small scale food processing), 19. Shop keeper, 20. Rice mill, 21. Businessman, 22. Motodop taxi, 23. Driver, 24. Mechanic, 25.
Urban services, 26. Factory worker, 27.Teacher, 28. Civil servant or LA, 29. Nurse/Dr/midwife, 30. Small industries, 31. Students/dependent, 32.Tailor, 33.Port worker, 34.Brick worker, 35.Junck collectors,
36.Other (please specify………………………………………………)
40
Short term or long term is include if they are migrated for the purpose of securing household sustainability and contribute to improving the family lives, they have plan to come back to help the family.
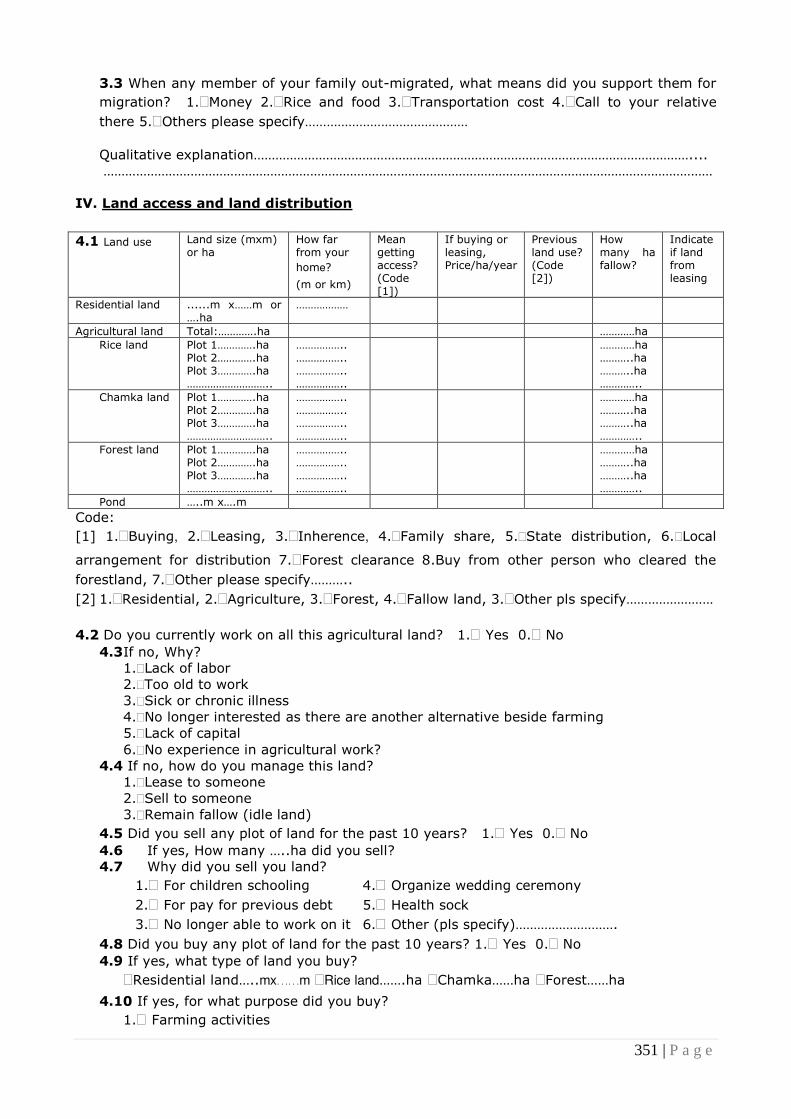
351 | P a g e
3.3 When any member of your family out-migrated, what means did you support them for
migration? 1.Money 2.Rice and food 3.Transportation cost 4.Call to your relative
there 5.Others please specify………………………………………
Qualitative explanation…………………………………………………………………………………………………………....
……………………………………………………………………………………………………………………………………………………
IV. Land access and land distribution
4.1 Land use Land size (mxm) or ha
How far from your
home?
(m or km)
Mean getting access? (Code [1])
If buying or leasing, Price/ha/year
Previous land use? (Code [2])
How many ha fallow?
Indicate if land from leasing
Residential land ......m x……m or ….ha
………………
Agricultural land Total:………….ha …………ha
Rice land Plot 1………….ha Plot 2………….ha Plot 3………….ha ………………………..
…………….. …………….. …………….. ……………..
…………ha ………..ha ………..ha …………..
Chamka land Plot 1………….ha Plot 2………….ha Plot 3………….ha ………………………..
…………….. …………….. …………….. ……………..
…………ha ………..ha ………..ha …………..
Forest land Plot 1………….ha Plot 2………….ha Plot 3………….ha ………………………..
…………….. …………….. …………….. ……………..
…………ha ………..ha ………..ha …………..
Pond …..m x….m
Code:
[1] 1.Buying, 2.Leasing, 3.Inherence, 4.Family share, 5.State distribution, 6.Local
arrangement for distribution 7.Forest clearance 8.Buy from other person who cleared the
forestland, 7.Other please specify………..
[2] 1.Residential, 2.Agriculture, 3.Forest, 4.Fallow land, 3.Other pls specify……………………
4.2 Do you currently work on all this agricultural land? 1. Yes 0. No
4.3 If no, Why?
1.Lack of labor
2.Too old to work
3.Sick or chronic illness
4.No longer interested as there are another alternative beside farming
5.Lack of capital
6.No experience in agricultural work?
4.4 If no, how do you manage this land? 1.Lease to someone
2.Sell to someone
3.Remain fallow (idle land)
4.5 Did you sell any plot of land for the past 10 years? 1. Yes 0. No
4.6 If yes, How many …..ha did you sell?
4.7 Why did you sell you land?
1. For children schooling 4. Organize wedding ceremony
2. For pay for previous debt 5. Health sock
3. No longer able to work on it 6. Other (pls specify)……………………….
4.8 Did you buy any plot of land for the past 10 years? 1. Yes 0. No
4.9 If yes, what type of land you buy?
Residential land…..mx……m Rice land…….ha Chamka……ha Forest……ha
4.10 If yes, for what purpose did you buy?
1. Farming activities
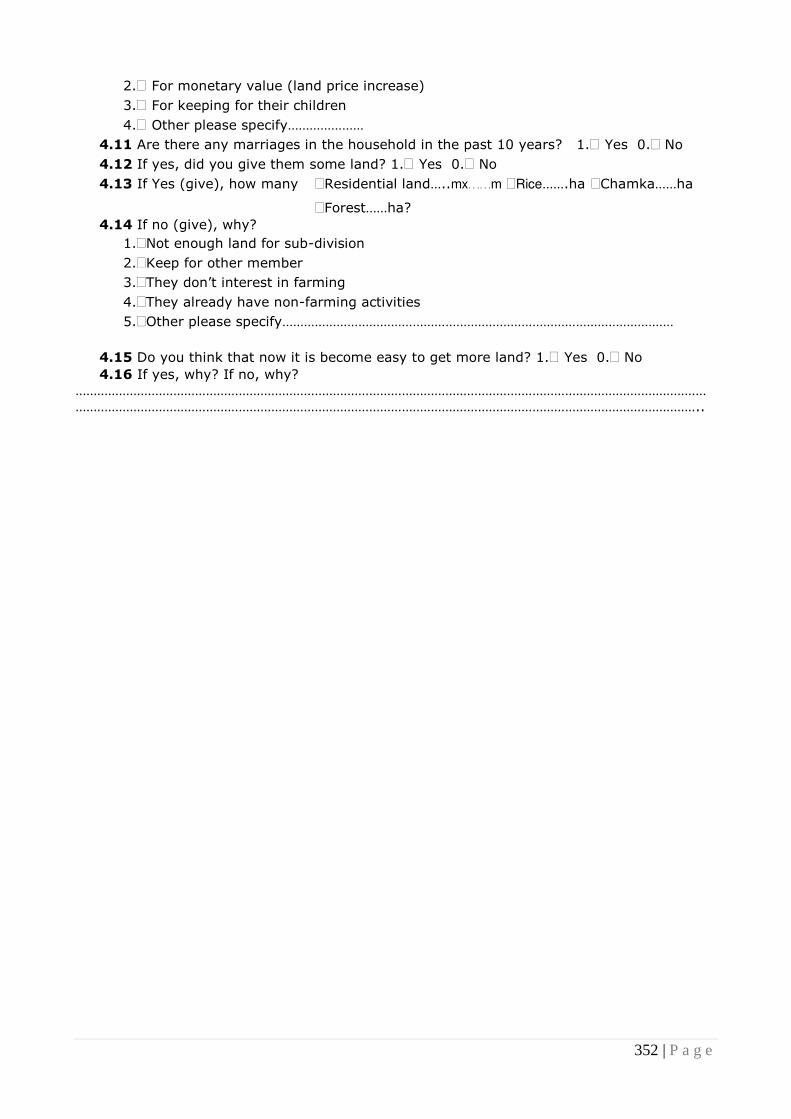
352 | P a g e
2. For monetary value (land price increase)
3. For keeping for their children
4. Other please specify…………………
4.11 Are there any marriages in the household in the past 10 years? 1. Yes 0. No
4.12 If yes, did you give them some land? 1. Yes 0. No
4.13 If Yes (give), how many Residential land…..mx……m Rice…….ha Chamka……ha
Forest……ha?
4.14 If no (give), why?
1.Not enough land for sub-division
2.Keep for other member
3.They don’t interest in farming
4.They already have non-farming activities
5.Other please specify………………………………………………………………………………………………
4.15 Do you think that now it is become easy to get more land? 1. Yes 0. No
4.16 If yes, why? If no, why?
…………………………………………………………………………………………………………………………………………………………
………………………………………………………………………………………………………………………………………………………..

353 | P a g e
V. Agricultural activities and income
5.1 What are crop productions do you cultivate?
No Crops Area
(ha)
Productions
(T/Kg)
Sold
(T/Kg)
Price
(Riel/Kg)
Incom
e
Expenditure
Seed Chemical
Fertilizer
Organic
fertilizer
Pestic
ide
Soil
preparation
Transplant
Harvest
Threshing Transportatio
n inputs and
produce
Renta
l land
Rental
equipm
ent
/animal
Gasoli
ne/wa
ter
pumpi
ng Kg Price
/kg Kg
Price
/kg Kg
Pric
e
/kg
Riel
Labor
input
(day)
Hire
(riel)
Labor
input
(day)
Hire
(riel)
Labor
input
(day)
Hire
(riel)
Labor
input
(day)
Hire
(riel)
Labor
input
(day)
Hire
(riel)
1 Rainy
season rice
2 Dry season rice
3 Floating
rice
4
Water
receding rice
5 Maize
6 Cassava
7 Sugarcane
8 Groundnut
9 Bean
10 Sesame
11 Fruit trees
12 Cucumber
13 Vegetable
14 Reed/lotus
15 Other…….

354 | P a g e
5.2 Animal productions
No Animal Nb Nb or Kg sold Price (Riel/Kg)
Income Labor input (day or month/year)
Expenditure
Food Forage Vaccination Treatment Others
1 Cattle
2 Buffalo
3 Sow/Piglet
4 Fattening pig
5 Chicken
6 Duck
7 Gees
8 Fish
9 Frock
10 eels
Other….
5.3 Access to common property resource
No Item Quantity Nb or Kg
sold Price
(Riel/Kg) Income
Labor input (day or month/year)
How far from
your home?
(m or km)
Expenditure
1 Fish
2 Timber
3 Firewood/Charcoal
4 NTFPs
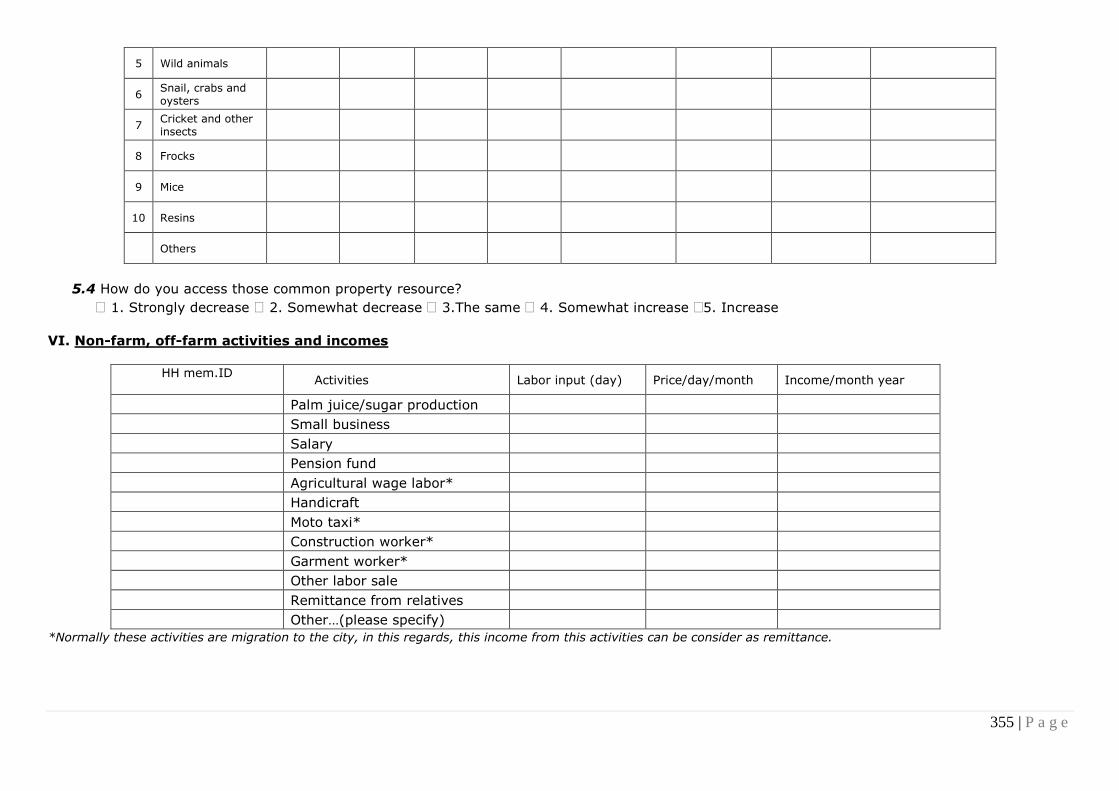
355 | P a g e
5 Wild animals
6 Snail, crabs and oysters
7 Cricket and other insects
8 Frocks
9 Mice
10 Resins
Others
5.4 How do you access those common property resource?
1. Strongly decrease 2. Somewhat decrease 3.The same 4. Somewhat increase 5. Increase
VI. Non-farm, off-farm activities and incomes
HH mem.ID
Activities Labor input (day) Price/day/month Income/month year
Palm juice/sugar production
Small business
Salary
Pension fund
Agricultural wage labor*
Handicraft
Moto taxi*
Construction worker*
Garment worker*
Other labor sale
Remittance from relatives
Other…(please specify)
*Normally these activities are migration to the city, in this regards, this income from this activities can be consider as remittance.

356 | P a g e
VII. Food security
8.1 Is your rice production is enough for the whole year consumption? 1. Yes 0. No
8.2 If no, how many……………month/day?
8.3 If no, how many ……………kg of rice do you buy more? 8.4 Price……….Riel/Kg
8.5 Have you borrowed someone to buy food? 1. Yes 0. No
8.6 If no, do you borrow some rice from your neighbor? 1. Yes 0. No
IIX. Household Capital
8.1 Do you have the following capital? No Yes if yes, how
many 1. Mobile phone 0 1 …………………… 2. Radio 0 1 …………………… 3. Television 0 1 …………………… 4. Satelite receiver 0 1 …………………… 5. Karaoke system 0 1 …………………… 6. Casset Player 7. DVD or VCD Player 8. Fan 9. Air conditioner 10. Paraffin lamp
0 0 0 0 0
1 1 1 1 1
…………………… …………………… …………………… …………………… ……………………
11. Torch
12. Recharge Battery Lamp
0
0
1
1
……………………
…………………… 13. Bio Gass 14. Table
0 0
1 1
…………………… ……………………
15. Chair 16. Bed
0 0
1 1
…………………… ……………………
17. Bycicle 0 1 …………………… 18. Pulling cart 0 1 …………………… 19. Horse cart 0 1 …………………… 20. Motor bike 0 1 …………………… 21. Car (tourism) 0 1 …………………… 22. Car (transport) 0 1 …………………… 23. Remorque 0 1 …………………… 24. Truck 0 1 ……………………
25. Electricity generator 0 1 ……………………
26. Small scale rice mill 0 1 ……………………
27. Other………………………………………………………………………… 0 1 ……………………
8.2 Do you have the following agricultural equipment? No Yes if yes,
how many
1. Plow 0 1 …………………… 2. Rake 0 1 …………………… 3. Oxen chart 0 1 …………………… 4. Motor-plow (Two wheels tractor) 5. Remorque.Motor.plow
0 0
1 1
…………………… ……………………
6. Tractor 0 1 …………………… 7. Water pump 0 1 ……………………
8. Grass trimming marchine 9. Pesticide sprayer 10.Threshing machine 11. Harvest machine 12.Other………………………………………………………………………
0 0 0 0 0
1 1 1 1 1
…………………… …………………… …………………… …………………… …………………… ……………………
8.3 Do you least the following agricultural equipment from s.o? No Yes if yes,
Quant. Exp
1. Plow 0 1 ……… ……… 2. Rake 0 1 ……… ……… 3. Oxen chart 0 1 ……… ……… 4. Motor-plow (Two wheels tractor) 5. Remorque.Motor.plow
0 0
1 1
……… ……..
……… ………
6. Tractor 0 1 ……… ……… 7. Water pump 0 1 ……… ……… 8. Grass trimming marchine 9. Pesticide sprayer
10.Threshing machine 11. Harvest machine 12.Other………………………………………………………………………
0 0
0 0 0
1 1
1 1 1
……… ………
……… ……… ………
……… ………
……… ……… ………
8.4 Do you lend the following agricultural equipment to s.o? No Yes if yes,
Quant. Income
1. Plow 0 1 ……… ………

357 | P a g e
2. Rake 0 1 ……… ………
3. Oxen chart 0 1 ……… ……… 4. Motor-plow (Two wheels tractor) 5. Remorque.Motor.plow
0 0
1 1
……… ………
……… ………
6. Tractor 0 1 ……… ……… 7. Water pump 0 1 ……… ……… 8. Grass trimming marchine 9. Pesticide sprayer 10.Threshing machine 11. Harvest machine 12.Other………………………………………………………………………
0 0 0 0 0
1 1 1 1 1
……… ……… ……… ……… ………
……… ……… ……… ……… ………
IX. Access to credit
9.1 Are you currently borrowing any money from someone? 1. Yes 0. No,
If yes, How much………………? 9.2 If yes, who do you currently borrow? 1. Family/relatives 2. your neighbor 3.Tontin
4.NGOs 5.Trader/Employer/Agricultural firm 6.MFI/Bank
7.Ricebank/village bank 8.Saving roup 9.Others…..
9.3 If no, why?
1.Do not need 2.Cannot afford 3.Too complicated to borrow 4.To high interest
5.Other pls explain...........................................................................
9.4 What means do you use for collateral?
1.Land title/house 2.Animals 3.Motor/car 4.Marchine 5.Family assurance
6.Self-help group assurance
7.Local authority witness 8.Other please specify………………………………….
9.5 For what purpose do you borrow?
1. For agricultural work, buy agricultural tools/inputs 2. Investment
3.to feed the family (buy more food) 4. to pay for the medical treatment
5.pay for children go to school 6. married/festival
7.for migration 8. to repay previous debt
9.House building 9.To cope with crop failure
10.For young married couple starting business
11.For help child to start agricultural work
12.Other pls specify……………………………………………………………………………………………
9.6 What you do you with the remittance earning by your family member who migrate(s)?
1. For agricultural work, buy agricultural tools/inputs 2. Investment
3.to feed the family (buy more food) 4. to pay for the medical treatment
5.pay for children go to school 6. married/festival
7.for migration 8. to repay previous debt
9.House building 9.To cope with crop failure
10.For young married couple starting business
11.For help child to start agricultural work
12.Other pls specify……………………………………………………………………………………………
9.7 How much can you save from your revenue each month or year?.............................Riels
9.8 What do you do with your saving from your revenue?
1. For agricultural work, buy agricultural tools/inputs 2. Investment
3.To feed the family (buy more food) 4. To pay for the medical treatment
5.To pay for children go to school 6. Married/festival
7.For migration 8. To repay previous debt
9.House building 9.To cope with crop failure
10.For young married couple starting business
11.For help child to start agricultural work
12.Other pls specify……………………………………………………………………………………………
Qualitative explanation…………………………………………………………………………………………………………....
……………………………………………………………………………………………………………………………………………………

358 | P a g e
X. Household consumption
Items Quantity Price Amount (Riel/day
or month)
Rice (kg)
Daily food (food ingredients)
Clothes
Medical
Electricity
Water
Cooking fuel (fuel wood, Chacoal, gas..)
Land tax, Other tax
Wedding party
Social contribution
Children schooling
Telephone
Transportation
Entertainment (traveling …)
Other (community member fee..etc)
XI. Social capital
11.1 Do any member of your family used to be taking part in group or NGOs or CBOs
projects?
1. Yes 0. No
11.2 If yes, pls list out name of groups in the table below:
HH
mem.
ID
Name of group, CBOs
or NGO ‘s projects,
Village/CC/district or
school authority
Participation
Mode of
participatio
n[a]
How often,
participation
?[b]
Nature of
group, CBOs
or NGO ‘s
projects[c] Year
Now, still
member?
(1.Yes,
0.No)
1……………………………
2……………………………
3……………………………
4……………………………
………
………
………
………
…………..
…………..
…………..
……………
…………..
…………..
…………..
……………
…………..
…………..
…………..
……………
…………..
…………..
…………..
……………
1……………………………
2……………………………
3……………………………
4……………………………
………
………
………
………
…………..
…………..
…………..
……………
…………..
…………..
…………..
……………
…………..
…………..
…………..
……………
…………..
…………..
…………..
……………
Code [a]
1. Leader 2. Member of committee 3. Member
Code [b]
1. Never participate
2. Part. Occasionally
3. Part. Frequently
4. Part. Very
frequently
Code [c]
1. Agricultural Production and Extension or livelihood improvement
2. Production or trade 3. Community Forestry or Natural
Resource Management 4. Finance, credit or saving 5. Health or education 6. Political
7. Religious 8. Other:............
11.3 Do you think that this existing NGOs or Group where you family’s member belong to is
good for villager? 1. Yes 0. No
11.4 If yes, pls explain why?............................................................................................
11.5 If no, pls explain why?.............................................................................................
………………………………………………………………………………………………………………………………………………………….
11.6 Do you think that this existing NGOs or Group where you family’s member belong to is
supportive enough accordingly to your need? 1. Yes 0. No
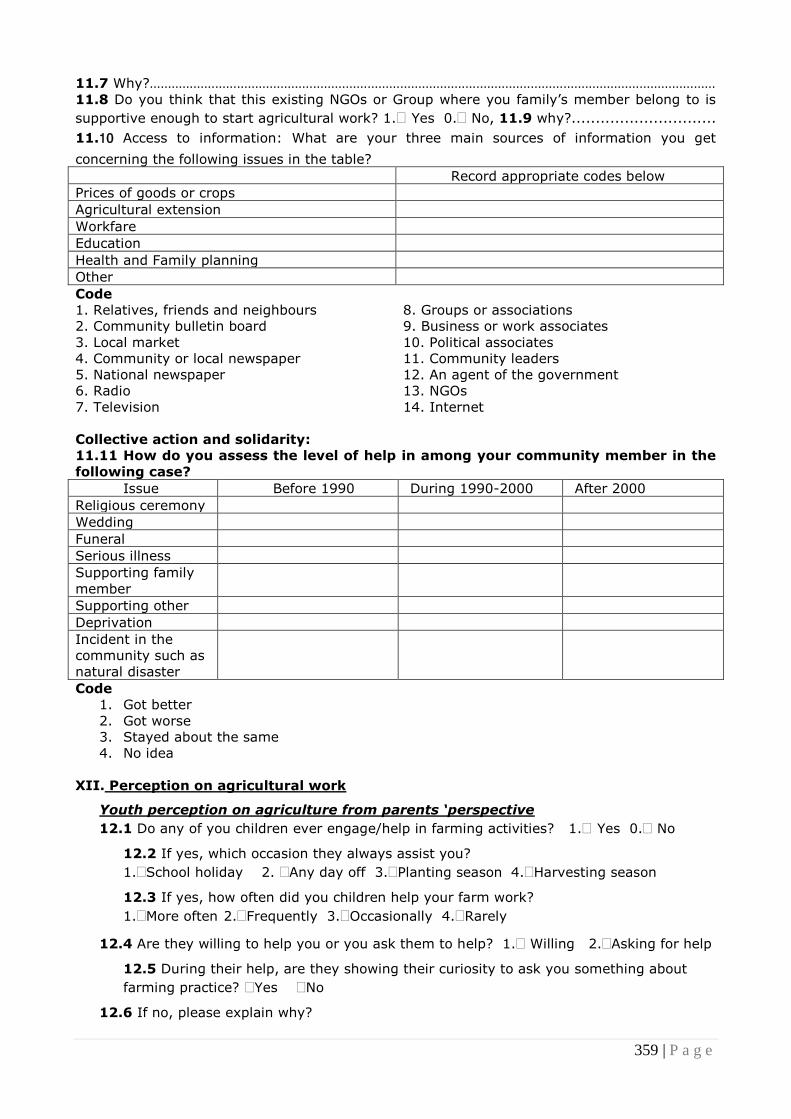
359 | P a g e
11.7 Why?…………………………………………………………………………………………………………………………………………
11.8 Do you think that this existing NGOs or Group where you family’s member belong to is
supportive enough to start agricultural work? 1. Yes 0. No, 11.9 why?.............................. 11.10 Access to information: What are your three main sources of information you get
concerning the following issues in the table?
Record appropriate codes below
Prices of goods or crops
Agricultural extension
Workfare
Education
Health and Family planning
Other
Code
1. Relatives, friends and neighbours
2. Community bulletin board
3. Local market
4. Community or local newspaper
5. National newspaper
6. Radio
7. Television
8. Groups or associations
9. Business or work associates
10. Political associates
11. Community leaders
12. An agent of the government
13. NGOs
14. Internet
Collective action and solidarity:
11.11 How do you assess the level of help in among your community member in the
following case?
Issue Before 1990 During 1990-2000 After 2000
Religious ceremony
Wedding
Funeral
Serious illness
Supporting family
member
Supporting other
Deprivation
Incident in the
community such as
natural disaster
Code
1. Got better
2. Got worse
3. Stayed about the same
4. No idea
XII. Perception on agricultural work
Youth perception on agriculture from parents ‘perspective
12.1 Do any of you children ever engage/help in farming activities? 1. Yes 0. No
12.2 If yes, which occasion they always assist you?
1.School holiday 2. Any day off 3.Planting season 4.Harvesting season
12.3 If yes, how often did you children help your farm work?
1.More often 2.Frequently 3.Occasionally 4.Rarely
12.4 Are they willing to help you or you ask them to help? 1. Willing 2.Asking for help
12.5 During their help, are they showing their curiosity to ask you something about
farming practice? Yes No
12.6 If no, please explain why?
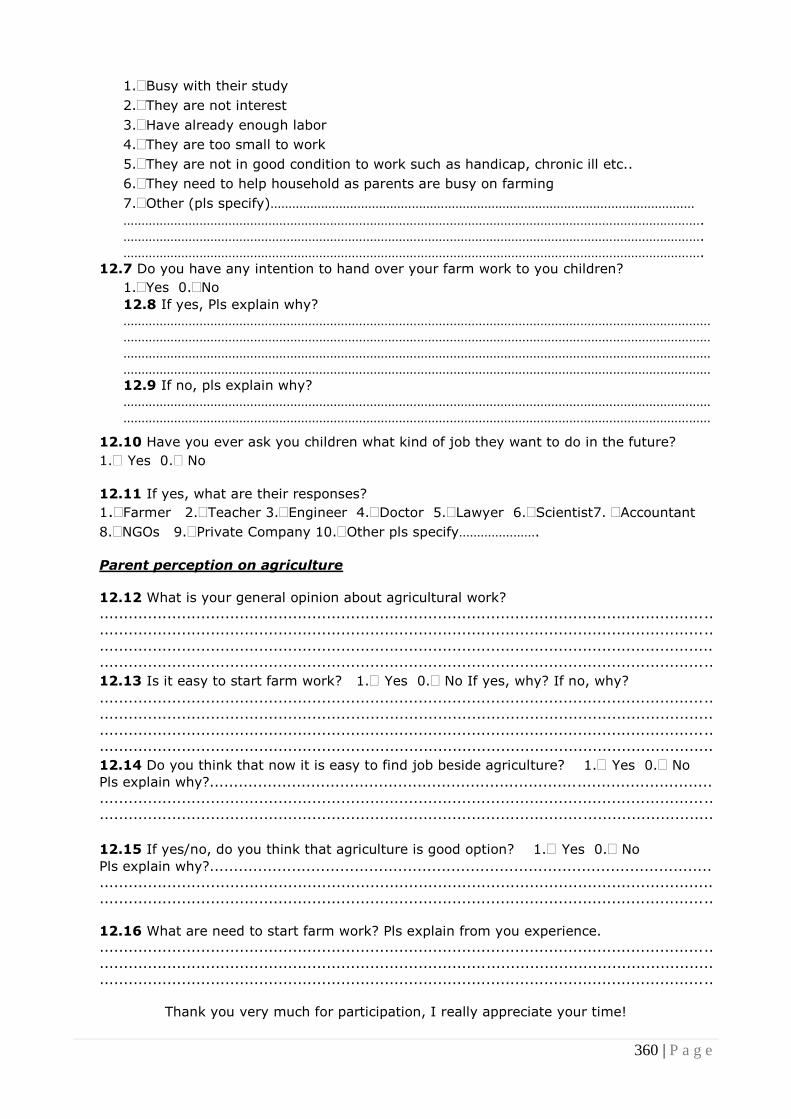
360 | P a g e
1.Busy with their study
2.They are not interest
3.Have already enough labor
4.They are too small to work
5.They are not in good condition to work such as handicap, chronic ill etc..
6.They need to help household as parents are busy on farming
7.Other (pls specify)………………………………………………………………………………………………………
…………………………………………………………………………………………………………………………………………….
…………………………………………………………………………………………………………………………………………….
…………………………………………………………………………………………………………………………………………….
12.7 Do you have any intention to hand over your farm work to you children?
1.Yes 0.No
12.8 If yes, Pls explain why?
………………………………………………………………………………………………………………………………………………
………………………………………………………………………………………………………………………………………………
………………………………………………………………………………………………………………………………………………
………………………………………………………………………………………………………………………………………………
12.9 If no, pls explain why?
………………………………………………………………………………………………………………………………………………
………………………………………………………………………………………………………………………………………………
12.10 Have you ever ask you children what kind of job they want to do in the future?
1. Yes 0. No
12.11 If yes, what are their responses?
1.Farmer 2.Teacher 3.Engineer 4.Doctor 5.Lawyer 6.Scientist7. Accountant
8.NGOs 9.Private Company 10.Other pls specify………………….
Parent perception on agriculture
12.12 What is your general opinion about agricultural work?
...............................................................................................................................
...............................................................................................................................
...............................................................................................................................
...............................................................................................................................
12.13 Is it easy to start farm work? 1. Yes 0. No If yes, why? If no, why?
...............................................................................................................................
...............................................................................................................................
...............................................................................................................................
...............................................................................................................................
12.14 Do you think that now it is easy to find job beside agriculture? 1. Yes 0. No
Pls explain why?........................................................................................................
...............................................................................................................................
...............................................................................................................................
12.15 If yes/no, do you think that agriculture is good option? 1. Yes 0. No
Pls explain why?........................................................................................................
...............................................................................................................................
...............................................................................................................................
12.16 What are need to start farm work? Pls explain from you experience.
...............................................................................................................................
...............................................................................................................................
...............................................................................................................................
Thank you very much for participation, I really appreciate your time!

361 | P a g e
Appendix – 15 Questionnaire survey on youth perception on agriculture
Questionnaire Survey on Youth Perception in Agriculture
Integration of youth into smallholding agriculture. Challenges, impacts and
prospects: perspectives from Cambodia
My name is………………………………student from …………………………………..I kindly ask you to
participate in my questionnaire survey. Your answers will be kept anonymous and the results
will be used to analyse the socio-economic impact of farming on your livelihood to fill the
requirement of our academic study. Thank you for your participation.
Interviewed by :………………………………
I. Information of respondent
1.1 Name:..............................1.2 Sex:1.Male 2.Female 1.3 Age:........years old,
1.4 Marital status: 1.Single, 2.Married, 3. Widow, 4.Divorce, 5.Seperate
1.5 How many brother and sister do you have?......brother......sister.
1.6 How many of them getting married? …………………..
1.7 How many of them still living with your parents? ………
1.8 At their marriage, Your parents give them some land? Yes, No
1.9 If yes, how many? Residential…..ha Rice…….ha Chamka……ha Forest……ha?
1.10 Are you the last child? Yes, No
1.11 If not, what is your order among your brother and sister? I am the ……..child
II. Education, Training and skill
2.1 What is your highest grade of education?..............
2.2 Are you currently studying? Yes No
2.3 Have you ever attend any training course done by NGO or development program? 1 0
2.4 If yes, what kind of training?
1.Hygiene and health care 2.Farming technic pls specify………………….
3.Animal production pls specify………………….
4.Saving 5.Law D&D 6.Self-development 7.Hair cutter/hair dresser 8.Tailor
9.Construction
2.5 Have you ever taking part in community development activities? Yes No
2.6 If yes, pls explain…………………………………………………………………………………………………………………
2.7 Have you ever studied any foreign language? Yes No,
2.8 If yes, what are they? English…….., Chinese…….., Thai………, Vietnamese……. Other……….
What is your level?
1.Beginner, 2.Elementary, 3.Pre-intermediate, 4.Intermediate, 5.Advance
III. Settlement and migration profile
3.1 Is this your home village? 1.Yes 0.No If no,
3.2 When does your family come to settle in the study area? Year:…………………………………
3.3 Why do your family come to settle here?
1.Seek for non-farm opportunities
2.Seek for land in agriculture
3.To work as wage labor in agriculture
4.To guard others‘ land
Code of questionnaire
Date of interview d d m M y y
Province
District
Commune
Village
Telephone
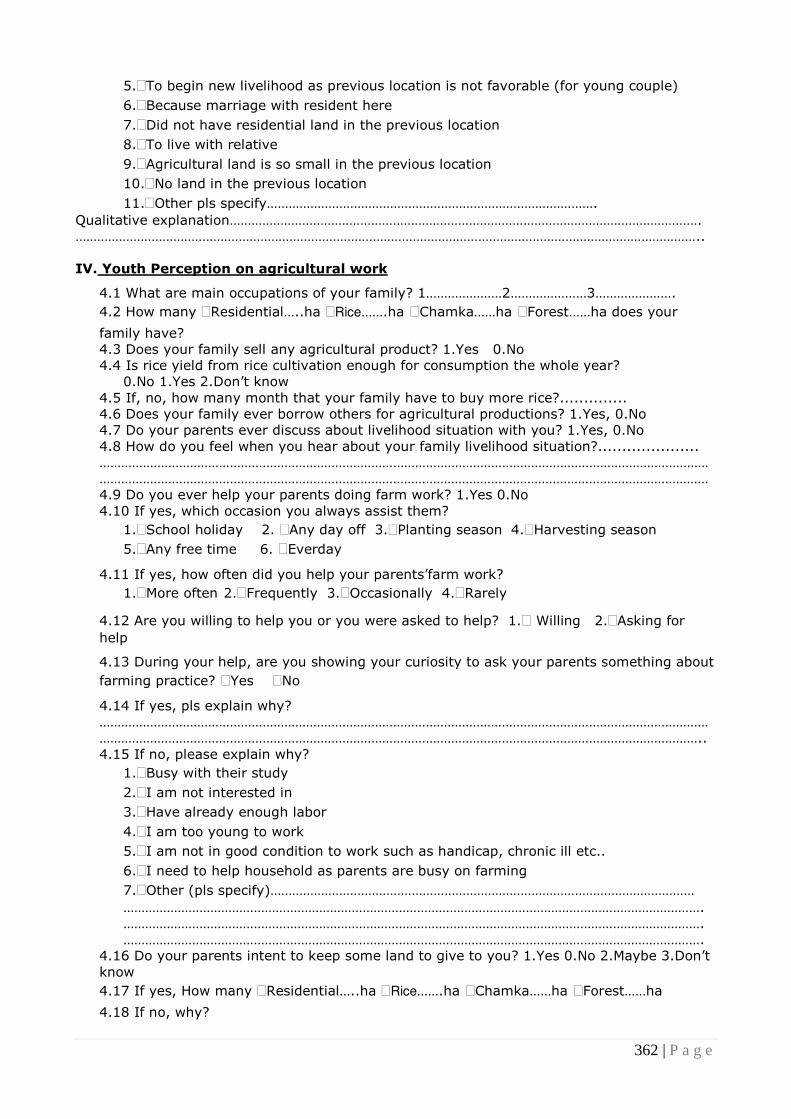
362 | P a g e
5.To begin new livelihood as previous location is not favorable (for young couple)
6.Because marriage with resident here
7.Did not have residential land in the previous location
8.To live with relative
9.Agricultural land is so small in the previous location
10.No land in the previous location
11.Other pls specify……………………………………………………………………………….
Qualitative explanation………………………………………………………………………………………………………………….
………………………………………………………………………………………………………………………………………………………..
IV. Youth Perception on agricultural work
4.1 What are main occupations of your family? 1…………………2…………………3………………….
4.2 How many Residential…..ha Rice…….ha Chamka……ha Forest……ha does your
family have?
4.3 Does your family sell any agricultural product? 1.Yes 0.No
4.4 Is rice yield from rice cultivation enough for consumption the whole year?
0.No 1.Yes 2.Don’t know
4.5 If, no, how many month that your family have to buy more rice?..............
4.6 Does your family ever borrow others for agricultural productions? 1.Yes, 0.No
4.7 Do your parents ever discuss about livelihood situation with you? 1.Yes, 0.No
4.8 How do you feel when you hear about your family livelihood situation?.....................
……………………………………………………………………………………………………………………………………………………
……………………………………………………………………………………………………………………………………………………
4.9 Do you ever help your parents doing farm work? 1.Yes 0.No
4.10 If yes, which occasion you always assist them?
1.School holiday 2. Any day off 3.Planting season 4.Harvesting season
5.Any free time 6. Everday
4.11 If yes, how often did you help your parents’farm work?
1.More often 2.Frequently 3.Occasionally 4.Rarely
4.12 Are you willing to help you or you were asked to help? 1. Willing 2.Asking for
help
4.13 During your help, are you showing your curiosity to ask your parents something about
farming practice? Yes No
4.14 If yes, pls explain why?
……………………………………………………………………………………………………………………………………………………
…………………………………………………………………………………………………………………………………………………..
4.15 If no, please explain why?
1.Busy with their study
2.I am not interested in
3.Have already enough labor
4.I am too young to work
5.I am not in good condition to work such as handicap, chronic ill etc..
6.I need to help household as parents are busy on farming
7.Other (pls specify)………………………………………………………………………………………………………
…………………………………………………………………………………………………………………………………………….
…………………………………………………………………………………………………………………………………………….
…………………………………………………………………………………………………………………………………………….
4.16 Do your parents intent to keep some land to give to you? 1.Yes 0.No 2.Maybe 3.Don’t
know
4.17 If yes, How many Residential…..ha Rice…….ha Chamka……ha Forest……ha
4.18 If no, why?

363 | P a g e
1.Not enough land for sub-division
2.Keep for other member
3.I am not interested in farming
4.My parent want me to do non-farming activities
5.Other please specify………………………………………………………………………………………………
Qualitative explaination......................................................................................
…………………………………………………………………………………………………………………………………………….
…………………………………………………………………………………………………………………………………………….
4.19 What is your general opinion about agricultural work?
...............................................................................................................................
...............................................................................................................................
...............................................................................................................................
...............................................................................................................................
4.20 Is it easy to start farm work? 1. Yes 0. No If yes, why? If no, why?
...............................................................................................................................
...............................................................................................................................
...............................................................................................................................
...............................................................................................................................
4.21 Do you think that now it is easy to find job beside agriculture? 1. Yes 0. No
Pls explain why?........................................................................................................
...............................................................................................................................
...............................................................................................................................
4.22 If yes/no, do you think that agriculture is good option for job? 1. Yes 0. No
Pls explain why?........................................................................................................
...............................................................................................................................
...............................................................................................................................
4.23 What are needs for starting farm work? Pls explain from your opinion.
...............................................................................................................................
...............................................................................................................................
4.24 Do you have any intention to take over farm work from your parents?
1.Yes 0.No
If yes, Pls explain why?
………………………………………………………………………………………………………………………………………………
………………………………………………………………………………………………………………………………………………
………………………………………………………………………………………………………………………………………………
If no, pls explain why?
………………………………………………………………………………………………………………………………………………
………………………………………………………………………………………………………………………………………………
4.25 Do you have any idea what do you want to do in the future? 1. Yes 0. No
4.26 If yes, what are your aspirations?
1.Farmer 2.Teacher 3.Engineer 4.Doctor 5.Lawyer 6.Scientist7. Accountant
8.NGOs 9.Private Company 10.Other pls specify………………….
4.27 What are means that could help you to achieve your aspiration?.............................
……………………………………………………………………………………………………………………………………………………
…………………………………………………………………………………………………………………………………………………..
(Family support, relative support, NGOs support….ect)
4.28 How likely do you think that your aspiration come true?
1. Pretty sure 2. Not so sure 3.Do not know 4. Other………………………………………..
Thank you very much for participation, I really appreciate your time!

364 | P a g e
Appendix – 16 Interview guide for key informants
Semi-structure interview guide for Key Informants ___________________________________________________________________________
Person interviewed (including role):
Province:
District:
Commune:
Village:
Date & time of the interview:
Interviewer/s:
Note taker:
Write up by:
1. Information about interviewee:
Sex
Age
Role, how s/he come to settle in the village?
Occupation and background of leadership
Economic activities
Production
Land holding
2. Demography
Total household in the village
Total population of the village and number of female
Number of household who have member migration
Total population migration including female
3. Local land use policy
Youth installation policy, is there any policy related to this?
Is that any local land use policy?
4. Land use history
Could you please explain the history of the village? How the village is established?
When people come to settle in this new village? (Accordingly to timeline)Why?
Where is the origin of new settler? Where are they come from? Why do they come to
settle here?
Land use change
When people start growing rice, vegetable and cassava? Before the year 2000, what
kind of crops people cultivated? Now, are change?
Land share among family member? How? In what way? What are the rule? Is there any
change about this rule?
5. Livelihood and copping strategies
What are main livelihood activities of people in the village?
What are challenge to livelihood?
Who do people deal with this challenge?
6. Youth situation and farming activities
Youth education: Do they all attend the school? What is the highest level of education
available in the village? How many percent of them drop out? Those who drop out
normally at what grade? And why they drop out?

365 | P a g e
What do they do after drop out? Farming? Migration? Or else?
From you own observation, do youth like farming activities?
From your point of view do you think that agriculture is good job? Why?
Do you have intension to keep you child working in farming activities?
If youth want to start agriculture, what are the needs?
What are the challenge and constraints for youth to start farm work?
What are need for young people to start farm work?
7.Social relation and social capital
What are name of those community or projects have been carry out in your village?
Could you please list out names of those project and their activities in brief?
What is your observation concerning the social relation among villager? Is it going
better, the same or worse?
8. Youth perception on agriculture from parents ‘perspective
Do any of you children ever engage/help in farming activities?
If yes, which occasion they always assist you?
Are they willing to help you or you ask them to help?
If no, please explain why?
Do you have any intention to take over farm work from your parent?
If yes, Pls explain why? If no, pls explain why?
Have you ever ask your children what kind of job they want to do in the future?
If yes, what are their responses?
9. Household head perception on agriculture
What is your general opinion about agricultural work?
Is it easy to start farm work?No If yes, why? If no, why?
Do you think that now it is easy to find job beside agriculture?
Pls explain why?
If yes/no, do you think that agriculture is good option?
Pls explain why?
What are need to start farm work? Pls explain from you experience.
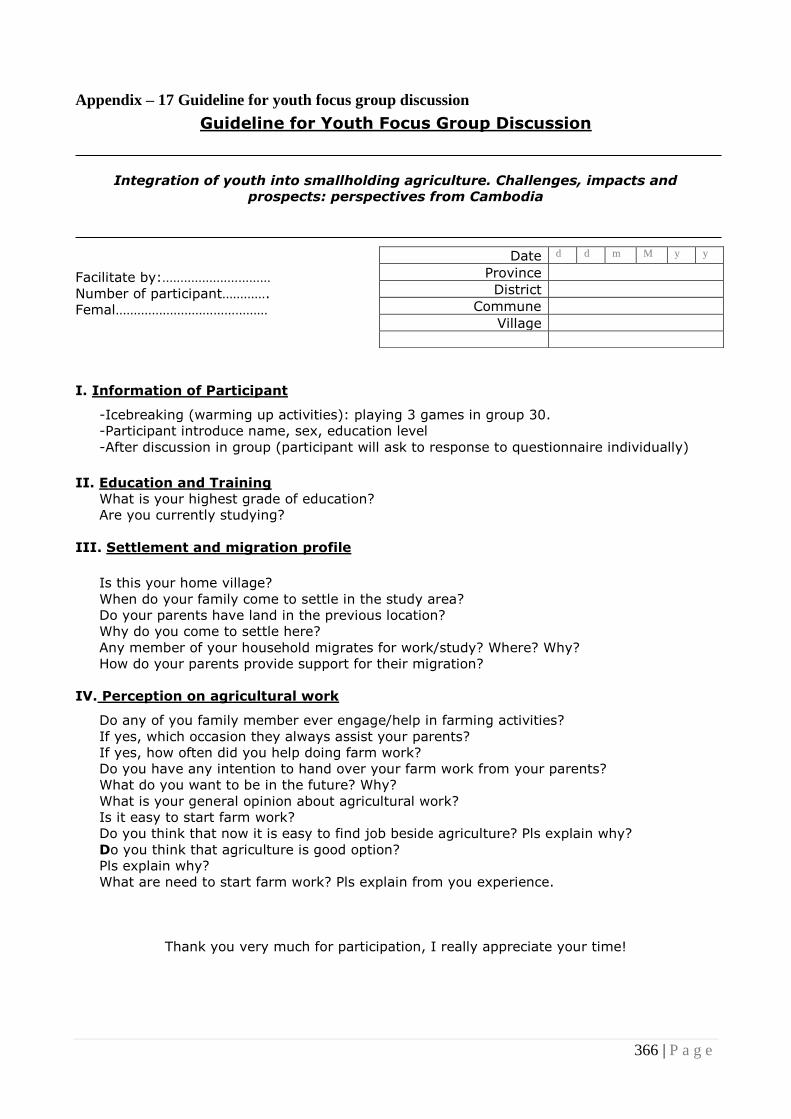
366 | P a g e
Appendix – 17 Guideline for youth focus group discussion
Guideline for Youth Focus Group Discussion
Integration of youth into smallholding agriculture. Challenges, impacts and
prospects: perspectives from Cambodia
Facilitate by:…………………………
Number of participant………….
Femal……………………………………
I. Information of Participant
-Icebreaking (warming up activities): playing 3 games in group 30.
-Participant introduce name, sex, education level
-After discussion in group (participant will ask to response to questionnaire individually)
II. Education and Training
What is your highest grade of education?
Are you currently studying?
III. Settlement and migration profile
Is this your home village?
When do your family come to settle in the study area?
Do your parents have land in the previous location?
Why do you come to settle here?
Any member of your household migrates for work/study? Where? Why?
How do your parents provide support for their migration?
IV. Perception on agricultural work
Do any of you family member ever engage/help in farming activities?
If yes, which occasion they always assist your parents?
If yes, how often did you help doing farm work?
Do you have any intention to hand over your farm work from your parents?
What do you want to be in the future? Why?
What is your general opinion about agricultural work?
Is it easy to start farm work?
Do you think that now it is easy to find job beside agriculture? Pls explain why?
Do you think that agriculture is good option?
Pls explain why?
What are need to start farm work? Pls explain from you experience.
Thank you very much for participation, I really appreciate your time!
Date d d m M y y
Province
District
Commune
Village
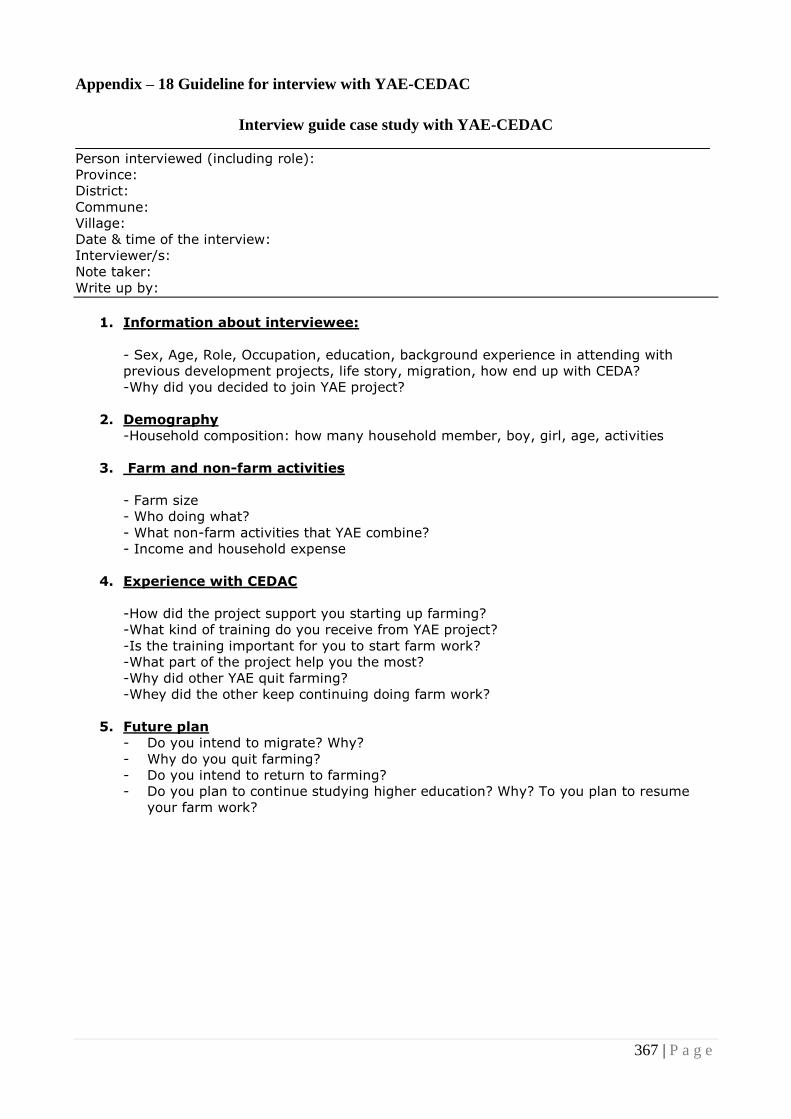
367 | P a g e
Appendix – 18 Guideline for interview with YAE-CEDAC
Interview guide case study with YAE-CEDAC ___________________________________________________________________________
Person interviewed (including role):
Province:
District:
Commune:
Village:
Date & time of the interview:
Interviewer/s:
Note taker:
Write up by:
1. Information about interviewee:
- Sex, Age, Role, Occupation, education, background experience in attending with
previous development projects, life story, migration, how end up with CEDA?
-Why did you decided to join YAE project?
2. Demography
-Household composition: how many household member, boy, girl, age, activities
3. Farm and non-farm activities
- Farm size
- Who doing what?
- What non-farm activities that YAE combine?
- Income and household expense
4. Experience with CEDAC
-How did the project support you starting up farming?
-What kind of training do you receive from YAE project?
-Is the training important for you to start farm work?
-What part of the project help you the most?
-Why did other YAE quit farming?
-Whey did the other keep continuing doing farm work?
5. Future plan
- Do you intend to migrate? Why?
- Why do you quit farming?
- Do you intend to return to farming?
- Do you plan to continue studying higher education? Why? To you plan to resume
your farm work?