Microfinance Growth and Poverty Reduction in Bangladesh: What Does the Longitudinal Data Say?
34
Institute of Microfinance (InM) March 2013 Working Paper No. 16 Microfinance Growth and Poverty Reduction in Bangladesh: What Does the Longitudinal Data Say? Shahidur R. Khandker Hussain A. Samad
Transcript of Microfinance Growth and Poverty Reduction in Bangladesh: What Does the Longitudinal Data Say?
The Institute of Microfinance (lnM) is an independent non-profit
organisation established primarily to meet the research and training needs
of national as well as of global microcredit programmes. Initiated and
promoted by Palli Karma-Sahayak Foundation (PKSF) on 1 November
2006, the Institute is principally funded by UKaid, Department for
International Development (DFID) through its Promoting Financial Services
for Poverty Reduction (PROSPER) Programme. lnM has an excellent team
of professionals in research, training and knowledge management. lnM
draws research scholars from reputed universities here and abroad. The
major services that lnM provides are research on poverty, microfinance,
enterprise development, impact assessment and evaluation of
microfinance programmes. Beside research, InM provides microfinance
related training, capacity building support and knowledge management
services to microfinance institutions and other development organisations.
For information please contact:
Institute of Microfinance (InM)
PKSF Bhaban, Agargaon, Dhaka-1207, Bangladesh
House # 2/1, Block-D, Lalmatia, Dhaka-1207, Bangladesh
PABX: +88-02-8100479, +88-02-8100676-7, Fax: +88-02-8100481
Email: [email protected] ; Web: www.inm.org.bd
m
m
Institute of Microfinance (InM)
March 2013
Working Paper No. 16
Microfinance Growth and Poverty Reduction in Bangladesh: What Does the
Longitudinal Data Say?
Shahidur R. Khandker
Hussain A. Samad

Microfinance Growth and Poverty Reduction in Bangladesh: What Does the Longitudinal Data Say?
Shahidur R. Khandker*Hussain A. Samad**
* Dr. Shahidur R. Khandker is a Lead Economist at the World Bank and a Visiting Fellow at the Institute of Microfinance (InM).
** Mr. Hussain A. Samad is a Consultant at the World Bank.
The analysis is based on several data sets, including the third round follow-up of microcredit survey (the InM-WB dataset) supported by the Institute of Microfinance (InM) and the World Bank. This paper’s analysis is partially supported by the World Bank’s South Asia Poverty Team in charge of producing the Bangladesh’s Poverty Assessment report. The authors would like to thank Dean Jolliffe, Rashid Faruqee, M. A. Baqui Khalily, Muhammad Abdul Latif, and Wahiduddin Mahmud for helpful comments, and Rubaba Ali and S. Badruddoza for research assistance.
This publication has been supported under the PROSPER Programme funded by UKaid, DFID. However, the views expressed in this paper are entirely those of the authors and do not necessarily reflect the views of InM, DFID, the World Bank or any other affiliated organisations.

AbstractThis paper, using several data sets, investigates whether microcredit programmes, which have been operating in rural Bangladesh for over 20 years, have any long-term effects in improving household income and expenditure and lowering poverty. Both descriptive and econometric analyses show that microcredit programmes helped participants earn higher income, consume more, and thereby lifted many of them out of poverty. Findings also suggest that while participation matters, those who have been with the programmes continuously for the last 20 years do even better. The paper concludes that poverty reduction, in particular the reduction of extreme poverty, due to microcredit intervention can be as high as 9 per cent of the total poverty reduction over the last decade in Bangladesh.

1. IntroductionOver the last 30 years, Bangladesh has been successful in arresting poverty at a remarkable rate. Overall poverty was 57 per cent in 1991 which reduced to 32 per cent in 2010, a 1.25 per cent reduction rate per year. Similarly, extreme poverty reduced from 41 per cent to 18 per cent during the same period (Table 1). On the other hand, in rural areas where more than 70 per cent of the country’s 150 million people live, overall poverty reduced from 59 per cent in 1991/92 to 35 per cent in 2010.1 The economy of Bangladesh was growing at more than 6 per cent in recent years (World Bank 2012). Besides GDP growth, other factors contribute to poverty reduction. This paper examines whether microfinance expansion over last two decades has helped reduce poverty. More specifically, we are interested in finding out if the huge microcredit expansion (from barely 1.9 million members in 1991 to 34 million members in 2010) helped contribute to the country’s poverty reduction during this period.
Poverty reduction through microcredit is not easy as with direct cash transfer. This is because a borrower has to earn enough from a microcredit-financed activity to repay loan before consuming, saving or making productive use of the profit. This requires time and resources (e.g., entrepreneurial ability), including a favourable local economic environment. Therefore, poverty reduction of credit is context-specific and can happen only under certain conditions.
Microfinance has nonetheless been successful in reaching the poor, especially women, who do not have access to mainstream financial institutions. It is possible microfinance satisfies the unmet demand for financial services of the poor, but the accrued benefits from microfinance expansion may not be large enough to contain poverty or sustain the poverty reduction effects over time, which can happen for a variety of reasons. Some argue that microfinance charges “exorbitant” interest rates (for example, the nominal on-lending rate of Grameen Bank is 20 per cent) that go against the spirit of its stated mission of poverty alleviation.2 Many also argue that microcredit expansion has increased indebtedness among the borrowers for reasons such as inability to make productive use of loans. Anecdotal evidence also suggests rising indebtedness without any profound relief from poverty among many microcredit participants.3
The analysis of this paper is focused on the extent of poverty reduction accrued by MFI participants and the economy as a whole as a result of an overwhelming expansion of microfinance portfolio in Bangladesh in the recent past. The paper’s analysis is based on three groups of data sets. The first one is from the published statistics by Credit and Development Forum (CDF), Institute of Microfinance (InM), and Grameen Bank. This data contains the programme level statistics at national level for various years. The second data set comes from Household Income Expenditure Survey (HIES) for 2000, 2005 and 2010. These surveys were conducted by Bangladesh Bureau of Statistics (BBS) to collect household data in Bangladesh to allow the government to monitor progress in the living standards and nutritional status, formulate appropriate policies related to poverty reduction,
1 The corresponding extreme poverty rates are 44 per cent and 21 per cent respectively. 2 A careful study examines the interest rate structures of microfinance institutions (MFIs) in Bangladesh which finds that the average effective interest rates were up to 35 per cent per annum until 2010 (Faruqee and Khalily, 2011). Because of an interest rate ceiling imposed by the country’s Microcredit Regulatory Authority (MRA) in 2010, the MFI interest rate is now not more than 27 per cent per year. 3 No rigorous analysis has shown yet the extent of indebtedness among microfinance participants in Bangladesh.
Microfinance Growth and Poverty Reduction in Bangladesh: What Does the Longitudinal Data Say?
Working Paper No. 16 05

and to evaluate various policies and programmes including microfinance programme on the living conditions of the population. The third data set is the one that this paper is mostly based on and will be described later. This data set comes from 3-period panel surveys spanning over 20 years (from 1991/92 to 2010/11) and is good for tracing the poverty reduction contribution of microcredit programmes over time. Notable studies that used earlier rounds of this survey include Pitt and Khandker (1998), based on the 1991/92 data, and Khandker (2005) which used the panel data covering1991/92 and 1998/99 surveys.
This paper’s objective is to verify if the growth in microcredit portfolio has led to higher income and expenditure growth and consequently poverty reduction over the study period. By focusing on the trend in poverty reduction among two comparable groups over time (that is, those who participated in 1991/92 and have remained with the programmes against those who were eligible in 1991/92 but never participated in microcredit programmes) it is possible to trace the microcredit programme’s contribution to the overall poverty reduction in rural areas of Bangladesh.
Moreover, the paper examines, using the Household Income Expenditure Surveys (HIES) of 2000, 2005, and 2010, the programme placement effect of a major microcredit programme such as Grameen Bank on poverty reduction over time.
2. Microfinance Growth and Poverty Reduction
Trends in Poverty Poverty figures reported in Table 1 are derived from the data of the Household Income and Expenditure Survey (HIES) using poverty lines based on the “cost of basic needs,” which includes the cost of a minimum food basket (food poverty line) and an allowance for non-food expenditures.4 Table 1 shows that, despite the significant progress in poverty reduction, urban-rural disparity remains a concern after all these years.
Besides the cost of a minimum food basket, actual food intake in terms of kilocalories per person per day can also be used directly to measure food poverty (according to the so-called direct calorie-intake method of poverty estimation). For this, two cut-off points of per capita daily kilocalorie intake can be considered: the higher one corresponds to 2,122 (the same that is used in the estimate of the food poverty line by the cost-of-basic-needs method) and refers to what we call moderate calorie-intake deficiency, whereas the lower one (which considers 1,805 kilocalorie per capita per day as the cut-off point) may be considered to represent severe deficiency. In line with the overall poverty estimates shown in Table 1, the proportions of people deficient in calorie intake, both moderate and severe, can be seen to have declined steadily since the early 1990s (Table 2).5 Unlike the findings reported in Table 1, urban population seem to be in a worse food deficiency than the rural population in 2005 in terms of both moderate and severe deficiencies. For example, moderate poverty in urban areas was little over 28 per cent in 2005, while moderate food deficiency in urban areas in the same year was 43 per cent. Overall, while the estimates
4 While estimation of moderate poverty compares household per capita total expenditure with the aggregate poverty line (allowing for the cost of food and non-food), extreme poverty compares household per capita total expenditure with the food poverty line. 5 The estimates for 2010 are not yet available from the published results.
Institute of Microfinance
Working Paper No. 1606

of moderate poverty are about the same in both measures in 2005, estimates of severe deficiency (extreme poverty) portray a more encouraging picture when calorie consumption is used instead of cost of basic needs.
In recent years, economic growth in many developing countries, including that in South Asia, has been accompanied by increased income inequality (Mahmud and Chowdhury 2008). In contrast, the pattern of economic growth in Bangladesh seems to have been relatively pro-poor—with the main stimulus to economic growth outside agriculture coming from labour-intensive garment export, micro- and small-scale enterprises in manufacturing sector and services, and remittances from migrants working abroad. In addition, since the late 1990s, real wages in the agricultural and other informal labour markets have shown strong upward trends. As shown by HIES of 2000 and later years, income inequality in urban and rural areas has not worsened in recent years, if not improved; as a result, poverty has reduced at a faster rate. All these sectors typically provide scope for upward economic mobility for the poor. Yet inequality tended to have increased in the 1990s, for two reasons: (a) even within a generally employment-intensive pattern of growth, major share of the benefits was reaped by those who were wealthy to begin with, and (b) growth was not strong enough to increase wages in the vast agricultural and informal labour markets. Since the early 1990s, Bangladesh has also achieved rapid improvements in many human development indicators, such as female school enrolment, child mortality, and contraceptive adoption rates. These achievements have been possible in spite of widespread poverty, low per capita public social spending, and the poor governance of service delivery systems in Bangladesh. Much of this progress has resulted from the adoption of low-cost solutions; for example, in health sector the use of oral rehydration saline for diarrhoea treatment has led to a significant decrease in child mortality. Progress has also come from increased public awareness created by effective social mobilisation campaigns, such as those for child immunisation, contraception, and girls’ school enrolment.6
While the gains from these low-cost solutions are reaped, further progress will depend on the amount of public social spending, quality of services, and synergies in poverty reduction. Also, in spite of the achievements cited, child malnutrition rates in Bangladesh remain among the highest in the world, with an estimated 46 per cent of children under 5 suffering from malnourishment, compared to 27 per cent in Sub-Saharan Africa (UNICEF 2010/11).7 This problem is common in other South Asian countries as well, especially in India and Nepal. The purpose of citing the poverty statistics is to demonstrate if microfinance growth over the years has been able to contribute to the continued reduction of poverty, especially in rural areas, where the MFIs have been very active.
Trends in Microfinance Growth IndicatorsMicrofinance operation which started predominantly with Grameen Bank and BRAC in the 1970s grew considerably in scale and scope over next few decades. Particularly in the 1990s, with the entry of other major NGO MFIs (ASA for example), availability of increased donor funds, and formation of PKSF (established in 1994), new branches were established
6 In Bangladesh, the scaling up of programmes through the spread of new ideas has been helped by a strong presence of the NGOs and by the density of settlements (see Ahluwalia and Mahmud 2004; Mahmud 2008).7 Malnourishment is measured by the extent of underweightness for a given age.
Microfinance Growth and Poverty Reduction in Bangladesh: What Does the Longitudinal Data Say?
Working Paper No. 16 07

all over in rural Bangladesh, disbursements intensified, and service portfolios expanded, and with that, microfinance operation in Bangladesh took off for a phenomenal growth.8 In this subsection, we examine the growth of various indicators of microfinance outreach during the last 15 years.
Figure 1 shows the growth pattern of microfinance members from 1996 to 2010. It is obvious that, while microfinance members grew steadily in general, after 2008 membership started dropping, although slowly. The membership of MFIs grew from about 8 million in 1996 to over 34 million in 2010. Table 3 shows the yearly growth rate of the MFIs since 2003. MFI membership grew by well over 10 per cent until 2008, and then the growth became negative, which was due to decline in the membership of non-Grameen MFIs. Table 3 also shows the growth of outstanding borrowers of the MFIs. Like the members, borrowers also grew at a rapid pace until 2008 before slowing down. This perhaps indicates certain degree of market saturation.
With a steady growth in membership, loan disbursement of the MFIs also increased steadily as shown in Figure 2. While the loan disbursement of the MFIs was little over Tk. 32 billion in 1997, it grew to about Tk. 372 billion in 2010. And like the trend in membership growth, disbursement also dropped between 2009 and 2010.
How much savings was mobilised by the MFIs during this period of expansion? As we can see from Figure 3, savings for the MFIs was around at Tk. 8 billion in 1996 and it went up steadily to Tk. 161 billion in 2010. It seems that savings growth was not affected much by the membership drop between 2009 and 2010. While savings, by itself, is a good measure of programme outreach and benefit, it often makes more sense to express it as a percentage of loans outstanding. Figure 4 shows that unlike the trends in savings itself, which grew monotonically, savings as a percentage of loans outstanding showed some fluctuation. In a zigzag pattern, saving as a percentage of loans outstanding dropped from close to 50 per cent in 1996 to little over 40 per cent in 1998, before jumping to about 64 per cent in 2004, and the falling again to 45 per cent over next 4 years. It eventually recovered to attain its highest value of 69 per cent in 2009.
3. Can Microfinance Reduce Poverty: What Does the Evidence Say?Before we analyse the long panel data in terms of the scope for poverty reduction among the participants, we review the literature on the evidence of poverty reduction effects of microfinance. The findings of vast literature have remained dubious if not misleading on the poverty reduction role of microfinance. There are two schools of thought on the effectiveness of microcredit as a poverty reduction instrument. One school espouses the expansion of microcredit programmes because it can help reduce poverty and also promote social and human welfare (Dunford 2006; Littlefield et al., 2003; Yunus 1995; Hermes and Lensink 2007; Khandker 1998). A large body of literature provides both anecdotal and rigorous evidence to validate these claims and argue that the recipients of microcredit, mostly
8 PKSF (Palli Karma-Sahayak Foundation in Bangla, meaning Rural Employment Support Foundation) is a wholesale agency, established by the government of Bangladesh in the 1990s, which lends government and donor-funded money to its partner organisations (POs) for on-lending as microcredit disbursements. Until March 2010, PKSF has lent Tk. 88.5 billion to over 250 POs who in turn disbursed about Tk. 525 billion to about 10 million microcredit members.
Institute of Microfinance
Working Paper No. 1608
women, benefit in various ways (Dunford 2006; Hossain 1988; Shaw 2004; Panjaitan-Drioadisuryo and Cloud 1999; Pitt, Khandker, and Cartwright, 2006).9
The most notable findings on the impacts of microcredit are based on a rigorous quasi-experimental programme evaluation carried by the World Bank and Bangladesh Institute of Development Studies (known as BIDS-WB study) on three well-known microcredit programmes in Bangladesh using the 1991/92 cross-sectional household survey data (e.g., Khandker 1998; Pitt and Khandker 1996; 1998; Pitt, Khandker, McKernan, and Latif 1999). The BIDS-WB study concludes that the positive impacts of microcredit are higher for women than for men, children benefit from women’s participation more than from the men’s, and microcredit empowers women. Few more recent household-level studies from other countries confirm the positive role of microcredit in reducing poverty and promoting social and economic development (e.g., Islam 2011; McIntosh, 2008; Kevane and Wydick 2001; Imai, Arun and Annim, 2010; Boonperm et al. 2009). Using cross-country panel data, another study confirms that microfinance reduces poverty significantly at the macro level and that development financial institutions support microfinance expansion worldwide for a sizeable effect on poverty and hunger (Imai, Gaiha, Thapa, and Annim, 2012).
Yet some studies using non-experimental survey data do cast doubt on the poverty reduction effects of microcredit (e.g., Copestake et al, 2001). The major argument posed by these studies is that microcredit does not reach the poorest of the poor (Scully 2004; Simanowitz 2002) or the most vulnerable in the society (e.g., Amin, Rai and Topa 2003). Consequently, special microcredit programmes are designed for the ultra-poor that combines credit with non-credit services on flexible terms. Several evaluations show that the ultra-poor benefit from specialised microcredit programmes in terms of raising income, consumption and physical assets (Emran et al, 2009; Khandker et al. 2010).
In contrast, there is an emerging school of thought that suspects the findings of the quasi-experimental studies. This school argues that the quasi-experimental or non-randomised techniques used in these studies are subject to measurements errors because of questionable statistical assumptions. Consequently, the second school of thought promotes the application of randomised control trial (RCT) where programme participants and non-participants are randomly selected before a microcredit programme starts providing credit and other services to its clients. The critical assumption underlying RCTs is that treated and non-treated individuals are statistically similar in observed traits except that one group is treated and the other group is not. RCTs are designed either through a deliberate choice of a programme or a natural experiment via external factors such as natural disaster.
Nevertheless, the findings of RCTs studies are mixed. An early study from Thailand shows that microfinance benefits the better-off households more than the poor (Coleman 1999; 2006). Karlan and Zinman (2010) shows that profits from businesses are higher for male borrowers and wealthy entrepreneurs. RCT studies in a number of countries show more beneficial effects in male-run microenterprises than in female-run businesses (see, McKenzie and Woodruff 2008, on male-run businesses in Mexico, and de Mel, McKenzie, and Woodruff 2008, on male- and female-run businesses in Sri Lanka). Other randomised studies find no support for the claim that microcredit increases household income, and/or consumption in the short-run (Augsburg et al. 2010/11, Attanasio, et al., 2010/11, Banerjee et al., 2010, Karlan and Zinman 2010 and 2010/11, Crépon et al., 2010/11). However, some RCT based studies find positive changes in the composition of consumption, for example,
9 A few studies, on the other hand, argue that women have no control over the obtained credit and, hence, do not benefit from programme participation (Amin and Pebley 1990; Goetz and Sen Gupta 1996; Mahmud 2003).
Microfinance Growth and Poverty Reduction in Bangladesh: What Does the Longitudinal Data Say?
Working Paper No. 16 09
food consumption increased and consumption of temptation goods such as tobacco, and alcohol, etc. decreased in India and Mongolia (Banerjee et al., 2010, Attanasio, et al., 2010/11). Karlan and Valdivia (2010/11) use a randomised trial in Peru to investigate whether adding a short business training course can improve microcredit impacts. They find increased client retention rates but no notable impacts on business revenue, profits, or employment. Banerjee et al. (2010) show from an experiment conducted in Hyderabad, India, that the effects of microfinance on household welfare are very moderate. Summarising the findings of several recent RCT studies, Roodman (2012) concludes that microfinance does not reduce poverty.
The use of RCTs in evaluating microcredit programmes has its own methodological weaknesses (Deaton 2010; Rodrik 2008; Ravallion 2012). The most critical assumption of observable similarity between treated and non-treated can be easily violated when individuals vary by unobserved traits such as entrepreneurial ability which are very critical for any productive use of a loan. That is, sample selection bias that questions the validity of non-RCT studies also holds in RCTs studies. Another critical factor damaging the findings of RCT studies is that RCT findings can hardly be generalised. What is found in a part of India cannot be generalised for other parts of the country. Yet critics based on several RCT studies argue that microfinance does not reduce poverty.
This paper argues that a critical factor for an assessment of a programme such as microcredit is the duration of a programme intervention. Unlike programmes such as conditional cash transfers (CCTs) which benefit the participants within a short period of time, microcredit takes time to have an impact that can be measured appropriately. In fact, a study using panel data over 1997-2005 drawn from Bangladesh shows that benefits from microcredit programmes vary more than proportionately with the length of programme exposure (Islam, 2010). Yet the RCT-based microcredit impact studies have hardly been conducted with any repeat surveys to address these issues or to verify the claim that microcredit indeed does not work (e.g., Hermes and Lensink 2007).
The RCT studies observed in the literature were conducted after short-duration of the interventions (not more than 24 months), which may not be enough to appropriately measure effects on consumption and poverty. In contrast, the leading non-RCT studies of Pitt and Khandker (1998), for example, assess the impact of microcredit loans that were taken for up to five years. We in this paper use long panel data (over 20 years) to validate whether those poverty reduction effects of microcredit programmes as observed in earlier studies are indeed sustained over time.
4. Longitudinal Household Survey and Data CharacteristicsThe World Bank jointly with the Bangladesh Institute of Development Studies (BIDS) carried out the first survey in 1991/92 to study the role of microfinance in economic and social upliftment among the poor. This was a survey of 1,798 households randomly drawn from 87 villages of 29 upazilas in rural Bangladesh.10 Out of 29 upazilas, 24 were programme upazilas (8 from each of the three programmes: Grameen Bank, BRAC, and BRDB RD-12 project), and 5 were non-programme upazilas. They were selected from 391 rural upazilas out of 460. Three villages in each programme upazila were randomly selected from a list of programme villages in which a programme had been in operation for at least three years.
10 An upazila is an administrative unit that is smaller than a district and consists of a number of villages.
Institute of Microfinance
Working Paper No. 1610

Three villages in each non-programme upazila were also randomly selected from the village census of the Government of Bangladesh. Villages with an unusually high or low number of households (fewer than 51 or higher than 600) were excluded from village survey design. A total of 87 villages were selected from which a total of 1,798 households were selected based on landholding. The household survey was conducted three times during 1991/92, based on the three cropping seasons: round 1 during Aman rice (November-February), round 2 during Boro rice (March-June), and round 3 during Aus rice (July-October). However, because of attrition only 1,769 households were available in the third round. A more detailed description of this survey can be found in Khandker (1998).
These households from 87 villages were revisited in 1998/99, again with the help of BIDS. Unlike the 1991/92 survey, these households were revisited once in 1998/99. However, among the 1,769 households surveyed in 1991/92 survey, 131 could not be re-traced in 1998/99, leaving 1,638 households available for the re-survey. The attrition rate is therefore 7.4 per cent. Re-survey included new households from old villages and newly included villages. Three new non-target households were randomly selected from each of the existing 87 villages. Also three new upazilas were randomly selected from the southern and south-eastern regions that were excluded in first round survey because of the cyclone in 1991/92. Three villages were drawn randomly from each of these new upazilas, making 9 additional villages in all. In these new villages, 20 households were drawn from both target and non-target households. Altogether 2,599 households were surveyed in 1998/99 out of which 2,226 were from old villages and 373 are from new villages. Among the 2,226 households in old villages, 279 households are new sampled households and 1,947 are old panel households surveyed in 1991/92. Number of panel households surveyed in 1998/99 (1,947 households) are more than that surveyed in 1991/92 (1,638 households) because some old households split after the first survey to form more than one new households. These split households are logically merged with the original households from which they split off.
The households were resurveyed again in 2010/11 this time jointly with the Institute of Microfinance (InM). The resurvey tried to revisit all the households (2,599) surveyed in 1998/99. However, due to attrition, 2,342 households were identified and 257 households failed to be interviewed. The attrition rate during the round survey is about 10 per cent. However, due to household split-off we ended up interviewing 3,082 households in 2010/11 with 740 households split off during this period. Overall, 1,509 original households from 1991/92 were common in all three surveys. The survey started in March 2012 and completed in September 2012.
5. Dynamics of Microcredit ParticipationTable 4 shows the microcredit participation status over for the three-period panel survey ranging from 1991/92 to 2010/11. The original sample included only participants from Grameen Bank, BRAC, and BRDB-12. However, over time, the BRDB-12 lost its membership substantially and then re-emerged after 1998/99 under the new name of the Palli Daridra Bimochan Foundation (PDBF), which is an outfit of the Ministry of Local Government and Rural Development (LGRD). A new NGO named ASA got prominence in microcredit service delivery after 1991/92 and hence, is included as a separate programme besides those three programmes originally identified in 1991/92. Besides these major programmes, there are a host of small NGOs supported by PKSF, the country’s wholesale
Microfinance Growth and Poverty Reduction in Bangladesh: What Does the Longitudinal Data Say?
Working Paper No. 16 11

microcredit programme, which emerged as a new source of funding after 1994/95 when PKSF was established.
Among the four major programmes, membership in a single programme has changed over time among the panel households included in this survey. For example, the membership exclusive to Grameen Bank increased from 8.7 per cent in 1991/92 to 12.1 per cent in 1998 but then reduced to 10.0 per cent in 2010/11. In contrast, BRAC’s exclusive membership stayed around at 11 per cent during the first two surveys but then dropped to only 4.5 per cent in 2010/11. Single membership in other small programmes increased over time and constituted 10.6 per cent of the rural population. Multiple programme membership is another phenomenon that expanded over the years since mid-1990s. It was 8.9 per cent in 1998/99 and 31.9 per cent in 2010/11 of the rural households. The households were members of both small programmes as well as major programmes such Grameen Bank or BRAC. Microcredit membership increased over time from 26.3 per cent in 1991/92 to 48.6 per cent in 1998/99 and to 68.5 per cent in 2010/11.
Because of an increase in multiple memberships over time, the actual membership in a programme is higher in 1998/99 and 2010/11 than the figures reported in Table 4. The actual programme participation rate is presented in Table 5. After accounting for membership in multiple programmes, Grameen Bank membership was found to have increased from 8.7 per cent in 1991/92 to 27.4 per cent in 2010/11, implying almost 7.5 percentage point gains per year over this period of 20 years. Table 5 also presents the distribution of borrowers across programmes and years. They are presented in the parentheses of Table 5. It shows that non-borrower membership increased over time for all programmes. For example, 23.3 per cent of all programmes are borrowers against 26.3 per cent of membership in 1991/92, with only 3 per cent are non-borrowers among members. In contrast, the per cent of borrowers were 56.2 per cent against 68.5 per cent members with some 12 per cent are non-borrowers members out of 68.5 per cent membership.
Figure 5 presents the breakdown of original 1,509 households from 1991/92 to 2010/11 by programme participation status. In 1991/92, 26.3 per cent of 1,509 households were microcredit programme participants compared to 73.7 per cent non-participants. By 1998/99, there was a drop among the participants of 2.8 percentage points while from the non-participants there was a switch to participation by 26.4 percentage points. Similar transitions continued as we can see in the 2010/11 survey. A trend is clear from such transitions – from the participants at each stage a very high proportion remained with the programmes over time and also from the non-participants a good proportion of the households decided to join microcredit programme over time, resulting in substantial growth in membership. Apparently, these households perceived certain benefits from microcredit participation.11
11 One may counter this by arguing that these households are trapped as they do not have an option either to graduate or opt out from microcredit programmes. We will see shortly if the points raised by this counter-argument are valid.
Institute of Microfinance
Working Paper No. 1612

6. Dynamics of Household-level Microcredit PortfolioThe major way membership brings in benefits is through loans which a poor household can hardly obtain from a formal financial institution or can borrow at low rates of interest from informal lenders. Therefore, one way to measure the benefits of microcredit programme is to assess the increased access to credit. Table 6 presents the distribution of microcredit borrowing from major programmes as well as the amount of combined borrowing from all microcredit sources. Clearly borrowing increased manifold: the total amount borrowed in 1991/92 was Tk. 9,252 compared to Tk. 17,006 in 2010/11, implying a simple growth of more than 4 per cent annually over the 20 year period.
A very high growth in household borrowing took place for programmes (dubbed “Other programmes” in Table 6) which are relatively new compared to the original programmes such as Grameen Bank – between 1998/99 to 2010/11, the average household borrowing from these programmes increased by 132 per cent, implying a growth rate of 10.9 per cent per year. Unlike other programmes, the average loan portfolio per borrower has declined for Grameen Bank. The highest growth in household borrowing took place for BRAC members, mainly because of the intensity of small and medium microenterprise (SME) loans which are of considerably large in size, compared to other microcredit loans.12
Microcredit programmes in Bangladesh target women more than men in obtaining credit and other financial services as part of their social agenda. On average, more than two-thirds of the loans are received by women over years. In 2010/11, women’s share was the highest for Grameen Bank (89 per cent) and the lowest for BRAC (38 per cent). Note, however, that women’s share of microloans in BRAC was much higher in earlier years (95 per cent, for example, in 1998/99) but this share dropped to only 38 per cent in 2010/11. The higher share of disbursement to male members in BRAC portfolio is due to the intensification of SME loans which are advanced mostly to men.
7. Welfare Gains from Microcredit ParticipationAs a result of enhanced micro-borrowing over a long period, it is conceivable that households enjoy a higher level of income (if income was augmented through activities financed under microcredit programmes), a higher level of consumption (since the participating households were poor to begin with) and consequently, a reduced level of poverty. Table 7 shows the distribution of income, expenditure, and poverty for participants and eligible nonparticipants for all three years.
The outcome of particular interest in this paper is the poverty dynamics over this long period of study. A set of 3 important indicators is selected for comparison purpose: income, expenditure, and poverty. Both income and expenditure are in real terms (in 1991/92 Tk.). The poverty line is based on the cost-of-basic-needs method. According to this method, one must establish the cost of a minimum food basket (called the food poverty line), and
12 Most SME loans (mostly over Tk. 100,000) are disbursed by BRAC, which facilitates microenterprise growth. According to the third round (2010/11) of the panel survey, such loans constitute about 6 per cent of the total number of BRAC loans, while they are only about one per cent of total loans number of loans disbursed by Grameen Bank.
Microfinance Growth and Poverty Reduction in Bangladesh: What Does the Longitudinal Data Say?
Working Paper No. 16 13

then add an allowance for non-food expenditure to constitute the moderate poverty line. Extreme poverty, in contrast, compares household’s total consumption expenditure on food and non-food with the food poverty line.
The households are categorised by programme participants and non-participants (households that were ineligible by programme criteria and non-participants during 1991/92 are excluded). This is to see the overall trend in income and poverty among eligible households (between those who participated in microcredit programmes and those who did not and are comparable).13
As Table 7 shows, between the surveys of 1991/92 and 2010/11 the real per capita income more than doubled overall–it increased by 104 per cent for programme participants, and 125 per cent for non-participants. Share of nonfarm income was consistently higher for the participants than for the non-participants, and furthermore, it also had a higher growth for the participants (13.8 percentage points) than for the non-participants (11.3 percentage points) during the same period. The shares of food and non-food in total expenditures remain the same for both participants and non-participants during the 20 years, and both types of households experienced the same growth in the share of non-food consumption, an indication of high level of welfare for rural Bangladesh overall. However, like the case with income, non-participants experienced a higher growth in per capita expenditure (89.6 per cent) than did the participants (74.6 per cent) over the last 20 years. The participant-nonparticipant difference in expenditure is statistically significant in 2010/11.
Unlike the trend in expenditure, the incidence of moderate poverty is lower for participants (32.9 per cent) than for the non-participants (34.6 per cent) in 2010/11, although the difference is not statistically significant. And, the extreme poverty rate for participants (16.2 per cent) is lower than that for non-participants (23.1 per cent) by a wider margin, which is statistically significant.14 It seems, therefore, while poverty has declined substantially over a period of 20 years for both participants and non-participants, it has declined more for the programme participants than for the non-participants. For example, extreme poverty dropped by 2.9 percentage points per year for programme participants, compared to a yearly reduction of 2.8 percentage points for the non-participants. Does it mean microcredit did help alleviate the poverty?15 Such a simple comparison does not tell what could have happened to the participants if they were not members of microcredit programmes. It is
13 There are leakages in microcredit programme participation - some 20 per cent of participants in 1991/92 were from ineligible households. However, if we drop all ineligible households (based on the land-based criteria) from the analysis regardless of their participation status, we do not observe much relative change in the findings for the participants and non-participants, and this is particularly true during 2010/11. 14 The finding that participants had lower per capita expenditure as well as lower extreme poverty than non-participants in 2010/11 seems puzzling. But this is possible because while the average per capita expenditure of the participants is less than that of the non-participants, the proportion of households with lower than poverty line expenditure among the participants is also less than that among the non-participants. That is, taking into account the 20-year trend we can say that extreme poor households among the participants did better to improve their expenditure level than their counterpart extreme poor among the non-participants, even though the participants as a whole did not do so well compared to the non-participants. 15 Note that using the impact estimates of the first cross-sectional analysis of the data set by Pitt and Khandker (1998), Khandker (1998) predicts that some 5 per cent of microcredit participants would lift themselves out of poverty every year if the estimated returns to borrowing are sustained over time. However, the panel data analysis of 1991/92-1998/99 (Khandker 2005) shows that the returns to borrowing have declined over the years, in which case the poverty reduction gains are likely to be reduced. Interestingly, these earlier findings are consistent with the findings of the analysis using the 3rd round survey. For example, extreme poverty among programme participants reduced by 4.5 percentage points per year during 1991/92-1998/99 and by 3.2 percentage points per year during 1998/99-2010/11. This suggests that the poverty reduction gains have reduced slightly over time, although this simple comparison does not tell that these poverty reductions of microcredit participants are purely because of microcredit participation. The poverty reduction effects of microcredit are shown in section 9.
Institute of Microfinance
Working Paper No. 1614
possible that the situation of programme participants could have been worse than what we observe in 2010/11. More importantly, such an average hides the underlying differences in unobserved factors among participants as the participants as a group may not be homogenous. Moreover, the same households do not participate in all 3 years – participants in one year are very likely to include non-participants from another year. So an interesting exercise would be to trace the same group of households across years (defined by certain participation status) and observe the trend in their outcomes. In the next section, we are going to explore such possibilities.
8. Dynamics of Welfare GainsSo far we examined the progress over time in income, expenditure and poverty reduction for households by their year-by-year participation status. While looking this way gives a snapshot of the welfare status of the households by their participation status, it does not differentiate between participants who remained with the programmes continuously for the entire 20 year period and those participants who were irregular members during the same period. In this section, we look at the welfare outcomes for two groups of participants (long-term versus short-term) against those who never participated even if they were eligible. More specifically, we identify three types of households as follows. The first group of households has been continuous participants of microcredit for last 20 years. That is, these households were found to participate in microcredit during all three surveys: 1991/92, 1998/99 and 2010/11. The second group of households is what we call irregular participants who participated for some time during last 20 years but not during all three surveys. The third group of households is what we call never participants who never participated in any microcredit programme over the last 20 years whatsoever. That is, these households were found non-participants in 1991/92, 1998/99 and 2010/11, even if they were eligible to participate in 1991/92. Grouping households this way gives us an opportunity to observe whether duration of participation matters.
We consider the same set of outcomes we examined before, such as, income, expenditure and poverty. But the comparison is made only for 2010/11 figures as only then the distinction among the three participation status can be made clear. Table 8 shows the inter-group differences for these outcomes of particular interest. As for per capita income, although the differences between participants (either long- or short-term) and non-participants are not statistically significant, differences within the participants are statistically significant – that is, long-term participants have a significantly higher income than short-term participants. More interestingly, although the per capita expenditure of either type of participants is significantly less than that of the non-participants, comparison within the participants shows that long-term participants again do significantly better than the short-term participants. The same pattern holds for both moderate and extreme poverty of the participants.
What we can summarise from the exercise of this section is the following. First, the reduction in poverty outcomes seems more for the participating households than for the non-participating households. Second, among the participants, those who participated in microcredit programmes continuously did much better than those who participated irregularly. This exercise, however, while helping us examine the inter-group differences in outcomes of particular interest, does not establish the causality between the outcomes and
Microfinance Growth and Poverty Reduction in Bangladesh: What Does the Longitudinal Data Say?
Working Paper No. 16 15

microcredit participation. Establishing such causality requires controlling for unobserved factors that influence microcredit programme placement and household participation once a programme is placed in a community. In the next section we address the causality and assess the programme impacts on the outcomes of particular interest.
9. Causal Effects of Microfinance Access on Poverty Reduction16
In this section, we estimate the programme effects of microcredit on the key welfare indicators that we have discussed in this paper. More specifically, we estimate the impacts of both programme participation and programme placement. We estimate the effects of household level participation in microcredit programmes on income, expenditure, moderate and extreme poverty, using the three rounds household survey data. Let us assume the following reduced-form equation of participation of the i-th household living in j-th village in period, t as:
bijt
bj
bijijtijt XB εμηλ +++= (1)
where, Bijt represents programme participation status of household i in village j during a period t, Xijt is a vector of household characteristics (that is, age, sex and education
of household head), λ is a vector of unknown parameters to be estimated, bijη is an
unmeasured determinant of the credit demand that is time-invariant within a household, bjµ is an unmeasured determinant of credit demand that is time-invariant within a village,
and εijt is a non-systematic error.
Household-level outcome (Yijt) in period t, conditional on programme participation, is defined as below:
yijt
yj
yijijtijtijt BXY εμηa ++++= (2)
where ρ measures the effects of programme participation on the outcome of interest.
Applying a deviation from the mean version of the double-difference (DD) to equation (2) above,
)()()()( y
ijy
ijtijijtijijtijijt BBXXYY εερα −+−+−=− (3a)
y
ijtijtijtijt BXY ερα ∆+∆+∆=∆⇒ ,
where bijtijtijt XB ελ ∆+∆=∆ (3b)
Since the terms yijη , y
jμ , and yijtε are uncorrelated across equations (3a) and (3b), consisting
of unobserved village and household heterogeneity, and are differenced out over time, it follows that the simple OLS estimation of equation (3a) will be consistent. In other words, a household-level fixed effect (FE) method is applied to estimate the programme effect.
16 This section provides estimates of average effects of microcredit participation. Note that programme participation is defined by those participants who borrowed and hence, the non-participants as well as the non-borrower participants are treated as non-participants.
Institute of Microfinance
Working Paper No. 1616
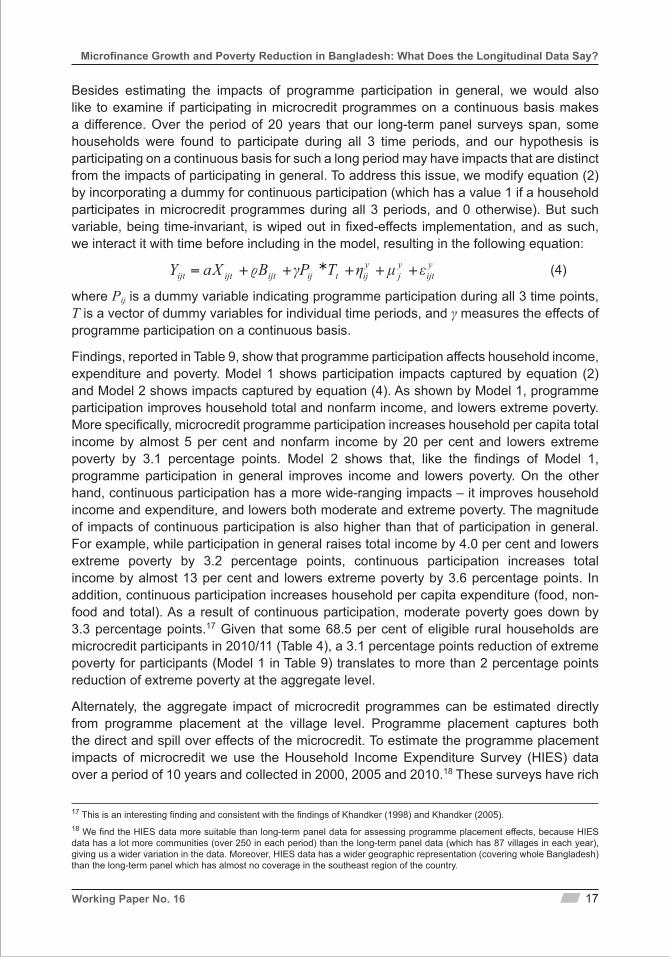
Besides estimating the impacts of programme participation in general, we would also like to examine if participating in microcredit programmes on a continuous basis makes a difference. Over the period of 20 years that our long-term panel surveys span, some households were found to participate during all 3 time periods, and our hypothesis is participating on a continuous basis for such a long period may have impacts that are distinct from the impacts of participating in general. To address this issue, we modify equation (2) by incorporating a dummy for continuous participation (which has a value 1 if a household participates in microcredit programmes during all 3 periods, and 0 otherwise). But such variable, being time-invariant, is wiped out in fixed-effects implementation, and as such, we interact it with time before including in the model, resulting in the following equation:
yijt
yj
yijtijijtijtijt TPBXY εμηγa +++*++= (4)
where Pij is a dummy variable indicating programme participation during all 3 time points, T is a vector of dummy variables for individual time periods, and γ measures the effects of programme participation on a continuous basis.
Findings, reported in Table 9, show that programme participation affects household income, expenditure and poverty. Model 1 shows participation impacts captured by equation (2) and Model 2 shows impacts captured by equation (4). As shown by Model 1, programme participation improves household total and nonfarm income, and lowers extreme poverty. More specifically, microcredit programme participation increases household per capita total income by almost 5 per cent and nonfarm income by 20 per cent and lowers extreme poverty by 3.1 percentage points. Model 2 shows that, like the findings of Model 1, programme participation in general improves income and lowers poverty. On the other hand, continuous participation has a more wide-ranging impacts – it improves household income and expenditure, and lowers both moderate and extreme poverty. The magnitude of impacts of continuous participation is also higher than that of participation in general. For example, while participation in general raises total income by 4.0 per cent and lowers extreme poverty by 3.2 percentage points, continuous participation increases total income by almost 13 per cent and lowers extreme poverty by 3.6 percentage points. In addition, continuous participation increases household per capita expenditure (food, non-food and total). As a result of continuous participation, moderate poverty goes down by 3.3 percentage points.17 Given that some 68.5 per cent of eligible rural households are microcredit participants in 2010/11 (Table 4), a 3.1 percentage points reduction of extreme poverty for participants (Model 1 in Table 9) translates to more than 2 percentage points reduction of extreme poverty at the aggregate level.
Alternately, the aggregate impact of microcredit programmes can be estimated directly from programme placement at the village level. Programme placement captures both the direct and spill over effects of the microcredit. To estimate the programme placement impacts of microcredit we use the Household Income Expenditure Survey (HIES) data over a period of 10 years and collected in 2000, 2005 and 2010.18 These surveys have rich
17 This is an interesting finding and consistent with the findings of Khandker (1998) and Khandker (2005). 18 We find the HIES data more suitable than long-term panel data for assessing programme placement effects, because HIES data has a lot more communities (over 250 in each period) than the long-term panel data (which has 87 villages in each year), giving us a wider variation in the data. Moreover, HIES data has a wider geographic representation (covering whole Bangladesh) than the long-term panel which has almost no coverage in the southeast region of the country.
Microfinance Growth and Poverty Reduction in Bangladesh: What Does the Longitudinal Data Say?
Working Paper No. 16 17
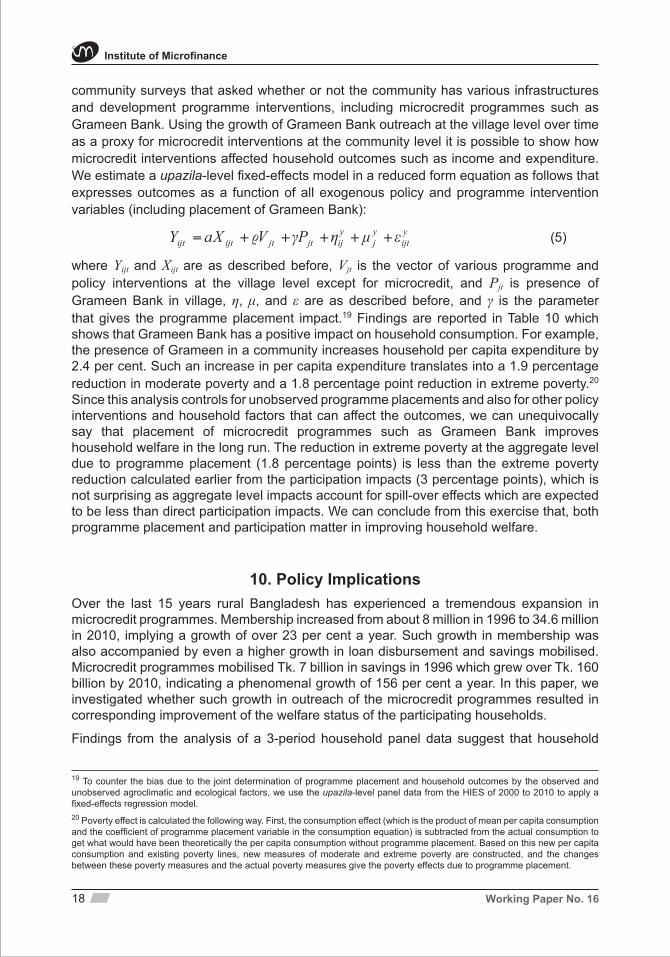
community surveys that asked whether or not the community has various infrastructures and development programme interventions, including microcredit programmes such as Grameen Bank. Using the growth of Grameen Bank outreach at the village level over time as a proxy for microcredit interventions at the community level it is possible to show how microcredit interventions affected household outcomes such as income and expenditure. We estimate a upazila-level fixed-effects model in a reduced form equation as follows that expresses outcomes as a function of all exogenous policy and programme intervention variables (including placement of Grameen Bank):
yijt
yj
yijjtjtijtijt PVXY εμηγa +++++= (5)
where Yijt and Xijt are as described before, Vjt is the vector of various programme and policy interventions at the village level except for microcredit, and Pjt is presence of Grameen Bank in village, η, μ, and ε are as described before, and γ is the parameter that gives the programme placement impact.19 Findings are reported in Table 10 which shows that Grameen Bank has a positive impact on household consumption. For example, the presence of Grameen in a community increases household per capita expenditure by 2.4 per cent. Such an increase in per capita expenditure translates into a 1.9 percentage reduction in moderate poverty and a 1.8 percentage point reduction in extreme poverty.20 Since this analysis controls for unobserved programme placements and also for other policy interventions and household factors that can affect the outcomes, we can unequivocally say that placement of microcredit programmes such as Grameen Bank improves household welfare in the long run. The reduction in extreme poverty at the aggregate level due to programme placement (1.8 percentage points) is less than the extreme poverty reduction calculated earlier from the participation impacts (3 percentage points), which is not surprising as aggregate level impacts account for spill-over effects which are expected to be less than direct participation impacts. We can conclude from this exercise that, both programme placement and participation matter in improving household welfare.
10. Policy ImplicationsOver the last 15 years rural Bangladesh has experienced a tremendous expansion in microcredit programmes. Membership increased from about 8 million in 1996 to 34.6 million in 2010, implying a growth of over 23 per cent a year. Such growth in membership was also accompanied by even a higher growth in loan disbursement and savings mobilised. Microcredit programmes mobilised Tk. 7 billion in savings in 1996 which grew over Tk. 160 billion by 2010, indicating a phenomenal growth of 156 per cent a year. In this paper, we investigated whether such growth in outreach of the microcredit programmes resulted in corresponding improvement of the welfare status of the participating households.
Findings from the analysis of a 3-period household panel data suggest that household
19 To counter the bias due to the joint determination of programme placement and household outcomes by the observed and unobserved agroclimatic and ecological factors, we use the upazila-level panel data from the HIES of 2000 to 2010 to apply a fixed-effects regression model.20 Poverty effect is calculated the following way. First, the consumption effect (which is the product of mean per capita consumption and the coefficient of programme placement variable in the consumption equation) is subtracted from the actual consumption to get what would have been theoretically the per capita consumption without programme placement. Based on this new per capita consumption and existing poverty lines, new measures of moderate and extreme poverty are constructed, and the changes between these poverty measures and the actual poverty measures give the poverty effects due to programme placement.
Institute of Microfinance
Working Paper No. 1618
income grew over a period of 20 years in general, so did the share of nonfarm income. However, both the total income and the share of nonfarm income grew for both microcredit participants and nonparticipants but more for non-participants than for participants. Similarly, household consumption grew for all households, but it grew more for the nonparticipants than for the participants. But while both moderate and extreme poverty rates went down for all households, they dropped more for the participants than for the non-participants during the last 20 years.
When we consider the continuity of programme participation over the 20 year period, we find the variation in outcomes is even starker within the participants based on participation duration than it is when outcomes are examined merely by participation status. For example, for most of the outcomes, households that participated in microcredit programmes continuously since 1991/92 have consistently done much better than those who participated in an irregular fashion or on short-term basis.
While such descriptive analyses allow us to observe the trends in household outcomes from a wider range of perspectives, it does not establish the causality between microcredit participation and the change in the outcomes, simply because the underlying factors (especially the unobserved ones) that might affect the programme placement and programme participation are not controlled for in these analyses. To resolve this issue, we first estimated the impacts of household programme borrowing using the long panel of 1991/92, 1998/98 and 2010/11 and modeling a household level fixed-effects model. Findings suggest that borrowing from microcredit programmes in general improves household income and lowers extreme poverty. At the same time, continuous participation in microcredit programmes increases both household income and consumption. And the poverty reduction impact for continuous participation is higher than it is for participation in general.
As for the aggregate level, the upazila-level fixed-effects analysis using a three-point upazila-level panel data (collected under HIES 2000, 2005 and 2010) shows that placement of microcredit programmes such as Grameen Bank at the village level improves household per capita expenditure and lowers their poverty. For example, placement of Grameen Bank at the village level lowers extreme poverty by 1.8 percentage points. This reduction of extreme poverty happened as a result of 10 years of programme intervention (from 2000 to 2010). Since the actual reduction in extreme poverty in rural Bangladesh during this period is 16.8 percentage points (Table 1), it seems the that extent of poverty reduction due to microcredit intervention accounts for over 9 per cent (1.8 over 16.8) of the total poverty reduction in rural Bangladesh – which is after all a significant achievement.
Microfinance Growth and Poverty Reduction in Bangladesh: What Does the Longitudinal Data Say?
Working Paper No. 16 19

BibliographyAhluwalia, Isher J., and Wahiduddin Mahmud. 2004. “Economic Transformation and Social Development in Bangladesh.” Economic and Political Weekly 39 (36): 4009–11.
Amin, S., A. S. Rai, G. Topa, G., (2003) “Does Microcredit Reach the Poor and Vulnerable? Evidence from Northern Bangladesh,” Journal of Development Economics, 70(1), 59-82.
Amin, S. and A. Pebley, (1990), “Gender Inequality within Households: The Impact of a Women’s Development Programme in 36 Bangladeshi Villages,” Bangladesh Development Studies, 22(2&3): 121–54.
Attanasio, O., B. Augsburg, R. D. Haas, E. Fitzsimons, and H. Harmgart (2012). “Group lending or individual lending? Evidence from a randomised field experiment in Mongolia.” Working paper, UCL.
Augsburg, Britta, Ralph de Haas, Heike Hamgart, and Costas Meghir, (2010/11). Microfinance at the margin: Experimental Evidence from Bosnia and Herzegovina, paper presented at the conference ‘Mind the Gap: From Evidence to Policy Impact’, Cuernavaca, Mexico, 16-17, June 2010/11.
Banerjee, A, E. Duflo, R. Glennerster, and C. Kinnan, (2010), “The Miracle of Microfinance? Evidence From a Randomised Evaluation” (working paper). Massachusetts Institute of Technology, (http://econ-www.mit.edu/files/4162).
Boonperm, Jirawan, Jonathan Haughton and Shahidur R. Khandker, (2009), “Does the Village Fund Matter in Thailand?” Policy Research Working Paper No. 5011, the World Bank, Washington, DC.
Chemin, M, (2008), “The benefits and costs of microfinance: Evidence from Bangladesh,” Journal of Development Studies, 44(4), 463-484.
Coleman, B. E. (2006), “Microfinance in northeast Thailand: who benefits and how much,” World Development, 34(9), pp. 1612–1638.
Coleman, B. E. (1999) “The impact of group lending in Northeast Thailand,” Journal of Development Economics, 60, pp. 105–141.
Copestake, James, Sonia Bhalotra, and Susan Johnson (2001), “Assessing the Impact of Microcredit: A Zambian Case Study.” The Journal of Development Studies, Vol. 37 (4), p. 81-100.
Crépon, Bruno, Florencia Devoto, Esther Duflo and William Parienté, (2010/11), “Impact of Microcredit in Rural Areas of Morocco: Evidence from a Randomised Evaluation,” Mimeo, MIT
Deaton, Angus, (2010), “Instruments, Randomisation, and Learning about Development,” Journal of Economic Literature, 48(2): 424-55.
Institute of Microfinance
Working Paper No. 1620
Deaton, Angus, (2009), “Instruments of Development: Randomisation in the Tropics, and the Search for the Elusive Keys to Economic Development.” NBER Working Paper 14690.
de Mel, Suresh, David McKenzie, and Christopher Woodruff, (2008), “Who are the microenterprise owners? Evidence from Sri Lanka on Tokman v. de Soto,” Policy Research Working Paper No.4635, The World Bank.
Dunford, C, (2006) “Evidence of Microfinance’s Contribution to Achieving the Millennium Development Goals: Freedom from Hunger”http://microfinancegateway.org/files/ 35795_file_Evidence_on_MDGs_Dunford.pdf
Emran, M. Shahe, Stephen C. Smith, and Virginia Robano (2009): “Assessing the Frontiers of Ultra-Poverty Reduction: Evidence from CFPR/TUP, an Innovative Programme in Bangladesh,” IIEP Working Papers: The George Washington University, Institute for International Economic Policy.
Faruqee, Rashid and Baqui Khalily, 2011, “Interest Rates in Bangladesh Microcredit Market”, Policy Paper, Institute of Microfinance, Dhaka, Bangladesh.
Goetz, A. M. and R. Sen Gupta (1996) “Who takes the credit? Gender, power and control over loan use in rural credit programmes in Bangladesh,” World Development, 24 (1), 45–63.
Hermes, N., and R. Lensink (2007), “The Empirics of Microfinance: What Do We Know?” Economic Journal, 117 (1): F1-F10.
Hossain, M., (1988), “Credit for Alleviation of Rural Poverty: The Grameen Bank in Bangladesh,” Research Report 65, International Food Policy Research Institute.
Imai, K. S., Gaiha, R., Thapa, G., and Annim, S. K., (2012), “Microfinance and Poverty: A Macro Perspective.” World Development, 40, no. 8: 1675-1689.
Imai, K. S., T. Arun, and S. K. Annim (2010), “Microfinance and household poverty reduction: new evidence from India.” World Development 38(12), December, 1760-1774.
Islam, Asadul, 2011, “Medium- and Long-term Participation in Microcredit: An Evaluation Using A New Panel Dataset from Bangladesh,” American Journal of Agricultural Economics, Vol. 93 (3): 847-866.
Karlan, Dean, and Martin Valdivia, (2010/11), “Teaching Entrepreneurship: Impact of Business Training on Microfinance Institutions and Clients” Review of Economics and Statistics, Vol. 93, No. 2, Pages 510-527.
Karlan, Dean and Jonathan Zinman, (2010/11), “Microcredit in Theory and Practice: Using Randomised Credit Scoring for Impact Evaluation,” Science, 332(6035):1278-1284.
Karlan, D. and Zinman, J., (2010), “Expanding Microenterprise Credit Access: Using Randomised Supply Decisions to Estimate the Impacts in Manila,” Working Paper, Abdul Latif Jameel Poverty Action Lab, Massachusetts Institute of Technology.
Microfinance Growth and Poverty Reduction in Bangladesh: What Does the Longitudinal Data Say?
Working Paper No. 16 21

Kevane, Michael and Bruce Wydic, (2001), “Microenterprise Lending to Female Entrepreneurs: Sacrificing Economic Growth for Poverty Alleviation?” World Development 29, 1225-1236.
Khandker, Shahidur R., Khalily, M. A. Baqui and Samad, Hussain A., (2010), “Seasonal and extreme poverty in Bangladesh: evaluating an ultra-poor microfinance project,” Policy Research Working Paper Series, No. 5331, The World Bank.
Khandker, Shahidur R., (2005), “Microfinance and Poverty: Evidence Using Panel Data from Bangladesh,” World Bank Economic Review, Oxford University Press, vol. 19(2), pages 263-286.
Khandker, Shahidur. R., (1998), Fighting poverty with microcredit: Experience in Bangladesh. Oxford University Press.
Littlefield, E, J Morduch and S Hashemi, (2003), “Is Microfinance an Effective Strategy to Reach the Millennium Development Goals?” CGAP Focus Note 24, http://www.cgap.org
Mahmud, Wahiduddin, (2008). “Social Development: Pathways, Surprises, and Challenges.” Indian Journal of Human Development, Vol. 2, No. 1: pp. 79-92.
Mahmud, Wahiduddin, and Anis Chowdhury, (2008). “South Asian Economic Development: Impressive Achievements but Continuing Challenges.” In Handbook on the South Asian Economies, eds. Wahiduddin Mahmud and Anis Chowdhury, 1–24. Cheltenham, U.K.: Edward Elgar.
Mahmud, S., (2003), “Actually how Empowering is Microcredit?” Development and Change, 34 (4), 577-605.
McIntosh, C. (2008): “Estimating Treatment Effects from Spatial Policy Experiments: An Application to Ugandan Microfinance,” Review of Economics and Statistics, 90(1), 15-28.
McKenzie, David, and Christopher Woodruff, (2008) “Experimental Evidence on Returns to Capital and Access to Finance in Mexico,” World Bank Economic Review, 22 (3): 457-482.
Panjaitan-Drioadisuryo, R. D. M., and K. Cloud. (1999). “Gender, Self-Employment and Microcredit Programmes: An Indonesian Case Study” The Quarterly Review of Economics and Finance 39: 769–79.
Pitt, M. M., S. R. Khandker and J. Cartwright, (2003), “Empowering Women with Micro Finance: Evidence from Bangladesh.” Economic Development and Cultural Change, Vol. 54, No. 4, pp. 791-831.
Pitt, Mark M., Shahidur R. Khandker, S-M. McKernan, and M. A. Latif, (1999) “Credit Programmes for the Poor and Reproductive Behaviour in Low Income Countries: Are the Reported Causal Relationships the Result of Heterogeneity Bias?” Demography. February 1999: 1-21.
Pitt, M. and Khandker, S. (1998), “The Impact of Group-Based Credit Programmes on Poor Households in Bangladesh: Does Gender of the participant Matter?” Journal of Political Economy, Vol. 106, pp. 958-996.
Institute of Microfinance
Working Paper No. 1622
Pitt, M. and Khandker, S. (1996) “Household and Intra-household Impact of the Grameen Bank and Similar Targeted Credit Programmes in Bangladesh.” World Bank Discussion Papers No. 320. Washington D.C.
Ravallion, M. (2012). “Fighting Poverty One Experiment at a Time: A Review of Abhijit Banerjee and Esther Duflo’s Poor Economics: A Radical Rethinking of the Way to Fight Global Poverty” Journal of Economic Literature, 50:1, 103-114.
Rodrik, Dani (2008). “The New Development Economics: We Shall Experiment, But How Shall We Learn?” Mimeo, Harvard University.
Roodman, D., (2012) “Latest Impact Research: Inching Towards Generalisation”, CGAP microfinance blog, http://microfinance.cgap.org/2012/04/11/latest-impact-research-inching-toward-generalisation/
Rosenberg, R. (2010) “Does Microcredit Really Help Poor People?” Washington DC: Focus Note No 59. CGAP.
Scully, N. (2004): Microcredit No Panacea for Poor Women, Global Development Research Centre, Washington DC, http://www.gdrc.org/icm/wind/micro.html
Shaw, J. (2004) “Microenterprise Occupation and Poverty Reduction in Microfinance Programmes: Evidence from Sri Lanka”, World Development 32 (7): 1247-64.
Simanowitz, A., (2002). “Ensuring impact: reaching the poorest while building financially self-sufficient institutions, and showing improvement in the lives of the poorest women and their families.” http://www.microcreditsummit.org/papers/+5simanowitz.pdf
UNICEF (United Nations Children’s Fund). 2010/11. The State of the World’s Children 2010/11. New York: UNICEF.
World Bank, 2012, “Bangladesh: Towards Accelerated, Inclusive, and Sustainable Growth—Opportunities and Challenges”, Washington, DC.
Yunus, Mohammad, (1995), “Towards Creating a Poverty-Free World.” Paper presented at the Annual Meeting of the U.S. Committee for World Food Day, January 25, Washington, D.C.
Microfinance Growth and Poverty Reduction in Bangladesh: What Does the Longitudinal Data Say?
Working Paper No. 16 23

Figures
Source: CDF (1996-2007), InM & CDF, (2008-2010), Grameen Bank (2010).
Note: Findings reported in this figure are provisional.
Source: CDF (1996-2007), InM & CDF (2008-2010), Grameen Bank (2010).
Note: Findings reported in this figure are provisional.
Figure 1
Trend of Microfinance Members in Bangladesh
1996
1997
1998
1999
2000
2001
2002
2003
2004
2005
2006
2007
2008
2009
2010
Calendar year
40
35
30
25
20
15
10
5
0
Act
ive
mem
bers
(mill
ions
)
Figure 2
Trend of Loan Disbursed by the MFIs in Bangladesh
400
350
300
250
200
150
100
50
0
Ann
ual d
isbu
rsem
ent (
billi
on T
k.)
1997
1998
1999
2000
2001
2002
2003
2004
2005
2006
2007
2008
2009
2010
Calendar year
Institute of Microfinance
Working Paper No. 1624

Source: CDF (1996-2007), InM & CDF (2008-2010), Grameen Bank (2010).
Note: Findings reported in this figure are provisional.
Source: CDF (1996-2007), InM & CDF (2008-2010), Grameen Bank (2010).
Note: Findings reported in this figure are provisional.
Figure 3
Trend of Savings Mobilised by the MFIs in Bangladesh
180160140120100
80604020
0Net
savi
ngs
(bill
ion
Tk.)
1996
1997
1998
1999
2000
2001
2002
2003
2004
2005
2006
2007
2008
2009
2010
Calendar year
Figure 4
Savings as a % of Loans Outstanding by MFIs in Bangladesh
8075706560555045403530
Savi
ngs
as a
% o
f loa
ns o
utst
andi
ng
1996
1997
1998
1999
2000
2001
2002
2003
2004
2005
2006
2007
2008
2009
2010
Calendar year
Microfinance Growth and Poverty Reduction in Bangladesh: What Does the Longitudinal Data Say?
Working Paper No. 16 25
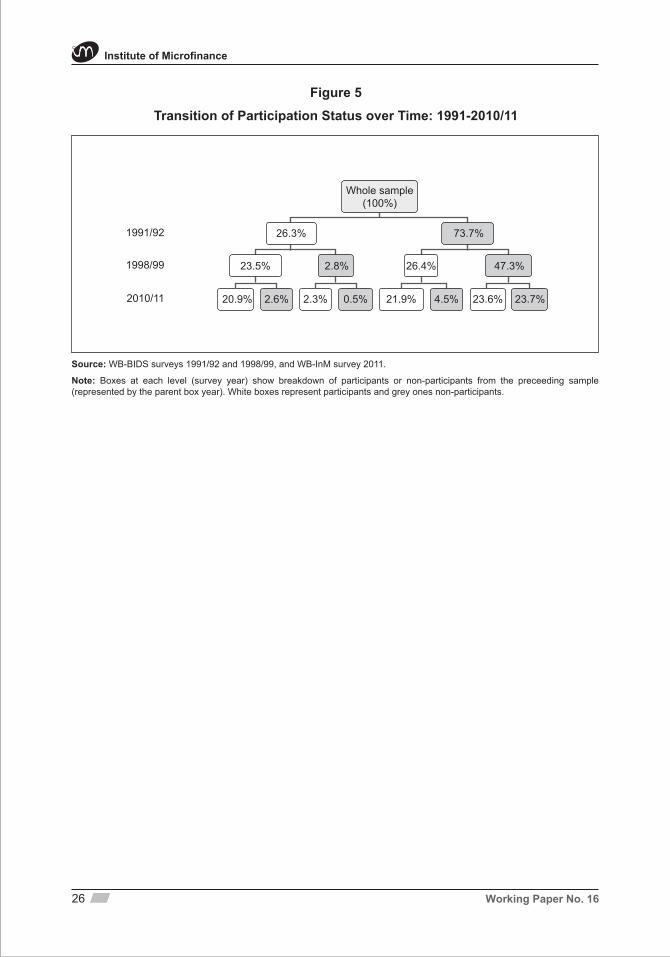
Source: WB-BIDS surveys 1991/92 and 1998/99, and WB-InM survey 2011.
Note: Boxes at each level (survey year) show breakdown of participants or non-participants from the preceeding sample (represented by the parent box year). White boxes represent participants and grey ones non-participants.
Figure 5
Transition of Participation Status over Time: 1991-2010/11
1991/92
Whole sample(100%)
26.3%
23.5%
20.9% 2.6% 2.3% 0.5% 21.9% 4.5% 23.6% 23.7%
2.8% 26.4% 47.3%
73.7%
1998/99
2010/11
Institute of Microfinance
Working Paper No. 1626

Tables
Table 1Moderate and Extreme Poverty Headcounts in Bangladesh: 1991/92–2010
(based on cost-of-basic-needs method)
YearModerate poverty rate
(%)Extreme poverty rate
(%)
Rural Urban National Rural Urban National
1991–92 58.7 42.7 56.6 43.7 23.6 41.0
1995–96 54.5 27.8 50.1 39.4 13.7 35.1
2000 52.3 35.2 48.9 37.9 20.0 34.3
2005 43.8 28.4 40.0 28.6 14.6 25.1
2010 35.2 21.3 31.5 21.1 7.7 17.6
Source: Household Income and Expenditure Survey (HIES), various rounds.
Table 2Percentage of Population with Moderate and Severe Deficiency in Food Intake
(calorie): 1991-92–2005
YearModerate deficiency
(< 2,122 kilocalories/person/day)Severe deficiency
(< 1,805 kilocalories/person/day)
Rural Urban National Rural Urban National
1991–92 47.6 46.7 47.5 28.3 26.3 28.0
1995–96 47.1 49.7 47.5 24.6 27.3 25.1
2000 42.3 52.5 44.3 18.7 25.0 20.0
2005 39.5 43.2 40.4 17.9 24.4 19.5
Source: HIES, various rounds.
Microfinance Growth and Poverty Reduction in Bangladesh: What Does the Longitudinal Data Say?
Working Paper No. 16 27
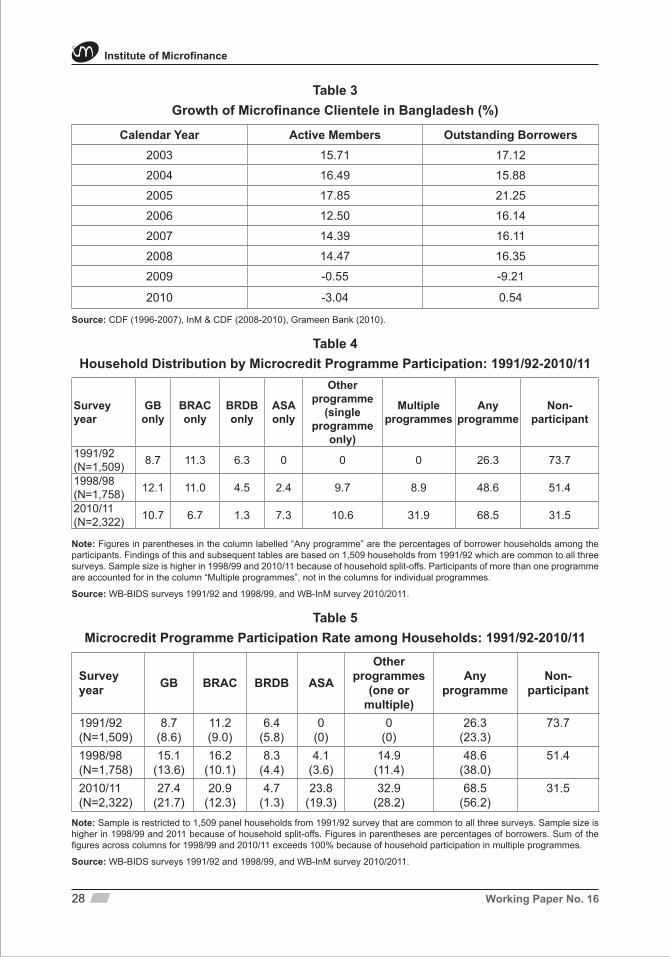
Table 3Growth of Microfinance Clientele in Bangladesh (%)
Calendar Year Active Members Outstanding Borrowers2003 15.71 17.12
2004 16.49 15.88
2005 17.85 21.25
2006 12.50 16.14
2007 14.39 16.11
2008 14.47 16.35
2009 -0.55 -9.21
2010 -3.04 0.54
Source: CDF (1996-2007), InM & CDF (2008-2010), Grameen Bank (2010).
Table 4Household Distribution by Microcredit Programme Participation: 1991/92-2010/11
Survey year
GB only
BRAC only
BRDB only
ASA only
Other programme
(single programme
only)
Multiple programmes
Any programme
Non-participant
1991/92(N=1,509) 8.7 11.3 6.3 0 0 0 26.3 73.7
1998/98(N=1,758) 12.1 11.0 4.5 2.4 9.7 8.9 48.6 51.4
2010/11(N=2,322) 10.7 6.7 1.3 7.3 10.6 31.9 68.5 31.5
Note: Figures in parentheses in the column labelled “Any programme” are the percentages of borrower households among the participants. Findings of this and subsequent tables are based on 1,509 households from 1991/92 which are common to all three surveys. Sample size is higher in 1998/99 and 2010/11 because of household split-offs. Participants of more than one programme are accounted for in the column “Multiple programmes”, not in the columns for individual programmes.
Source: WB-BIDS surveys 1991/92 and 1998/99, and WB-InM survey 2010/2011.
Table 5Microcredit Programme Participation Rate among Households: 1991/92-2010/11
Survey year GB BRAC BRDB ASA
Other programmes
(one or multiple)
Any programme
Non-participant
1991/92(N=1,509)
8.7(8.6)
11.2(9.0)
6.4(5.8)
0(0)
0(0)
26.3(23.3)
73.7
1998/98(N=1,758)
15.1(13.6)
16.2(10.1)
8.3(4.4)
4.1(3.6)
14.9(11.4)
48.6(38.0)
51.4
2010/11(N=2,322)
27.4(21.7)
20.9(12.3)
4.7(1.3)
23.8(19.3)
32.9(28.2)
68.5(56.2)
31.5
Note: Sample is restricted to 1,509 panel households from 1991/92 survey that are common to all three surveys. Sample size is higher in 1998/99 and 2011 because of household split-offs. Figures in parentheses are percentages of borrowers. Sum of the figures across columns for 1998/99 and 2010/11 exceeds 100% because of household participation in multiple programmes.
Source: WB-BIDS surveys 1991/92 and 1998/99, and WB-InM survey 2010/2011.
Institute of Microfinance
Working Paper No. 1628

Table 6Household Cumulative Borrowing from Microcredit Programmes
over Time: 1991/92-2010/11
Survey year GB loans BRAC
loansBRDB loans
ASA loans
Loans from other
programmes
Aggregate loans from all programmes
1991/92(N=769)
16,289.4(0.73)
5,276.7(0.71)
6,453.9(0.38)
0(-)
0(-)
9,252.3(0.67)
1998/99(N=1,099)
25,938.4(0.84)
6,377.1(0.95)
6,552.4(0.52)
6,346.8(0.99)
4,680.2(0.86)
13,262.1(0.84)
2010/11(N=1,770)
11,597.6(0.89)
13,452.3(0.38)
2,501.3(0.58)
7,760.1(0.84)
10,849.5(0.79)
17,005.6(0.73)
Note: Findings are restricted to microcredit participants. Loans are CPI-adjusted Tk. with 1991/92=100. Loans are cumulative for 5 years preceding the surveys. Figures in parentheses are sample size in column 1 and share of female loans in columns 2-7.
Source: WB-BIDS surveys 1991/92 and 1998/99, and WB-InM survey 2010/11.
Table 7Household Income, Expenditure and Poverty by Microcredit Participation Status:
1991/92-2010/11
Outcomes
1991/92 1998/99 2010/11
Participants (N=769)
Non-participants
(N=483)
Participants (N=1,014)
Non-participants
(N=420)
Participants (N=1,554)
Non-participants
(N=334)
Per capita income (Tk./month)
521.8 495.6 502.7 523.1 1,066.0 1,114.3
t=0.74 t=-0.86 t=-0.36
Share of nonfarm income in total income
0.627 0.613 0.678 0.641 0.765 0.726
t=0.60 t=2.05 t=2.40
Per capita expenditure
327.3 318.6 440.0 436.9 571.6 604.0
t=1.04 t=0.17 t=-1.71
Share of food exp. in total expenditure
0.813 0.821 0.751 0.762 0.662 0.650
t=-1.23 t=-1.15 t=1.59
Moderate poverty (%)
86.3 87.6 60.6 58.2 32.9 34.6
t=-0.67 t=0.88 t=-0.62
Extreme poverty (%)
75.1 78.5 43.6 46.5 16.2 23.1
t=-1.38 t=-1.05 t=-3.19
Note: Monetary figures are CPI-adjusted Tk. with 1991/92=100. The analysis is restricted to 1991/92 microcredit eligible households only (those who participated and those who were eligible but did not participate in microcredit programmes in 1991/92) which constitute 64, 62 and 61 per cent of the surveyed households in 1991/92, 1998/99 and 2010/11, respectively. Figures in parentheses are t-statistics of the differences between participants and non-participants.
Source: WB-BIDS surveys 1991/92 and 1998/99, and WB-InM survey 2010/11.
Microfinance Growth and Poverty Reduction in Bangladesh: What Does the Longitudinal Data Say?
Working Paper No. 16 29
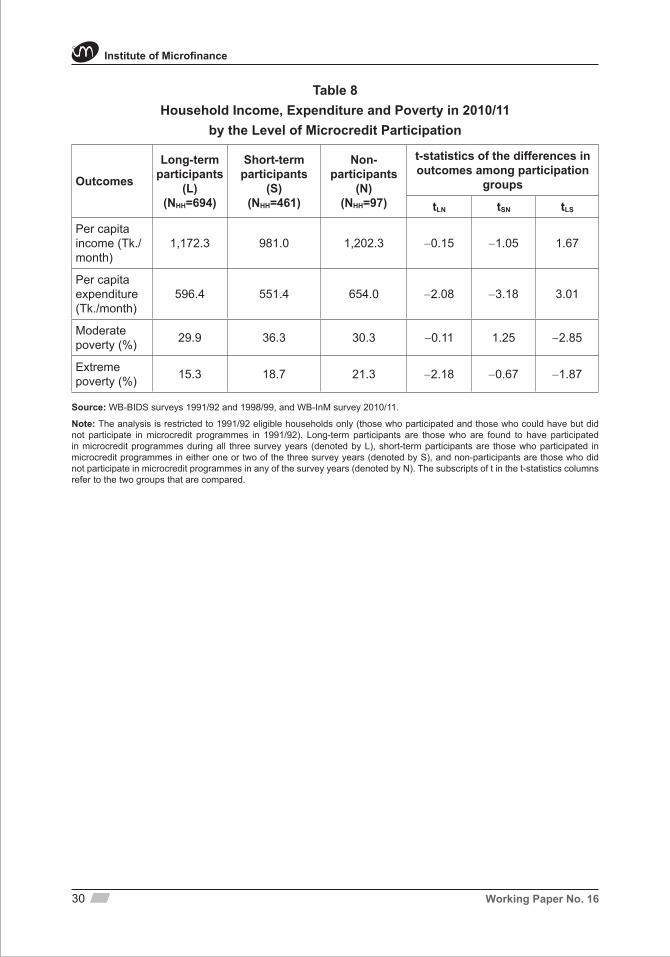
Table 8Household Income, Expenditure and Poverty in 2010/11
by the Level of Microcredit Participation
Outcomes
Long-term participants
(L)(NHH=694)
Short-term participants
(S)(NHH=461)
Non-participants
(N)(NHH=97)
t-statistics of the differences in outcomes among participation
groups
tLN tSN tLS
Per capita income (Tk./month)
1,172.3 981.0 1,202.3 −0.15 −1.05 1.67
Per capita expenditure (Tk./month)
596.4 551.4 654.0 −2.08 −3.18 3.01
Moderate poverty (%) 29.9 36.3 30.3 −0.11 1.25 −2.85
Extreme poverty (%) 15.3 18.7 21.3 −2.18 −0.67 −1.87
Source: WB-BIDS surveys 1991/92 and 1998/99, and WB-InM survey 2010/11.
Note: The analysis is restricted to 1991/92 eligible households only (those who participated and those who could have but did not participate in microcredit programmes in 1991/92). Long-term participants are those who are found to have participated in microcredit programmes during all three survey years (denoted by L), short-term participants are those who participated in microcredit programmes in either one or two of the three survey years (denoted by S), and non-participants are those who did not participate in microcredit programmes in any of the survey years (denoted by N). The subscripts of t in the t-statistics columns refer to the two groups that are compared.
Institute of Microfinance
Working Paper No. 1630

Tabl
e 9
HH
FE
Estim
ates
of t
he Im
pact
of M
icro
cred
it Pa
rtic
ipat
ion
(N=5
,589
, No.
of H
Hs=
1,50
9)
Mic
rocr
edit
part
icip
atio
n va
riabl
e
Log
per
capi
ta to
tal
inco
me
(Tk.
/mon
th)
Log
per
capi
ta fa
rm
inco
me
(Tk.
/mon
th)
Log
per
capi
ta
nonf
arm
in
com
e(T
k./m
onth
)
Log
per
capi
ta to
tal
expe
nditu
re
(Tk.
/mon
th)
Log
per
capi
ta fo
od
expe
nditu
re
(Tk.
/mon
th)
Log
per
capi
ta
non-
food
ex
pend
iture
(T
k./m
onth
)
Mod
erat
e po
vert
yEx
trem
e po
vert
y
Mod
el 1
HH
is a
pa
rtici
pant
0.04
9(1
.68)
-0.0
19(-
0.37
)0.
202
(2.4
1)-0
.001
(-0.
01)
-0.0
10(-
0.74
)0.
023
(0.7
8)-0
.007
(-0.
39)
-0.0
31(-
1.89
)
R2
0.11
10.
091
0.17
80.
379
0.27
70.
346
0.31
10.
335
Mod
el 2
HH
is a
pa
rtici
pant
0.04
9(1
.68)
-0.0
13(-
0.26
)0.
178
(2.3
1)-0
.002
(-0.
14)
-0.0
11(-
0.84
)0.
020
(0.6
7)-0
.007
(-0.
40)
-0.0
32(-
1.94
)
HH
is a
lo
ng-te
rm
parti
cipa
nt
0.13
2(3
.68)
0.16
5(2
.73)
0.05
5(0
.69)
0.03
2(2
.20)
0.02
1(2
.15)
0.06
3(2
.13)
-0.0
33(-
1.93
)-0
.036
(-2.
00)
R2
0.11
40.
094
0.17
90.
380
0.27
70.
435
0.31
20.
336
Sour
ce: W
B-B
IDS
sur
veys
199
8/99
and
WB
-InM
sur
vey
2010
/11.
Not
e: F
igur
es in
par
enth
eses
are
t-st
atis
tics
base
d on
robu
st s
tand
ard
erro
rs c
lust
ered
at t
he v
illag
e le
vel.
Reg
ress
ions
add
ition
ally
incl
ude
hous
ehol
d le
vel c
ontro
l var
iabl
es s
uch
as s
ex, a
ge
and
educ
atio
n of
the
head
, and
land
ass
et, a
nd v
illag
e le
vel c
ontro
l var
iabl
es s
uch
as c
omm
unity
pric
es o
f con
sum
er g
oods
, dai
ly w
age
rate
s of
men
and
wom
en, a
nd in
frast
ruct
ure
varia
bles
su
ch a
s pr
esen
ce o
f ele
ctric
ity, r
oads
, sch
ools
, ban
ks, g
over
nmen
t and
NG
O fo
od p
rogr
amm
es, a
nd s
o on
.
Microfinance Growth and Poverty Reduction in Bangladesh: What Does the Longitudinal Data Say?
Working Paper No. 16 31
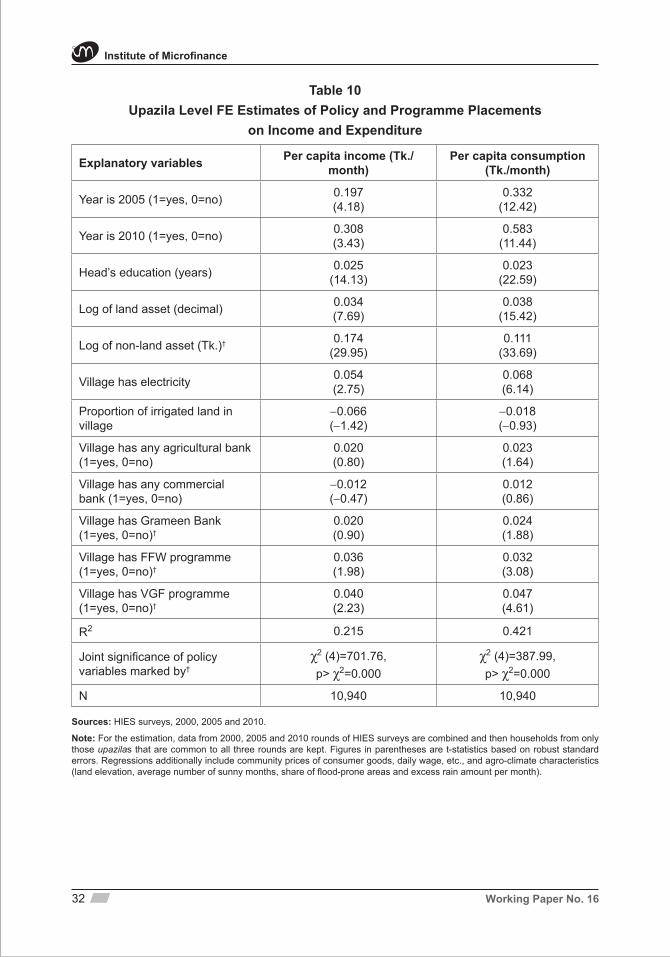
Table 10Upazila Level FE Estimates of Policy and Programme Placements
on Income and Expenditure
Explanatory variables Per capita income (Tk./month)
Per capita consumption (Tk./month)
Year is 2005 (1=yes, 0=no) 0.197(4.18)
0.332(12.42)
Year is 2010 (1=yes, 0=no) 0.308(3.43)
0.583(11.44)
Head’s education (years) 0.025(14.13)
0.023(22.59)
Log of land asset (decimal) 0.034(7.69)
0.038(15.42)
Log of non-land asset (Tk.)† 0.174(29.95)
0.111(33.69)
Village has electricity 0.054(2.75)
0.068(6.14)
Proportion of irrigated land in village
−0.066(−1.42)
−0.018(−0.93)
Village has any agricultural bank (1=yes, 0=no)
0.020(0.80)
0.023(1.64)
Village has any commercial bank (1=yes, 0=no)
−0.012(−0.47)
0.012(0.86)
Village has Grameen Bank (1=yes, 0=no)†
0.020(0.90)
0.024(1.88)
Village has FFW programme (1=yes, 0=no)†
0.036(1.98)
0.032(3.08)
Village has VGF programme (1=yes, 0=no)†
0.040(2.23)
0.047(4.61)
R2 0.215 0.421
Joint significance of policy variables marked by†
χ2 (4)=701.76,p> χ2=0.000
χ2 (4)=387.99,p> χ2=0.000
N 10,940 10,940
Sources: HIES surveys, 2000, 2005 and 2010.
Note: For the estimation, data from 2000, 2005 and 2010 rounds of HIES surveys are combined and then households from only those upazilas that are common to all three rounds are kept. Figures in parentheses are t-statistics based on robust standard errors. Regressions additionally include community prices of consumer goods, daily wage, etc., and agro-climate characteristics (land elevation, average number of sunny months, share of flood-prone areas and excess rain amount per month).
Institute of Microfinance
Working Paper No. 1632
The Institute of Microfinance (lnM) is an independent non-profit
organisation established primarily to meet the research and training needs
of national as well as of global microcredit programmes. Initiated and
promoted by Palli Karma-Sahayak Foundation (PKSF) on 1 November
2006, the Institute is principally funded by UKaid, Department for
International Development (DFID) through its Promoting Financial Services
for Poverty Reduction (PROSPER) Programme. lnM has an excellent team
of professionals in research, training and knowledge management. lnM
draws research scholars from reputed universities here and abroad. The
major services that lnM provides are research on poverty, microfinance,
enterprise development, impact assessment and evaluation of
microfinance programmes. Beside research, InM provides microfinance
related training, capacity building support and knowledge management
services to microfinance institutions and other development organisations.
For information please contact:
Institute of Microfinance (InM)
PKSF Bhaban, Agargaon, Dhaka-1207, Bangladesh
House # 2/1, Block-D, Lalmatia, Dhaka-1207, Bangladesh
PABX: +88-02-8100479, +88-02-8100676-7, Fax: +88-02-8100481
Email: [email protected] ; Web: www.inm.org.bd
m
m