The Bharat Microfinance - Report 2016 - Moneymint
132
Supported by: NABARD TheBharatMicrofinance Report2016 TheBharatMicrofinance Report2016
-
Upload
khangminh22 -
Category
Documents
-
view
0 -
download
0
Transcript of The Bharat Microfinance - Report 2016 - Moneymint

Supported by:
NABARD
The�Bharat�Microfinance�Report�2016
The�Bharat�Microfinance�Report�2016

Mission of Sa-Dhan
“To build the field of community development finance in India, to help its members and associate institutions to better serve low income households, particularly women, in both rural and urban India, in their quest for establishing stable livelihoods and improving their quality of life”.
With best compliments from:
National Bank for Agriculture and Rural Development(Printing of this document is supported by NABARD)
Mission of NABARD
“Promotion of sustainable and equitable agriculture and rural develop-ment through effective credit support, related services, institution devel-opment and other innovative initiatives”.

A 1- 248, 3rd Floor, Safdarjung Enclave, New Delhi – 110029, India
Tel: + 91- 11-47174400, Fax: + 91-11-47174405E-mail: [email protected], [email protected]
The Bharat Microfinance Report 2016

© Copyright reserved Sa-Dhan2016
Developed & Published by:Sa-Dhan
A 1- 248, 3rd Floor, Safdarjung Enclave, New Delhi – 110029, India
Tel: + 91- 11-47174400, Fax: + 91-11-47174405E-mail: [email protected], [email protected]
Cover Design & Printed by:Anil
9810803375, 8860127811
Disclaimer:The views expressed in this publication do not necessarily reflect the opinions/views of any of the
insitutions referred to and they are not to be held responsible for the opinions/views in this report.

Preface
The Indian Microfinance Sector has witnessed a phenomenal growth over the past 17 years. The number of Institutions providing microfinance services has gone up from a few to several hundreds. The quantum
of credit made available to the poor and financially excluded clients has gone past `60,000 crore and number of clients benefitted is close to 40 million as of March 2016. The SHG bank linkage programme has equally grown to touch the lives of individuals through SHGs with an outstanding loan portfolio of `57,119 crores.
The Government of India and the Reserve Bank of India have created conducive policy and regulatory framework for Microfinance Institutions (MFIs) to operate in the country. This has provided necessary legitimacy and impetus to the sector. MFIs in general comply to the regulations, take care of client protection issues, adhere to the Industry Code of Conduct. These factors go a long way in infusing confidence among all the stakeholders.
In this context, there are three areas which continue to deserve special attention. One is the need for articulating the fact that microfinance is a strategic part of the financial inclusion agenda of the government and that of the central bank. The second is the criticality of re-demonstrating our collective intention to help the poor and the unbanked populace by way of having the right mission, social performance measures and client protection process. The third area is in projecting the fact that microfinance institutions are sustainable financial institutions and they continue to be the investible destination for bankers and investors.
In order to reemphasise these positions, the sector needs empirical data. This Bharat Microfinance Report has been designed to provide comprehensive information and newer perspectives on the above three areas. Primary data received from 166 MFIs who represent around 95 percent of the microfinance sector in India and analysis thereon form the basis for this report.
Sa-Dhan, as the leading association of community development finance institutions in India, has been publishing The Bharat Microfinance Report for the past thirteen years. This year 166 MFIs reported data, including 61 non-members of Sa-Dhan. We thank them for reposing confidence in us and valuing transparency through data reporting.
This year the substantial part of the work relating to the report has been shouldered by Mr. Ardhendu Nandi, right from data collection, consolidation, analysis to report writing in which he was ably supported by Ms. Shyamasree Nandan and Mr. P.M Kamalesh. Mr. Somesh Dayal provided a broad support to the report, especially in sourcing useful inputs.
Special thanks are due to Prime M2i Consulting Pvt. Ltd, CRIF Highmark, Bharat Financial Inclusion Limited, Grameen Financial Services Pvt. Ltd, Satin Creditcare Network Limited, ItzCash, MCID-NABARD and Greenlight Planet Inc, for inputs in bringing out this report.
We are grateful to overall patronage from NABARD for generously sponsoring the publication and dissemination of the report widely among all stakeholders. We are also thankful to SIDBI, World Bank Group (IFC), DFID, RBI and Government agencies for their support to the activities and initiatives of Sa-Dhan.
We hope this report would be extremely useful to you as a reference and data source. We welcome suggestions for further enhancing its coverage and utility.
P. SatishExecutive Director14 September, 2016
iii

The Bharat Microfinance Report 2016iv
Contents
Preface iii
List of Boxes vi
List of Figures vii
List of Tables ix
List of Abbreviations x
Glossary xiii
Executive Summary xv
Chapter 1: Inclusive Financial Sector: Progress with Continuity 1
1.1 Introduction 1
1.2 Priority Sector Lending Certificates (PSLCs) 2
1.3 Financial Inclusion Plan (FIP) 3
1.4 Committee on Medium-Term Path on Financial Inclusion 3
1.5 Roadmap for Banking Facilities 4
1.6 Financial Inclusion Advisory Committee (FIAC) 4
1.7 Mudra 4
1.8 Self Help Groups 4
1.9 Peer-to-Peer (P2P) Lending 5
1.10 MFIs as Channels for Govt. Programmes 5
Chapter 2: Outreach and Loan Portfolio 7
2.1 Geographical Spread of Microfinance 7
2.2 Branch Network 9
2.3 Client Outreach 14
2.3.1 Regional Outreach of MFIs 14
2.3.2 State-wise Client Outreach 15
2.3.3 Rural – Urban Share of MFIs Borrowers 16
2.3.4 Outreach to Special Segment of Borrowers (Women, SC/ST, and Minorities) 16
2.3.5 Leading MFIs in Client Outreach 17
2.4 Loan Portfolio of MFIs 18
2.4.1 Rural – Urban Share of Gross Loan Portfolio 20
2.4.2 Regional Spread of Loan Portfolio 20
2.4.3 Loan Portfolio Across States 21
2.4.4 Managed Portfolio 22
2.4.5 Business Correspondent (BC) Portfolio 23
2.4.6 Loan Outstanding per Borrower 24
2.4.7 Trends in Outreach and Outstanding Portfolio 24
2.5 Loan Disbursement 25
2.5.1 Loan Disbursement - States/UTs and Regional Pattern 26
2.5.2 Rural – Urban Share of No. of Loans Disbursed 27
2.5.3 Loan Amount Disbursed 28
2.5.4 Purpose of Loan 28
2.5.4.1 Income Generation Loans 29
2.5.4.2 Non- Income Generation Loans 29

v
Chapter 3: Operational and Financial Aspects 31
Section I: Workforce, Productivity and Portfolio Quality 31 3.1.1 Workforce in MFIs 31 3.1.2 Staff Productivity 32 3.1.3 Portfolio Quality 34
Section II: Cost & Revenue 35 3.2.1 Expenditure Analysis 35 3.2.2 Income Analysis 38 3.2.3 Margin 40 3.2.4 Yield, Cost and Margin: Performance Across MFI size 40
Section III: Surplus, Sufficiency and Profitability 41 3.3.1 Surplus 41 3.3.2 Operational Self-Sufficiency (OSS) 41 3.3.3 Profitability Ratios 42
Section IV: Balance Sheet Distribution and Capital Structure 44 3.4.1 MFI Assets 44 3.4.2 Pattern of Portfolio Financing 45 3.4.2.i Net Owned Fund (NOF) 45 3.4.2.ii Debt Financing 46 3.4.3 Capital (Net Owned Fund) to Total Asset Ratio 57 3.4.4 Leverage / Debt – Equity Ratio 58
Chapter 4: Credit Plus Activities 59 4.1 Micro Insurance 59 4.1.1 MFIs Acting as Micro Insurance Agents 60 4.2 Micro Pension 62 4.2.1 NPS: Swavalamban 62 4.2.2 Composition of NPS Subscribers 63 4.2.3 Pradhan Mantri Bima Yojana 64 4.3 Other Development Services 65 4.4 Jagruti – An Initiative to Intensify client engagement and reduce client attrition. 70
Chapter 5: SHG Movement and its Role in Financial Inclusion 765.1 Self Help Group Bank Linkage Programme (SBLP) 76
5.1.1 Savings Performance of SBLP 76
5.1.2 No of SHGs Availing Bank Loan during 2015-16 78
5.1.3 Loan Outstanding with SHGs 81
5.2 Aajeevika – National Rural Livelihoods Mission (NRLM) 84
Chapter 6: BC Model and Technology 866.1 Business Correspondent Model 866.2 Reaching doorsteps through Business Correspondents 866.3 Progress and Challenges 876.4 MFIs as Business Correspondents 896.5 Use of Technology 92
Annexures 95
State wise Presence of Different MFIs 95
District wise No. of MFIs in Operation. 98
Distribution of MFIs which Contributed data to this Report 104
Profile of MFIs which Contributed Data to this Report 106

The Bharat Microfinance Report 2016
List of Boxes
Chapter1 Inclusive Financial Sector: Progress with Continuity
Box 1.1 Core Values of Microfinance 6
Chapter 2 Outreach and Loan Portfolio
Box 2.1 Responsible Finance - an Essential Component of Microfinance Industry 11
Chapter 4 Credit Plus Activities
Box 4.1 Microfinance and Affordable Clean Energy Access: 72 A Path to achieve Sustainable Development Goals
Box 4.2 Pradhan Mantri Mudra Yojana 73
Box 4.3 Grievance Redressal Mechanism 74
Chapter 6 BC Model And Technology
Box 6.1 Peer-to-Peer Lending 88
Box 6.2 Cashless Project - Journey so far 93
vi

List of Figures
Chapter 2 Outreach and Loan Portfolio
Figure 2.1 Top 10 MFIs Operating in Number of Indian States/Union Territories 8
Figure 2.2 Top 10 MFIs Operating in Number of Indian Districts 8
Figure 2.3 MFI Branch Network – Yearly Trend and Category –wise Breakup 10
Figure 2.4 Top 10 MFIs in Terms of Branch Network 10
Figure 2.5 Outreach to Borrowers: Yearly Trend and Category – wise Breakup for 2015-16 14
Figure 2.6 Regional break up of Client Outreach 14
Figure 2.7 Trends in Rural – Urban Share of MFI Borrowers 17
Figure 2.8 List of Top 10 MFIs with Client Outreach as of March 2016 17
Figure 2.9 Gross Loan Portfolio – Yearly Trend and Category–wise Breakup for 2015-16 19
Figure 2.10 Percentage of Rural – Urban Share of Gross Loan Portfolio 20
Figure 2.11 Region wise Loan Portfolio 20
Figure 2.12 Managed Loan Portfolio – Yearly Trend and Category–wise Breakup for 2015-16 23
Figure 2.13 BC Loan Portfolio and Category–wise Breakup for 2015-16 23
Figure 2.14 Loan Outstanding per Borrower yearly trend and across regions for the FY 2015-16 24
Figure 2.15 Growth Fluctuations in Outreach and Loan Outstanding over the Years 24
Figure 2.16 Loan Disbursement over the years 25
Figure 2.17 Regional Pattern of Loan Disbursement 25
Figure 2.18 Top 10 MFIs in Loan Disbursement during 2015-16 27
Figure 2.19 Percentage of Rural – Urban Share of No. of Loans Disbursed 27
Figure 2.20 Share of income generation loans and non income generation loans 28
Figure 2.21 Share of MFIs Income Generation Loans under Different Sub-sectors as of March 2016 29
Figure 2.22 Share of MFIs Non-Income Generation Loans under Different Sub-sectors as of March 2016 29
Chapter 3.1 Workforce, Productivity And Portfolio Quality
Figure 3.1.1 No. of MFI Staff - Yearly Trend and MFI-Category-wise Break-up 31
Figure 3.1.2 MFI Field Staff vs Other Staff Distribution – 2015 & 2016 31
Figure 3.1.3 New Staff Recruited by the MFIs over the years 32
Figure 3.1.4 Distribution of MFIs based on clients served per Staff & per Credit Officer 33
Figure 3.1.5 ABCO Across MFIs 33
Figure 3.1.6 Distribution of MFIs Based on Loan Portfolio per Credit Officer 34
Figure 3.1.7 MFI Loan Portfolio at Risk (PAR) 34
Figure 3.1.8 Distribution of MFIs Based on PAR 34
Chapter 3.2 Cost and Revenue
Figure 3.2.1 Break up of Expenses by Indian MFIs 35
Figure 3.2.2 Break up of Expenses by Indian MFIs based on Portfolio size 36
Figure 3.2.3 Operating Expenditure Ratio across MFIs 36
Figure 3.2.4 Finance Cost Ratio Across MFI Categories 37
Figure 3.2.5 Trends of OER and FCR 38
Figure 3.2.6 Break-up of Income 38
Figure 3.2.7 Yield Trend of MFIs 39
Figure 3.2.8 Yield on Portfolio across MFIs 39
Figure 3.2.9 Yield, Cost and Margin of MFIs –size wise 40
vii

The Bharat Microfinance Report 2016
Chapter 3.3 Surplus, Sufficiency and Profitability
Figure 3.3.1 OSS Across MFIs 41
Figure 3.3.2 OSS based on average loan size 42
Figure 3.3.3 OSS based on yield category 42
Figure 3.3.4 OSS based on OER of MFIs 42
Figure 3.3.5 Return on Asset (ROA) and Return on Equity (ROE) across MFI types 43
Figure 3.3.6 Return on Asset (ROA) and Return on Equity (ROE) of MFI-Size wise 43
Chapter 3.4 Balance Sheet Distribution and Capital Structure
Figure 3.4.1 MFI Total Assets- Yearly Trend 44
Figure 3.4.2 Composition of Total Assets of MFIs 44
Figure 3.4.3 MFI Equity Outstanding - Yearly Trend and MFI- Category- wise Break-up of 2016 Figure 45
Figure 3.4.4 Fresh Equity Raised by MFIs and MFI-Category-wise Break-up 46
Figure 3.4.5 Top 10 MFIs in terms of Equity Raised 46
Figure 3.4.6 Sources of funding based on types of instruments 47
Figure 3.4.7 Sources of funding based on Institution types 47
Figure 3.4.8 Outstanding Borrowing – Yearly Trend and MFI-Category wise Break-up of 2016 Figure 48
Figure 3.4.9 Fund Received during the year – Yearly Trend and MFI-Category wise Break-up of 2016 Figure 48
Figure 3.4.10 Source wise Share of Loans lent among Different Legal Forms of MFIs during 2015-16 49
Figure 3.4.11 Capital to Total Asset Ratio 58
Figure 3.4.12 Debt - Equity Ratio Trend and Break–up of 2016 Figure Across MFI –Categories 58
Chapter 4 Credit Plus Activities
Figure 4.1 Composition of NPS Subscribers 63
Figure 4.2 Most Recalled Theme 70
Figure 4.3 Mode of Delivery 71
Chapter 5 SHG Movement and its Role in Financial Inclusion
Figure 5.1 Historical Trend in Credit Linkage and Bank Loan Disbursed 76
Figure 5.2 All India Trend in SHG Savings Amount Held in the Indian Banking System 77
Figure 5.3 All India Trend in Average per SHG Savings Held in the Banking System 77
Figure 5.4 Savings of SHGs with Banks as on 31 March 2016 78
Figure 5.5 No. of SHGs availed Bank Loan during 2015-16 from the Banking System 78
Figure 5.6 Top 10 Banks in terms of Savings 79
Figure 5.7 All India Trend in Bank Loan Amount Disbursed to SHGs 79
Figure 5.8 Agency-wise loan disbursement – No. of SHGs and Loan Amount disbursed 80
Figure 5.9 Top 10 Banks in terms of Disbursement 80
Figure 5.10 All India Trend in Average Bank Loan Amount Disbursed per SHG 81
Figure 5.11 All India Trend in SHG Loan Outstanding in the Books of Banking System 81
Figure 5.12 All India Trend in Average per SHG Loan Outstanding in the Banking System 82
Figure 5.13 Agency-wise Bank Loan outstanding against SHGs as on 31 March 2016 82
Figure 5.14 Non Performing Asset Per Cent of SHG Loans with Banks 83
Figure 5.15 NPAs of Banks against SHGs Loan Outstanding 83
viii

List of Tables
Chapter 2 Outreach and Loan Portfolio
Table 2.1 No. of MFIs in Indian States/UTs 7
Table 2.2 No. of MFIs in Indian States/UTs and No. of Districts with MFI Operations 9
Table 2.3 Outreach (in lakh) of MFIs across States/UTs – 2015 & 2016 (decreasing order) 15
Table 2.4 Composition of Borrowers – Category wise 17
Table 2.5 List of Top MFIs with Loan Portfolio as of March 2016 19
Table 2.6 Loan Portfolio Outstanding across States/UTs – 2015 & 2016 (decreasing order) 21
Table 2.7 Loan Disbursement across States/UTs – 2015 & 2016 (decreasing order) 26
Table 2.8 Amount disbursed during the year 2015 and 2016 28
Chapter 3.1 Workforce, Productivity And Portfolio Quality
Table 3.1.1 Yearly trend of Total Staff vs Women Staff 32
Table 3.1.2 Staff Turn-over among MFIs during 2015-16 32
Chapter 3.4 Balance Sheet Distribution and Capital Structure
Table 3.4.1 List of lenders reported among Top 10 Lenders of the individual reporting MFIs 49
(in terms of Outstanding as of March 2016)
Table 3.4.2 MFI wise Loan Outstanding (based top 10 Lenders data) to Lenders 51
Table 3.4.3 Lender wise Loan Outstanding (based top 10 Lenders data) to MFIs 54
Chapter 4 Credit Plus Activities
Table 4.1 MFIs involved in Micro Insurance- Health 61
Table 4.2 MFIs involved in Micro Insurance - Non-health 62
Table 4.3 MFIs involved in Micro Pension 65
Table 4.4 Development Services of Reporting MFIs 65
Table 4.5 MFIs and Livelihoods Intervention 66
Table 4.6 MFIs and General Education Intervention 67
Table 4.7 MFIs and Preventive Healthcare Initiatives 68
Chapter 5 SHG Movement And Its Role In Financial Inclusion
Table 5.1 Present Status of NRLM 85
Chapter 6 BC Model And Technology
Table 6.1 Financial Inclusion Plan-Summary Progress of all Banks including RRBs 87
Table 6.2 MFIs as Banking Correspondents – No. of saving clients and amount saved 89
Table 6.3 MFIs as Banking Correspondents – No. of Loan clients, amount disbursed and amount outstanding 90
ix

The Bharat Microfinance Report 2016
List of Abbreviations
x
1 ABCO Active Borrowers per Credit Officer
2 APY Atal Pension Yojana
3 ATM Automated Teller Machine
4 AUM Assets Under Management
5 BC Business Correspondent
6 BCNM Business Correspondent Network Manager
7 BF Business Facilitator
8 BPL Below Poverty Line
9 BSBDA Basic Savings Bank Deposit Account
10 CAB College of Agricultural Banking
11 CAR Capital Adequacy Ratio
12 CBEO Community Based Economic Organization
13 CBS Core Banking Solution
14 CDR Corporate Debt Restructuring
15 CEO Chief Executive Officer
16 CGT Compulsory Group Training
17 CIB Credit Information Bureau
18 CIF Community Investment Fund
19 CmF Centre for Micro Finance
20 CO Credit Officer
21 CoC Code of Conduct
22 COCA Code of Conduct Assessment
23 CPPs Client Protection Principles
24 CRM Customer Relationship Management
25 CRR Cash Reserve Ratio
26 CSO Customer Service Officer
27 CSP Customer Service Point
28 DFS Department of Financial Services
29 DNBS Department of Non-Banking Supervision
30 DPD Days Past Due
31 DRDA District Rural Development Agency
32 DWCD Department of Women and Child Development
33 ECB External Commercial Borrowing
34 FCR Finance Cost Ratio
35 FDI Foreign Direct Investment
36 FER Finance Expense Ratio
37 FI Financial Institution
38 FIAC Financial Inclusion Advisory Committee
39 FIIs Foreign Institutional Investors
40 FIP Financial Inclusion Plan
41 FLCs Financial Literacy Centre
42 GCC General Credit Card
43 GIC General Insurance Corporation of India

xi
44 GLP Gross Loan Portfolio
45 GoI Government of India
46 GPRS General Packet Radio Service
47 GRT Group Recognition Test
48 HTTP Hyper Text Transfer Protocol
49 ICIB Inclusive Credit Information Bureau
50 ICT Information and Communication Technology
51 IMPS Immediate Payment Service
52 IPOs Initial Public Offerings
53 IRDA Insurance Regulatory Development Authority
54 IVR Interactive Voice Response
55 JLG Joint Liability Group
56 KCC Kisan Credit Card
57 KYC Know Your Customer
58 LAB Local Area Bank
59 MFDRC Micro Finance and Development Regulatory Council
60 MFIs Microfinance Institutions
61 MHL Mobile High-Definition Link
62 MIS Management Information System
63 MoA Memorandum of Association
64 MoF Ministry of Finance
65 MoRD Ministry of Rural Development
66 MoU Memorandum of Understanding
67 MSME Ministry of Micro Small & Medium Enterprises
68 MUDRA Micro Units Development & Refinance Agency
69 NABARD National Bank for Agriculture and Rural Development
70 NAMCABs National Mission for Capacity Building of Bankers
71 NBFC Non-Banking Finance Company
72 NBFC -SI -ND Systemically Important Non-Deposit taking NBFCs
73 NBFC-ND Non Deposit taking NBFCs
74 NCD Non-Convertible Debenture
75 NGO Non-Governmental Organization
76 NIM Net Interest Margin
77 NoF Net Owned Fund
78 NPA Non Performing Asset
79 NPCI National Payment Corporation of India
80 NPS National Pension System
81 NRLM National Rural Livelihood Mission
82 NULM National Urban Livelihood Mission
83 OD Overdraft
84 OER Operating Expense Ratio
85 OSS Operational Self Sufficiency
86 P2P Peer-to-Peer
87 PAR Portfolio at Risk

The Bharat Microfinance Report 2016
88 PFRDA Pension Fund Regulatory and Development Authority
89 PLF Primary Level Federation
90 PMDJY Pardhan Mantri Jan Dhan Yojana
91 PMMY Pradhan Mantri MUDRA Yojana
92 POS Point of Sale
93 PSIG Poorest State Inclusive Growth
94 PSL Priority Sector Lending
95 PSLCs Priority Sector Lending Certificates
96 PSU Public Sector Unit
97 RBI Reserve Bank of India
98 RF Revolving Fund
99 RFF Responsible Finance Forum
100 RFIP Rural Financial Institutions Programme
101 RIDF Rural Infrastructure Development Fund
102 RMK Rashtriya Mahila Kosh
103 RoA Return on Asset
104 RoE Return on Equity
105 RRBs Regional Rural Banks
106 RSETIs Rural Self Employment Training Institutes
107 SBLP Self-Help Group Bank Linkage Programme
108 SC/ST Scheduled Caste/Scheduled Tribe
109 SERP Society for Elimination of Rural Poverty
110 SFB Small Finance Bank
111 SHGs Self-Help Groups
112 SHPI Self Help Promoting Institute
113 SIDBI Small Industries Development Bank of India
114 SLBCs State Level Bankers’ Committees
115 SLR Statutory Liquidity Ratio
116 SMS Short Message Service
117 SPM Social Performance Management
118 SPOC Single Point Of Contact
119 SRO Self-Regulatory Organisation
120 TAT Turn Around Time
121 UCBs Urban Cooperative Banks
122 UT Union Territory
123 Y-O-Y Year On Year
xii

Glossary
ABCO
ABCO is an acronym for Average Borrower per Credit Officer, a measure of client-staff ratio. It is also known as Case Load
Average Loan Size
Average Loan size represents the client-per capita loan amount. It is calculated as: The Loan portfolio divided by the number of clients of an MFI.
Borrowing Cost
The total charge for taking on a debt obligation that can involve interest payments and other financing fees.
Capital Adequacy
Capital Adequacy is the means of measuring the solvency level of MFIs which is an important indicator of risk bearing ability of the entities. It is the proportion of the capital/own fund held by an MFI against its total asset
Capital to Total Assets
Ratio of net worth to total assets
Debt-Equity Ratio
Debt-Equity Ratio is the proportion of total debt borrowed to the total equity held at a given point of time.
Debt Funding
Debt Funding refers to the percentage of loan portfolio funded by outside borrowings
External Cost
External Cost here refers to Finance cost which is determined by the lending rate of banks and hence is beyond the control of MFIs
Finance Cost
Finance Cost here refers to the interest and other expenses incurred on average bank loan outstanding in the books of MFIs. This does not include notional cost of utilizing the equity fund.
Financial Inclusion
Financial Inclusion is the delivery of financial services at affordable costs to sections of disadvantaged and low income segments of society.
Margin
Margin refers to the difference between the finance cost on portfolio and the total yield on portfolio. This term is anal-ogous to the concept of Net Interest Margin (NIM) widely used in banking parlance. Margin Cap refers to the ceiling of Margin of 12 percent fixed by RBI.
Managed Loan Portfolio
Managed Loan Portfolio is the loan asset originated by MFIs and later sold to banks for getting liquidity. The MFIs continue to manage it i.e. collection of repayment on behalf of the banks which purchased the portfolio.
xiii

The Bharat Microfinance Report 2016
Non Performing Assets (NPA)
A debt obligation where the borrower has not paid any previously agreed upon interest and principal repayments to the designated lender for an extended period of time. The NPA is therefore not yielding any income to the lender in the form of principal and interest payments.
Operating Expense Ratio (OER)
Ratio of staff, travel, administration costs, other overheads and depreciation charges of the MFIs (non-financial costs) to the average loan portfolio during a year
Operating Self Sufficiency (OSS)
Operating Self Sufficiency (OSS) shows the sufficiency of income (operating income and investment income) earned by MFIs to cover the cost like operating cost, loan loss provision and finance cost, incurred for conducting the operations.
Portfolio Quality
Amount of risk of default in the loan portfolio. A high quality portfolio contains a lower amount of risk. Portfolio quality changes continually as loans are disbursed, payments are made, and payments become due.
Portfolio at Risk (PAR)
PAR indicates the proportion of outstanding amounts of all loan accounts having past due/arrears to the total out-standing loan. In general, PAR 60, i.e., the portfolio / part of the portfolio remaining unpaid 60 days and beyond crossing the due date, would be used as a measure to assess the portfolio quality.
Qualifying Assets
Qualifying Assets are loan portfolios created by MFIs adhering to certain conditions to make the MFIs eligible to be called as MFIs and to raise loans from banks under Priority Sector Advances Scheme ( as per recent RBI norms).
Return on Asset (RoA)
Return on Asset (RoA) is the universally accepted profitability measure which, in essence, is the percentage net in-come earned out of total average asset deployed by MFIs during a given period, say a year.
Return on Equity (RoE)
Return on Equity (RoE) is the net income earned out of average equity of MFIs held by MFIs during the given period.
Self Help Groups (SHGs)
SHGs refer to groups of 10-20 women coming together to form a semi formal community based institution to meet their common financial and social needs.
SHG Bank Linkage Programme (SBLP)
SHGs are linked to mainstream banks for depositing surplus savings of the SHGs and to obtain loans. It is considered to be an effective strategy to ensure financial inclusion.
Surplus
Surplus is Yield minus Total cost
Yield on Portfolio
Yield represents total income from microcredit operation-Interest income, processing fee/ service charge – earned out of average loan portfolio outstanding. It does not, include investment income. It is a good proxy / surrogate for loan interest rate.
xiv

Executive Summary
Context
For the microfinance sector in India the year 2015 -16 was one of steady growth and stability, though
some islands of heavy growth should be a matter of concern. RBI’s continuing interest in the sector is
reflected in its engagement with both the SROs of the Microfinance sector-Sa-Dhan and MFIN, and coming
out with modifications and improvements in guidelines whenever required.
At the policy level, MUDRA’s progress reflects the depth of financing by the MFIs. The Pradhan Mantri Bima
Yojana (PMBY) and the Atal Pension Yojana provide additional financial instruments for MFIs to offer to
their clientele. Bandhan Bank which rose from the microfinance sector completed one year of its service,
Capital Small Finance Bank was the first SFB to start off its operations and other Small Finance Banks and
Payment Banks will be in place by the close of the financial year. Further, RBI is coming up with guidelines
for Peer To Peer lending. These are game changers for the banking and financial sector landscape of the
country in general and for financial inclusion scenario in particular.
Objective
This report is an attempt to collect primary data on MFI client outreach, their loan portfolio and other
financials of MFIs in India that includes both members as well as non-members of Sa-Dhan.
The report purports to provide primary data based analytical information to a wide range of stakeholders
such as the Government, policymakers, regulators, banks, investors, researchers, media, MFIs and others,
helping them to understand the current status and the underlying trends in the sector in order to take
appropriate decisions/actions that are critical for the development of the industry.
Methodology
The contributing MFIs have voluntarily provided their data and detailed information as sought through a
data acquisition sheet consisting of their financial outreach, geographic spread, credit plus and developmental
activities etc. For this report we have compiled data from MFIs representing all legal forms (Societies, Trusts,
Sec-8 Companies, NBFC-MFIs, Cooperatives) the data has been collated, validated, and analysed for peer
groups.
The project team rigorously scrutinized the self reported data, validated it from the MFI’s financial statements,
and reconciled from other secondary sources. The validity of the findings however, is subject to the accuracy
of the self-reported data, though reconciliation techniques used would have minimized such errors.
The analysis of the report was undertaken on the basis of a predesigned framework and the findings have
been improved to the extent possible though advisory inputs from microfinance experts and practitioners.
The chapters pertaining to SHGs and the BC model, while culled out from secondary sources, have been
further enhanced by inputs from the experts in the field.
The Report Coverage
The report is divided into two parts. Part one covers the MFI sector and is based on primary data, whereas
Part two covers the SHG sector and the BC model and is mainly culled out from secondary sources of
information.
xv

The Bharat Microfinance Report 2016
Part 1 is further divided into four chapters. Chapter 1 represents an overview of the microfinance sector
within the larger ambit of financial inclusion, Chapter 2 deals with growth and outreach of MFIs, Chapter
3 deals with operational and financial aspects of credit services, while Chapter 4 deals with credit plus
activities. Chapter 3 is further subdivided into 4 sections. Section 1 dwells upon the workforce, productivity
and portfolio quality. Section 2 represents the cost and revenue aspects of the MFIs. Section-3 represents
surplus, sufficiency and profitability of the MFIs, while Section 4 deals with capital structure and balance
sheet distribution.
In the Part 2 of the report, Chapter 5 deals with the SHG section of microfinance and Chapter 6 presents an
overview of the BC model and other technology led approaches of financial inclusion.
Highlights of the Report
Growth and Outreach
MFIs currently operate in 29 States, 4 Union Territories and 588 districts in India. The reported 166 MFIs
with a branch network of 12,221 employees have reached out to an all time high of 39 million clients with
an outstanding loan portfolio of `63,853 crore. This includes a managed portfolio of `16,914 crore. Out of
managed portfolio, BC portfolio accounts for `7,984 crore. The average loan outstanding per borrower
stood at `11,425 and 94% of loans were used for income generation purposes.
Outreach grew by 8% and loan outstanding grew by 31% over the previous year. The Southern region
continues to have the highest share of both outreach and loans outstanding, followed by East. However
growth rates are higher in the Northeastern and Central regions. Outreach proportion of urban clientele
has decreased marginally as against the rural population. The proportion of urban clientele which was 67%
in 2014-15 decreased to 62% in 2015-16. Women borrowers constitute 97% of the total clientele of MFIs,
SC/ST borrowers constitute 30% and minorities 27%.
Of the total, NBFC-MFIs contribute to 85% of clients outreach and 88% of outstanding portfolio, while NGO
MFIs contribute to the remaining. MFIs with portfolio size of more than `500 crore contribute significantly
to the total outreach (85%) and loan outstanding (88%) of the sector.
Operational and Financial Aspects
MFI sector employs 1,03,415 personnel, out of which 15% are women, and 62% are field staff. An active
borrower per credit officer (ABCO) is 440, which is higher than the previous year indicating higher focus
on client services without much of staff growth.
Financial expense is the major expense (53%) incurred by MFIs. Personnel expense and other administrative
expenses contribute 24% and 23% respectively. Median OER (Operating Expense Ratio) and FCR (Finance
Cost Ratio) remained at 10.2% and 13.83% respectively. It is seen that the OER comes down with scale of
operation. MFIs, with portfolio of more than `500 crore have a median OER of 7.5% and FCR of 13.9%.
The Yield of the sector for the year was 21%, which is the highest for the Section 8 Companies and
Cooperatives (24%) and lowest for the Society/Trust (20%). The Margin for different types of institutions
was in the range of 9 -12%. NBFC-MFIs maintained a median margin of 10%. Median OSS (Operational Self
Sufficiency) is 113%. Approximately 16% of MFIs have OSS less than 100%. This includes 4% of the NBFC-
MFIs on account of AP portfolio and 12% not for profit MFIs. Generally, the OSS improves with the average
loan size and yield of the institution.
xvi

Median ROA and ROE for the sector remained at 2.2% and 11.6% respectively. The returns are generally
higher for not for profit MFIs and very large sized MFIs.
The CAR (Capital Adequacy Ratio) for all types of MFIs remained above the desirable level of 15%. NBFC-
MFIs have CAR of 20.1%. Leveraging of the sector was 3.2. The sector received a sum of `39,331 crore,
which includes a portfolio sale of `8,834 crore. Total outstanding borrowing of MFIs stood at `44,822 crore,
with a substantial share of this derived by NBFC-MFIs (97%) especially from the very large MFIs (87%).
Self-Help Groups and the BC model
Number of SHGs linked to credit and bank loan amount to SHGs has witnessed an increasing trend after
2010-11. The number of saving linked SHGs has also n increased during the year.; till date, 103 million
families have been covered under the SBLP program with a total number of 79.03 lakh SHGs with a saving
amount of `13,691 crores. A total of 46 lakh SHGs have a gross loan outstanding of `57,119 crores.
The amount of savings and the average per SHG savings (`14,662) held in the banking system are both
increasing since 2011-12. Average loan disbursed per SHG for 2015-16 is reported at `203,526, whereas
average loan outstanding per SHG stood at `122,258
The aggregate NPA of SHG loans remain a concern though it has declined marginally by 0.59% from 7.4%
in 2014-15 to 6.4% in 2015-16. Quality of SHGs, their performance has emerged as one of the major issues
affecting the movement.
Also the fact that NRLM will push for improvement in the SHG bank linkage with better monitoring, lower
rates of interest and a sharper focus on livelihood generation, would give a greater fillip to the growth of
SHG programme.
MFIs are finding the BC model increasingly attractive to carry out their activities on the credit side and to
spread it to deposit taking activities 51MFIs had an exposure to a BC loan portfolio of ̀ 7,191 crores through
linkage to 25 banks. Apart from this 13 MFIs were undertaking deposit related activities for 13 banks. The
deposit portfolio of BCs amounted to `871 crores.
xvii

The Bharat Microfinance Report 2016
Indicators: MFI Model 2016 2015 Change
Client Outreach 399 lakh 371 lakh
Women Clients 97% 97% No Change
SC/ST Clients 30% 28%
Other Minorities 27% 18%
Rural Clients 38% 33%
Gross Outstanding Portfolio `63853 Cr. `48882 Cr
Own Portfolio `46939 Cr. `39028 Cr
Managed Portfolio `16914 Cr. `9854 Cr
Avg. Loan per Borrower `11425 `13162
Income Generation Loan 94% 80%
Female Staff in MFIs 15% 16%
ABCO 440 419
OER 10.22% 11.45%
FCR 13.3% 12.42%
Yield 21% 24%
Margin 10.00% 10.20%
OSS 113% 113% No Change
ROA 2.2% 1.73%
ROE 11.6% 8.19%
CAR 19.39% 19.10%
Leverage 3.2 2.9
Fund Flow (Outstanding) `44822 Cr. `40802 Cr
Equity Outstanding `4509 Cr. `4195 Cr
NPA 0.15% 0.21%
SHG Model
Total No of SHGs Linked 79.03 lakh 77.12 lakh
No. of Families Reached 103 million 101 million
Total Savings of SHGs `13691 Cr `11307 Cr
Total No. of SHGs Credit Linkage 18.32 lakh 16.26 lakh
Gross Loan Outstanding `57119 Cr `51721 Cr
Total Loan Disbursed `37286 Cr `30334 Cr
Avg. Loan Disbursed per SHG `203526 `186556
Avg. Loan Outstanding per SHG `122258 `115759
NPA 6.45% 7.40%
Performance Highlights: A Snapshot
xviii

Inclusive Financial Sector: Progress with Continuity 1
Inclusive Financial Sector: Progress with ContinuityChapter 1
1.1 Introduction
Developments in the year give us the confidence to claim that we are progressing well on the path to achieving universal financial inclusion. The government, regulators and financial markets have shown
immense faith in the model of financial inclusion which we have been pursuing. Provisional licenses provided to the Small Finance Banks and successful Initial Public Offerings (IPOs) of Ujjivan and Equitas are a testimony to that. The MFIs which had obtained provisional licenses are well on their course to establish Small Finance Banks and are expected to overcome their limitations of currently being able to offer only a limited set of products to their clients. Bandhan Bank which just celebrated the first anniversary of its establishment is already providing a gamut of services and experience to its customers, majority of whom are microfinance clients.
MFIs are beginning to enjoy benefits of scale and there is evidence that they are passing on this benefit to clients in terms of reduction in interest rates. In fact, the top 10 NBFC-MFIs contributing 80% of the sector’s Gross Loan Portfolio or over `40,000 crores have a weighted average interest rate of 23.13%, far below the 26% max cap under PSL guidelines. Sa-Dhan data shows that over 36 NBFC-MFI members have reduced rates significantly in the last financial year itself.
There are also efforts to reduce cash transactions to reduce risks and increase efficiency. Advances in the adoption of technology coupled with the banks accounts opened under the Prime Minister Jan Dhan Yojana (PMJDY) have certainly helped in doing this.
1.1.1 Credit History of Clients
Building a credit history for the microfinance clients goes a long way in achieving universal financial inclusion. Directions from the RBI and industry’s code of conduct require all the MFIs to share their data to the credit bureaus. Enhanced penetration of Aadhaar is helping increase accuracy of data obtained from Credit Bureaus and improving credit appraisal. Recent directions from the Reserve Bank of India (RBI) to share details of individuals borrowings from the SHGs to the Credit Bureaus is expected to further enhance their utility and effectiveness.
1.1.2 Revised Code of Conduct
This year the revised Code Conduct for sector which is forward looking was adopted despite some voices in favour of dilution of some of the provisions. MFIs have taken steps to implement this revised code of conduct in letter and spirit. Reports from our field visits suggest that MFIs are disclosing interest rates and other terms and conditions to the borrowers in clear terms. They have also set up effective grievance redressal mechanisms.
1.1.3 Risk Management Issues
Reports from Sa-Dhan’s field visits also point out to several risks which the MFIs and their clients may be facing. There is evidence of pockets with concentration of several MFIs in a limited geographical area which has the potential to lead to over-indebtedness and other undesirable practices. There is also evidence of some unauthorized agents acting on behalf of the MFIs and unscrupulous organisations posing as MFIs. In a rush to grow, the MFIs should not overlook the importance of having good internal controls and training their field staff.

The Bharat Microfinance Report 20162
1.1.4 Product Development
Product development is another area in which the MFIs need to invest more. Much of the portfolio growth so far has come from the standard income generation loans. MFIs need to be cognizant of the fact that clients need credit for various purposes including water and sanitation, housing and education. Limited experience of various MFIs in these needs to be documented and shared. There is also a greater need for MFIs to expand their portfolio to credit plus products like microinsurance and micropensions.
A large numbers of MFIs have been providing micro insurance products and micropensions. As per the self-reported data, 15 MFIs have reached to 3.66 lakh clients for health products, 39 MFIs have reached to 55.38 lakh clients for non-health products and 11 MFIs have been providing micropensions services to 18.59 lakhs clients.
1.2PrioritySectorLendingCertificates(PSLCs)In the meanwhile RBI has taken several steps to ease the process of financial inclusion. One of these is the introduction of Priority Sector Lending Certificates (PSLCs). This scheme of PSLCs was introduced in April 2016. The Reserve Bank provided a platform to enable trading in the certificates through its core banking solution (CBS) portal (e-Kuber). All scheduled commercial banks (including RRBs), urban co-operative banks, small finance banks (when they become operational) and local area banks are eligible to participate in trading. Some of the main features of the scheme are:
• Four kinds of PSLCs: Agriculture, Small and Marginal farmers (SF/MF), Micro enterprises and General can be bought and sold via the platform.
• The certificates will have a standard lot size of `2.5 million and its multiples.
• There will be no transfer of credit risk on underlying assets as there is no transfer of tangible assets or related cash flows.
• Banks will be permitted to issue PSLCs up to 50 per cent of the previous year’s priority sector lending achievement without having the underlying in their books. Banks should meet priority sector targets through direct lending and net PSLCs.
• Banks may be required to invest in the Rural Infrastructure Development Fund (RIDF)/other funds to the extent of the shortfall.
• A bank with a shortfall in achieving any sub-target (for example, SF/MF, micro enterprises) will have to buy specific PSLCs to achieve the target. However, if a bank has a shortfall only with respect to the overall target, it could buy any PSLC.
• PSLCs will not be valid beyond the reporting date (March 31), irrespective of the date of first sale.
• A bank’s priority sector lending achievement will be computed as the sum of outstanding priority sector loans and the net nominal value of the PSLCs issued and purchased. Such computation will be done separately where sub-targets are prescribed as on the reporting date
Further in a move to boost entrepreneurial sensitivity among banks’ field-level functionaries, the Reserve Bank in collaboration with the College of Agricultural Banking (CAB), Pune, launched the National Mission for Capacity Building of Bankers for financing the MSME sector (NAMCABS). Since its inception, NAMCABS has imparted training to about 3,000 bankers.

Inclusive Financial Sector: Progress with Continuity 3
1.3 FinancialInclusionPlan(FIP)
Financial Inclusion Plan (FIP) initiated by RBI saw a steady progress during the year. This plan (FIP) provides a structured and planned approach to financial inclusion with a commitment at the highest echelons within banks in terms of Board approval of the plans. Out of 2,259 rural bank branches opened during April 2015-March 2016, 1,670 branches were opened in unbanked rural centres under FIP. Around 71 million basic savings bank deposit accounts were added taking the total to 469 million by March 2016. The total number of small farm sector credits (Kisan Credit Cards) and small non-farm sector credits (General Credit Cards) stood at 47 million and 11 million, respectively. With the conclusion of FIP’s Phase II (2013-16) on March 31, 2016, all domestic scheduled commercial banks (including RRBs) were advised to set new Board approved FIP targets for the next three years (April 2016 to March 2019).
1.4 CommitteeonMedium-TermPathonFinancialInclusion
The Committee on Medium-Term Path on Financial Inclusion, Chaired by Mr Deepak Mohanty, ED, RBI, which was constituted to work out a medium-term (five year) measurable action plan for financial inclusion, submitted its report in December 2015. The Committee recognised that substantial progress had been made in terms of access to financial products and services especially after the launch of the Pradhan Mantri Jan Dhan Yojana (PMJDY). The Committee identified significant gaps in terms of usage, inadequate ‘last mile’ service delivery, exclusion of women and small and marginal farmers and a very low formal link for micro and small enterprises. Against this background, the committee set a much wider vision of financial inclusion as ‘convenient’ access to a basket of basic formal financial products and services that should include savings, remittances, credit, government-supported insurance and pension products to small and marginal farmers and low-income households at reasonable costs with adequate protection progressively supplemented by social cash transfers. The Committee also suggested increasing micro and small enterprises’ access to formal finance with a greater reliance on technology to cut costs and improve service delivery, such that by 2021 over 90 per cent of the hitherto underserved sections of society become active stakeholders in economic progress empowered by formal finance.
Some of the recommendations of the committee are:
1. Welfare scheme “Sukanya Shiksha” for the girl child with a view to linking education with banking habits.
2. A low-cost solution based on mobile technology for enhancing the effectiveness of last mile delivery as also to facilitate usage.
3. Phasing out of the interest subvention scheme and ploughing the amount into universal crop insurance.
4. An open specialised interest-free window with simple products like demand deposits, agency and participation securities, offering products based on cost-plus financing, deferred payment and deferred delivery contracts.
5. Exploring a system of professional credit intermediaries / advisors for MSMEs to help bridge the information gap and thereby help banks take better credit decisions.
6. Creating a registry for BCs, encouraging BC certification / training programmes.
7. Inter-operability for pre-paid instruments and mobile transactions.
8. Strengthening the financial literacy centre (FLC) network and grievance redressal mechanism and devising a scheme based on transparent criteria that incentivises banks to expeditiously address customer grievances.

The Bharat Microfinance Report 20164
1.5RoadmapforBankingFacilitiesIn its Roadmap for Banking Facilities in Unbanked Villages, RBI initially advised the banks to complete Phase II of the roadmap for covering all 490,298 unbanked villages with population less than 2,000 by March 31, 2016. The timeline was advanced to August 14, 2015 in view of the on-going implementation of the Pradhan Mantri Jan Dhan Yojana (PMJDY). At end-March 2016, as reported by the State Level Bankers’ Committees (SLBCs), 450,686 villages (91.9 per cent of the target) had been covered by 14,901 branches, 415,207 villages through BCs and 20,578 villages through other modes such as ATMs and mobile vans. Keeping in view the necessity of brick and mortar branches for promoting banking penetration and financial inclusion, a roadmap for establishing such branches in villages with population above 5,000 but without a bank branch of a scheduled commercial bank was rolled out in December 2015. SLBC convenor banks have been advised to ensure opening of bank branches under this roadmap by March 2017.
1.6 FinancialInclusionAdvisoryCommittee(FIAC)
The Reserve Bank set up an advisory body, the FIAC, in 2012 to review financial inclusion policies on an on-going basis and to provide expert advice to the Reserve Bank in this matter. Given the renewed focus on financial inclusion by the Government of India, the on-going implementation of the PMJDY and the need for convergence of the efforts of various stakeholders, FIAC was re-constituted in June 2015. Its revised terms of reference include: (i) preparing a national strategy for financial inclusion which aims at converging financial inclusion efforts of various stakeholders and PMJDY, apart from monitoring the progress; (ii) monitoring progress on FIP; and (iii) monitoring progress on financial literacy. Sa-Dhan is a member of this Committee.
1.7 MUDRA
Micro Units Development & Refinance Agency Limited (MUDRA) and Pradhan Mantri MUDRA Yojana (PMMY) were launched on 08 April 2015 by the Hon’ble Prime Minister, Shri Narendra Modi. The guidelines of PMMY issued by Department of Financial Services (DFS), GOI indicated that all banks are required to lend to microenterprises engaged in manufacturing, processing, trading and service sector activities for a loan upto `10 lakh. Further, it was also advised that the loan may be given in three categories, i.e. Loan upto `50,000 under Shishu; `50,000 to `5 lakh under Kishor; and `5 lakh to `10 lakh under Tarun. Also, it was envisaged that more focus will have to be given for the Shishu category. A target of `1,22,188 crore was set for F.Y. 2015-16.
As against the target of `122188 crore, the Banks and MFIs together have disbursed `132954.73 crore, thereby achieving 109%. The achievements by Public Sector Banks indicate a substantial credit growth in this segment. Based on the data collected from the PSBs, it was seen that the disbursement by these banks in this segment was around `33,000 crore during the 2014-15 which has recorded a growth of 70% during 2015-16.
The Union Cabinet has given its approval for the creation of a credit guarantee fund for Micro Units Development Refinance Agency (MUDRA) loans. The fund is expected to guarantee more than `1 lakh crore worth of loans to micro and small units.
1.8 SelfHelpGroups
Self Help Group Bank Linkage Programme (SBLP) is a step to bring the “unbanked” poor into the formal banking system and to inculcate thrift and credit habits. A natural corollary is for the group members to graduate into seeking better livelihood opportunities through access to credit from financial institutions.

Inclusive Financial Sector: Progress with Continuity 5
The year witnessed steady progress in the Programme with total number of SHGs saving-linked with banks reaching 79.03 lakh, with a total saving amount of `13691 crore. Likewise the total number of SHGs with loan outstanding stood at 46.72 lakh with a total loan amount outstanding of `57119 crore. During 2015-16 the total No. of SHGs credit linked stood at 18.32 lakh with a total amount disbursed being `37286 crore. Signifiactly the NPA level declined by 0.59% over previous year.
1.9 Peer-to-Peer(P2P)Lending
Another far sighted step taken by RBI is with regard to Peer-to-peer (P2P) lending. This is an innovative form of crowd-funding with financial returns. It involves the use of an online platform to bring lenders and borrowers together and help in mobilising unsecured finance. The borrower can either be an individual or a business requiring a loan. The platform enables a preliminary assessment of the borrower’s creditworthiness and collection of loan repayments. Accordingly, a fee is paid to the platform by both borrowers and lenders. Interest rates range from a flat interest rate fixed by the platform to dynamic interest rates as agreed upon by borrowers and lenders using a cost-plus model (operational costs plus margin for the platform and returns for lenders).
One of the main advantages of P2P lending for borrowers is that the rates are lower than those offered by money lenders/unorganised sector, while the lenders benefit from higher returns than those obtained from a savings account or from any other investment. In India, there are currently many online P2P lending platforms and the sector has been growing at a rapid pace. The Reserve Bank released a consultation paper on P2P lending in April 2016. The paper deliberated the advantages and disadvantages of regulating P2P platforms and underscored the need to develop a balanced regulatory approach that would protect lenders and borrowers without curbing the underlying innovations. Accordingly, P2P platforms are proposed to be regulated as a separate category of NBFCs. The feedback received on the paper from various stakeholders is being examined by RBI to finalise the regulatory framework.
1.10MFIsasChannelsforGovt.ProgrammesReserve Bank granted NBFC-MFIs general permission to act as channelising agents for distribution of loans under special schemes of central/state government agencies exempting such loans from the qualifying assets criteria. This would be a big boost to MFIs to take a rightful place in the implementation of credit-linked poverty alleviation programmes of central and state governments. At the same time it would give a fillip to the spread of implementation of these programmes to the difficult and remoter areas still unreached by banks.

The Bharat Microfinance Report 20166
e Core Values of Micro nance which Guide the Micro nanceInstitutions are as Follows:
A. INTEGRITYn To provide low-
income clients women, men, and their families, with access to nancial services that are client focused, designed to enhance their wellbeing, and delivered in a manner that is ethical, digni ed, transparent, equitable and cost effective.
E. PRIVACY OF CLIENT INFORMATION
n To safeguard personal information of clients, allowing disclosures and exchange of relevant information with authorized personnel only, and with the knowledge and informed consent of clients.
B. QUALITY OF SERVICE
n To ensure quality services to clients, appropriate to their needs, and delivered efficiently in a convenient and timely manner.
n To maintain high standards of professionalism based on honesty, non-discrimination and customer centricity.
F. INTEGRATING SOCIAL VALUES INTO OPERATIONS
n To ensure high standards of governance and management focused on not only nancial performance but also social impact of business.
n To monitor and report social as well as nancial data.
n To assess the social performance and social relevance of the institution from time to time.
C. TRANSPARENCYn To provide complete
and accurate information to clients regarding all products and services offered.
n To create awareness and enable clients and all other stakeholders to understand the information provided with respect to
nancial services offered and availed.
G. FEEDBACK & GRIEVANCE REDRESSAL MECHANISM
n To provide clients formal and informal channels for feedback and suggestions.
n To consistently assess the impact of services in order to enhance competencies and serve clients better.
n To provide a formal and easy to access grievance redress mechanism for clients.
D. FAIR PRACTICESn To ensure that clients
are protected against fraud and misrepresentation, deception or unethical practices.
n To ensure that all practices related to lending and recovery of loans are fair and maintain respect for client's dignity and with an understanding of client's vulnerable situation.
Source: Revised Code of Conduct
Box 1.1 Core Values of Microfinance

Outreach and Loan Portfolio 7
Outreach and Loan PortfolioChapter 2
Client outreach and loan portfolio are two key indicators of an MFI’s contribution to financial inclusion as well as the depth and breadth of financial deepening achieved by it. This chapter aims to provide
an overview of MFIs’ outreach in terms of client coverage and loan portfolio, based on the data received from 166 MFIs. This chapter is divided into two parts; the first part explains geographic distribution of microfinance institutions and their client outreach. The second discusses the issues of portfolio outstanding, loan disbursement, and purpose of loan.
2.1GeographicalSpreadofMicrofinance
MFIs currently operate in 29 States, 4 Union Territories and 588 districts in India. Table 2.2 shows the distribution of MFIs by state. In particular, it shows the number of MFIs operating in each state, their total number of branches in the state and the number of districts with microfinance operations. Annexure1 indicates the state wise presence of different MFIs.
Twenty five MFIs with a large outreach and portfolio have operations in more than five states, out of which five leading MFIs are operating in more than fifteen states. A total of 62 MFIs (38%) are operating in two to five states, while 79 MFIs (48%) have confined their operations to only one state. The details of States/ Union Territories wise operation of 165 MFIs are given in Table 2.1.
Table 2.1: No. of MFIs in Indian States/UTs
No. of States/UTs No. of MFI
1 79
2 to 5 62
6 to 10 16
11 to 15 4
> 15 5
Total 166
MFIs with a smaller scale or regional focus have concentrated their operations in 1-2 states only whereas other MFIs have spread across a higher number of states in order to increase their size, scale and simultaneously mitigate concentration risk. MFIs operating in multiple states, in general, are typically larger in size and follow the legal form of an NBFC-MFI. The geographical expansion of bigger MFIs is illustrated by the fact that while in 2013 -14 only 15 MFIs had operations in more than 5 states, that number increased to 25 in 2015 -16. List of top 10 MFIs operating in more number of states and more number of districts are presented in Figure 2.1 and 2.2 respectively.

The Bharat Microfinance Report 20168
Figure 2.1: Top 10 MFIs Operating in Number of Indian States/Union Territories
Figure 2.2: Top 10 MFIs Operating in Number of Indian Districts
10
11
12
13
15
16
17
18
24
0 5 10 15 20 25 30
Annapurna, Equitas, ESAF, NERFL, Utkarsh
NABARD Fin Services Ltd.
Spandana
AML
Basix
Satin Creditcare
SKS Microfinance Ltd
SML, Janalakshmi
Ujjivan
No. of States/UTs
102
118
130
148
174
183
199
207
305
0 50 100 150 200 250 300 350
Basix, Sonata, Utkarsh
SVCL
AML
Equitas
Satin Credit care
Spandana
Janalakshmi
SML, Ujjivan
SKS
No. of Districts

Outreach and Loan Portfolio 9
Table 2.2: No. of MFIs in Indian States/UTs and No. of Districts with MFI Operation
Name of the States/UTs
No. of MFIs operating in the
state (including those having
Head Quarters outside)
No. of districts of
the state where
MFIs operate
No. of Branches
Andhra Pradesh 9 13 213
Arunachal Pradesh 3 5 12
Assam 21 25 320
Andaman & Nicobar 2 1 2
Bihar 34 38 856
Chandigarh 2 1 6
Chhattisgarh 22 23 312
Delhi 12 7 49
Goa 3 1 7
Gujarat 22 33 458
Haryana 16 20 165
Himachal Pradesh 5 4 7
Jammu & Kashmir 1 1 1
Jharkhand 24 24 276
Karnataka 32 30 1373
Kerala 16 13 301
Madhya Pradesh 37 48 948
Maharashtra 42 36 1029
Manipur 6 9 38
Meghalaya 7 6 20
Mizoram 5 8 31
Nagaland 3 2 3
Odisha 26 31 692
Puducherry 12 4 20
Punjab 9 21 132
Rajasthan 21 31 279
Sikkim 3 2 8
Tamil Nadu 33 34 1519
Telangana 6 9 155
Tripura 9 8 28
Uttarakhand 16 9 92
Uttar Pradesh 25 71 1291
West Bengal 45 20 1001
Total 588 11644
2.2 BranchNetworkThe MFIs in India had been consolidating their operations to cope with the effects of transition taking place in the sector. While 2012 and 2013 witnessed a decline in the branch network, the trend was arrested in 2014. In 2014 -15, MFIs have expanded their branches, posting a marginal growth of 4.57 %. In 2015 -16, total branch network of the MFIs excluding Bandhan was 11644. In 2014 -15, Bandhan alone had 2022 branches out of total branch network of 12221. Number wise branch network in 2015-16 has declined to 11644 from 12221 but actually there is a growth of 14% (factoring in Bandhan’s exit as an MFI).

The Bharat Microfinance Report 201610
The distribution of branches among different categories of MFIs as of March 2016 showed that NBFC-MFIs had the lion’s share of 9775 branches.
Figure 2.3: MFI Branch Network – Yearly Trend and Category – wise Breakup
SKS is the MFI with largest number of branches at 1191. Names of Top 10 MFIs in terms of Branch Network are given in Figure 2.4.
Figure 2.4: Top 10 MFIs in Terms of Branch Network
13562
1145910697
1168712221
11644
90350
916
9775
0
2000
4000
6000
8000
10000
12000
14000
16000
341
380
397
431
469
494
523
697
1191
0 200 400 600 800 1000 1200 1400
Janalakshmi , Utkarsh
AML
Equitas
Satin Creditcare
Ujjivan
Cashpor
Spandana
SML
SKS
No. of Branches

Outreach and Loan Portfolio 11
Box 2.1: Responsible Finance - An Essential Component of Microfinance Industry
The idea of Responsible Finance pivots around transparency, inclusion and customer-centricity.
Though, these principles should make their way to the charter of every financial service they are
altogether more important in Microfinance industry given that the client base is the underserved
population. Prevailing higher interest rates for the Joint Liability Group (JLG) Loans which are
offered to perhaps the most needy and vulnerable (read financially-less-aware) borrowers tend to raise
eyebrows more often than rates in other loan categories. Concern of profit earning targets of private
capital overwhelming the social objectives primarily revolves around areas like over-indebtedness,
lack of customer interest, underserved geographies and customer education, among others.
Indebtedness
The gross loan portfolio of the Microfinance JLG industry increased more than five folds to nearly
`81000 crores in 2016 from about `15000 crores in 2011. The gross loan portfolio of top 100 districts
grew by 54% between March 2015 and March 2016, a good 20 percent points higher than the national
number. Few leading players have grown their gross loan portfolios by over 80% in the 12 months of
2015-16. Such steep growth in loan portfolios without proportionate growth in borrower base indicate
towards potential case of over-indebtedness and subsequent lack of client protection. Although the
portfolio at risk (30-day) has been under 0.3%, a close monitoring of the situation is needed in 16
districts of the top 200 districts where 7% of borrowers have loans with more than 2 lenders.
To promote Responsible Finance amongst microfinance lenders, the Reserve Bank of India and the
Self-Regulatory Organizations (Sa-Dhan & MFIN) had intervened by setting up a code of conduct -
capping interest rates, defining practices to control over-lending to an individual, and laying out other
best practices. RBI and SROs have been keeping a close watch on the happenings within the industry
to make sure code of conduct guidelines are adhered to.
Credit Bureaus such as CRIF High Mark have helped lenders to comply with these guidelines,
especially with the ones related to over indebtedness. However, the distribution of loan portfolios is
changing from NBFC-MFIs to other type of institutions. Bandhan which started as a microfinance
company in 2001 has become a private bank – Bandhan Bank, and other 8 erstwhile NBFC-MFIs are
transforming themselves into Small Finance Banks (SFBs). Other private players including banks and
NBFCs, and public sector banks are also building up significant JLG portfolios, directly as well as
through business correspondent channels. However, the guidelines still refer to NBFC-MFIs, whereas
currently 40% of portfolio is not with NBFC-MFIs. Once these 8 players become SFBs, the gross loan
portfolio with NBFC-MFIs will reduce further to just about 35-40%.
The assessment of indebtedness for a microfinance borrower is incomplete without the evaluation of
borrower’s exposure to individual and SHG loans. The Reserve Bank of India has advised all banks
to capture and share borrower level data for SHG loans, this data has just started flowing into the
credit bureau database. CRIF High Mark already provides information to lenders about indebtedness
of borrower on JLG loans and Individual loans. CRIF High Mark is working with many smaller
cooperative banks and NBFCs also to include their entire data into the bureau database; this will help
in getting a more accurate picture of the borrower’s indebtedness.

The Bharat Microfinance Report 201612
The code of conduct guidelines which now are required to be followed only by NBFC-MFIs, should
be reviewed with the changing legal structures of leading microfinance lenders to at least include all
lenders practicing JLG loans irrespective of their legal organization. Should the exposure limit of Rs 1
lakh also consider individual loans and SHG loans instead of just JLG loans? A revised guideline can
support lenders to avoid over burdening of the end-borrower.
Customer-Centricity
Microfinance lenders are significantly investing in improving process efficiencies, mostly through
technology-enabled solutions. Tablet based loan origination solutions have not only helped improve
productivity for the lender, but also improved service quality for the customer by lowering turnaround
time. The field executive is now able to check credit history of a customer real-time and take a lending
decision. Decision of whether to lend and how much to lend are being automated using high end
technology thus enforcing consistency in policies for the lender and minimizing reviewer’s subjectivity
for the consumer.
The personal identity of an individual may be misused by an intermediary for personal benefits if the
individual is not aware or present for the transaction with the lender. The consumer’s interest can be
protected against such misuse by improving upon authentication and avoidance of cash transactions
between end-beneficiary and the lender.
Aadhaar which is slated to address the authentication problems especially for such segment of
customers, is now the most available identifier in the country with coverage across nearly 79 crore
adults (as of August 2016). Barring few states such as Assam and Meghalaya, other states have 90%+
adult population is covered under Aadhaar. 55% of newly disbursed loans by MFIN members in last
15 months are seeded with Aadhaar (UID). Other lenders are also increasingly preferring Aadhaar as
the proof of identity. Lenders are now testing and exploring use of Aadhaar biometric-based eKYC
service, which once implemented across the system will help address the matter of “presence” in
addition to that of “identity”.
Under the Prime Minister’s Jan Dhan Yojana (PMJDY), 24 crore banking accounts have been opened
in last 2 years ensuring almost all households in India with banking access. This unforeseeable
penetration of banking accounts and growing availability of banking avenues even in rural areas can
enable electronic disbursements of microfinance loans only to banking account of the consumer,
thereby reducing dealing in cash through the intermediaries and thus, the possible misappropriation
of funds. The repayments of the loans could also be encouraged through digital means, to begin with
in urban areas.
MFIs (especially larger ones) have lowered interest rates over past few years. Well-performing MFIs
have been able to raise funds at lower cost. These MFIs have also been able to become more cost-
efficient over the years. These benefits seem to have been passed to the customer.

Outreach and Loan Portfolio 13
Inclusion of Deeper Geographies
It wouldn’t be totally incorrect to say that substantial part of country is now serviced by the Microfinance
industry. There are 200+ districts which have 20 or more lenders operating, 500+ districts which have
5 or more lenders operating and 40 more districts which now have more than two lenders active.
Despite such widening of coverage, 60% of JLG lending is concentrated in urban areas and 53 districts
(excluding districts of Andhra Pradesh and Telangana) are still not covered by microfinance lenders.
CRIF High Mark provides Pin Point reports generally at pin code level and occasionally at village
level to lenders to help them identify business opportunities in newer geographies, thus creating
possibilities for them to explore deeper geographies. Development Financial Institutions such as
SIDBI also use such reports to influence financing of the MFIs operating in under-penetrated areas.
Education and Support
The borrowers need to be educated on how to manage debt better. MFIs as part of their initial training
module help borrowers understand importance of better debt management. The World Bank has also
taken initiatives to create educational material for more awareness amongst borrowers. MFIs also
support customers in taking their concerns to credit bureaus in case of any potential dispute on the
credit report. We at CRIF High Mark have been investing resources to provide adequate support to
address such queries.
Collectively, MFIs, other lenders, developmental institutions, industry associations and regulators can
help make micro-lending more responsible by continuing initiatives on more inclusion, customer-
centric solutions and customer education. We as CRIF High Mark Credit Bureau are geared up to
provide the required support to keep the underserved customer at the centre and include them in the
mainstream.
Courtesy: CRIF High Mark

The Bharat Microfinance Report 201614
Client Outreach grew by 8% 2016 relative to 2015 without Bandhan which indicates a sound growth of MFIs in 2015-16. This rise in the number of borrowers is positively correlated with an increase in fund flow from banks, MUDRA and financial institutions to MFIs.
2.3.1 Regional Outreach of MFIs
1 Clients of MFIs are essentially Loan Borrowers. ‘Clients’ and ‘Borrowers’ have been interchangeably used in this report.
2.3 Client1 OutreachThe total number of clients served by MFIs stood at 399 lakh as on 31 March, 2016. Client outreach of MFIs had grown substantially from 2005 to 2011, reaching a level of 317 lakh. This trend slowed down during 2012 and 2013 and the number of clients slumped to 275 lakh. The trend reversed in 2014 with a growth and reached a level of 330 lakhs. This trend continues in 2016 with a huge rise in clients/borrowers to an all time high of 399 lakh. Majority of these clients are being served by NBFC-MFIs (84.94%), primarily the larger ones. MFIs with outstanding portfolio above `500 crore are responsible for reaching out to 85.41% of the clients in the industry.
Figure 2.5: Outreach to Borrowers: Yearly Trend and Category–wise Breakup for 2016
335
267
317
275 275
330
371399
46
1 13
339
0.1 3 8 840
341
0
50
100
150
200
250
300
350
400
450
No
. o
f B
orr
ow
er (
in l
akh
)
Out of the total client base of 399 lakh, Southern region alone contributes to 39% followed by 20% each in East and Central region whereas West and North have 13% and 6% of total outreach respectively. Northeast has the least client outreach numbers with 3%. Share in outreach has expanded only in case of Central, West and North regions from 15 to 20 %, 11 to 13% and 4 to 6 % respectively.
Figure 2.6: Regional break up of Client Outreach
39%
20%
20%
13%
6%
2%
South East Central West North Northeast
Outreach and Loan Portfolio 15
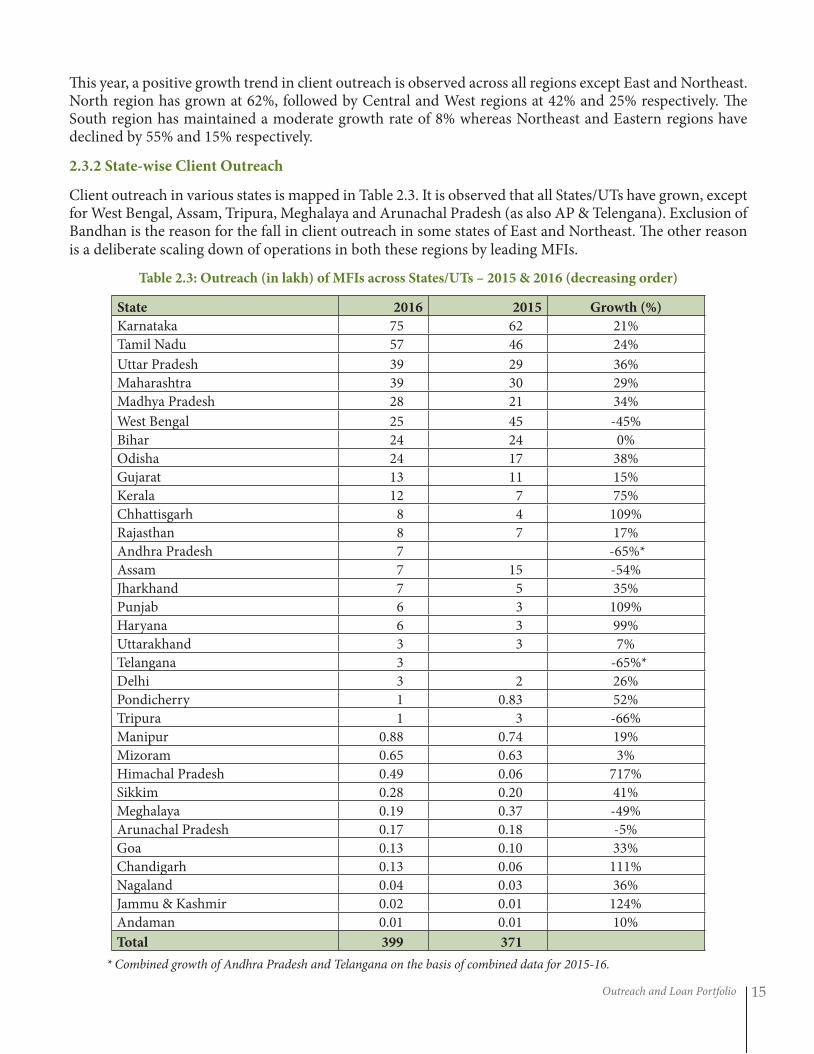
This year, a positive growth trend in client outreach is observed across all regions except East and Northeast. North region has grown at 62%, followed by Central and West regions at 42% and 25% respectively. The South region has maintained a moderate growth rate of 8% whereas Northeast and Eastern regions have declined by 55% and 15% respectively.
2.3.2 State-wise Client Outreach
Client outreach in various states is mapped in Table 2.3. It is observed that all States/UTs have grown, except for West Bengal, Assam, Tripura, Meghalaya and Arunachal Pradesh (as also AP & Telengana). Exclusion of Bandhan is the reason for the fall in client outreach in some states of East and Northeast. The other reason is a deliberate scaling down of operations in both these regions by leading MFIs.
Table 2.3: Outreach (in lakh) of MFIs across States/UTs – 2015 & 2016 (decreasing order)
State 2016 2015 Growth (%)
Karnataka 75 62 21%
Tamil Nadu 57 46 24%
Uttar Pradesh 39 29 36%
Maharashtra 39 30 29%
Madhya Pradesh 28 21 34%
West Bengal 25 45 -45%
Bihar 24 24 0%
Odisha 24 17 38%
Gujarat 13 11 15%
Kerala 12 7 75%
Chhattisgarh 8 4 109%
Rajasthan 8 7 17%
Andhra Pradesh 7 -65%*
Assam 7 15 -54%
Jharkhand 7 5 35%
Punjab 6 3 109%
Haryana 6 3 99%
Uttarakhand 3 3 7%
Telangana 3 -65%*
Delhi 3 2 26%
Pondicherry 1 0.83 52%
Tripura 1 3 -66%
Manipur 0.88 0.74 19%
Mizoram 0.65 0.63 3%
Himachal Pradesh 0.49 0.06 717%
Sikkim 0.28 0.20 41%
Meghalaya 0.19 0.37 -49%
Arunachal Pradesh 0.17 0.18 -5%
Goa 0.13 0.10 33%
Chandigarh 0.13 0.06 111%
Nagaland 0.04 0.03 36%
Jammu & Kashmir 0.02 0.01 124%
Andaman 0.01 0.01 10%
Total 399 371
* Combined growth of Andhra Pradesh and Telangana on the basis of combined data for 2015-16.

The Bharat Microfinance Report 201616
2.3.3 Rural – Urban Share of MFIs Borrowers
2014-15 can described as watershed year as far as the rural-urban divide in Indian microfinance is concerned. Hitherto Indian microfinance was touted as basically a rural phenomenon as compared to microfinance in Latin America as also in large parts of Africa and Asia. But that statement is no longer valid. A very interesting trend is seen in the rural-urban focus of MFIs. The share of rural clientele which was 69 % in 2012 decreased to 56 % in 2014 and has drastically come down to 33 %. The proportion of rural to urban clients for the year 2014-15 is 33% to 67%. In the year 2015-16, there is a slight improvement in the share of rural clientele which increased to 38% because of exclusion of Bandhan. One of the key findings from our research shows that the business models of MFIs are becoming urban centric in order to minimize operational expenses and maximize their operational efficiency so that regulation on margin cap is complied and a reasonable profitability is maintained.
Figure 2.7: Trends in Rural - Urban Share of MFI Borrowers
2.3.4 Outreach to Special Segment of Borrowers (Women, SC/ST, and Minorities)
Worldover the focus of microfinance has always been on serving women. In India as an alternate vehicle of credit, microfinance serves a large segment of people from Scheduled Castes, Scheduled Tribes and Minorities. Women clients constitute 97% of the total clients of MFIs. Similarly, SC/ST borrowers also constitute a substantial chunk (27%) of the clients. A trend analysis of women borrowers, SC/ST borrowers and minority borrowers is shown in numbers using a table. From the Table 2.4 below, it is observed that women borrowers, SC/ST borrowers and Minority borrowers have been consistently increasing for last four years.
For the first time, in 2014 -15, data for differently abled borrowers and borrowers having Aadhaar Cards has been collected. Coverage of MFIs in these two parameters is not satisfactory. Differently abled borrowers and borrowers with Aadhaar constitute only 0.05% and 10% of the total respectively. The reason for a low coverage under these heads is the non-collection of such data at MFI level.
In addition to differently abled borrowers and borrowers having Aadhaar Card, data on Clients’ Compliants received and resolved by the MFIs was also collected in 2014-15 with moderate response. The analysis reveals that 97% of the complaints are resolved by the MFIs.
69% 67%
56%
33%38%
31% 33%
44%
67%62%
0%
10%
20%
30%
40%
50%
60%
70%
80%
2012 2013 2014 2015 2016
Ru
ral-
Urb
an B
orr
ow
ers
(%)
Rural Urban

Outreach and Loan Portfolio 17
Focusing on microfinance services towards women, SC/ST and minorities, MFIs are contributing significantly to the wellbeing of the underprivileged, leading to a rise in their welfare and assisting with the financial inclusion agenda.
Table 2.4: Composition of Borrowers – Category wise
% to Total Borrowers
YearWomen
Borrowers
SC/ST Borrowers
Minority Borrowers
Differently abled
Borrowers
Borrowers having Aadhaar
Card
BC Borrowers
Individual Borrowers
2011 94%
2012 95% 20% 23%
2013 96% 21% 23%
2014 97% 19% 14%
2015 97% 28% 18% 0.05% 10%
2016 97% 30% 27% 4% 18% 15% 3%
Note: Data for SC/ST and Minorities is being collected from 2012; data for Differently abled borrowers and Borrowers having Aadhaar Card is being collected from 2015, whereas data for BC Borrowers and Individual Borrowers started from 2016.
2.3.5 Leading MFIs in Client Outreach
It is evident that large NBFC-MFIs have a larger client outreach in contrast to other legal forms of MFIs. Among these, SKS Microfinance Ltd has the largest client outreach i.e. approximately 12% of the total client outreach of the sector. Janalakshmi, SKDRDP, Ujjivan are the other major players in this area.
Figure 2.8: List of Top 10 MFIs with Client Outreach as of March 2016
10.68
12.06
13.28
18.51
20.57
27.44
30.50
36.34
46.23
46.37
0.00 5.00 10.00 15.00 20.00 25.00 30.00 35.00 40.00 45.00 50.00
Grama Vidiyal Micro Finance Ltd.
Grameen Koota Financial Services Pvt. Ltd.
Share Microfin Ltd.
Satin Creditcare Network Ltd.
Spandana Sphoorty Financial Ltd.
Equitas Micro Finance Ltd.
Ujjivan Financial Services Ltd.
SKDRDP
Janalakshmi Financial Services Ltd.,
SKS Microfinance Ltd
Client Outreach (in lakh)

The Bharat Microfinance Report 201618
Over the years, the entries in the Top 10 MFIs in terms of outreach have remained more or less unchanged. This year the only new entrant to top ten is Grama Vidiyal Microfinance Ltd which came in place of Bandhan. Interestingly, SKDRDP and CASHPOR remain the only non-NBFC MFIs with a large client outreach. Other than legal form, factors like availability of funds, business plan, regulatory environment etc also determine the scale of operation and client outreach. Among the top ten, it is observed that three MFIs have grown between 54% to 190%. The growth rates of some of these institutions have raised concerns among sector experts.
2 Source: CRIF Highmark
ActiveMicro-lenders2
2.4LoanPortfolioofMFIsAs per the NSS data of various years, including the latest one of 2013, majority of the population is still dependent largely on informal and expensive sources, including money lenders to meet their credit needs. Credit needs for such a population range from emergency loans, consumption loans, business loans, working capital loans, housing etc. Credit is the flagship service offered by MFIs to clients outside the net of formal financial services. For MFIs, loan portfolio is the primary revenue generating asset. It also gives details about the health of MFIs through financial performance, as the financial performance is a function of revenue and

Outreach and Loan Portfolio 19
cost. Loan portfolio of the MFIs and its trends are analyzed below to understand the performance of the institutions and their contribution to the goal of financial inclusion.
As of March 2016, the total loan portfolio of MFIs has reached an all time high of over ̀ 63,853 which is a 31% growth over last year that also includes a managed portfolio of nearly ̀ 16914 crore. Total managed portfolio
Table 2.5: List of Top MFIs with Loan Portfolio as of March 2016
S. No
Name of MFIGross Loan
Portfolio(` in crore)
1 Janalakshmi Financial Services Ltd. 10983
2 SKS Microfinance Ltd. 7682
3 Ujjivan Financial Services Ltd. 5389
4 SKDRDP 4994
5 Equitas Micro Finance Ltd. 3283
6 Satin Creditcare Network Ltd. 3271
7Grameen Koota Financial Services Pvt. Ltd.
2539
8 Spandana Sphoorty Financial Ltd. 2282
9ESAF Microfinance & Investments Pvt. Ltd.
1925
10 Share Microfin Ltd. 1540
Top ten contribute to `43887 crores of loan portfolio which is 69% of the sector’s total.
Figure 2.9: Gross Loan Portfolio – Yearly Trend and Category–wise Breakup of 2016
also includes a BC portfolio of `7984 crore which is 13% of total loan portfolio. The net loan portfolio or owned portfolio on the books of the MFIs stood at `46939 crore, which is an increase of 20% over the last year.
The share of NBFC-MFIs stood over 88%, followed by Societies and Trusts at 9%. Nearly 88% of the portfolio is held by MFIs with a portfolio size above `500 crore.
List of top 10 MFIs in terms of loan portfolio is indicated in Table 2.5. In this list ESAF Microfinance is the new entrant in place of Bandhan. Among the top 10, six MFIs have posted a growth between 53% to 191 % in loan portfolio. These growth rates have given rise to some concerns among the well-wishers of the sector.
24332 24607 25699
33517
48882
63853
5944
131 1556
56223
4 237 792 1088
5786
55947
0
10000
20000
30000
40000
50000
60000
70000
Gro
ss L
oan
Po
rtfo
lio
(`
in c
rore
)

The Bharat Microfinance Report 201620
2.4.1 Rural – Urban Share of Gross Loan Portfolio
Figure 2.10: Percentage of Rural - Urban Share of Gross Loan Portfolio
Figure 2.10 indicates that the Gross Loan Portfolio in Urban areas is `45685 crore which constitute 72% whereas the share of Rural areas is `18167 crore which constitutes 28%. Even in 2015, share of Urban and Rural portfolio was the same.
2.4.2 Regional Spread of Loan Portfolio
Among the regions, South still dominates the overall loan portfolio outstanding of MFIs with 40% followed by Central with 19%. East and West have a share of 18% and 14% respectively. While North and Northeast have least portfolio share of 7% and 2% respectively.
Figure 2.11: Region wise Loan Portfolio
All regions have experienced an upward trend in loan portfolio outstanding except East and Northeast. Exclusion of Bandhan influenced East and Northeast regions towards downward trend. Highest growth is visible in North with 75% followed by Central and West with 70% and 64% respectively while South has grown at 34%.
40%
18%
19%
14%
7%
2%
South East Central West North Northeast
28%
72%
28%
72%
Rural Urban
2015
2016

Outreach and Loan Portfolio 21
2.4.3 Loan Portfolio Across States
State-wise loan portfolio outstanding as shown in Table 2.6, indicates that States like, Himachal Pradesh, Pondicherry, Punjab, Chhattisgarh, Chandigarh and Haryana have substantially increased their portfolio size during 2015 -16 compared to the previous year. In West Bengal, Assam, Manipur, Tripura Meghalaya and Arunachal Pradesh the portfolio have shrunk as Bandhan became bank and not part of MF sector.
Table 2.6: Loan Portfolio Outstanding Across States/UTs – 2015 & 2016 (Deceasing Order)
States/UTs 2016 2015 Growth (%)
Karnataka 12645 8127 56%
Tamil Nadu 9039 6091 48%
Uttar Pradesh 6671 3977 68%
Maharashtra 6589 3855 71%
Madhya Pradesh 4088 2603 57%
Bihar 3526 3076 15%
West Bengal 3406 6087 -44%
Odisha 3339 1985 68%
Kerala 2372 1222 94%
Gujarat 2193 1355 62%
Rajasthan 1368 958 43%
Haryana 1186 446 166%
Chhattisgarh 1136 507 124%
Punjab 1116 471 137%
Assam 1013 2285 -56%
Jharkhand 977 643 52%
Andhra Pradesh 893 -61%*
Uttarakhand 577 381 51%
Delhi 559 422 33%
Telangana 393 -61%*
Puducherry 201 97 108%
Mizoram 170 169 1%
Manipur 134 158 -15%
Tripura 70 505 -86%
Arunachal Pradesh 49 51 -3%
Sikkim 34 26 31%
Meghalaya 29 57 -49%
Chandigarh 25 8 211%
Goa 23 16 45%
Himachal Pradesh 23 8 186%
Jammu & Kashmir 4 3 21%
Nagaland 4 3 19%
Andaman 1 0.59 0.06%
Total 63853 48882
* Combined growth of Andhra Pradesh and Telangana on the basis of combined data for 2015-16.

The Bharat Microfinance Report 201622
2.4.4 Managed Portfolio
MFIs have become increasingly prudent in using financial innovations to enhance their income and reduce risk. Securitization model was devised for the purpose of overcoming capital constraints. Under the guidelines of RBI, MFIs are required to maintain capital to the extent of at least 15% of their risk-weighted assets. In order to avoid further capital requirements on the mounting loan assets, they tend to sell a part of the portfolio to Banks/FIs. They, however, continue to manage them, on behalf of the purchasing bank/FI and get fee income from these banks. On the other hand, the model of securitization has helped banks to meet Priority Sector lending targets as these loans on the books of the banks would qualify under 18 % requirement of agriculture credit. Many MFIs have been taking recourse to the BC route to increase their outreach without straining their balance sheets.
Indian MFIs have collectively managed a portfolio worth of nearly `16914 crore as of March 2016. This represents a growth of nearly 72 % over previous year, indicating an increasing preference of MFIs for
District wise Penetration of Portfolio Outstanding of MFIs3
3 Source: CRIF Highmark

Outreach and Loan Portfolio 23
2.4.5 Business Correspondent (BC) Portfolio
Business Correspondents (BC) manage and service the loan portfolio on behalf of banks. Earlier only NGO-MFIs were allowed to be BCs but now NBFC-MFIs are also allowed by RBI to act as BCs. As a result more and more MFIs are coming forward to be BCs of banks. So Sa-Dhan felt the necessity of capturing BC portfolio separately and started data collection from the financial year 2015-16 onwards. BC Portfolio constitutes 13% of total portfolio and 47% of managed portfolio. The distribution of the BC portfolio among different categories of MFIs is displayed in the Figure 2.13.
Figure 2.13: BC Loan Portfolio and Category–wise Breakup for 2015-16
this route. Total managed portfolio also includes a BC portfolio of `7984 crore which is 13% of total loan portfolio. The distribution of the portfolio among different categories of MFIs is also displayed in the Figure 2.12.
Figure 2.12: Managed Loan Portfolio – Yearly Trend and Category–wise Breakup for 2015-16
7984
4741
0762
2480
0 14 207 321 550
6891
0
1000
2000
3000
4000
5000
6000
7000
8000
9000
BC
Po
rtfo
lio
(`
in c
rore
)
27763694 3361
4075
9854
16914
4904
2765
11243
0 17 207 3371181
15171
0
2000
4000
6000
8000
10000
12000
14000
16000
18000
Man
aged
Po
rtfo
lio
(`
in c
rore
)

The Bharat Microfinance Report 201624
2.4.6 Loan Outstanding per Borrower
Average loan outstanding per borrower has been an important criterion to understand the general profile of clients borrowing from MFIs (a surrogate indicator for depth of outreach). It has implications on operating cost as well as the adequacy of loan amount for the purpose it was borrowed.
Average loan for the year stood at nearly `11425 which is a big fall of 13% over the previous year. Average loan size in North is reported close to `15717 followed by South at `14124. It appears that loan size is marginally larger in North as the economic activities in this region require higher outlays due to higher cost of living.
Figure 2.14: Loan Outstanding per Borrower yearly trend and across regions for the FY 2015-16
2.4.7 Trends in Outreach and Outstanding Portfolio
Growth in outreach and loan portfolio has fluctuated year on year and reached its lowest level in 2012, owing to AP crisis and consequent drop in commercial funding to MFIs. In 2013, however, the reverse trend started and continued in 2015 thanks to resumption of bank funding to MFIs. This upward growth is broken again in 2015 because of Bandhan becoming a bank and exiting the MFI sector.
Figure 2.15: Growth Fluctuations in outreach and Loan Outstanding over the Years
7481 7725 8112
10079
13162
11425
0
2000
4000
6000
8000
10000
12000
14000
2011 2012 2013 2014 2015 2016Ave
rag
e lo
an p
er b
orr
ow
er (
`)
14124
8762
10992
13667
15717
10322
0
2000
4000
6000
8000
10000
12000
14000
16000
18000
Ave
rag
e lo
an p
er b
orr
ow
er (
`)
41
61
18 19
-15
3
20
138
72
97
56
18
-37
30 33 31
-40
-20
0
20
40
60
80
100
120
2008 2009 2010 2011 2012 2013 2014 2015 2016
Growth in Client Outreach (%)over previous year Growth in Loan Portfolio (%) over previous year

Outreach and Loan Portfolio 25
4No of MFIs reported in 2010 - 11 was much higher than other years (184 MFIs)
2.5 LoanDisbursementLoan disbursement is a factor of funds received by the MFIs from lenders, primarily the commercial banks. Loan disbursement in during 2010-11 was higher4 on account of large size sanctions made by the banks to the MFIs before the crisis hit in Andhra Pradesh. Subsequent years witnessed a sharp fall in disbursement as fund flow to the sector was severely constrained. Disbursement by MFIs in recent years indicates a positive trend since 2012-13. Loan disbursement increased by `15485 crore to `72345 crore during 2015-16 over the previous year accounting for a 27% increase.
List of Top 10 MFIs disbursing loan during 2015-16 is given in Figure 2.17
Figure 2.16: Loan Disbursement over the years
1713
2388
2402
3171
3349
6606
4889
6619
11537
12082
0 2000 4000 6000 8000 10000 12000 14000
Utkarsh Microfinance Pvt Ltd
ESAF Microfinance & Investments Pvt Ltd
Grama Vidiyal Micro Finance Ltd.
Equitas Microfinance Private Limited
Grameen Koota Financial Services Pvt Ltd
Satin Creditcare Network Ltd.
SKDRDP
Ujjivan Financial Services Pvt. Ltd.
Janalakshmi Financial Services Ltd.
SKS Microfinance Limited
Loan Disbursed (` in crore)
Figure 2.17: Top 10 MFIs disbursing Loan during 2015-16
2933035176
2263525796
38558
56860
72345
0
10000
20000
30000
40000
50000
60000
70000
80000
2010 2011 2012 2013 2014 2015 2016
Lo
an D
isb
urs
ed (
`in
cro
re)

The Bharat Microfinance Report 201626
2.5.1 Loan Disbursement- States/UTs and Regional Pattern
State-wise Disbursement as shown in Table 2.7, indicates that States like, Himachal Pradesh, Pondicherry, Punjab, Haryana and Kerala have substantially increased their disbursement during 2015-16 compared to the previous year. In West Bengal, Assam, Bihar, Tripura, Manipur, Meghalaya, Arunachal Pradesh, Mizoram, Goa and Andaman the disbursement have shrunk as Bandhan became bank and not part of MF sector.
Table 2.7: Loan Disbursement across States/UTs – 2015 & 2016 (decreasing order)
State 2016 2015 Growth (%)
Karnataka 13857 9284 49%
Tamil Nadu 10522 6943 52%
Uttar Pradesh 7791 5140 52%
Maharashtra 7435 4985 49%
West Bengal 4623 9449 -51%
Madhya Pradesh 4530 3530 28%
Bihar 4496 4675 -4%
Odisha 3834 2869 34%
Kerala 3010 1467 105%
Gujarat 2334 1620 44%
Rajasthan 1574 1299 21%
Punjab 1372 625 120%
Haryana 1355 592 129%
Jharkhand 1182 941 26%
Assam 1129 3044 -63%
Chhattisgarh 1066 736 45%
Uttarakhand 667 511 31%
Delhi 600 541 11%
Puducherry 273 127 115%
Andhra Pradesh 190 -20%*
Himachal Pradesh 117 10 1075%
Tripura 91 757 -88%
Manipur 79 122 -35%
Telangana 64 -20%*
Sikkim 60 36 68%
Meghalaya 30 73 -59%
Mizoram 18 97 -82%
Chandigarh 16 10 60%
Goa 12 18 -32%
Arunachal Pradesh 8 27 -70%
Nagaland 4 4 1%
Jammu & Kashmir 4 3 33%
Andaman 1 1 -43%
Total 72345
* Combined growth of Andhra Pradesh and Telangana on the basis of combined data for 2015-16.

Outreach and Loan Portfolio 27
Table 2.7 depicts that Karnataka disbursed `13857 crore during FY 2015-16, holding top position in terms of loan amount disbursed. Tamil Nadu occupied second position with `10522 crore disbursement, followed by Uttar Pradesh with ̀ 7791 crore and Maharashtra with ̀ 7435. Year 2015-16 has experienced a remarkable growth in MFI loan disbursement in South, Central, West and North regions.
Figure 2.18: Regional Pattern of Loan Disbursement
2.5.2 Rural – Urban Share of No. of Loans Disbursed
In 2015-16, 1957 lakh loans had been disbursed in Rural areas which constitute 26% of total, whereas 5668 lakh loans had been disbursed in Urban areas which constitutes 74%. Figure 2.19 depicts that number of loans in Urban areas had increased and number of loans in Rural areas had decreased over 2015 to 2016.
Figure 2.19: Percentage of Rural - Urban Share of No. of Loan Disbursed
39%
20%
19%
13%
7%
2%
South East Central West North Northeast
32%
68%
29%
71%
Rural Urban
2015
2016

The Bharat Microfinance Report 201628
2.5.3 Loan Amount Disbursed
In 2016, total loan amount disbursed increased by `13433 crore over 2015, there is a growth of 27% where amount increased in rural areas by 14% and in urban areas by 27%.
Table 2.8: Amount disbursed during the year 2015 and 2016
Loan disbursed in 2016 ( ` in crore)
Loan disbursed in 2015 ( ` in crore)
Amount of disbursement increase
in 2016 over 2015Growth (%)
Rural 20893 18291 2602 14%
Urban 51452 40621 10831 27%
Total 72345 58912 13433 23%
2.5.4 Purpose of Loan
Traditionally, MFIs have been lending for both consumption and productive purposes. It is believed that poor people use their loans for their emergency and consumption needs more than for livelihoods. In 2011, RBI regulation stipulated that a minimum of 70% of the MFI loans are to be deployed for income generating activities. Analysis of the loan portfolio held by reporting MFIs for 2014-15 and 2015-16 shows that the proportion of income generation loan to non income generation loan is 94:06. Loan usage under different sub sectors is presented in Figure 2.20 for both income generation and non income generation loans. Agriculture, animal husbandry and trading are major sub-sectors where income generation loans are deployed. Non income generation loans are used for consumption, housing, education, water & sanitation, health etc.
Figure 2.20: Share of Income Generation Loans and non Income Generation Loans
91%
80% 80%
94%
9%
20% 20%
6%
0%
10%
20%
30%
40%
50%
60%
70%
80%
90%
100%
2013 2014 2015 2016
Income Generation Loans Non-income Generation Loans

Outreach and Loan Portfolio 29
2.5.4.1 Income Generation Loans
Figure 2.21: Share of MFIs Income Generation Loans under Different Sub-sectors as of March 2016
Purpose of MFIs’ loans has assumed significant importance after the RBI regulation which stipulates that aggregate amount of loans, given for income generation, should not be less than 50 per cent of the total loans given by the MFIs. An analysis of the loan portfolio held by reporting MFIs under different sub-sectors is portrayed in Figure 2.21.
2.5.4.2 Non-Income Generation Loans
Figure 2.22: Share of MFIs Non-Income Generation Loans under Different Sub-sectors as of March 2016
The Figure 2.22 confirms that among the non-income generation loans, consumption loans are predominent with 61%. Housing stands second which is very encouraging.
15%
39%29%
1%1%3%
16%Agriculture
Animal Husbandry
Trading/Small business
Transport
Cottage
Handicraft
Any Other
Income Generation Loans
12%
18%
1%
7%61%
1%
Education
Housing
Health /Medical
Water & Sanitation
Consumption
Any Other
Non-income Generation Loans

The Bharat Microfinance Report 201630
StatewiseAverageLoanPortfolioperClient

Workforce, Productivity and Portfolio Quality 31
3.1.1 Workforce in MFIs
Microfinance services, by nature, have a close human touch with clients on the ground. Even with the advent of technology, these services still predominantly depend on human resources for ensuing
effective delivery. Considering the fact that personnel costs contribute substantially to the total expenses of MFIs (i.e.24% as given in section 3.2 of this report), staff productivity plays a major role in determining their cost efficiency. Staff productivity is measured through some key indicators such as active borrowers per credit officer (ABCO), active borrowers per MFI staff, amount of loan outstanding per credit officer etc.
The MFI sector had brought down its workforce significantly from over one lakh in 2011 to just over 75000 in 2013. Thanks to an increased fund flow to the sector, MFIs increased their workforce to 103415 in 2016 in order to support their enhanced activity. The following figure illustrates the trend and furthermore shows that NBFC–MFIs and large MFIs have major share of employees (Figure 3.1.1).
Figure 3.1.1: No. of MFI Staff - Yearly Trend and MFI-Category-wise Break-up
Workforce, Productivity and Portfolio QualityChapter 3Section-I
Sixty two per cent (62%) of total staff is field staff, working in the branches of MFIs. This is obviously because of the labour- intensive nature of the MFI- operation, which involves human interaction with clients, cash handling etc. Female staff comprises of approximately 15% of the total workforce of MFIs. In FY 2015-16, female staff reduced to 15% from 16% in 2015 otherwise this proportion has been increasing over the years till 2014.
Figure 3.1.2: MFI Field Staff vs Other Staff Distribution – 2015 & 2016
114659
8695675670
8014994773
103415
11172544 5314
86385
106 1882 3726 336913593
80739
0
20000
40000
60000
80000
100000
120000
140000
No
. o
f S
taff
64%
36%
62%
38%Field Staff
Other Staff2015
2016

The Bharat Microfinance Report 201632
In 2015 -16, ratio of Field Staff to Other Staff reduced over previous year. In 2014-15, share of Field staff to Total staff was 64% which reduced to 62% in 2015-16 indicating that either efficiency of the field staff has improved to handle more clients or more workload/ targets are being set for the field staff.
Table 3.1.1: Yearly trend of Total Staff vs Women Staff
YearTotal
Staff
Women
Staff
% of Women staff
to Total Staff
2011 114659 9265 8%
2012 86956 10435 12%
2013 75670 12283 16%
2014 80149 15279 19%
2015 94773 15027 16%
2016 103415 15724 15%
Figure 3.1.3: New Staff Recruited by the MFIsover the years
51051
12975 15295 16114
31157
39627
0
10000
20000
30000
40000
50000
60000
2011 2012 2013 2014 2015 2016
No
. o
f S
taff
rec
ruit
edThe number of new staff recruited came down heavily in 2012 after that again it is increasing steadily. Break-up of figures of new staff further indicate that major part of new staff were hired by for-profit MFIs. The disturbing trend is the level of staff turn-over (Table 3.1.2). Exit of staff from the sector and induction of new staff escalate the operating costs for training and orienting new staff frequently.
Table 3.1.2: Staff Turn-over among MFIs during 2015-16
No. of new Staff Recruited 39627
No. of Staff Left MFIs 23098
Net Gain 16529
Of the Total recruited, % recruited by NBFC-MFIs 88%
Of the Total recruited, % recruited by NGO-MFIs 12%
Of the Total staff left, % left from NBFC-MFIs 88%
Of the Total staff left, % left from NGO-MFIs 12%
3.1.2 Staff Productivity
Active Borrowers per Credit Officer (ABCO) and No of Borrowers per Staff
ABCO measures the number of active borrowers served by a Credit Officer (CO). The ratio is an effective way to measure the productivity. The number is significant as it determines the quantity and quality of time spent by the credit officer with a borrower, affecting his/her service quality. With very low ratio of ABCO, better service is possible, but it involves a higher cost to MFIs. Similarly, a very high ABCO ratio would affect the service quality.
Diversity in the microfinance industry is also reflected in staff productivity levels among different MFIs. Figure 3.1.4 depicts the staff productivity ratios measured through active borrowers per staff member and ABCO. We can find that about 11% of MFIs have less than 100 borrowers per staff member, 30% have 100-200 borrowers per staff, 27% have 200-300 borrowers per staff and 32% have more than 300 borrowers per staff. Similarly for ABCO, 29 % of MFIs have ABCO less than 300 while 30% fall between 300 to 500 and 41% have ABCO above 500. Among the 165, 14 MFIs are having ABCO above 1000 which indicating unrealistic targets being set for credit staff.

Workforce, Productivity and Portfolio Quality 33
Figure 3.1.4: Distribution of MFIs based on Clients Served per Staff & Credit Officer
The Median ABCO for 2016 stands at 440 as against 510 in 2012-13 ABCO has remained high for Cooperatives (508) followed by NBFC-MFIs (506). Section 8 Companies typically have lesser ABCO of 371, as most of these organisations follow the philosophy of providing financial services along with some development activities. ABCO seems to be increasing with the scale of operations. MFIs with larger scale of operations have systems and processes in place that require minimal time for credit officers to be spent at the client level.
Figure 3.1.5: ABCO Across MFIs
Distribution of MFIs Based on Loan Portfolio per Credit Officer
In additon to the number of clients reached by credit officers, the amount of loan handled by them is also an important measure that contributes to staff productivity. Figure 3.1.6 presents the distribution of MFIs across various bands of loan portfolio handled by each credit officer. Approx. 16% of MFIs have credit officers handling a loan portfolio of less than `20 lakh, while 31% of MFIs have a range of `20-40 lakh loan portfolio per credit officer. About 46% of MFIs in our sample have loan officers handling a portfolio worth more than `50 lakh.
<100
11%
100 -<200
30%
200 -<300
27%
300 -<400
20%
400 -<500
5%
> 500
7%
Client/Staff<100
4%100 -<200
8%
200 -<300
17%
300 -<400
12%400 -<500
18%
> 500
41%
Client/Credit Officer
440386
508
371
506
165
330
430 409
518
665
0
100
200
300
400
500
600
700

The Bharat Microfinance Report 201634
1 PAR indicates the proportion of outstanding amount of all loan accounts having past due/arrears to the total loan portfolio. In general, PAR 30, that is, the portfolio / part of the portfolio remaining unpaid 30 days and beyond crossing the due date, would be used as a measure to assess the portfolio quality.
3. 1. 3 Portfolio Quality
The loan portfolio is the primary income-generating asset in an MFI’s balance sheet. Interest income typically constitutes over 90% of the total income of MFIs. Lending, obviously, is fraught with the inherent risk of repayment default. Therefore, maintaining a healthy loan portfolio with minimum loan default ensures the profitability and financial health of an MFI. This section presents the analysis of current performance of the loan portfolio quality as measured through Portfolio at Risk1 (PAR 30 Days)
The portfolio quality of Indian MFIs is by and large healthy if we exclude the CDR (Corporate Debt Restructuring) MFIs’ figures based in Andhra Pradesh. The overall PAR for the MFI sector has been coming down since 2012, but has shown an increase in 2014-15 and 2015-16, adding to the concerns of the sector observers.
Figure 3.1.7: MFI Loan Portfolio at Risk (PAR) Figure 3.1.8: Distribution of MFIs Based on PAR
Figure 3.1.6: Distribution of MFIs Based on Loan Portfolio per Credit Officer
Distribution of MFIs as per various levels of PAR shows (Figure 3.1.8) that over 80% of MFIs have PAR <1 for 30 days and only about 6% of MFIs have a PAR of more than 5%. Approx 13% of MFIs have PAR in the range of 1-3%.
Another important indicator of portfolio quality is overdue installments beyond 180 days. The pending installment amount is `1319 crore as of March 2016, which is lower compared to March 2015 (`2860 crore). The significance of this amount is that the MFIs concerned ought to make 100 % provision in the balance sheet as per RBI prudential norms.
< `10 lakhs
7% `10 - < `20
lakhs
9%
`20 - < `30
lakhs
13%
`30 - < `40
lakhs
18%`40 - < `50
lakhs
7%
> `50 lakhs
46%
1
0.4
0.020.13
0.29
0
0.2
0.4
0.6
0.8
1
1.2
2012 2013 2014 2015 2016
<1 PAR
81%
1 -<3
PAR
11%
3 -<5
PAR
2%
>5 PAR
6%

Cost and Revenue 35
Cost and RevenueChapter 3Section-II
This section of the report covers the analysis of income and expenditure patterns of the microfinance sector and the sustainability of the sector through its profitability and self sufficiency. This section hence
contains the analysis of operational and financial expenses, revenues/income, margin, surplus, operational self sufficiency and return on assets and return on equity.
3.2.1 Expenditure Analysis
During the year 2015-16, `8119 crores were reported as the total expenses on microfinance operations of the MFIs that provided data for the report. The above expenses comprise of operating expenses (personnel expenses + administrative expenses + loan loss provisions) and finance expenses (mainly interest on borrowings). This year’s total expenses were approximately `1175 crores higher than last year on account of increase in microfinance operations. Loan Loss Provision (LLP) expenses have increased significantly from the previous years. In 2016, LLP to Operating Expenses is 9% whereas it was only 3% in 2015. This marks a deterioration in the overall quality of the outstanding portfolio of the sector.
As seen in Figure 3.2.1, the total expenses incurred are distributed at 53% in finance expenses and 47% in operating expenses. The operating expenses of 47% comprised of 24% personnel expenses and 23% other administrative expenses. Loan Loss Provisions for the year are 9% of operating expenses and 4% of total expenses have been incurred as a part of other administrative expenses.
Figure 3.2.1: Break up of Expenses by Indian MFIs
Since MFIs with an outstanding portfolio over `50 crores account for 98% of the total portfolio of the sector, it is understandable that they incur a major chunk of the expenditure too i.e. 98% of total financial expenses and 98% of total personnel expenses. This leaves the MFIs with portfolio less than `50 crores with financial expenses less than 2% and personnel expenses less than 2% of the overall expenses of the sector. This proportion of expenses is consistent with the outstanding portfolio of the MFIs.
53%
24%
23%
Financial Expenses
Personnel Expenses
Other Admn. Expenses

The Bharat Microfinance Report 201636
Figure 3.2.2: Break up of Expenses by Indian MFIs based on Portfolio size
Operating Expense Ratio1 (OER)
As seen above, operating expenses of MFIs form 47% of its total expenses. As can be seen from Figure 3.2.2 above, personnel costs make a significant contribution to the high operating costs of an MFI with about a quarter to one-third of their total expenses, except for MFIs with outstanding portfolio over `500 crores, where personnel expenses come down marginally to 24% of their total expenses.
The median operating expenses of the microfinance sector in 2016 is 10.2%. As can be seen in Figure 3.2.3, OER is lowest for NBFC-MFIs at 8.5%, followed by Section 8 Companies at 9.3 significantly lower than the OER of Society/Trust MFIs at 13.6%. Median OER for cooperatives stands even higher at 14.4%. In addition to the legal form, Figure 3.2.3 also shows that there is a direct correlation between OER and portfolio size. While the median OER is only 7.5% for MFIs with portfolio size of over `500 crores, it is at a high of 15.3% for MFIs with portfolio size of less than `1 crore.
Figure 3.2.3: Operating Expenditure Ratio Across MFIs
1 Denotes ratio of all administrative and salary expenses to average loan portfolio.
31%45% 42%
50% 52% 54%
34%
23% 28%25% 26% 24%
35% 32% 31% 26% 22% 23%
0%
20%
40%
60%
80%
100%
120%
< 1 crore 1-10 crore 10-50 crore 50-100 crore 100-500 crore >500 crore
Other Admn. Expenses
Personnel Expenses
Financial Expenses
10.2
13.614.4
9.38.5
15.3 14.6
10.39.3 9.3
7.5
0.0
2.0
4.0
6.0
8.0
10.0
12.0
14.0
16.0
18.0
Per
Cen
t

Cost and Revenue 37
Finance Cost Ratio2 (FCR)
As can be seen from Figure 3.2.4, NBFC-MFIs have the highest FCR among all legal forms of MFIs. Since bank loans are the major source of funds for MFIs and the rates are largely similar or within a range, FCR for most legal forms, especially those dependent mainly on bank loans, are almost similar with FCR for not for profit MFIs marginally lower than that of NBFC-MFIs. This is primarily because not for profit MFIs may have access to grants, revolving funds and subsidised loans from government sources. In case of cooperatives that mobilise deposits from its members at much lower rates, their FCR is significantly lower among all legal forms at 9.5%.
In the case of FCR and portfolio size, except for MFIs with outstanding portfolio of less than `1 crore, there is a more or less same FCR for all sizes of MFIs. This is due to the fact that smaller MFIs but with portfolio size higher than `1 crore have more access to low cost funds from NABARD, SIDBI, MUDRA, Ananya etc. compared to larger MFIs. However, this trend does not hold true for MFIs with portfolio size of less than `1 crore which have a median FCR of a significantly high 15.9%. The primary reason for this maybe that this segment of MFIs find it the most difficult to raise funds from banks and FIs due to the higher risk perception and hence end up mobilising funds at higher rates.
Figure 3.2.4: Finance Cost Ratio across MFI Categories
Trends of OER and FCR
OER of MFIs in 2015-16 has shown a sharp fall over the last year. In fact, while the OER had been consistently increasing for the last 3 years from 11.88% in 2011-12, to 12% in 2012-13 and 12.08% in 2013-14, OER has not only come down to 10.2% in 2015-16, it is also the lowest in the last 5 years.
FCR has been however growing consistently for the last 4 years from 11.89% in 2012-13, 12.17% in 2013-14 to 12.42% in 2014-15 and to 13.30% in 2015-16.
2 Denotes ratio of financial expenses paid to banks/FIs on average borrowing outstanding.
12.7
9.5
12.713.5
15.9
12.8 12.8 12.213.5
12.4
0.0
2.0
4.0
6.0
8.0
10.0
12.0
14.0
16.0
18.0
Per
Cen
t

The Bharat Microfinance Report 201638
Figure 3.2.5: Trends of OER and FCR
3.2.2 Income Analysis:
The total income earned by MFIs for the year 2015-16 is approximately `10329 crores, up from `8499 crores in 2014-15, a rise of nearly 22%. The median income of all legal forms of MFIs has shown an increase over the last year.
Figure 3.2.6 shows the break-up of income sources of MFIs, with 78% coming from interest on loan portfolio. The rest of the income comes from processing fees, investment income and income from sale of portfolio, other fees and commission income and other income.
Figure 3.2.6: Break-up of Income
Yield on Loan Portfolio (Financial Revenue Ratio)
While an analysis of yield on loan portfolio tells us about the pattern of income of MFIs, it is also very useful to study the yield as one of the results of portfolio quality and to understand the margin by comparing it to the costs.
Since the AP microfinance crisis, the portfolio quality of MFIs has been improving, reflecting in an increasing trend in yield on portfolio, however the yield came down in 2015-16 (Figure 3.2.7).
11.88 12.00 12.08
11.45
10.2
9
9.5
10
10.5
11
11.5
12
12.5
2012 2013 2014 2015 2016
12.0011.89
12.17
12.42
13.3
11.00
11.50
12.00
12.50
13.00
13.50
2012 2013 2014 2015 2016
78%
2%
4%
6%
5%5%
Interest Income on Loan portfolio
Interest Income from Investment
Income from Portfolio sale & securitision
Income from Processing fees
Other Fees & Commission income
Other Income

Cost and Revenue 39
Figure 3.2.7: Yield Trend of MFIs
Figure 3.2.8 shows that MFIs in all legal forms have a yield within the range of 20% to 24%. Among them Society/Trust have least yield at 20%, followed by NBFC-MFIs at 21% whereas both Cooperatives and Section 8 Companies have yield of 24%. But portfolio size has a very major bearing on the yield on portfolio. Yield is decreasing with the increase of portfolio size. Yield is lower at 19% for the bigger MFIs with the portfolio of above `500 crore whereas yield is marginally higher at 26% for the smallest MFIs with the portfolio of less than `1 crore.
Figure 3.2.8: Yield on Portfolio Across MFIs
17
22
24 24
21
0
5
10
15
20
25
30
2011-12 2012-13 2013-14 2014-15 2015-16
Per
Cen
t
2120
24 24
21
26
23 23
20 19 19
0
5
10
15
20
25
30

The Bharat Microfinance Report 201640
3.2.3 Margin3
MFIs, NBFC-MFIs in particular, need to comply with RBI norms on revenue margins for MFIs, which need to be maintained under 12% and 10%. As per the data reported by the MFIs for the study, MFIs have been compliant to this regulation with margins for all the legal forms of MFIs within 9-10% with NBFC-MFIs having a median margin of 10.07%, comfortably below the limit prescribed by RBI.
3.2.4 Yield, Cost and Margin: Performance Across MFI size
Taking the yield, cost and margin together and analysing them based on portfolio size of MFIs, it may be observed that largely, margins in MFIs with smaller portfolio sizes are higher than the MFIs with higher portfolio sizes.
As can be seen from Figure 3.2.9, MFIs with portfolio between `50-100 crores have the lowest financial cost and the second lowest yield on portfolio, but the highest margin while the MFIs with portfolio less than `1 crore have the highest financial cost and the second highest yield, as well as a high margin. The lowest margin is for those MFIs that have a portfolio above `500 crores, as their financial costs are moderate and yield is relatively lower.
Figure 3.2.9: Yield, Cost and Margin of MFIs –size wise
3 Margin is the difference between MFIs’ financial revenue (excluding processing fee) % age on average loan portfolio and the financial cost % age on average outstanding borrowing from different sources.
26.0
23.0 23.0
19.7 19.4 18.9
15.9
12.8 12.8 12.213.5
12.4
11.7 12.111.1
10.1 9.4 9.4
0.0
5.0
10.0
15.0
20.0
25.0
30.0
< 1 crore 1-10 crore 10-50 crore 50-100 crore 100-500 crore >500 crore
Yield
Finance Cost
Margin

Surplus, Sufficiency and Profitability 41
Surplus, Sufficiency and ProfitabilityChapter 3
Section-III
Sustainability of an organisation is a key factor and in MFIs it is measured through profitability and self sufficiency. Operational Self Sufficiency (OSS), Return on Assets (ROA) and Return on Equity (ROE)
etc. are some of the key ratios that are used to determine the profitability and self sufficiency of MFIs. In this report, operational profit is taken to be the net surplus after taxes.
3.3.1 Surplus
The total net surplus (after tax) generated by the sector is `1376 crore. This is despite the fact that some AP as well as non AP based MFIs having reported negative surplus. In line with the 88% outstanding portfolio that is owned by the giant MFIs, their contribution to the net surplus is also a similar 97% at `1337 crores. Almost the entire surplus (96%), at `1319 crores of the `1376 crores is from NBFC-MFIs.
3.3.2 OperationalSelfSufficiency(OSS)
Overall, the median OSS of all the MFIs that provided data for the report stands at over 100% at 113% for the year 2015-16. This indicates that as a sector, the income from operations of the MFIs is sufficient to meet their expenses. The lowest median OSS has been reported from Society/Trust at 107% whereas understandably, the maximum median OSS was reported by NBFC-MFIs at 119%. Hence no types of MFIs as a group have an OSS less than 100%. However, 12% of the individual MFIs that were not for profit reported OSS of less than 100%, while 4% of NBFC-MFIs, mainly with an exposure of portfolio in AP, too reported an OSS of less than 100%.
Figure 3.3.1 also shows a consistent relationship between OSS and scale of operations/portfolio size. The largest MFIs have the highest OSS and vice versa.
Figure 3.3.1: OSS Across MFIs
As can be seen from Figure 3.3.2, average loan size has a direct impact on the OSS of an MFI. While very small loan sizes result in lower OSS, higher loan sizes result in higher OSS. However, it may be also observed that while the OSS improves significantly (from 106% to 115%) when average loan size increases from less than `5000 to less than `15000 and increases marginally to 119% for loan sizes over `15000.
113107 110 109
119
104 106113 110 112
127
0
20
40
60
80
100
120
140

The Bharat Microfinance Report 201642
Figure 3.3.2: OSS Based on Average Loan size Figure 3.3.3: OSS Based on Yield Category
It is interesting to note the impact of yield on the OSS of MFIs. While it can be seen from Figure 3.3.3 that the median OSS increases steadily with yield till yield greater than 30%.
Impact of Operating Expense Ratio (OER) on Operational Self-Sufficiency (OSS): Figure 3.3.4 shows that MFIs with the lowest OER (<10%) have the best median OSS (125%) while MFIs with the highest OERs (>14%) have the lowest median OSS (109%). The figure also shows that any decrease in OER results in significant increase in OSS.
Figure 3.3.4: OSS Based on OER of MFIs
3.3.3 ProfitabilityRatios
Since the worst crisis of the microfinance sector in 2010, the sector has come back strongly and has been going from strength to strength for the last few years. This has again brought the sector in focus for the investors as it has shown immense potential in profitability, measured by the ROA and ROE of the last few years which has made the sector attractive to investment. While the ROA and ROE have increased marginally from 1.73% and 8.19% respectively of last year, they stand at a very healthy 2.21% and 11.57% for the year 2015-16.
Figure 3.3.5 shows the distribution of ROA and ROE across different legal forms of MFIs and it makes for interesting viewing. The chart shows clearly how the asset and equity base of the different types of MFIs differ and hence how it impacts the ROA and ROE of the MFIs. It has been established from 3.3.1 that NBFC-MFIs contribute to 96% of the surplus generated by the sector. In terms of ROA and ROE, NBFC-MFIs are at 2.58% and 12.51% respectively.
106
114 115 115119
95
100
105
110
115
120
OSS vs Average Loan Size
112
114 114
116
110
112
114
116
118
<20% 20-25% 25-30% >30%
OSS vs Yield
125
113110 109
100
105
110
115
120
125
130
<10% 10-12% 12-14% >14%
OSS vs OER

Surplus, Sufficiency and Profitability 43
NBFC-MFIs have highest ROA at 2.58%, followed by Society/Trust with 2.09%. As for ROE, Cooperatives have the highest at 19.32%, followed by NBFC-MFIs with 12.51% and Society/Trust with 11.24% Cooperatives have the highest ROE but the lowest ROA. This could be attributed to a very high asset base for many cooperatives but very small equity base for most of them.
Figure 3.3.5: Return on Asset (ROA) and Return on Equity (ROE) Across MFI Types
Impact of scale of operation on ROA and ROE: Figure 3.3.6 shows a clear trend of higher ROA and ROE for larger scale of operations. Hence the largest MFIs with outstanding portfolios over `500 crores have the second highest ROA and highest ROE of 2.9% and 19.3% respectively while the MFIs with outstanding portfolio under `1 crore have ROA and ROE of only 1.9% and 9.3%. While there are minor deviations in mid sized MFIs which could be due to various factors and stage of expansion, the overall trend is that scale of operations is directly proportional to ROA and ROE.
Figure 3.3.6: Return on Asset (ROA) and Return on Equity (ROE) of MFI-Size wise
2.21 2.09 1.72 1.762.58
11.57 11.24
19.32
10.62
12.51
0.00
5.00
10.00
15.00
20.00
25.00
All MFIs Society & Trust Cooperative Section 8 Com NBFC - MFIs
Per
Cen
t
RoA
RoE
1.9 1.63.5 2.8 2.5 2.9
9.3
6.2
13.215.0
11.3
19.3
0.0
5.0
10.0
15.0
20.0
25.0
< 1 cr 1-10 cr 10-50 cr 50-100 cr 100-500 cr >500 cr
Per
Cen
t
RoA
RoE

The Bharat Microfinance Report 201644
Balance Sheet Distribution and Capital StructureChapter 3Section-IV
It is critical for MFIs to manage their balance sheet effectively in order to be able to generate better profitability, strengthen themselves and attract investors and funders. This chapter attempts to analyse the
balance sheet structure of MFIs and studies the patterns of funding and leverage as well allocation of assets.
3.4.1 MFI Assets
While the total assets of MFIs have seen a consistent growth trend over the last 6 years, it has seen a sharp increase of close to 14% in 2015-16 over the last year. This can be attributed to the sharp growth of 31% in the loan portfolio of MFIs this year.
Figure 3.4.1: MFI Total Assets - Yearly Trend
Distribution of Assets: The assets of an MFI comprise mostly of its net loan portfolio. At the end of the year 2015-16, the net loan portfolio of reporting MFIs was over 76% of the total assets. This was followed by cash and cash equivalents of 15%. Cash and cash equivalents are at this level mainly because most MFIs receive debt funding largely towards the very end of the year while it can be lent to the clients only at the beginning of next year. Trade and other receivables form the other major component of MFI assets at 6%.
Figure 3.4.2: Composition of Total Assets of MFIs
2273625240
28051
36125
51564
58621
0
10000
20000
30000
40000
50000
60000
70000
2011 2012 2013 2014 2015 2016
Am
ou
nt
(`in
cro
re)
13%
8%
74%
1%4%
Cash & Cash Equivalent
Trade and other receivable
Net Loan Portfolio
Net Fixed Asset
Any Other

Balance Sheet Distribution and Capital Structure 45
3.4.2 Pattern of Portfolio Financing
3.4.2.i Net Owned Fund (NOF)
The MFIs reported a total Net Owned Funds (NOF) of close to `7361 crores for the year 2014-15. This NOF comprised of paid up equity, share premium, retained earnings and other reserves. NBFC-MFIs, as can be expected, hold the lion’s share of the NOF, at over 94% of the total NOF of the sector. Societies and Trusts follow with under 3% of the total NOF of the sector at `204 crores.
Equity Outstanding
Of the total NOF of `7361 crores equity constitutes nearly `4509 crores. This is marginally higher than total equity of `4195 crores in 2014-2015. The total equity has remained steady this year after seeing significant growth of 53.5% in 2012-13 to over 108% in 2013-14 and 3% in 2015-16 without Bandhan. It is understandable that NBFC-MFIs hold 98% of the equity as their legal form is the most conducive to absorb equity. Again, there is a direct correlation between equity size and portfolio size, as close to two-thirds of the total equity is held by MFIs with portfolio over `500 crores and close to 94% of the equity is held by MFIs with portfolio over `100 crores.
Figure 3.4.3: MFI Equity Outstanding - Yearly Trend and MFI-Category- wise Break-up of 2016 Figure
Fresh Equity Acquired
During the year 2015-16, the reporting MFIs collectively raised fresh equity to the tune of `679 crores. This is significantly lower than equity raised in the previous years. This is significant as this indicates that investors were awaiting the transformation of MFIs to SFBs.
Again, of the total fresh equity raised, close to 99% is by NBFC-MFIs and close to 89% by MFIs with portfolio over `500 crores.
1325
2034
4233 41954509
57 4 8
4440
0.01 65 68 147
933
3296
0
500
1000
1500
2000
2500
3000
3500
4000
4500
5000
Eq
uit
y O
uts
tan
din
g (
`in
cro
re)

The Bharat Microfinance Report 201646
Figure 3.4.4: Fresh Equity Raised by MFIs and MFI-Category-wise Break-up
List of Top 10 MFIs in term of equity received in showed in Figure 3.4.5.
Figure 3.4.5: Top 10 MFIs in Terms of Equity Raised
3.4.2.ii Debt Financing:
The confidence of lenders in the microfinance sector continues to grow post the AP microfinance crisis as MFIs show compliance to RBI guidelines and the strengthened regulatory framework takes effect. Strong performance of MFIs outside Andhra Pradesh, strengthening operational efficiency and the effective functioning of credit bureaus has again made banks start lending to MFIs in a major way.
679
4 2 3
671
1 4 5 860
602
0
100
200
300
400
500
600
700
800E
qu
ity
Rai
sed
(`
in c
rore
)
8
8
10
13
20
38
55
79
118
292
0 50 100 150 200 250 300 350
Light Microfinance Private Limited
ASA International India Microfinance Pvt Ltd.
Midland Microfin
Annapurna Micro Finance Pvt Ltd
Intrepid Finance & Leasing Pvt. Ltd.
Suryoday Micro Finance Ltd
Muthoot Microfin Limited
Satin Creditcare Network Limited
ESAF Microfinance & Investments Pvt Ltd
Ujjivan Financial Services Limited
Eq
uit
y R
aise
d (
` i
n c
rore
)

Balance Sheet Distribution and Capital Structure 47
The total MFI debt funding for the sector has been reported at over `44822 crores during the year 2015-16. While most of this funding is through borrowing (77%) and Non-Convertible Debenture (14%), Figure 3.4.6 indicates that subordinated debt, overdraft, bonds, and savings and deposits also form some minor avenues for fundraising for MFIs. Cooperatives have the added option to raise funds through deposits and savings from borrowers/members. In addition to Debt funding, 31 MFIs have raised funds to the tune of `8834 crores through securitisation deals in 2015-16.
Figure 3.4.6: Sources of Funding Based on Types of Instruments
The total amount of outstanding borrowings as on 31st March, 2016 for all MFIs collectively was close to `44822 crores without data of Asmitha, Share Microfin and Bandhan, an increase of 10% over the last year. Of this the maximum outstanding borrowings were from public sector banks at 33 % followed by private sector banks at 28%, for a combined portfolio outstanding of over 60% (`27116 crores) of the total borrowings.
Figure 3.4.7: Sources of Funding Based on Institution Types
77%
6%
1%
14%
2%
1%
1%
Borrowing
Subordinated debt
Bond
NCD
ECB
Saving & Deposit
Any Other
14731
12385
1938
2372569
4241
8586
Source-wise Loan Amount Outstanding
Public Sector
Private Sector
SIDBI
NABARD
MUDRA
Bulk Lenders
Other Financial Institutions

The Bharat Microfinance Report 201648
Out of total outstanding borrowing to lenders, the share of NBFC-MFIs alone constitutes `43268 crore (97%), whereas NGO-MFIs hold an outstanding borrowing close to 3%. Size-wise, MFIs with portfolio size above `500 crore hold 87% of the total outstanding amount and MFIs with portfolio size of `100-500 cr. hold another 10%. Smaller MFIs hold a miniscule amount of the outstanding borrowed portfolio.
Figure 3.4.8: Outstanding Borrowing – Yearly Trend and MFI-Category wise Break-up of 2016 Figure
The total debt fund received during the year (April ’15 – March ’16) for all MFIs collectively was close to `39331 crores without data of Asmitha, Share Microfin and Bandhan. Out of total debt fund received, the share of NBFC-MFIs alone constitutes `38372 crore (98%), whereas NGO-MFIs hold only 2%. Size-wise, MFIs with portfolio size above `500 crore hold 89% of the total debt fund received and MFIs with portfolio size of 100-500 cr. hold another 8%. Smaller MFIs hold a miniscule amount of the outstanding borrowed portfolio.
Figure 3.4.9: Fund Received during the year and MFI-Category wise Break-up of 2016 Figure
1695920724
27662
35573
44822
528 119 907
43268
4 143 473 6984556
38948
0
5000
10000
15000
20000
25000
30000
35000
40000
45000
50000
39331
288 42 629
38372
2 70 269 5903284
35117
0
5000
10000
15000
20000
25000
30000
35000
40000
45000

Balance Sheet Distribution and Capital Structure 49
It is not very difficult to understand the preference for legal form of MFIs of different lenders. It is evident that lenders of all kinds overwhelmingly prefer to lend to NBFC-MFIs over any other legal forms. This is understandable given the size of NBFC-MFIs and more importantly, the current regulatory framework.
Figure 3.4.10: Source wise Share of Loans lent among Different Legal Forms of MFIs during 2015-16
0.2%
0.02%
2%
3%
2%
3%
95%
97%
96%
99.7%
96.1%
96%
0% 20% 40% 60% 80% 100% 120%
Public Sector Banks
Private Sector Banks
SIDBI
NABARD
MUDRA
Bulk Lenders
Trust/Society
Cooperative
Section 8 Com
NBFC - MFI
It was also found that MFIs with a portfolio of `100 crore or above hold approximately 98% of the loan outstanding amount from all lenders.
Top Lenders to MFIs during 2015-16
The data of reporting MFIs has been further analysed to enumerate major banks and bulk lenders having outstanding balances with MFIs as of March 2016. The MFIs had been asked to list down lenders names who appear under Top 10 lenders as per their books as of March 2016.
Table 1 lists banks and bulk lenders respectively, which appear in the list of Top 10 lenders in the books of the MFIs. This list is obviously significant, though not exhaustive, as it contains the names of lenders who happened to be Top 10 among the reporting MFIs.
Table 3.4.1: List of Lenders Reported Among Top 10 Lenders of the Individual Reporting MFIs
(in terms of Outstanding as of March 2016)
Name of the BanksNo. of MFIs
Name of the other LendersNo. of MFIs
Allahabad Bank 3 AAV Sarl 2
Alwar Central Co-operative Bank 1 Ananya Finance 19
Andhra Bank 3 Assam Financial Corporation 3
Assam Cooperative Apex Bank Ltd. 2 Au Finance 3
Assam Gramin Vikash Bank 4 Blue Orchard 3
Axis Bank 16 BNP Paribas 1
Bangiya Gramin Bikash Bank 9 Capital First 9
Bank of Baroda 5 Caspian Impact Investment Pvt. Ltd. 3
Bank of India 4 CDC Emerging Markets Ltd. 1
Bank of Maharashtra 17 Cordaid 2

The Bharat Microfinance Report 201650
Baroda Kshetriya Gramin Bank, Rajasthan 1 Dia Vikas 5
Bharatiya Mahila Bank 4 Edelweise ARC 1
Canara Bank 20 Electronica 1
Catholic Syrian Bank 3 FWWB 7
Central Bank 7 Gojamjunde Finance Corp 1
Citibank 1 Gruh Finance Ltd 1
Corporation Bank 8 Habitat for Humanity India Trust, New Delhi 3
DCB Bank 9 Hinduja Leyland 1
Dena Bank 14 IFMR 15
Dhanalakshmi Bank 3 IGS 15
Federal Bank 5 Incofin 1
Grameen Bank of Aryawart 1 Intellegrow 1
Gujarat Mahila Sewa Energy Bank 1 Kashi Vishwanath Vigdhya Samithi 1
HDFC Bank 19 Kaushal Vintrade Pvt. Ltd. 1
HSBC Bank 5 KIVA 4
ICICI 13 Karnataka State Financial Corporation 1
IDBI 46 L&T 3
IDFC 7 Maanaveeya 18
Indian Bank 9 Manappuram 1
Indian Overseas Bank 14 MAS 32
IndusInd Bank 8 Michael & Susan Dell Foundation 1
Karnataka Bank 2 Micro Build 1
Karnataka Vikas Grameen Bank 1 Microfinance Initiative for Asia (MIFA) 1
Kashi Gomti Samyut Gramin Bank 1 Microfinance Solidaire 1
Kaveri Grameen Bank 2 MicroGraam Social Development Foundation 2
Kotak Mahindra Bank Ltd. 3 Microvest 1
Lakshmi Vilas Bank 6 MILAAP 3
NABARD 30 MUDRA 4
National Housing Bank 1 Muthoot Capital 4
Oriental Bank of Commerce 4 Nabkisan Finance Ltd 3
Primary Agri - Cultural Bank 1National Scheduled Catse Finance & Development Corporation 1
Pallavan Grama Bank 3 National Skill Development Corporation 1
Punjab and Sind Bank 1 Navaratra Trade Link 1
Punjab National Bank 6 NEDFI 10
Rabobank 3 Northern India Consultants Pvt. Ltd. 1
Ratnakar Bank 8 OIKO Credit 2
RBL Bank 8 One Acre Venture Pvt. Ltd. 1
Royal Bank of Scotland (RBS) 1 Rang De 2
Repco Bank 1 Rashtriya Mahila Kosh 10
SIDBI 39 Relaince Capital Ltd. 30
South Indian Bank 5 Reliance Home Finance Limited 2
Standard Chartered Bank 6 Religare 12
State Bank of Bikaner and Jaipur 3 ResponAbility 3

Balance Sheet Distribution and Capital Structure 51
State Bank of Hyderabad 3 Sampark Fin Services Ltd 1
State Bank of India 45 Symbiotic 5
State Bank of Mysore 1 Toyata Financial Services 2
State Bank of Patiala 2 Triple Jump 1
State Bank of Travancore 5 World Business Capital 1
Syndicate Bank 6
Tamilnad Mercantile Bank Ltd. 2
Tiruchi District Central Cooperative Bank 1
The Assam Co-Op Bank Ltd. 1
Triodo Bank 2
UCO Bank 14
Union Bank 17
United Bank of India 6
Vijaya Bank 12
Yes Bank 8
Table 3.4.2: MFI wise Loan Outstanding (based on top 10 lenders data) to Lenders
S.No. Name of MFIsAmount (` in crore)
Outstanding
1 Adhikar 0.76
2 Adhikar Micro Finance Pvt. Ltd. 27.68
3 Agradut Polly Unnyan Samity 1.39
4 Ajagar Social Circle 9.48
5 Altura Financial Services Ltd. 17.18
6 Anik Financial Services Pvt. Ltd. 1.17
7 Annapurna Mahila Coop Credit Society Ltd. 47.79
8 Annapurna Micro Finance Pvt. Ltd. 463.05
9 Arohan Financial Services Pvt. Ltd. 301.60
10 Arth Microfinance Pvt. Ltd. 16.38
11 ASA International India Microfinance Pvt. Ltd. 81.33
12 Asomi Finance Pvt. Ltd. 15.37
13 B U R S 0.57
14 Bagaria Relief Welfare Ambulance Society 0.26
15 Balajee Sewa Sansthan 0.04
16 Bal Mahila Vikas Samiti-VAMA 3.65
17 Barasat Unnayan Prostuti 0.30
18 Belghoria Janakalyan Samity 20.12
19 Bengal Women Welfare Association 0.18
20 Bhartiya Micro Credit 70.94
21 Bhartiya Samruddhi Finance Ltd. 179.10
22 Blaze Trust 1.70
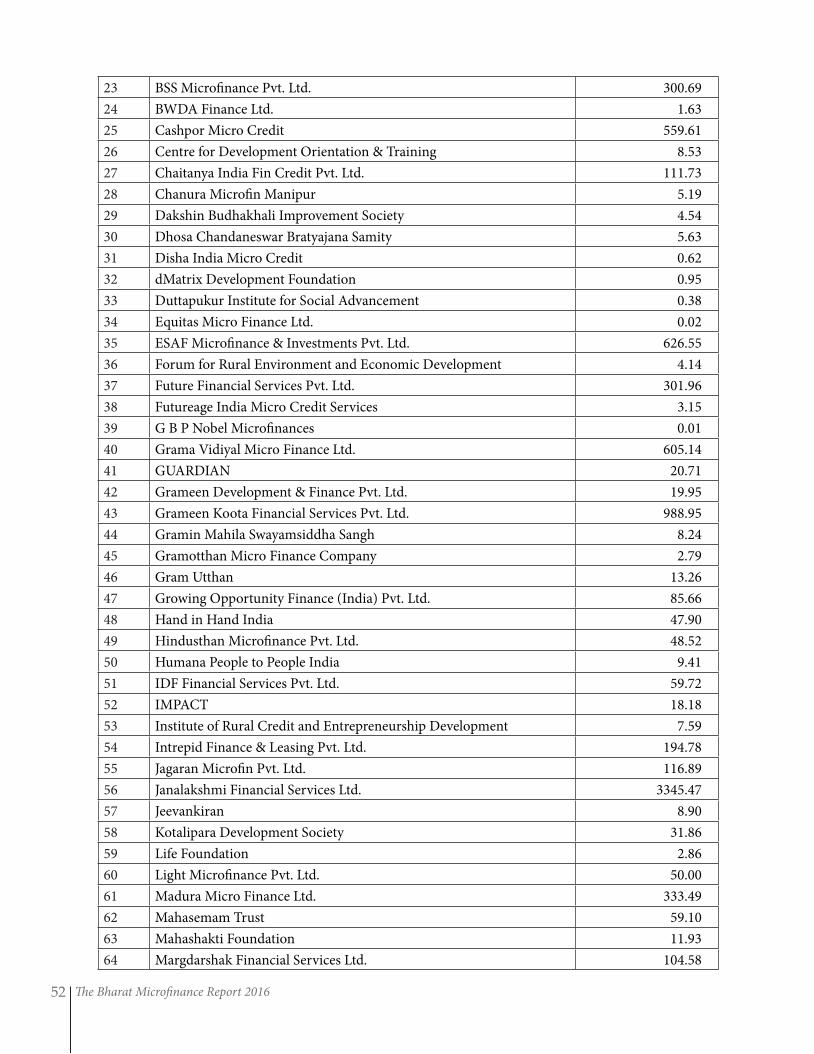
The Bharat Microfinance Report 201652
23 BSS Microfinance Pvt. Ltd. 300.69
24 BWDA Finance Ltd. 1.63
25 Cashpor Micro Credit 559.61
26 Centre for Development Orientation & Training 8.53
27 Chaitanya India Fin Credit Pvt. Ltd. 111.73
28 Chanura Microfin Manipur 5.19
29 Dakshin Budhakhali Improvement Society 4.54
30 Dhosa Chandaneswar Bratyajana Samity 5.63
31 Disha India Micro Credit 0.62
32 dMatrix Development Foundation 0.95
33 Duttapukur Institute for Social Advancement 0.38
34 Equitas Micro Finance Ltd. 0.02
35 ESAF Microfinance & Investments Pvt. Ltd. 626.55
36 Forum for Rural Environment and Economic Development 4.14
37 Future Financial Services Pvt. Ltd. 301.96
38 Futureage India Micro Credit Services 3.15
39 G B P Nobel Microfinances 0.01
40 Grama Vidiyal Micro Finance Ltd. 605.14
41 GUARDIAN 20.71
42 Grameen Development & Finance Pvt. Ltd. 19.95
43 Grameen Koota Financial Services Pvt. Ltd. 988.95
44 Gramin Mahila Swayamsiddha Sangh 8.24
45 Gramotthan Micro Finance Company 2.79
46 Gram Utthan 13.26
47 Growing Opportunity Finance (India) Pvt. Ltd. 85.66
48 Hand in Hand India 47.90
49 Hindusthan Microfinance Pvt. Ltd. 48.52
50 Humana People to People India 9.41
51 IDF Financial Services Pvt. Ltd. 59.72
52 IMPACT 18.18
53 Institute of Rural Credit and Entrepreneurship Development 7.59
54 Intrepid Finance & Leasing Pvt. Ltd. 194.78
55 Jagaran Microfin Pvt. Ltd. 116.89
56 Janalakshmi Financial Services Ltd. 3345.47
57 Jeevankiran 8.90
58 Kotalipara Development Society 31.86
59 Life Foundation 2.86
60 Light Microfinance Pvt. Ltd. 50.00
61 Madura Micro Finance Ltd. 333.49
62 Mahasemam Trust 59.10
63 Mahashakti Foundation 11.93
64 Margdarshak Financial Services Ltd. 104.58

Balance Sheet Distribution and Capital Structure 53
65 Matashree Gomati Devi Jan Seva Nidhi 356.98
66 Midland Microfin Ltd. 71.52
67 Muthoot Microfin Ltd. 831.00
68 NABARD Financial Services Ltd. 830.42
69 Namra Finance Ltd. 79.41
70 Navachetana Microfin Services Pvt. Ltd. 51.82
71 Network of Entrepreneurship & Economic Development 7.31
72 Nightingale Finvest Pvt. Ltd. 33.61
73 North East Region Finservices Ltd. 283.93
74 Organisation for Development Integrated Social and Health Action 0.96
75 Pahal Financial Services Pvt. Ltd. 16.84
76 People's Action for Transformation 12.52
77 Peoples Forum 12.43
78 Planned Social Concern 4.00
79 Pragathi Seva Samithi 0.88
80 Prakruthi Foundation 2.40
81 PRAYAS - Organization for Sustainable Development 14.58
82 Prochesta Thrift & Credit Co-Operative Society Asom Ltd. 1.44
83 Purba Barasat Prerana 0.83
84 Rashtriya Seva Samithi 48.58
85 Repco Micro Finance Ltd. 264.46
86 RGVN (NE) Microfinance Ltd. 343.46
87 RORS Finance Pvt. Ltd. 5.78
88 Rural Education Action and Development 1.77
89 S.M.I.L.E. Microfinance Ltd. 119.43
90 Sahara Utsarga Welfare Society 29.78
91 Saija Finance Pvt. Ltd. 56.71
92 Sakhi Samudaya Kosh 6.93
93 Samasta Micro Finance Ltd. 36.95
94 Sambandh Finserve Pvt. Ltd. 75.61
95 Samhita Community Development Services 22.81
96 Sampurna Training and Entrepreneurship Programme 1.41
97 Sanghamithra Rural Financial Services 109.98
98 Sarala Development and Microfinance Pvt. Ltd. 47.97
99 Sarvodaya Nano Finance Ltd. 20.99
100 Satin Creditcare Network Ltd. 1566.72
101 Seba - Rahara 9.13
102 Shikhar Microfinance Pvt. Ltd. 59.39
103 Social Action for Rural Community 0.22
104 Society for Model Gram Bikash Kendra 9.55
105 Sonata Finance Pvt. Ltd 384.58
106 Spandana Sphoorty Financial Ltd. 1095.22

The Bharat Microfinance Report 201654
107 Sreema Mahila Samity 20.74
108 Suryoday Micro Finance Ltd 482.17
109 SV Creditline Pvt. Ltd. 302.37
110 Swayamsampurna 0.20
111 Swayamshree Mahila Samabaya Samiti Ltd. 0.40
112 Swayamshree Micro Credit Services 24.00
113 The Eastern Multipurpose Coop Society ltd. 1.21
114 The Saath Saving And Credit Co Operative Society Ltd. 0.40
115 UACCO Financial Services Pvt. Ltd. 27.36
116 Ujjivan Financial Services Pvt. Ltd. 2280.32
117 Unnati Microfin Pvt. Ltd. 4.58
118 Utkarsh Microfinance Pvt. Ltd. 782.90
119 Uttrayan Financial Services Pvt. Ltd. 37.60
120 Varam Capital Pvt. Ltd. 76.00
121 Vedika Credit Capital Ltd. 123.42
122 Village Financial Services Pvt. Ltd. 163.25
123 Virutcham Microfinance Ltd. 2.98
124 Vivekananda Sevakendra -O- Sishu Uddyan 4.47
125 VVD 3.26
126 Welfare Services Ernakulam 44.14
127 WSDS Initiate 8.97
128 Yukti Samaj Sewa Society 0.22
129 YVU Financial Services Pvt. Ltd. 5.06
Total 20718
Table 3.4.3: Lender wise Loan Outstanding (based top 10 lenders data) to MFIs
S.N. Name of the Lenders Amount (` in crore)
Outstanding
1 AAV Sarl 65.65
2 Allahabad 15.94
3 Alwar Central Co-operative Bank 2.00
4 Ananya 34.07
5 Andhra Bank 48.69
6 Assam Cooperative Apex Bank Ltd. 1.66
7 Assam Financial Corporation 0.62
8 Assam Gramin Vikash Bank 14.65
9 Au Finance 16.60
10 Axis Bank Ltd. 1146.60
11 Bangiya Gramin Bikash Bank 23.56
12 Bank of Baroda 144.96
13 Bank of India 59.53
14 Bank of Maharashtra 159.11

Balance Sheet Distribution and Capital Structure 55
15 Baroda Kshetriya Gramin Bank Rajasthan 18.05
16 Bharatiya Mahila Bank 9.85
17 Blue Orchard 159.40
18 BNP Paribas 0.60
19 Canara Bank 118.04
20 Capital First 125.83
21 Caspian Impact Investment Pvt. Ltd. 14.60
22 Catholic Syrian Bank Ltd. 33.16
23 CDC Emerging Markets Ltd. 0.001
24 Central Bank of India 72.26
25 Citi Bank 23.50
26 Cordaid 2.48
27 Corporation Bank 24.11
28 Dena Bank 144.34
29 Development Credit Bank 169.69
30 Dhanalakshmi Bank 118.64
31 Dia Vikas 27.67
32 Edelweise ARC 8.68
33 Electronica 2.48
34 Federal Bank 164.37
35 FWWB 2.74
36 Gojamjunde Finance Corp 0.01
37 Grameen Bank of Aryawart 4.02
38 Gruh Finance Ltd. 0.15
39 Gujarat Mahila Sewa Energy Bank 0.11
40 Habitat for Humanity India 0.98
41 HDFC Bank 821.84
42 Hinduja Leyland 7.50
43 HSBC Bank 543.30
44 ICICI Bank Ltd. 1162.02
45 IDBI Bank 2136.84
46 IDFC Bank 239.55
47 IFMR 341.65
50 IGS 3.75
48 Incofin 40.00
49 Indian Bank 64.03
51 Indian Overseas Bank 226.73
52 IndusInd Bank 893.59
53 Intellegrow 2.69
54 Karnataka Bank 14.71
55 Karnataka Vikas Grameen Bank 14.20
56 Kashi Gomti Samyut Gramin Bank 4.21
57 Kashi Vishwanath Vigdhya Samithi 1.60

The Bharat Microfinance Report 201656
58 Kaushal Vintrade Pvt. Ltd. 0.60
59 Kaveri Grameen Bank 3.05
60 KIVA 26.34
61 Kotak Mahindra Bank Ltd. 197.21
62 KSFC 0.62
63 L&T 37.26
64 Lakshmi Vilas Bank 82.86
65 Maanaveeya 110.73
66 Manappuram 10.00
67 MAS 612.43
68 Michael & Susan Dell Foundation 5.91
69 Micro Build 2.00
70 Microfinance Initiative for Asia (MIFA) 35.00
71 Microfinance Solidaire 0.65
72 MicroGraam Social Development Foundation 0.39
73 Microvest 33.00
74 MILAAP 2.92
75 MUDRA 81.65
76 Muthoot Capital 33.97
77 NABARD 2245.53
78 Nabkisan Finance Ltd 3.81
79 National Housing Bank 1.49
80 National Scheduled Catse Finance & Development Corporation 0.15
81 National Skill Development Corporation 1.49
82 Navaratra Trade Link 0.50
83 NEDFI 118.11
84 North Eastern Development Finance Corporation Ltd. 4.34
85 Northern India Consultants Pvt. Ltd. 0.57
86 OIKO Credit 10.68
87 One Acre Venture Pvt. Ltd. 0.10
88 Oriental Bank of Commerce 38.82
89 PACB 0.26
90 Pallavan Grama Bank 9.31
91 Punjab and Sind Bank 59.43
92 Punjab National Bank 211.26
93 Rabobank 11.82
94 Rang De 1.12
95 Rashtriya Mahila Kosh 1.94
96 Ratnakar Bank 550.18
97 RBL Bank 395.75
98 RBS 22.00
99 Reliance Capital Ltd 307.38
100 Reliance Financial Services 0.13

Balance Sheet Distribution and Capital Structure 57
101 Reliance Home Finance Limited 10.36
102 RELIGARE 134.14
103 Repco Bank 193.41
104 ResponAbility 195.00
105 Sampark Fin Services Ltd. 0.35
106 SIDBI 1175.94
107 South Indian Bank Ltd. 51.17
108 Standard Chartered Bank 648.85
109 State Bank of Bikaner and Jaipur 10.62
110 State Bank of Hyderabad 30.29
111 State Bank of India 882.78
112 State Bank of Mysore 19.82
113 State Bank of Patiala 4.23
114 State Bank of Travancore 57.42
115 Symbiotic 270.28
116 Syndicate Bank 192.95
117 Tamilnad Mercantile Bank Ltd. 1.52
118 TDCCB 0.38
119 The Assam Co-op Bank Ltd. 5.96
120 TMB 10.00
121 Toyata Financial Services 0.13
122 Triodos Bank 86.70
123 Triple Jump 46.74
124 UCO Bank 87.15
125 Union Bank of India 272.37
126 United Bank of India 15.88
127 Vijaya Bank 136.93
128 World Business Capital 26.56
129 Yes Bank 908.18
130 Others 471.52
Total 20718
3.4.3 Capital1 (Net owned Fund) to Total Asset Ratio
The Capital Adequacy of Indian MFIs, by and large, is well above the prescribed norms. The RBI has stipulated that NBFC-MFIs need to maintain at least 15 per cent capital on their risk weighted assets. The risk-weighted asset details are not readily available. However, with the help of Net Owned Fund and Total Asset particulars, Figure 3.4.11 brings out the estimates of CAR for the MFIs who reported this data. The median CAR for 2015-16 stands at 19.4, which is slightly higher the figure of 19.1 for 2014-15.
NBFC-MFIs, for which maintaining Capital adequacy is now mandatory, have an adequate CAR of 20.1% in aggregate, while Sec-8 Companies have a CAR of 19.2%. Trust/Society also have a median CAR above the desirable limit of 17.1%. Only Cooperatives have a median CAR below the desirable limit of 17%.
1 The capital includes the free reserves and surplus also ( collectively termed as Net Owned Fund)

The Bharat Microfinance Report 201658
Figure 3.4.11: Capital to Total Asset Ratio
3.4.4 Leverage / Debt – Equity2 Ratio
MFIs, like any other business institution, use their own funds as a base for borrowing from banks. Their borrowing capacity depends on their capital. This leverage is generally understood as a multiple of their own capital amount; these borrowings are from outside sources including banks. Debt-Equity Ratio is the parameter considered for measuring the extent of leveraging of equity to raise outside debt. The leverage needs to be optimum to balance between the profitability and stability of MFIs.
Figure 3.4.12: Debt - Equity Ratio Trend and Break–up of 2016 Figure across MFI –Categories
Median for 2016 3.2
Society/Trust 2.3
Cooperative 1.4
Section 8 Com 2.7
NBFC-MFI 3.5
<1 cr. 0.6
1-10 cr. 0.6
10-50 cr. 2.6
50-100 cr. 3.7
100-500 cr. 3.9
>500 cr. 4.1
Leverage of NBFC-MFIs is highest at 3.5, followed by Section 8 companies at 2.7. Society/Trust and Cooperatives have a leverage ratio of 2.3 and 1.4 respectively. According to Size of MFIs, MFIs with portfolio of more than `500 crore have the highest median leverage of 4.1.
2 Equity refers to Net Owned Fund (Equity + Free Reserves and Surplus)
19.4 19.619.1
19.4
17.1 17.0
19.2
20.1
1515.5
1616.5
1717.5
1818.5
1919.5
2020.5
0.0
1.0
2.0
3.0
4.0
5.02016
Society / Trust
Cooperative
Section 8 Com
NBFC-MFI
< 1 crore1-10 crore
10-50 crore
50-100 crore
100-500 crore
>500 crore

Credit Plus Activities 59
Credit Plus ActivitiesChapter 4
Financial inclusion is not an Indian specific problem, it is global one. So now Financial inclusion is a topic of increasing interest on the international policy agenda. But in India, home to the second largest
population in the world, with huge mass of people below the poverty line spread across nearly 600,000 villages in 600 districts, it assumes utmost importance. India’s government has a long tradition of promoting financial inclusion. For more than 40 years, the Reserve Bank of India has been operating priority sector lending mandating a portion of banks’ loan portfolios to be in the agriculture sector and to small and micro enterprises. In 2005, it required banks to offer basic no-frills accounts with no, or very low, minimum balances and affordable charges. However, use of these accounts has been very low. In 2011, banks were advised to provide at a minimum four products: (a) a savings or overdraft account, (b) a remittance product for electronic transfer of government benefits and other remittances, (c) a pure savings product (ideally a recurring-deposit scheme), and (d) entrepreneurial credit. In a parallel initiative, in 2010 the government and the central bank set goals to provide by 2015 all villages in India with a banking outlet (either by a branch or a retail agent, in India known as a business correspondent), with stipulated annual targets along the way. While these targets were not specified by law, the Reserve Bank of India requires all banks to report progress regularly and closely monitors their achievements. It is still too early to say how successful the implementation of these ambitious goals will be. Some banks have risen to the challenge and opened numerous new outlets (mostly business correspondents). Others have complained that the financial inclusion targets hurt their profits.
For taking Financial Inclusion agenda forward, RBI granted “in-principle” licensing of 11 payments banks and 10 small finance banks. 11 payments Banks includes, Indian Post Office as the Indian post office has a huge network of branches with an unique outreach in rural areas. The sector is poised for much-needed disruption that will bring millions of Indian households into the formal financial system for the first time.
The nation has also enlarged the envelope of Financial Inclusion by including insurance, pension and other activities into its definition and priorities. The Pradhan Mantri Jan Dhan Yojana (PMJDY), which advocates for micro insurance and pension along with credit and savings, is one such recent development for an inclusive financial system. However, the Microfinance sector which is comprised of MFIs and SHPIs/SHGs has been proactively providing credit plus services such as micro-credit, savings, micro-insurance, micro-pensions, and other development related activities. The sector clearly understands the importance of credit plus services to low-income people. This chapter throws a light on such credit plus activities provided by MFIs and SHPIs.
4.1 Micro Insurance1
Micro-Insurance is much younger than other financial services for the poor and receives significant attention from all stakeholders. In order to facilitate penetration of micro insurance to the lower income segments of population, IRDA has formulated the micro insurance regulations. Micro Insurance Regulations, 2005 provide a platform to distribute insurance products, which are affordable to the rural and urban poor and to enable micro insurance to be an integral part of the country’s wider insurance system. The main thrust of micro insurance regulations is protection of low income people with affordable insurance products to help cope with and recover from common risks with standardized popular insurance products adhering to certain levels of cover, premium and benefit standards. These regulations have allowed Non Government Organizations (NGOs) and Self Help Groups (SHGs) to act as agents to insurance companies in marketing
1 IRDA Annual Report 2014-15.

The Bharat Microfinance Report 2016 60
the micro insurance products and have also allowed both life and non-life insurers to promote combi-micro insurance products.
The Authority has reviewed the Micro Insurance Regulations, 2005 comprehensively and notified IRDAI (Micro Insurance) Regulations, 2015 permitting several more entities like Business Correspondents of Scheduled commercial banks, District Co-operative banks, Regional Rural Banks, Urban Co-operative banks, Primary agricultural co-operative societies, other co-operative societies, RBI regulated NBFC-MFI’s to improve penetration of Micro Insurance.
The individual new business premium under the micro insurance segment for the year 2014-15 stood at `28.89 Crore for 8.16 lakh new policies, the group business premium amounted to `315.60 crore covering 2.31 crore lives. LIC contributed to a significant component of the business procured in this portfolio by garnering `16.40 crores of individual new business premium under 4 lakh policies and `281.93 crore of group premium covering 2.06 Crore lives.
The number of micro insurance agents at the end of March 2015 stood at 20855; of which 19379 agents pertained to the LIC and the remaining represented the private sector companies. Thirteen life insurers had 21 micro insurance products as at 31.3.2015. Of these 21 products, 13 were Individual products and the remaining 8 were Group products.
4.1.1 MFIs Acting as Micro Insurance Agents
In distributing micro insurance products, the insurance industry faces various challenges such as (1) challenge of high transaction cost, (2) high upfront investments to reduce risk so that premiums are affordable, (3) technical knowhow etc. MFIs are well placed to overcome these challenges given their experience in providing financial products in remote areas. Microfinance Institutions are one of the most effective and efficient delivery channels for credit; further adding micro insurance to the product mix enables them to achieve both social and economic objectives. Additionally, MFIs not only provide micro-insurance policies but also spread awareness about risk management. MFIs help their clients choose cost effective policies out of the 28 micro insurance products. MFIs do face some challenges in providing micro-insurance policies, which include:
(1) Relationship challenges with insurers such as burdensome claims documentation, delays in paying claims, and occasional claims rejections.
(2) To structure the product and price it appropriately, as they typically lack the in-house expertise to do this. The two most common approaches are either: (a) to pick a nice round number that the MFI thinks the clients can afford; or (b) the MFI copies the pricing offered by insurers.
(3) Other challenge of delivering the policies is of educating staff and clients about the products.
However a large numbers of MFIs have been providing micro insurance products. As the Table 4.1 below shows, 15 MFIs have reached to 3.66 lakh clients for health products and Table 4.2 states that 39 MFIs have reached to 55.38 lakh clients for non-health products.

Credit Plus Activities 61
Table 4.1: MFIs Involved in Micro Insurance-Health
S.N. Name of the Organisation State No. of Client
1 Annapurna Mahila Coop Credit Society Ltd. Maharashtra 192195
2 Centre For Development Orientation & Training Karnataka 5017
3 Grameen Koota Financial Services Pvt. Ltd. Karnataka 74831
4 Growing Opportunity Finance (India) Pvt. Ltd. Kerala 524
5 Mass Care International Gujarat 600
6 Micro Enterprises & Sustainable Projects Odisha 13
7 Organisation for Development Integrated Social and Health Action Bihar 1260
8 Prochesta Thrift & Credit Co-Operative Society Asom Ltd. Odisha 1250
9 Rural Education Action and Development Odisha 75
10 Sambandh Finserve (P) Ltd. Assam 4636
11 Sanghamithra Rural Financial Services Bihar 38635
12 Swayamshree Micro Credit Services Tamil Nadu 56
13 The Eastern Multipurpose coop Society ltd. Tamil Nadu 6762
14 The Saath Saving And Credit Co Operative Society Limited Odisha 8690
15 Welfare Services Ernakulam Jharkhand 31478
Total 366022
Note: The number of clients under microinsurance programmes appears lower than 2014-15 as fewer MFIs have provided data on this aspect.
Table 4.2: MFIs Involved in Micro Insurance - Non-health
S.N Name of the Organization State No. of Clients
1 Agradut Polly Unnyan Samity West Bengal 4122
2 Annapurna Mahila Coop Credit Society Ltd. Maharashtra 50076
3 Balajee Sewa Sansthan Uttarakhand 1400
4 Bengal Women Welware Association West Bengal 128
5 Blaze Trust Tamil Nadu 4545
6 Cashpor Micro Credit Uttar Pradesh 710201
7 Deshabandhu Micro Finance and Livelihood Institution Assam 130
8 Dhosa Chandaneswar Bratyajana Samity (DCBS) West Bengal 2500
9 Disha India Micro Credit Uttar Pradesh 65515
10 dMatrix Development Foundation Maharashtra 2952
11 G B P Nobel Microfinance Maharashtra 120
12 G U Financial Services Pvt. Ltd. Odisha 59774
13 Grama Vidiyal Micro Finance Ltd. Tamil Nadu 1045684
14 Grameen Development & Finance Pvt. Ltd. Assam 15440
15 Grameen Koota Financial Services Pvt. Ltd. Karnataka 3627760
16 Hand in Hand India Tamil Nadu 63752
17 IMPACT Tamil Nadu 13164
18 Kotalipara Development Society (KDS) West Bengal 2803
19 Krishna Bhima Samruddhi Local Area Bank Ltd. Telangana 34656
20 Mahashakti Foundation Odisha 89464
21 Mass Care International Bihar 600
22 Midland Microfin Punjab 2002

The Bharat Microfinance Report 2016 62
23 Organisation for Development Integrated Social and Health Action (ODISHA)
Odisha 865
24 PRAYAS - Organization for sustainable development Gujarat 20657
25 Rashtriya Seva Samithi (RASS) Andhra Pradesh 38832
26 Rural Education Action and Development Tamil Nadu 125
27 Sambandh Finserve (P) Ltd. Odisha 53567
28 Samhita Community Development Services Madhya Pradesh 261718
29 Sampada Entrepreneurship & Livelihoods Foundation Maharashtra 20170
30 Shroff Capital and Finance Pvt. Ltd. Gujarat 3936
31 Social Action for Rural Community Odisha 373
32 Society for Model Gram Bikash Kendra West Bengal 3395
33 Sreema Mahila Samity West Bengal 6920
34 Swashree Mahila Sakh Sahakari Sanstha Maryadit Madhya Pradesh 5739
35 Swayamshree Micro Credit Services Odisha 5065
36 Virutcham Microfinance Limited Tamil Nadu 5474
37 Volunteers for Village Development Manipur 2911
38 Welfare Services Ernakulam Kerala 21478
39 Yukti Samaj Sewa Society Madhya Pradesh 289
Total 5538101
Note: The number of clients under microinsurance programmes appears lower than 2014-15 as fewer MFIs have provided data on this aspect.
4.2 Micro Pension2
The country’s population pyramid is expected to “bulge” across the 15–64 age brackets over the next decade. Around 64% of India’s population is expected to be in the age bracket of 15–59 years by 2026, with 13% of the total aged above 60 years. However, India’s demographic dividend is expected to level off around 2040. In 2050, the old age dependency ratio is likely to increase to 18.7 % of the total population from 8.6 % in 2011. With the shift to nuclear families, intergenerational support cannot be the sole source of old age security. At this juncture, it is important to get prepared for the future challenge of old age income security of our people in their sunset years.
In India, almost 400 million people (more than 85% of working population of the country) work in the unorganized sector and 88 % of the Indian workforce are excluded from pension coverage. Of these, at least 120 million are women and the majority has no access to a formal old age income security scheme. Tenuous labor market attachments, intermittent incomes, poor access to social security etc render the unorganized workers highly vulnerable to economic shocks during their working lives and deprive them of old age security. Swavalamban is one such program supported by the Government to provide a pension scheme under NPS.
4.2.1 NPS: Swavalamban
Swavalamban Scheme, a co-contributory Pension Scheme, launched in September, 2010 to encourage people from the unorganised sector to voluntarily save for their retirement. The Central Government would contribute a sum of ̀ 1,000 in each National Pension System (NPS) account opened under the Scheme where the subscriber is able to save `1,000 to `12,000 during a financial year. The Government’s contribution is available upto Financial Year 2016-17. The scheme is for those citizens of India who are not part of any statutory pension/provident scheme. The target beneficiaries of Swavalamban Scheme are co-contributory
2 PFRDA
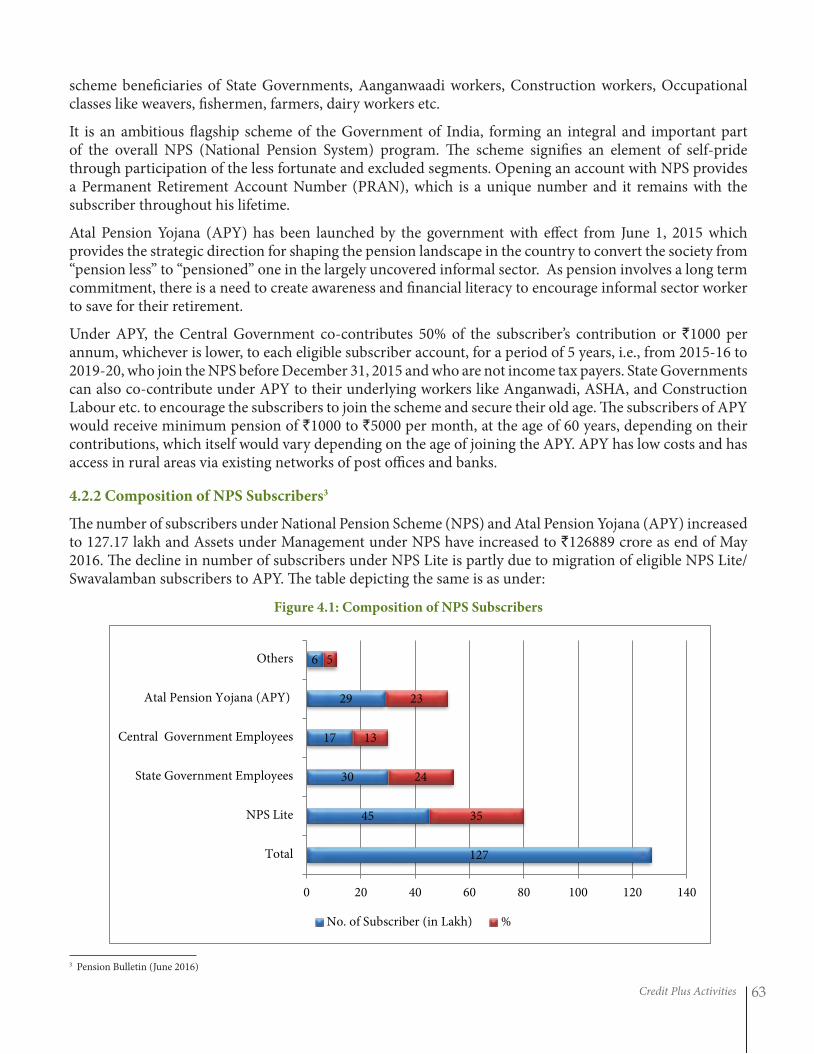
Credit Plus Activities 63
scheme beneficiaries of State Governments, Aanganwaadi workers, Construction workers, Occupational classes like weavers, fishermen, farmers, dairy workers etc.
It is an ambitious flagship scheme of the Government of India, forming an integral and important part of the overall NPS (National Pension System) program. The scheme signifies an element of self-pride through participation of the less fortunate and excluded segments. Opening an account with NPS provides a Permanent Retirement Account Number (PRAN), which is a unique number and it remains with the subscriber throughout his lifetime.
Atal Pension Yojana (APY) has been launched by the government with effect from June 1, 2015 which provides the strategic direction for shaping the pension landscape in the country to convert the society from “pension less” to “pensioned” one in the largely uncovered informal sector. As pension involves a long term commitment, there is a need to create awareness and financial literacy to encourage informal sector worker to save for their retirement.
Under APY, the Central Government co-contributes 50% of the subscriber’s contribution or `1000 per annum, whichever is lower, to each eligible subscriber account, for a period of 5 years, i.e., from 2015-16 to 2019-20, who join the NPS before December 31, 2015 and who are not income tax payers. State Governments can also co-contribute under APY to their underlying workers like Anganwadi, ASHA, and Construction Labour etc. to encourage the subscribers to join the scheme and secure their old age. The subscribers of APY would receive minimum pension of `1000 to `5000 per month, at the age of 60 years, depending on their contributions, which itself would vary depending on the age of joining the APY. APY has low costs and has access in rural areas via existing networks of post offices and banks.
4.2.2 Composition of NPS Subscribers3
The number of subscribers under National Pension Scheme (NPS) and Atal Pension Yojana (APY) increased to 127.17 lakh and Assets under Management under NPS have increased to `126889 crore as end of May 2016. The decline in number of subscribers under NPS Lite is partly due to migration of eligible NPS Lite/Swavalamban subscribers to APY. The table depicting the same is as under:
Figure 4.1: Composition of NPS Subscribers
3 Pension Bulletin (June 2016)
127
45
30
17
29
6
35
24
13
23
5
0 20 40 60 80 100 120 140
Total
NPS Lite
State Government Employees
Central Government Employees
Atal Pension Yojana (APY)
Others
No. of Subscriber (in Lakh) %

The Bharat Microfinance Report 2016 64
The scheme is structured into two tiers:
Tier - I account: This is the non - withdrawable permanent retirement account into which the accumulations are deposited and invested as per the option of the subscriber.
Tier - II account: This is a voluntary withdrawable account which is allowed only when there is an active Tier I account in the name of the subscriber. The withdrawals are permitted from this account as per the needs of the subscriber as and when claimed.
4.2.3 Pradhan Mantri Bima Yojana
Under Pradhan Mantri Bima Yojana, two schemes – (1) Pradhan Mantri Jeevan Jyoti Bima Yojana (life insurance policy) and (2) Pradhan Mantri Suraksha Bima Yojana (personal accident policy) have been launched by Central Government to increase the insurance penetration in the country.
Pradhan Mantri Suraksha Bima Yojana is a government-backed accident insurance scheme in India. It was originally mentioned in the 2015 Budget speech by Finance Minister Arun Jaitley in February 2015. It was formally launched by Prime Minister Narendra Modi on 9 May in Kolkata. As of May 2015, only 20% of India’s population has any kind of insurance, this scheme aims to increase the number.
Pradhan Mantri Suraksha Bima Yojana is available to people between 18 and 70 years of age with bank accounts. It has an annual premium of `12 excluding service tax, which is about 14% of the premium. The amount will be automatically debited from the account. In case of accidental death or full disability, the payment to the nominee will be `200000 and in case of partial disability `100000. Full disability has been defined as loss of use in both eyes, hands or feet. Partial disability has been defined as loss of use in one eye, hand or foot.
This scheme will be linked to the bank accounts opened under the Pradhan Mantri Jan Dhan Yojana scheme. Most of these accounts had zero balances initially. The government aims to reduce the number of such zero balance accounts by using this and related schemes.
Pradhan Mantri Jeevan Jyoti Bima Yojana is a government-backed Life insurance scheme in India. It was also formally launched by Prime Minister Narendra Modi on 9 May in Kolkata. As of May 2015, only 20% of India’s population has any kind of insurance, this scheme aims to increase the number.
Pradhan Mantri Jeevan Jyoti Bima Yojana is available to people between 18 and 50 years of age with bank accounts. It has an annual premium of `330 excluding service tax, which is above 14% of the premium. The amount will be automatically debited from the account. In case of death due to any cause, the payment to the nominee will be `200000.
This scheme will be linked to the bank accounts opened under the Pradhan Mantri Jan Dhan Yojana scheme. Most of these accounts had zero balances initially. The government aims to reduce the number of such zero balance accounts by using this and related schemes.
A number of MFIs have been providing micro pension services under various schemes. As the Table 4.3 below states, 11 MFIs have reached to 18.59 lakh clients.

Credit Plus Activities 65
Table 4.3: MFIs involved in Micro Pension
S.N. Name of the Organisation State No. of Client
1 Janalakshmi Financial Services Ltd Karnataka 1674416
2 Shri Mahila Sewa Sahakari Bank Ltd. Gujarat 76017
3 Cashpor Micro Credit Uttar Pradesh 49120
4 BWDA Finance Ltd Tamil Nadu 31571
5 Grameen Koota Financial Services Pvt. Ltd. Karnataka 19208
6 People's Action for Transformation Tamil Nadu 5534
7 Samhita Community Development Services Madhya Pradesh 1978
8 Sambandh Finserve (P) Ltd. Odisha 529
9 Swayamshree Micro Credit Services Odisha 446
10 Centre For Development Orientation & Training Bihar 111
11 Micro Enterprises & Sustainable Projects (MESP) Jharkhand 3
Total 1858933
4.3 Other Development Services
As we have seen, the Microfinance sector (MFIs, SHPIs, SHG federations etc.) along with other stakeholders has been significantly contributing in providing micro-insurance and micro-pension. There are also various other services which the MFIs and SHPIs provide, such as capacity building, empowerment of the community (especially for the women), education, financial literacy, housing, health and sanitation, training, livelihoods support etc. The reported MFIs undertake several developmental activities. No. of MFIs engaged in such activities is indicated in Table 4.4.
Table 4.4: Development Services of Reporting MFIs
Development Activities No. of MFIs
Capacity Building Initiatives 37
Education 34
Financial Literacy 52
Water and Sanitation 34
Livelihood Promotion 52
Preventive Healthcare 38
Training Initiatives 63
Sa-Dhan has received special reports from MFIs on their development activities undertaken during the last year. The primarily development interventions of reporting MFIs are summarized in Tables 4.5, 4.6, & 4.7.

The Bharat Microfinance Report 2016 66
Table 4.5: MFIs and Livelihoods Intervention
Name of MFI Main Livelihood Promotion Initiatives
Agradut Polly Unnyan Samity Sanitary Napkin, Readymade Garments
Anik Financial Services Pvt. Ltd. Training of Business Activities
Arohan Financial Services Pvt. Ltd. Skill Building training as a part of CSR
Balajee Sewa Sansthan SHG promotional, Vocational Training
Bal-Mahila Vikas Samiti -VAMA Running livelihood project in Block Morar with support of Church Auxiliaries for Social Action, Bhopal
Barasat Sampark Skill & Capacity Development for beneficiaries /members
Bengal Women Welware Association Shola Dry Flower Manufacturing
Blaze Trust New business ventures, Value addition trainings, Business plan preparation.
BWDA Finance Ltd Animal Husbandry and Milch animal. Distributed milch animal loans in collaboration with NABARD
Centre for Promoting Sustainable Livelihood(CPSL)
Analysis of livelihood processs taken by Group members
Dakshin Budhakhali Improvement Society (DBIS)
Training on Embroidery, Clay Modelling, Leather
Dhosa Chandaneswar Bratyajana Samity
Tailoring Training
Equitas Micro Finance Ltd Skill Training is being imparted to interested members for helping them to earn additional income
Gramin Mahila Swayamsiddha Sangh Compost bed, Azola bed
Gram-Utthan Livelihood promotion through integrated fish firming credit & technical support
Hand in Hand India Family based enterprises created
IMPACT On business development and income generation activities
Kotalipara Development Society (KDS)
Livelihood promotion activity like beautician, Tailoring, Driving, Distribu-tion of Van Rickshaw.
Mahasemam Trust Promoted Goat livelihood
Margdarshak Financial Services Ltd. Solar Products
Micro Enterprises & Sustainable Projects (MESP)
Through biri manufacturing, tailoring cluster development fish culture promotion, dairy sub sector promotion.
NABARD Financial Services Limited Sustainable Livelihood
Opportunity Microfinance India Ltd Provided loans for livelihood opportunities.
Pragathi Seva Samithi Conducted Micro Enterprises Trainings.
Prakruthi Foundation Agri. Training & Market Linkages
PRAYAS - Organization for sustain-able development
Promoted them to grow their business in terms of purchase agriculture products, livestock's and also for their small other businesses.
Prayas Juvenile Aid Centre (Prayas Micro Credit)
Beneficiaries placed under Jeevika in Bihar and Jharkhand states, under RSLDC in Rajasthan and under DWSSC in Delhi
Sampada Entrepreneurship & Liveli-hoods Foundation
The Borrowers were motivated and provided with credit for start up their livelihood activity.

Credit Plus Activities 67
Sampurna Training and Entrepre-neurship Programme
Vocational Training
Satin Creditcare Network Limited Improving Dhokra craft Artisan Livelihood opportunity at Sadaiberini village of Dhenkanal district of Odisha by setting up of Common Facility Center (CFC) with advance equipment, tools at the village level, & ensure availability required technology, product diversification, design develop-ment, and provide a marketing space for merchandise manufactured by the rural artisans in nearest vicinity possible.
Shikhar Microfinance Pvt. Ltd. Shikhar aims at providing financial services to promote livelihood oppor-tunities.
Social Action for Rural Community Livelihood training to beneficiaries on Vegetable/Paddy cultivation, Goat rearing, Mushroom Cultivation, Poultry farming, Handloom etc.
Society for Model Gram Bikash Kendra
Financial support has been provided for creation of livelihood promotion.
Swayamsampurna Promoting organization Jeevika Development Society conducting training programme for livelihood activities( tailoring unit and Agricultural unit)
Swayamshree Micro Credit Services Livelihood promotion of 10 beneficiaries on ice cream and other milk prod-ucts, 30 beneficiaries on mushroom cultivation and for 15 beneficiaries on tailoring centre provided.
Varam Capital Private Limited In the worst ever floods in Chennai during December 2015, Varam team actively participated in the relief across different areas of the city. Team has contributed to the Chennai Flood Relief by distributing blankets, milk, food packet, water bottles and other emergency relief materials.
Note: The list of MFIs taking up these services is not exhaustive.
Table 4.6: MFIs and General Education Intervention
Name of MFI Main General Education Initiatives
Agradut Polly Unnyan Samity Creche Centre, Sponsored by Central Social Welfare Board, New Delhi
Anik Financial Services Pvt. Ltd. Provides Awareness of Govt Schemes to members.
Bagaria Releif Welfare Ambulance Society Pre primary school.
Balajee Sewa Sansthan Child education
Barasat Sampark Books & other material purchasing for poor students
Blaze Trust Importance of child education
BURS Running a free pre-primary school
BWDA Finance Ltd BWDA gives general education apart from awareness and advocacy education through schools, colleges and polytechnics for the academic excellence. Community Knowledge centre is another aspect in which BWDA gives education facilities to the poor and downtrodden students in the community very practically in 30 villages of Tamil Nadu covering 2500 students.
Cashpor Micro Credit Remedial education program through PRATHAM and In-House as CEC.
Centre for Promoting Sustainable Liveli-hood(CPSL)
Educational loan for private tuition and private school.

The Bharat Microfinance Report 2016 68
Dakshin Budhakhali Improvement Society (DBIS) Arranging coaching classes at school level.
Grameen Koota Financial Services Pvt. Ltd. Interactive awareness program called “Jagruthi”, wherein awareness on various socially relevant subjects is communicated through open letters sent to all members.
Growing Opportunity Finance (India) Pvt. Ltd Awareness on Girl Child Education, Women Rights, Legal Rights.
Hand in Hand India Help in enrolling to Govt. school enrolment of the never enrolled children.
Jagaran Microfin Private Ltd Pre Primary School.
Jeevankiran Distribution of free study materials like text books, note books, bags, umbrellas, uniform, etc.
Kotalipara Development Society (KDS) Providing out-of school time back up education support.
Madura Micro Finance Limited Adult Literacy programme was given to the members.
Mahasemam Trust Children's scholarship through LIC of India.
Mass Care International Basic education imparted to out-of-school girls.
Micro Enterprises & Sustainable Projects (MESP)
Literacy drive to our borrowers.
Network of Entrepreneurship & Economic Development
Community schools covering 90% girl child by community teachers trained by NEED
People's Action for Transformation Tuition and Day Care centres.
Peoples Forum Education on Products & Grievance Redressal Mechanism, Observation of International Literacy Day.
PRAYAS-Organization for sustainable develop-ment
Encourage them to provide good education to their child and Prayas is facilitating that by giving them loan.
Purba Barasat Prerana Educational support for poor Student
Society for Model Gram Bikash Kendra As a part of regular activity it is provided to students through our school at Nadia
Suryoday Micro Finance Ltd General Education covered through Social Message for Com-munity awareness Programme.
Swayamsampurna training provided School going children to Awareness genera-tion for prevention of early girl child marriage issue
Note: The list of MFIs taking up these services is not exhaustive.
Table 4.7: MFIs and Preventive Healthcare Initiatives
Name of MFI Main Preventive Healthcare Initiatives
Blaze Trust Training on Women health and epidemic diseases
Belghoria Janakalyan Samity Training on health, hygiene and sanitation.
Varam Capital Private Limited Throughout the year the entire workforce at Varam & SET were actively involved in organising various medical camps, eye camps, jute Bag training, and celebration with customer-During Republic Day % Independence Day.
Growing Opportunity Finance (India) Pvt. Ltd Through Health Camps, Cancer Awareness Training, Tobacco Awareness Training, Adolescent Girl, Child and Women Health Meetings
Dakshin Budhakhali Improvement Society (DBIS) Swatch, Sanitation, Vaccination
Grameen Development & Finance Pvt. Ltd. Small health camp

Credit Plus Activities 69
IMPACT Preventable diseases, malnutrition and childhood illness with support from World Vision India
Society for Model Gram Bikash Kendra Periodical Health Camp
Pragathi Seva Samithi Orientation Programs conducted
BURS Organized health awareness campaign
Prayas Juvenile Aid Centre (Prayas Micro Credit)
Organised Health check-up camp for HIV at night shelters run by Prayas. People/Children attended health camps organised by organisation. Besides, Prayas is running health centre at Delhi & Assam. Organised advocacy sessions for beneficiaries for Dengue & Malaria etc.
Jeevankiran Meeting medical expenses of poor people
Hand in Hand India Medical camps organised
Welfare Services Ernakulam Medical camp
Centre for Promoting Sustainable Liveli-hood(CPSL)
Malnutrition status of children by comparing adopted vs control village.
Balajee Sewa Sansthan HIV-AIDS, TB and Tobacco control Program.
Purba Barasat Prerana Health check-up & Diabetic Awareness.
Kotalipara Development Society (KDS) Health check up, eligible couple awareness, community disease burden and preventive and curative strategies.
Gramin Mahila Swayamsiddha Sangh Health check up camp
Madura Micro Finance Limited Health Camp conducted at Palani for the devotees. Separate health camp at Virudhchalam.
Peoples Forum Health Awareness Camps on Prevention of Water Borne Diseases and Observation of World AIDS Day.
Mass Care International Focused on RCH/pre-maternity care.
People's Action for Transformation Eye Camps.
Life Foundation Done by various department/agency.
Barasat Sampark Doctor’s fee, Free medicine & others for beneficiaries / members.
Utkarsh Microfinance Pvt. Ltd Conducting fortnightly polyclinics at 8 branches, Primary health-care services through mobile van service at 10 branches
Equitas Micro Finance Ltd By organized free health camps member families are helped to save on the consultation fees. Free health camps are being orga-nized through 900+ hospitals with whom we have tied up
BWDA Finance Ltd BWDA is being involved in different healthcare preventive activities for the health issues like Tuberculosis, Dhyrea through programs like Gaon Kalyan Samiti(village health and sanitation committee), Awareness meetings, Cultural events, Medical camps, Auto announcement, Wall painting, Awareness rally, Distribution of awareness pamphlets etc.,
Sampurna Training and Entrepreneurship Programme
Awareness program on health
Bal-Mahila Vikas Samiti -VAMA Asha Training was conducted in District Datia for 6-7 Module, 1, 2 & 3 Phase.
Sarvodaya Nano Finance Limited 3055 beneficiaries were participated under various health programmes.
Cashpor Micro Credit Preventive health education sessions.
Note: The list of MFIs providing these services is not exhaustive

The Bharat Microfinance Report 2016 70
4.4 Jagruti – An Initiative to Intensify Client Engagement and Reduce Client Attrition
2010-12 was a very difficult period for MFIs as Microfinance sector was going through a crisis. Industry was in dire need to improve responsible lending and client protection. In this direction, Grameen Koota took an initiative called “Jagruti” to intensify customer engagement and reduce customer attrition. The key objectives of the initiative was educating customer, combat fatigue of frequent meetings, enhancing social awareness among members. An in-depth interview with women borrowers was conducted to understand their contexts, their challenges and finally ‘Jagruti’ was created to connect them. “Jagruti” is a trusted friend, advisor with whom women can share their worries and disseminate information that would be value adding to women, their families and their communities.
Taking Jagruti to the Borrowers
• Themes critical to woman are shortlisted (finance, health, sanitation etc.)
• Within each theme, relevant topics are selected – child nutrition, open defecation, saving etc.
• One small letter per topic is written in a simplistic manner. Till the letters are not been repeated.
• Each letter was scrutinize and reviewed for accuracy and neutrality.
• Letter then translated into local language
• Kendra Managers trained to read the letter in an engaging manner. Letters are so simple that a literate borrower also can read.
• Letter started reaching customers every week at the end of their center meeting.
Figure 4.2: Most Recalled Themes
Mode and Channel of the Delivery
Jagruti as a tool is embedded in everyday workflow of loan disbursement. It also has the unequivocal blessing of its leaders. The delivery channel has thus led to effective and seamless scale-up of the program are across geographies. Women customers themselves are the delivery channels in many branches.
1820 20
1615
1210
7 7
4
0
5
10
15
20
25
No
. o
f G
rou
pe

Credit Plus Activities 71
Figure 4.3: Mode of Delivery
Impact Assessment of Jagruti
A study conducted on 30 groups of borrowers of 15 branches across 15 locations in 2015 revealed some positive impact of the initiatives.
• Despite differences in social –cultural profiles, occupation, place of residence and exposure time to letter Jagruti is a critical information source.
• Engaging manner in which letter is written is huge plus point.
• Jagruti is seen as an educated woman who is worldly wise and knows a lot who cared deeply about their welfare.
• Across several branches women have opened or are in process to opening the Prime Minister’s Jan-Dhan Yojana
• Women are putting away some amount of money each month. Due to better financial planning, several women in have managed to buy televisions, gas stoves, washing machines etc.
• Women are less dependent on moneylenders, as they are aware of other more viable sources of obtaining loans to meet their needs
• Members also recalled the importance of getting insurance for themselves and/or other families.
After listening to the letter, they joined the government pension scheme and following suit were their husbands, families and neighbours.
The case of Nurani Majeedi (Channagiri)
“Other women think we are smart, and come to us for advice. We often try and get new people to join our group”. “After joining the Sangha, we are active and brave. We are strong. We have knowledge and together we are brave. Therefore women approach us, when they have problems – financial, children’s education. We guide them – try and understand their problems”.
4
6
7
13
0 2 4 6 8 10 12 14
Read by LO (Urdu speaking groups)
Largely read by LO
Both LO and literate members
Largely womenN
o.
of
Gro
up
Read by LO (Urdu
speaking groups)Largely read by LO
Both LO and literate
membersLargely women
No. of Group 4 6 7 13
Source: Grameen Financial Services Pvt. Ltd.

The Bharat Microfinance Report 2016 72
Box 4.1: “Microfinance and Affordable Clean Energy Access:
A Path to achieve Sustainable Development Goals”
India currently has more than 75 million households which lack adequate access to grid electricity and another 20 million underserved households which receive less than four hours of electricity in a day. While grid connectivity is expected to improve over the next 10 years, at the current rate of grid expansion, urbanization and population growth: 70-75 million households will still lack access to grid electricity by 2024. Since 90% of these households lie in rural areas, a significant reduction in the 83 million rural households who are currently not served or underserved by the grid is unlikely. It is important to understand that the same sets of households are also deprived of credit facilities which collectively hampers their growth.
With the focus on Sustainable Development Goal # 7, all key stakeholders will have to contribute effectively including Institutional investors. They will have to play a major role to scale up the collaboration of various stakeholders (like, MFI-Product manufacturer et al). Globally, $1.25 trillion investment is required by 2030, if one considers regions with great energy deficits such as South Asia, Sub-Saharan Africa etc. Having said this, the future definitely looks good for the end users!
In this junction, alternative energy at affordable cost can bridge the gap. In this direction, Greenlight Planet is a for-profit social business that develops and manufactures honest, reliable solar products designed to help people living off the electric grid.
But lack of awareness, unreliability and unaffordability are key barriers for the poor people in acceptance of quality solar lanterns and home systems in India. Microfinance Institutions (MFIs) cover 40 million poor clients across 33 States/UTs in India. MFIs as partner is creating awareness and financing to their clients. On the other hand, Greenlight Planet is helping this section by getting them reliable solar products at affordable cost.
So Greenlight Planet in collaboration with MFIs is changing the lives of poor people in India who are deprived from grid electricity and contributing towards sustainable development.
Greenlight Planet Inc
Greenlight Planet Inc is a global leader in delivering honest, affordable energy to the world’s 2 billion under-electrified consumers. In the last 7 years we’ve delivered over 6 million+ solar-powered lights through close partnerships with large organizations across 40+ countries.
Courtesy: Greenlight Planet Inc

Credit Plus Activities 73
Box 4.2: Pradhan Mantri Mudra Yojana
Micro Units Development & Refinance Agency Limited (MUDRA) and Pradhan Mantri MUDRA Yojana (PMMY) were launched on 08 April 2015 by the Hon’ble Prime Minister, Shri Narendra Modi. The guidelines of PMMY issued by Department of Financial Services (DFS), GOI indicated that all banks are required to lend to microenterprises engaged in manufacturing, processing, trading and service sector activities for a loan upto `10 lakh. Further, it was also advised that the loan may be given in three categories, i.e. Loan upto `50,000 under Shishu; `50,000 to `5 lakh under Kishor; and `5 lakh to `10 lakh under Tarun. Also, it was envisaged that more focus will have to be given for the Shishu category. A target of `1,22,188 crore was set for F.Y. 2015-16.
It was decided that MUDRA will monitor the progress of PMMY. The National Bank for Agriculture & Rural Development (NABARD) was also advised to closely monitor the progress of RRBs, as RRBs are under supervisory domain of NABARD.
In order to make the monitoring more effective, a dedicated portal (www.mudra.org.in) was put in place to capture the data on the performance under PMMY on a weekly basis to have consolidated data of nationwide disaggregated retail transactions details, including data on new entrepreneurs, women entrepreneurs, SC/ST, Minority, MUDRA card etc. The data so collected was analyzed and reported to GOI. The progress was closely followed up with the banks for improvement, if any. A team of officers at ‘Mission Mudra’ was constituted and placed with DFS for an overall supervision and follow up of the programme on behalf of GOI.
Subsequently, it was also decided that the MUDRA loans given by MFIs also needs to be captured as most of the MFIs are MUDRA partners. Accordingly, MFIN was given the responsibility for following up with the NBFC-MFI and getting their data on the portal. Similarly, Sa-Dhan was made responsible for collecting the data and on boarding the same for the non NBFC MFIs.
In order to give a boost to the lending under PMMY, especially for Shishu category loans, a credit campaign was carried out from 1stSeptember 2015 to 2nd October 2015. The campaign culminated in mega credit camps in different locations in the country from 25th September 2015 to 02nd October 2015. In order to enhance the awareness of the programme, MUDRA carried out a month long publicity campaign, on behalf of DFS, through print media and Radio. The credit campaign resulted in lending to 22.50 lakh borrowers as against a target of 25 lakh borrowers and lent `4120 crore.
With all these efforts, the target set under PMMY for the year 2015-16 was surpassed by the end of the year.
A Brief Analysis of the Performance
The overall performance of the Yojana indicates that the target has been achieved during the year. As against the target of `122188 crore, the Banks and MFIs together have disbursed `132954.73 crore, thereby achieving 109%. The achievements by Public Sector Banks indicate a substantial credit growth in this segment. Based on the data collected from the PSBs, it was seen that the disbursement by these banks in this segment was around `33,000 crore during the 2014-15 which has recorded a growth of 70% during 2015-16. The other lending institutions have also achieved high credit growth in this segment due to the initiative of Pradhan Mantri MUDRA Yojana.
Source: Review of performance of Pradhan Mantri Mudra Yojana – 2015-16

The Bharat Microfinance Report 2016 74
Box 4.3: Grievance Redressal Mechanism
BFIL formerly known as SKS has well established and best in class grievance redressal mechanism where member can register her query, service request and complaint through multiple channels-toll free number or in centre meeting.
This number is communicated and publicized through various channels. It is communicated during CGT (compulsory group training) for new members who are joining BFIL and is communicated during every centre meeting. It is written in Loan card and loan agreement which are possessed by the member. Detailed training on Customer Grievance Redressal is given during CPP training which is conducted annually. All these communication channels publicize not only toll free and ombudsman number but also numbers of SRO and RBI. Due to multiple channel of communication, volume of calls has subsequently increased.
CPP Awareness Calls
Overall 594779 verified member calls were received of which 86% were enquiries, 10.4% were service request and complaints were 3.6%.
Despite Increase in Call Volume by 60% abandoned rate is as low as 1% and TAT adherence
stands high at 98%.
MHL Process
Since Most of members have low literacy levels, BFIL toll free does not follow IVR based system. It’s
a unique approach, where contact numbers are tagged in system and numbers from respective
states are routed to the agents with knowledge of same language.
Most of member helpline executives are experienced staff in field operations because they have better understanding of processes, systems and customers. This provides them unique management of handling the customers.
e member addresses the issue to the Sangam Manager. He/she registers the complaint in the center register and enters a ticket No and resolves the issue within the TAT
In case the member wishes to lodge a complaint on a non-CM day or is not satis ed with the resolution provided by the Sangam Manager, she call the 1-800 Member Helpline and registers the complaint. HML Executive registers the complaint and a Ticket Number is generated while resolution is done within the TAT (member can also trace the complaint with her customer id)
If the issue is not resolved or member is not satis ed with the resolution provided by the MHL team, she raises a complaint with the Ombudsman Team which will resolve the issue within the TAT
1
2
3
CG
R
Step-3
Step-2
Step-1
ustomer
reviance
edressal

Credit Plus Activities 75
MHL Executives adheres to 3 step authentication process on every call (Name, Husband name,
Address). Post listening to customer he categorizes it as query, service request and complaint. MHL agent records it online in customer relationship management module (CRM) and it is tracked in CRM. If it is a service request or complaint it is forwarded to responsible stakeholder as per responsibility matrix. All the complaints and service request have standardized turnaround times and escalation matrix which is signed off by senior management and ombudsman. TAT and ticket number is communicated to member during registration of call. Once the Complaint/service request is resolved, concerned department informs CGR on resolution provided which in turn is communicated to the member through MHL.
If it is a service request or complaint it is forwarded to responsible stakeholder as per responsibility matrix. All the complaints and service request have standardized turnaround times and escalation matrix which is signed off by senior management and ombudsman. TAT and ticket number is communicated to member during registration of call. Once the Complaint/service request is resolved, concerned
department informs CGR on resolution provided which in turn is communicated to the member
through MHL.
In case any complaint or service request exceeds TAT it is escalated and followed up by separate team and weekly updates are shared with senior management. In case member registers a call on
ombudsman helpline it is immediately escalated to top management on priority and follows a 3
day TAT.
MHL has an independent quality team which evaluates the quality of all the calls on basis of soft skills, CPP and best business practices standards. Monthly coaching and evaluation of agents is done on
the basis of quality performance.
Courtesy: Bharat Financial Inclusion Limited formerly known as SKS

The Bharat Microfinance Report 201676
SHG Movement and its Role in Financial InclusionChapter 5
1 Source: NABARD
SHG – Bank Linkage Programme, the largest microfinance model in the world, began formally in 1992 with a set of guidelines issued by NABARD. RBI facilitated commercial banks to lend to SHGs without
collateral. Since then it has taken the shape of a movement. This chapter will present an aggregate picture of the SHG-Bank Linkage Programme and various initiatives taken up under it like the digitization of SHGs and SHGs as BCs.
The following sections present a brief overview of each aspect of the programme:
5.1 Self Help Group Bank Linkage Programme (SBLP)
Self Help Group Bank Linkage Programme (SBLP) is a step to bring the “unbanked” poor into the formal banking system and to inculcate thrift and credit habits. A natural corollary is for the group members to graduate into seeking better livelihood opportunities through access to credit from financial institutions.
Key Statistics under SBLP as of March 20161
• Total number of SHGs saving-linked with banks – 79.03 lakh
• Total saving amount of SHGs linked with banks – `13691 crore
• Total number of SHGs with loan outstanding – 46.72 lakh
• Total loan amount outstanding – `57119 crore
• Total No. of SHGs credit linked during 2015-16 – 18.32 lakh
• Total Amount disbursed during 2015-16 – `37286 crore
• NPA declined by 0.59% over previous year.
SBLP Activity since Inception
Banks have been active in accepting SHGs’ savings and lending to SHGs since the early nineties. Figure 5.1 brings out the historical trend in credit linkage of SHGs.
Trend of SHGs linked to banks has remained positive since the beginning though the credit linked SHGs have witnessed a decline during the year 2010-11 and 2011-12 as a ramification of the AP crisis. The credit linkage to banks resumed a positive trend after year 2012-13 and continued in 2015-16.
Figure 5.1: Historical Trend in Credit Linkage and Bank Loan Disbursed
Source: Data compiled from various reports of NABARD
10 2 4 6 12 33 136 288 545 102218562994
44996570
8849
1225414453 14548
16534
20585
24017
27582
0
5000
10000
15000
20000
25000
30000
0.00
2.00
4.00
6.00
8.00
10.00
12.00
14.00
16.00
18.00
Ban
k L
oan
(`
in c
rore
)
No
. o
f S
HG
s (i
n l
akh
)
Bank Loan Amount (Rs in crore No.of SHGs (in lakh)

SHG Movement and its Role in Financial Inclusion 77
5.1.1 Savings Performance of SBLP
The SHG savings amount held by banks has been growing (Figure 5.2) except for a marginal decline in 2011-12. This is largely due to the decline in saving of SHGs in the Eastern region. As of March 2016, the banking system held SHG savings to the tune of `13691 crore which is 24% more than the previous year.
Figure 5.2: All India Trend in SHG Savings Amount Held in the Indian Banking System
Source: NABARD
Average Savings per SHG:
The average savings per SHG amount to `17324 at an all India level as of March 2016. Figure 5.3 depicts the trend in the average savings held by the banking system.
Figure 5.3: All India Trend in Average per SHG Savings held in the Banking System
Source: NABARD
61997016
6551
8217
9897
11059
13691
0
2000
4000
6000
8000
10000
12000
14000
16000
2009-10 2010-11 2011-12 2012-13 2013-14 2014-15 2015-16
Sav
ing
Am
ou
nt
(`in
cro
re)
8915 94038230
11230
1332114367
17324
0
2000
4000
6000
8000
10000
12000
14000
16000
18000
20000
2009-10 2010-11 2011-12 2012-13 2013-14 2014-15 2015-16
Ave
rag
e S
avin
g p
er S
HG
(`
)

The Bharat Microfinance Report 201678
Average savings per SHG have been on an increasing trend since 2011. Year 2015-16 witnessed an increase of 21% in comparison to last year. Average savings had previously witnessed a decline of 12% in 2011-12, but in the subsequent year, the decline was arrested and growth restored.
Figure 5.4 depicts the savings of SHGs as on 31 March 2016 with various Banks viz. Commercial Banks, Regional Rural Banks and Cooperative Banks. Commercial Banks continue to play a leading role, serving 52% of total number of SHGs and accounting for 66% of the total savings by SHGs in the banking system. RRBs holding second position by serving 29% of total number of SHGs and accounting for 18% of the total savings by SHGs followed by Cooperative Banks by serving 19% of total number of SHGs and accounting for 16% of the total savings.
Figure 5.4: Savings of SHGs with Banks as on 31 March 2016
Source: NABARD
5.1.2 No of SHGs Availed Bank Loan during 2015-16
The year 2015 -16 witnessed a 10% increase in the number of SHGs availing bank loans, as evident in Figure 5.5.
Figure 5.5: No. of SHGs Availed Bank Loan during 2015-16 from the Banking System
Source: NABARD
41 23 15 79
9034
2484 2173
13691
0
2000
4000
6000
8000
10000
12000
14000
16000
Commercial Bank Regional Rural Bank Cooperative Bank Total
Am
ou
nt
(`in
cro
re)
No. of SHGs (in lakhs) Saving Amount (Rs in crore)
16
12 1112
14
16
18
0
2
4
6
8
10
12
14
16
18
20
2009-10 2010-11 2011-12 2012-13 2013-14 2014-15 2015-16
No
. o
f S
HG
ava
iled
Ban
k L
oan
s (i
n l
akh
)

SHG Movement and its Role in Financial Inclusion 79
Figure 5.6 shows top 10 banks in terms of savings where Andhra Bank is leading with `1838 crore, followed by State Bank of India with `1399 crore.
Figure 5.6: Top 10 Banks in Terms of Savings
Source: NABARD
Figure 5.7 depicts that the loan amount disbursed to SHGs at all India level during the year was ̀ 37286 crore which is an increase of 35% in comparison to last year.
Figure 5.7: All India Trend in Bank Loan Amount Disbursed to SHGs
Source: NABARD
1838
1399
965818
448 444 441344
236 216
0
200
400
600
800
1000
1200
1400
1600
1800
2000
Sav
ing
Am
ou
nt
(`in
cro
re)
14859 1454816535
20585
24017
27582
37286
0
5000
10000
15000
20000
25000
30000
35000
40000
2009-10 2010-11 2011-12 2012-13 2013-14 2014-15 2015-16
Ban
k L
oan
Dis
bu
rsed
to
SH
Gs
(`in
cro
re)

The Bharat Microfinance Report 201680
Figure 5.8: Agency-wise Loan Disbursement – No. of SHGs and Loan Amount Disbursed
Source: NABARD
Maintaining the trend, Commercial Banks are leading the chart in terms of bank loans disbursed to number of SHGs and amount disbursed during 2015-16 with `25184 crore having been given out to 11.3 lakh SHGs (Figure 5.7). Commercial Banks alone account for around 68% of the total loan amount disbursed to SHGs. RRBs and Cooperative banks come in at the second and third positions with 25% and 8% respectively.
Figure 5.9: Top 10 Banks in Terms of Disbursement
11.3 4.7 2.2 18.2
25184
9164
2936
37284
0
5000
10000
15000
20000
25000
30000
35000
40000
Commercial Bank Regional Rural Bank Cooperative Bank Total
No. of SHGs (in Lakh) Loan Disbursed (Rs in Crore)
4580
3492
1869 1754 1677 1631 16311336 1267
962
0
500
1000
1500
2000
2500
3000
3500
4000
4500
5000
Sav
ing
Am
ou
nt
(`in
cro
re)
Source: NABARD
Figure 5.9 shows top 10 banks in terms of amount disbursed where Andhra Bank is leading with `4580 crores, followed by State Bank of India with `3492 crores.

SHG Movement and its Role in Financial Inclusion 81
Average Loan Disbursement per SHG
Figure 5.10: All India Trend in Average Bank Loan Amount Disbursed per SHG
Source: NABARD
The average loan amount disbursed per SHG has been on the increase. It was ̀ 203495 during 2015-16 across India (Figure 5.10). Average loan amount disbursed per SHG has been maintaining an increasing trend over the period of years.
5.1.3 Loan Outstanding with SHGs
The outstanding loan amount has been on an increasing trend, which demonstrates the business viability of SHG lending for banks (Figure 5.11) in these areas. In 2015-16, at an all India level, the loan outstanding amount has witnessed a growth of 11% in comparison to last year.
Figure 5.11: All India Trend in SHG Loan Outstanding in the Books of Banking System
Source: NABARD
93616
121623
144046
168732175769 169608
203495
0
50000
100000
150000
200000
250000
2009-10 2010-11 2011-12 2012-13 2013-14 2014-15 2015-16
Ave
rag
e D
isb
urs
emen
t p
er S
HG
(`
)
2803831221
3634039375
42927
51545
57119
0
10000
20000
30000
40000
50000
60000
2009-10 2010-11 2011-12 2012-13 2013-14 2014-15 2015-16
Lo
an O
uts
tnd
ing
(`
in c
rore
)

The Bharat Microfinance Report 201682
Average Loan Outstanding per SHG
Figure 5.12: All India Trend in Average per SHG Loan Outstanding in the Banking System
Source: NABARD
On an average, the loan outstanding per SHG as of March 2016 is `122242 at an all India level, which is a jump of around 6%
Figure 5.13: Agency-wise Bank Loan outstanding against SHGs as on 31 March 2016
Source: NABARD
Figure 5.13 depicts the agency wise bank loans outstanding against SHGs as on 31 March 2016. Yet again, Commercial Banks lead the chart, with around 65% of total bank loans outstanding. RRBs are a distant second with 28%, followed by Cooperative banks with 7%.
26.2 14.4 6 46.6
37145
16109
3864
57118
0
10000
20000
30000
40000
50000
60000
Commercial Bank Regional Rural Bank Cooperative Bank Total
No. of SHGs (in Lakh) Loan Outstanding (Rs in Crore)
5779565224
8345588455
102273
115361122242
0
20000
40000
60000
80000
100000
120000
140000
2009-10 2010-11 2011-12 2012-13 2013-14 2014-15 2015-16
Ave
rag
e O
uts
tan
din
g p
er S
HG
(`
)

SHG Movement and its Role in Financial Inclusion 83
Portfolio Quality
At an all India level, the NPAs of banks stood at 6.5%, with a decrease of 8% in comparison to last year.
Figure 5.14: Non Performing Asset Per Cent of SHG Loans with Banks
4.7
6.1
7 6.8 7.06.5
0
1
2
3
4
5
6
7
8
2010-11 2011-12 2012-13 2013-14 2014-15 2015-16
Source: NABARD
Figure 5.15: NPAs of Banks against SHGs Loan Outstanding
Source: NABARD
Figure 5.15 throws light on Non Performing Assets of Banks against SHG loans outstanding as of 31 March 2016. It is evident that Cooperative Banks have highest NPA with 8.3%. However, they account for only 63% of total bank loans outstanding. On the contrary, Regional Rural Bank, which account for 29% of total loan outstanding, have an NPA of 6.6% while Cooperative Bank account for 8% of total loan outstanding, have an NPA of 7.8%.
Integration of credit history of individual SHG members in the Credit Bureau could be a way forward for reducing NPAs. A report from the Aditya Puri Committee highlighted the need for sharing the data of SHG members with CIBs. Furthermore, the Nachiket Mor Committee also stated the need to develop a robust legal and regulatory framework around customer data generated in various transactions (credit and payments, digital and off-line), with the objective of customer ownership of their own transactions data and
232139
106429
30053
368621
8.3 6.6 7.8 6.450
50000
100000
150000
200000
250000
300000
350000
400000
Commercial Bank Regional Rural Bank Cooperative Bank Total
Bank Loan Outstanding against SHGs (Rs in lakh) %

The Bharat Microfinance Report 201684
its use, among others, for signaling credit-worthiness and reduction of NPAs. Therefore, credit reporting systems are very important in today’s financial system; this information flow enables credit markets to function more efficiently.
5.1.4 Credit Information Reporting in Respect of Self Help Group (SHG) Members
In this endeavour, Sa-Dhan in association with PlaNet Finance (now Positive Planet) rolled out a project on building an Inclusive Credit Information Bureau (ICIB) that aims at capturing data sets of individual level SHG members. The project aims at building credit history and strengthening creditworthiness of the clients, reduction in NPAs and building transparency in the system. One of the positive outcomes of the project was that RBI came out with its notification on including SHG data on credit bureaus in two phases.
Reserve bank through its notification of January 20162 has brought the client data of Self Help Groups into the framework of Credit Information Bureaus. The major features of this notification are:
Banks shall put in place necessary systems and procedures including making necessary changes to their system software so as to be able to begin collection of the relevant information from the SHG members and reporting the required information to the CICs from 1 July 2016 ( Phase I) and 1 July 2017 (Phase II).
Banks have the option to collect and report the SHG member level data either themselves or by outsourcing it to other entities. However, banks shall follow all general instructions on outsourcing set out in DBR circular No. BP 40/21.04.158/2006-07 dated November 3, 2006 as amended from time to time to the extent applicable and shall continue to be responsible for the correctness of the data submitted by the outsourced agencies to the CICs. Banks must put in place appropriate controls to ensure the correctness of the data submitted by the entities to which it is outsourced.
The credit information relating to individual SHG members shall be collected, reported and disseminated as per the provisions of the Credit Information Companies (Regulations) Act, 2005 and the extant RBI directions on credit information reporting by banks and MFIs.
The CICs shall make the necessary changes in their systems and procedures to implement the above directions as per the timelines indicated above.
5.2 Aajeevika - National Rural Livelihoods Mission (NRLM)
National Rural Livelihoods Mission (NRLM) was launched by the Ministry of Rural Development (MoRD), Government of India in June 2011. Aided in part through investment support by the World Bank, the Mission aims at creating efficient and effective institutional platforms of the rural poor enabling them to increase household income through sustainable livelihood enhancements and improved access to financial services. NRLM has set out with an agenda to cover 7 Crore rural poor households, across 600 districts, 6000 blocks, 2.5 lakh Gram Panchayats and 6 lakh villages in the country through self-managed Self Help Groups (SHGs) and federated institutions and support them for livelihoods collectives in a period of 8 -10 years3.
There are four components of the NRLM (World Bank – Government of India project). The first component of the project is institutional and human capacity development. The objective of this component is to transform the role of the Ministry of Rural Development (MoRD) into a provider of high quality technical assistance in the field of rural livelihoods promotion. The second component of the project is state livelihood support. The objective of this component is to support state governments in the establishment of the necessary institutional architecture for the implementation of the National Rural Livelihoods Mission (NRLM)
2 https://rbidocs.rbi.org.in/rdocs/notification/PDFs/C29131BD0B179E4747D099BB4F72394F5FEE.PDF3 http://aajeevika.gov.in/content/welcome-national-rural-livelihoods-mission-nrlm

SHG Movement and its Role in Financial Inclusion 85
activities from the state to the block level. The third component of the project is innovation and partnership support. The objective of this component is to create an institutional mechanism to identify, nurture and support innovative ideas from across the country to address the livelihood needs of the rural poor. The fourth component of the project is project implementation support. The objective of this component is to establish an effective project management unit at the national level that develops key systems and processes for coordination and management of the project and the NRLM.
According to the latest report of DAY-NRLM4, NRLM has now been rolled out across 30 States/UTs, Number of Districts with intensive blocks in NRLM States stood at 493, Number of Blocks identified for intensive approach in NRLM States is 3240, Number of Blocks where intensive implementation has commenced is 3217, Number of villages in which intensive implementation has started is 190154, Number of households mobilized into SHGs (in Lakh) is 305.4, Number of SHGs promoted (in Lakh) is 26.3, Number of Village Organizations promoted is 137060, Amount of credit mobilized through banks reached (in ` Lakh) 56197.8
The tables below indicate the present status of NRLM.
Table 5.1: Present Status of NRLM
YearTotal
SHGs
NRLM Com-
pliant SHGsNo. of Loans
Per SHG
No. of loans
% of NRLM
Compliant
SHGs
Year on Year Growth
of NRLM Compliant
SHGs (%)
2013-14 2811446 1424648 1674436 1.18 50.67
2014-15 3301885 1603147 1975072 1.23 48.55 13
2015-16 3891700 1787980 2296338 1.28 45.94 12
2016-17 4005067 1806340 2343134 1.30 45.10 1
As per NRLM, at present there are 4005067 SHGs of which NRLM compliant ones are 1806340 i.e. 45.29 % of the total SHGs. There is a growth of 1% on NRLM compliant SHGs over the previous year.
5 http://nrlm.gov.in/outerReportAction.do;jsessionid=2A5FB65BA021DBB02AC4D8585E139C9C?methodName=showIndex
The Bharat Microfinance Report 201686
BC Model and TechnologyChapter 6
6.1 Business Correspondent Model
The BC model is an innovative technology-based banking model which enables people in remote areas
of India access to formal financial institutions. In November 2009, the RBI advised banks to draw up
a road map to establish presence in every village with a population above 2000 individuals, through the
use of business correspondents and business facilitators. Apart from banking outlets, branchless banking
connectivity had been extended to 534477 villages by 31st March 2016, using banking correspondents1, a
sixteen-fold increase as compared to 31st March, 2010.
In recent years, India has witnessed a high rate of economic growth2, which has resulted in greater personal
wealth for many Indians. However, a vast section of the society is still financially excluded, meaning it does
not have access to formal financial institutions. In light of recent research that shows a strong correlation
between financial exclusion and poverty and inequality, the Indian government has made financial inclusion
an integral part of its planning strategy. But how do you spread a banking network to a huge number of
settlements at an affordable cost? In India, an effort has been made to achieve financial inclusion by using
information and communication technology through the Business Correspondent model. This chapter
discusses the model, the role of MFIs in rolling out this model and the challenges it faces.
Financial inclusion has both demand-side and supply-side issues. On the supply side, the banks need to
reach out to a wider section of society, including the poor and vulnerable. The issue here is high cost,
which can be reduced only through information and communication technology solutions. On the demand
side, the major factors are low income and low asset holdings. Due to difficulties in accessing credit, poor
people resort to their own personal savings to invest in health, education, or entrepreneurial activities. In
emergencies, their entire savings can be eroded, leaving them vulnerable. Hence, the effort is to distribute
all government social security payments through banking channels. Once people have established bank
accounts, they can deposit their government payments in the bank and also access formal credit from the
bank.
6.2 Reaching Doorsteps Through Business Correspondents
In January 2006, the Reserve Bank of India issued guidelines allowing banks to designate Business
Correspondents (BCs) to increase their outreach3. A BC is an entity that acts as a teller for the bank and
carries out a full range of transactions on behalf of the bank. BCs are paid commissions by banks for the
services they render. (In the same guidelines, the Reserve Bank of India also allowed banks to designate
Business Facilitators, which can refer the customers’ proposals or facilitate banking transactions, but are not
allowed to carry out actual transactions.) Initially, only non-governmental organizations (NGOs), micro-
finance institutions, registered nonbanking financial companies, and post offices were allowed to function
as BCs. However, now the guidelines have been expanded to include individuals, local grocery shops, and
for-profit companies. The objective of establishing the BC role was to reach all villages with populations
greater than 2,000 by March 2012, and then to reach the rest of the villages in a phased manner over three
to five years.
1 RBI Annual Report 2015 -162 www.minneapolisfed.org/publications/community-dividend/business-correspondent-model-boosts-financial-inclusion-in-india3 www.minneapolisfed.org/publications/community-dividend/business-correspondent-model-boosts-financial-inclusion-in-india

BC Model and Technology 87
6.3 Progress and Challenges
India’s financial inclusion initiative expanded its presence manifold in 2010–2016. The number of banking
outlets in villages increased from 67694 at the end of March 2010 to 586307 at the end of March 2016,
comprising 51830 branches, and 534477 through branchless mode.
Table 6.1: Financial Inclusion Plan-Summary Progress of all Banks including RRBs4
The use of the BC model has the potential to change the lives of millions of people in the remotest parts of
the country5. For poor and vulnerable people, who could not think of going to the bank, banking has come
to them. Increases in the number of bank accounts and the volume of loans and deposits in areas that use
the BC model could indicate there is now far greater awareness of banking services. Frauds and diversions
of government payments are declining as people get their social security and pension payments through
bank accounts, at their doorsteps. People no longer need to travel miles to get their pension payments. In
disasters like floods and earthquakes, the government will be able to provide financial relief at a much faster
rate and to the targeted people. Even in cases of medical emergencies, poor people who formerly had to take
out high-interest loans from money lenders to cover doctors’ bills will now have access to credit.
The BC model is being used effectively for overall community development and social empowerment.
People are benefiting from credit linkages facilitated by BCs and are becoming more self-reliant. With the
help of credit, today they are able to afford education for their children, which is changing their lives forever
Particulars
Year ended
March
2010
Year ended
March
2015
Year ended
March
2016
Progress
April’15-
March’ 16
Banking Outlets in Villages – Branches 33,378 49,571 51,830 2,259
Banking Outlets in Villages – Branchless Mode 34,316 504,142 534,477 30,335
Banking Outlets in Villages –Total 67,694 553,713 586,307 32,594
Urban Locations covered through BCs 447 96,847 102,552 5,705
Basic Savings Bank Deposit A/c through branches (No. in million) 60 210 238 28
Basic Savings Bank Deposit A/c through branches (` billion) 44 365 474 109
Basic Savings Bank Deposit A/c through BCs (No. in million) 13 188 231 43
Basic Savings Bank Deposit A/c through BCs (` billion) 11 75 164 89
BSBDA-Total (No. in million) 73 398 469 71
BSBDA Total (` billion) 55 440 638 198
OD facility availed in BSBDAs (No. in million) 0.2 8 9 1
OD facility availed in BSBDAs (` billion) 0.1 20 29 9
KCCs (No. in million) 24 43 47 4
KCCs (` billion) 1,240 4,382 5,131 749
GCC (No. in million) 1 9 11 2
GCC (` billion) 35 1,302 1,493 191
ICT-A/Cs-BC Transactions (No. in million) 26.5 477 826.8 350
ICT-A/Cs-BC Transactions (` billion) 6.9 859.8 1,686.90 827
4 RBI Annual Report 2015 -165 www.minneapolisfed.org/publications/community-dividend/business-correspondent-model-boosts-financial-inclusion-in-india

The Bharat Microfinance Report 201688
Although India’s progress on financial inclusion is considerable, it is far below the target. The shortfall is due
to several challenges that have hindered the growth of the BC model. They include:
• Operational hurdles, such as cash handling (transporting, safekeeping, etc.), irregular accounting,
frauds, and misappropriations.
• Viability issues. Despite an increasing level of awareness about the value of banking services, the
majority of no-frills accounts opened by BCs are inactive. This has raised concerns that the model
may not be viable. As a result, there is a shortage of funding for building the capacity of BCs. In
some cases, BCs have lost money, forcing them to close. In addition, expanding into unbanked
areas involves costs that banks have to absorb. If banks are not able to recover the cost for small
transactions, their ability to provide credit is limited.
• Regulatory concerns. Current regulations require BCs to complete accounting and settle cash with
bank branches within 24 hours of a transaction, which may not be possible due to the huge distances
involved.
Box 6.1: Peer-to-Peer Lending
Peer-to-peer (P2P) lending is an innovative form of crowd funding with financial returns. It involves the use of an online platform to bring lenders and borrowers together and help in mobilizing unse-cured finance. The borrower can either be an individual or a business requiring a loan. The platform enables a preliminary assessment of the borrower’s creditworthiness and collection of loan repayments. Accordingly, a fee is paid to the platform by both borrowers and lenders. Interest rates range from a flat interest rate fixed by the platform to dynamic interest rates as agreed upon by borrowers and lenders using a cost-plus model (operational costs plus margin for the platform and returns for lenders).
One of the main advantages of P2P lending for borrowers is that the rates are lower than those offered by money lenders/unorganised sector, while the lenders benefit from higher returns than those obtained from a savings account or from any other investment.
Although there has been significant growth in online lending platforms globally, there is no uniformity in the regulatory stance with regard to this sector across countries. While P2P lending platforms are banned in Japan and Israel, they are regulated as banks in France, Germany and Italy, and are exempt from any regulation in China and South Korea.
Differences in regulatory stance emanate ideologically. It is argued that regulation may stifle the growth of this nascent sector. On the other hand, proponents of regulation argue that the unregulated growth of this sector may breed unhealthy practices by market players and may, in the long-run, have systemic concerns given the susceptibility of this sector to attract high risk borrowers and also weaken the monetary policy transmission mechanism.
In India, there are currently many online P2P lending platforms and the sector has been growing at a rapid pace. The Reserve Bank released a consultation paper on P2P lending in April 2016. The paper deliberated the advantages and disadvantages of regulating P2P platforms and underscored the need to develop a balanced regulatory approach that would protect lenders and borrowers without curbing the underlying innovations. Accordingly, P2P platforms are proposed to be regulated as a separate category of NBFCs. The feedback received on the paper from various stakeholders is being examined to finalise the regulatory framework.
Source: RBI Annual Report 2015 -16

BC Model and Technology 89
6.4 MFIs as Business Correspondents
Many MFIs are increasingly going in for a BC mode of operations as it frees them from the problems related
to accessing funds from banks and financial institutions. Data has been obtained from MFIs regarding their
BC operations. To the extent received the data is presented in the Tables below.
The MFIs which reported data had been operating as BCs of 13 banks (Table 6.2).
Table 6.2: MFIs as Banking Correspondents – No. of Saving Clients and Amount Saved
S.No. Name of the Banks Name of MFINo. of MFIs
Bank Wise No. of Saving
Clients
Bank Wise Amount Saved
(` in crore)
1 Canara Bank Blaze Trust, Bengal Women Welfare Association, SKDRDP
3 157510 25
2 Corporation Bank SKDRDP 1 977105 129
3 ICICI Bank Blaze Trust, Prayas JAC, Cashpor Micro Credit
3 240134 5
4 IDBI Light Microfinance Pvt. Ltd, SKDRDP, Bal Mahila Vikas Samiti
3 806170 207
5 IndusInd Bank Ltd. Cashpor Micro Credit 1 112848 5
6 Pragati Krishna Grameena Bank
SKDRDP 1 541680 124
7 Ratnakar Bank SKDRDP 1 91352 16
8 State Bank of India Blaze Trust, Dakshin Budhakhali Improvement Society, Organisation for Development Integrated Social and Health Action.
3 47416 5
9 State Bank of Mysore SKDRDP 1 140000 21
10 Syndicate Bank SKDRDP 1 215000 80
11 Union Bank of India SKDRDP 1 625570 113
12 Vijaya Bank SKDRDP 1 89647 75
13 Yes Bank Centre For Development Orientation & Training, PRAYAS , Arth Microfinance Pvt. Ltd, Disha India Micro Credit.
4 69679 67
Total 4114111 871

The Bharat Microfinance Report 201690
Table 6.3: MFIs as Banking Correspondents – No. of Loan Clients, Amount Disbursed and Amount Outstanding
S.No. Name of the Banks Name of MFINo. of MFIs
Bank Wise No. of Loan Clients
Amount of Loan
Disbursed (in crore)
Loan Amount
Outstand-ing (in crore)
1 Bank of India Gramalaya Urban and Rural Development Initiatives and Network
1 230 0.32 0.32
2 Canara Bank Asomi Finance Pvt. Ltd, Bengal Woman Welfare Society, SKDRDP
3 157510 241 202
3 Corporation Bank SKDRDP 1 977105 1051 866
4 DCB Bank Annapurna Micro Finance (P) Ltd, Peoples Forum, Pahal Financial Services Pvt. Ltd.
119042 132 141
5 Edelweiss SV Creditline Pvt. Ltd. 1 119213 232
6 ICICI Bank Asomi Finance Pvt. Ltd, Cashpor Micro Credit, People's Action for Transformation.
3 34622 50 45
7 IDBI Bank Annapurna Micro Finance Pvt. Ltd, Arohan Financial Services Pvt. Ltd, Asomi Finance Pvt. Ltd, Bhartiya Micro Credit, Grama Vidiyal Micro Finance Ltd, Jagaran Microfin Pvt. Ltd, Light Microfinance Pvt. Ltd, Mahashakti Foundation, Nirantara FinAccess Pvt. Ltd, Samasta Micro finance Ltd, Sonata Finance Pvt. Ltd, Gramin Mahila Swayamsiddha Sangh Rajgurunagar, Hand in Hand, Sarala Development and Microfinance Pvt. Ltd , Humana People to People India, Saija Finance Pvt. Ltd., SKDRDP, Uttrayan Financial Services Pvt. Ltd, Adhikar Micro Finance Pvt. Ltd, Cashpor Micro Credit, Margdarshak Financial Services Ltd, People's Action for Transformation, Sakhi Samudaya Kosh, ASA International India Microfinance Pvt. Ltd, Sambandh Finserve Pvt. Ltd, Samhita Community Development Services, Sreema Mahila Samity, Bal Mahila Vikas Samiti
28 1217112 1666 1553
8 IndusInd Bank Arohan Financial Services Pvt. Ltd, Suryoday Micro Finance Ltd, Sonata Finance Private Limited, SV Creditline Pvt. Ltd, Utkarsh Microfinance Pvt. Ltd, Cashpor Micro Credit, Samhita Community Development Services
7 587638 792 770
9 Kashi Gomti Samyut Gramin Bank
Bhartiya Micro Credit 1 3075 5.52 3.78
10 Kotak Mahindra Bank
SV Creditline Pvt. Ltd. 1 45175 81

BC Model and Technology 91
11 MAS Financial Service Ltd.
Prayas, Hindusthan Microfinance Pvt. Ltd, ASA International India Microfinance Pvt. Ltd.
3 22556 47 43
12 Nirmal Ujjwal Credit Co-operative Society Ltd,
Hindusthan Microfinance Pvt. Ltd 1 28564 66 57
13 Pragati Krishna Grameena Bank
SKDRDP 1 541680 871 800
14 Ratnakar Bank SKDRDP 1 91352 212 65
15 RBL Bank Nirantara FinAccess Pvt. Ltd, Sonata Finance Pvt. Ltd.
2 37331 94 82
16 Sornammal Educational Trust
Varam Capital Pvt. Ltd. 1 265 1
17 State Bank of India
Organisation for Development Integrated Social and Health Action
1 2864 1 1
18 State Bank of Mysore
SKDRDP 1 140000 236 240
19 Swarna Pragati Housing Micro Finance
Mahashakti Foundation, Sakhi Samudaya Kosh, Gram Utthan
3 5294 54 37
20 Syndicate Bank SKDRDP 1 215000 421 265
21 Tata Capital Financial Services Ltd
Light Microfinance Pvt. Ltd. 1 13
22 Union Bank of India
Bhartiya Micro Credit, SKDRDP 2 639156 658 1020
23 Utkal Grameen Bank
Organisation for Development Integrated Social and Health Action
1 604
24 Vijaya Bank SKDRDP 1 89647 270 250
25 Yes Bank Centre For Development Orientation & Training, Grama Vidiyal Micro Finance Limited, Humana People to People India, Margdarshak Financial Services Ltd, Mahashakti Foundation, Peoples Forum, Samasta Microfinance Ltd, Prayas, Bhartiya Micro Credit, Adhikar Micro Finance Pvt. Ltd, Institute of Rural Credit and Entrepreneurship Development, Adhikar, Arth Microfinance Pvt. Ltd., G U Financial Services Pvt. Ltd, Sakhi Samudaya Kosh, Sambandh Finserve (P) Ltd, Samhita Community Development Services, Uttrayan Financial Services Pvt. Ltd, Disha India Micro Credit
19 400882 574 437
Total 5475930 7443 7191

The Bharat Microfinance Report 201692
6.5 Use of Technology in BC
The Reserve Bank of India’s guidelines regarding BCs allow flexibility to banks regarding the use of technology for financial inclusion. This has resulted in innovations to provide inexpensive and efficient technological solutions. Today a vast array of technology, including hand-held mobile devices, Internet, and mini-ATMs and kiosks, is available. However, in India there are challenges relating to electricity and Internet connectivity in remote areas. As a result, mobile phone technology has emerged as the most effective and prevalent solution. Most of the banks use General Packet Radio Service (GPRS) enabled mobile-based online applications. Portable printing devices are synchronized with mobile handsets. Data are transferred to the bank’s intermediary server in real time. Internet security features include a default GPRS security check, an HTTPS-enabled database, and log-in password security check. Each of the BC’s customers is given a biometric smartcard, which makes identification easier and more secure. With the use of mobile technology, banks can reach vast geographic areas from a remote location.
Technology, innovation, and knowledge have become the key drivers of economic growth today6. A broad scan, across many industry verticals, suggests that much of the economic growth of the last decade has been facilitated by the existence of strong technology platforms.
The effective absorption and utilization of data and information is extremely important for any sector at various developmental stages. However, the importance of data management becomes more pronounced at the advent of the growth stage when an industry is expanding and diversifying rapidly. This is the state in which the Indian Microfinance industry is in today. As part of this growth stage, microfinance in India is undergoing rapid changes and discovering new challenges. Collecting money from scattered, remote clients, the cost of service delivery transactions in the “last mile”, effective information exchange at the institutional level, and effective growth management are just a few of the many challenges confronting MFIs. As a result, microfinance practitioners’ motivations to use technology interventions are the same as those for any other similar business model: technologies’ ability to speed up the flow of information and capital, automate transactions, control and analyze data, improve customer experience, reduce transaction costs, and increase efficiency and customer outreach. Technology potential has, therefore, led Microfinance stakeholders to believe that technology can have a profound impact on their operations.
As a result, technologies’ promise and potential is being explored by both technology providers and microfinance institutions. Though microfinance significantly differs in some ways from the traditional banking industry, traditional banking technologies, when applied innovatively in developing countries, have played a role in reducing costs and increasing outreach and penetration, of the microfinance model. Management Information Systems (MIS), Point of Sale technologies (POS), Automatic Teller Machines (ATMs), Interactive Voice Response (IVR) systems and smart cards are among the major technologies that have entered microfinance over the years from the formal financial sector. Across the four major stakeholder groups, technology can meet the process requirements and increase general information sharing, efficiency, and lower costs.
6 Indiasearchjournal.com

BC Model and Technology 93
Box 6.2: Cashless Project - Journey so Far
In the current scenario, the functioning of micro finance industry is such that it entails cash movement in very high volumes. This has adverse implications from a risk, efficiency and human resource perspective and is contradictiory with the government’s prime agenda of ‘Cashless India’. The associated operational risks/costs include, loss due to theft, fake currency, excess cash carrying in branch vaults insurance cost, legal expenses as well as excess man-hours invested in dealing with the operational and security concerns.
Cash handling at a large scale also compromises the operational efficiency. For instance, route planning of the branch staff is done with a view to only manage cash carrying risk. the centre meetings are scheduled keeping in mind the banking hours, wherein more than fifty percent of the time is devoted to cash counting and reconciliation, Branch staff have to visit the villages for a second time to comply with the CGT, and Pre GRT process as the same cannot be done immediately after the centre meetings due to cash carrying.
More than the financial risk and operational efficiency, the most concerning factor is the physical safety of the employees which is also at risk while they are carrying the huge volumes of cash over large distances. Moreover, complying with the security procedures, very often the staff who is at the receiving end of in cases of theft / snatching feels harassed in the routine of cross questioning by the authorities. The rise in criminal cases of theft / snatch over the past few months has had an adverse impact on the morale of the work force. The stressful work conditions are also bound to adversely impact the staff productivity. Thus, it was imperative that a permanent alternate solution is sought.
To address the problem of cash carrying, Satin Creditcare Network Limited (SCNL) in partnership with ItzCash commenced the collection from centres through closed loop prepaid cards which was piloted in Loni and Khair branches in May 2015. The project garnered huge success with a stark fall in physical cash transactions which in turn reflected well on the operational from, arresting the risks involved and bettering the transactional efficiency. The initial success derived from the pilot project encouraged the company to take this project to new heights.
One of the most challenging areas to work however was to kick start the project on a massive scale and Bihar was the state which ushered in the rising Sun of the cashless project.
Day to day challenges paved way for innovative solutions, which when implemented yielded better results. ItzCash provided a whole gamut of customer centric and innovative solutions It pioneered prepaid payment in India and also initiated the concept of digital payment solutions to the Indian consumer and business entities. Other products include the country’s first SMS based payments way back in 2006 to India’s first bank partnered open loop prepaid program with access to online as well as offline retailers and ATM, India’s first NFC based programs for government departments as well consumers. It is also differentiated as a “Phygital” brand; owing to the strong omni-channel presence across both physical and digital networks. These innovations paved a concrete path for the cashless revolution which started gaining pace across all geographical locations where Satin was currently operating. The program took a serious note of the distribution periphery while penetrating deeper in the operational locations.
ItzCash has put up a robust distribution model entailing a well-entrenched network of franchise outlets across the country comprising of more than 75000 retail touch points. The network is well poised to

The Bharat Microfinance Report 201694
roll out multiple distribution models including customised payment solutions for industries like Direct Selling, Government Payments among others. It also rolled out bank partnered open loop network branded instruments which provides access to payments both online and digital besides access back to your money through ATMs. It therefore services customers across all three segments of banked, under-banked and unbanked.
Presently we are operational in more than 260 branches across the geographies and transactions worth more than 3 crore are happening on a daily basis which are being routed through the cashless mode and we are still adding numbers on a daily basis. The average time a CSO was devoting to cash handling was approximately 1/3 of his total working time. Post implementation of the cashless project the life of CSO has now become easier with the complexities in the daily scenario of handling cash being now averted and the challenges associated with it having taken a back seat.
With the project being implemented in full scale criminal offences like theft and snatches will be completely abolished from the system rendering a very customer friendly and secured ambience for financial transactions.
Courtesy: Satin Creditcare Network Limited. and ItzCash

Annexures 95
State wise Presence of Different MFIsAnnexure 1
Name of the
States/UTsName of the MFIs
Total
No. of
MFIs in
opera-
tion.
No. of
MFIs hav-
ing head-
quarter in
same state
State
wise
District
covered
Andhra Pradesh
Disha Microfinance Pvt. Ltd, FFSL, KBSLAB, NABARD, RASS, Sanghamithra, Spandana, AML, SML
9 1 13
Arunachal Pradesh
NEREFS, Nightingale Finvest, RGVN NE 3 0 5
Assam Ajagar, Annapurna Microfinance, Arohan, ASA International, Asomi, Deshabandhu Micro, Grameen Development &
Finance Pvt. Ltd, Janalakshmi, KDS, NEREFS, Nightingale
Finvest, Prochesta, RGVN NE, Sarala, SATRA, Ujjivan, Unacco, Uttrayan, Village Fin, YVU, SML
21 9 25
Andaman BMC, BWDA 2 0 1
Bihar Annapurna Microfinance, Arohan, ASA International, Basix, BMC, Cashpor, CDoT, CPSL, Dhosa, ESAF, Intrepid Finance, Jagaran, Janalakshmi, KDS, Margdarshak, Mass Care, NBJK, NEED, Prayas Jac, Saija, Sarala, Satin Creditcare, Seba Rahara, SKS, SMGBK, SVCL, Ujjivan, Utkrash, Uttrayan, Vedika, Village Fin, Sonata, AML, SML
34 4 38
Chandigarh Satin Creditcare, Ujjivan 2 0 1
Chhattisgarh Altura, Annapurna Microfinance, Basix, Cashpor, Equitas, ESAF, Grameen Koota, Growing Opportunity, Hindusthan Microfinance, Janalakshmi, NABARD, Sambandh, Samhita, Satin Creditcare, SKS, Spandana, SVCL, Ujjivan, Utkrash, Varam, People’s Forum, SML
22 0 23
Delhi Basix, BMC, Gramin Micro Credit Foundation, Janalakshmi, NEREFS, Prayas Jac, Satin Creditcare, Shikhar Microfinance, SKS, Ujjivan, Utkrash, SML
12 4 7
Goa Spandana, Ujjivan, AML 3 0 1
Gujarat Adhikar Microfinance Pvt. Ltd, BMC, Disha Microfinance
Pvt. Ltd, Equitas, FFSL, Grama Vidiyal, Janalakshmi, Light
Microfinance, Namra Finance, Prayas, Saath, Satin Creditcare, Sewa Bank, Shroff, SKS, Spandana, Suryoday, Swayam Micro
Services, Ujjivan, Pahal Financial Services, AML, SML
22 9 33
Haryana Altura, Disha India, Equitas, HPPI, Janalakshmi, Margdarshak, Midland Microfin, Satin Creditcare, Shikhar Microfinance, SKS, SVCL, Ujjivan, Utkrash, Sonata, Helping Nation, SML
16 2 20
Himachal Pradesh
Disha India, Satin Creditcare, SKS, Ujjivan, Utkrash 5 0 4
Jammu & Kashmir
Satin Creditcare 1 0 1
Note : Names in bold indicate that the MFI is headquartered in that state.

The Bharat Microfinance Report 201696
Jharkhand Annapurna Microfinance, Arohan, Basix, Cashpor, ESAF, HPPI, Jagaran, Janalakshmi, KDS, MESP, NABARD, NBJK, Saija, Sambandh, Satin Creditcare, SKS, Spandana, Ujjivan, Utkrash, Vedika, Village Fin, People's Forum, AML, SML
24 2 24
Karnataka Basix, BSS Mirofin, Chaitanya India Fin Credit, Disha Microfinance Pvt. Ltd, Equitas, ESAF, FFSL, Grama Vidiyal, Grameen Koota, Hand In Hand, IDF, Intrepid Finance, IRCED, Janalakshmi, KBSLAB, Madura Micro Finance, NABARD, Navachetna, Opportunity Microfinance, Prakruthi
Foundation, Rors, Samasta Microfinance, Sanghamithra,
SKDRDP, SKS, Spandana, Suryoday, Ujjivan, AML, SML, Muthoot Microfin, Nirantara FinAccess
32 14 30
Kerala Blaze Trust, ESAF, FREED, Grama Vidiyal, Impact, Jeevankiran,
Life Foundation, Madura Micro Finance, NABARD, SKDRDP, SKS, Spandana, Ujjivan,WSE, SML, Muthoot Microfin
16 5 13
Madhya Pradesh
Annapurna Microfinance, Anupama Human Economic
Development, Arth Finance, Basix, BMC, Cashpor, Disha Microfinance Pvt. Ltd, Equitas, ESAF, FFSL, Grama Vidiyal, Grameen Koota, Hand In Hand, Hindusthan Microfinance, Intrepid Finance, Janalakshmi, Lok Biradari, NABARD, Namra Finance, Prayas, Samhita, Sanghamithra, Satin Creditcare, SKS, Spandana, Suryoday, SVCL, Ujjivan, Utkrash, Vama, Sonata, Swashree Mahila Sakh,People's Forum, Pahal Financial
Services, Yukti Samaj Sewa Society, AML, SML
37 6 48
Maharashtra Anik Financial Services Pvt. Ltd, Annapurna Mahila,
Annapurna Microfinance, Basix, BMC, BSS Mirofin, Chaitanya India Fin Credit, Disha Microfinance Pvt. Ltd, dMatrix, Equitas, ESAF, FFSL, G B P Nobel, Grama Vidiyal, Grameen Koota, Hand In Hand, Hindusthan Microfinance, IDF, Intrepid Finance,
IRCED, Janalakshmi, Madura Micro Finance, NABARD, Navachetna, Samasta Microfinance, Sampada, Sanghamithra, Satin Creditcare, SKS, Spandana, SSK, Suryoday, Ujjivan, Unnati
Microfin, Utkrash, Sonata, Samruddhi Welfare, People's Forum, Pahal Financial Services, Gramin Mahila Swayamsiddha Sangh, AML, SML
42 13 36
Manipur Chanura Microfin, NEREFS, Unacco, VVD, YVU, WSDS
Initiate
6 5 9
Meghalaya Annapurna Microfinance, Basix, Grameen Development & Finance Pvt. Ltd, NEREFS, Nightingale Finvest, RGVN NE, Ujjivan
7 0 6
Mizoram NABARD, NEREFS, Nightingale Finvest, Unacco, WSDS Initiate, 5 0 8
Nagaland Grameen Development & Finance Pvt. Ltd, NEREFS, RGVN NE, 3 0 2

Annexures 97
Odisha Adhikar, Adhikar Microfinance Pvt. Ltd, Annapurna Micro-
finance, Arohan, Basix, Gram Utthan, GU Financial, Hand In Hand, Jagaran, Janalakshmi, KDS, Mahashakti, ODISHA, Sam-
bandh, SARC, SKS, SMCS, Spandana, Suryoday, Swayanshree
Mahila, The Eastern Multipurpose, Ujjivan, Village Fin, Peo-
ple's Forum, Helping Nation, AML, Prasad Foundation
27 14 31
Puducherry BWDA, Equitas, ESAF, FFSL, Grama Vidiyal, Hand In Hand, Janalakshmi, Sarvodaya Nano, SMILE, Suryoday, Ujjivan, Valar Aditi
12 0 4
Punjab Equitas, Janalakshmi, Midland Microfin, NEREFS, Satin Credit-care, SKS, SVCL, Ujjivan, Sonata
9 0 21
Rajasthan Annapurna Microfinance, Arth Finance, Basix, Disha Microfinance Pvt. Ltd, Equitas, Hand In Hand, HPPI, Janalakshmi, Light Microfinance, Matashree, Midland Microfin, PSC, Pustikar, Satin Creditcare, SKS, Suryoday, SVCL, Ujjivan, Sonata, AML, SML,
21 3 31
Sikkim Basix, RGVN NE, , Village Fin 3 0 2
Tamil Nadu Blaze Trust, BWDA, Disha Microfinance Pvt. Ltd, Equitas, ESAF, FFSL, Grama Vidiyal, Grameen Koota, Growing Oppor-
tunity, Guardian, Hand In Hand, Impact, Janalakshmi, Madura
Micro Finance, Mahasemam, NABARD, Opportunity Microfi-nance, PAT, RASS, Repco Micro Finance, Rors, Samasta Mi-crofinance, Sanghamithra, Sarvodaya Nano, SMILE, Suryoday, Ujjivan, Valar Aditi, Varam, Virutcham, READ, SML, Muthoot Microfin
33 18 34
Telangana KBSLAB, NABARD, Spandana, Pragathi Seva Samithi, AML,
SML
6 5 9
Tripura Annapurna Microfinance, ASA International, Basix, KDS, NEREFS, RGVN NE, Ujjivan, Unacco, Village Fin
9 0 8
Uttarakhand Balajee Sewa, Basix, BMC, Disha India, HPPI, Janalakshmi, Margdarshak, NEREFS, Satin Creditcare, Shikhar Microfinance, SKS, SVCL, Ujjivan, Utkrash, Sonata, SML
16 0 9
Uttar Pradesh ASA International, Basix, BMC, Cashpor, Disha India, Futureage
India, Gramottan Micro, HPPI, Intrepid Finance, Janalakshmi, Margdarshak, NEED, Saija, Samhita, Satin Creditcare, Shikhar Microfinance, SKS, Spandana, SVCL, Ujjivan, Utkrash, Vedika,
Sonata, AML, SML
25 10 71
West Bengal Agradut Polly Unnayan Samity, Arohan, ASA International,
Bagaria Relief Welfare, Barasat Sampark, Barasat U Prostuti, Basix, BJS, Boys' Recreation Club, BURS, BWWA, Dakshin
Budhakali, Destiny, Dhosa, DISA, ESAF, Jagaran, Janalakshmi, KDS, MESP, NABARD, Purba Barasat Prerana, Sahara Utsarga,
Sampurna, Sarala, Satin Creditcare, Seba Rahara, SKS, SMGBK,
Swayamsampurna, Ujjivan, Unacco, Uttrayan, Vedika, Village
Fin, VSSU, Bagnan Mahila, Barasat Grameen Society, Parama
Mahila Samitee, Helping Nation, Jamalpur Panchyajanya, Bar-
asast Society, Sreema Mahila Samity, AML, SML
45 32 20
Total 588

The Bharat Microfinance Report 201698
District wise Number of MFIs in OperationAnnexure 2
S.No. Name of the District
No. of
MFIs
Operating1 North 24 Parganas 222 Indore 203 South 24 Parganas 204 Kanchipuram 185 Thiruvallur 186 Shimoga 177 Nagpur 178 Coimbatore 179 Erode 1710 Patna 1611 Haveri district 1612 Jabalpur 1613 Amravati 1614 Kolhapur 1615 Vellore 1616 Kolkata 1617 Vaishali 1518 Bangalore Rural 1519 Mysore 1520 Tumkur 1521 Chhindwara 1522 Jalgaon 1523 Yavatmal 1524 Cuttack 1525 Chennai 1526 Cuddalore 1527 Salem 1528 Virudhunagar 1529 Nadia 1530 Muzaffarpur 1431 Raipur 1432 Ahmedabad 1433 Belgaum 1434 Chamarajnagar 1435 Gadag 1436 Dhar 1437 Hoshangabad 1438 Khandwa (East Nimar) 1439 Sagar 1440 Seoni 1441 Ujjain 14
42 Bhadrak 14
43 Baleswar(Balasore) 14
44 Thiruvarur 14
45 Tiruvannamalai 14
46 Thirupur 14
47 Villupuram 14
48 Bardhaman 14
S.No. Name of the District
No. of
MFIs
Operating49 Kamrup 13
50 Bilaspur 13
51 Durg 13
52 East Singhbhum 13
53 Dharwad 13
54 Harda 13
55 Katni 13
56 Mandla 13
57 Ratlam 13
58 Aurangabad 13
59 Latur 13
60 Pune 13
61 Dindigul 13
62 Nagapattinam 13
63 Namakkal 13
64 Pudukkottai 13
65 Samastipur 12
66 Vadodara 12
67 Hazaribag 12
68 Ranchi 12
69 Bagalkot 12
70 Bellary 12
71 Davanagere 12
72 Hassan 12
73 Gulbarga 12
74 Kolar 12
75 Bhopal 12
76 Ahmednagar 12
77 Satara 12
78 Solapur 12
79 Wardha 12
80 Bargarh (Baragarh) 12
81 Khordha 1282 Jaipur 1283 Kanyakumari 1284 Madurai 1285 Sivagangai 1286 Tirunelveli 1287 Howrah 1288 Murshidabad 1289 Gaya 1190 Nalanda 1191 Kheda 1192 Sabarkantha 1193 Bidar 1194 Chikkaballapur 1195 Chikkamagaluru 1196 Chitradurga 1197 Mandya 11

Annexures 99
S.No. Name of the District
No. of
MFIs
Operating98 Dewas 1199 Khargone (West Nimar) 11100 Vidisha 11101 Akola 11102 Nashik 11103 Sangli 11104 Jajapur (Jajpur) 11105 Kalahandi 11106 Sambalpur 11107 Alwar 11108 Theni 11109 Birbhum 11110 Hooghly 11111 Bhojpur 10112 Saran 10113 Rajnandgaon 10114 Bokaro 10115 Ramgarh 10116 Koppal 10117 Raichur 10118 Ramanagara 10119 Betul 10120 Mandsaur 10121 Narsinghpur 10122 Neemuch 10123 Raisen 10124 Rewa 10125 Satna 10126 Beed 10127 Osmanabad 10128 Bolangir (Balangir) 10129 Kendujhar (Keonjhar) 10130 Koraput 10131 Krishnagiri 10132 Tanjore 10133 Trichy 10134 Udham Singh Nagar 10135 Allahabad 10136 Chandauli 10137 Deoria 10138 Jaunpur district 10139 Mirzapur 10140 Varanasi 10141 Malda 10142 Uttar Dinajpur 10143 Kamrup Metropolitan 9144 Darbhanga 9145 East Champaran 9146 Katihar 9147 Purnia 9
S.No. Name of the District
No. of
MFIs
Operating148 Janjgir-Champa 9149 Korba 9150 Mehsana 9151 Ambala 9152 Karnal 9153 Kurukshetra 9154 Yamuna Nagar 9155 Dhanbad 9156 Kodagu 9157 Vijayapura 9158 Yadgir 9159 Ashok Nagar 9160 Burhanpur 9161 Bhandara 9162 Dhule 9163 Dhenkanal 9164 Rayagada 9165 Sundargarh (Sundergarh) 9166 Puducherry 9167 Nilgiris 9168 Dehradun 9169 Haridwar 9170 Nainital 9171 Ambedkar Nagar 9172 Gorakhpur 9173 Nagaon 8174 Sonitpur 8175 Begusarai 8176 Buxar 8177 Nawada 8178 Rohtas 8179 Mahasamund 8180 Anand 8181 Aravalli 8182 Gandhinagar 8183 Surat 8184 Dumka 8185 Giridih 8186 Bangalore Urban 8187 Barwani 8188 Chhatarpur 8189 Damoh 8190 Guna 8191 Sehore 8192 Shajapur 8193 Thane 8194 Jharsuduga 8195 Mayurbhanj 8196 Nuapada 8197 Subarnapur (Sonepur) 8

The Bharat Microfinance Report 2016100
S.No. Name of the District
No. of
MFIs
Operating198 Pali 8199 Ariyalur 8200 Thoothukudi 8201 Agra 8202 Aligarh 8203 Bareilly 8204 Faizabad 8205 Kushinagar 8206 Lucknow 8207 Dakshin Dinajpur 8208 Medinapore (Purba) 8209 Nalbari 7210 Bhagalpur 7211 Gopalganj 7212 Khagaria 7213 Kishanganj 7214 Banaskantha 7215 Koderma 7216 Seraikela Kharsawan 7217 Uttara Kannada 7218 Alappuzha 7219 Ernakulam 7220 Kottayam 7221 Balaghat 7222 Gwalior 7223 Rajgarh 7224 Shahdol 7225 Angul 7226 Ganjam 7227 Kandhamal 7228 Nabarangpur 7229 Nayagarh 7230 Puri 7231 Patiala 7232 Bhilwara 7233 Karur 7234 Perambalur 7235 West Tripura 7236 Basti 7237 Fatehpur 7238 Ghazipur 7239 Hathras (Mahamaya Nagar) 7240 Maharajganj 7241 Mathura 7242 Saharanpur 7243 Sitapur 7244 Sultanpur 7245 Bankura 7246 Cooch Behar 7247 Medinapore (West) 7
S.No. Name of the District
No. of
MFIs
Operating248 Barpeta 6249 Bongaigaon 6250 Darrang 6251 Goalpara 6252 Jorhat 6253 Marigaon 6254 Aurangabad 6255 Siwan 6256 Baloda Bazar 6257 Mungeli 6258 Raigarh 6259 Bharuch 6260 Narmada 6261 Panchmahal 6262 Rewari 6263 Deoghar 6264 Dakshina Kannada 6265 Idukki 6266 Palakkad 6267 Thrissur 6268 Panna 6269 Buldhana 6270 Mumbai City 6271 Nanded 6272 Washim 6273 Imphal East 6274 East Khasi Hills 6275 Debagarh (Deogarh) 6276 Jalandhar 6277 Ludhiana 6278 Ajmer 6279 Bikaner 6280 Kota 6281 Nagaur 6282 Tuticorin 6283 Azamgarh 6284 Budaun 6285 Firozabad 6286 Ghaziabad 6287 Kaushambi 6288 Lakhimpur Kheri 6289 Mau 6290 Meerut 6291 Moradabad 6292 Sant Kabir Nagar 6293 Unnao 6294 Darjeeling 6295 Jalpaiguri 6296 Purulia 6297 Chittoor 5

Annexures 101
S.No. Name of the District
No. of
MFIs
Operating298 Golaghat 5299 Jehanabad 5300 Kaimur 5301 Dhamtari 5302 Surguja 5303 New Delhi 5304 North West Delhi 5305 Dahod 5306 Mahisagar 5307 Morbi 5308 Navsari 5309 Patan 5310 Valsad 5311 Hissar 5312 Kaithal 5313 Mahendragarh 5314 Palwal 5315 Panipat 5316 Rohtak 5317 Pakur 5318 West Singhbhum 5319 Pathanamthitta 5320 Thiruvananthapuram 5321 Gondia 5322 Hingoli 5323 Bishnupur 5324 Boudh (Bauda) 5325 Gajapati 5326 Bathinda 5327 Kapurthala 5328 Chittorgarh 5329 Jodhpur 5330 Sikar 5331 Dharmapuri 5332 Ramanathapura 5333 Tiruchirappalli 5334 Ballia 5335 Barabanki 5336 Bijnor 5337 Chitrakoot 5338 Gonda 5339 Hapur (Panchsheel Nagar) 5340 Hardoi 5341 Pilibhit 5342 Pratapgarh 5343 Sant Ravidas Nagar 5344 Shahjahanpur 5345 Dhemaji 4346 Dhubri 4347 Lakhimpur 4
S.No. Name of the District
No. of
MFIs
Operating348 Sibsagar 4349 Araria 4350 Banka 4351 West Champaran 4352 Balod 4353 Bemetara 4354 Gariaband 4355 Jashpur 4356 Koriya 4357 Surajpur 4358 West Delhi 4359 South Delhi 4360 Bhavnagar 4361 Botad 4362 Kutch 4363 Rajkot 4364 Surendranagar 4365 Tapi 4366 Bhiwani 4367 Faridabad 4368 Fatehabad 4369 Jind 4370 Sirsa 4371 Sirmaur 4372 Chatra 4373 Godda 4374 Udupi 4375 Kollam 4376 Malappuram 4377 Anuppur 4378 Dindori 4379 Shivpuri 4380 Tikamgarh 4381 Umaria 4382 Chandrapur 4383 Jalna 4384 Parbhani 4385 Sindhudurg 4386 Thoubal 4387 Aizawl 4388 Amritsar 4389 Barnala 4390 Faridkot 4391 Firozpur 4392 Mansa 4393 Moga 4394 Rupnagar (earlier Ropar) 4395 Sri Muktsar Sahib 4396 Sangrur 4397 Bundi 4

The Bharat Microfinance Report 2016102
S.No. Name of the District
No. of
MFIs
Operating398 Churu 4399 Juhnjhunun 4400 Bahraich 4401 Banda 4402 Bulandshahr 4403 Jhansi 4404 Raebareli 4405 Rampur 4406 Sonbhadra 4407 Anantapur 3408 Cacher 3409 Dibrugarh 3410 Tinsukia 3411 Lakhisarai 3412 Munger 3413 Chandigarh 3414 Kabirdham 3415 North Delhi 3416 East Delhi 3417 Amreli 3418 Chhota Udaipur 3419 Jamnagar 3420 Gurgaon 3421 Sonipat 3422 Garhwa 3423 Jamtara 3424 Sahibganj 3425 Simdega 3426 Kozhikode 3427 Jhabua 3428 Mumbai suburban 3429 Nandurbar 3430 Palghar 3431 Raigad 3432 Senapati 3433 Imphal West 3434 Kolasib 3435 Bhubaneswar 3436 Jagatsinghpur 3437 Malkangiri 3438 Karaikal 3439 Hoshiarpur 3440 Fatehgarh Sahib 3441 Sahibzada Ajit Singh Nagar (ear-
lier Mohali)3
442 Shahid Bhagat Singh Na-gar (Nawan Shahr)
3
443 Baran 3444 Dausa 3445 Hanumangarh 3
S.No. Name of the District
No. of
MFIs
Operating446 Rajsamand 3447 Tonk 3448 Udaipur 3449 East Sikkim 3450 Mahbubnagar 3451 Khowai 3452 Amethi (Chhatrapati Shahuji
Maharaj Nagar)3
453 Hamirpur 3454 Jalaun 3455 Kanpur Dehat (Ramabai Nagar) 3456 Mahoba 3457 Muzaffarnagar 3458 Sambhal (Bheem Nagar) 3459 Siddharthnagar 3460 Krishna 2461 Nellore 2462 Prakasam 2463 Vishakhapatnam 2464 East Siang 2465 Papum Pare 2466 Baksa 2467 Chirang 2468 Udalguri 2469 North and Middle Andaman 2470 Arwal 2471 Jamui 2472 Madhepura 2473 Madhubani 2474 Saharsa 2475 Sitamarhi 2476 Dantewada 2477 Kanker 2478 Sukma 2479 North East Delhi 2480 South Goa 2481 Devbhoomi Dwarka 2482 Gir Somnath 2483 Junagadh 2484 Jhajjar 2485 Gumla 2486 Khunti 2487 Palamu 2488 Kasaragod 2489 Datia 2490 Sheopur 2491 Gadchiroli 2492 Ratnagiri 2493 Churachandpur 2494 Ukhrul 2

Annexures 103
S.No. Name of the District
No. of
MFIs
Operating495 East Jaintia Hills 2496 Ri-Bhoi 2497 West Garo Hills 2498 Dimapur 2499 Pathankot (New) 2500 Banswara 2501 Bharatpur 2502 Ganganagar 2503 Jaisalmer 2504 Jhalawar 2505 Sawai Madhopur 2506 Sirohi 2507 South Sikkim 2508 Ranga Reddy 2509 Warangal 2510 South Tripura 2511 Gomati 2512 Sipahijala 2513 Rudraprayag 2514 Amroha (Jyotiba Phule Nagar) 2515 Bagpat 2516 Etah 2517 Kannauj 2518 Kanpur Nagar 2519 Kasganj (Kanshi Ram Nagar) 2520 Shamli 2521 Alipurduar 2522 East Godavari 1523 Guntur 1524 Kadapa 1525 Kurnool 1526 Srikakulam 1527 Vizianagaram 1528 West Godavari 1529 Lower Subansiri 1530 West Kameng 1531 West Siang 1532 Dima Hasao 1533 Hailakandi 1534 Karbi Anglong 1535 Sheikhpura 1536 Sheohar 1537 Supaul 1538 Balrampur 1539 Dang 1540 Porbandar 1541 Panchkula 1
S.No. Name of the District
No. of
MFIs
Operating542 Bilaspur 1543 Kangra 1544 Una 1545 Jammu District 1546 Latehar 1547 Lohardaga 1548 Wayanad 1549 Alirajpur 1550 Bhind 1551 Sidhi 1552 Chandel 1553 Tamenglong 1554 West Jaintia Hills 1555 North Garo Hills 1556 Champhai 1557 Lawngtlai 1558 Lunglei 1559 Mamit 1560 Saiha 1561 Serchhip 1562 Kohima 1563 Kendrapara 1564 Mahe 1565 Yanam 1566 Fazilka (New) 1567 Tarn Taran 1568 Barmer 1569 Dholpur 1570 Jalore 1571 Sri Ganganagar 1572 Hyderabad 1573 Karimnagar 1574 Khammam 1575 Medak 1576 Nalgonda 1577 Nizamabad 1578 Dhalai 1579 North Tripura 1580 Unakoti 1581 Almora 1582 Champawat 1583 Garhwal 1584 Tehri Garhwal 1585 Balrampur 1586 Gautam Buddh Nagar 1587 Mainpuri 1588 Shravasti 1

The Bharat Microfinance Report 2016104
Distribution of MFIs Across State and Membership Status
State Total No. of MFIsOf which No. of
Member MFIs
Of which No. of
Non-member MFIs
Andhra Pradesh 2 2 0
Assam 9 8 1
Bihar 4 2 2
Delhi 8 5 3
Gujarat 9 5 4
Haryana 2 2 0
Jharkhand 3 2 1
Karnataka 15 13 2
Kerala 5 2 3
Madhya Pradesh 6 1 5
Maharashtra 14 5 9
Manipur 4 4 0
Odisha 14 10 4
Punjab 1 1 0
Rajasthan 3 2 1
Tamil Nadu 18 14 4
Telangana 7 7 0
Uttrakhand 1 0 1
Uttar Pradesh 9 6 3
West Bengal 32 14 18
Total 166 105 61
Distribution of MFIs Across Legal Form
State Total No. of MFIsOf which No. of
Member MFIs
Of which No. of
Non-member
MFIs
NBFC 71 58 13
Local Area Bank 2 2 0
Society 49 23 26
Trust 13 7 6
Sec. 8 Company 24 11 13
MACS or Cooperative 7 4 3
Total 166 105 61
Distribution of Data Contributing MFIs for his Report
Annexure 3

Annexures 105
Note: States in bold indicate MFIs having headquarters in that state and have submitted data to BMR Report 2016.
No. of MFIs across Size (GLP Base)
Size Gross Loan Portfolio (GLP No. of MFIs Percentage (%)
Tiny < `1 Crore 13 8%
Small `1 Crore and < Rs 10 Crore 54 33%
Medium `10 Crore and < Rs 50 Crore 32 19%
Moderately Large `50 Crore and < Rs 100 Crore 14 8%
Large `100 Crore and < Rs 500 Crore 30 18%
Giant > ` 500 Crore 23 14%
Total 166
Distribution of MFIs across Region and State
Region States/Union Territtories No. of MFIs
North Delhi (8), Haryana (2), Rajasthan (3), Punjab (1), Chandigarh, Himachal Pradesh, Jammu & Kashmir
14
East Bihar (4), Odisha (14), Jharkhand (3), West Bengal (32), Andaman 53
West Gujarat (9), Maharashtra (14), Goa, Dadra & Nagar Haveli, Daman and Diu 23
South Andhra Pradesh (2), Karnataka (15), Kerala (5),Tamil Nadu (18), Telangana (7), Puducherry
47
North East
Assam (9), Manipur (4), Tripura, Nagaland, Sikkim, Meghalaya, Mizoram, Arunachal Pradesh
13
Central Madhya Pradesh (6), Uttarakhand (1), Uttar Pradesh (9), Chhattisgarh 16
Total 166

The Bharat Microfinance Report 2016106
(A) List of MFIs with Loan Portfolio Less than ` 1 crore
S.No. Name of the MFIs State Legal Form
1 Balajee Sewa Sansthan Uttrakhand Society
2 Barasast Society of Self Employment for Rural and All Liberal West Bengal Society
3 Barasat Unnayan Prostuti West Bengal Society
4 Deshabandhu Micro Finance and Livelihood Institution (DMLI) Assam Sec. 8 Company
5 G B P Nobel Microfinances Maharashtra Sec. 8 Company
6 Gramin Micro Credit Foundation Delhi Sec. 8 Company
7 Helping Nation Haryana Society
8 Jamalpur Panchyajanya Gram Vikash Samity West Bengal Society
9 Micro Enterpries & Suatainable Projects (MESP) Jharkhand Sec. 8 Company
10 Prayas Juvenile Aid Centre (Prayas Micro Credit) Delhi Society
11 Samruddhi Welfare Development Foundation Maharashtra Sec. 8 Company
12 Social Action for Rural Community Odisha Society
13 Yukti Samaj Sewa Society Madhya Pradesh Society
(B) List of MFIs with Loan Portfolio between ` 1 and <10 crore
S.No. Name of the MFIs State Legal Form
1 Adhikar Odisha Society
2 Agradut Polly Unnyan Samity West Bengal Society
3 Ajgar Social Circle Assam Society
4 Anik Financial Services Pvt Ltd Maharashtra NBFC-MFI
5 Anupama Human Economic Development Madhya Pradesh Sec. 8 Company
6 Bagaria Releif Welfare Ambulance Society West Bengal Society
7 Bal-Mahila Vikas Samiti -VAMA Madhya Pradesh Society
8 Barasat Grameen Society West Bengal Society
9 Barasat Sampark West Bengal Society
10 Bengal Women Welware Association West Bengal Sec. 8 Company
11 Blaze Trust Tamil Nadu Trust
12 Boy's Recreation Club West Bengal Society
13 BURS West Bengal Society
14 BWDA Finance Ltd Tamil Nadu NBFC
15 Centre For Development Orientation & Training- CDOT Bihar Society
16 Centre for Promoting Sustainable Livelihood(CPSL) Bihar Society
17 Chanura Microfin Manipur Manipur Society
18 Dakshin Budhakhali Improvement Society (DBIS) West Bengal Society
19 Destiny Finco Pvt. Ltd. West Bengal NBFC
20 Dhosa Chandaneswar Bratyajana Samity (DCBS) West Bengal Society
Profile of MFIs which Contributed Data for this ReportAnnexure 4

Annexures 107
21 dMatrix Development Foundation Maharashtra Sec. 8 Company
22 Duttapukur Institute for Social Advancement West Bengal Society
23 Forum for Rural Environment and Economic Development Kerala Society
24 Futureage India Micro Credit Services Uttar Pradesh Sec. 8 Company
25 Gramotthan Micro Finance Company Uttar Pradesh Sec. 8 Company
26 Jeevankiran Kerala Society
27 Life Foundation Kerala Trust
28 Lok Biradari Trust Madhya Pradesh Trust
29 Mass Care International Bihar Society
30 Matashree Gomati Devi Jan Seva Nidhi Rajasthan Trust
31 Nav Bharat Jagriti Kendra Jharkhand Society
32 Opportunity Microfinance India Ltd Karnataka NBFC
33Organisation for Development Integrated Social and Health Ac-tion (ODISHA)
Odisha Society
34 Parama Mahila Samitee West Bengal Society
35 Planned Social Concern Delhi Sec. 8 Company
36 Pragathi Seva Samithi TelanganaMacs or Copera-tive
37 Prakruthi Foundation Karnataka Trust
38 Prasad Foundation Odisha Society
39 Prochesta Thrift & Credit Co-Operative Society Asom Ltd. AssamMacs or Copera-tive
40 Purba Barasat Prerana West Bengal Society
41 Pustikar Sakh Sahakari Samiti Ltd. Rajasthan Society
42 Rural Education Action and Development Tamil Nadu Society
43 Sampurna Training and Entrepreneurship Programme West Bengal Sec. 8 Company
44 SATRA Development Finance Private Limited Assam NBFC
45 Shroff Capital and Finance Pvt Ltd Gujarat NBFC-MFI
46 Swashree Mahila Sakh Sahakari Sanstha Maryadit Madhya Pradesh Society
47 Swayamsampurna West Bengal Trust
48 The Eastern Multipurpose coop Society ltd. OdishaMacs or Copera-tive
49 Valar Aditi Social Finance (P) Ltd. Tamil Nadu NBFC
50 Virutcham Microfinance Limited Tamil Nadu NBFC-MFI
51 Vivekananda Sevakendra -O- Sishu Uddyan ( VSSU) West Bengal Society
52 Volenteers for Village Development Manipur Society
53 WSDS Initiate Manipur Society
54 YVU Financial Services Private Limited Manipur NBFC-MFI

The Bharat Microfinance Report 2016108
(C) List of MFIs with Loan Portfolio between ` 10 and <50 crore
S.No. Name of the MFIs State Legal Form
1 Altura Financial Services Limited Delhi NBFC-MFI
2 Bagnan Mahila Bikash Cooperative Credit Society Ltd. West Bengal Macs or Coperative
3 Belghoria Janakalyan Samity West Bengal Society
4 Disha India Micro Credit Uttar Pradesh Sec. 8 Company
5 G U Financial Services Pvt Ltd Odisha NBFC
6 Gramalaya Urban and Rural Development Initiatives and Network
Tamil Nadu Sec. 8 Company
7 Grameen Development & Finance Pvt Ltd Assam NBFC-MFI
8 Gramin Mahila Swayamsiddha Sangh Maharashtra Society
9 Gram-Utthan Odisha Society
10 IMPACT Tamil Nadu Sec. 8 Company
11 Institute of Rural Credit and Entrepreneurship Development Maharashtra Trust
12 Kotalipara Development Society (KDS) West Bengal Society
13 Mahashakti Foundation Odisha Trust
14 Network of Entrepreneurship & Economic Development Uttar Pradesh Society
15 Nightingale Finvest Pvt. Ltd. Assam NBFC-MFI
16 People's Action for Transformation Tamil Nadu Trust
17 PRAYAS - Organization for Sustainable Development Gujarat Trust
18 RORS Finance Private Limited Karnataka NBFC-MFI
19 Sahara Utsarga Welfare Society West Bengal Society
20 Sakhi Samudaya Kosh Maharashtra Sec. 8 Company
21 Sampada Entrepreneurship & Livelihoods Foundation Maharashtra Sec. 8 Company
22 Sarvodaya Nano Finance Limited Tamil Nadu NBFC
23 Seba - Rahara West Bengal Society
24 Society for Model Gram Bikash Kendra West Bengal Society
25 Sreema Mahila Samity West Bengal Society
26 Swayam Micro Services Gujarat Sec. 8 Company
27 Swayamshree Mahila Samabaya Samiti Ltd. Odisha Macs or Coperative
28 Swayamshree Micro Credit Services Odisha Sec. 8 Company
29 The Saath Saving and Credit Co Operative Society Limited Gujarat Macs or Coperative
30 Unacco Financial Services Pvt. Ltd. Assam NBFC-MFI
31 Unnati Microfin Pvt. Ltd. Maharashtra NBFC-MFI
32 Welfare Services Ernakulam Kerala Society

Annexures 109
(D) List of MFIs with Loan Portfolio between ` 50 and <100 crore
S.No. Name of the MFIs State Legal Form
1 Annapurna Mahila Coop Credit Society Ltd. Maharashtra Macs or
Coperative
2 Arth MicroFinance Pvt. Ltd. Rajasthan NBFC-MFI
3 Asomi Finance Pvt Ltd Assam NBFC
4 Growing Opportunity Finance (India) Pvt Ltd Tamil Nadu NBFC-MFI
5 Hand in Hand India Tamil Nadu Trust
6 Humana People to People India Delhi Sec. 8 Company
7 IDF Financial Services Pvt Ltd Karnataka NBFC
8 Mahasemam Trust Tamil Nadu Trust
9 Navachetana Microfin Services Pvt Ltd Karnataka NBFC
10 Nirantara FinAccess Pvt Ltd Karnataka NBFC-MFI
11 Rashtriya Seva Samithi (RASS) Andhra Pradesh Society
12 Sambandh Finserve (P) Ltd. Odisha NBFC-MFI
13 Shikhar Microfinance Pvt. Ltd. Delhi NBFC-MFI
14 Uttrayan Financial Services Pvt. Ltd. West Bengal NBFC-MFI
(E) List of MFIs with Loan Portfolio between ` 100 and <500 crore
S.No. Name of the MFIs State Legal Form
1 Adhikar Micro Finance Pvt Ltd Odisha NBFC-MFI
2 ASA International India Microfinance Pvt Ltd. West Bengal NBFC-MFI
3 Bhartiya Micro Credit Uttar Pradesh Sec. 8 Company
4 Bhartiya Samruddhi Finance Ltd Telangana NBFC
5 BSS Microfinance Private Ltd Karnataka NBFC-MFI
6 Chaitanya India Fin Credit Pvt Ltd Karnataka NBFC-MFI
7 Disha Microfin Pvt Ltd Gujarat NBFC-MFI
8 Hindusthan Microfinance Pvt. Ltd. Maharashtra NBFC-MFI
9 Intrepid Finance & Leasing Pvt. Ltd. Maharashtra NBFC-MFI
10 Jagaran Microfin Private Ltd West Bengal NBFC-MFI
11 Krishna Bhima Samruddhi Local Area Bank Ltd Telangana Local Area Bank
12 Light Microfinance Private Limited Gujarat NBFC-MFI
13 Margdarshak Financial Services Ltd Uttar Pradesh NBFC-MFI
14 Midland Microfin Punjab NBFC-MFI
15 Namra Finance Limited Gujarat NBFC-MFI
16 North East Region Finservices Limited Delhi NBFC
17 Pahal Financial Services Pvt Ltd Gujarat NBFC-MFI
18 Peoples Forum Odisha Society
19 Repco Microfinance limited Tamil Nadu NBFC-MFI
20 RGVN (NE) Microfinance Ltd. Assam NBFC-MFI
21 SMILE Microfinance Limited Tamil Nadu NBFC-MFI
22 Saija Finance Pvt Ltd Bihar NBFC-MFI
23 Samasta Microfinance Limited Karnataka NBFC-MFI
24 Samhita Community Development Services Madhya Pradesh Sec. 8 Company
25 Sanghamithra Rural Financial Services Karnataka Sec. 8 Company

The Bharat Microfinance Report 2016110
26 Sarala Development and Microfinance Pvt. Ltd. West Bengal NBFC-MFI
27 Shri Mahila Sewa Sahakari Bank Ltd. Gujarat Local Area Bank
28 Varam Capital Private Limited Tamil Nadu NBFC-MFI
29 Vedika Credit Capital Limited Jharkhand NBFC-MFI
30 Village Financial Services Pvt. Ltd. West Bengal NBFC-MFI
(F) List of MFIs with Loan above ` 500 crore
S.No. Name of the MFIs State Legal Form
1 Annapurna Micro Finance Pvt Ltd Odisha NBFC-MFI
2 Arohan Financial Services Pvt Ltd West Bengal NBFC-MFI
3 Ashmitha Microfin Ltd Telangana NBFC-MFI
4 Cashpor Micro Credit Uttar Pradesh Sec. 8 Company
5 Equitas Micro Finance Ltd Tamil Nadu NBFC-MFI
6 ESAF Microfinance & Investments Pvt Ltd Kerala NBFC-MFI
7 Future Finacial Servicess Pvt Ltd Andhra Pradesh NBFC-MFI
8 Grama Vidiyal Micro Finance Limited Tamil Nadu NBFC-MFI
9 Grameen Koota Financial Services Pvt Ltd Karnataka NBFC-MFI
10 Janalakshmi Financial Services Ltd., Karnataka NBFC-MFI
11 Madura Micro Finance Limited Tamil Nadu NBFC-MFI
12 Muthoot Microfin Limited Maharashtra NBFC-MFI
13 NABARD Financial Services Limited Karnataka NBFC-MFI
14 Satin Creditcare Network Limited Delhi NBFC-MFI
15 Share Microfin Limited Telangana NBFC-MFI
16 SKDRDP dharmasthala Trust
17 SKS Microfinance Ltd Telangana NBFC-MFI
18 Sonata Finance Private Limited Uttar Pradesh NBFC-MFI
19 Spandana Sphoorty Financial Limited Telangana NBFC-MFI
20 Suryoday Micro Finance Ltd Maharashtra NBFC-MFI
21 SV Creditline Pvt. Ltd. Haryana NBFC-MFI
22 Ujjivan Financial Services Limited Karnataka NBFC-MFI
23 Utkarsh Microfinance Pvt Ltd Uttar Pradesh NBFC-MFI

Data Acquisition Analytics& Report Generation by
Ardhendu Nandi
P. M. Kamalesh
Shyamasree Nandan

MAJOR ACTIVITIES
Ÿ Credit Functions: Refinance for production credit (Short Term) and investment credit (Medium and Long Term) to eligible Banks and financing institutions.
Ÿ Development Functions: To reinforce the credit functions and make credit more productive, development activities are being undertaken through
3 Research and Development Fund3 Financial Inclusion Fund (FIF)3 Farm Innovation and Promotion Fund (FIPF)3 Farmers' Technology Transfer Fund (FTTF)3 Watershed Development Fund (WDF)3 Rural Infrastructure Development Fund (RIDF)3 Tribal Development Fund (TDF)3 Cooperative Development Fund (CDF)3 Rural Innovation Fund.
Ÿ Supervisory Functions: NABARD shares with RBI certain regulatory and supervisory functions in respect of Cooperative Banks and RRBs.
Ÿ Provides consultancy services relating to Agriculture & Rural Development through NABCONS, ([email protected])
NABARD
NABARD
NABARD Head Office - Plot No. C-24, G-Block, Bandra KurlaComplex, Post Box No. 8121, Bandra (E), Mumbai-400051
visit us at : www.nabard.org
Taking Rural India >> Forward
Head�Office:A�1-�248,�3rd�Floor,�Safdarjung�EnclaveNew�Delhi�‒�110029,�IndiaTel:�+�91-�11-47174400Fax:�+�91-11-47174405E-mail:�[email protected]:�www.sa-dhan.net
Registered�Office:Plot�No.�4,�2nd�FloorChandragiri�Colony�(Near�RTA�Office)Trimulgherry,�Secunderabad-500015Tel:�+91�40�40216026Telefax�:�+91�40�40037179E-mail:�[email protected]