Microfinance and Small Deposit Mobilization: Fact or Fiction?
20
MIX Data Brief No. 2 Microfinance and Small Deposit Mobilization: Fact or Fiction? 1 Adrian Gonzalez, Lead Researcher, MIX, [email protected] Richard Meyer, Professor Emeritus, Ohio State University, [email protected] Two primary arguments can be made for volun- tary deposit mobilization among microfinance institutions (MFIs). 2 First, deposit mobilization is an alternative source of funds that was ne- glected by most MFIs until a few years ago. From this perspective, voluntary deposit mobili- zation helps MFIs achieve independence from donors and investors, which is particularly im- portant in periods of liquidity constraints. Sec- ond, poor households benefit greatly from hav- ing access to deposit mechanisms, and the benefits can be even greater than those derived from access to credit. 3 On the funding side, the industry has demonstrated great progress, with savings mobilization now representing more than half of the assets reported by deposit mo- bilizing MFIs, even though this share seems to have decreased a bit during the last three years. Since voluntary deposit mobilization has be- come an important source of funding for the mi- crofinance industry, the main question explored in this paper is whether deposit mobilizing MFIs are really serving small depositors. Most mi- crofinance observers automatically assume that all voluntary deposit mobilization by MFIs would be from small size accounts, and, hopefully, from depositors with similar socioeconomic traits as the clients they reach with their other services. 4 But until now, no one has addressed the question of depth of outreach of deposit mo- bilization on a global scale as is routinely done for microloans. This paper proposes a new indicator for depth of outreach of MFIs’ deposit mobilizing instru- ments, the ratio (called Ratio 1 in Annex: Table 5) of Average Deposits per Depositor to Aver- age Loan Balances per Borrower. We argue that smaller average deposits per depositor are associated with greater depth of outreach of the retail deposit products of MFIs, in the same way that the industry has argued that MFIs with smaller average loan balances per borrower have greater depth of outreach of their credit Introduction June, 2009 1. The authors have benefited immensely from discussions about this topic with Fernando Prado, Richard Rosenberg, Blaine Stephens, Robert Vogel, Peter Wall, and Glenn Wesley. All errors and omissions remain our only responsibility. 2. In this paper, the term “deposits” applies to any type of instrument used by microfinance institutions to mobilize deposits from their clients, and it is not restricted to any particular type of instrument, such as time deposits or savings accounts. 3. Rutherford, Stuart (2000), The Poor and Their Money, Oxford University Press, New Delhi. 4. We are not arguing that the mobilization of large deposits is wrong. Our argument here is that from the perspective of depth of outreach and increasing access to financial services to poor households, small deposit accounts presumably are made by poorer clients so they are more desirable than larger deposit accounts. And of course, a high concentration on a few very large deposit accounts may be highly risky for MFIs as well, even though it may be desirable from an administrative point of view.
Transcript of Microfinance and Small Deposit Mobilization: Fact or Fiction?

MIX
Da
ta B
rie
f N
o.
2
Microfinance and Small
Deposit Mobilization:
Fact or Fiction?1
Adrian Gonzalez, Lead Researcher, MIX, [email protected]
Richard Meyer, Professor Emeritus, Ohio State University, [email protected]
Two primary arguments can be made for volun-
tary deposit mobilization among microfinance
institutions (MFIs). 2 First, deposit mobilization is
an alternative source of funds that was ne-
glected by most MFIs until a few years ago.
From this perspective, voluntary deposit mobili-
zation helps MFIs achieve independence from
donors and investors, which is particularly im-
portant in periods of liquidity constraints. Sec-
ond, poor households benefit greatly from hav-
ing access to deposit mechanisms, and the
benefits can be even greater than those derived
from access to credit.3 On the funding side, the
industry has demonstrated great progress, with
savings mobilization now representing more
than half of the assets reported by deposit mo-
bilizing MFIs, even though this share seems to
have decreased a bit during the last three
years.
Since voluntary deposit mobilization has be-
come an important source of funding for the mi-
crofinance industry, the main question explored
in this paper is whether deposit mobilizing MFIs
are really serving small depositors. Most mi-
crofinance observers automatically assume that
all voluntary deposit mobilization by MFIs would
be from small size accounts, and, hopefully,
from depositors with similar socioeconomic
traits as the clients they reach with their other
services. 4 But until now, no one has addressed
the question of depth of outreach of deposit mo-
bilization on a global scale as is routinely done
for microloans.
This paper proposes a new indicator for depth
of outreach of MFIs’ deposit mobilizing instru-
ments, the ratio (called Ratio 1 in Annex: Table
5) of Average Deposits per Depositor to Aver-
age Loan Balances per Borrower. We argue
that smaller average deposits per depositor are
associated with greater depth of outreach of the
retail deposit products of MFIs, in the same way
that the industry has argued that MFIs with
smaller average loan balances per borrower
have greater depth of outreach of their credit
Introduction
June, 2009
1. The authors have benefited immensely from discussions about this topic with Fernando Prado, Richard Rosenberg, Blaine Stephens, Robert Vogel, Peter Wall, and Glenn Wesley. All errors and omissions remain our only responsibility. 2. In this paper, the term “deposits” applies to any type of instrument used by microfinance institutions to mobilize deposits from their clients, and it is not restricted to any particular type of instrument, such as time deposits or savings accounts. 3. Rutherford, Stuart (2000), The Poor and Their Money, Oxford University Press, New Delhi. 4. We are not arguing that the mobilization of large deposits is wrong. Our argument here is that from the perspective of depth of outreach and increasing access to financial services to poor households, small deposit accounts presumably are made by poorer clients so they are more desirable than larger deposit accounts. And of course, a high concentration on a few very large deposit accounts may be highly risky for MFIs as well, even though it may be desirable from an administrative point of view.

.
products. The implicit assumption in both cases is
that larger accounts are positively correlated with the
income level of the clients. Therefore, MFIs with
smaller average deposits per depositor will be
deemed as better than those with larger average bal-
ances, ceteris paribus.5 By this criterion, it is easy to
rank deposit mobilizing MFIs in the same country be-
cause average deposits per depositor are compara-
ble. However, the comparison of depth of savings
outreach for MFIs in different countries is not as
straight forward because of differences in per capita
income. Therefore, the proposed use of the ratio of
Average Deposits per Depositor to Average Loan per
Borrower as a new indicator of the depth of outreach
of MFIs deposit mobilizing instruments is especially
useful for international comparisons.
We are not suggesting any normative criteria regard-
ing the thresholds for this new indicator. Likewise,
economic theory cannot shed any light on this issue.
However, our analysis shows that for most MFIs and
countries, the level of average deposits per depositor
is far less than two-thirds the level of average loans
per borrower. The following analysis also shows that
small deposit mobilization by microfinance institutions
is very strong in most countries, with the exception of
a few countries in Latin America and the Caribbean
(LAC) and Eastern Europe and Central Asia (ECA).
Summary statistics for each country are presented
and country level statistical tests are used to validate
the significance of the country results. Also, correla-
tion coefficients confirm that the ratio of Average De-
posits to Loan Balances per Borrower is not highly
correlated with its numerator or denominator, or with
other indicators commonly used to benchmark de-
posit mobilization by MFIs. This suggests that this
indicator can bring a new dimension for the compari-
son of depth of outreach of microdeposit mobilization.
The following analysis does not offer definitive evi-
dence on the issue of depth of outreach of MFIs’ de-
posit mobilizing products, but some important results
emerge. The best feasible methodology using MIX
data is to compare average size of deposits per de-
positor to average size of loans per borrower.6 Of
course, an important caveat in using averages is that
they can be highly influenced by outliers. It is com-
monly expected that there will be more and larger
outliers in the deposit distribution than in the loan dis-
tribution because of the presence of larger savers
attracted by the interest rate premium often paid by
MFIs compared to other financial institutions in order
to attract deposits. When this is the case, it means
that even though these MFIs may be mobilizing many
smaller deposits, a large share of their deposits will
come from larger size accounts which presumably
mean richer savers.
The following discussion is based mostly on country
averages (Annex: Table 1), but the results based on
country medians produce similar results (Annex: Ta-
ble 2). Loan amounts per borrower and deposit
amounts per depositor are both presented as a per-
centage of GNI per capita in order to introduce some
comparability across countries and regions. MFIs are
divided into deposit mobilizing MFIs and non-
mobilizing MFIs7, and country average loan size per
borrower are calculated for each group. Most of the
data is from 2007, but in a few cases 2006 and
Microfinance and Small Deposit Mobilization: Fact or Fiction?
MIX Data Brief No. 2
June, 2009
Methodology
5. The ratio of average deposits per saver suffers the same problem as does the average loan balance per borrower in that we never know the distribution of loans and deposits when we only have average data to work with. 6. The analysis of this ratio is better than just comparing average deposits per depositor as percentage of GNI per capita for different coun-tries, because of the differences in income distribution between countries that make GNI per capita a noisy standardizer. At the end of the paper, we discuss some correlations between the proposed ratio and other common indicators of deposit mobilization. 7. Non-mobilizing MFIs include those that do not mobilize voluntary deposits, or only report compulsory or institutional deposits (as op-posed to retail deposits.)
Page 2
www.themix.org
.
www.themix.org
Microfinance and Small Deposit Mobilization: Fact or Fiction?
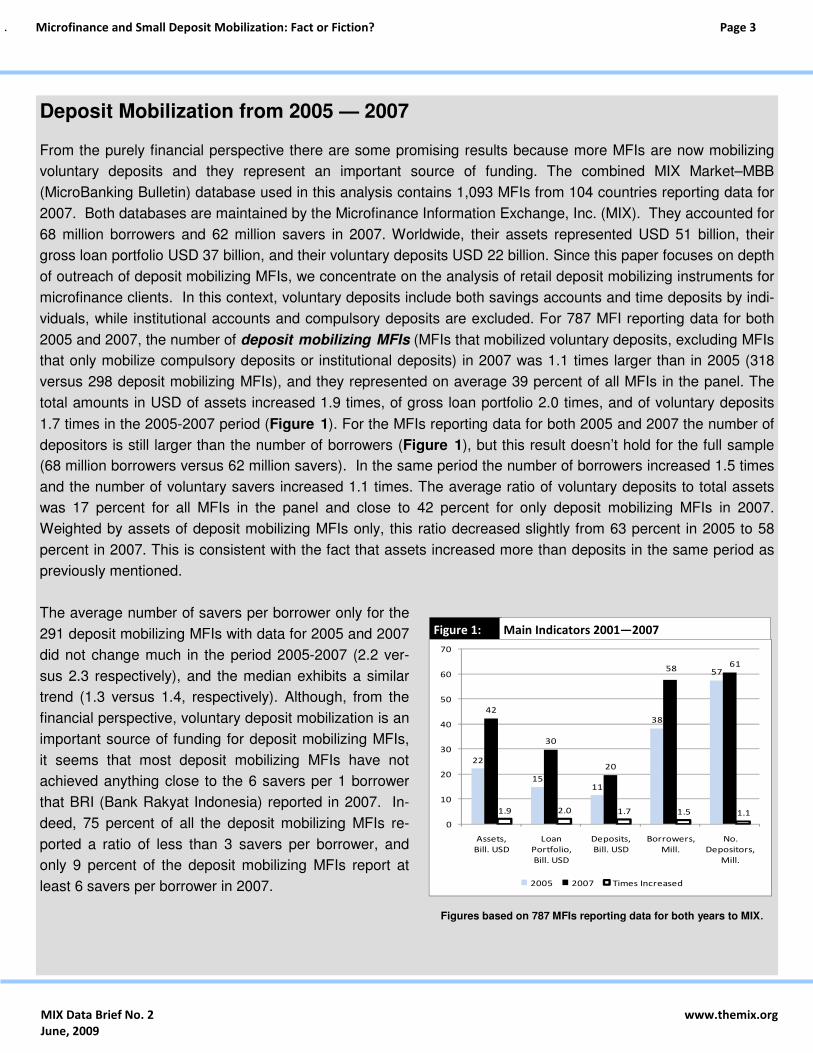
From the purely financial perspective there are some promising results because more MFIs are now mobilizing
voluntary deposits and they represent an important source of funding. The combined MIX Market–MBB
(MicroBanking Bulletin) database used in this analysis contains 1,093 MFIs from 104 countries reporting data for
2007. Both databases are maintained by the Microfinance Information Exchange, Inc. (MIX). They accounted for
68 million borrowers and 62 million savers in 2007. Worldwide, their assets represented USD 51 billion, their
gross loan portfolio USD 37 billion, and their voluntary deposits USD 22 billion. Since this paper focuses on depth
of outreach of deposit mobilizing MFIs, we concentrate on the analysis of retail deposit mobilizing instruments for
microfinance clients. In this context, voluntary deposits include both savings accounts and time deposits by indi-
viduals, while institutional accounts and compulsory deposits are excluded. For 787 MFI reporting data for both
2005 and 2007, the number of deposit mobilizing MFIs (MFIs that mobilized voluntary deposits, excluding MFIs
that only mobilize compulsory deposits or institutional deposits) in 2007 was 1.1 times larger than in 2005 (318
versus 298 deposit mobilizing MFIs), and they represented on average 39 percent of all MFIs in the panel. The
total amounts in USD of assets increased 1.9 times, of gross loan portfolio 2.0 times, and of voluntary deposits
1.7 times in the 2005-2007 period (Figure 1). For the MFIs reporting data for both 2005 and 2007 the number of
depositors is still larger than the number of borrowers (Figure 1), but this result doesn’t hold for the full sample
(68 million borrowers versus 62 million savers). In the same period the number of borrowers increased 1.5 times
and the number of voluntary savers increased 1.1 times. The average ratio of voluntary deposits to total assets
was 17 percent for all MFIs in the panel and close to 42 percent for only deposit mobilizing MFIs in 2007.
Weighted by assets of deposit mobilizing MFIs only, this ratio decreased slightly from 63 percent in 2005 to 58
percent in 2007. This is consistent with the fact that assets increased more than deposits in the same period as
previously mentioned.
The average number of savers per borrower only for the
291 deposit mobilizing MFIs with data for 2005 and 2007
did not change much in the period 2005-2007 (2.2 ver-
sus 2.3 respectively), and the median exhibits a similar
trend (1.3 versus 1.4, respectively). Although, from the
financial perspective, voluntary deposit mobilization is an
important source of funding for deposit mobilizing MFIs,
it seems that most deposit mobilizing MFIs have not
achieved anything close to the 6 savers per 1 borrower
that BRI (Bank Rakyat Indonesia) reported in 2007. In-
deed, 75 percent of all the deposit mobilizing MFIs re-
ported a ratio of less than 3 savers per borrower, and
only 9 percent of the deposit mobilizing MFIs report at
least 6 savers per borrower in 2007.
Deposit Mobilization from 2005 — 2007
Figures based on 787 MFIs reporting data for both years to MIX.
Figure 1: Main Indicators 2001—2007
22
1511
38
57
42
30
20
5861
1.9 2.0 1.7 1.5 1.1
0
10
20
30
40
50
60
70
Assets,
Bill. USD
Loan
Portfolio,
Bill. USD
Deposits,
Bill. USD
Borrowers,
Mill.
No.
Depositors,
Mill.
2005 2007 Times Increased
MIX Data Brief No. 2
June, 2009
Page 3

.
2008 data were used. For the country analysis, only
those countries with at least two deposit mobilizing
and two non-mobilizing MFIs were included. This re-
stricted the total sample size to 38 countries and 298
deposit mobilizing MFIs. One hundred and four MFIs
(64 percent) were eliminated, but resulted in exclud-
ing only 30 percent of the deposit mobilizing MFIs in
the total database with data for the years 2006-2008.
Considering the relatively small sample size for some
countries, the observed differences between means
were tested for statistical significance using t tests.
The Middle East and North Africa (MENA) region was
excluded because of the small number of deposit mo-
bilizing MFIs in the sample. BTA Bank (previously
known as INEXIMBANK) in Kyrgyzstan reports very
high average deposits per depositor compared to the
other MFIs in the country. In order to facilitate the
analysis, results for Kyrgyzstan without BTA Bank are
reported as Kyrgyzstan 2.
The main question explored by this paper is whether
deposit mobilizing MFIs are really mobilizing small or
large deposits. The analysis is based on the compari-
son of the ratio of average deposits per depositor to
average loans per borrowers for different countries.
In particular, the analysis focuses on three main com-
Microfinance and Small Deposit Mobilization: Fact or Fiction?
Savings accounts and time deposits are the two most important deposit instruments used by MFIs. We can as-
sume that savings accounts are smaller in size than time deposits, and most likely, savings accounts will be used
by clients with different socioeconomic traits than those with time deposits. However, since we cannot differenti-
ate between these two types of accounts based on MIX data, we will explore briefly the implications of this for our
analysis. Assume that MFIs A and B with the same size measured by both loan portfolio and assets mobilizes
voluntary deposits only through savings accounts and time deposits (example 1). Assume the distribution of
amounts of savings accounts and time deposits for MFI A is 10 percent and 90 percent, respectively, with an av-
erage of USD 10 per depositor of savings accounts and USD 100 per depositor of time deposits. Now assume
that MFI B in the same country only offers savings accounts with an average of USD 10 per depositor. The aver-
age deposit per depositor for MFI A is USD 53 compared with USD 10 for MFI B. This example illustrates a few
points. Small depositors represent almost 50 percent of all depositors of MFI A, but they contribute only 10 per-
cent of total deposits. Therefore MFI A is as successful as MFI B in mobilizing small size voluntary deposits, but
its average deposit per depositor is larger than the average deposit of MFI B due to the larger time deposits.8
Skewness of Deposits and Its Impact on Average Deposits per Depositor
Type of Account Number of Depositors Volume of Deposits Average per
Depositor Number % Total USD % Total
Time Deposits 90 47% $9,000 90% $100
Savings Accounts 100 53% $1,000 10% $10
Total 190 100% $10,000 100% $53
Example 1: Fictional Distribution of Deposits for MFI A
8. MFI A is not so fictional after all. Eighty-eight percent of all deposit accounts of five Bolivian Fondos Financieros Privados are smaller than $500, but they contributed only 5 percent of all deposits mobilized. The respective figures for savings accounts are 92 percent and 11 percent, but only 21 percent and 1 percent for time deposits. Figures are based on data reported by the Bolivian Superintendence of Banks for December 2007, and for the following Fondos Financieros Privados: EcoFuturo, Fassil, FIE, Fondo de la Comunidad, Fortaleza and PRODEM.
MIX Data Brief No. 2
June, 2009
Page 4
www.themix.org

.
parisons presented in Annex: Tables 1 and 2: i)
average deposit per depositor (D) versus average
loan size per borrower only for deposit mobilizing
MFIs (LD), ii) average loans per borrower of deposit
mobilizing MFIs (LD) versus average loans per bor-
rower of non-mobilizing MFIs (LN), and iii) average
deposits per depositor of deposit mobilizing MFIs (D)
versus average loans per borrower of non-mobilizing
MFIs (LN).
The average size of deposits per depositor is at
most two-thirds of average size of loans per bor-
rower for most deposit mobilizing MFIs. The aver-
age ratio of Average Deposits to Loan Balance per
Borrower of deposit mobilizing MFIs (D/LD), is 61
percent; and the 5th, 25th, 50th and 75th percentiles
are 7 percent, 20 percent, 31 percent and 63 percent
respectively, for the 298 MFIs from the countries with
at least two deposit mobilizing MFIs and two non-
mobilizing MFIs. Indeed, the ratio of Average Depos-
its to Loan Balance per Borrower of deposit mobiliz-
ing MFIs is over 100 percent for only 13 percent of
these MFIs, meaning that for most deposit mobilizing
MFIs, average deposits are considerably smaller than
average loans.9 These results make us question
whether those deposit mobilizing MFI with high levels
of Average Deposits to Loan Balance per Borrower
are really mobilizing most deposits from small deposi-
tors, given the relative low levels of Average Deposits
to Loan Balance per Borrower for most deposit mobi-
lizing MFIs. These results also show that most de-
posit mobilizing MFIs have been able to design and
mobilize funds with deposit products that match the
needs of their borrowers, and MFI clients find it as
useful to hold small deposits as it is to borrow small
loans. A high Average Deposits to Loan Balance per
Borrower ratio doesn’t rule out that some of the de-
posit accounts are smaller than the loan accounts,
but it means that the small accounts do not represent
Microfinance and Small Deposit Mobilization: Fact or Fiction?
Main Results
0
50
100
150
200
250
300
350
400
World Africa Asia ECA 1/ LAC
% o
f A
ve
rag
e L
oa
ns
pe
r B
orr
ow
er
Figure 2: Average Deposits per Depositor as % of Average Loan Balance per Borrower (2007)
Note: 298 deposit mobilizing MFIs. The thick horizontal bars represent medians; the top and bottom of the white boxes represent the 75th and 25th percentiles, and the high and low short bars represent the 95th and 5th percentiles, respectively. 1/ The 95th percentile for ECA is 595%.
9. Only 14 percent of the 427 deposit mobilizing MFIs in the full sample (without removing those countries with at least two deposit mobiliz-ing MFIs and two non-mobilizing MFIs), have an Average Deposits to Loan Balance per Borrower ratio over 100 percent, and the 75th percentile is 63 percent as in the sub-sample.
MIX Data Brief No. 2
June, 2009
Page 5
www.themix.org
.
the bulk of the deposits mobilized by the MFI, as dis-
cussed in the Text Box on page 3. This result is im-
portant because we are comparing the accounts’ size
of borrowers and depositors from the same institu-
tions, that in theory are served by the same branches
and operating in the same geographical regions.10
We are not arguing that there has to be a specific re-
lationship (i.e. 20 percent, 66 percent, 110 percent,
etc.) between average deposits per depositor and
average loans per borrowers. But we are finding
strong evidence suggesting that for most MFIs and
countries this relationship is quite low, as demon-
strated by high concentration around small percent-
ages reported in Figure 2.
Average deposits are smaller than average loans
of deposit mobilizing MFIs except in many coun-
tries from Eastern Europe and Central Asia (ECA).
Average deposits per depositor (D) were smaller than
average loans per borrower for the deposit mobilizing
MFIs (LD) in 33 out of the 38 countries with a sample
of at least two deposit mobilizing MFIs and two non-
mobilizing MFIs (Annex: Table 1). The average by
country of the ratio of Average Deposits to Loan Bal-
ance per Borrower of deposit mobilizing MFIs (D/LD),
is larger than 100 percent in only five countries, four
from ECA (Armenia, Azerbaijan, Russia, and Uzbeki-
stan) and Guinea. The median by country for the
same ratio is larger than 100 percent in the same
countries with the exception of Uzbekistan. Tests of
differences of means at the country level reveal 26
statistically significant differences: 25 countries where
deposits are statistically smaller than loans (indicated
by << for the two-tailed tests and < for the one-tailed
tests) and Russia where deposits are larger than
loans.11 At the regional level, deposits are also statis-
tically smaller than loans of deposit mobilizing MFIs in
all regions with the exception of ECA. Within ECA,
deposits are statistically smaller than loans for the
quintet of Albania, Bulgaria, Mongolia, Serbia and
Tajikistan, but not for Armenia, Azerbaijan, Kyr-
gyzstan, Russia and Uzbekistan. Based on the data,
it is not clear what is driving the differences between
the subsets of ECA countries.12
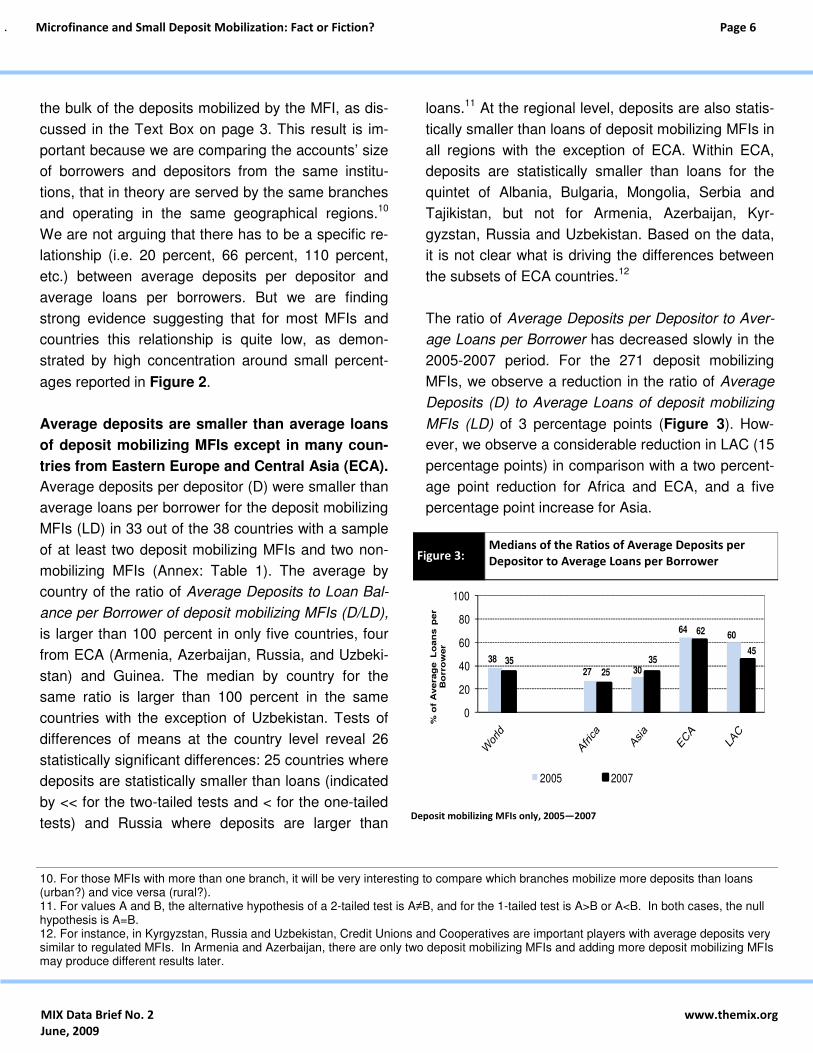
The ratio of Average Deposits per Depositor to Aver-
age Loans per Borrower has decreased slowly in the
2005-2007 period. For the 271 deposit mobilizing
MFIs, we observe a reduction in the ratio of Average
Deposits (D) to Average Loans of deposit mobilizing
MFIs (LD) of 3 percentage points (Figure 3). How-
ever, we observe a considerable reduction in LAC (15
percentage points) in comparison with a two percent-
age point reduction for Africa and ECA, and a five
percentage point increase for Asia.
Microfinance and Small Deposit Mobilization: Fact or Fiction?
10. For those MFIs with more than one branch, it will be very interesting to compare which branches mobilize more deposits than loans (urban?) and vice versa (rural?). 11. For values A and B, the alternative hypothesis of a 2-tailed test is A≠B, and for the 1-tailed test is A>B or A<B. In both cases, the null hypothesis is A=B. 12. For instance, in Kyrgyzstan, Russia and Uzbekistan, Credit Unions and Cooperatives are important players with average deposits very similar to regulated MFIs. In Armenia and Azerbaijan, there are only two deposit mobilizing MFIs and adding more deposit mobilizing MFIs may produce different results later.
Figure 3:
Deposit
Deposit mobilizing MFIs only, 2005—2007
Medians of the Ratios of Average Deposits per
Depositor to Average Loans per Borrower
38
27 30
6460
3525
35
62
45
0
20
40
60
80
100
% o
f A
vera
ge L
oan
s p
er
Bo
rro
wer
2005 2007
MIX Data Brief No. 2
June, 2009
Page 6
www.themix.org

.
The next step is to compare loan sizes of deposit mo-
bilizing MFIs (LD) with loan sizes of non-mobilizing
MFIs (LN). This comparison is useful in determining if
these two types of MFIs are serving different market
segments with their credit products. However, this
comparison is meaningless for Ethiopia and Indone-
sia because the number of non-mobilizing MFIs is
very small (2 and 4, respectively) compared to the
number of mobilizing MFIs (10 and 30, respectively).
For the same reason and for the same two countries,
later the ratio of Average Loans of deposit mobilizing
MFIs to Average Loans of non-mobilizing MFIs is
computed as average deposits per depositor (D) over
loans per borrower for all MFIs in the country (LA)
instead of only for non-mobilizing MFIs (LN), and sig-
nificant hypothesis tests are labeled as n.a.13 A simi-
lar argument can be applied to Benin, but deposits
per depositor are so small that the results do not
change when the adjustments are not made.
Average outstanding loans per borrower for de-
posit mobilizing MFIs are larger than for non-
mobilizing MFIs in most countries. In particular,
the average outstanding loans per borrower are 109
percent and 47 percent for the 298 deposit mobilizing
MFIs and 441 non-mobilizing MFIs respectively in
2007.14 The difference between these two averages
is statistically significant at the 99.9 percent level for
the whole sample, and on a regional basis with the
exception of ECA, for which the significance of the
two-tailed test was 89 percent but the one-tailed test
was significant at 96 percent. In the 38 countries with
at least two deposit mobilizing MFIs and two non-
mobilizing MFIs, loans per borrower of deposit mobi-
lizing MFIs (LD) were larger than those of non-
mobilizing MFIs (LN) in 32 countries, and the differ-
ence was statistically significant in 24 of these coun-
tries (only four were not significant on the two-tailed
tests). For the six countries where loans of deposit
mobilizing MFIs (LD) are smaller than loans of non-
mobilizing MFIs (LN), the one-tailed test was statisti-
cally significant only for Madagascar and Bangla-
desh.
Put very simply, average deposits per depositor (D)
are considerably smaller than average loans per bor-
Microfinance and Small Deposit Mobilization: Fact or Fiction?
13. This is only the case of the test of Average deposits to Average Loans per Borrower of non-mobilizing MFIs for Indonesia, as shown in Table 1. 14. This conclusion also holds for the full sample when those countries with less than two deposit mobilizing MFIs or less than two non-mobilizing MFIs are not removed. For the 610 non-mobilizing MFIs, the average loan per borrowers as percentage of GNI per capita (LN) in 2007 was 55 percent compared with 118 percent (LD) for the 483 deposit mobilizing MFIs. The difference between these two means is also statistically significant.
Figure 4: Average Loan Size per Borrower as % of GNI per Capita
109
189
43
180
9347 75
15
117
32
050
100150200250300350400
% o
f G
NI
per
cap
ita
Deposit Mobilizing MFIs Non Mobilizing MFIs
MIX Data Brief No. 2
June, 2009
Page 7
www.themix.org
.
rower of deposit mobilizing MFIs (LD), while average
loans of deposit mobilizing MFIs (LD) are considera-
bly larger than average loans of non-mobilizing MFIs
(LN). This difference in average loan size suggests
that these two types of MFIs serve different types of
borrowers in most countries. Therefore, we need to
compare average deposits per depositor (D) in de-
posit taking MFIs with average loans per borrower of
non-mobilizing MFIs (LN). The implicit assumption of
this comparison is that larger deposit accounts are
positively correlated with the income level of the de-
positors, in the same way as larger loan balances per
borrower are positively correlated with the income
level of borrowers. This comparison also assumes
that larger deposit accounts relative to average loans
are associated with richer borrowers.
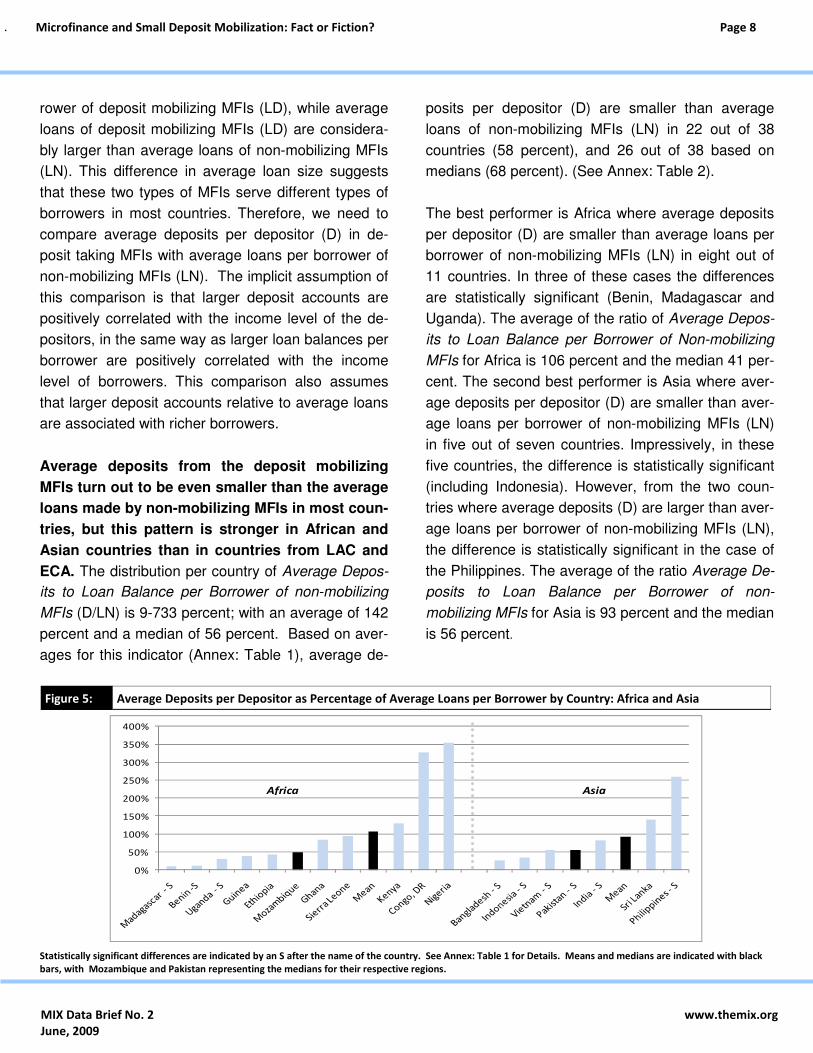
Average deposits from the deposit mobilizing
MFIs turn out to be even smaller than the average
loans made by non-mobilizing MFIs in most coun-
tries, but this pattern is stronger in African and
Asian countries than in countries from LAC and
ECA. The distribution per country of Average Depos-
its to Loan Balance per Borrower of non-mobilizing
MFIs (D/LN) is 9-733 percent; with an average of 142
percent and a median of 56 percent. Based on aver-
ages for this indicator (Annex: Table 1), average de-
posits per depositor (D) are smaller than average
loans of non-mobilizing MFIs (LN) in 22 out of 38
countries (58 percent), and 26 out of 38 based on
medians (68 percent). (See Annex: Table 2).
The best performer is Africa where average deposits
per depositor (D) are smaller than average loans per
borrower of non-mobilizing MFIs (LN) in eight out of
11 countries. In three of these cases the differences
are statistically significant (Benin, Madagascar and
Uganda). The average of the ratio of Average Depos-
its to Loan Balance per Borrower of Non-mobilizing
MFIs for Africa is 106 percent and the median 41 per-
cent. The second best performer is Asia where aver-
age deposits per depositor (D) are smaller than aver-
age loans per borrower of non-mobilizing MFIs (LN)
in five out of seven countries. Impressively, in these
five countries, the difference is statistically significant
(including Indonesia). However, from the two coun-
tries where average deposits (D) are larger than aver-
age loans per borrower of non-mobilizing MFIs (LN),
the difference is statistically significant in the case of
the Philippines. The average of the ratio Average De-
posits to Loan Balance per Borrower of non-
mobilizing MFIs for Asia is 93 percent and the median
is 56 percent.
Microfinance and Small Deposit Mobilization: Fact or Fiction?
Figure 5: Average Deposits per Depositor as Percentage of Average Loans per Borrower by Country: Africa and Asia
Statistically significant differences are indicated by an S after the name of the country. See Annex: Table 1 for Details. Means and medians are indicated with black
bars, with Mozambique and Pakistan representing the medians for their respective regions.
0%
50%
100%
150%
200%
250%
300%
350%
400%
Africa Asia
MIX Data Brief No. 2
June, 2009
Page 8
www.themix.org
.
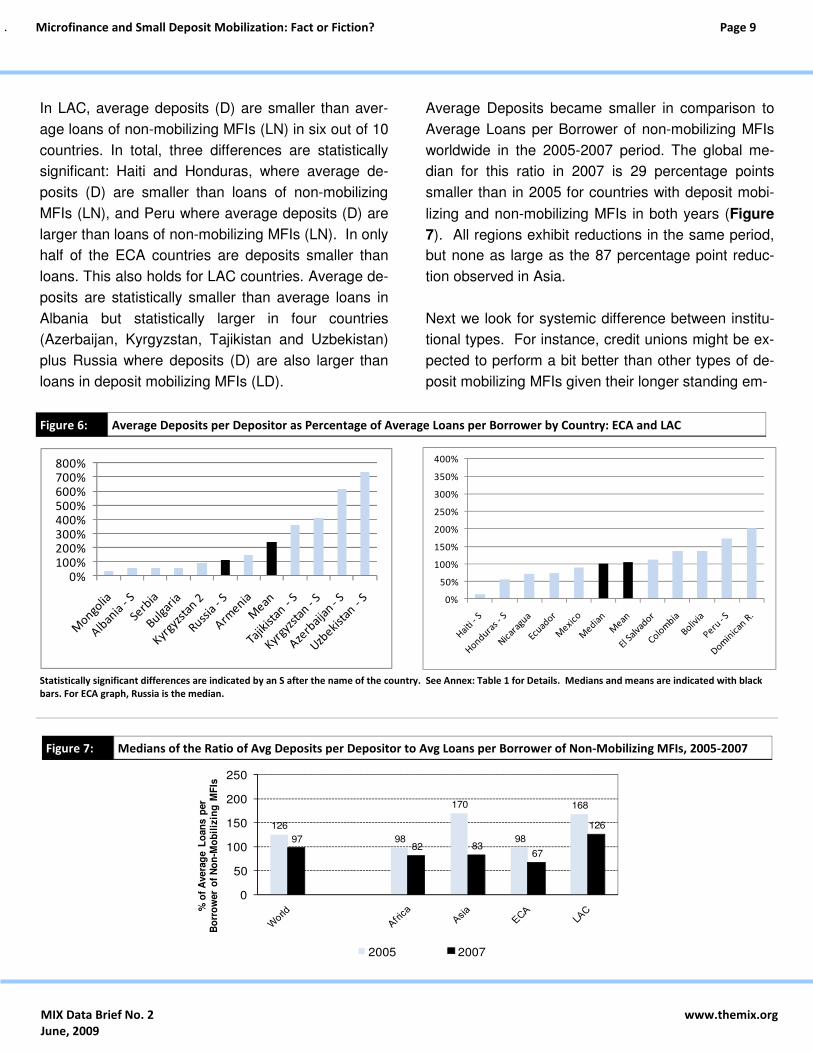
In LAC, average deposits (D) are smaller than aver-
age loans of non-mobilizing MFIs (LN) in six out of 10
countries. In total, three differences are statistically
significant: Haiti and Honduras, where average de-
posits (D) are smaller than loans of non-mobilizing
MFIs (LN), and Peru where average deposits (D) are
larger than loans of non-mobilizing MFIs (LN). In only
half of the ECA countries are deposits smaller than
loans. This also holds for LAC countries. Average de-
posits are statistically smaller than average loans in
Albania but statistically larger in four countries
(Azerbaijan, Kyrgyzstan, Tajikistan and Uzbekistan)
plus Russia where deposits (D) are also larger than
loans in deposit mobilizing MFIs (LD).
Average Deposits became smaller in comparison to
Average Loans per Borrower of non-mobilizing MFIs
worldwide in the 2005-2007 period. The global me-
dian for this ratio in 2007 is 29 percentage points
smaller than in 2005 for countries with deposit mobi-
lizing and non-mobilizing MFIs in both years (Figure
7). All regions exhibit reductions in the same period,
but none as large as the 87 percentage point reduc-
tion observed in Asia.
Next we look for systemic difference between institu-
tional types. For instance, credit unions might be ex-
pected to perform a bit better than other types of de-
posit mobilizing MFIs given their longer standing em-
Microfinance and Small Deposit Mobilization: Fact or Fiction?
Figure 6: Average Deposits per Depositor as Percentage of Average Loans per Borrower by Country: ECA and LAC
Statistically significant differences are indicated by an S after the name of the country. See Annex: Table 1 for Details. Medians and means are indicated with black
bars. For ECA graph, Russia is the median.
Figure 7: Medians of the Ratio of Avg Deposits per Depositor to Avg Loans per Borrower of Non-Mobilizing MFIs, 2005-2007
126
98
170
98
168
9782 83
67
126
0
50
100
150
200
250
% o
f A
vera
ge L
oan
s p
er
Bo
rro
wer
of
No
n-M
ob
iliz
ing
MF
Is
2005 2007
0%100%200%300%400%500%600%700%800%
0%
50%
100%
150%
200%
250%
300%
350%
400%
MIX Data Brief No. 2
June, 2009
Page 9
www.themix.org

.
phasis on savings and the fact that the same mem-
bers are simultaneously borrowers and savers in
member-based credit unions. Likewise, banks that
have operated for years might be perceived as being
a more secure place for savings than a fairly new
NGO or non-bank MFI. For the following analysis,
MFIs were classified into four categories: non-
governmental organizations (NGOs), credit unions
and cooperatives (COOPS), banks and non-bank
MFIs (licensed), and rural banks. Only those coun-
tries with at least two deposit mobilizing MFIs per le-
gal status were included.
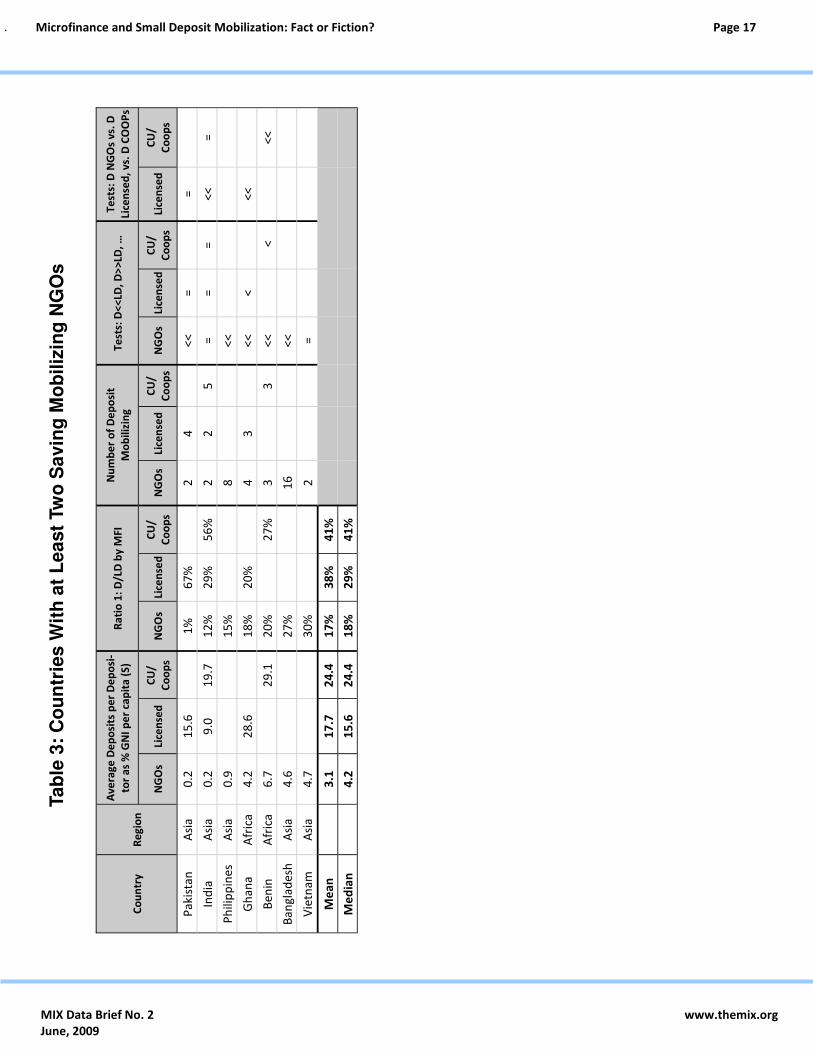
NGOs mobilize the smallest average deposits ac-
count per depositor in the seven countries with at
least two deposit mobilizing NGOs (Annex: Table
3). Average deposits per depositor (D) are statisti-
cally smaller than average loans per borrower of de-
posit mobilizing NGOs (LD) in five of these countries
(71 percent), and not statistically significant in India
and Vietnam. The Average Deposits to Loan Bal-
ance per Borrower ratio for NGOs is smaller than the
respective ratios for COOPs, licensed mobilizing
MFIs and rural banks in every country where the
comparison is possible. In addition, average deposits
per depositor as percentage of GNI per capita (D) of
NGOs are statistically smaller than the respective fig-
ures of the other types of deposit mobilizing MFIs on
a country basis in four out of six possible compari-
sons. In the other two cases (licensed MFIs in Paki-
stan and COOPs in India), the differences were not
statistically significant.
Credit unions and cooperatives are only slightly
better than licensed deposit mobilizing MFIs in
mobilizing small average deposit accounts per
depositor. There are 15 countries with at least two
deposit mobilizing COOPs in the sample (Annex: Ta-
ble 4). Average deposits per depositor of COOPs (D)
are statistically smaller than average loans per bor-
rower (LD) in five countries (33 percent), statistically
larger in one (Russia), and not statistically different in
nine (60 percent). In the eight countries where it is
possible to compare COOPs and licensed mobilizing
MFIs, average deposits per depositors (D) are statis-
tically smaller than average loans per borrower (LD)
in three countries for COOPs and in four (five if we
consider Kyrgyzstan 2) for licensed mobilizing MFIs.
In the same set of countries, average deposits per
depositor (D) of COOPs are statistically smaller than
those of licensed mobilizing MFIs in three countries
(Ecuador, Nicaragua and Peru), statistically larger in
Mexico and not statistically different in the other four
countries.
In 11 of 24 countries (45 percent or 50 percent if we
include Kyrgyzstan 2) with at least two licensed de-
posit mobilizing MFIs, average deposits per depositor
(D) of licensed mobilizing MFIs are significantly
smaller than average loans of deposit mobilizing
MFIs (LD). Only two countries (Indonesia and Philip-
pines) have at least two rural banks mobilizing depos-
its. In both cases, average deposits per depositor (D)
of rural banks (28 and 24 percent of GNI per capita
respectively) are statistically significantly larger than
average deposits held by other types of deposit mobi-
lizing MFIs.
Next we analyze some basic correlations to test if
MFI size affects deposit mobilization. These correla-
tions include Average Deposits to Loan Balance per
Borrower ratio of deposit mobilizing MFIs (D/LD), and
some basic indicators of deposit mobilization and the
size of MFIs: ratio of number of savers to borrowers;
average deposits per depositor as percentage of GNI
per capita (D); average loan balance per borrower as
percentage of GNI per capita (LD); years since MFI
started mobilizing deposits; total assets in USD; ratio
of voluntary deposits to assets; and number of
branches per MFI. This analysis was conducted for
the full sample of 453 deposit mobilizing MFIs, and
the correlations calculated for the total sample and for
Microfinance and Small Deposit Mobilization: Fact or Fiction?
MIX Data Brief No. 2
June, 2009
Page 10
www.themix.org

.
the regional sub-samples. Only correlations with a
significance level of 10 percent or greater are re-
ported in Annex: Table 5.15
The ratio of Average Deposits to Loan Balance
per Borrower of deposit mobilizing MFIs is com-
plementary to other commonly used indicators of
deposit mobilization because it is not highly cor-
related with them. Therefore this analysis en-
riches the discussion of deposit mobilization by
MFIs. It would be expected that the ratio of Average
Deposits to Loan Balance per Borrower would be
positively correlated with its numerator and negatively
correlated with its denominator. However, for the full
sample, the only statistically significant correlation for
Average Deposits to Loan Balance per Borrower ratio
is 30 percent with the ratio of average deposits per
depositor as percentage of GNI per capita (D). At the
regional level, the coefficients are 31 percent, 49 per-
cent and 97 percent for Africa, Asia and LAC respec-
tively, but statistically insignificant (0 percent correla-
tion) in ECA. Since average deposits per depositor
as percent of GNI per capita (D) is part of the nu-
merator of Average Deposits to Loan Balance per
Borrower (D/LD), these statistically significant correla-
tions confirm that larger deposit sizes are associated
with higher values for the Average Deposits to Loan
Balance per Borrower ratio of deposit mobilizing MFIs
(D/LD), but the correlations vary by region and tend
to be lower than expected. Similarly, the correlation
between Average Deposits to Loan Balance per Bor-
rower and its denominator, average loan balance per
borrower as percentage of GNI per capita (LD), is not
statistically significant for the full sample, and it is sta-
tistically significant only for the sub-sample of African
MFIs (-15 percent).
For the full sample, the correlation between Average
Deposits to Loan Balance per Borrower of deposit
mobilizing MFIs and the savers to borrowers ratio is
statistically insignificant. This means that Average
Deposits to Loan Balance per Borrower is not redun-
dant compared with this other commonly used indica-
tor for deposit mobilization. At the regional level there
are three statistically significant correlations between
Average Deposits to Loan Balance per Borrower and
savers to borrowers ratio, -31 percent, -16 percent
and -40 percent for Africa, Asia and ECA, respec-
tively, meaning that there is a lot of regional variability
in the sample. However, this correlation is statistically
insignificant for LAC, meaning there is no consistent
relationship between these two indicators.
Depth of deposits is not correlated with the num-
ber of years of deposit mobilization nor the num-
ber of MFI branches. Also the ratio of Average De-
posits to Loan Balance per Borrower of deposit mobi-
lizing MFIs is not correlated with MFI size as meas-
ured by assets in USD, or the deposits to assets ratio
or the number of branches of each MFI. In addition,
there is no significant global statistical correlation be-
tween Average Deposits to Loan Balance per Bor-
rower of deposit mobilizing MFIs and the number of
years the MFI has been mobilizing deposits.16 This is
a strong result because it suggests that once MFIs
decide on particular loans and deposits products,
there is not a lot of change in Average Deposits to
Loan Balance per Borrower of deposit mobilizing
MFIs as MFIs age. This implies that either the size of
savings deposits and loans does not change over
time, or more likely that both rise at roughly the same
pace as their clients become wealthier relative to GNI
per capita. The only exceptions occur in ECA, where
the correlation between Average Deposits to Loan
Balance per Borrower of deposit mobilizing MFIs and
Microfinance and Small Deposit Mobilization: Fact or Fiction?
15. More rigorous analysis is necessary to confirm these preliminary results. 16. Data on number of years since the MFI started mobilizing deposits were available only for MFIs that started offering voluntary deposit products after they started reporting to the database or that incorporated voluntary deposit products after they started microfinance opera-
tions.
MIX Data Brief No. 2
June, 2009
Page 11
www.themix.org

.
years of experience in mobilizing deposits is –32 per-
cent and Asia where the correlation coefficient is 22
percent. ECA is also the only region where Average
Deposits to Loan Balance per Borrower of deposit
mobilizing MFIs is significantly correlated with the
size of MFIs as measured by total assets. The nega-
tive correlation of -25 percent suggests that in ECA,
smaller MFIs are better at mobilizing smaller deposit
accounts than larger MFIs.
The main question explored in this paper is whether
deposit mobilizing MFIs serve small or large deposi-
tors. The low ratio found for Average Deposits per
Depositor to Average Loans per Borrower suggests
that most deposit mobilizing MFIs are reaching
small depositors, perhaps even smaller than their
borrowers. This means that they have been able to
design and mobilize voluntary deposits with instru-
ments that match the needs of individuals as poor or
even poorer than their borrowers. However, the pres-
ence of many large outliers also suggests that not all
MFIs have succeeded at microdeposit mobilization.
Additional client research is necessary to confirm
these results, but the striking difference between the
countries with lower Average Deposits to Loan Bal-
ance per Borrower ratio of deposit mobilizing MFIs
(D/LD), and those with the higher ratios, as in the
ECA countries, suggests some strong systematic pat-
terns in the data.
We also believe that the ratio of Average Deposits to
average Loan Balance per Borrower should be a fun-
damental indicator in the analysis of depth of out-
reach of deposit mobilizing instruments. This ratio
complements other indicators because it is not corre-
lated with them and, therefore, not redundant. In ad-
dition, this ratio facilitates the comparison of the per-
formance of saving mobilizing MFIs across countries.
It seems that in most countries, deposit mobilizing
MFIs serve different types of borrowers than do non-
mobilizing MFIs. We presented statistical tests sug-
gesting that these are not random results. Also, by
comparing average deposits per depositor at the
country level with the level of average loans per bor-
rower for non-mobilizing MFIs, we found clear leaders
in every region in terms of small deposit mobilization.
The results also suggest that there are more leaders
in Africa and Asia than in LAC and ECA. Some NGOs
lead in terms of depth of outreach of deposit mobiliza-
tion in countries where they are allowed to mobilize
deposits. Surprisingly, we did not find strong differ-
ences between Credit Unions and Cooperatives in
comparison with licensed deposit mobilizers.
In the same way that average data for loans can
mask important information about the distribution of
loans, so these data about savings may mask impor-
tant information about the distribution of savers. Fu-
ture research needs to be done to understand these
distributions. Research is also needed to separate
time deposits from demand deposits both in terms of
volume and number of clients and accounts. Many
other issues, such as the terms and conditions of
saving products, transaction costs for savers, and the
image of MFI in their market areas, need to be stud-
ied to understand the performance of deposit mobiliz-
ing MFIs regarding savings for the poor.
Microfinance and Small Deposit Mobilization: Fact or Fiction?
Conclusions
MIX Data Brief No. 2
June, 2009
Page 12
www.themix.org

.
Microfinance and Small Deposit Mobilization: Fact or Fiction?
Annex
The following definitions are to be applied to Table 1 of the Annex (pages14-15) and Table 2 of the Annex (page 16):
Variable Average Deposits to Loan Balance per Borrower of Deposit Mobilizing MFIs is defined as average deposits per depositor (D) as percentage of average loan size per borrower for deposit mobilizing MFIs (LD). This ratio is first calculated at the MFI level and the average (or median) of each ratio by country is presented in the tables. This ratio is not equal to the percentage of average deposits per depositor (D) over average loan size per borrower of deposit mobilizing MFIs (LD) as presented in the tables. A large mismatch between this ratio and the ratio of the averages presented in the tables is usually explained by the presence of outliers. Average Loans of Deposit Mobilizing MFIs to Average Loans of Non-Mobilizing MFIs is defined as average loan sizes per borrower of deposit mobilizing MFIs (LD) as percentage of average loan size per borrower of non-mobilizing MFIs (LN).
Average Deposits to Loan Balance per Borrower of Non-Mobilizing MFIs is defined as average deposits per
depositor (D) as percentage of average loan size per borrower of non-mobilizing MFIs (LN).
MIX Data Brief No. 2
June, 2009
Page 13
www.themix.org
.
Microfinance and Small Deposit Mobilization: Fact or Fiction?
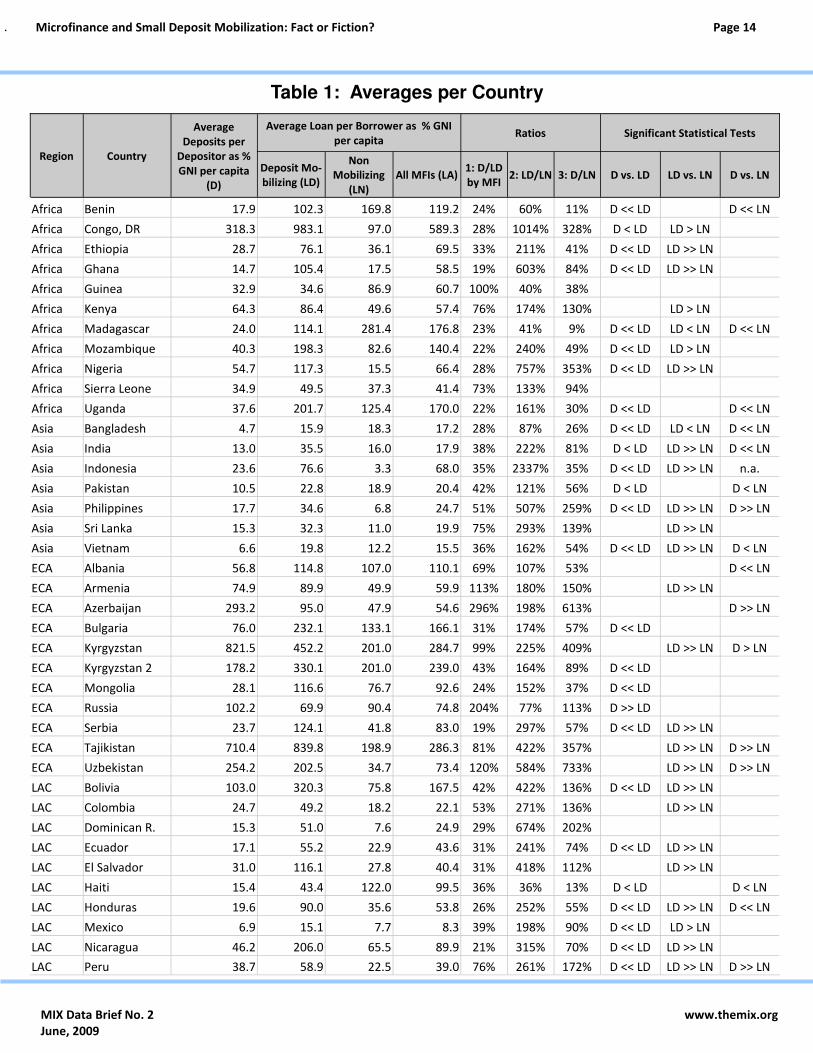
Region Country
Average
Deposits per
Depositor as %
GNI per capita
(D)
Average Loan per Borrower as % GNI
per capita Ratios Significant Statistical Tests
Deposit Mo-
bilizing (LD)
Non
Mobilizing
(LN)
All MFIs (LA) 1: D/LD
by MFI 2: LD/LN 3: D/LN D vs. LD LD vs. LN D vs. LN
Africa Benin 17.9 102.3 169.8 119.2 24% 60% 11% D << LD D << LN
Africa Congo, DR 318.3 983.1 97.0 589.3 28% 1014% 328% D < LD LD > LN
Africa Ethiopia 28.7 76.1 36.1 69.5 33% 211% 41% D << LD LD >> LN
Africa Ghana 14.7 105.4 17.5 58.5 19% 603% 84% D << LD LD >> LN
Africa Guinea 32.9 34.6 86.9 60.7 100% 40% 38%
Africa Kenya 64.3 86.4 49.6 57.4 76% 174% 130% LD > LN
Africa Madagascar 24.0 114.1 281.4 176.8 23% 41% 9% D << LD LD < LN D << LN
Africa Mozambique 40.3 198.3 82.6 140.4 22% 240% 49% D << LD LD > LN
Africa Nigeria 54.7 117.3 15.5 66.4 28% 757% 353% D << LD LD >> LN
Africa Sierra Leone 34.9 49.5 37.3 41.4 73% 133% 94%
Africa Uganda 37.6 201.7 125.4 170.0 22% 161% 30% D << LD D << LN
Asia Bangladesh 4.7 15.9 18.3 17.2 28% 87% 26% D << LD LD < LN D << LN
Asia India 13.0 35.5 16.0 17.9 38% 222% 81% D < LD LD >> LN D << LN
Asia Indonesia 23.6 76.6 3.3 68.0 35% 2337% 35% D << LD LD >> LN n.a.
Asia Pakistan 10.5 22.8 18.9 20.4 42% 121% 56% D < LD D < LN
Asia Philippines 17.7 34.6 6.8 24.7 51% 507% 259% D << LD LD >> LN D >> LN
Asia Sri Lanka 15.3 32.3 11.0 19.9 75% 293% 139% LD >> LN
Asia Vietnam 6.6 19.8 12.2 15.5 36% 162% 54% D << LD LD >> LN D < LN
ECA Albania 56.8 114.8 107.0 110.1 69% 107% 53%
D << LN
ECA Armenia 74.9 89.9 49.9 59.9 113% 180% 150% LD >> LN
ECA Azerbaijan 293.2 95.0 47.9 54.6 296% 198% 613%
D >> LN
ECA Bulgaria 76.0 232.1 133.1 166.1 31% 174% 57% D << LD
ECA Kyrgyzstan 821.5 452.2 201.0 284.7 99% 225% 409% LD >> LN D > LN
ECA Kyrgyzstan 2 178.2 330.1 201.0 239.0 43% 164% 89% D << LD
ECA Mongolia 28.1 116.6 76.7 92.6 24% 152% 37% D << LD
ECA Russia 102.2 69.9 90.4 74.8 204% 77% 113% D >> LD
ECA Serbia 23.7 124.1 41.8 83.0 19% 297% 57% D << LD LD >> LN
ECA Tajikistan 710.4 839.8 198.9 286.3 81% 422% 357% LD >> LN D >> LN
ECA Uzbekistan 254.2 202.5 34.7 73.4 120% 584% 733% LD >> LN D >> LN
LAC Bolivia 103.0 320.3 75.8 167.5 42% 422% 136% D << LD LD >> LN
LAC Colombia 24.7 49.2 18.2 22.1 53% 271% 136% LD >> LN
LAC Dominican R. 15.3 51.0 7.6 24.9 29% 674% 202%
LAC Ecuador 17.1 55.2 22.9 43.6 31% 241% 74% D << LD LD >> LN
LAC El Salvador 31.0 116.1 27.8 40.4 31% 418% 112% LD >> LN
LAC Haiti 15.4 43.4 122.0 99.5 36% 36% 13% D < LD D < LN
LAC Honduras 19.6 90.0 35.6 53.8 26% 252% 55% D << LD LD >> LN D << LN
LAC Mexico 6.9 15.1 7.7 8.3 39% 198% 90% D << LD LD > LN
LAC Nicaragua 46.2 206.0 65.5 89.9 21% 315% 70% D << LD LD >> LN
LAC Peru 38.7 58.9 22.5 39.0 76% 261% 172% D << LD LD >> LN D >> LN
Table 1: Averages per Country
MIX Data Brief No. 2
June, 2009
Page 14
www.themix.org
.
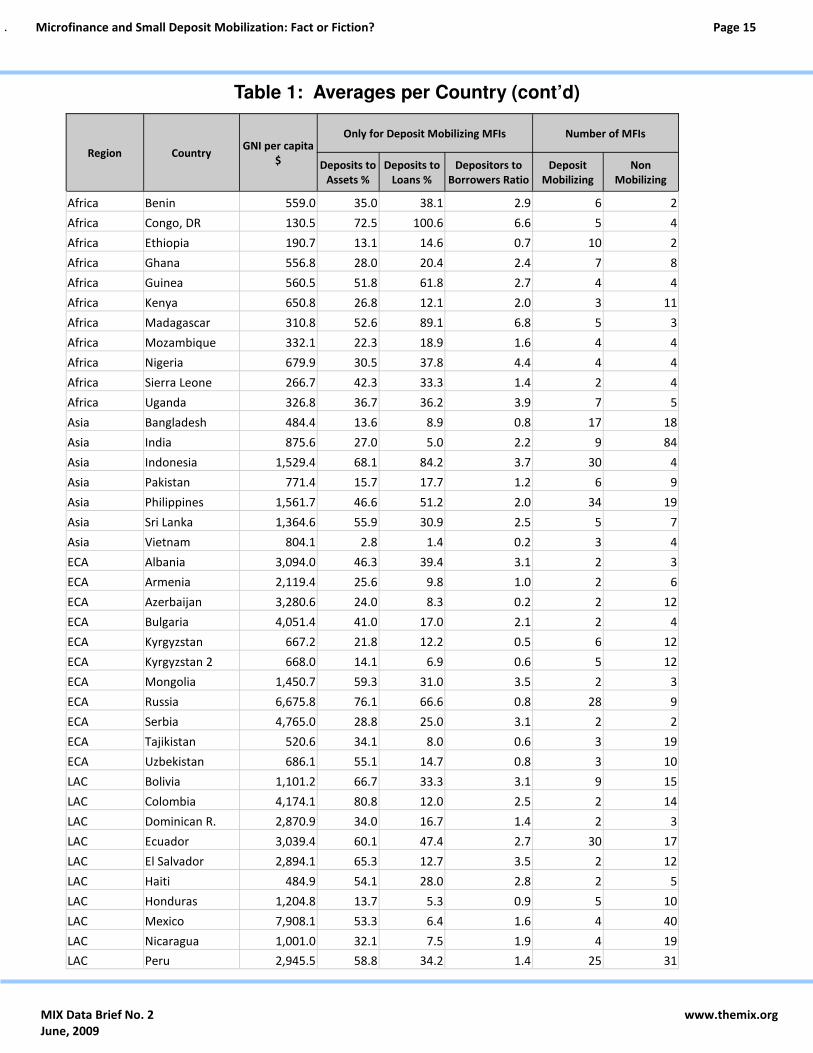
Microfinance and Small Deposit Mobilization: Fact or Fiction?
Region Country GNI per capita
$
Only for Deposit Mobilizing MFIs Number of MFIs
Deposits to
Assets %
Deposits to
Loans %
Depositors to
Borrowers Ratio
Deposit
Mobilizing
Non
Mobilizing
Africa Benin 559.0 35.0 38.1 2.9 6 2
Africa Congo, DR 130.5 72.5 100.6 6.6 5 4
Africa Ethiopia 190.7 13.1 14.6 0.7 10 2
Africa Ghana 556.8 28.0 20.4 2.4 7 8
Africa Guinea 560.5 51.8 61.8 2.7 4 4
Africa Kenya 650.8 26.8 12.1 2.0 3 11
Africa Madagascar 310.8 52.6 89.1 6.8 5 3
Africa Mozambique 332.1 22.3 18.9 1.6 4 4
Africa Nigeria 679.9 30.5 37.8 4.4 4 4
Africa Sierra Leone 266.7 42.3 33.3 1.4 2 4
Africa Uganda 326.8 36.7 36.2 3.9 7 5
Asia Bangladesh 484.4 13.6 8.9 0.8 17 18
Asia India 875.6 27.0 5.0 2.2 9 84
Asia Indonesia 1,529.4 68.1 84.2 3.7 30 4
Asia Pakistan 771.4 15.7 17.7 1.2 6 9
Asia Philippines 1,561.7 46.6 51.2 2.0 34 19
Asia Sri Lanka 1,364.6 55.9 30.9 2.5 5 7
Asia Vietnam 804.1 2.8 1.4 0.2 3 4
ECA Albania 3,094.0 46.3 39.4 3.1 2 3
ECA Armenia 2,119.4 25.6 9.8 1.0 2 6
ECA Azerbaijan 3,280.6 24.0 8.3 0.2 2 12
ECA Bulgaria 4,051.4 41.0 17.0 2.1 2 4
ECA Kyrgyzstan 667.2 21.8 12.2 0.5 6 12
ECA Kyrgyzstan 2 668.0 14.1 6.9 0.6 5 12
ECA Mongolia 1,450.7 59.3 31.0 3.5 2 3
ECA Russia 6,675.8 76.1 66.6 0.8 28 9
ECA Serbia 4,765.0 28.8 25.0 3.1 2 2
ECA Tajikistan 520.6 34.1 8.0 0.6 3 19
ECA Uzbekistan 686.1 55.1 14.7 0.8 3 10
LAC Bolivia 1,101.2 66.7 33.3 3.1 9 15
LAC Colombia 4,174.1 80.8 12.0 2.5 2 14
LAC Dominican R. 2,870.9 34.0 16.7 1.4 2 3
LAC Ecuador 3,039.4 60.1 47.4 2.7 30 17
LAC El Salvador 2,894.1 65.3 12.7 3.5 2 12
LAC Haiti 484.9 54.1 28.0 2.8 2 5
LAC Honduras 1,204.8 13.7 5.3 0.9 5 10
LAC Mexico 7,908.1 53.3 6.4 1.6 4 40
LAC Nicaragua 1,001.0 32.1 7.5 1.9 4 19
LAC Peru 2,945.5 58.8 34.2 1.4 25 31
Table 1: Averages per Country (cont’d)
MIX Data Brief No. 2
June, 2009
Page 15
www.themix.org

.
Microfinance and Small Deposit Mobilization: Fact or Fiction?
Region Country
Average Deposits
per Depositor as
% GNI per capita
(D)
Average Loan per Borrower as % GNI
per capita Ratios Only for Deposit Mobilizing MFIs
Deposit
Mobilizing
(LD)
Non
Mobilizing
(LN)
All MFIs (LA) 1: D/LD
by MFI 2: LD/LN 3: D/LN
Deposits
to Assets
%
Deposits
to Loans
%
Depositors to
Borrowers
Ratio
Africa Benin 11.5 48.7 169.8 95.0 23% 29% 7% 28.3 31.4 2.2
Africa Congo, DR 63.4 230.0 95.2 158.2 24% 242% 67% 67.7 102.3 6.2
Africa Ethiopia 13.0 68.4 36.1 67.2 22% 190% 19% 12.9 12.8 0.9
Africa Ghana 8.0 54.5 19.3 21.5 14% 282% 41% 21.5 0.0 0.9
Africa Guinea 26.6 32.0 40.3 37.4 111% 79% 66% 51.7 17.4 1.4
Africa Kenya 40.7 92.4 46.4 51.5 30% 199% 88% 15.5 0.0 1.3
Africa Madagascar 24.9 101.1 287.9 104.1 24% 35% 9% 55.2 65.8 9.0
Africa Mozambique 43.8 194.3 88.0 114.0 21% 221% 50% 19.1 3.5 1.3
Africa Nigeria 8.1 97.0 14.4 39.7 9% 671% 56% 24.2 5.6 3.3
Africa Sierra Leone 34.9 49.5 39.2 39.2 73% 126% 89% 42.3 0.0 1.4
Africa Uganda 26.8 177.0 95.1 106.6 17% 186% 28% 30.4 36.6 4.7
Asia Bangladesh 3.3 16.2 18.0 16.4 24% 90% 18% 8.0 0.0 1.0
Asia India 6.5 15.5 14.0 14.3 17% 111% 46% 17.8 0.0 1.7
Asia Indonesia 17.0 59.5 3.4 48.2 28% 1765% 35% 69.0 91.0 3.2
Asia Pakistan 5.1 22.5 19.2 19.8 18% 117% 27% 6.8 0.0 0.9
Asia Philippines 9.5 22.5 6.2 9.3 36% 363% 154% 57.8 25.4 1.3
Asia Sri Lanka 8.2 18.7 12.1 14.2 30% 154% 67% 59.3 0.0 2.0
Asia Vietnam 7.8 20.9 11.6 15.0 48% 181% 68% 2.5 0.0 0.1
ECA Albania 56.8 114.8 118.6 118.6 69% 97% 48% 46.3 0.0 3.1
ECA Armenia 74.9 89.9 44.5 49.7 113% 202% 169% 25.6 0.0 1.0
ECA Azerbaijan 293.2 95.0 21.1 23.4 296% 451% 1393% 24.0 0.0 0.2
ECA Bulgaria 76.0 232.1 81.5 149.3 31% 285% 93% 41.0 0.0 2.1
ECA Kyrgyzstan 184.1 330.8 104.5 192.1 37% 317% 176% 8.6 0.0 0.3
ECA Kyrgyzstan 2 27.3 287.3 104.5 178.0 11% 275% 26% 7.9 0.0 0.4
ECA Mongolia 28.1 116.6 28.9 113.7 24% 403% 97% 59.3 0.0 3.5
ECA Russia 65.3 49.0 70.3 55.9 108% 70% 93% 81.6 87.4 0.6
ECA Serbia 23.7 124.1 41.8 81.4 19% 297% 57% 28.8 23.9 3.1
ECA Tajikistan 508.3 859.9 112.7 120.0 81% 763% 451% 31.8 0.0 0.6
ECA Uzbekistan 130.3 217.4 27.5 40.1 62% 790% 474% 69.9 0.0 0.8
LAC Bolivia 116.0 238.9 69.6 105.8 25% 343% 167% 67.7 0.0 2.4
LAC Colombia 24.7 49.2 19.1 20.9 53% 258% 129% 80.8 0.0 2.5
LAC Dominican R. 15.3 51.0 5.6 13.4 29% 911% 273% 34.0 0.0 1.4
LAC Ecuador 11.7 43.7 19.5 36.7 28% 224% 60% 57.9 62.0 2.8
LAC El Salvador 31.0 116.1 26.4 33.3 31% 441% 118% 65.3 0.0 3.5
LAC Haiti 15.4 43.4 96.9 60.1 36% 45% 16% 54.1 0.0 2.8
LAC Honduras 20.0 83.1 36.1 45.3 21% 230% 55% 10.7 0.0 0.9
LAC Mexico 6.8 15.7 4.2 4.5 37% 374% 161% 62.3 0.0 1.9
LAC Nicaragua 39.3 154.8 69.9 72.2 24% 221% 56% 29.7 0.0 1.5
LAC Peru 33.9 57.4 14.2 33.2 66% 404% 238% 59.4 0.0 1.2
Table 2: Medians per Country
MIX Data Brief No. 2
June, 2009
Page 16
www.themix.org
.
Microfinance and Small Deposit Mobilization: Fact or Fiction?
Co
un
try
R
eg
ion
Av
era
ge
De
po
sits
pe
r D
ep
osi
-
tor
as
% G
NI
pe
r ca
pit
a (
S)
Ra
tio
1:
D/L
D b
y M
FI
Nu
mb
er
of
De
po
sit
Mo
bil
izin
g
Te
sts:
D<
<LD
, D
>>
LD,
…
Te
sts:
D N
GO
s v
s. D
Lice
nse
d,
vs.
D C
OO
Ps
NG
Os
Lice
nse
d
CU
/
Co
op
s N
GO
s Li
cen
sed
C
U/
Co
op
s N
GO
s Li
cen
sed
C
U/
Co
op
s N
GO
s Li
cen
sed
C
U/
Co
op
s Li
cen
sed
C
U/
Co
op
s
Pa
kis
tan
A
sia
0
.2
15
.6
1
%
67
%
2
4
<<
=
=
Ind
ia
Asi
a
0.2
9
.0
19
.7
12
%
29
%
56
%
2
2
5
=
=
=
<<
=
Ph
ilip
pin
es
Asi
a
0.9
1
5%
8
<
<
Gh
an
a
Afr
ica
4
.2
28
.6
1
8%
2
0%
4
3
<
<
<
<
<
Be
nin
A
fric
a
6.7
29
.1
20
%
2
7%
3
3
<<
<
<
<
Ba
ng
lad
esh
A
sia
4
.6
27
%
16
<
<
Vie
tna
m
Asi
a
4.7
3
0%
2
=
Me
an
3.1
1
7.7
2
4.4
1
7%
3
8%
4
1%
Me
dia
n
4
.2
15
.6
24
.4
18
%
29
%
41
%
Ta
ble
3:
Co
un
trie
s W
ith
at
Le
ast
Tw
o S
avin
g M
ob
iliz
ing
NG
Os
MIX Data Brief No. 2
June, 2009
Page 17
www.themix.org

.
Microfinance and Small Deposit Mobilization: Fact or Fiction?
Co
un
try
R
eg
ion
Av
era
ge
De
po
sits
pe
r D
ep
osi
-
tor
as
% G
NI
pe
r ca
pit
a (
D)
Ra
tio
1:
D/L
D b
y M
FI
Nu
mb
er
of
De
po
sit
Mo
bil
izin
g
Te
sts:
D<
<LD
, D
>>
LD,
…
Te
sts:
D C
OO
Ps
vs.
D N
GO
s, v
s. D
LIC
.
NG
Os
Lice
nse
d
CU
/
Co
op
s N
GO
s Li
cen
sed
C
U/
Co
op
s N
GO
s Li
cen
sed
C
U/
Co
op
s N
GO
s Li
cen
sed
C
U/
Co
op
s N
GO
S
Lice
nse
d
Nic
ara
gu
a
LAC
70
.7
21
.6
2
7%
1
6%
2
2
=
<
<
<
<
Pe
ru
LAC
45
.1
18
.4
7
7%
6
9%
19
6
<<
<
<
<
<
Ecu
ad
or
LAC
31
.5
15
.4
5
1%
2
9%
3
27
=
<<
<<
Ky
rgy
zsta
n
EC
A
1
46
0.2
1
82
.8
1
48
%
51
%
3
3
=
=
=
Ug
an
da
A
fric
a
4
6.3
1
5.8
23
%
22
%
5
2
<<
=
=
Ky
rgy
zsta
n 2
E
CA
17
1.4
1
82
.8
3
2%
5
1%
2
3
<
<
=
=
Bo
livi
a
LAC
98
.3
11
9.4
46
%
28
%
7
2
<<
=
=
Ind
ia
Asi
a
0.2
9
.0
19
.7
12
%
29
%
56
%
2
2
5
=
=
=
=
=
Me
xico
LA
C
2
.1
11
.7
1
9%
5
8%
2
2
<
=
>>
Be
nin
A
fric
a
6.7
29
.1
20
%
2
7%
3
3
<<
<
>>
Ma
da
ga
sca
r A
fric
a
24
.0
23
%
5
<<
Co
ng
o,
DR
A
fric
a
19
3.1
2
4%
4
=
Ind
on
esi
a
Asi
a
10
.0
41
%
4
=
Gu
ine
a
Afr
ica
3
4.4
8
1%
3
=
Uzb
ek
ista
n
EC
A
34
3.5
1
56
%
2
=
Ru
ssia
E
CA
9
4.4
2
10
%
27
>
>
All
Co
un
trie
s M
ea
n
2
14
.9
82
.2
5
0%
5
9%
Me
dia
n
4
6.3
2
6.5
32
%
46
%
On
ly
cou
ntr
ies
wit
h
Lice
nse
d
Me
an
21
4.9
6
5.3
50
%
42
%
Me
dia
n
4
6.3
1
9.7
32
%
51
%
Ta
ble
4:
Co
un
trie
s W
ith
at
Le
ast
Tw
o S
avin
g M
ob
iliz
ing
CO
OP
s
MIX Data Brief No. 2
June, 2009
Page 18
www.themix.org

.
Microfinance and Small Deposit Mobilization: Fact or Fiction?
Ratio 1* Depositors
to
Borrowers
Avg. Deposits/
Depositor
% GNIPC
Avg. Loan/
Borrower
% GNIPC
Year
Mobilizing
Deposits
Assets
Mill. USD
Deposits
to Assets
Ratio
Complete Sample = 453
Ratio 1* 1.00
Depositors to Borrowers 1.00
Avg. Deposits/Depositor % GNIPC 0.30 -0.09 1.00
Avg. Loan/Borrower % GNIPC 0.26 0.61 1.00
Year Mobilizing Deposits 1.00
Assets Mill USD 0.40 1.00
Deposits to Assets Ratio 0.45 0.13 -0.18 0.11 1.00
No. Branches 0.38 -0.12
Africa = 138
Ratio 1* 1.00
Depositors to Borrowers -0.31 1.00
Avg. Deposits/Depositor % GNIPC 0.31 1.00
Avg. Loan/Borrower % GNIPC -0.15 0.37 0.75 1.00
Year Mobilizing Deposits 1.00
Assets Mill USD 0.36 1.00
Deposits to Assets Ratio 0.65 0.24 0.32 1.00
No. Branches 0.30 0.51 0.18
Asia = 151
Ratio 1* 1.00
Depositors to Borrowers -0.16 1.00
Avg. Deposits/Depositor % GNIPC 0.49 -0.15 1.00
Avg. Loan/Borrower % GNIPC 0.24 0.38 1.00
Year Mobilizing Deposits 0.22 0.22 1.00
Assets Mill USD 0.15 0.25 1.00
Deposits to Assets Ratio 0.66 0.31 1.00
No. Branches 0.84 -0.17
Eastern Europe and Central Asia = 65
Ratio 1* 1.00
Depositors to Borrowers -0.40 1.00
Avg. Deposits/Depositor % GNIPC 1.00
Avg. Loan/Borrower % GNIPC 0.88 1.00
Year Mobilizing Deposits -0.32 0.68 1.00
Assets Mill USD -0.25 0.56 0.63 1.00
Deposits to Assets Ratio -0.24 1.00
No. Branches 0.35 0.35
Latin America and the Caribbean = 99
Ratio 1* 1.00
Depositors to Borrowers 1.00
Avg. Deposits/Depositor % GNIPC 0.97 -0.20 1.00
Avg. Loan/Borrower % GNIPC 0.47 1.00
Year Mobilizing Deposits 0.32 1.00
Assets Mill USD 0.41 1.00
Deposits to Assets Ratio 0.40 0.33 0.18 1.00
No. Branches 0.46 0.96
Table 5: Correlations for the Complete Sample and By Region
* Ratio 1 = Variable Average Deposits to Loan Balance per Borrower of Deposit Mobilizing MFIs (see page 13).
MIX Data Brief No. 2
June, 2009
Page 19
www.themix.org

Microfinance Information Exchange, Inc.
Data Brief, No. 2
When quoting from this paper, please cite as: Gonzalez, Adrian and Richard Meyer. “Microfinance and Small Deposit Mobilization: Fact or Fiction?” Data Brief No. 2, Microfinance Information Exchange, Inc.
The Microfinance Information Exchange, Inc. (MIX) is the leading provider of business information and data services for the microfinance industry. Dedicated to strengthening the microfinance sector by pro-moting transparency, MIX provides detailed performance and financial information on microfinance insti-tutions, funders, networks and service providers associated with the industry. MIX does this through a variety of publicly available platforms, including MIX Market (www.mixmarket.org) and the MicroBanking Bulleting (MBB). Visit www.themix.org for more information. MIX is a non profit organization founded by CGAP (Consultative Group to Assist the Poor) and spon-sored by CGAP, Citi Foundation, Deutsche Bank Americas Foundation, Omidyar Network, Open Society and the Soros Economic Development Fund, IFAD (International Fund for Agricultural Development), Bill and Melinda Gates Foundation, and others. MIX is a private corporation.
Microfinance Information Exchange, Inc. ● www.themix.org ● e-mail: [email protected]