Microcomputer-based Laboratories and Fieldwork
10
his past summer while spending several days on a lake with my family, I realized that learning and pleasure could be easily combined. Teachers can develop fun-to-do activities that expose students to inquiry and that can be incorporated into the regular academic year as part of the science curriculum. When students do field- work activities, coupled with the use of technology, in the collection and analysis of data, this gives them more of the true flavor of doing scientific research and investigation. In addition, such interdisciplinary activities extend the physi- cal setting, allowing learning to take place beyond the tra- ditional confines of the classroom and laboratory. This enables teachers to enhance the role of inquiry in student learning as required by national science education stan- dards (American Association for the Advancement of Sci- ence 1994; National Research Council 1996). My children and I performed a simple physical profile of a human-made lake. We used several probes and sensors to measure water temperature, pH, and conductivity at various points on the lake. The intent was to see whether there were any significant variations in these factors, particularly because the lake depth did not vary greatly, that is, it was only 1 / 2 m to approximately 3 m deep in some areas. The lake also had areas that were more shallow where sunlight could easi- ly penetrate to the bottom, which resulted in a considerable amount of underwater vegetation growth. The lake study activity would be appropriate for grades 7–12 students. Materials Laptop computer (1 per 4 students) Portable interface (e.g., LabPro, which is run on batteries and is lightweight) Batteries Probes and sensors (e.g., LabPro and Vernier; can be pur- chased at the companys’ Web sites) Graphing calculators (optional) Measuring tape Plastic bag Methodology Several states advocate the use of probes and sensors in scientific study, and those tools are part of the curriculum beginning at the middle school grades (The University of the State of New York State Education Department 1996; Web reference 1). When the probes are connected either to a computer or to a graphing calculator via an interface, the collector can analyze data in real time and measure the effect of changing one variable upon another, while con- trolling other significant factors such as pressure, humidity, light intensity, and so forth. Working with probes and sen- sors helps students develop an understanding of scientific methodology in addition to learning how to build hypothe- ses. The graphical analysis that is an integral part of the data collection fits quite well with the spirit of state standards, as it combines mathematics, science, and technology. The fieldwork aspect of the investigation requires porta- bility and the easy setup of the necessary equipment. My children and I connected a computer laptop to a portable interface that was in turn connected to each probe to take measurements. The role of the interface is to translate the sensor readings into visual displays. Figure 1 shows the basic components of the required equipment: a temperature sensor, a pH sensor, and a conductivity sensor are shown connected to the interface, with the interface connected to 9 T FERNANDO ESPINOZA is an assistant professor in the Depart- ment of Middle and High School Education at Lehman College, Bronx,New York. Dr. Espinoza is currently engaged in research that includes curriculum development based on inquiry and the use of emerging technologies to enhance the teaching and learning of science. His other research interest is investigating the philosophi- cal foundations of scientific knowledge as they relate to inquiry. FERNANDO ESPINOZA Developing Inquiry through Activities that Integrate Fieldwork and Microcomputer-Based Technology
-
Upload
oldwestbury -
Category
Documents
-
view
0 -
download
0
Transcript of Microcomputer-based Laboratories and Fieldwork

his past summer while spending several days on alake with my family, I realized that learning andpleasure could be easily combined. Teachers can
develop fun-to-do activities that expose students to inquiryand that can be incorporated into the regular academic yearas part of the science curriculum. When students do field-work activities, coupled with the use of technology, in thecollection and analysis of data, this gives them more of thetrue flavor of doing scientific research and investigation. Inaddition, such interdisciplinary activities extend the physi-cal setting, allowing learning to take place beyond the tra-ditional confines of the classroom and laboratory. Thisenables teachers to enhance the role of inquiry in studentlearning as required by national science education stan-dards (American Association for the Advancement of Sci-ence 1994; National Research Council 1996).
My children and I performed a simple physical profile of ahuman-made lake. We used several probes and sensors tomeasure water temperature, pH, and conductivity at variouspoints on the lake. The intent was to see whether there wereany significant variations in these factors, particularlybecause the lake depth did not vary greatly, that is, it was only1⁄2 m to approximately 3 m deep in some areas. The lake alsohad areas that were more shallow where sunlight could easi-ly penetrate to the bottom, which resulted in a considerableamount of underwater vegetation growth. The lake studyactivity would be appropriate for grades 7–12 students.
Materials
Laptop computer (1 per 4 students)Portable interface (e.g., LabPro, which is run on batteries
and is lightweight)BatteriesProbes and sensors (e.g., LabPro and Vernier; can be pur-
chased at the companys’ Web sites)Graphing calculators (optional)Measuring tape Plastic bag
Methodology
Several states advocate the use of probes and sensors inscientific study, and those tools are part of the curriculumbeginning at the middle school grades (The University ofthe State of New York State Education Department 1996;Web reference 1). When the probes are connected either toa computer or to a graphing calculator via an interface, thecollector can analyze data in real time and measure theeffect of changing one variable upon another, while con-trolling other significant factors such as pressure, humidity,light intensity, and so forth. Working with probes and sen-sors helps students develop an understanding of scientificmethodology in addition to learning how to build hypothe-ses. The graphical analysis that is an integral part of the datacollection fits quite well with the spirit of state standards, asit combines mathematics, science, and technology.
The fieldwork aspect of the investigation requires porta-bility and the easy setup of the necessary equipment. Mychildren and I connected a computer laptop to a portableinterface that was in turn connected to each probe to takemeasurements. The role of the interface is to translate thesensor readings into visual displays. Figure 1 shows thebasic components of the required equipment: a temperaturesensor, a pH sensor, and a conductivity sensor are shownconnected to the interface, with the interface connected to
9
T
FERNANDO ESPINOZA is an assistant professor in the Depart-ment of Middle and High School Education at Lehman College,Bronx, New York. Dr. Espinoza is currently engaged in researchthat includes curriculum development based on inquiry and the useof emerging technologies to enhance the teaching and learning ofscience. His other research interest is investigating the philosophi-cal foundations of scientific knowledge as they relate to inquiry.
FERNANDO ESPINOZA
Developing Inquirythrough Activities
that IntegrateFieldwork and
Microcomputer-Based Technology

the laptop. The software, interface, and sensors are compat-ible with both PC and Mac applications. The display canappear simultaneously in the form of a reading, a table ofvalues as time elapses, and a graphical depiction showingthe changes in measurements. Students can save this infor-mation for later analysis and evaluation.
Several other probes can be used in the activity. Thechoices I made were based on the portability and simplicityof the respective sensors and the applicability of the mea-surements to various parts of the science curriculum. I haveused this microcomputer-based technology to conductmany experiments that are featured in teacher portfolios inthe science education program at Lehman College. Thereare many advantages to using this technology in scienceinstruction, chief among them being the opportunity forevery student to contribute to tasks, for cooperative learn-ing, and for changing data in real time. This allows students
to view experiments as dynamic processes, rather than stat-ic representations of processes.
Background
With the assistance of two of my children, I measured thevalues of temperature, pH, and conductivity at differentlocations on the lake. To conduct the experiment, we madeuse of a canoe in which I placed a laptop, interface, and sen-sors on the floor. With the use of a plastic bag, we shieldedthe materials as much as possible from splashing and otherpotential sources of interference with the measurements.For the first part of the experiment, we immersed the sensorin the lake to a depth of 10 cm at each location. To give thesensors time to stabilize (and thus obtain reliable measure-ments), we took every instrument reading for approximate-ly 10 seconds in both parts of the experiment. For the sec-ond part of the experiment, we chose the deepest part of the
10 SCIENCE ACTIVITIES Vol. 39, No. 3
Figure 1.Three sensors connected to the interface (bottom right) and their readings displayed on the notebook screen.

lake (a channel that is approximately 3 m deep). Weattached the temperature and pH sensors to a measuringtape and lowered the tape to different depths. At each depth,we recorded the instrument readings of both factors.
Results and Data Analysis
The data we collected were saved and analyzed at a laterdate; and the graphs I obtained from it became the maincomponent by which to evaluate the measurements. Whenthe sensor is immersed in the water, the readings are dis-played on the computer screen. From the previouslydescribed types of simultaneous display, I selected a linegraph that showed the values of the measured variable dur-ing 10 seconds. Because the readings changed during thisinterval, I obtained the average value and considered thisthe reading at the specified location and depth. This proce-dure generated the graphs in Figures 2–4.
Graphing is a skill that should be emphasized again andagain throughout the educational process. I know many sci-ence teachers who lack even a rudimentary understanding of
how to produce graphs. They may understand terms such asbest-fit and standard error in other contexts, but when itcomes to applying this understanding to graphing, bothteachers and students have considerable difficulty. Severalstudies have pointed out the difficulties that students have, forexample, in relating the graphical description of the motionof an object to the actual motion (Barclay 1985; Beichner1996; Berg and Phillips 1994; Linn, Layman, and Nachmias1987; and McDermott, Rosenquist, and van Zee 1987).
The data collected in the lake study activities are dis-played in the following figures as a line graph showing themeasured variable on the vertical and the readings weretaken along the horizontal axis. Because the readings weretaken for 10 seconds, I plotted the average values as a func-tion of the location on the lake for a given depth.
Figure 2 shows a graph of temperature and pH at variouslocations on the lake taken at a depth of approximately 5 cmbelow the surface. The horizontal lines display the result ofthe graphical analysis and represent the slope of the linefrom which the data points deviate. In other words, the
Fall 2002 SCIENCE ACTIVITIES 11
Dr. Espinoza at his laptop, with two of his children using the temperature and pH sensors during the lake study.

point distributions approach straight lines having approxi-mately zero slope (being constant), and having values of21.8 ºC for the temperature and 6.2 for the pH. Two featuresof the data are significant: (1) the fairly constant value of
both quantities, which can be expected because of smallvariations in shallowness found throughout the lake, thusapproximating a constant depth; and (2) the smaller experi-mental error and value of the slope for the pH measure-
12 SCIENCE ACTIVITIES Vol. 39, No. 3
Figure 2. Graphs of pH and temperature values at different locations on the lake. The straight lines represent theslope of the line produced by the points plotted; the constant values of 6.2473 and 21.827 represent the mean val-ues of pH and temperature, respectively.

ments resulting from the larger number of readings taken,which approximates a constant value. In addition, the meanpH value (6.2473) suggests a slightly acidic lake, althoughthe value is still within the normal range (WisconsinDepartment of Natural Resources 2001 [Web reference 2]).
Figure 3 shows the variation of the conductivity at vari-ous locations, which is considerable even at a constantdepth just below the water surface. Conductivity is directlyproportional to total dissolved solids (TDS) in a lake; there-fore, the variations in conductivity throughout the lake canbe understood in terms of the photosynthesis and respira-tion that occur with aquatic plants. Conductivity values willchange when ions are introduced to water from salts or sol-uble gases that ionize in solution. During daylight hours,photosynthesis by aquatic plants adds oxygen to the waterand removes carbon dioxide. Daily ranges of oxygen andcarbon dioxide concentrations depend on the amounts ofphotosynthesis and respiration that take place. Other factorsthat affect photosynthesis are length of day, amount of sun-light, condition of the plants, depth and clarity of the water,and nutrient availability (see Web reference 3 [2001]). Iinterpret the considerable variation found in conductivity tobe a result of aquatic plant photosynthesis in many shallowareas where we saw appreciable underwater growth.
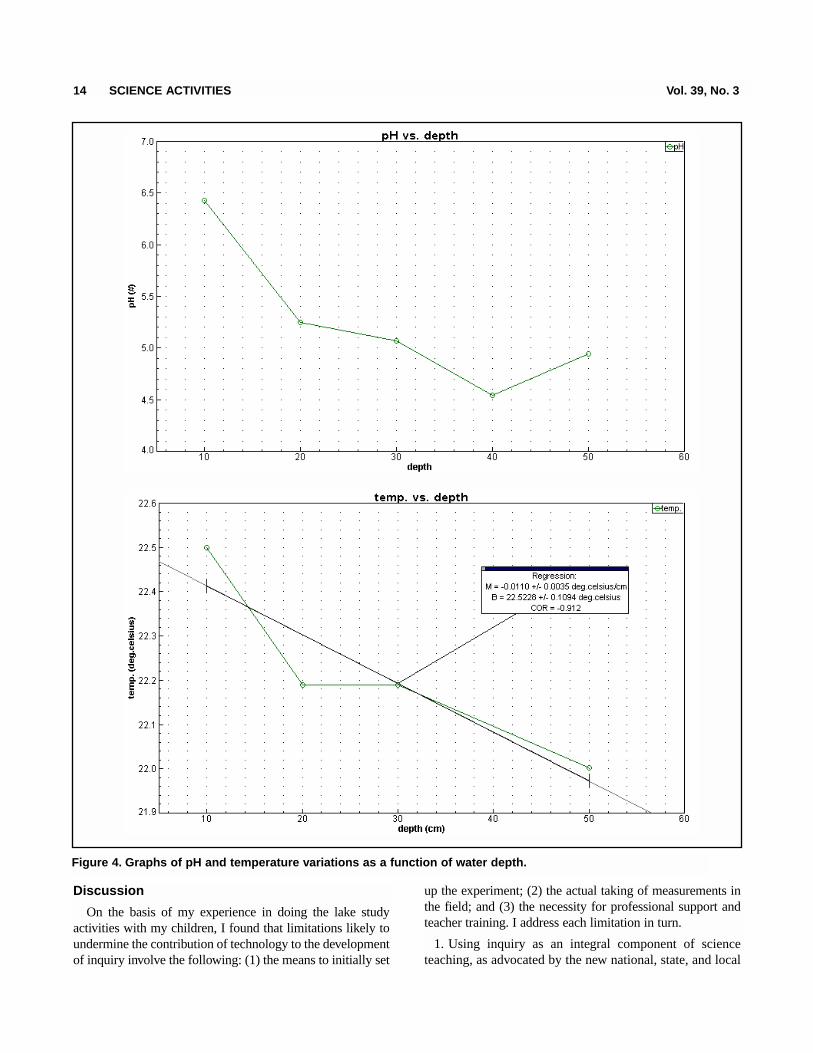
Figure 4 shows the results of part 2 of the experiment.The pH and temperature readings were plotted as functionsof the water depth. The decrease in value for both variables
appears consistent with a number of features commonlyfound in lakes:
• There is evidence of thermal stratification, that is, onelayer reflects a constant temperature and the other layerdecreasing temperature values. This layering characteristicis found in lakes and lagoons during both the summer andthe winter seasons. Even if a lake or lagoon is shallow, itsdeeper areas can develop stratification.
• There is evidence of a decrease in temperature consistentwith a layer approximating a thermocline (a layer in a largebody of water, such as a lake or a lagoon, that sharply sepa-rates regions differing in temperature, with an abrupt gradientacross the layer). In this layer, the temperature downwardtrend has a gradient of approximately 1.10 ºC—which is con-sistent with the typically expected value (North America LakeManagement Society 2001, p. 8 [Web reference 4]).
• The decrease in pH values with increasing depthimplied that, as we got closer to the bottom of the lake, theacidity of the water increased. (Note: You could initiate aninquiry-based discussion in which students reflect on theresults of those particular data. For example, the studentscould seek explanations consistent with the expectation thatvegetation and other processes are contributing to a higherionic concentration.) The lower the pH the more acidic theliquid, which is a consequence of chemical reactions asso-ciated in this case with plant growth under water.
Fall 2002 SCIENCE ACTIVITIES 13
Figure 3. Graph of conductivity values at different locations on the lake.
Discussion
On the basis of my experience in doing the lake studyactivities with my children, I found that limitations likely toundermine the contribution of technology to the developmentof inquiry involve the following: (1) the means to initially set
up the experiment; (2) the actual taking of measurements inthe field; and (3) the necessity for professional support andteacher training. I address each limitation in turn.
1. Using inquiry as an integral component of scienceteaching, as advocated by the new national, state, and local
14 SCIENCE ACTIVITIES Vol. 39, No. 3
Figure 4. Graphs of pH and temperature variations as a function of water depth.

standards, presents difficulties for teachers because thematerials available to implement it are not particularlyabundant. Although it is true that one can modify any text-based activity to make it inquiry-based, doing so takes timeand often requires a lot of preparation, thus discouragingteachers from undertaking such a project.
When students are learning about the ecological featuresof a lake, for example, this can be a good time for them to dorelated biological and physical science activities in the field.
The importance of doing summer activities becomesapparent in light of findings about achievement gaps—par-ticularly significant during the summer months—betweenmiddle-class and poor children (Cooper et al. 1996). Whenyoung people go to summer camp or to a summer programof some nature, however, and have the opportunity to doactivities like the ones I describe in this article, this helpsclose the achievement gap. Students enjoy the outdoorexperiences and do not necessarily feel that they are doingschoolwork. Such experiences are only possible though ifthe camp or summer program has the equipment and staff toimplement the activities.
2. Selecting measurements and probes for our lake studywas relatively easy; difficulties became apparent as webegan to perform the measurements. Several features of theprocedure proved challenging:
• I found looking at the computer screen to be nearlyimpossible because of the intensity of the sunlight. Toshield the screen and to be able to find the cursor, I had tobuild a cardboard shelter.
• The batteries discharged several times before all themeasurements at the chosen locations could be completed.Therefore, I had to choose locations, taking into account thetravel time. It was necessary to turn off the power to prolongbattery life, and this meant accessing the program aneweach time that measurements were taken, making theprocess frustratingly lengthy.
• Care needed to be taken not to get certain parts of theequipment wet, such as the amplifier part of the pH probe,which could not be submerged. This limited the depths thatwe could plummet.
• The type of boat that is used needs to be carefully con-sidered. Some choices are a rowboat, a motorboat, and acanoe. I chose a canoe for convenience; however, motor-boats passing by made waves that required waiting longer tobe able to take accurate measurements.
• The availability of safety equipment and appropriateadult supervision needs to be emphasized. Everyoneinvolved in doing lake study activities must wear a life jack-et because of the depth of the water in some areas of the lake.
• It is important to choose suitable probes. A longer tem-perature probe makes it easier to take deeper measurements,
whereas a pH probe that has a longer connector to a mini-amplifier prevents the amplifier from getting wet whenprobing deeper areas.
These and similar circumstances might easily prompt aless determined person to wonder, Is it worthwhile to dotechnology-based field activities? After all, the reason thatmany science teachers rely on curriculum materials isbecause those already have been field-tested. This said, theopportunity to combine fieldwork with the use of technolo-gy for inquiry projects still motivates creative teachers. It ispossible to bring water samples into the laboratory and toperform some of the analyses there (although temperaturereadings can only be done on site). However, this negatesthe value of fieldwork and students’ exposure to situationsthat scientists routinely encounter when doing research.Working only in a lab setting deprives students of theopportunity to see how science is actually done.
3. I have seen how excited teachers become when theytake courses and workshops on the uses of microcomputer-based technology. They respond quite favorably to the pow-erful measuring tools and means of analysis that the soft-ware provides. Unfortunately, the majority of teachers lacksuch equipment in their school settings (Bushweller 2001).Teachers who actively pursue the acquisition of microcom-puter-based measuring instruments or who try to use whatis available in their schools complain of the logisticsinvolved in using the computer room and of using comput-ers in the laboratory.
To obtain the full benefit of technology, teachers andadministrators need to go beyond the traditional “computerroom mentality,” whereby computers are only available forstudent use in a particular area. Computers must be availablein the classrooms and most important, available in the labo-ratories. There is a version of the software that is compatiblewith graphing calculators. I have found the directions for itsuse to be too similar to the so-called “cookbook” approachof traditional laboratory techniques, however. Realistically,some teachers may find its use more compatible with theirschool resources because it is ultimately less expensive touse a graphing calculator than a computer.
I believe the value of using a laptop lies in its portability,both in the field and in a school setting. You can conceiv-ably do experiments with groups that require several lap-tops and interfaces, which are the more expensive compo-nents of microcomputer-based technology. Sensors aremuch less expensive and are usually long lasting. What issorely needed though is professional development and sup-port for teachers who are interested in learning how toimplement the technology. A recent survey covering theuses of technology unequivocally asserts, “When there areproducts with comprehensive uses, such as a graphing cal-
Fall 2002 SCIENCE ACTIVITIES 15

culator or probeware, professional development becomesmore valuable than ever” (Ficklen and Muscara 2001).
Recommendations for the Implementation ofInquiry-Based, Lake Study Activities
You can structure the developed activities to implementinquiry among students when they are studying particularaspects of the ecology of a lake, a lagoon, or a coastal bay.For example, you can link the pattern of values found forthe three variables—temperature, pH, and conductivity— tomany other biological, chemical, and physical properties ofa lake. In the case of a lagoon, typical studies tend to focusmore on groundwater pollution caused by livestock, partic-ularly in areas where the water table is not very deep. Con-sequently, there is more information about nutrient environ-ment than about other water quality issues. The hydrologicconditions of coastal bays are not as well studied becausemeasurements are more difficult to take, partly because ofturbulence (see Web reference 5).
• Temperature. Students can predict what pattern thetemperature will have on the surface (e.g., students maythink that deeper areas will exhibit colder surface tempera-tures). You can tie their findings or predictions to a discus-sion of the role that the specific heat capacity of water has,compared with that of the air on the surface temperature.Extend the discussion to include the role of lakes andoceans in the weather of a region by demonstrating whytemperatures are usually warmer by the shore in winter andcooler in summer. Tie the existence of thermal stratificationto a discussion of winter stratification and why this is criti-cal to the survival of lifeforms at the bottom of a lake dur-ing the winter when the water surface may be frozen.
• pH. Have the students explain the meaning of pH. Adefinition of the pH factor may be more necessary than onefor temperature before the students can predict what its pat-tern of values will be at the surface. You can then discussacidity in terms of pH values and its effects on fish species.You can also discuss acid deposition from the watersheds,which makes lakes and lagoons highly susceptible to dam-age by pollution. Extend the discussion to the effects of acidrain on the weathering of certain materials.
• Conductivity. Tie the electrical properties of solutionsas they conduct a current to a discussion of ionic concen-tration and concepts of electrochemistry. Understanding thedirect relationship between conductivity and TDS helps stu-dents establish connections to aquatic life changes that areprecipitated by photosynthesis and respiration. The level ofTDS in water samples can be related to national, state, andlocal regulations regarding acceptable levels in drinkingwater. In summary, conductivity is an easy and informativewater-quality test that enables students to see the environ-mental issues surrounding chemical properties expressed in
terms of electrical concepts. Such experiments make for atruly interdisciplinary approach to learning.
Conclusion
The use of microcomputer-based technology in scienceeducation has been demonstrated to be a superb tool fordeveloping inquiry (Thornton and Sokoloff 1990). Featuresreported to enhance student engagement and learninginclude the following:
• Students observe phenomena after which they performanalyses and reflect on their findings.
• Data can be manipulated in real time, which lends an airof investigation and exploration to activities as studentssee the direct results of their interventions.
• Student cooperation is essential because most activitiesrequire group involvement and task management.
• The software and the instruments allow for the immedi-ate analysis of measurements, with minimal stepsbetween the main objectives and the hands-on procedure.
• Because all of the students are encouraged to contribute tothe tasks, different learning styles can be satisfied, partic-ularly through the kinesthetic features of the technology.
• The learning setting resembles the authentic workingenvironment of scientists more than it does the tradition-al classroom and laboratory.
The lake study activities performed and similar onesusing mbl should be done in groups of 3–4 students. Pro-ceed in the following manner:
1. You (or the students) can pose a question (promptedby the introduction of the topic) that requires the students tomake predictions.
2. Ask the students to devise a strategy that will helpthem gather the necessary data to answer the question.
3. Have the students construct a hypothesis based on thedata.
4. Ask the students to present their findings to the rest ofthe class, along with a justification for their conclusions.
(Note: Steps 2 and 3 must give priority to the data, evenif it appears to contradict the students’ prediction in step 1.)It is crucial for students to see scientific methodology atwork and to understand why evidence takes precedence inall kinds of scientific work. This is perhaps the main char-acteristic that distinguishes science from other forms ofknowledge. By upholding the evidence, the students willunderstand that what distinguishes science from otherforms of knowledge is not what is believed, but why andhow it is believed (Derry 1999).
References
American Association for the Advancement of Science. 1994.Benchmarks for science literacy. New York: Oxford UniversityPress.
16 SCIENCE ACTIVITIES Vol. 39, No. 3

Barclay, W. L. 1985. Graphing misconceptions and possible reme-dies using microcomputer-based labs. (Technical Report Num-ber TERC-TR-85-5). Cambridge, Mass.: Technical EducationResearch Center.
Beichner, R. J. 1996. The impact of video motion analysis on kine-matics graph interpretation skills. American Journal of Physics64(10) October: 1272–77.
Berg, C. A., and D. G. Phillips. An investigation of the relationshipbetween logical thinking structures and the ability to constructand interpret line graphs. Journal of Research in Science Teach-ing 31: 323–44.
Bushweller, K. Technology report finds inequities. EducationWeek, May 9, 2001, pp. 10–11.
Cooper, H., B. Nye, K. Charlton, J. Lindsay, and S. Greathouse.1996. The effects of summer vacation on achievement testscores: A narrative and meta-analytic review. Review of Educa-tional Research 66: 227–69.
Derry, G. N. 1999. What science is and how it works. Princeton:Princeton University Press.
Ficklen, E., and C. Muscara. 2001. Harnessing technology in theclassroom. American Educator, Fall: 22–29.
Linn, M. C. J. W. Layman, and R. Nachmias. 1987. Cognitive con-sequences of microcomputer-based laboratories: Graphingskills development. Contemporary Educational Psychology 12:244–53.
McDermott, L. C., M. L. Rosenquist, and E. H. van Zee. 1987.Student difficulties in connecting graphs and physics: Examplesfrom kinematics. American Journal of Physics 55: 503–13.
National Research Council. 1996. The national science educationstandards. Washington, D.C.: National Academy Press.
Thorton, R. K., and D. Solokoff. 1990. Learning motion conceptsusing real-time microcomputer-based laboratory tools. Ameri-can Journal of Physics 58(9): 858–66.
The University of the State of New York (The State EducationalDepartment). 1996. Intermediate Science, Standard 2, Key Idea1: 1.4.
Web References
1. A Google or Yahoo search will illustrate the required use ofprobes as part of inquiry in various states. Activities for usingprobes can be found at http://www2.ncsu.edu/ncsu/pams/science_house/CBLable/inquiry/html#other
2. Wisconsin Department of Natural Resources. pH acidity—Understanding lake data, p. 14. Retrieved 24 September 2001.http://www.dnr.state.wi.us/org/water/fhp/lakes/under/acidity.htm
3. http://water.usgs.gov/pubs/FS/FS-960-99. Retrieved 26 Sep-tember 2001.
4. North America Lake Management Society. Lake and waterword glossary, p. 8. Retrieved 24 September 2001. http://www.nalms.org/glossary/lkword_t.htm
5. An extensive list of references on lagoon studies can be foundat http://www.ukmarinesac.org.uk/activities/lagoons/16.htm
For coastal bays, the following Web sites are good resources:http://www.woodshole.er.usgs.govhttp://www.geophysics.rice.edu/department/faculty/res_prog.htmlhttp://www.ametsoc.org/AMS/curricula/pdfs/delaware.pdf
Fall 2002 SCIENCE ACTIVITIES 17