Surfactant and Surfactant-Polymer Flooding for Enhanced Oil Recovery
Upload
khangminh22Category
view
2download
0
بسم هللا الرحمن الرحيم
University Of Khartoum
Faculty Of Engineering
Department Of Petroleum And Natural Gas Engineering
Microbial Enhanced Oil Recovery (MEOR)
This Project Is Submitted As A Partial Fulfillment Of The Requirement Of The Degree Of B.Sc (Honors) In Petroleum And
Natural Gas Engineering
By Ahmed Eltayeb Gammer-Eldeen
Al Mustafa Ali Adam Alhadi Mohamed Abdelrahman Mergani
Supervisor
Dr. Hassan Bashir Nimir
Co-supervisor Mr. Khider khalid khider
June 2013

ACKNOWLEDGMENT
All the thanks due to Allah, for the continuous and endless blessings and guidance throughout our life. Our deepest heart gratitude is to our parents who strived to get us where we are now. We would like to express our deepest gratitude for our supervisor Dr. Hassan Bashir Nimir, for his continuous guidance and assistance through the project. Very thanks to Eng. Khider khalid khider for his guidance and support. Our appreciation to Asawer Oil & Gas Co. Ltd for sponsoring us, and providing us all the necessary assets and resources to accomplish our project. Our gratitude is also extended to the botany department, college of science, university of Khartoum for helping us. Special thanks to Dr. Marmar.
I
ABSTRACT
With the rapid decline in the discovered oil reserves and the
increasing consumption; emerged the need for enhanced oil recovery
techniques. Microbial Enhanced Oil Recovery(MEOR), has been
proposed for many years as a cheap and effective alternative to enhance
oil recovery as its different processes generally do not depend on oil
prices. This project divided to research and experimental sections,
discuss the MEOR technology.
The research part explains the mainframes of MEOR: microbial
system, the bioproducts , the mechanisms and the processes. A general
screening criterion, advantages and disadvantages , summary of world
MEOR trials and the common production responses is summarized.
Data from two Sudanese reservoirs was compared with the general
MEOR screening criteria.
the experimental part inspected the applicability of MEOR in sudan.
Where experiments on Sudanese crudes was carried. Two strains of
hydrocarbon degrading bacteria was put in a media where the crude is
the only carbon source. Encouraging results was obtained, implying
potentials for more researches.

II
:الملخص
برزت الحاجة , مع التدني المطرد في احتياطيات النفط المكتشفة والزيادة المستمرةلالستهالك
, قدم اإلنتاج الثانوي للنفط باستخدام الميكروبات منذ عديد من السنوات. لتقنيات اإلنتاج الثانوي للنفط
. حيث أن العديد من عملياته ال تعتمد علي أسعار النفط, كبديل فعال و رخيص لزياده إنتاج النفط
هذا المشروع مقسم لقسم بحثي وأخر معملي لدراسة تقنيه اإلنتاج الثانوي للنفط باستخدام
.الميكروبات
النظام : القسم البحثي يوضح اإلطارات الرئيسة لإلنتاج الثانوي للنفط باستخدام الميكروبات
, كم قدمت معايير اختيار المكامن. األليات والعمليات المستخدمة, المنتجات الحيوية, الميكروبي
ملخص لتجارب تطبيق اإلنتاج الثانوي للنفط باستخدام الميكروبات في , محاسن و مساوئ التقنية
.العالم و استجاباتاإلنتاج الشائعة
. كما قورنت بيانات مكمنين سودانيين بالمعايير العامةالختيار المكامن
حيث . القسم العملي يبحث إمكانية تطبيق اإلنتاج الثانوي للنفطباستخدام الميكروبات في السودان
ساللتين من البكتريا المكسرة للبترول وضعت في وسط . أجريت تجارب علي خامات نفط سودانية
أبرزت هذه النتائج , تم الحصول علي نتائج مشجعة . بحيث يكون الخام هو المصدر الوحيد للكربون
.إمكانيه كبيره للمزيد من البحوث
III
Table of content:
ABSTRACT ........................................................................................................... I
II .................................................................................................................... الملخص
Table of content: ................................................................................................ III
List of tables: ...................................................................................................... V
List of figures .................................................................................................... VI
Chapter One: INTRODUCTION ........................................................................... 1
1.1- Oil Recovery: .............................................................................................. 1
1-Primary Recovery: ....................................................................................... 1
2-Secondary Recovery: .................................................................................. 1
3-Enhanced Oil Recovery (EOR): .................................................................. 2
1.2-Microbial Enhanced Oil Recovery (MEOR): ................................................ 4
Chapter Two: LITERATURE REVIEW................................................................. 6
2.1- Microbes: .................................................................................................... 7
2.2- Sources Of Bacteria: ................................................................................. 9
2.3- The Nutrients : .......................................................................................... 10
2.4- The Bio-Products : .................................................................................... 11
1-Biomass: ................................................................................................... 11
2-Bio-surfactants: ......................................................................................... 11
3-Biopolymers: ............................................................................................. 12
4-Bio-Solvents: ............................................................................................. 13
5-Bio-Acids: .................................................................................................. 13
6-Biogases: .................................................................................................. 13
2.5- MEOR Mechanisms: ................................................................................. 15
2.6- MEOR PROCESSES: .............................................................................. 17
1- In Situ Process: ........................................................................................ 17
2- Ex Situ Process: ....................................................................................... 18
2.7- Field Trials ................................................................................................ 22
In The US: .................................................................................................... 22

IV
In Europe And South America: ..................................................................... 23
In Asia: ......................................................................................................... 23
Arab Region: ................................................................................................ 24
Survey on 407 field trials: ............................................................................. 25
2.8- MEOR Production Responses .................................................................. 31
2.9- MEOR advantages and disadvantages…………...…………………………35
Chapter Three: METHODOLOGY ..................................................................... 37
3.1- MEOR Screening...................................................................................... 38
3.2- Case study ............................................................................................... 42
3.3- The Experiments: ..................................................................................... 43
Chapter Four: RESULTS ................................................................................... 51
4.1- the experiments: ....................................................................................... 51
First Experiment: .......................................................................................... 51
Second experiment: ..................................................................................... 51
Chapter Five: DISCUSSION .............................................................................. 61
5.1- The Case Study: ....................................................................................... 61
5.2- The Experiments: ..................................................................................... 61
The First Experiment: ................................................................................... 61
The Second Experiment: .............................................................................. 62
Chapter Six: CONCLUSION .............................................................................. 65
Chapter Seven: RECOMMENDATIONS: .......................................................... 66
Chapter Eight: FUTURE WORK ........................................................................ 68
Appendix A ........................................................................................................ 69
Appendix B ........................................................................................................ 70
Appendix C ........................................................................................................ 71
REFERENCES ................................................................................................... 74
V
LIST OF FIGURES:
Figure 1.1- Oil Recovery Mechanisms……………………………………..………3
Figure 2.1: in situ MEOR process…………………………………………….…...17
Figure2.2: ex situ polymer flooding………………….………………….………….18
Figure 2.3: cyclic microbial recovery… …………………………………….…...21
Figure 2.4: microbial flooding……...……………………………………….…..…..21
Figure 2.5: the use of different recovery mechanisms…………………………..27
Figure 2.6; distribution of outcomes as a function of permeability……………..29
Figure 2.7: MEOR Water Flood- Wayne County, Illinois, Aux Vases …..…....31
Figure 2.8: Single Well MEOR- Grant County, Kansas, Chester Limestone…32
Figure 2.9: Single Well MEOR- Woodward County, Oklahoma, Oswego.. ….33
Figure 2.10: Waterflood- Johnson County, Wyoming, Curtis ...……….….……34
Figure 2.11: cost of different EOR methods ………………………………………35
Figure 3.1: gas chromatograph……………...……………………………….……..46
Figure 5.1: GC result for sample Lc ………………..………………………………51
Figure 4.2: GC result for sample L1……………………..………………………….52
Figure 4.3: GC result for sample L2…………………………..…………………….52
Figure 4.4: GC result for sample L3……………………………..………………….53
Figure 4.5: GC result for sample Sc…………………………………..………….…56
Figure 4.6: GC result for sample S1…………………………………….…………..57
Figure 4.7: GC result for sample S2……………………………………….……..…57
Figure 4.8: GC result for sample S3……………………………………….………..58
Figure (5.1): A comparison between the samples Lc, L1, L2, L3………………...62
Figure (5.2): A comparison between the samples Sc, S1, S2, S3……….........…63
VI
LIST OF TABLES Table 2.1: Reported bio-surfactants………………………………………………..12
Table 2.2: Microbial bioproducts and their producing microbes………………….14
Table 2.3- Microbial products, their role in enhanced oil recovery……………….16
Table 2.4: classification of MEOR treatments………………………………………19
Table 2.5: classification according to lithology…………………………………….25
Table 2.6: classification according to type of trial…………………………………25
Table 2.7: classification according to primary recovery mechanism…………....26
Table 2.8: classification according to microorganism used………………………27
Table 2.9: classification according to nutrients……………………………………28
Table 2.10: distribution according to permeability, lithology and outcomes…….29
Table 2.11: distribution of outcomes as function of temperature………………..30
Table 2.12: distribution of outcomes as function of salinity……………………...30
Table 3.1: A general MEOR screening ……………………………………………..41
Table 3.2: two Sudanese reservoirs data…………………………………………...42
Table 3.3: factors affecting biodegradation……………………………………..….44
Table 3.4: the properties of the used crudes…………………………………….…47
Table 3.5 : the salt mineral medium……………………………………………..….48
Table 3.6: the first experiment…………………………………………….………..49
Table 3.7: the second experiment…………………………………………………..50
Table 4.1 : GC report for crude L………………………………………………….…54
Table 4.2: GC report for crude S……………………………………………….....…59
Table A.1: Summary of modified enzyme treatment result in Mann field………69
Table B.1: Bacteria used in MEOR ,the respiration and bio-products………….70
Table C.1 :World experience on MEOR field trials……………………………..….71

1
Chapter One:
INTRODUCTION
1.1- Oil Recovery: There are three stages of oil recovery process employing mechanical,
physical and chemical methods [1]:
1-Primary Recovery:
Refers to production using the energy inherent in the reservoir where the
natural energy of the reservoir, mainly reservoir pressure, is utilized.
These natural driving forces include:
1- water drive from the aquifer.
2- solution gas drive that results from gas evolving from oil as reservoir
pressure decreases.
3- gas cap drive.
4- rock and fluid expansion
5- gravity drainage.
6- Combination of the above.
It usually produces about 12-15% of oil initially in place (OIIP).
2-Secondary Recovery:
Which takes place when the reservoir pressure tends to fall and becomes
insufficient to force the oil to the surface.
In this stage, external fluids are injected into the reservoir either to maintain
the reservoir pressure or to displace the oil in the reservoir.
The usual fluid injected is water; however, immiscible gases could also be
injected in this stage.
It usually gives additional 15-20 % OIIP.
2
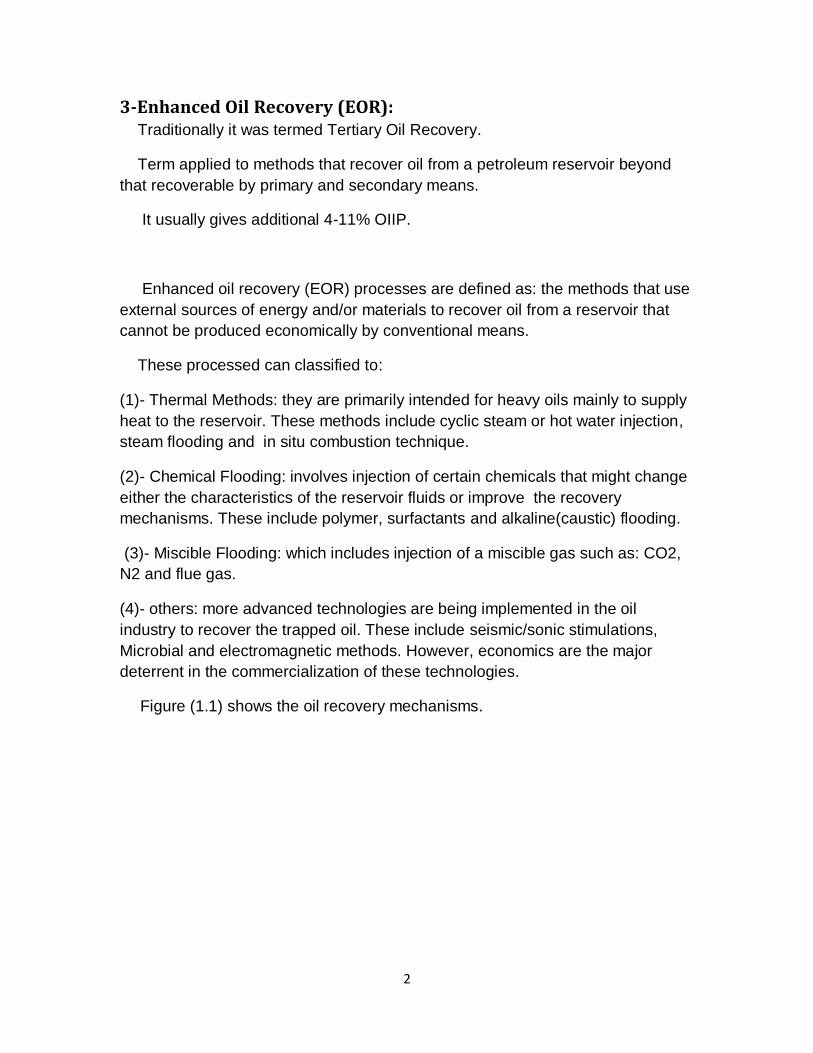
3-Enhanced Oil Recovery (EOR): Traditionally it was termed Tertiary Oil Recovery.
Term applied to methods that recover oil from a petroleum reservoir beyond
that recoverable by primary and secondary means.
It usually gives additional 4-11% OIIP.
Enhanced oil recovery (EOR) processes are defined as: the methods that use
external sources of energy and/or materials to recover oil from a reservoir that
cannot be produced economically by conventional means.
These processed can classified to:
(1)- Thermal Methods: they are primarily intended for heavy oils mainly to supply
heat to the reservoir. These methods include cyclic steam or hot water injection,
steam flooding and in situ combustion technique.
(2)- Chemical Flooding: involves injection of certain chemicals that might change
either the characteristics of the reservoir fluids or improve the recovery
mechanisms. These include polymer, surfactants and alkaline(caustic) flooding.
(3)- Miscible Flooding: which includes injection of a miscible gas such as: CO2,
N2 and flue gas.
(4)- others: more advanced technologies are being implemented in the oil
industry to recover the trapped oil. These include seismic/sonic stimulations,
Microbial and electromagnetic methods. However, economics are the major
deterrent in the commercialization of these technologies.
Figure (1.1) shows the oil recovery mechanisms.
3
Figure 1.1- Oil Recovery Mechanisms after Mamora-2010.

4
1.2-Microbial Enhanced Oil Recovery (MEOR):
Microbial enhanced oil recovery is a collection of techniques that utilizes
microorganisms and their metabolic products to improve the recovery of crude oil
from reservoir rock (Yen, 1990, Zhang and Xiang, 2010, Lazar, 2007).
Microbial Enhanced Oil Recovery (MEOR) a technologies that can be
implemented with a low operating cost. With a reported cost of 2-6 $/bbl per
incremental barrel.
It has several advantages compared to conventional EOR processes where it
does not consume large amounts of energy as do thermal processes, nor does it
depend on the oil price as do many chemical processes.
With all these potentials, MEOR is represented as a revolutionary technique
to enhance oil recovery.
With a lot of reported successful trials and full projects, the oil personnel are
still skeptical about whether MEOR is really what it’s claimed to be. This is due to
many reasons summarized as follows:
1- the negative perception on the use of bacteria and handling them in the
field for MEOR processes although it was verified by tests conducted by
public health laboratories which reported that the mixed cultures of
bacteria are safe to handle and pose no threat to the environment,
plants, animals or human beings. Besides, the reservoir’s environment is
not favorable for the pathogenic organisms to grow.
2- Another factor was the inconsistent technical performance and lack of
understanding of the mechanism of oil recovery. It is difficult to
extrapolate the results from one microbial field trial to other reservoirs as
each reservoir has its unique properties and microbial population for
indigenous MEOR cases.
5
3- One of the major reasons for MEOR not receiving wide popularity was
the absence of standardized field results and post trial analysis. Most
field trials were not followed for enough amount of time to determine the
long term effect.
4- In addition, another reason might be that extensive laboratory tests are
needed to determine the microbe to be used, its survival and
competitiveness in the reservoir, feeding regime strategy and to evaluate
the effectiveness of the process.
In this report the concept of MEOR will be studied as follows:
1- Study the available literature and make a main frame for the MEOR
technology and it’s aspects.
2- Conduct experimental studies on bacteria related to the MEOR.
3- Verify the possibility of MEOR in sudan.

6
Chapter Two:
LITERATURE REVIEW
The idea of using bacteria for the production of oil was first suggested by
Beckman back in 1926.
However in 1946, Zobell and his co-workers were the first to perform actual
experimental work to confirm Beckman’s theory. Their work continued till 1955
and they patented a process for secondary recovery of petroleum using
anaerobic bacteria, hydrocarbon utilizing, and sulfate reducing bacteria.
In 1954, the first field test was carried out in the Lisbon field in Arkansas,
USA.
From 1954 and until the 1970s there was intensive research in USA, USSR,
Czechoslovakia, Hungary and Poland.
The oil crisis of 1970 triggered a great interest in active MEOR research in
more than 15 countries.
From 1970 to 2000, basic MEOR research focused on microbial ecology and
characterization of oil reservoirs.
By 1990, MEOR achieved an interdisciplinary technology status.
In 1995, a survey of MEOR projects (322) in the USA showed that 81% of the
projects successfully increased oil production, and there was not a single case of
reduced oil production.
In 2010 at university of Khartoum ,khider khalid et al. conducted experiments
to clarify –qualitatively- the applicability of MEOR in sudan. Isolating and growing
the bacteria which taken from a local oil field soil sample, conducting bio-
chemical tests, the results were promising.
By today hundreds of MEOR papers, field trials and studies have been done.
Which provided a great help in writing this report.

7
2.1- Microbes: The first thing comes to one’s mind when hearing the MEOR, is what is the
role of microbes.
Only bacteria are considered promising candidates for MEOR. Molds, yeast ,
algae and protozoa are not suitable due to their size and instability to grow under
the conditions present in the reservoir.
Microbes can be classified in terms of their oxygen intake into three main
classifications [2] :
(1)- aerobes: where the growth depends on a plentiful supply of oxygen to make
cellular energy.
(2)- Strictly anaerobes: by contrast, which are sensitive to even low concentration
of oxygen and are found in deep oil reservoirs.
These anaerobes do not contain the appropriate complement of enzymes that
are necessary for growth in an aerobic environment.
(3)- facultative microbes: which can grow either in the presence or reduced
concentration of oxygen.
Appendix B lists some of the bacteria used in MEOR along with their
respiration type and their bioproducts.
8
Successful field experiments mostly used the anaerobic bacteria.
This favorability of bacteria is due to:
(1)- Their small cell size makes it easier for them to penetrate through the
reservoir’s porous media .
(2)- Their ability to tolerate harsh environments similar to those in the subsurface
reservoirs in terms of pressure, temperature, pH.
(3)- Their production of useful metabolic compounds which be discussed later.
The microorganisms that are most commonly used for MEOR field processes
are species of Bacillus and Clostridium.
These species have a greater potential for survival in petroleum reservoirs
because they produce spores. Spores are dormant, resistant forms of the cells
that can survive more stressful environmental conditions.
Clostridium species produce surfactants, gases, alcohols and solvents, while
Bacillus species produce surfactants, acids, and some gases. There are also
Bacillus species that produce polymers.

9
2.2- Sources of Bacteria:
There are many sources from which bacterial species that are MEOR
candidates can be isolated.
Depending on the place of extraction, bacteria sources are divided to:
(1)- Indigenous, which is the reservoir itself.
(2)- Exogenous, from external source.
Lazar [3] suggested four main sources that are suitable for bacterial isolation.
These are:
(1)- formation waters.
(2)- Sediments from formation water purification plants (gathering stations).
(3)- Sludge from biogas operations and effluents from sugar refineries.
(4)- Oil contaminated soil could be used as a good source of microbes isolation
for MEOR.
Isolation from hot water streams was also reported.

10
2.3- The Nutrients:
Nutrients are the largest expense in the MEOR processes where fermentation
medium can represent almost 30% of the cost for a microbial fermentation .
The microbes require mainly three components for growth and metabolic
productions [4]:
1- Carbon.
2- Nitrogen.
3- Phosphorous.
Media optimization is very important since the types of bio-products that are
produced by different types of bacteria are highly dependent on the types,
concentrations and components of the nutrients provided.
Sometimes, cheap raw materials are also used as nutrients such as:
molasses, cheese whey, beef extract and others that contain all the necessary
nutritional components.
It is important to carefully test the nutritional preferences of the studied
microbes that would maximize the production of desired metabolites provided
that cost effective supplies are assured.

11
2.4- The Bio-Products:
Microorganisms produce a variety of metabolites that are potentially useful for
oil recovery .
There are six main bioproducts or metabolites produced by microbes [5]:
(1)-Biomass: Bacteria are known to grow very fast as some are reported to multiply every
20 minutes under aerobic conditions. This forms a biomass of microbe cells in
the porous medium.
They are used for selective plugging and permeability modification.
(2)-Bio-surfactants: They are amphipatic molecules with both hydrophilicand hydrophobic parts
which are produced by variety of microorganisms [13].
They have the ability to reduce the surface and interfacial tension.
Table (2.1) shows the details of some of the reported bio-surfactants along
with their producing organisms.
In the past few years, bio-surfactants have gained attention because of their
biodegradability, low toxicity, and its cost effectiveness.
Since bio-surfactants can be produced from carbohydrates by fermentation
process, it is possible to produce huge amount more cheaply than the synthetic
surfactants, for which they are also developed for use in the oil industry.

12
Table (2.1) Reported bio-surfactants after Rosenberg E. Prokaryotes 2006.
Biosurfactant type Producing organism
Lipopeptides surfactin Bacillus subtilis
Lychenysin glycolipids Bacillus Licheniformis
Rhamnolipids Pseudomonas aeruginosa
Trehalose lipids Pseudomonas sp., r.erythropplis
Sophorolipids Arthobacter sp., mycobacterium sp.
Phospholipids Acinetobacter sp., t.thioosidans
Polymeric biosurfactant emulsan
Acinetobacter sp.
(3)-Biopolymers:
These are polysaccharides which are secreted by many strains of bacteria
mainly to protect them against temporary desiccation and predation as well as to
assist in adhesion to surfaces [13].
The proposed processes of biopolymers are mainly selective plugging of high-
permeability zones and thus permeability modification of the reservoir to redirect
the water flood to oil rich channels.
Another important process of biopolymers is their potential as mobility control
agents by increasing the viscosity of the displacing water hence improving the
mobility ratio and sweep efficiency.
There are different types of biopolymers. One of the biopolymers that is
currently in commercial product and have been subjected to extensive studies is
the Xanthan gum. It is produced by fermentation of carbohydrates and it is well
known as a thermally stable hetero-polysaccharide. In addition, its physical
properties of viscosity, shear resistance, temperature and salt tolerance made it
almost an ideal polymer for use in EOR.
13
(4)-Bio-Solvents: Sometimes solvents can also be produced as one of the metabolites of the
microbes. These include ethanol, acetone and butanol. They may also help in
reduction of oil viscosity and can also contribute as a co-surfactant in reducing
the interfacial tension between oil and water.
(5)-Bio-Acids: Some bacteria when given certain nutrients can produce acids such as lactic
acid, acetic acid and butyric acid.
These acids can be useful in carbonate reservoirs or sandstone formations
cemented by carbonates, since it can cause dissolution of the carbonate rock
and hence improve its porosity and permeability.
Production of organic acids by bacteria is a normal phase of anaerobic
fermentation of sugars. Clostridium sp., for example, can produce 0.0034 moles
of acid per kilogram of molasses.
(6)-Biogases: Bacteria can ferment carbohydrates to produce gases such as carbon
dioxide, hydrogen and methane gas. These gases can be used for enhancing oil
recovery by exploiting the mechanisms of reservoir re-pressurization and oil
swelling and viscosity reduction. These gases can contribute to the pressure
build-up in pressure depleted reservoirs.
Some of the reported gas-producing genera are Clostridium, Desulfovibrio,
Pseudomonas and certain methanogens. Methanogens produce about 60%
methane and 40% carbon dioxide where the methane will partition between oil
and gas phase while carbon dioxide will partition to the water phase as well and
hence improve the mobility of oil.
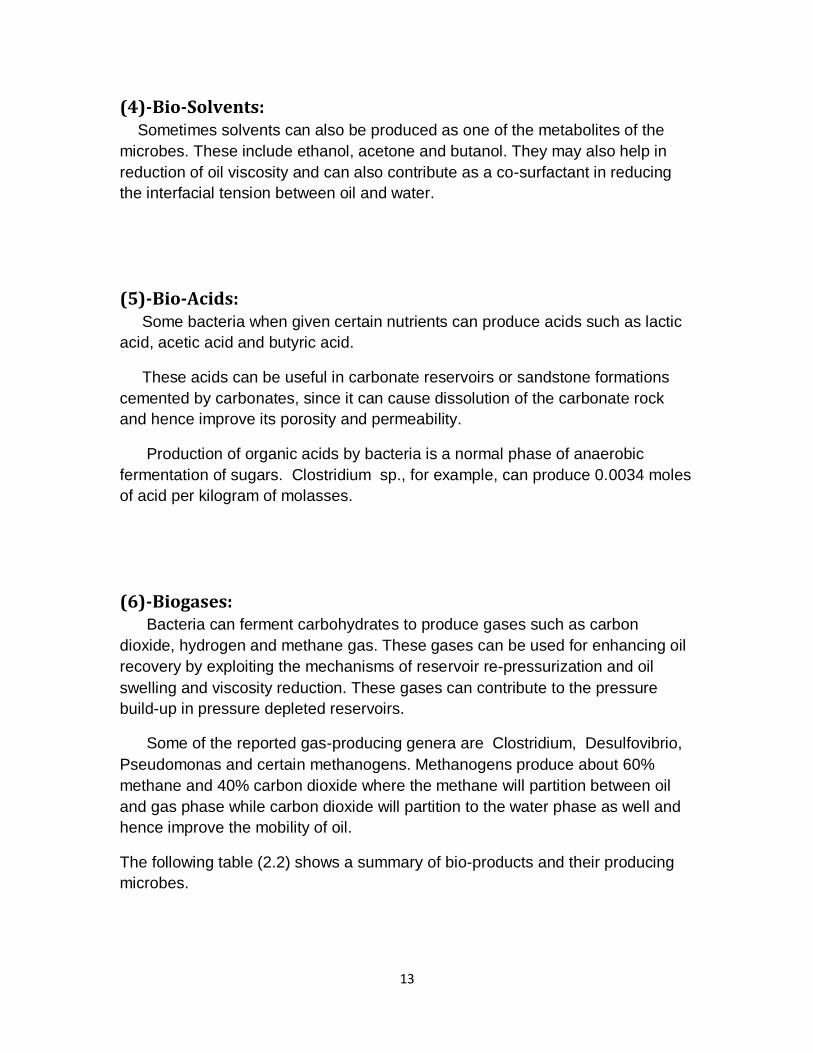
The following table (2.2) shows a summary of bio-products and their producing
microbes.
14
Table (2.2): Microbial bioproducts and their producing microbes after McInerney
MJ, 2002
Product
Microorganisms
Biomass
Bacillus Licheniformis, Leuconostoc Mesenteroides, Xanthhomonas Campestris
Biosurfactants
Acinetobacter Calcoaceticus, Arthrobacter Parraffineus Bacillus Sp., Clostridium Sp., Pseudomonas Sp.
Biopolymers
Bacillus Polymyxa, Brevibacterium Viscogenes, Leuconsostoc Mesenteroides, Xanthhomonas Campestris, Enterobacter Sp.
Bio-Solvents
Clostridium Acetobutylicum, Clostridium Pasteurianum, Zymomonas Mobilis
Bio-Acids
Clostridium Sp., Enterobactor Aerogenes
Biogases
Clostridium Sp., Enterobactor Aerogenes, Methanobacterium Sp.
15
2.5- MEOR Mechanisms:
It’s reported that the previously mentioned bioproducts can be used in
enhancing oil recovery by several mechanisms.
These mechanism solves production problems such as: Formation damage,
low oil relative permeability, trapped oil due to capillary forces, poor sweep
efficiency, channeling, unfavorable mobility ratio, low sweep efficiency, souring,
water or gas coning.
The main mechanisms are [8]:
(1) permeability modification: The formation of biomass can plug preferential
flow paths and increase a reservoir’s sweep efficiency by diverting flow to
alternate paths.
(2) Reduction of Interfacial tension.
(3) Wettability alteration: Microorganisms can colonize reservoir rock and
form biofilm that has wetting properties significantly different than the
existing reservoir rock, thus, a reservoir’s wettability can change to a more
water-wet or more oil-wet condition depending on the nature of the biofilm.
(4) Gas production: re-pressurize the reservoir and reduce oil viscosity.
(5) Oil degradation: microorganisms can utilize crude oil as a carbon source
and effectively reduce oil viscosity.
(6) Mobility modification: by increase water viscosity thereby increasing
sweep efficiency.
(7) Well stimulation: wellbore clean up, acidizing .. etc.
(8) Control of unwanted bacteria such as sulfate reducers by competition on
nutrients
A bioproducts may contribute in more than one recovery mechanism as
explained by table (2.3).

16
Table(2.3) Microbial products, their role in enhanced oil recovery after lazar 2007.
Product
Role In enhanced Oil Recovery
Biomass a- Physically displace oil by growing between oil and rock/water surface
b- Reversing wettability by microbial growth c- Can plug high permeability zones d- Selective partial degradation of whole crude oil e- Act as selective and nonselective plugging agents in
wetting, alteration of oil viscosity, oil power point, desulfurization.
Biosurfactants a- Reduce interfacial tension between oil and rock/water surface which causes emulsification; improving pore scale displacement.
b- Alter wettability
Biopolymers a- Improve the viscosity of water in waterflooding and direct reservoir fluids to previously upswept areas of the reservoir.
b- Improve the sweep efficiency of waterflood by plugging high permeability zones or water-invaded zones.
c- Control of water mobility.
Bio-Solvents a- Dissolve in oil reduce viscosity b- Dissolve and remove heavy, long chain
hydrocarbons from pore throat(increase effective permeability)
c- Involved in stabilizing and lowering interfacial tension that promotes emulsification.
Bio-Acids a- Improve effective permeability by dissolving carbonate precipitates from pores throat. Significant improvement of permeability and porosity
b- CO2 produced from chemical reactions between acids and carbonate reduce oil viscosity and causes oil droplet to swell.
Biogases a- Reduce oil viscosity, swelling and improve flow characteristics.
b- Sweep oil in place. c- Reservoir Repressurization.
17
2.6- MEOR PROCESSES:
There are two processes for MEOR depending on the site of the bioproducts
production [5]. These are namely in situ and ex situ processes:
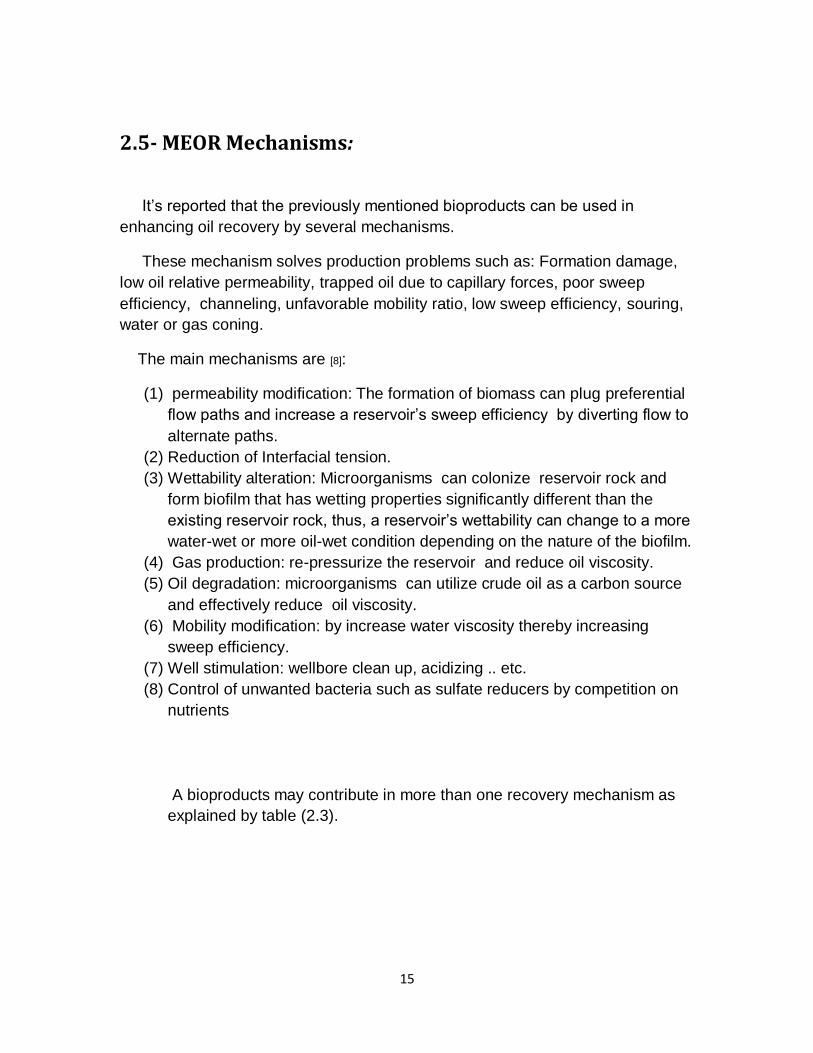
(1)- In Situ Process: involves producing the bacterial bioproducts inside the reservoir (figure 2.1).
This can be done either by:
(a)-Stimulating the indigenous reservoir microbes.
(b)- Injecting specially selected consortia of bacteria (exogenous microbes). That
will produce specific metabolic products in the reservoir.
Figure 2.1: in situ MEOR process after Gunhramns- 2013.
18
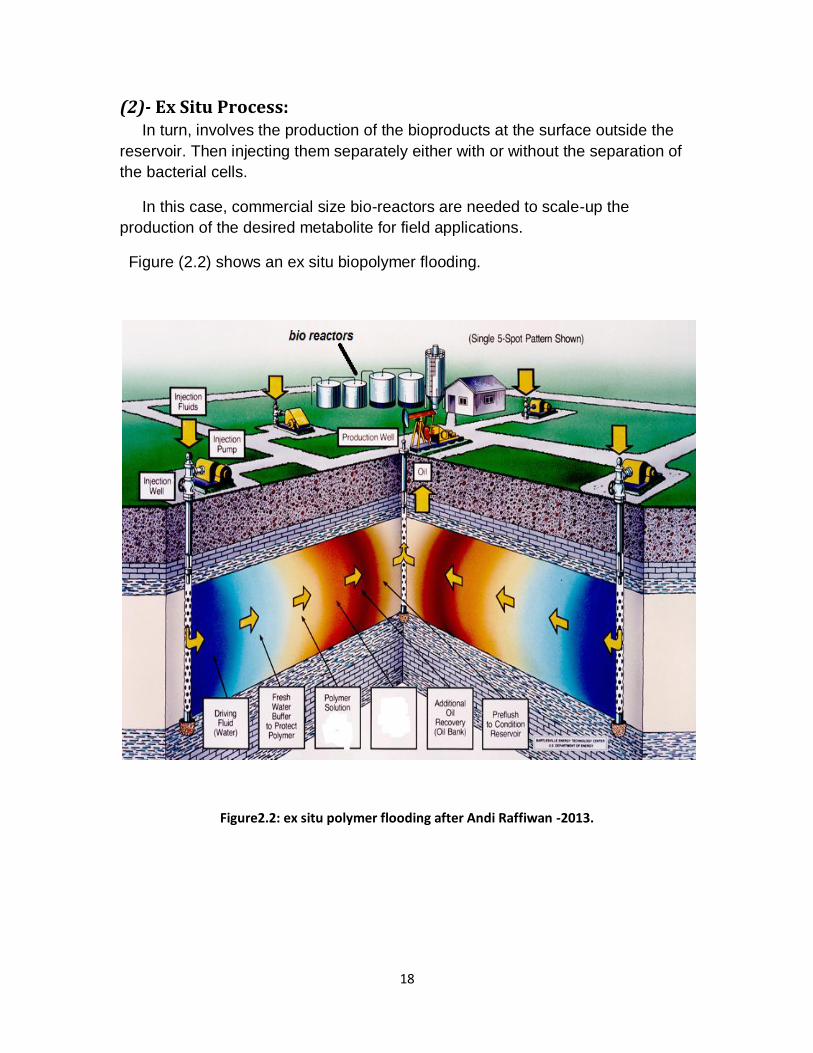
(2)- Ex Situ Process: In turn, involves the production of the bioproducts at the surface outside the
reservoir. Then injecting them separately either with or without the separation of
the bacterial cells.
In this case, commercial size bio-reactors are needed to scale-up the
production of the desired metabolite for field applications.
Figure (2.2) shows an ex situ biopolymer flooding.
Figure2.2: ex situ polymer flooding after Andi Raffiwan -2013.

19
According to the type of the process MEOR treatments are classified to[6]:
1- Well stimulation.
2- Wellbore cleanup.
3- chemical flooding.
4- Permeability modification.
5- Polymer flooding.
6- Mitigation of coning.
These classification and their corresponding production problems and type of
microorganism used are explained in table2.4:
Table (2.4): classification of MEOR treatments after [6].
MEOR process Production problem Type of microorganism used
Well stimulation formation damage. low oil relative permeability.
Surfactants, gas and acid producers.
Water flooding trapped oil due to capillary forces.
Surfactants, gas and acid producers.
Permeability modification poor seep efficiency. Channeling.
Polymer and biomass producers.
Wellbore clean up scales and paraffin.
Surfactants and acid producers.
Polymer flooding Unfavorable mobility ratio. Poor sweep efficiency.
Polymer producers.
Mitigation of coning Water or gas coning Polymer and biomass producers.
20
According to the injection method MEOR is classified to [7]:
1-Cyclic MEOR (Huff And Puff): Where the MEOR solution is pumped down the well, displaced by a fluid
(usually lease brine 2-3% KCL water). The well is shut in for a period of time
(usually ranges from 24 hours to 7 days) before it returned to production as
shown in figure (2.3).
This treatment procedure is repeated once every 3-6 months period.
2-Microbial Flooding: Where MEOR can be added to existing water floods to improve their
performance.
In this process MEOR materials are added either periodically or continuously,
as shown in figure (2.4).
The biological material are then transported into the reservoir within the
injection water or in a form of a slug in front of the water.
Little or no modification to the existing water injection systems is required.

21
Figure 2.3: cyclic microbial recovery after Zinan Li -2010.
Figure 2.4: microbial flooding after Andi Raffiwan-2013.
22
2.7- Field Trials
The first MEOR field test was carried out in Lisbon field Union County,
Arkansas, in 1954. Since then, several field trials were performed.
By 2003, more than 400 MEOR field tests have been conducted in the US
alone , in addition to numerous other field tests carried out in the rest of the
world.
There are two main purposes to go for MEOR field applications: single well
treatment and full field treatment..
A summary of trials around the world is as follows [5]:
In The US: Many of the early field trials were conducted in the US.
Johnson and his co-workers injected 150 stripper wells (production less than
10bbl/day) with mixed cultures of Bacillus and Clostridium species using crude
molasses. Most of these wells produced, on average, 2 bbl/day of oil and
reservoirs depths varied between 200-1000 ft. In successful cases, Johnson
reported that 20-30% of additional oil in place was recovered.
A field test of the microbial plugging process was conducted in the Southeast
Vassar Vertz sandstone reservoir located in Payne County, OK. Selective
reductions in the inter-well permeability between the injection well and three
production wells were observed after stimulation of the growth of indigenous
microorganisms by nutrient injection. Also, a major water channel from the
injection well to another portion of the reservoir was partially plugged. Increases
in alkalinity and sulfide concentration in the produced brines confirmed that
metabolic activity occurred as a consequence of nutrient injection. A causal
relationship between nutrient injection and sulfide production was observed,
which supported the conclusion that the reservoir had a microbial community
capable of mineralizing molasses with sulfate as the terminal electron acceptor.
These results show that a microbial plugging process for enhanced oil recovery
is technically feasible.
23
Hitzman reported on some preliminary field testing with 24 wells during
1977-1982. The depths varied from 300-4600 ft and he reported that 75% of the
wells showed a pressure increase of 10-200 psi. Most of the wells doubled the
production for a period between three to six months.
A very successful, well documented and characterized field trial was
conducted and supervised by Lewis Brown since 1994 . The field was the North
Blow horn Greek Unit in Lamar, Alabama, USA. It had 20 injectors and 32
production wells. The treatment process was MPPM by adding KNO3 and
NaH2PO4 to the water flood to stimulate the indigenous microbes. Brown
reported in his review that the production decline rate decreased from 18.9% per
year to 7-12% per year and that the field is still producing till today, although it
was scheduled to be abandoned in 1998.
In Europe And South America: Several field tests were conducted in other countries which include Romania ,
Argentina, Russia and others.
Lazar reported an extensive review on MEOR field applications that was
conducted in Romania during the period from 1971-1991. He emphasized on
three main areas of research namely examination of the bacterial populations
present in the formation water of the reservoir, adaptation of the microorganisms
to field conditions prior to injection and finally, field testing of the adapted
microorganisms. He concluded that the successful trials resulted in a two-fold
increase in the oil production for one to five years.
In Asia: In Eastern Asia, some MEOR experimental and field trials were reported in
China, Malaysia, India and Indonesia.
Several large-scale field tests were carried out in China including Jilin,
Xinjiang, Daqing, Fuyu and many others.
One of the successfully reported field trials was in Daqing oilfield (Biochemical
Engineering Journal 11 (2002) 197–199) which is the largest oilfield in China with
an average effective thickness of 30ft. In this application, Pseudomonas
aeruginosa (P-1) and its metabolic products were used which reduced the oil
viscosity by 38.5%. It was reported that 80% of the wells showed a significant
increase in oil production and total enhancement of oil recovery of 11% was
observed.
24
Arab Region: In the Arab world, some MEOR laboratory experimental tests were conducted
by Sayyouh and his co-workers since 1992 in Cairo University and in King Saud
University. They isolated their bacteria from the Egyptian and Saudi crude oils
and brine. They tested experimentally the effects of nutrient types and its
concentrations, bacterial type, salinity and permeability on oil recovery.
Some other experimental work was conducted by Zekri et al. in United Arab
Emirates University where they studied the possibility of increasing oil recovery
from UAE reservoirs using bacterial flooding. They also investigated the
parameters which affected the optimization of microbial flooding in carbonate
reservoirs.
A study was presented by Sayyouh on the applicability of MEOR for
recovering more oil under the Arab reservoir conditions where data was obtained
from more the 300 formations from seven Arab countries (Saudi Arabia, Egypt,
Kuwait, Qatar, UAE, Iraq and Syria). He anticipated that MEOR technology may
recover up to 30% of the residual oil under the Arab reservoir conditions.
Appendix C represent the experience of the world in MEOR field trials
25
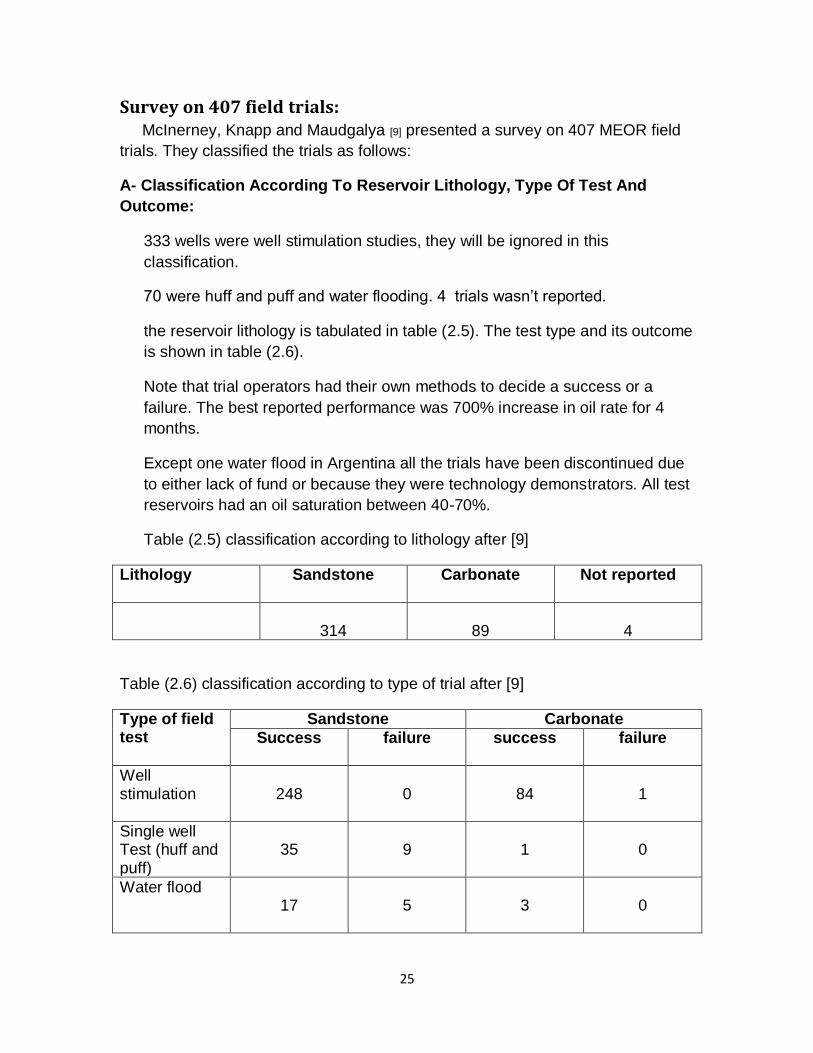
Survey on 407 field trials: McInerney, Knapp and Maudgalya [9] presented a survey on 407 MEOR field
trials. They classified the trials as follows:
A- Classification According To Reservoir Lithology, Type Of Test And
Outcome:
333 wells were well stimulation studies, they will be ignored in this
classification.
70 were huff and puff and water flooding. 4 trials wasn’t reported.
the reservoir lithology is tabulated in table (2.5). The test type and its outcome
is shown in table (2.6).
Note that trial operators had their own methods to decide a success or a
failure. The best reported performance was 700% increase in oil rate for 4
months.
Except one water flood in Argentina all the trials have been discontinued due
to either lack of fund or because they were technology demonstrators. All test
reservoirs had an oil saturation between 40-70%.
Table (2.5) classification according to lithology after [9]
Lithology
Sandstone Carbonate Not reported
314
89
4
Table (2.6) classification according to type of trial after [9]
Type of field test
Sandstone Carbonate
Success
failure success failure
Well stimulation
248
0
84
1
Single well Test (huff and puff)
35
9
1
0
Water flood
17
5
3
0

26
B- Classification According To The Type Of The Recovery Mechanism:
The 70 trials are classified according to the primary mechanism and outcome
and shown in table (2.7).
Except for 4 waterfloods , multiple mechanisms were active in trials.
Table (2.7) classification according to primary recovery mechanism after [9]
Type Of Primary Recovery Mechanism
No. of Trials Success Failure
Permeability Profile Modification
10
7
3
CO2 Gas Production
10
9
1
Bio-Surfactant, Alcohol, Biopolymers, Acids
26
20
6
Oil Biodegradation
34
29
5
C- Classification According To Microbes:
Trials were classified according to the used bacterium and test type as in table
(2.8) and figure (2.5).
Most experiments used a combination of bacterium.
Successful experiments mostly used anaerobic bacteria.
No conclusive relationship was observed between bacterium type and trial
outcome.
Microbial behavior was generally inconsistent between lab and field behavior.

27
Table (2.8) classification according to microorganism used after [9]
Type of Microorganism
No. of Tests Waterflood Single Well
Bacillus Sp. (Bio-Surfactant)
11
10
1
Clostridium Sp. (Gas And Acid)
37
13
24
Pseudomonas (Biomass And MPPM)
14
7
7
Nitrate Reducing Bacteria (MPPM)
3
2
1
Sulfate Reducing Bacteria (Biodegradation)
15
2
13
Unknown
39
11
28
Figure (2.5) the use of different recovery mechanisms after [9]

28
D- Classification According To Nutrients:
Nutrients are the largest expense in an MEOR project. Table (2.9) shows the
nutrients used in the 70 trials.
Table (2.9) classification according to nutrients after [9]
Type of nutrients
No. of trials
Only molasses
27
Molasses and N and P fertilizers
23
In situ hydrocarbons
17
Others
7
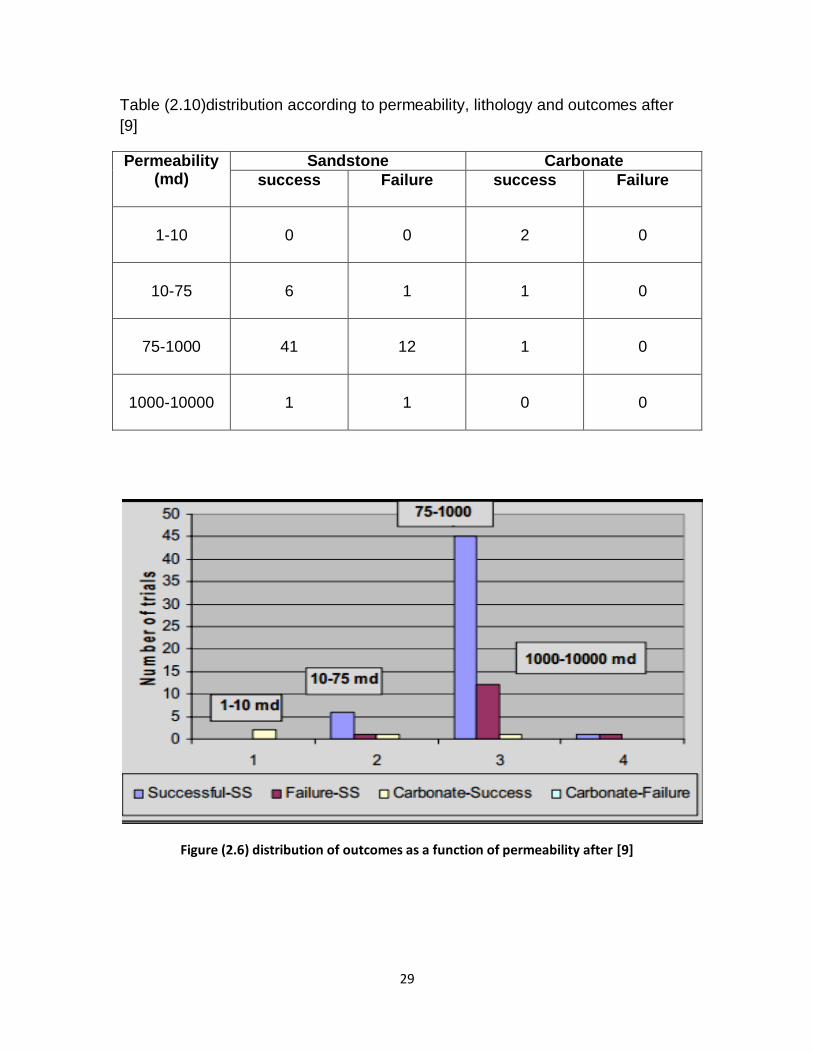
E-Classification According To Reservoir Properties:
Reservoir properties and conditions have a large impact on the ability of
microbes to produce products.
The main properties are: permeability, temperature and salinity. As shown in
Tables (2.10,2.11,2.12).
Three fourth of the trials in 75-1000 md permeability interval were successful.
One carbonate in range 1-10 md was reported as shown in figure (2.6).
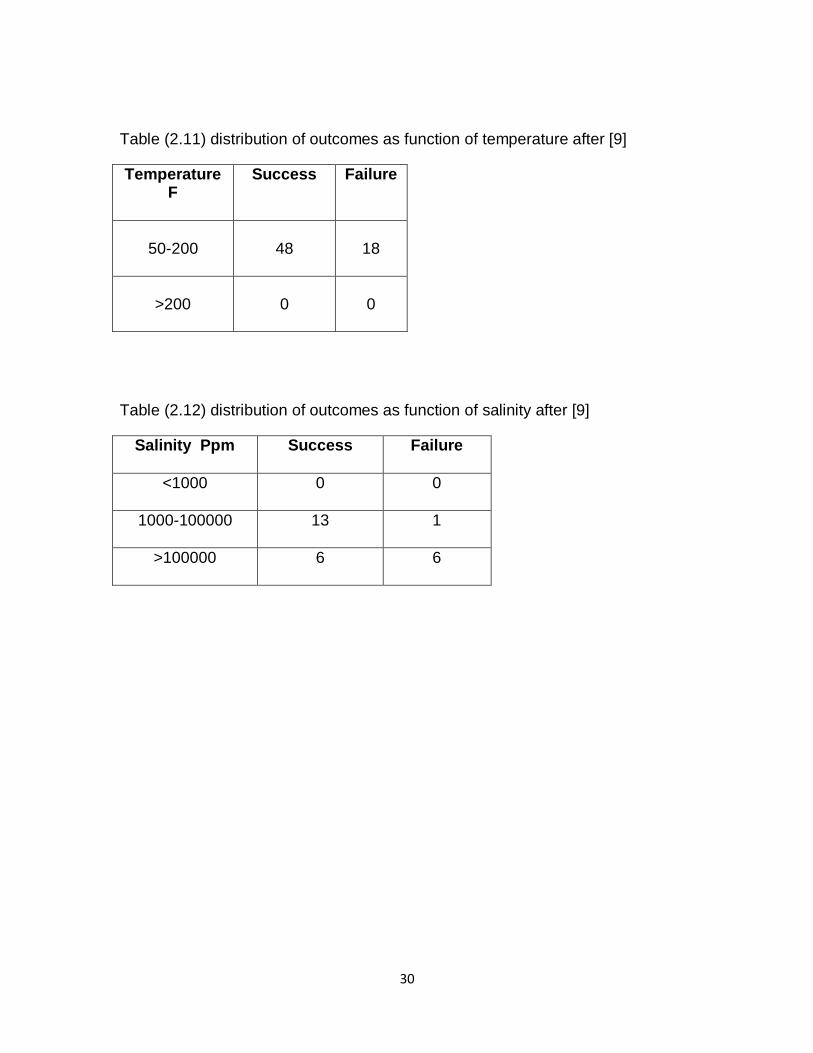
A lot of test didn’t report the salinity, making analysis very difficult.
Most reservoir temperatures were below 200 F.
29
Table (2.10)distribution according to permeability, lithology and outcomes after
[9]
Permeability (md)
Sandstone Carbonate
success Failure success Failure
1-10
0
0
2
0
10-75
6
1
1
0
75-1000
41
12
1
0
1000-10000
1
1
0
0
Figure (2.6) distribution of outcomes as a function of permeability after [9]
30
Table (2.11) distribution of outcomes as function of temperature after [9]
Temperature F
Success Failure
50-200
48
18
>200
0
0
Table (2.12) distribution of outcomes as function of salinity after [9]
Salinity Ppm
Success Failure
<1000
0 0
1000-100000
13 1
>100000
6 6
31
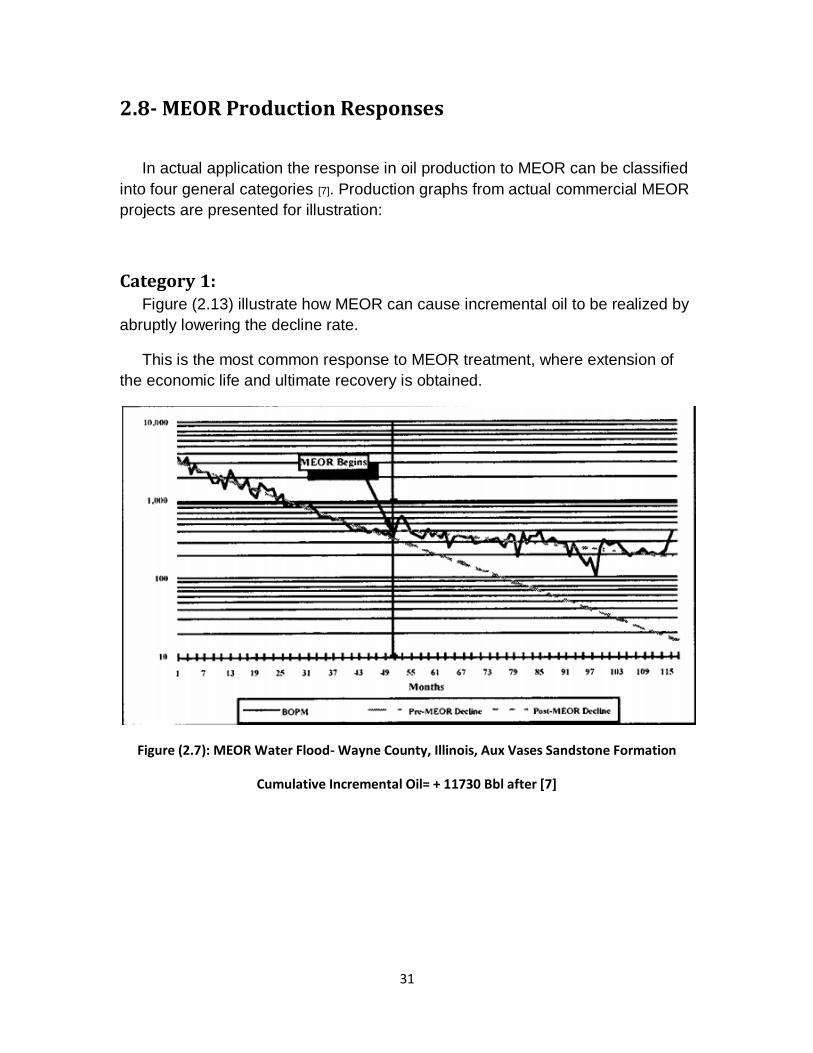
2.8- MEOR Production Responses
In actual application the response in oil production to MEOR can be classified
into four general categories [7]. Production graphs from actual commercial MEOR
projects are presented for illustration:
Category 1: Figure (2.13) illustrate how MEOR can cause incremental oil to be realized by
abruptly lowering the decline rate.
This is the most common response to MEOR treatment, where extension of
the economic life and ultimate recovery is obtained.
Figure (2.7): MEOR Water Flood- Wayne County, Illinois, Aux Vases Sandstone Formation
Cumulative Incremental Oil= + 11730 Bbl after [7]
32
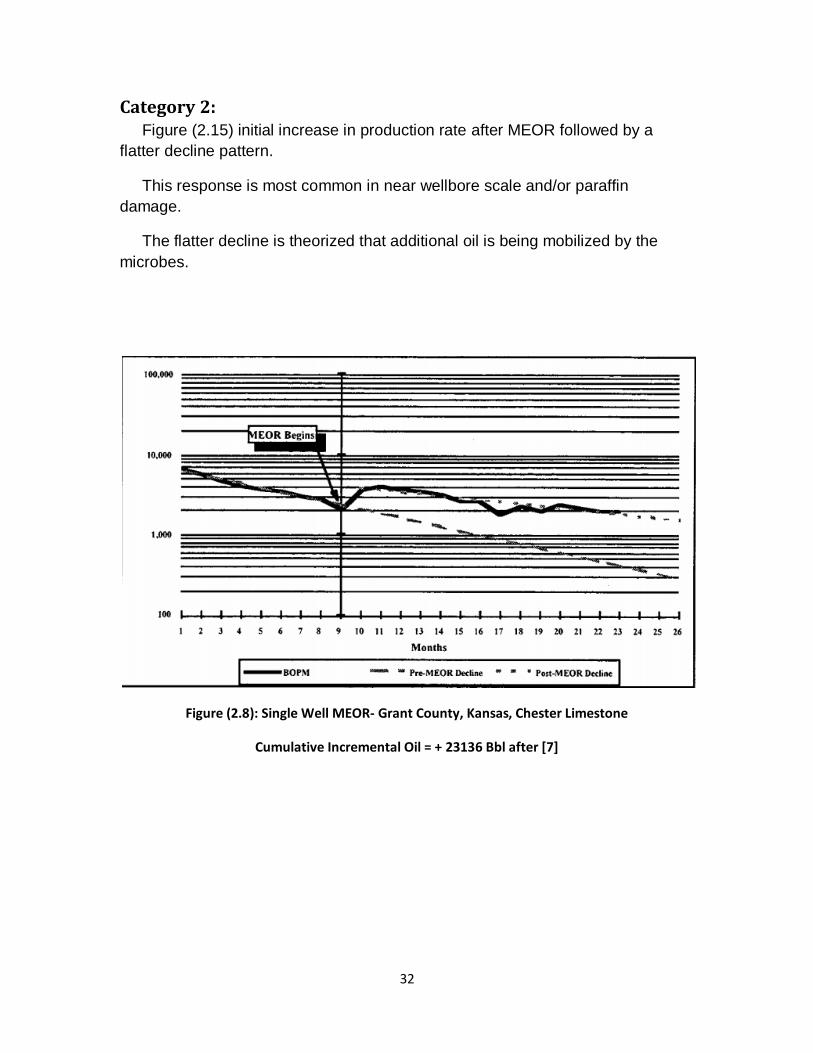
Category 2: Figure (2.15) initial increase in production rate after MEOR followed by a
flatter decline pattern.
This response is most common in near wellbore scale and/or paraffin
damage.
The flatter decline is theorized that additional oil is being mobilized by the
microbes.
Figure (2.8): Single Well MEOR- Grant County, Kansas, Chester Limestone
Cumulative Incremental Oil = + 23136 Bbl after [7]
33
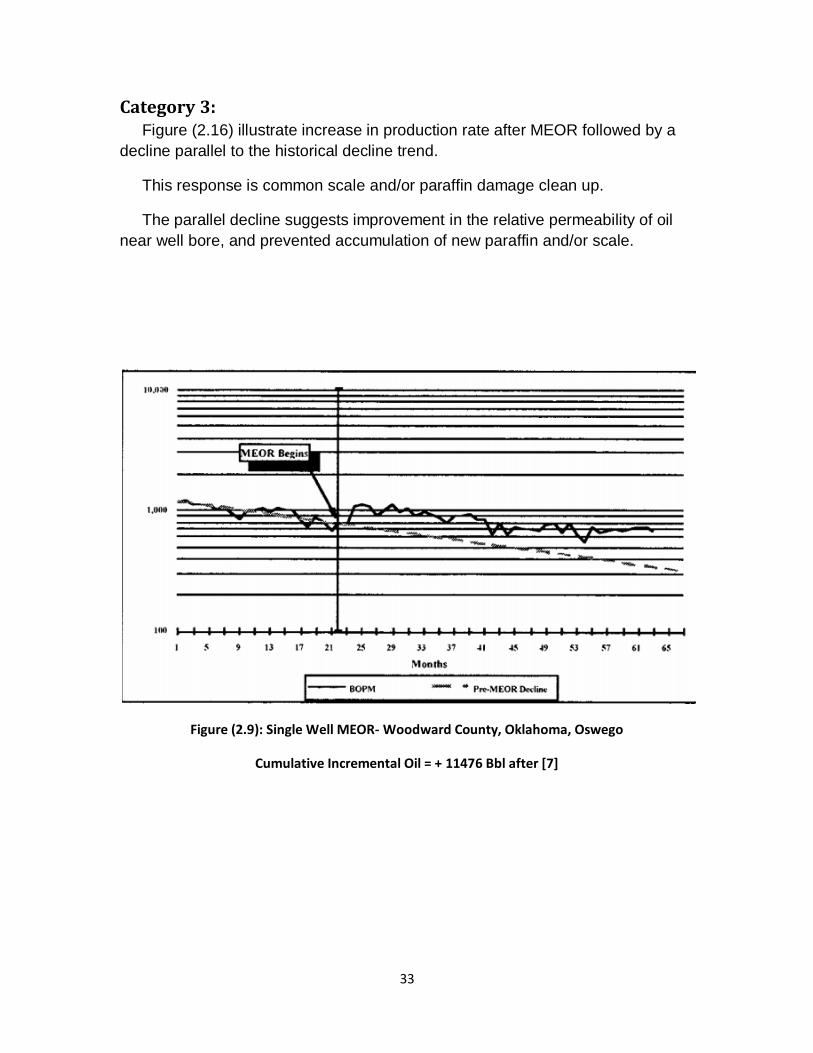
Category 3: Figure (2.16) illustrate increase in production rate after MEOR followed by a
decline parallel to the historical decline trend.
This response is common scale and/or paraffin damage clean up.
The parallel decline suggests improvement in the relative permeability of oil
near well bore, and prevented accumulation of new paraffin and/or scale.
Figure (2.9): Single Well MEOR- Woodward County, Oklahoma, Oswego
Cumulative Incremental Oil = + 11476 Bbl after [7]
34
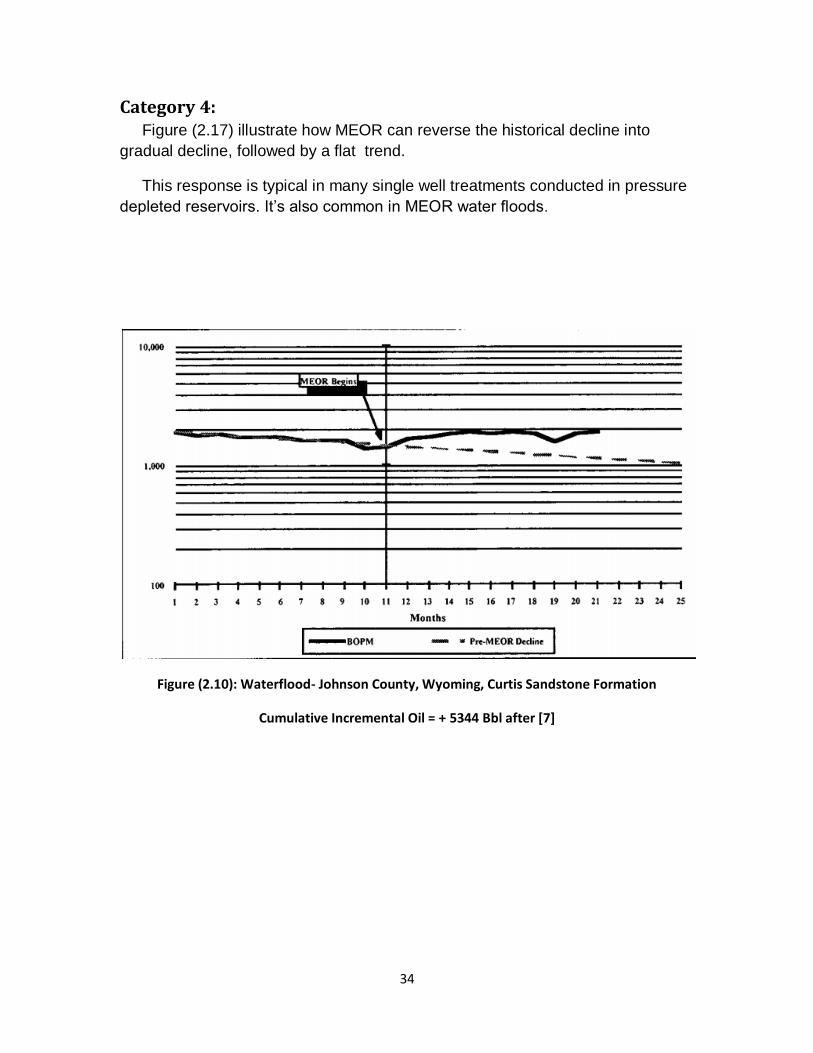
Category 4: Figure (2.17) illustrate how MEOR can reverse the historical decline into
gradual decline, followed by a flat trend.
This response is typical in many single well treatments conducted in pressure
depleted reservoirs. It’s also common in MEOR water floods.
Figure (2.10): Waterflood- Johnson County, Wyoming, Curtis Sandstone Formation
Cumulative Incremental Oil = + 5344 Bbl after [7]
35
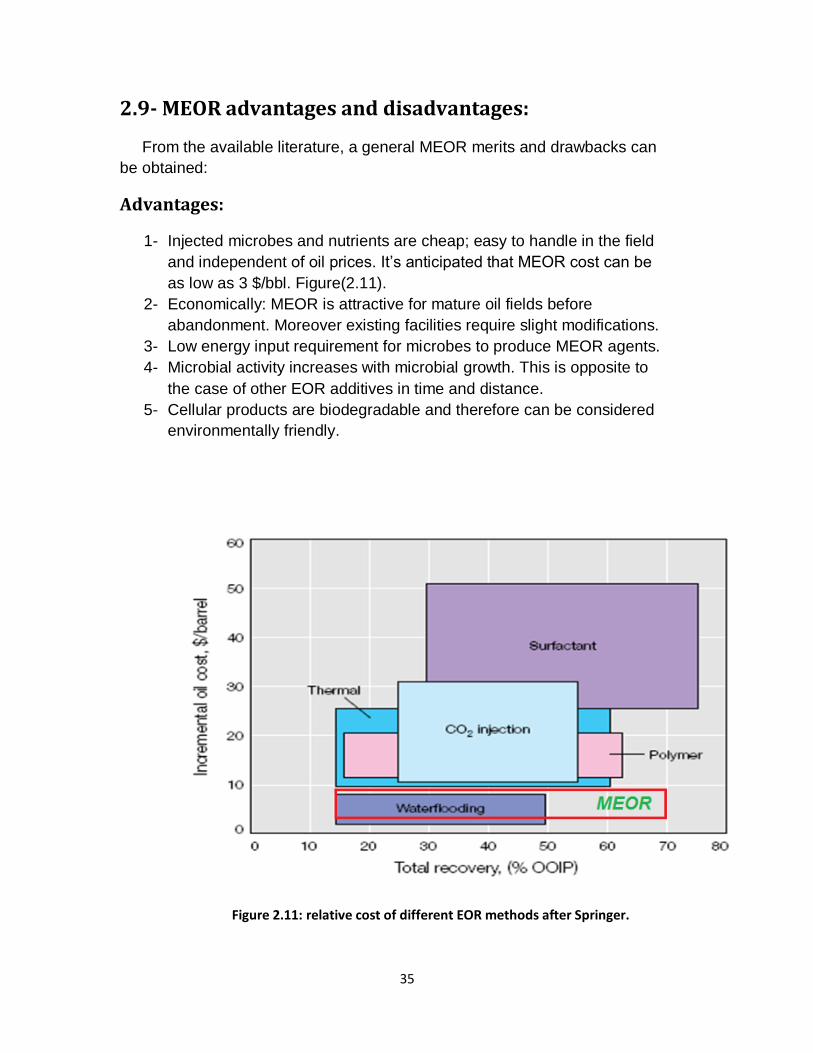
2.9- MEOR advantages and disadvantages:
From the available literature, a general MEOR merits and drawbacks can
be obtained:
Advantages:
1- Injected microbes and nutrients are cheap; easy to handle in the field
and independent of oil prices. It’s anticipated that MEOR cost can be
as low as 3 $/bbl. Figure(2.11).
2- Economically: MEOR is attractive for mature oil fields before
abandonment. Moreover existing facilities require slight modifications.
3- Low energy input requirement for microbes to produce MEOR agents.
4- Microbial activity increases with microbial growth. This is opposite to
the case of other EOR additives in time and distance.
5- Cellular products are biodegradable and therefore can be considered
environmentally friendly.
Figure 2.11: relative cost of different EOR methods after Springer.
36
Disadvantages:
1- The oxygen deployed in aerobic MEOR can act as corrosive agent on
non -resistant topside equipment and down -hole piping.
2- Anaerobic MEOR requires large amounts of sugar limiting its
applicability in
offshore platforms due to logistical problems.
3- Exogenous microbes require facilities for their cultivation.
4- Indigenous microbes need a standardized framework for evaluating
microbial activity, e.g. specialized coring and sampling techniques.
5- Permeability, salinity and temperature restrictions.
6- Potential health hazards: where possible mutations could occur resulting
in a pathogenic bacteria.
37
Chapter Three:
METHODOLOGY
This project was carried in the following sequence:
First:
References, papers and studies on MEOR available on a worldwide literature
was reviewed.
The literature was analyzed in order to state the important factors, that define
the general screening criteria for MEOR.
Second:
Data of two Sudanese reservoirs was obtained and compared to the general
screening criteria.
Third:
Laboratory experiments was carried to inspect the ability of chosen bacteria
cultures to perform their reported activities..
Strains of bacteria reported in the literature was obtained. Then was put in a
media where the crude oil is the only carbon source to inspect it’s ability to
degrade crude oil.
Local crude oil samples from sudan fields were used in the experiments.

38
3.1- MEOR Screening In MEOR each reservoir can have its own screening; since bacteria is
adaptable organisms. The condition and the properties of each reservoir affect
the behavior of the bacteria.
The most factors used in screening are as follows:
a- reservoir conditions: pressure and temperature.
b- Reservoir fluid properties: viscosity, density, PH and salinity.
c- Reservoir geology: lithology, depth, porosity and permeability.
Pressure:
Pressure affects biological process, although the limiting boundary is probably
set more by high temperatures than by high pressures.
Some researchers limited the pressure to 7000-8000 psi [12].
High hydrostatic pressures in the range of several dozen MPa are generally
assumed to be nonlethal but can exert adverse effects on the growth of
organisms that are adapted to atmospheric pressure(Abe et al.1999,
Bartlett,2002).
Temperature:
Temperature plays a significant role in bacteria metabolism. With increasing
depth, the temperature increases. Therefore it is certain that bacteria growth and
their metabolism will be affected as increasing temperature can exert negative
effects on enzyme function by disruption of important cell activities.
Depending on the temperature ranges for microorganisms survival, microbes
can be classified according to their optimum temperature range as psychrophiles
(< 25 ◦C), mesophiles (25-45 ◦C), and thermopiles (45-60 ◦C) [13].
Data suggest that microorganisms may grow at temperatures below 82 ◦ C as
microorganisms were only isolated from reservoirs below this temperature
(Magot et al., 2000). Still uncertainty surrounds the limiting value.

39
Viscosity:
Obviously the higher the viscosity of a crude oil, the more difficult it will be to
mobilize; yet, the principal mechanisms of microorganisms for improved
displacement efficiency, gas, surfactant and solvent production, and wettability
alteration should still apply.
API Gravity:
Although most MEOR field projects have been conducted with light crude oils
having API gravities around 30° to 40 °, successes have been reported with
heavy crudes having gravities around 20 ° API.
PH:
pH is one of the major environmental factors that affect microbial growth.
In general, the optimal pH for growth for microorganisms is between a pH of
4.0 and 9.0, but at very low pH, the metabolic activities (enzymes) of
microorganisms can be affected [12].
Salinity and metal content:
Tolerance of microorganisms to salt concentration is one of the most
important characteristics needed for microorganisms used in MEOR.
The salinity influences the growth, where the microorganisms have to sustain
the optimal salinity of cellular fluids to maintain enzymatic action (Madigan et al.,
2003)
Bryant and Burchfield stated that the total dissolved salt must not exceed
150000 ppm.
Obviously, there are microorganisms that can grow at much higher TDS
values, and the East German microbial-enhanced water floods demonstrates this
point.
As a revised screening criterion, it is recommended that the sodium
concentration continue to be less than 10% although the TDS value may be
much higher.

40
The presence of high (5 to 10 ppm) concentrations of some metals such as
arsenic, nickel, and selenium will affect microbial growth, and fluid compatibility
studies and a reservoir brine analysis can be used to identify any potential
problems with metal ions [12].
Lithology:
Some researchers claim that carbonate rock is desirable for microbial EOR
processes. Since many microbes produce acids when fermenting molasses, it is
believed that the presence of carbonate minerals can improve microbial CO2
production, as well as increase permeability [12].
clays may cause adsorption problems and inhibit growth.
Permeability:
Reservoir rock permeability ranges from one to thousands milli-darcies (md)
have been reported for MEOR field projects.
in some instances, for example in well stimulation treatments, the permeability
factor is probably less critical since the primary objective is to improve oil
recovery in the near-wellbore region. The crucial factor for single-well treatments
should be good injectivity.
In microbial-enhanced waterflooding, reservoir rock permeability becomes a
more important consideration. However, successful field tests have been
demonstrated in rock that was previously considered too tight for microbial
treatment (< 100 md).
permeability may not be a limiting factor for that particular reservoir. In revised
screening criteria, therefore no limitations will be placed on permeability,
although it is recommended that a single well injectivity test to be conducted prior
to a multi-well microbial water flood.
It is also recommended that if a particular formation is known to have low
permeability, then microbial EOR may not be a viable process.
41
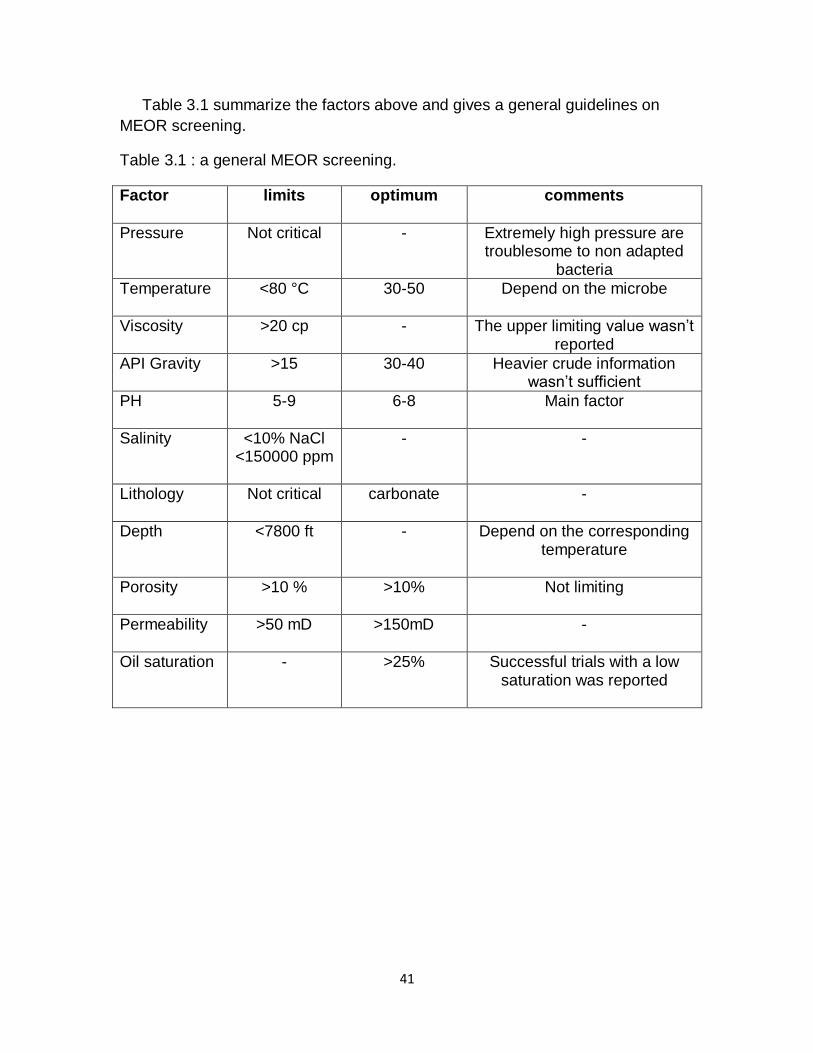
Table 3.1 summarize the factors above and gives a general guidelines on
MEOR screening.
Table 3.1 : a general MEOR screening.
Factor
limits optimum comments
Pressure Not critical
- Extremely high pressure are troublesome to non adapted
bacteria
Temperature <80 °C
30-50 Depend on the microbe
Viscosity >20 cp
- The upper limiting value wasn’t reported
API Gravity >15
30-40 Heavier crude information wasn’t sufficient
PH 5-9
6-8 Main factor
Salinity <10% NaCl <150000 ppm
- -
Lithology Not critical
carbonate -
Depth <7800 ft
- Depend on the corresponding temperature
Porosity >10 %
>10% Not limiting
Permeability >50 mD
>150mD -
Oil saturation - >25% Successful trials with a low saturation was reported
42
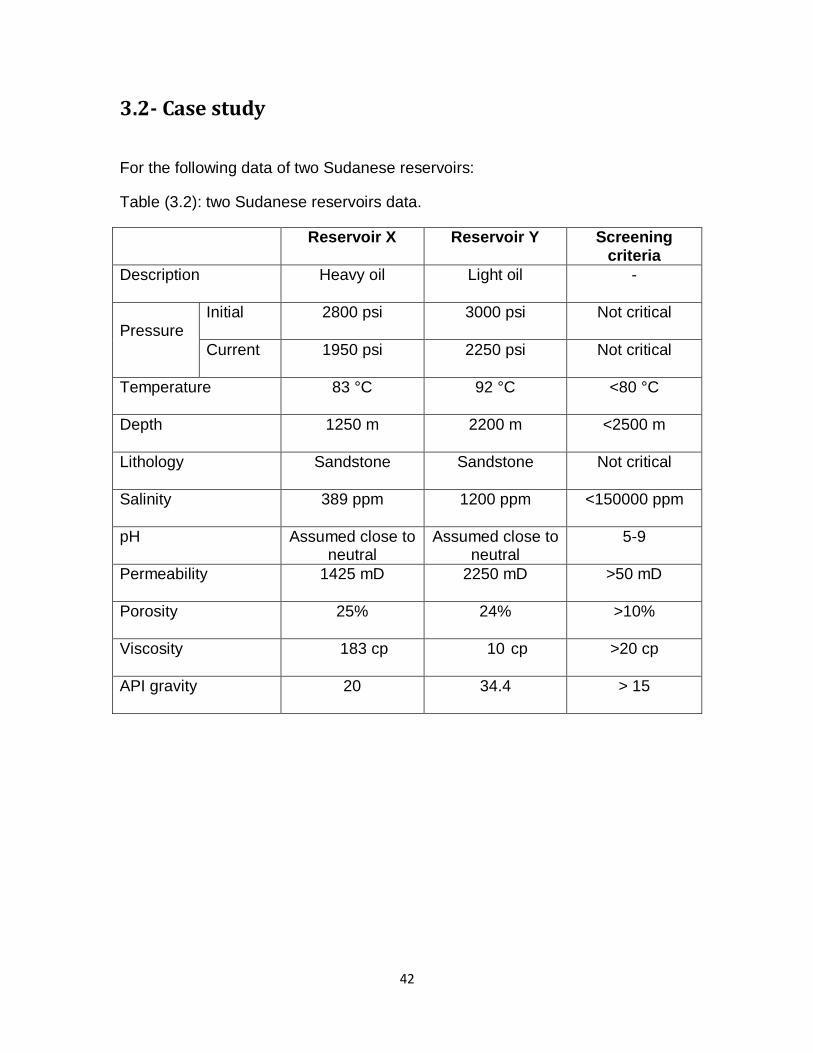
3.2- Case study
For the following data of two Sudanese reservoirs:
Table (3.2): two Sudanese reservoirs data.
Reservoir X
Reservoir Y Screening criteria
Description
Heavy oil Light oil -
Pressure
Initial 2800 psi
3000 psi
Not critical
Current 1950 psi
2250 psi
Not critical
Temperature
83 °C 92 °C <80 °C
Depth
1250 m 2200 m <2500 m
Lithology
Sandstone Sandstone Not critical
Salinity
389 ppm 1200 ppm <150000 ppm
pH
Assumed close to neutral
Assumed close to neutral
5-9
Permeability
1425 mD 2250 mD >50 mD
Porosity
25% 24% >10%
Viscosity
183 cp 10 cp >20 cp
API gravity
20 34.4 > 15

43
3.3- The Experiments: BIODEGRADATION
Biodegradation is defined as a process which occurs due to the action of
enzymes that are secreted by living organisms leading to its chemical
decomposition.
Crude oil is composed of varying sized carbon Organic material can be degraded aerobically with oxygen, or anaerobically without oxygen.
Biodegradation often involves utilization of the substance being broken down as a source of carbon-energy by the degrading organism. Under aerobic conditions, given complete utilization, a portion of the degraded substance will be converted to oxidized products (CO2, H2O, Oxidized inorganic molecules), and a portion will be converted to cell material.
The biological degradation of oil by bacteria which the bacteria will metabolize
the oil in much the same way humans convert food into energy. Like food, oil is a
compound rich in carbon.
The biodegradation of crude oil is frequently and mistakenly considered to be
identical with the biodegradation of hydrocarbons.
Crude oil contains a large number of non-hydrocarbon components and any alteration in their qualitative or quantitative composition may significantly alter the characteristics of the crude oil.
The bacteria produced enzymes inside and outside the cellular body of the bacteria for doing many process to ensure the continuity of the life cycle in idealistic mode.
The outside enzymes help bacteria to get it own energy source, So in bio-degradation process in MEOR these enzymes used and improved to cut the carbon chains in the crude oil.
Appendix A present a brief explanation of enzyme EOR.

44
The General Idea Of Biodegradation:
As we know there are three basic forces which affect the oil recovery from the reservoir :
1- Viscous force. 2- Capillary force. 3- Gravity force.
In biodegradation we play mainly on the viscous force by destroy heavy component in crud an then increase the lighter fractions which lead to increase API of crude and tend to reduce viscosity, thus increasing the oil’s mobility and flow characteristics.
The Factors Which Affecting The Bio-Degradation Process And The Rate Of The Bio-Degradation In The Field:
Table (3.3): factors affecting biodegradation.
The initial interaction between the compound and the organism.
The concentration of the degrading population.
The physicochemical parameters of the environment: Nutrients Oxygen pH value composition concentration bioavailability of the contaminants chemical and physical characteristics the pollution history of the contaminated environment.
The concentration of the chemical being degraded is very important. Many compounds which are inherently biodegradable become toxic for most bacteria if the concentration becomes too high (phenol is an example).
The external effect which catalyst the biodegradation fore example some experiments show that shedding UV on some type of bacteria increase the biodegradation .
45
Indicators Of Biodegradation:
Biodegradation can be indicated by:
(1)- The activity of aerobic microbes can be measured by the amount of oxygen they consume or the amount of carbon dioxide they produce.
(2)- It can be measured for anaerobic microbes by the amount of methane or alloy that they may be able to produce.
(3)- the turbidity in the flask can be a rough indicator of microbial growth. That is the bacteria fed on the carbon source.
Methods Of Evaluating Biodegradation :
To evaluate the bio-degradation performance it can be done by determining the changes in the components of crude oil before and after fermentation, there are many methods:
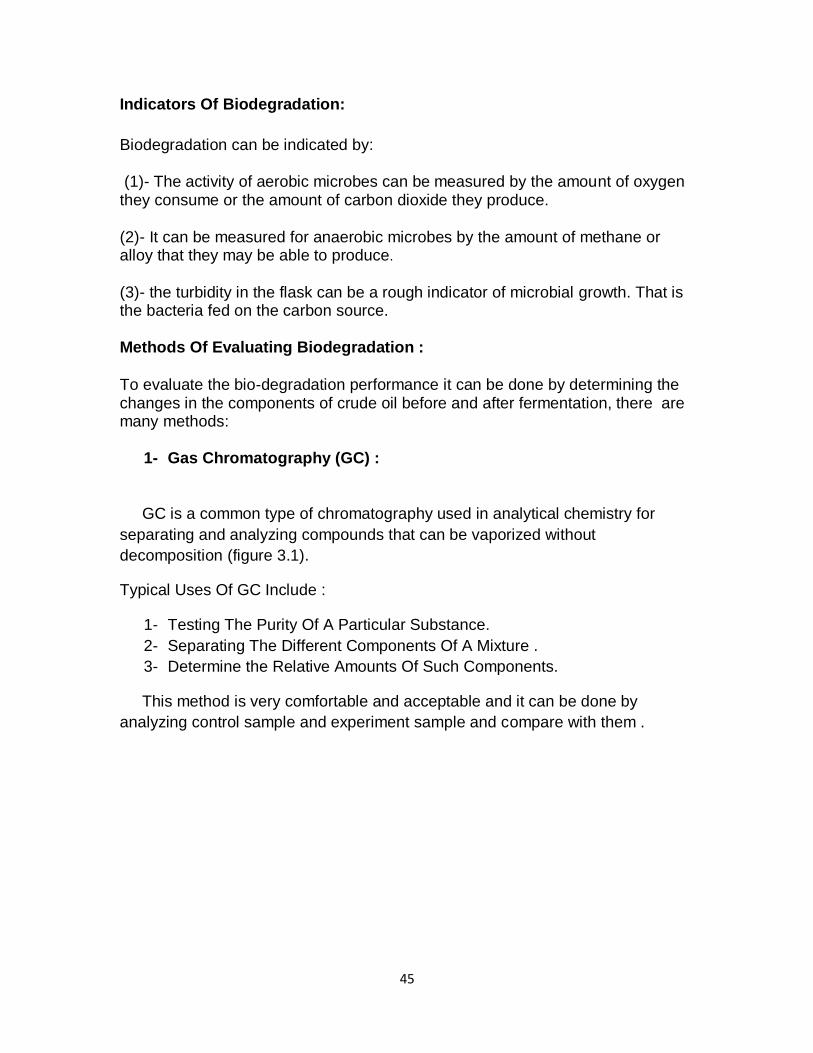
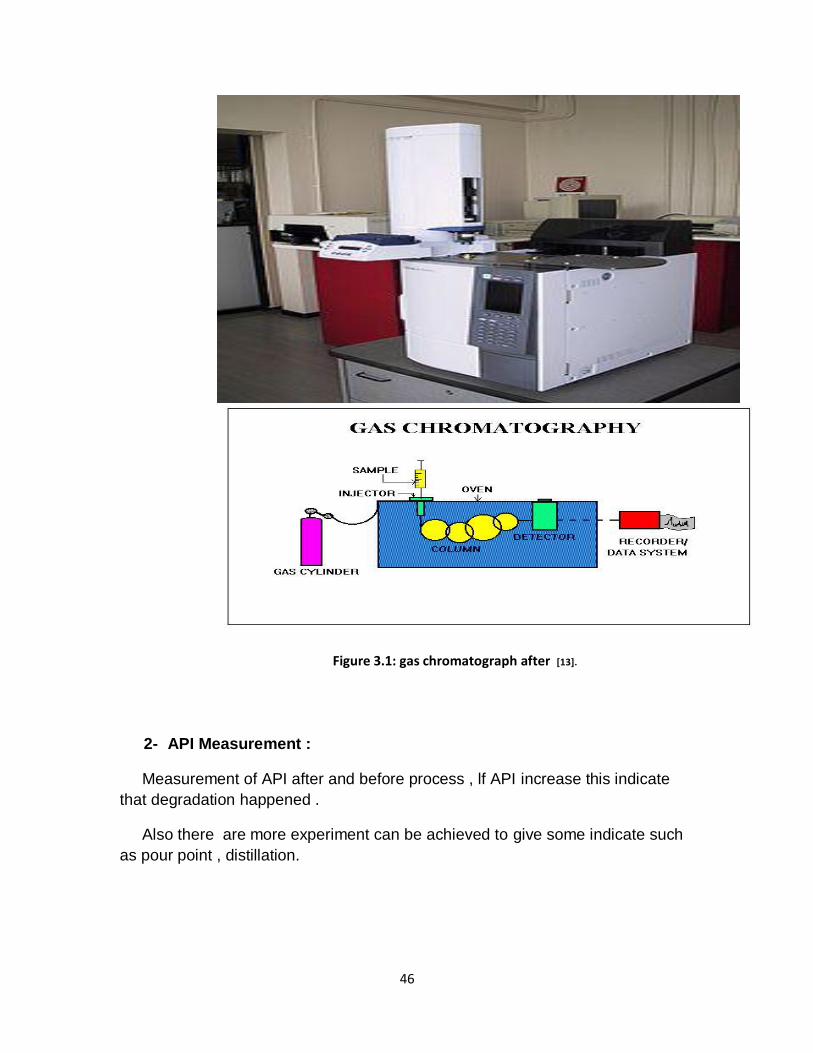
1- Gas Chromatography (GC) :
GC is a common type of chromatography used in analytical chemistry for
separating and analyzing compounds that can be vaporized without
decomposition (figure 3.1).
Typical Uses Of GC Include :
1- Testing The Purity Of A Particular Substance.
2- Separating The Different Components Of A Mixture .
3- Determine the Relative Amounts Of Such Components.
This method is very comfortable and acceptable and it can be done by
analyzing control sample and experiment sample and compare with them .
46
Figure 3.1: gas chromatograph after [13].
2- API Measurement :
Measurement of API after and before process , lf API increase this indicate
that degradation happened .
Also there are more experiment can be achieved to give some indicate such
as pour point , distillation.
47
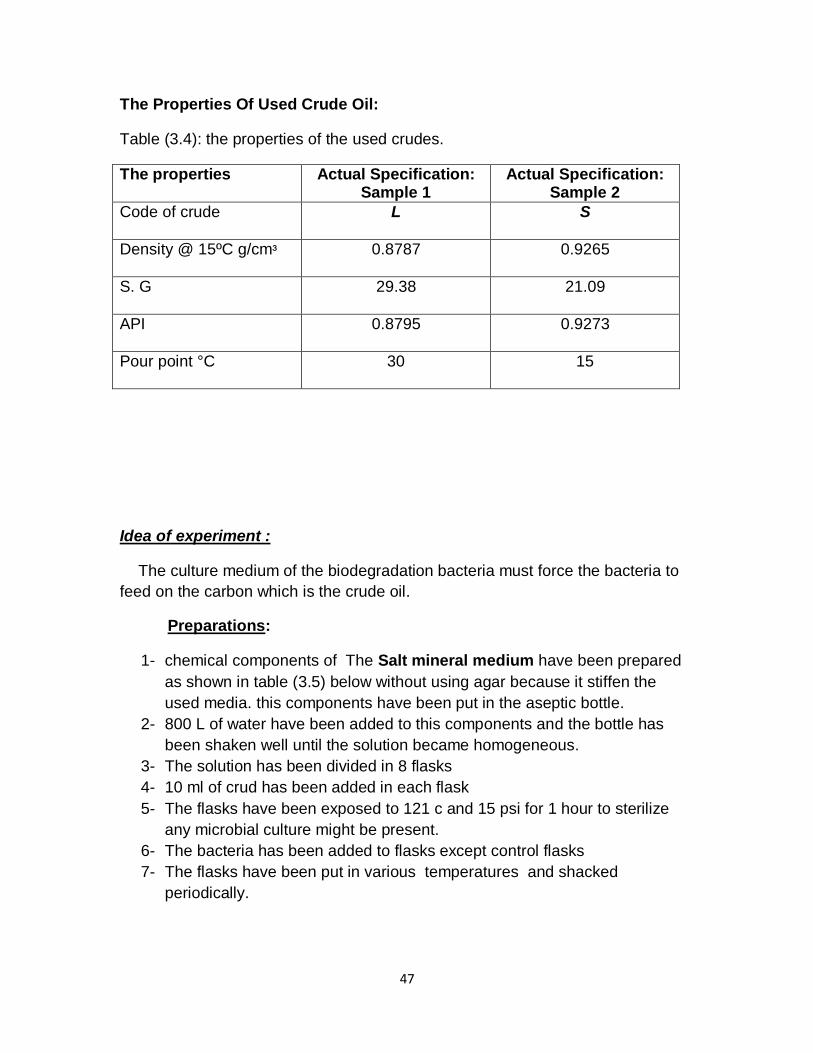
The Properties Of Used Crude Oil:
Table (3.4): the properties of the used crudes.
The properties Actual Specification: Sample 1
Actual Specification: Sample 2
Code of crude
L S
Density @ 15ºC g/cmᶟ
0.8787 0.9265
S. G
29.38 21.09
API
0.8795 0.9273
Pour point °C
30 15
Idea of experiment :
The culture medium of the biodegradation bacteria must force the bacteria to
feed on the carbon which is the crude oil.
Preparations:
1- chemical components of The Salt mineral medium have been prepared
as shown in table (3.5) below without using agar because it stiffen the
used media. this components have been put in the aseptic bottle.
2- 800 L of water have been added to this components and the bottle has
been shaken well until the solution became homogeneous.
3- The solution has been divided in 8 flasks
4- 10 ml of crud has been added in each flask
5- The flasks have been exposed to 121 c and 15 psi for 1 hour to sterilize
any microbial culture might be present.
6- The bacteria has been added to flasks except control flasks
7- The flasks have been put in various temperatures and shacked
periodically.

48
Table (3.5) : the salt mineral medium:
Components Amounts (gram/Litre) Amounts(gram/800 ml)
KH2PO4 .42 .336
K2HPO4 .375 .3
(NH4)2SO4 .244 .1952
NaCl .015 .012
CaCl2.2H2O .015 .012
MgSO4.7H2O .05 .04
FeCl3.6H2O .054 .0432
Control sample mean that the sample wasn't treated by bacteria and this is
important to evaluate the biodegradation by study the properties of crud before
and after treated .
PH have been chosen to be 7 because this is the approximately the PH of
Sudan fields .
49
First experiment :
Bacteria used BACILLUS (facultative)
After bacteria added to solution the flasks have been put in various condition as
shown in table 3.6 below :
Table (3.6): the first experiment.
Sample name
Type of crude
Type of sample
PH temperature Type of shaker
LC L
CONTROL 7 25 Automatic
L1 L
Treated 7 25 Automatic
L2 L
Treated 7 30 Manual
L3 L
Treated 7 40 Manual
SC S
CONTROL 7 25 Automatic
S1 S
Treated 7 25 Automatic
S2 S
Treated 7 30 Manual
S3 S
Treated 7 40 Manual
Note:
(1)- The sample was left for 24 hours, no signs of microbial was noticed.
(2)- the sample was left for additional 24 hours and no signs of microbial growth.
50
Second experiment :
Bacteria used PSUEDOMONAS (aerobic)
The Conditions similar to the conditions in the first experiment as shown in table
(3.7) :
Table (3.70: the second experiment.
Sample name
Type of crude
Type of sample
PH temperature Type of shaker
LC L CONTROL 7 25 Automatic
L1 L Treated 7 25 Automatic
L2 L Treated 7 30 Manual
L3 L Treated 7 40 Manual
SC S CONTROL 7 25 Automatic
S1 S Treated 7 25 Automatic
S2 S Treated 7 30 Manual
S3 S Treated 7 40 Manual
Notices:
(1)- The sample was left for 24 hours, then a visible turbidity was observed. This
indicated the growth of the bacteria.
(2)- The oil was then separated from the media by a separation funnel.
(3)- the separated oil was then analyzed by the gas chromatograph.
51
Chapter Four:
RESULTS
4.1- the experiments:
First Experiment: The Bacillus bacteria didn’t grow.
Second experiment: The gas chromatograph results was as follows:
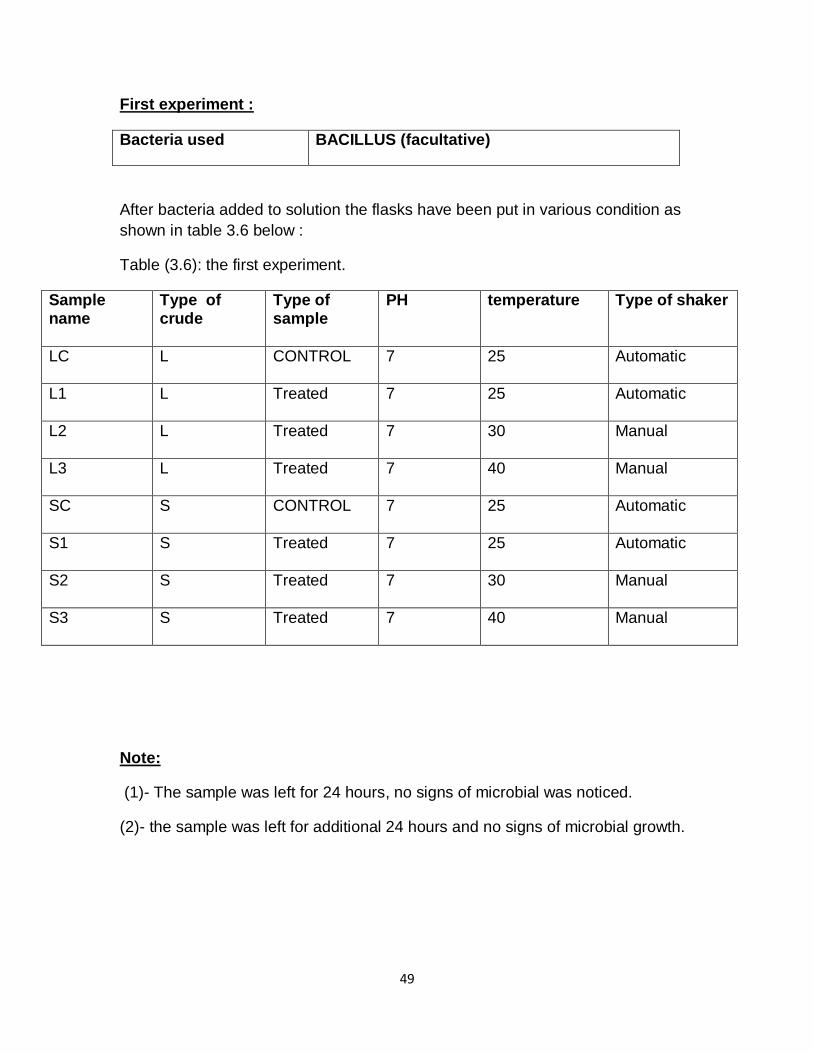
Crude L:
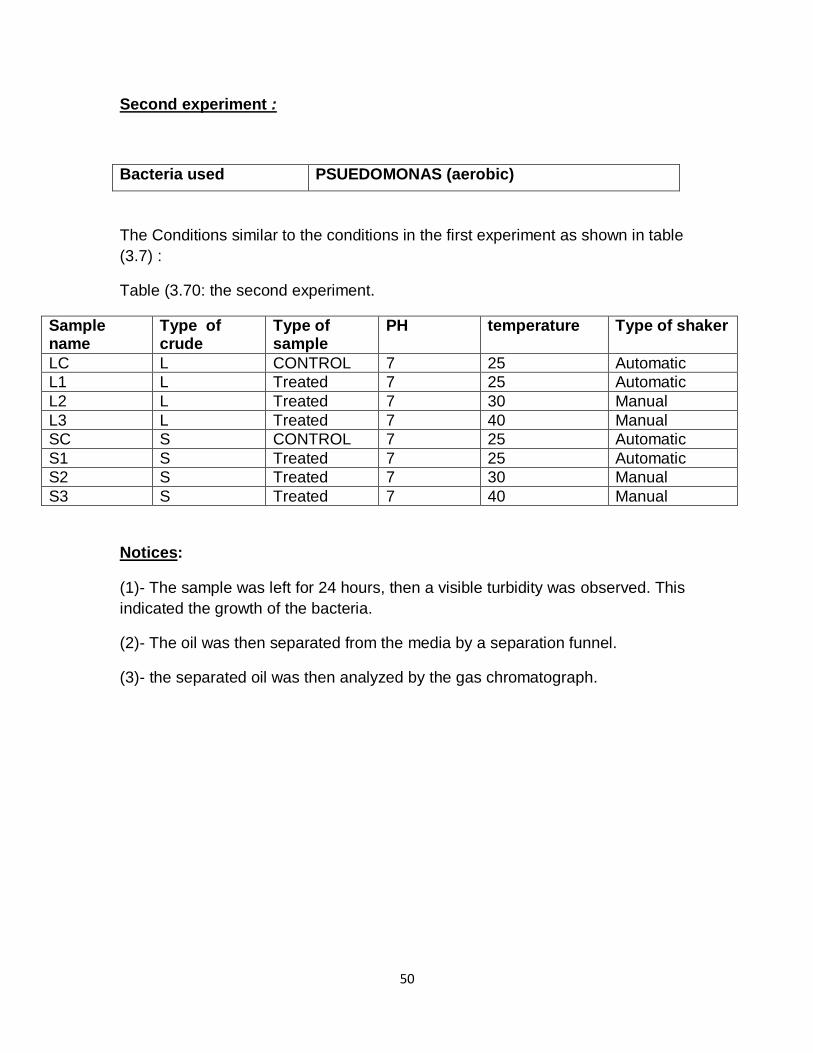
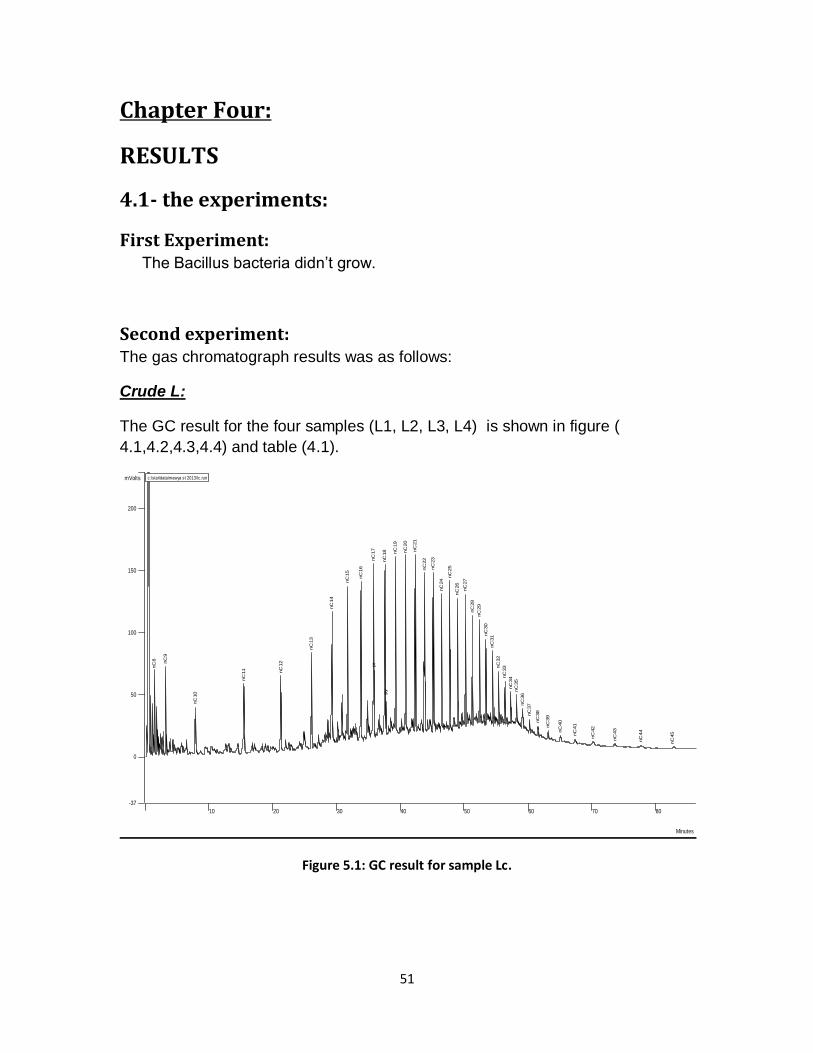
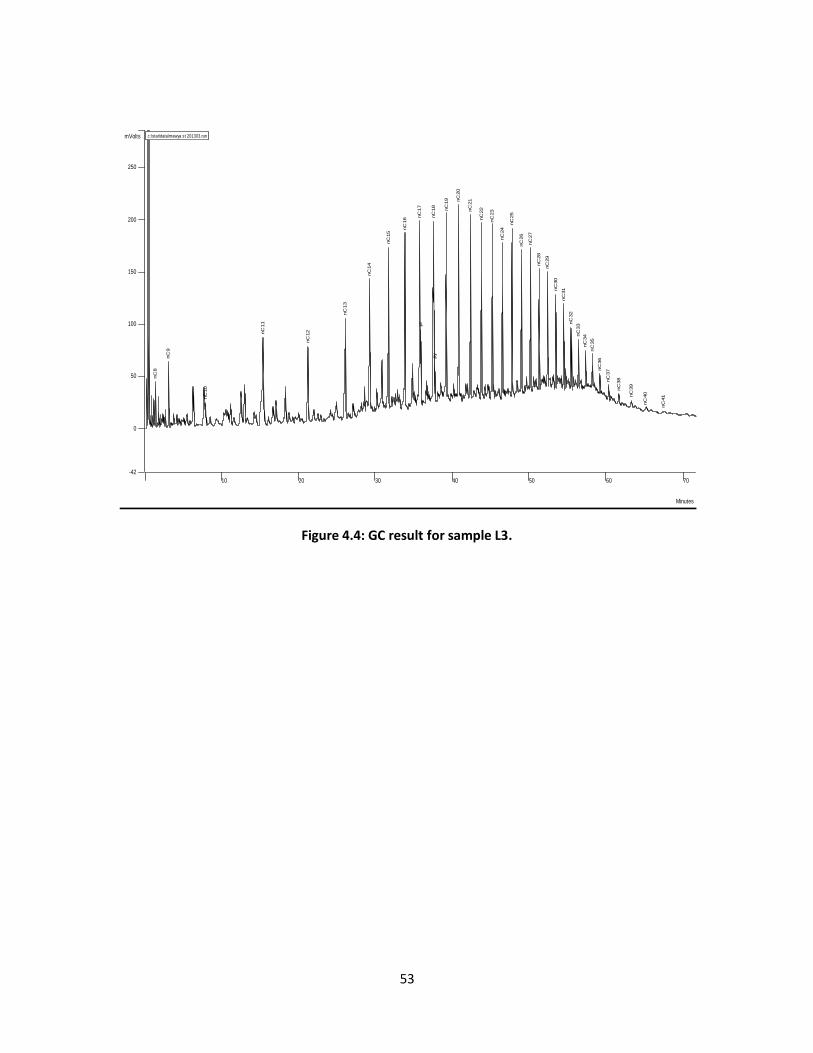
The GC result for the four samples (L1, L2, L3, L4) is shown in figure (
4.1,4.2,4.3,4.4) and table (4.1).
Figure 5.1: GC result for sample Lc.
10 20 30 40 50 60 70 80
Minutes
-37
0
50
100
150
200
mVolts
nC
8 nC
9
nC
10
nC
11 nC
12
nC
13
nC
14
nC
15
nC
16
nC
17
pr
nC
18
py
nC
19
nC
20
nC
21
nC
22
nC
23
nC
24
nC
25
nC
26
nC
27
nC
28
nC
29
nC
30
nC
31
nC
32
nC
33
nC
34
nC
35
nC
36
nC
37
nC
38
nC
39
nC
40
nC
41
nC
42
nC
43
nC
44
nC
45
c:\star\data\mawya st 2013\lc.run
52
Figure 4.2: GC result for sample L1.
Figure 4.3: GC result for sample L2.
10 20 30 40 50 60 70 80
Minutes
-43
0
50
100
150
200
250
mVolts
nC
8
nC
9
nC
10
nC
11
nC
12
nC
13
nC
14
nC
15
nC
16
nC
17
pr
nC
18
py
nC
19
nC
20
nC
21
nC
22
nC
23
nC
24
nC
25
nC
26
nC
27
nC
28
nC
29
nC
30
nC
31
nC
32
nC
33
nC
34
nC
35
nC
36
nC
37
nC
38
nC
39
nC
40
nC
41
nC
42
nC
43
nC
44
c:\star\data\mawya st 2013\l1.run
10 20 30 40 50 60 70
Minutes
-9
0
25
50
75
100
mVolts
nC
8
nC
9
nC
10
nC
11
nC
12
nC
13
nC
14
nC
15
nC
16
nC
17
pr
nC
18
py
nC
19
nC
20
nC
21
nC
22
nC
23
nC
24
nC
25
nC
26
nC
27
nC
28
nC
29
nC
30
nC
31
nC
32
nC
33
nC
34
nC
35
nC
36
nC
37
nC
38
nC
39
nC
40
nC
41
c:\star\data\mawya st 2013\al2.run
53
Figure 4.4: GC result for sample L3.
10 20 30 40 50 60 70
Minutes
-42
0
50
100
150
200
250
mVolts
nC
8
nC
9
nC
10
nC
11
nC
12
nC
13
nC
14
nC
15
nC
16
nC
17
pr
nC
18
py
nC
19 nC
20
nC
21
nC
22
nC
23
nC
24
nC
25
nC
26
nC
27
nC
28
nC
29
nC
30
nC
31
nC
32
nC
33
nC
34
nC
35
nC
36
nC
37
nC
38
nC
39
nC
40
nC
41
c:\star\data\mawya st 2013\l3.run

54
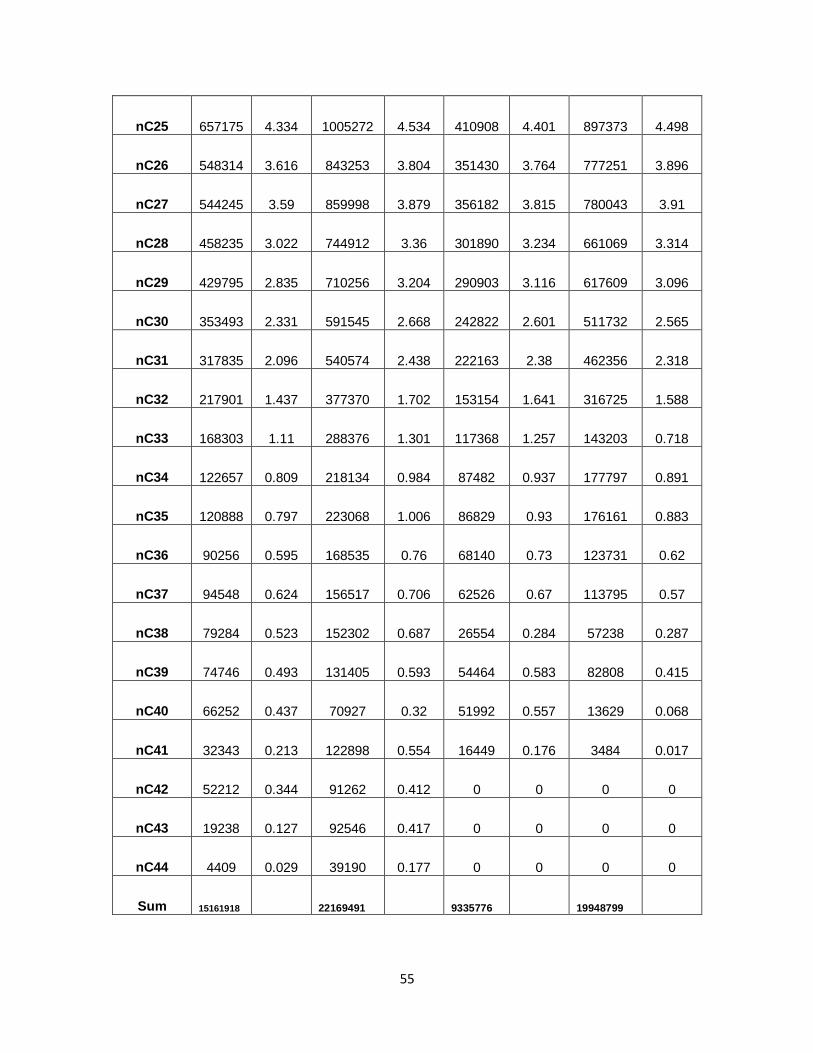
Table (4.1) : GC report for crude L.
Sample Name Lc L1 L2 L3
Area Area% Area
Area% Area
Area% Area
Area%
nC8 120521 0.795 147363 0.665 32538 0.349 78184 0.392
nC9 326130 2.151 440537 1.987 144212 1.545 275796 1.383
nC10 442091 2.916 577059 2.603 205803 2.204 198498 0.995
nC11 665445 4.389 1040078 4.691 479821 5.14 1111408 5.571
nC12 559019 3.687 797190 3.596 335966 3.599 705135 3.535
nC13 624162 4.117 885398 3.994 378195 4.051 838648 4.204
nC14 697859 4.603 941658 4.248 437157 4.683 939618 4.71
nC15 685006 4.518 876374 3.953 431617 4.623 895471 4.489
nC16 726292 4.79 993410 4.481 439828 4.711 966582 4.845
nC17 757916 4.999 1002588 4.522 470360 5.038 1048666 5.257
Pr 256044 1.689 319588 1.442 155229 1.663 335017 1.679
nC18 689395 4.547 919267 4.147 410954 4.402 935311 4.689
Py 141397 0.933 179155 0.808 81834 0.877 186819 0.936
nC19 737674 4.865 991898 4.474 447624 4.795 987627 4.951
nC20 727631 4.799 1004319 4.53 427943 4.584 1006559 5.046
nC21 697487 4.6 969165 4.372 419914 4.498 951582 4.77
nC22 647856 4.273 910044 4.105 394421 4.225 883327 4.428
nC23 622468 4.105 900086 4.06 379474 4.065 871542 4.369
nC24 585396 3.861 845974 3.816 361630 3.874 817005 4.096
55
nC25 657175 4.334 1005272 4.534 410908 4.401 897373 4.498
nC26 548314 3.616 843253 3.804 351430 3.764 777251 3.896
nC27 544245 3.59 859998 3.879 356182 3.815 780043 3.91
nC28 458235 3.022 744912 3.36 301890 3.234 661069 3.314
nC29 429795 2.835 710256 3.204 290903 3.116 617609 3.096
nC30 353493 2.331 591545 2.668 242822 2.601 511732 2.565
nC31 317835 2.096 540574 2.438 222163 2.38 462356 2.318
nC32 217901 1.437 377370 1.702 153154 1.641 316725 1.588
nC33 168303 1.11 288376 1.301 117368 1.257 143203 0.718
nC34 122657 0.809 218134 0.984 87482 0.937 177797 0.891
nC35 120888 0.797 223068 1.006 86829 0.93 176161 0.883
nC36 90256 0.595 168535 0.76 68140 0.73 123731 0.62
nC37 94548 0.624 156517 0.706 62526 0.67 113795 0.57
nC38 79284 0.523 152302 0.687 26554 0.284 57238 0.287
nC39 74746 0.493 131405 0.593 54464 0.583 82808 0.415
nC40 66252 0.437 70927 0.32 51992 0.557 13629 0.068
nC41 32343 0.213 122898 0.554 16449 0.176 3484 0.017
nC42 52212 0.344 91262 0.412 0 0 0 0
nC43 19238 0.127 92546 0.417 0 0 0 0
nC44 4409 0.029 39190 0.177 0 0 0 0
Sum 15161918 22169491 9335776 19948799

56
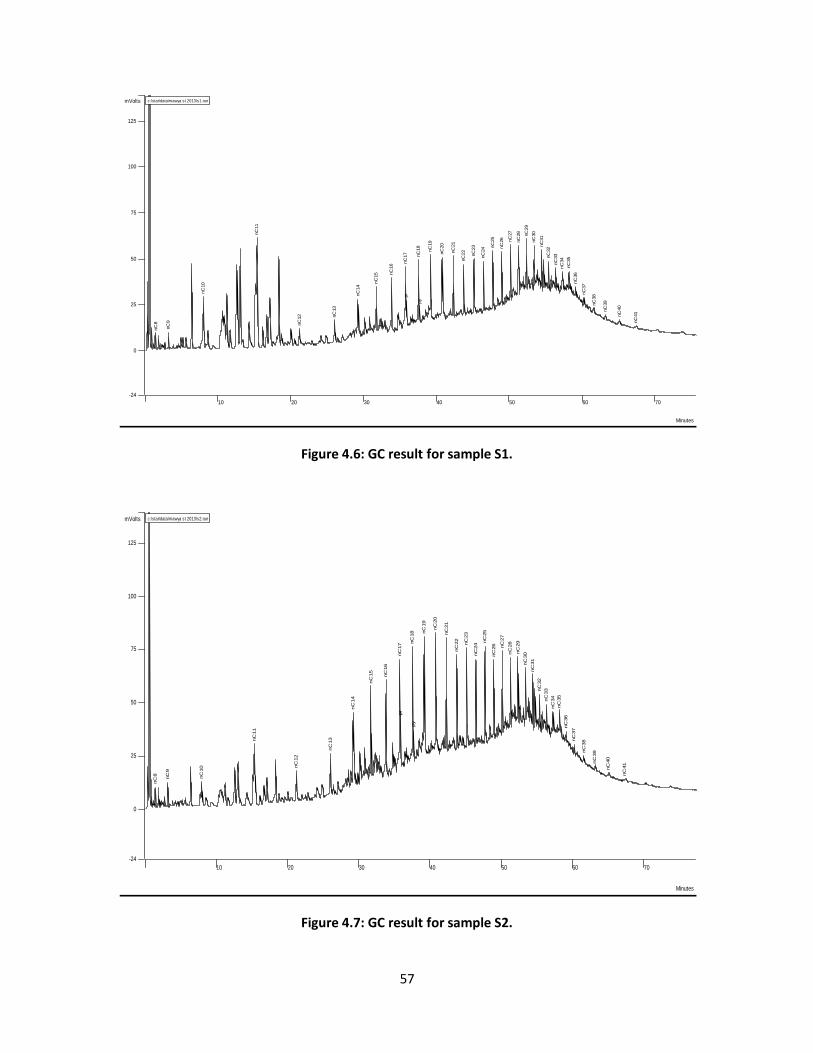
Crude S:
The GC result for the four samples (Sc, S1, S2, S3) is shown in figure
(4.5,4.6,4.7,4.8) and table (4.2).
Figure 4.5: GC result for sample Sc.
10 20 30 40 50 60
Minutes
-18
0
25
50
75
100
mVolts
nC
8 nC
9
nC
10
nC
11
nC
12
nC
13
nC
14
nC
15 nC
16
nC
17
pr
nC
18
py
nC
19
nC
20
nC
21
nC
22
nC
23
nC
24
nC
25
nC
26 nC
27
nC
28
nC
29
nC
30
nC
31
nC
32
nC
33
nC
34
nC
35
nC
36
nC
37
nC
38
nC
39
nC
40
nC
41
c:\star\data\mawya st 2013\sc.run
57
Figure 4.6: GC result for sample S1.
Figure 4.7: GC result for sample S2.
10 20 30 40 50 60 70
Minutes
-24
0
25
50
75
100
125
mVolts
nC
8
nC
9
nC
10
nC
11
nC
12 nC
13
nC
14
nC
15 nC
16
nC
17
pr
nC
18
py
nC
19
nC
20
nC
21
nC
22
nC
23
nC
24 n
C25
nC
26 nC
27
nC
28
nC
29
nC
30
nC
31
nC
32
nC
33
nC
34
nC
35
nC
36
nC
37
nC
38
nC
39
nC
40
nC
41
c:\star\data\mawya st 2013\s1.run
10 20 30 40 50 60 70
Minutes
-24
0
25
50
75
100
125
mVolts
nC
8
nC
9
nC
10
nC
11
nC
12
nC
13
nC
14
nC
15
nC
16
nC
17
pr
nC
18
py
nC
19
nC
20
nC
21
nC
22
nC
23
nC
24
nC
25
nC
26 nC
27
nC
28
nC
29
nC
30
nC
31
nC
32
nC
33
nC
34
nC
35
nC
36
nC
37
nC
38
nC
39
nC
40
nC
41
c:\star\data\mawya st 2013\s2.run

58
Figure 4.8: GC result for sample S3.
10 20 30 40 50 60 70
Minutes
-18
0
25
50
75
100
125
mVolts
nC
9
nC
10
nC
11
nC
12
nC
13
nC
14
nC
15
nC
16
nC
17
pr
nC
18
py
nC
19
nC
20
nC
21
nC
22 nC
23
nC
24 n
C25
nC
26 n
C27
nC
28
nC
29
nC
30
nC
31
nC
32
nC
33
nC
34
nC
35
nC
36
nC
37
nC
38
nC
39
nC
40
nC
41
c:\star\data\mawya st 2013\s3.run

59
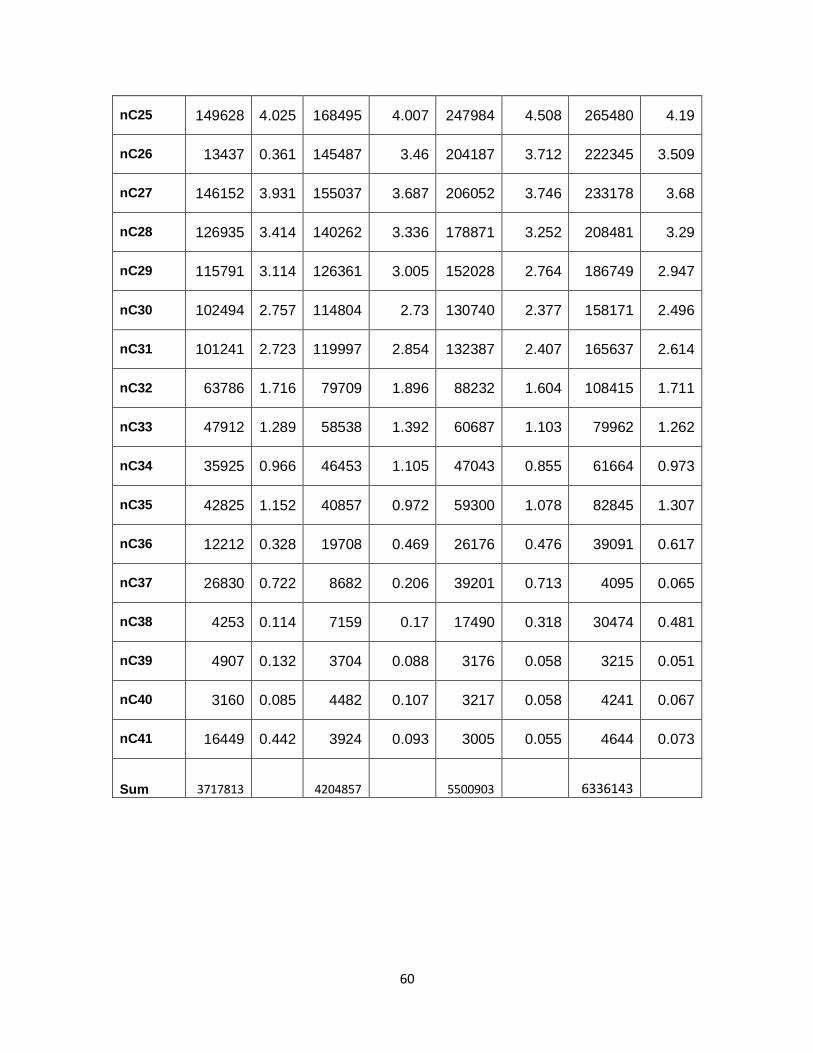
Table 4.2: GC report for crude S.
Sample Name Sc S1 S2 S3
Area
Area%
Area Area% Area Area% Area Area%
nC8 3502 0.094 8545 0.203 10426 0.19 0 0
nC9 15996 0.43 42554 1.012 51661 0.939 32538 0.514
nC10 194097 5.221 273093 6.495 109029 1.982 290366 4.583
nC11 506120 13.61 647717 15.4 371045 6.745 723355 11.42
nC12 64650 1.739 82162 1.954 129365 2.352 122108 1.927
nC13 94087 2.531 104744 2.491 158468 2.881 160539 2.534
nC14 157009 4.223 157523 3.746 260155 4.729 267772 4.226
nC15 141100 3.795 133491 3.175 230105 4.183 234534 3.702
nC16 164297 4.419 159053 3.783 273226 4.967 271189 4.28
nC17 171859 4.623 172822 4.11 294864 5.36 295900 4.67
pr 74778 2.011 70685 1.681 119180 2.167 119529 1.886
nC18 162811 4.379 150989 3.591 265537 4.827 275004 4.34
py 41741 1.123 39694 0.944 74765 1.359 77578 1.224
nC19 139695 3.757 143978 3.424 258668 4.702 255510 4.033
nC20 191457 5.15 181499 4.316 328676 5.975 345592 5.454
nC21 163752 4.405 163767 3.895 279906 5.088 285610 4.508
nC22 143785 3.867 155873 3.707 255272 4.641 263953 4.166
nC23 137730 3.705 135682 3.227 218167 3.966 234727 3.705
nC24 135410 3.642 137327 3.266 212612 3.865 221652 3.498
60
nC25 149628 4.025 168495 4.007 247984 4.508 265480 4.19
nC26 13437 0.361 145487 3.46 204187 3.712 222345 3.509
nC27 146152 3.931 155037 3.687 206052 3.746 233178 3.68
nC28 126935 3.414 140262 3.336 178871 3.252 208481 3.29
nC29 115791 3.114 126361 3.005 152028 2.764 186749 2.947
nC30 102494 2.757 114804 2.73 130740 2.377 158171 2.496
nC31 101241 2.723 119997 2.854 132387 2.407 165637 2.614
nC32 63786 1.716 79709 1.896 88232 1.604 108415 1.711
nC33 47912 1.289 58538 1.392 60687 1.103 79962 1.262
nC34 35925 0.966 46453 1.105 47043 0.855 61664 0.973
nC35 42825 1.152 40857 0.972 59300 1.078 82845 1.307
nC36 12212 0.328 19708 0.469 26176 0.476 39091 0.617
nC37 26830 0.722 8682 0.206 39201 0.713 4095 0.065
nC38 4253 0.114 7159 0.17 17490 0.318 30474 0.481
nC39 4907 0.132 3704 0.088 3176 0.058 3215 0.051
nC40 3160 0.085 4482 0.107 3217 0.058 4241 0.067
nC41 16449 0.442 3924 0.093 3005 0.055 4644 0.073
Sum 3717813 4204857 5500903 6336143

61
Chapter Five:
DISCUSSION
5.1- The Case Study: (1)- Reservoirs X and Y have a temperature value (83, 92 °C respectively) higher
than the upper limit for the general screening criteria (80 °C). With a temperature
gradient of approximately 3 °C/ 100 m, Sudanese reservoirs temperature is high.
This present a great challenge to find strains able to survive in this
temperature range.
A successful MEOR was carried in Vyngapour, Russia. With a temperature of
94 °C, the treatment resulted in 2268.6 tons oil increment. This suggested the
temperature limit for MEOR is still uncertain [10]. The used bacteria wasn’t
recorded.
(2)- For reservoir Y the viscosity was 10 cp, while the general criteria stated a
viscosity more than 20 cp.
This means the MEOR won’t be very efficient on low viscosity values, since
most of MEOR mechanisms works on viscosity of oil.
5.2- The Experiments:
The First Experiment: The possible reasons why the Bacillus strain didn’t grow might be:
(1)- Not suitable conditions (respiration, pH ..etc) or errors in mixing the salt
mineral media.
(2)- The quantity of oil was too much and toxicated the media.
(3)- The used strain was already dead.
Playing the conditions, use of UV rays and genetic engineering might yield
different results.
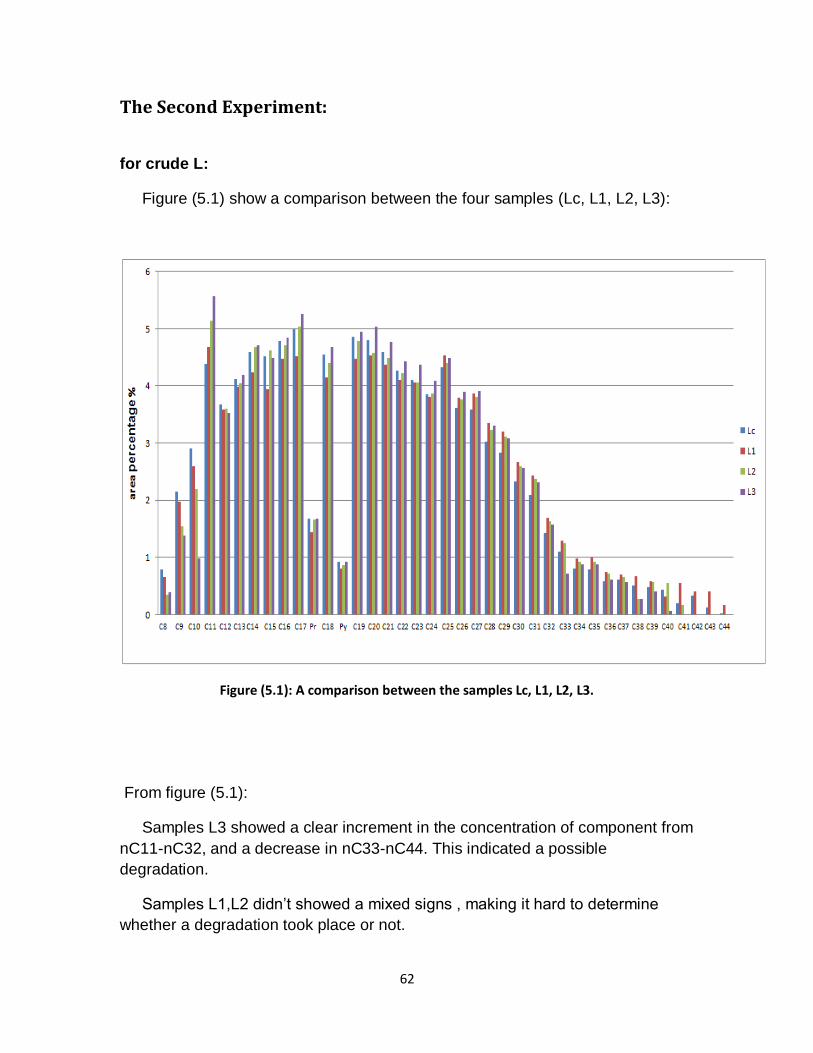
62
The Second Experiment:
for crude L:
Figure (5.1) show a comparison between the four samples (Lc, L1, L2, L3):
Figure (5.1): A comparison between the samples Lc, L1, L2, L3.
From figure (5.1):
Samples L3 showed a clear increment in the concentration of component from
nC11-nC32, and a decrease in nC33-nC44. This indicated a possible
degradation.
Samples L1,L2 didn’t showed a mixed signs , making it hard to determine
whether a degradation took place or not.
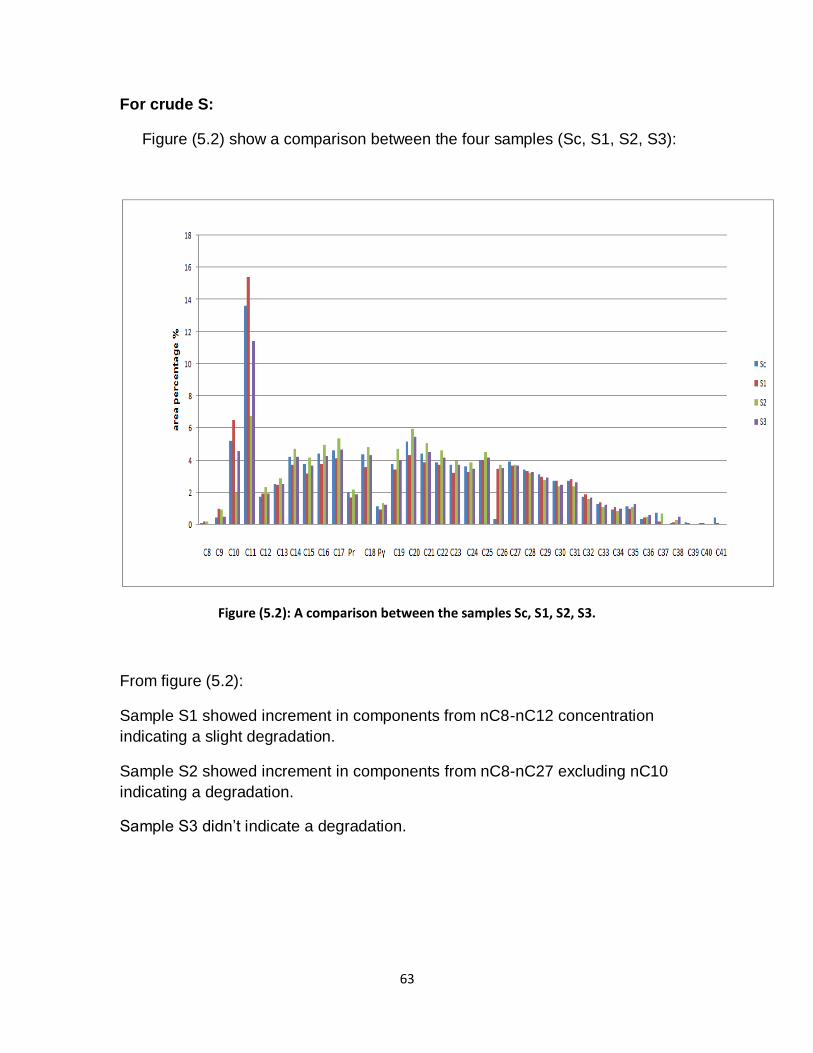
63
For crude S:
Figure (5.2) show a comparison between the four samples (Sc, S1, S2, S3):
Figure (5.2): A comparison between the samples Sc, S1, S2, S3.
From figure (5.2):
Sample S1 showed increment in components from nC8-nC12 concentration
indicating a slight degradation.
Sample S2 showed increment in components from nC8-nC27 excluding nC10
indicating a degradation.
Sample S3 didn’t indicate a degradation.
64
Generally the degradation wasn’t very clear. This might be due to the short
experiment time (24 hours).
The experiments showed a contrasting results, that is:
1- In crude L the degradation most obvious in L3, that is at temperature
40°C.
2- In crude S the degradation was most obvious in S2, that is at temperature
30 °C.
This lead to the conclusion that the bacteria act differently on the different crude
types.
The fact that the Psuedomonas fed on the crudes, it imply the possibility of it’s
use a Biomass producing bacteria.

65
Chapter 6:
CONCLUSION
Microbial enhanced oil recovery showed a lot of potentials as a cheap EOR
technique. It clearly needs more work to overcome it’s constraints, but the future
seems bright.
Applying MEOR in sudan is possible, but it needs a lot of work. Bacteria
strains which can work in sudan conditions must be researched.
The Psuedomonas strain proved it’s ability to feed on crude oil and degrade
the crude experimentally. With more researches it might be a powerful candidate
for MEOR in sudan.
66
Chapter Seven:
RECOMMENDATIONS:
For a successful MEOR project the following must be considered:
Reservoir evaluation:
The microbes must be able to thrive and grow under the reservoir conditions.
They must also produce the necessary products that will enhance oil recovery.
The screening criteria of the specific reservoir must be satisfied.
This evaluation of course should consider the basic EOR evaluations
including:
1- Preliminary estimation of oil recovery and potential economic return.
2- Analysis of reservoir data.
3- Assessment of environmental impacts.
Laboratory evaluation:
Where the separated microbes are evaluated, whether they were separated
from a reservoir, around sites of petroleum contamination or exogenous source.
Microbiologists can adapt these microbes by growing them under a series of
conditional and nutritional variations in order to enhance their tolerance.
Another thing to be evaluated is the pathogen-icity of the microbe, whether by
exposing a test mice or complete biochemical characterization.
Compatibility testing:
Compatibility of microbial formulations, reservoir fluids and injection fluids is
crucial in the success of any MEOR projects.
They should be tested at the reservoir conditions, some of these test are:
1- Testing of microbial formulation at several decreasing concentration of
nutrients. The nutrients will be diluted by formation and/or injection water.
2- Compatibility testing with reservoir brine and crude oil at the reservoir
temperature.
3- Compatibility testing with the reservoir rock.
4- Stability testing to determine microbial survival.
67
Contingency plan:
Handling procedures to avoid contamination of water source or human exposure are
needed.
A biocide should be available in case of accidental spill or stimulation of undesirable
organism in the reservoir.
The above mentioned plus the cooperation between: microbiologists, reservoir
engineers, geologists, economists will be the best way to define the feasibility of an
MEOR project.

68
Chapter Eight:
FUTURE WORK
A perfection of the experiments carried in this project the following id needed:
1- Carry the experiment on a longer various time periods.
2- Test the bacteria under various condition including the reservoir conditions
(specially the reservoir temperature)
3- Measuring the viscosity and API before and after the experiments to give
more indications on the degradation.
Use of different bacteria strains.
Use of bacteria isolated from reservoirs.
This project focused on biodegradation, researching the other mechanisms is
needed.
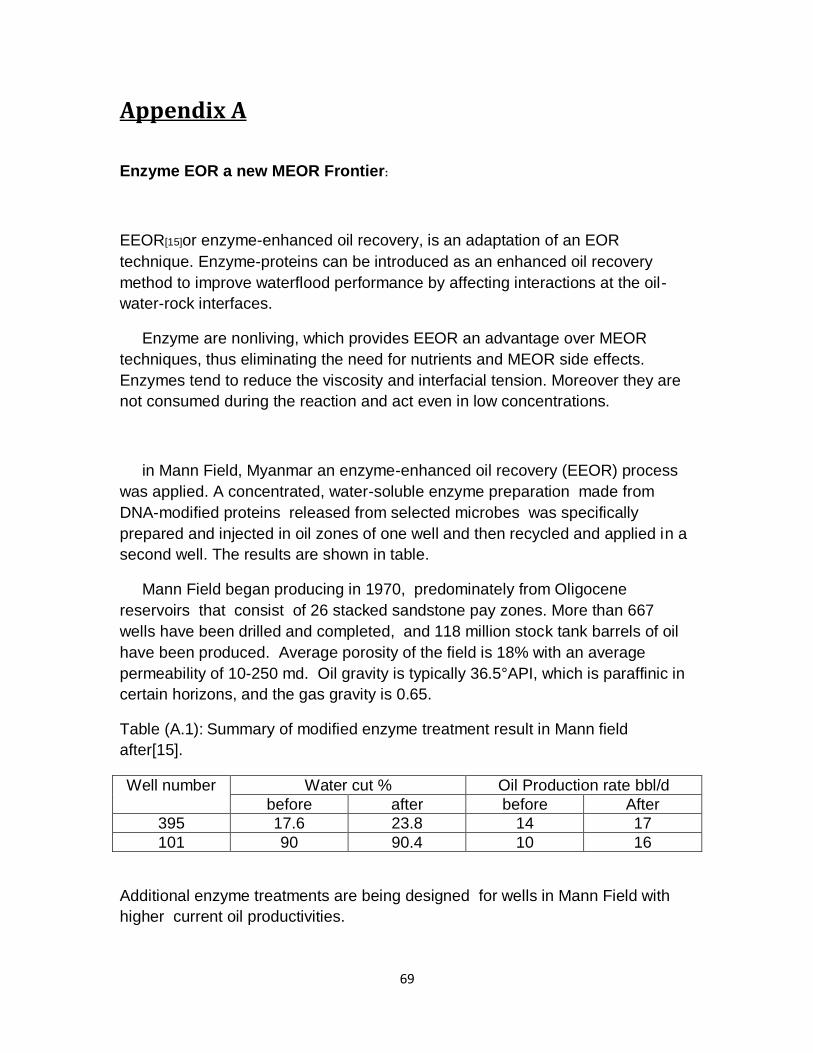
69
Appendix A
Enzyme EOR a new MEOR Frontier:
EEOR[15]or enzyme-enhanced oil recovery, is an adaptation of an EOR
technique. Enzyme-proteins can be introduced as an enhanced oil recovery
method to improve waterflood performance by affecting interactions at the oil-
water-rock interfaces.
Enzyme are nonliving, which provides EEOR an advantage over MEOR
techniques, thus eliminating the need for nutrients and MEOR side effects.
Enzymes tend to reduce the viscosity and interfacial tension. Moreover they are
not consumed during the reaction and act even in low concentrations.
in Mann Field, Myanmar an enzyme-enhanced oil recovery (EEOR) process
was applied. A concentrated, water-soluble enzyme preparation made from
DNA-modified proteins released from selected microbes was specifically
prepared and injected in oil zones of one well and then recycled and applied in a
second well. The results are shown in table.
Mann Field began producing in 1970, predominately from Oligocene
reservoirs that consist of 26 stacked sandstone pay zones. More than 667
wells have been drilled and completed, and 118 million stock tank barrels of oil
have been produced. Average porosity of the field is 18% with an average
permeability of 10-250 md. Oil gravity is typically 36.5°API, which is paraffinic in
certain horizons, and the gas gravity is 0.65.
Table (A.1): Summary of modified enzyme treatment result in Mann field
after[15].
Well number Water cut % Oil Production rate bbl/d
before after before After
395 17.6 23.8 14 17
101 90 90.4 10 16
Additional enzyme treatments are being designed for wells in Mann Field with
higher current oil productivities.

70
Appendix B
Bacteria that are used in MEOR and their products (Bryant and Burchfield, 1989).
Table (B.1): Bacteria used in MEOR ,the respiration and bio-products after
Bryant and Burchfield- 1989.
Family Respiration Type
Products
Clostridium Anaerobic Gases, Acids, Alcohols And Surfactants
Bacillus Facultative
Acids, biomass, polymer And Surfactants
Pseudomonas Aerobic Surfactants And Polymer Can Degrade Hydrocarbons
Xanthhomonas Aerobic
Polymers
Leuconostoc Facultative
Polymers
Desulfovibrio Anaerobic Gases And Acids
Arthrobacter Facultative
Surfactants And Alcohols
Corynebacterium Aerobic
Surfactants
Enterobacter Facultative
Gases And Acids
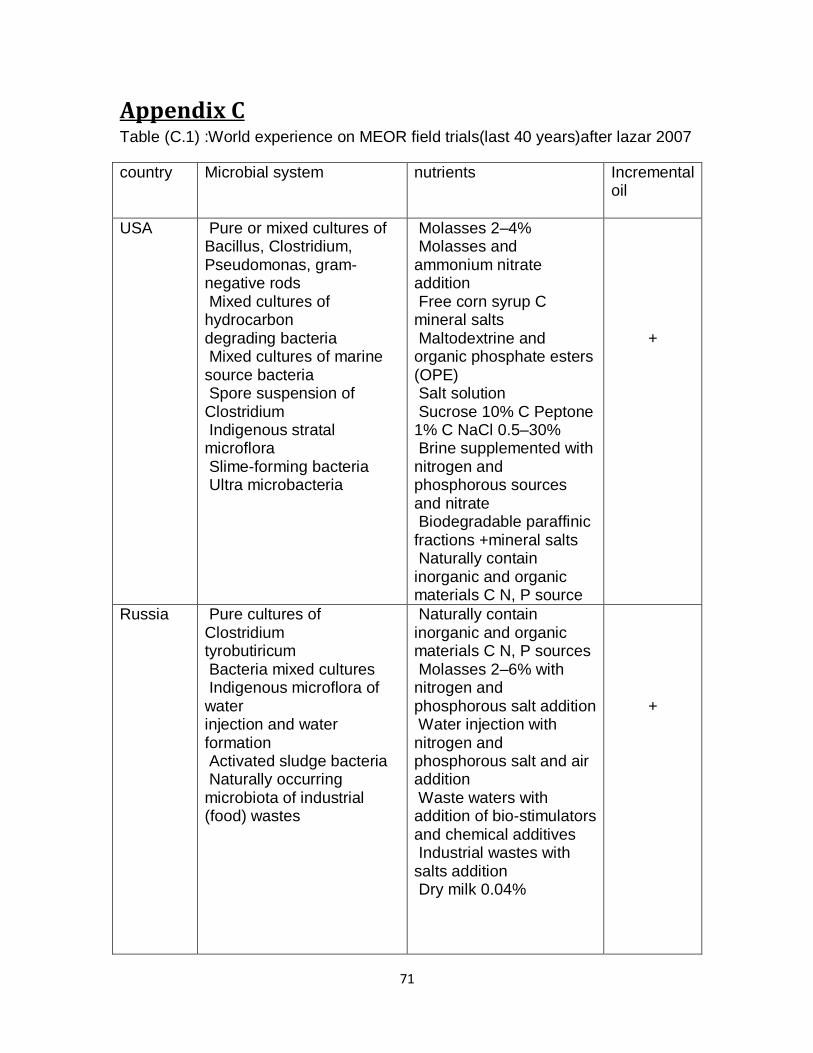
71
Appendix C Table (C.1) :World experience on MEOR field trials(last 40 years)after lazar 2007
country Microbial system
nutrients Incremental oil
USA Pure or mixed cultures of Bacillus, Clostridium, Pseudomonas, gram-negative rods Mixed cultures of hydrocarbon degrading bacteria Mixed cultures of marine source bacteria Spore suspension of Clostridium Indigenous stratal microflora Slime-forming bacteria Ultra microbacteria
Molasses 2–4% Molasses and ammonium nitrate addition Free corn syrup C mineral salts Maltodextrine and organic phosphate esters (OPE) Salt solution Sucrose 10% C Peptone 1% C NaCl 0.5–30% Brine supplemented with nitrogen and phosphorous sources and nitrate Biodegradable paraffinic fractions +mineral salts Naturally contain inorganic and organic materials C N, P source
+
Russia Pure cultures of Clostridium tyrobutiricum Bacteria mixed cultures Indigenous microflora of water injection and water formation Activated sludge bacteria Naturally occurring microbiota of industrial (food) wastes
Naturally contain inorganic and organic materials C N, P sources Molasses 2–6% with nitrogen and phosphorous salt addition Water injection with nitrogen and phosphorous salt and air addition Waste waters with addition of bio-stimulators and chemical additives Industrial wastes with salts addition Dry milk 0.04%
+

72
China Mixed enriched bacterial cultures of Bacillus, Pseudomonas, Eurobacterium, Fusobacterium, Bacteroides Slime-forming bacteria: Xanthomonas campestris, Brevibacterium viscogenes, Corynebacterium gumiform Microbial products as biopolymers, biosurfactants
Molasses 4–6% Molasses 5% C Residue sugar 4% C Crude oil 5% Xanthan 3% in waterflooding.
+
Australia Ultra microbacteria with surface active properties
Formulate suitable base media
+
Bulgaria Indigenous oil-oxidizing bacteria from water injection and water formation
Water containing air C ammonium and phosphate ions Molasses 2%
+
Canada Pure culture of Leuconostoc Mesenteroides
Dry sucrose C sugar beet molasses dissolved in water Molasses
-
Former Czechoslovakia
Hydrocarbon oxidizing bacteria (predominant Pseudomonas sp.) Sulfate-reducing bacteria
Molasses +
England Naturally occurring anaerobic strain, high generator of acids Special starved bacteria, good producers of exopolymers
Soluble carbohydrate sources Suitable growth media (type E and G).
/
Former East Germany
Mixed cultures of thermophilic: Bacillus and Clostridium Indigenous brine microflora
Molasses 2–4% with addition of nitrogen and phosphorous sources
+
Hungary Mixed sewage-sludge bacteria cultures (predominant: Clostridium, Pseudomonas, Desulfovibrio)
Molasses 2–4% with addition of sugar and nitrogen and phosphorous sources
+
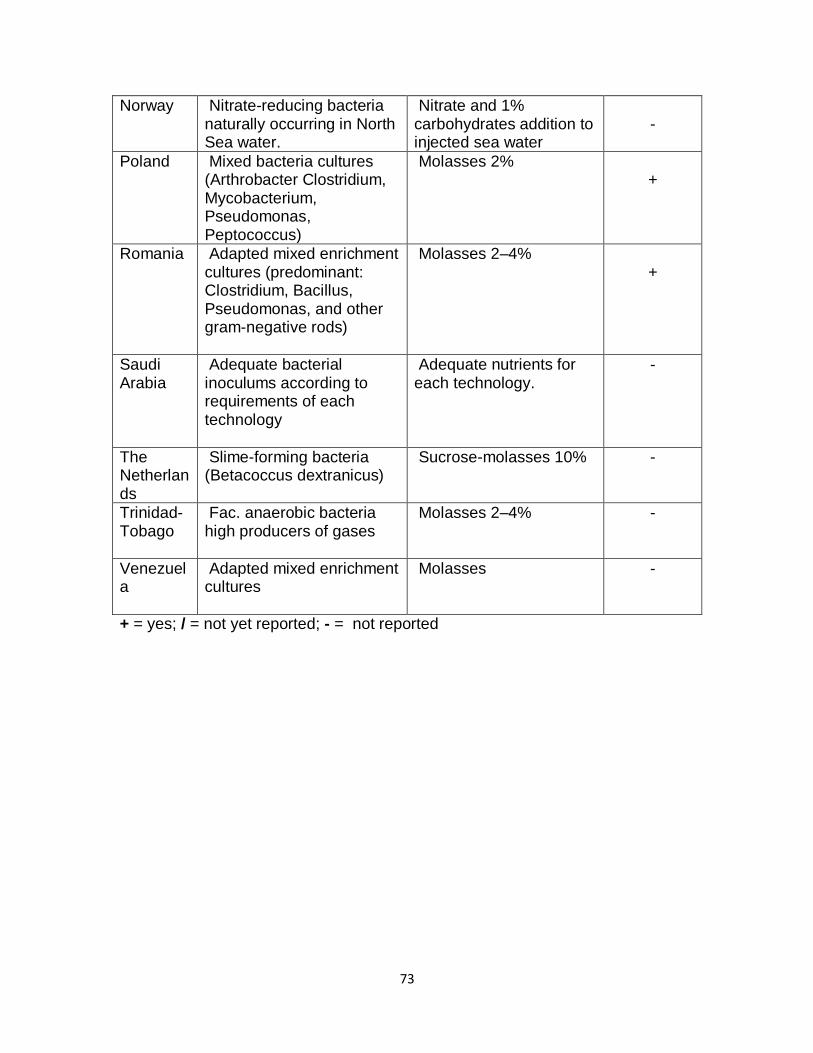
73
Norway Nitrate-reducing bacteria naturally occurring in North Sea water.
Nitrate and 1% carbohydrates addition to injected sea water
-
Poland Mixed bacteria cultures (Arthrobacter Clostridium, Mycobacterium, Pseudomonas, Peptococcus)
Molasses 2% +
Romania Adapted mixed enrichment cultures (predominant: Clostridium, Bacillus, Pseudomonas, and other gram-negative rods)
Molasses 2–4% +
Saudi Arabia
Adequate bacterial inoculums according to requirements of each technology
Adequate nutrients for each technology.
-
The Netherlands
Slime-forming bacteria (Betacoccus dextranicus)
Sucrose-molasses 10% -
Trinidad- Tobago
Fac. anaerobic bacteria high producers of gases
Molasses 2–4% -
Venezuela
Adapted mixed enrichment cultures
Molasses -
+ = yes; / = not yet reported; - = not reported

74
REFERENCES
[1]- Enhanced Oil Recovery: Don W.Green, G.Paul Willhite – 1998.
[2]- The Subsurface Environment: Erle C. Donaldson, Roy M. Knapp, T.F. Yen
And George V. Chilingarian.
[3]- Lazar I. Devel. Petr. Sci. 1991, 33:365-386.
[4]- Rodrigues LR, Teixeira JA, Oliveira R. Biochem Eng J.2006, 32:135-142.
[5]- Microbial biotechnology for enhancing oil recovery: Current developments
and future prospects: H. Al-Sulaimani, S. Joshi, Y. Al-Wahaibi, S. Al-Bahry, A.
Elshafie, A. Al-Bemani– 2011.
[6]- Microbial Enhanced Oil Recovery: Entering The Log Phase- Rebecca S.
Bryant.
[7]- A Commercial Microbial Enhanced Oil Recovery Process: Statistical
Evaluation Of A Multi-Project Database- J. T. Portwood - 1995.
[8]- Microbial Enhanced Oil Recovery (MEOR): I.Lazar, I. G. Petrisor and T. F.
Yenv- 2007.
[9]- Microbial Enhanced Oil Recovery Technologies: A Review Of The Past,
Present And The Future. Saikrishna Maudgalya, Roy M.Knapp And Michael
J.Mcinerney- 2007.
75
[10]- Oil Field Experiments Of Microbial Improved Oil Recovery In Vyngapour,
West Siberia. Russia : V. P. Murygina, A. A. Mats, M. U. Arinbasarov, Z. Z.
Salamov And A. B. Cherkasov- 1995
[11]- Microbial Control Of Hydrogen Sulfide Production: Anne D. Montgomery, K.
Bhupathiraju, Neil Wofford And Michael J. McInerney.
[12]- The Potential For In-Situ Microbial Applications: Gary E. Jenneman.
[13]- Wikipedia: www.wikipedia.com.
[14]- Potential Health Hazard Of Bacteria To Be Used In Microbial Enhanced Oil
Recovery: E. A. Grula, Hugh H. Russell And Mary M. Grula.
[15]- New Frontiers In EOR Methodologies By Application Of Enzymes: SPE
154690- 2012.
[16]- Geo-biology And Microbiologically Enhanced Oil Recovery: B. Bubella.
Copyright © 2022 FDOKUMEN