Managing soil microorganisms to improve productivity of agro-ecosystems

1
Development of Microorganisms with Improved Transport and
Biosurfactant Activity for Enhanced Oil Recovery
Final Report
Report Start Date: June 1, 2002 Report End Date: August 31, 2005
M. J. McInerney, K.E. Duncan, N. Youssef, T. Fincher, S. K. Maudgalya, M. J.
Folmsbee, R. Knapp, Randy R. Simpson, N. Ravi, and D. Nagle
Date of Report: August 15, 2005 DE-FC-02NT15321 R 02
Department of Botany and Microbiology and Department of Petroleum
Engineering University of Oklahoma
770 Van Vleet Oval Norman, OK 73019-0245

2
Disclaimer
This report was prepared as an account of work sponsored by an agency of
the United States Government. Neither the United States Government not any agency thereof, nor any of their employees, makes any warranty, expressed or implied, or assumes any legal liability or responsibility for the accuracy, completeness, or usefulness of any information, apparatus, product or process disclosed, or represents that its use would not infringe privately owned rights. Reference herein to any specific commercial product, process or service by trade name, trademark, manufacturer, or otherwise does not necessarily constitute or imply its endorsement, recommendation, or favoring by the United States Government or any agency thereof. The views and opinions of authors expressed herein do not necessarily state or reflect those of the United States Government or any agency thereof.

3
Table of Contents
Project Abstract....................................................................................................... 6 Executive Summary ................................................................................................ 8
Factors Affecting Oil Recovery ........................................................................ 14 Biosurfactant-Mediated Oil Recovery .............................................................. 14 Relationship to Program Goals and Objectives ................................................ 15 Improvements over Existing Technologies ...................................................... 15 Anticipated Benefits.......................................................................................... 16
Chapter 1. Anaerobic growth of and biosurfactant production by Bacillus mojavensis strain JF-2....................................................................................................... 19
1.1 Abstract. ...................................................................................................... 19 1.2 Introduction................................................................................................. 19 1.3. Methods and Materials............................................................................... 20 1.4. Results........................................................................................................ 21 1.5. Discussion. ................................................................................................. 38 1.6. Conclusion. ................................................................................................ 40 1.7. References.................................................................................................. 41
Chapter 2. Screening, selection, and genetic manipulation of biosurfactant-producing Bacillus strains................................................................................................. 42
2.1 Abstract ....................................................................................................... 42 2.2 Introduction................................................................................................. 42 2.3 Materials and methods ................................................................................ 43 2.4 Results......................................................................................................... 48 2.5. Discussion .................................................................................................. 66 2.6. References.................................................................................................. 67
Chapter 3. Importance of the 3-hydroxy fatty acid composition of lipopeptides for biosurfactant activity......................................................................................................... 69
3.1. Abstract ...................................................................................................... 69 3.2. Introduction................................................................................................ 69 3.3. Materials and methods ............................................................................... 70 3.4. Results........................................................................................................ 72 3.5. Discussion .................................................................................................. 79 3.6. References.................................................................................................. 81
Chapter 4. Efficacy of Biosurfactant Mixtures ................................................... 85 4.1. Abstract ...................................................................................................... 85 4.2. Introduction................................................................................................ 85 4.3. Materials and methods ............................................................................... 86 4.4. Results........................................................................................................ 88 4.5. Discussion .................................................................................................. 98 4.6. References.................................................................................................. 99
Chapter 5. Microbial Strains with Improved Transport Ability through Model Porous Systems. .............................................................................................................. 100
5.1 Abstract ..................................................................................................... 100 5.2 Introduction............................................................................................... 100 5.3. Materials and Methods............................................................................. 102

4
5.4 Results....................................................................................................... 104 5.5. Discussion ................................................................................................ 110 5.6. References................................................................................................ 112
Chapter 6. Tertiary oil recovery by the JF-2 biosurfactant from Berea sandstone cores and the development of a mathematical model relating oil-water interfacial tension to the concentration of the JF-2 biosurfactant................................................................. 115
6.1. Abstract .................................................................................................... 115 6.2. Introduction.............................................................................................. 115 6.3. Materials and Methods............................................................................. 116 6.4. Results...................................................................................................... 119 6.5. Discussion ................................................................................................ 130 6.6. References................................................................................................ 130
Chapter 7. Subsurface hydrocarbon mobilization using biosurfactants requires viscosity control and a low molecular weight alcohol.................................................... 132
7.1. Abstract. ................................................................................................... 132 7.2. Introduction.............................................................................................. 132 7.3. Experimental methods. ............................................................................ 133 7.4. Results...................................................................................................... 136 7.5. Discussion. ............................................................................................... 140 7.6. References................................................................................................ 141
Chapter 8. Interfacial Tension Measurements .................................................... 146 8.1 Abstract ..................................................................................................... 146 8.2. Introduction.............................................................................................. 146 8.3 Methods..................................................................................................... 146 8.4. Results...................................................................................................... 147 8.5. Discussion ................................................................................................ 150 8.6. Conclusions.............................................................................................. 151 8.7 List of references....................................................................................... 151
Chapter 9. In situ growth and biosurfactant production in a limestone formation: Results from a recent field test........................................................................................ 152
Abstract ........................................................................................................... 152 Introduction..................................................................................................... 152 Materials and methods .................................................................................... 153
Preparation of the inoculum........................................................................ 153 Pumping schedule ....................................................................................... 153 Sampling (# and volume of samples).......................................................... 154 Chemical analysis ....................................................................................... 155 Detection of biosurfactant production ........................................................ 156 Sugar analysis ............................................................................................. 156 Fatty acids/ alcohol detection...................................................................... 156 Microbiological analysis............................................................................. 157 Molecular Analysis ..................................................................................... 157
Results............................................................................................................. 158 Chemical analysis ....................................................................................... 158 Evidence for microbial metabolism............................................................ 159 Evidence for biosurfactant production........................................................ 164

5
Evidence for Bacillus growth...................................................................... 166 Carbon recovery.......................................................................................... 168 Molecular Analysis ..................................................................................... 168
Discussion ....................................................................................................... 171 References....................................................................................................... 172
Overall Conclusions............................................................................................ 174 Significant accomplishments .......................................................................... 178

6
Project Abstract The project had three objectives: (1) to develop microbial strains with improved
biosurfactant properties that use cost-effective nutrients, (2) to obtain biosurfactant strains with improved transport properties through sandstones, and (3) to determine the empirical relationship between surfactant concentration and interfacial tension and whether in situ reactions kinetics and biosurfactant concentration meets appropriate engineering design criteria. Here, we show that a lipopeptide biosurfactant produced by Bacillus mojavensis strain JF-2 mobilized substantial amounts of residual hydrocarbon from sand-packed columns and Berea sandstone cores when a viscosifying agent and a low molecular weight alcohol were present. The amount of residual hydrocarbon mobilized depended on the biosurfactant concentration. Tertiary oil recovery experiments showed that 10 to 40 mg/l of JF-2 biosurfactant in the presence of 0.1 mM 2,3-butanediol and 1 g/l of partially hydrolyzed polyacrylamide (PHPA) recovered 10-40% of residual oil from Berea sandstone cores. Even low biosurfactant concentrations (16 mg/l) mobilized substantial amounts of residual hydrocarbon (29%). The bio-surfactant lowered IFT by nearly 2 orders of magnitude compared to typical IFT values of 28-29 mN/m. Increasing the salinity increased the IFT with or without 2,3-butanediol present. The lowest interfacial tension observed was 0.1 mN/m. A mathematical model that relates oil recovery to biosurfactant concentration was modified to include the stepwise changes in IFT as biosurfactant concentrations changes. This model adequately predicted the experimentally observed changes in IFT as a function of biosurfactant concentration. Theses data show that lipopeptide biosurfactant systems may be effective in removing hydrocarbon contamination sources in soils and aquifers and for the recovery of entrapped oil from low production oil reservoirs.
Diverse microorganisms were screened for biosurfactant production and anaerobic growth at elevated salt concentrations to obtain candidates most suitable for microbial oil recovery. Seventy percent of the 205 strains tested, mostly strains of Bacillus mojavensis, Bacillus subtilis, Bacillus licheniformis, and Bacillus sonorensis, produced biosurfactants aerobically and 41% of the strains had biosurfactant activity greater than Bacillus mojavensis JF-2, the current candidate for oil recovery. Biosurfactant activity varied with the percentage of the 3-hydroxy-tetradecanoate isomers in the fatty acid portion of the biosurfactant. Changing the medium composition by incorporation of different precursors of 3-hydroxy tetradecanoate increased the activity of biosurfactant. The surface tension and critical micelle concentration of 15 different, biosurfactant-producing Bacillus strains was determined individually and in combination with other biosurfactants. Some biosurfactant mixtures were found to have synergistic effect on surface tension (e.g. surface tension was lowered from 41 to 31 mN/m in some cases) while others had a synergistic effect on CMD-1 values. We compared the transport abilities of spores from three Bacillus strains using a model porous system to study spore recovery and transport. Sand-packed columns were used to select for spores or cells with the best transport abilities through brine-saturated sand. Spores of Bacillus mojavensis strains JF-2 and ROB-2 and a natural recombinant, strain C-9, transported through sand at very high efficiencies. The earliest cells/spores that emerged from the column were re-grown, allowed to sporulate, and applied to a second column. This procedure greatly

7
enhanced the transport of strain C-9. Spores with enhanced transport abilities can be easily obtained and that the preparation of inocula for use in MEOR is feasible.
We conducted a push-pull test to study in-situ biosurfactant production by exogenous biosurfactant producers to aid in oil recovery from depleted reservoirs. Five wells from the same formation were used. Two wells received cells and nutrients, two wells were treated with nutrients only, and one well was used as the negative control where only brine was injected. We hypothesized that the wells receiving nutrients and cells treatment would be able to produce biosurfactant in-situ compared to nutrient only–treated wells or the negative control. After incubation and a shut-in period to allow in situ growth and metabolism, a series of chemical, microbiological, and molecular analyses were conducted on the produced fluids to obtain evidence for growth, metabolism, and biosurfactant production. Results showed that the wells treated with cells and nutrients indeed produced biosurfactant compared to the other wells as evidenced by the increase in surface activity. Lipopeptide biosurfactants of concentration up to 350 ppm were detected. This is an order of magnitude higher than the CMC. Evidences for substrate utilization and metabolism were detected in the wells treated with cells and nutrients where % carbon recovery was 124%, and 116%. Acids as acetate, formate, and lactate, and solvents as ethanol, and 2,3 butanediol were detected in the inoculated wells. MPN analysis of influents and effluents of the treated wells showed a ratio of 2.2 and 1.2 for the number of biosurfactant producers and a ratio of 654 and 1727 for the total number of cells in the produced fluids compared to the injection fluids of inoculated wells.
For the first time, we show that biosurfactants were produced in-situ using simple nutrients at concentrations that are sufficient to mobilize significant amounts of residual oil. Second, inoculation of oil wells with exogenous biosurfactant-producers was possible. These two findings support the efficacy of the use of biosurfactants to recover entrapped oil.

8
Executive Summary Current technology recovers only one-third to one-half of the oil that is originally
present in an oil reservoir. Since almost all regions of the world have been intensively explored for oil and the discovery of large new oil resources is unlikely, the exploitation of oil resources in existing reservoirs will be essential in the future. One step in this exploitation involves increasing the mobility of oil in existing reservoirs. Microorganisms produce a variety of compounds capable of generating the low interfacial tensions between the hydrocarbon and the aqueous phases required to mobilize residual hydrocarbon. In particular, the lipopeptide biosurfactant produced by Bacillus mojavensis JF-2 reduces the interfacial tension between hydrocarbon and aqueous phases to very low levels (<0.016 mN/m).
Biosurfactants are a diverse group of surface-active chemical compounds produced by a wide variety of microorganisms. They are amphiphilic molecules with both hydrophilic and hydrophobic domains, which allow them to partition at the interface of two fluids with differing polarities such as oil-water or water-air interfaces. They are thus capable of reducing the interfacial and/or surface tension. Such properties make them good candidates for enhanced oil recovery.
Biosurfactants have been investigated as replacements for synthetic surfactants since they are environmentally friendly and biodegradable. They are less sensitive to extreme conditions of temperature, salt concentration, and pressure than synthetic surfactants. Since biosurfactants have very low critical micelle concentration (mg/l), they are considered to be more economical to use than synthetic surfactants.
Traditionally, biosurfactants have been viewed as enhancing hydrocarbon mobilization by increasing the apparent aqueous solubility. Increasing the apparent solubility of petroleum hydrocarbons stimulates biodegradation, but does not lead to significant mobilization of the hydrocarbon. Thus, biosurfactants have not thought to be practical for enhanced oil recovery. Here, we show that a lipopeptide biosurfactant produced by B. mojavensis JF-2 mobilized substantial amounts of residual hydrocarbon from sand-packed columns and sandstone cores when a viscosifying agent and a low molecular weight alcohol were present. The amount of residual hydrocarbon mobilized depended on the biosurfactant concentration. One pore volume of cell-free culture fluid with 900 mg/l of the biosurfactant, 10 mM 2,3-butanediol and 1000 mg/l of partially hydrolyzed polyacrylamide polymer mobilized 82% of the residual hydrocarbon. Even low biosurfactant concentrations (16 mg/l) mobilized substantial amounts of residual hydrocarbon (29%).
The recovery of residual oil depends on the generation of low interfacial tensions in other to release oil that is entrapped in small pores. The data above suggest that the JF-2 biosurfactant could significantly lower the interfacial tension. As a result, studies were conducted to directly test whether the B. mojavensis JF-2 biosurfactant does generate low interfacial tensions. The presence of a co-surfactant, 2,3-butanediol improves oil recoveries possibly by changing the optimal salinity concentration of the formulation. For this reason, we also tested the effect of 2,3-butanediol and salinity on interfacial tension. The biosurfactant lowered IFT by nearly 2 orders of magnitude compared to typical

9
values of 28-29 mN/m. Increasing the salinity increased the IFT with or without 2,3-butanediol present. The lowest interfacial tension observed was 0.1 mN/m.
B. mojavensis JF-2 is the only strain known to grow and produce an effective biosurfactant anaerobically. Thus, this strain is the only one that can be used for in situ applications. However, anaerobic growth in the original medium was inconsistent and little biosurfactant was produced; in situ growth and biosurfactant production of B. mojavensis JF-2 in sandstone cores resulted in inconsistent oil recoveries probably due to its inconsistent growth under anaerobic conditions. For this reason, it was necessary to improve growth and control biosurfactant production by manipulating the medium components.
Improved anaerobic growth and biosurfactant production was accomplished with the addition of Proteose peptone to the medium, but the resulting medium was much too complex to allow a proper understanding of the nutritional controls of biosurfactant production. Consequently, it was necessary to elucidate the composition of the growth-enhancing factor found in Proteose peptone and identify any other growth factor requirement(s). Previously, we reported that Proteose peptone was necessary for anaerobic growth and biosurfactant production by Bacillus mojavensis JF-2. Preliminary data suggested that the growth-enhancing factor consisted of nucleic acids; however, nucleic acid bases, nucleotides or nucleosides did not replace the requirement for Proteose Peptone. Further studies revealed that salmon sperm DNA, herring sperm DNA, Echerichia coli DNA and synthetic DNA replaced the requirement for Proteose peptone. In addition to DNA, amino acids and nitrate were required for anaerobic growth and vitamins further improved growth. These results indicate that Proteose peptone is not necessary for in situ growth of B. mojavensis JF-2 and can be replaced by DNA, amino acids and vitamins. Since small amounts of DNA, amino acids and vitamins maybe naturally present in the environment or by cross-feeding from other microorganisms, only a carbon/energy source would need to be added to stimulate in situ growth and biosurfactant production.
Since genetic recombination is known to occur between mixed germinating spores of Bacillus species, we hypothesized that Bacillus strains with improved biosurfactant producing ability could be obtained by mixing germinating spores of JF-2 and those of other Bacillus species. Our aim is to obtain strains that produce higher amount of biosurfactants than JF-2, are able to grow anaerobically with minimal nutrient requirements, and can maintain their biosurfactant activity over long periods of time. We screened a large number of microorganisms for anaerobic growth and biosurfactant production, selected the most promising strains, and attempted to increase biosurfactant production through genetic recombination.
The elevated salinities and lack of oxygen in most mid-continent oil reservoirs are critical environmental factors that govern the type of microorganism used for biosurfactant-mediated oil recovery. We screened diverse microorganisms for biosurfactant production and anaerobic growth at elevated salt concentrations to obtain candidates most suitable for microbial oil recovery. We tested 205 strains, mostly strains of Bacillus mojavensis, Bacillus subtilis, Bacillus licheniformis, and Bacillus sonorensis, for aerobic and anaerobic growth in 5% salt medium and biosurfactant production. All strains grew aerobically with 5% salt and 145 of these strains (70%) produced a biosurfactant. Eighty-seven strains, 40%of those tested, mostly belonging to B. subtilis

10
subsp. subtilis and B. subtilis subsp. spizizenii, had biosurfactant activity greater than Bacillus mojavensis JF-2, the current candidate for oil recovery. Some strains maintained biosurfactant activity after 14 days of incubation compared to JF-2, which lost 50% of its biosurfactant activity after 7 days. Thirty-three strains grew anaerobically in the 5% salt medium. The fact that we found that biosurfactant-producing microbes can be readily isolated from uncontaminated, undisturbed arid soils as well as oil field brines argues that many oil field are likely to contain microorganisms that produce biosurfactants.
In order to optimize the activity of the biosurfactants, it is important to understand what portions of the biosurfactant molecule are most critical for its activity. We studied the relationship between biosurfactant structure and activity with a number of lipopeptide biosurfactants produced by the above Bacillus species. A new method of extraction and purification for lipopeptide biosurfactants was developed, which involved ammonium sulfate precipitation, solvent extraction, and thin layer chromatography. Not surprisingly, we found that biosurfactant activity increased with increasing concentration of the lipopeptide biosurfactant. In addition, we also found that the molecular structure of the biosurfactant (e.g., amino acid and fatty acid composition) affected activity. When biosurfactants from different bacilli were tested at the same concentration, biosurfactant activity varied with the percentage of the 3-hydroxy-tetradecanoate isomers in the fatty acid portion of the biosurfactant. Changing the medium composition by incorporation of different precursors of 3-hydroxy tetradecanoate increased the activity of biosurfactant. Thus, by understanding how the structure of the biosurfactant affects activity, we were able to develop simple approach to enhance biosurfactant activity by nutrient manipulation. Our work shows that diverse microorganisms produce biosurfactants and that nutrient manipulation may provide a mechanism to increase biosurfactant activity for more efficient oil recovery.
MEOR (microbially enhanced oil recovery) depends on the use of biosurfactants to mobilize residual oil in low production or depleted reservoirs. In order to optimize the surface activity of biosurfactants, we hypothesized that mixtures of biosurfactants with diverse structures will generate lower surface tensions compared to individual biosurfactants. In this study, the surface tension for 15 different Bacillus strains that are known to be surface active was measured both individually and in combination with other biosurfactants. Surface tension and CMD-1 values (critical micelle dilution defined as the reciprocal of the biosurfactant dilution at which a sharp increase in surface tension is observed) were compared to assess synergistic effects of the mixtures. Some biosurfactant mixtures were found to have a synergistic effect on surface tension (e.g. surface tension was lowered from 41 to 31 mN/m in some cases) while others had a synergistic effect on CMD-1 values. Since most oil reservoirs contain diverse microorganisms, the stimulation of biosurfactant production in the reservoir will likely result in the production of several different kinds of biosurfactants. While the presence of numerous microorganisms that could potentially compete for the injected nutrient has been viewed as a detriment to the development of MEOR, it may in fact be a benefit by allowing the production of diverse biosurfactants that may act synergistically.
We know that oil reservoirs contain active microbial communities. However, we do not know the prevalence of biosurfactant-producing microorganisms in oil fields. Thus, it is likely that the injection of biosurfactant-producing microorganisms will be needed for some reservoirs. Cells of the injected microorganisms must be able to move

11
through the porous matrix at high efficiency. Bacillus species have been widely used as model organisms during MEOR research. An important characteristic of Bacillus species is their ability to produce spores. Spores are essential for MEOR research because of their small size compared to vegetative cells, their ability to withstand harsh environmental conditions and their increased transport ability. The objective of our study was to obtain biosurfactant-producing strains with improved transport abilities through porous materials. We compared the transport abilities of spores from three Bacillus strains using a model porous system to study spore recovery and transport. Sand-packed columns were used to select for spores or cells with the best transport abilities through brine-saturated sand. Spores of Bacillus mojavensis strains JF-2 and ROB-2 and a natural recombinant strain C-9 transported through sand at very high efficiencies (almost complete recovery of the injected spores within one to two pore volumes). The earliest cells/spores that emerged from the column were re-grown, allowed to sporulate, and applied to a second column to determine whether spores or vegetative cells had enhanced transport properties. This procedure greatly enhanced the transport of strain C-9. Our data show that spores with enhanced transport abilities can be early obtained and that the preparation of inocula for use in MEOR is practical.
A critical piece of information that must be obtained for MEOR to be effective is the relationship between oil recovery and biosurfactant concentration. How much residual oil can be recovered per unit amount of biosurfactant? Will residual oil recovery increase linearly with increasing biosurfactant concentrations or is this relationship more complex? Tertiary oil recovery experiments showed that biosurfactant solutions with concentrations ranging from 10 to 40 mg/l in the presence of 0.1 mM 2,3-butanediol and 1 g/l of partially hydrolyzed polyacrylamide (PHPA) recovered 10-40% of residual oil from Berea sandstone cores. When PHPA was used alone, about 10% of the residual oil was recovered. Thus, about 10% of the residual oil recovered in these experiments was due to the increase in viscosity of the displacing fluid. The remainder of the recovered oil was due to the effect of the JF-2 biosurfactant on interfacial tension between oil and the displacing aqueous phase. The relationship between interfacial tension (IFT) reduction and biosurfactant concentration was defined. Little or no oil was recovered at biosurfactant concentrations below the critical micelle concentration (CMC) (about 10 mg/l). At concentrations lower than the CMC, IFT values were high. At biosurfactant concentrations from 10 to 40 mg/l, the IFT was 1 mN/m. As the biosurfactant concentration increased beyond 40 mg/l, IFT decreased to around 0.1 mN/m. At biosurfactant concentrations in excess of 10 mg/l, residual oil recovery was linearly related to biosurfactant concentration. A mathematical model that relates oil recovery to biosurfactant concentration was modified to include the stepwise changes in IFT as biosurfactant concentrations changes. This model adequately predicted the experimentally observed changes in IFT as a function of biosurfactant concentration.
An important aspect of microbially enhanced oil recovery is biosurfactant production in-situ to help mobilize entrapped residual oil. Whether biosurfactants will be produced in sufficient amounts to enhance oil recovery is a matter of considerable controversy. From our core experiments, we found that concentration of the lipopeptide biosurfactant in excess of 40 mg/l was sufficient to mobilize residual oil. In our field test, the lipopeptide biosurfactant was detected in concentrations of 210, and 350 mg/l in the treated wells, respectively. These amounts are one order of magnitude higher than

12
the minimum required according to the engineering criteria to mobilize residual oil, which means that biosurfactants can be produced in situ in sufficient amounts to aid in oil recovery.
Engineering models are required for successful microbially enhanced oil recovery. However, to develop these models, good mass balance data and information on the in situ microbial reaction rates and yields are needed. Our field test provides for the first time data for input in engineering models including, adsorption losses as shown by bromide recovery factor (1.09), growth rates (0.005, and 0.02 h-1), percent carbon recovery or mass balance (124, and 116%), biosurfactant production rates (0.016, and 0.019 h-1), and biosurfactant yields (0.0134, and 0.0135 mole biosurfactant/ mole glucose). These data show that both the source of nutrients and their concentration were sufficient for growth and product formation. They also suggest that minimal absorption occurred during transport. Engineers will certainly benefit from these data which can be used in simulations studies to obtain a thorough understanding of microbial activity under reservoir conditions. We should note that this is the first time that an in situ carbon/mass balance has been obtained for any MEOR process.
Microbial processes show great promise as cost-effective technologies for oil recovery. In the current study, the nutrients used were glucose and sodium nitrate. The inoculated wells, produced biosurfactant in amounts of 6.03, and 6.48 moles. The total nutrient costs were around $82 per well. This makes the cost to produce 1 mole of biosurfactant in situ around $13 per mole. This is cheap considering that the concentration of biosurfactant produced was one order of magnitude higher than that required for mobilization of oil. This means that the biosurfactant can be produced in economically, in sufficient amounts to mobilize residual oil, which is the main goal of MEOR, e. g., oil recovery at low cost using microbial byproducts.
The field test also shows success in the inoculation procedure. Since not all reservoirs have indigenous microorganisms that can produce a biosurfactant, sometimes addition of exogenous biosurfactant-producers that can grow under the reservoir conditions is required. The main concern usually associated with in situ biosurfactant production using exogenous microorganisms is the competition the injected cells might encounter due to the presence of indigenous microorganisms in the oil reservoir. In our case, competition did not prevent Bacillus growth, metabolism, and biosurfactant production in the wells treated with cells compared to the other wells that received the nutrient treatment. Growth and glucose utilization were observed in the nutrients only-treated wells but no evidence for biosurfactant production was observed in these wells. This means that indigenous microorganisms although able to utilize glucose, did not out-compete Bacillus for the substrate indicating that glucose is a more favorable substrate for Bacillus compared to indigenous microorganisms.
We show for the first time that it is possible to produce in situ biosurfactant concentrations that exceed appropriate engineering design criteria to recover significant amounts of residual oil. Our work specifically addressed the criticism of whether or not MEOR technologies meet the needed engineering design criteria. Our conclusion is that
biosurfactant-mediated oil recovery does in fact exceed engineering design criteria.

13
Overall Introduction The project had three objectives: (1) to develop microbial strains with improved
biosurfactant properties that use cost-effective nutrients, (2) to obtain biosurfactant strains with improved transport properties through sandstones, and (3) to determine the empirical relationship between surfactant concentration and interfacial tension and whether in situ reactions kinetics and biosurfactant concentration meets appropriate engineering design criteria. We used natural genetic exchange among a mixture of Bacillus species and screening of natural isolates to improve biosurfactant properties (high and stable concentrations). We obtained a strain with improved properties by genetic recombination. However, we found several naturally occurring strains that had high biosurfactant activity over long periods of incubation. In order to avoid regulatory complications with the use of genetically modified strains, we used the naturally occurring strains for our field test. We found that spores were highly efficient in transport through sand-packed columns and thus the need to obtain adhesion-deficient stains is not critical to the success of microbially enhanced oil recovery (MEOR) processes. Finally, the relationship between biosurfactant concentration and the interfacial tension was determined and a successful push-pull test was conducted to determine the in situ rate of biosurfactant production and its concentration. For the first time, in situ estimates of concentrations of products, yields, and rates of production and growth have been obtained for a microbial oil recovery process. We show for the first time that it is possible to produce in situ biosurfactant concentrations that exceed appropriate engineering design criteria to recover significant amounts of residual oil.
Although the long-term economic potential for enhanced oil recovery is large (more than 300 billion barrels of oil remain in domestic reservoirs after conventional technologies reach their economic limit), actual EOR production in the United States has never been very large, less than 10% of the total U. S. production. This has been the case even though a variety of economic incentives have been provided to stimulate the development and application of EOR processes. Often, the large capital or high chemical/energy costs of EOR technologies limit application to a few reservoirs with very favorable conditions. The development of more cost-effective technologies is clearly needed. MEOR has several unique advantages. MEOR processes do not consume large amounts of energy as do thermal processes, nor do MEOR processes depend on the price of crude oil, as do many chemical processes. Because microbial growth occurs at exponential rates, it should be possible to produce sufficient amounts of useful products rapidly from inexpensive and renewable resources. Several MEOR field projects produced incremental oil for as little a three dollars per barrel (6, 16). Several microbially-produced biosurfactant have interfacial tension activities that compare very favorably with chemically-made biosurfactants (11, 17). In particular, the lipopeptide biosurfactant produced by Bacillus mojavensis strain JF-2 can reduce the interfacial tension between oleic and aqueous mixtures to very low levels (<0.01 mN/m) (17, 19). These large reductions in interfacial tension should result in substantial recovery of residual oil. Residual oil is recovered by the in situ biosurfactant production, but oil recoveries were low probably due to the inconsistent production of the biosurfactant in the core due to nutrient limitations (2, 18, 21, 22, 24, 25) The inconsistent performance of

14
MEOR has led to criticisms whether sufficient quantities of microbial products can be produced in the reservoir at a rate sufficient to result in economic oil recovery (7).
We obtained microbial strains that can consistently produce high levels of the biosurfactant under simulated reservoir conditions without costly nutrient supplements. We also showed that transport of spores of Bacillus species is highly efficient so one does not need a non-adherent, biosurfactant-producing strains in order to have migrate over large distances within the oil reservoir. We derived an empirical relationship between biosurfactant concentration and interfacial tension between oil and water that predicts microbially mediated oil recovery and showed that biosurfactant can be produced in situ at concentrations that should mobilize substantial amounts of oil. Our work specifically addressed the criticism of whether or not MEOR technologies meet the needed engineering design criteria. Our conclusion is that biosurfactant-mediated oil recovery does in fact exceed engineering design criteria.
Factors Affecting Oil Recovery
The microscopic displacement efficiency is a measure of the amount of oil that
remains in small pores or dead-end pores after a recovery process and controls the ultimate oil recovery factor in most reservoirs, especially those at their economic limit of production. The viscous and capillary forces that hold this oil in place are expressed as a ratio called the capillary number (Nca):
Nca = (µw vw)/(σow) where µw is the viscosity, vw is the flux of fluid, and σow is the oil-water
interfacial tension. Large changes in the capillary number (about a factor of 1000) are needed for substantial oil recovery (20). Since large changes in viscous forces are only possible for the recovery of heavy oil, the reduction in interfacial tension by surfactants is the only way to achieve such a large change in capillary number. Chemical flooding techniques have very high microscopic displacement efficiencies in laboratory studies (23), but economics and other concerns have prevented widespread use of these technologies. One group of biosurfactants can generate ultra-low interfacial tensions (17, 19) and engineering analysis indicates that this may result in significant oil recovery factor (Sharma and Georgiou, 1993.
Biosurfactant-Mediated Oil Recovery
Many microorganisms are known to produce biosurfactant (11), but only a few
are known to significantly reduce the interfacial tension between oil and brine to the level needed for substantial oil recovery (12, 17, 19). Many biosurfactant-producing microorganisms are aerobic bacteria, making them unsuitable for in situ applications since most oil reservoirs are usually devoid of any oxygen. Several anaerobic bacteria are known to produce biosurfactants but the degree of surface tension reduction is much less than that reported for other organisms (8-10, 13, 15). This is not the case for lipopeptide surfactants produced by several species of Bacillus, especially the lipopeptide produced by Bacillus mojavensis strain JF-2.

15
B. mojavensis strain JF-2 produces a salt- tolerant, heat-stable, lipopeptide surfactant that reduces interfacial tension of oil brine mixtures to less than 0.01 mN/m (17, 19, 24, 25). Interfacial tensions as low as 0.006 mN/m have been observed with as little as 10 to 25 mg/l of the lipopeptide in the absence of a cosurfactant. Bacillus strain JF-2 grows and produces its biosurfactant anaerobically, at salt concentrations up to 8% NaCl, and temperatures up to 450 C (14, 19). Thus, this organism is able to grow and produce its biosurfactant under the conditions found in many reservoirs in the United States, making it an ideal candidate for MEOR. Other Bacillus strains also make effective biosurfactants (1, 21, 24, 25). Oil is recovered when strain JF-2 is grown in sandstone cores (18, 22). Cumulative oil recovery was highly correlated to cumulative surfactant oil production (r2 = 0.979) and very little oil was recovered from cores that were inoculated with a mutant strain of JF-2 that had lost the ability to reduce surface tension (18). Other laboratory experiments also showed residual oil is recovered by the in situ biosurfactant production (21, 24, 25) and, in one case, residual oil recoveries up to 39% were reported (1). We hypothesized that consistently high oil recoveries can be obtained by biosurfactant-mediated oil recovery if strains with improved biosurfactant properties (high and stable concentrations) that do not require nutrient supplements are developed.
Relationship to Program Goals and Objectives
While MEOR processes hold great promise for enhanced oil recovery, there are
several reasons that prevent their implementation including inconsistent performance, low ultimate oil recovery factor, and the uncertainty of whether microbial processes meet engineering design criteria (7). This is certainly the case for biosurfactant-mediated oil recovery where oil recovery is lower than for chemical surfactants and it is uncertain whether sufficient amounts of biosurfactant can be made in situ. We have shown that the lipopeptide biosurfactant produced by Bacillus mojavensis strain JF-2 can reduce the interfacial tension between oleic and aqueous mixtures to very low levels. These large reductions in interfacial tension should result in substantial recovery of residual oil. However, laboratory-flooding experiments using this strain or other microorganisms give inconsistent results. The use of strains that have high and stable biosurfactant production under oil reservoir conditions (anaerobic and high salinity) should solve these technical difficulties.
Improvements over Existing Technologies
Chemical surfactant flooding results in high microscopic displacement
efficiencies, but high concentrations of surfactants are needed which unfavorably increases costs. Our biosurfactant is effective at low concentrations (20 mg/liter) and is made from inexpensive, renewable resources. The most successful MEOR process by Brown and his coworkers (3) uses selective plugging to divert fluid into regions of the reservoir that have not been influenced by the waterflood. This process results in oil recovery for as little as $15 per m3. However, a large number of domestic reservoirs will require an increase in the microscopic displacement rather than sweep efficiency to enhance oil recovery. Our process will target at such reservoirs. Even with a modest

16
target of 15% residual oil recovery, we calculate that additional oil recovered would be approximately 2.6 million cubic meters from a representative domestic oil reservoir.
Anticipated Benefits
We developed biosurfactant formulations that are produced from cost-effective
nutrient sources and that are effective in a wide range of reservoir conditions and determine whether biosurfactant-mediated oil recovery exceed established engineering design criteria. In contrast to chemical surfactants, the use of biosurfactant offers no long-term risk to the environment since biosurfactants and the materials from which they are made are readily degraded. Our work will reduce the technical uncertainty associated with using microbial processes for enhanced oil recovery and lead to greater implementation of MEOR.
Two Department of Energy sponsored field trials show the great potential for biosurfactant-based microbial flooding processes (5, 6). In both cases, a mixture of bacteria containing B. licheniformis strain JF-2 or a related strain was used. Bryant et al. (4) reported that fluid collected from the production well about 6 weeks after inoculation contained cells of strain JF-2 (as evidenced by its unique colony morphology) and reduced surface tensions. Thus, it is possible to propagate strain JF-2 through the reservoir and to stimulate the production of a specific metabolite, e. g., the JF-2 biosurfactant. In a small scale field pilot, oil production from the field increased by 14% after the microbial treatment and improvements in the water to oil ratio were noted for well in the treated area (6). In a larger scale field project, beneficial effects on oil production were again noted. In both cases, additional oil was recovered at very economical costs.
LITERATURE CITED 1. Abdulrazag, Y., R. A. Almehaideb, and O. Chaalal. 1999. Project of
increasing oil recovery from UAE reservoirs using bacteria flooding. (SPE 56827). Presented at the Proceedings of the SPE Annual Technical Conference., Society of Petroleum Engineers, Richardson, TX.
2. Almehaideb, R., and A. Y. Zekri. 2002. Laboratory investigation of parameters affecting optimization of microbial flooding in carbonate reservoirs. Petroleum Science and Technology 20:377-392.
3. Brown, L. R., A. A. Vadie, and J. O. Stephens. 2002. Slowing production decline and extending the economic life of an oil field: new MEOR technology. SPE Reservoir Eval. & Eng. 5:33-41.
4. Bryant, R. S., and T. E. Burchfield. 1991. Microbial enhanced waterflooding: a pilot study. Devel. Petr. Sci. 31:399-420.
5. Bryant, R. S., T. E. Burchfield, D. M. Dennis, and D. O. Hitzman. 1990. Microbial-enhanced waterflooding: Mink Unit project. SPE Reservoir Eng. 5:9-13.
6. Bryant, R. S., A. K. Stepp, K. M. Bertus, T. E. Burchfield, and M. Dennis. 1993. Microbial-enhanced waterflooding field pilots. Devel. Petr. Sci. 39:289-306.

17
7. Bryant, S. L., and T. P. Lockhart. 2002. Reservoir engineering analysis of microbial enhanced oil recovery. SPE Reservoir Eval. & Eng. 5:365-374.
8. Busscher, H. J., T. R. Neu, and H. C. van der Mei. 1994. Biosurfactant production by thermophilic dairy streptococci. Appl. Microbiol. Biotechnol. 41:4-7.
9. Cooper, D. G., J. E. Zajic, D. F. Gerson, and K. I. Manninen. 1980. Isolation and identification of biosurfactants produced during the anaerobic growth of Clostridium pasterianum. J. Ferment. Technol. 58:83-86.
10. Denger, K., and B. Schink. 1995. New halo- and thermotolerant fermenting bacteria producing surface-active agents. Appl Microbiol. Biotechnol. 44:161-166.
11. Desai, J., and I. M. Banat. 1997. Microbial production of surfactants and their commercial potential. Microbiol. Mol. Biol. Rev. 61:47-64.
12. Finnerty, W. R., and M. E. Singer. 1983. Microbial enhancement of oil recovery. Bio/Technology 1:47-54.
13. Grula, E. A., H. H. Russell, D. Bryant, M. Kenaga, and M. Hart. 1983. Isolation and screening of clostridia for possible use in microbially enhanced oil recovery., p. 43-47. In E. C. Donaldson and J. B. Clark (ed.), International Conference on Microbial Enhancement of Oil Recovery. Bartlesville Energy Technology Center, U.S. Dept. of Energy, Bartlesville, Ok.
14. Javaheri, M., G. E. Jenneman, M. J. McInerney, and R. M. Knapp. 1985. Anaerobic production of a biosurfactant by Bacillus licheniformis JF-2. Appl. Environ. Microbiol. 50:698-700.
15. La Riviere, J. W. M. 1955. The production of surface active compounds by microorganisms and its possible significance in oil recovery. I. Some general observations on the change of surface tension in microbial cultures. Antonie van Leeuwenhoek J. Microbiol. Serol. 21:1-8.
16. Lazar, I., S. Dobrota, M. C. Stefanescu, L. Sandulescu, R. Paduraru, and M. Stefanescu. 1993. MEOR, recent field trials in Romania: reservoir selection, type of inoculum, protocol for well treatment and line monitoring. Devel. Petr. Sci. 39:265-288.
17. Lin, S.-C., M. A. Minton, M. M. Sharma, and G. Georgiou. 1994. Structural and immunological characterization of a biosurfactant produced by Bacillus licheniformis JF-2. Appl. Environ. Microbiol. 60:31-38.
18. Marsh, T. L., X. Zhang, R. M. Knapp, M. J. McInerney, P. K. Sharma, and B. E. Jackson. 1995. Mechanisms of microbial oil recovery by Clostridium acetobutylicum and Bacillus strain JF-2, p. 593-610. In R. S. Bryant and K. L. Sublette (ed.), The Fifth International Conference on Microbial Enhanced Oil Recovery and Related Problems for Solving Environmental Problems. (CONF-9509173). National Technical Information Service, Springfield, VA.
19. McInerney, M. J., M. Javaheri, and D. P. Nagle. 1990. Properties of the biosurfactant produced by Bacillus licheniformis strain JF-2. J. Indust. Microbiol. 5:95-102.
20. Reed, R. L., and R. Healy, N. 1977. Some physical aspects of microemulsion flooding: a review, p. 383-437. In D. O. Shah and R. S. Scheckter (ed.), Improved Oil Recovery by Surfactant and Polymer Flooding. Academic Press, Inc., New York.

18
21. Sugihardjo, E. H., and S. W. Pratomo. 1999. Microbial Core flooding experiments using indigenous microbes. (SPE 57306). Presented at the Proceedings of the SPE Asia Pacific Improved Oil Recovery Conference, Society of Petroleum Engineers, Richardson, TX.
22. Thomas, C. P., G. A. Bala, and M. L. Duvall. 1993. Surfactant-based enhanced oil recovery mediated by naturally occurring microorganisms. Soc. Petrol. Eng. Reservoir Eng. 11:285-291.
23. Van Poolen, H. K., and Associates. 1980. Fundamentals of Enhanced Oil Recovery. PennWell Publishing Co., Tulsa, OK.
24. Yakimov, M. M., M. Amro, M. Bock, K. Boseker, H. L. Fredrickson, D. G. Kessel, and K. N. Timmis. 1997. The potential of Bacillus licheniformis strains for in situ enhanced oil recovery. J. Petr. Sci. Engineer. 18:147-160.
25. Yonebayashi, H., K. Ono, H. Enomoto, T. Chida, C.-X. Hong, and K. Fujiwara. 1997. Microbial enhanced oil recovery field pilot in a waterflooded reservoir. Presented at the Proceedings of the 1997 Asia Pacific Oil and Gas Conference and Exhibition, Apr 14-16 1997, Society of Petroleum Engineers (SPE), Richardson, TX, USA.

19
Chapter 1. Anaerobic growth of and biosurfactant production by Bacillus mojavensis strain JF-2 1.1 Abstract.
Previously, we reported that Proteose peptone was necessary for anaerobic growth
and biosurfactant production by Bacillus mojavensis JF-2. The growth-enhancing factor in Proteose peptone was methanol insoluble, had an average molecular weight of 3900 Da, was retained by an anion exchange column, was acid and base stable, was low in protein, and absorbed at about 260 nm. These data suggested that the growth-enhancing factor consisted of or contained a nucleic acid; however, nucleic acid bases, nucleotides or nucleosides did not replace the requirement for Proteose Peptone. Further studies revealed that salmon sperm DNA, herring sperm DNA, Echerichia coli DNA and synthetic DNA replaced the requirement for Proteose peptone. As little as 20 mg/l of E. coli DNA was sufficient to increase growth from an Absorbancemax of about 0.08 to an Absorbancemax of about 0.25. In addition to DNA, amino acids were required for anaerobic growth and vitamins further improved growth from an Absorbancemax of about 0.4-0.6 to an Absorbancemax of about 0.8. A small amount of nitrate was required for anaerobic growth although not in stochiometric amounts relative to the amount of sucrose present. These results indicate that Proteose peptone is not necessary for in situ growth of B. mojavensis JF-2 and can be replaced by DNA, amino acids and vitamins. Since small amounts of DNA, amino acids and vitamins maybe naturally present in the environment or by cross-feeding from other microorganisms, only a carbon/energy source would need to be added to stimulate in situ growth and biosurfactant production. 1.2 Introduction.
Javahari et al., (4) reported both the successful anaerobic growth of and
biosurfactant production by Bacillus mojavensis strain JF-2. This biosurfactant effectively reduces both surface tension and interfacial tension and is potentially useful in enhanced oil recovery (6, 10). B. mojavensis JF-2 is the only strain known to grow and produce an effective biosurfactant anaerobically. Thus, this strain is the only one that can be used for in situ applications. However, anaerobic growth in the original medium described by Javahari et al. (3) was inconsistent and little biosurfactant was produced. In situ growth and biosurfactant production of B. mojavensis JF-2 in sandstone cores resulted in inconsistent oil recoveries probably due to its inconsistent growth under anaerobic conditions (8) (13). For this reason, it was necessary to improve growth and control biosurfactant production by manipulating the medium components.
Improved anaerobic growth and biosurfactant production was accomplished with the addition of Proteose peptone to the medium (9) but the resulting medium was much too complex to allow a proper understanding of the nutritional controls of biosurfactant production. Consequently, it was necessary to elucidate the composition of the growth-enhancing factor found in Proteose peptone and identify any other growth factor requirement(s). A thorough understanding of the exact nutritional requirements for

20
anaerobic growth will allow for the subsequent manipulation of these requirements to maximize biosurfactant production.
1.3. Methods and Materials.
Medium: Medium E contained the following components per liter (g): TES
buffer (N-tris(hydroxymethyl)methyl–2- aminoethansulfonic acid); sodium chloride (50); sucrose (10); yeast extract (1); sodium nitrate (1); dibasic potassium phosphate (1.0); ammonium sulfate (1); magnesium sulfate (0.25) and 10 ml of a metal solution. The metal solution was a modification of Wolin’s (3) metal solution and contained the following components per liter: Ethyldiaminetetraacetate (EDTA) (1); MnSO4•H2O (3); FeSO4•7H2O (0.1); CaCl2•2H2O (0.1); CoCl2•2H2O (0.1); ZnSO4•7H2O (0.1); CuSO4•7H2O (0.01); H3BO4 (0.01); Na2MO4•2H2O (0.01); AlK(SO4)2 (0.01). Cysteine hydrochloride was added in the concentration of 0.25 g/l.
For some experiments, medium E was supplemented with pools of amino acids, nucleic acid bases, vitamins and fatty acids that were prepared as described by Tanner et al., (12). The nucleic acid base stock solution was prepared as follows. Adenine, cytosine, guanine, thymine and uracil were combined in a single stock solution at 1 gram each per 100 mls of nanopure water. This stock solution was 10 times the final concentration of 0.1 g/l each base. Both the nucleotide and the nucleoside stock solutions were made in the same manner, at the same concentrations for each component. Adenosine, cytosine, guanosine, and thymididine were combined for the nucleotide stock solution and adenosine monophosphate, cytosine monophosphate, guanosine monophosphate, and thymididine monophosphate were combined for the nucleoside stock solution. Salmon sperm DNA, herring sperm DNA, and Echerichia coli DNA and RNA were added directly to the media at the concentration of 1g/l unless otherwise indicated. When the concentration of the DNA was varied, stock solutions were prepared in nanopure water at 10X the final concentration. Salmon sperm DNA was only used in the initial DNA experiment, E. coli DNA was used only where specified. All other experiments using DNA contained herring sperm DNA. All additions to the medium were added prior to autoclaving unless other wise indicated.
The vitamin stock solution was prepared 100 X the final concentration and consisted of 2 mg/l each of biotin and folic acid; 10 mg/l pyridoxine-HCl; 5 mg/l each of thiamine-HCl, riboflavin, nicotinic acid, calcium pantothenate, paraminobenzoic acid, and lipoic acid; and 0.1 mg/l of vitamin B12. Anaerobic media and solutions were prepared by the procedure of Balch and Wolfe (1).
Inoculation Protocol: A serum bottle with 100 ml of anaerobic Medium E was inoculated directly from a well-isolated colony of B. mojavensis strain JF-2 on a Medium E agar plate that had been incubated for 24 hr.. The serum bottle was incubated for 24 to 48 hours at 37oC and then used as an inoculum for experimentation. A 1% inoculum was used. All experiments were performed in serum tubes with 10 of medium and a nitrogen headspace. When the medium contained E. coli DNA or synthetic DNA, the serum tubes contained only two milliliters of medium.
Growth conditions: All tubes and serum bottles were incubated at 37oC. Growth was measured as absorbance at 600 nm.

21
Biosurfactant Quantification: The JF-2 biosurfactant was quantified by high-pressure liquid chromatography (HPLC). A C18 column was used with a mobile phase of 73% methanol and 27% 10 mM phosphate buffer at a pH of 6.5. The HPLC was run at a flow rate of 1 ml/min and the injection volume was 20 µl. A UV detector was used with the wavelength set at 210 nm.
Samples for HPLC analysis were prepared in the following manner. First, a 10-ml sample was centrifuged to remove the cells. The cells were discarded and the supernatant was acidified by the addition of 0.25 ml of 50% HCl. The sample was frozen until analyzed. Later, the sample was thawed, centrifuged and the supernatant was discarded. The remaining pellet was vortexed with 2 ml of methanol for 1 minute, then centrifuged in a microfuge for 5 min. The supernatant was poured off and 20 µl of it was injected into the HPLC.
Bacterial DNA extraction: DNA was purified by using the Marmur procedure (7).
Agarose Gel electrophoresis: The size of E. coli and herring sperm DNA fragments was determined by agarose gel electrophoresis. To make the gel, 0.3 g of agarose was dissolved in 30 mls of nanopure water by heating the water to boiling. After cooling a few minutes, 2 µl of ethidium bromide was added. This gel was then poured into a 7.1 X10 cm tray () with a comb for eight 20 µl wells and allowed to solidify. A 5 µl sample size was used. The gel was run 30 minutes at 96 volts. Polymerase chain reaction (PCR) size markers from 50 to 1000 nucleotide base pairs in length, were used as standards (Promega). The gel was viewed under UV light and an image of the gel was recorded by using a Nucleocam photographic system (Nucleotech Imaging, San Mateo, Ca).
Synthetic DNA: A random sequence of 50 nucleotide bases was generated and then tested for hairpin turns and self-annealing sequences with the oligonucleotides properties calculator found at www.basic.nwu.edu/biotools/oligocalc.html. Selected bases were changed until a sequence was generated that did not contain hairpin turns, or self-annealing areas, and was about 50% GC. The final sequence, named JF-2 SS, was TGG CGA AGG ATG CTG GCT ACA CTG CAG TTA TCT CTC ACC GTT CTG GCG AA. A DNA sequence that was complementary to JF-2 SS, named JF-2 COM was also generated and tested. Both sequences of DNA were obtained from Integrated DNA Technologies (IDT). To determine if single stranded or double stranded DNA supported anaerobic growth, three tubes of Medium E with 0.05% each of JF-2 SS, JF-2 COM and JF-2 SS plus JF-2 COM were inoculated as described above. An uninoculated control and an unamended control were used for each of the above treatments. 1.4. Results.
Requirement for DNA: It was previously shown that B. mojavensis strain JF-2
required Proteose peptone for anaerobic growth and biosurfactant production (8). B. mojavensis grew anaerobically to an absorbance600 of about 0.8 when 30 g/l of Proteose peptone was added to Medium E or to the complete medium (e. g., Medium E supplemented with nucleic acid bases, amino acids, vitamins and fatty acids), (Figure 1.1). Anaerobic growth of B. mojavensis JF-2 did not occur in medium E, or in the complete medium in the absence of Proteose peptone (Figure 1.1).

22
0.01
0.1
1
0 10 20 30 40 50 60
Time (h)
Gro
wth
(O
D 6
00
nm
)Medium E
Medium E + PP
Complete + PP
Complete
Figure 1.1. The effect of Proteose peptone on anaerobic growth of B.
mojavensis JF-2 in Medium E and in Complete medium. Abbreviation: PP, addition of Proteose peptone.
Anaerobic production of the biosurfactant by B. mojavensis JF-2 also required
Proteose peptone (Figure 1.2). If Proteose peptone was absent from both the inoculating culture medium and the experimental medium then only 1 mg/l or less of the JF-2 biosurfactant was produced. If an inoculum containing 1% Proteose peptone was used to inoculate experimental Medium E (resulting in > 1g/l in the experimental medium), then biosurfactant production increased to about 12 mg/l. Further increasing the concentration of Proteose peptone from 5 g/l to 30 g/l only slightly improved biosurfactant production. The presence of Proteose peptone in the inoculating medium did not influence biosurfactant production in the experimental medium if the experimental medium contained 5 g/l Proteose peptone or more.

23
0
5
10
15
20
0 <1 5 10 15 20 25 30
Proteose Peptone (g/l)
Bio
surf
acta
nt (m
g/l)
0
0.1
0.2
0.3
0.4
0.5
0.6
0.7
0.8
0.9
Gro
wth
(A
bsorb
ance a
t 600 n
m)
Biosurfactant (mg/l)
Growth (Final Absorbanceat 600 nm)
Figure 1.2. The effect of Proteose peptone on biosurfactant production and
growth of B. mojavensis strain JF-2. The next step was to identify the growth-enhancing factor. It was initially
assumed that the growth factor consisted of an amino acid or peptide since Proteose peptone is an enzymatic digest of protein. Individual amino acids such as glutamate, glutamine, phenylalanine, tyrosine, tryptophan and methionine and poly amino acids, such as polyglutamate, polyglutamine, polytyrosine, polytryptophane and polymethionine were each individually added to Medium E, but none replaced the requirement for Proteose Peptone (data not shown).
Subsequent crude purification of the growth-enhancing factor found in Proteose peptone revealed that it was methanol insoluble, had an average molecular weight of 3900 Da, was retained by an anion exchange column, was acid and base stable, was low in protein content, and exhibited a maximum absorbance at 260 nm (data not shown).

24
0.001
0.01
0.1
1
0 50 100
Time (Hours)
Gro
wth
(A
bso
rba
nce
60
0 n
m)
Medium E
Medium E +3 g/l PP
Medium E +30 g/l PP
Medium E +Nucleic acidBases
Medium E +Nucleic acidBases + 3g/l PP
Figure 1.3. The effect of nucleic acid bases combined with 3 g/l Proteose
peptone on the anaerobic growth of B. mojavensis strain JF-2 in medium E. These results suggested that the growth-enhancing factor consisted of or
contained nucleic acids or the components of nucleic acids. It was possible that Proteose peptone supplied both amino acids in the form of peptides and nucleic acids. Thus, we tested whether nucleic acid bases combined with a small amount of Proteose peptone could replace the requirement of Bacillus mojavensis JF-2 for a large amount of Proteose peptone for anaerobic growth. We found that the addition of nucleic acid bases to Medium E combined with 3 g/l Proteose peptone did not improve growth compared to that in Medium E with just 3 g/l Proteose peptone and did not replace the requirement for 20 to 30 g/l of Proteose peptone for anaerobic growth (Figure 1.3).

25
0.01
0.1
1
0 20 40 60
Time (Hours)
Gro
wth
(A
bsorb
ance 6
00 n
m)
Medium E
Medium E + 3 g/lPP
Medium E + DNA
Medium E + 30g/l PP
Medium E + 30g/l PP + DNA
Figure 1.4. The effect of salmon sperm DNA on anaerobic growth of Bacillus
mojavensis JF-2. As stated earlier, since crude purification of the growth-enhancing factor
suggested that it consisted of or contained nucleic acids, but the addition of nucleic acid bases to medium E did not replace the requirement for Proteose peptone, we tested whether nucleic acids could replace the Proteose peptone requirement.
Salmon sperm DNA supported anaerobic growth of B. mojavensis strain JF-2 (Figure 1.4), as did herring sperm DNA (Figure 1.5). Initially, salmon sperm and herring sperm DNA were used at the concentrations of 1 g/l, but it was also found that even 0.5 g/l herring sperm DNA supported anaerobic growth in medium E (Figure 1.6).

26
0.01
0.1
1
0 20 40 60 80 100
Time (Hours)
Gro
wth
(A
bso
rbance 6
00 n
m)
Medium E
Medium E + 30g/l PP
Medium E + DNA
Medium E + DNA + 3 g/l PP
Figure 1.5. The effect of herring sperm DNA on anaerobic growth of Bacillus
mojavensis JF-2. RNA and ribonucleosides were then added to the medium to see if the growth
enhancing effect of DNA could be replaced with other sources of nucleic acids or precursors to nucleic acids. From Figures 1.7 and 1.8, it is apparent that neither RNA nor ribonucleosides supported anaerobic growth of B. mojavensis strain JF-2 while growth was observed in medium supplemented with DNA. The presence of RNA or ribonucleosides was not inhibitory to the growth of B. mojavensis strain JF-2 in medium E with DNA. It is interesting to note that the presence of ribonucleosides in medium with DNA caused an extended lag phase.

27
0.001
0.01
0.1
1
0 20 40 60 80 100 120 140
Time (Hours)
Gro
wth
(Absorb
ance)
Medium E
Medium E + 0.5 g/l DNA
Medium E + 1 g/l DNA
Medium E + 3g/l DNA
Medium E 6 g/l DNA
Medium E + 10 g/l DNA
Figure 1.6. The effect of various concentrations of herring sperm DNA on
anaerobic growth of B. mojavensis JF-2. Initially, RNA and ribonucleosides were added prior to autoclaving the medium.
Since these some of these components may have been altered during autoclaving, this experiment was repeated with filter sterilized RNA, ribonucleosides and also included filter sterilized ribonucleotides. From Figures 1.9, 1.10, and 1.11, it is apparent that the addition of filter sterilized RNA, ribonucleotides or ribonucleosides did not replace the requirement for DNA. Again, the addition of ribonucleosides to medium with DNA resulted in an extended lag phase.
One important difference between RNA and DNA is that RNA contains a ribose sugar while DNA contains a deoxyribose sugar. Since RNA did not support anaerobic growth of B. mojavensis JF-2, it was possible that the deoxyribose sugar found in DNA was the actual growth factor. However, the addition of 1 g/l 2-deoxyribose to Medium E did not replace the growth-enhancing effect of DNA (data not shown).

28
0.001
0.01
0.1
1
0 50 100 150
Time (Hours)
Gro
wth
(Absorb
ance 6
00 n
m)
Medium E
Medium E + DNA
Medium E + RNA
Medium E + DNA + RNA
Figure 1.7. The effect of RNA on anaerobic growth of Bacillus mojavensis JF-
2.
0.001
0.01
0.1
1
0 50 100 150
Time (Hours)
Gro
wth
(Absorb
ance 6
00 n
m) Medium E
Medium E +Nucleosides
Medium E +DNA +Nucleosides
Medium E +DNA
Figure 1.8. The effect of ribonucleosides on anaerobic growth of Bacillus
mojavensis JF-2.

29
0.01
0.1
1
0 20 40 60 80 100Time (Hours)
Gro
wth
(Absorb
ance 6
00nm
) Medium E
Medium E+ DNA
Medium E+ FS DNA
Medium E+ FS RNA
Medium E+ FS RNA+ FS DNA
Figure 1.9. The effect of filter sterilized (FS) RNA on anaerobic growth of
Bacillus mojavensis JF-2.
0.01
0.1
1
0 20 40 60 80 100
Time (Hours)
Gro
wth
(Absorb
ance 6
00 n
m) Medium E
Medium E +FS DNA
Medium E +FSNucleosides
Medium E +FSNucleosides+ FS DNA
Figure 1.10. The effect of filter sterilized (FS) ribonucleosides on anaerobic
growth of Bacillus mojavensis JF-2. The above experiments used eukaryotic DNA since this form of DNA is readily
available. We also tested the ability of prokaryotic DNA to replace Proteose peptone by extracting and purifying DNA from Escherichia coli. It was found that DNA from E. coli replaced herring sperm DNA (Figure 1.12) and as little as 20 mg/l of E. coli DNA was sufficient to support evidence of anaerobic growth of B. mojavensis strain JF-2, resulting in an increase in absorbance of the culture from an absorbance of 0.08 to 0.25 (Figure 1.13).

30
0.01
0.1
1
0 20 40 60 80 100
Time (Hours)
Gro
wth
(Absorb
ance a
t 600nm
)
Medium E
Medium E +FS DNA
Medium E +FS Nucleotides
Medium E +FS Nucleotides+ FS DNA
Figure 1.11. The effect of filter sterilized (FS) ribonucleotides on anaerobic
growth of Bacillus mojavensis JF-2. However, from Figure 1.13, it is also apparent that herring sperm DNA was more
effective as a growth supplement than the E. coli DNA when tested at the same concentration. Growth was faster and resulted in a higher final absorbance when 1g/l herring sperm DNA was added to the growth medium compared to medium with 1g/l E. coli DNA.
As a result of the different responses to the two different DNA sources, the size of the DNA fragments of each of the two sources of DNA was determined by agarose gel electrophoresis. Herring sperm DNA consisted of smaller DNA fragments (about 50 base pairs) than did the E. coli DNA (about 1000 to 300 base pair fragments) (Figure 1.14), suggesting that smaller molecular weight fragments of DNA were more effectively utilized by B. mojavensis strain JF-2 than larger DNA fragments.
0.0
0.1
1.0
0 20 40 60 80
Time (Hours)
Gro
wth
(A
bsorb
ance 6
00nm
)
Medium E
Medium E + EC DNA
Medium E + EC DNA +HS DNA
Figure 1.12. The effect of E. coli DNA on anaerobic growth of Bacillus
mojavensis JF-2. EC DNA = 1 g/l E. coli DNA, HS DNA = 1 g/l herring sperm DNA.

31
0.00
0.01
0.10
1.00
0 50 100 150
Time (Hours)
Gro
wth
(A
bso
rba
nce
60
0n
m)
Medium E
Medium E + 20mg/l EC DNA
Medium E +0.200 g/l ECDNA
Medium E + 1 g/lEC DNA
Medium E + 1 g/lHS DNA
Figure 1.13. The effect of different concentrations of E. coli DNA on anaerobic
growth of Bacillus mojavensis JF-2. EC DNA = E. coli DNA; HS DNA = herring sperm DNA.
Figure 1.14. A polyacrylamide gel comparing the size of DNA fragments in
herring sperm DNA and E. coli DNA. Salmon sperm DNA, herring sperm DNA and E. coli DNA all consist of
cellularly produced DNA extracted and purified by the Marmur procedure. It was possible that these preparations contained a compound that was the actual growth-enhancing factor that was co-extracted with the DNA. To exclude this possibility, the ability of chemically synthesized DNA to support the anaerobic growth of B. mojavensis strain JF-2 was tested. From Figure 1.15, it is clear that synthetic DNA supported anaerobic growth of B. mojavensis strain JF-2 as did DNA purified from organisms. Both single stranded synthetic DNA and double stranded synthetic DNA supported growth.

32
Since the requirement for DNA for anaerobic growth has not been reported in any other prokaryotes, other strains of Bacillus were tested to see if they also required DNA for anaerobic growth. Both the type strain Bacillus mojavensis T (ABO21191) and a presumptive Bacillus mojavensis, strain ROB2, required DNA for anaerobic growth (Figures 1.16 and 1.17).
0.01
0.1
1
0 20 40 60 80Time (Hours)
Gro
wth
(A
bso
rba
nce
60
0 n
m) Medium E
Medium E +5 g/l HSDNA
Medium E +JF2 SS DNA
Medium E +SS JF2COM DNA
Medium E +DS DNA
Figure 1.15. The effect of synthetic DNA on the growth of B. mojavensis JF-2
in anaerobic medium. JF2 SS DNA = single stranded DNA; SS JF2 COM = the complementary strand of JF2 SS single stranded DNA; DS DNA = both single strands together, resulting in double stranded DNA.
In addition to requiring DNA, ROB2 may require some other component since an
absorbance greater than 1 was reached when Proteose peptone was included with the DNA compared to an absorbance of 0.4 in Medium E with just DNA
A presumptive Bacillus subtilus, ATCC 12332, also showed a requirement for DNA when growing anaerobically (Figure 1.18). The addition of Proteose peptone to the DNA supplemented medium further enhanced growth but not as dramatically as for ROB2. It is likely that this strain also requires some other component in addition to DNA for anaerobic growth.

33
Bacillus mojavensis T
0.01
0.1
1
10
0 20 40Time (Hours)
Gro
wth
(A
bsorb
ance 6
00
nm
)
Medium E
Medium E +Nucleosides+ CasaminoacidsMedium E +DNA
Medium E +DNA + PP
Figure 1.16. The effect of DNA on the anaerobic growth of Bacillus mojavensis
T (ABO21191) PP = Proteose peptone
ROB2
0.01
0.1
1
10
0 20 40
Hours
Gro
wth
(A
bso
rba
nce
6
00
nm
)
Medium E
Medium E +Nucleosides+ CasaminoacidsMedium E +DNA
Medium E +DNA + PP
Figure 1.17. The effect of DNA on the anaerobic growth of a presumptive
Bacillus mojavensis strain ROB2. DNA = 1 g/l herring sperm DNA, PP = 1 g/l Proteose peptone
Two strains of Bacillus licheniformis strains and two strains of Bacillus
sonorensis were also tested. None of these strains required DNA for anaerobic growth. All grew similarly to the strain shown in Figure 1.19. The addition of DNA to Medium E did not enhance anaerobic growth of these four strains over that in unamended

34
medium, but the addition of a mixture of Casamino acids and nucleosides to Medium E did enhance growth
ATCC 21332
0.01
0.1
1
10
-10 10 30 50
Time (Hours)
Gro
wth
(A
bsorb
ance
600nm
)
Medium E
Medium E +Nucleosides+ CasaminoacidsMedium E +DNA
Medium E +DNA + PP
Figure 1.18. The effect of DNA on anaerobic growth of a presumptive Bacillus
subtilus strain. DNA = 1 g/l herring sperm DNA; PP = 1 g/l Proteose peptone
T68-25
0.01
0.1
1
10
0 20 40
Time (Hours)
Gro
wth
(A
bso
rba
nce
60
0n
m)
Medium E
Medium E +Nucleosides+ CasaminoacidsMedium E +DNA
Medium E +DNA + PP
Figure 1.19. The effect of DNA on the anaerobic growth of a presumptive
Bacillus licheniformis. DNA = 1 g/l herring sperm DNA; PP = 1 g/l Proteose peptone With the addition of 1g/l of DNA to Medium E, it was possible that the DNA was
used as a carbon source and not simply a growth factor. However, as seen in Figure 1.20, DNA did not serve as a sole carbon or energy source for Bacillus mojavensis JF-2 in Medium E. No growth occurred when the medium lacked sucrose but had 1g/l DNA.

35
0.01
0.1
1
0.0 20.0 40.0 60.0
Time (Hours)
Gro
wth
(A
bsorb
ance 6
00nm
)
0mM
5mM
10mM
20mM
Figure 1.20. The effect of sucrose on the growth of B. mojavensis JF-2 in
anaerobic medium supplemented with 1 g/l DNA. Requirement for amino acids and vitamins of B. mojavensis JF-2: Medium E
contains 1 g/l yeast extract that could supply a number of growth factors. These growth factors include nucleic acid bases, amino acids and vitamins. We then tested if any of these three growth factors might be additional anaerobic growth requirements of B. mojavensis JF-2.
Anaerobic growth of B. mojavensis strain JF-2 was not observed in DNA supplemented Medium E that lacked yeast extractor amino acids (Figure 1.21). Bases or

36
0.01
0.1
1
0 50 100 150
Time (Hours)
Gro
wth
(A
bso
rba
nce
60
0 n
m)
Medium E(-)*
Medium E*
Medium E(-)* +Bases
Medium E(-)* +amino acids
Medium E(-)* +vitamins
Medium E(-)* +Amino acids +vitamins
Figure 1.21. The effect of the removal of yeast extract from DNA supplemented
Medium E and the addition of nucleic acid bases, amino acids and vitamins individually and in combination to DNA supplemented Medium E on the anaerobic growth of B. mojavensis JF-2. Medium E (-)* = DNA supplemented Medium E without yeast extract, Medium E* = DNA supplemented Medium E, DNA= 1 g/l herring sperm DNA, Bases = 1 g/l each of nucleic acid bases, AA = 1 g/l Casamino acids. vitamins alone did not replace yeast extract. The presence of amino acids in DNA supplemented Medium E did replace the requirement for yeast extract. Amino acid (plus DNA) supplemented Medium E supported a greater degree of growth (Absorbance = 0.9) than Medium E (plus DNA) supplemented with yeast extract (Absorbance = 0.5). Medium E supplemented with DNA, amino acids, and vitamins supported the best growth.
Under aerobic conditions, no growth requirements were clearly identified. The addition of DNA to Medium E that lacked yeast extract did not improve growth under aerobic conditions (Figure 1.22). The presence of yeast extract in Medium E (without DNA) did improve growth but only very slightly (an absorbance of 0.33 without yeast extract vs. an absorbance of 0.47 with yeast extract) (Figure 1.22). However the addition of amino acids instead of yeast extract to Medium E did improve growth (an absorbance of 0.47 with yeast extract and an absorbance of 0.7 with amino acids) and the combination of amino acids with vitamins (as a replacement for yeast extract in Medium E) resulted in the best growth (an absorbance of 0.8) (Figure 1.23 and 1.24).
Requirement for small amounts of nitrate by B. mojavensis JF-2: It has been
assumed that anaerobic growth of B. mojavensis JF-2 occurred as a result of nitrate respiration as this has been shown for B. subtilus (11). However B. mojavensis JF-2 did not require the stochiometric amounts of nitrate needed for the complete oxidation of

37
sucrose to carbon dioxide for anaerobic growth (Figure 1.25). In anaerobic Medium E with 30 g/l Proteose peptone and 1 g/l (12 mM) of sodium nitrate, about 10 mM of sucrose was consumed. The complete oxidation of 10 mM of sucrose to carbon dioxide would require about 96 mM nitrate. The actual requirement for nitrate for anaerobic growth of B. mojavensis JF-2 was as low as 6 mM nitrate, which would be insufficient for the oxidation of 10 mM sucrose. The actual minimal requirement for nitrate for B. mojavensis JF-2 when grown under anaerobic conditions has yet to be determined.
0.01
0.1
1
0 10 20 30 40 50
Time (Hours)
Gro
wth
(A
bso
rba
nce
60
0nm
)
Medium(-)
Medium E
Medium E(-)*
Figure 1.22. The effect of yeast extract and DNA on the aerobic growth of B.
mojavensis JF-2. Medium E (-)* = DNA supplemented Medium E without yeast extract, Medium E* = DNA supplemented Medium E, DNA= 1 g/l herring sperm DNA.
0.01
0.1
1
0 10 20 30 40 50
Time (Hours)
Gro
wth
(A
bsorb
ance 6
00nm
)
Medium E(-)*
Medium E*
Medium E(-)* + Aminoacids
Figure 1.23. The effect of yeast extract and amino acids on the aerobic growth of
B. mojavensis JF-2. Medium E (-)* = DNA supplemented Medium E without yeast extract, Medium E* = DNA supplemented Medium E, DNA= 1 g/l herring sperm DNA, Amino acids = 1 g/l Casamino acids.

38
0.01
0.1
1
0 10 20 30 40 50
Time (Hours)
Gro
wth
(A
bso
rba
nce
60
0n
m)
Medium E(-)*
Medium E(-)* + Bases
Medium E(-)* + Vitamins
Medium E(-)* + Aminoacids + Vitamins
Figure 1.24. The effect of nucleic acid bases and vitamins on the aerobic growth
of B. mojavensis JF-2 in DNA supplemented Medium E. Medium E (-)* = DNA supplemented Medium E without yeast extract, Medium E* = DNA supplemented Medium E, DNA= 1 g/l herring sperm DNA, Amino acids = 1 g/l Casamino acids, nucleic acid bases = 1 g/l each base, (for vitamin solution see methods and materials).
0.01
0.1
1
0 20 40 60 80 100
Time (Days)
Gro
wth
(A
bso
rban
ce 6
00n
m)
No nitrate0.5 g/l Nitrate1 g/l Nitrate1.5 g/l Nitrate2 g/l Nitrate3 g/l Nitrate4 g/l Nitrate5 g/l Nitrate
Error! Objects cannot be created from editing field codes.
Figure 1.25. The effect of nitrate on the growth of B. mojavensis JF-2 in
anaerobic medium supplemented with Proteose peptone.
1.5. Discussion.

39
Requirement for DNA: Proteose peptone is a complex source of nutrients both known and unknown. Its addition to Medium E was required for anaerobic growth of B. mojavensis JF-2 and also for biosurfactant production. However, the complexity of Proteose peptone restricts nutritional manipulation of the medium components since it is not possible to vary the amount of nitrogen, carbon, metals or other components that may result in improved biosurfactant production. However, we have now identified that DNA is one of the components that is required by B. mojavensis strain JF-2 and other strains of B. mojavensis and one strain of B. subtilis for anaerobic, but not aerobic growth. The replacement of Proteose peptone with DNA in anaerobic medium will allow us to manipulate the nutritional components of the medium to determine the optimal conditions for biosurfactant production. This will allow us to systematically vary not only the components of the medium, but also vary their concentrations to determine the optimal conditions for growth and biosurfactant production.
In addition to DNA, we found that Casamino acids and nitrate were required for anaerobic growth of B. mojavensis strain JF-2 and that the addition of Casamino acids and a vitamin solution containing 20 µg/l each of B vitamins stimulated aerobic and anaerobic growth Figure 1.21 and 1.24). While B-vitamins clearly improved aerobic and anaerobic growth, it will be necessary to transfer the bacterium in vitamin-free medium several times to determine if vitamins are actually required or merely stimulate growth. These experiments are currently in progress. Vitamins may also impact biosurfactant production, but this has yet to be determined. The requirement for DNA for anaerobic growth is unusual and has not been previously demonstrated for any other organism. This requirement is especially unusual since the requirement does not exist during aerobic growth. Generally, microorganisms synthesize the components needed for the synthesis of nucleic acids from their carbon/energy source while some microorganisms may require either the addition of one or more nucleic acid base(s) or entire nucleosides themselves in the medium for growth (11).
It is not yet clear why B. mojavensis requires DNA for anaerobic growth. However, a possible explanation for the requirement for DNA under anaerobic growth conditions and not under aerobic conditions may be due to the absence of a Class II or Class III enzyme ribonucleotide reductase. The Class I ribonucleotide reductase only functions under aerobic conditions, since it requires oxygen to generate the tyrosyl radical needed to make the deoxyribonucleotide for DNA synthesis (5). The Class II enzyme will function under anaerobic conditions and the Class III is will only function under anaerobic conditions (5). If B. mojavensis has only the Class I ribonucleotide reductase and does not have either Class II or Class III, then it would be unable to reduce the ribonucleotide to the deoxyribonucleotide under anaerobic conditions, thus unable to make DNA.
It is evident that the source of DNA is not critical. Both eukaryotic DNA and prokaryotic DNA will suffice. Long strands of DNA are not necessary and may even be less favorable than short strands of DNA since better growth of B. mojavensis strain JF-2 was observed when herring sperm DNA that had shorter strands of DNA was used compared to E. coli DNA that had longer strands of DNA. Single-stranded DNA is just as effective as double-stranded DNA (2.15). Small pieces of DNA such as these are likely to be found many environments, and thus it may not be necessary to supply DNA

40
for in situ growth. As a result, the requirement for Proteose peptone (and its high cost) very likely can be eliminated.
It is interesting to note that the addition of nucleosides to medium with DNA caused an extended lag phase of B. mojavensis under anaerobic conditions. The reason for this is not yet known, but may have been due to a disruption in the balance of cell building material with both nucleosides and DNA present or the nucleosides may interfere with the uptake of DNA.
The fact that other Bacilli also have this requirement for DNA under anaerobic growth conditions indicates that this novel physiology is not limited to B. mojavensis JF-2. It is possible that this requirement could be the phenotypic characteristic of B. mojavensis.
The fact that stochiometric quantities of nitrate are not required suggests that B. mojavensis is not growing by nitrate respiration. If JF-2 were growing by nitrate respiration as shown in the equation below,
Sucrose + 9.6NO3- + 9.6H+ 12CO2 + 4.8N2 + 15.8H2O
96 mM nitrate would be required to completely oxidize 10 mM sucrose. However, only 5 mM or less of nitrate is required for anaerobic growth. Clearly, B. mojavensis JF-2 is not respiring nitrate. The fermentative products such as 2,3-butanediol, acetate, and lactate have been detected in the medium after growth and, although a fermentation balance has not yet been completed, their presence indicates a fermentative metabolism.
Effect of amino acids and vitamins on growth of B. mojavensis JF: Our results show that yeast extract is not necessary for aerobic or anaerobic growth of B. mojavensis strain JF-2 if Casamino acids are supplied. Amino acids were required for anaerobic growth but not for aerobic growth and growth was improved with the addition of vitamins. The effect of these additions on biosurfactant production has yet to be tested. The effect of different sources of amino acids (other than Casamino acids) on growth and biosurfactant production has yet to be tested also.
Overall, it would appear that B. mojavensis JF-2 has numerous growth requirements, resulting in a relatively rich medium to support growth. However, it is quite common that bacteria require diverse organic growth factors (2). The growth requirements of a bacterium in pure culture reflect the environmental conditions under which is grows in natural environments. Thus, it is likely that DNA, amino acids and vitamins are naturally present in the environment where JF-2 was isolated. Since JF-s was isolated from oil field brine, this suggests that the organism must have had access to these nutrients in order to grow. If this is so, then it would not be necessary to supply them so long as B. mojavensis strain JF-2 can acquire these nutrients from other microorganisms that are present in the oil reservoir.
1.6. Conclusion.
By eliminating the Proteose peptone a major production cost has been eliminated
and new possibilities for enhancing biosurfactant production through the manipulation of the medium components are now possible. We can now test the effect of the concentration of different medium components such as amino acids and the type of amino acid on biosurfactant production. Our work also represents an important advance in our knowledge of the biology of microorganisms. Almost all ecosystems have very

41
diverse microbial populations and we know very little about the microorganisms that inhabit these ecosystems. The discovery of a DNA requirement for anaerobic growth may allow us to develop approaches to isolate and culture bacteria that so far have not been successfully cultured in a laboratory environment.
1.7. References.
1. Balch, W. E., and R. S. Wolfe. 1976. New approach to the cultivation of
methanogenic bacteria: 2-mercaptoethanesulfonic acid (HS-CoM)-dependent growth of Methanobacterium ruminantium in a pressurized atmosphere. Appl. Environ. Microbiol. 32:781-791.
2. Bryant, M. P. 1973. Nutritional requirements of the predominant rumen cellulolytic bacteria. Federation Proceedings 32:1809-13.
3. E. Wolin, M. W., R. Wolfe. 1963. Formation of methane in bacterial extracts. J. Bio. Chem. 238:2882-2886.
4. Javaheri, M., G. E. Jenneman, M. J. McInerney, and R. M. Knapp. 1985. Anaerobic production of a biosurfactant by Bacillus licheniformis JF-2. Appl. Environ. Microbiol. 50:698-700.
5. Jordan, A., P. Reichard. 1998. Ribonucleotide Reductases. Annu. Rev. Biochem. 67:71-98.
6. Lin, S. C., M. A. Minton, M. M. Sharma, and G. Georgiou. 1994. Structural and immunological characterization of a biosurfactant produced by Bacillus licheniformis JF-2. Appl. Environ. Microbiol. 60:31-38.
7. Marmur, J. A. 1961. A procedure for the isolation of deoxyribonucleic acid from microorganisms. J. Mol. Biol. 3:208-218.
8. Marsh, T. L., X. Zhang, R. M. Knapp, M. J. McInerney, P. K. Sharma, and B. E. Jackson. 1995. Mechanisms of microbial oil recovery by Clostridium acetobutylicum and Bacillus strain JF-2., p. 593-610. In R. S. Bryant and K. L. Sublette (ed.), The Fifth International Conference on Microbial Enhanced Oil Recovery and Related Problems for Solving Environmental Problems. Office of Scientific and Technical Information, CONF-9509173.
9. McInerney, M. J., S. O. Han, S. Maudgalya, H. Mouttaki, M. Folmsbee, R. Knapp, D. Nagle, B. Jackson, M. Staudt, and W. Frey. 2001. Development of more effective biosurfactants for enhanced oil recovery. Final Technical Report for DOE DE-AC26-98BC15113. University of Oklahoma.
10. McInerney, M. J., M. Javaheri, and D. P. Nagle. 1990. Properties of the biosurfactant produced by Bacillus licheniformis strain JF-2. J. Indust. Microbiol. 5:95-102.
11. Sonenshein, A. L., James A. Hoch, Richard Losick. 1993. Bacillus subtilus and Other Gram-positive Bacteria. ASM, Washington D.C.
12. Tanner, R. S. 1989. Monitoring sulfate-reducing bacteria: comparison of enumeration media. J. Microbiol. Methods. J. Microbiol. Methods 10:83-89.
13. Thomas, C. P., G. A. Bala, and M. L. Duvall. 1993. Surfactant-based enhanced oil recovery mediated by naturally occurring microorganisms. Soc. Petrol. Eng. Reservoir Eng. 11:285-291.

42
Chapter 2. Screening, selection, and genetic manipulation of biosurfactant-producing Bacillus strains.
2.1 Abstract
Microorganisms produce a wide range of biosurfactants with diverse chemical
structures. Their ability to partition at the water-oil interface makes them ideal candidates for MEOR. In this year of the project, 157 bacterial strains were screened for biosurfactant production under both aerobic and anaerobic conditions. These data were compared to the amount of biosurfactant produced by Bacillus mojavensis JF-2, a model biosurfactant-producing microorganism that has been extensively applied in MEOR. Several methods were used to screen for biosurfactant production. The oil spreading technique and high performance liquid chromatography (HPLC) were used as quantitative measures of biosurfactant activity. The ability of the strains to reduce surface tension was measured by using ring tensiometer. A hundred and forty seven strains produced either equal or higher amounts of biosurfactant compared to JF-2 and the 10 best strains were chosen for further study. In an attempt to increase biosurfactant production, a genetic recombination experiment was conducted by mixing germinating spores of four of the best strains with JF-2. Biosurfactant production was higher with the mixed spore culture than in the co-cultures containing JF-2 and each of the other 4 strains or in a mixed culture containing all five strains that had not undergone genetic exchange. Four isolates were obtained from the mixed spores culture that gave higher biosurfactant production than any of the original strains. Repetitive sequence-based polymerase chain reaction (REP-PCR) analysis showed differences in the band pattern for these strains compared to the parent strains, suggesting the occurrence of genetic recombination.
2.2 Introduction
Biosurfactants are a diverse group of surface-active chemical compounds
produced by a wide variety of microorganisms [1]. Members of the genera Arthrobacter, Bacillus, Candida, Pseudomonas, and Rhodococcus are known to produce biosurfactants of diverse chemical structures [1, 3]. Biosurfactants have been investigated as replacements for synthetic surfactants since they are environmentally friendly and biodegradable. They are less sensitive to extreme conditions of temperature, salt concentration, and pressure than synthetic surfactants. Since biosurfactants have very low critical micelle concentration (mg/l), they are considered to be more economical to use than synthetic surfactants [2]. Biosurfactants are amphiphilic molecules with both hydrophilic and hydrophobic domains, which allow them to partition at the interface of two fluids with differing polarities such as oil-water or water-air interfaces [1, 3, 4]. They are thus capable of reducing the interfacial and/or surface tension. Such properties make them good candidates for enhanced oil recovery.
Candidate microorganisms for microbially enhanced oil recovery (MEOR) should be able to grow and produce their biosurfactants at high temperatures (about 50°C) and high salt concentrations (around 5%) and under anaerobic conditions with minimal

43
nutrient requirements. The bacteria should be able to maintain their biosurfactant production over a long period of time. The lipopeptide biosurfactant produced by Bacillus mojavenesis strain JF-2 isolated from oil well produced waters has been used in MEOR due to its stability at high temperatures and high salinities [5]. The JF-2 biosurfactant reduces oil- brine interfacial tension to less than 0.01mN/m and has a low critical micellar concentration (CMC) of 10-25 mg/L. However, anaerobic growth and biosurfactant production by JF-2 require the addition of growth factors as proteose peptone and yeast extract. Also, the activity of biosurfactant produced decreases over time [5].
Since genetic recombination is known to occur between mixed germinating spores of Bacillus species [6, 7], we hypothesized that Bacillus strains with improved biosurfactant producing ability could be obtained by mixing germinating spores of JF-2 and those of other Bacillus species. Our aim is to obtain strains that produce higher amount of biosurfactants than JF-2, are able to grow anaerobically with minimal nutrient requirements, and can maintain their biosurfactant activity over long periods of time. We screened a large number of Bacillus strains for anaerobic growth and biosurfactant production, selected the most promising strains, and attempted to increase biosurfactant production through genetic recombination.
2.3 Materials and methods
Bacterial strains: The following strains were used in our study: Bacillus mojavensis strains: ROB-2, ROG-4, ROQQ-2, ROH-1, TG2-42, TG3-41,
TG6-33, and T89-14. Bacillus subtilis subsp. subtilis: T89-43, T89-44, T89-46, T89-47, T89-48, T89-49,
T89-50, T89-51, T89-42, TG6-27, T89-8, TG4-19, T89-2, TF-32, TF-34, TG1-11, TG2-5, TG5-13, T88-13, T89-1, T89-10, T89-13, T89-15, T89-17, and T89-18.
Bacillus subtilis subsp. spizizensis: T88-8, T88-9, T88-10, T88-11, T88-12, T88-19, T88-20, T88-39, T89-3, T89-4, T89-5, T89-6, T89-7, T89-9, T89-12, T89-16, T89-52, T89-53, T89-55, T89-56, TG1-16, TT1-48, TT1-33, TT1-23, TG3-43, TG6-19, TG6-11, TG2-31, TG1-44, TG1-24, T89-26, T89-27, T89-28, T89-29, T89-30, T89-31, T89-34, T89-36, T89-37, T89-54.
Bacillus licheniformis and sonorensis: TE-46, TG8-8, T88-15, T89-40, T89-38, TE-50, T89-32, TE-11, TE-45, TE-48, TG8-25, RF-1, T89-33, T89-11, T89-39, TE-12, TG2-32, TG1-15, TG3-38, and T88-14.
The above strains were isolated by Dr. K. Duncan from the Sonoran desert, Arizona [8].
Oil well isolates with unknown taxonomic affiliation from our culture collection were also used. These strains are designated: 39, 40, 41, 42, 44, 45, 46, 47, 48, 49, 50, 51, 52, 53, 54, 55, 56, 57, 58, 59, 61, 62, 63, 64, 65, 66, 67, 68, 69, 70, 71, 72, 73, 74, 78, 79, 80, 83, 84, 87, 88, 92, 93, 96, 102, 103, 104.
Media. All cultures were grown aerobically in liquid medium E (KH2PO4, 2.7 g/l;
K2HPO4, 13.9 g/l; sucrose, 10g/l; NaCl, 50g/l; yeast extract, 0.5g/l; NaNO3, 1g/l; pH 6.86). This was autoclaved and after cooling 10 ml/l of each of the following solutions was added: MgSO4, 2.5 g%; (NH4)2SO4 ,10 g%; Wolin’s trace metals solution containing

44
(EDTA, 0.5 g/l; MnSO4.H2O, 3g/l; NaCl, 1 g/l; CaCl2
.2H2O, 0.1g/l; ZnSO4.7H2O, 0.1 g/l;
FeSO4.7H2O, 0.1 g/l; CuSO4
.5H2O, 0.01 g/l; AlK(SO4)2, 0.01 g/l; Na2MoO4.2H2O, 0.01
g/l; boric acid, 0.01 g/l; Na2SeO4, 0.005g/l; NiCl2.6H2O, 0.003 g/l).
For anaerobic growth, anaerobic medium E with 15 g/l proteose peptone, 10 ml/l of Woiln’s trace metal solution containing 3 g/l MgSO4
.7H2O), and 0.1 mg/l resazurin as redox indicator was used. The medium was boiled under 100% N2 gas, allowed to cool under a stream of 100% N2, and then dispensed in serum tubes (10 ml/tube) with 100% N2 headspace. The tubes were then stoppered and 0.2 ml of cysteine.HCl (a 25 g/l solution) was added to each tube [9]. All media and solutions were sterilized by autoclaving at 121ºC for 15 min.
Spores were prepared on AK sporulation agar (Becton Dickinson, Sparks MD) plates.
Blood agar plates [blood agar base (Becton Dickinson, Sparks MD), 40 g/l; sheep blood (Brown laboratory, Topeka KA), 50 ml/l] were used for screening of biosurfactant production.
Methods used to screen for biosurfactant production: Strains were streaked on
blood agar plates, incubated for 48 hours at 37ºC. The plates were then visually inspected for zones of clearing around colonies, indicative of biosurfactant production. The diameters of the clearing zones are known to increase with increasing the concentration of the biosurfactant. The diameters of clearing zones were compared to those obtained with strain JF-2, which was used as a positive control. Strain JF-2 mutant strain, which does not produce biosurfactant, was used as the negative control of the experiment [10].
Two microliters of mineral oil were added to each well on a 96-microtiter plate lid. The lid was equilibrated for 1 hour, and then 5 µl of a culture grown in liquid medium E for 24 hours at 37ºc was added to the surface of oil. The shape of the drop on the surface of oil was inspected after 1 minute. Biosurfactant-producing cultures gave flat drops while those that did not produce biosurfactant gave rounded drops. Strain JF-2 was used as positive control while strain JF-2 mutant or water was used as negative controls [10, 11].
Fifty milliliters of distilled water were added to a large Petri dish (25 cm in diameter) followed by the addition of 20 µl of crude oil to the surface of the water. Ten microliters of a culture grown in liquid medium E for 24 hours at 37ºC was added to the surface of oil. The area of the clear zones on the oil surface was measured and related to the concentration of biosurfactant by using a standard curve prepared with the commercially available biosurfactant, surfactin (Sigma chemicals co., St. Louis, MO)[12].
Surface tension was measured using a Du Nouy ring tensiometer [9]. Pure water and a soap solution were used to standardize the tensiometer. Two milliliters of the sample were used for measurement.
The amount of biosurfactant was quantified by HPLC. A C-18 column was used with an isocratic mobile phase of 73% methanol and 27% 10 mM phosphate buffer at a pH of 6.5. The flow rate was 1 ml/min and the injection volume was 20 µl. A variable-wavelength UV absorbance detector at 210 nm was used to detect biosurfactant. Samples for HPLC analysis were prepared by centrifuging 10 ml of culture at 17,300xg for 10 minutes at 4ºC and the supernatant was collected. Acidification of the supernatant was

45
done by adding 1N HCl until a pH of 2 was reached. The acidified supernatant was placed at 4ºC for 24 hours and then centrifuged at 10,000xg for 30 minutes at 4ºC. The pellet was washed with 2 ml of methanol for 1 minute, and then centrifuged at 15,000 xg for 5 min. The supernatant was carefully decanted and used for analysis.
Genetic recombination experiment: Genetic recombination experiment was
conducted using 5 Bacillus mojavensis strains: JF-2, ROB-2, ROG-4, ROQQ-2, and T89-14. Spores were prepared from each of these strains by using AK sporulation medium. Plates of the solid AK medium were streaked with each of the strains (5 plates per strain) and incubated at room temperature for 1 week. Growth was then scraped off the plates and collected in 5 ml of sterile distilled water. To germinate the spores, each spore preparation was heated at 85ºC for 20 minutes.
Approximately 107 colony forming units (CFU) of heat-treated spores of JF-2 and one of each of the other 4 strains were placed onto the surface of a plate of plate count agar (PCA) (Difco, Inc. Detroit, MI), mixed, and then allowed to grow for 24 hours at 37ºC. A mixture containing spores of all 5 strains was also prepared as described above. This incubation would provide an opportunity for genetic exchange to occur between the different strains. As a control, germinating spores were grown separately on PCA plates for 24 hours at 37ºC followed by scraping off the growth into separate liquid medium E. After 24 hours of incubation cultures were combined. This control would account for differences in biosurfactant activity due to the presence of two or more biosurfactants. Higher biosurfactant activity observed with the mixed spore preparation where all five strains were allowed to germinate on the same plate compared to the control where the five strains were combined after germination and growth indicates that genetic recombination took place.
Biosurfactant activity in cultures of each of the single strains, mixed spores, and combined cultures was followed over a period of 14 days by using the oil spreading technique.
The above experiment was repeated where the incubation time for germinating spores was increased to 48 hours to test the effect of the incubation time on the occurrence of genetic recombination and biosurfactant activity.
Methods used to test for the occurrence of genetic recombination: Acid
precipitated biosurfactant was prepared from pure cultures of JF-2, ROB-2, cultures inoculated with mixed spores of both strains, and a co-culture of both strains where each organism was inoculated into the same culture. The cultures were grown in 1-liter volumes in medium E for 48 hours. After growth, the cells were removed by centrifugation at 17,300 xg for 15 minutes at 4ºC. The pH of the supernatant was adjusted to 2 by the addition of concentrated HCl and the acidified culture was kept overnight at 4ºC. The acidified culture fluid was centrifuged at 10,000 xg for 30 minutes at 4ºC and the pellet containing the biosurfactant was collected. The acid-precipitated biosurfactant was dissolved in water and the pH was adjusted to 7 with the addition of 1N NaOH [13].
A 5µl sample from each culture was spotted on silica gel plates previously heated at 110ºC for 1 hour. Each plate received 5µl of surfactin as the positive control.
After drying the plates were placed in a chamber and resolved using a solvent that contained CHCl3: CH3OH (2:1) for 10 minutes. Next, the plates were resolved with

46
Acetone: NH4OH (9:1) [14]. When the solvent reached the top of the plate, the plate was removed from the chamber and dried. To visualize the resolved spots, two reagents were used. Ninhydrin 0.2% in ethanol (Sigma spray reagent, cat. No. N-0757) gives reddish-purple spots with amino groups when the plate is heated at 110ºC for 10 min. Rhodamine 0.25 g% in absolute ethanol gives yellow or blue violet spot against pink-red background with lipids when the plate is exposed to UV light at 270 nm [15].
Developing JF-2 and ROB-2 strains with Rifampicin resistance: Plate count
agar (PCA) plates with 10 mg/l rifampicin were prepared and streaked heavily with JF-2 or ROB-2. The plates were incubated at 37ºC for 48 hours or until colonies started to appear. The colonies were restreaked 3 times to obtain a pure culture. The rifampicin-resistant strain was used for DNA extraction.
DNA extraction: A single colony was used to inoculate 10 ml of antibiotic
medium 3 (Difco, Detroit, MI), which was shaken at 37ºC until turbid. Two ml of this culture was then used to inoculate 100 ml of the same medium, which was incubated at 37ºC for 6 hours. The cells were pelleted by centrifugation at 5000xg for 15 minutes at 4ºC. The pellet was re-suspended in 5 ml of 50 mM Tris (tri hydroxymethyl amino methane)-HCl- EDTA (ethylene diamine tetra-acetic acid) (TE buffer) (pH 8) and 100 mg of lysozyme was added to lyse the cells. The lysozyme mixture was incubated at 37ºC for 50 minutes with occasional shaking. To hydrolyze RNA, 1 µl of RNAse ONE (Invitrogen) was added for each 3 ml of cell suspension, which was then incubated at 37ºC for 60 minutes. Next, the cell suspension received adding 0.1 ml of 10% sodium dodecyl sulfate (SDS) and 0.25 ml of 1 mg/ml proteinase K and was incubated at 37ºC overnight with shaking to hydrolyze proteins. To purify and extract the DNA, an equal volume of Tris-buffered phenol was added and the tube was inverted several times for mixing then centrifuged at 10000 xg for 5 min at room temperature. The aqueous layer was then extracted several times by adding an equal volume of chloroform: isoamyl alcohol (24:1) and centrifuging as above. The DNA was then precipitated by adding 0.1 volume of 3 M sodium acetate (pH 5.2) and 3 volumes of pure ethanol. The precipitated DNA was then spooled unto a glass pipette, rinsed in 70% and 100% ethanol, and left to dry at room temperature. DNA was then redissolved in TE buffer and the DNA concentration was determined by measuring the absorbance at 260 nm.
Transformation: To obtain transformants, 107 CFU of JF-2 germinating spores
and 2.5 µg of rifampicin-resistant, ROB-2 DNA were mixed on plate count agar (PCA) plate and incubated for 24 hours at 37ºC. Similarly, 107 CFU of ROB-2 germinating spores and 2.5 µg of rifampicin resistant, JF-2 DNA were mixed on PCA plate and incubated for 24 hours at 37ºC. As controls, germinating spores of either strain were grown on plates individually without DNA added. After incubation, growth on the plate was scraped off and mixed with aerobic, liquid medium E. The cell suspension was serially 10-fold diluted and the dilutions were inoculated to PCA plates with 10 mg/l of rifampicin and PCA plates without rifampicin. The DNA was also streaked on PCA plates and PCA with 10 mg/l rifampicin to check for contamination. Appearance of colonies on the rifampicin plates would suggest DNA uptake by the germinating spores.

47
Isolation of improved biosurfactant-producing strains: The mixed spore preparation containing the five Bacillus mojavensis strains that were allowed to germinate on the same plate (see above) was used. The growth from the initial germination plate was scrapped off and mixed with liquid medium E. After 24 hours of incubation at 37ºC, a PCA plate was streaked from the liquid culture and 90 colonies were picked to individual wells of a 96-microtiter plate each containing 1 ml medium E. The microtiter plate was incubated for 24 hours at 37ºC and biosurfactant production was monitored by using the drop collapse method. Wells that gave positive results from the drop collapse methods were further tested by the oil spreading technique and compared to the values obtained with cultures of 5 original strains. REP-PCR reaction:
In an attempt to determine whether the isolated strains from the mixed spore culture were genetic recombinants, REP-PCR was utilized. This technique relies on the fact that some of the non-coding regions in prokaryotic genomes are highly repetitive and conserved within a strain so the technique can be used to show genetic difference between different strains [16].
The PCR reaction was conducted with purified DNA for each of the parent strains and the new isolates according to the protocol shown in Table 2.1.
Table 2.1: Components of the master mix for the REP-PCR reaction:
Volume added (µL)*
PCR water 8.875
25 mM MgCl2 2
10 x PCR buffer 2.5
10 mM dNTPs 0.5
BOX A1R primer 1
Taq polymerase (5 U/µ l) 0.125
* Total volume was 15 µ l .
A hundred nanograms of DNA from each of the species was added to a PCR tube (PCR water was added in the negative control tube) followed by the addition of 15 µl of the master mix (Table 2.1) and mixing by inverting the tube several times. REP-PCR program used a protocol involving initial denaturation of the DNA for 4 minutes at 940C, 35 cycles of 940C for 1 minute, 500C for 1 minute, and 720C for 8 minutes, followed by a final extension at 720C for 8 minutes. Negative controls contained PCR water without DNA present.
Agarose gel electrophoresis was used to visualize the products of the REP-PCR reaction. Agarose gels were prepared as 1.5 g% in Tris Borate EDTA (TBE) buffer pH 8.3 (Eppendorf, Westbury, NY). Each gel was run at 40 volts for 5 hours. To better visualize the bands, polyacrylamide gel electrophoresis (PAGE) was used. PAGE gels were prepared as 5% in Tris Acetate EDTA (TAE) buffer pH 8.3 (Eppendorf, Westbury,

48
NY). Each gel was run at 35 volts for 17 hours at room temperature to examine the difference in pattern between the 4 new colonies compared to the original strains.
Selection of biosurfactant-producing strains: To select for biosurfactant-
producing strains, medium E was modified to contain Inipol (Atofina chemicals, Philadelphia, PA). Medium E was modified by the deletion of nitrate and the addition of 1 g/l Inipol. Inipol is a compound that has nitrogen in the form of urea completely enclosed in a lipid membrane. Biosurfactant-producing strains would be able to emulsify the lipid membrane making the urea available for the organism for growth.
Aerobic medium E containing inipol was prepared and inoculated with a loopful of a culture of JF-2, JF-2 mutant, ROB-2, mixed spores of JF-2 and ROB-2, and co-culture of both grown aerobically in liquid medium E. Then, 0.1 ml of the aerobic cultures grown in medium with inipol was used as an inoculum for the anaerobic medium E with inipol and proteose peptone. Growth was determined visually and biosurfactant production was followed over a period of 1 week by using the oil spreading technique.
2.4 Results
Comparing different methods used for screening of biosurfactant
production: Table 2.2 shows the total number of strains that were screened and the number of positive results obtained with each of the different screening methods. Table 2.2: Comparison of different methods used for screening of biosurfactant production.
Number of strains screened 157
Number of strains positive with oil spreading technique 147 Number of strains positive with drop collapse method 142 Number of strains positive with blood agar plates 123
Lysis of blood agar has been recommended as a method to screen for
biosurfactant activity. This method is useful in predicting the promising strains regarding biosurfactant production since, in most cases, the degree of lysis of red blood cells is directly proportional to the concentration of biosurfactant production. However, it has not been determined that all kinds of biosurfactants have a hemolytic activity and microorganisms may produce chemicals other than biosurfactants that can cause hemolysis. We found that a number of strains did not have hemolytic activity but did have biosurfactant activity when measured by the drop collapse method (19/142), or by the oil spreading technique (24/147). Drop collapse method is only semi-quantitative, but only gave 5 false negatives compared to the oil spreading technique. The drop collapse method may not be sensitive enough to detect small concentrations of biosurfactant. The oil spreading technique gave the highest number of positive results compared to the other two screening methods. It is also quantitative and reproducible, and is easy and cheap to use. Surface tension measurement can always be used to confirm biosurfactant activity by

49
measuring the decrease in surface tension caused by biosurfactants regardless of their chemical structure.
Optimization of oil spreading test: Table 2.3 shows the concentration of
biosurfactant present in a series of culture dilutions of both JF-2 and ROB-2 liquid cultures. Each strain was inoculated in 100 ml liquid medium E and incubated aerobically for 24 hours at 37ºC. Table 2.3: Effect of dilution on biosurfactant activity when measured by the oil spreading technique:
Strain Dilution Average diameter (cm) diameter
Concentration (mg/ml)
JF-2 (liquid
culture)
1:32 0 0
1:16 0.3 0.30
1:8 0.5 0.37
1:4 0.6 0.42
1:2 0.8 0.60
1 1.2 1.0
ROB-2 (liquid
culture)
1:32 0.5 0.37
1:16 0.7 0.50
1:8 0.9 0.64
1:4 1.2 1.0
1:2 1.5 1.3
1 1.8 1.8

50
Figure 2.1 shows the effect of dilution on the oil spreading technique. The linear response indicates that the biosurfactant activity as measured by the diameter of the clear zone on the oil-water surface decreases proportionally with a decrease in concentration of the biosurfactant. Thus, the oil spreading technique is a quantitative measure of biosurfactant activity.
Effect of acid precipitation: Table 2.4 shows the concentration of biosurfactant,
as calculated by oil spreading technique before and after acid precipitation. These results show that some of the biosurfactant produced by these strains is lost during the acidification-precipitation procedure as evidenced by the lower amount (in mg) obtained with the acid precipitated preparation as compared to that of liquid culture. The low recovery of the biosurfactant activity present in the ROB-2 culture may suggest that ROB-2 produces several kinds of biosurfactants
Table 3.4: Effect of acid precipitation on biosurfactant activity
Strain Fraction Concentration
(mg/ ml)
Final
Volume (ml)
(ml)
Final Amount
(mg) Percent recovery
Culture 0.95 100 ml 95.0 JF-2 Acid ppt. 11 7 ml 76.8
80.8
Culture 1.8 100 ml 182.3 ROB-2 Acid ppt. 5.9 7 ml 41.0
22.5

51
Screening of different Bacillus strains for growth and biosurfactant production: Table 2.5 shows the results obtained when the oil spreading technique was done for aerobic cultures of some promising Bacillus strains grown in liquid medium E and incubated at 37ºC for 24 hours. These cultures were able to produce either equal or higher amounts of biosurfactant as compared to the amount produced by JF-2. Table 2.5: Biosurfactant production by various Bacillus strains measured by the oil spreading technique.
Bacillus species Strain Ave. Diameter (cm)
Concentration (mg/ml)
B. mojavensis ROB-2 2.5±0 3.3 ROG-4 2±0 2.2 ROQQ-2 1.8±0 1.7 T89-14 1.2±0 0.95
B. subtilis subsp. subtilis T89-44 1.8±0.17 1.7 T89-49 1.8±0.17 1.7 T89-2 1.3±0.1 1.1 TG4-19 4.2±0.17 8.8 T89-42 5±0 12.4 TG6-27 3.2±0.17 5.2
B. subtilis subsp. spizizensis T88-8 2.4±0.17 2.8 T88-9 1.8±0.17 1.7 T88-11 3±0.17 4.6 T88-12 1.8±0.17 1.7 T88-19 3±0 4.6 T88-19 1.8±0 1.7
T88-39 3±0 4.6
T89-3 3±0.17 4.6 T89-6 1.8±0 1.7 T89-16 1.8±0.17 1.7 T89-52 1.5±0 1.3 T89-53 1.8±0 1.7
Oil well isolates 45 1.8±0 1.7 53 1.8±0.17 1.7 57 2.1±0.17 2.0 58 1.8±0.17 1.7 61 1.8±0.17 1.7 62 1.5±0 1.3 64 1.8±0.17 1.7 69 2.4±0.17 2.8 70 1.8±0.17 1.7

52
74 2.1±0.17 2.0 B. mojavensis JF-2 1.2±0.12 0.95
Figure 2.1a. shows the diameters obtained when the oil spreading technique was done with 10 of the best biosurfactant-producing strains. These strains have biosurfactant activity that is at least twice that produced by JF-2. All these strains were grown aerobically in liquid medium E at 37ºC for 24 hours. However, they were unable to produce biosurfactant when grown anaerobically in medium E at 37ºC for 24 hours.
Figure 2.1a: Biosurfactant activity by the 10 best biosurfactant-producing strains as measured by the oil spreading technique.
Table 2.6 summarizes the growth properties and biosurfactant production by all of the strains that were screened. Bacillus mojavensis strains were able to grow under both aerobic and anaerobic conditions (in presence of Proteose peptone) with 50 g/l of NaCl. However, they were only able to produce biosurfactant under aerobic conditions with 50 g/l of NaCl. Out of the 8 strains of Bacillus mojavensis screened, only 4 were able to produce equal or higher amount of biosurfactant than JF-2.
Bacillus subtilis subspecies subtilis strains were able to grow under both aerobic and anaerobic conditions (in presence of proteose peptone) with 50 g/l of NaCl. However, they were able to produce biosurfactant only under aerobic conditions with 50 g/l of NaCl. Out of the 30 strains of Bacillus subtilis subspecies subtilis screened, 7 were able to produce equal or higher amount of biosurfactant compared to JF-2, with 4 strains producing more than double the amount produced by JF-2.
Bacillus subtilis subspecies spizizensis strains were able to grow under both aerobic and anaerobic conditions (in presence of proteose peptone) with 50 g/l of NaCl. However, they were only able to produce biosurfactant under aerobic conditions with 50 g/l of NaCl. Out of the 40 strains of Bacillus subtilis subspecies spizizensis screened, 13

53
were able to produce equal or higher amount of biosurfactant than JF-2 with 5 strains producing more than double the amount produced by JF-2.
Bacillus licheniformis and sonorensis strains were able to grow under both aerobic and anaerobic conditions (in absence of proteose peptone) with 50 g/l of NaCl. However, they were not able to produce biosurfactant under either aerobic or anaerobic conditions with 5% salt. The strains that grew anaerobically in high salt medium without proteose peptone are candidates for our genetic recombination experiments. We hope to be able to transfer the genes required for anaerobic growth to strain JF-2 so Proteose peptone is no longer required.
Table 2.6: Summary of growth and biosurfactant properties of strains that have been analyzed to date.
Strains No. of strains
Biosurfactant production
(>0.95 mg/ml)
Aerobic growth
Anaerobic biosurfactant production
Anaerobic with P.P.*
Anaerobic without P.P.*
B. mojavensis 8 4 8 -- 8 --
B. subtilis subsp. Subtilis
30 7 30 -- ND --
B.subtilis subsp. Spizizensis
40 13 40 -- ND --
Oil well isolates
49 10 45 -- 29 13
B. licheniformis and sonorensis
20 -- 20 -- ND 20
*Abbreviation: P.P. proteose peptone
Genetic recombination experiment: Table 2.7 and Figure 2.2 show the concentrations of biosurfactant (mg/ml) obtained when germinating spores of JF-2 were mixed with those of other Bacillus mojavensis strains for 24 hours. The highest concentrations were obtained when JF-2 germinating spores were mixed with those of ROB-2 and when the germinating spores of all the five Bacillus mojavensis strains were mixed together. The amount of biosurfactant produced did not decrease over time in case of mixed spore preparation of JF-2 and ROB-2. This suggests that mixing germinating spores lead to the production of larger amounts of biosurfactants compared to the

54
amounts produced by strain JF-2. Some of the biosurfactants produced are stable over a period of 14 days while that produced by strain JF-2 decreased dramatically by the end of the 14 days.
Table 2.7: Biosurfactant production by 24-hour mixed spore preparations (The amounts of biosurfactants are shown in mg/ml. Biosurfactant production was measured by the oil spreading technique.)
Days JF-2 JF2+ ROG-4
JF2+ ROB-2
JF2+ ROQQ-2
JF2+ T8-14 All**
1 0.95 1.34 3.28 0.74 0.95 6.2 2 0.43 1.34 3.28 0.56 0.4 5.22 3 0.43 1.34 3.28 0.56 0.4 5.22 5 0.33 1.34 3.28 0.4 0.4 4.62 8 0.33 1.2 3.28 0.4 0.3 4.62 9 0.33 1.2 3.28 0.4 0.3 3.79 14 0.33 1.2 3.28 0.4 0.3 3.28 **All: mixed spore preparation containing all five strains.
Table 2.8 and Figure 2.3 show the concentrations of biosurfactant (mg/ml) obtained when germinating spores of JF-2 were mixed with those of other Bacillus

55
mojavensis strains for 48 hours. The highest concentrations were obtained when JF-2 germinating spores were mixed with those of ROB-2 and when the germinating spores of all five Bacillus mojavensis strains were mixed together. However, the amount of biosurfactant produced decrease over time in all cases. Table 2.8: Biosurfactant production by 48-hour mixed spore preparations (The amounts of biosurfactants are shown in mg/ml. Biosurfactant production was measured by the oil spreading technique.)
Days JF-2 JF-2+ ROG-4
JF2+ ROB-2
JF2+ ROQQ-2
JF-2+ T89-14 All**
1 0.95 2.19 2.6 1.34 0.95 6.2 2 0.4 2.19 1.82 1.34 0.95 6.2 4 0.4 2.19 1.82 0.74 0.4 5.22 7 0.3 1.34 1.82 0.74 0.37 3.28 8 0.3 0.95 1.82 0.74 0.29 2.19 13 0.3 0.69 1.82 0.49 0.29 1.82 **All: mixed spore preparation containing all five strains.
Comparison of the results between Tables 2.7 and 2.8 suggests that when spores were mixed on plates for 48 hours, biosurfactant production was higher as compared to mixing them for 24 hours. However, in case of the mixture of JF-2 with ROG-4 or ROB-2, or the mixed spore preparation containing all five strains, the amount of biosurfactant at the end of the 14 days was about one half of that observed when the spores were incubated for 24 hours. These experiments will be repeated in order to obtain a preparation that consistently give high biosurfactant activity over long incubation times.
56
Table 2.9 shows the concentration of biosurfactants (mg/ml) produced by pure cultures of the five Bacillus mojavensis strains, the mixed spores preparation of JF-2 with each of the other 4 strains (ROB-2, ROG-4, ROQQ-2, T89-14), the mixed spore preparation containing all five strains, co-cultures of JF-2 with each of the other 4 strains, and a mixed culture containing all 5 strains. Co-cultures and the mixed cultures were used as a control since DNA exchange did not occur in these cultures. Table 3.9: Biosurfactant production (mg/ml) by various combinations of Bacillus mojavensis strains that were (mixed spore preparations) and were not (co-cultures and mixed cultures) allowed to exchange DNA as measured by using the oil spreading technique. Time (days) Strain Single
strain Mixed spores with JF-2
Co-culture with JF-2
1 3.28 3.28 0.95 2 3.28 3.28 0.74 3 3.05 3.28 0.74 5 3.05 3.28 0.74 7 3.05 3.28 0.74 8 3.05 3.28 0.74 9 3.05 3.28 0.74 14
ROB-2
3.05 3.28 0.74
57
1 2.19 1.34 0.56 2 2.19 1.34 0.56 3 1.82 1.34 0.56 5 1.82 1.34 0.56 7 1.34 1.34 0.43 8 1.34 1.2 0.43 9 1.34 1.2 0.43 14
ROG-4
1.34 1.2 0.37 1 1.82 0.74 0.43 2 1.82 0.56 0.43 3 1.2 0.56 0.43 5 1.2 0.43 0.43 7 0.95 0.43 0.33 8 0.95 0.43 0.33 9 0.74 0.43 0.33 14
ROQQ-2
0.74 0.43 0.33 1 0.95 0.95 0.56 2 0.95 0.42 0.56 3 0.95 0.42 0.56 5 0.95 0.42 0.56 7 0.74 0.42 0.56 8 0.74 0.33 0.56 9 0.74 0.33 0.42 14
T89-14
0.74 0.33 0.33 1 6.2 2.60 2 5.2 2.60 3 5.2 2.2 5 4.62 2.2 7 4.62 1.82 8 4.62 1.82 9 3.79 1.82 14
All
3.05 1.34

58
Figure 2.4: Stabili ty of the biosurfactant produced by each of the 5 Bacillus mojavensis strains, their mixed spore preparation, and their mixed cultures over a period of 14 days.
Figure 2.4 shows that the amount of biosurfactant produced by mixed spores of all 5 strains was higher than that produced by any of the original strains. The amount of biosurfactant produced by mixed germinating spores of all five strains was higher compared to the control where each strain was present in the mixed culture. This might suggest the occurrence of genetic recombination between mixed germinating spores.
Testing for the occurrence of genetic recombination: Thin layer
chromatography was used to determine if different biosurfactants were made after mixing germinating spores of different strains. This would suggest the occurrence of genetic recombination. No spots were obtained upon spraying the plates with Ninhydrin possibly because the there is no free amino group in the structure of the cyclic lipopeptide biosurfactant. The results upon spraying with Rhodamine were not decisive since all the spots migrated to the same Rf value.
In order to verify that genetic recombination occurred between mixed sores of different strains, DNA with rifampicin resistance genes was mixed with germinating spores that lack the genes for rifampicin resistance. Appearance of colonies on PCA plates with rifampicin would suggest that DNA exchange occurred.
No colonies were obtained on rifampicin plates upon mixing the germinating spores with the rifampicin-resistant DNA. The transformation of cells with exogenous DNA is a random process that requires optimization of conditions in order to detect the event. Thus, the absence of detectable transformation does not exclude the possibility that

59
DNA exchange occurred with germinating spores. Further characterization of the strains were required (see below).
Isolation of strains with improved biosurfactant production: Another attempt
to verify genetic recombination was to isolate individual strains from the mixed spore preparation and determine whether they produced greater amounts of biosurfactant than any of the original strains. Using the drop collapse method, 21 out of the 90 colonies picked to wells of a 96-microtiter plate, gave positive results where the drop completely spread over the oil surface. Using the oil spreading technique to quantify the concentration of biosurfactant produced by these 21 cultures, only 4 out of the 21 cultures produced higher amounts of biosurfactant compared to that produced by any of the original 5 strains. These 4 cultures (C8, C9, E10, and F2) also had different colony morphologies than any of the 5 original strains. Table 2.10 and Figure 2.5 show the diameters obtained on the oil/water surface by the 5 original and the 4 new strains when using the oil spreading technique.
Table 2.10: The average diameter (cm) and the concentration of biosurfactant (mg/ml) obtained when oil spreading technique was done for aerobic cultures of the 5 original strains and the 4 putative recombinant strains. Strain Average diameter (cm) Concentration (mg/ml)
JF-2 1.2±0.12 1.0 ROB-2 2.4±0 3.1 ROG-4 2±0 2.2
ROQQ-2 1.8±0.12 1.8 T89-14 1.2±0.12 1.0
C8 3.6±0 6.5 C9 3.6±0 6.5 E10 3.6±0.17 6.5 F2 3±0 4.6
The values obtained for biosurfactant concentrations were higher for the 4 new isolates compared to the concentrations obtained with the 5 original strains. This may suggest that genetic recombination occurred by mixing the germinating spores of the 5 original strains.

60
Figure 2.4: The average diameter obtained when the oil spreading technique was done for aerobic cultures of the 5 original strains and the 4 new isolates.
In order to determine the stability of biosurfactant produced by the new isolates, the 4 new cultures and the 5 parent strains were sub-cultured in liquid medium E and incubated at 37ºC for 7 days. The amount of biosurfactant produced by the 9 strains was measured over the period of the 7 days by using the oil spreading technique. Table 2.11 shows the concentration of biosurfactant produced by the 9 strains over the 7-day period.
Table 2.11: Biosurfactant concentration in mg/ml obtained when oil spreading technique was done for aerobic cultures of the 5 original Bacillus mojavensis strains and the 4 new isolates.
Days JF-2 ROB-2
ROG-4
ROQQ-2
T89-14 C8 C9 E10 F2
1 1.0 3.0 2.2 1.8 1.0 6.54 6.54 5.54 4.62
2 1.0 3.0 2.2 1.8 1.0 6.54 6.54 5.54 4.62
3 0.60 3.0 1.8 1.2 0.74 6.54 6.54 4.62 4.62
7 0.37 3.0 1.3 1.0 0.74 3.05 6.54 1.82 3.8

61
Figure 2.6 shows the time course of biosurfactant production by the 5 original and the 4 new strains over a 7-day period. Only C9 continued to produce the same amount of biosurfactant over the period of 7 days.
Figure 2.6: Stabili ty of biosurfactant production over a period of 7 days.
Results of the REP-PCR experiment: The purpose of the REP-PCR experiment was to determine whether genetic differences exist between the 5 original Bacillus mojavensis strains and the 4 new isolates to determine whether the genetic recombination occurred. The agarose gel for the REP-PCR products in Figure 2.7 shows that the band pattern of the new isolates is similar to that of ROG-4, one of the original Bacillus mojavensis strains. This suggests that ROG-4 might be the recipient strain in the process of genetic transformation. To show the minor differences between the 4 strains and ROG-4 a PAGE gel was run and the results are shown in Figure 2.8. One of the bands of ROG-4 (shown) is absent in C8 and C9. This supports the assumption that C8 and C9 are actually different from the 5 original strains and that they might have developed from the genetic recombination experiment with ROG-4 being the recipient strain.

62
Figure 2.7: The agarose gel run for the products of the REP-PCR reaction done for the 5 original Bacillus mojavensis strains ( JF-2, ROB-2, ROG-4, ROQQ-2, T89-14) and the 4 new isolates (C8, C9, E10, F2). (N.C. is the negative control).

63
Figure 2.8: The PAGE gel elecrophoresis showing the products of the REP-PCR reaction done for the 5 original Bacillus mojavensis strains (JF-2, ROB-2, ROG-4, ROQQ-2, T89-14) and the 4 new isolates (C8, C9, E10, F2). (The arrow points to the band that is present in ROG-4, absent in C8 and C9).
Selection of biosurfactant-producing Bacillus strains: JF-2 mutant strain (which is known not to produce biosurfactant) was able to grow aerobically at 37ºC in the presence of inipol and absence of nitrate as nitrogen source. The medium still contains ammonium sulfate and yeast extract, which has other nitrogen sources that allow growth of the mutant. This suggests that inipol cannot be used for selection of biosurfactant producers unless all other nitrogen sources are removed from the medium.
Table 2.12 shows the diameters (cm) and biosurfactant concentrations (µg/ml) obtained when oil spreading technique was done over a 7-day period for both aerobic and anaerobic cultures of JF-2, ROB-2, mixed spores of both, and co-cultures of both in medium E with inipol instead of the nitrate. It was observed that in the aerobic medium prepared with inipol instead of the nitrate, the amount of biosurfactant produced with any of the strains (JF-2, ROB-2, mixed spores of both, and co-culture of both) decreased steadily over a period of 7 days. While in case of anaerobic medium with inipol instead of nitrate, there was an increase in the amount of biosurfactant production after 2 days. Biosurfactant activity then decreases on the third day. Biosurfactant activity was higher

64
under anaerobic conditions when medium E with inipol (without nitrate) was used compared to medium E with nitrate (without inipol). In the latter case, the maximum amount of biosurfactant produced was between 200-300 µg/ml for JF-2. Table 2.12: The diameters (cm) and biosurfactant concentration (mg/ml) measured by the oil spreading technique for aerobic and anaerobic samples of JF-2, ROB-2, mixed spores of both, and co-culture of both in medium E with inipol instead of the nitrate. Anaerobic Aerobic
Strain Days Diameter Conc. Strain Days Diameter Conc.
1 2.1 2.4 1 3.9 7.6
2 4.25 9.0 2 2.35 2.9
3 3 4.6 3 2.5 3.3
JF-2
6 1 0.74
JF-2
6 1.8 1.8
1 2.7 3.8 1 3.9 7.6
2 4 8.0 2 3 4.6
3 3 4.6 3 2.5 3.3
ROB-2
6 1.2 0.95
ROB-2
6 2.4 3.05
1 6.9 23.4 1 3 4.6
2 8 31.3 2 2 2.2
3 5.25 13.6 3 2 2.2
Mixed spores
6 1.8 1.8
Mixed spores
6 2.4 3.05
1 2.7 3.8 1 3.3 5.54
2 4.75 11.2 2 3.25 5.4
3 4.5 10.1 3 1.5 1.3
Co-culture
6 1 0.74
Co-culture
6 1.8 1.8

65
Figure 2.9: Stabili ty of the biosurfactant produced aerobically in medium E with inipol over 1 week period.
Figure 2.10: Stability of the biosurfactant produced anaerobically in medium E with inipol over 1 week period.
Figures 2.9 and 2.10 show the amount of biosurfactant produced over a 7-day period by JF-2, ROB-2, mixed spores of both, and co-cultures of both when they were grown in medium E with inipol under aerobic and anaerobic conditions respectively.
0
5
10
15
20
25
30
35
1 2 3 6
Time (Days)
Bio
surf
acta
nt c
once
ntra
tion
(mg/
ml)
JF-2ROB-2mixed sporesmixed cultures
012345678
1 2 3 6
Time (Days)
Bio
surf
acta
nt c
once
ntra
tion
(mg/
ml)
JF-2ROB-2mixed sporesMixed cultures

66
2.5. Discussion
In this work, we combined traditional screening of naturally occurring Bacillus
isolates and genetic recombination of Bacillus spores to obtain cultures capable of efficient biosurfactant production under various environmental conditions. The work clearly highlights the potential for biosurfactant production among natural Bacillus isolates, and also indicates the usefulness of genetic recombination to achieve the same goal. We also utilized the screening effort to compare various existing methods for biosurfactant screening, and highlight the advantages and disadvantages of each.
It has been known that genetic recombination can occur between mixed germinating spores of Bacillus species [6, 7]. This was tried successfully between members of Bacillus subtilis and Bacillus licheniformis [6]. We applied genetic recombination on biosurfactant-producing Bacillus mojavensis by mixing germinating spores preparation of five different Bacillus mojavensis strains. Our aim was to obtain Bacillus strains with better or improved biosurfactant-producing ability. The results showed that a more biosurfactant was produced by the mixed spore preparation compared to the amount produced by any of the individual strains or by the mixed culture controls. These results suggest that genetic recombination might have occurred between the 5 original strains. Isolation of 4 new isolates from the mixed spore preparation with a biosurfactant-producing ability better than any of the original strains in amount and stability, and differences in the band pattern of the REP-PCR reaction products between the 4 new isolates and the 5 original strains further support the contention that genetic recombination occurred.
The ability to obtain recombinant strains by mixing germinating spores of the parent strains is not only useful in improving biosurfactant-producing ability. It can be also applied to get strains that are capable of producing biosurfactant under anaerobic condition, or that do not require expensive nutrients for growth and biosurfactant production such as Proteose peptone (Chapter 2). The latter application would markedly reduced costs for in situ applications of microbially-mediated oil recovery. Biosurfactants produced by these new strains could also be useful in aspects other than MEOR depending on their chemical structure. Some biosurfactants are known to have therapeutic application as antibiotics, antimicrobial agents, antifungals, or antivirals. Biosurfactants can also be used in bioremediation processes of soil or sand, or in the cleanup of hydrocarbon contaminants in groundwater [17].
Screening 157 Bacillus strains for growth and biosurfactant production showed that 147 strains were capable of producing biosurfactant under aerobic conditions. Thirty three of these produced biosurfactants in amounts that were at least twice the amount produced by JF-2 with members of Bacillus subtilis subspecies subtilis being the most promising strains. In contrast to JF-2, some of the strains were able to maintain their biosurfactant production over a period of 7-14 days. Members of B. licheniformis and B. sonorensis did not require proteose peptone for growth under anaerobic conditions. Thus, we have a number of promising strains, either because of the amount of biosurfactant produced, the stability of biosurfactant production over time, or the capability of anaerobic growth without proteose peptone, that can be used in genetic recombination experiments with JF-2 in the future to obtain recombinant strains that have improved

67
properties for MEOR. This approach should allow us to obtain strains that do not have the technical problems that have been encountered with JF-2.
Several methods were used for screening of biosurfactant production. However, the oil spreading technique proved to be a quantitative and reproducible method for determining the activity of biosurfactant produced by different Bacillus strains. The principal of the method depends on the decrease in water-oil interfacial tension caused by the biosurfactant regardless of its structure [12]. Other quantitative approaches such as HPLC are effective. However, the chromatographic conditions have to be optimized for each class of biosurfactants, thus, making it difficult to use it as a general screening method to detect biosurfactants of unknown composition in diverse bacteria. The drop collapse method is only semi-quantitative and is not sensitive enough to detect slight differences in biosurfactant activity. However, it can be used for rapid screening of a large number of strains at the same time (96 strains per microtiter dish). The blood agar plate method is a useful preliminary approach in screening to detect biosurfactant production. However, it can give both false positive (hemolytic agents other than biosurfactants) and false negative (biosurfactants with non-hemolytic activity) results, which can only be discerned upon further testing.
2.6. References
Banat I. M. 1995. Characterization of biosurfactants and their use in pollution
removal-state of the art. Acta Biotechnologica 15, 251-267. Sullivan E. R. 1998. Molecular genetics of biosurfactant production. Current
opinion in biotechnology 9; 263-269. Banat I.M., Makkar R.S., and Cameotra S.S. 2000. Potential commercial
applications of microbial surfactants. Applied microbiology and biotechnology 53, 495-508.
Georgiou G., Lin S., and Sharma M. M. 1992. Surface-active compounds from microorganisms. Biotechnology 10, 60-65.
Lin S., Minton M.A., Sharma M.M., and Georgio G. 1994. Structural and immunological characterization of a biosurfactant produced by Bacillus licheniformis JF-2. Applied and environmental microbiology 60(1);
Duncan K.E., Istock C. A., Graham J. B., Ferguson N. 1989. Genetic exchange between Bacillus subtilis and Bacillus licheniformis: variable hybrid stability and the nature of bacterial species. Evolution 43(8); 1585-1609.
Orrego C., Arnaud M., and Halvorson H.O. 1978. Bacillus subtilis 168 genetic transformation mediated by outgrowing spores: necessity for cell contact. Journal of bacteriology 134(4); 973-981.
8.Duncan K. E., Ferguson N., Kimura K., Zhou X., and Istock C.A. 1994.Fine-scale genetic and phenotypic structure in natural populations of Bacillus subtilus and Bacillus licheniformis: implications for bacterial evolution and speciation. Evolution 48(6); 2002-2025.
9. Javaheri M., Jenneman G.E., Mcinerney M. J. and Knapp R.M. 1985. Anaerobic production of a biosurfactant by Bacillus licheniformis JF-2. Applied and environmental microbiology 50: 698-700.

68
10. Bodour A. A., and Miller-Maier R.M. 1998. Application of a modified drop collapse technique for surfactant quantitation and screening of biosurfactant-producing microorganisms. Journal of microbiological methods 32, 273-280.
11.Jain D. K., Collins-Thompson, D. L.; Lee, H.; and Trevors, J. T. 1991. A drop-collapsing test for screening surfactant-producing microorganisms. Journal of microbiological methods 13, 271-279.
12. Morikawa M., Hirata Y., and Imanaka T. 2000. A study on the structure-function relationship of lipopeptide biosurfactants. Biochimica et Biophysica Acta 1488(3); 211-218.
13. McInerney MJ, Javaheri M, Nagle DP Jr. 1990. Properties of the biosurfactant produced by Bacillus licheniformis strain JF-2. Journal of Industrial Microbiology 5(2-3): 95-101.
14. Matsuyama T., Sogawa M., and Yano I. 1987. Direct colony thin layer chromatography and rapid characterization of Serratia marcescens mutants defective in production of wetting agents. Applied and environmental microbiology 53(5); 1186-1188.
15. Stahl, E. 1969. Thin-layer chromatography. A laboratory handbook. Second edition, fully revised and expanded. Berlin, Heidelberg, New York, Springer.
16. Versalovic J., Schneider M., De Bruijn F. J., and Lupski J. R. 1994. Genomic fingerprinting of bacteria using repetitive sequence-based polymerase chain reaction. Methods in molecular and cellular biology 5:25-40.
17. Ron E. Z., and Rosenburg E. 2001. Natural roles of biosurfactants. Environmental microbiology `3(4); 229-236.

69
Chapter 3. Importance of the 3-hydroxy fatty acid composition of lipopeptides for biosurfactant activity
3.1. Abstract
Biosurfactant production may be an economic approach to improve oil recovery.
To obtain candidates most suitable for oil recovery, 207 strains, mostly belonging to the genus Bacillus, were tested for growth and biosurfactant production in medium with 5% NaCl under aerobic and anaerobic conditions. All strains grew aerobically with 5% NaCl and 147 strains produced a biosurfactant. Thirty-five strains grew anaerobically with 5% NaCl and two produced a biosurfactant. In order to relate structural differences to activity, eight lipopeptide biosurfactants with different specific activities produced by various Bacillus species were purified by a new protocol. The amino acid composition of the 8 lipopeptides was the same (Glu/ Gln: Asp/ Asn: Val: Leu; 1:1:1:4), but the fatty acid composition differed. Multiple regression analysis showed that the specific biosurfactant activity depended on the ratios of both iso to normal, even-numbered fatty acids and anteiso to iso, odd-numbered fatty acids. The multiple regression model accurately predicted the specific biosurfactant activity of 4 newly purified biosurfactants (r2 = 0.91). The fatty acid composition of the biosurfactant produced by Bacillus subtilis subsp. subtilis strain T89-42 was altered by the addition of branched-chain amino acids to the growth medium. The specific activities of biosurfactants produced in cultures with the different amino acid additions were accurately predicted by the multiple regression model from the fatty acid composition (r2 = 0.95). Our work shows that many strains of Bacillus mojavensis and Bacillus subtilis produce biosurfactants and that the fatty acid composition is important for biosurfactant activity.
3.2. Introduction Biosurfactants are compounds produced by a variety of microorganisms (3) that
are capable of lowering surface and/ or interfacial tension (3, 4, 13) by partitioning at the water/air and water/oil interfaces (34, 39). They can have a variety of structures including fatty acids, neutral lipids, phospholipids, glycolipids, and lipopeptides (13). Biosurfactants aid in the tertiary stage of oil recovery from low production oil reservoirs by releasing oil trapped by capillary pressure (34).
The activity of biosurfactants depends on their structural components, e.g. the types of hydrophilic and hydrophobic groups and their spatial orientation (9). Most lipopeptide biosurfactants have been shown to have a structure similar to surfactin, the biosurfactant produced by Bacillus subtilis (2, 14, 20, 32). Surfactin is a cyclic lipopeptide with β-hydroxy fatty acids linked to a heptapeptide (L-Glu-L-Leu-D-Leu-L-Val-L-Asp-D-Leu-L-Leu) (2, 14). Solubility and surface activity of surfactin depend on the arrangement of the amino acid residues to produce two domains, a minor hydrophilic domain and a major hydrophobic domain (9). Changes in the amino acids in position 2, 4,

70
and/ or 7 of surfactin to a more hydrophobic residue increased the surface activity and decreased the critical micelle concentration (8, 31, 32, 35, 36). In contrast, Yakimov et al. (40) changed the fatty acid composition of lichenysin A, a lipopeptide produced by Bacillus licheniformis BAS50, by addition of branched-chain amino acids to the growth medium. The increase in the percentage of branched-chain fatty acids in lichenysin A decreased the activity of the biosurfactant.
Candidate microorganisms for enhanced oil recovery should produce biosurfactants at low oxygen tension, slightly elevated temperatures, and high salt concentrations since these are the conditions encountered in many domestic oil reservoirs. The lipopeptide produced by Bacillus mojavenesis strain JF-2 generates low interfacial tension (less than 0.01 mN/m) needed for substantial oil recovery (24, 26). It grows and produces the lipopeptide anaerobically at salt concentrations up to 8% and temperatures up to 45ºC (19, 24). However, most of the activity is lost after extended incubations (N. Youssef, and M. J. McInerney, unpublished data), and complex nutrients are required for its anaerobic growth (25).
In an attempt to find better candidates for microbially enhanced oil recovery, a number of bacterial strains, mostly Bacillus strains, were screened for anaerobic growth and stable biosurfactant production (28, 42) in the presence of 5% NaCl. Biosurfactant activity varied markedly among the strains. To understand the factors that influence biosurfactant activity, the biosurfactant concentration and amino acid and fatty acid compositions of a number of lipopeptide biosurfactants produced by strains of Bacillus subtilis and Bacillus mojavensis were determined.
3.3. Materials and methods Bacterial strains and cultivation: The taxonomic affiliation and the number of
strains used in this study are shown in Table 3.1. All cultures were grown at 37ºC in presence and absence of O2 in a mineral salts medium with 5% NaCl and sucrose as the energy source as previously described (42). For screening, duplicate, 25-ml cultures were used, while duplicate or triplicate, 1-liter cultures were used for biosurfactant extraction and purification. Each culture was grown until maximal activity was obtained (usually between 42 and 44 h of incubation). When needed, amino acids (L-valine, L -alanine, L -leucine, and L -isoleucine) were added to the medium at 1 g/l before autoclaving.
Screening for biosurfactant production: Biosurfactant activity was measured
by the oil spreading technique (28, 42). Fifty milliliters of distilled water were added to a large Petri dish (25 cm in diameter) followed by the addition of 20 µl of crude oil to the surface of the water. Ten microliters of a culture grown in mineral medium was added to the surface of oil. The diameter of the clear zone on the oil surface was measured for triplicate samples from each replicate culture. Biosurfactant activity, defined as diameter of clearing on the oil surface in centimeters, ranged from 0 to 3 cm. The coefficient of variation ranged from 0 to 17% for replicates of the same strain. To compare biosurfactant stability, duplicate cultures of strains with the highest biosurfactant activity were sampled over a period of 14 days and tested for biosurfactant activity. The surface activity relative to that of the biosurfactant produced by B. mojavensis strain JF-2 was

71
obtained by dividing the oil displacement diameter obtained with a given strain by the value obtained for B. mojavensis strain JF-2, (1.2 ± 0.17 cm).
Biosurfactant extraction and purification: The method used for biosurfactant
extraction and purification was modified from Kim et al. (23). When the maximum oil displacement diameter was obtained, cells from duplicate or triplicate, 1-liter cultures were removed by centrifugation at 14,300 x g for 15 min at 4ºC. The pellet was dried at 110ºC overnight and the dry weight determined. Biosurfactant in the supernatant was precipitated with 40% w/v ammonium sulfate and incubated overnight at room temperature. The precipitate containing the biosurfactant along with other compounds was then collected by centrifugation at 14,300 x g for 30 min at 4ºC. The precipitate was extracted with 250 µl of chilled acetone to remove most of the proteins. Instead of the column chromatography steps used by Kim et al. (23), further purification was achieved by preparative thin layer chromatography (TLC) of the acetone extract. The whole acetone extract (250 µl) was spotted on preparative silica gel TLC plates (Whatman, Clifton, NJ) with a solvent system of isopropanol: water: 28% w/v ammonium hydroxide (80:11:9). The TLC plates were developed with iodine vapor. Each fraction was scraped off the plate, dissolved in 250 µl water, and tested for surface activity with the oil spreading technique. Surface-active fractions were lyophilized. The weight of the lyophilized biosurfactant was determined and used to calculate the biosurfactant yield (biosurfactant weight/ dry weight of cells). Biosurfactant yields of different strains varied from 0.9 to 3.1 mg•g-1 dry weight of cell. The coefficient of variation of biosurfactant yield between different batches of the same strain ranged from 4.9 to 27%.
To compare surface activities of different biosurfactants, 1µg•µl-1 solutions of purified biosurfactants were prepared and tested by oil spreading technique. The specific activity of the purified biosurfactant was expressed as the diameter of the clear zone in millimeters per microgram of the purified biosurfactant. Biosurfactant specific activity of different strains varied from 0.7 to 4.5 mm•µg-1. Triplicate samples were done for each culture. The coefficient of variation of specific activity between different batches of the same strain ranged from 4 to 26%, while that for the same batch of the same strain was less than 5%.
Amino acid analysis: The amino acid composition of each purified biosurfactant
was determined by the molecular biology research facility of the William K. Warren Research Institute (Oklahoma City, OK). Purified biosurfactants were acid hydrolyzed under vacuum in sealed tubes with 6N HCl at 110ºC for 18-24 hours. Each hydrolyzed sample was vacuum dried, dissolved in 0.01N HCl and filtered through a 0.45 µm nylon filter before analysis. Amino acid analysis was performed by cation exchange chromatography. Amino acid elution was accomplished with a two-buffer system. The sample was injected onto the column equilibrated with 0.2 N sodium citrate, pH 3.28. This buffer eluted the first 9 amino acids. The remaining amino acids were eluted by1N NaCl in 0.2 N sodium acetate, pH 7.4. Amino acids were detected by an on-line post-column reaction with ninhydrin (Tritone, Pickering Lab., Inc). Derivatized amino acids were quantified by their absorption at 570 nm, except for glutamic acid and proline, which were detected at 440 nm. The procedure was performed with a totally automated Beckman System Gold Model 126 HPLC Amino Acid Analyzer.
72
Fatty acid analysis: A methanolysis procedure, modified from the method of Yakimov et al. (40), was used to analyze the fatty acids. Two hundred micrograms of the purified biosurfactant were hydrolyzed under vacuum for 16 hours at 90ºC with 4 ml of 25% 12 N HCl in methanol in sealed tubes. The hydrolyzed fatty acids methyl esters (FAME) were then extracted with 7 ml of 1:1 v/v ethyl acetate: hexane (EAH solvent). The organic phase was concentrated under a stream of N2 to 0.6 ml. The concentrated fractions were neutralized with 0.5 ml of 0.4 M phosphate buffer (pH 12) and incubated at room temperature for 10 min. The FAME in the organic layer were derivatized with BSTFA (Pierce, Rockford, IL) and analyzed by gas chromatography/ mass spectrometry (GC/MS) (Agilent Technologies 6890N Network GC systems/ 5973 Network Mass Selective Detector, Willmington, DE). One microliter of each sample was used for injection; triplicate injections were made for each biosurfactant preparation. The oven temperature was set at 60ºC for 5 min and then increased to 250ºC over a 15-min interval. The column was a capillary column 0.25 mm X 30 m X 0.25 µm. The carrier gas was helium and the flow rate was 1.2 ml/min. The mass spectrometer was operated at 400Hz. Peak areas obtained on the GC chromatogram were used to calculate the percentage of the FAME isomers compared to the area of all FAME. The electron ionization mass spectra were dominated by fragment ions specific for trimethylsilyl (TMS) derivatives. The fragment ion at 175, which is specific for TMS derivatized hydroxyl groups in the beta position, was used to extract the chromatogram to detect peaks corresponding to 3-hydroxy fatty acids. The M-15 fragments (loss of methyl group) on the MS spectra were used to identify the carbon chain length of the fatty acid isomers. These corresponded to 301 for 3-OH-C13, 315 for 3-OH-C14, 329 for 3-OH-C15, 343 for 3-OH-C16, and 357 for 3-OH-C17. M-31 fragments, characteristic of fatty acids and corresponding to the loss of methanol, were also detected. Iso isomers of fatty acids were identified by the presence of M-43 fragment (loss of an isopropyl group) and the absence of M-29 fragment (loss of an ethyl group) from the MS spectra. Anteiso isomers were identified by the presence of M-57 fragment (loss of a secondary butyl group) and the absence of M-43 fragment (loss of an isopropyl group) from the MS spectra. Fragments M-29, M-43, and M-57 were very small in comparison to others specific for trimethylsilyl (TMS) derivatives, but were discernable by magnifying the mass spectrum. Retention times and mass spectra were compared to authentic standard methyl 3-hydroxy tetradecanoate (Larodan Fine Chemicals, Malamö, Sweden).
Statistical analyses: SPSS for windows (release 11.5.0, SPSS Inc., Chicago, IL)
and Microsoft excel for Mac (version 11.1.1) were used to calculate Pearson’s correlation coefficients and test regression models.
3.4. Results Screening of microorganisms. Thirty-five strains mostly belonging to Bacillus
licheniformis and Bacillus sonorensis grew anaerobically with 5% NaCl (Table 3.1), two of which produced a biosurfactant. One hundred and forty seven strains mostly belonging to Bacillus subtilis subsp. subtilis and B. subtilis subsp. spizizenii produced a biosurfactant under aerobic conditions (Table 3.1). Sixteen strains produced

73
biosurfactants with activities 1.75 to 2.5 times that of JF-2 biosurfactant. Sixty-nine strains had biosurfactant activity comparable to JF-2 (0.83 to 1.7 times) (Table 3.1). Some Bacillus mojavensis strains (2 out of 5 tested) maintained their biosurfactant activity over a 14-day incubation period compared to B. mojavensis strain JF-2 that lost 50% of its activity in 7 days.
Evaluation of a new protocol for biosurfactant purification: The lipopeptide
produced by triplicate cultures of Bacillus mojavensis strain ROB-2 was used to compare the efficiency of two purification methods. Method 1 involved acid precipitation (using 1N HCl to adjust the pH of the cell-free culture fluid to 2) (41) followed by thin layer chromatography (TLC). Method 2 used ammonium sulfate precipitation followed by acetone extraction and thin layer chromatography. Seventy five percent of the biosurfactant activity remained in the cell-free culture fluid after cell removal. The surface-active fraction obtained from the TLC plate by method 1 had 23 ± 7% of the activity originally present in the culture, while the surface-active fraction obtained from the TLC plate by method 2 had 63 ± 11% of the activity originally present in the culture. The specific biosurfactant activity of the surface-active fraction from the TLC plate for 12 different strains was 0.65 ± 0.07 mm• µg-1 by method 1 and 1.9 ± 0.7 mm• µg-1 by method 2. Method 2, being more efficient, was used to purify the biosurfactants.
Relationship between biosurfactant yield and activity: The biosurfactant
yields of seven different Bacillus strains (duplicate cultures for each strain) with activities ranging from 0.5 to 4.25 times that of B. mojavenesis strain JF-2 were determined. Biosurfactant activity was poorly correlated with biosurfactant yield (linear correlation coefficient r2 = 0.09, and Pearson correlation coefficient (15) = -0.29). The biosurfactant activity did not always increase with an increase in biosurfactant yield, i.e. some biosurfactants were produced in high yields, but had relatively low activity, while others were produced in low yields, but had high activity.
Biosurfactants structure-activity relationship: The lack of correlation between
biosurfactant yield and surface activity prompted us to study the effect of variation in structural components of different biosurfactants on activity. Amino acid analysis of eight purified biosurfactants showed that they contained the same amino acid composition (mean ± std dev of the mole ratio): Glu/ Gln: Asp/ Asn: Val: Leu (0.99 ± 0.04: 0.99 ±0.04: 1 ± 0.04: 3.6 ± 0.12). Since the acid hydrolysis method used for amino acid analysis does not differentiate between acid or amide forms of the acidic amino acids (i.e. glutamate and glutamine, or aspartate and asparagine), the peptide portion of these biosurfactants may differ in their Glu/ Gln and/ or their Asp/ Asn content.

74
Table 3.1: Numbers, taxonomic affiliations, growth properties, and biosurfactant production by bacterial strains used in this study.
a Number of strains showing growth or biosurfactant production under the conditions indicated in the column heading. All the strains were grown with 5% salt; duplicate cultures of each stain were analyzed for each condition. b Relative activity was measured by dividing diameter of clearing of different strains by that of JF-2 (diameter of clearing =1.2 ± 0.17 cm). The activity was measured in triplicates for each culture and the coefficient of variation for duplicates of the same strain ranged from 0 to 17%. c Reference provides the origin of the strains.
Growth Biosurfactant
production
Number of strains with biosurfactant
activity relative to JF-2 ranging fromb Referencesc
Species Number
of strains +O2 -O2 +O2 -O2 0.42-0.75 0.83-1.7 1.75-2.5
B.mojavensis 23 23a 1a 11a 1a 4 5 2 (33)
B.subtilis subsp.
subtilis 47 47 0 39 0 14 20 5 (10, 12, 18)
B.subtilis subsp.
spizizenii 43 43 0 38 0 10 20 8 (10, 12, 18)
B. megaterium 15 15 0 7 0 4 3 0 (18)
B. licheniformis 12 12 12 8 1 7 1 0 (12)
B. sonorensis 9 9 9 4 0 4 0 0 (29)
B . species 14 14 0 5 0 4 1 0 (18)
Oil well isolates 44 44 13 35 0 15 19 1 OU culture
collection

75
Table 3.2: Comparison of biosurfactant activity and fatty acid ratios of different biosurfactants
a Mean ± std dev of triplicate cultures. The specific activity of purified biosurfactant is expressed as diameter of spreading in mm per µg of the biosurfactant purified. b Mean ± the range of duplicate cultures. The numbers refer to the percentage of different fatty acids (% mass values) in the l ipid portion of the purified biosurfactant. The percentage was calculated by dividing the peak areas of individual fatty acids by the total peak area of al l FAME.
The fatty acid portion of the biosurfactants contained 3-hydroxy tridecanoate (3-
OH-C13), tetradecanoate (3-OH-C14), pentadecanoate (3-OH-C15), and hexadecanoate (3-OH-C16) (Table 3.2). The 3-OH-C13, and 3-OH-C15 fatty acids were present as mixtures of iso and anteiso isomers while 3-OH-C14 was comprised of normal and iso isomers. The 3-OH-C16 fatty acid contained only the normal isomer. In some cases, the 3-OH-C14 and 3-OH-C15 fatty acids together constituted the majority of the fatty acids of the lipopeptide. However, in other cases, the 3-OH-C14 alone was the major fatty acid isomer. When the fatty acids of the biosurfactant purified from duplicate cultures of the same strain were analyzed, the fatty acid composition varied from one batch to another along with the specific activity of the biosurfactant. Multiple regression analysis was
Fatty acid composition
Species Strain Specific activity
mm•µg-1 C13 C14 C15 C16
B. mojavensis JF-2 3 ±2a 1.3 ± 2.5b 49.6 ± 85.4b 11.3 ± 14.9 24.4 ± 45
B. subtilis subsp. spizizenii TG6-19 2.4 ± 0.8 3.6 ± 7.1 58.4 ± 54.8 30.3 ± 54.8 3.5 ± 0.2
B. subtilis subsp. subtilis T89-15 3 ± 2 2.4 ± 4.8 67.7 ± 47.2 22.7 ± 29.4 4.3 ± 3.8
B. subtilis subsp. subtilis T89-42 1.63 ± 0.3 4.7 ± 9.4 67.1 ± 29.4 24.6 ± 47.2 4.3 ± 38
B. subtilis subsp. spizizenii T88-8 3 ± 2.95 2.4 ± 4.8 61 ± 52.8 27.3 ± 52.8 6.3 ± 88
B. subtilis subsp. spizizenii CL1-14 2.55 ± 2.1 4.2 ± 8.4 67.3 ± 56.9 25.8 ± 44.4 4.4 ± 4.9
B. mojavensis T89-14 2 ± 2 6.4 ± 12.8 57 ± 69.5 32.8 ± 55.7 2.8 ± 1.2
B. subtilis subsp. spizizenii T89-3 1.35 ± 1.3 6.8 ± 13.6 49.7 ± 44.3 35.5 ± 29 6.2 ± 0.7

76
used to determine the fatty acid isomers that contributed to activity (43). All fatty acid isomers, the sums of the tridecanoate, tetradecanoate, pentadecanoate, hexadecanoate, ratios of even iso/normal isomers and other combinations were used to construct multiple regression models. There was a significant positive correlation between the % mass of the iso 3-OH C14 fatty acid and biosurfactant specific activity (Pearson’s bivariate correlation coefficient, r=0.813, p<0.001) and a significant positive linear correlation between ratio of iso to normal, even-numbered fatty acids and biosurfactant specific activity (Pearson’s bivariate correlation coefficient, r=0.953, p<0.001). No fatty acid other than the iso 3-OH C14 showed a significant positive linear correlation with biosurfactant specific activity. We found that the best model of specific activity of lipopeptide biosurfactants depended on both the ratio of iso to normal, even-numbered fatty acids (positive dependence) and the ratio of anteiso to iso, odd-numbered fatty acids (negative dependence). When the values expected for specific activity (obtained by using the multiple regression equation) were plotted against the values of specific activity obtained experimentally (Fig. 3.1, open squares) (43), the linear correlation coefficient (r2) was 0.91 (15) and the Pearson correlation coefficient (r) was 0.94 (15). The variation not explained by the multiple regression model might be due to the probability of the presence of a different amino acid in the peptide portion (Glu/ Gln and/ or Asp/ Asn content) of the lipopeptides.
The multiple regression model accurately predicted the specific biosurfactant activity from the ratios of both iso to normal, even-numbered fatty acids and anteiso to iso, odd-numbered fatty acids for four other lipopeptide biosurfactants produced by B. mojavensis and B. subtilis subsp. spizizenii strains (Fig. 3.1, closed diamonds).
Figure 3.1: Multiple regression analysis for the fatty acid predictors of specific activity of l ipopeptide biosurfactants. Values on the X-axis are the experimentally obtained specific activities of the different lipopeptide biosurfactants. Values on the Y-axis were obtained by using the multiple regression equation: y (specific activity) = 0.39 (ratio of iso to normal

77
even-numbered fatty acids) – 0.09 (ratio of anteiso to iso odd-numbered fatty acids) + 0.73. The equation of the straight line was y = 0.908 x + 0.214. The coefficient of linear regression was r2 = 0.908. The multiple regression equation above was used to predict the specific activity of four other strains. The coefficient of linear regression (r2) between the predicted and actual specific activity for these four strains was 0.9134 (y = 0.925x + 0.611). Squares: values for the experimentally obtained versus calculated specific activities for seven biosurfactants purified from duplicate cultures and 1 biosurfactant purified from triplicate cultures. Closed diamonds: values for the experimentally obtained versus calculated specific activities of four other purified biosurfactants.
Effect of amino acid addition: Precursors of branched chain fatty acids (21) were added to the growth medium of B. subtilis subsp. subtilis strain T89-42 to change the fatty acid composition and test the predictions of the multiple regression model (Table 3.3). When the strain was grown with 1g/l valine, the specific activity increased 3.2-fold, and the yield almost doubled compared to un-amended cultures. The ratio of iso to normal 3-OH even-numbered fatty acids increased 2.8-fold (Table 3.3). The increase in both the specific activity and the ratio of iso to normal even-numbered fatty acids when valine was added to the growth medium supports the finding that the specific activity is positively correlated to this ratio. When strain T89-42 was grown with alanine, the specific activity increased 1.7-fold, the ratio of iso to normal even-numbered fatty acids increased 1.2-fold, while the ratio of anteiso to iso odd-numbered fatty acids was about the same as in the control without amino acid addition (Table 3.3). When leucine was present, the specific activity doubled (Table 3.3). The increase in the specific activity with leucine addition could not be accounted for by an increase in the ratios of iso to normal even-numbered fatty acid isomers since the iso and normal isomers of even-numbered fatty acids with leucine addition comprised only 3.8% of the total fatty acids compared to 48 % of the total fatty acids in the control without amino acid addition. However, the decrease in the ratio of anteiso to iso odd-numbered fatty acids may explain the increase in specific activity since this ratio is negatively correlated to specific activity. When isoleucine was added to the growth medium, the specific activity was similar to the unamended control. An increase in the ratio of iso to normal even numbered fatty acids (1.7-fold) might have counteracted the increase in the ratio of anteiso to iso odd numbered fatty acids (2.7-fold) to keep the specific activity close to that of the control without amino acid addition.
Figure 3.2 shows that there was a strong linear correlation (r2 = 0.95) (15) between the values of specific activities of biosurfactants produced in cultures with the different amino acid additions and the specific activities predicted from the multiple regression equation based on the fatty acid composition. Pearson correlation coefficient (r) was 0.98 (15).

78
Table 3.3: Yields, surface activities, and fatty acid ratios of biosurfactants from Bacillus subtilis subsp. subti lis strain T89-42 grown in presence and absence of exogenous amino acids in the medium.
a Mean ± std dev of triplicate cultures. The biosurfactant yield is expressed as mg biosurfactant • g-1 dry weight of cells. b Mean ± std dev of triplicate cultures. Specific activity of biosurfactant is expressed as mm of clearing • µg-1 of biosurfactant. c Even-numbered fatty acids are iso-3-OH-C14, normal 3-OH-C14 and normal 3-OH-C16. Odd-numbered fatty acids are anteiso 3-OH-C13, 3-OH-C15 (and 3OH-C17 only in case of isoleucine addit ion), and iso 3-OH-C13, 3-OH-C15 (and 3-OH-C17 only in case of isoleucine and leucine additions). d Mean ±( range) of the fatty acid rat ios of the biosurfactant purified from duplicate cultures.
Amino acid added
Biosurfactant yield
Specific activity
Ratio of iso/n even-numbered fatty acidc
Ratio of anteiso/iso odd-numbered fatty acidsc
None 1.2 ± 0.25 a 2 ± 0.05 b 2.25 (± 0.5)d 0.55 (± 0.1)d Alanine 0.28 ± 0.006 3.1 ± 0.4 2.7 (± 0.6) 0.45 (±0.3) Valine 2.3 ± 0.06 5.7 ± 0.6 6.33 (± 0.06) 0.62 (± 1.05) Leucine 0.25 ± 0.04 4.1 ± 0.6 3.9 (± 0.38) 0.037 (± 0.07) Isoleucine 0.37 ± 0.09 2.2 ± 0.4 3.9 (± 3.2) 2.7 (± 0.6)

79
Figure 3.2: Correlation between the experimentally obtained specific biosurfactant activities and those predicted by the multiple regression equation based on known fatty acid composition. The predicted specific activity was calculated from the fatty acid ratios given in Table 3 with the multiple regression equation given in the legend to Figure 1. Data points represent each culture condition shown in Table 3. The error bars represent range of duplicate cultures for each growth condition. The equation of the straight line was y = 0.323 x + 1.12. The coefficient of linear regression was r2 = 0.902. 3.5. Discussion
The majority of strains examined in this study were members of Bacillus subtilis
(subspecies subtilis and spizizenii), Bacillus licheniformis, or species closely related to them. Although many of these strains had originally been isolated for other studies (10, 12, 18, 33) and therefore not selected to be biosurfactant producers, 68% produced biosurfactant, as compared to 80% of isolates from oil wells (Table 3.1). Approximately 14% of these strains that were examined with an oil-spreading technique had relative activities 1.75 to 2.5 times that of JF-2 (15 out of 110; Table 3.1), while 1 in 44 strains isolated from oil wells (2%) had such a high relative activity. Therefore, in accordance with recent findings (7), we found that biosurfactant-producing microbes can be readily isolated from uncontaminated, undisturbed arid soils. However, our percentage of biosurfactant-producing isolates was quite high (e.g. 68% vs. 3.4%), reflecting our focus upon Bacillus species known to contain strains that produce biosurfactants rather than screening more broadly for novel biosurfactant producers. Strains varied greatly in biosurfactant yield (mg biosurfactant produced per gram dry weight of cells) and in the surface activity of active fractions collected from TLC plates. There was only a weak correlation between yield and surface activity.

80
The lack of correlation between yield and activity suggested that the variability in surface activity of biosurfactants produced by the closely related strains used for this study was due to structure differences rather than a result of changed gene expression. The three dimensional structure of surfactin, the biosurfactant produced by B. subtilis (9), showed that the carboxylic groups of both glutamate and aspartate form a minor hydrophilic domain, and the non-polar residues in position 4 and, to a lesser extent, in positions 2 and 7 form major hydrophobic domains with the lipid tail. The presence of these 2 domains was found to be important for surface activity. Since then, structural variants of surfactin were obtained via chemical modification (38), cultural modification, or genetic recombination (8, 14, 31, 32, 35, 36) to obtain a biosurfactant molecule with higher surface activity. A substitution of valine to isoleucine in position 4 decreased the CMC by two-fold and increased the surface activity possibly due to the expansion of the major domain by the incorporation of the more hydrophobic isoleucine (8). Monoanionic biosurfactants (e.g. lichenysin A with asparagine in position 5) had higher surface activity compared to dianionic biosurfactants (e.g. surfactin with aspartate in position 5) (14, 41). In this study, all the biosurfactants tested had 1 valine and 4 leucines. Glutamine and/ or asparagine could replace glutamate and aspartate in positions 1 and 5, respectively, since these amino acids could not be distinguished by the method used for amino acid analysis. The presence of glutamine or asparagine in the peptide chain would mean that the biosurfactant is monoanionic and hence should have higher activity. A more detailed study on the presence of the amide form of acidic amino acids is required to rule out their effect on the biosurfactant activity.
The fatty acid composition of the lipopeptide also affects activity. Yakimov et al. (40) found that an increase in the percentage of branched chain fatty acids in lichenysin A of Bacillus licheniformis strain BAS50 decreased surface activity and an increase in the percentage of straight chain 3-hydroxy tetradecanoate (n-3OH-C14) increased surface activity. This is in contrast to our results that the percentage of 3-hydroxy iso even-numbered fatty acids (in our case iso-3-OH-C14 was the only even-numbered branched-chain fatty acid) was correlated to surface activity. However, Yakimov et al. (40) studied only one lipopeptide, lichenysin A. Lichenysin A is a monoanionic lipopeptide with a heptapeptide (Glu: Asn: Val: Leu: Ile; 1:1:1:3:1). The presence of the amide form asparagine and the more hydrophobic isoleucine residue results in a lipopeptide with different properties than the lipopeptides compared in this study.
Kaneda (21) showed that biosynthesis of branched chain fatty acids proceeds from the corresponding acyl CoA esters derived from branched-chain amino acids (L-valine, L-isoleucine, and L-leucine). Since the fatty acid composition of the biosurfactant, is controlled by the abundance of fatty acids precursors in the cell (1, 5, 6, 11, 16, 17), we added exogenous branched-chain amino acids to the growth medium to determine the effect of changes of fatty acid composition on biosurfactant activity. The results of the exogenous amino acid addition to the growth medium (Table 3.3) suggests that altering the ratios of even-numbered fatty acids has a more pronounced effect on specific activity than does altering the ratios of odd-numbered fatty acids. A 2.8-fold and 1.2-fold increase in the ratio of iso to normal even-numbered fatty acids (with valine, and alanine addition, respectively) led to a 3.2-fold and 1.7-fold increase in specific activity. However, a 15-fold decrease in the ratio of anteiso to iso odd numbered fatty acids only led to a 2-fold increase in the specific activity when leucine was added to the medium. A 2.7-fold

81
increase in the latter ratio with isoleucine addition did not change the specific activity much compared to the control without amino acid addition. We hypothesize that branched even numbered fatty acids (in this case iso C14 was the only branched even numbered fatty acid) might give the optimum hydrophilic-lipophilic balance required for optimum surface activity. A more definitive conclusion could be drawn if the lipopeptide with only the iso C14 fatty acid could be purified from the mixture of lipopeptides. A higher activity in this case would support this hypothesis.
This work shows that fatty acid of lipopeptide biosurfactants is important for activity and that manipulation of the medium composition to change the composition of the lipopeptide fatty acid composition may result in biosurfactants with higher specific activities. This may be a more useful approach than the molecular engineering of the lipopeptide (27, 35, 37) since the various regulatory policies make it difficult to use recombinant strains for in situ applications.
3.6. References
1. Akpa E, J. P., Wathelet B, Paquot M, Fuchs R, Buzikiewicz H, and
Thornart P. 2001. Influence of culture conditions on lipopeptide production by Bacillus subtilis. Appl. Microbiol. Biotechnol. 91-93:551-561.
2. Arima, K., A. Kakinuma, and G. Tamura. 1968. Surfactin, a crystaline peptidelipid surfactant produced by Bacillus subtilis: Isolation, characterization, and its inhibition of fibrin clot formation. Biochem. Biophys. Res. Commun. 31: 488-497.
3. Banat, I. M. 1995. Biosurfactants production and possible uses in microbial enhanced oil recovery and oil pollution remediation: a review. Bioresource Technol. 51:1-12.
4. Banat, I. M. 2002. Potential commercial applications of microbial surfactants. Appl. Microbiol. Biotechnol. 53: 495-508.
5. Besson F, and Hourdou M. 1987. Effect of amino acids on the biosynthesis of beta amino acids, constituents of bacillomycin F. J. Antibiot. 41: 221-223.
6. Besson, F., I. Tenoux, M. Hourdou, and G. Michel. 1992. Synthesis of b-hydroxy fatty acids and b-amino acid fatty acids by strains of Bacillus subtilis producing iturinic antibiotics. Biochim. Biophys. Acta 1123:51-58.
7. Bodour, A. A., M. Drees, and R. M. Maier. 2003. Distribution of biosurfactant-producing bacteria in undisturbed and contaminated arid southwestern soils. Appl. Environ. Microbiol. 69: 3280-3287.
8. Bonmatin, J.-M., H. Labbe, I. Grangemard, F. Peypoux, R. Maget-Dana, M. Ptak, and G. Michel. 1995. Production, isolation and characterization of [Leu4]- and [Ile4]-surfactins from Bacillus subtilis. Lett. Pept. Sci. 2: 41-7.
9. Bonmatin, J. M., Genest M, Labbe H, and Ptak M. 1994. Solution three-dimensional structure of surfactin: a cyclic lipopeptide studied by 1H-NMR, distance geometry, and molecular dynamics. Biopolymers 34 :975-986.
10. Cohan F. M., R. M. S., and King E. C. 1991. The potential genetic exchange by transformation within a natural population of Bacillus subtilis. Evolution 45: 1393-1421.

82
11. Desai, J., and I. M. Banat. 1997. Microbial production of surfactants and their commercial potential. Microbiol. Mol. Biol. Rev. 61:47-64.
12. Duncan, K. E., N. Ferguson, K. Kimura, X. Zhou, and C. A. Istock. 1994. Fine-scale genetic and phenotypic structures in natural populations of Bacillus subtilis and Bacillus licheniformis: Important implications for bacterial evolution and speciation. Evolution 48: 2002-2025.
13. Georgiou, G., S. C. Lin, and M. M. Sharma. 1999. Surface-active compounds from microorganisms. Biotechnol. 10:60-65.
14. Grangemard, I., J.-M. Bonmatin, J. Bernillon, B. C. Das, and F. Peypoux. 1999. Lichenysins G, a novel family of lipopeptide biosurfactants from Bacillus licheniformis IM 1307: production, isolation and structural evaluation by NMR and mass spectrometry. J. Antibiotics 52:363-373.
15. Hammond K R, a. H. J. E. 1962. Correlation, p. 174-231. In a. C. R. Krech D (ed.), Introduction to the statistical method, 1st ed. Alfred A Knopf, New York.
16. Hourdou ML, B. F., and Michel G. 1988. Studies on the biosynthesis of beta-amino acids, the lipid moiety of iturins A, in Bacillus subtilis. J. Antibiotics 41: 207-211.
17. Hourdou ML, B. F., Tenoux I, and Michel G. 1989. Fatty acid and beta-amino acid synthesis in strains of Bacillus subtilis producing iturinic antibiotics. Lipids 24: 940-944.
18. Istock, C. A., N. Ferguson, N. L. Istock, and K. E. Duncan. 2001. Geographical diversity of genomic lineages in Bacillus subtilis (Ehrenberg) Cohn sensu lato. Org. Divers. Evol. 1: 179-191.
19. Javaheri, M., G. E. Jenneman, M. J. McInerney, and R. M. Knapp. 1985. Anaerobic production of a biosurfactant by Bacillus licheniformis JF-2. Appl. Environ. Microbiol. 50: 698-700.
20. Jenny, K., O. Kaeppeli, and A. Fiechter. 1991. Biosurfactants from Bacillus licheniformis: Structural analysis and characterization. Appl. Microbiol. Biotechnol. 36: 5-13.
21. Kaneda, T. 1966. Biosynthesis of branched chain fatty acids. IV- Factors affecting relative abundance of fatty acids produced by Bacillus subtilis. Can. J. Microbiol. 12: 501-514.
22. Kaneda, T. 1967. Fatty acids in the genus Bacillus. I- Iso and anteiso fatty acids as characteristic constituent of lipids in 10 species. J. Bacteriol. 93: 894-903.
23. Kim, S. H., E. J. Lim, S. O. Lee, J. D. Lee, and T. H. Lee. 2000. Purification and characterization of biosurfactants from Nocardia sp. L-417. Biotech. Appl. Biochem. 31: 249-253.
24. Lin, S.-C., M. A. Minton, M. M. Sharma, and G. Georgiou. 1994. Structural and immunological characterization of a biosurfactant produced by Bacillus licheniformis JF-2. Appl. Environ. Microbiol. 60: 31-38.
25. McInerney, M. J., S. O. Han, S. Maudgalya, H. Mouttaki, M. Folmsbee, R. Knapp, D. Nagle, B. Jackson, M. Staudt, and W. Frey. 2001. Development of more effective biosurfactants for enhanced oil recovery. Final Technical Report @ www.osti.gov/dublincore/gpo/servlets/purl/806980-AEHLWH/native/
26. McInerney, M. J., M. Javaheri, and D. P. Nagle. 1990. Properties of the biosurfactant produced by Bacillus licheniformis strain JF-2. J. Ind. Microbiol. 5: 95-102.

83
27. Mootz HD, S. D., and Marahiel MA. 2000. Construction of hybrid peptide synthetases by module and domain fusion. Proc. Natl. Acad. Sci. USA 97:5848-5853.
28. Morikawa, M., Y. Hirata, and T. Imanaka. 2000. A study on the structure-function relationship of lipopeptide biosurfactants. Biochim. Biophys. Acta 1488:211-218.
29. Palmisano, M. N., L. K. Nakamura, K. E. Duncan, C. A. Istock, and F. M. Cohen. 2001. Bacillus sonorensis species nov., a close relative of Bacillus licheniformis, isolated from the soil in the Sonoran desert, Arizona. Int. J. Syst. Evol. Microbiol. 51: 1671-1679.
30. Parkinson, M. 1985. Bio-surfactants. Biotechnol. Adv. 3: 65-83. 31. Peypoux, F., Bonmatin J M, Labbe H, Grangemard I, Das B C, Ptak
M, Wallach J, and Michel G. 1994. [Ala 4] surfactin, a novel isoform from Bacillus subtilis studied by mass and NMR spectroscopies. Eur. J. Biochem. 224: 89-96.
32. Peypoux, F., J. M. Bonmatin, and J. Wallach. 1999. Recent trends in the biochemistry of surfactin. Appl. Microbiol. Biotechnol. 51: 553-563.
33. Roberts, M. S., L. K. Nakamura, and F. M. Cohen. 1994. Bacillus mojavenesis sp. nov., distinguished from Bacillus subtilis by sexual isolation, divergence in DNA sequence, and differences in fatty acid composition. Int. J. Syst. Bacteriol. 44: 256-264.
34. Ron, E. Z., and E. Rosenberg. 2001. Natural roles of biosurfactants. Environ. Microbiol. 3: 229-236.
35. Schneider A, S. T., Marahiel MA. 1998. Targeted alteration of the substrate specificity of peptide synthetases by rational module swapping. Mol. Gen. Genet. 257: 308-318.
36. Stachelhaus T, S. A., and Marahiel MA. 1995. Rational design of peptide antibiotics by targeted replacement of bacterial and fungal domains. Science 269: 5571-5574.
37. Symmank, H., Frank P, Saenger W, and Bernhard F. 2002. Modification of biologically active peptides: production of a novel lipohexapeptide after engineering of Bacillus subtilis surfactin synthetase. Protein Eng. 15:913-921.
38. Thimon L., P. F., Das B C, Wallach J, and Michel G. 1994. Selective esterification of surfactin: Preparation and properties of surfactin methyl esters. Biotechnol. Appl. Biochem. 20: 415-423.
39. Van Dyke, M. I., H. Lee, and J. T. Trevors. 1991. Applications of microbial surfactants. Biotechnol. Adv. 9: 241-252.
40. Yakimov, M. M., H. L. Fredrickson, and K. N. Timmis. 1996. Effect of heterogeneity of hydrophobic moieties on surface activity of lichenysin A, a lipopeptide biosurfactant from Bacillus licheniformis BAS50. Biotechnol. Appl. Biochem. 23:13-18.
41. Yakimov, M. M., K. N. Timmis, V. Wray, and H. L. Fredrickson. 1995. Characterization of a new lipopeptide surfactant produced by thermotolerant and halotolerant subsurface Bacillus licheniformis BAS50. Appl. Environ. Microbiol. 61: 1706-13.
42. Youssef, N., K. E. Duncan, D. Nagle, K. N. Savage, R. Knapp, and M. J. McInerney. 2004. Comparison of methods to detect biosurfactant production by diverse microorganisms. J. Microbiol. Methods 56: 339-347.

84
43. Zar, J. H. 1999. Multiple regression and correlation, p. 413-451. In T. Ryu (ed.), Biostatistical analysis, Fourth edition ed. Prentice Hall, Upper saddle river, NJ.

85
Chapter 4. Efficacy of Biosurfactant Mixtures
4.1. Abstract MEOR (microbially enhanced oil recovery) depends on the use of biosurfactants
to mobilize residual oil in low production or depleted reservoirs. In order to optimize the surface activity of biosurfactants, we hypothesized that mixtures of biosurfactants with diverse structures will generate lower surface and interfacial tensions compared to individual biosurfactants. In this study, the surface tension for 15 different Bacillus strains that are known to be surface active was measured both individually and in combination with other biosurfactants. Surface tension as well as CMD-1 values (critical micelle dilution defined as the reciprocal of the biosurfactant dilution at which a sharp increase in surface tension is observed) were compared to assess synergistic effects of the mixtures. The lowest surface tension was obtained with Bacillus subtilis subsp. spizizensis strain TG3-43 (34 mN/m). The lowest CMD-1 value was obtained with Bacillus subtilis subsp. spizizensis strain CL1-14 (10). Some biosurfactant mixtures were found to have synergistic effect on surface tension (e.g. surface tension was lowered from 41 to 31 mN/m in some cases); others had a synergistic effect on CMD-1 values. Moreover, surface and interfacial tensions were measured for partially purified biosurfactants to determine their CMC (critical micelle concentration defined as the concentration of the biosurfactant at which a sharp increase in surface tension is observed). CMC values in the range of 7 – 17 µg/ml and interfacial tensions as low as 5.7 mN/m were obtained with some biosurfactants. Further work will involve measuring the surface and interfacial tensions for mixtures of purified biosurfactants to determine the best mixture that can significantly lower surface and/ or interfacial tension or that will have the lowest CMC value.
4.2. Introduction
Biosurfactants are surface-active compounds produced by a wide variety of
microorganisms (1). The chemical structure of biosurfactants allows them to partition at the oil/ water interfaces and hence lower the interfacial tension. Biosurfactants belong to several groups including lipopeptides synthesized by many bacilli and other species, glycolipids synthesized by Pseudomonas species and Candida species, phospholipids synthesized by Thiobacillus thiooxidans, polysaccharide-lipid complexes synthesized by Acinetobacter species, or even the microbial cell surface itself (2, 6). Despite their different structures, all biosurfactants possess both polar and non-polar domains that allow their partitioning at interfaces and thus lowering surface or interfacial tensions.
Surfactin and iturin are two different lipopeptides produced by Bacillus species. Surfactin has the ability to lower interfacial tension and also has some antibacterial activity. Iturins on the other hand show antifungal activity. Surfactin was found to increase the antifungal activity of iturin by forming mixed micelles (4).
One hundred and forty five diverse strains (mostly belonging to the genus Bacillus) were found to produce biosurfactants using several screening methods (7). Upon studying the structure of some of these biosurfactants (Chapter 1), we found that

86
the biosurfactants produced by Bacillus species have very similar structures (i.e. they are all lipopeptide in structure). However, they do have minor differences in their amino acid (e.g. some will have glutamate instead of glutamine and/or aspartate instead of asparagine) and in their fatty acid compositions (e.g. differences in the carbon number and branching). We hypothesized that mixtures of biosurfactants with different structures will generate lower surface and interfacial tensions than the individual biosurfactants do.
In this study, we measured surface tension for several strains which were found to be biosurfactant producers by the oil spreading technique, either alone or in combination with other biosurfactant producers. The effect on surface tension and/ or critical micelle dilution (CMD-1 is defined as the reciprocal of the biosurfactant dilution at which a sharp increase in surface tension is observed) was compared for single cultures and mixtures of more than one biosurfactant producer in order to quantify any synergistic effect that the mixture might have on surface activity.
4.3. Materials and methods
Bacterial Strains Table 4.1 shows the names, taxonomic status, and surface
activity (expressed as the diameter of clear zones on the oil surface in centimeters by the oil spreading technique (7) of the strains used in this study.
Table 4.1. Names, taxonomic status, and surface activity of the strains used in this study.
Strain Species (Group) Oil spreading diameter (cm)
ROB-2 Bacillus mojavensis (A) 2.7 ROG-4 Bacillus mojavensis (A) 2 ROQQ-2 Bacillus mojavensis (A) 2.1 T89-14 Bacillus mojavensis (A) 1.2 JF-2 Bacillus mojavensis (A) 1.2 T89-42 Bacillus subtilis subsp. subtilis (B) 3 T89-1 Bacillus subtilis subsp. subtilis (B) 2.4 ROGG-2 Bacillus subtilis subsp. subtilis (B) 2.1 T89-15 Bacillus subtilis subsp. subtilis (B) 1.8 T89-46 Bacillus subtilis subsp. subtilis (B) 1.5 T89-3 Bacillus subtilis subsp. spizizensis (D) 3 T89-9 Bacillus subtilis subsp. spizizensis (D) 2.7 CL1-14 Bacillus subtilis subsp. spizizensis (D) 2.4 TG3-43 Bacillus subtilis subsp. spizizensis (D) 2.1 CL1-21 Bacillus subtilis subsp. spizizensis (D) 1.8
Media. All cultures were grown aerobically for 24 hours at 37ºC in liquid
medium E (KH2PO4, 2.7 g/l; K2HPO4, 13.9 g/l; sucrose, 10g/l; NaCl, 50g/l; yeast extract, 0.5g/l; NaNO3, 1g/l; pH 6.86). The medium was autoclaved and, after cooling, 10 ml/l of each of the following solutions was added: 2. 5% MgSO4; 10% (NH4)2SO4 ; and Wolin’s trace metals solution. Wolin’s trace metals solution contained the following: EDTA, 0.5 g/l; MnSO4
.•H2O, 3g/l; NaCl, 1 g/l; CaCl2.•2H2O, 0.1g/l; ZnSO4
.•7H2O, 0.1 g/l; FeSO4
.•7H2O, 0.1 g/l; CuSO4.•5H2O, 0.01 g/l; AlK(SO4)2, 0.01 g/l; Na2MoO4
.•2H2O, 0.01 g/l; boric acid, 0.01 g/l; Na2SeO4, 0.005g/l; NiCl2
.•6H2O, 0.003 g/l).
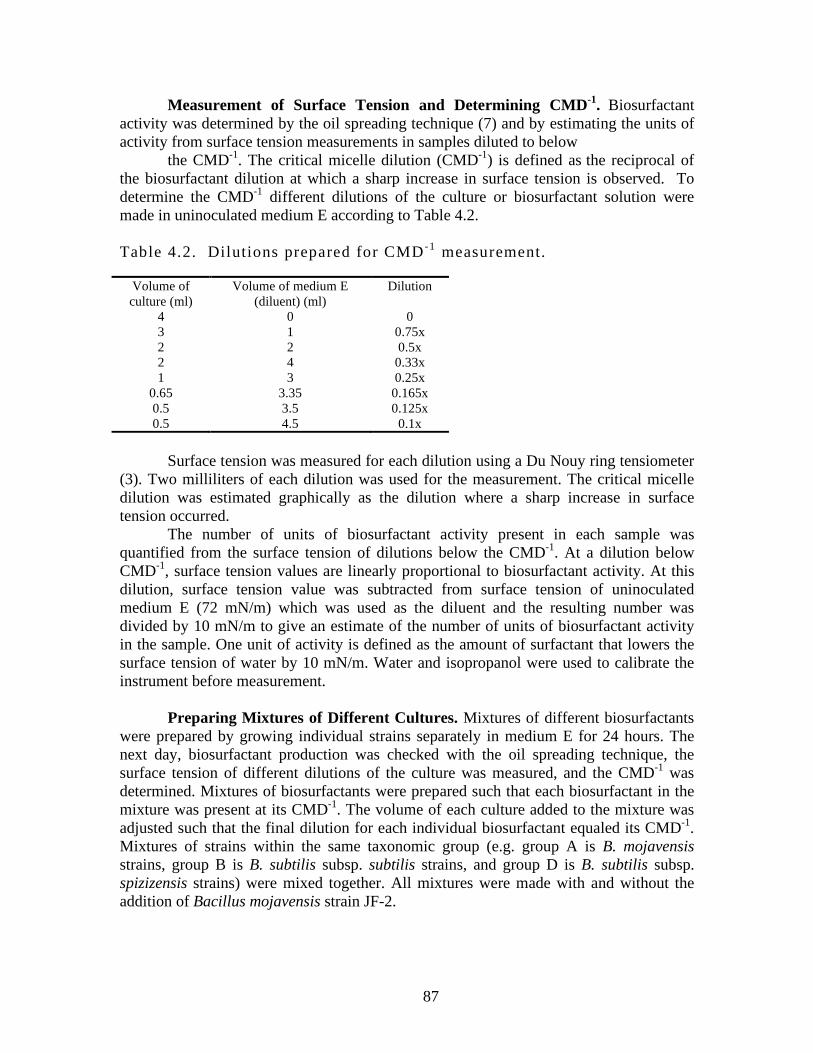
87
Measurement of Surface Tension and Determining CMD-1. Biosurfactant activity was determined by the oil spreading technique (7) and by estimating the units of activity from surface tension measurements in samples diluted to below
the CMD-1. The critical micelle dilution (CMD-1) is defined as the reciprocal of the biosurfactant dilution at which a sharp increase in surface tension is observed. To determine the CMD-1 different dilutions of the culture or biosurfactant solution were made in uninoculated medium E according to Table 4.2.
Table 4.2. Dilutions prepared for CMD-1 measurement.
Volume of culture (ml)
Volume of medium E (diluent) (ml)
Dilution
4 0 0 3 1 0.75x 2 2 0.5x 2 4 0.33x 1 3 0.25x
0.65 3.35 0.165x 0.5 3.5 0.125x 0.5 4.5 0.1x
Surface tension was measured for each dilution using a Du Nouy ring tensiometer
(3). Two milliliters of each dilution was used for the measurement. The critical micelle dilution was estimated graphically as the dilution where a sharp increase in surface tension occurred.
The number of units of biosurfactant activity present in each sample was quantified from the surface tension of dilutions below the CMD-1. At a dilution below CMD-1, surface tension values are linearly proportional to biosurfactant activity. At this dilution, surface tension value was subtracted from surface tension of uninoculated medium E (72 mN/m) which was used as the diluent and the resulting number was divided by 10 mN/m to give an estimate of the number of units of biosurfactant activity in the sample. One unit of activity is defined as the amount of surfactant that lowers the surface tension of water by 10 mN/m. Water and isopropanol were used to calibrate the instrument before measurement.
Preparing Mixtures of Different Cultures. Mixtures of different biosurfactants
were prepared by growing individual strains separately in medium E for 24 hours. The next day, biosurfactant production was checked with the oil spreading technique, the surface tension of different dilutions of the culture was measured, and the CMD-1 was determined. Mixtures of biosurfactants were prepared such that each biosurfactant in the mixture was present at its CMD-1. The volume of each culture added to the mixture was adjusted such that the final dilution for each individual biosurfactant equaled its CMD-1. Mixtures of strains within the same taxonomic group (e.g. group A is B. mojavensis strains, group B is B. subtilis subsp. subtilis strains, and group D is B. subtilis subsp. spizizensis strains) were mixed together. All mixtures were made with and without the addition of Bacillus mojavensis strain JF-2.

88
Surface Tension and CMD-1 of Biosurfactant Mixtures. After a mixture of several biosurfactants was prepared, the mixture was diluted in medium E to give final dilutions of 1x, 0.5x, and 0.25x. The surface tension of each dilution was measured and the CMD-1 was determined as described above for individual biosurfactants. To detect any synergistic effects, the surface tension of the undiluted mixture of biosurfactants was compared to the average of surface tension values of each individual biosurfactant that comprised the mixture. The latter were measured at the dilution used to create the mixture. A positive synergistic effect is defined as a surface tension of the mixture that is lower than the average surface tension of individual biosurfactants that comprise the mixture or a CMD-1 value that is lower than the CMD-1 values of the individual biosurfactants that comprise the mixture.
Purification of Biosurfactants. Biosurfactants from Bacillus mojavensis strains
ROB-2, ROG-4, and T89-14 were extracted and purified by using the method outlined in Chapter 1. The purified biosurfactants was diluted and the surface tension of each dilution was measured. This information was used to graphically determine the critical micelle concentration (CMC). The critical micelle concentration (CMC) is defined as the concentration of the biosurfactant at which a sharp increase in surface tension is observed. Purification of additional biosurfactants is underway to determine if they have lower CMC’s than previously characterized biosurfactants and if they act synergistically with mixtures of other biosurfactants.
Interfacial Tension Measurement. A model 500 Spinning Drop Tensiometer
was employed for all interfacial tension measurements. Samples were prepared from the biosurfactant such that the denser phase (the aqueous surfactant) is continuous and the less dense phase (oil phase) forms the drop. One milliliter of a1 mg/l solution of purified biosurfactant and three microliters of toluene were used. Each biosurfactant solution was measured in triplicate.
4.4. Results
Surface Tension and CMD-1 Values of Individual Strains. Fifteen strains
belonging to three different taxonomic groups of Bacillus that had high oil spreading activity (Table 4.1) were chosen to test for synergistic effects of biosurfactant mixtures (7). Figure 4.1 shows the surface tension of different dilutions of each strain. Bacillus subtilis subsp. spizizensis strain TG3-43 had a surface tension of 34 mN/m (group D, Figure 4.1c; Table 4.3), which was the lowest surface tension value of all the strains tested. Low surface tension values have been encountered before with other Bacillus strains (e.g. Bacillus mojavensis strain JF-2 showed surface tension of 27 mN/m, (3), although in this set of experiments the value for JF-2 was 27 mN/m2. The surface tension value often depends on the stage of growth at which the surface tension is measured. Bacillus species are known to produce their biosurfactant at the end of the log phase and the beginning of the stationary phase (5). Since we did not follow surface tension during the course of growth, the surface tension values shown in Figure 4.1 may not correspond to the lowest surface tension that can be attained by these strains.

89
Group A
30
35
40
45
50
55
60
65
0.1 0.125 0.165 0.25 0.33 0.5 0.75 1
Dilutions
Su
rface t
en
sio
n (
mN
/m)
ROB-2
ROG-4
ROQQ-2
T89-14
JF-2
Figure 4.1a. Surface tension values of different dilutions of group A strains (Bacillus mojavensis).
Group B
30
35
40
45
50
55
60
65
0.1 0.125 0.165 0.25 0.33 0.5 0.75 1
Dilutions
Surf
ace t
ensi
on (
mN
/m)
T89-42
T89-1
ROGG-2
T89-15
T89-46
Figure 4.1b. Surface tension values of different dilutions of group B strains (B. subtilis subsp. subtilis).

90
Group D
30
35
40
45
50
55
60
0.1 0.125 0.165 0.25 0.33 0.5 0.75 1
Dilutions
Surf
ace e
nsi
on (
mN
/m)
T89-3
T89-9
CL1-14
TG3-43
CL1-21
Figure 4.1c. Surface tension values of different dilutions of group D strains (Bacillus subtilis subsp. spizizensis) .
Surface Tension and CMD-1 Values of Biosurfactant Mixtures. CMD-1is defined as the reciprocal of the biosurfactant dilution at which a sharp increase in surface tension is observed. The higher the CMD-1 value, the more effective the biosurfactant is since the surface tension remains low even as the biosurfactant concentration is lowered. The highest CMD-1 value was obtained with Bacillus subtilis subsp. spizizensis strain CL1-14 (a CMD-1value of 10) (Table 4.3).
Biosurfactant mixtures were prepared by mixing cultures of individual strains according to the CMD-1. Culture medium of each individual strain was added to the mixture in an amount corresponding to its CMD-1 such that any synergistic effect on either surface tension or CMD-1 can be easily interpreted. Surface tension values of the biosurfactant mixtures were compared to the average surface tension value of each individual strain measured at its CMD-1. Any decrease in the surface tension of the mixture would then be considered as a synergistic effect and would suggest mixed micelles were being formed at the surface. Since each biosurfactant in the mixture was added at its CMD-1, then a lower CMD-1 of the mixture compared to the CMD-1 of each individual biosurfactant indicates a positive synergistic.

91
Table 4.3. Surface tension and CMD-1 values of the 15 strains used in this study.
Figure 4.2a shows the effect of mixing cultures of Bacillus mojavensis strains
ROB-2, ROG-4, and JF-2 on surface tension. The surface tension of the mixture was 33.5 mN/m. This mixture contained 40% ROB-2, 40% ROG-4, and 20% JF-2 culture fluid (each present at its CMD-1). Surface tension values for these cultures at the indicated dilutions were 40, 45, and 44, respectively (Figure 4.1a). The average of the three surface tension values is 43 mN/m. This clearly shows the positive synergistic effect of biosurfactant mixtures on surface tension. The CMD-1 of the mixture was 2, which is not better than the CMD-1’s of the individual strains.
Figure 4.2b shows the effect of mixing biosurfactants from a different combination of Group A strains. The mixture contained 50% ROB-2, 25% ROQQ-2, and 25% JF-2 culture fluid and had a surface tension of 41 mN/m, which is not different from average surface tension of the individual biosurfactants (Table 4.4). However, the CMD-1 of the mixture was greater than 4 (Figure 4.2b; Table 4.4), which is better than the CMD-1 values of individual cultures of strains ROB-2, ROQQ-2, and JF-2 (2, 2, and 3, respectively; Table 4.3). At a CMD-1 of 4, the mixture contained only 12.5% of ROB-2 and 6.25% of each of ROQQ-2 and JF-2 cultures, but still generated a much lower surface tension than if 100% of each culture was used. We could not determine the actual CMD-1 of this mixture since dilutions greater than those used are required. However, it is clear that mixing ROB-2, ROQQ-2, and JF-2 biosurfactants had a synergistic effect on the CMD-1.
Strain (group) Surface tension of 1x (mN/m) CMD-1
ROB-2 (A) 41.5 2 ROG-4 (A) 43 2
ROQQ-2 (A) 38 3 T89-14 (A) 38 3
JF-2 (A) 38 3 T89-42 (B) 38.5 8 T89-1 (B) 37 4
ROGG-2 (B) 37 4 T89-15 (B) 41.5 2 T89-46 (B) 39.5 2 T89-3 (D) 36.5 4 T89-9 (D) 42.5 2
CL1-14 (D) 42 10 TG3-43 (D) 34 6 CL1-21 (D) 42 4

92
30
35
40
45
50
55
60
65
0.1 0.13 0.17 0.25 0.33 0.5 0.75 1
Dilution
Surf
ace t
ensi
on (
mN
/m)
ROB-2
ROG-4
ROB-2+ROG-4+JF-2
Figure 4.2a. Surface tension values of a mixture of biosurfactants from Group A strains ROB-2, ROG-4, and JF-2 compared to each individual culture.
When biosurfactants from Group B strains T89-42 and ROGG-2 were mixed together, effects on surface tension but not CMD-1 were observed (Figure 4.3). The mixture contained 12.5% T89-42 and 25% ROGG-2 culture fluid. The surface tension of the mixture was 31 mN/m. The surface tension values for these strains at the above concentrations can be deduced from Figure 4.1c to be 41 and 41 mN/m, respectively. The average surface tension of the individual cultures is 41 mN/m, which is much higher than that of the mixture (Table 4.4). Thus, the mixture had much better surface tension lowering ability than either of the two biosurfactants alone.
30
35
40
45
50
55
60
0.1
0.125
0.165
0.25
0.33
0.5
0.75 1
Dilution
Surf
ace t
ensi
on (
mN
/m)
ROB-2
ROQQ-2
ROB-2+ROQQ-
2+JF-2
Figure 4.2b. Surface tension values of a mixed biosurfactants from Group A strains ROB-2, ROQQ-2, and JF-2 compared to each individual culture.

93
30
35
40
45
50
55
0.1 0.13 0.17 0.25 0.33 0.5 0.75 1
Dilution
Surf
ace t
ensi
on (
mN
/m)
T89-42
ROGG-2
T89-42+ROGG-2
Figure 4.3. Surface tension values of the mixture of biosurfactants from strains T89-42 and ROGG-2 of group B compared to each individual culture.

94
Table 4.4. Comparison of surface tension obtained with mixtures to the average value of the individual strains. CMD- 1 is also shown for the mixtures.
Mixing biosurfactants from Group D strains showed effects on surface tension and possibly on the CMD-1. Figure 4.4a shows the effect on surface tension when cultures of strains T89-3, CL1-14, and JF-2 were mixed together. A binary mixture of T89-3 and CL1-14 biosurfactants had a surface tension of 33 mN/m. This mixture contained 25% T89-3 and 12.5% CL1-14 culture fluid. Surface tension values for these strains at these concentrations were deduced from Figure 4.1c to be 36 and 43, respectively, giving an average of 39.5 mN/m (Table 4.4). Again, this is an example where the surface tension of the mixture is much lower than the average surface tension of the individual biosurfactants. A positive synergistic effect was also observed when JF-2 was added to the above binary mixture. The surface tension of the mixture was 31 mN/m. This mixture contained 25% T89-3, 12.5% CL1-14, and 25% JF-2. Surface tension values for culture of these strains at the above concentrations were deduced from
Group Strains mixed Surface tension of mixture (mN/m )
Surface tension of individual strains (avg)
CMD-1 of the mixture
ROB-2+ROG-4 40 39.75 2 ROB-2+ROQQ-2 40 42 2 ROB-2+T89-14 41 41 2 ROB-2+ROG-4+JF-2
33.5 43 2
ROB-2+ROQQ-2+JF-2
41 42.7 >4
A
ROB-2+T89-14+JF-2
35 42 Between 2 and 4
T89-42+T89-1 34 39 2 T89-42+ROGG-2 31 41 2 T89-42+T89-15 43.5 40.5 2
B
T89-42+T89-46 35 40.5 Between 2 and 4 T89-42+T89-1+JF-2 36.5 40.6 2 T89-42+ROGG-2+JF-2
40 42 Between 2 and 4
T89-42+T89-15+JF-2
35 41.6 Between 2 and 4
T89-42+T89-46+JF-2
42 41.6 2
B and JF-2
T89-42+JF-2 37 42.5 Between 2 and 4 T89-3+T89-9 32 39.25 Between 2 and 4 T89-3+CL1-14 33 39.5 Between 2 and 4 T89-3+TG3-43 36 38 Between 2 and 4
D
T89-3+CL1-21 34 39 Between 2 and 4 T89-3+JF-2 34 40 Between 2 and 4 T89-3+CL1-14+JF-2 31 41 Between 2 and 4 T89-3+TG3-43+JF-2 36 40 Between 2 and 4
D and JF-2
T89-3+CL1-21+JF-2 43 40.6 >4

95
Figure 4.1c to be 36, 43, and 44, respectively, giving an average of 41 mN/m. For these combinations of strains, no positive synergistic effect was observed on the CMD-1.
30
32
34
36
38
40
42
44
46
48
50
0.1 0.13 0.17 0.25 0.33 0.5 0.75 1
Dilutions
Surf
ace t
ensi
on (
mN
/m)
T89-3
CL1-14
T89-3+CL1-14
T89-3+CL1-14+JF-2
Figure 4.4a. Surface tension values of a mixture of biosurfactants from Group D strains T89-3 and CL1-14 with and without the JF-2 biosurfactant compared to the individual cultures.
30
32
34
36
38
40
42
44
46
48
50
0.1 0.13 0.17 0.25 0.33 0.5 0.75 1
Dilution
Surf
ace t
ensi
on (
mN
/m)
T89-3
CL1-21
T89-3+CL1-21+JF-2
Figure 4.4b. Surface tension values of a mixture of biosurfactants from Group D strains T89-3 and CL1-21 with JF-2 compared to each individual culture.
Mixing biosurfactants from a different combination of Group D strains gave a
positive synergistic effect on the CMD-1, but not the surface tension (Figure 4.4b). When T89-3, CL1-21, and JF-2 were mixed together in ratios of 25% of each, the CMD-1 of the mixture was greater than 4, which corresponds to a concentration of each biosurfactant of <6.25% each. T89-3, Cl1-21, and JF-2 cultures had CMD-1 values 4, 4, and 3, respectively (Table 4.3). However, the mixture had a CMD-1 greater than this when only

96
6.25% each culture fluid was present showing that mixing these 3 strains did have a synergistic effect. Table 4.4 summarizes the effect of mixing different biosurfactants on surface tension and CMD-1.
Surface and Interfacial Tensions of Partially Purified Biosurfactant.
Biosurfactants produced by some Bacillus strains were partially purified using a method that combines ammonium sulfate precipitation, acetone extraction and thin layer chromatography (Chapter 1). The partially purified biosurfactants were then used for both surface and interfacial tension measurements. The critical micelle concentration (CMC) of each partially purified biosurfactant was also determined. Figure 2.5 shows the surface tension of different concentrations of partially purified biosurfactants of Bacillus mojavensis strains ROB-2, ROG-4 and T89-14. The CMC values obtained for the partially purified biosurfactants from each strain ranged between 7 and 17 g/l. These concentrations are very low compared to synthetic surfactants.
Table 4.5. Interfacial tensions measured for different purified biosurfactants.
Interfacial tensions were measured for some purified biosurfactants by using
Spinning drop tensiometer. The samples were prepared in 1 mg/l concentration. Interfacial tensions obtained are reported in Table 4.5. The lowest interfacial tension was obtained with biosurfactants from Bacillus subtilis subsp. spizizensis strain CL1-14 and Bacillus subtilis subsp. subtilis strain T89-42. Meanwhile, larger amounts of biosurfactants are being prepared to determine interfacial tensions over a range of concentrations for each biosurfactant.
Biosurfactant purified from strain (group) Interfacial tension mN/m T89-3 (D) 11.6 ± 0.3
CL1-14 (D) 5.7 ± 0.1 CL1-21 (D) 11.9 ± 0.3 ROGG-2 (B) 8.8 ± 0.4 T89-46 (B) 12 ± 0.3 T89-1 (B) 13.8 ± 0.2
T89-42 (B) 5.9 ± 0.2

97
ROB-2
30
35
40
45
50
55
60
65
70
75
0
1.45 5.
8
7.26
8.72
10.2
11.6
13.1
14.5
17.4
20.3
27.6 32
34.9
37.8
40.7 45
52.3
58.1
Concentration (!g/ml)
Surf
ace
tens
ion
(dyn
e/cm
)
Figure 4.5a. Surface tension values of various concentrations of the partially purified biosurfactant of Bacillus mojavensis strain ROB-2. CMC is 17.4 g/l.
ROG-4
30
35
40
45
50
55
60
65
70
75
0
5.16
7.74
10.3
12.9
15.5
18.1
20.6
24.5
28.4 31
33.5
36.1 40
46.4
51.6
Concentration (!g/ml)
Surfa
ce te
nsio
n (d
yne/
cm)
Figure 4.5b. Surface tension values of various concentrations of the partially purified biosurfactant of Bacillus mojavensis strain ROG-4. CMC is 7.74 g/l.

98
T89-14
30354045505560657075
0
0.19
1.94
9.68
11.6
13.5
15.5
17.4
19.4
21.3
23.2
25.2
27.1 31
34.8
38.7
Concentration (!g/ml)
Surfa
ce te
nsio
n (d
yne/
cm)
Figure 4.5c. Surface tension values of various concentrations of the partially purified biosurfactant of Bacillus mojavensis strain T89-14. CMC is 17.4 g/l. 4.5. Discussion
In these experiments, we compared the surface activity of mixtures of
biosurfactants produced by two or three strains of Bacillus to the activity of the biosurfactants assayed singly. A synergistic effect on surface tension and/or on the CMD-1 value (reciprocal of the critical micelle dilution) was often found. Although only 15 strains and a fraction of the possible combinations were tested, in 14 instances out of 23, the surface tension of the mixture of biosurfactants was 5-10 mN/m lower that than of the weighted average of the individual strains. These findings are significant for MEOR for two reasons. First, it suggests a new approach for MEOR, e.g., the use of mixtures of biosurfactant than individual biosurfactants. Such an approach has not been considered for enhanced oil recovery previously. Secondly, since most oil field microbial communities contain diverse microorganisms, it is likely that these communities will produce diverse types of biosurfactants. Thus, the stimulation of populations indigenous to oil reservoirs may allow the production of self-generating biosurfactant mixtures that may be very effective for oil recovery.
Our work also raises the question why combinations of biosurfactants are more effective than individual biosurfactants in lowering surface tension. With single biosurfactants, repulsion due to charge or similar hydrophobic/hydrophilic properties may not generate micelles structures most effective for oil mobilization. When different biosurfactants with different structures are present, there is the possibility that the molecules align to reduce charge repulsion or detrimental hydrophobic interactions. Thus, the micelles may be more compact or form a structure that is more conducive for oil recovery.

99
4.6. References 1. Banat, I. M. 1995. Charaterization of biosurfactants and their use in
pollution removal-state of the art. Acta Biotechnol. 15:251-267. 2. Bodour, A. A., and R. M. Miller-Maier. 2002. Biosurfactants: types,
screening methods, and applications., p. 750-770, Encyclopedia of environmental microbiology. Wiley and Sons, N.Y.
3. McInerney, M. J., M. Javaheri, and D. P. Nagle. 1990. Properties of the biosurfactant produced by Bacillus licheniformis strain JF-2. J. Indust. Microbiol. 5:95-102.
4. Peypoux, F., J. M. Bonmatin, and J. Wallach. 1999. Recent trends in the biochemistry of surfactin. Appl Microbiol. Biotechnol. 51:553-563.
5. Sullivan, E. R. 1998. Molecular genetics of biosurfactant production. Curr. Opin. Biotech. 9:263-269.
6. Van Dyke, M. I., H. Lee, and J. T. Trevors. 1991. Applications of microbial surfactants. Biotech. Adv. 9:241-252.
7. Youssef, N., K. E. Duncan, D. Nagle, K. N. Savage, R. Knapp, and M. J. McInerney. 2004. Comparison of methods to dectect biosurfactant production by diverse microorganisms. J. Microbiol. Methods 56:339-347.

100
Chapter 5. Microbial Strains with Improved Transport Ability through Model Porous Systems.
5.1 Abstract
Bacillus species have been widely used as model organisms during MEOR
research. An important characteristic of Bacillus species is their ability to produce spores. Spores are essential for MEOR research because of their small size compared to vegetative cells, their ability to withstand harsh environmental conditions and their increased transport ability. The objective of this study was to obtain biosurfactant producing strains with improved transport abilities through sandstone. We compared the transport abilities of spores from three Bacillus strains using a model porous system to study spore recovery and transport. Sand-packed columns were used to select for spores or cells with the best transport abilities through brine-saturated sand. Spores of Bacillus mojavensis strains JF-2 and ROB-2 and a natural recombinant strain C-9 transported through sand at very high efficiencies. The earliest cells/spores that emerged from the column were re-grown, allowed to sporulate, and applied to a second column to determine whether spores or vegetative cells had enhanced transport properties. This procedure greatly enhanced the transport of strain C-9. Our data show that spores with enhanced transport abilities are obtained early in effluent and that the preparation of inocula is a practical and useful tool to study microbial enhanced oil recovery.
5.2 Introduction
Bacillus species capable of producing biosurfactants are commonly
isolated from oil reservoirs (1, 28, 34). However, indigenous strains may not produce biosurfactants that generate the ultra low interfacial tensions. Thus, the injection of one or more biosurfactant-producing strains into the reservoir may be required. For this reason, an understanding of the factors that affect microbial transport in porous media is needed. The physical, chemical and biological properties that affect microbial transport in porous media are grouped into two probabilities described by filtration theory: the probability of bacterial cell collision with sediment grain collectors upon approach (collector efficiency) and the probability of bacterial cell attachment to the collector upon collision (collision efficiency) (11, 12). The collector efficiency accounts for the physical factors that control the frequency of bacterial cell collisions with the grain surfaces such as interception, diffusion and gravitational settling. Due to the small pore size, straining will be an important factor controlling the penetration of bacteria in reservoirs (14, 20, 32). Jang, 1983, found that, because of their small size, spores were more effective at transport through Berea sandstone cores than vegetative cells. Spore formation is a key characteristic of the genus Bacillus and with their ability to make effective biosurfactants these are the organisms of choice for MEOR.
The small size of spores should allow them to penetrate greater distances within the reservoir than vegetative cells. However, less than 0.01% of the injected concentration of spores of Bacillus licheniformis were recovered in the effluent of short sandstone cores (10). Thus, collision efficiency is important. Collision efficiency describes the total interactive forces between bacterial and mineral surfaces as the sum of

101
the double layer, London-van der Waals and acid-base potential energies over the distance separating the cell from the surface (11). In addition to cell size, bacterial surface charge (usually negative), cell hydrophobility and cell motility are important biological factors controlling collision efficiency (3, 13, 24, 25, 29, 30). In aquifers, positively charged ferric iron oxides promote adhesion of the negatively charged bacterial cell (25). Most petroleum reservoirs are anaerobic so iron will be in its reduced form. However, it is not clear how reduced iron minerals affect microbial transport. Oil reservoirs also have sandstones partially coated with crude oil so hydrophobic interactions will be important. Cell hydrophobicity controls adhesion of cells to surfaces that are not strongly hydrophilic (29, 30, 32). Wiencek et al. (1990) found that spores of several species of Bacillus and Clostridium were more hydrophobic and thus adhered to surfaces more effectively than vegetative cells (33).
Populations of bacterial cells exhibit a wide range of heterogeneities with respect to their ability to adhere to grain surfaces (2, 27). Subsets of the bacterial population often have much reduced collision efficiencies, which may explain the migration of bacterial cells over large distances within aquifers (17). If low collision efficiency is a stable trait, we should be able to select for bacteria with improved transport properties by selecting for these cells or spores that do not adhere to crushed sandstone (4-6). This approach led to the development of a strain that showed to migrate over large distances in a fine-sand aquifer (17).
Bacillus species have been used in the research for microbial enhanced oil recovery because of their ability to produce spores and the production of biosurfactant. Spores are dormant cells, which are produced from stresses in the environment such as starvation. Spores are able to withstand many extreme environmental changes such as starvation, marked temperature and pH changes, desiccation, and many other factors. Biosurfactants produced by bacteria consist of a wide variety of surface and interfacially active compounds (9). These compounds are able to reduce surface and interfacial tensions between oil and water or oil and sand, making them excellent candidates for microbial enhanced oil recovery. An understanding of how biosurfactant-producing microorganisms transport and migrate through porous media will aid in the improvement of MEOR processes.
Jang et al. (1983) found that spores are better candidates for enhanced transport than vegetative cells (14). They also found that a large inocula of cells injected into a bench-top model increases the potential for plugging (14). The use of spores in situ could decrease the potential for plugging since spores are smaller than vegetative cells and have a decreased probability of blocking pore channels. Also, since spores are in a dormant state, nutrient injection to maintain viability is not required during injection and thus, spores should be able to transport further than vegetative cells. Several studies have shown penetration rates and permeability factors were key components when studying cell movement through porous media (15, 16, 18, 23, 26).
In this study, the migration of spores and vegetative cells of three different strains of Bacillus mojavensis, JF-2, ROB-2 and C-9, through sand packed columns was studied to select for a strain with enhanced transport abilities. Thus far, this is the first study on the potential of enhanced spore transport through unconsolidated porous media.

102
5.3. Materials and Methods Preparation of Spores. Bacillus mojavensis strains JF-2 and ROB-2 and the
natural recombinant strain C-9 were grown and sporulated in Difco sporulation broth (22) with the following modifications: Difco nutrient broth with 0.6 ml of 1 M NaOH, 10 ml of 1.2% (w/v) MgSO4, and 10 ml of 10% (w/v) KCl per liter. After autoclaving, the sporulation broth was supplemented with 1 ml of a mineral solution containing 0.01 M MnCl2, 1M Ca(NO3)2, and 0.001M FeSO4·7H2O per liter. Each culture was grown for 7 to 11 days at 37 oC. The spores were harvested by centrifugation (10,000 x g; 20 min; 4oC) and washed twice by suspending of the pellet in 35 ml of 0.85% NaCl solution and centrifugation as above. The spore preparation was stored at 4 oC until used as the inoculum for packed-sand columns.
Preparation of Sand-Packed Columns. Borosilicate glass columns with
polypropylene luer-lock fittings, approximately 2.5 cm in diameter by 10 cm in length, were used for the transport studies. Each column was packed with 95-100 g of quartz sand while sonicating the column in a bench-top sonicator. Silica gel was applied to the inside rim of the column cap to prevent leakage. After sonication, the columns were saturated with 0.85% NaCl and autoclaved (121 oC; 15 min.). The sonication step and autoclave sterilization was then repeated. The columns were allowed to equilibrate overnight before applying the spore preparation. An empty, sterile column fitted with a cotton-filled syringe on the cap was attached to the top of the sand column by a three-way, polypropylene, luer-lock fitting. The empty column served as the reservoir for the brine to flow into the sand column by natural flow.
Pore volume of the column was determined by weighing the column before and after saturation of the sand column with sterile brine (0.85% NaCl solution). Pore volumes were calculated as the difference between the wet-weight and dry weight of the sand-packed column. The dry weight of the sand-packed column was obtained after overnight incubation under constant airflow. In addition, Blue Dextran, a high molecular weight, inert material, was used to determine the pore volume of the sand column. One 1 ml of concentrated Blue Dextran was injected into the sand column and fractions were collected until the blue color began to appear in the effluent. The volume of the fractions collected prior to the appearance of the blue color was determined volumetrically. Pore volume for sand-packed columns containing 95-100 g of sand ranged from 11 to 16 ml, respectively.
Transport Experiments. After overnight equilibration with 0.85 % NaCl
solution, approximately 10 pore volumes of sterile 0.85% NaCl was injected into the column. Next, 1 ml of the spore preparation was injected into the sand column through the three-way value by using a sterile, 1-ml syringe. The reservoir column was filled completely with 0.85% NaCl and allowed to flow through the sand-packed column. Effluent fractions were collected as follows: fractions 1-5, 3 ml; fractions 6-23, 1 ml; fractions 24-29, 3 ml; and fractions 30-36, 5 ml. The total effluent volume collected in each case was 86 ml. As a control, 1 ml of sterile brine was injected into the column to ensure sterility of the column preparation procedure.

103
The concentration of both vegetative cells and spores in each effluent sample was estimated by end point dilution (EPD). Each fraction was serially diluted ten-fold by adding a 25 µl aliquot of the fraction to 225 µl of Medium E to the first well of a column of a 96-well, sterile microtiter plate. After mixing, 25 µl was withdrawn and used to inoculate the next well until a dilution of 1:108 was achieved. Microtiter plates were incubated for 24 hours at 37 oC. Positive wells were those that had increased turbidity compared to uninoculated, control wells. The EPD is the reciprocal of the most dilute well that showed growth. Composition of Medium E is given in Chapter 1. No growth was observed in any well inoculated with fractions collected when sterile brine was injected into the column.
The total number of viable microorganisms (colony-forming units, CFU·ml-1), which includes both vegetative cells and spores and spores alone were determined by pooling the total volume of each fractions together and serially diluting (ten fold) the pooled fraction in 0.85% NaCl, and inoculating agar medium. Viable plate counts were done to obtain a viable cell count (vegetative cells and spores) and spore count of inoculum used for each column. To determine the spore concentration, the fraction was heated for 20-25 min. at 85 oC to kill vegetative cells and to assist in germination of spores.
To obtain transport-enhanced strains, aliquots of the first effluent fractions (fraction 3, 4, or 5, depending on the strain) were grown and a new spore preparation was prepared as above. The transport properties of the original strain and the effluent fraction were compared.
Plate Count Methods. Plate counts were done to determine CFU·ml-1 for both
total viable cells (vegetative cells and spores) and spores alone for each preparation. Serial dilutions from 10-1 to 10-8 were achieved by adding 100 µl of preparation to 900 µl of 0.85% of NaCl in sterile glass tubes until a dilution of 10-8 was obtained. Then, 100µl from three dilutions were separately plated onto standard plate count agar in triplicate and incubated for 16 hours at 37 oC. Counts were only considered accurate for plates containing 30-300 colonies.
Rep-PCR. Isolated genomic DNA from strains JF-2, ROB-2 and C-9 was used as
templates for repetitive sequence-based, polymerase chain reaction (rep-PCR) (19, 31). DNA was isolated according to Dneasy Tissue Kit for Animal Tissue (Qiagen 2003). BoxA1R repetitive sequence–based oligonucleotide primers (5’-ctacggcaaggcgacgctgacg-3’) were used to identify any differences between the spores injected into the column and the spores recovered in the effluent (31). Each 30 µl PCR reaction contained 8.75 µl water, 8 µl of 25 mM MgCl2 and 10x PCR buffer mix, 1 µl 10 mM dNTP, 2 µl boxA1R primer (0.3 µg/µl), 0.25 µl Taq Polymerase (10nmol), and 10 µl of DNA template. PCR amplifications were carried out using a thermocycler with an initial denaturation at 94 oC for 4min., followed by 30 cycles of denaturation at 94 oC for 1 min. and annealing at 50 oC for 1 min. and an extension of 72 oC for 8 min. A final extension was run for one cycle at 72 oC for 8 min. The products of the PCR reactions were run on an 0.8% agarose gel.

104
5.4 Results B. mojavensis strains were inoculated into Difco sporulation broth and incubated
for 7-11 days, shaking at 150rpm at 37 oC. Cultures were centrifuged, suspended in brine (0.85% NaCl) and injected into a sterile column, after which, the earliest effluent fraction was collected, sporulated and applied to a second column. First, we quantified the recoveries of spores and cells exiting the columns to obtain an estimate of the degree of cell retention (Table 5.1). The variation in cell and spore recoveries was estimated by calculating the range since duplicate columns were run for each strain. The percent recovery of total viable colony forming units had ranges of 0.15 to 0.54 and the percent spore recovery had ranges of 0.09 to 1.55 (Table 5.1). This indicates that differences in percent recovery greater than two-fold are likely to be significant. The total viable colony forming units and spore counts of effluents were performed several weeks after the column was run. Thus, effluent percent recoveries based on plate counts may be an underestimation of the actual recoveries. However, our recovery data are several orders of magnitude higher than that cited in the literature. In addition, these recoveries were obtained using small pore volumes of displacement fluid. As shown the various figures, the elution patterns for different replicates of each strain were reproducible. The variation between replicates for a given fraction was within one order of magnitude, which is within the precision of the MPN method. Thus, elution patterns that differ by more than an order of magnitude are likely to be significant.
Table 5.1. Summary of plate counts and percent recoveries for each strain applied to a column.
*Percent spores in influent and percent spore recovery were calculated by the ratio of spore to viable cell counts for influent and effluent fractions. Parentheses show ranges between means of duplicate columns.
CFU·ml-1 Influent CFU·ml-1 Effluent
Total Recovery
*% Spore Recovery Strain
Viable Spore *% Spores Influent Viable Spore Spore
JF-2 3.1e8 (9.0e7)
2.9e8 (3.0e7)
96.5 (18.6)
1.5e6 (1.0e4)
1.6e6 (5.0e4)
0.50 (0.15)
0.53 (0.14)
JF-2(3) 4.03e7 (4.5e6)
4.1e7 (1.3e7)
100.1 (19.8)
3.29e5 (3.75e4)
3.1e5 (2.5e3)
0.82 (0.19)
0.78 (0.09)
ROB-2 2.3e8 (2.0e8)
1.7e8 (9.5e6)
89.5 (74.6)
6.7e5 (4.03e5)
1.19e6 (1.83e6)
0.42 (0.54)
0.86 (1.55)
ROB-2(4) 3.8e7 (0) 3.01e7 (0)
79.2 3.9e5 (8e4) 2.9e5 (6.5e4)
1.03 (0.21)
0.77 (0.17)
C-9 NA 5.0e8 NA 3.5 NA C-9(5) NA 2.4e9 NA 93.7 2.23e9

105
Table 5.1 summarizes the data collected for each transport experiments with strains JF-2, ROB-2, and C-9, and the early effluent fractions of these strains, JF-2(3), ROB-2(4) and C-9(5) that were regrown and reinjected into new columns. After passage of JF-2 through the column, the mean concentration of viable cells collected was 1.5e6 CFU·ml-1, while the average number of spores collected from the column was 1.6e6 spore·ml-1. The ratio of influent spores and the effluent spores shows that the percentage of JF-2 spores recovered from the column was 0.53%. We used an end point dilution to estimate the concentration of viable cells and spores (together) in each effluent fraction. Since a large number of fractions (36) were collected for each column, it was not possible to determine viable cell counts for each fraction by the agar plate technique.
Figure 5.1. Elution pattern of JF-2 from sand columns. Open and closed circles are duplicate columns showing EPD values for each effluent fraction. Pore volumes based on Blue Dextran ellutant was 12mls.
Figure 5.2. Cumulative elution pattern of JF-2 from sand columns. Pore volumes are based on Blue Dextran ellutant in 12mls.
Figure 5.1 compares the log concentrations of JF-2 cells ·ml-1 versus volume of
effluent that passed through the column. Comparing both columns of JF-2, the majority
1.0E+00
1.0E+01
1.0E+02
1.0E+03
1.0E+04
1.0E+05
1.0E+06
1.0E+07
1.0E+08
0 10 20 30 40 50 60 70 80 90
Volume (ml)
Lo
g
Co
ncentr
ati
on
1.0E+00
1.0E+01
1.0E+02
1.0E+03
1.0E+04
1.0E+05
1.0E+06
1.0E+07
1.0E+08
1.0E+09
0 1 2 3 4 5 6 7
Pore Volume
Lo
g
Co
ncentr
ati
on

106
of the cells and spores injected into the column was collected within the first two pore volumes at a significantly high cell concentrations, 108-107 cells·ml-1 (Figure 5.1). This suggests that JF-2 is moving in an ordered rather than a dispersed manner. When these data are expressed as the cumulative number of viable cells and spores collected with pore volume of effluent, one can clearly see that almost all of the viable cells and spores initially injected into the column was recovered (Figure 5.2). Initially, about 3.1e8 viable cells and spores of JF-2 were injected into the column. By EPD, we estimate that about 3.75e8 viable cells and spores were recovered in the first 1.5 pore volumes of effluent. This shows that JF-2 transported through the column at very high efficiency.
Figure 5.3. Effluent pattern of JF-2(3) (early breakthrough fraction of JF-2) from sand packed columns. Fraction 3 from Figure 3.1 was sporulated and passed through duplicate columns. Pore volume of the columns ranged from 11-15ml.
The third effluent fraction from each JF-2 column was collected, allowed to sporulate and injected into a second column. Figure 5.3 shows the log concentration of each fraction collected versus the volume in milliliters of effluent that passed through the column for the early breakthrough fraction of the original JF-2 culture, designated JF-2(3). The average percent recovery of spores of the duplicate JF-2(3) columns was 0.78% which was a 0.25% increase from the original strain. Figure 5.2 shows that nearly 100% recovery of the injected viable cells and spores were obtained within 1 to 2 pore volumes of displacement fluid. Again, showing that JF-2 transported through the column at high efficiency.
1.0E+00
1.0E+01
1.0E+02
1.0E+03
1.0E+04
1.0E+05
1.0E+06
1.0E+07
1.0E+08
0 10 20 30 40 50 60 70 80 90
Volume (ml)
Lo
g
Co
ncentra
tio
n
Pore volume 14.8ml
Pore Volume 16ml

107
Figure 5.4. Elution pattern of ROB-2 through sand packed columns. Open and closed circles are duplicate columns showing EPD values from each fraction.
ROB-2 transported through the column in a manner similar to strain JF-2. After passage of ROB-2 through the column, the mean concentration of viable cells collected was 6.7e5 CFU·ml-1, while the average number of spores collected from the column was 1.2e6 spore·ml-1. The ratio of influent spores and the effluent spores shows that the percentage of JF-2 spores recovered from the column was 0.86%, slightly higher than the recovery of JF-2. ROB-2 had higher concentration of cells/spores being released in the early fractions than JF-2. The recoveries of the early breakthrough fraction of ROB-2, ROB-2(4), were similar to that of the original ROB-2 preparation (Table 5.1). Effluent pattern shows that the majority of ROB-2 or ROB-2(4) cells and spores were released from the column within the second pore volume (Figure 5.4 and 5.5). Figure 5.4 shows the effluent pattern of ROB-2 had more fractions with higher EPD than the original JF-2 or its early breakthrough fraction, JF-2(3). When these data are expressed as the cumulative number of viable cells and spores collected with pore volume of effluent, it is clear that ROB-2 and its early breakthrough fraction, ROB-2(4) were transported at high
1.0E+00
1.0E+01
1.0E+02
1.0E+03
1.0E+04
1.0E+05
1.0E+06
1.0E+07
1.0E+08
0 10 20 30 40 50 60 70 80 90
Volume (ml)
Lo
g
Co
ncentra
tio
n
Pore volume 14.8ml
Pore Volume 16ml

108
efficiency (Figure 5.6). Initially, about 2.3e8 and 3.8e7 viable cells and spores of ROB-2 and ROB-2(4), respectively, were injected into the column. By EPD, we estimate that about 1e9 viable cells and spores for each were recovered in the first 2 pore volumes of effluent.
Figure 5.5. Elution pattern of early breakthrough fraction, ROB-2 (4).
C-9, a natural genetic recombinant strain of Bacillus mojavensis (21), was tested in our column system to compare its elution pattern to the other two strains. Figure 5.7 shows the effluent concentrations of each fraction collected of the C-9 original culture and Figure 5.8 provides this information for the early breakthrough fractions, C-9(5). The influent concentration of C-9 was 5.0e8 CFU·ml-1 and 2.4e9 for C-9(5) (Table 5.1). Based on EPD estimates, we recovered about 1.17e7 viable cells and spores of C-9 from the column, for an estimated percent recovery of 3.5. Interestingly, the early breakthrough fraction, C-9(5), transported through the column at much higher efficiencies than the original C-9. The percent spore recovery exceeded 91%, the influent spore concentration was 2.4e9 CFU·ml-1 and the effluent concentration was 2.2e9 CFU·ml-1. Fraction 4 in Figure 5.4 was collected, grown and spores were injected into another series of columns.
1.0E+00
1.0E+01
1.0E+02
1.0E+03
1.0E+04
1.0E+05
1.0E+06
1.0E+07
1.0E+08
1.0E+09
0 10 20 30 40 50 60 70 80 90
Volume (ml)
Lo
g
Co
ncentr
ati
on
Pore Volume 12mls
Pore Volume 13mls

109
Figure 5.6. Cumulative elution pattern of ROB-2 from sand columns. Pore volumes were based on dry versus wet weights.
Rep-PCR. During transport experiments, different colony morphologies were observed when plating effluents of JF-2, ROB-2 and C-9. The colonies were similar for all strains, mixtures of smooth and rough colonies. Rep-PCR was performed in order to determine if the different colony morphologies were due to variations in the same strain injected into the column, or by an unknown contaminant possibly present in the spore preparation (31). The results of the rep-PCR experiment showed that the smooth and rough colonies were variations in colony morphology. There was no change in the band pattern from the original strain to the early effluent fractions. The band pattern for JF-2 was compared to band patterns of Bacillus subtilis 168; the band patterns were slightly different but this was expected since they are different strains. The rep-PCR banding patterns were not different enough to believe that the initial spore preparations used to inject into the columns were contaminated for any of the strains.
1.0E+00
1.0E+01
1.0E+02
1.0E+03
1.0E+04
1.0E+05
1.0E+06
1.0E+07
1.0E+08
1.0E+09
1.0E+10
0 1 2 3 4 5 6
Pore Volume
Lo
g
Co
ncentra
tio
n
Pore Volume 14.8ml
Pore Volume 16.1 ml

110
Figure 5.7. Elution pattern of C-9 through sand columns. Pore volumes range from 10-14mls.
Figure 5.8. Elution profile of the early breakthrough fraction of C-9, C-9(5). Pore volume was not measured for these columns. 5.5. Discussion
Several important characteristics contribute to an organism’s ability to transport
through porous media. These characteristics include size, motility, exopolymer production, hydrophobicity, electrostatic charge, as well as others. The three Bacillus mojavensis strains used to select for spores with enhanced transport through saturated
1.0E+00
1.0E+01
1.0E+02
1.0E+03
1.0E+04
1.0E+05
1.0E+06
1.0E+07
1.0E+08
0 10 20 30 40 50 60 70 80 90
Volume (ml)
Log C
on
cen
trati
on
1.0E+00
1.0E+01
1.0E+02
1.0E+03
1.0E+04
1.0E+05
1.0E+06
1.0E+07
1.0E+08
1.0E+09
0 10 20 30 40 50 60 70 80 90
Volume (ml)
Lo
g
Co
ncentra
tio
n

111
unconsolidated porous media were allowed to flow through the columns naturally without added pressure. We believed that we could select for spores with enhanced transport ability by collecting the earliest fractions that exited the cores and running these fractions through columns until cells or spores are released in the first pore volume. However, we found that all of the strains passed through the sand packed columns at very high efficiencies. Transport was so efficient that, in only one case, e. g., strain C-9, could we distinguish a difference in transport between the original preparation and the early breakthrough fraction (Figures 5.7 and 5.8). Collecting the early effluent fractions may not be as necessary as first thought. Testing different variables such as higher salt concentrations and shorter inoculation times should now be looked at to predict the best method for enhanced transport and biosurfactant production.
Generally, cell recoveries from transport studies are much lower, often less than 0.01% of the injected concentration (10), an order of magnitude less than our minimum estimate of cell and spore recoveries are. The recovery of B. licheniformis spores was very low (0.001%). It is possible that the procedure that we used to prepare our inoculum contributed to the high transport efficiency. The culture was incubated for 7 to 11 days to allow sporulation. For much of this period, the culture would have been without needed nutrients. This may have provided an environment that allowed the organism not only to form spores, but also to produce spores with low collision efficiencies. Thus, the inoculum preparation procedure may be the most important aspect in obtaining strains with high transport efficiencies.
Figure 5.1 and 5.3 show the difference of effluent collected between JF-2 and JF-2(3). JF-2 had a spore percent recovery of 0.53% while fraction 3 had a spore percent recovery of 0.78%. This is a 0.25% increase of spores recovered with fraction 3 versus the original culture. Duplicate columns of JF-2 and JF-2(3), shows that fraction 3 travels through the column similar to its original strain. There was no significant difference in viable cell recovery compared to spore recovery in JF-2(3) or JF-2 showing that spores were moving at the same rate or faster than viable cells. Unlike JF-2, JF-2(3) passed in high concentration as a band of cells through the second pore volume, while JF-2 eluted more diffusely from the column.
Recoveries of ROB-2 cells and spores from the column were similar to that of JF-2. However, the elution of ROB-2(4) had one fraction with very high concentration,109 cells/ml, which is an order of magnitude higher than found for ROB-2 or JF-2. C-9 shows similar spore recoveries to JF-2 with 3.5% released from the original column. These data were based on EPD and not plate counts. The early breakthrough fraction for C-9, C-9(5), was transported through the column at much higher efficiencies than the original preparation. This is the one case where it is clear that a transport-enhanced strain was obtained.
Many studies have focused on the movement of bacterial cells through saturated porous media, but there has been fewer studies using spores. Jang et al. (1983) studied three different bacterial species for their ability to move through porous media as spores or vegetative cells (14). They found that Clostridia spores easily moved through porous media more so than vegetative cells. There has been reports of two adhesion deficient strains, Comamonas sp. and Erwinia herbicola, were studied based on attachment and detachment rates. They found 67% to 55% recoveries with pore volumes ranging from 530 – 754 milliliters (7). In the current study we have been able to get efficient transport

112
with smaller pore volumes. JF-2 spores move through the column at the same rate as vegetative cells, although further analysis of ROB-2 and C-9 will be needed to determine if these spores move through at the same rate or faster than vegetative cells. By running the earliest fraction through the column again, we may be able to select for smaller more transportable spores. Additional columns will allow for the selection of a strain with small spore size as well as possible changes in cell surface characteristics and increased biosurfactant production.
The use of sand columns for seeking out biosurfactant-producing strains with enhanced transport abilities is an efficient tool. We found two strains, JF-2 and ROB-2, that naturally had high transport efficiencies through sand and were able to select for a transport enhanced variant of strain C-9. The fact that all of the Bacillus strains studied in this project had high transport efficiencies coupled with the high percentage of biosurfactant producers among isolates from diverse environments suggests these organism may be present in many oil fields. Previous studies have focused on the transport of vegetative through porous media. Fontes et al. reported percent recoveries ranging from 49% to 11% using nonsporeforming bacteria through high ionic strength sand columns (8). In this case the average pore volume was 88cm3. We believe spores are good candidates because of their resilience to severe environmental conditions, and the fact that spores do not need a means to replenish nutrients. Another advantage of spores over vegetative cells is their small, consistent size, which allows movement through small pore sizes in porous media. Further studies are needed using oil saturated models to test the effects of oil on the transport of spores.
5.6. References
1. Abdulrazag, Y., R. A. Almehaideb, and O. Chaalal. 1999. Presented at
the SPE Annual Technical Conference and Exhibition, 1991. 2. Albinger, O., B. K. Biesemeyer, R. G. Arnold, and B. E. Logan. 1994.
Effect of bacterial heterogeneity on adhesion to uniform collectors by monoclonal populations. FEMS Microbiol. Let. 124:321-6.
3. Camesano, T. A., and B. E. Logan. 1998. Influence of Fluid Velocity and Cell Concentration on the Transport of Motile and Nonmotile Bacteria in Porous Media. Env. Sci. Tech. 32:1699-1708.
4. DeFlaun, M. F., B. M. Marshall, E. P. Kulle, and S. B. Levy. 1994. Tn5 insertion mutants of Pseudomonas fluorescens defective in adhesion to soil and seeds. Appl. Environ. Microbiol. 60:2637-42.
5. DeFlaun, M. F., S. R. Oppenheimer, S. Streger, C. W. Condee, and M. Fletcher. 1999. Alterations in adhesion, transport, and membrane characteristics in an adhesion-deficient pseudomonad. Appl. Environ. Microbiol. 65:759-765.
6. DeFlaun, M. F., A. S. Tanzer, A. L. McAteer, B. Marshall, and S. B. Levy. 1990. Development of an adhesion assay and characterization of an adhesion-deficient mutant of Pseudomonas fluorescens. Appl. Environ. Microbiol. 56:112-19.
7. Dong, H., R. Rothmel, T. Onstott, M. E. Fuller, M. F. DeFlaunn, S. H. Streger, R. Dunlap, and M. Fletcher. 2002. Simultaneous transport of two bacterial strains in intact cores from Oyster, Virginia: Biological effects and numerical modeling. Appl. Environ. Microbiol. 68:2120-2132.

113
8. Fontes, D. E., A. L. Mills, G. M. Horrnberger, and J. S. Herman. 1991. Physical and chemical factors influencing transport of microorganisms through porous media. Appl. Environ. Microbiol. 57.
9. Georgiou, G., S. C. Lin, and M. M. Sharma. 1992. Surface-active compounds from microorganisms. Biotech. 10:60-65.
10. Gullapalli, I. L., J. H. Bae, K. Hejl, and A. Edwards. 2000. Laboratory design and field implementation of microbial profile modification process. SEP Reservoir Eval. Eng. 3:42-49.
11. Harvey, R. W. 1991. Parameters involved in modeling movement of bacteria in groundwater, p. 89-114. In C. J. Hurst (ed.), Modeling the environmental fate of microorganisms. ASM Press, Washington, D. C.
12. Harvey, R. W., and S. P. Garabedian. 1991. Use of colloid filtration theory in modeling movement of bacteria through a contaminated sandy aquifer. Env. Sci. Tech. 25:178-85.
13. Harvey, R. W., L. H. George, R. L. Smith, and D. R. LeBlanc. 1989. Transport of microspheres and indigenous bacteria through a sandy aquifer: results of natural- and forced-gradient tracer experiments. Env. Sci. Tech. 23:51-6.
14. Jang, L. K., P. W. Chang, J. E. Findley, and T. F. Yen. 1983. Selection of bacteria with favorable transport properties through porous rock for the application of microbially enhanced oil recovery. Appl. Environ. Microbiol. 46:1066-1072.
15. Jenneman, G. E. 1985. Microbial penetration through Berea sandstone and the effect of nitrate on biogenic sulfide production: their relevance to microbial enhanced oil recovery. Univ. OK., Norman, OK.
16. Jenneman, G. E., M. J. McInerney, and R. M. Knapp. 1986. Effect of nitrate on biogenic sulfide production. Appl. Environ. Microbiol. 51:1205-1211.
17. Johnson, W. P., P. Zhang, M. E. Fuller, T. D. Scheibe, B. J. Mailloux, T. C. Onstott, M. F. Deflaun, S. S. Hubbard, J. Radtke, W. P. Kovacik, and W. Holben. 2001. Ferrographic tracking of bacterial transport in the field at the narrow channel focus area, Oyster, VA. Env. Sci. Tech. 35:182-91.
18. Johnson, W. P., P. Zhang, P. M. Gardner, M. E. Fuller, and M. F. DeFlaunn. 2001. Evidence for detachment of indigenous bacteria from aquifer sediment in response to arrival of infected bacteria. Appl. Environ. Microbiol. 67:4908-4913.
19. Judd, A. K., M. Schneider, M. J. Sadowsky, and F. J. De Bruijn. 1993. Use of repetitive sequences and the polymerase chain reaction technique to classify genetically related Bradyrhizoboum japonicum serocluster 123 strains. Appl. Environ. Microbiol. 59:1702-1708.
20. McInerney, M. J. 1991. Use of models to predict bacterial penetration and movement within a subsurface matrix, p. 115-135. In C. J. Hurst (ed.), Modeling the environmental fate of microorganisms. ASM Press, Washington, D.C.
21. McInerney, M. J., R. M. Knapp, D. P. Nagle, K. E. Duncan, N. Youssef, M. J. Folmsbee, and S. Maudgalya. 2003. Development of microorganisms with improved transport and biosurfactant activity for enhanced oil recovery DE-FE-02NT15321. DOE.
22. Nakano, M. M., M. A. Maraheil, and P. Zuber. 1988. identification of a genetic locus required for biosynthesis of the lipopeptide antibiotic surfactin in Bacillus subtilis. J. Bact. 170:5662-5668.

114
23. Reynolds, P. J., P. Sharma, G. E. Jenneman, and M. J. McInerney. 1989. Mechanisms of microbial movement in subsurface materials. Appl. Environ. Microbiol. 55:2280-2286.
24. Scholl, M. A., and R. W. Harvey. 1992. Laboratory investigations on the role of sediment surface and groundwater chemistry in transport of bacteria through a contaminated sandy aquifer. Env. Sci. Tech. 26:1410-17.
25. Scholl, M. A., A. L. Mills, J. S. Herman, and G. M. Hornberger. 1990. The influence of mineralogy and solution chemistry on the attachment of bacteria to representative aquifer materials. J. Cont. Hydrol. 6:321-36.
26. Sharma, M. M., and G. Georgiou. 1993. Microbial enhanced oil recovery research. Final Report for Annex X. Bartlesville Project Office, U. S. Department of Energy, Bartlesville, OK, DOE/BC/14445-12.
27. Simoni, S. F. 1998. Population heterogeneity affects transport of bacteria through sand columns at low flow rates. Environ. Sci. Technol. 32:2100-2105.
28. Sugihardjo, E. H., and S. W. Pratomo. 1999. Presented at the SPE Asia Pacific Improved Oil Recovery Conference, Kuala Lampur, Malaysia.
29. Van Loosdrecht, M. C. M., J. Lyklema, W. Norde, and A. J. B. Zehnder. 1989. Bacterial adhesion: a physicochemical approach. Micro. Eco. 17:1-15.
30. Van Loosdrecht, M. C. M., J. Lyklema, W. Norde, and A. J. B. Zehnder. 1990. Influence of interfaces on microbial activity. Microbiol. Rev. 54:75-87.
31. Versalovic, J., M. Schneider, F. J. De Bruijn, and J. R. Lupski. 1994. Genomic fingerprinting of bacteria using repetitive sequence-based polymerase chain reaction. Meth. Mol. Cell Bio. 5:25-40.
32. Weiss, T. H., A. L. Mills, G. M. Hornberger, and J. S. Herman. 1995. Effect of Bacterial Cell Shape on Transport of Bacteria in Porous Media. Environmental Science and Technology 29:1737-40.
33. Wiencek, K. M., N. A. Klapes, and P. M. Foegeding. 1990. Hydrophobicity of Bacillus and Clostridium spores. Applied and environmental microbiology 56:2600-5.
34. Yonebayashi, Y., K. Ono, H. Enomoto, T. Chida, C.-X. Hong, and K. Fujiwara. 1997. Presented at the SPE Asia Pacific Oil and Gas Conference, Kuala Lumpur.

115
Chapter 6. Tertiary oil recovery by the JF-2 biosurfactant from Berea sandstone cores and the development of a mathematical model relating
oil-water interfacial tension to the concentration of the JF-2 biosurfactant.
6.1. Abstract
Efficacy of the JF-2 biosurfactant was tested using Berea sandstone cores and
sand-packed columns which were flooded to residual oil saturation. Tertiary oil recovery experiments showed that biosurfactant solutions with concentrations ranging from 10 to 920 mg/l in the presence of 0.1 mM 2,3-butanediol and 1 g/l of partially hydrolyzed polyacrylamide (PHPA) recovered 10-40% of residual oil from Berea sandstone cores. When PHPA was used alone, about 10% of the residual oil was recovered. Thus, about 10% of the residual oil recovered in these experiments was due to the increase in viscosity of the displacing fluid. The remainder of the recovered oil was due to the effect of the JF-2 biosurfactant on interfacial tension between oil and the displacing aqueous phase. Capillary trapping may have prevented mobilized oil from being produced ahead of the biosurfactant front, but this oil was produced when a post surfactant brine solution was injected at three times the rate that the initial biosurfactant sludge was injected into the core. The relationship between interfacial tension (IFT) reduction and biosurfactant concentration was defined. Little or no oil was recovered at biosurfactant concentrations below the critical micelle concentration (CMC) (about 10 mg/l). At concentrations lower than the CMC, IFT values were high. At biosurfactant concentrations from 10 to 40 mg/l, the IFT was 1 mN/m. As the biosurfactant concentration increased beyond 40 mg/l, IFT decreased to around 0.1 mN/m. At biosurfactant concentrations in excess of 10 mg/l, residual oil recovery was linearly related to biosurfactant concentration. A mathematical model that relates oil recovery to biosurfactant concentration was modified to include the stepwise changes in IFT as biosurfactant concentrations changes. This model adequately predicted the experimentally observed changes in IFT as a function of biosurfactant concentration.
6.2. Introduction
The widespread use of petroleum hydrocarbons has resulted in the contamination
of valuable groundwater resources. Petroleum hydrocarbons may exist in the vadose and saturated zones as a free liquid or ganglia of residual hydrocarbon (3, 5). Even if the free liquid hydrocarbon can be removed, substantial amounts of residual hydrocarbon remain entrapped by capillary forces and represent a long-term source of contamination (5). Entrapment of petroleum hydrocarbons by capillary forces is also a major factor that limits oil recovery (1, 14, 16). Current technology recovers only one-third to one-half of the oil that is originally present in an oil reservoir. Since almost all regions of the world have been intensively explored for oil, the discovery of large new oil resources is unlikely and the exploitation of oil resources in existing reservoirs will be essential in the future.

116
Surfactants of synthetic or biological origin enhance hydrocarbon biodegradation by increasing the apparent aqueous solubility of the hydrocarbon or by enhancing the interaction of the microbial cell with the hydrocarbon. Alternately, bulk hydrocarbon displacement can occur if the capillary forces that entrap the hydrocarbon are reduced. Interfacial tension (IFT) between the hydrocarbon and aqueous phases is largely responsible for trapping the hydrocarbon in the porous matrix. Ultra-low values (several orders of magnitude reduction) of IFT are needed for hydrocarbon mobilization. To achieve these ultra-low IFT values, very high concentrations (> g l-1) of synthetic surfactants must be used, which makes chemical surfactant flooding expensive. Microbially-produced biosurfactants may be an economical method to recover residual hydrocarbons since they are effective at low concentrations (as indicated by their low critical micelle concentrations). However, the recovery of residual hydrocarbon by biosurfactants from model porous systems is inconsistent and often low.
Microorganisms produce a variety of biosurfactants (4), several of which generate the low interfacial tensions between the hydrocarbon and the aqueous phases required to mobilize residual hydrocarbon (4, 7, 10). In particular, the lipopeptide biosurfactant produced by Bacillus mojavensis strain JF-2 reduces the interfacial tension between oleic and aqueous phases to very low levels (<0.016 mN/m) (9, 10). The critical micelle concentration is 20 mg/l, indicating that the biosurfactant is effective even at very low concentrations (10). Residual oil is recovered when a biosurfactant-producing bacterium and the nutrients needed to support growth are introduced into sandstone cores (11, 18, 20), but residual hydrocarbon recoveries were often low (5 to 20%) and required multiple pore volumes of recovery fluid (11, 18).
Previously, we showed that substantial mobilization of residual hydrocarbon from a model porous system occurs at biosurfactant concentrations made naturally by B. mojavensis strain JF-1 if a polymer and 2,3-butanediol were present (12).
In this report, we include data on oil recovery from Berea sandstone experiments along with our previous data from sand pack columns in order to relate biosurfactant concentration to the fraction of oil recovered (12). A capillary desaturation curve was obtained between water flood phase capillary numbers and residual oil saturation in Berea sandstone cores. This curve indicates the change in the magnitude of the capillary number required to lower residual oil saturation in a core.
6.3. Materials and Methods
Medium and Cultivation. Bacillus mojavensis strain JF-2 was grown in medium
E as described in Chapter 1 of this report. The culture was centrifuged to remove cells (10,000 x g; 10 min; 4 oC). The concentration of the JF-2 biosurfactant was determined by high-pressure liquid chromatography (13). The cell-free culture fluid was used immediately for injection into the core. When more dilute biosurfactant concentrations were required, the cell-free culture fluid was diluted with sterile medium E. The partially hydrolyzed polyacrylamide (PHPA) and 2,3-butanediol were added to give final concentrations of 1 g/l and 10 mM, respectively, prior to injection in the cores.
Core Flooding. Berea sandstone cores were dried in an oven at 60o C for 4 days.
The dried cores were weighed and their length and diameter measured. The core was

117
inserted into a Hassler holder and placed under vacuum for 24 hours to remove air. The core was placed at 2000 psig and then flooded with at least multiple pore volumes of deareated 5% NaCl brine. After brine saturation, the core was flooded to connate water saturation (until no more brine exited the core) with crude oil (32o API gravity). The core was then flooded with 5% NaCl brine until near residual oil saturation, where only a trace of oil was detected in the effluent of the core.
After the core reached near residual oil saturation, cell-free culture fluid containing the indicated biosurfactant concentration and 1 g/l PHPA and 10 mM 2,3-butanediol was injected into core. Table 6.1 gives the pore volumes and flow rates used for biosurfactant injection. In most cases, the core was then treated with 5% NaCl brine after biosurfactant sludge was injected as indicated in Table 6.1. The flow rates used for post-flush brine injection are also given in Table 6.1.
Effluent samples were collected in flasks and the amounts of oil and brine collected were determined volumetrically.
Petrophysical properties of the Berea sandstone cores are given in Table 6.2. Brine viscosity ranged from 1.03 to 1.1 cp and crude oil viscosity ranged from 2.0 to 6.0 cp.
Establishment of a Capillary Desaturation Curve for Berea Sandstone Cores.
Capillary number is defined as the ratio of inertial to capillary forces. Capillary number increases with increases in the inertial forces or decreases in the interfacial forces. Increases in capillary number lower the residual oil saturation in the core and increase residual oil recovery.
Capillary number is mathematically defined as: NCP = vµ σ where, v: velocity through porous media (cm/sec), Q/ AΦ µ: viscosity of displacing fluid (brine), cp σ: Interfacial tension between oil and water, dynes/cm
and Q: the water flooding rate, A is the core’s cross-sectional area and Φ is the porosity of the core.

118
Table 6.1. Summary of oil recovery data at biosurfactant concentrations above and below the cri tical micelle concentration. Corrected percent residual oil recovery is corrected for the amount of residual oil recovered by polymer alone.
A Berea sandstone cores was dried in an oven at 600 C for four days, then
weighed and its length and diameter measured. The core was place under vacuum for 24 h to remove trapped air inside the core, saturated with deareated 5.0 % NaCl brine, and flooded to connate water saturation using crude oil. In the water flooding phase, 5.0% NaCl brine was injected at a flow rate of 2.5 ml/h until the core reached residual oil saturation (e. g., until no more oil was recovered from the core). The rate of brine injection was doubled (5.1 ml/h) and the core was again water flooded to residual oil saturation. The doubling of the flow rate continued until the brine flow rate reached a maximum of 576.0 ml/h. The amount of oil recovered at each flow rate was measured and the residual oil saturation determined.
Interfacial Tension (IFT) Measurements. Biosurfactant was prepared
aerobically in separate batches and had different biosurfactant concentrations. Some batches were diluted by one-half or one-quarter of the original biosurfactant concentration by diluting the cell-free culture fluid with sterile medium E. Composition and preparation of medium, growth of B. mojavensis strain JF-2, and preparation of cell-free culture fluids is given in Chapter 1. The concentration of the biosurfactant was determined by high-pressure liquid chromatography as described previously (13).
Core Biosurfactant concentration
(mg/l)
Volume of
recovery sludge
(PV)
Biosurfactant injection rate
(ml/h)
Volume of brine
post flush
(PV)
Post-flush
rate (ml/h)
Residual oil
recovered (ml)
Percent residual
oil recovery
Corrected percent
residual oil
recovery (%)
1 11 2 3.14 0 3.14 0 0 0
2 39 2 3.14 3 3.14 2.3 39 29.3
3 38 1 2.54 1 5.14 2 47 37.3
4 38 1 5.14 1 10 3 45 35.3
5 21 1 5.4 1 30.9 2.7 26.5 16.8
6 21 1 6.4 1 30.9 3 27.8 18.1
7 10.5 1 6.4 1 30.9 2 13.4 3.7
8 10.5 1 6.4 1 30.9 1.7 16.2 6.5
9 11 2 5.14 1 20.53 2.3 20.2 10.5
10 11 1 5.14 1 20.53 1.7 13.8 4.1
11 11 1 5.14 1 20.53 1.8 15.9 6.2
12 5.5 1 5.14 1 20.53 1 8.8 0
13 5.5 1 5.14 1 20.53 1.2 9.6 0
14 2.75 1 5.14 1 20.53 1.3 10.3 0.6
15 2.75 1 5.14 1 20.53 1.7 13.3 3.6
16 0 1 6.43 1 1.2 9.7 0

119
Table 6.2. Petrophysical properties of the Berea sandstone cores.
Interfacial tension measurements (IFT) were made by using a spinning drop tensiometer. Each sample was measured three times and in some cases four times for greater accuracy. The crude oil used was 320 API oil with a viscosity of 6.0 cp. The tensiometer readings were taken at room temperature (260 C).
6.4. Results
Core Flood Experiments. Table 6.1 summarizes the results of a series of core
flood experiments with different biosurfactant concentrations and flow regimes. Little or no oil was recovered at biosurfactant concentrations less than 21 mg/l. At biosurfactant concentrations ranging from 2.75 to 11 mg/l, the amount of residual oil recovered was similar to that of the control that lacked biosurfactant (Core 16, Table 6.1). Oil recovery at these low biosurfactant concentrations are most likely the result of increase in viscous forces due to polymer injection. When the biosurfactant concentration was 21 mg/l (Cores 5 and 6; Table 6.1), additional residual oil was recovered. At a biosurfactant concentration of 39 mg/l (Core 2-5; Table 6.1), the percent of residual oil that was recovered, corrected for residual oil recovered by the polymer alone, was twice that when the biosurfactant concentration was 21 mg/l (Table 6.1). These data indicate that once a threshold value of biosurfactant is reached, residual oil recovery becomes linearly proportional to the biosurfactant concentration. This linear dependence of residual oil recovery on biosurfactant concentration was observed previously in sand pack columns at higher biosurfactant concentrations (12). The threshold value is between 10 to 20 mg/l, which is the critical micelle concentration of the JF-2 biosurfactant (7).
Capillary Desaturation. To determine if the residual oil recoveries by biosurfactant injection were an artifact of the core flooding process (e. g., unusually high residual oil saturations or flow rates that may not be reflective of actual field conditions),
Core Porosity (%)
Pore volume (ml)
Absolute permeability
(md)
KO, Eff
(md)KW, Eff (md) Oil
saturation
(%)
Residual oil (ml)
1 13.9 23.9 35 27.2 13.7 20.9 5
2 23.1 39 26.5 14.3 8.3 15.1 5.9
3 13.9 18.9 31.3 21.3 1.2 20.9 4.8
4 13.4 27 31 14.3 4.2 24.8 6.7
5 14.9 25 34.8 21.1 5.2 40.8 10.2
6 18 30 22.8 19.2 2.8 36 10.8
7 16.7 29 21.6 6.7 51.4 14.9
8 15.7 26.5 29.7 21.6 5.4 39.6 10.5
9 18.4 31 103 36.3 20.2 36.8 11.4
10 17.9 31.5 108 39.5 13.8 39 12.3
11 18.2 32 72 39.5 15.9 35.3 11.3
12 18.2 32 72.2 39.5 4.5 35.6 11.4
13 17.4 30 68.7 37.7 4.3 40 12
14 18.2 31.8 60.9 38 5 39.6 12.6
15 18.4 32.5 122.2 48 6 39.4 12.8
16 18.7 33 240.1 47.8 8.8 36.1 11.9

120
a capillary desaturation curve was generated by measuring the oil saturations at different flow rates. The residual saturations and the capillary numbers obtained with different flow rates are shown in Table 6.3 and this relationship is plotted in Figure 6.1.
Table 6.3. Residual oil saturation and capillary Number with increase flow rates
Qw
(cc/hr) Sor,WF
(%) NCP
2.5 .3667 1.51 E-5
5.0 .3458 3.02 E-5
10.5 .3396 6.34 E-5
20.53 .3292 1.24 E-4
30.86 .3104 1.86 E-4
61.0 .3021 3.68 E-4
123.4 .2688 7.45 E-4
246.9 .2479 1.49 E-3
493.1 .2250 2.98 E-3
576.0 .2250 3.48 E-3

121
0.1000
0.1500
0.2000
0.2500
0.3000
0.3500
0.4000
0.4500
0.5000
1.00E-05 1.00E-04 1.00E-03 1.00E-02Ncp
Re
sid
ua
l O
il S
atu
rati
on
(%
)
Figure 6.1. Berea sandstone capillary desaturation curve.
0.1000
0.1500
0.2000
0.2500
0.3000
0.3500
0.4000
0.4500
0.5000
1.00E-05 1.00E-04 1.00E-03 1.00E-02
Ncp
Re
sid
ua
l O
il S
atu
rati
on
(%
)
CDC Core flood data
Figure 6.2. Comparison of core data with the capillary desaturation curve. Figure 6.2 shows this same curve as in given in Figure 6.1, with the residual oil
saturations obtained for some of the Berea sandstone cores used in the biosurfactant flooding experiments included.
Hysteresis of the oil trapping process results in larger inertial force being required to displace oil from a pore for discontinuous systems, where capillary number is

122
increased in a stepwise manner, compared to a system that is continuous (capillary number does not change) or where capillary number changes continually (15). Because it is expected that the biosurfactant process will be used in fields that have undergone water flooding to near residual oil saturations, the discontinuous process is more representative of he capillary number requirements to displace residual oil be biosurfactants. Comparison of the residual oil saturations of cores used for biosurfactant injection to the capillary desaturation curve shows that in some case higher and in other cases lower residual oil saturations were obtained. Thus, our experimental model is representative of the expected field conditions. When the capillary number at a given residual oil saturation for an individual core water flood is lower than that for the same residual oil saturation on the capillary desaturation curve, this would be advantageous from a tertiary recovery point of view since displacement will be a discontinuous process and the capillary number required to mobilize oil would be higher than that required for continuous process.
Analysis of Relationship Between Fractional Oil Recovery and Surfactant
Concentration. Table 6.4 summarizes the data that relate biosurfactant concentration to residual oil recovery for Berea sandstone and sand-packed column experiments. The data on residual oil recovery from Berea sandstone are corrected for the amount of oil produced by the polymer alone are included. Injection of the polymer alone in sand-packed columns did not recovery residual oil. These data can be used to relate interfacial tension, biosurfactant concentration, and oil recovery.
Figure 6.3 shows that the fraction of oil recovered by the viscous-biosurfactant solution, either corrected or not corrected for the contribution of the polymer, is linearly dependent on biosurfactant concentration when the concentration is greater than about 10 mg/l. When bio-surfactant concentration was close to 10-11 ppm, the fraction of oil recovered was close to zero. The data from sand-packed experimental systems also show a linear relationship between the fraction of oil recovered and biosurfactant concentration. However, the slope of this line differs from that obtained with Berea sandstone cores. This may reflect the differences in the petrophysical properties of the two porous systems or differences in the treatment protocols for biosurfactant injection. With sand packs, a viscous pre-flush ahead of the biosurfactant solution and post flush with different viscosities were used.

123
0
0.1
0.2
0.3
0.4
0.5
0.6
0.7
1 10 100 1000
Surfactant concentration (ppm)
Oil
re
co
ve
ry (
Fra
c)
Expt1 -41 ppm Expt 2 -38 ppm Expt 3 -21 ppmExpt 4 -11 ppm 41 ppm-No polymer 38 ppm-No polymer21 ppm-No polymer 11 ppm-No polymer Sand Packs
Figure 6.3. Plot of tertiary oil recovery from cores (before and after removing the polymer contribution) and sand-packed columns as a function of biosurfactant concentration.
The c losed symbols represent ter t iary o i l recover ies us ing the v iscous-surfactant so lut ion from sandstone cores before correc t ing for the polymer contr ibut ion. The open symbols are the recover ies after the 10% residual o i l recovered by the polymer solut ion a lone was subtrac ted from the o i l recovery data. Measurements from surfactant treatment of hor izonta l sand packs were a lso inc luded in the p lot (smal l c losed tr iangles). In the sand pack exper iments, each pack was f looded with a pore volume of v iscous sur fac tant
solut ion. These
points are inc luded to prov ide a greater range of surfactant concentrat ions over which o i l recovery could be analyzed. The s ingle sol id c irc le is the o i l recovery frac t ion after two pore volumes of b iosur factant (11 mg/ l) was f looded through a core.
The black circles on the plot (Figure 6.3) represent the fraction of oil recovered
when two pore volumes of a 11 mg/l biosurfactant solution was used. After correcting for the contribution of the polymer contribution, a single pore volume treatment at 11 mg/l of the biosurfactant did not recover any oil, but the two pore volume treatment at 11 mg/l of the biosurfactant recovered 0.1 of the residual oil. The adsorption of the biosurfactant to the porous matrix or trapping of the micelles in the pores may have lowered the effective biosurfactant concentration and prevented oil recovery when only one pore volume of the biosurfactant solution was used (6) (8). Adsorption of biosurfactant in the second pore volume would have been reduced, allowing for some residual oil recovery oil. As found with synthetic surfactants, these data indicate that adsorption and trapping of biosurfactants occur. This probably lowers the biosurfactant concentration below that needed for oil recovery. Biosurfactant-mediated water floods would require large volumes of recovery fluid or a high concentration of biosurfactant.

124
Table 6.4. Residual oil recoveries from sandstone and sand-packed model systems with different biosurfactant concentrations.
Surfactant
concentration (ppm)
Oil recovery (Frac.)
Oil recovery after removing polymer
contribution (Frac.) 41 0.39 0.29 38 0.48 0.38 38 0.45 0.35 21 0.27 0.17 21 0.28 0.18
10.5 0.13 0.04 10.5 0.16 0.07 11.0 0.14 0.04 11.0 0.16 0.06 5.5 0.09 0.0 5.5 0.10 0.0
2.75 0.10 0.06 2.75 0.13 0.04 920 0.64 - 920 0.63 - 283 0.53 - 283 0.48 - 43 0.22 - 43 0.22 -
Mathematical Model Relating Oil-water Interfacial Tension to JF-2
Biosurfactant Concentration. The construction and analysis of a mathematical relationship between oil-water interfacial tension (IFT) and biosurfactant concentration, salinity and co-surfactant 2,3-butenediol is presented here. Last year, we reported on the dependence of IFT and bio-surfactant concentration, salinity, and co-surfactant alcohol using a two-way analysis of variance method (13). We found that, at biosurfactant concentrations made naturally by B. mojavensis strain JF-2, IFT between the aqueous and oil phases was lowered by two orders of magnitude in some cases. Increasing salinity from 5% NaCl to 7.5 and 10%, with or without 2,3-butanediol present, increase the interfacial tension. The lowest IFT observed was 0.1 mN/m at 5% NaCl in the presence of 2,3-butanediol.
Here the effect of all three variables on IFT between oil and water is studied and a mathematical relationship between oil-water IFT and bio-surfactant concentration is presented.
Interfacial tension values at different biosurfactant concentrations are shown below in Table 6.5. These data were obtained using biosurfactant samples from different batches of aerobically grown cultures. The method of preparation and composition was the same for each batch. A spinning drop tensiometer was used to measure the data used to calculate IFT. Each measurement was repeated three times for greater accuracy.

125
Table 6.5. Interfacial tension values at different biosurfactant concentrations.
Concentration
of surfactant (ppm) IFT
(Dynes/cm) 58.0 0.35 29.0 0.38 11.6 1.88 54.0 0.168 27.0 0.42 10.8 0.37 57.0 0.10 28.5 1.50 11.4 2.50 11.0 2.54 41.0 1.21 38.0 1.48 21.0 1.50 10.5 2.00 11.0 0.93 5.5 3.00
2.75 4.20
Figure 6.4 shows a stepwise decrease in IFT with increasing biosurfactant concentration. The IFT between crude oil and 5% NaCl brine was measured first and its value was repeatedly found to be 29.0 mN/m. Interfacial tension first decreased from 29 mN/m to 1.0 mN/m as biosurfactant concentration increased from 0.0 to 11.0 mg/l. From 11.0 mg/l to 41.0 mg/l, the IFT stayed steady in a region close to 1.0 dyne/cm. When the bio-surfactant concentration increased beyond 41.0 ppm, IFT declined again with increasing concentration until it reached a region between 54-58 ppm. At this point, IFT was close to 0.1 dyne/cm. On the basis of conservative error at concentrations close to 58 ppm, IFT appeared to remain unchanged at concentrations beyond 58.0 ppm. But this has not been confirmed because 58.0 ppm was the highest concentration obtained in the laboratory.
Two critical concentrations were identified from inspection of Figure 6.4. The first critical biosurfactant concentration is around 11 mg/l. At this concentration, IFT decreases to 1.0 mN/m. IFT value remains unchanged until the biosurfactant concentration reaches 41.0 mg/l. The biosurfactant concentration of 11.0 mg/l may represent the critical micellar concentration (CMC) for the bio-surfactant. At the CMC, the concentration of surfactant molecules is sufficient to form micelles. The CMC of the purified JF-2 biosurfactant has been reported to be 10 mg/l (10), consistent with our findings. The second critical biosurfactant concentration is between 40 and 60 mg/l and this is where another decrease in IFT is observed. This region may the critical microemulsion concentration (CMEC). When surfactant concentrations reach the CMEC, a third phase called a microemulsion (in addition to the oil and aqueous phases) forms. The microemulsion phase is generally associated with ultra-low IFT values. The microemulsion phase region contains oil, water, and a microemulsion that may have oil and/or water molecules surrounded the surfactant molecules (6) (8). The two critical biosurfactant concentration regions are indicated with circles in Figure 6.4 below.

126
0.01
0.1
1
10
100
0 10 20 30 40 50 60 70
Concentration (PPM)
IFT
(P
PM
)
Figure 6.4. The relat ionship between interfacial tension and biosurfactant concentration.
Mathematical Model. The mathematical model used to represent the change in
IFT with changing biosurfactant concentration had been previously derived from laboratory experiments on synthetic surfactants (2, 17). It has also been used in an earlier model for biosurfactant-based microbial enhanced oil recovery (19). Approximating IFT through this relationship is straightforward. Studies have shown that other equations may be required where IFT is a function of the equivalent alkane number of the crude oil, salinity, or temperature. The exponent, ES, is an exponent factor that describes the dependency of interfacial tension on biosurfactant concentration. The concentration exponent is reported to be less than unity at low concentrations. The model parameters are given in Table 6.6. The equation is shown below as Equation (a).
Log10 (IFTC, Surf) =Log10 (IFTMin) + (Log10 (IFTMax/IFTMin))*((CSurf,Max-
CSurf)/Delsuf) E…..(a) Based on our analyses, we will use a different system of nomenclature from
Equation (a) to identify parameters used to predict IFT as a function of biosurfactant concentration as illustrated in Figure 6.5.

127
Table 6.6. Parameters used for the model that relates IFT to biosurfactant concentration.
Variable Value IFTC,Surf IFT at surfactant concentration between CSurf,Max and
CSurf,Min IFTMin Minimum interfacial tension (dynes/cm) IFTMax Maximum interfacial tension (dynes/cm) CSurf,Max Maximum surfactant concentration (mg/L) CSurf,Min Minimum surfactant concentration (mg/L)
CSurf Concentration of biosurfactant (mg/L) Delsuf CSurf, Max – CSurf, Min (mg/L)
ES Concentration exponent
0.01
0.1
1
10
100
0 10 20 30 40 50 60 70
Concentration (PPM)
IFT
(P
PM
)
Figure 6.5. Model parameters used to predict IFT reductions from biosurfactant concentration.
To model the stepwise profile that we obtained, two concentration ranges were identified. One range was between 0.0 mg/l and 41.0 mg/l. In this range, IFT reaches a minimum of 1.0 mN/m once the CMC of 11.0 mg/l is reached and appears to remain constant until 41 mg/l. The value 41.0 mg/l is called the higher critical micellar concentration (CMCH) and 11.0 mg/l is called the lower critical micellar concentration (CMCL). This region is defined by Equation (b). When concentrations exceed 41 mg/l, Equation (c) is used to define the relationship between IFT and higher biosurfactant concentrations. The minimum concentration for this region is called the higher critical
CS
urf.,CMCL CSurf.,CMCH
CS
urf.,CMEC
IFTMIN2
IFTMIN1
IFTMAX

128
micellar concentration and the maximum concentration (CMAX) has been assumed to equal a biosurfactant concentration greater than 58.0 mg/l. The IFT reaches a minimum of 0.1 mN/m at a critical microemulsion concentration (CMEC) of 58.0 mg/l and from then IFT is assumed to remain constant with further increases in biosurfactant concentrations.
For bio-surfactant concentrations between 0.0 and 41.0 mg/l, the model is defined by Equation b:
Log10 (IFTC, Surf) =Log10 (IFTMin1) + (Log10
(IFTMax/IFTMin,1))*((CSurf.,CMCH- CSurf)/Delsuf1) ES1….(b) For bio-surfactant concentrations between 41.0 to 58.0 mg/l and for larger
biosurfactant concentrations, the model is defined by Equation c: Log10 (IFTC, Surf) =Log10 (IFTMin2) + (Log10 (IFTMin2/IFTMin1))*((CSurf.,Max-
CSurf)/Delsuf2) ES2….. (c)
Model Prediction. When the biosurfactant concentration is between 0 and 41 mg/l, the model has a specific set of values (Table 6.7). These parameters differ when the concentration exceeds 41 mg/l (Table 6.8). This way, the stepwise behavior of the IFT is modeled by using the same mathematical equation, but with different parametric values. The model prediction is shown in Figure 6.6 below. The values for the parameters were obtained from the laboratory measurements.
Table 6.7. Parameter values for biosurfactant concentrations between 0.0 and 41.0 mg/l
Variable Value
CSurf.,Min (mg/L) 0.0 CSurf.,CMCH (Higher critical micellar concentration)
(mg/L) 0.041
CSurf.,CMCL (Lower critical micellar concentration) (mg/L)
0.011
IFTMin1 (dynes/cm) 1.0 IFTMax (dynes/cm) 29
ES1 7.0 Delsuf1 (mg/L) CSurf.,CMCH -
CSurf.,Min

129
Table 6.8. Parameter values for concentrations between 41.0 and 58.0 ppm
Variable Value CSurf.,CMCH (mg/L) 0.041 CSurf.,Max (mg/L) 0.080
CSurf.,CMEC (Critical microemulsion concentration) (mg/L)
0.058
IFTMin2 (dynes/cm) 0.1 IFTMin1 (dynes/cm) 1.0
ES2 3.0 Delsuf2 (mg/L) CSurf.,Max -
CSurf.,CMCH
0.01
0.10
1.00
10.00
100.00
0 10 20 30 40 50 60 70 80 90
Concentration (PPM)
IFT
(P
PM
)
Model 2 Lab Data Model 1
Figure 6.6. Comparison between model prediction (line) and laboratory measurements (squares)

130
6.5. Discussion We have modified our previous model that related biosurfactant concentration to
IFT by incorporating the stepwise behavior of IFT as a function of biosurfactant concentration (19). By using the same relationship with different input parameter values for different concentration ranges of the biosurfactant, we are able to model the changes in IFT behavior more accurately. A single set of parameter values did not model the observations accurately. A maximum biosurfactant concentration of 80.0 mg/l was used. This is an assumed value equal to the critical microemulsion concentration. The model has also been further improved by estimating the model parameters from laboratory data. The concentration exponent, ‘ES’ has a value greater than one for both critical biosurfactant concentrations. Though one expects that the value of ES should be less than unity for low biosurfactant concentrations (8), no specific surfactant concentration has been defined in the literature where ES would become less than unity. Since a value for ES of 7.0 for the first concentration range and 3.0 in the second concentration range provided a good fit, they were used in the model to simulate biosurfactant-based oil recovery.
6.6. References
1. Austad, T., and K. Taugbol. 1995. Chemical flooding of oil
reservoirs 1. Low tension polymer flood using a polymer gradient in three-phase region. Colloids and Surfaces, A: Physiochemical and Engineering aspects 101:87-97.
2. Bang, H. W., and B. H. Caudle. 1984. Modeling of a micellar/polymer process. SPEJ Dec.:617-627.
3. Brusseau, M. L., D. A. Sabatini, G. J.S., and M. D. Annable. 1999. Surfactant selection criteria for enhanced subsurface remediation. Adv. Chem. Series 725:8-23.
4. Desai, J., and I. M. Banat. 1997. Microbial production of surfactants and their commercial potential. Microbiol. Mol. Biol. Rev. 61:47-64.
5. Deshpande, S., B. J. Shiau, D. Wade, D. A. Sabatini, and J. H. Harwell. 1999. Surfactant selection for enhancing ex situ soil washing. Wat. Res. 33:351-360.
6. Dominquez, J. G., and G. P. Willhite. 1977. Retention and flow characteristics of polymer solutions in porous media. SPEJ April:111-121.
7. Georgiou, G., S. C. Lin, and M. M. Sharma. 1992. Surface-active compounds from microorganisms. Biotech. 10:60-65.
8. Green, D. W., and G. P. Willhite. 1998. Enhanced oil Recovery, vol. 6. SPE.
9. Knapp, R. M., J. L. Chisholm, and M. J. McInerney. 1990. Presented at the Proceedings of the SPE/UH emerging technologies conference.
10. Lin, S. C., K. S. Carswell, M. M. Sharma, and G. Georgiou. 1994. Continuous production of the lipopeptide biosurfactant of Bacillus licheniformis JF-2. Applied Microbiology and Biotechnology 41:281-5.
11. Marsh, T. L., X. Zhang, R. M. Knapp, M. J. McInerney, P. K. Sharma, and B. E. Jackson. 1995. Mechanisms of microbial oil recovery by

131
Clostridium acetobutylicum and Bacillus strain JF-2., p. 593-610. In R. S. Bryant and K. L. Sublette (ed.), The Fifth International Conference on Microbial Enhanced Oil Recovery and Related Problems for Solving Environmental Problems. Office of Scientific and Technical Information, CONF-9509173.
12. McInerney, M. J., S. O. Han, S. Maudgalya, H. Mouttaki, M. Folmsbee, R. Knapp, D. Nagle, B. Jackson, M. Staudt, and W. Frey. 2001. Development of more effective biosurfactants for enhanced oil recovery. Final Technical Report for DOE DE-AC26-98BC15113. University of Oklahoma.
13. McInerney, M. J., R. M. Knapp, D. P. Nagle, K. E. Duncan, N. Youssef, M. J. Folmsbee, and S. Maudgalya. 2003. Development of microorganisms with improved transport and biosurfactant activity for enhanced oil recovery DE-FE-02NT15321. DOE.
14. Miller, D. J., S.-P. von Halasz, M. Schmidt, and G. Pusch. 1991. Dual surfactant systems for enhanced oil recovery at high salinities. J. Petr. Sci. Engineer. 6:63-72.
15. Moore, T. F., and R. C. Slobod. 1956. The effect of viscosity and capillarity on the displacement of oil by water. Producers Monthly Aug:20-30.
16. Reed, R. L., and R. Healy, N. 1977. Some physical aspects of microemulsion flooding: a review., p. 383-437. In D. O. Shah and R. S. Scheckter (ed.), Improved Oil Recovery by Surfactant and Polymer Flooding. Academic Press, Inc., New York.
17. Saad, N. 1989. Field scale simulation of chemical flooding, Ph. D. Dissertation, University of Texas, Austin.
18. Thomas, C. P., G. A. Bala, and M. L. Duvall. 1993. Surfactant-based enhanced oil recovery mediated by naturally occurring microorganisms. Soc. Petrol. Eng. Reservoir Eng. 11:285-291.
19. Xhang, Z. 1994. Development of microbial oil recovery simulator, Ph. D. Dissertation, University of Oklahoma, Norman.
20. Yakimov, M. M., M. Amro, M. Bock, K. Boseker, H. L. Fredrickson, D. G. Kessel, and K. N. Timmis. 1997. The potential of Bacillus licheniformis strains for in stiu enhanced oil recovery. J. Petr. Sci. Engineer. 18:147-160.

132
Chapter 7. Subsurface hydrocarbon mobilization using biosurfactants requires viscosity control and a low molecular weight alcohol.
7.1. Abstract. Biosurfactants enhance hydrocarbon biodegradation by increasing the apparent
aqueous solubility or affecting the association of the cell with the poorly soluble hydrocarbon. Here, we show that a lipopeptide biosurfactant produced by Bacillus mojavensis strain JF-2 mobilized substantial amounts of residual hydrocarbon from sand-packed columns when a viscosifying agent and a low molecular weight alcohol are present. The amount of residual hydrocarbon mobilized depended on the biosurfactant concentration. One pore volume of cell-free culture fluid with 900 mg l-1 of the biosurfactant, 10 mM 2,3-butanediol and 1000 mg l-1 of partially hydrolyzed polyacrylamide polymer mobilized 82% of the residual hydrocarbon. Even low biosurfactant concentrations (16 mg l-1) mobilized substantial amounts of residual hydrocarbon (29%). The lipopeptide biosurfactant system may be an effective in removing hydrocarbon contamination sources in soils and aquifers and for the recovery of entrapped oil from low production oil reservoirs.
7.2. Introduction.
The widespread use of petroleum hydrocarbons has resulted in the contamination of valuable groundwater resources. Petroleum hydrocarbons may exist in the vadose and saturated zones as a free liquid or ganglia of residual hydrocarbon (6, 18, 51). Even if the free liquid hydrocarbon can be removed, substantial amounts of residual hydrocarbon remain entrapped by capillary forces and represent a long-term source of contamination (18). Entrapment of petroleum hydrocarbons by capillary forces is also a major factor that limits oil recovery (2, 32, 36). Current technology recovers only one-third to one-half of the oil that is originally present in an oil reservoir. Since almost all regions of the world have been intensively explored for oil, the discovery of large new oil resources is unlikely and the exploitation of oil resources in existing reservoirs will be essential in the future.
Surfactants of synthetic or biological origin enhance hydrocarbon biodegradation by increasing the apparent aqueous solubility of the hydrocarbon (12, 14-16, 21, 23, 27, 33-35, 37, 38, 45, 47, 48, 50, 54, 55) or by enhancing the interaction of the microbial cell with the hydrocarbon (1, 5, 37). Alternately, bulk hydrocarbon displacement can occur if the capillary forces that entrap the hydrocarbon are reduced (40, 43). Interfacial tension between the hydrocarbon and aqueous phases is largely responsible for trapping the hydrocarbon in the porous matrix and ultra-low values (several orders of magnitude reduction) are needed for hydrocarbon mobilization (2, 8, 9, 36, 51). To achieve ultra-low interfacial tensions, surfactant concentrations significantly above that needed to form micelles (e.g., the critical micelle concentration) are required (6, 41). Optimized

133
surfactant formulations recover almost all of the residual hydrocarbon present in laboratory test systems (2, 3, 12, 40, 43) and have been shown to be effective in removing hydrocarbon contamination in aquifers (39, 40). However, the large concentrations of surfactants required for mobilization necessitate recycling and reusing the surfactants and treating only small portions of the contaminated zone at a time (24). High chemical and low crude oil prices have prevented the widespread use of surfactants for enhanced oil recovery.
Microorganisms produce a variety of biosurfactants (11), several of which generate the low interfacial tensions between the hydrocarbon and the aqueous phases required to mobilize residual hydrocarbon (11, 17, 26). In particular, the lipopeptide biosurfactant produced by Bacillus mojavensis strain JF-2 reduces the interfacial tension between oleic and aqueous phases to very low levels (<0.016 mN/m)(26, 30). The critical micelle concentration is 20 mg/l, indicating that the biosurfactant is effective even at very low concentrations(26). The use of biosurfactants to mobilize residual hydrocarbon has met with mixed results. From 20 to 90% of hydrocarbons present in contaminated soils or oil shale cuttings were removed in the presence of biousrfactants (21, 49). The rhamnolipid biosurfactant produced by certain strains of Pseudomonas was 20 times more effective in solubilizing hexadecane than some synthetic surfactants (45) and mobilized up to 75% of the residual hexadecane from sand-packed columns (19, 20). However, the number of pore volumes required (40 to 70) was large. Residual oil is recovered when a biosurfactant-producing bacterium and the nutrients needed to support growth are introduced into sandstone cores (29, 46, 52), but residual hydrocarbon recoveries were often low (5 to 20%) and required multiple pore volumes of recovery fluid (29, 46).
Here, we show that substantial mobilization of residual hydrocarbon from a model porous system does occur at biosurfactant concentrations made naturally by B. mojavensis strain JF-1. Effective mobilization with a minimal volume of recovery fluid requires three components, a biosurfactant, a polymer and 2,3-butanediol.
7.3. Experimental methods. Cultivation. Bacillus mojavensis strain JF-2 (ATCC) was grown in a phosphate-
buffered, mineral salts medium (medium E)(22) with (in g l-1) 1 g yeast extract, 1 g NaNO3 and 30 g Proteose Peptone #3 (Difco Laboratories, Inc., Detroit, MI). B. mojavensis strain JF-2 was streaked onto agar plates of the above medium with 15 g l-1 agar and colonies were used to inoculate 100-ml liquid cultures of the above medium. The 100-ml cultures were incubated without shaking at 37oC for 24 hours and used to inoculate a 1-liter culture of the same medium. The 1-liter culture was incubated aerobically at room temperature until stationary phase was reached (about 48 h) with stirring provided by a magnetic stirrer and a stir bar.
Anaerobically prepared medium contained 0.025% cysteine•HC and was boiled and dispensed under O2-free 100% nitrogen gas phase(4). Additions to and transfers from sterile, anaerobic media were done by using sterile syringes and needles degassed with O2-free, 100% nitrogen prior to use(4).

134
Cell-free culture fluid preparation: After incubation, the cells from aerobically grown cultures were removed by centrifugation (10,000 x g; 4oC; 20 min). The cell-free culture fluid was divided into two portions and 2,3-butanediol was added to one portion to give a final concentration of 10 mM. Each portion then received sufficient partially-hydrolyzed polyacrylamide to give a final concentration of 1 g l-1. Uninoculated medium received the same concentrations of polymer and butanediol.
Preparation of cell-free culture fluid without biosurfactant. B. mojavensis
strain JF-2 was grown anaerobically in the above medium in one-liter volumes using 2-liter bottles. After growth ceased, the cells were removed by centrifugation as above and the pH of the cell-free medium was reduced to less that 2 by the addition of 50% HCl. The acidified, cell-free medium was left at 4oC overnight to precipitate the biosurfactant(10). The precipitated material was removed by centrifugation as described above. The pH of the biosurfactant-free, cell-free medium was adjusted to 7.0 by the addition of NaOH pellets.
Biosurfactant preparation. Large amounts of the biosurfactant were obtained by
growing B. mojavensis strain JF-2 aerobically in carboys containing 8 liters medium without Proteose peptone. After growth ceased, the pH of the medium was adjusted to less than 2 by the addition of concentrated HCl. The acidified medium was kept overnight at 4oC to precipitate the biosurfactant. The medium was centrifuged as described above. The supernate was discarded and the pellet was dissolved in 200 ml of methanol. The methanol solution was centrifuged as above to remove particulate material. The concentration of the biosurfactant in methanol was measured by high-pressure liquid chromatography (HPLC). An appropriate volume of the methanolic, biosurfactant solution was added to the neutralized, biosurfactant-free, cell-free medium to give the biosurfactant concentrations shown in Table 7.1.
Biosurfactant quantification: The biosurfactant from a 20-ml sample of cell-free
culture fluid was collected by acid precipitation and centrifugation as described above. The pellet containing the biosurfactant was extracted with 2 ml of methanol for 1 min with agitation. The insoluble material was removed by centrifugation as above. The biosurfactant was then quantified by a HPLC equipped with a C18 column and an ultraviolet detector set at 210 nm(25). The mobile phase was 70% methanol and 30% of a 10 mM phosphate buffer (pH of 6.8). The flow rate was 1 ml/min and the injection volume was 20 µl. Surfactin (Sigma Chemical Co. St. Louis, MO) was used as the standard. The amount of biosurfactant present in cultures was corrected for the percent recovery of known amounts of surfactin added to sterile medium after acid precipitation and methanol extraction.
Preparation of sand-packed columns. Plexiglas columns were approximately
4.5 cm (inside diameter) by 40 cm long and packed with quartz sand (approximately 100 mesh grain size). Each end had a plate had an O-ring to prevent leaks which had a fitting sealed with a rubber septum. Connections to sources of vacuum, gas and liquids were made with a syringe needle attached to nylon tubing that was inserted into this septum. The weight of the sand was calculated from the difference in weight before and

135
after packing with sand. Air was removed from the column by placing the column under vacuum for 10 minutes. The column was then saturated with a 5% NaCl brine solution by positive displacement. Once the brine reached the top of the column, a syringe needle was inserted into the top septum to allow the solution to exit the column. After one pore volume of the solution passed through the column, the flow rate was measured with a stopwatch and a graduated cylinder. The injection pressure was measured by using a pressure gauge attached between the fluid reservoir and the column and used to calculate the permeability of the column to the brine solution according to Darcy's law. The column was then weighed and the volume of brine inside the column (pore volume) was calculated from the difference in the wet and dry weight of the column and the brine density.
The column was then saturated with oil by positive displacement by keeping the oil reservoir pressurized with nitrogen gas. The displaced water was collected in a graduated cylinder to measure the volume. After only oil was displaced from the column, the flow rate and injection pressure were determined as described above. These data were used to calculate the effective permeability of the column to oil at residual water saturation. The amount of residual water present in the column was calculated from the amount of water displaced from the column during oil flooding and the amount of water present after brine saturation. The column was then flooded to residual oil saturation by injecting the brine solution into the column until no more oil was displaced from the column. The amount oil displaced from the column was determined volumetrically and used to calculate the residual oil saturation from difference in oil volume before and after brine flooding. After water breakthrough, the flow rate of brine and the injection pressure were determined as described above and used to calculate the effective permeability of the column to brine at residual oil saturation. At least six pore volumes of brine were injected through the column to ensure that it was at residual oil saturation.
Biosurfactant treatments. The column was flooded with a biosurfactant solution
as described above for brine flooding. Unless otherwise indicated, each column was flooded with 200 ml of the biosurfactant solution, approximately 2 pore volumes. Effluent from the columns was collected in 50-ml syringes held in a vertical position to allow the measurement of oil and brine volumes. Duplicate columns were used for each treatment. When the biosurfactant solution contained partially hydrolyzed polyacrylamide (PHPA) (1 g l-1), 5 ml of the PHPA (1 g l-1) in 2.5% NaCl was injected into the column prior to injection of biosurfactant-containing solution. After the biosurfactant-containing solution passed through the column, 25 ml of 1 g l-1 of PHPA in 2.5% NaCl followed by 25 ml of 0.7 g l-1 of PHPA in 2.5% NaCl were injected into the column. Each column was then flooded with 150 ml of 2.5% NaCl.
Petrophysical data. The sand packs had the following properties (mean ±
standard deviation): porosity, 31.9 ± 1.2 %; pore volume, 90.3 ± 6.9 ml; permeability, 2.0 ± 0.1 Darcies; and residual oil saturation, 21.9 ± 3.0 %. The crude oil had a density of 0.825 g cm-3. An average molecular weight for crude oil of 320 to 330 g mol-1 was estimated from the crude oil composition of an Oklahoma crude oil by using the method of Waston, Nelson and Murphy(7). The molar solubility ratio was estimated from the

136
slope of the line in Figure 7.1, the crude oil density and an assumed average molecular weight 320 to 330 g mol-1 (6).
7.4. Results.
Effect of the biosurfactant alone. Since surfactant-enhanced remediation
processes use surfactant concentrations far above the critical micelle concentration(6), we tested whether increasing the biosurfactant concentration would result in substantial mobilization of residual hydrocarbon. The amount of oil recovered when the biosurfactant-free culture fluid was used alone or with the addition of up to 1.7 g l-1 of the partially purified biosurfactant was very low and similar to the 5% NaCl control (Table 7.1). Even at a very high biosurfactant concentration (12.3 g l-1), similar to that used in surfactant-based enhanced oil recovery or groundwater remediation technologies (13, 40), the recovery of residual hydrocarbon was poor and not statistically significant different from that obtained with lower biosurfactant concentrations.
Table 7.1. Oil recovery with different concentrations of the biosurfactant a. Type of Fluid Injected
Polymer Present
Biosurfactant Concentration (mg l-1)
Volume Injected (ml)
Residual Oil Saturation (%)b
Volume of Oil Recovered (ml) b
Percent Residual Oil Recovery
b 5% NaCl - 0 200 20 (10) 0.2 (0) 1.3 (0.6) 2.5% NaCl + 0 150 8.4 (7.1) ND c ND c Biosurfactant-free culture fluid
- 0 200 25 (4) 0.2 (0.5) <0.1
- 100 100 13 (8) 0.1 (0) 1.1 (0.9) - 175 100 16 (4) 0.4 (0.1) 2.2 (0.5) - 300 100 17 (10) 0.4 (0.3) 2.3 (1.6) - 1700 200 27 (10) 0.4 (0.1) 1.6 (0.1) - 12300 200 22 (3.4) 0.9 (0.7) 4.9 (3.1) + 12300 60 13 (7.2) 2.6 (0.1)d 23.6
(13.9)d a Biosurfactant-free culture fluid was prepared by removing cells from an
anaerobically grown culture by centrifugation and then removing any biosurfactant that may have been present in the culture by acid precipitation. The pH of the medium was then adjusted to 7.0 and the indicated concentration of the partially purified biosurfactant was added. The concentration of partially hydrolyzed polyacryalmide was 1 g l-1.
b Mean of duplicate determinations with the range shown in parentheses. c ND, not determined. d Analysis of variance and Tukey test showed that these means were significantly
different from the means of the other treatments (P<0.05).

137
When the concentration of the biosurfactant used was 1.7 g l-1 or less, no visible
oil bank was formed. A few sand packs had places where clean sand was visible indicating that some oil had been mobilized. A visible oil bank formed when the concentration of the biosurfactant was 12.3 g l-1. However, the oil bank dissipated by the time it reached the middle of the sand pack, suggesting that substantial oil could be produced if a mechanism to stabilize the oil bank could be developed.
Effect of polymer. The addition of partially-hydrolyzed polyacrylamide (1 g l-1)
to cell-free culture fluid that contained 12.3 g l-1 of the biosurfactant significantly improved residual hydrocarbon recovery (Table 7.1). As these polymer-biosurfactant-treated packs were eluted, an oil-bank formed that grew in thickness as it migrated through the sand pack. The same concentration of the polymer alone in 2.5% NaCl did not lead to the formation of an oil-bank, nor was residual hydrocarbon recovered (Table 7.1).
Components needed for significant residual hydrocarbon recovery.
Surfactant-based oil or contaminant recovery technologies use a small molecular weight alcohol in addition to the viscosifying agent and the surfactant (2, 3, 41). We tested whether the addition of 2, 3-butanediol, an alcohol commonly made by Bacillus species during anaerobic growth (42) along with partially-hydrolyzed polyacrylamide would recover residual hydrocarbon at biosurfactant concentrations made naturally by B. mojavensis strain JF-1. When both partially-hydrolyzed polyacrylamide and 2,3-butanediol were added to cell-free culture fluid that contained the 16 ± 2.5 mg l-1 (mean with the range) of the biosurfactant, 4.4 ± 3.4 ml of oil representing about 29% of the hydrocarbon remaining in the sand pack was recovered (Table 7.2). Very little oil was recovered when partially-hydrolyzed polyacrylamide and 2,3-butanediol were added to sterile medium in the absence of the biosurfactant. Some oil was recovered when cell-free culture fluid with 16 mg l-1 of biosurfactant was used alone or when supplemented with either partially-hydrolyzed polyacrylamide or 2,3-butanediol. However, these values were significantly less than the treatment that contained the biosurfactant, butanediol and polymer.

138
Table 7.2. Effect of biosurfactant concentration and the addition of partially hydrolyzed polyacrylamide and 2,3-butanediol on oil recovery by cell-free spent medium of B. mojavensis strain JF-2.
Injected a solution
Additions Number of Replicates
Residual Oil Saturation (%)b
Volume of Oil Recovered (ml)b
Percent Residual Oil Recovery b
Sterile medium
None 2 14.6 (2.5) <0.1 NA c
Butanediol + Polymer
2 24.2 (5) 0.2 (0.1)* 1.1 (0.2)*
Spent medium
None 4 14.6 (6.5) 1.8 (0.6)** 10.6 (7)**
Butanediol 2 19.2 (5.7) 1.9 (0.6)** 15.2 (0.6)**
Polymer 2 16.3 (0.7) 2.4 (0.1)** 15.2 (0.6)**
Butanediol + Polymer
4 15.8 (5.6) 4.4 (3.4)*** 29.3 (15.6)***
a Spent medium was prepared by removing the cells by centrifugation from an
aerobically grown culture of B. mojavensis strain JF-2 that contained the 16 ± 2.5 mg l-1 of the biosurfactant. Sterile and spent media were amended with 1 g l-1 of partially purified polyacrylamide and 10 mM 2,3-butanediol as indicated.
b Mean value with the range shown in parentheses. Means with different number of * were significantly different from each other by analysis of variance and a Tukey test (P < 0.05).
c NA, not applicable.
Analysis of variance coupled with a Tukey test (53)showed that increasing the biosurfactant concentration significantly increased the amount of residual hydrocarbon recovered (P<0.05). About15.5 ml of oil representing about 81.6% of the residual hydrocarbon was recovered when 1 g l-1 of partially-hydrolyzed polyacrylamide and 10 mM 2,3-butanediol were added to cell-free culture fluid containing 914 mg l-1 of the biosurfactant. The relationship between residual hydrocarbon recovery and the amount of biosurfactant was linear (Figure 7.1). The molar solubility ratio was about 290 to 300.

139
0
5
10
15
20
Oil
vo
lum
e (
ml)
0 20 40 60 80 100
Biosurfactant (mg)
y = 0.113x + 5.225 r2 = 0.968
Figure 7.1. The relat ionship between oil recovery and the amount of biosurfactant injected into the sand packs.
Optimization of the injection protocol. Surfactant-based recovery technologies usually inject a small volume of the polymer before injection of the surfactant-alcohol-polymer mixture (2, 3). We found that there was a significant improvement in the volume of oil recovered (15.5 ml) when 5 ml of 1 g l-1 of partially purified polyacrylamide dissolved in 2.5% NaCl was injected immediately before the biosurfactant-containing recovery fluid compared to the amount of oil recovered without the polymer pre-injection (13.1 ml). The biosurfactant and 2,3-butanediol concentrations in this experiment were 914 mg l-1 and 10 mM, respectively. In another experiment, large amounts of oil were recovered even when less than one pore volume of the recovery fluid was injected into the sand packs (Table 7.3).

140
Table 7.3. Oil recovery when different volumes of recovery fluid were injected into sand packs.a
Volume of Recovery Fluid (Pore Volume)
Residual Oil Recovery
Volume of Oil Recovered (ml)b
Percent Residual Oil Recoveryb
1.1 16.2 (0.9) b 8.4 (0.9)y 50.4 (4.6)* 0.87 21.1 (3.4) 6.8 (0.5)y 32.9 (0.4)** 0.66 20.8 (0.1) 8.2 (1.4)y 38.4 (4.5)** 0.46 24.6 (3.9) 6.8 (0.9)y 30.2 (0.3)**
aCells from an aerobically grown culture of B. mojavensis strain JF-2 that
contained the 283 mg l-1 of the biosurfactant were removed by centrifugation and 1 g l-1 of partially purified polyacrylamide and 10 mM 2,3-butanediol were added.
b Mean of duplicate sand packs with the range shown in parentheses. Means with different number of * were shown to be significantly different from each other by analysis of variance and a Tukey test (P < 0.05).
7.5. Discussion.
Our data show that the lipopeptide biosurfactant produced by B. mojavensis strain
JF-2 mobilized large amounts of residual hydrocarbon from sand-packed columns at concentrations about 10 to 100-fold lower than typically used for surfactant-enhanced remediation process (2, 24, 41, 43, 44). Consistent with these findings, we found that the molar solubility ratio (MRS) for the JF-2 biosurfactant was 100 times greater than that of synthetic surfactants (6). The rhamnolipid biosurfactant was also shown to have a MSR 20 times greater than alkyl benzyl sulfonate surfactants(45). Thanamani and Shreve (45) argued that the rhamnolipid structure results in a large volume, low-density micelle that accommodates more hydrocarbon than alkyl benzyl sulfonate micelles. However, in our work, an oil bank formed, which suggests that once mobilized, the oil formed a separate phase that may not have required large amounts of biosurfactants to maintain.
Much anecdotal evidence implicates the need for a variety of products such as acids, gases, solvents, polymers, emulsifiers and/or biosurfactants or a combination of microorganisms that collectively make these products to recover residual oil from low production oil reservoirs (31). However, it is not clear whether these products are effective alone or if combinations of products are needed. The use of a mutant strain of B. mojavensis strain JF-2 defective in biosurfactant production clearly showed importance of biosurfactant production for residual oil recovery (28). Here, we found that a small molecular weight alcohol, 2,3-butanediol, and a vsicosifying agent, PHPA, are also required. Thus, the belief that microbially enhanced oil recovery requires multiple microbial species or products may be due to the need to form the three components we define here as necessary for residual hydrocarbon mobilization.
We observed that an oil-bank formed is formed dissipated before it reached the effluent end of the pack. Compared to oil, water moves rapidly through the porous material. This results in an irregular front with water pushing through the oil and reaching the production well first. To prevent this, polymers such as xanthan gum and

141
polyacrylamide are often added to chemical surfactant floods to increase the viscosity of the water phase (2). The role of 2,3-butanediol is less clear. Mobilization of residual oil requires middle-phase microemulsions where the surfactant is equally soluble in the water and oil phases and the prevention of mesophases (e.g., liquid crystals)(41). Alcohols are usually added to prevent surfactant liquid crystal formation and act to increase the effective surfactant concentration. Whether 2,3-butanediol serves such a role is unclear. In actual in situ applications, the addition of 2,3-butanediol may not be required since it is a common fermentative product of Bacillus species (42). We found that B. mojavensis strain JF-1 consistently produces between 5 to 10 mM 2,3-butanediol when grown anaerobically in our medium (unpublished data).
Our data indicate that the injection of biosurfactant-containing culture fluids with 2,3-butanediol and polyacrylamide will result in substantial recovery of residual hydrocarbon. The in situ biosurfactant production would be more difficult. The distribution of biosurfactant bacteria in aquifers and oil reservoirs is not known so it is not clear whether such organisms would have to be added. Once they are in the reservoir, a process that selectively stimulates the growth of biosurfactant-producing bacteria is needed. Preliminary results indicate that 15 to 90% of the total culturable population in groundwater samples contained the genes for the lipopeptide biosurfactant when the supplemented with proteose peptone and nitrate (unpublished data). Thus, it may be possible to enhance the growth of biosurfactant-producing bacteria by selective nutrient additions.
7.6. References.
1. Al-Tahhan, R. A., T. R. Sandrin, A. A. Bodour, and R. M. Maier. 2000. Rhamnolipid-induced removal of lipopolysaccharide from Pseudomonas aeruginosa: effect on cell surface properties and interaction with hydrophobic substrates. Appl. Environ. Microbiol. 66:3262-3268.
2. Austad, T., and K. Taugbøl. 1995. Chemical flooding of oil reservoirs 1. Low tension polymer flood using a polymer gradient in three-phase region. Colloids and Surfaces A: Physicochem. Eng. Aspects 101:87-97.
3. Austad, T., and K. Taugbøl. 1995. Chemical flooding of oil reservoirs 2. Dissociative surfactant-polymer interaction with negative effect on oil recovery. Colloids and Surfaces A: Physicochem. Eng. Aspects 103:73-81.
4. Balch, W. E., and R. S. Wolfe. 1976. New approach to the cultivation of methanogenic bacteria: 2-mercaptoethanesulfonic acid (HS-CoM)-dependent growth of Methanobacterium ruminantium in pressurized atmosphere. Appl. Environ. Microbiol. 32:781-791.
5. Bouchez-Naïtali, M., D. Blanchet, V. Bardin, and J. P. Vandecasteele. 2001. Evidence for interfacial uptake in hexadecane degradation by Rhodococcus equi: the importance of cell flocculation. Microbiology 147:2537-43.
6. Brusseau, M. L., D. A. Sabatini, J. S. Gierke, and M. D. Annable. 1999. Surfactant selection criteria for enhanced subsurface remediation. Adv. Chem. Series 725:8-23.

142
7. Buthod, P. 1987. Chapter 21, Crude Oil Properties and Condensate Properties and Correlations., p. 21-3--21-5. In H. B. Bradley (ed.), Petroleum Engineering Handbook. Society of Petroleum Engineers, Richardson, TX.
8. Cassidy, D. P., and A. J. Hudak. 2001. Microorganism selection and biosurfactant production in a continuously and periodically operated bioslurry reactor. J. Hazard. Mater. 84:253-64.
9. Chiu, Y. C., and P. R. Kuo. 1999. An empirical correlation between low interfacial tension and micellar size and solubilization for petroleum sulfonates in enhanced oil recovery. Colloids Surfaces A: Physiochem. Eng. Aspects 152:235-244.
10. Cooper, D. G., S. R. MacDonald, S. J. B. Duff, and N. Kosaric. 1981. Enhanced production of surfactin from Bacillus subtilis by continuous product removal and metal cation additions. Appl. Environ. Microbiol. 42:408-412.
11. Desai, J., and I. M. Banat. 1997. Microbial production of surfactants and their commercial potential. Microbiol. Mol. Biol. Rev. 61:47-64.
12. Deshpande, S., B. J. Shiau, D. Wade, D. A. Sabatini, and J. H. Harwell. 1999. Surfactant selection for enhancing ex situ soil washing. Wat. Res. 33:351-360.
13. Deshpande, S., L. Wesson, D. Wade, D. A. Sabatini, and J. H. Harwell. 2000. Dowfax surfactant components for enhancing contaminant solubilization. Wat. Res. 34:1030-1036.
14. Diallo, M. S., L. M. Abriola, and J. Weber, W. J. 1994. Solubilization of nonaqueous phase liquid hydrocarbons in micellar solutions of dodecyl alcohol ethoxylates. Environ. Sci. Technol. 28:1829-1837.
15. Edwards, D. A., R. G. Luthy, and Z. Liu. 1991. Solubilization of polycyclic aromatic hydrocarbons in micellar nonionic surfactant solutions. Environ. Sci. Technol. 25:127-133.
16. García-Junco, M., E. De Olmedo, and J. J. Ortega-Calvo. 2001. Bioavailability of solid and non-aqueous phase liquid (NAPL)-dissolved phenanthrene to the biosurfactant-producing bacterium Pseudomonas aeruginosa 19SJ. Environ. Microbiol. 3:561-9.
17. Georgiou, G., S.-C. Lin, and M. M. Sharma. 1992. Surface-active compounds from microorganisms. Biotechnology (N Y) 10:60-65.
18. Harwell, J. H., D. A. Sabatini, and R. C. Knox. 1999. Surfactants for ground water remediation. Colloids and Surfaces A: Physicochem. Eng. Aspects 151:255-268.
19. Herman, D. C., R. J. Lenhard, and R. M. Miller. 1997. Formation and removal of hydrocarbon residual in porous media: effects of attached bacteria and biosurfactants. Environ. Sci. Technol. 31:1290-1294.
20. Herman, D. C., Y. Zhang, and R. M. Miller. 1997. Rhamnolipid (biosurfactant) effects on cell aggregation and biodegradation of residual hexadecane under saturated flow conditions. Appl. Environ. Microbiol. 63:3622-3627.
21. Ivshina, I. B., M. S. Kuyukina, and N. Christofi. 1998. Oil desorption from mineral and organic materials using biosurfactant complexes produced by Rhodococcus species. World J. Microbiol. Biotechnol. 14:711-717.

143
22. Jenneman, G. E., R. M. Knapp, M. J. McInerney, D. E. Menzie, and D. E. Revus. 1984. Experimental studies of in-situ microbial enhanced oil recovery. Soc. Pet. Eng. J. 24:33-7.
23. Jones, W. R. 1997. Biosurfactants, bioavailability and bioremediation. Global Environ. Biotechnol.:379-390.
24. Krebs-Yuill, B., J. H. Harwell, D. A. Sabatini, and R. C. Knox. 1995. Presented at the ACS Symposium Series.
25. Lin, S.-C., K.-G. Lin, C. C. Lo, and Y.-M. Lin. 1998. Enhanced biosurfactant production by a Bacillus licheniformis mutant. Enzym. Microbiol. Technol. 23:267-273.
26. Lin, S.-C., M. A. Minton, M. M. Sharma, and G. Georgiou. 1994. Structural and immunological characterization of a biosurfactant produced by Bacillus licheniformis JF-2. Appl. Environ. Microbiol. 60:31-38.
27. Maier, R. M., and G. Soberon-Chavez. 2000. Pseudomonas aeruginosa rhamnolipids: biosynthesis and potential applications. Appl. Microbiol. Biotechnol. 54:625-633.
28. Marsh, T. L., X. Zhang, R. M. Knapp, M. J. McInerney, P. K. Sharma, and B. E. Jackson. 1995. Presented at The Fifth International Conference on Microbial Enhanced Oil Recovery and Related Problems for Solving Environmental Problems.
29. Marsh, T. L., X. Zhang, R. M. Knapp, M. J. McInerney, P. K. Sharma, and B. E. Jackson. 1995. Mechanisms of microbial oil recovery by Clostridium acetobutylicum and Bacillus strain JF-2., p. 593-610. In R. S. Bryant and K. L. Sublette (ed.), The Fifth International Conference on Microbial Enhanced Oil Recovery and Related Problems for Solving Environmental Problems. Office of Scientific and Technical Information, CONF-9509173.
30. McInerney, M. J., M. Javaheri, and D. P. Nagle. 1990. Properties of the biosurfactant produced by Bacillus licheniformis strain JF-2. J. Indust. Microbiol. 5:95-102.
31. McInerney, M. J., and D. W. S. Westlake. 1990. Microbial enhanced oil recovery, p. 409-445. In H. J. Ehrlich and C. Brierly (ed.), Microbial Mineral Recovery. MacMillian Publishing Co., New York.
32. Miller, D. J., S.-P. von Halasz, M. Schmidt, and G. Pusch. 1991. Dual surfactant systems for enhanced oil recovery at high salinities. J. Petr. Sci. Engineer. 6:63-72.
33. Morán, A. C., N. Olivera, M. Commendatore, J. L. Esteves, and F. Siñeriz. 2000. Enhancement of hydrocarbon waste biodegradation by addition of a biosurfactant from Bacillus subtilis O9. Biodegradation 11:65-71.
34. Pennell, K. D., L. M. Adriola, and J. Weber, W. J. 1993. Surfactant-enhanced solubilization of residual dodecane in soil columns. 1. Experimental investigation. Environ. Sci. Technol. 27:2332-2340.
35. Pennell, K. D., L. M. Adriola, and J. Weber, W. J. 1993. Surfactant-enhanced solubilization of residual dodecane in soil columns. 2. Mathematical modeling. Environ. Sci. Technol. 27:2341-2351.
36. Reed, R. L., and R. N. Healy. 1977. Some physicochemical aspects of microemulsion flooding: a review., p. 383-437. In D. O. Shah and R. S. Schechter

144
(ed.), Improved Oil Recovery by Surfactant and Polymer Flooding. Academic Press, Inc., Orlando, FL.
37. Ron, E. Z., and E. Rosenberg. 2001. Natural roles of biosurfactants. Environ. Microbiol. 3:229-236.
38. Rouse, J. D., D. A. Sabatini, J. M. Suflita, and J. H. Harwell. 1994. Influence of surfactants on microbial degradation of organic compounds. Crit. Rev. Environ. Sci. Technol. 24:325-370.
39. Sabatini, D. A., J. H. Harwell, M. Hasegawa, and R. Knox. 1998. Membrane processes and surfactant-enhanced subsurface remediation: results of a field demonstration. J. Memb. Sci. 151:87-98.
40. Sabatini, D. A., R. C. Knox, J. H. Harwell, and B. Wu. 2000. Integrated design of surfactant enhanced DNAPL remediation. Efficient supersolubilization and gradient systems. J. Contam. Hydrol. 45:99-121.
41. Salager, J.-L. 1999. Microemulsions, p. 253-302. In G. Broze (ed.), Handbook of Detergents. Part A. Properties. Marcel Dekker, Inc., New York.
42. Shariati, P., W. J. Mitchell, A. Boyd, and F. G. Priest. 1995. Anaerobic metabolism in Bacillus licheniformis NCIB 6346. Microbiology 141:1117-1124.
43. Shiau, B. J., D. A. Sabatini, and J. H. Harwell. 2000. Chlorinated solvent removal using food grade surfactants: column studies. J. Environ. Engineer.:611-621.
44. Smith, S. A., B.-J. Shiau, J. H. Harwell, J. F. Scamehorn, and D. A. Sabatini. 1996. Performance and chemical stability of a new class of ethoxylated sulfate surfactants in a subsurface remediation application. Colloids Surfaces A: Physiochem. Eng. Aspects 116:225-239.
45. Thangamani, S., and G. S. Shreve. 1993. Effect of anionic biosurfactant on hexadecane partitioning in multiphase systems. Environ. Sci. Technol. 28:1993-2000.
46. Thomas, C. P., G. A. Bala, and M. L. Duvall. 1993. Surfactant-based enhanced oil recovery mediated by naturally occurring microorganisms. Soc. Petrol. Eng. Reservoir Eng. 11:285-291.
47. Tiehm, A. 1994. Degradation of polycyclic aromatic hydrocarbons in the presence of synthetic surfactants. Appl. Environ. Microbiol. 60:258-263.
48. Toren, A., E. Z. Ron, R. Bekerman, and E. Rosenberg. 2002. Solubilization of polyaromatic hydrocarbons by recombinant bioemulsifier AlnA. Appl. Microbiol. Biotechnol. 59:580-584.
49. Van Dyke, M. I., P. Couture, M. Brauer, H. Lee, and J. T. Trevors. 1993. Pseudomonas aeruginosa UG2 rhamnolipid biosurfactants: structural characterization and their use in removing hydrophobic compounds from soil. Can. J. Microbiol. 39:1071-1078.
50. Volkering, F., A. M. Breure, J. G. van Andel, and W. H. Rulkens. 1995. Influence of nonionic surfactants on bioavailability and biodegradation of polycyclic aromatic hydrocarbons. Appl. Environ. Microbiol. 61:1699-1705.
51. West, C. C., and J. H. Harwell. 1992. Surfactants and subsurface remediation. Environ. Sci. Technol. 26:2324-2330.

145
52. Yakimov, M. M., M. Amro, M. Bock, K. Boseker, H. L. Fredrickson, D. G. Kessel, and K. N. Timmis. 1997. The potential of Bacillus licheniformis strains for in situ enhanced oil recovery. J. Petr. Sci. Engineer. 18:147-160.
53. Zar, J. H. 1999. Biostatistical Analysis. Fourth Ed. Prentice Hall, Upper Saddle River, New Jersey.
54. Zhang, Y., W. J. Maier, and R. M. Miller. 1997. Effect of rhamnolipids on the dissolution, bioavailability, and biodegradation of phenanthrene. Environ. Sci. Technol. 31:2211-2217.
55. Zhang, Y., and R. M. Miller. 1992. Enhanced octadecane dispersion and biodegradation by a Pseudomonas rhamnolipid surfactant (biosurfactant). Appl. Environ. Microbiol. 58:3276-3282.

146
Chapter 8. Interfacial Tension Measurements 8.1 Abstract
Interfacial tensions (IFT) between crude oil and water in the presence of varying
concentrations of the biosurfactant produced by Bacillus mojavensis JF-2 bio-surfactant were determined. Effects of salinity and co-surfactant 2,3-butanediol were also studied. The bio-surfactant lowered IFT by nearly 2 orders of magnitude compared to typical values of 28-29 mN/m. Increasing the salinity increased the IFT with or without 2,3-butanediol present. The lowest interfacial tension observed was 0.1 mN/m.
8.2. Introduction
In Chapter 7, we found that the JF-2 biosurfactant in the presence of a
viscosifying agent and a co-surfactant, 2,3-butanediol, could recover significant amounts of residual oil. The recovery of residual oil depends on the generation of low interfacial tensions in order to release oil that is entrapped in small pores. The data in Chapter 4 suggested that the JF-2 biosurfactant could significantly lower the interfacial tension. This study was conducted to test whether the JF-2 biosurfactant does generate low interfacial tensions. The presence of a cosurfactant, 2,3-butanediol was shown to improve oil recoveries (Maudgalya, 2002) possibly by changing the optimal salinity concentration of the formulation. For this reason, we also tested the effect of 2,3-butanediol on interfacial tension.
8.3 Methods
Procedures for the growth of Bacillus mojavensis strain JF-2, preparation of cell-
free culture fluids, and quantitation of the JF-2 biosurfactant are described in Chapter 2 of this report. Bacillus mojavensis strain JF-2 was grown aerobically in medium E in 300-ml cultures. The medium was inoculated with B. mojavensis strain JF-2 (1% by volume) and incubated at 37
o
C without shaking for 24 hours. The culture was then centrifuged to remove the cells and the concentration of the JF-2 biosurfactant in the cell-free culture fluid was determined by high-pressure liquid chromatography. The cell-free culture fluid was used immediately for analysis.
The effect of the biosurfactant concentration, salinity and the presence of 2,3-butanediol, a co-surfactant, on interfacial tension was determined. Cell-free culture fluid containing of the JF-2 biosurfactant was diluted two-fold and five-fold to give three aliquots of the original culture that contained 11, 28 or 57 mg/l of the JF-2 biosurfactant. The dilutions were preformed with uninoculated, sterile medium E in order to maintain the same salinity and chemical composition as the original culture. Each aliquot representing a different biosurfactant concentration was then split into three portions. Enough solid NaCl was added to one of the portions to give a final NaCl concentration of 75 g/l; another portion received enough NaCl to give a final NaCl concentration of 100

147
g/l. The remaining portion did not received additional NaCl and had a NaCl concentration of 50 g/l, which is the NaCl concentration of medium E.
In another experiment, the effect of the presence of a co-solvent, 2,3-butanediol, was studied along with studying the effects of biosurfactant concentration and salinity. The experiment was conducted in a similar fashion as described above using two different cultures of B. mojavensis strain JF-2 that contained 54.0 and 58.0 mg/l of the biosurfactant. Each culture was split into equal volumes and to one portion enough solid 2,3-butanediol was added to give a final concentration of 10 mM. Each portion (e. g., with and without 2,3-butanediol) was then two-and five-fold diluted as described above. After dilution, the concentration of the JF-2 biosurfactant from one culture was 54, 27 and 11 mg/l while that of the other culture was 58, 29 and 12 mg/l.
Interfacial tension (IFT) was measured by using a spinning drop tensiometer. Duplicate measurements were conducted for each of the above treatments. The capillary tube of the tensiometer was filled with the biosurfactant solution or the sterile medium E. A drop of 44°API crude oil was then introduced into the aqueous phase by using a syringe and needle. IFT’s were measured as the tube rotated at high speeds. The IFT value was recorded after the diameter of the drop did not change with time. 8.4. Results
The biosurfactant concentrations of three replicate cultures of B. mojavensis strain
JF-2 grown at different times with different inocula were 57, 54 and 58 mg/l to give a mean and standard deviation of 56.3 ± 2.1. The coefficient of variation was 3.7%, indicating a high degree of reproducibility in biosurfactant concentration among cultures grown at different times and with different inocula.
Table 8.1 summarizes the effects of biosurfactant concentration, salinity and the presence of 2,3-butanediol on the interfacial tension between culture medium and crude oil.
Table 8.1. Summary of interfacial tension measurements at different biosurfactant concentrations, sal inities with and without 2,3-butanediol.
Interfacial Tension (mN/m) at different NaCl concentrations
Biosurfactant Concentration (mg/l)
Additions
50 g/l 75 g/l 100 g/l 56 None 0.2 (0.15) 0.7 (0.7) 3.5 (0.8) Butanediol 0.2 (0.08) 1.5 (0.2) 2.0 (0.8) 23 None 0.8 (0.7) 1.1 (0.2) 2.6 (1.9) Butanediol 0.4 (0.2) 2.4 (0.4) 2.2 (0.7) 11 None 1.6 (1.0) 3.2 (0.8) 3.8 (0.7) Butanediol 2.0 (1.2) 2.0 (0.4) 3.6 (1.0)
*Values are means with the standard deviation given in parentheses.
The lowest interfacial tension measured was 0.1 mN/m. This is two orders of magnitude lower than the typical IFT between crude oil and water of 29 to 32 mN/m as

148
reported by Green and Willhite (1998). The interfacial tensions were lower at 50 g/l NaCl than at the higher salinities regardless of the biosurfactant concentration.
Two-factor analysis of variance was used to determine whether the biosurfactant concentration and salinity significantly affected interfacial tension. Table 8.2 shows the mean interfacial tensions of each treatment and Table 8.3 shows the results of the analysis of variance.
Table 8.2. Effect of salinity and biosurfactant concentration on interfacial tension between culture medium and crude oil without 2,3-butanediol.
Mean interfacial tensions at different salinities
Biosurfactant concentration (mg/l) 50 g/l 75 g/l 100 g/l
56 0.1 0.8 3.5 23 1.0 1.2 2.8 11 1.4 3.4 4.1 Table 8.3. Two-factor analysis of variance summary table on the effects of salinity and biosurfactant concentration on interfacial tension between culture medium and crude oil.
Source of Sums of Degrees Mean F value P value F critical variance squares of squared
freedom deviation from the mean
Concentration 16.3 2 8.1 7.953 0.00192 3.354
Salinity 43.1 2 21.6 21.05 3.1E-06 3.354
Interaction 6.6 4 1.7 1.622 0.19753 2.728 Within cells 27.7 27 1.0
Total 93.7 35
The analysis of variance shows that there were significant differences among all of the treatments (P<0.05). Both the biosurfactant concentration and the NaCl concentration affected the interfacial tension. Increasing the NaCl concentration significantly increased the interfacial tension as did decreasing the biosurfactant concentration. There was no significant interaction between these two factors. A second two-factor analysis of variance was conducted to assess the effect of 2,3-butanediol on interfacial tension. For this analysis, only data at a biosurfactant concentration of 23 mg/l was used since it was not possible to obtain interfacial tension measurements at all salt concentrations at the other two biosurfactant concentrations. The mean values obtained from this analysis are shown in Table 8.4 and the summary statistics are shown in Table 8.5.

149
Table 8.4. Effect of the presence of 2,3-butanediol on interfacial tension between culture medium and crude oil at a biosurfactant concentration of 26 mg/l.
Mean interfacial tensions at salinities (g/l) of Additions 50 75 100
None 0.4 0.75 1.2 2,3-butanediol 0.4 2.5 22 Table 8.5. Two factor analysis of variance summary table on the effect of the presence of 2,3-butanediol on interfacial tension between culture medium and crude oil. Source of Sums of Degrees of Mean F value P value F critical variance squares freedom squared deviation from the mean
Butanediol 5.0 1 5.0 24.9 9E-5 4.41
Salinity 8.3 2 4.1 20.6 2E-5 3.35
Interaction 2.9 2 1.4 7.24 0.005 3.35 Within 3.6 8 0.2 cells Total 19.9 23
Again, increasing salinity significantly affected the interfacial tension with the lowest values once again obtained at 50 g/l salt. Interfacial tensions were higher in the presence of 2, 3-butanediol compared to replicate treatments without 2, 3-butanediol. The interaction between these two factors was also significant.
With 50 g/l NaCl, the presence of 2, 3-butanediol had impact except at the lo west biosurfactant concentration (Figure 4.1). When the NaCl concentration was 75 g/l, the presence of 2, 3-butanediol raised the IFT compared to treatments without 2, 3-butanediol, except when the biosurfactant concentration was 11 mg/l . At 1 00 g/l NaCl concentration, 2, 3-butanediol lowered the IFT at all biosurfactant concentrations tested. With 56 m g/l of the biosurfactant and 100 g/l NaCl, the presence of 2, 3butanediol lowered the I FT by 50% compared to similar treatments without 2,3-butanediol.

150
8.5. Discussion
The interfacial tension increases as biosurfactant concentration decreases because
less biosurfactant is present at the interface between oil and water. Consequently, work done to bring the immiscible phases together results in higher interfacial tension. This is explained in detail by Rosen (1978). Healy et al. (1976) showed that salt ions repel biosurfactant molecules from the aqueous phase into the hydrocarbon phase as salinity increases. This results increases the IFT between the hydrocarbon and aqueous phases and explains the rise in IFT with increasing salinity
The increase in IFT in the presence of a co-surfactant such as 2,3-butanediol may be because alcohols alter biosurfactant behavior and raise the optimal salinity of the biosurfactant. Optimal salinity is the salinity where the lowest IFT can be found. Hsieh and Shah (1977) and Wade et al.(1978) have shown that addition of water soluble
Figure 8.1. Effect of 2,3-butanediol on interfacial tension between crude oil and medium at different biosurfactant and NaCl concentrations. Symbols. Diamonds, 50 g/l NaCl; squares, 75 g/l NaCl; and triangles, 100 g/l NaCl.

151
alcohols raises the optimal salinity of a surfactant system and consequently, the IFT. It is to be noted that at high alcohol concentrations, the addition of more alcohol does not affect the optimal salinities or IFT of a formulation. An interesting observation was that the salinity effects were more pronounced at lower concentrations and the co-surfactant did not alter this sensitiveness to salinity.
8.6. Conclusions
1. The bacteria Bacillus mojavensis JF-2 produced a bio-surfactant that lowered
interfacial tension between crude oil and water by two or more orders of magnitude. 2. Increasing salinity of the aqueous phase from 50 g/l to 10o g/l increased IFT
with larger increases at lower bio-surfactant concentrations. 3. Addition of 2,3-butanediol caused an increase in IFT.
8.7 List of references
1. Maudgalya, S.: “Development of a Bio-surfactant based Microbial Enhanced
Oil Recovery Process”, M.S Thesis, University of Oklahoma, 2002. 2. Green, D.W. and Willhite, G.P.: “Enhanced Oil Recovery”, SPE Text Book
Series Vol. 6,1998, pp. 239-300 3. Healy, R.N., Reed, R.L. and Stenmark, D.G.:“Multiphase Microemulsion
Systems”, SPEJ (June 1976), 147-160; Trans AIME 261. 4. Rosen, M.J.: “Surfactants and Interfacial Phenomena”, John Wiley and Sons
Inc., New York City, 1978. 5. Hsieh, W.C. and Shah, D.O.: “The Effect of Chain Length of Oil and Alcohol
as well as Surfactant to Alcohol ratio on the Solubilization, Phase Behavior and Interfacial tension of Oil-brine-Surfactant-Alcohol Systems”, SPE 6594, presented at the SPEAIME International Symposium on Oilfield and geothermal Chemistry, San Diego, CA, June 27-29, 1977.
6. Wade, W.H., Morgan, J.C., Schechter, R.S., Jacobson, J.K. and Salager, J.L.: “Interfacial tension and Phase behavior of Surfactant Systems”, SPEJ 1978, pp 242-252.

152
Chapter 9. In situ growth and biosurfactant production in a limestone formation: Results from a recent field test
Abstract
We conducted a push-pull test to study in-situ biosurfactant production by
exogenous biosurfactant producers to aid in oil recovery from depleted reservoirs. Five wells from the same formation were used. Two wells received cells and nutrients, two wells were treated with nutrients only, and one well was used as the negative control where only brine was injected. We hypothesized that the wells receiving nutrients and cells treatment would be able to produce biosurfactant in-situ compared to nutrient only–treated wells or the negative control. After incubation and a shut-in period to allow in situ growth and metabolism, a series of chemical, microbiological, and molecular analyses were conducted on the produced fluids to obtain evidence for growth, metabolism, and biosurfactant production. Results showed that the wells treated with cells and nutrients indeed produced biosurfactant compared to the other wells as evidenced by the increase in surface activity. Lipopeptide biosurfactants of concentration up to 350 ppm were detected. This is an order of magnitude higher than the CMC. Evidences for substrate utilization and metabolism were detected in the wells treated with cells and nutrients where % carbon recovery was 124%, and 116%. Acids as acetate, formate, and lactate, and solvents as ethanol, and 2,3 butanediol were detected in the inoculated wells. MPN analysis of influents and effluents of the treated wells showed a ratio of 2.2 and 1.2 for the number of biosurfactant producers and a ratio of 654 and 1727 for the total number of cells in the produced fluids compared to the injection fluids of inoculated wells. For the first time, we show that biosurfactants were produced in-situ using simple nutrients at concentrations that are sufficient to mobilize significant amounts of residual oil. Second, inoculation of oil wells with exogenous biosurfactant-producers was possible. These two findings support the efficacy of the use of biosurfactants to recover entrapped oil.
Introduction Surface-active microbial byproducts, biosurfactants, have been studied for their
potential use in oil recovery, where increased surface activity will enhance lowering of capillary pressure and hence initiate the mobilization of entrapped oil [1]. Lipopeptide biosurfactants can lower interfacial tension between water and oil by at least a hundred-fold making them good candidates for biosurfactant-mediated oil recovery [2].
Effectiveness of microbially enhanced oil recovery (MEOR) is often controlled by several factors mostly related to the well or the oil reservoir [3]. One of the factors that can adversely affect MEOR effectiveness is dissipation of nutrients due to adsorption to rocks or dilution effects [3]. Knowledge of key data such as the microbial reaction rate kinetics, adsorption kinetics, and flow rates will help increase understanding and predictability of microbial oil recovery processes. Also, nutrients concentrations, source of nutrients and whether the microorganisms are exogenous or indigenous to the reservoir will influence the effectiveness of microbial treatment [3].

153
The possibility of in-situ biosurfactant production in concentrations that will enhance oil recovery is usually an important question associated with MEOR [1, 3]. Additionally, not all reservoirs have indigenous microorganisms that can produce a biosurfactant. The use of exogenous microorganisms for MEOR is usually associated with the concerns of using appropriate concentrations for sufficient contact with the reservoir material.
Critical information concerning kinetics of in situ microbial processes are needed to estimate oil recovery and economic returns. In this study, information about rates of growth and biosurfactant production was obtained. This will aid in future modeling and application of MEOR.
Materials and methods
Preparation of the inoculum.
A putative strain of B. licheniformis and B. subtilis subsp. spizizenii strain NRRL B-23049 were each grown in 200 ml of medium E (see Chapter 1 for composition). Once the cultures reached late exponential phase of growth, a culture of each strain was used to inoculate a 10-liter carboy of the same medium. Each carboy was incubated at 37ºC for 48 hours. The cells were concentrated by using a tangential membrane flow system. The concentrated cells were stored at 4ºC until used to inoculate 30-gallon (132-liter) tanks of modified medium E. Modified medium E contained the following components (grams per 30 gallons (132 liters) of tap water): dibasic potassium phosphate (157.0), monobasic potassium phosphate (30.5), sucrose (1130.0), sodium chloride (1130.0), sodium nitrate (113.0), and yeast extract (113.0)). One liter of cell concentrate was used to inoculate each 30-gallon tank. Six tanks were inoculated with the putative strain of B. licheniformis and 4 tanks were inoculated with B. subtilis subspecies spizizenii. NRRL B-23049. The tanks were incubated for approximately 48 hours at room temperature.
Pumping schedule
Five wells in the Bebee field (Section 19, T5N, R5E, Pontotoc City, OK) that
produce from the same formation (a Viola limestone) were used for this study. Two wells (Robertson #13, and Robertson #15) received with an inoculum and nutrients, two wells (Parish #1, and Robertson #3) received just nutrients, while only one well served as the negative control (Robertson #5) where only brine was injected into the well. Each well received an initial injection (pre-flushed) of 10 barrels of brine, an injection of 50 barrels of the treatment (nutrients and cells, nutrient only, or brine) followed by 50 barrels of brine as post-flush to make a total of 110 barrels of fluids injected per well. Robertson #5 was used as the negative control and received only 100 bbl of brine instead of 110 bbl. A 120 bbl-vacuum truck was used for mixing and pumping. Samples for chemical, microbiological, and molecular analyses were collected from the vacuum truck before injection into the well. Production from each well was stopped for 108 hours to allow time for growth and metabolism to occur in the formation. After this incubation period, production was started.
Well numbers and treatments are shown in Table 9.1. The inoculum consisted of 90 gallons of a putative strain of B. licheniformis and 60 gallons of B. subtilis subsp.

154
spizizenii NRRL B-23049 for each well. The nutrients consisted of 79.5 kg of glucose, 7.9 kg of sodium nitrate, 19.9 g of magnesium sulfate, 2.0 g each of manganese sulfate, zinc sulfate, and iron sulfate, 0.2 g each of copper sulfate, aluminum/potassium sulfate, boric acid, and sodium molybdate, 0.1 g of sodium selenate, and 0.6 g of nickel chloride per well. Fluorescien and sodium bromide served as tracers and were each added at a concentration of 200 mg/l.
Table 9.1. Number of wells and treatments received.
Well # Nutrients Tracers Cells Volume of treatment
Parish #1 Glucose, metals, NaNO3
Fluorescien, sodium bromide
- 50 bbl
Robertson #3 Glucose, metals, NaNO3
Fluorescien, sodium bromide
- 50 bbl
Robertson #5 - - - 50 bbl (brine) Robertson #13 Glucose, metals,
NaNO3 Fluorescien,
sodium bromide Yesa 50 bbl
Robertson #15 Glucose, metals, NaNO3
Fluorescien, sodium bromide
Yesa 50 bbl
a: A putative strain of B. licheniformis and B. subtilis subsp. spizizenii NRRL B-23049 were used.
Sampling (# and volume of samples)
On the 5th day after shut in (total of 108 hours), production was started in the
wells at 5:00 am. Flow meters devices were attached to the tubing of Robertson #3, Robertson #13, and Robertson #15 to measure the rate and volume of fluid production. Sampling started at 8:00 am where a total of 3 samples of volumes 1 liter, 50 ml, and 2 liters were collected from each well for chemical, microbiological, and molecular analyses, respectively. The exact sampling time (military time), temperature (ºF), and the total volume produced (in barrels or gallons) were recorded in the sampling notebook. Table 9.2 shows the sampling times, and number of samples collected from each of the 5 wells.

155
Table 9.2. Sampling times and number of samples collected from each of the 5 wells studied.
a: Numbers refer to the number of hours since the production started in the wells after the shut in. b: x means that a sample has been collected from this well at the time recorded in the table heading. c: The total number of samples collected from the well after treatment.
Chemical analysis
Aliquots of the brine were taken and filtered through 0.2 µm membrane filters to remove particulate material and oil. The pH and conductivity (mS/ cm) were measured on filtered samples by using a hand-held pH/ conductivity meter (Fisher). Nitrate, nitrite, ammonium, and alkalinity were measured colorimetrically in mg/l by using Hach kits (Hach Chemical Co.) for each of the above according to the manufacturer’s instructions. Sulfide was measured colorimetrically. To avoid any sulfide loss from the samples prior to analysis, samples were fixed in DMPD reagent (per liter, Zn (CH3COO)2•2H2O, 1 g; DMPD.HCl , 1 g; and concentrated H2SO4, 50 ml) until analysis. Ten-microliters and 100-µl samples were fixed in the DMPD reagent with a 10-ml total volume. Before analysis, 100µl of ferric chloride reagent (FeCl3•6H2O, 250 g/l) was added to the fixed samples to develop the color. Absorbance was measured at 660 nm and concentration calculated from sulfide standard curve with concentrations ranging from 0 to 50 mg/l of sulfide [7].
An ultraviolet-visible scan for fluorescien showed that it absorbed maximally at 483 nm. The absorbance of filtered samples was measured in duplicate at this wavelength and the concentration of fluorescien in the sample was calculated from a standard curve that related fluorescien concentrations from 0 to 20 µM to absorbance [4].
Bromide in filtered samples was analyzed by using liquid chromatography with an anion exchange column. The analysis was done in duplicate and the concentration of
Time in hours after pumping started Wells
3a 6 7.5 9 10.5 12 13.5 15.5 32.5 # of samplesc
Parish #1 xb x x x x x x x 8
Robertson #3 X x x x x x x x 8
Robertson #5 x x x x x x x x 8 Robertson
#13 x x x x x x x x 8
Robertson #15 x x x x x x x x x 9

156
bromide in the samples was calculated from standard curve of NaBr with concentrations ranging from 0 to 500 µM [5].
Detection of biosurfactant production
Biosurfactant activity was measured by using the oil spreading technique [6]. Fifty milliliter of distilled water was added to a large Petri dish (25 cm in diameter) followed by the addition of 20 µl of crude oil to the surface of the water. Ten microliter of an un-filtered sample was added to the surface of oil. The diameter of the clear zone on the oil surface was measured in triplicate for each sample. Biosurfactant activity, defined as diameter of clearing on the oil surface in centimeters, ranged from 0 to 2 cm.
Surface tension was measured in duplicate for filtered samples using Du Nuoy ring tensiometer calibrated with water as the standard for high range surface tension and isopropanol as the standard for low range surface tension [2].
The lipopeptide biosurfactant was detected using high performance liquid chromatography (HPLC) with a reversed phase C18 column (250 mm length x 1.5 mm ID) and 60% acetonitrile as the mobile phase [11]. Twenty microliter samples were injected in duplicate. Retention times for biosurfactant were 2, 2.3 and 3.1 minutes corresponding to 3 different fatty acid tails of the lipopeptide. The concentrations were calculated by using standard curves of surfactin, as well as the highly purified lipopeptide produced by each of the two bacteria, Bacillus licheniformis type strain and Bacillus subtilis subsp. spizizenii NRRL B-23049 type strain, with concentrations ranging from 0 to 500 mg/l.
Sugar analysis
A modified orcinol/ H2SO4 method was used to determine the amount of sugar in the samples [8]. Each sample was analyzed in duplicate. To 300 µl of each sample, 2.7 mL of a solution containing 0.19% orcinol (in 53% H2SO4) was added. After heating at 80ºC for 30 min, the samples were cooled at room temperature for 15 min and the A421 was measured. The concentration of sugar in the samples was calculated from a glucose standard curve with concentrations ranging from 0 to 30 µg/ l.
Fatty acids/ alcohol detection
Acetate, ethanol, and 2,3 butanediol were detected by using gas chromatography (GC) with a 80/ 120 carbopack B-DA*/ 4% carbowax 20M (2m length x 2mm ID) glass column. Helium was used as the carrier gas at a flow rate of 24 ml/min [9, 10]. Injector temperature was 200ºC. Column temperature was kept at 155ºC for 3.5 minutes and then increased to 180ºC at 30ºC/ min. Temperature was then held at 180ºC for 10 minutes. One microliter of different dilutions of the sample in 30 mM oxalic acid was injected in duplicate. The metabolites were detected with a flame ionization detector at 200ºC. Ethanol and acetate eluted at 1.1 min, and 3 min respectively. 2,3 Butanediol eluted at 7.5 min. The metabolite concentrations were calculated by using standard curves with concentrations ranging from 0 to 1 mM.
Lactate and formate were detected by using HPLC with an Alltech Prevail organic acid column (250 mm length x 1.5 mm ID) and 25 mM KH2PO4 (pH 2.5) as the mobile phase according to manufacturer’s instructions. Fifty microliter samples were injected in duplicate. Retention times for formate and lactate corresponded to 3.43 and 4.88 minutes,

157
respectively. The metabolite concentrations were calculated from standard curves with concentrations ranging from 0 to 5 mM.
Microbiological analysis
Three-tube MPN technique was used to enumerate heterotrophic bacteria in the samples from the vacuum trucks and from the wells. The procedure was modified to use 96-well plates for the MPN enumerations and dilutions ranging from 100 to 10-5 were used for each sample. The MPN analysis was performed in duplicate. Two types of media were used. The Bacillus biofilm growth medium (BBGM) contained per liter of LB medium: 1g of glucose, 1 mmole of MgSO4, 150 mmole of ammonium sulfate, 34 mmole of sodium citrate, 100 mmole of potassium phosphate (pH 7), and 1 g of sodium nitrate [12]. Plate count broth (Difco, Inc.) was modified to contain 5 % NaCl. A portion of each sample was heat-treated (incubated at 85ºC for 20 minutes) and then used to inoculate BBGM to estimate the numbers of spore-forming bacteria. Five microliters of sterile crude oil was added to all dilutions that showed growth in the MPN plates. Oil displacement on the medium surface indicated that biosurfactant producers were present at that dilution [12]. These results were then used to enumerate of biosurfactant producers as above.
Three-tube MPN technique was used to enumerate sulfate-reducing bacteria (SRB) in samples. SRB medium was prepared as described previously [13]. Dilutions ranging from 10-1 to 10-6 were used for each sample.
Molecular Analysis
A 2-liter brine sample was taken from each well 2 days before inoculation as well as from the discharge line of the vacuum truck during treatment fluid injection to each well. Additional 2-liter brine samples were taken from each well over the time course of the experiment. We were careful to insure that no biocide treatment of the wells had occurred in the 2 weeks prior to sampling. The purpose of these samples was to obtain DNA from the microorganisms present in the brine in order to determine microbial community organization and to verify the presence of our Bacillus strains by molecular biology techniques. Sterile plastic bags were used to acquire brine samples, which were then placed on ice for transport to the lab where they were refrigerated at 40C.
Individual brine samples were transferred to a 2 L aspirator bottle at 40C the night before filtration to allow for entrained oil separation from the brine. Separated brine was transferred using the bottom port of the aspirator bottle into the top of a sterile, vacuum filtration apparatus. The filter consisted of a PES membrane of 90 mm diameter and 0.2 um pore space. The filtrate was collected in the bottom housing and the filter membrane containing the microorganisms was cut from the apparatus. Using aspetic techniques, the membrane was then placed in an autoclaved 50 mL screw cap centrifuge tube with an assortment of glass and silica/zirconium beads in the 0.1 to 6 mm range of diameter. These tubes were kept at -200C and transferred to -700C the night before cell lysis and DNA extraction was performed.
The cell lysis procedure began with taking the filter from the -700C freezer and immediately subjecting it to vortexing for 10 minutes. This rapid thaw and bead beating sheared the 90 mm filter into small pieces typically less than 5 mm. A 3 ml-volume of Stool Lysis Buffer (Qiagen) was aspectically pipetted into the tube and the contents

158
vortexed for 2 minutes to mix the buffer with the filter pieces. The 50 ml tube with beads, lysis buffer and filter pieces was incubated at 950C for 10 minutes in a water bath completing the cell lysis procedure. The tube was then placed at -200C until a modified QIAamp DNA Stool Minikit protocol (QIAGEN) for DNA extraction and purification was performed.
Resulting DNA was amplified in a Taq DNA polymerase chain reaction (PCR) using a thermal cycler and degenerate primers designed to hybridize with the srfA/licA gene sequences of a variety of Bacillus strains entered in the National Center for Biocatalyis GenBank using the DNAMAN multiple sequence alignment program. Colony PCR was utilized to amplify DNA from several type strains of Bacillus with these degenerate primers using agarose gel electrophoresis. The presence of a PCR product band was compared with biosurfactant activity using BBGM in wells of microtiter plates as described for bacterial enumeration. Furthermore, the DNA was PCR amplified with universal, eubacterial 16S rDNA primers for future use in denaturing gradient gel electrophoresis (DGGE) experiments to elucidate the eubacterial community organization and to verify the presence of the field strains used in the inoculum during the time course of the experiment by molecular methods.
Results
Chemical analysis
To estimate the amount of dilution of the nutrient package by dispersion in the formation, a non-metablizable tracer (bromide) was used. Assuming that no adsorption occurs, the recovery of bromide should be close to 1 if sufficient sampling is done. However, recovery factors less than 1 means that some of the tracer was adsorbed or lost in the formation. Tracer recovery factors were calculated in the 3 wells that had a total volumetric flow meter attached (Robertson #3, Robertson #13, and Robertson #15), which allows the determination of total volume produced during the sampling period. Since the Parrish #1 well was in the same formation, we used the average recovery factor of bromide obtained from wells Robertson #3, Robertson #13, and Robertson #15 in order to calculate mass recovery in the Parrish #1 well.
Table 9.3 shows the concentrations, amounts, and recovery factors for the tracers in Robertson #3, Robertson #13, and Robertson #15. Due to the wide variation in recovery factor of non-conservative fluorescien in the wells (43% variation) compared to conservative bromide (24.5% variation), bromide recovery factor was used for the mass balance calculations. The average bromide recovery factor from the 3 wells is 1.09, which indicates that no apparent adsorption of the tracer occurred. Values obtained for the analyses of various chemicals in Robertson #3, Robertson #13, and Robertson #15 were divided by the corresponding bromide recovery factor from that well (Table 9.3), while the average bromide recovery factor, 1.09, was used for mass balance calculations of chemical from the Parrish #1 well.

159
Table 9.3. Recovery factors estimation using the 2 tracers applied for this study.
Injected tracer concentration
Injected tracer mass (mmoles)
Recovered tracer mass (mmoles)
Recovery factor Well #
Fluor. (µM)
Br (mM)
Volume (liter)
Fluor. Br Fluor. Br Fluor. Br
Rob 3 25.6 2.4 7950 203.5 19.1 119.3 26.2 0.58 1.37 Rob 13 24.4 2.4 7950 194 19.1 285.3 18.9 1.47 0.99 Rob 15 21.2 2.4 7950 168.5 19.1 170.2 17.4 1.01 0.91
Evidence for microbial metabolism
Orcinol/ sulfuric acid method was used to calculate the concentration of glucose injected in Parrish #1, Robertson #3, Robertson #13, and Robertson #15 wells. Samples were diluted 1:1000 in water and duplicate 300 µl aliquots of each sample were assayed for sugar. Based on the amount of glucoses added to the pumping truck at each injection, we estimated that the injected concentration of glucose should be about 20 g/l. The actual glucose concentrations of the fluid collected from the truck after mixing and prior to injection was 18.1, 13.9, 17.2, and 13.9 g/l for the fluids injected into Parish #1, Robertson #3, Robertson #13, and Robertson #15, respectively. These values were lower than the expected amount of 20 g/l, but given the variability in the volumes of brine and/ or amounts of glucose added to the truck with each filling, these values are reasonably close to the effective glucoses concentration needed to stimulate metabolism in situ. Sugar was detected in all produced fluid samples from the wells that received nutrients, which suggests that the incubation period was not long enough to allow complete metabolism of the injected sugar. Mass balance calculations by multiplying the concentration of sugar by the volume of fluid recovered from that well during the time interval of the sample, summing each of these mass values to obtain the total mass of sugar recovered. The latter value was subtracted from the mass of sugar injected into the well to obtain the mass of sugar used. This value was divided by the bromide recovery factor to correct for dilution/adsorption effects. Table 9.4 shows mass recovery of sugar in the four wells that received nutrients. Figure 9.1 shows the time course of sugar concentrations in produced fluid samples from each well. While complete sugar used did not occur, it is clear that large amounts of sugar were metabolized in the wells that received nutrients, indicating that microbial metabolism occurred in the wells.

160
Table 9.4. Amount of sugar utilized in the wells receiving nutrients or nutrients and cells treatment.
•
Figure 9.1. Sugar concentrations in produced fluid samples from the five production wells. Time on the X-axis is the number of hours after the production started; the Y-axis is the concentration of glucose in g/l .
Microorganisms metabolize sugar to obtain energy and carbon for growth. Since the above analyses showed that sugar was consumed, the cells must have used the sugar and produced products that should be detectable in the produced fluids. A common microbial product is carbon dioxide (or bicarbonate/carbonate ions). An increase in alkalinity and carbon dioxide concentration was observed in the wells treated with cells and nutrients compared to the nutrient only-treated wells or the negative control (no cells or nutrients). The increase in alkalinity and carbon dioxide concentration most probably corresponds to cell growth and sugar utilization. Table 9.5 shows the increase in alkalinity and carbon dioxide concentration in Robertson #13 and Robertson #15 compared to the other wells.
Well # Sugar in (moles)
Sugar out (moles)
Sugar out (corrected
for bromide) Sugar used
Parish 1 804.1 404.2 370.8 433.3 Rob 3 613.9 136.1 99.34 514.6 Rob 13 759.4 303.8 306.9 452.5 Rob 15 613.9 114.7 126 478.9

161
Table 9.5. Alkalinity and CO2 concentration in the 5 wells studied. Well # CO3 (moles) CO3 (corrected
for bromide) (moles)
CO2 moles CO2 (corrected for bromide)
(moles) Parish1 125 114.9 267 250 Rob3 118.7 112 164.1 126.2 Rob5 86.7 79.5 113.8 104.4 Rob13 247.6 250.1 700.9 707.1 Rob15 296.6 325.9 586.9 644.9
In addition to carbon dioxide, Bacillus species will produce various organic acids and alcohols as products of sugar metabolism in the absence of air. End products of sugar utilization by Bacillus [14] were detected in the wells treated with cells and nutrients compared to the nutrient only-treated wells or the negative control. Acetate, formate, and lactate as well as ethanol and 2,3 butanediol were detected in Robertson #13 and Robertson #15. Some ethanol was detected in Robertson #3, Parrish #1, and Robertson #5. Therefore, in addition to NaBr recovery factor, all ethanol values were corrected by subtracting ethanol values in Robertson #5. In spite of some evidence of cell growth and metabolism in the nutrient only-treated wells (Parrish #1 and Robertson #3) as indicated by the decrease in sugar and the increase in the alkalinity and carbon dioxide concentration compared to the negative control well (Robertson #5), no end products of sugar metabolism by Bacillus other than ethanol were detected in the nutrient only-treated wells. This might suggest that the sugar was metabolized to other products not detected by the methods, which we used. Table 9.5 shows the different end products produced in Robertson #13 and Robertson #15. Figures 9.2 through 9.6 show the time course of end product concentrations in produced fluid samples from each well. Clearly, these data show that we did stimulate microbial metabolism in the reservoir. In addition, 2-3-butanediol a product often produced by Bacillus species, indicating that we did stimulate the microorganisms responsible for biosurfactant production.
Table 9.5. End products detected in Robertson #13 and Robertson #15.
Robertson 13 Robertson 15 End product Uncorrected Corrected Uncorrected Corrected
Acetate (moles) 20.26 20.46 11.37 12.49 Formate (moles) 52.2 52.7 30 32.9 Lactate (moles) 40.5 40.9 30 32.9 Ethanol (moles) 912.6 921.8 893.1 981.4 2,3-Butanediol (moles) 70.1 70.8 54.6 60

162
Figure 9.2. Concentration of ethanol in the produced fluid samples from Robertson #13 and #15. Time on the X-axis is hours after production started.
Figure 9.3. Concentration of 2,3 butanediol in the produced fluid samples of Robertson #13 and #15. Time on the X-axis is hours after production started.

163
Figure 9.4. Concentration of acetate in the produced fluid samples of Robertson #13 and #15. Time on the X-axis is hours after production started.
Figure 9.5. Concentration of formate in the produced fluid samples of Robertson #13 and #15. Time on the X-axis is hours after production started.

164
Figure 9.6. Concentration of lactate in the produced fluid samples of Robertson #13 and #15. Time on the X-axis is hours after production started.
Evidence for biosurfactant production
Biosurfactant production was immediately after sample collection by using both the oil spreading technique and surface tension measurements. Biosurfactant was produced in the wells that received cells and nutrients (Robertson #13, and Robertson #15) as evidenced by an increase in the oil spreading activity in these wells compared to the controls that received nutrients only (Robertson #3, and Parrish #1) or the negative control (Robertson #5) (Table 9.6). Lowering in surface tension was also observed in these wells compared to the control wells. Surface tension values of 56 and 57 dyne/ cm were obtained in Robertson 15 and Robertson 13, respectively (Table 9.6). Since the above 2 methods would only estimate biosurfactant activity not concentration, another method was used to determine the concentration and amount of biosurfactant produced in the wells where biosurfactant activity was observed. Biosurfactant concentration was measured using high performance liquid chromatography where lipopeptide biosurfactants are detected as 3 peaks corresponding to the 3 different fatty acid tails in the lipid portion of the biosurfactant. Amounts as high as 350 mg/l and 210 mg/l were detected in samples from Robertson 15 and Robertson 13, respectively (Table 9.6). These values are an order of magnitude higher than the critical micelle concentration of lipopeptide biosurfactants, which typically ranges from 10-20 mg/l [15], and are 4-6 times the concentrations usually encountered with Bacillus species grown anaerobically in batch cultures in the lab, which range from 40-60 mg/l[16]. The high concentrations of biosurfactants produced shows success in the main goal of the project, which is in-situ production of biosurfactant in a depleted oil reservoir. We were able to generate in situ biosurfactant concentrations in excess of that needed to mobilize large amounts of residual oil as determined from laboratory core flood experiments. A summary of results

165
for biosurfactant production data is given in Table 9.6. Figures 9.7 through 9.9 show the time course of these measurements in produced fluid samples from each well.
Table 9.6. Highest biosurfactant activity and total moles of biosurfactant produced in Robertson 13 and Robertson 15.
Well # Highest oil spreading
diameter (cm)
Lowest surface tension (mN/m)
Biosurfactant produced (moles)
Biosurfactant (corrected for
bromide) (moles)
Parish 1 0.5 72 0 0 Rob 3 0.5 69 0 0 Rob 5 0.4 68 0 0 Rob 13 1 56 6 6.06 Rob 15 2 57 5.9 6.48
Figure 9.7. Oil spreading results for the produced fluids samples from the 5 wells. Numbers on the X-axis are time in hours after production started.

166
Figure 9.8. Surface tension results for the produced fluid samples from Robertson #13 and #15. Numbers on the X-axis are t ime in hours after production started.
Figure 9.9. Biosurfactant concentrations detected in produced fluid samples from Robertson #13 and Robertson #15. Numbers on the X-axis are time in hours after production started.
Evidence for Bacillus growth
Three-tube MPN analysis was used to estimate the number of Bacillus cells present in both the injectate (from the vacuum truck) and production fluid (samples collected after shut in) for each of the wells. A modified method was also applied to estimate the number of biosurfactant producers compared to the total number of cells (see Materials and Methods). Bacillus biofilm growth medium (BBGM) was used to promote biofilm production [12]. Previous work has shown that there is a correlation between biofilm formation and biosurfactant production in Bacillus strains (M. Folmsbee,

167
unpublished data). We hypothesized that by using the BBGM and the modified method for detection of biosurfactant producers, the percentage of biosurfactant/ biofilm producers to the total number of cells could be determined. However, results of 3-tube MPN using BBGM did not show much biofilm production in the wells treated with cells and nutrients (Robertson #13 and #15). This was contradictory to the results obtained with end product analyses that suggested Bacillus metabolism. The MPN results using BBGM could be a consequence of differences in nutrient composition of the field and lab media resulting in proliferation of indigenous species. However, since Bacillus species are known to sporulate, the MPN experiment was repeated using heat-treated samples (heat treatment of the samples have the advantage of allowing only spores to germinate and grow). The results were more encouraging where the heat-killed treatment in the same kind of medium for the same wells showed 100% biofilm/ biosurfactant-producers.
To avoid overlooking any vegetative cells that might have been killed during heat treatment, plate count broth with 5% salt was used as a selective medium for the MPN analysis of our Bacillus strains. We hypothesized that the selective pressure of the salt would promote Bacillus growth. Results of MPN using PCB+5% salt showed more Bacillus growing as evidenced by their characteristic biofilms. The number of biofilm-producers in the effluent of Robertson #13 and Robertson #15 (wells treated with cells and nutrients) was 2-3 orders of magnitude lower than the total number of cells in the same medium, compared to 4 orders of magnitude lower in Parish #1 and Robertson #3 (nutrient only-treated wells). The ratio of biofilm/ biosurfactant producers in the produced fluid samples to the injectate (vacuum truck), in the wells treated with cells and nutrients was 2.2-fold in Robertson #13 and 1.2 fold in Robertson #15, while that in wells treated with nutrients only was 0.12 in Parrish #1, and 0.7 in Robertson #3. This supports the previous conclusions of the ability of Bacillus to grow and produce biosurfactant in the wells that were treated with cells and nutrients compared to the control wells. Total cell counts obtained with the PCB+5% salt medium are shown in Table 9.7. Growth rates can be calculated from the amount of cells produced during the shut-in period of 108 hours using the exponential growth equation, ln N/N0 = ekt where N is the number of cells at time t, N0 is the number of cells at time zero, and k is the growth rate. Growth rates of 0.005 and 0.02h-1 were obtained for Robertson #13, and Robertson #15, respectively.
Table 9.7. Comparison of total cell numbers and biosurfactant producers in the influent (vacuum truck) and effluents of the 5 wells studied (PCB +5% salt results).
Total Cell number Biosurfactant producers Well # Injectate Produced fluid Injectate Produced fluid Parish #1 6.62 x 10¹¹ 2.6 x 10¹⁴ 6.62 x 10¹¹ 8.2 x 10¹⁰ Rob #3 3.1 x 10¹² 9.8 x 10¹³ 2.52 x 10⁹ 1.9 x 10⁹ Rob #5 NA 1.2 x 10¹¹ NA 0 Rob #13 6.62 x 10¹¹ 4.3 x 10¹⁴ 6.62 x 10¹¹ 1.5 x 10¹² Rob #15 1.83 x 10¹² 3.2 x 10¹⁵ 1.39 x 10¹² 2.2 x 10¹² NA: sample is not available.

168
Samples from MPN plates that showed biofilm formation and biosurfactant activity were streaked out on blood agar plates and compared to the type strains injected into Robertson 13 and Robertson 15. We were able to retrieve the putative Bacillus licheniformis and B. subtilis subsp. spizizenii NRRL B-23049 field strains from the MPN plates inoculated with both the injectate (vacuum truck samples) and produced fluid samples. This proves that the cells injected were the ones that grew and produced the biosurfactant.
Carbon recovery
The percent carbon recovery was calculated for the Robertson #3, Robertson #13, Robertson #15, and Parish #1 using the number of moles of substrate utilized and number of moles of end products produced in each of the wells after correction for the amount of bromide recovered. Only ethanol and CO2 were detected in Parish #1 and Robertson #3. The % carbon recovery in Robertson #13 and Robertson #15 were 124, and 116% with C1/ C2 ratio at 0.81 and 0.7 respectively. Low C1/ C2 ratio in both Robertson #13 and Robertson #15 means that a more oxidized product is required to balance the carbon and electron recovery. This might be a result of the inaccurate determination of carbon dioxide in the effluent samples due to the loss of some CO2 from the headspace before measurement. Parish #1 and Robertson #3 had very low carbon recoveries as expected since the end products of metabolism were different than those of Robertson #13 and #15 and could not be detected on the GC or HPLC. This also explains the high C1/ C2 ratios in these wells. Table 9.8 shows molar ratios of substrates and products as well as and % carbon recoveries in Robertson #3, Robertson #13, Robertson #15, and Parrish #1.
Table 9.8. Molar ratios of substrates, and different products, and % carbon recoveries in treated wells.
Rob 13 Rob 15 Parrish 1 Rob 3 Substrates Glucose (6C) 452.5 479 433.3 514.6 Products Acetate (2C) 20.46 12.49 ND ND
Butanediol (4C) 70.8 60 ND ND Lactate (3C) 42.9 32.9 ND ND Formate (1C) 52.7 32.9 ND ND Ethanol (2C) 921.8 981.4 153.9 105.9 CO2 (1C) 707.1 644.9 250 126.2 Alkalinity (1C) 250.1 325.9 114.7 112 Biosurfactant (53C) 6.06 6.48 ND ND Cells (1C) 1.64 12.27 0.93 0.38
Using CO2 124% 116% 21.5% 10.9% % Carbon recovery Using alkalinity 107% 105% 16.3% 10.4% C1/ C2 ratio Using CO2 0.81 0.7 1.62 1.19
ND= not detected.
Molecular Analysis
Testing of the srfA/licA degenerate primers for hybridization to a variety of Bacillus species and other Gram-positive bacteria is shown in Figure 9.10.

169
Correspondence was found between 16 of the 18 Bacillus strains with respect to the presence of a srfA/licA homolog and biosurfactant activity including the two strains used in this field test as inoculum (i.e. putative B licheniformis and B. subtilis subsp. spizizenii NRRL B-23049). This is indicated by the presence of a 273 bp PCR product on agarose gel and the dispersion of oil in the well of the microtiter plate. Noteworthy is the fact that B. subtilis subsp. subtilis 168 had a srfA/licA band but no biosurfactant activity. This is precisely the case since there is a sfp mutation rendering the strain unable to make biosurfactant while having a srfA gene. Furthermore, none of the other non-Bacillus, Gram-positive strains had a srfA/licA band or biosurfactant activity. In addition, Pseudomonas aeruginosa PA14 (a Gram-negative bacterium) is known to produce a rhamnolipid biosurfactant, which showed activity on the oil microtiter assay, but no band for a srfA gene required for surfactin production. Since the precise sequence of the licA gene of our putative B. licheniformis strain is unknown as is the srfA gene of our other field strain B. subtilis subsp. spizizenii NRRL B-23049, this approach now allows us to determine the presence and absence of these field strains in the time course of produced fluid samples.
Figure 9.10: Summary of srfA/licA amplification by PCR with biosurfactant activity using BBGM microtiter assay.
B. atro
phae
usNRRL N
RS B-21
3
B. amylo
liquef
aciens
CBD 566
B. pum
ilus ATCC 70
61 (C
BD 400)
B. cereu
s ATCC 1457
9 (CBD 55
)
B. circ
ulans
ATCC 4513
(CBD 38
9)
B. mega
terium
ATCC 1458
1
B. subti
lissub
sp.sub
tilisO
KB105
B. sono
rensis
NRRL B-23
154
B. lich
enifo
rmis
B. subti
lissub
sp.spe
zizen
iiNRRL B
-2304
9
B. moja
vensis
ROB2
B. moja
vensis
NRRL B-14
698
B. moja
vensis
JF2
(volca
nic)
B. vall
ismort
isNRRL B
-1489
0
Strept
ococcu
s pyog
enes
OU 104
93
Enteroc
occus
faecal
isATCC 1
9493
Staph
ylococ
cus au
reus ATCC 65
38 (O
U 103
22)
B. subti
lissub
sp. su
btilis
168
Pseudo
monas
aerug
inosa
PA14
273 bp

170
Figure 9.11: srfA/licA amplification from selected time course brine and vacuum truck inoculum samples.
Figure 9.12: 16S rDNA gene amplification from selected time course and vacuum truck inoculum samples.
DNA extracted from the 800 military time brine samples for Robertson 15 and Robertson 13 which were injected with nutrients plus cells yielded a srfA/licA (273 bp)
ROB 15 (8
00)
ROB 13 (8
00)
TRUCK ROB 15 RC
(-)
TRUCK ROB 13
550 bp
ROB 15 (8
00)
ROB 13 (8
00)
TRUCK ROB 15 RC
(-)
TRUCK ROB 13
273 bp

171
and a 16S rDNA (550 bp) band when PCR amplified and resolved by agarose gel electrophoresis as indicated in Figures 9.11 and 9.12. The same result occurred when DNA extracted from brine samples taken from the vacuum truck discharge during inoculation of these same wells. This ability to detect sfrA/licA and 16S rDNA in DNA extracted from brine samples will allow us to correlate the presence or absence of our field strains with the production of biosurfactant in-situ at a molecular level.
Discussion
The experimental design in the current study used five wells in the same
formation, which allowed the employment of control wells to help eliminate any uncertainties as to changes in reservoir properties during operation. Previous studies were short of the use of control wells based on economical reasons associated with shutting down more than one well at the same time. We also employed 2 different tracers, fluorescien and bromide. The simultaneous use of 2 tracers different in chemical properties was important such that if one of them absorbed to the formation, the other can still be used for accurate calculation of percent carbon recoveries based on the tracer recovery factors. Clearly, our data show that we were able to grow the injected strains in situ and that they produced products characteristic of their metabolisms. Also, these strains were able to produce their lipopeptide biosurfactant in situ.
An important aspect of microbially enhanced oil recovery is biosurfactant production in-situ to help mobilize entrapped residual oil [3]. Whether biosurfactants will be produced in sufficient amounts to enhance oil recovery is a matter of considerable controversy. Previous core experiments have shown that 40 mg/l of the lipopeptide biosurfactant produced by Bacillus mojavensis strain JF-2 was sufficient to mobilize residual oil [16]. In the current study, the lipopeptide biosurfactant was detected in concentrations of 210, and 350 mg/l in the treated wells, respectively. These amounts are one order of magnitude higher than the minimum required according to the engineering criteria to mobilize residual oil, which means that biosurfactants can be produced in situ in sufficient amounts to aid in oil recovery.
Engineering models are required for successful microbially enhanced oil recovery. However, to develop these models, data such as microbial reaction rates kinetics, adsorption losses, flow rates, and nutrients and substrate concentrations sources are needed. Microbial reaction rates and adsorption rates are important to estimate the concentration of nutrients required to support growth and elicit sufficient product formation [3]. The current study provides for the first time data for input in engineering models including, adsorption losses as shown by bromide recovery factor (1.09), growth rates (0.005, and 0.02 h-1), percent carbon recovery or mass balance (124, and 116%), biosurfactant production rates (0.016, and 0.019 h-1), and biosurfactant yields (0.0134, and 0.0135 mole biosurfactant/ mole glucose). These data suggest that both the source of nutrients and their concentration were sufficient for growth and product formation. They also suggest that minimal absorption occurred during transport. Engineers will certainly benefit from these data for thorough understanding of microbial activity under reservoir conditions, which will lead to proper application of MEOR. We should note that this is the first time that an in situ carbon/mass balance has been obtained for any MEOR process.

172
Microbial processes show great promise as cost-effective technologies for oil recovery [3]. In the current study, the nutrients used were glucose and sodium nitrate. The inoculated wells, produced biosurfactant in amounts of 6.03, and 6.48 moles. The total nutrient costs were around $82 per well. This makes the cost to produce 1 mole of biosurfactant in situ around $13 per mole. This is cheap considering that the concentration of biosurfactant produced was one order of magnitude higher than that required for mobilization of oil. This means that with expenses as low as $8.2 (one tenth the current expenses), biosurfactant can be produced in sufficient amounts to mobilize residual oil, which is the main goal of MEOR, oil recovery at low cost using microbial byproducts.
Current work also shows success in the inoculation procedure. Since not all reservoirs have indigenous microorganisms that can produce a biosurfactant, sometimes addition of exogenous biosurfactant-producers that can grow under the reservoir conditions is required [1, 3]. The main concern usually associated with in situ biosurfactant production using exogenous microorganisms is the competition the injected cells might encounter due to the presence of indigenous microorganisms in the oil reservoir. In our case, competition did not prevent Bacillus growth, metabolism, and biosurfactant production in the wells treated with cells compared to the other wells that received the nutrient treatment. Growth and glucose utilization were observed in the nutrients only-treated wells but no evidence for biosurfactant production was observed in these wells. This means that indigenous microorganisms although able to utilize glucose, did not out-compete Bacillus for the substrate indicating that glucose is a more favorable substrate for Bacillus compared to indigenous microorganisms. Another factor is that indigenous microorganisms could be oligotrophic, while the laboratory strains can grow in the presence of high nutrients concentrations as the ones used for this study. This factor might have delayed the growth of indigenous microorganisms and prevented them from outcompeting Bacillus strains used in our inoculum.
Current study showed success in two major aspects. First, biosurfactants were produced in-situ using simple nutrients and the results provided data for input in engineering models. Second, inoculation of oil wells with exogenous biosurfactant-producers was possible. These two factors certainly argue for the future technical efficacy of MEOR.
References
1. McInerney, M.J., D.P. Nagle, and R.M. Knapp, Microbially enhanced oil
recovery: past, present, and future, in Petroleum Microbiology, B. Ollivier and M. Magot, Editors. 2005, ASM press: Washington D. C. p. 215-237.
2. McInerney, M.J., M. Javaheri, and D.P. Nagle, Properties of the biosurfactant produced by Bacillus licheniformis strain JF-2. J. Ind. Microbiol, 1990. 5: p. 95-102.
3. McInerney, M.J., et al., Critical assessment of the use of microorganisms for oil recovery. Recent Res. Devel. Microbiology, 2002. 6: p. 269-284.
4. Berkey, J.S., et al., Tracer studies for evaluation of in situ air sparging and in-well aeration system performance at a gasoline-contaminated site. J. Hazard Mater., 2003. 98(1-3): p. 127-44.

173
5. Reusser, D.E., et al., In-situ transformation of deuterated toluene and xylene to benzylsuccinic acid analogues in BTEX-contaminated aquifers. Environ. Sci. Technol., 2002. 36: p. 4127-37.
6. Youssef, N.H., et al., Comparison of methods to detect biosurfactant production by diverse microorganisms. J. microbiol. methods, 2004. 56(3): p. 339-347.
7. Cline, J.D., Spectrophotometric determination of hydrogen sulfide in natural waters. Limnol. Oceanogr., 1969. 14: p. 454-458.
8. Tahzibi, A., F. Kamal, and M.M. Assadi, Improved production of rhamnolipids by a Pseudomonas aeruginosa mutant. Iran. Biomed. J., 2004. 8(1): p. 25-31.
9. Henis, Y., J.R. Gould, and M. Alexander, Detection and identification of bacteria by gas chromatography. Appl. Microbiol., 1966. 14(4): p. 513-524.
10. Larrson, L., P.A. Mardh, and G. Odham, Detection of alcohols and volatile fatty acids by head-space gas chromatography in identification of anaerobic bacteria. J. Clin. Microbiol., 1978. 7(1): p. 23-27.
11. Youssef, N.H., et al. Screening diverse microorganisms for anaerobic growth and biosurfactant production. in Annual meeting of American Society for Microbiology. 2004. New Orleans, LA.
12. Hamon, M.A. and B.A. Lazazzera, The sporulation transcription factor Spo0A is required for biofilm development in Bacillus subtilis. Mol. Microbiol., 2001. 42(5): p. 1199-209.
13. Hines, M.E., P.T. Visscher, and R. Devereux, Sulfur cycling, in Manual of environmental microbiology., S.Y. Newell and R.R. Christian, Editors. 2002, ASM press: Washington D. C. p. 427-38.
14. Nakano, M.M., et al., Characterization of anaerobic fermentative growth of Bacillus subtilis: Identification of fermentation end products and genes required for growth. J. Bacteriol., 1997. 179(21): p. 6749-55.
15. Morikawa, M., Y. Hirata, and T. Imanaka, A study on the structure-function relationship of lipopeptide biosurfactants. Biochim. Biophys. Acta, 2000. 1488(3): p. 211-8.
16. Maudgalya, S., et al. Development of a biosurfactant-based enhanced oil recovery procedure. in Proceedings of the SPE/DOE improved oil recovery symposium. 2004. Richardson, TX.

174
Overall Conclusions Current technology recovers only one-third to one-half of the oil that is originally
present in an oil reservoir. Since almost all regions of the world have been intensively explored for oil and the discovery of large new oil resources is unlikely, the exploitation of oil resources in existing reservoirs will be essential in the future. One step in this exploitation involves increasing the mobility of oil in existing reservoirs. Microorganisms produce a variety of compounds capable of generating the low interfacial tensions between the hydrocarbon and the aqueous phases required to mobilize residual hydrocarbon. In particular, the lipopeptide biosurfactant produced by Bacillus mojavensis JF-2 reduces the interfacial tension between hydrocarbon and aqueous phases to very low levels (<0.016 mN/m).
Biosurfactants are a diverse group of surface-active chemical compounds produced by a wide variety of microorganisms. They are amphiphilic molecules with both hydrophilic and hydrophobic domains, which allow them to partition at the interface of two fluids with differing polarities such as oil-water or water-air interfaces. They are thus capable of reducing the interfacial and/or surface tension. Such properties make them good candidates for enhanced oil recovery.
Biosurfactants have been investigated as replacements for synthetic surfactants since they are environmentally friendly and biodegradable. They are less sensitive to extreme conditions of temperature, salt concentration, and pressure than synthetic surfactants. Since biosurfactants have very low critical micelle concentration (mg/l), they are considered to be more economical to use than synthetic surfactants.
Traditionally, biosurfactants have been viewed as enhancing hydrocarbon mobilization by increasing the apparent aqueous solubility. Increasing the apparent solubility of petroleum hydrocarbons stimulates biodegradation, but does not lead to significant mobilization of the hydrocarbon. Thus, biosurfactants have not thought to be practical for enhanced oil recovery. Here, we show that a lipopeptide biosurfactant produced by B. mojavensis JF-2 mobilizes substantial amounts of residual hydrocarbon from sand-packed columns when a viscosifying agent and a low molecular weight alcohol were present. The amount of residual hydrocarbon mobilized depended on the biosurfactant concentration. One pore volume of cell-free culture fluid with 900 mg/l of the biosurfactant, 10 mM 2,3-butanediol and 1000 mg/l of partially hydrolyzed polyacrylamide polymer mobilized 82% of the residual hydrocarbon. Even low biosurfactant concentrations (16 mg/l) mobilized substantial amounts of residual hydrocarbon (29%).
The recovery of residual oil depends on the generation of low interfacial tensions in other to release oil that is entrapped in small pores. The data above suggest that the JF-2 biosurfactant could significantly lower the interfacial tension. As a result, studies were conducted to directly test whether the B. mojavensis JF-2 biosurfactant does generate low interfacial tensions. The presence of a co-surfactant, 2,3-butanediol improves oil recoveries possibly by changing the optimal salinity concentration of the formulation. For this reason, we also tested the effect of 2,3-butanediol and salinity on interfacial tension. The biosurfactant lowered IFT by nearly 2 orders of magnitude compared to typical

175
values of 28-29 mN/m. Increasing the salinity increased the IFT with or without 2,3-butanediol present. The lowest interfacial tension observed was 0.1 mN/m.
In order to optimize the surface activity of biosurfactants, we hypothesized that mixtures of biosurfactants with diverse structures will generate lower surface tensions compared to individual biosurfactants. In this study, the surface tension for 15 different Bacillus strains that are known to be surface active was measured both individually and in combination with other biosurfactants. Surface tension and CMD-1 values (critical micelle dilution defined as the reciprocal of the biosurfactant dilution at which a sharp increase in surface tension is observed) were compared to assess synergistic effects of the mixtures. Some biosurfactant mixtures were found to have a synergistic effect on surface tension (e.g. surface tension was lowered from 41 to 31 mN/m in some cases) while others had a synergistic effect on CMD-1 values. Since most oil reservoirs contain diverse microorganisms, the stimulation of biosurfactant production in the reservoir will likely result in the production of several different kinds of biosurfactants. While the presence of numerous microorganisms that could potentially compete for the injected nutrient has been viewed as a detriment to the development of MEOR, it may in fact be a benefit by allowing the production of diverse biosurfactants that may act synergistically.
A critical piece of information that must be obtained for MEOR to be effective is the relationship between oil recovery and biosurfactant concentration. How much residual oil can be recovered per unit amount of biosurfactant? Will residual oil recovery increase linearly with increasing biosurfactant concentrations or is this relationship more complex? Tertiary oil recovery experiments showed that biosurfactant solutions with concentrations ranging from 10 to 40 mg/l in the presence of 0.1 mM 2,3-butanediol and 1 g/l of partially hydrolyzed polyacrylamide (PHPA) recovered 10-40% of residual oil from Berea sandstone cores. When PHPA was used alone, about 10% of the residual oil was recovered. Thus, about 10% of the residual oil recovered in these experiments was due to the increase in viscosity of the displacing fluid. The remainder of the recovered oil was due to the effect of the JF-2 biosurfactant on interfacial tension between oil and the displacing aqueous phase. The relationship between interfacial tension (IFT) reduction and biosurfactant concentration was defined. Little or no oil was recovered at biosurfactant concentrations below the critical micelle concentration (CMC) (about 10 mg/l). At concentrations lower than the CMC, IFT values were high. At biosurfactant concentrations from 10 to 40 mg/l, the IFT was 1 mN/m. As the biosurfactant concentration increased beyond 40 mg/l, IFT decreased to around 0.1 mN/m. At biosurfactant concentrations in excess of 10 mg/l, residual oil recovery was linearly related to biosurfactant concentration. A mathematical model that relates oil recovery to biosurfactant concentration was modified to include the stepwise changes in IFT as biosurfactant concentrations changes. This model adequately predicted the experimentally observed changes in IFT as a function of biosurfactant concentration.
B. mojavensis JF-2 is the only strain known to grow and produce an effective biosurfactant anaerobically. Thus, this strain is the only one that can be used for in situ applications. However, anaerobic growth in the original medium was inconsistent and little biosurfactant was produced; in situ growth and biosurfactant production of B. mojavensis JF-2 in sandstone cores resulted in inconsistent oil recoveries probably due to its inconsistent growth under anaerobic conditions. For this reason, it was necessary to

176
improve growth and control biosurfactant production by manipulating the medium components.
Improved anaerobic growth and biosurfactant production was accomplished with the addition of Proteose peptone to the medium, but the resulting medium was much too complex to allow a proper understanding of the nutritional controls of biosurfactant production. Consequently, it was necessary to elucidate the composition of the growth-enhancing factor found in Proteose peptone and identify any other growth factor requirement(s). Previously, we reported that Proteose peptone was necessary for anaerobic growth and biosurfactant production by Bacillus mojavensis JF-2. Preliminary data suggested that the growth-enhancing factor consisted of nucleic acids; however, nucleic acid bases, nucleotides or nucleosides did not replace the requirement for Proteose Peptone. Further studies revealed that salmon sperm DNA, herring sperm DNA, Echerichia coli DNA and synthetic DNA replaced the requirement for Proteose peptone. In addition to DNA, amino acids and nitrate were required for anaerobic growth and vitamins further improved growth. These results indicate that Proteose peptone is not necessary for in situ growth of B. mojavensis JF-2 and can be replaced by DNA, amino acids and vitamins. Since small amounts of DNA, amino acids and vitamins maybe naturally present in the environment or by cross-feeding from other microorganisms, only a carbon/energy source would need to be added to stimulate in situ growth and biosurfactant production.
Since genetic recombination is known to occur between mixed germinating spores of Bacillus species, we hypothesized that Bacillus strains with improved biosurfactant producing ability could be obtained by mixing germinating spores of JF-2 and those of other Bacillus species. Our aim is to obtain strains that produce higher amount of biosurfactants than JF-2, are able to grow anaerobically with minimal nutrient requirements, and can maintain their biosurfactant activity over long periods of time. In an attempt to increase biosurfactant production, a genetic recombination experiment was conducted by mixing germinating spores of four of the best strains with JF-2. Biosurfactant production was higher with the mixed spore culture than in the co-cultures containing JF-2 and each of the other 4 strains or in a mixed culture containing all five strains that had not undergone genetic exchange. Four isolates were obtained from the mixed spores culture that gave higher biosurfactant production than any of the original strains. Repetitive sequence-based polymerase chain reaction analysis showed differences in the band pattern for these strains compared to the parent strains, suggesting the occurrence of genetic recombination.
The elevated salinities and lack of oxygen in most mid-continent oil reservoirs are critical environmental factors that govern the type of microorganism used for biosurfactant-mediated oil recovery. We screened diverse microorganisms for biosurfactant production and anaerobic growth at elevated salt concentrations to obtain candidates most suitable for microbial oil recovery. We tested 205 strains, mostly strains of Bacillus mojavensis, Bacillus subtilis, Bacillus licheniformis, and Bacillus sonorensis, for aerobic and anaerobic growth in 5% salt medium and biosurfactant production. All strains grew aerobically with 5% salt and 145 of these strains (70%) produced a biosurfactant. Eighty-seven strains, 40%of those tested, mostly belonging to B. subtilis subsp. subtilis and B. subtilis subsp. spizizenii, had biosurfactant activity greater than Bacillus mojavensis JF-2, the current candidate for oil recovery. Some strains maintained

177
biosurfactant activity after 14 days of incubation compared to JF-2, which lost 50% of its biosurfactant activity after 7 days. Thirty-three strains grew anaerobically in the 5% salt medium. The fact that we found that biosurfactant-producing microbes can be readily isolated from uncontaminated, undisturbed arid soils as well as oil field brines argues that many oil field are likely to contain microorganisms that produce biosurfactants.
In order to optimize the activity of the biosurfactants, it is important to understand what portions of the biosurfactant molecule are most critical for its activity. We studied the relationship between biosurfactant structure and activity with a number of lipopeptide biosurfactants produced by the above Bacillus species. A new method of extraction and purification for lipopeptide biosurfactants was developed, which involved ammonium sulfate precipitation, solvent extraction, and thin layer chromatography. Not surprisingly, we found that biosurfactant activity increased with increasing concentration of the lipopeptide biosurfactant. In addition, we also found that the molecular structure of the biosurfactant (e.g., amino acid and fatty acid composition) affected activity. When biosurfactants from different bacilli were tested at the same concentration, biosurfactant activity varied with the percentage of the 3-hydroxy-tetradecanoate isomers in the fatty acid portion of the biosurfactant. Changing the medium composition by incorporation of different precursors of 3-hydroxy tetradecanoate increased the activity of biosurfactant. Thus, by understanding how the structure of the biosurfactant affects activity, we were able to develop simple approach to enhance biosurfactant activity by nutrient manipulation. Our work shows that diverse microorganisms produce biosurfactants and that nutrient manipulation may provide a mechanism to increase biosurfactant activity for more efficient oil recovery.
We know that oil reservoirs contain active microbial communities. However, we do not know the prevalence of biosurfactant-producing microorganisms in oil fields. Thus, it is likely that the injection of biosurfactant-producing microorganisms will be needed for some reservoirs. Cells of the injected microorganisms must be able to move through the porous matrix at high efficiency. Bacillus species have been widely used as model organisms during MEOR research. An important characteristic of Bacillus species is their ability to produce spores. Spores are essential for MEOR research because of their small size compared to vegetative cells, their ability to withstand harsh environmental conditions and their increased transport ability. The objective of our study was to obtain biosurfactant-producing strains with improved transport abilities through porous materials. We compared the transport abilities of spores from three Bacillus strains using a model porous system to study spore recovery and transport. Sand-packed columns were used to select for spores or cells with the best transport abilities through brine-saturated sand. Spores of Bacillus mojavensis strains JF-2 and ROB-2 and a natural recombinant strain C-9 transported through sand at very high efficiencies (almost complete recovery of the injected spores within one to two pore volumes). The earliest cells/spores that emerged from the column were re-grown, allowed to sporulate, and applied to a second column to determine whether spores or vegetative cells had enhanced transport properties. This procedure greatly enhanced the transport of strain C-9. Our data show that spores with enhanced transport abilities can be early obtained and that the preparation of inocula for use in MEOR is practical.
We conducted a push-pull test to study in-situ biosurfactant production by exogenous biosurfactant producers to aid in oil recovery from depleted reservoirs. Five

178
wells from the same formation were used. Two wells received cells and nutrients, two wells were treated with nutrients only, and one well was used as the negative control where only brine was injected. We hypothesized that the wells receiving nutrients and cells treatment would be able to produce biosurfactant in-situ compared to nutrient only–treated wells or the negative control. After incubation and a shut-in period to allow in situ growth and metabolism, a series of chemical, microbiological, and molecular analyses were conducted on the produced fluids to obtain evidence for growth, metabolism, and biosurfactant production. Results showed that the wells treated with cells and nutrients indeed produced biosurfactant compared to the other wells as evidenced by the increase in surface activity and the detection of the lipopeptide biosurfactant. Lipopeptide biosurfactants of concentration up to 350 ppm were detected. This is an order of magnitude higher than the CMC. Evidence for substrate utilization and metabolism were detected in the wells treated with cells and nutrients where % carbon recovery was 124%, and 116%. Acids as acetate, formate, and lactate, and solvents as ethanol, and 2,3 butanediol were detected in the inoculated wells. MPN analysis of influents and effluents of the treated wells showed a ratio of 2.2 and 1.2 for the number of biosurfactant producers and a ratio of 654 and 1727 for the total number of cells in the produced fluids compared to the injection fluids of inoculated wells. For the first time, we show that biosurfactants were produced in-situ using simple nutrients at concentrations that are sufficient to mobilize significant amounts of residual oil. Second, inoculation of oil wells with exogenous biosurfactant-producers was possible. These two findings support the efficacy of the use of biosurfactants to recover entrapped oil.
Significant accomplishments 1. We elucidated the growth-enhancing compound needed for anaerobic growth
of B. mojavensis strain JF-2. This component was deoxyribonucleic acid or its precursors, deoxyribonucleosides. This completed Task 1.1.
2. Diverse microorganisms produce biosurfactants. We found that 70% of the 205 strains tested produced biosurfactants at elevated salt concentrations and that some strains maintained this activity over a 14-day period.
3. In an attempt to increase biosurfactant production, genetic recombination experiments were conducted by mixing germinating spores of four of the best strains with B. mojavensis JF-2. Biosurfactant production was higher with the mixed spore culture than in the co-cultures containing B. mojavensis JF-2 and each of the other 4 strains or in a mixed culture containing all five strains that had not undergone genetic exchange. Four isolates were obtained from the mixed spores culture that gave higher biosurfactant production than any of the original strains. Repetitive sequence-based polymerase chain reaction analysis showed differences in the band pattern for these strains compared to the parent strains, suggesting the occurrence of genetic recombination. This completed Task 1.2.
4. We found that mixtures of biosurfactant-producing strains had higher biosurfactant activity compared to pure cultures of the same microorganisms. This completed Task 1.3.

179
5. We have three strains of Bacillus mojavensis that exhibit enhanced transport abilities through porous materials. Spores of Bacillus mojavensis strains JF-2 and ROB-2 and a natural recombinant strain C-9 transport through sand at very high efficiencies (almost complete recovery of the injected spores within one to two pore volumes). Our data show that use of spores for inocula in MEOR is practical. This completed Task 2.
6. We showed that that the JF-2 biosurfactant significantly lowers interfacial tension at elevated salt concentrations. The interfacial tension depended on biosurfactant concentration and the addition of 2,3-butanediol resulted in statistically significant reductions in interfacial tensions. Interfacial tensions (IFT) between crude oil and water in the presence of varying concentrations of the biosurfactant produced by B. mojavensis JF-2 bio-surfactant were determined. The bio-surfactant lowered IFT by nearly 2 orders of magnitude compared to typical IFT values of 28-29 mN/m. Increasing the salinity increased the IFT with or without 2,3-butanediol present. The lowest interfacial tension observed was 0.1 mN/m. This completed Task 3.1.
7. We defined the relationship between tertiary oil recovery and biosurfactant concentrations. Tertiary oil recovery experiments showed that 10 to 40 mg/l of JF-2 biosurfactant in the presence of 0.1 mM 2,3-butanediol and 1 g/l of partially hydrolyzed polyacrylamide (PHPA) recovered 10-40% of residual oil from Berea sandstone cores. When PHPA was used alone, about 10% of the residual oil was recovered. Interfacial tension (IFT) decreased in a stepwise manner as biosurfactant concentration increased with marked reductions in IFT occurring at biosurfactant concentrations of 10 and 40 mg/l. When the biosurfactant concentration was greater than 10 mg/l, residual oil recovery linearly increased with biosurfactant concentration.
8. A mathematical model that relates oil recovery to biosurfactant concentration was modified to include the stepwise changes in IFT as biosurfactant concentrations changes. This model adequately predicted the experimentally observed changes in IFT as a function of biosurfactant concentration. Accomplishments 7 and 8 complete Task 3.2.
9. The activity of lipopeptide biosurfactants depends on the ratio of branched-chain to straight-chain fatty acids in the molecule. A multiple regression model accurately predicted the specific biosurfactant activity of 4 new biosurfactants using this ratio.
10. Nutrient manipulation may provide a mechanism to increase biosurfactant activity. We identified a novel growth requirement, deoxyribonucleosides, which allows luxurious growth of biosurfactant-producing bacteria in the absence of air. The specific activity of the biosurfactants can be enhanced by nutrient manipulation.
11. The results of our field trial show that biosurfactants can be made in oil reservoirs at concentrations that exceed that required for significant oil recovery. For the first time, we provide data on in situ product concentrations, rates of substrate and product formation and growth of biosurfactant producers, yields of products per mole amount of substrate metabolized, and an excellent mass balance of carbon. It is now possible to use computer simulations to estimate costs and recoveries in oil reservoirs. This completed Task 3.3.
In summary, our work shows that 1) diverse microorganisms produce biosurfactants, 2) nutrient manipulation may provide a mechanism to increase biosurfactant activity, 3) biosurfactant concentrations in excess of the critical micelle

180
concentration recover substantial amounts of residual oil, 4) equations that describe the effect of the biosurfactant on IFT adequately predict residual oil recovery in sandstone cores, 5) biosurfactants can be made in situ at concentrations that can mobilize significant amounts of residual oil.
Copyright © 2022 FDOKUMEN