Micro Factors inhibiting education access, retention and completion by children from vulnerable...
72
ILO/IPEC Ministry of Education Tackling Child Labour through Education (TACKLE) Project MICRO FACTORS INHIBITING EDUCATION ACCESS, RETENTION AND COMPLETION BY CHILDREN FROM VULNERABLE COMMUNITIES IN KENYA Final Report submitted to ILO/IPEC/MOE Coordination Team Researchers Dr Sara Jerop Ruto Dr John Kabutha Mugo Tecla Kipserem March 2010
Transcript of Micro Factors inhibiting education access, retention and completion by children from vulnerable...

ILO/IPEC Ministry of Education
Tackling Child Labour through Education (TACKLE) Project
MICRO FACTORS INHIBITING EDUCATION ACCESS, RETENTION AND COMPLETION BY CHILDREN FROM
VULNERABLE COMMUNITIES IN KENYA
Final Report
submitted to
ILO/IPEC/MOE Coordination Team
Researchers
Dr Sara Jerop RutoDr John Kabutha Mugo
Tecla Kipserem
March 2010

2
Acknowledgements
This study has been made possible due to the invaluable contribution of many individuals, all of whom we cannot mention. We however wish to recognize the contribution of the following people who assisted in varied aspects related to the planning, conceptualization and sampling of the study:
Bernard Kiura ILO/IPEC TACKLE ProjectMohammed Yusuf Ministry of Education, Non Formal Education DeskMr. Thiga Ministry of EducationJane Mbagi UNICEF KCOBernard Ombasi Kenya National Bureau of statistics.
We extend our sincere gratitude to the research community: The Chairman CDF, the Area Education Office and provincial administration in Kirinyaga South District (Mwea) for allowing and facilitating the pilot study in Ndindiruku village. The District Commissioners of Kwale, Msambweni and Kinango districts where the main study was conducted, and their respective District Officers and District Education Officers for their hospitality and kind facilitation. The area chiefs and assistant chiefs, village elders of the 39 villages we worked in; head teachers and principals of the schools we visited, all children, pupils and students who agreed to answer to our questions, as well as the mothers, fathers, grandparents, relatives and neighbors who supported us throughout the study.
Finally we wish to recognize the invaluable contribution of the research team that consisted of Bodana Boru (Research Assistant); Zipporah Ongwenyi and Charles Magoma (Team Leaders) and 13 enumerators recruited from the three districts. This study owes a lot to their diligence, accuracy and enthusiasm to create knowledge.
And to all other persons, who in their big and small ways supported us to achieve our course, and whose names we can’t all mention: we thank you.
Dr Sara J. Ruto Dr John K. Mugo Tecla Kipserem
March 2010
3
List of Abbreviations and acronyms
ACRWC African Charter for the Rights and Welfare of the ChildAEO Area Education OfficerANPPCAN African Network for Prevention and Protection of Children against Child Abuse and
neglectASAL Arid and Semi-arid LandsBoG Board of GovernorsCBS Kenya National Bureau of StatisticsCRC Convention on the Rights of the ChildCSEC Commercial Sex Exploitation of ChildrenDC District CommissionerDEO District Education OfficerDO District OfficerEFA Education for AllE&T Education and TrainingFGM Female Genital MutilationGoK Government of KenyaHH HouseholdILO International Labor OrganizationIPEC International Program on the Elimination of Child LaborKIE Kenya Institute of EducationKESSP Kenya Education Sector ProgramKNUT Kenya National Union of TeachersMDG Millennium Development GoalsMPET Master Plan on Education and TrainingOOS Out of SchoolOVC Orphans and other children made vulnerable by HIV/AIDSPTA Parents/Teachers AssociationPTR Pupil-Teacher RatioSNE Special Needs EducationTSC Teachers Service CommissionUPE Universal Primary EducationUNESCO United Nations Educational, Scientific and Cultural OrganizationUNICEF United Nations Children’s FundWFCL Worst Forms of Child Labor

4
Table of contents
1. Introduction .......................................................................................................................71.1 Context to the study1.2 Sealing a knowledge gap (problem statement)1.3 Objectives of the study1.4 Scope and limitations of the study1.5 Organization of this report1.6 Operational Definition of Key Concepts
2. Literature Review................................................................................................................. 112.3 Push and Pull factors
3. Methodology .................................................................................................................... 17
4. Background Information of Study Districts ....................................................................244.1 Introduction4.2 Demographic characteristics of respondents
4.2.14.2.2 Sex of Informants4.2.3 Are biological parents alive?4.2.4 Who are children living with?4.2.5 Parents’ level of education4.2.6 Occupation of parents4.2.7 Parents’ marital status
4.3 Geographic and socio-economic contexts4.3.1 Geographic context4.3.2 Socio-economic context
5. Understanding schooling in Kwale, Msambweni and Kinango .....................................295.1 Enrolment in primary and secondary schools5.1.1 Enrolment trends since 20025.1.2 Staffing in primary school5.1.3 Staffing in secondary school5.1.4 Analysis of staffing trends, 2006-20095.1.5 Age of joining school
5.2 Absenteeism and temporary drop out5.2.1 Prevalence of absenteeism5.2.2 Major influences on absenteeism
5.3 Understanding the school dropout5.3.1 Prevalence of school dropout5.3.2 From which class(es) do children drop out5.3.3 Influences on dropout
5.4 Children who have never attended school

5
5.4.1 Prevalence of children who have never enrolled5.4.2 Influence factors on non-enrolling
5.5 The maze of schooling costs: Just how much is it?5.5.1 Compulsory school costs5.5.2 Side school costs5.5.3 Annual Schooling Cost Simulation5.5.4 Costing systems and procedures
5.6 Responsiveness of education programs to excluded children: Effective practices5.6.1 School feeding programs5.6.2 Community Networking and Collaboration5.6.3 Stewardship of local education leaders5.6.4 Diligence of school administrators5.6.5 Strengthened tripartite relationships in school communities (Teacher-Parent-Child)5.6.6 Focusing on academic improvement to reduce exclusion
6. Conclusions, Framework for Action and Recommendations .........................................656.1 Conclusions6.1.1 School exclusion shapes supply to child labor6.1.2 Education is a mitigation tool against child labor
6.1.3 The mirage of policy: The rift between policy formulation and implementation6.1.4 Examining the teacher: Agents of schooling or, push-out factor?6.1.5 Parents can be mobilized into change agents6.1.6 Community intervention is feasible6.1.7 Devolved funds could make difference, only if…
6.2 Framework for Action: The mouth system analogy6.3 Recommendations
6.3.1 Recommendations for the Ministry of education6.3.2 Recommendations for school head teachers6.3.3 Recommendations for School Management Committees6.3.4 Recommendations for development partners6.3.5 Recommendations for ILO/IPEC
6.4 Areas for further research
7 References........................................................................................................................72
6
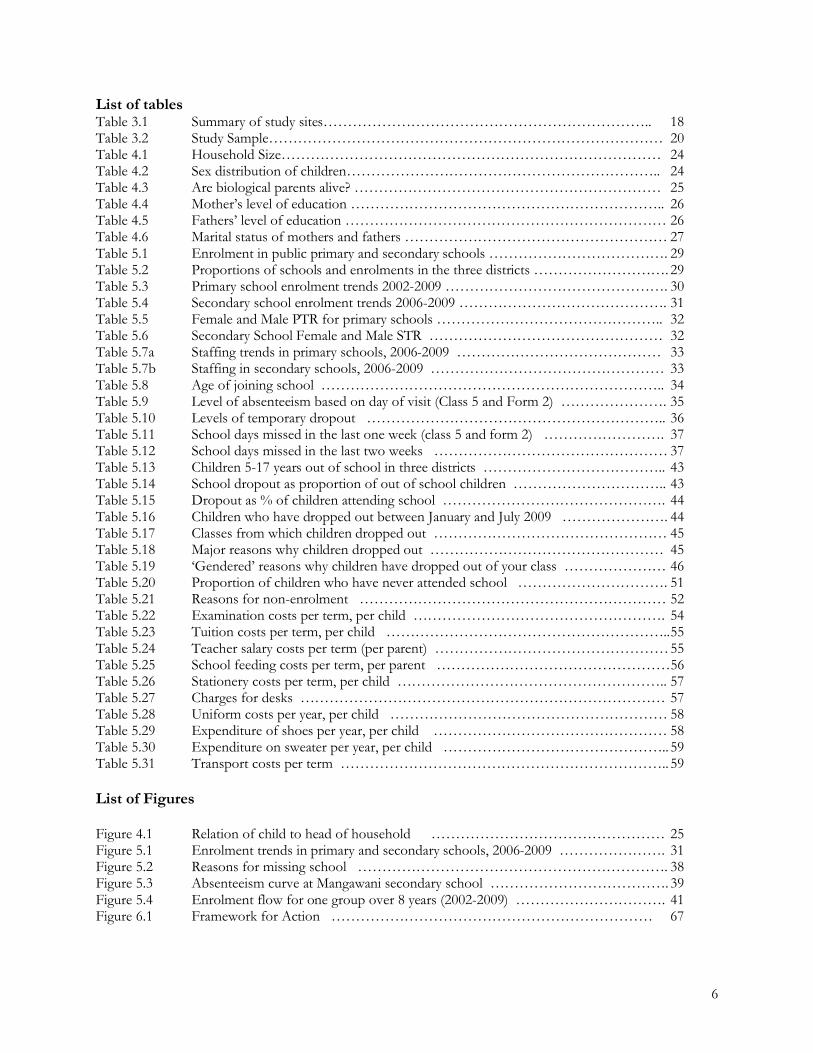
List of tablesTable 3.1 Summary of study sites………………………………………………………….. 18Table 3.2 Study Sample……………………………………………………………………… 20Table 4.1 Household Size…………………………………………………………………… 24Table 4.2 Sex distribution of children……………………………………………………….. 24Table 4.3 Are biological parents alive? ……………………………………………………… 25Table 4.4 Mother’s level of education ……………………………………………………….. 26Table 4.5 Fathers’ level of education ………………………………………………………… 26Table 4.6 Marital status of mothers and fathers ……………………………………………… 27Table 5.1 Enrolment in public primary and secondary schools ………………………………. 29Table 5.2 Proportions of schools and enrolments in the three districts ………………………. 29Table 5.3 Primary school enrolment trends 2002-2009 ………………………………………. 30Table 5.4 Secondary school enrolment trends 2006-2009 ……………………………………. 31Table 5.5 Female and Male PTR for primary schools ……………………………………….. 32Table 5.6 Secondary School Female and Male STR ………………………………………… 32Table 5.7a Staffing trends in primary schools, 2006-2009 …………………………………… 33Table 5.7b Staffing in secondary schools, 2006-2009 ………………………………………… 33Table 5.8 Age of joining school …………………………………………………………….. 34Table 5.9 Level of absenteeism based on day of visit (Class 5 and Form 2) …………………. 35Table 5.10 Levels of temporary dropout …………………………………………………….. 36Table 5.11 School days missed in the last one week (class 5 and form 2) ……………………. 37Table 5.12 School days missed in the last two weeks ………………………………………… 37Table 5.13 Children 5-17 years out of school in three districts ……………………………….. 43Table 5.14 School dropout as proportion of out of school children ………………………….. 43Table 5.15 Dropout as % of children attending school ………………………………………. 44Table 5.16 Children who have dropped out between January and July 2009 …………………. 44Table 5.17 Classes from which children dropped out ………………………………………… 45Table 5.18 Major reasons why children dropped out ………………………………………… 45Table 5.19 ‘Gendered’ reasons why children have dropped out of your class ………………… 46Table 5.20 Proportion of children who have never attended school …………………………. 51Table 5.21 Reasons for non-enrolment ……………………………………………………… 52Table 5.22 Examination costs per term, per child ……………………………………………. 54Table 5.23 Tuition costs per term, per child …………………………………………………..55Table 5.24 Teacher salary costs per term (per parent) …………………………………………55Table 5.25 School feeding costs per term, per parent …………………………………………56Table 5.26 Stationery costs per term, per child ……………………………………………….. 57Table 5.27 Charges for desks ………………………………………………………………… 57Table 5.28 Uniform costs per year, per child ………………………………………………… 58Table 5.29 Expenditure of shoes per year, per child ………………………………………… 58Table 5.30 Expenditure on sweater per year, per child ………………………………………..59Table 5.31 Transport costs per term …………………………………………………………..59
List of Figures
Figure 4.1 Relation of child to head of household ………………………………………… 25Figure 5.1 Enrolment trends in primary and secondary schools, 2006-2009 …………………. 31Figure 5.2 Reasons for missing school ………………………………………………………. 38Figure 5.3 Absenteeism curve at Mangawani secondary school ………………………………. 39Figure 5.4 Enrolment flow for one group over 8 years (2002-2009) …………………………. 41Figure 6.1 Framework for Action ………………………………………………………… 67
7
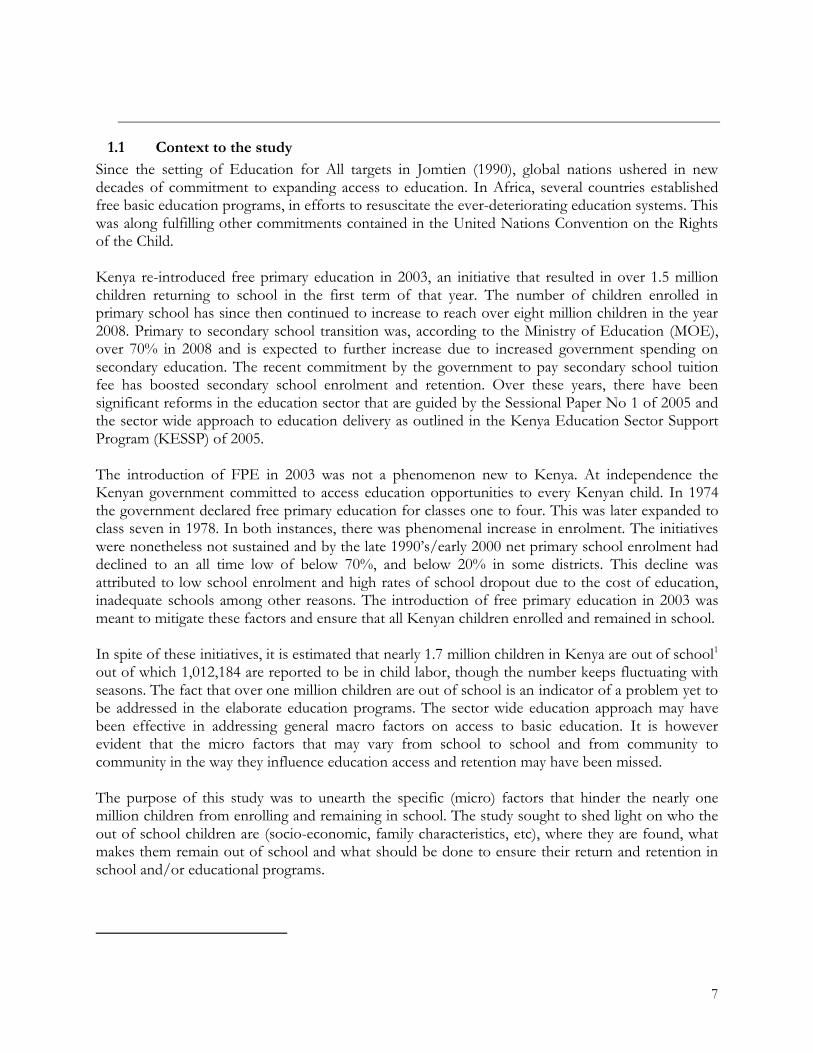
1.1 Context to the study Since the setting of Education for All targets in Jomtien (1990), global nations ushered in new decades of commitment to expanding access to education. In Africa, several countries established free basic education programs, in efforts to resuscitate the ever-deteriorating education systems. This was along fulfilling other commitments contained in the United Nations Convention on the Rights of the Child.
Kenya re-introduced free primary education in 2003, an initiative that resulted in over 1.5 million children returning to school in the first term of that year. The number of children enrolled in primary school has since then continued to increase to reach over eight million children in the year 2008. Primary to secondary school transition was, according to the Ministry of Education (MOE),over 70% in 2008 and is expected to further increase due to increased government spending on secondary education. The recent commitment by the government to pay secondary school tuition fee has boosted secondary school enrolment and retention. Over these years, there have been significant reforms in the education sector that are guided by the Sessional Paper No 1 of 2005 and the sector wide approach to education delivery as outlined in the Kenya Education Sector Support Program (KESSP) of 2005.
The introduction of FPE in 2003 was not a phenomenon new to Kenya. At independence the Kenyan government committed to access education opportunities to every Kenyan child. In 1974 the government declared free primary education for classes one to four. This was later expanded to class seven in 1978. In both instances, there was phenomenal increase in enrolment. The initiatives were nonetheless not sustained and by the late 1990’s/early 2000 net primary school enrolment had declined to an all time low of below 70%, and below 20% in some districts. This decline was attributed to low school enrolment and high rates of school dropout due to the cost of education, inadequate schools among other reasons. The introduction of free primary education in 2003 was meant to mitigate these factors and ensure that all Kenyan children enrolled and remained in school.
In spite of these initiatives, it is estimated that nearly 1.7 million children in Kenya are out of school1
out of which 1,012,184 are reported to be in child labor, though the number keeps fluctuating with seasons. The fact that over one million children are out of school is an indicator of a problem yet to be addressed in the elaborate education programs. The sector wide education approach may have been effective in addressing general macro factors on access to basic education. It is however evident that the micro factors that may vary from school to school and from community to community in the way they influence education access and retention may have been missed.
The purpose of this study was to unearth the specific (micro) factors that hinder the nearly one million children from enrolling and remaining in school. The study sought to shed light on who the out of school children are (socio-economic, family characteristics, etc), where they are found, what makes them remain out of school and what should be done to ensure their return and retention in school and/or educational programs.

8
1.2 Sealing a knowledge gap (problem statement)A recent analysis dubbed educational marginalization of the north has indicated that the net enrolment ratios averaged at 91.6% in the primary sector and 24.2% in the secondary sector between the year 2003 and 2007. While this was a remarkable improvement from the 1990s decade, concern should be raised about the districts getting lost in the average (Ruto, Ongwenyi & Mugo, 2009).Many districts of the north, including most of the pastoral districts, had ratios as low as 20.6% for primary (Wajir) and 1.6% for secondary (Marsabit). Gender disparities were even more disturbing. These disparities are often overlooked while considering the national average. This study sought to conduct an intensive investigation of the micro factors influencing schooling and non-schooling in Kenya.
Though many studies have focused on out of school children in Kenya, and indeed documented factors that lead to non-schooling, little effort has been invested to weighting the factors. Still, most of these studies have only focused on the school, while household investigations have remained rather unexplored.
This study, which was conducted within the framework of the ILO/IPEC Tackling Child LaborThrough Education (TACKLE) project, and in partnership with the Ministry of Education and UNICEF (KCO), situated formal schooling as a deterrent for child labor. While schooling keeps children off labor, both push and pull factors lead to a somehow systematic exclusion of vulnerable children. Understanding this exclusion process is rather complex, especially complicated by micro factors which may only be understood through extremely focused investigations. This current study attempted to assess school, home and community factors influencing schooling and non-schooling, while deepening understanding on who is in and out of school; what is maintaining him/her in and out of school; and what strategies are working to keep children in school.
1.3 Objectives of the studyThe overall intent of the study was to identify policy gaps in view of the education practice; highlight replicable strategies and expand the knowledge base on education and child labor.Specifically, the study sought to:
1. Produce a profile of out of school children in terms of sex, geographic location, and other relevant parameters;
2. Review and analyze micro factors inhibiting children from accessing and remaining in school;3. Review key education programs’ responsiveness to the learning needs of children excluded or
vulnerable to exclusion from education programs;4. Produce a comprehensive report detailing workable proposals on reaching educationally
excluded children.
1.4 Scope and limitations of the studyScopeThis study sought to analyze the salient social and economic factors that prevent children from attending school or push children out of school in spite of the government’s huge investment and determination to achieve EFA and MD goals. The study collected data from the schools and the community in order to profile school and community based factors inhibiting universal basic education in Kenya. Selection of the research locale was guided by statistics at the Ministry of Education, coupled with the preliminary findings of a UNICEF study (April 2009). Besides
9
reviewing education policies targeting excluded children, the study interacted with policy implementers at the local levels, as well as children, parents, teachers and community stakeholders. The study also sought to highlight effective practices in view of possible replication.
The study, in particular, analyzed the key strengths and shortfalls of the free primary education and the recently launched subsidized secondary education with a view to highlighting gaps that the government in partnership with the development partners could address to boost school enrolment and retention for all eligible children. The study paid special attention to micro factors, that would otherwise not be adequately addressed in macro interventions, and which often lead to early school dropout or non-enrolment.
LimitationsWhile it is acknowledged that dynamics of non-schooling vary within the different social and economic contexts of our country, this study focused on only three neighboring districts in coast province. The findings contained in this report may therefore not be generalized to reflect the situation in Kenya.
1.5 Organization of this report This report contains five sections. Section one lays down the context of the study, including background information, the knowledge gaps, objectives of the study, as well as its scope and limitations. Section two presents a summary of the literature reviewed, including prior studies that have been conducted, while reviewing education policies to identify gaps. Section three belabors the research design and methodology adopted by the study. This includes sampling and construction of research instruments.
Section four carries the bulk of this report, and discusses the findings, organized in nine themes: demographic characteristics of respondents; understanding schooling; absenteeism and temporary drop-out; understanding the school dropout; children who have never attended school; the maze of schooling costs; responsiveness of education programs to excluded children; and finally Reflecting on the research process: challenges and lessons learnt.
Finally, section five presents the conclusions of the study, followed by a conceptual analysis on a framework for action, recommendations and lastly areas for further research.
10
1.6 Operational Definition of Key Concepts
Child: Any person under the age of 18 years
Excluded Child: Any child, who for various reasons, is unable to enroll in either primary or secondary school, or whose schooling progress is inhibited by various factors.
Entry/Completion age: The acceptable age of school entry is age 3 years for pre-school and 6 years for primary school. As such, completion age for primary school is 13-14 years.
Primary School: The first formal school cycle, spreading from class 1 to 8 (8 years), under the current 8-4-4 system of education in Kenya, and which terminates with the Kenya Certificate of Primary Education (KCPE). Other arrangements of education outside the formal are not included in this definition.
Secondary School: The second formal school cycle, spreading from Form 1 to 4 (4 years), and which terminates with the Kenya Certificate of Secondary Education (KCSE).
Village: A cluster of households in a rural area, which also serves as the smallest administrative unit, of the provincial administration system of Kenya
Child Labor: Any work that interferes with the child’s physical, social, intellectual or emotional development and which adversely affects the schooling progress of a child.
Completion: Term used to refer to a child either completing the primary or secondary cycles, following enrollment into that particular cycle.
Absenteeism: Missing of at least one school day, and which may proceed to a continuous span of less than two weeks.
Temporary Dropout: Missing school for a continuous span of at least two weeks (14 school days) within a school term.
Dropout: Breaking school within a cycle, indicated by staying away from school for an indefinite period of time.
Compulsory School Costs: Any costs that have been set by the Ministry of Education or by the School Management Committee, and for which a child would be sent home or discontinued. These include examination fees, tuition fees, teacher salary, school feeding, stationery and costs for desks.
Side School Costs: Costs not determined by the Ministry of the School Management Committee, and which include the purchase of non-mandatory materials and services. These included basic uniform (shirt/shorts, blouse/skirt), shoes, sweater and transport costs.

11
This section focuses on the theoretical and empirical literature reviewed for the study. It presents the recent statistics and characteristics on out-of-school children both globally, in Africa and in Kenya. This phenomenon on out of school children is not quite new; it has been researched by a few researchers who have always looked at the macro factors that keep children out of school. However, the micro factors which seem to undermine the education of the children aged 5-17 years have been overlooked. Therefore, the uniqueness of this study is its major focus on these micro-factors.
2.1 Research Studies and statistics on out-of-school childrenAccording to a joint UNESCO Institute for Statistics (UIS)/UNICEF global estimate (2005), one hundred and fifteen million primary school-age children are out of school. This number equals 18% - or almost one in five - of the children worldwide in this age group. Most of the children who are in school may never complete their primary education or finish it without attaining even basic literacy skills. This results from the report entitled "Children Out of School: Measuring Exclusion from Primary Education" (2005), which presents new estimates and explores the characteristics of children out of school. It provides a single UNESCO/UNICEF source for global and regional estimates of out-of-school children based on an improved methodology and the integration of household survey data.
The report uses survey data from 80 countries (Kenya included) to explore child and household characteristics and factors associated with schooling status and presents compelling evidence of disparities due to household wealth, place of residence and sex based on survey data. For instance, more than three times as many children from the poorest households are out of school compared to those from the richest households – 38% compared to 12%. The major root causes of exclusion from schooling healthcare and other vital services have been identified to include discrimination, poverty, HIV/AIDS, armed conflict, and weak governance. Children who are denied these vital services are more likely to fall victim to abuse and exploitation.
Sub-Saharan Africa currently accounts for 43 million of the 115 million children out of School or just over one third of the total. That share is rising over time. By 2015, it is projected that approximately 19 million children in Sub-Saharan Africa will still be out-of-school, if current trends continue. Africa’s share of the global out of school population will have increased to 40%. While the region is making progress towards the Millennium Development Goals, the progress is too slow to achieve the target of Universal Primary Education by 2015. Around 20 countries with a total out-of-school population of 17 million have either gone backwards since 1990, or are off track by more than a generation (UNDP 2009). More recently, countries such as Tanzania, Uganda, Kenya and Rwanda have registered progress in increasing enrolments, but completion rates lag far behind.
Progress towards gender equity in primary education has been mixed. In Sub-Saharan Africa, girls account for 54% of out-of-school children in 2005, compared with South and West Asia at 66%, and the Arab States at 60% (cite author and year). Of the 14 countries in the world where girls account for less than 80% of primary school attendance, 11 are in Sub-Saharan Africa. Around 10 countries accounting for over 4 million out-of-school girls are either going backward or are on track for achieving the MDG more than a generation after the target date (UNDP 2009).
12
In Kenya, the Integrated Household Budget Survey (2005/2006) included an analysis of the schooling status of the country, considering the ages 5-17 years. From the survey population of 12.8 million children, it was reported that about 11.1 million were in school while 1.7 million were out ofschool. When compared to the 1998/1999 Child Labor Report, these results show that the proportion of children out of school has significantly decreased from 32.1% in 1999 to 12.9% in 2006. In 2004, statistics indicate that about 1.5 million children aged 6-14 years, and 200,000 aged between 15 and 17, were out of school (MOEST 2005b). A recent analysis indicates that around 2.3 million children of primary school age are engaged in neither schooling nor work, while a further 250,000 are combining schooling and work (UNICEF 2009). In addition, around 2.8 million children of secondary school going age are not participating in school.
After the initial boost in enrolment, the schools begun to experience a decline in enrolment due to drop out and transfer to private schools. The UNESCO study (2005) established a 5 percent drop in enrolment within a year. In Nairobi, there was a 22 percent decline between 2003 and 2004, attributed to dropout, poverty and transfers to private schools. Recent trends have pointed toincreasing dropout rates at the primary school level (Mwebia 2008). In 2007, the dropout rates for primary school averaged 4.8%, with disturbing regional and gender disparities. For example, several districts had drop-out rates exceeding 18 per cent, which included Kuria (18.4%) and Turkana (18.2%). Most disturbing, 18.9 % (Turkana) and 18.1 % (Tana River) of girls dropped out in 2007 (MoE Statistics 2009).
2.2 Characteristics that define out-of-school children in Kenya
Some studies have focused on the characteristics that define out-of-school children in Kenya. It has been established that out of school children are more likely to be found in certain geographical regions than others. ANPPCAN studies of 1990-91 revealed that children work in different sectors, predominantly the agriculture and domestic sectors. More recent studies (Ruto 2004) provide further evidence, gathered from urban and Arid and Semi-Arid lands of Kenya (ASAL) of the severe conditions children in domestic labor work in often at the expense of schooling. In these circumstances, non-attendance is linked to various economic and cultural factors, and inaccessibility and low quality of education However, the micro characteristic such as the hidden costs like fees, levies, books and uniforms have not merited deep analysis. This study attempts to bridge this gap.
Another landmark characteristic of children not attending school is that a sizeable proportion has lost either one or two parents. Recent surveys from Kenya, South Africa, and Tanzania, show that orphans are more likely to withdraw from school, less likely to be at an age-appropriate grade, and less likely to have limited family resources spent on their education (Cohen 2005). The Human Rights Watch report (October, 2005) documents how children suffer de facto discrimination in access to education from the moment HIV/AIDS afflicts their family. A study in Sierra Leone (UNICEF 2008) established that around 54 percent of children out of school were living with either extended members or caretakers. Indeed, orphanhood is a distinct factor in determining school non-attendance in Sierra Leone.
In Kenya, various studies have established that children leave school to perform household labor or to bereave their parents' death. The Human Rights Watch study (2005) indicated that many childrencould not afford school fees because their parents were too sick to earn a living. While Kenya has abolished primary school fees, schools repeatedly refuse admission to AIDS-affected children who cannot afford to pay for books, uniforms, and other school-related expenses. In the same study,
13
orphans and other AIDS-affected children said they had to leave school for reasons like failing to produce a birth certificate or failing to bring a desk to class. In many cases, they were being cared for by widows who had been stripped of their property when their husbands died of AIDS.
Besides child labor, geographical location, disability and loss of parents, gender has been used to characterize out of school children. Many girls in developing countries are required to stay at home and assist with household chores, and a majority of child domestic workers in other households are girls. One study established that for every 100 boys who are not in primary school, there are 117 girls who miss out on primary education, largely due to gender discrimination (UIS/UNICEF report 2007).
Other studies that have investigated children out of school have established that a substantial number may be found on the streets in major towns (Mugo 2004), while the commercial sex industry has also lured many children (ILO 2008). A survey by UNICEF in 2007 revealed that due to the increase in school drop outs, commercial sex tourism on the Kenya coast is not only growing but also gaining increasing acceptance as a valid means of earning an income. While others have focused on disability whereby most disabled children have continued to live with the reality of discrimination and exclusion from their basic right of accessing education (UNICEF, 2006). More recent analysis estimates that between 0.4 and 0.6 million children with special needs are either not appropriately placed, or are out of school (UNICEF 2009). Though great milestones have been made in recent past, disability remains a distinguished characteristic in both non-attendance and non-enrolment.
2.3 Push and Pull factorsExpanded analysis of the push and pulls factors arising from schools is critical in availing a broad understanding of factors affecting schooling. A few studies have decried deterioration of quality after introduction of Free Primary Education in 2003. The introduction of the tuition waiver in secondary schools is also facing a lot of challenges. It has been noted that after the initial increase in enrolment, schools begun to experience a sharp decline. A number of factors have been cited as those that prevent children from entering and remaining in school as well as influencing and affecting the supply to child labor (Mugo 2009). For instance there are economic, social and legislative factors which come into play in increasing the rate of school drop outs and getting into child labor. These factors are classified as school factors, family factors, and cultural factors, among others.
The school environment including poor sanitation and lack of sanitary towels for girls, repressive/authoritarian discipline, distance to school, too much emphasis on academic performancewhereby many children are subjected to repeating classes in order to pass examinations have been repeatedly blamed for pushing certain categories of children out of school (ANPPCAN 2005). Other factors include the poor quality of FPE leading to dropout (and transfer to private schools) and the inability of parents to afford the hidden costs (UNESCO 2005). Mwebia (2008) established that most schools experience inadequate physical facilities like desks, toilets and play materials. This hasworsened with the increased enrolment of children after the introduction of FPE which has not matched expansion of physical facilities and provision of adequate teaching and learning materials.
Prior to FPE, Bahemuka, et al (2000) argued that the education system was characterized by major flaws in terms of cost ranging from tuition fee, examinations/test fee, clothing, transport and schooling materials, availability and quality and thus, had led many children to drop out of school. In
14
this scenario, many poor parents perceived child labor as a preferred option. The introduction of cost sharing in education meant that parents had to buy books, school uniforms and pay numerous levies, costs which by and large were beyond the reach of many. The low opportunities for transition from primary to secondary school have always presented a disproportionate demand-supply scenario (UNICEF 2009).
Preventing children from non-enrolment and dropping out of school and getting into labor market, especially the worst forms, requires functional systems at the school, family, community and the society at large. Some studies have identified family deficits that often push/pull children out of school. Parents have been found to abuse alcohol, conduct illicit trades, which undermined the expected normal practices of child rearing (ANPPCAN 2005). According to Bonnet (1993), children in Africa are unable to attend school because their families/households cannot afford to pay for their education, especially when the cost of schooling is too high and the household income is too low. Inability of households to meet the basic needs of the children like education is what has forced most children out of school to engage in employment in an endeavor to improve their conditions and livelihoods. More studies show that families are unable to provide food for their children, a situation that makes many children go to school hungry. A hungry child cannot learn and subsequently may opt for any form of work for survival purposes. Many of these children have been rendered vulnerable by the death of their biological parents which effectively leaves them in the hands of relatives who for all practical purposes only regard them as tool for a cheap labor hence denying them their right to education.
Cultural roles and responsibilities also compete with education and drive many children out of school into child labor. For example, in pastoralist communities, family income is dependent on the pastoral economy which relies on different age groups to serve various functions. Herding (within the manyattas) is often a function of school age children. Discrimination of girl-child or preference of a boy-child, early marriages, belief in witchcraft are among issues that have persistently led to children either not enrolling or dropping out of school.
A report of the task force on special needs education (2003) revealed that when the Free Primary Education was declared, many children with SNE joined both special and regular schools but quickly dropped out due to lack support in terms of assistive/functional devices, learning resources, environmental adaptations, mandatory medication and a suitable curriculum. Considering that most special schools are boarding and parents have to pay for boarding facilities, children who joined these schools due to FPE dropped out of school within weeks because the parents could not afford to pay boarding fees.
2.2 Policy and Legislative frameworkThe current constitution amendments have been consistent on strengthening and protecting the rights of children to education. Key in the ongoing revisions is to guarantee all children free and compulsory basic education, which if fully implemented, will prevent many children getting into child labor. New proposals have included focus on children from economically challenged families, entitling them to social security. Besides, there have been proposals to include children with special needs as a special category, reiterating the state’s commitment to the development of their full human potential.
Education for All (EFA) is an inclusive concept that must encompass not only primary education, but also early childhood education, literacy and life skills programs. It must take into account the

15
needs of the poor and the most disadvantaged, including working children, remote rural dwellers and nomads, and ethnic and linguistic minorities, children, young people and adults affected by conflict, HIV/AIDS, hunger and poor health and those with special needs. A recommendation accompanying the ILO Convention 182 defines free basic education for all, including; children removed from Worst Forms of Labor, is supposed to be made available and accessible.
Kenya posses a rich framework for protection of children, and which focuses especially on the right of all children to quality education. This framework is defined by several acts of parliaments, as well as the various policies and action plans that have been formulated to the achievement of this goal. Education Act Cap 211 of Laws of Kenya directs how education should be provided, promoted and managed in Kenya. Currently, this Act is under review to be in tune with the policy of free basic education, which includes pre-school, primary education and secondary education. The Free Primary Education drive advocates for access of primary education for all children. Here the government is committed not only to address the issue of poor children, but to provide schools where these children attend with grants at primary level. Non-formal schools that offer education to excludedchildren are also targeted with various grants. Under section 14 of The Children Act, chapter 586, protects the child from harmful cultural practices, among them female circumcision, early marriage or other cultural rights, customs or traditional practices that are likely to negatively impact on the child’s life, education, health, social welfare, dignity or physical or psychological development. Master Plan on Education and Training MPET (1997-2010) maintains that the plight of the poor, weak and vulnerable should be the first charge of the Kenya society’s efforts to develop E&T. Such efforts are expected to respond to regional and gender disparities, the plight of the handicapped, and take into account the needs of future generations. The MPET saw development of E&T as centering on raising effectiveness as the basis for improved and sustainable participation.
Under the Sector Wide Approach to Program Planning (SWap), the government together with development partners developed the Kenya Education Sector Support Program (KESSP). The KESSP is the single largest investment program undertaken by the government in the education sector. It is situated within the broader national policy framework as detailed in the Economic Recovery Strategy and may be viewed as a sequel to the Sessional Paper no 1 of 2005 on a Policy Framework for Education, Training and Research. These policy documents currently seek to achieve the following targets: Attainment of UPE by 2005 and EFA by 2015; Achievement of a transition rate of 70 percent from primary to secondary school level from the current 47 percent, paying special attention to girls’ education by 2008; Enhancement of access, equity and quality in primary and secondary education through capacity building of 45,000 education managers by 2005;Construction/renovation of physical facilities/equipment in public learning institutions in disadvantaged areas, particularly in Arid and Semi-Arid Lands (ASALs) and urban slums by 2008;
2.3 SummaryAdmittedly, Free Primary Education in Kenya has enhanced access to education, but has proven inadequate to guarantee universal primary education. From the review, it is evident that out of school children and child labor have been of interest for a long time. While often, schooling and working have been viewed as alternatives, recent literature indicates that the two can happen concurrently, and many children attending school are involved in various forms of labor.
Though much progress has been made over the past, children out of school remain a key challenge. The various factors influencing non-attendance have been established, which include push and pull factors. However, many studies have stopped at “factor description” of say children in domestic

16
labor, in commercial sex etc. While this information is important, it is vital to provide supporting evidence that quantifies the factors. Kenya now has the possibility of more localized decision making and solution implementation through the CDF. For local communities to be able to analyzeschooling issues, they need holistic evidence which they can visualize of children more liable to effects of these factors, and how they combine to deter enrolment and attendance. Local education communities need tangible evidence on the effects of school practices, such as repetition, in pushing children out of school.
While Kenya has a rich policy framework on enhancing access to basic education, and while much has been going on in terms of support and funding since 2003, the relationship between schooling capitation and attendance has hardly been investigated. Indeed, the extent to which these policies are determining enrolment and attendance is largely undocumented.

17
This chapter discusses the study design that guided the research on out-of school children in Kenyawhose overall objective was to examine extent to which children within the age bracket of 5-17 years are still excluded from their basic right of participating in education. The study further sought to:
a) Provide a profile of out of school children in terms of sex, geographic location, and household status among other variables.
b) Review and analyze micro factors inhibiting children from accessing and remaining in school.
The chapter presents the description of the research design, sites, sampling procedures, data collection and analysis procedures.
3.1.The Study DesignThe study employed a mixed method research design situated within both the qualitative and quantitative research paradigms. The study adopted a “District Case study” approach which sought varied data on the Out of School (OOS) children. Hence, rather than select and address different labels of children known to be OOS (e.g. herders, domestic workers etc) the study captured more holistic data as evident in the study districts, be they numbers of OOS or reasons for their exclusion. The central and focal point of targeting this information was the household where the school/non-schooling status of all children aged 5-17 was captured. Selected variables in the school, that contribute to pushing children out of school were further isolated for study. This approach allowed in-depth description. The study design therefore bridged the school and the household in an effort to further unravel the factors.
3.2.Selecting the Research LocationThe varied socio-cultural and economic conditions in Kenya imply that different ranges of factors affect the continuing situation of children being out of school. Hence a sample comprising diverse socio-cultural and economic conditions was necessary in arriving at a holistic understanding of the phenomenon. The study location decided upon comprised the larger Kwale District in the Coast Province of Kenya. This is mainly an inland district but it has coastline south of Mombasa. According to the Kenya National Bureau of statistics (1999) the district has a population of 496,133. The district has three constituencies; Kinango, Msambweni and Matuga which are currently districts on their own. The three districts exhibit a range of socio-cultural and economic activities that could be representative of the Urban, Rural and Arid and Semi-Arid lands of Kenya.
3.2.1 Matuga ConstituencyIt is the current Kwale district. It covers a section of 1,052.1km2 of the Coast province with a literacy level of 57.5% and poverty index of 63.2%. According to the Kenya National Bureau of statistics (1999) the district has a population of 145,490. The district has two divisions Matuga and Kubo and four educational zones; Tsimba/Tiwi (26 primary schools), Ngomeni/Waa (17 primary schools), Mkongani (23 primary schools) and Shimba hills (12 primary schools). There are 21 secondary schools in the whole district. The economic activities comprises of subsistence and commercial farming like Bixa (a shrub like plant), oranges, mangoes, cashew nuts as well as maize. Other activities include dairy farming, poultry, goat and sheep rearing. The predominant religion Islamic which allows polygamy. The main ethnic communities are the Digo, Duruma and Kamba. The passability of the roads is dependent on the rainfall.

18
3.2.2 Kinango constituencyAccording to recent analyses, Kinango is among the five poorest constituencies in the country ranking 207 out of 210, with 75% of its population living below poverty line. It has a population of 220,000 (KNBS 1999) who mainly depend on subsistence farming and livestock keeping of the indigenous type of cows and goats. The area has erratic rainfall patterns. Land is communally owned. A number of private ranches are present. Most people are Christians, followed by Muslims and traditionalists. The communities found here are the Duruma, Kamba and Maasai towards the border to Tanzania. Polygamy is practiced by many.
3.2.3 Msambweni ConstituencyThis constituency was recently elevated to Msambweni district. Mostly rural, the district has some thriving urban/tourist spots such as Ukunda and Shimoni. Livelihoods comprise small-scale farming, fishing and small businesses. A sizeable percentage service the tourist industry. The main ethnic communities are the Digo, Kamba and Maasai. The population is approximately 211,814 people with 92,594 households (KNBS 1999). The district has a sizeable coastline and is one of Kenya’s main tourist destination locations. Hence an intersection of different cultures is evident in the more urban spots.
3.3 The Research SiteThis study utilized a multi site approach to reach the informants as follows:
a) the district level – district commissioner, district education officer, the CDF managerb) the school level - head teacher, Class 5/Form 2 girls, Class 5/Form 2 teachers)2
c) the household level – Chief, elders, parents.
3.4 The informant rangeThis research targeted school going age children of 5-17 years as well as secondary groups like the local leaders, teachers, parents and households who influenced the child’s life whether in school or out of school. These groups provided data on the general education indicators, the rates of enrolment, absenteeism, dropout, non-enrolment, the causes of these rates and the interventions. The following table provides a summary of the sites visited in all the districts/constituencies and the informant type.
Table 3.1 Summary of study sites
Site InformantHousehold Parents, household head, out of school childSchools The Head teacher/deputy, class five/form 2 teacher,
class five/form 2 girlsAdministration offices District commissioners, District officers, chiefsMinistry of Education Education officersConstituency Development Fund offices CDF chairperson/secretary
The research often received very little data or none especially when it came to schools where registers were needed for a number of years due to poor record keeping. The out of school children were hard to find at home as most had left for casual jobs in urban areas.
2 Class five was selected on basis of maturation. Studies have established that most girls are affected from class 5 (ages 11-12), when menstruation sets in. Form 2 was selected to represent the secondary school age, based on the fact that these girls have already settled in the school, and are at peak of their puberty and sexual maturation (ages 15-16).

19
3.5 Research samplingRandom sampling was used to generate the villages for study as well as to select at least 20 households per village. Data collection within the households was affected by distance, road network and financial and time resources. Schools were purposefully selected. In each school, random sampling (where there were more than 20 girls per class) was used to identify the class five/form two girls.
3.6 Methods of data collectionThe main methods utilized were interviews, data/fact sheets and questionnaires.
3.6.1 Key Informant InterviewQualitative interviews were conducted with key informants, including the District Education Officer, Area Education Officer, Head teachers, Chairperson of the Constituency Development Fund, with selected out-of-school children and their parents. This interview followed the key study themes, including magnitude of out of school children, factors inhibiting access, as well as absenteeism, and dropout factors. Each interview was conducted by a researcher and an assistant, while data were recorded through note-taking.
3.6.2 Class Teacher and Girl QuestionnairesThe class teacher questionnaire targeted class teachers of standard (grade) five (5) and Form two (grade 10). The instrument was made up of five key sections, seeking data on enrollment and absenteeism, dropout, school wastage, hidden costs and recommendations. The Girl questionnaire targeted all girls in class 5 and Form 2. Issues included in this tool touched on girl-specific factors in regard to enrolment, retention and completion.
3.6.3 Household Survey QuestionnairesThis was a comprehensive tool capturing household characteristics, household membership, schooling characteristics and profiles of all children, schooling costs, absenteeism and dropout, as well as recommendations.
3.6.4 Data/Fact sheetThese were table formats designed to capture data from schools, classes and education offices concerning the various indicators including enrolment, attendance, retention, costs and other integral themes of the study.
20
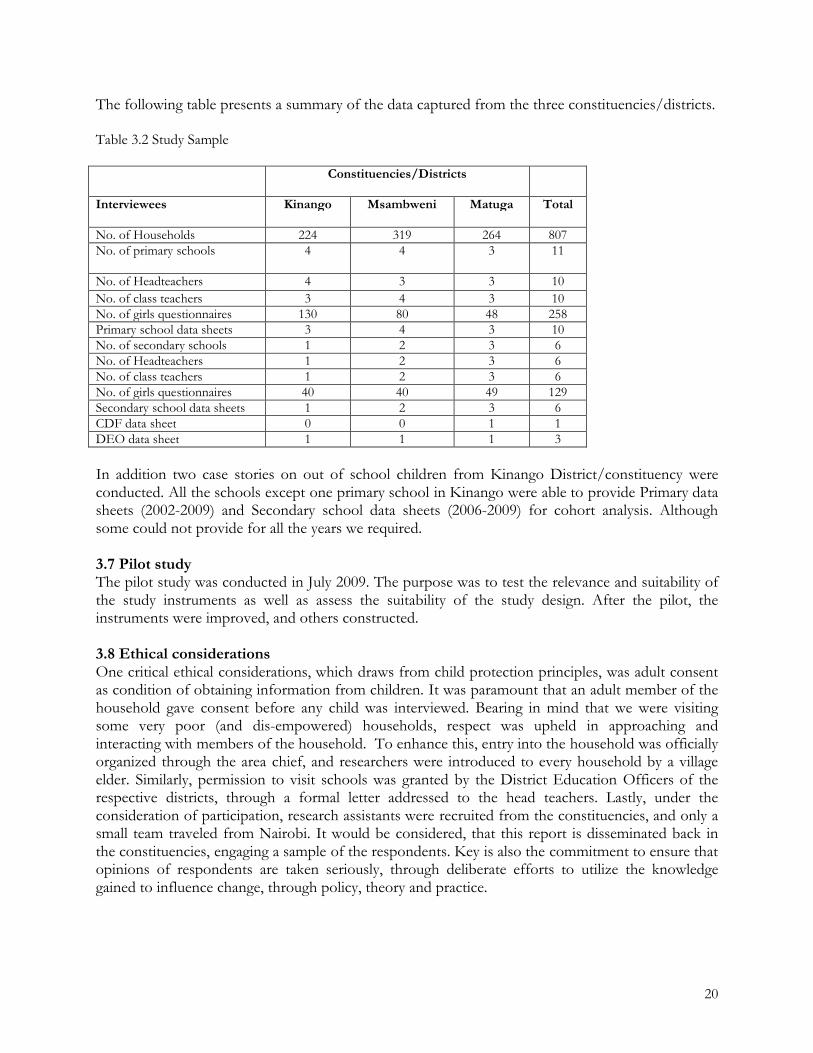
The following table presents a summary of the data captured from the three constituencies/districts.
Table 3.2 Study Sample
Constituencies/Districts
Interviewees Kinango Msambweni Matuga Total
No. of Households 224 319 264 807No. of primary schools 4 4 3 11
No. of Headteachers 4 3 3 10No. of class teachers 3 4 3 10No. of girls questionnaires 130 80 48 258Primary school data sheets 3 4 3 10No. of secondary schools 1 2 3 6No. of Headteachers 1 2 3 6No. of class teachers 1 2 3 6No. of girls questionnaires 40 40 49 129Secondary school data sheets 1 2 3 6CDF data sheet 0 0 1 1DEO data sheet 1 1 1 3
In addition two case stories on out of school children from Kinango District/constituency were conducted. All the schools except one primary school in Kinango were able to provide Primary data sheets (2002-2009) and Secondary school data sheets (2006-2009) for cohort analysis. Although some could not provide for all the years we required.
3.7 Pilot studyThe pilot study was conducted in July 2009. The purpose was to test the relevance and suitability of the study instruments as well as assess the suitability of the study design. After the pilot, the instruments were improved, and others constructed.
3.8 Ethical considerationsOne critical ethical considerations, which draws from child protection principles, was adult consent as condition of obtaining information from children. It was paramount that an adult member of the household gave consent before any child was interviewed. Bearing in mind that we were visiting some very poor (and dis-empowered) households, respect was upheld in approaching and interacting with members of the household. To enhance this, entry into the household was officially organized through the area chief, and researchers were introduced to every household by a village elder. Similarly, permission to visit schools was granted by the District Education Officers of the respective districts, through a formal letter addressed to the head teachers. Lastly, under the consideration of participation, research assistants were recruited from the constituencies, and only a small team traveled from Nairobi. It would be considered, that this report is disseminated back in the constituencies, engaging a sample of the respondents. Key is also the commitment to ensure that opinions of respondents are taken seriously, through deliberate efforts to utilize the knowledge gained to influence change, through policy, theory and practice.

21
3.9 LanguageThe coastal region is predominantly peopled by the Mijikenda communities who are also versatile in Kiswahili. The main language used when interacting with the study community was therefore Kiswahili. Only a few government officials, class teachers and head teachers were interviewed using the English medium. There was a language barrier in some villages in Lunga Lunga Division (Msabweni district), in households where both the parents and children have never had a schooling experience.
3.10 Capturing and analyzing dataThe main data capturing method used was note taking. The primary (2002-2009) and secondary (2006-2009) data sheets were filled for a cohort analysis. The notes taken were transcribed to provide qualitative analysis.
The household data sheets provided the main quantitative data. This data was analyzed via SPSS.
3.11 Reflecting on the research process: Challenges and lessons
Every research process forms its own unique experience, and which forms the basis for future research. This section reflects on the challenges that faced this study, while drawing lessons for related future studies.
a). Challenges
Challenges to the household studyBy far and wide, the household study was a success, though it witnessed several challenges.
Absence of respondentsForemost, conducting the study during the day. In many cases, enumerators landed in homes where there was no one to respond to questions. Parents and other adults were either engaged in their fields attending to crops and/or animals, or even out of their villages on other functions. This often disrupted the random sampling framework.
Long distances and tough terrainIn some parts of the three districts, the distances between villages and schools were so vast, separated by tough terrain and poorly-serviced roads. Still, in some villages, houses were very far apart, taking toll on the researchers with long, exhausting walks. This brought about enormous logistical difficulties, escalating transport costs and massive delays. Coverage of all targeted villages became impossible within the allocated time and budget. As research was going on in Ganze village, a far off village separated from Matuga centre by a couple of ridges, rain fell down, as an early warning was raised by one informant: itabidi muondoke hivi sasa kuelekea Matuga. Ikinyesha mkiwa hapa, mtaweza kaa nasi kwa siku kadha (you had better hurry back to Matuga. If it rains while you are here, you might have to stay with us for a couple of days!). The hurry exercised by the researchers was not fast enough, and the vehicle got stuck right inside the village farms. It took a near 4-hour pushing of the vehicle to get back to Matuga, plus of course some few hundred shillings paid to the youth for their hand in pushing.
22
Compassionate fatigueAs it is with most household studies, visiting extremely deprived homes elicits strong emotional load on the part of researchers. In Kinango, some homesteads visited are so poor, and the researcher felt a sense of hopelessness at having to walk away without offering any solutions. Hunger is a reality in many homes and in more densely populated villages, villagers would come flocking asking to be recorded because they thought that our survey may have something to do with food distribution.This emotional load usually led to exhaustion, and to an overall low performance of enumerators.
Poor lodging and diningDue to long distances, researchers in Kinango had to do with lodging in smaller towns in the district. One meal in these arrangements culminated into regrettable food poisoning of the team leader. Subsequently, the last day of field was extremely challenging for the team.
Relatively low research capacities of enumeratorsThough the enumerators were carefully selected, considering prior field research experience, some enumerators still displayed low capacities to conduct independent interviews. As a result, the first days required pairing up, to validate their abilities to work alone. This slackened the entire process.
Challenges to the school study
Poor records managementSome school head teachers had no well-kept data/records. Thus, it was hard for them to promptly respond to our questions or even provide the needed information. On the other hand, some teachers were unwilling and hesitant to take an interview or to fill in our data sheets. Due to poor records management, it became impossible to track pupil attendance (especially cohort analysis), as registers were either not marked consistently, or those of yester years were unavailable. Still, shuffling of students and pupils at the end of each year, a common practice in the schools, rendered the cohort analysis unfeasible for schools with more than one streams.
Language limitationsAs had been intended in the research methodology, questions on girls’ maturation (in class 5 and form 2) were to be covered by a questionnaire, to improve on confidentiality. However, English competency levels were too low, especially in primary schools. The situation necessitated that one researcher sits in, taking the respondents through each question, and awaiting them to fill as she/he addressed any difficulties. The exercise ended up taking almost double the time that had been allocated to it.
In the same token, some enumerators found it too daunting to translate the Kiswahili responses into English, and were actually encouraged to put it in Kiswahili. This called for extra effort and time during coding, analysis and writing.

23
b). Lessons learnt
As seen in the accounts in this report, this study was extensive, involving children in school, children out of school, parents/guardians, teachers, village elders and local education, constituency and provincial administration officers. Indeed, the study researchers have accumulated a wealth of experience in educational field research. Following are few lessons learnt:Pre-arrangement of study visitsAll schools visited in this study were not expecting the researchers. This ambushing of respondents, especially where certain records were required, led to lower response levels and study efficacy.
For future studies involving schools, it would be necessary to allocate resources for pre-arrangements, where head teachers are briefed ahead of time on the kind of data and records required. This could be either through prior visits, or telephone conversation. Alternatively, researchers could arrange to leave behind the data sheets, and collect them after two-three days. However, certain sensitive data, like levels of grade repetition and dropout may not be revealed.
More planning timeFor future studies, it would be advisable for researchers to take more time planning with local experts, to understand the distances and terrains, and be able to plan adequately ahead of visits. This calls for one full day at the respective district headquarters, mapping the area. At the local levels, more time would also be taken in mapping the villages, and receiving briefing from participating partners (gatekeepers) on the issues unique to the village. These exercises would enrich the quality of data (especially documentation of contexts), save time and optimize resource utilization.
Choice between quantity and qualityIn this study, it became extremely difficult to strike the balance between quantity (covering as many households and schools as possible) and quality (in-depth analysis of specific issues, villages, schools or cases). To end up with even richer analysis, it might be important for studies to specialize on one option, where adequate time and resources are not available. In this study, for instances, purposive sampling of certain villages, or certain schools, may have yielded deeper understanding of out of school children. On the other hand, coverage of more districts would have yielded more representative samples for generalization of findings.
Proper training of assistantsWhile selection of field assistants would be done more carefully, proper induction is a condition for optimal outputs. This training needs to take at least one full day, and up to two days, combining theoretical grounding on the study, and practical enumerating sessions.
More time for the processesWhile the initial time allocated to this entire process was only 65 days, we kept on requesting for extensions. In our experience, studies of this nature and magnitude require an allocation of at least 90 days. Much time is taken in the pre-field phase, reviewing literature and constructing the instruments, while the post-field phase demands ample time for data analysis, post-SPSS fine-tuning of analysis, and writing a quality report.

24
4.
4.1 Introduction
4.2 Demographic characteristics of respondentsThe study adopted a three-pronged approach, collecting data from households, schools and from policy makers. While a total of 807 households participated in the study, data were collected from 11primary and 6 secondary schools. Notable is that the study involved children in class five (5) in primary schools, and Form two (2) in the secondary schools.
This section presents an overview of the characteristics of the 2422 children who participated in this study (2164 children in the households, and 258 girls in class 5 and form 2).
4.2.1Of the three districts, Kinango had the highest number of members per household. Close to one in every three (27.5%) households had 10 or more persons living in one household, as compared to 19.3% in Msambweni and only 8.5% in Kwale. On the other hand, Kwale had slightly smaller families, with 36.4% of all households having between one and four members. Table 4.1 summarizes the household sizes in the three districts.
Table 4.1 Household size
No. of members Kinango Msambweni Kwale
1-4 3.7 22.2 36.4
5-9 68.8 58.5 55.1
10 and above 27.5 19.3 8.5
4.2.2 Sex of InformantsFrom the total of 2256 children captured in this analysis, 992 (44%) were female, while 1171 (52%)were male. A total of 46 children (2%) did not indicate their sex. Table 4.2 summarizes the distribution of children in sex among the three districts.
Table 4.2 Sex distribution of children in the three districts
District Gender Missing Total
Male Female
Kinango 385 281 - 666
Msambweni 438 429 - 913
Kwale 349 282 46 677
Total 1172 992 46 2256

4.2.3 Are biological parents alive?The study established that children have lost fathers four times as much as the three districts. The situation was worst in Kinango, where 22% of children reported having deceased biological fathers, as compared to 8% in Msambweni and 7.2% in Kwale. Only an average of 3.1% reported having deceased motherslife status for children, as percentage of the total number of children
Table 4.3 Are biological parents alive?
District Biological mother alive?
Yes No% %
Kinango 97.9 1.5Msambweni 87.5 3.1Kwale 90 4.6Total 91.8 3.1
4.2.4 Who are children livIn Kwale, only 54.8% of the children reported to be living with their biological fathers, while 76.1% were living with their biological mothers. In Kinango, 17% and 2.9% were not living with their biological fathers and mothers respectively. While 10.5% ofbiological mothers in Msambweni, 15.2% were not living with their biological fathers. children were mostly housed by relatives (innot with biological parents lived with their grandparents. with their grandparents, as compared to 11.4% in Msambweni and 3.2% in Kinango. Figure summarizes this information.
Figure 4.1 Relation of child to head of household
Are biological parents alive?hildren have lost fathers four times as much as they have lost mothers
. The situation was worst in Kinango, where 22% of children reported having as compared to 8% in Msambweni and 7.2% in Kwale. Only an average
of 3.1% reported having deceased mothers in the three districts. Table 4.3 summarizes the parents’ life status for children, as percentage of the total number of children.
Are biological parents alive?
Biological mother alive?
Biological father alive?
Missing Yes No Missing% % % %0.6 78 22 05.3 82 8 10.35.5 74 7.2 0.3
3.8 78 12 3.5
children living with?In Kwale, only 54.8% of the children reported to be living with their biological fathers, while 76.1% were living with their biological mothers. In Kinango, 17% and 2.9% were not living with their biological fathers and mothers respectively. While 10.5% of children were not living with their biological mothers in Msambweni, 15.2% were not living with their biological fathers. children were mostly housed by relatives (in-laws, neighbors etc). The biggest majority of children
lived with their grandparents. In Kwale, 11.9% of children were living with their grandparents, as compared to 11.4% in Msambweni and 3.2% in Kinango. Figure
Figure 4.1 Relation of child to head of household
25
they have lost mothers in . The situation was worst in Kinango, where 22% of children reported having
as compared to 8% in Msambweni and 7.2% in Kwale. Only an average in the three districts. Table 4.3 summarizes the parents’
In Kwale, only 54.8% of the children reported to be living with their biological fathers, while 76.1% were living with their biological mothers. In Kinango, 17% and 2.9% were not living with their
children were not living with their biological mothers in Msambweni, 15.2% were not living with their biological fathers. These
laws, neighbors etc). The biggest majority of children In Kwale, 11.9% of children were living
with their grandparents, as compared to 11.4% in Msambweni and 3.2% in Kinango. Figure 4.1
26
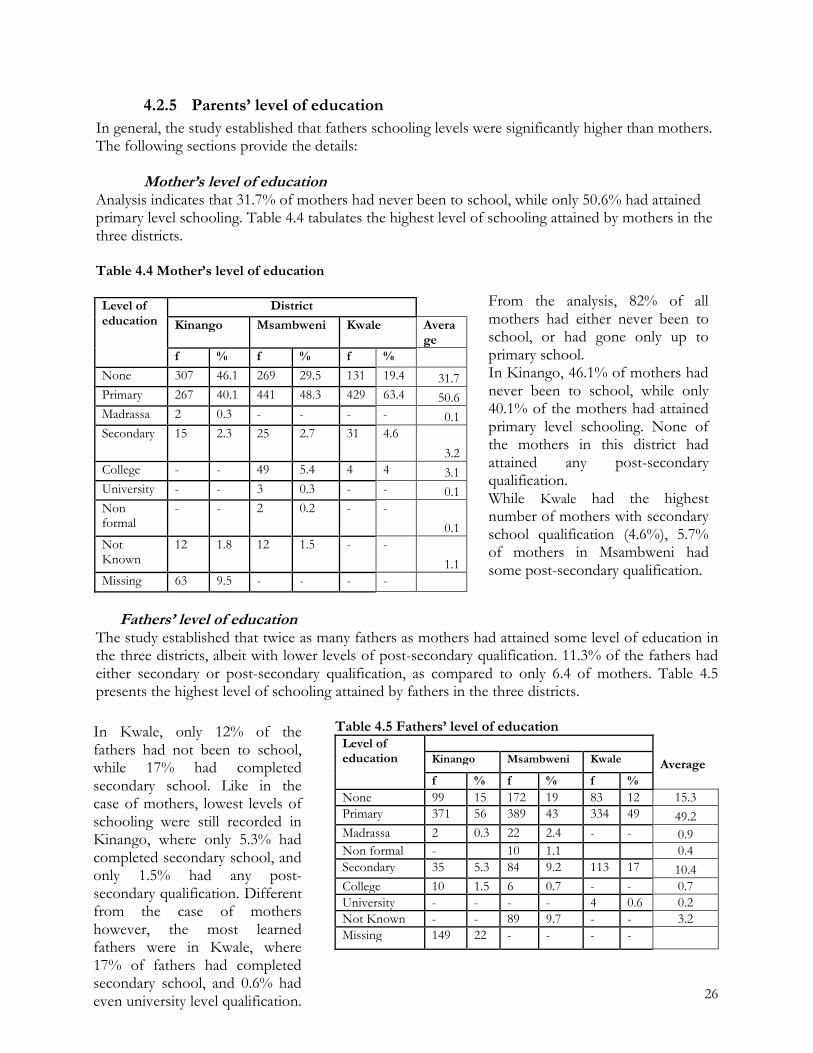
4.2.5 Parents’ level of education In general, the study established that fathers schooling levels were significantly higher than mothers. The following sections provide the details:
Mother’s level of educationAnalysis indicates that 31.7% of mothers had never been to school, while only 50.6% had attained primary level schooling. Table 4.4 tabulates the highest level of schooling attained by mothers in the three districts.
Table 4.4 Mother’s level of education
Level of education
District
Kinango Msambweni Kwale Average
f % f % f %None 307 46.1 269 29.5 131 19.4 31.7Primary 267 40.1 441 48.3 429 63.4 50.6Madrassa 2 0.3 - - - - 0.1Secondary 15 2.3 25 2.7 31 4.6
3.2College - - 49 5.4 4 4 3.1University - - 3 0.3 - - 0.1Non formal
- - 2 0.2 - -
0.1Not Known
12 1.8 12 1.5 - -
1.1Missing 63 9.5 - - - -
Fathers’ level of educationThe study established that twice as many fathers as mothers had attained some level of education in the three districts, albeit with lower levels of post-secondary qualification. 11.3% of the fathers had either secondary or post-secondary qualification, as compared to only 6.4 of mothers. Table 4.5 presents the highest level of schooling attained by fathers in the three districts.
Table 4.5 Fathers’ level of educationLevel of education Kinango Msambweni Kwale Average
f % f % f %None 99 15 172 19 83 12 15.3Primary 371 56 389 43 334 49 49.2Madrassa 2 0.3 22 2.4 - - 0.9Non formal - 10 1.1 0.4Secondary 35 5.3 84 9.2 113 17 10.4College 10 1.5 6 0.7 - - 0.7University - - - - 4 0.6 0.2Not Known - - 89 9.7 - - 3.2Missing 149 22 - - - -
From the analysis, 82% of all mothers had either never been to school, or had gone only up to primary school.In Kinango, 46.1% of mothers had never been to school, while only 40.1% of the mothers had attained primary level schooling. None of the mothers in this district had attained any post-secondary qualification. While Kwale had the highest number of mothers with secondary school qualification (4.6%), 5.7% of mothers in Msambweni had some post-secondary qualification.
In Kwale, only 12% of the fathers had not been to school, while 17% had completed secondary school. Like in the case of mothers, lowest levels of schooling were still recorded in Kinango, where only 5.3% had completed secondary school, and only 1.5% had any post-secondary qualification. Different from the case of mothers however, the most learned fathers were in Kwale, where 17% of fathers had completed secondary school, and 0.6% had even university level qualification.

27
4.2.6 Occupation of parentsMajority of the mothers (87.1%) were either housewives (40.6%) (engaging in non monetary activities such as housekeeping), subsistence farmers (33.4%) or small-scale entrepreneurs (13.1%) (selling groceries near home). There were 8 (1.2%) teachers and 4 (0.6%) in Kwale, the highest levels of professional occupation recorded among mothers. Though the number of housewives was lowest in Msambweni (10.7%), the highest proportion of mothers was engaged either in subsistence farming (59.9%) or small-scale businesses (14.9%). Unique from other districts, 9 mothers (1%) were employed in hotels. In tandem with the levels of education, highest levels of unemployment were established in Kinango, where 58.4% of mothers were just staying at home, and none of the mothers was in any professional occupation.
It was established that commensurate to the schooling levels, fathers had twice as many chances to engage in gainful employment as did the mothers. In the three districts, men had access to many more occupational opportunities and worked as teachers (5.2%), drivers (4.2%), casual workers (5%), as police officers, security officers, county council officers, beach and pool managers, fishermen and butchers. Msambweni had the highest levels of employment, with over 15% of all fathers being in salaried occupations, mostly teaching (7.8%), driving (4.2%), fishing (16%) and other occupations in the tourism and hotel sector. Just as in the case of mothers, the least employment opportunity for fathers was recorded in Kinango, where 21% were involved in survival farming, and 2.4% in brewing of alcoholic drinks. Only 5% of the fathers in Kinango were in gainful employment as teachers (0.3%), police officers (0.8%), drivers (3%) and security officers (0.8%).
4.2.7 Parents’ marital statusThe analysis indicates that more mothers (77.8%) were married than fathers (71.3%). While 5.9% of all children had single mothers, only 3.6% were living with single fathers. Divorce rates were highest in Kwale (9.2% mothers and 7.1% fathers). In Kinango, death/absence of fathers were highest, whereby a total of 15.3% of all mothers were either widowed (7.2%) or single (8.1%). Table 4.6summarizes the marital status of mothers and fathers in the three districts.
Table 4.6 Marital status of mothers and fathers
Marital status
District
Kinango Msambweni Kwale
Fathers Mothers Fathers Mothers Fathers MothersMarried 72.5 82.6 75.8 74 65.6 76.8Single 0.6 8.1 4.1 6.4 6 3.3Divorced /separated
0.3
0.6 2.1 4.2 7.1 9.2Widowed 0.9 7.2 0.5 0.3 0 0.6Cohabiting 0 -
1.3 1.3
1.5 0.6

28
4.3 Geographic and socio-economic contexts
4.3.1 Geographic contextKwale district covers the geographic area known as Matuga constituency. The district headquarters are in Kwale town, a temperate, forested town with pretty high precipitation. The district spreads from the Ng’ombeni, Waa and to Tiwi along the Mombasa-Lunga Lunga highway, to the northern parts of Mkongani across the Shimba Hills Game Reserve. To the east, Kwale spreads to Matuga, the second biggest town in the constituency and the base of education in the district.
Msambweni district picks from Ukunda on the Mombasa-Lunga Lunga highway, and spreads along the coastal line to the Kenya-Tanzania border. The headquarters of this district are in Msambweni. However the economic hub can be said to be Ukunda, a tourist haven.
Kinango district is the dry part of Kwale, to the north of Kwale district. Kinango occupies sections along Nairobi-Mombasa highway, spreading from Ndi, Samburu, to Mariakani and Mazeras. To the west, the district spreads up to the Kenya-Tanzania border, southwards of Taveta. The headquarters of the district are in Kinango town.
4.3.2 Socio-economic contextIn comparison, Kinango is rated lower than Kwale and Msambweni in terms of socio-economic indicators. Generally, Kinango is dry, and the main activity is subsistence farming, constantly threatened by extremely erratic rains. Livestock farming is also a key activity, involving mainly indigenous type of cows and goats. According to the District Education Officer, land in Kinango is communally owned, with a few ranches. Most families are polygamous. First pregnancy of often at an early age, marking an explosive demographic trend.
Kwale presents a rich mix in land use, from the Shimba hills game reserve, to the lower oceanic and business parts of Ng’ombeni, Waa and Tiwi. From the interviews and observation conducted, most parts of Kwale are not food-scarce, and a good deal of farming takes place involving farming of Bixa (a shrub like plant), oranges, mangoes, cashew nuts as well as maize. Dairy, poultry, sheep and goat farming is also visible in most parts of the district, especially the eastward parts of Matuga, as well as the upper sections of Mkongani. Despite this, Kwale has a high poverty index (of 63.2%), and with low literacy levels of about 57.5% (Interview, DEO July 2009). HIV/AIDS is prevalent, and continues to threaten the welfare of many children. Many families are polygamous. Divorce rates are relatively high, and hence prevalence of many single mothers and fathers.
Msambweni’s economic activities stretch between fishing and engagement in the service industry, mainly the hotel and tourism sectors (beach management, tour guiding, small businesses). However, marine parks and a few ranches are a feature of this district. Besides, farming is evident in someparts of this district where coconuts, maize and some plantation crops are grown. The region towards Lunga Lunga is however food scarce and most families are on relief food.
29
The three districts present diverse relationships in terms of access, equity and transition. This section gives an overview of the enrolment levels for both primary and secondary schools, while considering issues of staffing and schooling age of children.
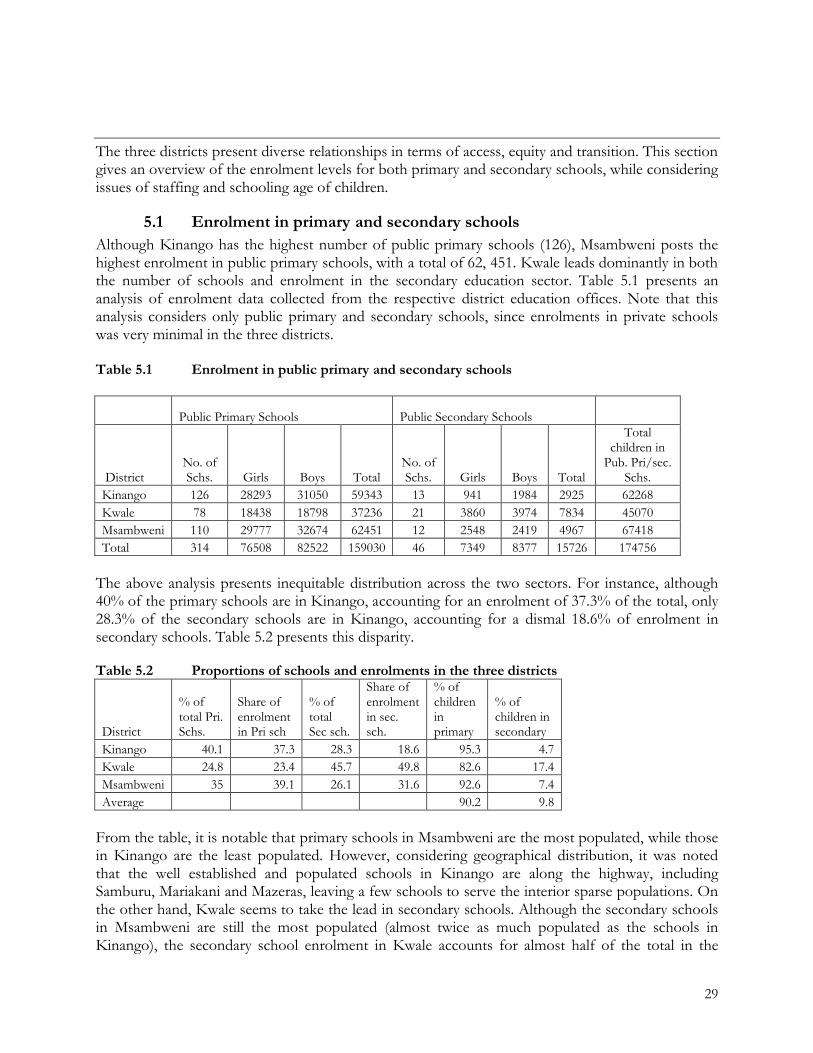
5.1 Enrolment in primary and secondary schoolsAlthough Kinango has the highest number of public primary schools (126), Msambweni posts the highest enrolment in public primary schools, with a total of 62, 451. Kwale leads dominantly in both the number of schools and enrolment in the secondary education sector. Table 5.1 presents an analysis of enrolment data collected from the respective district education offices. Note that this analysis considers only public primary and secondary schools, since enrolments in private schools was very minimal in the three districts.
Table 5.1 Enrolment in public primary and secondary schools
Public Primary Schools Public Secondary Schools
DistrictNo. of Schs. Girls Boys Total
No. of Schs. Girls Boys Total
Total children in
Pub. Pri/sec. Schs.
Kinango 126 28293 31050 59343 13 941 1984 2925 62268Kwale 78 18438 18798 37236 21 3860 3974 7834 45070Msambweni 110 29777 32674 62451 12 2548 2419 4967 67418Total 314 76508 82522 159030 46 7349 8377 15726 174756
The above analysis presents inequitable distribution across the two sectors. For instance, although 40% of the primary schools are in Kinango, accounting for an enrolment of 37.3% of the total, only 28.3% of the secondary schools are in Kinango, accounting for a dismal 18.6% of enrolment in secondary schools. Table 5.2 presents this disparity.
Table 5.2 Proportions of schools and enrolments in the three districts
District
% of total Pri. Schs.
Share of enrolmentin Pri sch
% of total Sec sch.
Share of enrolment in sec. sch.
% of children in primary
% of children in secondary
Kinango 40.1 37.3 28.3 18.6 95.3 4.7Kwale 24.8 23.4 45.7 49.8 82.6 17.4Msambweni 35 39.1 26.1 31.6 92.6 7.4Average 90.2 9.8
From the table, it is notable that primary schools in Msambweni are the most populated, while those in Kinango are the least populated. However, considering geographical distribution, it was noted that the well established and populated schools in Kinango are along the highway, including Samburu, Mariakani and Mazeras, leaving a few schools to serve the interior sparse populations. On the other hand, Kwale seems to take the lead in secondary schools. Although the secondary schools in Msambweni are still the most populated (almost twice as much populated as the schools in Kinango), the secondary school enrolment in Kwale accounts for almost half of the total in the

30
three districts. To the contrary, the children in secondary school in Kinango account for only 18.6% of the total (compare with 37.3% in primary school). Going with this, children in secondary schools account for only 4.7% of the total number of children schooling in that district, as compared to 7.4% and 17.4% in Msambweni and Kwale respectively. Unless it would be assumed that most children in Kinango are schooling outside the district, Kinango has, by far, the lowest transition to secondary, and the widest gender gaps, as the DEO (Kinango) put it:
Transition to secondary schools is a major problem here in Kinango. We had transition rates of only 27% in 2007, which improved to 44.69% in 2008 (after building a few more secondary schools) (Interview on Tuesday, 21st July 2009).
Scrutinizing the remarkable balance between primary and secondary school enrolments in Kwale, it is notable that majority of the well-established provincial schools are in this district, including schools such as Matuga Girls, Waa Boys and Waa Girls. Indeed, analysis indicates that 50% of mixed boarding, 67% of girls’ boarding and 75% of boys’ boarding schools are in Kwale district (Matuga constituency). As provincial schools, they are expected to serve the entire province. However there is preferential admission for the district housing the school. Children in Kwale aretherefore better placed to join these schools, factoring in issues of distance, proximity and the modeling effects that occur around the big schools. Similarly, bearing in mind distance and costs, the number of children coming from Kinango to the big schools in Kwale may be negligible.
5.1.1 Enrolment trends since 2002Both primary school and secondary school enrolments have been on a gradual upward trend. Primary school enrolments achieved a 30% boost after introduction of free primary education 2003.Case examples depict even more phenomenal growth. For example, enrollment in Kiruku primary school increased by 162% after introduction of FPE while Matuga primary school appreciated by 74%. General enrollment trends however decelerated by -3.5% in 2008, but recovered again this year. Table 5.3 summarizes the enrolment growth trends of eight primary schools since 2002, considering differences between girls and boys.
Table 5.3 Primary school enrolment trends 2002-2009
2009 2008 2007 2006 2005 2004 2003 2002Girls 3206 3027 3202 3038 3025 2897 2647 2066Boys 3581 3425 3483 3370 3367 3430 3118 2378Total 6787 6452 6685 6408 6392 6327 5765 4444% Increment 5.2 -3.5 4.3 0.3 1 9.7 29.7
Enrolment in the secondary school sector witnessed a remarkable jerk due to subsidized secondary education program, which was introduced in January 2008. The overall enrolment of six secondary schools appreciated by 20.2%, ranging from the extensive 11.1% in Kaya Tiwi, to a paltry 1.6% in Mangawani secondary (it was established that this school did not have teachers, and parents were withdrawing children). Table 5.4 summarizes the enrolment trends in secondary schools from 2006-2009, considering differences between girls and boys enrolments.

31
Table 5.4 Secondary school enrolment trends 2006-2009
2009 2008 2007 2006Girls 1305 1293 1181 1137Boys 1137 1091 802 750Total 2442 2384 1983 1887% increment 2.4 20.2 5.1
Figure 5.1 presents a visual representation of the general enrolment trends in primary and secondary schools, from 2006 to 2009, based on an analysis of eight (8) primary and six (6) secondary schools.
Figure 5.1 Enrolment trends in primary and secondary schools, 2006-2009
5.1.2 Staffing in primary school
The analysis indicates that the average primary school Pupil/Teacher ratio for the three districts is 82:1, but ranging from 94:1 in Kinango, 80:1 in Kwale to 74:1 in Msambweni. The worst recorded PTR was in Mabanda primary school, where each government teacher was in charge of 130 children. The best ratio was recorded in Msambweni Primary School, at 46:1. Table 5.5 summarizes the PTR in the nine (9) schools studied, having even a closer look at the differences between Female and Male PTR (ratios of girls/female teachers, and boys/male teachers).
0
2000
4000
6000
8000
2009 2008 2007 2006
Year
Enro
lmen
t is
sele
cted
sc
hool
s
PrimarySecondary
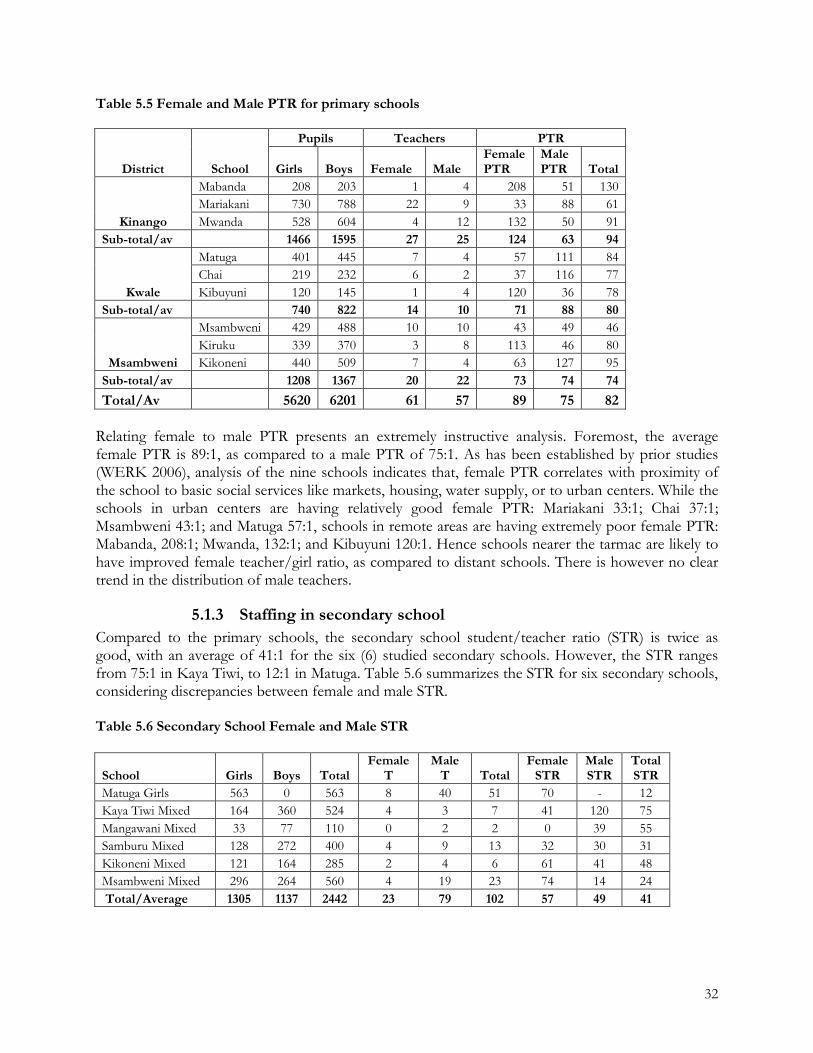
32
Table 5.5 Female and Male PTR for primary schools
District School
Pupils Teachers PTR
Girls Boys Female MaleFemalePTR
Male PTR Total
Kinango
Mabanda 208 203 1 4 208 51 130Mariakani 730 788 22 9 33 88 61Mwanda 528 604 4 12 132 50 91
Sub-total/av 1466 1595 27 25 124 63 94
Kwale
Matuga 401 445 7 4 57 111 84Chai 219 232 6 2 37 116 77Kibuyuni 120 145 1 4 120 36 78
Sub-total/av 740 822 14 10 71 88 80
Msambweni
Msambweni 429 488 10 10 43 49 46Kiruku 339 370 3 8 113 46 80Kikoneni 440 509 7 4 63 127 95
Sub-total/av 1208 1367 20 22 73 74 74
Total/Av 5620 6201 61 57 89 75 82
Relating female to male PTR presents an extremely instructive analysis. Foremost, the average female PTR is 89:1, as compared to a male PTR of 75:1. As has been established by prior studies(WERK 2006), analysis of the nine schools indicates that, female PTR correlates with proximity of the school to basic social services like markets, housing, water supply, or to urban centers. While the schools in urban centers are having relatively good female PTR: Mariakani 33:1; Chai 37:1; Msambweni 43:1; and Matuga 57:1, schools in remote areas are having extremely poor female PTR: Mabanda, 208:1; Mwanda, 132:1; and Kibuyuni 120:1. Hence schools nearer the tarmac are likely to have improved female teacher/girl ratio, as compared to distant schools. There is however no clear trend in the distribution of male teachers.
5.1.3 Staffing in secondary schoolCompared to the primary schools, the secondary school student/teacher ratio (STR) is twice as good, with an average of 41:1 for the six (6) studied secondary schools. However, the STR ranges from 75:1 in Kaya Tiwi, to 12:1 in Matuga. Table 5.6 summarizes the STR for six secondary schools, considering discrepancies between female and male STR.
Table 5.6 Secondary School Female and Male STR
School Girls Boys TotalFemale
TMale
T TotalFemale
STRMale STR
Total STR
Matuga Girls 563 0 563 8 40 51 70 - 12Kaya Tiwi Mixed 164 360 524 4 3 7 41 120 75Mangawani Mixed 33 77 110 0 2 2 0 39 55Samburu Mixed 128 272 400 4 9 13 32 30 31Kikoneni Mixed 121 164 285 2 4 6 61 41 48Msambweni Mixed 296 264 560 4 19 23 74 14 24Total/Average 1305 1137 2442 23 79 102 57 49 41

33
While the female STR has a small range, from 32:1 in Samburu to 74:1 in Msambweni, the male STR ranges from 14:1 in Msambweni to 120:1 in Kaya Tiwi. Most striking though are the differences in staffing among the six schools, highlighting the need for staff rationalization, even when it may be argued that student enrolments are erratic in smaller schools.
5.1.4 Analysis of staffing trends, 2006-2009Analysis of trends in staffing points to a very stable situation, with indeed limited mobility of teachers. After the seeming deployment of male teachers in the primary school that took place in 2007, which saw the total number of teachers in the studied schools appreciate from 106 (2006) to 117 in 2007, the number has remained stable to date. In the secondary school sector, five teachers left Matuga girls in 2007, influencing a decline in the total staffing of the six (6) studied schools from 79 in 2006 to 73 in 2007. The following tables present the staffing trends for primary and secondary schools, from 2006 to 2009.
Table 5.7a Staffing trends in primary schools, 2006-2009
2009 2008 2007 2006School Female Male Female Male Female Male Female Male
Mabanda 1 4 1 4 1 4 0 2Mariakani 22 9 24 9 22 12 20 9Mwanda 4 12 2 13 2 13 1 12Matuga 7 4 8 4 8 4 9 3Chai 6 2 6 2 6 2 5 2Kibuyuni 1 4 1 4 1 4 2 4Msambweni 10 10 10 8 11 7 11 8Kiruku 3 8 2 8 2 8 2 7Kikoneni 7 4 7 4 5 5 4 5Total 61 57 61 56 58 59 54 52
Table 5.7b Staffing in secondary schools, 2006-2009
School2009 2008 2007 2006
Female Male Female Male Female Male Female MaleSamburu Mixed 4 9 3 10 2 10 2 9Kaya Tiwi 4 3 4 4 4 4 4 5Matuga Girls 5 17 5 16 6 14 11 14Mangawani 1 3 1 3 1 4 1 2Kikoneni 2 4 2 4 2 5 3 5Msambweni 4 19 4 18 4 17 6 17Total 20 55 19 55 19 54 27 52

34
5.1.5 Age of joining schoolThe study established that generally, children are joining school at the recommended age, albeit with gender and regional disparities. By the age of 5, around 63% of all children will have joined pre-school in the three districts. However, the likelihood that this would happen is highest in Msambweni (75.3%) and lowest in Kwale (50.1%). The highest incidence of late entry was recorded in Kwale, whereby 10.2% and 10.7% of boys and girls joined pre-school after the age of nine (9). This late entry was attributed to long distances to school and dangers posed by flooding rivers.
Gender disparities were widest in Kinango, where boys started schooling much later than girls. This was associated with herding activities, which engaged mostly boys. Table 4.13 summarizes the age at which children joined preschool in the three districts.
Table 5.8 Age of joining school
District Sex 0-2 3-5 6-8 9-11 12 and over
Total number
By5
After 9
Kinango Male 5.6 53.7 35.4 5.3 0 356 59.3 5.3Female 2.3 64.8 24.6 8.3 0 264 67.1 8.3Total 4.2 58.4 30.8 6.6 0 620 63.2 6.8
Msambweni Male 6.6 69 20.1 3.3 1 393 75.6 4.3Female 7.8 67.1 21.6 3 0.5 398 74.9 3.5Total 7.2 68 20.9 3.2 0.8 791 75.3 3.9
Kwale Male 9.6 43.8 36.4 10.2 0 313 53.4 10.2Female 10.7 36.1 42.6 10.7 0 244 46.8 10.7Total 10.1 40.4 39.1 10.4 0 557 50.1 10.5
Total 7.2 55.6 30.3 6.7 0.3 1968 62.9 7.1
The findings therefore depict that majority members in the study community do enroll their children. However analysis will show that most remain in primary school for more than 10 years due to frequent absenteeism and repetition.

35
5.2 Absenteeism and temporary drop out
Prior studies have established that school absenteeism is a major predictor for school failure, a key deterrent to schooling progress, and risk factor for drop-out and entry into child labor. Missing on school days results to reduced teacher/learner contact, one of the known contributors to achievement. In this study, three levels of absenteeism have been differentiated. The lowest level is general absenteeism, where for instance, a child may have a cold and miss on some day. This absenteeism is neither persistent, nor is it predictable. The higher level is temporary dropout, where a child may miss school on more than 10 days (two weeks) consistently. This absenteeism may lead to school dropout. The third level is chronic absenteeism. This is when a child misses school persistently and consistently over a long time, say a term or a year. This absenteeism is as persistent as it is predictable, and is known lead to dropout. This section analyzes extents of absenteeism and the likelihood at which absenteeism may serve as a predictor to school dropout. The analysis does not however attempt to relate absenteeism to school achievement or progress.
5.2.1 Prevalence of absenteeismThe study established that all the three forms of absenteeism constituted a prevalent mark of schooling in the three districts.
General Absenteeism
One measure of absenteeism in this study was to take a count of the number of children absent on the day of study. An analysis from six primary and five secondary schools indicates that around 20% of learners in primary and 10% in secondary may be absent on any given day. On the day of visit, 26% of boys and 18% of girls in primary schools were absent, as compared to 6% (girls) and 12% (boys) in secondary school. Table 5.9 summarizes the count of absent children on the day of visit, for primary and secondary schools, basing on class five (5) and Form two (2).
Table 5.9 Level of absenteeism based on day of visit (Class 5 and Form 2)School Current Enrolment Absent TodayPrimary Girls Boys Subtotal Girls Boys Subtotal %Matuga Pri 30 27 57 4 3 7 12Chai Pri 26 15 41 6 2 8 20Kibuyuni Pri 10 13 23 2 4 6 26Msambweni Pri 35 60 95 3 10 13 14Kiruku Pri 51 50 101 18 22 40 40Kikoneni Pri 41 46 87 2 13 15 17Total 193 211 404 35 54 89 22SecondaryKaya Tiwi 23 42 65 1 1 2 3Matuga Girls 51 0 51 1 0 1 2Mangawani Sec 12 30 42 3 7 10 24Msambweni Sec 100 58 158 7 7 14 9Kikoneni 218 169 387 13 20 33 9

36
The highest ratio of absent children was established in Kiruku primary school, where 40% of children were away. In this school, 44% of all boys in class 5 were absent, presenting an extremely worrying phenomenon. The lowest level of absenteeism in primary school was in Matuga primary, at 12%. Similarly in Mangawani secondary, 25% of girls and 23% of boys were absent on the day of visit. Absenteeism in secondary school was however much lower than in primary school, considering that one school was full boarding, while three others had partial boarding for girls. In this analysis, general absenteeism is much lower for boarding schools, as compared to day schools. On the other hand, boys were more likely to be absent, than girls.
Temporary drop out
To gauge this type of absenteeism, the study sought to establish if children had missed school for a continuous period exceeding two weeks, since January 2009. This data was sought in the household study. Poor record keeping, especially in-availability of school registers made it difficult to corroborate this information from the schools. Table 5.10 presents the findings of this analysis.
Table 5.10 Levels of temporary dropout
District Gender Proportion of girls/boys left school temporarily Total Were absent %
Kinango Male 305 57 18.7Female 223 51 22.9Total 528 108 20.5
Msambweni Male 304 63 20.7Female 312 81 26Total 616 144 23.4
Kwale Male 283 50 17.7Female 224 48 21.4Total 507 98 19.3
Average Male 892 170 19Female 759 180 23.4
Chronic absenteeism
Further analysis was done on the number of school days missed in the one week and two weeks preceding the research visits, analyzing class registers on the one hand, and asking questions at the household level on the other. This analysis considered only a single stream in class 5 and form 2 respectively, in 3 primary and 4 secondary schools. From the analysis of one week prior, a total of 121 days had been missed in primary, and 143 days in secondary schools. This translates to the equivalent of one child missing school for 24 weeks and 28 weeks in primary and secondary school respectively. It was established that boys miss school more than girls, accounting for 57% of all days missed. Table 5.11 summarizes the analysis of registers based on one week prior to visit.
This analysis indicates that 19% of boys and 23.4% of girls had been absent from school for a period exceeding two weeks, during first and second terms of 2009. Temporary dropout was most prevalent in Msambweni, where 26% of girls had been absent. Temporary dropout was fairest in Kwale, with an average of 19.3%. Generally, girls were more likely to drop out temporarily in all three districts
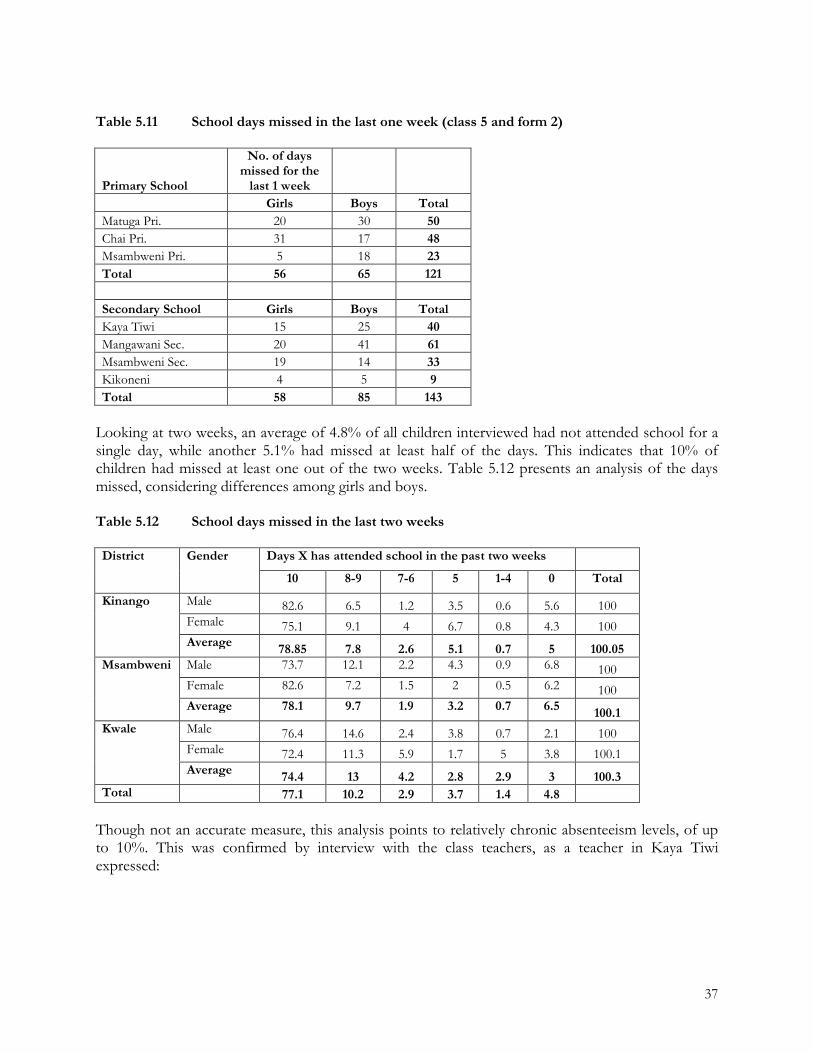
37
Table 5.11 School days missed in the last one week (class 5 and form 2)
Primary School
No. of days missed for the
last 1 weekGirls Boys Total
Matuga Pri. 20 30 50Chai Pri. 31 17 48Msambweni Pri. 5 18 23Total 56 65 121
Secondary School Girls Boys TotalKaya Tiwi 15 25 40Mangawani Sec. 20 41 61Msambweni Sec. 19 14 33Kikoneni 4 5 9Total 58 85 143
Looking at two weeks, an average of 4.8% of all children interviewed had not attended school for a single day, while another 5.1% had missed at least half of the days. This indicates that 10% of children had missed at least one out of the two weeks. Table 5.12 presents an analysis of the days missed, considering differences among girls and boys.
Table 5.12 School days missed in the last two weeks
District Gender Days X has attended school in the past two weeks
10 8-9 7-6 5 1-4 0 Total
Kinango Male 82.6 6.5 1.2 3.5 0.6 5.6 100Female 75.1 9.1 4 6.7 0.8 4.3 100Average 78.85 7.8 2.6 5.1 0.7 5 100.05
Msambweni Male 73.7 12.1 2.2 4.3 0.9 6.8 100Female 82.6 7.2 1.5 2 0.5 6.2 100Average 78.1 9.7 1.9 3.2 0.7 6.5 100.1
Kwale Male 76.4 14.6 2.4 3.8 0.7 2.1 100Female 72.4 11.3 5.9 1.7 5 3.8 100.1Average 74.4 13 4.2 2.8 2.9 3 100.3
Total 77.1 10.2 2.9 3.7 1.4 4.8
Though not an accurate measure, this analysis points to relatively chronic absenteeism levels, of up to 10%. This was confirmed by interview with the class teachers, as a teacher in Kaya Tiwi expressed:
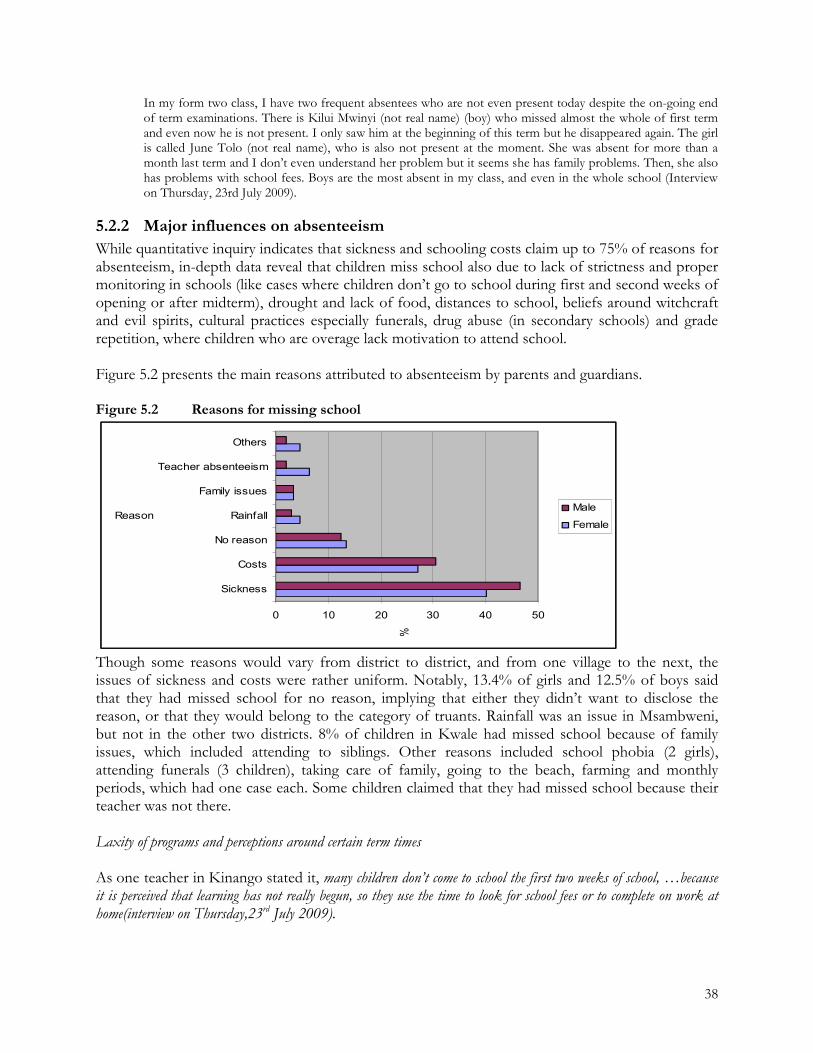
38
In my form two class, I have two frequent absentees who are not even present today despite the on-going end of term examinations. There is Kilui Mwinyi (not real name) (boy) who missed almost the whole of first term and even now he is not present. I only saw him at the beginning of this term but he disappeared again. The girl is called June Tolo (not real name), who is also not present at the moment. She was absent for more than a month last term and I don’t even understand her problem but it seems she has family problems. Then, she also has problems with school fees. Boys are the most absent in my class, and even in the whole school (Interview on Thursday, 23rd July 2009).
5.2.2 Major influences on absenteeismWhile quantitative inquiry indicates that sickness and schooling costs claim up to 75% of reasons for absenteeism, in-depth data reveal that children miss school also due to lack of strictness and proper monitoring in schools (like cases where children don’t go to school during first and second weeks of opening or after midterm), drought and lack of food, distances to school, beliefs around witchcraft and evil spirits, cultural practices especially funerals, drug abuse (in secondary schools) and grade repetition, where children who are overage lack motivation to attend school.
Figure 5.2 presents the main reasons attributed to absenteeism by parents and guardians.
Figure 5.2 Reasons for missing school
Though some reasons would vary from district to district, and from one village to the next, the issues of sickness and costs were rather uniform. Notably, 13.4% of girls and 12.5% of boys said that they had missed school for no reason, implying that either they didn’t want to disclose the reason, or that they would belong to the category of truants. Rainfall was an issue in Msambweni, but not in the other two districts. 8% of children in Kwale had missed school because of family issues, which included attending to siblings. Other reasons included school phobia (2 girls), attending funerals (3 children), taking care of family, going to the beach, farming and monthly periods, which had one case each. Some children claimed that they had missed school because their teacher was not there.
Laxity of programs and perceptions around certain term times
As one teacher in Kinango stated it, many children don’t come to school the first two weeks of school, …because it is perceived that learning has not really begun, so they use the time to look for school fees or to complete on work at home(interview on Thursday,23rd July 2009).
0 10 20 30 40 50
Sickness
Costs
No reason
Rainfall
Family issues
Teacher absenteeism
Others
Reason
%
Male
Female

39
Deeper analysis was conducted at Mangawani secondary school in Kwale, the school that had the highest rates of absenteeism. It was established that 60% of the absenteeism was experienced during the first 2 weeks after opening, and the week after mid-term, linked to the attitude that ‘no learning will be taking place. In week 1, 61% of the students did not go to school, followed by 47% in week 2. During the mid-term week (8), 48% did not attend school, and 36% in the subsequent week. As illustrated in figure 5.3 below, the lowest absenteeism was in weeks 11 and 12, which were the exam weeks. During these two weeks, absenteeism was low at only 8%. This however shot drastically in the closing week, where 34% of students did not attend school. While one would expect low absenteeism during the week preceding exams, it was noted that students missed school looking for exam fees, so that they were not closed out.
Figure 5.3 Absenteeism curve at Mangawani secondary school
Seasonal child labor
From the interviews conducted, it was evident that many children missed school to engage in one task or the other, both household chores and wage labor. At the primary school level, children missed school during the rainy and productive seasons (especially between March and July), to participate in farming activities including tilling of land, planting; as well asguarding the plants from destruction by monkeys and wild pigs. One parent explained that: …two of my sons have not been going to school this week. They keep alternating…because they help to scare off monkeys from the farms. This is really a bad period, because if we don’t watch over the monkeys, we won’t harvest anything (interview on Wednesday, 22nd July 2009 with a Father, Ganze village, Kwale).
Other forms of child work included taking care of siblings and nursing ailing parents. For secondary school, there were many incidences of boys and girls engaging seasonally on wage labor. Boys in Msambweni were reported to engage seasonally as beach boys, as one teacher expressed it: Some (boys) have gone as far as Shimoni area to work in this industry as beach boys but the good thing is that they at least come back to school after they have missed school for several days (Interview on 24th July, 2009 with a class teacher, Kikoneni secondary). Besides, boys were reported to miss school, especially the season from January to May, because this is the season when mangoes and coconuts are ready for plucking and boys are paid as harvesters (interview on Friday 24th July, 2009 with a class teacher, Kikoneni secondary). In Kwale, children were reported to attend school irregularly as they engaged in charcoal burning, brewing and selling of mnazi (coconut brew), and quarrying. In Kichaka Mkwaju, children skipped school to work on the rice farms.
050
100150200250
1 2 3 4 5 6 7 8 9 10 11 12 13 14
Week
No. o
f day
s m
isse
d
Boy days missedGirls days missed% absenteeism
40
Beliefs around witchcraft and evil spirits
The study established that many school days were lost as parents and their children engaged in sorcery, against ugonjwa wa kuanguka (disease of falling down). This disease is largely undefined, as one teacher in Kikoneni secondary described it:
One of the major problems that I have observed is the presence of undefined sickness which is usually associated with evil spirits. People usually call it “ugonjwa wa kuanguka”. This is what makes MM (a frequent absentee) not to come to school most of the days (interview on Friday 24th July, 2009).
This was confirmed as a problem in many schools also in the three study districts. The worst case encountered was a primary school in Kwale, where the scenario was described as follows:
It was the day before yesterday, during the morning assembly. Three girls started screaming and falling down. In no time, all children, especially girls, started running around and I could not manage the school. Children were extremely hysterical. Some members of the community ran into the school when they heard this, and started praying for the possessed girls. I sent the children [whole school] home to go and bring parents, the management committee came and we had a meeting. We could not continue learning, for this was a big problem. Children have now come back, and things are normalizing. One of the possessed girls is yet to come back… (Interview on Thursday 23rd July, 2009 with Headteacher, Chai Primary School).
Lack of food, long distances to school and safety
A sad story was told by one boy in Boyani village, Kwale:Yes, we go to school. I’m 18 years old, and in class 7. When I was younger, I fell down and have been having a problem with my knee. The school is so far, and I cannot run. I leave home around 4.30 in the morning, so that I am in school at 6.30, when we are expected there. My younger brother is in class 2. He is still young, and the distance to school is too far for him. So, he usually goes to school on Monday, rests on Tuesday, like that…(Interview on Saturday 25th 2009 with a Boy, 18, Boyani Village, Kwale).
This village was so far off, and though a satellite (feeder) school had been started, it was only up to nursery school. The next school here is around 5 kilometers away, and children have to pass through bushes. No child under the age of 9 can go to school here (village elder). Such cases were many in some villages in Kwale, which were poorly served by schools.
In Kinango and certain areas of Lunga Lunga division in Msambweni district, children missed school due to hunger:
Attendance is affected as this is an ASAL area and in fact there is no food. Only 38 out of 126 schools are under the school feeding program. When it is very dry, school attendance drops. Sometimes you find that there is food but there is no water to cook it. There is also the problem of human-wildlife conflict around here, because the elephants are also searching for water (interview, DEO Kinango, 21.07.2009).
Human-wildlife conflict was real threat to schooling in Kinango. During the dry season, elephants deviated from the park and harassed villagers, sometimes with fatal consequences. In one school, a girl was killed by an elephant on her way to school. Such acts often act as a deterrent to school attendance as parents then prefer to retain their children at home due to issues of safety.

41
Cultural practices
Two cultural practices were found to interfere with schooling are funerals and weddings. mourning takes up to three weeks here, and children involved do not go to school during this time. Weddings are accompanied by night discos. In such occasions, which are meant for adults, there are 80% children (Interview, DEO Kwale, 21.07.2009).
Previous studies conducted in the district (Ruto 2006) further documented that vigils and other night time as a big threat to the sexual safety of children. Therefore while the immediate visible effect seen is school absence, many girls often get pregnant in such occasions, meaning that schooling is permanently affected as a result of weddings and funerals. Rainy seasons
In Kwale and Msambweni, children missed school during the rainy seasons, as the paths to school became flooded and impassable. One parent explained that:
During the rains, children are not able to go to school here. The nearest public school is Matuga, more than 9 kilometers away. And, I hope you saw the big river valley as you were coming. During the rainy seasons, the river floods and no one can cross. If it floods during the night, children are unable to go to school for up to one month, and if it floods during the day, when children have already crossed over to the school, you may not see your child for over a month, without knowing where they sleep or what they eat (Interview, Father, Ganze village, Kwale, 22.07.09).
Grade repetition and overage children
One of the most disturbing qualities of education in the three districts was grade repetition. Bearing in mind that 7.1% children in the study sample start school after 9 years, it was common to find children who had repeated more than four grades, such that they reach 17 or 18 years while still in primary school. Repetition is such a common practice that one school (in Msambweni district) actually streamed repeaters in their own class. Analysis of how enrolment has been fluctuating over the classes for 8 primary schools (class 1 of 2002 to class 8 of 2009) revealed that most children repeat grade 7. In the transition from class 7 (2008) to 8 (2009), the number of girls dropped by 57.5%, against 33.1% for boys. This trend is illustrated in figure 5.4.
Figure 5.4 Enrolment flow for one group over 8 years (2002-2009)
0100200300400500
1 2 3 4 5 6 7 8
Class
Num
ber
GirlsBoys

42
Though grade repetition was defended as they were not ready to move to the next grade, the study established that children who have repeated tend to have low motivation, and are easily swayed to do something else to miss school. One teacher in Matuga quoted a case:
Ali (not real name) in my class (5) is among those who are absent today. The boy has missed school for five weeks. He is 15 years old, he was asked to repeat class five at the beginning of this year as he did not qualify to join class six but did not want to repeat. Due to his age, the boy does not feel comfortable in this class and most of his friends have left him and are now in class six. He normally hides in the bush instead of coming to school. In fact I talk to the brother of the boy and he says the boy does not want to come to school. The parents are ignorant and they do not even do any follow up to know whether the boy is in school or not. Even when you call them to school to come so that we can discuss about the boy’s behavior, they do not come but rather send someone else like the boy’s brother (Interview, Teacher 22.07.09).
Such cases were evident in many other schools in the three districts. Apparently, and as enrolments in any school would indicate, grade repetition was rampant, especially on class six, where children were mostly considered not ready to join the KCPE race at class 7. Rather than understanding the demeaning aspect of being overage in a class, teachers tended to cast blame on parents and children when signs of truancy set in. For girls, being overage was linked to the high incidence of pregnancy in primary schools: girls of age 18-19 years are found in primary school, because they either repeated grades or had enrolled late. When they get pregnant, we even cannot prosecute the men, because these are adults (Interview, DO, Matuga division, 21.07.2009).
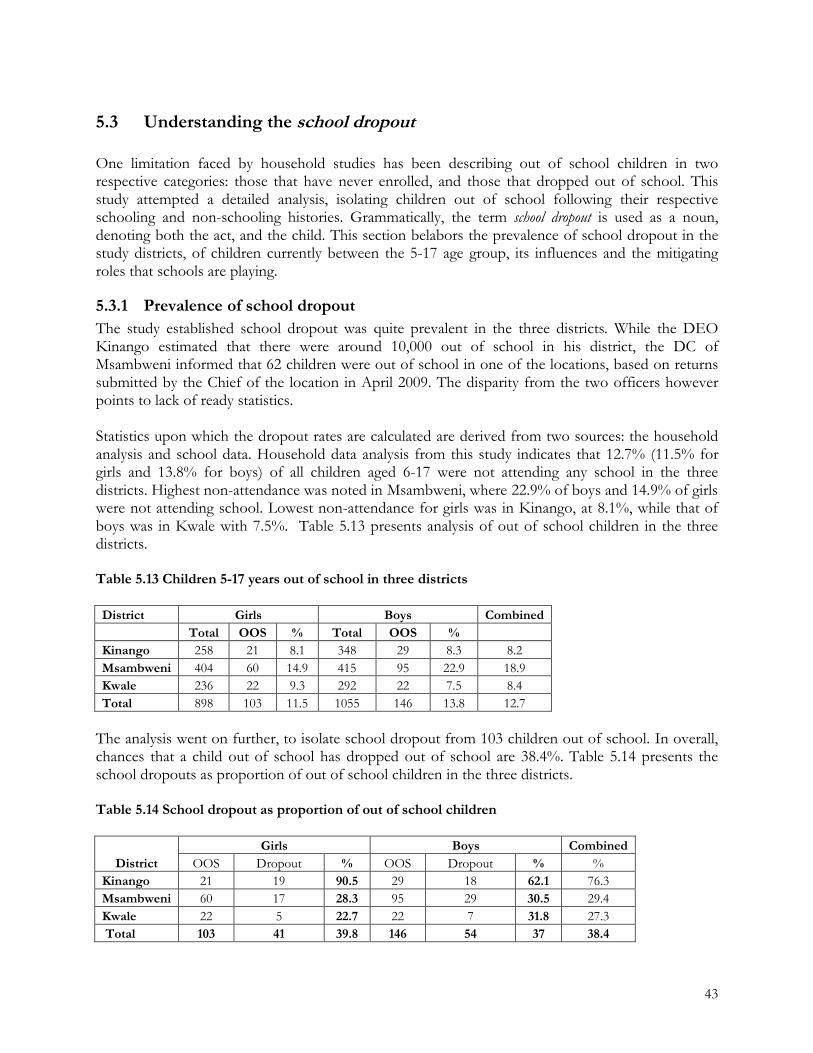
43
5.3 Understanding the school dropout
One limitation faced by household studies has been describing out of school children in two respective categories: those that have never enrolled, and those that dropped out of school. This study attempted a detailed analysis, isolating children out of school following their respective schooling and non-schooling histories. Grammatically, the term school dropout is used as a noun, denoting both the act, and the child. This section belabors the prevalence of school dropout in the study districts, of children currently between the 5-17 age group, its influences and the mitigating roles that schools are playing.
5.3.1 Prevalence of school dropoutThe study established school dropout was quite prevalent in the three districts. While the DEO Kinango estimated that there were around 10,000 out of school in his district, the DC of Msambweni informed that 62 children were out of school in one of the locations, based on returns submitted by the Chief of the location in April 2009. The disparity from the two officers however points to lack of ready statistics.
Statistics upon which the dropout rates are calculated are derived from two sources: the household analysis and school data. Household data analysis from this study indicates that 12.7% (11.5% forgirls and 13.8% for boys) of all children aged 6-17 were not attending any school in the three districts. Highest non-attendance was noted in Msambweni, where 22.9% of boys and 14.9% of girls were not attending school. Lowest non-attendance for girls was in Kinango, at 8.1%, while that of boys was in Kwale with 7.5%. Table 5.13 presents analysis of out of school children in the three districts.
Table 5.13 Children 5-17 years out of school in three districts
District Girls Boys CombinedTotal OOS % Total OOS %
Kinango 258 21 8.1 348 29 8.3 8.2Msambweni 404 60 14.9 415 95 22.9 18.9Kwale 236 22 9.3 292 22 7.5 8.4Total 898 103 11.5 1055 146 13.8 12.7
The analysis went on further, to isolate school dropout from 103 children out of school. In overall, chances that a child out of school has dropped out of school are 38.4%. Table 5.14 presents the school dropouts as proportion of out of school children in the three districts.
Table 5.14 School dropout as proportion of out of school children
DistrictGirls Boys Combined
OOS Dropout % OOS Dropout % %Kinango 21 19 90.5 29 18 62.1 76.3Msambweni 60 17 28.3 95 29 30.5 29.4Kwale 22 5 22.7 22 7 31.8 27.3Total 103 41 39.8 146 54 37 38.4
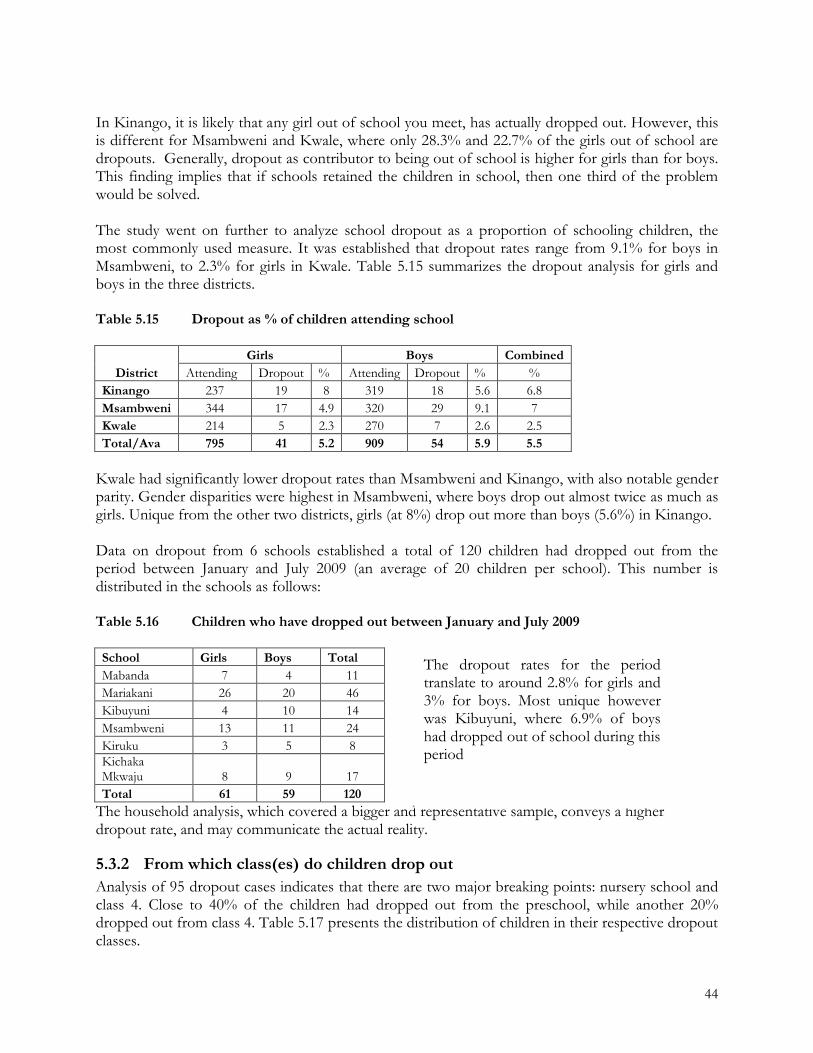
44
In Kinango, it is likely that any girl out of school you meet, has actually dropped out. However, this is different for Msambweni and Kwale, where only 28.3% and 22.7% of the girls out of school are dropouts. Generally, dropout as contributor to being out of school is higher for girls than for boys. This finding implies that if schools retained the children in school, then one third of the problem would be solved.
The study went on further to analyze school dropout as a proportion of schooling children, the most commonly used measure. It was established that dropout rates range from 9.1% for boys in Msambweni, to 2.3% for girls in Kwale. Table 5.15 summarizes the dropout analysis for girls and boys in the three districts.
Table 5.15 Dropout as % of children attending school
DistrictGirls Boys Combined
Attending Dropout % Attending Dropout % %Kinango 237 19 8 319 18 5.6 6.8Msambweni 344 17 4.9 320 29 9.1 7Kwale 214 5 2.3 270 7 2.6 2.5Total/Ava 795 41 5.2 909 54 5.9 5.5
Kwale had significantly lower dropout rates than Msambweni and Kinango, with also notable gender parity. Gender disparities were highest in Msambweni, where boys drop out almost twice as much as girls. Unique from the other two districts, girls (at 8%) drop out more than boys (5.6%) in Kinango.
Data on dropout from 6 schools established a total of 120 children had dropped out from the period between January and July 2009 (an average of 20 children per school). This number is distributed in the schools as follows:
Table 5.16 Children who have dropped out between January and July 2009
School Girls Boys TotalMabanda 7 4 11Mariakani 26 20 46Kibuyuni 4 10 14Msambweni 13 11 24Kiruku 3 5 8Kichaka Mkwaju 8 9 17Total 61 59 120
The household analysis, which covered a bigger and representative sample, conveys a higher dropout rate, and may communicate the actual reality.
5.3.2 From which class(es) do children drop outAnalysis of 95 dropout cases indicates that there are two major breaking points: nursery school and class 4. Close to 40% of the children had dropped out from the preschool, while another 20% dropped out from class 4. Table 5.17 presents the distribution of children in their respective dropout classes.
The dropout rates for the period translate to around 2.8% for girls and 3% for boys. Most unique however was Kibuyuni, where 6.9% of boys had dropped out of school during this period

45
Table 5.17 Classes from which children dropped out
District Gender Class at which X dropped out (classes 1 to 8)Pre-
school1 2 3 4 5 6 7 8 Form 1
TotalKinango Male 7 - 2 - 9 - - - - - 18
Female 13 - - 2 4 - - - - 19Total 20 - 2 2 13 - - - - - 37
Msambweni Male 12 3 2 4 4 2 1 0 1 0 29Female 4 3 0 2 2 2 1 1 1 1 17Total 16 6 2 6 6 4 2 1 2 1 46
Kwale Male - - - - - 3 4 - - 0 7Female - - - - - 1 2 - - 2 5Total - - - - - 4 6 - - 2 12
Total 36 6 4 8 19 8 8 1 2 3 95% 37.9 6.3 4.2 8.4 20 8.4 8.4 1.1 2.1 3.2 100
5.3.3 Influences on dropoutBoth the household and school studies established various factors that lead to children dropping out. School costs, often referred to as indirect (non-fees) costs were identified as the leading factor. Other factors included truancy (child does not want to learn), negative attitudes towards education and poor role modeling, pregnancy and early marriage, child labor and HIV and AIDS. Table 5.18summarizes the key reasons why children dropped out, from the household study.
Table 5.18 Major reasons why children dropped out
Reasons for X dropping out
District
Kinango Msambweni Kwale
Male Female Male Female Male Female Total %Sickness - 2 1 2 - - 5 6.8Lack of funds (PTA)
18 14 11 5 - -
48 65.8Peer influence - 2 1 - - - 3 4.1Does not want to learn
- - 2 3 6 2
13 17.8Lack of food - - 1 1 - - 2 2.7Pregnancy - - - 2 - - 2 2.7
This analysis points to two major reasons: lack of funds and truancy. Interestingly, issues of children dropping out of school to go and work, or early marriage and pregnancy did not emerge from the household study.

46
In another question, class teachers were engaged to identify reasons why children have dropped out from their classes (class five and form two). Table 5.19 presents an analysis from eight primary and four secondary school teachers.
Table 5.19 ‘Gendered’ reasons why children have dropped out of your class
Primary Sch. Secondary Sch.
Girls Boys Girls BoysPregnancy 8 0 4 0Early Marriage 3 1 2 0Maturation 3 2 3 1Peer Pressure 2 6 2 4Lured by men 3 0 3 0Drugs 0 2 0 2Low value for ed 6 7 2 3Low parental ed 1 4 1 3Sickness - - 3 0Truancy - - 0 1Distance to school 2 1 3 1Domestic issues 7 7 - -
Schooling costsDespite the Free Primary and Subsidized secondary education, schooling costs are a dominant factor why children drop out of school in Kwale, Msambweni and Kinango. Emphasizing on this factor, one head teacher exclaimed:
With the free education? There is nothing really free. The parents have been forced to bear the burden of exam fees, tuition fee for upper classes among other costs. There are some children I may not say exactly how many unless I go through every class register who have completely left school because they cannot afford to pay for any levies (HT Matuga).
At another day secondary school, where indeed students are expected to pay nothing as per the policy, several students were identified as being on and off school, as the principal expressed it:
The main reason here is lack of school fees. Despite the Government funding which is never adequate and sometimes never comes, and the children are forced to pay instead because the school has to run anyway. Most of the children who cannot pay are often on and off the school even for a month or two in a term… (Principal, Mangawani).
These cases were repeated in every school that was covered by the study. A deeper analysis of the schooling costs is presented in the section on school costs.
Child laborPositioning of the districts along the coastal line, and along the two major highways (Nairobi-Mombasa and Mombasa-Lunga Lunga) was seen to present unique vulnerabilities to the children in schools. This vulnerability is linked to the notion of quick money and easy life, which have been seen as major pull factors to child labor in the region. One informant vividly summarized the engagement of children in child labor:
All teachers identified pregnancy as the leading factor for girls in both primary andsecondary school. While domestic issues were identified as a key factor for both boys and girls in primary school, peer pressure was seen as the most influential factor for boys in secondary school. The other key factor was low value for education
47
…there is a problem along the highway to do with the girls and truck drivers. You see, these girls are poor, and therefore wanaenda kujitafutia [they go to fend for themselves]. In some cases, parents even encourage it. I was told of a girl who went to ask her grandmother for money to buy oil, and the old woman told her that she was sitting on the money. She stood up to check for the money and the grandmother told her that when she stands it is between her legs. Now, you can imagine that kind of advice coming from a guardian. Girls who have matured are seen to be big enough to take care of themselves by going out to look. Even one time I had a report here of a 15 year old girl dropping out of school here, and the parent was encouraging. a girl drops out and goes to Mombasa where she plays around and then eventually finds an old mzungu who marries her and then they go to Germany (DEO Kinango, July 21, 2009).
This account highlights the role played by parents and by communities in encouraging worst forms of child labor, especially child sexual exploitation of girls. Also in Kwale and Msambweni, cases were narrated of girls who had left school to either move to Mombasa to look for money, while others sprawled along the beaches hoping to get white boyfriends (tourists). Emphasizing on this notion of easy life, a teacher put it: some girls have come here and told me: teacher you are going to die poor. Wait until soon, when we catch white boyfriends. We shall come and carry you in our car… (Teacher, Kaya Tiwi Secondary, July 23, 2009). Just as the case of Kinango, this account presents certain legitimization of child sex, and indeed worrying trend. Besides sex and tourism, girls were reported to have left schools to work as child domestic workers in Mombasa.
On the other hand, boys were found to engage in tasks that were seen to bring in easier money, than the long, laborious schooling process,
Some boys would prefer income generating activities like operating boda boda and they are able to get quick money. Due to shortage of water in the area, some prefer to fetch water for people at the cost of 30 shillings per jerican. At the end of the day they will have made some money and this hunger for quick cash keeps them out of school and eventually they drop out (Teacher, Matuga primary, July 22, 2009).
At the coastal secondary schools like Kaya Tiwi and Msambweni, boys were also said to be working as beach boys, looking for white women. The rates of engagement in this activity were however much lower than girls.
Pregnancy and early marriageAnother vulnerability of girls that was expressed relates to pregnancy and early marriage. As noted above in the quantitative analysis (Table 5.19), pregnancy is a prevalent phenomenon in both the secondary and primary schools. In Kinango, the DEO explained that 32 cases of pregnancy had been reported within September to December 2008 timeframe. The office further acknowledged that these were only some of the cases. In Kwale, most of the schools visited had cases of girls who had fallen pregnant. Some of them had come back to school after delivery, while others, due to perceived shame and stigma, stayed away. The prevalence of pregnancy was blamed on social events and social organization, as the DEO of Kwale stated it:
Most girls are dropping our due to pregnancies and early marriages. For instance during the three weeks of funeral (mourning) and night discos in wedding, many girls of school age get pregnant. An example is the Bakaanda Primary school where 5-6 pregnancy dropout cases have been reported this term (DEO Kwale, July 21, 2009).
48
Though the policy of going back to school for young mothers was being enforced, and indeed many mothers were encountered in the schools, some girls made choices not to rejoin school, while others were offered off for marriage after child delivery.
Negative attitudes towards education and poor role modeling
The study established negative attitude and poor role modeling as another prominent factor for school drop-out. The anticipated outcomes of education were rather low, as compared to other avenues for economic empowerment like employment or getting married to a tourist. One class teacher, who took it upon herself to establish why many children were not going to school in Mangawani reported hostile reactions from parents: “mimi sikusoma na ninakula” [I didn’t go to school, but still can get food to eat]. The teacher regretted: ..hearing such a statement from a mother really carries a lot of weight. Even children will never wish to come to school if they hear such statements.
This view had influenced formation of negative attitudes towards education in the communities, and had in turn affected children’s view of schooling, as one teacher at Kaya Tiwi informed,
Our girls here have very low self-motivation to succeed in their academic life. They seem not to understand why they are in school, may be some of them are forced by their parents to be here or else they would be elsewhere like at the beach moving around with white men as it is always the wish of every girl here to have a ‘Mzungu’ boyfriend. I can actually say this tourism industry at the Coast region has stolen away our girls from school (July 23rd 2009).
Similarly, this set of mind was also seen to affect boys, in that …there is also the belief that there is no formal employment after schooling. Most of our boys would opt to miss school and go and be beach boys and move around with white women (Principal Mangawani secondary, July 24, 2009).
Alongside this, arguments were advanced, that girls who get married to tourists have become the only role models, as expressed by this informant:
…she returns a few years later [after moving with the boyfriend to Europe] looking very rich and together with her boyfriend or husband, they decide to donate money to build a classroom in a school. Now where do you place such a classroom? In fact sometimes you don’t even know that it is being built, you just see it there. Now, the children do not admire the classroom, but they want to be like the person who has built it, and they know she has no education. So, what is the need to study and you have been shown the route to follow? There is very little to emulate (DEO Kinango, July 21, 2009).
Indeed, suggestions were being advanced, to the effect that these ‘role models’ should be restrained from engaging in school development, since their ‘negative role modeling’ had more far reaching impact than the inadequacy of classrooms. The scarcity of role models was an outcry in all three districts. In Kinango, the DEO claimed to have been trying to get ladies from here to sensitize girls. Last year we had five schools with no single female candidate, while candidacy for KCPE recorded 1,951 boys, against only 1,000 girls. The rate at which girls were dropping out in upper classes was an increasing concern.
Further on, it was established that boys who dropped out to look for money, and ended up as touts or other money-making activities in the community, served as magnets for the girls they left in school: one girl just dropped out recently and got married to a matatu tout, these are the people they admire in the community, they are their role models (Deputy Principal, Kaya Tiwi, July 23, 2009).

49
Truancy
As indicated in the statistical analysis, many children did not want to learn. Cases were told of children who just opted out of school, and did not want to disclose the reason. Indiscipline was high, as one teacher noted: last year, I had two girls who were quite undisciplined. They could not listen to me as their class teacher nor even their parents who had given up on them. They used to miss school on several occasions and they eventually dropped out and I don’t even know where they are (Class teacher, Mangawani Secondary, 24th July 2009).
At Samburu secondary school, this case was narrated:…there is a boy who dropped out simply because he did not want to miss football matches for his village team. And also whenever there were any of these big games playing like Manchester united or arsenal, the boy would miss school because he had to go to look for somewhere to watch the matches. We tried to talk to him, to call the parents, but eventually he left and preferred to be available for his football team in the village (Principal, Samburu Sec., July 23, 2009).
Case 1: Musau, 14 yrs old, Kibuyuni village, Kwale
Aged 14 years, Musau, was a class three pupil at Kibuyuni primary school, having already repeated three grades. The parents separated in 2008. The father re-married and moved to Mombasa, while the mother left to do business in a far-off small town. Musau and his younger brother chose to remain with their paternal grandparents, as they continued with school. One day, their mother re-appeared, and said that she was going to take them with her, and that she would take them to school where she lived. They went with her, and after staying for sometime, they realized that the mother was not taking them to school as promised. So one day, they escaped and went back to their grandparents. The younger brother went back to school, while Musau claimed that he had finished school, and was not going to back to school again. Now he looks after his grandfather’s cows, and does not intend to go back to school.
Drug abuse
In secondary school, many boys were reported to leave school due to addiction to drugs. One headteacher in Msambweni expressed:
One of the biggest problems is drugs. Many of these boys have been abusing drugs. Msambweni is a very unique town. The children use even hard drugs. The commonly used drugs by the children are ‘kuberi’ and bhang. These drugs are readily sold in the shops. There are two form 2 boys who have left school in this year and they happen to be victims of this ‘Kuberi’. We know this because their parents came and reported this to the school administration (Headteacher, Msambweni secondary).
In Kaya Tiwi, boys were reported to be using drugs, especially alcohol, and this affected their school progress and sometimes had led to dropout.
HIV and AIDS
To a limited extent, HIV and AIDS was identified as a cause for school dropout. In Matuga, the school noted that they had a number of orphans who were serving as family heads. Some, especially those who were older, had left school to engage in wage labor, so as to support their siblings.
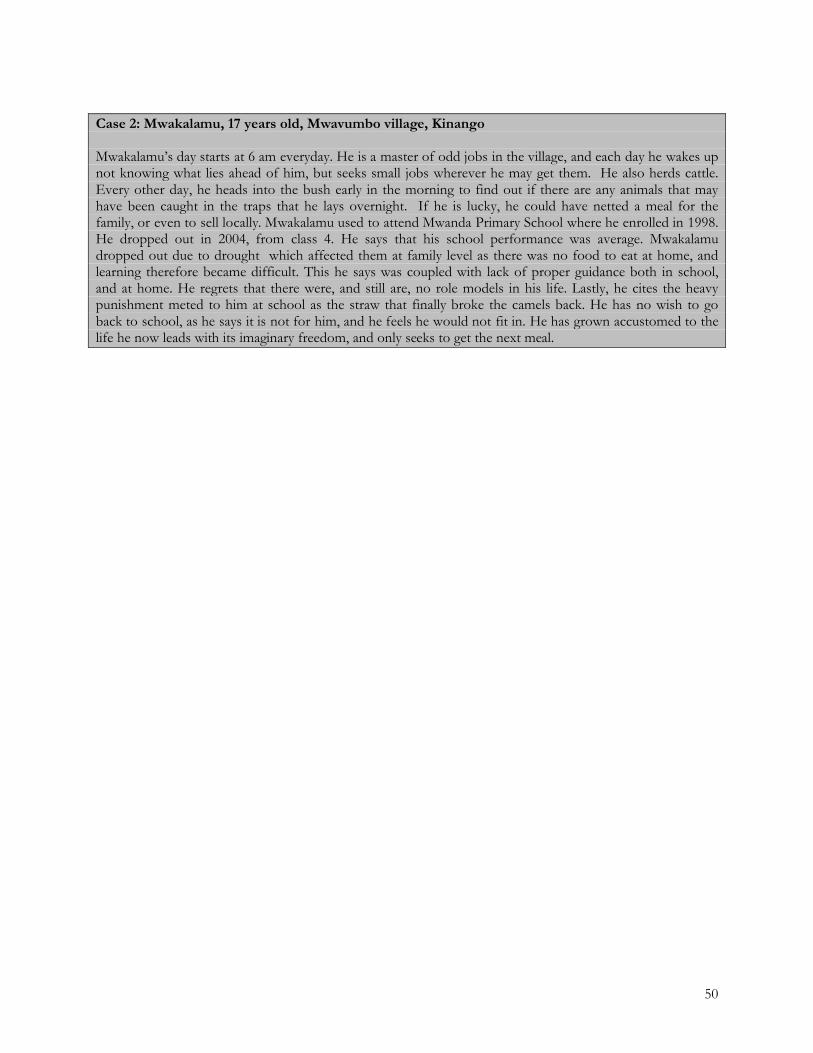
50
Case 2: Mwakalamu, 17 years old, Mwavumbo village, Kinango
Mwakalamu’s day starts at 6 am everyday. He is a master of odd jobs in the village, and each day he wakes up not knowing what lies ahead of him, but seeks small jobs wherever he may get them. He also herds cattle. Every other day, he heads into the bush early in the morning to find out if there are any animals that may have been caught in the traps that he lays overnight. If he is lucky, he could have netted a meal for the family, or even to sell locally. Mwakalamu used to attend Mwanda Primary School where he enrolled in 1998. He dropped out in 2004, from class 4. He says that his school performance was average. Mwakalamu dropped out due to drought which affected them at family level as there was no food to eat at home, and learning therefore became difficult. This he says was coupled with lack of proper guidance both in school, and at home. He regrets that there were, and still are, no role models in his life. Lastly, he cites the heavy punishment meted to him at school as the straw that finally broke the camels back. He has no wish to go back to school, as he says it is not for him, and he feels he would not fit in. He has grown accustomed to the life he now leads with its imaginary freedom, and only seeks to get the next meal.
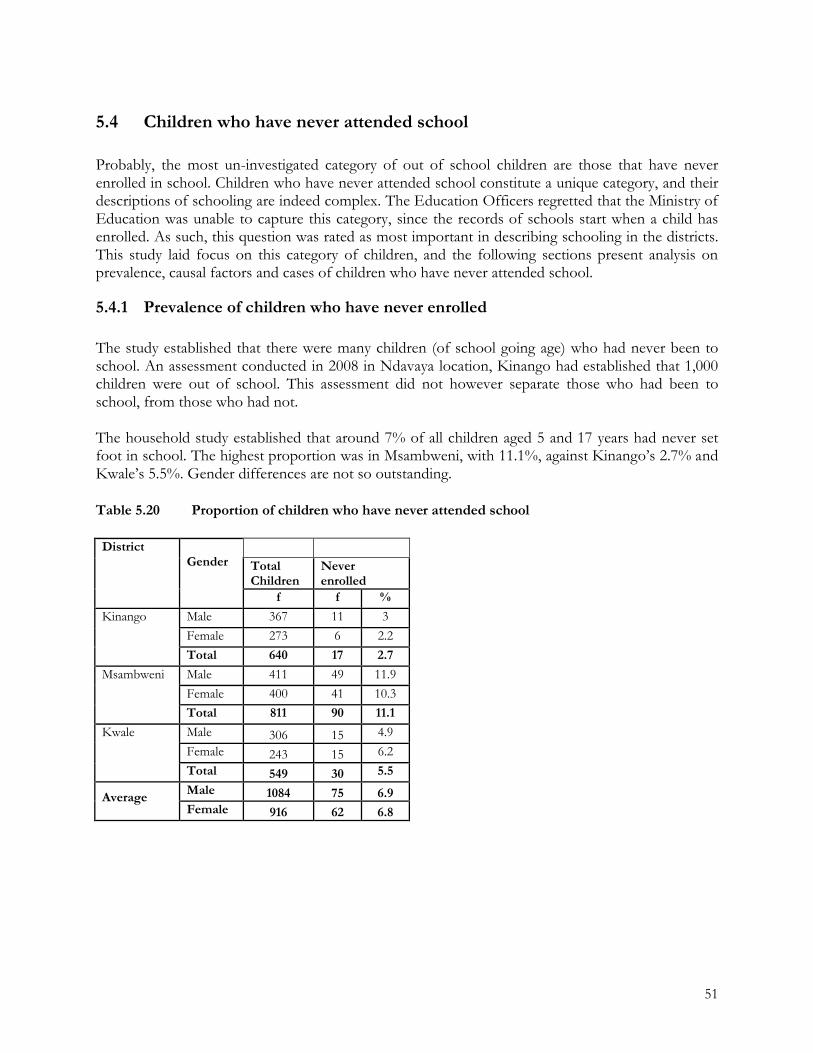
51
5.4 Children who have never attended school
Probably, the most un-investigated category of out of school children are those that have never enrolled in school. Children who have never attended school constitute a unique category, and their descriptions of schooling are indeed complex. The Education Officers regretted that the Ministry of Education was unable to capture this category, since the records of schools start when a child has enrolled. As such, this question was rated as most important in describing schooling in the districts. This study laid focus on this category of children, and the following sections present analysis on prevalence, causal factors and cases of children who have never attended school.
5.4.1 Prevalence of children who have never enrolled
The study established that there were many children (of school going age) who had never been to school. An assessment conducted in 2008 in Ndavaya location, Kinango had established that 1,000 children were out of school. This assessment did not however separate those who had been to school, from those who had not.
The household study established that around 7% of all children aged 5 and 17 years had never setfoot in school. The highest proportion was in Msambweni, with 11.1%, against Kinango’s 2.7% and Kwale’s 5.5%. Gender differences are not so outstanding.
Table 5.20 Proportion of children who have never attended school
District Gender Total
ChildrenNever enrolled
f f %
Kinango Male 367 11 3Female 273 6 2.2Total 640 17 2.7
Msambweni Male 411 49 11.9Female 400 41 10.3Total 811 90 11.1
Kwale Male 306 15 4.9Female 243 15 6.2Total 549 30 5.5
Average Male 1084 75 6.9Female 916 62 6.8

52
5.4.2 Influence factors on non-enrollingLike absenteeism and dropout, the main reason given as to why 115 children had never enrolled in a school was lack of funds, cited by around 70% of the respondents. Other reasons included ignorance and beliefs held by parents, distance to school, disability as well as the conflicting religious values and Islamic bias against secular education. Table 5.21 summarizes responses on why children had never enrolled in any school.
Table 5.21 Reasons for non-enrolment
Reasons for never enrolling
District
Kinango Msambweni Kwale Male Female Male Female Male Female Total %
Lack of funds 5 - 27 31 4 12 79 68.7Under age 4 - 0 2 - - 6 5.2Mental handicap - 2 0 1 - - 3 2.6Father/guardian ignorance - - 3 4 - - 7 6.1No reason - - 4 0 - - 4 3.5Distance to school - - 3 1 1 - 5 4.3Few admission slots - - 5 3 - - 8 7Decision of the father - - 2 1 - - 3 2.6Total 9 2 44 43 5 12 115
Stressing on the issue of schooling costs, one parent emphasized: we are told that before a child is enrolled in the nursery school, we must be ready to pay money for the teacher. I have been waiting until I am ready to raise this money, although my two children (twins) are now heading to 7 years (Mother, Msumbe Village, Kwale). In Msambweni, many parents complained about the ever-escalating costs, noting that it was becoming almost impossible for poor parents to afford education.
Parents’ ignorance and low literacyLow levels of parents’ education, as noted earlier in the analysis, have been attributed to non-enrolling of children in school. It was established that many parents, especially in rural communities hardly understand the importance of education and see no reason for taking their children to school. Coupled with this, they assign children domestic tasks at very tender age, like guarding rice fields against destruction by birds, taking care of younger siblings and so on (Head teacher, Kiriku primary). Such parents would rather have children working for them, and perceive schooling as conflicting with children’s traditional roles.
The religious factor
Repeatedly, adherence to the Islamic system was seen as a major cause for non-enrolment to formal schools. Some parents preferred Islamic education over the regular school, and ended up not enrolling their children at all. However, such parents enrolled their children in madrassa, and hence these may not qualify as children who have never attended school.
Distance to schoolAs earlier observed, some villages studied were poorly served by the network of schools, with some schools being as far as 8 kilometers away. In such a case, parents had no choice but to keep children

53
at home, until they are of age at which they could cover such distances. Still, secondary schools were too far apart for some villages, and children ended giving up on ever joining secondary school.
Nomadic lifestyle
The drier parts of Kinango and Msambweni, and along the Tanzanian border, are occupied by the Maasai. The DC of Msambweni blamed non-enrolment in Lunga Lunga division to the Maasai lifestyle of moving from place to place. When this is happening, hardly do they take any child to school. Incidentally, some of these areas are considered as arid, and mobile schools were not a feature of Msambweni.
Cultural beliefs
Witchcraft and some cultural beliefs were also found to carry blame on non-enrolment of children. One informant narrated:
… in Mbuguni area there is a lot of belief in witchcraft. There was a case of a boy who was told by the neighbor that he would be bewitched if he goes to school. So, the boy had not gone to school. (DO, Matuga Division, 21 July 2009).
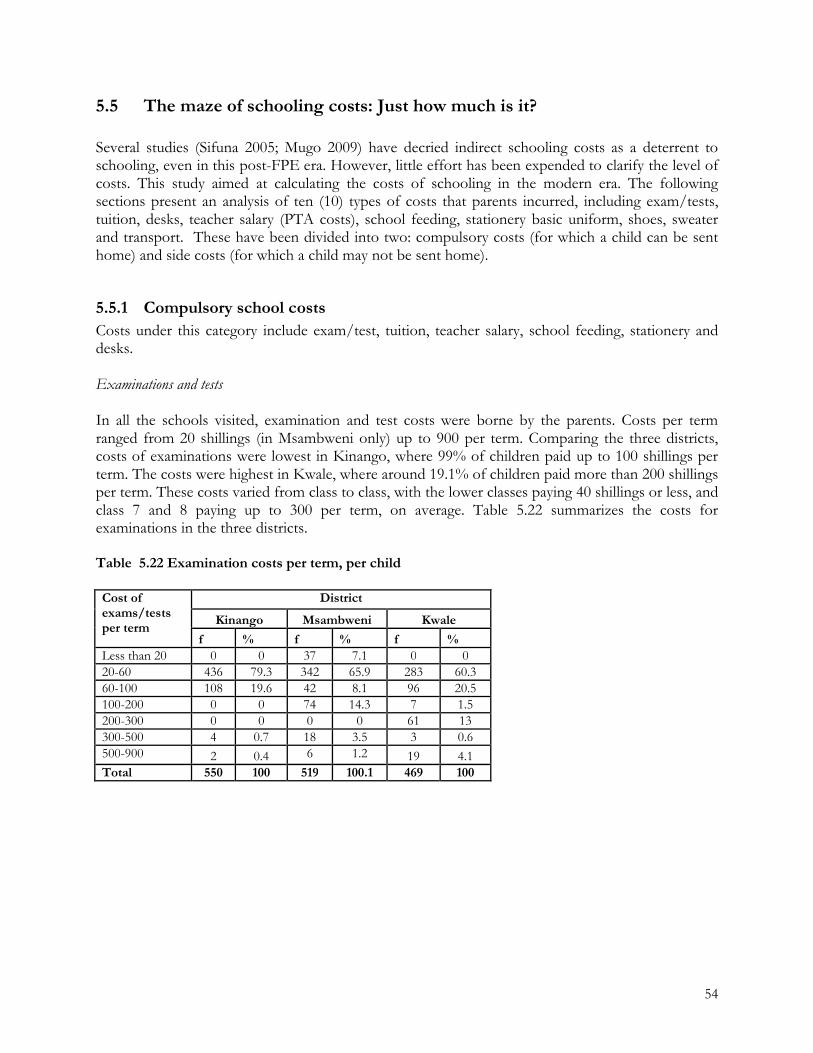
54
5.5 The maze of schooling costs: Just how much is it?
Several studies (Sifuna 2005; Mugo 2009) have decried indirect schooling costs as a deterrent to schooling, even in this post-FPE era. However, little effort has been expended to clarify the level of costs. This study aimed at calculating the costs of schooling in the modern era. The following sections present an analysis of ten (10) types of costs that parents incurred, including exam/tests, tuition, desks, teacher salary (PTA costs), school feeding, stationery basic uniform, shoes, sweater and transport. These have been divided into two: compulsory costs (for which a child can be sent home) and side costs (for which a child may not be sent home).
5.5.1 Compulsory school costsCosts under this category include exam/test, tuition, teacher salary, school feeding, stationery and desks.
Examinations and tests
In all the schools visited, examination and test costs were borne by the parents. Costs per term ranged from 20 shillings (in Msambweni only) up to 900 per term. Comparing the three districts, costs of examinations were lowest in Kinango, where 99% of children paid up to 100 shillings per term. The costs were highest in Kwale, where around 19.1% of children paid more than 200 shillings per term. These costs varied from class to class, with the lower classes paying 40 shillings or less, and class 7 and 8 paying up to 300 per term, on average. Table 5.22 summarizes the costs for examinations in the three districts.
Table 5.22 Examination costs per term, per child
Cost of exams/tests per term
District
Kinango Msambweni Kwale
f % f % f %Less than 20 0 0 37 7.1 0 020-60 436 79.3 342 65.9 283 60.360-100 108 19.6 42 8.1 96 20.5100-200 0 0 74 14.3 7 1.5200-300 0 0 0 0 61 13300-500 4 0.7 18 3.5 3 0.6500-900 2 0.4 6 1.2 19 4.1Total 550 100 519 100.1 469 100
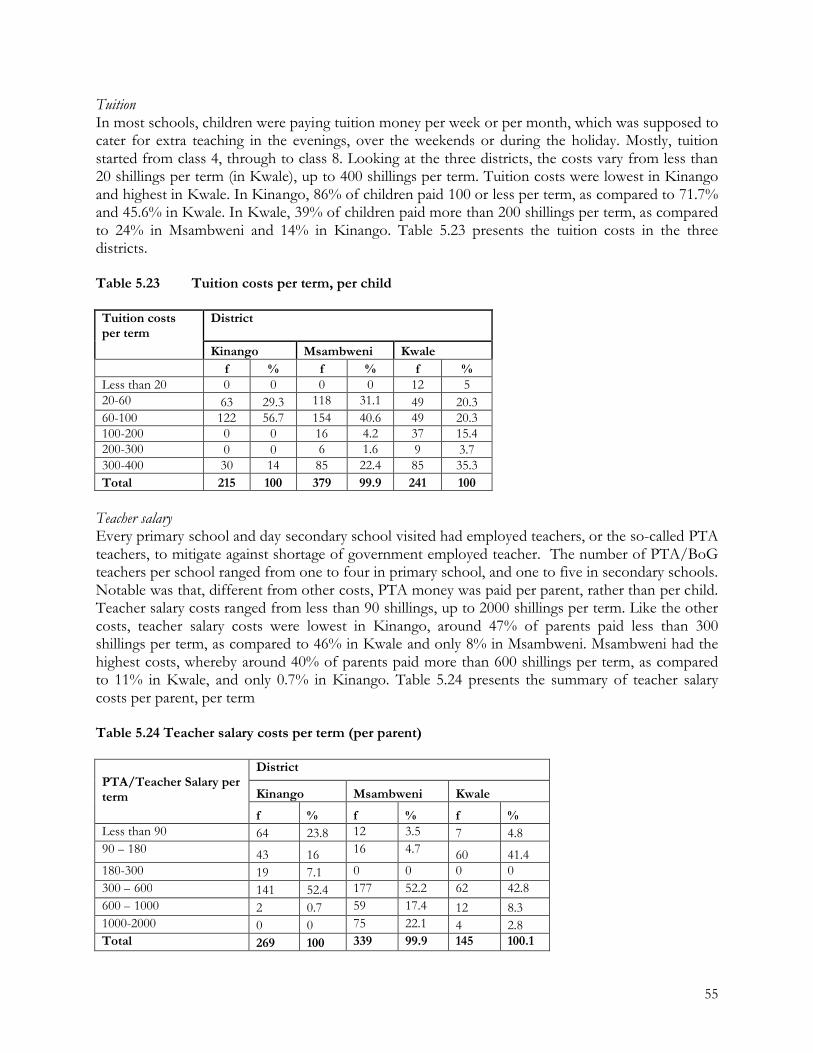
55
TuitionIn most schools, children were paying tuition money per week or per month, which was supposed to cater for extra teaching in the evenings, over the weekends or during the holiday. Mostly, tuition started from class 4, through to class 8. Looking at the three districts, the costs vary from less than 20 shillings per term (in Kwale), up to 400 shillings per term. Tuition costs were lowest in Kinango and highest in Kwale. In Kinango, 86% of children paid 100 or less per term, as compared to 71.7% and 45.6% in Kwale. In Kwale, 39% of children paid more than 200 shillings per term, as compared to 24% in Msambweni and 14% in Kinango. Table 5.23 presents the tuition costs in the three districts.
Table 5.23 Tuition costs per term, per child
Tuition costs per term
District
Kinango Msambweni Kwale f % f % f %
Less than 20 0 0 0 0 12 520-60 63 29.3 118 31.1 49 20.360-100 122 56.7 154 40.6 49 20.3100-200 0 0 16 4.2 37 15.4200-300 0 0 6 1.6 9 3.7300-400 30 14 85 22.4 85 35.3Total 215 100 379 99.9 241 100
Teacher salaryEvery primary school and day secondary school visited had employed teachers, or the so-called PTA teachers, to mitigate against shortage of government employed teacher. The number of PTA/BoGteachers per school ranged from one to four in primary school, and one to five in secondary schools. Notable was that, different from other costs, PTA money was paid per parent, rather than per child. Teacher salary costs ranged from less than 90 shillings, up to 2000 shillings per term. Like the other costs, teacher salary costs were lowest in Kinango, around 47% of parents paid less than 300 shillings per term, as compared to 46% in Kwale and only 8% in Msambweni. Msambweni had the highest costs, whereby around 40% of parents paid more than 600 shillings per term, as compared to 11% in Kwale, and only 0.7% in Kinango. Table 5.24 presents the summary of teacher salary costs per parent, per term
Table 5.24 Teacher salary costs per term (per parent)
PTA/Teacher Salary per term
District
Kinango Msambweni Kwale
f % f % f %Less than 90 64 23.8 12 3.5 7 4.890 – 180 43 16 16 4.7 60 41.4180-300 19 7.1 0 0 0 0300 – 600 141 52.4 177 52.2 62 42.8600 – 1000 2 0.7 59 17.4 12 8.31000-2000 0 0 75 22.1 4 2.8Total 269 100 339 99.9 145 100.1

56
School feeding costs
Most of the schools visited, both primary and secondary, were running feeding programs. While the food was donated from the World Food Program, through the ministry, parents had to contribute the structures for cooking, firewood, water and labor. Notably, most schools with feeding programs were in Kinango, followed by Kwale, while lest schools with feeding programs were in Msambweni. Feeding costs ranged from less than 20 (in Kinango) to over 700 in some secondary schools in Msambweni and Kwale. As per the trend, feeding costs were lowest in Kwale, where 85% of parents paid up to 60 shillings per term, as compared to 42% in Msambweni and only 11.5% in Kwale. No school was charging more than 100 shillings per term in Kinango. To the contrary, 28% and 26% were paying more than 200 shillings in Msambweni and Kwale respectively. Table 5.25 summarizes the feeding costs in schools in the three districts.
Table 5.25 School feeding costs per term, per parent
School feedingCosts per term
District
Kinango Msambweni Kwale
f % f % F %Less than 20 52 9.5 0 0 4 120-60 415 75.5 47 42.3 41 10.560-100 83 15 20 18 101 25.8100-150 0 0 13 11.7 143 36.5200-300 0 0 1 0.9 84 21.4500-700 0 0 24 21.6 10 2.6Over 700 0 0 6 5.4 9 2.3Total 550 100 111 100 392 100
Stationery costs
Even though stationery is covered under FPE, and indeed all children confirmed receiving stationeryfrom their schools, many children (especially those in upper classes) claimed that what they received was not adequate to push them through the whole term. As such, parents confirmed spending money to buy exercise books, pens and pencils. These costs ranged from less than 20 shillings per term in nursery schools, to as much as 300-700 shillings in Msambweni. Parents in Kinango incurred least on stationery, while those in Msambweni spent most. In Kinango, around 94% of children spent less than 100 shillings per term on stationeries, as compared to 70% in Kwale and only 48% in Msambweni. On the other hand, 20% of children in Kwale spent more than 200 shillings per term, followed by 18% of children in Msambweni. Table 5.26 outlines the amount of money that each child spent on stationeries per term in the three districts.

57
Table 5.26 Stationery costs per term, per child
Stationery costs per term
District
Kinango Msambweni Kwale Per term f % f % F %Less than 20 0 0 1 0.6 7 4.620-60 36 34.3 36 21.3 45 29.660-100 63 60 44 26 54 35.5100-200 0 0 57 33.7 16 10.5200-300 6 5.7 2 1.2 30 19.7300-700 0 0 29 17.2 0 0Total 105 100 169 100 152 100
Desks
Though desks were not a conventional cost, a few schools were found to be charging children. Such costs were mostly one-off, imposed upon admission. In total, 48 children reported to have paid for desks in their school. The few children reported to have paid between 20 and 300 shillings. Table 5.27 summarizes the costing of desks charges in the three districts.
Table 5.27 Charges for desks
Costs for desks per term District
Kinango Msambweni Kwale f f F
20-60 1 16 660-100 0 5 10100-200 0 0 8200-300 0 0 2Total 1 21 26
5.5.2 Side school costsIn this study, side school costs are defined to include basic uniform (shirt/shorts, blouse/skirt), shoes, sweater and transport costs.
Basic uniform
All schools visited had the uniform as norm, and most children were in proper school uniform. While girls mostly wore skirts or dresses with plain blouses, boys wore pairs of shorts and shirts. It should be noted that even when uniforms were not compulsory, children felt out of place and faced the risk of stigma, if they appeared in home clothes or in torn uniforms. As such, uniforms served a psychological-social function, which cannot be overlooked. A pair of uniforms, which would last up to one year, costs from 200 shillings, depending on the material, and whether new or second hand. As usual, parents paid more in Msambweni and Kwale, and less in Kinango. The highest amount spent on one child’s uniform per year was up to 700 shillings in Kinango, as compared to up to 2000 shillings in the other two districts. Table 5.28 summarizes the costs of uniform per child per year.
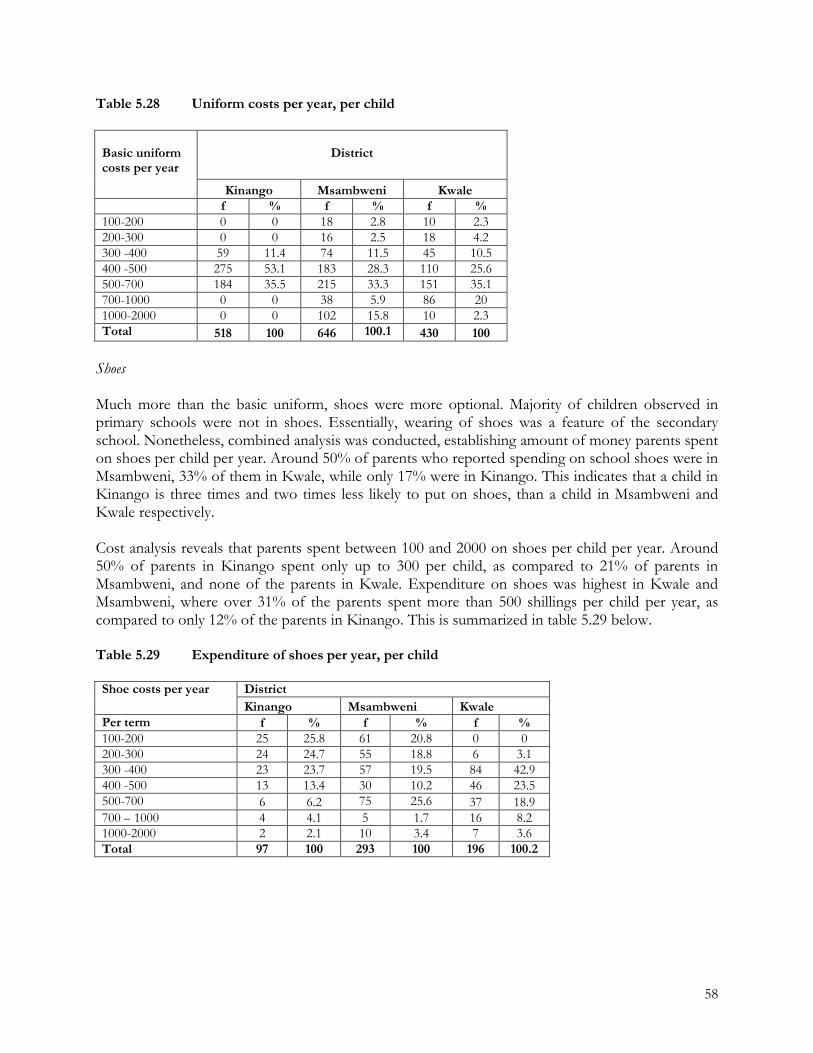
58
Table 5.28 Uniform costs per year, per child
Basic uniform costs per year
District
Kinango Msambweni Kwalef % f % f %
100-200 0 0 18 2.8 10 2.3200-300 0 0 16 2.5 18 4.2300 -400 59 11.4 74 11.5 45 10.5400 -500 275 53.1 183 28.3 110 25.6500-700 184 35.5 215 33.3 151 35.1700-1000 0 0 38 5.9 86 201000-2000 0 0 102 15.8 10 2.3Total 518 100 646 100.1 430 100
Shoes
Much more than the basic uniform, shoes were more optional. Majority of children observed in primary schools were not in shoes. Essentially, wearing of shoes was a feature of the secondary school. Nonetheless, combined analysis was conducted, establishing amount of money parents spent on shoes per child per year. Around 50% of parents who reported spending on school shoes were in Msambweni, 33% of them in Kwale, while only 17% were in Kinango. This indicates that a child in Kinango is three times and two times less likely to put on shoes, than a child in Msambweni and Kwale respectively.
Cost analysis reveals that parents spent between 100 and 2000 on shoes per child per year. Around 50% of parents in Kinango spent only up to 300 per child, as compared to 21% of parents in Msambweni, and none of the parents in Kwale. Expenditure on shoes was highest in Kwale and Msambweni, where over 31% of the parents spent more than 500 shillings per child per year, as compared to only 12% of the parents in Kinango. This is summarized in table 5.29 below.
Table 5.29 Expenditure of shoes per year, per child
Shoe costs per year District Kinango Msambweni Kwale
Per term f % f % f %100-200 25 25.8 61 20.8 0 0200-300 24 24.7 55 18.8 6 3.1300 -400 23 23.7 57 19.5 84 42.9400 -500 13 13.4 30 10.2 46 23.5500-700 6 6.2 75 25.6 37 18.9700 – 1000 4 4.1 5 1.7 16 8.21000-2000 2 2.1 10 3.4 7 3.6Total 97 100 293 100 196 100.2
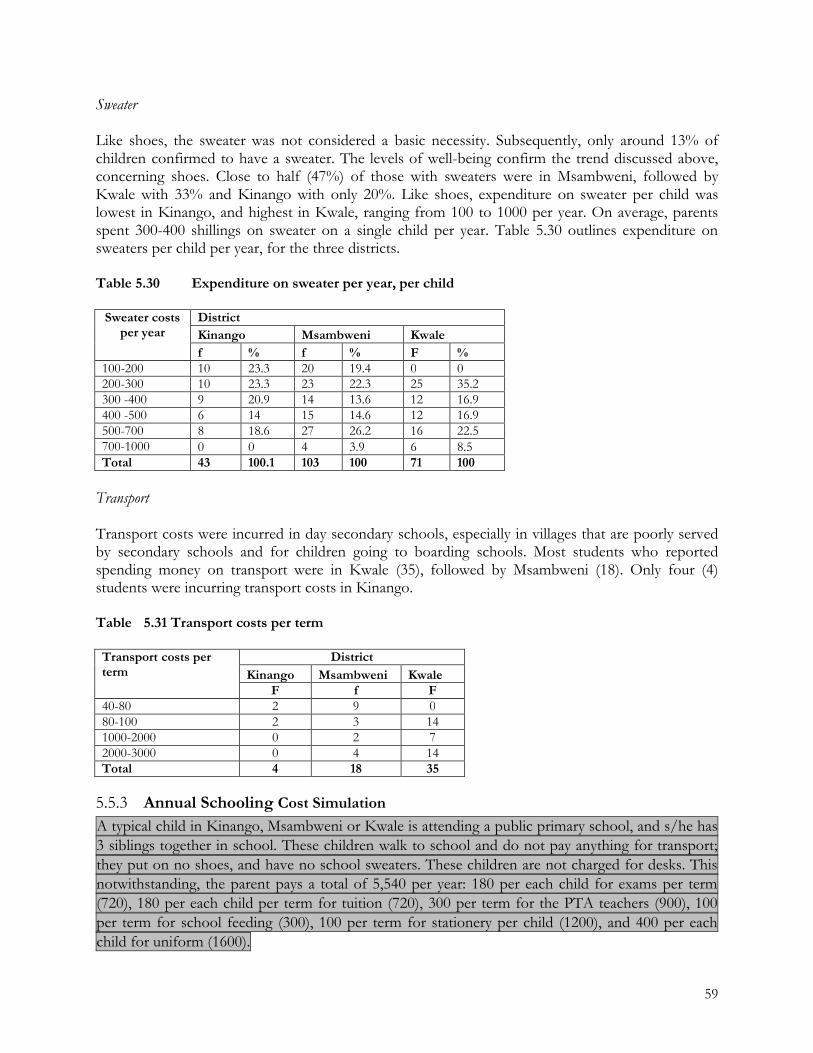
59
Sweater
Like shoes, the sweater was not considered a basic necessity. Subsequently, only around 13% of children confirmed to have a sweater. The levels of well-being confirm the trend discussed above, concerning shoes. Close to half (47%) of those with sweaters were in Msambweni, followed by Kwale with 33% and Kinango with only 20%. Like shoes, expenditure on sweater per child was lowest in Kinango, and highest in Kwale, ranging from 100 to 1000 per year. On average, parents spent 300-400 shillings on sweater on a single child per year. Table 5.30 outlines expenditure on sweaters per child per year, for the three districts.
Table 5.30 Expenditure on sweater per year, per child
Sweater costs per year
District Kinango Msambweni Kwale f % f % F %
100-200 10 23.3 20 19.4 0 0200-300 10 23.3 23 22.3 25 35.2300 -400 9 20.9 14 13.6 12 16.9400 -500 6 14 15 14.6 12 16.9500-700 8 18.6 27 26.2 16 22.5700-1000 0 0 4 3.9 6 8.5Total 43 100.1 103 100 71 100
Transport
Transport costs were incurred in day secondary schools, especially in villages that are poorly served by secondary schools and for children going to boarding schools. Most students who reported spending money on transport were in Kwale (35), followed by Msambweni (18). Only four (4) students were incurring transport costs in Kinango.
Table 5.31 Transport costs per term
Transport costs per term
DistrictKinango Msambweni Kwale
F f F40-80 2 9 080-100 2 3 141000-2000 0 2 72000-3000 0 4 14Total 4 18 35
5.5.3 Annual Schooling Cost SimulationA typical child in Kinango, Msambweni or Kwale is attending a public primary school, and s/he has3 siblings together in school. These children walk to school and do not pay anything for transport;they put on no shoes, and have no school sweaters. These children are not charged for desks. Thisnotwithstanding, the parent pays a total of 5,540 per year: 180 per each child for exams per term(720), 180 per each child per term for tuition (720), 300 per term for the PTA teachers (900), 100per term for school feeding (300), 100 per term for stationery per child (1200), and 400 per eachchild for uniform (1600).
60
5.5.4 Costing systems and procedures
From the look of it, one would rush to conclude that many costs still being borne by parents. Interestingly though, parents and teachers confirmed that systems and procedures followed were as per the policy of the ministry, that the school committee proposes, the PTA endorses, the school management implements. One head teacher explained the process:
We usually call the parents, tell them the problem that we have and ask them to give us the possible solution that solves these problems. For instance they tell us to teach their children over the holidays (tuition) and they give us some “chai” we don’t know Kama ni chai kwenye kikombe au kwenye mfuko” generally they are the ones who give us way forward (Head teacher, Msambweni primary).
Through this process, parents downplay and even defy the ministry’s directives, an example of that on tuition (the Ministry insists that no tuition should take place, while all primary schools visited had one arrangement or the other for tuition).
However, closer analysis, comparing the costs and parents who are able to pay, and keeping in mind that costs were cited as the single most consistent cause for absenteeism, dropout and non-enrolment, there may be possibility, that a few parents endorse decisions for others. As such, the processes of setting costs deserve deeper investigation.

61
5.6 Responsiveness of education programs to excluded children: Effective practices
Besides just focusing on the limitations of schools and their unresponsive nature to vulnerable children, this study went on to investigate locally-initiated interventions that were working to reduce exclusion of vulnerable children from the schools. The study established that much was happening on the ground, but certainly driven by initiative and diligence of leaders, including the local administration, education officers and head teachers. Six dimensions of responsiveness have been identified: school feeding programs, community networking and collaboration, stewardship of local education officers, diligence of school leadership, strengthened tripartite relationships among school communities and focusing on academic improvement. Indeed, the most prominent responsiveness factor identified is leadership, which has been found to rest not on the office, but on the individual.
The following sections present brief accounts of responsiveness, borrowing from identified effective practices.
5.6.1 School feeding programs Probably, schooling feeding is the most obvious and non-innovative aspect of responsiveness. However, no matter how much common it sounds, these programs were found to serve the expected purpose, and acted as magnets for children in all the schools visited. Even in parts of Kwale, where it would be felt that people had enough to eat, school feeding programs were associated with reduced absenteeism, dropout and improved enrolment. One head teacher had noted, that children are pushed to go to school by the parents so that they can get something to eat (Head teacher, Matuga primary).
While food was contributed by the World Food Program, through the Ministry of Education, it was upon the local school communities to implement the program and contribute other program ingredients, including the cooking infrastructure, fuel, water and labor.
5.6.2 Community Networking and CollaborationOne may confidently assert that everyone has an interest in the school, be it the local administration, the village elder, or the local development partners. The school is probably the most powerful networking space at the local level, the convergence point of interests, ranging from religious interests to political and even economic concerns. However, the extent to which these interests are harnessed to serve school’s (rather than self) interest depends entirely on goodwill of present leaders. In this study, several effective practices relating to networking and collaboration were identified and have been documented. This collaboration touches on different government arms, including the provincial administration, police department, constituency development fund and the ministry of health.
62
Reducing distance to schools: the case of Kinango
In Kinango, one challenge to inclusion of vulnerable children has been the long distances to schools. Being a dry area, and hence relatively lower population density, quite a number of villages were poorly served by the network of schools and in some cases, children have to walk up to 8 kilometers to the nearest school. To address this, the District Education Board put building of schools on top of its agenda, to reduce the distances covered by children to school. Over the recent years, and through sustained focus and effort, the number of primary schools in Kinango has increased from 98 to 126, presenting an assumed reduced distance by 29 percent.
School-provincial administration partnershipsOne of greatest problems is the drugs. To curb this problem which has led to many children dropping out of school, I have personally reported this matter to the provincial administration, that is, the likes of chiefs who make follow ups to solve the problem amicably (Msambweni Secondary School). I have taken it upon myself to address the challenges facing education in this area. Some of these touch on lack of female models, and reduced value for girl education. Being a young lady, I hold weekly barazas with the communities, and present advantages of educating the girl child. Besides, we have instituted measures for dealing with parents who are not taking their children to school, getting them in custody to serve as lessons for others. This is slowly improving education standards in the division (District Officer, Matuga Division). We have banned Taarab night dances in the district. During taarab night dances, young girls remove their ‘buibuis’ and go to dance with old, rich men. This is irrespective of whether the following day is a school day or not (District Commissioner, Msambweni).
5.6.3 Stewardship of local education leadersEvery success in reducing exclusion calls for the presence of a strong education leader. For the local education office to be effective, it is paramount that the officers work beyond normal duty, engaging strongly with local communities to solve local problems. Besides just issuing political statements about what the Ministry has planned to do, and policies that have been issued, such a leader engages a partner on the ground. When this happens, likelihood is that resistance of local education programs against imminent challenges is going to be strengthened.
Education leadership in Kwale district
In every zone, we have zonal improvement teams, whose purpose is to shape education therein. Each committee takes turns to invite me so that we can talk together on the education progress of the zone. Last year, we had to use the police to force a boy to do his standard 8 examinations. The boy had been removed from school by the parent and taken from Bakari to Lamu to do some housework for a family. The parent claimed he did not have money for the boy’s secondary schooling. The boy did so well and he got 370 marks and the CDF has assisted him to pay his secondary school fees.
5.6.4 Diligence of school administratorsAt the school level, a progressive head teacher was found to be the most influential determinant of responsiveness. Only by reaching the gate of a school, one was able to tell the quality of headteacher to expect. Good schools. In most schools, the concern of the teacher is the child who has come to school on a certain day. However, proactive systems engage with communities to address the plight of all children of school-going age within their catchment areas. Let us consider the following two practices.

63
Active follow-up on children at risk
We follow up children when they miss school for two to three days. We also involve the provincial administration where there is need to do so (Mabanda primary school).The other thing is making follow-ups on those children who have left school for some reason or another. We make sure that they are brought back to school and this has worked out successfully (Kikoneni primary school).I personally do follow up for any child who shows any signs of truancy which normally leads to dropping out of school. I call the child to my office and talk with him or her at a parent level (Matuga Primary).
A holistic approach: Case of Matuga primary– For young men who are used to impregnating school girls, we put them in and even publicize them
through radio Kaya, which is one of our local radio stations here in Kwale– In terms of any IGAs for the school, the school is already having a Green Project for Casuarina trees
for poles. We hope by selling them we can get money for exams which children are really struggling to pay. We also ensure that there is no child engaging in labor at the cost of education.
– We emphasize on regular school attendance as I normally go round the school every Monday to check on the registers, note the absentees’ especially in upper classes and I personally call them in my office to ask them why they were absent.
– The school committee has come up with a strategy whereby the child who has dropped out is followed up to their home. Using the significant persons like the chiefs and the religious leaders, the parents and child are talked to so as to find out the root cause of dropping out. Eventually the child is convinced back to school
5.6.5 Strengthened tripartite relationships in school communities (Teacher-Parent-Child)
Working closely with parents to address vulnerabilities facing children has been known to deliver positive outcomes. In most schools, less initiative was noted as relates to school-parent partnerships. Most informants just stated it: we call parents and talk to them; we hold meetings with parents and talk about problems; and so on. However, one practice for parent engagement was found quite innovative, at Samburu Secondary school in Kinango.
Work for fees program: Case of Samburu Secondary School
We … have a work program here where we offer menial jobs to poor parents and the money they get paid is used to offset the school fees balance they may have. For example when there is a building to be constructed, we use parents and then pay them for their labor. We also ask the women to fetch firewood for the school, and this money for firewood is used to offset the children’s fees. That way, children don’t have to drop out due to lack of money.
5.6.6 Focusing on academic improvement to reduce exclusionStudies have established a strong relationship between academic failure and school breakage. Subsequently, schools that have paid attention to poorly-performing students as vulnerable students
64
have actually intervened against exclusion. In this study, some schools had laid deliberate focus on promoting poorly-performing students, and mitigating against their vulnerability. This had reduced school dropout.
Mitigating against dropout through improvement of academic standards
For those who tend to lose hope due to their low performance we normally have academic clinics every year for the low performing students and their parents. Sincerely speaking, most parents never follow up the academic performance of their children and most children lie to their parents on their grades. These academic clinics help a lot as the low performing girls feel encouraged and some of them have improved a lot. This has helped to curb dropout rates at our school (Matuga girls).We have an initiative called benchmarking in our school. We take a section of the school both teachers and students to well performing schools. For instance this year at the beginning of first term, we went to MamaNgina Girls High School in Mombasa, which is a well performing school in the province. While at the school,we let our girls to integrate with their girls at all levels, that is, in the classrooms, dormitory, dining halls and even play games with them. We do this to make our girls learn some few lessons of good performance (Matuga girls).We are really trying hard as teachers to bring these parents on board so as to improve performance of individual child and the entire school. Even today we are having a meeting for the class 8 candidates and their parents (Matuga primary).

65
6.1 ConclusionsThe previous chapter has presented the findings of this study, covering aspects of demographic characteristics of the respondents and nature of the households, the geographic and socio-economic contexts of the three districts, deepening understanding around absenteeism, school dropout and non-enrolment; all through to analyzing schooling costs and documenting effective practices in responding to the plight of excluded children.
Against the backdrop of these findings, the study makes the following conclusions:
6.1.1 School exclusion shapes supply to child laborFrom the study, around 90% of all children not attending school, had at one point, been to school. Even the 7% of children who had never been to school cited various school access barriers to their non-enrolment. These children faced exclusion due to schooling costs, coupled with the numerous other factors. These children are engaged in the various labor sectors, ranging from domestic work (working in family farms to scare monkeys, rearing younger siblings), child domestic workers (girls migrating to bigger towns for employment as househelps), all through to working on the beach and sex for money (in the tourism industry). School failure, then, is directly linked to the supply of child labor.
6.1.2 Education is a mitigation tool against child laborFrom findings of this report, education emerges as a powerful intervention against child labor. Though many children were said to be dropping out, or combining schooling and work, especially in Msambweni, some schools have demonstrated capacity to retain vulnerable children, by addressing their various special needs like fees (the initiatives in Matuga primary and Samburu secondary), academic failure and frustration (the case of Matuga girls), while other schools had created surveillance and advocacy structures within their communities (cases of Mabanda, Kikoneni and Matuga primary schools). Seemingly, some poor schools may indeed be pushing children out. There is room for improvement, and certain things might create change. These include making education compulsory, creating monitoring committees at grassroots level, and especially, ensuring that each school has the best leadership possible (head teachers).
6.1.3 The mirage of policy: The rift between policy formulation and implementationIn spite of extremely sound school policies and directives, that: no child shall be sent home because of lack of uniform; every pregnant girl who delivers shall be allowed back to school; no school shall charge anything more than what is directed by the ministry; there is a salient gap between heeding these directives and implementation. School management authorities and communities have their own opinions about how they want their schools run. They construct their own meaning from the realities they face, and depending on how deep these meanings are engraved, adopting the Ministry’s directives and policies remains a choice. As such implementing some policies, especially those that relate to extra levies, tuition becomes indeed daunting. At school level, some policies have remained a mirage.
66
6.1.4 Examining the teacher: Agents of schooling or, push-out factor?Teachers, especially the head teacher and the class teacher are seated at extremely vantage positions to serve as change agents. For any school-related success to be achieved, proactive and tactical leadership must be exercised at the school and classroom levels. From the findings of this study, school leadership, if properly propagated, could lead to extremely positive schooling outcomes. Responsiveness to exclusion of children is driven by sound school leadership; while, to the contrary, poor school leaders and indifferent class teachers are fanning exclusion.
6.1.5 Parents can be mobilized into change agentsParents can be effectively mobilized to engage with and support schools. The apathetic parents are often unschooled; therefore raising the schooling level of parents will have the desired effect on learners. The study showed that a relative proportion of children live with their grandparents, who often are unable to monitor children. The “grandmother” guardian therefore needs to be reached as a special group.
6.1.6 Community intervention is feasibleNetworking and collaboration has emerged as a strong factor in responsiveness of schools against exclusion of vulnerable children. Each community possesses various skills and capacities which could be harnessed to improve educational standards. The Provincial administration has emerged as instrumental in enforcing policies and raising awareness among communities.
6.1.7 Devolved funds could make difference, only if…A case study of Matuga constituency shows that devolved funds are making difference. The bursary awards, coupled with building of schools, are helping to cover gaps, and to expand schools’ capacities to respond against exclusion of children. However, if CDF is to make change, its intervention must be more aligned to education needs, and start from where ‘needed most’. For now, the CDF act limits intervention to receipt of proposals from the communities. More so, CDF needs to create linkages, so that allocation of funds is also based on regular assessment of the gaps, as well as expert analyses.
Besides the CDF, NGOs like Plan International, APHIA II, World Vision and FAWE were active in the communities. The only question was: could they be creating more dependency among communities, than the change they are creating?
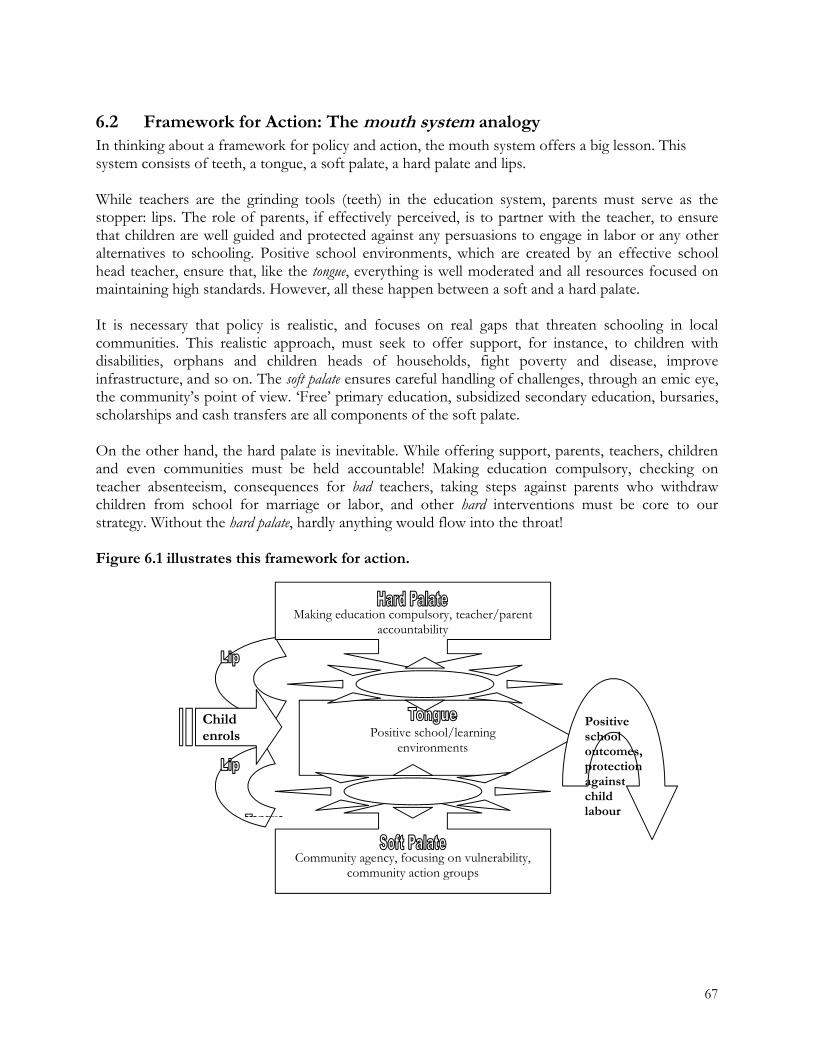
67
6.2 Framework for Action: The mouth system analogyIn thinking about a framework for policy and action, the mouth system offers a big lesson. This system consists of teeth, a tongue, a soft palate, a hard palate and lips.
While teachers are the grinding tools (teeth) in the education system, parents must serve as the stopper: lips. The role of parents, if effectively perceived, is to partner with the teacher, to ensure that children are well guided and protected against any persuasions to engage in labor or any other alternatives to schooling. Positive school environments, which are created by an effective school head teacher, ensure that, like the tongue, everything is well moderated and all resources focused on maintaining high standards. However, all these happen between a soft and a hard palate.
It is necessary that policy is realistic, and focuses on real gaps that threaten schooling in local communities. This realistic approach, must seek to offer support, for instance, to children with disabilities, orphans and children heads of households, fight poverty and disease, improve infrastructure, and so on. The soft palate ensures careful handling of challenges, through an emic eye, the community’s point of view. ‘Free’ primary education, subsidized secondary education, bursaries, scholarships and cash transfers are all components of the soft palate.
On the other hand, the hard palate is inevitable. While offering support, parents, teachers, children and even communities must be held accountable! Making education compulsory, checking on teacher absenteeism, consequences for bad teachers, taking steps against parents who withdraw children from school for marriage or labor, and other hard interventions must be core to our strategy. Without the hard palate, hardly anything would flow into the throat!
Figure 6.1 illustrates this framework for action.
Child enrols
Making education compulsory, teacher/parent accountability
Community agency, focusing on vulnerability, community action groups
Positive school/learning environments
Positive school outcomes, protection against child labour
68
6.3 RecommendationsFollowing the findings of the study, and guided by the framework for action, the study makes the following recommendations:
6.3.1 Recommendations for the Ministry of educationSeveral policy gaps have been highlighted by this study, and so has been the rift between policy formulation and implementation. In our view, the Ministry of Education needs to:
1. Make basic education compulsory, and utilize SMC as enforcerFindings of this study indicate that there was less absenteeism, drop-out and non-enrolment in communities that had drawn sanctions for parents. Similarly, prior studies have appreciated reducing cost of schooling, but decried the fact that education in Kenya is not compulsory! In some of the schools visited, parents were still left to exercise many choices against schooling for their children. Sending children to guard against monkeys on a school day, as parents bask at home, should be seen as unacceptable. The only key: make education compulsory, and for each child out of school: hold the parent to account. If this was pronounced as policy, the next issue would be its enforcement. The study established that the School Management Committees draw strongly from the community’s strength, and more than just being a mere compliance with MoE policy (especially being signatories to bank accounts), this structure has the potential to serve as education action team, working with the community to ensure that children enroll and remain in school. The MoE could then exploit this potential, through redefining the mandate of the team, and building their action capacity.
2. Complete a school mapping tool, and create distance normsIn some of the villages visited, some children covered up to more than 8 kilometers (one way) to get to the nearest school. As CDF and KESSP resources are focusing on infrastructural improvement, there is need for MoE to come up with school distance norms, spelling out the maximum allowable distance that each child can walk to school, and engage gainfully in schooling. This would only be possible, if proper school mapping is done, to indicate red areas in every constituency. While it would be costly to establish full schools in some of the red areas, especially due to low population density, satellite/feeder schools may provide an opportunity, as is already happening.
3. Rationalize teacher distribution and be vigilant on PTRThere is teacher shortage in the school! This is the statement that one is most likely to hear from the media, or from political pronouncements. And actually, looking at the teacher/learner ratios established by this study, this statement is absolutely true. However, the more disturbing concern is on the disparity in staffing among schools. Even while the ministry does not have enough resources, why should one school be bloating with teachers, while another one, only 10 kilometers away, is starving? Teacher/pupil ratio in primary school ranged from 46:1 to 130:1, while the female PTR was even worse, ranging from 33:1 to 208:1. While recent policies by TSC, as regards employing teachers to seal specific vacancies in schools are appreciated, distribution of teachers under the old system needs to be rationalized. Still, it is recommended that the Ministry, like has been done in this study, engenders the teacher/learner ratio, so that analysis is always done along gender lines, to identify gaps.
69
4. Improve quality assurance at local level to improve teacher accountabilityThe days of the inspectorate, seem to be long gone, and the teacher seems to have relaxed. This study has linked learner absenteeism to teacher absenteeism, and indeed, teachers have been associated with fuelling of school dropout. Following this finding, it is recommended that the Ministry, through the TSC, strengthens systems to ensure teacher accountability. Many teachers are on the payroll, while most of their time is spent attending to personal matters and businesses.
6.3.2 Recommendations for school head teachers5. Implement school policy on grade repetition, and hold head teachers accountableIn almost all primary schools visited, grade repetition was very rampant. In one school, an estimated 30% of children seated in each class, would repeat that grade at the end of the year. While teachers advanced arguments, that these children were not ready to progress to the next grade, one would wonder, who teachers want to blame. In any case, repeating one grade may not necessarily mean performing well, at long last. School communities must cease being places for minting of good competitive grades, and perceive their role in the broader sense of holistic andlife-long learning. Alongside this, schools must lead communities to appreciate individual differences, and focus on the potential of each child and their individual talents.
It is recommended that school head teachers spearhead a rethinking process for all teachers in their schools. Saying that children are not ready for the next grade simply implies, that teachers have not done their work! This policy needs to be approached through attitude change towards children, while recognizing individual differences among children. This policy must be enforced, if the school is to be an effective guard against child labor.
6. Make your school a knowledge economy The study has established two types of schools: where locally-available knowledge is utilized to create change, and where knowledge is ignored. Essentially, the teacher is a researcher. Head teachers, teachers and other school stakeholders need to see the school as a knowledge-driven economy, where experiences are carefully documented, and utilized to inform practice. Teachers must strive to apply their research methods training, while seeking more support from the ministry on their capacity to generate and utilize knowledge within their schools. Lessons can be learnt from progressive schools in the districts.
7. Like a team captain, motivate performance among all; reprimand failureWhile many head teachers were not aware about what was happening in the classrooms, one head teacher is reported to have a program, visiting all classes on Monday, to motivate performance and get to know the issues on the ground. In the findings of this study, the school leader (head) has emerged as the most influential agent of change. Head teachers need to assume their role to the full, motivating performance in all its dimensions, while reprimanding and discouraging failure in their schools.
6.3.3 Recommendations for School Management Committees 8. As much as you can, keep costs down
This study has established that even with free primary and secondary education, the cost of schooling is still too high. We should also appreciate that however much we would like, the Kenyan economy may not sustain a 100% free schooling program. Some of the costs identified by this study, actually are set by some parents for other parents! This is where the school management committees

70
must come in. Affirmative action is required, to keep costs low for the poor, so that no child is pushed out. Can, for instance, examinations costs be brought down, if, instead of buying all exams, teachers locally-set their own, quality exams? Would any school be bold enough to do away completely with uniform? These are the kinds of issues school committees might need to engage with.
9. Steer a clear community mobilization agendaFindings of this study have shown, that school management committees can be proactive in mobilizing communities to improve education standards. Rather than just discussing about the children in your school, the committee needs to have a concrete mobilization agenda, for children who ought to be in your school, but they are not. This agenda has helped some schools in this study to respond more in protecting vulnerable children in the communities.
10. Favor education standards, over infrastructural developmentMany school management committees and boards of governors have the school infrastructure only, as their sole concern. Besides just building the school, first concern (agenda) must be maintained high education standards. While good schools may be known to have reasonably good infrastructure, the ultimate test for good schools is the products they produce. Tightening concern for improved standards is likely to guard schools against wastage, and excluding vulnerable children.
6.3.4 Recommendations for development partners11. Rather than propagate dependency in schools, partner with school communities to create
sustainable development12. Lay focus on improvement education standards, for infrastructure does not always translate to
education standards
6.3.5 Recommendations for ILO/IPECIf ILO/IPEC seeks to continue its efforts in strengthening education as guard against child labor, this intervention calls for innovation. Critical in all efforts would be working through the Ministry and grassroots school communities. The following are seen as interventions that harbor immense potential for change.
13. Create forums for sharing of effective school practicesIt has come to realization, that each individual school in unique in nature. The study has identified extremely effective practices in some schools. What is interesting though, is that another school a few kilometers away would be unaware of such strategy. Creating forums for exchange, where school leaders come together to share practices, may make a lot of meaning to school improvement.
14. School Leadership SupportIn all cases of success and failure, the head teacher emerges as the principal determinant. It is recommended that, in partnership with the Ministry, ILO/IPEC initiates a school leadership support initiative, including awards for best school leaders. Motivating sound leadership in schools is key in controlling migration to child labor.

71
15. Deliberate focus on boysIn this study, non-schooling has assumed an extremely gendered dimension. It seems like boys are more threatened by non-schooling than girls. 22.9% of all boys aged 6-17 are not attending school in Msambweni, and have not completed KCSE. This finding confirms other recent studies on dynamics of child labor. Caution needs to be exercised, to protect the boy child in this part of the country, as part of the gender campaign.
16. Pilot-test the framework for action suggested by this studyThis study has proposed a framework for action, based on the analogy of the mouth system. In the short-term, this framework requires piloting and enhancement, for replication. It is recommended that a 2-year project is created, focusing on the weakest school identified by this study, to build the intervention framework and test its efficiency. Critical would be the documentation of all processes, for ease of replication.
6.4 Areas for further researchThough the study attempted to establish the micro-factors influencing schooling and non-schooling, certain dimensions did not get deserved attention.First, it would be necessary to conduct a study on school costing processes and procedures. To what level do especially poor parents participate in making such decisions, and what power and influence is at their disposal? Is it possible, that decisions to pay money is made on behalf of them, taking advantage of their powerlessness?
The second aspect relates to the potential of the SMC, how the members perceive their role, and interpret their mandate. This being the lowest-placed, yet most effective management structure, more understanding is required on the threshold of influence that is possible in partnering with this structure.

72
7 References
ANPPCAN (2005). ‘Combating Child Labour and Enhancing Education: Child Watch Quarterly Magazine: No 41, January 2005.
Human Rights Watch (2005). Africa: Neglect of AIDS Orphans Fuels School Drop-out. On www.hrw.org/en/news retrieved on 17/6/2009.
ILO (2008). Combating Child Labour In Kenya: A study on Commercial Sex Exploitation of Children in Kwale, Kakamega, Eldoret, Nairobi and Nyeri
Ministry of Education, Science and Technology (MOEST) (2005b). Kenya Education Sector support programme 2000-2010. Nairobi: Government Printers
Mugo, J.K. (2004). Rehabilitation of Street Children in Kenya: Approaches, Quality and Challenges. Frankfurt: IKO
Mugo, J.K. (2009). Education and Child Labour Trends in Kenya. In P.O. Arila and J.M. Njoka (eds). Child Labour: New and enduring forms of child labour from an African development Policy Perspective. Nairobi: Institute of Development Studies.
Mwebia, R.J. (2008). Efficacy of Free Primary Education in withdrawing children from child labour in Kiambu District, Kenya ( Unpublished M.Ed thesis, Kenyatta University).
Ruto, S.J., Ongwenyi, Z.M. & Mugo, J.K. (2009). Educational Marginalization in Northern Kenya. Background Paper for the Education For All Global Monitoring Report 2010, Reaching the Marginalized.
Ruto, S.K. (2004). The Phenomenon of Child Domestic Labour in Nairobi and Garissa: Implications on the right to education (a research report submitted to UNICEF-Kenya country office).
UIS/UNESCO (2005). Children Out of School: Measuring Exclusion from Primary Education Out of school children: How Many are There and Who are they? On www.uis.unesco.org/ev.php,
retrieved on 17/6/2009.UNDP (2009). Sub-Saharan Africa- the Human costs of 2015 ‘business-as-usual’ scenario, on
www.content.undp.org retrieved on 17/6/2009UNESCO (2005). Challenges of implementing free primary education in Kenya. Assessment report.
Nairobi: UNESCOUNICEF (2006). The state of world’s children 2006.