Methodical мaterials - EUKI
52
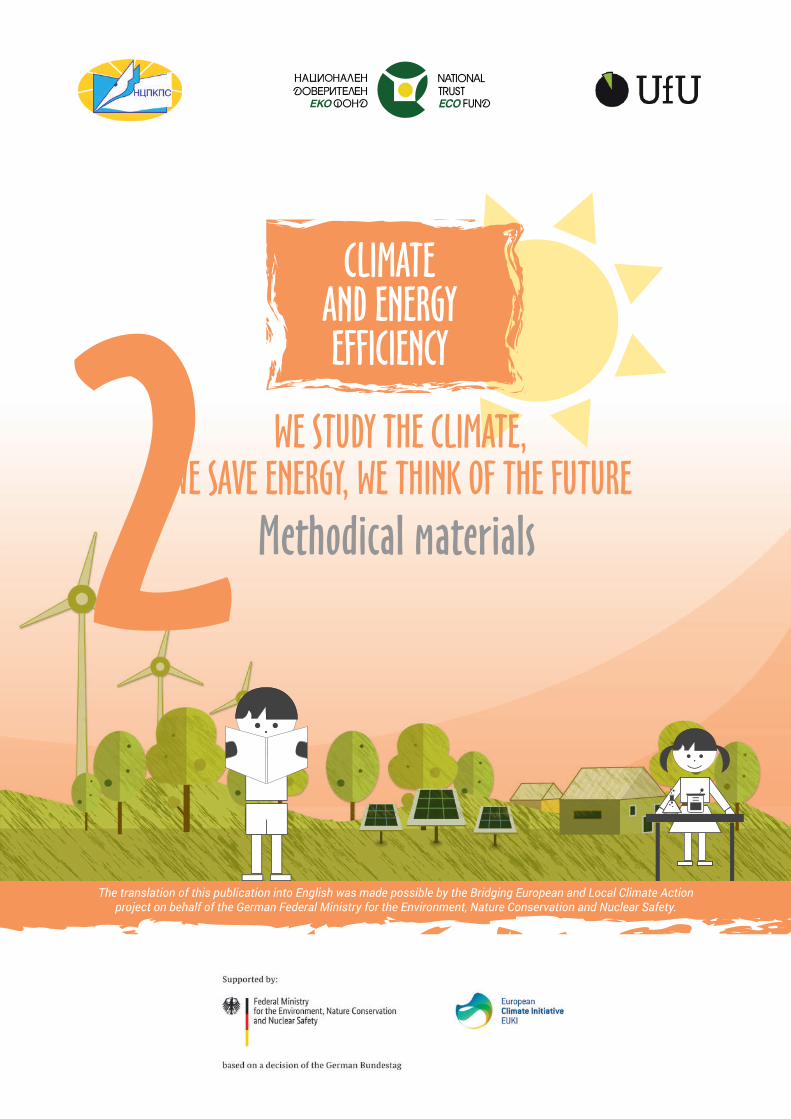
WE STUDY THE CLIMATE, WE SAVE ENERGY, WE THINK OF THE FUTURE CLIMATE AND ENERGY EFFICIENCY Methodical мaterials The translation of this publication into English was made possible by the Bridging European and Local Climate Action project on behalf of the German Federal Ministry for the Environment, Nature Conservation and Nuclear Safety.
-
Upload
khangminh22 -
Category
Documents
-
view
1 -
download
0
Transcript of Methodical мaterials - EUKI
WE STUDY THE CLIMATE, WE SAVE ENERGY, WE THINK OF THE FUTURE
CLIMATE AND ENERGY EFFICIENCY
WE STUDY THE CLIMATE, WE SAVE ENERGY, WE THINK OF THE FUTUREENERGY TEAM IN SCHOOL
CLIMA
TE AN
D ENER
GY EFF
ICIENCY
Methodical мaterials
Methodical мaterials
This project is part of the European Climate Initiative (EUKI). EUKI is a project financing tool of the German Federal Ministry of Environment, Nature Conservation and Nuclear Safety (BMU). The EUKI calls
for project ideas which are implemented by Deutsche Gesellschaft für Internationale Zusammenarbeit (GIZ) GmbH. EUKI’s main goal is to encourage cooperation on climate topics in the European Union, in order to mitigate
greenhouse gas emissions. For more information please visit: www.euki.de
The positions and opinions presented in this publication are the responsibility of the author/s only and do not necessarily represent the opinion of the Federal Ministry of Environment, Nature Conservation and Nuclear Safety (BMU).
TOWARDS THE INTRODUCTION OF CLIMATE CHANGE AND ENERGY EFFICIENCY EDUCATION IN SCHOOLS
The translation of this publication into English was made possible by the Bridging European and Local Climate Action project on behalf of the German Federal Ministry for the Environment, Nature Conservation and Nuclear Safety.

PART ONE. TEACHER’S MANUAL. METHODOLOGICAL GUIDELINES................................. 1 1. Education for sustainable development in Bulgarian schools....................... 2
2. Project objective....................................................................................................... 3
3. Key competencies................................................................................................... 4
4. Methodological approaches.................................................................................. 4
5. Tasks in worksheets................................................................................................ 5
PART TWO. WORKSHEETS - TOPICS AND TASKS............................................................. 7
WORKSHEET 1 - CLIMATE AND WEATHER................................................................. 8
WORKSHEET 2 - CYCLE OF SUBSTANCES IN NATURE..........................................14
WORKSHEET 3 - GREENHOUSE EFFECT....................................................................18
WORKSHEET 4 - CONSEQUENCES OF THE GREENHOUSE EFFECT - CLIMATE CHANGE............................................................................................................23
WORKSHEET 5 - CONSEQUENCES OF NATURAL POLLUTION..............................28
WORKSHEET 6 - ENERGY SOURCES. TYPES AND USES........................................31
WORKSHEET 7 - SAVING ENERGY AND RESOURCES.............................................38
WORKSHEET 8 - ENERGY EFFICIENCY IN SCHOOL. ENERGY TOUR. MEASUREMENT OF PARAMETERS - LIGHT, CARBON DIOXIDE, TEMPERATURE, POWER OF APPLIANCES. ENERGY-SAVING BEHAVIOUR........40
WORKSHEET 9 - SUSTAINABLE DEVELOPMENT......................................................48
CONTEN
TS
ISBN 978-619-7593-34-1
http://education.ecofund-bg.org/en/documents-materials/
AUTHORS: DIMITAR ZHELEV, ELENA BOYADZHIEVA, MAYA GAYDAROVA,
MILENA KIROVA, SNEZHANA TOMOVAREVIEWERS:
PROF. DR. ADRIANA TAFROVA AND PROF. DR. IRINA KOLEVAGRAPHIC DESIGN AND PRINT: “LAMBADZHIEV STANDART” LTD
GRAPHIC CONCEPT AND ILLUSTRATIONS:LILLY SAMOKOVSKA
TRANSLATION: TEODORA STANISHEVAEDITOR OF THE ENGLISH VERSION: TOM PHILLIPSCOMPILER OF THE SERIES: KAMELIA GEORGIEVA
DISTRIBUTED FREE OF CHARGE
NATIONAL TRUST ECOFUNDSofia, 67B "Shipchenski prohod" Blvd
+359 2 973 36 37, [email protected]; www.myclimate.org
WE STUDY THE CLIMATE, WE SAVE ENERGY, WE THINK OF THE FUTURE
Methodical мaterialsENERGY TEAM IN SCHOOL
CLIMATE AND ENERGY EFFICIENCY
TOWARDS THE INTRODUCTION OF CLIMATE CHANGE AND ENERGY EFFICIENCY EDUCATION IN SCHOOLS

1
PART ONE. TEACHER’S MANUAL. METHODOLOGICAL GUIDELINES
2
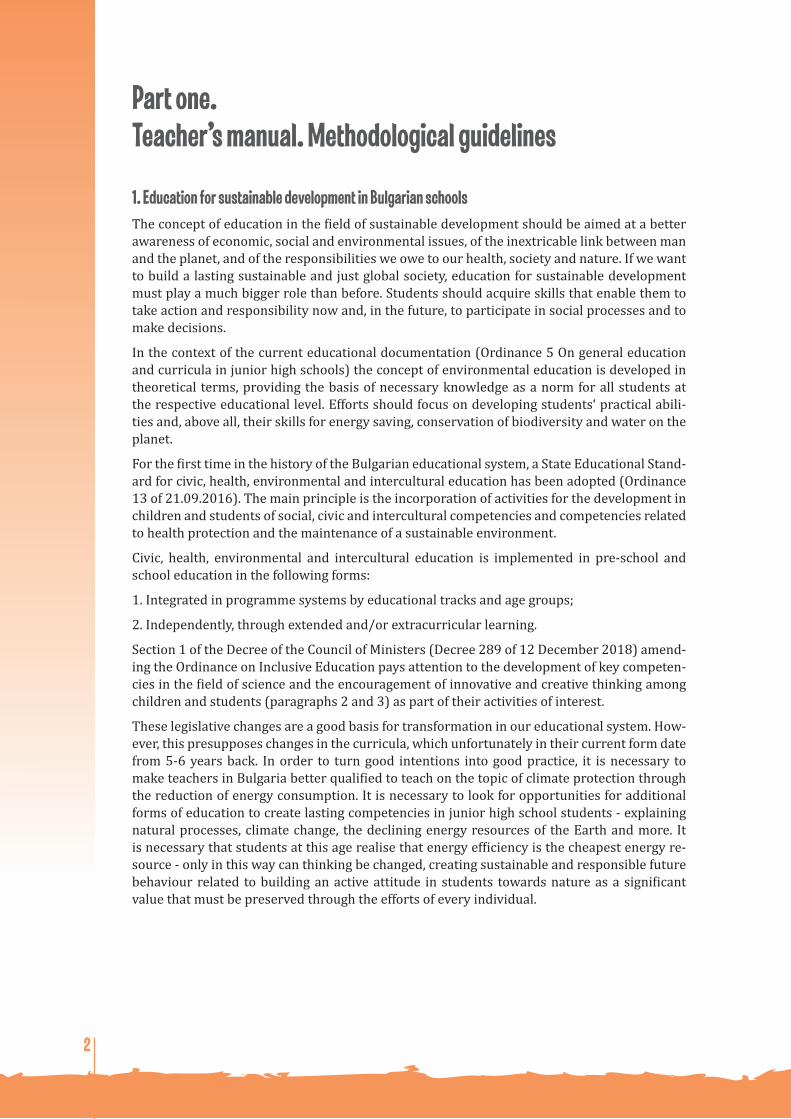
Part one. Teacher’s manual. Methodological guidelines
1. Education for sustainable development in Bulgarian schoolsThe concept of education in the field of sustainable development should be aimed at a better awareness of economic, social and environmental issues, of the inextricable link between man and the planet, and of the responsibilities we owe to our health, society and nature. If we want to build a lasting sustainable and just global society, education for sustainable development must play a much bigger role than before. Students should acquire skills that enable them to take action and responsibility now and, in the future, to participate in social processes and to make decisions.
In the context of the current educational documentation (Ordinance 5 On general education and curricula in junior high schools) the concept of environmental education is developed in theoretical terms, providing the basis of necessary knowledge as a norm for all students at the respective educational level. Efforts should focus on developing students‘ practical abili-ties and, above all, their skills for energy saving, conservation of biodiversity and water on the planet.
For the first time in the history of the Bulgarian educational system, a State Educational Stand-ard for civic, health, environmental and intercultural education has been adopted (Ordinance 13 of 21.09.2016). The main principle is the incorporation of activities for the development in children and students of social, civic and intercultural competencies and competencies related to health protection and the maintenance of a sustainable environment.
Civic, health, environmental and intercultural education is implemented in pre-school and school education in the following forms:
1. Integrated in programme systems by educational tracks and age groups;
2. Independently, through extended and/or extracurricular learning.
Section 1 of the Decree of the Council of Ministers (Decree 289 of 12 December 2018) amend-ing the Ordinance on Inclusive Education pays attention to the development of key competen-cies in the field of science and the encouragement of innovative and creative thinking among children and students (paragraphs 2 and 3) as part of their activities of interest.
These legislative changes are a good basis for transformation in our educational system. How-ever, this presupposes changes in the curricula, which unfortunately in their current form date from 5-6 years back. In order to turn good intentions into good practice, it is necessary to make teachers in Bulgaria better qualified to teach on the topic of climate protection through the reduction of energy consumption. It is necessary to look for opportunities for additional forms of education to create lasting competencies in junior high school students - explaining natural processes, climate change, the declining energy resources of the Earth and more. It is necessary that students at this age realise that energy efficiency is the cheapest energy re-source - only in this way can thinking be changed, creating sustainable and responsible future behaviour related to building an active attitude in students towards nature as a significant value that must be preserved through the efforts of every individual.

3
2. Project objective
The project Towards the introduction of climate action in the educational curriculum of Bulgarian schools focuses on activities to increase students‘ competencies on climate change, which are related to the production, transformation and saving of energy.
The purpose of the project can be defined as:
Forming competencies in junior high school students for knowing and understanding the relation between climate change and human energy consumption and its conse-quences, and for building sustainable responsible behaviour for energy efficiency in their actions.
This is related to building an active attitude in students towards nature, where it is attributed a significant value and its protection is made a priority human activity. The project involves students, teachers and school staff and administration over the course of its implementation. Different parties in the school institution work together and cooperate to achieve set goals. The concept of teamwork is a basic principle in conducting the individual activities.
Students are given direct access to the technical infrastructure of the school and thus get ac-quainted with the building’s energy budget and they conduct measurements to determine the benefits of their „new“ energy-efficient behaviour. Children see the real results of their work through the savings in energy costs achieved.
Involvement in the project provides an opportunity for each participant to contribute actively to climate change mitigation. Motivating students with the idea that their work on the topic of energy efficiency is important for the protection of the planet is crucial for the successful implementation of the project. Each student should feel personally involved in the activities and realize that they are helping humanity to prevent a severe environmental catastrophe. It is important to create the feeling that committed students are part of a global wave of young people who want to save the world and find ways to contribute to that. Crucial to motivation is creating a sense of pride in the students that their school is participating in such a large international project and they themselves are contributing to better results for their local com-munities and Bulgaria as a whole in the fight against climate change. An additional incentive can be the fact that, thanks to them, their school will save money from their energy-efficient behaviour and that these funds will be used for other well-defined purposes. The personal role of each teacher is to motivate their students and to demonstrate the significance and impor-tance of the project through personal example and their attitude towards it.
The subject matter of the curriculum is interdisciplinary in nature, although it is refracted through the prism of different subjects. The practical activities with the students make clear interdisciplinary connections between Bulgarian language and Literature, Mathematics, Man and Nature, Biology and Health Education, Physics and Astronomy, Chemistry and Environ-mental Protection, Geography and Economics and Fine Arts. In carrying out the individual activities, students can successfully use their knowledge and skills acquired from these respec-tive subjects.

4
3. Key competencies
Within the project a curriculum has been developed in which the following key competencies are integrated:
• key competencies in natural sciences - use of knowledge about the structure and processes in the Earth‘s geospheres (biosphere, atmosphere, hydrosphere) to understand connections and relationships in nature and predict their possible applications in practice, human ac-tivities based on scientific facts, knowledge of the main characteristics of scientific research and awareness of the relationship: development of science - practice - limitations and risks;
• skills to support sustainable development and a healthy lifestyle - supporting activities aimed at protecting personal health and the environment; understanding the human-environment relationship and minimizing the effect of anthropogenic factors leading to changes in the state of populations, biocenoses, ecosystems, landscapes, biosphere;
• learning skills - independent work with information from different sources, discussing prob-lems, demonstrating critical thinking, teamwork, planning activities, expressing opinions and formulating decisions, learning rules that support the cognitive process; self-monitor-ing and exercising self-control in performing didactic tasks, solving tasks and cases aimed at forming functional literacy;
• competencies in the field of the Bulgarian language - development of students’ reading tech-nique and written culture; enriching their language culture by using specific terminology; developing skills for working with different types of text; extraction of essential information from texts; creation of a text in oral or written form - description, summary, plan, results and conclusions from the activity; improving skills for dialogical communication when discuss-ing joint activities, expressing opinions, etc.;
• communication skills in foreign languages - extracting information about the structure and functioning of the biosphere, atmosphere and hydrosphere from various sources of a for-eign language studied by students;
• digital competence - searching, collecting, processing and presenting information for com-puter presentations and posters;
• competence in the field of mathematics and technology - practical classes include measure-ments and calculations;
• social and civic competencies - communication skills, critical and creative thinking in deci-sion making; maintaining a tolerant attitude and accepting different points of view in dis-cussions and debates;
• initiative and entrepreneurship - skills for planning, organizing and managing cognitive ac-tivity;
• cultural competence and skills for creative expression - making models, mock-ups, posters, projects, computer presentations, etc.
4. Methodological approaches
Competence approachThe competence approach is a basic approach in education, through which students acquire knowledge and skills that are the basis of their attitude to the world - nature and society. Com-petencies build on knowledge and determine behaviour, motives and needs.
Systematic approachNature teaches us to think systematically. It sustains life by creating and operating systems. Understanding that the behaviour of systems in nature depends on all its parts and that a lack

5
or imbalance in one part of the system affects the normal functioning of others is a basic idea in the formation of environmental awareness in students. Important concepts here are mod-eling and the visualization of systems, as well as defining the boundaries within which they exist. The idea of feedback between systems, and the climate-human system in particular, is important. A person’s energy actions are described, actions which create positive or negative feedback, i.e. controlling the system or reinforcing certain factors that change it, such as reduc-ing energy consumption.
Activity approachAccording to the constructivist approach, one learns by creating structures oneself and fill-ing them with content. The best way to learn and apply what is learned is to do it through various engaging activities during which students experience ideas together and develop their own concepts and solutions. The practical part, performed by groups or individually, is impor-tant for the acquisition of specific skills related to the application of knowledge about climate and energy. It is also important that the activity is diverse and includes measurement work, work with data, models, discussions, self-assessment of the work done, etc.
An integrated approachAs part of nature, man studies it by creating models that describe different aspects of its exist-ence. Thus, Physics, Chemistry, Biology, Geography together create a unified picture of nature, which they present as a set of interconnected systems. Discovering the causal links that un-derlie changes in nature is important for the understanding of natural phenomena associated with climate change and the factors that either depend or do not depend on human activity.
5. Tasks in the worksheets
The learning task is the practical unit for the formation and development of the knowledge and skills covered in the programme and the development of key competencies. As a pedagogical phenomenon, the task has three main dimensions: executive, constructive, analytical. The ex-ecutive dimension is associated with the acquisition of experience; the constructive dimension with the correlation of elements in the external situation with the parameters of experience, choice, awareness of goals and enrichment of experience; while the analytical dimension is directly related to constructing a new whole and transferring elements of experience into new situations. The tasks are of different types, but are directly related to the expected results de-scribed for each topic.
The tasks require teamwork, which predetermines group discussion of a problem, elaboration of a plan (algorithm) of work, intragroup and intergroup discussion of the results obtained, etc. The solution of tasks constructed should be considered according to two interconnected plans: external - with an emphasis on the comparison, selection and deduction of consequences; and internal - with an emphasis on the analysis of experience (ontological and semiotic), systema-tization and attachment of key attributes from the chosen field of experience to the goal, etc.
The worksheets developed include tasks of different types related to the application of knowl-edge and skills in a concrete situation, the solving of specific problems (theoretical or practi-cal), the application of methods for researching objects and processes, and are directly related to the topic’s expected results, activity groups and key competencies. The main focus of the topics is on skills for assessing, analysing situations and the reasoning behind a decision, for choosing a model of behaviour, for proving the influence of environmental factors (abiotic, biotic and anthropogenic) on the state of the biosphere and human health.

6
Guidelines for teachers conducting educational activities:
• To conduct the individual activities fruitfully, teachers are recommended to get acquaint-ed with them in advance and obtain some of the necessary materials.
• The necessary materials can be found on hand and do not require additional budget.
• The main goal of the tasks developed is for students to acquire competencies for energy efficiency and climate change through engaging and inspiring activities.
• Each teacher can adapt the teaching material and activities to the specific educational level of their students, based on age and socio-cultural environment.
• In the course of working with students, it’s necessary to use a wide range of educational methods and practices: observation, experiment, working with maps, modeling, brain-storming, case solving, discussion, play, scenario review, storytelling, talking, working with text and images. Tasks accompany each specific topic and include the methods to varying degrees.

7
PART TWO. WORKSHEETS - TOPICS AND TASKS

8
WORKSHEET 1
Climate and weather
TASK 1. Determine the differences between „climate“ and „weather“
Required materials: Table with examples of weather and climate.
Steps:
1. Place the given examples in the two columns using the sign √.
EXAMPLES WEATHER CLIMATE1. It‘s been raining cats and dogs all day.
2. In summer it is sunny and warm.
3. Yesterday was very cold and windy.
4. From December to March, bears hibernate.
5. This year in early August the sea was rough and the waves flooded the pier.
6. In the morning the sun was very hot, but at noon clouds appeared and it rained.
7. Spring comes with warm sun and the scent of flowering trees.
8. March weather is erratic - sometimes sunny, sometimes rainy.
9. At the end of August, the storks gather in flocks and fly south.
10. The wind ruffled the yellowed leaves and carried them to the field.
2. Discuss in the group the rate at which the changes occur and write down the main difference between weather and climate in the appropriate place in the table.
WEATHER CLIMATE
......................................................................................
......................................................................................
.....................................................................................
..........................................................................
..........................................................................
.........................................................................
TASK 2. Working with a real meteorological archive
Analyse the graphs that determine the weather in Sofia for a certain period. Answer the ques-tions:
1. To which season does the data refer?
2. Which graph shows the average daily temperature?WOR
KSHE
ET 1

9
3. Is there a relationship between humidity and temperature?
4. What are the rainiest days?
5. What are the days when the winds are strongest, the temperatures are the lowest and there is precipitation?
6. What do you think the yellow colour on the precipitation diagram means? And the grey?
https://www.meteoblue.com/bg/времето/прогноза/archive/София
TASK 3. Make a thermometer
Required materials: A bottle, coloured water (maybe a mixture with alcohol), plasticine, hot water, bath, marker, clear straw, alcohol or digital thermometer.
Steps:
1. Fill the bottle to ¾ with coloured water and alco-hol.
2. Place a straw (without touching the bottom) and secure it with plasticine around the neck of the bottle.
3. Place a mark on the bottle at the liquid level with the marker.
4. Record the temperature of the liquid (use the thermometer).
5. Place the bottle in warm water and wait until the liquid level stops changing.
6. Measure the height of the water in the straw and mark with a marker.
Note: To reduce evaporation, add a little oil to the surface of the water.
WORKSHEET 1

10
TASK 4. Measure the amount of precipitation
Required materials: Plastic bottle, tape, ruler, pebbles, marker, water.
Steps:
1. Cut off the top of the bottle and place it upside down like a funnel in the rest of the bottle.
2. Place pebbles on the bottom to make the bottle stable.
3. Tape down the edges of the funnel.
4. Fill with water to cover the pebbles. This is the zero position you need to mark with a marker on a vertical scale.
5. Draw a vertical scale with a ruler (see picture).
6. Place the bottle outdoors for 24 hours (or less) when it is raining.
7. Determine the volume of water collected using the cyl-inder volume formula (the height of the liquid collected on the front of the base).
8. Measure the diameter of the cut part of the bottle and determine the amount of precipitation in L/m2.
TASK 5. Determine the humidity
Required materials: Paper (cardboard), scissors, two pushpins (nails), long hair (20-24 cm), an arrow made of straw or paper, felt-tip pen, duct tape.
Steps:
1. Tie one end of the hair to the arrow (or se-cure it with duct tape) and wrap the other around the pushpin at some distance be-low, as shown in the diagram, so that the hair is stretched.
2. Insert the arrow with a nail so that it can rotate around a perpendicular axis.
3. Draw a scale that is perpendicular to the ar-row.
4. Observe the position of the arrow relative to the scale in wet and in dry weather.
5. Why does the arrow take a position up or down at different humidity?
Conclusion: When the arrow shortens, the ar-row points upwards – the weather gets better.
Question: Why does hair shorten in low hu-midity?
WOR
KSHE
ET 1

11
TASK 6. Analyse the influence of climate on the organism world of the Earth
Required materials: Text and figure for the development of the organism world.
Steps:
1. Read the text carefully.
The Earth was formed about 5 billion years ago. For nearly 1 billion years, our planet was unin-habited - volcanoes erupted, lava flowed, light-ning ripped through the skies. The first organ-isms on Earth were unicellular without a nucleus (prenuclear, prokaryotic organisms). They were simply arranged, similar to the bacteria living to-day. For billions of years, bacteria were the only inhabitants of the planet. Later, single-celled or-ganisms with a nucleus (eukaryotic organisms) appeared. Multicellular organisms - plants, ani-mals and fungi – were the last to appear on Earth.
Unicellular, prenuclearorganisms
Unicellular organismswith a nucleus
Multicellular organisms(plants, animals and fungi)
2. Analyse the figure.
The figure shows a clock of time from the formation of planet Earth to the present day (from 0 to 12 hours). Numbers (1, 2, 3 and 4) indicate the billions of years of the planet’s history.
If we imagine the sequence in which the various organisms on Earth appeared on this clock, then 3 hours after the formation of the planet, unicellular prenuclear organisms appeared. At 6 o’clock, single-celled organisms with a nucleus appeared, and at 10 o’clock, there were already multicellular organisms on Earth. According to this “clock of time”, the appearance of man took place at about 11 hours, 59 minutes and 50 seconds.
3. Based on the data from the text and the figure, calculate and fill in how many billion years ago the different groups of organisms appeared in the table.
Emergence of: Around … years ago: 1. Unicellular prenuclear organisms 2. Unicellular nuclear organisms 3. Multicellular organisms
TASK 7. Trace climate change in annual tree circles
As a result of photosynthesis, huge amounts of carbon dioxide accumulate in wood in the form of organic matter. Every year, new conductive wood bundles are formed in the stem, through which wa-ter rises from the roots to the leaves, situated in a concentric circle (the so-called annual circle). Each annual circle consists of lighter and darker wood. The lighter parts of the annual circle are formed by wider conductive tufts - usually in the spring, when there is more rainfall - while the conductive tufts formed in the summer are narrower due to drought and therefore appear dark.
WORKSHEET 1

12
The annual circles provide information about various climatic conditions during the life of the tree - precipitation, droughts, solar activity, etc.
Required materials: Pictures of the cross-section of a tree trunk.
Steps:
Divide into 4 teams. Each team must analyse a cross-sectional photo of a tree trunk.
Team
1.
A cross-sectional photo of a tree trunk planted in autumn 1970 is provided.
А) Determine how old the tree was when it was cut down.
Answer:........
B) Identify and mark on the chart the years during which there was the least rainfall from March to July.
Answer:.........
Explain how you „obtained“ this information from the diagram.
fig. 1
Team
2. A photo of a cross-section of the trunk of a deciduous tree cut in the late autumn of 2019 is provided.
А) Mark on the chart the year in which the youngest member of your team was born.
Answer:.........
B) Was it rainy or dry in the spring and early summer of 2011?
Answer:.........
Explain how you „obtained“ this information. fig. 2
Team
3. A photo of a cross section of a tree trunk is provided.
А) Determine the year in which the tree was planted, bearing in mind that it was felled in February 2009.
Answer:.........
B) In which year was a rainy spring followed by drought and again by precipitation in early summer?
Answer:.........
Explain how you „obtained“ this information.
fig. 3
Team
4. A photo of a cross section of a tree planted in the early spring of 1986 is provided.
А) Determine the year in which the tree was cut down.
Answer: .........
B) Were there droughts or torrential rains and in which years?
Answer: .........fig. 4
WOR
KSHE
ET 1

13
TASK 8. Recycle and learn
Required materials: Blue, green, yellow and red plastic caps.
Remember the main climate zones on Earth.
1. Select a specific cap colour for each climate zone.
2. Use glue to stick the caps on the card so that you mark the main climate zones.
TASK 9. Attention !!! Tornado!
Make a tornado yourself and watch one of nature’s biggest threats.
Required materials: Transparent bottle, liquid soap, water, brocade particles, blue paint.
Steps:
1. Fill the bottle with water up to 80% of its volume.
2. Put the brocade in the bottle - it will play the role of the dust particles that the tornado swirls.
3. Pour in 1 tablespoon of liquid soap and close the bottle tightly.
4. Turn it upside down and try to swirl the water in a circular motion.
5. Observe the funnel that descends from the bottom of the bottle to its neck.
6. Discuss: What are the causes of the tornado? Which are the areas with the most intense tornadoes? How can climate change cause natural disasters? Discuss what natural disasters caused by climate change threaten your locality.
WORKSHEET 1

14
WORKSHEET 2
Cycle of substances in nature
TASK 1. Observing the condensation in a bottle
Required materials: Transparent plastic water bottle, water, food colouring, felt-tip pen, glass, ice (desirable).
Steps:
1. Remove the label from the bottle and fill 1/3 with water. Put in some food colouring and shake.
2. Close tightly with the cap.
3. Turn the bottle upside down in a wide glass as shown in the picture.
4. Draw clouds and rain on the sides of the bottle.
5. Place ice cubes on the upturned bottom of the bottle and place in the sun.
6. Wait about 30 minutes. Explain the phenomenon.
7. What role does the ice placed on the bottom of the bottle play?
TASK 2. Investigate how caves are formed
We have all admired and held our breath at the bizarre shapes in caves formed over hun-dreds of thousands of years ago. And you’re probably wondering how they formed? And here once again we see the role of carbon dioxide. Natural water is rich in carbon dioxide. When it infiltrates through cracks in the limestone rocks, some of it dissolves, the cracks expand and turn into a cave. These changes are part of the carbon cycle in nature. With the following experiments we will follow some of the natural processes described.
WOR
KSHE
ET 2
15
Required materials: Clear lime water, carbonated water, test tube, alcohol lamp, pipette, tube clip, matches.
Steps:
1. Fill about one-fifth of the tube with clear lime water. Using a pipette, carefully add carbonat-ed water (carbonated water contains carbon dioxide) to it. Describe the changes observed.
2. During this process, you observed turbidity of the clear lime water. This is due to the result-ing calcium carbonate. It is part of limestone rocks.
3. Continue to add soda water until the solution is clear. This is a process through which solu-ble compounds are obtained. This is how caves are formed.
4. Hold the tube with the clip and carefully heat it until cloudy. Again you get calcium carbon-ate. The stalactites and stalagmites in caves are formed in a similar way.
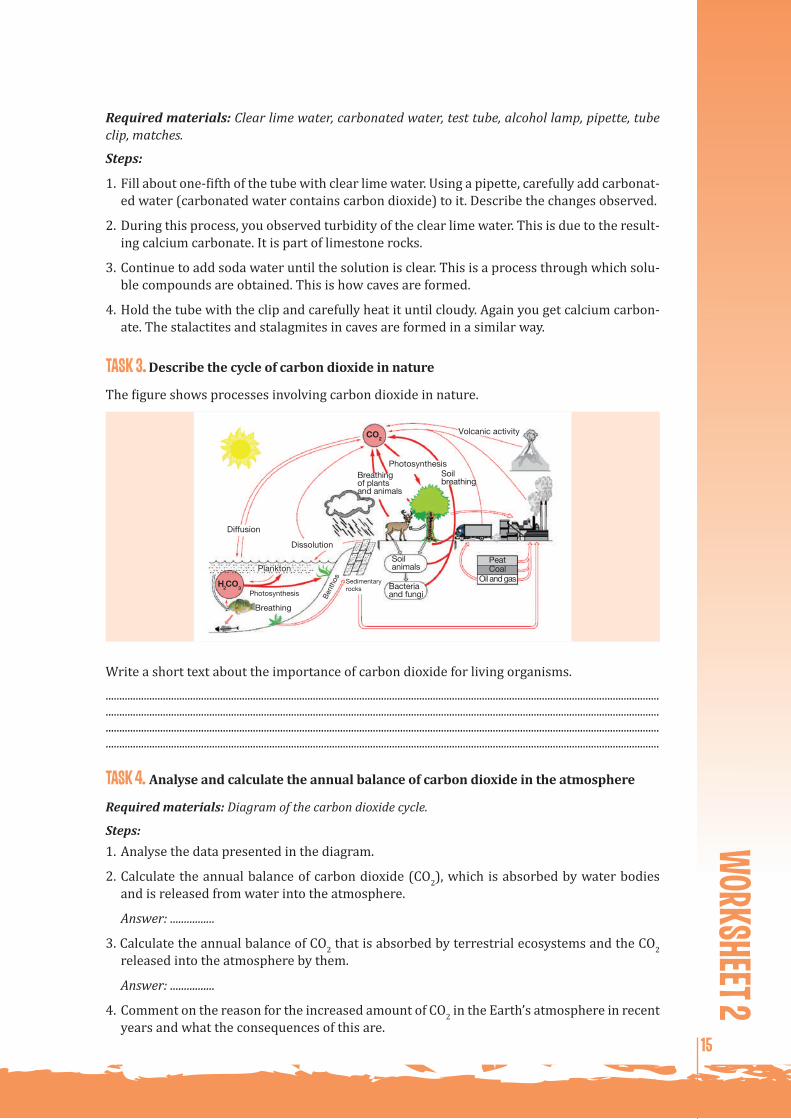
TASK 3. Describe the cycle of carbon dioxide in nature
The figure shows processes involving carbon dioxide in nature.
Breathing
Photosynthesis
Plankton
Diffusion
Dissolution
H2CO
3
CO2
Oil and gasCoalPeatSoil
animals
Bacteria and fungi
Breathing of plants and animals
PhotosynthesisSoilbreathing
Volcanic activity
Sedimentary rocks
Benthos
Write a short text about the importance of carbon dioxide for living organisms.
...........................................................................................................................................................................................................
...........................................................................................................................................................................................................
...........................................................................................................................................................................................................
...........................................................................................................................................................................................................
TASK 4. Analyse and calculate the annual balance of carbon dioxide in the atmosphere
Required materials: Diagram of the carbon dioxide cycle.
Steps:1. Analyse the data presented in the diagram.
2. Calculate the annual balance of carbon dioxide (CO2), which is absorbed by water bodies and is released from water into the atmosphere.
Answer: ................
3. Calculate the annual balance of CO2 that is absorbed by terrestrial ecosystems and the CO2 released into the atmosphere by them.
Answer: ................
4. Comment on the reason for the increased amount of CO2 in the Earth’s atmosphere in recent years and what the consequences of this are.
WORKSHEET 2

16
TASK 5. Create a food web
Every living being needs energy and food. Photosynthetic organisms use solar energy, which they “lock” into the nutrients they synthesize. Herbivores feed on these substances and use the energy stored in them to live. Herbivores, in turn, are food for predators. This forms a chain (the so-called food chain) of organisms, through which energy and nutrients are constantly transferred.
In an ecosystem (such as a forest), food chains intertwine to form complex food webs. If even one species disappears from the ecosystem, all associated organisms will be left without food.
FOOD WEBFOXBUZZARD
SNAKE
FROG
STORK
BUTTERFLYGREENFLY
TITMOUSEMOUSE
RABBIT
PLANTAIN
LADYBIRD
BERRIES
GRASSHOPPER
Required materials: Text, large sheet of paper (cardboard), coloured sheets of paper, felt-tip pens, ruler, scissors, glue
Create a food web, including the following organisms: snake, woodpecker, owl, mouse, man-tis, hawk, grasshopper, lizard, squirrel, ant, wheat, ladybug, caterpillar, oak, grassW
ORKS
HEET
2

Energy teams in action
17
Steps:
1. Divide the organisms into three groups: producers, consumers and decomposers.
2. Cut out slips of coloured paper and write one of the listed organisms on each of them.
3. Careful! Use the same colour for the organisms from each group (producers, consumers or decomposers).
4. Arrange and glue the coloured slips on the large sheet of paper. Connect the individual or-ganisms (slips of paper) with arrows showing the direction of transfer of substances and energy. This will create a food web.
Note! Include as many of the organisms listed in the web as possible.
WORKSHEET 2

18
WORKSHEET 3
Greenhouse effect
TASK 1. Model a greenhouse effect by heating
Required materials: Two identical metal cans (of drink, etc.), water, thermometer, table lamp, glass, which can cover one of the cans.
1 2
Steps:
1. Fill both cans with the same amount of water.
2. Cover one of the cans with the glass.
3. Switch on the lamp and place it at the same distance from both (or place them on an over-head projector).
4. Measure the water temperature in both cans every 4-5 minutes.
5. Write down the temperatures you measure in order in the table.
6. Draw a conclusion about the difference in water temperatures in the two cans. Write it down.
Time Temperature Can 1 (°С)
Temperature Can 2 (°С)
TASK 2. Create the greenhouse effect in a bottle
The main gas that causes the Earth’s greenhouse effect is carbon dioxide.
Required materials: Clean glass 2l bottles with labels removed - 2 pcs.; a piece of foil (or tinfoil); thermometer for measuring room temperature - 2 pcs.; a 250ml glass (bottle); effervescent tablet (tablet releasing bubbles of carbon dioxide), e.g. Alka-seltzer 324mg - 1 pc.; 150W bulb - 1 pc.; ruler - 1 pc; watch – 1pc.
Note: Another way to get carbon dioxide is a mixture of baking soda and vinegar.
Steps:1. Place the lamp on a table.2. Number the bottles with a marker - №1 and №2.
WOR
KSHE
ET 3

19
3. Pour about 200ml of water into each bottle.4. Place the two bottles next to each other about 15 cm from the lamp.5. Tie each of the two thermometers at the top with a piece of string, and place tape
on top of the string for additional safety.6. Place a thermometer in bottle №1 so that it is in the middle and does not touch
the water. Make sure you can read the temperature. Use a piece of foil to close the bottle. The foil will also help to better attach the thermometer’s string to the bot-tle.
7. Break the effervescent tablet in half and place the two parts in the second bottle. Quickly insert the second thermometer, attach it to the neck of the bottle well and close it with foil, as with the first bottle.
8. Turn on the lamp and make sure that it shines on both bottles equally.9. Measure the temperature in the two bottles every two minutes for 20 minutes and record
the data in the table.
Temperature reading time
(min)
Bottle №1(only water)
Bottle №2(water + carbon dioxide)
0
2
4
6
8
10
12
14
16
18
20
Write down your conclusion from the results obtained: ………...........................................................................................................................................................................................................................................................
Answer the following questions:
А) What is different in the two bottles? What is the role of bottle №1?
.................................................................................................................................................................................................
B) What is the role of the lamp in this experiment?
.................................................................................................................................................................................................
C) Describe what goes on in the bottle with the carbon dioxide.
.................................................................................................................................................................................................
D) Suggest how you could change this experiment if you wanted to know the effect of different amounts of carbon dioxide.
.................................................................................................................................................................................................
WORKSHEET 3

20
TASK 3. Investigate what the solubility of carbon dioxide depends on
We know that water covers about 71% of the Earth’s surface. You are probably already won-dering if carbon dioxide from the atmosphere can dissolve in it? You can answer this question from personal experience. We have all tasted a slightly sour taste in sparkling water. This is due to the carbon dioxide dissolved in it, albeit in very small amounts.
Required materials: Two identical bottles of carbonated water from a refrigerator, two bal-loons, a refrigerator, two cups, hot and cold water.
Steps:
1. Open both bottles of sparkling water at the same time and place the balloons on their necks.
2. Return one bottle to the refrigerator and leave the other warm.
3. Wait about 20 minutes. Remove the bottle from the refrigerator.
4. Compare the volume of the two balloons and draw a conclusion about the solubility of car-bon dioxide.
Variant of the first test:
1. Pour cold water into a cup, warm into another.
2. Pour the same amount of carbonated water into two test tubes and place them in the warm and cold water respectively.
3. Describe the observed changes and draw conclusions about the effect of temperature on the solubility of carbon dioxide in water.
...........................................................................................................................................................................................................
Additional tasks:
Observe the bottle of sparkling water while unopened. Without shaking it, open it carefully and describe what you observe then. Draw a conclusion about the effect of pressure on the solubility of carbon dioxide.
...........................................................................................................................................................................................................
...........................................................................................................................................................................................................
WOR
KSHE
ET 3

21
TASK 4. Describe the consequences for humans of increasing the amount of CO2 indoors
Required materials: Text and diagram concerning the impact of increased amounts of CO2 on humans.
Steps:
1. Read the text.
The air we inhale contains 0.03% CO2 (this is equal to 300 ppm), and the air we exhale con-tains about 100 times more - 3% CO2 (about 30,000 ppm.). When we are in a closed room, as a result of breathing, oxygen decreases, while the level of carbon dioxide increases. Thus, in the classroom, the amount of CO2 increases in just a few minutes. This leads to dizziness, confusion and headaches. Higher concentrations of CO2 cause other side effects.
The amount of CO2 can increase suddenly due to fires and volcanic activity. Heavier-than-air carbon dioxide settles in the lower parts of affected areas, where it accumulates and becomes a deadly trap for all living organisms there.
2. Analyse the data presented in the diagram.
SightBlurryvision
Centralnervous system
ConfusionNauseaHeadacheInsomnia
Cardiovascularsystem
Increase of heartrate
Increase in bloodpressure
Hearingloss
MotorsystemTremor
SkinPerspiration
RespirratorysystemLack
of air (oxygen)
Symptoms of increased concentration of CO2
Percentage of CO2
in the air:
1%
3%
5%
8%
3. Suggest an idea for a board in the classroom showing students the consequences of in-creased amounts of CO2, especially for health.
TASK 5. Let’s “catch” the carbon dioxide in the classroom
1. Analyse the experiment described.
Students decided to check if large amounts of carbon dioxide were accumulating in their classroom. With the help of their teacher and parents, they prepared a wide glass vessel filled with clear lime water. They placed the vessel in a suitable place and recorded the re-sults for a week
WORKSHEET 3

22
2. Answer the questions.
• What is the source of carbon dioxide in the classroom? .....................................................................................................................................................................................................................................................................
• Why did the students use clear lime water in this study? ………………………….............................................................................................................................................................................................................................
• Where did they place the vessel and which property of carbon dioxide affected the choice of location? ………………………………………………………………………………………..........................................................................................................................................................................................................................
• What results do you think were observed during the winter? …………………………………..........................................................................................................................................................................................
• What measures should be taken to reduce the amount of carbon dioxide in the class-room? .............................................................................................................................................................................................................................................................................................................................................................
WOR
KSHE
ET 3

23
WORKSHEET 4
Consequences of the greenhouse effect - climate change
TASK 1. Experimentally test how melting ice increases the level of the oceans
Important! We assume that the oceans are full of fresh water to simplify the experience!
Required materials: Glass, water, saucer, ice, marker.
Steps:
1. Place the glass on the saucer.2. Fill the glass almost completely with water.3. Mark the water level with the marker.4. Drop a few ice cubes into it and read the water level against the initial one.5. Wait for the ice to melt and read the water level again.6. Record the results of your observations in the table.
What happens to the water level when we drop several ice cubes inside?
Rises Drops Stays the same
What happens to the water level after the ice cubes melt?
Rises Drops Stays the same
Read the text and solve the task.
Global warming is causing the oceans and seas to rise. Look at the picture and discuss the pos-sible reasons for the rising water level. Not all are correct, so think twice.
1. Rainfall is increasing and rivers are bringing more water to the oceans.
2. Glaciers in the mountains are melting, so more water is entering the ocean.
3. The weather warms up and more people go into the water, which raises its level.
4. Water heats up as temperatures rise and therefore expands, taking up more space.
5. It’s likely the Earth’s crust rises under the oceans, which raises their level.
6. The glaciers at the poles are melting, which increases the water in the oceans.
WORKSHEET 4

24
TASK 2. Analyse the effects on nature of the invasion of alien species
Required materials: Two press releases about the spread of recent invasive species for Bulgaria, which cause plant diseases and damage to agriculture, and a table to fill in.
Steps:
1. Read the information in the press releases.
Press release 1. A parasitic fungus (Sphaeropsis sapinea) destroys the pines in a Bulgarian forest Under normal conditions, black pine lives 200-300 years. Recently, however, 20-30-year-old trees have been withering en masse. It has been established that the withered trees were attacked by a fungus, which was first registered in our country about 15 years ago, but quickly spread throughout the territory, because it has no natural enemies. In 2017-2018, the withering already affected more than 20,000 decares in Southeast Bulgaria. Experts believe that one of the reasons for the withering is the lack of sufficient moisture in the region as a result of rising temperatures in recent years. Due to this warm-ing, heavy hail fell in the region, injuring the trunks and branches of trees so that fungal hyphae could quickly penetrate the injured parts.
There is no protection against the fungus, except for sanitary felling.
Press release 2. Potato plantations are in dangerEarly blight disease in potatoes is caused by a parasitic fungus (Sphaeropsis sapinea), which spread to our country about 20 years ago due to rising temperatures. The fungus grows at temperatures of 20-35°C. It causes damage to leaves, which turn yellow and fall off. Dark brown areas form on the infected tubers and they become unfit for con-sumption.
In the winter, the fungus survives in the form of spores on leaf debris, as well as inside the tubers. These spores are spread on the leaves by the wind or water droplets. They can infect potato plants at any stage of their devel-opment, with losses of up to 100%.
2. Write in the table the reasons for the invasion by the two pathogenic species.
3. Write in the table the consequences for the distribution of each of the species by sorting them according to their degree of destructiveness (disease) for the ecosystem.
4. Suggest ideas for specific measures to prevent or at least reduce harm.
5. Discuss your suggestions.
WOR
KSHE
ET 4

25
Pathogenic species
Reasons for the spread of
the pathogenic species in
our country
Symptoms of the disease
Consequences (damage done)
Ideas for specific
measures to prevent
or reduce harm
1. Fungus that causes withering of black pine2. Fungus that causes early blight on potatoes
TASK 3. Analyse the threat from the ladybug-alligator for biodiversity in our country
Invasive species grow and multiply very quickly due to the lack of natural enemies in the new habitat, causing major disturbances in the natural balance of natural ecosystems. Spiny crab, black bottom catfish, Chinese sleeper and ladybug-alligator are interesting, cute-sounding names for species that are actually uninvited guests in our land.
Required materials: Information about the ladybug-alligator.
Steps:
1. Read the text carefully.
Uninvited guest
Chinese predatory ladybugs, also known as cannibals, have not only taken over trees and shrubs in gardens, but have also settled in basements and even dormitories in Southern Europe. With the warming of the climate, they entered our country a few years ago from Greece, where they were transported from China by cargo ships.
Chinese 24-spot ladybugs are omnivorous. They feed on aphids, small butterflies, and attack and eat our 7-point red or yellow ladybugs. They also use the leaves, flowers and fruits of herbaceous plants for food, but most often they attack grapes, which means their number increases mainly at the beginning of the grape harvest. The invaders have a strong shell and emit a protective liquid with a pungent odour that repels birds and spiders. The only threat to Chinese cannibals are frogs and ants, which are not affected by the protective fluid and use them for food.
2. Make a food web where the cannibal ladybug also takes part.
WORKSHEET 4

26
TASK 4. Analyse the threat for human health from the spread of the Asian tiger mosquito
Required materials: Information about the Asian tiger mosquito.
Steps:
1. Read the text.
Asian tiger mosquito
The tiger mosquito (Aedes albop-ictus) has black and white colour-ation of the body and limbs. The species is characteristic of the tropical and subtropical regions of Asia. It was first found in Bul-garia in 2011.
Tiger mosquitoes transmit dan-gerous viral and parasitic dis-eases to humans and domestic animals (dengue, chikungunya, zika, etc.).
Dengue is a viral disease. It is also known as „bone-breaking“ fever, as a person has the feeling that his bones are breaking. Symptoms include fever, headache, skin rash and muscle and joint pain.
Chikungunya is also a viral disease with dengue-like symptoms - severe joint pain, twisting of the fingers and immobilization of patients for a period of several weeks to several months.
2. Search for information about the zika disease.
3. Make a diagram outlining the diseases that the tiger mosquito carries and their symptoms.
Note: Draw the mosquito in the centre of the diagram.
TASK 5. Scenario for role-playing game My Planet, my future
The future of the planet is in your hands. You are the people who need to inform the world about upcoming cataclysms and how to overcome and prevent them. You decide how to do this most effectively. We all know that in the 21st century, ideas reach many people on Earth at the same time, and in an extremely rapid way. Together with your teacher and your loved ones, write a story-based role-playing script to inform as many people as possible about climate change and the fight against it.
Movie title: ……………………………………
Directors: ………………………………………..
Screenwriters: ……………………………………….
Starring: ………………………………………......
WOR
KSHE
ET 4

27
TASK 6. Find out the reasons for floods
Since ancient times, many settlements have been built in river valleys that are a natural source of protection and drinking water. At the same time, floods are one of the most catastrophic natural disasters. They affect the lives of millions of people. Today, there are hundreds of cities through which rivers flow, making them vulnerable to flooding.
Build a village through which a river can pass Required materials: Plasticine, water, transparent medium-sized box, recyclable materials.
Steps:
Action: Demonstrate a heavy rainfall and watch what happens to the village. Use whatever materials you think are best. Model a riverbed from plasticine. Make a coniferous forest, arable land, housing. Build a village by the river. Now start slowly pouring water into your riverbed. Climate change is a fact! The alternation of heatwaves and heavy rains is a normal phenom-enon during climate change. Your village is in a period of heavy rainfall. Watch what happens to it when the river overflows.
WORKSHEET 4
28
WORKSHEET 5
Consequences of natural pollution
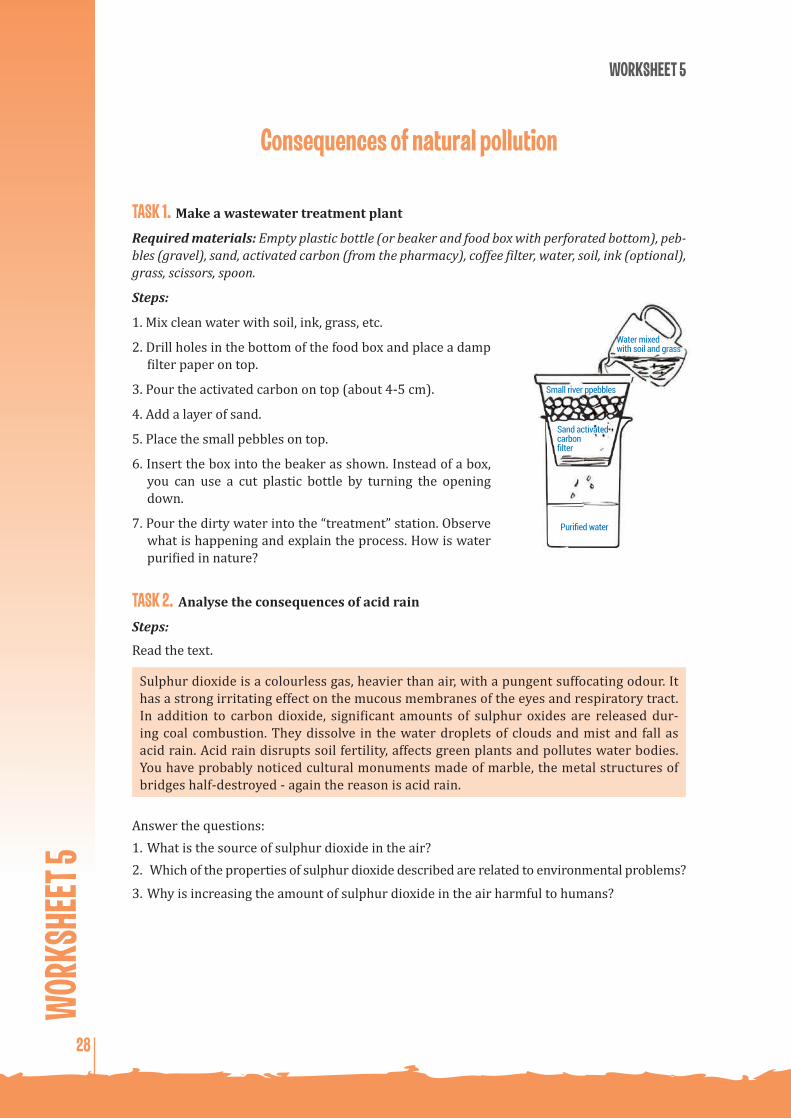
TASK 1. Make a wastewater treatment plant
Required materials: Empty plastic bottle (or beaker and food box with perforated bottom), peb-bles (gravel), sand, activated carbon (from the pharmacy), coffee filter, water, soil, ink (optional), grass, scissors, spoon.
Steps:
1. Mix clean water with soil, ink, grass, etc.
2. Drill holes in the bottom of the food box and place a damp filter paper on top.
3. Pour the activated carbon on top (about 4-5 cm).
4. Add a layer of sand.
5. Place the small pebbles on top.
6. Insert the box into the beaker as shown. Instead of a box, you can use a cut plastic bottle by turning the opening down.
7. Pour the dirty water into the “treatment” station. Observe what is happening and explain the process. How is water purified in nature?
TASK 2. Analyse the consequences of acid rain
Steps:
Read the text.
Sulphur dioxide is a colourless gas, heavier than air, with a pungent suffocating odour. It has a strong irritating effect on the mucous membranes of the eyes and respiratory tract. In addition to carbon dioxide, significant amounts of sulphur oxides are released dur-ing coal combustion. They dissolve in the water droplets of clouds and mist and fall as acid rain. Acid rain disrupts soil fertility, affects green plants and pollutes water bodies. You have probably noticed cultural monuments made of marble, the metal structures of bridges half-destroyed - again the reason is acid rain.
Answer the questions:1. What is the source of sulphur dioxide in the air?2. Which of the properties of sulphur dioxide described are related to environmental problems?
3. Why is increasing the amount of sulphur dioxide in the air harmful to humans?
Water mixed with soil and grass
Small river ppebbles
Sand activated carbonfilter
Purified water
WOR
KSHE
ET 5

29
TASK 3. Why are nitrogen oxides dangerous? Find out the reasons
Steps:
Read the text and analyse the figure.
Nitrogen oxides are also air pollutants. Most of them are released during the running of gasoline engines. Like sulphur oxides, they form acid rain from water droplets. Dense car traffic and dust particles emitted in certain climatic conditions are the reasons for the formation of smog. The word smog is formed from the words smoke (fume) + fog (mist). Smog, like a thick diaper, spreads low above the ground and causes a number of diseases.
The figure presents data on nitrogen oxide pollution from the National Automated System for Environmental Monitoring. The data were collected at two different stations for the same day in Sofia. Nitrogen oxides are measured in micrograms per cubic meter of air (μg/m3).
Based on the text and data from the figures:
1. Compare the differences in the measurements from the two stations.
2. What do you think are the reasons for the excessive levels of nitrogen dioxide in one of the stations?
3. What environmental problems can these pollutants cause?
STATION: AS PAVLOVOAveraging period - 1h, MPC 200 µg/m3
µg/m
3
200
150
100
50
0
17:0
0
18:0
0
19:0
0
20:0
0
21:0
0
22:0
0
23:0
0
00:0
0
01:0
0
02:0
0
03:0
0
04:0
0
05:0
0
06:0
0
07:0
0
08:0
0
09:0
0
10:0
0
11:0
0
12:0
0
13:0
0
14:0
0
15:0
0
16:0
0
01.02.2017/ 02.02.2017
STATION: AS KOPITOTOAveraging period - 1h, MPC 200 µg/m3
µg/m
3
8
6
4
2
0
17:0
0
18:0
0
19:0
0
20:0
0
21:0
0
22:0
0
23:0
0
00:0
0
01:0
0
02:0
0
03:0
0
04:0
0
05:0
0
06:0
0
07:0
0
08:0
0
09:0
0
10:0
0
11:0
0
12:0
0
13:0
0
14:0
0
15:0
0
16:0
0
01.02.2017/ 02.02.2017
WORKSHEET 5

30
TASK 4. Investigate the behaviour of oil in water
Required materials: 2 bowls, 1 tablespoon oil, liquid soap or dishwashing detergent, paper tow-els, cotton, feathers, strips of cotton cloth, nylon strips about ½ cm wide and about 5 cm long.
Steps:
Preliminary preparation: Divide into groups; each group should have a bowl full of water to which one tablespoon of oil is added and another bowl of waste. Each group should try to remove the oil using a different material.
1. Read the text.
Oil is the main raw material for fuels and for the production of many substances. The journey from the bowels of the Earth to us is long and every step of it can potentially relate to the emergence of environmental problems. From the given text, determine the causes of oil pollution in water and the damage it causes.
The discharge of oil from platforms in open waters, as well as wrecked tankers, creates oil spills. Some oil pollution is due to the improper discharge of fuel from ships. The spillage of oil on the water surface prevents oxygen from the air dissolving in the water and leads to the death of aquatic creatures. Petroleum products stick to birds‘ feathers, making it difficult for them to move and find food.
1. Simulate an oil spill.
2. Suggest ways to clean up the greasy spill. Using the materi-als that each group has chosen, try to remove the greasy stain from the surface of the water. Put the waste in another bowl.
...................................................................................................................................
...................................................................................................................................
...................................................................................................................................
3. Evaluate the effectiveness of the various cleaning materials.
4. Compare your results with those of other groups that used different materials.
5. Discuss the experiments performed and the answers to the following questions:
а. Describe what happens when the oil is poured on the water. Draw a conclusion about the density of the oil and its solubility in water.
...........................................................................................................................................................................................................
..........................................................................................................................................................................................................
b. If you used feathers as a cleaning agent, why are birds at risk from oil spills?
...........................................................................................................................................................................................................
..........................................................................................................................................................................................................
с. What is the role of the detergent?
...........................................................................................................................................................................................................
..........................................................................................................................................................................................................WOR
KSHE
ET 5

31
WORKSHEET 6
Energy sources. Types and uses
TASK 1. Determine the amount of light energy depending on the inclination of the Earth’s axis
Required materials: Globe, table lamp, rul-er, two identical thermometers (luxmeters), adhesive tape. You can use a ball instead of a globe.
Steps:
1. Place the lamp on a horizontal surface about 30cm from the globe.
2. Aim the lamp so that it shines directly on the equator (point B).
3. Place the two identical thermometers (with duct tape or plasticine) at points A and B. If you only have one thermometer, follow the steps in sequence.
4 . Turn on the lamp and wait 3-5 minutes.
5. Record the temperature values at points A and B.
6. Explain the result. How does the temperature change from the equator to the pole? How does the amount of solar energy change from the equator to the pole?
TASK 2. Investigate the relationship between the energy received from the Sun and the colour of objects
Required materials: Two identical bottles, two small bubbles, black and white paints (white and black paper).
Steps:
1. Paint the bottles white and black (or wrap them in white and black paper).
2. Place the balloons on the neck of the bottles. If neces-sary, tie them with an elastic band or tape.
3. Leave them in the sun for a while. If the day is not sunny, place them very close to an electric stove or table lamp.
4. Observe the balloons. Which one swells more? What caused this?
5. Draw a conclusion from the activity. Black bodies are ....................... from white ones.
6. Experiment with different bottle colours.
7. Arrange the colours you use according to how they heat up.
A
B
RAYS FROM THE LAM
P
WORKSHEET 6

32
TASK 3. Make a SWOT analysis of an energy source of your choice
Preliminary preparation: divide into groups; each group must choose one energy source.
Steps:
1. Using your knowledge of energy sources, evaluate the advantages, disadvantages, opportu-nities and risks of using your group’s energy source and fill in the table.
Energy source................................................................................................................................................
Strengths Weaknesses
Opportunities Threats
2. Listen carefully to the group reports. Think about what additions you would make to the strengths, weaknesses, opportunities and risks of other energy sources. Write them down here.
3. Participate in the discussion on assessing energy sources.
4. Make a logo for your energy source and hang it on the wall when your group reports the results of your energy source analysis.
5. Look at the logos of some energy sources. Write which is which below them:
............... ............... ............... ............... ...............
WOR
KSHE
ET 6

33
TASK 4. Identify the advantages and disadvantages of the energy sources used in practice
Methanol, ethanol and biogas and hydrogen are defined as renewable energy sources.
Steps:
1. Read the text.
2. Determine the advantages and disadvantages of the fuels described.
3. Fill in the table.
Hydrogen is the most environmentally friendly fuel because it produces only water when burned. Its use, however, is still limited today. Its safe production, storage, transport and use are the subject of studies and research.
Ethanol and methanol are used alone or in a mixture with gasoline. Their combustion emits significantly less carbon dioxide than the combustion of gasoline and diesel fuels. They are obtained from sugar cane, corn and others by fermentation. However, large tracts of tropical forest have already been cut down to sow these crops.
Biogas is obtained through the activity of bacteria in an oxygen-free environment from organic waste, manure, sewage sludge and household waste. It contains up to 85% meth-ane, carbon dioxide and other gases. After purification, biomethane is obtained from it. The largest source of methane, as a greenhouse gas, is agriculture and animal husbandry. Therefore, the production of biogas is especially suitable in areas where the raw materi-als required for it are most available. Methane has a stronger greenhouse effect than car-bon dioxide. However, its combustion produces a relatively large amount of energy and smaller amounts of carbon dioxide compared to other fuels.
Fuel Advantages DisadvantagesHydrogenEthanolMethanolBiogas
TASK 5. Explore the dependence of photosynthesis on the light intensity
Required materials: Aquatic plant (Elodea), table lamp, Beher cup, test tube, funnel, thermom-eter, 60W bulb, laboratory clock, ruler (centimetres).
Steps:
1. Read the text.
CO2 + H2O glucose + O2
Solar energy
Chlorophyll
Photosynthetic organisms (plants, some unicellular) use the energy of the sun‘s rays to form organic substances from carbon dioxide (CO2) and water (H2O), which are food for organisms. In addition to organic substances, photosynthesis also produces the oxygen necessary for the respiration of organisms, which is released into the atmosphere.
WORKSHEET 6

34
2. Prepare the equipment for work.
a) Put the aquatic plant in the Beher cup.
b) Place the funnel over the plant so that it is attached to three plastic caps (see Fig. 1), which will fix it to the bottom - so that the water you pour enters the funnel.
c) Carefully add water to the cup, hold-ing the funnel so that it does not move. The water should also cover some of the narrow part of the funnel.
d) Place the tube on the funnel and add some more water.
e) Place the table lamp at a distance of 10cm from the Beher cup.
f) Turn on the lamp and wait 5 minutes for the plant to adjust to the light intensity. You will observe the release of gas bubbles in the tube.
Fig. 1
MOVE THE LAMP BY 10 CM RULER
TABLE LAMPbubbles released from the
photosynthesistube
water
aquatic plant (Elodea)Beher cup
funnel
3. Explore the dependence of photosynthesis on light intensity.
a) Count the gas bubbles that are released in 1 minute at a distance of 10cm from the table lamp and record the result in the table below.
b) Move the table lamp to a distance of 20cm from the cup, wait 5 minutes and repeat the first step.
c) Repeat the activity for each of the distances indicated in the table.Note: Switch off the lamp at the end of the work.
d) Record the results of the activity in the table.
Distance of lamp from cup (in cm)
Number of released gas bubbles(per 1 min)
10 20304050
WOR
KSHE
ET 6
35
5. Write down your conclusion from the results obtained:
Conclusion:.....................................................................................................................................................................................................................................................................................................................................................................................................................................................................................................................
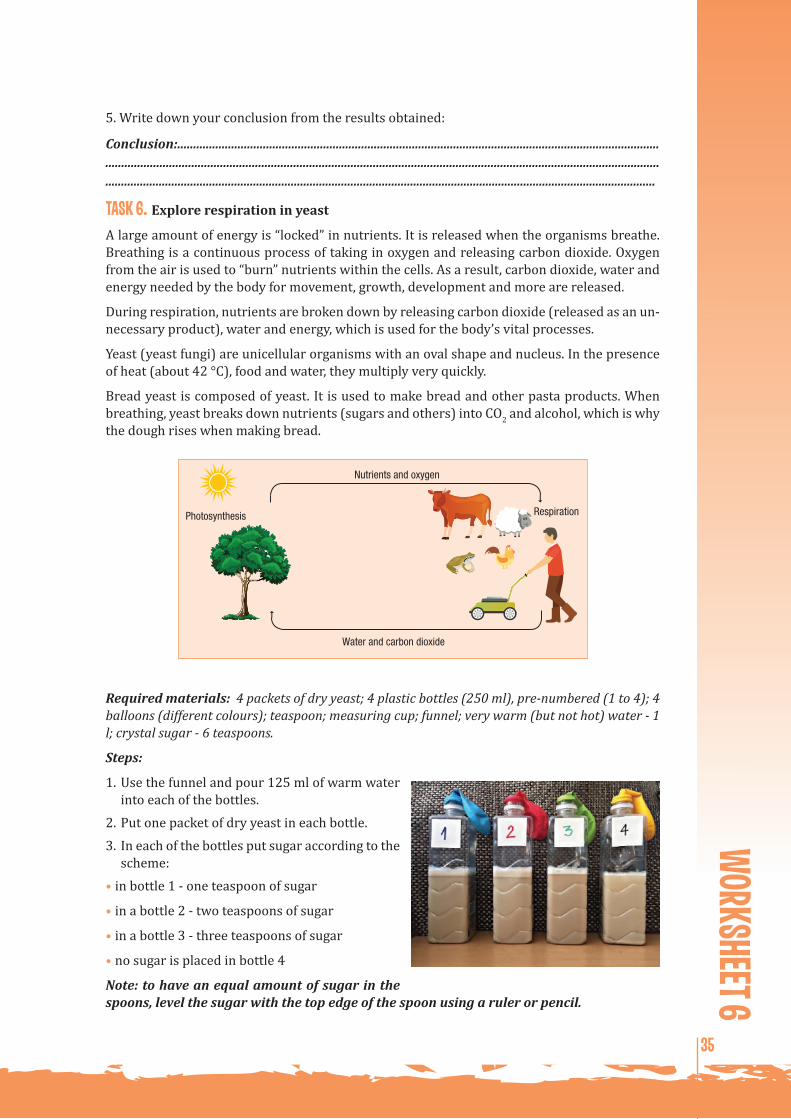
TASK 6. Explore respiration in yeast
A large amount of energy is “locked” in nutrients. It is released when the organisms breathe. Breathing is a continuous process of taking in oxygen and releasing carbon dioxide. Oxygen from the air is used to “burn” nutrients within the cells. As a result, carbon dioxide, water and energy needed by the body for movement, growth, development and more are released.
During respiration, nutrients are broken down by releasing carbon dioxide (released as an un-necessary product), water and energy, which is used for the body’s vital processes.
Yeast (yeast fungi) are unicellular organisms with an oval shape and nucleus. In the presence of heat (about 42 °C), food and water, they multiply very quickly.
Bread yeast is composed of yeast. It is used to make bread and other pasta products. When breathing, yeast breaks down nutrients (sugars and others) into CO2 and alcohol, which is why the dough rises when making bread.
Photosynthesis Respiration
Water and carbon dioxide
Nutrients and oxygen
Required materials: 4 packets of dry yeast; 4 plastic bottles (250 ml), pre-numbered (1 to 4); 4 balloons (different colours); teaspoon; measuring cup; funnel; very warm (but not hot) water - 1 l; crystal sugar - 6 teaspoons.
Steps:
1. Use the funnel and pour 125 ml of warm water into each of the bottles.
2. Put one packet of dry yeast in each bottle.3. In each of the bottles put sugar according to the
scheme:• in bottle 1 - one teaspoon of sugar
• in a bottle 2 - two teaspoons of sugar
• in a bottle 3 - three teaspoons of sugar
• no sugar is placed in bottle 4
Note: to have an equal amount of sugar in the spoons, level the sugar with the top edge of the spoon using a ruler or pencil.
WORKSHEET 6

36
4. Close the bottle caps tightly and shake well.5. Remove the caps and place a balloon on the opening of each bottle. Note: The balloon must fit tightly around the neck of the bottle!6. Wait about 10-15 minutes and report the results.7. Record the results in the table:
Bottle №
Sugar content in the bottle
The amount of gas in the balloonUse the following quantitative equivalents:
0 - no gas, 1 - very little gas, 2 - medium amount of gas; 3 - a large amount of gas
1 1 spoons2 2 spoons3 3 spoons4 No sugar
Conclusion:..........................................................................................................................................................................................................................................................................................................................................................................................................................................................................................................................................................................................
TASK 7. Calculate the amount of energy in the nutrient levels of the ecosystem
Steps:
1. Read the text and take a look at the diagram.
Only about 1% of the sun‘s energy on the Earth‘s surface is absorbed by producers and converted into chemical energy. This energy is transmitted through food chains (food web) in the ecosystem and is constantly decreasing.
This process is called energy flow.
The producers have the most energy at the nutri-tional level. Only part of the energy passes into each subsequent nutritional level. Organisms use about 90% of the energy for their life pro-cesses, releasing energy in the form of heat. As a result of the transfer, the energy decreases in the direction from the producers to the consumers.
ENERGY FLOW
tertiary consumers (III)
secondary consumers (II)
primary consumers (I)
PRODUCERS
heat
heat
heat
Fig. Flow of energy in a food chain
2. Calculate how much energy there will be in the food level of consumers in the I, II and III lines of the food web you have composed, if the energy at the level of the producers is:
1) 20 200 Kcal 2) 30 400 Kcal 3) 21 600 Kcal 4) 46 200 Kcal 5) 38 800 Kcal
WOR
KSHE
ET 6

37
TASK 8. Make your own solar oven
Required materials: Cardboard box, black paper, foil, transparent glass bowl, two thermom-eters, crushed crayons, paper cake cup, aluminum cooking foil.
Steps:
1. Wrap the inside of the cardboard box with aluminum foil.2. Place the black paper on the bottom.3. Pour the crushed crayons into the paper cake cup.4. Place one of the thermometers next to the paper pad and cover with a clear bowl. Put the
other thermometer away from the box.5. Make a table in which to record the time (in mins.) from the beginning of the experiment
and the temperature (in °C) measured with the two thermometers.6. Observe what happens to the crushed crayons and draw a conclusion.
TASK 9. Make your own wind turbine
Make your own wind turbine. Place it in the school yard and watch it move.
Required materials: 5 cardboard cups (try to use instead of plastic cups), two wooden skewers (you can use two straws instead), pencil, glue.
Steps:
1. Make a cross with the two wooden skewers through one of the cups as shown in the picture.
2. Bore a hole in the bottom of one of the cups with a pencil and glue the pencil to the already crossed skewers. Bore and attach the 4 remaining cups as shown in the image.
3. Go out into the school yard to try out your new wind tur-bine.
4. Count the rotations for one minute. Calculate the distance travelled by one cup. Use the cir-cle length formula. To do this, you need to measure the length of the straw between the two holes in the cups with a ruler. Calculate the wind speed.
5. Discuss the possibility of building a local renewable energy source (RES) in or around your school. Think about where RESs are built in your area.
Note: In the absence of any wind at all, use a hairdryer.
WORKSHEET 6

38
WORKSHEET 7
Saving energy and resources
TASK 1. Explore the mechanism behind heating up the air in the room
Required materials: Three identical cans without their bottoms, duct tape, two thick books, wire, a square sheet of paper, pins or pushpins.
Steps:
1. Make a tube by connecting the three bottomless cans with duct tape.
2. Make a carousel out of a sheet of paper by making four cuts diagonally.
3. Use the wire and secure the carousel at one end of the tube as shown.
4. Place the tube on two thick books so that there is an opening at the bottom.
5. Observe the rotation of the carousel. What is this physical phenomenon called?
TASK 2. Try to keep a hot water bottle warm for as long as possible
Preliminary preparation: Divide into groups.
Required materials: Hot water bottle, thermometer, various materials (aluminum foil, paper bag, woollen scarf, wooden box, glass tank, paper towels, newspapers, cork, cotton socks, etc.).
Steps:
1. Examine the packaging materials.
2. Recall which of them have good insulating properties.
3. Discuss in the group and select a material.
4. Make a package with the specified purpose that’s suitable for the bottle.
5. Pour hot water into the bottle. The water temperature must be the same for the different groups’ bottles.
6. Wait a while and measure the temperature of the bottled water at the same time.
7. Write down the most suitable material by comparing the cooling time of different bottles.
The most suitable material for insulation is: ...........................................................................................
TASK 3. Suggest ideas for reducing the amount of electricity used in everyday life
Steps:
1. Record in the table (column 1) the activities you used electricity for over the last 24 hours (from waking up in the morning until this morning).W
ORKS
HEET
7

39
2. Discuss in the group specific actions to reduce electricity consumption tomorrow. Write your ideas in column 2 of the table.
3. Discuss your ideas with the other groups.
Activities in which I used electricity yesterday
Ideas on how to reduce my electricity consumption tomorrow
....................................................................
....................................................................
....................................................................
....................................................................
....................................................................
....................................................................
....................................................................
....................................................................
....................................................................
....................................................................
....................................................................
....................................................................
....................................................................
TASK 4. Prove the need to use energy-efficient LED bulbs
Required materials: Electric table lamp; ordinary 40-50W light bulb; 6-9W bulb; luxmeter; thermometer.
Steps:
1. Place the luxmeter and the thermometer on the desk next to the table lamp.
2. Measure and record the luxmeter and thermometer readings:
luxmeter: ..................................... thermometer:......................................
3. Insert the LED bulb into the table lamp and plug it into the mains. Wait 3-4 minutes and read and record the readings of the luxmeter and thermometer:
luxmeter: ..................................... thermometer:......................................
4. Turn off the lamp and replace the LED bulb with an incandescent bulb. Wait 3-4 minutes, read and record the readings of the luxmeter and thermometer:
luxmeter: ..................................... thermometer: ......................................
5. Compare the results of the activity and record a conclusion from your observations.
6. Write a conclusion for the experiment: ............................................................................................................
WORKSHEET 7

40
WORKSHEET 8
Energy efficiency in school. Energy tour. Measurement of parameters - light, carbon dioxide,
temperature, power of appliances. Energy-saving behaviour.
TASK 1. Measure the content of carbon dioxide in the classroom
Required materials:Instrument for measuring the content of carbon dioxide in the air, tables (1 and 2).
Steps:
1. Get familiar with the device for measuring the content of carbon dioxide. You have a measuring device for the content of CO2 in the air - it measures from 0 to
3000ppm (volume parts per million). Switch on the device and the measurement starts after a sound signal. The appliance should be placed at table level because it shows differ-ent values at different heights from the floor. Table 1 also provides hygiene levels for the CO2 content in ppm.
Table 1
Amount of C02(ppm)
Hygienic assessment Prescription
< 1000 Harmless None
1000 - 2000 Doubtful The room can be ventilated
> 2000 Unacceptable The room must be ventilated
Note: It is recommended that you do not place the appliance in a corner of the room.
Measurement 1. Begin 20 minutes after the start of the training session. a) Place the device on a flat surface (table, chair, etc.). b) Read and record the data from the device in the table. c) Assess the condition of the air using the table with hygiene standards. d) Open the windows wide (for 5 minutes) to ventilate the classroom.Measurement 2. After closing the windows, make a second reading of the CO2 content data - follow the sequence of work described in the first measurement. Record the result in Table 2.Measurement 3. After 20 minutes of work in the classroom, read the data again. Record the result in Table 2.
Measurement of CO2 content Recorded data on CO2 contentMeasurement 1. Before ventilating the roomMeasurement 2. After ventilatingMeasurement 3. After 20 minutes of work in the classroom
Table 2
Analyse Table 2. Follow the readings of the CO2 meter to prevent the accumulation of high amounts of CO2 in the room.W
ORKS
HEET
8

41
TASK 2. Calculate the average temperature in the classroom
Earth temperature measurements are made at different points on the planet, during different seasons, during different parts of the day over a long period of time, after which the data obtained are averaged.
To understand how that is not at all simple, consider and propose a plan for measuring the temperature in a large room.
Required materials: Secondary thermometer.
Steps:
1. Determine the points at which the measurement will take place.
2. Write down your selection arguments for each temperature measurement point you have planned, depending on:
• height from the floor• distance to the window• surface on which you will place the thermometer (colour of the surface, material from
which it is made, etc.)• number of students in the room.
3. Record the number of measurements at each point and the exact time of day when each measurement will be taken.
4. Record the duration of the measurements over time (e.g. month, season, year, etc.).5. Calculate the total number of measurements in the period you specified.6. Calculate the average value.Implement your plan by measuring the temperature at five points in the classroom. Write the data in the table. Use a room temperature thermometer to measure.
Note: The thermometer must be at a distance from the body so that body temperature does not affect the measured value.
Points at which
measurements will be made
Arguments for selection of measuring points
Measurement data(оС)
1.
2.
3.
4.
5.
Average temperature: ..............................................
WORKSHEET 8

42
TASK 3. Investigate how best to ventilate classrooms during the cold winter days
Required materials: Ventilation scheme, lighted candle.
Steps:
1. Learn about the ways in which it is possible to ventilate living spaces and classrooms.2. Which kind of ventilation is recommended for saving heat energy?
А. Always sloping
ventilation - partially
open window.
B. Shock ventilation -
fully open window for a short time
(3-5 minutes).
C. Cross-ventilation - open for a short time
opposite windows or window and door
open for a short time.
3. Prove experimentally how warm air leaves the room during ventilation and how cold air enters the room. Use a lighted candle and follow the direction of the flame at the bottom and top of an open window.
TASK 4. Self-evaluate your actions for thermal energy efficiency
Steps:
1. Fill in the table, evaluating your behaviour in terms of energy efficiency when using thermal energy. For each “yes”, award yourself one point.
Energy efficiency actions Yes No Points
1. We do not put furniture and curtains in front of the radiator.2. Only shock or cross-ventilate the room for a few minutes.3. We reduce or turn off the heating when we are not there.4. During ventilation, switch off the radiator (at *).5. The room temperature is within range 20°C – 22°C.
6. The temperature in the corridor, hall, etc. is within the range 14°C – 17°C.
7. We wear appropriate clothing for the season.8. Do not place the radiator valve above position 3.9. We reduce or turn off the heating at night.
2. Add all the points. Make a self-assessment of your energy-efficiency behaviour.
10-9 points - excellent behaviour for energy efficiency;7-8 points - you have good habits that you follow;5-6 points - a good start, more diligence;1-4 points - get acquainted with all the suggestions that you do not follow and start working towards effective behaviour.
WOR
KSHE
ET 8

43
TASK 5. Measure the brightness of the workplace with a luxmeter
Required materials: Luxmeter.
Steps:
1 Read the text.
Electricity in school is mainly used for lighting and pow-ering various appliances, such as computers, electronic devices and others. Therefore, energy savings are mainly associated with lighting control. Luminosity is a value that depends on the flow of sunlight falling on one square meter. It depends on the power of a lamp and the distance from it. It is measured in lx (lux). For comparison - 0.0001lx - to-tal starlight in cloudy skies; 100lx - very dark cloudy day; 10,000-25,000lx - daylight, in the shade; 320-500lx - light-ing in an office, study room. The recommended lighting in the workplace is 300lx and 200lx for corridors and stairs. Not all lamps need to be lit if there is enough light. We measure the luminosity with a luxmeter.
2. Get acquainted with the operation of the luxmeter.3. Measure the luminosity in different parts of the room when the lights are on and when us-
ing only sunlight.4. Evaluate the luminosity at your workspace. Is it enough for normal work?5. Turn off some lights if the luminosity exceeds the recommended limits.
TASK 6. Self-evaluate your actions for light energy efficiency
Steps:
1. Fill in the table, evaluating your behaviour in terms of energy efficiency when using light energy. For each “yes”, award yourself one point.
Actions for light energy efficiency Yes No Points
1. We do not leave the lights on when we are not in the room.
2. We use table lamps and lanterns when we use part of the space in the room.
3. We use only energy-saving lamps.
4. We do not let too many lamps light up in the room. It is better to use one powerful lamp than several others.5. We understand and use the symbols green, yellow and red where they are used. 6. When we are close to the window and it is still light, we do not turn on the row of lamps next to the window.
7. We regularly clean the surfaces of lighting fixtures.
8. We do not illuminate stairs, corridors, gyms too much.
9. If sunlight is sufficient, do not turn on lamps. Therefore, our workspace should be close to the window at home.
WORKSHEET 8

44
2. Add up all your points. 3. Make a self-assessment of your energy-efficiency behaviour.
10-9 points - excellent behaviour for energy efficiency;7-8 points - you have good habits that you follow;5-6 points - a good start, more diligence;1-4 points - get acquainted with all the suggestions that you do not follow and start working towards effective behaviour.
TASK 7. Self-evaluate your actions for electricity efficiency
Steps:
1. Fill in the table, evaluating your behaviour and the behaviour of other family members in terms of energy efficiency when using electricity. For each “yes”, award yourself one point.
Actions for electricity efficiency Yes No Points1. We mainly use appliances with energy class A, A + and A ++2. We often defrost the refrigerator.3. Place the refrigerator in a cool place, away from the stove.4. We do not let the refrigerator work at very low temperatures.5. We do not leave the appliances in stand-by mode for a long time.6. We turn off electrical appliances when we are not using them.7. We run the washing machine when it is almost or completely full.8. We put a lid on the pot when we cook.9. Do not put hot or hot food in the refrigerator.10. We turn off the chargers when not in use.
2. Add up all the points. Make a self-assessment of your energy-efficiency behaviour.10-9 points - excellent behaviour for energy efficiency;7-8 points - you have good habits that you follow;5-6 points - a good start, more diligence;1-4 points - get acquainted with all the suggestions that you do not follow and start working for effective behaviour.
3. Introduce your parents to these energy-saving rules!
TASK 8. Measure the energy consumed by an appliance
Required materials: Electrical appliance, e.g. iron, hair dryer, pressure cooker, computer. The wattmeter measures the operation of a device and its power consumption.Steps:1. Calculate the value of electricity consumed for a quarter of
an hour by the switched-on appliance, with the given pow-er (written on its side). Assume that the price for 1kWh (1,000Wh) is BGN 0.19.Note: For example, if the appliance has a power of 2,200W and has worked for half an hour, the electricity consumed is calculated as follows:Power (in watts W) X time (hours h) = electricity (watts-hour Wh)W
ORKS
HEET
8
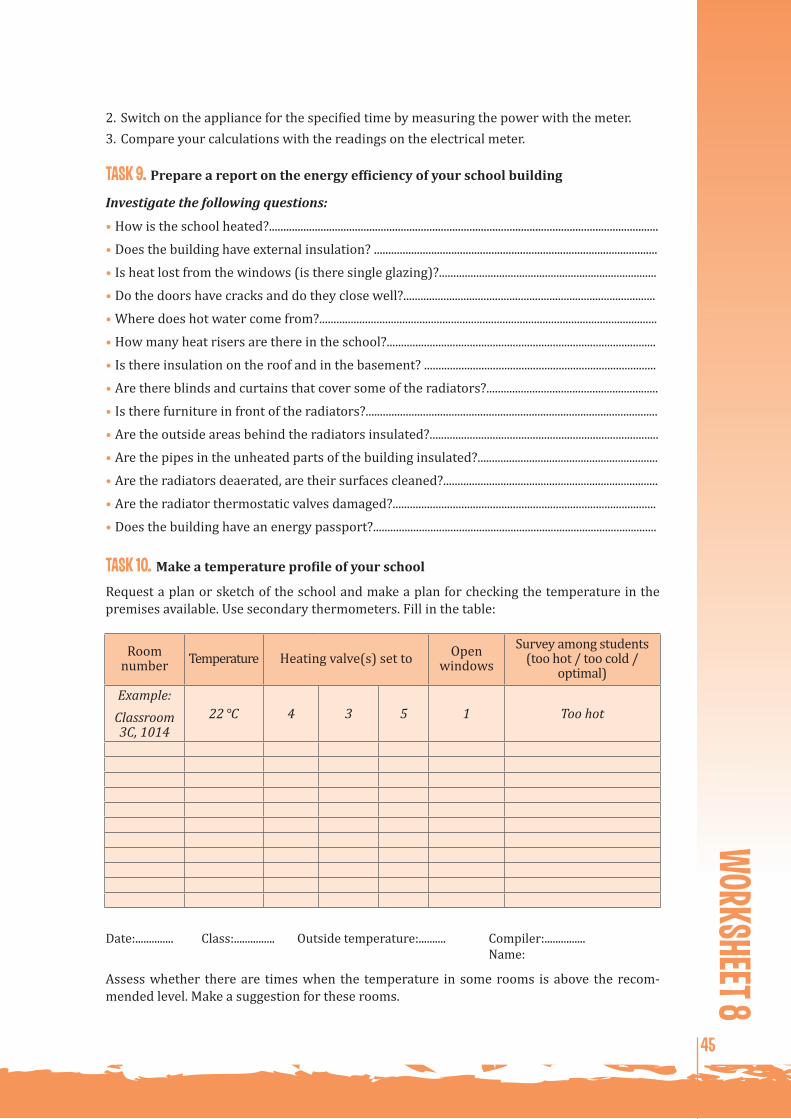
45
2. Switch on the appliance for the specified time by measuring the power with the meter.3. Compare your calculations with the readings on the electrical meter.
TASK 9. Prepare a report on the energy efficiency of your school building
Investigate the following questions:
• How is the school heated?........................................................................................................................................• Does the building have external insulation? ...................................................................................................• Is heat lost from the windows (is there single glazing)?............................................................................• Do the doors have cracks and do they close well?........................................................................................• Where does hot water come from?......................................................................................................................• How many heat risers are there in the school?..............................................................................................• Is there insulation on the roof and in the basement? .................................................................................• Are there blinds and curtains that cover some of the radiators?............................................................• Is there furniture in front of the radiators?......................................................................................................• Are the outside areas behind the radiators insulated?................................................................................• Are the pipes in the unheated parts of the building insulated?...............................................................• Are the radiators deaerated, are their surfaces cleaned?...........................................................................• Are the radiator thermostatic valves damaged?............................................................................................• Does the building have an energy passport?...................................................................................................
TASK 10. Make a temperature profile of your school
Request a plan or sketch of the school and make a plan for checking the temperature in the premises available. Use secondary thermometers. Fill in the table:
Room number Temperature Heating valve(s) set to Open
windowsSurvey among students
(too hot / too cold /optimal)
Example:Classroom 3С, 1014
22 °С 4 3 5 1 Too hot
Date:.............. Class:............... Outside temperature:.......... Compiler:............... Name:
Assess whether there are times when the temperature in some rooms is above the recom-mended level. Make a suggestion for these rooms.
WORKSHEET 8

46
WORKSHEET 9
Sustainable development
TASK 1. Analyse some of the goals of sustainable deveopment
Today the expression “sustainable development” is prevalent in the news and on various popular programmes. This expression is associated with the protection of nature and the development of society.
Steps:
1. Read the following text.
The term „sustainable development“ has been used since the 18th century. It was then associated with forestry and forest management. Sustainable forest development means cutting down as much wood as the forest can produce in the same year from existing trees or through planting new ones. Ideas for sustainable and prudent use of natural wood resources have been spreading gradually in different countries - Britain, Germany - since the 18th century and are one of the prerequisites for the development of forestry and forest management.
After the middle of the 20th century, the term began to be used more and more often in connection with environmental protection. In 1987, the United Nations’ World Commission on Environment and Development published the report Our Common Future. The report includes what is now one of the most widely accepted definitions of sustainable development:
„Sustainable development is development that meets the needs of the present without compromising the ability of future generations to meet their own needs.“
2. Write down your ideas and associations with the term “sustainable development”. There are no right or wrong answers, you just need to present your point of view.
………………………………………………………………………………………………………………………………………………………………………………………………………………………........................................................................................................... …………………………………………………………………………………………………………………………………………………
3. Answer the questions.
a) Which of your word-associations coincide with the idea of sustainable development from the 18th century?
………………………………………………………………………………………………………………………………………………………………………………………………………………………........................................................................................................... …………………………………………………………………………………………………………………………………………………
b) Which of your word-associations match the definition of sustainable development today?
………………………………………………………………………………………………………………………………………………………………………………………………………………………........................................................................................................... …………………………………………………………………………………………………………………………………………………
c) How do you think the principle of sustainable development can be observed in your locality and your school?
………………………………………………………………………………………………………………………………………………………………………………………………………………………........................................................................................................... …………………………………………………………………………………………………………………………………………………
WOR
KSHE
ET 9

47
d) Take a look at the chart for the 17 UN Sustainable Development Goals to reach by 2030 that was adopted in 2015.
e) Choose a goal that you consider particularly important.
(1. No poverty; 2. No hunger, creation and use of sustainable crops; 3. Ensuring a healthy life; 4. Quality education and lifelong learning; 5. Gender equality; 6. Clean water and sanitation for all; 7. Ensuring affordable and clean energy for all; 8. Decent work and economic growth; 9. Flexible infrastructure, innovation and industry; 10. Reducing inequalities between people in countries and between countries; 11. Sustainable and safe development of cities and other settlements; 12. Responsible production and consumption; 13. Urgent action to limit climate change; 14. Preservation of life in the oceans, seas and other basins for sustainable develop-ment; 15. Preservation of life on land, forests and soils, protection; 16. Ensuring peace, justice and strong institution building at all levels; 17. Ensuring a global partnership for sustainable development.)
f) Discuss in your group:
• Why do you consider this goal important?• How is it possible to achieve such a goal? List specific measures to achieve it.• Make another possible logo for this goal that reflects its meaning with your group. Draw it
on a piece of paper and hang it on the board.
TASK 2. Calculate and present your environmental footprint
For this task you can use the calculator provided by Gorichka (Горичка)on this website: http://first.gorichka.bg/index.php?p=61&l=1
The carbon footprint is the amount of carbon dioxide produced during one’s life at home, at school, in transport, etc. Enter the data you have previously obtained from electricity and heat-ing bills from home and school into the calculator.
Steps:
1. Open the link and fill in the table there.
2. Calculate the total carbon footprint of the group.
3. How many trees do you need to plant to compensate for the carbon emissions associated with your personal carbon footprint?
4. How can you change your habits to reduce carbon emissions?
WORKSHEET 9

48
List of published photos from schools participating in the programme All published photos are property of the National Trust EcofundInside front cover ‒ „Tsanko Tserkovski” High School, Polski Trambesh page 1 ‒ “Ekzarh Antim I” High School, Kazanlakpage 6 ‒ “St. Patriarch Evtimii” Primary School, Veliko Tarnovopage 7 ‒ “Hristo Botev” High School, Pavel banya
page 17‒ Professional high school for restaurant and hotel business, Pavel banyapage 22 ‒ “St. Patriarch Evtimii” Primary School, Veliko Tarnovopage 27 ‒ “Vasil Levski” Priamry School, Edrevo, municipality Nikolaevo, region Stara Zagora
List of teachers, participating in the project 1. Albena Aleksandrova NGDEK
“St. Konstantin-Kiril Filosof” ‒ Sofia 2. Alexandra Danova 79 High School “Indira Gandi” ‒
Sofia, Lyulin region3. Aneta Ivanova “Ivan Vazov” High School ‒
Stara Zagora 4. Aneta Pencheva NGDEK
“St. Konstantin-Kiril Filosof” ‒ Sofia5. Anna Mihalkova 7 High School
“Sv. Sedmochislenici” ‒ Sofia6. Atanas Trifonov “Nikola Velchev” Sports School ‒
Samokov7. Bilyana Katsarska “Nikola Velchev” Sports School ‒
Samokov 8. Bonka Borisova “Neofit Rilski” Primary School ‒
Kilifarevo, municipality Veliko Tarnovo
9. Borka Mladenova 40 High School “Lui Pasteur“ ‒
Sofia, Lyulin region10. Darinka Boneva “Emiliyan Stanev” High School ‒
Veliko Tarnovo11. Desislava Misheva 79 High School “Indira Gandi“ ‒
Sofia, Lyulin region12. Desislava Staykova “Vasil Levski“ High School
for foreign languages ‒ Burgas13. Diana Doncheva “Kulata” Primary School ‒ Kazanlak14. Dimitar Pavlov “Ivan Mirchev” Primary School ‒
Stara Zagora15. Donika Dimitrova “Ekzarh Antim I” High School ‒
Kazanlak16. Dora Marinova 40 High School “Lui Pasteur“ ‒ Sofia17. Elena Dimitrova “Hristo Botev” High School ‒
Pavel banya18. Emiliya Genova “Bratya Miladinovi”
Primary School ‒ Burgas19. Galina Kirova PMG “Vasil Drumev“ High School ‒
Veliko Tarnovo20. Galya Popova - Adirkova “Nikola Velchev” Sports School ‒
Samokov21. Ganka Mushikova “Ekzarh Antim I” High School ‒
Kazanlak22. Genka Mincheva PMG “Vasil Drumev” High School ‒
Veliko Tarnovo23. Gergana Miteva – Stefanova “Hristo Botev” Primary School ‒
Pavel banya24. Greta Koseva “P.R. Slaveikov” Primary School ‒
Veliko Tarnovo
25. Greta Stoyanova “Alexander Georgiev Kodzhakafaliyata”
Primary School ‒ Burgas26. Iskra Georgieva “Vasil Levski” Primary School ‒ Edrevo, municipality Nikolaevo, region Stara Zagora27. Ivalina Nikolova
“Neofit Rilski” Primary School ‒ Gabrovo
28. Ivanichka Petkova “St. Patriarch Evtimii” Primary School ‒ Veliko Tarnovo
29. Kameliya Krumova “Ivan Vazov” High School ‒
Stara Zagora30. Kirilka Torlashka “Neofit Rilski” Primary School ‒
Gabrovo31. Liliya Borisova 90 High School “Gen. Jose de San
Martin“ ‒ Sofia, Lyulin region32. Lilyana Minkova “Otets Paisii” High School ‒Samokov33. Magdalena Shurelova “Petko Rosen” High School ‒ Burgas34. Malinka Yosifova 97 High School “Bratya Miladinovi“ ‒
Sofia, Lyulin region35. Mariana Boyadzhieva “Georgi Raychev” Primary School ‒
Stara Zagora36. Mariana Djigova Professional highschool of
restaurant and hotel business ‒ Pavel banya
37. Mariana Yordanova “General Skobelev” Primary School ‒
Skobelevo, municipality Pavel banya38. Marianka Borisova “St. St. Kiril and Metodii” Primary
School ‒ Radanovo, municipality Polski Trambesh
39. Mariya Dikova 97 High School
„Bratya Miladinovi“ ‒ Sofia40. Mariya Ivanova “Otets Paisii” High School ‒ Samokov41. Mariya Karcheva
NGDEK “St. Konstantin-Kiril Filosof“ ‒ Sofia
42. Milena Atanasova “Hristo Botev” High School ‒
Pavel banya43. Nadya Stoeva
40 High School “Lui Pasteur“‒ Sofia 44. Nadya Yankova
“Otets Paisii” High School ‒ Samokov45. Neli Dimitrova
“Vasil Levski“ Primary School ‒ Petko Karavelovo, municipality Polski Trambesh
46. Penka Gogova “Hristo Botev” High School ‒ Pavel banya
47. Penka Popova “St. Patriarch Evtimii” Primary School ‒ Veliko Tarnovo
48. Penka Yoteva “St. St. Kiril and Metodii” Primary School ‒ Gabrovo
49. Polina Hristova “Tsanko Tserkovski” High School ‒ Polski Trambesh
50. Radka Dimitrova “St. Paisii Hilendarski”
Primary School ‒ Kazanlak51. Rumyana Gamalova “Otets Paisii” High School ‒ Samokov52. Silvana Lobutova “Otets Paisii” High School ‒ Samokov53. Silviya Yanakieva “Otets Paisii” High School ‒ Samokov54. Slaveika Budinova “Otets Paisii” High School ‒ Samokov55.Snezhana Kaneva “Hristo Smirnenski” Primary School ‒
Tulovo, municipality Maglizh56. Snezhana Stefanova “P.R. Slaveikov” Primary School ‒
Veliko Tarnovo57. Stefan Venkov “Neofit Rilski” Primary School ‒
Veliko Tarnovo58. Stiliyana Kazalova “Ivan Vazov” High School ‒
Stara Zagora59. Tanya Ilieva “St. Patriarch Evtimii”
Primary School ‒ Veliko Tarnovo60. Tanya Kostova “Hristo Smirnenski” Primary School ‒
Tulovo, municipality Maglizh61. Teodora Mineva
Professional highschool of restaurant and hotel business ‒ Pavel banya
62. Tsvetelina Asenova 79 High School “Indira Gandi“‒ Sofia, Lyulin region
63. Valentina Nikolova “St. St Kiril and Metodii“
High School ‒ Gabrovo64. Vanya Zheleva “Kulata” High School ‒ Kazanlak65. Vasilka Baytasova “Hristo Maximov” Primary School ‒
Samokov66. Veneta Kirkovska “Kiril Hristov” Primary School ‒
Stara Zagora67. Violeta Gyoneva “Georgy Raychev” Primary School ‒
Stara Zagora68. Violeta Mihaylova 7 High School
“Sv. Sedmochislenici“ ‒ Sofia69. Yana Ashikova
“Petko Rosen” High School ‒ Burgas70. Yordanka Nedelcheva 90 High School “Gen. Jose de San
Martin”‒ Sofia, Lyulin region71. Yovka Ivanova “Petko Rosen” High School ‒Burgas72. Zhivka Georgieva “Vasil Levski” Primary School ‒
Gita, municipality Chirpan

PART ONE. TEACHER’S MANUAL. METHODOLOGICAL GUIDELINES................................. 1 1. Education for sustainable development in Bulgarian schools....................... 2
2. Project objective....................................................................................................... 3
3. Key competencies................................................................................................... 4
4. Methodological approaches.................................................................................. 4
5. Tasks in worksheets................................................................................................ 5
PART TWO. WORKSHEETS - TOPICS AND TASKS............................................................. 7
WORKSHEET 1 - CLIMATE AND WEATHER................................................................. 8
WORKSHEET 2 - CYCLE OF SUBSTANCES IN NATURE..........................................14
WORKSHEET 3 - GREENHOUSE EFFECT....................................................................18
WORKSHEET 4 - CONSEQUENCES OF THE GREENHOUSE EFFECT - CLIMATE CHANGE............................................................................................................23
WORKSHEET 5 - CONSEQUENCES OF NATURAL POLLUTION..............................28
WORKSHEET 6 - ENERGY SOURCES. TYPES AND USES........................................31
WORKSHEET 7 - SAVING ENERGY AND RESOURCES.............................................38
WORKSHEET 8 - ENERGY EFFICIENCY IN SCHOOL. ENERGY TOUR. MEASUREMENT OF PARAMETERS - LIGHT, CARBON DIOXIDE, TEMPERATURE, POWER OF APPLIANCES. ENERGY-SAVING BEHAVIOUR........40
WORKSHEET 9 - SUSTAINABLE DEVELOPMENT......................................................48
CONTEN
TS
ISBN 978-619-7593-34-1
http://education.ecofund-bg.org/en/documents-materials/
AUTHORS: DIMITAR ZHELEV, ELENA BOYADZHIEVA, MAYA GAYDAROVA,
MILENA KIROVA, SNEZHANA TOMOVAREVIEWERS:
PROF. DR. ADRIANA TAFROVA AND PROF. DR. IRINA KOLEVAGRAPHIC DESIGN AND PRINT: “LAMBADZHIEV STANDART” LTD
GRAPHIC CONCEPT AND ILLUSTRATIONS:LILLY SAMOKOVSKA
TRANSLATION: TEODORA STANISHEVAEDITOR OF THE ENGLISH VERSION: TOM PHILLIPSCOMPILER OF THE SERIES: KAMELIA GEORGIEVA
DISTRIBUTED FREE OF CHARGE
NATIONAL TRUST ECOFUNDSofia, 67B "Shipchenski prohod" Blvd
+359 2 973 36 37, [email protected]; www.myclimate.org
WE STUDY THE CLIMATE, WE SAVE ENERGY, WE THINK OF THE FUTURE
Methodical мaterialsENERGY TEAM IN SCHOOL
CLIMATE AND ENERGY EFFICIENCY
TOWARDS THE INTRODUCTION OF CLIMATE CHANGE AND ENERGY EFFICIENCY EDUCATION IN SCHOOLS

WE STUDY THE CLIMATE, WE SAVE ENERGY, WE THINK OF THE FUTURE
CLIMATE AND ENERGY EFFICIENCY
WE STUDY THE CLIMATE, WE SAVE ENERGY, WE THINK OF THE FUTUREENERGY TEAM IN SCHOOL
CLIMA
TE AN
D ENER
GY EFF
ICIENCY
Methodical мaterials
Methodical мaterials
This project is part of the European Climate Initiative (EUKI). EUKI is a project financing tool of the German Federal Ministry of Environment, Nature Conservation and Nuclear Safety (BMU). The EUKI calls
for project ideas which are implemented by Deutsche Gesellschaft für Internationale Zusammenarbeit (GIZ) GmbH. EUKI’s main goal is to encourage cooperation on climate topics in the European Union, in order to mitigate
greenhouse gas emissions. For more information please visit: www.euki.de
The positions and opinions presented in this publication are the responsibility of the author/s only and do not necessarily represent the opinion of the Federal Ministry of Environment, Nature Conservation and Nuclear Safety (BMU).
TOWARDS THE INTRODUCTION OF CLIMATE CHANGE AND ENERGY EFFICIENCY EDUCATION IN SCHOOLS
The translation of this publication into English was made possible by the Bridging European and Local Climate Action project on behalf of the German Federal Ministry for the Environment, Nature Conservation and Nuclear Safety.