Method for Recovery and Immunoaffinity Enrichment of Membrane Proteins Illustrated with Metastatic...
16
Hindawi Publishing Corporation International Journal of Proteomics Volume 2012, Article ID 838630, 15 pages doi:10.1155/2012/838630 Research Article Method for Recovery and Immunoaffinity Enrichment of Membrane Proteins Illustrated with Metastatic Ovarian Cancer Tissues Luke V. Schneider, 1 Varsha Likhte, 1 William H. Wright, 1 Frances Chu, 1 Emma Cambron, 1 Anne Baldwin-Burnett, 1 Jessica Krakow, 1 and Gary B. Smejkal 2, 3 1 Target Discovery, Inc., 4030 Fabian Way, Palo Alto, CA 94030, USA 2 Pressure Biosciences, Inc., 14 Norfolk Avenue, South Easton, MA 02375, USA 3 Hubbard Center for Genome Studies, University of New Hampshire, Durham, NH 03824, USA Correspondence should be addressed to Luke V. Schneider, luke [email protected] Received 1 March 2012; Accepted 30 April 2012 Academic Editor: Winston Patrick Kuo Copyright © 2012 Luke V. Schneider et al. This is an open access article distributed under the Creative Commons Attribution License, which permits unrestricted use, distribution, and reproduction in any medium, provided the original work is properly cited. Integral membrane proteins play key biological roles in cell signaling, transport, and pathogen invasion. However, quantitative clinical assays for this critical class of proteins remain elusive and are generally limited to serum-soluble extracellular fragments. Furthermore, classic proteomic approaches to membrane protein analysis typically involve proteolytic digestion of the soluble pieces, resulting in separation of intra- and extracellular segments and significant informational loss. In this paper, we describe the development of a new method for the quantitative extraction of intact integral membrane proteins (including GPCRs) from solid metastatic ovarian tumors using pressure cycling technology in combination with a new (ProteoSolve-TD) buffer system. This new extraction buffer is compatible with immunoaffinity methods (e.g., ELISA and immunoaffinity chromatography), as well as conventional proteomic techniques (e.g., 2D gels, western blots). We demonstrate near quantitative recovery of membrane proteins EDG2, EDG4, FASLG, KDR, and LAMP-3 by western blots. We have also adapted commercial ELISAs for serum-soluble membrane protein fragments (e.g., sVEGFR2) to measure the tissue titers of their transmembrane progenitors. Finally, we demonstrate the compatibility of the new buffers with immunoaffinity enrichment/mass spectrometric characterization of tissue proteins. 1. Introduction Integral membrane proteins, particularly G-protein-coupled receptors (GPCRs), are the biological targets for half of all the small molecule pharmaceuticals on the market today [1–3]. Membrane transport proteins, such as P-glycoprotein and related efflux pumps, are thought to impart chemother- apy agent resistance by transporting the drugs from the cytoplasm faster than they can diffuse back, thus lowering the effective drug concentrations at the site of action [4]. Even the common cold (rhinovirus) invades the cell by first binding to specific cell surface proteins [5–7], at least some of which are thought to involve glycosylated and sialylated extracelluar domain recognition sites [7, 8]. Clearly, integral membrane proteins play key biological roles in cell signaling, transport, and pathogen invasion. As such, membrane proteins also play key clinical roles in drug efficacy and resistance and should have a larger role in clinical diagnostics and personalized medicine. However, quantitative clinical assays (e.g., immunosorbent assays) for this important class of proteins remain elusive and are generally limited to serum-soluble extracellular fragments. Many serum markers for cancer detection and treatment monitoring—such as CA-125 (a serum-soluble fragment of mucin-16 approved for recurrence monitoring of ovarian cancer), CA 15-3 (a serum-soluble fragment of mucin-1 approved for recurrence monitoring of breast cancer), sVEGFR (a serum-soluble fragment of the vascular endothelial growth factor receptor that is implicated as a prognostic marker in lung cancer) [9], and sEGFR (a serum-soluble fragment of endothelial growth
-
Upload
independent -
Category
Documents
-
view
5 -
download
0
Transcript of Method for Recovery and Immunoaffinity Enrichment of Membrane Proteins Illustrated with Metastatic...
Hindawi Publishing CorporationInternational Journal of ProteomicsVolume 2012, Article ID 838630, 15 pagesdoi:10.1155/2012/838630
Research Article
Method for Recovery and ImmunoaffinityEnrichment of Membrane Proteins Illustrated withMetastatic Ovarian Cancer Tissues
Luke V. Schneider,1 Varsha Likhte,1 William H. Wright,1 Frances Chu,1 Emma Cambron,1
Anne Baldwin-Burnett,1 Jessica Krakow,1 and Gary B. Smejkal2, 3
1 Target Discovery, Inc., 4030 Fabian Way, Palo Alto, CA 94030, USA2 Pressure Biosciences, Inc., 14 Norfolk Avenue, South Easton, MA 02375, USA3 Hubbard Center for Genome Studies, University of New Hampshire, Durham, NH 03824, USA
Correspondence should be addressed to Luke V. Schneider, luke [email protected]
Received 1 March 2012; Accepted 30 April 2012
Academic Editor: Winston Patrick Kuo
Copyright © 2012 Luke V. Schneider et al. This is an open access article distributed under the Creative Commons AttributionLicense, which permits unrestricted use, distribution, and reproduction in any medium, provided the original work is properlycited.
Integral membrane proteins play key biological roles in cell signaling, transport, and pathogen invasion. However, quantitativeclinical assays for this critical class of proteins remain elusive and are generally limited to serum-soluble extracellular fragments.Furthermore, classic proteomic approaches to membrane protein analysis typically involve proteolytic digestion of the solublepieces, resulting in separation of intra- and extracellular segments and significant informational loss. In this paper, we describe thedevelopment of a new method for the quantitative extraction of intact integral membrane proteins (including GPCRs) from solidmetastatic ovarian tumors using pressure cycling technology in combination with a new (ProteoSolve-TD) buffer system. Thisnew extraction buffer is compatible with immunoaffinity methods (e.g., ELISA and immunoaffinity chromatography), as well asconventional proteomic techniques (e.g., 2D gels, western blots). We demonstrate near quantitative recovery of membrane proteinsEDG2, EDG4, FASLG, KDR, and LAMP-3 by western blots. We have also adapted commercial ELISAs for serum-soluble membraneprotein fragments (e.g., sVEGFR2) to measure the tissue titers of their transmembrane progenitors. Finally, we demonstrate thecompatibility of the new buffers with immunoaffinity enrichment/mass spectrometric characterization of tissue proteins.
1. Introduction
Integral membrane proteins, particularly G-protein-coupledreceptors (GPCRs), are the biological targets for half of allthe small molecule pharmaceuticals on the market today[1–3]. Membrane transport proteins, such as P-glycoproteinand related efflux pumps, are thought to impart chemother-apy agent resistance by transporting the drugs from thecytoplasm faster than they can diffuse back, thus loweringthe effective drug concentrations at the site of action [4].Even the common cold (rhinovirus) invades the cell by firstbinding to specific cell surface proteins [5–7], at least someof which are thought to involve glycosylated and sialylatedextracelluar domain recognition sites [7, 8]. Clearly, integralmembrane proteins play key biological roles in cell signaling,
transport, and pathogen invasion. As such, membraneproteins also play key clinical roles in drug efficacy andresistance and should have a larger role in clinical diagnosticsand personalized medicine. However, quantitative clinicalassays (e.g., immunosorbent assays) for this important classof proteins remain elusive and are generally limited toserum-soluble extracellular fragments. Many serum markersfor cancer detection and treatment monitoring—such asCA-125 (a serum-soluble fragment of mucin-16 approvedfor recurrence monitoring of ovarian cancer), CA 15-3 (aserum-soluble fragment of mucin-1 approved for recurrencemonitoring of breast cancer), sVEGFR (a serum-solublefragment of the vascular endothelial growth factor receptorthat is implicated as a prognostic marker in lung cancer) [9],and sEGFR (a serum-soluble fragment of endothelial growth
2 International Journal of Proteomics
factor receptor that is implicated as a theranostic marker fortrastuzumab treatment in breast cancer) [10]—are currentlyonly accessible for clinical assays once extracellular fragmentsare shed from the tumor cell membranes into the circulatorysystem. Other membrane protein biomarkers—such as HER-2/neu (an oncogenic growth factor receptor approved foruse in herceptin therapy guidance) [11] and the estrogenreceptor (an indicator for hormonal therapy in breast cancer)[12]—are currently only accessible through gene-basedassays. Yet, genetic assays are unable to detect potentiallyclinically relevant posttranslational modifications, such asglycosylation, phosphorylation, acetylation, ubiquitination,and editing. Furthermore, as has been well established formore than a decade, measurements of mRNA levels, whichare produced transiently, do not correlate well to proteinlevels, which accumulate over time [13, 14].
1.1. Membrane Protein Recovery and Purification. Classically,detergents are used to extract membrane proteins frombiological membranes. Detergents also mediate membraneprotein solubility in aqueous solutions, which is a prereq-uisite for further protein purification [15]. The surfactantconcentrations required to keep most membrane proteins inaqueous solution also typically denature immunoglobulins,precluding their use for immunoaffinity purification andenrichment. Therefore, purification of membrane proteins isoften very tedious and is made more so because surfactantscan only partially mimic the lipid bilayer environment ofthe protein in nature [16]. Thus, many membrane proteinsno longer retain their native biological conformations oractivities in surfactant solutions [17], except in isolatedcases [18]. Furthermore, not all proteins can be recoveredefficiently with the same surfactant. Mitic et al. showedhow the recovery of claudin-4 (with four transmembranesequences) from insect cell cultures failed to consistentlytrack total protein recovery over 37 different surfactantstested, ranging from 0 to 169% of the sodium dodecyl sulfate(SDS) control [19]. Surfactants also create limitations onfurther proteomic analysis of membrane proteins, since sub-sequent polyacrylamide gel electrophoresis of the recoveredproteins generally requires SDS, or other ionic surfactantssuch as perfluorooctanoic acid [20]. With the exception ofnewer acid-cleavable forms [21], surfactants can produceionization problems for mass spectrometric analyses, exceptat very low concentrations [22, 23], which are too low tosupport solubility of membrane proteins. Surfactants alsobind to surfaces, significantly altering the behavior of liquidchromatographic media [24].
Because of the problems surfactants pose in chromato-graphic and mass spectrometric proteomic analyses, severalmembrane protein extraction schemes have been reportedbased on chaotropic agents and organic solvents. Jacks et al.report a 4 : 1 : 1 mixture of ethanol : acetonitrile : water asbeing useful for recovering membrane proteins of mitochon-drial and spherosomal origin in a system that is opticallytransparent in the range of 200–700 nm [25]. The lowerend of this optical range is particularly useful for studyingprotein structure by circular dichroism or quantification
by absorbance. Zhang et al. report on the use of aqueousmethanol, trifluoroethanol, and aqueous urea for the extrac-tion of membrane proteins from red blood cells, finding thateach solvent system liberated different membrane proteins[26]. Cordwell has advocated the use of a series of potentchaotropic agents and detergents (increasing progressivelyin strength) for protein extraction and fractionation, endingwith thiourea and amidosulfobetaine-14 [27]. He appliedthis method to Gram-negative bacteria, cultured mammaliancells, and heart tissue.
In all these cases, the more readily soluble proteinsare generally recovered first from the patient sample instandard aqueous buffers from which they can be morereadily purified and assayed since all the solvents, detergents,and chaotropic agents necessary to recover and solubilizethe integral membrane proteins are incompatible with thedownstream separation and purification schemes. Therefore,the only applicable immunoaffinity technique that can beused on most membrane proteins after surfactant extractionis western blotting [28], which has only been sparing appliedin clinical settings (e.g., early human immunodeficiencyvirus testing [29], early bovine spongiform encephalopathytesting [30], and Lyme disease [31]). Even these were quicklyreplaced when more robust nucleic acid or enzyme-linkedimmunosorbent assay (ELISA) alternatives became available.
1.2. Proteolysis of Intra- and Extracellular Domains. Anotherclassic proteomic approach to membrane protein analysisinvolves digestion of the generally soluble intra- and extracel-lular domains from the generally insoluble transmembraneregions. Nuhse et al. used this approach in combination withimmobilized metal ion affinity chromatography (IMAC) tostudy the phosphopeptides resulting from trypsin treatmentof the plasma membrane fraction isolated from culturedArabidopsis cells [32]. However, membrane proteins canbe refractory to digestion, particularly to trypsin, andnonspecific digestion enzymes (e.g., pepsin and elastase)are more commonly employed for this purpose [33]. Thechallenge, therefore, is to control the degree of digestionso that optimal recoveries are obtained. The resultingmixtures of partially digested peptides limit detection ofthe subsequent peptides by distributing the available signalover more distinct, but related, mass spectrometric species.Furthermore, this approach is generally only suited forglobal proteomic analysis by liquid chromatography andmass spectrometry since the resultant peptides are often notimmunologically active and mixtures of peptides are createdfrom all the membrane proteins found in the sample (bothdiagnostic and nondiagnostic).
With the exception of qualitative immunohistochem-istry, clinical exploitation of integral membrane proteins hasheretofore been limited by our ability to recover these pro-teins in a form suitable for quantitative immunoassays andrapid proteomic characterization. In this paper, we describe anew approach for the combined quantitative recovery of bothcytosolic and integral membrane proteins in a buffer systemimmediately suitable for direct use in immunosorbent assaysand subsequent mass spectrometric analyses. This approach
International Journal of Proteomics 3
uses the commercial ProteoSolve-TD1 and -TD2 extractionbuffers, developed in our laboratory and commercializedby Pressure Biosciences (PBI), in combination with PBI’spressure cycling technology (PCT). This new approach isdemonstrated by extraction and analysis of several differentbiomarker proteins from fresh frozen human metastaticovarian tumor tissues.
2. Material and Methods
2.1. Tissue Preparation and Protein Extraction. Fresh frozensamples of metastatic ovarian tumors (surgically isolatedfrom the omentum of several different individuals) werepurchased from Bio-Options (Fullerton, CA). All sampleswere reported to have been obtained from surgical resectionsof stages III and IV ovarian cancer patients. The frozen tumorsamples were finely diced and mixed prior to extraction toprovide better sample homogeneity.
2.2. Cryogenic Grinding. Diced tumor tissue (200 mg) wasweighed into an aluminum weigh boat, precooled over dryice, to keep the samples frozen during processing. A mortarand pestle were precooled by addition of liquid N2 untila permanent lake of liquid N2 could be maintained in themortar. The tissue sample was added to the lake of liquid N2
and cryogenically ground under liquid N2 to a fine powder(about the consistency of corn starch). Additional liquidN2 was added as necessary. After grinding, the liquid N2
was allowed to evaporate, and the frozen tissue along withany frozen condensate was transferred to a PULSE tube (anintegral part of the Barocycler device), which was precooledin a bed of dry ice.
2.3. Extraction Buffers. Three different buffer systems wereused to extract proteins from the ground tumor tissuesamples. The control extraction buffer, adapted from Songet al. for the homogenization of liver tissue for subse-quent protein recovery and analysis, consisted of 20 mMHEPES adjusted to pH 7.5 with NaOH [34]. This bufferalso forms the basis of the ProteoSolve-TD1 extractionbuffer (Pressure Biosciences, South Easton, MA), whichcontains additional agents for membrane protein extractionand stabilization. The ProteoSolve-TD2 extraction buffer(Pressure Biosciences) was subsequently formulated withadditional agents to stabilize the ground tissue dispersionduring Barocycler operation, improving the reproducibilityof protein extraction between samples. All these bufferswere formulated to be compatible with subsequent pro-tein labeling chemistries (e.g., aldehyde Schiff-base, N-hydroxysuccinimide, or iodoacetamide) to facilitate quanti-tative stable isotope work, such as isotope-coded affinity tags(ICATs) [35], isobaric tags for relative and absolute quanti-tation (iTRAQ) [36], and mass defect (isotope-differentiatedbinding energy shift tags, IDBEST) [37].
2.4. Barocycler Extraction. The NEP2320 Barocycler (Pres-sure Biosciences) was precooled with a circulating water bathto 4◦C prior to use. All extraction buffers were refrigerated
(0–4◦C) overnight prior to use and used cold. Commercialprotease and phosphatase inhibitor cocktails (P8340, P5726,and P2850, Sigma Aldrich, St. Louis, MO) were added toeach buffer according to package directions immediatelyprior to use. PULSE tubes were loaded according to themanufacturer’s instructions using 1.3 mL of the appropriatebuffer in each tube. The tubes were immediately processedin the Barocycler (20 cycles from 0 to 35,000 psi for 20 sec oneach cycle).
The resulting extracts were viscous and were treated with25 μL of micrococcal nuclease from Staphylococcus aureus(New England Biolabs, Ipswich, MA) reconstituted at 1,000units per mL per the manufacturer’s instructions, for 15 minon ice. The resulting extract was recovered with a transferpipette and placed in a 2 mL microfuge tube along with anyresidual pellet. The pellets with HEPES and TD1 extractionbuffers appeared as soft sticky disks generally pressed againstthe center frit of the PULSE tube. Significantly less pelletwas formed in the TD2 extraction buffer, and the TD2postextraction pellet proved to be very friable.
Insoluble materials were recovered from each extractby centrifugation (13,000×g for 15 minutes at 4◦C). Theclarified extracts were recovered by aspiration to a secondmicrofuge tube. The pellets were resuspended in 1 mL of TD1buffer by passing them through a 21-gauge syringe needleseveral times to disperse the pellet. Because the pellets werenot washed, they contain some residual soluble protein. Boththe pellets and clarified extracts were stored in aliquots at−80◦C prior to use.
2.5. 2-D Gel Electrophoresis. Aliquots (45 μL) of both theHEPES- and TD1-clarified extracts were diluted into 365 μLof ProteoSolve-IEF buffer (Pressure BioSciences, Inc.). Firstdimension separation was carried out with 200 μL of eachdiluted extract on the computer-controlled IsoelectrIQ2 IEFapparatus (Proteome Systems, Ltd. Sydney, AU) using 11 cm,pH 3–10 ReadyStrip IPG strips (Bio-Rad Laboratories, Inc.,Hercules, CA). Separation was programmed with currentlimited to 50 μA/strip in two steps: twelve hours on a concavevoltage ramp set to start at 100 V and end at 10,000 V,followed by a constant voltage for 8 hours at 10,000 V. Thestrips were removed at 90 kV-h. The second dimension wasperformed on Criterion 8–16% polyacrylamide Tris-HClprecast gels in a Dodeca Cell (both from Bio-Rad Labora-tories), equipped with the Thermo-EC 570–90 power supplyat constant current of 60 mA/gel for 2 h. Gels were fixed andstained with a ProteomIQ Blue Colloidal Coomassie gel stainas described previously [38]. Gel images were acquired on aUMAX PowerLook III flatbed scanner as 48-bit color TIFFfiles and converted to 16-bit grayscale using ImageJ software(NIH). Image analysis was performed using Ludesi REDFIN3 software (Ludesi AB, Malmo, Sweden).
2.6. Western Blots. Aliquots (17.5 μL) of each clarified extractand corresponding pellet suspension were denatured by theaddition of 5 μL of 4x NuPAGE LDS Sample Buffer (Invitro-gen), 2 μL of 1 M dithiothreitol, followed by heating to 90◦Cfor 10 minutes. The samples were centrifuged at 13,000×g
4 International Journal of Proteomics
(5 min) and the entire contents run on precast 4–12% Bis-Tris NuPAGE minigels, using the XCell SureLock system(Invitrogen, Carlsbad, CA), according to the manufacturer’sinstructions. Both SeeBlue and Magimark (Invitrogen) wereused as molecular weight markers on each gel accordingto package instructions. Proteins were transferred to PVDFmembranes at 65 V for 2 hours using a transfer bufferconsisting of 20 mM TRIS, 160 mM glycine, and 0.04% SDS.
The PVDF membranes were blocked on a rotary shakerat room temperature with two different blocking buffers. Ablocking buffer consisting of 100 mM phosphate bufferedsaline with 0.05% Tween, 0.01% Thimerosal, and 10% nonfatmilk was used for the FASLG, NRP1, KDR, LAMP-3, BCL-2, CCNE2, and AKT blots. These were incubated for 10 minbefore primary antibody addition. The blocking buffer usedfor the EDG4, EDG2, GPC3, and TUBB blots consistedof 25 mM Tris, 0.15 M NaCl, 0.1% Tween-20, and 0.01%thimerosal at pH 7.4 containing 2% nonfat milk. The secondset of membranes were blocked for 1 h before addition of theprimary antibody. In both cases, the blocking buffer used forincubation was removed before addition of fresh buffer withthe primary antibody. Primary antibodies were added at anominal concentration of 1 μg/mL in 10 mL of the respectiveblocking buffers for FASLG, NRP1, KDR, LAMP-3, BCL-2,CCNE2, and AKT blots, and a nominal concentration of0.5 μg/mL in 12 mL for the EDG4, EDG2, GPC3, and TUBBblots (except with 1% nonfat milk). Each blot was incubatedwith the primary antibody overnight on a rotary shakerat 0–4◦C. Primary antibodies consisted of affinity-purifiedpolyclonal antibodies against each biomarker purchasedfrom various sources (Table 1). Appropriate cell lysates wereused as positive controls for each of the antibodies in thewestern blots (Table 1).
After overnight incubation with the primary antibody,the blots were washed 4-5 times with their respective block-ing buffers (without the nonfat milk). Washed blots wereplaced in 4 mL of the respective blocking buffer (withoutthe nonfat milk) to which the appropriate antiprimary,secondary HRP-conjugated antibody (Cell Signaling) wasadded as supplied at a 1 : 1000 dilution for the FASLG, NRP1,KDR, LAMP-3, BCL-2, CCNE2, and AKT blots and 1 : 10,000dilution for the EDG4, EDG2, GPC3, and TUBB blots.Blots were incubated with the HRP-conjugated secondaryantibodies for 1 h at room temperature on a rotary shaker.Blots were again washed as described above and developedusing Supersignal West Femto substrate (Pierce, Thermo-Fisher) following the manufacturer’s recommendations. Thechemiluminescent images were collected using a FluorchemSP gel imager (Alpha Innotech, San Leandro, CA). The greyscale was inverted during postprocessing.
2.7. Sample Preparation for Immunoaffinity Techniques.Ovarian tumor samples extracted with TD2 buffer usingthe Barocycler (as described above) were diluted 1 : 10 inProteoSolve-TDilute (Pressure Biosciences) containing bothphosphatase and protease inhibitors (previously described)prior to any immunoaffinity work.
2.8. Enzyme-Linked Immunosorbent Assays. The effect ofthe diluted TD2 buffer on immunoassays was evaluated inseveral commercial ELISA kits, including human transferrinkit (Bethyl Laboratories, Montgomery, TX), QuantikineMMP-2 and MMP-3 (R&D Systems, Minneapolis, MN), andPathScan total p53 and PathScan total AKT1 (Cell Signaling,Danvers, MA). Immunoassays were performed followingthe manufacturer’s instructions and in parallel with stan-dards reconstituted in the diluted TD2 buffer (describedabove). Rate assays (change in absorbance with time) wereperformed, instead of the standard single time point, toascertain any residual effects of the TD2 buffer componentson the amplification step of the assay (i.e., modulation ofhorseradish peroxidase [HRP] enzyme kinetics or quenchingof substrate color development).
Nonlinear least squares curve fit of the antibody binding(1) to the standards prepared in each buffer system wasused to get the apparent affinity constants (Kaff ). While thetotal antigen concentration [An] is known in the standardcurve, the total antibody concentration [Ab] and the affinityconstant were determined simultaneously by nonlinear curvefit. The one sigma error of the estimate in each fittedparameter was determined from the Jacobian matrix.
Rate = k1 + kaff [An]− kaff [Ab]
2kaff
+
√4k2
aff [An][Ab] + (kaff [An]− kaff [Ab]− 1)2
2kaff.
(1)
The ovarian TD2 extracts (after 1 : 10 dilution inProteoSolve-TDilute) were also run in each assay to deter-mine the effective biomarker concentrations in the extract.Because of this dilution, the highest tissue concentrationtested was 15 mg of tissue/mL, which in a 100 μL ELISAsample well is the equivalent of 1.5 mg of tissue.
2.9. Immunoaffinity Enrichment of Specific Biomarkers.Antibody-conjugated PhyTips (PhyNexus, Sunnyvale, CA)were used for all immunoaffinity enrichment experiments.The experiments were conducted on a PhyNexus MEA robotsystem (PhyNexus, Sunnyvale, CA) using deep well plates.Each tip contained 100 μL fluidized beds of AminoLinkResin (Pierce Protein Research, Thermo-Fisher Scientific,Rockford, IL) conjugated to affinity-purified polyclonal anti-transferrin antibody (Bethyl Laboratories, Montgomery, TX)and packed in glycerol. The antibody conjugation procedureis described below. The sample consisted of 1 mL of ovariantumor extract prepared in TD2 buffer and diluted (1 : 10 inProteoSolve-TDilute) as described above. Nonspecific goatIgG (Equitech-Bio, Kerrville, TX) was added to the sample(9 mg per 10 mL of diluted sample) to suppress histonebinding to the antibodies present on the bead surface [39].
Glycerol (used to pack and store the PhyTips) was foundto significantly alter flow through the PhyTips and suppressionization in the subsequent mass spectrometric analyses.This glycerol was removed by washing the PhyTips with100 mM PBS (pH 7.2) in two stages using 96-well deep welltrays (Seahorse Labware, no. S30009, 2 mL per well). The
International Journal of Proteomics 5
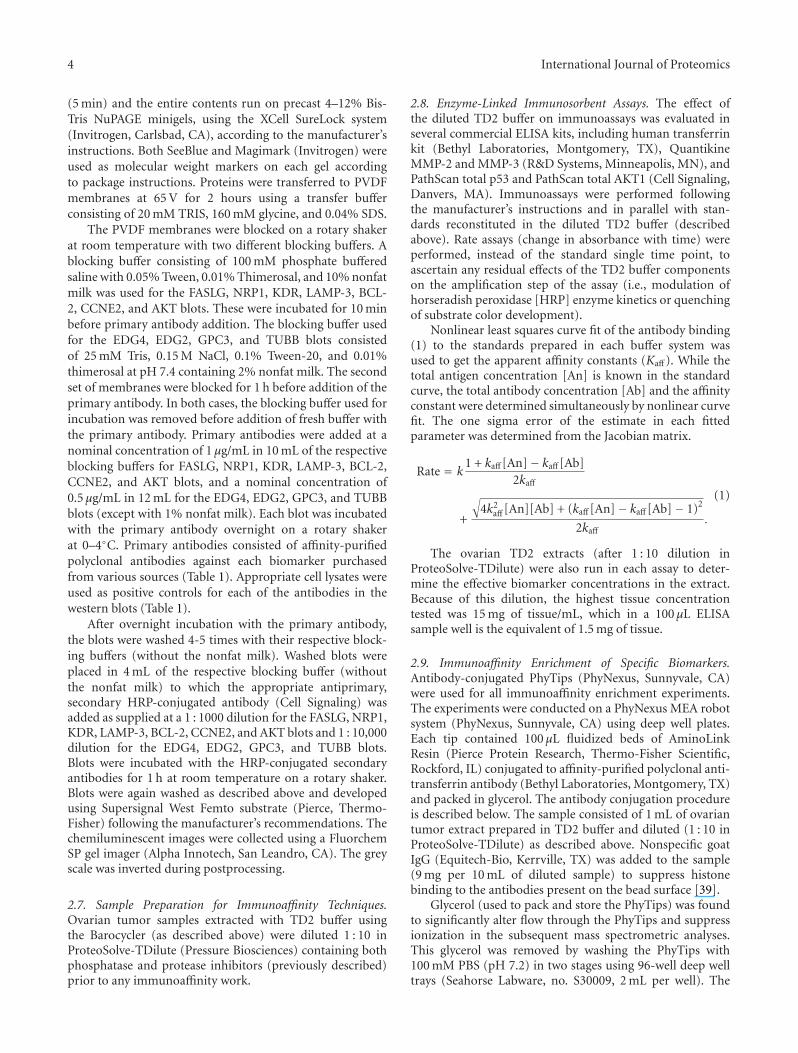
Table 1: Affinity-purified polyclonal antibodies used for western blots and their sources.
Biomarker Source Ab Catalog no. Control cell lysate
Lysophosphatidic acid receptor 2 (EDG4) Santa Cruz Biotechnology sc25490 BT-20
Lysophosphatidic acid receptor 1 (EDG2) Abcam ab23698 A549
CD95L, tumor necrosis factor ligand (FASLG) Cell Signaling 4233S MDA-MB-231
CD304, neurophilin-1 (NRP1) Santa Cruz Biotechnology sc7329 MDA-MB-231
CD309, vascular endothelial growth factor receptor 2 (KDR) Santa Cruz Biotechnology sc48161 MOLT-4
CD63, lysosomal-associated membrane protein 3 (LAMP-3) Santa Cruz Biotechnology sc15363 MOLT-4
Apoptosis regulator 2 (BCL2) Cell Signaling 2872 MOLT-4
Cyclin-E2, G1/S-specific (CCNE2) Strategic Diagnostics 2901.00.02 MOLT-4
Glypican-3 (GPC3) Santa Cruz Biotechnologysc11395 (30 kDa)
sc10455 (60–80 kDa)MDA-MB-231
RAC serine/threonine-protein kinases (pan-AKT) R&D Systems AF2055 MOLT-4
β-tubulin (TUBB) Santa Cruz Biotechnology sc9935 NIH/3T3
first stage wash consisted of four successive quick rinses insingle draw and expel cycle each of 1 mL at a 2 mL/minflow rate (with 2 min holds at the top and bottom of eachcycle). This removed the glycerol surrounding the bead bed,but left glycerol saturating the beads themselves. Diffusionof the glycerol out of the pores of the beads in the secondstage required four additional washes consisting of a 0.5 mLdraw followed by 60 cycles of 0.3 mL volume at a 2 mL/minflow rate (with 2 and 10 sec holds at the bottom and topof each cycle). This totaled about 30 min in each 20 mLwash volume (for 12 tips). Immediately following glycerolremoval, the tips were immersed in a trough of an 8-rowdeep trough trays (Seahorse Labware, no. S30020, 32 mL pertrough) containing 10 mL of diluted tumor sample. Next,0.5 mL of sample was drawn into each tip, and 0.3 mL wascycled 240 times at 2 mL/min (with 2 and 10 sec holds atthe bottom and top). This totaled about 2-hour for samplebinding. Sample binding was immediately followed by astringency wash in 4.17 M NaCl with 83 mM NaPO4 (pH 7.2)for 60×0.5 mL cycles at 2 mL/min (with 2 and 10 sec holds atbottom and top). This was followed by buffer exchange into150 mM pyridinium acetate (pH 6). Five washes in 10 mLof pyridinium acetate in a trough (0.5 mL with 48 cyclesof 0.3 mL each at 2 mL/min with 2 and 10 sec holds at thebottom and top of each cycle) were required to diffuse all thesalts from within the bead pores. Antigens were subsequentlyeluted directly into 2 mL microfuge tubes containing 0.6 mLof 50% aqueous acetic acid (0.5 mL draw with 30 cycles of0.3 mL at 2 mL/min). The eluates were dried overnight in aSpeedVac (Savant). The residual pyridium acetate is a volatilebuffer, which evaporated with the water in the SpeedVac.
2.10. Antitransferrin Antibody Conjugation to PhyTips. Cus-tom PhyTips were purchased from PhyNexus (Sunnyvale,CA). These were 1.1 mL volume pipette tips packed byPhyNexus with 100 μL of AminoLink beads (ThermoFisher)in a fluidized bed configuration. Affinity-purified, carrier-free, goat polyclonal antitransferrin antibodies (no. A80-128A, Bethyl Laboratories, Montgomery, TX) were dissolved
at 83 μg/mL in 100 mM PBS (pH 7.8) with 33 mM sodiumcyanoborohydride (NaCNBH3). A 0.6 mL quantity of theantibody solution was placed in the well of a deep-well platefor each tip. A 0.5 mL quantity of the antibody solution wasdrawn into each glycerol-free PhyTips (washed as describedabove) and processed for 960 cycles of 0.3 mL at 2 mL/min(6 h). Unreacted AminoLink aldehydes were then quenchedwith a 0.5 mL draw and 60 cycles of 0.3 mL each at 2 mL/min(0.5 h) in 1 M tris(hydroxymethyl)-aminomethane chloride(pH 7.8) with 33 mM NaCNBH3. Residual TRIS andcyanoborohydride were removed with five washes (0.5 mLdraw and 60 cycles of 0.3 mL each) in 100 mM PBS, the lastof which contained 0.05% sodium azide. The tips were thenpacked with glycerol and stored refrigerated. An average of35 μg Ab was bound to each PhyTip, as determined by UV280
absorbance change in the conjugation solution.
2.11. MALDI-MS Analysis. Immunoaffinity-enriched trans-ferrin from ovarian tumor extracts was identified by peptidemass fingerprinting. The dried eluates (described above)were dissolved in 0.1 mL of 20 mM ammonium bicarbonate(pH 8.2), simultaneously reduced and capped by the additionof 2 μL each of 2-vinylpyridine (50 mM in isopropanol)and triethylphosphine (25 mM in isopropanol) at 37◦Cfor 1 h, following the procedure described by Hale et al.[40]. After capping, the eluates were digested by adding2.5 μL of trypsin (Sequencing Grade-Modified, Promega,Madison, WI), reconstituted at 100 μg/mL in 20 mM ammo-nium bicarbonate, for 2 h at 37◦C. Addition of 0.11 mLof HPLC grade acetonitrile quenched the digestion, andthe digest was evaporated overnight in a SpeedVac. Thepellet was resuspended in 25 μL of MALDI matrix (α-cyano-4-hydroxycinnamic acid dissolved at 5 mg/mL in 50 : 50acetonitrile : water with 0.1% trifluoroacetic acid), and 1 μLof the digest was spotted on a stainless steel MALDI plate andanalyzed using a Q-TOF Premier (Waters, Milford, MA). Theresulting monoisotopic peptide peaks were selected usingmMass [41], and matching proteins were identified usingMASCOT to search the Swiss-Prot protein database [42].
6 International Journal of Proteomics
3. Results and Discussion
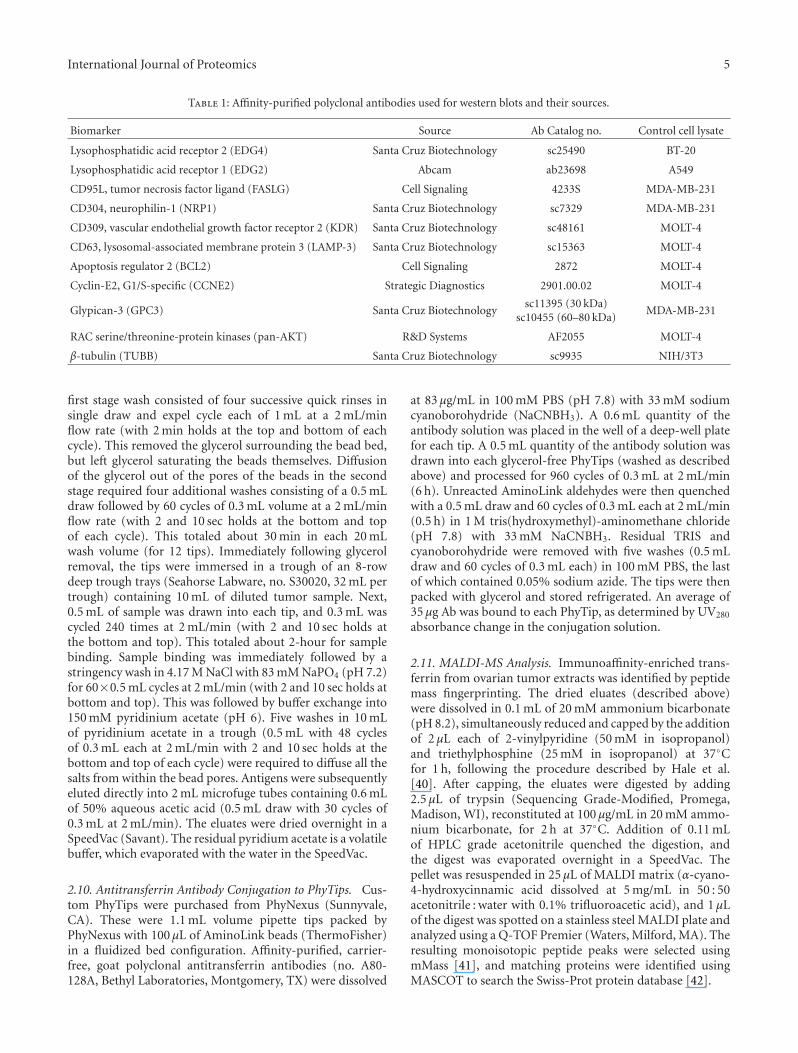
3.1. Global Protein Recovery. In order to show equivalence toclassic extraction buffers, we performed a global proteomicanalysis (2D gel electrophoresis) using separate 100 mgaliquots of a cryogenically ground metastatic ovarian tumorsample pool (sourced from multiple patients). Using theBarocycler, the first aliquot was extracted in HEPES bufferand a second processed in the TD2 buffer. The clarifiedextracts were diluted to 8.6 mg of tissue/mL in denaturingIEF buffer for 2D gel analysis. Comparison of the resultinggels by image analysis (Figure 1) reveals few differencesin the more abundant protein species recovered. Of 585discrete protein spots identified, 97% were common in bothposition and abundance between the two gels. Only 14protein spots were unique to the TD2 extraction buffergel. One spot was unique to the HEPES extraction buffer.These 15 differences were all in less abundant proteins.Therefore, TD2 buffer appears fully compatible with classicgel electrophoretic methods with little alteration in recoveryof the more abundant proteins.
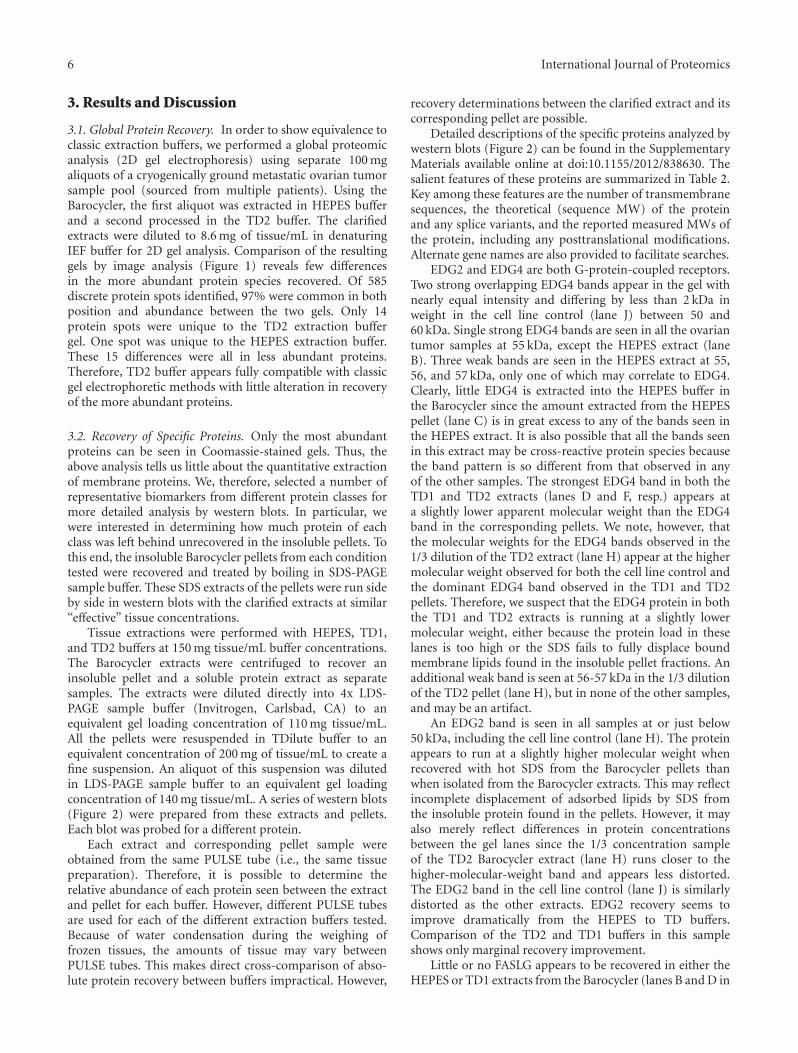
3.2. Recovery of Specific Proteins. Only the most abundantproteins can be seen in Coomassie-stained gels. Thus, theabove analysis tells us little about the quantitative extractionof membrane proteins. We, therefore, selected a number ofrepresentative biomarkers from different protein classes formore detailed analysis by western blots. In particular, wewere interested in determining how much protein of eachclass was left behind unrecovered in the insoluble pellets. Tothis end, the insoluble Barocycler pellets from each conditiontested were recovered and treated by boiling in SDS-PAGEsample buffer. These SDS extracts of the pellets were run sideby side in western blots with the clarified extracts at similar“effective” tissue concentrations.
Tissue extractions were performed with HEPES, TD1,and TD2 buffers at 150 mg tissue/mL buffer concentrations.The Barocycler extracts were centrifuged to recover aninsoluble pellet and a soluble protein extract as separatesamples. The extracts were diluted directly into 4x LDS-PAGE sample buffer (Invitrogen, Carlsbad, CA) to anequivalent gel loading concentration of 110 mg tissue/mL.All the pellets were resuspended in TDilute buffer to anequivalent concentration of 200 mg of tissue/mL to create afine suspension. An aliquot of this suspension was dilutedin LDS-PAGE sample buffer to an equivalent gel loadingconcentration of 140 mg tissue/mL. A series of western blots(Figure 2) were prepared from these extracts and pellets.Each blot was probed for a different protein.
Each extract and corresponding pellet sample wereobtained from the same PULSE tube (i.e., the same tissuepreparation). Therefore, it is possible to determine therelative abundance of each protein seen between the extractand pellet for each buffer. However, different PULSE tubesare used for each of the different extraction buffers tested.Because of water condensation during the weighing offrozen tissues, the amounts of tissue may vary betweenPULSE tubes. This makes direct cross-comparison of abso-lute protein recovery between buffers impractical. However,
recovery determinations between the clarified extract and itscorresponding pellet are possible.
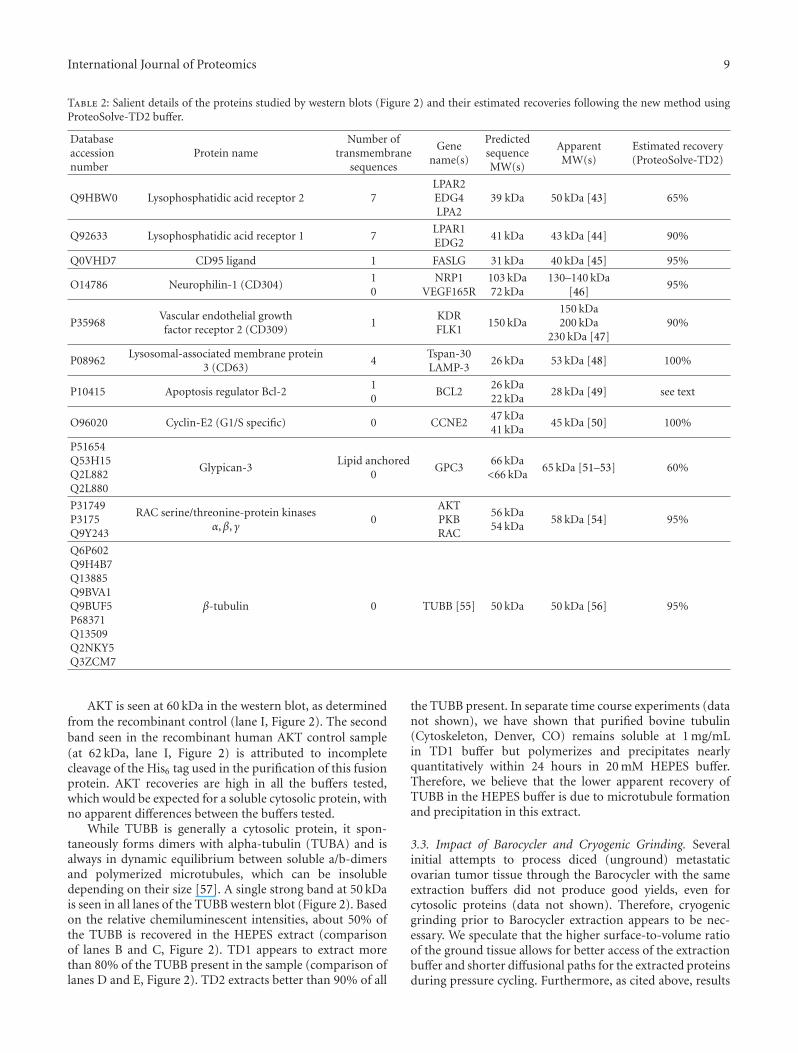
Detailed descriptions of the specific proteins analyzed bywestern blots (Figure 2) can be found in the SupplementaryMaterials available online at doi:10.1155/2012/838630. Thesalient features of these proteins are summarized in Table 2.Key among these features are the number of transmembranesequences, the theoretical (sequence MW) of the proteinand any splice variants, and the reported measured MWs ofthe protein, including any posttranslational modifications.Alternate gene names are also provided to facilitate searches.
EDG2 and EDG4 are both G-protein-coupled receptors.Two strong overlapping EDG4 bands appear in the gel withnearly equal intensity and differing by less than 2 kDa inweight in the cell line control (lane J) between 50 and60 kDa. Single strong EDG4 bands are seen in all the ovariantumor samples at 55 kDa, except the HEPES extract (laneB). Three weak bands are seen in the HEPES extract at 55,56, and 57 kDa, only one of which may correlate to EDG4.Clearly, little EDG4 is extracted into the HEPES buffer inthe Barocycler since the amount extracted from the HEPESpellet (lane C) is in great excess to any of the bands seen inthe HEPES extract. It is also possible that all the bands seenin this extract may be cross-reactive protein species becausethe band pattern is so different from that observed in anyof the other samples. The strongest EDG4 band in both theTD1 and TD2 extracts (lanes D and F, resp.) appears ata slightly lower apparent molecular weight than the EDG4band in the corresponding pellets. We note, however, thatthe molecular weights for the EDG4 bands observed in the1/3 dilution of the TD2 extract (lane H) appear at the highermolecular weight observed for both the cell line control andthe dominant EDG4 band observed in the TD1 and TD2pellets. Therefore, we suspect that the EDG4 protein in boththe TD1 and TD2 extracts is running at a slightly lowermolecular weight, either because the protein load in theselanes is too high or the SDS fails to fully displace boundmembrane lipids found in the insoluble pellet fractions. Anadditional weak band is seen at 56-57 kDa in the 1/3 dilutionof the TD2 pellet (lane H), but in none of the other samples,and may be an artifact.
An EDG2 band is seen in all samples at or just below50 kDa, including the cell line control (lane H). The proteinappears to run at a slightly higher molecular weight whenrecovered with hot SDS from the Barocycler pellets thanwhen isolated from the Barocycler extracts. This may reflectincomplete displacement of adsorbed lipids by SDS fromthe insoluble protein found in the pellets. However, it mayalso merely reflect differences in protein concentrationsbetween the gel lanes since the 1/3 concentration sampleof the TD2 Barocycler extract (lane H) runs closer to thehigher-molecular-weight band and appears less distorted.The EDG2 band in the cell line control (lane J) is similarlydistorted as the other extracts. EDG2 recovery seems toimprove dramatically from the HEPES to TD buffers.Comparison of the TD2 and TD1 buffers in this sampleshows only marginal recovery improvement.
Little or no FASLG appears to be recovered in either theHEPES or TD1 extracts from the Barocycler (lanes B and D in
International Journal of Proteomics 7
(a) (b)
(c)
Gel 1Gel 2
1E+05
1E+051E+01
1E+01
1E+02
1E+02
1E+03
1E+03
1E+04
1E+04
Ratio <2
SpotsTotal
Unique
Gel 1 Gel 2584433 433137 13714
571
1Ratio >2
(d)
Figure 1: 2D gel analysis of proteins extracted from the same metastatic ovarian tumor sample by (a) HEPES buffer (Gel 1) and (b) TD2buffer (Gel 2). Each extraction was conducted for 30 pressure cycles (30,000 psi for 20 sec followed by 0 psi for 20 sec) at a concentrationof 75 mg tissue/mL of extraction buffer using the Barocycler. The samples were subsequently diluted to 8.6 mg/mL in ProteoSolve-IEF (adenaturing IEF gel buffer) for gel analysis. Automated gel image analysis of the Coomassie-stained gels suggests that 97% of the protein spotsare shared between the two gels in position with most (74%) of the same abundance (d). One spot is uniquely found in the HEPES control,and 14 spots are unique to the ProteoSolve-TD2 extraction.
Figure 2). FASLG is seen in high abundance in the insolublepellets from both of these extracts. However, nearly completerecovery of FASLG is seen in the soluble TD2 extract withlittle remaining in the insoluble pellet. Other experiments(data not shown) suggested that FASLG recovery was variablewith TD1 buffer, but was consistently high in the TD2 buffer.FASLG was not recovered in the extract after several attemptswith the HEPES buffer.
No evidence of the 72 kDa soluble form of NRP1 isseen on the western blots. The 140 kDa membrane boundform is present in all extracts (lanes B, D, and F). However,NRP1 recovery into the soluble fraction was lowest in HEPESbuffer with most of the protein found in the HEPES pellet.About half of the NRP1 appeared to be recovered in theTD1 extract in this experiment. However, NRP1 recoveryin the TD1 buffer was inconsistent between trials (data notshown). Almost complete recovery is seen in the TD2 extractwith only a trace of NRP1 left in the pellet. This result wasconsistent between trials (data not shown). NRP1 was notseen in the cell line control. It is possible that the antibodyused in these blots was reactive to a variant of the NRP1
protein that was not present in the cell line control used andwhich presents an epitope that is removed in the creation ofthe 72 kDa soluble form.
Both the intermediate and mature KDR proteins areapparent in the western blot for both the cell line controland the tumor samples at 200 kDa and 230 kDa, respectively.Partial recovery of the more abundant mature KDR proteinis seen in HEPES extract (lane B) with most of the protein leftin the HEPES pellet (lane C). The intermediate glycosylatedform was not seen in the HEPES extract or pellet, possiblydue to its lower solubility in the HEPES buffer than either theTD1 or TD2 buffers. The aqueous solubility of the matureform is expected to be greater due to the higher level ofglycosylation. Most of the intermediate glycosylated formappears to be extracted into both the TD1 and TD2 buffers(lanes D and F) with apparently little left in either pellet(lanes E and G). At least some of the more abundant matureform (230 kDa) was seen in all the extracts (lanes B, D, and F,Figure 2) and both the HEPES and TD1 pellets (lanes C andE, Figure 2). The best relative KDR extraction was observedwith the TD2 buffer (lanes F and G, Figure 2).
8 International Journal of Proteomics
A B C D E F G H I J K
EDG4
EDG2
FASLG
NRP1
KDR
LAMP-3
BCL2
CCNE2
GPC3
AKT
TUBB
60–80 kDa
30 kDa
60 kDa50 kDa
50 kDa
40 kDa
148 kDa
250 kDa
80 kDa
60 kDa
30 kDa
50 kDa40 kDa80 kDa
60 kDa30 kDa
60 kDa
50 kDa
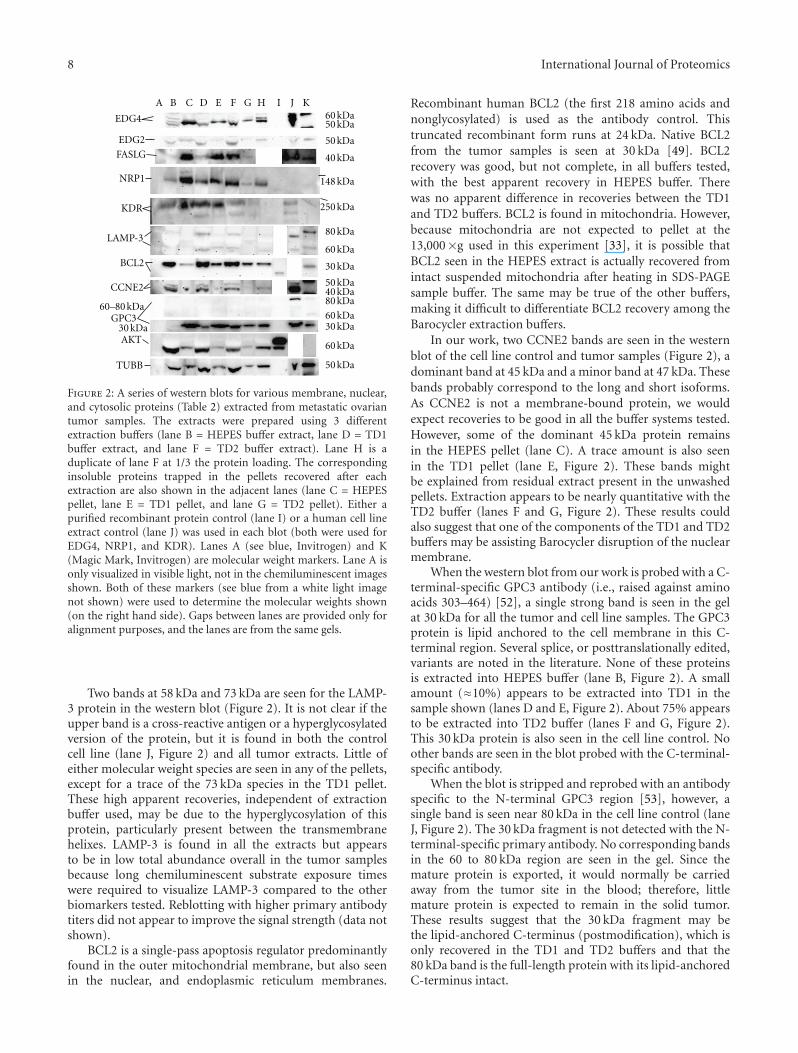
Figure 2: A series of western blots for various membrane, nuclear,and cytosolic proteins (Table 2) extracted from metastatic ovariantumor samples. The extracts were prepared using 3 differentextraction buffers (lane B = HEPES buffer extract, lane D = TD1buffer extract, and lane F = TD2 buffer extract). Lane H is aduplicate of lane F at 1/3 the protein loading. The correspondinginsoluble proteins trapped in the pellets recovered after eachextraction are also shown in the adjacent lanes (lane C = HEPESpellet, lane E = TD1 pellet, and lane G = TD2 pellet). Either apurified recombinant protein control (lane I) or a human cell lineextract control (lane J) was used in each blot (both were used forEDG4, NRP1, and KDR). Lanes A (see blue, Invitrogen) and K(Magic Mark, Invitrogen) are molecular weight markers. Lane A isonly visualized in visible light, not in the chemiluminescent imagesshown. Both of these markers (see blue from a white light imagenot shown) were used to determine the molecular weights shown(on the right hand side). Gaps between lanes are provided only foralignment purposes, and the lanes are from the same gels.
Two bands at 58 kDa and 73 kDa are seen for the LAMP-3 protein in the western blot (Figure 2). It is not clear if theupper band is a cross-reactive antigen or a hyperglycosylatedversion of the protein, but it is found in both the controlcell line (lane J, Figure 2) and all tumor extracts. Little ofeither molecular weight species are seen in any of the pellets,except for a trace of the 73 kDa species in the TD1 pellet.These high apparent recoveries, independent of extractionbuffer used, may be due to the hyperglycosylation of thisprotein, particularly present between the transmembranehelixes. LAMP-3 is found in all the extracts but appearsto be in low total abundance overall in the tumor samplesbecause long chemiluminescent substrate exposure timeswere required to visualize LAMP-3 compared to the otherbiomarkers tested. Reblotting with higher primary antibodytiters did not appear to improve the signal strength (data notshown).
BCL2 is a single-pass apoptosis regulator predominantlyfound in the outer mitochondrial membrane, but also seenin the nuclear, and endoplasmic reticulum membranes.
Recombinant human BCL2 (the first 218 amino acids andnonglycosylated) is used as the antibody control. Thistruncated recombinant form runs at 24 kDa. Native BCL2from the tumor samples is seen at 30 kDa [49]. BCL2recovery was good, but not complete, in all buffers tested,with the best apparent recovery in HEPES buffer. Therewas no apparent difference in recoveries between the TD1and TD2 buffers. BCL2 is found in mitochondria. However,because mitochondria are not expected to pellet at the13,000×g used in this experiment [33], it is possible thatBCL2 seen in the HEPES extract is actually recovered fromintact suspended mitochondria after heating in SDS-PAGEsample buffer. The same may be true of the other buffers,making it difficult to differentiate BCL2 recovery among theBarocycler extraction buffers.
In our work, two CCNE2 bands are seen in the westernblot of the cell line control and tumor samples (Figure 2), adominant band at 45 kDa and a minor band at 47 kDa. Thesebands probably correspond to the long and short isoforms.As CCNE2 is not a membrane-bound protein, we wouldexpect recoveries to be good in all the buffer systems tested.However, some of the dominant 45 kDa protein remainsin the HEPES pellet (lane C). A trace amount is also seenin the TD1 pellet (lane E, Figure 2). These bands mightbe explained from residual extract present in the unwashedpellets. Extraction appears to be nearly quantitative with theTD2 buffer (lanes F and G, Figure 2). These results couldalso suggest that one of the components of the TD1 and TD2buffers may be assisting Barocycler disruption of the nuclearmembrane.
When the western blot from our work is probed with a C-terminal-specific GPC3 antibody (i.e., raised against aminoacids 303–464) [52], a single strong band is seen in the gelat 30 kDa for all the tumor and cell line samples. The GPC3protein is lipid anchored to the cell membrane in this C-terminal region. Several splice, or posttranslationally edited,variants are noted in the literature. None of these proteinsis extracted into HEPES buffer (lane B, Figure 2). A smallamount (≈10%) appears to be extracted into TD1 in thesample shown (lanes D and E, Figure 2). About 75% appearsto be extracted into TD2 buffer (lanes F and G, Figure 2).This 30 kDa protein is also seen in the cell line control. Noother bands are seen in the blot probed with the C-terminal-specific antibody.
When the blot is stripped and reprobed with an antibodyspecific to the N-terminal GPC3 region [53], however, asingle band is seen near 80 kDa in the cell line control (laneJ, Figure 2). The 30 kDa fragment is not detected with the N-terminal-specific primary antibody. No corresponding bandsin the 60 to 80 kDa region are seen in the gel. Since themature protein is exported, it would normally be carriedaway from the tumor site in the blood; therefore, littlemature protein is expected to remain in the solid tumor.These results suggest that the 30 kDa fragment may bethe lipid-anchored C-terminus (postmodification), which isonly recovered in the TD1 and TD2 buffers and that the80 kDa band is the full-length protein with its lipid-anchoredC-terminus intact.
International Journal of Proteomics 9
Table 2: Salient details of the proteins studied by western blots (Figure 2) and their estimated recoveries following the new method usingProteoSolve-TD2 buffer.
Databaseaccessionnumber
Protein nameNumber of
transmembranesequences
Genename(s)
PredictedsequenceMW(s)
ApparentMW(s)
Estimated recovery(ProteoSolve-TD2)
Q9HBW0 Lysophosphatidic acid receptor 2 7LPAR2EDG4LPA2
39 kDa 50 kDa [43] 65%
Q92633 Lysophosphatidic acid receptor 1 7LPAR1EDG2
41 kDa 43 kDa [44] 90%
Q0VHD7 CD95 ligand 1 FASLG 31 kDa 40 kDa [45] 95%
O14786 Neurophilin-1 (CD304)10
NRP1VEGF165R
103 kDa72 kDa
130–140 kDa[46]
95%
P35968Vascular endothelial growthfactor receptor 2 (CD309)
1KDRFLK1
150 kDa150 kDa200 kDa
230 kDa [47]90%
P08962Lysosomal-associated membrane protein
3 (CD63)4
Tspan-30LAMP-3
26 kDa 53 kDa [48] 100%
P10415 Apoptosis regulator Bcl-210
BCL226 kDa22 kDa
28 kDa [49] see text
O96020 Cyclin-E2 (G1/S specific) 0 CCNE247 kDa41 kDa
45 kDa [50] 100%
P51654Q53H15Q2L882Q2L880
Glypican-3Lipid anchored
0GPC3
66 kDa<66 kDa
65 kDa [51–53] 60%
P31749P3175Q9Y243
RAC serine/threonine-protein kinasesα,β, γ
0AKTPKBRAC
56 kDa54 kDa
58 kDa [54] 95%
Q6P602Q9H4B7Q13885Q9BVA1Q9BUF5P68371Q13509Q2NKY5Q3ZCM7
β-tubulin 0 TUBB [55] 50 kDa 50 kDa [56] 95%
AKT is seen at 60 kDa in the western blot, as determinedfrom the recombinant control (lane I, Figure 2). The secondband seen in the recombinant human AKT control sample(at 62 kDa, lane I, Figure 2) is attributed to incompletecleavage of the His6 tag used in the purification of this fusionprotein. AKT recoveries are high in all the buffers tested,which would be expected for a soluble cytosolic protein, withno apparent differences between the buffers tested.
While TUBB is generally a cytosolic protein, it spon-taneously forms dimers with alpha-tubulin (TUBA) and isalways in dynamic equilibrium between soluble a/b-dimersand polymerized microtubules, which can be insolubledepending on their size [57]. A single strong band at 50 kDais seen in all lanes of the TUBB western blot (Figure 2). Basedon the relative chemiluminescent intensities, about 50% ofthe TUBB is recovered in the HEPES extract (comparisonof lanes B and C, Figure 2). TD1 appears to extract morethan 80% of the TUBB present in the sample (comparison oflanes D and E, Figure 2). TD2 extracts better than 90% of all
the TUBB present. In separate time course experiments (datanot shown), we have shown that purified bovine tubulin(Cytoskeleton, Denver, CO) remains soluble at 1 mg/mLin TD1 buffer but polymerizes and precipitates nearlyquantitatively within 24 hours in 20 mM HEPES buffer.Therefore, we believe that the lower apparent recovery ofTUBB in the HEPES buffer is due to microtubule formationand precipitation in this extract.
3.3. Impact of Barocycler and Cryogenic Grinding. Severalinitial attempts to process diced (unground) metastaticovarian tumor tissue through the Barocycler with the sameextraction buffers did not produce good yields, even forcytosolic proteins (data not shown). Therefore, cryogenicgrinding prior to Barocycler extraction appears to be nec-essary. We speculate that the higher surface-to-volume ratioof the ground tissue allows for better access of the extractionbuffer and shorter diffusional paths for the extracted proteinsduring pressure cycling. Furthermore, as cited above, results
10 International Journal of Proteomics
with the TD1 buffer proved inconsistent from sample tosample. Some samples yielded small friable pellets and hadgood protein yields, and others appeared to leave a largesticky pellet after pressure cycling. These latter samplesexhibited poor protein recovery. The addition of a dispersionaid (TD2 buffer) resulted in vastly improved sample-to-sample reproducibility. Furthermore, no appreciable proteincould be extracted from ground tumor samples heated at95◦C for 1 h in either the TD1 or TD2 buffers in the absenceof pressure cycling. When SDS was added to these samples,in the form of SDS-PAGE sample buffer (Invitrogen), proteinwas subsequently recovered on additional heating (datanot shown). This demonstrates that pressure cycling is anintegral part of the membrane protein extraction processwith the ProteoSolve-TD buffers and that the buffers alonedo not act as detergents.
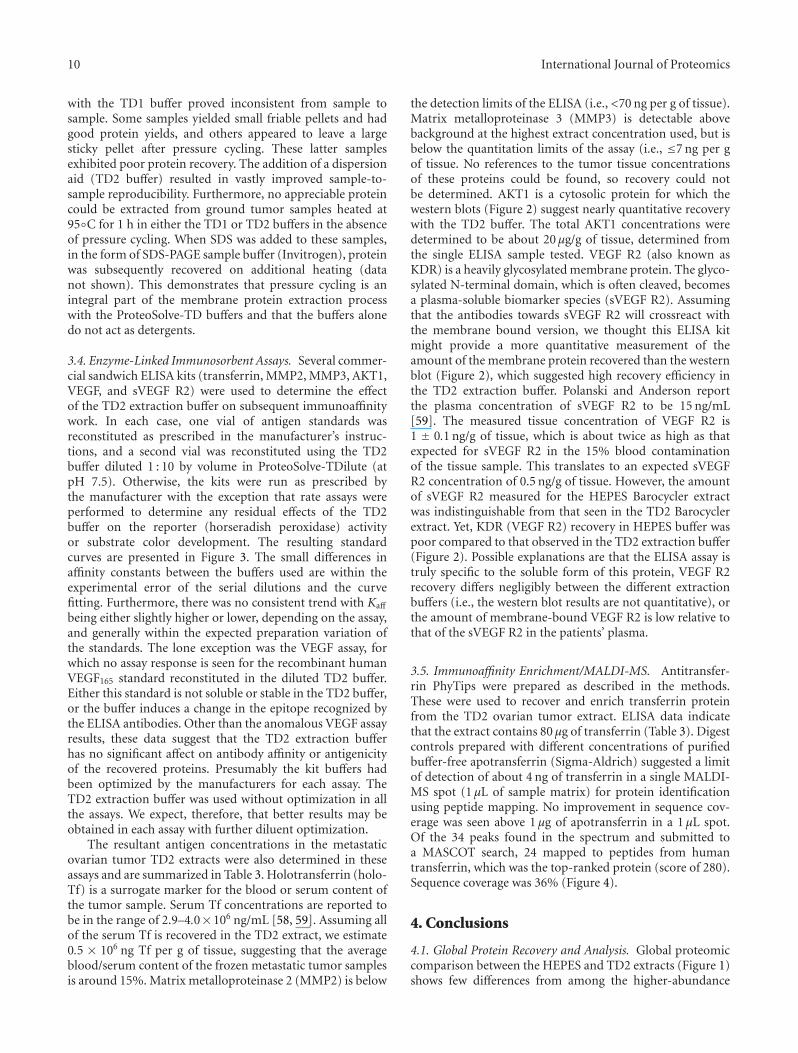
3.4. Enzyme-Linked Immunosorbent Assays. Several commer-cial sandwich ELISA kits (transferrin, MMP2, MMP3, AKT1,VEGF, and sVEGF R2) were used to determine the effectof the TD2 extraction buffer on subsequent immunoaffinitywork. In each case, one vial of antigen standards wasreconstituted as prescribed in the manufacturer’s instruc-tions, and a second vial was reconstituted using the TD2buffer diluted 1 : 10 by volume in ProteoSolve-TDilute (atpH 7.5). Otherwise, the kits were run as prescribed bythe manufacturer with the exception that rate assays wereperformed to determine any residual effects of the TD2buffer on the reporter (horseradish peroxidase) activityor substrate color development. The resulting standardcurves are presented in Figure 3. The small differences inaffinity constants between the buffers used are within theexperimental error of the serial dilutions and the curvefitting. Furthermore, there was no consistent trend with Kaff
being either slightly higher or lower, depending on the assay,and generally within the expected preparation variation ofthe standards. The lone exception was the VEGF assay, forwhich no assay response is seen for the recombinant humanVEGF165 standard reconstituted in the diluted TD2 buffer.Either this standard is not soluble or stable in the TD2 buffer,or the buffer induces a change in the epitope recognized bythe ELISA antibodies. Other than the anomalous VEGF assayresults, these data suggest that the TD2 extraction bufferhas no significant affect on antibody affinity or antigenicityof the recovered proteins. Presumably the kit buffers hadbeen optimized by the manufacturers for each assay. TheTD2 extraction buffer was used without optimization in allthe assays. We expect, therefore, that better results may beobtained in each assay with further diluent optimization.
The resultant antigen concentrations in the metastaticovarian tumor TD2 extracts were also determined in theseassays and are summarized in Table 3. Holotransferrin (holo-Tf) is a surrogate marker for the blood or serum content ofthe tumor sample. Serum Tf concentrations are reported tobe in the range of 2.9–4.0×10⁶ ng/mL [58, 59]. Assuming allof the serum Tf is recovered in the TD2 extract, we estimate0.5 × 106 ng Tf per g of tissue, suggesting that the averageblood/serum content of the frozen metastatic tumor samplesis around 15%. Matrix metalloproteinase 2 (MMP2) is below
the detection limits of the ELISA (i.e., <70 ng per g of tissue).Matrix metalloproteinase 3 (MMP3) is detectable abovebackground at the highest extract concentration used, but isbelow the quantitation limits of the assay (i.e., ≤7 ng per gof tissue. No references to the tumor tissue concentrationsof these proteins could be found, so recovery could notbe determined. AKT1 is a cytosolic protein for which thewestern blots (Figure 2) suggest nearly quantitative recoverywith the TD2 buffer. The total AKT1 concentrations weredetermined to be about 20 μg/g of tissue, determined fromthe single ELISA sample tested. VEGF R2 (also known asKDR) is a heavily glycosylated membrane protein. The glyco-sylated N-terminal domain, which is often cleaved, becomesa plasma-soluble biomarker species (sVEGF R2). Assumingthat the antibodies towards sVEGF R2 will crossreact withthe membrane bound version, we thought this ELISA kitmight provide a more quantitative measurement of theamount of the membrane protein recovered than the westernblot (Figure 2), which suggested high recovery efficiency inthe TD2 extraction buffer. Polanski and Anderson reportthe plasma concentration of sVEGF R2 to be 15 ng/mL[59]. The measured tissue concentration of VEGF R2 is1 ± 0.1 ng/g of tissue, which is about twice as high as thatexpected for sVEGF R2 in the 15% blood contaminationof the tissue sample. This translates to an expected sVEGFR2 concentration of 0.5 ng/g of tissue. However, the amountof sVEGF R2 measured for the HEPES Barocycler extractwas indistinguishable from that seen in the TD2 Barocyclerextract. Yet, KDR (VEGF R2) recovery in HEPES buffer waspoor compared to that observed in the TD2 extraction buffer(Figure 2). Possible explanations are that the ELISA assay istruly specific to the soluble form of this protein, VEGF R2recovery differs negligibly between the different extractionbuffers (i.e., the western blot results are not quantitative), orthe amount of membrane-bound VEGF R2 is low relative tothat of the sVEGF R2 in the patients’ plasma.
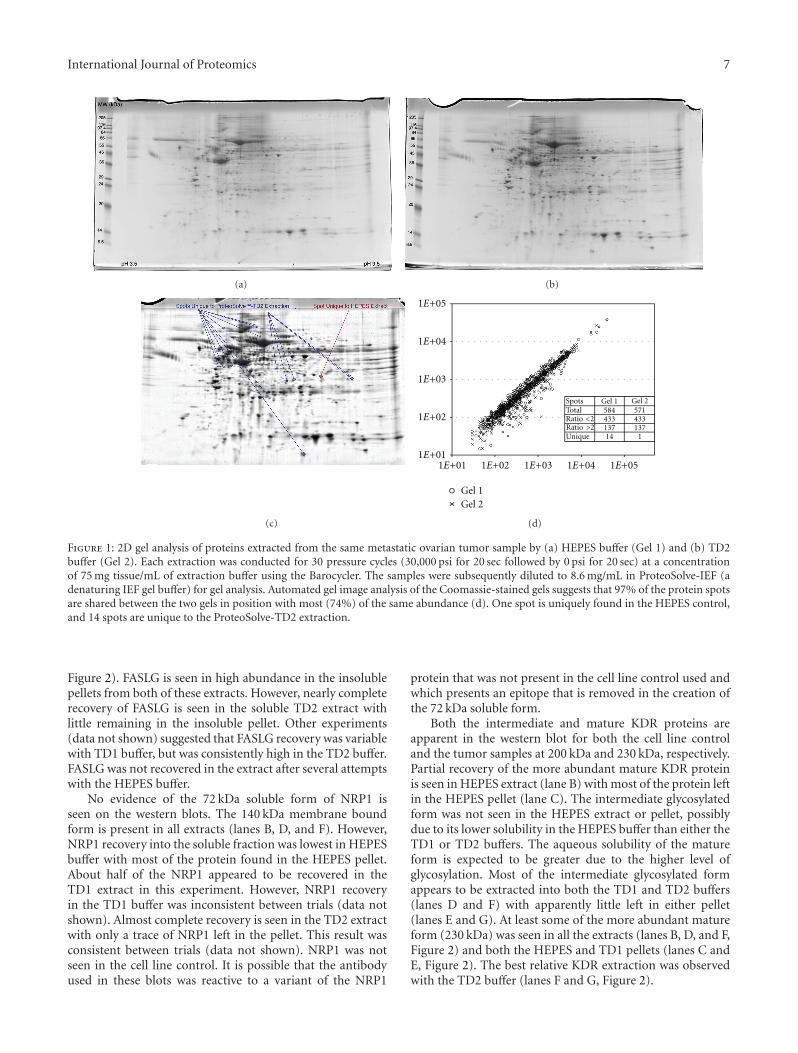
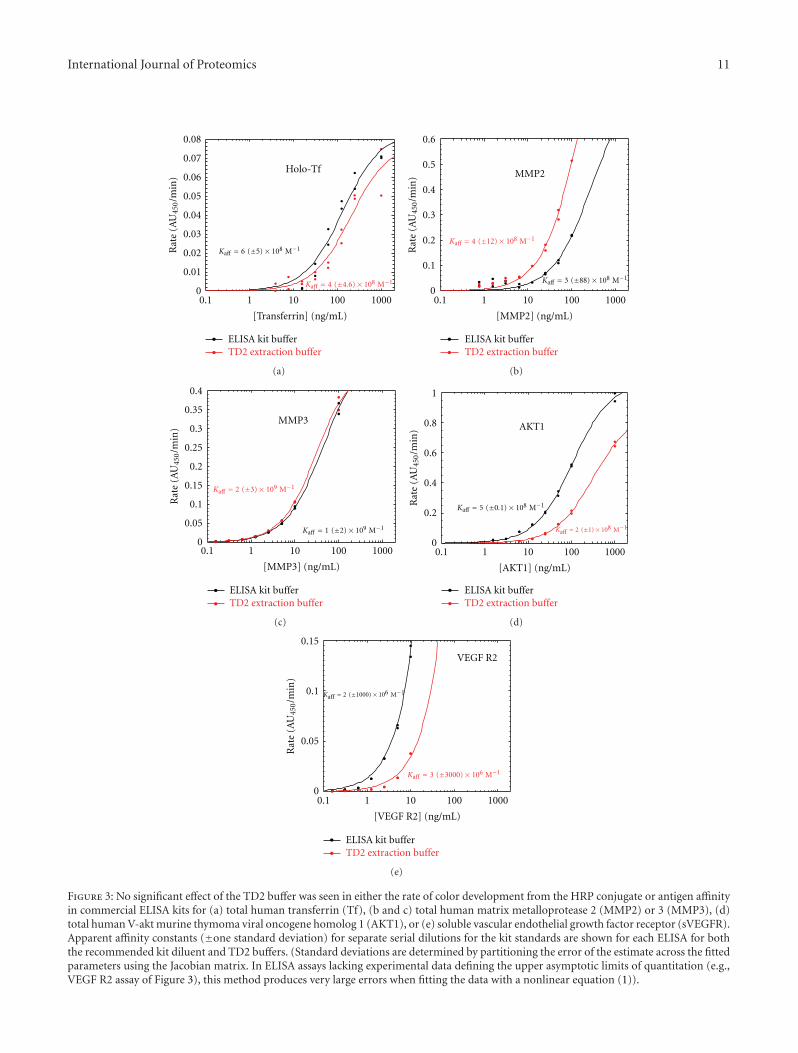
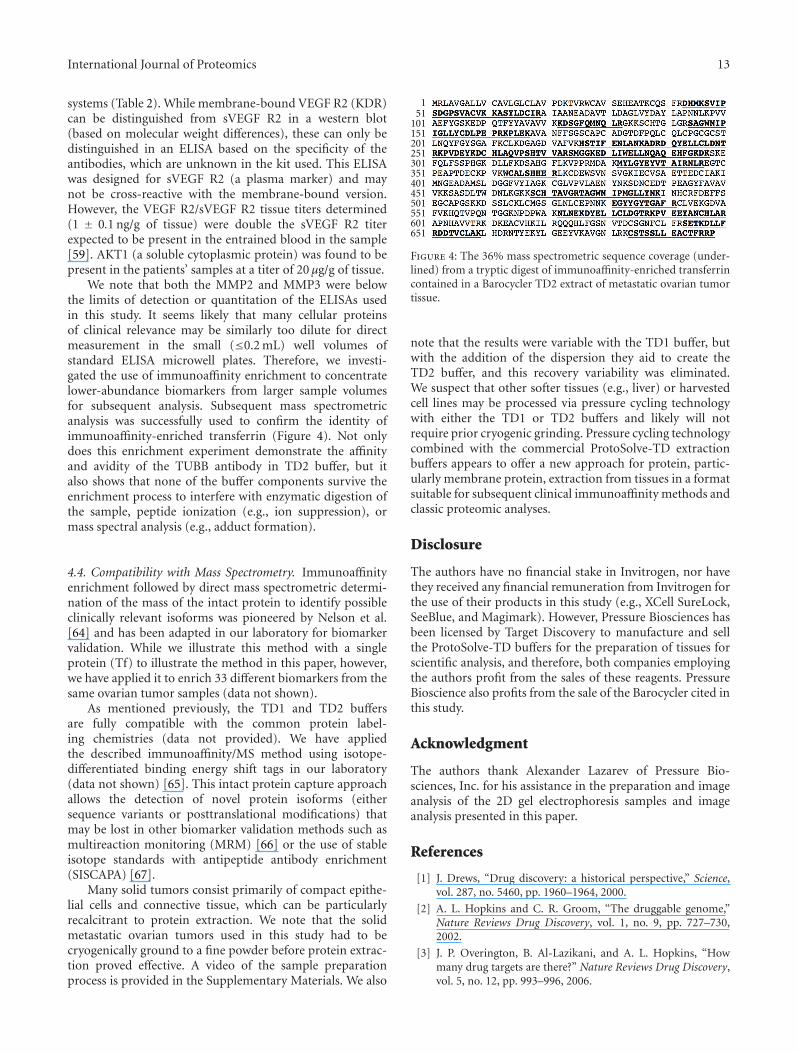
3.5. Immunoaffinity Enrichment/MALDI-MS. Antitransfer-rin PhyTips were prepared as described in the methods.These were used to recover and enrich transferrin proteinfrom the TD2 ovarian tumor extract. ELISA data indicatethat the extract contains 80 μg of transferrin (Table 3). Digestcontrols prepared with different concentrations of purifiedbuffer-free apotransferrin (Sigma-Aldrich) suggested a limitof detection of about 4 ng of transferrin in a single MALDI-MS spot (1 μL of sample matrix) for protein identificationusing peptide mapping. No improvement in sequence cov-erage was seen above 1 μg of apotransferrin in a 1 μL spot.Of the 34 peaks found in the spectrum and submitted toa MASCOT search, 24 mapped to peptides from humantransferrin, which was the top-ranked protein (score of 280).Sequence coverage was 36% (Figure 4).
4. Conclusions
4.1. Global Protein Recovery and Analysis. Global proteomiccomparison between the HEPES and TD2 extracts (Figure 1)shows few differences from among the higher-abundance
International Journal of Proteomics 11
0
0.01
0.02
0.03
0.04
0.05
0.06
0.07
0.08
0.1 1 10 100 1000
ELISA kit bufferTD2 extraction buffer
Holo-TfR
ate
(AU
450/m
in)
Kaff = 6 (±5)× 108 M−1
Kaff = 4 (±4.6)× 108 M−1
[Transferrin] (ng/mL)
(a)
ELISA kit bufferTD2 extraction buffer
0
0.1
0.2
0.3
0.4
0.5
0.6
0.1 1 10 100 1000
MMP2
Rat
e (A
U45
0/m
in)
Kaff = 4 (±12)× 108 M−1
Kaff = 3 (±88)× 108 M−1
[MMP2] (ng/mL)
(b)
0
0.05
0.1
0.15
0.2
0.25
0.3
0.35
0.4
0.1 1 10 100 1000
MMP3
Rat
e (A
U45
0/m
in)
ELISA kit bufferTD2 extraction buffer
Kaff = 1 (±2)× 109 M−1
Kaff = 2 (±3)× 109 M−1
[MMP3] (ng/mL)
(c)
0
0.2
0.4
0.6
0.8
1
0.1 1 10 100 1000
AKT1R
ate
(AU
450/m
in)
ELISA kit bufferTD2 extraction buffer
Kaff = 5 (±0.1)× 108 M−1
Kaff = 2 (±1)× 108 M−1
[AKT1] (ng/mL)
(d)
Rat
e (A
U45
0/m
in)
Kaff = 3 (±3000)× 106 M−1
Kaff = 2 (±1000)× 106 M−1
[VEGF R2] (ng/mL)
0
0.05
0.1
0.15
0.1 1 10 100 1000
VEGF R2
ELISA kit bufferTD2 extraction buffer
(e)
Figure 3: No significant effect of the TD2 buffer was seen in either the rate of color development from the HRP conjugate or antigen affinityin commercial ELISA kits for (a) total human transferrin (Tf), (b and c) total human matrix metalloprotease 2 (MMP2) or 3 (MMP3), (d)total human V-akt murine thymoma viral oncogene homolog 1 (AKT1), or (e) soluble vascular endothelial growth factor receptor (sVEGFR).Apparent affinity constants (±one standard deviation) for separate serial dilutions for the kit standards are shown for each ELISA for boththe recommended kit diluent and TD2 buffers. (Standard deviations are determined by partitioning the error of the estimate across the fittedparameters using the Jacobian matrix. In ELISA assays lacking experimental data defining the upper asymptotic limits of quantitation (e.g.,VEGF R2 assay of Figure 3), this method produces very large errors when fitting the data with a nonlinear equation (1)).
12 International Journal of Proteomics
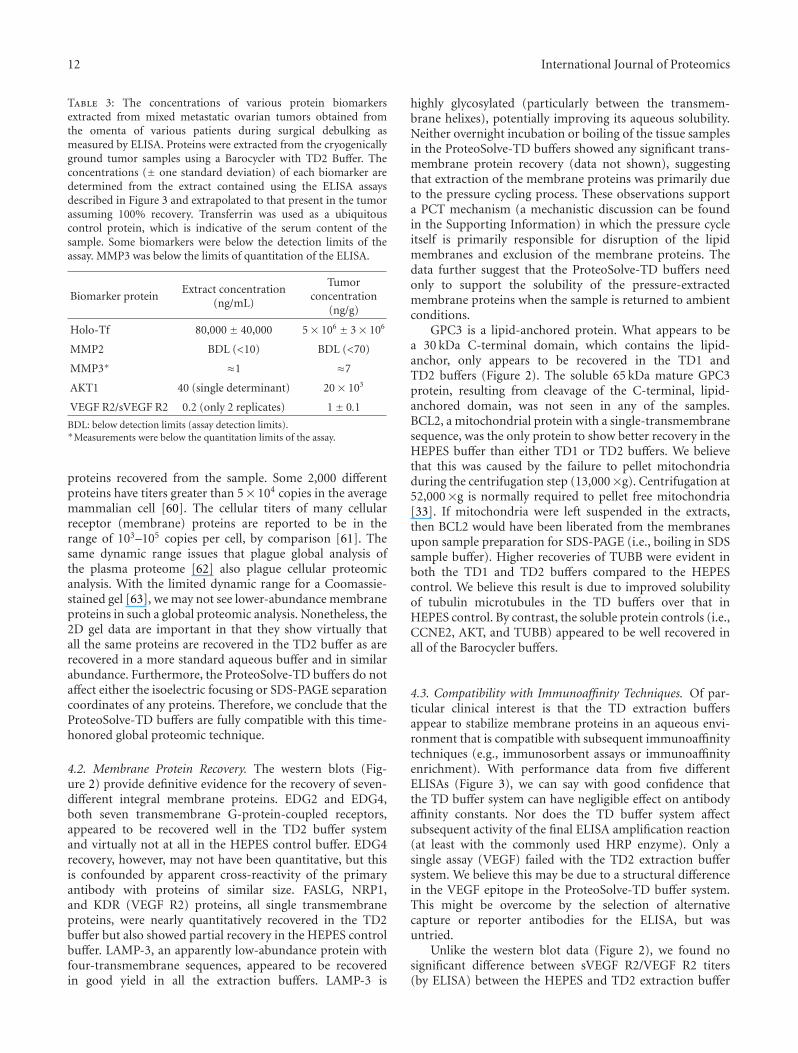
Table 3: The concentrations of various protein biomarkersextracted from mixed metastatic ovarian tumors obtained fromthe omenta of various patients during surgical debulking asmeasured by ELISA. Proteins were extracted from the cryogenicallyground tumor samples using a Barocycler with TD2 Buffer. Theconcentrations (± one standard deviation) of each biomarker aredetermined from the extract contained using the ELISA assaysdescribed in Figure 3 and extrapolated to that present in the tumorassuming 100% recovery. Transferrin was used as a ubiquitouscontrol protein, which is indicative of the serum content of thesample. Some biomarkers were below the detection limits of theassay. MMP3 was below the limits of quantitation of the ELISA.
Biomarker proteinExtract concentration
(ng/mL)
Tumorconcentration
(ng/g)
Holo-Tf 80,000 ± 40,000 5× 10⁶ ± 3× 10⁶
MMP2 BDL (<10) BDL (<70)
MMP3∗ ≈1 ≈7
AKT1 40 (single determinant) 20× 103
VEGF R2/sVEGF R2 0.2 (only 2 replicates) 1± 0.1
BDL: below detection limits (assay detection limits).∗Measurements were below the quantitation limits of the assay.
proteins recovered from the sample. Some 2,000 differentproteins have titers greater than 5× 10⁴ copies in the averagemammalian cell [60]. The cellular titers of many cellularreceptor (membrane) proteins are reported to be in therange of 103–105 copies per cell, by comparison [61]. Thesame dynamic range issues that plague global analysis ofthe plasma proteome [62] also plague cellular proteomicanalysis. With the limited dynamic range for a Coomassie-stained gel [63], we may not see lower-abundance membraneproteins in such a global proteomic analysis. Nonetheless, the2D gel data are important in that they show virtually thatall the same proteins are recovered in the TD2 buffer as arerecovered in a more standard aqueous buffer and in similarabundance. Furthermore, the ProteoSolve-TD buffers do notaffect either the isoelectric focusing or SDS-PAGE separationcoordinates of any proteins. Therefore, we conclude that theProteoSolve-TD buffers are fully compatible with this time-honored global proteomic technique.
4.2. Membrane Protein Recovery. The western blots (Fig-ure 2) provide definitive evidence for the recovery of seven-different integral membrane proteins. EDG2 and EDG4,both seven transmembrane G-protein-coupled receptors,appeared to be recovered well in the TD2 buffer systemand virtually not at all in the HEPES control buffer. EDG4recovery, however, may not have been quantitative, but thisis confounded by apparent cross-reactivity of the primaryantibody with proteins of similar size. FASLG, NRP1,and KDR (VEGF R2) proteins, all single transmembraneproteins, were nearly quantitatively recovered in the TD2buffer but also showed partial recovery in the HEPES controlbuffer. LAMP-3, an apparently low-abundance protein withfour-transmembrane sequences, appeared to be recoveredin good yield in all the extraction buffers. LAMP-3 is
highly glycosylated (particularly between the transmem-brane helixes), potentially improving its aqueous solubility.Neither overnight incubation or boiling of the tissue samplesin the ProteoSolve-TD buffers showed any significant trans-membrane protein recovery (data not shown), suggestingthat extraction of the membrane proteins was primarily dueto the pressure cycling process. These observations supporta PCT mechanism (a mechanistic discussion can be foundin the Supporting Information) in which the pressure cycleitself is primarily responsible for disruption of the lipidmembranes and exclusion of the membrane proteins. Thedata further suggest that the ProteoSolve-TD buffers needonly to support the solubility of the pressure-extractedmembrane proteins when the sample is returned to ambientconditions.
GPC3 is a lipid-anchored protein. What appears to bea 30 kDa C-terminal domain, which contains the lipid-anchor, only appears to be recovered in the TD1 andTD2 buffers (Figure 2). The soluble 65 kDa mature GPC3protein, resulting from cleavage of the C-terminal, lipid-anchored domain, was not seen in any of the samples.BCL2, a mitochondrial protein with a single-transmembranesequence, was the only protein to show better recovery in theHEPES buffer than either TD1 or TD2 buffers. We believethat this was caused by the failure to pellet mitochondriaduring the centrifugation step (13,000×g). Centrifugation at52,000×g is normally required to pellet free mitochondria[33]. If mitochondria were left suspended in the extracts,then BCL2 would have been liberated from the membranesupon sample preparation for SDS-PAGE (i.e., boiling in SDSsample buffer). Higher recoveries of TUBB were evident inboth the TD1 and TD2 buffers compared to the HEPEScontrol. We believe this result is due to improved solubilityof tubulin microtubules in the TD buffers over that inHEPES control. By contrast, the soluble protein controls (i.e.,CCNE2, AKT, and TUBB) appeared to be well recovered inall of the Barocycler buffers.
4.3. Compatibility with Immunoaffinity Techniques. Of par-ticular clinical interest is that the TD extraction buffersappear to stabilize membrane proteins in an aqueous envi-ronment that is compatible with subsequent immunoaffinitytechniques (e.g., immunosorbent assays or immunoaffinityenrichment). With performance data from five differentELISAs (Figure 3), we can say with good confidence thatthe TD buffer system can have negligible effect on antibodyaffinity constants. Nor does the TD buffer system affectsubsequent activity of the final ELISA amplification reaction(at least with the commonly used HRP enzyme). Only asingle assay (VEGF) failed with the TD2 extraction buffersystem. We believe this may be due to a structural differencein the VEGF epitope in the ProteoSolve-TD buffer system.This might be overcome by the selection of alternativecapture or reporter antibodies for the ELISA, but wasuntried.
Unlike the western blot data (Figure 2), we found nosignificant difference between sVEGF R2/VEGF R2 titers(by ELISA) between the HEPES and TD2 extraction buffer
International Journal of Proteomics 13
systems (Table 2). While membrane-bound VEGF R2 (KDR)can be distinguished from sVEGF R2 in a western blot(based on molecular weight differences), these can only bedistinguished in an ELISA based on the specificity of theantibodies, which are unknown in the kit used. This ELISAwas designed for sVEGF R2 (a plasma marker) and maynot be cross-reactive with the membrane-bound version.However, the VEGF R2/sVEGF R2 tissue titers determined(1 ± 0.1 ng/g of tissue) were double the sVEGF R2 titerexpected to be present in the entrained blood in the sample[59]. AKT1 (a soluble cytoplasmic protein) was found to bepresent in the patients’ samples at a titer of 20 μg/g of tissue.
We note that both the MMP2 and MMP3 were belowthe limits of detection or quantitation of the ELISAs usedin this study. It seems likely that many cellular proteinsof clinical relevance may be similarly too dilute for directmeasurement in the small (≤0.2 mL) well volumes ofstandard ELISA microwell plates. Therefore, we investi-gated the use of immunoaffinity enrichment to concentratelower-abundance biomarkers from larger sample volumesfor subsequent analysis. Subsequent mass spectrometricanalysis was successfully used to confirm the identity ofimmunoaffinity-enriched transferrin (Figure 4). Not onlydoes this enrichment experiment demonstrate the affinityand avidity of the TUBB antibody in TD2 buffer, but italso shows that none of the buffer components survive theenrichment process to interfere with enzymatic digestion ofthe sample, peptide ionization (e.g., ion suppression), ormass spectral analysis (e.g., adduct formation).
4.4. Compatibility with Mass Spectrometry. Immunoaffinityenrichment followed by direct mass spectrometric determi-nation of the mass of the intact protein to identify possibleclinically relevant isoforms was pioneered by Nelson et al.[64] and has been adapted in our laboratory for biomarkervalidation. While we illustrate this method with a singleprotein (Tf) to illustrate the method in this paper, however,we have applied it to enrich 33 different biomarkers from thesame ovarian tumor samples (data not shown).
As mentioned previously, the TD1 and TD2 buffersare fully compatible with the common protein label-ing chemistries (data not provided). We have appliedthe described immunoaffinity/MS method using isotope-differentiated binding energy shift tags in our laboratory(data not shown) [65]. This intact protein capture approachallows the detection of novel protein isoforms (eithersequence variants or posttranslational modifications) thatmay be lost in other biomarker validation methods such asmultireaction monitoring (MRM) [66] or the use of stableisotope standards with antipeptide antibody enrichment(SISCAPA) [67].
Many solid tumors consist primarily of compact epithe-lial cells and connective tissue, which can be particularlyrecalcitrant to protein extraction. We note that the solidmetastatic ovarian tumors used in this study had to becryogenically ground to a fine powder before protein extrac-tion proved effective. A video of the sample preparationprocess is provided in the Supplementary Materials. We also
151
101151201251301351401451501551601651
Figure 4: The 36% mass spectrometric sequence coverage (under-lined) from a tryptic digest of immunoaffinity-enriched transferrincontained in a Barocycler TD2 extract of metastatic ovarian tumortissue.
note that the results were variable with the TD1 buffer, butwith the addition of the dispersion they aid to create theTD2 buffer, and this recovery variability was eliminated.We suspect that other softer tissues (e.g., liver) or harvestedcell lines may be processed via pressure cycling technologywith either the TD1 or TD2 buffers and likely will notrequire prior cryogenic grinding. Pressure cycling technologycombined with the commercial ProtoSolve-TD extractionbuffers appears to offer a new approach for protein, partic-ularly membrane protein, extraction from tissues in a formatsuitable for subsequent clinical immunoaffinity methods andclassic proteomic analyses.
Disclosure
The authors have no financial stake in Invitrogen, nor havethey received any financial remuneration from Invitrogen forthe use of their products in this study (e.g., XCell SureLock,SeeBlue, and Magimark). However, Pressure Biosciences hasbeen licensed by Target Discovery to manufacture and sellthe ProtoSolve-TD buffers for the preparation of tissues forscientific analysis, and therefore, both companies employingthe authors profit from the sales of these reagents. PressureBioscience also profits from the sale of the Barocycler cited inthis study.
Acknowledgment
The authors thank Alexander Lazarev of Pressure Bio-sciences, Inc. for his assistance in the preparation and imageanalysis of the 2D gel electrophoresis samples and imageanalysis presented in this paper.
References
[1] J. Drews, “Drug discovery: a historical perspective,” Science,vol. 287, no. 5460, pp. 1960–1964, 2000.
[2] A. L. Hopkins and C. R. Groom, “The druggable genome,”Nature Reviews Drug Discovery, vol. 1, no. 9, pp. 727–730,2002.
[3] J. P. Overington, B. Al-Lazikani, and A. L. Hopkins, “Howmany drug targets are there?” Nature Reviews Drug Discovery,vol. 5, no. 12, pp. 993–996, 2006.
14 International Journal of Proteomics
[4] M. M. Gottesman, “How cancer cells evade chemotherapy:sixteenth Richard and Hinda Rosenthal Foundation AwardLecture,” Cancer Research, vol. 53, no. 4, pp. 747–754, 1993.
[5] G. Abraham and R. J. Colonno, “Many rhinovirus serotypesshare the same cellular receptor,” Journal of Virology, vol. 51,no. 2, pp. 340–345, 1984.
[6] M. G. Rossmann, “Viral cell recognition and entry,” ProteinScience, vol. 3, no. 10, pp. 1712–1725, 1994.
[7] A. T. H. Burness, “Glycophorin and sialylated components asreceptors for viruses,” in Virus Receptors, Part 2, K. Lonberg-Holm and L. Phillpson, Eds., pp. 64–84, Chapman and Hall,London, UK, 1981.
[8] M. G. Rossmann, “Viral cell recognition and entry,” ProteinScience, vol. 3, no. 10, pp. 1712–1725, 1994.
[9] W. Naumnik, T. Izycki, E. Swidzinska, M. Ossolinska, andE. Chyczewska, “Serum levels of VEGF-C, VEGF-D, andsVEGF-R2 in patients with lung cancer during chemotherapy,”Oncology Research, vol. 16, no. 9, pp. 445–451, 2007.
[10] A. T. Baron, J. A. Wilken, D. E. Haggstrom, S. T. Goodrich,and N. J. Maihle, “Clinical implementation of soluble EGFR(sEGFR) as a theragnostic serum biomarker of breast, lungand ovarian cancer,” IDrugs, vol. 12, no. 5, pp. 302–308, 2009.
[11] J. S. Winston, J. Ramanaryanan, and E. Levine, “HER-2/neuevaluation in breast cancer are we there yet?” American Journalof Clinical Pathology, vol. 121, pp. S33–49, 2004.
[12] J. Thomas, A. Hanby, S. Pinder et al., “Implications of incon-sistent measurement of ER status in non-invasive breastcancer: a study of 1,684 cases from the Sloane project,” BreastJournal, vol. 14, no. 1, pp. 33–38, 2008.
[13] L. Anderson and J. Seilhamer, “A comparison of selectedmRNA and protein abundances in human liver,” Electrophore-sis, vol. 18, no. 3-4, pp. 533–537, 1997.
[14] S. P. Gygi, Y. Rochon, B. R. Franza, and R. Aebersold, “Cor-relation between protein and mRNA abundance in yeast,”Molecular and Cellular Biology, vol. 19, no. 3, pp. 1720–1730,1999.
[15] O. T. Jones, J. P. Earnest, and M. G. McNamee, “Solubilizationand reconstitution of membrane proteins,” in BiologicalMembranes: A Practical Approach, J. B. C. Findlay and W. H.Evans, Eds., pp. 139–177, IRL Press, Washington, DC, USA,1987.
[16] G. Von Heijne, “A day in the life of Dr K. or how I learned tostop worrying and love lysozyme: a tragedy in six acts,” Journalof Molecular Biology, vol. 293, no. 2, pp. 367–379, 1999.
[17] T. Arnold and D. Linke, “Phase separation in the isolationand purification of membrane proteins,” BioTechniques, vol.43, no. 4, pp. 427–440, 2007.
[18] M. Greenberg and Tian Yow Tsong, “Detergent solubilizationand affinity purification of a local anesthetic binding proteinfrom mammalian axonal membranes,” Journal of BiologicalChemistry, vol. 259, no. 21, pp. 13241–13245, 1984.
[19] L. L. Mitic, V. M. Unger, and J. M. Anderson, “Expression,solubilization, and biochemical characterization of the tightjunction transmembrane protein claudin-4,” Protein Science,vol. 12, no. 2, pp. 218–227, 2003.
[20] M. Ramjeesingh, L. J. Huan, E. Garami, and C. E. Bear,“Novel method for evaluation of the oligomeric structure ofmembrane proteins,” Biochemical Journal, vol. 342, no. 1, pp.119–123, 1999.
[21] A. A. Klammer and M. J. MacCoss, “Effects of modified diges-tion schemes on the identification of proteins from complexmixtures,” Journal of Proteome Research, vol. 5, no. 3, pp. 695–700, 2006.
[22] T. M. Annesley, “Ion suppression in mass spectrometry,”Clinical Chemistry, vol. 49, no. 7, pp. 1041–1044, 2003.
[23] D. C. Grant and R. J. Helleur, “Surfactant-mediated matrix-assisted laser desorption/ionization time-of-flight mass spec-trometry of small molecules,” Rapid Communications in MassSpectrometry, vol. 21, no. 6, pp. 837–845, 2007.
[24] M. Tang and S. N. Deming, “Interfacial tension effects of non-ionic surfactants in reversed-phase liquid chromatography,”Analytical Chemistry, vol. 55, no. 3, pp. 425–428, 1983.
[25] T. J. Jacks, R. H. Barker, and T. P. Hensarling, “Solubilizationof protein with ethanol-acetonitrile-water solvent system,” USPatent 3975343, 1976.
[26] H. Zhang, Q. Lin, S. Ponnusamy et al., “Differential recoveryof membrane proteins after extraction by aqueous methanoland trifluoroethanol,” Proteomics, vol. 7, no. 10, pp. 1654–1663, 2007.
[27] S. J. Cordwell, “Sequential extraction of proteins by chemicalreagents.,” Methods in Molecular Biology, vol. 424, pp. 139–146,2008.
[28] W. N. Burnette, ““Western Blotting”: electrophoretic transferof proteins from sodium dodecyl sulfate-polyacrylamide gelsto unmodified nitrocellulose and radiographic detection withantibody and radioiodinated protein A,” Analytical Biochem-istry, vol. 112, no. 2, pp. 195–203, 1981.
[29] O. I. Iweala, “HIV diagnostic tests: an overview,” Contracep-tion, vol. 70, no. 2, pp. 141–147, 2004.
[30] B. J. Bennionn and V. Daggett, “Protein conformation anddiagnostic tests: the prion protein,” Clinical Chemistry, vol. 48,no. 12, pp. 2105–2114, 2002.
[31] S. M. Engstrom, E. Shoop, and R. C. Johnson, “Immunoblotinterpretation criteria for serodiagnosis of early Lyme disease,”Journal of Clinical Microbiology, vol. 33, no. 2, pp. 419–427,1995.
[32] T. S. Nuhse, A. Stensballe, O. N. Jensen, and S. C. Peck, “Large-scale analysis of in vivo phosphorylated membrane proteinsby immobilized metal ion affinity chromatography and massspectrometry.,” Molecular & Cellular Proteomics, vol. 2, no. 11,pp. 1234–1243, 2003.
[33] M. Jansson, K. Warell, F. Levander, and P. James, “Membraneprotein identification: N-terminal labeling of nontrypticmembrane protein peptides facilitates database searching,”Journal of Proteome Research, vol. 7, no. 2, pp. 659–665, 2008.
[34] Y. Song, Y. Hao, A. Sun et al., “Sample preparation project forthe subcellular proteome of mouse liver,” Proteomics, vol. 6,no. 19, pp. 5269–5277, 2006.
[35] M. P. Hall, S. Ashrafi, I. Obegi, R. Petesch, J. N. Peterson, andL. V. Schneider, ““Mass defect” tags for biomolecular massspectrometry,” Journal of Mass Spectrometry, vol. 38, no. 8, pp.809–816, 2003.
[36] S. P. Gygi, B. Rist, S. A. Gerber, F. Turecek, M. H. Gelb, and R.Aebersold, “Quantitative analysis of complex protein mixturesusing isotope-coded affinity tags,” Nature Biotechnology, vol.17, no. 10, pp. 994–999, 1999.
[37] P. L. Ross, Y. N. Huang, J. N. Marchese et al., “Multiplexedprotein quantitation in Saccharomyces cerevisiae using amine-reactive isobaric tagging reagents,” Molecular and CellularProteomics, vol. 3, no. 12, pp. 1154–1169, 2004.
[38] G. B. Smejkal, M. H. Robinson, and A. Lazarev, “Comparisonof fluorescent stains: relative photostability and differentialstaining of proteins in two-dimensional gels,” Electrophoresis,vol. 25, no. 15, pp. 2511–2519, 2004.
[39] U. Groschel-Stewart, P. Heurich, and D. I. H. Stewart, “Non-specific interactions of histones with serum components and
International Journal of Proteomics 15
contractile proteins,” Biochemistry International, vol. 13, no. 6,pp. 927–932, 1986.
[40] J. E. Hale, J. P. Butler, V. Gelfanova, J. S. You, and M. D.Knierman, “A simplified procedure for the reduction andalkylation of cysteine residues in proteins prior to proteolyticdigestion and mass spectral analysis,” Analytical Biochemistry,vol. 333, no. 1, pp. 174–181, 2004.
[41] M. Strohalm, M. Hassman, B. Kosata, and M. Kodıcek,“mMass data miner: an open source alternative for massspectrometric data analysis,” Rapid Communications in MassSpectrometry, vol. 22, no. 6, pp. 905–908, 2008.
[42] D. N. Perkins, D. J. C. Pappin, D. M. Creasy, and J. S.Cottrell, “Probability-based protein identification by search-ing sequence databases using mass spectrometry data,” Elec-trophoresis, vol. 20, no. 18, pp. 3551–3567, 1999.
[43] Product data sheet, CD63 (R-13): sc-31213, Santa CruzBiotechnology, Santa Cruz, Calif, USA, 2009.
[44] Product data sheet, EDG2 antibody (ab23698), Abcam, Cam-bridge, UK, 2009.
[45] Product data sheet, Fas (C18C12) Rabbit mAb, no. 4233, CellSignaling Technology, Danvers, Mass, USA, 2009.
[46] Product data sheet, Anti-human neuropilin-1 antibody,AF3870, R&D Systems, Minneapolis, Minn, USA, 2009.
[47] Product data sheet, FLK-1 (6B11):sc-101560, Santa CruzBiotechnology, Santa Cruz, Calif, USA, 2009.
[48] Product data sheet, CD63 (R-13): sc-31213, Santa CruzBiotechnology, Santa Cruz, Calif, USA, 2009.
[49] Product data sheet, Bcl-2 (C-2): sc-7382, Santa Cruz Biotech-nology, Santa Cruz, Calif, USA, 2009.
[50] Product data sheet, cyclin E2 (C-19): sc-9568, Santa CruzBiotechnology, Santa Cruz, Calif, USA, 2009.
[51] Product data sheet, glypican-3 (C-17): sc-34095, Santa CruzBiotechnology, Santa Cruz, Calif, USA, 2009.
[52] Product data sheet, glypican-3 (H-162): sc-11395, Santa CruzBiotechnology, Santa Cruz, Calif, USA, 2009.
[53] Product data sheet, glypican-3 (W-18): sc-10455, Santa CruzBiotechnology, Santa Cruz, Calif, USA, 2010.
[54] Product data sheet, Affinity-Purified Rabbit Anti-Human PanAkt Antibody, R&D Systems, Minneapolis, Minn, USA, 2007.
[55] S. A. Lewis and N. J. Cowan, “Tubulin genes: structure,expression and regulation,” in Microtubule Protein, J. Avia, Ed.,pp. 37–66, CRC Press, Boca Raton, Fla, USA, 1990.
[56] Product data sheet, beta Tubulin (L-15):sc-31782, Santa CruzBiotechnology, Santa Cruz, Calif, USA, 2009.
[57] R. L. Margolis and L. Wilson, “Addition of colchicine tubulincomplex to microtubule ends: the mechanism of substoi-chiometric colchicine poisoning,” Proceedings of the NationalAcademy of Sciences of the United States of America, vol. 74, no.8, pp. 3466–3470, 1977.
[58] N. L. Anderson, M. Polanski, R. Pieper et al., “The humanplasma proteome,” Molecular and Cellular Proteomics, vol. 3,no. 4, pp. 311–326, 2004.
[59] M. Polanski and N. Anderson, “A list of candidate cancerbiomarkers for targeted proteomics,” Biomarker Insights, vol.1, pp. 1–48, 2006.
[60] T. A. Brown, Genomes, John Wiley & Sons, New York, NY,USA, 2nd edition, 2002.
[61] D. A. Lauffenberger and J. J. Linderman, Receptors: modelsfor binding, trafficking, and signaling, Oxford University Press,New York, NY, USA, 1996.
[62] M. P. Hall and L. V. Schneider, “Isotope-differentiated bindingenergy shift tags (IDBEST) for improved targeted biomarker
discovery and validation,” Expert Review of Proteomics, vol. 1,no. 4, pp. 421–431, 2004.
[63] G. B. Smejkal, “The Coomassie chronicles: past, present andfuture perspectives in polyacrylamide gel staining,” ExpertReview of Proteomics, vol. 1, no. 4, pp. 381–387, 2004.
[64] R. W. Nelson, J. R. Krone, A. L. Bieber, and P. Williams, “Massspectrometric immunoassay,” Analytical Chemistry, vol. 67,no. 7, pp. 1153–1158, 1995.
[65] L. V. Schneider and M. P. Hall, “Stable isotope methods forhigh-precision proteomics,” Drug Discovery Today, vol. 10, no.5, pp. 353–363, 2005.
[66] N. R. Kitteringham, R. E. Jenkins, C. S. Lane, V. L. Elliott,and B. K. Park, “Multiple reaction monitoring for quantitativebiomarker analysis in proteomics and metabolomics,” Journalof Chromatography B, vol. 877, no. 13, pp. 1229–1239, 2009.
[67] N. L. Anderson, N. G. Anderson, L. R. Haines, D. B. Hardie,R. W. Olafson, and T. W. Pearson, “Mass spectrometricquantitation of peptides and proteins using stable isotopestandards and capture by anti-peptide antibodies (SISCAPA),”Journal of Proteome Research, vol. 3, no. 2, pp. 235–244, 2004.

Submit your manuscripts athttp://www.hindawi.com
Hindawi Publishing Corporationhttp://www.hindawi.com Volume 2014
Anatomy Research International
PeptidesInternational Journal of
Hindawi Publishing Corporationhttp://www.hindawi.com Volume 2014
Hindawi Publishing Corporation http://www.hindawi.com
International Journal of
Volume 2014
Zoology
Hindawi Publishing Corporationhttp://www.hindawi.com Volume 2014
Molecular Biology International
GenomicsInternational Journal of
Hindawi Publishing Corporationhttp://www.hindawi.com Volume 2014
The Scientific World JournalHindawi Publishing Corporation http://www.hindawi.com Volume 2014
Hindawi Publishing Corporationhttp://www.hindawi.com Volume 2014
BioinformaticsAdvances in
Marine BiologyJournal of
Hindawi Publishing Corporationhttp://www.hindawi.com Volume 2014
Hindawi Publishing Corporationhttp://www.hindawi.com Volume 2014
Signal TransductionJournal of
Hindawi Publishing Corporationhttp://www.hindawi.com Volume 2014
BioMed Research International
Evolutionary BiologyInternational Journal of
Hindawi Publishing Corporationhttp://www.hindawi.com Volume 2014
Hindawi Publishing Corporationhttp://www.hindawi.com Volume 2014
Biochemistry Research International
ArchaeaHindawi Publishing Corporationhttp://www.hindawi.com Volume 2014
Hindawi Publishing Corporationhttp://www.hindawi.com Volume 2014
Genetics Research International
Hindawi Publishing Corporationhttp://www.hindawi.com Volume 2014
Advances in
Virolog y
Hindawi Publishing Corporationhttp://www.hindawi.com
Nucleic AcidsJournal of
Volume 2014
Stem CellsInternational
Hindawi Publishing Corporationhttp://www.hindawi.com Volume 2014
Hindawi Publishing Corporationhttp://www.hindawi.com Volume 2014
Enzyme Research
Hindawi Publishing Corporationhttp://www.hindawi.com Volume 2014
International Journal of
Microbiology