Metallogeny of Chah-Mesi - Montanuniversität Leoben
172
-
Upload
khangminh22 -
Category
Documents
-
view
0 -
download
0
Transcript of Metallogeny of Chah-Mesi - Montanuniversität Leoben
آنچه شما را آزار می دهد ، شما را برکت می دهد. تاریکی شمع شماست
“What hurts you, blesses you. Darkness is your candle.” - Rūmī
2
ACKNOWLEDGMENTS
I am very grateful for this opportunity to work on the Chah-Mesi project and for the considerable
logistical support I received from Montanuniversität Leoben and the Shahid Chamran University Ahvaz.
Alireza Zarasvandi is thanked for shaping this joint project, organizing the field trip, obtaining
permissions for visiting the mines and core shed and for sharing his expertise with me in the field. I am
especially thankful to my Iranian friends Mohsen Rezai and Majid Tashi for providing reports and
analytical data as well as accompanying me during field work and for fruitful discussions. Moreover,
they ensured that I was well looked after during my field visit and they showed me the best spots for
pizza and ice cream in Ahvaz.
To my supervisor, Johann Raith, thank you for your guidance and particularly your patience. Also, for
several hours-long discussions and mutual sessions on the microscope. I have learned so much from
you. Your trust means a lot to me and I am so glad that you have given me the chance to see so many
amazing places and stunning deposits during our field trip to Iran. Working on this wonderful project
with you and traveling to this beautiful country was really a dream come true.
This work also benefited from several conversations over some beers with the godfather of ore
microscopy, Werner Paar. Several parts of this thesis were completed thanks to your wisdom on ore
mineralogy and microscopy. Thanks for giving me inspiration and sharing your passion for the world of
ore minerals with me.
Thank you also, Ronald Bakker, for awakening my interest in the stunning field of Fluid Inclusions and
your precious words of advice. I appreciated your help during seemingly endless Raman and
microthermometry sessions.
To Gerhard Feitzinger, my workmate and very good friend, you introduced me to the great world of
mining and ore deposits. I am glad that I eventually followed your advice in starting my education in
Leoben, where I learned more than I could have ever imagined. Thank you for your generous support
and continued encouragement during my studies. This would have never been possible without you and
it is great to have you as my mentor.
I am so grateful for my friends at the Chair of Resource Mineralogy. Kristina Stocker, Monika Feichter,
Daniela Wallner and Maik Zimmermann, thank you for endless discussions during coffee breaks and
for helping me out whenever I was clueless. Especially, I want to thank Maik for giving me advice on
the microprobe and for the preparation of all of my samples.
Love and thanks to my parents, Monika and Peter. You encouraged me during hard times of my studies
and never lost faith in me. Moreover, all of this would not have been possible without your financial
help for my excessive student life.
Last but not least, I cannot properly put into words how grateful I am for my girl. Eva, you are the best.
Thank you for your patience and support to fulfill my dreams during my days in Leoben. You always
help me with my English whenever I need your advice, such as in this moment. Moreover, thank you
for occasionally kicking me outside for some needed fresh air. I could not have done all of this without
you!
3
Abstract
The epithermal Chah-Mesi Cu-Pb-Zn-(Ag-Au) deposit, SE Iran:
Petrography, ore mineralogy and fluid inclusions
In the southeastern part of the Cenozoic Urumieh-Dokhtar Magmatic Belt of Iran the NW-trending
Kerman Porphyry Copper Belt hosts major porphyry Cu-(Mo-Au) deposits (PCD) of Miocene age; e.g.
the diorite-type Cu-Au Meiduk and granodiorite-type Cu-Mo Sar Cheshmeh deposits. The polymetallic
vein type deposit Chah-Mesi is located ~ 1.5 km south of the Meiduk porphyry stock. Its genetic relation
to the porphyry system is unclear. At Chah-Mesi, Paleocene to Eocene calc-alkaline volcanic and
pyroclastic rocks of mainly basaltic-andesitic composition were intruded by Miocene microdioritic
dykes. The host rocks were affected by intense hydrothermal alteration exhibiting a central zone of
strong silicification that grades into sericitization and propylitic alteration towards the peripheral parts.
Argillic alteration is restricted to superficial areas and in direction to the Meiduk PCD propylitic
alteration changes into potassic alteration. Six different vein types are distinguished: including two
porphyry-related vein types, three alteration-related types of veinlets as well as mineralized veins
showing massive, banded, crustiform and brecciated textures. Mineralization occurs as open space
fillings and minor replacement and breccia bodies. The paragenetic sequence encompasses four
mineralization stages starting with the early high-sulfidation assemblage pyrite + chalcopyrite +
enargite-luzonite ± bornite with a continuous transition into intermediate-sulfidation state assemblages
comprising pyrite + chalcopyrite + tennantite-tetrahedrite ± electrum ± Ag-bearing sulfosalts. The late
paragentic stage with sphalerite + galena + pyrite ± electrum overprints the earlier ones. Supergene
mineralization with chalcocite + covellite + Fe-oxyhydroxides + Cu-carbonate hydroxides is restricted
to the shallow weathered part of the deposit. A regional zoning of ore minerals is apparent; central parts
of the deposit are dominated by Cu-Fe-rich sulfides showing a transition to Pb-Zn-dominated zones
mainly in the deeper and distal sections. Variations in the chemical composition of fahlores range from
Fe-bearing tennantite to Zn-rich tetrahedrite with a strong positive correlation between Sb and Ag
contents. The fahlores are complexly zoned and display a progressive increase of Sb concentration with
increasing distance to the nearby Meiduk deposit. Primary fluid inclusions in mineralized O-type veins
are low saline aqueous H2O-salt inclusions. They yield homogenization temperatures (Th LV→L) between
115 to 295 °C for sphalerite and 145 to 397 °C for quartz. Salinity values range between 1.2 to 9.9 and
2.1 to 9.2 wt% NaCl equiv., respectively. Raman spectroscopy confirms low CO2 concentrations of the
vapor phase of the fluid inclusions. The fluids are interpreted to be of magmatic origin as indicated by
previously published stable isotope studies. We propose that ascending cooling magmatic fluids were
responsible for the transport of metals and mineral precipitation occurred in the epithermal regime upon
dilution of magmatic fluids with meteoric water. Similar low-salinity, CO2-bearing fluids were reported
from the nearby Meiduk deposit. Conclusively, Chah-Mesi is classified as an intermediate-sulfidation
epithermal deposit with a genetic link to the Meiduk porphyry (Cu-Au) deposit. Mineralization is
inferred to hydrothermal fluids with an initial high-sulfidation state, which changed into intermediate-
sulfidation state during cooling, dilution and fluid-wallrock interaction.
4
Zusammenfassung
Die polymetallische Cu-Pb-Zn-(Ag-Au) Epithermallagerstätte Chah-Mesi,
Südostiran: Petrographie, Erzmineralogie und Fluideinschlüsse
Im Südosten des iranischen Urumieh-Dokhtar Magmatic Belts befindet sich der NW streichende
Kerman Porphyry Copper Belt mit bedeutenden, miozänen porphyrischen Kupferlagerstätten (PCD);
z.B. die Cu-Au bzw. Cu-Mo Tagbaue Meiduk und Sar Cheshmeh. Die polymetallische Ganglangerstätte
Chah-Mesi befindet sich ca. 1,5 km südlich von Meiduk. Der genetische Zusammenhang war bisher
unklar. In Chah-Mesi bilden paläozäne bis eozäne Andesite und dazitische Pyroklastite sowie miozäne
Intrusionen von Mikrodioriten das Nebengestein. Dieses wurde hydrothermal stark alteriert und weist
im Lagerstättenzentrum intensive Silizifizierung auf. Zur Peripherie findet zunächst ein Übergang in
serizitische und schließlich in propylitische Alteration statt. Argillitisch alterierte Gesteine finden sich
an der Oberfläche und nächst der Meiduk Lagerstätte tritt die äußerste potassische Zone auf.
Unterschieden werden sechs Gangtypen: zwei Porphyry-assoziierte und drei Alteration-assoziierte
Gangtypen sowie Erzgänge mit massiven, gebänderten, krustiformen und brekziierten Texturen. Die
Vererzung tritt versprengt in Gängen, sowie in metasomatischen Erzkörpern und Erzbrekzien auf. Die
paragenetische Abfolge umfasst vier Vererzungsphasen. Die frühe, hoch sulfidierte Vergesellschaftung
von Pyrit + Chalcopyrit + Enargit-Luzonit ± Bornit geht kontinuierlich in eine intermediär sulfidierte
Vergesellschaftung mit Pyrit + Chalcopyrit + Tennantit-Tetraedrit ± Electrum ± Ag-reiche Sulfosalze
über. Die Spätphase mit Sphalerit + Galenit + Pyrit ± Electrum überprägt frühere Vererzungen. Die
supergene Vererzung umfasst Chalkosin + Covellin + Fe-Oxyhydroxide + Cu-Carbonate und ist auf den
oberflächennahen, verwitterten Lagerstättenbereich begrenzt. Die regionale Erzzonierung zeigt im
Lagerstättenzentrum Cu-Fe bzw. zur Teufe und lateral Pb-Zn dominierte Sulfiderze. Die Fahlerzchemie
reicht von Fe-Tennantit bis Zn-Tetraedrit und zeigt häufig eine positive Korrelation zwischen den Sb-
und Ag-Gehalten. Komplex zonierte Fahlerzkristalle weisen einen progressiven Anstieg der Sb
Konzentration mit steigender Distanz zur Meiduk Lagerstätte auf. Primäre Fluideinschlüsse in Quarz
und Sphalerit der Erzgänge bestehen aus gering salzhaltigen, wässrigen H2O-Salz Lösungen. Die
Homogenisierungstemperatur (Th LV→L) liegt zwischen 115 und 295 °C in Sphaleriteinschlüssen und
reicht von 145 bis 397 °C in Quarzeinschlüssen. Die Salinität erreicht zwischen 1,2 und 9,9 bzw. 2,1
und 9,2 Gew% NaCl equiv. Mittels Raman Spektroskopie wurden in der Gasphase von Einschlüssen
geringe Konzentrationen an CO2 nachgewiesen. Publizierte stabile Isotopendaten deuten auf einen
magmatischen Ursprung der Fluide hin. Der Metalltransport wird auf aszendente Fluide magmatischer
Abstammung zurückgeführt. Die epithermale Erzausfällung erfolgte, als die magmatischen Lösungen
mit Grundwasser ausreichend verdünnt waren. Ähnliche CO2 führende Fluide mit geringem Salzgehalt
wurden auch in Meiduk dokumentiert. Chah-Mesi wird als eine intermediär sulfidierte
Epithermallagerstätte klassifiziert, die eine genetische Verbindung zur porphyrischen Kupferlagerstätte
Meiduk aufweist. Die hydrothermale Vererzung bildete sich anfänglich noch durch hoch sulfidierte
Fluide, die kontinuierlich durch Abkühlung, Verdünnung und Reaktionen mit dem Nebengestein in
einen intermediär sulfidierten Zustand übergingen.
5
Contents
Page
1 INTRODUCTION ............................................................................................................. 8
2 GEOLOGY AND METALLOGENY ........................................................................... 10
2.1 Geodynamic evolution of the Tethyan orogenic belt ................................................. 10
2.2 Geological and structural units of Iran ....................................................................... 15
2.2.1 Zagros Fold and Thrust Belt (the Southern Unit) ............................................................16
2.2.2 Cimmerian Blocks (the Central Unit) .............................................................................18
2.2.2.1 Sanandaj-Sirjan Zone ..............................................................................................18
2.2.2.2 Urumieh-Dokhtar Magmatic Belt ............................................................................18
2.2.2.3 Central Iranian Zone ................................................................................................19
2.2.2.4 Alborz Belt ..............................................................................................................20
2.2.3 The Northern Unit ...........................................................................................................20
2.3 Metallogeny of Iran .................................................................................................... 21
2.4 Major ore deposits in the Kerman Belt ...................................................................... 23
2.4.1 Sar Cheshmeh porphyry deposit .....................................................................................23
2.4.2 Meiduk porphyry deposit ................................................................................................24
2.4.3 Latala deposit ..................................................................................................................24
2.5 Chah-Mesi deposit ..................................................................................................... 25
2.5.1 Previous studies on Chah-Mesi .......................................................................................25
2.5.2 Geology of the Chah-Mesi deposit ..................................................................................26
2.5.3 Field observations ...........................................................................................................29
3 METHODS ...................................................................................................................... 33
3.1 Sampling .................................................................................................................... 33
3.2 Optical microscopy .................................................................................................... 34
3.3 Electron probe micro analysis (EPMA) ..................................................................... 35
3.4 Fluid inclusion measurements .................................................................................... 36
4 PETROGRAPHY ............................................................................................................ 37
4.1 Host rocks .................................................................................................................. 38
4.1.1 Microdiorite .....................................................................................................................38
4.1.2 Andesite...........................................................................................................................41
4.1.3 Pyroclastic rocks .............................................................................................................43
4.2 Vein classification ...................................................................................................... 45
4.2.1 B2-type .............................................................................................................................47
4.2.2 D1-type ............................................................................................................................47
6
4.2.3 Quartz-chlorite-sericite veinlets (QCS-type)...................................................................49
4.2.4 Ore veins (O-type) ...........................................................................................................51
4.2.4.1 Massive veins ..........................................................................................................51
4.2.4.2 Banded veins ...........................................................................................................54
4.2.4.3 Crustiform veins ......................................................................................................59
4.2.4.4 Mineralized breccia zones .......................................................................................62
4.2.5 Prehnite-calcite-epidote veins (PCE-type) ......................................................................65
4.2.6 Calcite veins (CC-type) ...................................................................................................66
4.3 Alteration ................................................................................................................... 68
4.3.1 Silicic alteration ..............................................................................................................69
4.3.2 Advanced argillic alteration ............................................................................................69
4.3.3 Sericitic alteration ...........................................................................................................70
4.3.4 Argillic alteration ............................................................................................................71
4.3.5 Propylitic alteration .........................................................................................................71
4.3.6 Potassic (biotite-rich) alteration ......................................................................................71
5 ORE MINERALOGY ..................................................................................................... 73
5.1 Ore zoning .................................................................................................................. 74
5.2 Ore paragenesis and ore textures ............................................................................... 80
5.2.1 Early stage .......................................................................................................................81
5.2.2 Main stage .......................................................................................................................82
5.2.3 Late stage ........................................................................................................................84
5.2.4 Supergene stage ...............................................................................................................85
5.3 Mineral chemistry ...................................................................................................... 86
5.3.1 Fahlore group minerals....................................................................................................86
5.3.2 Other sulfides and sulfosalts ...........................................................................................95
5.3.3 Ca-Mg-Mn-Fe-carbonates ...............................................................................................97
6 FLUID INCLUSIONS .................................................................................................... 99
6.1 Fluid inclusion petrography and types of inclusions ............................................... 100
6.2 Fluid inclusion microthermometry ........................................................................... 102
6.3 Raman spectroscopy of fluid inclusions .................................................................. 105
7 DISCUSSION ................................................................................................................ 107
7.1 Porphyry copper and epithermal deposits reviewed ................................................ 107
7.1.1 Porphyry copper deposits ..............................................................................................107
7.1.1.1 Geodynamic setting ...............................................................................................109
7.1.1.2 Magma characteristics of PCDs ............................................................................110
7.1.1.3 Hydrothermal alteration and mineralization ..........................................................111
7
7.1.1.4 Genesis of porphyry systems .................................................................................114
7.1.2 Epithermal deposits .......................................................................................................117
7.1.2.1 Classification .........................................................................................................117
7.1.2.2 High-sulfidation deposits (HS-type) ......................................................................120
7.1.2.3 Low-sulfidation deposits (LS-type) .......................................................................121
7.1.2.4 Intermediate-sulfidation deposits (IS-type) ...........................................................122
7.2 Characteristics of Chah-Mesi and comparison to epithermal subtypes ................... 123
7.2.1 Host rocks and geodynamic setting ...............................................................................123
7.2.2 Deposit style and ore zonation ......................................................................................125
7.2.3 Ore mineralogy and mineral distribution ......................................................................126
7.2.4 Precious metals ..............................................................................................................127
7.2.5 Gangue mineralogy and textures ...................................................................................127
7.2.6 Hydrothermal alteration ................................................................................................127
7.2.7 Fluid inclusions .............................................................................................................128
7.3 Mineralization and regional trends on the ore deposit scale .................................... 129
7.3.1 Conditions of ore formation and physicochemical fluid evolution ...............................129
7.3.1.1 Iron content of sphalerite .......................................................................................130
7.3.1.2 Witnesses of hydrothermal fluid processes: gangue textures and fluid inclusions 131
7.3.1.3 The role of wallrock buffering...............................................................................132
7.3.2 Regional zoning seen in fahlore chemistry ...................................................................133
7.4 Chah-Mesi and Meiduk: porphyry to epithermal transition? ................................... 135
7.5 Regional geodynamics and ore genesis ................................................................... 137
7.5.1 Regional geodynamics and metallogeny .......................................................................137
7.5.2 Genetic model for Chah-Mesi – Meiduk .......................................................................138
8 CONCLUSIONS ........................................................................................................... 141
9 REFERENCES .............................................................................................................. 144
APPENDICES ........................................................................................................................... I
I. LIST OF MINERAL ABBREVIATIONS AND FORMULAS ...................................... I
II. EPMA DATA OF THE STUDIED SULFIDES AND SULFOSALTS ........................ II
III. BSE IMAGES WITH SPOTS OF EPMA ANALYSIS ............................................ VIII
Introduction 8
1 Introduction
Chah-Mesi (چاه مسی) is a Farsi expression and has the meaning of ‘well copper’ in the Persian language.
Based on the omnipresence of superficial Cu mineralization in this area it is obviously a suitable name
for the Chah-Mesi deposit, which is located about 40 km northeast of Shahr-e-Babak city and only 1.5
km south of the Meiduk porphyry copper mine. Geologically, the mineralization occurs within the
Kerman Porphyry Copper Belt in the southeastern part of the Urumieh-Dokhtar Magmatic Belt
(UDMB), extending from Shahr-e-Babak to Bazman. In this 600 km northwest-southeast trending belt
more than 300 copper deposits and showings are known, including 20 major porphyry copper deposits
(PCDs) (Ghorbani, 2013). Vein type, base metal deposits with varying amounts of precious metals are
also common and some of them are spatially associated with porphyry copper deposits (Padyar et al.,
2017).
In 2018 Shahid Chamran University Ahvaz, Iran, invited Montanuniversität Leoben, Austria, for a joint
project including a field trip to investigate and sample the Chah-Mesi deposit and the nearby Meiduk
porphyry deposit. This study arises from a joint project of the two universities on "Transitional porphyry
to epithermal systems in Iran" that started in 2018. During the visit of the open pits several samples of
host rocks and different vein types were collected. Moreover, drill cores of five exploration drillings
from an earlier exploration project by the National Iranian Copper Industries Company (NICICO) were
extensively sampled and drill core samples were brought back to Austria for further investigation.
The present thesis attempts to understand the origin and evolution of mineralization at Chah-Mesi and
to confirm or rebut any genetic relationship to the nearby Meiduk porphyry system. Polymetallic Cu-
Zn-Pb-(Ag-Au) vein type mineralization at Chah-Mesi is linked with strong hydrothermal alteration and
the deposit is spatially located close to the Meiduk porphyry deposit suggesting a genetic link.
To establish a correct ore deposit model for Chah-Mesi and to find out whether there is a genetic link
between the hydrothermal vein type and the porphyry style mineralization are the main aims. The
hypothesis to be tested is: Chah-Mesi could represent an epithermal deposit formed at the periphery or
on top of the nearby Meiduk porphyry system.
The first aspect to be defined is a relative chronology of the vein formation to receive an estimation of
hydrothermal development. This is done by studying crosscutting vein relationships of field
observations and drill cores. Hydrothermal alteration is an ubiquitous characteristic of the deposit. Its
distribution and type of alteration were investigated by optical microscopy, electron probe micro
analysis (EPMA) and Laser Raman micro-spectroscopy (LRMS). To answer the questions regarding
mineralization type and the mineral chemical composition of the ore minerals, a detailed mineralogical
study of the ore and gangue mineral assemblages of the different veins demands the use of optical
microscopy and EPMA. These methods were also used to check whether the deposit contains any
precious metals (Au, Ag) and to identify the carriers. By studying the textural relationship between the
ore minerals, a possible paragenetic sequence for the mineralization and the distinction of several
mineralization stages has been established. Mineral chemistry data were also correlated with the position
and depths of the sampled drill cores in order to find out if there is a spatial distribution of certain
elements or minerals that could eventually be used for vectoring. Fluid inclusion studies provided
important evidence for the ore deposit model and allowed to constrain the development of mineralizing
fluids and PT-X conditions of ore formation.
Introduction 9
Data of ore mineralogy and fluid inclusion investigations are compared with published data for the
Meiduk deposit. The purpose is to see if there is any relation to the proximal porphyry stock of Meiduk
and therefore a genetic link with PCD. Additionally, comparisons are drawn of the studied ore
mineralization, alteration and fluid inclusions of the hydrothermal veins in Chah-Mesi with similar
epithermal vein style mineralization elsewhere. On that basis, epithermal mineralization at Chah-Mesi
is classified with respect to high- (HS), intermediate- (IS) and low- (LS) sulfidation state deposits.
Conclusively, a synthesis of all obtained data and information is used to construct a correct genetic
model for the Chah-Mesi deposit.
Geology and metallogeny 10
2 Geology and metallogeny
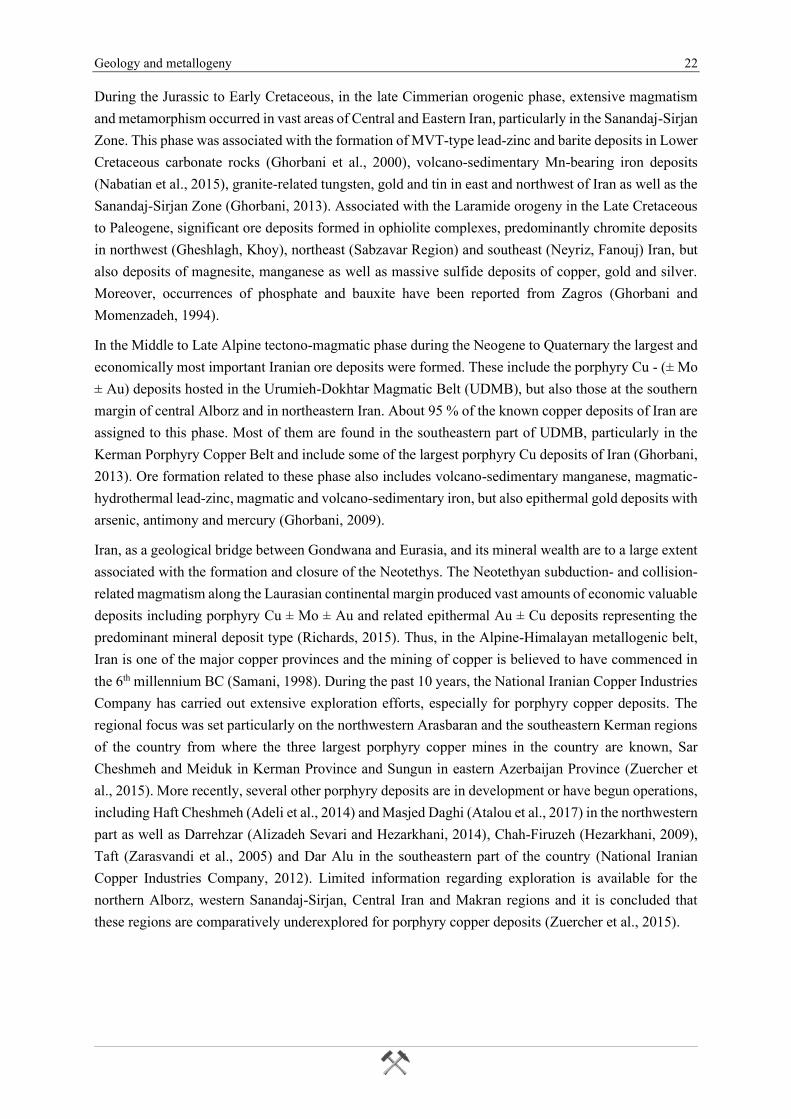
2.1 Geodynamic evolution of the Tethyan orogenic belt
The Alpine-Himalayan Tethyan orogenic belt extends over 12000 km from the Alps, along southeastern
Europe, Turkey, Iran, Pakistan, Tibet to Indochina. The Neotethyan orogenic belt comprises sections
where oceanic lithosphere is still being subducted, such as in the eastern Mediterranean and the Makran
Trench, and other segments with advanced continental collision as in the Alps or Himalayas. Tectonic,
magmatic and metallogenic processes provided a variety of valuable mineral deposits. The formation of
porphyry Cu ± Mo ± Au deposits related to subduction of the Neotethys and subsequent collisional
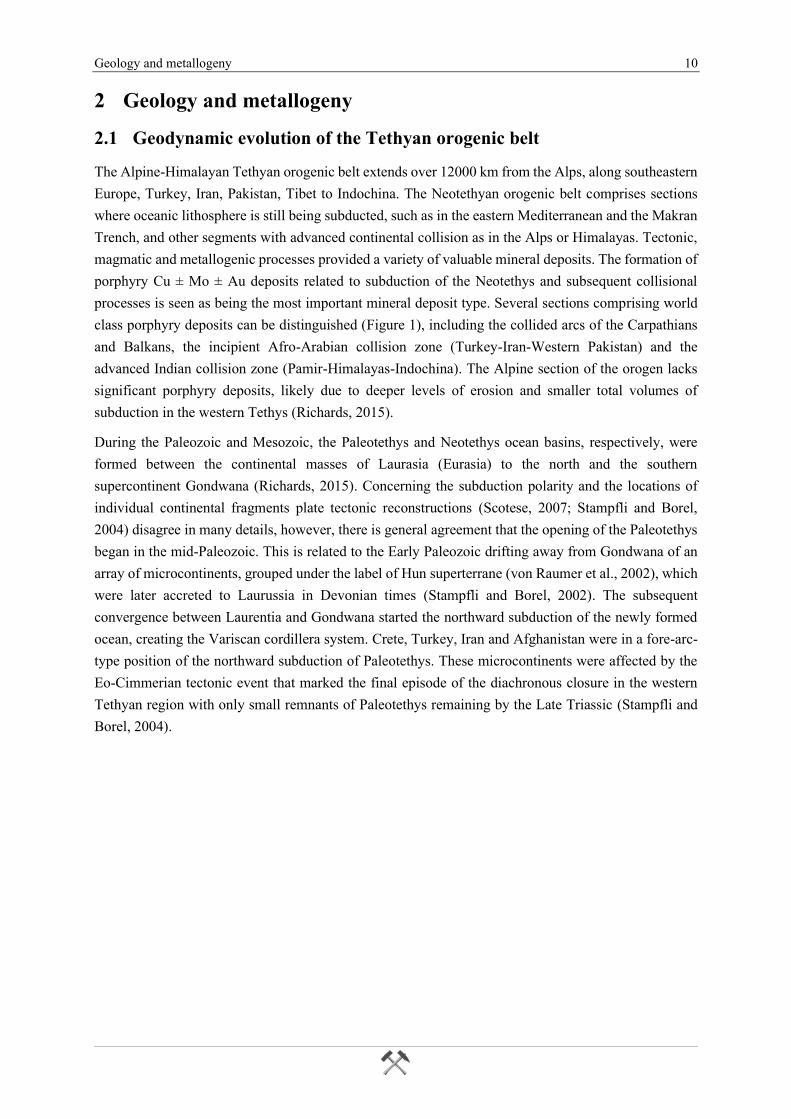
processes is seen as being the most important mineral deposit type. Several sections comprising world
class porphyry deposits can be distinguished (Figure 1), including the collided arcs of the Carpathians
and Balkans, the incipient Afro-Arabian collision zone (Turkey-Iran-Western Pakistan) and the
advanced Indian collision zone (Pamir-Himalayas-Indochina). The Alpine section of the orogen lacks
significant porphyry deposits, likely due to deeper levels of erosion and smaller total volumes of
subduction in the western Tethys (Richards, 2015).
During the Paleozoic and Mesozoic, the Paleotethys and Neotethys ocean basins, respectively, were
formed between the continental masses of Laurasia (Eurasia) to the north and the southern
supercontinent Gondwana (Richards, 2015). Concerning the subduction polarity and the locations of
individual continental fragments plate tectonic reconstructions (Scotese, 2007; Stampfli and Borel,
2004) disagree in many details, however, there is general agreement that the opening of the Paleotethys
began in the mid-Paleozoic. This is related to the Early Paleozoic drifting away from Gondwana of an
array of microcontinents, grouped under the label of Hun superterrane (von Raumer et al., 2002), which
were later accreted to Laurussia in Devonian times (Stampfli and Borel, 2002). The subsequent
convergence between Laurentia and Gondwana started the northward subduction of the newly formed
ocean, creating the Variscan cordillera system. Crete, Turkey, Iran and Afghanistan were in a fore-arc-
type position of the northward subduction of Paleotethys. These microcontinents were affected by the
Eo-Cimmerian tectonic event that marked the final episode of the diachronous closure in the western
Tethyan region with only small remnants of Paleotethys remaining by the Late Triassic (Stampfli and
Borel, 2004).
Geology and metallogeny 11
Figure 1: Topographic relief map of the Alpine-Himalayan Tethyan orogenic belt, showing major structures, Tethyan sutures and porphyry Cu ± Au deposits grouped by age. Larger deposits (generally
>100 Mt resource) are identified by names and larger symbol sizes. Locations and ages of porphyry deposits are derived principally from Singer et al. (2008) with included updates collected by Richards
(2015), e.g. Perelló et al. (2008) and Taghipour et al. (2008). Tethyan sutures and structures are derived primarily from Stampfli and Kozur (2006) with additional information collected by Richards (2015).
Plate velocities relative to Eurasia are from Calais and Amarjargal (2000) and (Regard et al., 2005). The map is from Richards (2015) and for further information see therein. Abbreviations: EAF – East
Anatolian Fault, IAES – Izmir-Ankara-Erzincan suture zone, NAF – North Anatolian Fault, SSZ – Sanandaj-Sirjan Zone, UDMA – Urumieh-Dokhtar magmatic arc.
Geology and metallogeny 12
The final welding of Gondwana and Laurasia culminated in the creation of the Permo-Triassic
supercontinent Pangea (Stampfli and Borel, 2004). The Neotethyan ocean basin began to form in the
southwest of Paleotethys also during the Permian-Early Triassic (Richards, 2015). In the Middle
Permian the margin in southeastern Europe was a transform-type plate boundary and due to locking of
the Gondwana-Laurasia suture little subduction occurred. In Late Permian roll-back of the Paleotethys
slab generated quite active back-arc rifting along the entire Paleotethys northern margin and progressed
to sea-floor spreading and opening of a series of marginal oceanic basins together with a general collapse
of the Variscan cordillera from Italy to Iran (Stampfli and Borel, 2004). In Iran, the development of a
large molassic basin (Shemshak basin) was generated by the closing of the Paleotethyan ocean and also
caused subduction progradation to the northern side of Neotethys (Stampfli and Borel, 2004).
The subduction-related Mesozoic volcanics are preserved in the central Iranian NW-SE striking
Sanandaj-Sirjan Zone, the eastern Alborz-Kopeh Dagh and the Central Iranian microcontinent. The
detailed history of Neotethyan basin opening and closure in Iran is still under debate, but several
ophiolite belts across the country indicate the formation of several (back-arc?) basins in addition to the
main Neotethys ocean basin (Desmons and Beccaluva, 1983; Takin, 1972). The opening of the main
Neotethys ocean basin was initiated by rifting of a collage of island arcs and continental fragments, the
Cimmerian continents, from the northeastern margin of Gondwana in the Early Triassic (Hooper et al.,
1994). The Cimmerian continents included the cores of present-day Turkey, Tibet and Indochina, as
well as the Iranian Sanandaj-Sirjan Zone and the Central Iranian microcontinent (Lut, Tabas and Yazd
blocks). These drifted northwards and eventually accreted to the southern margin of Eurasia in the Late
Triassic-Early Jurassic along the Paleotethys suture, followed by northward-directed subduction of the
Neotethys beneath this accreted margin (Horton et al., 2008; Richards, 2015). Related to this period of
subduction Late Triassic-Cretaceous I-type arc plutons intruded the Iraqi Zagros Suture Zone, the
Sanandaj-Sirjan Zone and the Makran (Agard et al., 2005; Ali et al., 2013). Further, several small ocean
basins such as the Sabzevar and Sistan oceans (Figure 2 a, b) in northeast and eastern Iran, respectively,
formed along the accreted margin due to back-arc rifting, whereas the closure of these basins gave rise
to calc-alkaline arc magmatism in the Arghash Massif and Lut Block during the Late Cretaceous-
Oligocene (Alaminia et al., 2013). Concerning the collision between the Sanandaj-Sirjan Zone, Central
Iran and Arabia paleogeographic reconstructions indicate that in the Mesozoic the Sanandaj-Sirjan Zone
docked with Eurasia (Figure 2 a). This is associated with formation of a small back-arc basin between
these blocks in the Middle Cretaceous (Ghasemi and Talbot, 2006). For the final phase of Neotethyan
closure, Alavi (1980, 1994) assumed a Cretaceous age for the collision of the Sanandaj-Sirjan Zone with
Arabia, whereas Hooper et al. (1994) suggested an Oligocene age, followed by the Late Cenozoic
collision with Central Iran (Ghalamghash et al., 2009).
Geology and metallogeny 13
During the Late Cretaceous/Paleogene the Mesozoic arc magmatism shifted from the Sanandaj-Sirjan
Zone about 100 km to the northeast to the Urumieh-Dokhtar Magmatic Belt. The reasons of this shift
are still under debate. The simplest explanation would be that the angle of subduction flattened, so the
NW-SE axis of magmatism moved further to the northeast to form the Urumieh-Dokhtar arc (Mohajjel
and Fergusson, 2014). Glennie (2000) postulates the closure of two separate Neotethyan basins to the
south and north of the Sanandaj-Sirjan Zone. Verdel et al. (2011) prefer the alternative explanation that
the angle of Neotethyan subduction shallowed in the Cretaceous and forced a northeastern shift of the
axis of arc magmatism from the Sanandaj-Sirjan Zone to the parallel extending Urumieh-Dokhtar
Magmatic Belt. Then the flat-subducting slab rolled back prior to Miocene collision and exposed
hydrated lithosphere to an influx of hot asthenospheric material in the re-opened mantle wedge. Initially,
the Eocene magmatism was of calc-alkalic character, but developed to more potassic (shoshonitic)
compositions during the Oligocene to Early-Middle Miocene, and finally changed to even more alkaline
composition in the Late Neogene (Hassanzadeh, 1993). The transition reflects the onset of diachronous
collision between the irregular shaped Arabian indenter and the accreted Eurasian margin. A Miocene
age is generally preferred for the final collision along the Bitlis-Zagros subduction zone (Agard et al.,
2005). Initialized in the Late Eocene (35 Ma), the collision was followed by crustal thickening in the
Oligocene and uplift of the central Iranian plateau in the Middle Miocene (15-12 Ma) prior to slab
breakoff (Mouthereau et al., 2012). Eocene volcanism also occurred behind the main Neotethyan
destructive margin, such as in the Alborz in north and northeastern Iran, as well as in the Lut Block in
eastern Iran and it appears to have involved the formation and destruction of several small back-arc
basins, such as the Sabzevar and Sistan oceans (Richards, 2015). The Oligocene magmatism in
northeastern Iran was of collisional character and coincided with the onset of oroclinal bending and the
uplift in the Kopeh Dagh (Hollingsworth et al., 2010). Similar magmatic development is recognized in
northwestern Iran, where normal calc-alkaline magmatism in the early Oligocene changed to shoshonitic
plutonism in the late Oligocene (Aghazadeh et al., 2011).
Geology and metallogeny 14
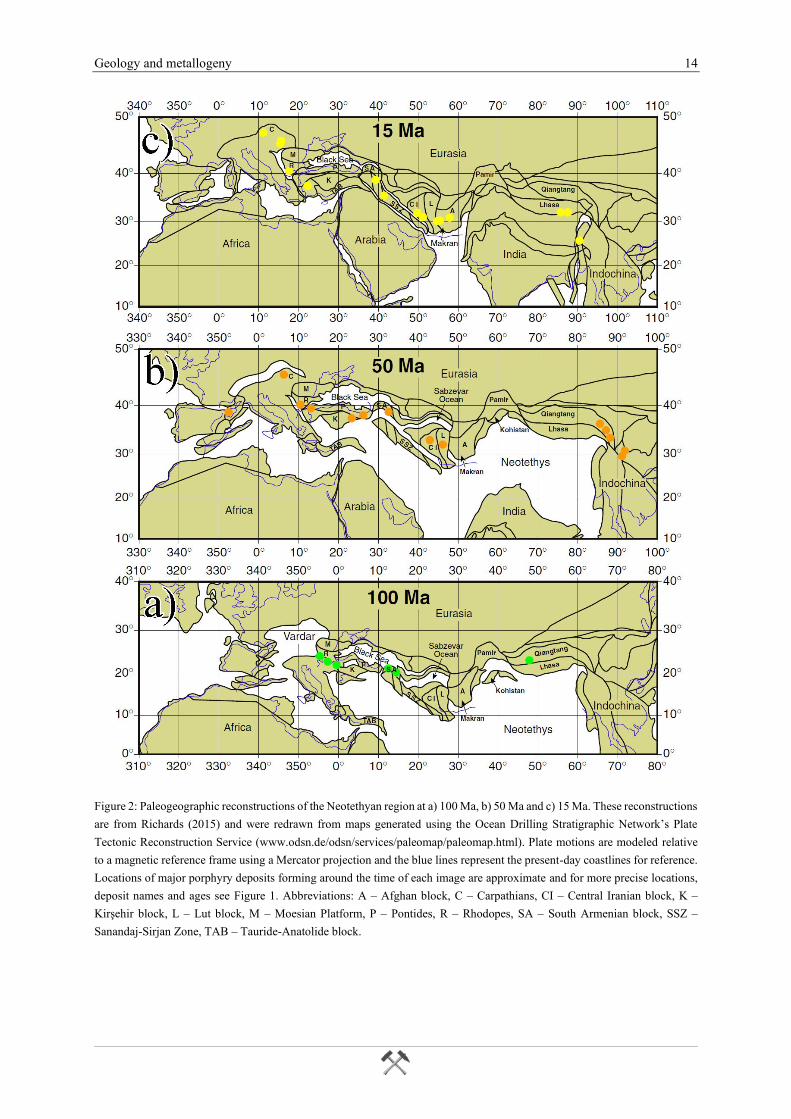
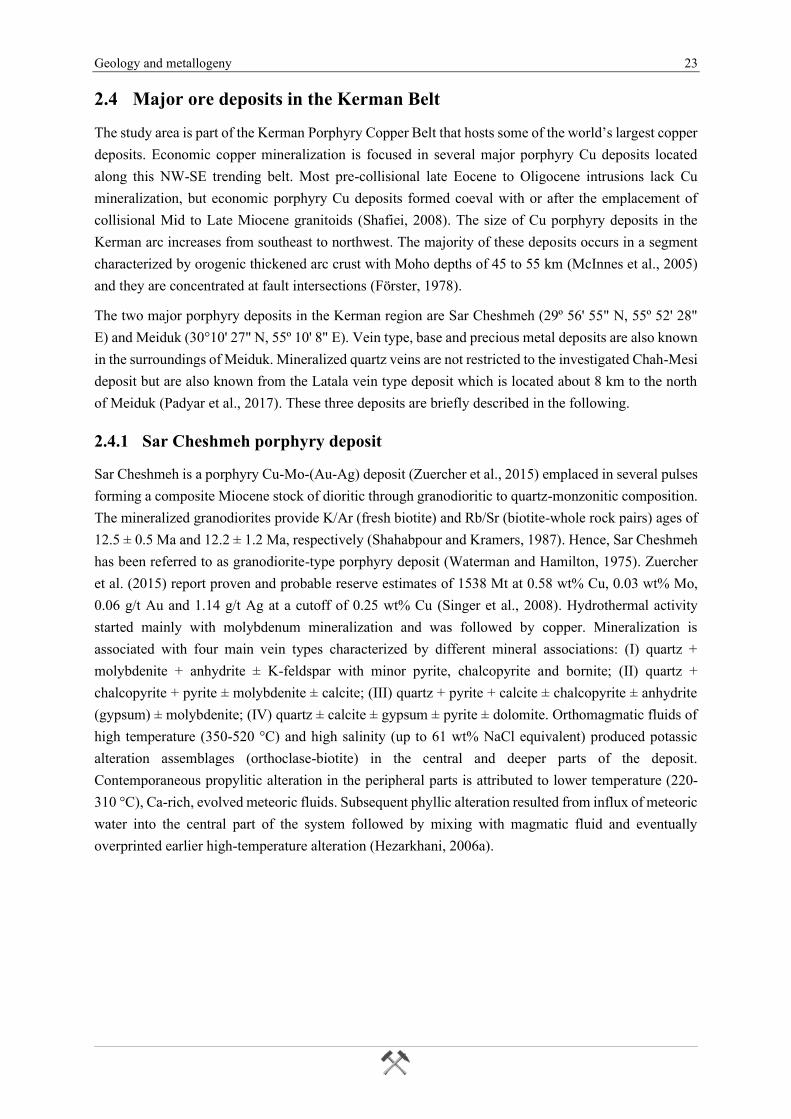
Figure 2: Paleogeographic reconstructions of the Neotethyan region at a) 100 Ma, b) 50 Ma and c) 15 Ma. These reconstructions
are from Richards (2015) and were redrawn from maps generated using the Ocean Drilling Stratigraphic Network’s Plate
Tectonic Reconstruction Service (www.odsn.de/odsn/services/paleomap/paleomap.html). Plate motions are modeled relative
to a magnetic reference frame using a Mercator projection and the blue lines represent the present-day coastlines for reference.
Locations of major porphyry deposits forming around the time of each image are approximate and for more precise locations,
deposit names and ages see Figure 1. Abbreviations: A – Afghan block, C – Carpathians, CI – Central Iranian block, K –
Kirşehir block, L – Lut block, M – Moesian Platform, P – Pontides, R – Rhodopes, SA – South Armenian block, SSZ –
Sanandaj-Sirjan Zone, TAB – Tauride-Anatolide block.
Geology and metallogeny 15
The orogen was lengthened by Neogene dextral strike-slip faulting (Figure 2 c) as the eastward extension
was blocked by the collision of the Afghan plate with India (Allen et al., 2011) and the shortening of
about 68 km across the Zagros and 120 km across the Arabian plate caused crustal thickening (Allen et
al., 2013). Further, the subsequent slab breakoff in the Mid-Late Miocene (Allen et al., 2011) or Plio-
Pleistocene (Molinaro et al., 2005) caused uplift and post-collisional magmatism throughout Iran. The
Neogene-Quaternary mafic post-collisional volcanism expanded from the northwest to the Lut Block
and showed potassic to ultrapotassic character with subduction-modified mantle lithosphere origin
(Ahmadzadeh et al., 2010). Concerning the isolated Damavand stratovolcano, Davidson et al. (2004)
assumed that perhaps an asthenospheric component was also included. Usually, volcanism is localized
along trans-tensional structures (Ahmadzadeh et al., 2010). Alkali basaltic rocks are associated with N-
S oriented strike-slip faults in eastern Iran that formed in response to extension following delamination
of thickened subcontinental lithospheric mantle as a delayed response to Late Cretaceous collision
between the Lut and Afghan blocks (Pang et al., 2012). The magmatic arc of Urumieh-Dokhtar is
characterized by Eocene calc-alkaline, followed by Oligocene shoshonitic magmatism and finally
developed to bimodal felsic and mafic alkalic composition during the Miocene (Hassanzadeh, 1993).
Adakite-like Pliocene-Quaternary magmatism is associated with slab breakoff (Omrani et al., 2008) and
the Miocene formation of post-collisional calc-alkaline magmas involved a significant fraction of
remobilized subduction-modified lower crust (Shafiei et al., 2009).
2.2 Geological and structural units of Iran
Magmatic activities, metamorphism and tectonics related to orogenic events created several structural
units, each representing an exclusive component in a geological mosaic that builds up todays Iran. The
first subdivision into structural zones was done by Stöcklin and Nabavi (1973) and remained as a
reference for later models with separation into several microcontinental blocks (Aghanabati, 2004;
Alavi, 1994; Berberian and King, 1981; Ghorbani, 2013). The continental blocks are separated from
each other by fold and thrust belts that are related to the opening and closure of ocean basins in the
former Tethys realm (Stampfli and Borel, 2002).
Berberian and King (1981) distinguished three major structural units based on geological features and
fold-thrust belts. These major units comprise the Southern Unit represented by the Zagros Fold and
Thrust Belt, the Cimmerian Blocks as the Central Unit and the Northern Unit. In western Iran the very
distinctive mountain range of the NW-SE striking Zagros Orogen consists of three subparallel tectonic
zones. These are from northeast to southwest: the Urumieh-Dokhtar Magmatic Belt, the Sanandaj-Sirjan
Zone and the Zagros Fold and Thrust Belt (Alavi, 2007). Each zone records its individual geological
development and belongs to a different major structural unit.
Geology and metallogeny 16
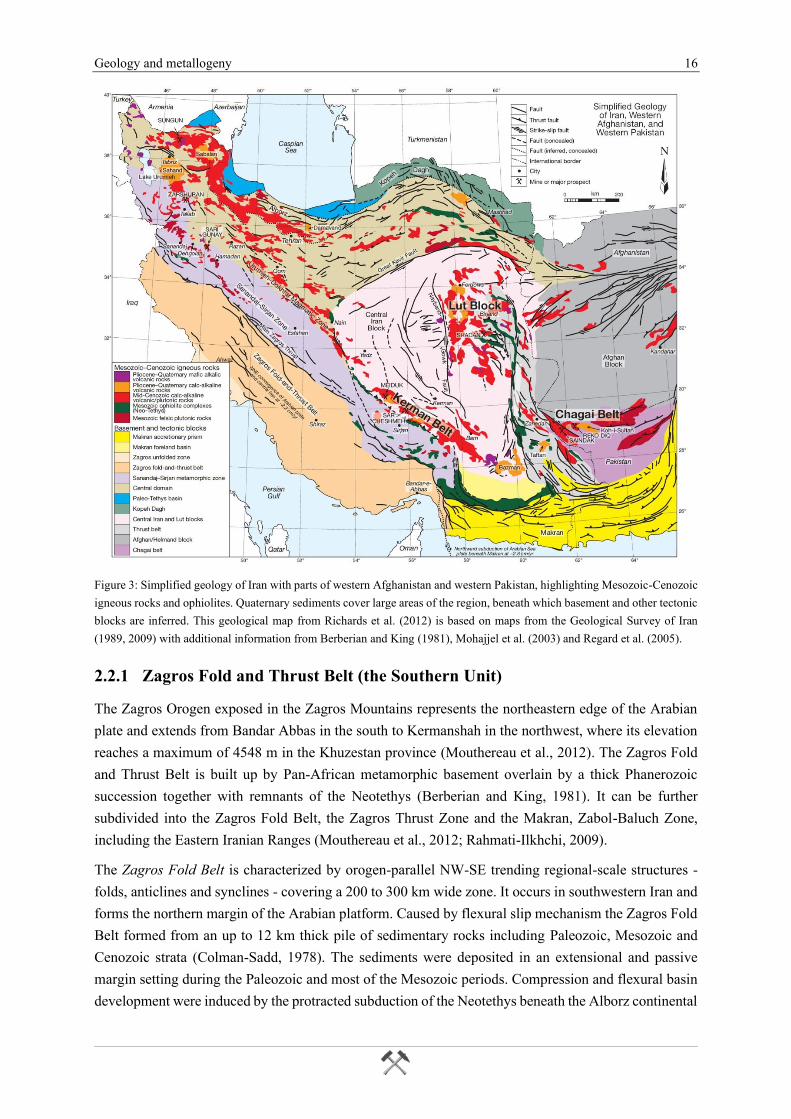
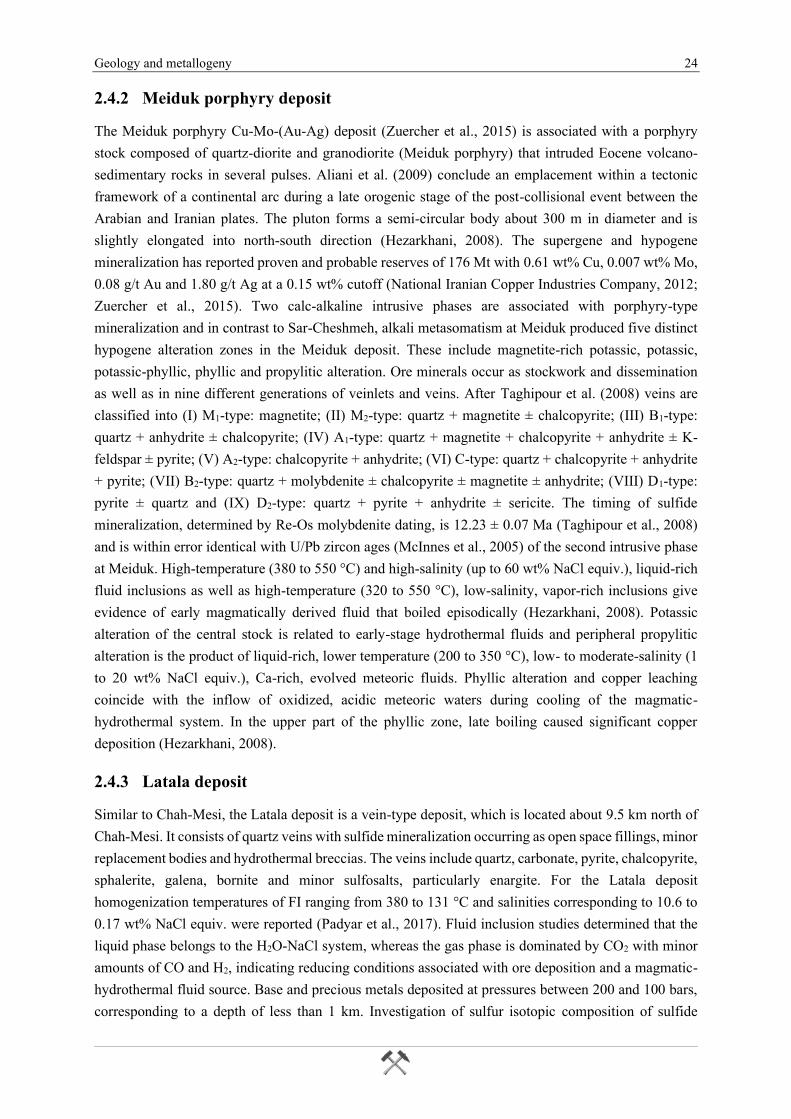
Figure 3: Simplified geology of Iran with parts of western Afghanistan and western Pakistan, highlighting Mesozoic-Cenozoic
igneous rocks and ophiolites. Quaternary sediments cover large areas of the region, beneath which basement and other tectonic
blocks are inferred. This geological map from Richards et al. (2012) is based on maps from the Geological Survey of Iran
(1989, 2009) with additional information from Berberian and King (1981), Mohajjel et al. (2003) and Regard et al. (2005).
2.2.1 Zagros Fold and Thrust Belt (the Southern Unit)
The Zagros Orogen exposed in the Zagros Mountains represents the northeastern edge of the Arabian
plate and extends from Bandar Abbas in the south to Kermanshah in the northwest, where its elevation
reaches a maximum of 4548 m in the Khuzestan province (Mouthereau et al., 2012). The Zagros Fold
and Thrust Belt is built up by Pan-African metamorphic basement overlain by a thick Phanerozoic
succession together with remnants of the Neotethys (Berberian and King, 1981). It can be further
subdivided into the Zagros Fold Belt, the Zagros Thrust Zone and the Makran, Zabol-Baluch Zone,
including the Eastern Iranian Ranges (Mouthereau et al., 2012; Rahmati-Ilkhchi, 2009).
The Zagros Fold Belt is characterized by orogen-parallel NW-SE trending regional-scale structures -
folds, anticlines and synclines - covering a 200 to 300 km wide zone. It occurs in southwestern Iran and
forms the northern margin of the Arabian platform. Caused by flexural slip mechanism the Zagros Fold
Belt formed from an up to 12 km thick pile of sedimentary rocks including Paleozoic, Mesozoic and
Cenozoic strata (Colman-Sadd, 1978). The sediments were deposited in an extensional and passive
margin setting during the Paleozoic and most of the Mesozoic periods. Compression and flexural basin
development were induced by the protracted subduction of the Neotethys beneath the Alborz continental
Geology and metallogeny 17
margin in Late Cretaceous times. Consumption of oceanic crust lasted until Early Eocene when the
Urumieh-Dokhtar Magmatic Arc started to collide with the magmatic assemblage of the Alborz
Mountains (Alavi, 2007; Homke et al., 2009).
The Zagros Thrust Zone and Zagros Suture, also known as the High Zagros, represent a narrow zone
that occurs along the northeastern margin of the Zagros Fold Belt separated by the High Zagros Fault.
The belt consists of an imbricate fault system that comprises a more deeply eroded level exposing
Paleozoic rocks close to the Dezful Embayment as well as less deeply eroded mainly Mesozoic rocks
around Kermanshah. Structurally, it constitutes the more deformed, internal part of the Zagros Fold and
Thrust Belt. The NE-dipping imbricate stack of Early Paleozoic to Early Cenozoic rocks shows a duplex
style tectonics controlled by detachments along locally intruded Cambrian salt diapirs. For the High
Zagros and part of the adjoining Zagros Fold Belt a minimum shortening of 37 % during the Mesozoic
and Cenozoic convergence between the Arabian and Eurasian plate was calculated (Mohajjel and
Fergusson, 2014).
The Zagros Suture shows imbrications of thrust units of different tectonic origins including rifted
continental blocks, ophiolites and tectonic mélanges. To the north, the High Zagros is bounded by the
Main Zagros Thrust, a north steeply-dipping thrust with a southward connection to the hanging wall
carrying ultramafic suites of the Kermanshah and Neyriz obducted complexes (Mouthereau et al., 2012).
Berberian and King (1981) interpret this as the plate boundary between the folded cover of the Arabian
margin to the SW and the upper magmatic-metamorphic belt of central Iran to the NE.
The southeastern continuation of the Zagros Mountains is to be found in the Makran accretionary
wedge, which stretches from eastern Iran to central Pakistan. It is located to the south of the Jazmourian
depression and the Minab fault in the west confines the structural unit together with the Oman sea in the
south (Nabavi, 1976). Formed by still ongoing subduction of the Arabian plate underneath Eurasia the
Makran accretionary wedge consists largely of sediments scraped off the Arabian plate (Berberian and
King, 1981). The accretionary prism still propagates seaward at a rate of approximately 10 mm per year
(White, 1982) with an extremely low subduction angle of about 5° (Byrne et al., 1992). Large sections
of ophiolite series can be found along the east-west trending faults that dominate the northern part of
Makran. Cretaceous to Paleocene ophiolites are the oldest rocks in the Makran area which are overlain
by a 5 km thick sequence of sandstone, shale and marl deformed prior to Early Miocene. This series is
covered by a sequence of Neogene rock units with a thickness in excess of 5 km (Nabavi, 1976).
The east of Iran comprises flysch and mélange sediments of the Zabol-Baluch Zone to the east of the
Lut Block. Rock units can be grouped into flyschoid sediments, a series of volcanic, volcano-
sedimentary and intrusive rocks, as well as an ophiolitic series (Ghorbani, 2013). These post-Cretaceous
flysch to molasse type sediments (Falcon, 1974) were deposited on a basement of oceanic crust and
show intense deformation and tectonization. A succession of thick deep-sea sediments, such as
argillaceous and silicic shales, radiolarite and pelagic limestone overlay the flyschoid sediments.
Volcanic rocks are also present and include, basalt, spilitic basalt, diabase, andesite, dacite, rhyolite and
subordinate serpentinized ultramafic rocks.
Geology and metallogeny 18
2.2.2 Cimmerian Blocks (the Central Unit)
This assemblage of several tectonic units represents detached marginal fragments from northern
Gondwana (Brunet, 2009) that drifted northward across the Paleotethys during Early Permian to Late
Early Triassic (Muttoni et al., 2009). The opening of the Neotethys accreted these Cimmerian Blocks to
southern Eurasia in Triassic times (Horton et al., 2008) and caused the Eo-Cimmerian orogeny with the
final closure of the Paleozoic Paleotethys ocean (Berberian & King, 1981). The northeast-directed
subduction of the Neotethys ocean induced the Middle Cimmerian orogenic event of the Middle Jurassic
(Fürsich et al., 2009). The Central Unit comprises major parts of the Zagros Orogen, such as the
Sanandaj-Sirjan Zone and the UDMB as well as parts of the Central Iranian Zone and the Alborz
Mountains (Rahmati-Ilkhchi, 2009).
2.2.2.1 Sanandaj-Sirjan Zone
Located to the northeast of the Main Zagros Thrust the Sanandaj-Sirjan Zone represents the tectono-
magmatic and metamorphic part of the Zagros Mountains with a length of about 1500 km (Rahmati-
Ilkhchi, 2009). The zone consists of sedimentary and metamorphic rocks of Paleozoic to Cretaceous age
formed at the former active margin of an Iranian microcontinent which collided with the Arabian plate
during the Miocene (Berberian and Berberian, 1981). Mohajjel et al. (2003) subdivide the zone into an
outer belt of imbricate thrust slices comprising radiolarite, ophiolite and marginal sub-zones consisting
of Mesozoic deep-marine sediments, shallow-marine carbonates, oceanic crust and volcanic arcs. The
inner complexly deformed sub-zone represents a Late Paleozoic-Mesozoic passive margin succession.
In the Late Jurassic to Cretaceous the subduction of the Neotethys resulted in deformation,
metamorphism and development of unconformities in the marginal and complexly deformed sub-zones.
The Late Cretaceous deformation climax created a major southwest-vergent fold belt associated with
greenschist facies metamorphism post-dated by emplacement of abundant Paleogene granitic plutons.
Ophiolite emplacement onto the northern Arabian margin occurred in the southwestern Sanandaj-Sirjan
Zone due to a Late Cretaceous island arc – passive margin collision. The Zagros suture is located along
this discontinuous ophiolite bearing zone at the southwestern margin of the Sanandaj-Sirjan Zone
(Mohajjel et al., 2003).
2.2.2.2 Urumieh-Dokhtar Magmatic Belt
Positioned between the Sanandaj-Sirjan Zone and continental blocks of the Central Iranian Zone the
Urumieh-Dokhtar Magmatic Belt (UDMB) extends over 2000 km from the NW to the SE of Iran
extending parallel to the Zagros Mountains (Alavi, 2007). Voluminous tholeiitic, calc-alkaline, and K-
rich magmatic rocks form the magmatic arc of UDMB. Magmatic activity shows migration from the SE
to NW and magmatism was mainly active in the Eocene associated with the subduction and closure of
the Neotethys followed by the Paleogene to Neogene continent-continent collision (Mohajjel et al.,
2003). Episodes of slab retreat or slab rollback forced an extensional magmatic flare-up from 55 to 37
Ma which generated vast amounts of Paleocene-Eocene volcanic rocks (Verdel et al., 2011). The
Paleogene volcanics together with the sedimentary rocks reach 3-8 km in thickness indicating
subsidence due to back-arc extension (Ballato et al., 2011). In the Oligocene OIB-like magmatism
reflects asthenospheric-derived melting (Verdel et al., 2011). The youngest rocks in the UDMB formed
Geology and metallogeny 19
due to breakoff of the Neotethyan slab beneath the Iranian Plateau (Omrani et al., 2008). They mostly
consist of alkaline lava flows and pyroclastics of Pliocene and Quaternary age.
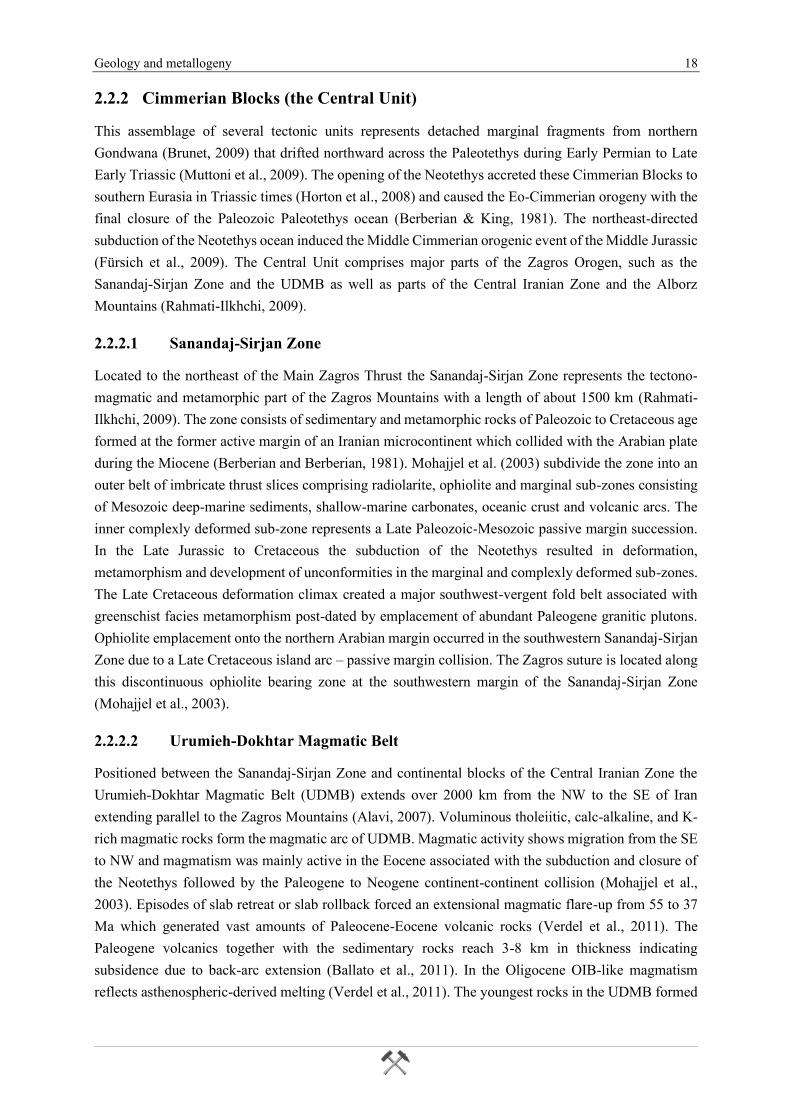
The southern segment of the Urumieh-Dokhtar Magmatic Belt is known as Kerman Porphyry Copper
Belt (or Kerman Belt, Figure 3) and constitutes the main Cu-bearing region of Iran. The Cenozoic
magmatic assemblage forms a 40 to 50 km wide, northwest-southeast trending arc segment extending
over 400 km along the southern margin of the central Iranian micro-continent (Mirzaie et al., 2015). The
southern structural boundary between the Kerman belt and its ophiolite suture zone is formed by the
Nain-Baft thrust, whereas the Rafsanjan strike-slip fault represents the northern separation of the
Kerman arc and Central Iran. Geophysical and structural field constraints indicate a collisional
northeast-verging fold and thrust belt traversed by cross-cutting dextral strike slip faults (Shafiei et al.,
2009). The distinct magmatic history of the Kerman porphyry copper belt and the main Urumieh-
Dokhtar Magmatic Belt shows differences that may be related to regional changes in the collisional
tectonic setting (Shafiei, 2008). Igneous rock formation of the Kerman Belt happened during the early
Eocene when the steep and oblique subduction of the Neotethyan oceanic lithosphere beneath the
rotating micro-continent of central Iran initiated the onset of volcanic activity. Mid to Late Eocene
basaltic-rhyolitic volcaniclastic sequences followed as well as intrusions of barren granitoids
(Dimitrijevic, 1973) both showing calc-alkaline and locally tholeiitic affinity, typical for subduction-
related island arc settings (Shahabpour, 2007). During the Oligocene, magmatic activity was
characterized by mainly high-K calc-alkaline and shoshonitic volcanic complexes and plutonic rocks
(Hassanzadeh, 1993). A short interruption of magmatic activity is reflected by Oligocene to Miocene
red beds and limestones that overly volcaniclastics and intrusive rocks unconformably (Dimitrijevic,
1973). However, magmatism resumed during the Mid-Late Miocene with a second episode of intrusive
activity associated with porphyritic ore-hosting granitoids (McInnes et al., 2005) and continued into the
Pliocene. The concentration of more felsic rocks in the northwestern and central part of the Kerman Belt
indicate a northwestern shift of Neogene magmatism and the production of Pliocene to Quaternary alkali
basalts and foidites represent the youngest magmatic activity (Dimitrijevic, 1973; Hassanzadeh, 1993).
2.2.2.3 Central Iranian Zone
The Central Iranian Zone comprises a microcontinent consisting of several crustal fragments and is
located between the Alborz and Kopeh Dagh ranges in the north and the ranges of Zagros and Makran
in the west and south, respectively. The Central Iranian Zone consists of the Central Iran Block in the
northeast and three north to south oriented crustal domains, namely from east to west the Lut Block, the
Tabas Block and Yazd Block (Masoodi et al., 2013). Upper Cretaceous to Lower Eocene ophiolites
partly confine the structural components (Takin, 1972).
The Central Iran Block is situated in the middle of Iran with a triangular shape and borders the Alborz
Mountains in the north, the Yazd, Tabas and Lut Blocks in the east and the Sanandaj-Sirjan Zone in the
south-southwest (Stöcklin and Nabavi, 1973). Alavi (1991) subdivides the Central Iran Block into the
eastern Sabzevar Block and the western Tabriz Qom Belt. The Lut Block extends over 900 km in north-
south direction restricted by the Dorooneh fault in the north and the Jazmourian depression in the south.
The Nehbandan fault separates the Lut Block from Eastern Iran and the Zabol-Baluch Zone, whereas
the western boundary to the Tabas Block is the north-trending Nayband fault and the Shotori Mountains.
Between the Tabas and Yazd Blocks the 600 km long and narrow Kashmar-Kerman Tectonic Zone is a
Geology and metallogeny 20
distinct fault bounded zone of Upper Neoproterozoic to Lower Paleozoic metamorphic rock units
intruded by Upper Triassic granite-tonalite plutons and overlain by Cenozoic strata series (Masoodi et
al., 2013). The Lut Block is covered by Neogene volcanic and continental deposits with widely scattered
outcrops of Mesozoic to Paleozoic rocks overlying the metamorphic basement. The succession of the
Lut Block is characterized by a low degree of Alpine deformation and shows different lithologies than
the Precambrian to Quaternary succession of Central Iran. The Yazd and Tabas Blocks in the west of
the Nayband fault show a succession of fault-bounded, graben-like structures. There, horsts expose the
metamorphic basement and its Paleozoic cover and the grabens are filled with thick and strongly folded
Jurassic to Cretaceous sediments (Stöcklin, 1974b).
2.2.2.4 Alborz Belt
As a 1500 km long mountain system, the Alborz Belt, extends from Azerbaijan to the Caspian Sea in its
central part and further to Afghanistan forming a gently sinuous east-west range in the north of Iran
(Stöcklin, 1974a). Several successive tectonic events affected this northernmost geological unit of Iran,
such as the Eo-Cimmerian orogeny causing Pliocene-Quaternary intracontinental transpression (Allen
et al., 2003). The Alborz Belt comprises stratigraphic successions with more than 12 km in thickness,
spanning from the Late Precambrian to the Holocene (Alavi, 1991).
2.2.3 The Northern Unit
The Northern Unit is composed of remnants of the Paleotethys and crustal rocks formed at the margins
of the Variscan orogen in Central Asia that were overprinted by the Alpine orogeny. A suture separates
the Northern Unit from the Cimmerian Blocks. The continental crust includes fragments of Paleozoic
oceanic crust and was deformed and consolidated during the early Cimmerian and late Alpine orogenic
events (Stöcklin, 1977). According to Rahmati-Ilkhchi (2009) the Northern Unit also includes the South
Caspian depression, the northern part of the Iranian suture zone, the Paropamisus, the Western Hindu
Kush ranges and the Kopeh Dagh range.
The fold and thrust belt of Kopeh Dagh is an intra continental range that marks the northern limit of the
Alpine-Himalayan orogeny in northeastern Iran. The stratigraphic succession of the Kopeh Dagh was
deposited in a former basin that developed after the Cimmerian orogeny (Garzanti and Gaetani, 2002)
and was covered with a vast continental shelf sea from Middle Jurassic to Oligocene when the onset of
uplift within the Kopeh Dagh begun about 30 Ma ago (Berberian and King, 1981; Robert et al., 2014).
Overlying the Variscan metamorphosed basement a sequence of continuous marine and continental
sediments reaches about 10 km in thickness with no major sedimentary gap or volcanic activities during
Jurassic to Oligocene. The sedimentary pile was affected by final Alpine tectonics during Plio- to
Pleistocene and therefore provides suitable conditions for accumulation of hydrocarbons (Ghorbani,
2013; Rahmati-Ilkhchi, 2009).
Geology and metallogeny 21
2.3 Metallogeny of Iran
Iran, as a part of the Alpine-Himalayan belt, was affected by several orogenic phases from the
Precambrian to the Cenozoic, but especially the Alpine orogeny constitutes an essential period during
the metallogenic evolution of the country. Hence, all the major Mesozoic and Cenozoic tectonic units
evolved in response to the Alpine-Himalayan orogeny as a result of the Neotethyan subduction. The
metallogenetic record of Iran provides a good correlation between the mineralization phases and
tectono-magmatic events, which include Pan-African, Hercynian, Early and Late Cimmerian, Laramide,
and Middle to Late Alpine. All events played an essential role in the formation of mineral resources
(Ghorbani and Momenzadeh, 1995; Momenzadeh and Walther, 1984). A generally accepted
metallogenic classification of Iran has not been established yet, but Ghorbani (1999) introduced the
following geographic metallogenic provinces: Central Iran, Urumieh-Dokhtar, Sanandaj-Sirjan,
Northeast metallogenic province (Taknar, Kavir, Sabzevar Belts), Alborz, Southeast and east of Iran
metallogenic province, Zagros oil and gas province and Kopet Dagh oil and gas province (Figure 3).
When considering mining of the various commodities several belts are distinguished in Iran: Malayer-
Isfahan lead and zinc belt, Kerman copper belt, Esfandagheh-Faryab chromite ophiolitic belt, Khash-
Nehbandan belt (with chromium, copper and magnesium deposits), Qom-Naein belt (with manganese,
barite and copper deposits), Kavir-Sabzevar belt (with copper, chromium, gold and iron deposits) and
Taknar belt (with copper, gold and arsenic deposits).
These metallogenic provinces and belts of Iran are the result of the above-mentioned orogenic phases
and tectono-magmatic events. Based on timing of magmatism, stratigraphy, structural geology as well
as the geological evolution of Iran, Ghorbani (2013) classifies the mineralization phases of Iran as
follows:
A first mineralization phase during Late Proterozoic to Early Cambrian (800 to 530 Ma) coincided with
the Pan-African tectono-magmatic event. During this phase, mineralization included mainly
sedimentary and volcano-sedimentary iron deposits (Jafarzadeh et al., 1995), large deposits of lead-zinc
associated with submarine volcanic activities, mesothermal gold deposits, high-grade magmatic iron
ores of Kiruna-type (Nabatian et al., 2015) and nonmetallic deposits such as salt or sedimentary
phosphate (Ghorbani and Momenzadeh, 1994; Ghorbani et al., 2000).
The Lower Paleozoic phase corresponds to the Caledonian tectono-magmatic event and is poor in
metallic mineralizations. During the Early Paleozoic mainly deposits of silica and phosphate formed in
different regions of Iran, but also smaller copper deposits in the Zagros region are related to this phase.
In contrast, the Late Paleozoic to Triassic phase associated with the Hercynian and Early Cimmerian
tectono-magmatic events induced the deposition of metallic and nonmetallic ores during the Devonian,
Carboniferous, Permian and Early to Middle Triassic in all places of Iran. Mineralization during this
phase includes massive sulfide deposits with copper-lead-zinc, volcano-sedimentary iron and iron-
manganese deposits, magmatic-hydrothermal lead-zinc-silver occurrences, but also deposits of fireclay,
bauxite, phosphate, barite and fluorite (Ghorbani and Momenzadeh, 1994).
Geology and metallogeny 22
During the Jurassic to Early Cretaceous, in the late Cimmerian orogenic phase, extensive magmatism
and metamorphism occurred in vast areas of Central and Eastern Iran, particularly in the Sanandaj-Sirjan
Zone. This phase was associated with the formation of MVT-type lead-zinc and barite deposits in Lower
Cretaceous carbonate rocks (Ghorbani et al., 2000), volcano-sedimentary Mn-bearing iron deposits
(Nabatian et al., 2015), granite-related tungsten, gold and tin in east and northwest of Iran as well as the
Sanandaj-Sirjan Zone (Ghorbani, 2013). Associated with the Laramide orogeny in the Late Cretaceous
to Paleogene, significant ore deposits formed in ophiolite complexes, predominantly chromite deposits
in northwest (Gheshlagh, Khoy), northeast (Sabzavar Region) and southeast (Neyriz, Fanouj) Iran, but
also deposits of magnesite, manganese as well as massive sulfide deposits of copper, gold and silver.
Moreover, occurrences of phosphate and bauxite have been reported from Zagros (Ghorbani and
Momenzadeh, 1994).
In the Middle to Late Alpine tectono-magmatic phase during the Neogene to Quaternary the largest and
economically most important Iranian ore deposits were formed. These include the porphyry Cu - (± Mo
± Au) deposits hosted in the Urumieh-Dokhtar Magmatic Belt (UDMB), but also those at the southern
margin of central Alborz and in northeastern Iran. About 95 % of the known copper deposits of Iran are
assigned to this phase. Most of them are found in the southeastern part of UDMB, particularly in the
Kerman Porphyry Copper Belt and include some of the largest porphyry Cu deposits of Iran (Ghorbani,
2013). Ore formation related to these phase also includes volcano-sedimentary manganese, magmatic-
hydrothermal lead-zinc, magmatic and volcano-sedimentary iron, but also epithermal gold deposits with
arsenic, antimony and mercury (Ghorbani, 2009).
Iran, as a geological bridge between Gondwana and Eurasia, and its mineral wealth are to a large extent
associated with the formation and closure of the Neotethys. The Neotethyan subduction- and collision-
related magmatism along the Laurasian continental margin produced vast amounts of economic valuable
deposits including porphyry Cu ± Mo ± Au and related epithermal Au ± Cu deposits representing the
predominant mineral deposit type (Richards, 2015). Thus, in the Alpine-Himalayan metallogenic belt,
Iran is one of the major copper provinces and the mining of copper is believed to have commenced in
the 6th millennium BC (Samani, 1998). During the past 10 years, the National Iranian Copper Industries
Company has carried out extensive exploration efforts, especially for porphyry copper deposits. The
regional focus was set particularly on the northwestern Arasbaran and the southeastern Kerman regions
of the country from where the three largest porphyry copper mines in the country are known, Sar
Cheshmeh and Meiduk in Kerman Province and Sungun in eastern Azerbaijan Province (Zuercher et
al., 2015). More recently, several other porphyry deposits are in development or have begun operations,
including Haft Cheshmeh (Adeli et al., 2014) and Masjed Daghi (Atalou et al., 2017) in the northwestern
part as well as Darrehzar (Alizadeh Sevari and Hezarkhani, 2014), Chah-Firuzeh (Hezarkhani, 2009),
Taft (Zarasvandi et al., 2005) and Dar Alu in the southeastern part of the country (National Iranian
Copper Industries Company, 2012). Limited information regarding exploration is available for the
northern Alborz, western Sanandaj-Sirjan, Central Iran and Makran regions and it is concluded that
these regions are comparatively underexplored for porphyry copper deposits (Zuercher et al., 2015).
Geology and metallogeny 23
2.4 Major ore deposits in the Kerman Belt
The study area is part of the Kerman Porphyry Copper Belt that hosts some of the world’s largest copper
deposits. Economic copper mineralization is focused in several major porphyry Cu deposits located
along this NW-SE trending belt. Most pre-collisional late Eocene to Oligocene intrusions lack Cu
mineralization, but economic porphyry Cu deposits formed coeval with or after the emplacement of
collisional Mid to Late Miocene granitoids (Shafiei, 2008). The size of Cu porphyry deposits in the
Kerman arc increases from southeast to northwest. The majority of these deposits occurs in a segment
characterized by orogenic thickened arc crust with Moho depths of 45 to 55 km (McInnes et al., 2005)
and they are concentrated at fault intersections (Förster, 1978).
The two major porphyry deposits in the Kerman region are Sar Cheshmeh (29º 56' 55" N, 55º 52' 28"
E) and Meiduk (30°10' 27" N, 55º 10' 8" E). Vein type, base and precious metal deposits are also known
in the surroundings of Meiduk. Mineralized quartz veins are not restricted to the investigated Chah-Mesi
deposit but are also known from the Latala vein type deposit which is located about 8 km to the north
of Meiduk (Padyar et al., 2017). These three deposits are briefly described in the following.
2.4.1 Sar Cheshmeh porphyry deposit
Sar Cheshmeh is a porphyry Cu-Mo-(Au-Ag) deposit (Zuercher et al., 2015) emplaced in several pulses
forming a composite Miocene stock of dioritic through granodioritic to quartz-monzonitic composition.
The mineralized granodiorites provide K/Ar (fresh biotite) and Rb/Sr (biotite-whole rock pairs) ages of
12.5 ± 0.5 Ma and 12.2 ± 1.2 Ma, respectively (Shahabpour and Kramers, 1987). Hence, Sar Cheshmeh
has been referred to as granodiorite-type porphyry deposit (Waterman and Hamilton, 1975). Zuercher
et al. (2015) report proven and probable reserve estimates of 1538 Mt at 0.58 wt% Cu, 0.03 wt% Mo,
0.06 g/t Au and 1.14 g/t Ag at a cutoff of 0.25 wt% Cu (Singer et al., 2008). Hydrothermal activity
started mainly with molybdenum mineralization and was followed by copper. Mineralization is
associated with four main vein types characterized by different mineral associations: (I) quartz +
molybdenite + anhydrite ± K-feldspar with minor pyrite, chalcopyrite and bornite; (II) quartz +
chalcopyrite + pyrite ± molybdenite ± calcite; (III) quartz + pyrite + calcite ± chalcopyrite ± anhydrite
(gypsum) ± molybdenite; (IV) quartz ± calcite ± gypsum ± pyrite ± dolomite. Orthomagmatic fluids of
high temperature (350-520 °C) and high salinity (up to 61 wt% NaCl equivalent) produced potassic
alteration assemblages (orthoclase-biotite) in the central and deeper parts of the deposit.
Contemporaneous propylitic alteration in the peripheral parts is attributed to lower temperature (220-
310 °C), Ca-rich, evolved meteoric fluids. Subsequent phyllic alteration resulted from influx of meteoric
water into the central part of the system followed by mixing with magmatic fluid and eventually
overprinted earlier high-temperature alteration (Hezarkhani, 2006a).
Geology and metallogeny 24
2.4.2 Meiduk porphyry deposit
The Meiduk porphyry Cu-Mo-(Au-Ag) deposit (Zuercher et al., 2015) is associated with a porphyry
stock composed of quartz-diorite and granodiorite (Meiduk porphyry) that intruded Eocene volcano-
sedimentary rocks in several pulses. Aliani et al. (2009) conclude an emplacement within a tectonic
framework of a continental arc during a late orogenic stage of the post-collisional event between the
Arabian and Iranian plates. The pluton forms a semi-circular body about 300 m in diameter and is
slightly elongated into north-south direction (Hezarkhani, 2008). The supergene and hypogene
mineralization has reported proven and probable reserves of 176 Mt with 0.61 wt% Cu, 0.007 wt% Mo,
0.08 g/t Au and 1.80 g/t Ag at a 0.15 wt% cutoff (National Iranian Copper Industries Company, 2012;
Zuercher et al., 2015). Two calc-alkaline intrusive phases are associated with porphyry-type
mineralization and in contrast to Sar-Cheshmeh, alkali metasomatism at Meiduk produced five distinct
hypogene alteration zones in the Meiduk deposit. These include magnetite-rich potassic, potassic,
potassic-phyllic, phyllic and propylitic alteration. Ore minerals occur as stockwork and dissemination
as well as in nine different generations of veinlets and veins. After Taghipour et al. (2008) veins are
classified into (I) M1-type: magnetite; (II) M2-type: quartz + magnetite ± chalcopyrite; (III) B1-type:
quartz + anhydrite ± chalcopyrite; (IV) A1-type: quartz + magnetite + chalcopyrite + anhydrite ± K-
feldspar ± pyrite; (V) A2-type: chalcopyrite + anhydrite; (VI) C-type: quartz + chalcopyrite + anhydrite
+ pyrite; (VII) B2-type: quartz + molybdenite ± chalcopyrite ± magnetite ± anhydrite; (VIII) D1-type:
pyrite ± quartz and (IX) D2-type: quartz + pyrite + anhydrite ± sericite. The timing of sulfide
mineralization, determined by Re-Os molybdenite dating, is 12.23 ± 0.07 Ma (Taghipour et al., 2008)
and is within error identical with U/Pb zircon ages (McInnes et al., 2005) of the second intrusive phase
at Meiduk. High-temperature (380 to 550 °C) and high-salinity (up to 60 wt% NaCl equiv.), liquid-rich
fluid inclusions as well as high-temperature (320 to 550 °C), low-salinity, vapor-rich inclusions give
evidence of early magmatically derived fluid that boiled episodically (Hezarkhani, 2008). Potassic
alteration of the central stock is related to early-stage hydrothermal fluids and peripheral propylitic
alteration is the product of liquid-rich, lower temperature (200 to 350 °C), low- to moderate-salinity (1
to 20 wt% NaCl equiv.), Ca-rich, evolved meteoric fluids. Phyllic alteration and copper leaching
coincide with the inflow of oxidized, acidic meteoric waters during cooling of the magmatic-
hydrothermal system. In the upper part of the phyllic zone, late boiling caused significant copper
deposition (Hezarkhani, 2008).
2.4.3 Latala deposit
Similar to Chah-Mesi, the Latala deposit is a vein-type deposit, which is located about 9.5 km north of
Chah-Mesi. It consists of quartz veins with sulfide mineralization occurring as open space fillings, minor
replacement bodies and hydrothermal breccias. The veins include quartz, carbonate, pyrite, chalcopyrite,
sphalerite, galena, bornite and minor sulfosalts, particularly enargite. For the Latala deposit
homogenization temperatures of FI ranging from 380 to 131 °C and salinities corresponding to 10.6 to
0.17 wt% NaCl equiv. were reported (Padyar et al., 2017). Fluid inclusion studies determined that the
liquid phase belongs to the H2O-NaCl system, whereas the gas phase is dominated by CO2 with minor
amounts of CO and H2, indicating reducing conditions associated with ore deposition and a magmatic-
hydrothermal fluid source. Base and precious metals deposited at pressures between 200 and 100 bars,
corresponding to a depth of less than 1 km. Investigation of sulfur isotopic composition of sulfide
Geology and metallogeny 25
minerals showed variations between -9.8 and -1.0 ‰, and were explained with a magmatic sulfur source.
In comparison to Meiduk, the Latala deposit shows similar evolution in respect to P-T paths and fluid
composition. Sulfur isotopic (δ34S) analysis of sulfides suggests that magmatic fluid was modified by
mixing with circulating meteoric water. The ore-bearing magmatic fluid transported metals from deeper
levels through structural pathways to shallow environments. In this context the formation of brittle
tectonic structures, such as large-scale ring structures and NE-SW as well as NW-SE striking fault
systems as fluid conduits is important (Sadeghi et al., 2008). Thus, Padyar et al. (2017) assumed a direct
link between the Latala base metal deposit and the porphyry system of Meiduk, which is further
supported by elevated assays of Cu-Au-Mo in Latala.
2.5 Chah-Mesi deposit
Chah-Mesi is situated about 40 km to the northeast of Shahr-e-Babak city in the Kerman region of
central Iran and only 1.5 km to the south of the Meiduk porphyry copper mine (Figure 4). In the
following chapters a short summary of the previous studies on the Chah-Mesi deposit and its regional
geology is given.
2.5.1 Previous studies on Chah-Mesi
Chah-Mesi is characterized as polymetallic Cu-Au vein deposit (Tangestani and Moore, 2002) hosted
by rocks of the Middle-Upper Eocene Razak volcanic complex and shallow Oligocene intrusions of
intermediate composition. Hosseinkhani (2009) identified an enrichment in LREE relative to HREE in
the REE patterns of these rocks and a weak Eu anomaly, features consistent with an arc-related
continental margin setting. Both volcanics and porphyritic intrusives are highly faulted and fractured
and structural analysis of Shafiei and Ghiyasi (2014) indicates that formation of the NNE-SSW trending
main ore veins in the deposit is related to extensional faulting. Minor veins are related to extensional-
shear faults postdating the phase of main faulting. Hydrothermal fluid transport along the NNE-SSW
and NW-SE trending major fracture system in the area caused the formation of mainly NNE-SSW
trending Cu-Pb-Zn bearing quartz veins containing gold. Several smaller quartz veins and four distinct
ore-bearing silica veins with 100 to 300 m length and several centimeters to 12 m thickness were
determined to constitute the main host to mineralization (Ebadi Rajoli et al., 2015).
Pyrite, chalcopyrite, galena and sphalerite represent the main ore minerals within the mineralized veins.
Gold is mainly hosted by pyrite and associated sulfosalt minerals, such as enargite and tetrahedrite-
tennantite. Sulfosalts may contain up to 950 ppm Au and 1520 ppm Ag, respectively (Hosseinkhani,
2009). The average ore grade is 1.27 wt% copper, 1.01 wt% lead and 2.12 wt% zinc with minor amounts
of silver (10-150 ppm) and gold up to 7 ppm (Ebadi Rajoli et al., 2015; Omaljev, 1972). Ebadi Rajoli et
al. (2015) distinguished different populations of mineralized veins and reported up to 2.24 wt% Cu for
the highly mineralized veins. Au values range from 0.08 to 3.54 ppm. Hosseinkhani (2009) reported
δ18O values of fluid in equilibrium with quartz ranging between +1.9 and +6.04 ‰ suggesting a
magmatic fluid source that was mixed with meteoric waters. The δ18O and δD values of fluid in
equilibrium with sericite range from -5.2 to -9.6 ‰, and from -95.5 to -108.5 ‰, respectively. Hence,
the oxygen and hydrogen isotope composition indicate meteoric water as the source of fluids that caused
sericitic alteration.
Geology and metallogeny 26
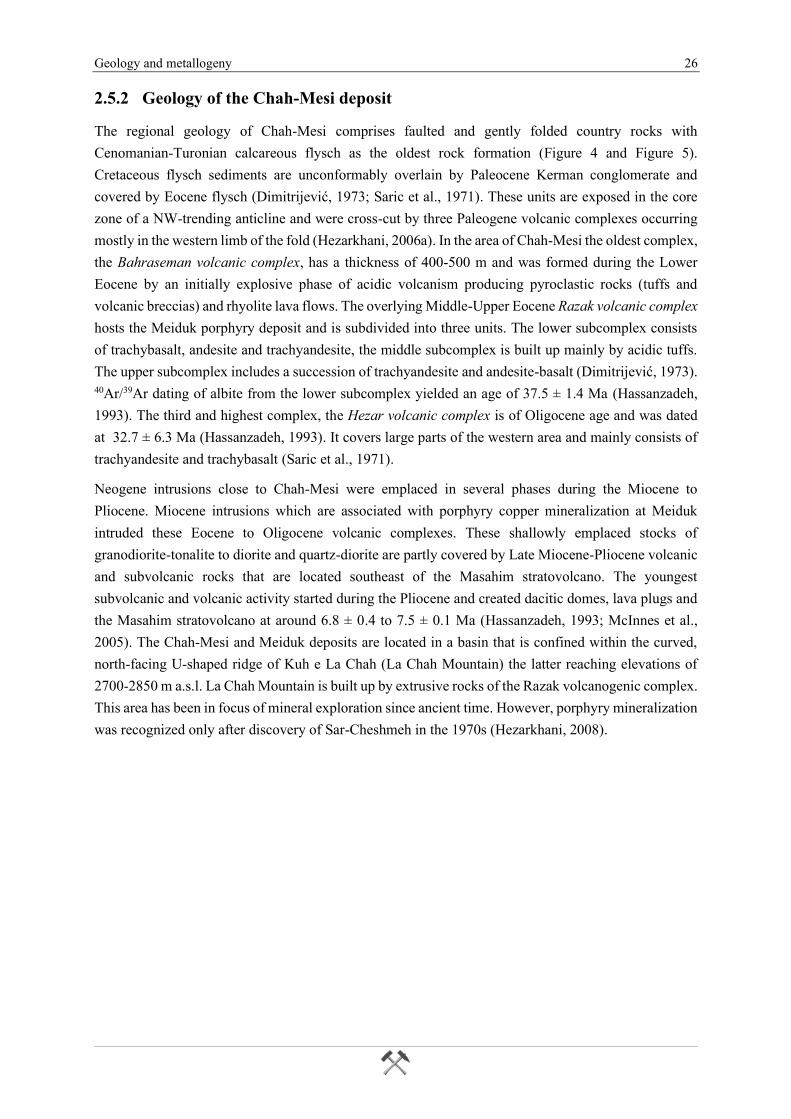
2.5.2 Geology of the Chah-Mesi deposit
The regional geology of Chah-Mesi comprises faulted and gently folded country rocks with
Cenomanian-Turonian calcareous flysch as the oldest rock formation (Figure 4 and Figure 5).
Cretaceous flysch sediments are unconformably overlain by Paleocene Kerman conglomerate and
covered by Eocene flysch (Dimitrijevic, 1973; Saric et al., 1971). These units are exposed in the core
zone of a NW-trending anticline and were cross-cut by three Paleogene volcanic complexes occurring
mostly in the western limb of the fold (Hezarkhani, 2006a). In the area of Chah-Mesi the oldest complex,
the Bahraseman volcanic complex, has a thickness of 400-500 m and was formed during the Lower
Eocene by an initially explosive phase of acidic volcanism producing pyroclastic rocks (tuffs and
volcanic breccias) and rhyolite lava flows. The overlying Middle-Upper Eocene Razak volcanic complex
hosts the Meiduk porphyry deposit and is subdivided into three units. The lower subcomplex consists
of trachybasalt, andesite and trachyandesite, the middle subcomplex is built up mainly by acidic tuffs.
The upper subcomplex includes a succession of trachyandesite and andesite-basalt (Dimitrijevic, 1973). 40Ar/39Ar dating of albite from the lower subcomplex yielded an age of 37.5 ± 1.4 Ma (Hassanzadeh,
1993). The third and highest complex, the Hezar volcanic complex is of Oligocene age and was dated
at 32.7 ± 6.3 Ma (Hassanzadeh, 1993). It covers large parts of the western area and mainly consists of
trachyandesite and trachybasalt (Saric et al., 1971).
Neogene intrusions close to Chah-Mesi were emplaced in several phases during the Miocene to
Pliocene. Miocene intrusions which are associated with porphyry copper mineralization at Meiduk
intruded these Eocene to Oligocene volcanic complexes. These shallowly emplaced stocks of
granodiorite-tonalite to diorite and quartz-diorite are partly covered by Late Miocene-Pliocene volcanic
and subvolcanic rocks that are located southeast of the Masahim stratovolcano. The youngest
subvolcanic and volcanic activity started during the Pliocene and created dacitic domes, lava plugs and
the Masahim stratovolcano at around 6.8 ± 0.4 to 7.5 ± 0.1 Ma (Hassanzadeh, 1993; McInnes et al.,
2005). The Chah-Mesi and Meiduk deposits are located in a basin that is confined within the curved,
north-facing U-shaped ridge of Kuh e La Chah (La Chah Mountain) the latter reaching elevations of
2700-2850 m a.s.l. La Chah Mountain is built up by extrusive rocks of the Razak volcanogenic complex.
This area has been in focus of mineral exploration since ancient time. However, porphyry mineralization
was recognized only after discovery of Sar-Cheshmeh in the 1970s (Hezarkhani, 2008).
Geology and metallogeny 27
Figure 4: Geological map of Shahr-e-Babak area after Saric et al. (1971). The location of Chah-Mesi is marked with a red star.
Inset shows topography and location of the study area (red arrow); made with Natural Earth. Free vector and raster map data
@ naturalearthdata.com. For legend see Figure 5.
Geology and metallogeny 28
Figure 5: Legend of the geological map of Shahr-e-Babak shown in Figure 4; after Saric et al. (1971).
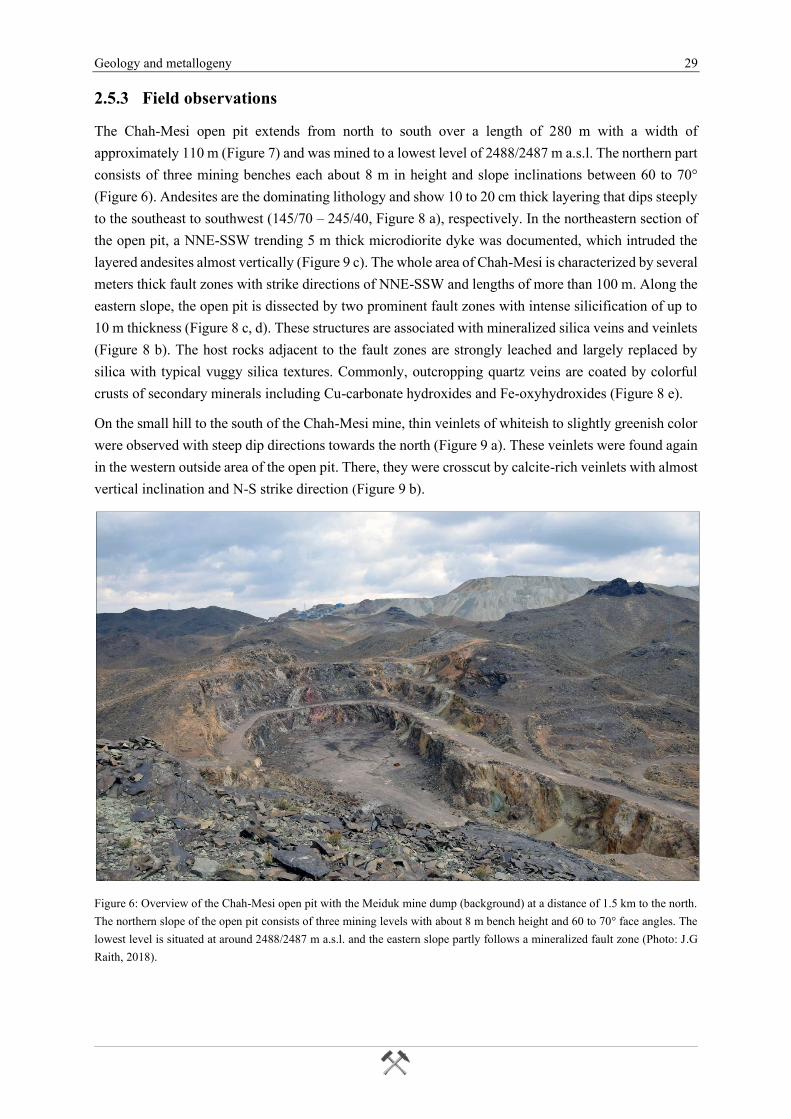
Geology and metallogeny 29
2.5.3 Field observations
The Chah-Mesi open pit extends from north to south over a length of 280 m with a width of
approximately 110 m (Figure 7) and was mined to a lowest level of 2488/2487 m a.s.l. The northern part
consists of three mining benches each about 8 m in height and slope inclinations between 60 to 70°
(Figure 6). Andesites are the dominating lithology and show 10 to 20 cm thick layering that dips steeply
to the southeast to southwest (145/70 – 245/40, Figure 8 a), respectively. In the northeastern section of
the open pit, a NNE-SSW trending 5 m thick microdiorite dyke was documented, which intruded the
layered andesites almost vertically (Figure 9 c). The whole area of Chah-Mesi is characterized by several
meters thick fault zones with strike directions of NNE-SSW and lengths of more than 100 m. Along the
eastern slope, the open pit is dissected by two prominent fault zones with intense silicification of up to
10 m thickness (Figure 8 c, d). These structures are associated with mineralized silica veins and veinlets
(Figure 8 b). The host rocks adjacent to the fault zones are strongly leached and largely replaced by
silica with typical vuggy silica textures. Commonly, outcropping quartz veins are coated by colorful
crusts of secondary minerals including Cu-carbonate hydroxides and Fe-oxyhydroxides (Figure 8 e).
On the small hill to the south of the Chah-Mesi mine, thin veinlets of whiteish to slightly greenish color
were observed with steep dip directions towards the north (Figure 9 a). These veinlets were found again
in the western outside area of the open pit. There, they were crosscut by calcite-rich veinlets with almost
vertical inclination and N-S strike direction (Figure 9 b).
Figure 6: Overview of the Chah-Mesi open pit with the Meiduk mine dump (background) at a distance of 1.5 km to the north.
The northern slope of the open pit consists of three mining levels with about 8 m bench height and 60 to 70° face angles. The
lowest level is situated at around 2488/2487 m a.s.l. and the eastern slope partly follows a mineralized fault zone (Photo: J.G
Raith, 2018).
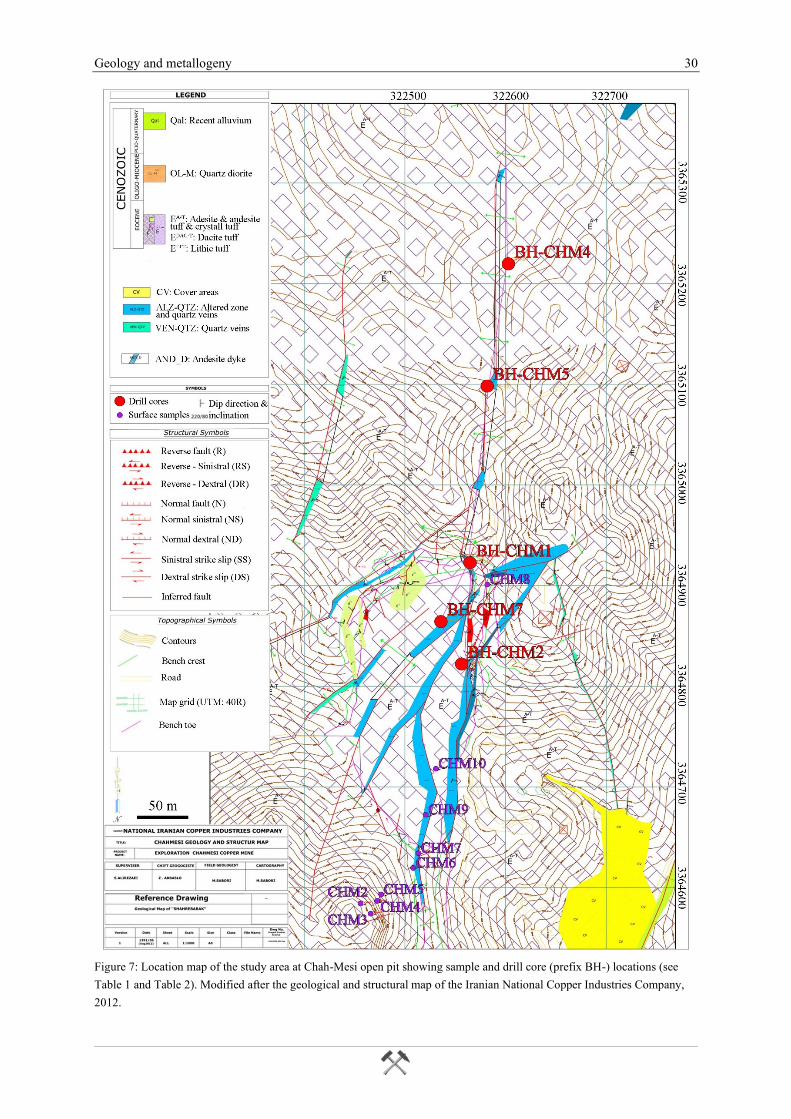
Geology and metallogeny 30
Figure 7: Location map of the study area at Chah-Mesi open pit showing sample and drill core (prefix BH-) locations (see
Table 1 and Table 2). Modified after the geological and structural map of the Iranian National Copper Industries Company,
2012.
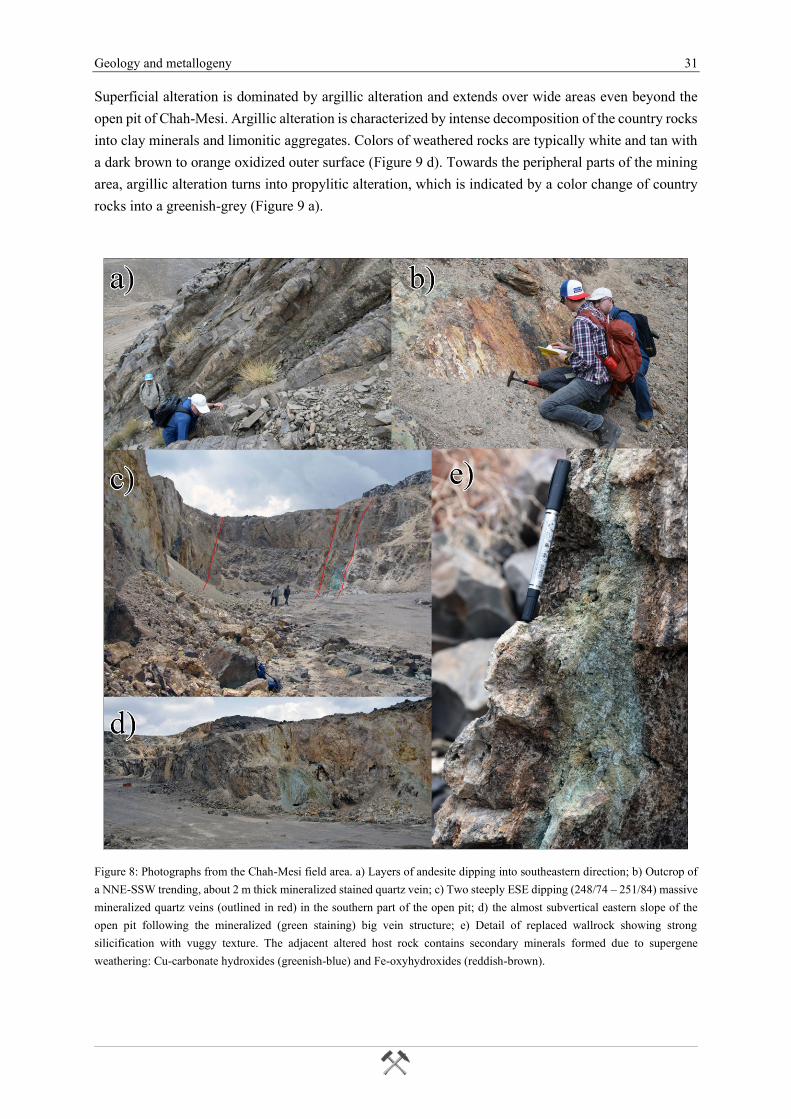
Geology and metallogeny 31
Superficial alteration is dominated by argillic alteration and extends over wide areas even beyond the
open pit of Chah-Mesi. Argillic alteration is characterized by intense decomposition of the country rocks
into clay minerals and limonitic aggregates. Colors of weathered rocks are typically white and tan with
a dark brown to orange oxidized outer surface (Figure 9 d). Towards the peripheral parts of the mining
area, argillic alteration turns into propylitic alteration, which is indicated by a color change of country
rocks into a greenish-grey (Figure 9 a).
Figure 8: Photographs from the Chah-Mesi field area. a) Layers of andesite dipping into southeastern direction; b) Outcrop of
a NNE-SSW trending, about 2 m thick mineralized stained quartz vein; c) Two steeply ESE dipping (248/74 – 251/84) massive
mineralized quartz veins (outlined in red) in the southern part of the open pit; d) the almost subvertical eastern slope of the
open pit following the mineralized (green staining) big vein structure; e) Detail of replaced wallrock showing strong
silicification with vuggy texture. The adjacent altered host rock contains secondary minerals formed due to supergene
weathering: Cu-carbonate hydroxides (greenish-blue) and Fe-oxyhydroxides (reddish-brown).
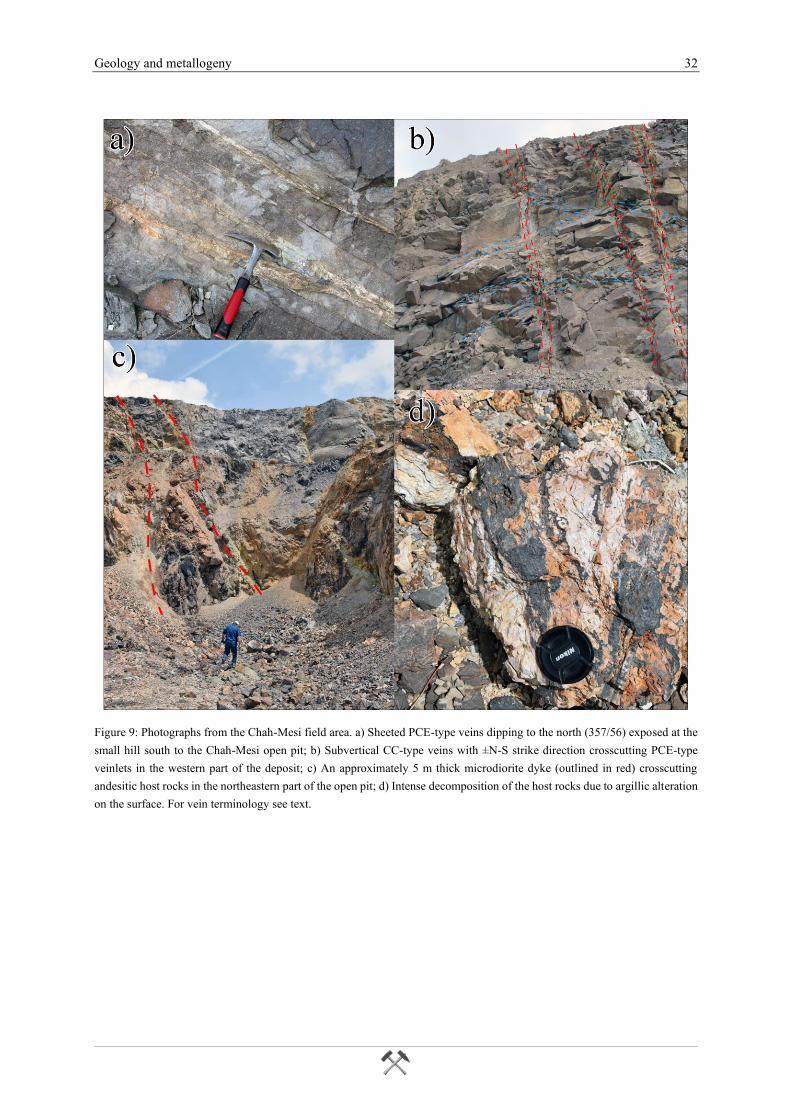
Geology and metallogeny 32
Figure 9: Photographs from the Chah-Mesi field area. a) Sheeted PCE-type veins dipping to the north (357/56) exposed at the
small hill south to the Chah-Mesi open pit; b) Subvertical CC-type veins with ±N-S strike direction crosscutting PCE-type
veinlets in the western part of the deposit; c) An approximately 5 m thick microdiorite dyke (outlined in red) crosscutting
andesitic host rocks in the northeastern part of the open pit; d) Intense decomposition of the host rocks due to argillic alteration
on the surface. For vein terminology see text.
Methods 33
3 Methods
In order to answer the scientific questions of this project outlined in chapter 1, the focus of sampling
and analysis was mainly on mineralized veins and adjacent wallrocks. A detailed mineralogical
investigation was done on samples taken from outcrops in the Chah-Mesi open pit mine and from drill
cores. Methods included transmitted and reflected light microscopy of thin and polished sections
combined with mineral chemical analysis by electron microprobe techniques focusing on the ore
minerals particularly the sulfosalts. Mineralogical investigations were complemented by a preliminary
fluid inclusion study.
3.1 Sampling
In total, eighty-seven samples of altered wallrock and different vein types from the polymetallic Chah-
Mesi deposit were collected from surface outcrops and drill cores. The cores are from exploration
drillings made by National Iranian Copper Industries Company in the period of January to April 2007.
The cores are stored at the NICICO drill core stock in Rafsanjan about 80 km to the east of Meiduk
Copper Mine. Seventy-five samples were gathered from five drill cores (Table 1). Selective sampling
focused mainly on vein core intercepts and adjacent wallrocks. Representative material was collected
for detailed investigation of the ore mineralogy as well as the alteration. Several samples were also taken
from non-mineralized core to study the petrography of the host rock and the alteration. Regarding the
location of the drill cores, the original bore holes were aligned north to south and encompass an about
400 m long profile extending from the small hill to the south of Chah-Mesi to the northernmost borehole
with a distance of 1100 m to the Meiduk open pit (Figure 4 and Figure 7). Information about the
geographic position of the drill holes is summarized in Table 1.
Table 1: Data of drill holes at Chah-Mesi sampled for this project (National Iranian Copper Ind. Co.)
Hole id Coordinates (WGS84 – UTM:40R)
Depth (m) Inclination x y m a.s.l.
BH-CHM1 3364923 322563 2487 195.05 70° - NW
BH-CHM2 3364822 322558 2488 200.00 70° - NW
BH-CHM4 3365223 322602 2506 188.35 70° - NW
BH-CHM5 3365097 322584 2511 135.45 75° - NW
BH-CHM7 3364864 322535 2492 150.25 75° - SW
Samples were also gathered during the mine visit from eleven different locations to sample those parts
of Chah-Mesi exposed at the surface. Large samples of several kilograms were collected in the field,
but much of this material was processed in the laboratories at Shahid Chamran University of Ahvaz.
There, it was cut and for easier transportation representative smaller samples (slabs) were taken; the
remaining material was archived at SCU. At Montanuniversität Leoben polished sections and polished
thin sections were prepared of 59 samples including two sections for fluid inclusion investigation.
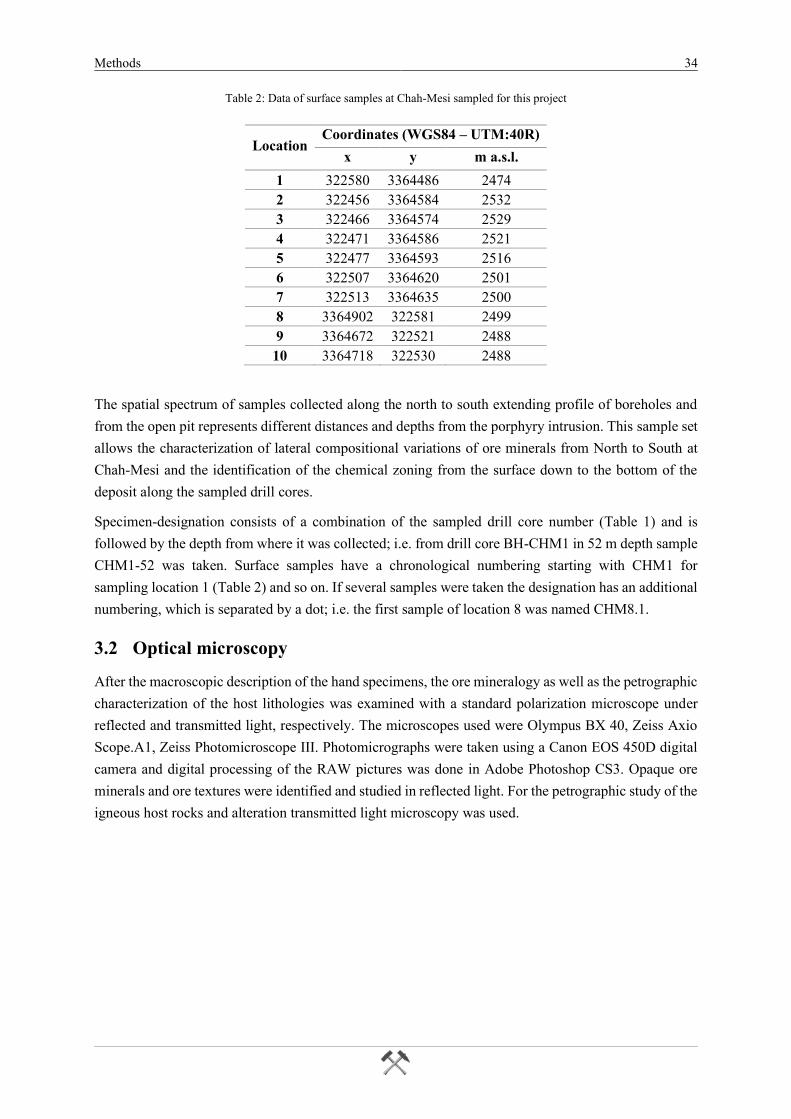
Methods 34
Table 2: Data of surface samples at Chah-Mesi sampled for this project
Location Coordinates (WGS84 – UTM:40R)
x y m a.s.l.
1 322580 3364486 2474
2 322456 3364584 2532
3 322466 3364574 2529
4 322471 3364586 2521
5 322477 3364593 2516
6 322507 3364620 2501
7 322513 3364635 2500
8 3364902 322581 2499
9 3364672 322521 2488
10 3364718 322530 2488
The spatial spectrum of samples collected along the north to south extending profile of boreholes and
from the open pit represents different distances and depths from the porphyry intrusion. This sample set
allows the characterization of lateral compositional variations of ore minerals from North to South at
Chah-Mesi and the identification of the chemical zoning from the surface down to the bottom of the
deposit along the sampled drill cores.
Specimen-designation consists of a combination of the sampled drill core number (Table 1) and is
followed by the depth from where it was collected; i.e. from drill core BH-CHM1 in 52 m depth sample
CHM1-52 was taken. Surface samples have a chronological numbering starting with CHM1 for
sampling location 1 (Table 2) and so on. If several samples were taken the designation has an additional
numbering, which is separated by a dot; i.e. the first sample of location 8 was named CHM8.1.
3.2 Optical microscopy
After the macroscopic description of the hand specimens, the ore mineralogy as well as the petrographic
characterization of the host lithologies was examined with a standard polarization microscope under
reflected and transmitted light, respectively. The microscopes used were Olympus BX 40, Zeiss Axio
Scope.A1, Zeiss Photomicroscope III. Photomicrographs were taken using a Canon EOS 450D digital
camera and digital processing of the RAW pictures was done in Adobe Photoshop CS3. Opaque ore
minerals and ore textures were identified and studied in reflected light. For the petrographic study of the
igneous host rocks and alteration transmitted light microscopy was used.
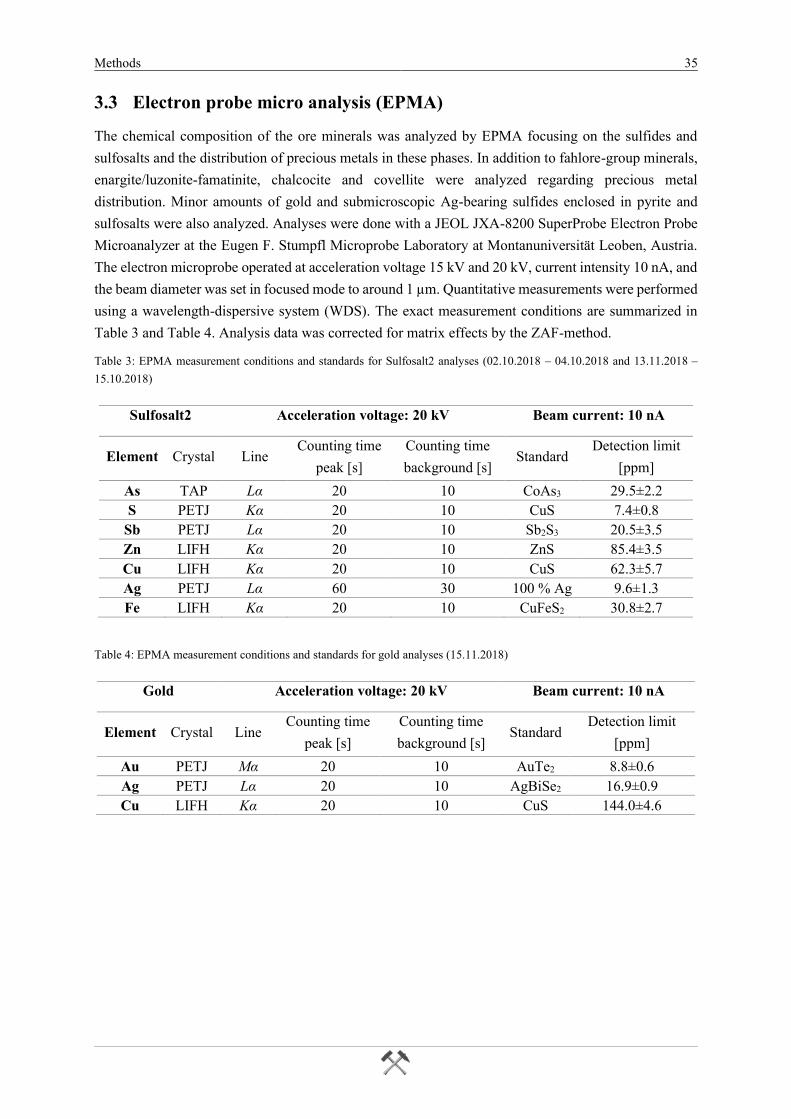
Methods 35
3.3 Electron probe micro analysis (EPMA)
The chemical composition of the ore minerals was analyzed by EPMA focusing on the sulfides and
sulfosalts and the distribution of precious metals in these phases. In addition to fahlore-group minerals,
enargite/luzonite-famatinite, chalcocite and covellite were analyzed regarding precious metal
distribution. Minor amounts of gold and submicroscopic Ag-bearing sulfides enclosed in pyrite and
sulfosalts were also analyzed. Analyses were done with a JEOL JXA-8200 SuperProbe Electron Probe
Microanalyzer at the Eugen F. Stumpfl Microprobe Laboratory at Montanuniversität Leoben, Austria.
The electron microprobe operated at acceleration voltage 15 kV and 20 kV, current intensity 10 nA, and
the beam diameter was set in focused mode to around 1 µm. Quantitative measurements were performed
using a wavelength-dispersive system (WDS). The exact measurement conditions are summarized in
Table 3 and Table 4. Analysis data was corrected for matrix effects by the ZAF-method.
Table 3: EPMA measurement conditions and standards for Sulfosalt2 analyses (02.10.2018 – 04.10.2018 and 13.11.2018 –
15.10.2018)
Sulfosalt2 Acceleration voltage: 20 kV Beam current: 10 nA
Element Crystal Line Counting time
peak [s]
Counting time
background [s] Standard
Detection limit
[ppm]
As TAP Lα 20 10 CoAs3 29.5±2.2
S PETJ Kα 20 10 CuS 7.4±0.8
Sb PETJ Lα 20 10 Sb2S3 20.5±3.5
Zn LIFH Kα 20 10 ZnS 85.4±3.5
Cu LIFH Kα 20 10 CuS 62.3±5.7
Ag PETJ Lα 60 30 100 % Ag 9.6±1.3
Fe LIFH Kα 20 10 CuFeS2 30.8±2.7
Table 4: EPMA measurement conditions and standards for gold analyses (15.11.2018)
Gold Acceleration voltage: 20 kV Beam current: 10 nA
Element Crystal Line Counting time
peak [s]
Counting time
background [s] Standard
Detection limit
[ppm]
Au PETJ Mα 20 10 AuTe2 8.8±0.6
Ag PETJ Lα 20 10 AgBiSe2 16.9±0.9
Cu LIFH Kα 20 10 CuS 144.0±4.6
Methods 36
3.4 Fluid inclusion measurements
The fluid inclusion study focused on mineralized quartz-carbonate veins. Samples containing fluid
inclusions that were trapped during ore formation were found in several sections providing ore-gangue
assemblages with transparent sphalerite and euhedral cogenetic quartz grains. After careful fluid
inclusion petrography few samples were selected for further measurements. Microthermometric
measurements of the fluid inclusion assemblages were performed using a Linkam MDS 600 heating and
freezing stage mounted on an Olympus BX 60 microscope adapted for the use with infra-red and
transmitted-visible light. Chemical species within fluid inclusions were identified using a HORIBA
LabRAM HR Evolution confocal-Raman spectrometer equipped with a frequency-doubled Nd-YAG
laser (100 mW, 532 nm) and diffraction gratings of 1800 grooves mm-1. Detection is with a Peltier-
cooled, slow-scan, CCD matrix detector. Laser focusing and sample viewing are performed through an
Olympus BX 40 microscope fitted with a 100x objective lens. The spot size has a diameter of about 1
µm, the resolution of the spectroscope is 0.2 cm-1. The power of the laser can be reduced by density
filters to about 1, 0.1 and 0.01 mW.
Fluid inclusion investigation allowed determination of the physical state of the fluid (single- vs. two-
phase), the type of fluid system (H2O-NaCl, presence or absence of condensed gases such as CO2), fluid
salinity and fluid density. In case of fluid entrapment in the two-phase field, the study provided
information about pressure and temperature of entrapment. In order to determine the temperature of
homogenization (Th), the temperature of ice melting (Tm(ice)) as well as the temperature of ice nucleation
during freezing (Tn(ice)) (Bakker, 2011), microthermometric studies were carried out on several grains of
quartz and sphalerite. The investigation focused on different type of veins to compare the individual
information of hydrothermal fluids and find out possible differences in the conditions of formation. The
heating rate was approximately 3 °C/min near the temperatures of phase transitions. Data processing
was done with the program AqSo_NaCl (Bakker, 2018). The software allows to calculate pressure –
molar volume – temperature – composition (p-V-T-x) properties, enthalpy and heat capacity of the
binary H2O-NaCl system. The obtained microthermometric data (i.e. Th and Tm(ice)) were used to
calculate bulk fluid properties of fluid inclusions, such as salinity (NaCl wt% equivalent), density
(g/cm³) and pressure at homogenization (MPa).
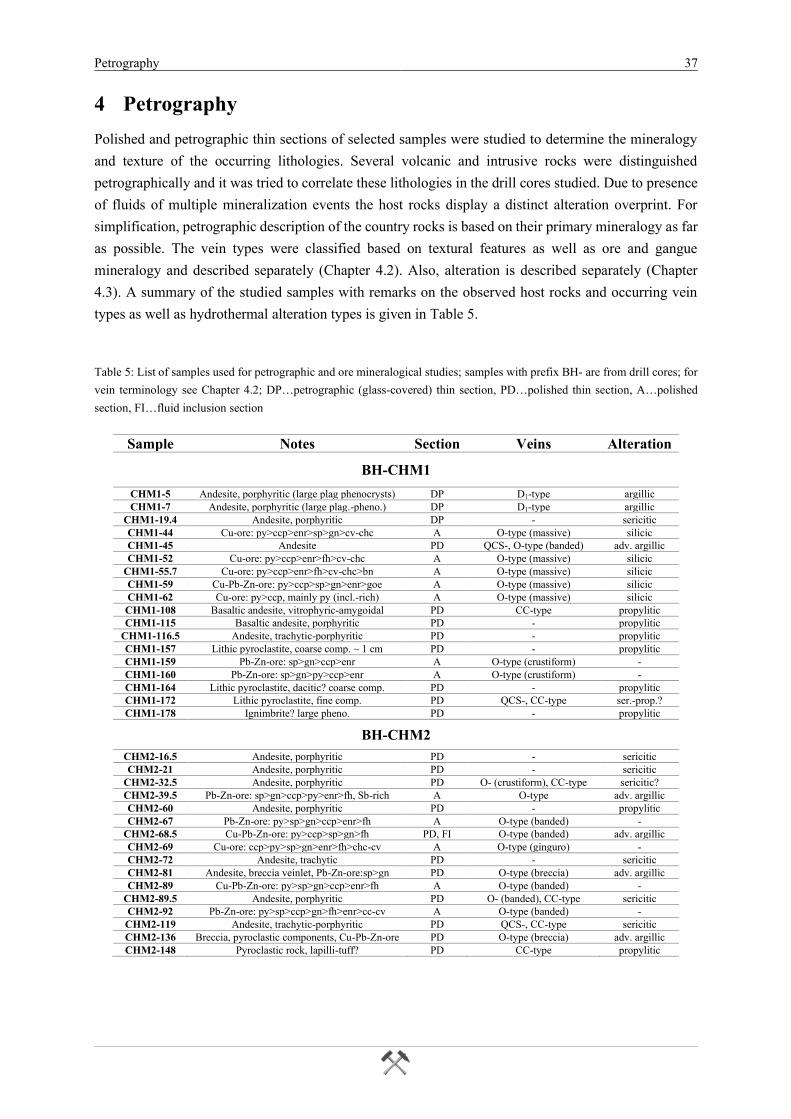
Petrography 37
4 Petrography
Polished and petrographic thin sections of selected samples were studied to determine the mineralogy
and texture of the occurring lithologies. Several volcanic and intrusive rocks were distinguished
petrographically and it was tried to correlate these lithologies in the drill cores studied. Due to presence
of fluids of multiple mineralization events the host rocks display a distinct alteration overprint. For
simplification, petrographic description of the country rocks is based on their primary mineralogy as far
as possible. The vein types were classified based on textural features as well as ore and gangue
mineralogy and described separately (Chapter 4.2). Also, alteration is described separately (Chapter
4.3). A summary of the studied samples with remarks on the observed host rocks and occurring vein
types as well as hydrothermal alteration types is given in Table 5.
Table 5: List of samples used for petrographic and ore mineralogical studies; samples with prefix BH- are from drill cores; for
vein terminology see Chapter 4.2; DP…petrographic (glass-covered) thin section, PD…polished thin section, A…polished
section, FI…fluid inclusion section
Sample Notes Section Veins Alteration
BH-CHM1
CHM1-5 Andesite, porphyritic (large plag phenocrysts) DP D1-type argillic
CHM1-7 Andesite, porphyritic (large plag.-pheno.) DP D1-type argillic
CHM1-19.4 Andesite, porphyritic DP - sericitic
CHM1-44 Cu-ore: py>ccp>enr>sp>gn>cv-chc A O-type (massive) silicic
CHM1-45 Andesite PD QCS-, O-type (banded) adv. argillic
CHM1-52 Cu-ore: py>ccp>enr>fh>cv-chc A O-type (massive) silicic
CHM1-55.7 Cu-ore: py>ccp>enr>fh>cv-chc>bn A O-type (massive) silicic
CHM1-59 Cu-Pb-Zn-ore: py>ccp>sp>gn>enr>goe A O-type (massive) silicic
CHM1-62 Cu-ore: py>ccp, mainly py (incl.-rich) A O-type (massive) silicic
CHM1-108 Basaltic andesite, vitrophyric-amygoidal PD CC-type propylitic
CHM1-115 Basaltic andesite, porphyritic PD - propylitic
CHM1-116.5 Andesite, trachytic-porphyritic PD - propylitic
CHM1-157 Lithic pyroclastite, coarse comp. ~ 1 cm PD - propylitic
CHM1-159 Pb-Zn-ore: sp>gn>ccp>enr A O-type (crustiform) -
CHM1-160 Pb-Zn-ore: sp>gn>py>ccp>enr A O-type (crustiform) -
CHM1-164 Lithic pyroclastite, dacitic? coarse comp. PD - propylitic
CHM1-172 Lithic pyroclastite, fine comp. PD QCS-, CC-type ser.-prop.?
CHM1-178 Ignimbrite? large pheno. PD - propylitic
BH-CHM2
CHM2-16.5 Andesite, porphyritic PD - sericitic
CHM2-21 Andesite, porphyritic PD - sericitic
CHM2-32.5 Andesite, porphyritic PD O- (crustiform), CC-type sericitic?
CHM2-39.5 Pb-Zn-ore: sp>gn>ccp>py>enr>fh, Sb-rich A O-type adv. argillic
CHM2-60 Andesite, porphyritic PD - propylitic
CHM2-67 Pb-Zn-ore: py>sp>gn>ccp>enr>fh A O-type (banded) -
CHM2-68.5 Cu-Pb-Zn-ore: py>ccp>sp>gn>fh PD, FI O-type (banded) adv. argillic
CHM2-69 Cu-ore: ccp>py>sp>gn>enr>fh>chc-cv A O-type (ginguro) -
CHM2-72 Andesite, trachytic PD - sericitic
CHM2-81 Andesite, breccia veinlet, Pb-Zn-ore:sp>gn PD O-type (breccia) adv. argillic
CHM2-89 Cu-Pb-Zn-ore: py>sp>gn>ccp>enr>fh A O-type (banded) -
CHM2-89.5 Andesite, porphyritic PD O- (banded), CC-type sericitic
CHM2-92 Pb-Zn-ore: py>sp>ccp>gn>fh>enr>cc-cv A O-type (banded) -
CHM2-119 Andesite, trachytic-porphyritic PD QCS-, CC-type sericitic
CHM2-136 Breccia, pyroclastic components, Cu-Pb-Zn-ore PD O-type (breccia) adv. argillic
CHM2-148 Pyroclastic rock, lapilli-tuff? PD CC-type propylitic
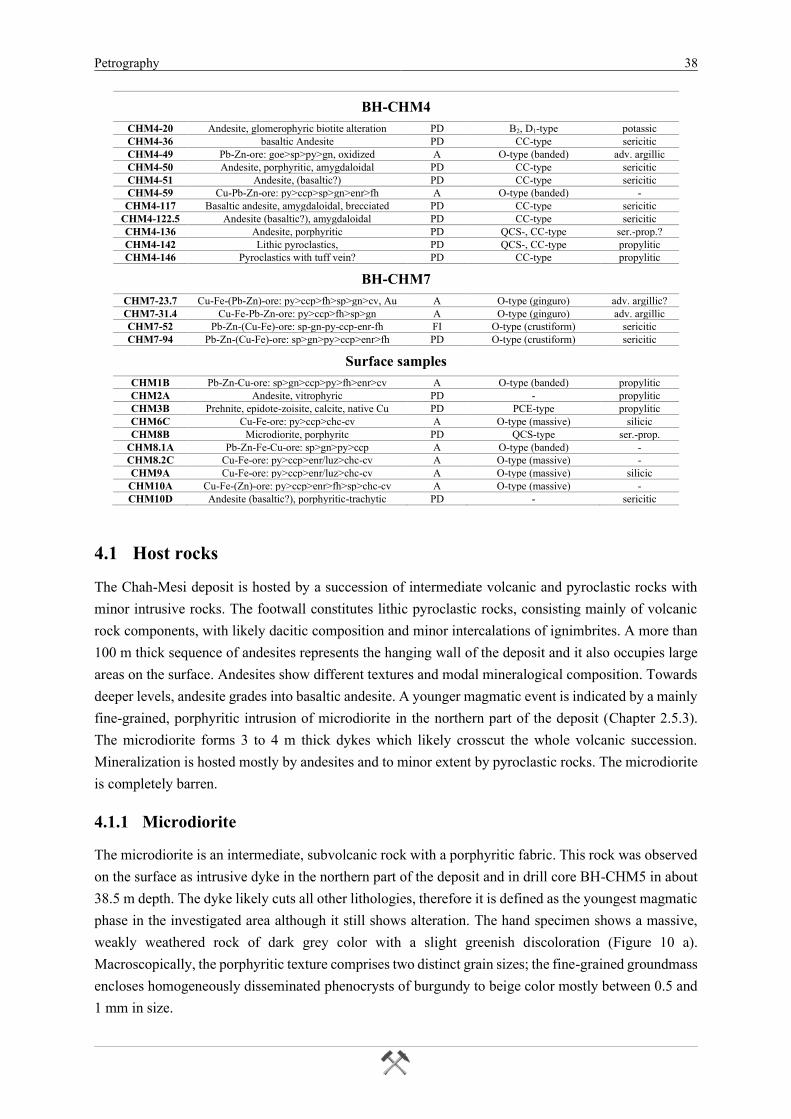
Petrography 38
BH-CHM4
CHM4-20 Andesite, glomerophyric biotite alteration PD B2, D1-type potassic
CHM4-36 basaltic Andesite PD CC-type sericitic
CHM4-49 Pb-Zn-ore: goe>sp>py>gn, oxidized A O-type (banded) adv. argillic
CHM4-50 Andesite, porphyritic, amygdaloidal PD CC-type sericitic
CHM4-51 Andesite, (basaltic?) PD CC-type sericitic
CHM4-59 Cu-Pb-Zn-ore: py>ccp>sp>gn>enr>fh A O-type (banded) -
CHM4-117 Basaltic andesite, amygdaloidal, brecciated PD CC-type sericitic
CHM4-122.5 Andesite (basaltic?), amygdaloidal PD CC-type sericitic
CHM4-136 Andesite, porphyritic PD QCS-, CC-type ser.-prop.?
CHM4-142 Lithic pyroclastics, PD QCS-, CC-type propylitic
CHM4-146 Pyroclastics with tuff vein? PD CC-type propylitic
BH-CHM7
CHM7-23.7 Cu-Fe-(Pb-Zn)-ore: py>ccp>fh>sp>gn>cv, Au A O-type (ginguro) adv. argillic?
CHM7-31.4 Cu-Fe-Pb-Zn-ore: py>ccp>fh>sp>gn A O-type (ginguro) adv. argillic
CHM7-52 Pb-Zn-(Cu-Fe)-ore: sp-gn-py-ccp-enr-fh FI O-type (crustiform) sericitic
CHM7-94 Pb-Zn-(Cu-Fe)-ore: sp>gn>py>ccp>enr>fh PD O-type (crustiform) sericitic
Surface samples
CHM1B Pb-Zn-Cu-ore: sp>gn>ccp>py>fh>enr>cv A O-type (banded) propylitic
CHM2A Andesite, vitrophyric PD - propylitic
CHM3B Prehnite, epidote-zoisite, calcite, native Cu PD PCE-type propylitic
CHM6C Cu-Fe-ore: py>ccp>chc-cv A O-type (massive) silicic
CHM8B Microdiorite, porphyritc PD QCS-type ser.-prop.
CHM8.1A Pb-Zn-Fe-Cu-ore: sp>gn>py>ccp A O-type (banded) -
CHM8.2C Cu-Fe-ore: py>ccp>enr/luz>chc-cv A O-type (massive) -
CHM9A Cu-Fe-ore: py>ccp>enr/luz>chc-cv A O-type (massive) silicic
CHM10A Cu-Fe-(Zn)-ore: py>ccp>enr>fh>sp>chc-cv A O-type (massive) -
CHM10D Andesite (basaltic?), porphyritic-trachytic PD - sericitic
4.1 Host rocks
The Chah-Mesi deposit is hosted by a succession of intermediate volcanic and pyroclastic rocks with
minor intrusive rocks. The footwall constitutes lithic pyroclastic rocks, consisting mainly of volcanic
rock components, with likely dacitic composition and minor intercalations of ignimbrites. A more than
100 m thick sequence of andesites represents the hanging wall of the deposit and it also occupies large
areas on the surface. Andesites show different textures and modal mineralogical composition. Towards
deeper levels, andesite grades into basaltic andesite. A younger magmatic event is indicated by a mainly
fine-grained, porphyritic intrusion of microdiorite in the northern part of the deposit (Chapter 2.5.3).
The microdiorite forms 3 to 4 m thick dykes which likely crosscut the whole volcanic succession.
Mineralization is hosted mostly by andesites and to minor extent by pyroclastic rocks. The microdiorite
is completely barren.
4.1.1 Microdiorite
The microdiorite is an intermediate, subvolcanic rock with a porphyritic fabric. This rock was observed
on the surface as intrusive dyke in the northern part of the deposit and in drill core BH-CHM5 in about
38.5 m depth. The dyke likely cuts all other lithologies, therefore it is defined as the youngest magmatic
phase in the investigated area although it still shows alteration. The hand specimen shows a massive,
weakly weathered rock of dark grey color with a slight greenish discoloration (Figure 10 a).
Macroscopically, the porphyritic texture comprises two distinct grain sizes; the fine-grained groundmass
encloses homogeneously disseminated phenocrysts of burgundy to beige color mostly between 0.5 and
1 mm in size.
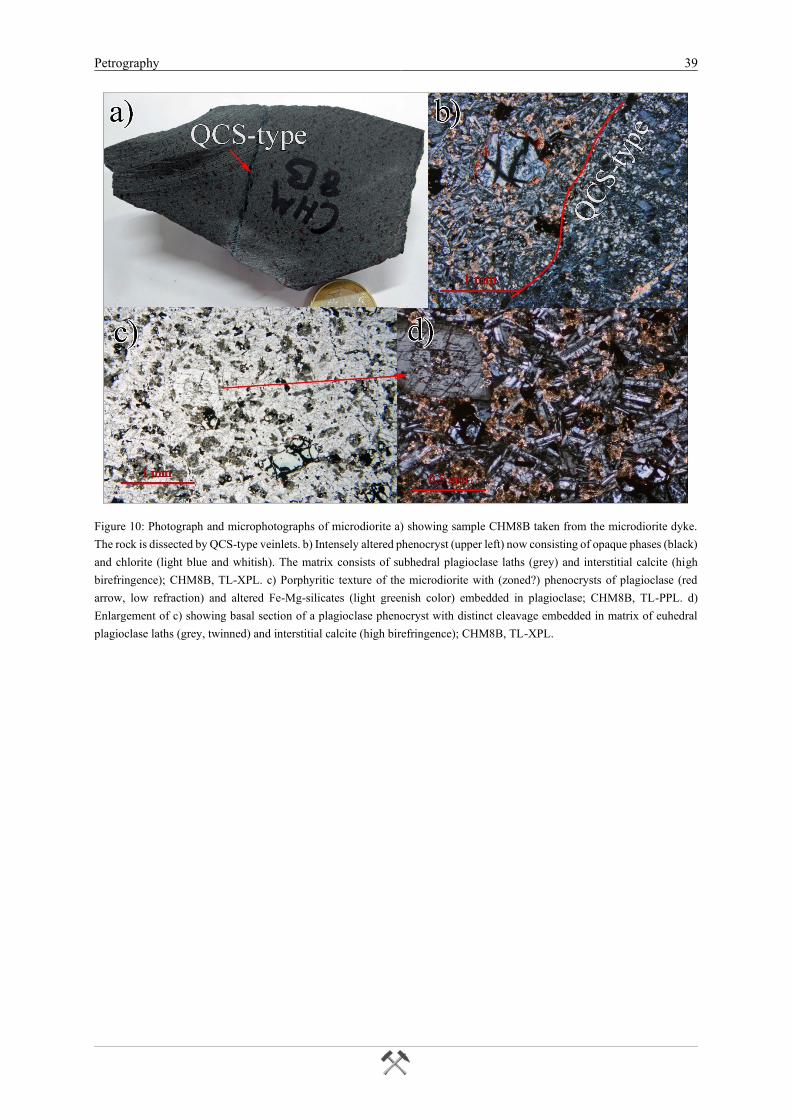
Petrography 39
Figure 10: Photograph and microphotographs of microdiorite a) showing sample CHM8B taken from the microdiorite dyke.
The rock is dissected by QCS-type veinlets. b) Intensely altered phenocryst (upper left) now consisting of opaque phases (black)
and chlorite (light blue and whitish). The matrix consists of subhedral plagioclase laths (grey) and interstitial calcite (high
birefringence); CHM8B, TL-XPL. c) Porphyritic texture of the microdiorite with (zoned?) phenocrysts of plagioclase (red
arrow, low refraction) and altered Fe-Mg-silicates (light greenish color) embedded in plagioclase; CHM8B, TL-PPL. d)
Enlargement of c) showing basal section of a plagioclase phenocryst with distinct cleavage embedded in matrix of euhedral
plagioclase laths (grey, twinned) and interstitial calcite (high birefringence); CHM8B, TL-XPL.
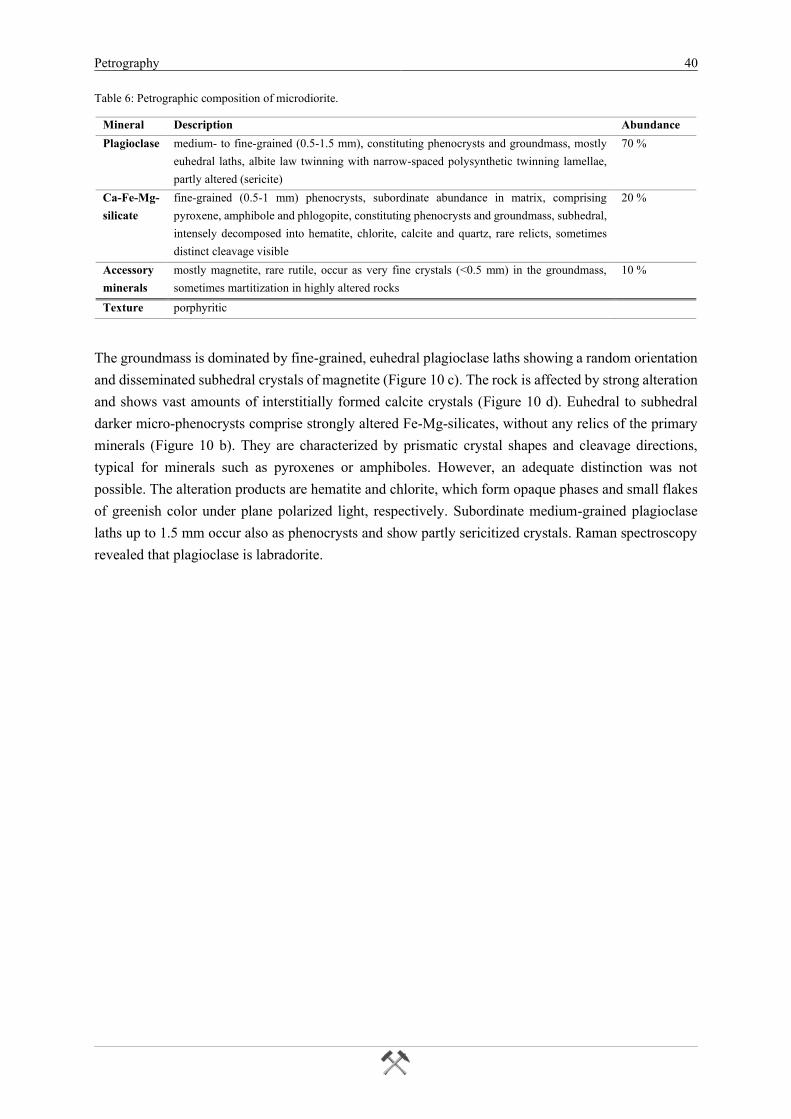
Petrography 40
Table 6: Petrographic composition of microdiorite.
Mineral Description Abundance
Plagioclase medium- to fine-grained (0.5-1.5 mm), constituting phenocrysts and groundmass, mostly
euhedral laths, albite law twinning with narrow-spaced polysynthetic twinning lamellae,
partly altered (sericite)
70 %
Ca-Fe-Mg-
silicate
fine-grained (0.5-1 mm) phenocrysts, subordinate abundance in matrix, comprising
pyroxene, amphibole and phlogopite, constituting phenocrysts and groundmass, subhedral,
intensely decomposed into hematite, chlorite, calcite and quartz, rare relicts, sometimes
distinct cleavage visible
20 %
Accessory
minerals
mostly magnetite, rare rutile, occur as very fine crystals (<0.5 mm) in the groundmass,
sometimes martitization in highly altered rocks
10 %
Texture porphyritic
The groundmass is dominated by fine-grained, euhedral plagioclase laths showing a random orientation
and disseminated subhedral crystals of magnetite (Figure 10 c). The rock is affected by strong alteration
and shows vast amounts of interstitially formed calcite crystals (Figure 10 d). Euhedral to subhedral
darker micro-phenocrysts comprise strongly altered Fe-Mg-silicates, without any relics of the primary
minerals (Figure 10 b). They are characterized by prismatic crystal shapes and cleavage directions,
typical for minerals such as pyroxenes or amphiboles. However, an adequate distinction was not
possible. The alteration products are hematite and chlorite, which form opaque phases and small flakes
of greenish color under plane polarized light, respectively. Subordinate medium-grained plagioclase
laths up to 1.5 mm occur also as phenocrysts and show partly sericitized crystals. Raman spectroscopy
revealed that plagioclase is labradorite.
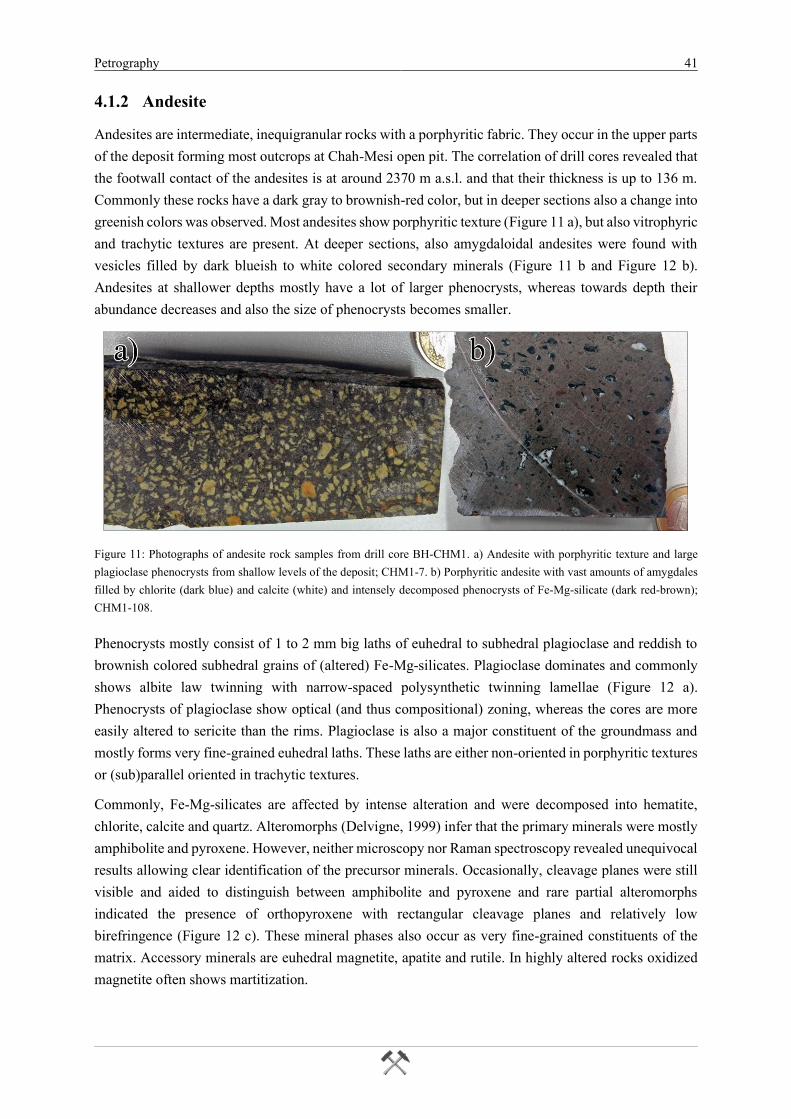
Petrography 41
4.1.2 Andesite
Andesites are intermediate, inequigranular rocks with a porphyritic fabric. They occur in the upper parts
of the deposit forming most outcrops at Chah-Mesi open pit. The correlation of drill cores revealed that
the footwall contact of the andesites is at around 2370 m a.s.l. and that their thickness is up to 136 m.
Commonly these rocks have a dark gray to brownish-red color, but in deeper sections also a change into
greenish colors was observed. Most andesites show porphyritic texture (Figure 11 a), but also vitrophyric
and trachytic textures are present. At deeper sections, also amygdaloidal andesites were found with
vesicles filled by dark blueish to white colored secondary minerals (Figure 11 b and Figure 12 b).
Andesites at shallower depths mostly have a lot of larger phenocrysts, whereas towards depth their
abundance decreases and also the size of phenocrysts becomes smaller.
Figure 11: Photographs of andesite rock samples from drill core BH-CHM1. a) Andesite with porphyritic texture and large
plagioclase phenocrysts from shallow levels of the deposit; CHM1-7. b) Porphyritic andesite with vast amounts of amygdales
filled by chlorite (dark blue) and calcite (white) and intensely decomposed phenocrysts of Fe-Mg-silicate (dark red-brown);
CHM1-108.
Phenocrysts mostly consist of 1 to 2 mm big laths of euhedral to subhedral plagioclase and reddish to
brownish colored subhedral grains of (altered) Fe-Mg-silicates. Plagioclase dominates and commonly
shows albite law twinning with narrow-spaced polysynthetic twinning lamellae (Figure 12 a).
Phenocrysts of plagioclase show optical (and thus compositional) zoning, whereas the cores are more
easily altered to sericite than the rims. Plagioclase is also a major constituent of the groundmass and
mostly forms very fine-grained euhedral laths. These laths are either non-oriented in porphyritic textures
or (sub)parallel oriented in trachytic textures.
Commonly, Fe-Mg-silicates are affected by intense alteration and were decomposed into hematite,
chlorite, calcite and quartz. Alteromorphs (Delvigne, 1999) infer that the primary minerals were mostly
amphibolite and pyroxene. However, neither microscopy nor Raman spectroscopy revealed unequivocal
results allowing clear identification of the precursor minerals. Occasionally, cleavage planes were still
visible and aided to distinguish between amphibolite and pyroxene and rare partial alteromorphs
indicated the presence of orthopyroxene with rectangular cleavage planes and relatively low
birefringence (Figure 12 c). These mineral phases also occur as very fine-grained constituents of the
matrix. Accessory minerals are euhedral magnetite, apatite and rutile. In highly altered rocks oxidized
magnetite often shows martitization.
Petrography 42
At deeper levels, andesites grade into a transition of basaltic and andesitic composition with a higher
abundance of mafic minerals (>35 %) and less amounts of plagioclase phenocrysts. Mostly basaltic-
andesites include varying amounts of amygdales and might show an amygdaloidal texture.
Table 7: Petrography of andesite.
Mineral Remarks Abundance
Plagioclase
medium-grained (1-2 mm) phenocrysts, very fine-grained (<0.5 mm) in groundmass, mostly
euhedral laths and rectangles, albite twinning with narrow-spaced polysynthetic twinning
lamellae, often altered (sericite, calcite)
60-70 %
Ca-Fe-Mg-
silicate
fine-grained (0.5-1 mm) phenocrysts, very fine-grained (<0.5 mm) in groundmass,
comprising pyroxene, amphibolite, phlogopite?, subhedral, intensely decomposed into
hematite, chlorite, calcite and quartz, rare relicts, sometimes distinct cleavage visible
30-40 %
Accessory
minerals
mostly magnetite, apatite and rutile, occur as small crystals in the groundmass, sometimes
martitization in highly altered rocks 5-10 %
Texture mainly porphyritic, vitrophyric, trachytic; occasional amygdaloidal
Figure 12: Photomicrographs of andesites; transmitted light with crossed nicols. a) Plagioclase phenocryst (partly altered or
corroded) with albite law twinning embedded in a groundmass consisting of plagioclase, opaque phases etc.; CHM1-19.5. b)
Amygdale filled with chlorite (light green to deep blue) and calcite (brownish red). Commonly, small quartz aggregates are
found along the undulating boundaries of amygdales. Exterior parts are characterized by thin layers of light green chlorite fibers
oriented perpendicular to the wall rock contact. Central parts of voids are mostly filled by Prussian blue chlorite exhibiting
unoriented fibrous crystals. CC-type veinlet dissects amygdale filling; CHM1-108. c) Partial alteromorph of Fe-Mg-silicate in
andesite showing trachytic texture with subparallel oriented plagioclase laths. The distinct rectangular cleavage and relatively
low birefringence suggests orthopyroxene, CHM2-119. d) Strongly altered Fe-Mg-silicate in a porphyritic textured andesite;
the matrix is mostly composed of unoriented laths of plagioclase; CHM1-115.
Petrography 43
4.1.3 Pyroclastic rocks
Pyroclastic rocks consist of various volcanic rock fragments and crystals embedded in a finer-grained,
sometimes even layered matrix (Figure 13 a, b). They were only observed in drill cores at depths below
2370 m a.s.l. Usually this rock type shows many different colors depending on the predominating
components. Colors commonly range between greenish-grey and purple-red. The occurring pyroclastic
rocks are predominated by rock fragments and therefore can be classified as lithic pyroclastic rocks in
general. Depending on the grain size lithic pyroclastic rocks can be subdivided into fine and coarse tuffs
(e.g., lapilli tuff; Figure 13 a). Minor amounts of ignimbrites were observed in the deepest parts of the
drill cores. They show vitrophyric texture and welded fabrics with larger oriented rock fragments and
crystals in a former glassy (?) groundmass (Figure 13 b). Microscopic investigation of the components
revealed that plagioclase overweighs alkali feldspar. As quartz is also present the pyroclastic rocks are
assumed to be mostly of dacitic composition.
Figure 13: Photographs of pyroclastic rocks from drill cores showing different kind of textures. a) Lapilli tuff consisting of
mainly rounded lithic components with grain sizes between 0.5 mm to 1 cm; CHM2-148. b) Ignimbrite exhibiting a welded
fabric with elongated, highly altered, coarse-grained fiammae-like components (? alkalifeldspar); CHM1-164.
Rock fragments are angular to sub-rounded (Figure 14 a); often the larger components are better
rounded. The average grain size of lithic components is below 2 mm, but in lapilli-tuffs grain sizes may
reach up to 1 cm. Typically, the larger lithic components exhibit porphyritic texture with euhedral
feldspar phenocrysts and micro-crystalline to (altered) glassy groundmass (Figure 14 b). Also, grains of
pumice were observed. They occur as 1-2 mm large vesicle-rich grains with a black colored, glassy
groundmass under plane polarized light (Figure 14 c). Crystalline components are usually alkali feldspar
and plagioclase. Their distinction is not always easy, due to the high degree of alteration. However,
plagioclase commonly can be recognized by its characteristic twinning. It seems that plagioclase is more
affected by sericitization than alkali feldspar. In contrast, alkali feldspar is mostly totally decomposed
into fine-crystalline aggregates of clay minerals and twinning is usually absent. Minor crystalline
constituents are rounded quartz grains with sizes between 0.1 to 0.3 mm, which often exhibit corroded
margins.
In tuffs the matrix consists mostly of microcrystalline to very fine-grained particles of ash or aggregates
of clay (Figure 14 d). However, most tuffs are dominated by lithic and crystalline components and
therefore show a component-supported fabric. In ignimbrites the matrix is mostly made up by glass and
shows a vitrophyric texture with subparallel aligned feldspar phenocrysts and subrounded rock
fragments.
Petrography 44
Table 8: Petrography of pyroclastic rocks.
Component Remarks Abundance
Rock
fragments
(very) coarse-grained up to 1 cm in lapilli-tuffites, mostly <2 mm, components often show
porphyritic textures with feldspar phenocrysts or vesicle-rich pumice, mostly altered and
decomposed into clay or sericite
65 %
Alkali
feldspar
coarse- to medium grained, euhedral to subhedral, altered, often decomposed into clay or
sericite (chlorite?)
15 %
Plagioclase mostly medium-grained (0.5 to 1 mm), euhedral to subhedral, twinning lamellae, often
sericitized
10 %
Matrix mostly glass (partly devitrified?), fine-grained to microcrystalline ash, sometimes small
rounded quartz crystals with corroded margins
10 %
Texture volcanic rock fragments and crystals in fine-grained to layered matrix
Figure 14: Photomicrographs of pyroclastic rocks. a) Medium- to coarse-grained crystals and subhedral feldspar crystals in a
black colored glassy groundmass; CHM1-157, TL-PPL. b) Coarse-grained subrounded rock fragment in altered groundmass
surrounded by feldspar phenocrysts; CHM1-178, TL-PPL. c) Pumice as a lithic component in lapilli-tuff showing a vesicle-
rich microcrystalline groundmass; CHM1-157, TL-PPL. d) Same image as in b) under crossed nicols showing a large lithic
component (center) embedded in an argillaceous matrix; CHM1-178, TL-XPL.
Petrography 45
4.2 Vein classification
Successive hydrothermal activities produced six generations of veins and veinlets that can be
distinguished in respect of vein mineralogy, wall rock alteration, mineralization and textural features.
For general nomenclature, the studied veins and veinlets were compared to established vein types of
Sillitoe (2010) and Gustafson and Hunt (1975). However, the used nomenclature is mainly applicable
for PCDs and thus most vein types are named after the initial letters of the major vein filling minerals
and are specific for Chah-Mesi. As Taghipour et al. (2008) distinguished several vein types at the nearby
Meiduk deposit, their classification was also used for better comparison with Meiduk.
Two vein types associated with potassic alteration seem to be linked with porphyry-related activities
and occur very close to Meiduk. These types include (1) B2-type and (2) D1-type veins and may represent
the earliest formed veins in that area. Further, three vein types were distinguished and determined to be
more or less barren, such as (3) QCS-type, (4) PCE-type and (5) CC-type veins. Mineralization is
restricted to (6) O-type veins and textural as well as mineralogical features allowed to subdivide this
type of vein into four subtypes.
These are: (1) Massive veins contain massive to disseminated sulfide mineralization and consist of
mainly fine- to coarse-grained equigranular quartz associated with replacement and leaching textures.
(2) Banded veins refer to a vein type characterized by banded or layered texture of mainly fine-grained
ore and gangue minerals. (3) Crustiform veins are characterized by coarse ore and gangue minerals,
typically comprising comb quartz textures and a high abundance of carbonates. Often banded and
crustiform veins show transition states including diagnostic features of both subtypes. (4) Mineralized
breccia zones consist of fragmented and altered wallrocks cemented by gangue minerals and sulfides.
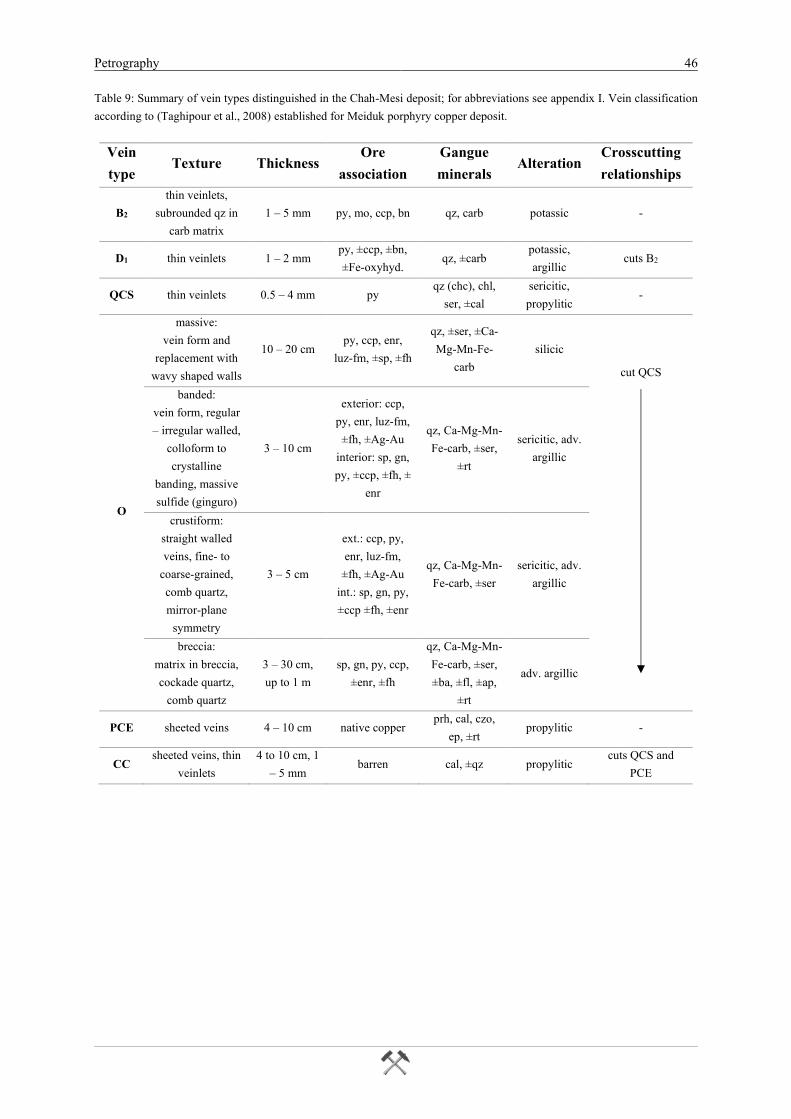
Petrography 46
Table 9: Summary of vein types distinguished in the Chah-Mesi deposit; for abbreviations see appendix I. Vein classification
according to (Taghipour et al., 2008) established for Meiduk porphyry copper deposit.
Vein
type Texture Thickness
Ore
association
Gangue
minerals Alteration
Crosscutting
relationships
B2
thin veinlets,
subrounded qz in
carb matrix
1 – 5 mm py, mo, ccp, bn qz, carb potassic -
D1 thin veinlets 1 – 2 mm py, ±ccp, ±bn,
±Fe-oxyhyd. qz, ±carb
potassic,
argillic cuts B2
QCS thin veinlets 0.5 – 4 mm py qz (chc), chl,
ser, ±cal
sericitic,
propylitic -
O
massive:
vein form and
replacement with
wavy shaped walls
10 – 20 cm py, ccp, enr,
luz-fm, ±sp, ±fh
qz, ±ser, ±Ca-
Mg-Mn-Fe-
carb
silicic
cut QCS
banded:
vein form, regular
– irregular walled,
colloform to
crystalline
banding, massive
sulfide (ginguro)
3 – 10 cm
exterior: ccp,
py, enr, luz-fm,
±fh, ±Ag-Au
interior: sp, gn,
py, ±ccp, ±fh, ±
enr
qz, Ca-Mg-Mn-
Fe-carb, ±ser,
±rt
sericitic, adv.
argillic
crustiform:
straight walled
veins, fine- to
coarse-grained,
comb quartz,
mirror-plane
symmetry
3 – 5 cm
ext.: ccp, py,
enr, luz-fm,
±fh, ±Ag-Au
int.: sp, gn, py,
±ccp ±fh, ±enr
qz, Ca-Mg-Mn-
Fe-carb, ±ser
sericitic, adv.
argillic
breccia:
matrix in breccia,
cockade quartz,
comb quartz
3 – 30 cm,
up to 1 m
sp, gn, py, ccp,
±enr, ±fh
qz, Ca-Mg-Mn-
Fe-carb, ±ser,
±ba, ±fl, ±ap,
±rt
adv. argillic
PCE sheeted veins 4 – 10 cm native copper prh, cal, czo,
ep, ±rt propylitic -
CC sheeted veins, thin
veinlets
4 to 10 cm, 1
– 5 mm barren cal, ±qz propylitic
cuts QCS and
PCE
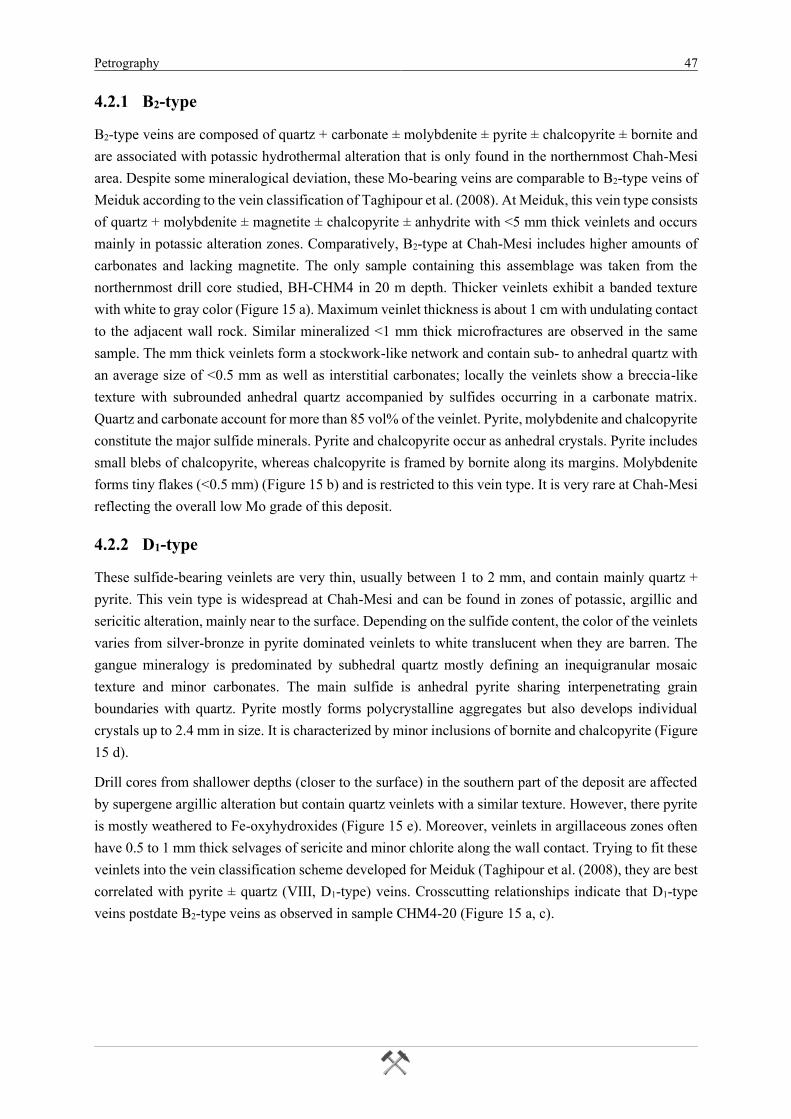
Petrography 47
4.2.1 B2-type
B2-type veins are composed of quartz + carbonate ± molybdenite ± pyrite ± chalcopyrite ± bornite and
are associated with potassic hydrothermal alteration that is only found in the northernmost Chah-Mesi
area. Despite some mineralogical deviation, these Mo-bearing veins are comparable to B2-type veins of
Meiduk according to the vein classification of Taghipour et al. (2008). At Meiduk, this vein type consists
of quartz + molybdenite ± magnetite ± chalcopyrite ± anhydrite with <5 mm thick veinlets and occurs
mainly in potassic alteration zones. Comparatively, B2-type at Chah-Mesi includes higher amounts of
carbonates and lacking magnetite. The only sample containing this assemblage was taken from the
northernmost drill core studied, BH-CHM4 in 20 m depth. Thicker veinlets exhibit a banded texture
with white to gray color (Figure 15 a). Maximum veinlet thickness is about 1 cm with undulating contact
to the adjacent wall rock. Similar mineralized <1 mm thick microfractures are observed in the same
sample. The mm thick veinlets form a stockwork-like network and contain sub- to anhedral quartz with
an average size of <0.5 mm as well as interstitial carbonates; locally the veinlets show a breccia-like
texture with subrounded anhedral quartz accompanied by sulfides occurring in a carbonate matrix.
Quartz and carbonate account for more than 85 vol% of the veinlet. Pyrite, molybdenite and chalcopyrite
constitute the major sulfide minerals. Pyrite and chalcopyrite occur as anhedral crystals. Pyrite includes
small blebs of chalcopyrite, whereas chalcopyrite is framed by bornite along its margins. Molybdenite
forms tiny flakes (<0.5 mm) (Figure 15 b) and is restricted to this vein type. It is very rare at Chah-Mesi
reflecting the overall low Mo grade of this deposit.
4.2.2 D1-type
These sulfide-bearing veinlets are very thin, usually between 1 to 2 mm, and contain mainly quartz +
pyrite. This vein type is widespread at Chah-Mesi and can be found in zones of potassic, argillic and
sericitic alteration, mainly near to the surface. Depending on the sulfide content, the color of the veinlets
varies from silver-bronze in pyrite dominated veinlets to white translucent when they are barren. The
gangue mineralogy is predominated by subhedral quartz mostly defining an inequigranular mosaic
texture and minor carbonates. The main sulfide is anhedral pyrite sharing interpenetrating grain
boundaries with quartz. Pyrite mostly forms polycrystalline aggregates but also develops individual
crystals up to 2.4 mm in size. It is characterized by minor inclusions of bornite and chalcopyrite (Figure
15 d).
Drill cores from shallower depths (closer to the surface) in the southern part of the deposit are affected
by supergene argillic alteration but contain quartz veinlets with a similar texture. However, there pyrite
is mostly weathered to Fe-oxyhydroxides (Figure 15 e). Moreover, veinlets in argillaceous zones often
have 0.5 to 1 mm thick selvages of sericite and minor chlorite along the wall contact. Trying to fit these
veinlets into the vein classification scheme developed for Meiduk (Taghipour et al. (2008), they are best
correlated with pyrite ± quartz (VIII, D1-type) veins. Crosscutting relationships indicate that D1-type
veins postdate B2-type veins as observed in sample CHM4-20 (Figure 15 a, c).
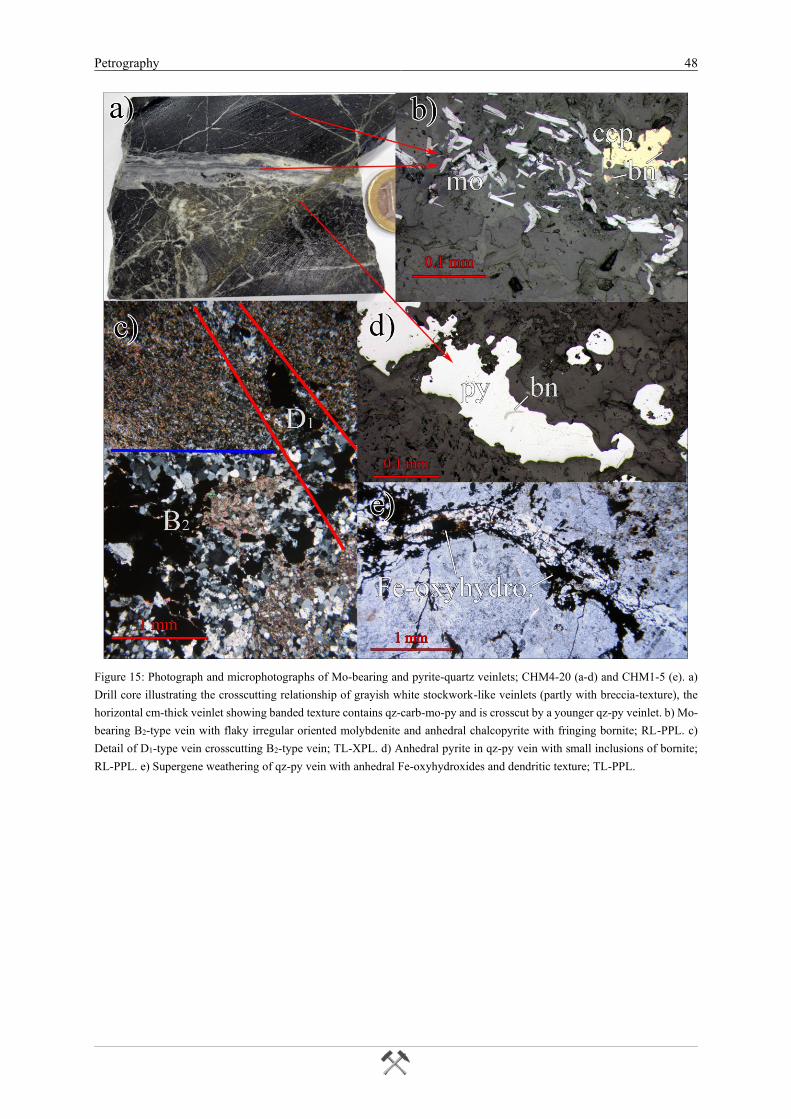
Petrography 48
Figure 15: Photograph and microphotographs of Mo-bearing and pyrite-quartz veinlets; CHM4-20 (a-d) and CHM1-5 (e). a)
Drill core illustrating the crosscutting relationship of grayish white stockwork-like veinlets (partly with breccia-texture), the
horizontal cm-thick veinlet showing banded texture contains qz-carb-mo-py and is crosscut by a younger qz-py veinlet. b) Mo-
bearing B2-type vein with flaky irregular oriented molybdenite and anhedral chalcopyrite with fringing bornite; RL-PPL. c)
Detail of D1-type vein crosscutting B2-type vein; TL-XPL. d) Anhedral pyrite in qz-py vein with small inclusions of bornite;
RL-PPL. e) Supergene weathering of qz-py vein with anhedral Fe-oxyhydroxides and dendritic texture; TL-PPL.
Petrography 49
4.2.3 Quartz-chlorite-sericite veinlets (QCS-type)
This vein type is characterized by quartz-chlorite-sericite (QCS) and lack of mineralization. It is present
in many parts of Chah-Mesi deposit occurring in different lithologies. It was observed in pyroclastic
rocks in the deepest sections of the deposit as well as in volcanic and intrusive rocks at shallower depths.
Because QCS veins are crosscut by mineralized veins, this vein-type is regarded as pre-mineralization
(Table 9).
QCS-type veins mostly form single individual veinlets with a thickness between 3 and 5 mm. In hand
specimen the veinlets show varying colors from white to beige with irregular brownish bands or
homogeneous white to bluish green. Wallrock contacts are sharp and straight and occasionally a
distinctive selvage of calcite is developed along the margins. QCS veins are crosscut by crustiform
textured mineralized veins and younger coarse- and fine-grained calcite veins (Figure 16 a). This vein
type is common in zones of propylitic alteration; the wall rocks are mostly strongly altered with
extensive formation of secondary calcite, chlorite, sericite and minor epidote. Vein mineralogy consists
of SiO2 minerals, commonly present as rhythmic chalcedony bands that form at the margins of the
veinlets and show micro-fibrous habit (Figure 16 c, d). Besides chalcedony also fine grained to
microcrystalline quartz may occur. The inner parts of the veinlets are dominated by chlorite with minor
sericite. However, sericite and calcite can also be a major phase in the center of the veinlet (Figure 16
b). Microcrystalline to fine grained sericite and chlorite are oriented (sub)parallel to the vein walls.
Chlorite shows anomalous interference colors (greenish Prussian blue) but the exact classification of
these chlorite-group minerals was not possible even with Raman spectroscopy. Frequently, the veinlet
cores contain coarse-grained calcite (Figure 16, e). QCS veins are completely barren; i.e. no sulfides or
any other ore minerals were detected.
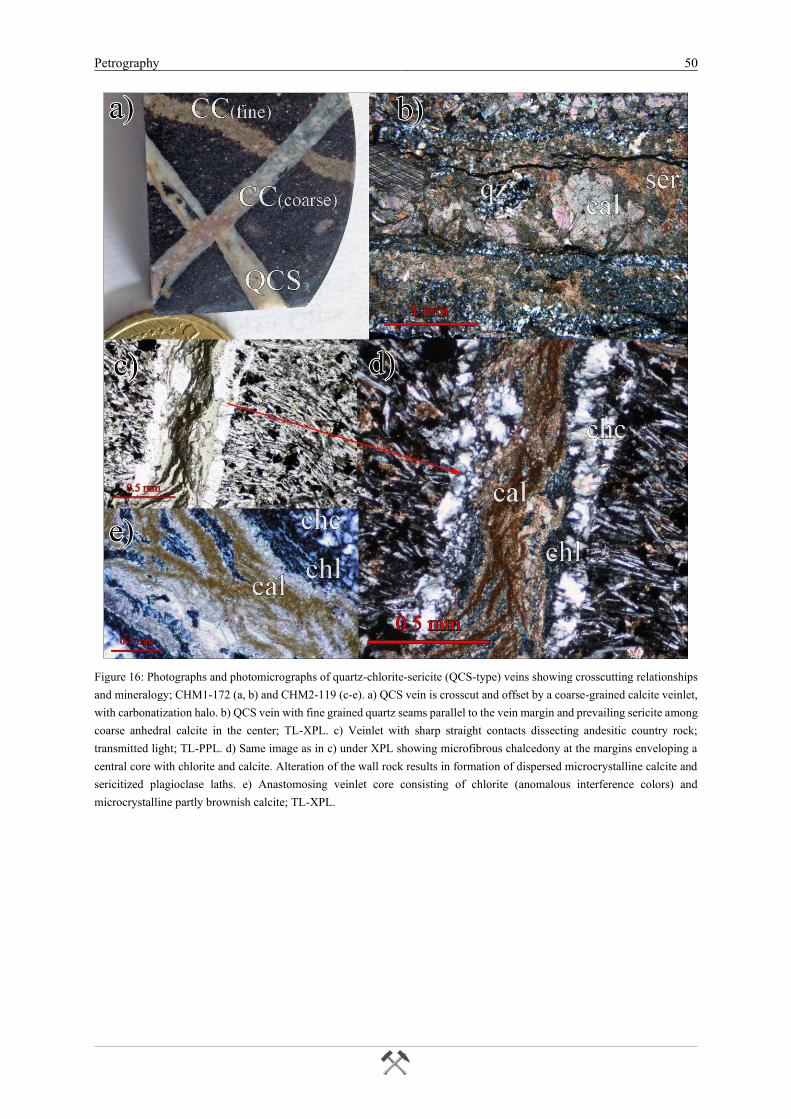
Petrography 50
Figure 16: Photographs and photomicrographs of quartz-chlorite-sericite (QCS-type) veins showing crosscutting relationships
and mineralogy; CHM1-172 (a, b) and CHM2-119 (c-e). a) QCS vein is crosscut and offset by a coarse-grained calcite veinlet,
with carbonatization halo. b) QCS vein with fine grained quartz seams parallel to the vein margin and prevailing sericite among
coarse anhedral calcite in the center; TL-XPL. c) Veinlet with sharp straight contacts dissecting andesitic country rock;
transmitted light; TL-PPL. d) Same image as in c) under XPL showing microfibrous chalcedony at the margins enveloping a
central core with chlorite and calcite. Alteration of the wall rock results in formation of dispersed microcrystalline calcite and
sericitized plagioclase laths. e) Anastomosing veinlet core consisting of chlorite (anomalous interference colors) and
microcrystalline partly brownish calcite; TL-XPL.
Petrography 51
4.2.4 Ore veins (O-type)
Ore veins show a close relationship to the NNE-SSW trending fault zones (Figure 7 and Figure 8) with
intense silicification. This vein type occurs mainly as open space fillings that formed along fault zones
and caused distinct alteration and subordinate replacement of the adjacent wallrocks. Mineralization
within veins formed mainly in unfilled voids or is intergrown with gangue minerals.
At Chah-Mesi, several subtypes of ore veins can be distinguished based on vein texture, wallrock
alteration and mineralogy. In the following they are referred to as (1) massive veins, (2) banded veins,
(3) crustiform veins and (4) mineralized breccia zones. The different veins record a sequence of several
mineralizing pulses. It is to be noted that transitions do exist.
The gangue minerals in the central parts of the deposit consist mainly of quartz associated with
replacement and leaching textures (vuggy quartz) and massive O-type veins. Vein textures comprise
mainly fine- to coarse-grained equigranular quartz. Carbonates are almost absent in the central parts.
However, they join the gangue assemblage towards the peripheral and deeper deposit sections where
they become increasingly abundant. Banded and crustiform veins occur mainly in ore zones 2 and 3
(Chapter 5.1). These often show comb quartz textures, whereas cockade quartz is typical for mineralized
breccias. Carbonates are very common in the banded and crustiform veins and in the breccia, though
quartz is still the dominant gangue mineral. Only few crustiform veins consist mainly of coarse-grained
carbonate which is associated with sphalerite and galena. Open spaces and vugs between quartz are
often filled with rhombohedral carbonate crystals and therefore a relatively late formation is plausible.
Carbonates often show a distinct growth zonation with cores of ankerite and rims of siderite. Often
ankerite and siderite are manganiferous, but Mn-carbonates such as kutnohorite or rhodochrosite may
be present as well. Other gangue minerals comprise minor barite, apatite, fluorite and anhydrite.
4.2.4.1 Massive veins
Mineralized massive quartz veins are most abundant in the Chah-Mesi open pit where they are 10 to 20
cm thick. They contain massive to disseminated sulfide mineralization. These veins are exposed on the
surface particularly along the NNE-SSW striking vein system (Figure 8 c-d). Samples were studied from
outcrops at sample locations CHM6, CHM8 and CHM9. Investigation of drill core BH-CHM1
confirmed that massive quartz veins are also present close to the northern border of the open pit at drill
hole depths from 44 to 62 m (i.e. 2443 to 2425 m a.s.l.).
The host rocks adjacent to the veins show strong silicification. The silicified host rocks and the veins
typically contain clusters of open vugs and voids (Figure 17 c). Also, irregular channel-like leaching
textures were observed in wallrock samples adjacent to massive quartz veins. Occasionally euhedral
crystal of quartz form in these cavities (Figure 17 d). In drill core BH-CHM1 massive quartz veins occur
in a dense spacing at depths of 44, 52, 55.7 and 62 m forming a voluminous silicified ore body of up to
15 m thickness. This zone is characterized by strong fragmentation elucidated by low RQD (Rock-
quality designation after Deere, 1964) values and core loss observed in drill cores (Figure 17 a, b).
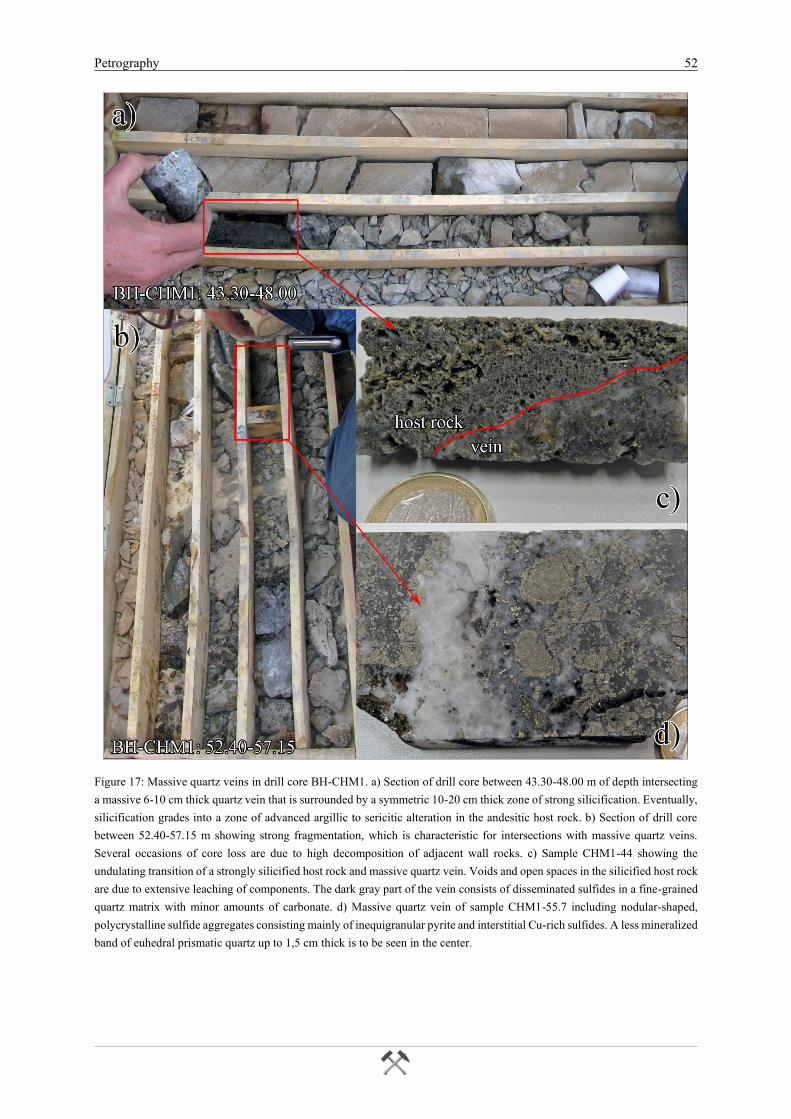
Petrography 52
Figure 17: Massive quartz veins in drill core BH-CHM1. a) Section of drill core between 43.30-48.00 m of depth intersecting
a massive 6-10 cm thick quartz vein that is surrounded by a symmetric 10-20 cm thick zone of strong silicification. Eventually,
silicification grades into a zone of advanced argillic to sericitic alteration in the andesitic host rock. b) Section of drill core
between 52.40-57.15 m showing strong fragmentation, which is characteristic for intersections with massive quartz veins.
Several occasions of core loss are due to high decomposition of adjacent wall rocks. c) Sample CHM1-44 showing the
undulating transition of a strongly silicified host rock and massive quartz vein. Voids and open spaces in the silicified host rock
are due to extensive leaching of components. The dark gray part of the vein consists of disseminated sulfides in a fine-grained
quartz matrix with minor amounts of carbonate. d) Massive quartz vein of sample CHM1-55.7 including nodular-shaped,
polycrystalline sulfide aggregates consisting mainly of inequigranular pyrite and interstitial Cu-rich sulfides. A less mineralized
band of euhedral prismatic quartz up to 1,5 cm thick is to be seen in the center.
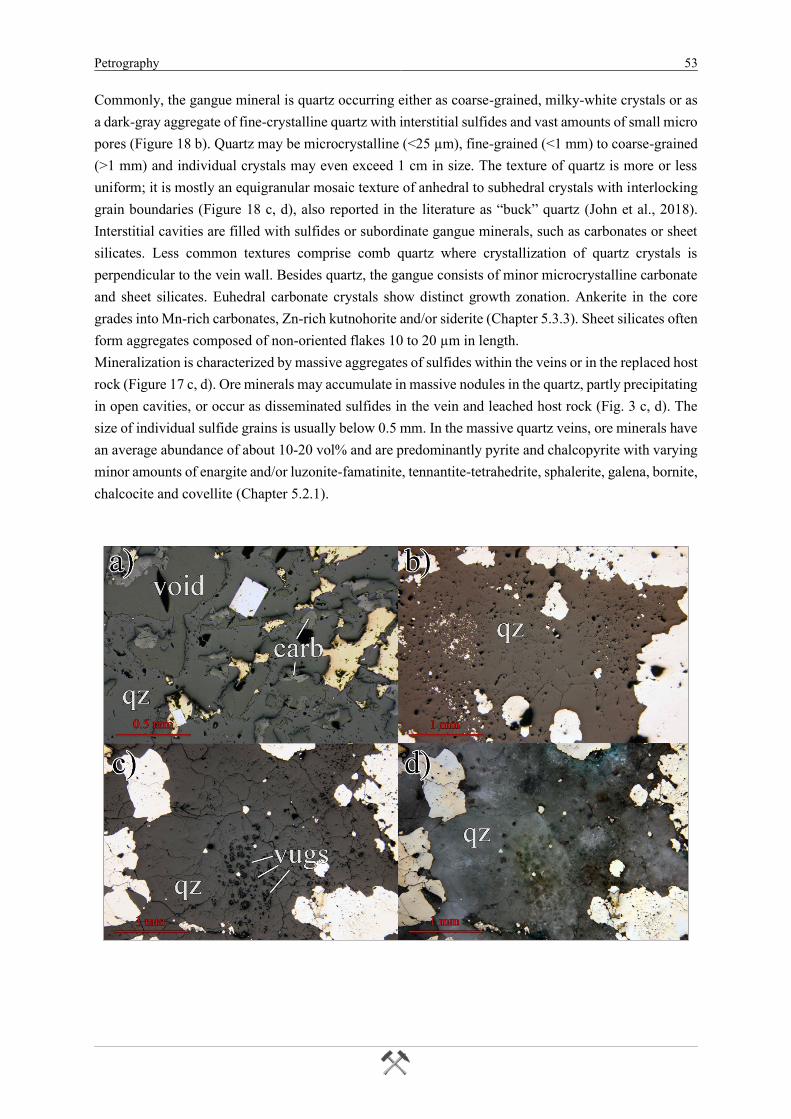
Petrography 53
Commonly, the gangue mineral is quartz occurring either as coarse-grained, milky-white crystals or as
a dark-gray aggregate of fine-crystalline quartz with interstitial sulfides and vast amounts of small micro
pores (Figure 18 b). Quartz may be microcrystalline (<25 µm), fine-grained (<1 mm) to coarse-grained
(>1 mm) and individual crystals may even exceed 1 cm in size. The texture of quartz is more or less
uniform; it is mostly an equigranular mosaic texture of anhedral to subhedral crystals with interlocking
grain boundaries (Figure 18 c, d), also reported in the literature as “buck” quartz (John et al., 2018).
Interstitial cavities are filled with sulfides or subordinate gangue minerals, such as carbonates or sheet
silicates. Less common textures comprise comb quartz where crystallization of quartz crystals is
perpendicular to the vein wall. Besides quartz, the gangue consists of minor microcrystalline carbonate
and sheet silicates. Euhedral carbonate crystals show distinct growth zonation. Ankerite in the core
grades into Mn-rich carbonates, Zn-rich kutnohorite and/or siderite (Chapter 5.3.3). Sheet silicates often
form aggregates composed of non-oriented flakes 10 to 20 µm in length.
Mineralization is characterized by massive aggregates of sulfides within the veins or in the replaced host
rock (Figure 17 c, d). Ore minerals may accumulate in massive nodules in the quartz, partly precipitating
in open cavities, or occur as disseminated sulfides in the vein and leached host rock (Fig. 3 c, d). The
size of individual sulfide grains is usually below 0.5 mm. In the massive quartz veins, ore minerals have
an average abundance of about 10-20 vol% and are predominantly pyrite and chalcopyrite with varying
minor amounts of enargite and/or luzonite-famatinite, tennantite-tetrahedrite, sphalerite, galena, bornite,
chalcocite and covellite (Chapter 5.2.1).
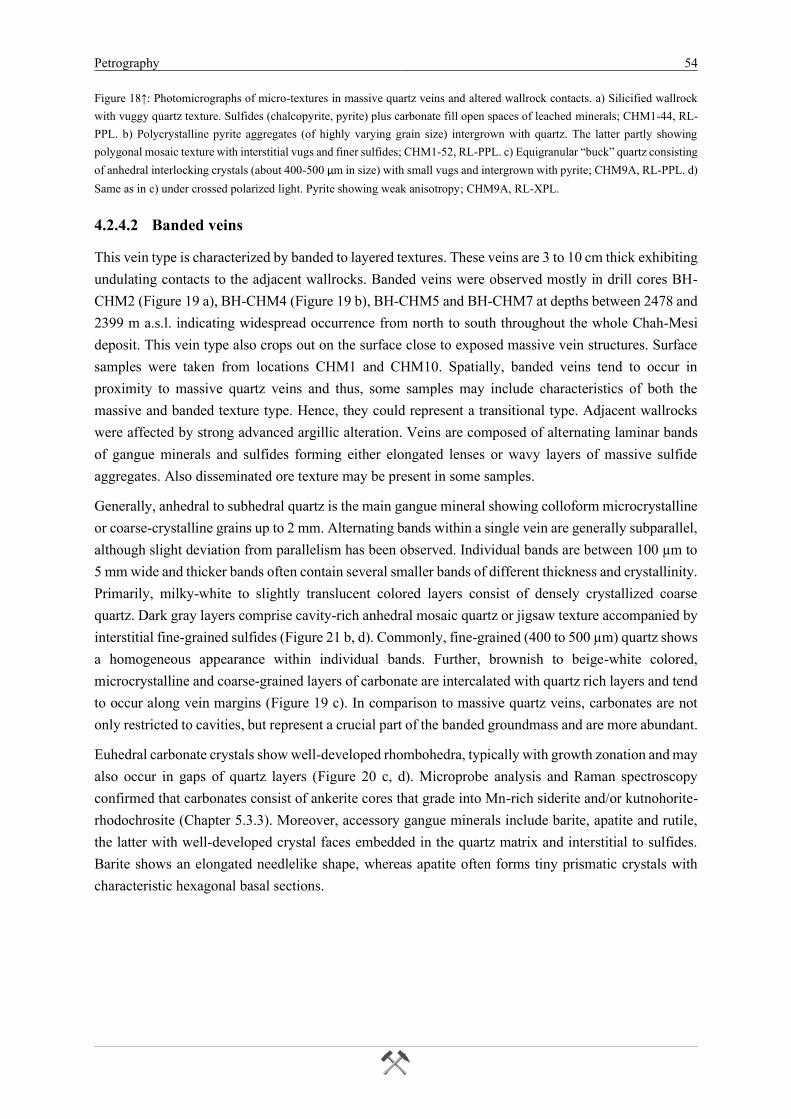
Petrography 54
Figure 18↑: Photomicrographs of micro-textures in massive quartz veins and altered wallrock contacts. a) Silicified wallrock
with vuggy quartz texture. Sulfides (chalcopyrite, pyrite) plus carbonate fill open spaces of leached minerals; CHM1-44, RL-
PPL. b) Polycrystalline pyrite aggregates (of highly varying grain size) intergrown with quartz. The latter partly showing
polygonal mosaic texture with interstitial vugs and finer sulfides; CHM1-52, RL-PPL. c) Equigranular “buck” quartz consisting
of anhedral interlocking crystals (about 400-500 μm in size) with small vugs and intergrown with pyrite; CHM9A, RL-PPL. d)
Same as in c) under crossed polarized light. Pyrite showing weak anisotropy; CHM9A, RL-XPL.
4.2.4.2 Banded veins
This vein type is characterized by banded to layered textures. These veins are 3 to 10 cm thick exhibiting
undulating contacts to the adjacent wallrocks. Banded veins were observed mostly in drill cores BH-
CHM2 (Figure 19 a), BH-CHM4 (Figure 19 b), BH-CHM5 and BH-CHM7 at depths between 2478 and
2399 m a.s.l. indicating widespread occurrence from north to south throughout the whole Chah-Mesi
deposit. This vein type also crops out on the surface close to exposed massive vein structures. Surface
samples were taken from locations CHM1 and CHM10. Spatially, banded veins tend to occur in
proximity to massive quartz veins and thus, some samples may include characteristics of both the
massive and banded texture type. Hence, they could represent a transitional type. Adjacent wallrocks
were affected by strong advanced argillic alteration. Veins are composed of alternating laminar bands
of gangue minerals and sulfides forming either elongated lenses or wavy layers of massive sulfide
aggregates. Also disseminated ore texture may be present in some samples.
Generally, anhedral to subhedral quartz is the main gangue mineral showing colloform microcrystalline
or coarse-crystalline grains up to 2 mm. Alternating bands within a single vein are generally subparallel,
although slight deviation from parallelism has been observed. Individual bands are between 100 µm to
5 mm wide and thicker bands often contain several smaller bands of different thickness and crystallinity.
Primarily, milky-white to slightly translucent colored layers consist of densely crystallized coarse
quartz. Dark gray layers comprise cavity-rich anhedral mosaic quartz or jigsaw texture accompanied by
interstitial fine-grained sulfides (Figure 21 b, d). Commonly, fine-grained (400 to 500 µm) quartz shows
a homogeneous appearance within individual bands. Further, brownish to beige-white colored,
microcrystalline and coarse-grained layers of carbonate are intercalated with quartz rich layers and tend
to occur along vein margins (Figure 19 c). In comparison to massive quartz veins, carbonates are not
only restricted to cavities, but represent a crucial part of the banded groundmass and are more abundant.
Euhedral carbonate crystals show well-developed rhombohedra, typically with growth zonation and may
also occur in gaps of quartz layers (Figure 20 c, d). Microprobe analysis and Raman spectroscopy
confirmed that carbonates consist of ankerite cores that grade into Mn-rich siderite and/or kutnohorite-
rhodochrosite (Chapter 5.3.3). Moreover, accessory gangue minerals include barite, apatite and rutile,
the latter with well-developed crystal faces embedded in the quartz matrix and interstitial to sulfides.
Barite shows an elongated needlelike shape, whereas apatite often forms tiny prismatic crystals with
characteristic hexagonal basal sections.
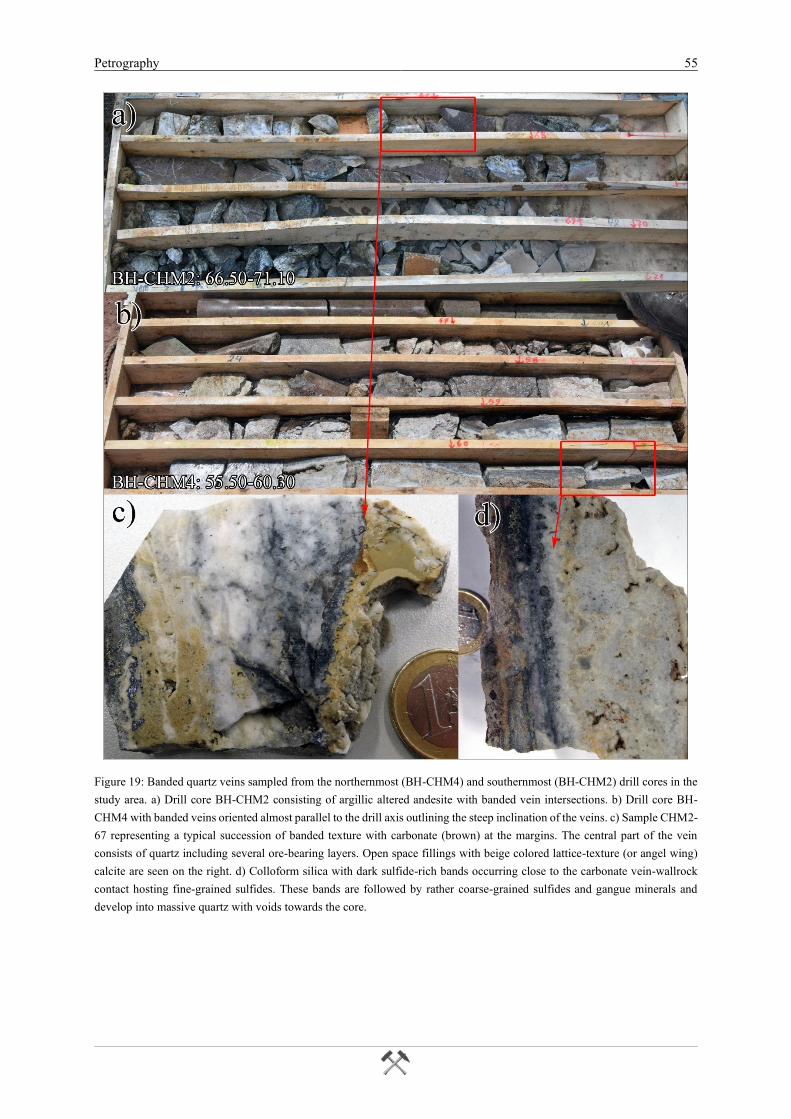
Petrography 55
Figure 19: Banded quartz veins sampled from the northernmost (BH-CHM4) and southernmost (BH-CHM2) drill cores in the
study area. a) Drill core BH-CHM2 consisting of argillic altered andesite with banded vein intersections. b) Drill core BH-
CHM4 with banded veins oriented almost parallel to the drill axis outlining the steep inclination of the veins. c) Sample CHM2-
67 representing a typical succession of banded texture with carbonate (brown) at the margins. The central part of the vein
consists of quartz including several ore-bearing layers. Open space fillings with beige colored lattice-texture (or angel wing)
calcite are seen on the right. d) Colloform silica with dark sulfide-rich bands occurring close to the carbonate vein-wallrock
contact hosting fine-grained sulfides. These bands are followed by rather coarse-grained sulfides and gangue minerals and
develop into massive quartz with voids towards the core.
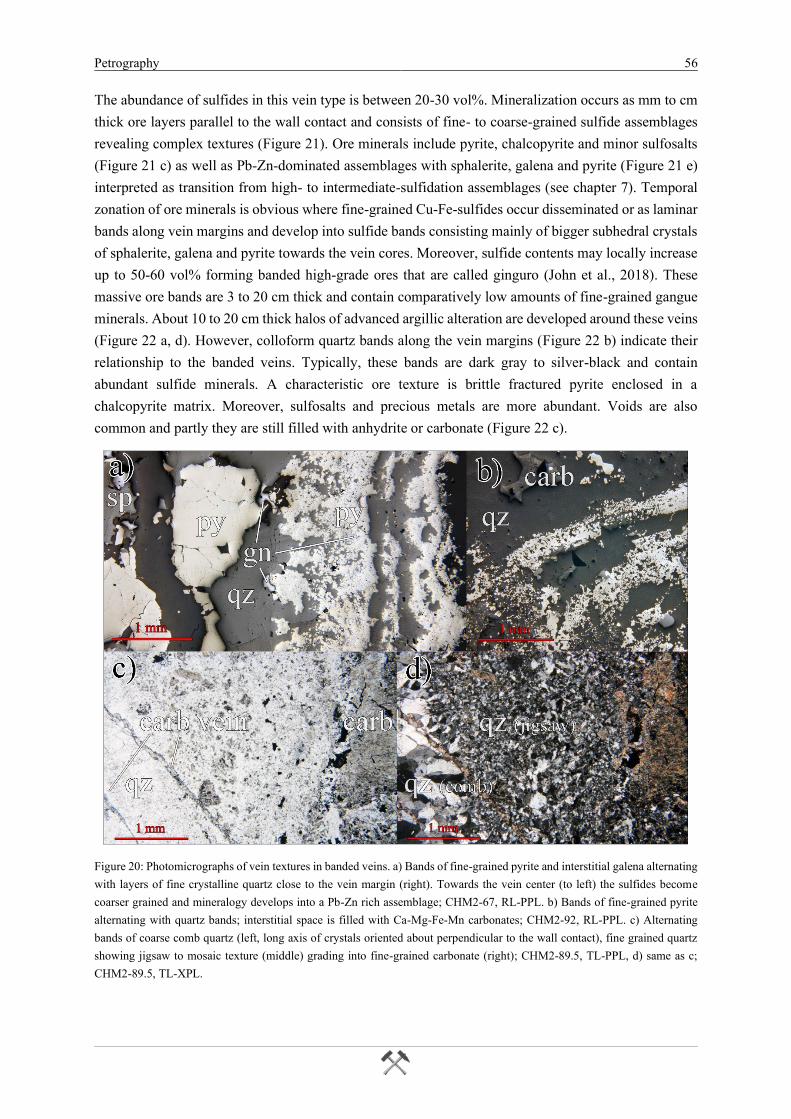
Petrography 56
The abundance of sulfides in this vein type is between 20-30 vol%. Mineralization occurs as mm to cm
thick ore layers parallel to the wall contact and consists of fine- to coarse-grained sulfide assemblages
revealing complex textures (Figure 21). Ore minerals include pyrite, chalcopyrite and minor sulfosalts
(Figure 21 c) as well as Pb-Zn-dominated assemblages with sphalerite, galena and pyrite (Figure 21 e)
interpreted as transition from high- to intermediate-sulfidation assemblages (see chapter 7). Temporal
zonation of ore minerals is obvious where fine-grained Cu-Fe-sulfides occur disseminated or as laminar
bands along vein margins and develop into sulfide bands consisting mainly of bigger subhedral crystals
of sphalerite, galena and pyrite towards the vein cores. Moreover, sulfide contents may locally increase
up to 50-60 vol% forming banded high-grade ores that are called ginguro (John et al., 2018). These
massive ore bands are 3 to 20 cm thick and contain comparatively low amounts of fine-grained gangue
minerals. About 10 to 20 cm thick halos of advanced argillic alteration are developed around these veins
(Figure 22 a, d). However, colloform quartz bands along the vein margins (Figure 22 b) indicate their
relationship to the banded veins. Typically, these bands are dark gray to silver-black and contain
abundant sulfide minerals. A characteristic ore texture is brittle fractured pyrite enclosed in a
chalcopyrite matrix. Moreover, sulfosalts and precious metals are more abundant. Voids are also
common and partly they are still filled with anhydrite or carbonate (Figure 22 c).
Figure 20: Photomicrographs of vein textures in banded veins. a) Bands of fine-grained pyrite and interstitial galena alternating
with layers of fine crystalline quartz close to the vein margin (right). Towards the vein center (to left) the sulfides become
coarser grained and mineralogy develops into a Pb-Zn rich assemblage; CHM2-67, RL-PPL. b) Bands of fine-grained pyrite
alternating with quartz bands; interstitial space is filled with Ca-Mg-Fe-Mn carbonates; CHM2-92, RL-PPL. c) Alternating
bands of coarse comb quartz (left, long axis of crystals oriented about perpendicular to the wall contact), fine grained quartz
showing jigsaw to mosaic texture (middle) grading into fine-grained carbonate (right); CHM2-89.5, TL-PPL, d) same as c;
CHM2-89.5, TL-XPL.
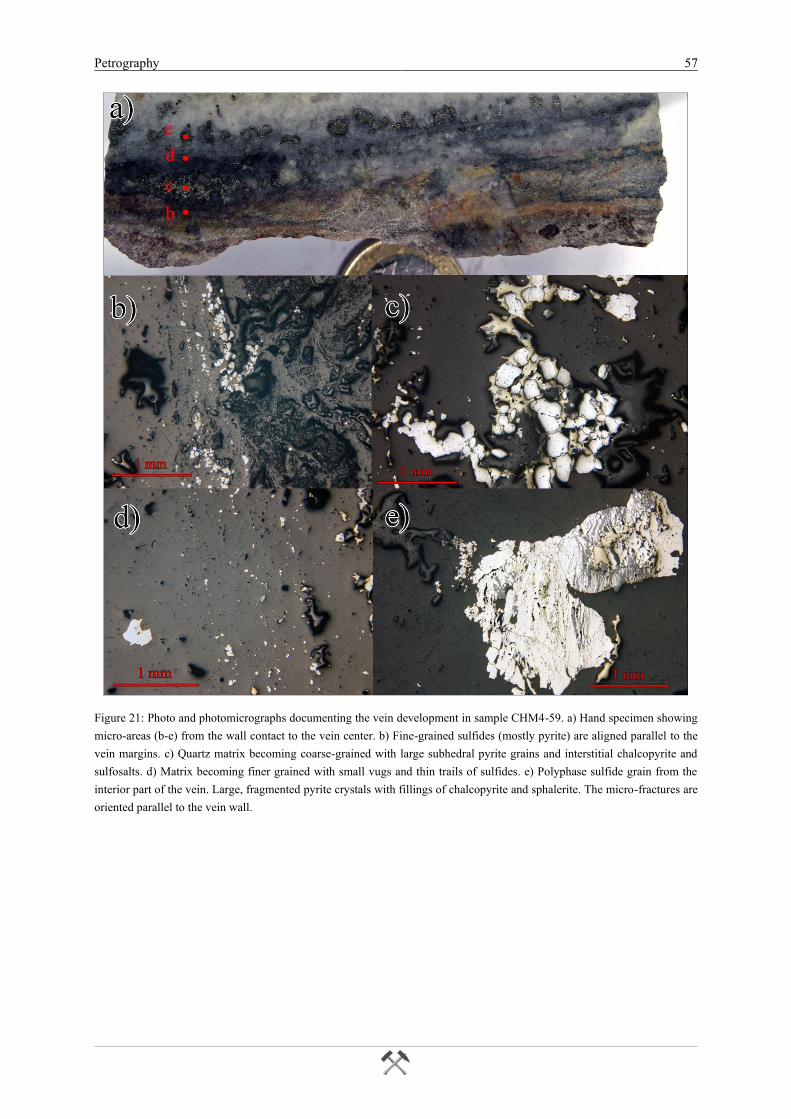
Petrography 57
Figure 21: Photo and photomicrographs documenting the vein development in sample CHM4-59. a) Hand specimen showing
micro-areas (b-e) from the wall contact to the vein center. b) Fine-grained sulfides (mostly pyrite) are aligned parallel to the
vein margins. c) Quartz matrix becoming coarse-grained with large subhedral pyrite grains and interstitial chalcopyrite and
sulfosalts. d) Matrix becoming finer grained with small vugs and thin trails of sulfides. e) Polyphase sulfide grain from the
interior part of the vein. Large, fragmented pyrite crystals with fillings of chalcopyrite and sphalerite. The micro-fractures are
oriented parallel to the vein wall.
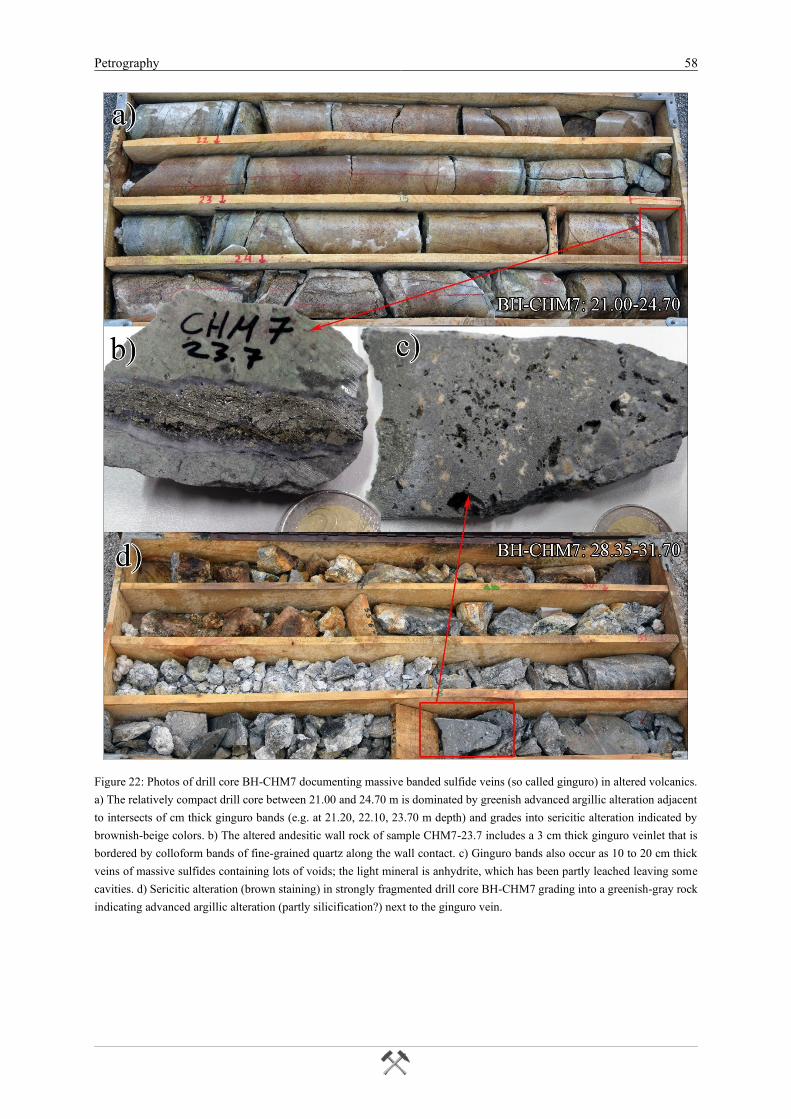
Petrography 58
Figure 22: Photos of drill core BH-CHM7 documenting massive banded sulfide veins (so called ginguro) in altered volcanics.
a) The relatively compact drill core between 21.00 and 24.70 m is dominated by greenish advanced argillic alteration adjacent
to intersects of cm thick ginguro bands (e.g. at 21.20, 22.10, 23.70 m depth) and grades into sericitic alteration indicated by
brownish-beige colors. b) The altered andesitic wall rock of sample CHM7-23.7 includes a 3 cm thick ginguro veinlet that is
bordered by colloform bands of fine-grained quartz along the wall contact. c) Ginguro bands also occur as 10 to 20 cm thick
veins of massive sulfides containing lots of voids; the light mineral is anhydrite, which has been partly leached leaving some
cavities. d) Sericitic alteration (brown staining) in strongly fragmented drill core BH-CHM7 grading into a greenish-gray rock
indicating advanced argillic alteration (partly silicification?) next to the ginguro vein.
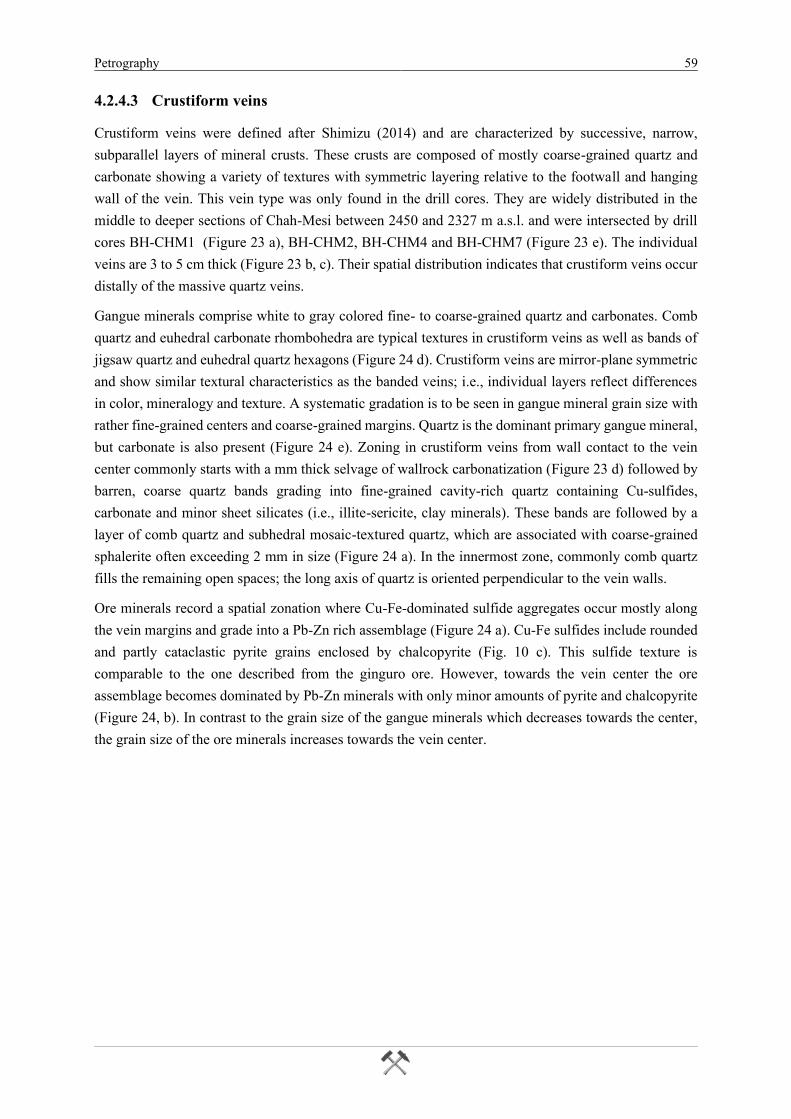
Petrography 59
4.2.4.3 Crustiform veins
Crustiform veins were defined after Shimizu (2014) and are characterized by successive, narrow,
subparallel layers of mineral crusts. These crusts are composed of mostly coarse-grained quartz and
carbonate showing a variety of textures with symmetric layering relative to the footwall and hanging
wall of the vein. This vein type was only found in the drill cores. They are widely distributed in the
middle to deeper sections of Chah-Mesi between 2450 and 2327 m a.s.l. and were intersected by drill
cores BH-CHM1 (Figure 23 a), BH-CHM2, BH-CHM4 and BH-CHM7 (Figure 23 e). The individual
veins are 3 to 5 cm thick (Figure 23 b, c). Their spatial distribution indicates that crustiform veins occur
distally of the massive quartz veins.
Gangue minerals comprise white to gray colored fine- to coarse-grained quartz and carbonates. Comb
quartz and euhedral carbonate rhombohedra are typical textures in crustiform veins as well as bands of
jigsaw quartz and euhedral quartz hexagons (Figure 24 d). Crustiform veins are mirror-plane symmetric
and show similar textural characteristics as the banded veins; i.e., individual layers reflect differences
in color, mineralogy and texture. A systematic gradation is to be seen in gangue mineral grain size with
rather fine-grained centers and coarse-grained margins. Quartz is the dominant primary gangue mineral,
but carbonate is also present (Figure 24 e). Zoning in crustiform veins from wall contact to the vein
center commonly starts with a mm thick selvage of wallrock carbonatization (Figure 23 d) followed by
barren, coarse quartz bands grading into fine-grained cavity-rich quartz containing Cu-sulfides,
carbonate and minor sheet silicates (i.e., illite-sericite, clay minerals). These bands are followed by a
layer of comb quartz and subhedral mosaic-textured quartz, which are associated with coarse-grained
sphalerite often exceeding 2 mm in size (Figure 24 a). In the innermost zone, commonly comb quartz
fills the remaining open spaces; the long axis of quartz is oriented perpendicular to the vein walls.
Ore minerals record a spatial zonation where Cu-Fe-dominated sulfide aggregates occur mostly along
the vein margins and grade into a Pb-Zn rich assemblage (Figure 24 a). Cu-Fe sulfides include rounded
and partly cataclastic pyrite grains enclosed by chalcopyrite (Fig. 10 c). This sulfide texture is
comparable to the one described from the ginguro ore. However, towards the vein center the ore
assemblage becomes dominated by Pb-Zn minerals with only minor amounts of pyrite and chalcopyrite
(Figure 24, b). In contrast to the grain size of the gangue minerals which decreases towards the center,
the grain size of the ore minerals increases towards the vein center.
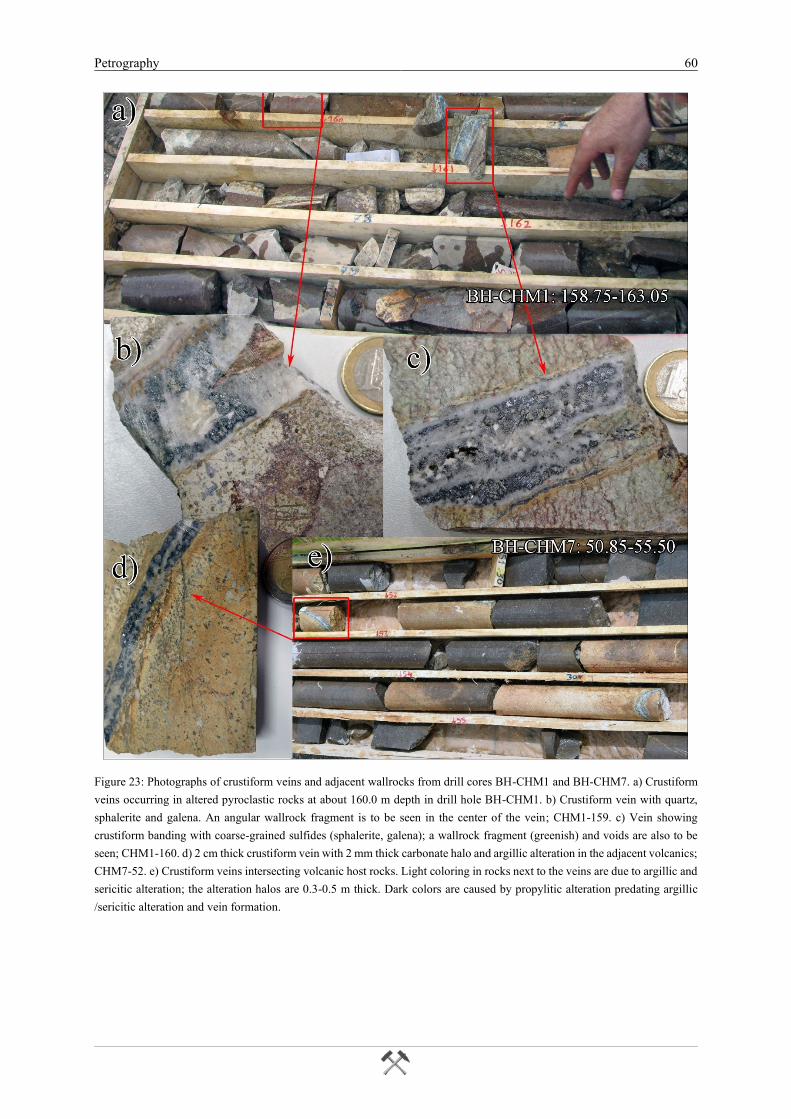
Petrography 60
Figure 23: Photographs of crustiform veins and adjacent wallrocks from drill cores BH-CHM1 and BH-CHM7. a) Crustiform
veins occurring in altered pyroclastic rocks at about 160.0 m depth in drill hole BH-CHM1. b) Crustiform vein with quartz,
sphalerite and galena. An angular wallrock fragment is to be seen in the center of the vein; CHM1-159. c) Vein showing
crustiform banding with coarse-grained sulfides (sphalerite, galena); a wallrock fragment (greenish) and voids are also to be
seen; CHM1-160. d) 2 cm thick crustiform vein with 2 mm thick carbonate halo and argillic alteration in the adjacent volcanics;
CHM7-52. e) Crustiform veins intersecting volcanic host rocks. Light coloring in rocks next to the veins are due to argillic and
sericitic alteration; the alteration halos are 0.3-0.5 m thick. Dark colors are caused by propylitic alteration predating argillic
/sericitic alteration and vein formation.
Petrography 61
Figure 24: Photomicrographs of crustiform vein textures in samples CHM7-52 and CHM7-94. a) Cross-section through
crustiform vein. Fe-Cu-dominated sulfides close to the wall rock (right, close-up image in c) grade into a coarse-grained Pb-
Zn-dominated assemblage towards the center (left); CHM7-52, RL-PPL. b) Central part of crustiform vein with sphalerite,
galena and minor chalcopyrite; CHM7-94, RL-PPL. c) Detail of a) showing the sulfide assemblage at the vein margin with
subhedral pyrite cemented by chalcopyrite and sulfosalts (enargite, luzonite-famatinite, fahlore); CHM7-52, RL-PPL. d)
Approximately 3 mm thick veinlet consisting mainly of subhedral to euhedral carbonate (brown-beige) and subhedral quartz
(colorless); CHM7-94, TL-PPL. e) Same area as in d) with coarse-grained quartz enclosed in inequigranular carbonates.
Carbonate crystals become more fine-grained towards the center; CHM7-94, TL-XPL.
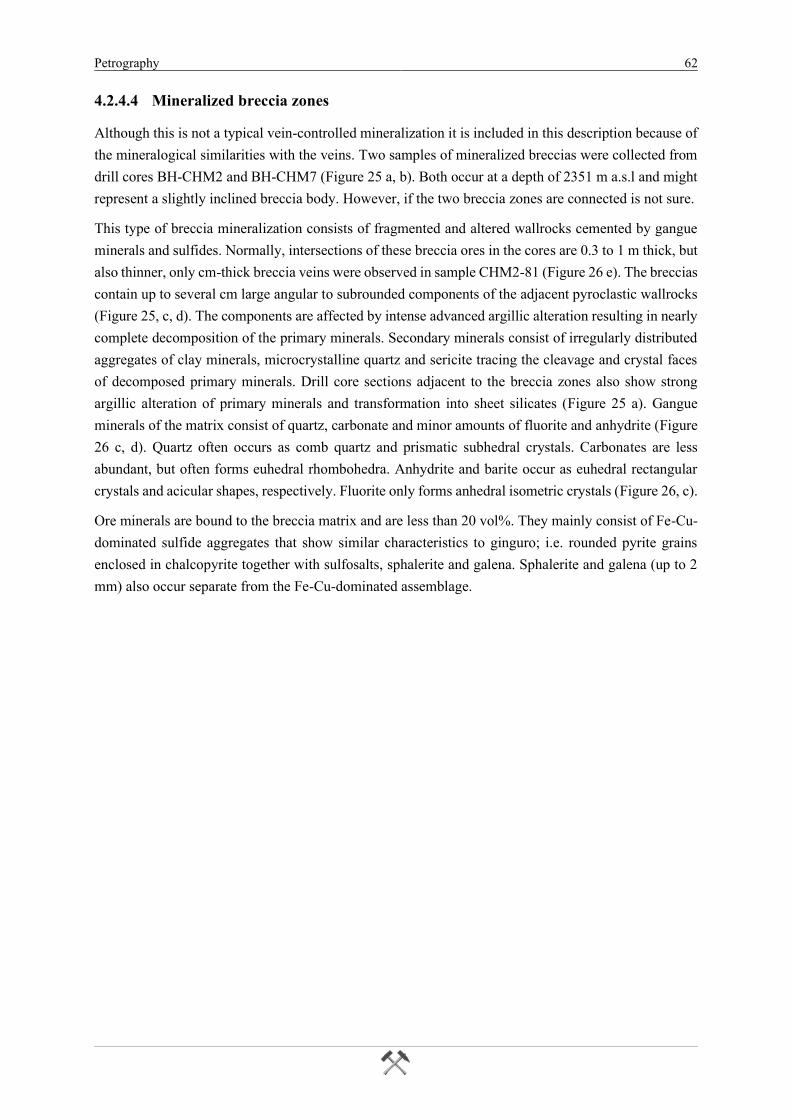
Petrography 62
4.2.4.4 Mineralized breccia zones
Although this is not a typical vein-controlled mineralization it is included in this description because of
the mineralogical similarities with the veins. Two samples of mineralized breccias were collected from
drill cores BH-CHM2 and BH-CHM7 (Figure 25 a, b). Both occur at a depth of 2351 m a.s.l and might
represent a slightly inclined breccia body. However, if the two breccia zones are connected is not sure.
This type of breccia mineralization consists of fragmented and altered wallrocks cemented by gangue
minerals and sulfides. Normally, intersections of these breccia ores in the cores are 0.3 to 1 m thick, but
also thinner, only cm-thick breccia veins were observed in sample CHM2-81 (Figure 26 e). The breccias
contain up to several cm large angular to subrounded components of the adjacent pyroclastic wallrocks
(Figure 25, c, d). The components are affected by intense advanced argillic alteration resulting in nearly
complete decomposition of the primary minerals. Secondary minerals consist of irregularly distributed
aggregates of clay minerals, microcrystalline quartz and sericite tracing the cleavage and crystal faces
of decomposed primary minerals. Drill core sections adjacent to the breccia zones also show strong
argillic alteration of primary minerals and transformation into sheet silicates (Figure 25 a). Gangue
minerals of the matrix consist of quartz, carbonate and minor amounts of fluorite and anhydrite (Figure
26 c, d). Quartz often occurs as comb quartz and prismatic subhedral crystals. Carbonates are less
abundant, but often forms euhedral rhombohedra. Anhydrite and barite occur as euhedral rectangular
crystals and acicular shapes, respectively. Fluorite only forms anhedral isometric crystals (Figure 26, c).
Ore minerals are bound to the breccia matrix and are less than 20 vol%. They mainly consist of Fe-Cu-
dominated sulfide aggregates that show similar characteristics to ginguro; i.e. rounded pyrite grains
enclosed in chalcopyrite together with sulfosalts, sphalerite and galena. Sphalerite and galena (up to 2
mm) also occur separate from the Fe-Cu-dominated assemblage.
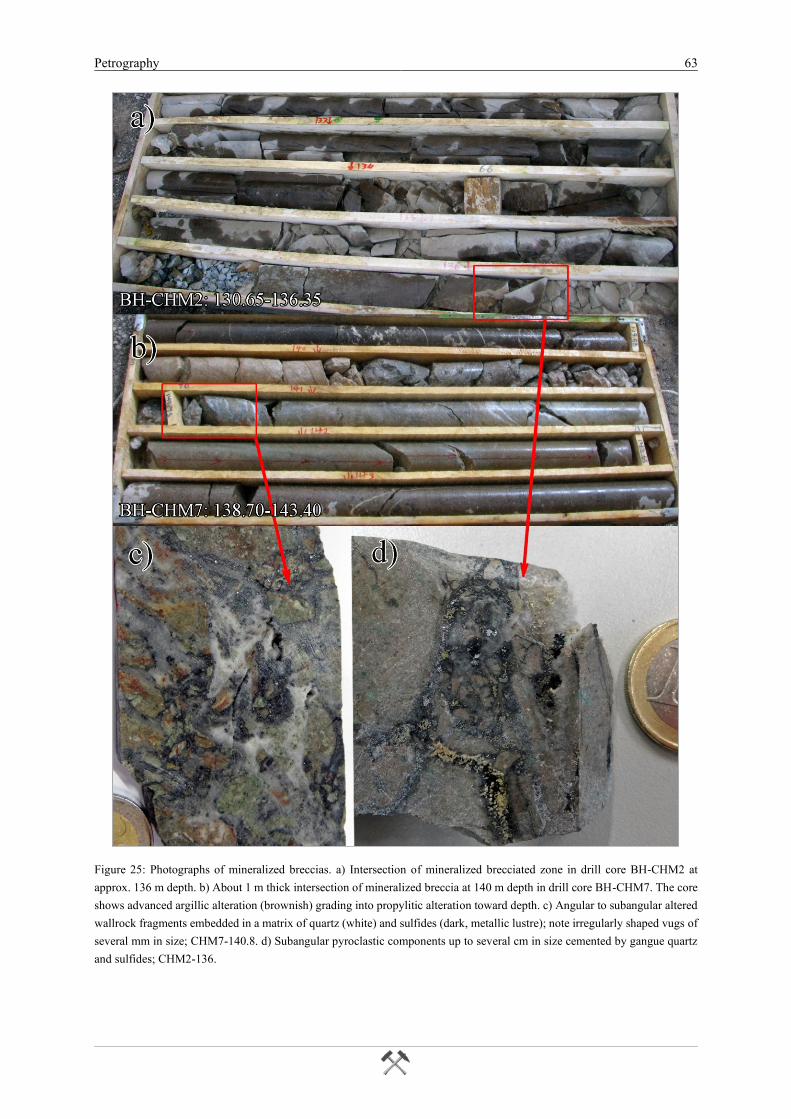
Petrography 63
Figure 25: Photographs of mineralized breccias. a) Intersection of mineralized brecciated zone in drill core BH-CHM2 at
approx. 136 m depth. b) About 1 m thick intersection of mineralized breccia at 140 m depth in drill core BH-CHM7. The core
shows advanced argillic alteration (brownish) grading into propylitic alteration toward depth. c) Angular to subangular altered
wallrock fragments embedded in a matrix of quartz (white) and sulfides (dark, metallic lustre); note irregularly shaped vugs of
several mm in size; CHM7-140.8. d) Subangular pyroclastic components up to several cm in size cemented by gangue quartz
and sulfides; CHM2-136.
Petrography 64
Figure 26: Photomicrographs of breccia microtextures in samples CHM2-136 and CHM2-81. a) Open spaces between breccia
components are filled with prismatic quartz and comb quartz. The crystals are partly oriented perpendicular to wall contacts.
Opaque phases of the interior part are sulfides (see b); CHM2-136, TL-XPL. b) Sulfides consisting of subhedral pyrite grains
enclosed in chalcopyrite and sulfosalts; CHM2-136, RL-PPL. c) Detail of a) showing prismatic quartz associated with carbonate
and fluorite; CHM2-136, TL-PPL. d) Strongly silicified breccia component (upper right area) consisting primarily of
microcristalline quartz and cut by thin carbonate veinlet. The gangue minerals are subhedral quartz and anhydrite (lower area);
CHM2-136, TL-XPL. e) Contact of altered wallrock with highly decomposed pyroxene (?) phenocryst (left) and cm thick
breccia vein (right). Opaque phases in altered wallrock are fine-grained Pb-Zn sulfides and pyrite; CHM2-81, TL-PPL. f)
Interior part of breccia veinlet consisting of comb quartz, carbonate, small apatite and elongated baryte crystals. Carbonate is
coarse-crystalline (right) or forms microcrystalline fringes around comb quartz (left, gray aggregates). Opaque phase is coarse-
grained galena; CHM2-81, TL-PPL.
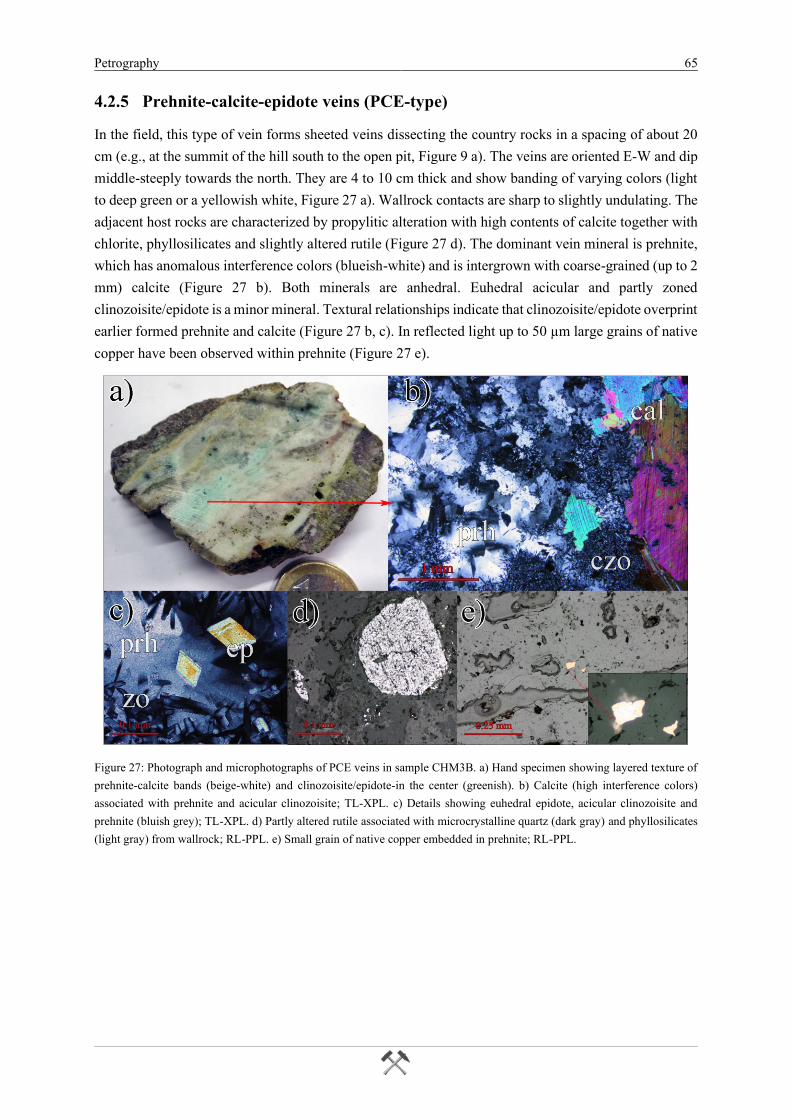
Petrography 65
4.2.5 Prehnite-calcite-epidote veins (PCE-type)
In the field, this type of vein forms sheeted veins dissecting the country rocks in a spacing of about 20
cm (e.g., at the summit of the hill south to the open pit, Figure 9 a). The veins are oriented E-W and dip
middle-steeply towards the north. They are 4 to 10 cm thick and show banding of varying colors (light
to deep green or a yellowish white, Figure 27 a). Wallrock contacts are sharp to slightly undulating. The
adjacent host rocks are characterized by propylitic alteration with high contents of calcite together with
chlorite, phyllosilicates and slightly altered rutile (Figure 27 d). The dominant vein mineral is prehnite,
which has anomalous interference colors (blueish-white) and is intergrown with coarse-grained (up to 2
mm) calcite (Figure 27 b). Both minerals are anhedral. Euhedral acicular and partly zoned
clinozoisite/epidote is a minor mineral. Textural relationships indicate that clinozoisite/epidote overprint
earlier formed prehnite and calcite (Figure 27 b, c). In reflected light up to 50 µm large grains of native
copper have been observed within prehnite (Figure 27 e).
Figure 27: Photograph and microphotographs of PCE veins in sample CHM3B. a) Hand specimen showing layered texture of
prehnite-calcite bands (beige-white) and clinozoisite/epidote-in the center (greenish). b) Calcite (high interference colors)
associated with prehnite and acicular clinozoisite; TL-XPL. c) Details showing euhedral epidote, acicular clinozoisite and
prehnite (bluish grey); TL-XPL. d) Partly altered rutile associated with microcrystalline quartz (dark gray) and phyllosilicates
(light gray) from wallrock; RL-PPL. e) Small grain of native copper embedded in prehnite; RL-PPL.
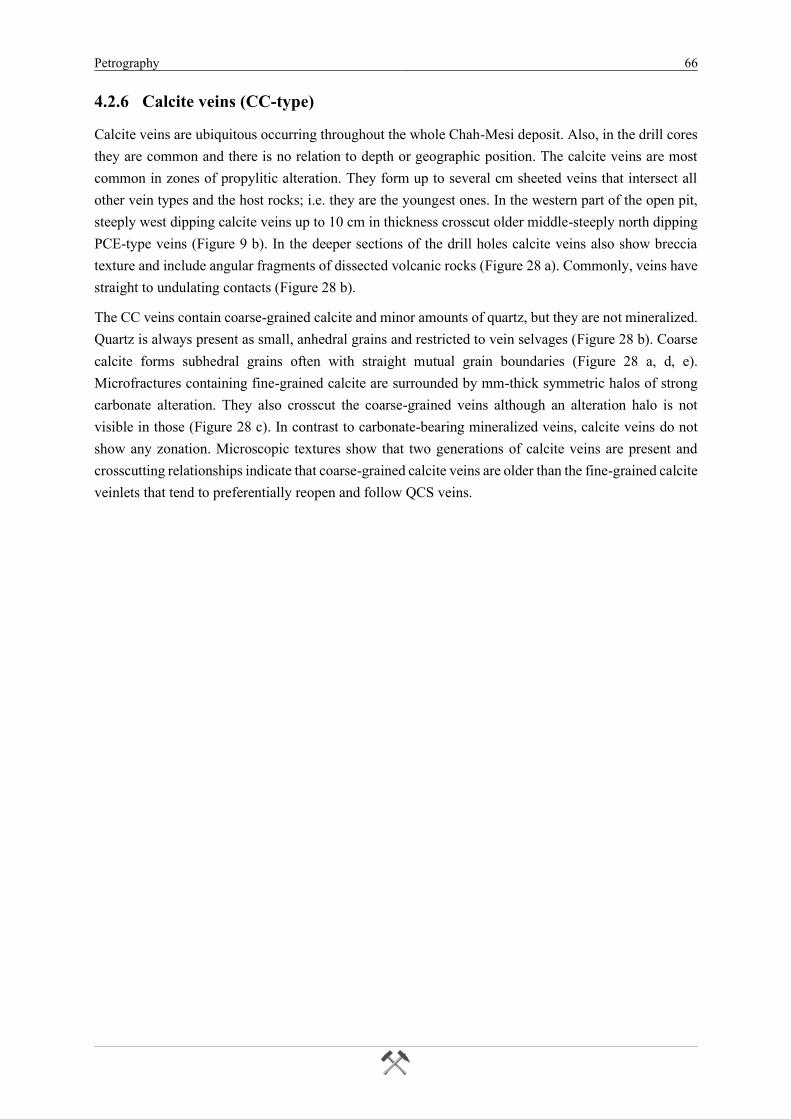
Petrography 66
4.2.6 Calcite veins (CC-type)
Calcite veins are ubiquitous occurring throughout the whole Chah-Mesi deposit. Also, in the drill cores
they are common and there is no relation to depth or geographic position. The calcite veins are most
common in zones of propylitic alteration. They form up to several cm sheeted veins that intersect all
other vein types and the host rocks; i.e. they are the youngest ones. In the western part of the open pit,
steeply west dipping calcite veins up to 10 cm in thickness crosscut older middle-steeply north dipping
PCE-type veins (Figure 9 b). In the deeper sections of the drill holes calcite veins also show breccia
texture and include angular fragments of dissected volcanic rocks (Figure 28 a). Commonly, veins have
straight to undulating contacts (Figure 28 b).
The CC veins contain coarse-grained calcite and minor amounts of quartz, but they are not mineralized.
Quartz is always present as small, anhedral grains and restricted to vein selvages (Figure 28 b). Coarse
calcite forms subhedral grains often with straight mutual grain boundaries (Figure 28 a, d, e).
Microfractures containing fine-grained calcite are surrounded by mm-thick symmetric halos of strong
carbonate alteration. They also crosscut the coarse-grained veins although an alteration halo is not
visible in those (Figure 28 c). In contrast to carbonate-bearing mineralized veins, calcite veins do not
show any zonation. Microscopic textures show that two generations of calcite veins are present and
crosscutting relationships indicate that coarse-grained calcite veins are older than the fine-grained calcite
veinlets that tend to preferentially reopen and follow QCS veins.
Petrography 67
Figure 28: Photo and photomicrographs (b-f, all taken in transmitted light) of calcite veins. a) Anastomosing calcite vein
showing fragmentation of pyroclastic wallrock with angular components included in calcite matrix; sample CHM4-117. b)
Calcite veinlet with sharp contact to host rock. Inequigranular calcite grains show distinct lamellar twinning; sample CHM1-
172, XPL. c) Fine grained microfracture calcite producing a calcite-rich alteration halo in the host rock; it also crosscuts the
coarse-grained calcite vein; sample CHM1-172, PPL. d) Vein of coarse calcite interleaved by undulating veinlets containing
fine-grained calcite; sample CHM1-115, XPL. e) Coarse calcite vein crosscutting QCS vein and altered host rock (lower right).
f) Thin veinlet of coarse calcite (upper left to lower right) crosscutting QCS vein (upper right to lower left). Microfractures
with fine-grained follow the QCS direction and crosscut the coarse calcite veinlet.
Petrography 68
4.3 Alteration
Several alteration types were documented in the Chah-Mesi deposit (Table 10). Regarding the scale, a
more regional alteration (deposit scale) has to be distinguished from local alteration, the latter related to
individual veins. Adjacent and within to major fault zones silicification dominates and most of the
adjacent O-type veins have advanced argillic alteration halos. Sericitic alteration forms a contiguous
zone to advanced argillic alteration and is the most common type of alteration at Chah-Mesi deposit.
Propylitic alteration formed distally to the ore deposit. In the northernmost part of Chah-Mesi, towards
the Meiduk porphyry copper deposit, potassic alteration has been recorded in BH-CHM4.
Alteration assemblages were only determined by microscope. Thus, a definite distinction of very fine-
grained minerals and particularly of the clay minerals was not possible. The nomenclature used in the
following is based on the terminology of Thompson and Thompson (1996) and the well-established
alteration types recorded from porphyry copper systems as summarized by Sillitoe (2010).
Table 10: Types of hydrothermal alteration at Chah-Mesi.
Alteration Mineral assemblage Description
Silicic Quartz, chalcedony adjacent to O-type veins, mostly related to
massive and banded textures, vuggy-residual
silica
Advanced argillic Clay minerals (kaolinite, montmorillonite,
illite-smectite), quartz, pyrite, sericite, APS?,
Fe-oxyhydroxides
restricted alteration halos around veins
dominated by high-sulfidation mineral
assemblages
Sericitic Sericite, chlorite, clay minerals, calcite most present alteration type, dominates the
central parts of the deposit, transition into
shallow argillic and lateral propylitic, borders
potassic towards north, QCS-veinlets
Argillic Clay minerals (illite-smectite,
montmorillonite), Fe-oxyhydroxides, quartz
strong decomposition of host rocks into mainly
clay minerals at shallow deposit levels
Propylitic Calcite, chlorite, epidote, sericite, clay
minerals, pyrite
occurs as an outer regionally extensive
alteration zone, PCE-, CC-veinlets
Potassic Biotite, chlorite, sericite, anhydrite forms peripheral alteration zone in wallrocks,
associated with porphyry-related veins, in
proximity to Meiduk
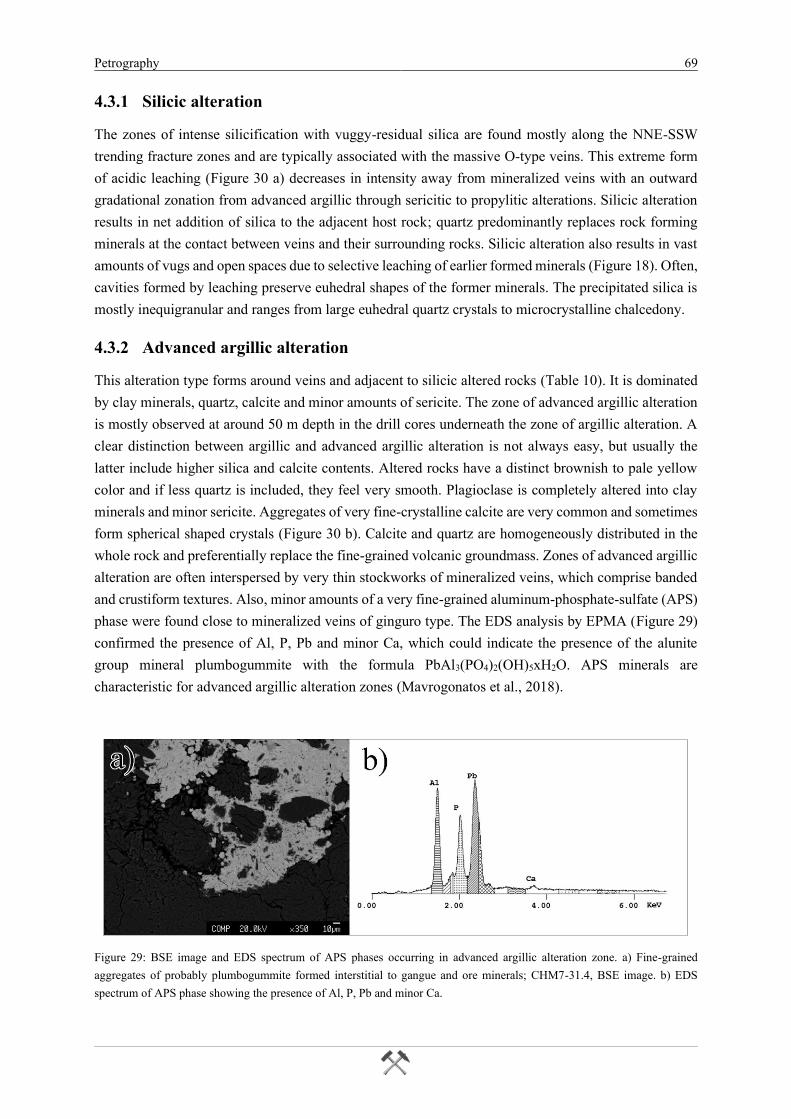
Petrography 69
4.3.1 Silicic alteration
The zones of intense silicification with vuggy-residual silica are found mostly along the NNE-SSW
trending fracture zones and are typically associated with the massive O-type veins. This extreme form
of acidic leaching (Figure 30 a) decreases in intensity away from mineralized veins with an outward
gradational zonation from advanced argillic through sericitic to propylitic alterations. Silicic alteration
results in net addition of silica to the adjacent host rock; quartz predominantly replaces rock forming
minerals at the contact between veins and their surrounding rocks. Silicic alteration also results in vast
amounts of vugs and open spaces due to selective leaching of earlier formed minerals (Figure 18). Often,
cavities formed by leaching preserve euhedral shapes of the former minerals. The precipitated silica is
mostly inequigranular and ranges from large euhedral quartz crystals to microcrystalline chalcedony.
4.3.2 Advanced argillic alteration
This alteration type forms around veins and adjacent to silicic altered rocks (Table 10). It is dominated
by clay minerals, quartz, calcite and minor amounts of sericite. The zone of advanced argillic alteration
is mostly observed at around 50 m depth in the drill cores underneath the zone of argillic alteration. A
clear distinction between argillic and advanced argillic alteration is not always easy, but usually the
latter include higher silica and calcite contents. Altered rocks have a distinct brownish to pale yellow
color and if less quartz is included, they feel very smooth. Plagioclase is completely altered into clay
minerals and minor sericite. Aggregates of very fine-crystalline calcite are very common and sometimes
form spherical shaped crystals (Figure 30 b). Calcite and quartz are homogeneously distributed in the
whole rock and preferentially replace the fine-grained volcanic groundmass. Zones of advanced argillic
alteration are often interspersed by very thin stockworks of mineralized veins, which comprise banded
and crustiform textures. Also, minor amounts of a very fine-grained aluminum-phosphate-sulfate (APS)
phase were found close to mineralized veins of ginguro type. The EDS analysis by EPMA (Figure 29)
confirmed the presence of Al, P, Pb and minor Ca, which could indicate the presence of the alunite
group mineral plumbogummite with the formula PbAl3(PO4)2(OH)5xH2O. APS minerals are
characteristic for advanced argillic alteration zones (Mavrogonatos et al., 2018).
Figure 29: BSE image and EDS spectrum of APS phases occurring in advanced argillic alteration zone. a) Fine-grained
aggregates of probably plumbogummite formed interstitial to gangue and ore minerals; CHM7-31.4, BSE image. b) EDS
spectrum of APS phase showing the presence of Al, P, Pb and minor Ca.
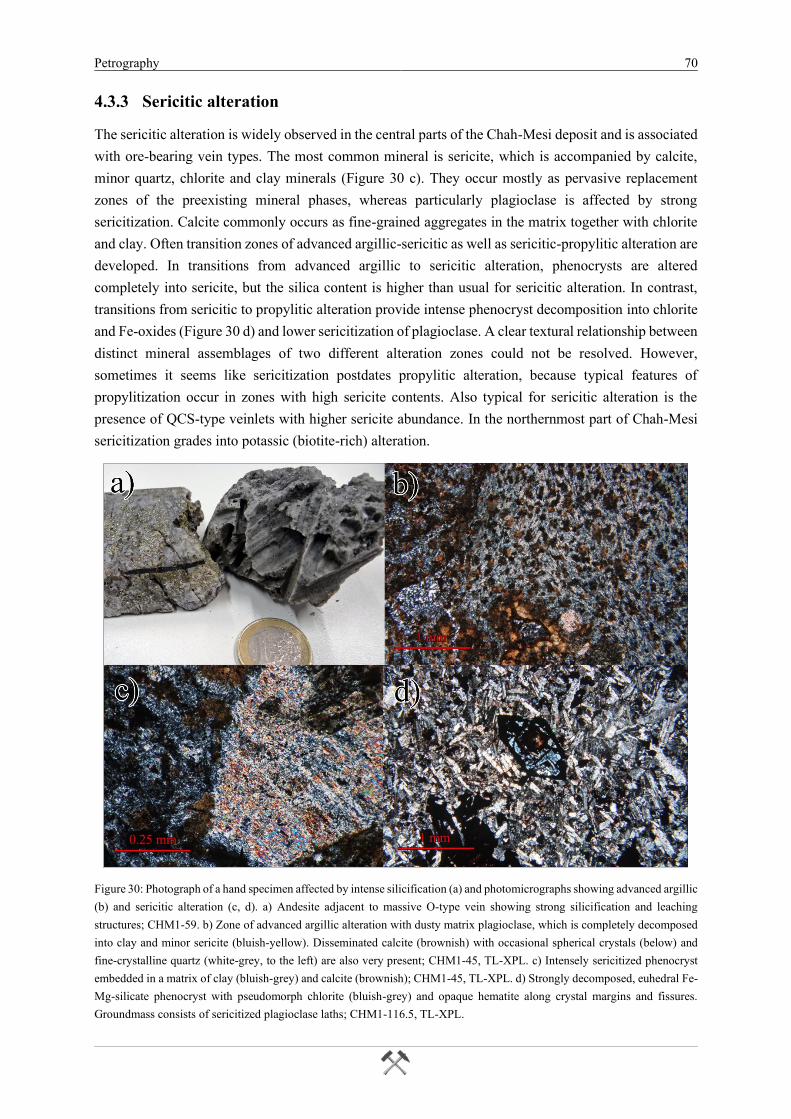
Petrography 70
4.3.3 Sericitic alteration
The sericitic alteration is widely observed in the central parts of the Chah-Mesi deposit and is associated
with ore-bearing vein types. The most common mineral is sericite, which is accompanied by calcite,
minor quartz, chlorite and clay minerals (Figure 30 c). They occur mostly as pervasive replacement
zones of the preexisting mineral phases, whereas particularly plagioclase is affected by strong
sericitization. Calcite commonly occurs as fine-grained aggregates in the matrix together with chlorite
and clay. Often transition zones of advanced argillic-sericitic as well as sericitic-propylitic alteration are
developed. In transitions from advanced argillic to sericitic alteration, phenocrysts are altered
completely into sericite, but the silica content is higher than usual for sericitic alteration. In contrast,
transitions from sericitic to propylitic alteration provide intense phenocryst decomposition into chlorite
and Fe-oxides (Figure 30 d) and lower sericitization of plagioclase. A clear textural relationship between
distinct mineral assemblages of two different alteration zones could not be resolved. However,
sometimes it seems like sericitization postdates propylitic alteration, because typical features of
propylitization occur in zones with high sericite contents. Also typical for sericitic alteration is the
presence of QCS-type veinlets with higher sericite abundance. In the northernmost part of Chah-Mesi
sericitization grades into potassic (biotite-rich) alteration.
Figure 30: Photograph of a hand specimen affected by intense silicification (a) and photomicrographs showing advanced argillic
(b) and sericitic alteration (c, d). a) Andesite adjacent to massive O-type vein showing strong silicification and leaching
structures; CHM1-59. b) Zone of advanced argillic alteration with dusty matrix plagioclase, which is completely decomposed
into clay and minor sericite (bluish-yellow). Disseminated calcite (brownish) with occasional spherical crystals (below) and
fine-crystalline quartz (white-grey, to the left) are also very present; CHM1-45, TL-XPL. c) Intensely sericitized phenocryst
embedded in a matrix of clay (bluish-grey) and calcite (brownish); CHM1-45, TL-XPL. d) Strongly decomposed, euhedral Fe-
Mg-silicate phenocryst with pseudomorph chlorite (bluish-grey) and opaque hematite along crystal margins and fissures.
Groundmass consists of sericitized plagioclase laths; CHM1-116.5, TL-XPL.
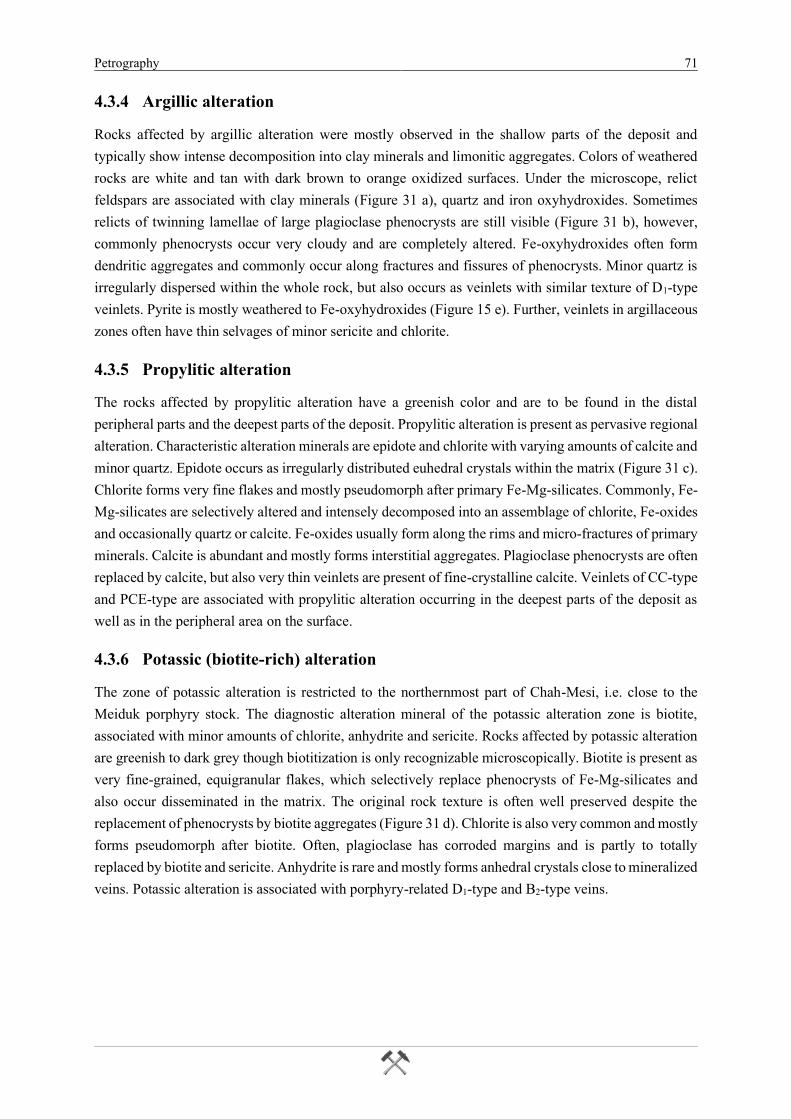
Petrography 71
4.3.4 Argillic alteration
Rocks affected by argillic alteration were mostly observed in the shallow parts of the deposit and
typically show intense decomposition into clay minerals and limonitic aggregates. Colors of weathered
rocks are white and tan with dark brown to orange oxidized surfaces. Under the microscope, relict
feldspars are associated with clay minerals (Figure 31 a), quartz and iron oxyhydroxides. Sometimes
relicts of twinning lamellae of large plagioclase phenocrysts are still visible (Figure 31 b), however,
commonly phenocrysts occur very cloudy and are completely altered. Fe-oxyhydroxides often form
dendritic aggregates and commonly occur along fractures and fissures of phenocrysts. Minor quartz is
irregularly dispersed within the whole rock, but also occurs as veinlets with similar texture of D1-type
veinlets. Pyrite is mostly weathered to Fe-oxyhydroxides (Figure 15 e). Further, veinlets in argillaceous
zones often have thin selvages of minor sericite and chlorite.
4.3.5 Propylitic alteration
The rocks affected by propylitic alteration have a greenish color and are to be found in the distal
peripheral parts and the deepest parts of the deposit. Propylitic alteration is present as pervasive regional
alteration. Characteristic alteration minerals are epidote and chlorite with varying amounts of calcite and
minor quartz. Epidote occurs as irregularly distributed euhedral crystals within the matrix (Figure 31 c).
Chlorite forms very fine flakes and mostly pseudomorph after primary Fe-Mg-silicates. Commonly, Fe-
Mg-silicates are selectively altered and intensely decomposed into an assemblage of chlorite, Fe-oxides
and occasionally quartz or calcite. Fe-oxides usually form along the rims and micro-fractures of primary
minerals. Calcite is abundant and mostly forms interstitial aggregates. Plagioclase phenocrysts are often
replaced by calcite, but also very thin veinlets are present of fine-crystalline calcite. Veinlets of CC-type
and PCE-type are associated with propylitic alteration occurring in the deepest parts of the deposit as
well as in the peripheral area on the surface.
4.3.6 Potassic (biotite-rich) alteration
The zone of potassic alteration is restricted to the northernmost part of Chah-Mesi, i.e. close to the
Meiduk porphyry stock. The diagnostic alteration mineral of the potassic alteration zone is biotite,
associated with minor amounts of chlorite, anhydrite and sericite. Rocks affected by potassic alteration
are greenish to dark grey though biotitization is only recognizable microscopically. Biotite is present as
very fine-grained, equigranular flakes, which selectively replace phenocrysts of Fe-Mg-silicates and
also occur disseminated in the matrix. The original rock texture is often well preserved despite the
replacement of phenocrysts by biotite aggregates (Figure 31 d). Chlorite is also very common and mostly
forms pseudomorph after biotite. Often, plagioclase has corroded margins and is partly to totally
replaced by biotite and sericite. Anhydrite is rare and mostly forms anhedral crystals close to mineralized
veins. Potassic alteration is associated with porphyry-related D1-type and B2-type veins.
Petrography 72
Figure 31: Photomicrographs showing argillic (a, b), propylitic (c) and potassic (d) alteration. a) Plagioclase phenocrysts are
totally altered to very fine aggregates of clay minerals plus Fe-oxyhydroxides; CHM1-5, TL-PPL. b) Twinning lamellae are
still visible in altered plagioclase phenocryst (lower left corner). Fe-oxyhydroxides occurring as opaque phases with increasing
reddish birefringence towards the margins; CHM1-5, TL-XPL. c) Euhedral crystals of epidote (purple-blue to yellow-orange)
beneath altered plagioclase with fine-grained calcite (high birefringence, red-orange); CHM1-178, TL-XPL. d) Fine-grained
biotite crystals (high birefringence, yellow-green to red) selectively replacing ferromagnesian phenocrysts of a potassic altered
andesite and forming a glomerophyric-like texture. Biotite also constitutes the groundmass together with (altered) plagioclase
and magnetite; CHM4-20, TL-XPL.
Ore mineralogy 73
5 Ore mineralogy
At the Chah-Mesi polymetallic vein deposit the predominant sulfide minerals are pyrite, chalcopyrite,
galena and sphalerite. Associated minor minerals include enargite, luzonite-famatinite, tetrahedrite-
tennantite, covellite and chalcocite. Gold is present as electrum and silver is contained in fahlore group
minerals and rare Ag-bearing sulfosalts and sulfides. Ore minerals are predominantly restricted to O-
type veins (Chapter 4.2.4) occurring as open space infillings or replacement ores. Gangue minerals
comprise quartz and Ca-Mg-Mn-Fe-carbonates together with minor sericite, anhydrite, apatite and
barite. Sulfides are either disseminated or form thin layers/bands within the veins parallel to the vein
wallrock contacts. In breccia zones, sulfides form ore coatings around fragmented wallrock components
and constitute a major part of the matrix. Open space deposition and replacement textures indicate a late
stage hydrothermal sulfide deposition. Supergene mineralization comprises chalcocite and covellite
together with goethite-limonite, malachite, azurite and anglesite.
On the basis of mineralogy and textural relationships it was tried to establish a paragenetic sequence of
mineralization. An unequivocal differentiation into distinct ore assemblages was hardly possible,
because almost all samples studied contained the same ore minerals, however, showing varying modal
and metal proportions. These differences in metal proportions reflect a deposit-scale spatial as well as
time zonation. Fe-Cu-dominated assemblages predominate in massive O-type veins in the center and in
shallow ore zones grading into Pb-Zn-richer ores within banded to crustiform veins towards the
periphery of Chah-Mesi deposit. Zonation is even documented on the vein scale where the outer parts
(earlier) of individual composite veins tend to be richer in Fe and Cu than the interior parts (later) which
contain more Pb and Zn.
This metal distribution was used to distinguish four ore zones, which exhibit extensive zonal overlap.
Hence, transitions are common. Supergene mineralization is ubiquitous and restricted to superficial
areas at Chah-Mesi. The established paragenetic sequence of the ore minerals in the Chah-Mesi
polymetallic vein deposit is shown in Figure 37. The mineralogical and textural features of the distinct
ore zones are summarized and in Table 11.
The terminology used in this chapter mainly follows Barton (1970) and Einaudi et al. (2003). Mineral
assemblages are defined as a group of minerals that occur in direct contact (mutual grain contacts) and
display no evidence of reaction with one another. Minerals that constitute an assemblage are joined with
"+" signs in the text. Mineral association is a group of minerals that are characteristic of a given zone
of mineralization, however, the minerals are not always in mutual contact and they were not necessarily
all deposited at the same time (Einaudi et al., 2003). An ore zone designates a restricted section of the
deposit, which is characterized by distinct proportions of the metallic species and mineral association
(i.e. Fe-Cu- or Pb-Zn-dominated). The term mineralization stage is used for a group of phases that
represents an interval of deposition during which no discernible chemical or physical change has
happened (Barton, 1970). The term paragenesis refers to the sequential formation of minerals (Craig
and Vaughan, 1994).
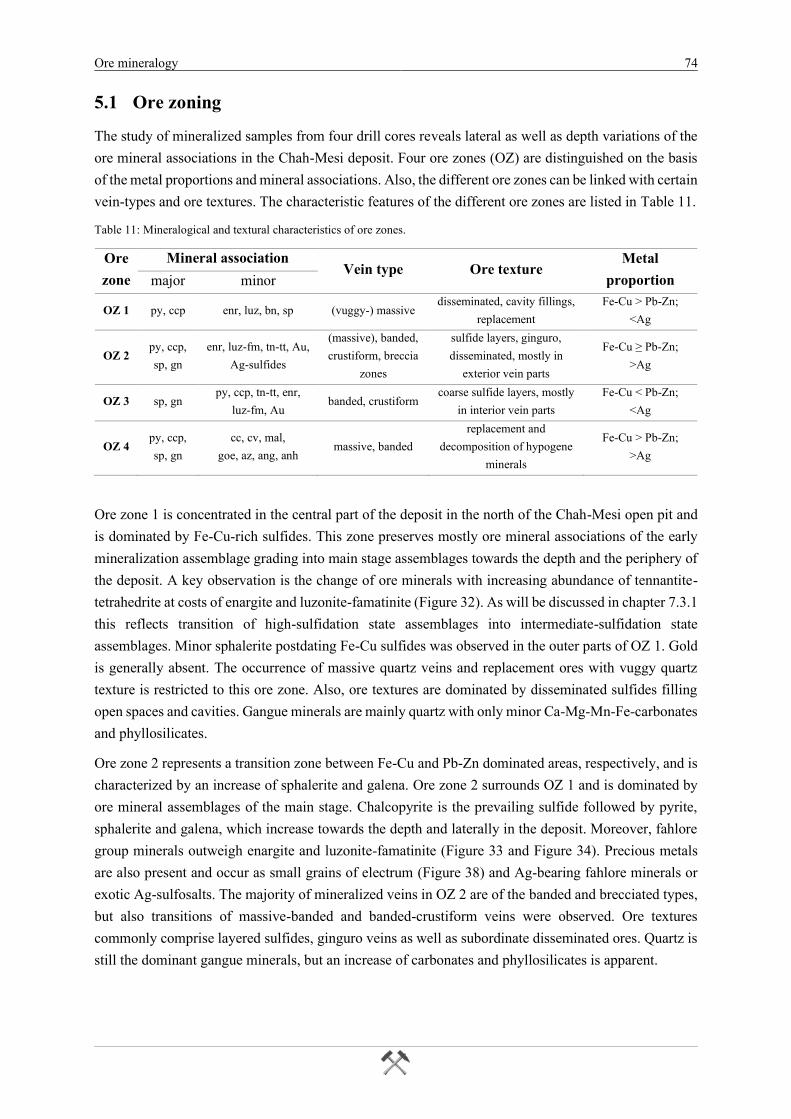
Ore mineralogy 74
5.1 Ore zoning
The study of mineralized samples from four drill cores reveals lateral as well as depth variations of the
ore mineral associations in the Chah-Mesi deposit. Four ore zones (OZ) are distinguished on the basis
of the metal proportions and mineral associations. Also, the different ore zones can be linked with certain
vein-types and ore textures. The characteristic features of the different ore zones are listed in Table 11.
Table 11: Mineralogical and textural characteristics of ore zones.
Ore
zone
Mineral association Vein type Ore texture
Metal
proportion major minor
OZ 1 py, ccp enr, luz, bn, sp (vuggy-) massive disseminated, cavity fillings,
replacement
Fe-Cu > Pb-Zn;
<Ag
OZ 2 py, ccp,
sp, gn
enr, luz-fm, tn-tt, Au,
Ag-sulfides
(massive), banded,
crustiform, breccia
zones
sulfide layers, ginguro,
disseminated, mostly in
exterior vein parts
Fe-Cu ≥ Pb-Zn;
>Ag
OZ 3 sp, gn py, ccp, tn-tt, enr,
luz-fm, Au banded, crustiform
coarse sulfide layers, mostly
in interior vein parts
Fe-Cu < Pb-Zn;
<Ag
OZ 4 py, ccp,
sp, gn
cc, cv, mal,
goe, az, ang, anh massive, banded
replacement and
decomposition of hypogene
minerals
Fe-Cu > Pb-Zn;
>Ag
Ore zone 1 is concentrated in the central part of the deposit in the north of the Chah-Mesi open pit and
is dominated by Fe-Cu-rich sulfides. This zone preserves mostly ore mineral associations of the early
mineralization assemblage grading into main stage assemblages towards the depth and the periphery of
the deposit. A key observation is the change of ore minerals with increasing abundance of tennantite-
tetrahedrite at costs of enargite and luzonite-famatinite (Figure 32). As will be discussed in chapter 7.3.1
this reflects transition of high-sulfidation state assemblages into intermediate-sulfidation state
assemblages. Minor sphalerite postdating Fe-Cu sulfides was observed in the outer parts of OZ 1. Gold
is generally absent. The occurrence of massive quartz veins and replacement ores with vuggy quartz
texture is restricted to this ore zone. Also, ore textures are dominated by disseminated sulfides filling
open spaces and cavities. Gangue minerals are mainly quartz with only minor Ca-Mg-Mn-Fe-carbonates
and phyllosilicates.
Ore zone 2 represents a transition zone between Fe-Cu and Pb-Zn dominated areas, respectively, and is
characterized by an increase of sphalerite and galena. Ore zone 2 surrounds OZ 1 and is dominated by
ore mineral assemblages of the main stage. Chalcopyrite is the prevailing sulfide followed by pyrite,
sphalerite and galena, which increase towards the depth and laterally in the deposit. Moreover, fahlore
group minerals outweigh enargite and luzonite-famatinite (Figure 33 and Figure 34). Precious metals
are also present and occur as small grains of electrum (Figure 38) and Ag-bearing fahlore minerals or
exotic Ag-sulfosalts. The majority of mineralized veins in OZ 2 are of the banded and brecciated types,
but also transitions of massive-banded and banded-crustiform veins were observed. Ore textures
commonly comprise layered sulfides, ginguro veins as well as subordinate disseminated ores. Quartz is
still the dominant gangue minerals, but an increase of carbonates and phyllosilicates is apparent.
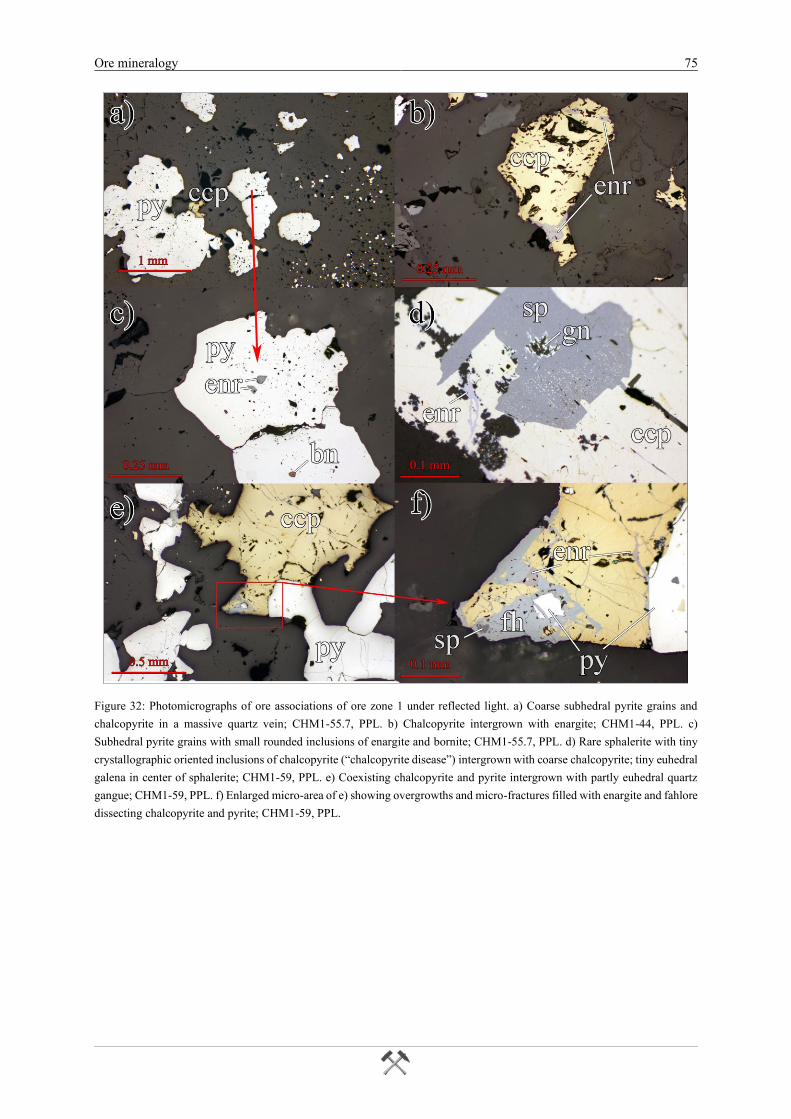
Ore mineralogy 75
Figure 32: Photomicrographs of ore associations of ore zone 1 under reflected light. a) Coarse subhedral pyrite grains and
chalcopyrite in a massive quartz vein; CHM1-55.7, PPL. b) Chalcopyrite intergrown with enargite; CHM1-44, PPL. c)
Subhedral pyrite grains with small rounded inclusions of enargite and bornite; CHM1-55.7, PPL. d) Rare sphalerite with tiny
crystallographic oriented inclusions of chalcopyrite (“chalcopyrite disease”) intergrown with coarse chalcopyrite; tiny euhedral
galena in center of sphalerite; CHM1-59, PPL. e) Coexisting chalcopyrite and pyrite intergrown with partly euhedral quartz
gangue; CHM1-59, PPL. f) Enlarged micro-area of e) showing overgrowths and micro-fractures filled with enargite and fahlore
dissecting chalcopyrite and pyrite; CHM1-59, PPL.
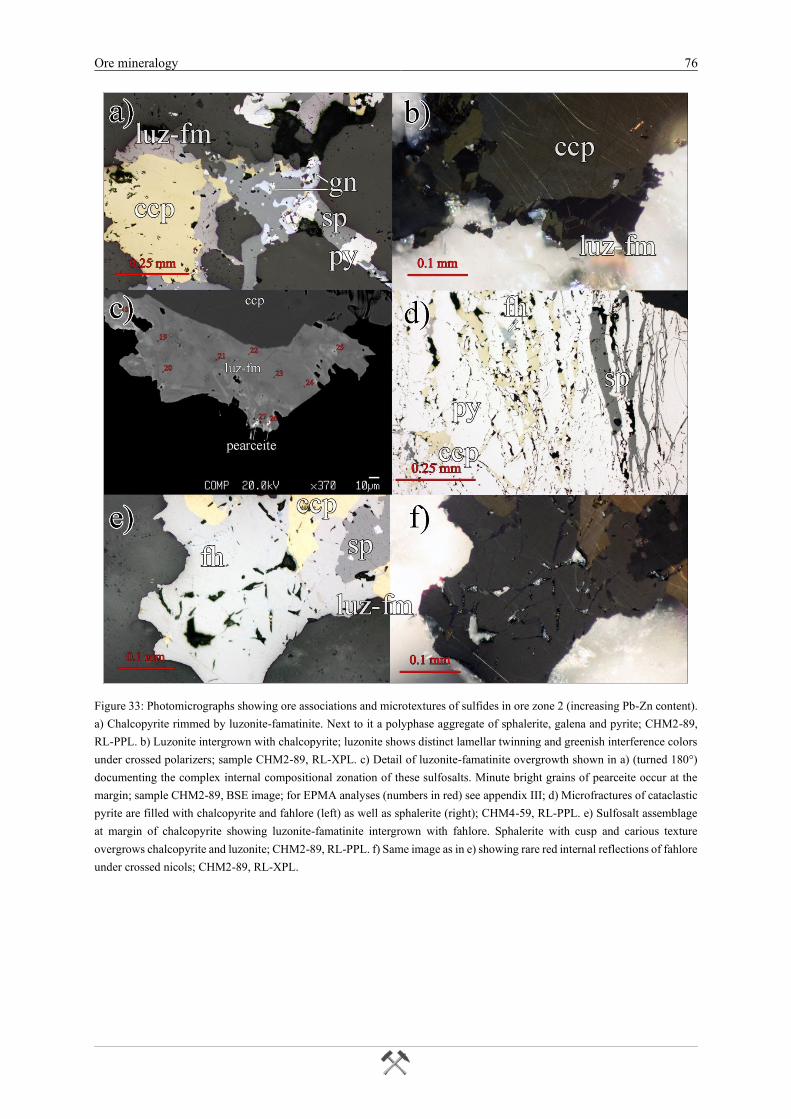
Ore mineralogy 76
Figure 33: Photomicrographs showing ore associations and microtextures of sulfides in ore zone 2 (increasing Pb-Zn content).
a) Chalcopyrite rimmed by luzonite-famatinite. Next to it a polyphase aggregate of sphalerite, galena and pyrite; CHM2-89,
RL-PPL. b) Luzonite intergrown with chalcopyrite; luzonite shows distinct lamellar twinning and greenish interference colors
under crossed polarizers; sample CHM2-89, RL-XPL. c) Detail of luzonite-famatinite overgrowth shown in a) (turned 180°)
documenting the complex internal compositional zonation of these sulfosalts. Minute bright grains of pearceite occur at the
margin; sample CHM2-89, BSE image; for EPMA analyses (numbers in red) see appendix III; d) Microfractures of cataclastic
pyrite are filled with chalcopyrite and fahlore (left) as well as sphalerite (right); CHM4-59, RL-PPL. e) Sulfosalt assemblage
at margin of chalcopyrite showing luzonite-famatinite intergrown with fahlore. Sphalerite with cusp and carious texture
overgrows chalcopyrite and luzonite; CHM2-89, RL-PPL. f) Same image as in e) showing rare red internal reflections of fahlore
under crossed nicols; CHM2-89, RL-XPL.
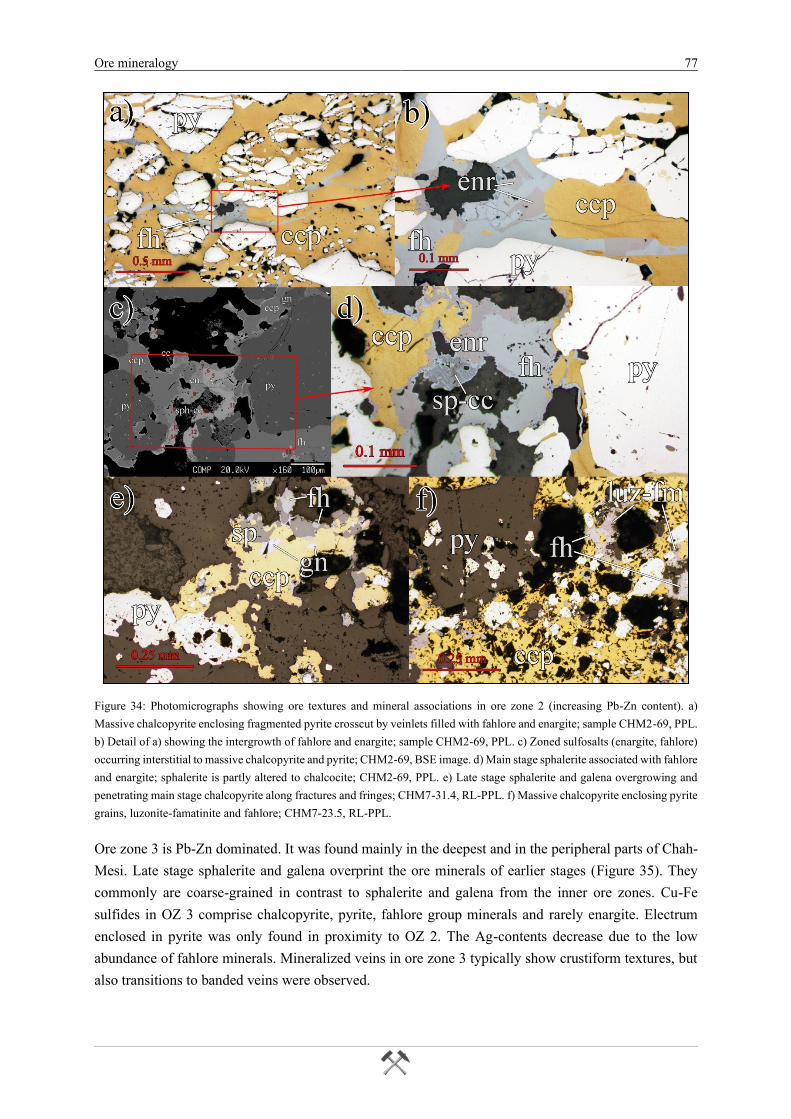
Ore mineralogy 77
Figure 34: Photomicrographs showing ore textures and mineral associations in ore zone 2 (increasing Pb-Zn content). a)
Massive chalcopyrite enclosing fragmented pyrite crosscut by veinlets filled with fahlore and enargite; sample CHM2-69, PPL.
b) Detail of a) showing the intergrowth of fahlore and enargite; sample CHM2-69, PPL. c) Zoned sulfosalts (enargite, fahlore)
occurring interstitial to massive chalcopyrite and pyrite; CHM2-69, BSE image. d) Main stage sphalerite associated with fahlore
and enargite; sphalerite is partly altered to chalcocite; CHM2-69, PPL. e) Late stage sphalerite and galena overgrowing and
penetrating main stage chalcopyrite along fractures and fringes; CHM7-31.4, RL-PPL. f) Massive chalcopyrite enclosing pyrite
grains, luzonite-famatinite and fahlore; CHM7-23.5, RL-PPL.
Ore zone 3 is Pb-Zn dominated. It was found mainly in the deepest and in the peripheral parts of Chah-
Mesi. Late stage sphalerite and galena overprint the ore minerals of earlier stages (Figure 35). They
commonly are coarse-grained in contrast to sphalerite and galena from the inner ore zones. Cu-Fe
sulfides in OZ 3 comprise chalcopyrite, pyrite, fahlore group minerals and rarely enargite. Electrum
enclosed in pyrite was only found in proximity to OZ 2. The Ag-contents decrease due to the low
abundance of fahlore minerals. Mineralized veins in ore zone 3 typically show crustiform textures, but
also transitions to banded veins were observed.
Ore mineralogy 78
The crustiform veins contain sphalerite and galena, which preferentially occur in the inner parts of veins
and show an increase of the crystal size towards the center. Moreover, Ca-Mg-Mn-Fe-carbonates
become important gangue minerals with only minor euhedral quartz.
Figure 35: Photomicrographs showing ore associations and microtextures of ore zone 3. a) Galena showing undulating mutual
grain boundaries with sphalerite and also filling micro-fracture in pyrite; CHM2-67, RL-PPL. b) Sphalerite, galena and
chalcopyrite and pyrite; pyrite and sphalerite partly overgrow chalcopyrite. Note that bireflectance of sphalerite occurs due to
an uneven surface of the fluid inclusion thick section; FI-sample CHM7-52, RL-PPL. c) Galena showing slightly deformed
cleavage pits (“Bleischweife”) indicating minor deformation; CHM7-94, RL-PPL. d) Cusp and carious texture indicating
crystal growth of sphalerite at expense of galena; CHM7-94, RL-PPL. e) Coarse-grained sphalerite enclosing galena; CHM1-
159, RL-PPL. f) Sphalerite and galena from crustiform vein at deeper level of the deposit. Sphalerite contains small worm-like
inclusions of chalcopyrite; CHM1-160, RL-PPL.
Ore mineralogy 79
Ore zone 4 represents the zone of supergene weathering extending from the surface to a depth of
approximately 50 m and affecting all hypogene mineral associations in the various vein types.
Characteristic ore minerals of this zone are chalcocite and covellite as well as malachite, azurite, goethite
and limonite (Figure 36). Typically, chalcocite and covellite replace hypogene sulfides of the early, main
and late stage. Gold was not observed in this zone, but higher Ag contents have been recorded. In
contrast to the deeper zones, where tetrahedrite and tennantite act as the main Ag-carrier, chalcocite and
covellite seem to be the main Ag-bearing phases in the supergene zone (Chapter 5.3.2).
Figure 36: Photomicrographs of supergene mineralization and secondary minerals on the surface of ore zone 4. a) Chalcopyrite
showing beginning supergene alteration to covellite, which forms fringes and grows into corrosion-related cavities and open
spaces; CHM8.1, RL-PPL. b) Covellite replacing chalcopyrite. Pyrite is commonly unaffected; CHM9.1, RL-PPL. c) Coarse-
grained sphalerite with fringe of galena showing beginning replacement by chalcocite and covellite along micro-fracture.
Galena is altered to anglesite (dark grey, upper right corner); CHM8.1, RL-PPL. d) Supergene alteration of galena with mainly
chalcocite forming in fringes and fissures. Additionally, minor anglesite forms (center); CHM1B, BSE image. e) Fracture-
filling with malachite and azurite in limonitic gangue material; banded malachite is composed of fibrous crystals; azurite shows
deep blue internal reflections; CHM6, RL-XPL. f) Void-filling microcrystalline anhydrite showing white to milky white
internal reflection in weathered chalcopyrite-rich ore; CHM7-31.4, RL-XPL.
Ore mineralogy 80
5.2 Ore paragenesis and ore textures
Based on mineralogy and textural relationships four mineralization stages were established defining a
paragenetic sequence (Figure 37). They reflect ore formation due to continuous (?) changes of
physicochemical conditions (e.g. temperature, ƒS2) and of fluid composition. Based on textural relations
an early, main and late hypogene mineralization stage are distinguished. The fourth stage is supergene
weathering. The early stage is dominated by pyrite and chalcopyrite with minor enargite/luzonite-
famatinite and bornite. The mineral assemblage of this stage reflect formation at higher sulfidation
states. The main stage consists of pyrite, chalcopyrite, tennantite-tetrahedrite with minor sphalerite, gold
and exotic Ag-sulfosalts. The late stage of hypogene mineralization is mainly represented by sphalerite,
galena and pyrite. The main and late stage reflect cooling of the hydrothermal system and intermediate-
sulfidation states. Supergene mineralization overprints all hypogene features and shows distinct textures
of replacement and decomposition related to weathering.
Figure 37: Paragenetic sequence of ore and gangue minerals in the Chah-Mesi polymetallic vein deposit. Early stage
mineralization is characterized by quartz rich veins with pyrite, chalcopyrite, enargite-luzonite and minor bornite. The main
mineralization stage comprises the associations of quartz-carbonate gangue with chalcopyrite, pyrite, fahlore (tennantite-
tetrahedrite), electrum, Ag-sulfides and minor sphalerite plus galena. The late mineralization stage refers to Pb-Zn rich
dominated sulfides with mainly sphalerite and galena occurring together with pyrite and small amounts of chalcopyrite and
native gold. In the near-surface zone, hypogene mineralization is overprinted by supergene mineralization with abundant
chalcocite, covellite and other secondary minerals.
Ore mineralogy 81
5.2.1 Early stage
The mineral assemblage of the early mineralization stage is concentrated in ore zone 1 of the central
part of the deposit where they are found in massive quartz veins and minor replacement bodies. Pyrite
and chalcopyrite of the early stage have mutual grain boundaries with smooth to undulating contacts.
Pyrite is the dominant sulfide of the early stage although it is also an important constituent of the later
mineralization stages. Usually, it occurs either as inequigranular, granoblastic grains reaching almost 2
mm in size or as nodular pyrite in “porphyritic” ore textures. Pyrite is also present as disseminated cubes
within the matrix of adjacent wallrocks. Early stage pyrite often has euhedral to subhedral morphology
and contains rounded inclusions that range between 20 and 30 µm in diameter. These inclusions mostly
consist of chalcopyrite, enargite/luzonite and minor bornite (Figure 32 c). The latter phase is only present
in inclusions; i.e. it is an early stage phase (Figure 37). Compared to enargite or luzonite, bornite
inclusions appear slightly darker in color and show rather weak anisotropy.
The dominant Cu-mineral of the early stage assemblage is chalcopyrite. It commonly occurs as
subhedral and anhedral grains up to 1 to 2 mm in size. Twinning is often visible under crossed polarizers
with non-deformed twin lamellae indicating a stress-free crystallization. Inclusions in chalcopyrite are
rare and mostly consist of small grains of pyrite as well as bornite. At shallow depths and particularly
on the surface chalcopyrite is commonly fringed and replaced by chalcocite and covellite.
Enargite and luzonite are in grain contact with chalcopyrite and pyrite but seem to have formed slightly
later. Commonly, they occur along the rims of chalcopyrite grains or within microfractures (Figure 37,
Figure 32 a, b) and develop anhedral to subhedral crystals smaller than 100 µm in size. In some sections,
thin microfractures filled with enargite/luzonite crosscut chalcopyrite and minor pyrite (Figure 32 e, f).
In addition to chemical composition (Chapter 5.3.2), the distinct lamellar twinning of luzonite, visible
under crossed polars in reflected light, was used to distinguish enargite from its dimorph luzonite (Figure
33 b). Enargite and luzonite associated with chalcopyrite are key minerals of the early mineralization
stage as they indicate high-sulfidation conditions (Chapter 7.1.2.1).
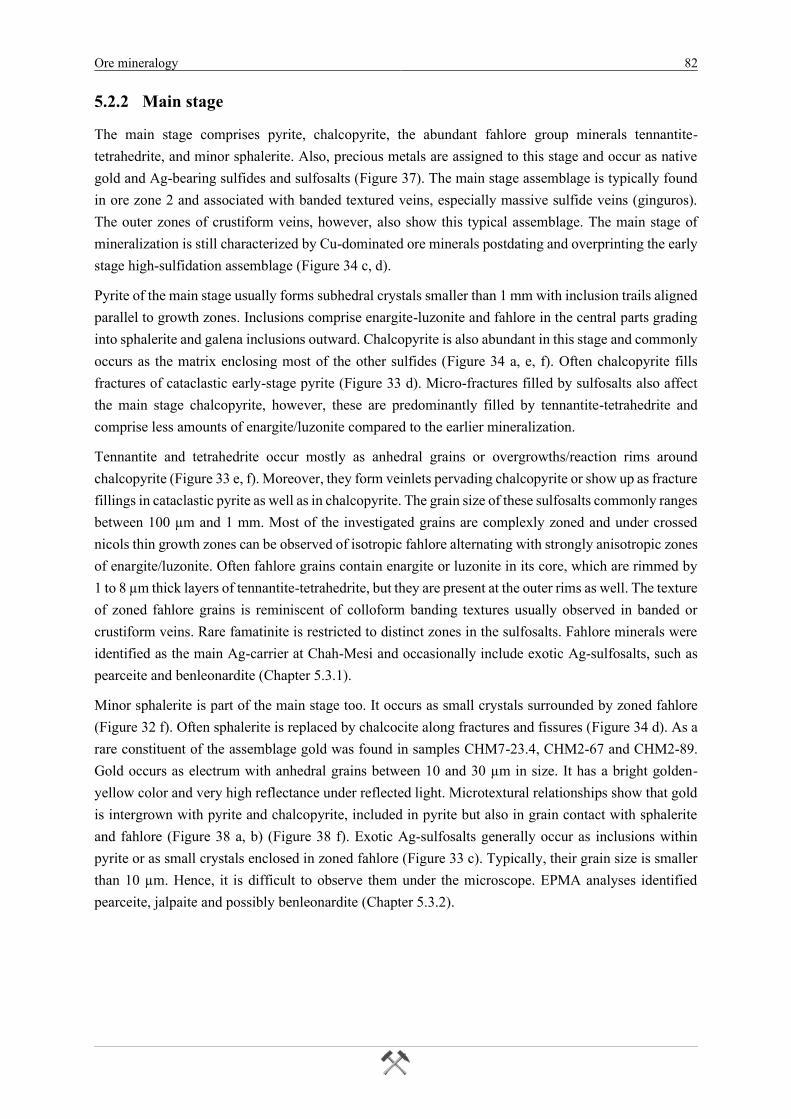
Ore mineralogy 82
5.2.2 Main stage
The main stage comprises pyrite, chalcopyrite, the abundant fahlore group minerals tennantite-
tetrahedrite, and minor sphalerite. Also, precious metals are assigned to this stage and occur as native
gold and Ag-bearing sulfides and sulfosalts (Figure 37). The main stage assemblage is typically found
in ore zone 2 and associated with banded textured veins, especially massive sulfide veins (ginguros).
The outer zones of crustiform veins, however, also show this typical assemblage. The main stage of
mineralization is still characterized by Cu-dominated ore minerals postdating and overprinting the early
stage high-sulfidation assemblage (Figure 34 c, d).
Pyrite of the main stage usually forms subhedral crystals smaller than 1 mm with inclusion trails aligned
parallel to growth zones. Inclusions comprise enargite-luzonite and fahlore in the central parts grading
into sphalerite and galena inclusions outward. Chalcopyrite is also abundant in this stage and commonly
occurs as the matrix enclosing most of the other sulfides (Figure 34 a, e, f). Often chalcopyrite fills
fractures of cataclastic early-stage pyrite (Figure 33 d). Micro-fractures filled by sulfosalts also affect
the main stage chalcopyrite, however, these are predominantly filled by tennantite-tetrahedrite and
comprise less amounts of enargite/luzonite compared to the earlier mineralization.
Tennantite and tetrahedrite occur mostly as anhedral grains or overgrowths/reaction rims around
chalcopyrite (Figure 33 e, f). Moreover, they form veinlets pervading chalcopyrite or show up as fracture
fillings in cataclastic pyrite as well as in chalcopyrite. The grain size of these sulfosalts commonly ranges
between 100 µm and 1 mm. Most of the investigated grains are complexly zoned and under crossed
nicols thin growth zones can be observed of isotropic fahlore alternating with strongly anisotropic zones
of enargite/luzonite. Often fahlore grains contain enargite or luzonite in its core, which are rimmed by
1 to 8 µm thick layers of tennantite-tetrahedrite, but they are present at the outer rims as well. The texture
of zoned fahlore grains is reminiscent of colloform banding textures usually observed in banded or
crustiform veins. Rare famatinite is restricted to distinct zones in the sulfosalts. Fahlore minerals were
identified as the main Ag-carrier at Chah-Mesi and occasionally include exotic Ag-sulfosalts, such as
pearceite and benleonardite (Chapter 5.3.1).
Minor sphalerite is part of the main stage too. It occurs as small crystals surrounded by zoned fahlore
(Figure 32 f). Often sphalerite is replaced by chalcocite along fractures and fissures (Figure 34 d). As a
rare constituent of the assemblage gold was found in samples CHM7-23.4, CHM2-67 and CHM2-89.
Gold occurs as electrum with anhedral grains between 10 and 30 µm in size. It has a bright golden-
yellow color and very high reflectance under reflected light. Microtextural relationships show that gold
is intergrown with pyrite and chalcopyrite, included in pyrite but also in grain contact with sphalerite
and fahlore (Figure 38 a, b) (Figure 38 f). Exotic Ag-sulfosalts generally occur as inclusions within
pyrite or as small crystals enclosed in zoned fahlore (Figure 33 c). Typically, their grain size is smaller
than 10 µm. Hence, it is difficult to observe them under the microscope. EPMA analyses identified
pearceite, jalpaite and possibly benleonardite (Chapter 5.3.2).
Ore mineralogy 83
The fahlore group minerals together with sphalerite are the typical key minerals of this paragenetic stage
because they illustrate a transition into intermediate-sulfidation state. Several textures also elucidate the
change of sulfidation state and chemical composition of the ore fluids during ore precipitation (Chapter
7.3.1), such as pyrite inclusions. Due to the complex zoning of typical HS- and IS-indicating sulfosalts,
a clear separation between the early and main stage is difficult and it might indicate a continuous
transition between early and main stage mineralization rather than two separate mineralizing events.
Figure 38: Photomicrographs showing association of gold with main stage (a, b, f) and late stage (c, d, e) ore minerals under
reflected light (PPL). a) Gold grain of about 50 µm (center) occurring at the grain boundary of subhedral pyrite; CHM7-23.5.
b) Several grains of gold occupying interstitial spaces between small euhedral pyrite grains enclosed by chalcopyrite; cavities
and voids of chalcopyrite are black; CHM7-23.5, PPL. c) Gold grain (30 µm) as a part of the late stage assemblage pyrite +
sphalerite + galena; CHM2-67, RL-PPL. d) Inclusions of gold (bright golden-yellow) in pyrite that is intergrown with galena;
CHM2-67, RL-PPL. e) Detail of c) showing the association of gold with pyrite and sphalerite; CHM2-67, RL-PPL. f) Electrum
of the main stage enclosed in a fahlore crystal that is surrounded by massive chalcopyrite; CHM7-32.5, RL-PPL.
Ore mineralogy 84
5.2.3 Late stage
The late stage mineralization is characterized by galena, sphalerite, pyrite. Rare electrum has also been
observed in this assemblage (Figure 37). This stage overprints all previous ore minerals as indicated by
galena and sphalerite mostly overgrowing and penetrating chalcopyrite, pyrite, enargite and fahlore
minerals of the early and main stage. The Pb-Zn dominated mineralization is more abundant in the distal
and deeper parts of the Chah-Mesi deposit associated with ore zone 3. It typically occurs in the
crustiform O-type veins. However, this late stage assemblage is also developed in the center of banded
veins and in brecciated ores.
Sphalerite is the dominant zinc mineral in Chah-Mesi. In Cu-sulfide dominated veins sphalerite is rather
irregularly distributed forming small to medium-grained, anhedral crystals in micro-fractures and
between other sulfides. In contrast, Pb-Zn dominated ores show crustiform banding subparallel to vein
walls with large, subhedral sphalerite crystals up to 5 mm in size (Figure 35 b). Chalcopyrite is
commonly included in this coarse-grained sphalerite. It has varying grain size and minute ovoid grains
and spherical droplets are arranged in cloud-like aggregates. Moreover, sphalerite contains inclusions
of various sulfosalts and galena.
The color of the internal reflections of sphalerite vary from white to bright yellow. Under reflected light,
in some cases, a transition of color and reflectivity can be observed that ranges from light gray with a
bluish tinge to lighter gray. Transmitted light microscopy shows that lighter gray sphalerite domains are
more transparent and contain numerous primary fluid inclusions (Chapter 6). In the near-surface area
chalcocite and covellite replace sphalerite along crystal rims and fissures.
Galena is the dominant lead mineral in Chah-Mesi. It is always associated with sphalerite sharing similar
textural characteristics though it is less abundant. Coarse-grained, subhedral galena crystals up to 2 mm
in size are observed in veinlets dominated by sphalerite and galena. In Cu-rich assemblages galena forms
anhedral to subhedral crystals in micro-fractures and open spaces and is associated with pyrite,
chalcopyrite and sulfosalts. Additionally, idiomorphic cubes smaller than 10 µm were observed along
grain boundaries and in cavities of finely fragmented sphalerite. Solid inclusions are rare, but if present,
it is chalcopyrite and subordinate pyrite, occasionally accompanied by small grains of sphalerite.
Deformation textures such as curved cleavage pits (“Bleischweife”) are rarely present and indicate
minor deformation (Figure 35 c). Mutual grain boundaries between galena and sphalerite are smooth to
undulating (Figure 35 a), although, often sphalerite seems to penetrate galena forming cusp and carious
textures (Figure 35 d, e, f).
Pyrite crystals of the late stage are subhedral to anhedral, between 50 µm and 2 mm in size and often
overgrow chalcopyrite of the earlier stages. Larger crystals are commonly fragmented, however, open
spaces and fractures remained unfilled and no replacement by other sulfides was observed. In
comparison to the early and main stage, inclusions in pyrite are rare; if present they mostly comprise
fahlore, sphalerite and galena. Electrum of the late stage is associated with pyrite. It occurs as anhedral
10 to 30 µm large inclusions in pyrite (Figure 38 d) or along pyrite-sphalerite grain boundaries (Figure
38 c, e).
Ore mineralogy 85
5.2.4 Supergene stage
Supergene mineralization represents the final stage of ore formation with chalcocite- and covellite-group
minerals, Fe-hydroxides, Cu-carbonate hydroxides, etc. (Figure 37). This mineral assemblage is
restricted to the weathered surface area associated with ore zone 4 and progressively decreases towards
a depth of approximately 50 m below the surface. Chalcocite and covellite preferentially replace
chalcopyrite, sphalerite and galena, less so pyrite (Figure 36 a, b). Commonly, covellite forms irregular
reaction rims around chalcopyrite (Figure 36 a, b) with fine granular but more frequently lamellar
crystallizations. Chalcocite also forms reaction rims around chalcopyrite. The reflection color has bluish
tints and EPMA analysis revealed copper sulfides of composition CuxS 1.24 ≤ x ≤ 1.59 indicating mainly
sulfides of the geerite-covellite series (Chapter 5.3.2). Both minerals also replace sphalerite; this process
starts from micro-fractures but can be quite extensive. Successive multiple reaction coronas were
observed on galena and sphalerite. Chalcocite formed first and is replaced by covellite (Figure 36 c, d).
Fe-oxyhydroxides are represented by goethite and limonite. Together they form encrustations around
non-weathered gangue minerals or acicular crystals in small open cavities. Goethite preferentially
replaces chalcopyrite and occasionally forms radial laths. Larger crystals of goethite were only observed
in two samples from deeper parts of the weathered zone. Malachite and azurite are abundant in the near-
surface zone and occur either as small fracture-fillings or dispersed impregnations (Figure 36 e).
Malachite is more common than azurite. Malachite crystals in banded material is preferentially fibrous,
whereas azurite rather forms fine-grained aggregates (Figure 36 e). Anglesite and anhydrite are rare
(Figure 36 f). Commonly, both occur as fine-crystalline aggregates in open spaces and cavities.
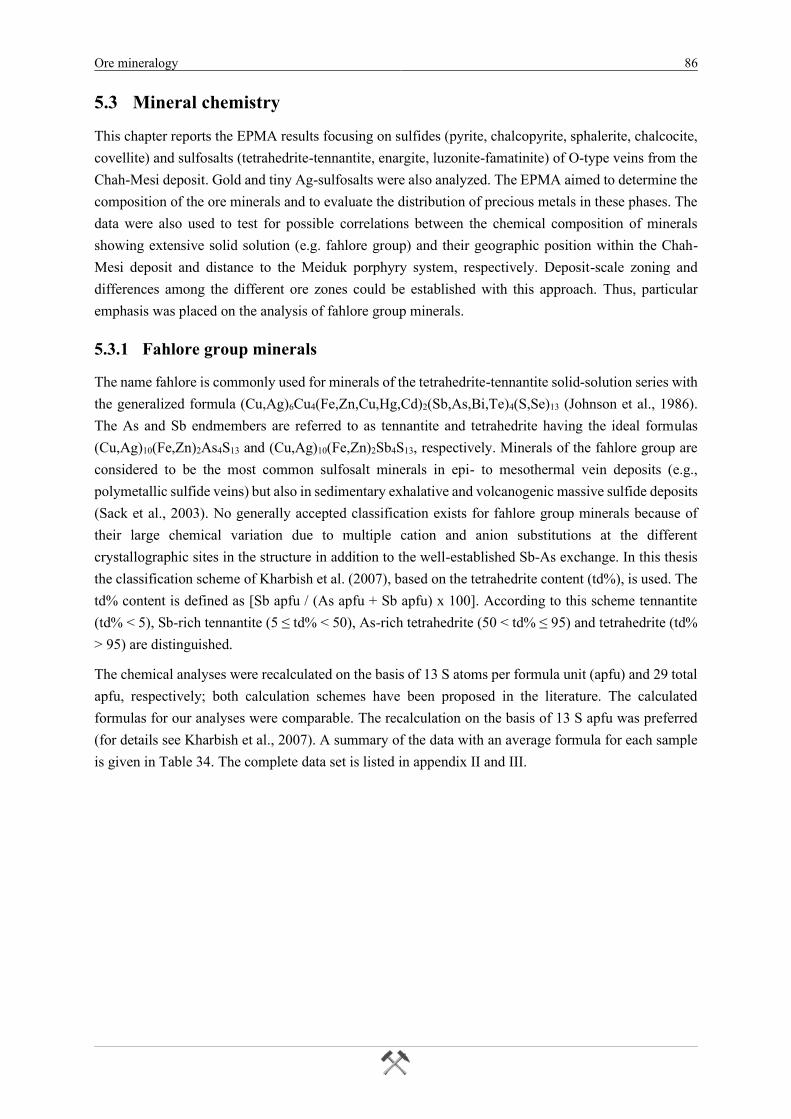
Ore mineralogy 86
5.3 Mineral chemistry
This chapter reports the EPMA results focusing on sulfides (pyrite, chalcopyrite, sphalerite, chalcocite,
covellite) and sulfosalts (tetrahedrite-tennantite, enargite, luzonite-famatinite) of O-type veins from the
Chah-Mesi deposit. Gold and tiny Ag-sulfosalts were also analyzed. The EPMA aimed to determine the
composition of the ore minerals and to evaluate the distribution of precious metals in these phases. The
data were also used to test for possible correlations between the chemical composition of minerals
showing extensive solid solution (e.g. fahlore group) and their geographic position within the Chah-
Mesi deposit and distance to the Meiduk porphyry system, respectively. Deposit-scale zoning and
differences among the different ore zones could be established with this approach. Thus, particular
emphasis was placed on the analysis of fahlore group minerals.
5.3.1 Fahlore group minerals
The name fahlore is commonly used for minerals of the tetrahedrite-tennantite solid-solution series with
the generalized formula (Cu,Ag)6Cu4(Fe,Zn,Cu,Hg,Cd)2(Sb,As,Bi,Te)4(S,Se)13 (Johnson et al., 1986).
The As and Sb endmembers are referred to as tennantite and tetrahedrite having the ideal formulas
(Cu,Ag)10(Fe,Zn)2As4S13 and (Cu,Ag)10(Fe,Zn)2Sb4S13, respectively. Minerals of the fahlore group are
considered to be the most common sulfosalt minerals in epi- to mesothermal vein deposits (e.g.,
polymetallic sulfide veins) but also in sedimentary exhalative and volcanogenic massive sulfide deposits
(Sack et al., 2003). No generally accepted classification exists for fahlore group minerals because of
their large chemical variation due to multiple cation and anion substitutions at the different
crystallographic sites in the structure in addition to the well-established Sb-As exchange. In this thesis
the classification scheme of Kharbish et al. (2007), based on the tetrahedrite content (td%), is used. The
td% content is defined as [Sb apfu / (As apfu + Sb apfu) x 100]. According to this scheme tennantite
(td% < 5), Sb-rich tennantite (5 ≤ td% < 50), As-rich tetrahedrite (50 < td% ≤ 95) and tetrahedrite (td%
> 95) are distinguished.
The chemical analyses were recalculated on the basis of 13 S atoms per formula unit (apfu) and 29 total
apfu, respectively; both calculation schemes have been proposed in the literature. The calculated
formulas for our analyses were comparable. The recalculation on the basis of 13 S apfu was preferred
(for details see Kharbish et al., 2007). A summary of the data with an average formula for each sample
is given in Table 34. The complete data set is listed in appendix II and III.
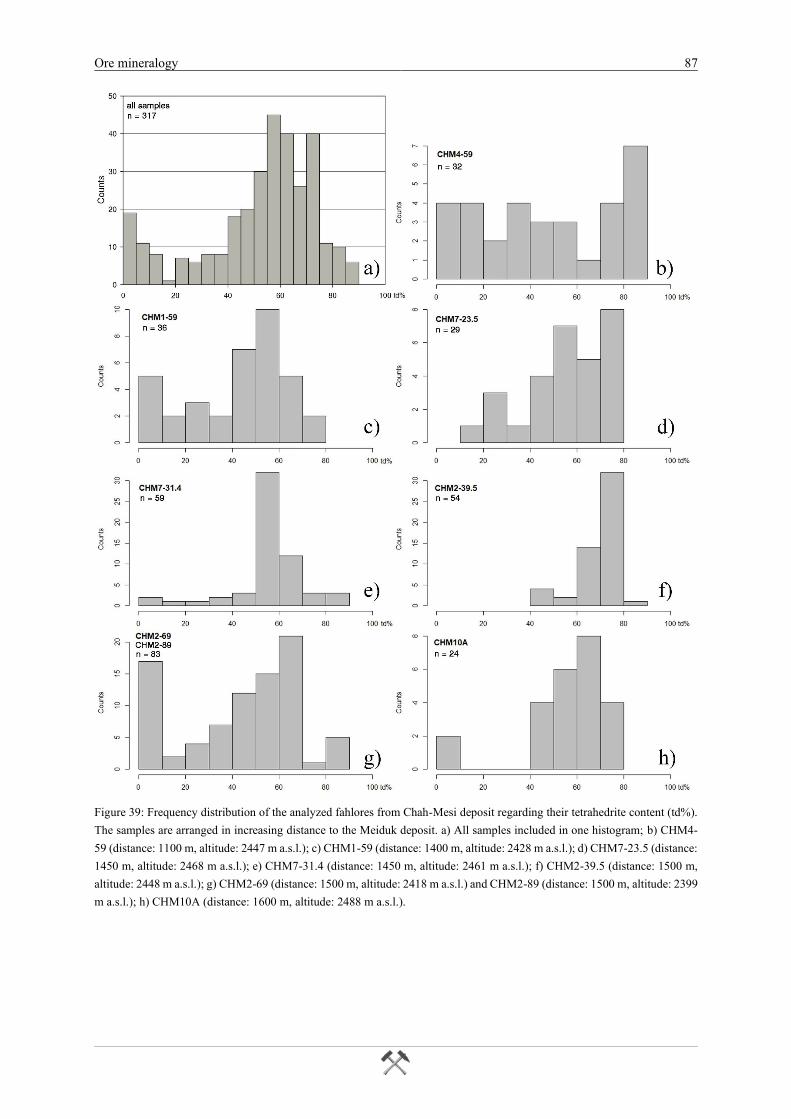
Ore mineralogy 87
Figure 39: Frequency distribution of the analyzed fahlores from Chah-Mesi deposit regarding their tetrahedrite content (td%).
The samples are arranged in increasing distance to the Meiduk deposit. a) All samples included in one histogram; b) CHM4-
59 (distance: 1100 m, altitude: 2447 m a.s.l.); c) CHM1-59 (distance: 1400 m, altitude: 2428 m a.s.l.); d) CHM7-23.5 (distance:
1450 m, altitude: 2468 m a.s.l.); e) CHM7-31.4 (distance: 1450 m, altitude: 2461 m a.s.l.); f) CHM2-39.5 (distance: 1500 m,
altitude: 2448 m a.s.l.); g) CHM2-69 (distance: 1500 m, altitude: 2418 m a.s.l.) and CHM2-89 (distance: 1500 m, altitude: 2399
m a.s.l.); h) CHM10A (distance: 1600 m, altitude: 2488 m a.s.l.).
Ore mineralogy 88
Generally, two populations of fahlores can be distinguished based on their td% (Figure 39 a). The first
has its maximum at 0-5 td% representing the almost pure As-endmember tennantite, whereas the second
one constitutes As-rich tetrahedrite with a well-defined mode at ~60 td% within a wide compositional
range between 40 and 75 td%. The data set reveals a nearly complete solid solution with Sb/(As+Sb)
ratios within the range of td 0 to 90%. The Sb/(As+Sb) values show a wider range in samples from the
deeper levels (CHM2-69-89, CHM4-59, CHM1-59, Figure 39 b, c, g). There, the compositions range
from pure tennantite to As-rich tetrahedrite with ~85 td%. Most samples from shallower areas (CHM7-
23.5-31.4, CHM2-39.5, CHM10A, Figure 39 d, e, f, h) comprise mainly As-rich tetrahedrite and minor
Sb-rich tennantite with compositions between 40 and 80 td%.
The individual samples exhibit a distinct distribution of fahlore composition. As the closest sample to
the Meiduk deposit (distance about 1100 m), sample CHM4-59 (2447 m a.s.l.) shows the widest range
of composition between 0 and 90 td% and a maximum at 80 to 90 td%, which correlates to almost pure
tetrahedrite (Figure 39 b). About 300 m to the south, fahlores of sample CHM1-59 (2428 m a.s.l.) have
still a wide range between 0 and 80 td%, but a separation of two fahlore populations is visible between
0 and 10 td% and 40 and 70 td%, respectively (Figure 39 c). Within the Chah-Mesi open pit, drill core
BH-CHM7 shows a lack of tennantite in a depth of 23.5, corresponding to 2468 m a.s.l., and the
composition of fahlores ranges from 10 to 80 td%. The highest counts are in the range of As-rich
tetrahedrite between 50 and 80 td% (Figure 39 d). At a depth of 31.4 (2461 m a.s.l.) the fahlore chemistry
extends from 0 to 90 td% but shows a well-defined mode at ~60 td%. However, the abundance of pure
and Sb-rich tennantite is very low (Figure 39 e).
In drill core BH-CHM2 the shallow sample from 39.5 m depth (2448 m a.s.l.) is characterized by a
narrow range of fahlore composition between 40 and 90 td% and dominated by As-rich tetrahedrite with
a well-defined mode at ~75 td% (Figure 39 f). In the deeper sections of the drill core, at a depth of 69
and 89 m, corresponding to 2418 and 2399 m a.s.l., the range of fahlore chemistry widens from 0 to 90
td% and the abundance of As increases. Two fahlore populations are apparent, whereas one showing
pure tennantite composition and the other has its highest counts between 40 to 70 td%. The most distant
sample CHM10A is dominated by As-rich tetrahedrite with a range between 40 to 80 td% and a mode
at ~70 td% but also minor amounts of pure tennantite are present.
Ore mineralogy 89
Most fahlore grains are complexly zoned showing oscillatory zoning of As and Sb (Figure 40 and Figure
41). This is best seen in back-scattered electron images and mainly reflects different concentrations of
Sb and As. However, there is also some zoning to be seen for Zn, which exhibits a positive correlation
with Sb-rich sections in sample CHM2-69 (Figure 40). Yet, this observation cannot be determined in
sample CHM1-59 (Figure 41). Oscillatory zoning caused by exclusive variation in the Sb, As, Fe and
Zn contents were also reported by Plotinskaya et al. (2015) and (Marushchenko et al., 2018). The reasons
for oscillatory zoning are currently unclear, but Shore and Fowler (1996) reported the major reasons as
extrinsic (e.g. change in solution composition, pressure or temperature) and intrinsic (e.g. adsorption of
growth inhibitors) mechanisms. Plotinskaya et al. (2015) reports that the oscillatory zoning of the
tennantite-tetrahedrite solid solution is caused by variable activities of As and Sb in the mineralizing
fluids due to growth rate kinetics of the fahlore crystals. This is controlled by the concentrations of these
elements in the reaction zone of growing crystals.
Figure 40: Back-scattered electron image of zoned fahlore crystals (see red numbers in appendix III) and WDS element
mappings of AsLα, SbLα, CuKα, FeKα and ZnKα. X-ray images elucidate that the complex zoning is mainly due to oscillating
As-Sb contents. Sample CHM2-69.
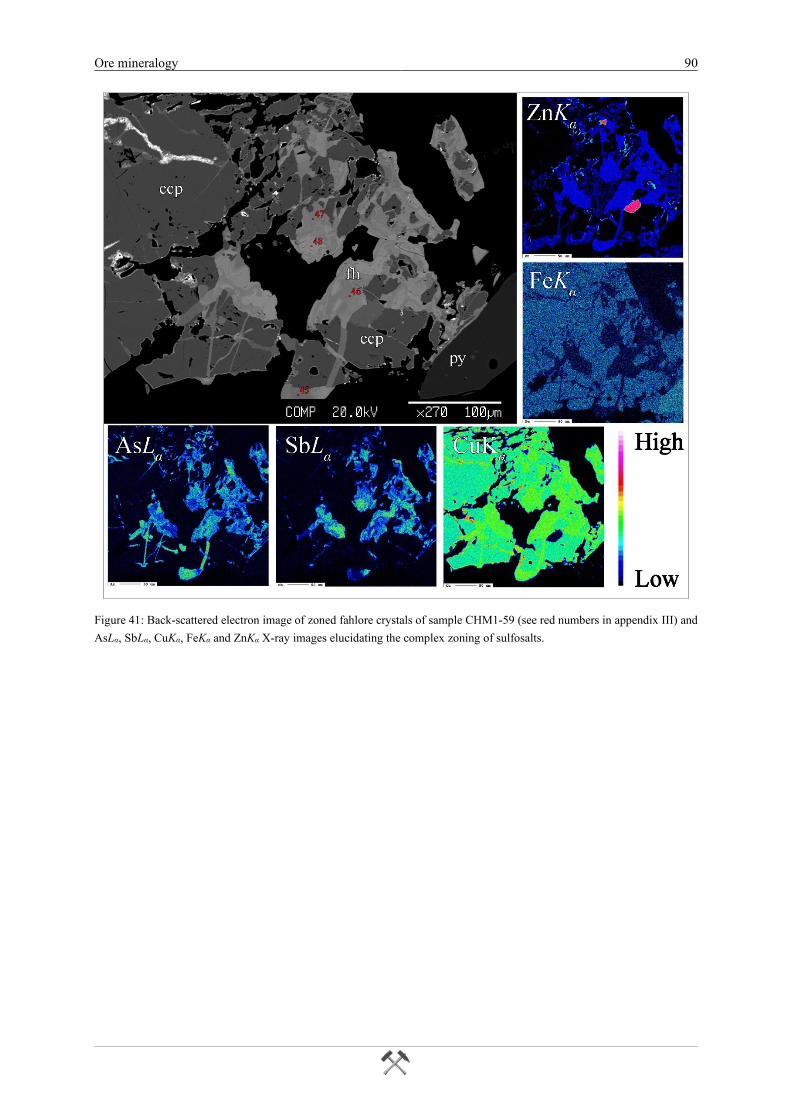
Ore mineralogy 90
Figure 41: Back-scattered electron image of zoned fahlore crystals of sample CHM1-59 (see red numbers in appendix III) and
AsLα, SbLα, CuKα, FeKα and ZnKα X-ray images elucidating the complex zoning of sulfosalts.
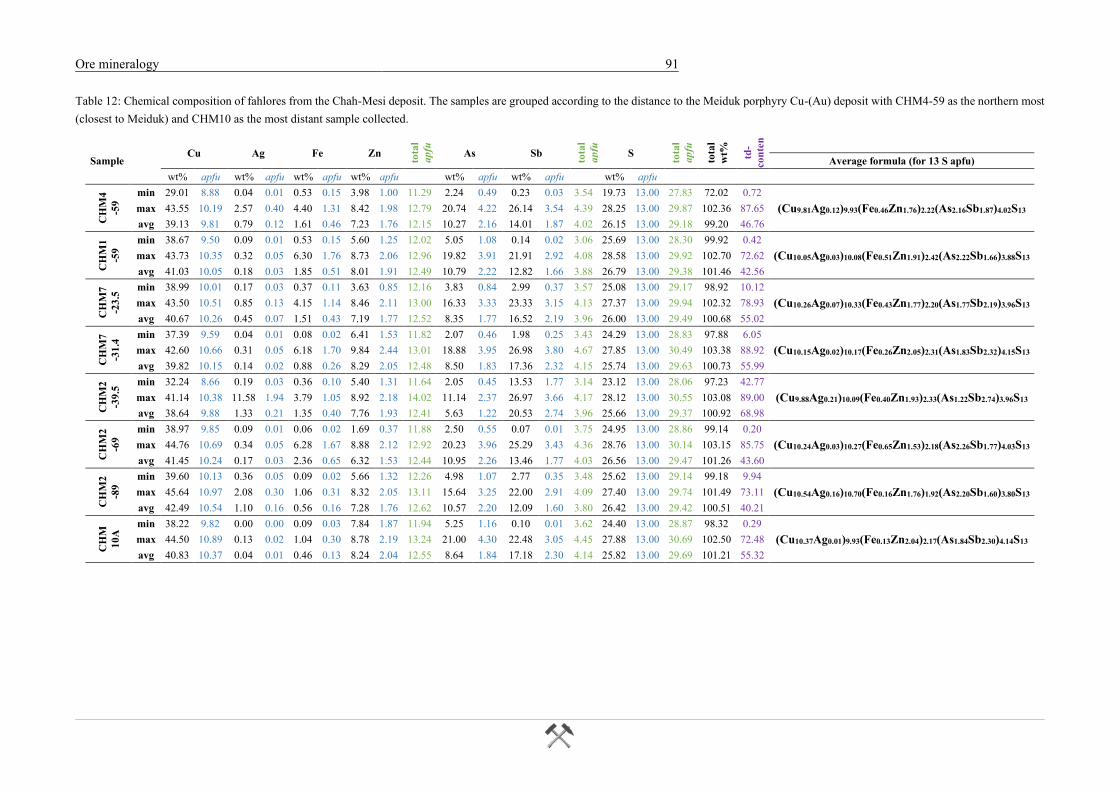
Ore mineralogy 91
Table 12: Chemical composition of fahlores from the Chah-Mesi deposit. The samples are grouped according to the distance to the Meiduk porphyry Cu-(Au) deposit with CHM4-59 as the northern most
(closest to Meiduk) and CHM10 as the most distant sample collected.
Sample
Cu Ag Fe Zn
tota
l
apfu
As Sb
tota
l
apfu
S
tota
l
apfu
tota
l
wt%
td-
co
nte
n
t
Average formula (for 13 S apfu)
wt% apfu wt% apfu wt% apfu wt% apfu wt% apfu wt% apfu wt% apfu
CH
M4
-59
min 29.01 8.88 0.04 0.01 0.53 0.15 3.98 1.00 11.29 2.24 0.49 0.23 0.03 3.54 19.73 13.00 27.83 72.02 0.72
max 43.55 10.19 2.57 0.40 4.40 1.31 8.42 1.98 12.79 20.74 4.22 26.14 3.54 4.39 28.25 13.00 29.87 102.36 87.65 (Cu9.81Ag0.12)9.93(Fe0.46Zn1.76)2.22(As2.16Sb1.87)4.02S13
avg 39.13 9.81 0.79 0.12 1.61 0.46 7.23 1.76 12.15 10.27 2.16 14.01 1.87 4.02 26.15 13.00 29.18 99.20 46.76
CH
M1
-59
min 38.67 9.50 0.09 0.01 0.53 0.15 5.60 1.25 12.02 5.05 1.08 0.14 0.02 3.06 25.69 13.00 28.30 99.92 0.42
max 43.73 10.35 0.32 0.05 6.30 1.76 8.73 2.06 12.96 19.82 3.91 21.91 2.92 4.08 28.58 13.00 29.92 102.70 72.62 (Cu10.05Ag0.03)10.08(Fe0.51Zn1.91)2.42(As2.22Sb1.66)3.88S13
avg 41.03 10.05 0.18 0.03 1.85 0.51 8.01 1.91 12.49 10.79 2.22 12.82 1.66 3.88 26.79 13.00 29.38 101.46 42.56
CH
M7
-23
.5 min 38.99 10.01 0.17 0.03 0.37 0.11 3.63 0.85 12.16 3.83 0.84 2.99 0.37 3.57 25.08 13.00 29.17 98.92 10.12
max 43.50 10.51 0.85 0.13 4.15 1.14 8.46 2.11 13.00 16.33 3.33 23.33 3.15 4.13 27.37 13.00 29.94 102.32 78.93 (Cu10.26Ag0.07)10.33(Fe0.43Zn1.77)2.20(As1.77Sb2.19)3.96S13
avg 40.67 10.26 0.45 0.07 1.51 0.43 7.19 1.77 12.52 8.35 1.77 16.52 2.19 3.96 26.00 13.00 29.49 100.68 55.02
CH
M7
-31
.4 min 37.39 9.59 0.04 0.01 0.08 0.02 6.41 1.53 11.82 2.07 0.46 1.98 0.25 3.43 24.29 13.00 28.83 97.88 6.05
max 42.60 10.66 0.31 0.05 6.18 1.70 9.84 2.44 13.01 18.88 3.95 26.98 3.80 4.67 27.85 13.00 30.49 103.38 88.92 (Cu10.15Ag0.02)10.17(Fe0.26Zn2.05)2.31(As1.83Sb2.32)4.15S13
avg 39.82 10.15 0.14 0.02 0.88 0.26 8.29 2.05 12.48 8.50 1.83 17.36 2.32 4.15 25.74 13.00 29.63 100.73 55.99
CH
M2
-39
.5 min 32.24 8.66 0.19 0.03 0.36 0.10 5.40 1.31 11.64 2.05 0.45 13.53 1.77 3.14 23.12 13.00 28.06 97.23 42.77
max 41.14 10.38 11.58 1.94 3.79 1.05 8.92 2.18 14.02 11.14 2.37 26.97 3.66 4.17 28.12 13.00 30.55 103.08 89.00 (Cu9.88Ag0.21)10.09(Fe0.40Zn1.93)2.33(As1.22Sb2.74)3.96S13
avg 38.64 9.88 1.33 0.21 1.35 0.40 7.76 1.93 12.41 5.63 1.22 20.53 2.74 3.96 25.66 13.00 29.37 100.92 68.98
CH
M2
-69
min 38.97 9.85 0.09 0.01 0.06 0.02 1.69 0.37 11.88 2.50 0.55 0.07 0.01 3.75 24.95 13.00 28.86 99.14 0.20
max 44.76 10.69 0.34 0.05 6.28 1.67 8.88 2.12 12.92 20.23 3.96 25.29 3.43 4.36 28.76 13.00 30.14 103.15 85.75 (Cu10.24Ag0.03)10.27(Fe0.65Zn1.53)2.18(As2.26Sb1.77)4.03S13
avg 41.45 10.24 0.17 0.03 2.36 0.65 6.32 1.53 12.44 10.95 2.26 13.46 1.77 4.03 26.56 13.00 29.47 101.26 43.60
CH
M2
-89
min 39.60 10.13 0.36 0.05 0.09 0.02 5.66 1.32 12.26 4.98 1.07 2.77 0.35 3.48 25.62 13.00 29.14 99.18 9.94
max 45.64 10.97 2.08 0.30 1.06 0.31 8.32 2.05 13.11 15.64 3.25 22.00 2.91 4.09 27.40 13.00 29.74 101.49 73.11 (Cu10.54Ag0.16)10.70(Fe0.16Zn1.76)1.92(As2.20Sb1.60)3.80S13
avg 42.49 10.54 1.10 0.16 0.56 0.16 7.28 1.76 12.62 10.57 2.20 12.09 1.60 3.80 26.42 13.00 29.42 100.51 40.21
CH
M
10
A min 38.22 9.82 0.00 0.00 0.09 0.03 7.84 1.87 11.94 5.25 1.16 0.10 0.01 3.62 24.40 13.00 28.87 98.32 0.29
max 44.50 10.89 0.13 0.02 1.04 0.30 8.78 2.19 13.24 21.00 4.30 22.48 3.05 4.45 27.88 13.00 30.69 102.50 72.48 (Cu10.37Ag0.01)9.93(Fe0.13Zn2.04)2.17(As1.84Sb2.30)4.14S13
avg 40.83 10.37 0.04 0.01 0.46 0.13 8.24 2.04 12.55 8.64 1.84 17.18 2.30 4.14 25.82 13.00 29.69 101.21 55.32
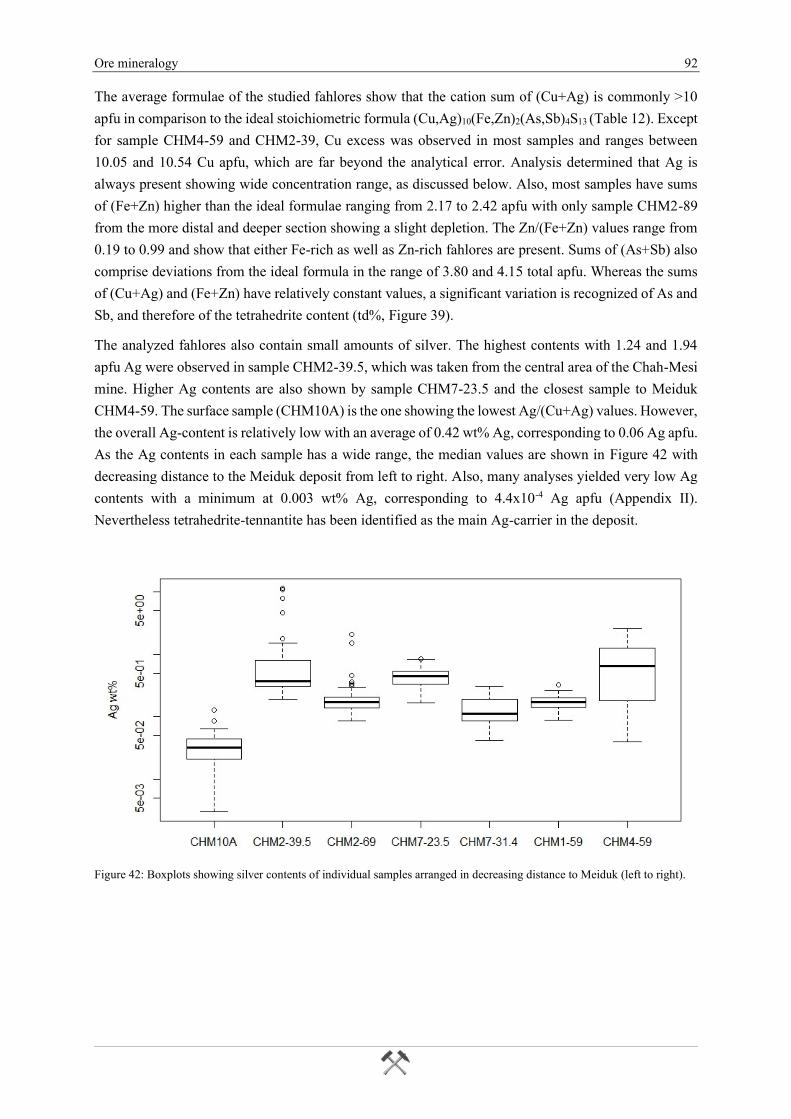
Ore mineralogy 92
The average formulae of the studied fahlores show that the cation sum of (Cu+Ag) is commonly >10
apfu in comparison to the ideal stoichiometric formula (Cu,Ag)10(Fe,Zn)2(As,Sb)4S13 (Table 12). Except
for sample CHM4-59 and CHM2-39, Cu excess was observed in most samples and ranges between
10.05 and 10.54 Cu apfu, which are far beyond the analytical error. Analysis determined that Ag is
always present showing wide concentration range, as discussed below. Also, most samples have sums
of (Fe+Zn) higher than the ideal formulae ranging from 2.17 to 2.42 apfu with only sample CHM2-89
from the more distal and deeper section showing a slight depletion. The Zn/(Fe+Zn) values range from
0.19 to 0.99 and show that either Fe-rich as well as Zn-rich fahlores are present. Sums of (As+Sb) also
comprise deviations from the ideal formula in the range of 3.80 and 4.15 total apfu. Whereas the sums
of (Cu+Ag) and (Fe+Zn) have relatively constant values, a significant variation is recognized of As and
Sb, and therefore of the tetrahedrite content (td%, Figure 39).
The analyzed fahlores also contain small amounts of silver. The highest contents with 1.24 and 1.94
apfu Ag were observed in sample CHM2-39.5, which was taken from the central area of the Chah-Mesi
mine. Higher Ag contents are also shown by sample CHM7-23.5 and the closest sample to Meiduk
CHM4-59. The surface sample (CHM10A) is the one showing the lowest Ag/(Cu+Ag) values. However,
the overall Ag-content is relatively low with an average of 0.42 wt% Ag, corresponding to 0.06 Ag apfu.
As the Ag contents in each sample has a wide range, the median values are shown in Figure 42 with
decreasing distance to the Meiduk deposit from left to right. Also, many analyses yielded very low Ag
contents with a minimum at 0.003 wt% Ag, corresponding to 4.4x10⁻⁴ Ag apfu (Appendix II).
Nevertheless tetrahedrite-tennantite has been identified as the main Ag-carrier in the deposit.
Figure 42: Boxplots showing silver contents of individual samples arranged in decreasing distance to Meiduk (left to right).
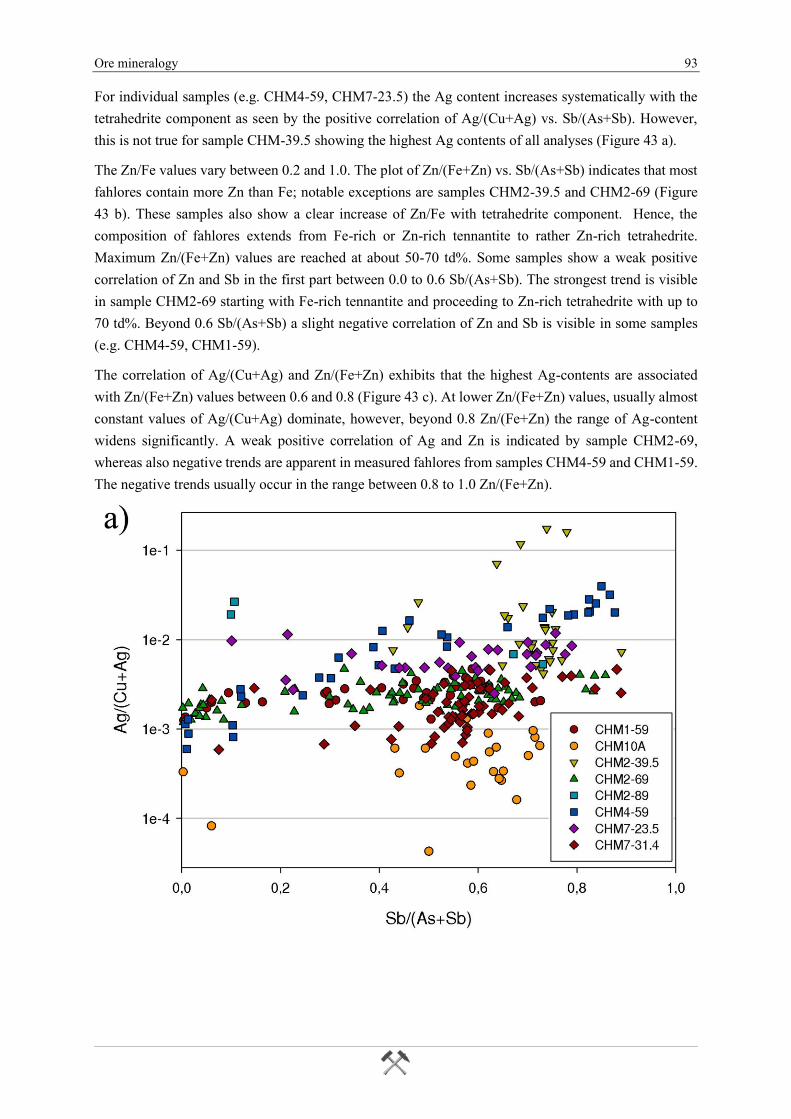
Ore mineralogy 93
For individual samples (e.g. CHM4-59, CHM7-23.5) the Ag content increases systematically with the
tetrahedrite component as seen by the positive correlation of Ag/(Cu+Ag) vs. Sb/(As+Sb). However,
this is not true for sample CHM-39.5 showing the highest Ag contents of all analyses (Figure 43 a).
The Zn/Fe values vary between 0.2 and 1.0. The plot of Zn/(Fe+Zn) vs. Sb/(As+Sb) indicates that most
fahlores contain more Zn than Fe; notable exceptions are samples CHM2-39.5 and CHM2-69 (Figure
43 b). These samples also show a clear increase of Zn/Fe with tetrahedrite component. Hence, the
composition of fahlores extends from Fe-rich or Zn-rich tennantite to rather Zn-rich tetrahedrite.
Maximum Zn/(Fe+Zn) values are reached at about 50-70 td%. Some samples show a weak positive
correlation of Zn and Sb in the first part between 0.0 to 0.6 Sb/(As+Sb). The strongest trend is visible
in sample CHM2-69 starting with Fe-rich tennantite and proceeding to Zn-rich tetrahedrite with up to
70 td%. Beyond 0.6 Sb/(As+Sb) a slight negative correlation of Zn and Sb is visible in some samples
(e.g. CHM4-59, CHM1-59).
The correlation of Ag/(Cu+Ag) and Zn/(Fe+Zn) exhibits that the highest Ag-contents are associated
with Zn/(Fe+Zn) values between 0.6 and 0.8 (Figure 43 c). At lower Zn/(Fe+Zn) values, usually almost
constant values of Ag/(Cu+Ag) dominate, however, beyond 0.8 Zn/(Fe+Zn) the range of Ag-content
widens significantly. A weak positive correlation of Ag and Zn is indicated by sample CHM2-69,
whereas also negative trends are apparent in measured fahlores from samples CHM4-59 and CHM1-59.
The negative trends usually occur in the range between 0.8 to 1.0 Zn/(Fe+Zn).
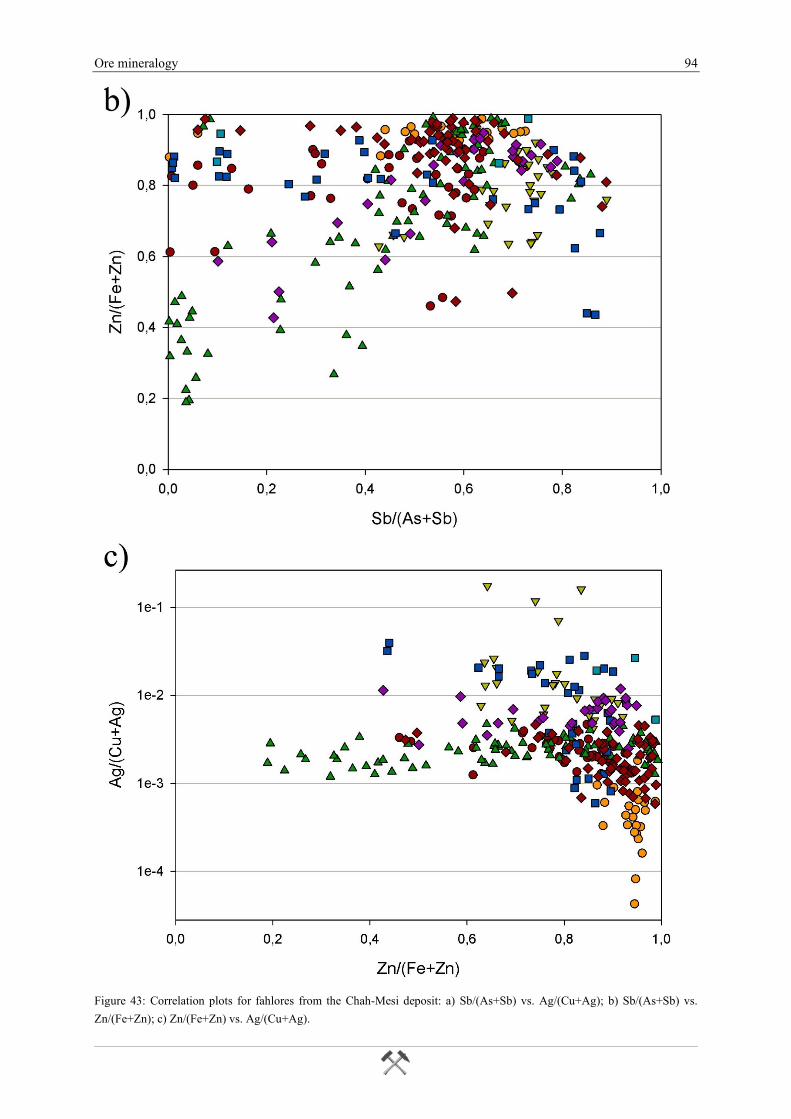
Ore mineralogy 94
Figure 43: Correlation plots for fahlores from the Chah-Mesi deposit: a) Sb/(As+Sb) vs. Ag/(Cu+Ag); b) Sb/(As+Sb) vs.
Zn/(Fe+Zn); c) Zn/(Fe+Zn) vs. Ag/(Cu+Ag).
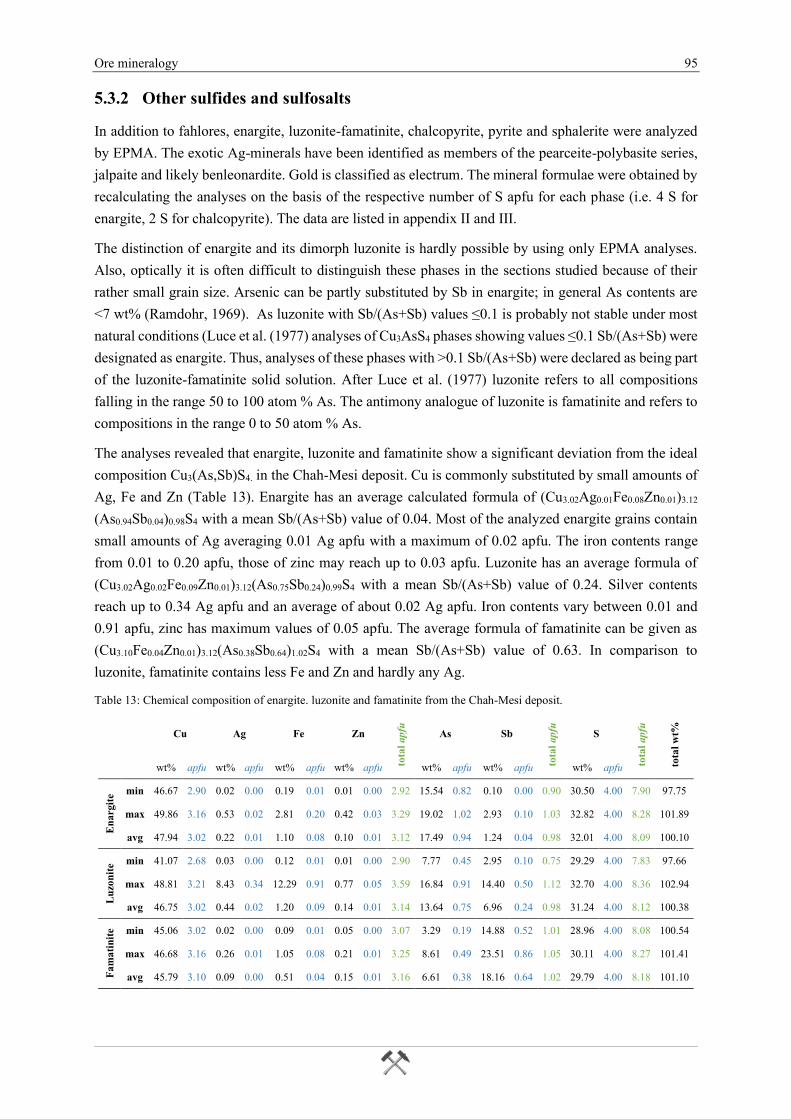
Ore mineralogy 95
5.3.2 Other sulfides and sulfosalts
In addition to fahlores, enargite, luzonite-famatinite, chalcopyrite, pyrite and sphalerite were analyzed
by EPMA. The exotic Ag-minerals have been identified as members of the pearceite-polybasite series,
jalpaite and likely benleonardite. Gold is classified as electrum. The mineral formulae were obtained by
recalculating the analyses on the basis of the respective number of S apfu for each phase (i.e. 4 S for
enargite, 2 S for chalcopyrite). The data are listed in appendix II and III.
The distinction of enargite and its dimorph luzonite is hardly possible by using only EPMA analyses.
Also, optically it is often difficult to distinguish these phases in the sections studied because of their
rather small grain size. Arsenic can be partly substituted by Sb in enargite; in general As contents are
<7 wt% (Ramdohr, 1969). As luzonite with Sb/(As+Sb) values ≤0.1 is probably not stable under most
natural conditions (Luce et al. (1977) analyses of Cu3AsS4 phases showing values ≤0.1 Sb/(As+Sb) were
designated as enargite. Thus, analyses of these phases with >0.1 Sb/(As+Sb) were declared as being part
of the luzonite-famatinite solid solution. After Luce et al. (1977) luzonite refers to all compositions
falling in the range 50 to 100 atom % As. The antimony analogue of luzonite is famatinite and refers to
compositions in the range 0 to 50 atom % As.
The analyses revealed that enargite, luzonite and famatinite show a significant deviation from the ideal
composition Cu3(As,Sb)S4. in the Chah-Mesi deposit. Cu is commonly substituted by small amounts of
Ag, Fe and Zn (Table 13). Enargite has an average calculated formula of (Cu3.02Ag0.01Fe0.08Zn0.01)3.12
(As0.94Sb0.04)0.98S4 with a mean Sb/(As+Sb) value of 0.04. Most of the analyzed enargite grains contain
small amounts of Ag averaging 0.01 Ag apfu with a maximum of 0.02 apfu. The iron contents range
from 0.01 to 0.20 apfu, those of zinc may reach up to 0.03 apfu. Luzonite has an average formula of
(Cu3.02Ag0.02Fe0.09Zn0.01)3.12(As0.75Sb0.24)0.99S4 with a mean Sb/(As+Sb) value of 0.24. Silver contents
reach up to 0.34 Ag apfu and an average of about 0.02 Ag apfu. Iron contents vary between 0.01 and
0.91 apfu, zinc has maximum values of 0.05 apfu. The average formula of famatinite can be given as
(Cu3.10Fe0.04Zn0.01)3.12(As0.38Sb0.64)1.02S4 with a mean Sb/(As+Sb) value of 0.63. In comparison to
luzonite, famatinite contains less Fe and Zn and hardly any Ag.
Table 13: Chemical composition of enargite. luzonite and famatinite from the Chah-Mesi deposit.
Cu Ag Fe Zn
tota
l apfu
As Sb
tota
l apfu
S
tota
l apfu
tota
l w
t%
wt% apfu wt% apfu wt% apfu wt% apfu wt% apfu wt% apfu wt% apfu
En
argit
e min 46.67 2.90 0.02 0.00 0.19 0.01 0.01 0.00 2.92 15.54 0.82 0.10 0.00 0.90 30.50 4.00 7.90 97.75
max 49.86 3.16 0.53 0.02 2.81 0.20 0.42 0.03 3.29 19.02 1.02 2.93 0.10 1.03 32.82 4.00 8.28 101.89
avg 47.94 3.02 0.22 0.01 1.10 0.08 0.10 0.01 3.12 17.49 0.94 1.24 0.04 0.98 32.01 4.00 8.09 100.10
Lu
zon
ite min 41.07 2.68 0.03 0.00 0.12 0.01 0.01 0.00 2.90 7.77 0.45 2.95 0.10 0.75 29.29 4.00 7.83 97.66
max 48.81 3.21 8.43 0.34 12.29 0.91 0.77 0.05 3.59 16.84 0.91 14.40 0.50 1.12 32.70 4.00 8.36 102.94
avg 46.75 3.02 0.44 0.02 1.20 0.09 0.14 0.01 3.14 13.64 0.75 6.96 0.24 0.98 31.24 4.00 8.12 100.38
Fa
ma
tin
ite min 45.06 3.02 0.02 0.00 0.09 0.01 0.05 0.00 3.07 3.29 0.19 14.88 0.52 1.01 28.96 4.00 8.08 100.54
max 46.68 3.16 0.26 0.01 1.05 0.08 0.21 0.01 3.25 8.61 0.49 23.51 0.86 1.05 30.11 4.00 8.27 101.41
avg 45.79 3.10 0.09 0.00 0.51 0.04 0.15 0.01 3.16 6.61 0.38 18.16 0.64 1.02 29.79 4.00 8.18 101.10
Ore mineralogy 96
The recalculated chalcopyrite analyses provide the average formula Cu1.07Fe1.01S2 and show only minor
deviation from the ideal stoichiometric composition. Occasionally, chalcopyrite showing an excess in
Cu and deficiency in Fe incorporates minor amounts of Ag with a maximum of 0.09 Ag apfu. The
average of the pyrite analyses gives a formula of Fe1.06S2. Occasionally, minor copper was analyzed with
up to 0.02 Cu apfu. Contamination due to small inclusions of chalcopyrite cannot be ruled out.
Sphalerite is characterized by (very) low Fe contents ranging from 0.09 to 2.73 wt% Fe and recalculation
revealed an ideal stoichiometric average formula of Zn0.99Fe0.1S. Some analyses show elevated Cu
contents of up to 0.07 apfu, probably associated with “chalcopyrite disease”.
The compounds of the Cu-S system were mostly observed in the near-surface area replacing galena
(Figure 36 d) and other sulfides. Analyses show mainly non-stoichiometric compositions with Cu/S
ratios varying between 1.24 and 1.59. These ratios refer to the geerite-covellite series, including the
CuxS minerals geerite (Cu1.5-1.6S), spionkopite (Cu1.4S), yarrowite (Cu1.1S) and covellite (CuS) (Gablina,
1997). Most recalculations of the analyzed CuxS phases reveal a composition of 1.31 ≤ x ≤ 1.46, which
is suggested to represent spionkopite with an average formula of Cu1.36S. However, also geerite and
probably yarrowite with an average formula of Cu1.57S and Cu1.24S, respectively, were determined. The
minerals of the geerite-covellite series include Ag contents of up to 0.1 apfu.
Exotic Ag-bearing minerals that were only detected by EPMA include phases of the pearceite-polybasite
series, jalpaite and benleonardite (Figure 44 a. b). Pearceite-polybasite occurs as small inclusions of
fahlore and luzonite-famatinite crystals. The calculated average formula (Ag8.10Cu7.84Fe0.18Zn0.15)16.27
(As1.66Sb0.24)1.90S10.98 shows significant deviation from the ideal formula (Ag,Cu)16(As,Sb)2S11. The high
value of Cu and low content of Sb indicates that the measured phases are pearceite (Bindi et al., 2007).
The main substitution is that of Ag and Cu. Their values range from 6.00 to 11.56 Ag apfu and 4.45 to
10.77 Cu apfu. The Sb/(As+Sb) value is relatively constant with an average of about 0.12. One small
grain of jalpaite was detected as an inclusion of pyrite. It has a calculated formula of Ag2.86Cu0.98S2.02
what is close to the ideal formula Ag3CuS2. In sample CHM2-89, significant amounts of Te were
detected in an Ag-rich phase by EDS (Figure 44 d). This phase that is interstitial to pyrite, chalcopyrite
and enargite was not fully quantitatively analyzed, because of a missing Te standard. Neglecting Te only
analyses with totals of about 87 wt% could be obtained. Assuming that the difference to 100 wt% is all
tellurium, recalculation results in the formula Ag15.19Cu2.55(Sb2.13As0.17)2.30S8.82Te2.69. This phase could
therefore be benleonardite, which has the ideal formula Ag15Cu(Sb,As)2S7Te4.
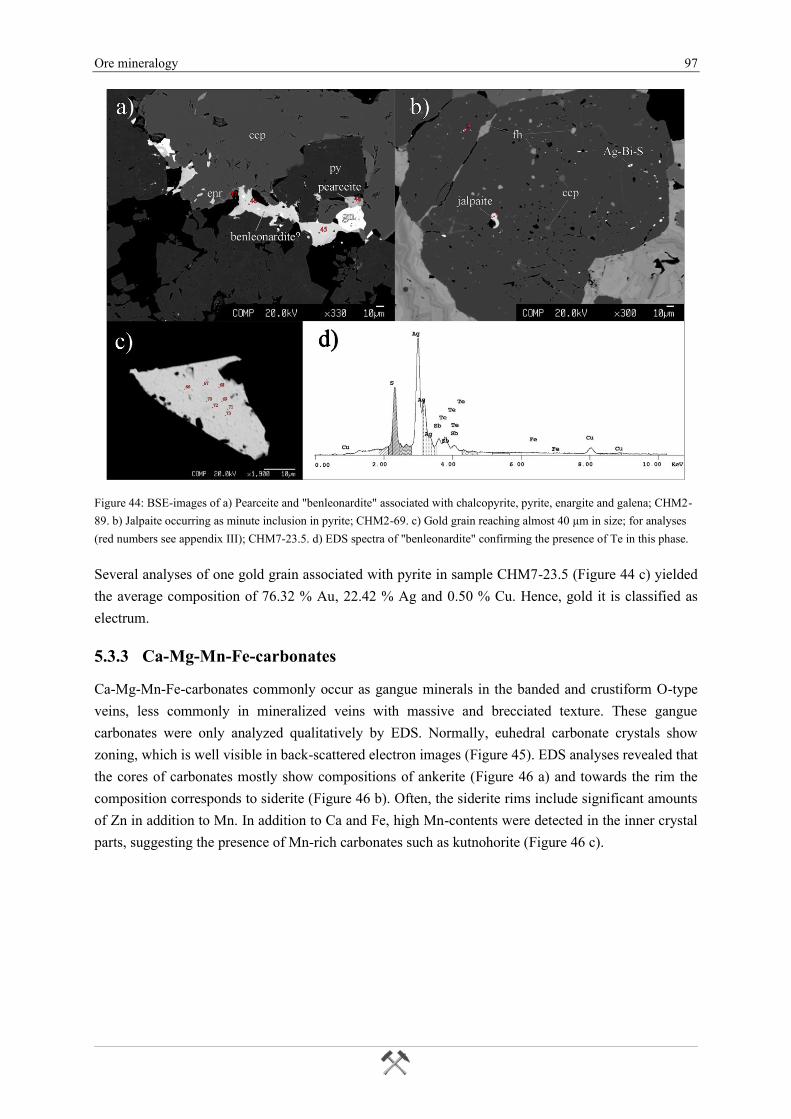
Ore mineralogy 97
Figure 44: BSE-images of a) Pearceite and "benleonardite" associated with chalcopyrite, pyrite, enargite and galena; CHM2-
89. b) Jalpaite occurring as minute inclusion in pyrite; CHM2-69. c) Gold grain reaching almost 40 µm in size; for analyses
(red numbers see appendix III); CHM7-23.5. d) EDS spectra of "benleonardite" confirming the presence of Te in this phase.
Several analyses of one gold grain associated with pyrite in sample CHM7-23.5 (Figure 44 c) yielded
the average composition of 76.32 % Au, 22.42 % Ag and 0.50 % Cu. Hence, gold it is classified as
electrum.
5.3.3 Ca-Mg-Mn-Fe-carbonates
Ca-Mg-Mn-Fe-carbonates commonly occur as gangue minerals in the banded and crustiform O-type
veins, less commonly in mineralized veins with massive and brecciated texture. These gangue
carbonates were only analyzed qualitatively by EDS. Normally, euhedral carbonate crystals show
zoning, which is well visible in back-scattered electron images (Figure 45). EDS analyses revealed that
the cores of carbonates mostly show compositions of ankerite (Figure 46 a) and towards the rim the
composition corresponds to siderite (Figure 46 b). Often, the siderite rims include significant amounts
of Zn in addition to Mn. In addition to Ca and Fe, high Mn-contents were detected in the inner crystal
parts, suggesting the presence of Mn-rich carbonates such as kutnohorite (Figure 46 c).
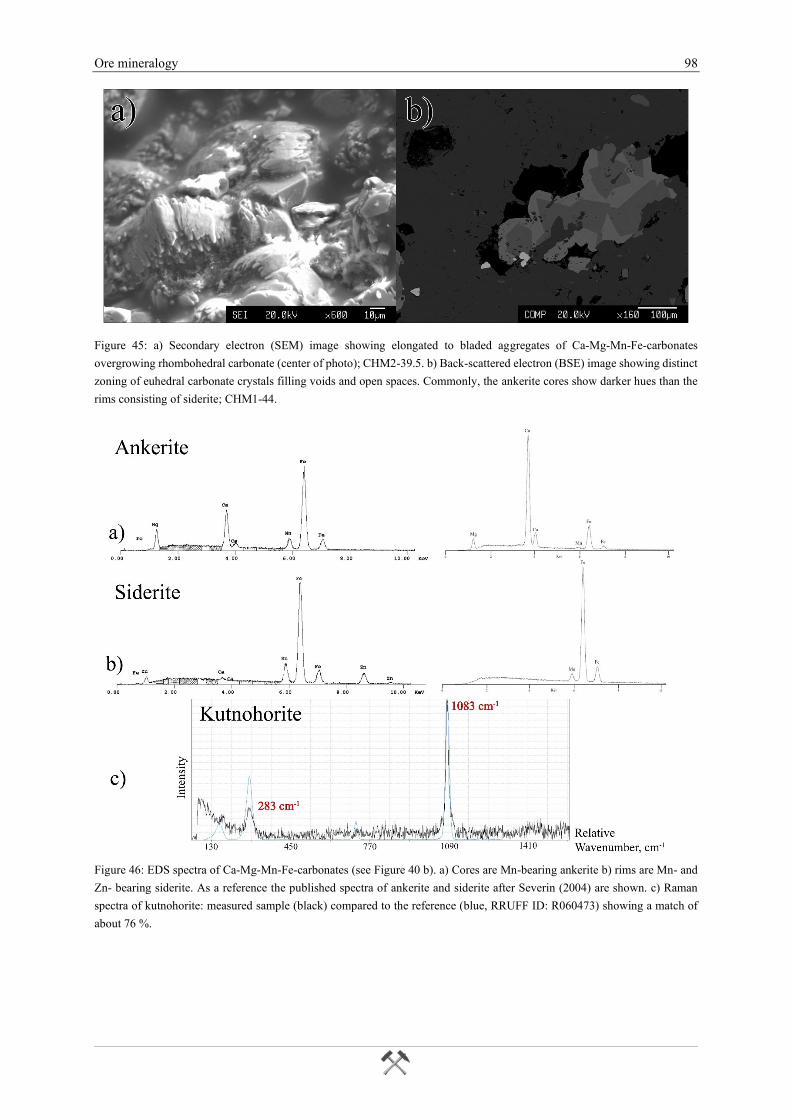
Ore mineralogy 98
Figure 45: a) Secondary electron (SEM) image showing elongated to bladed aggregates of Ca-Mg-Mn-Fe-carbonates
overgrowing rhombohedral carbonate (center of photo); CHM2-39.5. b) Back-scattered electron (BSE) image showing distinct
zoning of euhedral carbonate crystals filling voids and open spaces. Commonly, the ankerite cores show darker hues than the
rims consisting of siderite; CHM1-44.
Figure 46: EDS spectra of Ca-Mg-Mn-Fe-carbonates (see Figure 40 b). a) Cores are Mn-bearing ankerite b) rims are Mn- and
Zn- bearing siderite. As a reference the published spectra of ankerite and siderite after Severin (2004) are shown. c) Raman
spectra of kutnohorite: measured sample (black) compared to the reference (blue, RRUFF ID: R060473) showing a match of
about 76 %.
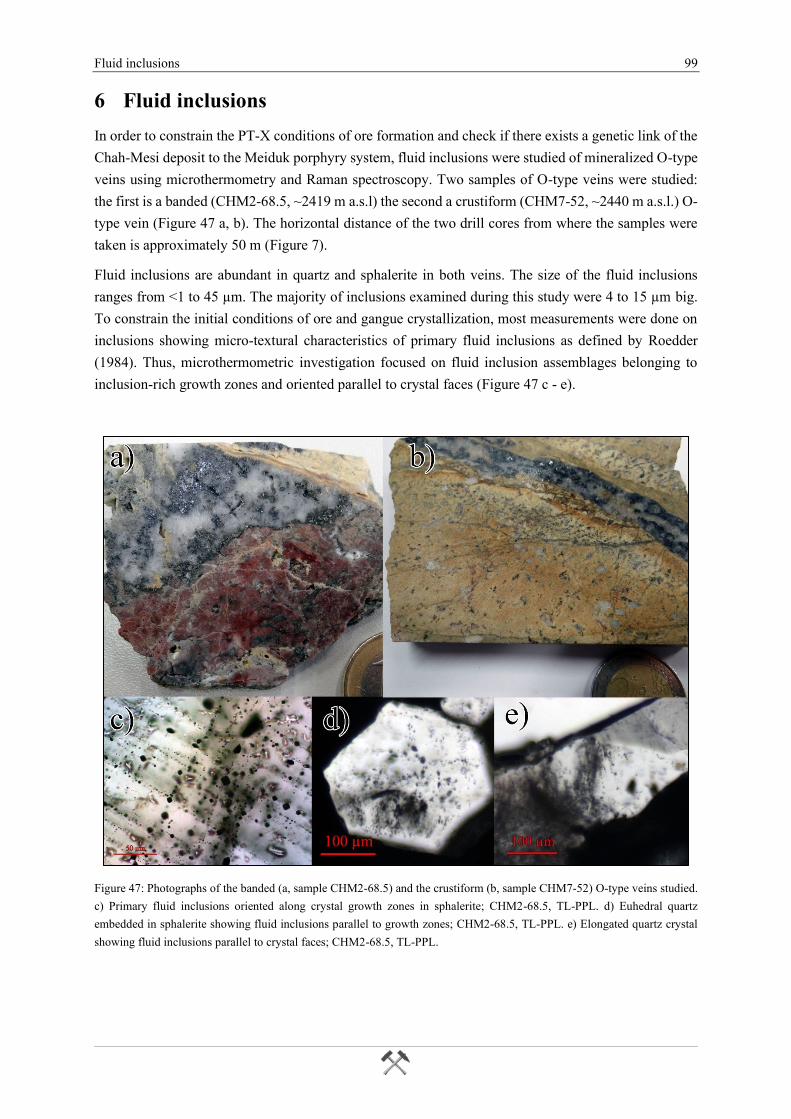
Fluid inclusions 99
6 Fluid inclusions
In order to constrain the PT-X conditions of ore formation and check if there exists a genetic link of the
Chah-Mesi deposit to the Meiduk porphyry system, fluid inclusions were studied of mineralized O-type
veins using microthermometry and Raman spectroscopy. Two samples of O-type veins were studied:
the first is a banded (CHM2-68.5, ~2419 m a.s.l) the second a crustiform (CHM7-52, ~2440 m a.s.l.) O-
type vein (Figure 47 a, b). The horizontal distance of the two drill cores from where the samples were
taken is approximately 50 m (Figure 7).
Fluid inclusions are abundant in quartz and sphalerite in both veins. The size of the fluid inclusions
ranges from <1 to 45 µm. The majority of inclusions examined during this study were 4 to 15 µm big.
To constrain the initial conditions of ore and gangue crystallization, most measurements were done on
inclusions showing micro-textural characteristics of primary fluid inclusions as defined by Roedder
(1984). Thus, microthermometric investigation focused on fluid inclusion assemblages belonging to
inclusion-rich growth zones and oriented parallel to crystal faces (Figure 47 c - e).
Figure 47: Photographs of the banded (a, sample CHM2-68.5) and the crustiform (b, sample CHM7-52) O-type veins studied.
c) Primary fluid inclusions oriented along crystal growth zones in sphalerite; CHM2-68.5, TL-PPL. d) Euhedral quartz
embedded in sphalerite showing fluid inclusions parallel to growth zones; CHM2-68.5, TL-PPL. e) Elongated quartz crystal
showing fluid inclusions parallel to crystal faces; CHM2-68.5, TL-PPL.
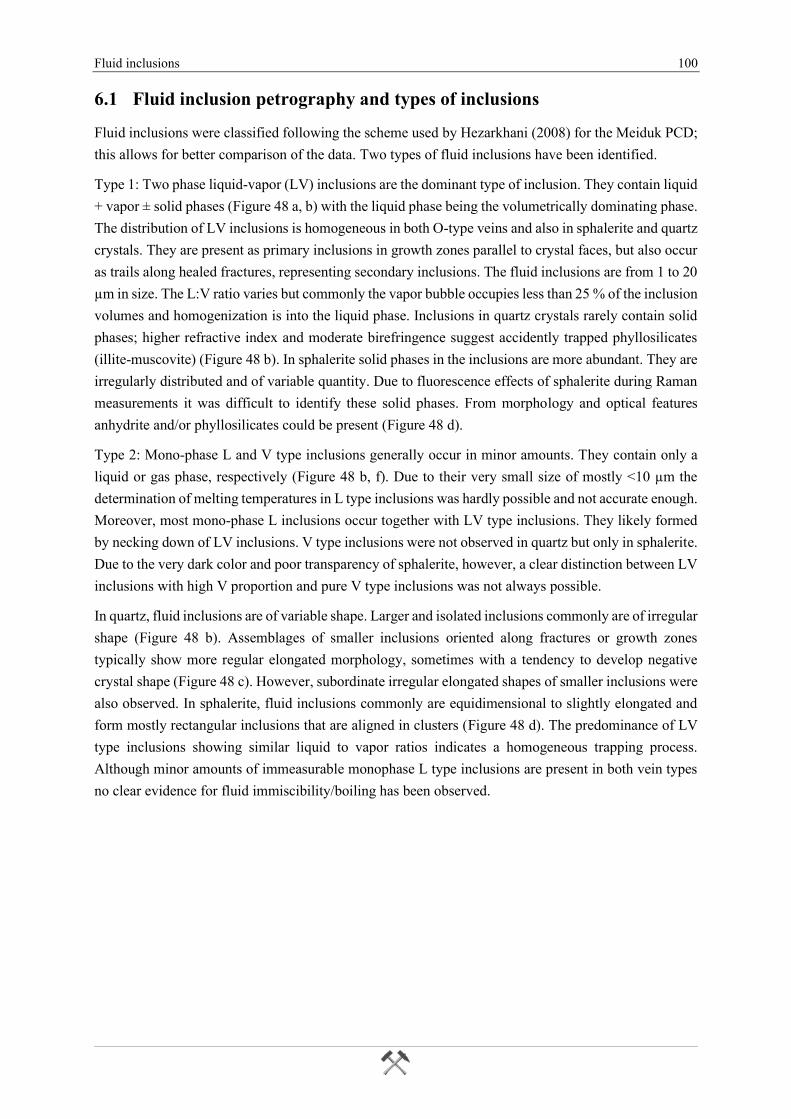
Fluid inclusions 100
6.1 Fluid inclusion petrography and types of inclusions
Fluid inclusions were classified following the scheme used by Hezarkhani (2008) for the Meiduk PCD;
this allows for better comparison of the data. Two types of fluid inclusions have been identified.
Type 1: Two phase liquid-vapor (LV) inclusions are the dominant type of inclusion. They contain liquid
+ vapor ± solid phases (Figure 48 a, b) with the liquid phase being the volumetrically dominating phase.
The distribution of LV inclusions is homogeneous in both O-type veins and also in sphalerite and quartz
crystals. They are present as primary inclusions in growth zones parallel to crystal faces, but also occur
as trails along healed fractures, representing secondary inclusions. The fluid inclusions are from 1 to 20
µm in size. The L:V ratio varies but commonly the vapor bubble occupies less than 25 % of the inclusion
volumes and homogenization is into the liquid phase. Inclusions in quartz crystals rarely contain solid
phases; higher refractive index and moderate birefringence suggest accidently trapped phyllosilicates
(illite-muscovite) (Figure 48 b). In sphalerite solid phases in the inclusions are more abundant. They are
irregularly distributed and of variable quantity. Due to fluorescence effects of sphalerite during Raman
measurements it was difficult to identify these solid phases. From morphology and optical features
anhydrite and/or phyllosilicates could be present (Figure 48 d).
Type 2: Mono-phase L and V type inclusions generally occur in minor amounts. They contain only a
liquid or gas phase, respectively (Figure 48 b, f). Due to their very small size of mostly <10 µm the
determination of melting temperatures in L type inclusions was hardly possible and not accurate enough.
Moreover, most mono-phase L inclusions occur together with LV type inclusions. They likely formed
by necking down of LV inclusions. V type inclusions were not observed in quartz but only in sphalerite.
Due to the very dark color and poor transparency of sphalerite, however, a clear distinction between LV
inclusions with high V proportion and pure V type inclusions was not always possible.
In quartz, fluid inclusions are of variable shape. Larger and isolated inclusions commonly are of irregular
shape (Figure 48 b). Assemblages of smaller inclusions oriented along fractures or growth zones
typically show more regular elongated morphology, sometimes with a tendency to develop negative
crystal shape (Figure 48 c). However, subordinate irregular elongated shapes of smaller inclusions were
also observed. In sphalerite, fluid inclusions commonly are equidimensional to slightly elongated and
form mostly rectangular inclusions that are aligned in clusters (Figure 48 d). The predominance of LV
type inclusions showing similar liquid to vapor ratios indicates a homogeneous trapping process.
Although minor amounts of immeasurable monophase L type inclusions are present in both vein types
no clear evidence for fluid immiscibility/boiling has been observed.
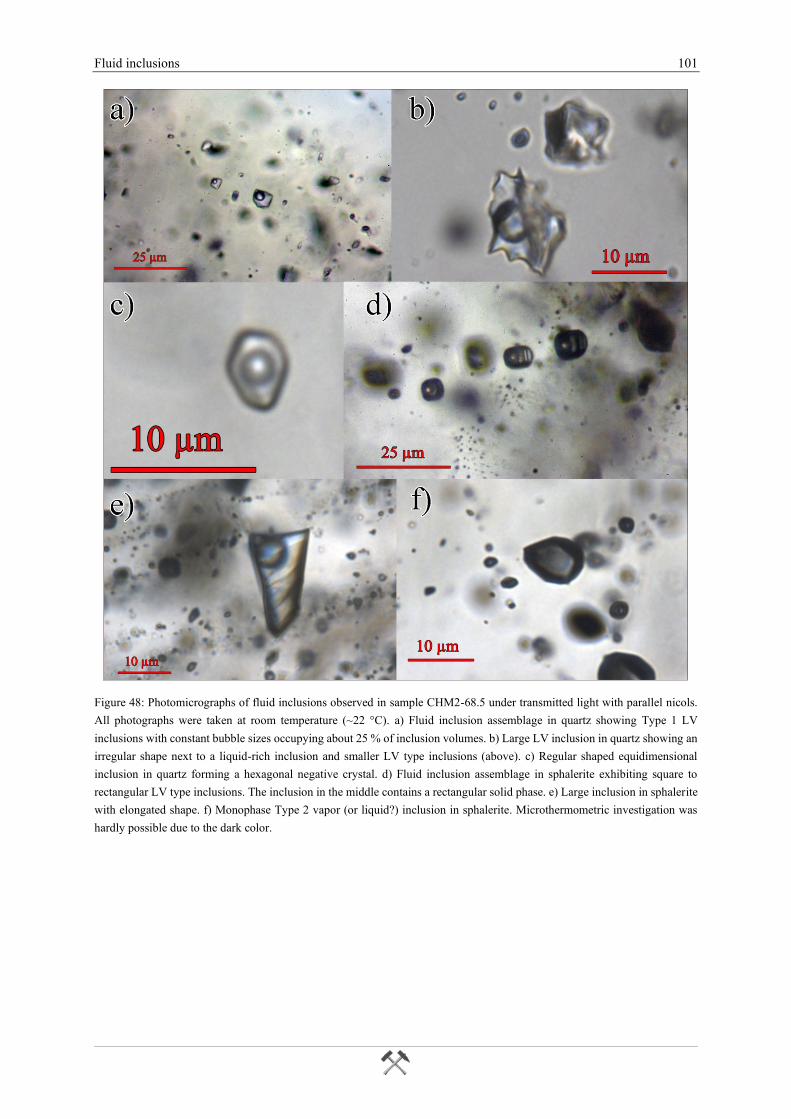
Fluid inclusions 101
Figure 48: Photomicrographs of fluid inclusions observed in sample CHM2-68.5 under transmitted light with parallel nicols.
All photographs were taken at room temperature (~22 °C). a) Fluid inclusion assemblage in quartz showing Type 1 LV
inclusions with constant bubble sizes occupying about 25 % of inclusion volumes. b) Large LV inclusion in quartz showing an
irregular shape next to a liquid-rich inclusion and smaller LV type inclusions (above). c) Regular shaped equidimensional
inclusion in quartz forming a hexagonal negative crystal. d) Fluid inclusion assemblage in sphalerite exhibiting square to
rectangular LV type inclusions. The inclusion in the middle contains a rectangular solid phase. e) Large inclusion in sphalerite
with elongated shape. f) Monophase Type 2 vapor (or liquid?) inclusion in sphalerite. Microthermometric investigation was
hardly possible due to the dark color.
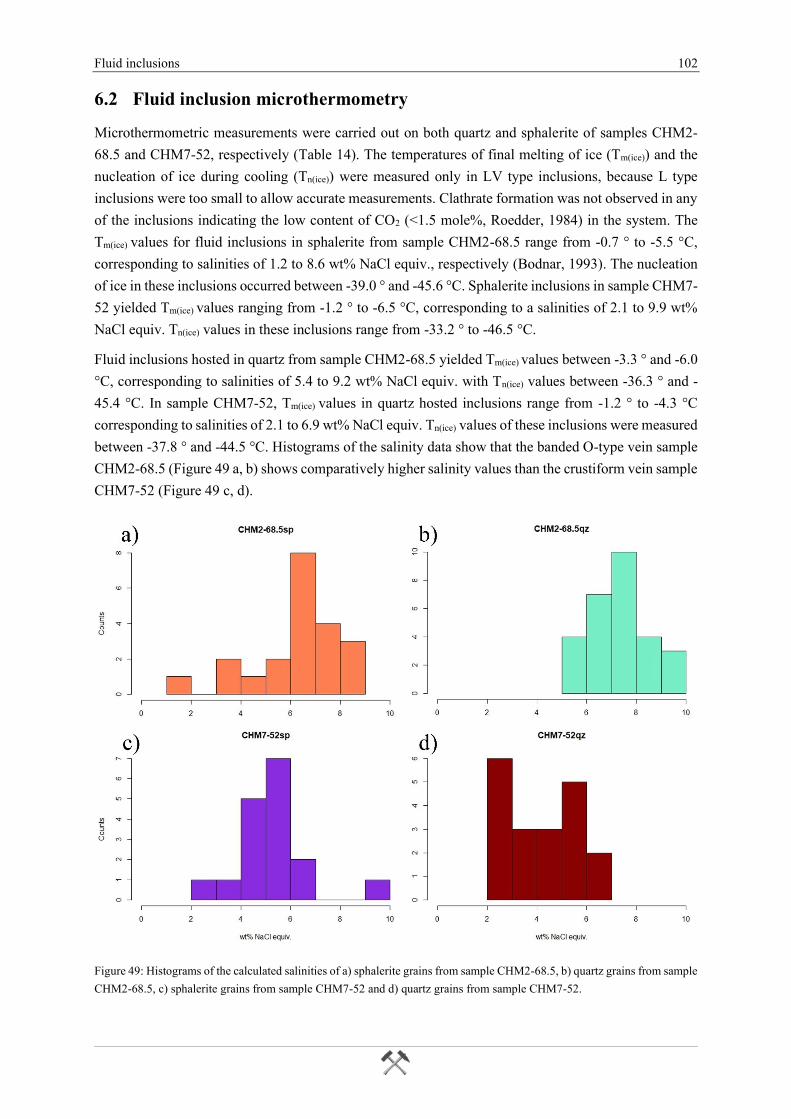
Fluid inclusions 102
6.2 Fluid inclusion microthermometry
Microthermometric measurements were carried out on both quartz and sphalerite of samples CHM2-
68.5 and CHM7-52, respectively (Table 14). The temperatures of final melting of ice (Tm(ice)) and the
nucleation of ice during cooling (Tn(ice)) were measured only in LV type inclusions, because L type
inclusions were too small to allow accurate measurements. Clathrate formation was not observed in any
of the inclusions indicating the low content of CO2 (<1.5 mole%, Roedder, 1984) in the system. The
Tm(ice) values for fluid inclusions in sphalerite from sample CHM2-68.5 range from -0.7 ° to -5.5 °C,
corresponding to salinities of 1.2 to 8.6 wt% NaCl equiv., respectively (Bodnar, 1993). The nucleation
of ice in these inclusions occurred between -39.0 ° and -45.6 °C. Sphalerite inclusions in sample CHM7-
52 yielded Tm(ice) values ranging from -1.2 ° to -6.5 °C, corresponding to a salinities of 2.1 to 9.9 wt%
NaCl equiv. Tn(ice) values in these inclusions range from -33.2 ° to -46.5 °C.
Fluid inclusions hosted in quartz from sample CHM2-68.5 yielded Tm(ice) values between -3.3 ° and -6.0
°C, corresponding to salinities of 5.4 to 9.2 wt% NaCl equiv. with Tn(ice) values between -36.3 ° and -
45.4 °C. In sample CHM7-52, Tm(ice) values in quartz hosted inclusions range from -1.2 ° to -4.3 °C
corresponding to salinities of 2.1 to 6.9 wt% NaCl equiv. Tn(ice) values of these inclusions were measured
between -37.8 ° and -44.5 °C. Histograms of the salinity data show that the banded O-type vein sample
CHM2-68.5 (Figure 49 a, b) shows comparatively higher salinity values than the crustiform vein sample
CHM7-52 (Figure 49 c, d).
Figure 49: Histograms of the calculated salinities of a) sphalerite grains from sample CHM2-68.5, b) quartz grains from sample
CHM2-68.5, c) sphalerite grains from sample CHM7-52 and d) quartz grains from sample CHM7-52.
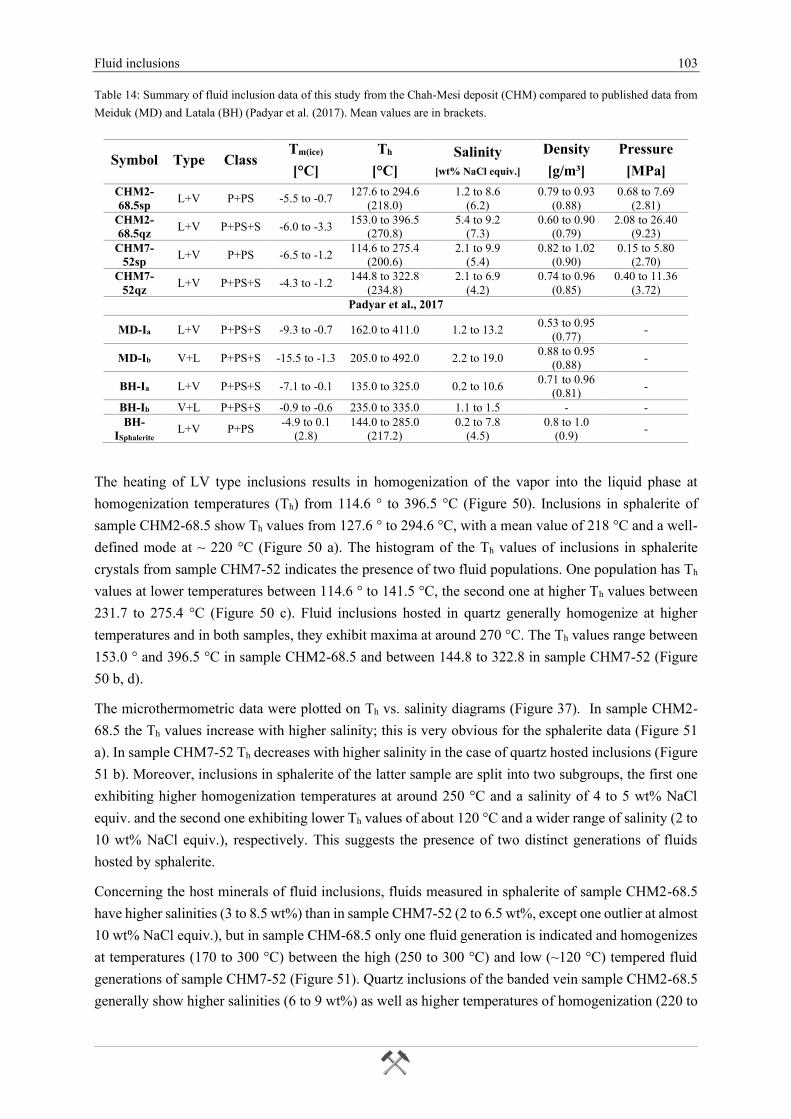
Fluid inclusions 103
Table 14: Summary of fluid inclusion data of this study from the Chah-Mesi deposit (CHM) compared to published data from
Meiduk (MD) and Latala (BH) (Padyar et al. (2017). Mean values are in brackets.
Symbol Type Class Tm(ice)
[°C]
Th
[°C]
Salinity
[wt% NaCl equiv.]
Density
[g/m³]
Pressure
[MPa]
CHM2-
68.5sp L+V P+PS -5.5 to -0.7
127.6 to 294.6
(218.0)
1.2 to 8.6
(6.2)
0.79 to 0.93
(0.88)
0.68 to 7.69
(2.81)
CHM2-
68.5qz L+V P+PS+S -6.0 to -3.3
153.0 to 396.5
(270.8)
5.4 to 9.2
(7.3)
0.60 to 0.90
(0.79)
2.08 to 26.40
(9.23)
CHM7-
52sp L+V P+PS -6.5 to -1.2
114.6 to 275.4
(200.6)
2.1 to 9.9
(5.4)
0.82 to 1.02
(0.90)
0.15 to 5.80
(2.70)
CHM7-
52qz L+V P+PS+S -4.3 to -1.2
144.8 to 322.8
(234.8)
2.1 to 6.9
(4.2)
0.74 to 0.96
(0.85)
0.40 to 11.36
(3.72)
Padyar et al., 2017
MD-Ia L+V P+PS+S -9.3 to -0.7 162.0 to 411.0 1.2 to 13.2 0.53 to 0.95
(0.77) -
MD-Ib V+L P+PS+S -15.5 to -1.3 205.0 to 492.0 2.2 to 19.0 0.88 to 0.95
(0.88) -
BH-Ia L+V P+PS+S -7.1 to -0.1 135.0 to 325.0 0.2 to 10.6 0.71 to 0.96
(0.81) -
BH-Ib V+L P+PS+S -0.9 to -0.6 235.0 to 335.0 1.1 to 1.5 - -
BH-
ISphalerite L+V P+PS
-4.9 to 0.1
(2.8)
144.0 to 285.0
(217.2)
0.2 to 7.8
(4.5)
0.8 to 1.0
(0.9) -
The heating of LV type inclusions results in homogenization of the vapor into the liquid phase at
homogenization temperatures (Th) from 114.6 ° to 396.5 °C (Figure 50). Inclusions in sphalerite of
sample CHM2-68.5 show Th values from 127.6 ° to 294.6 °C, with a mean value of 218 °C and a well-
defined mode at ~ 220 °C (Figure 50 a). The histogram of the Th values of inclusions in sphalerite
crystals from sample CHM7-52 indicates the presence of two fluid populations. One population has Th
values at lower temperatures between 114.6 ° to 141.5 °C, the second one at higher Th values between
231.7 to 275.4 °C (Figure 50 c). Fluid inclusions hosted in quartz generally homogenize at higher
temperatures and in both samples, they exhibit maxima at around 270 °C. The Th values range between
153.0 ° and 396.5 °C in sample CHM2-68.5 and between 144.8 to 322.8 in sample CHM7-52 (Figure
50 b, d).
The microthermometric data were plotted on Th vs. salinity diagrams (Figure 37). In sample CHM2-
68.5 the Th values increase with higher salinity; this is very obvious for the sphalerite data (Figure 51
a). In sample CHM7-52 Th decreases with higher salinity in the case of quartz hosted inclusions (Figure
51 b). Moreover, inclusions in sphalerite of the latter sample are split into two subgroups, the first one
exhibiting higher homogenization temperatures at around 250 °C and a salinity of 4 to 5 wt% NaCl
equiv. and the second one exhibiting lower Th values of about 120 °C and a wider range of salinity (2 to
10 wt% NaCl equiv.), respectively. This suggests the presence of two distinct generations of fluids
hosted by sphalerite.
Concerning the host minerals of fluid inclusions, fluids measured in sphalerite of sample CHM2-68.5
have higher salinities (3 to 8.5 wt%) than in sample CHM7-52 (2 to 6.5 wt%, except one outlier at almost
10 wt% NaCl equiv.), but in sample CHM-68.5 only one fluid generation is indicated and homogenizes
at temperatures (170 to 300 °C) between the high (250 to 300 °C) and low (~120 °C) tempered fluid
generations of sample CHM7-52 (Figure 51). Quartz inclusions of the banded vein sample CHM2-68.5
generally show higher salinities (6 to 9 wt%) as well as higher temperatures of homogenization (220 to
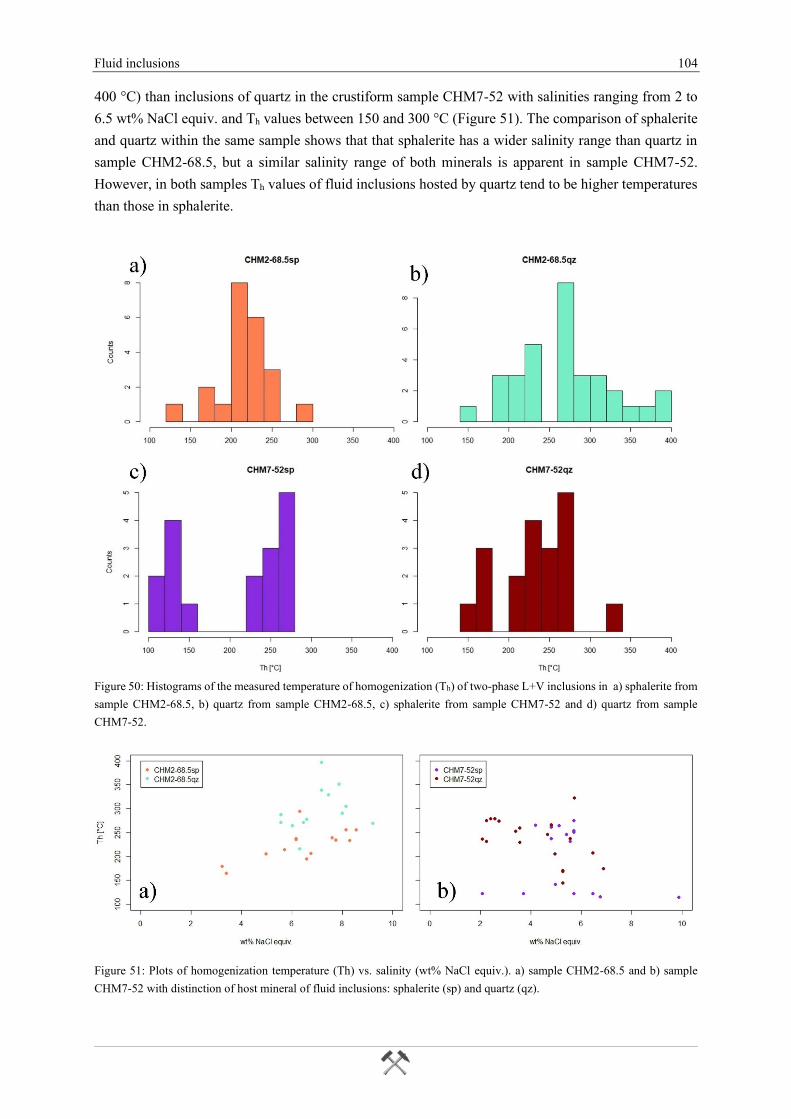
Fluid inclusions 104
400 °C) than inclusions of quartz in the crustiform sample CHM7-52 with salinities ranging from 2 to
6.5 wt% NaCl equiv. and Th values between 150 and 300 °C (Figure 51). The comparison of sphalerite
and quartz within the same sample shows that that sphalerite has a wider salinity range than quartz in
sample CHM2-68.5, but a similar salinity range of both minerals is apparent in sample CHM7-52.
However, in both samples Th values of fluid inclusions hosted by quartz tend to be higher temperatures
than those in sphalerite.
Figure 50: Histograms of the measured temperature of homogenization (Th) of two-phase L+V inclusions in a) sphalerite from
sample CHM2-68.5, b) quartz from sample CHM2-68.5, c) sphalerite from sample CHM7-52 and d) quartz from sample
CHM7-52.
Figure 51: Plots of homogenization temperature (Th) vs. salinity (wt% NaCl equiv.). a) sample CHM2-68.5 and b) sample
CHM7-52 with distinction of host mineral of fluid inclusions: sphalerite (sp) and quartz (qz).
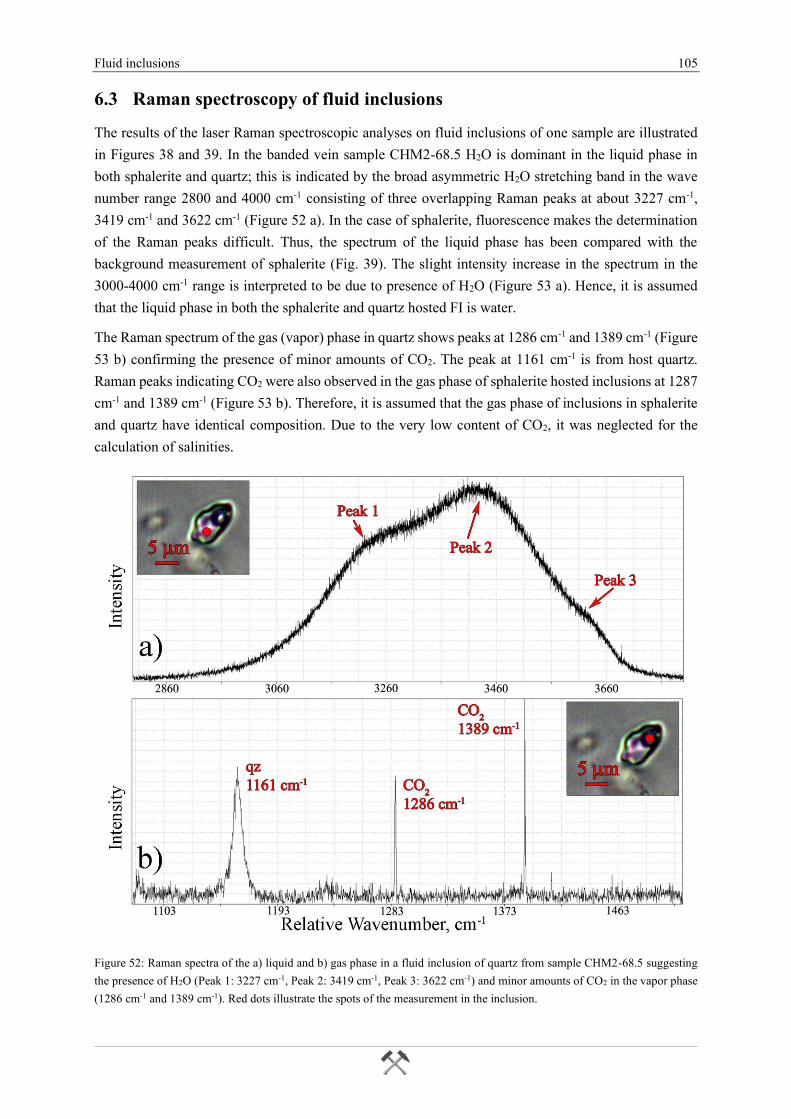
Fluid inclusions 105
6.3 Raman spectroscopy of fluid inclusions
The results of the laser Raman spectroscopic analyses on fluid inclusions of one sample are illustrated
in Figures 38 and 39. In the banded vein sample CHM2-68.5 H2O is dominant in the liquid phase in
both sphalerite and quartz; this is indicated by the broad asymmetric H2O stretching band in the wave
number range 2800 and 4000 cm-1 consisting of three overlapping Raman peaks at about 3227 cm-1,
3419 cm-1 and 3622 cm-1 (Figure 52 a). In the case of sphalerite, fluorescence makes the determination
of the Raman peaks difficult. Thus, the spectrum of the liquid phase has been compared with the
background measurement of sphalerite (Fig. 39). The slight intensity increase in the spectrum in the
3000-4000 cm-1 range is interpreted to be due to presence of H2O (Figure 53 a). Hence, it is assumed
that the liquid phase in both the sphalerite and quartz hosted FI is water.
The Raman spectrum of the gas (vapor) phase in quartz shows peaks at 1286 cm-1 and 1389 cm-1 (Figure
53 b) confirming the presence of minor amounts of CO2. The peak at 1161 cm-1 is from host quartz.
Raman peaks indicating CO2 were also observed in the gas phase of sphalerite hosted inclusions at 1287
cm-1 and 1389 cm-1 (Figure 53 b). Therefore, it is assumed that the gas phase of inclusions in sphalerite
and quartz have identical composition. Due to the very low content of CO2, it was neglected for the
calculation of salinities.
Figure 52: Raman spectra of the a) liquid and b) gas phase in a fluid inclusion of quartz from sample CHM2-68.5 suggesting
the presence of H2O (Peak 1: 3227 cm-1, Peak 2: 3419 cm-1, Peak 3: 3622 cm-1) and minor amounts of CO2 in the vapor phase
(1286 cm-1 and 1389 cm-1). Red dots illustrate the spots of the measurement in the inclusion.
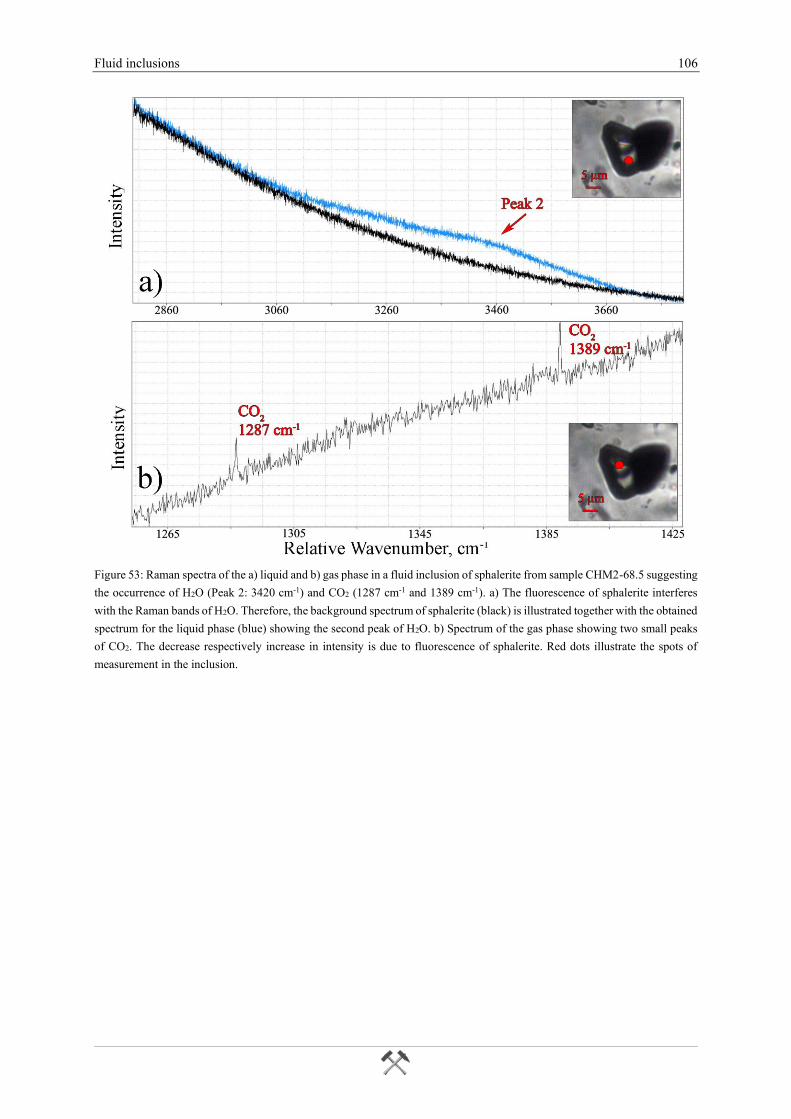
Fluid inclusions 106
Figure 53: Raman spectra of the a) liquid and b) gas phase in a fluid inclusion of sphalerite from sample CHM2-68.5 suggesting
the occurrence of H2O (Peak 2: 3420 cm-1) and CO2 (1287 cm-1 and 1389 cm-1). a) The fluorescence of sphalerite interferes
with the Raman bands of H2O. Therefore, the background spectrum of sphalerite (black) is illustrated together with the obtained
spectrum for the liquid phase (blue) showing the second peak of H2O. b) Spectrum of the gas phase showing two small peaks
of CO2. The decrease respectively increase in intensity is due to fluorescence of sphalerite. Red dots illustrate the spots of
measurement in the inclusion.
Discussion 107
7 Discussion
This Master thesis focused on the investigation of the polymetallic Chah-Mesi vein deposit, which is
located close to the Meiduk porphyry system in the Kerman Copper Belt of SE Iran. The study aimed
to obtain mineralogical data on the precious and base metal bearing veins. The data was used to interpret
the physicochemical conditions of ore formation, to estimate the evolutionary path of hydrothermal
fluids in space and time and to classify the deposit. Investigation included the sampling of five
exploration drill cores brought down by the National Iranian Copper Industries Company in 2007.
Macroscopic studies of the samples as well as microscopic and microanalytical data permitted the
definition of several vein types, establishing the spatial distribution of the ore and alteration zones and
the identification of a paragenetic sequence of mineral formation. In the following discussion the
obtained data are compared to the general characteristics of epithermal deposits as e.g. summarized by
Cooke and Simmons (2000) and Einaudi et al. (2003). A special focus was to establish regional trends
on the deposit scale based on metal and ore associations. For this purpose, fahlore composition proved
to be a valuable tool. Preliminary fluid inclusion studies allowed to constrain the PTX-conditions of ore
formation. Finally, the possible genetic link of the polymetallic veins at Chah-Mesi with the nearby
Meiduk porphyry deposit is discussed in the light of our new and previously published data (Hezarkhani,
2008; Hosseinkhani, 2009; Padyar et al., 2017). Conclusively, in order construct a genetic model, a
synthesis of all obtained data discussed in this study and previously published information about Chah-
Mesi and Meiduk is used.
7.1 Porphyry copper and epithermal deposits reviewed
As an introduction and for setting the background of the discussion the following chapter reviews
important characteristics of porphyry copper deposits (PCDs) and summarizes general features of
porphyry and epithermal systems.
7.1.1 Porphyry copper deposits
Porphyry systems involve some of the most widely distributed deposit types forming at convergent plate
boundaries, including porphyry copper deposits (PCDs) centered around shallow intrusions, skarn,
carbonate-replacement, and sediment-hosted Au deposits in peripheral locations as well as high- and
intermediate-sulfidation epithermal deposits (Figure 54). Porphyry systems presently supply about 75
% of the world’s Cu, 50 % Mo, 20 % Au, most of the Re, and minor amounts of other metals, such as
Ag, Pd, Te, Se, Bi, Zn and Pb (Sillitoe, 2010). PCDs are characterized by low- to moderate metal grade
(~0.3-2.0 % Cu) but are large tonnage (>100 Mt of ore) ore bodies that extend over several km² and
allow profitable mining in huge open pit operations. Mineralization is disseminated, breccia and vein-
hosted and forms in altered and genetically-related porphyry intrusions and adjacent wall rocks;
stockwork-like mineralization is very typical. Commonly, these systems are connected to broadly coeval
volcanism, shallowly emplaced (<10 km depth) stocks and dikes as well as underlying plutons and
batholiths (John et al., 2010; Pohl, 2011).
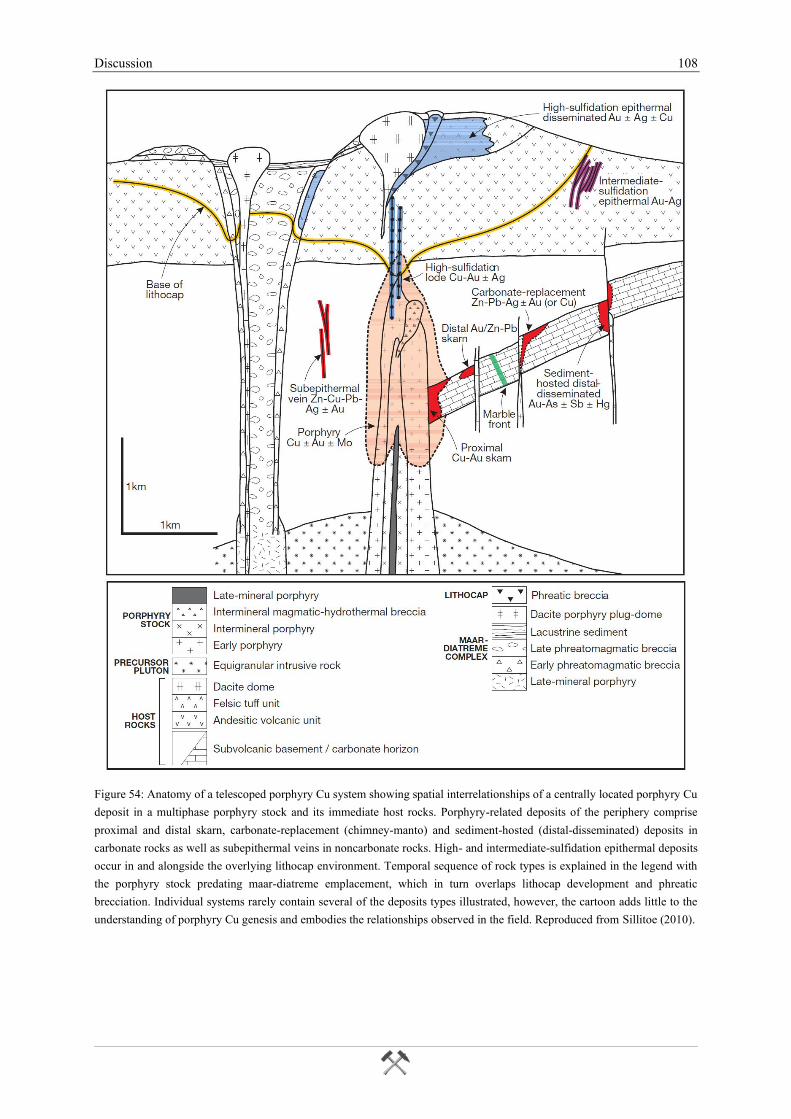
Discussion 108
Figure 54: Anatomy of a telescoped porphyry Cu system showing spatial interrelationships of a centrally located porphyry Cu
deposit in a multiphase porphyry stock and its immediate host rocks. Porphyry-related deposits of the periphery comprise
proximal and distal skarn, carbonate-replacement (chimney-manto) and sediment-hosted (distal-disseminated) deposits in
carbonate rocks as well as subepithermal veins in noncarbonate rocks. High- and intermediate-sulfidation epithermal deposits
occur in and alongside the overlying lithocap environment. Temporal sequence of rock types is explained in the legend with
the porphyry stock predating maar-diatreme emplacement, which in turn overlaps lithocap development and phreatic
brecciation. Individual systems rarely contain several of the deposits types illustrated, however, the cartoon adds little to the
understanding of porphyry Cu genesis and embodies the relationships observed in the field. Reproduced from Sillitoe (2010).
Discussion 109
Typically, porphyry Cu deposits are centered above cylindrical stock-like, composite intrusions (Figure
54) having dimensions of about 1.5 x 2 km. Igneous rocks typically show porphyritic textures in the
inner core surrounded by an outer shell of equigranular medium-grained rock. The porphyritic texture
indicates rapid crystallization to produce the finer grained groundmass surrounding earlier formed
phenocrysts (plagioclase, hornblende, biotite) (Evans, 1993). The porphyry intrusions comprise multiple
intrusive phases, that were emplaced before (early porphyries), during (inter-mineral porphyries), near
the end of (late mineral porphyries), and after (post-mineral porphyries) the alteration and mineralization
event (Sillitoe, 2010).
7.1.1.1 Geodynamic setting
Most porphyry systems form at convergent plate margins and range from Precambrian to Quaternary in
age, though the most known deposits formed during the Cenozoic and Mesozoic (Cooke et al., 2005;
John et al., 2010). However, porphyry Cu deposits have also been discovered in ancient fold belts and
in post-collisional settings (Asadi, 2018; Richards, 2009). At convergent margins, porphyry deposits are
genetically linked to intermediate to felsic calc-alkaline magmas in volcano-plutonic arcs above active
subduction zones (Figure 55 A) at continental margins (e.g. Andean porphyries) and at intra-oceanic
island arcs (e.g. Pacific island porphyries). The magmas derive their fundamental characteristics of
relatively high oxidation state and enrichments in water, alkalis, S, and Cl, H2O, and some metals from
the subduction process. These characteristics are critical to the formation of magmatic-hydrothermal ore
deposits of this type: the high oxidation state suppresses the formation of significant amounts of
magmatic sulfide phases, which would strip the magma of chalcophile and siderophile metals (Richards,
2005); the high water content results in saturation of the magma in an aqueous fluid phase upon ascent
into the upper crust, into which these metals will efficiently partition (Candela and Holland, 1984). In
most cases, arc crust is relatively thick with evidence for broadly coeval contractional or transpressional
tectonism (John et al., 2010). It is suggested that most porphyry deposits formed during specific periods
of subduction and changes in the tectonic regime (e.g. stress field) is important for porphyry ore genesis
(Cooke et al., 2014). Cooke et al. (2005) showed that many giant copper- and gold-rich porphyries are
inferred to be associated with regions where flat or shallow subduction was induced by subduction of
buoyant oceanic features, such as ridges, ocean plateaus or seamount chains and synchronous with ore
formation. These collisions do not cause a cessation of subduction but do result in crustal thickening,
rapid uplift and exhumation.
Although most PCDs are present in subduction-related magmatic arcs, the recent recognition of
porphyry-style mineralization in parts of Tibet, China and SE Iran (Asadi, 2018) revealed that some
porphyry copper deposits are related to post-subduction magmatism. Richards (2009) proposes that post-
subduction porphyry copper deposits can form from remelting of subduction-metasomatized mantle in
both extensional and compressional environments (Figure 55 B, C, D). These environments include: (1)
areas of post-subduction arc extension where decompressional melting occurs in upwelling subduction-
metasomatized asthenosphere and lithosphere, which generates mafic alkaline magmas of shoshonitic
or hawaiitic composition (Figure 55 B); and (2) post-subduction arc contraction caused by collision that
can lead to crustal thickening and delamination of the subcontinental lithospheric mantle. The partial
melting of lower crustal rocks results from depression of lower crustal rocks as isotherms rebound or
due to invasion of hot asthenosphere. During these processes, melts with more felsic, calc-alkaline or
Discussion 110
mildly alkaline compositions are generated (Figure 55 C, D). The magmas of both extensional and
compressional post-subduction settings tend to be small volume, spatially isolated and mildly (high-
potassium ± sodium calc-alkaline) to strongly alkaline in composition. The remelting of rocks containing
residual copper- and gold-rich sulfides left in cumulates during earlier subduction-related magmatism
provide a fertile source of copper and gold that eventually are redeposited in these post-subduction
porphyry deposits (John et al., 2010; Richards, 2009).
Figure 55: Geodynamic setting of porphyry Cu deposits. A) Typical continental margin arc above subduction zone. Porphyry
copper generation as a product of normal arc magmatism. B) Collisional lithospheric thickening. C) Post-collisional
lithospheric mantle delamination. D) Post-subduction lithospheric extension. MASH: zone of melting, assimilation, storage,
and homogenization; SCLM: subcontinental lithospheric mantle; B-D) Remelting of subduction-metasomatized SCLM or
lower crustal hydrous cumulate zones (black layer) leading to potential porphyry copper-gold and epithermal gold deposit
formation. High Sr/Y and La/Yb magmas may be generated in all cases by residual or fractionating hornblende (± garnet,
titanite) in the lower crust (John et al., 2010). Reproduced from Richards (2009).
7.1.1.2 Magma characteristics of PCDs
Porphyry intrusions are exclusively of I-type and magnetite-series affiliation, and typically
metaluminous and medium K calc-alkaline, but magmas may also show high K calc-alkaline
(shoshonitic) or even alkaline characteristics. The range of compositions comprises calc-alkaline diorite
and quartz diorite through granodiorite to quartz monzonite as well as alkaline diorite through monzonite
and subordinate syenite (Sillitoe, 2010). Host intrusions in island arc settings have primitive initial 87Sr/86Sr isotope ratios (0.705-0.702) and the melts therefore presumably derived from the upper mantle
and/or recycled oceanic crust. Higher Sr isotope ratios in mineralized intrusions in continental settings
indicate derivation from or contamination by crustal material (Evans, 1993; Seedorff et al., 2005).
Discussion 111
Investigation on the geochemical evolution of low-mineralized to well-mineralized porphyry copper
systems of the UDMB has shown that in general all porphyry intrusions exhibit LREE enrichment
relative to HREE. However, economic deposits (e.g. Sungun, Sar Cheshmeh, Meiduk) exhibit a
relatively steep LREE to HREE profile reflecting a higher LREE abundance than in sub-economic
porphyry copper systems (e.g. Reagan and Daraloo; Habibi and Hezarkhani, 2013; Hezarkhani, 2006b).
Moreover, Eu anomalies vary from distinct negative in sub-economic deposits (Eu/Eu* = 0.28-0.70) to
either markedly less negative or positive anomalies (Eu/Eu* = 0.45-1.67) in economic deposits. The
lack of distinct negative Eu anomalies is referred to more oxidized PCD magmas, where all REEs occur
trivalent (including Eu3+). Also, the lack of significant plagioclase fractionation reflects the high
magmatic water contents and depression of plagioclase fractionation. High La/Sm and Sm/Yb values
may indicate economic porphyry deposits and reflect high crustal assimilation in a relatively thickened
crust and the fractionation of hornblende with garnet. The steep downward LREE to MREE and flatter
MREE to HREE slopes in economic deposits indicate hornblende involvement with magma evolution
toward more volatile content. Thus, it is proposed that in an ongoing process of subduction, during
compression and crustal shortening, sub-economic intrusions are followed by adakite-like hydrous
economic Cu-bearing intrusions (Zarasvandi et al., 2015).
7.1.1.3 Hydrothermal alteration and mineralization
Hydrothermal alteration and mineralization are essential features of porphyry deposits. Ideally,
alteration zones form concentric shells around the intrusions. Alteration affects a large volume of
wallrocks around and above the intrusions. The classical model of Lowell and Guilbert (1970) is the
result of fundamental comparative studies on several porphyry copper deposits. It demonstrates that the
nature and distribution of the zones of hydrothermal wallrock alteration is the best reference framework
to which all the other features of these deposits can be related (Lowell and Guilbert, 1970). Alteration
of wallrocks includes alkali-dominated assemblages (potassic, sodic, sodic-calcic), acid assemblages
(advanced argillic, sericitic) and propylitic alteration. The hydrothermal alteration varies from early
high-temperature and proximal alkali-rich minerals (potassic alteration zone) to later and mostly distal
sheet silicate- and pyrite-rich mineral zones (sericitic or phyllic, intermediate argillic and advanced
argillic alteration types) (John et al., 2010).
Subsequent to the Lowell-Guilbert model that is based on porphyry deposits related to intrusives with
high silica to alkali ratios, deposits in association with intrusives that show a low ratio of these elements
are best pictured by the diorite model of Hollister (1978). These porphyry deposits related to diorites
differ in a number of ways from the Lowell-Guilbert model. One of the main reasons could be that sulfur
concentrations were relatively low in the mineralizing fluids in the latter. As a result, not all iron in the
host rocks is converted to pyrite and much iron remains fixed in chlorite and biotite while excess iron
tends to occur as magnetite that may be present in all alteration zones.
Regarding alteration zoning, the phyllic and argillic zones are usually absent in diorite-hosted porphyry
systems. In this case, the potassic zone is directly bordered by propylitic alteration. Diorite-hosted
porphyry systems are present in both island arc and continental arc settings. Concerning the
mineralization, the main difference is that significant amounts of gold may occur, and molybdenum
usually is low. Fractures containing gangue silicates and copper sulfides are mostly devoid of quartz
and commonly rich in chlorite, epidote and albite.
Discussion 112
7.1.1.3.1 Hydrothermal alteration
The model after Sillitoe (2010) summarizes alteration patterns of porphyry Cu deposits, which display
a broad-scale alteration-mineralization zoning that comprises, centrally from the bottom upward, sodic-
calcic, potassic, chlorite-sericite, sericitic and advanced argillic alteration. Chloritic and propylitic
alteration zones develop distally at shallow and deeper levels, respectively. Opaque mineral assemblages
are intrinsic parts of each alteration type because of the direct linkage between sulfidation state, the chief
control on sulfide assemblages, and solution pH, a principal control of alteration type (Einaudi et al.,
2003; Meyer and Hemley, 1967). Sulfidation state (Chapter 7.1.2.1) changes from low through
intermediate to high as temperature declines (Einaudi et al., 2003). Generally, the alteration-
mineralization types become progressively younger upward, with the result that the shallower alteration-
mineralization zones overprint and partly reconstitute deeper ones (Figure 56 a). The sequence, from
potassic with peripheral propylitic through chlorite-sericite and sericitic to advanced argillic, is the result
of increasing acidity consequent upon the declining temperature of the hydrothermal fluids (Figure 56
b). A parallel simultaneous increase in sulfidation state of the fluids results in changes in the sulfide
assemblage from chalcopyrite-bornite, through chalcopyrite-pyrite and pyrite-bornite, to pyrite-enargite
or pyrite-covellite. Cu-bearing sulfides are commonly absent in the early, high-temperature advanced
argillic zone (Sillitoe, 2010).
Figure 56: a) Generalized alteration-mineralization zoning pattern for porphyry Cu deposits. Shallow alteration-mineralization
types consistently overprint deeper ones. Volumes of the different alteration types vary markedly from deposit to deposit.
Sericitic alteration may project vertically downward and often separates the potassic and propylitic zones as well as cutting the
potassic zone centrally. Alteration-mineralization in the lithocap is commonly far more complex than shown. See text for
further details. b) Schematic representation of generalized alteration-mineralization sequence in relation to paleodepth and
system life span. Both figures are from Sillitoe (2010) and modified after Sillitoe (2000).
Sodic-calcic alteration affects commonly the immediate wallrocks to the porphyry intrusions and is
normally poorly preserved at depth with only minor amounts of sulfides and metals. Large parts of many
porphyry Cu deposits, especially deeply formed, are made up predominantly of potassic alteration,
which grades marginally into weakly developed propylitic zones. The potassic zone alteration is
characterized by the alteration assemblage quartz + K-feldspar ± biotite ± sericite ± anhydrite (Lowell
and Guilbert, 1970). This alteration affects mainly the early and inter-mineral porphyry generations
(Figure 54) and is generally pervasive (Sillitoe, 2010). Alteration minerals replace primary magmatic
Discussion 113
orthoclase, plagioclase and mafic minerals (Pirajno, 1992). Common ore minerals are pyrite,
chalcopyrite, bornite with minor magnetite and molybdenite. This assemblage is ascribed to high-
temperature magmatic-hydrothermal fluids.
Chlorite-sericite alteration is widespread in the shallower parts and overprints preexisting potassic
assemblages. The alteration is typified by partial to complete transformation of mafic minerals to
chlorite, plagioclase to sericite-illite as well as magmatic and any hydrothermal magnetite to hematite
(martite and/or specularite). The zone of sericitization (also known as phyllic alteration) overprints and
wholly or partially destroys the potassic and chlorite-sericite assemblages (Sillitoe, 2010).
Sericitic alteration is characterized by the assemblage quartz-sericite-pyrite (QSP zone). It usually
includes minor chlorite, illite and rutile. Pyrophyllite may be present, but carbonate and anhydrite are
very rare. The inner part of this zone is dominated by sericite, whereas further outward clay minerals
become more important. Sericitization affects feldspars and primary biotite and results in silica-
generating reactions producing much secondary quartz causing silicification. The contact with the
potassic zone is gradational over tens of meters and disseminated and veinlet pyrite shows its major
abundance within zones of sericitic alteration (Pirajno, 1992).
Advanced argillic alteration occurs in the near-surface lithocaps and often the root zones overprint the
upper parts of porphyry Cu deposits. Sericitic alteration is commonly transitional upward to quartz-
pyrophyllite, an assemblage widespread in the deep, higher temperature parts of many lithocaps. The
assemblage of quartz-kaolinite is related to lower temperatures and also known as argillic alteration after
Lowell and Guilbert (1970). The argillic zone (also known as intermediate argillic alteration) comprises
mainly clay minerals with kaolinite being dominant close to the orebody and montmorillonite further
away. In comparison to the sericitic zone, pyrite is less abundant, but still very common. It occurs in
veinlets rather than disseminated. Biotite may be unaffected or converted to chlorite and feldspars are
generally only slightly decomposed.
As the outermost zone, the propylitic alteration zone is always present and chlorite is the most common
mineral there. Calcite and epidote usually join the alteration assemblage and primary mafic minerals
(biotite and hornblende) are altered partially or completely to chlorite and carbonate. The propylitic zone
fades out into the unaltered surrounding rocks over several hundreds of meters (Evans, 1993).
7.1.1.3.2 Mineralization in PCD
Copper is the dominant metal produced from porphyry copper deposits with important by-products
being Mo, Au and lesser amounts of Ag, Re and PGEs. Copper minerals include chalcopyrite, bornite,
chalcocite, enargite and digenite in hypogene ore and chalcocite, covellite, tenorite, chrysocolla,
malachite, azurite, and native copper in supergene ore. The distribution of metals (Cu, Mo, Au, Zn, Pb,
Ag) varies and zonation often broadly correlates with fluid flow directions (pressure gradients),
reactivity of wall rocks (alteration types) and gradients of both temperature and reduced sulfur species
in the hydrothermal fluids with the more soluble base metals (Zn, Pb) mostly found distally (John et al.,
2010). Ore deposition may occur totally within the intrusive stock, in the stock and within the country
rocks or only in the country rocks.
The shape of many porphyry copper deposits mimic those of their host intrusions and many of them
have vertically extensive orebodies, which become progressively lower grade both outward and
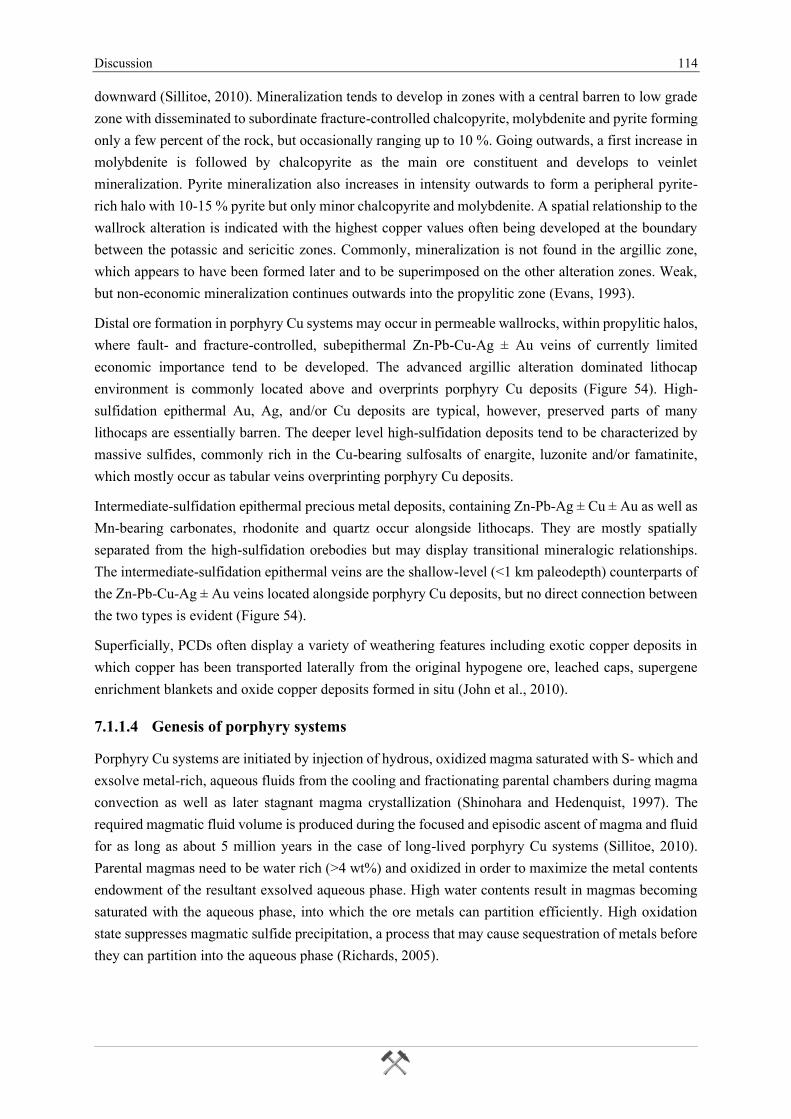
Discussion 114
downward (Sillitoe, 2010). Mineralization tends to develop in zones with a central barren to low grade
zone with disseminated to subordinate fracture-controlled chalcopyrite, molybdenite and pyrite forming
only a few percent of the rock, but occasionally ranging up to 10 %. Going outwards, a first increase in
molybdenite is followed by chalcopyrite as the main ore constituent and develops to veinlet
mineralization. Pyrite mineralization also increases in intensity outwards to form a peripheral pyrite-
rich halo with 10-15 % pyrite but only minor chalcopyrite and molybdenite. A spatial relationship to the
wallrock alteration is indicated with the highest copper values often being developed at the boundary
between the potassic and sericitic zones. Commonly, mineralization is not found in the argillic zone,
which appears to have been formed later and to be superimposed on the other alteration zones. Weak,
but non-economic mineralization continues outwards into the propylitic zone (Evans, 1993).
Distal ore formation in porphyry Cu systems may occur in permeable wallrocks, within propylitic halos,
where fault- and fracture-controlled, subepithermal Zn-Pb-Cu-Ag ± Au veins of currently limited
economic importance tend to be developed. The advanced argillic alteration dominated lithocap
environment is commonly located above and overprints porphyry Cu deposits (Figure 54). High-
sulfidation epithermal Au, Ag, and/or Cu deposits are typical, however, preserved parts of many
lithocaps are essentially barren. The deeper level high-sulfidation deposits tend to be characterized by
massive sulfides, commonly rich in the Cu-bearing sulfosalts of enargite, luzonite and/or famatinite,
which mostly occur as tabular veins overprinting porphyry Cu deposits.
Intermediate-sulfidation epithermal precious metal deposits, containing Zn-Pb-Ag ± Cu ± Au as well as
Mn-bearing carbonates, rhodonite and quartz occur alongside lithocaps. They are mostly spatially
separated from the high-sulfidation orebodies but may display transitional mineralogic relationships.
The intermediate-sulfidation epithermal veins are the shallow-level (<1 km paleodepth) counterparts of
the Zn-Pb-Cu-Ag ± Au veins located alongside porphyry Cu deposits, but no direct connection between
the two types is evident (Figure 54).
Superficially, PCDs often display a variety of weathering features including exotic copper deposits in
which copper has been transported laterally from the original hypogene ore, leached caps, supergene
enrichment blankets and oxide copper deposits formed in situ (John et al., 2010).
7.1.1.4 Genesis of porphyry systems
Porphyry Cu systems are initiated by injection of hydrous, oxidized magma saturated with S- which and
exsolve metal-rich, aqueous fluids from the cooling and fractionating parental chambers during magma
convection as well as later stagnant magma crystallization (Shinohara and Hedenquist, 1997). The
required magmatic fluid volume is produced during the focused and episodic ascent of magma and fluid
for as long as about 5 million years in the case of long-lived porphyry Cu systems (Sillitoe, 2010).
Parental magmas need to be water rich (>4 wt%) and oxidized in order to maximize the metal contents
endowment of the resultant exsolved aqueous phase. High water contents result in magmas becoming
saturated with the aqueous phase, into which the ore metals can partition efficiently. High oxidation
state suppresses magmatic sulfide precipitation, a process that may cause sequestration of metals before
they can partition into the aqueous phase (Richards, 2005).
Discussion 115
Figure 57: Schematic time slices through a telescoped porphyry Cu system illustrated in Figure 54 based on modeling by
Sillitoe and Hedenquist (2003) and Heinrich (2005). The illustration after Sillitoe (2010) is showing the evolution of the main
magmatic fluid and alteration-mineralization types together with progressive downward magma solidification, cooling and
paleosurface degradation. For detailed explanation of the individual genetic stages see text.
The sequence of alteration-mineralization events is a consequence of progressive rock and fluid cooling
(from >700 °C to <250 °C) caused by solidification of the underlying parental plutons and downward
propagation of the lithostatic-hydrostatic transition as well as paleosurface degradation. At the early
stage (Figure 57, left side), magma is present at the top of the parental chamber and, a single-phase, low-
to moderate-salinity (2-10 wt% NaCl equiv.), fluid exsolves from the magma (Heinrich, 2005). This
aqueous liquid phase decompresses, cools and therefore undergoes phase separation during ascent to
generate immiscible hypersaline liquid fluid (brine) and larger volume of low-density vapor. The liquid
phase/brine is enriched in Na, K and Fe chlorides, whereas the vapor phase contains acidic volatile
species, such as SO2, H2S, CO2, HCl and HF (Giggenbach, 1992). Phase separation causes the selective
fractionation of specific element suites between the vapor and hypersaline liquid with vapor containing
appreciable amounts of the Cu, Au, Ag and S, plus much of the As, Sb, Te and B. However, Fe, Zn, Pb,
Mn and possibly Mo preferentially partition into the hypersaline liquid (Heinrich, 2005). During the
cooling of the porphyry Cu system through the 700° to 550 °C temperature range, the fluids initiate
potassic alteration plus low-sulfidation state high-temperature porphyry Cu mineralization that affects
mainly early to inter-mineral porphyries and their immediate wall rocks. Quartz-veined cores of the
potassic zones remain barren because temperatures are too high to permit Cu-Fe ± Au sulfide deposition,
potentially giving rise to the bell- and cap-shaped ore zones described by the Lowell and Guilbert (1970)
Discussion 116
model and documented from many porphyry deposits. Coincident with the potassic alteration, heated
external water, largely meteoric with subordinate connate component, generates the peripheral propylitic
alteration. The convective circulation of the external water takes place where rock permeabilities are
adequately high and causes moderate-temperature hydration reactions (Meyer and Hemley, 1967).
Upward-escaping, low-pressure vapor that does not reach the paleosurface as high-temperature
fumaroles (Hedenquist et al., 1993) undergoes disproportionation of the contained SO2 (to H2SO4 and
H2S) that, eventually, condenses together with HCl into ground water (Giggenbach, 1992). This acidic
condensate produces the extremely low pH fluid responsible for the generally barren advanced argillic
alteration of the lithocap environment on top of the porphyry system (Figure 56 a) and the generation of
the vuggy, residual quartz cores (Meyer and Hemley, 1967).
As magma solidification advances downward (Figure 57, middle), the entire porphyry system cools
rapidly and the rock can fracture in a brittle fashion on cooling below 400 °C, hence, lithostatic gives
way to hydrostatic pressure. Due to lower temperature conditions the aqueous liquid phase exsolves
more slowly from the still crystallizing magma and, in turn, advects more slowly and cools, what may
prevent the intersection of its solvus. A single-phase, low- to moderate-salinity (5-20 wt% NaCl equiv.)
liquid in the 350° to 250 °C temperature range ascends directly from the parental chambers into the
overlying porphyry Cu system (Shinohara and Hedenquist, 1997). The mixing of the magmatic fluid
with meteoric water is often responsible for the formation of the late sericitic ± chlorite (phyllic)
alteration zones, particularly at the margins of systems where the advecting magmatic fluid may entrain
and mix with convecting meteoric water. Sericitic alteration may be related with variable degrees of Cu
± Au mobilization and cooling of hypersaline liquids fluids in contact with external wallrocks that are
diluted with meteoric water causes Zn, Pb, Ag and Mn precipitation giving rise to geochemical halos
and localized veins in the propylitic halos.
The fluid most likely induces high-sulfidation (HS) epithermal Au ± Ag ± Cu mineralization (Figure
57, right side) in the relatively barren, early formed lithocaps whereas the low- to moderate-salinity,
H2S-rich, aqueous fluid produced the underlying sericitic alteration zone. On entering the lithocap
environment, this intermediate-sulfidation state fluid becomes unbuffered and easily evolves to a higher
sulfidation state on cooling. These fluids may pass into adjoining, less altered rocks and undergo
sufficient neutralization and reduction during outward flow and wallrock reaction to produce fluids
capable of forming intermediate-sulfidation (IS) epithermal deposits. Alternatively, the intermediate-
sulfidation state fluids derived from deeper parts of the system may bypass the lithocaps entirely and
produce epithermal intermediate-sulfidation mineralization at shallow levels (Einaudi et al., 2003;
Sillitoe and Hedenquist, 2003).
Discussion 117
7.1.2 Epithermal deposits
Epithermal systems are defined as those formed at low to moderate temperatures (between about 50 and
300° C) and low pressures (< 500 bar or depth equivalent of < 1 to 1.5 km) from hydrothermal fluids of
low to moderate salinity (<1 to 5-15 wt% NaCl equivalent). The fluids often have a magmatic-meteoric
signature with HCl, CO2 and H2S being of magmatic derivation. Due to their formation at near-surface
levels in geotectonic settings characterized by rapid erosion the preservation potential of epithermal
systems in the ancient geological record is generally poor. Therefore, most known epithermal systems
are of Cenozoic age and, like porphyry systems, they are especially abundant at convergent plate
margins as well as in rift-related settings.
Common and distinct mineralogical features of epithermal mineralization are the presence of fine-
grained chalcedonic silica, calcite, quartz pseudomorphs after calcite (indicative of boiling fluids) as
gangue minerals. The elemental association typically is typically Au, Ag, As, Sb, Hg, Tl, Te, Pb, Zn and
Cu, whereas these elements commonly form sulfides and Cu-bearing sulfosalts (enargite, luzonite-
famatinite and/or tennantite-tetrahedrite). Characteristic ore textures include open space fillings (low
pressure environment), crustifications, colloform banding and comb structures. Mineralization is formed
from the surface to approximately 1.5 km below the surface and consists of veins, stockworks and
disseminations occurring either together or as single entities. Hydrothermal breccias can also be present.
Generally, epithermal deposits provide easy mining targets with Au and Ag being the main metals of
interest. They are either mined as open cast or shallow underground operations depending on tonnage
and grades (Pirajno, 2009).
7.1.2.1 Classification
Modern classification schemes of epithermal deposits are based on alteration assemblages, hypogene
sulfide-oxide assemblages and the oxidation/sulfidation states (Einaudi et al., 2003; Sillitoe and
Hedenquist, 2003). The term sulfidation state was originally defined by Barton (1970) and has been
used analogous to oxidation state, whereas nowadays the frame of reference is temperature and the
fugacities of S2 (ƒS2) and O2 (ƒO2), respectively. The sulfur respectively oxygen fugacity of a system, at
any temperature, is compared to standard mineral reactions (buffers), such as
4𝐹𝑒3𝑂4 + 𝑂2 = 6𝐹𝑒2𝑂3
magnetite hematite ( 1 )
for oxygen, or
2𝐹𝑒𝑆 + 𝑆2 = 2𝐹𝑒𝑆2
pyrrhotite pyrite ( 2 )
for sulfur. The basis for assigning relative sulfidation or oxidation states are the differences between the
sulfur or oxygen fugacity deduced for the natural mineral assemblage compared to that of a buffer
reaction. In nature the most stable species of sulfur in the oxidized state is SO42- and in the reduced state
H2S. In hydrothermal systems, sulfidation state controls the speciation of sulfur and the deposition of
ore minerals whereby ore-forming fluids contain S in various valence states (Seedorff et al., 2005).
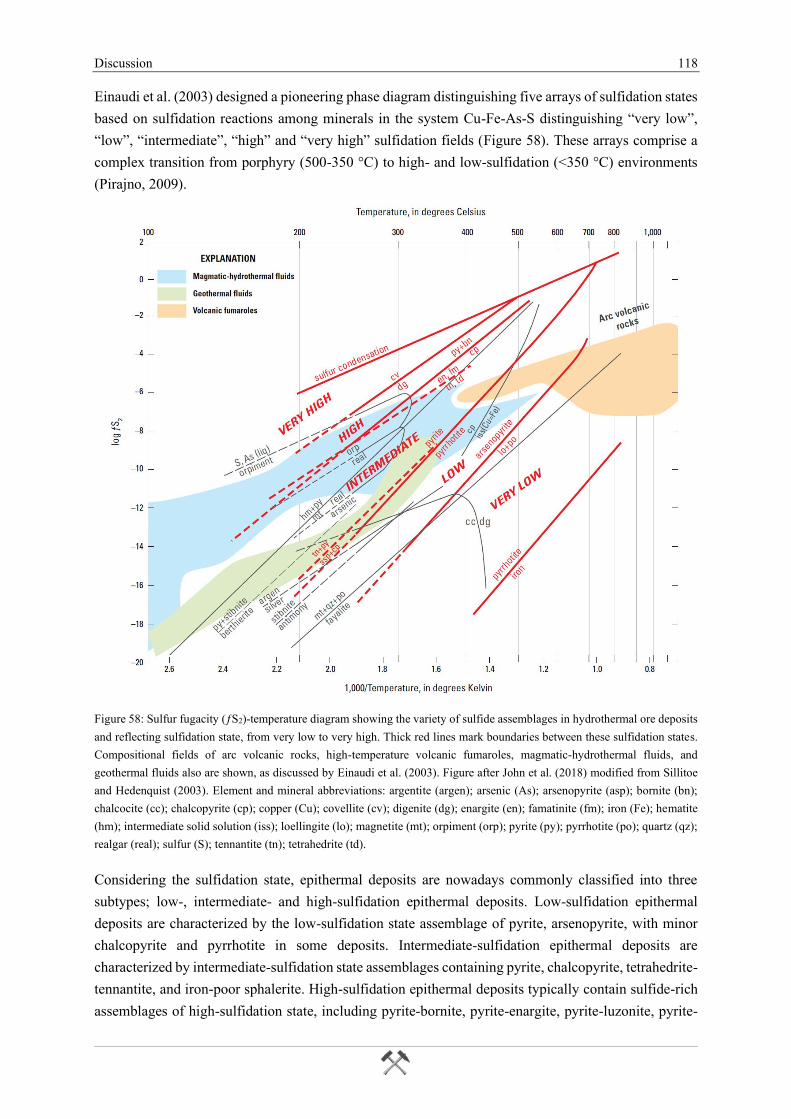
Discussion 118
Einaudi et al. (2003) designed a pioneering phase diagram distinguishing five arrays of sulfidation states
based on sulfidation reactions among minerals in the system Cu-Fe-As-S distinguishing “very low”,
“low”, “intermediate”, “high” and “very high” sulfidation fields (Figure 58). These arrays comprise a
complex transition from porphyry (500-350 °C) to high- and low-sulfidation (<350 °C) environments
(Pirajno, 2009).
Figure 58: Sulfur fugacity (ƒS2)-temperature diagram showing the variety of sulfide assemblages in hydrothermal ore deposits
and reflecting sulfidation state, from very low to very high. Thick red lines mark boundaries between these sulfidation states.
Compositional fields of arc volcanic rocks, high-temperature volcanic fumaroles, magmatic-hydrothermal fluids, and
geothermal fluids also are shown, as discussed by Einaudi et al. (2003). Figure after John et al. (2018) modified from Sillitoe
and Hedenquist (2003). Element and mineral abbreviations: argentite (argen); arsenic (As); arsenopyrite (asp); bornite (bn);
chalcocite (cc); chalcopyrite (cp); copper (Cu); covellite (cv); digenite (dg); enargite (en); famatinite (fm); iron (Fe); hematite
(hm); intermediate solid solution (iss); loellingite (lo); magnetite (mt); orpiment (orp); pyrite (py); pyrrhotite (po); quartz (qz);
realgar (real); sulfur (S); tennantite (tn); tetrahedrite (td).
Considering the sulfidation state, epithermal deposits are nowadays commonly classified into three
subtypes; low-, intermediate- and high-sulfidation epithermal deposits. Low-sulfidation epithermal
deposits are characterized by the low-sulfidation state assemblage of pyrite, arsenopyrite, with minor
chalcopyrite and pyrrhotite in some deposits. Intermediate-sulfidation epithermal deposits are
characterized by intermediate-sulfidation state assemblages containing pyrite, chalcopyrite, tetrahedrite-
tennantite, and iron-poor sphalerite. High-sulfidation epithermal deposits typically contain sulfide-rich
assemblages of high-sulfidation state, including pyrite-bornite, pyrite-enargite, pyrite-luzonite, pyrite-
Discussion 119
famatinite, and pyrite-covellite (Einaudi et al., 2003; Sillitoe and Hedenquist, 2003). Silver sulfides and
selenides, silver-bearing sulfosalts and electrum (>20 wt% Ag) are mostly restricted to low- and
intermediate-sulfidation deposits, whereas enargite and silver-poor gold (<10 wt% Ag) are common in
nearly all high-sulfidation deposits. Geological features and metal contents also differ between low- and
intermediate-sulfidation deposits. Low-sulfidation deposits commonly consist of multiple stages of
sheeted veins, vein stockworks and breccias with comb and crustiform textures. These mineralized veins
include fine concordant and discordant layered mineral assemblages. Intermediate-sulfidation deposits
consist of multistage veins and associated breccias that contain significant amounts of other base metals
like Cu, Pb and Zn in addition to gold and silver (Cooke and Simmons, 2000; John et al., 2018).
Hydrothermal alteration assemblages (Chapter 7.1.1.3.1) typically are zoned laterally and vertically
around the ore bodies and relative to the paleowater table. Alteration associated with low- and
intermediate-sulfidation deposits includes near-neutral pH alkali-dominated assemblages formed below
the water table and steam-heated acid assemblages formed at and above the water table. Below the
paleowater table, hydrothermal alteration around ore zones is commonly zoned with silicification and
potassic (adularia-illite) alteration in the inner zones grading outward to argillic and propylitic
assemblages. Argillic and advanced argillic alteration is present at and above the paleowater table.
Hydrothermal alteration associated with high-sulfidation deposits results from intense acid leaching by
low-pH fluids formed by condensation of HCl- and SO2-rich fluid in groundwater. Characteristically,
alteration is zoned with residual (vuggy) quartz and quartz-alunite assemblages around fluid conduits in
the innermost zone grading outward into advanced argillic (kaolinite/dickite or pyrophyllite), argillic
(illite-montmorillonite) and propylitic assemblages (John et al., 2018).
Geological and geochemical evidence demonstrates that subaerial epithermal mineralization and
associated cogenetic hydrothermal alteration form predominantly from meteoric waters with variable
amounts of magmatic volatiles released during emplacement and crystallization of temporally and
spatially associated mafic to silicic magmas. High-sulfidation deposits typically show hydrothermal
alteration assemblages, geochemical characteristics and isotopic compositions reflecting stronger
magmatic fluid input than intermediate- and low-sulfidation deposits. The ultimate source of gold, silver
and other metals in epithermal gold-silver deposits is uncertain, but likely includes multiple sources in
the upper mantle and crust (John et al., 2018). Sillitoe (2008) suggested that many mineral deposits may
be associated with, and in some cases are transitional to, epithermal deposits (Figure 59). These deposit
types include hot spring mercury (Hg), porphyry copper (Cu, Mo, Au), skarn (Cu, Fe, Au, Zn),
polymetallic vein (Au, Ag, Cu, Zn, Pb, Mn, As), polymetallic replacement (“manto”, Ag, Pb, Zn, Cu,
Au), intrusion-related breccia pipe (Au, Ag, Cu, Pb, Zn), sedimentary-rock hosted gold (Au) and distal-
disseminated gold-silver (Au, Ag), placer (Au) and stratiform sulfur (S).
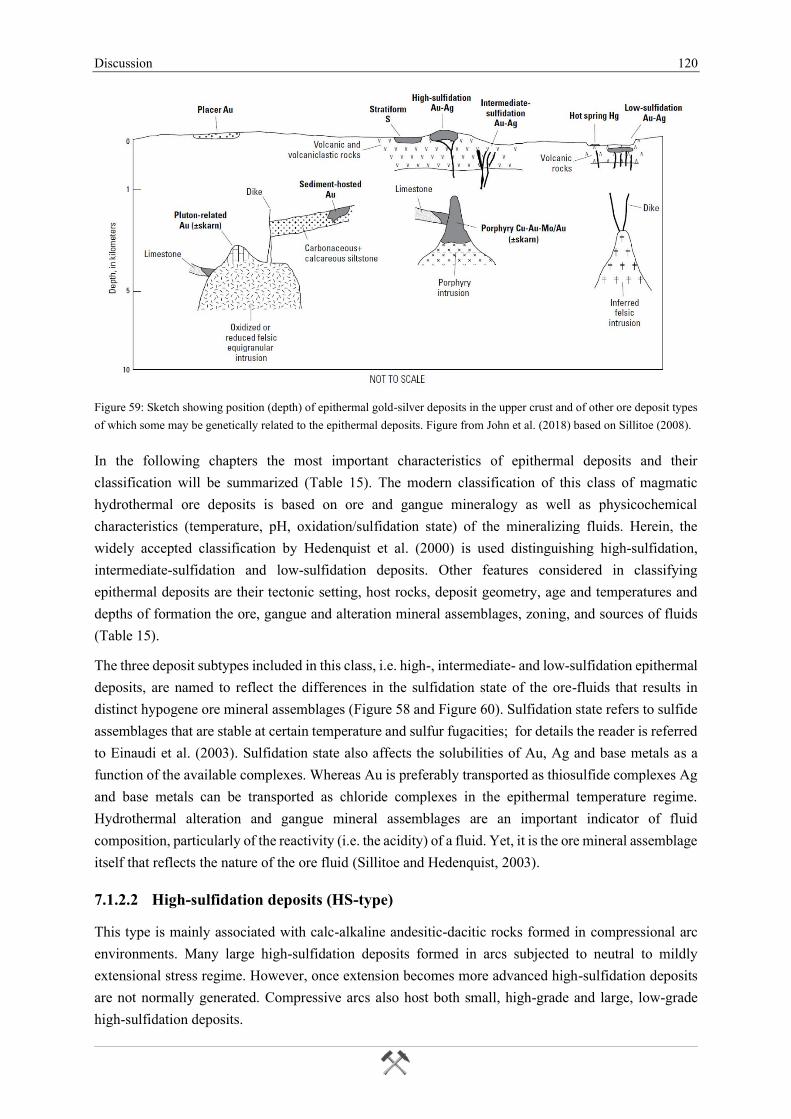
Discussion 120
Figure 59: Sketch showing position (depth) of epithermal gold-silver deposits in the upper crust and of other ore deposit types
of which some may be genetically related to the epithermal deposits. Figure from John et al. (2018) based on Sillitoe (2008).
In the following chapters the most important characteristics of epithermal deposits and their
classification will be summarized (Table 15). The modern classification of this class of magmatic
hydrothermal ore deposits is based on ore and gangue mineralogy as well as physicochemical
characteristics (temperature, pH, oxidation/sulfidation state) of the mineralizing fluids. Herein, the
widely accepted classification by Hedenquist et al. (2000) is used distinguishing high-sulfidation,
intermediate-sulfidation and low-sulfidation deposits. Other features considered in classifying
epithermal deposits are their tectonic setting, host rocks, deposit geometry, age and temperatures and
depths of formation the ore, gangue and alteration mineral assemblages, zoning, and sources of fluids
(Table 15).
The three deposit subtypes included in this class, i.e. high-, intermediate- and low-sulfidation epithermal
deposits, are named to reflect the differences in the sulfidation state of the ore-fluids that results in
distinct hypogene ore mineral assemblages (Figure 58 and Figure 60). Sulfidation state refers to sulfide
assemblages that are stable at certain temperature and sulfur fugacities; for details the reader is referred
to Einaudi et al. (2003). Sulfidation state also affects the solubilities of Au, Ag and base metals as a
function of the available complexes. Whereas Au is preferably transported as thiosulfide complexes Ag
and base metals can be transported as chloride complexes in the epithermal temperature regime.
Hydrothermal alteration and gangue mineral assemblages are an important indicator of fluid
composition, particularly of the reactivity (i.e. the acidity) of a fluid. Yet, it is the ore mineral assemblage
itself that reflects the nature of the ore fluid (Sillitoe and Hedenquist, 2003).
7.1.2.2 High-sulfidation deposits (HS-type)
This type is mainly associated with calc-alkaline andesitic-dacitic rocks formed in compressional arc
environments. Many large high-sulfidation deposits formed in arcs subjected to neutral to mildly
extensional stress regime. However, once extension becomes more advanced high-sulfidation deposits
are not normally generated. Compressive arcs also host both small, high-grade and large, low-grade
high-sulfidation deposits.
Discussion 121
HS deposits contain sulfide assemblages of high-sulfidation state, typically pyrite + enargite, pyrite +
luzonite, pyrite + famatinite and pyrite + covellite. Enargite and Ag-poor gold (<10 wt% Ag) are present
in almost all high-sulfidation deposits. HS deposits are hosted by leached silicic rocks surrounded by a
halo of advanced argillic alteration. This alteration results from intense acid leaching by low-pH fluids
formed by the condensation of HCl- and SO2-rich magmatic-hydrothermal fluid when it came into
contact with groundwater. In this zone of mixing so-called lithocaps form (Cooke et al., 2017).
Characteristically, alteration progressively grades outward from inner residual (vuggy) quartz and
quartz-alunite assemblages to advanced argillic, argillic and propylitic assemblages. Stable isotopes
evidence that epithermal mineralization and associated hydrothermal alteration form predominantly
from mixing of meteoric waters with variable amounts of magmatic fluids released from crystallizing
mafic to silicic magmas. Typically, high-sulfidation deposits have hydrothermal alteration assemblages,
geochemical characteristics and isotopic compositions reflecting larger magmatic fluid input than
intermediate- and low-sulfidation deposits.
High-sulfidation ore fluids are commonly highly acidic causing extreme leaching and formation of
quartz-alunite assemblages in the lithocap. Leaching requires fluids with pH <2 to mobilize Al, and
alunite most likely forms at a pH of 2 to 3 (Stoffregen, 1987). The early leaching fluid is a condensate
of magmatic vapor with very low salinity of <1 wt% NaCl equiv. However, fluids with a wide range of
salinities, from <1 to 45 wt% NaCl equiv., were present during formation of HS deposits. Hypersaline
fluids are associated with sericitic and K-silicate alteration in deeper parts of these systems (Arribas,
1995). Fluid inclusions of high-sulfidation deposits commonly show dilute (<1 to 6 wt% NaCl equiv.),
moderate temperature (Th = 155 to 330 °C, some excess 400 °C), two-phase fluid inclusions (Cooke and
Simmons, 2000; John et al., 2018).
7.1.2.3 Low-sulfidation deposits (LS-type)
Andesite-dacite-rhyolite arcs comprising alkaline and calc-alkaline series are more favorable for the
formation of low-sulfidation deposits. Many of these deposits are formed in continental and island-arcs
characterized by bimodal volcanism and extension. Extension may occur in intra-, near- and back-arc
settings during subduction of oceanic lithosphere and is typically attributed to slab rollback, oblique
subduction, asthenospheric upwelling, post-collisional collapse or hot-spot activity (Sillitoe and
Hedenquist, 2003).
LS deposits contain the characteristic low-sulfidation assemblage pyrite + arsenopyrite, with the latter
in rather minor quantities. Minor Cu is present as chalcopyrite or, less commonly, tetrahedrite-
tennantite. Often, minor Fe-rich sphalerite and galena join the assemblage and pyrrhotite is present in
trace amounts. LS deposits are associated with high gold and silver contents with low Ag/Au ratios.
Gold-silver selenides, silver-bearing sulfosalts and electrum (>20 wt% Ag) are a common feature of LS
deposits. Gangue minerals comprise quartz, chalcedony and adularia plus subordinate calcite; the latter
often with characteristic bladed morphology. Low-sulfidation deposits commonly consist of multistage
veins, stockworks, sheeted veins and also breccia bodies (Sillitoe and Hedenquist, 2003). Veins are
commonly characterized by lattice textures (platy calcite and its pseudomorphs) as well as shallowly
formed crustiform and colloform quartz. In deeper parts, veins consist mostly of coarse crystalline comb
quartz (Cooke and Simmons, 2000).
Discussion 122
The hydrothermal alteration from the vein selvage into the adjacent country rock shows that adularia
gives way to illite and also quartz abundance diminishes. These minerals reflect mineralization in the
presence of a reduced and near-neutral pH low-salinity fluid. The deeper levels and peripheral alteration
consist of a propylitic assemblage containing quartz, chlorite, illite, pyrite, calcite, albite, adularia and
epidote. Silica sinter is deposited where boiling or boiled low-sulfidation fluids discharge at the surface
(Cooke and Simmons, 2000). Fluid inclusions of LS deposits are mostly two phases (L+V) and are
liquid-rich (>65 vol%), but also vapor-rich (>98 vol%) inclusions might be present. Homogenization
temperatures range from <130° to 290 °C. Diluted low-salinity values (<3 wt% NaCl equiv.) are a
characteristic feature (John et al., 2018).
7.1.2.4 Intermediate-sulfidation deposits (IS-type)
Most intermediate-sulfidation epithermal deposits, like their high-sulfidation brethren, occur in calc-
alkaline andesitic-dacitic arcs. Generally, IS deposits show a wide geodynamic distribution and can
develop under variable stress states (compressive, neutral and extensional) in magmatic arcs, back arcs
and post-collisional orogenic belts. However, local extensional and neutral stress regimes are reported
to be more favorable for the formation of IS deposits (Wang et al., 2019).
Mineralization in most intermediate-sulfidation deposits occurs as veins and/or brecciated bodies
extending laterally up to several kilometers. Precious metal-bearing orebodies are commonly found
within a depth interval between 300 to 800 m (Hedenquist et al., 2000). Textures of ore and gangue
minerals in IS veins share much similarity with those in LS veins. Most common textures include
crustiform and symmetric banding, vugs, cockade and comb textures. Often, mineral textures, such as
colloform quartz and lattice-bladed (or platy) calcite), indicate boiling in IS deposits. Many IS-type
deposits host polyphase and multi-stage veins, which appear to be the product of an episodic process of
cracking and sealing of veins (Wang et al., 2019).
Intermediate-sulfidation deposits possess sulfidation states between the two above mentioned
epithermal endmembers. Sulfide mineral assemblage in the majority of IS deposits can be relatively
simple and include combinations of pyrite, chalcopyrite, tetrahedrite-tennantite, Fe-poor sphalerite and
galena. Precious metals are represented by electrum, native gold, acanthite-argentite and many other
silver sulfosalts (Sillitoe and Hedenquist, 2003). Silver is the major commercial element in many IS
deposits, which hosted in sulfides, sulfosalts, tellurides or occurs as native silver. The gangue minerals
in IS are primarily quartz, Mn-carbonates, commonly rhodochrosite and manganoan calcite, as well as
adularia. Locally, barite, fluorite, dolomite-ankerite, muscovite, albite and Mn-silicates may be present.
The relative contents of ore and gangue minerals in veins can be used as diagnostic features to
distinguish IS and LS deposits in the field (Wang et al., 2019).
Hydrothermal alteration mineral assemblages are commonly zoned laterally and vertically around the
ore bodies. Alteration below the paleowater table in intermediate-sulfidation deposits is commonly
zoned around former fluid conduits and ore zones. Silicification and potassic (adularia, illite) alteration
in the inner zones grades outward to argillic and propylitic assemblages. Above the paleowater table
argillic and advanced argillic alteration is normally developed (John et al., 2018).
Discussion 123
Intermediate-sulfidation ore fluids have a wider range of salinity due to fluctuations in salinity between
the different ore stages (Sillitoe and Hedenquist, 2003). John et al. (2018) report a range of
homogenization temperature between ~135-385 °C for liquid rich and vapor-rich fluid inclusions.
Salinities vary from 1 to 12 wt% NaCl equiv. with distinctly different value ranges among districts and
deposits. Elevated salinities have been interpreted to reflect a magmatic water component in ore-forming
fluids what is supported by stable isotope studies.
7.2 Characteristics of Chah-Mesi and comparison to epithermal subtypes
In order to correctly classify the Chah-Mesi deposit the results of this study are compared to the
characteristics of HS, IS and LS deposits (Table 16). Obviously, Chah-Mesi shows common
characteristics with each subtype regarding host rocks and geodynamic setting, deposit style,
hydrothermal mineralization and alteration, precious metals as well as epithermal ore-fluid
compositions. In the following arguments for assigning Chah-Mesi to the IS subtype are discussed in
more detail.
7.2.1 Host rocks and geodynamic setting
Petrography of the host rocks (Chapter 4.1) shows that Chah-Mesi is mainly hosted by a calc-alkaline
sequence of andesitic rocks with underlying dacitic pyroclastics and minor microdioritic intrusions.
Although the modal mineralogy of andesites might indicate a transition into basaltic andesite towards
the deeper levels, they were mainly designated as andesites (Aliani et al., 2009; Taghipour et al., 2008)
due to the high abundance of plagioclase either as phenocrysts or in the groundmass.
Concerning the geodynamic setting, there have been several recent papers dealing with the geochemistry
and age of the intrusive rocks hosting porphyry Cu deposits within the UDMB including the Meiduk
(e.g. Aliani et al., 2009; Alirezaei et al., 2017). These studies confirm that the fertile intrusions in UDMB
chemically differ from normal calc-alkaline series showing adakite-like chemical and mineralogical
signatures (Alirezaei et al., 2017). Age data of the PCD deposits in UDMB also support their post-
subduction formation during the post-collision stage (Aliani et al., 2009).
Chah-Mesi shows a close spatial relation to the Meiduk porphyry. With about 1.5 km distance a common
geodynamic evolution is therefore assumed. Geochemical data from Aliani et al. (2009) and Alirezaei
et al. (2017) suggest that the porphyry stock at Meiduk is an adakite-like, H2O-enriched, high-pressure
differentiated product of hydrous mafic partial melts of lithospheric mantle. The melting probably
resulted from slab break-off and upwelling of the hot asthenospheric mantle. Thus, the porphyry system
of Meiduk is proposed to have been formed in a continental arc setting during post-collisional tectonic
processes after the continental collision between the Arabian and Iranian plates at the final evolution
stage of the UDMB (Aliani et al., 2009).
The petrographic features of the investigated country rocks actually correlate with all three subtypes of
epithermal deposits. However, as LS deposits commonly have a wider range of host rock compositions
and are often associated with bimodal magmatism, it is more likely that the country rocks represent an
environment more typical of HS and IS deposits.
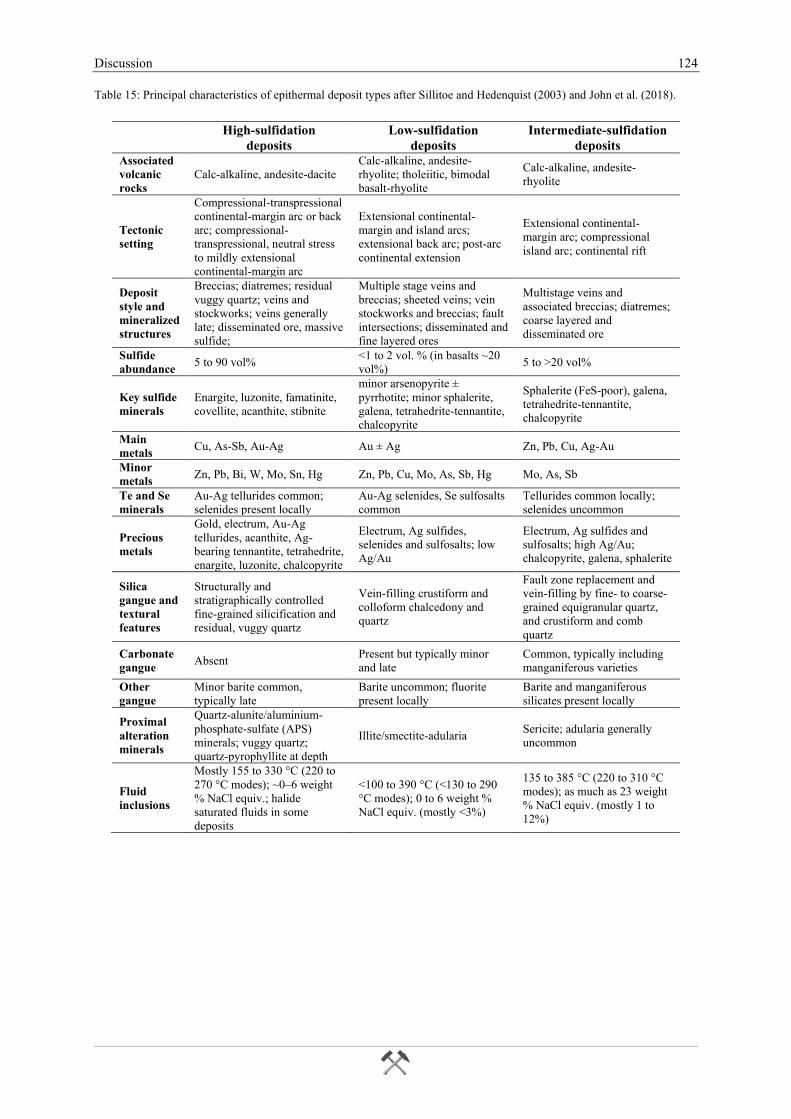
Discussion 124
Table 15: Principal characteristics of epithermal deposit types after Sillitoe and Hedenquist (2003) and John et al. (2018).
High-sulfidation
deposits
Low-sulfidation
deposits
Intermediate-sulfidation
deposits Associated
volcanic
rocks
Calc-alkaline, andesite-dacite
Calc-alkaline, andesite-
rhyolite; tholeiitic, bimodal
basalt-rhyolite
Calc-alkaline, andesite-
rhyolite
Tectonic
setting
Compressional-transpressional
continental-margin arc or back
arc; compressional-
transpressional, neutral stress
to mildly extensional
continental-margin arc
Extensional continental-
margin and island arcs;
extensional back arc; post-arc
continental extension
Extensional continental-
margin arc; compressional
island arc; continental rift
Deposit
style and
mineralized
structures
Breccias; diatremes; residual
vuggy quartz; veins and
stockworks; veins generally
late; disseminated ore, massive
sulfide;
Multiple stage veins and
breccias; sheeted veins; vein
stockworks and breccias; fault
intersections; disseminated and
fine layered ores
Multistage veins and
associated breccias; diatremes;
coarse layered and
disseminated ore
Sulfide
abundance 5 to 90 vol%
<1 to 2 vol. % (in basalts ~20
vol%) 5 to >20 vol%
Key sulfide
minerals
Enargite, luzonite, famatinite,
covellite, acanthite, stibnite
minor arsenopyrite ±
pyrrhotite; minor sphalerite,
galena, tetrahedrite-tennantite,
chalcopyrite
Sphalerite (FeS-poor), galena,
tetrahedrite-tennantite,
chalcopyrite
Main
metals Cu, As-Sb, Au-Ag Au ± Ag Zn, Pb, Cu, Ag-Au
Minor
metals Zn, Pb, Bi, W, Mo, Sn, Hg Zn, Pb, Cu, Mo, As, Sb, Hg Mo, As, Sb
Te and Se
minerals
Au-Ag tellurides common;
selenides present locally
Au-Ag selenides, Se sulfosalts
common
Tellurides common locally;
selenides uncommon
Precious
metals
Gold, electrum, Au-Ag
tellurides, acanthite, Ag-
bearing tennantite, tetrahedrite,
enargite, luzonite, chalcopyrite
Electrum, Ag sulfides,
selenides and sulfosalts; low
Ag/Au
Electrum, Ag sulfides and
sulfosalts; high Ag/Au;
chalcopyrite, galena, sphalerite
Silica
gangue and
textural
features
Structurally and
stratigraphically controlled
fine-grained silicification and
residual, vuggy quartz
Vein-filling crustiform and
colloform chalcedony and
quartz
Fault zone replacement and
vein-filling by fine- to coarse-
grained equigranular quartz,
and crustiform and comb
quartz
Carbonate
gangue Absent
Present but typically minor
and late
Common, typically including
manganiferous varieties
Other
gangue
Minor barite common,
typically late
Barite uncommon; fluorite
present locally
Barite and manganiferous
silicates present locally
Proximal
alteration
minerals
Quartz-alunite/aluminium-
phosphate-sulfate (APS)
minerals; vuggy quartz;
quartz-pyrophyllite at depth
Illite/smectite-adularia Sericite; adularia generally
uncommon
Fluid
inclusions
Mostly 155 to 330 °C (220 to
270 °C modes); ~0–6 weight
% NaCl equiv.; halide
saturated fluids in some
deposits
<100 to 390 °C (<130 to 290
°C modes); 0 to 6 weight %
NaCl equiv. (mostly <3%)
135 to 385 °C (220 to 310 °C
modes); as much as 23 weight
% NaCl equiv. (mostly 1 to
12%)
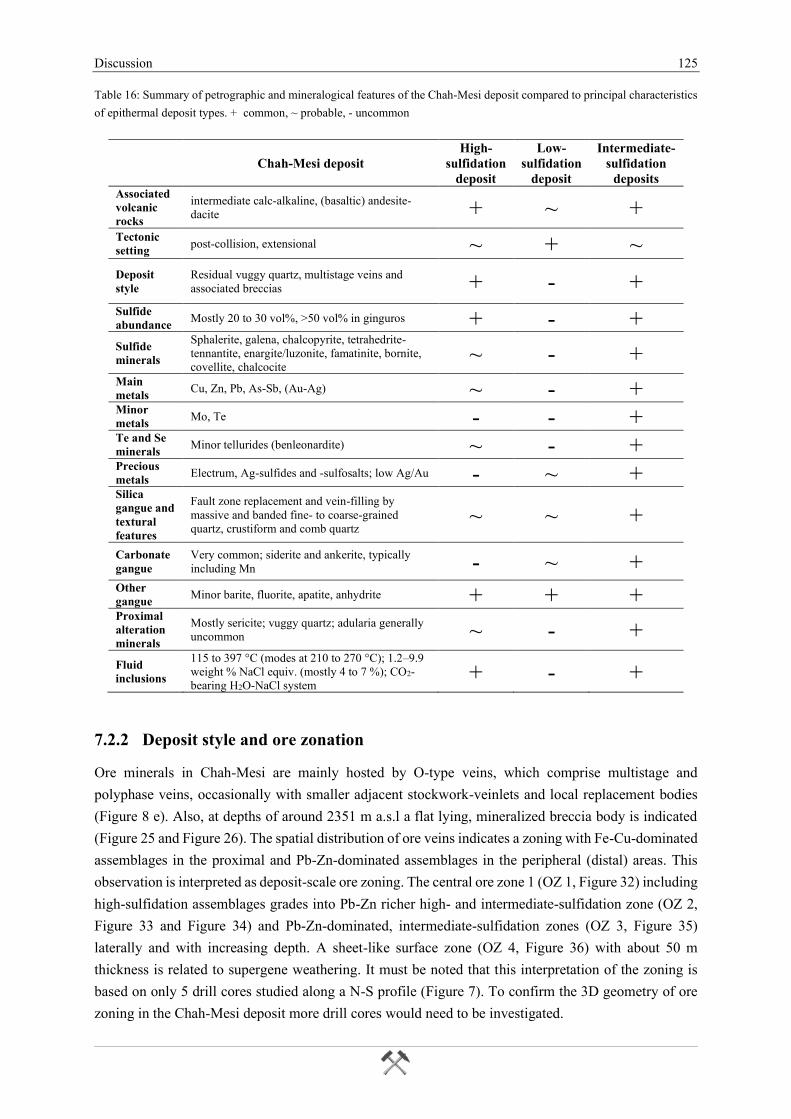
Discussion 125
Table 16: Summary of petrographic and mineralogical features of the Chah-Mesi deposit compared to principal characteristics
of epithermal deposit types. + common, ~ probable, - uncommon
Chah-Mesi deposit
High-
sulfidation
deposit
Low-
sulfidation
deposit
Intermediate-
sulfidation
deposits Associated
volcanic
rocks
intermediate calc-alkaline, (basaltic) andesite-
dacite + ~ + Tectonic
setting post-collision, extensional ~ + ~
Deposit
style
Residual vuggy quartz, multistage veins and
associated breccias + - + Sulfide
abundance Mostly 20 to 30 vol%, >50 vol% in ginguros + - +
Sulfide
minerals
Sphalerite, galena, chalcopyrite, tetrahedrite-
tennantite, enargite/luzonite, famatinite, bornite,
covellite, chalcocite ~ - +
Main
metals Cu, Zn, Pb, As-Sb, (Au-Ag) ~ - +
Minor
metals Mo, Te - - +
Te and Se
minerals Minor tellurides (benleonardite) ~ - +
Precious
metals Electrum, Ag-sulfides and -sulfosalts; low Ag/Au - ~ +
Silica
gangue and
textural
features
Fault zone replacement and vein-filling by
massive and banded fine- to coarse-grained
quartz, crustiform and comb quartz ~ ~ +
Carbonate
gangue
Very common; siderite and ankerite, typically
including Mn - ~ + Other
gangue Minor barite, fluorite, apatite, anhydrite + + +
Proximal
alteration
minerals
Mostly sericite; vuggy quartz; adularia generally
uncommon ~ - +
Fluid
inclusions
115 to 397 °C (modes at 210 to 270 °C); 1.2–9.9
weight % NaCl equiv. (mostly 4 to 7 %); CO2-
bearing H2O-NaCl system + - +
7.2.2 Deposit style and ore zonation
Ore minerals in Chah-Mesi are mainly hosted by O-type veins, which comprise multistage and
polyphase veins, occasionally with smaller adjacent stockwork-veinlets and local replacement bodies
(Figure 8 e). Also, at depths of around 2351 m a.s.l a flat lying, mineralized breccia body is indicated
(Figure 25 and Figure 26). The spatial distribution of ore veins indicates a zoning with Fe-Cu-dominated
assemblages in the proximal and Pb-Zn-dominated assemblages in the peripheral (distal) areas. This
observation is interpreted as deposit-scale ore zoning. The central ore zone 1 (OZ 1, Figure 32) including
high-sulfidation assemblages grades into Pb-Zn richer high- and intermediate-sulfidation zone (OZ 2,
Figure 33 and Figure 34) and Pb-Zn-dominated, intermediate-sulfidation zones (OZ 3, Figure 35)
laterally and with increasing depth. A sheet-like surface zone (OZ 4, Figure 36) with about 50 m
thickness is related to supergene weathering. It must be noted that this interpretation of the zoning is
based on only 5 drill cores studied along a N-S profile (Figure 7). To confirm the 3D geometry of ore
zoning in the Chah-Mesi deposit more drill cores would need to be investigated.
Discussion 126
The multistage and crustiform to comb textured quartz veins as seen at Chah-Mesi are a common
characteristic of LS and IS type deposits. However, the presence of intense silicification in the central
part is rather unusual for low-sulfidation deposits but is commonly observed in IS types. These central
silica-rich parts including HS assemblages would rather correspond to high-sulfidation type deposits.
Anyhow, the fact that they are limited to fault zones rather than comprising the whole deposit and the
high abundance of veins hosting multistage and polyphase ore minerals favors the assignment as
intermediate-sulfidation deposit.
7.2.3 Ore mineralogy and mineral distribution
Mineralization in Chah-Mesi is subdivided into several stages of ore formation (Figure 37). The
abundance of ore minerals in O-type veins (Chapter 4.2.4) ranges between 20 and 30 vol%, however,
ginguro veins even contain up to 50-60 vol% sulfides. Early mineral assemblages comprise pyrite +
chalcopyrite + enargite + luzonite-famatinite ± bornite and are mainly present in ore zone 1. This
assemblage is referred to be of high-sulfidation state due to the presence of key minerals, such as
enargite, luzonite-famatinite and minor bornite. Early mineralization is followed by the main stage
assemblage with pyrite + chalcopyrite + tennantite-tetrahedrite + sphalerite + galena ± Au ± Ag-
sulfosalts ± enargite/luzonite. This assemblage is designated as main stage because it is the most
abundant one in the whole deposit and occupies the most extensive ore zone 2. The presence of
tennantite-tetrahedrite coexisting enargite/luzonite and the increase in Pb-Zn minerals indicate that this
stage was formed under transitional high to intermediate-sulfidation conditions. Late stage sphalerite,
galena, chalcopyrite, pyrite with minor tennantite-tetrahedrite is mainly present in ore zone 3. Fe-poor
sphalerite is the most prominent sulfide in ore zone 3. The spatial distribution of ore minerals
demonstrates that Chah-Mesi is dominated by veins including mainly intermediate-sulfidation
assemblages. Ore textures indicate that lower sulfidation state assemblages generally overprint higher
sulfidation assemblages and that the outer Pb-Zn richer ore zones likely postdate and encroach on the
inner Cu-rich zone. It is obvious that low-sulfidation key minerals, such as arsenopyrite and pyrrhotite
are lacking at Chah-Mesi. This together with presence of Fe-poor sphalerite is typical for IS deposits.
Regarding the HS-dominated centers surrounded by IS assemblages, Einaudi et al. (2003) mention that
many high-sulfidation deposits record a shift to lower sulfidation states with time, whereby enargite is
replaced by tennantite at the time of gold deposition. However, intermediate-sulfidation deposits also
feature such a decrease in sulfidation state. This is because HS and IS fluids are in disequilibrium with
the wallrocks outside the silicified zone and therefore the natural long-term tendency is for hydrothermal
fluids to become more reduced due to enhanced fluid rock interaction.
Nevertheless, differences between these two subtypes are evident. IS deposits typically are well zoned,
whereas high-sulfidation deposits are commonly telescoped. The mineralogy of intermediate-sulfidation
deposits is more complex and the metal suite includes Cu, Zn, Pb, and Ag and tends to be associated
with molybdenum-bearing, gold-poor porphyries, such as Meiduk. In contrast, many HS deposits are
associated with gold-rich porphyry Cu deposits containing only minor Mo and other metals.
The ore mineralogy at Chah-Mesi is rather complex and dominated by transitional high to intermediate-
sulfidation assemblages. Zoning is established on the deposit scale by distribution of Cu-Zn-Pb minerals
but also by the chemical composition of fahlore group minerals (see below). Moreover, the
Discussion 127
predominating metal association of Cu, Zn, Pb and Ag and the proximity to the Mo-bearing (0.007 wt%)
and Au-poor (0.08 g/t) porphyry of Meiduk (Chapter 2.4.2) favors Chah-Mesi to be an epithermal
intermediate-sulfidation deposit.
7.2.4 Precious metals
Based on ore microscopy and microanalytical studies the deposit is characterized by the metals Cu, Zn,
Pb, As, Sb with minor Ag and Au. Geochemical analysis conducted on samples from the Chah-Mesi
open pit during a previous exploration program from the KAN Iran Consulting Engineers (2006) showed
that Au contents range between 0.01 and 57.9 ppm. Most analysis are below 1 ppm and have a mode at
0.7 ppm. Ag contents vary from 0.5 to 100 ppm with a median at 38.2 ppm. Ag/Au ratios are between
2 and 425, with a mode at around 32. As shown in this study the precious metals occur mostly as
electrum, Ag-sulfides and Ag-sulfosalts. Ag-bearing sulfides include chalcopyrite and CuxS minerals.
On average chalcopyrite contains 0.02 Ag apfu and CuxS phases include 0.01 Ag apfu. Ag-bearing
sulfosalts include enargite, luzonite-famatinite with an average Ag content of 0.02 apfu and up to a
maximum of 0.34 apfu. Further, exotic silver minerals that were documented, are phases of the
polybasite-pearceite solid solution series. Trace metals present in Chah-Mesi ores comprise Mo and Te.
Molybdenum was only observed in porphyry-related veins (Chapter 4.2.1) close to the Meiduk
porphyry. Tellurium was only proven in an accessory sulfosalt phase interpreted as benleonardite.
The dominating metal suite with Cu, Zn, Pb, As, Sb as well as the high Ag-contents in gold are typical
features of IS deposits. The low contents of Au and Ag and the high Ag/Au ratio support this
interpretation.
7.2.5 Gangue mineralogy and textures
Mineralization at Chah-Mesi is structurally controlled and mainly hosted in veins and in the surrounding
altered host rocks. Vuggy quartz textures in the central parts of the deposit are indicative of high-
sulfidation environments. Yet, this zone constitutes only a small area in comparison to the surroundings,
where veins with banded, crustiform and comb quartz texture and carbonate gangue minerals are more
common, features which are more typical for LS and IS types. Importantly, the presence of Mn-
carbonates at Chah-Mesi is a diagnostic feature to discern IS from LS deposits (Wang et al., 2019) and
support the interpretation of Chah-Mesi as an intermediate-sulfidation deposit.
7.2.6 Hydrothermal alteration
Hydrothermal alteration in Chah-Mesi (Chapter 4.3) shows a distinct zoning and consists of central
structure-related silicification, which includes minor replacement bodies and vuggy quartz textures.
Silicic alteration is associated with the HS assemblage bearing, massive O-type veins and grades into
advanced argillic and argillic alteration halos. Pervasive sericitization with QCS-type veinlets becomes
the predominant alteration of the deposit either close or with increased distance to O-type veins. Sericitic
alteration grades into propylitic alteration with PCE- and CC-type veinlets. The transition between
sericitic and propylitic alteration shows characteristics of the chlorite-sericite zone (Sillitoe, 2010),
which occurs very close to porphyry Cu core zones. Potassic (biotite-rich) alteration represents the
outermost alteration at Chah-Mesi in the north closest to the Meiduk porphyry deposit. The potassic
zone also includes the porphyry-related D1- and B2-type veins. It is hypothesized that potassic alteration
Discussion 128
and these veins in drill core BH-CHM4 already belong to the Meiduk PCD. Unfortunately, the relative
time relations of these veins/potassic alteration to the Chah-Mesi veins could not be established from
studying a single drill core.
The hydrothermal alteration in the central part of Chah-Mesi is well comparable to HS-type deposits
due to the presence of leached host rocks and strong silicification indicative of strongly acidic fluids.
However, the diagnostic assemblage of quartz plus aluminum-phosphate-sulfate (APS) minerals, such
as alunite, which is a characteristic HS deposit mineral, could not be determined. The only APS mineral
observed was plumbogummite (Figure 29), which was found in the (advanced argillic) alteration halo
around a ginguro vein.
Adularia is a very common mineral in mineralized veins in LS deposits. Yet, adularia could not be
determined at Chah-Mesi either. Therefore, the lack of alunite and adularia and the ubiquitous presence
of sericite proximal to O-type veins further support the classification of Chah-Mesi as intermediate-
sulfidation deposit.
7.2.7 Fluid inclusions
Most of the fluid inclusion assemblages described in this study are aqueous H2O-NaCl fluids with minor
amounts of CO2 and dominated by liquid-rich LV type inclusions with subordinate occurrence of vapor-
rich VL (Chapter 6.1). Minute solid phases were present, but mostly recognized as trapped mineral
phases, such as quartz or phyllosilicates, rather than daughter minerals (Figure 48). Thus, halide
saturated fluid inclusions were not determined, which indicates that hypersaline fluids were probably
not involved in ore-forming processes. Anyhow, the composition of fluid inclusions commonly showed
a relatively low-salinity. The obtained Tm(ice) values in sphalerite and quartz were recalculated to total
salinities of 1.2 to 9.9 wt% and 2.1 to 9.2 wt% NaCl equiv., respectively. The measured high-
temperature phase changes into the liquid phase and comprised Th values in the range of 114.6 to 294.6
°C with modes at ~220 °C for sphalerite and 153.0 to 396.5 °C with modes at ~270 °C for quartz.
Commonly, the minimum homogenization temperatures are represented by sphalerite hosted inclusions
(114.6 – 127.6 °C) and maximum temperatures were observed mainly in quartz crystals (322.8 – 396.5
°C).
The determined information of fluid inclusions shows that the range of salinity is too high for typical
low-sulfidation fluid inclusions, which might range between 0 and 6 wt% but mostly are below 3 wt%
NaCl equiv. Also, the measured Th values are usually too high for LS environments. Hence, an affiliation
to LS deposits is highly unlikely. The fluid inclusion properties of Chah-Mesi correspond rather to HS
and IS deposits regarding salinity and Th values. The measured inclusions accord well to the
characteristic HS fluids, despite a wider range of Th values at Chah-Mesi and halide saturated fluids are
completely absent. This could be also referred to the local HS type characteristics at Chah-Mesi.
However, the wider range of salinity and Th is rather a typical feature of IS type deposits, which would
also be the favored interpretation for the studied fluid inclusions.
Discussion 129
7.3 Mineralization and regional trends on the ore deposit scale
The Chah-Mesi deposit hosts several types of mineralized veins, which are classified as O-type veins
and comprise mainly massive, banded and crustiform textures. Minor mineralization occurs also as
replacement bodies and in breccia zones within the deposit. The spatial distribution of O-type veins
suggests a zoning of mineralization in respect of sulfidation state. One of the most common minor ore
minerals is tennantite-tetrahedrite. Due to its complex zoning and variation of As-Sb ratio, particular
emphasis was placed on the analysis of fahlore group mineral to gather information about their spatial
distribution and to find out if there is a relation to the nearby porphyry system.
7.3.1 Conditions of ore formation and physicochemical fluid evolution
The paragenetic sequence (Figure 37) of ore minerals is interpreted to start with high-sulfidation
assemblages with pyrite + chalcopyrite + enargite + luzonite-famatinite ± bornite during the early stage
and mainly occupies OZ 1 close to the central NNE-SSW trending fault zones. This stage grades into
intermediate-sulfidation assemblages with pyrite + chalcopyrite + tennantite-tetrahedrite + sphalerite +
galena. Gold and only minor enargite also formed during the main stage in OZ 2. The late Pb-Zn
dominated stage is characterized by sphalerite + galena + chalcopyrite + pyrite ± tennantite-tetrahedrite
in OZ 3 distal to fault zones. Gold and silver are also present in this stage.
Textural relationships show that IS assemblages commonly overprint HS assemblages. This is also
illustrated in individual ore samples, which include both HS and IS assemblages containing
enargite/luzonite as well as tennantite-tetrahedrite. From the coexistence of these phases, it is proposed
that ore-forming fluids evolved from high- to intermediate-sulfidation states crossing the important
sulfidation reaction:
0.67𝐶𝑢12𝐴𝑠4𝑆13 + 𝑆2 = 2.67𝐶𝑢3𝐴𝑠𝑆4
tennantite enargite ( 3 )
This coexistence might also relate to a continuous mineralization process rather than several pulses of
ore formation. By contrast, banded and crustiform O-type veins often show HS-IS assemblages at the
vein-wallrock contact and mainly IS assemblages (dominated by sphalerite and galena) in the central
parts. These two mineralized layers are often separated by barren zones consisting only of carbonate and
quartz. This could indicate a temporal separation between the main and late stage of ore formation,
reflecting several pulses of ore-forming fluids. The late stage formation of sphalerite and galena in the
central parts of veins (Figure 21) and in the outer ore zones in the deposit suggests that the late fluids
were characterized by decreased sulfidation state and even more reduced conditions.
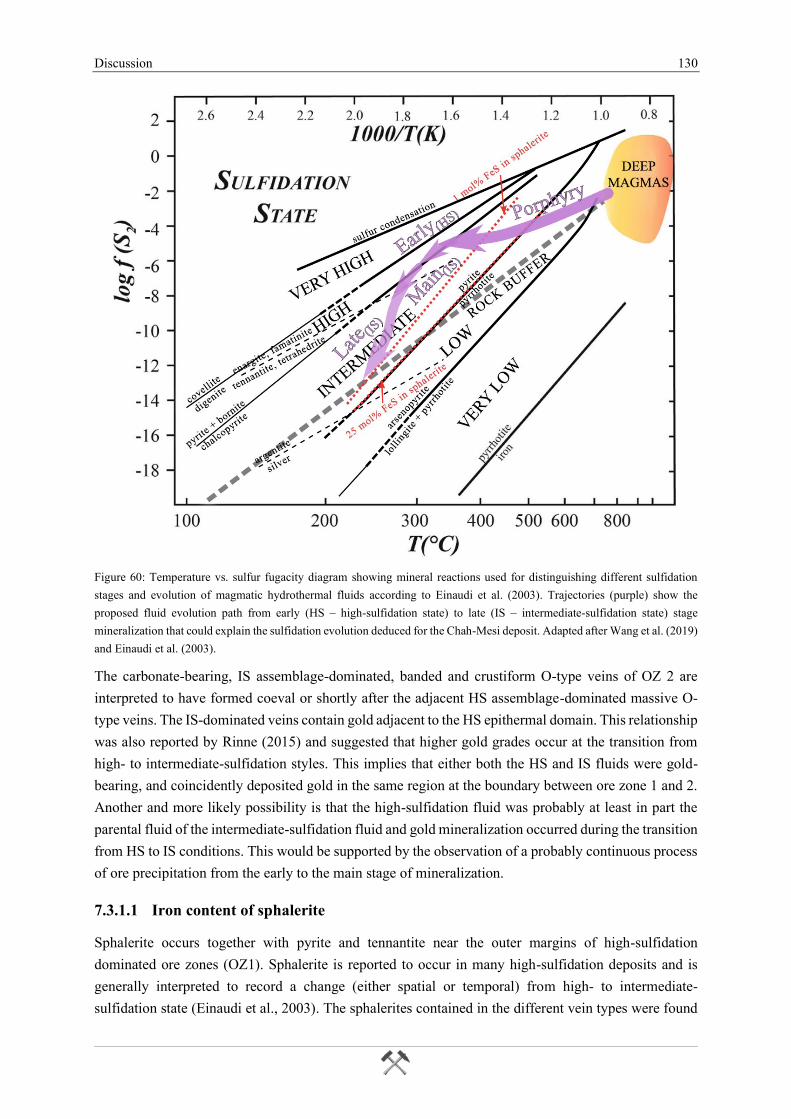
Discussion 130
Figure 60: Temperature vs. sulfur fugacity diagram showing mineral reactions used for distinguishing different sulfidation
stages and evolution of magmatic hydrothermal fluids according to Einaudi et al. (2003). Trajectories (purple) show the
proposed fluid evolution path from early (HS – high-sulfidation state) to late (IS – intermediate-sulfidation state) stage
mineralization that could explain the sulfidation evolution deduced for the Chah-Mesi deposit. Adapted after Wang et al. (2019)
and Einaudi et al. (2003).
The carbonate-bearing, IS assemblage-dominated, banded and crustiform O-type veins of OZ 2 are
interpreted to have formed coeval or shortly after the adjacent HS assemblage-dominated massive O-
type veins. The IS-dominated veins contain gold adjacent to the HS epithermal domain. This relationship
was also reported by Rinne (2015) and suggested that higher gold grades occur at the transition from
high- to intermediate-sulfidation styles. This implies that either both the HS and IS fluids were gold-
bearing, and coincidently deposited gold in the same region at the boundary between ore zone 1 and 2.
Another and more likely possibility is that the high-sulfidation fluid was probably at least in part the
parental fluid of the intermediate-sulfidation fluid and gold mineralization occurred during the transition
from HS to IS conditions. This would be supported by the observation of a probably continuous process
of ore precipitation from the early to the main stage of mineralization.
7.3.1.1 Iron content of sphalerite
Sphalerite occurs together with pyrite and tennantite near the outer margins of high-sulfidation
dominated ore zones (OZ1). Sphalerite is reported to occur in many high-sulfidation deposits and is
generally interpreted to record a change (either spatial or temporal) from high- to intermediate-
sulfidation state (Einaudi et al., 2003). The sphalerites contained in the different vein types were found
Discussion 131
to have low Fe concentrations ranging from 0.05 to 1.5 mole% FeS substituting for ZnS in the sphalerite
structure. Studies of Einaudi et al. (2003) showed that the Fe content of sphalerite can be related to the
sulfidation state of epithermal fluids, assuming that sphalerite coexists with either pyrite or pyrrhotite.
High-sulfidation fluids are associated with low-Fe sphalerite containing less than approximately 0.1
mole% FeS, whereas Fe concentrations of ZnS are above this value in IS deposits. Sphalerite forming
under low-sulfidation conditions are expected to have very high Fe concentrations exceeding 20 mole%
Fe (Einaudi et al., 2003). Based on the range of Fe concentrations encountered in sphalerite of the
different vein stages, it is concluded that the epithermal fluids that precipitated the sphalerite were indeed
characterized by an intermediate-sulfidation state (Figure 60).
EPMA analyses of sphalerite contained in mineralized breccia zones show an average Fe concentration
of about 0.19 mole% FeS indicating a relatively high-sulfidation state. As it is assumed, that the
sulfidation state decreased over time and space, as indicated by the paragenetic sequence and ore zoning,
mineralized breccia zones are assigned to an early stage of ore formation and fluid evolution.
Moreover, banded veins closest to the silicified HS assemblage-bearing fault zones show average Fe
concentrations of 0.11 mole% FeS. In contrast, sphalerites hosted by ginguro veins further away from
fault zones have FeS values of about 1.16 mole%, hence indicating a decreasing sulfidation state. This
decrease is explained with increasing influence of fluid-rock interactions upon cooling and increasing
transport distance of the fluids (Einaudi et al., 2003). The decrease in sulfidation state reflects a decrease
in fluid/rock ratios and increasingly reducing conditions which causes a shift in sphalerite precipitation
from lower Fe to higher Fe contents with increasing distance to the silicified veins.
7.3.1.2 Witnesses of hydrothermal fluid processes: gangue textures and fluid inclusions
According to the textures and gangue minerals of mineralized veins it is suggested that ore and gangue
mineral deposition occurred under non-boiling conditions. This is evidenced by the presence of
crustiform bands with fine-grained Ca-Mg-Mn-Fe-carbonate often having rhombic textures. However,
minute occurrence of lattice bladed calcite and colloform quartz may indicate boiling (Dong et al., 1995;
Shimizu et al., 1998). Other minerals inferred to boiling processes, such as adularia, are completely
missing (Guzman; Shimizu, 2014). Fluid inclusions show a constant proportion of liquid and vapor in
LV type inclusions in banded and crustiform vein types. The subordinate occurrence of vapor-rich VL
type inclusions also suggests that probably no or only limited boiling has happened. The low
homogenization temperature of quartz and sphalerite of 200.6 – 270.8 °C and salinities between 5 to 10
wt% NaCl equiv. support the fact that no phase separation (i.e. boiling process) has happened during
ore precipitation.
A temporal or at least spatial difference of ore formation is indicated by fluid inclusion studies conducted
on two different vein types. Banded and crustiform O-type veins comprise low-salinity fluids with
slightly different Th values. The minimum homogenization temperatures are represented by sphalerite
hosted inclusions (114.6 – 127.6 °C) and maximum temperatures were observed in quartz crystals (322.8
– 396.5 °C). Primary sphalerite inclusions commonly show lower average Th values (200.6 – 218.0 °C)
than inclusions in quartz (234.8 – 270.8 °C) and indicate that sphalerite postdates quartz crystallization,
when the mineralizing fluids were already cooling down. The spatial distribution of Th values shows
that the vein sample located closer to HS-bearing fault zone structures contains inclusions with higher
Discussion 132
homogenization temperature than the one located more in the distal parts. Also, the salinity of the
observed inclusions seems to decrease with increasing distance. Although only two samples were
studied, the decreasing salinity and homogenization temperature could be referred to the dilution of hot,
higher saline waters by cold, near-surface meteoric water during their ascent and lateral flow,
respectively. This is illustrated by the extrapolation of the dilution trend to zero salinity (0 wt% NaCl
equiv.; Figure 62), indicating that the dilutant could have been groundwater with T <100 °C (Hurai et
al., 2015). In fact, the effect of meteoric water is also supported by δ18O values of fluid in equilibrium
with quartz ranging between +1.9 and +6.0 ‰ (Hosseinkhani, 2009). This study also assumed a dilution
of magmatic fluids with meteoric water. Further, δ18O and δD values of fluid in equilibrium with sericite
range from -5.2 to -9.6 ‰, and from -95.5 to -108.5 ‰, respectively. Hence, the oxygen and hydrogen
isotope composition indicate meteoric water as one source of fluids that caused sericitic alteration.
7.3.1.3 The role of wallrock buffering
The gradation of high-sulfidation state into intermediate state assemblages can be explained with to the
model by Sillitoe and Hedenquist (2003). They propose two possibilities for IS fringing HS centers. One
option is that deep fluids bypass the lithocap along fractures to directly form IS veins in distal portions.
The other possibility is that deep IS fluid evolves to HS conditions on entering the unbuffered lithocap,
followed by sufficient neutralization and reduction during outward flow and water-rock reaction to
return to intermediate stability. The latter process is supported by the increasing Fe contents of sphalerite
towards the periphery indicating decreasing sulfidation states of fluids.
Wallrock buffering is a process where rock-forming minerals interact with a hydrothermal fluid at
submagmatic temperatures and mediate its sulfidation/oxidation state and total acidity (Barton, 1970).
Minerals that are likely to be act as buffers are the ferromagnesian minerals with iron in different valence
states, such as Fe2+ in pyroxene, olivine, biotite and magnetite and Fe3+ in biotite and magnetite (Einaudi
et al., 2003). At Chah-Mesi totally decomposed phenocrysts of former Fe-Mg-silicates in altered rocks
may be attributed to this process.
As discussed by Einaudi et al. (2003), epithermal systems are only capable to achieve intermediate- or
high-sulfidation states if the fluid chemistry is buffered by the presence of H2S and SO2. This requires
the input of magmatic volatiles into the hydrothermal system. Upon cooling and increases in transport
distance, the sulfidation state of hydrothermal fluids becomes increasingly influenced by fluid-rock
interactions. Wallrock buffering at low temperatures (Th of sphalerite ~230 °C, Figure 60) may explain
the decrease in the sulfidation state. It is assumed that wallrock buffering as evidenced by the strong
alteration of Fe-Mg-silicates, was an important process affecting the chemistry of the ore-forming fluids
at Chah-Mesi.
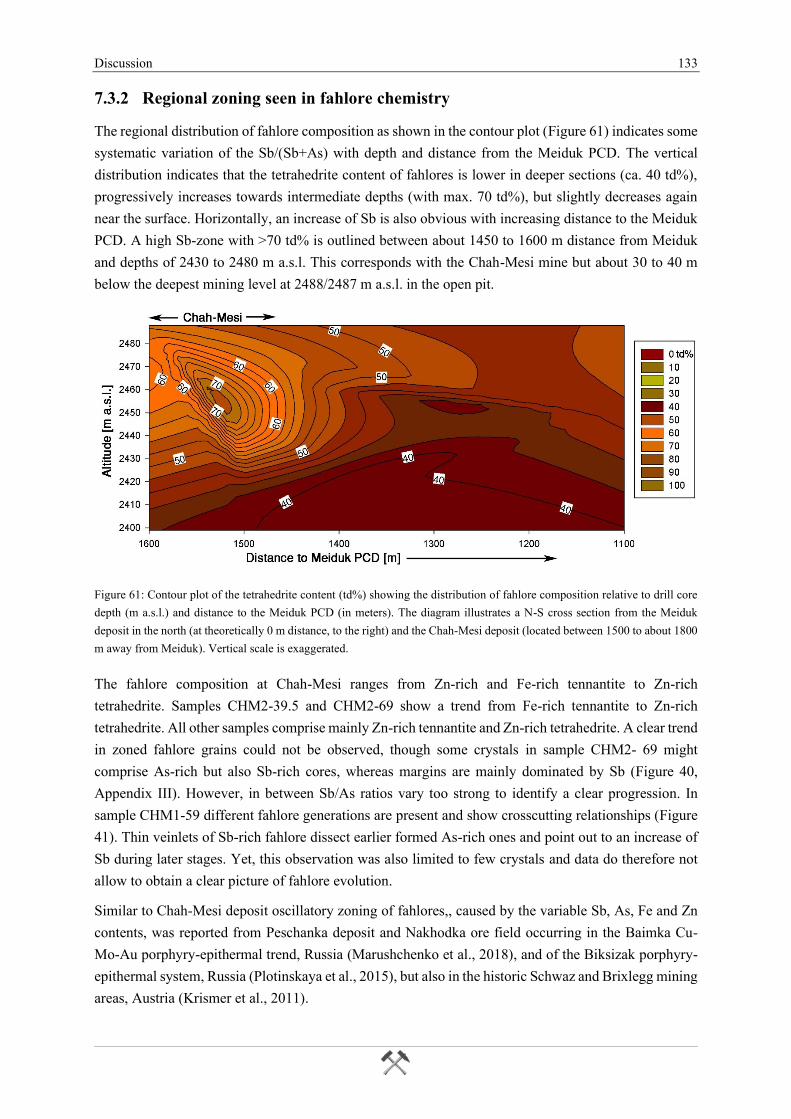
Discussion 133
7.3.2 Regional zoning seen in fahlore chemistry
The regional distribution of fahlore composition as shown in the contour plot (Figure 61) indicates some
systematic variation of the Sb/(Sb+As) with depth and distance from the Meiduk PCD. The vertical
distribution indicates that the tetrahedrite content of fahlores is lower in deeper sections (ca. 40 td%),
progressively increases towards intermediate depths (with max. 70 td%), but slightly decreases again
near the surface. Horizontally, an increase of Sb is also obvious with increasing distance to the Meiduk
PCD. A high Sb-zone with >70 td% is outlined between about 1450 to 1600 m distance from Meiduk
and depths of 2430 to 2480 m a.s.l. This corresponds with the Chah-Mesi mine but about 30 to 40 m
below the deepest mining level at 2488/2487 m a.s.l. in the open pit.
Figure 61: Contour plot of the tetrahedrite content (td%) showing the distribution of fahlore composition relative to drill core
depth (m a.s.l.) and distance to the Meiduk PCD (in meters). The diagram illustrates a N-S cross section from the Meiduk
deposit in the north (at theoretically 0 m distance, to the right) and the Chah-Mesi deposit (located between 1500 to about 1800
m away from Meiduk). Vertical scale is exaggerated.
The fahlore composition at Chah-Mesi ranges from Zn-rich and Fe-rich tennantite to Zn-rich
tetrahedrite. Samples CHM2-39.5 and CHM2-69 show a trend from Fe-rich tennantite to Zn-rich
tetrahedrite. All other samples comprise mainly Zn-rich tennantite and Zn-rich tetrahedrite. A clear trend
in zoned fahlore grains could not be observed, though some crystals in sample CHM2- 69 might
comprise As-rich but also Sb-rich cores, whereas margins are mainly dominated by Sb (Figure 40,
Appendix III). However, in between Sb/As ratios vary too strong to identify a clear progression. In
sample CHM1-59 different fahlore generations are present and show crosscutting relationships (Figure
41). Thin veinlets of Sb-rich fahlore dissect earlier formed As-rich ones and point out to an increase of
Sb during later stages. Yet, this observation was also limited to few crystals and data do therefore not
allow to obtain a clear picture of fahlore evolution.
Similar to Chah-Mesi deposit oscillatory zoning of fahlores,, caused by the variable Sb, As, Fe and Zn
contents, was reported from Peschanka deposit and Nakhodka ore field occurring in the Baimka Cu-
Mo-Au porphyry-epithermal trend, Russia (Marushchenko et al., 2018), and of the Biksizak porphyry-
epithermal system, Russia (Plotinskaya et al., 2015), but also in the historic Schwaz and Brixlegg mining
areas, Austria (Krismer et al., 2011).
Discussion 134
Marushchenko et al. (2018) distinguished different evolution trends for fahlore group minerals of
porphyry, transitional epithermal-porphyry and IS epithermal settings. In PCDs they evolve from Fe-
rich tennantite to Zn-rich tetrahedrite, whereas in transitional deposits they evolve from Zn-rich
tetrahedrite to Zn-rich tennantite exhibiting oscillatory zoned fahlore grains. IS epithermal-related
fahlore evolves from Zn-rich tennantite to Zn-rich tetrahedrite. It has therefore been suggested that the
character of the chemical evolution of fahlore minerals is a criterion to discriminate porphyry,
transitional and epithermal mineralization. The evolution from tennantite to tetrahedrite at the porphyry
and epithermal setting is caused by the Sb increase in the fluid. The concentrations of Fe and Zn are
largely the function of ƒS2 in mineralizing fluid, with higher ƒS2 corresponding to higher Zn
concentration (Krismer et al., 2011). The progression of transitional fahlores indicates fluctuations in
As and Sb regime in fluid.
A complimentary increase of Sb and Ag content in fahlores from early to late generation was previously
reported (Dimitrova et al., 2007; Vassileva et al., 2014). Plotinskaya et al. (2015) determined higher Sb
and Ag contents and wider variations in fahlores with increasing distance from the dioritic porphyry
intrusion at Biksizak. Hackbarth and Petersen (1984) described this feature in detail at Coeur d’Alene,
Idaho, United States and Orcopampa and Julcani, Peru, and established a correlation between the
contents of Sb and Ag. They suggested that the zoning of fahlore composition is caused by the evolution
of fluid. This implies that fahlores enriched in As and Cu firstly precipitate from the fluid moving from
center towards the margins of the hydrothermal system. The result is the enrichment of residual fluid in
Sb and Ag and therefore fahlores of the assemblages latest and furthest from hydrothermal centers are
enriched in Sb and Ag.
The spectrum of fahlore composition in Chah-Mesi ranging from Fe- and Zn-rich tennantite to Zn-rich
tetrahedrite could be referred to all three settings proposed by Marushchenko et al. (2018). A clear
evolutionary trend could not be determined but it is assumed that the Sb content increased over time in
Chah-Mesi as evidenced by crosscutting fahlore veinlets and Sb-dominated grain margins. This could
be due to Sb increase in the hydrothermal solution and also increasing ƒS2 conditions. However, this
trend must have been accompanied by periods of significant fluctuations in the As and Sb
concentrations, as evidenced by the oscillatory zoning of the fahlore grains.
Spatially, the Sb/(Sb+As) values are highest away from the Meiduk PCD with an increase of td% with
distance and from deeper levels towards intermediate depths. This zoning is comparable to the model of
Hackbarth and Petersen (1984) and might indicate the flow-direction and evolution of mineralizing
fluids from Meiduk to Chah-Mesi, whereas hydrothermal fluids became enriched in Sb with increasing
distance and decreasing depth. A correlation of Ag content could not be determined and an evolutionary
trend is not visible for this element.
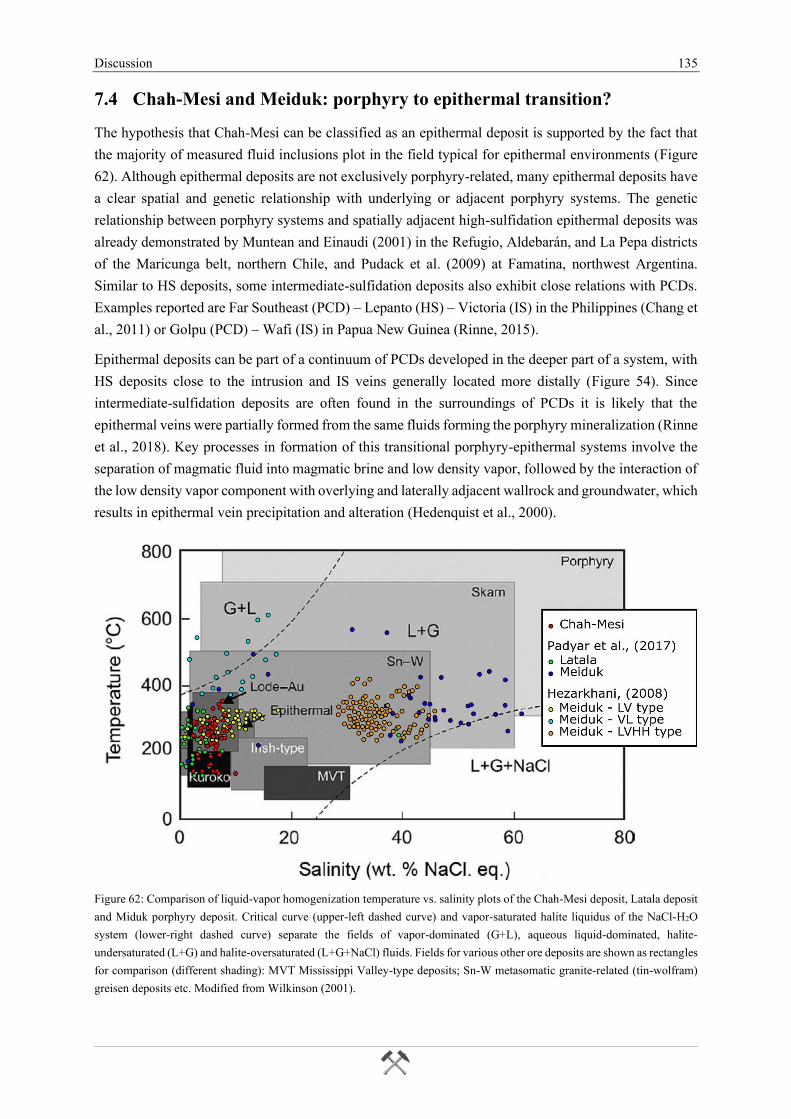
Discussion 135
7.4 Chah-Mesi and Meiduk: porphyry to epithermal transition?
The hypothesis that Chah-Mesi can be classified as an epithermal deposit is supported by the fact that
the majority of measured fluid inclusions plot in the field typical for epithermal environments (Figure
62). Although epithermal deposits are not exclusively porphyry-related, many epithermal deposits have
a clear spatial and genetic relationship with underlying or adjacent porphyry systems. The genetic
relationship between porphyry systems and spatially adjacent high-sulfidation epithermal deposits was
already demonstrated by Muntean and Einaudi (2001) in the Refugio, Aldebarán, and La Pepa districts
of the Maricunga belt, northern Chile, and Pudack et al. (2009) at Famatina, northwest Argentina.
Similar to HS deposits, some intermediate-sulfidation deposits also exhibit close relations with PCDs.
Examples reported are Far Southeast (PCD) – Lepanto (HS) – Victoria (IS) in the Philippines (Chang et
al., 2011) or Golpu (PCD) – Wafi (IS) in Papua New Guinea (Rinne, 2015).
Epithermal deposits can be part of a continuum of PCDs developed in the deeper part of a system, with
HS deposits close to the intrusion and IS veins generally located more distally (Figure 54). Since
intermediate-sulfidation deposits are often found in the surroundings of PCDs it is likely that the
epithermal veins were partially formed from the same fluids forming the porphyry mineralization (Rinne
et al., 2018). Key processes in formation of this transitional porphyry-epithermal systems involve the
separation of magmatic fluid into magmatic brine and low density vapor, followed by the interaction of
the low density vapor component with overlying and laterally adjacent wallrock and groundwater, which
results in epithermal vein precipitation and alteration (Hedenquist et al., 2000).
Figure 62: Comparison of liquid-vapor homogenization temperature vs. salinity plots of the Chah-Mesi deposit, Latala deposit
and Miduk porphyry deposit. Critical curve (upper-left dashed curve) and vapor-saturated halite liquidus of the NaCl-H2O
system (lower-right dashed curve) separate the fields of vapor-dominated (G+L), aqueous liquid-dominated, halite-
undersaturated (L+G) and halite-oversaturated (L+G+NaCl) fluids. Fields for various other ore deposits are shown as rectangles
for comparison (different shading): MVT Mississippi Valley-type deposits; Sn-W metasomatic granite-related (tin-wolfram)
greisen deposits etc. Modified from Wilkinson (2001).
Discussion 136
The observed small CO2-contents in fluid inclusions could indicate a magmatic origin that might be
associated with magmatic brines derived from the Meiduk porphyry. Kokh et al. (2017) suppose that
fluid mixing with CO2-rich waters in porphyry systems may be an important process for the formation
of epithermal deposits. CO2-rich fluid pulses from the underlying magma chamber can mix with metal-
bearing fluids and result in the precipitation of more than half of the Au and the initial Cu and Fe load
of the aqueous fluid in porphyry Cu-Au deposits. This CO2-rich fluid may pass through the porphyry,
mix with epithermal ore fluids and trigger precipitation of ore minerals, forming Ca-Mg-Mn-Fe-
carbonate at the same time when HCO3- decomposes and combines with Ca2+, Fe2+, Mn2+ and Mg2+.
Further, the gathered information of fluid inclusions was compared to fluids determined by Hezarkhani
(2008) for his group I and group III veins (Chapter 2.4.2). Veins of group I include the sulfide
assemblage molybdenite + pyrite ± chalcopyrite ± bornite and correlate well with the observed B2-type
veins of the potassic zone. Group III vein sulfide assemblage of pyrite ± chalcopyrite correlates in part
with the described D1-type veins consisting of pyrite ± chalcopyrite ± bornite, despite the missing
anhydrite gangue and additional bornite. Fluids studied from group I and group III veinlets include LV
type, VL type and LVHH type inclusions.
Both vein groups comprise LV type inclusions consisting of liquid + vapor ± solid, VL type of vapor +
liquid ± solid and LVHH type inclusions are multiphase and consist of liquid + vapor + halite + other
solids. All these inclusion types were compared to LV type inclusions at Chah-Mesi and are compiled
in the Th-salinity plot after Wilkinson (2001) shown in Figure 62. Hezarkhani (2008) proposed that early
hydrothermal fluids are represented by high-temperature (380 to 550 °C), high-salinity (~60 wt% NaCl
equiv.) LVHH inclusions and high-temperature (320 to 550 °C), low-salinity VL inclusions. These are
interpreted as orthomagmatic fluid that boiled episodically and caused potassic alteration. Additionally,
they are associated with the deposition of group I veins. The influx of meteoric water into the central
part of the system and mixing with magmatic fluid produced a lower temperature (200 to 350 °C), low-
to intermediate-salinity (1 to 20 wt% NaCl equiv.), Ca-rich, evolved meteoric fluid associated with LV
type inclusions. This type was mainly responsible for propylitic alteration and formation of group III
veins.
Data of Chah-Mesi overlap with LV type inclusions of Meiduk (Figure 62). These comprise salinities
of 3.9 to 10.2 wt% for group I and 4.1 to 17.9 wt% NaCl equiv. for group III. LV type fluid inclusions
homogenize to liquid at temperatures between 180 and 350 °C with well-defined modes at ~270 C° for
group I and around 300 C° for group III. These microthermometric data are well comparable to the ore-
forming fluids at Chah-Mesi. However, the Meiduk fluids also show slightly higher salinities and
homogenization temperatures. Hence, it must be assumed that they have been affected by continuing
dilution and cooling until they reached the epithermal environment at Chah-Mesi.
The Chah-Mesi data are also well comparable to the inclusions from the epithermal Latala deposit
(Table 14, Figure 62), which is situated about 8 km to the north of Meiduk and for which a genetic link
to the nearby porphyry system was suggested (Padyar et al., 2017). Properties of fluids at Latala are
consistent with a magmatic-hydrothermal fluid circulating from deeper levels to shallower environments
and also δ34S values of ore minerals (mostly between -2.5 to +0.9 ‰) support a magmatic-hydrothermal
source. Padyar et al. (2017) proposed a genetic model in which epithermal mineralization occurred upon
Discussion 137
dilution of the high-salinity magmatic fluid with meteoric water, which entered the hydrothermal system
as it cooled.
Fluid mixing has also been deduced from δ18O values of quartz at Chah-Mesi. Calculated fluid
compositions range between +1.9 and +6.0 ‰ (Hosseinkhani, 2009) in accordance with the
interpretation that magmatic fluids derived from Meiduk were diluted by meteoric water during their
circulation and ascent.
The regional extent of the hydrothermal alteration also indicates the proximity and close relation to the
Meiduk porphyry system. Alteration zoning consists of silicification and advanced argillic alteration
close to structure-related fluid conduits and a transition into sericitic, argillic and propylitic and
eventually potassic alteration; the latter one is closest to the Meiduk porphyry system and points to
Meiduk as source of ore-forming hydrothermal-magmatic fluids. Similar zoning associated with
porphyry Cu-Mo deposits has been recorded by Darabi-Golestan et al. (2013). However, what seems
very unusual is that potassic alteration at Meiduk was recognized upon 3366900 N and represents an
about 50 m thick halo surrounding the porphyry stock. In Chah-Mesi potassic alteration starts at 3365300
N, which corresponds to about 1600 m distance to the outer boundary of Meiduk potassic alteration.
Therefore, a direct connection between these two zones is very unlikely.
7.5 Regional geodynamics and ore genesis
This chapter gives an interpretation of the possible metallogenetic evolution of Chah-Mesi and presents
a genetic model (Figure 63) from the author’s viewpoint. For this purpose, the results of this study are
discussed in combination with other published data and ideas.
7.5.1 Regional geodynamics and metallogeny
The epithermal deposit Chah-Mesi and the nearby porphyry copper deposit Meiduk are located in the
Kerman Porphyry Copper Belt of the southeastern UDMB. The formation of the UDMB is closely
related to the subduction of oceanic lithosphere of the Neotethys. The opening of the Neotethys started
in the Permian and the collision of the Arabian and Iranian plates occurred during the end of the Eocene
(Alirezaei et al., 2017; Berberian and King, 1981). The subduction of the Neotethys caused the formation
of an active continental margin environment and initiated the deposition of calc-alkaline volcanic rocks
in the Meiduk area (Aliani et al., 2009). The main volcanic activity of this area started during the Lower
Eocene with the Bahraseman complex. Andesitic and dacitic-pyroclastic host rocks described in this
study belong to the overlying Middle-Upper Eocene Razak complex, which was deposited at 37.5 ± 1.4
Ma (Hassanzadeh, 1993). The uppermost Oligocene Hezar complex was formed at 32.7 ± 6.3 Ma
Hassanzadeh (1993).
The Mid- to Late Miocene post-collisional and late orogenic slab breakoff (Allen et al., 2011) following
the collision of the Arabian and Iranian plates is widely considered to have caused uplift and adakite-
like magmatism in the UDMB (Omrani et al., 2008). Shafiei et al. (2009) proposed that post-collisional
calc-alkaline magmas involved a significant fraction of remobilized subduction-modified lower crust
and argue that this process is key to the fertility of these Middle-Miocene magmas, which are related to
the formation of the largest porphyry Cu-Mo deposits in Iran (e.g. Sar Cheshmeh, Meiduk). During this
time the Meiduk porphyry granitic stocks, related to the Kuh-Panj type granitoids, intruded into the
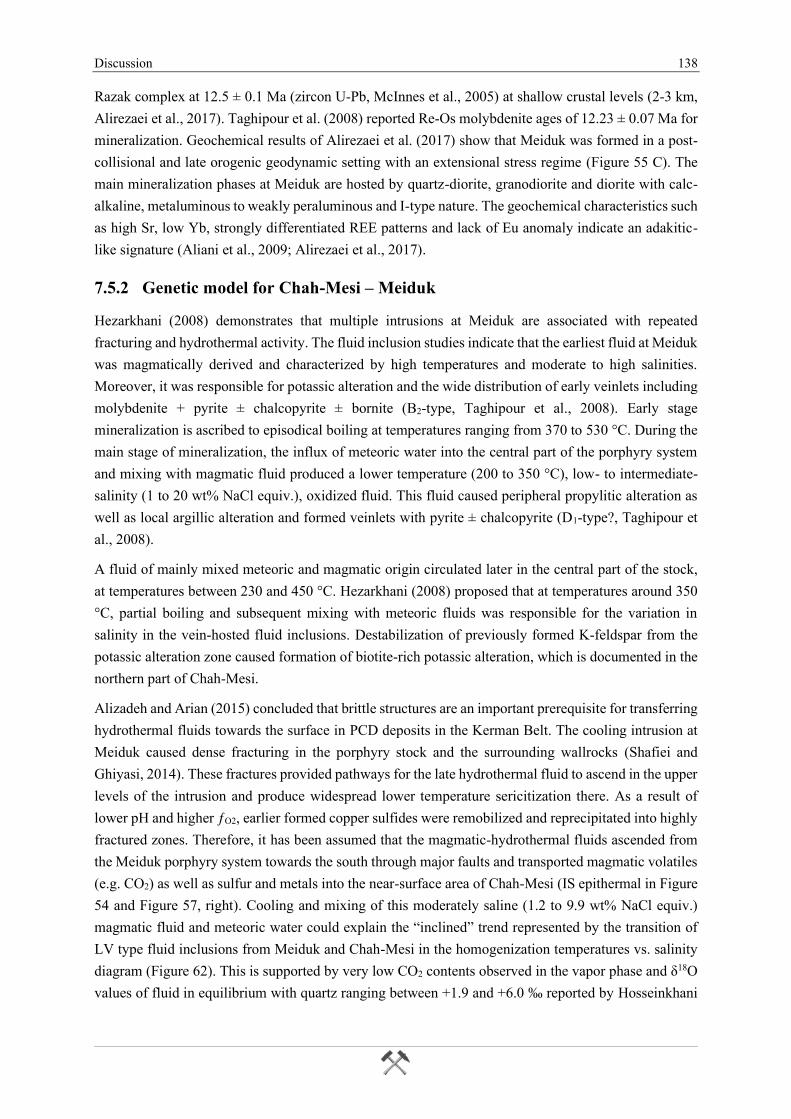
Discussion 138
Razak complex at 12.5 ± 0.1 Ma (zircon U-Pb, McInnes et al., 2005) at shallow crustal levels (2-3 km,
Alirezaei et al., 2017). Taghipour et al. (2008) reported Re-Os molybdenite ages of 12.23 ± 0.07 Ma for
mineralization. Geochemical results of Alirezaei et al. (2017) show that Meiduk was formed in a post-
collisional and late orogenic geodynamic setting with an extensional stress regime (Figure 55 C). The
main mineralization phases at Meiduk are hosted by quartz-diorite, granodiorite and diorite with calc-
alkaline, metaluminous to weakly peraluminous and I-type nature. The geochemical characteristics such
as high Sr, low Yb, strongly differentiated REE patterns and lack of Eu anomaly indicate an adakitic-
like signature (Aliani et al., 2009; Alirezaei et al., 2017).
7.5.2 Genetic model for Chah-Mesi – Meiduk
Hezarkhani (2008) demonstrates that multiple intrusions at Meiduk are associated with repeated
fracturing and hydrothermal activity. The fluid inclusion studies indicate that the earliest fluid at Meiduk
was magmatically derived and characterized by high temperatures and moderate to high salinities.
Moreover, it was responsible for potassic alteration and the wide distribution of early veinlets including
molybdenite + pyrite ± chalcopyrite ± bornite (B2-type, Taghipour et al., 2008). Early stage
mineralization is ascribed to episodical boiling at temperatures ranging from 370 to 530 °C. During the
main stage of mineralization, the influx of meteoric water into the central part of the porphyry system
and mixing with magmatic fluid produced a lower temperature (200 to 350 °C), low- to intermediate-
salinity (1 to 20 wt% NaCl equiv.), oxidized fluid. This fluid caused peripheral propylitic alteration as
well as local argillic alteration and formed veinlets with pyrite ± chalcopyrite (D1-type?, Taghipour et
al., 2008).
A fluid of mainly mixed meteoric and magmatic origin circulated later in the central part of the stock,
at temperatures between 230 and 450 °C. Hezarkhani (2008) proposed that at temperatures around 350
°C, partial boiling and subsequent mixing with meteoric fluids was responsible for the variation in
salinity in the vein-hosted fluid inclusions. Destabilization of previously formed K-feldspar from the
potassic alteration zone caused formation of biotite-rich potassic alteration, which is documented in the
northern part of Chah-Mesi.
Alizadeh and Arian (2015) concluded that brittle structures are an important prerequisite for transferring
hydrothermal fluids towards the surface in PCD deposits in the Kerman Belt. The cooling intrusion at
Meiduk caused dense fracturing in the porphyry stock and the surrounding wallrocks (Shafiei and
Ghiyasi, 2014). These fractures provided pathways for the late hydrothermal fluid to ascend in the upper
levels of the intrusion and produce widespread lower temperature sericitization there. As a result of
lower pH and higher ƒO2, earlier formed copper sulfides were remobilized and reprecipitated into highly
fractured zones. Therefore, it has been assumed that the magmatic-hydrothermal fluids ascended from
the Meiduk porphyry system towards the south through major faults and transported magmatic volatiles
(e.g. CO2) as well as sulfur and metals into the near-surface area of Chah-Mesi (IS epithermal in Figure
54 and Figure 57, right). Cooling and mixing of this moderately saline (1.2 to 9.9 wt% NaCl equiv.)
magmatic fluid and meteoric water could explain the “inclined” trend represented by the transition of
LV type fluid inclusions from Meiduk and Chah-Mesi in the homogenization temperatures vs. salinity
diagram (Figure 62). This is supported by very low CO2 contents observed in the vapor phase and δ18O
values of fluid in equilibrium with quartz ranging between +1.9 and +6.0 ‰ reported by Hosseinkhani
Discussion 139
(2009), which indicate a dilution of these magmatic fluids with meteoric water upon epithermal
mineralization.
The formation of mineralized O-type veins at Chah-Mesi started with an early highly acidic fluid of
high-sulfidation state that caused strong silicification and local replacement bodies with vuggy quartz.
These textures are limited to the NNE-SSW striking major faults (OZ1) and are associated with massive
silica-rich O-type veins including the early ore assemblage pyrite + chalcopyrite + enargite + luzonite-
famatinite ± bornite. With increasing distance to the central fault zones (OZ2) the mineralizing fluids
were affected by continuous reaction with the surrounding wallrock and further dilution with meteoric
water. This caused an increase in pH and the reduced as well as cooled conditions provided a decrease
into intermediate-sulfidation state. The physicochemical change resulted in widespread sericitization
and open space precipitation of banded and crustiform veins hosting the main stage assemblage pyrite
+ chalcopyrite + tennantite-tetrahedrite + sphalerite + galena ± enargite ± Ag-sulfides ± electrum. The
mineralized breccia zone of the deeper level is probably related to the transition between early (HS) and
main (IS) mineralization due to very low Fe contents of sphalerite.
Petrographic features and fluid inclusion data do not support boiling as an ore deposition mechanism
but cannot completely rule it out either. The contribution of meteoric water as the source of fluids that
caused sericitic alteration is supported by stable isotope data (Hosseinkhani, 2009). The systematic
variation of the fahlore composition with oscillatory zoned crystals reflect significant fluctuations in the
As and Sb concentrations of the ore-forming fluids. However, a general trend of Sb increase with time
is recorded by fahlores and in space with increasing tetrahedrite content away from the Meiduk deposit
and shallow depths.
It can be speculated that a separate pulse of ore-forming fluids caused the late stage hypogene
mineralization, which is Pb-Zn dominated and occurs distal to the major fault zones (OZ3) and
overprints earlier Cu-rich assemblages. It consists of sphalerite + galena + chalcopyrite + pyrite ±
tennantite-tetrahedrite with predominately Ca-Mg-Mn-Fe-carbonates as gangue mineral.
The final stage of mineralization is associated with supergene weathering and oxidation. It is
characterized by the replacement of chalcopyrite, sphalerite and galena by secondary copper and iron
minerals. Hence, the assemblage of chalcocite- and covellite-group minerals, Fe-hydroxides, Cu-
carbonate hydroxides, etc. is restricted to the weathered surface area and progressively decreases
towards a depth of approximately 50 m below the surface.
Discussion 140
Figure 63: N-S crossection of Chah-Mesi deposit schematically showing the distribution of tetrahedrite content (dotted purple lines), ore zones (dashed orange lines), alteration zones and host rocks. Ore
zone 1 (OZ1) surrounds areas of intense silicification associated with Fe-Cu-dominated sulfides and grades through the transitional ore zone 2 (OZ2) into the Pb-Zn-dominated ore zone 3 (OZ3) affected
by mainly sericitic to minor propylitic alteration. Ore zone 4 is associated with supergene alteration on the surface and was excluded for reasons of clarity. Tetrahedrite content (td%) indicating Sb-
enrichment towards shallow levels and increasing distance to Meiduk (contour lines are taken from Figure 61).
Conclusions 141
8 Conclusions
This Master’s thesis presents a detailed investigation of the epithermal veins at Chah-Mesi deposit in
the Kerman Porphyry Copper Belt in southeastern Iran. The main purpose of this study was to correctly
classify Chah-Mesi regarding epithermal deposit types. Detailed textural and mineralogical studies
allowed to distinguish different vein types, establish a paragenetic sequence of ore mineralization and
provide new data on the mineral chemistry of the ore minerals and their deposit-scale distribution. The
physicochemical conditions of ore-forming fluids and their evolution through time and space were
reconstructed on the basis of ore mineral assemblages, mineral chemistry and fluid inclusion studies. It
is discussed that hydrothermal fluids derived from the porphyry system and that there exists a causal
link of epithermal mineralization at Chah-Mesi with the Meiduk porphyry.
The polymetallic Chah-Mesi Cu-Pb-Zn-(Ag-Au) vein type deposit is classified as intermediate-
sulfidation (IS) state epithermal deposit. This is supported by the following data:
(1) Chah-Mesi deposit is hosted by a calc-alkaline succession of intermediate volcanic rocks (andesites,
pyroclastics of dacitic composition) and minor hypabyssal rocks (microdiorite) formed in a post-
collisional arc setting within an extensional stress regime. Mineralized polymetallic epithermal
veins are related to NNE-SSW striking fault zones.
(2) Polymetallic mineralization is restricted to multistage veins, associated breccias and minor
replacement bodies with residual vuggy quartz. The main metals are Cu, Zn, Pb, As, Sb with minor
Ag and Au and trace amounts of Mo and Te. The average sulfide abundance is between 20 and 30
vol% and may exceed 50 vol% in ginguro veins. Hypogene ore minerals include sphalerite, galena,
chalcopyrite, tetrahedrite-tennantite, enargite, luzonite-famatinite and minor bornite. Precious
metals occur as electrum, Ag-bearing sulfides and sulfosalts (e.g. jalpaite, pearceite, benleonardite).
Supergene mineralization contains chalcocite and covellite together with Fe-oxyhydroxides and Cu-
carbonate hydroxides.
(3) Textural features of silica gangue comprise fault zone replacement and vein filling by massive and
banded fine- to coarse-grained quartz as well as crustiform and comb quartz textures. Common
carbonate gangue minerals in the banded and crustiform veins are Mn and Zn bearing siderite,
ankerite and rare kutnohorite. Other gangue minerals involve barite, fluorite, apatite and anhydrite.
(4) Hydrothermal alteration zoning consists of central structure-controlled silicification grading into
local advanced argillic and argillic alteration halos. Pervasive sericitization grading into regional
propylitic alteration is commonly further away from the deposit. Potassic (biotite-rich) alteration is
found in the north closest to the Meiduk porphyry deposit.
(5) The investigated fluid inclusions contain aqueous H2O-NaCl fluids with minor CO2. Low salinity
liquid-rich LV type inclusions dominate the assemblages determined in sphalerite and quartz; total
salinities are 1.2 to 9.9 wt% in sphalerite and 2.1 to 9.2 wt% NaCl equiv. in quartz. Th values range
from 114.6 to 294.6 °C for sphalerite and 153.0 to 396.5 °C for quartz.
Conclusions 142
A total of 59 representative drill core and surface samples from the various vein types and lithologies
were collected. These were taken from 5 drill cores from different depths and locations within the Chah-
Mesi deposit. Optical microscopy was conducted to constrain the textural and mineralogical
characteristics of the mineralization and alteration and to establish an ore paragenetic sequence and
alteration zoning for the Chah-Mesi deposit. The study of the samples allowed to draw the following
conclusions:
(1) Two types of veins are directly linked with porphyry mineralization and occur in the potassic
alteration zone very close to Meiduk. They include B2-type (quartz, carbonate, pyrite, molybdenite,
chalcopyrite and bornite) and D1-type (mainly quartz and pyrite with minor carbonate, chalcopyrite,
bornite and Fe-oxyhydroxides) veins and represent the earliest veins. Furthermore, three barren
alteration-related vein types were distinguished, termed QCS-type (quartz, chlorite, sericite and
minor calcite), PCE-type (prehnite, calcite, clinozoisite, epidote with minor rutile and native copper)
and CC-type (calcite and minor quartz) veins. Mineralization is restricted to O-type veins which are
subdivided into four subtypes; i.e. massive, banded and crustiform veins as well as mineralized
breccia zones.
(2) The paragenetic sequence of ore minerals is initiated by a high-sulfidation stage with pyrite +
chalcopyrite + enargite + luzonite-famatinite ± bornite, which mainly occurs in ore zone 1 (OZ 1)
close to the central NNE-SSW trending fault zones. This early stage assemblage grades into
intermediate-sulfidation assemblages with pyrite + chalcopyrite + tennantite-tetrahedrite +
sphalerite + galena. Gold and only minor enargite also formed during the main stage, which mainly
occurs in OZ 2. The subsequent Pb-Zn dominated stage is characterized by sphalerite + galena +
chalcopyrite + pyrite ± tennantite-tetrahedrite to be found mostly in OZ 3 distal to fault zones. The
fourth stage represents supergene weathering and is characterized by the mineral assemblage of
chalcocite + covellite + malachite + azurite + goethite + limonite. It is restricted to OZ 4 extending
from the surface to a depth of approximately 50 m.
(3) Alteration associated with the HS massive O-type veins consists of central structure-related
silicification grading into advanced argillic and argillic alteration halos. Sericitization is associated
with QCS-type veinlets, propylitic alteration with PCE- and CC-type veinlets. In the north closest
to the Meiduk porphyry deposit potassic (biotite-rich) alteration is associated with the porphyry-
related D1- and B2-type veins.
Electron microprobe analysis was conducted on fahlore group minerals and other sulfides and sulfosalts.
It allowed to establish a spatial distribution of Sb/As ratios of fahlore group minerals and to identify the
main Ag carriers.
(1) Fahlore group minerals define a trend of increasing Sb content (td%) with increasing distance from
Meiduk and from deeper towards intermediate depths at Chah-Mesi. However, individual samples
record significant compositional zoning and grain-scale variations of As and Sb due to fluctuations
of these elements in the hydrothermal fluid.
(2) Fahlore group minerals are identified as the main Ag carriers with contents up to 1.94 apfu Ag in
the central part of Chah-Mesi. The overall Ag content shows an average of 0.06 Ag apfu. In some
samples the Ag content increases systematically with the tetrahedrite component. Moreover,
enargite and luzonite contain small amounts of Ag averaging 0.01 Ag apfu with a maximum of 0.02
Conclusions 143
apfu. Chalcopyrite showing an excess in Cu and deficiency in Fe incorporates minor amounts of Ag
with a maximum of 0.12 Ag apfu. The minerals of the geerite-covellite series have Ag contents of
up to 0.1 apfu. Exotic Ag-bearing minerals identified comprise phases of the pearceite-polybasite
series, jalpaite and benleonardite.
(3) The sphalerite contained in the different vein types has low Fe concentrations ranging from 0.05 to
1.5 mole% FeS substituting for ZnS in the sphalerite structure.
The combined mineralogical and fluid inclusion studies permit to constrain changes in the
physicochemical conditions of ore forming fluids and to establish a genetic link to Meiduk porphyry
deposit:
(1) Banded and crustiform O-type veins formed from H2O-NaCl fluids with subordinate CO2 content,
indicating a magmatic origin. The properties of LV type fluid inclusions of these veins are similar
to those reported from the nearby epithermal Latala deposit. Moreover, there is a strong overlap
with low salinity LV type inclusions reported from Meiduk PCD. Thus, it is suggested that
epithermal mineralization at Chah-Mesi is linked with magmatic-hydrothermal fluids derived from
the Meiduk porphyry system. These fluids migrated upward and laterally from the deep high-
temperature porphyry level into shallow epithermal environments where, upon cooling, they were
diluted by meteoric water.
(2) The early stage magmatic hydrothermal fluids were highly acidic and high-sulfidation state fluids
that caused the intense silicification and replacement of host rocks along the major faults at Chah-
Mesi. They produced the HS sulfide assemblages. Due to cooling, fluid-wallrock interaction and
mixing with meteoric water the fluids were neutralized and the sulfidation state changed to
intermediate towards the peripheral parts of the deposit as well as in the younger parts of multiple
sulfide veins. This change in physicochemical conditions triggered the formation of Au- and Ag-
bearing IS assemblages and strong sericitization. Fluid inclusions and vein textures indicate that
mineralization occurred under non-boiling conditions. Hence, mixing of fluids and fluid-rock
interaction controlling the sulfidation state are interpreted to have played key roles in ore
precipitation at Chah-Mesi.
References 144
9 References
Adeli, Z., Rasa, I., and Darvishzadeh, A., 2014, Fluid inclusion study of the ore-quartz veins at
Haftcheshmeh porphyry copper (Mo) deposit, Ahar–Arasbaran Magmatic Belt, NW Iran, Ore
Geology Reviews, 502-511 p.:
Agard, P., Omrani, J., Jolivet, L., and Mouthereau, F., 2005, Convergence history across Zagros (Iran):
constraints from collisional and earlier deformation: International Journal of Earth Sciences, v.
94, no. 3, p. 401-419.
Aghanabati, A., 2004, Geology of Iran, Tehran, Geological Survey of Iran, 606 p.:
Aghazadeh, M., Castro, A., Badrzadeh, Z., and Vogt, K., 2011, Post-collisional polycyclic plutonism
from the Zagros hinterland: the Shaivar Dagh plutonic complex, Alborz belt, Iran: Geological
Magazine, v. 148, no. 5-6, p. 980-1008.
Ahmadzadeh, G., Jahangiri, A., Lentz, D., and Mojtahedi, M., 2010, Petrogenesis of Plio-Quaternary
post-collisional ultrapotassic volcanism in NW of Marand, NW Iran: Journal of Asian Earth
Sciences, v. 39, no. 1, p. 37-50.
Alaminia, Z., Karimpour, M. H., Homam, S. M., and Finger, F., 2013, The magmatic record in the
Arghash region (northeast Iran) and tectonic implications: International Journal of Earth
Sciences, v. 102.
Alavi, M., 1980, Tectonostratigraphic evolution of the Zagrosides of Iran: Geology, v. 8, no. 3, p. 144-
149.
-, 1991, Sedimentary and structural characteristics of the paleo-Tethys remnant in NE Iran: Geological
Society of America Bulletin, v. 103, p. 983-992.
-, 1994, Tectonics of the zagros orogenic belt of iran: new data and interpretations: Tectonophysics, v.
229, no. 3, p. 211-238.
-, 2007, Structures of the Zagros fold-thrust belt in Iran, American Journal of Science - AMER J SCI,
1064-1095 p.:
Ali, S. A., Buckman, S., Aswad, K. J., Jones, B. G., Ismail, S. A., and Nutman, A. P., 2013, The tectonic
evolution of a Neo-Tethyan (Eocene–Oligocene) island-arc (Walash and Naopurdan groups) in
the Kurdistan region of the Northeast Iraqi Zagros Suture Zone: Island Arc, v. 22, no. 1, p. 104-
125.
Aliani, F., Alirezaei, A., Moradian, A., and Abbasloo, Z., 2009, Geochemistry and petrography of the
Meiduk porphyry copper deposit, Kerman, Iran: Australian Journal of Basic and Applied
Sciences, v. 3, p. 3786-3800.
Alirezaei, A., Arvin, M., and Dargahi, S., 2017, Adakite-like signature of porphyry granitoid stocks in
the Meiduk and Parkam porphyry copper deposits, NE of Shahr-e-Babak, Kerman, Iran:
Constrains on geochemistry: Ore Geology Reviews, v. 88, p. 370-383.
Alizadeh, H., and Arian, M., 2015, Rule of structural factors in formation of porphyry copper deposits
in south western part of Kerman area, Iran: Open Journal of Geology, v. 5, no. 7, p. 489-498.
Alizadeh Sevari, B., and Hezarkhani, A., 2014, Hydrothermal evolution of Darrehzar porphyry copper
deposit, Iran: evidence from fluid inclusions: Arabian Journal of Geosciences, v. 7, no. 4, p.
1463-1477.
Allen, M. B., Ghassemi, M. R., Shahrabi, M., and Qorashi, M., 2003, Accommodation of late Cenozoic
oblique shortening in the Alborz range, northern Iran: Journal of Structural Geology, v. 25, no.
5, p. 659-672.
Allen, M. B., Kheirkhah, M., Emami, M. H., and Jones, S. J., 2011, Right-lateral shear across Iran and
kinematic change in the Arabia—Eurasia collision zone: Geophysical Journal International, v.
184, no. 2, p. 555-574.
Allen, M. B., Saville, C., Blanc, E. J. P., Talebian, M., and Nissen, E., 2013, Orogenic plateau growth:
Expansion of the Turkish-Iranian Plateau across the Zagros fold-and-thrust belt: Tectonics, v.
32, no. 2, p. 171-190.
Arribas, A., 1995, Characteristics of high-sulfidation epithermal deposits, and their relation to magmatic
fluid: Mineral. Asso. Canada Short Course Series, v. 23, p. 419-454.
Asadi, S., 2018, Triggers for the generation of post–collisional porphyry Cu systems in the Kerman
magmatic copper belt, Iran: New constraints from elemental and isotopic (Sr–Nd–Hf–O) data:
Gondwana Research, v. 64, p. 97-121.
References 145
Atalou, S., Nezafati, N., Lotfi, M., and Aghazadeh, M., 2017, Fluid Inclusion Investigations of the
Masjed Daghi Copper-Gold Porphyry-Epithermal Mineralization, East Azerbaijan Province,
NW Iran, Open Journal of Geology, 1110-1127 p.:
Bakker, R., 2011, The use of quantities, units and symbols in fluid inclusion research, Berichte der
Geologischen Bundesanstalt, Volume 87, p. 5-11.
-, 2018, AqSo_NaCl: Computer program to calculate p-T-V-x properties in the H 2 O-NaCl fluid system
applied to fluid inclusion research and pore fluid calculation: Computers & Geosciences, v. 115.
Ballato, P., Uba, C. E., Landgraf, A., Strecker, M. R., Sudo, M., Stockli, D. F., Friedrich, A., and
Tabatabaei, S. H., 2011, Arabia-Eurasia continental collision: Insights from late Tertiary
foreland-basin evolution in the Alborz Mountains, northern Iran: GSA Bulletin, v. 123, no. 1-2,
p. 106-131.
Barton, P. B., 1970, Sulfide petrology: Mineral. Soc. Amer. Spec. Pap., v. 3, p. 187-198.
Berberian, F., and Berberian, M., 1981, Tectono-Plutonic Episodes in Iran, in Gupta, H. K., and Delany,
F. M., eds., Zagros-Hindu Kush-Himalaya Geodynamic Evolution, Geodynamic Series,
Volume 3: Washington DC, American Geophysical Union, p. 5-32.
Berberian, M., and King, G. C. P., 1981, Towards a paleogeography and tectonic evolution of Iran:
Canadian Journal of Earth Sciences, v. 18, no. 2, p. 210-265.
Bindi, L., Evain, M., Spry, P. G., and Menchetti, S., 2007, The pearceite-polybasite group of minerals:
Crystal chemistry and new nomenclature rules: American Mineralogist, v. 92, no. 5-6, p. 918-
925.
Bodnar, R. J., 1993, Revised equation and table for determining the freezing point depression of H2O-
NaCl solutions: Geochimica Et Cosmochimica Acta, v. 57, no. 3, p. 683-684.
Brunet, M.-F., 2009, South Caspian to Central Iran Basins, Volume 312: London U6 - ctx_ver=Z39.88-
2004&ctx_enc=info%3Aofi%2Fenc%3AUTF-
8&rfr_id=info%3Asid%2Fsummon.serialssolutions.com&rft_val_fmt=info%3Aofi%2Ffmt%
3Akev%3Amtx%3Ajournal&rft.genre=article&rft.atitle=South+Caspian+to+Central+Iran+Ba
sins&rft.au=Brunet%2C+Marie-
Fran%C3%A7oise&rft.series=Geological+Society+special+publication&rft.date=2009-01-
01&rft.pub=Geological+Soc&rft.volume=312&rft.externalDocID=LG00006581¶mdict=
en-US U7 - Web Resource, Geological Soc.
Byrne, D. E., Sykes, L. R., and Davis, D. M., 1992, Great thrust earthquakes and aseismic slip along the
plate boundary of the Makran Subduction Zone: Journal of Geophysical Research: Solid Earth,
v. 97, no. B1, p. 449-478.
Calais, E., and Amarjargal, S., 2000, New constraints on current deformation in Asia from continuous
GPS measurements at Ulan Baatar, Mongolia: Geophysical Research Letters, v. 27, no. 10, p.
1527-1530.
Candela, P. A., and Holland, H. D., 1984, The partitioning of copper and molybdenum between silicate
melts and aqueous fluids: Geochimica et Cosmochimica Acta, v. 48, no. 2, p. 373-380.
Chang, Z., Hedenquist, J. W., White, N. C., Cooke, D. R., Roach, M., Deyell, C. L., Garcia, J., Jr.,
Gemmell, J. B., McKnight, S., and Cuison, A. L., 2011, Exploration Tools for Linked Porphyry
and Epithermal Deposits: Example from the Mankayan Intrusion-Centered Cu-Au District,
Luzon, Philippines*: Economic Geology, v. 106, no. 8, p. 1365-1398.
Colman-Sadd, S. P., 1978, Fold development in Zagros simply folded belt, Southwest Iran: AAPG
Bulletin, v. 62, no. 6, p. 984-1003.
Cooke, D. R., Hollings, P., and Walshe, J. L., 2005, Giant porphyry deposits; characteristics,
distribution, and tectonic controls: Economic Geology and the Bulletin of the Society of
Economic Geologists, v. 100, no. 5, p. 801-818.
Cooke, D. R., Hollings, P., Wilkinson, J. J., and Tosdal, R. M., 2014, Geochemistry of Porphyry
Deposits, in Holland, H. D., and Turekian, K. K., eds., Treatise on Geochemistry, Second
Edition, Volume 13: Oxford Elsevier, p. 357-381.
Cooke, D. R., and Simmons, S. F., 2000, Characteristics and Genesis of Epithermal Gold Deposits, in
Hagemann, S. G., and Brown, P. E., eds., Gold in 2000, Volume 13, Society of Economic
Geologists, p. 221-244.
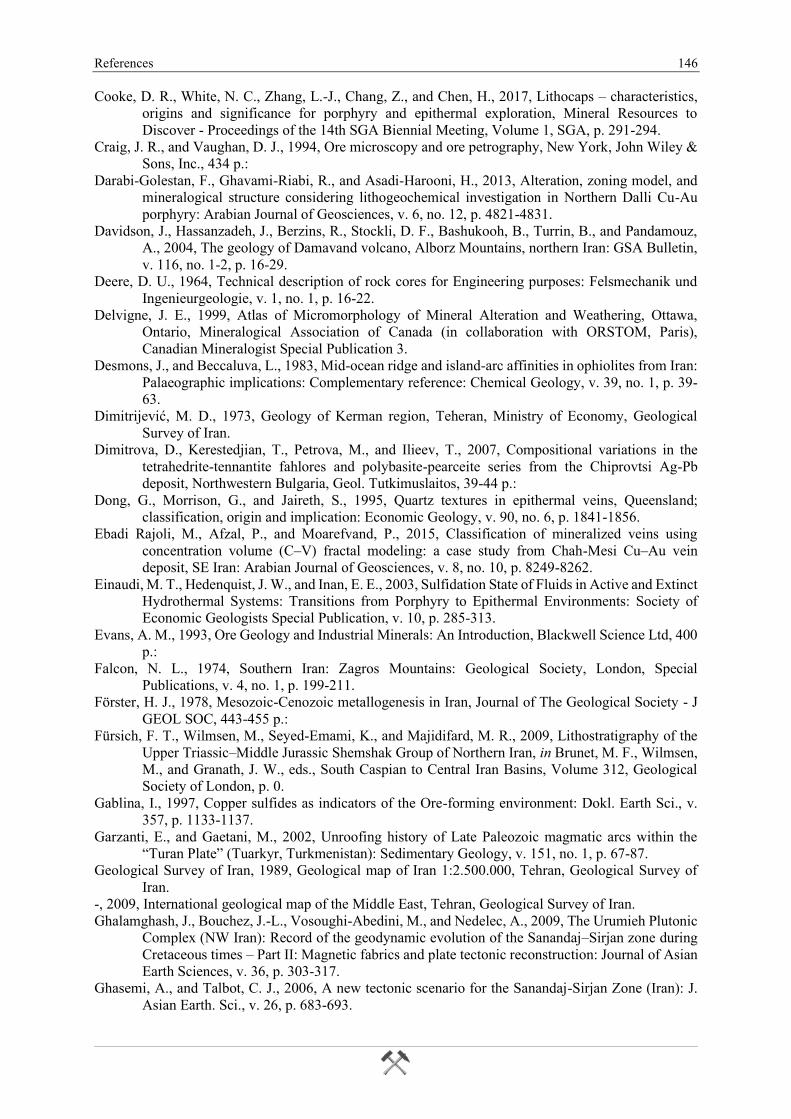
References 146
Cooke, D. R., White, N. C., Zhang, L.-J., Chang, Z., and Chen, H., 2017, Lithocaps – characteristics,
origins and significance for porphyry and epithermal exploration, Mineral Resources to
Discover - Proceedings of the 14th SGA Biennial Meeting, Volume 1, SGA, p. 291-294.
Craig, J. R., and Vaughan, D. J., 1994, Ore microscopy and ore petrography, New York, John Wiley &
Sons, Inc., 434 p.:
Darabi-Golestan, F., Ghavami-Riabi, R., and Asadi-Harooni, H., 2013, Alteration, zoning model, and
mineralogical structure considering lithogeochemical investigation in Northern Dalli Cu-Au
porphyry: Arabian Journal of Geosciences, v. 6, no. 12, p. 4821-4831.
Davidson, J., Hassanzadeh, J., Berzins, R., Stockli, D. F., Bashukooh, B., Turrin, B., and Pandamouz,
A., 2004, The geology of Damavand volcano, Alborz Mountains, northern Iran: GSA Bulletin,
v. 116, no. 1-2, p. 16-29.
Deere, D. U., 1964, Technical description of rock cores for Engineering purposes: Felsmechanik und
Ingenieurgeologie, v. 1, no. 1, p. 16-22.
Delvigne, J. E., 1999, Atlas of Micromorphology of Mineral Alteration and Weathering, Ottawa,
Ontario, Mineralogical Association of Canada (in collaboration with ORSTOM, Paris),
Canadian Mineralogist Special Publication 3.
Desmons, J., and Beccaluva, L., 1983, Mid-ocean ridge and island-arc affinities in ophiolites from Iran:
Palaeographic implications: Complementary reference: Chemical Geology, v. 39, no. 1, p. 39-
63.
Dimitrijevic, M. D., 1973, Geology of Kerman region, Teheran, Ministry of Economy, Geological
Survey of Iran.
Dimitrova, D., Kerestedjian, T., Petrova, M., and Ilieev, T., 2007, Compositional variations in the
tetrahedrite-tennantite fahlores and polybasite-pearceite series from the Chiprovtsi Ag-Pb
deposit, Northwestern Bulgaria, Geol. Tutkimuslaitos, 39-44 p.:
Dong, G., Morrison, G., and Jaireth, S., 1995, Quartz textures in epithermal veins, Queensland;
classification, origin and implication: Economic Geology, v. 90, no. 6, p. 1841-1856.
Ebadi Rajoli, M., Afzal, P., and Moarefvand, P., 2015, Classification of mineralized veins using
concentration volume (C–V) fractal modeling: a case study from Chah-Mesi Cu–Au vein
deposit, SE Iran: Arabian Journal of Geosciences, v. 8, no. 10, p. 8249-8262.
Einaudi, M. T., Hedenquist, J. W., and Inan, E. E., 2003, Sulfidation State of Fluids in Active and Extinct
Hydrothermal Systems: Transitions from Porphyry to Epithermal Environments: Society of
Economic Geologists Special Publication, v. 10, p. 285-313.
Evans, A. M., 1993, Ore Geology and Industrial Minerals: An Introduction, Blackwell Science Ltd, 400
p.:
Falcon, N. L., 1974, Southern Iran: Zagros Mountains: Geological Society, London, Special
Publications, v. 4, no. 1, p. 199-211.
Förster, H. J., 1978, Mesozoic-Cenozoic metallogenesis in Iran, Journal of The Geological Society - J
GEOL SOC, 443-455 p.:
Fürsich, F. T., Wilmsen, M., Seyed-Emami, K., and Majidifard, M. R., 2009, Lithostratigraphy of the
Upper Triassic–Middle Jurassic Shemshak Group of Northern Iran, in Brunet, M. F., Wilmsen,
M., and Granath, J. W., eds., South Caspian to Central Iran Basins, Volume 312, Geological
Society of London, p. 0.
Gablina, I., 1997, Copper sulfides as indicators of the Ore-forming environment: Dokl. Earth Sci., v.
357, p. 1133-1137.
Garzanti, E., and Gaetani, M., 2002, Unroofing history of Late Paleozoic magmatic arcs within the
“Turan Plate” (Tuarkyr, Turkmenistan): Sedimentary Geology, v. 151, no. 1, p. 67-87.
Geological Survey of Iran, 1989, Geological map of Iran 1:2.500.000, Tehran, Geological Survey of
Iran.
-, 2009, International geological map of the Middle East, Tehran, Geological Survey of Iran.
Ghalamghash, J., Bouchez, J.-L., Vosoughi-Abedini, M., and Nedelec, A., 2009, The Urumieh Plutonic
Complex (NW Iran): Record of the geodynamic evolution of the Sanandaj–Sirjan zone during
Cretaceous times – Part II: Magnetic fabrics and plate tectonic reconstruction: Journal of Asian
Earth Sciences, v. 36, p. 303-317.
Ghasemi, A., and Talbot, C. J., 2006, A new tectonic scenario for the Sanandaj-Sirjan Zone (Iran): J.
Asian Earth. Sci., v. 26, p. 683-693.
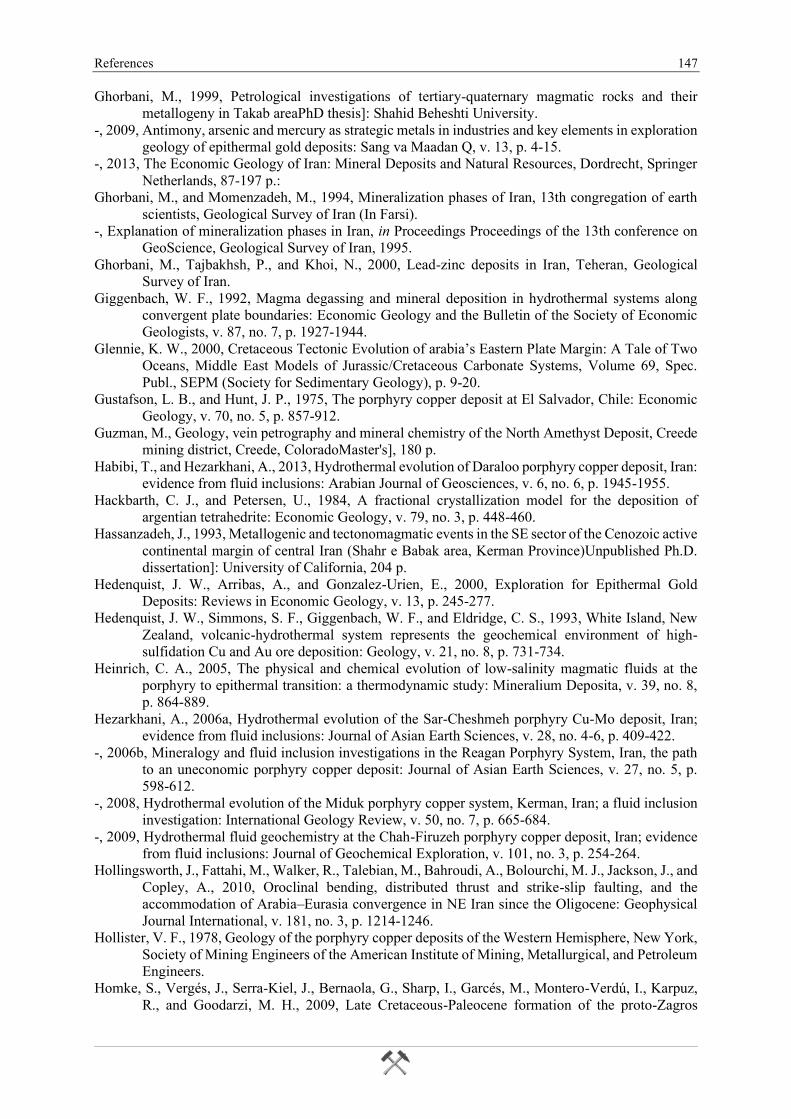
References 147
Ghorbani, M., 1999, Petrological investigations of tertiary-quaternary magmatic rocks and their
metallogeny in Takab areaPhD thesis]: Shahid Beheshti University.
-, 2009, Antimony, arsenic and mercury as strategic metals in industries and key elements in exploration
geology of epithermal gold deposits: Sang va Maadan Q, v. 13, p. 4-15.
-, 2013, The Economic Geology of Iran: Mineral Deposits and Natural Resources, Dordrecht, Springer
Netherlands, 87-197 p.:
Ghorbani, M., and Momenzadeh, M., 1994, Mineralization phases of Iran, 13th congregation of earth
scientists, Geological Survey of Iran (In Farsi).
-, Explanation of mineralization phases in Iran, in Proceedings Proceedings of the 13th conference on
GeoScience, Geological Survey of Iran, 1995.
Ghorbani, M., Tajbakhsh, P., and Khoi, N., 2000, Lead-zinc deposits in Iran, Teheran, Geological
Survey of Iran.
Giggenbach, W. F., 1992, Magma degassing and mineral deposition in hydrothermal systems along
convergent plate boundaries: Economic Geology and the Bulletin of the Society of Economic
Geologists, v. 87, no. 7, p. 1927-1944.
Glennie, K. W., 2000, Cretaceous Tectonic Evolution of arabia’s Eastern Plate Margin: A Tale of Two
Oceans, Middle East Models of Jurassic/Cretaceous Carbonate Systems, Volume 69, Spec.
Publ., SEPM (Society for Sedimentary Geology), p. 9-20.
Gustafson, L. B., and Hunt, J. P., 1975, The porphyry copper deposit at El Salvador, Chile: Economic
Geology, v. 70, no. 5, p. 857-912.
Guzman, M., Geology, vein petrography and mineral chemistry of the North Amethyst Deposit, Creede
mining district, Creede, ColoradoMaster's], 180 p.
Habibi, T., and Hezarkhani, A., 2013, Hydrothermal evolution of Daraloo porphyry copper deposit, Iran:
evidence from fluid inclusions: Arabian Journal of Geosciences, v. 6, no. 6, p. 1945-1955.
Hackbarth, C. J., and Petersen, U., 1984, A fractional crystallization model for the deposition of
argentian tetrahedrite: Economic Geology, v. 79, no. 3, p. 448-460.
Hassanzadeh, J., 1993, Metallogenic and tectonomagmatic events in the SE sector of the Cenozoic active
continental margin of central Iran (Shahr e Babak area, Kerman Province)Unpublished Ph.D.
dissertation]: University of California, 204 p.
Hedenquist, J. W., Arribas, A., and Gonzalez-Urien, E., 2000, Exploration for Epithermal Gold
Deposits: Reviews in Economic Geology, v. 13, p. 245-277.
Hedenquist, J. W., Simmons, S. F., Giggenbach, W. F., and Eldridge, C. S., 1993, White Island, New
Zealand, volcanic-hydrothermal system represents the geochemical environment of high-
sulfidation Cu and Au ore deposition: Geology, v. 21, no. 8, p. 731-734.
Heinrich, C. A., 2005, The physical and chemical evolution of low-salinity magmatic fluids at the
porphyry to epithermal transition: a thermodynamic study: Mineralium Deposita, v. 39, no. 8,
p. 864-889.
Hezarkhani, A., 2006a, Hydrothermal evolution of the Sar-Cheshmeh porphyry Cu-Mo deposit, Iran;
evidence from fluid inclusions: Journal of Asian Earth Sciences, v. 28, no. 4-6, p. 409-422.
-, 2006b, Mineralogy and fluid inclusion investigations in the Reagan Porphyry System, Iran, the path
to an uneconomic porphyry copper deposit: Journal of Asian Earth Sciences, v. 27, no. 5, p.
598-612.
-, 2008, Hydrothermal evolution of the Miduk porphyry copper system, Kerman, Iran; a fluid inclusion
investigation: International Geology Review, v. 50, no. 7, p. 665-684.
-, 2009, Hydrothermal fluid geochemistry at the Chah-Firuzeh porphyry copper deposit, Iran; evidence
from fluid inclusions: Journal of Geochemical Exploration, v. 101, no. 3, p. 254-264.
Hollingsworth, J., Fattahi, M., Walker, R., Talebian, M., Bahroudi, A., Bolourchi, M. J., Jackson, J., and
Copley, A., 2010, Oroclinal bending, distributed thrust and strike-slip faulting, and the
accommodation of Arabia–Eurasia convergence in NE Iran since the Oligocene: Geophysical
Journal International, v. 181, no. 3, p. 1214-1246.
Hollister, V. F., 1978, Geology of the porphyry copper deposits of the Western Hemisphere, New York,
Society of Mining Engineers of the American Institute of Mining, Metallurgical, and Petroleum
Engineers.
Homke, S., Vergés, J., Serra-Kiel, J., Bernaola, G., Sharp, I., Garcés, M., Montero-Verdú, I., Karpuz,
R., and Goodarzi, M. H., 2009, Late Cretaceous-Paleocene formation of the proto-Zagros
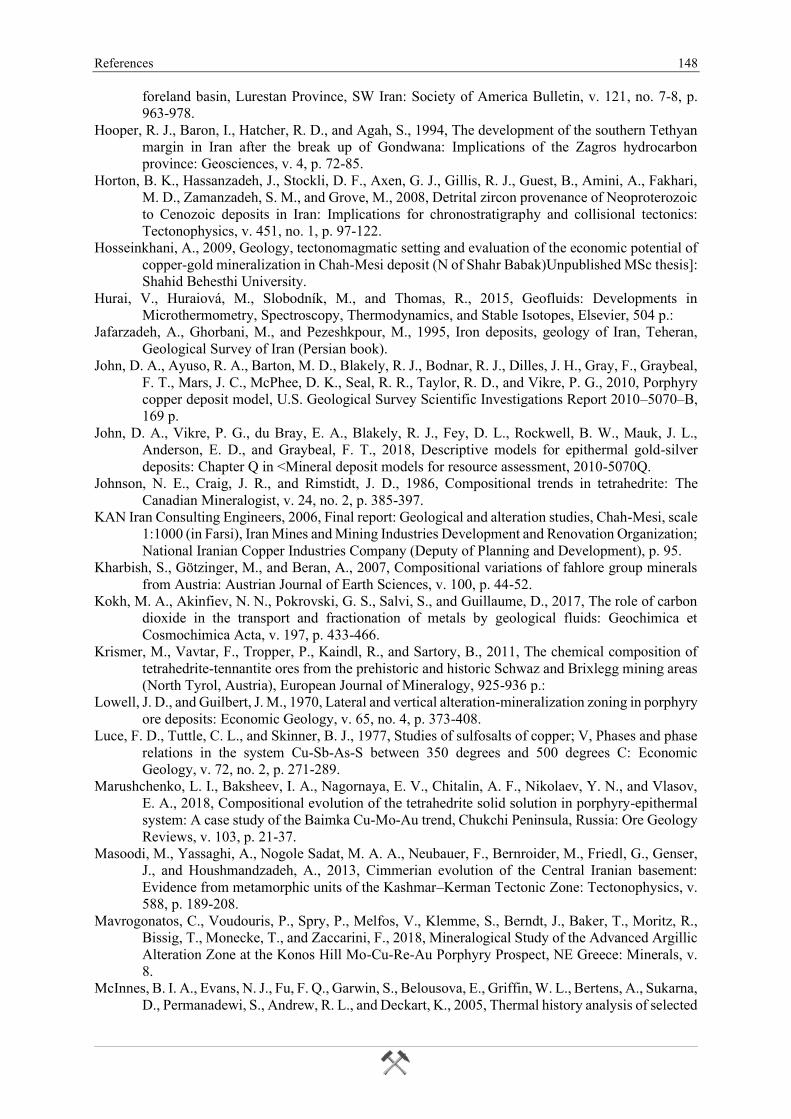
References 148
foreland basin, Lurestan Province, SW Iran: Society of America Bulletin, v. 121, no. 7-8, p.
963-978.
Hooper, R. J., Baron, I., Hatcher, R. D., and Agah, S., 1994, The development of the southern Tethyan
margin in Iran after the break up of Gondwana: Implications of the Zagros hydrocarbon
province: Geosciences, v. 4, p. 72-85.
Horton, B. K., Hassanzadeh, J., Stockli, D. F., Axen, G. J., Gillis, R. J., Guest, B., Amini, A., Fakhari,
M. D., Zamanzadeh, S. M., and Grove, M., 2008, Detrital zircon provenance of Neoproterozoic
to Cenozoic deposits in Iran: Implications for chronostratigraphy and collisional tectonics:
Tectonophysics, v. 451, no. 1, p. 97-122.
Hosseinkhani, A., 2009, Geology, tectonomagmatic setting and evaluation of the economic potential of
copper-gold mineralization in Chah-Mesi deposit (N of Shahr Babak)Unpublished MSc thesis]:
Shahid Behesthi University.
Hurai, V., Huraiová, M., Slobodník, M., and Thomas, R., 2015, Geofluids: Developments in
Microthermometry, Spectroscopy, Thermodynamics, and Stable Isotopes, Elsevier, 504 p.:
Jafarzadeh, A., Ghorbani, M., and Pezeshkpour, M., 1995, Iron deposits, geology of Iran, Teheran,
Geological Survey of Iran (Persian book).
John, D. A., Ayuso, R. A., Barton, M. D., Blakely, R. J., Bodnar, R. J., Dilles, J. H., Gray, F., Graybeal,
F. T., Mars, J. C., McPhee, D. K., Seal, R. R., Taylor, R. D., and Vikre, P. G., 2010, Porphyry
copper deposit model, U.S. Geological Survey Scientific Investigations Report 2010–5070–B,
169 p.
John, D. A., Vikre, P. G., du Bray, E. A., Blakely, R. J., Fey, D. L., Rockwell, B. W., Mauk, J. L.,
Anderson, E. D., and Graybeal, F. T., 2018, Descriptive models for epithermal gold-silver
deposits: Chapter Q in <Mineral deposit models for resource assessment, 2010-5070Q.
Johnson, N. E., Craig, J. R., and Rimstidt, J. D., 1986, Compositional trends in tetrahedrite: The
Canadian Mineralogist, v. 24, no. 2, p. 385-397.
KAN Iran Consulting Engineers, 2006, Final report: Geological and alteration studies, Chah-Mesi, scale
1:1000 (in Farsi), Iran Mines and Mining Industries Development and Renovation Organization;
National Iranian Copper Industries Company (Deputy of Planning and Development), p. 95.
Kharbish, S., Götzinger, M., and Beran, A., 2007, Compositional variations of fahlore group minerals
from Austria: Austrian Journal of Earth Sciences, v. 100, p. 44-52.
Kokh, M. A., Akinfiev, N. N., Pokrovski, G. S., Salvi, S., and Guillaume, D., 2017, The role of carbon
dioxide in the transport and fractionation of metals by geological fluids: Geochimica et
Cosmochimica Acta, v. 197, p. 433-466.
Krismer, M., Vavtar, F., Tropper, P., Kaindl, R., and Sartory, B., 2011, The chemical composition of
tetrahedrite-tennantite ores from the prehistoric and historic Schwaz and Brixlegg mining areas
(North Tyrol, Austria), European Journal of Mineralogy, 925-936 p.:
Lowell, J. D., and Guilbert, J. M., 1970, Lateral and vertical alteration-mineralization zoning in porphyry
ore deposits: Economic Geology, v. 65, no. 4, p. 373-408.
Luce, F. D., Tuttle, C. L., and Skinner, B. J., 1977, Studies of sulfosalts of copper; V, Phases and phase
relations in the system Cu-Sb-As-S between 350 degrees and 500 degrees C: Economic
Geology, v. 72, no. 2, p. 271-289.
Marushchenko, L. I., Baksheev, I. A., Nagornaya, E. V., Chitalin, A. F., Nikolaev, Y. N., and Vlasov,
E. A., 2018, Compositional evolution of the tetrahedrite solid solution in porphyry-epithermal
system: A case study of the Baimka Cu-Mo-Au trend, Chukchi Peninsula, Russia: Ore Geology
Reviews, v. 103, p. 21-37.
Masoodi, M., Yassaghi, A., Nogole Sadat, M. A. A., Neubauer, F., Bernroider, M., Friedl, G., Genser,
J., and Houshmandzadeh, A., 2013, Cimmerian evolution of the Central Iranian basement:
Evidence from metamorphic units of the Kashmar–Kerman Tectonic Zone: Tectonophysics, v.
588, p. 189-208.
Mavrogonatos, C., Voudouris, P., Spry, P., Melfos, V., Klemme, S., Berndt, J., Baker, T., Moritz, R.,
Bissig, T., Monecke, T., and Zaccarini, F., 2018, Mineralogical Study of the Advanced Argillic
Alteration Zone at the Konos Hill Mo-Cu-Re-Au Porphyry Prospect, NE Greece: Minerals, v.
8.
McInnes, B. I. A., Evans, N. J., Fu, F. Q., Garwin, S., Belousova, E., Griffin, W. L., Bertens, A., Sukarna,
D., Permanadewi, S., Andrew, R. L., and Deckart, K., 2005, Thermal history analysis of selected
References 149
Chilean, Indonesian and Iranian Porphyry Cu-Mo-Au deposits., in Porter, T. M., ed., Super
porphyry copper and gold deposits: a global perspective: Adelaide, PGC publishing, p. 1-16.
Meyer, C., and Hemley, J. J., 1967, Wall rock alteration, in Barnes, H. L., ed., Geochemistry of
hydrothermal ore deposits: New York, Holt Rinehart & Winston, p. 166-235.
Mirzaie, A., Bafti, S. S., and Derakhshani, R., 2015, Fault control on Cu mineralization in the Kerman
porphyry copper belt, SE Iran: A fractal analysis: Ore Geology Reviews, v. 71, p. 237-247.
Mohajjel, M., and Fergusson, C. L., 2014, Jurassic to Cenozoic tectonics of the Zagros Orogen in
northwestern Iran: International Geology Review, v. 56, no. 3, p. 263-287.
Mohajjel, M., Fergusson, C. L., and Sahandi, M. R., 2003, Cretaceous–Tertiary convergence and
continental collision, Sanandaj–Sirjan Zone, western Iran: Journal of Asian Earth Sciences, v.
21, no. 4, p. 397-412.
Molinaro, M., Zeyen, H., and Laurencin, X., 2005, Lithospheric structure beneath the south-eastern
Zagros Mountains, Iran: recent slab break-off?: Terra Nova, v. 17, no. 1, p. 1-6.
Momenzadeh, M., and Walther, H. W., 1984, Mineral Deposits and Metallogenic Epochs in the Area of
the Geotraverse Across Iran - a Review: N. Jb. Geol. Paläont. Abh., v. 168, no. 2/3, p. 468-478.
Mouthereau, F., Lacombe, O., and Vergés, J., 2012, Building the Zagros collisional orogen: Timing,
strain distribution and the dynamics of Arabia/Eurasia Plate convergence, Tectonophysics, 27–
60 p.:
Muntean, J. L., and Einaudi, M. T., 2001, Porphyry-Epithermal Transition: Maricunga Belt, Northern
Chile: Economic Geology, v. 96, no. 4, p. 743-772.
Muttoni, G., Mattei, M., Balini, M., Zanchi, A., Gaetani, M., and Berra, F., 2009, The drift history of
Iran from the Ordovician to the Triassic, in Brunet, M. F., Wilmsen, M., and Granath, J. W.,
eds., South Caspian to Central Iran Basins, Volume 312, Geological Society of London, p. 0.
Nabatian, G., Rastad, E., Neubauer, F., Honarmand, M., and Ghaderi, M., 2015, Iron and Fe–Mn
mineralisation in Iran: implications for Tethyan metallogeny: Australian Journal of Earth
Sciences, v. 62, no. 2, p. 211-241.
Nabavi, M. H., 1976, An introduction to geology of Iran, Tehran, Geological Survey of Iran.
National Iranian Copper Industries Company, 2012, National Iranian Copper Industries Company:
International Copper Study Group Meeting, 39th, Lisbon, Portugal, April 25-27, 2012.
Omaljev, V., 1972, Report on exploration of Chah-Mesi copper deposit, Report no. 43/Yu, Iran,
Geological Survey of Iran.
Omrani, J., Agard, P., Whitechurch, H., Benoit, M., Prouteau, G., and Jolivet, L., 2008, Arc-magmatism
and subduction history beneath the Zagros Mountains, Iran: A new report of adakites and
geodynamic consequences: Lithos, v. 106, no. 3–4, p. 380-398.
Padyar, F., Rahgoshay, M., Alirezaei, S., Tarantola, A., Vanderhaeghe, O., and Caumon, M. C., 2017,
Evolution of the Mineralizing Fluids and Possible Genetic Links between Miduk Porphyry
Copper and Latala Vein Type Deposits, Kerman Copper Belt, South Iran: Journal Geological
Society of India, v. 90, p. 558-568.
Pang, K.-N., Chung, S.-L., Zarrinkoub, M. H., Mohammadi, S. S., Yang, H.-M., Chu, C.-H., Lee, H.-
Y., and Lo, C.-H., 2012, Age, geochemical characteristics and petrogenesis of Late Cenozoic
intraplate alkali basalts in the Lut–Sistan region, eastern Iran: Chemical Geology, v. 306-307,
p. 40-53.
Perelló, J., Razique, A., Schloderer, J., and Asad-ur-Rehman, 2008, The Chagai Porphyry Copper Belt,
Baluchistan Province, Pakistan: Economic Geology, v. 103, no. 8, p. 1583-1612.
Pirajno, F., 1992, Hydrothermal Mineral Deposits: Principles and Fundamental Concepts for the
Exploration Geologist, Springer-Verlag Berlin Heidelberg, 709 p.:
-, 2009, Hydrothermal Processes and Mineral Systems, Springer Netherlands, 1250 p.:
Plotinskaya, O. Y., Grabezhev, A. I., and Seltmann, R., 2015, Fahlores compositional zoning in a
porphyry-epithermal system: Biksizak occurrence, South Urals, Russia as an example: Geology
of Ore Deposits, v. 57, no. 1, p. 42-63.
Pohl, W., 2011, Economic Geology Principles and Practice: Metals, Minerals, Coal and Hydrocarbons
– Introduction to Formation and Sustainable Exploitation of Mineral Deposits, Chicester, United
Kingdom, John Wiley and Sons Ltd, 663 p.:
References 150
Pudack, C., Halter, W. E., Heinrich, C. A., and Pettke, T., 2009, Evolution of Magmatic Vapor to Gold-
Rich Epithermal Liquid: The Porphyry to Epithermal Transition at Nevados de Famatina,
Northwest Argentina: Economic Geology, v. 104, no. 4, p. 449-477.
Rahmati-Ilkhchi, M., 2009, Metamorphism and Geotectonic Position of the Shotur Kuh Complex,
Central Iranian Block [Ph.D. dissertation]: Charles University, 119 p.
Ramdohr, P., 1969, The ore minerals and their intergrowths, Oxford, Pergamon Press, International
series of monographs in earth sciences, XVI, 1174 p.:
Regard, V., Bellier, O., Thomas, J. C., Bourlès, D., Bonnet, S., Abbassi, M. R., Braucher, R., Mercier,
J., Shabanian, E., Soleymani, S., and Feghhi, K., 2005, Cumulative right-lateral fault slip rate
across the Zagros—Makran transfer zone: role of the Minab—Zendan fault system in
accommodating Arabia—Eurasia convergence in southeast Iran: Geophysical Journal
International, v. 162, no. 1, p. 177-203.
Richards, J. P., 2005, Cumulative factors in the generation of giant calc-alkaline porphyry Cu deposits,
in Porter, T. M., ed., Super porphyry copper and gold deposits: A global perspective, Volume
1: Adelaide, PGC Publishing, p. 7-25.
-, 2009, Postsubduction porphyry Cu-Au and epithermal Au deposits: Products of remelting of
subduction-modified lithosphere: Geology, v. 37, no. 3, p. 247-250.
-, 2015, Tectonic, magmatic, and metallogenic evolution of the Tethyan orogen; from subduction to
collision: Ore Geology Reviews, v. 70, p. 323-345.
Richards, J. P., Spell, T., Rameh, E., Razique, A., and Fletcher, T., 2012, High Sr/Y magmas reflect arc
maturity, high magmatic water content, and porphyry Cu+ or -Mo+ or -Au potential; examples
from the Tethyan arcs of central and eastern Iran and western Pakistan: Economic Geology and
the Bulletin of the Society of Economic Geologists, v. 107, no. 2, p. 295-332.
Rinne, M. L., 2015, Geology, alteration, and mineralisation of the Golpu Porphyry and Wafi Epithermal
deposit, Morobe Province, Papua New Guinea [PhD thesis]: University of Tasmania, 255 p.
Rinne, M. L., Cooke, D. R., Harris, A. C., Finn, D. J., Allen, C. M., Heizler, M. T., and Creaser, R. A.,
2018, Geology and Geochronology of the Golpu Porphyry and Wafi Epithermal Deposit,
Morobe Province, Papua New Guinea: Economic Geology, v. 113, no. 1, p. 271-294.
Robert, A. M. M., Letouzey, J., Kavoosi, M. A., Sherkati, S., Müller, C., Vergés, J., and Aghababaei,
A., 2014, Structural evolution of the Kopeh Dagh fold-and-thrust belt (NE Iran) and interactions
with the South Caspian Sea Basin and Amu Darya Basin: Marine and Petroleum Geology, v.
57, p. 68-87.
Roedder, E., 1984, Fluid Inclusions, Washington D.C., Mineralogical Society of America, Reviews in
Mineralogy, v. 12, 644 p.:
Sack, R. O., Lynch, J. V. G., and Foit, F., 2003, Fahlore as a petrogenetic indicator: Keno Hill Ag-Pb-
Zn District, Yukon, Canada, Mineralogical Magazine, Volume 67, p. 1023.
Sadeghi, M., Borg, G., and Cornelia, G., 2008, Relationship between large-scale ring structures and
lineaments with big porphyry copper deposits in Iran: Geosciences, v. 17, no. 1, p. 199-205.
Samani, B., 1998, Distribution, Setting and Metallogenesis of Copper Deposits in Iran, in Porter, T. M.,
ed., Porphyry and Hdrothermal Copper and Gold Deposits: A Global Perspective: Adelaide,
PGC Publishing, p. 151-174.
Saric, A., Djordjevic, M., and Dimitrijevic, M. N., 1971, Geological map of Shahr-Babak, Scale
1:100.000, Teheran, Iran, Geological Survey of Iran.
Scotese, C. R., 2007, Atlas of Earth History, Paleogeography, Volume 1, University of Texas at
Arlington. Department of Geology. PALEOMAP Project, p. 52.
Seedorff, E., Dilles, J. H., Proffett, J. M., Jr., Einaudi, M. T., Zurcher, L., Stavast, W. J. A., Johnson, D.
A., and Barton, M. D., 2005, Porphyry deposits; characteristics and origin of hypogene features,
in Hedenquist, J. W., Thompson, J. F. H., Goldfarb, R. J., and Richards, J. P., eds., Economic
Geology One Hundreth Anniversary Volume 1905-2005: Liitleton, CO, Society of Economic
Geologists, Littleton, CO, p. 251-298.
Severin, K. P., 2004, Energy Dispersive Spectrometry of Common Rock Forming Minerals, Dordrecht,
Kluwer Academic Publishers, IX, 225 p.:
Shafiei, B., 2008, Metallogenic model of Kerman orphyry copper belt and its exploratory approaches,
Unpublished Ph.D. thesis: Iran, Shaheed Bahonar University of Kerman, p. 257.
References 151
Shafiei, B., Haschke, M., and Shahabpour, J., 2009, Recycling of orogenic arc crust triggers porphyry
Cu mineralization in Kerman Cenozoic arc rocks, southeastern Iran: Mineralium Deposita, v.
44, no. 3, p. 265.
Shafiei, S., and Ghiyasi, M., 2014, Analysis of Structural Control on Chahmesi Deposit, Miduke Area,
SE Iran: Scientific Quaterly Journal, GEOSCIENCES, v. 23, no. 92, p. 177 - 186.
Shahabpour, J., 2007, Island-arc affinity of the Central Iranian Volcanic Belt: Journal of Asian Earth
Sciences, v. 30, p. 652-665.
Shahabpour, J., and Kramers, J. D., 1987, Lead isotope data from the Sar-Cheshmeh porphyry copper
deposit, Iran: Mineralium Deposita, v. 22, no. 4, p. 278-281.
Shimizu, T., 2014, Reinterpretation of Quartz Textures in Terms of Hydrothermal Fluid Evolution at
the Koryu Au-Ag Deposit, Japan: Economic Geology, v. 109, no. 7, p. 2051-2065.
Shimizu, T., Matsueda, H., Ishiyama, D., and Matsubaya, O., 1998, Genesis of epithermal Au-Ag
mineralization of the Koryu Mine, Hokkaido, Japan: Economic Geology, v. 93, no. 3, p. 303-
325.
Shinohara, H., and Hedenquist, J. W., 1997, Constraints on Magma Degassing beneath the Far Southeast
Porphyry Cu–Au Deposit, Philippines: Journal of Petrology, v. 38, no. 12, p. 1741-1752.
Shore, M., and Fowler, A. D., 1996, Oscillatory zoning in minerals; a common phenomenon: The
Canadian Mineralogist, v. 34, no. 6, p. 1111-1126.
Sillitoe, R. H., 2000, Gold-Rich Porphyry Deposits: Descriptive and Genetic Models and Their Role in
Exploration and Discovery, in Hagemann, S. G., and Brown, P. E., eds., Gold in 2000, Volume
13, Society of Economic Geologists, p. 315-345.
-, 2008, Special Paper: Major Gold Deposits and Belts of the North and South American Cordillera:
Distribution, Tectonomagmatic Settings, and Metallogenic Considerations: Economic Geology,
v. 103, no. 4, p. 663-687.
-, 2010, Porphyry Copper Systems: Economic Geology, v. 105, no. 1, p. 3-41.
Sillitoe, R. H., and Hedenquist, J. W., 2003, Linkages between volcanotectonic settings, ore-fluid
compositions, and epithermal precious-metal deposits, Society of Economic Geologists: Special
Publication, 315-343 p.:
Singer, D. A., Berger, V. I., and Moring, B. C., 2008, Porphyry copper deposits of the world; database
and grade and tonnage models, 2008: Open-File Report - U. S. Geological Survey, p. 45.
Stampfli, G. M., and Borel, G. D., 2002, A plate tectonic model for the Paleozoic and Mesozoic
constrained by dynamic plate boundaries and restored synthetic oceanic isochrons: Earth and
Planetary Science Letters, v. 196, p. 17-33.
Stampfli, G. M., and Borel, G. D., 2004, The TRANSMED Transects in Space and Time: Constraints
on the Paleotectonic Evolution of the Mediterranean Domain, in Cavazza, W., Roure, F.,
Spakman, W., Stampfli, G. M., and Ziegler, P. A., eds., The TRANSMED Atlas. The
Mediterranean Region from Crust to Mantle: Geological and Geophysical Framework of the
Mediterranean and the Surrounding Areas: Berlin, Heidelberg, Springer Berlin Heidelberg, p.
53-80.
Stampfli, G. M., and Kozur, H. W., 2006, Europe from the Variscan to the Alpine cycles, in Gee, D. G.,
and Stephenson, R. A., eds., European lithosphere dynamics, Volume 32: London, Geological
Society of London, p. 57-82.
Stöcklin, J., 1974a, Northern Iran: Alborz Mountains: Geological Society, London, Special Publications,
v. 4, no. 1, p. 213.
-, 1974b, Possible Ancient Continental Margins in Iran, in Burk, C. A., and Drake, C. L., eds., The
Geology of Continental Margins: Berlin, Heidelberg, Springer Berlin Heidelberg, p. 873-887.
-, 1977, Structural correlation of the alpine ranges between Iran and Central Asia: Mémoires hors Série
de la Société Géologique de France, v. 8, p. 333-353.
Stöcklin, J., and Nabavi, M. H., 1973, Tectonic Map of Iran, scale 1:2.500.000, in Iran, G. S., ed., report
no. 31, Tehran Offset Press, p. 100.
Stoffregen, R. E., 1987, Genesis of acid-sulfate alteration and Au-Cu-Ag mineralization at Summitville,
Colorado: Economic Geology, v. 82, no. 6, p. 1575-1591.
Taghipour, N., Aftabi, A., and Mathur, R., 2008, Geology and Re-Os geochronology of mineralization
of the Miduk porphyry copper deposit, Iran: Resource Geology (Tokyo. 1998), v. 58, no. 2, p.
143-160.
References 152
Takin, M., 1972, Iranian Geology and Continental Drift in the Middle East: Nature, v. 235, no. 5334, p.
147-150.
Tangestani, M. H., and Moore, F., 2002, The use of Dempster–Shafer model and GIS in integration of
geoscientific data for porphyry copper potential mapping, north of Shahr-e-Babak, Iran:
International Journal of Applied Earth Observation and Geoinformation, v. 4, no. 1, p. 65-74.
Thompson, A. J. B., and Thompson, J. F. H., 1996, Atlas of alteration : a field and petrographic guide
to hydrothermal alteration minerals: St. John's, Nfld., Geological Association of Canada,
Mineral Deposits Division.
Vassileva, R., Atanassova, R., and Kouzmanov, K., 2014, Tennantite-tetrahedrite series from the Madan
Pb-Zn deposits, Central Rhodopes, Bulgaria: Mineralogy and Petrology, v. 108, p. 515-531.
Verdel, C., Wernicke, B. P., Hassanzadeh, J., and Guest, B., 2011, A Paleogene extensional arc flare-
up in Iran: Tectonics, v. 30, no. 3.
von Raumer, J., Stampfli, G. M., Borel, G., and Bussy, F., 2002, Organization of pre-Variscan basement
areas at the north-Gondwanan margin: International Journal of Earth Sciences, v. 91, no. 1, p.
35-52.
Wang, L., Qin, K., Song, G., and Li, G., 2019, A review of intermediate sulfidation epithermal deposits
and subclassification, v. 107, p. 434-456.
Waterman, G. C., and Hamilton, R. L., 1975, The Sar Cheshmeh porphyry copper deposit: Economic
Geology and the Bulletin of the Society of Economic Geologists, v. 70, no. 3, p. 568-576.
White, R. S., 1982, Deformation of the Makran accretionary sediment prism in the Gulf of Oman (north-
west Indian Ocean): Geological Society, London, Special Publications, v. 10, no. 1, p. 357.
Wilkinson, J. J., 2001, Fluid inclusions in hydrothermal ore deposits: Lithos, v. 55, p. 229-272.
Zarasvandi, A., Liaghat, S., and Zentilli, M., 2005, Geology of the Darreh-Zerreshk and Ali-Abad
porphyry copper deposits, central Iran: International Geology Review, v. 47, no. 6, p. 620-646.
Zarasvandi, A., Rezaei, M., Sadeghi, M., Lentz, D., Adelpour, M., and Pourkaseb, H., 2015, Rare earth
element signatures of economic and sub-economic porphyry copper systems in Urumieh-
Dokhtar magmatic arc (UDMA), Iran: Ore Geology Reviews, v. 70, p. 407-423.
Zuercher, L., Bookstrom, A. A., Hammarstrom, J. M., Mars, J. C., Ludington, S., Zientek, M. L.,
Dunlap, P., Wallis, J. C., Drew, L. J., Sutphin, D. M., Berger, B. R., Herrington, R. J., Billa, M.,
Kuscu, I., Moon, C. J., and Richards, J. P., 2015, Porphyry copper assessment of the Tethys
region of western and southern Asia: Scientific Investigations Report, p. 232.
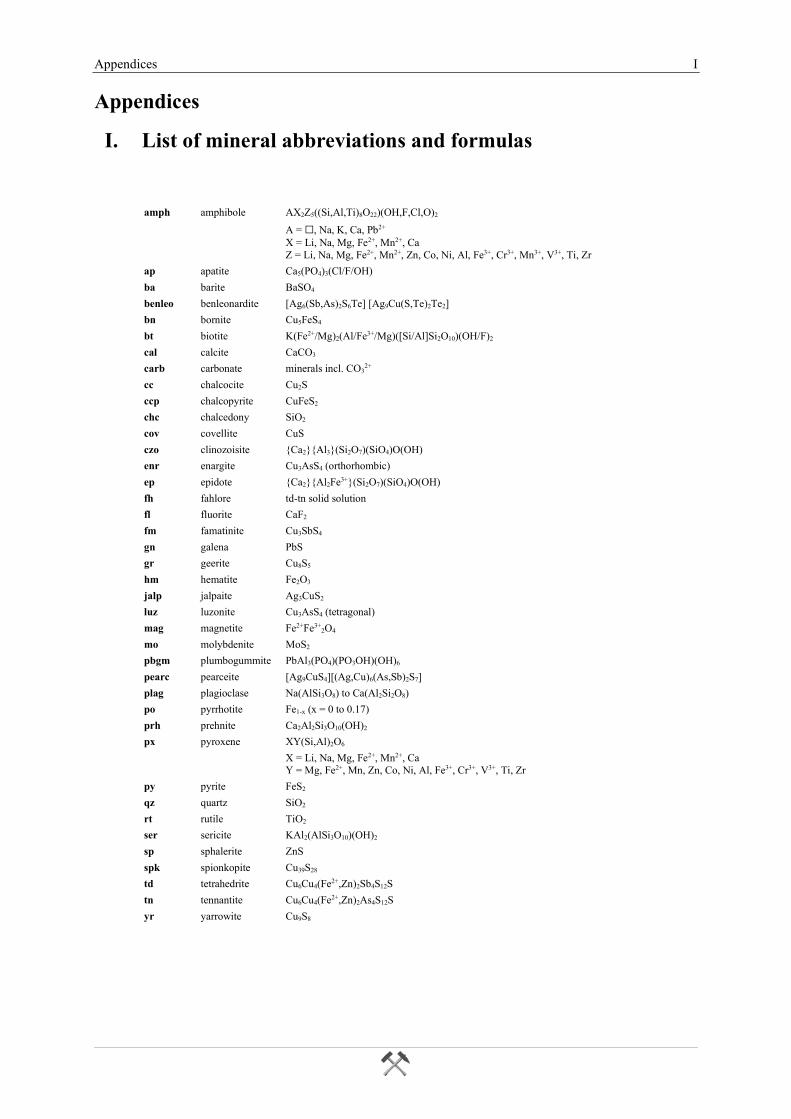
Appendices I
Appendices
I. List of mineral abbreviations and formulas
amph amphibole AX2Z5((Si,Al,Ti)8O22)(OH,F,Cl,O)2
A = ☐, Na, K, Ca, Pb2+
X = Li, Na, Mg, Fe2+, Mn2+, Ca
Z = Li, Na, Mg, Fe2+, Mn2+, Zn, Co, Ni, Al, Fe3+, Cr3+, Mn3+, V3+, Ti, Zr
ap apatite Ca5(PO4)3(Cl/F/OH)
ba barite BaSO4
benleo benleonardite [Ag6(Sb,As)2S6Te] [Ag9Cu(S,Te)2Te2]
bn bornite Cu5FeS4
bt biotite K(Fe2+/Mg)2(Al/Fe3+/Mg)([Si/Al]Si2O10)(OH/F)2
cal calcite CaCO3
carb carbonate minerals incl. CO32+
cc chalcocite Cu2S
ccp chalcopyrite CuFeS2
chc chalcedony SiO2
cov covellite CuS
czo clinozoisite {Ca2}{Al3}(Si2O7)(SiO4)O(OH)
enr enargite Cu3AsS4 (orthorhombic)
ep epidote {Ca2}{Al2Fe3+}(Si2O7)(SiO4)O(OH)
fh fahlore td-tn solid solution
fl fluorite CaF2
fm famatinite Cu3SbS4
gn galena PbS
gr geerite Cu8S5
hm hematite Fe2O3
jalp jalpaite Ag3CuS2
luz luzonite Cu3AsS4 (tetragonal)
mag magnetite Fe2+Fe3+2O4
mo molybdenite MoS2
pbgm plumbogummite PbAl3(PO4)(PO3OH)(OH)6
pearc pearceite [Ag9CuS4][(Ag,Cu)6(As,Sb)2S7]
plag plagioclase Na(AlSi3O8) to Ca(Al2Si2O8)
po pyrrhotite Fe1-x (x = 0 to 0.17)
prh prehnite Ca2Al2Si3O10(OH)2
px pyroxene XY(Si,Al)2O6
X = Li, Na, Mg, Fe2+, Mn2+, Ca
Y = Mg, Fe2+, Mn, Zn, Co, Ni, Al, Fe3+, Cr3+, V3+, Ti, Zr
py pyrite FeS2
qz quartz SiO2
rt rutile TiO2
ser sericite KAl2(AlSi3O10)(OH)2
sp sphalerite ZnS
spk spionkopite Cu39S28
td tetrahedrite Cu6Cu4(Fe2+,Zn)2Sb4S12S
tn tennantite Cu6Cu4(Fe2+,Zn)2As4S12S
yr yarrowite Cu9S8
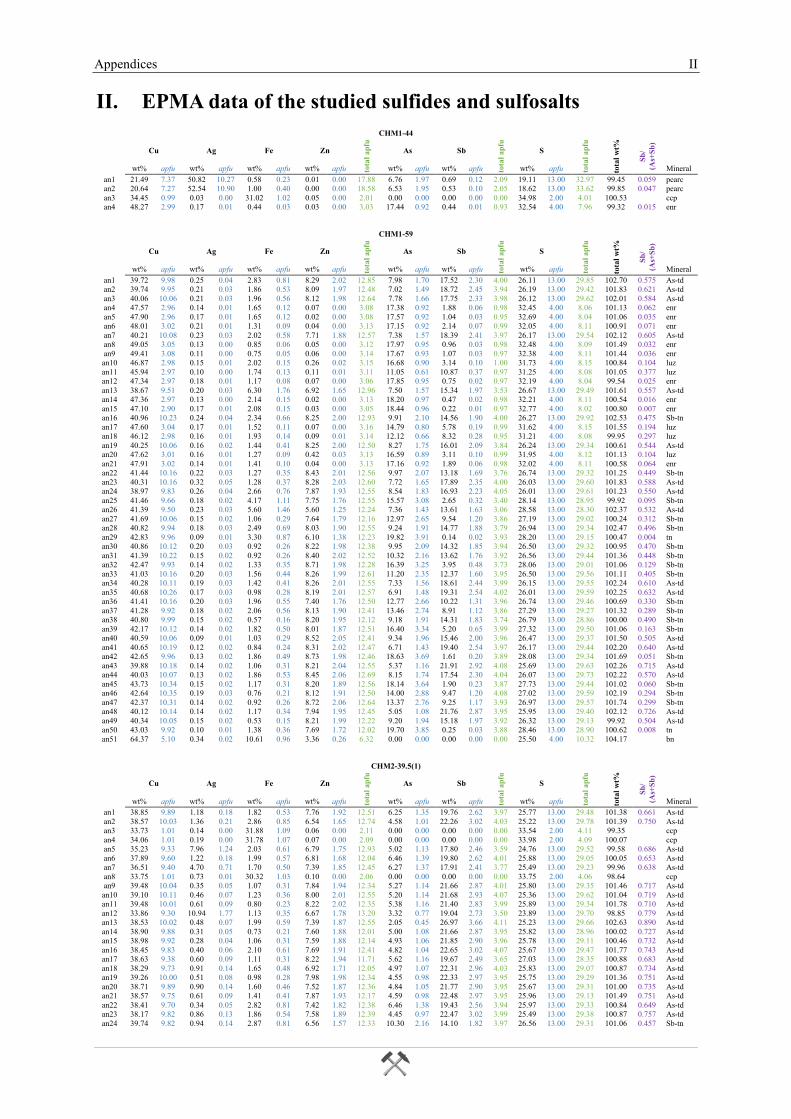
Appendices II
II. EPMA data of the studied sulfides and sulfosalts
CHM1-44
Cu Ag Fe Zn
tota
l ap
fu
As Sb
tota
l ap
fu
S
tota
l ap
fu
tota
l w
t%
Sb
/
(As+
Sb
)
wt% apfu wt% apfu wt% apfu wt% apfu wt% apfu wt% apfu wt% apfu Mineral
an1 21.49 7.37 50.82 10.27 0.58 0.23 0.01 0.00 17.88 6.76 1.97 0.69 0.12 2.09 19.11 13.00 32.97 99.45 0.059 pearc
an2 20.64 7.27 52.54 10.90 1.00 0.40 0.00 0.00 18.58 6.53 1.95 0.53 0.10 2.05 18.62 13.00 33.62 99.85 0.047 pearc
an3 34.45 0.99 0.03 0.00 31.02 1.02 0.05 0.00 2.01 0.00 0.00 0.00 0.00 0.00 34.98 2.00 4.01 100.53 ccp
an4 48.27 2.99 0.17 0.01 0.44 0.03 0.03 0.00 3.03 17.44 0.92 0.44 0.01 0.93 32.54 4.00 7.96 99.32 0.015 enr
CHM1-59
Cu Ag Fe Zn
tota
l ap
fu
As Sb
tota
l ap
fu
S
tota
l ap
fu
tota
l w
t%
Sb
/
(As+
Sb
)
wt% apfu wt% apfu wt% apfu wt% apfu wt% apfu wt% apfu wt% apfu Mineral
an1 39.72 9.98 0.25 0.04 2.83 0.81 8.29 2.02 12.85 7.98 1.70 17.52 2.30 4.00 26.11 13.00 29.85 102.70 0.575 As-td
an2 39.74 9.95 0.21 0.03 1.86 0.53 8.09 1.97 12.48 7.02 1.49 18.72 2.45 3.94 26.19 13.00 29.42 101.83 0.621 As-td
an3 40.06 10.06 0.21 0.03 1.96 0.56 8.12 1.98 12.64 7.78 1.66 17.75 2.33 3.98 26.12 13.00 29.62 102.01 0.584 As-td
an4 47.57 2.96 0.14 0.01 1.65 0.12 0.07 0.00 3.08 17.38 0.92 1.88 0.06 0.98 32.45 4.00 8.06 101.13 0.062 enr
an5 47.90 2.96 0.17 0.01 1.65 0.12 0.02 0.00 3.08 17.57 0.92 1.04 0.03 0.95 32.69 4.00 8.04 101.06 0.035 enr
an6 48.01 3.02 0.21 0.01 1.31 0.09 0.04 0.00 3.13 17.15 0.92 2.14 0.07 0.99 32.05 4.00 8.11 100.91 0.071 enr
an7 40.21 10.08 0.23 0.03 2.02 0.58 7.71 1.88 12.57 7.38 1.57 18.39 2.41 3.97 26.17 13.00 29.54 102.12 0.605 As-td
an8 49.05 3.05 0.13 0.00 0.85 0.06 0.05 0.00 3.12 17.97 0.95 0.96 0.03 0.98 32.48 4.00 8.09 101.49 0.032 enr
an9 49.41 3.08 0.11 0.00 0.75 0.05 0.06 0.00 3.14 17.67 0.93 1.07 0.03 0.97 32.38 4.00 8.11 101.44 0.036 enr
an10 46.87 2.98 0.15 0.01 2.02 0.15 0.26 0.02 3.15 16.68 0.90 3.14 0.10 1.00 31.73 4.00 8.15 100.84 0.104 luz
an11 45.94 2.97 0.10 0.00 1.74 0.13 0.11 0.01 3.11 11.05 0.61 10.87 0.37 0.97 31.25 4.00 8.08 101.05 0.377 luz
an12 47.34 2.97 0.18 0.01 1.17 0.08 0.07 0.00 3.06 17.85 0.95 0.75 0.02 0.97 32.19 4.00 8.04 99.54 0.025 enr
an13 38.67 9.51 0.20 0.03 6.30 1.76 6.92 1.65 12.96 7.50 1.57 15.34 1.97 3.53 26.67 13.00 29.49 101.61 0.557 As-td
an14 47.36 2.97 0.13 0.00 2.14 0.15 0.02 0.00 3.13 18.20 0.97 0.47 0.02 0.98 32.21 4.00 8.11 100.54 0.016 enr
an15 47.10 2.90 0.17 0.01 2.08 0.15 0.03 0.00 3.05 18.44 0.96 0.22 0.01 0.97 32.77 4.00 8.02 100.80 0.007 enr
an16 40.96 10.23 0.24 0.04 2.34 0.66 8.25 2.00 12.93 9.91 2.10 14.56 1.90 4.00 26.27 13.00 29.92 102.53 0.475 Sb-tn
an17 47.60 3.04 0.17 0.01 1.52 0.11 0.07 0.00 3.16 14.79 0.80 5.78 0.19 0.99 31.62 4.00 8.15 101.55 0.194 luz
an18 46.12 2.98 0.16 0.01 1.93 0.14 0.09 0.01 3.14 12.12 0.66 8.32 0.28 0.95 31.21 4.00 8.08 99.95 0.297 luz
an19 40.25 10.06 0.16 0.02 1.44 0.41 8.25 2.00 12.50 8.27 1.75 16.01 2.09 3.84 26.24 13.00 29.34 100.61 0.544 As-td
an20 47.62 3.01 0.16 0.01 1.27 0.09 0.42 0.03 3.13 16.59 0.89 3.11 0.10 0.99 31.95 4.00 8.12 101.13 0.104 luz
an21 47.91 3.02 0.14 0.01 1.41 0.10 0.04 0.00 3.13 17.16 0.92 1.89 0.06 0.98 32.02 4.00 8.11 100.58 0.064 enr
an22 41.44 10.16 0.22 0.03 1.27 0.35 8.43 2.01 12.56 9.97 2.07 13.18 1.69 3.76 26.74 13.00 29.32 101.25 0.449 Sb-tn
an23 40.31 10.16 0.32 0.05 1.28 0.37 8.28 2.03 12.60 7.72 1.65 17.89 2.35 4.00 26.03 13.00 29.60 101.83 0.588 As-td
an24 38.97 9.83 0.26 0.04 2.66 0.76 7.87 1.93 12.55 8.54 1.83 16.93 2.23 4.05 26.01 13.00 29.61 101.23 0.550 As-td
an25 41.46 9.66 0.18 0.02 4.17 1.11 7.75 1.76 12.55 15.57 3.08 2.65 0.32 3.40 28.14 13.00 28.95 99.92 0.095 Sb-tn
an26 41.39 9.50 0.23 0.03 5.60 1.46 5.60 1.25 12.24 7.36 1.43 13.61 1.63 3.06 28.58 13.00 28.30 102.37 0.532 As-td
an27 41.69 10.06 0.15 0.02 1.06 0.29 7.64 1.79 12.16 12.97 2.65 9.54 1.20 3.86 27.19 13.00 29.02 100.24 0.312 Sb-tn
an28 40.82 9.94 0.18 0.03 2.49 0.69 8.03 1.90 12.55 9.24 1.91 14.77 1.88 3.79 26.94 13.00 29.34 102.47 0.496 Sb-tn
an29 42.83 9.96 0.09 0.01 3.30 0.87 6.10 1.38 12.23 19.82 3.91 0.14 0.02 3.93 28.20 13.00 29.15 100.47 0.004 tn
an30 40.86 10.12 0.20 0.03 0.92 0.26 8.22 1.98 12.38 9.95 2.09 14.32 1.85 3.94 26.50 13.00 29.32 100.95 0.470 Sb-tn
an31 41.39 10.22 0.15 0.02 0.92 0.26 8.40 2.02 12.52 10.32 2.16 13.62 1.76 3.92 26.56 13.00 29.44 101.36 0.448 Sb-tn
an32 42.47 9.93 0.14 0.02 1.33 0.35 8.71 1.98 12.28 16.39 3.25 3.95 0.48 3.73 28.06 13.00 29.01 101.06 0.129 Sb-tn
an33 41.03 10.16 0.20 0.03 1.56 0.44 8.26 1.99 12.61 11.20 2.35 12.37 1.60 3.95 26.50 13.00 29.56 101.11 0.405 Sb-tn
an34 40.28 10.11 0.19 0.03 1.42 0.41 8.26 2.01 12.55 7.33 1.56 18.61 2.44 3.99 26.15 13.00 29.55 102.24 0.610 As-td
an35 40.68 10.26 0.17 0.03 0.98 0.28 8.19 2.01 12.57 6.91 1.48 19.31 2.54 4.02 26.01 13.00 29.59 102.25 0.632 As-td
an36 41.41 10.16 0.20 0.03 1.96 0.55 7.40 1.76 12.50 12.77 2.66 10.22 1.31 3.96 26.74 13.00 29.46 100.69 0.330 Sb-tn
an37 41.28 9.92 0.18 0.02 2.06 0.56 8.13 1.90 12.41 13.46 2.74 8.91 1.12 3.86 27.29 13.00 29.27 101.32 0.289 Sb-tn
an38 40.80 9.99 0.15 0.02 0.57 0.16 8.20 1.95 12.12 9.18 1.91 14.31 1.83 3.74 26.79 13.00 28.86 100.00 0.490 Sb-tn
an39 42.17 10.12 0.14 0.02 1.82 0.50 8.01 1.87 12.51 16.40 3.34 5.20 0.65 3.99 27.32 13.00 29.50 101.06 0.163 Sb-tn
an40 40.59 10.06 0.09 0.01 1.03 0.29 8.52 2.05 12.41 9.34 1.96 15.46 2.00 3.96 26.47 13.00 29.37 101.50 0.505 As-td
an41 40.65 10.19 0.12 0.02 0.84 0.24 8.31 2.02 12.47 6.71 1.43 19.40 2.54 3.97 26.17 13.00 29.44 102.20 0.640 As-td
an42 42.65 9.96 0.13 0.02 1.86 0.49 8.73 1.98 12.46 18.63 3.69 1.61 0.20 3.89 28.08 13.00 29.34 101.69 0.051 Sb-tn
an43 39.88 10.18 0.14 0.02 1.06 0.31 8.21 2.04 12.55 5.37 1.16 21.91 2.92 4.08 25.69 13.00 29.63 102.26 0.715 As-td
an44 40.03 10.07 0.13 0.02 1.86 0.53 8.45 2.06 12.69 8.15 1.74 17.54 2.30 4.04 26.07 13.00 29.73 102.22 0.570 As-td
an45 43.73 10.34 0.15 0.02 1.17 0.31 8.20 1.89 12.56 18.14 3.64 1.90 0.23 3.87 27.73 13.00 29.44 101.02 0.060 Sb-tn
an46 42.64 10.35 0.19 0.03 0.76 0.21 8.12 1.91 12.50 14.00 2.88 9.47 1.20 4.08 27.02 13.00 29.59 102.19 0.294 Sb-tn
an47 42.37 10.31 0.14 0.02 0.92 0.26 8.72 2.06 12.64 13.37 2.76 9.25 1.17 3.93 26.97 13.00 29.57 101.74 0.299 Sb-tn
an48 40.12 10.14 0.14 0.02 1.17 0.34 7.94 1.95 12.45 5.05 1.08 21.76 2.87 3.95 25.95 13.00 29.40 102.12 0.726 As-td
an49 40.34 10.05 0.15 0.02 0.53 0.15 8.21 1.99 12.22 9.20 1.94 15.18 1.97 3.92 26.32 13.00 29.13 99.92 0.504 As-td
an50 43.03 9.92 0.10 0.01 1.38 0.36 7.69 1.72 12.02 19.70 3.85 0.25 0.03 3.88 28.46 13.00 28.90 100.62 0.008 tn
an51 64.37 5.10 0.34 0.02 10.61 0.96 3.36 0.26 6.32 0.00 0.00 0.00 0.00 0.00 25.50 4.00 10.32 104.17 bn
CHM2-39.5(1)
Cu Ag Fe Zn
tota
l ap
fu
As Sb
tota
l ap
fu
S
tota
l ap
fu
tota
l w
t%
Sb
/
(As+
Sb
)
wt% apfu wt% apfu wt% apfu wt% apfu wt% apfu wt% apfu wt% apfu Mineral
an1 38.85 9.89 1.18 0.18 1.82 0.53 7.76 1.92 12.51 6.25 1.35 19.76 2.62 3.97 25.77 13.00 29.48 101.38 0.661 As-td
an2 38.57 10.03 1.36 0.21 2.86 0.85 6.54 1.65 12.74 4.58 1.01 22.26 3.02 4.03 25.22 13.00 29.78 101.39 0.750 As-td
an3 33.73 1.01 0.14 0.00 31.88 1.09 0.06 0.00 2.11 0.00 0.00 0.00 0.00 0.00 33.54 2.00 4.11 99.35 ccp
an4 34.06 1.01 0.19 0.00 31.78 1.07 0.07 0.00 2.09 0.00 0.00 0.00 0.00 0.00 33.98 2.00 4.09 100.07 ccp
an5 35.23 9.33 7.96 1.24 2.03 0.61 6.79 1.75 12.93 5.02 1.13 17.80 2.46 3.59 24.76 13.00 29.52 99.58 0.686 As-td
an6 37.89 9.60 1.22 0.18 1.99 0.57 6.81 1.68 12.04 6.46 1.39 19.80 2.62 4.01 25.88 13.00 29.05 100.05 0.653 As-td
an7 36.51 9.40 4.70 0.71 1.70 0.50 7.39 1.85 12.45 6.27 1.37 17.91 2.41 3.77 25.49 13.00 29.23 99.96 0.638 As-td
an8 33.75 1.01 0.73 0.01 30.32 1.03 0.10 0.00 2.06 0.00 0.00 0.00 0.00 0.00 33.75 2.00 4.06 98.64 ccp
an9 39.48 10.04 0.35 0.05 1.07 0.31 7.84 1.94 12.34 5.27 1.14 21.66 2.87 4.01 25.80 13.00 29.35 101.46 0.717 As-td
an10 39.10 10.11 0.46 0.07 1.23 0.36 8.00 2.01 12.55 5.20 1.14 21.68 2.93 4.07 25.36 13.00 29.62 101.04 0.719 As-td
an11 39.48 10.01 0.61 0.09 0.80 0.23 8.22 2.02 12.35 5.38 1.16 21.40 2.83 3.99 25.89 13.00 29.34 101.78 0.710 As-td
an12 33.86 9.30 10.94 1.77 1.13 0.35 6.67 1.78 13.20 3.32 0.77 19.04 2.73 3.50 23.89 13.00 29.70 98.85 0.779 As-td
an13 38.53 10.02 0.48 0.07 1.99 0.59 7.39 1.87 12.55 2.05 0.45 26.97 3.66 4.11 25.23 13.00 29.66 102.63 0.890 As-td
an14 38.90 9.88 0.31 0.05 0.73 0.21 7.60 1.88 12.01 5.00 1.08 21.66 2.87 3.95 25.82 13.00 28.96 100.02 0.727 As-td
an15 38.98 9.92 0.28 0.04 1.06 0.31 7.59 1.88 12.14 4.93 1.06 21.85 2.90 3.96 25.78 13.00 29.11 100.46 0.732 As-td
an16 38.45 9.83 0.40 0.06 2.10 0.61 7.69 1.91 12.41 4.82 1.04 22.65 3.02 4.07 25.67 13.00 29.47 101.77 0.743 As-td
an17 38.63 9.38 0.60 0.09 1.11 0.31 8.22 1.94 11.71 5.62 1.16 19.67 2.49 3.65 27.03 13.00 28.35 100.88 0.683 As-td
an18 38.29 9.73 0.91 0.14 1.65 0.48 6.92 1.71 12.05 4.97 1.07 22.31 2.96 4.03 25.83 13.00 29.07 100.87 0.734 As-td
an19 39.26 10.00 0.51 0.08 0.98 0.28 7.98 1.98 12.34 4.55 0.98 22.33 2.97 3.95 25.75 13.00 29.29 101.36 0.751 As-td
an20 38.71 9.89 0.90 0.14 1.60 0.46 7.52 1.87 12.36 4.84 1.05 21.77 2.90 3.95 25.67 13.00 29.31 101.00 0.735 As-td
an21 38.57 9.75 0.61 0.09 1.41 0.41 7.87 1.93 12.17 4.59 0.98 22.48 2.97 3.95 25.96 13.00 29.13 101.49 0.751 As-td
an22 38.41 9.70 0.34 0.05 2.82 0.81 7.42 1.82 12.38 6.46 1.38 19.43 2.56 3.94 25.97 13.00 29.33 100.84 0.649 As-td
an23 38.17 9.82 0.86 0.13 1.86 0.54 7.58 1.89 12.39 4.45 0.97 22.47 3.02 3.99 25.49 13.00 29.38 100.87 0.757 As-td
an24 39.74 9.82 0.94 0.14 2.87 0.81 6.56 1.57 12.33 10.30 2.16 14.10 1.82 3.97 26.56 13.00 29.31 101.06 0.457 Sb-tn
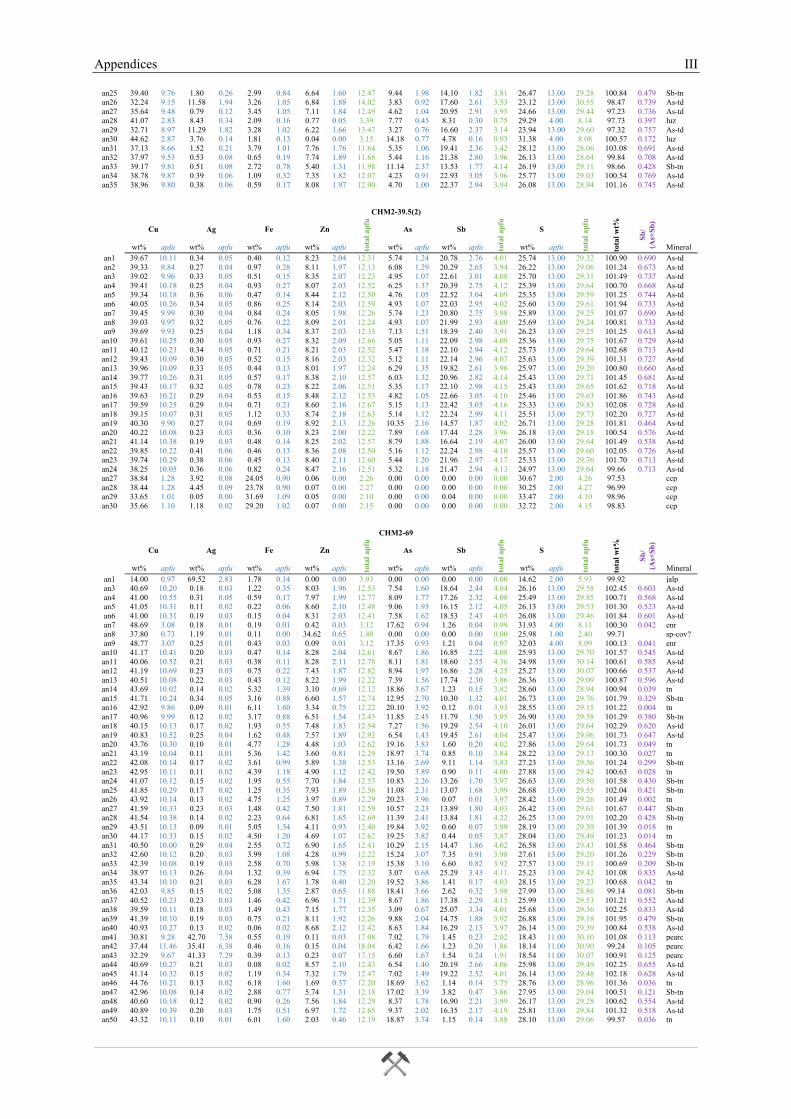
Appendices III
an25 39.40 9.76 1.80 0.26 2.99 0.84 6.64 1.60 12.47 9.44 1.98 14.10 1.82 3.81 26.47 13.00 29.28 100.84 0.479 Sb-tn
an26 32.24 9.15 11.58 1.94 3.26 1.05 6.84 1.88 14.02 3.83 0.92 17.60 2.61 3.53 23.12 13.00 30.55 98.47 0.739 As-td
an27 35.64 9.48 0.79 0.12 3.45 1.05 7.11 1.84 12.49 4.62 1.04 20.95 2.91 3.95 24.66 13.00 29.44 97.23 0.736 As-td
an28 41.07 2.83 8.43 0.34 2.09 0.16 0.77 0.05 3.39 7.77 0.45 8.31 0.30 0.75 29.29 4.00 8.14 97.73 0.397 luz
an29 32.71 8.97 11.29 1.82 3.28 1.02 6.22 1.66 13.47 3.27 0.76 16.60 2.37 3.14 23.94 13.00 29.60 97.32 0.757 As-td
an30 44.62 2.87 3.76 0.14 1.81 0.13 0.04 0.00 3.15 14.18 0.77 4.78 0.16 0.93 31.38 4.00 8.08 100.57 0.172 luz
an31 37.13 8.66 1.52 0.21 3.79 1.01 7.76 1.76 11.64 5.35 1.06 19.41 2.36 3.42 28.12 13.00 28.06 103.08 0.691 As-td
an32 37.97 9.53 0.53 0.08 0.65 0.19 7.74 1.89 11.68 5.44 1.16 21.38 2.80 3.96 26.13 13.00 28.64 99.84 0.708 As-td
an33 39.17 9.81 0.51 0.08 2.72 0.78 5.40 1.31 11.98 11.14 2.37 13.53 1.77 4.14 26.19 13.00 29.11 98.66 0.428 Sb-tn
an34 38.78 9.87 0.39 0.06 1.09 0.32 7.35 1.82 12.07 4.23 0.91 22.93 3.05 3.96 25.77 13.00 29.03 100.54 0.769 As-td
an35 38.96 9.80 0.38 0.06 0.59 0.17 8.08 1.97 12.00 4.70 1.00 22.37 2.94 3.94 26.08 13.00 28.94 101.16 0.745 As-td
CHM2-39.5(2)
Cu Ag Fe Zn
tota
l ap
fu
As Sb
tota
l ap
fu
S
tota
l ap
fu
tota
l w
t%
Sb
/
(As+
Sb
)
wt% apfu wt% apfu wt% apfu wt% apfu wt% apfu wt% apfu wt% apfu Mineral
an1 39.67 10.11 0.34 0.05 0.40 0.12 8.23 2.04 12.31 5.74 1.24 20.78 2.76 4.01 25.74 13.00 29.32 100.90 0.690 As-td
an2 39.33 9.84 0.27 0.04 0.97 0.28 8.11 1.97 12.13 6.08 1.29 20.29 2.65 3.94 26.22 13.00 29.06 101.24 0.673 As-td
an3 39.02 9.96 0.33 0.05 0.51 0.15 8.35 2.07 12.23 4.95 1.07 22.61 3.01 4.08 25.70 13.00 29.31 101.49 0.737 As-td
an4 39.41 10.18 0.25 0.04 0.93 0.27 8.07 2.03 12.52 6.25 1.37 20.39 2.75 4.12 25.39 13.00 29.64 100.70 0.668 As-td
an5 39.34 10.18 0.36 0.06 0.47 0.14 8.44 2.12 12.50 4.76 1.05 22.52 3.04 4.09 25.35 13.00 29.59 101.25 0.744 As-td
an6 40.05 10.26 0.34 0.05 0.86 0.25 8.14 2.03 12.59 4.93 1.07 22.03 2.95 4.02 25.60 13.00 29.61 101.94 0.733 As-td
an7 39.45 9.99 0.30 0.04 0.84 0.24 8.05 1.98 12.26 5.74 1.23 20.80 2.75 3.98 25.89 13.00 29.25 101.07 0.690 As-td
an8 39.03 9.97 0.32 0.05 0.76 0.22 8.09 2.01 12.24 4.93 1.07 21.99 2.93 4.00 25.69 13.00 29.24 100.81 0.733 As-td
an9 39.69 9.93 0.25 0.04 1.18 0.34 8.37 2.03 12.33 7.13 1.51 18.39 2.40 3.91 26.23 13.00 29.25 101.25 0.613 As-td
an10 39.61 10.25 0.30 0.05 0.93 0.27 8.32 2.09 12.66 5.05 1.11 22.09 2.98 4.09 25.36 13.00 29.75 101.67 0.729 As-td
an11 40.12 10.23 0.34 0.05 0.71 0.21 8.21 2.03 12.52 5.47 1.18 22.10 2.94 4.12 25.73 13.00 29.64 102.68 0.713 As-td
an12 39.43 10.09 0.30 0.05 0.52 0.15 8.16 2.03 12.32 5.12 1.11 22.14 2.96 4.07 25.63 13.00 29.39 101.31 0.727 As-td
an13 39.96 10.09 0.33 0.05 0.44 0.13 8.01 1.97 12.24 6.29 1.35 19.82 2.61 3.96 25.97 13.00 29.20 100.80 0.660 As-td
an14 39.77 10.26 0.31 0.05 0.57 0.17 8.38 2.10 12.57 6.03 1.32 20.96 2.82 4.14 25.43 13.00 29.71 101.45 0.681 As-td
an15 39.43 10.17 0.32 0.05 0.78 0.23 8.22 2.06 12.51 5.35 1.17 22.10 2.98 4.15 25.43 13.00 29.65 101.62 0.718 As-td
an16 39.63 10.21 0.29 0.04 0.53 0.15 8.48 2.12 12.53 4.82 1.05 22.66 3.05 4.10 25.46 13.00 29.63 101.86 0.743 As-td
an17 39.59 10.25 0.29 0.04 0.71 0.21 8.60 2.16 12.67 5.15 1.13 22.42 3.03 4.16 25.33 13.00 29.83 102.08 0.728 As-td
an18 39.15 10.07 0.31 0.05 1.12 0.33 8.74 2.18 12.63 5.14 1.12 22.24 2.99 4.11 25.51 13.00 29.73 102.20 0.727 As-td
an19 40.30 9.90 0.27 0.04 0.69 0.19 8.92 2.13 12.26 10.35 2.16 14.57 1.87 4.02 26.71 13.00 29.28 101.81 0.464 As-td
an20 40.22 10.08 0.23 0.03 0.36 0.10 8.23 2.00 12.22 7.89 1.68 17.44 2.28 3.96 26.18 13.00 29.18 100.54 0.576 As-td
an21 41.14 10.38 0.19 0.03 0.48 0.14 8.25 2.02 12.57 8.79 1.88 16.64 2.19 4.07 26.00 13.00 29.64 101.49 0.538 As-td
an22 39.85 10.22 0.41 0.06 0.46 0.13 8.36 2.08 12.50 5.16 1.12 22.24 2.98 4.10 25.57 13.00 29.60 102.05 0.726 As-td
an23 39.74 10.29 0.38 0.06 0.45 0.13 8.40 2.11 12.60 5.44 1.20 21.96 2.97 4.17 25.33 13.00 29.76 101.70 0.713 As-td
an24 38.25 10.05 0.36 0.06 0.82 0.24 8.47 2.16 12.51 5.32 1.18 21.47 2.94 4.13 24.97 13.00 29.64 99.66 0.713 As-td
an27 38.84 1.28 3.92 0.08 24.05 0.90 0.06 0.00 2.26 0.00 0.00 0.00 0.00 0.00 30.67 2.00 4.26 97.53 ccp
an28 38.44 1.28 4.45 0.09 23.78 0.90 0.07 0.00 2.27 0.00 0.00 0.00 0.00 0.00 30.25 2.00 4.27 96.99 ccp
an29 33.65 1.01 0.05 0.00 31.69 1.09 0.05 0.00 2.10 0.00 0.00 0.04 0.00 0.00 33.47 2.00 4.10 98.96 ccp
an30 35.66 1.10 1.18 0.02 29.20 1.02 0.07 0.00 2.15 0.00 0.00 0.00 0.00 0.00 32.72 2.00 4.15 98.83 ccp
CHM2-69
Cu Ag Fe Zn
tota
l ap
fu
As Sb
tota
l ap
fu
S
tota
l ap
fu
tota
l w
t%
Sb
/
(As+
Sb
)
wt% apfu wt% apfu wt% apfu wt% apfu wt% apfu wt% apfu wt% apfu Mineral
an1 14.00 0.97 69.52 2.83 1.78 0.14 0.00 0.00 3.93 0.00 0.00 0.00 0.00 0.00 14.62 2.00 5.93 99.92 jalp
an3 40.69 10.20 0.18 0.03 1.22 0.35 8.03 1.96 12.53 7.54 1.60 18.64 2.44 4.04 26.16 13.00 29.58 102.45 0.603 As-td
an4 41.00 10.55 0.31 0.05 0.59 0.17 7.97 1.99 12.77 8.09 1.77 17.26 2.32 4.08 25.49 13.00 29.85 100.71 0.568 As-td
an5 41.05 10.31 0.11 0.02 0.22 0.06 8.60 2.10 12.48 9.06 1.93 16.15 2.12 4.05 26.13 13.00 29.53 101.30 0.523 As-td
an6 41.00 10.31 0.19 0.03 0.15 0.04 8.31 2.03 12.41 7.58 1.62 18.53 2.43 4.05 26.08 13.00 29.46 101.84 0.601 As-td
an7 48.69 3.08 0.18 0.01 0.19 0.01 0.42 0.03 3.12 17.62 0.94 1.26 0.04 0.99 31.93 4.00 8.11 100.30 0.042 enr
an8 37.80 0.73 1.19 0.01 0.11 0.00 34.62 0.65 1.40 0.00 0.00 0.00 0.00 0.00 25.98 1.00 2.40 99.71 sp-cov?
an9 48.77 3.07 0.25 0.01 0.43 0.03 0.09 0.01 3.12 17.35 0.93 1.21 0.04 0.97 32.03 4.00 8.09 100.13 0.041 enr
an10 41.17 10.41 0.20 0.03 0.47 0.14 8.28 2.04 12.61 8.67 1.86 16.85 2.22 4.08 25.93 13.00 29.70 101.57 0.545 As-td
an11 40.06 10.52 0.21 0.03 0.38 0.11 8.28 2.11 12.78 8.11 1.81 18.60 2.55 4.36 24.98 13.00 30.14 100.61 0.585 As-td
an12 41.19 10.69 0.23 0.03 0.75 0.22 7.43 1.87 12.82 8.94 1.97 16.86 2.28 4.25 25.27 13.00 30.07 100.66 0.537 As-td
an13 40.51 10.08 0.22 0.03 0.43 0.12 8.22 1.99 12.22 7.39 1.56 17.74 2.30 3.86 26.36 13.00 29.09 100.87 0.596 As-td
an14 43.69 10.02 0.14 0.02 5.32 1.39 3.10 0.69 12.12 18.86 3.67 1.23 0.15 3.82 28.60 13.00 28.94 100.94 0.039 tn
an15 41.71 10.24 0.34 0.05 3.16 0.88 6.60 1.57 12.74 12.95 2.70 10.30 1.32 4.01 26.73 13.00 29.76 101.79 0.329 Sb-tn
an16 42.92 9.86 0.09 0.01 6.11 1.60 3.34 0.75 12.22 20.10 3.92 0.12 0.01 3.93 28.55 13.00 29.15 101.22 0.004 tn
an17 40.96 9.99 0.12 0.02 3.17 0.88 6.51 1.54 12.43 11.85 2.45 11.79 1.50 3.95 26.90 13.00 29.38 101.29 0.380 Sb-tn
an18 40.15 10.13 0.17 0.02 1.93 0.55 7.48 1.83 12.54 7.27 1.56 19.29 2.54 4.10 26.01 13.00 29.64 102.29 0.620 As-td
an19 40.83 10.52 0.25 0.04 1.62 0.48 7.57 1.89 12.92 6.54 1.43 19.45 2.61 4.04 25.47 13.00 29.96 101.73 0.647 As-td
an20 43.76 10.30 0.10 0.01 4.77 1.28 4.48 1.03 12.62 19.16 3.83 1.60 0.20 4.02 27.86 13.00 29.64 101.73 0.049 tn
an21 43.19 10.04 0.11 0.01 5.36 1.42 3.60 0.81 12.29 18.97 3.74 0.85 0.10 3.84 28.22 13.00 29.13 100.30 0.027 tn
an22 42.08 10.14 0.17 0.02 3.61 0.99 5.89 1.38 12.53 13.16 2.69 9.11 1.14 3.83 27.23 13.00 29.36 101.24 0.299 Sb-tn
an23 42.95 10.11 0.11 0.02 4.39 1.18 4.90 1.12 12.42 19.50 3.89 0.90 0.11 4.00 27.88 13.00 29.42 100.63 0.028 tn
an24 41.07 10.12 0.15 0.02 1.95 0.55 7.70 1.84 12.53 10.83 2.26 13.26 1.70 3.97 26.63 13.00 29.50 101.58 0.430 Sb-tn
an25 41.85 10.29 0.17 0.02 1.25 0.35 7.93 1.89 12.56 11.08 2.31 13.07 1.68 3.99 26.68 13.00 29.55 102.04 0.421 Sb-tn
an26 43.92 10.14 0.13 0.02 4.75 1.25 3.97 0.89 12.29 20.23 3.96 0.07 0.01 3.97 28.42 13.00 29.26 101.49 0.002 tn
an27 41.59 10.33 0.23 0.03 1.48 0.42 7.50 1.81 12.59 10.57 2.23 13.89 1.80 4.03 26.42 13.00 29.61 101.67 0.447 Sb-tn
an28 41.54 10.38 0.14 0.02 2.23 0.64 6.81 1.65 12.69 11.39 2.41 13.84 1.81 4.22 26.25 13.00 29.91 102.20 0.428 Sb-tn
an29 43.51 10.13 0.09 0.01 5.05 1.34 4.11 0.93 12.40 19.84 3.92 0.60 0.07 3.99 28.19 13.00 29.39 101.39 0.018 tn
an30 44.17 10.33 0.15 0.02 4.50 1.20 4.69 1.07 12.62 19.25 3.82 0.44 0.05 3.87 28.04 13.00 29.49 101.23 0.014 tn
an31 40.50 10.00 0.29 0.04 2.55 0.72 6.90 1.65 12.41 10.29 2.15 14.47 1.86 4.02 26.58 13.00 29.43 101.58 0.464 Sb-tn
an32 42.60 10.12 0.20 0.03 3.99 1.08 4.28 0.99 12.22 15.24 3.07 7.35 0.91 3.98 27.61 13.00 29.20 101.26 0.229 Sb-tn
an33 42.39 10.08 0.19 0.03 2.58 0.70 5.98 1.38 12.19 15.38 3.10 6.60 0.82 3.92 27.57 13.00 29.11 100.69 0.209 Sb-tn
an34 38.97 10.13 0.26 0.04 1.32 0.39 6.94 1.75 12.32 3.07 0.68 25.29 3.43 4.11 25.23 13.00 29.42 101.08 0.835 As-td
an35 43.34 10.10 0.21 0.03 6.28 1.67 1.78 0.40 12.20 19.52 3.86 1.41 0.17 4.03 28.15 13.00 29.23 100.68 0.042 tn
an36 42.03 9.85 0.15 0.02 5.08 1.35 2.87 0.65 11.88 18.41 3.66 2.62 0.32 3.98 27.99 13.00 28.86 99.14 0.081 Sb-tn
an37 40.52 10.23 0.23 0.03 1.46 0.42 6.96 1.71 12.39 8.67 1.86 17.38 2.29 4.15 25.99 13.00 29.53 101.21 0.552 As-td
an38 39.59 10.11 0.18 0.03 1.49 0.43 7.15 1.77 12.35 3.09 0.67 25.07 3.34 4.01 25.68 13.00 29.36 102.25 0.833 As-td
an39 41.39 10.10 0.19 0.03 0.75 0.21 8.11 1.92 12.26 9.88 2.04 14.75 1.88 3.92 26.88 13.00 29.18 101.95 0.479 Sb-tn
an40 40.93 10.27 0.13 0.02 0.06 0.02 8.68 2.12 12.42 8.63 1.84 16.29 2.13 3.97 26.14 13.00 29.39 100.84 0.538 As-td
an41 30.81 9.28 42.70 7.58 0.55 0.19 0.11 0.03 17.08 7.02 1.79 1.45 0.23 2.02 18.43 11.00 30.10 101.08 0.113 pearc
an42 37.44 11.46 35.41 6.38 0.46 0.16 0.15 0.04 18.04 6.42 1.66 1.23 0.20 1.86 18.14 11.00 30.90 99.24 0.105 pearc
an43 32.29 9.67 41.33 7.29 0.39 0.13 0.23 0.07 17.15 6.60 1.67 1.54 0.24 1.91 18.54 11.00 30.07 100.91 0.125 pearc
an44 40.69 10.27 0.21 0.03 0.08 0.02 8.57 2.10 12.43 6.54 1.40 20.19 2.66 4.06 25.98 13.00 29.49 102.25 0.655 As-td
an45 41.14 10.32 0.15 0.02 1.19 0.34 7.32 1.79 12.47 7.02 1.49 19.22 2.52 4.01 26.14 13.00 29.48 102.18 0.628 As-td
an46 44.76 10.21 0.13 0.02 6.18 1.60 1.69 0.37 12.20 18.69 3.62 1.14 0.14 3.75 28.76 13.00 28.96 101.36 0.036 tn
an47 42.96 10.08 0.14 0.02 2.88 0.77 5.74 1.31 12.18 17.02 3.39 3.82 0.47 3.86 27.95 13.00 29.04 100.51 0.121 Sb-tn
an48 40.60 10.18 0.12 0.02 0.90 0.26 7.56 1.84 12.29 8.37 1.78 16.90 2.21 3.99 26.17 13.00 29.28 100.62 0.554 As-td
an49 40.89 10.39 0.20 0.03 1.75 0.51 6.97 1.72 12.65 9.37 2.02 16.35 2.17 4.19 25.81 13.00 29.84 101.32 0.518 As-td
an50 43.32 10.11 0.10 0.01 6.01 1.60 2.03 0.46 12.19 18.87 3.74 1.15 0.14 3.88 28.10 13.00 29.06 99.57 0.036 tn
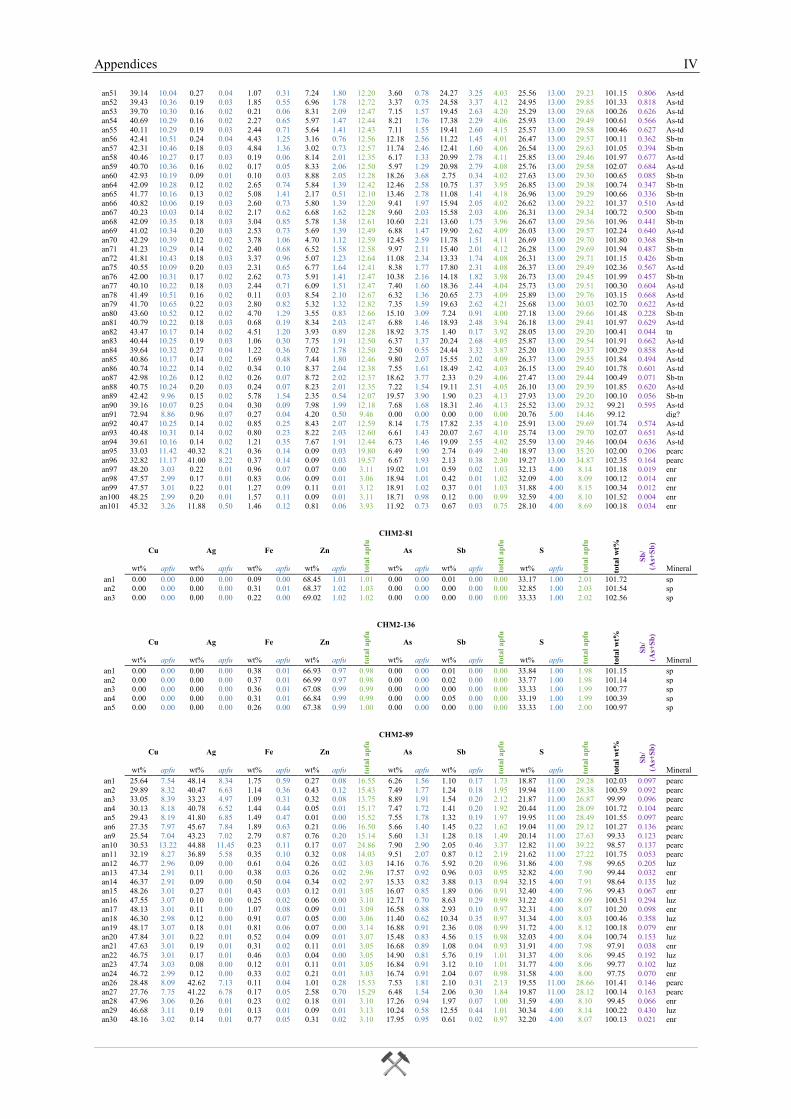
Appendices IV
an51 39.14 10.04 0.27 0.04 1.07 0.31 7.24 1.80 12.20 3.60 0.78 24.27 3.25 4.03 25.56 13.00 29.23 101.15 0.806 As-td
an52 39.43 10.36 0.19 0.03 1.85 0.55 6.96 1.78 12.72 3.37 0.75 24.58 3.37 4.12 24.95 13.00 29.85 101.33 0.818 As-td
an53 39.70 10.30 0.16 0.02 0.21 0.06 8.31 2.09 12.47 7.15 1.57 19.45 2.63 4.20 25.29 13.00 29.68 100.26 0.626 As-td
an54 40.69 10.29 0.16 0.02 2.27 0.65 5.97 1.47 12.44 8.21 1.76 17.38 2.29 4.06 25.93 13.00 29.49 100.61 0.566 As-td
an55 40.11 10.29 0.19 0.03 2.44 0.71 5.64 1.41 12.43 7.11 1.55 19.41 2.60 4.15 25.57 13.00 29.58 100.46 0.627 As-td
an56 42.41 10.51 0.24 0.04 4.43 1.25 3.16 0.76 12.56 12.18 2.56 11.22 1.45 4.01 26.47 13.00 29.57 100.11 0.362 Sb-tn
an57 42.31 10.46 0.18 0.03 4.84 1.36 3.02 0.73 12.57 11.74 2.46 12.41 1.60 4.06 26.54 13.00 29.63 101.05 0.394 Sb-tn
an58 40.46 10.27 0.17 0.03 0.19 0.06 8.14 2.01 12.35 6.17 1.33 20.99 2.78 4.11 25.85 13.00 29.46 101.97 0.677 As-td
an59 40.70 10.36 0.16 0.02 0.17 0.05 8.33 2.06 12.50 5.97 1.29 20.98 2.79 4.08 25.76 13.00 29.58 102.07 0.684 As-td
an60 42.93 10.19 0.09 0.01 0.10 0.03 8.88 2.05 12.28 18.26 3.68 2.75 0.34 4.02 27.63 13.00 29.30 100.65 0.085 Sb-tn
an64 42.09 10.28 0.12 0.02 2.65 0.74 5.84 1.39 12.42 12.46 2.58 10.75 1.37 3.95 26.85 13.00 29.38 100.74 0.347 Sb-tn
an65 41.77 10.16 0.13 0.02 5.08 1.41 2.17 0.51 12.10 13.46 2.78 11.08 1.41 4.18 26.96 13.00 29.29 100.66 0.336 Sb-tn
an66 40.82 10.06 0.19 0.03 2.60 0.73 5.80 1.39 12.20 9.41 1.97 15.94 2.05 4.02 26.62 13.00 29.22 101.37 0.510 As-td
an67 40.23 10.03 0.14 0.02 2.17 0.62 6.68 1.62 12.28 9.60 2.03 15.58 2.03 4.06 26.31 13.00 29.34 100.72 0.500 Sb-tn
an68 42.09 10.35 0.18 0.03 3.04 0.85 5.78 1.38 12.61 10.60 2.21 13.60 1.75 3.96 26.67 13.00 29.56 101.96 0.441 Sb-tn
an69 41.02 10.34 0.20 0.03 2.53 0.73 5.69 1.39 12.49 6.88 1.47 19.90 2.62 4.09 26.03 13.00 29.57 102.24 0.640 As-td
an70 42.29 10.39 0.12 0.02 3.78 1.06 4.70 1.12 12.59 12.45 2.59 11.78 1.51 4.11 26.69 13.00 29.70 101.80 0.368 Sb-tn
an71 41.23 10.29 0.14 0.02 2.40 0.68 6.52 1.58 12.58 9.97 2.11 15.40 2.01 4.12 26.28 13.00 29.69 101.94 0.487 Sb-tn
an72 41.81 10.43 0.18 0.03 3.37 0.96 5.07 1.23 12.64 11.08 2.34 13.33 1.74 4.08 26.31 13.00 29.71 101.15 0.426 Sb-tn
an75 40.55 10.09 0.20 0.03 2.31 0.65 6.77 1.64 12.41 8.38 1.77 17.80 2.31 4.08 26.37 13.00 29.49 102.36 0.567 As-td
an76 42.00 10.31 0.17 0.02 2.62 0.73 5.91 1.41 12.47 10.38 2.16 14.18 1.82 3.98 26.73 13.00 29.45 101.99 0.457 Sb-tn
an77 40.10 10.22 0.18 0.03 2.44 0.71 6.09 1.51 12.47 7.40 1.60 18.36 2.44 4.04 25.73 13.00 29.51 100.30 0.604 As-td
an78 41.49 10.51 0.16 0.02 0.11 0.03 8.54 2.10 12.67 6.32 1.36 20.65 2.73 4.09 25.89 13.00 29.76 103.15 0.668 As-td
an79 41.70 10.65 0.22 0.03 2.80 0.82 5.32 1.32 12.82 7.35 1.59 19.63 2.62 4.21 25.68 13.00 30.03 102.70 0.622 As-td
an80 43.60 10.52 0.12 0.02 4.70 1.29 3.55 0.83 12.66 15.10 3.09 7.24 0.91 4.00 27.18 13.00 29.66 101.48 0.228 Sb-tn
an81 40.79 10.22 0.18 0.03 0.68 0.19 8.34 2.03 12.47 6.88 1.46 18.93 2.48 3.94 26.18 13.00 29.41 101.97 0.629 As-td
an82 43.47 10.17 0.14 0.02 4.51 1.20 3.93 0.89 12.28 18.92 3.75 1.40 0.17 3.92 28.05 13.00 29.20 100.41 0.044 tn
an83 40.44 10.25 0.19 0.03 1.06 0.30 7.75 1.91 12.50 6.37 1.37 20.24 2.68 4.05 25.87 13.00 29.54 101.91 0.662 As-td
an84 39.64 10.32 0.27 0.04 1.22 0.36 7.02 1.78 12.50 2.50 0.55 24.44 3.32 3.87 25.20 13.00 29.37 100.29 0.858 As-td
an85 40.86 10.17 0.14 0.02 1.69 0.48 7.44 1.80 12.46 9.80 2.07 15.55 2.02 4.09 26.37 13.00 29.55 101.84 0.494 As-td
an86 40.74 10.22 0.14 0.02 0.34 0.10 8.37 2.04 12.38 7.55 1.61 18.49 2.42 4.03 26.15 13.00 29.40 101.78 0.601 As-td
an87 42.98 10.26 0.12 0.02 0.26 0.07 8.72 2.02 12.37 18.62 3.77 2.33 0.29 4.06 27.47 13.00 29.44 100.49 0.071 Sb-tn
an88 40.75 10.24 0.20 0.03 0.24 0.07 8.23 2.01 12.35 7.22 1.54 19.11 2.51 4.05 26.10 13.00 29.39 101.85 0.620 As-td
an89 42.42 9.96 0.15 0.02 5.78 1.54 2.35 0.54 12.07 19.57 3.90 1.90 0.23 4.13 27.93 13.00 29.20 100.10 0.056 Sb-tn
an90 39.16 10.07 0.25 0.04 0.30 0.09 7.98 1.99 12.18 7.68 1.68 18.31 2.46 4.13 25.52 13.00 29.32 99.21 0.595 As-td
an91 72.94 8.86 0.96 0.07 0.27 0.04 4.20 0.50 9.46 0.00 0.00 0.00 0.00 0.00 20.76 5.00 14.46 99.12 dig?
an92 40.47 10.25 0.14 0.02 0.85 0.25 8.43 2.07 12.59 8.14 1.75 17.82 2.35 4.10 25.91 13.00 29.69 101.74 0.574 As-td
an93 40.48 10.31 0.14 0.02 0.80 0.23 8.22 2.03 12.60 6.61 1.43 20.07 2.67 4.10 25.74 13.00 29.70 102.07 0.651 As-td
an94 39.61 10.16 0.14 0.02 1.21 0.35 7.67 1.91 12.44 6.73 1.46 19.09 2.55 4.02 25.59 13.00 29.46 100.04 0.636 As-td
an95 33.03 11.42 40.32 8.21 0.36 0.14 0.09 0.03 19.80 6.49 1.90 2.74 0.49 2.40 18.97 13.00 35.20 102.00 0.206 pearc
an96 32.82 11.17 41.00 8.22 0.37 0.14 0.09 0.03 19.57 6.67 1.93 2.13 0.38 2.30 19.27 13.00 34.87 102.35 0.164 pearc
an97 48.20 3.03 0.22 0.01 0.96 0.07 0.07 0.00 3.11 19.02 1.01 0.59 0.02 1.03 32.13 4.00 8.14 101.18 0.019 enr
an98 47.57 2.99 0.17 0.01 0.83 0.06 0.09 0.01 3.06 18.94 1.01 0.42 0.01 1.02 32.09 4.00 8.09 100.12 0.014 enr
an99 47.57 3.01 0.22 0.01 1.27 0.09 0.11 0.01 3.12 18.91 1.02 0.37 0.01 1.03 31.88 4.00 8.15 100.34 0.012 enr
an100 48.25 2.99 0.20 0.01 1.57 0.11 0.09 0.01 3.11 18.71 0.98 0.12 0.00 0.99 32.59 4.00 8.10 101.52 0.004 enr
an101 45.32 3.26 11.88 0.50 1.46 0.12 0.81 0.06 3.93 11.92 0.73 0.67 0.03 0.75 28.10 4.00 8.69 100.18 0.034 enr
CHM2-81
Cu Ag Fe Zn
tota
l ap
fu
As Sb
tota
l ap
fu
S
tota
l ap
fu
tota
l w
t%
Sb
/
(As+
Sb
)
wt% apfu wt% apfu wt% apfu wt% apfu wt% apfu wt% apfu wt% apfu Mineral
an1 0.00 0.00 0.00 0.00 0.09 0.00 68.45 1.01 1.01 0.00 0.00 0.01 0.00 0.00 33.17 1.00 2.01 101.72 sp
an2 0.00 0.00 0.00 0.00 0.31 0.01 68.37 1.02 1.03 0.00 0.00 0.00 0.00 0.00 32.85 1.00 2.03 101.54 sp
an3 0.00 0.00 0.00 0.00 0.22 0.00 69.02 1.02 1.02 0.00 0.00 0.00 0.00 0.00 33.33 1.00 2.02 102.56 sp
CHM2-136
Cu Ag Fe Zn
tota
l ap
fu
As Sb
tota
l ap
fu
S
tota
l ap
fu
tota
l w
t%
Sb
/
(As+
Sb
)
wt% apfu wt% apfu wt% apfu wt% apfu wt% apfu wt% apfu wt% apfu Mineral
an1 0.00 0.00 0.00 0.00 0.38 0.01 66.93 0.97 0.98 0.00 0.00 0.01 0.00 0.00 33.84 1.00 1.98 101.15 sp
an2 0.00 0.00 0.00 0.00 0.37 0.01 66.99 0.97 0.98 0.00 0.00 0.02 0.00 0.00 33.77 1.00 1.98 101.14 sp
an3 0.00 0.00 0.00 0.00 0.36 0.01 67.08 0.99 0.99 0.00 0.00 0.00 0.00 0.00 33.33 1.00 1.99 100.77 sp
an4 0.00 0.00 0.00 0.00 0.31 0.01 66.84 0.99 0.99 0.00 0.00 0.05 0.00 0.00 33.19 1.00 1.99 100.39 sp
an5 0.00 0.00 0.00 0.00 0.26 0.00 67.38 0.99 1.00 0.00 0.00 0.00 0.00 0.00 33.33 1.00 2.00 100.97 sp
CHM2-89
Cu Ag Fe Zn
tota
l ap
fu
As Sb
tota
l ap
fu
S
tota
l ap
fu
tota
l w
t%
Sb
/
(As+
Sb
)
wt% apfu wt% apfu wt% apfu wt% apfu wt% apfu wt% apfu wt% apfu Mineral
an1 25.64 7.54 48.14 8.34 1.75 0.59 0.27 0.08 16.55 6.26 1.56 1.10 0.17 1.73 18.87 11.00 29.28 102.03 0.097 pearc
an2 29.89 8.32 40.47 6.63 1.14 0.36 0.43 0.12 15.43 7.49 1.77 1.24 0.18 1.95 19.94 11.00 28.38 100.59 0.092 pearc
an3 33.05 8.39 33.23 4.97 1.09 0.31 0.32 0.08 13.75 8.89 1.91 1.54 0.20 2.12 21.87 11.00 26.87 99.99 0.096 pearc
an4 30.13 8.18 40.78 6.52 1.44 0.44 0.05 0.01 15.17 7.47 1.72 1.41 0.20 1.92 20.44 11.00 28.09 101.72 0.104 pearc
an5 29.43 8.19 41.80 6.85 1.49 0.47 0.01 0.00 15.52 7.55 1.78 1.32 0.19 1.97 19.95 11.00 28.49 101.55 0.097 pearc
an6 27.35 7.97 45.67 7.84 1.89 0.63 0.21 0.06 16.50 5.66 1.40 1.45 0.22 1.62 19.04 11.00 29.12 101.27 0.136 pearc
an9 25.54 7.04 43.23 7.02 2.79 0.87 0.76 0.20 15.14 5.60 1.31 1.28 0.18 1.49 20.14 11.00 27.63 99.33 0.123 pearc
an10 30.53 13.22 44.88 11.45 0.23 0.11 0.17 0.07 24.86 7.90 2.90 2.05 0.46 3.37 12.82 11.00 39.22 98.57 0.137 pearc
an11 32.19 8.27 36.89 5.58 0.35 0.10 0.32 0.08 14.03 9.51 2.07 0.87 0.12 2.19 21.62 11.00 27.22 101.75 0.053 pearc
an12 46.77 2.96 0.09 0.00 0.61 0.04 0.26 0.02 3.03 14.16 0.76 5.92 0.20 0.96 31.86 4.00 7.98 99.65 0.205 luz
an13 47.34 2.91 0.11 0.00 0.38 0.03 0.26 0.02 2.96 17.57 0.92 0.96 0.03 0.95 32.82 4.00 7.90 99.44 0.032 enr
an14 46.37 2.91 0.09 0.00 0.50 0.04 0.34 0.02 2.97 15.33 0.82 3.88 0.13 0.94 32.15 4.00 7.91 98.64 0.135 luz
an15 48.26 3.01 0.27 0.01 0.43 0.03 0.12 0.01 3.05 16.07 0.85 1.89 0.06 0.91 32.40 4.00 7.96 99.43 0.067 enr
an16 47.55 3.07 0.10 0.00 0.25 0.02 0.06 0.00 3.10 12.71 0.70 8.63 0.29 0.99 31.22 4.00 8.09 100.51 0.294 luz
an17 48.13 3.01 0.11 0.00 1.07 0.08 0.09 0.01 3.09 16.58 0.88 2.93 0.10 0.97 32.31 4.00 8.07 101.20 0.098 enr
an18 46.30 2.98 0.12 0.00 0.91 0.07 0.05 0.00 3.06 11.40 0.62 10.34 0.35 0.97 31.34 4.00 8.03 100.46 0.358 luz
an19 48.17 3.07 0.18 0.01 0.81 0.06 0.07 0.00 3.14 16.88 0.91 2.36 0.08 0.99 31.72 4.00 8.12 100.18 0.079 enr
an20 47.84 3.01 0.22 0.01 0.52 0.04 0.09 0.01 3.07 15.48 0.83 4.56 0.15 0.98 32.03 4.00 8.04 100.74 0.153 luz
an21 47.63 3.01 0.19 0.01 0.31 0.02 0.11 0.01 3.05 16.68 0.89 1.08 0.04 0.93 31.91 4.00 7.98 97.91 0.038 enr
an22 46.75 3.01 0.17 0.01 0.46 0.03 0.04 0.00 3.05 14.90 0.81 5.76 0.19 1.01 31.37 4.00 8.06 99.45 0.192 luz
an23 47.74 3.03 0.08 0.00 0.12 0.01 0.11 0.01 3.05 16.84 0.91 3.12 0.10 1.01 31.77 4.00 8.06 99.77 0.102 luz
an24 46.72 2.99 0.12 0.00 0.33 0.02 0.21 0.01 3.03 16.74 0.91 2.04 0.07 0.98 31.58 4.00 8.00 97.75 0.070 enr
an26 28.48 8.09 42.62 7.13 0.11 0.04 1.01 0.28 15.53 7.53 1.81 2.10 0.31 2.13 19.55 11.00 28.66 101.41 0.146 pearc
an27 27.76 7.75 41.22 6.78 0.17 0.05 2.58 0.70 15.29 6.48 1.54 2.06 0.30 1.84 19.87 11.00 28.12 100.14 0.163 pearc
an28 47.96 3.06 0.26 0.01 0.23 0.02 0.18 0.01 3.10 17.26 0.94 1.97 0.07 1.00 31.59 4.00 8.10 99.45 0.066 enr
an29 46.68 3.11 0.19 0.01 0.13 0.01 0.09 0.01 3.13 10.24 0.58 12.55 0.44 1.01 30.34 4.00 8.14 100.22 0.430 luz
an30 48.16 3.02 0.14 0.01 0.77 0.05 0.31 0.02 3.10 17.95 0.95 0.61 0.02 0.97 32.20 4.00 8.07 100.13 0.021 enr
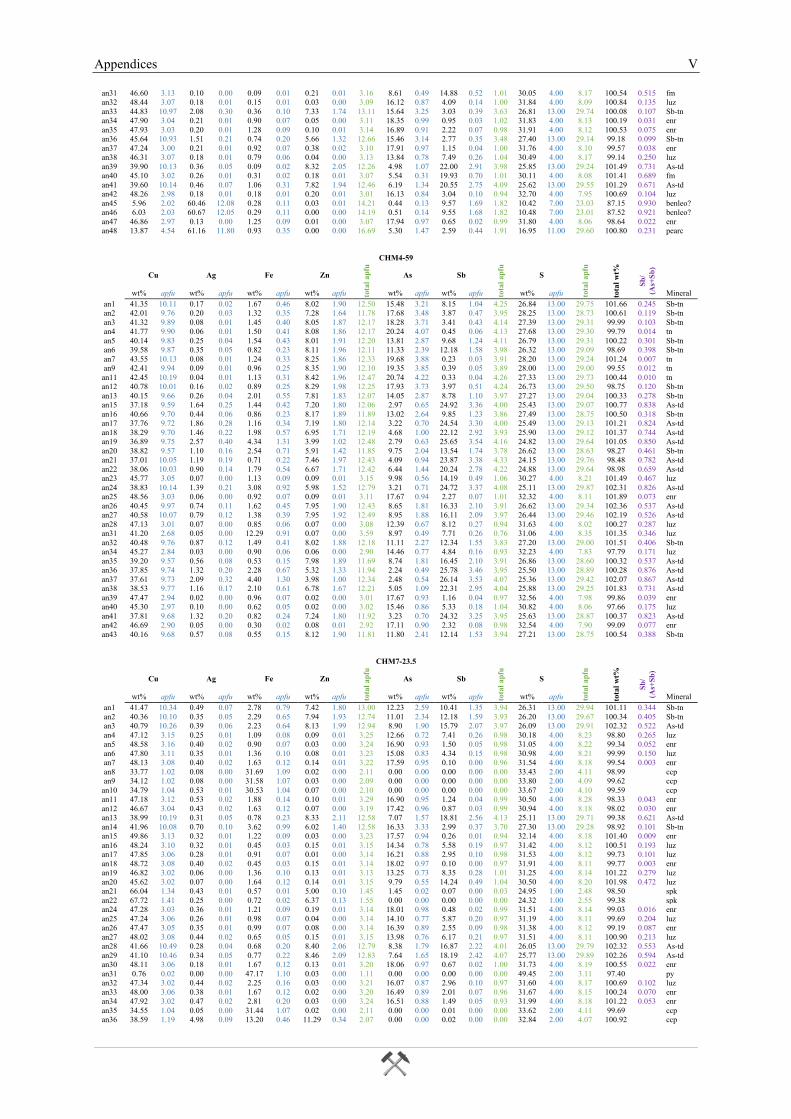
Appendices V
an31 46.60 3.13 0.10 0.00 0.09 0.01 0.21 0.01 3.16 8.61 0.49 14.88 0.52 1.01 30.05 4.00 8.17 100.54 0.515 fm
an32 48.44 3.07 0.18 0.01 0.15 0.01 0.03 0.00 3.09 16.12 0.87 4.09 0.14 1.00 31.84 4.00 8.09 100.84 0.135 luz
an33 44.83 10.97 2.08 0.30 0.36 0.10 7.33 1.74 13.11 15.64 3.25 3.03 0.39 3.63 26.81 13.00 29.74 100.08 0.107 Sb-tn
an34 47.90 3.04 0.21 0.01 0.90 0.07 0.05 0.00 3.11 18.35 0.99 0.95 0.03 1.02 31.83 4.00 8.13 100.19 0.031 enr
an35 47.93 3.03 0.20 0.01 1.28 0.09 0.10 0.01 3.14 16.89 0.91 2.22 0.07 0.98 31.91 4.00 8.12 100.53 0.075 enr
an36 45.64 10.93 1.51 0.21 0.74 0.20 5.66 1.32 12.66 15.46 3.14 2.77 0.35 3.48 27.40 13.00 29.14 99.18 0.099 Sb-tn
an37 47.24 3.00 0.21 0.01 0.92 0.07 0.38 0.02 3.10 17.91 0.97 1.15 0.04 1.00 31.76 4.00 8.10 99.57 0.038 enr
an38 46.31 3.07 0.18 0.01 0.79 0.06 0.04 0.00 3.13 13.84 0.78 7.49 0.26 1.04 30.49 4.00 8.17 99.14 0.250 luz
an39 39.90 10.13 0.36 0.05 0.09 0.02 8.32 2.05 12.26 4.98 1.07 22.00 2.91 3.98 25.85 13.00 29.24 101.49 0.731 As-td
an40 45.10 3.02 0.26 0.01 0.31 0.02 0.18 0.01 3.07 5.54 0.31 19.93 0.70 1.01 30.11 4.00 8.08 101.41 0.689 fm
an41 39.60 10.14 0.46 0.07 1.06 0.31 7.82 1.94 12.46 6.19 1.34 20.55 2.75 4.09 25.62 13.00 29.55 101.29 0.671 As-td
an42 48.26 2.98 0.18 0.01 0.18 0.01 0.20 0.01 3.01 16.13 0.84 3.04 0.10 0.94 32.70 4.00 7.95 100.69 0.104 luz
an45 5.96 2.02 60.46 12.08 0.28 0.11 0.03 0.01 14.21 0.44 0.13 9.57 1.69 1.82 10.42 7.00 23.03 87.15 0.930 benleo?
an46 6.03 2.03 60.67 12.05 0.29 0.11 0.00 0.00 14.19 0.51 0.14 9.55 1.68 1.82 10.48 7.00 23.01 87.52 0.921 benleo?
an47 46.86 2.97 0.13 0.00 1.25 0.09 0.01 0.00 3.07 17.94 0.97 0.65 0.02 0.99 31.80 4.00 8.06 98.64 0.022 enr
an48 13.87 4.54 61.16 11.80 0.93 0.35 0.00 0.00 16.69 5.30 1.47 2.59 0.44 1.91 16.95 11.00 29.60 100.80 0.231 pearc
CHM4-59
Cu Ag Fe Zn
tota
l ap
fu
As Sb
tota
l ap
fu
S
tota
l ap
fu
tota
l w
t%
Sb
/
(As+
Sb
)
wt% apfu wt% apfu wt% apfu wt% apfu wt% apfu wt% apfu wt% apfu Mineral
an1 41.35 10.11 0.17 0.02 1.67 0.46 8.02 1.90 12.50 15.48 3.21 8.15 1.04 4.25 26.84 13.00 29.75 101.66 0.245 Sb-tn
an2 42.01 9.76 0.20 0.03 1.32 0.35 7.28 1.64 11.78 17.68 3.48 3.87 0.47 3.95 28.25 13.00 28.73 100.61 0.119 Sb-tn
an3 41.32 9.89 0.08 0.01 1.45 0.40 8.05 1.87 12.17 18.28 3.71 3.41 0.43 4.14 27.39 13.00 29.31 99.99 0.103 Sb-tn
an4 41.77 9.90 0.06 0.01 1.50 0.41 8.08 1.86 12.17 20.24 4.07 0.45 0.06 4.13 27.68 13.00 29.30 99.79 0.014 tn
an5 40.14 9.83 0.25 0.04 1.54 0.43 8.01 1.91 12.20 13.81 2.87 9.68 1.24 4.11 26.79 13.00 29.31 100.22 0.301 Sb-tn
an6 39.58 9.87 0.35 0.05 0.82 0.23 8.11 1.96 12.11 11.33 2.39 12.18 1.58 3.98 26.32 13.00 29.09 98.69 0.398 Sb-tn
an7 43.55 10.13 0.08 0.01 1.24 0.33 8.25 1.86 12.33 19.68 3.88 0.23 0.03 3.91 28.20 13.00 29.24 101.24 0.007 tn
an9 42.41 9.94 0.09 0.01 0.96 0.25 8.35 1.90 12.10 19.35 3.85 0.39 0.05 3.89 28.00 13.00 29.00 99.55 0.012 tn
an11 42.45 10.19 0.04 0.01 1.13 0.31 8.42 1.96 12.47 20.74 4.22 0.33 0.04 4.26 27.33 13.00 29.73 100.44 0.010 tn
an12 40.78 10.01 0.16 0.02 0.89 0.25 8.29 1.98 12.25 17.93 3.73 3.97 0.51 4.24 26.73 13.00 29.50 98.75 0.120 Sb-tn
an13 40.15 9.66 0.26 0.04 2.01 0.55 7.81 1.83 12.07 14.05 2.87 8.78 1.10 3.97 27.27 13.00 29.04 100.33 0.278 Sb-tn
an15 37.18 9.59 1.64 0.25 1.44 0.42 7.20 1.80 12.06 2.97 0.65 24.92 3.36 4.00 25.43 13.00 29.07 100.77 0.838 As-td
an16 40.66 9.70 0.44 0.06 0.86 0.23 8.17 1.89 11.89 13.02 2.64 9.85 1.23 3.86 27.49 13.00 28.75 100.50 0.318 Sb-tn
an17 37.76 9.72 1.86 0.28 1.16 0.34 7.19 1.80 12.14 3.22 0.70 24.54 3.30 4.00 25.49 13.00 29.13 101.21 0.824 As-td
an18 38.29 9.70 1.46 0.22 1.98 0.57 6.95 1.71 12.19 4.68 1.00 22.12 2.92 3.93 25.90 13.00 29.12 101.37 0.744 As-td
an19 36.89 9.75 2.57 0.40 4.34 1.31 3.99 1.02 12.48 2.79 0.63 25.65 3.54 4.16 24.82 13.00 29.64 101.05 0.850 As-td
an20 38.82 9.57 1.10 0.16 2.54 0.71 5.91 1.42 11.85 9.75 2.04 13.54 1.74 3.78 26.62 13.00 28.63 98.27 0.461 Sb-tn
an21 37.01 10.05 1.19 0.19 0.71 0.22 7.46 1.97 12.43 4.09 0.94 23.87 3.38 4.33 24.15 13.00 29.76 98.48 0.782 As-td
an22 38.06 10.03 0.90 0.14 1.79 0.54 6.67 1.71 12.42 6.44 1.44 20.24 2.78 4.22 24.88 13.00 29.64 98.98 0.659 As-td
an23 45.77 3.05 0.07 0.00 1.13 0.09 0.09 0.01 3.15 9.98 0.56 14.19 0.49 1.06 30.27 4.00 8.21 101.49 0.467 luz
an24 38.83 10.14 1.39 0.21 3.08 0.92 5.98 1.52 12.79 3.21 0.71 24.72 3.37 4.08 25.11 13.00 29.87 102.31 0.826 As-td
an25 48.56 3.03 0.06 0.00 0.92 0.07 0.09 0.01 3.11 17.67 0.94 2.27 0.07 1.01 32.32 4.00 8.11 101.89 0.073 enr
an26 40.45 9.97 0.74 0.11 1.62 0.45 7.95 1.90 12.43 8.65 1.81 16.33 2.10 3.91 26.62 13.00 29.34 102.36 0.537 As-td
an27 40.58 10.07 0.79 0.12 1.38 0.39 7.95 1.92 12.49 8.95 1.88 16.11 2.09 3.97 26.44 13.00 29.46 102.19 0.526 As-td
an28 47.13 3.01 0.07 0.00 0.85 0.06 0.07 0.00 3.08 12.39 0.67 8.12 0.27 0.94 31.63 4.00 8.02 100.27 0.287 luz
an31 41.20 2.68 0.05 0.00 12.29 0.91 0.07 0.00 3.59 8.97 0.49 7.71 0.26 0.76 31.06 4.00 8.35 101.35 0.346 luz
an32 40.48 9.76 0.87 0.12 1.49 0.41 8.02 1.88 12.18 11.11 2.27 12.34 1.55 3.83 27.20 13.00 29.00 101.51 0.406 Sb-tn
an34 45.27 2.84 0.03 0.00 0.90 0.06 0.06 0.00 2.90 14.46 0.77 4.84 0.16 0.93 32.23 4.00 7.83 97.79 0.171 luz
an35 39.20 9.57 0.56 0.08 0.53 0.15 7.98 1.89 11.69 8.74 1.81 16.45 2.10 3.91 26.86 13.00 28.60 100.32 0.537 As-td
an36 37.85 9.74 1.32 0.20 2.28 0.67 5.32 1.33 11.94 2.24 0.49 25.78 3.46 3.95 25.50 13.00 28.89 100.28 0.876 As-td
an37 37.61 9.73 2.09 0.32 4.40 1.30 3.98 1.00 12.34 2.48 0.54 26.14 3.53 4.07 25.36 13.00 29.42 102.07 0.867 As-td
an38 38.53 9.77 1.16 0.17 2.10 0.61 6.78 1.67 12.21 5.05 1.09 22.31 2.95 4.04 25.88 13.00 29.25 101.83 0.731 As-td
an39 47.47 2.94 0.02 0.00 0.96 0.07 0.02 0.00 3.01 17.67 0.93 1.16 0.04 0.97 32.56 4.00 7.98 99.86 0.039 enr
an40 45.30 2.97 0.10 0.00 0.62 0.05 0.02 0.00 3.02 15.46 0.86 5.33 0.18 1.04 30.82 4.00 8.06 97.66 0.175 luz
an41 37.81 9.68 1.32 0.20 0.82 0.24 7.24 1.80 11.92 3.23 0.70 24.32 3.25 3.95 25.63 13.00 28.87 100.37 0.823 As-td
an42 46.69 2.90 0.05 0.00 0.30 0.02 0.08 0.01 2.92 17.11 0.90 2.32 0.08 0.98 32.54 4.00 7.90 99.09 0.077 enr
an43 40.16 9.68 0.57 0.08 0.55 0.15 8.12 1.90 11.81 11.80 2.41 12.14 1.53 3.94 27.21 13.00 28.75 100.54 0.388 Sb-tn
CHM7-23.5
Cu Ag Fe Zn
tota
l ap
fu
As Sb
tota
l ap
fu
S
tota
l ap
fu
tota
l w
t%
Sb
/
(As+
Sb
)
wt% apfu wt% apfu wt% apfu wt% apfu wt% apfu wt% apfu wt% apfu Mineral
an1 41.47 10.34 0.49 0.07 2.78 0.79 7.42 1.80 13.00 12.23 2.59 10.41 1.35 3.94 26.31 13.00 29.94 101.11 0.344 Sb-tn
an2 40.36 10.10 0.35 0.05 2.29 0.65 7.94 1.93 12.74 11.01 2.34 12.18 1.59 3.93 26.20 13.00 29.67 100.34 0.405 Sb-tn
an3 40.79 10.26 0.39 0.06 2.23 0.64 8.13 1.99 12.94 8.90 1.90 15.79 2.07 3.97 26.09 13.00 29.91 102.32 0.522 As-td
an4 47.12 3.15 0.25 0.01 1.09 0.08 0.09 0.01 3.25 12.66 0.72 7.41 0.26 0.98 30.18 4.00 8.23 98.80 0.265 luz
an5 48.58 3.16 0.40 0.02 0.90 0.07 0.03 0.00 3.24 16.90 0.93 1.50 0.05 0.98 31.05 4.00 8.22 99.34 0.052 enr
an6 47.80 3.11 0.35 0.01 1.36 0.10 0.08 0.01 3.23 15.08 0.83 4.34 0.15 0.98 30.98 4.00 8.21 99.99 0.150 luz
an7 48.13 3.08 0.40 0.02 1.63 0.12 0.14 0.01 3.22 17.59 0.95 0.10 0.00 0.96 31.54 4.00 8.18 99.54 0.003 enr
an8 33.77 1.02 0.08 0.00 31.69 1.09 0.02 0.00 2.11 0.00 0.00 0.00 0.00 0.00 33.43 2.00 4.11 98.99 ccp
an9 34.12 1.02 0.08 0.00 31.58 1.07 0.03 0.00 2.09 0.00 0.00 0.00 0.00 0.00 33.80 2.00 4.09 99.62 ccp
an10 34.79 1.04 0.53 0.01 30.53 1.04 0.07 0.00 2.10 0.00 0.00 0.00 0.00 0.00 33.67 2.00 4.10 99.59 ccp
an11 47.18 3.12 0.53 0.02 1.88 0.14 0.10 0.01 3.29 16.90 0.95 1.24 0.04 0.99 30.50 4.00 8.28 98.33 0.043 enr
an12 46.67 3.04 0.43 0.02 1.63 0.12 0.07 0.00 3.19 17.42 0.96 0.87 0.03 0.99 30.94 4.00 8.18 98.02 0.030 enr
an13 38.99 10.19 0.31 0.05 0.78 0.23 8.33 2.11 12.58 7.07 1.57 18.81 2.56 4.13 25.11 13.00 29.71 99.38 0.621 As-td
an14 41.96 10.08 0.70 0.10 3.62 0.99 6.02 1.40 12.58 16.33 3.33 2.99 0.37 3.70 27.30 13.00 29.28 98.92 0.101 Sb-tn
an15 49.86 3.13 0.32 0.01 1.22 0.09 0.03 0.00 3.23 17.57 0.94 0.26 0.01 0.94 32.14 4.00 8.18 101.40 0.009 enr
an16 48.24 3.10 0.32 0.01 0.45 0.03 0.15 0.01 3.15 14.34 0.78 5.58 0.19 0.97 31.42 4.00 8.12 100.51 0.193 luz
an17 47.85 3.06 0.28 0.01 0.91 0.07 0.01 0.00 3.14 16.21 0.88 2.95 0.10 0.98 31.53 4.00 8.12 99.73 0.101 luz
an18 48.72 3.08 0.40 0.02 0.45 0.03 0.15 0.01 3.14 18.02 0.97 0.10 0.00 0.97 31.91 4.00 8.11 99.77 0.003 enr
an19 46.82 3.02 0.06 0.00 1.36 0.10 0.13 0.01 3.13 13.25 0.73 8.35 0.28 1.01 31.25 4.00 8.14 101.22 0.279 luz
an20 45.62 3.02 0.07 0.00 1.64 0.12 0.14 0.01 3.15 9.79 0.55 14.24 0.49 1.04 30.50 4.00 8.20 101.98 0.472 luz
an21 66.04 1.34 0.43 0.01 0.57 0.01 5.00 0.10 1.45 1.45 0.02 0.07 0.00 0.03 24.95 1.00 2.48 98.50 spk
an22 67.72 1.41 0.25 0.00 0.72 0.02 6.37 0.13 1.55 0.00 0.00 0.00 0.00 0.00 24.32 1.00 2.55 99.38 spk
an24 47.28 3.03 0.36 0.01 1.21 0.09 0.19 0.01 3.14 18.01 0.98 0.48 0.02 0.99 31.51 4.00 8.14 99.03 0.016 enr
an25 47.24 3.06 0.26 0.01 0.98 0.07 0.04 0.00 3.14 14.10 0.77 5.87 0.20 0.97 31.19 4.00 8.11 99.69 0.204 luz
an26 47.47 3.05 0.35 0.01 0.99 0.07 0.08 0.00 3.14 16.39 0.89 2.55 0.09 0.98 31.38 4.00 8.12 99.19 0.087 enr
an27 48.02 3.08 0.44 0.02 0.65 0.05 0.15 0.01 3.15 13.98 0.76 6.17 0.21 0.97 31.51 4.00 8.11 100.90 0.213 luz
an28 41.66 10.49 0.28 0.04 0.68 0.20 8.40 2.06 12.79 8.38 1.79 16.87 2.22 4.01 26.05 13.00 29.79 102.32 0.553 As-td
an29 41.10 10.46 0.34 0.05 0.77 0.22 8.46 2.09 12.83 7.64 1.65 18.19 2.42 4.07 25.77 13.00 29.89 102.26 0.594 As-td
an30 48.11 3.06 0.18 0.01 1.67 0.12 0.13 0.01 3.20 18.06 0.97 0.67 0.02 1.00 31.73 4.00 8.19 100.55 0.022 enr
an31 0.76 0.02 0.00 0.00 47.17 1.10 0.03 0.00 1.11 0.00 0.00 0.00 0.00 0.00 49.45 2.00 3.11 97.40 py
an32 47.34 3.02 0.44 0.02 2.25 0.16 0.03 0.00 3.21 16.07 0.87 2.96 0.10 0.97 31.60 4.00 8.17 100.69 0.102 luz
an33 48.00 3.06 0.38 0.01 1.67 0.12 0.02 0.00 3.20 16.49 0.89 2.01 0.07 0.96 31.67 4.00 8.15 100.24 0.070 enr
an34 47.92 3.02 0.47 0.02 2.81 0.20 0.03 0.00 3.24 16.51 0.88 1.49 0.05 0.93 31.99 4.00 8.18 101.22 0.053 enr
an35 34.55 1.04 0.05 0.00 31.44 1.07 0.02 0.00 2.11 0.00 0.00 0.01 0.00 0.00 33.62 2.00 4.11 99.69 ccp
an36 38.59 1.19 4.98 0.09 13.20 0.46 11.29 0.34 2.07 0.00 0.00 0.02 0.00 0.00 32.84 2.00 4.07 100.92 ccp
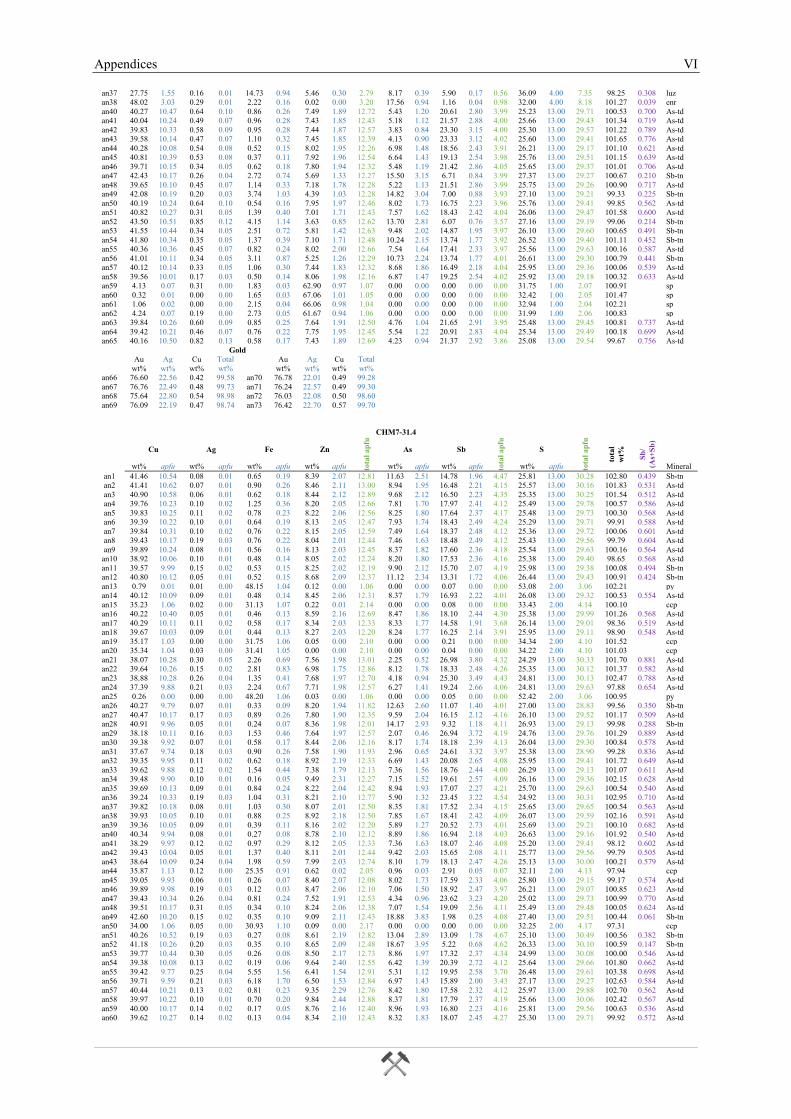
Appendices VI
an37 27.75 1.55 0.16 0.01 14.73 0.94 5.46 0.30 2.79 8.17 0.39 5.90 0.17 0.56 36.09 4.00 7.35 98.25 0.308 luz
an38 48.02 3.03 0.29 0.01 2.22 0.16 0.02 0.00 3.20 17.56 0.94 1.16 0.04 0.98 32.00 4.00 8.18 101.27 0.039 enr
an40 40.27 10.47 0.64 0.10 0.86 0.26 7.49 1.89 12.72 5.43 1.20 20.61 2.80 3.99 25.23 13.00 29.71 100.53 0.700 As-td
an41 40.04 10.24 0.49 0.07 0.96 0.28 7.43 1.85 12.43 5.18 1.12 21.57 2.88 4.00 25.66 13.00 29.43 101.34 0.719 As-td
an42 39.83 10.33 0.58 0.09 0.95 0.28 7.44 1.87 12.57 3.83 0.84 23.30 3.15 4.00 25.30 13.00 29.57 101.22 0.789 As-td
an43 39.58 10.14 0.47 0.07 1.10 0.32 7.45 1.85 12.39 4.13 0.90 23.33 3.12 4.02 25.60 13.00 29.41 101.65 0.776 As-td
an44 40.28 10.08 0.54 0.08 0.52 0.15 8.02 1.95 12.26 6.98 1.48 18.56 2.43 3.91 26.21 13.00 29.17 101.10 0.621 As-td
an45 40.81 10.39 0.53 0.08 0.37 0.11 7.92 1.96 12.54 6.64 1.43 19.13 2.54 3.98 25.76 13.00 29.51 101.15 0.639 As-td
an46 39.71 10.15 0.34 0.05 0.62 0.18 7.80 1.94 12.32 5.48 1.19 21.42 2.86 4.05 25.65 13.00 29.37 101.01 0.706 As-td
an47 42.43 10.17 0.26 0.04 2.72 0.74 5.69 1.33 12.27 15.50 3.15 6.71 0.84 3.99 27.37 13.00 29.27 100.67 0.210 Sb-tn
an48 39.65 10.10 0.45 0.07 1.14 0.33 7.18 1.78 12.28 5.22 1.13 21.51 2.86 3.99 25.75 13.00 29.26 100.90 0.717 As-td
an49 42.08 10.19 0.20 0.03 3.74 1.03 4.39 1.03 12.28 14.82 3.04 7.00 0.88 3.93 27.10 13.00 29.21 99.33 0.225 Sb-tn
an50 40.19 10.24 0.64 0.10 0.54 0.16 7.95 1.97 12.46 8.02 1.73 16.75 2.23 3.96 25.76 13.00 29.41 99.85 0.562 As-td
an51 40.82 10.27 0.31 0.05 1.39 0.40 7.01 1.71 12.43 7.57 1.62 18.43 2.42 4.04 26.06 13.00 29.47 101.58 0.600 As-td
an52 43.50 10.51 0.85 0.12 4.15 1.14 3.63 0.85 12.62 13.70 2.81 6.07 0.76 3.57 27.16 13.00 29.19 99.06 0.214 Sb-tn
an53 41.55 10.44 0.34 0.05 2.51 0.72 5.81 1.42 12.63 9.48 2.02 14.87 1.95 3.97 26.10 13.00 29.60 100.65 0.491 Sb-tn
an54 41.80 10.34 0.35 0.05 1.37 0.39 7.10 1.71 12.48 10.24 2.15 13.74 1.77 3.92 26.52 13.00 29.40 101.11 0.452 Sb-tn
an55 40.36 10.36 0.45 0.07 0.82 0.24 8.02 2.00 12.66 7.54 1.64 17.41 2.33 3.97 25.56 13.00 29.63 100.16 0.587 As-td
an56 41.01 10.11 0.34 0.05 3.11 0.87 5.25 1.26 12.29 10.73 2.24 13.74 1.77 4.01 26.61 13.00 29.30 100.79 0.441 Sb-tn
an57 40.12 10.14 0.33 0.05 1.06 0.30 7.44 1.83 12.32 8.68 1.86 16.49 2.18 4.04 25.95 13.00 29.36 100.06 0.539 As-td
an58 39.56 10.01 0.17 0.03 0.50 0.14 8.06 1.98 12.16 6.87 1.47 19.25 2.54 4.02 25.92 13.00 29.18 100.32 0.633 As-td
an59 4.13 0.07 0.31 0.00 1.83 0.03 62.90 0.97 1.07 0.00 0.00 0.00 0.00 0.00 31.75 1.00 2.07 100.91 sp
an60 0.32 0.01 0.00 0.00 1.65 0.03 67.06 1.01 1.05 0.00 0.00 0.00 0.00 0.00 32.42 1.00 2.05 101.47 sp
an61 1.06 0.02 0.00 0.00 2.15 0.04 66.06 0.98 1.04 0.00 0.00 0.00 0.00 0.00 32.94 1.00 2.04 102.21 sp
an62 4.24 0.07 0.19 0.00 2.73 0.05 61.67 0.94 1.06 0.00 0.00 0.00 0.00 0.00 31.99 1.00 2.06 100.83 sp
an63 39.84 10.26 0.60 0.09 0.85 0.25 7.64 1.91 12.50 4.76 1.04 21.65 2.91 3.95 25.48 13.00 29.45 100.81 0.737 As-td
an64 39.42 10.21 0.46 0.07 0.76 0.22 7.75 1.95 12.45 5.54 1.22 20.91 2.83 4.04 25.34 13.00 29.49 100.18 0.699 As-td
an65 40.16 10.50 0.82 0.13 0.58 0.17 7.43 1.89 12.69 4.23 0.94 21.37 2.92 3.86 25.08 13.00 29.54 99.67 0.756 As-td
Gold
Au Ag Cu Total Au Ag Cu Total
wt% wt% wt% wt% wt% wt% wt% wt%
an66 76.60 22.56 0.42 99.58 an70 76.78 22.01 0.49 99.28
an67 76.76 22.49 0.48 99.73 an71 76.24 22.57 0.49 99.30
an68 75.64 22.80 0.54 98.98 an72 76.03 22.08 0.50 98.60
an69 76.09 22.19 0.47 98.74 an73 76.42 22.70 0.57 99.70
CHM7-31.4
Cu Ag Fe Zn
tota
l ap
fu
As Sb
tota
l ap
fu
S
tota
l ap
fu
tota
l
wt%
Sb
/
(As+
Sb
)
wt% apfu wt% apfu wt% apfu wt% apfu wt% apfu wt% apfu wt% apfu Mineral
an1 41.46 10.54 0.08 0.01 0.65 0.19 8.39 2.07 12.81 11.63 2.51 14.78 1.96 4.47 25.81 13.00 30.28 102.80 0.439 Sb-tn
an2 41.41 10.62 0.07 0.01 0.90 0.26 8.46 2.11 13.00 8.94 1.95 16.48 2.21 4.15 25.57 13.00 30.16 101.83 0.531 As-td
an3 40.90 10.58 0.06 0.01 0.62 0.18 8.44 2.12 12.89 9.68 2.12 16.50 2.23 4.35 25.35 13.00 30.25 101.54 0.512 As-td
an4 39.76 10.23 0.10 0.02 1.25 0.36 8.20 2.05 12.66 7.81 1.70 17.97 2.41 4.12 25.49 13.00 29.78 100.57 0.586 As-td
an5 39.83 10.25 0.11 0.02 0.78 0.23 8.22 2.06 12.56 8.25 1.80 17.64 2.37 4.17 25.48 13.00 29.73 100.30 0.568 As-td
an6 39.39 10.22 0.10 0.01 0.64 0.19 8.13 2.05 12.47 7.93 1.74 18.43 2.49 4.24 25.29 13.00 29.71 99.91 0.588 As-td
an7 39.84 10.31 0.10 0.02 0.76 0.22 8.15 2.05 12.59 7.49 1.64 18.37 2.48 4.12 25.36 13.00 29.72 100.06 0.601 As-td
an8 39.43 10.17 0.19 0.03 0.76 0.22 8.04 2.01 12.44 7.46 1.63 18.48 2.49 4.12 25.43 13.00 29.56 99.79 0.604 As-td
an9 39.89 10.24 0.08 0.01 0.56 0.16 8.13 2.03 12.45 8.37 1.82 17.60 2.36 4.18 25.54 13.00 29.63 100.16 0.564 As-td
an10 38.92 10.06 0.10 0.01 0.48 0.14 8.05 2.02 12.24 8.20 1.80 17.53 2.36 4.16 25.38 13.00 29.40 98.65 0.568 As-td
an11 39.57 9.99 0.15 0.02 0.53 0.15 8.25 2.02 12.19 9.90 2.12 15.70 2.07 4.19 25.98 13.00 29.38 100.08 0.494 Sb-tn
an12 40.80 10.12 0.05 0.01 0.52 0.15 8.68 2.09 12.37 11.12 2.34 13.31 1.72 4.06 26.44 13.00 29.43 100.91 0.424 Sb-tn
an13 0.79 0.01 0.01 0.00 48.15 1.04 0.12 0.00 1.06 0.00 0.00 0.07 0.00 0.00 53.08 2.00 3.06 102.21 py
an14 40.12 10.09 0.09 0.01 0.48 0.14 8.45 2.06 12.31 8.37 1.79 16.93 2.22 4.01 26.08 13.00 29.32 100.53 0.554 As-td
an15 35.23 1.06 0.02 0.00 31.13 1.07 0.22 0.01 2.14 0.00 0.00 0.08 0.00 0.00 33.43 2.00 4.14 100.10 ccp
an16 40.22 10.40 0.05 0.01 0.46 0.13 8.59 2.16 12.69 8.47 1.86 18.10 2.44 4.30 25.38 13.00 29.99 101.26 0.568 As-td
an17 40.29 10.11 0.11 0.02 0.58 0.17 8.34 2.03 12.33 8.33 1.77 14.58 1.91 3.68 26.14 13.00 29.01 98.36 0.519 As-td
an18 39.67 10.03 0.09 0.01 0.44 0.13 8.27 2.03 12.20 8.24 1.77 16.25 2.14 3.91 25.95 13.00 29.11 98.90 0.548 As-td
an19 35.17 1.03 0.00 0.00 31.75 1.06 0.05 0.00 2.10 0.00 0.00 0.21 0.00 0.00 34.34 2.00 4.10 101.52 ccp
an20 35.34 1.04 0.03 0.00 31.41 1.05 0.00 0.00 2.10 0.00 0.00 0.04 0.00 0.00 34.22 2.00 4.10 101.03 ccp
an21 38.07 10.28 0.30 0.05 2.26 0.69 7.56 1.98 13.01 2.25 0.52 26.98 3.80 4.32 24.29 13.00 30.33 101.70 0.881 As-td
an22 39.64 10.26 0.15 0.02 2.81 0.83 6.98 1.75 12.86 8.12 1.78 18.33 2.48 4.26 25.35 13.00 30.12 101.37 0.582 As-td
an23 38.88 10.28 0.26 0.04 1.35 0.41 7.68 1.97 12.70 4.18 0.94 25.30 3.49 4.43 24.81 13.00 30.13 102.47 0.788 As-td
an24 37.39 9.88 0.21 0.03 2.24 0.67 7.71 1.98 12.57 6.27 1.41 19.24 2.66 4.06 24.81 13.00 29.63 97.88 0.654 As-td
an25 0.26 0.00 0.00 0.00 48.20 1.06 0.03 0.00 1.06 0.00 0.00 0.05 0.00 0.00 52.42 2.00 3.06 100.95 py
an26 40.27 9.79 0.07 0.01 0.33 0.09 8.20 1.94 11.82 12.63 2.60 11.07 1.40 4.01 27.00 13.00 28.83 99.56 0.350 Sb-tn
an27 40.47 10.17 0.17 0.03 0.89 0.26 7.80 1.90 12.35 9.59 2.04 16.15 2.12 4.16 26.10 13.00 29.52 101.17 0.509 As-td
an28 40.91 9.96 0.05 0.01 0.24 0.07 8.36 1.98 12.01 14.17 2.93 9.32 1.18 4.11 26.93 13.00 29.13 99.98 0.288 Sb-tn
an29 38.18 10.11 0.16 0.03 1.53 0.46 7.64 1.97 12.57 2.07 0.46 26.94 3.72 4.19 24.76 13.00 29.76 101.29 0.889 As-td
an30 39.38 9.92 0.07 0.01 0.58 0.17 8.44 2.06 12.16 8.17 1.74 18.18 2.39 4.13 26.04 13.00 29.30 100.84 0.578 As-td
an31 37.67 9.74 0.18 0.03 0.90 0.26 7.58 1.90 11.93 2.96 0.65 24.61 3.32 3.97 25.38 13.00 28.90 99.28 0.836 As-td
an32 39.35 9.95 0.11 0.02 0.62 0.18 8.92 2.19 12.33 6.69 1.43 20.08 2.65 4.08 25.95 13.00 29.41 101.72 0.649 As-td
an33 39.62 9.88 0.12 0.02 1.54 0.44 7.38 1.79 12.13 7.36 1.56 18.76 2.44 4.00 26.29 13.00 29.13 101.07 0.611 As-td
an34 39.48 9.90 0.10 0.01 0.16 0.05 9.49 2.31 12.27 7.15 1.52 19.61 2.57 4.09 26.16 13.00 29.36 102.15 0.628 As-td
an35 39.69 10.13 0.09 0.01 0.84 0.24 8.22 2.04 12.42 8.94 1.93 17.07 2.27 4.21 25.70 13.00 29.63 100.54 0.540 As-td
an36 39.24 10.33 0.19 0.03 1.04 0.31 8.21 2.10 12.77 5.90 1.32 23.45 3.22 4.54 24.92 13.00 30.31 102.95 0.710 As-td
an37 39.82 10.18 0.08 0.01 1.03 0.30 8.07 2.01 12.50 8.35 1.81 17.52 2.34 4.15 25.65 13.00 29.65 100.54 0.563 As-td
an38 39.93 10.05 0.10 0.01 0.88 0.25 8.92 2.18 12.50 7.85 1.67 18.41 2.42 4.09 26.07 13.00 29.59 102.16 0.591 As-td
an39 39.36 10.05 0.09 0.01 0.39 0.11 8.16 2.02 12.20 5.89 1.27 20.52 2.73 4.01 25.69 13.00 29.21 100.10 0.682 As-td
an40 40.34 9.94 0.08 0.01 0.27 0.08 8.78 2.10 12.12 8.89 1.86 16.94 2.18 4.03 26.63 13.00 29.16 101.92 0.540 As-td
an41 38.29 9.97 0.12 0.02 0.97 0.29 8.12 2.05 12.33 7.36 1.63 18.07 2.46 4.08 25.20 13.00 29.41 98.12 0.602 As-td
an42 39.43 10.04 0.05 0.01 1.37 0.40 8.11 2.01 12.44 9.42 2.03 15.65 2.08 4.11 25.77 13.00 29.56 99.79 0.505 As-td
an43 38.64 10.09 0.24 0.04 1.98 0.59 7.99 2.03 12.74 8.10 1.79 18.13 2.47 4.26 25.13 13.00 30.00 100.21 0.579 As-td
an44 35.87 1.13 0.12 0.00 25.35 0.91 0.62 0.02 2.05 0.96 0.03 2.91 0.05 0.07 32.11 2.00 4.13 97.94 ccp
an45 39.05 9.93 0.06 0.01 0.26 0.07 8.40 2.07 12.08 8.02 1.73 17.59 2.33 4.06 25.80 13.00 29.15 99.17 0.574 As-td
an46 39.89 9.98 0.19 0.03 0.12 0.03 8.47 2.06 12.10 7.06 1.50 18.92 2.47 3.97 26.21 13.00 29.07 100.85 0.623 As-td
an47 39.43 10.34 0.26 0.04 0.81 0.24 7.52 1.91 12.53 4.34 0.96 23.62 3.23 4.20 25.02 13.00 29.73 100.99 0.770 As-td
an48 39.51 10.17 0.31 0.05 0.34 0.10 8.24 2.06 12.38 7.07 1.54 19.09 2.56 4.11 25.49 13.00 29.48 100.05 0.624 As-td
an49 42.60 10.20 0.15 0.02 0.35 0.10 9.09 2.11 12.43 18.88 3.83 1.98 0.25 4.08 27.40 13.00 29.51 100.44 0.061 Sb-tn
an50 34.00 1.06 0.05 0.00 30.93 1.10 0.09 0.00 2.17 0.00 0.00 0.00 0.00 0.00 32.25 2.00 4.17 97.31 ccp
an51 40.26 10.52 0.19 0.03 0.27 0.08 8.61 2.19 12.82 13.04 2.89 13.09 1.78 4.67 25.10 13.00 30.49 100.56 0.382 Sb-tn
an52 41.18 10.26 0.20 0.03 0.35 0.10 8.65 2.09 12.48 18.67 3.95 5.22 0.68 4.62 26.33 13.00 30.10 100.59 0.147 Sb-tn
an53 39.77 10.44 0.30 0.05 0.26 0.08 8.50 2.17 12.73 8.86 1.97 17.32 2.37 4.34 24.99 13.00 30.08 100.00 0.546 As-td
an54 39.38 10.08 0.13 0.02 0.19 0.06 9.64 2.40 12.55 6.42 1.39 20.39 2.72 4.12 25.64 13.00 29.66 101.80 0.662 As-td
an55 39.42 9.77 0.25 0.04 5.55 1.56 6.41 1.54 12.91 5.31 1.12 19.95 2.58 3.70 26.48 13.00 29.61 103.38 0.698 As-td
an56 39.71 9.59 0.21 0.03 6.18 1.70 6.50 1.53 12.84 6.97 1.43 15.89 2.00 3.43 27.17 13.00 29.27 102.63 0.584 As-td
an57 40.44 10.21 0.13 0.02 0.81 0.23 9.35 2.29 12.76 8.42 1.80 17.58 2.32 4.12 25.97 13.00 29.88 102.70 0.562 As-td
an58 39.97 10.22 0.10 0.01 0.70 0.20 9.84 2.44 12.88 8.37 1.81 17.79 2.37 4.19 25.66 13.00 30.06 102.42 0.567 As-td
an59 40.00 10.17 0.14 0.02 0.17 0.05 8.76 2.16 12.40 8.96 1.93 16.80 2.23 4.16 25.81 13.00 29.56 100.63 0.536 As-td
an60 39.62 10.27 0.14 0.02 0.13 0.04 8.34 2.10 12.43 8.32 1.83 18.07 2.45 4.27 25.30 13.00 29.71 99.92 0.572 As-td
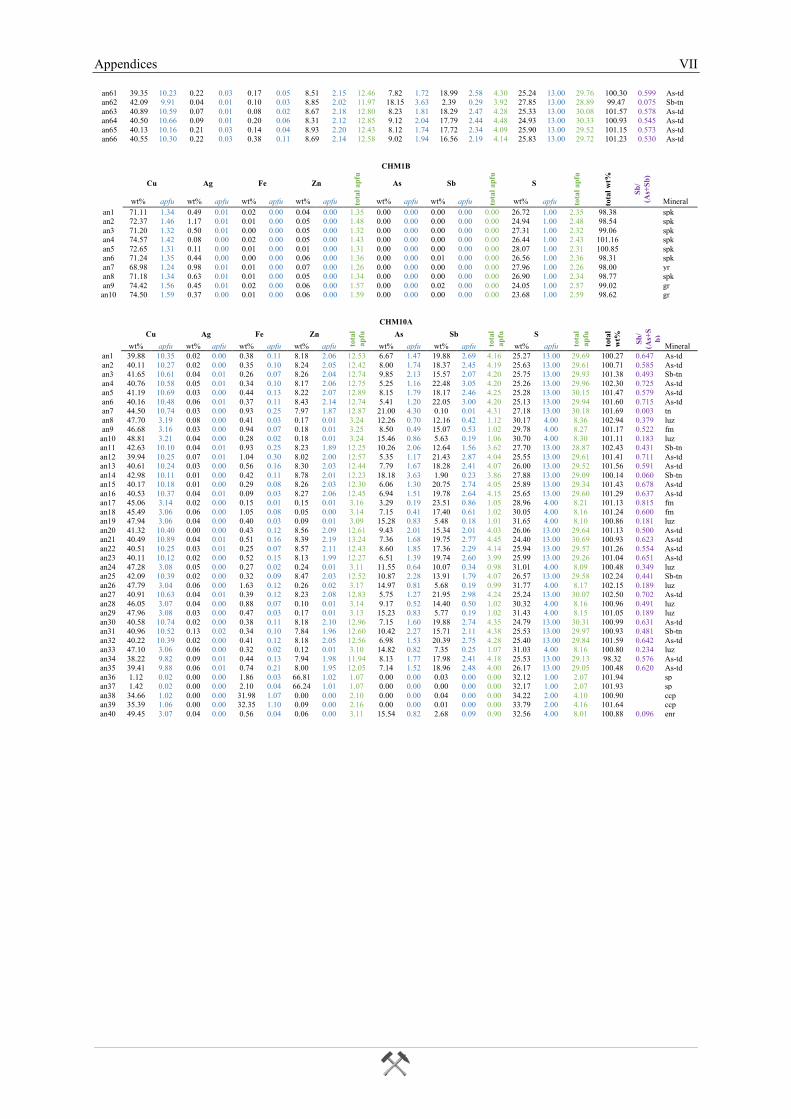
Appendices VII
an61 39.35 10.23 0.22 0.03 0.17 0.05 8.51 2.15 12.46 7.82 1.72 18.99 2.58 4.30 25.24 13.00 29.76 100.30 0.599 As-td
an62 42.09 9.91 0.04 0.01 0.10 0.03 8.85 2.02 11.97 18.15 3.63 2.39 0.29 3.92 27.85 13.00 28.89 99.47 0.075 Sb-tn
an63 40.89 10.59 0.07 0.01 0.08 0.02 8.67 2.18 12.80 8.23 1.81 18.29 2.47 4.28 25.33 13.00 30.08 101.57 0.578 As-td
an64 40.50 10.66 0.09 0.01 0.20 0.06 8.31 2.12 12.85 9.12 2.04 17.79 2.44 4.48 24.93 13.00 30.33 100.93 0.545 As-td
an65 40.13 10.16 0.21 0.03 0.14 0.04 8.93 2.20 12.43 8.12 1.74 17.72 2.34 4.09 25.90 13.00 29.52 101.15 0.573 As-td
an66 40.55 10.30 0.22 0.03 0.38 0.11 8.69 2.14 12.58 9.02 1.94 16.56 2.19 4.14 25.83 13.00 29.72 101.23 0.530 As-td
CHM1B
Cu Ag Fe Zn
tota
l ap
fu
As Sb
tota
l ap
fu
S
tota
l ap
fu
tota
l w
t%
Sb
/
(As+
Sb
)
wt% apfu wt% apfu wt% apfu wt% apfu wt% apfu wt% apfu wt% apfu Mineral
an1 71.11 1.34 0.49 0.01 0.02 0.00 0.04 0.00 1.35 0.00 0.00 0.00 0.00 0.00 26.72 1.00 2.35 98.38 spk
an2 72.37 1.46 1.17 0.01 0.01 0.00 0.05 0.00 1.48 0.00 0.00 0.00 0.00 0.00 24.94 1.00 2.48 98.54 spk
an3 71.20 1.32 0.50 0.01 0.00 0.00 0.05 0.00 1.32 0.00 0.00 0.00 0.00 0.00 27.31 1.00 2.32 99.06 spk
an4 74.57 1.42 0.08 0.00 0.02 0.00 0.05 0.00 1.43 0.00 0.00 0.00 0.00 0.00 26.44 1.00 2.43 101.16 spk
an5 72.65 1.31 0.11 0.00 0.01 0.00 0.01 0.00 1.31 0.00 0.00 0.00 0.00 0.00 28.07 1.00 2.31 100.85 spk
an6 71.24 1.35 0.44 0.00 0.00 0.00 0.06 0.00 1.36 0.00 0.00 0.01 0.00 0.00 26.56 1.00 2.36 98.31 spk
an7 68.98 1.24 0.98 0.01 0.01 0.00 0.07 0.00 1.26 0.00 0.00 0.00 0.00 0.00 27.96 1.00 2.26 98.00 yr
an8 71.18 1.34 0.63 0.01 0.01 0.00 0.05 0.00 1.34 0.00 0.00 0.00 0.00 0.00 26.90 1.00 2.34 98.77 spk
an9 74.42 1.56 0.45 0.01 0.02 0.00 0.06 0.00 1.57 0.00 0.00 0.02 0.00 0.00 24.05 1.00 2.57 99.02 gr
an10 74.50 1.59 0.37 0.00 0.01 0.00 0.06 0.00 1.59 0.00 0.00 0.00 0.00 0.00 23.68 1.00 2.59 98.62 gr
CHM10A
Cu Ag Fe Zn
tota
l
ap
fu
As Sb
tota
l
ap
fu
S
tota
l
ap
fu
tota
l
wt%
Sb
/
(As+
S
b)
wt% apfu wt% apfu wt% apfu wt% apfu wt% apfu wt% apfu wt% apfu Mineral
an1 39.88 10.35 0.02 0.00 0.38 0.11 8.18 2.06 12.53 6.67 1.47 19.88 2.69 4.16 25.27 13.00 29.69 100.27 0.647 As-td
an2 40.11 10.27 0.02 0.00 0.35 0.10 8.24 2.05 12.42 8.00 1.74 18.37 2.45 4.19 25.63 13.00 29.61 100.71 0.585 As-td
an3 41.65 10.61 0.04 0.01 0.26 0.07 8.26 2.04 12.74 9.85 2.13 15.57 2.07 4.20 25.75 13.00 29.93 101.38 0.493 Sb-tn
an4 40.76 10.58 0.05 0.01 0.34 0.10 8.17 2.06 12.75 5.25 1.16 22.48 3.05 4.20 25.26 13.00 29.96 102.30 0.725 As-td
an5 41.19 10.69 0.03 0.00 0.44 0.13 8.22 2.07 12.89 8.15 1.79 18.17 2.46 4.25 25.28 13.00 30.15 101.47 0.579 As-td
an6 40.16 10.48 0.06 0.01 0.37 0.11 8.43 2.14 12.74 5.41 1.20 22.05 3.00 4.20 25.13 13.00 29.94 101.60 0.715 As-td
an7 44.50 10.74 0.03 0.00 0.93 0.25 7.97 1.87 12.87 21.00 4.30 0.10 0.01 4.31 27.18 13.00 30.18 101.69 0.003 tn
an8 47.70 3.19 0.08 0.00 0.41 0.03 0.17 0.01 3.24 12.26 0.70 12.16 0.42 1.12 30.17 4.00 8.36 102.94 0.379 luz
an9 46.68 3.16 0.03 0.00 0.94 0.07 0.18 0.01 3.25 8.50 0.49 15.07 0.53 1.02 29.78 4.00 8.27 101.17 0.522 fm
an10 48.81 3.21 0.04 0.00 0.28 0.02 0.18 0.01 3.24 15.46 0.86 5.63 0.19 1.06 30.70 4.00 8.30 101.11 0.183 luz
an11 42.63 10.10 0.04 0.01 0.93 0.25 8.23 1.89 12.25 10.26 2.06 12.64 1.56 3.62 27.70 13.00 28.87 102.43 0.431 Sb-tn
an12 39.94 10.25 0.07 0.01 1.04 0.30 8.02 2.00 12.57 5.35 1.17 21.43 2.87 4.04 25.55 13.00 29.61 101.41 0.711 As-td
an13 40.61 10.24 0.03 0.00 0.56 0.16 8.30 2.03 12.44 7.79 1.67 18.28 2.41 4.07 26.00 13.00 29.52 101.56 0.591 As-td
an14 42.98 10.11 0.01 0.00 0.42 0.11 8.78 2.01 12.23 18.18 3.63 1.90 0.23 3.86 27.88 13.00 29.09 100.14 0.060 Sb-tn
an15 40.17 10.18 0.01 0.00 0.29 0.08 8.26 2.03 12.30 6.06 1.30 20.75 2.74 4.05 25.89 13.00 29.34 101.43 0.678 As-td
an16 40.53 10.37 0.04 0.01 0.09 0.03 8.27 2.06 12.45 6.94 1.51 19.78 2.64 4.15 25.65 13.00 29.60 101.29 0.637 As-td
an17 45.06 3.14 0.02 0.00 0.15 0.01 0.15 0.01 3.16 3.29 0.19 23.51 0.86 1.05 28.96 4.00 8.21 101.13 0.815 fm
an18 45.49 3.06 0.06 0.00 1.05 0.08 0.05 0.00 3.14 7.15 0.41 17.40 0.61 1.02 30.05 4.00 8.16 101.24 0.600 fm
an19 47.94 3.06 0.04 0.00 0.40 0.03 0.09 0.01 3.09 15.28 0.83 5.48 0.18 1.01 31.65 4.00 8.10 100.86 0.181 luz
an20 41.32 10.40 0.00 0.00 0.43 0.12 8.56 2.09 12.61 9.43 2.01 15.34 2.01 4.03 26.06 13.00 29.64 101.13 0.500 As-td
an21 40.49 10.89 0.04 0.01 0.51 0.16 8.39 2.19 13.24 7.36 1.68 19.75 2.77 4.45 24.40 13.00 30.69 100.93 0.623 As-td
an22 40.51 10.25 0.03 0.01 0.25 0.07 8.57 2.11 12.43 8.60 1.85 17.36 2.29 4.14 25.94 13.00 29.57 101.26 0.554 As-td
an23 40.11 10.12 0.02 0.00 0.52 0.15 8.13 1.99 12.27 6.51 1.39 19.74 2.60 3.99 25.99 13.00 29.26 101.04 0.651 As-td
an24 47.28 3.08 0.05 0.00 0.27 0.02 0.24 0.01 3.11 11.55 0.64 10.07 0.34 0.98 31.01 4.00 8.09 100.48 0.349 luz
an25 42.09 10.39 0.02 0.00 0.32 0.09 8.47 2.03 12.52 10.87 2.28 13.91 1.79 4.07 26.57 13.00 29.58 102.24 0.441 Sb-tn
an26 47.79 3.04 0.06 0.00 1.63 0.12 0.26 0.02 3.17 14.97 0.81 5.68 0.19 0.99 31.77 4.00 8.17 102.15 0.189 luz
an27 40.91 10.63 0.04 0.01 0.39 0.12 8.23 2.08 12.83 5.75 1.27 21.95 2.98 4.24 25.24 13.00 30.07 102.50 0.702 As-td
an28 46.05 3.07 0.04 0.00 0.88 0.07 0.10 0.01 3.14 9.17 0.52 14.40 0.50 1.02 30.32 4.00 8.16 100.96 0.491 luz
an29 47.96 3.08 0.03 0.00 0.47 0.03 0.17 0.01 3.13 15.23 0.83 5.77 0.19 1.02 31.43 4.00 8.15 101.05 0.189 luz
an30 40.58 10.74 0.02 0.00 0.38 0.11 8.18 2.10 12.96 7.15 1.60 19.88 2.74 4.35 24.79 13.00 30.31 100.99 0.631 As-td
an31 40.96 10.52 0.13 0.02 0.34 0.10 7.84 1.96 12.60 10.42 2.27 15.71 2.11 4.38 25.53 13.00 29.97 100.93 0.481 Sb-tn
an32 40.22 10.39 0.02 0.00 0.41 0.12 8.18 2.05 12.56 6.98 1.53 20.39 2.75 4.28 25.40 13.00 29.84 101.59 0.642 As-td
an33 47.10 3.06 0.06 0.00 0.32 0.02 0.12 0.01 3.10 14.82 0.82 7.35 0.25 1.07 31.03 4.00 8.16 100.80 0.234 luz
an34 38.22 9.82 0.09 0.01 0.44 0.13 7.94 1.98 11.94 8.13 1.77 17.98 2.41 4.18 25.53 13.00 29.13 98.32 0.576 As-td
an35 39.41 9.88 0.06 0.01 0.74 0.21 8.00 1.95 12.05 7.14 1.52 18.96 2.48 4.00 26.17 13.00 29.05 100.48 0.620 As-td
an36 1.12 0.02 0.00 0.00 1.86 0.03 66.81 1.02 1.07 0.00 0.00 0.03 0.00 0.00 32.12 1.00 2.07 101.94 sp
an37 1.42 0.02 0.00 0.00 2.10 0.04 66.24 1.01 1.07 0.00 0.00 0.00 0.00 0.00 32.17 1.00 2.07 101.93 sp
an38 34.66 1.02 0.00 0.00 31.98 1.07 0.00 0.00 2.10 0.00 0.00 0.04 0.00 0.00 34.22 2.00 4.10 100.90 ccp
an39 35.39 1.06 0.00 0.00 32.35 1.10 0.09 0.00 2.16 0.00 0.00 0.01 0.00 0.00 33.79 2.00 4.16 101.64 ccp
an40 49.45 3.07 0.04 0.00 0.56 0.04 0.06 0.00 3.11 15.54 0.82 2.68 0.09 0.90 32.56 4.00 8.01 100.88 0.096 enr
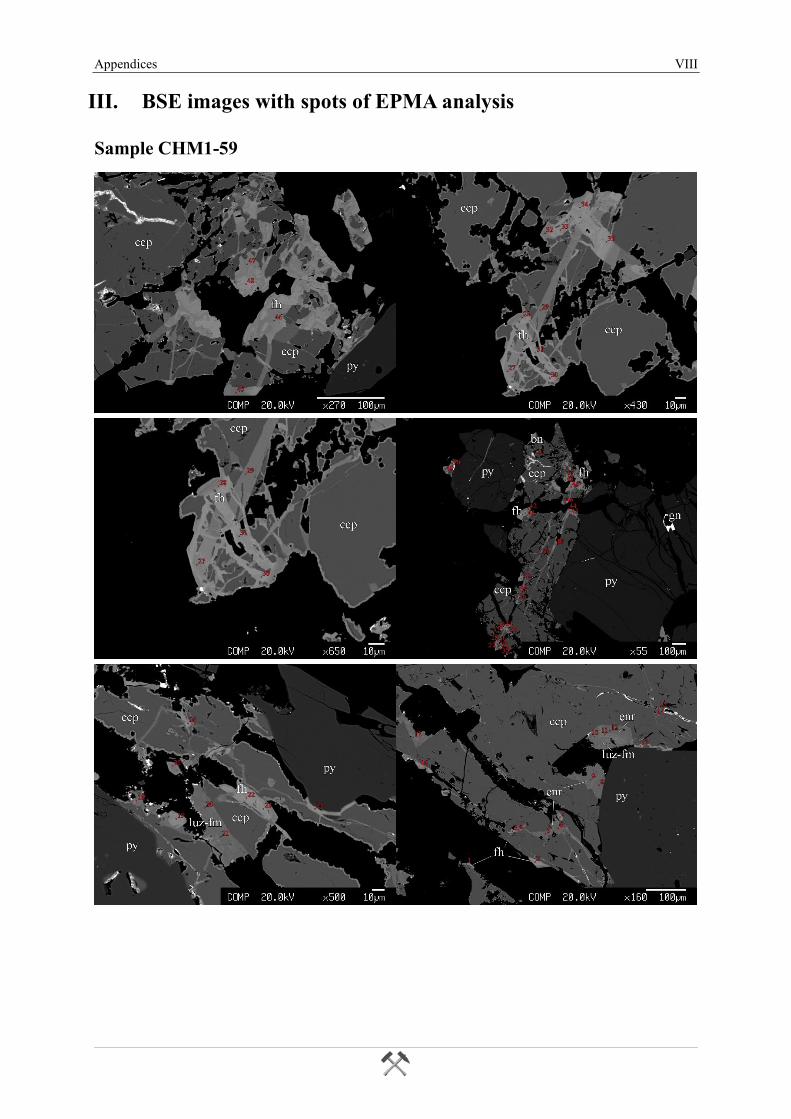
Appendices VIII
III. BSE images with spots of EPMA analysis
Sample CHM1-59
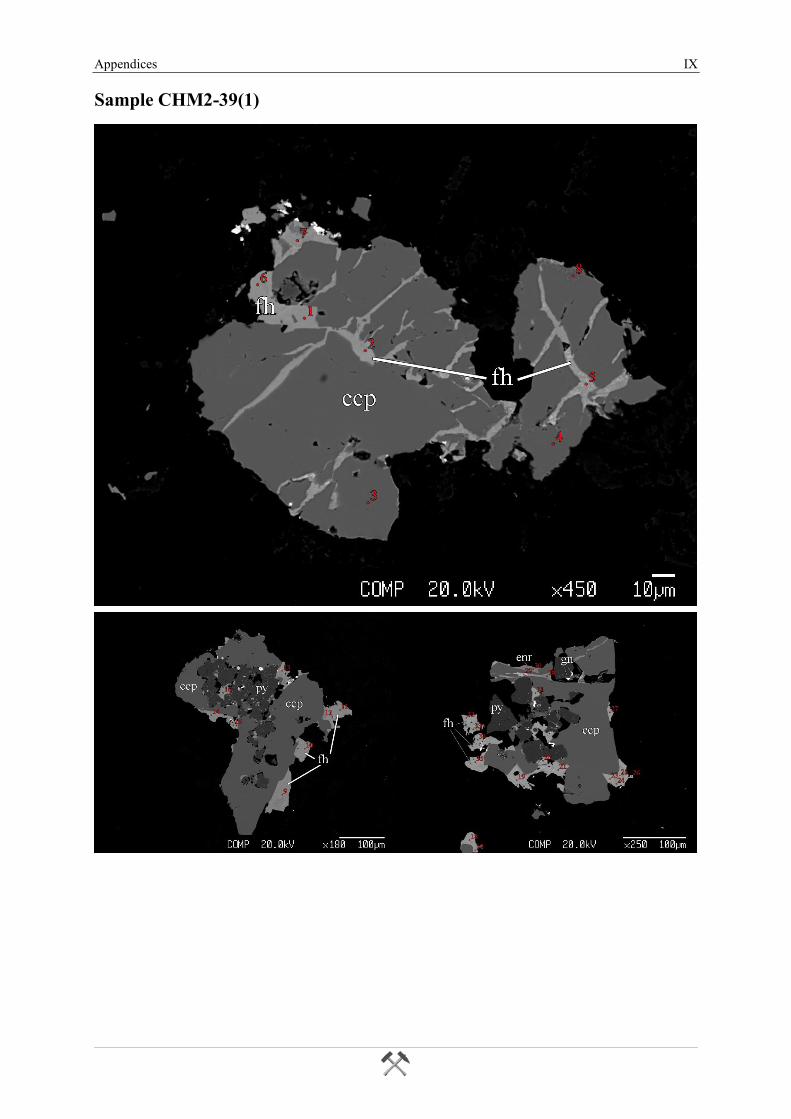
Appendices IX
Sample CHM2-39(1)
Appendices X
Sample CHM2-39.5(2)
Appendices XI
Sample CHM2-69
Appendices XII
Sample CHM2-81
Sample CHM2-136
Appendices XIII
Sample CHM2-89
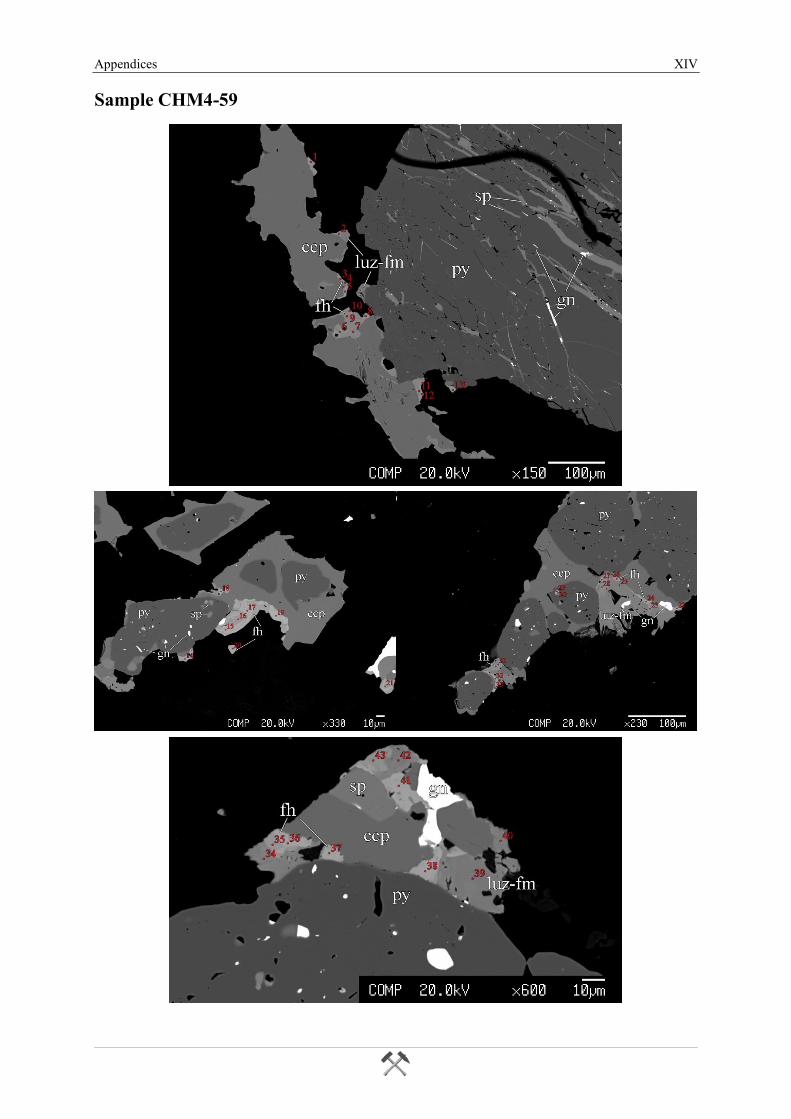
Appendices XIV
Sample CHM4-59
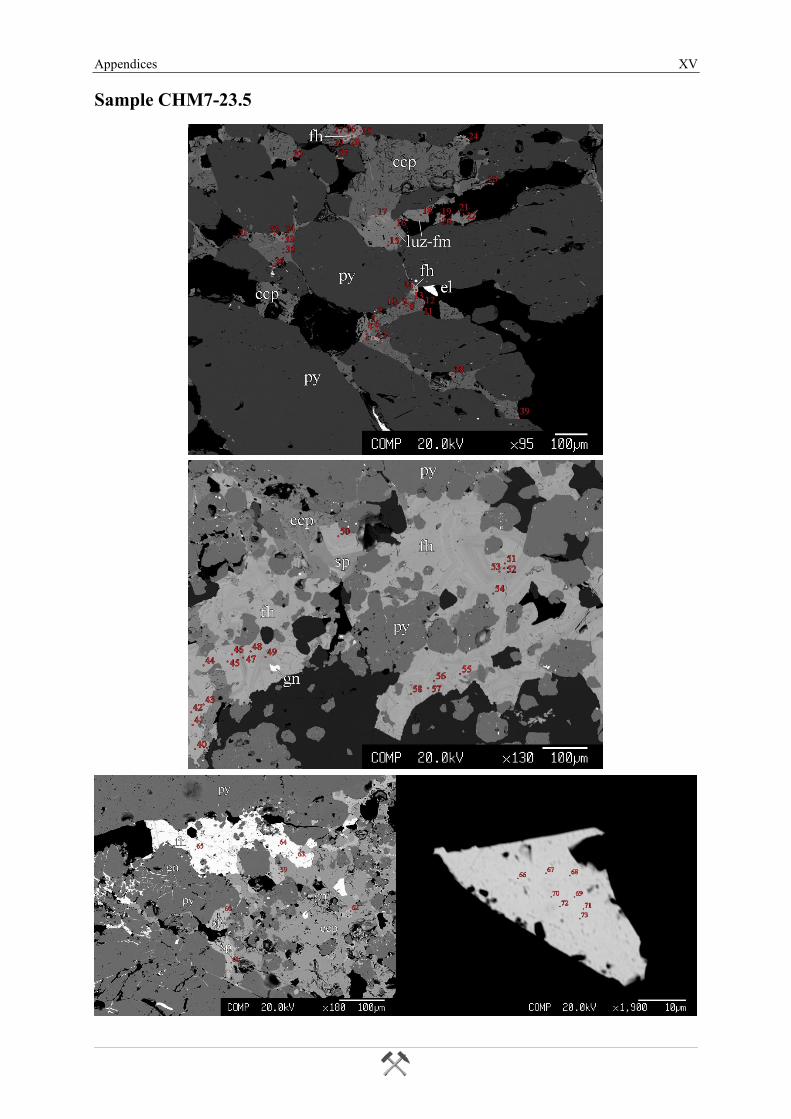
Appendices XV
Sample CHM7-23.5
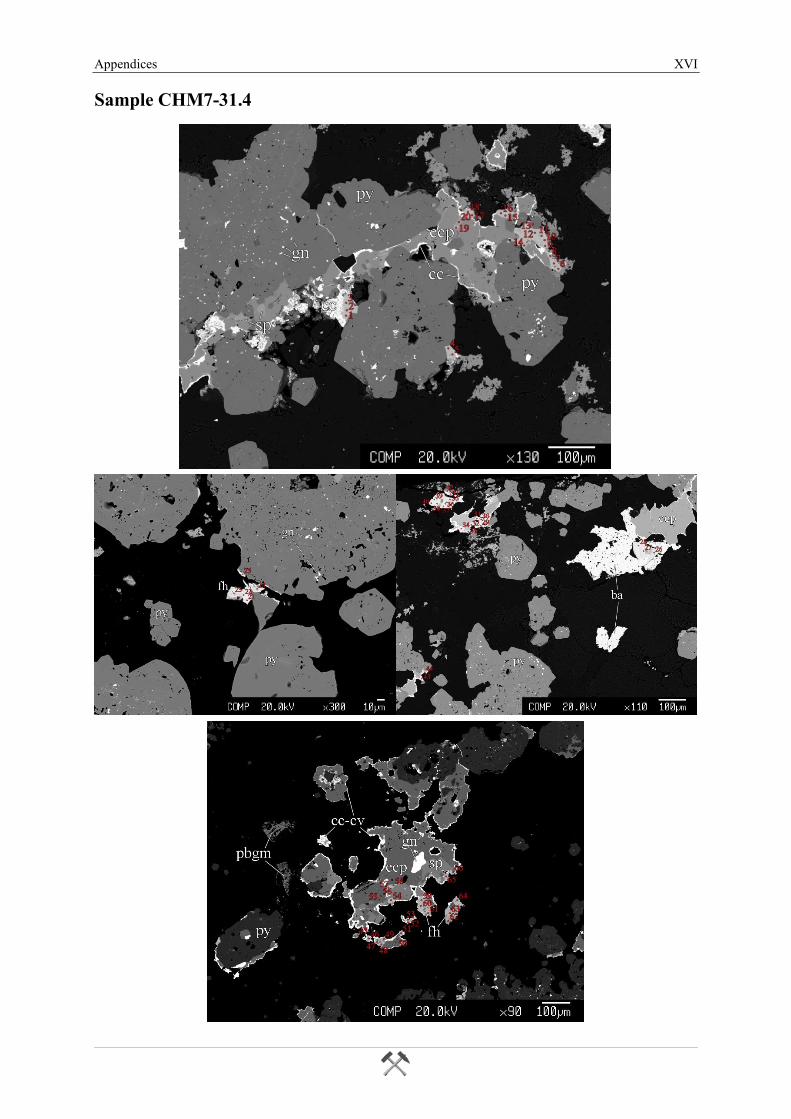
Appendices XVI
Sample CHM7-31.4
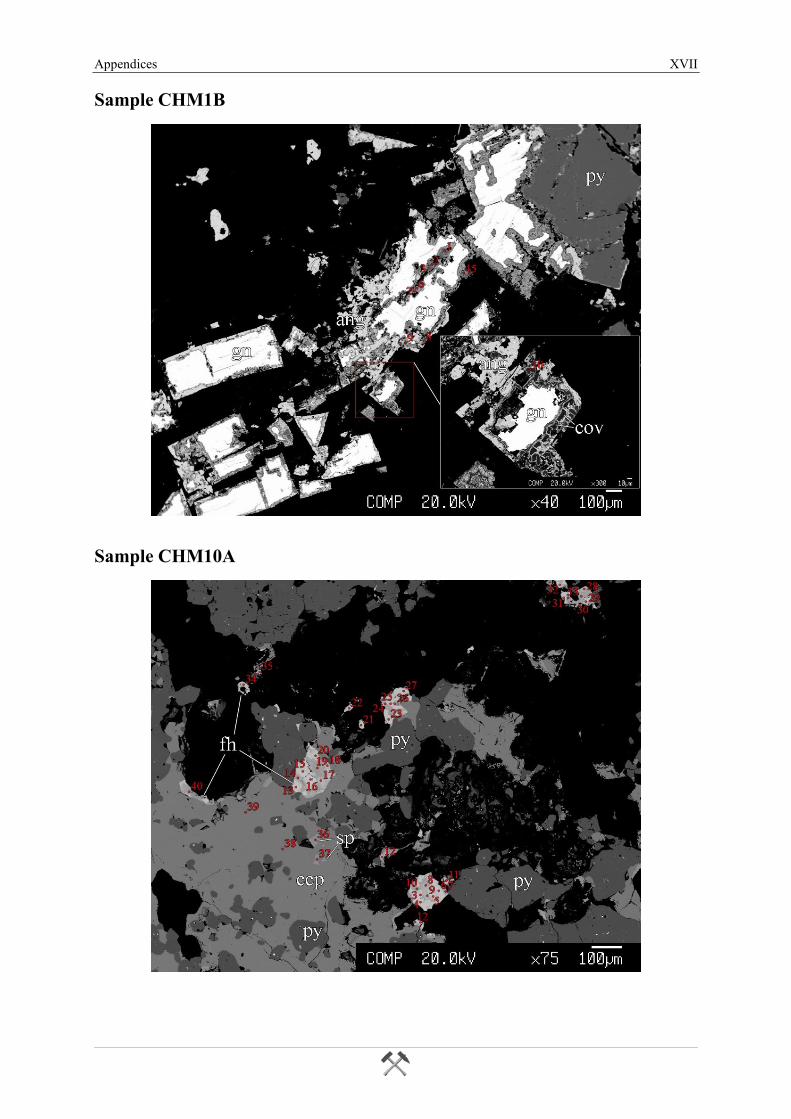
Appendices XVII
Sample CHM1B
Sample CHM10A