Metabonomics: A Useful Tool for the Future Surgeon
11
RESEARCH REVIEW Metabonomics: A Useful Tool for the Future Surgeon Paul Goldsmith, M.B., Ch.B.,* ,2 Hayley Fenton, B.Sc.,† Gareth Morris-Stiff, M.D.,* Niaz Ahmad, M.D.,* Julie Fisher, Ph.D.,† ,1 and K. Rajendra Prasad, F.R.C.S.* *Hepatopancreatobiliary and Transplant Unit, St. James’s University Hospital, Leeds, United Kingdom; and †School of Chemistry, University of Leeds, United Kingdom Submitted for publication November 11, 2008 Background. In the past decade or so, a range of technologies have emerged that have shown promise in increasing our understanding of disease processes and progression. These advances are referred to as the ‘‘omics’’ technologies; genomics, transcriptomics, and proteomics. More recently, another ‘‘omics’’ approach has come to the fore: metabonomics, and this technology has the potential for significant clinical impact. Metabonomics refers to the analysis of the metabolome, that is, the metabolic profile of a system. The advantage of studying the metabolome is that the end points of biological events are elucidated. Results. Although still in its infancy, the metabo- nomics approach has shown immense promise in areas as diverse as toxicology studies to the discov- ery of biomarkers of disease. It has also been applied to studies of both renal and hepatic transplants. Me- tabolome analysis may be conducted on a variety of biological fluids and tissue types and may utilize a number of different technology platforms, mass spectrometry (MS) and nuclear magnetic resonance (NMR) spectroscopy being the most popular. In this review, we cover the background to the evolution of metabonomics and its applications with particular emphasis on clinical applications. Conclusions. We conclude with the suggestion that metabonomics offers a platform for further bio- marker development, drug development, and in the field of medicine. Ó 2010 Elsevier Inc. All rights reserved. Key Words: metabonomics; nuclear magnetic reso- nance spectroscopy; mass spectrometry; proteomics biomarkers; surgery. INTRODUCTION Metabonomics is a relatively new term, having been coined in 1999 [1]. It is defined as ‘‘the quantitative measurement of the dynamic multiparametric meta- bolic response of living systems to pathophysiologic stimuli or genetic modification’’ and is concerned with the high throughput identification and quantification of the small molecule metabolites in the metabolome [2]. The metabolome is the collection of the complete complement of all low molecular weight (<1500 Daltons [Da]) metabolites found in a system (cell, tissue, or or- ganism) under a given set of conditions [2, 3]. The me- tabolome constitutes the interaction between small molecules, such as metabolic substrates and products, lipids, small peptides, vitamins, and other protein co- factors [4, 5]. A summary of metabonomic related definitions is provided in Table 1 [6]. Metabonomics is a rapidly expanding area of scien- tific research and is one of the new ‘‘omics’’ joining geno- mics, transcriptomics, and proteomics, in an area of science trying to understand global systems biology [7]. This expansion has been reflected in the number of publications over the last 30 to 40 y with a steady in- crease since the year 2000 [5, 7]. Further evidence of the rapid growth in the field is the recent launch of a dedi- cated journal Metabolomics. The profiling of metabolites was first reported in the literature in the 1950s but subsequent progress was slow, and only since the turn of the new millennium has metabonomics started to become a stand alone sci- entific entity. The recent developments have occurred due to improvements in analytical techniques and data handling systems [8]. Whilst metabonomics is at the endpoint of the ‘‘omics cascade’’ and the closest to the phenotype, there is still no single-instrument plat- form that can currently analyze all metabolites [6], 1 To whom correspondence should be addressed at the School of Chemistry, University of Leeds, Leeds, LS9 2JT, UK. E-mail: j. fi[email protected]. 2 To whom reprint requests should be addressed at The Hepatopan- creatobiliary and Transplant Unit, St James’s University Hospital, Leeds, UK. E-mail: [email protected]. 0022-4804/09 $36.00 Ó 2010 Elsevier Inc. All rights reserved. 122 Journal of Surgical Research 160, 122–132 (2010) doi:10.1016/j.jss.2009.03.003
-
Upload
szabist-isb -
Category
Documents
-
view
2 -
download
0
Transcript of Metabonomics: A Useful Tool for the Future Surgeon

Journal of Surgical Research 160, 122–132 (2010)doi:10.1016/j.jss.2009.03.003
RESEARCH REVIEW
Metabonomics: A Useful Tool for the Future Surgeon
Paul Goldsmith, M.B., Ch.B.,*,2 Hayley Fenton, B.Sc.,† Gareth Morris-Stiff, M.D.,* Niaz Ahmad, M.D.,*Julie Fisher, Ph.D.,†,1 and K. Rajendra Prasad, F.R.C.S.*
*Hepatopancreatobiliary and Transplant Unit, St. James’s University Hospital, Leeds, United Kingdom; and †School of Chemistry,University of Leeds, United Kingdom
Submitted for publication November 11, 2008
Background. In the past decade or so, a range oftechnologies have emerged that have shown promisein increasing our understanding of disease processesand progression. These advances are referred to asthe ‘‘omics’’ technologies; genomics, transcriptomics,and proteomics. More recently, another ‘‘omics’’approach has come to the fore: metabonomics, andthis technology has the potential for significant clinicalimpact. Metabonomics refers to the analysis of themetabolome, that is, the metabolic profile of a system.The advantage of studying the metabolome is that theend points of biological events are elucidated.
Results. Although still in its infancy, the metabo-nomics approach has shown immense promise inareas as diverse as toxicology studies to the discov-ery of biomarkers of disease. It has also been appliedto studies of both renal and hepatic transplants. Me-tabolome analysis may be conducted on a variety ofbiological fluids and tissue types and may utilizea number of different technology platforms, massspectrometry (MS) and nuclear magnetic resonance(NMR) spectroscopy being the most popular. In thisreview, we cover the background to the evolutionof metabonomics and its applications with particularemphasis on clinical applications.
Conclusions. We conclude with the suggestion thatmetabonomics offers a platform for further bio-marker development, drug development, and in thefield of medicine. � 2010 Elsevier Inc. All rights reserved.
Key Words: metabonomics; nuclear magnetic reso-nance spectroscopy; mass spectrometry; proteomicsbiomarkers; surgery.
1 To whom correspondence should be addressed at the Schoolof Chemistry, University of Leeds, Leeds, LS9 2JT, UK. E-mail: [email protected].
2 To whom reprint requests should be addressed at The Hepatopan-creatobiliary and Transplant Unit, St James’s University Hospital,Leeds, UK. E-mail: [email protected].
0022-4804/09 $36.00� 2010 Elsevier Inc. All rights reserved.
122
INTRODUCTION
Metabonomics is a relatively new term, having beencoined in 1999 [1]. It is defined as ‘‘the quantitativemeasurement of the dynamic multiparametric meta-bolic response of living systems to pathophysiologicstimuli or genetic modification’’ and is concerned withthe high throughput identification and quantificationof the small molecule metabolites in the metabolome[2]. The metabolome is the collection of the completecomplement of all low molecular weight (<1500 Daltons[Da]) metabolites found in a system (cell, tissue, or or-ganism) under a given set of conditions [2, 3]. The me-tabolome constitutes the interaction between smallmolecules, such as metabolic substrates and products,lipids, small peptides, vitamins, and other protein co-factors [4, 5]. A summary of metabonomic relateddefinitions is provided in Table 1 [6].
Metabonomics is a rapidly expanding area of scien-tific research and is one of the new ‘‘omics’’ joining geno-mics, transcriptomics, and proteomics, in an area ofscience trying to understand global systems biology[7]. This expansion has been reflected in the numberof publications over the last 30 to 40 y with a steady in-crease since the year 2000 [5, 7]. Further evidence of therapid growth in the field is the recent launch of a dedi-cated journal Metabolomics.
The profiling of metabolites was first reported in theliterature in the 1950s but subsequent progress wasslow, and only since the turn of the new millenniumhas metabonomics started to become a stand alone sci-entific entity. The recent developments have occurreddue to improvements in analytical techniques anddata handling systems [8]. Whilst metabonomics is atthe endpoint of the ‘‘omics cascade’’ and the closest tothe phenotype, there is still no single-instrument plat-form that can currently analyze all metabolites [6],

TABLE 1
Definitions Related to Metabonomics
Metabolite Small molecules that participate ingeneral metabolic reactions and thatare required for the maintenance,growth and normal function of a cell
Metabolome The complete set of metabolites in anorganism
Metabonomics Identification and quantification of allmetabolites in a biologic system
Genomics
Proteomics
Metabonomics
DNA
Protein
Metabolites
Small moleculeprofile
Specific smallmolecule markers
FIG. 1. The ‘‘omics’’ family. (Color version of figure is availableonline.)
GOLDSMITH ET AL.: METABONOMICS 123
nor is there a standard complete metabolic database.When attaining a metabolic profile from a sample foranalysis, the process focuses on groups of metabolites.Often prior to the study the metabolites that may pre-dict outcome are unknown and the method is akin toa ‘‘fishing episode,’’ which involves looking for trendsthat may foresee a result before it occurs. This canlead to problems; as with any high throughput technol-ogy, metabonomics can be subject to high rates of falsenegative or false positive results.
The importance of metabolites in relation to the path-ogenesis of disease is only just beginning to be fully un-derstood, yet it is well appreciated that metabolitesserve as markers for both the genome and proteome.Single amino acid changes in a protein or a single basechange in a gene can lead to as much as a 10,000-foldchange in the concentration of certain metabolites [9].
Under toxic stress, cells attempt to maintain homeo-stasis and metabolic control by varying the compositionof the body fluids that either perfuse them or are se-creted by them. This involves the simultaneous adjust-ment in the concentrations of hundreds or thousands ofmetabolites in order to maintain cell characteristics.This metabolic adjustment is expressed as a metabolicfingerprint that can be sampled, analyzed and com-pared [10]. Some authors [11, 12] have also suggestedthat a large proportion of chronic disease, and thereforemorbidity, arise from an adverse reaction betweenmetabolite and the genome or proteome.
WHAT LINKS THE ‘‘OMICS’’?
Although metabonomics invariably deals with mole-cules less than 1500 Da in weight there is crossover inanalysis and interaction between metabonomics andthe better known proteomics and genomics (Fig.1).
Genomics was derived from the term genome, whichin turn was derived from a combination of the wordsgene and chromosome to indicate the complete set ofchromosomes, and the genes contained in them. The‘‘omics’’ have come to mean an approach capable of gen-erating a comprehensive data set of whatever is beingmeasured, be it transcripts (transcriptomics), proteins(proteomics), or metabolites (metabonomics) [13]. It
has been commented that given the large amount ofmoney spent on genomics and proteomics over the lastdecade there has been surprisingly little impact on thenumbers of new drugs making it into the clinical arena[14]. A possible explanation for this observation is thatgenomics and proteomics do not provide evidence of end-point markers for disease diagnosis, or evaluation ofbeneficial or adverse drug effects. With metabonomics,the ability to document the metabolites and thereforethe phenotype, an absolute endpoint, may provide theultimate diagnostic information [10]. It may well be eas-ier to work from the phenotype through to the genotypethan to try and speculate the significance of thousandsof changes in transcript expression [13].
The fields of proteomics and metabonomics use simi-lar kinds of equipment for analysis, predominantly,mass spectrometry (MS) and nuclear magnetic reso-nance (NMR) spectroscopy [15]. In proteomics, prob-lems arise from the sheer number of dynamicallyfluctuating proteins. In metabonomics, the general esti-mations of the size and number of a species-specific me-tabolome are at a preliminary stage [16]. The number ofmetabolites present in any given species is still un-known and estimates vary from 2000 in humans to upto 200,000 in plants [6, 17].
All proteins are formed from amino acids that arethemselves metabolites. Proteins use metabolites fortheir everyday functions in the form of cofactors, signal-ing molecules or stabilizing agents, and when these pro-teins eventually decompose they return to a metaboliteform. Proteins require metabolites and in return themetabolites require the proteins [3].
ANALYTICAL TECHNIQUES
In principle, the approach to metabonomics consists oftwo distinguishable parts: first, an experimental

TABLE 2
The Pros and Cons of Mass Spectrometry (MS) andNuclear Magnetic Resonance (NMR)
JOURNAL OF SURGICAL RESEARCH: VOL. 160, NO. 1, MAY 1, 2010124
technique must be used to collect data from obtained sam-ples. Second, a data processing technique must be appliedto the dataset in order to sift out areas of interest from themillions of individual datapoints that are present.
Variable NMR MS
Equipment cost High HighMaintenance cost High HighPer sample cost Low HighReproducibility
(within oracross labs)
High Moderate
Identification ofunknownmetabolites
Takes time Can be fast
Sensitivity Lower than MS butapproachesmicromolar
Higher than NMR
Quantitation Routine DifficultResolvable metabolites Possible PossiblePotential for
sample biasNo Yes
Data analysisautomation
Some Yes
SAMPLE COLLECTION
Metabolites are generally labile species, are chemi-cally very diverse, and often present in a wide dynamicrange. A major goal of all metabolite-profiling is to ex-amine all metabolites within the biological system be-ing sampled. Since body fluids such as plasma andurine contain huge numbers of small molecules, thisrepresents a considerable analytical challenge [17]. In-deed, prior to any investigation, careful considerationneeds to be given to the type of sample, time taken toprocess, containers used in transit, and the addition ofany preservatives as these will all effect sample qualityirreversibly [18].
Before any metabolites are measured, it is importantthat any metabolic activity is stopped as quickly as pos-sible to halt ongoing metabolic activity. With human tis-sue this can by done by snap freezing in liquid nitrogen orby freezing to –80 �C [19]. At this point, samples are verystable enzyme activity has stopped and can be safelystored without continuing metabolic activity prior toanalysis. Platelet or erythrocyte membrane samplesmay be analyzed in other solvent media enablingrelatively non-water soluble lipid-like metabolites to bemonitored.
SAMPLE ANALYSIS
There are two main technologies that may be used foranalysis of the metabolome, namely MS and NMR.NMR-based metabonomics has the advantage of beingnondestructive; nonselective (i.e., removes bias fora specific molecule); cost-effective; fast; and with mini-mal requirements for sample preparation. MS, how-ever, is a much more sensitive technique and thereforethe concentration detection limit is much lower thanNMR [2, 6, 20, 21]. The relative pros and cons of thetwo techniques are summarized in Table 2 [13, 22].
NUCLEAR MAGNETIC RESONANCE SPECTROSCOPY
NMR is widely used in chemistry and can providedetailed information on molecular structure. It workson the basis that certain nuclei possess the propertyof spin. When placed in a magnetic field, these spinsalign themselves with respect to the magnetic field.Application of a radiofrequency pulse inverts the spinsto a higher energy orientation and the magnetizationof the sample is deflected away from the direction of
the magnetic field. When the radiofrequency isswitched off, the spins undergo relaxation to theiroriginal lower energy orientations. During these pro-cesses, a detectable NMR signal is produced that canbe analyzed with the aid of a computer in the formof readable spectra. Each molecule results in a set oflines in the spectrum, the positions of which (chemicalshift) depends on chemical environment of the nucleibeing observed (Fig. 2) [23]. The area under the peak(any line for a nucleus from a particular molecule) isproportional to the concentration of that moleculepresent in the solution. Nuclei such as 1H, 13C, 15N,and 31P may be observed but 1H is the most sensitive(non-radioactive) NMR nucleus and thus dominatesNMR-based metabonomic studies. The NMR spectrumof most metabolites has been analyzed and hence it ispossible to interpret new spectra on the basis of avail-able data [22, 24]. If signals arise that have not previ-ously been reported, other NMR experiments may beemployed to unambiguously assign these and therebyidentify a new metabolite. Typically, spectra of bio-fluids such as urine and plasma contain thousands ofsignals. Generally, it is necessary to use data reduc-tion and pattern recognition techniques in order to ac-cess the latent biochemical information present in thespectra and detect meaningful correlations [10].Difficulties do occur not only in practicality but alsointerpretation of data. For example, the main compo-nent of any biofluid is water, which produces anNMR peak so huge that it can obscure other molecularinformation and cause dynamic range problems in theNMR detector [10]. Suppression techniques are possi-ble to solve the high concentration of water seen in

FIG. 2. 1H-NMR spectrum ala ¼ alanine, ile ¼ isoleucine, lys ¼ lysine, met ¼ methionine, thr ¼ throsine, val ¼ valine.
GOLDSMITH ET AL.: METABONOMICS 125
blood whilst analyzing the samples which does notinterfere or destroy the sample.
MASS SPECTROSCOPY
MS is widely available and widely used and is thestandard technique in the pharmaceutical industry en-abling identification and quantification of drug metabo-lites. MS offers quantitative analyses with highselectivity and sensitivity [6] and molecular formulaedetermination via accurate mass measurements [20].This makes it an incredibly powerful tool for analysisof large numbers of metabolites [21]. MS based tech-niques are intrinsically more sensitive than NMR butusually require a sample preparation step, which un-like NMR can cause metabolite losses, and based onthe sample introduction system and the ionization tech-nique used, specific metabolite classes may be discrim-inated [6]. Differing types of MS exist, with theirvarying advantages and disadvantages. Ion suppres-sion and matrix effects can also lead to difficulties in de-tecting certain compounds. These problems can beovercome by coupling a chromatography system to themass spectrometer. The chromatographic step is ableto reduce the number of competing analytes enteringthe mass spectrometer in addition to separating com-plex mixtures of metabolites [24]. As a result, liquidchromatography-MS is increasingly being used to pro-file low-molecular-weight metabolites [25–27].Gaschromatography-MS is also growing in popularity forthe profiling of volatile compounds [28, 29]. This couldbe deemed a disadvantage, as most biofluids and tissueare involatile. Therefore, processing of samples needs tobe undertaken to convert samples into volatilesubstances.
STATISTICAL ANALYSIS
Chemometrics is the term generally ascribed to datareduction and pattern recognition applied to chemicalnumerical data. The aim is to assign and classify thespectral peaks. The most commonly used statistical ap-proach at present is that of principal components analy-sis (PCA). In its simplest application to NMR dataanalysis, PCA requires the spectrum to be divided intomany equally spaced regions (binning) and the area ofthe signal in each of these regions measured. Each ‘‘re-gion’’ is then interpreted for each clinical case. The re-gions with the biggest variation in area are likely toreport of the status of the patient (healthy/unhealthy)and in this way provide a clinically useful biomarkerof the condition [6]. The combination of NMR with sta-tistical data analysis allows the measurement and in-terpretation of hundreds of metabolites, quickly,easily, and inexpensively [20, 30, 31] (Fig. 3).
There are other methods also available for data re-duction. Genetic algorithm aligns the peaks in auto-matically selected segments in each spectrum to thecorresponding peaks in a preselected reference spec-trum. A disadvantage to this process is that referencespectrum cannot account for loss or appearance ofnew peaks [32]. Statistical heterospectroscopy (SHY)allows data coanalysis and rapid structural informationform metabolites by direct comparison between NMRand MS signals [33].
APPLICATIONS
Whilst still in its infancy, metabonomics is beginningto define its importance in the role of future of medicaladvances. Some important considerations include:

FIG. 3. Data reduction ‘‘binning’’ of 1H Spectra and the PCA scores plot from such data. (Color version of figure is available online.)
JOURNAL OF SURGICAL RESEARCH: VOL. 160, NO. 1, MAY 1, 2010126
1. Over 95% of all diagnostic clinical assays look forsmall molecules [34]
2. 89% of known drugs are small molecules [35]3. 50% of all drugs are derived from pre-existing me-
tabolites [36]4. 30% of identified genetic disorders involve
diseases of small molecule metabolism [37]
In the clinical setting, metabonomics can be used totest cohorts of patients with certain pathologies andcompare their metabolic profile with a ‘‘normal’’ controlcohort or to compare the metabolic profile within diseasegroups. This is known as metabolic fingerprinting. Anumber of complex diseases, such as atherosclerosis,type 2 diabetes mellitus, and cancer [3] may resultfrom a chronic imbalance of normal metabolism. There-fore, metabonomic based approaches may be of use inidentifying surrogate biomarkers of pathological states[21]. Initially in this approach the intention is not toidentify each observed metabolite, but to compare pat-terns or ‘‘fingerprints’’ of metabolites that change in re-sponse to disease, toxin exposure, environmental, orgenetic alterations [6]. At present metabolic finger-prints have been reported for some disease states, whichinclude pre-eclampsia [23] motor neurone disease [38],
Alzheimer’s [39], coronary artery disease [40], breastcancer [41], ovarian cancer [42], and hepatic cancer [43].
TOXICOLOGY
Currently in the field of toxicology, NMR and MShave been used to assess the health risk of particulartoxins/drugs and identifying metabolic differences inexperimental animals and humans (Table 3) [44–48].The administration of a drug generally induces a seriesof metabolic events, many in a time dependent manner,analysis of which can provide insight to toxicology/efficacy of the drug [49–52].
MARKERS OF DISEASE
Clinical medicine strives for noninvasive biomarkersthat can diagnose clinically relevant processes. Asmany diseases are indeed a result of metabolic disor-ders, it makes a great deal of sense to measure metabo-lites directly. The value of the glucose stick in diabetesor urine tests for the diagnosis of pregnancy show theworth of such simple bedside tests. Therefore, a very ac-tive area of research within metabonomics is that of

TABLE 3
Metabolic Markers Associated with Toxins as Determined by Metabonomic Analysis
Toxin Target organ/toxicity type Associated biomarkers
Amiodarone Phospholipidosis (lung) [Phenylacetylglycine, [DMGa-Naphthylisothiocyanate (ANIT) Liver (cholestasis) [acetate, [bile acids, Y�citrate, [glucose, [�hippurate,
Y�2-OG,�succinateChloroquine Phospholipidosis & liver necrosis [Phenylacetylglycine, [DMGEthionine Liver [glucose,�2-OG, taurineGalactosamine Liver (hepatitis like lesion) [acetate, [betaine, [bile acids, [creatine, Y�hippurate,
[organic acids, [taurine, [urocanic acid Y�2-OG, Y�succinateLead acetate Liver/lung/kidney [acetate, [creatine, Y�citrate, [glucose, Y�hippurate, [lactate,
Y�2-OG, [N-acetyls, Y�succinate, [taurineParaquat Kidney & lung [amino acids, Y�citrate Y�creatinine, [glucose, Y�hippurate,
[lactate & organic acids, Y�valinePuromycin aminonucleoside Kidney (glomerulus & proximal tubular) [acetate, [alanine, Y�citrate, [creatine, [formate, [glucose,
[macromolecules (proteins and lipids),Y�2-OG, [taurine, [TMAO
Sodium chromate Kidney (S1 proximal tubular) [�citrate, [glucose, Y�hippurate, Y�2-OGSodium fluoride Kidney (proximal tubular) [acetate, [amino acids, Y�citrate Y�creatinine, [glucose,
Y�hippurate, [organic acids, Y�2-OG,Y�succinate, [threonine
GOLDSMITH ET AL.: METABONOMICS 127
discovering which metabolites are indicative of disease[19]. The advantages of metabonomics in revealinga biomarker are shown in Table 4 [53].
Some biomarkers have already been identified.Sanins et al. identified taurine a metabolite specific tothe liver as a marker of disease. They found that raisedurinary levels of taurine were associated with necrosisand fatty liver. These results correlated with routineblood investigations [54]. Liver dysfunction was also co-incident with the appearance of certain types of bileacids present in both serum and urine. Beckwith-Hallet al. found that on ingestion of liver toxins, certain me-tabolites were present in high concentrations such ascholic, glycocholic, and taurocholic acids [44].
Changes in taurine concentrations were also ob-served by Gartland et al. They found that followingexposure to hydrazine, taurine, citrate and lactatelevels were affected [55]. Nicholson et al. identified suc-cinate, glycine, and dimethylamine in the blood thatwere found to be indicators of kidney damage [56]. Mea-surement of urine metabolites has proven to be a goodmarker of kidney damage due to the nature of where
TABLE 4
Advantages of Metabonomics in IdentifyingNoninvasive Biomarkers
SamplingEasy access to samples – blood, urine, tissue biopsyRepeatable/serial sampling possibleMarker stability – samples can be stored for long periodsAnalysisReproducible processRobustness against interfering substances in the sample – disease
context specificExplanatory powerPotential for good specificity and sensitivity – established in literature
urine is derived. Anthony et al. and Gartland et al. foundmetabolites such as glucose, lactate, alanine, lysine,glutamine, glutamate, and valine to be present in abun-dance when damage to the proximal tubule of the kidneyhas occurred. This is due to the inability of the damagedkidney to filter metabolites present in the blood [57–60].
The main concern in the area of biomarker identifica-tion from initial studies is that the same metabolites (2-oxoglutarate, acetate, citrate, creatine, creatinine, glu-cose, hippurate, lactate, succinate, taurine, and tri-methyl amine/trimethyl amine oxide (TMA/TMAO)[13] are often present in response to drug administra-tion, regardless of the nature of the drug, i.e., differentdrugs often result in similar metabolic profiles whenanalyzing samples such as urine [57, 60–62]. Impor-tantly, however, not all these molecules materialize inresponse to every toxicant nor do they appear in thesame concentrations.
TRANSPLANTATION
In the field of solid organ transplantation, some of theearly metabonomic studies have looked into primarynon-function, delayed graft function, and acute rejec-tion. There is currently no single test to differentiatethese pathologies. Some of the metabolite findingsalready observed in the field of transplant aresummarized in Table 5 [31].
In the field of hepatic transplantation, the wideningof indications for liver transplant coupled with theshortage of donors has led to the increased utilizationof marginal grafts, which have higher rates of non-func-tion and graft failure [63–65]. The need for early diag-nosis in these settings is becoming more apparent.The inability to diagnose primary graft non-function
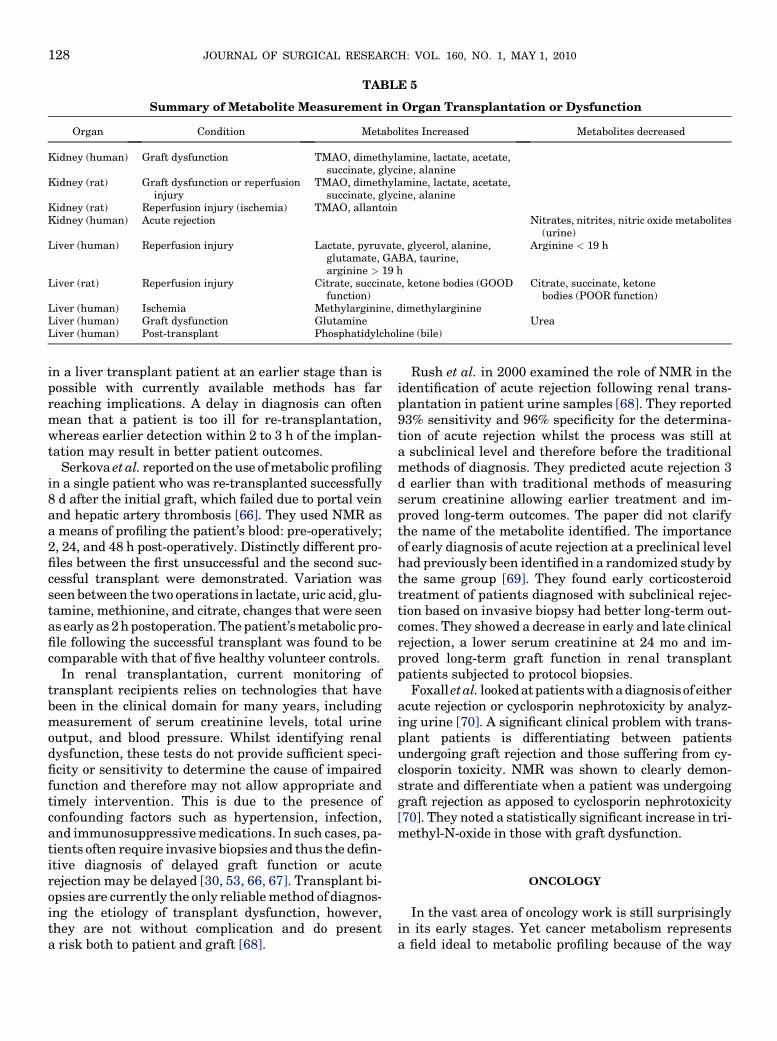
TABLE 5
Summary of Metabolite Measurement in Organ Transplantation or Dysfunction
Organ Condition Metabolites Increased Metabolites decreased
Kidney (human) Graft dysfunction TMAO, dimethylamine, lactate, acetate,succinate, glycine, alanine
Kidney (rat) Graft dysfunction or reperfusioninjury
TMAO, dimethylamine, lactate, acetate,succinate, glycine, alanine
Kidney (rat) Reperfusion injury (ischemia) TMAO, allantoinKidney (human) Acute rejection Nitrates, nitrites, nitric oxide metabolites
(urine)Liver (human) Reperfusion injury Lactate, pyruvate, glycerol, alanine,
glutamate, GABA, taurine,arginine > 19 h
Arginine < 19 h
Liver (rat) Reperfusion injury Citrate, succinate, ketone bodies (GOODfunction)
Citrate, succinate, ketonebodies (POOR function)
Liver (human) Ischemia Methylarginine, dimethylarginineLiver (human) Graft dysfunction Glutamine UreaLiver (human) Post-transplant Phosphatidylcholine (bile)
JOURNAL OF SURGICAL RESEARCH: VOL. 160, NO. 1, MAY 1, 2010128
in a liver transplant patient at an earlier stage than ispossible with currently available methods has farreaching implications. A delay in diagnosis can oftenmean that a patient is too ill for re-transplantation,whereas earlier detection within 2 to 3 h of the implan-tation may result in better patient outcomes.
Serkova et al. reported on the use of metabolic profilingin a single patient who was re-transplanted successfully8 d after the initial graft, which failed due to portal veinand hepatic artery thrombosis [66]. They used NMR asa means of profiling the patient’s blood: pre-operatively;2, 24, and 48 h post-operatively. Distinctly different pro-files between the first unsuccessful and the second suc-cessful transplant were demonstrated. Variation wasseen between the two operations in lactate, uric acid, glu-tamine, methionine, and citrate, changes that were seenas early as 2 h postoperation. The patient’s metabolicpro-file following the successful transplant was found to becomparable with that of five healthy volunteer controls.
In renal transplantation, current monitoring oftransplant recipients relies on technologies that havebeen in the clinical domain for many years, includingmeasurement of serum creatinine levels, total urineoutput, and blood pressure. Whilst identifying renaldysfunction, these tests do not provide sufficient speci-ficity or sensitivity to determine the cause of impairedfunction and therefore may not allow appropriate andtimely intervention. This is due to the presence ofconfounding factors such as hypertension, infection,and immunosuppressive medications. In such cases, pa-tients often require invasive biopsies and thus the defin-itive diagnosis of delayed graft function or acuterejection may be delayed [30, 53, 66, 67]. Transplant bi-opsies are currently the only reliable method of diagnos-ing the etiology of transplant dysfunction, however,they are not without complication and do presenta risk both to patient and graft [68].
Rush et al. in 2000 examined the role of NMR in theidentification of acute rejection following renal trans-plantation in patient urine samples [68]. They reported93% sensitivity and 96% specificity for the determina-tion of acute rejection whilst the process was still ata subclinical level and therefore before the traditionalmethods of diagnosis. They predicted acute rejection 3d earlier than with traditional methods of measuringserum creatinine allowing earlier treatment and im-proved long-term outcomes. The paper did not clarifythe name of the metabolite identified. The importanceof early diagnosis of acute rejection at a preclinical levelhad previously been identified in a randomized study bythe same group [69]. They found early corticosteroidtreatment of patients diagnosed with subclinical rejec-tion based on invasive biopsy had better long-term out-comes. They showed a decrease in early and late clinicalrejection, a lower serum creatinine at 24 mo and im-proved long-term graft function in renal transplantpatients subjected to protocol biopsies.
Foxalletal. lookedat patientswith adiagnosisofeitheracute rejection or cyclosporin nephrotoxicity by analyz-ing urine [70]. A significant clinical problem with trans-plant patients is differentiating between patientsundergoing graft rejection and those suffering from cy-closporin toxicity. NMR was shown to clearly demon-strate and differentiate when a patient was undergoinggraft rejection as apposed to cyclosporin nephrotoxicity[70]. They noted a statistically significant increase in tri-methyl-N-oxide in those with graft dysfunction.
ONCOLOGY
In the vast area of oncology work is still surprisinglyin its early stages. Yet cancer metabolism representsa field ideal to metabolic profiling because of the way

GOLDSMITH ET AL.: METABONOMICS 129
its metabolism differs substantially from normal cells,especially that of the glucose and phospholipidmetabolism [71].
Conventional treatment has a somewhat blunder-buss approach with treatment strategy based on tumorsize and stage. A more individual approach targetingspecific antigens and antibodies has led to the develop-ment of specific biomarkers to assess treatment prog-ress. Linking metabolic profiles to cancer dependsheavily on the analytical instruments available sincein the etiopathogenesis of cancers, abnormalities ingene expression, protein expression, and biochemicalpathways often coexist [72]. Traditional approaches us-ing single molecular markers are often associated witha low predictive value [70]. Current markers identifiedare shown in Table 6 [73–81, 89].
NMR is able to assess and quantify all upregulatedglycolytic enzymes. Genes known to be associatedwith cancer p53, c-MYC, and HIF-1 all cause an in-crease in glucose metabolism. Metabolic profiling canassess this increase in glucose uptake via the tumorcells [82–84].
Griffiths and Stubbs used NMR spectroscopy tomeasure metabolite changes in mouse-derived tumorcells that were deficient in the transcription factor,hypoxia-inducible factor-1 (HIF-1) [85]. HIF-1 hasbeen widely shown to play a direct role in acceleratingtumour growth. They found that adenosine triphos-phate production was impaired in HIF-1 deficient tu-mour cells. The spectra also revealed lowerconcentrations of glycine, betaine, and some choline-based metabolites. These metabolites are requiredfor purine synthesis thus demonstrating possible ave-nues for future drug therapies in the bid to stoptumour growth [85, 86].
Sitter et al. studied patients with breast cancerand looked at 88 tumour samples and 18 tissuesamples from adjacent non-tumour tissue [86].With the use of high-resolution magic-angle spin-ning (HR-MAS) magnetic resonance spectroscopy,they compared the fingerprints obtained from thetwo types of tissue. The concentrations of glycero-
TABLE 6
Oncologic Biomarkers
Metabolite Tumor association
Taurine Increased in squamous cell carcinoma, prostatecancer, and liver metastases
Alanine Increased in astrocytomas, gliomas, meningiomas,and hepatomas
Myo-inositol Increased in colonic and ovarian cancer; decreasedin breast cancer
Choline Varying levels in hepatomas, prostate, andbrain tumors
phosphocholine, phosphocholine, and choline signalswere recorded. They reported 82% sensitivity and100% specificity. The study demonstrated that tu-moral tissues, when assessable by HR-MAS MRspectroscopy, differed in their metabolic contentfrom their benign counterparts [87].
Odunsi et al. [42] compared 38 patients with epithe-lial ovarian cancer with 12 patients with benign ovar-ian cysts and 53 healthy women. Clear differentiationwas observed between those with cancer and thosewithout, although the nature of the metabolites givingrise to the discrimination has yet to be determined.
Prostate cancer has a high incidence in men over 50 yold, and current tests such as prostate specific antigen(PSA) and digital rectal examination (DRE) are not suf-ficiently specific. PSA, although only seen in relation toprostatic pathology, can be elevated in benign condi-tions such as benign prostatic hyperplasia and prostati-tis. Abnormal PSA and DRE findings are only accuratefor cancer in between 25% and 50% of cases [88]. Thiscan often lead to prostate core biopsies, an invasive pro-cedure not without its own morbidity, but neverthelessthe gold standard in this field of cancer diagnosis [89].Sheidler et al. combined magnetic resonance spectro-scopic imaging with traditional techniques of magneticresonance imaging. This involved quantitative detec-tion of choline, citrate, and creatine via echo delay.They demonstrated an increase in sensitivity and spec-ificity for the diagnosis of prostate cancer of 95% and91% respectively, compared with established sensitiv-ities and specificities of between 60% and 75% with cur-rent tests. The process noted that the three metabolitesappeared in different ratios when compared betweenbenign and malignant conditions [90].
Excellent discrimination in lung cancer patients hasbeen seen by Vautz et al. Analysis of 36 lung cancer pa-tients versus 54 healthy controls using metabolicprofiles of breath showed correct classification in 99%of the patients. The process involved using ion mobilityspectrometry (IMS) coupled to a multicapillary columnalongside an integrated medical software system fordata processing [91].
CORONARY HEART DISEASE
Brindle et al. used NMR analysis of serum to differen-tiate patients with triple vessel coronary heart diseasefrom angiographically normal subjects [92]. They wereable to distinguish not only the presence of disease butalso the severity of the coronary disease on the basis ofNMR studies. Their study differentiated greater than90% of patients with three vessel disease over patientswith normal angiograms.
JOURNAL OF SURGICAL RESEARCH: VOL. 160, NO. 1, MAY 1, 2010130
However, doubt in this area of medicine does exist,and this work has been questioned [93]. Acute eventssuch as myocardial infarctions are by their nature un-predictable, which precludes prior blood sampling forpredictive purposes. The atherothrombotic plaques in-volved in coronary artery disease are varied in theirproportions, which may influence plasma biochemistry.
THE FUTURE
Metabonomics is a burgeoning science, combininghigh resolution NMR or MS with pattern recognitionstrategies to rapidly and accurately diagnose themetabolic status of the sample being studied. It hasdeveloped considerably in the last decade and isnow recognized as an independent and widely usedtechnique, as well as a proteomics complementingtechnology [94].
Metabonomics has the ability to evaluate onset, du-ration, severity and organ specificity of a disease orcondition from easily available samples. As knowledgein this field of metabonomics improves, along with theevolution of the Human Metabolome Project [3], thediscovery of new metabolites and their interactionwith the human genome and proteome will allow fur-ther advances in drug manufacture with enhanceddrug targeting, development of biomarkers, and a bet-ter understanding of diseases processes. It has alreadybeen adopted by a number of pharmaceuticalcompa-nies in their drug development initiatives [10].
With regards to its clinical potential, metabonomicsallows diagnosis of pathological conditions throughidentification of disease specific fingerprints, andchanges in such profiles will assist in assessing diseaseprogression and monitoring treatment [23]. The tech-nology will also be able to predict drug toxicity and re-sponse following medical intervention such asadministration of chemotherapy to oncology patients.
Metabonomics can provide new biomarkers, andwith its ability to measure more than one metaboliteat anyone time, this process will surely be more pre-dictive than traditional single marker testing. Overtime, a powerful list of diagnostic markers will evolve,which can be measured using high-throughput assaysenabling earlier diagnosis and quicker, more patient-specific treatment.
REFERENCES
1. Nicholson JK, Lindon JC, Holmes E. ‘‘Metabonomics’’: Under-standing the metabolic responses of living systems to pathophys-iological stimuli via multivariate statistical analysis of biologicalNMR spectroscopic data. Xenobiotica 1999;29:1181.
2. Goodacre R, Vaidyanathan S, Dunn WB, et al. Metabolomics bynumbers: Acquiring and understanding global metabolite data.Trends Biotechnol 2004;22:245.
3. Wishart D. Proteomics and the human metabolome project.Expert Rev Proteomics 2007;4:333.
4. Ryals J. Metabolomics: An important emerging science. Busi-ness Briefing Pharmatech, http://www.touchbriefings.com,2004;51.
5. Beecher CWW. The human metabolome. In: Harrigan GG,Goodacre R, Eds. Metabolic profiling:Its role in biomarker dis-covery and gene function analysis. Norwell, MA: Kluwer Aca-demic Publishers, 2003:1.
6. Dettmer K, Aronov AP, Hammock BD. Mass spectrometry-basedmetabolomics. Mass Spectrom Rev 2007;26:51.
7. Schmidt C. Metabolomics takes its place as latest up-and-coming‘‘omic’’ science. JNCI 2004;96:732.
8. Rochfort S. Metabolomics reviewed: A new ‘‘omics’’ platformtechnology for systems biology and implications for natural prod-ucts research. J Nat Prod 2005;68:1813.
9. Bory C, Boulieu R, Chantin C, et al. Diagnosis of alcaptonuria:Rapid analysis of homogentisic acid by HPLC. Clin Chim Acta1990;189:7.
10. Lindon JC, Holmes E, Bollard ME, et al. Metabonomics technol-ogies and their applications in physiological monitoring, drugsafety assessment and disease diagnosis. Biomarkers 2004;9:1.
11. Katzmarzyk PT, Janssen L. The economic costs associated withphysical inactivity and obesity. Can J Appl Physiol 2004;29:90.
12. Johnson JA, Pohar SL, Majumdar SR. Health care use and costsin the decade after the identification of type 1 and type 2 diabe-tes. A population based study. Diabetes Care 2006;29:2043.
13. Robertson DG. Metabonomics in toxicology: A review toxicologicalsciences 2005;85:809.
14. Stumm G, Russ A, Nehls M. Deductive genomics - a functionalapproach to identify innovative drug targets in the post-genomicera. Am J Pharmacogenomics 2002;2:263.
15. Drysdale R, Bayraktaroglu L. Current awareness. Yeast 2000;17:159.
16. Weckwerth W, Morgenthal K. Metabolomics: From pattern rec-ognition to biological interpretation. DDT 2005;22:1551.
17. Fiehn O. Metabolomics–the link between genotypes and pheno-types. Plant Mol Biol 2002;48:155.
18. Holland NT, Smith MT, Eskenazi B, et al. Biological samplecollection and processing for molecular epidemiological studies.Mutat Res 2003;543:217.
19. Hollywood K, Brison DR, Goodacre R. Metabolomics: Currenttechnologies and future trends. Proteomics 2006;6:4716.
20. Dunn WB, Bailey NJ, Johnson HE. Measuring the metabolome:Current analytical technologies. Analyst 2005;130:606.
21. Whitfield PD, German AJ, Noble PJM. Metabolomics: An emerg-ing post-genomic tool for nutrition. Br J Nutr 2004;92:549.
22. Claudino WM, Quattrone A, Biganzoli L, et al. Metabolomics:Available results, current research projects in breast cancer,and future applications. J Clin Onc 2007;25:2840.
23. Turner E, Brewster JA, Simpson NAB, et al. Hypertension inpregnancy 2007;26:329.
24. Griffin JL. Metabolic profiles to define the genome: Can we hearthe phenotypes? Philos TransR Soc Lond B Biol Sci. 2004;359:857.
25. Pham-Tuan H, Kashavelis L, Daykin CA, et al. Method develop-ment in high-performance liquid chromatography for highthroughput profiling and metabonomic studies of biofluid sam-ples. J Chromatogr 2003;789B:283.
26. Plumb RS, Stumpf CL, Gorenstein MV, et al. Metabonomics: Theuse of electrospray mass spectrometry coupled to reversed-phaseliquid chromatography shows potential for the screening of raturine in drug development. Rapid Commun Mass Spectrom2002;16:1991.
GOLDSMITH ET AL.: METABONOMICS 131
27. Idborg-Bjorkman H, Edlund PO, Kvalheim OM, et al. Screeningof biomarkers in rat urine using LC/electrospray ionization-MSand two-way data analysis. Anal Chem 2003;75:4784.
28. Dunn WB. Current trends and future requirements for the massspectrometric investigation of microbial mammalian and plantmetabolomes. Phys Biol 2008;5:1.
29. Lenz ME, Wilson ID. Analytical strategies in metabonomics.J Proteome Res 2007;6:443.
30. Wishart D. Metabonomics in monitoring kidney transplants.Curr Op Nephrol Hypertens 2006;15:637.
31. Wishart D. Metabonomics: The principles and potential applica-tions to transplantation. Am J Transplant 2005;5:2814.
32. Forshed J, Schuppe-Koistinen I, Jacobsson SP. Peak alignmentof NMR signals by means of a genetic algorithm. Anal Chim Acta2003;487:189.
33. Crockford DJ, Holmes E, Lindon JC, et al. Statistical heterospec-troscopy, an approach to the integrated analysis of NMR andUPLC-MS data sets: Application in metabonomic toxicologystudies. Anal Chem 2006;78:363.
34. Tietz NW. Clinical guide to laboratory tests. 3rd ed. Philadel-phia, PA: W.B. Saunders Press, 1995.
35. Drugbank. www.drugbank.ca
36. Mahido C, Ruchiwarat S, Prawat H, et al. Biodiversity andnatural product drug discovery. Pure Appl Chem 1998;70:2065.
37. Hamosh A, Scott AF, Amberger J, et al. Online mendelian inher-itance in man (OMIM) a knowledge base of human genes and ge-netic disorders. Nucleic Acid Res 2002;30:52.
38. Rozen S, Cudkowicz ME, Bogdanov M, et al. Metabolomic anal-ysis and signatures in motor neuron disease. Metabolomics2005;1:101.
39. Han XM, Holtzman D, McKeel DW, et al. Substantial sulfatidedeficiency and ceramide elevation in very early Alzheimer’s dis-ease: Potential role in disease pathogenesis. J Neurochem 2002;82:809.
40. Sabatine MS, Liu E, Morrow DA, et al. Metabolomic identifica-tion of novel biomarkers of myocardial ischemia. Circulation2005;112:3868.
41. Fan X, Bai J, Shen P. Diagnosis of breast cancer using HPLCmetabonomics fingerprints coupled with computationalmethods. Conf Proc IEEE Eng Med Biol Soc 2005;6:6081.
42. Odunsi K, Wollman RM, Ambrosone CB, et al. Detection ofepithelial ovarian cancer using 1H-NMR-based metabonomics.Int J Cancer 2005;113:782.
43. Yang J, Xu G, Zheng Y, et al. Diagnosis of liver cancer usingHPLC-based metabonomics avoiding false-positive result fromhepatitis and hepatocirrhosis diseases. J Chromatogr B AnalTechnol Biomed Life Sci 2004;813:59.
44. Beckwith-Hall BM, Nicholson JK, Nicholls A, et al. Nuclearmagnetic resonance spectroscopic and principal componentsanalysis investigations into biochemical effects of three modelhepatotoxins. Chem Res Toxicol 1998;11:260.
45. Nicholson JK, Wilson ID. High resolution proton NMR spectros-copy of biological fluids. Prog NMR Spectrosc 1989;21:444.
46. Robertson DG, Reily MD, Sigler RE, et al. Metabonomics: Eval-uation of nuclear magnetic resonance (NMR) and pattern recog-nition technology for rapid in vivo screening of liver and kidneytoxicants. Toxicol Sci 2000;57:326.
47. Lindon JC, Nicholson JK, Holmes E, et al. Metabonomics: Met-abolic processes studied by NMR spectroscopy of biofluids. Con-cept Mag Reson 2000;12:289.
48. Bairaktari E, Katopodis K, Siamopoulos KC, et al. Paraquat-in-duced renal injury studied by 1H NMR spectroscopy of urine.Clin Chem 1998;44:1256.
49. Nicholls AW, Holmes E, Lindon JC, et al. Metabonomic investi-gations into hydrazine toxicity in the rat. Chem Res Toxicol2001;14:975.
50. Waters NJ, Holmes E, Waterfield CJ, et al. NMR and pattern rec-ognition studies on liver extracts and in livers from rats treatedwith alpha-naphthylisothiocyanate. Biochem Pharmacol 2002;64:67.
51. Lenz EM, Bright J, Knight R, et al. Cyclosporin A-inducedchanges in endogenous metabolites in rat urine: A metabonomicinvestigation using high field 1HNMR spectroscopy. HPLC-TOF/MS and chemometrics. J Pharm Biomed Anal 2004;35:599.
52. Lindon J. Metabonomics—Techniques and applications. Busi-ness briefing: Future Drug Discov 2004, p. 1.
53. Gwinner W. Renal transplant rejection markers. World J Urol2007;25:445.
54. Sanins SM, Nicholson JK, Elcombe C, et al. Hepatotoxin-in-duced hypertaurinuria: A proton NMR study. Arch Toxicol1990;64:407.
55. Gartland KPR, Beddell CR, Lindon JC, et al. Application of pat-tern recognition methods to the analysis and classification of tox-icological data derived from proton nuclear magnetic resonancespectroscopy of urine. Mol Pharmacol 1991;39:629.
56. Nicholson JK, Connelly J, Lindon JC, et al. Metabonomics: Aplatform for studying drug toxicity and gene function. Nat RevDrug Discov 2002;1:153.
57. Anthony ML, Gartland KP, Beddell CR, et al. Studies of the bio-chemical toxicology of uranyl nitrate in the rat. Arch Toxicol1994;68:43.
58. Gartland KP, Bonner FW, Nicholson JK. Investigations into thebiochemical effects of region-specific nephrotoxins. Mol Pharma-col 1989;35:242.
59. Gartland KP, Bonner FW, Timbrell JA, et al. Biochemical char-acterization of para-aminophenol-induced nephrotoxic lesions inthe F344 rat. Arch Toxicol 1989;63:97.
60. Holmes E, Bonner FW, Sweatman BC, et al. Nuclear magneticresonance spectroscopy and pattern recognition analysis of thebiochemical processes associated with the progression of and re-covery from nephrotoxic lesions in the rat induced by mercury(II) chloride and 2-bromoethanamine. Mol Pharmacol 1992;42:922.
61. Nicholls AW, Holmes E, Lindon JC, et al. Metabonomic investi-gations into hydrazine toxicity in the rat. Chem Res Toxicol2001;14:975.
62. Robertson DG, Reily MD, Sigler RE, et al. Metabonomics: Eval-uation of nuclear magnetic resonance (NMR) and pattern recog-nition technology for rapid in vivo screening of liver and kidneytoxicants. Toxicol Sci 2000;57:326.
63. Vilca Melendez H, Rela M, Murphy G, et al. Assessment of graftfunction before liver transplantation: Quest for the lost ark?Transplantation 2000;70:560.
64. Duarte IF, Stanley EG, Holmes E, et al. Metabolic assessment ofhuman liver transplants from biopsy samples at the donor andrecipient stages using high-resolution magic angle spinning1H-NMR spectroscopy. Anal Chem 2005;77:5570.
65. Serkova NJ, Zhang Y, Coatney JL, et al. Early detection of graftfailure using the blood metabolic profile of a liver recipient.Transplantation 2007;83:517.
66. Veronese FV, Manfro RC, Roman FR, et al. Reproducibility ofthe Banff classification in subclinical kidney transplant rejec-tion. Clin Transplant 2005;19:518.
67. Hauert T, Baumert H, Gibelin H, et al. Noninvasive monitoringof citrate, acetate, lactate and renal medullary osmolyte excre-tion in urine as biomarkers of exposure to ischemic reperfusioninjury. Cryobiology 2000;41:280.

JOURNAL OF SURGICAL RESEARCH: VOL. 160, NO. 1, MAY 1, 2010132
68. Rush D, Somorjai RL, Deslauriers R, et al. Subclinical rejec-tion—a potential surrogate marker for chronic rejection— maybe diagnosed by protocol biopsy or urine spectroscopy. AnnTransplant 2000;5:44.
69. Rush D, Nickerson P, Gough J, et al. Beneficial effects of treat-ment of early subclinical rejection: A randomized study. J AmSoc Nephrol 1998;9:2129.
70. Foxall PJ, Mellotte GJ, Bending MR, et al. NMR spectroscopy asa novel approach to the monitoring of renal transplant function.Kidney Int 1993;43:234.
71. Serkova N, Spratlin J, Eckhardt S. NMR-based metabolomics:Translational application and treatment of cancer. Curr OpinMol Ther 2007;9:572.
72. Schmidt C. Metabolomics takes its place as latest up-and-coming‘‘omic’’ science. J Nat Cancer Inst 2004;96:732.
73. Marcotte EM. The path not taken. Nat Biotechnol 2001;19:626.
74. El-Sayed S, Bezabeh T, Odlum O, et al. An ex vivo study explor-ing the diagnostic potential of 1H magnetic resonance spectros-copy in squamous cell carcinoma of the head and neck region.Head Neck 2002;24:766.
75. Moreno A, Lopez LA, Fabra A, et al. H MRS markers of tumorgrowth in intrasplenic tumors and liver metastasis induced byinjection of HT-29 cells in nude mice spleen. NMR Biomed1998;11:93.
76. Ben-Yoseph O, Badar-Goffer RS, Morris PG, et al. Glycerol 3-phosphate and lactate as indicators of the cerebral cytoplasmicredox state in severe and mild hypoxia respectively: A 13C-and 31P-n. m. r. study. Biochem J 1993;291:915.
77. Beckonert O, Monnerjahn J, Bonk U, et al. Visualizing metabolicchanges in breast-cancer tissue using 1 H-NMR spectroscopyand self-organizing maps. NMR Biomed 2003;16:1.
78. Howells SL, Maxwell RJ, Peet AC, et al. An investigation of tu-mor 1H nuclear magnetic resonance spectra by the applicationof chemometric techniques. Magn Reson Med 1992;28:214.
79. Carmichael PL. Mechanisms of action of antiestrogens: Rele-vance to clinical benefits and risks. Cancer Invest 1998;16:604.
80. Chen JH, Enloe BM, Fletcher CD, et al. Biochemical analysis us-ing high-resolution magic angle spinning NMR spectroscopy dis-tinguishes lipoma-like well-differentiated liposarcoma fromnormal fat. J Am Chem Soc 2001;123:9200.
81. Millis K, Weybright P, Campbell N, et al. Classification of hu-man liposarcoma and lipoma using ex vivo proton NMR spectros-copy. Magn Reson Med 1999;41:257.
82. Matoba S, Kang JG, Patino WD, et al. p53 regulates mitochon-drial respiration. Science 2006;312:1650.
83. Kim JW, Tchernyshyov I, Semenza GL, et al. HIF-1-mediatedexpression of pyruvate dehydrogenase kinase: A metabolicswitch required for cellular adaptation to hypoxia. Cell Metab2006;3:177.
84. ShimH, Dolde C, Lewis BC, et al. c-Myc transactivation of LDH-A:Implications for tumor metabolismand growth. Proc Natl AcadSciUSA 1997;94:6658.
85. Griffiths JR, McSheehy PM, Robinson SP, et al. Metabolicchanges detected by in vivo magnetic resonance studies ofHEPA-1 wild-type tumors and tumors deficient in hypoxia-in-ducible factor-1b (HIF-1b): Evidence of an anabolic role for theHIF-1 pathway. Cancer Res 2002;62:688.
86. Griffiths JR, Stubbs M. Opportunities for studying cancer bymetabolomics: Preliminary observations on tumors deficient inhypoxia-inducible factor 1. Adv Enzyme Regul 2003;43:67.
87. Sitter B, Lundgren S, Bathen TF, et al. Comparison of HR MASMR spectroscopic profiles of breast cancer tissue with clinical pa-rameters. NMR Biomed 2006;19:30.
88. DeVita VT, Hellman S, Rosenberg SA. Cancer principles andpractice of oncology. Philadelphia, PA: Lippincott Williams andWilkins, 2005.
89. Jordan KW, Cheng LL. NMR based metabolomics approach totarget biomarkers for human prostate cancer. Expert Rev Pro-teomics 2007;4:389.
90. Sheidler J, Hricak H, Vigneron DB, et al. Prostate Cancer: Local-ization with three-dimensional proton MR spectroscopic imag-ing – clinicopathologic study. Radiology 1999;213:473.
91. Vautz W, Baumbach JI. Exemplar application of multi-capillarycolumn ion mobility spectrometry for biological and medical pur-pose. Int J Ion Mobil Spectr 2008. Online publication date: 6-Jul-2008.
92. Brindle JT, Antti H, Holmes E, et al. Rapid and noninvasivediagnosis of the presence and severity of coronary heart diseaseusing 1H NMR-based metabonomics. Nat Med 2002;8:1439.
93. Kirschenlohr HL, Griffen JL, Clarke SC, et al. Proton NMR anal-ysis of plasma is a weak predictor of coronary artery disease. NatMed 2006;12:705.
94. Weckwerth W. Metabolomics in systems biology. Annu RevPlant Biol 2003;54:669.