
Messages from Conference Chairman - สถาบันเหล็กและ ...
164
-
Upload
khangminh22 -
Category
Documents
-
view
3 -
download
0
Transcript of Messages from Conference Chairman - สถาบันเหล็กและ ...


-1-
Messages from Conference Chairman
Metal-working industries have always held their importance in engineering works. This trend will unarguably continue through the future. The field of Metallurgy will, therefore, continually need lots of input especially in the form of research works from both academic and industrial sectors around the world. In industrialized countries, such as United States, European countries, South Korea, and Japan, Conferences in Metallurgy field have continually been held many times each year. The 1st Thailand Metallurgy Conference was successfully held the first time in Thailand in 2007. It was initiated by Director of the Iron and Steel Institute of Thailand (ISIT) and Director of the National Metals and Materials Technology Center of Thailand (MTEC) together with research Institutions in Thailand. The meeting was really successful and received much attention from people in all sectors related to the field. The last success has strong driving force for the next conference to be organized. Given an opportunity to organize The 2nd Thailand Metallurgy Conference (2 TMETC), “Metallurgy for Sustainable Development”, in 2008, King Mongkut’s University of Technology (KMUTT) is hosting this conference together with ISIT and MTEC. This conference will be part of the 48th Anniversary of KMUTT, found in 1960. In 2008 Conference, all paper contributions will be categorized into oral and poster presentations. And again, those who will receive the awards of “The Young Outstanding Metallurgist” and “Thailand Metallurgist of the Year” will be announced during the conference. The best Oral and Poster presentations will also rewarded. We do hope that a fruitful discussion will be produced and new scientific contacts and friendships will be established. On behalf of the organizing committee, I would like to thank all participants with the warmth welcome. Wish all of you have a pleasant stay during the 2nd Thailand Metallurgy Conference.
(Assoc. Professor Dr. Booncharoen Sirinaovakul)
Conference Chairman

The 2nd Thailand Metallurgy Conference (2 TMETC)
-2-
Organized by King Mongkut’s University of Technology Thonburi Iron and Steel Institute of Thailand National Metal and Materials Technology Center
Co-organized by Chulalongkorn University Chiang Mai University Kasetsart University Mahidol University Narasuan University Prince of Songkla University Suranaree University of technology Thammasart University King Mongkut’s University of Technology North Bangkok King Mongkut’s Institute of Technology Ladkrabang The Engineering Institute of Thailand Under H.M. The King's Patronage
Sponsored by
LPN Plate Mill PCL Co., Ltd Thai Parkerizing Co., Ltd Thai Tech Steel (2003) Co., Ltd Sahaviriya Steel Industries PCL. Chieng Sang Textile Industries Co., Ltd S. Y. K. Factory and Products Co., Ltd Sammitr Motors Manufacturing Public Company Limited Toyota Boshoku Asia Co., Ltd The Engineering Institute of Thailand Under H.M. The King's Patronage

The 2nd Thailand Metallurgy Conference (2 TMETC)
-3-
Organizing Committees
Conference Chairman Assoc. Professor Dr. Booncharoen Sirinaovakul Dean of Faculty of Engineering, King Mongkut,s University of Technology Thonburi
Committee Mr. Wikom Vajragupta Iron and Steel Institute of Thailand Assoc. Prof. Dr. Weerasak Udomkichdacha National Metal and Materials Technology Center Assoc. Prof. Dr. Gobboon Faculty of Engineering, Chulalongkorn University Asst. Prof. Dr. Ekgasit Nisaratanaporn Metallurgy and Materials Science Research Institute, Chulalongkorn University Mr. Wiroj Sirithanasart Thai Tool and Die Industry Association Assoc. Prof. Dr. Dech Budcharoentong Dean of Faculty of Science, King Mongkut,s University of Technology Thonburi Asst. Prof. Chulsiri Sringaphong King Mongkut,s University of Technology Thonburi
Technical Committee
Assoc. Prof. Dilok Sriprapai Faculty of Engineering, King Mongkut’s University Of Technology Thonburi Assoc. Prof. Dr. Surasak Suranuntchai Faculty of Engineering, King Mongkut’s University Of Technology Thonburi Assoc. Prof. Dr. Varunee Premanond Faculty of Engineering, King Mongkut’s University Of Technology Thonburi Asst. Prof. Dr. Sutasn Thipprakmas Faculty of Engineering, King Mongkut’s University Of Technology Thonburi Dr.Karuna Toojinda Faculty of Engineering, King Mongkut’s University Of Technology Thonburi Dr. Manisara Phiriyawirut Faculty of Engineering, King Mongkut’s University Of Technology Thonburi Dr. Jirapoprn Eachalitanukul Faculty of Engineering, King Mongkut’s University Of Technology Thonburi Dr. Kusol Prommul Faculty of Engineering, King Mongkut’s University Of Technology Thonburi Dr. Surasit Rojananan Faculty of Engineering, King Mongkut’s University Of Technology Thonburi Dr. Ratchanee Hato Faculty of Engineering, King Mongkut’s University Of Technology Thonburi Dr. Sirinthorn Thongsang Faculty of Engineering, King Mongkut’s University Of Technology Thonburi

The 2nd Thailand Metallurgy Conference (2 TMETC)
-4-
Ms. Onnjira Deawwanich) Faculty of Engineering, King Mongkut’s University Of Technology Thonburi Mr. Noppadol Kumanuvong Faculty of Engineering, King Mongkut’s University Of Technology Thonburi Assoc Prof. Dr. Pongpan Kaewtatip Faculty of Engineering, King Mongkut’s University Of Technology Thonburi Asst. Prof. Dr. Anak Khantachawana Faculty of Engineering, King Mongkut’s University Of Technology Thonburi Asst. Prof. Dr. Bovornchok Poopat Faculty of Engineering, King Mongkut’s University Of Technology Thonburi Asst. Prof. Dr. Sombun Charoenvilaisiri Faculty of Engineering, King Mongkut’s University Of Technology Thonburi Assoc. Prof. Dr. Chaowalit Limmaneevichitr Faculty of Engineering, King Mongkut’s University Of Technology Thonburi Dr. Pongsak Thungsuk Faculty of Engineering, King Mongkut’s University Of Technology Thonburi Dr. Paiboon Chuangthong Faculty of Engineering, King Mongkut’s University Of Technology Thonburi Asst. Prof. Dr. Siriporn Rojananan School of Energy, Envelopment and Materials, King Mongkut’s University Of Technology Thonburi Dr. Nuchthana Poolthong School of Energy, Envelopment and Materials, King Mongkut’s University Of Technology Thonburi Asst. Prof. Dr. Ekasit Nisarattanapron Faculty of Engineering, Chulalongkorn University Assoc. Prof. Dr. Prasong Sricharoenchai Faculty of Engineering, Chulalongkorn University Asst. Prof. Dr. Sawai Danchaivijit Faculty of Engineering, Chulalongkorn University Asst. Prof. Dr. Itthipon Diewwanit Faculty of Engineering, Chulalongkorn University Asst. Prof. Dr. Charkorn Jarupisitthorn Faculty of Engineering, Chulalongkorn University Dr. Seksak Asavavisithchai Faculty of Engineering, Chulalongkorn University Dr. Thachai Haengwaranant Faculty of Engineering, Chulalongkorn University Mr. Suvanchai Pongsugitwat Faculty of Engineering, Chulalongkorn University Dr. Patama Visuttipitukul Faculty of Engineering, Chulalongkorn University Dr. Mawin Supradit Na Ayuthaya Faculty of Engineering, Chulalongkorn University Dr. Panyawat Wangyao Faculty of Engineering, Chulalongkorn University Dr. Yutthanant Boonyongmaneerat Metallurgy and Materials Science Research Institute, Chulalongkorn University Dr. Nattita Chuankerikkul Metallurgy and Materials Science Research Institute, Chulalongkorn University Ms. Kanokwan Saengkiettiyut Metallurgy and Materials Science Research Institute, Chulalongkorn University Assoc. Prof. dr. Paritat Pantubanyong

The 2nd Thailand Metallurgy Conference (2 TMETC)
-5-
National Science and Technology Development agency Dr. Julathep Kajornchaiyakul National Metal and Materials Technology Center Dr. Anchalee Manonukul National Metal and Materials Technology Center Dr.Ruangdaj Tongsri National Metal and Materials Technology Center Dr. Ekgarat Wiyanit National Metal and Materials Technology Center Dr. Usanee Kitkamthorn Faculty of Engineering, Suranaree University Dr. Tapany Udomphol Faculty of Engineering, Suranaree University Dr. Pornwasa Wongpanya Faculty of Engineering, Suranaree University Asst. Prof. Dr. Sureerat Polsilapa Faculty of Engineering, Kasetsart University Dr. Patiphan Juijerm Faculty of Engineering, Kasetsart University Asst. Prof. Dr. Somrerk Chandra-ambhorn King Mongkut’s University of Technology North Bangkok Dr. Nattapong Sornsuwit King Mongkut’s University of Technology North Bangkok Assoc. Prof. Pornsak Attavanich Faculty of Engineering, King Mongkut’s Institute of Technology Ladkrabang Dr. Sutha Sutthiruangwong , Science Faculty Faculty of Engineering, King Mongkut’s Institute of Technology Ladkrabang Dr. Jessada Wannasin Prince of Songkla University Dr. Saisamorn Niyomsaruan Burapha University Asst. Prof. Dr. Soranat Rhaipu Faculty of Engineering, Mahidol University Assoc. Prof. Dr. Chaosuan Kanchanomai Faculty of Engineering, Thammasart University Assoc. Prof. Dr. Chatchai Somsiri Thainox stainless sPublic Company Limited

The 2nd Thailand Metallurgy Conference (2 TMETC)
-6-
Technical Program
October 16, 2008 Time / Room Grand Ballroom 08:30 - 09:00 Registration 09:00 – 09:30 Opening Ceremony
By Prof. Dr. Chaivat Toskulkao Deputy Permanent Secretary
Ministry of Science and Technology
Welcome address By
Assoc. Prof. Dr. Booncharoen Sirinaovakul Dean of Faculty of Engineering, King Mongkut's University of Technology Thonburi
and Award for Young Outstanding Metallurgist and Thailand Metallurgist of the Year
09:30 – 10:00 Special Lecture “Metallurgy in the Development of Thailand”
Mr. Khemadhat Sukondhasingha Chief Executive Officer Sikor Group of Companies
10:00 – 10:40 Keynote Lecture 1 “Research Development of TiNi-base Shape Memory Alloys”
Prof. Dr. Shuichi Miyazaki Institute of Materials Science, University of Tsukuba, Japan
10:40 – 11:00 Refreshment 11:00 – 11:30 Invited Lecture 1
“Metal Forming with Semi-Solid Casting Process” Dr. Jessada Wannasin
Department of Mining and Materials Engineering, Faculty of Engineering, Prince of Songkla University
11:30 – 12:00 Invited Lecture 2 “TRD Application on Tool Steels”
Assoc. Prof. Dr Prasonk Sricharoenchai Department of Metallurgical Engineering,
Faculty of Engineering, Chulalongkorn University 12:00 – 12:30 Invited Lecture 3
“Finite Element Application in Metal Work” Asst. Prof. Dr. Wiroj Limtrakarn
Department of Mechanical Engineering, Faculty of Engineering, Thammasat University
12:30 – 13:30 Lunch 13:30 – 14:10 Keynote Lecture 2
“Forming and Processing Parameter Effect on Metal Properties” Prof. Dr. Kazunari Yoshida
School of Engineering, Tokai University, Japan 14:10 – 14:40 Invited Lecture 4
“Hardening of Tool Steels in Vacuum Furnaces” Assoc. Prof. Somnuk Watanasriyakul Department of Production Engineering,
Faculty of Engineering, King Mongkut’s University of Technology North Bangkok
Time / Room
Grand Ballroom Ayutthaya 1 Structure Session 1
Session Chair: Asst. Prof. Dr. Ekasit Nisaratanaporn, Metallurgy and Materials Science Research Institute, Chulalongkorn University
Application Session 1 Session Chair: Assoc. Prof. Dr. Varunee Premanond, Department of Tool and Materials Engineering, Faculty of Engineering, King Mongkut's University of Technology Thonburi

The 2nd Thailand Metallurgy Conference (2 TMETC)
-7-
Session Asst: Dr. Manisara Phiriyawirut (KMUTT) Committee: Asst. Prof. Dr. Anak Khantachawana (KMUTT) Dr. Panyawat Wangyao (CU) Dr. Ratchanee Hato (KMUTT) Dr. Patama Visuttipitukul (CU) Dr. Preecha Termsuksawad (KMUTT)
Session Asst: Ms. Onnjira Diewwanit (KMUTT) Committee: Assoc. Prof. Dr. Pongpan Kaewtatip (KMUTT) Dr. Seksak Asavavisithchai (CU) Dr. Tapany Udomphol (SUT) Dr. Yuttanant Boonyongmaneerat (MMRI) Dr. Kusol Prommul (KMUTT)
14:40 – 15:00 A-01 : Effects of chemical Composition on Microstructure of Batch Annealed AISI 430 N. Thaweepornkhasemsukh Thainox Stainless Public Company Limited
D-01 : Nickel Thin Plate Forming for Microsensor Leadframe Production O. Trithaveesak, P. Choungthong Thai Microelectronics Center, NECTEC
15:00 – 15:20 A-02 : Electron Microscopy for Cast Metals T. Chairuangsri, A. Wiengmoon, N. Poolthong, S. Rojananan, A. Nisarattanaporn, J. Kajornchaiyakul, C. Thanachayanont, J. T. H. Pearce Department of Industrial Chemistry and the Electron Microscopy Research and Service Center, Faculty of Science, Chiang Mai University
D-02 : Modelling the Particulate Reinforced Metal Matrix Composites under Forward Bar Extrusion Using Finite Element Method S. Suranuntchai , P. Kritboonyarit Tool and Materials Engineering Department, Faculty of Engineering, King Mongkut’s University of Technology Thonburi
15:20 – 15:40 Refreshment Grand Ballroom Ayutthaya 1
Time / Room Properties Session 1 Session Chair: Assoc. Prof. Dr. Gobboon Lothongkum, Department of Metallurgical Engineering, Faculty of Engineering, Chulalongkorn University Session Asst: Dr. Chiraporn Auechalitanukul (KMUTT) Committee: Assit. Dr. Siriporn Rojananan(KMUTT) Dr. Sutha Sutthiruangwong (KMITL) Dr. Patipan Jiijerm (KU) Dr. Karuna Toojinda (KMUTT) Ms. Kanokwan Saengkiettiyut (MMRI)
Processing Session 1 Session Chair: Assoc. Prof. Dilok Sriprapai, Department of Tool and Materials Engineering, Faculty of Engineering, King Mongkut's University of Technology Thonburi Session Asst: Asst. Prof. Dr. Sutasn Thipprakmas (KMUTT) Committee: Dr. Ruangdaj Tongsri (MTEC) Dr. Nutthita Chuankrerkkul (MMRI) Dr. Somrerk Chandra-Ambhorn (KMITNB) Dr. Nuttaphong, Sornsuwit (KMITNB) Mr Noppadol Kumanuvong (KMUTT)
15:40 – 16:00 C-01 : Production of SG-Si and SG-Al Cast Iron and Comparison of Their Properties M.M. Haque, S. K. Shahaม Ahmad F. Ismail Department of Manufacturing and Materials Engineering, Kulliyyah of Engineering International Islamic University Malaysia
B-01 : Low Sintering Temperature Silver Clay W. Sroisuriya, C. Thammacharoen, S. Ekgasit Sensor Research Unit, Department of Chemistry, Faculty of Science, Chulalongkorn University
16:00 – 16:20 C-02 : On the Strength of Dissimilar Metals Joint between Magnesium Alloys and Aluminum Alloys
R. Borrisutthekul Suranaree University of Technology
B-02 : Synthesis of Dual Color Gold Nanoparticles P. Pienpinijtham, C. Thammacharoen, S. Ekgasit Sensor Research Unit, Department of Chemistry, Faculty of Science, Chulalongkorn University
16:20 – 16:40 C-03 : Welding Residual Stresses in Two Competing Single V-Butt Joints P. Wongpanya School of Metallurgical Engineering, Suranaree University of Technology
B-03 : Material Separation of AlMMC by Using Cake Filtration Mechanism N. Nicom, N. Ponsena, A. Rayabsri, T. Puthikitakawiwong, H. Nomura Department of Physics, Faculty of Science, Mahasarakham University

The 2nd Thailand Metallurgy Conference (2 TMETC)
-8-
16:40 – 17:00 C-04 : Mechanical Properties of Beta Titanium Alloys for Biomaterials P.Thiangpak, S. Rojananan, S. Rojananan Division of Materials Technology, School of Energy , Environment and Materials King Mongkut’s University of Technology Thonburi
B-04 : Development of SS400 Dual Phase Steel C. Duengkratok, S. Chandra-Ambhorn, W. Eidhed Materials and Metallurgical Engineering Programme, King Mongkut’s University of Technology North Bangkok
Time / Room Grand Ballroom17:00 – 18:00 Refreshment
and Poster Session Ayutthaya 2-4
18:00 – 20:30 Dinner
October 17, 2008
Time / Room Grand Ballroom 09:00 – 10:00 Invited Lecture 5
“Galvanized Reinforcing Steel for Concrete Structures” Assoc. Prof. Dr. Satian Niltawach
Padaeng Industry Public Company Limited
Time / Room
Grand Ballroom Ayutthaya 1 Processing Session 2
Session Chair: Asst. Prof. Wisit Locharoenrat, Department of Materials Engineering, Faculty of Engineering, Kasetsart University Session Asst: Asst.Prof.Dr. Sutasn Thipprakmas (KMUTT) Committee: Asst. Prof. Dr. Sombun Charoenvilaisiri KMUTT Asst. Prof. Dr. Soranat Rhaipu (MU) Dr. Rattana Borrisutthekul (SUT) Dr. Saisamorn Niyomsuan (BUU) Mr Noppadol Kumanuvong (KMUTT)
Structure Session 2 Session Chair: Assoc. Prof. Dr. Turranin Chairuangsri, Department of Industrial Chemistry and the Electron Microscopy Research and Service Center, Faculty of Science, Chiang Mai University Session Asst: Ms. Onnjira Diewwanit (KMUTT) Committee: Asst. Prof.Dr. Anak Khantachawana (KMUTT) Asst. Prof.Dr. Sureerat polsilapa (KU) Dr. Ratchanee Hato (KMUTT) Mr. Suvanchai Pongsugitwat (CU) Dr. Preecha Termsuksawad (KMUTT)
10:00 – 10:20 B-05 : Effects of Heat Treatment on Dry Wear and Corrosion Properties of 18wt%Cr-3wt%C-6.7wt%Mo Cast Iron A. Wiengmoon, T. Chairuangsri, J.T.H. Pearce . Department of Physics, Faculty of Science, Naresuan University
A-03 : Failure of the aluminum die casting parts: Case study S.Kaewkumsai, S. Uamparn, A. Chianpairot National Metal and Materials Center
10:20 – 10:40 B-06 : Picklability of Thermal Oxide Scales on Carbon Steel in Hot Rolling Line: Effect of Coiling Temperature S. Chandra-ambhorn, W. Thanatepolake , S. Thanateburapasap , S. Intarasakda , S. Iamsupapong Department of Materials Engineering and Production Technology, King Mongkut’s University of Technology North Bangkok
A-04 : Grain Refinement of 7075 Al-Alloy by Thermomechanical Treatment K. Runruksa, P. Srichandr Division of Materials Technology, School of Energy , Environment and Materials King Mongkut’s University of Technology Thonburi
10:40 – 11:00 Refreshment 11:00 – 11:20 B-07 : Effect of Process Parameters of Cooling
Plate Technique on Microstructure of Semi-Solid Aluminum Alloy A. Pirunsarn, N. Poolthong, P. Srichandr Division of Materials Technology, School of Energy, Environment and Materials, King Mongkut’s University of Technology Thonburi
A-05 : On the relationship between specimen thickness and graphite morphology of compacted graphite cast iron (CGI) T. Kumma, K. Teeratatpong, A. Sritong, N. Liamdee, T. Udomphol Suranaree University of Technology

The 2nd Thailand Metallurgy Conference (2 TMETC)
-9-
11:20 – 11:40 B-08 : Semi-Solid Aluminum Alloy Produced by Cooling Plate Rheo-diecasting Process N. Poolthong, C.t Koompai, W. Jirattiticharoean, A. Rengsomboon, K. Srimuang, S. Yupa Division of Materials Technology, School of Energy, Environment and Materials, King Mongkut’s University of Technology Thonburi
A-06 : Size and Distribution of Primary Silicon in Semi-Solid State of A390 Aluminum Alloy Subject to Mechanical Vibration P. Senthongkaew, N. Poolthong, C.Limmaneevichitr Division of Materials Technology, School of Energy, Environment and Material, King Mongkut’s University of Technology Thonburi
11:40 – 12:00 B-09 : Evaluation and Control of Steel Cleanliness by Infrared Spectroscopy A. Mahasaksawat, L. Amonkitbamrung, C. Thammacharoen, S. Ekgasit Sensor Research Unit, Department of Chemistry, Faculty of Science, Chulalongkorn University
A-07 : Powder Metallurgy of Silver Nanoparticles for Jewelry Making P. Thongnopkun, W. Sroisuriya, S. Ekgasit
Faculty of Gems (Chanthaburi), Burapha University
12:00 – 12:20 B-10 : Influences of Ironing ratio on Phase Transformations of Ni-Ti SMAs plate A. Phukaoluan, A. Khantachawana, P. Kaewtatip, V. Premanond Department of Mechanical Engineering, Faculty of Engineering, King Mongkut’s University of Technology Thonburi,Bangkok
12:20 – 13.20 Lunch
Time / Room
Grand Ballroom Ayutthaya 1 Properties Session 2
Session Chair: Dr. Pongsak Tuengsook Department of Industrial Engineering, Faculty of Engineering, King Mongkut's University of Technology Thonburi Session Asst: Dr. Chiraporn Auechalitanukul (KMUTT) Committee: Asst. Dr. Siriporn Rojananan(KMUTT) Asst. Prof. Dr. Itthipon Diewwanit(CU) Dr.-Ing. Pornwasa Wongpanya (SUT) Dr. Karuna Toojinda (KMUTT) Dr.-Ing. Paiboon Choungthong (KMUTT)
Application Session 2 Session Chair: Assoc. Prof. Dr. Surasak Suranuntchai, Department of Tool and Materials Engineering, Faculty of Engineering, King Mongkut's University of Technology Thonburi Session Asst: Dr. Manisara Phiriyawirut (KMUTT) Committee: Assoc. Prof. Dr. Pongpan Kaewtatip (KMUTT) Dr. Tachai luangvaranunt (CU) Dr. Sirinthorn Thongsang (KMUTT) Dr. Usanee Kitkamthorn (SUT) Dr. Kusol Prommul (KMUTT)
13:20 – 13:40 C-05 : Effects of Surface Pretreatment in Hot Dip Galvanizing Process Y. Boonyongmaneerat, P. Rattanawaleedirojn, K. Saenkiettiyut,C.Angkaprasert, N. Chuankrerkkul Metallurgy and materials Science Research Institute, Chulalongkorn University
D-03 : Surface Modification of Pearls with Metal Nanoparticles T. Parnklang, C.Thammacharoen, S. Ekgasit Sensor Research Unit, Department of Chemistry, Faculty of Science, Chulalongkorn University
13:40 – 14:00 C-06 : Extraction of Mechanical Properties of DLC Films: A Finite Element Analysis N. Panich, P. Wangyao, N. Vattanaprateep , P. VisuttipP. Sricharoenchai Center of Innovative Nanotechnology, Chulalongkorn University
D-04 : Continuous Synthesis of high Concentration Colloidal Silver Nanoparticles P. Maneewattanapinyo, N. Pimpha, C. Thammacharoen. Sanong Ekgasit Sensor Research Unit, Department of Chemistry, Faculty of Science, Chulalongkorn University
14:00 – 14:20 C-07 : Determination of Yield Behaviour of Boron Alloy Steel at High Temperature J. Tungtrongpairoj, V. Uthaisangsuk, W. Bleck Materials and Metallurgical Engineering Programme, King Mongkut’s University of Technology North Bangkok
D-05 : Room Temperature Sintered Conductive Silver Ink C. Lertvachirapaiboon, C. Thammacharoen, S. Ekgasit Sensor Research Unit, Department of Chemistry, Faculty of Science, Chulalongkorn University

The 2nd Thailand Metallurgy Conference (2 TMETC)
-10-
14:20 – 14:40 C-08 : The Study of Oil Impregnation Effect on Powder Metallurgy Tin Bronze Wear Behavior by Pin-On-Disk Method T. Chotibhawaris, T.Laungwaranunt, S. Charoenvilaisiri King Mongkut’s University of Technology Thonburi,Bangkok
D-06 : Polymer Coating with an Antibacterial Property through the Incorporation of Silver Nanoparticle for Ambulance P. Sonprasit, C. Thammacharoen, S. Ekgasit Sensor Research Unit, Department of Chemistry, Faculty of Science, Chulalongkorn University
14:40 – 15:00 C-09 : The comparison between the properties of various commercial NiTi arch wires used in orthodontics R. Isarapatanapong, S. Dechkunakorn, N. Anuwongnukroh, J. kajornchaiyakul, A. Khantachawana, A. Phukaoluan Department of Orthodontics, Faculty of Dentistry, Mahidol University
D-07 : The Antimicrobial Action of Silver Foams A. Oonpraderm, U. Ruktanonchai, S. Asavavisithchai Department of Metallurgical Engineering, Faculty of Engineering, Chulalongkorn University
15:00 – 15:20 Refreshment Time / Room Grand Ballroom15:20 – 15:50 Invited Lecture 6
“Role of Metallurgies in the Development of Thailand” Asst. Prof. Dr. Panya Srichandr
Division of Materials Technology, School of Energy , Environment and Materials King Mongkut’s University of Technology Thonburi
15:50 – 16:20 Award Presentation for “The Best Oral and Poster Presentation” of each session Closing ceremony by
Assoc. Prof. Dr. Booncharoen Sirinaovakul Dean of Faculty of Engineering, King Mongkut's University of Technology Thonburi
Remark:
Invited Poster Presentations PI-01 Development of microtube for painless microneedle
Kazuyoshi TSUCHIYA school of Engineering Department of Precision Engineering, Tokai University, Japan
PI-02 Easy-Release Screw
Kazunari Yoshida School of Engineering, Tokai University, Japan
PI-03 Development of Magnesium Alloy Sheets by New Twin-Roll Casting System
GONDA METAL INDUSTRY Co.,Ltd. PI-04 Magnesium Alloy AZ61 Sheet
GONDA METAL INDUSTRY Co.,Ltd

The 2nd Thailand Metallurgy Conference (2 TMETC)
-11-
Poster Presentations
P-01 Green Binder System for Powder Injection Moulding N. Chuankrerkkul Metallurgy and Materials Science Research Institute, Chulalongkorn University
P-02 Interfacial Microstructures and Solder Joint Strength of Sn- 3.0 wt.%Ag-0.5wt.%Cu Lead-
free Solder Balls on Ni/Au Finished Printed Circuit Boards O. Diewwanit, N. Tantivanitchanon, S. Sirimethanon Department of Tool and Materials Engineering, King Mongkut’s university of Technology Thonburi, Bangkok
P-03 Zinc Phosphating on Aluminium Plate Using Ni as Catalyst and Post-treatment by Sodium
Silicate S. Dech-Oup, T. Chairuangsri Department of Industrial Chemistry, Faculty of Science, Chiang Mai University
P-04 Morphology and Optical Properties of Copper Nanoparticles Prepared by Pulsed Laser
Ablation in Distilled Water P. Pimpang, H. Lin Aye, T. Chairuangsri, S. Choopun Department of Industrial Chemistry, Faculty of Science, Chiang Mai University
P-05 Failure due to Hydrogen Embrittlement of Cap-Screw Bolt
S. Kaewkumsai, S. Sorachot, W. Khonraeng National Metal and Material Technology Center (MTEC)
P-06 Stress Corrosion Cracking in Welded 316SS Screener Shaft
S. Kaewkumsai, S. Aumparn, E. Viyanit National Metal and Material Technology Center (MTEC)
P-07 Galvanic Corrosion induced Failure of Ceiling Suspension
S. Kaewkumsai, W. Khonraeng, A. Chianpairot National Metal and Material Technology Center (MTEC)
P-08 A Feasibility Study of Silver Recovery from a Waste in Zinc-Ore-Hot-Acid Leaching Process
W. Prasong, T. Chairuangsri Department of Industrial Chemistry, Faculty of Science, Chiang Mai University
P-09 Corrosion Resistance of Hot-Dip Galvanized Steels in Saline and Swine Urine Environments
K. Saengkiettiyut, C. Angkaprasert, P. Rattanawaleedirojn, S. Saenapitak, A. Thueploy, Jumpot Wanichsampan, S. Lisnunt, N. Chuankrerkkul, Y. Boonyongmaneerat Metallurgy and Materials Science Research Institute, Chulalongkorn University
P-10 Acceptable TIG-Pulse Welding Parameters of AISI 304L Stainless Steels at 8-h Welding Position N. Sornsuwit , S. Chandra-ambhorn Department of Materials Engineering and Production Technology, Faculty of Engineering, King Mongkut’s University of Technology North Bangkok (KMUTNB)

The 2nd Thailand Metallurgy Conference (2 TMETC)
-12-
Content
Keynote Lectures
K-01 Research Development of TiNi-base Shape Memory Alloys 17 S. Miyazaki
K-02 Drawability Improvement of Titanium Wire and Fabrication of 18 Microparts of medical applications
K. Yoshida
Invited Lectures
I-01 Metal Forming with Semi-Solid Casting Process” 20 J. Wannasin
I-02 TRD application on Tool Steels 21 P. Sricharoenchai
I-03 Finite Element Application in Metal Work 22
W. Limtrakarn
I-04 Hardening of Tool Steels in Vacuum Furnaces 23 S. Watanasriyakul
I-05 Galvanized Reinforcing Steel in Concrete Structures 24
S. Niltawach Oral Presentations Structures Session
A-01 Effects of chemical Composition on Microstructure of Batch Annealed 26 AISI 430 N. Thaweepornkhasemsukh A-02 Electron Microscopy for Cast Metals 29
T. Chairuangsri, A. Wiengmoon, N. Poolthong, S. Rojananan, A. Nisarattanaporn, J. Kajornchaiyakul, C. Thanachayanont, J. T. H. Pearce
A-03 Failure of the aluminum die casting parts: Case study 31
S.Kaewkumsai, S. Uamparn, A. Chianpairot
A-04 Grain Refinement of 7075 Al-Alloy by Thermomechanical Treatment 35 K. Runruksa, P. Srichandr
A-05 On the relationship between specimen thickness and graphite morphology 39 of compacted graphite cast iron (CGI)
T. Kumma, K. Teeratatpong, A. Sritong, N. Liamdee, and T. Udomphol
A-06 Size and Distribution of Primary Silicon in Semi-Solid State of A390 41 Aluminum Alloy Subject to Mechanical Vibration
P. Senthongkaew, N. Poolthong, C. Limmaneevichitr
A-07 Powder Metallurgy of Silver Nanoparticles for Jewelry Making 44 P. Thongnopkun, W. Sroisuriya , S. Ekgasit

The 2nd Thailand Metallurgy Conference (2 TMETC)
-13-
Processing Session
B-01 Low Sintering Temperature Silver Clay 47 W. Sroisuriya, C. Thammacharoen, S. Ekgasit
B-02 Synthesis of Dual Color Gold Nanoparticles 49
P. Pienpinijtham, C. Thammacharoen, S. Ekgasit B-03 Material Separation of AlMMC by Using Cake Filtration Mechanism 51
N. Nicom, N. Ponsena, A. Rayabsri, T. Puthikitakawiwong, H. Nomura
B-04 Development of SS400 Dual Phase Steel 53 C. Duengkratok, S. Chandra-Ambhorn, W. Eidhed
B-05 Effects of Heat Treatment on Dry Wear and Corrosion Properties of 56 18wt%Cr-3wt%C-6.7wt%Mo Cast Iron
A. Wiengmoon, T. Chairuangsri, J.T.H. Pearce .
B-06 Picklability of Thermal Oxide Scales on Carbon Steel in Hot Rolling Line: 58 Effect of Coiling Temperature
S. Chandra-ambhorn, W. Thanatepolake , S. Thanateburapasap , S. Intarasakda , S. amsupapong
B-07 Effect of Process Parameters of Cooling Plate Technique on 60 Microstructure of Semi-Solid Aluminum Alloy
A. Pirunsarn, N. Poolthong, P. Srichandr B-08 Semi-Solid Aluminum Alloy Produced by Cooling Plate Rheo-diecasting 62 Process
N. Poolthong, C. Koompai, W. Jirattiticharoean, A. Rengsomboon, K. Srimuang, S. Yupa
B-09 Evaluation and Control of Steel Cleanliness by Infrared Spectroscopy 64
A. Mahasaksawat, L. Amonkitbamrung, C. Thammacharoen, S. Ekgasit
B-10 Influences of Ironing ratio on Phase Transformations of Ni-Ti SMAs plate 66 A. Phukao luan, A. Khantachawana, P. Kaewtatip, V. Premanond
Properties Session
C-01 Production of SG-Si and SG-Al Cast Iron and Comparison of Their 69 Properties M. M. Haque, S. K. Shaha and A. F. Ismail C-02 On the Strength of Dissimilar Metals Joint between Magnesium Alloys and 73 Aluminum Alloys
R. Borrisutthekul C-03 Welding Residual Stresses in Two Competing Single V-Butt Joints 75
P. Wongpanya
C-04 Mechanical Properties of Beta Titanium Alloys for Biomaterials 82 P.Thiangpak, S. Rojananan, S. Rojananan
C-05 Effects of Surface Pretreatment in Hot Dip Galvanizing Process 84
Y. Boonyongmaneerat, P. Rattanawaleedirojn,

The 2nd Thailand Metallurgy Conference (2 TMETC)
-14-
K. Saenkiettiyut,C.Angkaprasert, N. Chuankrerkkul C-06 Extraction of Mechanical Properties of DLC Films: 87 A Finite Element Analysis N. Panich, P. Wangyao, N. Vattanaprateep , P. Visuttipitukul, P. Sricharoenchai C-07 Determination of yield behaviour of boron alloy steel at high temperature 90
J. Tungtrongpairoj, V. Uthaisangsuk, W. Bleck C-08 The Study of Oil Impregnation Effect on Powder Metallurgy Tin Bronze 97 Wear Behavior by Pin-On-Disk Method
T. Chotibhawaris, T.Laungwaranunt, S. Charoenvilaisiri
C-09 The comparison between the properties of various commercial NiTi arch 100 wires used in orthodontics
R. Isarapatanapong, S. Dechkunakorn, N. Anuwongnukroh, J. kajornchaiyakul, A. Khantachawana, A. Phukaoluan
Application Session D-01 Nickel Thin Plate Forming for Microsensor Leadframe Production 107 O. Trithaveesak, P. Choungthong D-02 Modelling the Particulate Reinforced Metal Matrix Composites under 109 Forward Bar Extrusion Using Finite Element Method
S. Suranuntchai , P. Kritboonyarit D-03 Surface Modification of Pearls with Metal Nanoparticles 114 T. Parnklang, C.Thammacharoen, S. Ekgasit
D-04 Continuous Synthesis of high Concentration Colloidal Silver Nanoparticles 116 P. Maneewattanapinyo, N. Pimpha, C. Thammacharoen. Sanong Ekgasit
D-05 Room Temperature Sintered Conductive Silver Ink 118
C. Lertvachirapaiboon, C. Thammacharoen, S. Ekgasit D-06 Polymer Coating with an Antibacterial Property through the 120 Incorporation of Silver Nanoparticle for Ambulance
P. Sonprasit , C. Thammacharoen, S. Ekgasit D-07 The Antimicrobial Action of Silver Foams 122
A. Oonpraderm, U. Ruktanonchai and S. Asavavisithchai Poster Presentations
P-01 Green Binder System for Powder Injection Moulding 125
N. Chuankrerkkul P-02 Interfacial Microstructures and Solder Joint Strength of 127 Sn- 3.0 wt.%Ag-0.5wt.%Cu Lead-free Solder Balls on Ni/Au Finished Printed Circuit Boards
O. Diewwanit, N. Tantivanitchanon, S. Sirimethanon
P-03 Zinc Phosphating on Aluminium Plate Using Ni as Catalyst and 129 Post-treatment by Sodium Silicate
S. Dech-Oup, T. Chairuangsri

The 2nd Thailand Metallurgy Conference (2 TMETC)
-15-
P-04 Morphology and Optical Properties of Copper Nanoparticles Prepared 131 by Pulsed Laser Ablation in Distilled Water
P. Pimpang, H. Lin Aye, T. Chairuangsri, S. Choopun
P-05 Failure due to Hydrogen Embrittlement of Cap-Screw Bolt 133 S. Kaewkumsai, S. Sorachot, W. Khonraeng
P-06 Stress Corrosion Cracking in Welded 316SS Screener Shaft 134
S. Kaewkumsai, S. Aumparn, E. Viyanit P-07 Galvanic Corrosion induced Failure of Ceiling Suspension 139
S. Kaewkumsai, W. Khonraeng, A. Chianpairot
P-08 A Feasibility Study of Silver Recovery from a Waste in Zinc-Ore-Hot-Acid 142 Leaching Process
W. Prasong, T. Chairuangsri
P-09 Corrosion Resistance of Hot-Dip Galvanized Steels in Saline and Swine 144 Urine Environments
K. Saengkiettiyut, C. Angkaprasert, P. Rattanawaleedirojn, S. Saenapitak, A. Thueploy, J. Wanichsampan, S. Lisnunt, N. Chuankrerkkul, Y. Boonyongmaneerat
P-10 Acceptable TIG-Pulse Welding Parameters of AISI 304L Stainless Steels 147 at 8-h Welding Position
N. Sornsuwit , S. Chandra-ambhorn

Keynote Lectures

The 2nd Thailand Metallurgy Conference (2 TMETC)
-17-
Research Development of TiNi-base Shape Memory Alloys
Shuichi Miyazaki Institute of Materials Science, University of Tsukuba, Tsukuba, Ibaraki 305-8573, Japan
ABSTRACT-Ti-Ni alloys have been investigated since the first report on shape memory effect (SME) in a Ti-Ni alloy in 1963. However, the Ti-Ni alloys had presented many difficult problems with many puzzling phenomena for about 20 years until 1982 when the basic understanding was established on the relationship between the microstructure and the corresponding deformation behavior such as SME and superelasticity (SE). Since then, many puzzling phenomena have been clarified: e.g., the microstructures which cause the rhombohedral phase (R-phase) transformation to appear, the orientation dependence of shape memory and superelastic behavior observed in single crystals, the temperature dependence of deformation and fatigue behavior, the shape memory mechanism, etc. The history of the development of Ti-Ni alloys will be surveyed.
The Ti-Ni alloys have been successfully applied for many products both in engineering and medical fields since 1982. Some of these applications will be shown in the present talk. For further expanding the application market, new types of shape memory alloys are required, e.g., high temperature shape memory alloys (SMAs), thin film SMAs, Ni-free Ti SMAs, etc. Recent development of these new alloys is also reviewed. .

The 2nd Thailand Metallurgy Conference (2 TMETC)
-18-
Drawability Improvement of Titanium Wire and Fabrication of Microparts of medical applications
Kazunari Yoshida Department of Precision Engineering, School of Engineering, Tokai University
1117 kitakaname, Hiratsuka, Kanagawa, 259-1292, Japan, [email protected]
ABSTRACT-Titanium has great advantages, such as nontoxicity and high biocompatibility. Recently, it has begun to be used with high expectations in the medical field, such as for fabricating guide wire, orthodontic wires and microparts of medical appliances. However, because the plastic workability of Titanium is inferior to that of other metals, there is difficulty in manufacturing Titanium products, such as extrafine wires and microscrews, without cracks and other defects. Moreover, although the effects of small amounts of O and N in a pure Ti wire on its mechanical properties have been discussed, the effects on plastic workability, such as drawability, have not been clarified yet. In this study, we examined the effects of the amounts of O and N on workability and product strength during drawing, heading and rolling, and clarified the optimal conditions for cold drawing. We can infer the magnitude of the drawing limit on the basis of the break strain of mother wire. The fabrication of the guide wire, microspring and microscrews in medical fields as an application of the obtained drawn wire are also targeted in this study. The fabrications of these products were found possible by the metal forming which is selected an appropriate conditions.

The 2nd Thailand Metallurgy Conference (2 TMETC)
-19-
Invited Lectures

The 2nd Thailand Metallurgy Conference (2 TMETC)
-20-
Metal Forming with Semi-Solid Casting Process การขึ้นรูปโลหะโดยกระบวนการ Semi-Solid Casting
ดร. เจษฎา วรรณสินธุ
ทีมวิจัยโลหะกึ่งของแข็ง ภาควิชาวิศวกรรมเหมืองแรและวัสดุ มหาวิทยาลัยสงขลานครินทร อ. หาดใหญ จ. สงขลา 90112
การขึ้นรูปโลหะในอุตสาหกรรมการผลิตชิ้นสวนตางๆในประเทศไทยโดยทั่วไปแบงไดเปน 2 กรรมวิธีหลักๆ คือ การขึ้นรูปในสถานะของแข็ง เชน การทุบขึ้นรูป (Forging) และการขึ้นรูปในสถานะของเหลว เชน การหลอ (Casting) โดยทั้งสองกรรมวิธีนี้ตางมีขอดีและขอดอยทําใหเหมาะกับการผลิตชิ้นงานโลหะตางกนั ช้ินงานที่ผลิตจากการทุบขึ้นรูปจะมีโครงสรางที่สมบูรณ ปราศจากรูพรุน และมีสมบัติเชิงกลที่สูง แตในการขึ้นรูปตองใชพลังงานที่สูงและเครื่องจักรที่ราคาแพง สวนชิ้นงานที่ผลิตจากการหลอโลหะจะมีตนทุนการผลิตที่ต่ํากวาและมีอัตราการผลิตที่สูงกวา แตสมบัติเชิงกลท่ีไดจะต่ํากวาเนื่องจากโครงสรางที่ไมสมบูรณนัก นอกจากกรรมวิธีการข้ึนรูปหลักทั้ง 2 ที่กลาวมานี้ยังมีอีกกรรมวิธีท่ีกําลังใชในการผลิตในตางประเทศ น่ันคือ การขึ้นรูปโลหะในสถานะกึ่งของแข็ง ซึ่งหมายถึง โลหะในขณะการขึ้นรูปมีสวนที่เปนของแข็งและสวนท่ีเปนของเหลวผสมอยู ทําใหในการขึ้นรูปไมจําเปนตองใชแรงและพลังงานมากเทากับการทุบขึ้นรูปจึงทําใหมีตนทุนการผลิตที่ต่ํากวา นอกจากนี้โครงสรางของชิ้นงานที่ผลิตไดมีความสมบูรณมากกวาการหลอ ทําใหสมบัติเชิงกลที่ไดมีคาสูงกวา ในการบรรยายพิเศษน้ีจะกลาวถึงการขึ้นรูปโลหะในสถานะกึ่งของแข็ง การพัฒนาและการนําไปใชจริงในอุตสาหกรรมตางๆในตางประเทศ กระบวนการ Semi-Solid Casting ซึ่งกําลังอยูในชวงวิจัยและพัฒนาโดยทมีวจิยัโลหะกึ่งของแข็ง ที่ภาควิชาวิศวกรรมเหมืองแรและวัสดุ มหาวิทยาลัยสงขลานครินทร รวมถึงโอกาสการนํากระบวนการ Semi-Solid Casting ไปประยุกตใชในอุตสาหกรรมในประเทศไทย

The 2nd Thailand Metallurgy Conference (2 TMETC)
-21-
TRD application on Tool Steels
การเคลือบผิวเหล็กกลาแมพิมพดวยกระบวนการ TRD
รศ.ดร. ประสงค ศรีเจริญชัย ภาควิชาวิศวกรรมโลหการ คณะวิศวกรรมศาสตร จุฬาลงกรณมหาวิทยาลัย
กระบวนการ TRD (Thermo-reactive deposition and diffusion) เปนกระบวนการเคลือบผิวท่ีอุณหภูมิสูงที่ฟอรมชั้นเคลือบแข็งของชั้นคารไบด การเคลือบใชอางเกลือท่ีมีบอแรกซหลอมเหลวโดยเติมสารที่ฟอรมเปนคารไบดในรูปของเฟอรโรอัลลอย หรือรูปของออกไซดรวมกับตัวรีดิวส อุณหภูมิเคลือบแปรผันระหวาง 900-1000oC และแปรผันระยะเวลาเพื่อใหไดความหนาตามที่ตองการ เหล็กกลาแมพิมพที่ใชเคลือบคือเหล็กกลา SKD11, SKD61 และ SKH51 ผลการเคลือบผิวเหล็กกลาแมพิมพดวยกระบวนการ TRD รายงานเปนพารามิเตอรที่ควบคุมความหนาของชั้นเคลือบคารไบด กลาวคือปริมาณสารที่ฟอรมเปนคารไบด ปริมาณคารบอนในเนื้อเหล็กกลา อุณหภูมิที่เคลือบและเวลาที่เคลือบ
ช้ันเคลือบที่นิยมเคลือบดวยกระบวนการ TRD คือช้ันเคลือบวาเนเดยีมคารไบดซ่ึงมคีวามแข็ง 3000 Hv หรือมากกวาจงึใชตานทานการสึกหรอไดด ี อยางไรก็ดช้ัีนเคลือบเชิงซอนวาเนเดียมไนโอเบียมคารไบดท่ีเคลือบดวยกระบวนการเดียวกนันีม้ีความแข็งสูงกวาวาเนเดียมคารไบดจึงอาจใชตานทานการสึกหรอแบบขัดสีไดดีข้ึนอีก

The 2nd Thailand Metallurgy Conference (2 TMETC)
-22-
Finite Element Application in Metal Work
การประยุกตไฟไนตเอลิเมนตในงานทางโลหะ
ผศ. ดร. วิโรจน ลิ่มตระการ คณะวิศวกรรมศาสตร มหาวิทยาลัยธรรมศาสตร
ปจจุบันงานทางโลหะดานการพัฒนานวัตกรรมใหม ๆ หรือ พัฒนาผลิตภัณฑโลหะเดิมใหมีตนทุนการผลิตที่ต่ําลง เปนสวนที่บริษัทจํานวนมากใหความสําคัญและตองการใหเกิดเปนรูปธรรม บางบริษัทเริ่มมีการนําเทคโนโลยีการออกแบบและการผลิตเขามาชวย เพื่อพัฒนาศักยภาพดานการแขงขันของบริษัทใหทัดเทียม หรือ ดีกวาบริษัทคูแขงทั้งภายในประเทศและตางประเทศ ระเบียบวิธีไฟไนตเอลิเมนตเปนเทคโนโลยีการคํานวณทางวิศวกรรมที่ไดรับการยอมรับในวงกวางวามีประสิทธิภาพสูงในดานการประยุกตกับงานทางวิศวกรรมทั้งการออกแบบและผลิต จากความตองการใชงานของกลุมวิศวกรทําใหในปจจุบันมีซอฟแวรไฟไนตเอลิเมนตเกิดขึ้นมาหลายรอยซอฟแวร โดยมีขีดความสามารถในการวิเคราะหผลิตภัณฑโลหะท่ีสรางมาจากโลหะแผนบาง เชน โครงรถยนต เปนตน หรือ กอนโลหะ เชน กานสูบเครื่องยนต เปนตน การประยุกตใชไฟไนตเอลิเมนตไดอยางมีประสิทธิภาพและแขงขันไดเทาทันกับคูแขงนั้น ผูใชจําเปนตองเขาใจในทฤษฎีและแนวคิดการประยุกตระเบียบวิธีไฟไนตเอลิเมนตอยางชัดแจง แลวจึงคอยพัฒนาเทคนิคและประสบการณการประยุกตซอฟแวรไฟไนตเอลิเมนตเขากับผลิตภัณฑ หรือโจทยของตนเองตอไป ดังนั้นการประยุกตไฟไนตเอลิเมนตในงานโลหะ และงานดานอื่น ๆ จึงจําเปนตองพัฒนาคนของบรษิทัขึน้มากอน หลังจากนั้นจะทําใหเกิดผลประโยชนข้ึนกับตัวผูใชเอง รวมถึงบริษัทในระยะยาวไดอยางยั่งยืน
The 2nd Thailand Metallurgy Conference (2 TMETC)
-23-
Hardening of Tool Steels in Vacuum Furnaces
การชุบแข็งเหล็กกลาเครื่องมือในเตาสุญญากาศ
รศ. สมนึก วัฒนศรียกลุ ภาควิชาวิศวกรรมการผลิต คณะวิศวกรรมศาสตร มหาวิทยาลัยเทคโนโลยีพระจอมเกลาพระนครเหนือ
โทรศัพท 029132500-24 ตอ 8203 โทรสาร 025870029 e-mail [email protected]
เหล็กกลาเครื่องมือ (Tool Steels) เปนวัตถุดิบสําคัญในการผลิตเครื่องมือ (Tools) ประเภทตางๆ เชน แมพิมพข้ึนรูป (Forming Die) แมพิมพกดอัด (Extrusion Die) แมพิมพหลอฉีด (Die Casting) ลูกรีด (Roller) แมพิมพตัด (Punch Die) มีดตัด (Shear Blade) ฯลฯ เครื่องมือเหลานี้เมื่อผลิตเสร็จกอนที่จะนําไปใชงานไดตองผานกระบวนการชุบแข็งกอนเสมอ ดังนั้นการชุบแข็งจึงนับวาเปนสวนหนึ่งของกระบวนการผลิตเครื่องมือ โดยทั่วไปผูผลิตเครื่องมือจะไมทําการชุบแข็งเอง เนื่องจากการชุบแข็งใชเทคนิคเฉพาะ และมีผลตอคุณภาพและตนทุนของเครื่องมือโดยตรง สวนใหญจึงนิยมมอบใหผูรับจางชุบแข็งเปนผูดําเนินการ การดําเนินการชุบแข็งเหล็กกลาเครื่องมือปจจุบันนิยมทําในเตาสุญญากาศเนื่องจากมีขอดีดานคุณภาพหลายอยาง เชนความสม่ําเสมอของความแข็งที่ได สภาพผิวช้ินงานที่สะอาด และการเสียรูปต่ํา หลักการทํางานของเตา ช้ินงานจะถูกใหความรอนในหองสุญญากาศจนถึงอุณหภูมิชุบแข็ง จากนั้นจะถูกทําใหเย็นตัวเร็วโดยการฉีดแกสไนโตเจนความดันสูง (max. 12 bar) ทําใหช้ินงานเย็นตัวจนเปลี่ยนโครงสรางสมบูรณภายในเตา เตาสุญญากาศทั้งหมดนําเขาจากตางประเทศสวนใหญจากยุโรป อเมริกาและญี่ปุน ผูเขียนไดรวบรวมจํานวนและตําแหนงที่ตั้งของโรงงานรับจางชุบแข็งเหล็กกลาเครื่องมือ รวมถึงราคาคาชุบแข็ง ซึ่งขอมูลนี้นาจะเปนประโยชนตอผูผลิตเครื่องมือในประเทศ

The 2nd Thailand Metallurgy Conference (2 TMETC)
-24-
Galvanized Reinforcing Steel in Concrete Structures
Assoc. Prof. Dr. Satian Niltawach Padaeng Industry Public Company Limited
ABSTRACT-Black steel as reinforcement for concrete normally lasts a long time, due to the formation of a passive Fe(OH)2 film on the steel surface contacted by wet cement with pH greater than 13. In carbonation, carbonic acid reduces the concrete pH to below 11.5. At this point, a non-protective layer of FeCO3 replaces Fe(OH)2 leaving the unprotected steel to degenerate into rust. Whereas in chloride attack, even if the pH of concrete is above 11.5, chloride ions diffuse inward to attack the Fe(OH)2 film to form FeCl2, which further corrodes to become Fe2O3. The remaining Fe(OH)2 is subsequently wiped out by the rust. Rust has a specific volume 3 times that of steel. The volumetric expansion gives rise to a stress which breaks loose the concrete from the corroded steel. When wet cement contacts zinc on galvanized steel, a tenacious film of calcium hydroxyzincate forms. Apart from giving high bond strength between concrete and the reinforcement, zinc effectively prevents carbonation and chloride attack on the steel. Hence, the working life of concrete structures reinforced with galvanized steel is extended.

Oral Presentations
Structure Session

The 2nd Thailand Metallurgy Conference (2 TMETC)
-26-
Effects of Chemical Composition on Microstructure of Batch Annealed AISI 430
N. Thaweepornkhasemsukh
Thainox Stainless Public Company Limited, Rayong, Thailand Tel. 038-636125 ext. 539, Fax. 038-952125, E-Mail: [email protected]
ABSTRACT - Observation of hot rolled AISI 430 stainless steel shows ferrite(α) and martensite(α′). It was found that the amount of martensite phase decreased as the ratio of Cr eq / Ni eq content increased. In this experiment, the hot rolled samples were annealed with different ratio of Cr eq / Ni eq at 800°C to 900°C for 1 hour and then water quenched. Area fraction of martensite and hardness of the samples were then characterized with optical microscope (OM) and Rockwell. Correlation between martensite content and chemical composition were analyzed. It can be concluded that as Cr eq / Ni eq ratio increased, the annealing temperature could be increased, so annealing time can be reduced. KEY WORDS -- AISI 430, batch annealing process, chemical composition, microstructure, phase transformation
1. Introduction Microstructure of AISI 430 stainless steel in hot rolled condition consists of ferrite (α) and martensite(α′) streaks in hot rolling direction [1-2]. During hot rolling, the ferrite was transformed to austenite(γ), and when fast cooled the austenite will transform to martensite. The mechanical properties of hot coils were not suitable for cold rolling process. Its properties can be improved by annealing process. The annealing was to dissolve martensite and aid phase transformation to ferrite and chromium carbide (Cr23C6) [1-6]. Its hardness and strength are reduced and that they are suitable for subsequent cold rolling process. As mentioned above, a correlation of phase transformation is connected with chemical composition ratio of Cr eq / Ni eq which determines maximum annealing temperature [1-3]. Because the chemical composition has a great effect to phase transformation from ferrite to austenite, as shown in Figure 1. Because AISI 430 is semi-ferritic stainless steel, it exhibits some austenite phase at high temperature, which can transform to martensite during cooling condition. [1-6] Therefore, maximum annealing temperature is limited to avoid austenite phase occurrences. In this work, the final microstructure are related to variation of ratio of Cr eq / Ni eq with the annealing temperature. Hence, the objective of this work is to make projection of microstructure and hardness with the chemical composition for batch annealing process.
Figure1: Effect of carbon and nitrogen content (wt%) on austenite and ferrite in iron – chromium system [3] 2. Experimental Procedures AISI 430 stainless steel was hot rolled to a thickness of 3 mm and batch annealed. Table 1 shows chemical composition of AISI 430 samples. According to relationship of the effect on phase stabilized, which followed in Schaeffler Diagram [3], as equation 2.1 and 2.2. Table 2 shows the variation ratio of chromium equivalent and nickel equivalent. Cr eq = %Cr + 2%Si + 1.5%Mo + 1.75%Nb
+ 5.5%Al + 5%V + 1.5%Ti + 0.75%W (2.1) Ni eq = %Ni + 0.5%Mn + 30%C + 25%N + 0.3%Cu + %Co (2.2)
γ
α

The 2nd Thailand Metallurgy Conference (2 TMETC)
-27-
Table1: Chemical compositions of AISI 430 (% wt) Samples C N Si Cr Mn Ni Cu Mo
1 0.051 0.047 0.31 16.20 0.36 0.15 0.013 0.01
2 0.046 0.043 0.35 16.01 0.37 0.19 0.024 0.02
3 0.049 0.036 0.40 16.09 0.41 0.16 0.120 0.03
4 0.042 0.042 0.28 16.34 0.33 0.15 0.118 0.03
5 0.040 0.035 0.23 16.16 0.55 0.17 0.076 0.02
6 0.038 0.038 0.32 16.19 0.32 0.14 0.068 0.03
Table2: Cr eq / Ni eq ratio of AISI 430
Samples Cr eq / Ni eq
1 5.54
2 5.90
3 6.11
4 6.37
5 6.55
6 7.00
Batch annealing simulation, specimens were annealed in box furnace at 800°C, 825°C, 850°C, 875°C and 900°C for 1 hour and then quenched. Optical Microscope (OM) was used to investigate and analyze microstructure. Finally, Rockwell hardness test were carried out on all samples. 3. Results and Discussions Hot rolled of AISI 430 microstructure consists of banded structure of ferrite (white) and martensite (dark) oriented in hot rolling direction [1-2], as shown in Figure 2. This structure indicates characteristic of wrought structure. Furthermore, area fraction of martensite in the samples, were found to be approximately 53 - 56 % (Table 3).
Low magnification High magnification Figure 2: Microstructure of AISI 430 in hot rolled condition. After annealed of specimen which has Cr eq / Ni eq ratio of 5.54, the ferrite and chromium carbide (Cr23C6) [1] were found on the microstructures of all condition. Nevertheless, martensite was found on the ferrite matrix after annealing at 850°C, 875°C and 900°C, as shown in Figure 3(a) - (e). First two samples exhibit ferrite and chromium carbide. But when annealing temperature increased to 850°C, the martensite content started to appear on the microstructure.
(a) annealing at 800°C (b) annealing at 825°C
(c) annealing at 850°C (d) annealing at 875°C
(e) annealing at 900°C
Figure3: Microstructures of AISI 430 specimens which Cr eq / Ni eq ratio of 5.54 after annealing conditions for 1 hour and then water cool Figure 4 shows relationship between the Cr eq / Ni eq ratio and annealing temperature on the martensitic transformation. It is noted that these martensitic transformation starts at annealing temperature higher than 850°C. Additionally, the appropriate annealing temperature is depending on the Cr eq / Ni eq ratio, as seen in Figure 1. Figure 4 shows annealing temperature and Cr eq / Ni eq ratio that would not result in martensitic transformation upon water quenched. Table 3 shows area fraction of martensite on these microstructures. The martensite content decreased, with an increase of Cr eq / Ni eq ratio and a decrease in the annealing temperature. From these results, it could be explained that the hardness increased with the martensite formation, as shown in Table 4. The results of hardness were depending on the area fraction of martensite. Finally, it could be summarized that the martensite appearance represents non-suitable annealing condition.
ND
RD
ND
RD
Ferrite Cr23C6
Cr23C6

The 2nd Thailand Metallurgy Conference (2 TMETC)
-28-
Figure4: Effect of Cr eq / Ni eq ratio on martensitic transformation of AISI 430 Table3: Area fraction of martensite phase of AISI 430
Remark: HR is hot rolled sample. Table4: Hardness tests (HRB) of as-annealed samples of AISI 430
Cr eq / Ni eq 800°C 825°C 850°C 875°C 900°C HR
5.54 73.4 72.1 71.9 76.5 81.0 98.6
5.90 73.9 74.1 73.3 75.2 77.6 99.4
6.11 72.5 73.9 73.7 74.6 76.1 98.5
6.37 71.7 71.5 71.0 74.8 73.5 98.6
6.55 72.6 73.4 72.1 72.9 72.4 99.0
7.00 73.1 73.7 72.5 71.6 70.3 98.8
4. Conclusions 1. When Cr eq / Ni eq ratio was high enough, phase
transformation from ferrite to austenite does not occur. As a consequence martensite presence is suppressed.
2. Annealing temperature can be increased for alloys having high Cr eq / Ni eq ratio.
3. Hardness of the annealed product, after quenching can be used as a controlling parameter to indicate proper annealing of the AISI 430 stainless steel.
5. References [1] ASM Handbook, Stainless Steel, 1st edition, USA, 1994. [2] ASM Handbook, Metallography and Microstructures, 1st edition, USA, 1998. [3] J. Beddoes, J. G. Parr, Introduction to Stainless Steel, 3rd edition, USA,1999.
[4] P. Lacombe, B. Baroux and G. Beraner, Stainless Steels, France, 1993. [5] R.E. Reed-Hill and R. Abbaschian, Physical Metallurgy Principles, 3rd edition, USA,1994. [6] G.E. Dieter, Mechanical Metallurgy, 1st edition, Singapore, 1988.

The 2nd Thailand Metallurgy Conference (2 TMETC)
-29-
Electron Microscopy for Cast Metals : Activities at Chiang Mai University
T. Chairuangsri1, A. Wiengmoon2, N. Poolthong3, S. Rojananan3, A. Nisarattanaporn4, J. Kajornchaiyakul5, C. Thanachayanont5, J. T. H. Pearce5
1Department of Industrial Chemistry and the Electron Microscopy Research and Service Center, Faculty of Science, Chiang Mai University (CMU), Chiang Mai, 50200, Thailand
2Department of Physics, Faculty of Science, Naresuan University (NU), Phitsanulok, 65000, Thailand
3Division of Materials Technology, School of Energy, Environmental and Materials, King Mongkut's University of Technology Thonburi (KMUTT), Bangkok, 10140, Thailand
4Department of Metallurgical Engineering, Faculty of Engineering, Chulalongkorn University (CU), Bangkok, 10330, Thailand
5National Metal and Materials Technology Center (MTEC), Bangkok, 10400, Thailand
ABSTRACT - Electron microscopy has been extensively used for structural and compositional analysis of wrought metals. However, less work, especially on transmission electron microscopy, was performed on cast metals due probably to difficulty in sample preparation causing by heterogeneity of the casting structure. Our recent electron microscopy investigations of cast metals including high chromium cast irons, cast aluminium alloy A356, cast duplex stainless steel and cast silver alloy, were reviewed in this article. These research activities have been conducting at the Department of Industrial Chemistry and the Electron Microscopy Research and Service Center (EMRSc), Faculty of Science, Chiang Mai University in collaboration with metallurgy laboratories in other institutes. In addition, because of a potential to be applied in many industrial fields, effects of semi-solid cast process, in which molten alloys are cooled and partially solidified before the shape making operation is performed, has also been studied in comparison to conventional cast process. KEY WORDS -- electron microscopy, cast metals, high chromium cast irons, cast aluminium alloy A356, cast duplex stainless steel, cast silver alloy, semi-solid cast process บทคัดยอ จุลทรรศนศาสตรอิเล็กตรอนถูกใชอยางกวางขวางในการวิเคราะหโครงสราง และองคประกอบเคมีของโลหะรีด อยางไรก็ตาม งานศึกษาทางดานน้ีในโลหะหลอมีนอย โดยเฉพาะจุลทรรศนศาสตรอิเล็กตรอนแบบสองผาน ซึ่งอาจเปนเพราะความยากในการเตรียมชิ้นงานเน่ืองจากความไมเปนเน้ือเดียวของโครงสรางงานหลอ บทความน้ีเปนการทบทวนงานของเราท่ีใชจุลทรรศนศาสตรอิเล็กตรอนศึกษาโลหะหลอ ประกอบดวย เหล็กหลอโครเมียมสูง โลหะผสมอะลูมิเนียมหลอ เอ356 เหล็กกลาไรสนิมดูเพล็กซหลอ และโลหะผสมเงินหลอ งานวิจัยเหลาน้ีไดดําเนินอยู ณ ภาควิชาเคมีอุตสาหกรรม และศูนยวิจัยและบริการจุลทรรศนศาสตรอิเล็กตรอน คณะวิทยาศาสตร มหาวิทยาลัยเชียงใหม ในความรวมมือกับหองปฏิบัติการโลหะวิทยาของสถาบันอ่ืน ๆ นอกจากน้ี เน่ืองจากศักยภาพในการประยุกตกับอุตสาหกรรมตาง ๆ จึงไดศึกษาผลของกระบวนการหลอแบบก่ึงแข็ง ซึ่งโลหะหลอมถกูทําใหเย็นและแข็งตัวบางสวนกอนการขึ้นรูป เปรียบเทียบกับกระบวนการหลอดั้งเดิมดวย คําสําคัญ -- จุลทรรศนศาสตรอิเล็กตรอน, โลหะหลอ, เหล็กหลอโครเมียมสูง, โลหะผสมอะลูมิเนียมหลอ เอ356, เหล็กกลา
ไรสนิมดูเพล็กซหลอ, โลหะผสมเงินหลอ, กระบวนการหลอแบบก่ึงแข็ง 1. Introduction The first part of this paper shows observations of high chromium cast irons in as-cast and different heat-treating conditions. Microstructural modification by semi-solid cast process was also investigated. These irons are of interest because they are relevant to Thai industries e.g. in zinc extraction plant and cement manufacturing. The second part presents an observation of a cast aluminium alloy A356. Alloys in this group are particularly used for aircraft and automotive
applications, e.g. lightweight wheels for sports car. Complexity of aging precipitation sequence has made the precipitation subject in this alloy group remains controversial and hence electron microscopy study of precipitation in this alloy has been motivated. A study of a cast duplex stainless steel is given in the third part. This alloy consist of both ferrite and austenite and is used in some industries relevant to Thailand, e.g. chemical, petrochemical and power industries, due to its superior corrosion resistance particularly in chloride-containing environments. However, its precipitation behavior is not well-understood and has

The 2nd Thailand Metallurgy Conference (2 TMETC)
-30-
therefore been exploring. Finally, an observation on a cast silver alloy was given. This precious alloy is used in jewelry in Thailand and little information on its microstructure was reported in literatures.
2. Experimental procedures Both conventional and semi-solid cast process were used to prepare the alloys. CO2-silicate and metal moulds were utilized. For semi-solid cast process, a sloped cooling plate was used whereby liquid metal was poured over a semi-circular copper plate coated with a thin layer of boron nitride to prevent sticking of solidified alloys. Specimens for examination by light microscopy (LM) and scanning electron microscopy (SEM) were prepared by a standard grinding and polishing procedure. Appropriate etchants were chosen to reveal general microstructure. An Olympus BX60M optical microscope and a JEOL 5910LV SEM, operated at 15-30 kV, were used. Thin foils for transmission electron microscopy (TEM) were prepared by a Struers Tenupol-3 twin-jet electropolisher with proper electrolytes. A JEOL JEM2010 TEM-STEM were used, operated at 200 kV.
3. Results and Discussion 3.1 High Chromium Cast Irons Microstructure and crystallography of carbides in 27-30 wt%Cr cast irons in as-cast and after destabilization and/or tempering heat treatments were revealed.[1] Eutectic and secondary carbides are mainly M7C3 and M23C6, respectively, which possess orientation relationships with their matrixes. By combining a reverse effect of some particular etchants, quantitative analyses on secondary carbide precipitation and eutectic carbide transformation due to destabilization heat treatment were successful.[2] Unusual structure, which can affect properties of casting, was firstly reported by us and the mechanism of formation has been proposed.[3] Spheroidal primary phase and radiating clusters of eutectic structure were obtained as a result of semi-solid processing.[4] Effects of some alloying elements including V, W and Mo are being investigated. 3.2 Cast Aluminium Alloy A356 A cast Al-7%Si-0.3%Mg alloy was studied in as-cast and after the T6 artificial aging heat treatment. Nanometer-scale aging precipitates were successfully revealed only by TEM.[5] The results support a suggestion on aging precipitation sequence as reported in the case of wrought Al alloys in this group; supersaturated solid solution α → GP zones I → GP zones II (β’’) → β’ → β (Mg2Si). Peak aging at 160 oC was associated with the β’’ phase. However, further experiment on HREM is needed to definitely conclude the types of the aging precipitates. 3.3 Cast Duplex Stainless Steel A cast 22wt%Cr-0.037wt%C duplex stainless steel has been studying. Slow cooling after a normal heat treatment at 1175 oC resulted in a precipitation of an intergranular precipitate.[6] This precipitation led to a detrimental effect on corrosion resistance of the alloy. An experiment on isothermal transformation between
500-1000 oC has been performed and resulted in a complex, both intergranular and intragranular, precipitation. Only SADP technique alone cannot solve firmly the structure of these precipitates and further studies using advanced techniques, e.g. CBED and EELS, is needed. 3.4 Cast Silver Alloy A 93.5wt%Ag - 6.37wt%Cu - 0.13wt%Be silver alloy was studied. Beryllium had an effect on modifying eutectic structure from a typical, pearlite-like lamellar to a structure with more sphericity and on improving the macrohardness and other mechanical properties after aging due to a fine precipitation within the primary phase, which could be revealed only by TEM. Despite a difficulty in detecting Be in this alloy by EDS, the type of aging precipitate could tentatively be Be12Ag orε -Cu.[7]
4. Conclusion Electron microscopy, especially transmission electron microscopy, is an essential technique to study precipitation and transformation in cast metals and it was succeeded for some extent. However, some difficulties still remain in (i) sample preparation and (ii) phase identification when chemical compositions are not different or light elements, e.g. B or Be, are present. FIB technique can be helpful for sample preparation and advanced techniques in TEM, e.g. CBED, HREM and EELS, are indispensable for some particular cases.
5. Acknowledgement Miss S. Imurai, Mr. N. Chomsaeng, Mr. S. Kuimalee and Mr. T. Sukree are thanked for providing their results and valuable discussion.
6. References [1] A. Wiengmoon et al., “Microstructural and crystallographical study of carbides in 30wt.%Cr cast irons”, Acta Materialia, Vol.53, 2005, pp. 4143–4154. [2] A. Wiengmoon et al., “A Microstructural Study of Destabilised 30wt%Cr-2.4wt%C High Chromium Cast Iron”, ISIJ International, Vol. 44, No. 2, 2004, p. 396. [3] A. Wiengmoon et al., “An Usual Structure of an As-cast 30%Cr Cast Iron”, ISIJ International, 45 (11), 2005, pp. 1658-1665.

The 2nd Thailand Metallurgy Conference (2 TMETC)
-31-
Failure of the aluminum die casting parts: Case study S. Kaewkumsai, S. Ouamparn, and A. Chianpairot
National Metal and Materials Center (MTEC), National Science and Technology Development Agency (NSTDA),
114 Thailand Science Park, Paholyothin Rd., Klong 1, Klongluang, Pathumtani 12120 THAILAND
Phone 66-2564-6500 ext.4736, Fax. 66-2564-6332, E-mail: [email protected]
ABSTRACT - The paper described failure of an aluminum die casting, as component of electricity suspensions and automotive parts, which failed within a short period after the installation and start-up. Radioscopic inspection system was used to determine the internal casting defects. It was observed that the presence of casting defects was mainly responsible for the part fracture. Fractography showed the origins coming from defects, porosity and shrinkage. The cause of failure was attributed to the presence of a high amount of defects. Based on the analysis, it is recommended that the better quality control of die casting process should be conducted in order to avoid fracture of these parts. KEY WORDS -- Aluminum die casting Porosity, Shrinkage, Fractography
1. Introduction High pressure die casting parts made of aluminum alloys offer several benefits in automotive uses. In certain, the cost efficiency of the casting process and the possibility to cast the part in thinly-wall of complex geometries led to the use of this kind of materials in new model of lightweight engines [1]. Aluminum die casting alloys are made by the rapid injection of molten metal into metal molds under high pressure. These alloys have a dense and fine grain surface, and are easily made by mass production [2]. For the applications, products with complicated structure are desired. Following increasing application for aluminum alloy die-cast products, many studies have been carried out on their mechanical properties, and it has been reported that the mechanical properties were largely influenced by casting defects, such as irregular structures, porosities, and so on. The part that applied to cyclic load was found to be fracture, especially at the thin section. Fatigue properties of aluminum components strongly depend on casting defects and microstructural appearances [3]. It has been mentioned that the tensile strength and the fatigue strength of die-casts decreased with the increase in the amount of porosities. The irregularities in the structure also affect their mechanical properties, and among irregular structures, cold flakes largely reduce the mechanical properties of the die-castings. Cold flakes are included in products during injection process of the cold chamber high-pressure die casting as follows. The solid layers are disintegrated and transmitted into the die cavity to form cold flakes in the die-castings. Shrinkage occurs during solidification as a result of volumetric differences between liquid and solid states [4]. In this present paper, failure analyses of aluminum die casting parts were conducted. The failed components were the electricity suspension and automotive parts which were made from aluminum casting. They broke after in serviced for a few periods.
2. Investigation Methods Visual examinations with the aid of a stereo microscope were thoroughly carried out on the failed parts and sites of fracture. Then, defects and discontinuities of the failed samples were observed by the radioscopic inspection system, Giladoni: CHF 225 S/G. A portion of the failed part with the fracture surface was used for fractography study using a stereo microscope and a scanning electron microscope. A spark emission spectrometer was used for determine the chemical composition of a bulk of samples. And finally, the samples were prepared using a standard metallographic technique and etched with nital (a dilute solution of HNO3 in alcohol). The microstructure of the material was analyzed by a reflected light microscope.
3. Case studies 3.1 Failure of Electricity Suspension 3.1.1 Background Information The failed components were the Strain Clamp 5U-Bolts which were made from aluminum casting grade LM6 (British Standard). They were the component of electricity system and served as a support of aluminum cable in the Scandinavia. They broke in service after a few months installed. The failed part for analysis is shown in Fig.1. 3.1.2 Radioscopic inspection Radiography of the failed parts in the fracture area reveals a large amount of internal defects and discontinuities, including shrinkage, porosity, and micro-cracks as shown in Fig.2.

The 2nd Thailand Metallurgy Conference (2 TMETC)
-32-
(a) (b) Fig.1 a) The failed component b) cracking site
Fig.2: X-ray (3.1 mA, 82 kV) of a failed sample at the large crack area with evidence of shrinkage porosities and crack initiated from these defects 3.1.3 Fractography The fractographs show the macroscopic features in Fig.3a. The fracture surface shows shrinkage porosities near the working surface (red arrows) and the crack directions indicates that it initiated from pores. SEM fractographs at the areas which cracks initiating are shown in Fig.3b-3c, shrinkages and porosities were found.
(a)
(b) (c)
Figure 3: SEM fractographs showing the casting defects a) macrofractography b) surface of shrinkage c) dendrite growth in shrinkage area 3.1.4 Chemical analysis Chemical composition analyses of a bulk of electricity suspension part are showed in Table 1. The results are close to the specification of LM6.
Table 1 Chemical compositions of LM6 base material
Alloy Compositions (mass %) Cu 0.09 Si 11.6 Mg 0.08 Zn 0.07 Fe 0.57 Mn 0.45 Ni 0.08 Sn 0.0.05 Al Balance
3.1.5 Microstructure analysis The microstructure of a piece of the failed sample conformed to the near eutectic structure as shown in Fig. 4a. The microstructure consisted of the eutectic silicon phase and defects with many dispersed shrinkage pores. Fig. 4b showed that the micro-crack had initiated from the shrinkage pores.
(a) (b)
Fig. 4: Microstructure of the failed part a) a large amount of porosities b) the crack linked of many pores 3.1.6 Discussions Observation from the radiography, fractography and the metallography reveals that the casting quality contributes to the fractured problem. The x-ray inspection in the fractured area shows a lot of internal defect, shrinkage porosity and micro-cracks. Microstructural analysis revealed that the cracks had initiated from the shrinkage pores. Fracture surface observations by SEM confirm that the fracture of the Strain Clamp 5U-Bolts could come from the presence of shrinkage pores and oxide film inclusions. Defects and discontinuities act as the stress concentrator and then they become the crack initiation sites for fracture under tensile and fatigue conditions. Gas pores are, typically, spherical, whereas shrinkage pores have an irregular three dimensional shape. Both of these types of pores can also be associated with aluminum oxide film [2]. Since the cold flake contains the oxide layer of poor cohesive bonding with the surrounding matrix, the cold flake reduces the mechanical properties of the die-castings components. Turbulence during melting, metal transfers and in particular during filling of the mold introduces cold flake oxide film defects that seriously reduce the mechanical properties. It is suggest that the use of non-turbulent bottom filling of moulds coupled with the use of ceramic filters in the running systems has very significant improvements in mechanical performance.

The 2nd Thailand Metallurgy Conference (2 TMETC)
-33-
3.1.7. Conclusion The determination of internal defect, microstructure and fractography were made that the casting defects (i.e. shrinkage porosity, oxide film inclusion) was a major contributing factor in this failure. Closely control the production line with no-turbulent flow is recommended.
3.2 Failure Analysis of an Autopart 3.2.1 Background Information The failed component was the oil-cooler part, which was the component of automotive. It was made of aluminum alloy grade ADC12 by the high pressure die casting process. Manual torque tightening was conducted for installation the oil-cooler part connecting with the engine. During performance testing for 280 hours, the oil leaked from this part. The pressure test was about 15 bars under the vibration load. As-received sample is shown in Fig. 5.
Fig. 5: The as-received automotive part for analysis 3.2.2 Visual examination Visual examination of the fractured part revealed that the part impart into two pieces produced by cracking. It generated during performance testing process. Machine cutting for opened crack was also observed in the opposite side. The fracture surface clearly exhibits the origin and the pattern. The fracture site is marked by pencil point. 3.2.3 Fracture surface analysis Fracture surface analysis with Stereo Microscope The macroscopically visible fractographic features can be used to identify the fracture origin at the external surface as shown in Fig. 6a. It can identify the fracture directions of crack propagation by redial marks. Radial marks [5] are lined on the fracture surface that radiate outward from the origin. They are formed by the propagation of brittle fractures. It does not show the beach mark patterns, characteristic of fatigue fracture. Some areas show the porosity and shrinkage porosity.
(a) (b) Fig. 6: Fractographs show a) origin (arrow) and b) porosity on fracture surface
Fracture surface analysis with SEM The fracture surface analysis with SEM shows microscopic feature as present in Fig. 6b. It shows the physical appearances of shrinkage porosity that was generated during solidification, consistent with the high pressure die casting process. 3.2.4 Chemical analysis Chemical composition analyses of a bulk of oil-cooling part are showed in Table 2. The results are close to the specification of ADC12. Table 2 Chemical compositions of ADC12 base material
Alloy Compositions (mass %) Cu 2.34 Si 11.80 Mg 0.17 Zn 0.55 Fe 0.79 Mn 0.16 Ni 0.04 Sn 0.02 Pb 0.06 Al Balance
3.2.5 Cross-section and microstructure analysis The cross-section and microstructure of the area close to the fractured surface that was observed with optical microscope are shown in Fig. 7. The microstructure shows dispersion of porosities in matrix structure (Fig. 7a). Some area is free from porosity as shown in Fig.7b. SEM micrograph shows the shrinkage porosity as shown in Fig.8. 3.2.6 Discussions The macroscopic examination of the fractured sample reveals that fracture proceeds from the external surface. This surface area exhibited the radial mark pattern, characteristic of overload and fast fracture. It probably caused due to the over-torque tightening during installation. The microstructure analysis reveals that the area near fracture surface contains some of porosity. The tensile strength and fatigue strength of die-cast decrease with the increase in the amount of porosity. The microstructure appearances were also influence to the strength of material. The porosity near the internal hole surface did not generate the crack origin. The crack was caused by bending stress. The applied and vibration loads increased the stress much more than the porosity. Then the fracture of this part could come from the overload during testing and/or the improper design, high stress concentration site, low strength of the material.
100 μm

The 2nd Thailand Metallurgy Conference (2 TMETC)
-34-
(a) (b)
Fig.7: Microstructure of the failed part a) showing porosities at the fracture origin area b) normal structure
Fig. 8: SEM micrograph shows the shrinkage porosity 3.2.7 Conclusion The fracture was originated at the external surface and propagated with radial mark patterns, characteristic of overload failure. The over-torque tightening could be the cause of failure. The casting defects were also acted as the contribution factor. Then, the torque tightening could closely control to prevent the overload failure. Alternatively, quality control of casting process was proposed for avoiding casting defects. 4. References [1]. Dirk Mohr, Roland Treitler, 2008, “Onset of fracture in high pressure die casting aluminum alloys”, Engineering Fracture Mechanics, Vol. 75, pp. 97–116. [2] K. Nakata, Y.G. Kim, H. Fujii, T. Tsumura, T. Komazaki., 2006, “Improvement of mechanical properties of aluminum die casting alloy by multi-pass friction stir processing”, Materials Science and Engineering A, Vol. 437, pp. 274–280. [3] Q.G. Wang et al., 2001, “Fatigue Behavior of A356-T6 aluminum cast alloys. Part I. Effect of casting defects”, Journal of Light Metals, vol.1, pp.73-84. [4] The Influence and Control of Porosity and Inclusions in Aluminum Castings, ASM Handbook. [5] Brittle Fracture, Understanding How Component Fail, ASM
10 μm

The 2nd Thailand Metallurgy Conference (2 TMETC)
-35-
Grain Refinement of 7075 Al-Alloy by Thermomechanical Treatment
K. Runruksa, P. Srichandr* Division of Materials Technology, School of Energy , Environment and Materials King
Mongkut’s University of Technology Thonburi (KMUTT)Thailand , Tel. 0-2470-8643, Fax 0-2427-9062, Email; [email protected]
ABSTRACT - Alloy with fine grains exhibit superior properties compare with coarser-grained ones including better strength, more toughness and better formability. Attempts are therefore made to obtain as small grains as possible in the manufacturing of metallic parts. This research attempts to refine the grain size of 7075 aluminum alloys by thermomechanical treatment process. The results showed that aging temperature influenced the final grain size considerably. With the aging temperatures of 100, 200 and 400 ºC, the resulting with final grain size were, 61, 47 and 34 microns, respectively. It is concluded that the higher the aging temperature, the smaller the final grain size. Aging time was also found to have some effect on the final grain size, though not quite in the same manner as aging temperature. It is concluded that grain refinement of 7075 alloy from 140 microns to 10 microns is attainable by thermomechanical treatment. The presence of MgZn2 in the structure prior to rolling and recrystallization anneal is required in order to obtain such fine grains. KEY WORDS -- Thermomechanical Treament, Grain Refinement, Alloy 7075
บทคัดยอ โลหะที่มีขนาดเกรนเล็กจะมีสมบัติท่ีดีกวาโลหะที่มีขนาดเกรนใหญหลายดาน เปนตนวา มีความแข็งแรงสูงกวา มีความเหนียวดีกวา การขึ้นรูปทําไดงายกวา ในการผลิตชิ้นงานโลหะจึงมีความพยายามลดขนาดเกรนโดยวิธีการตางๆ ท่ีจะทําใหโลหะมีขนาดเกรนเล็กท่ีสุดเทาที่จะเปนไปได งานวิจัยนี้เปนความพยายามที่จะลดขนาดเกรนของอลูมิเนียมผสมเบอร 7075 โดยกระบวนการเทอรโมเมคแคนนิคัล ผลการวิจัยพบวาอุณหภูมิในการบมมีผลตอขนาดเกรนคอนขางมาก กลาวคือท่ีอุณหภูมิการบม 100, 200, และ 400 oC จะไดขนาดเกรน 61, 47, และ 34 ไมครอน ตามลําดับ สรุปไดวาในชวงอุณหภูมิการบม 100-400 oC อุณหภูมิการบมสูงขึ้นจะไดขนาดเกรนเล็กลง สวนเวลาในการบมมีอิทธิพลตอขนาดเกรนเชนเดียวกันแตไมเหมือนอุณหภูมิ การปลอยใหชิ้นงานเย็นตัวอยางชา ๆ ในเตาอบหลังการบมกอนที่จะนําไปรีดและอบเพื่อใหเกิดผลึกใหมจะทําใหไดขนาดเกรนของอลูมิเนียม 7075 ท่ีมีขนาดเล็กมากระดับ 10 ไมครอน ผลการวิจัยสรุปไดวาเราสามารถปรับลดขนาดเกรนอลูมิเนียม 7075 จาก 140 ไมครอนเปน 10 ไมครอน ไดโดยกระบวนการเทอรโมเมคแคนนิคัล แตตองอบใหได MgZn2 ในโครงสรางกอนที่จะนํามารีดและอบเพื่อใหเกิดผลึกใหม คําสําคัญ -- กระบวนการเทอรโมเมคแคนนิคัล, การปรับขนาดเกรน, อลูมิเนียม 7075
1. Introduction To enhance equiaxed fine grain structure of metal and alloy; the foundry men has tried many grain refining process to treat of metal and alloy. Master alloy usually added to melt metal before pouring to achieve the 100-300� grain size area, also cold deforming and recrystallisation process are seldom used to achieve the metal structure of 40-50� grain size area. The more fine grain structure of metal the more tensile strength and more ductile metal will be. Z.M. El Narade and et al.[1,2] have founded that when grain size area of Al-alloy was reduced from 46� to 16�, more tensile strength up to 84.3% was yielded. Improve strength and ductility were improved up to 116% and 287% respectively. D.H. Shin and A. Smolej [3,10,11] found that when the grain size area of 7075 Al-alloy was reduced to 10� beside the more strength was achieved, the 7055 Al-alloy became a
superplastic behavior metal. R. Kaibyshey and et al. [4] simulated high temperature elongation of 11� grain size of 7075 Al-alloy, they founded that, due to the superplastic behavior of metal, 960% of elongated grains were achieved. Superplastic behavior of metal could fulfill the more complex shape of sheet metal could be formed such as fuselage skin or hue elongation were needed. With the problem in grain size limited effect of 70xx Al-alloy in cold deforming processes. Cold deforming process were usually performed at <0.5Tm; tearing of metal parts were usually occurred when high volume deformed metal were proceeded if large grains size after recrystallization annealed was occurred. The problem could be cured by the precipitation of small size of secondary phase during aging. F.J. Humphreys et al [7-9] had proved that when the size of secondary phase were about 1-2�they would be the nucleation site of

The 2nd Thailand Metallurgy Conference (2 TMETC)
-36-
smaller than 10� grains area. This paper deal with aging variables the affected the secondary phase size such as grain size after cold reduction and after recrystallization annealing. 2. Experimental procedures The 12×30×100 mm. specimen size of 7075 Al-alloy with 6Zn, 2Mg, 1.7Cu, 0.18Cr and 0.19Fe were investigated. The 140�original grains size was prepared by 1 mm. cold reduction and recrystalliation for 1 hr. at 500oC. Then the aging variables has been investigated. 2.1 The Temperature. The specimens were solution heat treated for 4 hr. at 500oC, water quenched to stabilized the solid solution at room temperature. All specimens were aged at 100, 200, and 350oC, water quenched after 12 hr. aged. After that aged specimen were rolled reduction to 2 mm at 250oC and recrystalized at 480oC for 12 hr. 2.2 The Time. The specimens were solution heat treated for 4 hr. at 500oC, water quenched to stabilized the solid solution at room temperature. After solution treatment and quenching the specimens were aged at 350oC for 1, 12, and 24 hr. All specimens were rolled reduction to 2mm. hick at 250oC followed by recrystallization at 480oC for 1 hr. 2.3 The Cooling Rate. The specimens were solution heat treated for 4 hr. at 500oC, and water quenched. After that the specimens were aged at 350oC for 12 hr. follow by furnace cooled and water quenched. After that the specimens were rolled reduction to 2 mm. thick at 250oC. After rolling the metal were recrystallized at 480oC for 1 hr. 2.4 Microstructure Development and Analysis. The rolled specimens were preparing for microstructure development and XRD analysis. Keller’s reagent was used for microstructure development with optical microscope analysis and line intercept grain size area could be determined, XRD was used to determined the composition of each phases. 3. Results & Discussion 3.1 Effect of Aging Temperature on Microstructure. Original elongated grain microstructure of alloy 7075 form supplier has shown figure 1(a), after 1 mm. cold reduction and recrystallization; grains structure of specimen has been recrysed to 140� grain size as shown in figure 1(b)and has been used as datum grain size to evaluated the effects. Aster aging process at various temperature 100. 200, and 400oC, the effect of temperature had changed the grain size of the specimen to 61, 47 and 34�respectively, the smallest grain size had shown in figure 1(c). It is clearly shown that the lower aging temperature the larger grain size will be. Since the more secondary phase would be precipitated at grain boundary than in the matrix during low temperature aging. The precipitated
secondary phase size in the matrix was to small to be nucleation site to growth. So that the recrystallization would be occurred at the former grains boundary and at sub grains site as nucleation site[5]. Even through, at higher temperature aging, such as 200oC, the smaller grain size could be occurred, but it was larger than the 400oC aging. At 200oC aging; even if the precipitated secondary phases particle were large enough to be nucleation site but the number of nucleation site were less and smaller than the 400oC aging. Then the 400oC aging was the best aging temperature to produce the fineness grains size in 7075 alloy.
(a) As-receive
(b) Grain size starting (140 micron)
(c) Aging at 400 ºC 12 hr( 34 micron)
(d) Aging at 400 ºC, 12hr,furnace cooled (10 micron)

The 2nd Thailand Metallurgy Conference (2 TMETC)
-37-
Figure1. Microstructure of 7075 aluminum alloys (a) as-received (b) Aging at 100 ºC (c)Aging at 200 ºC and (d) Aging at 400 ºC 3.2 Effect of Aging Time on Microstructure. At 1, 12, and 24 hr. aging time; the precipitated grains size were 65, 34, and 41� respectively, the smallest grain size was 34� as shown in figure 1(c). It was shown that since 1 hr. aging the grain size were larger as 65� than 12 and 24 hr. aging. Since the primary precipitation would be take place at the vacancies sites[5] and take time to growth or transform to another phase. So that 1 hr. aging could not enough to proceed the growth or transformation to be the nucleation site of new grains. Then the larger grain size would be form at 1 hr. aging than 12 and 24 hr. aging. The smaller grain size would be gain during 12 hr. than 24 hr. aging, since the longer aging period at the constant temperature the result of the larger precipitated phase would be. So that at higher temperature aging than solubility limit of the matrix the precipitated phase or � phase would be re-dissolve. So that longer aging time would be made the re-dissolve in the matrix more than to be growth. So 12 hr. aging would be gain the best effect of finer grain size. 3.3 Effect of Cooling Rate After Aging on Microstructure. Grain size of cold reduction and recrystallization of furnace and water quench cooled the aged specimens, grains size area of the metal specimens were 10 and 34� respectively; the smallest grain size were shown in figure 1(d). The main factors that affect the smaller grain size were 1) the more nucleation site the smaller grain size would be, 2) inhabitation of growth process of grain during cooling. Intermetallic compound in 7075 alloy such AlCr and metallic Zn were the primary solid particles that would be precipitated during recrystalliztion after final rolling. These particles of size more than 0.5�[1] would be the nucleation site for growth to be grains. Forming of these particles were the result of diffusion and growth of each alloying elements. Time and temperature would the factors that promoted the diffusion process. So that the furnace cooled specimen after recrystallization would gain the finer grain size than the water cooled specimen. Since, the furnace cooled, all the particle size would be lager and more dispersing than the water cooled specimens; cold deforming effect broke down and pushing these particles and made it more dispersing. So that after recrystalliation process the more finer grain size would be. Comparison examination Due to the XRD examination; the structure of as received 7075 alloy did not appeared the MgZn2 as shown in figure 2(a). It shown the small peak of MgZn2 in the furnace cooled 12 and 24hr. aged specimens as shown in figure 2(b)-2(c) respectively.
(a)as-receive
(b )Aging at 400 ºC ,12 h r
(b )Aging at 400 ºC ,12 hr
(c )Aging at 400 ºC ,24 hr
(d)Aging at 400 ºC 12 hr , furnace cooled Figure2. X-ray diffraction (a) as-received (b) Aging at 12hr (c)Aging at 24 hr and (d) Aging at 400 ºC ,furnace cooled

The 2nd Thailand Metallurgy Conference (2 TMETC)
-38-
4. Conclusions The more finer recrystaled grain size of 7075 alloy would be gained in the furnace cooled aged specimens. The fineness grain size of 10� was obtained from the cold deformed and recrystallization of 34� gain size specimen. MgZn2 were precipitated in furnace cooled aged specimens, and result in finer grain size. This research ha been reduced the gain size down to only 10�, since there were some uncontrolled factors the affecting the recrystaled process. 5. Acknowledgement The authors would like to thank the Division of Material Technology, School of Energy, Environment and Material, King Mongkut’s University of Technology Thonburi and National Metal and Materials Technology Center (MTEC) for financial supports. 6. References [1] William F. Smith, Structure and Properties of Engineering Alloys, McGraw-Hill, New York, 1993. [2] Z. M. El-Baradie, M. El-Sayed, Effect of double thermomecchanical treatment on properties of 7075 Al alloy (1995), Mat. Proc. Tech., pp. 6276-80. [3] D.H.Shin, C.S.Lee, W.J.Kim, High-temperature deformation in a superplastic 7475 Al alloy with a relatively large grain size ,(1997), Acta Mat. 45, [4.] R.Kaibyshev, T.Sakai,F.Musin, I.nikulin, and H.Miura(2001), Superplastic behavior of a 7075 aluminum alloy, Scrita mat. 45,1373-1380 [5.] Robert E.Reed-Hill, Physical Metallurgy Principles, Litton Education Publishing inc(1973).190-374. [6.] R.D.Doherty, D.A.Hughes, F.J.Humphreys, J.J.Jonus, D.Juul Jensen, Mat.Science and Eng.A238(1997) 219-274. [7.] F.J.Humphreys,(1977), The nucleation of recrystallization at second phase particles in deformed aluminium, Acta Mett.25, 1323-1344 [8.] J.Pilling and N.ridley, superplasticity in crystalline solids ,the institute of metals (1989) 17-21.65-101 [9.] F.J.Humphreys,Philip B.prangnell, Ronald Priestner, Fine-grained alloy by thermomecchanical processing, (2001),Cur.Op.Mat.Sci.5, 15-21 [10.] A.Smolej ,M.Gnamus, E.Slacek, The influence of the thermomechnical processing and forming parameters on superplastic behavior of the 7475 aluminium alloy, (2001) ,Mat.Proc, Tech. 118,397-402 [11.] D.H.Shin, K-T.Park, E.J.Lavernia (1995), High-temperature deformation in a superplastic 7475 Al alloy with a relatively lare grain size, Mat. Science. A201 ,118-126

The 2nd Thailand Metallurgy Conference (2 TMETC)
-39-
On the relationship between specimen thickness and graphite morphology of compacted graphite cast iron (CGI) T. Kumma, K. Teeratatpong, A. Sritong, N. Liamdee, and T. Udomphol
Suranaree University of Technology, Thailand Tel.044-224483, Fax.044-224482, E-mail:[email protected]
ABSTRACT – Graphite morphology of compacted graphite cast iron has been observed to be significantly affected by specimen thickness (1/8-2 inches) at 1500-1550oC treatment temperatures using 0.3-0.7% commercial COMPACTMAG (nodularizer). Fine graphite morphology was obtained in small thickness whereas thick sections provided coarser graphite structure. Higher treatment temperature resulted in higher losses in the amount of Mg. % Residual Mg has been observed to greatly influence the graphite morphology at individual treatment temperatures and specimen thickness investigated. KEY WORDS -- Compacted graphite cast iron, graphite morphology, specimen thickness, treatment temperature, residual magnesium บทคัดยอ ในการศึกษาการหลอเหล็กหลอกราไฟตตัวหนอนโดยทําการเติมสาร COMPATMAG (Nodularizer) ในชวง 0.3-
0.7% ท่ีอุณหภูมิ 1500-1550oC พบวา รูปทรงของกราไฟตมีความสัมพันธกับความหนาของชิ้นงานหลอ โดยมีขนาดความหนาที่ศึกษาคือ 1/8-2 นิ้ว ชิ้นงานที่บางจะใหรูปทรงของกราไฟตท่ีมีขนาดละเอียด สวนชิ้นงานที่หนาจะใหกราไฟตท่ีมีขนาดหยาบขึ้น นอกจากนี้ จะเกิดการสูญเสียแมกนีเซียมมากขึ้นหากทําการทรีทเมนตท่ีอุณหภูมิสูง และปริมาณการเติม COMPACTMAG มีความสําคัญอยางมากตอรูปทรงของกราไฟตท่ีอุณหภูมิเติมสารและความหนาตางๆกนั
คําสําคัญ -- เหล็กหลอกราไฟตตัวหนอน รูปทรงกราไฟต ความหนาชิ้นงาน อุณหภูมิทรีทเมนต แมกนีเซียมเหลือคาง
1. Introduction Compacted graphite cast iron (CGI) has been increasingly satisfied many engineering applications especially replacing some of the existing cast iron components such as diesel engines for automotive industry due to its high strength and thermal conductivity [1]. However the production of the CGI has long been difficult to achieve the desirable compacted graphite morphology, which depends significantly on magnesium treatment prior to casting as well as casting thickness. Under-treatment provides undesirable graphite flake whereas over-treatment yields nodular graphite morphology. In order to obtain the satisfied compacted graphite morphology, an investigation into the effects of specimen thickness on the graphite morphology has been carried out at 1500-1550oC treatment temperatures using 0.3-0.7% COMPACTMAG (nodularizer) to provide a useful operating window for the production of compacted graphite cast iron. 2. Experimental procedures CGI of 3.4-3.9%C, 1.8-2.1%Si compositions were melted in a 40 kg crucible followed by magnesium treatment at 1500-1550oC by adding the commercial COMPACTMAG of 0.3-0.7%. The sandwich process was carried out in a 35 kg ladle with the treatment temperatures being controlled within ±15oC prior to casting. Step bars of different thickness (1/8-2 inches) as shown in fig. 1 were cast in sand molds such that directional solidification was attained. Investigation of the graphite morphology at individual test conditions
was carried out using an optical microscope. Chemical composition of CGI castings was analyzed using a spark emission spectro analyzer whereas the carbon equivalence was measured using a carbon equivalent meter following the magnesium treatment.
Figure 1. Step bar used for CGI sand casting
3. Results & Discussion Chemical compositions and carbon equivalence (CE) of the CGI castings in different conditions are shown in table 1. The contents of carbon and silicon are in the controlled ranges, giving the CE values of 3.9-4.5. The contents of residual Mg are varied in relation to the addition of COMPACTMAG and the treatment temperatures. Mg losses occurred in greater amounts when treated at higher temperature as shown in fig. 2.
300 mm 12 inches
3.2 mm1/8 inch
6.3 mm1/4 inch
12.7 mm 1/2 inch
25.4 mm 1 inch
38.1 mm1 1/2 inches
50.8 mm2 inches
Test Area 100 mm4 inches

The 2nd Thailand Metallurgy Conference (2 TMETC)
-40-
Table 1. Chemical compositions of CGI castings
TTreatment oC/ %COMPACTMA
G C Si Mg % CE
1500 oC 0.3% 0.5% 0.7%
3.39 3.10 3.39
2.44 2.58 2.95
0.015 0.016 0.025
4.1 3.9 4.4
1550 oC 0.3% 0.5%
0.7%
3.38 3.39 3.40
2.63 2.78 2.85
0.009 0.014 0.016
4.5 4.3 4.1
Relationship between %COMPACTMAG and % residual Mg at different treatment temperatures
0.015 0.016
0.025
0.009
0.0140.016
0.000
0.005
0.010
0.015
0.020
0.025
0.030
0.3 0.5 0.7
%COMPACTMAG
%Re
sidu
al M
g
1500 oC1550 oC
Figure 2. Relationship between %COMPACTMAG and %residual Mg in CGI castings at 1500 and 1550oC Fig.3 shows variations of graphite morphology obtained from CGI castings in relation to % residual Mg for each specimen thickness. It can be seen that at individual specimen thickness, the graphite morphology has changed from flake to compacted (vermicular) and finally to nodular with increasing % residual Mg. This is due to the effect of Mg in promoting nodular graphite formation. At 1500oC, under-treatment giving the undesirable flake graphite was obtained especially in thick sections when treated with 0.3% COMPACTMAG whereas over-treatment has shown in small sections treated with 0.5 and 0.7% COMPACTMAG. Over-treatment appeared in a lesser extent when treated at 1550oC, due to a higher loss of Mg. According to experimental data, the desirable compacted graphite morphology has been achieved where % residual Mg lied within 0.014-0.02%. Furthermore, comparison at individual % residual Mg showed that specimen thickness significantly affected the graphite morphology. Coarsening of flake, compacted and nodular graphite has been observed for 0.009%, 0.014% and 0.025% residual Mg respectively. Potential processing window for CGI treated at 1550oC is schematically shown in fig. 4.
Figure 3. Variation of graphite morphology according to % residual magnesium at specimen thicknesses of 1/8, 1/2 and 1 1/2 inches
Figure 4.Processing window of CGI. Note: F-flake, C-compacted, N-nodular
4. Conclusions 1. An increase in specimen thickness (1/8-2 inches) has coarsened the graphite observed at each treatment temperature. 2. Increasing amounts of % residual Mg (0.009-0.025%) has changed the graphite morphology from flake to compacted and finally to nodular graphite. 5. Acknowledgement Many thanks are due to undergrads, technicians and academic supports from Suranaree University of Tech. 6. References [1] W.L.Guesser, et al, “Compacted graphite cast iton for diesel engine cylinder blocks”, 106th AFS Casting Congress, Kansas City, 4-7 May 2002. [2] X.J. Sun, et al, Identification and evaluation of modification level for compacted graphite cast iron, Journal of materials processing, 2007.
F
F
F
FF
FC
CC
C
C
C
C
C
C
N C
N
N C
NC
0.3% 0.5% 0.7% COMPACTMAG
Step 11/8 ” Step 21/4 ” Step 31/2 ” Step 41 ” Step 51 1/2 ” Step 62 ”
Treatment temperature at 1550oC
F
F F
F F
F
N
C
CC
C
C
C
C
C
C
N C
N N
C N
C
C
C N
N
NC
N
NC
C
Step 1 1/8 ” Step 2 1/4 ” Step 3 1/2 ” Step 4 1 ” Step 5 1 1/2 ” Step 6 2 ”
0.009 0.014 0.016 0.025%Mg
0.009% residual Mg 0.014% residual Mg 0.025% residual Mg
200 μm 200 μm 200 μm
200 μm 200 μm 200 μm
200 μm 200 μm 200 μm
Step 11/8 inch
Step 51 1/2 inches
Step 31/2 inch

The 2nd Thailand Metallurgy Conference (2 TMETC)
-41-
Size and Distribution of Primary Silicon in Semi-Solid State of A390 Aluminum Alloy Subject to Mechanical Vibration
P. Senthongkaew 1 , N. Poolthong 2 and C. Limmaneevichitr *3 1 Division of Materials Technology, School of Energy, Environment and Material,
King Mongkut’s University of Technology Thonburi, Bangkok, Thailand 2 Division of Materials Technology, School of Energy, Environment and Materials,
King Mongkut’s University of Technology Thonburi, Bangkok, Thailand 3 Department of Production Engineering, Faculty of Engineering, King Mongkut’s University
of Technology Thonburi, Bangkok, Thailand Tel. 02-470-9188 Fax. 02-470-9198 * E-mail: [email protected]
ABSTRACT - This research studied the effects of mechanical vibration in semi-solid state on size and distribution of primary silicon in A390 aluminum alloy. The molten aluminum alloy was mechanically vibrated in a stainless steel mold with six different amplitudes ranging from 17.65 to 151.38 µm and constant frequency of 200 Hz. The melt was held in molten salt bath at various temperatures to obtain the fraction of solid at 3.9, 5.0 or 7.8%. Vibration durations were set at 5 min. It was found that samples with fraction of solid at 7.8% and amplitudes of 19.73 µm had primary silicon particles about 30 µm in diameter and the tips of the primary silicon phase became smooth. It was believed that mechanical vibration caused fragmentations of primary silicon and smoothed out the morphology. The main microstructures were eutectic structures surrounded by aluminum dendrite. However, samples from vibration with amplitude of 151.38 µm increased the primary silicon size. This might result from agglomerations of primary silicon. Key Words -- Mechanical Vibration, Semi-solid, Primary Silicon, Aluminum-Silicon alloy บทคัดยอ งานวิจัยนี้เปนการศึกษาอิทธิพลของผลของการสั่นสะเทือนทางกลในสภาวะกึ่งของแข็งตอขนาดและการกระจายตัวของโครงสรางซิลิคอนปฐมภูมิของอะลูมิเนียมผสมเกรด A390 โดยทําการทดลองสั่นสะเทือนอะลูมิเนียม-ซิลิคอนผสมเกรด A390 ในเบาสเตนเลสที่คงอุณหภูมิคงที่ในอางเกลือหลอมเหลวที่ต้ังอุณหภูมิท่ีเทียบไดกับสภาวะกึ่งของแข็งที่สัดสวนของแข็งรอยละ 3.9, 5.0 และ 7.8 มีการปรับแอมพลิจูดที่คาตางๆ ท้ังหมด 6 คา ในชวงตั้งแต 17.65 ถึง 151.38 ไมครอน โดยใชเวลา 5 นาทีท่ีคาความถี่ 200 Hz จากการทดลองพบวาสัดสวนของแข็งรอยละ 7.8 สั่นที่แอมพลิจูด 19.73 ไมครอน ทําใหซิลิคอนปฐมภูมิมีรูปทรงสัณฐานปลายมนและมีขนาดเสนผานศูนยกลางเฉลี่ยประมาณ 30 ไมครอน ในปริมาณมากที่สุด ท้ังนี้คาดวาการสั่นสะเทือนทางกลที่เหมาะสมทําใหผลึกซิลิคอนปฐมภูมิเกิดการแตกหักและปลายมน กระจายตัวอยูในโครงสรางพื้นฐาน โดยโครงสรางสวนใหญเปนยูเทคติคและปรากฏเดนไดรทอะลูมิเนียมรอบๆผลึกของซิลิคอนปฐมภูมิ อยางไรก็ตามเมื่อเพิ่มคาแอมพลิจูดเปน 151.38 ไมครอน พบวาซิลิคอนปฐมภูมิโดยสวนมากมีขนาดใหญขึ้นและปลายมน ซึ่งอาจเกิดจากผลึกซิลิคอนปฐมภูมิเกิดรวมตัวเปนกลุมกอนขนาดใหญขึ้น คําสําคัญ -- การสั่นสะเทือนทางกล, ก่ึงของแข็ง, ซิลิคอนปฐมภูมิ, อะลูมิเนียมผสมซิลิคอน
1. Introduction Aluminum-Silicon alloy grade A390 has been continuously used with much attention in automobile industries. The major application is for making piston due to several specific properties such as high strength, excellent in wear resistance and low thermal expansion coefficient. In general, fine primary silicon is preferable to obtain better properties for general applications [1-6]. The conventional method to obtain fine primary silicon is to add phosphorus. However, the technique was not completely controllable and subject to cause detrimental effect when contaminated with modifier. Lu et al. [4] obtained fine primary Si particles by electromagnetic force. However, using
electromagnetic force is rather expensive. Some investigators used mechanical vibration technique to refine primary silicon because it is much cheaper as compared to using electromagnetic force [6-8]. However, the vibration acted on aluminum melt in a short period of time during solidification. In this research, mechanical vibration in z-direction was used during semi-solid state of aluminum melt for 5 minutes so the vibration may better act on the silicon refinement.

The 2nd Thailand Metallurgy Conference (2 TMETC)
-42-
2. Experimental procedures An A390 Al-Si ingot of 170 grams was melted using an induction furnace using silicon carbide as crucible. After complete melting at 700°C, the melt was poured into a stainless steel mold (50- mm. in diameter and 90-mm. in height.) that was set inside a salt bath as illustrated in Fig. 1. The salt bath was set at temperature to obtain the solid fraction of 7.8, 5.0 or 3.9 %. The molten aluminum alloy was mechanically vibrated and isothermally held in a stainless steel mold with six different amplitudes of 17.65, 19.73, 45.86, 90.41 and 151.38 µm and constant frequency of 200 Hz for 5 minutes. Finally, the stainless mold was quenched into water bath and the sample was then prepared for light optical microscope examination and particle size and distribution of primary silicon analysis mainly on zone B.
Figure 1. Schematic sketch of mechanical vibration equipment set in salt bath. Figure 2. Zones for microstructure analysis. 3. Results and Discussion The melt was isothermally held at various temperature representing different solid fractions of 3.9, 5.0 and 7.8 %. It was found that the average primary silicon sizes are 63, 85 and 105 µm, respectively. Isothermal holding the melt at high solid fraction resulted in larger primary silicon size. As shown in Fig. 3, the morphology of primary silicon is mainly polyhedral with aluminum dendrite around.
(a) (b) (c) Figure 3. Micrographs showing samples holding at various fractions of solid (a) 3.9% (b) 5.0 % (c) 7.8 % with no vibration. It should be noted that the temperatures for different fractions of solid were calculated based on chemical composition using Thermo-calc. The other set of experiment was conducted in similar way by isothermal holding the melt at different fractions of solid. However, the mechanical vibration was introduced into the melt during holding the melt at different temperature to obtain different fractions of solid as shown Fig 4. It was found that, at certain amplitude range, average primary silicon size decreases with increasing amplitude at the fraction of solid of 5.0 and 7.8%. If the amplitude was higher than about 40 micron, the size became larger again. It is interesting to see that increasing amplitude did not reduce the size of primary silicon for samples with large fraction of solid, i.e. 7.8%. The graph showing primary silicon size subject to mechanical vibration at different amplitudes and fraction of solid was demonstrated in Fig. 5. To better understand the size distribution of primary silicon, the size distributions were determined. However, the complete size distribution cannot be presented here because of space limitation.
(a) (b)
(c)
Figure 4. Microstructure showing the effect of mechanical vibration to amplitude: (a) 0 µm (b) 19.73 µm (c) 151.38 µm
NaNO
+KNO 3
3
700 ํC
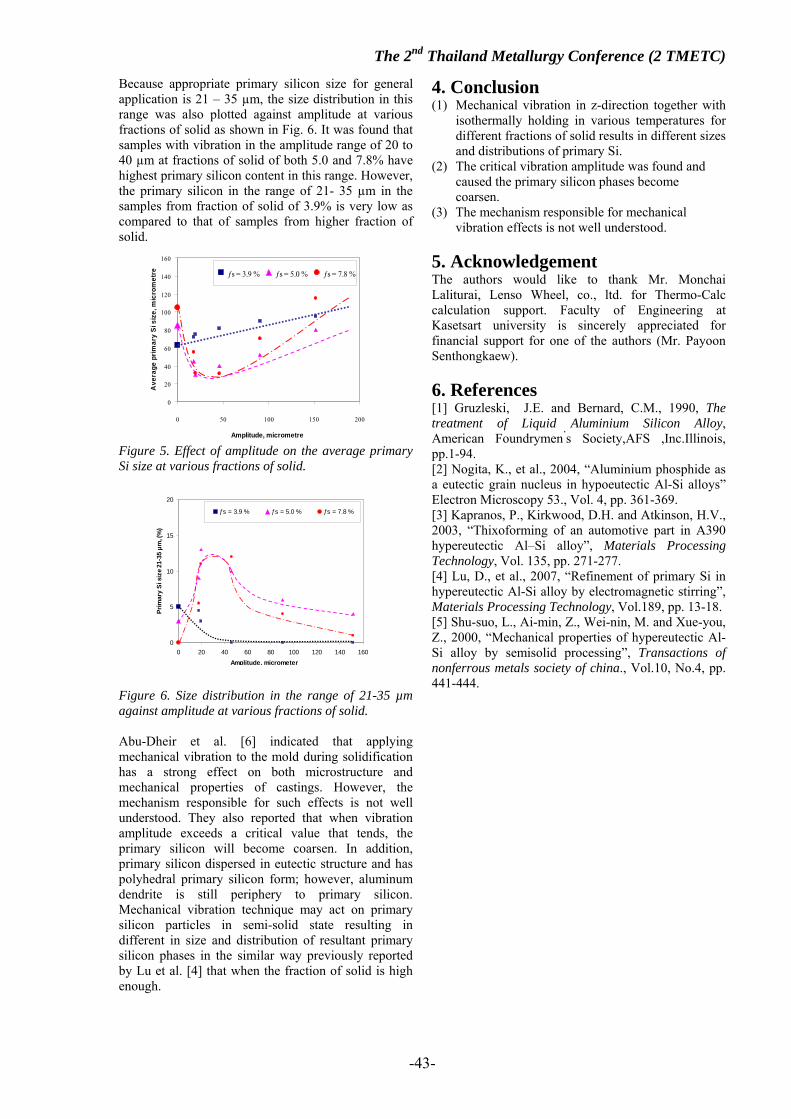
The 2nd Thailand Metallurgy Conference (2 TMETC)
-43-
Because appropriate primary silicon size for general application is 21 – 35 µm, the size distribution in this range was also plotted against amplitude at various fractions of solid as shown in Fig. 6. It was found that samples with vibration in the amplitude range of 20 to 40 µm at fractions of solid of both 5.0 and 7.8% have highest primary silicon content in this range. However, the primary silicon in the range of 21- 35 µm in the samples from fraction of solid of 3.9% is very low as compared to that of samples from higher fraction of solid. Figure 5. Effect of amplitude on the average primary Si size at various fractions of solid. Figure 6. Size distribution in the range of 21-35 µm against amplitude at various fractions of solid. Abu-Dheir et al. [6] indicated that applying mechanical vibration to the mold during solidification has a strong effect on both microstructure and mechanical properties of castings. However, the mechanism responsible for such effects is not well understood. They also reported that when vibration amplitude exceeds a critical value that tends, the primary silicon will become coarsen. In addition, primary silicon dispersed in eutectic structure and has polyhedral primary silicon form; however, aluminum dendrite is still periphery to primary silicon. Mechanical vibration technique may act on primary silicon particles in semi-solid state resulting in different in size and distribution of resultant primary silicon phases in the similar way previously reported by Lu et al. [4] that when the fraction of solid is high enough.
4. Conclusion (1) Mechanical vibration in z-direction together with
isothermally holding in various temperatures for different fractions of solid results in different sizes and distributions of primary Si.
(2) The critical vibration amplitude was found and caused the primary silicon phases become coarsen.
(3) The mechanism responsible for mechanical vibration effects is not well understood.
5. Acknowledgement The authors would like to thank Mr. Monchai Laliturai, Lenso Wheel, co., ltd. for Thermo-Calc calculation support. Faculty of Engineering at Kasetsart university is sincerely appreciated for financial support for one of the authors (Mr. Payoon Senthongkaew). 6. References [1] Gruzleski, J.E. and Bernard, C.M., 1990, The treatment of Liquid Aluminium Silicon Alloy, American Foundrymen’s Society,AFS ,Inc.Illinois, pp.1-94. [2] Nogita, K., et al., 2004, “Aluminium phosphide as a eutectic grain nucleus in hypoeutectic Al-Si alloys” Electron Microscopy 53., Vol. 4, pp. 361-369. [3] Kapranos, P., Kirkwood, D.H. and Atkinson, H.V., 2003, “Thixoforming of an automotive part in A390 hypereutectic Al–Si alloy”, Materials Processing Technology, Vol. 135, pp. 271-277. [4] Lu, D., et al., 2007, “Refinement of primary Si in hypereutectic Al-Si alloy by electromagnetic stirring”, Materials Processing Technology, Vol.189, pp. 13-18. [5] Shu-suo, L., Ai-min, Z., Wei-nin, M. and Xue-you, Z., 2000, “Mechanical properties of hypereutectic Al-Si alloy by semisolid processing”, Transactions of nonferrous metals society of china., Vol.10, No.4, pp. 441-444.
0
20
40
60
80
100
120
140
160
0 50 100 150 200
Amplitude, micrometre
Ave
rage
prim
ary
Si s
ize,
mic
rom
etre ƒs = 3.9 % ƒs = 5.0 % ƒs = 7.8 %
0
5
10
15
20
0 20 40 60 80 100 120 140 160Amplitude, micrometer
Prim
ary
Si s
ize
21-3
5 µm
, (%
)
ƒs = 3.9 % ƒs = 5.0 % ƒs = 7.8 %

The 2nd Thailand Metallurgy Conference (2 TMETC)
-44-
Powder Metallurgy of Silver Nanoparticles for Jewelry Making
P. Thongnopkun,1 W. Sroisuriya,2 and S. Ekgasit2
1Faculty of Gems (Chanthaburi), Burapha University, Chanthaburi 22170, THAILAND
Tel. (+66) – 8 – 1996 – 0902; E – mail: [email protected] 2Sensor Research Unit, Department of Chemistry, Faculty of Science,
Chulalongkorn University, Bangkok 10330, THAILAND Tel./Fax. (+66) – 2218 – 7585; E – mail: [email protected]
ABSTRACT – Silver nanoparticles were successfully synthesized using chemical reduction
method in aqueous solution. The particles were precipitated and dried in order to make nano-
silver powder. SEM images show their size in the range of 50 – 200 nm. Silver nanoparticles
powder was mixed with organic binder and water to be nano-silver clay. The clay can be shaped
like any soft clay, by hand or using moulds. Sintering temperature of the synthesized nano-silver
clay is 300 ºC which is lower than that of commercial silver clay. The synthesized nano-silver clay
becomes silver metal after firing at 600 ºC for 30 min. It can be applied for jewelry and art
works.
KEY WORDS – Silver nanoparticles, Silver clay, Sintering temperature, Jewelry making
บทคัดยอ อนุภาคขนาดนาโนของเงินถูกสังเคราะหขึ้นดวยวิธีเคมี และตกตะกอนใหอยูในรูปของแข็งลักษณะเปนผง
การศึกษาดวยกลองจุลทรรศนอิเล็คตรอนแบบสองกราดพบวาขนาดอนุภาคเงินที่สังเคราะหไดอยูในชวง 50 – 200 นาโนเมตร ผงอนุภาคซิลเวอรนาโนเมื่อนํามาผสมกับตัวประสานอินทรียและน้ําจะไดนาโนซิลเวอรเคลยท่ีมีลักษณะคลายดินเหนียว สามารถปนขึ้นรูปดวยมือและแมพิมพได อุณหภูมิในการเผาผนึกของผงอนุภาคซิลเวอรนาโนมีคาประมาณ 300ºC ซึ่งต่ํากวาซิลเวอรเคลยท่ีมีขายเชิงพาณิชย ผงอนุภาคซิลเวอรนาโนสามารถเผาขึ้นรูปเปนโลหะเงินไดท่ีอุณหภูมิ 600ºC เวลา 30 นาที และสามารถนําไปประยุกตทําเปนเครื่องประดับและงานศิลปะอ่ืนๆได
คําสําคัญ – อนุภาคขนาดนาโนของเงิน, ซิลเวอรเคลย, อุณหภูมิเผาผนึก, การทําเครื่องประดับ
1. Introduction The gems and jewelry industry has been a powerful export earner for Thailand. In jewelry industry, there are many techniques for making jewelry products depending on its design, value, demand, consumer, etc. The general manufactures of jewelry are manual, casting, pressing and electroforming techniques. For silver jewelry, there is a large of energy lost in melting and molding process of silver metal because the melting point of silver metal is about 960ºC. However, its melting temperature tends to decrease depending on its particle size. Silver clay is an alternative way for producing unique handmade jewelry. Silver clay is made of micron-sized silver particles, water, and non-toxic organic binders. When firing at appropriated temperature (650-850°C), the organic binders burn off, leaving a pure silver piece. In recently, the new product of metal clays tend to have small metal particles and low proportions of binder and water in
order to make them stronger, low shrinkage, and able to sinter faster at lower temperatures. When particle size is decreased to nanometer level, the melting point goes down from normal melting point more than several hundred Celsius degree. In this work, silver nanoparticles were introduced to create nano-silver clays. Their particle size and sintering temperature were determined. Example of nano-silver clay jewelry was presented. 2. Experimental procedures Silver nanoparticles were synthesized by chemical reduction method in aqueous solution with concentration 10,000 – 50,000 ppm. The particles were precipitated from silver nanoparticles colloid and were dried to be nano-silver powder at room temperature. Particle size of silver powder was characterized by scanning electron microscope (SEM) and sintering temperature of silver clay was determined by

The 2nd Thailand Metallurgy Conference (2 TMETC)
-45-
differential temperature analysis (DTA). The nano-silver powder was mixed with organic binder and water in appropriated ratio to form nano-silver clay. The clay was molded to be many shapes for making jewelry. After drying, the clay was sintered by oven at 600ºC for 30 min. 3. Results & Discussion Fig. 1 shows the shape and particle size of nano-silver powder. The particle size is in range of 50 – 200 nm and the shape is spherical.
Figure 1. SEM images of silver powder.
Sintering temperature of silver clay was determined by differential temperature analysis (DTA). It was found that sintering temperature is ≈ 300ºC far less than normal melting point, 960ºC. When silver clay was heated, water was evaporated and silver particles moved closer. After firing at 600ºC for 30 min., nano-silver clay changed to silver metal. It may cause that silver particles are quite small, there is a small cavity between particles and then they sintered without porosity. As shown in Fig. 2 and 3, the nano-silver clay can present the fine texture of fingerprint and can roll to make the complex jewelry.
Figure 2. Sintered silver clay of finger print.
Figure 3. Example of nano-silver clay jewelry. 4. Conclusions Nano-silver power was produced from high concentration silver nanoparticles colloid. Their particle sizes are 50 – 200 nm. The sintering temperature is at 300ºC. The powder was mixed with water and organic binder to be silver clay. The nano-silver clay can be shaped by hand or using mould to make jewelry. The firing temperature and time are 600ºC and 30 min., respectively. 5. Acknowledgements The authors gratefully acknowledge support from the Thailand Research Fund (TRF) and Commission on Higher Education (CHE). 6. References [1] Hirasawa, J. and Ido, Y., Silver Powder for Silver Clay and Silver Clay Containing This Silver Powder, US Patent No. 007081149B2, 2006. [2] Wang, H.; Qiao, X.; Chen, J. and Ding, S., Preparation of Silver Nanoparticles by Chemical Reduction Method, Coll. Surf. A, 2005, 256, 111-115
A
C
B

The 2nd Thailand Metallurgy Conference (2 TMETC)
-35-
Grain Refinement of 7075 Al-Alloy by Thermomechanical Treatment
K. Runruksa, P. Srichandr* Division of Materials Technology, School of Energy , Environment and Materials King
Mongkut’s University of Technology Thonburi (KMUTT)Thailand , Tel. 0-2470-8643, Fax 0-2427-9062, Email; [email protected]
ABSTRACT - Alloy with fine grains exhibit superior properties compare with coarser-grained ones including better strength, more toughness and better formability. Attempts are therefore made to obtain as small grains as possible in the manufacturing of metallic parts. This research attempts to refine the grain size of 7075 aluminum alloys by thermomechanical treatment process. The results showed that aging temperature influenced the final grain size considerably. With the aging temperatures of 100, 200 and 400 ºC, the resulting with final grain size were, 61, 47 and 34 microns, respectively. It is concluded that the higher the aging temperature, the smaller the final grain size. Aging time was also found to have some effect on the final grain size, though not quite in the same manner as aging temperature. It is concluded that grain refinement of 7075 alloy from 140 microns to 10 microns is attainable by thermomechanical treatment. The presence of MgZn2 in the structure prior to rolling and recrystallization anneal is required in order to obtain such fine grains. KEY WORDS -- Thermomechanical Treament, Grain Refinement, Alloy 7075
บทคัดยอ โลหะที่มีขนาดเกรนเล็กจะมีสมบัติท่ีดีกวาโลหะที่มีขนาดเกรนใหญหลายดาน เปนตนวา มีความแข็งแรงสูงกวา มีความเหนียวดีกวา การขึ้นรูปทําไดงายกวา ในการผลิตชิ้นงานโลหะจึงมีความพยายามลดขนาดเกรนโดยวิธีการตางๆ ท่ีจะทําใหโลหะมีขนาดเกรนเล็กท่ีสุดเทาที่จะเปนไปได งานวิจัยนี้เปนความพยายามที่จะลดขนาดเกรนของอลูมิเนียมผสมเบอร 7075 โดยกระบวนการเทอรโมเมคแคนนิคัล ผลการวิจัยพบวาอุณหภูมิในการบมมีผลตอขนาดเกรนคอนขางมาก กลาวคือท่ีอุณหภูมิการบม 100, 200, และ 400 oC จะไดขนาดเกรน 61, 47, และ 34 ไมครอน ตามลําดับ สรุปไดวาในชวงอุณหภูมิการบม 100-400 oC อุณหภูมิการบมสูงขึ้นจะไดขนาดเกรนเล็กลง สวนเวลาในการบมมีอิทธิพลตอขนาดเกรนเชนเดียวกันแตไมเหมือนอุณหภูมิ การปลอยใหชิ้นงานเย็นตัวอยางชา ๆ ในเตาอบหลังการบมกอนที่จะนําไปรีดและอบเพื่อใหเกิดผลึกใหมจะทําใหไดขนาดเกรนของอลูมิเนียม 7075 ท่ีมีขนาดเล็กมากระดับ 10 ไมครอน ผลการวิจัยสรุปไดวาเราสามารถปรับลดขนาดเกรนอลูมิเนียม 7075 จาก 140 ไมครอนเปน 10 ไมครอน ไดโดยกระบวนการเทอรโมเมคแคนนิคัล แตตองอบใหได MgZn2 ในโครงสรางกอนที่จะนํามารีดและอบเพื่อใหเกิดผลึกใหม คําสําคัญ -- กระบวนการเทอรโมเมคแคนนิคัล, การปรับขนาดเกรน, อลูมิเนียม 7075
1. Introduction To enhance equiaxed fine grain structure of metal and alloy; the foundry men has tried many grain refining process to treat of metal and alloy. Master alloy usually added to melt metal before pouring to achieve the 100-300� grain size area, also cold deforming and recrystallisation process are seldom used to achieve the metal structure of 40-50� grain size area. The more fine grain structure of metal the more tensile strength and more ductile metal will be. Z.M. El Narade and et al.[1,2] have founded that when grain size area of Al-alloy was reduced from 46� to 16�, more tensile strength up to 84.3% was yielded. Improve strength and ductility were improved up to 116% and 287% respectively. D.H. Shin and A. Smolej [3,10,11] found that when the grain size area of 7075 Al-alloy was reduced to 10� beside the more strength was achieved, the 7055 Al-alloy became a
superplastic behavior metal. R. Kaibyshey and et al. [4] simulated high temperature elongation of 11� grain size of 7075 Al-alloy, they founded that, due to the superplastic behavior of metal, 960% of elongated grains were achieved. Superplastic behavior of metal could fulfill the more complex shape of sheet metal could be formed such as fuselage skin or hue elongation were needed. With the problem in grain size limited effect of 70xx Al-alloy in cold deforming processes. Cold deforming process were usually performed at <0.5Tm; tearing of metal parts were usually occurred when high volume deformed metal were proceeded if large grains size after recrystallization annealed was occurred. The problem could be cured by the precipitation of small size of secondary phase during aging. F.J. Humphreys et al [7-9] had proved that when the size of secondary phase were about 1-2�they would be the nucleation site of

The 2nd Thailand Metallurgy Conference (2 TMETC)
-36-
smaller than 10� grains area. This paper deal with aging variables the affected the secondary phase size such as grain size after cold reduction and after recrystallization annealing. 2. Experimental procedures The 12×30×100 mm. specimen size of 7075 Al-alloy with 6Zn, 2Mg, 1.7Cu, 0.18Cr and 0.19Fe were investigated. The 140�original grains size was prepared by 1 mm. cold reduction and recrystalliation for 1 hr. at 500oC. Then the aging variables has been investigated. 2.1 The Temperature. The specimens were solution heat treated for 4 hr. at 500oC, water quenched to stabilized the solid solution at room temperature. All specimens were aged at 100, 200, and 350oC, water quenched after 12 hr. aged. After that aged specimen were rolled reduction to 2 mm at 250oC and recrystalized at 480oC for 12 hr. 2.2 The Time. The specimens were solution heat treated for 4 hr. at 500oC, water quenched to stabilized the solid solution at room temperature. After solution treatment and quenching the specimens were aged at 350oC for 1, 12, and 24 hr. All specimens were rolled reduction to 2mm. hick at 250oC followed by recrystallization at 480oC for 1 hr. 2.3 The Cooling Rate. The specimens were solution heat treated for 4 hr. at 500oC, and water quenched. After that the specimens were aged at 350oC for 12 hr. follow by furnace cooled and water quenched. After that the specimens were rolled reduction to 2 mm. thick at 250oC. After rolling the metal were recrystallized at 480oC for 1 hr. 2.4 Microstructure Development and Analysis. The rolled specimens were preparing for microstructure development and XRD analysis. Keller’s reagent was used for microstructure development with optical microscope analysis and line intercept grain size area could be determined, XRD was used to determined the composition of each phases. 3. Results & Discussion 3.1 Effect of Aging Temperature on Microstructure. Original elongated grain microstructure of alloy 7075 form supplier has shown figure 1(a), after 1 mm. cold reduction and recrystallization; grains structure of specimen has been recrysed to 140� grain size as shown in figure 1(b)and has been used as datum grain size to evaluated the effects. Aster aging process at various temperature 100. 200, and 400oC, the effect of temperature had changed the grain size of the specimen to 61, 47 and 34�respectively, the smallest grain size had shown in figure 1(c). It is clearly shown that the lower aging temperature the larger grain size will be. Since the more secondary phase would be precipitated at grain boundary than in the matrix during low temperature aging. The precipitated
secondary phase size in the matrix was to small to be nucleation site to growth. So that the recrystallization would be occurred at the former grains boundary and at sub grains site as nucleation site[5]. Even through, at higher temperature aging, such as 200oC, the smaller grain size could be occurred, but it was larger than the 400oC aging. At 200oC aging; even if the precipitated secondary phases particle were large enough to be nucleation site but the number of nucleation site were less and smaller than the 400oC aging. Then the 400oC aging was the best aging temperature to produce the fineness grains size in 7075 alloy.
(a) As-receive
(b) Grain size starting (140 micron)
(c) Aging at 400 ºC 12 hr( 34 micron)
(d) Aging at 400 ºC, 12hr,furnace cooled (10 micron)
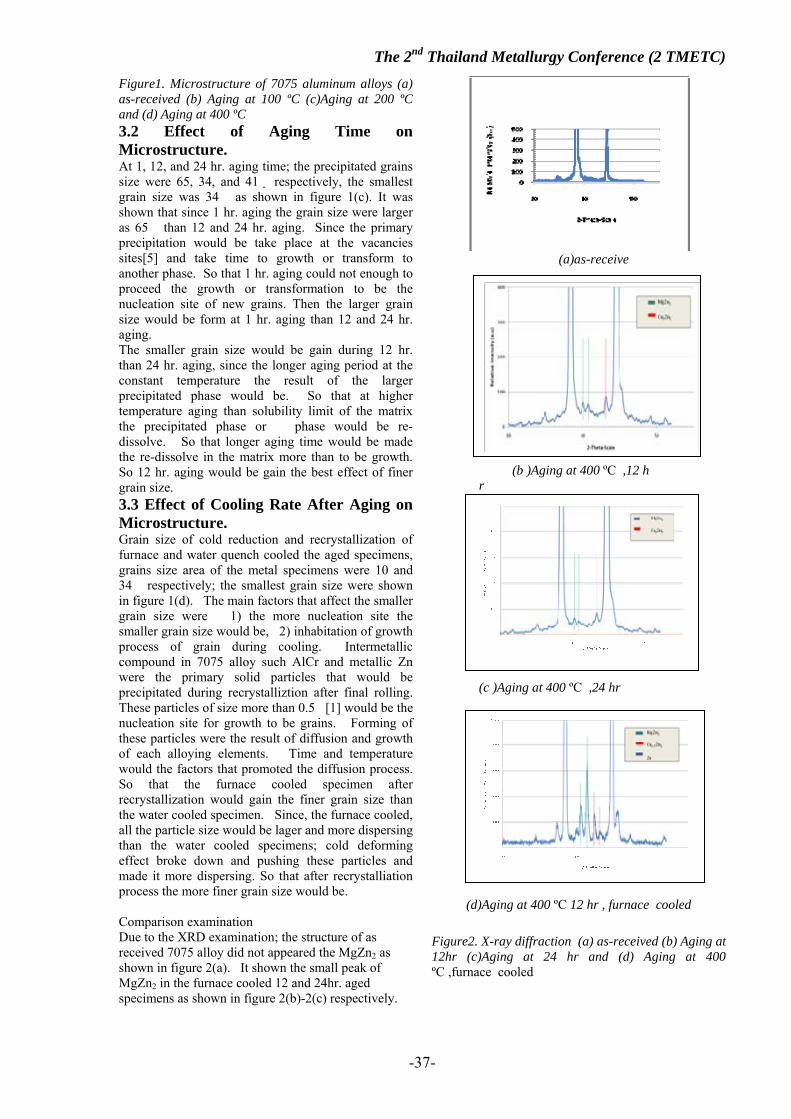
The 2nd Thailand Metallurgy Conference (2 TMETC)
-37-
Figure1. Microstructure of 7075 aluminum alloys (a) as-received (b) Aging at 100 ºC (c)Aging at 200 ºC and (d) Aging at 400 ºC 3.2 Effect of Aging Time on Microstructure. At 1, 12, and 24 hr. aging time; the precipitated grains size were 65, 34, and 41� respectively, the smallest grain size was 34� as shown in figure 1(c). It was shown that since 1 hr. aging the grain size were larger as 65� than 12 and 24 hr. aging. Since the primary precipitation would be take place at the vacancies sites[5] and take time to growth or transform to another phase. So that 1 hr. aging could not enough to proceed the growth or transformation to be the nucleation site of new grains. Then the larger grain size would be form at 1 hr. aging than 12 and 24 hr. aging. The smaller grain size would be gain during 12 hr. than 24 hr. aging, since the longer aging period at the constant temperature the result of the larger precipitated phase would be. So that at higher temperature aging than solubility limit of the matrix the precipitated phase or � phase would be re-dissolve. So that longer aging time would be made the re-dissolve in the matrix more than to be growth. So 12 hr. aging would be gain the best effect of finer grain size. 3.3 Effect of Cooling Rate After Aging on Microstructure. Grain size of cold reduction and recrystallization of furnace and water quench cooled the aged specimens, grains size area of the metal specimens were 10 and 34� respectively; the smallest grain size were shown in figure 1(d). The main factors that affect the smaller grain size were 1) the more nucleation site the smaller grain size would be, 2) inhabitation of growth process of grain during cooling. Intermetallic compound in 7075 alloy such AlCr and metallic Zn were the primary solid particles that would be precipitated during recrystalliztion after final rolling. These particles of size more than 0.5�[1] would be the nucleation site for growth to be grains. Forming of these particles were the result of diffusion and growth of each alloying elements. Time and temperature would the factors that promoted the diffusion process. So that the furnace cooled specimen after recrystallization would gain the finer grain size than the water cooled specimen. Since, the furnace cooled, all the particle size would be lager and more dispersing than the water cooled specimens; cold deforming effect broke down and pushing these particles and made it more dispersing. So that after recrystalliation process the more finer grain size would be. Comparison examination Due to the XRD examination; the structure of as received 7075 alloy did not appeared the MgZn2 as shown in figure 2(a). It shown the small peak of MgZn2 in the furnace cooled 12 and 24hr. aged specimens as shown in figure 2(b)-2(c) respectively.
(a)as-receive
(b )Aging at 400 ºC ,12 h r
(b )Aging at 400 ºC ,12 hr
(c )Aging at 400 ºC ,24 hr
(d)Aging at 400 ºC 12 hr , furnace cooled Figure2. X-ray diffraction (a) as-received (b) Aging at 12hr (c)Aging at 24 hr and (d) Aging at 400 ºC ,furnace cooled

The 2nd Thailand Metallurgy Conference (2 TMETC)
-38-
4. Conclusions The more finer recrystaled grain size of 7075 alloy would be gained in the furnace cooled aged specimens. The fineness grain size of 10� was obtained from the cold deformed and recrystallization of 34� gain size specimen. MgZn2 were precipitated in furnace cooled aged specimens, and result in finer grain size. This research ha been reduced the gain size down to only 10�, since there were some uncontrolled factors the affecting the recrystaled process. 5. Acknowledgement The authors would like to thank the Division of Material Technology, School of Energy, Environment and Material, King Mongkut’s University of Technology Thonburi and National Metal and Materials Technology Center (MTEC) for financial supports. 6. References [1] William F. Smith, Structure and Properties of Engineering Alloys, McGraw-Hill, New York, 1993. [2] Z. M. El-Baradie, M. El-Sayed, Effect of double thermomecchanical treatment on properties of 7075 Al alloy (1995), Mat. Proc. Tech., pp. 6276-80. [3] D.H.Shin, C.S.Lee, W.J.Kim, High-temperature deformation in a superplastic 7475 Al alloy with a relatively large grain size ,(1997), Acta Mat. 45, [4.] R.Kaibyshev, T.Sakai,F.Musin, I.nikulin, and H.Miura(2001), Superplastic behavior of a 7075 aluminum alloy, Scrita mat. 45,1373-1380 [5.] Robert E.Reed-Hill, Physical Metallurgy Principles, Litton Education Publishing inc(1973).190-374. [6.] R.D.Doherty, D.A.Hughes, F.J.Humphreys, J.J.Jonus, D.Juul Jensen, Mat.Science and Eng.A238(1997) 219-274. [7.] F.J.Humphreys,(1977), The nucleation of recrystallization at second phase particles in deformed aluminium, Acta Mett.25, 1323-1344 [8.] J.Pilling and N.ridley, superplasticity in crystalline solids ,the institute of metals (1989) 17-21.65-101 [9.] F.J.Humphreys,Philip B.prangnell, Ronald Priestner, Fine-grained alloy by thermomecchanical processing, (2001),Cur.Op.Mat.Sci.5, 15-21 [10.] A.Smolej ,M.Gnamus, E.Slacek, The influence of the thermomechnical processing and forming parameters on superplastic behavior of the 7475 aluminium alloy, (2001) ,Mat.Proc, Tech. 118,397-402 [11.] D.H.Shin, K-T.Park, E.J.Lavernia (1995), High-temperature deformation in a superplastic 7475 Al alloy with a relatively lare grain size, Mat. Science. A201 ,118-126

The 2nd Thailand Metallurgy Conference (2 TMETC)
-39-
On the relationship between specimen thickness and graphite morphology of compacted graphite cast iron (CGI) T. Kumma, K. Teeratatpong, A. Sritong, N. Liamdee, and T. Udomphol
Suranaree University of Technology, Thailand Tel.044-224483, Fax.044-224482, E-mail:[email protected]
ABSTRACT – Graphite morphology of compacted graphite cast iron has been observed to be significantly affected by specimen thickness (1/8-2 inches) at 1500-1550oC treatment temperatures using 0.3-0.7% commercial COMPACTMAG (nodularizer). Fine graphite morphology was obtained in small thickness whereas thick sections provided coarser graphite structure. Higher treatment temperature resulted in higher losses in the amount of Mg. % Residual Mg has been observed to greatly influence the graphite morphology at individual treatment temperatures and specimen thickness investigated. KEY WORDS -- Compacted graphite cast iron, graphite morphology, specimen thickness, treatment temperature, residual magnesium บทคัดยอ ในการศึกษาการหลอเหล็กหลอกราไฟตตัวหนอนโดยทําการเติมสาร COMPATMAG (Nodularizer) ในชวง 0.3-
0.7% ท่ีอุณหภูมิ 1500-1550oC พบวา รูปทรงของกราไฟตมีความสัมพันธกับความหนาของชิ้นงานหลอ โดยมีขนาดความหนาที่ศึกษาคือ 1/8-2 นิ้ว ชิ้นงานที่บางจะใหรูปทรงของกราไฟตท่ีมีขนาดละเอียด สวนชิ้นงานที่หนาจะใหกราไฟตท่ีมีขนาดหยาบขึ้น นอกจากนี้ จะเกิดการสูญเสียแมกนีเซียมมากขึ้นหากทําการทรีทเมนตท่ีอุณหภูมิสูง และปริมาณการเติม COMPACTMAG มีความสําคัญอยางมากตอรูปทรงของกราไฟตท่ีอุณหภูมิเติมสารและความหนาตางๆกนั
คําสําคัญ -- เหล็กหลอกราไฟตตัวหนอน รูปทรงกราไฟต ความหนาชิ้นงาน อุณหภูมิทรีทเมนต แมกนีเซียมเหลือคาง
1. Introduction Compacted graphite cast iron (CGI) has been increasingly satisfied many engineering applications especially replacing some of the existing cast iron components such as diesel engines for automotive industry due to its high strength and thermal conductivity [1]. However the production of the CGI has long been difficult to achieve the desirable compacted graphite morphology, which depends significantly on magnesium treatment prior to casting as well as casting thickness. Under-treatment provides undesirable graphite flake whereas over-treatment yields nodular graphite morphology. In order to obtain the satisfied compacted graphite morphology, an investigation into the effects of specimen thickness on the graphite morphology has been carried out at 1500-1550oC treatment temperatures using 0.3-0.7% COMPACTMAG (nodularizer) to provide a useful operating window for the production of compacted graphite cast iron. 2. Experimental procedures CGI of 3.4-3.9%C, 1.8-2.1%Si compositions were melted in a 40 kg crucible followed by magnesium treatment at 1500-1550oC by adding the commercial COMPACTMAG of 0.3-0.7%. The sandwich process was carried out in a 35 kg ladle with the treatment temperatures being controlled within ±15oC prior to casting. Step bars of different thickness (1/8-2 inches) as shown in fig. 1 were cast in sand molds such that directional solidification was attained. Investigation of the graphite morphology at individual test conditions
was carried out using an optical microscope. Chemical composition of CGI castings was analyzed using a spark emission spectro analyzer whereas the carbon equivalence was measured using a carbon equivalent meter following the magnesium treatment.
Figure 1. Step bar used for CGI sand casting
3. Results & Discussion Chemical compositions and carbon equivalence (CE) of the CGI castings in different conditions are shown in table 1. The contents of carbon and silicon are in the controlled ranges, giving the CE values of 3.9-4.5. The contents of residual Mg are varied in relation to the addition of COMPACTMAG and the treatment temperatures. Mg losses occurred in greater amounts when treated at higher temperature as shown in fig. 2.
300 mm 12 inches
3.2 mm1/8 inch
6.3 mm1/4 inch
12.7 mm 1/2 inch
25.4 mm 1 inch
38.1 mm1 1/2 inches
50.8 mm2 inches
Test Area 100 mm4 inches

The 2nd Thailand Metallurgy Conference (2 TMETC)
-40-
Table 1. Chemical compositions of CGI castings
TTreatment oC/ %COMPACTMA
G C Si Mg % CE
1500 oC 0.3% 0.5% 0.7%
3.39 3.10 3.39
2.44 2.58 2.95
0.015 0.016 0.025
4.1 3.9 4.4
1550 oC 0.3% 0.5%
0.7%
3.38 3.39 3.40
2.63 2.78 2.85
0.009 0.014 0.016
4.5 4.3 4.1
Relationship between %COMPACTMAG and % residual Mg at different treatment temperatures
0.015 0.016
0.025
0.009
0.0140.016
0.000
0.005
0.010
0.015
0.020
0.025
0.030
0.3 0.5 0.7
%COMPACTMAG
%Re
sidu
al M
g
1500 oC1550 oC
Figure 2. Relationship between %COMPACTMAG and %residual Mg in CGI castings at 1500 and 1550oC Fig.3 shows variations of graphite morphology obtained from CGI castings in relation to % residual Mg for each specimen thickness. It can be seen that at individual specimen thickness, the graphite morphology has changed from flake to compacted (vermicular) and finally to nodular with increasing % residual Mg. This is due to the effect of Mg in promoting nodular graphite formation. At 1500oC, under-treatment giving the undesirable flake graphite was obtained especially in thick sections when treated with 0.3% COMPACTMAG whereas over-treatment has shown in small sections treated with 0.5 and 0.7% COMPACTMAG. Over-treatment appeared in a lesser extent when treated at 1550oC, due to a higher loss of Mg. According to experimental data, the desirable compacted graphite morphology has been achieved where % residual Mg lied within 0.014-0.02%. Furthermore, comparison at individual % residual Mg showed that specimen thickness significantly affected the graphite morphology. Coarsening of flake, compacted and nodular graphite has been observed for 0.009%, 0.014% and 0.025% residual Mg respectively. Potential processing window for CGI treated at 1550oC is schematically shown in fig. 4.
Figure 3. Variation of graphite morphology according to % residual magnesium at specimen thicknesses of 1/8, 1/2 and 1 1/2 inches
Figure 4.Processing window of CGI. Note: F-flake, C-compacted, N-nodular
4. Conclusions 1. An increase in specimen thickness (1/8-2 inches) has coarsened the graphite observed at each treatment temperature. 2. Increasing amounts of % residual Mg (0.009-0.025%) has changed the graphite morphology from flake to compacted and finally to nodular graphite. 5. Acknowledgement Many thanks are due to undergrads, technicians and academic supports from Suranaree University of Tech. 6. References [1] W.L.Guesser, et al, “Compacted graphite cast iton for diesel engine cylinder blocks”, 106th AFS Casting Congress, Kansas City, 4-7 May 2002. [2] X.J. Sun, et al, Identification and evaluation of modification level for compacted graphite cast iron, Journal of materials processing, 2007.
F
F
F
FF
FC
CC
C
C
C
C
C
C
N C
N
N C
NC
0.3% 0.5% 0.7% COMPACTMAG
Step 11/8 ” Step 21/4 ” Step 31/2 ” Step 41 ” Step 51 1/2 ” Step 62 ”
Treatment temperature at 1550oC
F
F F
F F
F
N
C
CC
C
C
C
C
C
C
N C
N N
C N
C
C
C N
N
NC
N
NC
C
Step 1 1/8 ” Step 2 1/4 ” Step 3 1/2 ” Step 4 1 ” Step 5 1 1/2 ” Step 6 2 ”
0.009 0.014 0.016 0.025%Mg
0.009% residual Mg 0.014% residual Mg 0.025% residual Mg
200 μm 200 μm 200 μm
200 μm 200 μm 200 μm
200 μm 200 μm 200 μm
Step 11/8 inch
Step 51 1/2 inches
Step 31/2 inch

The 2nd Thailand Metallurgy Conference (2 TMETC)
-41-
Size and Distribution of Primary Silicon in Semi-Solid State of A390 Aluminum Alloy Subject to Mechanical Vibration
P. Senthongkaew 1 , N. Poolthong 2 and C. Limmaneevichitr *3 1 Division of Materials Technology, School of Energy, Environment and Material,
King Mongkut’s University of Technology Thonburi, Bangkok, Thailand 2 Division of Materials Technology, School of Energy, Environment and Materials,
King Mongkut’s University of Technology Thonburi, Bangkok, Thailand 3 Department of Production Engineering, Faculty of Engineering, King Mongkut’s University
of Technology Thonburi, Bangkok, Thailand Tel. 02-470-9188 Fax. 02-470-9198 * E-mail: [email protected]
ABSTRACT - This research studied the effects of mechanical vibration in semi-solid state on size and distribution of primary silicon in A390 aluminum alloy. The molten aluminum alloy was mechanically vibrated in a stainless steel mold with six different amplitudes ranging from 17.65 to 151.38 µm and constant frequency of 200 Hz. The melt was held in molten salt bath at various temperatures to obtain the fraction of solid at 3.9, 5.0 or 7.8%. Vibration durations were set at 5 min. It was found that samples with fraction of solid at 7.8% and amplitudes of 19.73 µm had primary silicon particles about 30 µm in diameter and the tips of the primary silicon phase became smooth. It was believed that mechanical vibration caused fragmentations of primary silicon and smoothed out the morphology. The main microstructures were eutectic structures surrounded by aluminum dendrite. However, samples from vibration with amplitude of 151.38 µm increased the primary silicon size. This might result from agglomerations of primary silicon. Key Words -- Mechanical Vibration, Semi-solid, Primary Silicon, Aluminum-Silicon alloy บทคัดยอ งานวิจัยนี้เปนการศึกษาอิทธิพลของผลของการสั่นสะเทือนทางกลในสภาวะกึ่งของแข็งตอขนาดและการกระจายตัวของโครงสรางซิลิคอนปฐมภูมิของอะลูมิเนียมผสมเกรด A390 โดยทําการทดลองสั่นสะเทือนอะลูมิเนียม-ซิลิคอนผสมเกรด A390 ในเบาสเตนเลสที่คงอุณหภูมิคงที่ในอางเกลือหลอมเหลวที่ต้ังอุณหภูมิท่ีเทียบไดกับสภาวะกึ่งของแข็งที่สัดสวนของแข็งรอยละ 3.9, 5.0 และ 7.8 มีการปรับแอมพลิจูดที่คาตางๆ ท้ังหมด 6 คา ในชวงตั้งแต 17.65 ถึง 151.38 ไมครอน โดยใชเวลา 5 นาทีท่ีคาความถี่ 200 Hz จากการทดลองพบวาสัดสวนของแข็งรอยละ 7.8 สั่นที่แอมพลิจูด 19.73 ไมครอน ทําใหซิลิคอนปฐมภูมิมีรูปทรงสัณฐานปลายมนและมีขนาดเสนผานศูนยกลางเฉลี่ยประมาณ 30 ไมครอน ในปริมาณมากที่สุด ท้ังนี้คาดวาการสั่นสะเทือนทางกลที่เหมาะสมทําใหผลึกซิลิคอนปฐมภูมิเกิดการแตกหักและปลายมน กระจายตัวอยูในโครงสรางพื้นฐาน โดยโครงสรางสวนใหญเปนยูเทคติคและปรากฏเดนไดรทอะลูมิเนียมรอบๆผลึกของซิลิคอนปฐมภูมิ อยางไรก็ตามเมื่อเพิ่มคาแอมพลิจูดเปน 151.38 ไมครอน พบวาซิลิคอนปฐมภูมิโดยสวนมากมีขนาดใหญขึ้นและปลายมน ซึ่งอาจเกิดจากผลึกซิลิคอนปฐมภูมิเกิดรวมตัวเปนกลุมกอนขนาดใหญขึ้น คําสําคัญ -- การสั่นสะเทือนทางกล, ก่ึงของแข็ง, ซิลิคอนปฐมภูมิ, อะลูมิเนียมผสมซิลิคอน
1. Introduction Aluminum-Silicon alloy grade A390 has been continuously used with much attention in automobile industries. The major application is for making piston due to several specific properties such as high strength, excellent in wear resistance and low thermal expansion coefficient. In general, fine primary silicon is preferable to obtain better properties for general applications [1-6]. The conventional method to obtain fine primary silicon is to add phosphorus. However, the technique was not completely controllable and subject to cause detrimental effect when contaminated with modifier. Lu et al. [4] obtained fine primary Si particles by electromagnetic force. However, using
electromagnetic force is rather expensive. Some investigators used mechanical vibration technique to refine primary silicon because it is much cheaper as compared to using electromagnetic force [6-8]. However, the vibration acted on aluminum melt in a short period of time during solidification. In this research, mechanical vibration in z-direction was used during semi-solid state of aluminum melt for 5 minutes so the vibration may better act on the silicon refinement.

The 2nd Thailand Metallurgy Conference (2 TMETC)
-42-
2. Experimental procedures An A390 Al-Si ingot of 170 grams was melted using an induction furnace using silicon carbide as crucible. After complete melting at 700°C, the melt was poured into a stainless steel mold (50- mm. in diameter and 90-mm. in height.) that was set inside a salt bath as illustrated in Fig. 1. The salt bath was set at temperature to obtain the solid fraction of 7.8, 5.0 or 3.9 %. The molten aluminum alloy was mechanically vibrated and isothermally held in a stainless steel mold with six different amplitudes of 17.65, 19.73, 45.86, 90.41 and 151.38 µm and constant frequency of 200 Hz for 5 minutes. Finally, the stainless mold was quenched into water bath and the sample was then prepared for light optical microscope examination and particle size and distribution of primary silicon analysis mainly on zone B.
Figure 1. Schematic sketch of mechanical vibration equipment set in salt bath. Figure 2. Zones for microstructure analysis. 3. Results and Discussion The melt was isothermally held at various temperature representing different solid fractions of 3.9, 5.0 and 7.8 %. It was found that the average primary silicon sizes are 63, 85 and 105 µm, respectively. Isothermal holding the melt at high solid fraction resulted in larger primary silicon size. As shown in Fig. 3, the morphology of primary silicon is mainly polyhedral with aluminum dendrite around.
(a) (b) (c) Figure 3. Micrographs showing samples holding at various fractions of solid (a) 3.9% (b) 5.0 % (c) 7.8 % with no vibration. It should be noted that the temperatures for different fractions of solid were calculated based on chemical composition using Thermo-calc. The other set of experiment was conducted in similar way by isothermal holding the melt at different fractions of solid. However, the mechanical vibration was introduced into the melt during holding the melt at different temperature to obtain different fractions of solid as shown Fig 4. It was found that, at certain amplitude range, average primary silicon size decreases with increasing amplitude at the fraction of solid of 5.0 and 7.8%. If the amplitude was higher than about 40 micron, the size became larger again. It is interesting to see that increasing amplitude did not reduce the size of primary silicon for samples with large fraction of solid, i.e. 7.8%. The graph showing primary silicon size subject to mechanical vibration at different amplitudes and fraction of solid was demonstrated in Fig. 5. To better understand the size distribution of primary silicon, the size distributions were determined. However, the complete size distribution cannot be presented here because of space limitation.
(a) (b)
(c)
Figure 4. Microstructure showing the effect of mechanical vibration to amplitude: (a) 0 µm (b) 19.73 µm (c) 151.38 µm
NaNO
+KNO 3
3
700 ํC

The 2nd Thailand Metallurgy Conference (2 TMETC)
-43-
Because appropriate primary silicon size for general application is 21 – 35 µm, the size distribution in this range was also plotted against amplitude at various fractions of solid as shown in Fig. 6. It was found that samples with vibration in the amplitude range of 20 to 40 µm at fractions of solid of both 5.0 and 7.8% have highest primary silicon content in this range. However, the primary silicon in the range of 21- 35 µm in the samples from fraction of solid of 3.9% is very low as compared to that of samples from higher fraction of solid. Figure 5. Effect of amplitude on the average primary Si size at various fractions of solid. Figure 6. Size distribution in the range of 21-35 µm against amplitude at various fractions of solid. Abu-Dheir et al. [6] indicated that applying mechanical vibration to the mold during solidification has a strong effect on both microstructure and mechanical properties of castings. However, the mechanism responsible for such effects is not well understood. They also reported that when vibration amplitude exceeds a critical value that tends, the primary silicon will become coarsen. In addition, primary silicon dispersed in eutectic structure and has polyhedral primary silicon form; however, aluminum dendrite is still periphery to primary silicon. Mechanical vibration technique may act on primary silicon particles in semi-solid state resulting in different in size and distribution of resultant primary silicon phases in the similar way previously reported by Lu et al. [4] that when the fraction of solid is high enough.
4. Conclusion (1) Mechanical vibration in z-direction together with
isothermally holding in various temperatures for different fractions of solid results in different sizes and distributions of primary Si.
(2) The critical vibration amplitude was found and caused the primary silicon phases become coarsen.
(3) The mechanism responsible for mechanical vibration effects is not well understood.
5. Acknowledgement The authors would like to thank Mr. Monchai Laliturai, Lenso Wheel, co., ltd. for Thermo-Calc calculation support. Faculty of Engineering at Kasetsart university is sincerely appreciated for financial support for one of the authors (Mr. Payoon Senthongkaew). 6. References [1] Gruzleski, J.E. and Bernard, C.M., 1990, The treatment of Liquid Aluminium Silicon Alloy, American Foundrymen’s Society,AFS ,Inc.Illinois, pp.1-94. [2] Nogita, K., et al., 2004, “Aluminium phosphide as a eutectic grain nucleus in hypoeutectic Al-Si alloys” Electron Microscopy 53., Vol. 4, pp. 361-369. [3] Kapranos, P., Kirkwood, D.H. and Atkinson, H.V., 2003, “Thixoforming of an automotive part in A390 hypereutectic Al–Si alloy”, Materials Processing Technology, Vol. 135, pp. 271-277. [4] Lu, D., et al., 2007, “Refinement of primary Si in hypereutectic Al-Si alloy by electromagnetic stirring”, Materials Processing Technology, Vol.189, pp. 13-18. [5] Shu-suo, L., Ai-min, Z., Wei-nin, M. and Xue-you, Z., 2000, “Mechanical properties of hypereutectic Al-Si alloy by semisolid processing”, Transactions of nonferrous metals society of china., Vol.10, No.4, pp. 441-444.
0
20
40
60
80
100
120
140
160
0 50 100 150 200
Amplitude, micrometre
Ave
rage
prim
ary
Si s
ize,
mic
rom
etre ƒs = 3.9 % ƒs = 5.0 % ƒs = 7.8 %
0
5
10
15
20
0 20 40 60 80 100 120 140 160Amplitude, micrometer
Prim
ary
Si s
ize
21-3
5 µm
, (%
)
ƒs = 3.9 % ƒs = 5.0 % ƒs = 7.8 %
The 2nd Thailand Metallurgy Conference (2 TMETC)
-44-
Powder Metallurgy of Silver Nanoparticles for Jewelry Making
P. Thongnopkun,1 W. Sroisuriya,2 and S. Ekgasit2
1Faculty of Gems (Chanthaburi), Burapha University, Chanthaburi 22170, THAILAND
Tel. (+66) – 8 – 1996 – 0902; E – mail: [email protected] 2Sensor Research Unit, Department of Chemistry, Faculty of Science,
Chulalongkorn University, Bangkok 10330, THAILAND Tel./Fax. (+66) – 2218 – 7585; E – mail: [email protected]
ABSTRACT – Silver nanoparticles were successfully synthesized using chemical reduction
method in aqueous solution. The particles were precipitated and dried in order to make nano-
silver powder. SEM images show their size in the range of 50 – 200 nm. Silver nanoparticles
powder was mixed with organic binder and water to be nano-silver clay. The clay can be shaped
like any soft clay, by hand or using moulds. Sintering temperature of the synthesized nano-silver
clay is 300 ºC which is lower than that of commercial silver clay. The synthesized nano-silver clay
becomes silver metal after firing at 600 ºC for 30 min. It can be applied for jewelry and art
works.
KEY WORDS – Silver nanoparticles, Silver clay, Sintering temperature, Jewelry making
บทคัดยอ อนุภาคขนาดนาโนของเงินถูกสังเคราะหขึ้นดวยวิธีเคมี และตกตะกอนใหอยูในรูปของแข็งลักษณะเปนผง
การศึกษาดวยกลองจุลทรรศนอิเล็คตรอนแบบสองกราดพบวาขนาดอนุภาคเงินที่สังเคราะหไดอยูในชวง 50 – 200 นาโนเมตร ผงอนุภาคซิลเวอรนาโนเมื่อนํามาผสมกับตัวประสานอินทรียและน้ําจะไดนาโนซิลเวอรเคลยท่ีมีลักษณะคลายดินเหนียว สามารถปนขึ้นรูปดวยมือและแมพิมพได อุณหภูมิในการเผาผนึกของผงอนุภาคซิลเวอรนาโนมีคาประมาณ 300ºC ซึ่งต่ํากวาซิลเวอรเคลยท่ีมีขายเชิงพาณิชย ผงอนุภาคซิลเวอรนาโนสามารถเผาขึ้นรูปเปนโลหะเงินไดท่ีอุณหภูมิ 600ºC เวลา 30 นาที และสามารถนําไปประยุกตทําเปนเครื่องประดับและงานศิลปะอ่ืนๆได
คําสําคัญ – อนุภาคขนาดนาโนของเงิน, ซิลเวอรเคลย, อุณหภูมิเผาผนึก, การทําเครื่องประดับ
1. Introduction The gems and jewelry industry has been a powerful export earner for Thailand. In jewelry industry, there are many techniques for making jewelry products depending on its design, value, demand, consumer, etc. The general manufactures of jewelry are manual, casting, pressing and electroforming techniques. For silver jewelry, there is a large of energy lost in melting and molding process of silver metal because the melting point of silver metal is about 960ºC. However, its melting temperature tends to decrease depending on its particle size. Silver clay is an alternative way for producing unique handmade jewelry. Silver clay is made of micron-sized silver particles, water, and non-toxic organic binders. When firing at appropriated temperature (650-850°C), the organic binders burn off, leaving a pure silver piece. In recently, the new product of metal clays tend to have small metal particles and low proportions of binder and water in
order to make them stronger, low shrinkage, and able to sinter faster at lower temperatures. When particle size is decreased to nanometer level, the melting point goes down from normal melting point more than several hundred Celsius degree. In this work, silver nanoparticles were introduced to create nano-silver clays. Their particle size and sintering temperature were determined. Example of nano-silver clay jewelry was presented. 2. Experimental procedures Silver nanoparticles were synthesized by chemical reduction method in aqueous solution with concentration 10,000 – 50,000 ppm. The particles were precipitated from silver nanoparticles colloid and were dried to be nano-silver powder at room temperature. Particle size of silver powder was characterized by scanning electron microscope (SEM) and sintering temperature of silver clay was determined by

The 2nd Thailand Metallurgy Conference (2 TMETC)
-45-
differential temperature analysis (DTA). The nano-silver powder was mixed with organic binder and water in appropriated ratio to form nano-silver clay. The clay was molded to be many shapes for making jewelry. After drying, the clay was sintered by oven at 600ºC for 30 min. 3. Results & Discussion Fig. 1 shows the shape and particle size of nano-silver powder. The particle size is in range of 50 – 200 nm and the shape is spherical.
Figure 1. SEM images of silver powder.
Sintering temperature of silver clay was determined by differential temperature analysis (DTA). It was found that sintering temperature is ≈ 300ºC far less than normal melting point, 960ºC. When silver clay was heated, water was evaporated and silver particles moved closer. After firing at 600ºC for 30 min., nano-silver clay changed to silver metal. It may cause that silver particles are quite small, there is a small cavity between particles and then they sintered without porosity. As shown in Fig. 2 and 3, the nano-silver clay can present the fine texture of fingerprint and can roll to make the complex jewelry.
Figure 2. Sintered silver clay of finger print.
Figure 3. Example of nano-silver clay jewelry. 4. Conclusions Nano-silver power was produced from high concentration silver nanoparticles colloid. Their particle sizes are 50 – 200 nm. The sintering temperature is at 300ºC. The powder was mixed with water and organic binder to be silver clay. The nano-silver clay can be shaped by hand or using mould to make jewelry. The firing temperature and time are 600ºC and 30 min., respectively. 5. Acknowledgements The authors gratefully acknowledge support from the Thailand Research Fund (TRF) and Commission on Higher Education (CHE). 6. References [1] Hirasawa, J. and Ido, Y., Silver Powder for Silver Clay and Silver Clay Containing This Silver Powder, US Patent No. 007081149B2, 2006. [2] Wang, H.; Qiao, X.; Chen, J. and Ding, S., Preparation of Silver Nanoparticles by Chemical Reduction Method, Coll. Surf. A, 2005, 256, 111-115
A
C
B

Oral Presentations
Processing Session

The 2nd Thailand Metallurgy Conference (2 TMETC)
-47-
Low Sintering Temperature Silver Clay
Wimonnan Sroisuriya, Chuchaat Thammacharoen and Sanong Ekgasit Sensor Research Unit, Department of Chemistry, Faculty of Science, Chulalongkorn
University, 254 Phyathai Road, Patumwan, Bangkok 10330, Thailand. Tel: +66-2218-7585; Website: www.sru.reseach.chula.ac.th E-mail: [email protected]
ABSTRACT – Silver clay was synthesized in aqueous solution by chemical reduction method. The synthesized silver particles have size in sub-micrometer scale and have an average size of 200 nm. Sintering temperature of silver clay is about 300 °C and it was much lower than sintering temperature of imported silver clay (Art Clay Silver (ACS) and Precious Metal Clay (PMC)). Synthesized silver clay can be applied in various art works and jewelry applications. KEY WORDS -- silver clay, sintering temperature
บทคัดยอ งานวิจัยนี้ไดทําการสังเคราะหซิลเวอรเคลยดวยกระบวนการรีดักชันทางเคมีโดยใชน้ําเปนตัวทําละลาย ขนาดอนุภาคซิลเวอรท่ีสังเคราะหไดมีขนาดโดยเฉลี่ยประมาณ 200 นาโนเมตร ซิลเวอรเคลยมีอุณหภูมิในการเผาซินเทอร ประมาณ 300 องศาเซลเซียสและมีอุณหภูมิตํ่ากวาซิลเวอรเคลยท่ีนําเขาจากตางประเทศมาก (Art Clay Silver (ACS) และ Precious Metal Clay (PMC)) ซิลเวอรเคลยนี้สามารถนําไปประยุกตใชในงานดานศิลปะและเครื่องประดับไดหลากหลาย
คําสําคัญ -- ซิลเวอรเคลย อุณหภูมิการเผาซินเทอร 1. Introduction Nowadays, there are two imported brands of silver clay: Art Clay Silver (ACS) and Precious Metal Clay (PMC). These products consist of microscopic particles of silver suspended in an organic binder when it is heated to a high temperature, the binder burns away and the silver particles fuse to form solid silver. The last version of two brands silver clay (ACS and PMC) have sintering condition of 30 minutes at 650 and 600 °C. These imported silver clay are very expensive and have high sintering temperature. So, this study was designed for synthesizing nanoscale silver clay particles with low sintering temperature. 2. Experimental procedures The silver clay was synthesized in aqueous solution by chemical reduction method. Concentrations of silver clay of 10,000 ppm were produced by silver salt solution mixed with the solution of reducing agent in tubular flow reactor. The particles size of synthesized silver clay was measured via scanning electron microscope (SEM) and the sintering temperature profile was measured via differential thermal analysis (DTA).
Figure 1. The synthesized silver clay by chemical reduction method: (a) synthesized silver colloid (b) precipitated silver clay (c) silver clay or dry silver powder
Figure 2. Scanning electron microscope(SEM) image of dried silver clay.
a b c
1 μm

The 2nd Thailand Metallurgy Conference (2 TMETC)
-48-
3. Results & Discussion The synthesized silver clay by chemical reduction method are shown in Figure 1. This study found that the particle size of the synthesized silver clay have sub-micrometer scale and have an average particle size of 200 nm. Synthesized silver clay has smaller particle size than the imported product. In addition, the sintering temperature of silver clay is about 300 °C as observed by differential thermal analysis. It was much lower than sintering temperature of imported silver clay (Art Clay Silver (ACS) and Precious Metal Clay (PMC)). 4. Conclusions It is concluded that the silver clay can be synthesized by chemical reduction of silver salt solution and the solution of reducing agent in tubular flow reactor. According to the results of the study found that the silver clay have particle in the sub-micrometer to nanometer scale. Sintering temperature of silver clay was much lower than sintering temperature of imported silver clay (Art Clay Silver (ACS) and Precious Metal Clay (PMC)). Synthesized silver clay can be applied in many works including art works and jewelry applications. 5. Acknowledgement The authors acknowledge support from the Commission on Higher Education (CHE), the National Research Council of Thailand (NRCT) and the Thailand Research Fund (TRF). 6. References [1] Hirasawa, J. and Ido, Y., Silver Powder for Silver Clay and Silver Clay Containing This Silver Powder, US Patent No. 007081149B2, 2006. [2] Wang, H.; Qiao, X.; Chen, J. and Ding, S., Preparation of Silver Nanoparticles by Chemical Reduction Method, Coll. Surf. A, 2005, 256, 111-115.
1 μm

The 2nd Thailand Metallurgy Conference (2 TMETC)
-49-
Synthesis of Dual Color Gold Nanoparticles Prompong Pienpinijtham, Chuchaat Thammacharoen, and Sanong Ekgasit*
Sensor Research Unit, Department of Chemistry, Faculty of Science, Chulalongkorn University, Bangkok 10330, THAILAND
Tel./Fax. (+66) – 2218 – 7585; E – mail: [email protected]
ABSTRACT – Gold nanoparticles have many colors depending on their shapes, sizes, and how they interact with light or electromagnetic wave at different wavelengths. At suitable size, gold nanoparticles can scatter light at some wavelengths and absorb light at other wavelengths, so they display a “dual color” property. UV/Visible spectra of gold nanoparticles were calculated and simulated by Mie theory for searching the size which shows the “dual color” property. Gold nanoparticles were synthesized in aqueous solution by varying reducing agents, stabilizers, their pH, and concentrations. The size of synthesized gold nanoparticles was characterized by UV/Visible spectrum, AFM, SEM and TEM. Synthesized gold nanoparticles were added into resin polymer and they still showed the “dual color” property in polymer matrix. KEY WORDS -- Gold nanoparticles, Dual color property, Mie theory
บทคัดยอ อนุภาคขนาดนาโนของทองคํามีสีท่ีหลากหลายขึ้นอยูกับขนาดและรูปรางของอนุภาค เนื่องจากอนุภาคขนาดนาโนของทองคําเกิดอันตรกิริยากับแสงหรือคล่ืนแมเหล็กไฟฟาที่ความยาวคลื่นที่แตกตางกัน เม่ืออนุภาคมีขนาดที่เหมาะสม อนุภาคขนาดนาโนของทองคําจะสามารถกระเจิงแสงที่ความยาวคลื่นหนึ่งและดูดกลืนแสงที่อีกความยาวคลื่นหนึ่งได จึงทําใหอนุภาคแสดงสมบัติสองสี ยูวี/วิซิเบิลสเปกตรัมของอนุภาคขนาดนาโนของทองคําถูกคํานวณและจําลองดวย Mie
Theory เพือ่ท่ีจะหาขนาดของอนุภาคของทองคําที่แสดงสมบัติสองสี อนุภาคขนาดนาโนของทองคําถูกสังเคราะหในสารละลายน้ําโดยการปรับเปลี่ยนตัวรีดิวซ ตัวเพิ่มเสถียรภาพ คาพีเอช และความเขมขนตางๆ ขนาดของอนุภาคขนาดนาโนของทองคําที่สังเคราะหไดถูกวิเคราะหดวยยูวี/วิซิเบิลสเปกตรัม ภาพเอเอฟเอ็ม ภาพจากกลองจุลทรรศนอิเล็คตรอนแบบสองกราดและแบบสองผาน อนุภาคขนาดนาโนของทองคําที่ผสมกับพอลิเมอรเรซินยังคงแสดงสมบัติสองสีขณะที่อยูในพอลิเมอรเรซิน คําสําคัญ -- อนุภาคขนาดนาโนของทองคํา, สมบัติสองสี, Mie Theory
1. Introduction Gold nanoparticles have many colors depending on their shapes, sizes, and how they interact with light or electromagnetic wave at different wavelengths. At suitable size, gold nanoparticles can scatter light at some wavelengths and absorb light at other wavelengths, so they illustrate a “dual color” property. When we look at gold nanoparticles in the transmission mode, the color of gold nanoparticles is different from that in the reflection mode. Gold nanoparticles with a “dual color” property can be added into transparent matrices such as polymer and color of the matrix is changed. It is very useful to increase value of many products. 2. Experimental procedures Mie theory was used to calculate the size of gold nanoparticles which presents a “dual color” property and UV/Visible spectra of gold nanoparticles were simulated. Gold nanoparticles were synthesized in aqueous solution by varying reducing agent, stabilizer, pH, and their concentrations. The size of synthesized gold nanoparticles was characterized by UV/Visible spectrum, AFM, SEM, and TEM. Finally, synthesized
gold nanoparticles were added into resin polymer and the color of polymer was determined. 3. Results & Discussion From Fig. 1, gold nanoparticles give scattering and absorption peaks at different wavelengths. And the differences are more obvious when the particles are larger. Fig. 2 shows extinction spectrum of one size of the synthesized gold nanoparticles. The maximum of extinction spectrum is at 546 nm that represents the size of 60 – 70 nm. All types of synthesized gold nanoparticles, the sizes in the range of 50 – 100 nm, show a “dual color” property. The sizes and shapes of gold nanoparticles were confirmed by AFM, SEM and TEM. After mixing gold nanoparticles into a transparent polymer, gold nanoparticles still show a “dual color” property and color of the polymer matrix was changed as shown in Fig. 3.

The 2nd Thailand Metallurgy Conference (2 TMETC)
-50-
Figure 1. Spectra of absorption, scattering, and extinction coefficient of gold nanoparticles in the range of 10 – 200 nm simulated by Mie theory.
200 300 400 500 600 700 8000.0
0.5
1.0
Extin
ctio
n
Wavelength (nm)200 300 400 500 600 700 800
0.0
0.5
1.0
Extin
ctio
n
Wavelength (nm)200 300 400 500 600 700 800
0.0
0.5
1.0
200 300 400 500 600 700 8000.0
0.5
1.0
Extin
ctio
n
Wavelength (nm) Figure 2.Measured extinction spectrum of synthesized gold nanoparticles.
Figure 3. Transparent polymer mixed with dual color gold nanoparticles: (A) viewing under the transmission mode and (B) viewing with the reflection mode.
4. Conclusions Dual color gold nanoparticles were synthesized in aqueous solution. Sizes of the particles are in the range of 50 – 100 nm and the particles show a “dual color” property. The transparent polymer mixed with gold nanoparticles also has a “dual color” property. 5. Acknowledgements The authors gratefully acknowledge supports from the Thailand Research Fund (TRF), and Commission on Higher Education (CHE). A scholarship for P. Pienpinijtham was supported by DPST (The Development and Promotion of Science and Technology Talents Project). 6. Reference [1] G.F. Bohren and D. R. Huffman, “Absorption and Scattering of Light by Small Particles”, John Wiley & Sons, Inc., 198
0
1
2
3
4
5
QA
bs
0
2
4
QS
cat
200 300 400 500 600 700 8000
2
4
6
QE
xt
Wavelength (nm)
0
1
2
3
4
5
QA
bs
0
1
2
3
4
5
QA
bs
0
2
4
QS
cat
0
2
4
QS
cat
200 300 400 500 600 700 8000
2
4
6
QE
xt
Wavelength (nm)200 300 400 500 600 700 800
0
2
4
6
QE
xt
Wavelength (nm)
10 nm
200 nm
10 nm
200 nm
10 nm
200 nm
A
B

The 2nd Thailand Metallurgy Conference (2 TMETC)
-51-
Material Separation of AlMMC by Using Cake Filtration Mechanism
Nakornriab Nicom1, Nongyao Ponsena1, Arthit Rayabsri1, Thirapote Puthikitakawiwong1 and Hiroyuki Nomura2
1Department of Physics, Faculty of Science, Mahasarakham University, Mahasarakham 44150 Thailand
2Department of Materials, Physics and Energy Engineerin, Graduate School of Engineering, Nagoya University, Nagoya 464-8603Japan
Tel.0-4375-4379 Fax.0-4371-2040 E-mail: [email protected]
ABSTRACT – With respect to material separation, cake filtration mechanism is utilized to obtain a purified metal matrix of AlMMC reinforced with SiCp. There are two kinds of filtration method, which consist of a semi-solid cake layer and solid packed bed. The cake layer, an AC4C alloy with 10 mm depth and 35 mm diameter is a filter with semi-solid state. In the case of solid packed bed, steel balls with various sizes i.e. 5 and 7 mm diameters are utilized. Both the cake layer and solid packed bed, they are located at the bottom of a stainless steel crucible. In the present study AlMMC scraps with unknown SiCp content are melted in the stainless steel crucible, which is fabricated within resistance furnace. Argon gas is applied on the top surface of composite melt to force the molten metal through cake layer or packed bed dropped into the reservoir. Experimental results showed that the formation of solid network within a cake layer producing a narrow flow channel and screening the SiCp in order of 10 µm diameter in size. Flow channels of the cake layer are narrower than that of steel ball packed bed, concerning the infiltration efficiency. KEY WORDS -- Cake filtration, Aluminum metal matrix composite, Semi-solid processing, Solid packed bed, Material separation บทคัดยอ - กลไกการกรองแบบเคกถูกใชสําหรับการแยกวัสดุโลหะพื้นออกจากวัสดุเสริมแรง การทดลองนี้ใชวิธีการกรอง 2
วิธี คือ ชั้นเคกก่ึงของแข็ง และชั้นของแข็งอัด วิธีแรกชั้นเคก คือ โลหะผสม AC4C ขนาดเสนผาศูนยกลางและความหนา คือ 35 และ 10 มม ตามลําดับ ซึ่งกระทําเสมือนตัวกรองในสภาวะกึ่งของแข็ง วิธีท่ีสอง ชั้นของแข็งอัดทําดวยลูกบอลเหล็กขนาดเสนผาศูนยกลาง 5 และ 7 มม ชั้นกรองทั้งสองแบบถูกวางไวท่ีสวนลางของเบาหลอมโลหะเหล็กกลาไรสนิม ในการศึกษาครั้งนี้ เศษวัสดุ AlMMC (ไมรูความจุของ SiCp) ถูกหลอมละลายภายในเบาเหล็กกลาไรสนิมดวยเตาหลอมแบบความตานทาน แกสอารกอนถูกอัดลงบนชิ้นทดลอง ทําใหโลหะหลอมเหลวไหลผานชั้นกรองลงสูภาชนะรองรับ ผลการทดลอง พบวา การกอตัวของโครงขายของแข็งภายในชั้นเคกทําใหเกิดชองการไหลแคบๆ และสามารถกรอง SiCp ขนาดประมาณ 10 μm ได ชองการไหลของชั้นเคกนั้นเล็กกวาชองการไหลของชั้นของแข็งอัด ซึ่งสัมพันธกับประสิทธิภาพการกรองดวย
คําสําคัญ -- การกรองแบบเคก อลูมินัมคอมโพสิท กระบวนการกึ่งของแข็ง ช้ันของแข็งอัด การแยกวัสดุ 1. Introduction There are several attempts to purify the used composite materials by using ceramic foam filter. The entrapment of the inclusions is considered to be a result of inclusion transportation and capturing the inclusions due to interfacial or surface forces [1]. Because of the large pore size of filter, it is quite difficult to screen the inclusions or solid particles with size of several ten micrometers in diameter. Infiltration technique is a method utilizing molten metal flow through solid network with controlled liquid phase movement by pressurization within the packed column or cake layer. Taking the material separation of used composite materials, as an example, the pressure infiltration technique can be efficiently used to purify
the SiCp reinforced aluminum metal matrix composite (Al MMC) [2-4]. This work aims to separate a scrap of composite materials into the purified matrix and reinforcement phase. Semi-solid cake layer of AC4C alloy and a solid packed bed of steel balls with cake filtration mechanism are compared. 2. Experimental procedures The experimental apparatuses are constructed to control the flow of liquid and solid mixture of AlMMC as shown in figure 1. Semi-solid cake layer is an AC4C with 7 wt.% silicon fabricated at the bottom of stainless steel crucible (on the ceramic foam filter) as shown in figure 1(a). A solid packed bed of many steel
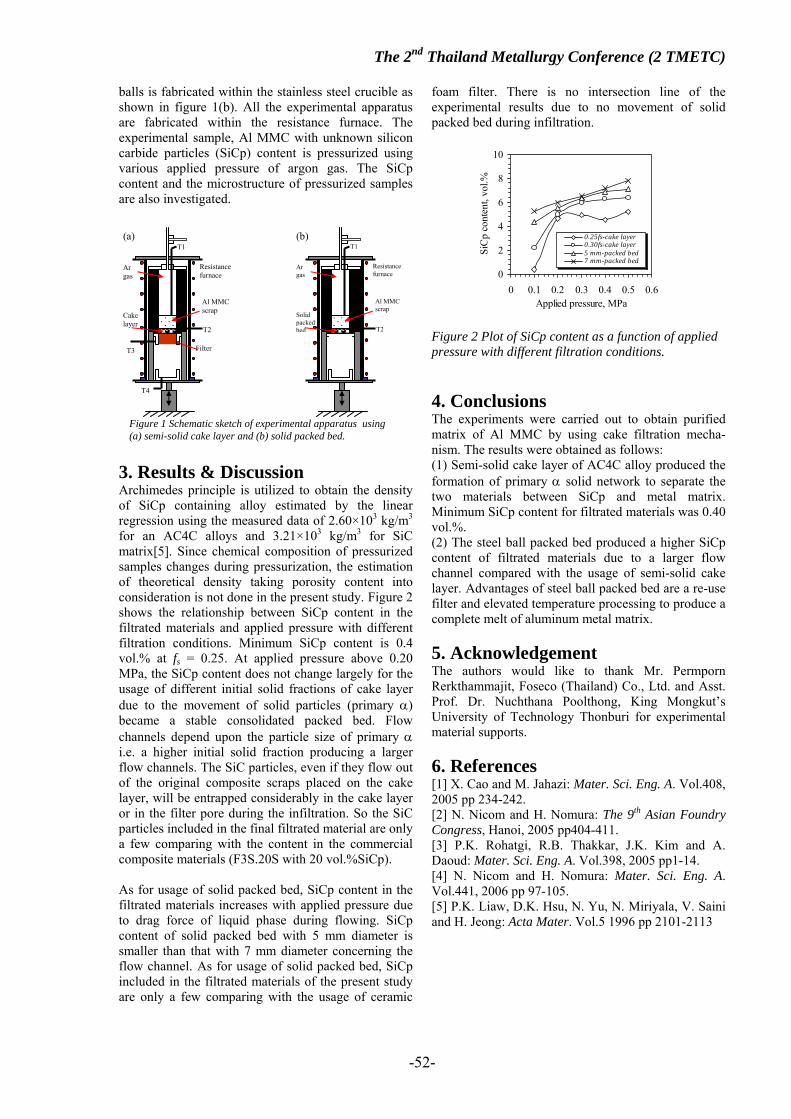
The 2nd Thailand Metallurgy Conference (2 TMETC)
-52-
balls is fabricated within the stainless steel crucible as shown in figure 1(b). All the experimental apparatus are fabricated within the resistance furnace. The experimental sample, Al MMC with unknown silicon carbide particles (SiCp) content is pressurized using various applied pressure of argon gas. The SiCp content and the microstructure of pressurized samples are also investigated.
3. Results & Discussion Archimedes principle is utilized to obtain the density of SiCp containing alloy estimated by the linear regression using the measured data of 2.60×10³ kg/m3 for an AC4C alloys and 3.21×10³ kg/m3 for SiC matrix[5]. Since chemical composition of pressurized samples changes during pressurization, the estimation of theoretical density taking porosity content into consideration is not done in the present study. Figure 2 shows the relationship between SiCp content in the filtrated materials and applied pressure with different filtration conditions. Minimum SiCp content is 0.4 vol.% at fs = 0.25. At applied pressure above 0.20 MPa, the SiCp content does not change largely for the usage of different initial solid fractions of cake layer due to the movement of solid particles (primary α) became a stable consolidated packed bed. Flow channels depend upon the particle size of primary α i.e. a higher initial solid fraction producing a larger flow channels. The SiC particles, even if they flow out of the original composite scraps placed on the cake layer, will be entrapped considerably in the cake layer or in the filter pore during the infiltration. So the SiC particles included in the final filtrated material are only a few comparing with the content in the commercial composite materials (F3S.20S with 20 vol.%SiCp). As for usage of solid packed bed, SiCp content in the filtrated materials increases with applied pressure due to drag force of liquid phase during flowing. SiCp content of solid packed bed with 5 mm diameter is smaller than that with 7 mm diameter concerning the flow channel. As for usage of solid packed bed, SiCp included in the filtrated materials of the present study are only a few comparing with the usage of ceramic
foam filter. There is no intersection line of the experimental results due to no movement of solid packed bed during infiltration. Figure 2 Plot of SiCp content as a function of applied pressure with different filtration conditions. 4. Conclusions The experiments were carried out to obtain purified matrix of Al MMC by using cake filtration mecha-nism. The results were obtained as follows: (1) Semi-solid cake layer of AC4C alloy produced the formation of primary α solid network to separate the two materials between SiCp and metal matrix. Minimum SiCp content for filtrated materials was 0.40 vol.%. (2) The steel ball packed bed produced a higher SiCp content of filtrated materials due to a larger flow channel compared with the usage of semi-solid cake layer. Advantages of steel ball packed bed are a re-use filter and elevated temperature processing to produce a complete melt of aluminum metal matrix. 5. Acknowledgement The authors would like to thank Mr. Permporn Rerkthammajit, Foseco (Thailand) Co., Ltd. and Asst. Prof. Dr. Nuchthana Poolthong, King Mongkut’s University of Technology Thonburi for experimental material supports. 6. References [1] X. Cao and M. Jahazi: Mater. Sci. Eng. A. Vol.408, 2005 pp 234-242. [2] N. Nicom and H. Nomura: The 9th Asian Foundry Congress, Hanoi, 2005 pp404-411. [3] P.K. Rohatgi, R.B. Thakkar, J.K. Kim and A. Daoud: Mater. Sci. Eng. A. Vol.398, 2005 pp1-14. [4] N. Nicom and H. Nomura: Mater. Sci. Eng. A. Vol.441, 2006 pp 97-105. [5] P.K. Liaw, D.K. Hsu, N. Yu, N. Miriyala, V. Saini and H. Jeong: Acta Mater. Vol.5 1996 pp 2101-2113
T2
Ar gas
T1
T3
T4
Filter
Cake layer
(a)
Al MMC scrap
Resistance furnace
T2
Ar gas
T1
Solid packed bed
(b)
Al MMC scrap
Resistance furnace
Figure 1 Schematic sketch of experimental apparatus using (a) semi-solid cake layer and (b) solid packed bed.
0
2
4
6
8
10
0 0.1 0.2 0.3 0.4 0.5 0.6Applied pressure, MPa
SiC
p co
nten
t, vo
l.%
0.25fs-cake layer0.30fs-cake layer5 mm-packed bed7 mm-packed bed

The 2nd Thailand Metallurgy Conference (2 TMETC)
-53-
Development of SS400 Dual Phase Steel Chaichan Duengkratok
a, Somrerk Chandra-Ambhorn
b, Witthaya Eidhed
c
aThe Materials and Metallurgical Engineering Program, TGGS.
b,cDepartment of Materails and Production Technology Engineering, Factory of Engineering
a,b,cKing Monkut's University of Technology North Bangkok, Bangkok
E-mail: [email protected],
ABSTRACT – In this work, a dual phase (DP) steel was developed using a SS400 hot-rolled steel. Effects of intercritical annealing temperature (IAT) and deformation ratio on microstructures and mechanical properties of the SS400 DP steel were investigated. In an experimental procedure, the SS400 hot-rolled was deformed by using cold rolling. The heat treatment was carried out at 735, 750, 785 and 800
oC for 5 min and immediately quenched into
cold water. It is found that the martensite volume fractions (MVF) are increased by increasing of the IAT. A 45%deformed sample exhibited smaller and uniform distribution of martensite. Both yield stress (YS) and ultimate tensile stress (UTS) increased with increasing of the IAT. After holding at 780 and 800
oC, the 25%deformed sample has higher tensile strength compared to the
sample holding at lower temperature. Moreover, we also found that the 20%MVF DP steel had good formability compared to the 10, 30 and 40%MVF sample resulted of low value of YS/UTS ratio. KEY WORDS -- Dual Phase steel, Martensite, Intercritical annealing temperature
บทคัดยอ งานวิจัยนี้ไดพัฒนาเหล็กกลาสองเฟสเกรด SS400 จากเหล็กแผนรีดรอน โดยเนนศึกษาอิทธิพลของการอบออนที่
อุณหภูมิระหวางเสนวิกฤตและอัตราการเปลี่ยนรูปถาวรตอโครงสรางจุลภาคและสมบัติทางกล ในการทดลองไดนําเหล็กกลาแผนรีดรอนเกรด SS400 มารีดเย็นและตัดใหเปนรูปชิ้นงานสําหรับทดสอบแรงดึง จากนั้นนําชิ้นงานไปอบ ณ อุณหภูมิ 735,
750, 785 และ 800oC เปนเวลา 5 นาที หลังจากนั้นทําใหชิ้นงานเย็นตัวอยางรวดเร็วลงในน้ําเย็น ผลการทดลองพบวาเฟสมาร
เทนไซทจะมีปริมาณเพิ่มขึ้นเม่ืออุณหภูมิการของอบเพิ่มสูงขึ้น เหล็กกลาที่เปล่ียนรูปถาวร 45% จะมีเฟสมารเทนไซทขนาดเล็กและมีการกระจายตัวสมํ่าเสมอ ผลจากการทดสอบการตานทานตอแรงดึงพบวาคาความแข็งแรงที่จุดครากและความแข็งแรงสูงสุดจะเพิ่มขึ้นเม่ืออุณหภูมิการของอบเพิ่มขึ้นดวยเชนเดียวกัน เหล็กกลาที่เปล่ียนรูปถาวร 25% มีคาความตานทานแรงดึงสูงที่สุด นอกจากนี้ยังพบวาอัตราสวนระหวางคาความแข็งแรงที่จุดครากตอความแข็งแรงสูงสุดของเหล็กกลาสองเฟสที่มีปริมาณเฟสมารเทนไซท 20% มีคานอยกวาเหล็กกลาที่มีปริมาณ เฟสมารเทนไซทเทากับ 10, 30 และ 40%
คําสําคัญ -- เหล็กกลาสองเฟส, มารเทนไซท, การอบออนอุณหภูมิระหวางเสนวิกฤต
1. Introduction The dual phase (DP) steel is an attractive material and become important as newly advanced high strength steel (AHSS) especially developed for the automotive parts; which requires high strength and formability to reduce the weight in order to save the energy consumption [1]. Low value of the yield stress/ultimate tensile stress (YS/UTS) ratio is required for excellent formability and easy to fabricate [2]. Generally, the DP steel consists of the ferrite and martensite and a few number of retained austenite; which produce by heating to the intercritical annealing temperature (IAT) between Ac
1 and Ac
3 lines to form
ferrite and austenite, then rapidly cool to room temperature in order to transform the austenite into martensite. The mechanical properties of the DP steels are affected by several factors, such as the ferrite grain
size, morphologies and volume fraction of the martensite [3]. In the present work, the effects of the IAT and deformation ratio on microstructure and mechanical properties of the SS400 DP steel are investigated. Table 1. Chemical compositions of as-received SS400 hot-rolled steel.
Steel %C %Si %S %P %Mn 0.111 0.017 0.012 0.014 0.519 %Ni %Cr %Mo %Cu %Al SS400 0.045 0.040 0.008 0.44 0.071
2. Experimental procedures Table 1. shows the chemical compositions of as-

The 2nd Thailand Metallurgy Conference (2 TMETC)
-54-
received SS400 hot-rolled steel with thickness about 2.6mm. Then, it was deformed by cold rolling for 25, 35 and 45% deformations. The deformed steels were cut into tensile samples. The heat treatment is carried out by using a salt-bath furnace at 735, 750, 785 and 800
oC for 5 min and then specimens are quenched into
cold water. The microstructure observation was etched by using 2%Nital, followed by a solution of 100 ml distilled water mixed with 5g sodium metabisulfite [1].
3. Results & Discussion 3.1 Microstructure Figure 1(a-d) show the microstructures of the SS400 DP steel heated at different IAT, it is found that ferrite appears as grey color and martensite is brown-black color without retained austenite. Few numbers of martensite are observed in the sample heated at 735
oC
compared to higher temperatures. Figure 2 shows the relationship between the MVF as a function of the IAT. The MVF is related to austenite volume fraction during re-crystallization in the α+γ region. In a case of high temperature, the austenite is easily occurred and grown. Then, it resulted to increasing the amount of martensite after quenched as compared to the lower IAT. Figure 3(a-c) show the effect of deformation on microstructure of the 40%MVF samples. The 45% deformed sample exhibiting smaller martensite compared to 25 and 35%deformed samples. This result can explain by regarding to the re-crystallization of the ferrite before transformation into austenite. Thus, the small ferrite produces the small austenite in the α+γ region. Therefore; the smaller martensite is related to newly re-crystallized ferrite and austenite grains.
Figure 1. Microstructures of 35% deformed SS400 DP steel heated at (a) 735
oC, (b) 750
oC, (c) 780
oC and (d)
800oC.
3.2 Mechanical Properties The mechanical properties of the SS400 DP steels are shown in Figure 4. It can be observed that the YS and UTS are increased with increasing the IAT. The 25% deformed sample has higher tensile stress compared to the 35 and 45%deformed samples because of the coarse martensite grain size (Figure 3(a)) has a higher YS and UTS than fine martensite grain size. The YS of
all samples slightly increase form 735 to 750oC (about
10-20% MVF) after that, it strongly increase again at 785-800
oC (about 30-40%MVF). The values of
YS/UTS ratio of 20%MVF samples are approximately 0.45-0.46, and show lowest with compared to the 10, 30 and 40%MVF samples. This result indicates the 20%MVF samples have good formability for automotive parts.
Figure 2. MVF as function of IAT
Figure 3. Microstructures of SS400 DP steel heated at 800
oC, (a) 25, (b) 35 and (c) 45%
deformations.
Figure 4. YS and UTS of SS400 DP steels.

The 2nd Thailand Metallurgy Conference (2 TMETC)
-55-
4. Conclusions The MVF of SS400 DP steel increases by increasing of the IAT. Smaller martensite obtained from 45%deformed sample. 5. Acknowledgement The authors are truthfully grateful to the Sahaviriya steel industries public Co., Ltd, for supported the hot rolled steel. 6. References [1] J. Qu, W. Dabbossi, F. Hassani, J. Nemes, S. Yue, Mat Sci Eng. A, (2008) Vol.479-451, pp. 93-104. [2] R.O Rochaal, T.M.F. Melo, E.V. Pereloma, D.B. Santos, Mat Sci Eng. A, (2005), V 391, pp. 296-304. [3] K. S. Park, K. Park, D.L. Lee, C.S. Lee, Mat Sci Eng. A, (2007), V 449-451, pp. 1135-1138.

The 2nd Thailand Metallurgy Conference (2 TMETC)
-56-
Effects of Heat Treatment on Dry Wear and Corrosion Properties of 18wt%Cr-3wt%C-6.7wt%Mo Cast Iron
A. Wiengmoon1,*, T. Chairuangsri 2 and J.T.H. Pearce 3. 1 Department of Physics, Faculty of Science, Naresuan University, Phitsanulok, 65000.
2 Department of Industrial Chemistry, Faculty of Science, Chiang Mai University, Chiang Mai, 50200.
3 National Metals & Materials Technology Centre, 114 Paholyothin Rd, Patumthani, 12120. * Corresponding author: A. Wiengmoon; E-mail: [email protected].
ABSTRACT – Dry wear and corrosion resistance of an 18wt%Cr-3wt%C-6.7wt%Mo iron in the as-cast and heat treated conditions have been investigated by a pin-on-disc method and potentiodynamic technique respectively. Heat treatments included destabilisation and air hardening with and without subsequent tempering. The results show that corrosion and wear resistance were increased after heat treatment. However, tempering after destabilisation and air hardening decreased wear resistance when compared to the destabilised + hardened condition.
KEY WORDS -- high chromium iron, microstructure, abrasive wear, corrosion resistance
บทคัดยอ ความตานทานการสึกหรอในสภาวะแหงและความตานทานการกัดกรอนของเหล็กหลอ 18wt%Cr-3wt%C-
6.7wt%Mo ในสภาพหลอและผานการอบชุบทางความรอน ไดทดสอบแบบ pin-on-disc และเทคนิคโพเทนชิโอไดนามิกส ตามลําดับ โดยชิ้นงานหลอไดทําการอบดีสเตบิไลเซชันและใหเย็นตัวในอากาศ รวมทั้งการอบเทมเปอริ่งหลังการอบดีสแตบิไลเซชัน ผลการทดลองพบวาความตานทานการสึกหรอและความตานทานการกัดกรอนมีคาสูงขึ้น ภายหลังการอบชุบทางความรอน อยางไรก็ตาม การอบเทมเปอริ่งหลังการอบดีสแตบิไลเซชันสงผลใหความตานทานการสึกหรอลดลง เม่ือเปรียบเทียบกับชิ้นงานที่ผานการการดีสแตบิไลเซชันอยางเดียว
คําสําคัญ -- เหล็กหลอโครเมียมสูง โครงสรางจุลภาค การสึกหรอแบบขัดถู ความตานทานการกัดกรอน
1. Introduction Alloy white cast irons with 15-30wt %Cr and normally up to 3.5wt%Mo (ASTM A532) are used in applications requiring wear and corrosion resistance [1]. Abrasion and corrosion resistance can be improved by destabilisation + hardening heat treatment which enables carbon and chromium to precipitate out as secondary carbides in an austenite matrix. After air hardening, the microstructure then consists of eutectic and secondary carbides in a martensite matrix together with some retained austenite [1-4]. Tempering after destabilisation heat treatment reduces the level of the retained austenite and can increase the hardness. Addition of Mo to high chromium iron increases the hardenability during heat treatment [5-7] and improves tempering characteristics [1,5,8]. Special high Mo grades e.g. 3wt%C-18wt%Cr-5wt%Mo have been developed by specialist foundries to produce heavy section rollers and grinding tables for use in the power industry. This paper reports some aspects of work on structure-performance relationships of one such special grade which contains 6.7wt%Mo.
2. Experimental Wear test and corrosion test specimens were taken from 18wt%Cr-3wt%C with 6.7wt%Mo iron which
had been produced as sand cast test bars 150mm in length by 20mm square. As-cast specimens were destabilised at 1000oC for 4 hours and then hardened by air cooling. Some hardened specimens were then tempered at 450oC for 4 hours followed by air cooling. Dry wear resistance was examined under conditions of low stress abrasion using a rubber wheel test. A potentiodynamic technique was used to determine aqueous corrosion resistance via analysis of anodic polarisation characteristics using a solution containing 0.5 molar sulphuric acid. Microstructures and wear & corrosion damage were studied by OM and SEM. Vickers macro-hardness and micro-hardness were measured.
3. Results and Discussion The as-cast microstructure contained austenite dendrites, duplex eutectic carbides and eutectic austenite partially transformed to martensite. The duplex eutectic carbides consisted of Cr-rich eutectic carbide and lamellar Mo-rich eutectic carbide. After destabilisation, secondary carbides were precipitated within the prior austenite matrix, which later transformed to martensite (α′) during air cooling. Tempering after destabilisation further increased the precipitation of secondary carbide within tempered

The 2nd Thailand Metallurgy Conference (2 TMETC)
-57-
1.00E-06
1.00E-05
1.00E-04
1.00E-03
1.00E-02
1.00E-01
1.00E+00
1.00E+01
1.00E+02
-2.5 -1.5 -0.5 0.5 1.5 2.5E vs Ag/AgCl (V)
Log
i (A
/cm2 )
183 AC 183 Des 183 D+T as-cast destabilised destabilised+tempered
martensite. The measured wear rate of the as-cast iron was greater than for the heat treated irons (see Figure 1) because the softer austenite matrix provides less support to the hard eutectic carbides when compared to both un-tempered and tempered martensites. Anodic polarisation curves, in Figure 2, show that the martensite matrix has better corrosion resistance than the austenite matrix in the as-cast iron. This resulted from the depletion in Cr of the eutectic austenite phase close to the eutectic carbides leading to severe local attack of this austenite. The heat-treated iron is expected to be more uniform in chromium distribution, particularly in eutectic regions, compared to the as-cast iron. Anodic polarisation studies [2, 9] has shown similar trends for the effect of heat treatment on corrosion behaviour of 25wt%Cr irons. 4. Conclusions (1) The microstructure of as-cast 18Cr-3C-6.7Mo
iron contained both Cr rich M7C3 and Mo rich lamellar eutectic carbides in an essentially austenitic matrix.
(2) After destabilisation heat treatment, the hardness and wear resistance were increased due to the precipitation of secondary carbides and subsequent transformation of austenite to martensite on air cooling. Although it did not reduce hardness tempering of the air hardened iron gave an unexpected reduction in wear resistance.
(3) Both heat treated conditions gave some improvement in corrosion resistance compared to the as-cast condition.
5. Acknowledgement We kindly acknowledge The Faculty of Science, Naresuan University for funding support.
6. References [1] Pearce, JTH . Br. Foundryman; 78 (1985) 13-23. [2] Pearce, JTH. Foundryman, 95 (2002) 156-166 [3] Wiengmoon, A . et al. Acta Materialia, 53 (2005)
4143-4154. [4] Laird, G . ,Gundlach , R . and Rohrig , K. , American
Foundry Society, USA, (2000) 222. [5] Pearce, J .T. H. Trans. AFS 92 (1984) 599-622. [6] C.P. Tabrett, I.R.Sare, Scripta. Materialia. 38
(1998) 1747-1753. [7] M. Ikeda, T. Umeda, , C.P. Tong, T. Suzuki, N.
Niwa, O. Kato, ISIJ International, 32 (1992) 1157-1162.
[8] Pearce, JTH. Metal Casting Technologies 47 (2001) 41-43.
[9] Pearce, JTH et Al. Bulletin du Cercle d’Etudes des Metaux, 15 (1989) 25/1-13.
Figure 1. The effect of heat treatment on wear resistance of 18wt%Cr-3wt%C-6.7%Mo irons.
Figure 2. Anodic polarisation curves for 18wt%Cr -3wt%C-6.7%Mo iron in as-cast, destabilisation at 1000oC for 4 hours and destabilisation plus tempering at 450oC for 4 hours.

The 2nd Thailand Metallurgy Conference (2 TMETC)
-58-
Picklability of Thermal Oxide Scales on Carbon Steel in Hot Rolling Line: Effect of Coiling Temperature S. Chandra-ambhorn 1*, W. Thanatepolake 1, S. Thanateburapasap 1,
S. Intarasakda 2, and S. Iamsupapong 3 1 Department of Materials Engineering and Production Technology, Faculty of Engineering;
2 The Sirindhorn International Thai-German Graduate School of Engineering (TGGS); 3 Department of Production Engineering, Faculty of Engineering;
King Mongkut’s University of Technology North Bangkok (KMUTNB), Bangkok, Thailand * Corresponding author, Tel. (662) 5874335 Fax. (662) 5874335 E-mail: [email protected]
ABSTRACT – Thermal oxide scales on 0.09-wt%C steel were produced by different coiling temperatures (CT) in the hot rolling mill. Their pickalbility in simulated pickling solution used in the plant was investigated. It was observed from a scanning electron microscope that the scale on steel produced by lower CT was thinner than that on steel produced by higher CT. The steel produced by lower CT promotes the shorter pickling time in the immersion test, and lower charge-transfer resistance obtained by the electrochemical impedance spectroscopy for specimens immersed in 0.1 m NaCl solution for 1 day. It was discussed that thin scale and high temperature gradient between finishing and coiling temperatures of steel produced by low CT promote the picklability of scale from its substrate. KEY WORDS -- Thermal oxide scale, carbon steel, picklability, and coiling temperature
บทคัดยอ งานวิจัยนี้ไดปรับคาอุณหภูมิการมวนเก็บเหล็กกลาคารบอนในกระบวนการรีดรอน เพื่อใหไดสเกลออกไซด
เนื่องจากความรอนที่เกิดจากอุณหภูมิการมวนเก็บที่ตางกัน จากนั้นจึงศึกษาความสามารถในการกําจัดสเกลดังกลาวดวยสารละลายกรดที่จําลองมาจากกระบวนการในโรงงาน จากภาพถายจากกลองจุลทรรศนอิเล็กตรอนแบบสองกราด พบวา สเกลที่เกิดขึ้นจากอุณหภูมิการมวนเก็บที่ตํ่า บางกวาสเกลที่เกิดขึ้นจากอุณหภูมิการมวนเก็บที่สูงกวา จากการทดสอบแบบจุมและวิธีอิมพีแดนซทางเคมีไฟฟา พบวา สเกลท่ีเกิดขึ้นจากอุณหภูมิการมวนเก็บที่ตํ่า สามารถถูกกัดออกไดเร็วกวา และมีความตานทานการถายเทประจุไฟฟาเม่ือแชในสารละลายโซเดียมคลอไรด 0.1 โมลาร เปนเวลา 1 วัน ตํ่ากวาสเกลที่เกิดขึ้นจากอุณหภูมิการมวนเก็บที่อุณหภูมิสูง ผลการทดลองดังกลาวนําไปสูการอภิปรายวา สเกลที่เกิดขึ้นจากอุณหภูมิการมวนเก็บท่ีตํ่า จะบางกวาและตกอยูภายใตความตางของอุณหภูมิหลังแทนรีดละเอียดแทนสุดทายและอุณหภูมิการมวนเก็บที่สูง จึงทําใหสามารถกําจัดสเกลออกดวยกรดไดงาย คําสําคัญ -- สเกลออกไซด เหล็กกลาคารบอน ความสามารถในการกัดกรด และอุณหภูมิในการมวนเก็บ
1. Introduction The picklability of thermal oxide scale on hot-rolled carbon steel is controlled by many parameters in the hot rolling process [1-3]. The temperature at the end of the run-out table before coiling at a down coiler - coiling temperature - is one of the important parameters. The objective of this work is to investigate the effect of coiling temperature on the picklability of thermal oxide scale on carbon steel produced by different finishing temperatures. 2. Experimental procedures Samples used in this study is a 0.09-wt% carbon steel produced by Sahaviriya Steel Industry Public Company Limited (SSI). Samples were produced by two different CT, high CT and low CT, which were in the range from 550 to 700 ˚C. The difference between these two CT is 120 ˚C. Oxide thickness was observed by a scanning electron microscope (SEM).
An immersion test of samples in HCl solution as a simulated pickling solution used in the plant was conducted in function of time up to 60 second. The pickled area of scale on steel surface, and weight loss during the test were observed. An electrochemical impedance spectroscopy (EIS) was further applied. The samples were tested in 3.5 wt% NaCl solution for one day. 3. Results & Discussion The SEM micrographs of steels produced using low and high CT are shown in Figure 1. The scale thickness was ca. 5 mμ for the sample produced using low CT as in Fig. 1(a). The scale thickness was 7 mμ for the sample produced using high CT as in Fig. 1(b).
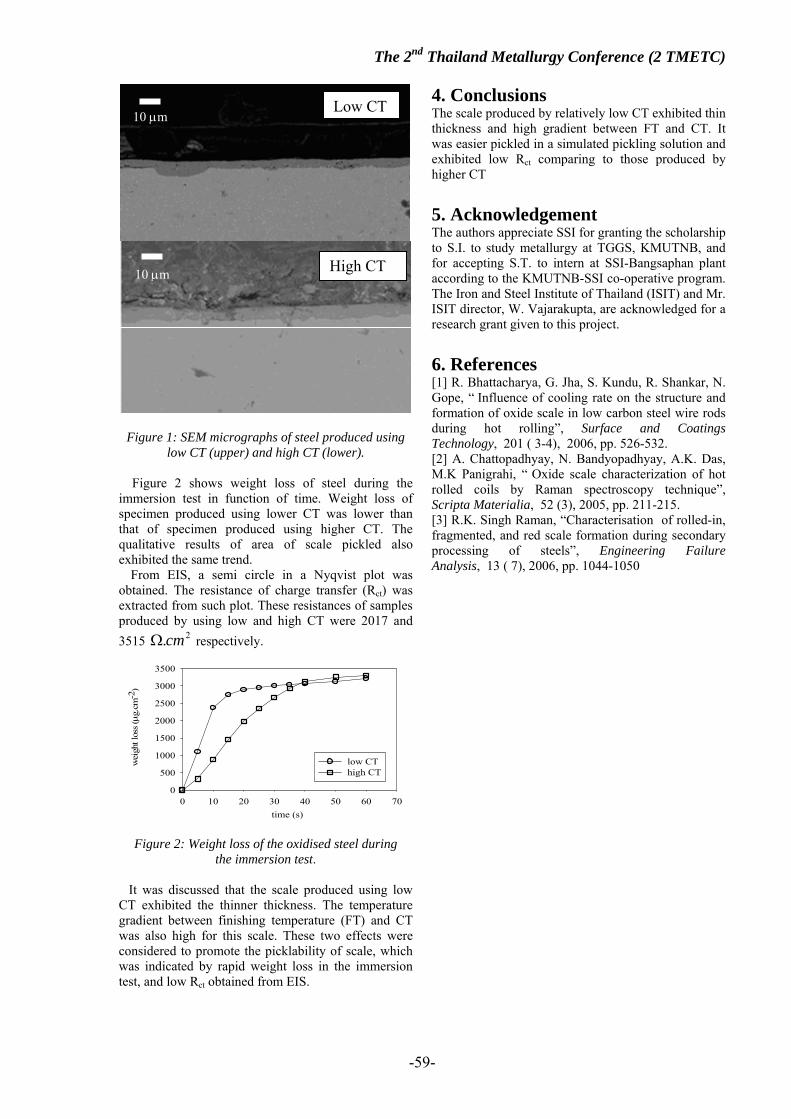
The 2nd Thailand Metallurgy Conference (2 TMETC)
-59-
Figure 1: SEM micrographs of steel produced using low CT (upper) and high CT (lower).
Figure 2 shows weight loss of steel during the immersion test in function of time. Weight loss of specimen produced using lower CT was lower than that of specimen produced using higher CT. The qualitative results of area of scale pickled also exhibited the same trend. From EIS, a semi circle in a Nyqvist plot was obtained. The resistance of charge transfer (Rct) was extracted from such plot. These resistances of samples produced by using low and high CT were 2017 and 3515 2.cmΩ respectively.
time (s)0 10 20 30 40 50 60 70
wei
ght l
oss (μ g
.cm
-2)
0
500
1000
1500
2000
2500
3000
3500
low CThigh CT
Figure 2: Weight loss of the oxidised steel during the immersion test.
It was discussed that the scale produced using low CT exhibited the thinner thickness. The temperature gradient between finishing temperature (FT) and CT was also high for this scale. These two effects were considered to promote the picklability of scale, which was indicated by rapid weight loss in the immersion test, and low Rct obtained from EIS.
4. Conclusions The scale produced by relatively low CT exhibited thin thickness and high gradient between FT and CT. It was easier pickled in a simulated pickling solution and exhibited low Rct comparing to those produced by higher CT 5. Acknowledgement The authors appreciate SSI for granting the scholarship to S.I. to study metallurgy at TGGS, KMUTNB, and for accepting S.T. to intern at SSI-Bangsaphan plant according to the KMUTNB-SSI co-operative program. The Iron and Steel Institute of Thailand (ISIT) and Mr. ISIT director, W. Vajarakupta, are acknowledged for a research grant given to this project. 6. References [1] R. Bhattacharya, G. Jha, S. Kundu, R. Shankar, N. Gope, “ Influence of cooling rate on the structure and formation of oxide scale in low carbon steel wire rods during hot rolling”, Surface and Coatings Technology, 201 ( 3-4), 2006, pp. 526-532. [2] A. Chattopadhyay, N. Bandyopadhyay, A.K. Das, M.K Panigrahi, “ Oxide scale characterization of hot rolled coils by Raman spectroscopy technique”, Scripta Materialia, 52 (3), 2005, pp. 211-215. [3] R.K. Singh Raman, “Characterisation of rolled-in, fragmented, and red scale formation during secondary processing of steels”, Engineering Failure Analysis, 13 ( 7), 2006, pp. 1044-1050
Low CT
High CT
10 μm
10 μm

The 2nd Thailand Metallurgy Conference (2 TMETC)
-60-
Effect of Process Parameters of Cooling Plate Technique on Microstructure of Semi-Solid Aluminum Alloy
Apiwat Pirunsarn, Nuchthana Poolthong, Panya Srichandr Division of Materials Technology, School of Energy, Environment and Materials,
King Mongkut’s University of Technology Thonburi Tel. 0-2470-8644 Fax. 0-2470-8643 e-mail: [email protected]
ABSTRACT – Cooling plate technique was employed to process A356 semi-solid aluminum alloy. Effects of pouring temperature, mold temperatures, length and incline of cooling plate on microstructures were studied. It was found that microstructure of semi-solid aluminum alloy poured in between 620 – 640oC has non-dendritic structure. Increased pouring temperature is observed to distort globularity and increase the eutectic phase. The different cooling plate length has small effect on the microstructure. Increase in mold temperature improved globularity and increased the grain size. The best angle of cooling plate is 60o because particles were most spherical. KEY WORDS -- Semi-Solid Processing, Cooling plate
บทคัดยอ ในงานวิจัยนี้เทคนิคขึ้นรูปแบบกึ่งแข็งแบบรางหลอเย็นถูกนํามาใชในการผลิตอะลูมิเนียมเกรด A356 โดยศึกษาถึง
อิทธิพลของอุณหภูมิเท อุณหภูมิแมพิมพ ความยาว และองศาของรางเทหลอเย็นตอโครงสรางจุลภาค จากการวิจัยพบวาโครงสรางจุลภาคของอะลูมิเนียมก่ึงแข็งที่เทท่ีอุณหภูมิในชวง 620 – 640oC ใหโครงสรางจุลภาคที่ไมเปนเดนไดรท การเพิ่มอุณหภูมิเทพบวาลดความกลมและทําใหเฟสยูเทคติคเพิ่มขึ้น ความยาวของรางเทหลอเย็นที่แตกตางกันมีผลคอนขางนอยกับลักษณะโครงสรางของอะลูมิเนียมก่ึงแข็ง อุณหภูมิของแมพิมพท่ีสูงขึ้นมีผลตอปรับปรุงความกลมและเพิ่มขนาดของเกรน องศาของรางเทหลอเย็นที่เหมาะสมคือ 60o เนื่องจากทําใหไดชิ้นงานที่มีความกลมมากที่สุดเม่ือเทียบกับองศาอื่น
คําสําคัญ -- กระบวนการหลอก่ึงแข็ง, รางหลอเย็น 1. Introduction Semi-solid metal processing of alloys is one of the key technologies for producing advanced materials. Products can be cast into a near net shape part directly from the semi-solid state. They have higher structural integrity with superior mechanical properties than castings, yet can be produced at lower cost than forging. Among several methods developed to produce semi-solid metal are mechanical stirring, magneto-hydrodynamic stirring, liquidus casting, low temperature pouring, and cooling plate technique. This research employed the cooling plate technique for fabrication of samples. The cooling plate technique produces fine globular grain structure and is a simple setup. The Al alloy used as matrix material was A356. This alloy has been selected because of its good fluidity as well as the presence of Si and Mg. The large semi-solid interval of this alloy (about 70oC) makes it suitable for semi-solid processing. The effects of pouring temperature, cooling plate length and inclined of cooling slope on microstructures were investigated. 2. Experimental procedures A356 aluminum alloy (6.04%Si, 0.19%Mg, 0.48%Fe and 0.077%Cu) were prepared and melted in a graphite crucible in an electric resistance furnace held at 700oC. After cooling to a temperature above the liquidus, the melt were taken out of the furnace and
poured into a metal mold via a cooling plate. The arrangement of cooling plate and mould used in the experiments was as shown in Fig 1. The cooling plate was 50mm wide and 500mm long semi-circular channel made of copper. Before pouring, a boron nitride coating was applied on the surface of the cooling plate to allow precipitating crystals to detach easily from the cooling plate wall. The experimental conditions are shown in Table1. Each condition was poured into uniform section size bars in metal mould of 25mm wide and 200mm long. The samples were cut from the top of the casting about 20mm-long and examined by optical microscope. Table 1 Experimental conditions Temperature of molten metal 620, 630, 640 oC
Temperature of mould 30, 150, 250 oC
Angle of the cooling plate 30, 45, 60
Cooling plate length 250, 500, 800 mm

The 2nd Thailand Metallurgy Conference (2 TMETC)
-61-
Figure 1. Experimental set-up 3. Results & Discussion The microstructure of semi-solid aluminum alloy is shown in Fig.2. If was found that the primary phase morphology has transformed into a non-dendritic structure. When molten metal is poured in between 620 – 640oC onto a cooling plate, heat was lost through the plate-wall and consequently nucleation was initiated along the melt/plate contact surface as explained by crystal separation theory.[1] These crystals were detached from the cooling plate, trapped in the flowing melt and moved in the mold at the bottom of the cooling plate.
Figure 2. Microstructures of semi-solid aluminum alloy from inclined of 30o with the following pouring temperature and cooling length values: (a) 640oC-800mm (b) 630oC-800mm (c) 620oC-800mm (d) 640oC-250mm (e) 630oC-250mm (f) 620oC-250mm Increasing the temperature of pouring led to slurry of higher liquid fraction entering the mold, giving rise the eutectic phase and may collide with others and
coalescence to from agglomerates.[2]
The different cooling plate length has small effect on the microstructure as observed in Fig.2 Fig.3 shows microstructure of semi-solid aluminum alloy poured at difference molding temperature. It was found that increasing mold temperature increased the grain size and globularity. This is due to the decreasing mold heat transfer. The best angle of cooling plate is 60o because particles were most spherical. Figure 3. Microstructures of semi-solid aluminum alloy from a pouring temperature of 620oC and inclined of 60o with a cooling length of 800mm and the mold temperature values: (a) 150oC and (b) 250o 4. Conclusions • Increased pouring temperature is observed to
distort globularity and increase the eutectic phase. • The different cooling plate length has small effect
on the microstructure. • Increase in mold temperature improved
globularity and increased the grain size. • The best angle of cooling plate is 60o because
particles were most spherical. 5. Acknowledgement The authors would like to acknowledge the financial support from King Mongkut’s University of Technology Thonburi, Commission on Higher Education (Project No. 133/2549), and Bureau of Supporting Industries Development (BSID), Department of Industrial Promotion (Project No. 77/2550).
6. References [1] A. Ohno, T. Motegi and H. Soda, “Origin of Equiaxed Crystals in Castings”, Transactions of the Iron and Steel Institute of Japan, Vol.11, 1971. p.18-26. [2] A. Muumbo, M. Takita, and H. Nomura, “Processing of Semi-Solid Gray Cast Iron Using the Cooling Plate Technique, Materials Transactions, Vol.44, 2003, pp.893 – 900 .
Crucible
Water inlet
Water outlet
Motor
Slurry flow
Metal mold
Cooling plate
(a)
(b)
(c) (f)
(d)
(e)
50μm 50μm
50μm 50μm
50μm 50μm
(a) (b)
100μm 100μm

The 2nd Thailand Metallurgy Conference (2 TMETC)
-62-
Semi-Solid Aluminum Alloy Produced by Cooling Plate Rheo-diecasting Process
Nuchthana Poolthong1, Chayant Koompai2, Worawit Jirattiticharoean3 Amornsak Rengsomboon4 Kanokkan Srimuang1, Suwanna Yupa1
1Division of Materials Technology, School of Energy, Environment and Materials, 2Department of Electrical Engineering, Faculty of Engineering,
King Mongkut’s University of Technology Thonburi 3Bureau of Supporting Industries Development, Department of Industrial Promotion
4National Metal and Materials Technology Center Tel. 0-2470-8644 Fax. 0-2470-8643 e-mail: [email protected]
ABSTRACT – In the high-pressure die casting (HPDC) process, the melt is forced into a die cavity at very high speed causing turbulent flow. As a result, air is trapped within the cavity, forming porosities in the components. The porosity due to turbulent could be reduced if the viscosity of the metal flow could be increased with the solid fraction of semi-solid slurry. The objective of this research is to provide an apparatus and method which is adapted for producing semi-solid metal alloys and improve die-casting system suitable for production of high integrity component. The cooling plate rheo-diecasting (CPRDC) process adapts the cooling plate to creation of semi-solid metal (SSM) followed by direct shaping of the SSM into a component using the existing high-pressure die-casting process. Using this technique the porosity due to turbulent mould filling and shrinkage porosity can be reduced. KEY WORDS -- Semi-solid metal, Cooling plate rheo-diecasting
บทคัดยอ ในกระบวนการฉีดโลหะดวยแรงดันสูง โลหะหลอมเหลวถูกแรงอัดเขาไปยังชองวางของแมพิมพดวยความเร็วสูง
ทําใหเกิดการไหลปนปวน ดวยเหตุนี้ทําใหอากาศถูกดึงเขาไปในชองวางดวย ซึ่งนําไปสูการเกิดรูพรุนจํานวนมากในชิ้นงาน รูพรุนเนื่องจากการไหลปนปวนนี้สามารถทําใหลดลงได ถาความหนืดของโลหะที่ไหลเขาไปในชองวางของแมพิมพเพิ่มขึ้จาก การที่มีสัดสวนของแข็ง วัตถุประสงคของงานวิจัยนี้คือการจัดหาอุปกรณและวิธีการในการพัฒนาโลหะกึ่งแข็งและปรับปรุงระบบการฉีดโลหะใหเหมาะสมกับการผลิตชิ้นสวนที่มีความซับซอนสูง กระบวนการหลอรีโอไดคาสติ้งแบบรางหลอเย็น เปนกระบวนการที่ประยุกตรางเทหลอเย็นมาใชในการสรางโลหะกึ่งแข็งตามดวยการขึ้นรูปโดยการฉีดดวยแรงดันสูง การใชเทคนิคนี้สามารถทําใหรูพรุนซึ่งเกิดจากการไหลปนปวนเขาไปยังแมพิมพ และโพรงหดตัวลดลงได คําสําคัญ -- โลหะกึ่งแข็ง, กระบวนการหลอรีโอไดคาสติ้งแบบรางเทหลอเย็น 1. Introduction Al alloys casting are playing an important role in the automotive industry. A large proportion of Al casting are produced by high-pressure diecasting (HPDC) process. However, the quality of components manufactured by this process is limited by the presence of porosity, which reduces the component strength and can cause component rejection if holes appear on the surface after machining. The porosity due to turbulent could be reduced or even eliminated if the viscosity of the metal flow could be increased with the solid fraction of such a semi-solid slurry so trapped air is minimized.[1] Many new rheocasting technologies were developed such as the new rheocasting (NRCTM) process,[2] and the twin-screw rheo-diecasting.[1] Until now, the rheocasting process has been continuously developed by creating simpler and more economical methods for producing SSM. In this study, a new rheocasting process, CPRDC was developed by combined the
cooling plate technique with diecasting machine. Cooling plate technique produces fine globular grain structure and is a simple setup. 2. Experimental procedures A356 aluminum alloy (6.04%Si, 0.19%Mg, 0.48%Fe and 0.077%Cu) samples were prepared and melted in an induction furnace held at 700oC. The CPRDC process started from feeding liquid metal with low superheat in to the cooling plate. Some of liquid alloy was rapidly cooled and became slurry. The semi-solid slurry with pre-determined volume fraction of the solid phase was then transfer to the shot chamber of a HCDP machine with a 100 tones clamping force for component shaping. The arrangement of cooling plate and diecasting machine used in this experiment was shown in Fig 1. The cooling plate was 50mm wide and 500mm long semi-circular channel made of steel. The experimental conditions are shown in Table1. The die used for casting test samples has two cavities of rectangular bar. The dimensions of the bar are 6mm in

The 2nd Thailand Metallurgy Conference (2 TMETC)
-63-
width and 60mm in length.
Figure 1. Experimental set-up
Table 1. Shows experimental conditions
Sample No.
Velocity (m/sec)
Pouring Temperature (oC)
0 - 630 1 0.2 650 2 0.2 640 3 0.2 630 4 0.2 620 5 0.2 610 6 1 630 7 1 620
3. Results & Discussion The microstructures of semi-solid aluminum alloy are shown in Fig.2. Comparing a normal gravity casting (Fig.2(a)) to the combination of semi-solid processing and pressurization (Fig.2(b) - (f)), it was found that the last process led to improvement in globularity and elimination of gas entrapment and centerline porosity. It was found that the hardness of the all samples were not much different (Fig.3). They are in between 55 – 63 HB. However, the harness of sample no.5 is the lowest because high porosity produced by too low pouring temperature. 4. Conclusions The CPRDC process was shown to effectively produce high quality semi-solid aluminum alloy. Using this technique grain size and the porosity due to turbulent mould filling and shrinkage porosity can be reduced if process parameters are suitable. 5. Acknowledgement The authors would like to acknowledge the financial support from Commission on Higher Education (Project No. 133/2549), Bureau of Supporting Industries Development (Project No. 77/2550) and U.M.C. Die Casting Co.,Ltd.
Figure 2. Microstructure of (a) sample no.0 (b) sample no.2 (c) sample no.3 (d) sample no.4 (e) sample no.6 and (f) sample no.7
Figure 3. Effect of process parameters on Brinell hardness 6. References [1] Z. Fan, X. Fang, S. Ji, “Microstructure and Mechanical Properties of Rheo-Diecasting (RDC) Aluminum Alloys”, Materials Science and Engineering A, Vol.412, 2005, pp.298-306. [2] Hall, K., Kaufmann, H., and Mudl, “Processing and Cost Considerations for New Rheocasting of Light Metal Alloys”, Proceedings of the Sixth International Conference on Semi-Solid Processing of Alloys and Composites, 2000, Turin, Italy: pp. 23-28.
40
45
50
55
60
65
70
0 1 2 3 4 5 6 7 8
Sample No.
Har
dnes
s (H
B)
(b)
(c) (d)
(a)
(e) (f)
30μm30μm
30μm30μm
30μm30μm
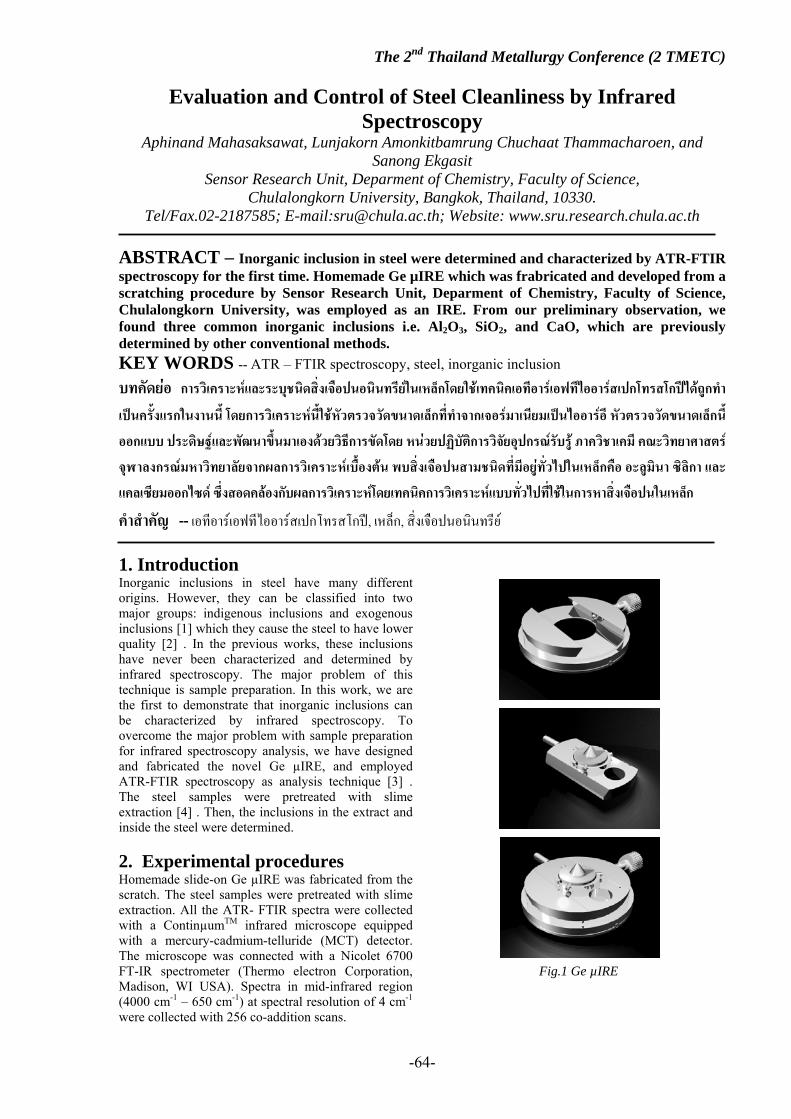
The 2nd Thailand Metallurgy Conference (2 TMETC)
-64-
Evaluation and Control of Steel Cleanliness by Infrared Spectroscopy
Aphinand Mahasaksawat, Lunjakorn Amonkitbamrung Chuchaat Thammacharoen, and Sanong Ekgasit
Sensor Research Unit, Deparment of Chemistry, Faculty of Science, Chulalongkorn University, Bangkok, Thailand, 10330.
Tel/Fax.02-2187585; E-mail:[email protected]; Website: www.sru.research.chula.ac.th
ABSTRACT – Inorganic inclusion in steel were determined and characterized by ATR-FTIR spectroscopy for the first time. Homemade Ge µIRE which was frabricated and developed from a scratching procedure by Sensor Research Unit, Deparment of Chemistry, Faculty of Science, Chulalongkorn University, was employed as an IRE. From our preliminary observation, we found three common inorganic inclusions i.e. Al2O3, SiO2, and CaO, which are previously determined by other conventional methods. KEY WORDS -- ATR – FTIR spectroscopy, steel, inorganic inclusion
บทคัดยอ การวิเคราะหและระบุชนิดสิ่งเจือปนอนินทรียในเหล็กโดยใชเทคนิคเอทีอารเอฟทีไออารสเปกโทรสโกปไดถูกทําเปนคร้ังแรกในงานนี้ โดยการวิเคราะหนี้ใชหัวตรวจวัดขนาดเล็กท่ีทําจากเจอรมาเนียมเปนไออารอี หัวตรวจวัดขนาดเล็กนี้ออกแบบ ประดิษฐและพัฒนาขึ้นมาเองดวยวิธีการขัดโดย หนวยปฏิบัติการวิจัยอุปกรณรับรู ภาควิชาเคมี คณะวิทยาศาสตร จุฬาลงกรณมหาวิทยาลัยจากผลการวิเคราะหเบื้องตน พบสิ่งเจือปนสามชนิดที่มีอยูท่ัวไปในเหล็กคือ อะลูมินา ซิลิกา และ แคลเซียมออกไซด ซึ่งสอดคลองกับผลการวิเคราะหโดยเทคนิคการวิเคราะหแบบทั่วไปที่ใชในการหาสิ่งเจือปนในเหล็ก คําสําคัญ -- เอทีอารเอฟทีไออารสเปกโทรสโกป, เหล็ก, สิ่งเจือปนอนินทรีย 1. Introduction Inorganic inclusions in steel have many different origins. However, they can be classified into two major groups: indigenous inclusions and exogenous inclusions [1] which they cause the steel to have lower quality [2] . In the previous works, these inclusions have never been characterized and determined by infrared spectroscopy. The major problem of this technique is sample preparation. In this work, we are the first to demonstrate that inorganic inclusions can be characterized by infrared spectroscopy. To overcome the major problem with sample preparation for infrared spectroscopy analysis, we have designed and fabricated the novel Ge µIRE, and employed ATR-FTIR spectroscopy as analysis technique [3] . The steel samples were pretreated with slime extraction [4] . Then, the inclusions in the extract and inside the steel were determined. 2. Experimental procedures Homemade slide-on Ge µIRE was fabricated from the scratch. The steel samples were pretreated with slime extraction. All the ATR- FTIR spectra were collected with a ContinµumTM infrared microscope equipped with a mercury-cadmium-telluride (MCT) detector. The microscope was connected with a Nicolet 6700 FT-IR spectrometer (Thermo electron Corporation, Madison, WI USA). Spectra in mid-infrared region (4000 cm-1 – 650 cm-1) at spectral resolution of 4 cm-1 were collected with 256 co-addition scans.
Fig.1 Ge µIRE

The 2nd Thailand Metallurgy Conference (2 TMETC)
-65-
3. Results & Discussion From our preliminary observations, we found the three common inclusions i.e. alumina, silica, and calcium oxide, which are also determined by other well-known conventional techniques. Therefore, our developed accessories and technique of analysis were, to some extent, reliable. Now, we are further exploring other types of inclusions that are found in the steel with our developed technique. 4. Conclusions We are the first to demonstrate that ATR-FTIR spectroscopy was capable for inorganic inclusions analysis in the steel. However, this can only be accomplished only if we have the novel slide-on Ge µIRE. 5. Acknowledgement We appreciate the financial support from Iron and Steel Institute of Thailand. 6. References [1] L. Zhang, “Inclusion and Bubble in Steel”, Journal of Iron and Steel Research International, 2006, 13, 3.pp.01-08. [2] L. Zhang, B. G. Thomas, X. Wang and K. Cai, “Evaluation and Control of Steel Cleanliness”, 85th Steelmaking Conference Proceedings, 2002. pp. 431-452. [3] S. Ekgasit, N. Pattayakorn, D. Thongsakul, C. Thammacharoen and T. Kongyou, “A Novel ATR FT-IR Microspectroscopy Technique for Surface Contamination Analysis without Interference of the Substrate”, Analytical sciences, 2007, 23.pp. 863-868. [4] B. Chatterjee, “Electrowinning of Gold from Anode slimes”, Material Chemistry and Physics, 1996, 45.pp. 27-32.

The 2nd Thailand Metallurgy Conference (2 TMETC)
-66-
Influences of Ironing ratio on Phase Transformations of Ni-Ti SMAs plate
Aphinan Phukaoluan1, Anak Khantachawana2, Pongpan Kaewtatip3 and Varunee Premanond4
1,2,3Department of Mechanical Engineering, Faculty of Engineering, King Mongkut’s University of Technology
Bangkok 10140, Thailand Tel: 0-2470-9116 Fax: 0-2470-9111 E-mail: [email protected]
4Department of Tool and Material Engineering, Faculty of Engineering, King Mongkut’s University of Technology
Bangkok 10140, Thailand Tel: 0-2470-9209 Fax: 0-2470-9210
ABSTRACT – Shape memory alloys (SMAs) are widely used in many fields due to their compact sizes, rapidly response and high recovery force. NiTi-base alloys are known to be the most important shape memory alloys (SMAs) because of their numerous applications based on the stable shape memory effect (SME)[1] and pseudo-elasticity (PE)[2,3]. This research is aimed for study the influences of ironing ratio on the phase transformation of NiTi shape memory alloys. NiTi thin plate (Ni50.2-Ti49.8 (%at)) with original thickness of 0.256 mm and width of 7 mm was prepared. Cold work was done by ironing at room temperature with various ironing ratios. KEY WORDS -- Ni-Ti/Ironing process/ Reduction ratio/ Phase transformation The ironing die was made from tungsten carbide (Fig. 1) with an approach angle of 10 degree and die land of 1 mm. Sodium stearate soap mixed with ISO cut 570 A was applied as a lubricant. The velocity for ironing process was 30 mm/min.
Figure 1. Ironing process and apparatus. Prior to ironing, the specimens were heat-treated at 600oC for 1 hr. After ironing process, the specimens with reduction ratio of 9%, 13%, 15% and 18% were obtained. The specimens were subsequently heat-treated at 470oC for 1 hr.
Figure. 2 DSC curves of NiTi shape memory alloy with
various reduction ratios.
0
20
40
60
80
100
120
0 5 10 15 20%Reduction
Tra
nsfo
rmat
ion
Tem
pera
ture
(o C) Af
Ms
(a)
35
40
45
50
0 5 10 15 20%Reduction
Tra
nsfo
rmat
ion
tem
pera
ture
hy
ster
esis
(o C)
(b)
Figure. 3 (a) % Reduction dependence of Ms and Af temperatures. (b) % Reduction dependence of
temperature hysteresis.
Transformation temperatures of each specimen were detected by Differential scanning calorimeter (DSC) under temperature ranging from 0 oC and 130 oC with heating and cooling rate of 10 oC/min. DSC curves show the transformation peak corresponding to transformation between martensitic and austenitic phase during heating while 2-step transformations between martensite, R-phase and austenite phase can be confirmed during cooling. It is found that Af and Ms temperature slightly decreases with increasing reduction ratio. However, it is seen

The 2nd Thailand Metallurgy Conference (2 TMETC)
-67-
that even a small reduction ratio of 8% can depress martensite transformation to be 10 oC lower than that of 0% reduction.
On the other hand, transformation temperature hysteresis increased with increasing reduction ratio. This should be caused from the introduction of dislocation during cold work. For the aspect of working history, work-hardening such as cold-work increases the dislocation density. Cold work has been reported to decrease Af and Ms. In addition, the cold-work method also has a substantial impact on the critical stress for slip in NiTi alloy. Moreover, the movement of phase boundary is disturbed by a high density of dislocation, resulting in broadening of transformation temperature range Summary 1. Martensite transformation can be observed in all specimens with various ironing ratios. 2. Af and Ms temperatures slightly decreased with increasing reduction ratio. 3. Transformation temperature hysteresis from the peak to peak tended to increase with increasing reduction ratio. References [1] S. Miyazaki, K. Otsuka, Y. Suzuki, Scripta Metall. 15 (1981) pp.287 [2] S. Miyazaki, Y. Ohmi, K. Otsuka, Y. Suzuki, Proceedings of ICOMAT-82, J. Phys. 43 (1982) C4-255 [3] S. Miyazaki, T. Imai, Y. Igo, K. Otsuka, Metall. Trans. A17 (1986) [4] S.K. Wu, et al., 1996 ,“A study on the wire drawing of TiNi shape memory alloys” , Elsevier Science S.A., 1996, pp. 113-119 [5] Ming H. Wu, 2001, “Fabrication of Nitinol Material and Component”, Proceedings of the International Conference on Shape Memory and Superelastic Technologies, Kunming , China , pp.1-8

Oral Presentations
Properties Session

The 2nd Thailand Metallurgy Conference (2 TMETC)
-69-
Production of SG-Si and SG-Al Cast Iron and Comparison of Their Properties
M. M. Haque, Sugrib K. Shaha and A. Faris Ismail Kulliyyah of Engineering, International Islamic University Malaysia (IIUM)
Gombak, 53100 Kuala Lumpur, Malaysia. Tel: 06-03-6196-4505, Fax: 06-03-6196-4477, Email: [email protected]
ABSTRACT – The presence of aluminium and silicon in iron-carbon alloy system has similar effect on graphitization process. As such, iron-carbon-aluminium system has been developed, but in the production of SG-Al cast iron various difficulties have been faced. In the present study, these difficulties have been elaborated and comparison with SG-Si cast iron has been made. Special inoculation technique together with feeding arrangement needs to be adopted to produce SG-Al cast iron. The properties of SG-Si cast iron are found to be higher than those of the SG-Al cast iron because of the presence of higher shrinkage porosity in the SG-Al cast iron.
KEY WORDS -- Graphitization, Inoculation, Feeding, Shrinkage porosity
1. Introduction Aluminium and silicon have a similar effect on iron-carbon alloy system and thus attempts have been made to replace silicon by aluminium. Among the earliest records, silicon from the conventional grey cast iron was first replaced by Keep [1] in 1888-1889. After a long time, other investigators have paid attention to iron-carbon-aluminium system, but they worked with either flake or compacted graphite aluminium cast iron except Ghoreshy and Kondic [2]. In 1983, they opened up a new era with eutectic solidification of SG-Al cast iron containing 0.16% Si. This is because; the SG-Al cast iron offers following advantages over conventional SG-Si cast iron:
(a) Fully pearlitic matrices can be readily obtained in both the as-cast and heat treated conditions. (b) A wide range of mechanical properties can be achieved easily some of which are at a higher level than those obtained in the SG-Si cast iron. (c) In the production of high duty austempered ductile iron (ADI), The Fe-C-Al alloy system is beneficial because of following [3]:
(i) The UTS of SG-Al cast iron austenitized at 900oC and austempered between 300-425oC increases with austempering time, and the values do not change considerably with time. (ii) If the austempering time is increased during heat treatment, the hardness values of the SG-Al cast iron increases steadily. (iii) In austempered SG-Al cast iron, a very high impact value (~110J) is obtained after 3 hrs of austempering, while in SG-Si cast iron, the impact values decrease sharply after 1 hr. However, Haque and Young [4] observe that the production of SG-Al is subject to some specific limitations. The melting, inoculation treatment and feeding techniques must be performed according to specific criteria. However, in the present study, an attempt has been made to compare the properties and structures of the as-cast SG-Si and SG-Al cast irons.
2. Experimental Procedure The mould consisted of clay free dry sand (AFS grain fineness 60) bonded with 1.5% resin and 0.5% catalyst. The mould used for this experiment contained four identical wedge shaped test pieces having a common sprue in the centre (Fig. 1). This design allowed comparing directly three in-mould-placed inoculants with an untreated sample. This type of design was chosen to measure the depth of chill, mottled portion and carbide-free region if any from the same test piece. In order to compare the results of in-mould inoculation technique, a few melts were inoculated in the ladle before pouring as well as in the mould. Another mould was used to compare the properties including the fluidity, which contained two identical test pieces of 12 mm wide and about a metre long (Fig. 2). However, the thickness for different test pieces vary ranging from 1 mm, 3.5 mm and 7.0 mm and cast separately. Two types of charge materials were used to produce SG-Si and SG-Al cast irons. The charging sequence and the proportions of the raw materials including their approximate composition are shown in Table 1.
Table 1, Details of raw materials for the production of SG-Si and SG-Al cast irons.
Types of Cast Iron
Names and sequences of charging materials
Weight (%)
SG-Si Pig iron (4.3% C, 0.15% Si) Mild steel (0.15% C) Fe Si90 Ni shots FeSi42Mg5.5
80.00 15.50 01.62 00.68 02.20
SC-Al Pig iron (4.3% C, 0.15% Si) Mild steel (0.15% C) Commercially pure Al NiMg15
80.00 16.50 02.70 00.80

The 2nd Thailand Metallurgy Conference (2 TMETC)
-70-
Fig. 1, Showing four patterns with common central sprue for simultaneous comparison of different inoculation effects.
Fig. 2, Showing one metre long fluidity pattern.
The melting operation was carried out in a 50 kW medium frequency induction furnace. The melts for SG-Si and SG-Al cast irons were first spheroidised by plunging FeSi42Mg5.5 and NiMg15 treatment alloy and super heated to about 1450o C and 1500o C
respectively, keeping their actual superheating range at almost the same level [5]. Both melts were then stirred and inoculation treatment was then carried out with FeSiSr+ZrSi for both melts. Immediately after inoculation, the melts were deslagged with suitable fluxing material and poured into the moulds at about 1375o C and 1425o C for SG-Si and SG-Al cast irons, respectively. For the in-mould inoculation, the inoculants were placed spreading over the runner or the ingate mouth. During pouring, the molten alloy was poured into the mould in a continuous stream and the tip of the crucible was held just above the pouring basin of the mould. This procedure was followed in order to avoid any turbulence and splashing during pouring of the melt. This is because; high levels of magnesium and silicon in ductile iron increase the possibility of dross formation [6]. After removing the gating systems from all cast samples, they were radiographically X-rayed and the films were examined to see the internal flaws and to assess the quality of the castings. After fluidity and density measurement, the samples were machined to prepare the tensile specimens. The tensile testing was performed using an Instron Universal Testing Machine at constant cross head speed of 2 mm per minute and the results were averaged from two tests. Metallographic specimens were polished and etched in 2% and 10% nital solution for SG-Si and SG-Al cast irons, respectively. The microstructures were examined optically to see the morphology and nodularity of the graphite phase for both cast irons. 3. Results and discussion In order to produce the SG-Al cast iron, a separate melting technique was found necessary [3, 4] and super heating temperature was needed higher. Furthermore, in the production of SG-Al cast iron, metal like nickel in the form of NiMg15 is required. This alloy is more expensive than the FeSi42Mg5.5 temper alloy, which is commonly used for the spheroidization treatment of the SG-Si cast iron. These are the serious drawbacks in the production of SG-Al cast iron, which must not be ignored. Thus, in order to simplify the production technique of the SG-Al cast iron, a few attempts have been made. In one of such attempts, four identical wedge shaped test pieces having a common sprue in the centre is used to identify the best inoculant for the production of SG-Al cast iron. In terms of chill depth, high nodule count and carbide free pearlitic matrix structure, the best inoculant superseed (FeSi78Sr7) has been identified. However, the inoculation technique should be adopted as in-ladle in conjunction with in-mould treatment [4] in order to inoculate the alloy more effectively. In an another attempt, simpler fluidity mould having two identical test pieces of 12 mm wide and about a metre long is used [7]. The fluidity lengths of the SG-

The 2nd Thailand Metallurgy Conference (2 TMETC)
-71-
Si cast iron were found higher than those of the SG-Al cast iron, irrespective of the section thickness, indicating that the SG-Si cast iron is more fluid than the SG-Al cast iron. This may be because of the following two reasons: the element silicon in SG-Si cast iron increases the fluidity of the alloy. On the other hand, the oxide film of aluminium moving ahead of the melt resists in filling the mould cavity for the SG-Al casting. The tensile properties of the SG-Si cast iron also showed almost consistently higher than those of SG-Al cast iron. This is probably because of the higher carbon equivalent value, which is nearer to the eutectic point than that of the SG-Al cast iron. It has been reported that optimum properties are obtained when the alloys are in eutectic composition [2, 8, 9]. Another reason may be that the amount of shrinkage porosity is more in the SG-Al cast iron as compared to that of the SG-Si cast iron. This is partly because of the higher pouring temperature employed for the SG-Al cast iron and partly because of the oxide film which makes longer the solidification time for the alloy [10]. Therefore, it can be suggested that more fluid metal needs to be fed for producing sound SG-Al casting. Microstructures of SG-Si and SG-Al cast irons showed massive carbide in 1 mm section, while in 3.5 mm section specimen of SG-Si cast iron showed no carbide. On the other hand, SG-Al cast iron specimen (in 3.5 mm thick) showed little carbide [7]. However, in 7 mm thick samples of both cast irons showed pearlite, ferrite rings surrounding the graphites, and no carbide (Fig. 3). It is also noticed from the figure that the degree of nodularity for graphite is more and the ferrite rings are more uniform in the matrix structure of the SG-Si cast iron compared to those of the SG-Al cast iron.
(a) (b) Fig. 3, Showing microstructures of (a) SG-Si and (b) SG-Al cast irons. However, the new concept proposed by Campbell [11] is a defect structure, in which the defects are constituted by fragments of the entrained liquid surface. The liquid surface is commonly covered with an oxide, and the entrainment mechanism is a folding action, the entrainment defects are double oxide films. They are necessarily folded dry side to dry side, entrapping a layer of air, and thus experiencing no bonding between the two films (Fig. 4). The defects have been called as ‘bifilms’ and they act as cracks in suspension in the liquid.
Fig. 4, Showing the formation of bifilms defect. For cast material that takes a long time to solidify, the extended period in the liquid gives the bifilms time to open to their maximum amount, causing properties to fall significantly. Therefore, this may be one of the probable reasons why the SG-Al cast iron showed inferior tensile properties compared to the SG-Si cast iron. 4. Conclusions and Recommenda-tions The following conclusions and recommendations can be made from the present study:
(a) In-ladle and in-mould inoculation technique needs to be adopted for the production of SG-Al cast iron. (b) More fluid metal needs to be fed to reduce shrinkage porosity in SG-Al cast iron. (c) Further investigation needs to be carried out to economize the production process and to improve the nodularity of graphite in SG-Al cast iron. 5. Acknowledgement The authors are grateful to the Ministry of Science, Technology and Innovation (MOSTI) of Malaysian Government for sanctioning the fund to carry out the present investigation. 6. References [1] W. J. Keep, Trans. Am. Inst. Mining Eng., Vol. 18, p. 102, 1889. [2] M. Ghoreshy and V. Kondic, Solidification Technology in the Foundry and Cast House, The Mets. Soc., p. 562, 1983. [3] S. M. A. Boutorabi, Ph. D. Thesis, University of Birmingham, U. K., 1991. [4] M. M. Haque and J. M. Young, “Production of SG-Al Cast Iron and the Factors Affecting it”, J.of Materials Processing Technology, Vol. 55, p. 186, 1995. [5] R. Vogel and H. Mader, Archiv. Fur Das Eisenhuttenwesen, Vol. 9, p. 333, 1935-36. [6] H. Kind , R. Neuman and N. Wukovich, Foundry Practices, in AFS Ductile Iron Hand Book, p. 179, 1992. [7] M. M. Haque, “Investigation on Properties and Microstructures of Spheroidal Graphite Fe-C-2Si and Fe-C-2Al cast irons”, J. of Materials Processing Technology, Vol. 191, p. 360, 2007.

The 2nd Thailand Metallurgy Conference (2 TMETC)
-72-
[8] B. Merineck, Proc. of the Institution of British Foundry (IBF) Conference, Harrogate, U.K., Paper No. 12, 1991. [9] J. Campbell, Castings, Butterworth-Heinemann Ltd., Oxford, U.K., p. 77, 2003. [10] A. A. Zhukov, Met. Sci., p. 127, 1987. [11] J. Campbell, Proc. of the 66th World Foundry Congress (WFC), Istanbul, Turkey, Vol. 1, p. 33, 2004.

The 2nd Thailand Metallurgy Conference (2 TMETC)
-73-
On the Strength of Dissimilar Metals Joint between Magnesium Alloys and Aluminum Alloys
Rattana Borrisutthekul Lecturer, Suranaree University of Technology, Suranaree, Naknon-Ratchasima, 30000
Thailand, e-mail: [email protected]
ABSTRACT – In this paper, the explanations of effect of intermetallic compound phase on the joining strength of dissimilar metals joint between magnesium alloy and aluminum alloys was gathered from various research works and was discussed. From various research works, it was found that joining strength of dissimilar metals welding between magnesium alloy and aluminum alloys is relied on thickness of intermetallic compound layer, intermetallic compound morphology, and types of intermetallic compound formed. KEY WORDS -- Dissimilar metals welding, Joining between Mg/Al, Strength of dissimilar metals joint
บทคัดยอ ในบทความนี้ไดทําการรวบรวมแนวคิดใน การอธิบายถึงผลของสารประกอบเชิงโลหะที่กอตัวขึ้นระหวางการเชื่อมโลหะตางชนิดระหวางแมกนีเซียมผสมกับอลูมิเนียมผสมตอสมบัติเชิงกลของชิ้นงานเชื่อมนั้น จากการศึกษารวบรวมผลการการวิจัยจากหลายแหลงรวมไปถึงงานวิจัยของผูนําเสนอเอง พบวาความแข็งแรงของรอยเชื่อมระหวางแมกนีเซียมผสมกับอลูมิเนียมผสมขึ้นอยูกับปจจัยหลักสามประการ คือ ความหนาของชั้นสารประกอบเชิงโลหะ ลักษณะรูปทรงของสารประกอบเชิงโลหะตอสภาพของแรง และ เฟสของสารประกอบเชิงโลหะที่กอตัวขึ้นจากวิธีการตางๆ คําสําคัญ -- การเชื่อมโลหะตางชนิด การเชื่อมแมกนีเซียมและอลูมิเนียม ความแข็งแรงของรอยเชื่อมโลหะตางชนิด
1. Introductions Dissimilar metals joints between magnesium alloys and aluminum alloys have been interested for reduction of the weight of the vehicle, which contributes to improve its energy efficiency. During dissimilar metals joining between magnesium alloys and aluminum alloys, the intermetallic compound phases are formed at the bond region, which is brittle and low strength. Various research works, which were done in welding of this combination, have revealed the mechanism to obtain well joining strength. In this present study, the mechanism to obtain well joining strength of dissimilar metals joining between magnesium alloy and aluminum alloy was gather and discussed.
2. Effects of Al/Mg IMP thickness
on joining strength There are many research works carried out the joining of magnesium/ aluminum and indicating the effects of intermetallic compound layer thickness on the joining strength. Fugimaki et al.[1] carried out the diffusion
joining of AZ31 magnesium alloy/A5052 aluminum alloy at various conditions. In their work, they revealed that intermetallic compound layer formed between AZ31/A052 composed of three layers as shown in Fig. 1. The joining strength obtained in their work decreases with increasing thickness of intermetallic compound layer as shown in Fig. 2. The maximum joining strength of diffusion joint was obtained at 80 MPa in tensile mode when the thinnest Al-Mg intermetallic compound layer was observed at about 40 μm of thickness. Another research work was done by Rattana, et al. [2]. They also carried out joining of AZ31/A5052, but they used other welding technique, laser welding with lap joining configuration. From their work, the shear joining strength was in range of 13 to 48 MPa, In case of joining strength obtained was at 13 MPa, the intermetallic compound layer thickness was found at about 120 μm. But in the case of 48 MPa joining strength, the intermetallic compound layer thickness was about 40 μm. From above results, it could be indicated that decreasing intermetallic compound layer could improve joining strength.
3. Effect on mechanical interlocking
effect on joining strength There are various research works indicating the improvement of joining strength by mechanical interlocking of phase. Rattana et al [3]. was carried out the laser welding with butt configuration. The Al-Mg intermetallic compound layer shape was not same as diffusion bonding case but it looks like the snack movement as shown in Fig. 3. Although its thickness obtained in this study was about 100-200 μm, but the joining strength was shown at the same level of thin
Fig. 1Microstructure of diffusion bonding of AZ31to A5052
Fig. 2 Strength obtained under various intermetallic compound layer thickness
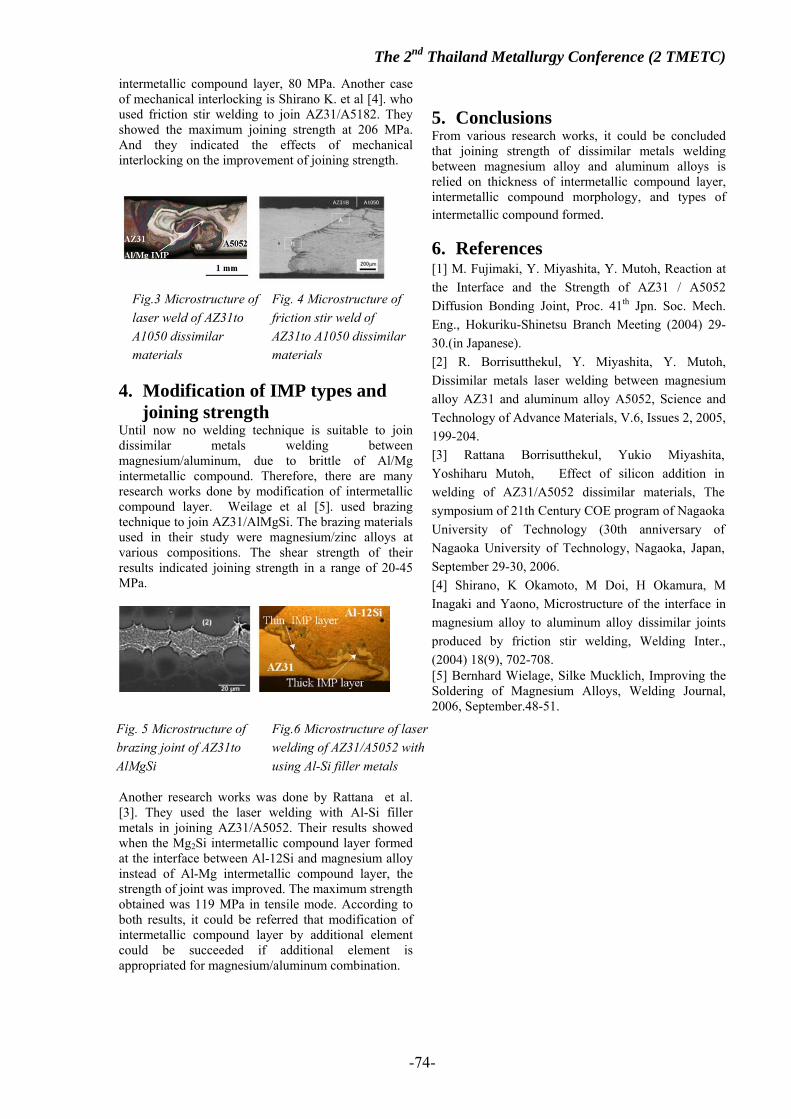
The 2nd Thailand Metallurgy Conference (2 TMETC)
-74-
Fig. 5 Microstructure of brazing joint of AZ31to AlMgSi
Fig.6 Microstructure of laser welding of AZ31/A5052 with using Al-Si filler metals
intermetallic compound layer, 80 MPa. Another case of mechanical interlocking is Shirano K. et al [4]. who used friction stir welding to join AZ31/A5182. They showed the maximum joining strength at 206 MPa. And they indicated the effects of mechanical interlocking on the improvement of joining strength.
4. Modification of IMP types and
joining strength Until now no welding technique is suitable to join dissimilar metals welding between magnesium/aluminum, due to brittle of Al/Mg intermetallic compound. Therefore, there are many research works done by modification of intermetallic compound layer. Weilage et al [5]. used brazing technique to join AZ31/AlMgSi. The brazing materials used in their study were magnesium/zinc alloys at various compositions. The shear strength of their results indicated joining strength in a range of 20-45 MPa.
Another research works was done by Rattana et al. [3]. They used the laser welding with Al-Si filler metals in joining AZ31/A5052. Their results showed when the Mg2Si intermetallic compound layer formed at the interface between Al-12Si and magnesium alloy instead of Al-Mg intermetallic compound layer, the strength of joint was improved. The maximum strength obtained was 119 MPa in tensile mode. According to both results, it could be referred that modification of intermetallic compound layer by additional element could be succeeded if additional element is appropriated for magnesium/aluminum combination.
5. Conclusions From various research works, it could be concluded that joining strength of dissimilar metals welding between magnesium alloy and aluminum alloys is relied on thickness of intermetallic compound layer, intermetallic compound morphology, and types of intermetallic compound formed. 6. References [1] M. Fujimaki, Y. Miyashita, Y. Mutoh, Reaction at the Interface and the Strength of AZ31 / A5052 Diffusion Bonding Joint, Proc. 41th Jpn. Soc. Mech. Eng., Hokuriku-Shinetsu Branch Meeting (2004) 29-30.(in Japanese). [2] R. Borrisutthekul, Y. Miyashita, Y. Mutoh, Dissimilar metals laser welding between magnesium alloy AZ31 and aluminum alloy A5052, Science and Technology of Advance Materials, V.6, Issues 2, 2005, 199-204. [3] Rattana Borrisutthekul, Yukio Miyashita, Yoshiharu Mutoh, Effect of silicon addition in welding of AZ31/A5052 dissimilar materials, The symposium of 21th Century COE program of Nagaoka University of Technology (30th anniversary of Nagaoka University of Technology, Nagaoka, Japan, September 29-30, 2006. [4] Shirano, K Okamoto, M Doi, H Okamura, M Inagaki and Yaono, Microstructure of the interface in magnesium alloy to aluminum alloy dissimilar joints produced by friction stir welding, Welding Inter., (2004) 18(9), 702-708. [5] Bernhard Wielage, Silke Mucklich, Improving the Soldering of Magnesium Alloys, Welding Journal, 2006, September.48-51.
Fig. 4 Microstructure of friction stir weld of AZ31to A1050 dissimilar materials
Fig.3 Microstructure of laser weld of AZ31to A1050 dissimilar materials

The 2nd Thailand Metallurgy Conference (2 TMETC)
-75-
Welding Residual Stresses in Two Competing Single V-Butt Joints Pornwasa Wongpanya
School of Metallurgical Engineering, Suranaree University of Technology Nakhon Ratchasima, 30000 Thailand
Tel. +66-44-224486 Fax. +66-44-224482. E-mail:[email protected]
ABSTRACT – During fabrication of welded components residual stresses are generated as a result of non-uniform temperature distribution during the welding and particularly the cooling process. Such residual stresses have a major effect on the overall performance of a component in service, especially when hydrogen is involved and the component might become prone to Hydrogen Assisted Cold Cracking (HACC). Up to the present, most of the welding standard and specification to test the resistance of welds against HACC test are without consideration of the restraint intensity provided by the surrounding structure. This may lead to a misunderstanding of the welding heat treatment procedures, i.e. preheating and interpass temperature, for multi-pass welding of extra high strength steels. Such restrained welds might also interact at real components with respect to the stresses and strains produced in the transverse direction. This point has not been addressed within the recent years and in order to elucidate such effects, two competing single v-butt joints in high strength steel with a yield strength level of 1100 MPa are investigated in the present contribution by Finite Element Analyses (FEA). As a specific result, it turned out that the transverse residual stresses increase with the restraint intensity of the surrounding structure. As a consequence of the different restraint intensity during completion of the joints, the stresses are distributed inhomogeneously in the component and special attention has to be paid to such regions with respect to cold cracking. KEY WORDS -- Residual stress, high strength steel and Restrain effect
บทคัดยอ - ในระหวางกระบวนการผลิตโครงสรางทางวิศวกรรมโดยการเชื่อม ความเคนเหลือคางเกิดขึ้นเนื่องจากการกระจายตัวของอุณหภูมิไมสมํ่าเสมอ ความเคนเหลือคางมีผลตอประสิทธิภาพของโครงสรางในระหวางใชงาน โดยเฉพาะอยางยิ่งเม่ือสภาวะการใชงานมีกาซไฮโดรเจนเขามาเกี่ยวของ ทําใหโครงสรางดังกลาวมีความเสี่ยงตอการแตกราวแบบเย็น ณ ปจจุบันเกือบทั้งหมดของ มาตรฐานการทดสอบการแตกราวแบบเย็นในงานเชื่อมไมไดพิจารณาผลของระดับแรงกระทําจากภายนอก อาจทําใหเกิดความเขาใจผิดเก่ียวกับตัวแปร เชน อุณหภูมิท่ีใชกอน และระหวางเชื่อม สําหรับงานเชื่อมท่ีมีหลายชั้นของเนื้อรอยเชื่อม สําหรับเหล็กกลาที่มีความแข็งแรงสูง เพื่อใหสอดคลองกับโครงสรางจริงที่ประกอบดวยรอยเชื่อมจํานวนมาก และเพื่อตรวจสอบผลของแรงกระทําจากภายนอก รอยเชื่อมคูขนานในเหล็กกลาที่มีคายังมอดูลัส 1100 เมกะปาสคาล ถูกตรวจสอบ วิเคราะหดวยไฟไนตอิเลเมนต จากการศึกษาพบวา ความเคนเหลือคาง (ทิศทางขวางรอยเชื่อม) เพิ่มขึ้นเม่ือมีแรงกระทําจากภายนอก ผลจากระดับแรงกระทําภายในเนื้อรอยเช่ือม และแรงกระทําจากภายนอกที่ระดับตางๆในระหวางการเชื่อมทําใหมีความเคนเหลือคางกระจายตัวอยางไมสมํ่าเสมอ และจําเปนตองระมัดระวัง วิเคราะหวาบริเวณใดเสี่ยงตอการเกิดการแตกราวแบบเย็น คําสําคัญ -- ความเคนเหลือคาง เหล็กกลาที่มีความแข็งแรงสูง และผลของแรงกระทําจากภายนอก
1. Introduction Over the past decades, High Strength Structural Steels (HSSS) have been used in many welded steel constructions. The reduction of weight is the most important advantage in using steels with yield strength levels of up to 1100 MPa in various industrial applications, i.e. for mobile cranes, bridge structures and pipelines. However, applications of such steels have been accompanied by failure cases that occur mostly as Hydrogen Assisted Cold Cracking (HACC) during fabrication and service.
A unique characteristic of HACC in welded components is generally promoted by three main inter-related factors, i.e. susceptible microstructure, hydrogen concentration and residual stress, as shown in ผิดพลาด! ไมพบแหลงการอางอิง. In order to solve such failure cases, many techniques are used to control of HACC in the weld based on the reduction of hydrogen input, pre- and postheating, heat input consideration. Such techniques can be used to remove some critical factors, i.e. hydrogen concentration and susceptible microstructure, but the interaction of the thermal cycle with the components reaction in terms of the stress build up has not been completely understood,

The 2nd Thailand Metallurgy Conference (2 TMETC)
-76-
particularly with respect to HACC avoidance ผิดพลาด! ไมพบแหลงการอางอิง. Therefore, this paper will discuss predominantly in the topic of welding residual stress in the single V-butt joints of three plates.
Figure 1 Three main inter-related factors to encourage HACC in welded structures Traditionally, welding residual stress is produced by three main processes ผิดพลาด! ไมพบแหลงการอางอิง:
1. Residual stress due to shrinkage process 2. Residual stress due to quenching process 3. Residual stress due to phase transformation It was found that the external load or stiffness of the surrounding construction significantly increases both the transverse and longitudinal welding residual stress, as shown in the red line in ผิดพลาด! ไมพบแหลงการอางอิง. As a further point, in real welded components also the interaction between the stresses resulting from welding with further (external) service loads still have to be clarified, also with respect to avoidance of delayed cold cracking within the first periods of service operation ผิดพลาด! ไมพบแหลงการอางอิง-ผิดพลาด! ไมพบแหลงการอางอิง. Such structural stiffness in the vicinity of a joint is providing a shrinkage restraint which significantly influences the thermal-mechanical loads introduced during welding and, in particular, cooling of a specific joint in any component. For better understanding of such structural effect, the principle of considering the stiffness by the total restraint intensity produced in the weld has to be understood firstly.
Figure 2 Schematic illustration of four main factors producing welding residual stress In general, the total restraint intensity produced in the weld is generally dependent on the three main factors, i.e. edge preparation (RFy,1), the plate dimensions (RFy,2) and the surrounding construction or external force (RFy,3). Such three main factors contribute individually to the intensity of restraint and thus, these
three parts have to be evaluated to calculate the total restraint intensity (RFy, total) of a weld by
3,2,1,,
1111
yyyy FFFtotalF RRRR++=
(1)
The shrinkage restraint transversely to a real weld is usually determined ahead of welding and simply represents the spring constant of the material surrounding the joint. It can thus be evaluated by the transverse reaction force Fy related to the respective root gap displacement in both transverse directions 2⋅Δy, normalized by the total weld length lW:
w
yF ly2
FR
y ⋅Δ=
(2)
Figure 3 Schematic illustration relating to the definition of the restraint intensity RFy, total for symmetric joint ผิดพลาด! ไมพบแหลงการอางอิง
Figure 4 Three plates with single V-butt joints and application of external force However, such consideration has been undertaken so far only at one joint for two plates, mostly butt welds, but also fillet welds. But, in the present case of two competing welds, the principle has to be transferred to a three plate joint, as illustrated in Figure 4.
2. Numerical procedure 2.1 Background As this is a continuing approach of the previous investigation at a single V-butt joint, the same shape has been applied to the two competing welds for comparison. ผิดพลาด! ไมพบแหลงการอางอิง, ผิดพลาด! ไมพบแหลงการอางอิง-ผิดพลาด! ไมพบแหลงการอางอิง. The previous results already showed that the experimentally and numerically obtained temperature histories and at the surface of the IRC test plates at a distance of 25 mm

The 2nd Thailand Metallurgy Conference (2 TMETC)
-77-
from the centreline of the weld bead are fairly well consistent. The IRC test has been developed firstly by Hoffmeister ผิดพลาด! ไมพบแหลงการอางอิง in order to measure the reaction forces and moments during welding and subsequent cooling. The test has been extensively applied to avoid cold cracking of linear welds and to investigate the effects of heat input as well as pre- and postheating on the reaction force, and stress build up during cooling after welding of specifically restrained joints. These are the reasons why the IRC test is selected to evaluate cold cracking risk. Moreover, the strain level obtained from Finite Element Modelling (FEM) showed a good agreement with the experiment measuring by using rosette strain gauge located at the bottom and at the distance of 20 mm from the weld centreline. This means that stress distribution build up during welding and subsequent cooling can be evaluated successfully by FEM. As a consequence, the procedure for the single weld can reliably be transferred to the two welds. 2.2 Materials A S 1100 QL steel is considered to be evaluated in this study because such steel represents the maximum yield strength level of the modern high strength steels in this period. The other reason for selecting this material is due to the fact that there is no existing standardization for cold cracking avoidance and welding procedure in welding of such material. This means that it is still challenging task to find the proper welding procedure for such material in particular cold cracking avoidance. The chemical compositions of the base material and filler material are shown in ผิดพลาด! ไมพบแหลงการอางอิง.
Table 1 Chemical compositions of S 1100 QL and Union X96 Material C Si Mn Cr Mo Ni S 1100 QL 0.17 0.27 0.85 0.46 0.45 1.88 Union X96 0.12 0.78 1.86 0.46 0.53 2.36 2.3 Geometry of joints As described previously in the introduction, the restraint intensity of a welded joint is one of the means of evaluating the magnitude of the residual stresses and the susceptibility to weld cracking for mechanical reasons. And, in order to clarify the effects of plate dimension and the stress interaction between them on the restraint intensity and subsequent the residual stress distribution, three plates are being welded with various restraint lengths between them (L2, ผิดพลาด! ไมพบแหลงการอางอิงb), i.e. the restraint length of L=55mm and L=110mm. In order to perform the worst-case assessment, the rigidly clamping forces have been applied at the end of model. Finally, the thermal-mechanical results of welding three-plates have to be compared with that of welding two-plates. The overview of the different dimensions of the single V-butt joints for two and three plates, which have to be modelled, are summarized in ผิดพลาด! ไมพบแหลงการอางอิง.
H = 20 mm L1 = L2 = 55mm, α = 60° (a) Plate dimension for two-welded plates
The 1st calculated case H=20mm L1=L2=L3=55mm α = 60°
The 2nd calculated case H=20mm L1=L3=55mm L2=110mm α = 60°
(b) Plate dimension for three-welded plates Figure 5 Overview of the different dimensions of the model 2.4 Numerical approach 2.4.1 Material properties Most of the welding processes are based on a local heating of manufacturing parts up to melting temperature and then cooling them down. The temperature distribution is highly nonuniform both in spatial co-ordinates and in time. This non uniform heating is a reason for residual stress in a welded component. It can be seen that the stress solution is significantly dependent on a temperature field. And, the another important is that the calculated temperatures (from thermal analysis) are used as body forces for the subsequent thermal-mechanical analyses, the thermo-physical material properties such as density, heat convection coefficient, enthalpy and thermal conductivity will significantly affect the finally calculated stresses and strains. They have thus been selected very carefully from Richter’s diagrams ผิดพลาด! ไมพบแหลงการอางอิง for steel with similar composition than the relatively new S 1100 QL type and have been applied to all microstructures of the joint, i.e. the weld metal, the Heat Affected Zone (HAZ) and the base material. Generally, the thermo-mechanical properties vary significantly with the weld microstructure. For instance, the yield strength and the ultimate tensile strength change drastically, if the steel is austenitized during heating or if the austenite decomposes into a martensitic-bainitic microstructure during cooling. As another point, the percentage of martensite produced between the martensite start and finish temperature range follows a complex function. In this context, the true stress-strain behaviour was determined experimentally for the various simulated weld microstructures ผิดพลาด! ไมพบแหลงการอางอิง-ผิดพลาด! ไมพบแหลงการอางอิง and is shown in ผิดพลาด! ไมพบแหลงการอางอิง. For simplification, the complex microstructure

The 2nd Thailand Metallurgy Conference (2 TMETC)
-78-
0.0E+00
1.0E-01
2.0E-01
3.0E-01
4.0E-01
5.0E-01
6.0E-01
7.0E-01
8.0E-01
0 200 400 600 800 1000 1200 1400Temperature in °C
Spec
ific
heat
0.0E+00
1.0E-02
2.0E-02
3.0E-02
4.0E-02
5.0E-02
6.0E-02
7.0E-02
8.0E-02
Ther
mal
con
duct
ivity
Den
sity
Specific heat (J/g*K)
Thermal conductivity (W/mm*K)
Density (g/mm³)
0.0E+00
5.0E+04
1.0E+05
1.5E+05
2.0E+05
2.5E+05
0 200 400 600 800 1000 1200 1400Temperature in °C
Youn
g's
mod
ulus
0.0E+00
5.0E-06
1.0E-05
1.5E-05
2.0E-05
2.5E-05Th
erm
al e
xpan
sion
Hea
t con
vect
ion
coef
ficie
ntYoung's modulus (N/mm²)
Thermal expansion (1/K)
Heat convection coefficient (W/mm²*K)
0
200
400
600
800
1000
1200
1400
1600
0.00 0.05 0.10 0.15 0.20 0.25Strain
Stre
ss i
n M
Pa
BM 20°CBM 300°CBM 500°CBM 700°CWM 20°CWM 300°CWM 500°CWM 700°C
0
200
400
600
800
1000
1200
1400
1600
0.00 0.05 0.10 0.15 0.20 0.25Strain
Stre
ss in
MPa
CHAZ 20°CCHAZ 300°CCHAZ 500°CCHAZ 700°CFHAZ 20°CFHAZ 300°CFHAZ 500°CFHAZ 700°C
transformation processes were modelled by respective interpolation between the various temperature dependent stress-strain curves and by the temperature dependent thermal expansion coefficients (ผิดพลาด! ไมพบแหลงการอางอิง).
(a) Specific heat, thermal conductivity and density
(b) Young’s modulus, thermal expansion and heat convection coefficient Figure 6 Temperature dependent thermo-physical properties for thermal analysis ผิดพลาด! ไมพบแหลงการอางอิง 2.4.2 Calculation procedure In order to determine the residual stress, indirectly coupled thermal and structural two dimensional analyses are carried out using the nodal results of the non-linear transient thermal calculations as body force for the subsequent non-linear structural elastic-plastic numerical analysis, as represented in ผิดพลาด! ไมพบแหลงการอางอิง. Thermal- stresses can then be calculated at each time increment, and the final state of accumulated residual stresses will be governed by the thermal strain and stress. In order to simulate the heat dissipation into the clamping devices of the IRC Test or similarly, into a surrounding construction, a constant temperature has been assigned to both ends of the model. Heat convection has been modeled at all free surfaces of the joint. As described previously ผิดพลาด! ไมพบแหลงการอางอิง, heat loss by radiation can be neglected for solid materials in contrast to liquids and has thus been ignored in the modeling procedure. 3. Results and Discussion 3.1 Effect of restraint length on the residual stress in three-welded plates
ผิดพลาด! ไมพบแหลงการอางอิง and ผิดพลาด! ไมพบแหลงการอางอิง show transverse residual stress distribution in three-welded plated after cooling down to room temperature for rigidly clamping forces at the both ends of the model with various restraint lengths, i.e. at L2=55 mm and at L2=110 mm, respectively.
(a) Modified values for base material (BM) and for weld metal (WM)
(b) Modified values for coarse and fine grain heat affected zone (CHAZ and FHAZ) Figure 7 true stress-strain behaviour of S 1100 QL steel as thermo-mechanical properties for structural analysis
Figure 8 Flow chart of indirectly coupled thermal and structural two dimensional analyses
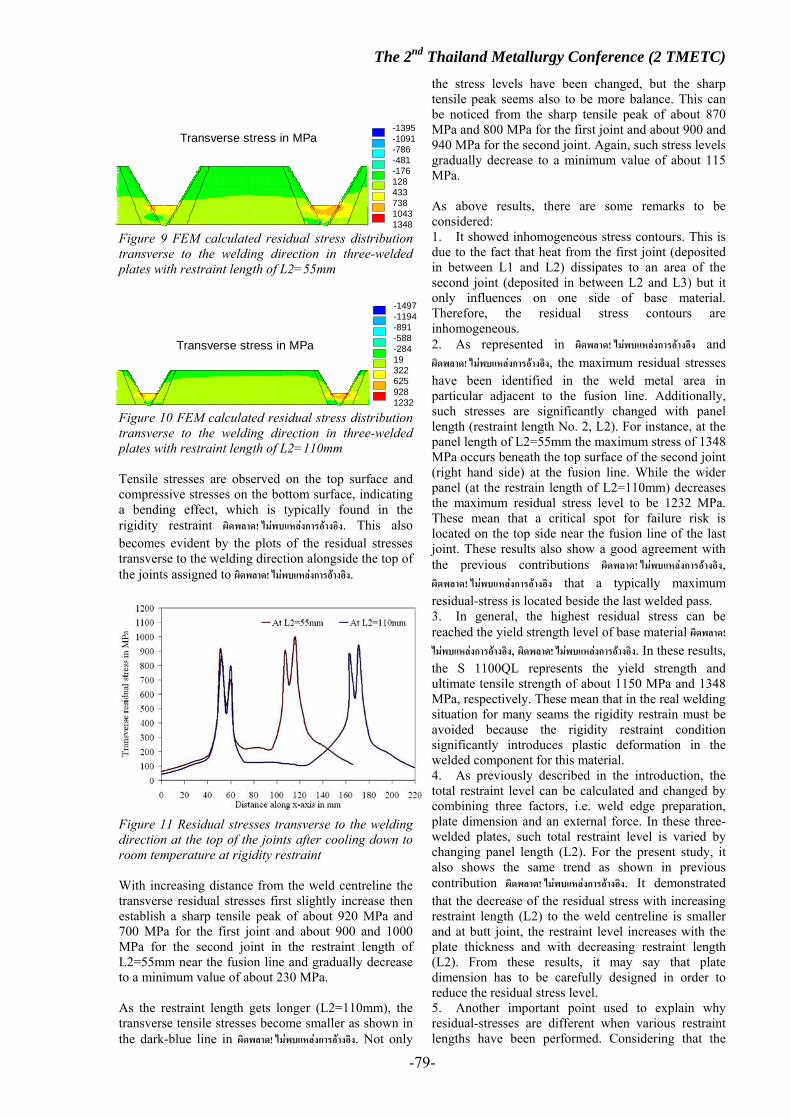
The 2nd Thailand Metallurgy Conference (2 TMETC)
-79-
Figure 9 FEM calculated residual stress distribution transverse to the welding direction in three-welded plates with restraint length of L2=55mm
Figure 10 FEM calculated residual stress distribution transverse to the welding direction in three-welded plates with restraint length of L2=110mm Tensile stresses are observed on the top surface and compressive stresses on the bottom surface, indicating a bending effect, which is typically found in the rigidity restraint ผิดพลาด! ไมพบแหลงการอางอิง. This also becomes evident by the plots of the residual stresses transverse to the welding direction alongside the top of the joints assigned to ผิดพลาด! ไมพบแหลงการอางอิง.
Figure 11 Residual stresses transverse to the welding direction at the top of the joints after cooling down to room temperature at rigidity restraint With increasing distance from the weld centreline the transverse residual stresses first slightly increase then establish a sharp tensile peak of about 920 MPa and 700 MPa for the first joint and about 900 and 1000 MPa for the second joint in the restraint length of L2=55mm near the fusion line and gradually decrease to a minimum value of about 230 MPa. As the restraint length gets longer (L2=110mm), the transverse tensile stresses become smaller as shown in the dark-blue line in ผิดพลาด! ไมพบแหลงการอางอิง. Not only
the stress levels have been changed, but the sharp tensile peak seems also to be more balance. This can be noticed from the sharp tensile peak of about 870 MPa and 800 MPa for the first joint and about 900 and 940 MPa for the second joint. Again, such stress levels gradually decrease to a minimum value of about 115 MPa. As above results, there are some remarks to be considered: 1. It showed inhomogeneous stress contours. This is due to the fact that heat from the first joint (deposited in between L1 and L2) dissipates to an area of the second joint (deposited in between L2 and L3) but it only influences on one side of base material. Therefore, the residual stress contours are inhomogeneous. 2. As represented in ผิดพลาด! ไมพบแหลงการอางอิง and ผิดพลาด! ไมพบแหลงการอางอิง, the maximum residual stresses have been identified in the weld metal area in particular adjacent to the fusion line. Additionally, such stresses are significantly changed with panel length (restraint length No. 2, L2). For instance, at the panel length of L2=55mm the maximum stress of 1348 MPa occurs beneath the top surface of the second joint (right hand side) at the fusion line. While the wider panel (at the restrain length of L2=110mm) decreases the maximum residual stress level to be 1232 MPa. These mean that a critical spot for failure risk is located on the top side near the fusion line of the last joint. These results also show a good agreement with the previous contributions ผิดพลาด! ไมพบแหลงการอางอิง, ผิดพลาด! ไมพบแหลงการอางอิง that a typically maximum residual-stress is located beside the last welded pass. 3. In general, the highest residual stress can be reached the yield strength level of base material ผิดพลาด! ไมพบแหลงการอางอิง, ผิดพลาด! ไมพบแหลงการอางอิง. In these results, the S 1100QL represents the yield strength and ultimate tensile strength of about 1150 MPa and 1348 MPa, respectively. These mean that in the real welding situation for many seams the rigidity restrain must be avoided because the rigidity restraint condition significantly introduces plastic deformation in the welded component for this material. 4. As previously described in the introduction, the total restraint level can be calculated and changed by combining three factors, i.e. weld edge preparation, plate dimension and an external force. In these three-welded plates, such total restraint level is varied by changing panel length (L2). For the present study, it also shows the same trend as shown in previous contribution ผิดพลาด! ไมพบแหลงการอางอิง. It demonstrated that the decrease of the residual stress with increasing restraint length (L2) to the weld centreline is smaller and at butt joint, the restraint level increases with the plate thickness and with decreasing restraint length (L2). From these results, it may say that plate dimension has to be carefully designed in order to reduce the residual stress level. 5. Another important point used to explain why residual-stresses are different when various restraint lengths have been performed. Considering that the
Z BUFFER-1395 -1091 -786 -481 -176 128 433 738 1043 1348
Transverse stress in MPa
Z BUFFER-1497 -1194 -891 -588 -284 19 322 625 928 1232
Transverse stress in MPa

The 2nd Thailand Metallurgy Conference (2 TMETC)
-80-
thermal heat conduction is significantly changing with the plate dimension, this effect can be attributed to the differences in the temperature distribution and therefore to the various influences of phase transformation on the residual stresses of various restraint lengths. 3.2 Welding residual stress in single V-butt joints of two and three-welded plates ผิดพลาด! ไมพบแหลงการอางอิง shows the residual stress contours transverse to the welding direction in two-welded plates after cooling down to room temperature for a rigidly clamped S 1100 QL root joint. Normally, the root is located asymmetrically to the neutral axis of the joint and thus, the stresses increase from compression at the root to tension at the top of the weld. The highest tensile stresses of about 1129 MPa are thus located near the top surface at the fusion line (ผิดพลาด! ไมพบแหลงการอางอิง). Again, residual-stresses at the specific nodes along x-axis beneath the top surface are selected to be plotted as shown in ผิดพลาด! ไมพบแหลงการอางอิง. At the top surface of the joint the values show the typical M-shape curve.
Figure 12 FEM calculated residual stress distribution transverse to the welding direction in two-welded plates for a rigidly clamped S1100 QL root joint
Figure 13 Transverse residual-stress distribution along x-axis in two-welded plates for a rigidly clamped S 1100 QL root joint As shown by comparison of ผิดพลาด! ไมพบแหลงการอางอิง and ผิดพลาด! ไมพบแหลงการอางอิง, the residual-stress distribution
in two-welded plates is more symmetry than that in three-welded plates. The other thing is that the maximum residual-stress in the three-welded plates is higher than that in the two-welded plates. This relies on the fact that the first joint (In three-welded plates) has been welded completely before the last joint is being welded. Therefore, the first joint inhibits movement of the last joint during welding and cooling. It may say that each weld seems to be a stiffener of the other, if there are many seams deposited side by side.
4. Conclusions From the first investigations of the welding residual stresses in two competing single V-butt joints, the following conclusions can be drawn: [1] The highest residual stress level in three-welded plates of single V-butt joints has been identified in the weld metal adjacent to the fusion line as same as in welding of two-welded plates. In contrast to the previously investigated symmetric two plate joint, the residual stress distribution is not homogeneous, in particular because the welds were carried out and were cooling after each other. [2] In order to avoid higher residual stress in more than two-welded plates, the restraint length (L2) should be applied in a distance of more than 110 mm away from a weld, in order to reduce restraint intensity from plate dimension view point (RFy2). However, this effect has to be further studied in order to clarify an appropriate restraint length for the real welding construction. [3] As elucidated by the numerical simulation, the residual stresses in three-welded plates can achieve a much higher level than that in two-welded plates, at the same conditions. This has to be attributed to the fact that the firstly welded plate cannot move freely and that with the second weld an additional temperature field is produced contributing to an additional respective straining and stress build-up in the joint. This is particular the case for the last weld seam, showing the highest stresses. In future, the effects of the time passing between completion of the first joint and starting the next weld on the stress build-up will be investigated. 5. Perspectives The present study is only the beginning of welding procedures for cold cracking avoidance in three-welded plates of S 1100 QL. The further studies have been evaluated as following: [1] In the real situation of welding construction, it is usual to apply a multi-pass welding process. Although, there were many studies reported on weld cracks in multi-pass welds, but it is very difficult to find information concerning detailed mechanical behaviour of multi-pass joints in the entire course of welding. Therefore, a further study has to be evaluated in particular for effects of welding sequences on stress distribution in multi-pass welds of three-welded plates with the same material, dimension and external force applied in this study. [2] Another important point is preparing restraint length (L2) and residual stress level diagram providing
Transverse Stress in MPa
Z BUFFER-261 -106 48 203 357 512 666 821 975 1129

The 2nd Thailand Metallurgy Conference (2 TMETC)
-81-
the data to assess the failure risk of welded construction from the view point of welding design. [3] As shown in the previous results ผิดพลาด! ไมพบแหลงการอางอิง, it is frequently anticipated that a controlled interpass temperature in addition to and without preheating might reduce the residual stresses in multi-layer welds. With respect to practical applications, such assumptions have also to be re-considered regarding the shrinkage restraint. While at without restraint, a controlled interpass temperature and preheating might reduce the residual stresses after cooling to room-temperature in high strength structural steel butt joints, the opposite might be the case, if such multi-layer joints are welded at rigidity restraint corresponding to real welded components. It is still challenging task to evaluate welding procedure in terms of controlled interpass temperature and preheating in multi-pass welds in particular the three-welded plates. [4] Of course, hydrogen is one of major factors for HACC in welded component. Therefore, hydrogen diffusion analysis and hydrogen removal heat treatment procedure have been clarified by using FEM. [5] Finally, all of above targets have been evaluated together in order to determine cold cracking behavior in three-welded plates. 6. Acknowledgement
The author would like to acknowledge Prof. Dr.-Ing. Thomas Boellinghaus, (Vice President of Federal Institute for Materials Research and Testing, Berlin) for the fruitful discussions.
7. References [1] K.-J. Hipp and H. Hoffmeister, “Zur Prüfung von Schweiβverbindungen im instrumentierten Einspannversuch (In German)” , Prüfverfahren zur Beurteilung der Kaltrissanfälligkeit von Stählen, DVS-Bericht 64, DVS, Düsseldorf, 1980, pp. 35-39. [2] ASM Welding Handbook, Vol. 6 [3] Th. Boellinghaus, Th. Kannengiesser and M. Neuhaus, “Effects of the structural restraint intensity on the stress-strain build up in butt joint”, Mathematical Modelling of Weld Phenomena 7, H. Cerjak Edition, IOM, London, pp. 651-669. [4] Th. Kannengiesser, Th. Boellinghaus, W. Florian and H. Herold, “Effect of weld metal strength and welding conditions on reaction forces and stress distribution of restraint component”, Welding in the World, Vol.45, No.1/2, 2001, pp. 18-26. [5] M. A. Wahab, M. S. Alam, M. J. Painter and P. E. Stafford, “Experimental and numerical simulation of restraining forces in gas metal arc welded joints”, Welding Journal, February 2006, pp.35-43s. [6] P. Wongpanya, Th. Boellinghaus and G. Lothongkum, “Effects of hydrogen removal heat treatment on residual stresses in high strength structural steel welds”, Welding in the World, Vol. 50, Special Issue 2006, pp. 96-103. [7] H. Hoffmeister, “Concept and procedure description of the IRC test for assessing hydrogen assisted weld cracking”, Comp. Steel Research, Vol.
57, No.7, 1986, pp. 73-78 and IIW doc. IX-1369-85. [8] F. Richter, “Die Wichtigsten Physikalischen Eigenschaften von 52 Eisenwerkstoffen”, Heft 8, Verlag Stahleisen, Düsseldorf, 1973. [9] P. Zimmer, D. M. Seeger and Th. Boellinghaus, “Hydrogen permeation and related material properties of high strength structural steels”, Proceedings of High Strength Steels for Hydropower Plants, Graz, 5-6 July 2005, paper no. 17. [10] P. Zimmer, Th. Boellinghaus and Th. Kannengiesser, “Effects of hydrogen on weld microstructure and mechanical properties of high strength structural steels S690Q and S1100QL”, IIW doc. II-A-141-04 [11] J. A. Goldak and M. Akhlaghi, “Computational welding mechanics”, Springer Science & Business Media, Inc., ISBN-10: 0-387-23287-7, 2005, pp. 321. [12] Th. Boellinghaus, H. Hoffmeister, “Finite element calculations of pre- and postheating procedures for sufficient hydrogen removal in butt joints”, Mathematical Modelling of Weld Phenomena 3, H. Cerjak Edition, IOM, London, pp. 276-756. [13] C. K. Leung, R. J. Pick and D. H. B. Mok, “Finte element modeling of a single pass weld”, Welding Research Council Bulletin, 356, August 1990, pp.42. [14] N. Bailey, “Weldability of ferritic steels”, ASM International, Abington Publishing, Cambridge, England, ISBN 1-85573-092-8, 1994, pp. 286. [15] P. Wongpanya, Th. Boellinghaus and G. Lothongkum, “Way to reduce the cold cracking risk in high strength structural steel welds”, International Conference of the International Institute of Welding , 25-29 May 2008, Johannesburg, South Africa

The 2nd Thailand Metallurgy Conference (2 TMETC)
-82-

The 2nd Thailand Metallurgy Conference (2 TMETC)
-83-
Mechanical Properties of Beta Titanium Alloys for Biomaterials Pakapa Thiangpak1 Siriporn Rojananan2∗ Surasit Rojananan 3
1Graduate Student, Materials Technology, School of Energy, Environment and Materials 2Asst. Professor, Materials Technology, School of Energy, Environment and Materials
3Lectuerer, Department of Tool and Materials Engineering, Faculty of Engineering King Mongkut’s University of Technology Thornburi, Bangkok. 10140
Tel. 02-4708695 ext. 322, Fax. 02-4708643, ∗E-mail: [email protected]
ABSTRACT – The main objective of this article is to study the mechanical properties of beta titanium alloys Ti-15Mo and Ti-15Mo-5Zr-4Sn for biomaterials. The experimental procedures started with preparing of the nominal composition ingot by the argon arc melting. Later, test on extraction method was used toexamine for toxicity. Samples were heat treated, subsequently, mechanical properties and structures were investigated. The results showed that the Ti-15Mo and Ti-15Mo-5Zr-4Sn alloys were beta phase (β-BCC) at room temperature, non toxic and low modulus. After aging at 600ºC, the tensile strength of the Ti-15Mo-5Zr-4Sn alloy reviewed higher than that the Ti-15Mo alloy. It could be concluded that both alloys could be candidates for biomaterials. KEY WORDS -- Mechanical Properties / Beta Titanium Alloys / Biomaterials / Ti-15Mo Alloy
บทคัดยอ วัตถุประสงคของงานวิจัยนี้ เพื่อศึกษาสมบัติทางกลของโลหะผสมไทเทเนียมเฟสบีตา Ti-15Mo และ Ti-15Mo-
5Zr-4Sn สําหรับงานวัสดุทางการแพทย ในการทดลองเริ่มทดสอบความเปนพิษดวยวิธี Test on Extract หลังจากนั้นทํากรรมวิธีทางความรอนโดยการอบบม ศึกษาสมบัติทางกลและโครงสรางจุลภาค จากผลการทดลองพบวาโลหะ Ti-15Mo และ Ti-15Mo-5Zr-4Sn มีโครงสรางเปนเฟสบีตา (β-BCC) ท่ีอุณหภูมิหอง ไมพบความเปนพิษ คามอดูลัสต่ํา หลังการอบบมท่ี 600 องศาเซลเซียส พบวาคาความตานแรงดึงสูงสุดของโลหะผสม Ti-15Mo-5Zr-4Sn มีคาสูงกวาของโลหะผสม Ti-15Mo จึงสรุปไดวาโลหะผสมทั้งสองชนิดนี้ สามารถใชเปนวัสดุทางการแพทยได คําสําคัญ -- สมบัติทางกล / ไทเทเนียมเฟสบีตา / วัสดุทางการแพทย / โลหะผสมไทเทเนียม-โมลิบดินัม
1. Introduction Commercial pure titanium and titanium alloy Ti-6A14V ELI have basically been developed for structural materials although they are still widely used as representative titanium alloys for implant materials but vanadium exhibits high cytotoxicity and aluminium may induce senile dementia [1]. Therefore, it is required to research and develop new types of titanium alloy which have no reports that they are toxic to human’s tissue. Previously, titanium alloy in the classification of alpha phase (α-HCP) and beta phase (β-BCC) had been used but later it was found that the biocompatibility is not effective enough. As a the result, only beta phase titanium alloy has been developed and it is found that its qualification is good. 2. Experimental procedure TheTi-15Mo and Ti-15Mo-5Zr-4Sn alloys were prepared from pure metals by arc melting. Later, ingots were analyzed for their chemical composition by inductively coupled plasma spectrometry. Toxicity of samples was tested by a test on extract method with ISO 10993-5. After that, samples were cold rolled to reduce the diameter to 2.6 millimeter. Heat treatments of rolled samples were carried on solution treatment (ST) at 825ºC for one hour, then water quenching,
subsequently, aging at 300, 350, 400, 450, 500, 550, and 600ºC for 2 hours. Microstructures were characterized. Hardness and tensile were measured.
3. Experimental Results The chemical analysis result indicates that every component has element quantity similar to required quantity. The toxicity tests result (refer to the testing result report of National Metal and Materials technology Center No. HT 0119/50) found that there are the normal cells as the control unit, therefore they are not toxic. The structures of Ti-15Mo and Ti-15Mo-5Zr-4Sn samples after aging at different temperatures are shown as the figures 1 and 2, respectively. It can be seen that the all structures of the Ti-15Mo and Ti-15Mo-5Zr-4Sn samples after solution treatment at 825ºC (ST825) and subsequent water quenching, reviewed equiaxed grains of the beta phase, which is in agreement with the previous reports [2]. Collings [3] revealed that adding Mo more that 10%weight in pure titanium will lead to beta phase at ambient temperature. The Ti-15Mo alloy was classified as a beta titanium alloy; thus after solution treatment and immediate cooling down, the martensite phase will not occur. It is because the beta transus temperature (Tβ)

The 2nd Thailand Metallurgy Conference (2 TMETC)
-84-
of Ti-15Mo is at 750 ºC [4] while Zr and Sn do not affect the phase transition temperature. The structures of Ti-15Mo after aging at 300-500ºC do not have any obvious transformation. For the structures of Ti-15Mo which had been aged at 550 ºC and 600 ºC are found that there are plates of alpha phase. It can be seen that there are black plates and needles scattering at grain edge and internal grains of beta phase. This result conforms to previous researches [5] which reveal that after aging Ti-15Mo at 600 ºC, alpha phase combined with beta phase has occurred. For the structure of Ti-15Mo-5Zr-4Sn after aging at 500 ºC, the alpha phase firstly occurs the beta phase surface which is affected by Zr and Sn addition. After aging at 550 ºC and 600 ºC, the alpha phase occurs more and more. Hardness of Ti-15Mo and Ti-15Mo-5Zr-4Sn are presented in figure 3. It is noted that the maximum averaged hardness of both alloys are received after aging in the range of temperatures 400-450 ºC. Nag et. al [6] found that Ti-15Mo alloy after aging at 350-450 ºC lead to develop the omega phase that became harder. Due to a small size of omega phase, microstructure observation must study by TEM. The increasing aging temperature results in reducing their hardness. After aging at 600ºC, microhardness reduces to 275 HV due to the alpha and beta phases. Mechanical properties of Ti-15Mo and Ti-15Mo-5Zr-4Sn alloys after aging at 400 and 600 ºC are presented in table 1.
Figure 1 Microstructures of Ti-15Mo alloy after aging.
Figure 2 Microstructures of Ti-15Mo-5Zr-4Sn alloy.
200
300
400
500
600
250 300 350 400 450 500 550 600 650
Aging Temperature (oC)
Har
dnes
s (H
V)
Ti-15Mo
Ti-15Mo-5Zr-4Sn
Figure 3 Hardness and aging temperatures of
Ti alloys.
Table 1 Mechanical property of alloys after aging. Alloys Aging
Temperature (°C)
Tensile strength
(MPa)
Modulus (GPa)
400 658 91 Ti-15Mo
600 968 60 400 998 71 Ti-15Mo-
5Zr-4Sn 600 1202 62
4. Conclusions Mechanical properties of Ti-15Mo and Ti-15Mo-5Zr-4Sn alloys after aging at 600 ºC have tensile strength of 968 and 1202 MPa, and modulus of 60 and 62 GPa, respectively. Both alloys are not toxic. It could be concluded that both alloys could be candidates for biomaterials. 5. Acknowledgements The authors would like to express the financial support of this research by the research fund of King Mongkut’s University of Technology Thornburi 2004, Office of the National Research Council of Thailand and The Shell Centenary Scholarship Fund (TSCSF) 2005, including MTEC for toxicity test.
6. References [1] Smallman, R.E. and Bishop, R.J., 2003, 6th, Modern Physical Metallurgy and Materials Engineering, Butterworth-Heinemann, Oxford. [2] Weiss, I. and Semiatin, S.L., 1998, “Thermomechanical processing of beta titanium alloys-an overview”, Materials Science and Engineering A, No. 243, pp. 46-65. [3] Collings, E.W., 1994, Materials Properties Handbook: Titanium Alloys, ASM, Materials Park, USA, p. 1. [4] Lütjering, G., and Williams, J.C., 2003, Titanium, Springer, Germany. [5] Guo, H. and Enomoto, M., 2006, “Surface reconstruction associated with a precipitation in a Ti–Mo alloy”, Scripta Materialia, No. 54, pp. 1409-413. [6] Nag, S., Banerjee, S. and Fraser, H.L., 2005, “Microstructural evolution and strengthening mechanism in Ti-Nb-Zr-Ta, Ti-Mo-Zr-Fe and Ti-5Mo biocompatible alloys”, Materials Science and Engineering C, No. 25, pp. 357-362.
(a) STA550
(a) STA550 (b) STA600
(b) STA600

The 2nd Thailand Metallurgy Conference (2 TMETC)
-85-
Effects of Surface Pretreatment in Hot-Dip Galvanizing Process Yuttanant Boonyongmaneerat1,*, Kanokwan Saengkiettiyut1, Charttanong Angkaprasert2,
Pranee Rattanawaleedirojn1, Nutthita Chuankrerkkul1, Jumpot Wanichsampan1, Sawalee Saenapitak1, Adisak Thueploy1, Run Sa-nguan-moo3
Affiliation: 1. Metallurgy and Materials Science Research Institute, Chulalongkorn University 2. Department of Materials Engineering, Kasetsart University
3. Department of Metallurgical Engineering, Chulalongkorn University *Tel.02-218-4243 Fax.02-611-7586. E-mail:[email protected]
ABSTRACT – The influence of steels’ surface pretreatment in the hot-dip galvanizing process, including acid pickling and fluxing, on microstructures and properties of zinc-coated low carbon steels is investigated. Effective pickling and fluxing conditions are found essential to ensure good adhesion between the coatings and substrates. Furthermore, fluxing also appears to influence the evolution of iron-zinc intermetallic layers. Ammonium-containing flux can generally provides coatings with decent corrosion and mechanical properties, while nickel-containing flux facilitates the formation of relatively thin zinc coatings. KEY WORDS -- hot-dip galvanizing; low-carbon steel; corrosion; pretreatment
บทคัดยอ งานวิจัยไดศึกษาถึงอิทธิพลของการเตรียมผิวเหล็กคารบอนต่ํา ซึ่งประกอบดวยการทําความสะอาดชิ้นงานดวยกรดและ การเคลือบผิวดวยฟลักซ ท่ีมีตอการเคลือบเหล็กดวยสังกะสีโดยวิธีจุมรอน การเตรียมผิวชิ้นงานที่มีประสิทธิภาพจะสงผลให ชั้นเคลือบมีสมบัติการยึดเกาะที่ดี อีกท้ังยังพบวาฟลักซสามารถมีอิทธิพลตอการเกิดของชั้น Intermetallic ในชั้นเคลือบสังกะสี เหล็กชุบสังกะสีท่ีเตรียมโดยฟลักซท่ีมีสวนผสมของแอมโมเนียมมีสมบัติเชิงกลและความตานทานตอการกัดกรอนที่ดี ในขณะที่วัสดุท่ีเตรียมโดยฟลักซท่ีประกอบดวยนิกเกิลจะมีชั้นเคลือบที่มีความบาง คําสําคัญ -- เคลือบสังกะสี เหล็กคารบอนต่ํา การกัดกรอน การเตรียมผิว 1. Introduction Due to its superior barrier and cathodic protecting abilities, zinc is commonly used as a coating for steels [1-3]. With zinc at the surface, steels can be well-prevented from corrosion and mechanical damages. One of the typical methods to apply zinc on steels’ surfaces is the hot-dip galvanizing process, whereby steel articles are immersed into a molten zinc bath for certain period of time [4-5]. When zinc coating is solidified, an outer zinc layer and inner iron-zinc intermetallic layers of the coating can be obtained [6-7]. The crucial process that determines the coating quality and microstructure of the materials, which in turn control the properties of galvanized steels, is pretreatment of steels prior to hot dipping. The process includes degreasing, acid pickling and fluxing steps. In this study, we systematically investigate the influence of pickling and fluxing conditions on galvanizing, corresponding microstructure and properties of coated steels. The knowledge gained from the study would contribute to effective and economical fabrications of galvanized steels of desired properties. 2. Experimental procedures Non-reactive low carbon steel specimens (C=0.03%) cut to the size of 70x20x0.4 mm were used in the study. The steel coupons were degreased in NaOH at
60oC and then subjected to various acid pickling and fluxing conditions, according to Table I. The pickling step was performed for 20 minutes. Subsequently, the specimens were dipped in the flux solutions having approximate density of 1.1g/cm3 and oven-dried at 110oC. Table 1. Acid Pickling and Fluxing Conditions
Set HCl Concentration [%] Type of Flux
1 8 ZnCl2.3NH4Cl2 14 "3 18 "4 14 ZnCl2.2NH4Cl5 " ZnCl2.4NH4Cl6 " NiCl2.3NH4Cl7 " NiCl28 " (ZnCl2.NiCl2).3NH4Cl
Following the pretreatment step, the specimens were hot-dipped in a molten zinc bath set to 450oC. The immersion time varied between 10 seconds to 6 minutes, upon which the samples were quenched in water. To assess the corrosion behaviors, the specimens were subsequently subjected to a salt spray test using 5%NaCl solutions. Furthermore, mechanical properties of the materials are investigated with T-bending, and micro-indentation (25g load). The microstructure and chemistry of the materials are analyzed using a

The 2nd Thailand Metallurgy Conference (2 TMETC)
-86-
scanning electron microscope equipped with energy dispersive spectroscopy. 3. Results & Discussion The molten zinc appeared to wet and coat the specimens properly in all cases examined. In comparison, a controlled specimen that was not treated with flux exhibited non-uniform zinc coating and un-coated areas. Fig.1 illustrates a typical microstructure that was observed in the galvanized steels specimens. The microstructure is composed of a steel layer, Fe-Zn intermetallic layers, and a pure zinc layer at the surface.
Figure 1. Microstructure of galvanized steels composing of Fe-Zn intermetallic compound layers and pure Zn at the outer layer (Set 6, 3-minute hot-dipping).
While the coating structure appears generally the same, the thickness of the individual coating layer, especially the Fe-Zn intermetallic compound layers, are distinct from one set to another when different types of flux were employed. The most notable are specimens of set 7 with relatively thin intermetallic and pure zinc layers. This may be attributed to the influence of Ni in the flux that hinders the reaction between Fe and Zn. With longer dipping time, increasing of the intermetallic compounds’ layer thickness was observed in all cases.
0
10
20
30
40
50
60
70
80
90
1 2 3 4 5 6 7 8Specimen Sets
Ave
rage
Thi
ckne
ss (m
icro
n)
Zinc LayerAlloy Layer
Figure 2. The thickness of the Fe-Zn intermetallic compound and metallic Zn layers of the galvanized specimens hot-dipped for 3 minutes As the specimens were subjected to salt spray test, white rust of zinc oxide appeared on the surface of all specimens within 24 hours of testing. Passing the 200th hour mark, no specimens exhibited a clear sign of red rust’s formation, indicating that the thickness
and integrity of the coating layer are well-adequate for preventing the steels from corrosion. At 300th hour, iron oxides started to generate on the specimens that were galvanized for 3 minutes. Figure 3 compares a bare steel with a galvanized specimen of set 7 (3 minutes hot-dipping) experienced the salt spray condition for ~300 hours. Excellent corrosion protection needs to be coupled with good mechanical performance . The T-bend testing revealed that the coatings of the specimens in set 1 poorly adhered to the steel substrates, in agreement with the observation of pores and microcracks along the steel/intermetallic interface. This indicates that inadequate acid pickling, i.e., 20 mins in the 8%HCl solution in this case, would lead to non-thorough removal of surface oxides, imperfection of the coating interface, and ultimately delamination of Zn coatings. The micro-indentation test shows that the outer Zn coating layer has hardness of 0.4 GPa, while the intermetallic compound layers are significantly stronger with hardness between 1.5-3 GPa. The exception to this is found in the specimens of set 7, whose thin intermetallic layers exhibit relatively low hardness of 0.7 GPa.
Figure 3. Appearance of an un-coated steel (left) and galvanized steel specimen (Set7, 3-minute hot-dipping) following salt-spray testing for ~300 hours. 4. Conclusions The study has provided an insight into the relationship between the pretreatment conditions in the galvanizing process to the structures, corrosion properties, and mechanical properties of Zn-coated steels. Sufficient acid pickling is found necessary for achieving uniform reactions between Fe and Zn, while flux solutions also appear to play a role in the evolution of the Fe-Zn intermetallic compound layers of the coatings. With the knowledge of how fluxing contributes to the thickness and microstructure of the materials, galvanized steels of desired corrosion-resistance and mechanical integrity can thus be designed. 5. Acknowledgement This work is supported by the Iron and Steel Institute of Thailand under contract คก.026/2551. The authors also gratefully acknowledge Assoc. Prof. Satian Niltawach and Asst. Prof. Ekasit Nisaratanaporn for their guidance and encouragement, and Bangkok Nail&Wire Co., Ltd. and Thai Cold Rolled Steel Sheet Public Co., Ltd. for materials used in the study.
Steel
Fe-Zn Intermetallic
Zn

The 2nd Thailand Metallurgy Conference (2 TMETC)
-87-
6. References [1] K. Saber et al., “Pulse current electrodeposition of nanocrystalline zinc,” Materials Science &Engineering A, 341, 2003, pp.174-181. [2] G. Vourlias et al., “A comparative study of the structure and the corrosion behavior of zinc coatings deposited with various methods,” Surface & Coatings Technology, 200, 2006, pp. 6594-6600. [3] H.C. Shih et al., “The lifetime assessment of hot-dip 5% Al-Zn coatings in chloride environments,” Surface and Coatings Technology, 150, 2002, pp.70-75. [4] J.B. Nasr et al., “Optimization of hot-dip galvanizing process of reactive steels,” Materials Letters, 62, 2008, pp.3328-30. [5] Y. De Abreu et al., “Study of zinc coatings on steel substrate attained by two different techniques,” Surface and Coatings Technology, 120-121, 1999, pp.682-6. [6] A.R. Marder, “The metallurgy of zinc-coated steel,” Progress in Materials Science, 45, 2000, pp.191-271. [7] S.A Eliot, “Method for metallographically revealing intermetallic formation at Galfan/steel interfaces,” Materials Characterization, 30, 1993, 295-7.

The 2nd Thailand Metallurgy Conference (2 TMETC)
-88-
Extraction of Mechanical Properties of DLC Films: A Finite Element Analysis
N. Panich1, P. Wangyao2, N. Vattanaprateep 1, P. Visuttipitukul2, P. Sricharoenchai2 1 Center of Innovative Nanotechnology, Chulalongkorn University, Thailand
2Department of Metallurgical Engineering, Faculty of Engineering, Chulalongkorn University, Thailand
ABSTRACT – This paper introduces the usage of Finite Element Analysis (FEA) method to determine the mechanical properties of the coated film. Two dimensional FEA model can simulate the loading-unloading curves. The model was simulated to investigate the extraction of the intrinsic mechanical properties from tetrahedral amorphous carbon - a diamond like carbon films (DLC), by matching the load-displacement curve of simulation model and experimental data, known as ‘best fit method’ in order to find out the actual properties of the thin DLC films. KEY WORDS -- DLC films, finite element analysis, mechanical properties.
บทคัดยอ - ในงานวิจัยนี้ไดมีการพัฒนาแบบจําลองแบบ 2 มิติเพื่อศึกษาการอินเดนเตชันในระดับนาโนเมตรของ ฟลม
DLC ดวยวิธีไฟไนตเอลิเมนต การพัฒนาแบบจําลองนี้ ทําใหสามารถจําลองกราฟโหลดดิงและอันโหลดดิง และนําผลการคํานวณของแบบจําลองไปเปรียบเทียบกับผลการทดลองจริงจะเห็นไดวาผลลัพทกราฟโหลดดิงและอันโหลดดิง มีความใกลเคียง กันมากและสงผลทําใหแบบจําลองที่พัฒนานี้มีความนาเชื่อถืออีกดวย
คําสําคัญ -- วิธีไฟไนตเอลิเมนต, นาโนอินเดนเตชัน,โมดูลัสของความยืดหยุน 1. Introduction Finite element technique is applied to study the complex stress-strain field of thin film or bulk materials in a nano-indentation process. Different numerical approaches have been developed by many investigators and are used in many indentation problems [1, 2] . The earliest FEM work was that from Stanford University by Bhattachaya and Nix [3], who had utilized the finite element (FE) technique with an axsymmetric conical indenter in the two-dimensional (2-D) model to solve the indentation problem. The cone shape is confined to hold equal volume as a pyramid-shaped indenter for a given depth. The FE hardness results corresponded with the experimental data. Additionally, they presented an elastoplastic analysis of axisymmetric conical indenter and demonstrated that the shape of the plastic zone was strongly dependable on the indentation angle and they were namely Young’s modulus and yield stress. Similarly, in another research study, Panich and Sun. [4] had also developed an axisymmetric FE model to simulate the indentation of a coating-substrate system by utilizing a conical indenter which was shaped to hold similar projected area of the Berkovich indenter as a function of the indentation depth Generally, FEM has been applied to indentation measurements as a tool in understanding the indentation process or improving the analytical method used to extract mechanical properties from the data. FEM enables the mechanical properties of complex samples to be measured when the conventional analytical treatments fail to perform.
2. Experimental procedures The conical rigid indenter, which has similar projected area-depth functions as the standard Berkovich, is also used to define an axisymmetric model with a semi- angle of 70.3o. The use of a conical indenter simplifies the analysis to a two dimension (2-D) axisymmetric problem. Accordingly, from the simulated model, the indentation process was modeled with the FE mesh as shown in Fig. 1 (a). A total of 19,965 four-node axisymmetric reduced integration elements (CAX4R element type) [5] was used to model the coated film and a very fine mesh was used in the coating and the substrate adjacent to the contact zone. The mesh was continuously coarsened further away from the contact area (Fig. 1 (b)).
Figure 1. (a) The FE mesh and boundary conditions (b) Details of the mesh in the region near the tip of the indenter during the loading stage for the coated thin film system.
Subsequently, one corresponded to the coating and the other corresponded to the substrate and was used to

The 2nd Thailand Metallurgy Conference (2 TMETC)
-89-
define the elastic and plastic properties of the coating and the substrate materials separately. To distinguish the contact association between the coating surface and the rigid indenter, the contact constraint is defined by selecting the indenter as the master surface and the coating surface as the slave surface. Notably, as mentioned, only the master surface can penetrate into the slave surface and the contact or separation process between the master surface and slave surface nodal points is automatically detected and monitored in the program. 3. Results & Discussion After running the FEA model, the Load-displacement curves of the simulation model can be plotted. Then calculated load-displacement curves with different properties were plotted and compared with the experimental curve (see Models (1) to (10) in Figure 2.) The true hardness, the calculated hardness and effective modulus of the simulated models were also retrieved by applying the famous Oliver & Pharr method [6] shown in Table 1. Table 1. Calculated effective modulus and calculated hardness of DLC coated film
Model No.
Indentation depth (nm)
Calculated Effective Modulus
(GPa)
Calculated hardness
(GPa)
1 70 368.78 19.81 2 70 372.65 21.21 3 70 374.76 22.55 4 70 297.88 23.71 5 70 292.26 26.69 6 70 298.07 27.83 7 70 267.20 28.39 8 70 253.99 34.36 9 70 256.02 34.68
10 70 261.02 35.31 From Figure 2, it shows that Model no.9 illustrated the best fit of the FE curve to the experimental curve. Hence, it could be assumed that the mechanical properties of this DLC coating are: Young’s modulus is 227GPa and yield strength is 13.5GPa, respectively. To further support that this curve fit result is accurate, the below findings are elaborated. The FEA calculated hardness obtained is 34.68 GPa for Model no.9. These hardness results which are consistent with the hardness result obtained from DLC film was tested from the nano-indentation machine with approximately around 36 GPa [7]. From the experiment, it seems that the calculated by FE shows a result similar to the experimental one.
Figure 2. Comparison of the load-displacement curves between experimental and FEM results to find the best fit of both curves. Figure 3 shows the FEA indenter tip of the indentation process at maximum load stage onto the DLC coated film. At Point A (Figure 3), the hardness result obtained is 26.91GPa and at Point B (Figure 3), the hardness result obtained is 34.68GPa. The hardness result that is obtained from the nano-indentation machine is based on the undeformable indenter tip and this attributes to the reason why the hardness value is higher. Nevertheless the true hardness should be in

The 2nd Thailand Metallurgy Conference (2 TMETC)
-90-
between 26.91 and 34.68 GPa since the real indenter tip will be deformed and the contact with the DLC coated film would be during Point A and Point B.
Figure 3. Maximum loading of the real indenter tip onto the DLC coated film. 4. Conclusions From the above discussion, it is comprehensible that with the utilization of the FE technique, the coating properties such as hardness and modulus could be derived, particularly the yield strength, which could not be extracted from experimental nano-indentation. 5. Acknowledgement Authors would like to thanks Prof. Chen Zhong and Mr.Tan Yong Kwang from School of Material Sciences and Engineering, Nanyang Technological University, Singapore, for the FEA technical assistance. 6. References [1] Y.Sun, T.Bell and S.Zheng, “Finite element analysis of the critical ratio of coating thickness to indentation depth for coating property measurement by nanoindentation” Thin Solid Film, 258, 1995. pp.198-204. [2]A.Bolshakov, W.C.Oliver and G.M. Pharr, “Influences of stress on the measurement of mechanical properties using nanoindentation: Part II. Finite element simulations”, Journal of Materials Research, Vol.11, 1996. pp.760-768. [4] A. K. Bhattacharya and W. D. Nix, “Analysis of elastic and plastic deformation associated with indentation testing of thin films on substrates,” Int. J. Solids Struct., Vol.24, No.12, 1988. pp. 1287-1298. [4] N. Panich and Y. Sun, “Effect of Penetration Depth on Indentation Response of Soft Coatings on Hard Substrates: A Finite Element Analysis”, Surface and Coatings Technology, Vol.182, 2004. pp. 342-350. [5] Hibbitt, Karlsson and Sorensen, Inc., ABAQUS, Version 6.4, User’s Manual, Pawtucket, RI, 2003. [6] W. C. Oliver and G. M. Pharr, “An improved technique for determining hardness and elastic modulus using load and displacement sensing indentation experiments”, Journal of Materials Research, Vol. 7, 1992. pp. 1564-1583. [7] Y.B. Zhang, S.P. Lau, D. Sheeja and B.K. Tay, “Study of mechanical properties and stress of tetrahedral amorphous carbon films prepared by pulse
biasing”, Surface and Coatings Technology, Vol. 195, Issues 2-3, 2005. pp. 338-343.
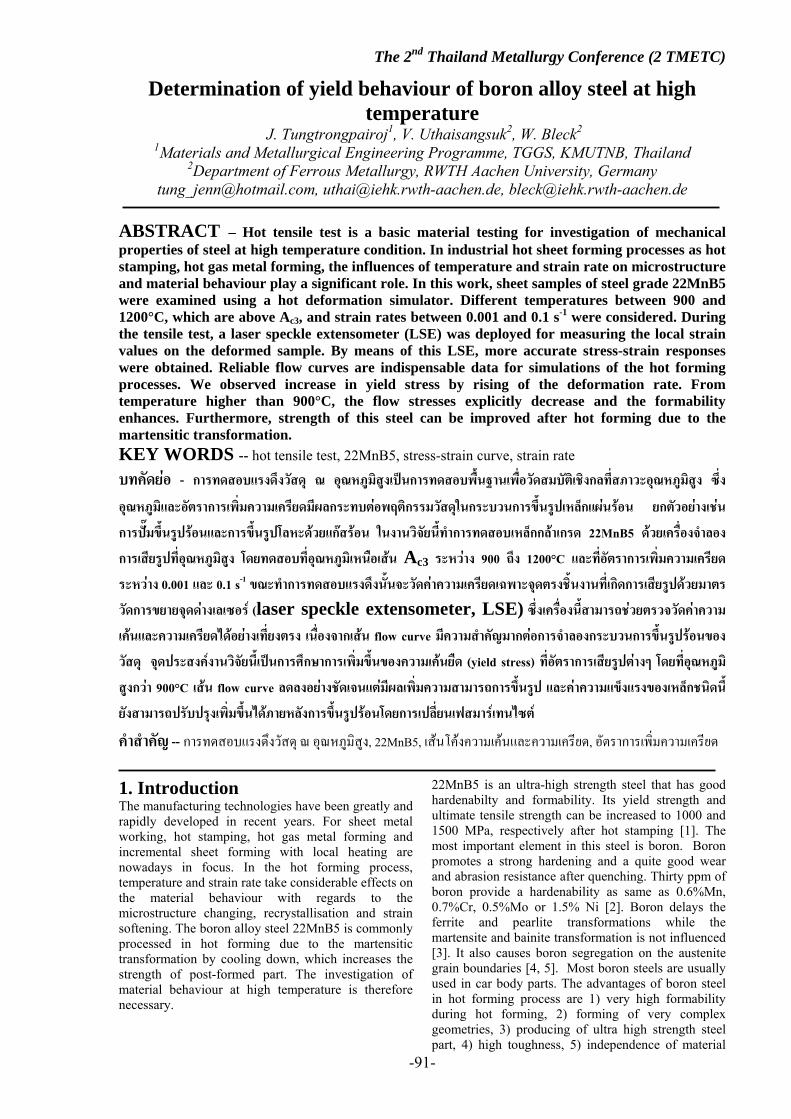
The 2nd Thailand Metallurgy Conference (2 TMETC)
-91-
Determination of yield behaviour of boron alloy steel at high temperature
J. Tungtrongpairoj1, V. Uthaisangsuk2, W. Bleck2 1Materials and Metallurgical Engineering Programme, TGGS, KMUTNB, Thailand
2Department of Ferrous Metallurgy, RWTH Aachen University, Germany [email protected], [email protected], [email protected]
ABSTRACT – Hot tensile test is a basic material testing for investigation of mechanical properties of steel at high temperature condition. In industrial hot sheet forming processes as hot stamping, hot gas metal forming, the influences of temperature and strain rate on microstructure and material behaviour play a significant role. In this work, sheet samples of steel grade 22MnB5 were examined using a hot deformation simulator. Different temperatures between 900 and 1200°C, which are above Ac3, and strain rates between 0.001 and 0.1 s-1 were considered. During the tensile test, a laser speckle extensometer (LSE) was deployed for measuring the local strain values on the deformed sample. By means of this LSE, more accurate stress-strain responses were obtained. Reliable flow curves are indispensable data for simulations of the hot forming processes. We observed increase in yield stress by rising of the deformation rate. From temperature higher than 900°C, the flow stresses explicitly decrease and the formability enhances. Furthermore, strength of this steel can be improved after hot forming due to the martensitic transformation. KEY WORDS -- hot tensile test, 22MnB5, stress-strain curve, strain rate
บทคัดยอ - การทดสอบแรงดึงวัสดุ ณ อุณหภูมิสูงเปนการทดสอบพื้นฐานเพื่อวัดสมบัติเชิงกลที่สภาวะอุณหภูมิสูง ซึ่งอุณหภูมิและอัตราการเพิ่มความเครียดมีผลกระทบตอพฤติกรรมวัสดุในกระบวนการขึ้นรูปเหล็กแผนรอน ยกตัวอยางเชนการปมขึ้นรูปรอนและการขึ้นรูปโลหะดวยแกสรอน ในงานวิจัยนี้ทําการทดสอบเหล็กกลาเกรด 22MnB5 ดวยเคร่ืองจําลองการเสียรูปท่ีอุณหภูมิสูง โดยทดสอบที่อุณหภูมิเหนือเสน Ac3 ระหวาง 900 ถึง 1200°C และท่ีอัตราการเพิ่มความเครียดระหวาง 0.001 และ 0.1 s-1 ขณะทําการทดสอบแรงดึงนั้นจะวัดคาความเครียดเฉพาะจุดตรงชิ้นงานที่เกิดการเสียรูปดวยมาตรวัดการขยายจุดดางเลเซอร (laser speckle extensometer, LSE) ซึ่งเครื่องนี้สามารถชวยตรวจวัดคาความเคนและความเครียดไดอยางเที่ยงตรง เนื่องจากเสน flow curve มีความสําคัญมากตอการจําลองกระบวนการขึ้นรูปรอนของวัสดุ จุดประสงคงานวิจัยนี้เปนการศึกษาการเพิ่มขึ้นของความเคนยืด (yield stress) ท่ีอัตราการเสียรูปตางๆ โดยที่อุณหภูมิสูงกวา 900°C เสน flow curve ลดลงอยางชัดเจนแตมีผลเพ่ิมความสามารถการขึ้นรูป และคาความแข็งแรงของเหล็กชนิดนี้ยังสามารถปรับปรุงเพิ่มขึ้นไดภายหลังการขึ้นรูปรอนโดยการเปลี่ยนเฟสมารเทนไซต คําสําคัญ -- การทดสอบแรงดึงวัสดุ ณ อุณหภูมิสูง, 22MnB5, เสนโคงความเคนและความเครียด, อัตราการเพิ่มความเครียด 1. Introduction The manufacturing technologies have been greatly and rapidly developed in recent years. For sheet metal working, hot stamping, hot gas metal forming and incremental sheet forming with local heating are nowadays in focus. In the hot forming process, temperature and strain rate take considerable effects on the material behaviour with regards to the microstructure changing, recrystallisation and strain softening. The boron alloy steel 22MnB5 is commonly processed in hot forming due to the martensitic transformation by cooling down, which increases the strength of post-formed part. The investigation of material behaviour at high temperature is therefore necessary.
22MnB5 is an ultra-high strength steel that has good hardenabilty and formability. Its yield strength and ultimate tensile strength can be increased to 1000 and 1500 MPa, respectively after hot stamping [1]. The most important element in this steel is boron. Boron promotes a strong hardening and a quite good wear and abrasion resistance after quenching. Thirty ppm of boron provide a hardenability as same as 0.6%Mn, 0.7%Cr, 0.5%Mo or 1.5% Ni [2]. Boron delays the ferrite and pearlite transformations while the martensite and bainite transformation is not influenced [3]. It also causes boron segregation on the austenite grain boundaries [4, 5]. Most boron steels are usually used in car body parts. The advantages of boron steel in hot forming process are 1) very high formability during hot forming, 2) forming of very complex geometries, 3) producing of ultra high strength steel part, 4) high toughness, 5) independence of material
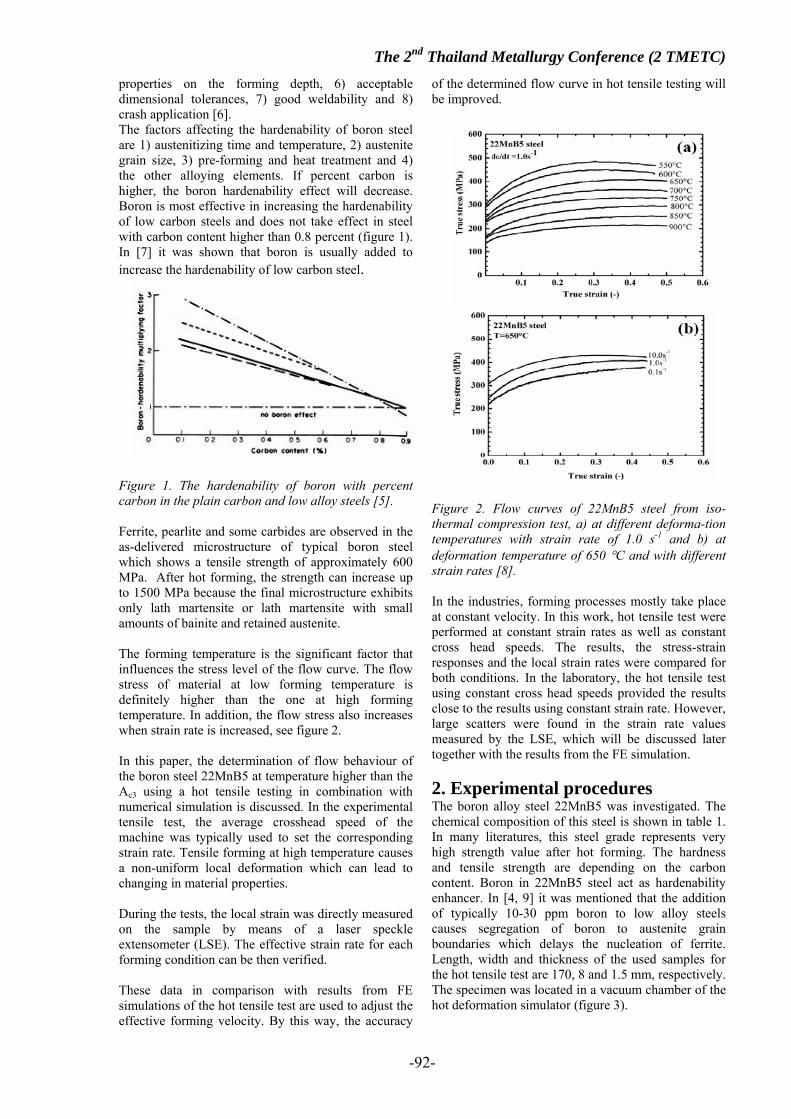
The 2nd Thailand Metallurgy Conference (2 TMETC)
-92-
properties on the forming depth, 6) acceptable dimensional tolerances, 7) good weldability and 8) crash application [6]. The factors affecting the hardenability of boron steel are 1) austenitizing time and temperature, 2) austenite grain size, 3) pre-forming and heat treatment and 4) the other alloying elements. If percent carbon is higher, the boron hardenability effect will decrease. Boron is most effective in increasing the hardenability of low carbon steels and does not take effect in steel with carbon content higher than 0.8 percent (figure 1). In [7] it was shown that boron is usually added to increase the hardenability of low carbon steel.
Figure 1. The hardenability of boron with percent carbon in the plain carbon and low alloy steels [5]. Ferrite, pearlite and some carbides are observed in the as-delivered microstructure of typical boron steel which shows a tensile strength of approximately 600 MPa. After hot forming, the strength can increase up to 1500 MPa because the final microstructure exhibits only lath martensite or lath martensite with small amounts of bainite and retained austenite. The forming temperature is the significant factor that influences the stress level of the flow curve. The flow stress of material at low forming temperature is definitely higher than the one at high forming temperature. In addition, the flow stress also increases when strain rate is increased, see figure 2. In this paper, the determination of flow behaviour of the boron steel 22MnB5 at temperature higher than the Ac3 using a hot tensile testing in combination with numerical simulation is discussed. In the experimental tensile test, the average crosshead speed of the machine was typically used to set the corresponding strain rate. Tensile forming at high temperature causes a non-uniform local deformation which can lead to changing in material properties. During the tests, the local strain was directly measured on the sample by means of a laser speckle extensometer (LSE). The effective strain rate for each forming condition can be then verified. These data in comparison with results from FE simulations of the hot tensile test are used to adjust the effective forming velocity. By this way, the accuracy
of the determined flow curve in hot tensile testing will be improved.
Figure 2. Flow curves of 22MnB5 steel from iso-thermal compression test, a) at different deforma-tion temperatures with strain rate of 1.0 s-1 and b) at deformation temperature of 650 °C and with different strain rates [8]. In the industries, forming processes mostly take place at constant velocity. In this work, hot tensile test were performed at constant strain rates as well as constant cross head speeds. The results, the stress-strain responses and the local strain rates were compared for both conditions. In the laboratory, the hot tensile test using constant cross head speeds provided the results close to the results using constant strain rate. However, large scatters were found in the strain rate values measured by the LSE, which will be discussed later together with the results from the FE simulation. 2. Experimental procedures The boron alloy steel 22MnB5 was investigated. The chemical composition of this steel is shown in table 1. In many literatures, this steel grade represents very high strength value after hot forming. The hardness and tensile strength are depending on the carbon content. Boron in 22MnB5 steel act as hardenability enhancer. In [4, 9] it was mentioned that the addition of typically 10-30 ppm boron to low alloy steels causes segregation of boron to austenite grain boundaries which delays the nucleation of ferrite. Length, width and thickness of the used samples for the hot tensile test are 170, 8 and 1.5 mm, respectively. The specimen was located in a vacuum chamber of the hot deformation simulator (figure 3).

The 2nd Thailand Metallurgy Conference (2 TMETC)
-93-
Table 1. Chemical composition of investigated material (values in weight %) [10]
C Si Mn Ni Cr P
0.226 0.269 1.200 - - 0.013
S N Al Nb Ti B
22MnB5
0.003 0.006 0.029 0.001 0.039 0.0035
Thermocouples were welded in the middle of the sample in order to measure and control the temperature. The induction coil was used to heat the sample. At the beginning of the experiments, argon or helium gas was blown into the chamber. The specimen was heated up with a heating rate of 6 K/s and pulled by machine then cooled down with a cooling rate around 10 K/s by air. In this paper, some specimens were only heated (6 K/s) and fast cooled down (200 K/s) by inert gas such as helium and argon for observing the grain size and microstructure before deformation at different test temperature. The LSE was applied to identify the local strain values on the deformed samples. The LSE consists of two lasers and two cameras. These two lasers project beams to the rough surface of specimen. To measure the displacement of the surface, the movement of the speckle pattern was traced.
Figure 3. Hot deformation simulator and the LSE ABAQUS was used to simulate the hot tensile test in this work. The plastic true stress-strain data from the experiment is most important input data for the FE simulations. The other required material parameters are i.e. the density, heat transfer coefficient, heat conductivity. Furthermore, the total simulation time corresponding to the cross head speeds of the machine were given in order to regulate the strain rate. In this work, a one-eighth of the tensile specimen was modelled because of the symmetry condition. This could reduce the calculation time. However, during the result evaluation force values must be multiplied by four and displacement values by two due to the simplification. The results after the numerical necking of the sample could not be correctly predicted. Therefore, the experimental and calculated curve can be compared until this point. In experimental tensile test at high temperature, the overall tensile rate was controlled only by the cross head-speed of the machine. In the FEM simulation, an
averaged tensile rate was firstly identified. This average values were used as correction factor to set the simulation times which are in accordance with the investigated crosshead-speeds. By this way, the effect of the inhomogeneous distribution of temperature and the non-uniform local strain rate in the heat-affected zone of the sample were taken into account. The simulations were performed under the condition as in isothermal high temperature tensile test. It means that the temperature on the sample was kept to be constant during the forming step. 3. Results & Discussion During the hot tensile test, the forces and the local strains were recorded. Using these data, engineering stress-strain curves were evaluated, which represent the important mechanical values such as the yield strength, ultimate tensile strength, uniform elongation and elongation at fracture. The plastic true stress-strain curve or the flow curves were also evaluated to apply in the simulation. 3.1 The flow behaviour The investigated steel 22MnB5 exhibits identical strain hardening rate at different temperatures as illustrated in the engineering stress-strain diagrams for a tested strain rate of 0.01s-1 in figure 4. The flow stress as well as formability of material at temperature higher than 900°C explicitly decreases.
0
20
40
60
80
100
0 0.1 0.2 0.3 0.4 0.5Strain (-)
Stre
ss (
MPa
)
900C
1000C
1100C
1200C
22MnB5, strain rate 0.01
Figure 4. Engineering stress-strain curves at the strain rate of 0.01 s-1for different temperatures As mentioned, when temperature increases, strength of material become lower. In contrast, strength increases when rate of deformation rises, as shown in figure 4. As a result, the tensile strength at 1200°C is 60 MPa less than the tensile strength at 900 °C. In figure 5, the tensile strength for temperature of 1000°C at 0.01 s-1 is 40 MPa less than the one at 0.1 s-1. Additional experiments without forming were carried out to investigate the final microstructure. Samples were austenitized at different temperature and then cooled down with the cooling rate that is faster than used in the hot tensile test. The resulted microstructures mainly contain fine martensite lath-link with some retained austenite, figure 6. Figure 7 presents the microstructures near to the fracture areas of the samples where strain localisation occurred after hot tensile straining. Martensite was also observed in the most area. The influence of 0.003% boron delays the ferrite-pearlite transformation
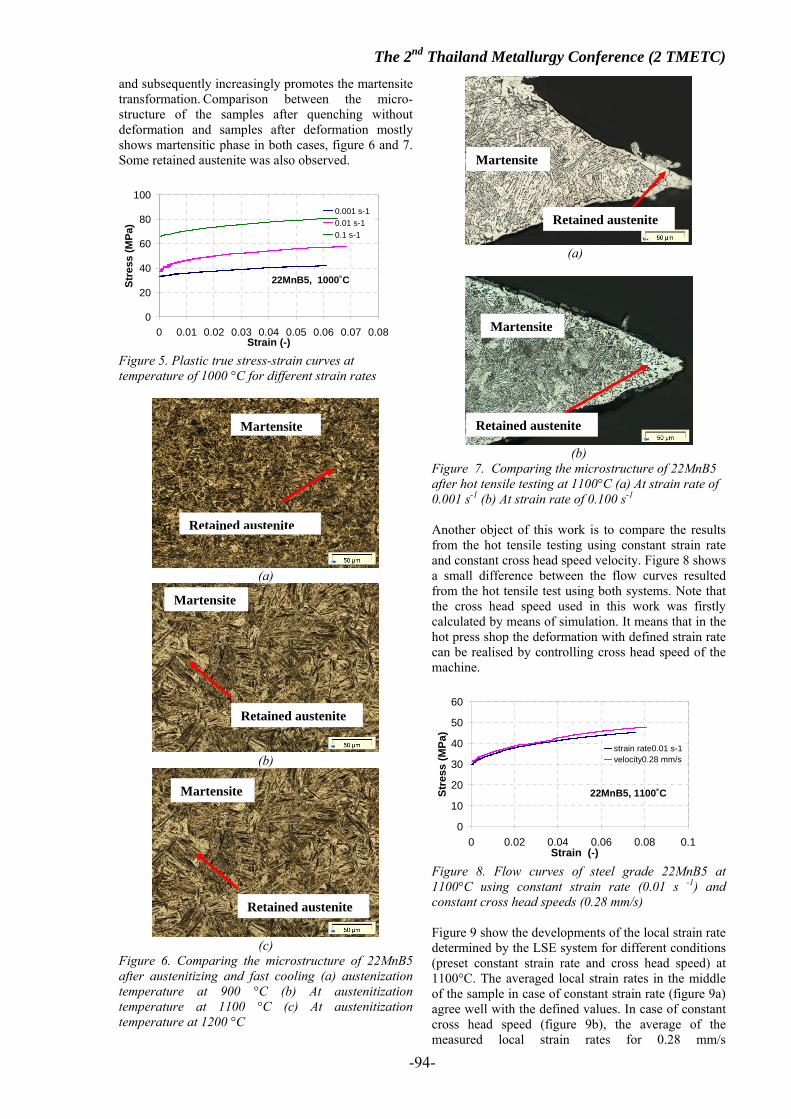
The 2nd Thailand Metallurgy Conference (2 TMETC)
-94-
and subsequently increasingly promotes the martensite transformation. Comparison between the micro-structure of the samples after quenching without deformation and samples after deformation mostly shows martensitic phase in both cases, figure 6 and 7. Some retained austenite was also observed.
0
20
40
60
80
100
0 0.01 0.02 0.03 0.04 0.05 0.06 0.07 0.08Strain (-)
Stre
ss (M
Pa)
0.001 s-10.01 s-10.1 s-1
22MnB5, 1000˚C
Figure 5. Plastic true stress-strain curves at temperature of 1000 °C for different strain rates
(a)
(b)
(c)
Figure 6. Comparing the microstructure of 22MnB5 after austenitizing and fast cooling (a) austenization temperature at 900 °C (b) At austenitization temperature at 1100 °C (c) At austenitization temperature at 1200 °C
(a)
(b)
Figure 7. Comparing the microstructure of 22MnB5 after hot tensile testing at 1100°C (a) At strain rate of 0.001 s-1 (b) At strain rate of 0.100 s-1 Another object of this work is to compare the results from the hot tensile testing using constant strain rate and constant cross head speed velocity. Figure 8 shows a small difference between the flow curves resulted from the hot tensile test using both systems. Note that the cross head speed used in this work was firstly calculated by means of simulation. It means that in the hot press shop the deformation with defined strain rate can be realised by controlling cross head speed of the machine.
0
10
20
30
40
50
60
0 0.02 0.04 0.06 0.08 0.1Strain (-)
Stre
ss (M
Pa)
strain rate0.01 s-1velocity0.28 mm/s
22MnB5, 1100˚C
Figure 8. Flow curves of steel grade 22MnB5 at 1100°C using constant strain rate (0.01 s -1) and constant cross head speeds (0.28 mm/s) Figure 9 show the developments of the local strain rate determined by the LSE system for different conditions (preset constant strain rate and cross head speed) at 1100°C. The averaged local strain rates in the middle of the sample in case of constant strain rate (figure 9a) agree well with the defined values. In case of constant cross head speed (figure 9b), the average of the measured local strain rates for 0.28 mm/s
Martensite
Retained austenite
Martensite
Retained austenite
Martensite
Retained austenite
Martensite
Retained austenite
Martensite
Retained austenite

The 2nd Thailand Metallurgy Conference (2 TMETC)
-95-
underestimate the expected strain rate of 0.01 s-1. It should be mentioned that the measured local strain rate on the sample in hot tensile test are not exactly equal to the given input strain rate. This could be caused by the imprecise data determined by the laser speckle extensometer and the calibration of the preset cross head speed. However, the scatters of the local strain rate are in acceptable range. Furthermore, in case of very low strain rate condition the development of the local strain rate using constant strain rate in figure 9c is similar to the one using constant cross head speed.
0
0.005
0.01
0.015
0.02
0.025
0.03
0 0.1 0.2 0.3 0.4Strain (-)
Stra
in ra
te (s
-1)
0.001 s-1
0.01 s-1
Average
Average
22MnB5, 1100˚C
(a)
0
0.005
0.01
0.015
0.02
0.025
0.03
0.035
0 0.1 0.2 0.3 0.4Strain (-)
Stra
in ra
te (s
-1)
0.018 mm/s
0.28 mm/s22MnB5, 1100˚C
Average
Average
(b)
22MnB5, 1100 ºC
00.0020.0040.0060.008
0.010.0120.0140.016
0 0.05 0.1 0.15 0.2 0.25 0.3 0.35 0.4Strain (-)
Stra
in ra
te (s
-1) strain rate 0.001 s-1
velocity 0.018 mm/s
AverageAverage
(c)
Figure 9. The development of strain rate of steel grad 22MnB5 that measured by LSE in hot tensile test (a) using preset constant strain rate, 1100°C (b) using preset constant cross head speeds, 1100°C (c) Comparison of the both cases (1100 °C). 3.2 Simulation analysis The plastic true stress-strain curves determined from the experiments were used as the input data for the simulations. The results from the simulation can only be used up to the beginning of the numerical necking,
which are observed as the drop of the force in figure 10. The experimental and calculated force-displacement curves from the hot tensile test at 1100°C and strain rate of 0.01 s-1 are compared in figure 10. The curves until the maximum force are in good agreement. The part of the curve beyond this point was neglected, because the necking process was not considered in this work. The force-displacement curves for other temperatures and strain rates were also calculated. In figure 11, calculated force-displacement curves of the investigated steel during hot tensile test at temperature between 900 and 1100°C were illustrated. The trend of the predicted force-displacement curves in this temperature range is reasonable. In addition, force-displacement curves for temperature of 1050°C and different strain rates are calculated and shown in figure 12.
0
0.1
0.2
0.3
0.4
0.5
0.6
0 5 10 15 20 25 30 35Displacement (mm)
Forc
e (k
N)
simulationexperiment_strain rate0.01 s-1experiment_velocity0.28 mm/s
22MnB5, 1100˚C
Figure 10. The experimental and calculated force-displacement curves of steel grade 22MnB5 during hot tensile test at 1100°C, strain rate of 0.01 s-1 and crosshead speed of 0.28 mm/s.
00.20.40.60.8
11.21.41.6
0 5 10 15 20 25 30 35Displacement (mm)
Forc
e (k
N)
900C950C1050C1100C
22MnB5, Strain rate 0.1 s-1
Figure 11. Prediction of force-displacement curves in hot tensile test at temperature between 900 and 1100°C and strain rate of 0.1 s-1for steel grade 22MnB5. 3.3 Microstructure The as-delivered microstructure shows anisotropic inhomogeneity that is observed as the secondary microstructural banding of ferritic-pearlitic steel in figure 13 [3]. This structure was caused by the cold rolling process. The grains are oriented in the rolling direction and present in a preferred orientation. The ferritic-pearlitic phases are transformed to martensite after hot deformation. The martensitic transformation was effected by the boron in this steel and the cooling rate. In this work, the type of martensite is the lath martensite due to the low carbon content. Martensitic phase will be fine if the process is done at very high

The 2nd Thailand Metallurgy Conference (2 TMETC)
-96-
cooling rate. By this condition, the steel cannot homogeneously solidify and the growing of the link is therefore prevented. The austenitization temperature influences not only to the grain growth in microstructure, but also increases the amount of retained austenite, figure 6. If the austenitization temperature increases, the Ms temperature will become higher.
00.10.20.30.40.50.60.70.80.9
0 5 10 15 20 25 30 35Displacement (mm)
Forc
e (k
N)
0.1 s-1
0.05 s-1
0.01 s-1
22MnB5, 1050˚C
Figure 12. Prediction of force-displacement curves in hot tensile test at temperature of 1050°C and strain rate between 0.01 and 0.1 s-1 for steel grade 22MnB5. After hot tensile test, quite large voids were observed in some samples. Figure 14 (a) shows these porosities in the microstructure of the sample after hot tensile test at 1100°C and strain rate of 0.1 s-1. The failure of this steel at high temperature is attributed to cup and cone fracture that is the feature of ductile fracture. The ductile fracture usually occurs in the low carbon steel. A slightly more homogeneous dimple structure was found in the sample failed at highest strain rate, discussed in [11].
Figure 13. Microstructure of as-delivered 22MnB5 steel As a result, forming at high strain rate condition will tend to a large dimple occurrence. Furthermore, the high temperature promotes the ductile fracture because of FCC structure. In the results in figure 4, the stress values decreases when the forming temperature increases. From these results, they confirm that the ductile fracture will occur at high temperature. In addition, the cracks usually initiated in the region of the retained austenite because this region is a softer zone in microstructure, figure 14 (b).
(a)
(b) Figure 14. Microstructures of 22MnB5 after hot tensile test at 1100°C and at strain rate of 0.1 s- 1(a) 100x (b) 500x 4. Conclusions The determination of material behaviour at high temperature of steel grade 22MnB5 by using the hot tensile test and LSE system was presented. Stress-strain responses at different temperatures and strain rates were considered. The local deformation and strain rate values were characterised. This steel grade can provide very high strength properties after controlled cooling process. Cooling rate, austenitization temperature, strain rate and chemical composition (i.e. carbon and boron) are the main factors that affect the mechanical properties and microstructure development. The martensite phase in the sample after hot deformation at higher strain rate or after higher cooling rate is fine. In contrast to the hot forming at high temperature, the links of martensite are coarse. Chemical composition is the factor that could be controlled by steel making process. The special element of 22MnB5 is boron that promotes the hardness and strength properties. The simulated force-displacement curves are in good agreement with the experimental results. FEM simulation is a useful method to give a first estimated result in the hot sheet metal working. Furthermore, the hot tensile test can provide reliable important mechanical properties of material at high temperature. The results from the hot tensile test can be used for the material design in the industrial manufacturing.
Porosity
Retained austenite
Banded ferritic-pearlitic microstructure

The 2nd Thailand Metallurgy Conference (2 TMETC)
-97-
5. Acknowledgement This work has been carried out under a collaborative research between RWTH Aachen University and the Sirindhorn International Thai-German Graduate School of Engineering (TGGS) at KMUTNB. The authors gratefully acknowledge the financial support of the Deutsche Forschungsgemeinschaft (DFG) and the Research Fund for Coal and Steel of the European Community within the project RFSR-CT-2004-00034. 6. References [1] M. Naderi, V. Uthaisangsuk, U. Prahl and W. Bleck, A numerical and experimental investigation into hot stamping of boron alloyed heat treated steels, Steel Research International 79, 2008, No. 2, 77-84. [2] G. Tackle, K. Forch, A. Sartorious, Heat treatable and surface hardening steels for vehicle and machine construction, Steel, 1993, Vol. 2, Applications, springer-verlag, 118-176. [3] W. Bleck: Material Science of Steel; Text book for RWTH Students, Department of Ferrous Metallurgy, RWTH Aachen University, 2007, p. 165-166. [4] K. E. Thelning, Steel and its Heat Treatment, Butterworths, 1984, 409 – 419. [5] W.C. Leslie, The Physical Metallurgy of steels, McGraw-Hill international book Company, USA, 1981, 269 – 281. [6] M. Jonsson; Products in hot stamped boron steel, GESTAMP, www.autosteel.org. [7] B. Kapadia, Prediction of the boron hardenability effect in steel-A comprehensive review, Hardenability concepts with applications to steel, Con.Proc. Chicago, 24 – 26 Oct. 1977, 448 – 482. [8] M. Naderi, L. Durenberger, A. Molinari, W. Bleck, Constitutive relationships for 22MnB5 boron steel deformed isothermally at high temperatures, Journal of Materials Science and Engineering A, In Press, 2007. [9] Morral, J. E. and Cameron, J. B.: Boron hardenability mechanisms, the Metallurgical Society of the A.I.M.E., 1980. [10] L. Vadillo, M.T.Santos, M.A.Gutierrez, I. Perez, B. Gonzalez and V. Uthaisangsuk, Simulation and Experimental Results of The Hot Metal Gas Forming Technology for High Strength Steel and Stainless Steel Tubes Forming, In Proceeding of the 9th International Conference on Numerical Methods in Industrial Forming Processes, June 17-21, 2007, Porto, Portugal, p. 1199-1204. [11] Effect of strain rate and temperature on mechanical properties and fracture mode of high strength precipitation hardened ferritic steels S. Vaynman,a,* M.E. Fine,a S. Leeb and H.D. Espinosab a Department of Materials Science and Engineering, Northwestern University, United State

The 2nd Thailand Metallurgy Conference (2 TMETC)
-98-
The Study of Oil Impregnation Effects on Powder Metallurgy Tin Bronze Wear Behavior by Pin-On-Disk Method
Thanakrit Chotibhawaris1, Dr.Tachai Laungwaranunt2, Asst.Dr.Sombun Charoenvilaisiri3 1Mater Degree Student of King Mongkut’s University of Technology Thonburi,Bangkok 10140
Lecturer of Mahanakorn University of Technology, Bangkok 10530 Phone 0-2988-3655 ext. 273, Fax. 0-2988-4040, E-Mail: [email protected]
2Chulalognkorn University, Bangkok 10330 Phone 0-2218-6947, Fax.0-2564-7001, E-Mail: [email protected] 3King Mongkut’s University of Technology Thonburi, Bangkok 10140
Phone 0-2470-9199, Fax. 0-2470-9198, E-Mail: [email protected]
ABSTRACT – Self-lubricated bearing is vastly made of powder metallurgy tin bronze. Wear is the major damage of this product. The objective of this research is to study the wear behavior of the oil impregnated powder metallurgy tin bronze against 304 stainless steel, which is the practical condition of a slider made of powder metallurgy tin bronze in a print head sliding on a stainless steel guide shaft in a printer. The oil impregnated powder metallurgy tin bronze pin wear patterns were mild fatigue wear collaborated with abrasive wear. The maximum load without the obvious stick-slip sliding were 12 N (1.82 MPa) respectively, with an average specific wear rate of 0.1526×10⁻¹² m3/(N-m). At 13 N (1.91 Mpa) and above, ploughing appeared. KEY WORDS -- Powder Metallurgy Process / Fatigue Wear / Abrasive Wear / Adhesion / Transfer Layer / Stick-Slip Sliding / Ploughing / Pin-On-Disk Method / Tin Bronze บทคัดยอ - ทองแดงผสมดีบุกขึ้นรูปดวยกรรมวิธีโลหะผงมักใชผลิตเปนแบริ่งหลอล่ืนไดเอง ความเสียหายสวนใหญเกิดจากการสึกหรอ งานวิจัยนี้ศึกษาพฤติกรรมการสึกหรอชิ้นงานดังกลาวที่ผานการอัดน้ํามันที่เสียดสีกับเหล็กกลาไรสนิม 304 ซึ่งเปนลักษณะการเคลื่อนที่ของแบริ่งของหัวเคร่ืองพิมพบนแกนเหล็กกลาไรสนิม พบวาภาระ 12 นิวตันเปนภาระสูงสุดที่ไมเกิดการเสียดสีแบบ Stick-Slip อยางรุนแรง การสึกหรอเปนแบบขัดถูรวมกับลาตัว ในขณะที่ภาระตั้งแต 13 นิวตันขึ้นไปเกิดขูดเปนรองลึกอยางชัดเจน คําสําคัญ -- กรรมวิธีโลหะผง / การสึกหรอแบบลาตัว / การสึกหรอแบบขดัถู / การเกาะติด / ช้ันเกาะติด / การเคลื่อนที่
แบบ stick-slip / การขูด / วิธีการทดสอบแบบ Pin-On-Disk / ทองแดงผสมดีบุก
1. Introduction Powder metallurgy tin bronze is mostly used to produce self-lubricated bearing by blending with solid lubricant. Graphite is more effective in wear and friction reduction while MoS2 present brittle CuMo2S3 [1]. The tin bronze could be impregnated with oil instead of blending with solid lubricant. The research focus on characteristics of wear behavior and microstructure changes of the oil impregnated powder metallurgy tin bronze. 2. Experimental procedures 2.1 Testing Apparatus The equipment for wear testing is pin-on-disk apparatus as shown in the Fig. 1.
Fig.1 The pin-on-disk apparatus
2.2 Specimens The pins were made of tin bronze powder that consisted of 90wt.% copper powder mixed with 10wt.% tin powder which was compacted under pressure of 1-3 Ton/cm2. Sintering process is by preheating at 350-400 0C for 30 minutes followed by sintering at 770 0C for 3.5 hours under 100%H2 atmosphere in the hot zone and 90%N2 with 10%H2 in the cooling zone then impregnated with ‘Shell Tellus Oil 68’ at 10 in Hg. The pin diameter was 3 mm. Their shape and microstructure are shown as the Fig. 2. Table 1 shows the tin bronze powder size distribution. Table 2 shows the mechanical properties of the tin bronze specimens. Table 1 Tin bronze powder size
U.S. Mesh Particle Size (micron) Weight % + 060 + 250 0 + 100 + 150 0 + 150 + 112 0.5 + 200 + 74 12.9 + 325 + 45 30.3 - 325 - 45 56.3

The 2nd Thailand Metallurgy Conference (2 TMETC)
-99-
(a)
(b)
Fig.2 The oil impregnated P/M tin bronze pin (a) microstructure 50x (b) pin shape
Table 2 Mechanical properties of the tin bronze specimens
Mechanical properties of the tin bronze specimens Ultimate Tensile Strength (MPa) 78.19
Yield Strength 0.2% Offset Strain (MPa) 71.26 Transverse Rupture Strength (MPa) 240.6
Density (103 kg/m3) 6.0 The tin bronze pins rubbed against the 304 stainless steel disks which have average roughness of 0.73 micron. 2.3 Experiment Table 3 Conditions of load and distance.
Factors Velocity (cm/s) distance (m) load (N)
11 12 13 15 17
10,000
20 11 12 13 15
20,000
17 10 11 12 13 15
50
30,000
17 The radius of rotation of the pin-on-disk apparatus was 8 mm, rotating at constant velocity of 50 cm/s. Testing conditions are summarized in Table 3.
3. Results & Discussion Results are shown as figure 3 and 4, we found that
(a)
(b) (c)
Fig.3 (a) friction coefficient graph (b) macrostructure x10 (c) microstructure x1,500 of oil impregnated P/M tin bronze worn surface at 12 N and 30,000 m
(a)
(b) (c)
Fig.4 (a) friction coefficient graph (b) macrostructure x10 (c) microstructure x1,500 of oil impregnated P/M tin bronze worn surface at 13 N and 30,000 m

The 2nd Thailand Metallurgy Conference (2 TMETC)
-100-
Specific Wear Rate of Oil Impregnated P/M Tin Bronze Pin
00.10.20.30.40.50.60.70.80.9
1
5000 10000 15000 20000 25000 30000 35000
distance (m)
k (x
10-1
2 m3 /(N
-m))
10 N 11 N 12 N 13 N15 N 17 N 20 N
Fig.5 Relationship between specific wear rate and distance at various loads
Friction coefficient of Oil Impregnated P/M Tin Bronze Pin
0.14
0.16
0.18
0.20
0.22
5,000
10,000
15,000
20,000
25,000
30,000
35,000
distance ( m)
Fric
tion
coef
ficie
nt
10 N. 11 N. 12 N. 13 N.15 N. 17 N. 20 N.
Fig.6 Relationship between friction coefficient and distance at various loads at 12 N, hydrodynamic lubrication appeared in the middle of wear distance then near the end of the distance the ‘saw-tooth pattern’ [2] appeared. The pattern presented stick-slip trend. The microstructure showed abrasive wear with mild fatigue wear with remained pores on the worn surface as shown in the Fig.3. But at 13 N, severe stick-slip occurred almost of the wear distance. Ploughing occurred dominantly collaborated with abrasive wear and almost pores closed that indicated severe plastic deformation formed as shown in the Fig.4. In the Fig.5, the average specific wear rate of at 10, 11 and 12 N are a little different. But at 13 N the average specific wear rate is more than at 10, 11 and 12 N obviously. In the same way, from the Fig. 6, the friction coefficient of at 10, 11 and 12 N are almost equal but at 13 N is larger significantly. At 12 N, the average specific wear rate was 0.1526×10⁻¹² m3/(N-m) However, when compare the results as above with the results from the wear test of powder metallurgy tin bronze without oil impregnation that the friction coefficient (about 0.8) and wear rate were very high, the wear characters were predominantly fatigue and abrasion collaborated with adhesion especially at high loads [3], we found that oil impregnation could deplete dramatically wear severity.
Fig.6 EDS analysis of wear debris from the wear test of at 12 N and distance 30,000 m. From the Fig.6, we found that carbon was the most amount element in the wear debris, it meant that carbon from the impregnated oil reacted to, diffused into or bond with pin surface during the wear testing process then the surface broke into debris. The other metal elements in debris such as Fe, Mn, Cr implied that the P/M tin bronze pin contacted with 304 stainless steel disk directly, so the impregnated oil couldn’t separate completely the pin surface from the disk surface. However, it could prevent transfer layer formation because no transfer layer was observed on any 304 stainless steel specimen surface. 4. Conclusions 1. The maximum load that maintained hydrodynamic lubrication during sliding was 12 N. Abrasive wear collaborated with mild fatigue wear appeared while loads more than 12 N, Ploughing occurred obviously with abrasive wear. Severe stick-slip sliding appeared almost wear distance. 2. Remained pores on worn surface implied the severity of plastic deformation, at 12 N existed the remained pores while almost pores closed at 13 N indicated that severe plastic deformation occured. 3. Impregnated oil on the specimen surface could reduce largely wear severity when compared with the results of dry sliding. Further more, it could prevent transfer layer formation on 304 stainless steel surface. 5. Acknowledgement We are thankful to Mr.Wuttiporn Wanchai, the manager assistant of ‘K. Powder Metal’ Co., Ltd. who supported all powder metallurgy tin bronze specimens. 6. References [1] Kato, H., Takama, M., Iwai, Y., Washida, K. and Sasaki, Y., 2003, “Wear and Mechanical Properties of Sintered Copper-Tin Composites Containing Graphite of Molybdenum Disulfide”, Wear [Electronic], 2003, Vol. 255, 573-578, Available : Elsevier / Science Direct [2007, March 05]. [2] Bhushan, B., 1999, Principles and Applications of Tribology, John Wiley & Sons, The United States of America, pp.382-383. [3] Thanakrit, C., Tachai, L., Sombun, C., 2008, “The Study of P/M Tin Bronze Wear Behavior by Pin-On-Disk Method”, 5th Thailand Materials Science and Technology Conference (MSAT-5), September 18-19,2008, Miracle Grand Convention Hotel, Bangkok, Thailand.
failed at 24,016.65 m.
failed at 24,016.65
m.
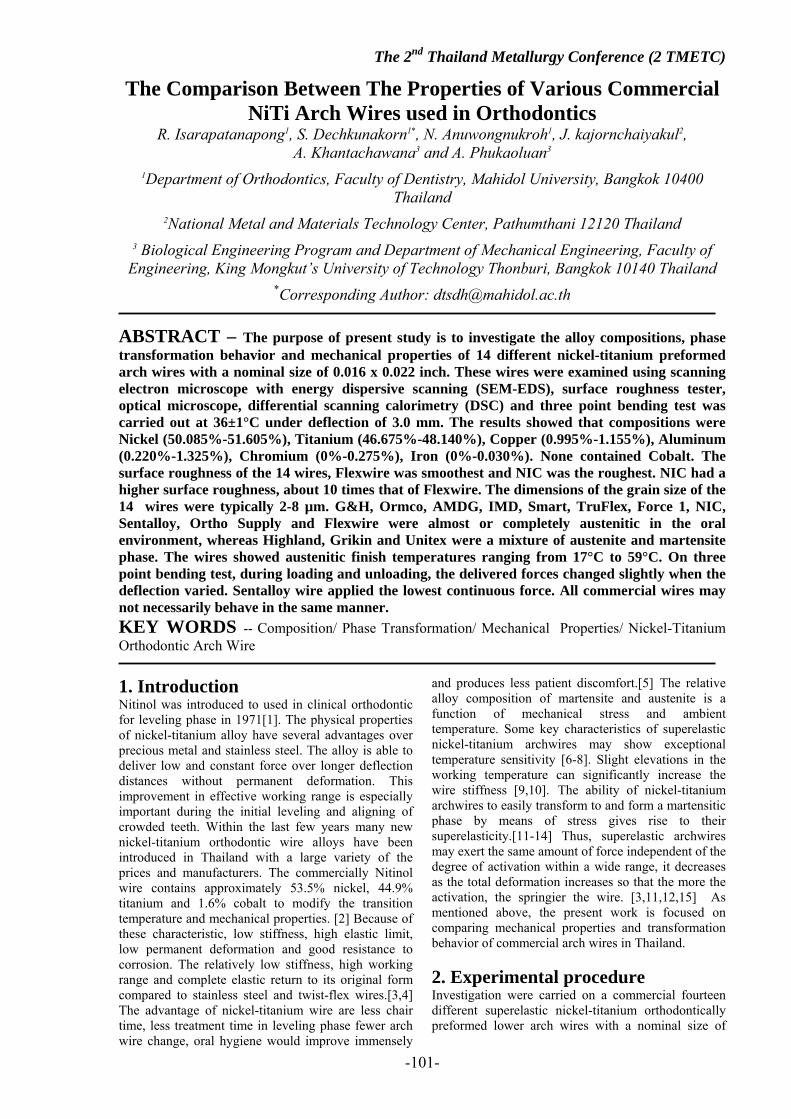
The 2nd Thailand Metallurgy Conference (2 TMETC)
-101-
The Comparison Between The Properties of Various Commercial NiTi Arch Wires used in Orthodontics
R. Isarapatanapong1, S. Dechkunakorn1*, N. Anuwongnukroh1, J. kajornchaiyakul2, A. Khantachawana3 and A. Phukaoluan3
1Department of Orthodontics, Faculty of Dentistry, Mahidol University, Bangkok 10400 Thailand
2National Metal and Materials Technology Center, Pathumthani 12120 Thailand 3 Biological Engineering Program and Department of Mechanical Engineering, Faculty of
Engineering, King Mongkut’s University of Technology Thonburi, Bangkok 10140 Thailand
*Corresponding Author: [email protected]
ABSTRACT – The purpose of present study is to investigate the alloy compositions, phase transformation behavior and mechanical properties of 14 different nickel-titanium preformed arch wires with a nominal size of 0.016 x 0.022 inch. These wires were examined using scanning electron microscope with energy dispersive scanning (SEM-EDS), surface roughness tester, optical microscope, differential scanning calorimetry (DSC) and three point bending test was carried out at 36±1°C under deflection of 3.0 mm. The results showed that compositions were Nickel (50.085%-51.605%), Titanium (46.675%-48.140%), Copper (0.995%-1.155%), Aluminum (0.220%-1.325%), Chromium (0%-0.275%), Iron (0%-0.030%). None contained Cobalt. The surface roughness of the 14 wires, Flexwire was smoothest and NIC was the roughest. NIC had a higher surface roughness, about 10 times that of Flexwire. The dimensions of the grain size of the 14 wires were typically 2-8 µm. G&H, Ormco, AMDG, IMD, Smart, TruFlex, Force 1, NIC, Sentalloy, Ortho Supply and Flexwire were almost or completely austenitic in the oral environment, whereas Highland, Grikin and Unitex were a mixture of austenite and martensite phase. The wires showed austenitic finish temperatures ranging from 17°C to 59°C. On three point bending test, during loading and unloading, the delivered forces changed slightly when the deflection varied. Sentalloy wire applied the lowest continuous force. All commercial wires may not necessarily behave in the same manner. KEY WORDS -- Composition/ Phase Transformation/ Mechanical Properties/ Nickel-Titanium Orthodontic Arch Wire 1. Introduction Nitinol was introduced to used in clinical orthodontic for leveling phase in 1971[1]. The physical properties of nickel-titanium alloy have several advantages over precious metal and stainless steel. The alloy is able to deliver low and constant force over longer deflection distances without permanent deformation. This improvement in effective working range is especially important during the initial leveling and aligning of crowded teeth. Within the last few years many new nickel-titanium orthodontic wire alloys have been introduced in Thailand with a large variety of the prices and manufacturers. The commercially Nitinol wire contains approximately 53.5% nickel, 44.9% titanium and 1.6% cobalt to modify the transition temperature and mechanical properties. [2] Because of these characteristic, low stiffness, high elastic limit, low permanent deformation and good resistance to corrosion. The relatively low stiffness, high working range and complete elastic return to its original form compared to stainless steel and twist-flex wires.[3,4] The advantage of nickel-titanium wire are less chair time, less treatment time in leveling phase fewer arch wire change, oral hygiene would improve immensely
and produces less patient discomfort.[5] The relative alloy composition of martensite and austenite is a function of mechanical stress and ambient temperature. Some key characteristics of superelastic nickel-titanium archwires may show exceptional temperature sensitivity [6-8]. Slight elevations in the working temperature can significantly increase the wire stiffness [9,10]. The ability of nickel-titanium archwires to easily transform to and form a martensitic phase by means of stress gives rise to their superelasticity.[11-14] Thus, superelastic archwires may exert the same amount of force independent of the degree of activation within a wide range, it decreases as the total deformation increases so that the more the activation, the springier the wire. [3,11,12,15] As mentioned above, the present work is focused on comparing mechanical properties and transformation behavior of commercial arch wires in Thailand. 2. Experimental procedure Investigation were carried on a commercial fourteen different superelastic nickel-titanium orthodontically preformed lower arch wires with a nominal size of

The 2nd Thailand Metallurgy Conference (2 TMETC)
-102-
0.016 x 0.022 inch were used in this study are shown in Table 1. Table 1. Details on the various arch wires used in this study.
Materials Manufacturer Price
(Baht) Unitex TM : Nitinol
Super-Elastic Archwire
3M Unitex, USA 270
Ni-Ti® : Preformed
Archwires
Ormco, Mexico 140
Force 1 : Nickel
Titanium memory wire
American Orthodontics,
USA
68.5
Preformed Nickel
Titanium (Nitinol)
Arches
AMDG manufacturing,
USA
60
SE NiTi Europa Form I G&H Wire Company,
USA
60
TruFlex TM Nickel
Titanium Archwire
Ortho Technology, USA 55
Flexwire : Super Elastic
Ni-Ti Archwire
Flexwire, USA 38
Highland : Super elastic
NiTi
Highland Metals Inc.,
USA
28.5
Orthosupply USA 30
Sentalloy : Super elastic
nickle titanium alloy
TOMY , Japan 80
GRIKIN : NiTi Super-
elastic
Grikin Advance Materials,
China
40
IMD : NiTi Super-
elastic
Innovative Material and
Devices, Inc., China
30
NIC arch wire : Super-
Elastic NiTi:
SuperLine Technology,
China
28
Smart® : NiTi arch Wire China 20
X-ray Energy-Dispersive Spectroscope (EDS) were used to assess alloy compositions of the wires. Spectra were obtained at three randomly selected regions on the surface of the wires under the following conditions: 100 µA beam current, 500x original magnification with a 0.26 x 0.26-mm sampling window, 100 seconds acquisition time, and 30-40% dead time. Grain structure by optical microscope were subjected to metallographic analysis after polishing and etching to evaluate the morphological and structural of wire surfaces. The specimens were embedded in epoxy resin and polished using 240-1000 grit size SiC papers and 1-µm diamond paste on a polishing unit. Specimens were further etched with an etching solution of concentrated hydrofluoric, nitric, and acetic acids at 1:1:1 volume ratio to reveal the martensitic structure of alloy. All specimens were studied under reflected light microscopy, and phase-transformation temperatures were detected by Differential Scanning Calorimeter (DSC). The three-point bending tests were carried out in order to obtain
loading-unloading curves. The wires were supplied in arch forms and tested in as-received condition. From each batch, 25 mm-long pieces were cut from the nearly straight posterior sections. All groups of testing were 5 samples. The apparatus used for the three-point bending test is a further development of the device described by Kawashima [19]. A stylus was connected to the cross head of Lloyd Universal testing machine and centered at the midspan of each wire specimen. The span was 10 mm. A Lloyd Universal testing machine was used to deflect all wires. The crosshead rate was 0.1 mm./sec. The load cell registered the force placed on the wire specimen and transmitted this value to a computer. Specimens were loaded to either a deflection of 3.0 mm. Surface roughness was measured by surface roughness tester (Talysurf series 2 Tylor-Hobson Ltd., Leicester,England). 3. Results and Discussion 3.1 Chemical composition The chemical composition of the experimental alloy used in the present investigation(as determined by chemical analysis) is listed in Figure 1.
0
10
20
30
40
50
60
Ni Ti Cu Al Cr Fe
Chemical
Ato
mic
per
cent
(at%
)
Force 1
Flexwire
Ortho Supply
G&H
NIC
TruFlex
Unitex
Smart
AMDG
Grikin
Sentalloy
OrmCo
Highland
IMD
Figure 1. Chemical composition of the alloy (unit: weight %)
It is known that factors such as nickel content, aging, thermo-mechanical treatment and addition of alloying elements, which affect the structure, are important for controlling the memory behavior [10]. The fourteen orthodontic nickel-titanium arch wires had the following ranges of compositions: Nickel (50.085%-51.605%), Titanium (46.675%-48.140%), Copper (0.995%-1.155%), Aluminum (0.220%-1.325%), Chromium (0%-0.275%), Iron (0%-0.030%) and have none contained Cobalt. ASM International [17] states that excess nickel, in amounts up to about 1%, is the most common alloy addition. Excess nickel strongly depresses the transformation temperature and increases the yield strength of the austenite. Other frequently used elements are iron and chromium (to lower the transformation temperature), and copper (to decrease the hysteresis and lower the deformation stress of the martensite). Because common contaminants such as oxygen and carbon can also shift the transformation temperature and degrade the mechanical properties, it is also desirable to minimize the amount of these elements.

The 2nd Thailand Metallurgy Conference (2 TMETC)
-103-
3.2 Grain structure The nickel-titanium wire contains approximately equiatomic proportions of nickel and titanium are based on the intermetallic compound nickel-titanium. Examination of the binary phase diagram revealed that often there is some deviation from stoichiometry for nickel-titanium. From our investigation, the microstructure of 14 nickel-titanium arch wires in which the longitudinal area was analysed. The central area comprised elongated grains parallel to the long axis of wire, whereas the peripheral section consisted of less elongated, dense and smaller grains in this direction. The grain size with dimensions were typically 2-8 µm. of all nickel-titanium arch wires. This indicates that annealing of fourteen nickel-titanium orthodontic arch wires in the thermo-mechanical treatment should be done at near the recrystallization temperature. The grains of this investigation are elongated parallel to the extended plastic deformation caused to the material during cold drawing, a process that is used for manufacturing wires. The grains at the outer regions of the specimens are dense and appear to have small sizes at this section causing the material to appear from round to rectangular wires during fabrication. 3.3 Phase Transformation Transformation temperatures of each wire detected by DSC were shown in Figure 2.
0
10
20
30
40
50
60
70
As Af Ms MfPhases transformation
Tem
pera
ture
(o C
)
Force 1FlexwireOrtho SupplyG&HNICTruFlexUnitexSmartAMDGGrikinSentalloyOrmcoHighlandIMD
Figure 2. Transformation temperatures and enthalpy
changes (ΔH) for nickel-titanium orthodontic wires.
The heating curves suggest that G&H, Ormco, AMDG, IMD, Smart, TruFlex, Force 1, NIC, Sentalloy, Ortho Supply and Flexwire should be almost or completely austenitic in the oral environment, whereas Highland, Grikin and Unitex should be a mixture of austenite and martensite. In this study, NIC, Force 1, Sentalloy, Ortho Supply, Flexwire, Highland, Grikin and Unitex were largely martensitic at room temperature. Smart and TruFlex were mixed with martensitic and austenitic, and G&H, Ormco, AMDG and IMD were austenitic at room temperature. The NIC, Sentalloy, Ortho Supply and Flexwire should be entirely or almost entirely martensitic at room temperature, although these products would be partially transformed to austenite at mouth temperature. Alternatively, if the cooling
differential scanning calorimetry curves are used to predict the phases, G&H, Ormco, AMDG, IMD, Smart, TruFlex, Force 1, NIC, Sentalloy, Ortho Supply and Flexwire would be austenitic at 37°C, whereas Highland, Grikin and Unitex would be mainly austenite with some martensite present. At room temperature, both Smart and TruFlex would be a mixture of austenite and martensite. Another source of variation in nickel-titanium experiments is the complexity of the manufacturing procedures. Wires of similar composition can show very different transitional temperature ranges, especially when they are manufactured by different companies. As a result, the findings of different experiments are hardly comparable [15,18]. 3.4 Surface Characteristics The surface roughness of the experimental alloy used in the present investigation (as determined by surface roughness tester) is listed in Table 2. Table 2. Surface roughness (mean ± SD) of alloy.
Wire brand Surface roughness (µm) Flexwire 0.04383 ± 0.000289
Ortho Supply 0.05370 ± 0.003995
AMDG 0.06190 ± 0.004943
Highland 0.09297 ± 0.004163
Smart 0.09440 ± 0.002851
Force 1 0.10773 ± 0.002369
IMD 0.12500 ± 0.003219
TruFlex 0.16760 ± 0.009460
G&H 0.19503 ± 0.013051
Unitex 0.22840 ± 0.010470
Sentalloy 0.25240 ± 0.010310
Ormco 0.27900 ± 0.011953
Grikin 0.39933 ± 0.018440
NIC 0.45833 ± 0.019970
Regarding the hot and cold working of nickel-titanium alloys, after removing the surface layer, the ingot is forged and rolled into a bar or a slab with appropriate size. Rod or wire products are roll-worked using a bar rolling mill, which has a pair of grooved rollers. Although the workability of the nickel-titanium alloy is improved at higher temperatures, the alloy surface is more roughened by oxidation. The optimum heating temperature for hot-working is around 1073 K. This investigation show that differences in surface texture and roughness exist among the various types of nickel-titanium orthodontic arch wires. The fourteen manufacturer’s surface roughness showed that Flexwire was the smoothest and NIC was the roughest. NIC had a higher surface roughness than Flexwire about 10 times. At the same magnification and resolution, the fourteen orthodontic nickel-titanium arch wires were qualitatively different (Figure 3 (a-n)). As a result of the wire-drawing process, eleven arch wires showed striations along the longitudinal axes
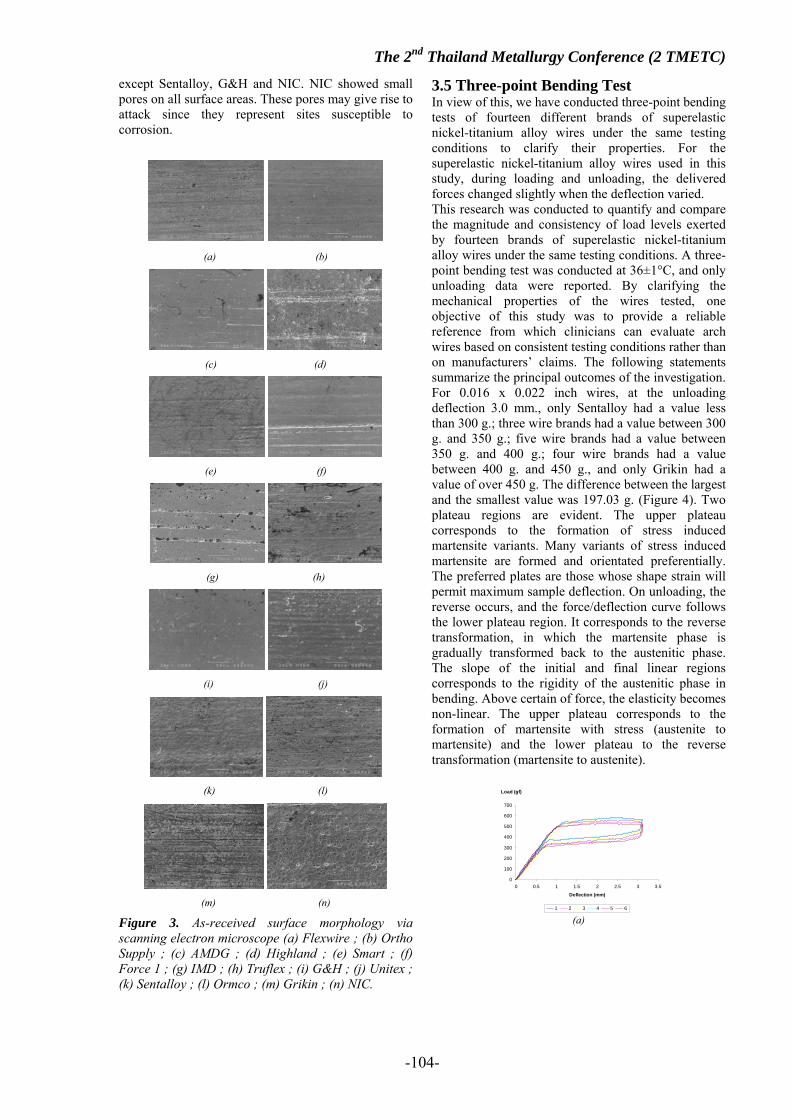
The 2nd Thailand Metallurgy Conference (2 TMETC)
-104-
except Sentalloy, G&H and NIC. NIC showed small pores on all surface areas. These pores may give rise to attack since they represent sites susceptible to corrosion.
(a) (b)
(c) (d)
(e) (f)
(g) (h)
(i) (j)
(k) (l)
(m) (n)
Figure 3. As-received surface morphology via scanning electron microscope (a) Flexwire ; (b) Ortho Supply ; (c) AMDG ; (d) Highland ; (e) Smart ; (f) Force 1 ; (g) IMD ; (h) Truflex ; (i) G&H ; (j) Unitex ; (k) Sentalloy ; (l) Ormco ; (m) Grikin ; (n) NIC.
3.5 Three-point Bending Test In view of this, we have conducted three-point bending tests of fourteen different brands of superelastic nickel-titanium alloy wires under the same testing conditions to clarify their properties. For the superelastic nickel-titanium alloy wires used in this study, during loading and unloading, the delivered forces changed slightly when the deflection varied. This research was conducted to quantify and compare the magnitude and consistency of load levels exerted by fourteen brands of superelastic nickel-titanium alloy wires under the same testing conditions. A three-point bending test was conducted at 36±1°C, and only unloading data were reported. By clarifying the mechanical properties of the wires tested, one objective of this study was to provide a reliable reference from which clinicians can evaluate arch wires based on consistent testing conditions rather than on manufacturers’ claims. The following statements summarize the principal outcomes of the investigation. For 0.016 x 0.022 inch wires, at the unloading deflection 3.0 mm., only Sentalloy had a value less than 300 g.; three wire brands had a value between 300 g. and 350 g.; five wire brands had a value between 350 g. and 400 g.; four wire brands had a value between 400 g. and 450 g., and only Grikin had a value of over 450 g. The difference between the largest and the smallest value was 197.03 g. (Figure 4). Two plateau regions are evident. The upper plateau corresponds to the formation of stress induced martensite variants. Many variants of stress induced martensite are formed and orientated preferentially. The preferred plates are those whose shape strain will permit maximum sample deflection. On unloading, the reverse occurs, and the force/deflection curve follows the lower plateau region. It corresponds to the reverse transformation, in which the martensite phase is gradually transformed back to the austenitic phase. The slope of the initial and final linear regions corresponds to the rigidity of the austenitic phase in bending. Above certain of force, the elasticity becomes non-linear. The upper plateau corresponds to the formation of martensite with stress (austenite to martensite) and the lower plateau to the reverse transformation (martensite to austenite).
0
100
200
300
400
500
600
700
0 0.5 1 1.5 2 2.5 3 3.5
Deflection (mm)
Load (gf)
1 2 3 4 5 6 (a)
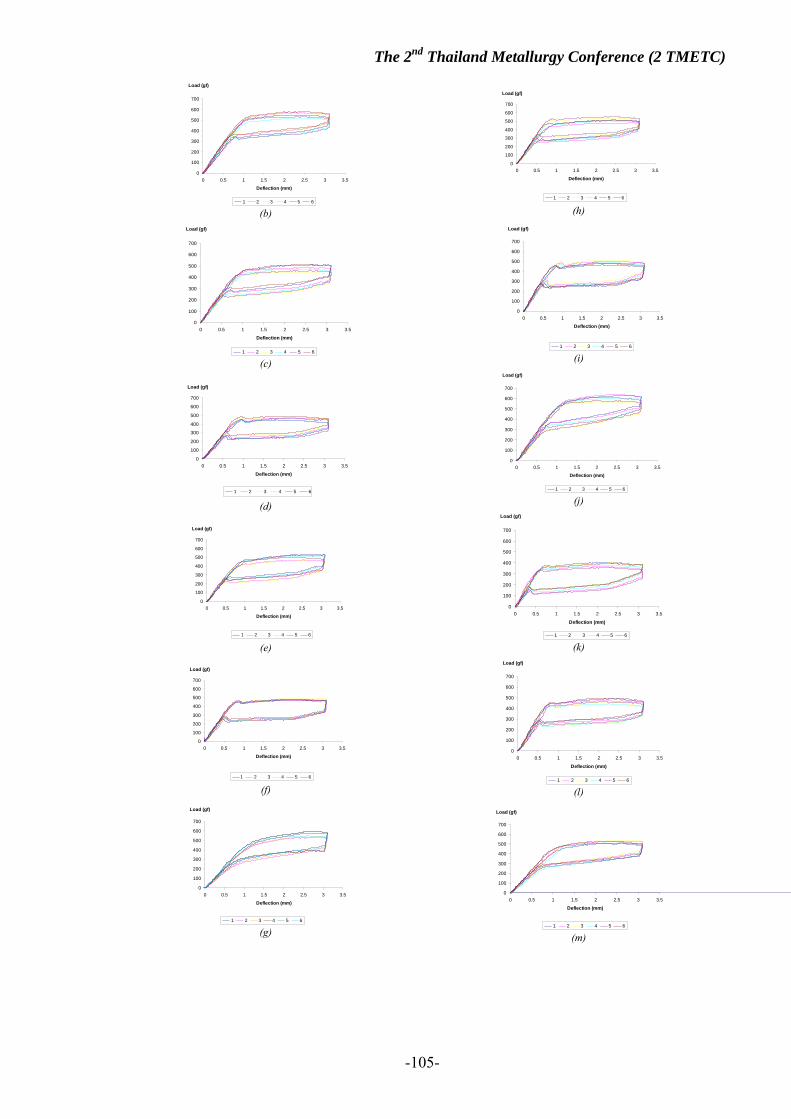
The 2nd Thailand Metallurgy Conference (2 TMETC)
-105-
0
100
200
300
400
500
600
700
0 0.5 1 1.5 2 2.5 3 3.5
Deflection (mm)
Load (gf)
1 2 3 4 5 6 (b)
0
100
200
300
400
500
600
700
0 0.5 1 1.5 2 2.5 3 3.5
Deflection (mm)
Load (gf)
1 2 3 4 5 6 (c)
0
100
200
300
400
500
600
700
0 0.5 1 1.5 2 2.5 3 3.5
Deflection (mm)
Load (gf)
1 2 3 4 5 6 (d)
0
100
200
300
400
500
600
700
0 0.5 1 1.5 2 2.5 3 3.5
Deflection (mm)
Load (gf)
1 2 3 4 5 6 (e)
0
100
200
300
400
500
600
700
0 0.5 1 1.5 2 2.5 3 3.5
Deflection (mm)
Load (gf)
1 2 3 4 5 6 (f)
0
100
200
300
400
500
600
700
0 0.5 1 1.5 2 2.5 3 3.5
Deflection (mm)
Load (gf)
1 2 3 4 5 6 (g)
0
100
200
300
400
500
600
700
0 0.5 1 1.5 2 2.5 3 3.5
Deflection (mm)
Load (gf)
1 2 3 4 5 6 (h)
0
100
200
300
400
500
600
700
0 0.5 1 1.5 2 2.5 3 3.5
Deflection (mm)
Load (gf)
1 2 3 4 5 6 (i)
0
100
200
300
400
500
600
700
0 0.5 1 1.5 2 2.5 3 3.5
Deflection (mm)
Load (gf)
1 2 3 4 5 6 (j)
0
100
200
300
400
500
600
700
0 0.5 1 1.5 2 2.5 3 3.5
Deflection (mm)
Load (gf)
1 2 3 4 5 6 (k)
0
100
200
300
400
500
600
700
0 0.5 1 1.5 2 2.5 3 3.5
Deflection (mm)
Load (gf)
1 2 3 4 5 6 (l)
0
100
200
300
400
500
600
700
0 0.5 1 1.5 2 2.5 3 3.5
Deflection (mm)
Load (gf)
1 2 3 4 5 6 (m)

The 2nd Thailand Metallurgy Conference (2 TMETC)
-106-
0100
200300400500
600700
0 0.5 1 1.5 2 2.5 3 3.5
Deflection (mm)
Load (gf)
1 2 3 4 5 6 (n)
Figure 4. As-received surface morphology via scanning electron microscope(a) Flexwire ; (b) Ortho Supply ; (c) AMDG ; (d) Highland ; (e) Smart ; (f) Force 1 ; (g) IMD ; (h) Truflex ; (i) G&H ; (j) Unitex ; (k) Sentalloy ; (l) Ormco ; (m) Grikin ; (n) NIC. 4. Conclusions By investigate the principal parameters such as chemical composition, phase transformation and mechanical properties of fourteen commercial nickel-titanium orthodontic arch wires, it is able to said that nickel-titanium orthodontic arch wires have differences in composition, phase transformation and mechanical properties. This information is valuable for the evaluation of differences in performance of nickel-titanium orthodontic wires found in clinical studies. The surface roughness, grain size of the 14 wires, Ortho Supply and Flexwire were almost or completely austenitic in the oral environment, whereas Highland, Grikin and Unitex were a mixture of austenite and martensite. The wires showed austenitic finish temperatures ranging from 17°C to 59°C. On three point bending test, during loading and unloading, the delivered forces changed slightly when the deflection varied. Sentalloy wire applied the lowest continuous force. All commercial wires may not necessarily behave in the same manner.
5. References [1] Andresen GF, zhilleman TB. An evaluation of 55-cobalt substituted wire for orthodontics. J Am Dent Assoc 1971;81:1373-5. [2] Civjan S, Huget EF, DeSimon LB. Potential applications of certain nickel-titanium:(Nitinol) alloys. J Dent Res 1975;54:89-96. [3] Andreasen GF, Barrett RD. An evaluation of cobalt-substituted nitinol wire in orthodontics. Am J Orthod 1973;63:462-70. [4] Kusy RP, Greenberg AR. Effects of composition and cross section on the elastic properties of orthodontic wires. Angle Orthod 1981;51:325-41. [5] Andresen GF, Bigelow, Andrew JG. 55 Nitinol wire: Force developed as a function of “elastic memory”. Aust Dent J 1979;24:146-49. [6] Meling TR, Odegaard J. The effect of temperature on the elastic responses to longitudinal torsion of rectangular nickel-titanium archwires. Angle Orthod1998;68:357-68. [7] Meling TR, Odegaard J. The effect of short-term temperature changes on the mechanical properties of
rectangular nickel-titanium archwires tested in torsion. Angle Orthod 1998;68:369-76. [8] Meling TR, Odegaard J. Short-term temperature changes influence the force exerted by superelastic nickel-titanium archwires activated in orthodontic bending. Am J Orthod Dentofac Orthop 1998;114:503-9. [9] Andreasen GF, Heilmann H, Krell D. Stiffness changes in thermodynamic nitinol with increasing temperature. Angle Orthod 1985;55:120-6. [10] Tonner RI, Waters NE. The characteristics of super-elastic Ni-Ti wires in three- point bending: part I, the effect of temperature.Eur J Orthod 1994;16:409-19. [11] Burstone CJ, Qin B, Morton JY. Chinese NiTi wire-a new orthodontic alloy. Am J Orthod 1985;87:445-52. [12] Miura F, Mogi M, Ohura Y, Hamanakab H. The super-elastic property of Japanese NiTi alloy for use in orthodontics. Am J Orthod 1986;90:1-10. [13] Thayer TA, Bagby MD, Moore RN, DeAngelis RJ. X-ray diffraction of nitinol orthodontic arch wires. Am J Orthod Dentofac Orthop 1995;107:604-12. [14] Miura F. Discovery and uses of super-elasticity in clinical orthodontics. Dent Jpn1990;27:187-96. [15] Water NE. Orthodontic products update: Superelastic nickel-titanium wires. Br J Orthod 1992;19:319-22.] [16] Otsuka K, Wayman. Shape memory materials. United Kingdom: Cambridge University Press; 1998. p.49-148. [17] ASM International, Metals Handbook, volume 2. Properties and Selection: Nonferrous Alloys and Special-Purpose Materials. 10th ed. USA; 1990. p. 898-902. [18] Bradley TG, Brantley WA, Culbertson BM. Differential scanning calorimetry (DSC) analyses of superelastic and nonsuperelastic nickel-titanium orthodontic wires. Am J Orthod Dentofac Orthop 1996;109:589-597. [19] Kawashima I, Ohno H, Sachdeva R. Relationship between Af temperature and load changes in Ni-Ti orthodontic comditions.Dent Mater J 1999; 18(4):403-12

Oral Presentations
Application Session

The 2nd Thailand Metallurgy Conference (2 TMETC)
-107-
Nickel Thin Plate Forming for Microsensor Leadframe Production
Sornvipard Pornnoppadol1 , Paiboon Choungthong1, Opas Trithaveesak2, Charndet Hruanun2, Amporn Poyai2
1 Engineering Faculty, Production Engineering Department, King Mongkut’s University of Technology,
126 Pracha-utid Road, Bangmod, Toongkru, Bangkok, Thailand 2 Thai Microelectronics Center
51/4 Moo 1, Wangtakien District, Chachoangsao, Thailand Tel.038-857-100 Fax.039-857175. E-mail: [email protected]
ABSTRACT – The aim of this research is to study the forming process of nickel thin plate by using the electro plating method for the microsensor leadframe production. Due to the electro plating process, there are 2 important components. The first component is the electrolyte and the second one is the metal electrode. During the process, nickel piece is connected with the positive pole and the stainless steel connected with the negative pole. Gradually, the nickel thin plate forms on the stainless plate without sticking on it. This lead to the simple way of the removal step from the stainless plate. Due to our research, the most optimal condition for the electrical current density is between 0.3-3 A/dm2. The thinnest nickel plate can be achieved with the thickness growth rate of 3.75- 34.86 micrometer/ hour. KEY WORDS -- Leadframe, Microsensor, Nickel
บทคัดยอ - ในงานวิจัยนี้เปนการศึกษาการสรางแผนนิเกิลบางที่มีลวดลายดวยเทคนิคทางเคมีไฟฟา เพื่อจะนําแผนโลหะบางนี้มาใชเปนขั้วโลหะของอุปกรณไมโครเซนเซอร โดยในงานนี้จะใชกับเซนเซอรสําหรับวัดคา pH ในการสรางแผนโลหะนี้มีสวนประกอบสําคัญ 2 อยางคือ สารละลายที่มีอิออนของนิเกิลและโลหะที่ใชเปนขั้วไฟฟา โดยสารละลายที่ใชเปนสารละลายที่ใชในการชุบนิเกิล สวนโลหะที่นํามาใชกับขั้วไฟฟาไดชิ้นโลหะนิเกิล และแผนสแตนเลส ในการสรางแผนนิเกิลบางนั้นชิ้นโลหะนิเกิลจะตอกับขั้วไฟฟาบวก และแผนสแตนเลสตอกับขั้วลบ โดยที่แผนนิเกิลบางจะเกิดขึ้นบนแผนสแตนเลส และไมเกาะกับแผนสแตนเลส ดวยเหตุนี้จึงสามารถลอกแผนนิเกิลบางออกจากแผนสแตนเลสได จากการทดลองในงานวิจัยนี้พบวาเม่ือใชความหนาแนนของกระแสไฟฟาในชวง 0.31-1.5 แอมป/ตารางเดซิเมตร จะไดแผนบางที่มีความเรียบที่สุด โดยมีอัตราการเกิดของแผนโลหะบางที่ 3.75-17.75 ไมโครเมตร/ชั่วโมง คําสําคัญ -- ฐานรอง ไมโครเซนเซอร นิเกิล 1. Introduction By the packaging of Integrated Circuits (IC) the leadframe has 2 important functions. In the first function, it is used for mechanical stability, to hold and transfer the small pieced of IC. The second function of the leadframe is the electrical connection to the external circuit. In the industry the forming of leadframe begin with a metal plate which is cut or chemical etched to get the leadframe with designed shape. Due to the complicated tools and processes it is suitable just for mass production in the industry not for prototype production with a small volume. In this paper, a method of Nickel thin plate forming with pattern is demonstrated. The method conforms to the electroplating technique. In the experiments, the leadframes for microsensor is designed and formed as examples by this technique.
2 Experiments The thin plate forming can be separated in 2 steps. In the first step the designed pattern is transferred to the stainless steel plate which used as substrate. After this step the stainless steel plate is immersed in the Nickel solution for the plating.
Fig.1 Patterns on the transparency film 2.1 Patterning Transfer The patterns is designed with the L-Edit Program and printed on the transparency film. Figure 1 shows the printed patterns on the transparency film. In the following step, the patterns were transferred on the

The 2nd Thailand Metallurgy Conference (2 TMETC)
-108-
stainless steel plate by the lithography technique. It begins with the covering of dry photosensitive film on the stainless steel plate. The films is exposed with UV light through the transparency film with the designed pattern. After the developing in the NaCO3 solution the film part, which was not exposed, is dissolve in the solution. The result of this step is showed in fig.2.
Fig.2 Patterns on stainless steel plate 2.2 Thin plate forming As mentions before the Nickel thin plate is formed by electroplating technique. In the experiments the thin plates were formed by different current density from 0.3-3 A/dm2 by constant time, 2 hours to study the growth rate. After the plating process the thickness of the thin plate was performed with Field Emission Scanning Electron Microscope. 3 Results and Discussion Fig.3 shows the growth rate of the Nickel thin plate by different current density. Evidently, the growth rate increase with the current density until 2 A/dm2. By the higher current density the thin plates growth. rate
decreases. Additionally the surface of the thin plate is rough while the current density is higher than 1.5 A/dm2. The both phenomena cause from the ion collision due to the high ion density on the cathode[3]. Fig. 3 Growth rate by different current density 4. Conclusion From the results, the current density should be lower than 1.5 A/dm2 to gain the best products.
5. Acknowledge We thank Dr. Anurat Wisutsoorat for the beginning condition. 6. References [1] Lowenheim, F.A.,1978, Electroplating, McGraw-
Hill. Inc., New York, pp. 167-386 [2] คณะวิทยาศาสตร สาขาวชิาวัสดุศาสตร (อัญมณีและเครื่องประดับ) มหาวิทยาลัยศรีนครินทร วิโรฒ, พื้นฐานความรูเกี่ยวกับการชุบโลหะดวยไฟฟา [Online], Available [3] Ghouse M., Viswanathan M., and Ramachandran E.G. 1980, “Electrocodeposition of Nickel Molybdenum Disulfide and Nickel-Tungsten Disulfide”, Metal Finishing, Vol.78, No. 4, pp. 44-47

The 2nd Thailand Metallurgy Conference (2 TMETC)
-109-
Modeling the Particulate Reinforced Metal Matrix Composites under Forward Bar Extrusion Using Finite Element Method
S. Suranuntchai1 and P. Kritboonyarit2 Tool and Materials Engineering Department, Faculty of Engineering
King Mongkut’s University of Technology Thonburi (KMUTT) 126 Pracha-uthit Rd., Bangmod, Thungkhru, Bangkok 10140
Tel. 0-2470-9211 Fax: 0-2872-9080 Email1: [email protected] Email2: [email protected]
ABSTRACT – Finite Element Method (FEM) has becoming more influences in analyzing and solving metal forming problems from the beginning of punch and die designed up to setting the appropriated surrounding constrains in the deformation processes. This research was concerning about the study of simulation in cold forward bar extrusion of some aluminum alloys reinforced with ceramic particles by using a commercial FE program; MSC. Marc 2003 (MSC. Software Corporation 2003) to enhance the analysis. Two most important parameters in extrusion were investigated, which included area reduction ratio, εA, and die angle, 2α, that affected to the forming force in the workpiece. In this research, the matrix part of composites studied was varied as follow: AA6061, AA6082 and AA230A reinforced by particles of SiC and Al2O3. Also, the volume fraction of reinforcement was another material parameter needed for the study. The dimension of initial billet in the simulation had 24.7 mm of diameter and 30 mm of length. The punch and die were assumed to be rigid which neglected the deformation. In case of heat dissipation, they were not considered in this simulation; therefore, the process assumed to be done isothermally at room temperature of 20oC. From the modeling results, the suitable conditions for different parameters were obtained, which assisted to the consideration of appropriated forward bar extrusion processes of such particulate reinforced Metal Matrix Composites (MMCs). KEY WORDS – Modelling, Particulate Reinforced Metal Matrix Composites, Forward Bar Extrusion, Finite Element Method 1. Introduction The term Metal Matrix Composite is commonplace in the materials world today. MMCs are a type of promising advanced engineering materials open to a diverse range of potential industrial applications. These composites offer improved strength and stiffness, thus increasing the specific strength and stiffness of the material. They also offer improved high temperature performance, as well as better wear resistance properties. MMCs are now employed in or being considered for use in a variety of applications. In the automobile industry, for example, they have been used to make several critical components, including automotive drive shafts, cylinder liners, connecting rods and brake rotors (Allison and Cole, 1993). MMCs are metallic materials reinforced by the addition of continuous fiber, whisker or particulate ceramics. Reinforcement with continuous fibers or whiskers yields large increases in mechanical properties, but with extreme directionally. Furthermore, fiber-reinforced MMCs cannot be easily fabricated or deformed via a second metal-processing operation such as extrusion, rolling, or forging without risking breakage of fibers. In contrast, particulate-reinforced MMCs, in which the particles have a low
aspect ratio, can be formed without undue damage to the particles, the matrix, or the interfacial bond between them. As the particles have no preferred orientation, the material properties are largely isotropic (Suresh et al., 1993). Because particulate-reinforced MMCs have some advantages; like low cost, near-isotopic properties and the ability of being processed using conventional fabrication and metal-forming methods, they are attractive materials for numerous engineering applications. A remarkably class of MMCs which has been employed to produce the commercial components, especially automobile parts, by conventional processing routes such as extrusion is typically particulate-reinforced aluminum-based composites (Davies, 1995). Wide use of MMC can only be achieved when advances in the currently available processing techniques are made. Further, these progresses must be kept abreast with the development made in the MMCs themselves. Hence, sufficient research efforts must be devoted to understanding and modeling the processing of MMCs, so that cost-effective techniques can be found. One of the most cost-effective ways of improving existing processes is the application of computers to model such processes. The most common and powerful modeling technique in use in academia and industry alike is the Finite Element (FE)

The 2nd Thailand Metallurgy Conference (2 TMETC)
-110-
method (Kobayashi et al., 1989). It allows the deformation of the material to be studied in detail with minimum or even without the need of performing expensive and/or time-consuming experiments once necessary material data are available. It also allows other physical phenomena such as defect formation and microstructural changes of the material, as well as other important factors such as die wear, etc., to be examined, which are difficult and costly to do by experimental means (Wagoner and Chenot, 2001). Although computer modeling of forming processes has been widely used for monolithic metal alloys, but its application to MMCs has until now been very limited. Many long shaped products with solid, hollow, and different cross sectional area have been produced by extrusion processes as shown in Figure 1, which are difficult to be manufactured by other types of process. There are two types of extrusion process which can be distinguished by the direction of punch and the flow direction of material (Lange, 1985). In forward extrusion, punch moves in the same direction with the flow of material as shown in Figure 2. In backward extrusion, punch moves in the opposite direction with the flow of material.
Figure 1. Different kinds of products produced by extrusion.
Figure 2. Two types of extrusion processes a) forward extrusion b) backward extrusion. 2. Simulation Model In this forward bar extrusion according to the experimental report of Wagener and Wolf, 1995, the initial billet had the dimension of 24.7 mm. in diameter and 30 mm. in length. For the first
composite material AA6082, which had 25% of SiC reinforcement, the materials had been extruded for εA=30%, 50% and 70% to reduce the cross sectional area with fixed die angle of α = 45o. To study the effect of die angle, this kind of composites had also been extruded with fixed reduction area of εA= 50%, while the die angle had been varied from 30o, 45o, 60o and 90o. For the second composite material AA6061, which has been reinforced with Al2O3, the materials had been extruded with fixed reduction area of εA= 70% and die angle of α = 45o, while the volume fraction of the reinforcement had been varied from 0%, 15% and 20%. The coulomb friction coefficient of μ = 0.045 was assumed according to the experimental investigation. In these experiments, counter pressure by punch has been setup with 650 MPa to prevent the initiation of damage in the central part of the workpiece. This mathematical model can be analyzed symmetrically as shown in Figure 3. Since this condition was cold extrusion process, the heat generation inside material and transferred between material and die during the processes had little effect and could be neglected. The material properties behaved according to the flow curves that have been reported from compression tests and assumed to be isotropy (Wagener and Wolf, 1993). Punch and die were assumed to be rigid, which to simplified the process for some effects of deflection of punch and die during the process. The type of finite element for the material was Quard-4 element. 810 elements had been observed with good predictions, which gave optimal manipulation times and consistent accuracy results.
Figure 3. The symmetrical simulation model of forward extrusion with counter punch. 3. Results and Discussion From simulations, the result data had converged to a single solution as the number of elements increased; however, time consumed in the simulation also increased. Thus the appropriated mathematical model with right number of 810 elements had been selected from this comparison and these model parameters were varied for further analysis. The effects of reduction area die opening angle, volume fraction, and different material properties will be discussed in the next topics. 3.1 The Effect of Area Reduction Ratio The reduction in cross sectional area was calculated from the equation:
%100AA
lnε1
0A ∗=

The 2nd Thailand Metallurgy Conference (2 TMETC)
-111-
where A0 is the workpiece initial cross sectional area and A1 is the workpiece final cross sectional area. Considering from the results, the simulation of aluminum alloy AA6082 had 25% reinforcement of ceramics SiC. The reduction in cross sectional area were varied εA = 30%, 50% and 70%, with fixed die opening angel of α = 45o and the friction coefficient of μ = 0.045. The force and travel diagram from the simulation were shown in Figure 4. Typical load stoke curves for cold forward extrusions had some similarity. At the beginning of the process, the force increased sharply. After a maximum force was reached and the die was totally filled, the press load slowly decreased. This decreasing in the load was due to the reduction in the frictional contact length between the workpiece and die. For larger friction coefficient, the decreasing in the press load can be clearly seen. The increasing in the reduction of cross sectional area had increased the press load (Dixon, 1992).
0
100
200
300
400
500
600
700
800
900
0 2 4 6 8 10 12 14 16 18 20
Punch Travel (mm.)
Ext
rusi
on F
orce
(kN
)
Prediction ε = 0.3Prediction ε = 0.5Prediction ε = 0.7Experiment ε = 0.3Experiment ε = 0.5Experiment ε = 0.7
Figure 4. Force travel diagram of AA6082 with 25% SiC, with parameters of εA = 30%, 50% and 70%, α = 45o, and μ = 0.045
Figure 5. The equivalent stress distribution of AA6082 with 25% SiC, with parameters of εA = 30%, 50% and 70%, α = 45o, and μ = 0.045 The equivalent stress distributed in the workpieces shown in Figure 5. The equivalent stress in the middle of the workpiece had increased as the reduction in cross sectional area increased. The increased of reduction in cross sectional area caused higher
equivalent stress in the deformation area. This was caused by the larger obstruction of the metal flow at larger reduction in cross sectional area, which also required larger press load (Avitzur, 1983). 3.2 The Effect of Die Angle It is informative to study the effects of die angle on the behavior of the composite extrudate by assuming a constant of reduction in cross sectional area and the friction coefficient. Thus, with such the simulation, AA6082 with 25% of SiC ceramics were extruded by varying the die opening angle α from 30o, 45o, 60o and 90o with fixed reduction in cross sectional area of εA = 50% and the friction coefficient of μ = 0.045. It can be seen that the load stroke curves predicted from the simulations were plotted and shown in Figure 6. By considering for the beginning of the load stroke curves, the increment in die opening angle caused the press load to increase very sharply at the initial filling of the die, as expected. From the curves, it clearly pointed out that the increasing in the die opening angle increased the press load and obtained shorter punch stroke of the maximum load (Aravas, 1986).
0
100
200
300
400
500
600
700
800
0 2 4 6 8 10 12 14 16 18 20
Punch Travel (mm.)
Extr
usio
n Fo
rce
(kN
)
Prediction 30 องศาPrediction 45 องศาPrediction 60 องศาPrediction 90 องศาExperiment 45 องศา
Figure 6. Force travel diagram of AA6082 with 25% SiC, with parameters of α = 30o, 45o, 60o and 90o, εA = 50%, and μ = 0.045
Figure 7. The equivalent stress distribution of AA6082 with 25% SiC, with parameters of α = 30o, 45o, 60o and 90o, εA = 50%, and μ = 0.045 Figure 7 shows the predicted distribution of the equivalent stress within the extrudate for process parameters given above. Comparing in the deformation area, the equivalent stress at the surface

The 2nd Thailand Metallurgy Conference (2 TMETC)
-112-
became higher than those at the central of the workpiece, when die opening angle increased. Thus the difference of the equivalent stress between the central axis and the surface increased as the die opening angle increased. This means that the effect of metal obstruction did not advanced to the middle of the workpiece for a small die opening angle, but did obstructed for a large die opening angle [6]. 3.3 The Effect of Volume Fraction The predicted extrusion forces as functions of the punch travels for AA6061 reinforced by Al2O3 with three different volume fractions; i.e., vf = 0%, 15% and 20%, while reduction in cross sectional area fixed at εA = 70%, die opening angel of α = 45o and the friction coefficient of μ = 0.045, had been presented in Figure 8. Considering for the beginning of the load stroke curves, the increased in volume fraction caused the press load to increase very sharply at die area. From curves, it clearly pointed out that the increasing in the volume fraction increased the press load, as expected. Thus increased in volume fraction had increased the material strength which increased the difficulty of material to deform [4].
0
100
200
300
400
500
600
700
800
900
0 5 10 15 20 25
Punch Travel (mm.)
Extru
sion
For
ce (k
N)
Prediction 0%Prediction 15%Prediction 20%Experiment 0%Experiment 15%Experiment 20%
Figure 8. Force travel diagram of AA6061 with vf = 0%, 15% and 20% Al2O3, and process parameters of εA = 70%, α = 45o, and μ = 0.045 For the PRMMC considered at 0%, 15% and 20% volume fractions, the contour plots of the equivalent stresses distributed in the workpieces were represented in Figure 9. From the contour plots, the high levels of equivalent stresses were found in the deformation area and the parts of the extrudate next to it on both sides. Away from this zone, the stress levels gradually decreased. Also, its values at the surface became higher than those at the central of the workpiece in all values of volume fractions. When volume fractions increased, the difference of the equivalent stress between the central axis and the surface increased. 3.4 The Effect of Different Matrix Material To investigate the effects of different kinds of matrix materials used as the main part of a composite, AA230A and AA6082 with 25% reinforcement of ceramics SiC were conducted in the simulation. The extrusion parameters were fixed as followings: reduction in cross sectional area εA = 50%, die opening
angel of α = 45o and the friction coefficient of μ = 0.045. The predicted load stroke curves obtained from such the simulation were displayed in Figure 10. Considering for the beginning of the load stroke curves, the change of matrix materials caused the press load to increase a little at the filling of material in die area. From modeling curves, it clearly pointed out that the increasing in the material strength increased the press load. Thus different matrix materials had different effects to the deformation of material during extrusion processes (Aravas, 1986).
Figure 9. The equivalent stress distribution of AA6061 with vf = 0%, 15% and 20% Al2O3, and process parameters of εA = 70%, α = 45o, and μ = 0.045 The contour plots of equivalent stresses distributed within two kinds of different composite materials given were shown in Figure 11. Comparing in the deformation area, the equivalent stresses of AA230A became higher than those of the AA6082. Thus the difference of the equivalent stresses between these two composites increased as the material strength increased, especially in term of matrix materials. This mean that the effect of metal matrix properties did changed the deformation of material flow in the extrusion process [8].
0
100
200
300
400
500
600
700
800
0 2 4 6 8 10 12 14 16 18 20
Punch Travel (mm.)
Extru
sion
For
ce (k
N)
Prediction AA230APrediction AA6082Experiment AA230AExperiment AA6082
Figure 10. Force travel diagram of AA230A and AA6082 with vf = 25% of SiC, and process parameters of εA = 50%, α = 45o, and μ = 0.045

The 2nd Thailand Metallurgy Conference (2 TMETC)
-113-
Figure 11. The equivalent stress distribution of AA230A and AA6082 with vf = 25% of SiC, and process parameters of εA = 50%, α = 45o, and μ = 0.045 4. Conclusions The cold forward extrusion have significant role in the aluminum industry. The detail information about the material behavior is very helpful in the further development and understanding of the cold forward extrusion process. The forward extrusion processes were carried out throughout the simulation by aided of commercial program, MSC. Marc 2003. By varying different parameters, the analysis results show the effectiveness in the reduction of total consumption of cost and time. As shown in this study, the parameters such as the increased in the reduction area caused an increase in the extrusion force and caused higher equivalent stress in the central part, that effected by larger obstruction of die. The increased in die opening angle also caused an increased in extrusion force and equivalent stress at die area, which increased difficult for metal to flow. The increased in the volume fraction caused an increased in the extrusion force, which caused by increase of material strength by the reinforcement. The changed in material property had effected to the extrusion processes in which higher material strength would required higher extrusion force. Those parameters, that had been considered, were major influence on the press load, stress distribution, and the flow of the metal. Beside other parameters for further analysis would provide better
understanding of the forward extrusion process, which could be done by considering for thermal condition, elastic die properties, and different die figures. 5. References [1] Allison, J.E., and Cole, G.S., (1993), “Metal-Matrix Composites in the Automobile Industry: Opportunities and Challenges”, JOM, 45, 1, pp. 19-24. [2] Aravas, N., (1986), “The Analysis of Void Growth that Leads to Central Bursting During Extrusion”, J. Mech. Phy. Solids, 34, 1, pp. 55-79. [3] Davies, C.H.J., (1995), “Critical Issues in the Extrusion of Particle Reinforced Metal Matrix Composites”, Key Engineering Materials, 104-107, 1, pp. 447-458. [4] Wagener, H.W., and Wolf, J., (1993), “Cold Forging of MMCs of Aluminium Alloy Matrix”, J. Mater. Proc. Technol., 37, 1-4, pp. 253-265. [5] Wagener, H.W., and Wolf, J., (1995), “Forming Parameters and Mechanical Properties of Cold Extruded MMCs of Aluminium Alloy Matrix”, Key Engineering Materials, 104-107, 1, pp. 99-110. [6] Zimerman, Z., and Avitzur, B. (1970). “Analysis of the Effects of Strain Hardening on Central Bursting Defects in Drawing and Extrusion.” Trans. ASME, J. Eng. Ind., 92, 1, pp. 135-145. [7] Dixon, W., (1992), “Extrusion of Particulate-Reinforced Aluminum-Based Metal Matrix Composites”, 5th Int. Aluminum Extrusion Technology Seminar, Chicago, Illinois, USA, 19-22 May 1992, The Aluminum Association, Washington, D.C., USA, Vol. I, pp. 429-436. [8] Avitzur, B., (1983), Handbook of Metal Forming Processes, John Wiley & Sons, New York. [9] Kobayashi, S., Oh, S.I., and Altan, T., (1989), Metal Forming and the Finite-Element Method. Oxford, Oxford University Press. [10] Lange, K., (1985), Handbook of Metal Forming, McGraw-Hill Book Company. [11] MSC. Software Corporation (2003), MSC. Marc 2003 Manual, Santa Ana, California, USA. [12] Suresh, S., Mortensen, A., and Needleman, A., (1993), Fundamentals of Metal-Matrix Composites, Butterworth-Heinemann, Stoneham, MA, USA

The 2nd Thailand Metallurgy Conference (2 TMETC)
-114-
Surface Modification of Pearls with Metal Nanoparticles T. Parnklang, C.t Thammacharoen, and S. Ekgasit
Sensor Research Unit, Department of Chemistry, Faculty of Science, Chulalongkorn University, Phayathai, Bangkok, 10330.
Tel/Fax.+66-218-7585; E-mail:[email protected]; Website: www.sru.research.chula.ac.th.
ABSTRACT – We explored the surface topography of pearls with atomic force microscopy. The optical properties of pearls are associated with their surface structures. From these understanding, we proposed a novel method that employed metal nanoparticles to modify the color of pearls without any interruption to their original surface structures. Therefore, the luster and iridescence of pearls were kept unchanged. In addition, various colors are possible with localized surface plasmon resonance properties of metal nanoparticles. KEY WORDS -- Pearls, Metal Nanoparticles, Iridescence.
บทคัดยอ - สมบัติเชิงพื้นผิวของไขมุกไดถูกตรวจสอบโดยการใช atomic force microscopy ผลการทดลองแสดงใหเห็นวาสมบัติเชิงแสงของไขมุกมีความสัมพันธกับโครงสรางเชิงพื้นผิว จากความเขาใจพื้นฐานนี้ เราไดนําเสนอวิธีการใหมในการเปล่ียนสีไขมุกโดยใชอนุภาคนาโนของโลหะ วิธีการนี้จะไมทําใหสมบัติเชิงพื้นผิวดั้งเดิมของไขมุกเปลี่ยนแปลงไป จึงยังคงรักษาความแวววาวของไขมุกไวได นอกจากนี้การเปลี่ยนสีไขมุกโดยการใชอนุภาคนาโนของโลหะ ยังสามารถที่จะเลือกเฉดสีใดก็ได เนื่องจากอนุภาคนาโนของโลหะมีสมบัติ localized surface plasmon resonance properties ซึ่งเปนสมบัติท่ีขึ้นกับขนาด รูปราง และชนิดของอนุภาคนาโนของโลหะ คําสําคัญ -- ไขมุก อนุภาคนาโนของโลหะ สีรุงของไขมุก 1. Introduction Pearls are the only kind of gemstones that are generated by living creatures i.e., pearl oysters. Pearls are nanocomposite materials between the hexagonal platelet of calcium carbonate called nacre and the protein binding matrix called conchiolin. Building in brick-and-mortar structure, pearls are regarded as a nanocomposite with superior mechanical strength. This inspired the researchers around the world to explore why these natural occurring materials are extremely strong i.e., stronger than any other manmade nanocomposites. Although the mechanical properties of pearl are thoroughly investigated, the optical properties of pearl are not well understood. From the advancement of microscopy technology, many research groups have reported that color in nature may be due to their natural photonic structure, instead of their pigments. For pearls, in addition to pigments in the protein matrix that make pearl colorful, the complex light-materials interaction with the nano- and micro-structures of pearls may play pivotal roles in their iridescent structures. Inspired by the beautifulness of pearls, we explore the relationship between the surface topography and the optical properties of pearl. Moreover, since all the pearls may not look beautiful and colorful, we proposed a novel method that employs metal nanoparticles to modify the color of pearls. Metal nanoparticles have localized surface plasmon resonance properties, which are size, shape, and type dependent. We can generate fancy spectral
color of pearls by varying their size, shape, and type of metal nanoparticles immobilized on pearls. 2. Experimental procedures All pearls were purchased from local jewelry retailers. The metal nanoparticles (silver and gold) were synthesized by our proprietary developed procedures. The surface topography of both original and metal nanoparticles immobilized pearls were investigated by SPA400 scanning probe microscope with NanoNavi® station in tapping mode. 3. Results & Discussion The surface topography of marine water and fresh water pearls are shown in Figure 1. The marine water pearl is more luster than the fresh water pearl. From the surface topography, we also see that the surface roughness of marine water pearl is less than that of fresh water pearl. Normally, smooth surface are better for reflecting than rough surface. Therefore, pearls with smoother surface will have more luster than the rougher ones. The marine water pearl also shows iridescent property, while the fresh water pearl does not. When we explore further to the nanostructure of the surface, we found some interesting periodic structure in the marine water pearl. This periodic structure can have complex interaction with the incident lights, modulate them, and reflecting back to our eyes with the rainbow color. The iridescence is also an angle dependent phenomena. Therefore, if we stare at the pearl from

The 2nd Thailand Metallurgy Conference (2 TMETC)
-115-
different angles, the various beautiful colors will be appeared to our eyes. This phenomena is not possible with the absorption of the color pigment, since the absorption is not an angle dependent phenomena. Figure 1.Surface topography of pearls: fresh water pearl [(A) and (B)]; Marine water pearl [(C) and (D)]. The surface topography of metal nanoparticles immobilized pearls are shown in Figure 2. When we immobilized silver nanoparticles on pearls, their color changed to yellow. When we immobilized gold nanoparticles on pearls, their color changed to violet. The original color of pearls was white. From the surface topography, we observed that pearls have more affinity to silver than gold. This may because the preferred interaction between the protein binding matrix and silver. The immobilized silver nanoparticles were spherical, and their sizes were varied from 5 – 40 nm. In the case of immobilized gold nanoparticles, they tended to aggregate into large particles. When we washed the modified pearls with organic solvent (methanol, ethanol, and acetone), the color were still unchanged. Moreover, unless we deliberately destroyed the surface of pearls with rigid materials, scratching them with finger nails or rubbing them together cannot alter the color at all. These were obvious evidences for the tolerance of the modified pearls. In addition, since the metal nanoparticles were only penetrated to the structure of pearls without any further interruption (for example, the size of the calcium carbonate nanograins or the thickness of the nacre layers), we can conserve the original luster and iridescence of pearls completely. 4. Conclusions The optical properties i.e., luster and iridescence of pearls are associated with their surface structure. The luster is associated with the roughness. The iridescence is associated with the ordered periodic structure. In
order to modify the color of pearls without any interruption to their original surface structure, we proposed a novel method that employed metal nanoparticles as dyeing agents. Various colors are possible because of the surface plasmon resonance properties of the metal nanoparticles. The color shade can be also modified with the percentage of surface coverage of metal nanoparticles. We are now exploring further how to grow different shapes and sizes of various metal nanoparticles on the surface of pearls to obtain fancy spectral color. Figure 2.Surface topography of metal nanoparticle immobilized pearls: Silver nanoparticles [(A) and (B)]; Gold nanoparticles [(C) and (D)]. 5. Acknowledgement We appreciate the financial supports from Commission on Higher Education (CHE) and Chulalongkorn University. 6. References [1] P. Vukusic and J. R. Samble, “Photonic Structures in Biology”, Nature, Vol. 424, August 2003. pp. 852-855.
5 μm
A
200 nm
B
5 μm
C
200 nm
D
5 μm
A
200 nm
B
5 μm
C
200 nm
D

The 2nd Thailand Metallurgy Conference (2 TMETC)
-116-
Continuous Synthesis of High Concentration Colloidal Silver Nanoparticles
P. Maneewattanapinyo1, N. Pimpha2, C. Thammacharoen1 and Sanong Ekgasit1
1Sensor Research Unit, Department of Chemistry, Faculty of Science, Chulalongkorn University,Bangkok 10330, Thailand.
E-mail: [email protected] 2 National Nanotechnology Center (NANOTEC), Thailand Science Park, 111 Paholyothin Rd,
Klong Luang, Pathumthani, Bangkok 12120, Thailand.
ABSTRACT – The purpose of this study was to develop a tubular flow reactor for continuously producing large amount of silver nanoparticles (AgNPs). The highly concentrated silver nanoparticle colloids were synthesized by chemical reduction of silver salt with a reducing agent in a tubular flow reactor. The tubular flow reactor was continuously produced silver nanoparticles at 18 liter per hour (18 L/hr) of high concentrated silver nanoparticles (i. e, greater than 10,000 ppm). The synthesized silver nanoparticles were very stable. The plasmon absorptions of silver nanoparticles were measured. The plasmon absorptions indicated that the synthesized silver nanoparticles had smaller size and narrow size distribution than those of the commercial products. KEY WORDS -- tubular flow reactor, silver colloid, silver nanoparticles, continuous process
บทคัดยอ - งานวิจัยชิ้นนี้มีจุดมุงหมายที่จะพัฒนาเครื่องปฏิกรณไหลแบบทอสําหรับผลิตคอลลอยดน้ําปริมาณมากของอนุภาคซิลเวอรนาโนแบบตอเนื่อง คอลลอยดน้ําความเขมขนสูงของอนุภาคซิลเวอรนาโนผลิตโดยกระบวนการรีดักชันดวยวิธีทางเคมี ระหวางสารละลายเกลือของโลหะเงินและสารละลายตัวรีดิวซในเครื่องปฏิกรณไหลแบบทอ จากการทดลองพบวาเคร่ืองปฏิกรณไหลแบบทอสามารถผลิตคอลลอยดน้ําของอนุภาคซิลเวอรนาโนไดอยางตอเนื่อง (อัตราการผลิตเฉลี่ย 18 ลิตรตอชั่วโมง) และปรับเปลี่ยนความเขมเขนในการผลิตคอลลอยดน้ําของอนุภาคซิลเวอรนาโนในชวงความเขมขนมากกวา 10,000 สวนในลานสวนโดยไมตองปรับเปลี่ยนเคร่ืองปฏิกรณ คอลลอยดน้ําของอนุภาคซิลเวอรนาโนที่สังเคราะหดวยเคร่ืองปฏิกรณไหลแบบทอ สามารถควบคุมขนาดอนุภาค มีความเขมขนและเสถียรภาพ สเปกตรัมการดูดกลืนแสงพลาสมอนของอนุภาคเงินที่สังเคราะห โดยเครื่องปฏิกรณไหลแบบทอแสดงใหเห็นวา อนุภาคเงินมีขนาดเล็กกวาและมีการกระจายตัวท่ีแคบกวาอนุภาคนาโนของเงินที่มีจําหนายในเชิงพาณิชย คําสําคัญ -- เครื่องปฏิกรณไหลแบบทอ, คอลลอยดน้ําของอนุภาคเงิน, อนุภาคซิลเวอรขนาดนาโน, การผลิตอยางตอเนื่อง
1. Introduction The properties of silver nanoparticles are very effective for antibacterial activity. It has been integrated into many consumer products for antibacterial applications, such as fabric, food packaging, cleaning cloth, and cosmetics [1, 2]. Nowadays, the imported silver nanoparticles are very expensive while the synthesized silver nanoparticles from laboratory scale that are not enough for supporting industrial applications. A continuous process and high concentration of silver nanoparticles are necessary for industrial application. Several studies have indicated that research with a chemical reduction method to synthesize silver nanoparticles by batch reactor is not enough for industrial applications [3-6]. There are no studies that develop and make tubular flow reactor for continuously producing large amount of silver
nanoparticles. So, the present study was designed to develop the continuous flow reactor and synthesized silver nanoparticles by tubular flow reactor for producing large amount and high concentration silver nanoparticles. 2. Experimental procedures The pulse processes of highly concentrated silver nanoparticles were synthesized by chemical reduction of silver salt solution mixed with the solution of reducing agent in tubular flow reactor (shown in Figure 1). Concentrations of silver nanoparticles of 10,000 up to 100,000 ppm were produced. The plasmon absorptions of highly concentrated silver nanoparticles were measured by a portable UV/Vis spectrophotometer (Ocean Optics USB 4000 UV/Vis spectrophotometer). The particles size of highly concentrated silver nanoparticles was measured via transmission electron microscope (TEM).

The 2nd Thailand Metallurgy Conference (2 TMETC)
-117-
Figure 1. The tubular flow reactor for continuous synthesis of high concentration silver nanoparticles. Figure 2. The plasmon absorption bands of the silver nanoparticles: (a) Batch reactor synthesized silver nanoparticles (λMax = 399 nm). (b) Tubular flow reactor synthesized silver nanoparticles (λMax = 400 nm). (c) Commercial product (λMax = 405 nm). 3. Results & Discussion In the support of prior research, this study found that the shape of the plasmon absorption spectrum related to the size and size distribution of the particles [7]. The narrow peak indicates the narrow particle size distribution. The shift of the peak to longer wavelength means the particle size is larger. The synthesized silver nanoparticles are shown in Figure 2. The plasmon absorption of diluted silver nanoparticles has maxima of 399, 400 and 405 nm for silver nanoparticles synthesized by the batch reactor, the tubular flow reactor and the commercial silver nanoparticles, respectively. This indicates that the synthesized particles by the batch reactor and the tubular flow reactor has smaller particle size than that of the commercial product. In addition, the full width at half height, (FWHH), of the plasmon absorption of the flow synthesized silver nanoparticles indicate a board size distribution than that of the batch synthesized silver nanoparticles. 4. Conclusions The highly concentrated silver nanoparticles were synthesized by chemical reduction of silver salt with the reducing agent in tubular flow reactor. The tubular flow reactor was continuously produced silver
nanoparticles in 18 liter per hour (18 L/hr) and variously concentrated silver nanoparticles. The synthesized silver nanoparticles have a small size and narrow size distribution, which can be produced in mass scale production that are enough for industrial applications. 5. Acknowledgement The authors acknowledge support from the National Research Council of Thailand (NRCT) and the Thailand Research Fund (TRF). 6. References [1] S. H. Jeong, S. Y. Yeo and S. C. Yi, “The Effect of
Filler Particle Size on the Antibacterial Properties of Compounded Polymer/Silver Fibers”. J. Mater. Sci., Vol. 40, 2005. pp. 5407-5411.
[2] Y. M. Mohan, K. Lee, T. Premkumar and K. E. Geckeler, “Hydrogel Networks as Nanoreactors: A Novel Approach to Silver Nanoparticles for Antibacterial Applications”. Polymer, Vol. 48, 2007. pp. 158-164.
[3] N. Shirtcliffe, U. Nickel and S. Schneider, “Reproducible Preparation of Silver Sols with Small Particle Size Using Borohydride Reduction: For Use as Nuclei for Preparation of Larger Particles”. J. Colloid Inter. Sci., Vol. 211, 1999. pp. 122-129.
[4] R. Poovathinthodiyil, F. Jie and L. W. Scott, “Completely “Green” Synthesis and Stabilization of Metal Nanoparticles”. J. Am. Chem. Soc., Vol. 125, 2003. pp. 13940-13941.
[5] H. Wang, X. Qiao, J. Chen and S. Ding, “Preparation of Silver Nanoparticles by Chemical Reduction Method”. Coll. Surf. A, Vol. 256, 2005. pp. 111-115.
[6] K. Raghuraman and K. K. Katti, “Methods for Producing Silver Nanoparticles”. US Patent No. 0045916A1, 2006.
300 350 400 450 500 550 600
abc
Abs
orba
nce
Wavelength (nm)300 350 400 450 500 550 600
abc
300 350 400 450 500 550 600
abc
Abs
orba
nce
Wavelength (nm)

The 2nd Thailand Metallurgy Conference (2 TMETC)
-118-
Room Temperature Sintered Conductive Silver Ink C. Lertvachirapaiboon, C. Thammacharoen, and S. Ekgasit*
Sensor Research Unit, Department of Chemistry, Faculty of Science, Chulalongkorn University, Bangkok 10330, Thailand
Tel: +66-2218-7585; Website: www.sru.research.chula.ac.th; E-Mail: [email protected]
ABSTRACT – The sintering temperature of conductive silver ink developed by Sensor Research Unit was substantially lower than those of the conventional conductive silver inks due to the nano-sized effect of the silver particles. Conductive silver ink made of silver nanoparticles was precipitated from high concentration silver colloids. After the conductive ink was applied and dried on substrate under ambient condition, the silver nanoparticles can be sintered and showed conductive without any thermal treatment. Morphology of conductive silver ink was analyzed by scanning electron microscope (SEM) and atomic force microscope (AFM). The room temperature sintered conductive silver ink can be applied on a temperature-sensitive surface such as low glass transition temperature plastic, thermoplastic film, and paper without deforming or destroying the substrate. KEY WORDS -- Conductive silver ink; Sintering temperature
บทคัดยอ - หนวยปฏิบัติการวิจัยอุปกรณรับรูสามารถพัฒนาหมึกนําไฟฟาซึ่งนําไฟฟาไดโดยไมมีการใหความรอน
เนื่องจากอนุภาคระดับนาโนเมตรของโลหะเงินสามารถซินเทอรไดท่ีอุณหภูมิหอง หมึกนําไฟฟาทําจากอนุภาคระดับนาโนเมตรของโลหะเงินความเขมขนสูง เม่ือนําไปเขียนบนวัสดุรองรับ แลวปลอยใหแหงที่อุณหภูมิหอง จะแสดงคุณสมบัติในการนําไฟฟาไดทันที การศึกษาลักษณะทางโครงสรางของหนึกนําไฟฟาทําจากอนุภาคระดับนาโนเมตรของโลหะเงินจะศึกษาดวย scanning electron microscope (SEM) และ atomic force microscope (AFM) คุณสมบัติท่ีดีเดนของหมึกนําไฟฟาทําจากอนุภาคระดับนาโนเมตรของโลหะเงินสามารถซินเทอรไดท่ีอุณหภูมิหอง คือ สามารถใชไดกับวัสดุท่ีสลายตัวไดงาย เชน พลาสติกท่ีมี glass transition temperature ตํ่า เทอรโมพลาสติก หรือแมแตนําไปใชกับกระดาษ คําสําคัญ -- หมึกนําไฟฟาทําจากอนุภาคเงินระดับนาโนเมตร; การซินเทอร 1. Introduction The sintering temperature of conductive silver ink developed by Sensor Research Unit was substantially lower than those of the conventional conductive silver inks due to the nano-sized effect of the silver particles. Conductive silver ink made of silver nanoparticles was precipitated from high concentration silver colloids. It can be made into ballpoint pen, stamp printing, and inkjet printing. After conductive ink was dried on substrate under ambient condition, the silver nanoparticles can be sintered and showed conductive property without any thermal treatment.
2. Experimental procedures AgNO3 was used as precursor of silver nanoparticles while NaBH4 was employed as a reducing agent. First, the silver metal was reacted with nitric acid in order to make a silver salt stock solution. The silver salt was then reduced into silver nanoparticles. After the reaction was completed a water colloid of highly concentrated and highly stabilized silver nanoparticles was obtained. Size and shape of the synthesized nanoparticles was investigated by atomic force microscope and scanning electron microscope.
3. Results & Discussion The morphology of conductive silver ink was observed by atomic force microscope (AFM), size of silver nanoparticles between 10 and 50 nm (Figure 1). After conductive ink was dried on substrate under ambient condition, the silver nanoparticles aggregate to larger particles (50 - 100 nm). Small size silver nanoparticles can be sintered at low temperature. When solvent evaporate, silver particles have been closed up and sintered. Finally, silver particles aggregate to the large particles (Figure 2) Figure 1. AFM images of conductive sliver ink. At very low concentration, size of silver particles was in the range 10 - 50 nm.
100 nm1 µm
A B

The 2nd Thailand Metallurgy Conference (2 TMETC)
-119-
Figure 2. AFM images of conductive sliver ink. The silver particles agglomerated from less than 10 nm to 50 – 100 nm. After the solvent evaporated and/or adsorbed onto substrate the particles were packed and became conductive.
4. Conclusions We have successfully developed conductive silver ink from silver nanoparticle. The conductive silver ink can be sintered and conducted at ambient temperature. The conductive silver ink can be made into a conductive line by writing, stamping, and printing process. It can be applied on a temperature-sensitive surface such as low glass transition temperature plastic, thermoplastic film, and paper without deforming or destroying the substrate. 5. Acknowledgement We appreciate financial supports from The National Research Council of Thailand (NRCT), and The Thailand Research Fund (TRF).
6. References [1] Luke M. Davis and David W. Thompson. “Novel and Facile Approach to the Fabrication of Metal-Patterned Dielectric Substrate”, Chem. Mater., Vol. 19, 2007, pp. 2299-2303. [2] Dongjo Kim, Sunho Jeong, and Jooho Moon, “Ink-Jet Printing of Silver Conductive Tracks on Flexible Substrates”, Mol. Cryst. Liq. Cryst., Vol. 459, 2006, pp. 45-55. [3] Jolk Perelaer, Berend-Jan de Gans, and Ulrich S. Schubert, “Ink-jet Printing and Microwave Sintering of Conductive Silver Tracks”, Adv. Mater., Vol. 18, 2006, pp. 2101-2014.
A
100 nm500 nm
A B

The 2nd Thailand Metallurgy Conference (2 TMETC)
-120-
Polymer Coating with an Antibacterial Property through the Incorporation of Silver Nanoparticle for Ambulance
P. Sonprasit , Chuchaat Thammacharoen and Sonong Ekgasit
Sensor Research Unit, Department of Chemistry, Faculty of science,ChulalongkornUnversity, 254 Phyathai Roat, patumwan, Bangkok 10330 Thailand
Tel: +66-2218-7585; Website: www.sru.reseach.chula.ac.th E-mail: [email protected]
ABSTRACT – Novel silver nanoparticle incorporated polymer coating for ambulance was developed. Spherical silver nanoparticle (20 – 80 nm) colloid at the concentration of 500 ppm was mixed into gel coat with the aid of mechanical stirring for 20 seconds. The coating were then coated on the mold and the surface of ambulance. The coated surface were polished to obtain a smoother the surface. After the spray coating process was finished, the antibacterial property of the coated surface was verified against Staphylococcus aureus (JIS Z 2801). From the test, the antibacterial efficiency was evaluated KEY WORDS -- silver nanoparticles, antibacterial Property, Ambulance
บทคัดยอ - พอลิเมอรเคลือบผิวแบบใหมท่ีมีสวนประกอบของอนุภาคนาโนของเงินไดถูกพัฒนาขึ้นเพื่อใชสําหรับการ
เคลือบผิวภายในของรถพยาบาล อนุภาค นาโนของเงินทรงกลมขนาด (20 – 80 nm) ความเขมขน 500 ppm ผสมกับพอลิเมอรแบบเจลโดยการกวน และนําไปเคลือบบนผิวพอลิเมอรตัวอยางดวย วิธีการพน หลังการพนตัวอยางถูกนําไปขัดเพื่อใหผิวเรียบ และนําไปทดสอบสมบัติการยับยั้งเชื้อแบคทีเรียตามมาตรฐาน JIS Z 2801 ดวยเชื้อ Staphylococcusaureus ผลการทดสอบแสดงวาพอลิเมอรแบบใหมท่ีพั ฒนาขึ้นมีประสิทธิภาพการยับยั้งเชื้อแบคทีเรีย 90 – 95%
คำสำคัญ - อนุภาคขนาดนาโนของเงิน, คุณสมบัติการยับยั้งเชื้อแบคทีเรีย, รถพยาบาล
1. Introduction Bacterial are the causes of many diseases. In addition, they are also the cause of bad smell. An ambulance is the place that is inevitably contaminated, more or less, with bacteria. With the well-known antibacterial properties of silver nanoparticles, it is possible to develop silver nanoparticle incorporated polymer coating that specifically design for ambulance.
2. Experiment Silver colloid master batch were prepared by the following procedure: 500 mL of silver nanoparticle colloid 10000 ppm were evaporated until the water content was not more than 1%. The gel coat was then mixed with the aid of mechanical stirring until the initial volume was reproduced. The prepared master batch was then diluted to 500 ppm with gel coat. 300 g of diluted master batch was spray coated to the 30 cm x 30 cm square fiber glass. The coated fiber glass was then polished with polishing wax until the smooth surface was obtained. Half of the coated fiber glass was polished with the conventional polishing wax, and the other half the coated fiber glass was polished with the nanoscale polishing wax for comparison. After finish polishing, the coated fiber glass was tested against Staphyllococcus aureus by the JIS Z 2801 method.
3. Results & Discussion The spray coated fiber glass were yellow as shown in Figure 1. This is the characteristic of spherical silver nanoparticles. However, this was undesirable because the completely white surface was required. Therefore, we had to developed new colorless gel coat formula, which are now in progress. Another problem that we had to face with was the water content of the master batc h. High water content in the master batch may cause the brittleness of the coating, slow hardening rate, and bubbles in the coating layer. The water content can be control by evaporating the silver nanoparticle colloid precursor during the preparation of gel coat master batch

The 2nd Thailand Metallurgy Conference (2 TMETC)
-121-
A1; stock solution 500 ppm was sprayed on mold A2; stock solution 500 ppm was sprayed on mold and rubbed with wax B1; stock solution 500 ppm was sprayed on surface B2; stock solution 500 ppm was sprayed on surface and rubbed with wax When the spray coated sample were tested against Staphylococcus aureus, the sample A1 and A2 shown excellent bacterial inhibition. The sample B1 and B2 shown 95% antibacterialsactivity. The different
inhibitions are caused by the nature of nanoparticles distribution on the surface. Direct coating (sample B1 and B2) was less effective than that of thecoating via mold, technique. 4. Conclusion Silver nanoparticles 500 ppm is enough for incorporating with gel coat for producing antibacterial polymer coating. However, this formulated polymer coating cannot be is not suitable for ambulance due to its intrinsic yellow color. The development of colorless polymer coating are in progress. 5. Acknowledgement The authors gratefully appreciated the supports from the Ratchadaphiseksompot Endowment Fund (Chulalongkorn University, the Thailand Research Fund (TRF), and the National Research Council of Thailand (NRCT ), Supreme Product co.,LTD. 6. Reference [1]Thin Solid Films, 398-399, 602 (2001). 2.K.H. Cho, J.E. Park, T. Osaka and S.G. Park, "The study of antimicrobial activity and preservative effects of nanosilver ingredient", Electrochim. Acta., 51, 956 (2005). [2] D. P. Dowling, K. Donnelly, M. L. McConnell, R. Eloy and M. N. Arnaud," Deposition of anti-bacterial silver coatings on polymeric substrates",

The 2nd Thailand Metallurgy Conference (2 TMETC)
-122-
The Antimicrobial Action of Silver Foams A. Oonpraderma, U. Ruktanonchaib and S. Asavavisithchaic*
a,cDepartment of Metallurgical Engineering, Faculty of Engineering, Chulalongkorn University, 254 Phayathai Rd. Phatumwan Bangkok, 10330
Tel: +66-2-218-6938, Fax: +66-2-218-6942, *E-mail: [email protected] bNational Nanotechnology Center (Nanotec), National Science and Technology Development
Agency, Thailand Science Park, Pathumthani 12120 Tel: +66-2-564-7100, Fax: +66-2-564-7100, E-mail: [email protected]
ABSTRACT – Open-cell Ag foams show a strong antimicrobial activity. The growth of E. coli was inhibited better than S. aureus. When the foam porosity increases, the growth inhibition of both E. coli and S. aureus also increases. The growth inhibition activity of both bacterias is also greater when the pore size of the foams is larger. KEY WORDS -- Metallic foam, Silver, Antimicrobial activity, Powder metallurgy, Porosity
บทคัดยอ - โฟมเงินที่มีโครงสรางแบบเปดสามารถตานจุลชีพไดอยางมีประสิทธิภาพ การเติบโตของเชื้ออีโคไลถูกยับย้ังไดดีกวาเชื้อเอสออเรียส เม่ือปริมาณรูพรุนของโฟมเพิ่มขึ้นจะทําใหการยับย้ังการเจริญเติบโตของเชื้ออีโคไลและเอสออเรียสมีประสิทธิภาพเพิ่มขึ้นดวย การยับยั้งการเจริญเติบโตของแบคทีเรียท้ังสองชนดิยังดีขึ้นดวยเม่ือขนาดรูพรุนของโฟมเพิ่มขึ้น คําสําคัญ -- โฟมโลหะ, เงิน, การตอตานจุลชีพ, กรรมวิธีโลหะผง, รูพรุน 1. Introduction Open-cell metallic foams are attractive for functional applications, such as filter, flame arrester, heat exchanger and biocompatible insert [1]. The penetrable internal structure of foams with high specific surface area also allows them to be used as large reaction sites in catalytic support. Fabrication of open-cell foams can be made by many methods, but the replication process through powder metallurgy route is preferable due to the ability to control the pore architecture by careful selection of space-holders [2]. Recently, open-cell silver (Ag) foams, developed at Chulalongkorn University, show several promising physical and mechanical properties [3]. It is known that Ag is antimicrobial metal which is widely used as bactericidal inhibitor for medical applications [4]. It is generally believed that the interaction of Ag ion with thiol (-SH) groups results in the inactivation of bacteria [5]. The present study aims to investigate the antibacteria action of Ag foams against Staphylococcus aureus (S. aureus) and Escherichia coli (E. coli). 2. Experimental procedures Ag foams were produced from the mixture of pure Ag powder with 60, 70 and 80 vol.% NaCl particles of various sizes. The mixed powder of 1.5 g was uniaxially pressed at 200 MPa in a 11-mm cylindrical tool steel dies, followed by dissolution in hot water and sintered at 750°C for 3 h. The complete description of Ag foam fabrication process can be found elsewhere [3]. Ag foam specimens were sterilized using autoclave at 121°C for 15 min. S.aureus (ATCC6538) and E.coli (ATCC25922) were used as a model for Gram-positive
and Gram-negative bacterias, respectively. Bacteria cultures were incubated at 37°C for 24 h in nutrient broth (NB). Bacterial dilution was made at 108, 107, 106 and 105 CFU⋅ml-1, followed by the addition of the foam specimens to NB at 105 CFU⋅ml-1. Activated samples were mixed using a shaking incubator at 37°C for 15 min. Serial dilutions of microbial were made at 101 and 102 CFU⋅ml-1 and incubated at 37°C for 24 h. Amounts of viable bacterial were calculated as the number of bacteria per specimen.
A
100B)(A%Reduction ×−= (1)
Where A = number of viable bacteria in control medium (CFU⋅ml-1), B = number of viable bacteria in sample (CFU⋅ml-1) 3. Results & Discussion Fig. 1 shows an Ag foam after removing 70 vol.% NaCl. It can be seen that the foam composes of large interconnected porosity.
Figure 1. A silver foam made using 70 vol.% NaCl Fig. 2 shows % bacterial reduction of Ag foams made using 60, 70 and 80 vol.% NaCl, respectively, with various pore sizes which are equivalent to the average sizes of NaCl. It is clear that the growth of E.coli, in

The 2nd Thailand Metallurgy Conference (2 TMETC)
-123-
all cases, were inhibited better than S.aureus. An increase in the porosity of foams resulted in higher % reduction for both bacterias.
Figure 2. Growth inhibition of Ag foams made using 60, 70 and 80 vol.% NaCl of: (a) 494 µm, (b) 337 µm, (c) 126 µm and (d) 39 µm Fig. 3 shows the amount of viable bacteria colonies after 15 min of incubation. The quantity of E.coli colonies was clearly lower than S.aureus, indicating that the Ag foams are able to inhibit the growth of E. coli at higher degree. 4. Conclusions Open-cell Ag foams show a strong antimicrobial activity. The growth of E. coli was inhibited better than S. aureus. When the foam porosity increases, the growth of both E. coli and S. aureus also increases. 5. Acknowledgement The supply of Ag grains from Dr. Ekasit
Nisaratanaporn was acknowledged. The authors are grateful for technical assistance with microbial test by Choochart Warin.
Figure 3. Inhibition of colonies after 15 min incubation of Ag foams made using 70 vol.% NaCl (337 µm): (a) S.aureus and (b) E.coli 6. References [1] Ashby, M.F., et al., “Metal foams: a design guide”, Butterworth-Heinemann, Oxford, UK, 2000 [2] Conde, Y., et al., “Replication processing of highly porous materials”. Advanced Engineering Materials, 2006. 8(9), pp. 795-803 [3] Asavavisithchai, S. and E. Nisaratanaporn, “Fabrication of open-cell silver foams using a replication process”, in Proceedings of the MetFoam 2007 International Conference on Porous Metals and Metallic Foams, MIT-Verlag Montreal, Canada, (in press) [4] N. Grier, “Silver and its compounds, disinfection, sterilization and preservation”, Lea and Febiger, Philadelphia, 1983 [5] Liau, S.Y., et al., “Interaction of silver nitrate with readily identifiable groups: Relationship to the antibacterial action of silver ions”, Letters in Applied Microbiology, 1997. 25(4), pp. 279-283
(a) S.aureus (b) E.coli

Poster Presentations

The 2nd Thailand Metallurgy Conference
-125-
Green Binder System for Powder Injection Moulding
Nutthita Chuankrerkkul Metallurgy and Materials Science Research Institute, Chulalongkorn University
Soi Chula 12, Phyathai Road, Bangkok 10330, Thailand Tel.02-2184234 Fax 02-6117586 E-mail: [email protected]
ABSTRACT – An environmentally friendly binder system is successfully developed for powder injection moulding of tungsten carbide-cobalt hardmetals. The binder system contains a major fraction of polyethylene glycol (PEG) and a minor fraction of a very finely dispersed polymethyl methacrylate (PMMA). Stearic acid (SA) is sometimes added into the system to act as a lubricant. PEG can be removed using water leaching technique, creating open-pore channels which allow the remaining binder, i.e. PMMA, to be removed by pyrolysis during ramping up to sintering temperature. Powder characteristics and binder compositions had an influence on the PIM process. Rate of PEG removal depends on time and water temperature employed in the experiment. Specimens retained their shape during and after leaching of the PEG. Properties of the components after sintering were also investigated. KEY WORDS – green binder, powder injection moulding, tungsten carbide-cobalt hardmetals
บทคัดยอ - ตัวประสานที่เปนมิตรตอสิ่งแวดลอมไดรับการพัฒนาขึ้นสําหรับกระบวนการฉีดขึ้นรูปวัสดุผงทังสเตนคารไบด-โคบอลตฮารดเมทัล ตัวประสานชนิดนี้มีองคประกอบหลักเปนพอลิเอทิลีนไกลคอล และมีองคประกอบรองเปนพอลิเมทิล เมทาคริเลท นอกจากนั้นยังมีการเติมกรดสเตียริกเพื่อทําหนาที่เปนสารชวยในการหลอล่ืนอีกดวย พอลิเอทิลีนไกลคอลจะถูกกําจัดโดยการใชน้ํา และจะเกิดชองวางภายในชิ้นงานซึ่งทําใหตัวประสานที่เหลืออยู ไดแกพอลิเมทิลเมทาคริเลท ถูกกําจัดออกไปไดในระหวางกระบวนการใหความรอนเพื่อทําการเผาซินเทอร ลักษณะเฉพาะของอนุภาคและปริมาณตัวประสานจะมีอิทธิพลกับกระบวนการฉีดขึ้นรูป อัตราของการกําจัดพอลิเอทิลีนไกลคอลจะขึ้นกับเวลาและอุณหภูมิของน้ําที่ใชในการทดลอง ชิ้นงานสามารถคงรูปอยูไดระหวางขั้นตอนการกําจัดตัวประสานและหลังจากนั้น นอกจากนั้นยังมีการศึกษาสมบัติของชิ้นงานหลังเผาดวย คําสําคัญ - ตัวประสานที่เปนมิตรตอสิ่งแวดลอม, กระบวนการฉีดขึ้นรูปวัสดุผง, ทังสเตนคารไบด-โคบอลตฮารดเมทัล 1. Introduction Powder injection moulding (PIM) is currently a well-established process for a fabrication of complex-shaped components for high performance applications [1]. Binder systems are the main differences between various PIM processes. Several classes of binder were used but most have long debinding times which are detrimental to economic of the process. Development of binder systems that can be removed by solvent debinding technique showed some advantages. However, the use of chemical solvents was required. To overcome this problem, the green binder, which contained a major fraction of polyethylene glycol (PEG) and a minor fraction of a very finely dispersed polymethyl methacrylate (PMMA) with a small amount of stearic acid (SA), was developed [2,3]. 2. Experimental procedures Powder mixture of 94 wt% of tungsten carbide (WC) and 6 wt% of cobalt (Co) was used in the present study. A Coulter LS130 particle size analyzer was used to measure particle size distribution. The
morphology of the powder was observed by scanning electron microscope (SEM). The binder system comprises 83 wt% of PEG, 15 wt% of PMMA and 2 wt% of SA. Various feedstock compositions were prepared. Powder loadings were varied from 54 – 57 vol%. Injection moulding was performed using a simple plunger-typed injection moulding machine with 44 MPa injection pressure. Feedstocks were heated to 100oC and injected into a mould having a dimension of 5 × 5 × 55 mm. The mouldings were subjected to water leaching at 40oC and 60oC from 30 minutes to 6 hours. Sintering treatments were carried out in argon atmosphere at temperature in the range of 1400oC – 1450oC for 60 minutes. Density and hardness measurements were made. The microstructures of specimens were also observed using optical microscope and SEM. 3. Results & Discussion In the study, the maximum mouldable solids content that had been possible for the hardmetal powder was 57 vol%. Water leaching tests were carried out to establish time required for the removal of the PEG at

The 2nd Thailand Metallurgy Conference
-126-
temperature below or above its melting temperature. The results are presented in Figure 1. Interconnected pores are formed after water leaching, which allows faster removal of the remaining PMMA by following pyrolysis prior to sintering.
0102030405060708090
100
0 1 2 3 4 5 6 7
Time (hr)
% P
EG re
mov
ed
(a) water temperature at 40 °C
0102030405060
708090
100
0 1 2 3 4 5 6 7
Time (hr)
% P
EG re
mov
ed
54 vol% 56 vol% 57 vol% (b) water tempearature at 60 °C
Figure 1. Results of leaching the mouldings at (a) 40 °C and (b) 60 °C The mouldings retained their shapes during and after leaching at both temperatures and for all times. The leaching was rapid in the initial stage. It is shown that larger amounts of PEG were removed from mouldings made with the lower nominal powder loadings at both temperatures. Figure 1 also shows that water leaching at higher temperature resulted in faster removal of the PEG. Sintering was performed in an argon atmosphere. The density increased when the temperature was raised from 1400 °C to 1425 °C. However, when temperature was raised to 1450 °C, no statistically significant difference(4) was observed. The sintered densities are listed in Table 1. In addition, for a study of the effect of powder loading, no statistical difference at the 95% confidence level was observed for the specimens having nominal powder loadings of 54 vol% to 57 vol%. 4. Conclusions It has been found possible to develop an environmentally friendly binder system for powder injection moulding of WC-Co hardmetals. The major fraction of the binder can be removed using water. The
leaching is rapid at the initial step and the rate of removal is higher when using water at elevated temperature. The sintered density achieved is higher than 95% of the theoretical value. It is possible that a higher density might be obtained if the mouldings will be subjected to vacuum sintering. Table 1. Densities of mouldings, sintered in an argon atmosphere at 1400 °C, 1425 °C or 1450 °C for 60 minutes
Code Ar/1400/60 Ar/1425/60 Ar/1450/60 P54 13.91 ± 0.22 14.36 ± 0.07 14.35 ± 0.37 P56 13.99 ± 0.20 14.46 ± 0.17 14.45 ± 0.25 P57 14.07 ± 0.30 14.38 ± 0.27 14.65 ± 0.40
5. Acknowledgement I would like to express my sincere gratitude to Professor Hywel Davies and Dr. Peter Messer, for their valuable advice, support and guidance throughout the study. I am very grateful for a scholarship from the Government of Thailand. 6. References [1] R. M. German and A. Bose, Injection moulding of metals and ceramics, Metal Powder Industries Federation, Princeton, NJ, 1997 [2] M. Y. Anwar, P. F. Messer, H. A. Davies and B. Ellis, “Injection moulding of 316L stainless steel powder using novel binder system”, Powder Metallurgy, Vol. 38, No. 2, 1995, pp. 113-119 [3] N. Chuankrerkkul, Powder injection moulding of WC-Co hardmetals using a PEG/PMMA binder, PhD Thesis, The University of Sheffield, U.K., 2006 [4] M. Hamburg and P. Young, Statistical Analysis for Decision Making, The Dresden Press, Fort Worth, TX, 1994

The 2nd Thailand Metallurgy Conference
-127-
Interfacial Microstructures and Solder Joint Strength of Sn- 3.0 wt.%Ag-0.5wt.%Cu Lead-free Solder Balls on Ni/Au
Finished Printed Circuit Boards
Onnjira Diewwanit, Narawit Tantivanitchanon, Siriporn Sirimethanon Department of Tool and Materials Engineering, King Mongkut’s university of Technology
Thonburi, Bangkok, Thailand Tel.(02)470-9216Fax.(02)872-9080 E-mail:[email protected]
ABSTRACT – Sn-3.0 wt%Ag-0.5wt%Cu solder balls were mounted on Ni/Au Cu substrate printed circuit boards by using reflow soldering process. The samples were aged at 150 oC for 50-1000 h. The interfacial microstructures of the solder joints were investigated using scanning electron microscopy (SEM). The pull strength of solder joints were examined by pull off test method. It was found that intermetallic compound layer, (CuNi)6Sn5, was formed and slightly increased with the aging time to a certained value which about 2.3-2.4 μm. The pull strength of intermetallic compound layer may stronger than the strength of bull solder, because the shear plane is the nonunderfilled flip chip assemblies is through the bulk solder above the IMC layer. The pull strength are in the range of 5.7-5.9 N. KEY WORDS – Lead-free solders; joint strength; intermetallic compound (IMC)
บทคัดยอ - โลหะบัดกรีสวนผสมดีบุก-เงิน 3 %โดยน้ําหนัก-ทองแดง 0.5 % โดยน้ําหนัก ชนิดลูกบอลถูกบัดกรีบน
แผนวงจรสําเร็จรูปท่ีมีการเคลือบ นิเกิล/ทองคําบนพื้นทองแดง จากนั้นนําไปอบใหความรอนที่อุณหภูมิ 150oC เปนเวลาตางๆจนถึง 1000 ชั่วโมง ทําการตรวจสอบโครงสรางจุลภาคบริเวณตําแหนงรอยบัดกรีดวยกลองจุลทรรศนอิเลกตรอนแบบสองกราด (scanning electron microscope) และทดสอบความแข็งแรงของรอยบัดกรีดวยวิธีดึงทดสอบ (pull-off method) โครงสรางจุลภาคบริเวณรอยบัดกรีจะเกิดชั้นสารประกอบเชิงโลหะ (CuNi)6Sn5 ซึ่งมีความหนาเพิ่มขึ้นเล็กนอยตามเวลาใน
การอบที่เพิ่มขึ้นอยางไรก็ตามชั้นความหนาของสารประกอบมีความหนาเฉลี่ยประมาณ 2.3-2.4 μm สวนความสามารถในการทนแรงดึงทดสอบของรอยบัดกรีอยูในชวง 5.7-5.9 นิวตัน และระนาบที่เกิดการแตกจะอยูในสวนของโลหะบัดกรี (bulk solder) ท้ังสิ้น
คําสําคัญ -- โลหะบัดกรีปราศจากตะกั่ว, ความแข็งแรงของรอยบัดกรี, สารประกอบเชิงโลหะ 1. Introduction Sn-Ag-Cu alloys are regarded as a potential lead-free solder which can be replaced Sn-Pb solder. Previous studies have indicated that the interfacial reaction, intermetallic compounds (IMCs) between solder and substrates have a strongly effect on the mechanical properties and reliability of solder joints. The brittleness of the intermetallic compounds causes failure of the solder joints. Ni/Au substrate was used as a barrier between solder and Cu substrate. In this study, commercial Sn-3.0 wt.%Ag-0.5 wt.%Cu (Sn-3Ag-0.5Cu) solder balls, were jointed on Ni/Au copper substrate of a printed circuit board (PCB). The samples were stored at 150 oC for various aging times. The solder joint strength was examined using pull-off test and the microstructures of the joints were characterized using scanning electron microscopy (SEM) and energy dispersive spectrometry (EDS).
2. Experimental procedures The Sn-3Ag-0.5Cu solder balls with 300 μm in diameter were deposited on Ni/Au copper substrate of PCB. The soldering process was conducted in a reflow oven. After assembly, the samples were stored at 150 oC for 50, 100, 150, 200, 250, 300, 400, 500, 600, 800 and 1000 h. A pull-off test system was used to measure the adhesion strength of the solder joints after aging. 3. Results & Discussion Figure 1 shows the cross-section of Sn-3Ag-0.5 Cu solder joint after reflow process. Au which coated between Ni and solder did not appeared because of high solubility of gold atom in the solder alloys. Moreover, the (CuNi)6Sn5 intermetallic compound formed at the interface of Ni layer and the solder. The thickness of the IMC is 1.85 μm. After aging at 150 oC for 50 to 200 h. the IMC thickness increased from 2.08 to 2.33 μm which is the maximum. The

The 2nd Thailand Metallurgy Conference
-128-
1.5
2
2.5
3
5
5.5
6
6.5
7
0 200 400 600 800 1000 1200
IMCs thickness
adhesion force
IMC
thic
knes
s, μm
pull strength, N
aging time, h
photomicrographs of interface microstructure of samples are exhibited in Figure 2. Prolonged aging time did not change on the IMC thickness as shown in Figure 3. This was due to the Ni layer that retard the diffusion of copper atom into the solder alloy.
Figure 1. Interfacial microstructure of Sn-3Ag-0.5Cu sample after reflow soldering.
Figure 2. Interfacial microstructures of Sn-3Ag-0.5Cu samples aged at 150 oC for (a) 50 h, (b) 200 h. Figure 3 also shows the pull strength of Sn-3Ag-0.5Cu solder joints after aging at 150 oC for various times. The pull strength of the solder joints are in the range of 5.7-5.9 N. A number of nonunderfilled flip chip assemblies were also subjected to 1000 h of aging at 150 oC. The fracture surface is shown in Figure 4. It can be seen that the shear plane on the nonunderfilled flip chip assemblies is through the bulk solder above the IMC layer. These may be summarized that the adhesion strength of IMC layer and substrates is stronger than the strength of the bulk solder. 4. Conclusions After reflow, (CuNi)6Sn5 IMC formed at the interface between the Sn-3Ag-0.5Cu alloy and substrate. Ni
layer retarded the formation of IMC. Aging time at 150oC, didn’t affect the IMC growth. The thickness of IMCs layer after aging at 150 for 50-1000 h. was in the range of 2.08-2.4 μm. Therefore, the pull strength of the solder joints was not much different.
Figure 3. Intermetallic compound layer thickness and pull strength of Sn-3Ag-0.5Cu solder joints aged at 150 oC.
Figure 4. Pull test fracture surface (through ball solder) of Sn-3Ag-0.5Cu solder joint after aging at 150 oC for 1000 h. 5. Acknowledgement The author would like to thank Spansion (Thailand) Co, Ltd for a part of financial support. 6. References [1] K. Suganuma et.al, “Effect of intermetallic compounds on properties of Sn-Ag-Cu lead-free soldered joints”, J. Alloys and Compds, vol. 352, No.1-2, pp. 226-236 [2] F. Olivier et.al, “Conception of a consumable copper reaction zone for a NiTi/SnAgCu composite material”, Composite, vol. 13, No.10, pp. 1391-1393 [3] John H. Lau, C.P. Wong, Ning Cheng Lee, S.W. Ricky Lee, Electronics Manufacturing with lead-free, halogen free& conductive-adhesive materials, McGraw-Hill Handbook
Mold compound
Cu substrate
Ni layer
(CuNi)6Sn5
(a)
(b)
(CuNi)6Sn5
(CuNi)6Sn5
Ni layer
Ni layer
Cu substrate
Cu substrate

The 2nd Thailand Metallurgy Conference
-129-
Zinc Phosphating on Aluminium Plate Using Ni as Catalyst and Post-treatment by Sodium Silicate
Supansa Dech-Oup, Torranin Chairuangsri
Department of Industrial Chemistry, Faculty of Science, Chiang Mai University,50200 Thailand
Tel 087-2067489 Fax 053-892262 E-mail [email protected]
ABSTRACT - Zinc phosphating and post-treatment processes for an aluminium alloy used as cathode plate in zinc electrowinning cell was studied. It is possible to perform zinc phosphating on the aluminium plate by using a solution containing Ni(NO3)2.6H2O 25 g/l as catalyst and post-treatment by a solution containing sodium silicate 10 g/l. Coating layer on the surface after zinc phosphating consisted mainly of phosphophylite. Post-treatment by sodium silicate led to a higher coverage by filling of fine, aggromerated crystals between phosphophylite grains. This should result in a superior corrosion resistance. KEY WORDS - Zinc phosphating, Aluminium, Sodium silicate, Scanning electron microscopy, Phosphophylite บทคัดยอ - ไดศึกษากระบวนการเคลือบสังกะสีฟอสเฟต และการปรับสภาพหลังเคลือบบนโลหะผสมอะลูมิเนียมท่ีใชเปน
แผนแคโทดในเซลแยกสังกะสีดวยไฟฟา พบวามีความเปนไปไดในการเคลือบสังกะสีฟอสเฟตบนโลหะผสมอะลูมิเนียมดังกลาวโดยใชสารละลายที่มีความเขมขนของ Ni(NO3)2.6H2O 25 กรัมตอลิตรเปนตัวเรงปฏิกิริยา และในการปรับสภาพผิวหลังเคลือบดวยสารละลายที่มีโซเดียมซิลิเกตเขมขน 10 กรัมตอลิตร ชั้นเคลือบบบนผิวหลังเคลือบสังกะสีฟอสเฟตมีผลึกฟอสโฟฟไลตเปนหลัก การปรับสภาพหลังเคลือบดวยโซเดียมซิลิเกตนําไปสูการปกคลุมท่ีสูงขึ้นดวยผลึกขนาดเล็กท่ีเกาะกลุมกันและเติมเต็มระหวางเกรนฟอสโฟฟไลต ซึ่งนาจะทาํใหความตานทานการกัดกรอนเพิ่มมากขึ้น
คําสําคัญ -สังกะสีฟอสเฟต, อะลูมิเนียม, โซเดียมซิลิเกต, จุลทรรศนศาสตรอิเล็กตรอนแบบสองกราด, ฟอสโฟฟไลต
1. Introduction Zinc phosphating is an important surface treatment process widely used in various industries for corrosion prevention, primer for painting, wear reduction, metal-forming lubricants and electrical insulation [1]. Zinc phosphating needs a catalyst to initiate precipitation. Typically, catalysts used can be e.g. Ni2+, Mn2+, F- and cations of rare earth metals [2]. Normally, after zinc phosphating process, coverage may not be completed and post-treatment is needed in some special cases. Hexa-valent chromating is the most effective treatment [3]. However, other alternatives have been searching e.g. sodium molybdate [3] and sodium silicate [1]. Zinc phosphating process has been successfully developed for hot-dip galvanizing steels, steels, magnesium alloys and aluminium alloys. However, a few works on zinc phosphating process for the aluminium alloy used as cathode plate in zinc electrowinning cell were reported. Therefore, it is the aim of this work to study this by using Ni2+ as a catalyst and post-treatment by sodium silicate. 2. Experimental procedures Aluminium alloy used as cathode plate in zinc electrowinning cell was obtained from the Zinc Extraction Plant, Tak Province, Thailand. It was cut as specimens with 1 cm width x 3 cm length x 1 cm
thick. The chemical composition of zinc phosphating bath was given in Table 1 together with that of the post-treatment bath. Conditions during the processes including temperature of the solution bath, pH and time were also given in the Table. After each process, the coating surface was observed using scanning electron microscopy (SEM) by secondary electron imaging (SEI) and energy dispersive x-rays spectrometry (EDS). A JEOL 5910LV-SEM was utilized and operated at 15 kV. Table 1 Chemical compositions and conditions used for zinc phosphating and post-treatment processes
Phosphating Process Post-treatment Process
ZnO 1.24 g/l Ni(NO3)2.6H2O 25 g/l 85%H3PO4 10.8 ml/l NaF 1.11 g/l Temperature 45oC pH 4 time 10 min.
Na2Si2O5 10.0 g/l Temperature 35oC pH 6 time 5 min.
3. Results & Discussion Surface of specimens after zinc phosphating observed by eyes is grey and became white after post-treatment by sodium silicate. Observation by SEM-SEI in Figure

The 2nd Thailand Metallurgy Conference
-130-
1 revealed equiaxed crystals, a typical morphology of phosphophylite, formed as coating layer after zinc phosphating process. The chemical composition analysed by EDS point analysis was in agreement with that of phosphophylite. The surface microstructure after post-treatment was given in Figure 2. Fine, aggromerated crystals of sodium silicate were found filling between grains of phosphophylite. EDS point analysis was also corresponding to the chemical composition of sodium silicate. This led to higher coverage and should result in a superior corrosion resistance.
Figure 1. SEI and EDS spectrum of the coating layer on the aluminium alloy after zinc phosphating. 4. Conclusions 1. It is possible to perform zinc phosphating on the
aluminum alloy used as cathode plate in zinc electrowinning cell using Ni2+ as catalyst and post-treatment by sodium silicate.
2. Coating layer on the surface after zinc phosphating contained mainly phosphophylite.
3. Post-treatment by sodium silicate led to a higher coverage by filling of fine, aggromerated crystals between phosphophylite grains.
5. Acknowledgement The authors gratefully thank for accessing to electron microscopy facilities at the Electron Microscopy Research and Service Center (EMRSc), Faculty of Science, Chiang Mai University.
Figure 2. SEI and EDS spectrum of the coating layer on the aluminium alloy after post-treatment. 6. References [1] Yu-ye XU and Bi-lan LIN, “Effect of silicate pretreatment, post-sealing and additives on corrosion resistance of phosphated galvanized steel”, Trans. Nonferrous Met. SOC, Vol. 17, 2007, pp. 1248-1253. [2] A. S. Akhtar, D. Susac, P. Glaze, K. C. Wong, and K.A.R. Mitchell, “The effect of Ni2+ on zinc of zinc phosphating of 2024-T3Al alloy”, Surface and Coating Technology, Vol.515, 2004, pp. 208-215. [3] Bi-lan Lin, Jin-Tang Lu and Gang Kong, “Effect of molybdate post-sealing on the corrosion resistance of zinc phosphate coating on hot-dip galvanized steel”, Corrosion Science, Vol. 50, pp. 962-967.

The 2nd Thailand Metallurgy Conference
-131-
Morphology and Optical Properties of Copper Nanoparticles Prepared by Pulsed Laser Ablation in Distilled Water
Pichitchai Pimpang1, Htain Lin Aye2, Torranin Chairuangsri2, Supab Choopun1. 1 Department of Physics, Faculty of Science, Chiang Mai University, Chiang Mai 50200, Thailand
2 Department of Industrial Chemistry, Faculty of Science, Chiang Mai University, Chiang Mai 50200, Thailand Tel. 053-943401, [email protected]
ABSTRACT - This research is mainly studied on morphology and optical properties of copper nanoparticles prepared by pulsed laser ablation in distilled water. Colloidal copper nanoparticles were prepared by pulsed Nd:YAG laser with the fundamental frequency at 1064 nm in distilled water. Size and optical properties of the nanoparticles were characterized by Transmission Electron Microscopy (TEM) and UV/visible spectroscopy, respectively. The copper nanoparticles were rather spherical with the mean particle size about 381 nm and surface plasmon resonance peak at 650 nm. The color of the colloidal solution is light green. It was concluded that the ablation of copper target in distilled water is a physical and flexible method for synthesis of copper nanoparticles. KEY WORDS - Laser ablation; Copper nanoparticles; Colloids; Surface plasmon resonance; Transmission electron microscopy บทคัดยอ - งานวิจัยนี้ศึกษาลักษณะโครงสรางและสมบัติทางแสงของอนุภาคนาโนของทองแดงที่เตรียมโดยการยิงดวย
พัลสแสงเลเซอรชนิด Nd:YAG ความถี่พื้นฐานมีความยาวคลื่น 1064 นาโนเมตร โดยใชน้ํากล่ันเปนตัวกลาง ขนาดและสมบัติทางแสงของอนุภาคนาโนถูกศึกษาโดยเทคนิคจุลทรรศนศาสตรอิเล็กตรอนแบบสองผานและอัลตราไวโอเลต-วิสิเบิลสเปกโตรสโคป ตามลําดับ อนุภาคที่ไดมีลักษณะทรงกลม มีขนาดเฉลี่ย 381 นาโนเมตรและมีสมบัติเซอรเฟสพลาสมอนเรโซแนนซสูงสุดที่ 650 นาโนเมตร สีปรากฏของสารละลายคอลลอยดท่ีไดเปนสีเขียว สรุปไดวาวิธีการยิงเปาทองแดงในตัวกลางที่เปนน้ํากลั่นเปนวิธีการทางฟสิกสและยืดหยุนไดสําหรับการสังเคราะหอนุภาคนาโนของทองแดง
คําสําคัญ - พัลสแสงเลเซอร; อนุภาคนาโนของทองแดง; คอลลอยด; เซอรเฟสพลาสมอนเรโซแนนซ; จุลทรรศนศาสตรอิเล็กตรอนแบบสองผาน
1. Introduction Various methods of synthesis have great influence on size and shape of nanoparticles. Hence, many techniques such as microemulsion, reverse micelles and reduction of copper salts have been developed to prepare copper nanoparticles [1,2]. Pulsed laser ablation was extensively used for many applications in synthesis of nanostructured materials, among which nanoparticles formation, alloying, dissociation, fragmentation and size control of particles are important [3]. Synthesis of copper nanoparticles in distilled water has been focused on size, shape, composition and optical properties by pulsed laser ablation of a copper target [4]. 2. Experimental Copper nanoparticles were prepared by pulsed laser ablation of a copper target. The target was 0.1 mm thickness and filled with 3 ml of distilled water in a glass vessel. A pulsed Nd:YAG laser with the fundamental wavelength of 1064 nm, energy of 50 mJ/pulsed and pulse length of 50 μs were used for
laser ablation. After ablation, the sample was measured for an absorbance spectrum by UV/VIS spectroscopy. Shape and size of nanoparticles were characterized by transmission electron microscopy (JEOL, JEM 2010, operated at 200 kV). Specimens for TEM experiments were prepared by depositing a drop of copper nanoparticles onto carbon-coated copper grids. 3. Results and Discussion The shape and size of copper nanoparticles in distilled water observed in TEM were shown in Figure 1. Figure 1a illustrates a typical bright-field TEM image of copper nanoparticles which were synthesized in distilled water. It suggested that the size of the particles is between 339 and 423 nm. Figure 1b is the corresponding selected area electron diffraction pattern. The pattern consists of four resolved concentric rings, measured as fcc Cu (111), (200), (220) and (311) planes. Absorbance spectrum of copper nanoparticles in distilled water was shown in Figure 2. It is clearly seen that the wavelength of

The 2nd Thailand Metallurgy Conference
-132-
maximum absorbance is 650 nm, which is related to the surface plasmon resonance of copper nanoparticles in distilled water.
Figure 1 (a) bright-field TEM image and (b) selected area electron diffraction pattern of copper nanoparticles prepared in distilled water.
Figure 2 Absorbance spectrum of colloidal copper nanoparticles synthesized by pulsed laser ablation a copper target in distilled water. 4. Conclusions In this work, copper nanoparticles were synthesis by pulsed Nd:YAG laser with the fundamental frequency of 1064 nm on a copper target in distilled water. Transmission electron microscopy was employed for characterization of size and shape of the copper nanoparticles. The particles are rather spherical with the average diameter of 381 nm and exhibit maximum absorbance at around 650 nm. The color of the colloidal solution obtained is light green. 5. Acknowledgement The authors would like to thank the Thailand International Development Cooperation Agency (TICA) for financial support and the Electron Microscopy Research and Service Center (EMRSc), Faculty of Science, Chiang Mai University, for electron microscopy facilities.
6. References [1] Environment protection agency, “Nanotechnology
white paper”, 2007 [online]. Available: http://es.epa.gov/ncer/nano/publications/whitepaper12022005.pdf.
[2] L. Guo, Z.H. Wu, K. Ibrahim and T. Liu., Research of non linear optical properties copper nanoparticles, Eur. Phys. J. D, Vol. 9, 1999. pp. 591-594.
[3] P.D. Townsend, R. Brooks, D.E. Hole and Z. Wu., Luminescence from copper nanoparticles, Apply. Phys. B, Vol. 73, 2001, pp. 345-353.
[4] R.M. Tilaki, A. Iraji Zad and S.M. Mahdavi., Size composition and optical properties of copper nanoparticles prepared by laser ablation in liquids, Apply. Phys. A, Vol. 88, 2007, pp. 415-419.
(b) (a)

The 2nd Thailand Metallurgy Conference
-133-
Failure due to Hydrogen Embrittlement of Cap-Screw Bolt
S. Kaewkumsai, S. Sorachot, and J. Troset
National Metal and Material Technology Center (MTEC), National Science and Technology Development Agency (NSTDA),
114 Thailand Science Park, Paholyothin Rd., Klong 1, Klong Luang, Pathumthani 12120 THAILAND
Phone 66-2564-6500 ext. 4736, Fax.66-2564-6332, E-Mail: [email protected]
ABSTRACT - Alloy steel bolt is used for pump applications in petrochemical plant failed after in serviced for nearly 6 years. One such fastener parted into two pieces during operation. Analysis revealed that the fracture surface of the failed fastener consisted of two distinct regions, a bright region at the center encircled by a relatively dark region. The dark region spread all along the periphery of the fracture surface. Fractography revealed that the central bright region consisted of dimples, while the dark region consisted of intergranular facets. From the evidences it was concluded that the fastener failed due to hydrogen embrittlement. The possible sources for hydrogen were the uncontrolled furnace atmosphere during case hardening treatment. It was recommended that the heat treating process of the bolt should be more carefully controlled. KEY WORDS - Bolt, Hydrogen Embrittlement, Intergranular Crack, Dimple 1. Introduction Hydrogen embrittlement is a form of environmentally assisted failure which is caused by the action of hydrogen often in combination with residual or applied stress resulting in the reduction of the load bearing capacity of a component [1]. The cause of the embrittlement is the penetration of atomic hydrogen into the structure of metal. Generally a small quantity of hydrogen is sufficient to cause failures because it has the ability to magnify its effect by migrating to regions of high tri-axial stress. Hydrogen embrittlement manifests itself in diverse modes of material failures each of which is highly specific to the alloy system. In all cases, the fracture of bolt takes place starting from the root of the last engaged thread [2]. Hydrogen can be formed on the material surface both during a manufacturing process and during service. During manufacturing the most common sources of hydrogen is in acid cleaning and electrolytic plating. In the service life, hydrogen can be generated by the dissolution of hydrocarbon gases and cathodic protection system [3]. In this paper, the failed part was the stud bolts size M32 at the flange-end of external screw pump. It had been in service for nearly 6 years. It was made of the alloy steel, ASTM SA-574. They were used for connecting the flange-end with the pump. During service, the bolt was exposed to the hydrocarbon-containing environment in the range of temperature around 60-70 °C. It was reported that the tightening torque was 1200 ft-lb. Fracture of stud bolt was found during operation. 2. Experimental procedures As-received fractured bolt was thoroughly examined by visually and the aid of a stereo microscope. Then the fracture surface analysis was conducted to find out
the origin site and propagation direction in the fractured surface by using a stereo optical microscope. Fractography observation at high magnification was also studied by a scanning electron microscope (SEM). A hardness survey was made across the cross-section of the sample using hardness tester (300-gram load) in the Hv scale (Hv0.3), which had carried out on metallographic sample. Chemical composition analysis was performed by a spark emission spectrometer to determine the bulk composition of material. Finally, the samples were prepared using a standard metallographic technique and etched with nital solution (a dilute solution of HNO3 in alcohol). The microstructure of the failed bolt was analyzed by an optical microscope. 3. Results & Discussion Visual Examination Observation of the failed bolt revealed that it broke into two pieces in the abrupt change of diameter (head-to- shank radius). The fracture surface was aligning normal to the shank axis. No significant reduction of cross-section area. Corrosion was absent. Concave fracture surface was also observed. Fracture Surface Analysis The fracture surface showed the origin at the outer surface and propagated by radial marks indicative of brittle fracture (Fig.1a). Radial marks are lines on the fracture surface that radiate outward from the origin. They are formed by the intersection of brittle fractures propagating at different levels. Fracture topography of the periphery of the circular fracture face was exhibited by the intergranular hairline cracks, features often associated with both hydrogen embrittlement and quench cracking (Fig.1b). While at the center of the fracture surface was characterized by equiaxed

The 2nd Thailand Metallurgy Conference
-134-
dimples (Fig.1c), common features of ductile overload (final stage of fracture).
(a)
(b) (c)
Figure 1. Fractography; a) macrofractography, b) intergranular fracture, and c) dimples fracture Microstructure Analysis Microstructure of the fractured bolts reflected the normal, tempered martensite structure, characteristic of this material for the require strength and typical of hardened and tempered steel. The microstructure of this sample is showed in Fig. 2. Hardness Testing A hardness survey was made across the cross-section of the bolt using hardness tester in the Hv scale according to ASTM E18 C-2001. The schematic drawing of cross-section of bolt shows the indentation site for hardness measurement as shown in Fig. 3. The length of each indentation sites was 1.0 mm. The average hardness results of 3 indentation lines that ran from the case through the core are showed in Fig.4. The hardness values of the case layer were found to be greater than that of base metal. The hardness values of the case hardened layer are shown significant information.
Figure 2. Tempered martensite structure and crack in the case hardened layer Composition Analysis Chemical composition analysis of a piece of the bolt was determined with a spark emission spectrometer. The analytical results are in agreement with the
specification for the ASTM SA-574. Table 1 shows the results of bulk composition of the bolt in comparison with the nominal composition of the standard. Figure 3. Schematic drawing of indentation sites
0
50
100
150
200
250
300
350
400
450
500
1 2 3 4 5 6 7 8 9 core
Figure 4. Hardness profiles across cross-section of the bolt
Table 1. The composition of the bolt compares with the specification of ASTM SA-574
Composition (Wt. %) Mat.
C Si Mn Cr P S
Bolt 0.39 0.23 0.76 1.00 0.001 0.001
SA-574 0.33
(min) NR NR NR
0.04
Max
0.045
Max
4. Discussions The fractography revealed the concave fracture surface, typical indicates that there was a serious stress concentration [4]. The stress concentration played an important part in causing the failure, such as a sharp corner on a step in a shaft. The material did not exhibit much plasticity during fracture, which was anticipated from an embrittlement type of failure [5]. The presence of intergranular hairline cracks indications along grain facets on the fracture surface point to hydrogen embrittlement. The presence of a ductile fracture mode at the core and an intergranular fracture mode at the outer surface of a case hardening bolt is typical of hydrogen embrittlement [6], but could also be stress corrosion cracking (SCC). However, SCC can be eliminated, because the microstructure analysis results showed no presence of branched cracks. Many hydrogen embrittlement mechanisms have been proposed, but none is universally accept. However, the phenomenon of hydrogen embrittlement is widely present. Evidences found in this case can be explained in a supportive manner through several mechanisms as
10 μm mm
100 μm
1 2 3 4 5 6 7 8 9 core
Hv0.3
Indentation sites

The 2nd Thailand Metallurgy Conference
-135-
mono-atomic hydrogen as small interstitial atom diffuse very rapidly above room temperature, eventually accumulates at voids/defects and other metallurgical discontinuities. With increase in concentration of hydrogen at such discontinuities, a high internal pressure is produced that enhances void growth and results in separate of grains. The hydrogen diffusion took place under the influence of residual stress, introduced in the material during thermal quenching treatment. The presence of hydrogen in steel reduces the strength of materials. It can be cause premature failure under static load. The time for failure depends on the stress applied to the component and the amount of hydrogen that has diffused in to steel. Because of this characteristic, hydrogen embrittlement is sometimes called hydrogen induced crack failure. The probable causes for entrapment of hydrogen in this material were heat treatment of the steel under uncontrolled furnace atmosphere and subsequent of quenching process. Similar failure of cadmium plated 4140 steel [7] accumulator ring for aerospace application due to hydrogen embrittlement, on account of insufficient stress relieving after cadmium plating has been reported else where. Some studies [3] have reported that the steel becomes susceptible to at hardness levels greater than HRC 40, while others state that the steels above HRC 35 are more susceptible. In this study, the average hardness at the case hardened layer of the bolt was about 400 Hv (~41 HRC). It appeared to be over the critical limit of hardness value. Furthermore, quench cracks in bolt may be occur result from stresses produced during the austenite-to-martensite transformation, which is accompanied by an increase in volume. Then the fracture of the bolt could be the contributed of high hardness value. 5. Conclusions The bolt failed due to hydrogen embrittlement. The probably cause of this failure could produce from the improper of heat treating process, especially the insufficient stress relieve after quenching process. To avoid such failure, it is recommended that the heat treating process should closely control. 6. References [1] R.K. Dayal and et al., “Hydrogen embrittlement in power plant steels”, Sadhana, Vol. 28, Parts 3&4, 2003, pp. 431–451. [2] Milan M.T., “Failure analysis of a SAE 4340 steel locking bolt”, Eng Fail Anal, Vol. 11, 2004, pp. 915–924. [3] Karl P. Fischer, “Bolter og Bolteforbindelser offshore”, MATERIALDAGEN 2003, 2003. [4] Sachs N.W., “Understanding the Surface Features of Fatigue Fractures: How They Describe the Failure Cause and the Failure History”, JFAP, Vol.5, 2005, pp.11-15. [5] Victor K., “Failed Main Rotor Pitch Horn Bolt from an Army Attack Helicopter”, Handbook of Case
Histories in Failure Analysis, ASM, Vol. 2, pp.338-391, 1996. [6] Mark Tanner, G., Hydrogen Embrittlement Failure of Socket Head Cap Screws, “Handbook of Case Histories in Failure Analysis”, ASM, Vol.1, pp.332-334, 1996. [7] A.K. Jha et al., “Hydrogen embrittlement of 3.5Ni–1.5Cr–0.5Mo steel fastener”, Eng Fail Anal, Vol. 15, 2008, pp. 431–439.

The 2nd Thailand Metallurgy Conference
-136-
Stress Corrosion Cracking in Welded 316SS Screener Shaft
S. Kaewkumsai, N. Bunchoo, and E. Viyanit National Metal and Material Technology Center (MTEC),
National Science and Technology Development Agency (NSTDA), 114 Thailand Science Park, Paholyothin Rd., Klong 1,
Klong Luang, Pathumthani 12120 THAILAND Phone 66-2564-6500 ext. 4736, Fax.66-2564-6332, E-Mail: [email protected]
ABSTRACT - This paper described the failure of stainless steel shaft grade AISI 316, which has been investigated after being in service for nearly 3 years. It failed by stress corrosion cracking, which was originated at the welded zone. The investigation included visual examination, optical microscopy, scanning electron microscopy (SEM), energy dispersive spectroscopy (EDS), spectrometry, and metallography. Analytical results revealed that crack was propagated at the outer surface of the welded zone. Significant evidence of pitting was observed in the originated zones which results from the corrosion attacked. It is necessary to check the material properties after welding process and one should ensure that the residual tensile stresses is prohibited. KEY WORDS – Stress Corrosion Cracking, Stainless Steel, Branched Crack 1. Introduction Stress corrosion cracking (SCC) is a term used to describe failures in engineering parts that result from environmentally assisted cracks propagation. This phenomenon is associated with a combination of stresses above some threshold values, specific environment and sensitive material, which leads to surface cracks especially in passive film forming metal [1]. Austenitic stainless steel parts were frequently subject to failure from stress corrosion cracking in chloride containing environments. To induce SCC, a high chloride concentration is required, although relatively small amount of chloride is sufficient on heated surfaces, area where chloride concentration can occur, or where chloride is concentrated by pitting or crevice corrosion. The cracking continues at low stresses and commonly occurs as a result of residual stresses from welding or manufacturing. The cracking is normally transgranular, although it may switch to intergranular mode as a result of sensitization of the steel. In service, welding residual stresses can superpose on applied stress and if being tensile in nature, they may promote SCC. For on-site application, the maximum residual stresses produced in the welding process may be higher than the yield strength of material [2]. Since the breakdown of passive films has been recognized as playing a key role in the pitting and SCC of austenitic stainless steels, it is reasonable to correlate the effects of microstructure and residual stress on corrosion resistance to the properties of the passive film. The failed material for failure analysis was the stainless steel screener shaft, which had been in service for nearly 3 years. The shaft was made of commercial stainless steel grade AISI 316. The shaft was used for vibrated the screener of plastic powder. The vibration amplitude and frequency cycles were controlled around 3 mm and 1000 cycle/second,
respectively. The temperature in serviced was exposing around 80-90 °C. The shaft was fabricated by welding process without preheat and post-heat at the welded location and fracture was found in this area. The fractured shaft for failure analysis is shown in figure 1.
(a) (b) Figure 1. As- received screener shaft for failure analysis and fracture site 2. Investigation Methods and Results 2.1 Visual Examination As-received fractured shaft was thoroughly examined visually with the aid of a stereo microscope. The shaft had fractured into two pieces. A portion of one of the mating fracture surfaces was cut away from the shaft and used for fractography. The fracture surface, which cut from as received failed shaft, was carefully examined both visually and the aid of a stereoscopic microscope (up to 10X). The fracture surface on the shaft shows the macro-view in Fig.2a. The fracture surface was displayed a flat region normal to the axis on the shaft. The prominent array of radial marks indicative of brittle fast fracture was visibly observed [Fig.2b]. The crack originated on the outside surface of the shaft nearby the welded area. It emanated from the surface pit. Examination of the outside cylindrical surface of the shaft at the fracture origin site revealed a rust color scale and evidence of a small hole.

The 2nd Thailand Metallurgy Conference
-137-
2.2 Fractography with SEM The fracture initiation site in the fractured specimen was examined in the scanning electron microscope (SEM). SEM examination of the surface of fracture origin area revealed a branched crack generated from the fracture origin and also was covered by the corrosion products as shown in Fig. 3a. The Energy Dispersive Spectrometry (EDS) was used to determine the chemical composition analysis of contaminant particles on the surface of fracture origin. The results of the corrosion products in a fracture origin area revealed the high peak of chlorine (Fig.3b).
(a) (b) Figure 2. Fracture surface of the failed part a) entire fracture surface b) radial marks radiated from the origin
(a)
(b) Figure 3.a SEM fractograph of the fracture origin surface revealed a branched crack and was covered by corrosion products b) EDS spectrum of the corrosion products on in the area of fracture origin
(a) (b) Figure 4. a) Normal structure b) cracks at the weld interface 2.3 Composition Analysis A piece of shaft was subjected to spark emission
spectrometer to determine the bulk composition of material. The chemical composition of the test sample is close to specification of AISI 316. 2.4 Cross-sectional and Microstructure Analysis A sample was cut from the section near the fracture surface. The sample was prepared for examination by mounting, polishing, and etching with glyceregia solution. The microstructure in the base metal was generally found to be austenitic structure (Fig. 4a). The welded metal shows the dendritic structure, which was resulted from fast cooling rate. The microstructure characteristic near the fusion region is presented in Fig.4b. Note the slag inclusions at the weld interface were found. A branched crack was found adjacent to base metal and welded metal (Fig.11). The crack morphology is typical of stress corrosion cracking. 2.5 Hardness Testing Micro-hardness measurements were taken across the fusion line region that included base metal and weld metals, which had carried out on metallographic sample. The hardness values of the welded metal were found to be a little greater than that of base metal. The hardness values are not shown significant information. 3. Discussions Visual and macro-examination and SEM fractography clearly established that the screener shaft failed in mode of brittle fracture as indicated by the radial mark. The origin was located at a localized region on the outside cylindrical surface of the shaft. It was occurred nearby the toe of welded area that contained a small hole of slag inclusions and branched-cracks, which act as stress concentrators and fracture origin sites. SCC in austenitic stainless steels is easily recognized by the branched nature of transgranular cracks [3]. EDS analysis of the impurities on a small hole revealed that it contained a large amount of chlorine, an element that contributed to crack initiation. Chlorides are the big problem when using the 300 series grades of stainless steel. The combination of the residual stress, the presence of chlorine, and cyclic load makes the material susceptible to fracture. Normally, stainless steel has a protective film that resists corrosion damage from chemical species. For the failed part, the defects generated from rust caused discontinuities in protective film. Welding often makes this situation worse, prone to the metallurgical alters and residual stresses introduced. Therefore, the failure of the shaft was probably caused by the interaction between the residual stress and chloride containing media at the welded areas followed by crack initiation and propagation. NCS [4] said that the temperature usually needs to be above 70 C before SCC can occur. In this case, the service temperature was operated at 80-90 C, the ideal for generated SCC. The higher temperature, the higher concentration of chloride promote to occurrence of SCC. In service, welding residual stresses can superpose on applied stresses and, the shaft being tensile in nature, they may promote
Origin
100 μm 10 μm

The 2nd Thailand Metallurgy Conference
-138-
SCC. In engineering practice, the maximum residual stresses produced in welding process may be higher than the yield strength of material, so that they can induce SCC without the aid of applied stresses. 4. Conclusions The screener shaft was failed by stress corrosion cracking which was induced by chloride contamination in the service environment and the presence of residual stress. Stress relieve of the shaft after welding is necessary. Periodic cleaning of contaminants on the surface of the shaft is also recommended to avoiding such failure. 5. References [1] Manfredi C. et al, “Failures by SCC in buried pipelines”, Eng Fail Anal, Vol.9, 2002, pp.495-509. [2] Lu B.T., “Pitting and stress corrosion cracking behavior in welded austenitic stainless steel”, Electrochemica Acta, Vol.5, 2005, pp.1391-1403. [3] Lynch S.P., “Failures of Structures and Components by Environmentally Assisted Cracking”, Failure Analysis Case Studies, Eng Fail Anal, Vol.1, 1994, pp.77-90. [4] Suresh M. et al, “Failure Analysis of Stainless Steel Pipeline”, Eng Fail Anal, 2008, pp.497-504.

The 2nd Thailand Metallurgy Conference
-139-
Galvanic Corrosion induced Failure of Ceiling Suspension
S. Kaewkumsai, W. Khonraeng, and A. Chianpairot National Metal and Material Technology Center (MTEC),
National Science and Technology Development Agency (NSTDA), 114 Thailand Science Park, Paholyothin Rd.,
Klong 1, Klong Luang, Pathumthani 12120 THAILAND Phone 66-2564-6500 ext. 4736, Fax.66-2564-6332, E-Mail: [email protected]
ABSTRACT - Failure of parts and equipments by galvanic corrosion was commonly seen in many industries in Thailand. Some cases of failure, such as galvanic corrosion of high pressure pipeline or tap water system, were detrimental to environment, health and safety. In this case, galvanic corrosion of ceiling suspension part was analyzed for the cause of failure and preventive measures were suggested. The investigations consisted of visual examination, chemical analysis of corrosion products by energy dispersive spectrometry. Cross-section analysis was conducted on both degraded and normal part for comparison. The effect of water absorption of polystyrene foam on loading of ceiling suspension, which may give rise to failure, was also tested. The results showed that galvanic corrosion between stainless steel clamp and galvanized steel pin-lock acted as the main cause of the degradation. The oxidizing salt from absorbed water in styrene foam contributed to this failure. KEY WORDS – Galvanic corrosion, Oxidizing salt, Polystyrene foam, Overload 1. Introduction Stainless steels, especially austenitic type, are widely used many steel construction structures designed for extended service life for operating in highly aggressive environments [1]. Their use is limited mainly to those special cases due to the material cost, which is about one order of magnitude higher for stainless steel than for carbon steel. The use of stainless steels in new structures, combined with carbon steel or in replacement/repair work of damaged areas has increased as an alternative way of costs reduction [2]. Galvanic corrosion [3] is defined as “A form of electrochemical corrosion that occurs when two dissimilar metals come together in the presence of an electrolyte to form a couple, known as a galvanic couple.” In the building industry, particularly nearby the coast, the electrolyte is usually oxidizing salt, present in the form of liquid or vapor (rainwater or atmospheric humidity). When a galvanic couple forms, one of the metals in the couple becomes the anode and corrodes faster than it would all by itself, while the other becomes the cathode and corrodes slower than it would alone. In the case of galvanized steel [4], steel is plated with or dipped in molten zinc, and this process is driven by galvanic couples. Plating results in a zinc coating on the steel, whereas with hot-dipping the zinc diffuses partway into the steel. If the zinc coating is penetrated, by a scratch or other mechanical means, the zinc and steel will form a galvanic couple; the zinc acting as the anode. Initially, the zinc will give up electrons and corrode until it is nearly all gone. Then, of course, the steel will begin to corrode. Background information The ceiling suspension and polystyrene foam which
were the component of insulation of a large ice-cream room were falling down. It had been in service for nearly 12 years. The dimension of the insulation room was about 30 x 60 m. The ceiling was fabricated from the block of polystyrene foam with 1.2 m W, x 5 m L, x 10 inch D, and wrapped with galvanized steel plate. Each of the polystyrene foam blocks had 2 of the hanged positions by the clamp suspensions. Before the accident, it was found that the top of the ceiling was immersed with the rain water at the position directly under the leakage of the roof. The rain water was removed later. The hang suspensions were fabricated from the 304SS U-clamp and the pin-locks of galvanized steel. 2. Experimental procedures The ceiling suspension parts which were collected from the failed area were thoroughly examined by visual inspection and then photographed. Chemically analyze the rust deposits on the surfaces of degraded pin-lock to determine the corrosive element. The results were compared with that of the surface of normal pin-lock by performing chemical microanalytical technique with an energy dispersive spectrometer attached to a scanning electron microscope. The samples were sectioned from the severely degraded and from the normal pin-lock for cross-section and microstructure analysis. After being cut, the sample was ground, polished, etched, and finally examined under an optical microscope. The main objective of the microstructure analysis is to determine the appearance of coating layer and mode of corrosion penetration. Finally, cut the specimen from the used-polystyrene foam with the dimension of 10 X 10 X 10 cm. After being cut, they were weighed and

The 2nd Thailand Metallurgy Conference
-140-
then immersed in water and re-weighed again after immersed for 20 and 40 hours. 3. Results & Discussion 3.1 Visual inspection Visual inspection of the ceiling suspension parts which were collected from the failed site revealed the different appearance of degradation of metal parts. The direct contact with the ceiling and galvanized steel plate, stainless steel part, exhibited the lower degradation than those of the other parts (galvanized steel). The galvanized steel parts showed the spalling of galvanized layer, rust deposit, and material loose from corrosion attack as shown in Fig. 1.
(a) (b) Figure 1. Failed suspension parts a) suspension clamp b) galvanic corrosion The most severe part was the pin-lock, revealed the plastic distortion (Fig. 1b) and material loose from corrosion attacked. The corrosion of cable wire was also observed. Close observation of the most severe part, pin-lock, exhibited the severely degradation. The fracture site exhibited the metal loose and reduction of cross-section area in comparison with the other pin-locks.
Figure 2. shows the qualitative chemical compositions of the surface of the degraded of pin-lock part. 3.2 Chemical composition analysis The result of chemical composition analysis of the surface of normal pin-lock and degraded pin-lock are shown in Fig. 2. The surface of corrode pin-lock showed the contamination of Magnesium, Aluminum, Silicon, Sulfur, Chlorine, and Calcium.
3.3 Microstructure analysis Cross sectional analysis of the degraded pin-lock revealed the disappearance of coating layer as a result of corrosion occurred on the steel surface. The microstructure consisted of a small amount pearlitic
structure on the ferritic matrix structure which is consistent with the structure of the low carbon steel. Observation on the external surface revealed that corrosion was propagated at grain boundary, giving rise to loose material as shown in Fig. 3a. Cracks of the zinc coated layer were found on the normal pin-lock (Fig. 3b).
(a) (b) Figure 3. a) cross-section of the failed sample a disappeared of zinc coated layer and b) cracks of the zinc coated layer of the normal pin-lock 3.4 Water absorption of polystyrene foam Immersing the tested polystyrene foam into water and weighing after 20 and 40 hours indicated that it could absorb water and that the absorption of water rise with time as shown in Fig. 4.
Figure 4. Water absorption of polystyrene foam 3.5 Discussions The visual inspection of the ceiling suspension parts, indicate that corrosion occurred on the galvanized steel part. Severe corrosion attack was found on the contact surface between stainless steel part and galvanized steel part. This form of corrosion happened due to the difference of corrosion potentials of the two metals [5]. In addition, stainless steel had higher corrosion potential than that of galvanized steel [6]. Corrosion of two dissimilar metals is consequently an alternative name for galvanic corrosion [3]. Pin-lock part had suffered severe deformation as evident by distortion and loose metal from corrosion. Distortion deformation of this part indicated that it had applied load over the yield strength limit. Deformation of pin-lock could occur from 2 factors, reduction of strength form degradation effect and increasing of applied load. Chemical composition of deposit on the degraded pin-lock indicated the contaminant elements such as Magnesium, Aluminum, Silicon, Sulfur, Chlorine, and Calcium in comparison with the surface of normal pin-lock. These are the corrosive elements especially for Sulfur and Chlorine which could be contained in sea salt and in form of other compounds. When corrosive

The 2nd Thailand Metallurgy Conference
-141-
compounds exposed with the metal surface, corrosion of galvanize coating occurred. In long-term service, the materials lose the coating layer and corrosion occurred on the steel surface as evident in form of corrosion product of iron oxide. These factors reduce the strength of material and support loads. Analysis of cross section of pin-lock indicated that the material had severe corrosion as present in form of intergranular attack. Loss of galvanized coating reduced the corrosion resistant of steel. When the material exposed with the oxidizing salt, the compound that contains chlorine element accelerated the corrosion. Furthermore, acceleration of corrosion could come from the contact with the higher corrosion resistant metal, stainless steel. This form of corrosion is called galvanic corrosion as mentioned above. The failures of this component come from the reduction of cross section area which reduces the strength of material. In long-term service, the falling down of the ceiling could occur. It is a time-dependent process but it could be accelerated by the external factors. From the investigation of the distorted pin-lock, it failed from overload. It is possible that one of the two hanged positions failed at first and led to failure of remaining part by overload and distortion from the increasing load. From the data, the increase in applied load could have come from the weight of plant personnel standing over and of rain water absorbed by polystyrene foam. Normally, hydroxyl groups can easily absorb the water as well [7]. Immersion of polystyrene foam into the water revealed that it could absorb large quantity of water. Then, if the joint area of any block of polystyrene foam had broken or separated, the water could penetrate through the polystyrene foam and accelerated this failure. Metal part especially the small size of pin-lock supported the shear loading. Reduction of cross section area due to corrosion led to overload of material. The applied load might be maintained as the original or increased by the absorption water of polystyrene foam. However, experimentation by immersion of polystyrene foam into water confirms the increasing weight of polystyrene foam. 4. Conclusions The probable cause of this failure may be produced from the combination of two factors: degradation of metal part in form of galvanic corrosion and increased applied load from water absorption of polystyrene foam. 5. Recommendations There are several possible methods to prevent galvanic corrosion.
1. Selection of materials near one another in the Galvanic Series eliminates the driving force for galvanic attack.
2. Insulate the contact surface of two metals to eliminate the galvanic couple.
3. Careful use of coating and maintaining the proper conditions.
4. Routine visual inspection should be conducted.
5. Removal of deposits must be performed. 6. If it suffers excessive corrosion, it must be
replaced with the new part. 6. References [1]. C.M. Abreu and et al., 2002, “Galvanic coupling between carbon steel and austenitic stainless steel in alkaline media”, Electrochimica Acta, Vol. 47, pp. 2271-/2279. [2] Galvanic coupling between stainless steel and carbon steel reinforcements in concrete structures, National Research Council Canada [Online], Available: http://irc.nrc-cnrc.gc.ca/ui/cs/galvanic_e.html. [3] Robert B., “Galvanic Corrosion”, ASM handbook, Vol. 13, pp.83-86. [4] Hot-Dip Galvanizing for Corrosion Protection of Steel Product, American Galvanizers Association [Online], Available: http://www.galvanizeit.org. [5] Galvanic/dissimilar metal corrosion, ASSDA, Australia [online], Available: http://www.assda.asn.au. [6] Galvanic, The University of Delaware Sea Grant College Program [online], http://www.ocean.udel.edu. [7] Malinee C, 2005, “The role of recycled waste polystyrene foam on physical and mechanical properties of novel ceiling board”, Thammasat Int.J.Sc.Tech., Vol.10, No.3, pp.9-11.

The 2nd Thailand Metallurgy Conference
-142-
A Feasibility Study of Silver Recovery from a Waste in Zinc-Ore-Hot-Acid Leaching Process
Warangkana Prasong, Torranin Chairuangsri
Department of Industrial Chemistry, Faculty of Science, Chiang Mai University, 50200, Thailand
Tel 087-2067489, Fax 053-892262, E-mail [email protected]
ABSTRACT – A feasibility study of silver recovery from a waste in zinc-ore-hot-acid leaching process was performed. It was found that silver recovery from the waste is possible by using ammonium thiosulphate solution as leachant. A batch experiment revealed that the optimum leaching time was 8 hours at room temperature, 700 rpm stirring rate and the solid:liquid ratio at 1g : 5ml. In a multistage cross-current process, three stages can be used and a leaching solution can be reused to more than 5 times without exceeding the solubility limit. KEY WORDS -- Silver recovery, Waste, Zinc Ore, Leaching
บทคัดยอ - ไดศึกษาความเปนไปไดในการนําโลหะเงินกลับคืนจากของเสียในกระบวนการชะสินแรสังกะสีดวยกรดรอน พบวามีความเปนไปไดท่ีจะนําโลหะเงินกลับคืนจากของเสียดังกลาวโดยใชสารละลายแอมโมเนียมไธโอซัลเฟตเปนสารชะ การทดลองในระบบรุนพบวาเวลาชะที่เหมาะสมคือ 8 ชั่วโมง ท่ีอุณหภูมิหอง อัตราการกวน 700 rpm และอัตราสวนของแข็งตอของเหลว 1 กรัม :5 มิลลิลิตร ในการสกัดหลายขั้นแบบกระแสไหลขาม ควรใชขั้นสกัด 3 ขั้น และสารละลายสามารถใชซ้ําไดมากกวา 5 คร้ังโดยไมเกินคาการละลาย คําสําคัญ -- การนําโลหะเงินกลับคืน, ของเสีย, สินแรสังกะสี, การชะ 1. Introduction At present, it is realized that industrial wastes have a strong effect on our environment. Materials recovery is therefore an active subject of research worldwide. Zinc extraction is an important metallurgical industry in Thailand, which produces different kinds of wastes during the process. After hot-acid leaching of zinc ore, a waste consisting mainly of lead is produced. The waste also contains silver with the content attractive for a feasibility study of silver recovery, which is the aim of this work. 2. Experimental procedures Sampling The waste used in this study is in a powder form containing about 15 wt%Pb and 0.01wt%Ag, provided by the Zinc Extraction Plant in Tak Province, Thailand. Sampling was done by a typical quartering method (Figure 1) Batch leaching A batch leaching experiment was carried out at room temperature with a stirring rate of 700 rpm. The leachant used is a solution of 1 M ammonium thiosulphate in distilled water [1,2]. The solid:liquid ratios were 1:125 ml and 1g:5ml. The leaching time was in the range of 1-16 hours. At the end of the leaching experiment, solid-liquid separation was done by filtration and the silver content in the leaching solution was analysed by atomic absorption spectrometry (AAS).
Figure 1. A typical quartering method used for sampling. (a) as-received waste 70 kg, (b) & (c) quartering to 17.5 kg, (d) keeping two opposite portions and (e) hand sampling by arrays of 10cm W x 10 cm L x 8.5 cm H to 100 g each. Multistage Cross-Current Leaching A stirring rate of 700 rpm was controlled and the optimum leaching time from the batch leaching experiment was used. Two experiments were performed in multistage cross-current leaching. In the first experiment (MV), the underflow (L0-L5) was maintained continuously, while the fresh leachant (V0) was used in each stage (Figure 2). In the second experiment (ML), the overflow (V0-V5) was maintained continuously, while the fresh solid (L0) was used in each stage (Figure 3). In all experiment, the solid:liquid ratio was controlled at 1g:5ml. At the end of each stage, solid-liquid separation was done by decantation and the silver content in the leaching solution was analysed by atomic absorption spectrometry (AAS).
(a) (b) (c) (d) (e)

The 2nd Thailand Metallurgy Conference
-143-
Figure 2. Multistage cross-current leaching : MV
Figure 3. Multistage cross-current leaching : ML
3. Results & Discussion Figure 4 shows for example the silver content in leaching solutions versus leaching time after the batch leaching experiment at room temperature, a stirring rate of 700 rpm and the solid:liquid ratio of 1g:125ml. The optimum leaching time was 8 hours. Increasing leaching time longer than 8 hours was not beneficial. Figure 5 shows the silver content in the overflow after the MV experiment. Three stages is enough for multistage cross-current process by considering that no amount of silver was extracted in V4. Figure 6 shows the silver content in the overflow after the ML experiment. The results revealed that a single leaching solution can be reused to more than 5 times without exceeding its solubility limit. 4. Conclusions 1. It is possible to recover silver from a waste in zinc-
ore-hot-leaching process using ammonium thiosulphate solution as leachant.
2. At room temperature, 700 rpm stirring rate and solid:liquid ratio at 1g:5ml, the optimum leaching time was 8 hours.
3. Three stages can be used in multistage cross-current process and a single leaching solution can be reused to more than 5 times without exceeding the solubility limit.
Batch leaching by ammonium thiosulfate 1 M
0
500
1000
1500
2000
2500
0 1 2 3 4 5 6 7 8 9 10 11 12 13 14 15 16 17
time,hour
mg
Ag/
/kg
was
te
Figure 4. The silver content in leaching solutions versus leaching time.
Multistage cross-current
-50
0
50
100
150
200
0 1 2 3 4 5 6
Stage, number
mg
Ag/
kg w
aste
Figure 5. The silver in the overflow after the MV experiment.
Multistage cross-current
0
500
1000
1500
0 1 2 3 4 5 6
Stage,number
mg
Ag
/kg
Solu
tion
Figure 6. The silver content in the overflow after the ML experiment. 5. References [1] F. Arslan and B. Sayiner, “Extraction of gold and silver from Turkish gold ore by ammoniacal thiosulphate leaching”, Mineral Processing & Extractive Metall. Rev., Vol. 29, 2008. pp. 68-82. [2] J. Ficeriova, P. Balaz and E. Boldizarova, “Combined mechanochemical and thiosulphate leaching of silver from a complex sulphide concentrate”, Int.J.Miner.Process, Vol. 76, 2005, pp.260-265
V0
V1
V2
V3
V4
V5
L0
L0
L0
L0
L0
L1
L2
L3
L4
L5
1
2
3
4
5
V2
L1 L2
V1 V3 V4 V5
1 2 3 4 5
V0 V0
L4L3
V0V0
L5 L0
V0

The 2nd Thailand Metallurgy Conference
-144-
Corrosion Resistance of Hot-Dip Galvanized Steels in Saline and Swine Urine Environments
Kanokwan Saengkiettiyut
1
, Charttanong Angkaprasert2
, Pranee Rattanawaleedirojn1
, Sawalee Saenapitak
1
, Adisak Thueploy1
, Jumpot Wanichsampan1
, Sutthirat Lisnunt1
, Nutthita Chuankrerkkul
1
, Yuttanant Boonyongmaneerat1,*
1Metallurgy and Materials Science Research Institute, Chulalongkorn University
2Department of Materials Engineering, Kasetsart University *Tel.02-218-4243 Fax.02-611-7586. E-mail:[email protected]
ABSTRACT - The present work investigates the influence of coating thickness, which is in turn controlled by processing time, on corrosion resistance of hot-dip galvanized steels fabricated using nickel chloride and ammonium chloride as flux constituents. The corrosion resistance of the specimens is assessed in the salt spray environment for 528 hours, and also evaluated in swine urine, which exhibits alkaline nature, for 28 days. The result shows that the thickness of zinc-iron alloy layer increases with increasing dipping duration. In the saline environment, relatively more brown rust is evident on the surface of galvanized steels exhibiting thinnest coating of approximately 60 micron. On the other hand, all specimens in swine urine show decrement of corrosion potential in the first 2 days of immersion, before increasing monotonically without appearance of brown rust. KEY WORDS - corrosion; hot-dip galvanizing; sheet steel; saline; alkaline
บทคัดยอ - งานวิจัยนี้ศึกษาความตานทานการกัดกรอนของแผนเหล็กชุบสังกะสีแบบจุมรอนที่ใชระยะเวลาในการจุมตางก ัน โดยใชฟลักซท่ีมีสวนผสมของนิคเกิลคลอไรดและแอมโนเมียคลอไรดเปนองคประกอบ ทดสอบความตานทานการกัดกรอนของชิ้นงานในบรรยายกาศละอองเกลือเปนระยะเวลา 528 ชั่วโมง และในปสสาวะสุกรซึ่งมีสมบัติเปนดางเปนระยะเวลา 28 วัน จากการศึกษาพบวา การเพิ่มเวลาในการจุมสังกะวีทําใหชั้นอัลลอยดสังกะสี-เหล็กมีความหนาเพิ่มขึ้น ซึ่งเม่ือนําไปทดสอบในบรรยากาศเกลือ พบวาเหล็กแผนชุบสังกะสีแบบจุมรอนที่มีความหนาชั้นเคลือบบางที่สุด ประมาณ 60 ไมครอน มีปริมาณสนิมสําน้ําตาลบนผิวชิ้นงานมากกวาชิ้นงานอื่น สําหรับคาศักยไฟฟาการกัดกรอนของชิ้นงานทุกชิ้นที่แชในปสสาวะสุกรมีคาลดลงในชวง 2 วันแรก หลังจากนั้นคาศักยไฟฟาการกักรอนจะเพิ่มขึ้นอยางตอเนื่อง โดยไมมีสนิมสีน้ําตาลปรากฏบนผิวชิ้นงาน คําสําคัญ - การกัดกรอน, การเคลือบสังงกะสีแบบชุบรอน, เหล็กแผน, เกลือ, ดาง 1. Introduction Hot dip galvanizing, which refers to coating of zinc, has been employed to prevent corrosion of steels for more than 200 years. This is attributed to the ability of zinc in providing barrier protection and cathodic protection to steels [1-2]. As zinc is gradually corroded while protecting steels, it may be speculated that thickness of the zinc-coating layer is one of the main factors that determine the performance of galvanizing. In this study we investigate the influence of coating thickness on the corrosion resistance of galvanized steels in two important environments, namely saline and alkaline. In particular, the corrosion behaviors of zinc-coated steels in salt-spray condition and in swine urine are evaluated. The understanding gained from the study would facilitate a fabrication of galvanized steels with proper coating thickness adequate for withstanding
a particular service environment. 2. Experimental procedures Low carbon cold-rolled steel sheets (C 0.040 % Cr 0.050% Mn 0.240% Al 0.058% N 0.004% P 0.013% S 0.007% Si 0.010%) were cut to 70x20x0.4 mm. The specimens were degreased in 10% NaOH solution at 60
o
C, pickled in 14% HCl solution, rinsed with water, and subsequently fluxed in an aqueous solution containing NiCl2 and NH4Cl. The surface-treated specimens were then dipped in a molten zinc bath at 450
o
C. The dipping durations used in the study were 10 seconds, 1 minute and 6 minutes. Following the galvanizing process, the microstructure of cross-sectioned specimens was analyzed using a scanning electron microscope. Subsequently, the specimens were subjected to corrosion tests in salt spray and in alkaline conditions. The salt spray test was carried out as per the ASTM B117 standard, using 5% NaCl solution at 35°C, for a period of

The 2nd Thailand Metallurgy Conference
-145-
528 hours. As for testing in an alkaline environment, the specimens were submerged in swine urine which exhibits pH of approximately 8. The corrosion potential, which is the difference between the potential of working electrode and that of Ag/AgCl reference electrode, was measured throughout the 28 days of urine exposure, and the appearance of all specimens were periodically examined during the corrosion tests. 3. Results & Discussion A typical microstructure of the galvanized specimens is illustrated in Figure 1. It can be observed that the coating is composed of Zn-Fe alloy layer and pure Zn layer at the surface. Figure 2 presents the thickness of the two coating layers of galvanized specimens with the dipping time of 10 seconds, 1 minute, and 6 minutes. The result shows that the thickness of the alloy layer increases with prolonging dipping duration, and the total thickness of the coating varied between ~60 micron to ~100 micron.
Figure 1. Cross-section micrograft of the galvanized steel specimen with dipping time of 1 minute.
Figure 2. Thickness of the Zn-Fe alloy and Zn layers of the galvanized specimens with different dipping durations. The first visible corrosion product formed on the surface of galvanized steel specimens subjected to the salt spray test was in the form of white rust followed by brown rust. Figure 2 shows a formation of brown rust on specimens’ surfaces following 528 hours of exposure to salt spray.
Comparing the 10-sec specimen to other sets, it was observed that brown rust was originated in relatively early stage, and that more brown rust appeared on the specimen surface at the end of the test, as shown in Figure 3. The coating thicker than approximately 60 micron is therefore necessary for galvanized steels to survive in the 5%NaCl environment in ~500 hours.
Figure 3. Appearance of corrosion product on surface of galvanized steel specimens after salt-spray testing for 520 hours. On the other hand, no white rust or brown rust was clearly observed on the surface of the specimens submerged in swine urine after 28 days. Figure 4, which presents the corrosion potential of these specimens, indicates that, as time progressed, the corrosion potential of all specimens decreased initially, then became stable, and increased gradually toward the end. The initial decrement of the potential, which suggests higher tendency to corrosion, may be attributed to corroding of the zinc layer. As organic substance started to form on the specimens, the surface could be protected from further corrosion, resulting in stable or slightly increasing potentials as observed in the middle regime. At longer immersion period, more zinc may be corroded away to the point where steel started to expose to the solution, setting up a galvanic couple of zinc and iron. Consequently, the corrosion potential of the specimens increased towards the end of the test, and the potential varied with the coating thickness, with the 10-sec specimen exhibits the highest potential.
Figure 4. Corrosion potentials of galvanized steel specimens in swine urine for 28 days.

The 2nd Thailand Metallurgy Conference
-146-
4. Conclusions The hot-dipping duration in the galvanizing process has a significant influence on the thickness of the coating, especially for the zinc-iron alloy layer. While galvanized steels behave differently in saline and swine urine environments, thicker coating does provide better corrosion resistance to the materials in these conditions. 5. Acknowledgement This work is supported by the Iron and Steel Institute of Thailand under contract คก.026/2551. The authors would like to acknowledge Assoc. Prof. Satian Niltawach and Asst. Prof. Ekasit Nisaratanaporn for their guidance and encouragement, and Bangkok Nail&Wire Co., Ltd., Thai Cold Rolled Steel Sheet Public Co., Ltd., and Bangkok Steel Industry Public Co., Ltd. for materials used in the study. 6. References [1] A.R. Marder, “The metallurgy of zinc-coated steel,” Progress in Materials Science, 45, 2000, pp.191-271. [2] Y. De Abreu et al., “Study of zinc coatings on steel substrate attained by two different techniques,” Surface and Coatings Technology, 120-121, 1999, pp.682-6.

The 2nd Thailand Metallurgy Conference
-147-
Acceptable TIG-Pulse Welding Parameters of AISI 304L Stainless Steels at 8-h Welding Position
N. Sornsuwit and S. Chandra-ambhorn
Department of Materials Engineering and Production Technology, Faculty of Engineering King Mongkut’s University of Technology North Bangkok (KMUTNB), Bangkok, Thailand
Tel. (662) 5874335 Fax. (662) 5874335 E-mail: [email protected]
ABSTRACT - The TIG-pulse welding parameters of AISI 304L stainless steel at 8-h welding position giving the acceptable weld bead according to DIN 8563 Quality class BS were investigated. The pre-experiment was conducted at 6-h welding position. At this welding position, it was found that at the base current of 43 A, the pulse frequency of 7 Hz and 45% on time gave rise to the high depth-per-width ratio of 0.52. These parameters were further fixed for the welding at 8-h position. At 8-h position, when the welding speed increased up to 8 mm/s, the higher pulse current in the range from 154 to 280 A is required to give the acceptable weld bead. Nitrogen gas was mixed in Ar shielding gas. It was found that at the welding speed of 8 mm/s, when nitrogen gas was added up to 4% V/V, the pulse current required to give the acceptable weld bead was decreased in the range from 280 to 252 A. KEY WORDS - TIG pulse welding, AISI 304 stainless steel, and welding parameter
บทคัดยอ - บทความนี้มุงศึกษาพารามิเตอรในการเชื่อมทิกพัลสเหล็กกลาไรสนิมเกรด AISI 304L ท่ีทําใหไดรูปรางรอยเชื่อมท่ียอมรับไดตาม DIN 8563 ชั้นคุณภาพ BS การทดลองในเบื้องตนกระทําที่ตําแหนงการเชื่อม 6 นาฬิกา ท่ีตําแหนงการเชื่อมดังกลาวพบวา การใชกระแสไฟฟาเบส 43 แอมแปร ความถี่พัลส 7 เฮิรตซ และรอยละการจายกระแสพัลสเปน 45 จะใหอัตราสวนระยะซึมลึกตอความกวางของรอยเชื่อมเปน 0.52 คาดังกลาวไดรับการกําหนดใหคงที่ในการทดลองที่ตําแหนงการเชื่อม 8 นาฬิกา ท่ีตําแหนงการเชื่อม 8 นาฬิกา เม่ือเพิ่มอัตราเร็วในการเชื่อมจนถึง 8 มิลลิเมตรตอวินาที กระแสพัลสท่ีทําใหไดรอยเชื่อมท่ียอมรับไดมีคาสูงขึ้นและอยูในชวง 154 ถึง 280 แอมแปร การทดลองไดผสมไนโตรเจนเขาไปในแกสปกคลุมอารกอน ผลการทดลองที่อัตราเร็วในการเชื่อมเปน 8 มิลลิเมตรตอวินาที พบวา เม่ือเพิ่มไนโตรเจนลงไปจนถึงปริมาณรอยละ 4 โดยปริมาตร กระแสพัลสท่ีทําใหไดรอยเชื่อมท่ียอมรับไดมีคาลดลงและอยูในชวง 280 ถึง 252 แอมแปร คําสําคัญ - การเชื่อมทิกพัลส เหล็กกลาไรสนิมเกรด AISI 304 และพารามิเตอรในการเชื่อม 1. Introduction A TIG pulse welding of stainless steel pipe has been extensively applied as root pass welding. The welding parameters giving the acceptable weld bead formation and microstructure in term of corrosion were investigated as for the case of duplex stainless steels [1], and austenitic ones [2-4]. In the previous work [2,4], the TIG pulse welding parameters of AISI 304L stainless steels at 6-, 9-, 10-, and 12-h welding positions were reported. Those at 8-h welding position have not been studied yet. It is then the objective of this work. The experimental design used in this paper followed the one described in Reference [3]. 2. Experimental procedures The pre-experiment was conducted at 6–h welding position. The base current was also fixed at 43 A, since it qualitatively gave the stable arc when the welding speed of 3 mm/s was applied. At this welding position, the effects of pulse frequency in the range from 1 to 10 Hz, and % on time in the range from 35 to 75%, on the
dept and width of weld metal were further investigated. The set of pulse frequency, % on time, and base current to give the high dept-per-width ratio (D/W) were selected and set as constants for other welding positions. At 8-h welding position, the welding speed was varied from 2 to 8 mm/s. The pulse current required to give the acceptable weld bead according to DIN 8563 quality class BS was found out. In the next set of the experiment, nitrogen gas was mixed in Ar shielding gas at the welding speed of 8 mm/s. The pulse current required to give the acceptable weld bead according to DIN 8563 quality class BS was also found out. 3. Results & Discussion In the pre-experiment at 6-h welding position, the effects of pulse frequency and % on time on D/W were shown Figure 1. It was found that, at 45% on time, the increase in pulse frequency up to 5 Hz increased the D/W of weld metal. The increase in pulse frequency from 5 to 10 Hz did not significantly affect the D/W. Increasing % on time from 35% to 45% significantly

The 2nd Thailand Metallurgy Conference
-148-
increase D/W on time were further investigated. However, the increase in %on time from 45 to 75% did not significantly change D/W. from the Figure, it was found that using % on time of 45% and pulse frequency of 7 Hz gave the high D/W of 0.52. These parameters were then set as constants for the welding at 8-h position.
0.2
0.3
0.4
0.5
0.6
0 1 2 3 4 5 6 7 8 9 10 11pulse frequency (Hz)
D/W
75% on time65% on time55% on time45% on time35% on time
Figure 1: Effects of pulse frequency and % on time on dept-per-width ratio (D/W) of weld metal (Welding conditions: base current of 43 A, pulse current of 105 A, and welding speed of 3 mm/s) As for the 8-h welding position, Figure 2 shows the pulse current required to give the acceptable weld bead according to DIN 8563 quality class BS in function of welding speed. It was found that when the welding speed was faster, the higher pulse current is required to give the acceptable weld bead.
50
100
150
200
250
300
2 3 4 5 6 7 8
welding speed (mm/s)
pulse
cur
rent
(A)
Figure 2: Effect of welding speed on the pulse current required to give the weld bead according to DIN quality class BS (Welding conditions: base current of 43 A, pulse frequency of 7 Hz, and 45% on time) To reduce the pulse current applied at high welding speed, another shielding gas was mixed in Ar shielding gas to help conduct the heat input to the weld joint. In this work, nitrogen gas was mixed in Ar shielding gas when the welding speed of 8 mm/s was applied. The pulse current required to give the acceptable weld bead according to DIN 8563 quality class BS in function of %v/v of nitrogen mixed in Ar gas is shown in Figure 3. It was found that adding nitrogen up to 4%v/v reduced the pulse current required from 280 to 252 A. It means that pulse current required can be reduced by 10.7 % if 4%v/v of nitrogen was mixed in Ar shielding gas. It was also reported that increasing of nitrogen in shielding gas, and therefore in weld metal, can adjust the ratio of delta ferrite in austenite matrix. This can
reduce the delta ferrite network that causes network corrosion in the weld metal.
200
220
240
260
280
300
0 1 2 3 4nitrogen gas (%v/v)
pulse
cur
rent
(A)
Figure 3: Effect of nitrogen mixed in Ar shielding gas on the pulse current required to give the weld bead according to DIN quality class BS (Welding conditions: base current of 43 A, pulse frequency of 7 Hz, and 45% on time) 4. Conclusions At 8-h welding position with the base current of 43 A, the pulse frequency of 7, and 45 % on time, when the welding speed increased up to 8 mm/s, the higher pulse current in the range from 154 to 280 A was required to give the weld bead in accordance with DIN 8563 quality class BS. At the welding speed of 8 mm/s, the addition of 4%v/v nitrogen in Ar shielding gas reduced the pulse current required from 280 to 252 A. 5. References [1] R.K. Huismann and H. Hoffmeister, “Investigation of the Effects of TIG Pulse Parameters and Shoelding Gas Compositions on Weld Bead Formation and Microstructure of Duplex Stainless Steel Orbital TIG Root Welds”, LWS Report, University of Federal Arm Force, Hamburg, Germany, 1992. [2] G. Lothongkum, P. Chaumbai and P. Bhandhubanyong, Journal of Materials Processing Technology, 89-90, 1999. (p.410-414). [3] G. Lothongkum, E. Viyanit and P. Bhandhubanyong, Journal of Materials Processing Technology, 110(2), 2001. (p.233-238). [4] N. Sonsuvit, S. Chandra-ambhorn, and G. Lothongkum, The Symposium on Welding for Pipeline and Energy Applications, Welding Show 2005, organized by the American Welding Society (AWS), Dallas, Texas, USA., April 26-28, 200
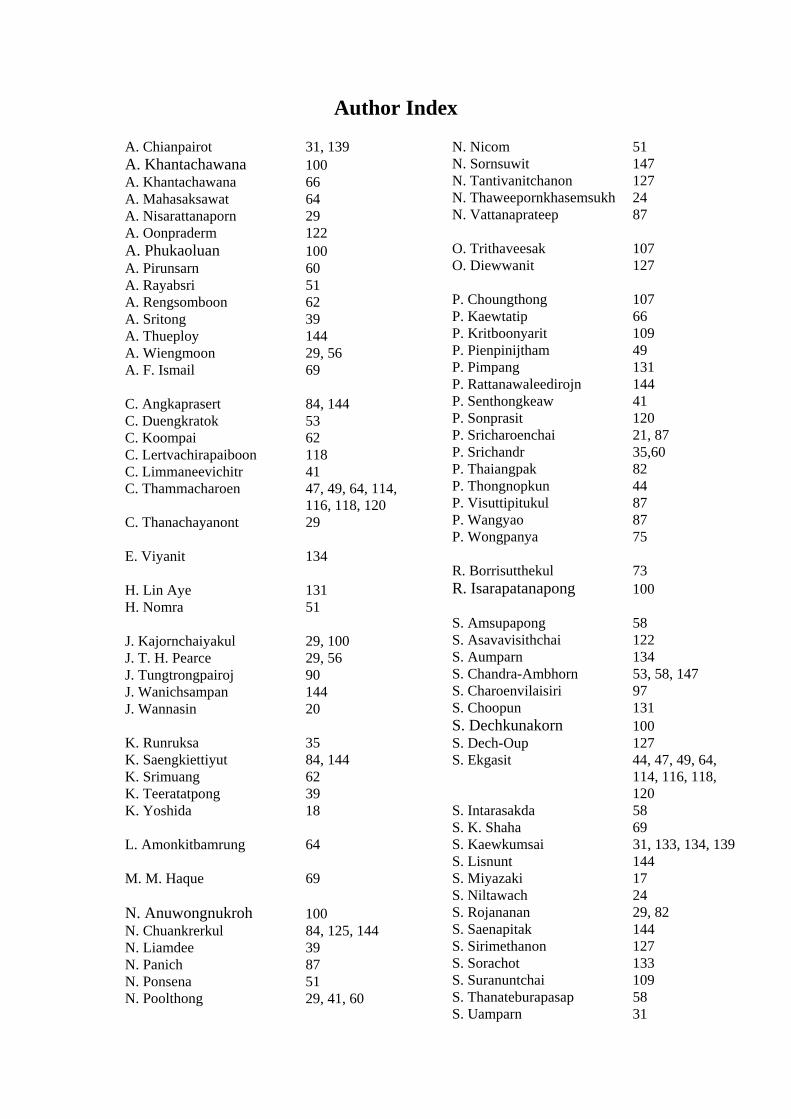
Author Index A. Chianpairot 31, 139 A. Khantachawana 100 A. Khantachawana 66 A. Mahasaksawat 64 A. Nisarattanaporn 29 A. Oonpraderm 122 A. Phukaoluan 100 A. Pirunsarn 60 A. Rayabsri 51 A. Rengsomboon 62 A. Sritong 39 A. Thueploy 144 A. Wiengmoon 29, 56 A. F. Ismail 69 C. Angkaprasert 84, 144 C. Duengkratok 53 C. Koompai 62 C. Lertvachirapaiboon 118 C. Limmaneevichitr 41 C. Thammacharoen 47, 49, 64, 114,
116, 118, 120 C. Thanachayanont 29 E. Viyanit 134 H. Lin Aye 131 H. Nomra 51 J. Kajornchaiyakul 29, 100 J. T. H. Pearce 29, 56 J. Tungtrongpairoj 90 J. Wanichsampan 144 J. Wannasin 20 K. Runruksa 35 K. Saengkiettiyut 84, 144 K. Srimuang 62 K. Teeratatpong 39 K. Yoshida 18 L. Amonkitbamrung 64 M. M. Haque 69 N. Anuwongnukroh 100 N. Chuankrerkul 84, 125, 144 N. Liamdee 39 N. Panich 87 N. Ponsena 51 N. Poolthong 29, 41, 60
N. Nicom 51 N. Sornsuwit 147 N. Tantivanitchanon 127 N. Thaweepornkhasemsukh 24 N. Vattanaprateep 87 O. Trithaveesak 107 O. Diewwanit 127 P. Choungthong 107 P. Kaewtatip 66 P. Kritboonyarit 109 P. Pienpinijtham 49 P. Pimpang 131 P. Rattanawaleedirojn 144 P. Senthongkeaw 41 P. Sonprasit 120 P. Sricharoenchai 21, 87 P. Srichandr 35,60 P. Thaiangpak 82 P. Thongnopkun 44 P. Visuttipitukul 87 P. Wangyao 87 P. Wongpanya 75 R. Borrisutthekul 73 R. Isarapatanapong 100 S. Amsupapong 58 S. Asavavisithchai 122 S. Aumparn 134 S. Chandra-Ambhorn 53, 58, 147 S. Charoenvilaisiri 97 S. Choopun 131 S. Dechkunakorn 100 S. Dech-Oup 127 S. Ekgasit 44, 47, 49, 64,
114, 116, 118, 120
S. Intarasakda 58 S. K. Shaha 69 S. Kaewkumsai 31, 133, 134, 139 S. Lisnunt 144 S. Miyazaki 17 S. Niltawach 24 S. Rojananan 29, 82 S. Saenapitak 144 S. Sirimethanon 127 S. Sorachot 133 S. Suranuntchai 109 S. Thanateburapasap 58 S. Uamparn 31

S. Watanasriyakul 23 S. Yapa 62 T. Chairuangsri 29, 56, 129, 131,
142 T. Chotibhawaris 97 T. Kumma 39 T. Laungwaranunt 97 T. Parnklang 114 T. Puthaikitakawiwong 51 T. Udomphol 39 U. Ruktanonchai 122
V. Premanond 66 V. Uthaisansuk 90 W. Bleck 90 W. Eidhed 53 W. Jirattiticharoen 62 W. Khonraeng 133, 139 W. Limtrakarn 22 W. Prasong 142 W. Sroisuriya 44, 47 W. Thanatepolake 48 Y. Boonyongmaneerat 144