Mercury speciation and mobilization in contaminated soils of the Valle del Azogue Hg mine (SE, Spain
13
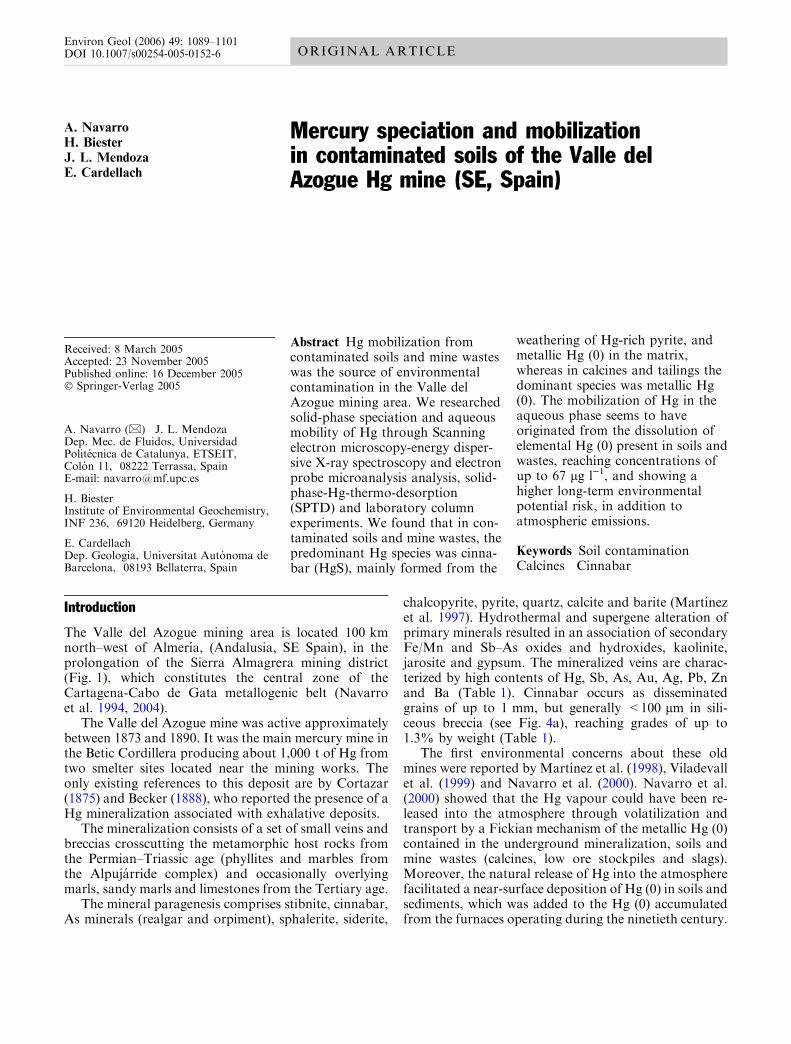
Introduction The Valle del Azogue mining area is located 100 km north–west of Almerı´a, (Andalusia, SE Spain), in the prolongation of the Sierra Almagrera mining district (Fig. 1), which constitutes the central zone of the Cartagena-Cabo de Gata metallogenic belt (Navarro et al. 1994, 2004). The Valle del Azogue mine was active approximately between 1873 and 1890. It was the main mercury mine in the Betic Cordillera producing about 1,000 t of Hg from two smelter sites located near the mining works. The only existing references to this deposit are by Cortazar (1875) and Becker (1888), who reported the presence of a Hg mineralization associated with exhalative deposits. The mineralization consists of a set of small veins and breccias crosscutting the metamorphic host rocks from the Permian–Triassic age (phyllites and marbles from the Alpuja´rride complex) and occasionally overlying marls, sandy marls and limestones from the Tertiary age. The mineral paragenesis comprises stibnite, cinnabar, As minerals (realgar and orpiment), sphalerite, siderite, chalcopyrite, pyrite, quartz, calcite and barite (Martı´nez et al. 1997). Hydrothermal and supergene alteration of primary minerals resulted in an association of secondary Fe/Mn and Sb–As oxides and hydroxides, kaolinite, jarosite and gypsum. The mineralized veins are charac- terized by high contents of Hg, Sb, As, Au, Ag, Pb, Zn and Ba (Table 1). Cinnabar occurs as disseminated grains of up to 1 mm, but generally <100 lm in sili- ceous breccia (see Fig. 4a), reaching grades of up to 1.3% by weight (Table 1). The first environmental concerns about these old mines were reported by Martı´nez et al. (1998), Viladevall et al. (1999) and Navarro et al. (2000). Navarro et al. (2000) showed that the Hg vapour could have been re- leased into the atmosphere through volatilization and transport by a Fickian mechanism of the metallic Hg (0) contained in the underground mineralization, soils and mine wastes (calcines, low ore stockpiles and slags). Moreover, the natural release of Hg into the atmosphere facilitated a near-surface deposition of Hg (0) in soils and sediments, which was added to the Hg (0) accumulated from the furnaces operating during the ninetieth century. A. Navarro H. Biester J. L. Mendoza E. Cardellach Mercury speciation and mobilization in contaminated soils of the Valle del Azogue Hg mine (SE, Spain) Received: 8 March 2005 Accepted: 23 November 2005 Published online: 16 December 2005 Ó Springer-Verlag 2005 Abstract Hg mobilization from contaminated soils and mine wastes was the source of environmental contamination in the Valle del Azogue mining area. We researched solid-phase speciation and aqueous mobility of Hg through Scanning electron microscopy-energy disper- sive X-ray spectroscopy and electron probe microanalysis analysis, solid- phase-Hg-thermo-desorption (SPTD) and laboratory column experiments. We found that in con- taminated soils and mine wastes, the predominant Hg species was cinna- bar (HgS), mainly formed from the weathering of Hg-rich pyrite, and metallic Hg (0) in the matrix, whereas in calcines and tailings the dominant species was metallic Hg (0). The mobilization of Hg in the aqueous phase seems to have originated from the dissolution of elemental Hg (0) present in soils and wastes, reaching concentrations of up to 67 lgl )1 , and showing a higher long-term environmental potential risk, in addition to atmospheric emissions. Keywords Soil contamination Calcines Cinnabar Environ Geol (2006) 49: 1089–1101 DOI 10.1007/s00254-005-0152-6 ORIGINAL ARTICLE A. Navarro (&) J. L. Mendoza Dep. Mec. de Fluidos, Universidad Polite´cnica de Catalunya, ETSEIT, Colo´n 11, 08222 Terrassa, Spain E-mail: [email protected] H. Biester Institute of Environmental Geochemistry, INF 236, 69120 Heidelberg, Germany E. Cardellach Dep. Geologia, Universitat Auto´noma de Barcelona, 08193 Bellaterra, Spain
-
Upload
independent -
Category
Documents
-
view
4 -
download
0
Transcript of Mercury speciation and mobilization in contaminated soils of the Valle del Azogue Hg mine (SE, Spain
Introduction
The Valle del Azogue mining area is located 100 kmnorth–west of Almerıa, (Andalusia, SE Spain), in theprolongation of the Sierra Almagrera mining district(Fig. 1), which constitutes the central zone of theCartagena-Cabo de Gata metallogenic belt (Navarroet al. 1994, 2004).
The Valle del Azogue mine was active approximatelybetween 1873 and 1890. It was the main mercury mine inthe Betic Cordillera producing about 1,000 t of Hg fromtwo smelter sites located near the mining works. Theonly existing references to this deposit are by Cortazar(1875) and Becker (1888), who reported the presence of aHg mineralization associated with exhalative deposits.
The mineralization consists of a set of small veins andbreccias crosscutting the metamorphic host rocks fromthe Permian–Triassic age (phyllites and marbles fromthe Alpujarride complex) and occasionally overlyingmarls, sandy marls and limestones from the Tertiary age.
The mineral paragenesis comprises stibnite, cinnabar,As minerals (realgar and orpiment), sphalerite, siderite,
chalcopyrite, pyrite, quartz, calcite and barite (Martınezet al. 1997). Hydrothermal and supergene alteration ofprimary minerals resulted in an association of secondaryFe/Mn and Sb–As oxides and hydroxides, kaolinite,jarosite and gypsum. The mineralized veins are charac-terized by high contents of Hg, Sb, As, Au, Ag, Pb, Znand Ba (Table 1). Cinnabar occurs as disseminatedgrains of up to 1 mm, but generally <100 lm in sili-ceous breccia (see Fig. 4a), reaching grades of up to1.3% by weight (Table 1).
The first environmental concerns about these oldmines were reported by Martınez et al. (1998), Viladevallet al. (1999) and Navarro et al. (2000). Navarro et al.(2000) showed that the Hg vapour could have been re-leased into the atmosphere through volatilization andtransport by a Fickian mechanism of the metallic Hg (0)contained in the underground mineralization, soils andmine wastes (calcines, low ore stockpiles and slags).Moreover, the natural release of Hg into the atmospherefacilitated a near-surface deposition of Hg (0) in soils andsediments, which was added to the Hg (0) accumulatedfrom the furnaces operating during the ninetieth century.
A. Navarro
H. Biester
J. L. Mendoza
E. Cardellach
Mercury speciation and mobilizationin contaminated soils of the Valle delAzogue Hg mine (SE, Spain)
Received: 8 March 2005Accepted: 23 November 2005Published online: 16 December 2005� Springer-Verlag 2005
Abstract Hg mobilization fromcontaminated soils and mine wasteswas the source of environmentalcontamination in the Valle delAzogue mining area. We researchedsolid-phase speciation and aqueousmobility of Hg through Scanningelectron microscopy-energy disper-sive X-ray spectroscopy and electronprobe microanalysis analysis, solid-phase-Hg-thermo-desorption(SPTD) and laboratory columnexperiments. We found that in con-taminated soils and mine wastes, thepredominant Hg species was cinna-bar (HgS), mainly formed from the
weathering of Hg-rich pyrite, andmetallic Hg (0) in the matrix,whereas in calcines and tailings thedominant species was metallic Hg(0). The mobilization of Hg in theaqueous phase seems to haveoriginated from the dissolution ofelemental Hg (0) present in soils andwastes, reaching concentrations ofup to 67 lg l)1, and showing ahigher long-term environmentalpotential risk, in addition toatmospheric emissions.
Keywords Soil contamination ÆCalcines Æ Cinnabar
Environ Geol (2006) 49: 1089–1101DOI 10.1007/s00254-005-0152-6 ORIGINAL ARTICLE
A. Navarro (&) Æ J. L. MendozaDep. Mec. de Fluidos, UniversidadPolitecnica de Catalunya, ETSEIT,Colon 11, 08222 Terrassa, SpainE-mail: [email protected]
H. BiesterInstitute of Environmental Geochemistry,INF 236, 69120 Heidelberg, Germany
E. CardellachDep. Geologia, Universitat Autonoma deBarcelona, 08193 Bellaterra, Spain
Mercury ores were processed in retorts, producingcoarse-grained, poorly sorted calcines, and placed nearthe furnace in small stockpiles.
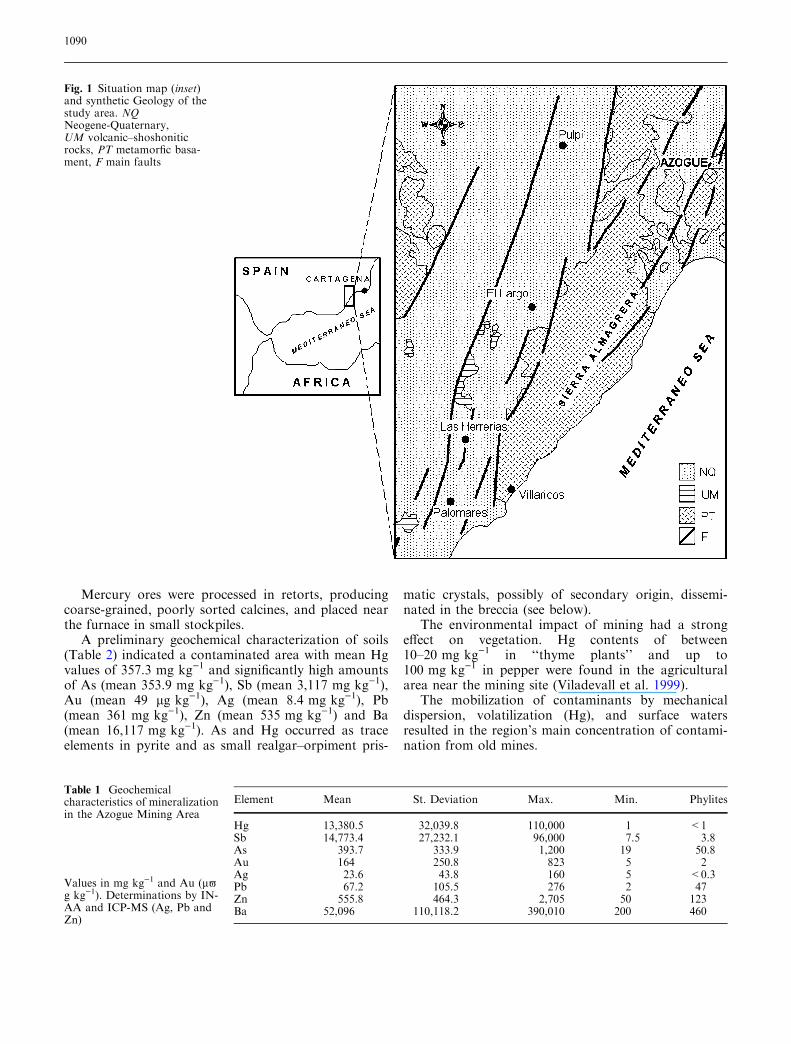
A preliminary geochemical characterization of soils(Table 2) indicated a contaminated area with mean Hgvalues of 357.3 mg kg)1 and significantly high amountsof As (mean 353.9 mg kg)1), Sb (mean 3,117 mg kg)1),Au (mean 49 lg kg)1), Ag (mean 8.4 mg kg)1), Pb(mean 361 mg kg)1), Zn (mean 535 mg kg)1) and Ba(mean 16,117 mg kg)1). As and Hg occurred as traceelements in pyrite and as small realgar–orpiment pris-
matic crystals, possibly of secondary origin, dissemi-nated in the breccia (see below).
The environmental impact of mining had a strongeffect on vegetation. Hg contents of between10–20 mg kg)1 in ‘‘thyme plants’’ and up to100 mg kg)1 in pepper were found in the agriculturalarea near the mining site (Viladevall et al. 1999).
The mobilization of contaminants by mechanicaldispersion, volatilization (Hg), and surface watersresulted in the region’s main concentration of contami-nation from old mines.
Fig. 1 Situation map (inset)and synthetic Geology of thestudy area. NQNeogene-Quaternary,UM volcanic–shoshoniticrocks, PT metamorfic basa-ment, F main faults
Table 1 Geochemicalcharacteristics of mineralizationin the Azogue Mining Area
Values in mg kg)1 and Au (l-g kg)1). Determinations by IN-AA and ICP-MS (Ag, Pb andZn)
Element Mean St. Deviation Max. Min. Phylites
Hg 13,380.5 32,039.8 110,000 1 <1Sb 14,773.4 27,232.1 96,000 7.5 3.8As 393.7 333.9 1,200 19 50.8Au 164 250.8 823 5 2Ag 23.6 43.8 160 5 <0.3Pb 67.2 105.5 276 2 47Zn 555.8 464.3 2,705 50 123Ba 52,096 110,118.2 390,010 200 460
1090
This paper aims to characterize the solid phases of Hgpresent in the ore, soil, calcines and mine wastes, and toevaluate the mobility of Hg in the aqueous phase. Solid-phase Hg speciation is important for determining therisk of contaminated soils and wastes, because theenvironmental risk posed by Hg is directly related to itsenvironmental mobility (Barnett et al. 1997, Rytuba2002).
Previous studies showed that Hg pyrolysis is a usefultechnique for distinguishing cinnabar from metallic Hg(0) or matrix-bound Hg (Biester and Scholz 1997;Biester et al. 1999). In order to better characterize theHg-bearing species in soils, calcines and ore samples, Hgpyrolysis data were complemented with SEM-EDS andEPMA analyses. Finally, the mobilization of Hg inaqueous phase was determined by column experiments,using the PHREEQC model to evaluate the masstransfer between the soil and the pore water flowingthrough the column.
Materials and methods
Soil characterization
Samples of soils and mine wastes were collected andanalysed to determine the concentration of mercury andother trace elements, and to evaluate their speciationand aqueous mobility. Soils and sediments were hand-
sampled using a method derived from standardizedmethods for describing and sampling contaminated soils(EPA 1991). The metal contamination and compositionof the soils was determined using local geochemicalprofiling from soil cores sampled in areas of apparentlyhigh contamination. We obtained 80-cm-deep soil coresfrom auger holes and stainless steel soil sample rings,taking four samples from each core at 20 cm intervals.
The soil, sediment and tailing samples were sealed tominimize exposure to the atmosphere and dried them at30�C for 48 h. Soil and mine wastes were then homog-enized and their grain size, porosity and bulk densitywas determined. In the samples from soil profiles grainsize, porosity, bulk density, pH and electric conductivitywere measured.
Before carrying out the chemical analysis, we pow-dered and homogenized the soil, calcines and miningwastes. We quantitatively analysed Au, Ag, As, Ba, Br,Ca, Ce, Co, Cr, Cs, Eu, Fe, Hf, Hg, Ir, La, Lu, Na, Ni,Nd, Rb, Sb, Sc, Se, Sm, Sn, Sr, Ta, Th, Tb, U, W, Y andYb by instrumental neutron activation analysis (INAA)and Mo, Cu, Pb, Zn, Ag, Ni, Mn, Sr, Cd, Bi, V, Ca, P,Mg, Tl, Al, K, Y and Be by inductively coupled plasmaemission spectroscopy (ICP-OES). Table 3 shows theresults of these analyses.
We also analysed ore samples to discover the meanmetal contents of the ore deposit and their influence onthe Hg species in the soil, calcines and mining wastes.Table 4 shows the results.
Table 2 Main geochemicalcharacteristics of contaminatedsoils in the Azogue MiningArea
Values in mg kg)1 and Au (l-g kg)1). Determinations by IN-AA and ICP-MS (Ag, Pb andZn)NCS Non contaminatedsoils
Element Mean St. Deviation Max. Min. NCS
Hg 357.3 587.7 2,300 1 <1Sb 3,117.7 6,829.3 32,000 19 22As 353.9 399.6 1,610 18 18Au 49.0 98.6 480 5 <5Ag 8.4 11.6 60 5 <5Pb 361.4 601.7 2,554.9 7 15Zn 535.1 755.8 2,970 50 90Ba 16,117 32,264.6 170,000 200 870
Table 3 Geochemistry of soils and mine wastes used in the study of speciation and aqueous mobility
Sample Description Hg Sb As Au Ag Pb Zn Ba
M02 Soil 450 1,300 296 30 13 670 549 19,000M03 Calcine 470 14,800 1,610 <76 75.1 2,555 2,002 170,000A01 Mine waste 530 1,200 300 23 9.6 489 336 75,000A02 Mine waste 1,000 1,800 620 32 24.6 1,497 4,033 58,000A03 Soil 210 625 184 7 3.1 323 543 29,000A04 Mine waste 540 8,600 680 <164 108.7 3,422 14,295 170,000A05 Calcine 400 4,200 320 66 39.3 1,143 878 100,000A06 Mine waste 600 2,200 610 <35 9.7 778 2,074 17,000A07 Mine waste 820 2,600 410 <43 21.3 799 954 38,000
Values in mg kg)1 and lg kg)1 (Au)
1091
Hg, Sb, As, Au, Ag, Pb, Zn and Ba concentrations insoil, calcines and mining wastes were high and similar tothe values previously published by Navarro et al. (2000).
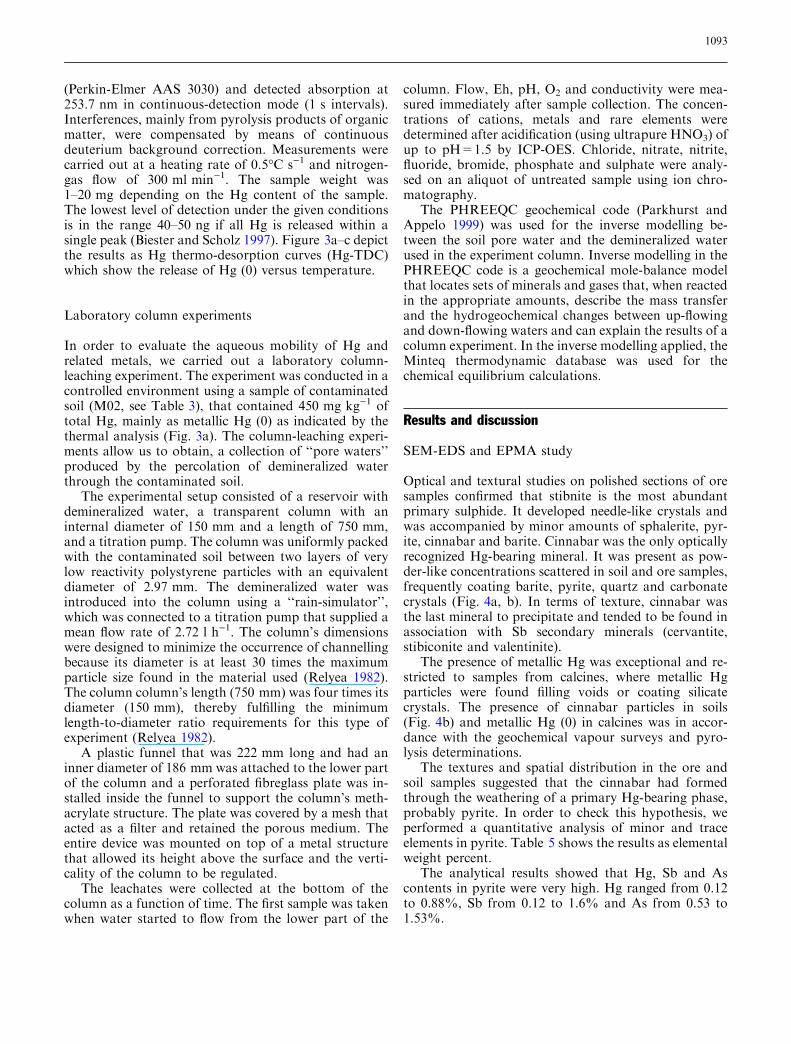
Although the mercury content in the soils and minewastes ranged from 357 to 1,000 mg kg)1, the concen-tration in calcines was especially remarkable(66–470 mg kg)1), above the mean values reported byRytuba (2000) for calcined tailings from rotary furnaces(20–150 mg kg)1), and similar to those of calcined tail-ings from Scott furnaces (500–1,000 mg kg)1, Rytuba2000) and tailing samples from the Idrija mercury mine(42–1,640 mg kg)1, Biester et al. 1999). The evolution ofcontaminants in the soil profiles from the central area ofthe Valle del Azogue mine (Fig. 2) showed a decrease inHg and As concentrations with depth, suggesting asimilar evolution of As and Hg in the soil and a possibleenrichment in Pb with depth associated with the likelypresence of base metals in the deeper sections of themineralization.
Soil mineralogy
The mineralogy of the soil samples was examined under abinocular microscope and the fine fraction was analysed
using X-ray powder diffraction (XRD). The results of themineralogical study indicated that the most abundantminerals were quartz (80–85%), mica (5–10%), feldspar(5–10%), barite (1–5%), calcite (1–5%), and hematite(1–5%), while the secondary minerals were jarosite(KFe3(SO4)2(OH)6), crystalline oxyhydroxide of Fe(goethite), amorphous ferric hydroxide (Fe(OH)3), clayminerals and gypsum (CaSO4Æ2H2O).
Major and trace element analysis of minerals
Scanning electron microscopy (SEM) and energy dis-persive X-ray spectroscopy (EDS) were used to charac-terize the solid forms of Hg in ore, soil and calcinesamples at the Electronic Microscopy Laboratory of theAutonomous University of Barcelona. Pyrite wasquantitatively analysed using electron probe micro-analysis (EPMA) to determine the presence of Hg, Ni,Co, Sb and As in this mineral using a Cameca SX50 atthe Analysis Services of the University of Barcelona. Weobtained quantitative data by comparing the intensitiesof X-rays generated from the sample with standards ofknown composition. In this case, we used the followingcompounds as standards: HgS, FeS2, InSb, GaAs, NiOand Co. The working conditions were 20 Kv and 20 nAwith 10 s of acquisition time for each element.
Thermo-desorption analysis of Hg
The determination of Hg phases by solid-phase-Hg-thermo-desorption (SPTD) is based on the specificthermal desorption or decomposition of Hg compoundsfrom solids at different temperatures. SPTD can identifyfewer species than other methods (EXAFS), but it is agood method for identifying Hg (0) and solid matrixwith elemental mercury (Sladek et al. 2002).
We determined the mercury thermo-desorptioncurves using an in-house apparatus consisting of anelectronically controlled heating unit and an Hg-detec-tion unit. For Hg detection, we placed a quartz cuvette,through which the thermally released Hg is purged in theoptical system of an atomic absorption spectrometer
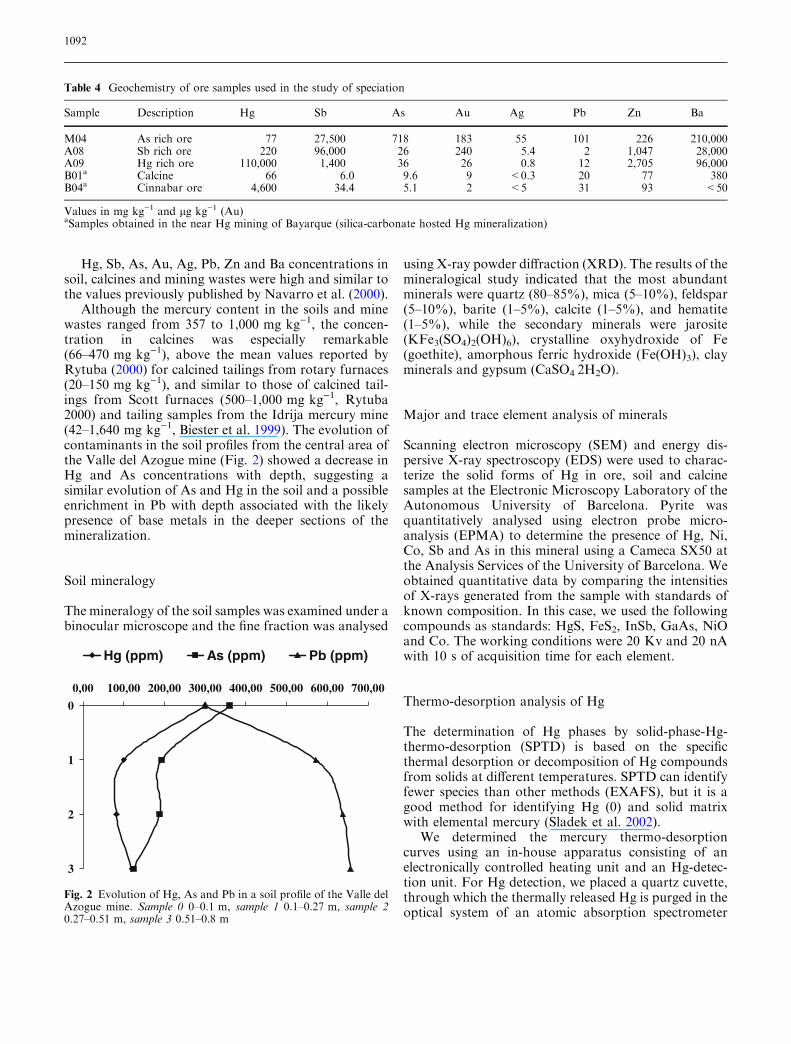
Table 4 Geochemistry of ore samples used in the study of speciation
Sample Description Hg Sb As Au Ag Pb Zn Ba
M04 As rich ore 77 27,500 718 183 55 101 226 210,000A08 Sb rich ore 220 96,000 26 240 5.4 2 1,047 28,000A09 Hg rich ore 110,000 1,400 36 26 0.8 12 2,705 96,000B01a Calcine 66 6.0 9.6 9 <0.3 20 77 380B04a Cinnabar ore 4,600 34.4 5.1 2 <5 31 93 <50
Values in mg kg)1 and lg kg)1 (Au)aSamples obtained in the near Hg mining of Bayarque (silica-carbonate hosted Hg mineralization)
0
1
2
3
0,00 100,00 200,00 300,00 400,00 500,00 600,00 700,00
Hg (ppm) As (ppm) Pb (ppm)
Fig. 2 Evolution of Hg, As and Pb in a soil profile of the Valle delAzogue mine. Sample 0 0–0.1 m, sample 1 0.1–0.27 m, sample 20.27–0.51 m, sample 3 0.51–0.8 m
1092
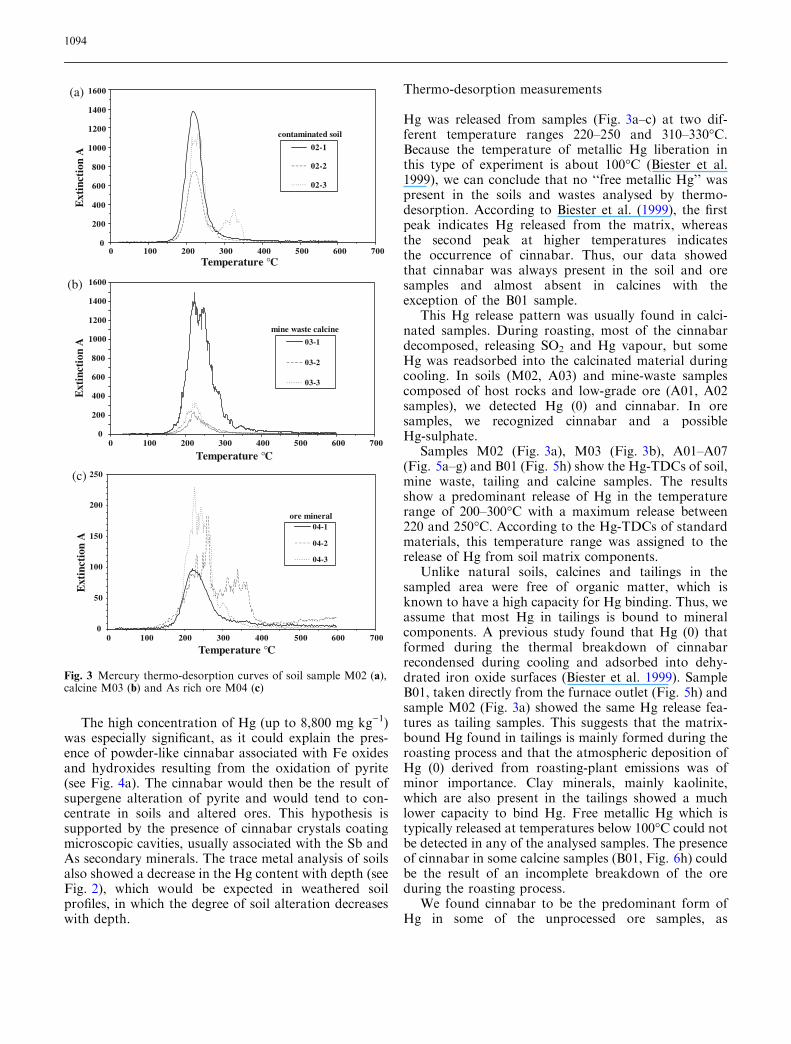
(Perkin-Elmer AAS 3030) and detected absorption at253.7 nm in continuous-detection mode (1 s intervals).Interferences, mainly from pyrolysis products of organicmatter, were compensated by means of continuousdeuterium background correction. Measurements werecarried out at a heating rate of 0.5�C s)1 and nitrogen-gas flow of 300 ml min)1. The sample weight was1–20 mg depending on the Hg content of the sample.The lowest level of detection under the given conditionsis in the range 40–50 ng if all Hg is released within asingle peak (Biester and Scholz 1997). Figure 3a–c depictthe results as Hg thermo-desorption curves (Hg-TDC)which show the release of Hg (0) versus temperature.
Laboratory column experiments
In order to evaluate the aqueous mobility of Hg andrelated metals, we carried out a laboratory column-leaching experiment. The experiment was conducted in acontrolled environment using a sample of contaminatedsoil (M02, see Table 3), that contained 450 mg kg)1 oftotal Hg, mainly as metallic Hg (0) as indicated by thethermal analysis (Fig. 3a). The column-leaching experi-ments allow us to obtain, a collection of ‘‘pore waters’’produced by the percolation of demineralized waterthrough the contaminated soil.
The experimental setup consisted of a reservoir withdemineralized water, a transparent column with aninternal diameter of 150 mm and a length of 750 mm,and a titration pump. The column was uniformly packedwith the contaminated soil between two layers of verylow reactivity polystyrene particles with an equivalentdiameter of 2.97 mm. The demineralized water wasintroduced into the column using a ‘‘rain-simulator’’,which was connected to a titration pump that supplied amean flow rate of 2.72 l h)1. The column’s dimensionswere designed to minimize the occurrence of channellingbecause its diameter is at least 30 times the maximumparticle size found in the material used (Relyea 1982).The column column’s length (750 mm) was four times itsdiameter (150 mm), thereby fulfilling the minimumlength-to-diameter ratio requirements for this type ofexperiment (Relyea 1982).
A plastic funnel that was 222 mm long and had aninner diameter of 186 mm was attached to the lower partof the column and a perforated fibreglass plate was in-stalled inside the funnel to support the column’s meth-acrylate structure. The plate was covered by a mesh thatacted as a filter and retained the porous medium. Theentire device was mounted on top of a metal structurethat allowed its height above the surface and the verti-cality of the column to be regulated.
The leachates were collected at the bottom of thecolumn as a function of time. The first sample was takenwhen water started to flow from the lower part of the
column. Flow, Eh, pH, O2 and conductivity were mea-sured immediately after sample collection. The concen-trations of cations, metals and rare elements weredetermined after acidification (using ultrapure HNO3) ofup to pH=1.5 by ICP-OES. Chloride, nitrate, nitrite,fluoride, bromide, phosphate and sulphate were analy-sed on an aliquot of untreated sample using ion chro-matography.
The PHREEQC geochemical code (Parkhurst andAppelo 1999) was used for the inverse modelling be-tween the soil pore water and the demineralized waterused in the experiment column. Inverse modelling in thePHREEQC code is a geochemical mole-balance modelthat locates sets of minerals and gases that, when reactedin the appropriate amounts, describe the mass transferand the hydrogeochemical changes between up-flowingand down-flowing waters and can explain the results of acolumn experiment. In the inverse modelling applied, theMinteq thermodynamic database was used for thechemical equilibrium calculations.
Results and discussion
SEM-EDS and EPMA study
Optical and textural studies on polished sections of oresamples confirmed that stibnite is the most abundantprimary sulphide. It developed needle-like crystals andwas accompanied by minor amounts of sphalerite, pyr-ite, cinnabar and barite. Cinnabar was the only opticallyrecognized Hg-bearing mineral. It was present as pow-der-like concentrations scattered in soil and ore samples,frequently coating barite, pyrite, quartz and carbonatecrystals (Fig. 4a, b). In terms of texture, cinnabar wasthe last mineral to precipitate and tended to be found inassociation with Sb secondary minerals (cervantite,stibiconite and valentinite).
The presence of metallic Hg was exceptional and re-stricted to samples from calcines, where metallic Hgparticles were found filling voids or coating silicatecrystals. The presence of cinnabar particles in soils(Fig. 4b) and metallic Hg (0) in calcines was in accor-dance with the geochemical vapour surveys and pyro-lysis determinations.
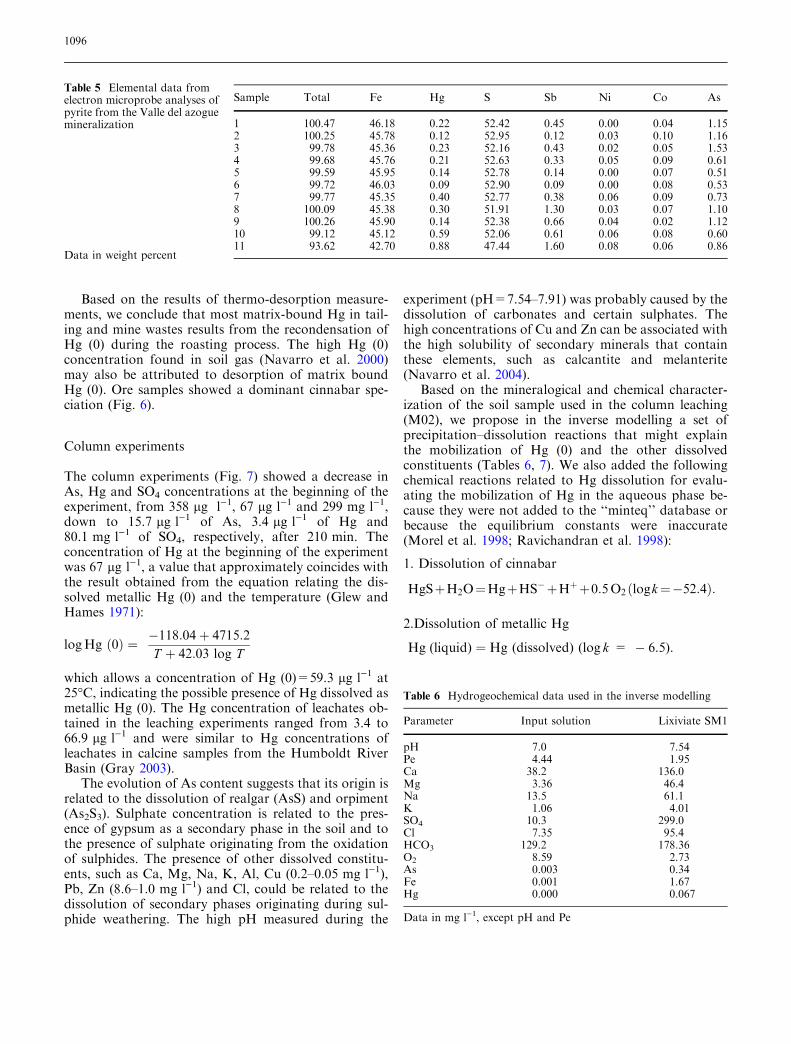
The textures and spatial distribution in the ore andsoil samples suggested that the cinnabar had formedthrough the weathering of a primary Hg-bearing phase,probably pyrite. In order to check this hypothesis, weperformed a quantitative analysis of minor and traceelements in pyrite. Table 5 shows the results as elementalweight percent.
The analytical results showed that Hg, Sb and Ascontents in pyrite were very high. Hg ranged from 0.12to 0.88%, Sb from 0.12 to 1.6% and As from 0.53 to1.53%.
1093
The high concentration of Hg (up to 8,800 mg kg)1)was especially significant, as it could explain the pres-ence of powder-like cinnabar associated with Fe oxidesand hydroxides resulting from the oxidation of pyrite(see Fig. 4a). The cinnabar would then be the result ofsupergene alteration of pyrite and would tend to con-centrate in soils and altered ores. This hypothesis issupported by the presence of cinnabar crystals coatingmicroscopic cavities, usually associated with the Sb andAs secondary minerals. The trace metal analysis of soilsalso showed a decrease in the Hg content with depth (seeFig. 2), which would be expected in weathered soilprofiles, in which the degree of soil alteration decreaseswith depth.
Thermo-desorption measurements
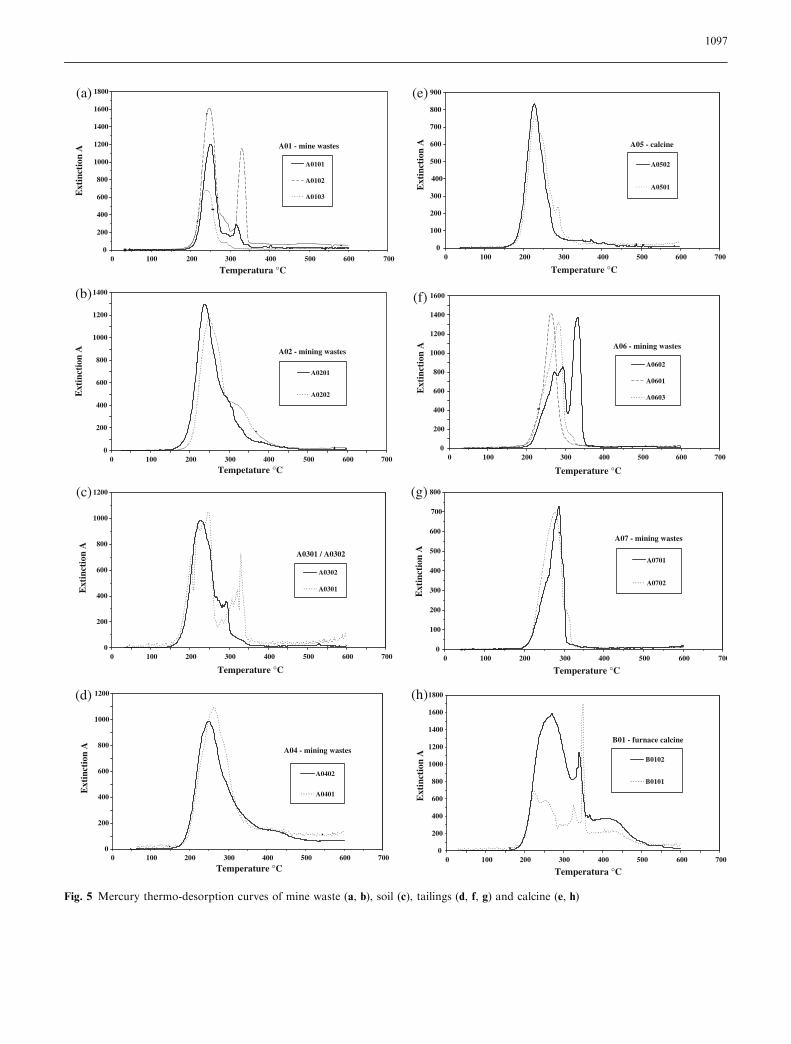
Hg was released from samples (Fig. 3a–c) at two dif-ferent temperature ranges 220–250 and 310–330�C.Because the temperature of metallic Hg liberation inthis type of experiment is about 100�C (Biester et al.1999), we can conclude that no ‘‘free metallic Hg’’ waspresent in the soils and wastes analysed by thermo-desorption. According to Biester et al. (1999), the firstpeak indicates Hg released from the matrix, whereasthe second peak at higher temperatures indicatesthe occurrence of cinnabar. Thus, our data showedthat cinnabar was always present in the soil and oresamples and almost absent in calcines with theexception of the B01 sample.
This Hg release pattern was usually found in calci-nated samples. During roasting, most of the cinnabardecomposed, releasing SO2 and Hg vapour, but someHg was readsorbed into the calcinated material duringcooling. In soils (M02, A03) and mine-waste samplescomposed of host rocks and low-grade ore (A01, A02samples), we detected Hg (0) and cinnabar. In oresamples, we recognized cinnabar and a possibleHg-sulphate.
Samples M02 (Fig. 3a), M03 (Fig. 3b), A01–A07(Fig. 5a–g) and B01 (Fig. 5h) show the Hg-TDCs of soil,mine waste, tailing and calcine samples. The resultsshow a predominant release of Hg in the temperaturerange of 200–300�C with a maximum release between220 and 250�C. According to the Hg-TDCs of standardmaterials, this temperature range was assigned to therelease of Hg from soil matrix components.
Unlike natural soils, calcines and tailings in thesampled area were free of organic matter, which isknown to have a high capacity for Hg binding. Thus, weassume that most Hg in tailings is bound to mineralcomponents. A previous study found that Hg (0) thatformed during the thermal breakdown of cinnabarrecondensed during cooling and adsorbed into dehy-drated iron oxide surfaces (Biester et al. 1999). SampleB01, taken directly from the furnace outlet (Fig. 5h) andsample M02 (Fig. 3a) showed the same Hg release fea-tures as tailing samples. This suggests that the matrix-bound Hg found in tailings is mainly formed during theroasting process and that the atmospheric deposition ofHg (0) derived from roasting-plant emissions was ofminor importance. Clay minerals, mainly kaolinite,which are also present in the tailings showed a muchlower capacity to bind Hg. Free metallic Hg which istypically released at temperatures below 100�C could notbe detected in any of the analysed samples. The presenceof cinnabar in some calcine samples (B01, Fig. 6h) couldbe the result of an incomplete breakdown of the oreduring the roasting process.
We found cinnabar to be the predominant form ofHg in some of the unprocessed ore samples, as
contaminated soil
0
200
400
600
800
1000
1200
1400
1600
0 100 200 300 400 500 600 700Temperature °C
Ext
inct
ion
A 02-1
02-2
02-3
(a)
mine waste calcine
0
200
400
600
800
1000
1200
1400
1600
0 100 200 300 400 500 600 700
Temperature °C
Ext
inct
ion
A 03-1
03-2
03-3
(b)
ore mineral
0
50
100
150
200
250
0 100 200 300 400 500 600 700
Temperature °C
Ext
inct
ion
A
04-1
04-2
04-3
(c)
Fig. 3 Mercury thermo-desorption curves of soil sample M02 (a),calcine M03 (b) and As rich ore M04 (c)
1094

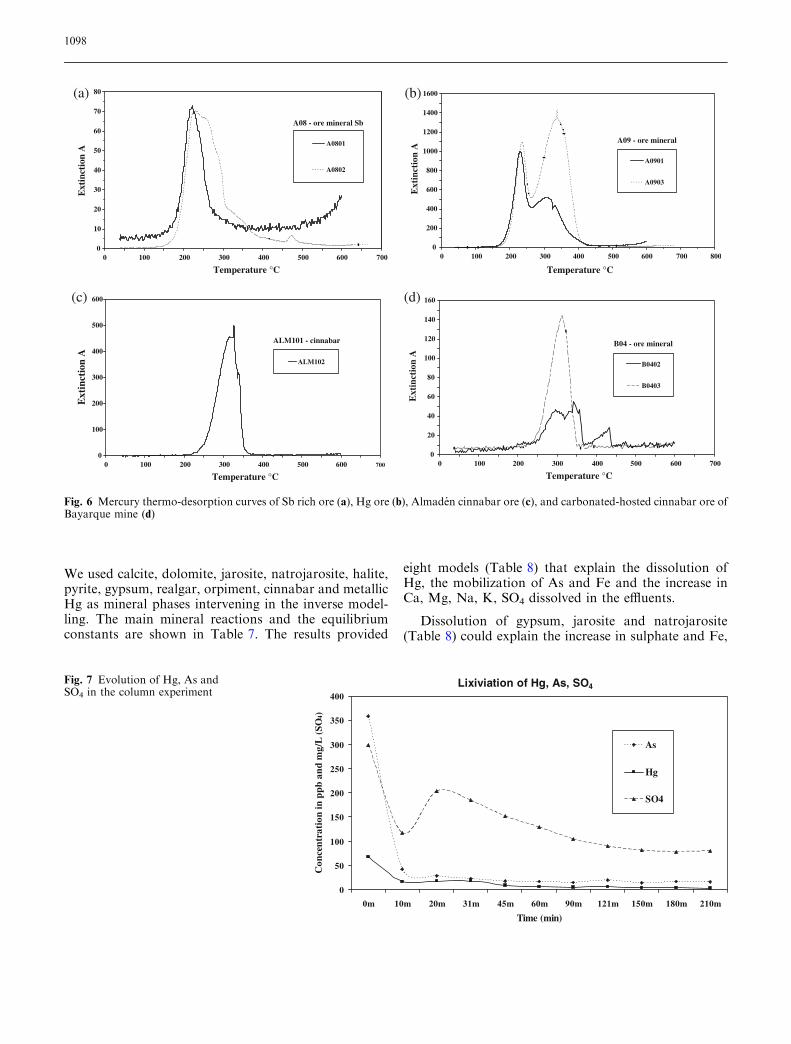
indicated by the Hg release curves in Fig. 6b (sampleA09) and 6d (sample B04). Since cinnabar was foundto be the predominant form of Hg, as in some of themine wastes we assumed that this was the unpro-cessed/roasted material.
We also found cinnabar to be the predominant geo-genic Hg species in alluvial soils in the study area(sample M02 in Fig. 3a and sample A03 in Fig. 5c),although we also detected matrix-bound Hg forms in allof the unprocessed samples as well.
Fig. 4 a Pyrite crystal (Py) sur-rounded by secondary cinnabar(Cin) and barite (Bar). BSEimage. Scale bar=20 lm. bSEM image of soil (M02) par-ticles. Cinnabar crystals (Cin)coating barite (Bar) and Sboxides. Scale bar=10 lm
1095
Based on the results of thermo-desorption measure-ments, we conclude that most matrix-bound Hg in tail-ing and mine wastes results from the recondensation ofHg (0) during the roasting process. The high Hg (0)concentration found in soil gas (Navarro et al. 2000)may also be attributed to desorption of matrix boundHg (0). Ore samples showed a dominant cinnabar spe-ciation (Fig. 6).
Column experiments
The column experiments (Fig. 7) showed a decrease inAs, Hg and SO4 concentrations at the beginning of theexperiment, from 358 lg l)1, 67 lg l)1 and 299 mg l)1,down to 15.7 lg l)1 of As, 3.4 lg l)1 of Hg and80.1 mg l)1 of SO4, respectively, after 210 min. Theconcentration of Hg at the beginning of the experimentwas 67 lg l)1, a value that approximately coincides withthe result obtained from the equation relating the dis-solved metallic Hg (0) and the temperature (Glew andHames 1971):
logHg ð0Þ ¼ �118:04þ 4715:2
T þ 42:03 log T
which allows a concentration of Hg (0)=59.3 lg l)1 at25�C, indicating the possible presence of Hg dissolved asmetallic Hg (0). The Hg concentration of leachates ob-tained in the leaching experiments ranged from 3.4 to66.9 lg l)1 and were similar to Hg concentrations ofleachates in calcine samples from the Humboldt RiverBasin (Gray 2003).
The evolution of As content suggests that its origin isrelated to the dissolution of realgar (AsS) and orpiment(As2S3). Sulphate concentration is related to the pres-ence of gypsum as a secondary phase in the soil and tothe presence of sulphate originating from the oxidationof sulphides. The presence of other dissolved constitu-ents, such as Ca, Mg, Na, K, Al, Cu (0.2–0.05 mg l)1),Pb, Zn (8.6–1.0 mg l)1) and Cl, could be related to thedissolution of secondary phases originating during sul-phide weathering. The high pH measured during the
experiment (pH=7.54–7.91) was probably caused by thedissolution of carbonates and certain sulphates. Thehigh concentrations of Cu and Zn can be associated withthe high solubility of secondary minerals that containthese elements, such as calcantite and melanterite(Navarro et al. 2004).
Based on the mineralogical and chemical character-ization of the soil sample used in the column leaching(M02), we propose in the inverse modelling a set ofprecipitation–dissolution reactions that might explainthe mobilization of Hg (0) and the other dissolvedconstituents (Tables 6, 7). We also added the followingchemical reactions related to Hg dissolution for evalu-ating the mobilization of Hg in the aqueous phase be-cause they were not added to the ‘‘minteq’’ database orbecause the equilibrium constants were inaccurate(Morel et al. 1998; Ravichandran et al. 1998):
1. Dissolution of cinnabar
HgSþH2O¼HgþHS�þHþþ0:5O2 ðlogk¼�52:4Þ:
2.Dissolution of metallic Hg
Hg (liquid) ¼ Hg (dissolved) (log k = � 6.5).
Table 5 Elemental data fromelectron microprobe analyses ofpyrite from the Valle del azoguemineralization
Data in weight percent
Sample Total Fe Hg S Sb Ni Co As
1 100.47 46.18 0.22 52.42 0.45 0.00 0.04 1.152 100.25 45.78 0.12 52.95 0.12 0.03 0.10 1.163 99.78 45.36 0.23 52.16 0.43 0.02 0.05 1.534 99.68 45.76 0.21 52.63 0.33 0.05 0.09 0.615 99.59 45.95 0.14 52.78 0.14 0.00 0.07 0.516 99.72 46.03 0.09 52.90 0.09 0.00 0.08 0.537 99.77 45.35 0.40 52.77 0.38 0.06 0.09 0.738 100.09 45.38 0.30 51.91 1.30 0.03 0.07 1.109 100.26 45.90 0.14 52.38 0.66 0.04 0.02 1.1210 99.12 45.12 0.59 52.06 0.61 0.06 0.08 0.6011 93.62 42.70 0.88 47.44 1.60 0.08 0.06 0.86
Table 6 Hydrogeochemical data used in the inverse modelling
Parameter Input solution Lixiviate SM1
pH 7.0 7.54Pe 4.44 1.95Ca 38.2 136.0Mg 3.36 46.4Na 13.5 61.1K 1.06 4.01SO4 10.3 299.0Cl 7.35 95.4HCO3 129.2 178.36O2 8.59 2.73As 0.003 0.34Fe 0.001 1.67Hg 0.000 0.067
Data in mg l)1, except pH and Pe
1096
A01 - mine wastes
0
200
400
600
800
1000
1200
1400
1600
1800
0 100 200 300 400 500 600 700
Temperatura °C
Ext
inct
ion
A
A0101
A0102
A0103
(a)
A02 - mining wastes
0
200
400
600
800
1000
1200
1400
0 100 200 300 400 500 600 700
Tempetature °C
Ext
inct
ion
A
A0201
A0202
(b)
A0301 / A0302
0
200
400
600
800
1000
1200
0 100 200 300 400 500 600 700
Temperature °C
Ext
inct
ion
A
A0302
A0301
(c)
A04 - mining wastes
0
200
400
600
800
1000
1200
0 100 200 300 400 500 600 700
Temperature °C
Ext
inct
ion
A
A0402
A0401
(d)
A05 - calcine
0
100
200
300
400
500
600
700
800
900
0 100 200 300 400 500 600 700
Temperature °C
Ext
inct
ion
A
A0502
A0501
(e)
A06 - mining wastes
0
200
400
600
800
1000
1200
1400
1600
0 100 200 300 400 500 600 700
Temperature °C
Ext
inct
ion
A
A0602
A0601
A0603
(f)
A07 - mining wastes
0
100
200
300
400
500
600
700
800
0 100 200 300 400 500 600 700
Temperature °C
Ext
inct
ion
A
A0701
A0702
(g)
B01 - furnace calcine
0
200
400
600
800
1000
1200
1400
1600
1800
0 100 200 300 400 500 600 700
Temperatura °C
Ext
inct
ion
A
B0102
B0101
(h)
Fig. 5 Mercury thermo-desorption curves of mine waste (a, b), soil (c), tailings (d, f, g) and calcine (e, h)
1097
We used calcite, dolomite, jarosite, natrojarosite, halite,pyrite, gypsum, realgar, orpiment, cinnabar and metallicHg as mineral phases intervening in the inverse model-ling. The main mineral reactions and the equilibriumconstants are shown in Table 7. The results provided
eight models (Table 8) that explain the dissolution ofHg, the mobilization of As and Fe and the increase inCa, Mg, Na, K, SO4 dissolved in the effluents.
Dissolution of gypsum, jarosite and natrojarosite(Table 8) could explain the increase in sulphate and Fe,
A08 - ore mineral Sb
0
10
20
30
40
50
60
70
80
0 100 200 300 400 500 600 700
Temperature °C
Ext
inct
ion
A
A0801
A0802
(a)
A09 - ore mineral
0
200
400
600
800
1000
1200
1400
1600
0 100 200 300 400 500 600 700 800
Temperature °C
Ext
inct
ion
AE
xtin
ctio
n A
A0901
A0903
(b)
ALM101 - cinnabar
0
100
200
300
400
500
600
0 100 200 300 400 500 600 700
Temperature °C
Ext
inct
ion
A
ALM102
(c)
B04 - ore mineral
0
20
40
60
80
100
120
140
160
0 100 200 300 400 500 600 700
Temperature °C
B0402
B0403
(d)
Fig. 6 Mercury thermo-desorption curves of Sb rich ore (a), Hg ore (b), Almaden cinnabar ore (c), and carbonated-hosted cinnabar ore ofBayarque mine (d)
Lixiviation of Hg, As, SO4
0
50
100
150
200
250
300
350
400
0m 10m 20m 31m 45m 60m 90m 121m 150m 180m 210m
Time (min)
Con
cen
trat
ion
in p
pb
an
dm
g/L
(SO
4)
As
Hg
SO4
Fig. 7 Evolution of Hg, As andSO4 in the column experiment
1098

while dissolution of realgar and orpiment might causethe mobilization of As into the leachates. Moreover,the dissolution of Hg (liquid), cinnabar, dolomite,gypsum, jarosite, halite, pyrite, realgar and orpimentmay account for the mobilization of contaminants (Hgand As) as well as other elements, such as Ca, Mg, Fe,Na and K. In accordance with this, Bigham andNordstrom (2000) and Navarro et al. (2004) indicatedthat ‘‘the fast dissolution’’ of accumulated soluble saltsduring subsequent rainfall events may release acidityand produce ‘‘pulses’’ of contaminants in the environ-ment.
Thus, when pore water migrates through the column,metallic Hg is dissolved and metals and cations arereleased through sulphide oxidation reactions and ini-tially immobilized. Besides, in a semiarid environment,metals and cations can be removed from precipitatedsecondary mineral (jarosite, gypsum, orpiment) by dis-solution–desorption mechanisms. Therefore, the disso-lution of metallic Hg and secondary minerals couldexplain the mobility of Hg, As, Ca, Fe, Mg, Na and K inthe elution experiment.
The dissolution of cinnabar, which inverse modellingresults show to be theoretically possible, is sometimesinhibited by divalent cations such asCa2+ (Ravichandranet al. 1998) and could explain the preferential dissolutionofmetallicHg in the columnexperiment.Moreover, basedon the kinetics of cinnabar dissolution, we discard therelease of large amounts of Hg (Craw et al. 2000),
particularly under the prevailing environmental condi-tions in the Valle del Azogue mine and the leaching col-umn experiment.
The pH–Eh conditions during the laboratory exper-iments (pH=7.0–7.91, Eh=0.115–0.135 V, O2=2.73–8.59 mg l)1), were in keeping with the Eh–pH equilib-rium conditions for Hg species (Morel et al. 1998),indicating that the most stable species is dissolvedmetallic Hg (0), as is usual in aquatic environments. Thecolumn experiment showed that metals from secondaryphases dissolved in pore water can be mobilized bycolumn flow, which is very similar to what occurred inthe mining site soils during wet periods. Thus, when adry period begins, secondary phases would be newlyformed at depth in soils, dumps and tailings, againproducing temporary acidity and causing metal con-tamination accumulation.
Conclusions
The Valle del Azogue mine provides an excellentexample of mercury and arsenic contamination in soils,calcines and tailings derived from an abandoned Sb–Hgmineral deposit, that was mined in the ninetieth centuryand exposed to weathering in a semi-arid environment.
The primary mineralization consists of stibnite,sphalerite, siderite, chalcopyrite, pyrite quartz, calcite
Table 7 Mineral phases in theinverse modelling Mineral phase Reaction log k (Minteq)
Calcite CaCO3 = Ca2+ + 2CO32) )8.47
Dolomite CaMg(CO3)2 = Ca2+ + Mg2+ CO32) )17.0
Jarosite KFe3(SO4)2(OH)6 + 6H+ = K+ + 3Fe3+ + 2SO42) + 6H2O )14.8
Natrojarosite NaFe3(SO4)2(OH)6 + 6H+ = Na+ + 3Fe3+ + 2SO42) + 6H2O )11.2
Halite NaCl = Na+ + Cl- 1.582Pyrite FeS2 + 2H+ 2e- = Fe2+ + 2SH- )18.47Gypsum CaSO4:2H2O = Ca2+ + SO4
2) + 2H2O )4.848Realgar AsS + 3H2O = H3AsO3 + HS- + e- )19.747Orpiment As2S3 + 6H2O = 2 H3AsO3 + 3HS- + 3H+ )60.971
Table 8 Models and molar transfers calculated by PHREEQC
Phase M-1 M-2 M-3 M-4 M-5 M-6 M-7 M-8
Calcite )2.65e-003 )2.65e-003 )2.65e-003 )2.65e-003 )2.65e-003 )2.65e-003 )2.66e-003 )2.66e-003Dolomite 1.59e-003 1.59e-003 1.59e-003 1.59e-003 1.59e-003 1.59e-003 1.59e-003 1.59e-003Gypsum 3.20e-003 3.20e-003 3.20e-003 3.20e-003 3.20e-003 3.20e-003 3.20e-003 3.20e-003Jarosite-K 7.55e-005 7.55e-005 7.55e-005 7.55e-005 7.55e-005 7.55e-005 7.55e-005 7.55e-005Halite 2.21e-003 2.21e-003 2.21e-003 2.21e-003 2.21e-003 2.21e-003 2.21e-003 2.21e-003Pyrite 4.43e-005 4.81e-005 4.43e-005 4.79e-005 4.43e-005 4.43e-005 4.95e-005 4.93e-005Jarosite-Na )8.04e-005 )8.16e-005 )8.04e-005 )8.14e-005 )8.04e-005 )8.04e-005 )8.20e-005 )8.19e-005Realgar )1.05e-005 )1.11e-005 4.50e-006 4.50e-006 4.50e-006Oripment 2.25e-006 2.25e-006 7.50e-006 2.25e-006 7.83e-006Cinnabar 5.58e-006 3.34e-007 3.34e-007 7.83e-006Hg metal )5.25e-006 3.34e-007 3.34e-007 )7.50e-006 3.34e-007 3.34e-007
Negative values indicate precipitation and positive values dissolution
1099
and baryte. Secondary minerals, formed after weath-ering, include cinnabar, orpiment, realgar, gypsum andFe and As–Sb oxide and hydroxides. By carrying outEPMA and SEM-EDS studies, we confirmed that cin-nabar is a secondary phase, precipitated after the alter-ation of a Hg-bearing pyrite, which may reach contentsof up to 8,800 mg kg)1 of Hg.
Soils, calcines and mine wastes have high mercurycontents with mean values of 357.3, 66–470 and 530–1,000 mg kg)1, respectively. A large amount of residualHg, remains in calcines (66–470 mg kg)1), above themean values cited by Rytuba (2000) for calcined tailingsfrom rotary furnaces (20–150 mg kg)1) and similar tocalcined tailings fromScott furnaces (500–1,000 mg kg)1)and tailings from the Idrija mercury mine(42–1,640 mg kg)1, Biester et al. 1999).
The thermal analysis of soil and waste samplesindicated that Hg was released at two different tem-perature ranges: 220–250 and 310–330�C. The firsttemperature range could correspond to metallic Hgreleased from the matrix, whereas the second peak, athigher temperatures, would indicate the presence ofcinnabar.
In calcine samples, the metallic Hg can be attributedto Hg readsorbed after the roasting process, with aminor atmospheric deposition of Hg (0) derived fromroasting plant emissions.
The results of leaching column experiments on soilsample M02, showed a decrease in As, Hg and SO4
concentrations at the beginning of the experiment from
358 lg l)1, 67 lg l)1 and 299 mg l)1, respectively, downto 15.7 lg l)1, 3.4 lg l)1 and 80.1 mg l)1, after 210 min.These results suggest the dissolution of Hg (0) present inthe soil sample, the dissolution of As from pyrite, realgarand orpiment and the mobilization of sulphates origi-nated in the sulphide oxidation and/or the dissolution ofsome sulphates from the secondary phases.
The different models resulting from the inversemodelling applied to the leaching fluids, indicate thatdissolution of Hg (liquid), cinnabar, dolomite, gypsum,jarosite, halite, pyrite, realgar and orpiment may ac-count for the mobilization of Hg and As and otherelements such as Ca, Mg, Fe, Na and K. The dissolutionof metallic Hg in the column experiment suggests thepossibility of aqueous mobilization of this contaminantin the environmental conditions of the Valle del Azoguemine.
The decrease in Hg content in soil profiles is consis-tent with the assumed weathering of Hg-enriched pyrite.The Hg content in soils is higher near the topographicsurface where the Hg-bearing minerals (pyrite) are moreexposed to the atmosphere.
Acknowledgements This work was supported by Spanish Ministryof Science and Technology (project REN2003-09247-C04-03) incollaboration with the Research Centre for Energy Environmentand Technology (CIEMAT). The authors wish to thank Dr. M.Viladevall and the anonymous reviewer for their interesting sug-gestions. The authors gratefully acknowledge the leaching experi-ments carried out by the staff of the Department of FluidMechanics (UPC).
References
Barnett MO, Harris LA, Turner RR, Ste-venson RJ, Henson TJ, Melton RC,Hoffman DP (1997) Formation ofmercuric sulfide in soil. Environ SciTechnol 31:3037–3043
Becker GF (1888) Geology of the Quick-silver deposits of the Pacific Slope withan Atlas. US Geological Survey Li-brary, Document 23442, Spanish local-ities, pp 27–32
Biester H, Scholz E (1997) Determinationof mercury phases in contaminatedsoils—Hg-pyrolysis versus sequentialextractions. Environ Sci Technol31:233–239
Biester H, Gosar M, Muller G (1999) Mer-cury speciation in tailings of the idrijamercury mine. J Geochem Explor65:195–204
Bigham JM, Nordstrom DK (2000) Ironand aluminium hydroxysulfates fromacid sulfate waters. In: Alpers CN,Jambor JL, Nordstrom DK (eds) Sul-fate minerals –crystallography, geo-chemistry, and environmentalsignificance. Mineralogical Society ofAmerica, Rev Miner Geochem 40:351–403
Cortazar D (1875) Resena fısica y geologicade la region Norte de la provincia deAlmerıa.- Bol. de la Comision del MapaGeol. Espana 2:164–234
Craw D, Chappell D, Reay A (2000)Environmental mercury and arsenicsources in fossil hydrothermal systems,Northland, New Zealand. Environ Geol39(8):875–887
EPA (1991) Description and sampling ofcontaminated soils. A field pocketguide. EPA/625/12–91/002, 122 pp
Glew DN, Hames DA (1971) Aqueous nonelectrolyte solutions. Part X. Mercurysolubility in water. Can J Chem 49:3114
Gray JE (2003) Leaching, transport, andmethylation of mercury in and aroundabandoned mercury mines in theHumboldt River Basin and surroundingareas, Nevada. US Geological SurveyBull, 2210-C, 15 pp
Martınez J, Navarro A, Lunar R (1997)First reference of pyrite framboids in aHg–Sb mineralization: the Valle delAzogue mineral deposit (SE Spain). NJb Miner Mh Jg 4:175–184
Martınez J, Navarro A, Lunar R, Garcıa-Guinea J (1998) Mercury pollution in alarge marine basin: a natural ventingsystem in the south–west Mediterraneanmargin. Nat Resour 34(3):9–15
Morel FMM, Kraepiel AML, Amyot M(1998) The chemical cycle and bioaccu-mulation of mercury. Ann Rev EcolSyst 29:543–566
1100
Navarro A, Viladevall M, Font X, Rodri-guez P (1994) Las mineralizaciones au-rıferas de Sierra Almagrera (Almerıa).Estudio geoquımico y modelos de yac-imientos. Bol ITGE 109(2):105–112
Navarro A, Martınez J, Font X, ViladevallM (2000) Modelling of modern mercuryvapor transport in an ancient hydro-thermal system: environmental andgeochemical implications. Appl Geo-chem 15:281–294
Navarro A, Collado D, Carbonell M,Sanchez JA (2004) Impact of miningactivities in a semi-arid environment:Sierra Almagrera district, SE Spain.Environ Geochem Health 26:383–393
Parkhurst DL, Appelo CAJ (1999) Usersguide to PHREEQC (version 2)—a
computer program for speciation,batch-reaction, one-dimensional trans-port, and inverse geochemical calcula-tions. US Geological Survey, Water-Resources Investigations Report 99–4259, 326 pp
Ravichandran M, Aiken GR, Reddy MM,Ryan JN (1998) Enhanced dissolutionof Cinnabar (mercuric sulfide) by dis-solved organic matter from the FloridaEverglades. Environ Sci Technol32:3305–3311
Relyea JF (1982) Theoretical and experi-mental considerations for the use of thecolumn method for determining retar-dation factors. Radioactive WasteManag 3(2):151–166
Rytuba JJ (2000) Mercury mine drainageand processes that control its environ-mental impact. Sci Total Environ260:57–71
Rytuba JJ (2002) Mercury geoenviron-mental models. In: Seal RR, Foley NK(eds) Progress on geoenvironmentalmodels for selected mineral deposittypes. US Geological Survey Open-FileReport 02–195, pp 161–175
Sladek C, Gustin-Sexauer M, Kim C, Bi-ester H (2002) Assessment of threemethods for determining mercury spe-ciation in mine wastes. Geochem ExplorEnviron Anal 4:369–375
Viladevall M, Font X, Navarro A (1999)Geochemical mercury survey in theAzogue Valley (Betic area, SE Spain). JGeochem Exploration 66:27–35
1101