MENTAL HEALTH AMONG SCHOOL CHILDREN IN KINSHASA, DEMOCRATIC
22
1 MENTAL HEALTH AMONG SCHOOL CHILDREN IN KINSHASA, DEMOCRATIC REPUBLIC OF CONGO. Running title: Child mental health Espérance Kashala 1,3 , Irene Elgen 2 , Kristian Sommerfelt 2 , Thorkild Tylleskar 2,3 1 Department of Neurology, Kinshasa University Hospital, Kinshasa, Dem. Rep. of Congo. 2 Department of Paediatrics, Barneklinikken, N-5021 Haukeland Sykehus, Bergen, Norway. 3 University of Bergen, Center for International Health, N-5021 Armauer Hansens Building, Bergen, Norway. Corresponding author and request for reprints: Espérance Kashala University of Bergen, Center for International Health Armauer Hansens Building N-5021 Bergen, Norway Phone: +47 55 97 46 92 Fax: +47 55 97 49 79 e-mail: [email protected]
Transcript of MENTAL HEALTH AMONG SCHOOL CHILDREN IN KINSHASA, DEMOCRATIC

1
MENTAL HEALTH AMONG SCHOOL CHILDREN IN KINSHASA, DEMOCRATIC
REPUBLIC OF CONGO.
Running title: Child mental health
Espérance Kashala 1,3, Irene Elgen 2, Kristian Sommerfelt 2, Thorkild Tylleskar 2,3
1 Department of Neurology, Kinshasa University Hospital, Kinshasa, Dem. Rep. of Congo.
2 Department of Paediatrics, Barneklinikken, N-5021 Haukeland Sykehus, Bergen, Norway.
3 University of Bergen, Center for International Health, N-5021 Armauer Hansens Building,
Bergen, Norway.
Corresponding author and request for reprints:
Espérance Kashala
University of Bergen, Center for International Health
Armauer Hansens Building
N-5021 Bergen, Norway
Phone: +47 55 97 46 92
Fax: +47 55 97 49 79
e-mail: [email protected]
2
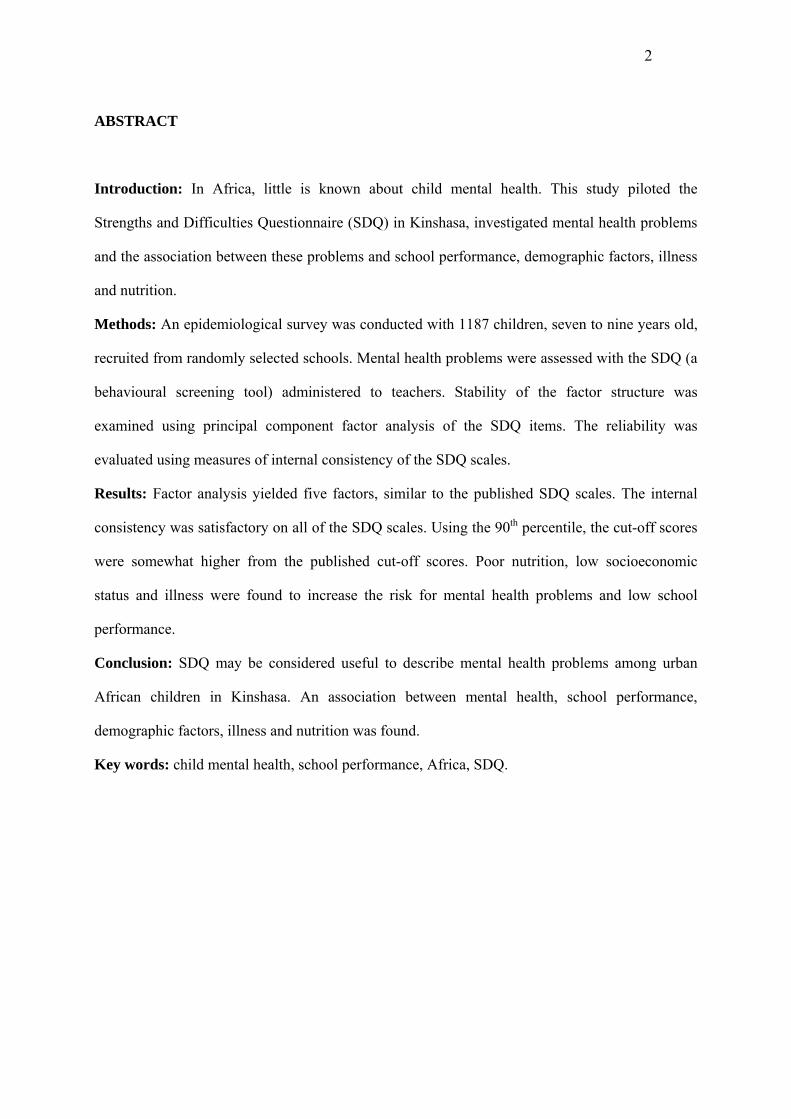
ABSTRACT
Introduction: In Africa, little is known about child mental health. This study piloted the
Strengths and Difficulties Questionnaire (SDQ) in Kinshasa, investigated mental health problems
and the association between these problems and school performance, demographic factors, illness
and nutrition.
Methods: An epidemiological survey was conducted with 1187 children, seven to nine years old,
recruited from randomly selected schools. Mental health problems were assessed with the SDQ (a
behavioural screening tool) administered to teachers. Stability of the factor structure was
examined using principal component factor analysis of the SDQ items. The reliability was
evaluated using measures of internal consistency of the SDQ scales.
Results: Factor analysis yielded five factors, similar to the published SDQ scales. The internal
consistency was satisfactory on all of the SDQ scales. Using the 90th percentile, the cut-off scores
were somewhat higher from the published cut-off scores. Poor nutrition, low socioeconomic
status and illness were found to increase the risk for mental health problems and low school
performance.
Conclusion: SDQ may be considered useful to describe mental health problems among urban
African children in Kinshasa. An association between mental health, school performance,
demographic factors, illness and nutrition was found.
Key words: child mental health, school performance, Africa, SDQ.

3
INTRODUCTION
The World Health Organisation (WHO) estimates that about 10-20% of children world-wide have
mental or behavioural problems. Furthermore, many of the affected children are neglected and do
not have access to appropriate resources for recognition, support and treatment (19). In several
studies, the overall prevalence of mental health problems among children in high-income
countries like Great Britain (13) and Sweden (3) varies around 10-20%. Similar rates have been
reported in non-African low-income countries such as India (12).
In Africa, little is known about mental health problems in children. The few data available
from Ethiopia (1) and South Africa (11) describe prevalences in the range of 3-20%, similar to
those found in high-income countries.
Different behavioural questionnaires have been used world-wide in child psychiatry to
examine mental health profile, but many of them have not been evaluated in Africa yet. Therefore
the aims of the study were: 1) to pilot the use of a short child behaviour questionnaire (Strengths
and Difficulties Questionnaire, SDQ) in an urban African setting; 2) to investigate the association
between abnormal scores (signs of mental health problems) and various demographic factors,
illness and nutrition; 3) to investigate whether child school performance was associated with these
factors; 4) to investigate whether children with mental health problems have lower school
performance than those without such problems.

4
SUBJECTS AND METHODS
Study area
The Democratic Republic of Congo (DR Congo), formerly Zaïre, is a large country (2 345 000
km2) in central Africa with an estimated population of 51 million (22). More than 300 local
languages are spoken in the whole country. This linguistic variety is bridged both by the use of
French as the official language and one of the four national Lingua Franca (Kikongo, Lingala,
Swahili and Tshiluba) in each region.
Although, mental health cares have been included among the health policy objectives and
priorities, health care is not subsidised or available for all in the DR Congo. The country has only
one referral center for neurologic and psychiatric disorders for both adults and children. This
university hospital center is located in the capital and is the main academic institution of the
country.
The present study was conducted in Kinshasa, the capital city, from July to September
2002. The city lies on the south bank of the Congo River, in the far Western part of the country,
which is about 2-3 hours by airplane away from the war-affected area. Kinshasa has an estimated
population of 5 million inhabitants and is thus one of the largest cities in Africa. Most of the
Congolese ethnic groups, each with their own mother tongue, are represented in Kinshasa. The
main communication language for any oral interaction outside the family in Kinshasa is Lingala.
French, however, remains the administrative and the most important language in writing, and the
educational language used for education from nursery to university level.

5
Despite the deterioration of the educational system during the 1990’ies resulting from the political
instability, children at six to twelve years of age are required to attend school. This is accepted by
most parents. The schooling system includes both public and private schools, with public schools
being more common. According to the last census, the schooling rate in Kinshasa is 75% (14).
This low percentage is due to the fact that education is not subsidized and school fees are paid by
parents.
Study population
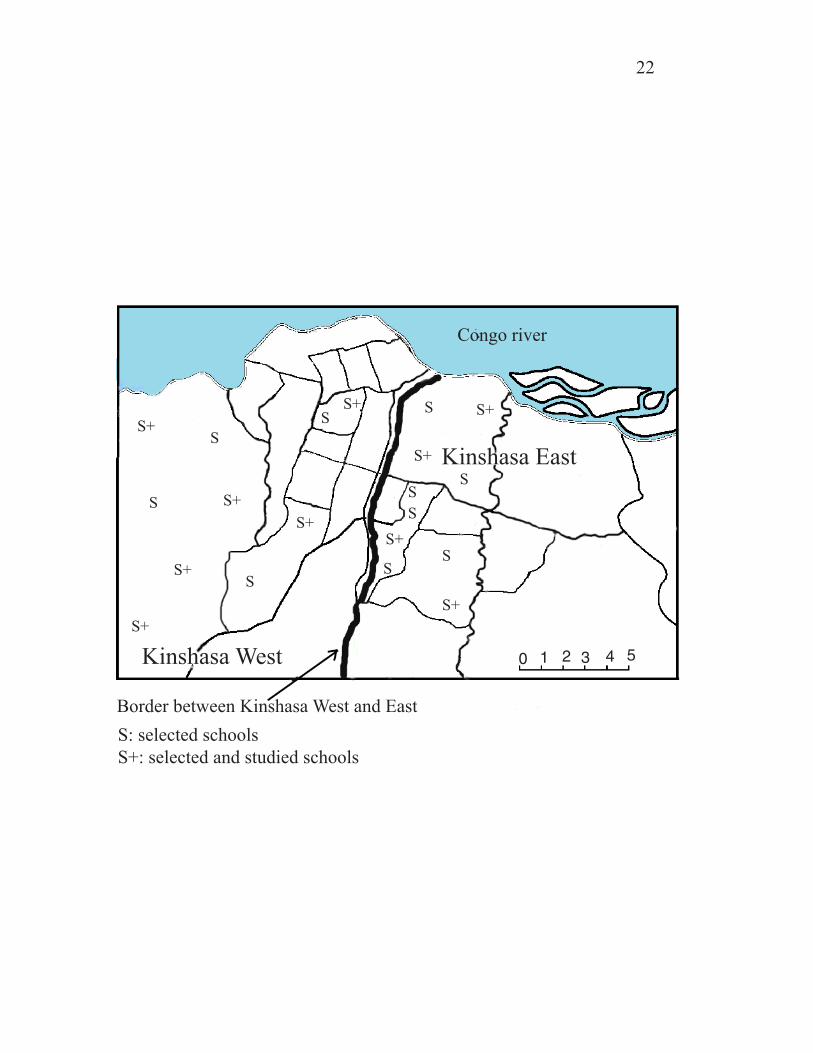
A cluster sampling procedure was used. Kinshasa is divided into two administrative sectors by the
Ministry of Education: Kinshasa East and Kinshasa West with 10 and 14 municipalities
respectively. From the two sectors, six municipalities were randomly selected using the basket
method. In two baskets, the 24 municipalities’ names (10 and 14 respectively) were written on
small sheet of papers and from each basket, respectively three municipalities’ names were
randomly picked out. From the six municipalities, all the 30 primary schools (public and private)
were listed and a random sample of 20 schools (10 public and 10 private) was drawn also using
the basket method performed in the described manner. Of the 20 randomly selected schools, five
schools (four public and one private) were excluded because of lack of lists of pupils that would
reduce the loss to follow-up. Thus 15 schools fulfilled the inclusion criteria, of which 10 (five
public and five private) agreed to participate in the study (Figure 1); among them one was a girl’s
school. The five schools (one public and four private) that didn’t agree to participate were not
different from the 10 remaining schools in terms of population size or schooling program. All
pupils in the 10 schools aged from seven to nine years at the time of the survey were considered
eligible for the study.
6
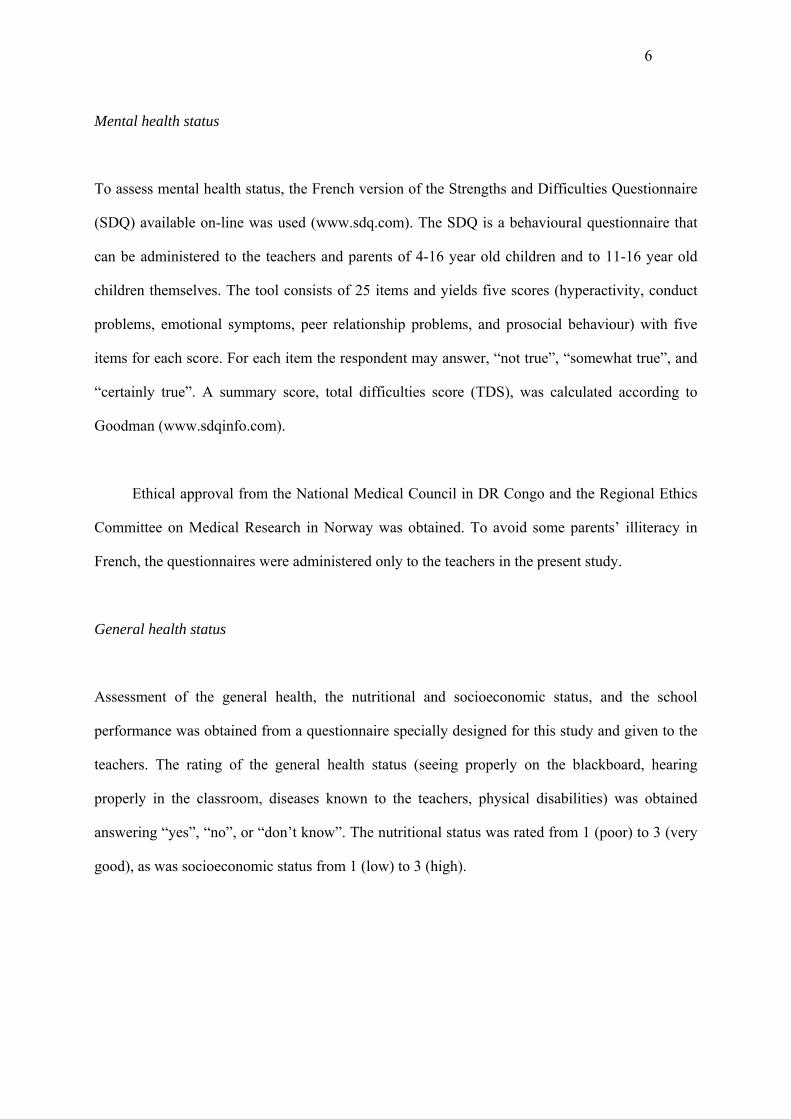
Mental health status
To assess mental health status, the French version of the Strengths and Difficulties Questionnaire
(SDQ) available on-line was used (www.sdq.com). The SDQ is a behavioural questionnaire that
can be administered to the teachers and parents of 4-16 year old children and to 11-16 year old
children themselves. The tool consists of 25 items and yields five scores (hyperactivity, conduct
problems, emotional symptoms, peer relationship problems, and prosocial behaviour) with five
items for each score. For each item the respondent may answer, “not true”, “somewhat true”, and
“certainly true”. A summary score, total difficulties score (TDS), was calculated according to
Goodman (www.sdqinfo.com).
Ethical approval from the National Medical Council in DR Congo and the Regional Ethics
Committee on Medical Research in Norway was obtained. To avoid some parents’ illiteracy in
French, the questionnaires were administered only to the teachers in the present study.
General health status
Assessment of the general health, the nutritional and socioeconomic status, and the school
performance was obtained from a questionnaire specially designed for this study and given to the
teachers. The rating of the general health status (seeing properly on the blackboard, hearing
properly in the classroom, diseases known to the teachers, physical disabilities) was obtained
answering “yes”, “no”, or “don’t know”. The nutritional status was rated from 1 (poor) to 3 (very
good), as was socioeconomic status from 1 (low) to 3 (high).

7
School performance
The average school performance and also specified performance in reading, spelling, writing,
mathematics, geometry, and manual work were obtained by rating from 1 (non-optimal) to 3
(optimal). Furthermore, the teachers were asked whether the pupil had repeated a grade or needed
extra educational resources.
A pilot study of the questionnaire was carried out with 25 pupils. Prior to the survey, the
head master and the parents’ committee of each selected school approved the study. Each item of
the screening tool was carefully explained to the teachers.
Statistical analysis
Statistical analyses were done in five stages. First, a principal component factor analysis with
Varimax rotation, including all 25 items of the SDQ questionnaire was performed on all children.
This was done to reduce the number of outcome variables and facilitate analysis and
interpretations. Second, the cut-off levels for males and females were calculated using the 90th
percentile for each gender. Third, reliability was assessed using the internal consistency
(Cronbach α coefficient). Fourth, the gender, the nutritional and socioeconomic factors, and
illness were subjected to logistic regression analysis with the SDQ Total Difficulties Score (TDS)
as the dependent variable. Fifth, interaction effects of illness and nutritional status as predictors of
abnormal scoring on the TDS were investigated from the multiple regression analyses. This was
done by computing a new variable, a product of the illness and the nutritional status variables.
Similar procedure was repeated using the socioeconomic variable. The new variable was forcibly
entered into the model with prorated TDS as the dependent variable. Sixth, the mean school
performance within the different groups was compared using the χ2 test, and the odd ratio was
used for the risk estimate. All analyses were 2-tailed and results were considered statistically

8
significant with a p-value less than or equal to 0.05. The Statistical Package for the Social
Sciences (SPSS) for Windows, version 11.5 was used for the statistical analyses.
RESULTS
Population
A total of 1306 pupils were included and assessed by teachers. The teachers’ response rate was
100%. Of the 1306 assessed pupils, 119 were outside the age range (below seven or more than
nine years of age) and the total number of eligible children according to age range was 1187: 502
boys (42%) and 685 girls (58%). The mean age was 7.9 years (SD 0.8).
Mental health status
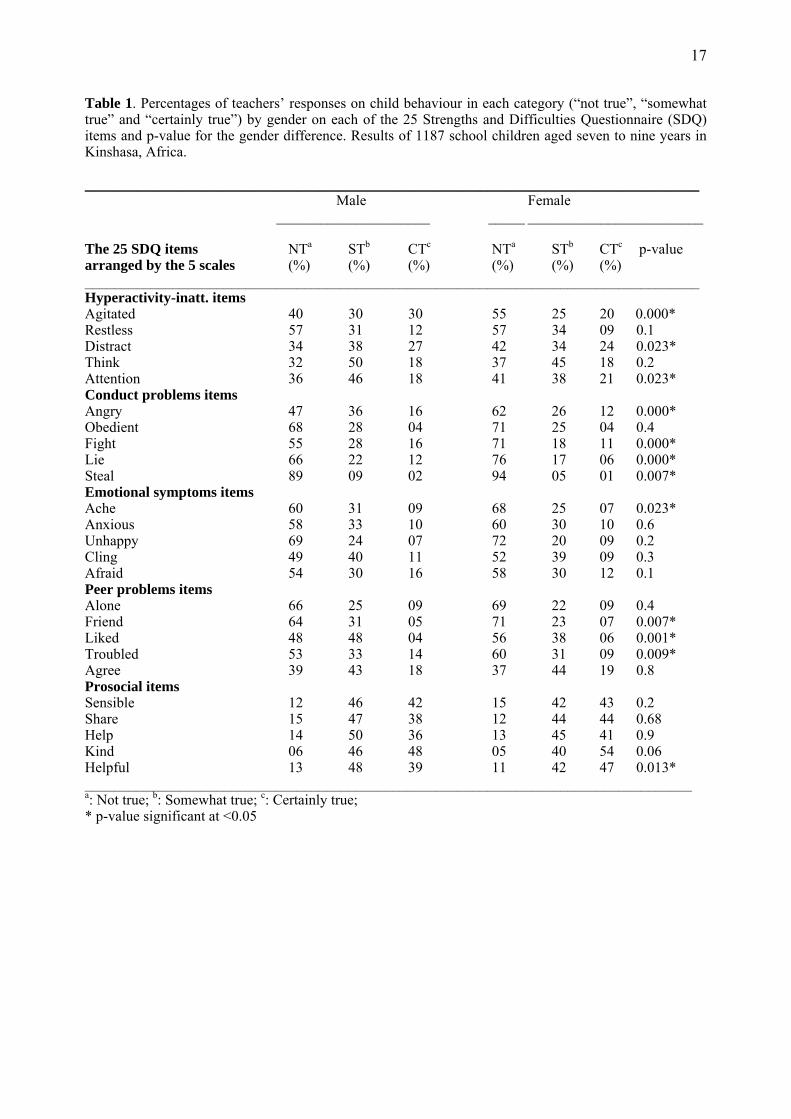
Boys were reported as being more hyperactive than girls, more often fighting, and had more often
with hot tempers, whereas girls were reported as more often liked by other children, more
attentive, friendly and helpful according to teachers (Table 1).
The principal component analysis of the questionnaire indicated that the Eigen values
levelled off at five factors, with the five factors having Eigen values above 1.0. Therefore based
on that and the predicted number of factors on theoretical grounds, a five-factor model was
chosen, explaining 44% of the total variance. The majority of the items loaded on the published
factors with some items also loading on additional factors (Table 2).
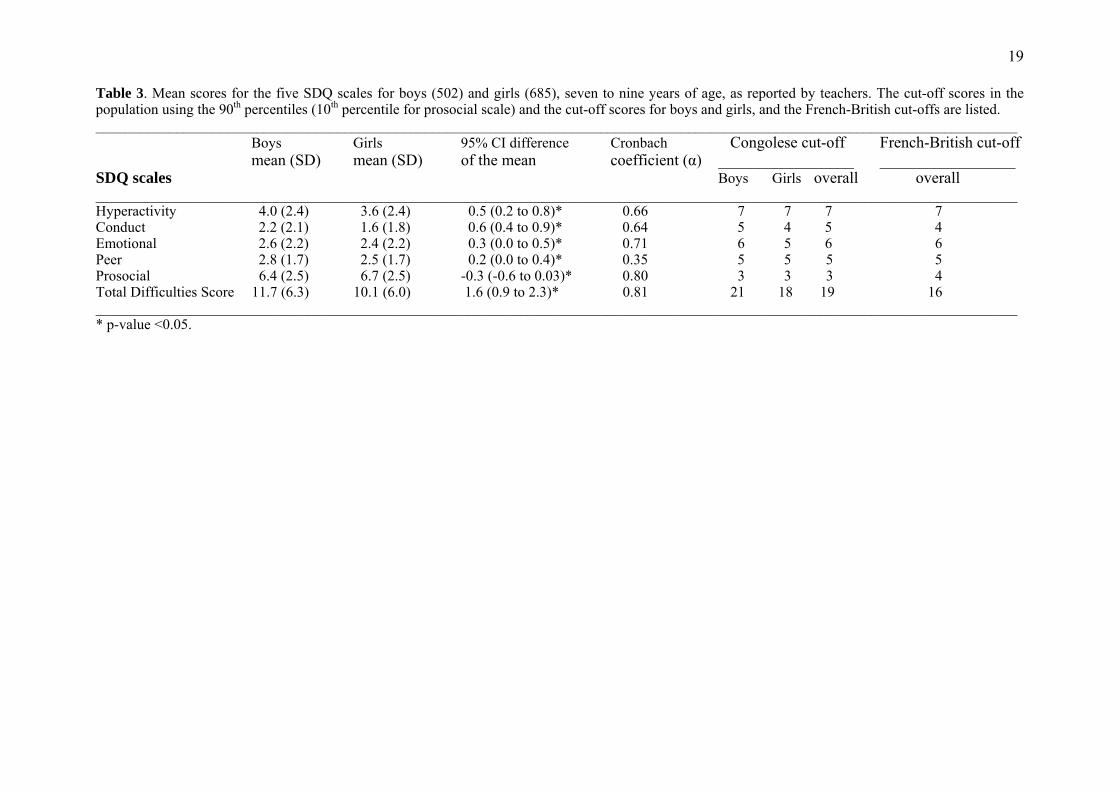
The mean scores on all SDQ scales, including TDS, were significantly higher for boys
compared to girls (Table 3). Using the 90th percentile (10th percentile for prosocial), we found the
Kinshasa cut-offs scores to be somewhat different from the French/British cut-offs scores (Table
9
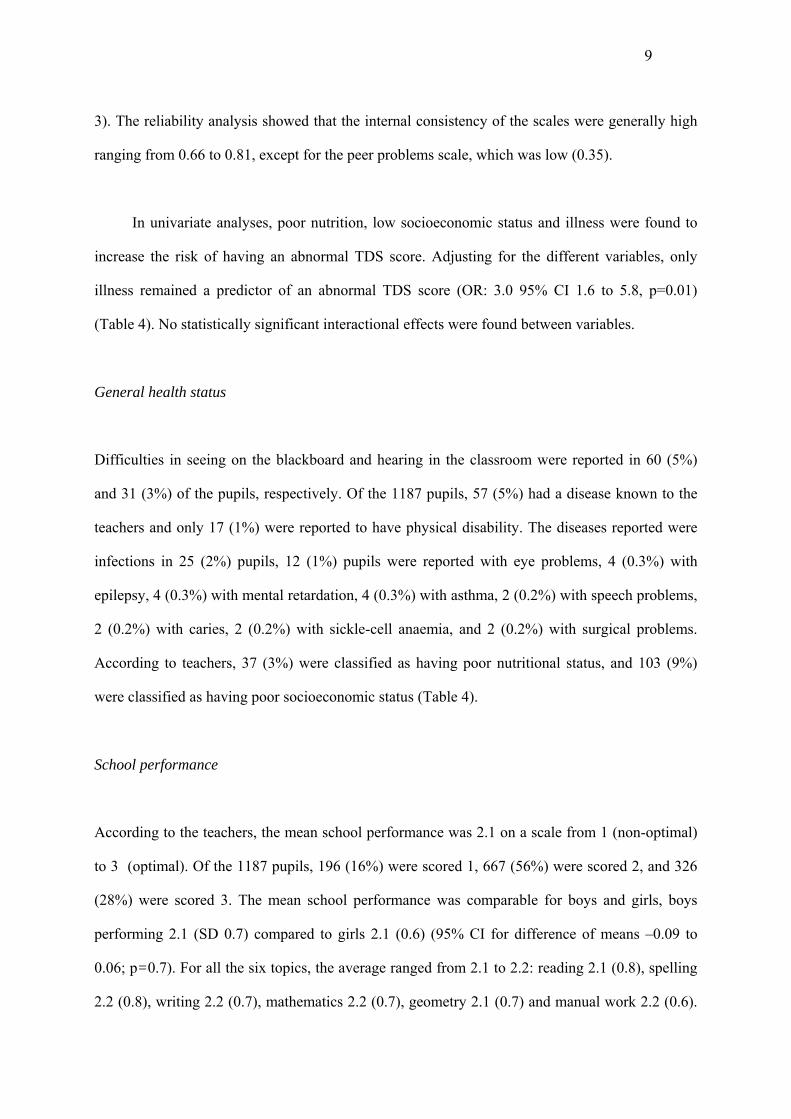
3). The reliability analysis showed that the internal consistency of the scales were generally high
ranging from 0.66 to 0.81, except for the peer problems scale, which was low (0.35).
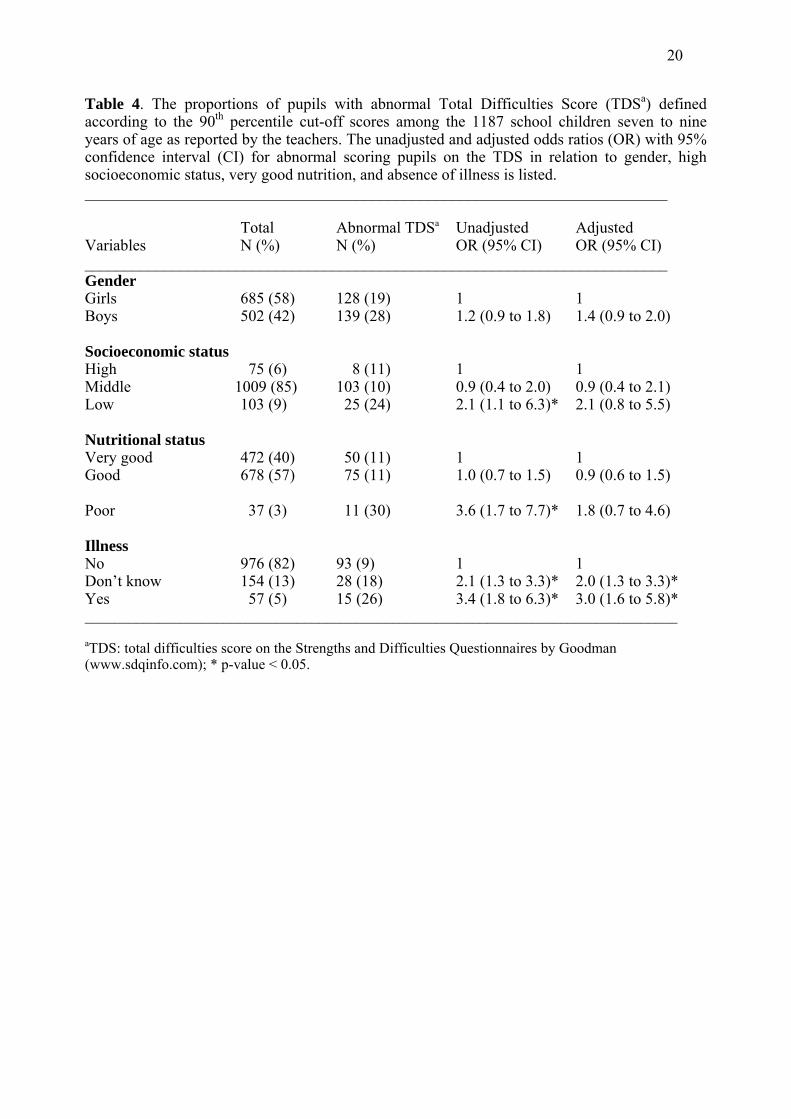
In univariate analyses, poor nutrition, low socioeconomic status and illness were found to
increase the risk of having an abnormal TDS score. Adjusting for the different variables, only
illness remained a predictor of an abnormal TDS score (OR: 3.0 95% CI 1.6 to 5.8, p=0.01)
(Table 4). No statistically significant interactional effects were found between variables.
General health status
Difficulties in seeing on the blackboard and hearing in the classroom were reported in 60 (5%)
and 31 (3%) of the pupils, respectively. Of the 1187 pupils, 57 (5%) had a disease known to the
teachers and only 17 (1%) were reported to have physical disability. The diseases reported were
infections in 25 (2%) pupils, 12 (1%) pupils were reported with eye problems, 4 (0.3%) with
epilepsy, 4 (0.3%) with mental retardation, 4 (0.3%) with asthma, 2 (0.2%) with speech problems,
2 (0.2%) with caries, 2 (0.2%) with sickle-cell anaemia, and 2 (0.2%) with surgical problems.
According to teachers, 37 (3%) were classified as having poor nutritional status, and 103 (9%)
were classified as having poor socioeconomic status (Table 4).
School performance
According to the teachers, the mean school performance was 2.1 on a scale from 1 (non-optimal)
to 3 (optimal). Of the 1187 pupils, 196 (16%) were scored 1, 667 (56%) were scored 2, and 326
(28%) were scored 3. The mean school performance was comparable for boys and girls, boys
performing 2.1 (SD 0.7) compared to girls 2.1 (0.6) (95% CI for difference of means –0.09 to
0.06; p=0.7). For all the six topics, the average ranged from 2.1 to 2.2: reading 2.1 (0.8), spelling
2.2 (0.8), writing 2.2 (0.7), mathematics 2.2 (0.7), geometry 2.1 (0.7) and manual work 2.2 (0.6).

10
Hundred and fifty-three (13%) pupils had repeated a grade and 581 (49%) needed extra
educational resources according to teachers.
Mean school performance on a scale from 1 (non-optimal) to 3 (optimal) was significantly
higher among pupils with very good nutritional status 2.3 (SD 0.6) vs. pupils with good nutritional
status 2.0 (0.6) (95% CI for difference of the mean 0.2 to 0.4; p=0.001) and also significantly
higher among pupils with good nutritional status vs. those with poor nutritional status 1.6 (0.6)
(95% CI for difference of the mean 0.2 to 0.6; p=0.001). Pupils with high socioeconomic status
had a higher mean school performance 2.4 (0.6) compare to those with middle socioeconomic
status 2.1 (0.6) (95% CI for difference of the mean 0.08 to 0.38; p=0.002). The mean school
performance was significantly higher among pupils with middle vs. pupils with low
socioeconomic status 1.8 (0.7) (95% CI for difference of the mean 0.19 to 0.45; p=0.001).
Using the 90th percentile for the TDS as cut off level for having a mental health problem,
we found that the risk for low school performance was significantly higher among children with
abnormal TDS compared to those with normal TDS (OR: 7.1, 95% CI: 4.8 to 10.4, χ2 = 122, p=
0.001). Similar results were found for all the five SDQ scales, with the highest risk found on the
hyperactivity scale (OR: 9.5, 95% CI: 6.7 to 13.6, χ2 = 194, p= 0.001).
DISCUSSION
This is the first epidemiological study evaluating mental health using Strengths and Difficulties
Questionnaire, SDQ, in an African urban setting. Factor analysis yielded five factors, mostly
similar to the predicted SDQ scales. The internal consistency was satisfactory on all of the SDQ
scales, except for the peer problem scale. The 90th percentile cut-off scores were somewhat
different from the French/British published scores and varied according to gender. Poor nutrition,
low socioeconomic class, and illness were predictors of mental health problems. School
11
performance was lower among children with poor nutrition, low socioeconomic status and mental
health problems.
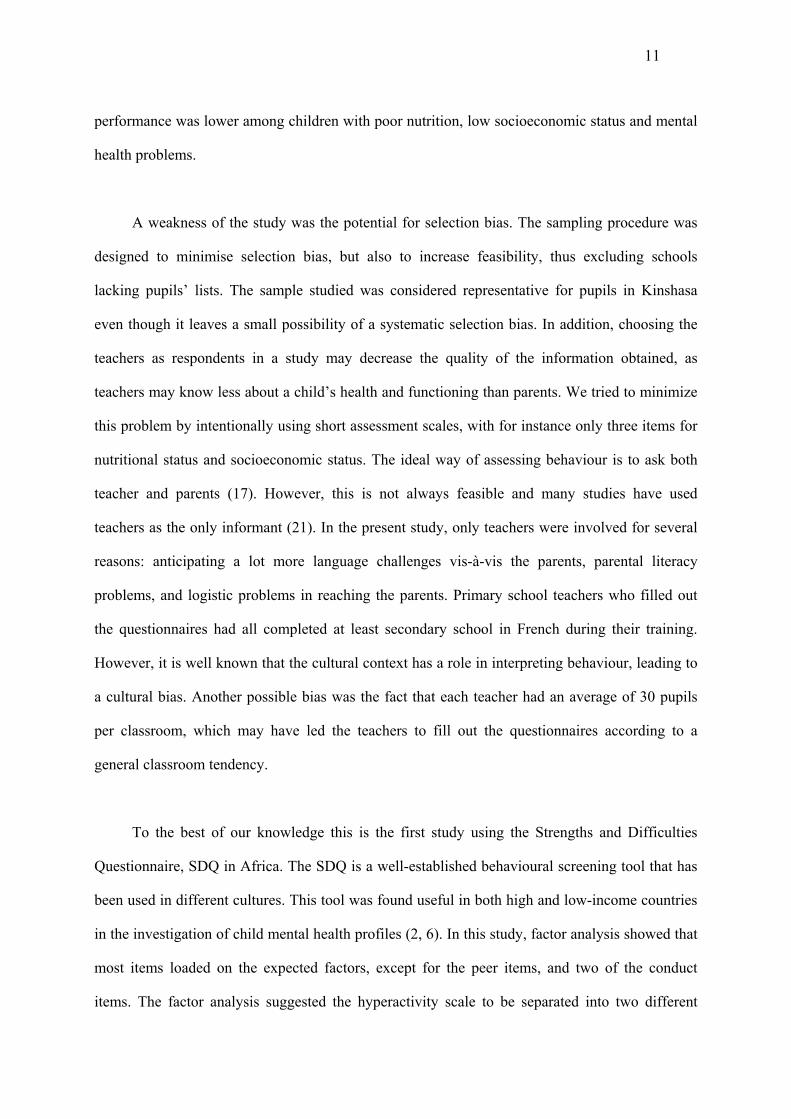
A weakness of the study was the potential for selection bias. The sampling procedure was
designed to minimise selection bias, but also to increase feasibility, thus excluding schools
lacking pupils’ lists. The sample studied was considered representative for pupils in Kinshasa
even though it leaves a small possibility of a systematic selection bias. In addition, choosing the
teachers as respondents in a study may decrease the quality of the information obtained, as
teachers may know less about a child’s health and functioning than parents. We tried to minimize
this problem by intentionally using short assessment scales, with for instance only three items for
nutritional status and socioeconomic status. The ideal way of assessing behaviour is to ask both
teacher and parents (17). However, this is not always feasible and many studies have used
teachers as the only informant (21). In the present study, only teachers were involved for several
reasons: anticipating a lot more language challenges vis-à-vis the parents, parental literacy
problems, and logistic problems in reaching the parents. Primary school teachers who filled out
the questionnaires had all completed at least secondary school in French during their training.
However, it is well known that the cultural context has a role in interpreting behaviour, leading to
a cultural bias. Another possible bias was the fact that each teacher had an average of 30 pupils
per classroom, which may have led the teachers to fill out the questionnaires according to a
general classroom tendency.
To the best of our knowledge this is the first study using the Strengths and Difficulties
Questionnaire, SDQ in Africa. The SDQ is a well-established behavioural screening tool that has
been used in different cultures. This tool was found useful in both high and low-income countries
in the investigation of child mental health profiles (2, 6). In this study, factor analysis showed that
most items loaded on the expected factors, except for the peer items, and two of the conduct
items. The factor analysis suggested the hyperactivity scale to be separated into two different

12
factors in contrast to the published factor. Two of the conduct items loaded on the hyperactivity
factor. This finding suggested that teachers were able to differentiate between externalising
(hyperactivity and conduct) and internalising (emotional) items. None of the peer items loaded on
the predicted factor suggesting that either those items are not appropriate in this population or that
children themselves rather than teachers should be considered as better informants when reporting
peer problems. The overlap between the items loading on the internalising and externalising
scales was very small. This confirms that SDQ items assessing internalising and externalising
symptoms do not cross-load (7).
The reliability of the questionnaire and the internal consistency of the scales were
satisfactory in general as reported in other studies (16). However, in line with the British studies,
the internal consistency was notably low for the peer scale (5). The findings indicate that SDQ
may be useful in describing mental health problems in African populations, and further studies
regarding validity are welcomed.
The mean scores of the scales, except for the prosocial scale, were higher compared to the
published norms from British children (www.sdqinfo.com). However, the boys prosocial and
hyperactivity mean scores were comparable to the British norms. Of the five scales, the highest
mean scores were on the prosocial behaviour and hyperactivity scales. This indicated that teachers
easily notice and tend to report disruptive behaviours, which may be more noticeable in a formal
setting such as a classroom. Kolvin et al (10) have reported that teachers tend to focus mainly on
antisocial and disruptive behaviour. In addition, these results suggest that child behaviour is
subject to change according to settings (8).
In the present study, the 90th percentile cut-off scores were used and some cut-off scores
were different from the published French/British cut-offs. The higher TDS cut-off score in this
population compared to British/French may indicate a higher frequency of mental problems

13
among school children in Kinshasa. On the other hand, it could be explained by cultural
differences in the description of such problems. Re-standardisation may hide real cross-cultural
differences in the prevalence of mental health problems. In addition, higher cut-off scores on the
conduct scale and lower on the prosocial scale were found compared to the British/French norms,
whereas there were similar for the hyperactivity, emotional and peer scales. The satisfactory
internal consistency and the similar cut-off scores on the hyperactivity and emotional scales
suggest that the related items properly assess hyperactivity and emotional symptoms.
Using the 90th percentile, the cut-off scores on the conduct, prosocial and TDS scales
differed by gender. According to teachers, boys were scored higher than girls, except on the
prosocial scale meaning that teachers considered girls as being more prosocial than boys. This is
consistent with the findings of previous studies (18). It is known that disruptive behaviours are
differently expressed in boys and girls; therefore teachers are more likely to notice externalising
problems in boys (20). Our results suggest that the cut-off scores in this population need to be
adjusted for gender as recommended by Goodman in different cultures (4).
Poor nutrition, low socioeconomic status, and illness increased the risk of having mental
health problems, with illness being the strongest predictor. In line with previous studies, we found
that children with diseases, poor nutrition, or from economically disadvantaged families were at
increased risk of having mental health problems. It is known that malnutrition, infectious diseases,
poverty and social disintegration may affect mental health (15).
We found that school children with mental health problems had a considerably increased
risk of low school performance, in accordance with other studies (9, 21). The contrast between the
fair to very good school performance reported in the majority of the pupils and the high mean
scores in all the five scales and TDS found in this study may be explained by teachers over-
reporting symptoms. Alternatively, some items were not appropriate in this population and tend to

14
over-estimate mental health problems. Teachers reported that every other child was in need of
extra educational resources, which also contrasts with the school performance. An explanation to
this may be that though pupils perform well in school, teachers think that they can improve their
school performance if they have extra educational resources.
To conclude, the findings of the present study indicate that SDQ may be a useful
behavioural questionnaire to examine mental health profile of children in Kinshasa, thus further
investigations of validity are welcomed. Furthermore, the findings suggest that mental health
problems are related to poor school performance, various demographic factors, illness and poor
nutrition. Therefore more emphasis on child mental health is needed in order to ensure appropriate
recognition and management in this setting.
Acknowledgements
The authors wish to thank all the parents, head masters and teachers for their kind collaboration.
We are also grateful to the Department of Neurology at Kinshasa University Hospital and to the
“Centre Médicale Monkole” for their assistance. The University of Bergen, Norway funded this
study.

15
REFERENCES
1. Ashenafi Y, Kebede D, Desta M, Alem A (2001) Prevalence of mental and behavioural
disorders in Ethiopian children. East African Medical Journal 78: 308-311
2. Cury CR, Golfeto JH (2003) Strengths and difficulties questionnaire (SDQ): a study of school
children in Ribeirao Preto. Revista Brasileira de Psiquiatria 25: 139-145
3. Gillberg C (1998) Hyperactivity, inattention and motor control problems: prevalence,
comorbidity and background factors. Folia Phoniatrica Logopaedica 50: 107-117
4. Goodman R (1997) The Strengths and Difficulties Questionnaire: a research note. Journal of
Child Psychology and Psychiatry 38: 581-586
5. Goodman R (2001) Psychometric properties of the strengths and difficulties questionnaire.
Journal of the American Academy of Child and Adolescent Psychiatry 40: 1337-1345
6. Goodman R, Ford T, Simmons H, Gatward R, Meltzer H (2000) Using the Strengths and
Difficulties Questionnaire (SDQ) to screen for child psychiatric disorders in a community
sample. British Journal of Psychiatry 177: 534-539
7. Goodman R, Scott S (1999) Comparing the Strengths and Difficulties Questionnaire and the
Child Behavior Checklist: is small beautiful? Journal of Abnormal Child Psychology 27: 17-24
8. Goodman R, Scott S (2001). Child Psychiatry. Blackwell Science. Great Britain
9. Harel EH, Brown WD (2003) Attention deficit hyperactivity disorder in elementary school
children in Rhode Island: associated psychosocial factors and medications used. Journal of
Clinical Paediatric (Phila) 42: 497-503
10. Kolvin I, Garside RF, Nicol AR, Leitch I, Macmillan A (1977) Screening schoolchildren for
high risk of emotional and educational disorder. British Journal of Psychiatry 131: 192-206
11. Liang H, Flisher AJ, Chalton DO (2002) Mental and physical health of out of school children
in a South African township. European Child and Adolescent Psychiatry 11: 257-260
12. Malhotra S, Kohli A, Arun P (2002) Prevalence of psychiatric disorders in school children in
Chandigarh, India. Indian Journal of Medical Research 116: 21-28

16
13. Meltzer H, Gatward R, Goodman R, Ford T (2000). Mental health of children and adolescents
in Great Britain. Office for National Statistics. London
14. Ministère de l'Education Nationale. Education pour tous, bilan à l'an 2000. Kinshasa:
Ministère de l'Education Nationale; 1999.
15. Mullick MS, Goodman R (2001) Questionnaire screening for mental health problems in
Bangladeshi children: a preliminary study. Social Psychiatry and Psychiatric Epidemiology 36:
94-99.
16. Muris P, Meesters C, Van Den Berg F (2003) The Strengths and Difficulties Questionnaire
(SDQ) Further evidence for its reliability and validity in a community sample of Dutch
children and adolescents. European Child and Adolescent Psychiatry 12: 1-8
17. Smedje H, Broman JE, Hetta J, von Knorring AL (1999) Psychometric properties of a
Swedish version of the "Strengths and Difficulties Questionnaire". European Child and
Adolescent Psychiatry 8: 63-70
18. Tadesse B, Kebede D, Tegegne T, Alem A (1999) Childhood behavioural disorders in Ambo
district, western Ethiopia. I. Prevalence estimates. Acta Psychiatrica Scandinavica Suppl 397:
92-97
19. WHO. The World Health Report 2: Mental Health: new understanding, new hope. Geneva:
World Health Organisation; 2001.
20. Wilens TE, Biederman J, Spencer TJ (2002) Attention Deficit/Hyperactivity Disorder across
the Lifespan. Annual Review of Medicine 53: 113-131
21. Wolraich ML, Lambert EW, Baumgaertel A, Garcia-Tornel S, Feurer ID, Bickman L, et al.
(2003) Teachers' screening for attention deficit/hyperactivity disorder: comparing
multinational samples on teacher ratings of ADHD. Journal of Abnormal Child Psychology 31:
445-455
22. www.unicef.org/statis/. Democratic Republic of Congo. In; 2002.
2214.05.04 17
Table 1. Percentages of teachers’ responses on child behaviour in each category (“not true”, “somewhat true” and “certainly true”) by gender on each of the 25 Strengths and Difficulties Questionnaire (SDQ) items and p-value for the gender difference. Results of 1187 school children aged seven to nine years in Kinshasa, Africa. ____________________________________________________________________________________ Male Female _____________________ _____ ________________________ The 25 SDQ items NTa STb CTc NTa STb CTc p-value arranged by the 5 scales (%) (%) (%) (%) (%) (%) ____________________________________________________________________________________ Hyperactivity-inatt. items Agitated 40 30 30 55 25 20 0.000* Restless 57 31 12 57 34 09 0.1 Distract 34 38 27 42 34 24 0.023* Think 32 50 18 37 45 18 0.2 Attention 36 46 18 41 38 21 0.023* Conduct problems items Angry 47 36 16 62 26 12 0.000* Obedient 68 28 04 71 25 04 0.4 Fight 55 28 16 71 18 11 0.000* Lie 66 22 12 76 17 06 0.000* Steal 89 09 02 94 05 01 0.007* Emotional symptoms items Ache 60 31 09 68 25 07 0.023* Anxious 58 33 10 60 30 10 0.6 Unhappy 69 24 07 72 20 09 0.2 Cling 49 40 11 52 39 09 0.3 Afraid 54 30 16 58 30 12 0.1 Peer problems items Alone 66 25 09 69 22 09 0.4 Friend 64 31 05 71 23 07 0.007* Liked 48 48 04 56 38 06 0.001* Troubled 53 33 14 60 31 09 0.009* Agree 39 43 18 37 44 19 0.8 Prosocial items Sensible 12 46 42 15 42 43 0.2 Share 15 47 38 12 44 44 0.68 Help 14 50 36 13 45 41 0.9 Kind 06 46 48 05 40 54 0.06 Helpful 13 48 39 11 42 47 0.013* ___________________________________________________________________________________ a: Not true; b: Somewhat true; c: Certainly true; * p-value significant at <0.05

14.05.04 18
Table 2. Principal components factor analysis of the 25 items of the Strengths and Difficulties Questionnaire (SDQ*) for the 1187 school children, seven to nine years of age, with complete data sets according to teachers. Only factors above 0.40 are reported. ____________________________________________________________________________ Factors: ___________________________________________________________ SDQ items Factor 1 Factor 2 Factor 3 Factor 4 Factor 5 ___________________________________________________________________________________ Hyperactivity Agitated 0.68 Restless 0.70 Distract 0.63 Think 0.81 Attention 0.79 Conduct Angry 0.56 Obedient -0.49 Fights 0.61 0.49 Lies 0.58 Steals 0.68 Emotional Ache 0.42 Anxious 0.72 Unhappy 0.63 Cling 0.44 0.48 Afraid 0.67 Peer Alone 0.59 Friend -0.66 Liked -0.69 Troubled 0.49 Agree Prosocial Sensible 0.47 -0.56 Share 0.75 Help 0.75 Kind 0.73 Helpful 0.72 __________________________________________________________________________________ * www.sdqinfo.com
19
Table 3. Mean scores for the five SDQ scales for boys (502) and girls (685), seven to nine years of age, as reported by teachers. The cut-off scores in the population using the 90th percentiles (10th percentile for prosocial scale) and the cut-off scores for boys and girls, and the French-British cut-offs are listed. ______________________________________________________________________________________________________________________________ Boys Girls 95% CI difference Cronbach Congolese cut-off French-British cut-off mean (SD) mean (SD) of the mean coefficient (α) _________________ _________________ SDQ scales Boys Girls overall overall ______________________________________________________________________________________________________________________________ Hyperactivity 4.0 (2.4) 3.6 (2.4) 0.5 (0.2 to 0.8)* 0.66 7 7 7 7 Conduct 2.2 (2.1) 1.6 (1.8) 0.6 (0.4 to 0.9)* 0.64 5 4 5 4 Emotional 2.6 (2.2) 2.4 (2.2) 0.3 (0.0 to 0.5)* 0.71 6 5 6 6 Peer 2.8 (1.7) 2.5 (1.7) 0.2 (0.0 to 0.4)* 0.35 5 5 5 5 Prosocial 6.4 (2.5) 6.7 (2.5) -0.3 (-0.6 to 0.03)* 0.80 3 3 3 4 Total Difficulties Score 11.7 (6.3) 10.1 (6.0) 1.6 (0.9 to 2.3)* 0.81 21 18 19 16 ______________________________________________________________________________________________________________________________ * p-value <0.05.
14.05.04 20
Table 4. The proportions of pupils with abnormal Total Difficulties Score (TDSa) defined according to the 90th percentile cut-off scores among the 1187 school children seven to nine years of age as reported by the teachers. The unadjusted and adjusted odds ratios (OR) with 95% confidence interval (CI) for abnormal scoring pupils on the TDS in relation to gender, high socioeconomic status, very good nutrition, and absence of illness is listed. _________________________________________________________________________
Total Abnormal TDSa Unadjusted Adjusted Variables N (%) N (%) OR (95% CI) OR (95% CI) _________________________________________________________________________ Gender Girls 685 (58) 128 (19) 1 1 Boys 502 (42) 139 (28) 1.2 (0.9 to 1.8) 1.4 (0.9 to 2.0) Socioeconomic status High 75 (6) 8 (11) 1 1 Middle 1009 (85) 103 (10) 0.9 (0.4 to 2.0) 0.9 (0.4 to 2.1) Low 103 (9) 25 (24) 2.1 (1.1 to 6.3)* 2.1 (0.8 to 5.5) Nutritional status Very good 472 (40) 50 (11) 1 1 Good 678 (57) 75 (11) 1.0 (0.7 to 1.5) 0.9 (0.6 to 1.5) Poor 37 (3) 11 (30) 3.6 (1.7 to 7.7)* 1.8 (0.7 to 4.6) Illness No 976 (82) 93 (9) 1 1 Don’t know 154 (13) 28 (18) 2.1 (1.3 to 3.3)* 2.0 (1.3 to 3.3)* Yes 57 (5) 15 (26) 3.4 (1.8 to 6.3)* 3.0 (1.6 to 5.8)* _________________________________________________________________________________
aTDS: total difficulties score on the Strengths and Difficulties Questionnaires by Goodman (www.sdqinfo.com); * p-value < 0.05.
14.05.04 21
Figure 1. Map of Kinshasa showing the two sectors with the selected and studied schools
Congo river
Kinshasa East
Kinshasa West
Border between Kinshasa West and EastS: selected schoolsS+: selected and studied schools
22
SS
S+
S
S+
S
S+
S+
S
S
S+S
S+S
S+
S+
S+S
S+
S
0 1 2 3 4 5