MEMORY HiCORDER - Hioki
514
MEMORY HiCORDER INSTRUCTION MANUAL 8846
-
Upload
khangminh22 -
Category
Documents
-
view
2 -
download
0
Transcript of MEMORY HiCORDER - Hioki

MEMORY HiCORDER
INSTRUCTION MANUAL
8846


1
2
3
4
5
6
7
8
9
10
11
12
13
14
A
Contents
Introduction i
Inspection ii
Safety Notes iii
Notes on Use v
Chapter Summary ix
Chapter 1 Product Overview 11.1 Major Features 1
1.2 Identification of Controls and Indicators 3
Chapter 2 Specifications 112.1 General Specifications 11
2.2 Trigger Unit Specifications 14
2.3 Memory Recorder Function Specifications 15
2.4 Recorder Function Specifications 16
2.5 FFT Function Specifications 17
2.6 Auxiliary Functions Specifications 18
2.7 Accessories and Options 21
2.8 System Operation 22
Chapter 3 Logic and Analog Inputs 233.1 Logic Inputs 23
3.1.1 Logic Probes 24
3.2 8916 ANALOG UNIT 25
3.2.1 Specifications 25
3.2.2 Safety Requirements 26
3.3 8917 DC/RMS UNIT 27
3.3.1 Specifications 27
3.3.2 Safety Requirements 28
3.4 8918 TEMPERATURE UNIT 29
3.4.1 Specifications 29
3.4.2 Safety Requirements 30
3.4.3 Notes on Installation Site 31

3.5 8919 FFT ANALOG UNIT 32
3.5.1 Specifications 32
3.5.2 Safety Requirements 33
3.6 8927 ANALOG UNIT 34
3.6.1 Specifications 34
3.6.2 Safety Requirements 35
3.7 8928 STRAIN UNIT 36
3.7.1 Specifications 36
3.7.2 Safety Requirements 37
3.7.3 Strain Unit Settings 37
3.8 Replacement Procedure 38
3.9 Input Cables 39
3.10 Measurement Errors Caused by Signal Source Internal
Resistance 40
Chapter 4 Installation and Preparation 414.1 Installation of the Unit 41
4.2 Power Supply and Ground Connection 44
4.3 Power On/Off 47
4.4 Probe and Thermocouple Connection 48
4.5 Connection to a Strain Gauge Adapter 51
4.6 Connecting the Voltage Transformer 52
4.7 Loading Recoding Paper 54
4.8 Storage and Handling Precautions 56
4.9 Notes on Measurement 57
Chapter 5 Basic Operation and Measurement 595.1 Basic Operation 59
5.1.1 Basic Display Operation 59
5.1.2 JOG/SHUTTLE Control and Select Key 60
5.1.3 Setting Items 62
5.1.4 Measurement Start and End 62
5.2 Basic Measurement and Setting Procedures 63
5.2.1 Measuring and Recording a Voltage
(Memory Recorder, Recorder) 63
5.2.2 Frequency Analysis of Measured Voltage (FFT) 74

1
2
3
4
5
6
7
8
9
10
11
12
13
14
A
Chapter 6 Memory Recorder Function 816.1 Outline 81
6.2 Making Settings 83
6.2.1 Setting the Function Mode 83
6.2.2 Setting the Time Axis Range 84
6.2.3 Setting the Recording Length 85
6.2.4 Setting the Format 86
6.2.5 Using the X-Y Waveform Plots 90
6.2.6 Setting the Interpolation Function 93
6.2.7 Setting the Roll Mode 94
6.2.8 Superimpose 95
6.2.9 Other Settings (STATUS Screen) 96
6.3 Settings on the Display Screen and Auto Settings 98
6.3.1 Setting Magnification/Compression Along the Time Axis 98
6.3.2 Making Channel Settings 99
6.3.3 Automatic Setting of Time Axis and Voltage Axis 100
6.4 Start and Stop Measurement Operation 102
Chapter 7 Recorder Function 1057.1 Outline 105
7.2 Making Settings 106
7.2.1 Setting the Function Mode 106
7.2.2 Setting the Time Axis Range 107
7.2.3 Setting the Magnification Along the Time Axis 109
7.2.4 Setting the Recording Time 112
7.2.5 Setting the Format 113
7.2.6 Setting the Interpolation Function 116
7.2.7 Setting the Recording Medium 117
7.2.8 Recording a Voice Memo 118
7.2.9 Transferring Data to the Memory Recorder Function 119
7.2.10 Other Settings 121
7.3 Settings on the Display Screen and Auto Settings 123
7.3.1 Making Channel Settings 123
7.3.2 Automatic Setting of Time Axis and Voltage Axis 123
7.4 Start and Stop Measurement Operation 125

Chapter 8 FFT Function 1278.1 Outline 127
8.2 Item Settings 128
8.2.1 Setting the FFT Function 128
8.2.2 Setting the FFT Channel Mode 129
8.2.3 Setting the Frequency Range 130
8.2.4 Setting the Window Function 132
8.2.5 Setting the Display Format 134
8.2.6 Selecting Reference Data 136
8.2.7 Setting the Peak Display 138
8.2.8 Setting the FFT Analysis Mode 140
8.2.9 Setting the Analysis Channel 141
8.2.10 Setting the X-axis and Y-axis Displays 142
8.2.11 Setting the Display Scale 144
8.2.12 Octave Filter Setting 146
8.2.13 Setting the Interpolation Function 147
8.2.14 Other Settings 148
8.3 Analysis Function 150
8.3.1 Storage Waveform [STR] 151
8.3.2 Linear Spectrum [LIN] 152
8.3.3 RMS Spectrum [RMS] 154
8.3.4 Power Spectrum [PSP] 156
8.3.5 Auto Correlation [ACR] 158
8.3.6 Histogram [HIS] 159
8.3.7 Transfer Function [TRF] 160
8.3.8 Cross Power Spectrum [CSP] 162
8.3.9 Cross Correlation [CCR] 164
8.3.10 Unit Impulse Response [IMP] 166
8.3.11 Coherence [COH] 168
8.3.12 Octave Analysis [OCT] 170

1
2
3
4
5
6
7
8
9
10
11
12
13
14
15
Chapter 9 Input Channel Settings 1759.1 Overview 175
9.2 Selecting Units (SYSTEM Screen) 176
9.3 Selecting Functions 177
9.4 Selecting the Input Type 178
9.5 Making Logic Input Settings (FFT Excluded) 180
9.6 Making Analog Input Settings 181
9.6.1 Waveform Display Color (FFT Excluded) 181
9.6.2 Display Graph Type (FFT Excluded) 183
9.6.3 Setting the Voltage Axis, Temperature Axis, Strain Axis
Ranges 184
9.6.4 Setting the Input Coupling (Not Required for 8918, 8928) 187
9.6.5 Setting Voltage Axis, Temperature Axis, and Strain Axis
Magnification/ Compression 188
9.6.6 Setting the Zero Position 189
9.6.7 Setting the Low-Pass Filter 191
9.6.8 Setting the Thermocouple Type (8918 Only) 192
9.6.9 Setting the Antialiasing Filter (8919 Only) 193
9.6.10 Arbitrary Setting if Voltage Axis Magnification/
Compression and Display Range 195
9.6.11 Copying Channel Settings 197
9.6.12 Making Channel Settings on Display Screen 198
Chapter 10 Trigger Functions 19910.1 Overview 199
10.2 Setting the Trigger Mode 200
10.3 Setting Trigger Source AND/OR Linking 201
10.4 Setting the Pretrigger (Memory recorder, FFT) 202
10.5 Using the Analog Trigger Function 204
10.5.1 Level Trigger 205
10.5.2 Window-In, Window-Out Trigger 208
10.6 Using the Logic Trigger Function 210
10.7 Using the External Trigger Function 214
10.8 Using the Timer Trigger Function 215
10.9 Trigger Output Connector 218

Chapter 11 SYSTEM Screen Settings 21911.1 Overview 219
11.2 How to Use the SYSTEM Screen 220
11.3 Initialization [ INITIALIZE ] 221
11.3.1 Setting the Clock [ TIME SET ] 221
11.3.2 Clear Waveform Data [ DATA CLEAR ] 222
11.3.3 System Reset [ SYSTEM RESET ] 223
11.4 Special Function Settings [ SETUP ] 226
11.4.1 Channel Selection [ using unit ] 227
11.4.2 Start Key Backup [ start backup ] 228
11.4.3 Setting the Grid [ grid type ] 229
11.4.4 Channel Marker Function [ channel marker ] 231
11.4.5 Time Axis Display [ time axis ] 232
11.4.6 List and Gauge Functions [ list & gauge ] 233
11.4.7 Backlight Saver Function [ backlight saver ] 234
11.4.8 Setting Screen Colors [ LCD color type ] 235
11.4.9 Setting the Volume [ volume ] 236
11.4.10 Intermittent Printing [ intermittent print ] 237
11.4.11 Selecting the Hard Copy Destination 238
11.4.12 Setting the Display Language 239
11.5 Scaling Function [ SCALING ] 240
11.5.1 Conversion Ratio Scaling 241
11.5.2 2-Point Scaling 242
11.5.3 Scaling Setting Example 245
11.6 Adding Comments to a Graph [ COMMENT ] 247
11.6.1 Comment and File Name Entry Procedure 248
11.7 Self Check 249
11.7.1 ROM/RAM Check 250
11.7.2 LED Check 251
11.7.3 Printer Check 252
11.7.4 Key Check 253
11.7.5 Display Check 254
11.7.6 MO Check 255
11.7.7 D/A Unit Output Check 256
11.8 Interface Settings 257

1
2
3
4
5
6
7
8
9
10
11
12
13
14
15
Chapter 12 Printout of Waveform Data and Processing
Data 25912.1 Overview 259
12.2 Selecting Waveform or Numeric Print 260
12.3 Using the Smooth Print Function 262
12.4 Print Settings on SYSTEM Screen 263
12.5 Printing Procedure 264
12.5.1 Normal Print (Manual) (All Functions) 264
12.5.2 Normal Print (Auto) (Memory Recorder, FFT) 266
12.5.3 Real-Time Print (Recorder Function) 267
12.5.4 Partial Print (Memory Recorder, Recorder) 269
12.5.5 Screen Hard Copy (All Functions) 271
12.5.6 A4 Print (Memory Recorder, Recorder) 272
12.5.7 List Print (All Functions) 273
12.5.8 Paper Change During Printing 274
12.6 Reading the Display and Printout 275
Chapter 13 Storing Data on DDS Tape/Reading Data
From DDS Tape 28313.1 Overview 283
13.2 About the MO Disk 284
13.3 MO Drive Operation 285
13.4 Displaying File List and File Information 287
13.4.1 Displaying a File List 287
13.4.2 Displaying File Information 288
13.5 Storing Data on a MO Disk 289
13.5.1 Storing Memory Recorder and FFT Data 289
13.5.2 Storing Recorder Data 295
13.5.3 Automatic File Name Assignment 297
13.5.4 File Contents and Size 298
13.6 Reading Data From MO Disk 302
13.6.1 Reading Stored Data 302
13.6.2 Playback of Stored Data 304
13.7 Recording the Recorder Waveform Data Stored on MO
in Memory Recorder Function/FFT Function
(FILEtoMEM/FFTT) 309
13.8 Deleting Stored Data (directory and file deleting) 311

13.9 Renaming File (file name and directory name) 313
13.10 Operating the Disk/ Deleting the Window (HELP key) 314
13.10.1 Creating a Directory 316
13.10.2 Searching file 317
13.10.3 Sorting files 319
13.10.4 Formatting a MO Disk 320
13.10.5 Formatting a MO Disk Physically (Physical Format) 321
Chapter 14 Calculating Waveform Data 32314.1 Overview 323
14.2 Preparing for Waveform Processing 324
14.3 Defining the Processing Equation 326
14.3.1 Entering the Equation 326
14.3.2 Deleting an Equation 329
14.3.3 Copying an Equation 330
14.4 Setting the Channel for Recording Processing Results 331
14.5 Setting the Display Scale 332
14.6 Specifying the Waveform Processing Range 333
14.7 Setting Example for Waveform Processing 334
14.8 Details on Operators 337
Chapter 15 Determining Waveform
Parameters / EvaluatingParameter Values 34315.1 Overview 343
15.2 Making Settings for Waveform Parameter Calculation 344
15.3 Making Settings for Waveform Parameter Evaluation 348
15.4 Using the NG Output 351
15.5 Specifying a Range for Waveform Parameter Calculation 352
15.6 Printing Out Waveform Parameter Calculation Results 353
15.7 Waveform Parameter Calculation and Waveform
Parameter Evaluation Examples 354
15.8 Parameter Calculation Details 357

16
17
18
19
20
21
22
23
24
10
11
12
13
14
15
APP
IND
Chapter 16 Waveform GO/NG Evaluation 36116.1 Overview 361
16.2 Waveform Evaluation Settings 362
16.3 Creating the Evaluation Area 366
16.4 Editor Command Details 368
16.5 Using the NG Output 378
16.6 Setting Example for Waveform Evaluation 379
Chapter 17 Memory Segmentation Function 38317.1 Overview 383
17.2 Using the Sequential Save Function 384
17.3 Using the Multi-Block Function 389
Chapter 18 Waveform Averaging 39318.1 Overview 393
18.2 Setting the Averaging Function 395
18.2.1 When Using Memory Recorder Function 395
18.2.2 When Using FFT Function 398
18.3 Averaging Equations 403
Chapter 19 Using the A/B Cursors / Waveform
Scrolling 40519.1 Overview 405
19.2 Using the A/B Cursors 406
19.3 Scrolling the Waveform 414
Chapter 20 LEVEL MON. / CH.SET / HELP Keys 41920.1 Overview 419
20.2 Checking the Input Level (LEVEL MON. Key) 420
20.3 Selecting the Input Channel on the Display Screen and
L.evel Monitor Screen (CH.SET Key) 422
20.4 Checking the Waveform Display Position (HELP Key) 425

Chapter 21 External Input/Output Connectors / Key Lock
Function 43321.1 Overview 433
21.2 Using the External Start, Stop, and Print Terminals 434
21.3 Using the External Trigger Input (EXT TRIG) 436
21.4 Using the External Trigger Output (TRIG OUT) 437
21.5 Using the External Sampling Input (EXT SMPL) 438
21.6 Using the NG Evaluation Output (NG) 439
21.7 Using the Microphone Input (MIC) 441
21.8 Using the Key Lock Function 442
Chapter 22 Using the D/A Output Unit 9539 (Option) 44322.1 Overview 443
22.2 Specifications 444
22.3 Usage Precautions 446
22.4 Replacing Units 447
22.5 Output of a Waveform Recorded With the Memory
Recorder or Recorder Function 448
Chapter 23 Maintenance 45123.1 Cleaning of the Unit and Parts 451
23.2 Replacing the DC Power Supply Fuse 454
23.3 Removing the Battery Before Discarding the 8846 455
23.4 Troubleshooting 457
Chapter 24 Error and Warning Messages 459
24.1 Overview 459
24.2 Error Messages 460
24.3 Warning Messages 461
Appendix APPENDIX 1Appendix 1 Glossary APPENDIX 1
Appendix 2 Reference APPENDIX 5
Appendix 2.1 Memory Recorder Function,
Recorder Function APPENDIX 5
Appendix 2.2 FFT Function APPENDIX 8
Appendix 3 Reference Table APPENDIX 18

i────────────────────────────────────────────────────
Introduction────────────────────────────────────────────────────
Introduction
Thank you for purchasing this HIOKI "8846 MEMORY HiCORDER."To get the maximum performance from the unit, please read this manual first,and keep this at hand.

ii────────────────────────────────────────────────────
Inspection────────────────────────────────────────────────────
Inspection
・When the unit is delivered, check and make sure that it has not beendamaged in transit. In particular, check the accessories, panel switches, andconnectors.
・If the unit is damaged, or fails to operate according to the specifications,contact your dealer or HIOKI representative.
Accessories
□ Power cord 1□ DC power cord 1□ Recording paper (roll paper) 1□ Spare fuse 1
(DC supply 10 - 30 V: class A melting fuse (NM) 12 A/250 V,6.4 dia.×31.8 mm)
□ Instruction Manual 1□ Protect cover 1□ MO disk (230MB) 1□ Recording paper attachment 2□ Eject pin 1

iii────────────────────────────────────────────────────
Safety Notes────────────────────────────────────────────────────
DANGER During high voltage measurement, incorrect measurement procedurescould result in injury or death, as well as damage to the equipment.Please read this manual carefully and be sure that you understand itscontents before using the equipment. The manufacturer disclaims allresponsibility for any accident or injury except that resulting due todefect in its product.
・This symbol is affixed to locations on the equipment where theoperator should consult corresponding topics in this manual(which are also marked with the symbol) before using relevantfunctions of the equipment.
・In the manual, this mark indicates explanations which it isparticularly important that the user read before using theequipment.
Indicates a grounding terminal.
Indicates a grounding terminal for measurement.
Indicates a fuse.
Indicates AC (Alternating Current).
Indicates DC (Direct Current).
Indicates both DC (Direct Current) and AC (Alternating Current).
PEAK Indicates a peak value.
Safety Notes
This Instruction Manual provides information and warnings essential foroperating this equipment in a safe manner and for maintaining it in safeoperating condition. Before using this equipment, be sure to carefully read thefollowing safety notes.
Safety symbols

iv────────────────────────────────────────────────────
Safety Notes────────────────────────────────────────────────────
DANGER Indicates that incorrect operation presents extreme danger ofaccident resulting in death or serious injury to the user.
WARNING Indicates that incorrect operation presents significant danger ofaccident resulting in death or serious injury to the user.
CAUTIONIndicates that incorrect operation presents possibility of injury to theuser or damage to the equipment.
NOTE Denotes items of advice related to performance of the equipment orto its correct operation.
Method
Operation
Step
Reference
Example
Indicates a setting or operating procedure. Follow the numberedsequence and perform the indicated steps.
Additional information about setting and operating procedures.
Indicate practical examples for setting and operating procedures.
(Bold character)
[ ]
Example
Set to FFT
( Section ..)
F1
[ FFT ]
Indicates display items or selection items.
Indicates sections for reference.
Indicates operation keys.
Indicates function key displays.
Conventions used in this manual
The following symbols are used in this Instruction Manual to indicate therelative importance of cautions and warnings.
Symbols used for setting and operating steps

v────────────────────────────────────────────────────
Notes on Use────────────────────────────────────────────────────
WARNING The unit should always be operated in a range from 5℃ to 40℃ and 35%to 80% RH or less. Do not use the unit in direct sunlight, dustyconditions, or in the presence of corrosive gases.
DANGER Before connecting the unit, make sure that the power supply voltagematches the rated power supply voltage of the 8846 ( Section 4.2,"Power Supply and Ground Connection".
Before connecting the unit to a battery or other DC source, make surethat the intermediate switch is set to OFF. If the switch is ON, there is arisk of sparks.
Notes on Use
In order to ensure safe operation and to obtain maximum performance fromthe unit, observe the cautions listed below.
(1) Installation environment
(2) Power supply connections
(3) Protective grounding・Be sure to connect the ground terminal to a good ground ( Section 4.2,
"Power Supply and Ground Connection"). If the AC outlet is grounded, usingthe supplied power cord with 3-prong plug will establish the groundconnection.
・Also when powering the unit from a battery or other DC source, connect theground terminal to a good ground.
(4) Before powering on・Check that the power supply is correct for the rating of the unit. Also check
that the correct fuse is fitted. ( Section 4.2, "Power Supply and GroundConnection". (The AC fuse is integrated in the unit.)
・The power switches of this unit are separate for AC power (power switch on8846) and DC power (intermediate switch on DC power supply cable). If DCpower is being supplied and the intermediate switch is set to ON, the 8846will operate also if the power switch is set to OFF.

vi────────────────────────────────────────────────────
Notes on Use────────────────────────────────────────────────────
DANGER Maximum input ratings for the analog units 8916 - 8919, 8927, and 8928and the input terminals of the 8846 are shown below. To avoid the riskof electric shock and damage to the unit, take care not to exceed theseratings.
The 8918 TEMPERATURE UNIT is designed specifically forthermocouples. Do not use it with any other components. (Circuitprotection is provided for up to 100 V DC or AC, but any voltage abovethis value will destroy the unit.)
The maximum floating voltage of 8916 to 8919, 8928 (voltage betweeninput and 8846 frame ground, and between inputs of other analog units)is shown below. To avoid the risk of electric shock and damage to theunit, take care that voltage between channels and between a channeland ground does not exceed these ratings.
The maximum floating voltage rating applies also if an input attenuatoror similar is used.
The 8927 ANALOG UNIT is not isolated from the ground of the 8846(common ground). To avoid the risk of electric shock and damage to theunit, make sure that the ground connection and input connections arecorrectly established. ( Section 4.4)
When measuring power line voltages with the 8916, 8917, or 8919,always connect the probe to the secondary side of the circuit breaker.Connection to the primary side involves the risk of electric shock anddamage to the unit.
Always use the supplied input cables (units 8916, 8917, and 8919 usethe input cable 9574, and unit 8927 uses the connecting cable 9437).Any exposed metal sections in an input cable consist a risk of electricshock.
Input/output terminal Maximum input rating Maximum floating voltage
8916 inputs8917 inputs8919 inputs
500 V DC+AC peak 450 V AC/DC
8918 inputs 100 V AC/DC 250 V AC/DC
8927 inputs 50 V DC+AC peak No floating
8928 inputs 10 V DC+AC peak 40 V DC+AC peak
EXT TRIGSTARTSTOPPRINTEXT SMPL
-5 V to 10 V No floating
MIC 0 V to 5 V DC+AC peak No floating
TRIG OUTNG
-20 V to +30 V500 mA max200 mW max
No floating
(5) Probe Connection, Measurement Voltage Input

vii────────────────────────────────────────────────────
Notes on Use────────────────────────────────────────────────────
WARNING The logic units all have and the 8846 have a common ground.
DANGER Use a DC power supply fuse of the proper rating (12 A/250 V).
In order to avoid accidents from electric shock, before removing orreplacing an input unit or changing a fuse, check that the input cablesare disconnected, turn off the power, and remove the power cable.
Normally keep all eight input units installed permanently. If a unit is notfitted, it must be replaced by a blanking panel. If the unit is operatedwith an input unit not in place it poses a shock hazard.
CAUTION ・This unit uses a thermal printer. The recording paper supplied hascharacteristics finely tuned for use with the printer.Using recording paper of a different specification may not only result inimpaired printing quality, but even prevent the printer from operating. Alwaysuse the HIOKI specified product.
・Insert the paper with correct orientation ( Section 4.6, "Loading RecordingPaper").
CAUTION Using the printer in a high-temperature or high-humidity environment should beavoided at all costs. This can seriously reduce the printer life.
NOTE
(6) Replacing the fuse and input units
(7) Recording paper
(8) Using a printer
(9) Storing
When the unit is not to be used for an extended period, set the head up/downlever to the "head up" position. This will protect the printer head and preventdeformation of the rubber roller.

viii────────────────────────────────────────────────────
Notes on Use────────────────────────────────────────────────────
CAUTION Remove the printer paper from the unit. If the paper is left in the unit, papersupport parts may be damaged due to vibrations.Remove the tape from the unit.
NOTE
NOTE
(10) Shipping
If reshipping the unit, preferable use the original packing.
(11) Others
・ In the event of problems with operation, first refer to Section 23.4, "Troubleshooting".・ Carefully read and observe all precautions in this manual.
ix────────────────────────────────────────────────────
Chapter Summary────────────────────────────────────────────────────
Chapter Summary
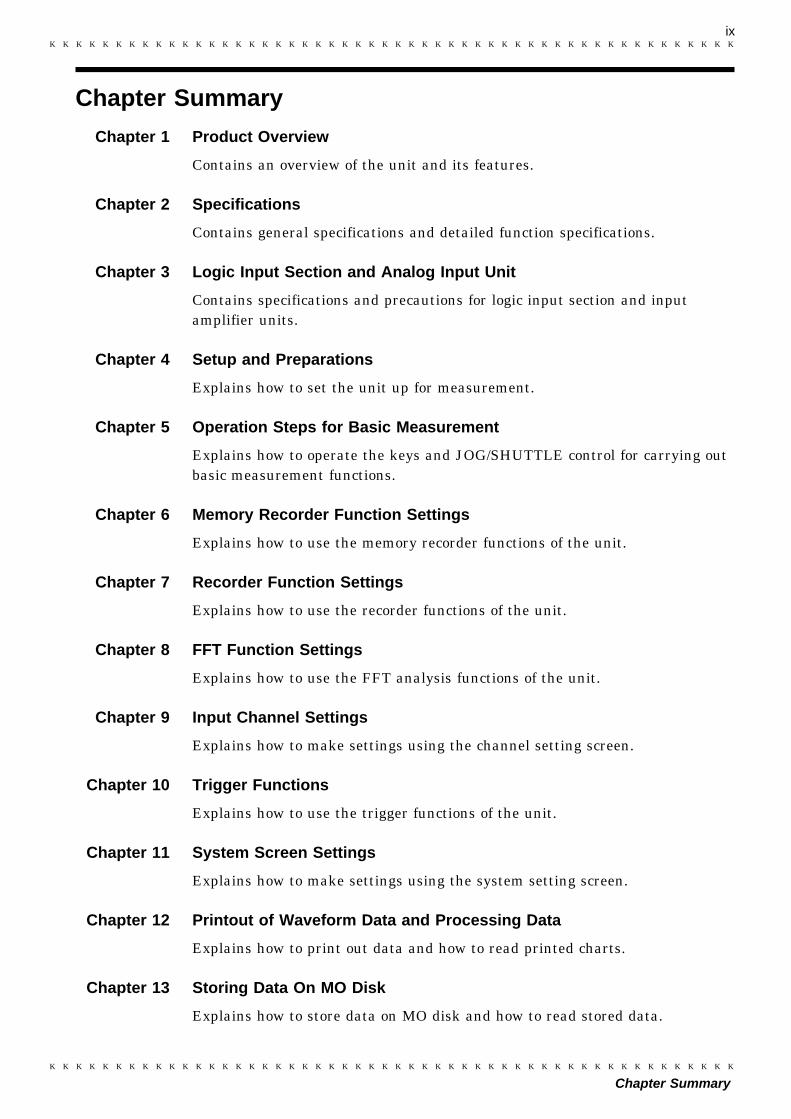
Chapter 1 Product Overview
Contains an overview of the unit and its features.
Chapter 2 Specifications
Contains general specifications and detailed function specifications.
Chapter 3 Logic Input Section and Analog Input Unit
Contains specifications and precautions for logic input section and inputamplifier units.
Chapter 4 Setup and Preparations
Explains how to set the unit up for measurement.
Chapter 5 Operation Steps for Basic Measurement
Explains how to operate the keys and JOG/SHUTTLE control for carrying outbasic measurement functions.
Chapter 6 Memory Recorder Function Settings
Explains how to use the memory recorder functions of the unit.
Chapter 7 Recorder Function Settings
Explains how to use the recorder functions of the unit.
Chapter 8 FFT Function Settings
Explains how to use the FFT analysis functions of the unit.
Chapter 9 Input Channel Settings
Explains how to make settings using the channel setting screen.
Chapter 10 Trigger Functions
Explains how to use the trigger functions of the unit.
Chapter 11 System Screen Settings
Explains how to make settings using the system setting screen.
Chapter 12 Printout of Waveform Data and Processing Data
Explains how to print out data and how to read printed charts.
Chapter 13 Storing Data On MO Disk
Explains how to store data on MO disk and how to read stored data.
x────────────────────────────────────────────────────
Chapter Summary────────────────────────────────────────────────────
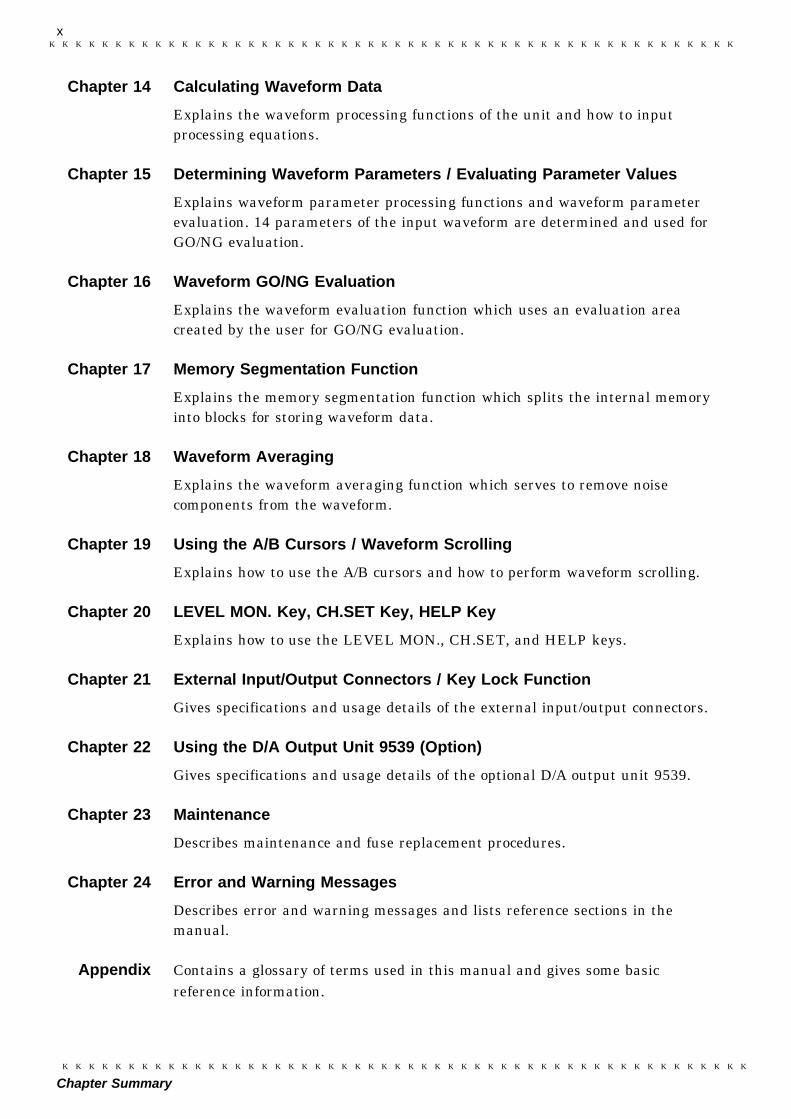
Chapter 14 Calculating Waveform Data
Explains the waveform processing functions of the unit and how to inputprocessing equations.
Chapter 15 Determining Waveform Parameters / Evaluating Parameter Values
Explains waveform parameter processing functions and waveform parameterevaluation. 14 parameters of the input waveform are determined and used forGO/NG evaluation.
Chapter 16 Waveform GO/NG Evaluation
Explains the waveform evaluation function which uses an evaluation areacreated by the user for GO/NG evaluation.
Chapter 17 Memory Segmentation Function
Explains the memory segmentation function which splits the internal memoryinto blocks for storing waveform data.
Chapter 18 Waveform Averaging
Explains the waveform averaging function which serves to remove noisecomponents from the waveform.
Chapter 19 Using the A/B Cursors / Waveform Scrolling
Explains how to use the A/B cursors and how to perform waveform scrolling.
Chapter 20 LEVEL MON. Key, CH.SET Key, HELP Key
Explains how to use the LEVEL MON., CH.SET, and HELP keys.
Chapter 21 External Input/Output Connectors / Key Lock Function
Gives specifications and usage details of the external input/output connectors.
Chapter 22 Using the D/A Output Unit 9539 (Option)
Gives specifications and usage details of the optional D/A output unit 9539.
Chapter 23 Maintenance
Describes maintenance and fuse replacement procedures.
Chapter 24 Error and Warning Messages
Describes error and warning messages and lists reference sections in themanual.
Appendix Contains a glossary of terms used in this manual and gives some basicreference information.

1────────────────────────────────────────────────────
1.1 Major Features────────────────────────────────────────────────────
1
2
3
4
5
6
7
8
9
10
11
12
13
14
A
Chapter 1Product Overview
1.1 Major Features
(1) Storage capability using MO disk
Waveform data and parameter information can be recorded on MO disk.
(2) Easy to read, large color display
The 9.5-inch TFT color screen with a resolution of 640 × 480 dots shows allinformation at a glance.
(3) Built-in thermal printer for A4-size printouts
・The built-in printer delivers waveform printouts on the spot.・The printer can also be used to print screen shots and parameter information.
(4) 16-channel, 14-bit high-resolution recording capability
Using the analog unit 8927 (designed specifically for the 8845 and 8846, notisolated from ground), waveform recording can be performed in up to 16channels with 14-bit resolution.
(5) Expansion units designed for 8840 can be used
・The 8916 ANALOG UNIT, 8917 DC/RMS UNIT, 8918 TEMPERATURE UNIT,and 8919 FFT UNIT can be used in the 8846.
・Units designed for 8840 are connected in a floating configuration (isolatedfrom ground).
(6) Playback of recorded waveform data
The optional 9539 D/A OUTPUT UNIT allows output of recorded waveformdata (2 channels) as an analog waveform with a +6.4 to -6.4 V range.
(7) Voice memo capability
Simply by connecting a microphone to the unit, the user can record a voicememo along with waveform data.

2────────────────────────────────────────────────────
1.1 Major Features────────────────────────────────────────────────────
(8) Simple function key interface
Thanks to its GUI-inspired design using large function key graphics, the unitis easy to set up and operate.
(9) 3 incorporated functions
・Memory recorder with up to 200 kS/s and 2 M word capacity (using 1 unit/1channel); X-Y plotting also possible.
・Continuous real-time recording capability to tape or paper in recorder function・FFT function with 12 analysis patterns
(10) Trigger function
・Digital trigger circuit・4 trigger types: level trigger, window-in trigger, window-out trigger, logic
trigger
(11) Waveform data processing
Absolute waveform values, integral values, and differential values can becalculated, and arithmetic processing of multiple waveform data is alsopossible.
(12) Waveform parameter calculation
14 waveform values including maximum, minimum, and effective values canbe determined.
(13) Waveform evaluation
A good/no-good decision (GO/NG) can be performed depending on whether thewaveform is in a standard area or not. The standard area can be easily set upusing the graphics editor.
(14) Scaling function
By setting the physical amount and the unit to be used for 1 V input, themeasurement result can be converted into any desired scale.
(15) Strain gauge adapter
The measurement with a strain gauge adapter is possible by using the 8928STRAIN UNIT.
(16) GP-IB interface
The optional 9537 GP-IB INTERFACE applied to IEEE-488.2 can be used.It is possible to input and output data and remotely control.
(17) SCSI interface
The optional 9538 SCSI INTERFACE applied to ANSI-X3.131-1986, JIS-X6051can be used. The waveform data recorded on a MO disk can be transferred toa personal computer with using the 9606 DATA CONVERSION UTILITY.

3────────────────────────────────────────────────────
1.2 Identification of Controls and Indicators────────────────────────────────────────────────────
1
2
3
4
5
6
7
8
9
10
11
12
13
14
A
1.2 Identification of Controls and Indicators
Controls and indicators of the unit are listed on the following pages, alongwith a simple explanation of their function.

4────────────────────────────────────────────────────
1.2 Identification of Controls and Indicators────────────────────────────────────────────────────
18 17 16
7
41 2 3
5
6
8
9
10
11
12
13
19 141520
Front Panel

5────────────────────────────────────────────────────
1.2 Identification of Controls and Indicators────────────────────────────────────────────────────
1
2
3
4
5
6
7
8
9
10
11
12
13
14
A
1
2
3
4
5
6
7
8
9
10
11
12
13
14
15
16
17
18
19
20
STATUS key Causes the display to show the STATUS screen whichserves for setting most measurement parameters.
CHAN key Causes the display to show the CHANNEL screen whichserves for making input channel settings.
DISP key Causes the display to show measurement and analysisresults.
SYSTEM key Causes the display to show the SYSTEM screen whichserves for making system-wide settings such as for thescaling function ( Chapter 11).
FILE key Causes the display to show the MO screen which servesfor making MO disk settings ( Chapter 13).
AUTO key Pressing this key activates automatic setting of X and Yaxis range values for easy reading ( Sections 6.3, 7.3).
PRINT key Serves to print out stored waveforms ( Chapter 12).
COPY key Serves to print out a hard copy of the current screendisplay ( Chapter 12).
FEED key Causes the printer paper to advance for as long as thekey is pressed ( Chapter 12).
Select key Selects the function that is controlled by theJOG/SHUTTLE knob. With each push of the key, thefunctions is toggled between VALUE and WAVE A BCSR. The respective LED lights up ( Chapter 19).
JOG key Rotary control knob that serves to change values, movethe A/B cursors, and scroll the waveform.
SHUTTLE key Concentric ring that serves to move the flashing cursor,A/B cursors, and to scroll the waveform. The speed ofmovement is proportional to the rotation angle( Chapter 19).
CURSOR keys These keys serve to move the flashing cursor in the fourdirections.
START key Initiates the measurement and analysis. Duringmeasurement, the LED above the key is lit.
STOP key Stops measurement and analysis.
LEVEL MON. key Serves to check the input signal level ( Chapter 20).
CH. SET key Serves to display and change measurement parametersfor the various channels ( Chapter 20).
HELP key Serves to indicate the position of the currently displayedscreen information in relation to the entire recordinglength ( Chapter 20).
F1 - F5 keys Serve to select setting items.
LCD screen

6────────────────────────────────────────────────────
1.2 Identification of Controls and Indicators────────────────────────────────────────────────────
21
Left Side View
2122
23
26 27 28 31
3325 2924
3230
Right Side View

7────────────────────────────────────────────────────
1.2 Identification of Controls and Indicators────────────────────────────────────────────────────
1
2
3
4
5
6
7
8
9
10
11
12
13
14
A
21
22
23
24
25
26
27
28
29
30
31
32
33
Printer
AC POWER switch Serves to turn the unit on and off.
Protective ground terminal (GND)
AC connector The supplied power cord must be plugged in here.
Input unit slots These slots accept various input units, such asthe 8916 ANALOG UNIT, 8917 DC/RMS UNIT,8918 TEMPERATURE UNIT, 8919 FFT ANALOG UNIT,8927 ANALOG UNIT, and 8928 STRAIN UNIT.
Analog input connector (on 8927 ANALOG UNIT) Unbalanced analog input
Ventilation slots
Fastening screw Secures the plug-in unit.
Expansion slot Accepts the optional unit.The 9537 GP-IB INTERFACE, 9538 SCSI INTERFACE,and 9539 D/A OUTPUT UNIT can be used.
Analog output connector (of the 9539 D/A OUTPUT UNIT)
BUSY lamp MO drive activity indicator. Indicates during driveoperation.
Disk insertion slot The MO disk is inserted here.
Tilt support Serves to tilt the unit upwards.

8────────────────────────────────────────────────────
1.2 Identification of Controls and Indicators────────────────────────────────────────────────────
35
38
3736 4142 40 44
34
39 43
Top View
45
Bottom View

9────────────────────────────────────────────────────
1.2 Identification of Controls and Indicators────────────────────────────────────────────────────
34
35
36
37
38
39
40
41
42
43
44
45
Ventilation slots
Handle Serves for transporting the 8846.
Logic probe connectors Input connector for the logic input section, designed forthe dedicate logic probes (CH A, CH B, CH C, CH D)( Chapter 3).
MIC (microphone) For connection of a microphone ( Chapter 21).connector
Trigger connectors Can be used to synchronize multiple units, using theEXT TRIG input and TRIG OUT output( Chapter 21).
KEY LOCK switch When this switch is set to ON, all keys of the 8846 areinactive. The key lock condition is maintained also whenthe power is switched off and on again ( Chapter 21).
Remote terminals Start, stop, and print operation can be controlled viaexternal signals ( Chapter 21).
NG evaluation output When the waveform evaluation based on waveformterminal parameters has resulted in NG, a signal is output from
this terminal ( Chapter 21).
External sampling Allows input of an external sampling signalterminal ( Chapter 21).
DC power supply Allows use of an external DC source to power the unitconnector (with dedicated DC cable).
Fuse holder Contains a DC power supply fuse.
Ventilation slots

10────────────────────────────────────────────────────
1.2 Identification of Controls and Indicators────────────────────────────────────────────────────

11────────────────────────────────────────────────────
2.1 General Specifications────────────────────────────────────────────────────
1
2
3
4
5
6
7
8
9
10
11
12
13
14
A
■ Basic specifications
Number of units(maximum)
Analog 8 units8 channels when using with only the 8916, 8917, 8918, 8919, 892816 channels when using with only the 8927(The logic channels are standard equipment for the 8846, commonground with main unit)
Memory capacity
When 1 unit is in useWhen 2 units are in useWhen 4 units are in useWhen 8 units are in use
2 M words 8916, 8917, 8918, 8919, 8928 892712 bits×2 M words /channel 14 bits×1 M words /channel12 bits×1 M words /channel 14 bits×500 K words /channel12 bits×500 K words /channel 14 bits×200 K words /channel12 bits×200 K words /channel 14 bits×100 K words /channelone unit of the 8928 equals two units of the 8916 to 8919
Maximum sampling speed Memory recorder, FFT 200 kS/s (8927 is not in use) 100 kS/s (8927 is in use)Recorder 80 kS/s
Input method Plug-in analog input unitsfloating input 8916, 8917, 8918, 8919, 8928no floating 8927
Time measurementfunctions
Auto calendar with automatic leap year, 24 hour clock
Time measurementprecision (maximum)
20 ppm (25℃)
Backup battery andlifetime
Used for clock and to preserve settings, 8 years (reference value at25℃)
Operational ranges fortemperature and humidity
Temperature: 5℃ to 40℃Relative humidity: 35% to 80% RH (with no condensation)
Temperature and humidityranges for assuredaccuracy
Temperature: 23℃±5℃Relative humidity: 35% to 80% RH (with no condensation)
Temperature and humidityranges for storage
Temperature: -10℃±50℃Relative humidity: 35% to 80% RH (with no condensation)
Chapter 2Specifications
2.1 General Specifications

12────────────────────────────────────────────────────
2.1 General Specifications────────────────────────────────────────────────────
Insulation resistance anddielectric strength
At least 10 MΩ/500 VDC, one minute at 1.5 kVAC(between the frame and the AC power supply)At least 10 MΩ/500 VDC, one minute at 700 VDC(between the frame and the DC power supply)At least 100 MΩ/500 VDC, one minute at 2 kVAC(between the input units (excluding 8918, 8927, 8928) and the frame)At least 100 MΩ/500 VDC, one minute at 1.5 kVAC(between the input unit (8918) and the frame)At least 100 MΩ/500 VDC, one minute at 500 VAC(between the input unit (8928) and the frame)At least 100 MΩ/500 VDC, one minute at 2 kVAC(between the input units (excluding 8918, 8927, 8928))At least 100 MΩ/500 VDC, one minute at 500 VAC(between the input units (8928))
Power supply 90 to 250 VAC (50/60 Hz)10 to 30 VDC
Fuse 10 to 30 VDC class A melting fuse (NM) 12 A/250 V6.4 dia.×31.8 mm (DC power supply)
Maximum rated power AC: 350 VA (when printer off, 130 VA)DC: 130 VA (when printer off, 70 VA)
Dimensions Approx. 280 (W)×306 (H)×140 (D) mm (excluding projections)
Mass Approx. 7 kg
■ Display
Screen 9.5 inch LCD display (TFT color LCD, 640×480 dots)
Display resolution Waveform: 20 DIV f.s. × 15 DIV f.s.Text: 60 characters × 40 characters(1 DIV= 32 dots (vertically) × 32 dots (horizontally)
Dots spacing 0.30 mm × 0.30 mm
Maximum display defectratio
Always-on dots + always-off dots = max. 15
■ Recorder
Method of recording Thermosensitive recording method using a thermal line head
Recording paper Roll type thermosensitive recording paper, 216 mm × 30 m (long)
Width of recording Total recording width: 212 mm±1mm (1696 dots)Waveform portion: 200 mm±1mm f.s. (1 DIV=10 mm)
Recording speed Approx. 25 mm/s max
Paper feed accuracy ±1% (25℃, 60% RH)

13────────────────────────────────────────────────────
2.1 General Specifications────────────────────────────────────────────────────
1
2
3
4
5
6
7
8
9
10
11
12
13
14
A
■ External data storage
Device 3.5-inch MO drive
Capacity 640 MB (540, 230, 128 MB)
Data format Accordance with ISO standard , overwrite object supported
Recorded data Binary format and text format of the waveform data (memoryrecorder, recorder, FFT), settings, waveform decision area, screen copy(BMP file)
■ External input /output terminals
STARTSTOPPRINT
Input signal active LOW HIGH level 2.5 to 5.0 V LOW level 0 to 1.0 VPulse width HIGH level 20 ms at least LOW level 10 ms at leastMaximum allowable input -5 to 10 V
EXT TRIG Input signal active LOW HIGH level 2.5 to 5.0 V LOW level 0 to 1.0 VPulse width LOW level 5 μs at leastMaximum allowable input -5 to 10 VInput terminal mini-jack connector, 3.5 mm diameter
EXT SMPL Input signal active LOW HIGH level 2.5 to 5.0 V LOW level 0 to 1.0 VPulse width LOW level 1 μs at leastFrequency 180 kHz max (90 kHz max when using the 8927)Maximum allowable input -5 to 10 V
MIC Maximum allowable input 0 to 5.0 V DC+AC peakInput terminal mini-jack connector, 3.5 mm diameter
TRIG OUT Output signal active LOW HIGH level 4.5 to 5.0 V LOW level 0 to 0.5 VPulse width LOW level 1.5±0.5 msMaximum allowable input -20 to 30 V, 500 mA max, 200 mW maxOutput terminal mini-jack connector, 3.5 mm diameter
NG Output signal active LOW HIGH level 4.5 to 5.0 V LOW level 0 to 0.5 VPulse width HIGH level 20 ms at least LOW level 70 ms approx.Maximum allowable input -20 to 30 V, 500 mA max, 200 mW max

14────────────────────────────────────────────────────
2.2 Trigger Unit Specifications────────────────────────────────────────────────────
Trigger Method Digital comparison
Trigger modes Memory recorder, FFT Single, repeat, auto, auto-stopfunctionsRecorder function Single repeat
Trigger source CH1 - CH16 Analog waveform to input for each channelCHA - CHD Logic waveform to input for each channelExternal trigger Input signal to EXT TRIG terminalTimer trigger Start, stop, interval selectableSources can be set on or off. When all sources are off, the unit is inthe free-run state.Trigger conditions can be set for each source individually.
Analog trigger Uses analog input waveform (channel 1 - 16) as trigger source.Level trigger Trigger level is set as voltage. Triggering occurs
when the signal passes the trigger level with theselected slope (rising edge, falling edge).
Window-in trigger Upper and lower trigger levels can be set.Triggering occurs when the waveform enters thedefined area.
Window-out trigger Upper and lower trigger levels can be set.Triggering occurs when the waveform leaves thedefined area.
Logic trigger Uses the logic input waveform (CH A - CH D) as trigger source.Triggering occurs when the set pattern is matched.
Trigger source AND, OR AND, OR logic can be used to link trigger sources.AND Triggering occurs when all sources have been triggered.OR Triggering occurs when one trigger source has been
triggered.
Trigger filter Trigger width can be set by number of sampling points.OFF, 10, 20, 50, 100, 150, 200, 250, 500, 1000
Trigger level resolution 0.25 % f.s. (f.s. = 20 DIV)
Pre-trigger 0, 2, 5, 10, 20, 30, 40, 50, 60, 70, 80, 90, 95, 100, -95 % (in the memoryrecorder function,) unsettable at external sampling
Trigger output Signal is output from TRIG OUT terminal when triggering occurs.
2.2 Trigger Unit Specifications
15────────────────────────────────────────────────────
2.3 Memory Recorder Function Specifications────────────────────────────────────────────────────
1
2
3
4
5
6
7
8
9
10
11
12
13
14
A
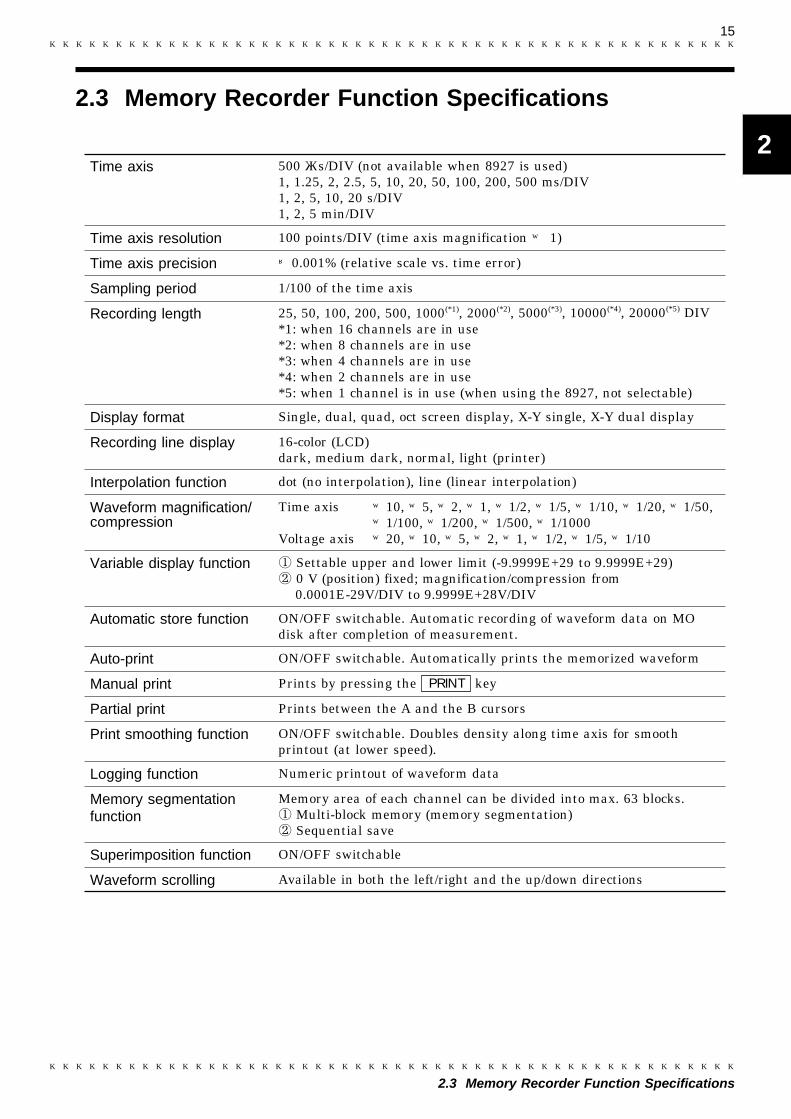
Time axis 500 μs/DIV (not available when 8927 is used)1, 1.25, 2, 2.5, 5, 10, 20, 50, 100, 200, 500 ms/DIV1, 2, 5, 10, 20 s/DIV1, 2, 5 min/DIV
Time axis resolution 100 points/DIV (time axis magnification × 1)
Time axis precision ±0.001% (relative scale vs. time error)
Sampling period 1/100 of the time axis
Recording length 25, 50, 100, 200, 500, 1000(*1), 2000(*2), 5000(*3), 10000(*4), 20000(*5) DIV*1: when 16 channels are in use*2: when 8 channels are in use*3: when 4 channels are in use*4: when 2 channels are in use*5: when 1 channel is in use (when using the 8927, not selectable)
Display format Single, dual, quad, oct screen display, X-Y single, X-Y dual display
Recording line display 16-color (LCD)dark, medium dark, normal, light (printer)
Interpolation function dot (no interpolation), line (linear interpolation)
Waveform magnification/compression
Time axis ×10, ×5, ×2, ×1, ×1/2, ×1/5, ×1/10, ×1/20, ×1/50,×1/100, ×1/200, ×1/500, ×1/1000
Voltage axis ×20, ×10, ×5, ×2, ×1, ×1/2, ×1/5, ×1/10
Variable display function Settable upper and lower limit (-9.9999E+29 to 9.9999E+29)0 V (position) fixed; magnification/compression from0.0001E-29V/DIV to 9.9999E+28V/DIV
Automatic store function ON/OFF switchable. Automatic recording of waveform data on MOdisk after completion of measurement.
Auto-print ON/OFF switchable. Automatically prints the memorized waveform
Manual print Prints by pressing the PRINT key
Partial print Prints between the A and the B cursors
Print smoothing function ON/OFF switchable. Doubles density along time axis for smoothprintout (at lower speed).
Logging function Numeric printout of waveform data
Memory segmentationfunction
Memory area of each channel can be divided into max. 63 blocks.Multi-block memory (memory segmentation)Sequential save
Superimposition function ON/OFF switchable
Waveform scrolling Available in both the left/right and the up/down directions
2.3 Memory Recorder Function Specifications

16────────────────────────────────────────────────────
2.4 Recorder Function Specifications────────────────────────────────────────────────────
Time axis (*1)1.25, 2, (*2)2.5, (*3)5, (*4)10, (*5)20, 50, 100, 200, 500 ms/DIV1, 2, 5, 10, 20 s/DIV1, 2, 5, 10, 20 min/DIV1 h/DIV*1: when 1 channel is in use*2: when 2 channels are in use*3: when 4 channels are in use*4: when 8 channels are in use*5: when 16 channels are in use
Time axis resolution 100 points/DIV (time axis magnification × 1)
Time axis precision ±0.001% (relative scale vs. time error)
Recording time Continuous or settable from 1 second to 366 days 23 h 59 min 59 s in1-second intervals
Display format Single, dual, quad, oct screen display
Recording line display 16-color (LCD)dark, medium dark, normal, light (printer)
Interpolation function dot (no interpolation), line (linear interpolation) line only whenmeasurement
Waveform magnification/compression
Time axis ×10, ×5, ×2, ×1, ×1/2, ×1/5, ×1/10, ×1/20, ×1/50,×1/100, ×1/200, ×1/400, ×1/500, ×1/800, ×1/1000,×1/2000, ×1/5000, ×1/10000, ×1/20000, ×1/50000,×1/100000
Voltage axis ×20, ×10, ×5, ×2, ×1, ×1/2, ×1/5, ×1/10
Variable display function Settable upper and lower limit (-9.9999E+29 to 9.9999E+29)0 V (position) fixed; magnification/compression from0.0001E-29 V/DIV to 9.9999E+28 V/DIV
Data storage medium OFF, printer, MO
Data transferring Transfer the recorded data in memory recorder function to memoryrecorder function.
Manual printing Activated by pressing the PRINT keyPrintout of data in memory at completion of recordingPrintout of all recording data when data are read
Partial print Prints between the A and the B cursors
Waveform scrolling Available in both the left/right and the up/down directions
Logging function Numeric printout of waveform data
2.4 Recorder Function Specifications

17────────────────────────────────────────────────────
2.5 FFT Function Specifications────────────────────────────────────────────────────
1
2
3
4
5
6
7
8
9
10
11
12
13
14
A
FFT range setting 133, 333, 667 mHz2, 4, 8, 20, 40, 80, 200, 400, 800 Hz2, 4, 8, 16, 20, 32, 40, 80* kHz (*:not available when 8927 is used)
Frequency resolution 1/400
Number of sampling points 1000 (storage waveform)
Dynamic range 72 dB (logical value for 8916, 8917, 8918, 8919, 8928)84 dB (logical value for 8927)
Antialiasing filter ON/OFF switchable. Automatic cutoff frequency selection linked tofrequency range (for channels using 8919 FFT unit)
Window functions Rectangular, Hanning, Exponential
FFT analysis modes Storage waveform, linear spectrum, RMS spectrum, power spectrum,auto-correlation function, histogram, transfer function, cross-powerspectrum, cross-correlation function, unit-impulse response, coherencefunction, octave analysis
X-axis setting Time, frequency (linear, logarithmic), real-number voltage (Nyquistonly)
Y-axis setting Voltage (real-number, imaginary number, absolute value, logarithmic)
FFT channel mode 1 channel FFT, 2 channel FFT
Analysis channels 2 channels selectable from all analog channels
Reference data Newly read waveform, waveform stored with memory recorderfunction
Display format Single, dual screen display, Nyquist display
Recording line display Identical fixed color for g1, g2 (display), Dark (printer)
Interpolation function dot (no interpolation), line (linear interpolation)
Waveform magnification/compression
Selectable upper and lower limit (only voltage values set withSTATUS screen; settings made with CHANNEL screen are valid onlyfor histogram of X-axis)
Automatic store function ON/OFF switchable. Automatic recording of waveform data on MOdisk after completion of measurement.
Auto-print ON/OFF switchable. Automatically prints the memorized waveform
Manual print Prints by pressing the PRINT key
Logging function Numeric printout of waveform data
2.5 FFT Function Specifications

18────────────────────────────────────────────────────
2.6 Auxiliary Functions Specifications────────────────────────────────────────────────────
■ Averaging function
Memory recorder Averaging count (OFF, 2 - 256, summing averaging up to specifiedcount, then exponent averaging)
FFT Averaging count (OFF, 2 - 4096)Selectable functions: summing averaging, exponent averaging (each ontime axis or frequency axis), peak hold (frequency axis)
■ Waveform decision function
Waveform area evaluation Comparison to reference areaMemory recorder (single, X-Y single display)FFT (single, Nyquist display)
Decision modes Out NG (fail) if any part of the waveform goes out of the decisionarea.
All out NG (fail) if the waveform is entirely outside the decisionarea.
Stop modes Go stop, NGstop, GO&NG stopOn stop, printer output and waveform save can be selected.
Decision time 20 ms approx.
Decision period 1.75 s approx. (1 ch, 1 mS/DIV, 25 DIV, ×1, line display duringcompressed display or when the recoding length is long, this becomesslower.
Reference area editor Graphic editor
Editor commands Line (dotted line), Paint, Read Waveform, Erase, Parallel Move (withoverwrite), Reverse, Clear (partial deletion), All Clear (screendeletion), Undo, Save
Waveform parameterevaluation(memory recorder, recorder)
Upper and lower trigger limits for waveform parameter processing canbe set
Evaluation modes Out NG when parameter leaves specified rangeIn NG when parameter enters specified range
Evaluation output Signal is output from NG terminal when NG occurs.
2.6 Auxiliary Functions Specifications

19────────────────────────────────────────────────────
2.6 Auxiliary Functions Specifications────────────────────────────────────────────────────
■ Calculation processing
Waveform processing(Memory recorder)
Arithmetic calculation, absolute value, exponent, common logarithm,square root, displacement average, 1st and 2nd differential, 1st and2nd integral, parallel displacement on time axis, trigonometricfunctions (sin, cos, tan), reverse trigonometric functions (asin, acos,atan)
Waveform parameter(Memory recorder, recorder)
Average value, effective value, peak-to-peak value, maximum value,time to maximum value, minimum value, time to minimum value,period, frequency, rise time, fall time, area, standard deviation, areavalue, XY area value,
■ Other function
(1) System screen
Start condition backup ON/OFF switchable. (Retains measurement status.)
Grid settings OFF, standard, fine, standard (dark), fine (dark), standard (shaded),fine (shaded) (only OFF and standard for display)
Channel marker ON/OFF switchable. Waveform numbered with channel number.Always used (regardless of ON/OFF setting) for logic waveforms. Notvalid for FFT.
List/gauge print function ON/OFF switchable. Together with measurement waveform,measurement settings (list) and Y-axis scale (gauge) information isprinted.
LCD backlight saverfunction
ON/OFF switchable. Turns LCD backlight off automatically after 10minutes of key inactivity.
Comment input function Input and printout of comments possible.
Scaling function ON/OFF switchable. Converts voltage values into any unit. Can be setseparately for each channel.
Subsampling print function ON/OFF switchable. Omits interpolation in envelope display.
(2) Key operation
A4 print function Activated by pressing FEED key and COPY key simultaneously.Displayed waveform is printed out in A4 size.
Display copy function Activated by pressing COPY key. Produces a hard copy of displaycontents.
List print function Activated by pressing PRINT key when display shows settinginformation. Produces a list of parameter settings.
Auto-range function Activated by pressing AUTO key (not valid in FFT mode). Selectsoptimum time axis and voltage axis for input waveform.
Level monitor function Activated by pressing LEVEL MON. key. Serves to verify voltagerange position for input waveform in each channel.
Help function Activated by pressing HELP key. Shows relative position ofdisplayed data within entire recorded data. When voltage axis isenlarged, relative position of displayed data to full-scale point for eachchannel is shown (memory recorder, recorder).When memory segmentation is used, usage condition of each block isshown (memory recorder).

20────────────────────────────────────────────────────
2.6 Auxiliary Functions Specifications────────────────────────────────────────────────────
(3) External terminal and switches
Remote control Measurement start, stop, and print control via rear- panel connectors.
External sampling Signal input to EXT SMPL connector (max. 180 kHz) can be used forsampling (limited by number of recording channels and input units).
Voice memo function Microphone connected to MIC connector can be used to record a voicememo for any unit.
Key lock ON/OFF switchable
(4) Others
Comment printing Function, channel, input range, 0 V position, trigger time, DIV andother information can be printed.
Cursor measurementfunction
Time, potential, temperature, frequency difference between A and Bcursor can be measured.Potential, time from trigger, frequency at A or B cursor can bemeasured.
21────────────────────────────────────────────────────
2.7 Accessories and Options────────────────────────────────────────────────────
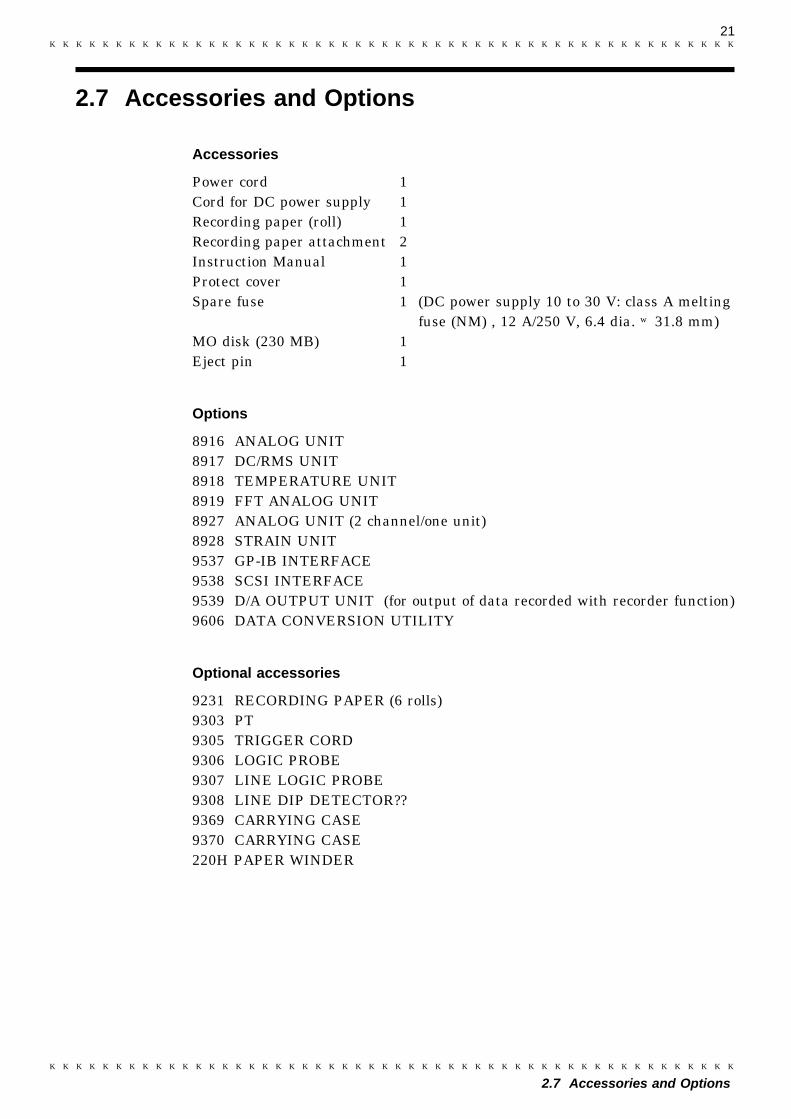
2.7 Accessories and Options
Accessories
Power cord 1Cord for DC power supply 1Recording paper (roll) 1Recording paper attachment 2Instruction Manual 1Protect cover 1Spare fuse 1 (DC power supply 10 to 30 V: class A melting
fuse (NM) , 12 A/250 V, 6.4 dia. ×31.8 mm)MO disk (230 MB) 1Eject pin 1
Options
8916 ANALOG UNIT8917 DC/RMS UNIT8918 TEMPERATURE UNIT8919 FFT ANALOG UNIT8927 ANALOG UNIT (2 channel/one unit)8928 STRAIN UNIT9537 GP-IB INTERFACE9538 SCSI INTERFACE9539 D/A OUTPUT UNIT (for output of data recorded with recorder function)9606 DATA CONVERSION UTILITY
Optional accessories
9231 RECORDING PAPER (6 rolls)9303 PT9305 TRIGGER CORD9306 LOGIC PROBE9307 LINE LOGIC PROBE9308 LINE DIP DETECTOR??9369 CARRYING CASE9370 CARRYING CASE220H PAPER WINDER

22────────────────────────────────────────────────────
2.8 System Operation────────────────────────────────────────────────────
Analog input unit8927 (1 unit 2 channels)
Main unit
8916 to 8919, 8928
Logic input(4 probes, corresponding to 1 unit)
Pre- A/Damplifier
Pre- A/Damplifier
Logicprobe
Logicprobe
Logicprobe
Logicprobe
LCD display
32 bit CPU
Storedmemory
(2 M words)
Memorycontrol and
triggercircuit
Printer
Control
MO drive
953795389539
Option
Pre- A/DPhotocoupleramplifier
Block Diagram
2.8 System Operation
System operation is explained according to the block diagram.
(1) All system operations are controlled by a 32-bit CPU.(2) The input units 8916, 8917, 8918, and 8919 incorporate high-speed 12-bit A/D
converters which are connected to the main unit via a photocoupler integratedin each input unit. Each channel has its own power supply, to assure electricalisolation from the main unit.
(3) The analog unit 8927 incorporates a 14-bit A/D converter and uses a commonground with the main unit.
(4) The input signals for each channel are converted into digital form by the A/Dconverter, and the resulting data are stored in the memory by the memorycontrol circuit.
(5) Measurement data stored in memory are processed by the CPU and displayedon the LCD screen. The waveform displayed on the screen can be printed out.
(6) Waveforms can be recorded on MO disk and redisplayed using the D/A outputunit (option).

23────────────────────────────────────────────────────
3.1 Logic Inputs────────────────────────────────────────────────────
1
2
3
4
5
6
7
8
9
10
11
12
13
14
A
WARNING The 8846 has separate inputs for four probes, but the ground lines ofthese inputs are not isolated from each other and from the frame groundof the unit (common ground).
Do not connect logic probes other than supplied by HIOKI to the logicinputs.
Logic input
8846 main unit
GND
Logic input unit
Common ground
Logicprobes
Not floating
NOTE
Chapter 3Logic and Analog Inputs
3.1 Logic Inputs
・The logic input is located on the top side of the unit. Up to four probes can beconnected.
・Since one logic probe can record 4 channels, the combined maximum recordingcapability for logic waveforms is 16 channels.
If no logic probe is connected, the corresponding logic waveform is displayedon the screen ad high level.
24────────────────────────────────────────────────────
3.1 Logic Inputs────────────────────────────────────────────────────
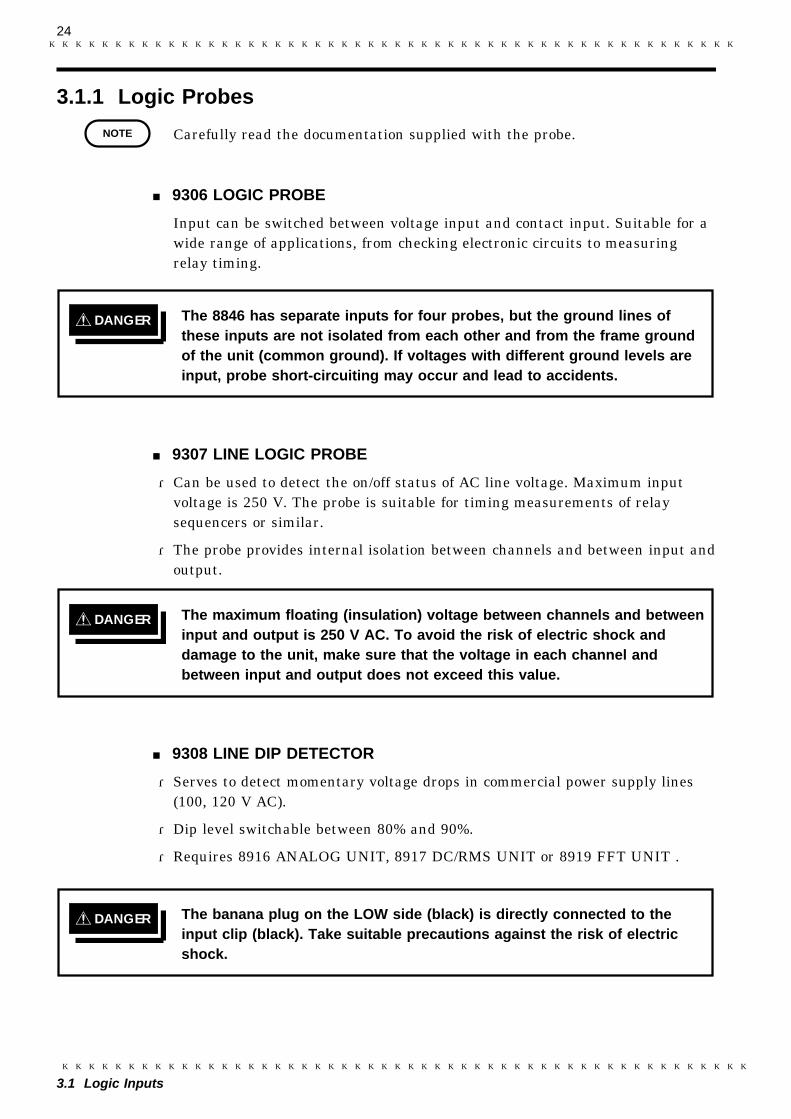
3.1.1 Logic Probes
NOTE
DANGER The 8846 has separate inputs for four probes, but the ground lines ofthese inputs are not isolated from each other and from the frame groundof the unit (common ground). If voltages with different ground levels areinput, probe short-circuiting may occur and lead to accidents.
DANGER The maximum floating (insulation) voltage between channels and betweeninput and output is 250 V AC. To avoid the risk of electric shock anddamage to the unit, make sure that the voltage in each channel andbetween input and output does not exceed this value.
DANGER The banana plug on the LOW side (black) is directly connected to theinput clip (black). Take suitable precautions against the risk of electricshock.
Carefully read the documentation supplied with the probe.
■ 9306 LOGIC PROBE
Input can be switched between voltage input and contact input. Suitable for awide range of applications, from checking electronic circuits to measuringrelay timing.
■ 9307 LINE LOGIC PROBE
・Can be used to detect the on/off status of AC line voltage. Maximum inputvoltage is 250 V. The probe is suitable for timing measurements of relaysequencers or similar.
・The probe provides internal isolation between channels and between input andoutput.
■ 9308 LINE DIP DETECTOR
・Serves to detect momentary voltage drops in commercial power supply lines(100, 120 V AC).
・Dip level switchable between 80% and 90%.
・Requires 8916 ANALOG UNIT, 8917 DC/RMS UNIT or 8919 FFT UNIT .

25────────────────────────────────────────────────────
3.2 8916 ANALOG UNIT────────────────────────────────────────────────────
1
2
3
4
5
6
7
8
9
10
11
12
13
14
A
3.2.1 Specifications
Measurement ranges 5, 10, 20, 50, 100, 200, 500 mV/DIV1, 2, 5, 10, 20 V/DIV
DC amplitude accuracy ±0.25% f.s.
Zero position accuracy ±0.1% f.s.(after zero adjustment)
Temperature characteristic Gain: ±0.02%f.s./℃Zero position: ±0.015%f.s./℃
Frequency characteristic DC to 100 kHz, -3 dB
Noise 180 μVp-p (typical) maximum sensitivity range, with input shorted
Common mode rejectionratio
100 dB minimum (at 50/60 Hz and with signal source resistance100 Ω maximum)
Low-pass filter Cutoff frequency 5, 50, 500 Hz, 5 kHz approx.Can be turned on and off
Input type Unbalanced (floating)
Input resistance andcapacitance
1 MΩ±1% (at power supply off, 500 kΩ)approx. 20 pF (at 100 kHz)
A/D resolution 12 bits
Maximum sampling speed 200 kS/s
Input terminals 2 terminals (for banana plugs)
Maximum allowable inputvoltage
500 V (DC+AC peak)
Maximum floating voltage 450 V AC/DC (between input unit and frame, and between inputunits)
Dimensions and mass 110 (W) × 20 (H) × 88 (D) mm (excluding projections), 110 g approx.
Accessories 9574 INPUT CABLE (1)
3.2 8916 ANALOG UNIT
・The 8916 is the analog unit for the 8840 and 8846 MEMORY HiCORDER.・Follow carefully the advice of Section 3.2.2, "Safety Requirements."
Accuracy at 23℃±5℃, after 1 hour warming-up timeAccuracy guaranteed for six months.

26────────────────────────────────────────────────────
3.2 8916 ANALOG UNIT────────────────────────────────────────────────────
3.2.2 Safety Requirements
DANGER The maximum floating voltage (voltage between 8916 input and 8846frame, and between inputs of other analog units) is 450 V AC/DC. Toavoid the risk of electric shock and damage to the unit, take care thatvoltage between 8916 input and 8846 frame, and between inputs of otheranalog units does not exceed these ratings.
The maximum allowable input to the 8916 is 500 V (DC+AC peak). Toavoid the danger of electric shock or damage to the equipment, ensurethat the applied voltage never exceeds this level.
WARNING The maximum floating voltage rating applies also if an input attenuatoror similar is used.
When measuring voltages in power lines with high current capability,always connect the probe to the secondary side of the circuit breaker, toavoid the risk of electric shock and damage to the unit.
CAUTION ・For safety reasons, only use the 9574 INPUT CABLE provided with the unitfor measurement.
・Before using the unit, make sure that the sheathing on the input cables is notdamaged and that no bare wire is exposed. If there is damage, using theunit could cause electric shock. Replace with the specified 9574 INPUTCABLE.
8846 main unit
GND
500 V DC+AC peak max
450 V AC, DC max
H
L8916
ANALOG UNIT

27────────────────────────────────────────────────────
3.3 8917 DC/RMS UNIT────────────────────────────────────────────────────
1
2
3
4
5
6
7
8
9
10
11
12
13
14
A
1
2
3
4
5
6
7
8
9
10
11
12
13
14
A
3.3.1 Specifications
Measurement ranges 5, 10, 20, 50, 100, 200, 500 mV/DIV1, 2, 5, 10, 20 V/DIV
DC amplitude accuracy ±0.3% f.s.
Zero position accuracy ±0.1% f.s. (after zero adjustment)
RMS accuracy ±1% f.s. (DC, 40 to 1 kHz), ±8% f.s. (1 to 100 kHz),
Temperature characteristic Gain: ±0.02%f.s./℃Zero position: ±0.05%f.s./℃
Frequency characteristic DC to 100 kHz, -3dB
RMS response rate 100 ms typical (0→90%f.s.)200 ms typical (100→10%f.s.)
Crest factor 2
Noise 250 μVp-p (typical) maximum sensitivity range, with input shorted
Common mode rejectionratio
100 dB minimum (at 50/60 Hz and with signal source resistance100 Ω maximum)
Low-pass filter Cutoff frequency 5, 500 Hz, approx.Can be turned on and off
Input type Unbalanced (floating)
Input resistance andcapacitance
1 MΩ±1% (at power supply off, 500 kΩ)approx. 20 pF (at 100 kHz)
A/D resolution 12 bits
Maximum sampling speed 200 kS/s
Input terminals 2 terminals (for banana plugs)
Maximum allowable inputvoltage
500 V (DC+AC peak)
Maximum floating voltage 450 V AC/DC (between input unit and frame, and between inputunits)
Dimensions and mass 110 (W) × 20 (H) × 88 (D) mm (excluding projections), 110 g approx.
Accessories 9574 INPUT CABLE (1)
3.3 8917 DC/RMS UNIT
・The 8917 DC/RMS UNIT is the analog unit for the 8840, 8845, and 8846MEMORY HiCORDERs.
・Records the voltage level converted into RMS values.・Follow carefully the advice of Section 3.3.2, Safety Requirements."
Accuracy at 23℃±5℃, after 1 hour warming-up timeAccuracy guaranteed for six months.

28────────────────────────────────────────────────────
3.3 8917 DC/RMS UNIT────────────────────────────────────────────────────
3.3.2 Safety Requirements
DANGER The maximum floating voltage (voltage between 8917 input and 8846frame, and between inputs of other analog units) is 450 V AC/DC.To avoid the risk of electric shock and damage to the unit, take care thatvoltage between 8917 input and 8846 frame, and between inputs of otheranalog units does not exceed these ratings.
The maximum allowable input voltage to the 8917 is 500 V (DC+ACpeak). To avoid the danger of electric shock or damage to theequipment, ensure that the applied voltage never exceeds this level.
WARNING The maximum floating voltage rating applies also if an input attenuatoror similar is used.
When measuring voltages in power lines with high current capability,always connect the probe to the secondary side of the circuit breaker,to avoid the risk of electric shock and damage to the unit.
CAUTION ・For safety reasons, only use the 9574 INPUT CABLE provided with the unitfor measurement.
・Before using the unit, make sure that the sheathing on the input cables is notdamaged and that no bare wire is exposed. If there is damage, using theunit could cause electric shock. Replace with the specified 9574 INPUTCABLE.
500 V DC+AC peak max
450 V AC, DC max
8846 main unit
GND
H
L8917
DC/RMS UNIT

29────────────────────────────────────────────────────
3.4 8918 TEMPERATURE UNIT────────────────────────────────────────────────────
3.4.1 Specifications
Measurement ranges 10 (0.125), 20 (0.25), 50 (0.625)℃/DIV ( ): minimum resolution
Measurement input range K (CA) -90 to 1200℃J (IC) -90 to 800℃T (CC) -90 to 400℃
Zero position -110 to 110% of recording width in 1% steps (no zero adjustment)
Reference contactcompensation
Automatic compensation
Accuracy ±0.25%f.s.±2℃
Temperature characteristic ±0.05%f.s./℃
Frequency characteristic DC to 500 Hz, -3dB typical
Response time 1 ms typical (0→90%f.s.), (100→10%f.s.)Low-pass filter 5 Hz ON 100 ms typical (0→90%f.s.)
100 ms typical (100→10%f.s.)Low-pass filter 1.5 Hz ON 300 ms typical (0→90%f.s.)
300 ms typical (100→10%f.s.)
Normal mode rejectionratio
50 dB typical (at 50/60 Hz with 1.5 Hz low-pass filter ON)
Common mode rejectionratio
100 dB minimum (at 50/60 Hz and with signal source resistance100 Ω maximum)
Low-pass filter Cutoff frequency 1.5, 5 Hz approx.Can be turned on and off
Input resistance 5 MΩ approx.
A/D resolution 12 bits
Maximum sampling speed 50 kS/s
Input terminals Press-screw type terminal board
Maximum allowable inputvoltage
100 V rms
Maximum floating voltage 250 V AC/DC (between input unit and frame, and between inputunits)
Dimensions and mass 110 (W) × 20 (H) × 88 (D) mm (excluding projections), 110 g approx.
Accessories Flat blade screwdriver (1)
3.4 8918 TEMPERATURE UNIT
・The 8918 TEMPERATURE UNIT is a thermocouple unit that is used the8840, 8845, and 8846 MEMORY HiCORDERs for measuring temperature.
・Using the 8918, temperature can be measured by any of three types ofthermocouples: K, J, T.
・Follow carefully the advice of Section 3.4.2, Safety Requirements."
Accuracy at 23℃±5℃, after 1 hour warming-up timeAccuracy guaranteed for six months.

30────────────────────────────────────────────────────
3.4 8918 TEMPERATURE UNIT────────────────────────────────────────────────────
3.4.2 Safety Requirements
DANGER The maximum floating voltage (voltage between 8918 input and 8846frame, and between inputs of other analog units) is 250 V AC/DC. Toavoid the risk of electric shock and damage to the unit, take care thatvoltage between 8918 input and 8846 frame, and between inputs of otheranalog units does not exceed these ratings.
The maximum permitted input to the 8918 is 100 V rms. To avoid thedanger of electric shock or damage to the equipment, ensure that theapplied voltage never exceeds this level.
WARNING When using an non-insulated thermocouple to measure temperature in aplace where voltage is present, be careful to avoid touching the terminals,since voltage may be present.
CAUTION The 8918 TEMPERATURE UNIT input terminal is only for connection to a thermocouple.
Never apply any input other than that from a thermocouple to this input terminal.
8846 main unit
GND
100 V AC, DC max
250 V AC, DC max
H
L
8918TEMPERATUREUNIT
NOTE The 8918 input and the 8846 frame are insulated.

31────────────────────────────────────────────────────
3.4 8918 TEMPERATURE UNIT────────────────────────────────────────────────────
3.4.3 Notes on Installation Site
・Strong wind striking the input terminal can disrupt the thermal balance ofthe input circuit, resulting in incorrect readings. When taking measurementsin windy environments, arrange the equipment to prevent wind from directlystriking the input terminal.
・Abrupt changes on ambient temperature can also disrupt the thermal balanceof the input circuit. To prevent measurement error, allow the unit to adjust tothe new temperature for about 30 minutes before starting measurement.

32────────────────────────────────────────────────────
3.5 8919 FFT ANALOG UNIT────────────────────────────────────────────────────
3.5.1 Specifications
Measurement ranges 5, 10, 20, 50, 100, 200, 500 mV/DIV1, 2, 5, 10, 20 V/DIV
DC amplitude accuracy ±0.25% f.s.
Zero position accuracy ±0.1% f.s. (after zero adjustment)
Temperature characteristic Gain: ±0.02%f.s./℃Zero position: ±0.015%f.s./℃
Frequency characteristic DC to 100 kHz, -3dB
Noise 180 μVp-p (typical) maximum sensitivity range, with input shorted
Common mode rejectionratio
100 dB minimum (at 50/60 Hz and with signal source resistance100 Ω maximum)
Low-pass filter Cutoff frequency 5, 500 Hz approx., can be turned on and offAttenuation is -6 dB/OCT
Anti-aliasing filter Cutoff frequency (fc) of 20, 40, 80, 200, 400, 800 Hz,2, 4, 8, 20, 40 kHz
Input type Unbalanced (floating)
Input resistance andcapacitance
1 MΩ±1%, approx. 27 pF (at 100 kHz)
A/D resolution 12 bits
Maximum sampling speed 200 kS/s
Input terminals 2 terminals (for banana plugs)
Maximum allowable inputvoltage
500 V (DC+AC peak)
Maximum floating voltage 450 V AC/DC (between input unit and frame, and between inputunits)
Dimensions and mass 110 (W) × 20 (H) × 88 (D) mm (excluding projections), 110 g approx.
Accessories 9574 INPUT CABLE (1)
3.5 8919 FFT ANALOG UNIT
・The 8919 FFT ANALOG UNIT is used for the 8840, 8845, and 8846 MEMORYHiCORDER.
・The 8919 is equipped with a builed-in anti-aliasing filter to suppress aliasing.・The anti-aliasing filter’s cutoff frequency is automatically set according to the
setting of the frequency axis (or time axis) range.・The anti-aliasing filter can be turned on or off using the Memory recorder or
FFT function.・Follow carefully the advice of Section 3.5.2, "Safety Requirements."
Accuracy at 23℃±5℃, after 1 hour warming-up timeAccuracy guaranteed for six months.

33────────────────────────────────────────────────────
3.5 8919 FFT ANALOG UNIT────────────────────────────────────────────────────
3.5.2 Safety Requirements
DANGER The maximum floating voltage (voltage between 8919 input and 8846frame, and between inputs of other analog units) is 450 V AC/DC.To avoid the risk of electric shock and damage to the unit, take care thatvoltage between 8919 input and 8846 frame, and between inputs of otheranalog units does not exceed these ratings.
The maximum permitted input to the 8919 is 500 V (DC+AC peak).To avoid the danger of electric shock or damage to the equipment,ensure that the applied voltage never exceeds this level.
WARNING The maximum floating voltage rating applies also if an input attenuatoror similar is used.
When measuring voltages in power lines with high current capability,always connect the probe to the secondary side of the circuit breaker,to avoid the risk of electric shock and damage to the unit.
CAUTION ・For safety reasons, only use the 9574 INPUT CABLE provided with the unitfor measurement.
・Before using the unit, make sure that the sheathing on the input cables is notdamaged and that no bare wire is exposed. If there is damage, using theunit could cause electric shock. Replace with the specified 9574 INPUTCABLE.
8846 main unit
GND
500 V DC+AC peak max
450 V AC, DC max
H
L
8919FFT ANALOGUNIT

34────────────────────────────────────────────────────
3.6 8927 ANALOG UNIT────────────────────────────────────────────────────
3.6.1 Specifications
Measurement ranges 20, 50, 100, 200, 500 mV/DIV1 V/DIV
DC amplitude accuracy ±0.25% f.s.
Zero position accuracy ±0.2% f.s.(after zero adjustment)
Temperature characteristic Gain: ±0.02%f.s./℃Zero position: ±0.025%f.s./℃
Frequency characteristic DC to 50 kHz, -3dB
Noise 375 μVp-p typical, 625 μVp-p maximum (sensitivity range, withinput shorted)
Crosstalk betweenchannels
-56 dB max.(same range, 50/60 Hz at full-span voltage input)
Low-pass filter Cutoff frequency 5, 50, 500 Hz, 5 kHz approx.Can be turned on and off
Input type Unbalanced (one side grounded; input ground connected directly tounit ground)
Input resistance andcapacitance
1 MΩ±1% (at power supply off, 700 kΩ)approx. 20 pF (at 50 kHz)
A/D resolution 14 bits
Maximum sampling speed 100 kS/s
Input terminals BNC connector
Maximum allowable inputvoltage
50 V (DC+AC peak)
Dimensions and mass 110 (W) × 20 (H) × 88 (D) mm (excluding projections), 125 g approx.
Accessories 9437 CONNECTION CABLE (between BNC and clip, cable containsfuses×2Spare fuse F0.5 A/250 V rating (spark killer)×2
3.6 8927 ANALOG UNIT
・The 8927 is the analog unit for the 8846 MEMORY HiCORDER. It cannot beused for the 8845 and 8846 MEMORY HiCORDERs.
・One unit has input facilities for 2 channels with 14- bit resolution, allowingdetailed waveform recording.
・Follow carefully the advice of Section 3.6.2, "Safety Requirements."
Accuracy at 23℃±5℃, after 1 hour warming-up timeAccuracy guaranteed for six months.

35────────────────────────────────────────────────────
3.6 8927 ANALOG UNIT────────────────────────────────────────────────────
3.6.2 Safety Requirements
DANGER The input ground lines of the analog units 8927 are not isolated againsteach other and against the frame ground of the 8846. In particular, inputGND and frame GND are connected directly. Therefore it is essential toconnect the protective ground terminal of the 8846 to a good ground.Otherwise, a potential may exist between the input of the 8927 ANALOGUNIT and exposed metal parts of the 8846.
The input ground lines of the 8927 ANALOG UNIT channels are directlylinked. Be sure to connect all input GND (black) leads to themeasurement object ground and make sure that all connections arecorrectly established. Otherwise the 8846 and/or the measurementobject may be damaged, or short-circuiting may occur which can lead toaccidents. ( Section 4.4)
Never use the 8927 ANALOG UNIT for power line measurements, toavoid the risk of electric shock and damage to the unit.
The maximum allowable voltage for the 8927 is 50 V (DC + AC peak).Make sure that this rating is not exceeded, to avoid the risk of electricshock and damage to the unit.
CAUTION For safety reasons, only use the 9437 CONNECTION CABLE provided withthe unit for measurement.
8927
ANALOG UNIT
Common ground
H50 V
DC+AC peak
Not floating
L8846 main unit
GND

36────────────────────────────────────────────────────
3.7 8928 STRAIN UNIT────────────────────────────────────────────────────
3.7.1 Specifications
Measurement ranges 20, 50, 100, 200, 500, 1000με/DIV
DC amplitude accuracy ± (0.5% f.s. + 2με) (after auto-balancing)
Zero position accuracy ±0.5%f.s. (after auto-balancing)
Temperature characteristic Gain: ±0.05%f.s./℃ max (after auto-balancing)Zero position: ±2με/℃ max (20, 50με/DIV ranges), ±0.1%f.s./℃max (100, 200, 500, 1000 με/DIV)
Frequency characteristic DC to 16 kHz +1-3 dB
Appropriate adapter Strain gauge adapterBridge resistance: 120 Ω to 1 kΩ
Gauge ratio 2.00 (fixed)
Bridge voltage 3±0.05 V
Balancing Electronic auto-balancing
Balance adjustment range ±10000με max
Low-pass filter Cutoff frequencyOFF, 10 Hz, 30 Hz, 300 Hz, 3 kHz ±30%
Number of input channels 2
A/D resolution 12 bits
Maximum sampling speed 200 kS/s
Input terminals TAJIMI PRC03-23A10-7F
Maximum allowable inputvoltage
10 V (DC+AC peak)
Maximum floating voltage 40V(DC+ACpeak)
Dimensions and mass 110(W)×40(H)×88(D)mm (not including projection), 245 g approx.
Standards applying Safety: Pollution Degree 2 Overvoltage Category (anticipatedtransient overvoltage 330 V)
3.7 8928 STRAIN UNIT
・The 8928 STRAIN UNIT is an option for the 8840, 8845, and 8846 MEMORYHiCORDERs.
・This unit for measurement with a strain gauge adapter.・Follow carefully the advice of Section 3.7.2, "Safety Requirements."
Accuracy at 23℃±5℃, after 1 hour warming-up timeAccuracy guaranteed for six months.

37────────────────────────────────────────────────────
3.7 8928 STRAIN UNIT────────────────────────────────────────────────────
3.7.2 Safety Requirements
DANGER The maximum floating voltage is 40 V (DC+ACpeak). To avoid the risk ofelectric shock and damage to the unit, take care that voltage between8928 input and 8840, 8846 frames, and between inputs of other analogunits does not exceed these ratings.
The maximum permitted input (between BD terminals) to the 8928 is 10V (DC+ACpeak).To avoid the damage to the equipment, ensure that the applied voltagenever exceeds this level.
D
GND
B 10V DC+AC peak
40V DC+AC peak
8846 main unit8928
STRAIN UNIT
3.7.3 Strain Unit Settings
CH1
CH2
CH3
CH4
・The upper input on the unit is the lower-numbered channel, and the lowerinput is the higher-numbered channel.
・When the unit is inserted in the slot shown, the channel assignments are as inthe figure below.

38────────────────────────────────────────────────────
3.8 Replacement Procedure────────────────────────────────────────────────────
WARNING To avoid the danger of electric shock, never operate the unit with aninput unit removed. If you should wish to use the unit after removing aninput unit, fit a blank panel over the opening of the removed unit.
To prevent electrical shock, before adding or replacing the input unit,check that the power for the unit is off and the power cord and inputcables are disconnected. The fixing screws must be firmly tightened orthe input unit may not function up to specification, or may even fail.
3.8 Replacement Procedure
・This section describes how to replace the input units; 8916, 8917, 8918, 8919,8927, and 8928.
・The following procedure describes how to remove the input unit.・Install the units by reversing the procedure for removal.
1. Remove the input cables and thermocouples from all input units.
2. Power off the 8846 main unit, and disconnect the power cord.
3. Remove the two or four fixing screws with a Phillips screwdriver, as shown inthe figure below.
4. Grasp the handle on 8916 - 8919, 8928 units or the BNC connector on 8927unit and pull the unit out, as shown in the illustration.

39────────────────────────────────────────────────────
3.9 Input Cables────────────────────────────────────────────────────
Operating temperature andhumidity range
0 to 40℃, 80%RH max (with no condensation)
Dimensions Approx. 1.7 m
Mass Approx. 100 g
Operating temperature andhumidity range
5 to 40℃, 20 to 80%RH max (with no condensation)
Dimensions Approx. 1.7 m
Mass Approx. 90 g
Fuse Fast-blow, high-insulation type fuse (0.5 A/250 V)with spark killer 5.2 mm dia×20 mm
Fuse holder
To remove the fuse
Fuse
3.9 Input Cables
■ 9574 INPUT CABLE (8916, 8917, 8919)
・Only use the special-purpose 9574 INPUT CABLE for connection to the 8916ANALOG UNIT, 8917 DC/RMS UNIT, and 8919 FFT ANALOG UNIT.
・A plastic cover on the unit connector serves as protection against electricshock.
■ 9437 CONNECTION CABLE

40────────────────────────────────────────────────────
3.10 Measurement Errors Caused by Signal Source Internal Resistance────────────────────────────────────────────────────
Rs
Rin
Es
Es:Signal voltage
Rs: Signal source resistance
Rin: Input resistance
RinMeasurement errors=Es 1- ――――― [V] Rs+Rin
3.10 Measurement Errors Caused by Signal Source
Internal Resistance
If the signal source impedance is higher than the input impedance of the unit,a measurement error will occur.
Example The input impedance of the 8916 ANALOG UNIT is 1 MΩ. If the signalsource impedance is 1 kΩ, an error of about 0.1% will occur.

41────────────────────────────────────────────────────
4.1 Installation of the Unit────────────────────────────────────────────────────
1
2
3
4
5
6
7
8
9
10
11
12
13
14
A
Chapter 4Installation and Preparation
4.1 Installation of the Unit
Installation orientation
Install the unit on a flat, level surface.
mac/8845f
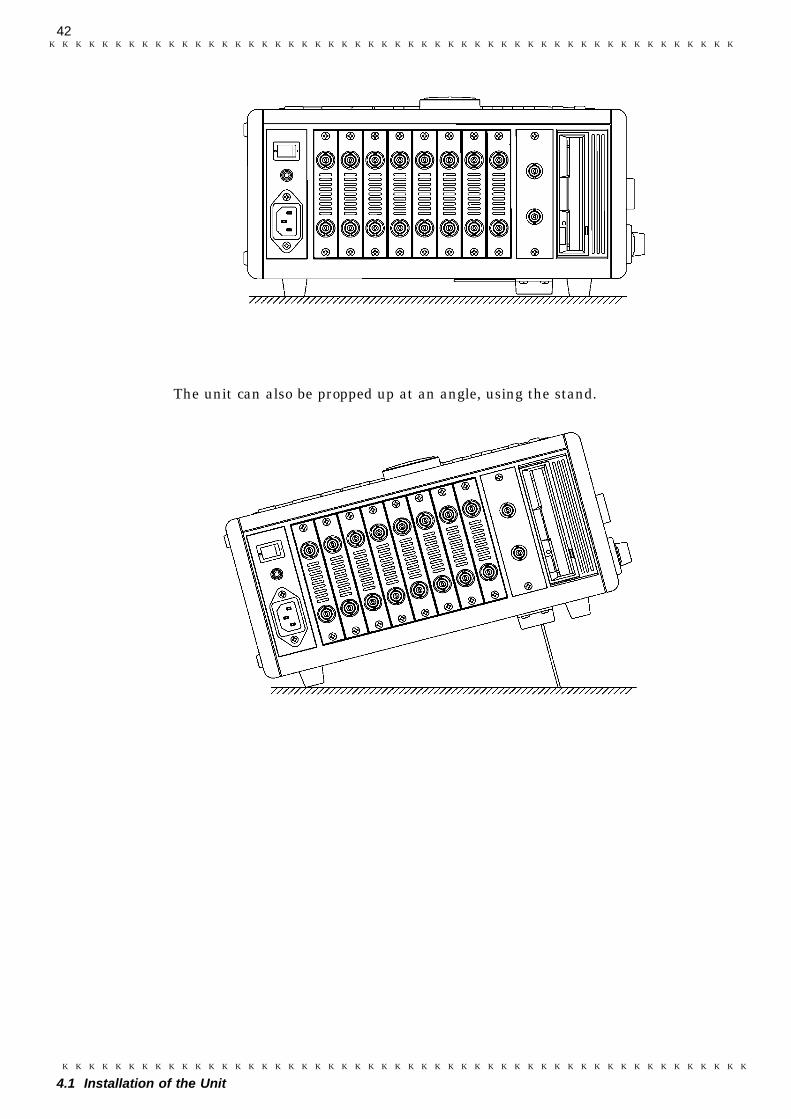
42────────────────────────────────────────────────────
4.1 Installation of the Unit────────────────────────────────────────────────────
The unit can also be propped up at an angle, using the stand.

43────────────────────────────────────────────────────
4.1 Installation of the Unit────────────────────────────────────────────────────
1
2
3
4
5
6
7
8
9
10
11
12
13
14
A
NOTE
Ventilation
mac/8845f
NOTE
Ambient conditions
Temperature 5 to 40℃, 23±5℃ recommended for high-precisionmeasurements
Humidity 35 - 80% RH (no condensation); 50±10% RH (nocondensation) recommended for high-precision measurements
Ventilation Take care not to block the ventilation openings and assureproper ventilation. When using the unit in an uprightposition, take care not to block the openings on the bottom.
Avoid operation at above 37℃ as far as possible. (If operated at above 37℃,the disk protection function is activated, and it is not possible to save or readdata.)
Avoid the following locations:・Subject to direct sunlight・Subject to high levels of dust, steam, or corrosive gases・Subject to vibrations・In the vicinity of equipment generating strong electromagnetic fields

44────────────────────────────────────────────────────
4.2 Power Supply and Ground Connection────────────────────────────────────────────────────
WARNING Take care never to exceed the power supply ratings given below, to avoidthe risk of electric shock and damage to the unit.
Protective groundterminal
To ground
4.2 Power Supply and Ground Connection
Power supply, fuse
Rated power supply voltage 90 - 250 V AC 10 - 30 V DC
Rated AC power supply frequency 50/60 Hz
Fuses AC incorporated in power supply(not user- replaceable)
DC class A melting fuse (NM) 12 A/250 V,6.4 dia. × 31.8 mm
Grounding
・To ensure safety during operation, always ground the unit.・Connect the GND terminal on the side of the unit to a good ground.
Check the following points before connecting the unit to a powersupply:
・The power supply matches the ratings shown above.・The AC power switch of the 8846 and the intermediate switch in the DC cable
are set to OFF.・The ground connection is established.・Use only the supplied AC power cord or DC power supply cable.

45────────────────────────────────────────────────────
4.2 Power Supply and Ground Connection────────────────────────────────────────────────────
1
2
3
4
5
6
7
8
9
10
11
12
13
14
A
WARNING Make sure that the AC power switch of the 8846 is set to OFF.
AC power connector
AC power switch
Rated voltage:90 - 250 V AC
Rated line frequency:50/60 Hz
DANGER Before connecting the unit to a battery or other DC source, make surethat the intermediate switch is set to OFF. If the switch is ON, there is arisk of sparks.
WARNING When connecting the DC cable, take care not to mix up the red (+) andblack (-) leads. If polarity is reversed, the 8846 may be damaged.
When wishing to extend DC cable, use a cable of identical or betterrating as the supplied cable.
Connecting the unit to a power supply:
(1) AC power supply
1. Verify that the AC power switch of the 8846 is set to OFF.
2. Plug the supplied AC power cord into the AC power connector on the side ofthe 8846.
3. Plug the power cord into an AC outlet corresponding to the rating of the 8846.
(2) DC power supply

46────────────────────────────────────────────────────
4.2 Power Supply and Ground Connection────────────────────────────────────────────────────
To disconnect
Groove
Ridge
Intermediate switch
Rated voltage: 10 - 30 V DC
To connect
Operation condition Running time
Printer not used (trigger waiting) Approx. 5 h 30 min
Printer usedRecorder function500 ms/DIV, all store
Approx. 3 h 30 min
NOTE
1. Verify that the intermediate switch in the DC cable is set to OFF.
2. Align the ridge of the connector on the unit with the groove in the plug andinsert the plug fully.
3. Connect the red alligator clip to the positive side (+) and the black alligatorclip to the negative side (-) of the power supply.
4. To remove the plug of the DC cable, rotate it as shown in the illustration.
Estimated battery operation hours (at room temperature)
Battery type: 12 V, 38 Ah, fully charged8846: channels 8927 installed in channels 1 - 16, GP-IB not installed
・Actual running time may differ, depending on battery age, charge condition,ambient temperature, and other factors.
・Running time is approximately proportional to battery capacity. Increasingbattery voltage to 24 V will extend running time by a factor of about 1.5 foridentical capacity.
・ This unit is not equipped to charge an external battery.・ When using a battery, take care not to deplete it completely.

47────────────────────────────────────────────────────
4.3 Power On/Off────────────────────────────────────────────────────
1
2
3
4
5
6
7
8
9
10
11
12
13
14
A
AC power switchDC cable switch
Power-on
( Section 9.6.6)
Wait for1 hour
Zeroadjustment Measurement
4.3 Power On/Off
(1) Check before power-on
・Unit is correctly installed ( Section 4.1).・Power cord is correctly connected and unit is properly grounded ( Section
4.2).
(2) Power switch on/off
・There is no need for the user to manually select AC or DC power.・When both AC and DC power are connected, AC power has priority.・When AC power is disconnected (or falls under 90 V), the 8846 automatically
switches to DC (if both the AC power switch of the 8846 and the intermediateswitch of the DC cable are set to ON).
・If a DC power source is connected and the intermediate switch of the DC cableis set to ON, the 8846 will be operative even if the AC power switch on theunit is set to OFF.
(3) To assure high measurement precision
Turn the unit on and let it warm up for about one hour, to allow internaltemperature to fully stabilize. Then carry out zero adjustment and start themeasurement.
(4) Power-off
When the unit is turned off, it memorizes the currently used settings andreestablishes the same settings the next time the unit is turned on again.

48────────────────────────────────────────────────────
4.4 Probe and Thermocouple Connection────────────────────────────────────────────────────
WARNING The 8846 has separate inputs for four probes, but the ground lines ofthese inputs are not isolated from each other and from the frame groundof the unit (common ground).
If voltages with different ground levels are input, probe short-circuitingmay occur and lead to accidents.
Groove
WARNING Never connect the probe to the 8846 while the probe is already connectedto the measurement object. Otherwise there is a risk of electric shock.
H (red)
L (black)
4.4 Probe and Thermocouple Connection
Logic probe connection
Connect the probe by aligning the groove on theplug with the ridge on the connector.
Connection cable ( Section 3.9)
(1) 9574 INPUT CABLE (8916, 8917, 8919)
Connect the cable so that H and L of the cablematch H (red) and L (black) on the unit.

49────────────────────────────────────────────────────
4.4 Probe and Thermocouple Connection────────────────────────────────────────────────────
DANGER Use only the specified type of fuse. ( Section 3.9, "Input Cables")
The input ground line is directly connected to the frame ground of theunit. Be sure to connect the reference connector of the probe (black)and the ground pin of the input BNC connector to the ground potentialof the measurement object.
Before measurement, connect the protective ground terminal of the 8846to a good ground.
Never use the cable for a power line connection.
CAUTION When disconnecting a BNC connector, be sure to release the lock first, thenhold the connector and pull carefully. Using force to pull the connector withoutreleasing the lock, or pulling on the cable instead of the connector maydamage the connector.
Connectorridge
NOTE
(2) 9437 CONNECTION CABLE (8927)
1. The 9437 CONNECTION CABLE is equippedwith a protective fuse. Before starting themeasurement, verify that the fuse has not blown.
2. Match the grooves on the plug with the ridges onthe connector when inserting the plug.
Before using the 8927 ANALOG UNIT to measure, be sure to read thefollowing notes.・ With some measurement objects (equipment), a noise current may flow in the
ground line, leading to a degradation of S/N ratio. This is especially apparentat high sensitivity range settings.・ Do not connect any unnecessary input cables. For minimum noise, the use of
BNC-BNC cables is recommended.

50────────────────────────────────────────────────────
4.4 Probe and Thermocouple Connection────────────────────────────────────────────────────
DANGER When an uninsulated thermocouple is used to measure temperature at apoint carrying electric potential, take care not to touch the terminals andconnector screws. Otherwise there is a risk of electric shock.
25 mm
8 mm
Thermocouple leadsInner insulation
Outer insulation (mantle)
Screws
Connectors
NOTE
Thermocouple connection (8918)
1. Strip off the insulation as shown in the illustration.
2. Loosen the connector screws on the unitwith a flat blade screwdriver.
3. Connect the thermocouple + and - leads tothe H (+) and L (-) connectors on the unit,taking care to observe correct polarity.
4. Tighten the screws.
・ Do not use thermocouples other than the specified types (K, J, T).・ If the thermocouple is connected in reverse, the temperature reading will not
be correct.

51────────────────────────────────────────────────────
4.5 Connection to a Strain Gauge Adapter────────────────────────────────────────────────────
Bridge voltage(Apply voltage)
3 V
+
-
+-
To insert the connectors To disconnect the connectors
Input
4.5 Connection to a Strain Gauge Adapter
This section describes connection to a strain gauge adapter.
1. Align the projecting portion of the connector on the main unit with the cutoutportion of the connector, and plug it in. (Hold the portion colored in theillustration.)
2. When removing the connector, hold the connector (the portion colored in theillustration), and pull it toward you and out.

52────────────────────────────────────────────────────
4.6 Connecting the Voltage Transformer────────────────────────────────────────────────────
PT
Input
Voltage transformer ground terminal
H
L8846 main unit
GND
8917, 8918, 8919
Proper ground(Ground terminal of groundedAC outlet or similar)
PT
Input
H
L8846 main unit
GND
Proper ground(Ground terminal of groundedAC outlet or similar)
8917, 8918, 8919
NOTE
4.6 Connecting the Voltage Transformer
Explains how to connect the 8916, 8917, 8919, or 8927 and PT (voltagetransformer)
8916, 8917, 8919
When the voltage transformer has a ground terminal
When the voltage transformer has no ground terminal
・ The 8916, 8917, 8919 input and the 8846 frame are insulated.・ When making measurements on as AC power line for example, using a voltage
transformer, be sure to connect the transformer input to the secondary side ofthe breaker.・ Be sure to connect the protective ground terminal to ground.

53────────────────────────────────────────────────────
4.6 Connecting the Voltage Transformer────────────────────────────────────────────────────
PT
Input
Voltage transformer ground terminal
8846 main unit
GND
8927
Proper ground(Ground terminal of groundedAC outlet or similar)
PT
Input
89278846 main unit
GND
Proper ground(Ground terminal of groundedAC outlet or similar)
NOTE
8927
When the voltage transformer has a ground terminal (9303)
When the voltage transformer has no ground terminal
・ The 8927 input and the 8846 have a common ground.・ When making measurements on as AC power line for example, using a voltage
transformer, be sure to connect the transformer input to the secondary side ofthe breaker.・ Be sure to connect the protective ground terminal to ground.・ When using the cable supplied with the 9303, use a commercially available
BNC-to-banana-plug adapter.

54────────────────────────────────────────────────────
4.7 Loading Recoding Paper────────────────────────────────────────────────────
Stock cover
Printer exit slot
Head up/downlever
9231Recording paper
Holder
Attachment
4.7 Loading Recoding Paper
1. Press the stock cover and open it.
2. Raise the had up/down lever.
3. Insert the attachments into the ends of theroll of recording paper and set the paper intoits holder.

55────────────────────────────────────────────────────
4.7 Loading Recoding Paper────────────────────────────────────────────────────
Printer roller
NOTE
Head up/downlever
NOTE
CAUTION Before shipping, remove the printer paper from the unit. If the paper is left inthe unit, paper support parts may be damaged due to vibrations.
NOTE
4. Insert the leading edge of the recording paperfrom above into the gap behind the printerroller, and pull it out to the other side.
Do not insert it into the gap between theroller and the black sheet metal portion.
5. Pull the end of the recording paper out atleast 10 cm, and make sure that it ispositioned quite straight.
Do this very carefully, because if therecording paper is slanted with respect to theroller there is a danger that later a paper jamwill occur.
6. Put down the head up/down lever.
7. Pull the recording paper to the outsidethrough the printer exit slot in the stockcover.
8. Close the stock cover, and finish by tearing offthe recording paper against the edge of theprinter exit slot.
・ Always put the unit in the head up condition when it is to be transported or ifit is to be stored for a long period of time. If the unit is left to lie in the statewhere the roller is being subjected to pressure by the head, then the rollermay become deformed or the characters may become uneven.・ Particularly care should be taken not to put the recording paper in back to
front by mistake, because if this happens the waveform cannot be drawn.

56────────────────────────────────────────────────────
4.8 Storage and Handling Precautions────────────────────────────────────────────────────
Direct sunlight Organic solvent
4.8 Storage and Handling Precautions
・While unopened, thermal paper will not be affected by the environment,provided that ambient temperature and humidity do not exceed normal levels.For long-term storage, temperature should be lower than 40. Lowtemperatures cause no problem.
・After opening, protect the paper from strong light, to prevent discoloration.
Storing recordings
The recording paper uses a thermochemical reaction. Note the followingpoints:
・To avoid discoloration, do not leave recording paper in direct sunlight.・Store at not more than 40℃ and 90% RH.・To keep definitive data, make photocopies of the recordings.・Thermal paper will blacken when brought into contact with alcohol, ester,
ketone, or other volatile organic substances.・If the thermal paper absorbs an organic solvent such as alcohols or ketones it
may no longer develop properly, and recorded information may fade. Soft PVCfilm and transparent contact adhesive tape contain such solvents, so avoidusing them with recordings.
・Avoid interleaving the thermal recordings with damp diazo copies.

57────────────────────────────────────────────────────
4.9 Notes on Measurement────────────────────────────────────────────────────
DANGER Maximum input ratings for the analog units 8916 - 8919, 8927, and 8928and the input terminals of the 8846 are shown below. To avoid the riskof electric shock and damage to the unit, take care not to exceed theseratings.
The 8918 TEMPERATURE UNIT is designed specifically forthermocouples. Do not use it with any other components. (Circuitprotection is provided for up to 100 V DC or AC, but any voltage abovethis value will destroy the unit.)
The maximum floating voltage of 8916 to 8919, 8928 (voltage betweeninput and 8846 frame ground, and between inputs of other analog units)is shown below. To avoid the risk of electric shock and damage to theunit, take care that voltage between channels and between a channeland ground does not exceed these ratings.
The 8927 ANALOG UNIT is not isolated from the ground of the 8846(common with ground). To avoid the risk of electric shock and damageto the unit, make sure that the ground connection and input connectionsare correctly established. ( Section 4.4, "Probe and ThermocoupleConnection")
Input/output terminal Maximum allowableinput rating Maximum floating voltage
8916 inputs8917 inputs8919 inputs
500 V DC+AC peak 450 V AC/DC
8918 inputs 100 V AC/DC 250 V AC/DC
8927 inputs 50 V DC+AC peak No floating
8928 inputs 10 V DC+AC peak 40 V DC + AC peak
EXT TRIGSTARTSTOPPRINTEXT SMPL
-5 V to 10 V No floating
MIC 0 V to 5 V DC+AC peak No floating
TRIG OUTNG
-20 V to +30 V500 mA max200 mW max
No floating
WARNING The logic units all have and the 8846 have a common ground.
4.9 Notes on Measurement

58────────────────────────────────────────────────────
4.9 Notes on Measurement────────────────────────────────────────────────────

59────────────────────────────────────────────────────
5.1 Basic Operation────────────────────────────────────────────────────
1
2
3
4
5
6
7
8
9
10
11
12
13
14
A
5.1.1 Basic Display Operation
Status key Channel key Display key
System key
FILE key
Chapter 5Basic Operation and
Measurement
5.1 Basic Operation
This section explains basic steps and settings for measurement.
STATUS key Calls up the STATUS screen. Serves to switch pages. Serves to make main settings for various functions.
CHAN key Calls up the CHANNEL screen. Serves to switch pages. Serves to set voltage range, position, etc. for input channels.
DISP key Calls up the display screen. Serves to display and observe waveforms.

60────────────────────────────────────────────────────
5.1 Basic Operation────────────────────────────────────────────────────
5.1.2 JOG/SHUTTLE Control and Select Key
Select key
Jog control
Shuttle control
Function key display Meaning gui/com/jog10: Item up, value up
: Item down, value down
Function key display Meaning com/jog20: Value up, large step
: Value up, small step
: Value down, small step
: Value down, large step
SYSTEM key Calls up the SYSTEM screen. Serves to switch pages. Serves to make common settings for all functions (clock
setting, comment input, etc.).
FILE key Calls up the MO screen. Serves to display, store, read, and delete files.
Entering numbers and setting items com/jog10

61────────────────────────────────────────────────────
5.1 Basic Operation────────────────────────────────────────────────────
1
2
3
4
5
6
7
8
9
10
11
12
13
14
A
Function key display Meaning jog30: Value up, 10-units
: Value up, 1-units
: Value down, 1-units
: Value down, 10-units
Function key display Meaning jog40: Channel number up
: Channel number down
Function key display Meaning jog50: Function number up
: Function number down
LED JOG/SHUTTLE control function
VALUE Numeric input of values
WAVE・A.B CSR Waveform scrolling, movement of A/B cursors
Scroll waveform, move A/B cursors
JOG/SHUTTLE control can be used to scroll the waveform and to move the A andB cursors ( Chapter 19).
Switch between numeric input and waveform scroll/cursor movement
Use the select key when the screen is in measurement display mode.

62────────────────────────────────────────────────────
5.1 Basic Operation────────────────────────────────────────────────────
5.1.3 Setting Items
Cursor keys
Function keys
5.1.4 Measurement Start and End
CURSOR keys Serve to move the flashing cursor.
F1 to F5 Select items.(Function key) The respective items are shown in the function key display.
Start measurement
Press the START key and the LED lights.
Stop measurement
Press the STOP key.

63────────────────────────────────────────────────────
5.2 Basic Measurement and Setting Procedures────────────────────────────────────────────────────
1
2
3
4
5
6
7
8
9
10
11
12
13
14
A
5.2.1 Measuring and Recording a Voltage (Memory Recorder,
Recorder)
10 μF
200 Ω1/4 W
10 V p-p
60 HzSine wave
CH1
Voltage measurement and recording
Use memory recorder function Use recorder function
・Store waveform data in internal memory.・Monitor waveform.
・Directly record waveform data on MO diskor printer paper.
・Perform long-term recording.
5.2 Basic Measurement and Setting Procedures
This section uses some representative examples to describe basic measurementsteps and settings.
Example Monitor and record a power supply voltage, as shown in the illustration.

64────────────────────────────────────────────────────
5.2 Basic Measurement and Setting Procedures────────────────────────────────────────────────────
Observe on display
Store on MO
Print out
Aftermeasurement
Initial setting
Steps 1 - 4 Change settings
Step 5 Start measurement
Step 6 Terminate measurement
Step 7 Record data
Measuring voltage with memory recorder function
The following measurement is carried out:
・Monitor input waveform on one screen.・Print waveform or record on tape after measurement is completed.
Only steps which require changing from factory default condition aredescribed.

65────────────────────────────────────────────────────
5.2 Basic Measurement and Setting Procedures────────────────────────────────────────────────────
1
2
3
4
5
6
7
8
9
10
11
12
13
14
A
1
2
3
4
05-02 ###
Step 1 Setup and measurement preparations ( Chapter 4)
・Install the 8846 in a proper location.・Install analog units 8927 in the CH1 and CH2 slots.・Connect the power cord and turn the unit on.・Use the connecting cable to connect the input connectors to the measurement
object.
Step 2 CHANNEL screen settings (page 1) ( Chapter 9)
・Press the CHAN key to call up the CHANNEL screen (page 1).・Press the CH. SET key to select the screen for CH1 - CH8 or CH9 - CH16.
Set function to MEMORY (Memory recorder).
1. Move the flashing cursor to the function item.
2. Press F1 [ MEMORY ].
Set CH1 to analog input.
Move the flashing cursor to the graph for CH1 and press F1 [ ANALOG ].
Set CH1 waveform to be shown on display with color 1 (printout: dark).
1. Move the flashing cursor to the color item.
2. Press F2 [ # 1 (dark) ]. (Set CH2 to OFF.)
Select suitable voltage range for input.
・Since input voltage in this example is 10 Vp-p, select 1V/DIV.・Automatic setting by pressing the AUTO key is also possible ( Section
6.3.3).
1. Move the flashing cursor to the range item.
2. Use the JOG control or the function keys F1 [ + ] and F2 [ ー ] to select the1V/DIV range.

66────────────────────────────────────────────────────
5.2 Basic Measurement and Setting Procedures────────────────────────────────────────────────────
1
2
3
05-03 ###
Step 3 STATUS screen settings (page 1) ( Chapter 6)
Press the STATUS key to call up the STATUS screen (page 1).
Set function to MEMORY (Memory recorder).
1. Move the flashing cursor to the function item.
2. Press F1 [ MEMORY ].
Set time axis range.
・Since the frequency in this example is 60 Hz, one cycle is 1/60 ≒ 16.67 ms.To observe two cycles on the display (15 DIV), the time axis should be 16.67 ms × 2/15 DIV = 2.22 ms/DIV.Therefore the setting 2.5 ms/DIV should be selected.
・If the frequency is unknown, search for a suitable range, starting with highsampling frequencies.
・Automatic setting by pressing the AUTO key is also possible ( Section6.3.3).
1. Move the flashing cursor to the time/div item.
2. Use the JOG control or the function keys F1 [ + ] and F2 [ ー ] to select the2.5ms/DIV range.
Set recording length (recording time)
・Recording time = time axis range (s/DIV) × recording length (DIV)・If recording length is to be 25 DIV, the recording time is 2.5 ms/DIV × 25 DIV = 62.5 ms.
1. Move the flashing cursor to the shot item.
2. Use the JOG control or the function keys F1 [ + ] and F2 [ ー ] to select25DIV.

67────────────────────────────────────────────────────
5.2 Basic Measurement and Setting Procedures────────────────────────────────────────────────────
1
2
05-04
Step 4 Trigger settings ( Chapter 10)
Press the STATUS key to call up the STATUS screen (page 2).
Set the trigger mode.
・Determine whether triggering is to be used continuously.・Four trigger types are available: SINGLE, REPEAT, AUTO, and AUTO STOP.・For continuous trigger-activated waveform sampling and recording, choose
REPEAT.・For automatic setup, choose AUTO.
1. Move the flashing cursor to the trig mode item.
2. Press F2 [ REPEAT ].
Select input waveform of CH 1 as trigger source.
・Waveform data recording starts when the input waveform crosses the 0 Vlevel from below (rising edge).
・When the AUTO key was used, the setting becomes LEVEL.
1. Move the flashing cursor to the CH 1 position.
2. Press F2 [ LEVEL ].
3. Use the JOG control or function keys F1 - F4 to set the voltage level to 0V.
4. Select F1 [ UP ] for slope.

68────────────────────────────────────────────────────
5.2 Basic Measurement and Setting Procedures────────────────────────────────────────────────────
05-13 ####
Press the PRINT key.
The waveform data stored mostrecently in memory are printed out.scan/5.2.1wav
Step 5 Measurement start
Press the START key. The LED above the keylights up and measurement starts.
Step 6 Measurement end
Since trigger mode is set to REPEAT, measurement continues until the STOP
key is pressed. Press the STOP key to terminate the measurement.
Step 7 Recording waveform data
The most recently acquired waveform data can be printed out or stored ontape.
(1) Printing the waveform

69────────────────────────────────────────────────────
5.2 Basic Measurement and Setting Procedures────────────────────────────────────────────────────
Waveform dataMeasurement parameters
05-14-15-17######
1
2
3
4
6
5
(2) Storing waveform data on MO (Storing in binary format)
Press the FILE key to call up the MOscreen.
Make a displaying of the directory in whichthe data is stored, and press the functionkey F4 [ SAVE ].
Since waveform data are to be stored,select F1 [ WAVE ].
Move the flashing cursor to the file name itemand input the file name ( Section 11.6.1).
Press F2 [ binary ] to set the storing type.
Press F1 [ exec ].

70────────────────────────────────────────────────────
5.2 Basic Measurement and Setting Procedures────────────────────────────────────────────────────
Observe on display
MO disk
1 hour
Simultaneously record on MO
Initial setting
Step 1 - 4 Change settings
Step 5 Start measurement
Step 6 Terminate measurement
Measuring voltage with recorder function
The following measurement is carried out:
・Monitor input waveform on one screen.・Record waveform on disk for one hour.
Only steps which require changing from factory default condition aredescribed.

71────────────────────────────────────────────────────
5.2 Basic Measurement and Setting Procedures────────────────────────────────────────────────────
1
2
3
4
05-06 ###
Step 1 Setup and measurement preparations ( Chapter 4)
・Install the 8846 in a proper location.・Install 8927 ANALOG UNIT in the CH1 and CH2 slots.・Connect the power cord and turn the unit on.・Use the connecting cable to connect the input connectors to the measurement
object.
Step 2 CHANNEL screen settings (page 1) ( Chapter 9)
・Press the CHAN key to call up the CHANNEL screen (page 1).・Press the CH. SET key to select the screen for CH1 - CH8 or CH9 - CH16.
Set function to RECORDER (Recorder).
1. Move the flashing cursor to the function item.
2. Press F2 [ RECORDER ]. (Set CH2 to OFF.)
Set CH1 to analog input.
Move the flashing cursor to the graph for CH1 and press F1 [ ANALOG ].
Set CH1 waveform to be shown on display with color 1 (printout: dark).
1. Move the flashing cursor to the color item.
2. Press F2 [ # 1 (dark) ].
Select suitable voltage range for input.
・Since input voltage in this example is 10 Vp-p, select 1V/DIV.・Automatic setting by pressing the AUTO key is also possible ( Section
7.3.3).
1. Move the flashing cursor to the range item.
2. Use the JOG control or the function keys F1 [ + ] and F2 [ ー ] to select the1V/DIV range.

72────────────────────────────────────────────────────
5.2 Basic Measurement and Setting Procedures────────────────────────────────────────────────────
1
2
3
05-07
4
Step 3 STATUS screen settings (page 1) ( Chapter 7)
Press the STATUS key to call up the STATUS screen (page 1).
Set function to RECORDER.
1. Move the flashing cursor to the function item.
2. Press F2 [ RECORDER ].
Set time axis range.
Since the frequency in this example is 60 Hz, one cycle is 1/60 = 16.67 ms.The setting 20 ms/DIV should be selected.
1. Move the flashing cursor to the time/div item.
2. Use the JOG control or the function keys F1 [ + ] and F2 [ ー ] to select the20ms/DIV range.
Set recording time
Set recording time to 1 hour.
1. Move the flashing cursor to the recording time item.
2. Use the JOG control or function keys F1 - F4 to set the recording time to1h.
Choose recording medium.
1. Move the flashing cursor to the recording medium item and select F3 [ MO ].
2. Move the flashing cursor to the file name item to enter the file name.
( Section 11.6.1, "Comment and File Name Entry Procedure" )

73────────────────────────────────────────────────────
5.2 Basic Measurement and Setting Procedures────────────────────────────────────────────────────
1
2
05-08
Step 4 Trigger settings ( Chapter 10)
Press the STATUS key to call up the STATUS screen (page 2).
Set the trigger mode.
・Determine whether triggering is to be used continuously.・Four trigger types are available: SINGLE, REPEAT.・For stop recording after 1 hour, choose SINGLE.・For automatic setup, choose SINGLE.
1. Move the flashing cursor to the trig mode item.
2. Press F1 [ SINGLE ].
Select input waveform of CH 1 as trigger source.
・Waveform data recording starts when the input waveform crosses the 0 Vlevel from below (rising edge).
・When the AUTO key was used, the setting becomes LEVEL.
1. Move the flashing cursor to the CH 1 position.
2. Press F2 [ LEVEL ].
3. Use the JOG control or function keys F1 - F4 to set the voltage level to 0V.
4. Select F1 [ UP ] for slope.
Step 5 Measurement start
Press the START key. The LED above the key lights up and measurementstarts.
Step 6 Measurement end
After recording the waveform data for 1 hour, the measurement is terminated.

74────────────────────────────────────────────────────
5.2 Basic Measurement and Setting Procedures────────────────────────────────────────────────────
5.2.2 Frequency Analysis of Measured Voltage (FFT)
Input waveform
FFT
Display indicationPrint out
Store on MO
After measurement
Initial setting
Steps 1 - 4 Change settings
Step 5 Start measurement
Step 6 Terminate measurement
Step 7 Record data
Example Monitor and record a power supply voltage, as shown in the illustration inSection 5.2.1, and analyze the frequency content of the measured voltage,using FFT (Fast Fourier Transform).
The following measurement is carried out:・Analyze the linear spectrum.・Display the analysis result on one screen.・Print out the waveform or record data on MO disk after measurement is
completed.
Only steps which require changing from factory default condition aredescribed.

75────────────────────────────────────────────────────
5.2 Basic Measurement and Setting Procedures────────────────────────────────────────────────────
1
2
3
05-10###
Step 1 Setup and measurement preparations ( Chapter 4)
・Install the 8846 in a proper location.・Install 8927 ANALOG UNIT in the CH1 and CH2 slots.・Connect the power cord and turn the unit on.・Use the connecting cable to connect the input connectors to the measurement
object.
Step 2 CHANNEL screen settings (page 1) ( Chapter 9)
・Press the CHAN key to call up the CHANNEL screen (page 1).・Press the CH. SET key to select the screen for CH1 - CH8 or CH9 - CH16.
Set function to FFT.
1. Move the flashing cursor to the function item.
2. Press F3 [ FFT ].
Set CH1 to analog input.
Move the flashing cursor to the graph for CH1 and press F1 [ ANALOG ].
Select suitable voltage range for input.
Since input voltage in this example is 10 Vp-p, select 1V/DIV.
1. Move the flashing cursor to the range item.
2. Use the JOG control or the function keys F1 [ + ] and F2 [ ー ] to select the1V/DIV range.

76────────────────────────────────────────────────────
5.2 Basic Measurement and Setting Procedures────────────────────────────────────────────────────
1
2
3
05-11###4
5
6
Step 3 STATUS screen settings (page 1) ( Chapter 8)
Press the STATUS key to call up the STATUS screen (page 1).
Set function to FFT.
1. Move the flashing cursor to the function item.
2. Press F3 [ FFT ].
Set the frequency range.
Since frequencies up to 8 kHz are to be observed, set the range to 8kHz.
1. Move the flashing cursor to the max. frequency item.
2. Use the JOG control or the function keys F1 [ + ] and F2 [ - ] to select 8kHz.
Set the analysis mode.
・12 different analysis settings are available.・Select the linear spectrum in this example.
1. Move the flashing cursor to the mode item of g1.
2. Select F2 [ LIN ].
Set the analysis channel.
1. Move the flashing cursor to the w1 item.
2. Use the JOG control or the function keys F1 [ + ] and F2 [ - ] to select CH1.
Set the Y-axis (vertical axis).
・The setting differs, depending on the analysis mode.・In this example, the magnitude of the frequency components is to be observed.
The setting therefore should be linear amplitude.
1. Move the flashing cursor to the y-axis item.
2. Select F3 [ LIN-MAG ] (linear amplitude).

77────────────────────────────────────────────────────
5.2 Basic Measurement and Setting Procedures────────────────────────────────────────────────────
1
05-12
2
Set the X-axis (horizontal axis).
・The setting differs, depending on the analysis mode.・In this example, the frequency is to be observed on a logarithmic scale.
The setting therefore should be logarithmic frequency.
1. Move the flashing cursor to the x-axis item.
2. Select F2 [ LOG-Hz ] (logarithmic frequency).
Step 4 Trigger settings ( Chapter 10)
Press the STATUS key to call up the STATUS screen (page 2).
Set the trigger mode.
・Determine whether triggering is to be used continuously.・Four trigger types are available: SINGLE, REPEAT, AUTO, and AUTO STOP.・For continuous trigger-activated waveform sampling and recording, choose
REPEAT.・For automatic setup, choose AUTO.
1. Move the flashing cursor to the trig mode item.
2. Press F2 [ REPEAT ].
Select input waveform of channel 1 (ch1) as trigger source.
・Waveform data recording starts when the input waveform crosses the 0 Vlevel from below (rising edge).
・When the AUTO key was used, the setting becomes LEVEL.
1. Move the flashing cursor to the ch1 position.
2. Press F2 [ LEVEL ].
3. Use the JOG control or function keys F1 - F4 to set the voltage level to 0V.
4. Select F1 [ UP ] for slope.

78────────────────────────────────────────────────────
5.2 Basic Measurement and Setting Procedures────────────────────────────────────────────────────
05-16###
Press the PRINT key.
The waveform data stored mostrecently in memory are printed out.
Step 5 Measurement start
Press the START key. The LED above the keylights up and measurement starts.
Step 6 Measurement end
Since trigger mode is set to REPEAT, measurement continues until the STOP
key is pressed. Press the STOP key to terminate the measurement.
Step 7 Recording waveform data
The most recently acquired waveform data can be printed out or stored ontape.
(1) Printing the waveform

79────────────────────────────────────────────────────
5.2 Basic Measurement and Setting Procedures────────────────────────────────────────────────────
Waveform dataMeasurement parameters
05-18-19-20###
1
2
3
5
6
4
(2) Storing waveform data on MO (Storing in binary format)
Press the FILE key to call up the MOscreen.
Make a displaying of the directory in whichthe data is stored, and press the functionkey F4 [ SAVE ].
Since waveform data are to be stored,select F1 [ WAVE ].
Move the flashing cursor to the file name itemand input the file name ( Section 11.6.1).
Press F2 [ binary ] to set the storing type.
Press F1 [ exec ].

80────────────────────────────────────────────────────
5.2 Basic Measurement and Setting Procedures────────────────────────────────────────────────────

81────────────────────────────────────────────────────
6.1 Outline────────────────────────────────────────────────────
1
2
3
4
5
6
7
8
9
10
11
12
13
14
A
Chapter 6Memory Recorder Function
6.1 Outline
(1) After being stored in the internal memory, input signal data can be displayed andprinted.
(2) All input channel data are recorded on the same time axis.
Since data for all channels can be superimposed, the relative relationshipbetween input signals can be observed visually.
(3) Time axis setting
Up to 20 steps: 500 μs/DIV (8927 not installed), 1 ms/DIV - 5 min/DIV.
(4) Time axis resolution 100 points/DIV
(5) Storage capacity
2 M words (8916 - 8919 one unit or 8928 one channel: 20,000 DIV; 8927 oneunit: 10,000 DIV)
(6) Waveform magnification/compression display and print
・Time axis direction: ×10 to ×1/1000・Voltage axis direction: user-variable display range
(7) Voltage axis resolution
320 dots/DIV (8927), 80 dots/DIV (8916 - 8919, 8928) (magnification factor ×1)
(8) Display format・Time axis waveform: single, dual, quad, oct screen display・X-Y waveform: X-Y single, X-Y dual display
(9) Printing
Normal print, A4 print, partial print, screen hard copy. Multiple printingpossible.
(10) High-quality print
Smooth print function approximates analog waveform.
(11) Logging function
Numeric printout of waveform data

82────────────────────────────────────────────────────
6.1 Outline────────────────────────────────────────────────────
(12) Pretrigger function
Allows monitoring of signal also before triggering.
(13) Memory segmentation function
Helps to reduce dead time. Up to 63 waveforms corresponding to 25 DIV canbe stored per channel.
(14) Waveform evaluation function detects abnormal waveforms
(15) Processing functions
Waveform processing (arithmetic processing, differential processing etc.)Waveform parameter processing (frequency measurement, rms measurementetc.)

83────────────────────────────────────────────────────
6.2 Making Settings────────────────────────────────────────────────────
1
2
3
4
5
6
7
8
9
10
11
12
13
14
A
6.2.1 Setting the Function Mode
1
1
1
Function keydisplay Meaning com/func###
: Memory recorder function
: Recorder function
: FFT function
6.2 Making Settings
・The 8846 has three function modes: the memory recorder function mode, therecorder function mode, and the FFT function mode
・Select the memory recorder function.
Method Screen: STATUS (page 1), CHANNEL(page1), DISPLAY
1. Move the flashing cursor to the position shown inthe figure on the left.
2. Press F1 [ MEMORY ].
06-0206-0106-03

84────────────────────────────────────────────────────
6.2 Making Settings────────────────────────────────────────────────────
6.2.2 Setting the Time Axis Range
2
2
1
1
Function keydisplay Meaning com/jog1
500 μs (not selectable when 8927 isuse.)1, 1.25, 2, 2.5, 5, 10, 20, 50, 100, 200,500 ms,1, 2, 5, 10, 20 s1, 2,5 min,EXT (external)
NOTE
・Set the speed for inputting and storing the waveform of the input signal.・Time axis range setting expresses the time for 1 DIV.・The sampling period is 1/100th of the set value for the time axis range. (100
samples/DIV)
Method Screen: STATUS (page 1), DISPLAY
1. Move the flashing cursor to the time/div item.
2. Use the JOG control or the function keys to makethe selection.
・When analog unit 8927 is used, 500 μs/DIVcannot be selected.
・Sampling rate is shown below time axis range.・When time axis range is changed during
measurement, measurement starts again withthe new setting.
・ When using the external sampling,: Section21.5
06-0406-05

85────────────────────────────────────────────────────
6.2 Making Settings────────────────────────────────────────────────────
1
2
3
4
5
6
7
8
9
10
11
12
13
14
A
6.2.3 Setting the Recording Length
06-06
1
2
Function keydisplay Meaning
25, 50, 100, 200, 500, 1000, 2000,5000, 10000, 20000 DIV(when 1 unit is used, excluding 8927)
2
1
NOTE
Number of Units and Maximum Recording Length
Number of units1 2 4 8
1ch 2ch 1ch 2ch 1ch 2ch 1ch 2ch
Maximum recording lengthDIV
20000 10000 5000 2000 1000
1ch: Only 8916 - 8919, 8928 can be used.2ch: 8916 - 8919, 8927, 8928 can coexist, or 8927 can be used exclusively. (For the 8928, one
channel corresponds to one unit.)
The length of recording for one measurement operation (number of DIV) canbe set.
Method Screen: STATUS (page 1), DISPLAY
1. Move the flashing cursor to the shot item.
2. Use the JOG control or the function keys to makethe selection.
・Depending on the number and types of units, therecording length is limited as shown in the tablebelow.
・When recording length is changed duringmeasurement, measurement starts again withthe new setting.
06-07

86────────────────────────────────────────────────────
6.2 Making Settings────────────────────────────────────────────────────
6.2.4 Setting the Format
Input waveform
Input waveform
Graph 1
Graph 2
・The style can be set for showing input signal waveforms on the screen displayand recording them on the printer.
・The styles single, dual, quad, oct, X-Y single, and X-Y dual are available. (ForX-Y single and X-Y dual: Section 6.2.5, "Using the X-Y Waveform Plots")
(1) Single
Display and record as one graph. (At the most, 16 analog signals and 14analog + 16 logic signals)
(2) Dual
・Display and record as two graphs. (On each graph, at most, 16 analog signalsand 14 analog + 16 logic signals)
・Specify which input channel to use for waveform graph display and recording.

87────────────────────────────────────────────────────
6.2 Making Settings────────────────────────────────────────────────────
1
2
3
4
5
6
7
8
9
10
11
12
13
14
A
Input waveform
Graph 1
Graph 2
Graph 3
Graph 4
Input waveform
Graph 1
Graph 2
Graph 7
Graph 8
(3) Quad
・Display and record as four graphs. (On each graph, at most, 16 analog signalsand 14 analog + 8 logic signals)
・Specify which input channel to use for waveform graph display and recording.
(4) Oct
・Display and record as eight graphs. (On each graph, at most, 16 analog signalsand 14 analog + 4 logic signals)
・Specify which input channel to use for waveform graph display and recording.

88────────────────────────────────────────────────────
6.2 Making Settings────────────────────────────────────────────────────
06-08, 09
1
2
・ 1/2Function key
display Meaning com/sc1
: Single (one division only)
: Dual (divided into two)
: Quad (divided into four)
: Oct (print only divided into eight)
: Switch to 2/2
・ 2/2Function key
display Meaning com/sc2
: X-Y single ( Section 6.2.5)
: X-Y dual ( Section 6.2.5)
: Switch to 1/2
Method Screen: STATUS (page 1)
1. Move the flashing cursor to the format item.
2. Use the function keys to select the displayformat.
3. If dual, quad, or octo screen display was chosenin step 2, determine which input channel todisplay on which graph. This setting is madewith the CHANNEL screen.
Press the CHAN key to call up the CHANNELscreen.
Move the flashing cursor to the point shown inthe illustration at left.
・The illustration shows the setting for CH1.・Settings for CH2 - CH16 should be made in the
same way.
Use the function keys to select the graph.

89────────────────────────────────────────────────────
6.2 Making Settings────────────────────────────────────────────────────
・ 1/2Function key
display
com/gr1Meaning
: Graph 1
: Graph 2
: Graph 3 (*1)
: Graph 4 (*1)
: Switch to 2/2
・ 2/2Function key
display
com/gr2Meaning
: Graph 5 (*2)
: Graph 6 (*2)
: Graph 7 (*2)
: Graph 8 (*2)
: Switch to 1/2
*1: displays when the quad or oct screen display is selected*2: displays when the oct screen display is selected

90────────────────────────────────────────────────────
6.2 Making Settings────────────────────────────────────────────────────
6.2.5 Using the X-Y Waveform Plots
Input waveform
→X
→Y
X-Y plot
Y-axis
X-axis
Input waveform
Graph 1, graph 3
Graph 2, graph 4
X-Y plot
・Setting the display format to X-Y single or X-Y dual allows up to four X-Ywaveforms to be combined.
・Assign any analog channel to the X axis and Y axis to form the combined plot.・Voltage axis magnification/compression is active also when using X-Y
combined plotting.・Using the A/B cursors, it is possible to specify the data between the cursors for
partial plotting.
(1) X-Y single screen
・Display and recording is carried out using only one X-Y graph.・The X-Y waveforms of graph 1 - graph 4 are shown on one screen.
(2) X-Y dual screen
・Display and recording is carried out using only two X-Y graphs.・The X-Y waveforms of graph 1 - graph 4 use superimposition of graph 1 and 3
and graph 2 and 4, respectively.

91────────────────────────────────────────────────────
6.2 Making Settings────────────────────────────────────────────────────
1
3
06-11
1
4 3 2
Function keydisplay Meaning
CH1 to CH16
Method
(1) STATUS screen settings
1. Move the flashing cursor to the format item.
2. Use the function key to call up page 2/2.
3. Select F1 [ X-Y single ] or F2 [ X-Y dual ] using thefunction keys.
06-10
(2) CHANNEL screen settings
1. Press the CHAN key to call up the CHANNELscreen.
If X-Y single or X-Y dual was selected with theSTATUS screen, the graph items are shown, asfollows.
Graph 1: x1 and y1 combined plotGraph 2: x2 and y2 combined plotGraph 3: x3 and y3 combined plotGraph 4: x4 and y4 combined plot
2. Move the flashing cursor to the point shown inthe illustration and use the function keys tospecify display OFF and waveform color.
OFF, color 1 - color 16
3. Set the X-axis channel.

92────────────────────────────────────────────────────
6.2 Making Settings────────────────────────────────────────────────────
X-Y plot
Specified portion for X-Y plotting
06-12, 13###
4. Set the Y-axis channel in the same way as the X-axis channel.5. Make the same setting for graphs 2 - 4.
Reference The graph setting can also be carried out with the CH. SET key while thescreen is in measurement display mode ( Section 20.3).
Partial X-Y plot
Using the A/B cursors, it is possible to specify a range for partial X-Y plotting.(Normal X-Y plotting covers all data of the recording length.)
Method 1. Display the captured waveform data, using a format other than X-Y singleor X-Y dual.
2. Use the A/B cursors to specify the desired portion for plotting ( Section19.2).
3. Press the STATUS key to call up the STATUS screen.
4. Carry out combined plotting as described above.

93────────────────────────────────────────────────────
6.2 Making Settings────────────────────────────────────────────────────
6.2.6 Setting the Interpolation Function
Line Display (with interpolation)06-17
Dot Display06-18
1
2
Function keydisplay Meaning com/dot
:Linear interpolation is not performed.The sampled data is displayed just asit comes.
: Linear interpolation is performed.The display is easier on the eye. Highspeed display is available whencompression is being performed.
This setting determines whether the input waveform (sampling data) is to bedisplayed and printed as a series of dots or a line using linear interpolation.
Method Screen: STATUS (page 1) 06-14
1. Move the flashing cursor to the dot-line item.
2. Use the function keys to make the selection.

94────────────────────────────────────────────────────
6.2 Making Settings────────────────────────────────────────────────────
6.2.7 Setting the Roll Mode
1
2
Function keydisplay Meaning
: Roll mode off
: Roll mode on
NOTE
Time axismagnification
Logging interval
×10 ×5 ×2 ×1 ×1/2 ×1/5 ×1/10 ×1/20 ×1/50 ×1/100 ×1/200 ×1/500 ×1/1000
10010010010050
10050555151
・This mode can be used at a time axis range setting of 20 ms/DIV or slower.・In normal recording, the waveform is displayed only after all data of the
recording length have been captured. At low sampling speed settings, this willcause a considerable delay between the start of measurement and theappearance of the waveform on the display.
・When local mode is set to ON, the waveform is displayed immediately at thestart of recording (the screen scrolls).
Method Screen: STATUS (page 1) 06-151. Move the flashing cursor to the roll mode item.
2. Use the function keys to make the selection.
・When the roll mode function is ON, thesuperimposition function and averaging functioncan not be used.
・Local mode is not available when an externalsampling signal is used.
・When the roll mode function is on and then thenumerical output is carried out with normal print(auto), the maximum output interval for the timeaxis magnification is as shown in the left table.It is not possible to print more than these outputintervals.

95────────────────────────────────────────────────────
6.2 Making Settings────────────────────────────────────────────────────
6.2.8 Superimpose
1
2
Function keydisplay Meaning
: Not perform superimpose
: Perform superimpose
・Overlay is performed without clearing the currently displayed waveform (iftrigger mode is REPEAT, AUTO, or AUTO STOP).
・This allows comparison to the immediately preceding waveform.06-20
Method Screen: STATUS (page 1) 06-16
1. Move the flashing cursor to the superimpose item.
2. Use the function keys to make the selection.

96────────────────────────────────────────────────────
6.2 Making Settings────────────────────────────────────────────────────
NOTE
6.2.9 Other Settings (STATUS Screen)
Status Screen (page 1)
Section 12.2
Section 12.3
Section 12.5.2
Section 13.5.1 (2)
06-24
・ If trigger mode is SINGLE, measurement terminates after one set of data hasbeen collected. Therefore the overlay setting is invalid.・ While the overlay function is being used, waveform scrolling and waveform
evaluation cannot be carried out.・ When normal printing ( Section 19.2.1) is carried out, only the last
waveform will be printed.・ If one of the following settings is changed, the overlay waveform display
terminates and only the last waveform is shown:Screen zoom ratio (along time axis or voltage axis)Display formatWaveform interpolationWaveform display or store channelX axis or Y axis during X-Y display
・ When the START key is pressed again during recording, all overlaidwaveforms are erased (including the last waveform).
For details, refer to the following sections.

97────────────────────────────────────────────────────
6.2 Making Settings────────────────────────────────────────────────────
Status Screen (page 2)
Chapter 10
06-25
Status Screen (page 3)
Chapter 17
06-26
Chapter 18
Chapter 16
Chapter 15
Status Screen (page 4)
Chapter 14
06-27

98────────────────────────────────────────────────────
6.3 Settings on the Display Screen and Auto Settings────────────────────────────────────────────────────
6.3.1 Setting Magnification/Compression Along the Time Axis
06-2106-2206-23
×5
×1/5
6.3 Settings on the Display Screen and Auto Settings
Explains the setting items on the Display screen and the auto-setting of thevoltage axis and time axis.
・The magnification/compression ratio along the time axis can be set.・By magnifying the waveform, detailed observations can be made. By
compressing the waveform, an entire change can be promptly apprehended.

99────────────────────────────────────────────────────
6.3 Settings on the Display Screen and Auto Settings────────────────────────────────────────────────────
1
2
Function keydisplay Meaning
×10, ×5, ×2, ×1, ×1/2, ×1/5,×1/10, ×1/20, ×1/50, ×1/100,×1/200, 1/400, ×1/500, ×1/1000
NOTE
6.3.2 Making Channel Settings
CH. SET key:
Serves to make channel settingsin measurement display mode.
Method Screen: DISPLAY 06-19
1. Move the flashing cursor to the position shown inthe figure on the left.
2. Use the JOG control or the function keys toselect the magnification/compression ratio.
・ The magnification/compression factor can be changed also after measurementis completed.・ To display the long recording length with compressed when the interpolation
function is set to dot, it takes about maximum 80 seconds.
Reference The HELP key can be used to check which position within the entirerecording length is occupied by the currently shown waveform ( Section20.4).
While the screen is in measurement display mode, the CH. SET key can beused to make settings for the various channels ( Section 20.3).

100────────────────────────────────────────────────────
6.3 Settings on the Display Screen and Auto Settings────────────────────────────────────────────────────
6.3.3 Automatic Setting of Time Axis and Voltage Axis
Function key display Meaning com/auto: Auto range (only display)
: Enable auto range function
: Disable auto range function
(Auto Range Function)
This function automatically selects the time axis range (TIME/DIV), voltageaxis range (V/DIV) and zero position.
Method 1. Press the AUTO key.
2. Use the function keys to make the selection.
3. Press F2 [ exec ]. The automatic range setting is made and measurementstarts.

101────────────────────────────────────────────────────
6.3 Settings on the Display Screen and Auto Settings────────────────────────────────────────────────────
NOTE
When the auto range function is used to start the measurement, the followingitems are changed.
(1) Channel settings・Range and position Automatically set・Low-pass filter OFF (all channels)・Input coupling DC
(2) Trigger parameters・Trigger source AND/OR OR・Internal trigger Only channel with lowest number of all
active display channels is set to ON, otherchannels are OFF (if difference betweenmaximum and minimum value is large).
・Trigger type Level trigger: trigger level automatically set(only 1 channel)
・Trigger mode Auto・Trigger filter OFF・Pretrigger 20%・External trigger, timer trigger OFF
(3) STATUS settings・Time axis range (TIME/DIV) Automatically set・Time axis magnification/compression,
voltage axis magnification ×1・Memory segmentation OFF
・ The time axis range is set using the channel with lowest number of all activedisplay channels. (The setting is made so that out of 25 DIV units, a cycle of 1- 2.5 is recorded.)・ If the channel for which the time axis range has been set is at the maximum
sensitivity range (8916, 8917, 8919: 5 mV/DIV, 8918: 10℃/DIV, 8927: 20mV/DIV, 8928: 20 με) and the difference between the maximum andminimum input signal level is 1 DIV or less, the next higher channel is usedfor time axis range setting.・ If range setting cannot be performed for all active channels, the measurement
is terminated with a warning message.・ When the WAVE・A.B CSR LED is lit on the DISPLAY screen, the AUTO key
is invalid.

102────────────────────────────────────────────────────
6.4 Start and Stop Measurement Operation────────────────────────────────────────────────────
Record
・・・Trigger
Measurement start Measurement endRecording length
Trigger standby
Record
・・・Trigger
Measurementstart
Recording length
Trigger standby
Press STOP key. Measurement ends afterrecording length data have been stored.
6.4 Start and Stop Measurement Operation
Method
To start the measurement:
Press the START key and the LED lights
To stop the measurement:
Press the STOP key.
Trigger mode and measurement operation
(1) When trigger mode is SINGLE
・After START key has been pressed, data recording starts when triggerconditions are met.
・When data corresponding to recording length have been stored in memory,measurement stops also without pressing the STOP key.
(2) When trigger mode is REPEAT
・After START key has been pressed, data recording starts when triggerconditions are met.
・Each time when trigger conditions are met, data are recorded and memorycontents are overwritten.
・When STOP key is pressed, measurement stops after data corresponding torecording length have been stored in memory.

103────────────────────────────────────────────────────
6.4 Start and Stop Measurement Operation────────────────────────────────────────────────────
occurs or 1 second elapses▽ Record
・・・Trigger
Measurementstart
Recording length
Press STOP key. Measurement ends afterrecording length data have been stored.
・・・Trigger
Recording length
If measurement was startedafter 1 second has elapsed
Measurementstart
occurs or 1 second elapses▽ Record
Measurement endsif started by
Press STOP key. Measurement ends afterrecording length data have been stored.
(3) When trigger mode is AUTO
・When START key is pressed, unit waits for about 1 second for triggerconditions to be met. After this interval, data recording starts, regardless oftrigger state.
・Data are recorded repeatedly and memory contents are overwritten.・When STOP key is pressed, measurement stops after data corresponding to
recording length have been stored in memory.
(4) When trigger mode is AUTO STOP
・When START key was pressed and trigger conditions are met, data recordingstarts and continues until data corresponding to recording length have beenstored in memory.
・Unit waits for about 1 second. If trigger conditions are not met, data recordingstarts and continues until data corresponding to recording length have beenstored in memory. This process is repeated until trigger conditions are met.
・When STOP key is pressed in trigger standby condition, measurement stopsafter data corresponding to recording length have been stored in memory.

104────────────────────────────────────────────────────
6.4 Start and Stop Measurement Operation────────────────────────────────────────────────────
Press STOP key once to terminatemeasurement after recording length data arestored.
Press STOP key twice to terminatemeasurement immediately.
Stopping measurement
Pressing STOP key once
・When STOP key is pressed once, data recording continues until datacorresponding to recording length have been stored in memory. (LED above
START key is lit.)・If START key is pressed after STOP key was pressed once and before
waveform data recording is completed, the measurement is restarted.
Pressing STOP key twice
・When STOP key is pressed twice, waveform recording is stoppedimmediately.
・If trigger mode is SINGLE, or if recording length is maximum length, thewaveform is not displayed.
・If trigger mode is REPEAT, AUTO, or AUTO STOP and if recording length is belowmaximum length, the previously stored waveform is displayed.
・If time axis range is 20 ms/DIV or slower, the waveform up to the currentpoint is displayed.

105────────────────────────────────────────────────────
7.1 Outline────────────────────────────────────────────────────
1
2
3
4
5
6
7
8
9
10
11
12
13
14
A
Chapter 7Recorder Function
7.1 Outline
(1) Real-time recording of input signal data on MO or printer paper
(2) All input channel data are recorded on the same time axis.
Since data for all channels can be superimposed, the relative relationshipbetween input signals can be observed visually.
(3) Time axis setting
Up to 21 steps: 1.25 ms//DIV - 1 h/DIV.
(4) Time axis resolution 100 points/DIV
(5) Waveform magnification/compression display and printout
・Time axis direction: ×10 to ×1/1000・Voltage axis direction: variable display range up to 10 μV/DIV - 100 V/DIV,
10 μV steps
(6) Voltage axis resolution
320 dots/DIV (8927), 80 dots/DIV (8916 - 8919, 8928) (magnification factor ×1)
(7) Display format
Time axis waveform: single, dual, quad, octo screen display
(8) High-quality print
Smooth print function approximates analog waveform.
(9) Logging function
Numeric printout of waveform data
(10) Waveform parameter processing (frequency measurement, rms measurementetc.)
(11) Voice memo function using a microphone (using a MO disk)
(12) Recorded waveform data can be transferred to memory recorder function

106────────────────────────────────────────────────────
7.2 Making Settings────────────────────────────────────────────────────
7.2.1 Setting the Function Mode
1
1
1
Function keydisplay Meaning
: Memory recorder function
: Recorder function
: FFT function
7.2 Making Settings
・The 8846 has three function modes: the memory recorder function mode, therecorder function mode, and the FFT function mode
・Select the recorder function.
Method Screen: STATUS (page 1), CHANNEL(page1), DISPLAY
1. Move the flashing cursor to the position shown inthe figure on the left.
2. Press F2 [ RECORDER ].
07-0107-0207-03

107────────────────────────────────────────────────────
7.2 Making Settings────────────────────────────────────────────────────
1
2
3
4
5
6
7
8
9
10
11
12
13
14
A
7.2.2 Setting the Time Axis Range
1
2
2
1
Function keydisplay Meaning
1.25, 2, 2.5, 5, 10, 20, 50,100, 200, 500 ms,1, 2, 5, 10, 20 s,1, 2,5, 10, 20 min,1 hEXT (external)
・Set the speed for inputting and storing the waveform of the input signal.・Time axis range setting expresses the time for 1 DIV.・The sampling period is 1/100th of the set value for the time axis range.
Method Screen: STATUS (page 1), DISPLAY
1. Move the flashing cursor to the time/div item.
2. Use the JOG control or the function keys to makethe selection.
07-0407-05

108────────────────────────────────────────────────────
7.2 Making Settings────────────────────────────────────────────────────
NOTE
Time Axis Range and Number of Units
Number of units1 2 4 8
1ch 2ch* 1ch 2ch 1ch 2ch 1ch 2ch
Upper time axis range limitms/DIV
1.25 2.5 5 10 20
1ch: (1 channel) Only 8916 - 8919, 8928 can be used.2ch: (2 channels) 8916 - 8919, 8927, 8928 can coexist, or 8927 can be used exclusively.
(For the 8928, one channel corresponds to one unit.)
Magnification Ratio and Number of Units (at external sampling)
Number of units1 2 4 8
1ch 2ch 1ch 2ch 1ch 2ch 1ch 2ch
Magnification ratio(maximum value) 1/800 1/400 1/200 1/100 1/50
1ch: Only 8916 - 8919, 8928 can be used.2ch: 8916 - 8919, 8927, 8928 can coexist, or 8927 can be used exclusively.
(For the 8928, one channel corresponds to one unit.)
・ Time axis range settings depend on the number and type of installed units.
* When using only one 8927 unit, range selection up to 1.25 mV/DIV is possible,but only 1 channel can be used.
・When using external sampling for the recorder, data dropouts may occur atsampling frequencies above 80 kHz.
・When time axis range is changed during measurement, measurement startsagain with the new setting.
・The magnification ratio of the screen display using external sampling dependon the number of installed units.
・When carrying out measurement with a fast time axis range, use an MO diskwhich has been newly formatted by the 8846. For details, see Section 13.10.4.(If the MO disk has had frequent file additions and deletions made, theresulting fragmentation may cause recording to be lost, and the measurementto stop.)

109────────────────────────────────────────────────────
7.2 Making Settings────────────────────────────────────────────────────
1
2
3
4
5
6
7
8
9
10
11
12
13
14
A
7.2.3 Setting the Magnification Along the Time Axis
1
2
Function keydisplay Meaning
×10, ×5, ×2, ×1, ×1/2, ×1/5,×1/10, ×1/20, ×1/50, ×1/100,×1/200, 1/400, ×1/500, ×1/1000,×1/20000, ×1/50000, ×1/100000
1
2
NOTE
・The magnification ratio along the time axis can be set and changed.・By magnifying the waveform, detailed observations can be made. By
compressing the waveform, an entire change can be promptly apprehended.
Method Screen: STATUS (page 1), DISPLAY 7-25
1. Move the flashing cursor to the time/div zoom item.
2. Use the JOG control or the function keys to setthe the magnification ratio.
・ Compression of a waveform takes longer thanmagnification. The higher the compressionfactor, the more time will be required until thedisplay appears.・ The magnification ratio during measurement
depend on the time axis( Section 12.5.3)

110────────────────────────────────────────────────────
7.2 Making Settings────────────────────────────────────────────────────
1
2
Function keydisplay Meaning
time axis ×1 to ×2880000
1
2
For higher-resolution time axis compression
By choosing a different ratio setting, you can increase the detail resolution oftime axis compression.
Method Screen: STATUS (page 1), DISPLAY ##7-261. Move the flashing cursor to the position shown in
the figure on the left.
2. Use the JOG control or the function keys tochange the time for one division.

111────────────────────────────────────────────────────
7.2 Making Settings────────────────────────────────────────────────────
1
2
3
4
5
6
7
8
9
10
11
12
13
14
A
NOTE
Time axis (TIME/DIV) and compression ratio (reciprocal for magnification ratio)
time axis(TIME/DIV)
time axis display
1.25ms
2ms
2.5ms
5ms
10ms
20ms
50ms
100ms
200ms
500ms 1 s 2 s 5 s 10 s 20 s 1
min2
min5
min10min
20min 1 h
1.25 ms 1 - 2 4 8 16 40 80 160 400 800 1.6k 4k 8k 16k 48k 96k 240k 480k 960k2880k
2 ms - 1 - - 5 10 25 50 100 250 500 1k 2.5k 5k 10k 30k 60k 150k 300k 600k1800k
2.5 ms - - 1 2 4 8 20 40 80 200 400 800 2k 4k 8k 24k 48k 120k 240k 480k1440k
5 ms - - - 1 2 4 10 20 40 100 200 400 1k 2k 4k 12k 24k 60k 120k 240k 720k
10 ms - - - - 1 2 5 10 20 50 100 200 500 1k 2k 6k 12k 30k 60k 120k 360k
20 ms - - - - - 1 - 5 10 25 50 100 250 500 1k 3k 6k 15k 30k 60k 180k
50 ms - - - - - - 1 2 4 10 20 40 100 200 400 1.2k 2.4k 6k 12k 24k 72k
100 ms - - - - - - - 1 2 5 10 20 50 100 200 600 1.2k 3k 6k 12k 36k
200 ms - - - - - - - - 1 - 5 10 25 50 100 300 600 1.5k 3k 6k 18k
500 ms - - - - - - - - - 1 2 4 10 20 40 120 240 600 1.2k 2.4k 7.2k
1 s - - - - - - - - - - 1 2 5 10 20 60 120 300 600 1.2k 3.6k
2 s - - - - - - - - - - - 1 - 5 10 30 60 150 300 600 1.8k
5 s - - - - - - - - - - - - 1 2 4 12 24 60 120 240 720
10 s - - - - - - - - - - - - - 1 2 6 12 30 60 120 360
20 s - - - - - - - - - - - - - - 1 3 6 15 30 60 180
1 min - - - - - - - - - - - - - - - 1 2 5 10 20 60
2 min - - - - - - - - - - - - - - - - 1 - 5 10 30
5 min - - - - - - - - - - - - - - - - - 1 2 4 12
10 min - - - - - - - - - - - - - - - - - - 1 2 6
20 min - - - - - - - - - - - - - - - - - - - 1 3
1 h - - - - - - - - - - - - - - - - - - - - 1
-:cannot be set
Time Axis Range and Number of Units
Number of units 1 2 4 8 16
Magnification ratio to 960 k to 480 k to 280 k to 120 k to 60 k
The setting values are shown in the table below.
Time axis settings depend on the number of installed units.
Reference The HELP key can be used to check which position within the entirerecording length is occupied by the currently shown waveform ( Section20.4).
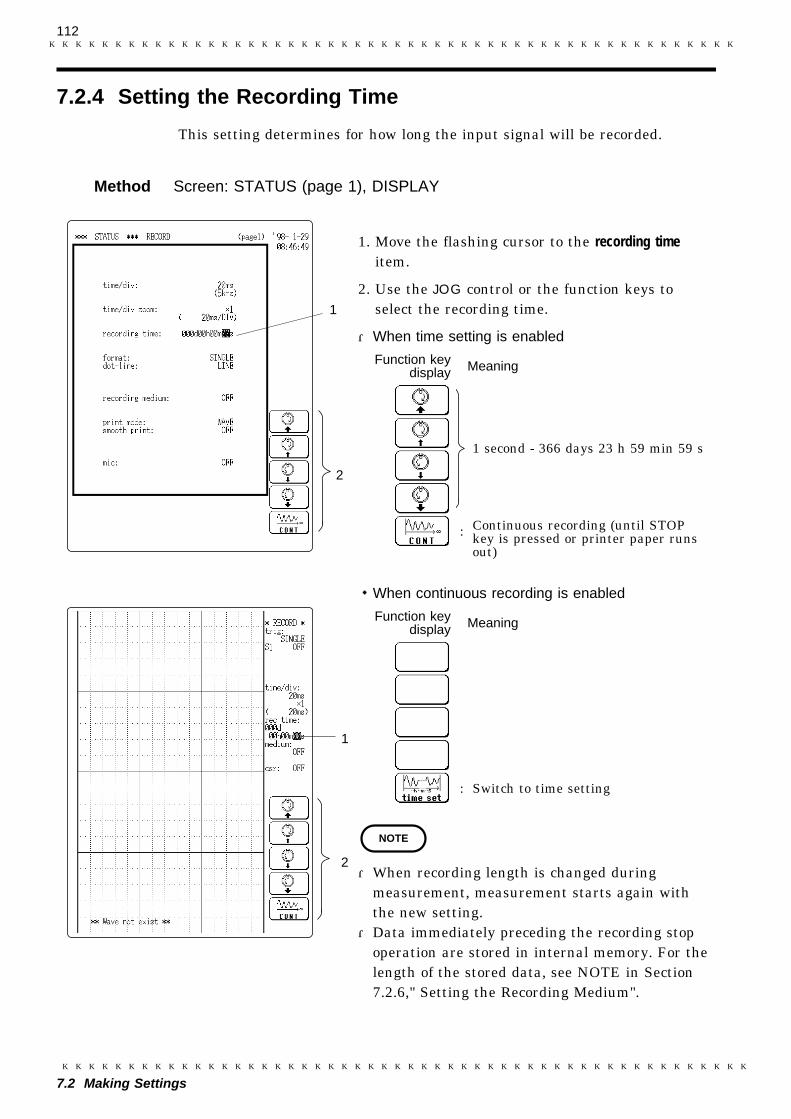
112────────────────────────────────────────────────────
7.2 Making Settings────────────────────────────────────────────────────
7.2.4 Setting the Recording Time
2
1
Function keydisplay Meaning
1 second - 366 days 23 h 59 min 59 s
07-g03
: Continuous recording (until STOPkey is pressed or printer paper runsout)
2
1
Function keydisplay Meaning
07-g04
: Switch to time setting
NOTE
This setting determines for how long the input signal will be recorded.
Method Screen: STATUS (page 1), DISPLAY 07-06
1. Move the flashing cursor to the recording timeitem.
2. Use the JOG control or the function keys toselect the recording time.
・When time setting is enabled
・When continuous recording is enabled
07-07
・When recording length is changed duringmeasurement, measurement starts again withthe new setting.
・Data immediately preceding the recording stopoperation are stored in internal memory. For thelength of the stored data, see NOTE in Section7.2.6," Setting the Recording Medium".

113────────────────────────────────────────────────────
7.2 Making Settings────────────────────────────────────────────────────
7.2.5 Setting the Format
Input waveform
Input waveform
Graph 1
Graph 2
・The style can be set for showing input signal waveforms on the screen displayand recording them on the printer.
・The styles single, dual, quad, and oct are available.
(1) Single
Display and record as one graph. (At the most, 16 analog signals and 14analog + 16 logic signals)
(2) Dual
・Display and record as two graphs. (On each graph, at most, 16 analog signalsand 14 analog + 16 logic signals)
・Specify which input channel to use for waveform graph display and recording.

114────────────────────────────────────────────────────
7.2 Making Settings────────────────────────────────────────────────────
Input waveform
Graph 1
Graph 2
Graph 3
Graph 4
Input waveform
Graph 1
Graph 2
Graph 7
Graph 8
(3) Quad
・Display and record as four graphs. (On each graph, at most, 16 analog signalsand 14 analog + 16 logic signals)
・Specify which input channel to use for waveform graph display and recording.
(4) Oct
・Display and record as eight graphs. (On each graph, at most, 16 analog signalsand 14 analog + 16 logic signals)
・Specify which input channel to use for waveform graph display and recording.

115────────────────────────────────────────────────────
7.2 Making Settings────────────────────────────────────────────────────
07-0807-09
*1: displays when the quad or oct screenis selected
*2: displays when the oct screen isselected
1
2
Function keydisplay Meaning com/sc11
: Single (one division only)
: Dual (divided into two)
: Quad (divided into four)
: Oct (print only divided into eight)
・ 1/2Function key
display Meaning com/gr1
: Graph 1
: Graph 2
: Graph 3 (*1)
: Graph 4 (*1)
: Switch to page 2/2
・ 2/2Function key
display Meaning com/gr2
: Graph 5 (*2)
: Graph 6 (*2)
: Graph 7 (*2)
: Graph 8 (*2)
: Switch to page 1/2
Method Screen: STATUS (page 1)
1. Move the flashing cursor to the format item.
2. Use the function keys to select the format.
3. If dual, quad, or octo screen display was chosenin step 2, determine which input channel todisplay on which graph. This setting is madewith the CHANNEL screen.Press the CHAN key to call up the CHANNELscreen.Move the flashing cursor to the point shown inthe illustration at left.
・The illustration shows the setting for CH1.・Settings for CH2 - CH16 should be made in the
same way.・Use the function keys to select the graph.

116────────────────────────────────────────────────────
7.2 Making Settings────────────────────────────────────────────────────
7.2.6 Setting the Interpolation Function
Line(linear interpolation) Dot
1
2
Function keydisplay Meaning com/dot
:Linear interpolation is not performed.The sampled data is displayed just asit comes.
: Linear interpolation is performed.The display is easier on the eye.High speed display is available whencompression is being performed.
NOTE
Set the input waveform (sampling data) to display or print as dot or linearinterpolation.
Method Screen: STATUS (page 1) 07-10
1. Move the flashing cursor to the dot-line item.
2. Use the function keys to make the selection.
When carrying out real-time printing (waveform isprinted as it is being captured( Section 12.9.3), the display is a line also whenDOT is selected.

117────────────────────────────────────────────────────
7.2 Making Settings────────────────────────────────────────────────────
7.2.7 Setting the Recording Medium
1
2
1
2
Function keydisplay Meaning 07-g09
: No recording (display only)
: Print data on printer( Section 12.5.3)
: Record data on MO( Section 13.5.2)
NOTE
・Only 8916 - 8919, 8928 can be used
Recording time (s) =Time axis range(s/DIV)×1.8 M
Number of units×100
・8927 one unit can be used
・8916 - 8919, 8927, and 8928 can coexist, or8927 can be used exclusively
Recording time (s) =Time axis range(s/DIV)×1.8 M
Number of channels×100
Recording time (s) =Time axis range(s/DIV)×1.8 M
Number of units×200
(For the 8928, one channel corresponds to one unit.)
This setting determines whether the measurement data are printed out in realtime, recorded on MO, or not recorded (recorded in the internal memory).
Method Screen: STATUS (page 1), DISPLAY 07-11, 13
1. Move the flashing cursor to the recording mediumitem.
2. Use the function keys to make the selection.
Also when recording medium is OFF, dataimmediately preceding the recording stop operationare stored in internal memory. The length of thestored data is determined by the followingequations (1 M = 106).

118────────────────────────────────────────────────────
7.2 Making Settings────────────────────────────────────────────────────
7.2.8 Recording a Voice Memo
2
3
NOTE
Function keydisplay Meaning
: Increase channel number
: Decrease channel number
NOTE
NOTE
・When MO is selected as a recording medium, a voice memo can be recordedalong with the waveform data.
・During playback, the voice memo is reproduced along with the monitoredoutput ( Section 13.6.2).
Method Screen: STATUS (page 1) 07-141. Set the items time/div and recording medium on the
STATUS screen (page 1) as follows.
・time/divChoose a setting between 1.25 ms/DIV and 10ms/DIV
・recording medium MO
When time axis sampling is set to a slow settingsuch as 20 ms/DIV or more, the voice memo willbecome garbled.
2. Move the flashing cursor to the mic item.
3. Use the JOG control or the function keys to makethe setting.
When the microphone is used, one channel will become unavailable. (On theCHANNEL screen, mic is displayed.
4. Connect the microphone to the MIC jack.
For information on microphone types and connection: Section 21.7.
5. Press the START key to start the measurement. When trigger has occurredand the waveform is being recorded, voice memo recording is possible.
Speak into the microphone from a distance of about 10 to 20 cm, to preventdistortion.

119────────────────────────────────────────────────────
7.2 Making Settings────────────────────────────────────────────────────
7.2.9 Transferring Data to the Memory Recorder Function
The waveform data stored in recorder function can be transferred to memoryrecorder function.
Data which can be transferred
・Waveform data stored in memory immediately before stopping recordingoperation.
・Waveform data recorded on a MO disk. (REC file)
Data length transferred
The waveform of the following data length is transferred from the left end ofthe display screen.
Data length transferred (s) = time axis (s/DIV) when recording × recording lengthin memory recorder function which is set before transferring.
Method Screen: DISPLAY (recorder) → STATUS, DISPLAY (memory recorder) →STATUS (recorder)7-20e
1. Record the data in recorder function, or load thewaveform data from a MO disk.
2. Scroll the waveform on the display screen andspecify the start position (left end of the screen)to transfer data.

120────────────────────────────────────────────────────
7.2 Making Settings────────────────────────────────────────────────────
NOTE
3. Set the item shot on the STATUS screen (page 1)or display screen in memory recorder function.( Section 6.2.3)
4. Move the flashing cursor to the change to MEMORYfunction item on the STATUS screen in recorderfunction (page 3), and press the F1 [exec] key.
5. The data is transferred and the waveform isdisplayed on the display screen in memoryrecorder function.
・ If the recording length in memory recorderfunction is set to maximum recording length, thedata can not be transferred. ( Section 6.2.3)・ The waveform data which is measured by using
the 8927 unit, with 1.25 or 2ms/DIV time axisrange cannot be transferred.・ When measuring with time axis range (10, 20
min, or 1h/DIV) in recorder function only, thewaveform data can be transferred.

121────────────────────────────────────────────────────
7.2 Making Settings────────────────────────────────────────────────────
7.2.10 Other Settings
Status Screen (page 1)
Section 12.2
Section 12.3
07-17
Status Screen (page 2)
Chapter 10
07-18
For details, refer to the following sections.

122────────────────────────────────────────────────────
7.2 Making Settings────────────────────────────────────────────────────
Status Screen (page 3)
Chapter 15
07-19

123────────────────────────────────────────────────────
7.3 Settings on the Display Screen and Auto Settings────────────────────────────────────────────────────
7.3.1 Making Channel Settings
CH. SET key:
Serves to make channel settingsin measurement display mode.
7.3.2 Automatic Setting of Time Axis and Voltage Axis
7.3 Settings on the Display Screen and Auto Settings
Explains the setting items on the Display screen and the auto-setting of thevoltage axis and time axis.
While the screen is in measurement display mode, the CH. SET key can beused to make settings for the various channels ( Section 20.3).
(Auto Range Function)This function automatically selects the time axis range (TIME/DIV), voltageaxis range (V/DIV) and zero position.
Method 1. Press the AUTO key.
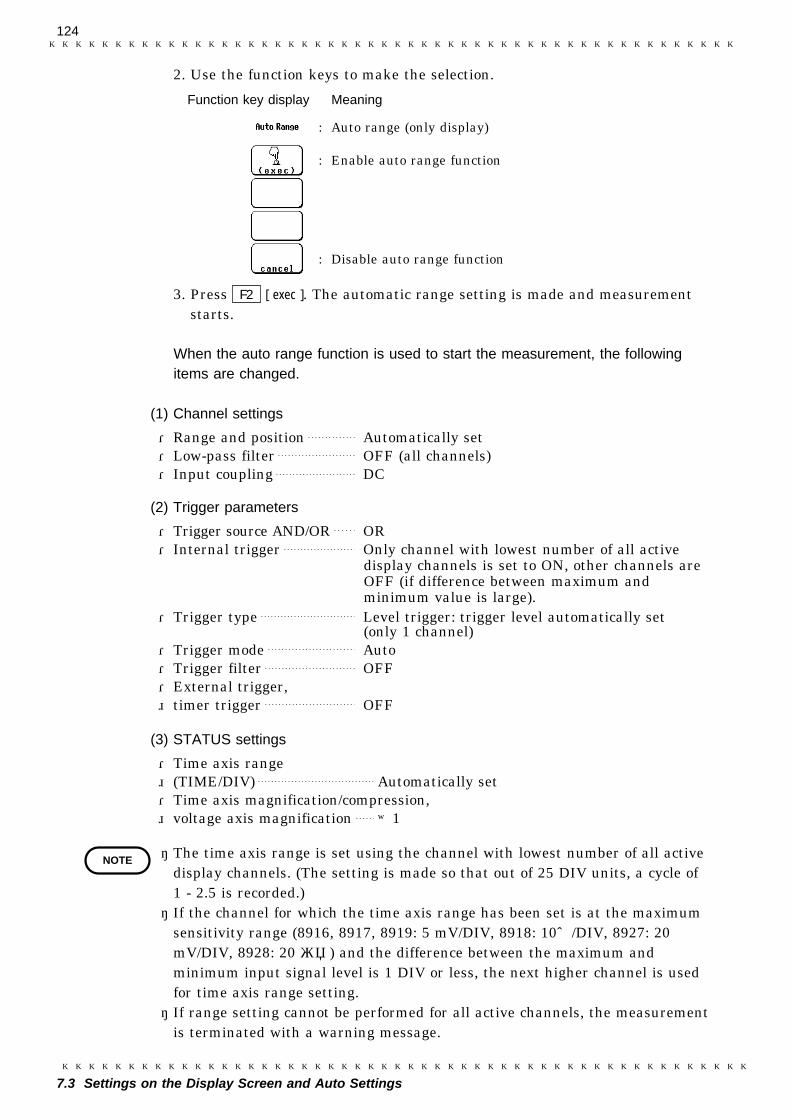
124────────────────────────────────────────────────────
7.3 Settings on the Display Screen and Auto Settings────────────────────────────────────────────────────
Function key display Meaning com/auto: Auto range (only display)
: Enable auto range function
: Disable auto range function
NOTE
2. Use the function keys to make the selection.
3. Press F2 [ exec ]. The automatic range setting is made and measurementstarts.
When the auto range function is used to start the measurement, the followingitems are changed.
(1) Channel settings
・Range and position Automatically set・Low-pass filter OFF (all channels)・Input coupling DC
(2) Trigger parameters
・Trigger source AND/OR OR・Internal trigger Only channel with lowest number of all active
display channels is set to ON, other channels areOFF (if difference between maximum andminimum value is large).
・Trigger type Level trigger: trigger level automatically set(only 1 channel)
・Trigger mode Auto・Trigger filter OFF・External trigger, timer trigger OFF
(3) STATUS settings
・Time axis range (TIME/DIV) Automatically set・Time axis magnification/compression, voltage axis magnification ×1
・ The time axis range is set using the channel with lowest number of all activedisplay channels. (The setting is made so that out of 25 DIV units, a cycle of1 - 2.5 is recorded.)・ If the channel for which the time axis range has been set is at the maximum
sensitivity range (8916, 8917, 8919: 5 mV/DIV, 8918: 10℃/DIV, 8927: 20mV/DIV, 8928: 20 με) and the difference between the maximum andminimum input signal level is 1 DIV or less, the next higher channel is usedfor time axis range setting.・ If range setting cannot be performed for all active channels, the measurement
is terminated with a warning message.

125────────────────────────────────────────────────────
7.4 Start and Stop Measurement Operation────────────────────────────────────────────────────
Record
・・・Trigger
Measurement start Measurement end
Recording length
Trigger standby
Record
・・・Trigger
Measurementstart
Recording length
Trigger standby
Press STOP key. Measurement ends afterrecording length data have been stored.
7.4 Start and Stop Measurement Operation
Method
To start the measurement:
Press the START key and the LED lights
To stop the measurement:
Press the STOP key.
Recording length, trigger mode and measurement operation
(1) When time setting is enabled:
Trigger mode: SINGLE
・After START key has been pressed, data recording starts when triggerconditions are met.
・When data corresponding to recording length have been stored in memory,measurement stops also without pressing the STOP key.
Trigger mode: REPEAT
・After START key has been pressed, data recording starts when triggerconditions are met.
・Each time when trigger conditions are met, data are recorded and memorycontents are overwritten.
・When STOP key is pressed, measurement stops after data corresponding torecording length have been stored in memory.

126────────────────────────────────────────────────────
7.4 Start and Stop Measurement Operation────────────────────────────────────────────────────
Record
・・・Trigger
Measurement start
Trigger standby
Press STOP key. Measurement ends.
To terminate measurement after recordinglength data are stored:Press STOP key once.
To terminate measurement immediately:Press STOP key twice.
(2) When continuous recording is enabled
Trigger mode: SINGLE or REPEAT
・After START key has been pressed, data recording starts when triggerconditions are met.
・When STOP key is pressed twice, measurement stops.
Stopping measurement
(1) Pressing STOP key once
・When STOP key is pressed once, data recording continues until datacorresponding to recording length have been stored in memory. (LED above
START key is lit.)・If START key is pressed after STOP key was pressed once and before
waveform data recording is completed, the measurement is restarted.
(2) Pressing STOP key twice
・When STOP key is pressed twice, waveform recording is stoppedimmediately.
・The waveform until the current point is displayed.

127────────────────────────────────────────────────────
8.1 Outline────────────────────────────────────────────────────
1
2
3
4
5
6
7
8
9
10
11
12
13
14
A
Chapter 8FFT Function
8.1 Outline
(1) FFT (Fast Fourier Transform) processing can be performed on input signal datafor frequency analysis.
(2) Frequency range
133 mHz to 40 kHz or 80 kHz (when 8927 is not used), 20 steps
(3) Frequency resolution
1/400 of frequency range
(4) 12 types of analysis functions
Storage waveform, linear spectrum, RMS spectrum, power spectrum, auto-correlation function, histogram, transfer function, cross-power spectrum, cross-correlation function, unit-impulse response, coherence function, octave analysis
(5) Analysis modes
1-channel FFT, 2-channel FFT
(6) Analysis of data stored with memory recorder function possible
(7) Switchable antialiasing filter
Automatic selection of cutoff frequency to match frequency range (8919 FFTunit)
(8) Waveform evaluation function using evaluation area

128────────────────────────────────────────────────────
8.2 Item Settings────────────────────────────────────────────────────
8.2.1 Setting the FFT Function
1
1
1
Function keydisplay Meaning
: Memory recorder function
: Recorder function
: FFT function
8.2 Item Settings
・The 8846 has three function modes; the memory recorder function, therecorder function, the FFT function.
・Select the FFT function for performing FFT analysis.
Method Screen: STATUS (page 1), CHANNEL(page1), DISPLAY 08-01, 02, 031. Move the flashing cursor to the position shown in
the figure on the left.
2. Press F3 [ FFT ].

129────────────────────────────────────────────────────
8.2 Item Settings────────────────────────────────────────────────────
1
2
3
4
5
6
7
8
9
10
11
12
13
14
A
1
2
3
4
5
6
7
8
9
10
11
12
13
14
A
8.2.2 Setting the FFT Channel Mode
2
1Function key
display Meaning 08-g02
: Used for FFT analysis of signalsfrom one channel.
: Used for simultaneous FFT analysisof two channels.
NOTE
・This setting determines whether only one channel (1ch-FFT) or two channels(2ch-FFT) are used for FFT processing.
・When "1ch-FFT" is selected, certain FFT analysis modes will not be available.
Method Screen: STATUS (page 1) 08-041. Move the flashing cursor to the FFT mode item.
2. Use the function key to make the selection.
The following analysis functions are not possible in 1-channel FFT mode:
Transfer function (TRF), cross-power spectrum (CSP), cross-correlationfunction (CCR), impulse response (IMP), coherence function (COH)

130────────────────────────────────────────────────────
8.2 Item Settings────────────────────────────────────────────────────
8.2.3 Setting the Frequency Range
2
1
Function keydisplay Meaning
133, 333, 667 mHz2, 4, 8, 20, 40, 80, 200, 400, 800 Hz2, 4, 8, 16, 20, 32, 40, 80 kHzEXT (external)
2
1
NOTE
・The frequency range (frequency axis maximum value) can be set as follows.・The frequency range corresponds to the time axis range (TIME/DIV) setting of
the memory function.
Method Screen: STATUS (page 1), DISPLAY 08-05, 061. Move the flashing cursor to the max. frequency
item on the STATUS screen or the freq item onthe DISPLAY screen.
2. Use the JOG control or the function keys to makethe selection.
・When the analog unit 8927 is used, the 80 kHzrange cannot be selected (maximum setting 40kHz).
・The antialiasing filter (8919 FFT unit) cutofffrequency is the same as the selected frequencyrange.
・When EXT was selected, octave analysis cannot becarried out.
・To use external sampling: Section 21.5

131────────────────────────────────────────────────────
8.2 Item Settings────────────────────────────────────────────────────
1
2
3
4
5
6
7
8
9
10
11
12
13
14
A
Frequency Range, Frequency Resolution, Window Width,Corresponding Time Axis Range
Frequency range[ Hz ]
Frequencyresolution
[ Hz ]Window width Time axis
[ /DIV ]
80 k *140 k32 k *220 k16 k *38 k4 k2 k8004002008040208 *44 *42 *4667 m *4333 m *4133 m *4(67 m) *4(33 m) *4(11 m) *4
2001008050402010521500 m200 m100 m50 m20 m10 m5 m1.67 m0.83 m0.33 m0.17 m0.08 m0.03 m
5 ms10 ms12.5 ms20 ms25 ms50 ms100 ms200 ms500 ms1 s2 s5 s10 s20 s50 s100 s200 s10 min20 min50 min100 min200 min10 hour
500 μs1 ms1.25 ms2 ms2.5 ms5 ms10 ms20 ms50 ms100 ms200 ms500 ms1 s2 s5 s10 s20 s1 min2 min5 min10 min20 min1 hour
The cutoff frequency of the antialiasing filter is the same as the selectedfrequency range, except for the cases listed below.
*1: Antialiasing filter is OFF.
*2: Cutoff frequency is 40 kHz.
*3: Cutoff frequency is 20 kHz.
*4: Cutoff frequency is 20 Hz.
( ) indicates range for FILEtoFFT mode. Normally it can not be used.
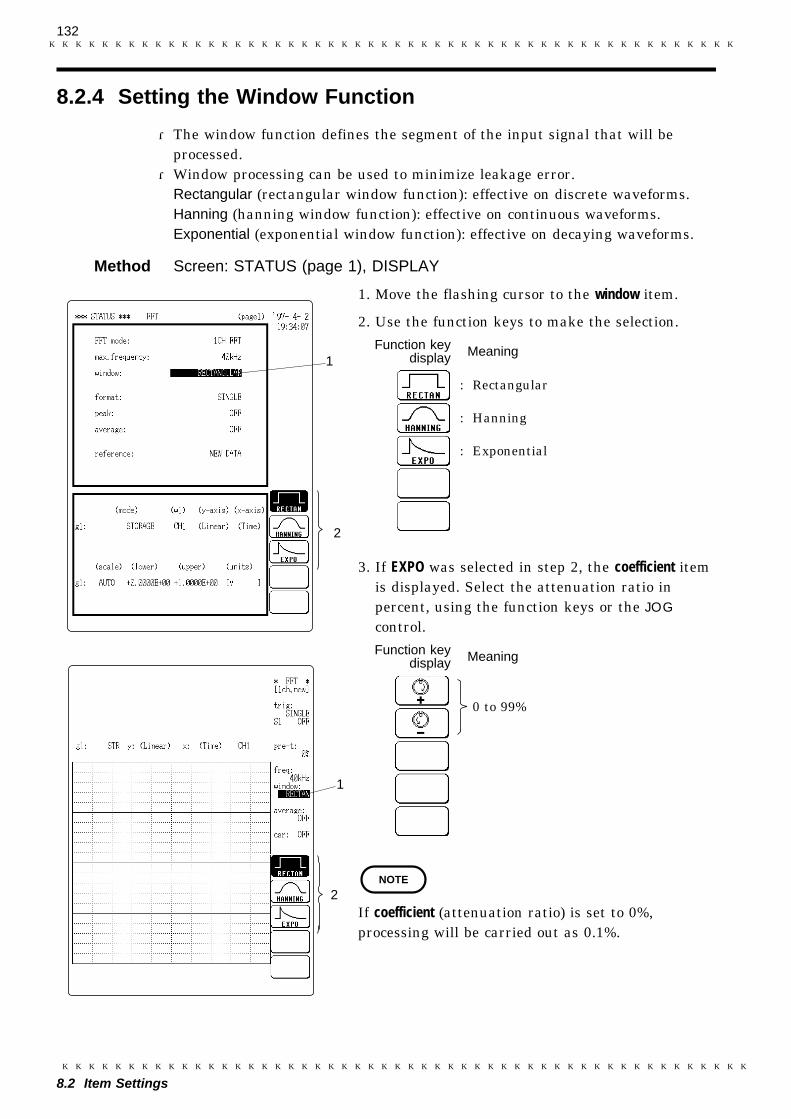
132────────────────────────────────────────────────────
8.2 Item Settings────────────────────────────────────────────────────
8.2.4 Setting the Window Function
08-07, 08
2
1
2
1
Function keydisplay Meaning
: Rectangular
: Hanning
: Exponential
Function keydisplay Meaning
0 to 99%
NOTE
・The window function defines the segment of the input signal that will beprocessed.
・Window processing can be used to minimize leakage error.Rectangular (rectangular window function): effective on discrete waveforms.Hanning (hanning window function): effective on continuous waveforms.Exponential (exponential window function): effective on decaying waveforms.
Method Screen: STATUS (page 1), DISPLAY
1. Move the flashing cursor to the window item.
2. Use the function keys to make the selection.
3. If EXPO was selected in step 2, the coefficient itemis displayed. Select the attenuation ratio inpercent, using the function keys or the JOG
control.
If coefficient (attenuation ratio) is set to 0%,processing will be carried out as 0.1%.

133────────────────────────────────────────────────────
8.2 Item Settings────────────────────────────────────────────────────
1
2
3
4
5
6
7
8
9
10
11
12
13
14
A
100%
100%
Waveform captured in one operation(1000 points)
10%
10%
Noise on attenuated waveform is reduced
Setting: Exponential window function Attenuation ratio 10%
NOTE
Example Attenuation ratio set to 10%
When measurements are taken using the Hanning window or exponentialwindow, note that the calculation results in the display of a value that islower than the amplitude obtained when using a rectangular window.

134────────────────────────────────────────────────────
8.2 Item Settings────────────────────────────────────────────────────
8.2.5 Setting the Display Format
FFT
Data for 100 points
Stored waveform
FFT
FFT
A input waveform is analyzed in two ways
Two input waveforms are analyzed
FFT
・You can set the format for displaying input signal waveforms on the screenand recording them on the printer.
・The SINGLE, DUAL, and NYQUIST formats are available.
(1) Single
Displays the waveform on a single screen.
(2) Dual
Divides the waveform display screen into upper and lower screens.

135────────────────────────────────────────────────────
8.2 Item Settings────────────────────────────────────────────────────
Imaginary number of part
Real number of part
2
1Function key
display Meaning com/sc12
: Single
: Dual
: Nyquist
sc12
(3) Nyquist
For the linear spectrum, cross power spectrum, and transfer function, displaysthe real-number portion of the data for the FFT calculation result on the X-axis, and the imaginary number portion of the data on the Y-axis.
Method Screen: STATUS (page 1) 08-09
1. Move the flashing cursor to the format item.
2. Use the function keys to make the selection.

136────────────────────────────────────────────────────
8.2 Item Settings────────────────────────────────────────────────────
8.2.6 Selecting Reference Data
FFT
1000 points of input signal are sampled
Measurement start
FFT
Data for 1000 points
FFT
Data for 1000 points
A B
When A/B cursors are used
Select data to be used for FFT processing.
New data
When START key is pressed, data for 1000 points are captured and used forFFT processing.
Memory waveform
・When START key is pressed, FFT processing is carried out using data storedin memory with the memory function.
・Processing start point can be specified on the memory recorder display, usingthe A/B cursors.
・ When the A/B cursors are used, data for 1000 points from the first cursor areused for FFT processing.

137────────────────────────────────────────────────────
8.2 Item Settings────────────────────────────────────────────────────
2
1
Function keydisplay Meaning
: Capture new waveform data for FFTprocessing
: Use stored waveform data for FFTprocessing
08-g08
NOTE
Trigger mode set to SINGLE
Data for 1000 points
FFT
Trigger mode set to REPEAT, AUTO, AUTO STOP
Data for 1000 points
FFT FFT FFT FFT
Method Screen: STATUS (page 1) 08-12
1. Move the flashing cursor to the reference item.
2. Use the function keys to select the data.
When stored waveform data are used, the trigger setting is not required. Butthe trigger mode is active, and when REPEAT, AUTO, or AUTO STOP isselected, FFT analysis is performed continuously for 1000-point data at a time,until the end of data. (Calculation is not performed if less than 1000 points.)

138────────────────────────────────────────────────────
8.2 Item Settings────────────────────────────────────────────────────
8.2.7 Setting the Peak Display
Peak 1 ,・・・・Data
Peak 2
Maximum value 1
Maximum value 4
Maximum value 5
,・・・・Data
Maximum value 3
Maximum value 6
Maximum value 2
・From the sampling points and FFT processing results, the 10 peak values ormaximum values can be shown.
・This setting is available only in single-screen mode.
Peak value
・When data at one point are higher than data within the vicinity, the point is apeak.
・The 10 highest peaks are shown.
Maximum value
Points with the 10 highest values are shown.

139────────────────────────────────────────────────────
8.2 Item Settings────────────────────────────────────────────────────
2
1Function key
display Meaning 08-g07
: OFF
: Shows the 10 peak values
: Shows the 10 highest peaks
Method Screen: STATUS (page 1) 08-10, 11
1. Move the flashing cursor to the peak item.
2. Use the function keys to make the selection.
Peak values
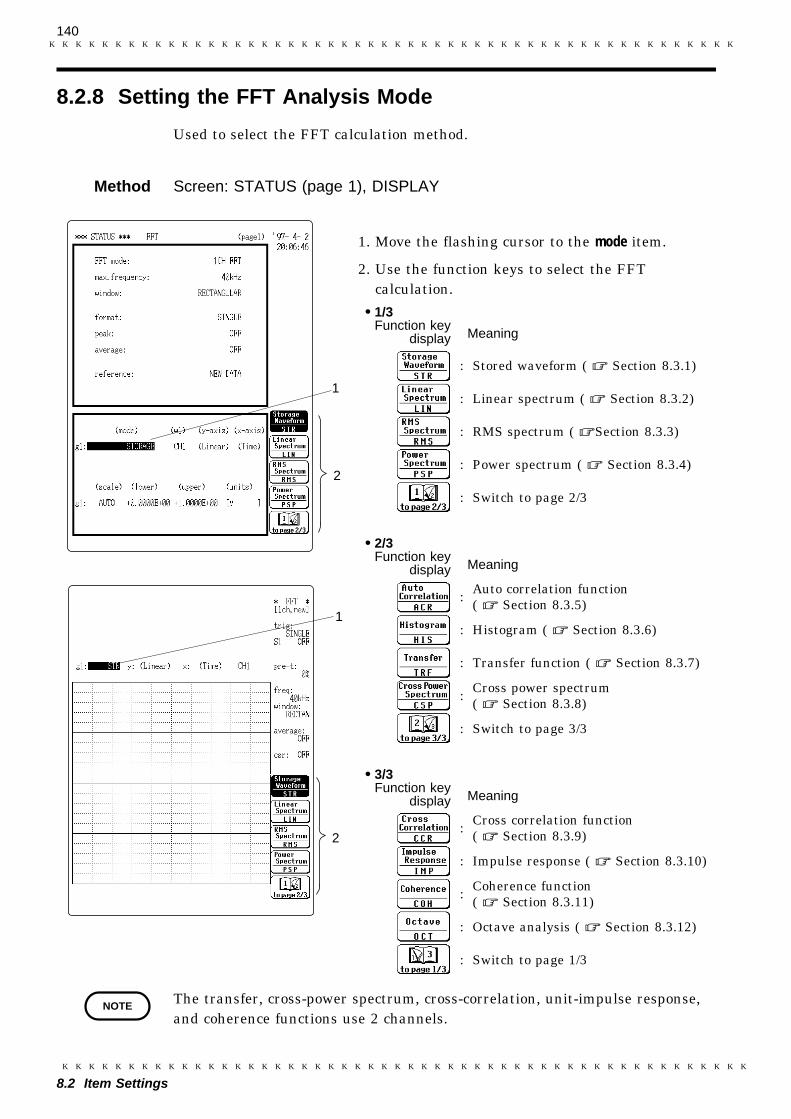
140────────────────────────────────────────────────────
8.2 Item Settings────────────────────────────────────────────────────
8.2.8 Setting the FFT Analysis Mode
1
2
1
2
1/3Function key
display Meaning 08-g09
: Stored waveform ( Section 8.3.1)
: Linear spectrum ( Section 8.3.2)
: RMS spectrum ( Section 8.3.3)
: Power spectrum ( Section 8.3.4)
: Switch to page 2/3
2/3Function key
display Meaning 8-g10
: Auto correlation function( Section 8.3.5)
: Histogram ( Section 8.3.6)
: Transfer function ( Section 8.3.7)
: Cross power spectrum( Section 8.3.8)
: Switch to page 3/3
3/3Function key
display Meaning 8-g11
: Cross correlation function( Section 8.3.9)
: Impulse response ( Section 8.3.10)
: Coherence function( Section 8.3.11)
: Octave analysis ( Section 8.3.12)
: Switch to page 1/3
NOTE
Used to select the FFT calculation method.
Method Screen: STATUS (page 1), DISPLAY 08-13, 14
1. Move the flashing cursor to the mode item.
2. Use the function keys to select the FFTcalculation.
The transfer, cross-power spectrum, cross-correlation, unit-impulse response,and coherence functions use 2 channels.

141────────────────────────────────────────────────────
8.2 Item Settings────────────────────────────────────────────────────
8.2.9 Setting the Analysis Channel
2
1
1
2
Function keydisplay Meaning
CH1 to CH16
NOTE
Select the channel for FFT analysis.
Method Screen: STATUS (page 1), DISPLAY 08-15, 16
1. Move the flashing cursor to the w1 item.
2. Use the JOG control or the function keys toselect the channel.
3. When 2CH-FFT was selected, the w2 item isdisplayed. Select the channel in the same way asfor w1.
For the transfer function and impulse response,calculation is performed from "(w2)/(w1)".

142────────────────────────────────────────────────────
8.2 Item Settings────────────────────────────────────────────────────
8.2.10 Setting the X-axis and Y-axis Displays
1
2
2
3
3
1
Function keydisplay Meaning 08-g13
: Frequency (linear display)
: Frequency (logalism display)
Function keydisplay Meaning 08-g14
: 1/3 octave
: 1/1 octave
Function keydisplay Meaning 08-g15
: Real number part (linear display)
: Imaginary number part (lineardisplay)
: Amplitude (linear display)
: Amplitude (decibel display)
: Phase (degree display)
・Set the X and Y axis for display of FFT calculation results.・Different units can be selected for the X and Y axis.・With some FFT analysis modes, one of the axis cannot be set.
Method Screen: STATUS (page 1), DISPLAY 08-17, 18
1. Move the flashing cursor to the x-axis item.
2. Use the function keys to make the selection.
3. For the y-axis, select in the same way as for x-axis.
・X-axis
(when octave analysis)
・Y-axis

143────────────────────────────────────────────────────
8.2 Item Settings────────────────────────────────────────────────────
X and Y Axis Settings Available with each FFT Analysis Mode
FFT analysis modeX-axis
(horizontal axis)Y-axis
(vertical axis)
STR Storage Waveform (Time) (Linear)
LIN Linear Spectrum LIN-HzLOG-Hz
LIN-REALLIN-IMAGLIN-MAG
LOG-MAGPHASE
RMS RMS Spectrum LIN-HzLOG-Hz
LIN-REALLIN-IMAGLIN-MAG
LOG-MAGPHASE
PSP Power Spectrum LIN-HzLOG-Hz
LIN-MAGLOG-MAG
ACR Auto Correlation Function (Time) (Linear)
HIS Histogram (Volt) (Linear)
TRF Transfer Function LIN-HzLOG-Hz
LIN-REALLIN-IMAGLIN-MAG
LOG-MAGPHASE
CSP Cross Power Spectrum LIN-HzLOG-Hz
LIN-REALLIN-IMAGLIN-MAG
LOG-MAGPHASE
CCR Cross Correlation Function (Time) (Linear)
IMP Unit Impulse Response (Time) (Linear)
COH Coherence Function LIN-HzLOG-Hz
(Linear)
OCT Octave Analysis 1/3 OCT1/1 OCT
LIN-MAGLOG-MAG
NOTE When external sampling is used, the X-axis (horizontal axis) expresses thedata count.

144────────────────────────────────────────────────────
8.2 Item Settings────────────────────────────────────────────────────
8.2.11 Setting the Display Scale
2
1
Function keydisplay Meaning com/manu
: Scale set automatically.
: Scale set manually
The display scale for showing the FFT processing result can either be setmanually or automatically.
AUTO
The vertical axis (Y-axis) scale is set automatically, depending on theprocessing result.
MANUAL
The vertical axis (Y-axis) scale can be set as desired, to match the purpose ofthe measurement.This is useful for enlarging or reducing the amplitude and for shifting thewaveform up or down.
Method Screen: STATUS (page 1) ) 08-19
1. Move the flashing cursor to the scale item.
2. Use the function keys to make the selection.
(1) When AUTO is selected
Upper and lower limits are set automatically, according to the processingresult.
(2) When MANUAL is selected
・The upper and lower limits for the display scale can be set by the user.・Make settings to match processing results.・Setting range is -9.9999E+29 to 9.9999E+29. (exponent is E-29 to E+29).

145────────────────────────────────────────────────────
8.2 Item Settings────────────────────────────────────────────────────
2
1 3
Function keydisplay Meaning
0 to 9(-9 to +9 for the most significantdigit, -29 to +29 for exponent.)
NOTE
Method Screen: STATUS (page 1) 08-201. Move the flashing cursor to the lower item.
2. Use the JOG control or the function keys toselect the lower limit for each digits.
3. Set the upper limit in the same manner.
Displaying the display scale units
・The selected unit is displayed with "scaling" in the system screen.・When scaling is turned OFF, V (volts) or ℃ is displayed.
The X-axis setting for the histogram can be changed on the channel settingpage (page 1) or the variable setting page (page 2) of the CHANNEL screen.
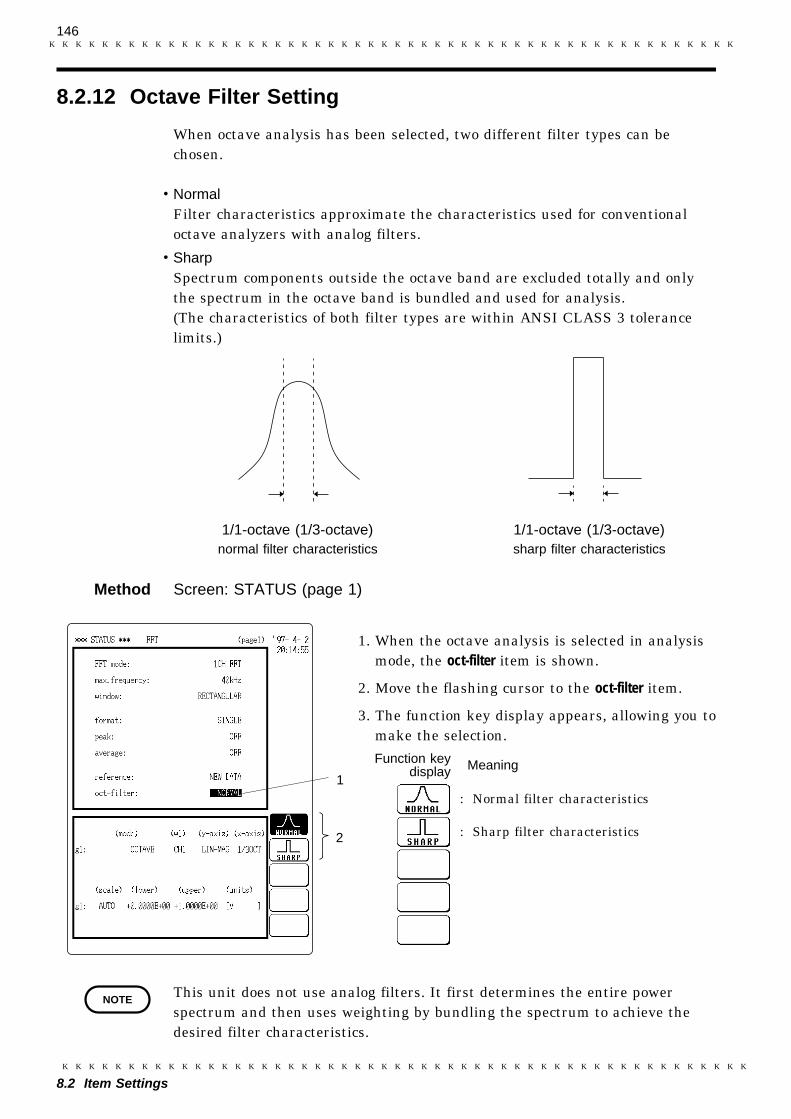
146────────────────────────────────────────────────────
8.2 Item Settings────────────────────────────────────────────────────
8.2.12 Octave Filter Setting
1/1-octave (1/3-octave)normal filter characteristics
1/1-octave (1/3-octave)sharp filter characteristics
2
1
Function keydisplay Meaning 08-g18
: Normal filter characteristics
: Sharp filter characteristics
NOTE
When octave analysis has been selected, two different filter types can bechosen.
NormalFilter characteristics approximate the characteristics used for conventionaloctave analyzers with analog filters.
SharpSpectrum components outside the octave band are excluded totally and onlythe spectrum in the octave band is bundled and used for analysis.(The characteristics of both filter types are within ANSI CLASS 3 tolerancelimits.)
Method Screen: STATUS (page 1) 08-21
1. When the octave analysis is selected in analysismode, the oct-filter item is shown.
2. Move the flashing cursor to the oct-filter item.
3. The function key display appears, allowing you tomake the selection.
This unit does not use analog filters. It first determines the entire powerspectrum and then uses weighting by bundling the spectrum to achieve thedesired filter characteristics.

147────────────────────────────────────────────────────
8.2 Item Settings────────────────────────────────────────────────────
8.2.13 Setting the Interpolation Function
2
1
Function keydisplay Meaning com/dot
:Linear interpolation is not performed.The sampled data is displayed just asit comes.
: Linear interpolation is performed.The display is easier on the eye.
The input signal (sampled data) and FFT waveform can be displayed andrecorded as is, or after linear interpolation.
Method Screen: STATUS (page 3) 08-22
1. Move the flashing cursor to the dot-line item.
2. Use the function keys to make the selection.

148────────────────────────────────────────────────────
8.2 Item Settings────────────────────────────────────────────────────
8.2.14 Other Settings
Status Screen (page 1)
Chapter 18
08-62
Status Screen (page 2)
Chapter 10
08-63
For details, refer to the following sections.

149────────────────────────────────────────────────────
8.2 Item Settings────────────────────────────────────────────────────
Status Screen (page 3)
Section 12.2
Section 12.5.2
Section 13.5.1 (2)
Chapter 16
08-64

150────────────────────────────────────────────────────
8.3 Analysis Function────────────────────────────────────────────────────
8.3 Analysis Function
The following waveform data can be analyzed.
Storage waveform STR
Linear spectrum LIN
RMS spectrum RMS
Power spectrum PSP
Auto correlation function ACR
Histogram HIS
Transfer function TRF
Cross power spectrum CSP
Cross correlation function CCR
Unit impulse response IMP
Coherence function COH
Octave analysis OCT

151────────────────────────────────────────────────────
8.3 Analysis Function────────────────────────────────────────────────────
8.3.1 Storage Waveform [STR]
Function
Horizontalcursor
Verticalcursor
Vertical axis Display
LIN-REAL (real-number part) -
LIN-IMAG (imaginary-number part) -
LIN-MAG (amplitude) fa
LOG-MAG (logarithmic amplitude) -
PHASE (phase) -
X-axis
Y-axis
Input signalwaveform
08-23
Displays the time domain waveform of the input signal. Displays the time domainwaveform of the input signal.
fa
Time Time axis displayIndicates the value of the specified TIME/DIV frequency range.(Refer to the table of the frequency range and time axis inSection 8.2.3.)
Linear Indicates the value of the measurement range of the input unitin voltage units.
Example Stored waveform

152────────────────────────────────────────────────────
8.3 Analysis Function────────────────────────────────────────────────────
8.3.2 Linear Spectrum [LIN]
Function
Horizontalcursor
Verticalcursor
Vertical axis Display
LIN-REAL (real-number part) |Fa|・cos∠θa
LIN-IMAG (imaginary-number part) |Fa|・ sin∠θa
LIN-MAG (amplitude) |Fa|
LOG-MAG (logarithmic amplitude) 20・log |Fa|
PHASE (phase) ∠θa
The frequency domain waveform of the input signal, including magnitude andphase information.
Major applications include:・Determining the peaks of waveform frequency components・Determining the levels of high and low harmonics
Fa = (fa) = |Fa|exp(jθa) = |Fa|exp(cos∠θa + jsin∠θa)
LIN-Hz Frequency spectrum display as linear units.The range is from DC to the maximum frequency range value.
LOG Hz Frequency spectrum display as logarithmic units.The range is from 1/400 the maximum frequency range value tothe maximum frequency range value.
Real Linear display of real-number part of the data as voltage(Nyquist mode)
LIN-REAL Linear display of real-number part of the data as voltage
LIN-IMAG Linear display of imaginary-number part of the data as voltage
LIN-MAG Linear display of analysis data as voltage
LOG-MAG Logarithmic display of analysis data as dB(0dB reference value: 1 V peak=αV p-p)
PHASE Degrees (deg) display of phase component of data
Imag Linear display of imaginary-number part of the data as voltage(Nyquist mode)

153────────────────────────────────────────────────────
8.3 Analysis Function────────────────────────────────────────────────────
Stored waveform Y-axis: LIN-REAL (X-axis: LOG-Hz)
Y-axis: LIN-IMAG (X-axis: LOG-Hz) Y-axis: LIN-MAG (X-axis: LOG-Hz)
Y-axis: LOG-MAG (X-axis: LOG-Hz) Y-axis: PHASE (X-axis: LOG-Hz)
Nyquist
08-23,24,25,26,27,28,29
Examples Linear spectra waveforms

154────────────────────────────────────────────────────
8.3 Analysis Function────────────────────────────────────────────────────
8.3.3 RMS Spectrum [RMS]
FunctionDC components: Ra = Fa
Ra = Fa
= |Ra|exp(jθa) = |Ra|(cos∠θa + jsin∠θa)
Horizontalcursor
Verticalcursor
Vertical axis Display
LIN-REAL (real-number part) |Ra|・cos∠θa
LIN-IMAG (imaginary-number part) |Ra|・sin∠θa
LIN-MAG (amplitude) |Ra|
LOG-MAG (logarithmic amplitude) 20・log |Ra|
PHASE (phase) ∠θa
NOTE
Displays the frequency domain waveform of the input signal, including magnitude(effective value) and phase information.
Major applications include:・Determining the peaks of waveform frequency components.・Determining the effective values of frequency components.
LIN-Hz Frequency spectrum display as linear units. The range is fromDC to the maximum frequency range value.
LOG-Hz Frequency spectrum display as logarithmic units. The range isfrom 1/400 the maximum frequency range value to the maximumfrequency range value.
LIN-REAL Linear display of real-number part of the data as voltage
LIN-IMAG Linear display of imaginary-number part of the data as voltage
LIN-MAG Linear display of analysis data as voltage
LOG-MAG Logarithmic display of analysis data as dB (0dB reference value:1 Vrms)
PHASE Degrees (deg) display of phase component of data
The RMS spectrum display and the LOG-MAG display express the sameprocessing result.

155────────────────────────────────────────────────────
8.3 Analysis Function────────────────────────────────────────────────────
Stored waveform Y-axis: LIN-REAL (X-axis: LOG-Hz)
Y-axis: LIN-IMAG (X-axis: LOG-Hz) Y-axis: LIN-MAG (X-axis: LOG-Hz)
Y-axis: LOG-MAG (X-axis: LOG-Hz) Y-axis: PHASE (X-axis: LOG-Hz)
Example RMS spectra waveform 08-23, 30, 31, 32, 33, 34

156────────────────────────────────────────────────────
8.3 Analysis Function────────────────────────────────────────────────────
8.3.4 Power Spectrum [PSP]
Function Gaa = Fa*・Fa
= {Re2(Fa) + Im2 (Fa)}
= |Fa|
Dc component:
Gaa = Fa*・Fa ={Re2(Fa) + Im2 (Fa)} = |Fa|2
Fa*:complex conjugate of Fa
Re(Fa):real number component of Fa
Im(Fa):imaginary number component of Fa
Horizontalcursor
Verticalcursor
Vertical axis Display
LIN-REAL (real-number part) -
LIN-IMAG (imaginary-number part) -
LIN-MAG (amplitude) Gaa
LOG-MAG (logarithmic amplitude) 10 log |Gaa|
PHASE (phase) -
NOTE
Displays the energy spectrum of the input signal, consisting of only magnitudeinformation.
Major applications include:
・Determining the peaks of waveform frequency components・Determining the energy levels of high and low harmonics
LIN-Hz Frequency spectrum display as linear units. The range is fromDC to the maximum frequency range value.
LOG Hz Frequency spectrum display as logarithmic units. The range isfrom 1/400 the maximum frequency range value to the maximumfrequency range value.
LIN-MAG Linear display of analysis data as binary exponential voltageThis expresses the energy component.
LOG-MAG Logarithmic display of analysis data as dB(0dB reference value: 1 V2 rms)
The LOG-MAG display and the RMS spectrum display express the sameprocessing result.
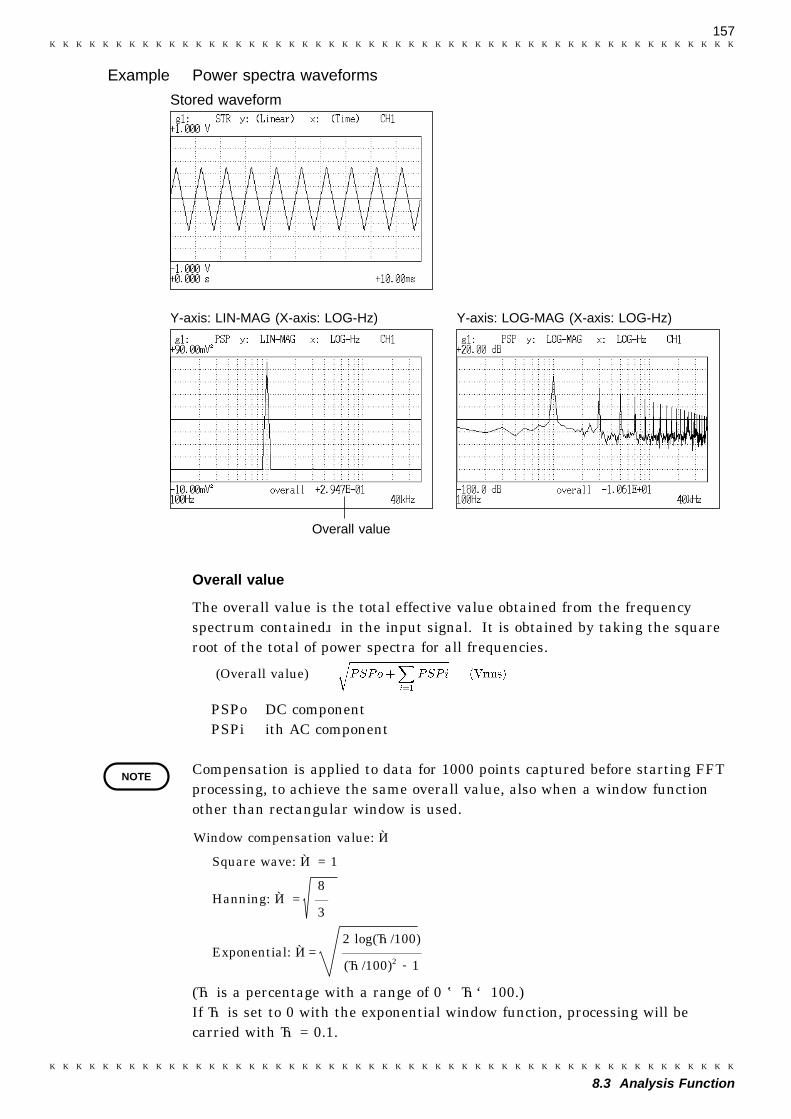
157────────────────────────────────────────────────────
8.3 Analysis Function────────────────────────────────────────────────────
Stored waveform
Y-axis: LIN-MAG (X-axis: LOG-Hz) Y-axis: LOG-MAG (X-axis: LOG-Hz)
Overall value
08-23, 35, 36
(Overall value)
NOTE
Window compensation value: γ
Square wave: γ = 1
8Hanning: γ = 3
2 log(α/100)Exponential: γ= (α/100)2 ー 1
Example Power spectra waveforms
Overall value
The overall value is the total effective value obtained from the frequencyspectrum contained in the input signal. It is obtained by taking the squareroot of the total of power spectra for all frequencies.
PSPo DC componentPSPi ith AC component
Compensation is applied to data for 1000 points captured before starting FFTprocessing, to achieve the same overall value, also when a window functionother than rectangular window is used.
(α is a percentage with a range of 0 ≦α<100.)If α is set to 0 with the exponential window function, processing will becarried with α = 0.1.

158────────────────────────────────────────────────────
8.3 Analysis Function────────────────────────────────────────────────────
8.3.5 Auto Correlation [ACR]
Function Raa (τ) = -1 (Gaa)
= Gaa (ω)exp(jωτ)dω
Horizontalcursor
Verticalcursor
Vertical axis Display
LIN-REAL (real-number part) -
LIN-IMAG (imaginary-number part) -
LIN-MAG (amplitude) Raa
LOG-MAG (logarithmic amplitude) -
PHASE (phase) -
Because the input waveform is the frequencywaveform, peaks are repeated at regular intervals.
0The time until the first peakis the input signal period.
Stored waveform Auto correlation function
Displays the degree of similarity between two points in the input signal separatedby time difference (τ).
Major applications:・Detecting a periodic signal contained in a noisy signal with an improvement in
signal-to-noise ratio.・Checking the periodic signal components contained in a noisy waveform, and
periodic noise.
Time Time display. The center indicates the reference (τ=0), the rightside indicates time lag (+τ), and the left side indicates time lead(-τ).
Linear Readings are between +1 and -1 (without units).+1: the highest similarity for time differential τ0: the lowest similarity, -1: the polarity is completely opposite.Due to the characteristics of the function, τ=0 always results in+1.
Example Auto correlation function waveforms 08-65, 38

159────────────────────────────────────────────────────
8.3 Analysis Function────────────────────────────────────────────────────
8.3.6 Histogram [HIS]
Function
Horizontalcursor
Verticalcursor
Vertical axis Display
LIN-REAL (real-number part) -
LIN-IMAG (imaginary-number part) -
LIN-MAG (amplitude) Pa
LOG-MAG (logarithmic amplitude) -
PHASE (phase) -
High amplitude indicates high number of data
Stored waveform Histogram function
Displays the frequencies of the magnitudes of sampled points.
Major applications include:・Determining waveform imbalance・Determining whether a waveform is artificial or natural from the waveform
distribution (most natural waveforms are regular sine waves).
Pa
Volt Linear display of the measurement range of the input unit.
Linear Number of sample points for the time axis data (total: 1000points).
Example Histogram function waveforms 08-66, 39

160────────────────────────────────────────────────────
8.3 Analysis Function────────────────────────────────────────────────────
8.3.7 Transfer Function [TRF]
Function Fb Fb・Fa* GabHab = = = Fa Fa・Fa* Gab
|Gab| = {cos(∠θb ー ∠θa) + jsin (∠θb ー ∠θa)} |Gaa|
Horizontalcursor
Verticalcursor
Vertical axis Display
LIN-REAL (real-number part) |Hab|・cos∠θb-∠θa
LIN-IMAG (imaginary-number part) |Hab|・sin∠θb-∠θa
LIN-MAG (amplitude) |Hab|
LOG-MAG (logarithmic amplitude) 20 log |Hab|
PHASE (phase) ∠θb-∠θa
Displays the transfer function (frequency characteristics) of the system beingmeasured calculated from input and output signals.
Nyquist diagrams can also be displayed, including magnitude and phaseinformation.
Major applications include:・Determining filter frequency characteristics.・Determining feedback control system stability through Nyquist diagrams.・Determining the physical resonant frequency using an impulse hammer and
pick-up sensor.
LIN-Hz Frequency spectrum display as linear units. The range is fromDC to the maximum frequency range value.
LOG-Hz Frequency spectrum display as logarithmic units. The range isfrom 1/400 the maximum frequency range value to the maximumfrequency range value.
Real Linear display of the real-number part of the input-to-outputratio (Nyquist mode)
RIN-REAL Linear display of the real-number part of the input-to-outputratio (no units).
LIN-IMAG Linear display of the imaginary-number part of the input-to-output ratio (no units).
LIN-MAG Linear display of input-to-output ratio (no units)This expresses the amplitude component.
LOG-MAG Logarithmic display of input-to-output ratio as dB (no units)This expresses the amplitude component.
PHASE Degrees (deg) display of phase component of data of input-to-output ratio
Imag Linear display of the imaginary-number part of the input-to-output ratio (Nyquist mode).

161────────────────────────────────────────────────────
8.3 Analysis Function────────────────────────────────────────────────────
Stored waveform (input signal) Stored waveform (output signal)
Y-axis: LIN-REAL (X-axis: LOG-Hz) Y-axis: LIN-IMAG (X-axis: LOG-Hz)
Y-axis: LIN-MAG (X-axis: LOG-Hz) Y-axis: LOG-MAG (X-axis: LOG-Hz)
Y-axis: PHASE (X-axis: LOG-Hz)
After bandpass filter
Nyquist
Example Transfer function spectra waveform 8-40, 41, 42, 43, 44, 45, 46, 47

162────────────────────────────────────────────────────
8.3 Analysis Function────────────────────────────────────────────────────
8.3.8 Cross Power Spectrum [CSP]
Function Gab = Fa*・Fb
= |Fa|・|Fb|{cos(∠θb ー ∠θa) + jsin (∠θb ー ∠θa)}
Horizontalcursor
Verticalcursor
Vertical axis Display
LIN-REAL (real-number part) |Gab|・cos∠θb-∠θa
LIN-IMAG (imaginary-number part) |Gab|・sin∠θb-∠θa
LIN-MAG (amplitude) |Gab|
LOG-MAG (logarithmic amplitude) 10 log |Gab|
PHASE (phase) ∠θb-∠θa
Displays the product of the spectra of two input signals.
The magnitude and phase information of the frequency components that arecommon to both signals can be displayed.
Major applications:Obtaining frequency components common to two signals.
LIN-Hz Frequency spectrum display as linear units. The range is fromDC to the maximum frequency range value.
LOG Hz Frequency spectrum display as logarithmic units. The range isfrom 1/400 the maximum frequency range value to the maximumfrequency range value.
Real Linear display of real-number part of the data as voltage(Nyquist mode).
LIN-REAL Linear display of real-number part of the data as binaryexponential voltage
LIN-IMAG Linear display of imaginary-number part of the data as binaryexponential voltage
LIN-MAG Linear display of amplitude component as binary exponentialvoltage
LOG-MAG Logarithmic display of the amplitude component as dB(0dB reference value; 1V2rms.)
PHASE Degrees (deg) display of phase component of data
Imag Linear display of imaginary-number part of the data as binaryexponential voltage (Nyquist mode)

163────────────────────────────────────────────────────
8.3 Analysis Function────────────────────────────────────────────────────
Stored waveform 1 Stored waveform 2
Y-axis: LIN-REAL (X-axis: LOG-Hz) Y-axis: LIN-IMAG (X-axis: LOG-Hz)
Y-axis: LIN-MAG (X-axis: LOG-Hz) Y-axis: LOG-MAG (X-axis: LOG-Hz)
Y-axis: PHASE (X-axis: LOG-Hz)
8-40,41,48,49,50,51,52,53
Nyquist
Example Cross power spectra waveforms
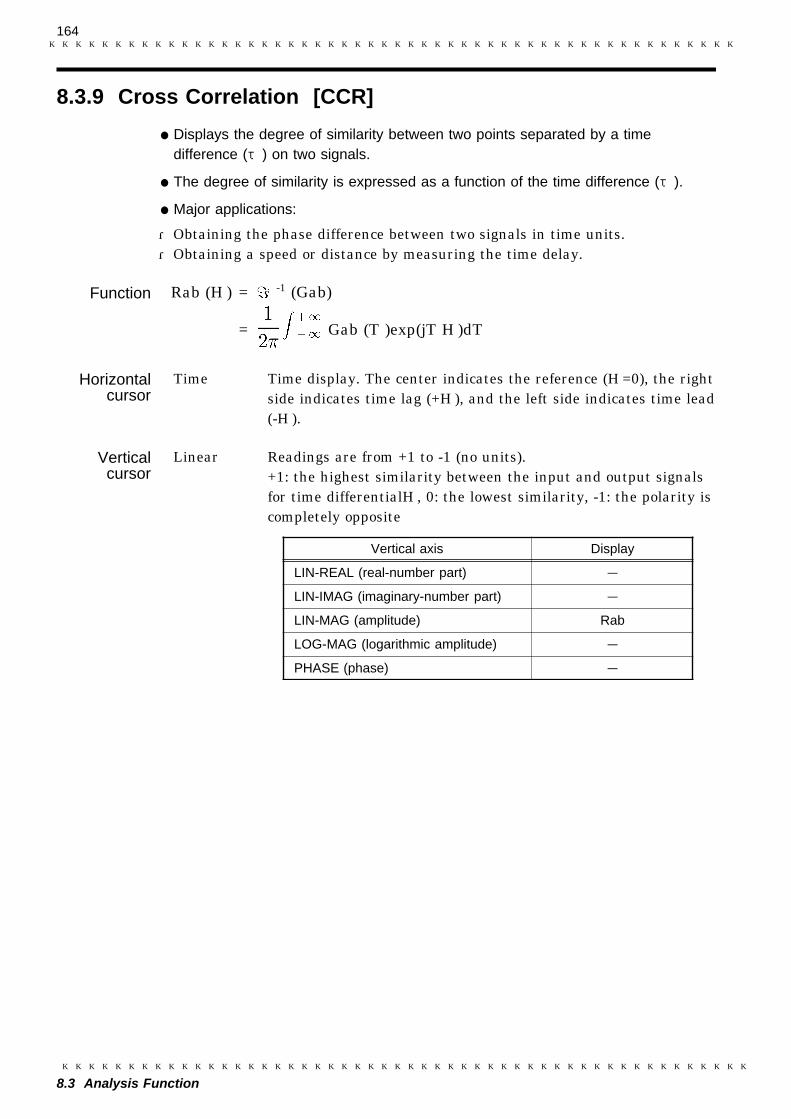
164────────────────────────────────────────────────────
8.3 Analysis Function────────────────────────────────────────────────────
8.3.9 Cross Correlation [CCR]
Function Rab (τ) = -1 (Gab)
= Gab (ω)exp(jωτ)dω
Horizontalcursor
Verticalcursor
Vertical axis Display
LIN-REAL (real-number part) -
LIN-IMAG (imaginary-number part) -
LIN-MAG (amplitude) Rab
LOG-MAG (logarithmic amplitude) -
PHASE (phase) -
Displays the degree of similarity between two points separated by a timedifference (τ) on two signals.
The degree of similarity is expressed as a function of the time difference (τ).
Major applications:
・Obtaining the phase difference between two signals in time units.・Obtaining a speed or distance by measuring the time delay.
Time Time display. The center indicates the reference (τ=0), the rightside indicates time lag (+τ), and the left side indicates time lead(-τ).
Linear Readings are from +1 to -1 (no units).+1: the highest similarity between the input and output signalsfor time differentialτ, 0: the lowest similarity, -1: the polarity iscompletely opposite

165────────────────────────────────────────────────────
8.3 Analysis Function────────────────────────────────────────────────────
Stored waveform (input waveform) Stored waveform (output waveform)
Cross correlation function
08-54, 55,56
Phase differences between input signaland output signal
Example Cross correlation function waveforms

166────────────────────────────────────────────────────
8.3 Analysis Function────────────────────────────────────────────────────
8.3.10 Unit Impulse Response [IMP]
Function
Horizontalcursor
Verticalcursor
Vertical axis Display
LIN-REAL (real-number part) -
LIN-IMAG (imaginary-number part) -
LIN-MAG (amplitude) IMP
LOG-MAG (logarithmic amplitude) -
PHASE (phase) -
Displays the frequency response of a system in the time domain.
A response waveform equivalent to the unit impulse function is obtained byanalyzing the input and output signals of the system being measured.
Major applicationsChecking circuit time constants.
IMP = -1 (Hab)
Time Time display. The center indicates the reference (τ=0), the rightside indicates time lag (+τ), and the left side indicates time lead(-τ).
Linear Inverse Fourier conversion value of the transfer function (Hab)(no units).

167────────────────────────────────────────────────────
8.3 Analysis Function────────────────────────────────────────────────────
Stored waveform (input signal) Stored waveform (output signal)
Unit impulse response
40, 41, 57
0
Input point of impulse signal
Example Unit impulse response waveforms

168────────────────────────────────────────────────────
8.3 Analysis Function────────────────────────────────────────────────────
8.3.11 Coherence [COH]
Function Gab*・GabCOH = Gaa・Gbb
Horizontalcursor
Verticalcursor
Vertical axis Display
LIN-REAL (real-number part) -
LIN-IMAG (imaginary-number part) -
LIN-MAG (amplitude) COH
LOG-MAG (logarithmic amplitude) -
PHASE (phase) -
NOTE
Displays the output signal component that is coherent (interference possible) tothe input signal, yielding a value from 0 to 1.
Major applications include:・Evaluation of transfer functions.・Determining the contribution of individual input lines to the output of multi-
input systems.
LIN-Hz Frequency spectrum display as linear units. The range is fromDC to the maximum frequency range value.
LOG-Hz Frequency spectrum display as logarithmic units. The range isfrom 1/400 the maximum frequency range value to the maximumfrequency range value.
Linear The relationship between the two input signals. The degree ofrelationship is indicated from 0 to 1 on a linear scale (no units).
For a single measurement, the coherence function returns 1 for allfrequencies. When measuring, be sure to use frequency averaging.

169────────────────────────────────────────────────────
8.3 Analysis Function────────────────────────────────────────────────────
Stored waveform (input signal) Stored waveform (output signal)
Coherence
Frequencies in this range have highcoherence.
Example Coherence function waveforms

170────────────────────────────────────────────────────
8.3 Analysis Function────────────────────────────────────────────────────
8.3.12 Octave Analysis [OCT]
Function
Horizontalcursor
Verticalcursor
Vertical axis Display
LIN-REAL (real number) -
LIN-IMAG (imaginary number) -
LIN-MAG (amplitude) OCT
LOG-MAG (logarithmic amplitude) 10log (OCT)
PHASE -
This function displays the spectrum of a noise signal or other signal, using 1/1-octave or 1/3-octave band filters with fixed ratio.
Main usesFrequency analysis of noise
OCT
1/1 OCT 1/1-octave band filtering
1/3 OCT 1/3-octave band filtering
LIN-MAG Linear display of octave analysis value as voltage
LOG-MAG Logarithmic display of octave analysis value as dB
・For frequency analysis of a noise signal or similar, the signal is passedthrough fixed-ratio band filters with 1/1-octave or 1/3-octave bandwidth.
・As opposed to the power spectrum function, where the signal is divided intobands of identical width and the power in each band is displayed, octaveanalysis divides the frequency axis evenly on a logarithmic scale andexpresses the level as a bar for each band.
・In analog octave analysis, the octave band center frequencies and filtercharacteristics are determined according to the ANSI CLASS 3 standard. Inthe 8846, the power spectrum is measured first and bundling is then used toperform 1/1-octave or 1/3-octave analysis. This allows the following analysisfunctions:
5-band 1/1-octave analysis15-band 1/3-octave analysis
・15-band 1/3-octave analysis and filter characteristics of the 8846 correspond tothe ANSI CLASS 3 standard. However, in the upper bands of frequencyanalysis, there are no leak components from higher frequencies.
For example, the 20 kHz band contains no leak components from the 25 kHzband or other bands.
・15-band 1/3-octave analysisIn this mode, the 400 spectrum lines of regular frequency analysis are bundledinto 1/3 octave bands and shown as a bar graph.

171────────────────────────────────────────────────────
8.3 Analysis Function────────────────────────────────────────────────────
Stored waveform
1/1 octave analysis 1/3 octave analysis
08-37, 59, 60
・5-band 1/1-octave analysisIn this mode, the 400 spectrum lines of regular frequency analysis are bundledinto 1/1 octave bands and shown as a bar graph.
Example Octave analysis waveforms

172────────────────────────────────────────────────────
8.3 Analysis Function────────────────────────────────────────────────────
BandNo. Center
frequency(Hz)
Frequency ranges (Hz)
1/1 1/3 133m
333m
667m 2 4 8 20 40 80 200 400 800 2 k 4 k 8 k 16
k20k
32k
40k
80k
-8 -24-23
4 m5 m
X0X
-7-22-21-20
6.3 m8 m10 m
0X0X0X
X0X
-6-19-18-17
12.5 m16 m20 m
0X0X0X
0X0X0X
X0X
-5-16-15-14
25 m31.5 m40 m
0X0X0X
0X0X0X
0X0X0X
-4-13-12-11
50 m63 m80 m
0X0X0X
0X0X0X
0X0X0X
0X0X
-3-10-9-8
100 m125 m160 m
0X0X0
0X0X0X
0X0X0X
0X0X0X
0X0X
-2-7-6-5
200 m250 m315 m
0X0X0
0X0X0X
0X0X0X
0X0X0X
0X0X
-1-4-3-2
400 m500 m630 m
0X0X0
0X0X0X
0X0X0X
0X0X0X
X0X
0-101
800 m11.25
0X0X0X
0X0X0X
0X0X0X
0X0X0X
X0X
1234
1.622.5
0X0X
0X0X0X
0X0X0X
0X0X0X
0X0X0X
X0X
2567
3.1545
0X0X
0X0X0X
0X0X0X
0X0X0X
0X0X0X
389
10
6.3810
0X0X
0X0X0X
0X0X0X
0X0X0X
00X0X
4111213
12.51620
0X0X0
0X0X0X
0X0X0X
0X0X0X
00X0X
5141516
2531.540
0X0X0
0X0X0X
0X0X0X
0X0X0X
00X0X
6171819
506380
0X0X0
0X0X0X
0X0X0X
0X0X0X
0X0X
7202122
100125160
0X0X0X
0X0X0X
0X0X0X
0X0X0X
0X0X
8232425
200250315
0XX
0X0X0X
0X0X0X
0X0X0X
0X0X0X
0X0X
9262728
400500630
0XX
0X0X0X
0X0X0X
0X0X0X
0X0X0X
0X0X
X0X
Frequency ranges and measurable range widths (0: 1/3 OCT, X: 1/1 OCT)

173────────────────────────────────────────────────────
8.3 Analysis Function────────────────────────────────────────────────────
BandNo. Center
frequency(Hz)
Frequency ranges (Hz)
1/1 1/3 133m
333m
667m 2 4 8 20 40 80 200 400 800 2 k 4 k 8 k 16
k20k
32k
40k
80k
10293031
8001 k1.25 k
0XX
0X0X0X
0X0X0X
0X0X0X
0X0X0X
0X0X0X
0X0X
X0X
11323334
1.6 k2 k2.5 k
0X0X
0X0X0X
0X0X0X
0X0X0X
0X0X0X
0X0X0X
0X0X0X
X0X
12353637
3.15 k4 k5 k
0X0X
0X0X0X
0X0X0X
0X0X0X
0X0X0X
0X0X0X
0X0X0X
13383940
6.3 k8 k10 k
0X0X
0X0X0X
0X0X0X
0X0X0X
0X0X0X
0X0X0X
14414243
12.5 k16 k20 k
0X0X
0X0X0
0X0X0X
0X0X0X
0X0X0X
15444546
25 k31.5 k40 k
0X0X
0X0X0
0X0X0X
16474849
50 k63 k80 k
0X0X0

174────────────────────────────────────────────────────
8.3 Analysis Function────────────────────────────────────────────────────

175────────────────────────────────────────────────────
9.1 Overview────────────────────────────────────────────────────
1
2
3
4
5
6
7
8
9
10
11
12
13
14
15
Chapter 9Input Channel Settings
9.1 Overview
(For all functions)
・Input channel settings are made with the CHANNEL screen of each function.
・The 8846 can use up to 16 analog channels or 14 analog and 16 logic channels.
・Settings are made separately for one analog channel or four logic channels (1probe).
・Using the CH. SET key, channel settings can also be made from the displayscreen. ( Section 20.3).
・Before making input channel settings, use the SYSTEM screen to select theunits to be used.

176────────────────────────────────────────────────────
9.2 Selecting Units (SYSTEM Screen)────────────────────────────────────────────────────
NOTE
9.2 Selecting Units (SYSTEM Screen)
・Perform this setting before making the input channel settings.・This setting on the SYSTEM screen determines the number of units in use.・Use the menu items SETUP and (1) using unit.・For details, see Section 11.4.1.
09-01
・ Depending on the number of units in use, the recording length of the memoryrecorder function differs ( Section 6.2.3).・ Depending on the number of units in use, the time axis of the recorder
function differs ( Section 7.2.3).

177────────────────────────────────────────────────────
9.3 Selecting Functions────────────────────────────────────────────────────
1
2
3
4
5
6
7
8
9
10
11
12
13
14
15
1
Function keydisplay Meaning
: Memory recorder function
: Recorder function
: FFT function
9.3 Selecting Functions
・Press the CHAN key to call up the CHANNEL screen.・Select the function.
Method
1. Move the flashing cursor to the position shown inthe figure.
2. Use the function keys to make the selection.
09-02###

178────────────────────────────────────────────────────
9.4 Selecting the Input Type────────────────────────────────────────────────────
1
2
Function keydisplay Meaning 09-g02
: Select analog input
: Select logic input
Function keydisplay Meaning 09-g03
: Set channel to non-use
: Select logic input
9.4 Selecting the Input Type
Specifies whether analog input or logic input is used for each channel.
Method Screen: STATUS (page 1), CHANNEL (page 1), DISPLAY) 09-031. Move the flashing cursor to a channel with an
odd number, as shown in the illustration.
2. Use the function keys to make the selection.
・If a unit is installed in specified channel
・If no unit is installed in specified channel
Channel where 8927 is installed
Channel where 8916 is installed
Channel where 8917 is installed
Channel where 8918 is installed
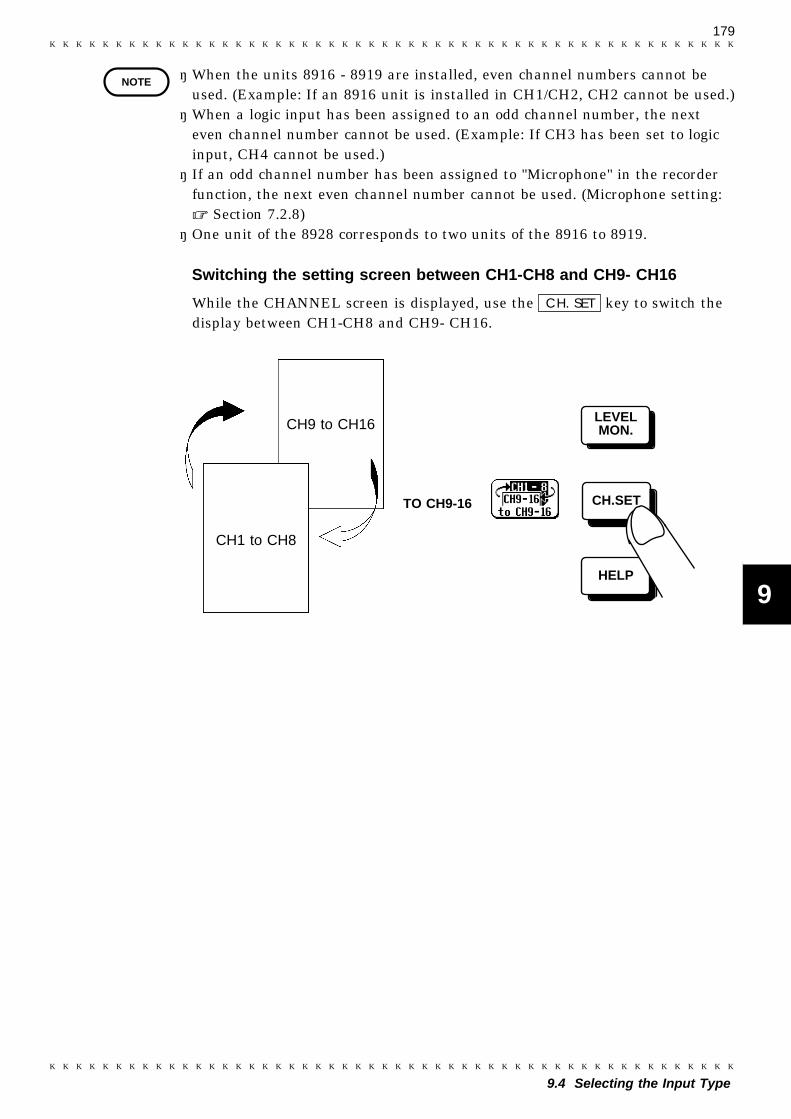
179────────────────────────────────────────────────────
9.4 Selecting the Input Type────────────────────────────────────────────────────
1
2
3
4
5
6
7
8
9
10
11
12
13
14
15
NOTE
09-g25CH1 to CH8
CH9 to CH16
CH.SET
LEVELMON.
HELP
LEVELMON.
CH.SET
HELP
TO CH9-16
・ When the units 8916 - 8919 are installed, even channel numbers cannot beused. (Example: If an 8916 unit is installed in CH1/CH2, CH2 cannot be used.)・ When a logic input has been assigned to an odd channel number, the next
even channel number cannot be used. (Example: If CH3 has been set to logicinput, CH4 cannot be used.)・ If an odd channel number has been assigned to "Microphone" in the recorder
function, the next even channel number cannot be used. (Microphone setting:Section 7.2.8)
・ One unit of the 8928 corresponds to two units of the 8916 to 8919.
Switching the setting screen between CH1-CH8 and CH9- CH16
While the CHANNEL screen is displayed, use the CH. SET key to switch thedisplay between CH1-CH8 and CH9- CH16.

180────────────────────────────────────────────────────
9.5 Making Logic Input Settings (FFT Excluded)────────────────────────────────────────────────────
2 1
09-04
Function keydisplay Meaning 09-g09
: Position 1
: Position 2
: Position 3
: Position 4
: Switch to page 2/2
Function keydisplay Meaning 09-g10
: Position 5
: Position 6
: Position 7
: Position 8
: Switch to page 1/2
NOTE
9.5 Making Logic Input Settings (FFT Excluded)
・When a channel has been set to logic input as described in Section 9.4, thelogic channel setting items are displayed.
・Select the display positions for CH A - CH D (1 probe).
Method
1. Specify the display colors for each channel( Section 9.6.1).
2. Specify the display position for the logicwaveform.
For channels where a logic waveform is recorded, the indication logic is shownat the (/div) location.

181────────────────────────────────────────────────────
9.6 Making Analog Input Settings────────────────────────────────────────────────────
1
2
3
4
5
6
7
8
9
10
11
12
13
14
15
9.6.1 Waveform Display Color (FFT Excluded)
2
1
09-05
・ 1/5Function key
display Meaning 09-g04
: No waveform display
: Color 1 (dark)
: Color 2 (dark)
: Color 3 (dark)
: Switch to page 2/5
・ 2/5Function key
display Meaning 09-g05
: Color 4 (dark)
: Color 5 (medium dark)
: Color 6 (medium dark)
: Color 7 (medium dark)
: Switch to page 3/5
・ 3/5Function key
display Meaning 09-g06
: Color 8 (medium dark)
: Color 9 (normal)
: Color 10 (normal)
: Color 11 (normal)
: Switch to page 4/5
9.6 Making Analog Input Settings
Set the display color for the waveform.
Method 1. Move the flashing cursor to the point shown in the illustration.
2. Use the function keys to make the selection.The indication in brackets refers to the printout color (dark, medium dark,normal, light).

182────────────────────────────────────────────────────
9.6 Making Analog Input Settings────────────────────────────────────────────────────
・ 4/5Function key
display Meaning 09-g07
: Color 12 (normal)
: Color 13 (light)
: Color 14 (light)
: Color 15 (light)
: Switch to page 5/5
・ 4/5Function key
display Meaning 09-g08
: Color 16 (light)
: Switch to page 1/5
NOTE ・ When the display color is changed using the SETUP item on the SYSTEMscreen, the waveform display color also changes.・ When the copy function was used to copy settings between the temperature
unit (8918) and other units (8916, 8917, 8919, 8927, 8928) ( Section 9.6.11),only the waveform display color and the display graph type are copied.・ The FFT waveform display color is fixed to color 1.

183────────────────────────────────────────────────────
9.6 Making Analog Input Settings────────────────────────────────────────────────────
9.6.2 Display Graph Type (FFT Excluded)
2
1
09-06
・ 1/2Function key
display Meaning com/gr1
: Graph 1
: Graph 2
: Graph 3 (*1)
: Graph 4 (*1)
: Switch to page 2/2 (*2)
・ 2/2Function key
display Meaning com/gr2
: Graph 5 (*2)
: Graph 6 (*2)
: Graph 7 (*2)
: Graph 8 (*2)
: Switch to page 1/2. (*2)
(*1): Setting available when "quad" or "octo" screen displayhas been selected.
(*2): Setting only available when "octo" screen display hasbeen selected.
NOTE
・Specify which graph type to use when display format has been set to DUAL,QUAD, or OCT screen display on the STATUS screen.
・When the display format has been set to SINGLE, this item is not available.・When the display format has been set to XY SINGLE or XY DUAL display,
refer to Section 6.2.5.
Method
1. Move the flashing cursor to the position shown inthe figure.
2. Use the function keys to make the selection.
When the copy function was used to copy settings between the temperatureunit (8918) and other units (8916, 8917, 8919, 8927, 8928) ( Section 9.6.11),only the waveform display color and the display graph type are copied.

184────────────────────────────────────────────────────
9.6 Making Analog Input Settings────────────────────────────────────────────────────
9.6.3 Setting the Voltage Axis, Temperature Axis, Strain Axis
Ranges
2
1
Function keydisplay Meaning
(When using the 8916, 8917, 8919)5, 10, 20, 50, 100, 200, 500 mV1, 2, 5, 10, 20 V
(When using the 8927)20, 50, 100, 200, 500 mV, 1 V
(When using the 8918)10, 20, 50℃
(When using the 8928)20, 50, 100, 200, 500, 1000 με
Carries out auto-balancing for theselected channel only.
Carries out auto-balancing for all ofthe strain unit channels.
:
:
NOTE
・Set the voltage axis range for each channel.・The voltage axis range is the voltage unit per 1 DIV on the vertical axis (when
magnification/compression is set to 1).・The available settings depend on the type of unit that is installed.・When histogram analysis of the FFT function is used, the range setting affects
the X-axis.
Method
1. Move the flashing cursor to the range item.
2. Use the JOG control or the function keys toselect the range.
When the histogram analysis of the FFT function is used, the change involtage axis (X axis) only becomes active after a restart.

185────────────────────────────────────────────────────
9.6 Making Analog Input Settings────────────────────────────────────────────────────
NOTE
0V
Voltage range (V/DIV)Strain range (με/DIV)
×25.6 DIV
Voltage range (V/DIV)Strain range (με/DIV)
×-25.6 DIV
: Measurement range
Auto-balancing
Align the reference output level of the adapter with the specified originposition. (Zero position Section 9.6.6)
・ Auto-balancing is carried out for the strain units only. It is not carried out forother input units (8916, 8917, 8918, 8919, and 8927).・ When the next setting or change is made, carry out auto-balancing again.
Changing the setting range, changing the strain gauge adapter, change ofreference state, powering on, or unit replacement
Measurement voltage range
With 8916, 8917, 8919, 8927, 8928:

186────────────────────────────────────────────────────
9.6 Making Analog Input Settings────────────────────────────────────────────────────
421
0
-90-90.875
(Uppersaturation limit)
842
0
-90
-181.75
2105
1200
0
-90
-454.375
10℃/DIV range 20℃/DIV range 50℃/DIV range
: Measurement range
[ ℃]
[ ℃]
[ ℃ ]
(Uppersaturation limit)
(Uppersaturation limit)
(Lowersaturation limit) (Lower
saturation limit)
(Lowersaturation limit)
NOTE
With 8918:
・ When the input has exceeded the lower measurement limit of thethermocouple, the display extends fully to the lower saturation level.・ When the input has exceeded the upper measurement limit of the
thermocouple, or if burnout has occurred, the display extends fully to theupper saturation level.
Thermocouple types and measurement range
K(CA) -90 to 1200℃J(IC) -90 to 800℃T(CC) -90 to 400℃

187────────────────────────────────────────────────────
9.6 Making Analog Input Settings────────────────────────────────────────────────────
9.6.4 Setting the Input Coupling (Not Required for 8918, 8928)
2
1
09-08
Function keydisplay Meaning 09-g14
:The input signal is directly connected tothe amplifier. This allows a DCcomponent to be measured.
: The input signal is not connected. Thisallows the zero position to be checked.
: The input signal is converted to a realeffective value (8917 only).
: The ground in RMS mode is displayed.(8917 only).
NOTE
・For the 8917 DC/RMS unit, two types of input coupling (DC or RMSconversion) can be selected.
・The ground level can be checked.・This item does not appear for channels set to the 8918 TEMPERATURE
UNIT.
Method
1. Move the flashing cursor to the position asshown in the figure.
2. Use the function keys to select the inputcoupling.
When one channel of the 8927 analog unit has been set to GND, the setting forthe other channel automatically also becomes GND.

188────────────────────────────────────────────────────
9.6 Making Analog Input Settings────────────────────────────────────────────────────
9.6.5 Setting Voltage Axis, Temperature Axis, and Strain Axis
Magnification/ Compression
2
1
09-09
Function keydisplay Meaning
×20, ×10, ×5, ×2, ×1, ×1/2, ×1/5,×1/10
NOTE
・Set the magnification/compression ratio for each channel.・Magnification/compression can be used to make the waveform easy to read.・When histogram analysis of the FFT function is used, the
magnification/compression setting affects the X axis.・When wishing to set the voltage axis to an arbitrary magnification/
compression value, refer to Section 9.6.10.
Method
1. Move the flashing cursor to the position asshown in the figure.
2. Use the function keys to make the selection.
Based on the voltage axis range and the magnification/compression, thedisplay range (/div) is determined.

189────────────────────────────────────────────────────
9.6 Making Analog Input Settings────────────────────────────────────────────────────
9.6.6 Setting the Zero Position
2
1Function key
display Meaning 09-g16
When the magnification ratio is 1:-15.6 to 35.6 DIV
:Zero adjustment is performed.( Section 9.6.6)not displayed with the 8928
Magnification ratio Setting range (units: DIV)
×20×10×5×2×1×1/2×1/5×1/10
-502.0 to 522.0-246.0 to 266.0-118.0 to 138.0-41.2 to 61.2-15.6 to 35.6-2.8 to 22.8
0.0 to 20.00.0 to 20.0
NOTE
Display screen
20 DIV
0 DIV
10 DIV
25 DIV
0 DIV
0 V
・This setting determines the DIV position at which the 0 V, 0 ℃, or 0 με islocated for each channel.
・The available setting range depends on the magnification/compression setting.・When histogram analysis of the FFT function is used, the setting affects the X
axis.
Method
1. Move the flashing cursor to the position item.
2. Use the JOG control or the function keys to makethe selection.
The zero position is as follows:

190────────────────────────────────────────────────────
9.6 Making Analog Input Settings────────────────────────────────────────────────────
2
1
NOTE
Zero adjustment
This function calibrates the 0 V position (ground position) to the selected zeroposition. Use it to assure precise results.
Method
・Allow the unit to warm up for at least 1 hour toensure that the internal temperature of the inputunits has stabilized.
・Compensation for the voltage axis range orfrequency axis range (8919 FFT unit) isperformed.
1. Move the flashing cursor to the position item.
2. Press F5 [ 0 Adjust ]. All channels (all unitsinstalled) will be calibrated together.
・ Zero adjustment cannot be performed during measurement.・ Repeat the zero adjustment when the input unit was changed, when the power
is on/off, or when the system is set to reset.・ The 8918 TEMPERATURE UNIT does not have a zero adjustment function.
The function applies only to other input units.・ For the 8928 STRAIN UNIT, the zero adjustment is not also carried out.・ When there is a sudden change in ambient temperature, the zero position may
drift. To assure continued measurement precision, perform the zeroadjustment again.・ Zero adjustment may take up to 80 seconds. During this time, the keys are
inactive.

191────────────────────────────────────────────────────
9.6 Making Analog Input Settings────────────────────────────────────────────────────
9.6.7 Setting the Low-Pass Filter
2
1
09-11
Function keydisplay Meaning 09-g17
: No low pass filter is used.
: A filter with 5 kHz cutoff is used.
: A filter with 500 Hz cutoff is used.
: A filter with 50 Hz cutoff is used.
: A filter with 5 Hz cutoff is used.
Function keydisplay Meaning 09-g18
: No low pass filter is used.
: A filter with 500 Hz cutoff is used.
: A filter with 5 Hz cutoff is used.
Function keydisplay Meaning 09-g18
: No low pass filter is used.
: A filter with 5 Hz cutoff is used.
: A filter with 1.5 Hz cutoff isused.
Function keydisplay Meaning 09-G28
: OFF (cutoff 20 kHz)
: 3 kHz Cutoff filter
: 300 Hz Cutoff filter
: 30 Hz Cutoff filter
: 10 Hz Cutoff filter
・Set the cutoff frequency for the low-pass filter, which limits the frequencybandwidth.
・When the observed waveform has high ripple content or noise, causing therecording line to become thick, or if pulse type noise is present, the low-passfilter should be enabled.
Method 1. Move the flashing cursor to the position shown in
the figure.
2. Use the JOG control or the function keys to makethe selection. Available setting items depend onthe type of input unit.
8916, 8927 Analog units
8917 DC/RMS, 8919 FFT units
8918 Temperature unit 8928 Strain unit

192────────────────────────────────────────────────────
9.6 Making Analog Input Settings────────────────────────────────────────────────────
9.6.8 Setting the Thermocouple Type (8918 Only)
2
1
09-16
Function keydisplay Meaning 09-g26
: K (CA) thermocouple
: J (IC) thermocouple
: T (CC) thermocouple
NOTE
The temperature unit 8918 can use three types of thermocouples. Choose thecorrect setting for the thermocouple in use.
Method
1. Move the flashing cursor to the point shown inthe figure. (This item is not displayed forchannels where the temperature unit 8918 is notinstalled.)
2. Use the function keys to make the selection.
If the setting and the actually used thermocouple are different, themeasurement reading will be wrong.

193────────────────────────────────────────────────────
9.6 Making Analog Input Settings────────────────────────────────────────────────────
9.6.9 Setting the Antialiasing Filter (8919 Only)
2
Channel with 8919
1
09-12
Function keydisplay Meaning 09-g20
: Antialiasing filter disabled
: Antialiasing filter enabled
NOTE
Voltage axis range×25.6
0 V
×-25.6Antialiasing filter OFF Antialiasing filter ON
0 V
・The FFT unit 8919 incorporates an antialiasing filter designed to preventaliasing distortion ( Appendix 2). The filter can be set to ON or OFF. Thecutoff frequency of the filter is set automatically, according to the frequencyrange and time axis setting.
・This item is only available when the FFT unit 8919 is installed.
Method
1. Move the flashing cursor to the point shown inthe figure. (This item is not displayed forchannels where the FFT unit 8919 is notinstalled.)
2. Use the function keys to make the selection.
When the antialiasing filter is set to ON, the measurement is slightly shifted.
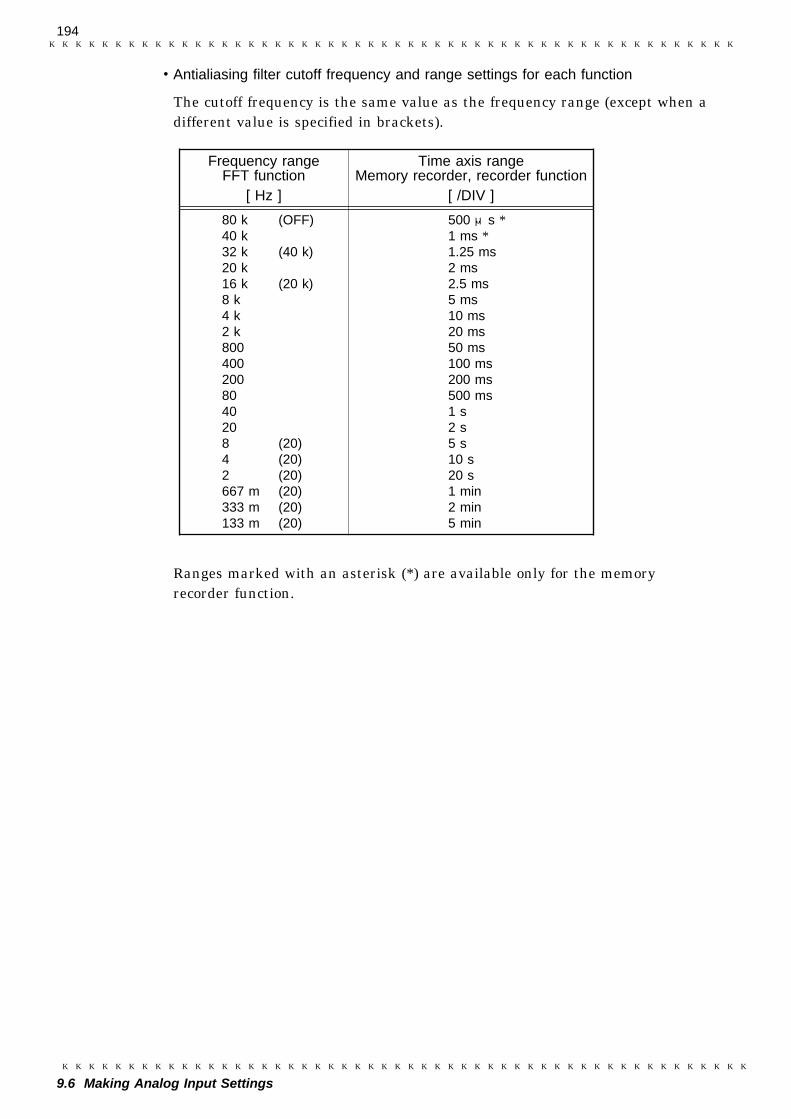
194────────────────────────────────────────────────────
9.6 Making Analog Input Settings────────────────────────────────────────────────────
Frequency rangeFFT function
Time axis rangeMemory recorder, recorder function
[ Hz ] [ /DIV ]
80 k (OFF)40 k32 k (40 k)20 k16 k (20 k)8 k4 k2 k8004002008040208 (20)4 (20)2 (20)667 m (20)333 m (20)133 m (20)
500 μs *1 ms *1.25 ms2 ms2.5 ms5 ms10 ms20 ms50 ms100 ms200 ms500 ms1 s2 s5 s10 s20 s1 min2 min5 min
Antialiasing filter cutoff frequency and range settings for each function
The cutoff frequency is the same value as the frequency range (except when adifferent value is specified in brackets).
Ranges marked with an asterisk (*) are available only for the memoryrecorder function.

195────────────────────────────────────────────────────
9.6 Making Analog Input Settings────────────────────────────────────────────────────
9.6.10 Arbitrary Setting if Voltage Axis Magnification/
Compression and Display Range
2 3 4 1
09-13
Function keydisplay Meaning 09-g21
0 to 9(-9 to +9 for the most significantdigit, -29 to +28 for exponent.)
: Changes display range by a factorof 2
: Changes display range by a factorof 1/2
: Reset
(Variable Display Function) (FFT Excluded)
This function allows setting the 1 DIV value on the voltage axis or the displayrange in voltage axis direction to any setting.
(1) Voltage axis magnification/compression・Set the value which should correspond to 1 DIV on the voltage axis.・Set the zero position to any position.
(2) Display range in voltage axis direction・Set the lower and upper limit of the display to any desired setting.
The variable function can be set to ON or OFF for each channel individually.
(1) Setting the 1 DIV value and zero position for the voltage axis
Method Screen: CHANNEL (page 2)
Move the flashing cursor in the order shown belowto make the setting.
1. Use the CHAN key to call up the CHANNELscreen (page 2).
2. Set the variable function for the desired channelsto ON.
3. Set the voltage axis range (Display range/div).・The zero position is fixed, and the voltage axis 1
DIV value changes.・Setting range: +0.0001E-29 to +9.9999E+28

196────────────────────────────────────────────────────
9.6 Making Analog Input Settings────────────────────────────────────────────────────
Function keydisplay Meaning com/jog11
0 to 9( -9 to +9 for the most significantdigit, -29 to +29 for exponent.)
: Reset
NOTE
2 3 4 1
Function keydisplay Meaning com/jog11
0 to 9( -9 to +9 for the most significantdigit, -29 to +29 for exponent)
: Reset
NOTE
4. Set the position item.(Same as in step 3.)
When voltage axis range or zero position are changed, the upper limit andlower limit values also change.
(2) Setting the upper and lower display limit
Method Screen: CHANNEL (page 1) 09-14Move the flashing cursor in the order shown belowto make the setting.
1. Use the CHAN key to call up the CHANNELscreen (page 2).
2. Set the variable function for the desired channelsto ON.
3. Set the lower and upper items.・Setting range: +0.0001E-29 to +9.9999E+29・The setting must be (lower limit) ≧ (upper limit)・Move the flashing cursor to the respective digits
to make the setting.
When the upper limit and lower limit values are changed, the voltage axisrange or zero position also change.

197────────────────────────────────────────────────────
9.6 Making Analog Input Settings────────────────────────────────────────────────────
NOTE
9.6.11 Copying Channel Settings
Function keydisplay Meaning
: (display only)
: Increase channel number
: Copy source is shown (display only)
: Decrease channel number
: Execute copy
NOTE
Reset
When the flashing cursor is on the items range/div, position, lower, or upper,pressing this key causes the upper and lower limit values to be calculatedfrom the voltage axis range setting and zero position setting (page 1). Thecalculated values are automatically inserted in the respective positions.
・ If no input unit is installed, "--" is displayed and the item cannot be set.・ Channels for which the variable function has been set to ON are denoted by
the indication variable below the lower - upper indication on page 1 of theCHANNEL screen.
Reference The settings for one channel can be copied to another channel ( Section9.6.11).
・While using the CHANNEL screen, settings made for one channel can becopied to another channel.
・The copy source is the channel whose settings are being copied to the "copytarget" channel.
Method
1. Move the flashing cursor to the number of thechannel to be used as copy source.
2. Use the function keys or the JOG control tospecify the copy target channel.
3. When F5 [ exec ] is pressed, the settings of thecopy source channel are copied to the copy targetchannel.
・ When making a copy settings for channel between temperature unit and otherunits (8916, 8917, 8919, 8927, 8928), only display color of the waveform andgraph display can be copied.・ In case of copying between strain unit (8928) and voltage unit (8916, 8917,
8919, 8927), the settings for range and lowpass filter cannot be copied.

198────────────────────────────────────────────────────
9.6 Making Analog Input Settings────────────────────────────────────────────────────
9.6.12 Making Channel Settings on Display Screen
・With the CH. SET key, individual channel setting items and the variablefunction setting can be superimposed on the current display screen. The itemis switched with each push of the button.
・Move the flashing cursor to the item and make the setting in the same way asdescribed for the CHANNEL screen. Results can be judged immediately byobserving the waveform.
・For details, see Section 20.3.

199────────────────────────────────────────────────────
10.1 Overview────────────────────────────────────────────────────
1
2
3
4
5
6
7
8
9
10
11
12
13
14
15NOTE
Chapter 10Trigger Functions
10.1 Overview
(For all functions)
・The term "trigger" refers to a signal which is used to control the timing forrecording start or stop.
・The term "triggering has occurred" refers to the state when such a signal hasactivated recording start or stop.
・Trigger parameters for the various functions are set using the STATUS screen(page 2).
・There are four types of signals which can be used for triggering (as triggersource).
Analog trigger
・The input signal to analog units (CH1 - CH16) is used as trigger source.・The input signal is constantly monitored, and triggering occurs when the
preset trigger conditions are met.
Logic trigger
・The input signal to logic channels (CH A - CH D) is used as trigger source.・The input signal is constantly monitored, and triggering occurs when the
preset trigger conditions are met.
External trigger
・Triggering occurs when the EXT TRIG connector is shorted or when a high-level signal (2.5-5.0 V) at this connector changes to low-level (0-1.0 V).
・External triggering is used for example when several Memory HiCorderunits are connected in parallel for synchronized operation.
Timer trigger
・Triggering occurs from a preset start time to a preset stop time.・Serves for real-time recording.
・The above trigger sources can be combined with AND/OR.・The trigger mode setting determines whether repeated triggering is used.・The pretrigger setting can be used to record the waveform not only after but
also before triggering has occurred (memory recorder, FFT).
If the trigger settings (trigger source AND, OR, trigger source parameters,pretrigger) are changed during recording, the measurement is restarted, usingthe new settings.

200────────────────────────────────────────────────────
10.2 Setting the Trigger Mode────────────────────────────────────────────────────
2
10-01, 02, 15, 16
1
1
1
1
Function keydisplay Meaning 10-g01
: See below.
:
:
:
10.2 Setting the Trigger Mode
・The trigger mode determines the way triggering is used to control operation ofthe 8846.
・When all trigger sources are OFF, the waveform is recorded continuously inthe interval between pressing the START key and the STOP key (free-runoperation).
Method Screen: STATUS (page 2), DISPLAY
1. Move the flashing cursor to the trig mode item.
2. Use the function keys to make the selection.
Trigger is registered only once. After START keywas pressed, unit starts waveform recordingwhen triggering occurs and continues for presetrecording length. Measurement then endsautomatically.
Trigger is registered continuously. Unit is intrigger standby condition when triggerconditions are not met. Measurement ends when
STOP key is pressed.
Trigger is registered continuously. If triggerconditions are not met within 1 second,waveform recording starts automatically andcontinues for preset recording length.Measurement ends when STOP key is pressed(memory recorder, FFT).
When triggering occurs, waveform recording iscarried out for preset recording length. If triggerconditions are not met within 1 second,waveform recording starts automatically andcontinues for preset recording length (memoryrecorder, FFT).

201────────────────────────────────────────────────────
10.3 Setting Trigger Source AND/OR Linking────────────────────────────────────────────────────
1
2
3
4
5
6
7
8
9
10
11
12
13
14
15
NOTE
2
1
Function keydisplay Meaning com/or
: Link trigger sources with logicaloperator OR.
: Link trigger sources with logicaloperator AND.
AND linking
0V
CH1 waveform
CH2 waveform
CH1 and CH2 level both intersect 0 V line from below
OR linking
0V
CH1 or CH2 level intersects 0 V line from below
CH1 waveform
CH2 waveform
10.3 Setting Trigger Source AND/OR Linking
The analog trigger, logic trigger, and timer trigger can be linked with theAND/OR logical operators.AND: Triggering occurs when conditions for all triggers are met.OR: Triggering occurs when conditions for one trigger are met.
The external trigger cannot be AND/OR linked with other trigger sources.
Method Screen: STATUS (page 2)
1. Move the flashing cursor to the trigger sourceitem.
2. Use the function keys to select the AND or OR.
Example The figures below show the effectof AND/OR linking.
CH1: level trigger; level 0.00 V, slope ; filter OFFCH2: level trigger; level 0.00 V, slope ; filter OFF

202────────────────────────────────────────────────────
10.4 Setting the Pretrigger (Memory recorder, FFT)────────────────────────────────────────────────────
0%95%
100%
0%50%
100%
0%5%
100%
-95%0% 100%
Recordingstart point
0%
Recordingend point
100%
・・・・Recording range (recording length)(recording length)
95 %
50 %
5 %
-95 %
95% of the recording before the trigger
50% before and 50% after the trigger
95% of the recording after the trigger
Recording is about one recording lengthafter the trigger
10.4 Setting the Pretrigger (Memory recorder, FFT)
・The pretrigger function serves to record the waveform not only after but alsobefore triggering has occurred.
・Using the recording start point as 0% and the recording end point as 100%,the trigger point can be specified in percent.
・When all trigger sources are set to OFF, pretrigger cannot be set.

203────────────────────────────────────────────────────
10.4 Setting the Pretrigger (Memory recorder, FFT)────────────────────────────────────────────────────
1
2
3
4
5
6
7
8
9
10
11
12
13
14
15
2
1
Function keydisplay Meaning
0, 2, 5, 10, 20, 30, 40, 50, 60, 70, 80,90, 95, 100, -95%
10-04, 05, 17
1
1
NOTE
Method Screen: STATUS (page 1), CHANNEL (page 1), DISPLAY
1. Move the flashing cursor to the pre-trig item.
2. Use the JOG control or the function keys to makethe selection.
・When the pretrigger is set (memory recorder orFFT: 2 - 100%), the trigger will not be registeredfor a certain period after the start ofmeasurement. (During this interval, Pretriggerstandby is shown on the display.)
・When the trigger can be registered, the indicationWaiting for trigger is shown on the display.
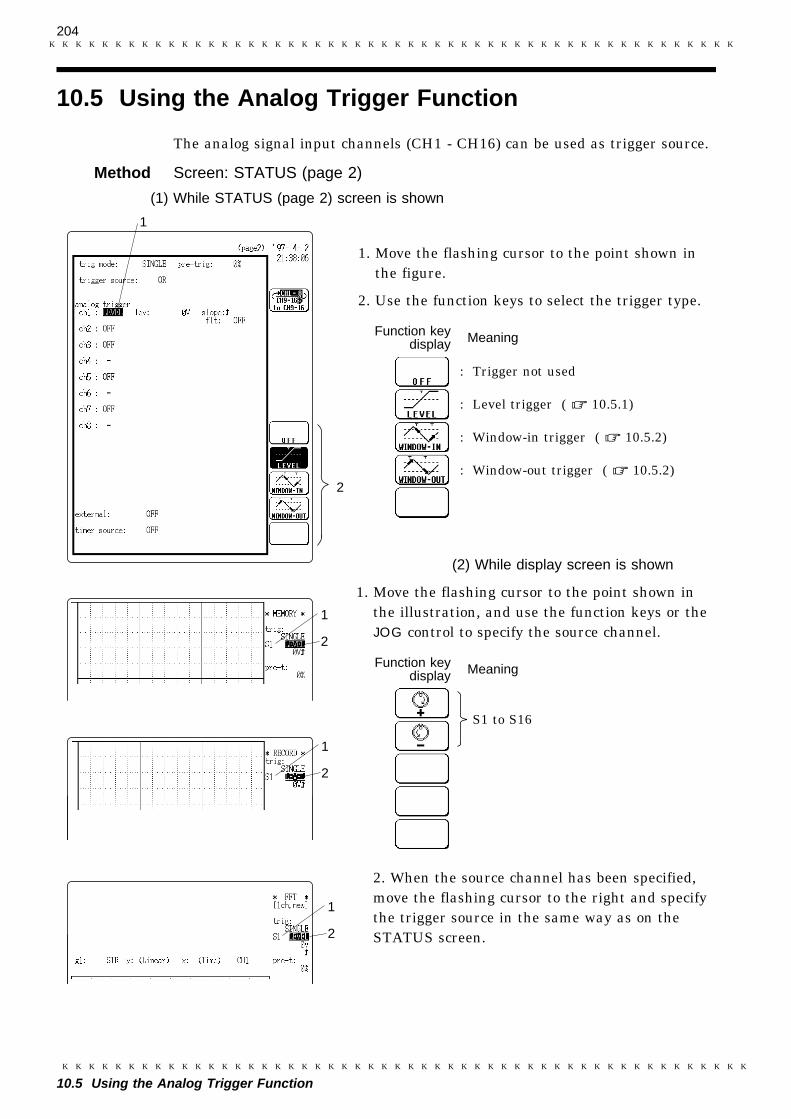
204────────────────────────────────────────────────────
10.5 Using the Analog Trigger Function────────────────────────────────────────────────────
2
1
Function keydisplay Meaning 10-g04
: Trigger not used
: Level trigger ( 10.5.1)
: Window-in trigger ( 10.5.2)
: Window-out trigger ( 10.5.2)
10-07, 18, 19
1
2
1
2
1
2
Function keydisplay Meaning
S1 to S16
10.5 Using the Analog Trigger Function
The analog signal input channels (CH1 - CH16) can be used as trigger source.
Method Screen: STATUS (page 2) 10-06(1) While STATUS (page 2) screen is shown
1. Move the flashing cursor to the point shown inthe figure.
2. Use the function keys to select the trigger type.
(2) While display screen is shown
1. Move the flashing cursor to the point shown inthe illustration, and use the function keys or theJOG control to specify the source channel.
2. When the source channel has been specified,move the flashing cursor to the right and specifythe trigger source in the same way as on theSTATUS screen.

205────────────────────────────────────────────────────
10.5 Using the Analog Trigger Function────────────────────────────────────────────────────
1
2
3
4
5
6
7
8
9
10
11
12
13
14
15
10.5.1 Level Trigger
Trigger level Trigger level
(Upward trigger direction (slope : ) Downward trigger direction (slope : )
Input waveform
Trigger level
Filter width
Triggering occurs
Triggering does not occur here
Rising trigger slope :
・Triggering occurs when the input signal crosses the preset trigger level(voltage) with the preset trigger slope ( , ).
・When a trigger filter is used, triggering occurs only within the filter width.This is useful to exclude noise.
Trigger filter
・Triggering occurs when the trigger conditions are met within the filter width.・This is useful to prevent spurious triggering by noise.・The filter width is specified by number of sampling points.

206────────────────────────────────────────────────────
10.5 Using the Analog Trigger Function────────────────────────────────────────────────────
10-08, 09, 20, 21
1
2
3
1 2 3 4
1
2
3
1
2
3
Function keydisplay Meaning
Trigger voltage level
Function keydisplay Meaning 10-g07
:Trigger will occur when the input signalcrossed the trigger level from below goingupwards.
: Trigger will occur when the input signalcrossed the trigger level from below goingdownwards.
Function keydisplay Meaning
OFF, 10, 20, 50, 100, 150, 200, 250,500, 1000
Method Screen: STATUS (page 2), DISPLAYCan be used when the specified channel is an analog input channel.
1. Move the flashing cursor to the position asshown in the figure, and press F2 [ LEVEL ].
2. Set the trigger level.Use the JOG control or the function keys to makethe selection.
3. Select the trigger direction (slope).Use the function keys to make the selection.
4. Set the trigger filter・This setting cannot be made from the display
screen.・Use the function keys or the JOG control to make
the setting.・Filter width is specified using sampling points.

207────────────────────────────────────────────────────
10.5 Using the Analog Trigger Function────────────────────────────────────────────────────
NOTE
Time axis range(/DIV)
Filter width(maximum value)
1.25 ms - 200 ms all settable
500 ms 250
1 s 200
2 s 100
5 s 20
10 s 20
20 s 10
1 min - all unsettable
200 mV
0 V
-600 mV
A
B
A
・ To cause triggering at point A or point B with the sine wave shown below,make the following settings.・ When using the recorder function, the filter width is limited by the time axis
range setting.
Example Point A trigger level: 200 mV, trigger direction (slope): rising ( )Point B trigger level: -600 mV, trigger direction (slope): falling ( )

208────────────────────────────────────────────────────
10.5 Using the Analog Trigger Function────────────────────────────────────────────────────
10.5.2 Window-In, Window-Out Trigger
Upper limit
Lower limit
上限値
下限値
Window-in-trigger Window-out-trigger
Upper limit
Lower limit
1 2 3
4
Function keydisplay Meaning com/jog2
Trigger voltage level
Window-in trigger
Set upper limit level and lower limit level and activated when the input signalenters the range between these limits.
Window-out trigger
Set upper limit level and lower limit level and activated when the input signalleaves this range.
Method Screen: STATUS (page 2), DISPLAY
Can be used when the specified channel is ananalog input channel.
1. Move the flashing cursor to the point shown inthe figure.Press F3 [ WINDOW-IN ] or F4 [ WINDOW-OUT ].
2. Set the lower trigger level.Use the JOG control or the function keys to makethe selection.
・The value must be larger than the upper triggerlevel.

209────────────────────────────────────────────────────
10.5 Using the Analog Trigger Function────────────────────────────────────────────────────
1
2
3
1
2
3
1
2
3
Function keydisplay Meaning
OFF, 10, 20, 50, 100, 150, 200, 250,500, 1000
Window-out trigger Upper limit : 1 V, lower limit: -1 V
1 V
-1 V
3. Set the upper trigger level
・Make the setting as in step 2.・The value must be smaller than the lower trigger
level.
4. Set the trigger filter
・This setting cannot be made from the displayscreen.
・Use the function keys or the JOG control to makethe setting.
・Filter width is specified using sampling points.
Setting example of the window trigger
In order to cause triggering when the signal as shown in the figure belowleaves the hatched area, the following settings are made:

210────────────────────────────────────────────────────
10.6 Using the Logic Trigger Function────────────────────────────────────────────────────
NOTE
2
1 3 4 5
10-12
Function keydisplay Meaning 10-g11
: Logic trigger is not used.
: Logic trigger is used.
Function keydisplay Meaning
: Signal disregarded
: Low level signal
: High level signal
10.6 Using the Logic Trigger Function
・The signal of a logic channel can be used as trigger source.・The channel must be set to LOGIC on the CHANNEL screen ( Section 9.4).・A trigger pattern and logical operator (AND/OR) are specified, and triggering
occurs when the trigger conditions are met.・A trigger filter can be specified, so that triggering occurs only when the trigger
conditions are met within the filter width.
If no channel has been set to LOGIC on the CHANNEL screen, the logic triggercannot be set.
Method Screen: STATUS (page 2), DISPLAY
(1) While STATUS (page 2) screen is shown
1. Move the flashing cursor to the position asshown in the figure.
2. Press F2 [ ON (PATN) ].
3. Set the trigger pattern
・When "CH A" is selected, the setting is for logicinput CH A1 - CH A4 from left to right.
・Make the setting with the function keys.

211────────────────────────────────────────────────────
10.6 Using the Logic Trigger Function────────────────────────────────────────────────────
Function key display Meaning
: Triggering occurs if any one of the logic input signalsconforms to the trigger pattern.
: Triggering only occurs if all of the logic input signalsconforms to the trigger pattern.
NOTE
Function key display Meaning
OFF, 10, 20, 50, 100, 150, 200, 250, 500, 1000
4. Set the AND/OR operator.
Determine whether to use the AND or OR logical operator.
If the conditions are met already when measurement is started (AND: alltrigger patterns are met, OR: one trigger pattern is met), triggering does notoccur at this slope. Triggering only occurs if the conditions are removed andthen met again.
5. Set the trigger filter.・Use the function keys or the JOG control to make the setting.・Filter width is specified using sampling points.

212────────────────────────────────────────────────────
10.6 Using the Logic Trigger Function────────────────────────────────────────────────────
10-13, 24, 25
1
2
3
1
2
3
1
2
3
Function keydisplay Meaning
S1 to S16
Function keydisplay Meaning
Logic A to D
(2) While display screen is shown
1. Move the flashing cursor to the point shown inthe illustration, and select a channel that is setto logic input.
2. Move the flashing cursor to the point shown inthe illustration, and select a logic channel.
3. Set the logic trigger conditions (same as steps 1to 4 when using the STATUS screen).

213────────────────────────────────────────────────────
10.6 Using the Logic Trigger Function────────────────────────────────────────────────────
OR
Trigger pattern
CHA1 1
CHA2 0
CHA3 ×
CHA4 ×
AND
Trigger pattern
CHA1 1
CHA2 0
CHA3 ×
CHA4 ×
Setting example of the logic trigger
(1) If the trigger pattern has been set to "10××" with the operator OR, thentriggering occurs as shown in the figure below.
(2) If the trigger pattern has been set to "10××" with the operator AND, thentriggering occurs as shown in the figure above.

214────────────────────────────────────────────────────
10.7 Using the External Trigger Function────────────────────────────────────────────────────
External trigger connector
2
1
Function keydisplay Meaning
: External trigger is not used.
: External trigger is used.
NOTE
10.7 Using the External Trigger Function
・An external signal can be used as trigger source.・The EXT TRIG connector is used for this purpose.・For details, refer to Section 21.3.
Method Screen: STATUS (page 2)
1. Move the flashing cursor to the external item.
2. Press F2 [ ON ].
The external trigger cannot be linked to other trigger sources with the logicalAND operator.

215────────────────────────────────────────────────────
10.8 Using the Timer Trigger Function────────────────────────────────────────────────────
Time interval
Start time End time
Time interval
2
1
3
4
5
Function keydisplay Meaning
: Timer trigger is not used.
: Timer trigger is used.
Function keydisplay Meaning 10-g15
Set numerals for month, day, hour,minute
:Use current time as start time or endtime
10.8 Using the Timer Trigger Function
・This function serves to activate recording at preset times.・Triggering can be performed at constant intervals within a preset start time
and end time.
Method Screen: STATUS (page 2)
1. Move the flashing cursor to the timer source item.
2. Press F2 [ ON ].
3. Set the start time (month, day, hour, minute).
Move the flashing cursor to the start item.Use the function keys or the JOG control tomake the setting.

216────────────────────────────────────────────────────
10.8 Using the Timer Trigger Function────────────────────────────────────────────────────
Function key display Meaning com/jog3
Set numerals for month, day, hour, minute
NOTE
Start time
Measurement startInvalid (overlaps with recording)
Level triggerslope:
Timer trigger
Interval
End time
Recording length
4. Set the end time (month, day, hour, minute).
Move the flashing cursor to the stop item.Use the function keys or the JOG control to make the setting.
5. Set the trigger interval (day, hour, minute, second).
・The setting range is 0 s to 10 d 23 h 59 m 59 s.Move the flashing cursor to the interval item.Use the function keys or the JOG control to make the setting.
Set the start time and end time to a point after the pressing of the STARTkey.
Relation between timer trigger and AND/OR linking
(1) When trigger sources are set to OR
All trigger sources are valid. If other trigger sources have been set, triggeringcan also occur before the start time or after the end time.

217────────────────────────────────────────────────────
10.8 Using the Timer Trigger Function────────────────────────────────────────────────────
Start time End time
Invalid (overlaps with recording)
Invalid (not more than one trigger in interval)Outside oftimer trigger
AND AND AND
Measurementstart
Level triggerslope
Timer trigger
Recording length
Interval
Outside oftimer trigger
NOTE
(2) When trigger sources are set to AND
・Measurement is carried out from the start time to the end time. Triggeringoccurs at the preset intervals if the conditions for the other trigger sources arealso met at these points.
・If the interval has been set to 0s, triggering occurs at any point between thestart and end time, if if the conditions for the other trigger sources are met.
・ When the trigger mode has been set to SINGLE, only one triggering actionoccurs after the measurement was started.・ To perform recording at regular intervals, establish the following settings.
Trigger mode: continuousTrigger source linking: AND or OROther trigger sources: all OFF

218────────────────────────────────────────────────────
10.9 Trigger Output Connector────────────────────────────────────────────────────
Trigger output connector
10.9 Trigger Output Connector
・When triggering occurs, a signal is output from the TRIG OUT connector.・This can be used to synchronize several 8846 units.・For details, refer to Section 21.4.

219────────────────────────────────────────────────────
11.1 Overview────────────────────────────────────────────────────
1
2
3
4
5
6
7
8
9
10
11
12
13
14
15
Chapter 11SYSTEM Screen Settings
11.1 Overview
(For all functions)
The SYSTEM screen serves to set the following items which are common to allfunctions. (Refer to the following Sections)
・Setting the clock (11.3.1)
・Clearing waveform data (11.3.2)
・System reset (11.3.3)
・Channel selection (11.4.1)
・Start key backup (11.4.2)
・Setting the grid (11.4.3)
・Channel marker function (11.4.4)
・Time axis display (11.4.5)
・List and gauge functions (11.4.6)
・Backlight saver function (11.4.7)
・Setting screen colors (11.4.8)
・Setting the volume (11.4.9)
・Intermittent printing (11.4.10)
・Setting the screen hard copy destination (11.4.11)
・Display language setting (11.4.12)
・Scaling function (11.5)
・Appending comments (11.6)
・Self-test (11.7)
・Interface settings (11.8)

220────────────────────────────────────────────────────
11.2 How to Use the SYSTEM Screen────────────────────────────────────────────────────
Flashing cursor ・ 1/2Function key
display Meaning 11-g01##
: Set clock / clear waveform data /system reset ( Section 11.3)
: Channel selection and other functions( Section 11.4)
: Scaling function ( Section 11.5)
: Input titles and comments( Section 11.6)
: Switch to page 2/2
・ 2/2Function key
display Meaning 11-g02
: Perform self-test ( Section 11.7)
: Make interface settings( Section 11.8)
: Switch to page 1/2
11.2 How to Use the SYSTEM Screen
・Press the SYSTEM key to call up the SYSTEM screen.・On the SYSTEM screen, items common to all functions are displayed.・Use the function keys to select the item you wish to set and then make the
setting. (Press the SYSTEM key to switch items.)・When the flashing cursor is at the point shown in the illustration, the function
keys have the following assignments.
Method 11-01###

221────────────────────────────────────────────────────
11.3 Initialization [ INITIALIZE ]────────────────────────────────────────────────────
1
2
3
4
5
6
7
8
9
10
11
12
13
14
15
11.3.1 Setting the Clock [ TIME SET ]
11.3 Initialization [ INITIALIZE ]
Setting the clock (TIME SET), clearing waveform data (DATA CLEAR), andinitialization of setting items (SYSTEM RESET) are available.
Method Screen: SYSTEM (INITIALIZE) 11-02##1. Press F1 [ INITIALIZE ].
2. Move the flashing cursor to the setting item, andpress the function key to make the selection.
For details on settings, see Sections 11.3.1 to11.3.3.
This unit incorporates a calendar with automatic leap year compensation and24-hour clock.
The clock is used for the following functions:
・Display of year/month/day/hour/minutes/seconds on STATUS, CHANNEL, andSYSTEM screens
・Timer trigger function・Trigger time list printout・Date/time printout at every 5 DIV when time axis is set to DATE

222────────────────────────────────────────────────────
11.3 Initialization [ INITIALIZE ]────────────────────────────────────────────────────
1
2
11-03
Function keydisplay Meaning 11-g03
Set numerals for year, month, day,hour, minute, second
:Insert current date and time inrespective fields
: Start clock
11.3.2 Clear Waveform Data [ DATA CLEAR ]
1
2
Function keydisplay Meaning 11-g04
: Clear waveform data
NOTE
Method Screen: SYSTEM (INITIALIZE)
1. Move the flashing cursor to the year, month, day,hour, minute, second items of (1) TIME SET andmake the settings.
2. Press F5 [ set ] to start the clock.
Clears waveform data stored in memory.
Method Screen: SYSTEM (INITIALIZE) 11-041. Move the flashing cursor to (2) DATA CLEAR.
2. Press F1 [ exec ].
When memory segmentation ( Chapter 17) is used, data in all blocks arecleared.

223────────────────────────────────────────────────────
11.3 Initialization [ INITIALIZE ]────────────────────────────────────────────────────
1
2
3
4
5
6
7
8
9
10
11
12
13
14
15
11.3.3 System Reset [ SYSTEM RESET ]
1
2
Function keydisplay Meaning 11-04
: Reset all system items
Memory recorder function
Settings Display items Initial settings
Time axis range time/div 500 μs/DIV (8927 notinstalled), 1 ms/DIV
Recording length shot 25 DIV
Display format format SINGLE
Interpolation dot-line LINE
Superimpose superimpose OFF
Printer recording format print mode WAVEFORM
Smooth printAuto printAuto save
smooth printauto printauto save
OFF
Trigger mode trig mode SINGLE
Pretrigger pre-trig 0%
Trigger source AND/OR trigger source OR
Trigger source analog trigger all OFF
Memory segmentationAveragingWaveform decisionWaveform parametercalculationWaveform processing
memory divaveragingwave comparisonmeasurement
wave calculation
OFF
・Resets all settings to the factory default values.・The same effect can be achieved by turning power to the unit on while holding
down the STOP key ( Section 23.5).
Method Screen: SYSTEM (INITIALIZE)
1. Move the flashing cursor to the (3) SYSTEM RESETitem.
2. Press F1 [ exec ].
System reset list
(1) STATUS screen

224────────────────────────────────────────────────────
11.3 Initialization [ INITIALIZE ]────────────────────────────────────────────────────
Recorder function
Settings Display items Initial settings
TIme axis range time/div 10 ms/DIV (8927 notinstalled), 20 ms/DIV
Time axismagnification
time/div zoom ×1
Recording time recording time 0 s
Display format format SINGLE
Interpolation dot-line LINE
Recording medium recording medium OFF
Printer recordingformat
print mode WAVEFORM
Smooth printMicrophone
smooth printmic OFF
Trigger mode trig mode SINGLE
Trigger source AND/OR linking
trigger source OR
Trigger source analog trigger all OFF
Waveform parametercalculation
measurement OFF
FFT function
Settings Display items Initial settings
FFT mode FFT mode 1CH FFT
Frequency range max.frequency 80 kHz(8927 notinstalled), 40 kHz
Window function window RECTAN
Display format format SINGLE
Peak value displayAveraging
peakaverage OFF
Reference data reference NEW DATA
Mode (mode) STRAGE
w1 (w1) CH1
Scale (scale) AUTO
Trigger mode trig mode SINGLE
Pretrigger pre-trig 0%
Trigger sourceAND/OR
trigger source OR
Trigger source analog trigger all OFF
Interpolation dot-line LINE
Printer recordingformat
print mode WAVEFORM
Auto printAuto saveWaveform evaluation
auto printauto savewave comparison
OFF
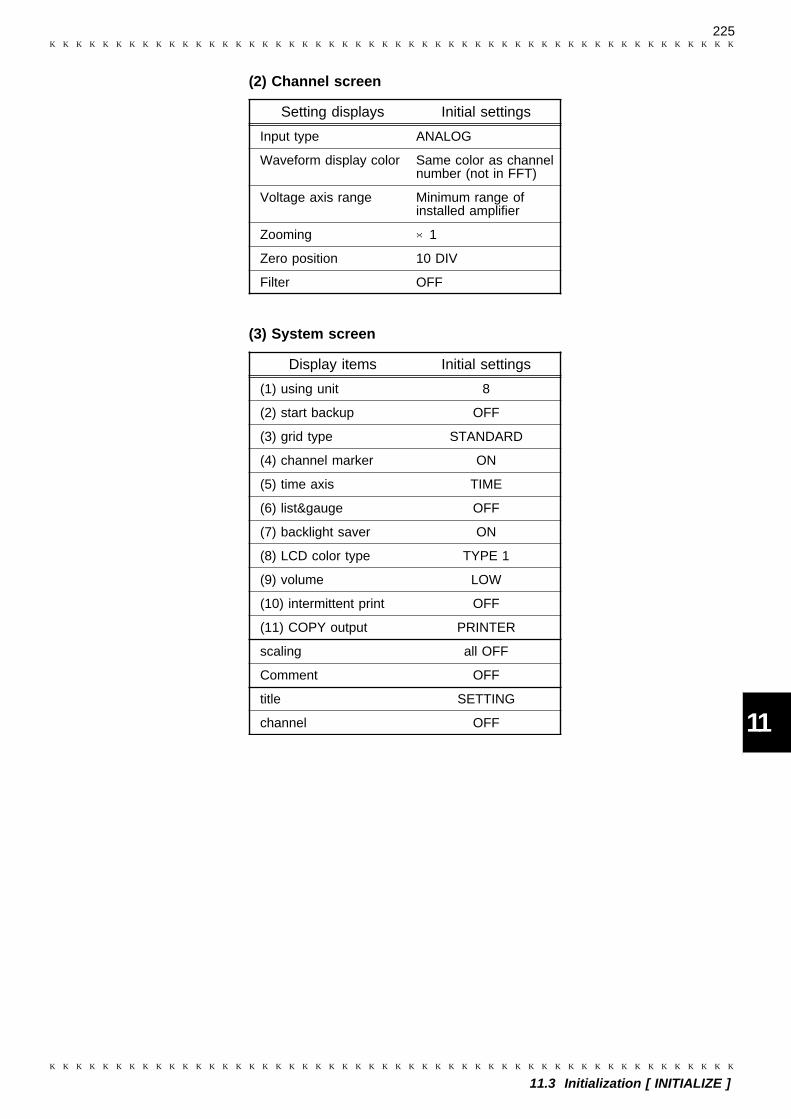
225────────────────────────────────────────────────────
11.3 Initialization [ INITIALIZE ]────────────────────────────────────────────────────
1
2
3
4
5
6
7
8
9
10
11
12
13
14
15
(2) Channel screen
Setting displays Initial settings
Input type ANALOG
Waveform display color Same color as channelnumber (not in FFT)
Voltage axis range Minimum range ofinstalled amplifier
Zooming ×1
Zero position 10 DIV
Filter OFF
(3) System screen
Display items Initial settings
(1) using unit 8
(2) start backup OFF
(3) grid type STANDARD
(4) channel marker ON
(5) time axis TIME
(6) list&gauge OFF
(7) backlight saver ON
(8) LCD color type TYPE 1
(9) volume LOW
(10) intermittent print OFF
(11) COPY output PRINTER
scaling all OFF
Comment OFF
title SETTING
channel OFF

226────────────────────────────────────────────────────
11.4 Special Function Settings [ SETUP ]────────────────────────────────────────────────────
11.4 Special Function Settings [ SETUP ]
The following 10 functions are available.
(1) Channel selection ( 11.4.1 )
(2) Start key backup ( 11.4.2 )
(3) Setting the grid ( 11.4.3 )
(4) Channel marker function ( 11.4.4 )
(5) Time axis display ( 11.4.5 )
(6) List and gauge functions ( 11.4.6 )
(7) Backlight saver function ( 11.4.7 )
(8) Setting screen colors ( 11.4.8 )
(9) Setting the volume ( 11.4.9 )
(10) Intermittent printing ( 11.4.10 )
(11) Setting the screen hard copy destination (11.4.11)
(12) Setting the display language ( 11.4.12 )
Method Screen: SYSTEM (SETUP) 11-06 ##1. Press F2 [ SETUP].
2. Move the flashing cursor to the various itemsand use the function keys to make the selection.
For details, see Sections 11.4.1 - 11.4.11.

227────────────────────────────────────────────────────
11.4 Special Function Settings [ SETUP ]────────────────────────────────────────────────────
11.4.1 Channel Selection [ using unit ]
NOTE
CH3 CH1
CH4 CH21 unit
4 units8 units
2 unit
2
1Function key
display Meaning
1, 2, 4, 8 (unit)
・This function allows limiting the number of units to be used.・Be sure to make this setting before measurement.・Units in use are assigned to channels in ascending order.
・ When using the memory recorder function, the number of units determines theavailable recording length ( Section 6.2.3).・ When using the recorder function, the number of units determines the
available time axis range ( Section 7.2.2).
Method Screen: SYSTEM (SETUP) 11-07###
1. Move the flashing cursor to the (1) using unit item.
2. Use the JOG control or the function keys to makethe selection.

228────────────────────────────────────────────────────
11.4 Special Function Settings [ SETUP ]────────────────────────────────────────────────────
11.4.2 Start Key Backup [ start backup ]
If power fails during recording...
...recording is restarted when power is restored.
2
1
Function keydisplay Meaning com/off
: Start key backup is not enabled.
: Start key backup is enabled.
When this function is enabled, the unit will operate as follows: If the powersupply is interrupted during measurement (while the START key LED is lit),recording is restarted immediately as soon as the power is restored. If thetrigger function is used, the unit goes into trigger standby mode.
Method Screen: SYSTEM (SETUP) 11-08 ##1. Move the flashing cursor to (2) start backup item.
2. Press the function key to make the settings.

229────────────────────────────────────────────────────
11.4 Special Function Settings [ SETUP ]────────────────────────────────────────────────────
11.4.3 Setting the Grid [ grid type ]
The DISPLAY screen
Grid: OFF Grid: ON(excluding the OFF setting)
11-40, 41
Printed recordings
OFF Standard Fine
Standard (dark) Fine (dark)
Standard (shaded) Fine (shaded)
・Sets the type of grid to be used for printout.・The following seven settings are available: OFF (no grid), standard, fine,
standard (dark), fine (dark), standard (shaded), fine (shaded).・Only OFF and standard (used at any other setting) are available for the
display.

230────────────────────────────────────────────────────
11.4 Special Function Settings [ SETUP ]────────────────────────────────────────────────────
2
1
11-09 ##
・ 1/2Function key
display Meaning 11-g08
: Off
: Standard
: Fine
: Switch to page 2/2
・ 2/2Function key
display Meaning 11-g22
: Standard (dark)
: Fine (dark)
: Standard (shaded)
: Fine (shaded)
: Switch to page 1/2
NOTE
Method Screen: SYSTEM (SETUP)
1. Move the flashing cursor to (3) grid type item.
2. Press the function key to make the settings.
For the FFT function, the settings are "Standard (shaded)" → "Standard(dark)", "Fine (shaded)" → "Fine (dark)".
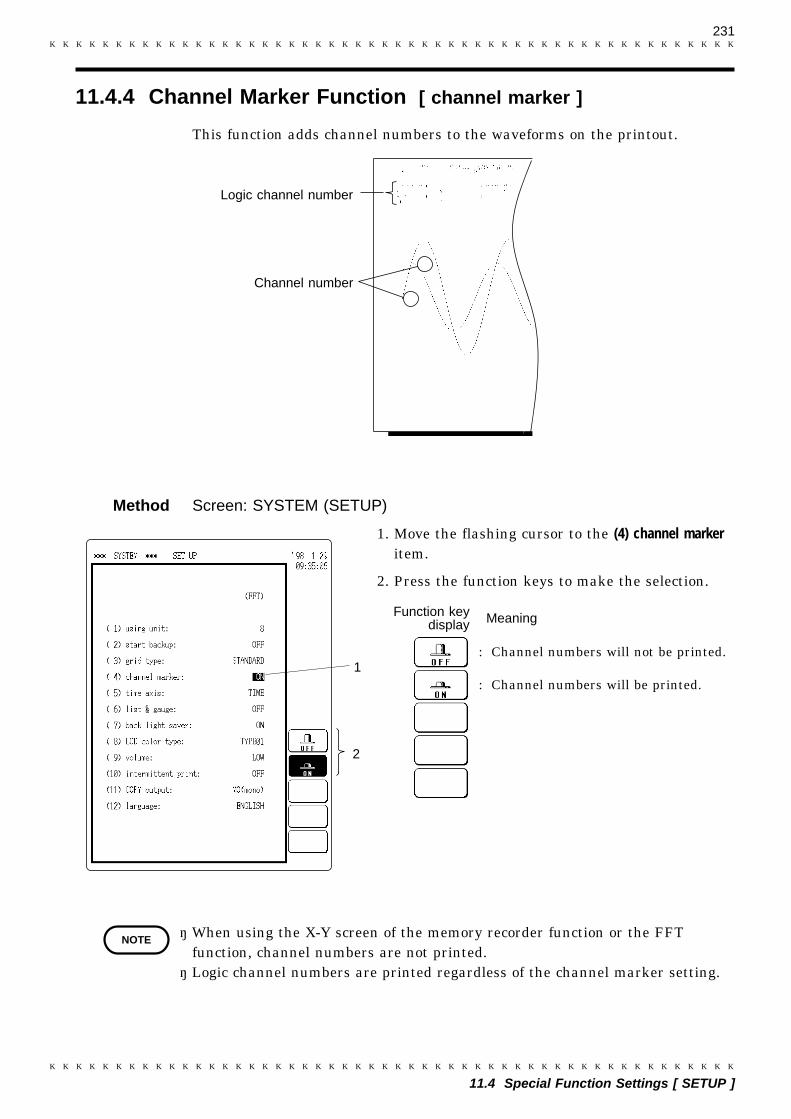
231────────────────────────────────────────────────────
11.4 Special Function Settings [ SETUP ]────────────────────────────────────────────────────
11.4.4 Channel Marker Function [ channel marker ]
Logic channel number
Channel number
scan/11.4.4
2
1
Function keydisplay Meaning
: Channel numbers will not be printed.
: Channel numbers will be printed.
NOTE
This function adds channel numbers to the waveforms on the printout.
Method Screen: SYSTEM (SETUP) 11-10 ##1. Move the flashing cursor to the (4) channel marker
item.
2. Press the function keys to make the selection.
・ When using the X-Y screen of the memory recorder function or the FFTfunction, channel numbers are not printed.・ Logic channel numbers are printed regardless of the channel marker setting.

232────────────────────────────────────────────────────
11.4 Special Function Settings [ SETUP ]────────────────────────────────────────────────────
11.4.5 Time Axis Display [ time axis ]
Time
Time (base 60)
Scale
Date
+0s +300s
+0s +5min
0 +5
'96-11-22 03:00:00 000'000" '96-11-22 03:05:00 000'000"
2
1
Function keydisplay Meaning 11-g10
: Displays the time from the triggerpoint (unit: fixed).
: Displays the time from the triggerpoint (unit: base 60).
: Displays the number of DIV fromtrigger point.
: Print date and time every 5 DIV
NOTE
Determines the way the time from the trigger point is printed out.
Method Screen: SYSTEM (SETUP) 11-11 ##1. Move the flashing cursor to the (5) time axis item.
2. Use the function keys to make the selection.
・ When using the FFT function, DIV and DATE are identical to TIME.・ When external sampling is used, the following applies.
(1) If printer format is set to WAVE, the "Scale" setting is used in any case.(2) If printer format is set to LOGGING, the setting except "Scale" is the sampling
count.If printer format is set to LOGGING and "Date" is used, μs and lower valuesare discarded.

233────────────────────────────────────────────────────
11.4 Special Function Settings [ SETUP ]────────────────────────────────────────────────────
11.4.6 List and Gauge Functions [ list & gauge ]
Graph List of settings
scan/11.4.6-1, 2 ##CH1 gauge CH2 gauge
5.0
CH2
4.5
10.0
CH1
9.0
2
1
Function keydisplay Meaning 11-g11
: No gauges or listing
: Print listing only
: Print gauges only
: Print both gauges and listing
NOTE
When a waveform is being printed (except for screen hard copies), a gauge(vertical scale) and list of setting items can be added.
Method Screen: SYSTEM (SETUP) 11-12##1. Move the flashing cursor to (6) list & gauge item.
2. Use the function keys to make the selection.
・ The gauge is only printed for channels for which the waveform is beingdisplayed.・ When the X-Y plot of the memory recorder function is used, the number of
gauges for the X axis is restricted to 2.・ When single screen display is used, channels using the same voltage range,
magnification/compression factor, zero position, variable setting, and scalingsetting are displayed with the same gauge.

234────────────────────────────────────────────────────
11.4 Special Function Settings [ SETUP ]────────────────────────────────────────────────────
11.4.7 Backlight Saver Function [ backlight saver ]
2
1
Function keydisplay Meaning
: Backlight is always on
: Backlight is turned off automatically
Up/down keys
Turning the LCD backlight off
・When this function is enabled, LCD backlighting is turned off automatically ifno key is pressed for about 10 minutes.
・Pressing any key will turn the backlight on again.・This increases the service life of the backlight.
Method Screen: SYSTEM (SETUP) 11-13##1. Move the flashing cursor to the (7) backlight saver
item.
2. Use the function keys to make the selection.
LCD backlight ON/OFF
・To turn the LCD backlight off:press the up and down cursor keys simultaneously.
・To turn the LCD backlight on:press any key.

235────────────────────────────────────────────────────
11.4 Special Function Settings [ SETUP ]────────────────────────────────────────────────────
11.4.8 Setting Screen Colors [ LCD color type ]
2
1
Function keydisplay Meaning com/jog1
: Switch to the next higher pattern
: Switch to the next lower pattern
: Reset to type 1
NOTE
The user can choose between various color patterns for the display.
Method Screen: SYSTEM (SETUP) 11-14##1. Move the flashing cursor to the (8) LCD color type
item.
2. Use the function keys to make the selection.
Changing the display color has no effect on theprintout (normal printing, screen hard copy, A4print).

236────────────────────────────────────────────────────
11.4 Special Function Settings [ SETUP ]────────────────────────────────────────────────────
11.4.9 Setting the Volume [ volume ]
2
1
Function keydisplay Meaning 11-g14
: No sound from speaker
: Volume low
: Volume medium
: Volume high
・This setting controls the volume of the error and warning beep that is alsoproduced when a waveform decision result is NG, and when stop mode isentered.
・The setting also affects the volume with which a voice memo is played backwhen using the recorder function.
Method Screen: SYSTEM (SETUP) 11-151. Move the flashing cursor to the (9) volume item.
2. Use the function keys to make the selection.

237────────────────────────────────────────────────────
11.4 Special Function Settings [ SETUP ]────────────────────────────────────────────────────
11.4.10 Intermittent Printing [ intermittent print ]
Intermittent printing OFF Intermittent printing ONscanner/11-P14
scanner/11-P15
2
1
Function keydisplay Meaning
: Intermittent printing is disabled.
: Intermittent printing is enabled.
NOTE
・When the interpolation function is set to ON and the envelope waveformexceeds 0.5 DIV, printout is carried out with reduced frequency.
・When operating the unit on DC, this can help to conserve power.・The intermittent printing setting can be chosen also when operating the unit
on AC.・Print speed will differ depending on the density of the screen display.・Real-time printing when the unit is operated from a DC source is intermittent,
also when the setting is OFF.
Method Screen: SYSTEM (SETUP) 11-161. Move the flashing cursor to the (10) intermittent
print item.
2. Use the function keys to make the selection.
・In dot display mode the intermittent printingfunction has no effect.
・In FFT mode the intermittent printing functionhas no effect.

238────────────────────────────────────────────────────
11.4 Special Function Settings [ SETUP ]────────────────────────────────────────────────────
11.4.11 Selecting the Hard Copy Destination
2
1
Function keydisplay Meaning 11-g
: Output to printer.
: Save bitmap file to MO disk(monochrome).
: Save bitmap file to MO disk (256colors).
Method Screen: SYSTEM (SETUP) 11-1. Move the flashing cursor to the (11) COPY output
item.
2. Use the function keys to make the selection.

239────────────────────────────────────────────────────
11.4 Special Function Settings [ SETUP ]────────────────────────────────────────────────────
11.4.12 Setting the Display Language
2
1
Function keydisplay Meaning 11-g
: Display in Japanese.
: Display in English
NOTE
The display languages can be switched between Japanese and English.
Method Screen: SYSTEM (SETUP) 11-1. Move the flashing cursor to the (12) language item.
2. Use the function keys to make the selection.
A system reset does not change the languagesetting.

240────────────────────────────────────────────────────
11.5 Scaling Function [ SCALING ]────────────────────────────────────────────────────
Conversion is performed using theincline (conversion ratio) and offsetvalue.
eu
V
Conversion ratio and offset value arecalculated from 2 points.
eu
V
SCH
VHVL
SCL
11.5 Scaling Function [ SCALING ]
・The scaling function can be used to convert an output voltage from a sensor orsimilar into a physical quantity.
・Two types of scaling functions are available.
Method 1 (conversion ratio method)
Scaling is performed by specifying a physical quantity to correspond to a 1Vinput signal (conversion ratio: eu/v), an offset value, and the unit (eu:engineering units). This will cause the measurement voltage to be convertedinto the selected units.
Method 2 (2-point method)
Scaling is performed by specifying two input signal points (voltage values) andthe conversion values for these two points in engineering units (eu). This willcause the measurement voltage to be converted into the selected units.
・The gauge scale (maximum and minimum values of horizontal axis) and A/Bcursor measurement values are displayed in the scaled units.
・Scaling can be performed for every channel.

241────────────────────────────────────────────────────
11.5 Scaling Function [ SCALING ]────────────────────────────────────────────────────
11.5.1 Conversion Ratio Scaling
12
Channel number
3
Scaling ON
4
Set conversionratio and offset
5
Enter engineeringunit (eu)
Function keydisplay Meaning 11-g25
: Use conversion ratio method
: Use 2-point method
Function keydisplay Meaning 11-g16
: Scaling not used
: Scaling used (specify exponent asinteger)
: Scaling used (specify exponent asmultiple of 3)
: Conversion ratio = +1.0000E+0,offset = +0.0000E+0
Function keydisplay Meaning
0 to 9(the most significant digit and theexponent, from -9 to +9
Method Screen: SYSTEM (SCALING) 11-171. Press F3 [ SCALING ] to call up the scaling screen.
2. Move the flashing cursor to scale kind and selectRATIO.
3. Move the flashing cursor to the channel forwhich you want to perform scaling and changethe setting to ON.
4. Enter the "Conversion ratio: eu/V" and "Offset".・The setting range for both these items is -9.9999E+9 to +9.9999E+9 (exponent
E-9 to E+9).・Move the flashing cursor to each item and make the setting.

242────────────────────────────────────────────────────
11.5 Scaling Function [ SCALING ]────────────────────────────────────────────────────
11.5.2 2-Point Scaling
Channel number
4Set voltage valueconversion value.
5Enter engineeringunit (eu)
Voltage high point
3Scaling on
Voltage low point
12
Function keydisplay Meaning 11-g25
: Use conversion ratio method
: Use 2-point method
Function keydisplay Meaning 11-g18
: Scaling not used
: Scaling used (specify exponent asinteger)
: Scaling used (specify exponent asmultiple of 3)
:Enter the voltage upper and lowerlimits of screen
5. Enter the "Unit name: eu".
・The unit name can be up to 7 characters long.・When the flashing cursor is moved within the [ ] brackets, the function key
display for comment input appears.・For details on how to enter the unit name, refer to Section 11.6.1
Method Screen: SYSTEM (SCALING)
1. Press F3 [ SCALING ] to call up the scalingscreen.
2. Move the flashing cursor to scale kind and selectPOINT.
3. Move the flashing cursor to the channel forwhich you want to perform scaling and changethe setting to ON.
4. Enter the two points.・Enter the voltage value on the left and the corresponding converted value on
the right.・Enter the higher voltage value in the top row and the lower voltage value in
the bottom row.・The setting range is -9.9999E+29 to +9.9999E+29.

243────────────────────────────────────────────────────
11.5 Scaling Function [ SCALING ]────────────────────────────────────────────────────
Function keydisplay Meaning
0 to 9( -9 to +9 for the most significantdigit, -29 to +29 for exponent.)
NOTE
VH: Voltage high point SCH: Scaling high point
VL: Voltage low point SCL: Scaling low point
・Move the flashing cursor to each item and make the setting.
5. Enter the "Unit name: eu".
・The unit name can be up to 7 characters long.・When the flashing cursor is moved within the [ ] brackets, the function key
display for comment input appears.・For details on how to enter the unit name, refer to Section 11.6.1
・ When the 2-point method is used, scaling is performed using the followingequation.
・The ranges for the parts enclosed in dotted lines are as follows.
-9.9999E+9 ≦ value of enclosed part ≦ -1.0000E-9
Value of enclosed part = 0
-1.0000E-9 ≦ value of enclosed part ≦ +9.9999E+9
・When a setting outside of the above range is attempted, a warning indicationis given and the setting becomes "converted value" = "voltage value" (noscaling).
・For channels in which waveform processing result data are recorded, only theunit is valid (scaling is invalid).
・The scaling value is used for the gauge scale, upper and lower display limits,and for A/B cursor readings.
Reference The settings for one channel can be copied to another channel ( Section9.6.10).
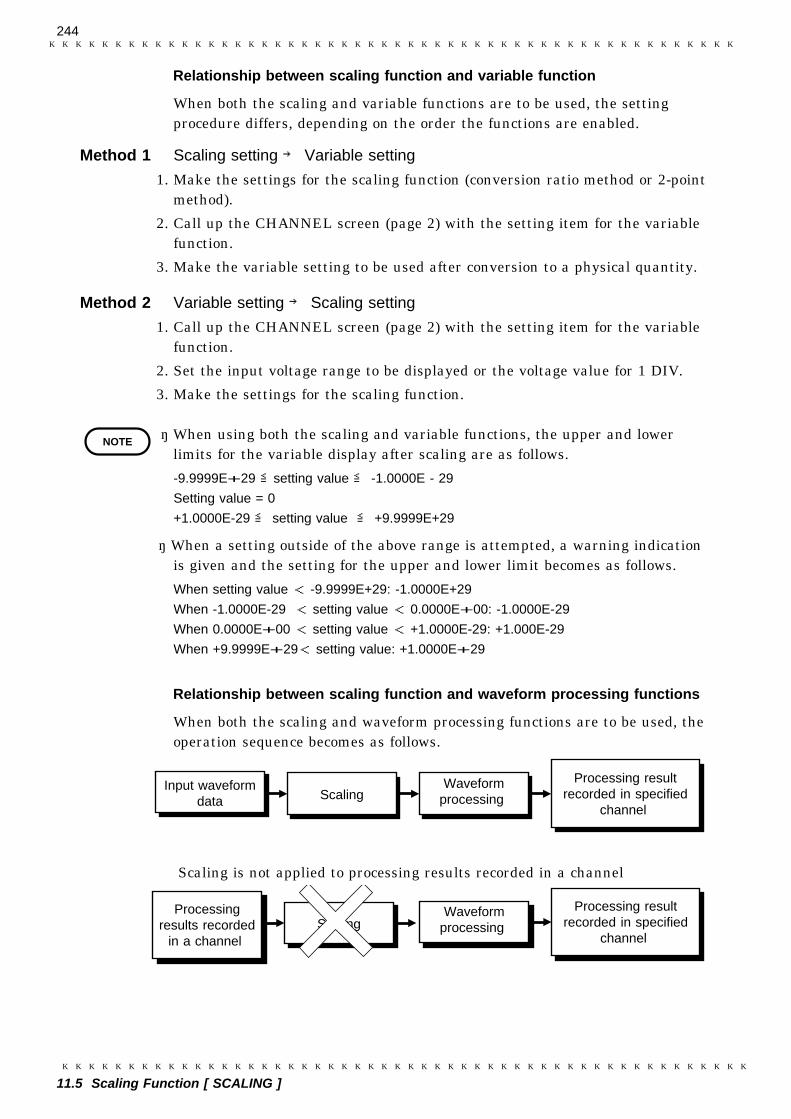
244────────────────────────────────────────────────────
11.5 Scaling Function [ SCALING ]────────────────────────────────────────────────────
NOTE
Processing resultrecorded in specified
channel
Input waveformdata Scaling
Waveformprocessing
Processingresults recorded
in a channelScaling
Processing resultrecorded in specified
channel
Waveformprocessing
Relationship between scaling function and variable function
When both the scaling and variable functions are to be used, the settingprocedure differs, depending on the order the functions are enabled.
Method 1 Scaling setting → Variable setting
1. Make the settings for the scaling function (conversion ratio method or 2-pointmethod).
2. Call up the CHANNEL screen (page 2) with the setting item for the variablefunction.
3. Make the variable setting to be used after conversion to a physical quantity.
Method 2 Variable setting → Scaling setting
1. Call up the CHANNEL screen (page 2) with the setting item for the variablefunction.
2. Set the input voltage range to be displayed or the voltage value for 1 DIV.
3. Make the settings for the scaling function.
・ When using both the scaling and variable functions, the upper and lowerlimits for the variable display after scaling are as follows.
-9.9999E+29 ≦setting value ≦ -1.0000E - 29
Setting value = 0
+1.0000E-29 ≦ setting value ≦ +9.9999E+29
・ When a setting outside of the above range is attempted, a warning indicationis given and the setting for the upper and lower limit becomes as follows.
When setting value < -9.9999E+29: -1.0000E+29
When -1.0000E-29 < setting value < 0.0000E+00: -1.0000E-29
When 0.0000E+00 < setting value < +1.0000E-29: +1.000E-29
When +9.9999E+29 < setting value: +1.0000E+29
Relationship between scaling function and waveform processing functions
When both the scaling and waveform processing functions are to be used, theoperation sequence becomes as follows.
Scaling is not applied to processing results recorded in a channel

245────────────────────────────────────────────────────
11.5 Scaling Function [ SCALING ]────────────────────────────────────────────────────
11.5.3 Scaling Setting Example
10 μF
200 Ω1/4 W
10 V p-p
60 HzSine wave
CH1CH2
Example In a circuit as shown below, the measure voltage in CH2 is to be convertedinto current.
To determine current from voltage, Ohm’s law is applied as follows.
Y = 200X (1)
X: Current flowing in resistor (A)Y: Voltage between resistor terminals (V)
Method 1 (conversion ratio method) 11-31
Equation (1) is transformed into
X = 0.005Y (2)
From equation (2), the settings for "Conversionratio (eu/V)" and "Offset" are as follows.
Conversion ratio (eu/V) = 5.0000E-3Offset = 0.0000E+0Unit : A
Use these value to make the setting. This willcause the voltage measured in CH2 to be convertedinto current (A) for observation.

246────────────────────────────────────────────────────
11.5 Scaling Function [ SCALING ]────────────────────────────────────────────────────
11-32
Method 2 (2-point method)
Equation (1) is transformed into
X=0.005Y (2)
From equation (2), two points are chosen.
Point A:When voltage Y=0 (V), then current X=0 (A)
Point B:When voltage Y=10 (V), then current X=0.05 (A)
These two points are converted.A: (0.0000E+0 → 0.0000E+0)B: (1.0000E+1 → 5.0000E-2)Unit: A
This will cause the voltage measured in CH2 to beconverted into current (A) for observation.

247────────────────────────────────────────────────────
11.6 Adding Comments to a Graph [ COMMENT ]────────────────────────────────────────────────────
2
1
3
Function keydisplay Meaning 11-G20
: Off
: Setting item is printed.
: Comment is printed.
: Both item and comment are printed.
Function keydisplay Meaning 11-G21
: Enter comment input mode
Clear the comment.:
11.6 Adding Comments to a Graph [ COMMENT ]
Comments for titles or each channel can be added. The maximum length for acomment is 20 characters in normal print (see Section 12.5).
Method Screen: SYSTEM (COMMENT) 11-19, 201. Press the F3 [ COMMENT ] key to call up the
comment setting screen.
2. Move the flashing cursor to title item.
3. Use the function key to select the item to beprinted.
4. When [ COMMENT ] or [ SET&CMT ] is selected, enterthe comment.
・When the flashing cursor is moved with theCURSOR keys, the following function keyindication appears.
・For details on comment input refer to Section11.6.1.
5. Move the flashing cursor to the channel item andselect the item to be printed, using the functionkeys. (The function key indication is the same asfor step 3.)

248────────────────────────────────────────────────────
11.6 Adding Comments to a Graph [ COMMENT ]────────────────────────────────────────────────────
11.6.1 Comment and File Name Entry Procedure
Flashing cursor(move by using jog control)
3
1Flashing cursor(move by using cursor keys)
Function keydisplay Meaning 11-G24
: Enter selected character
: Delete character left of cursor(backspace key)
: Confirm entry and terminate inputmode
NOTE
6. If comment or SET & CMT was selected, enter the comment for each channel.
Reference The settings entered for one channel can be copied to another channel.( Section 9.6.11)
When the mode for input of a comment, file name, or unit is activated, thedisplay changes as follows.
Method
1. Move the cursor to select a character.
2. Press F1 [ set char ].
3. After input characters, press F3 [ end ].
・ When the file name is input (inputting, changing, or searching of thedirectory name and file name), the following characters cannot be used.", *, +, /, =, ?, <, >, ., :, 3
・ The small letters are changed to capital letters during file input.

249────────────────────────────────────────────────────
11.7 Self Check────────────────────────────────────────────────────
NOTE
11.7 Self Check
The following tests can be carried out.
(1) ROM/RAM check ( 11.7.1 )
(2) LED check ( 11.7.2 )
(3) Printer check ( 11.7.3 )
(4) Key check ( 11.7.4 )
(5) Display check ( 11.7.5 )
(6) MO check ( 11.7.6 )
(7) D/A unit output check (when D/A output unit 9539 is installed) ( 11.7.7 )
Method Screen: SYSTEM (SELF-TEST) 11-21 ###1. Press the 2/2 function key and then the F1
[ SELF CHECK ] key.
2. Move the flashing cursor to the various itemsand use the [ exec ] function key to start the test.
For details on the various tests, refer to Sections11.7.1 - 11.7.7.
When the result of a self-test is "NG", or if anotherproblem is observed during the test, the unit shouldbe returned for servicing.

250────────────────────────────────────────────────────
11.7 Self Check────────────────────────────────────────────────────
11.7.1 ROM/RAM Check
1
2
11-22, 23
NOTE
・This test checks the internal memory (ROM and RAM) of the 8846.・The test is non-destructive; it does not affect the contents of RAM.・The result is displayed as follows. OK: Passed, NG: Failed
Method Screen: SYSTEM (SELF-TEST) 11-22##1. Move the flashing cursor to the (1) ROM/RAM check
item.
2. Press F1 [ exec ] to start the test. .
・During the test, all keys are disabled.・When "OK" appears, the test result was normal.
3. When the test is completed, press any key toreturn to the self-test setting screen.

251────────────────────────────────────────────────────
11.7 Self Check────────────────────────────────────────────────────
11.7.2 LED Check
2 red LEDs
1 yellow LED
1
・This test checks the LED indicators.・The three LED indicators on the front panel ( START key, VALUE, WAVE・A.B
CURSOR) flash simultaneously, and a beep should be heard from the speaker.
Method Screen: SYSTEM (SELF CHECK) 11-24###1. Move the flashing cursor to the (2) LED check
item.
2. Press F1 [ exec ] to start the test.
3. When the test is completed, press any key toreturn to the self-test setting screen.

252────────────────────────────────────────────────────
11.7 Self Check────────────────────────────────────────────────────
11.7.3 Printer Check
2
1
Printer test pattern
NOTE
This test checks the printer operation.
Method Screen: SYSTEM (SELF CHECK) 11-25###1. Move the flashing cursor to the (3) PRINTER check
item.
2. Press F1 [ exec ] to start the test.
To cancel the test pattern printout, press theSTOP key.
When operated from a DC source, the black sections are printed usingintermittent printing.

253────────────────────────────────────────────────────
11.7 Self Check────────────────────────────────────────────────────
11.7.4 Key Check
1
2
NOTE
NOTE
This test checks the key operation.
Method Screen: SYSTEM (SELF CHECK) 11-26, 271. Move the flashing cursor to the (4) KEY check
item.
2. Press F1 [ exec ]. The key test screen appears.
3. Press any key on the front panel. If thecorresponding field on the display changes toreverse, the key is operating normally.
4. Turn the JOG and SHUTTLE controls at least oneturn fully clockwise and counterclockwise. Whenall key fields on the screen are shown in reverse,the test is completed.
Rotate the SHUTTLE control slowly and with care.
5. Press any key to return to the self-test settingscreen.
・If any key is defective, the key test cannot not becompleted normally.
・In this case, press the START key while holdingdown the STOP key to return to the self-testsetting screen.

254────────────────────────────────────────────────────
11.7 Self Check────────────────────────────────────────────────────
11.7.5 Display Check
2
1
Test start
Display test (grid display)(red/white → green/white → blue/white → black/white)
Display test (monochrome)(red → green → blue → white → black)
Contrast test(red → green → blue)
Test end
This test checks the display.
Method Screen: SYSTEM (SELF CHECK) 11-28###1. Move the flashing cursor to the (5) DISPLAY check
item.
2. Press F1 [ exec ] to start the test.
3. When the test is completed, press any key toreturn to the self-test setting screen.

255────────────────────────────────────────────────────
11.7 Self Check────────────────────────────────────────────────────
11.7.6 MO Check
2
1
NOTE
・This test checks whether the DAT drive and the 8846 main unit arecommunicating properly.
・The result is displayed as follows.(OK: Passed, NG: Failed)
Method Screen: SYSTEM (SELF CHECK) 11-29, 30###1. Move the flashing cursor to the (6) MO check
item.
2. Press F1 [ exec ] to start the test.
During the test, all keys are disabled.
3. When the test is completed, press any key toreturn to the self-test setting screen.

256────────────────────────────────────────────────────
11.7 Self Check────────────────────────────────────────────────────
11.7.7 D/A Unit Output Check
4
3
11-44
・This item is available when the 9539 D/A OUTPUT UNIT is installed in theexpansion slot.
・Use an oscilloscope or similar to check the waveform.
Method Screen: SYSTEM (SELF-TEST)
1. Move the flashing cursor to the (7) D/A OUTPUT check item.
2. Press the F1 [ exec ] key to start the test.
3. Items for 0 V to ±6.4 V DC and sawtooth waveform (12.8 Vp-p, approx. 0.3Hz) are displayed.
Move the flashing cursor to the respective item and press F1 [ exec ].
4. The indication Output active appears. When the function key for channel 1( F2 ) or channel 2 ( F3 ) is pressed, the display appears in reverse and thewaveform is output.
5. Press the STOP key to terminate the self test.

257────────────────────────────────────────────────────
11.8 Interface Settings────────────────────────────────────────────────────
GP-IB Setting Screen
SCSI Setting Screen11-46e
11.8 Interface Settings
・Serves to set up the optional GP-IB interface and SCSI interface.・This item is available when the 9537 GP-IB INTERFACE or 9538 SCSI
INTERFACE is installed in the expansion slot.・For details on setting method, refer to the Instruction Manual of each optional
units.
7070 mode:By connecting the HIOKI 7070 WAVEFORMGENERATOR and the 8846 using the GP-IBinterface, the waveform data of the 8846 can betransferred to the 7070.The HIOKI 7070 WAVEFORM GENERATOR can bepurchased in Japan only.

258────────────────────────────────────────────────────
11.8 Interface Settings────────────────────────────────────────────────────

259────────────────────────────────────────────────────
12.1 Overview────────────────────────────────────────────────────
1
2
3
4
5
6
7
8
9
10
11
12
13
14
15
Chapter 12Printout of Waveform Data
and Processing Data
12.1 Overview
(For all functions)
Waveform data can be printed out in two formats: waveform or numeric.
A smooth print function is available for waveform printout.
The following seven printing modes are available:
・Normal print (manual)・Normal print (auto)・Real-time print・Partial print・Screen hard copy・A4 print・List print
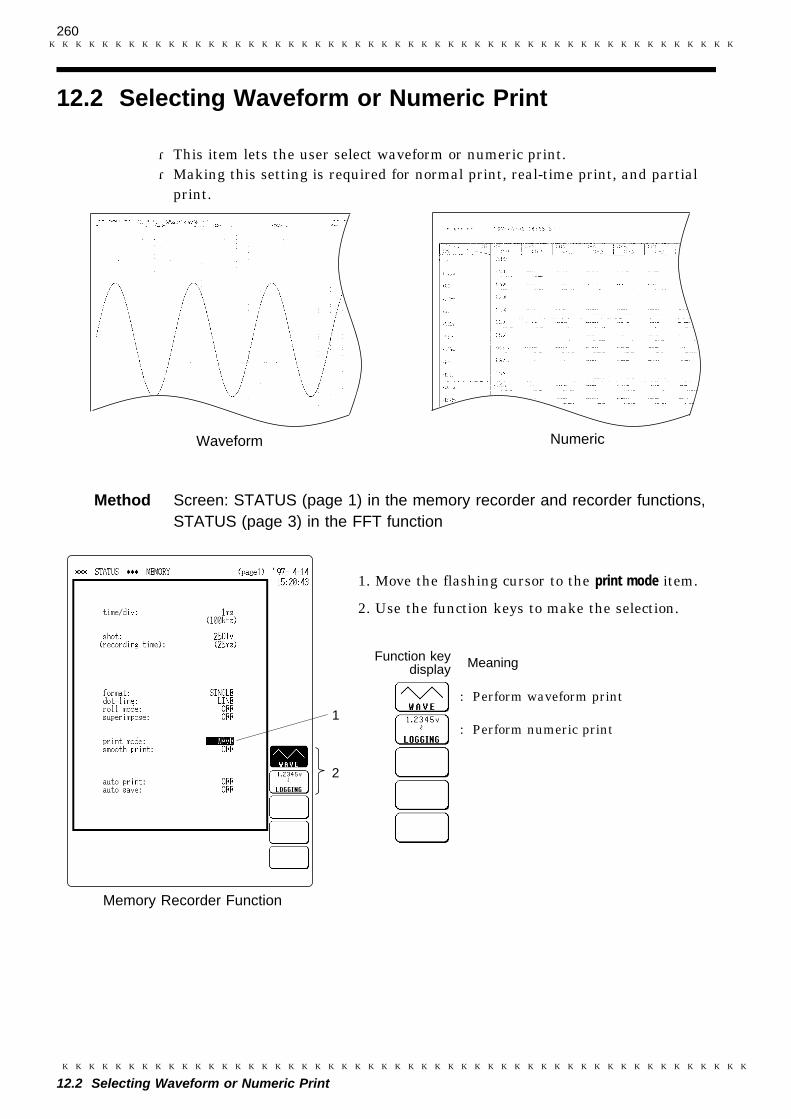
260────────────────────────────────────────────────────
12.2 Selecting Waveform or Numeric Print────────────────────────────────────────────────────
Waveformscan/12.2wav
Numericscan/12.2num
2
1
Memory Recorder Function
12-01
Function keydisplay Meaning 12-g01
: Perform waveform print
: Perform numeric print
12.2 Selecting Waveform or Numeric Print
・This item lets the user select waveform or numeric print.・Making this setting is required for normal print, real-time print, and partial
print.
Method Screen: STATUS (page 1) in the memory recorder and recorder functions,STATUS (page 3) in the FFT function
1. Move the flashing cursor to the print mode item.
2. Use the function keys to make the selection.

261────────────────────────────────────────────────────
12.2 Selecting Waveform or Numeric Print────────────────────────────────────────────────────
1
2
3
4
5
6
7
8
9
10
11
12
13
14
15
1
Recorder Function
FFT Function
2
1
2
12-02, 03
Function keydisplay Meaning
1, 2, 5, 10, 20, 50, 100, 200, 500,1000, 2000, 5000, 10000
NOTE
Item Data
Storage waveformAuto correlation functionCross-correlation functionImpulse response
1000
Octaveanalysis
1/1 octave 6
1/3 octave 16
Other functions 401
3. When numeric was selected in step 2, specify thedata sample interval to be used.
When numeric is selected in FFT mode, the numberof output data is fixed and depends on the analysistype.

262────────────────────────────────────────────────────
12.3 Using the Smooth Print Function────────────────────────────────────────────────────
Smooth print OFF Smooth print ON
Memory Recorder Function
Recorder Function
Function keydisplay Meaning
: Smooth print OFF
: Smooth print ON
NOTE
12.3 Using the Smooth Print Function
・When waveform print is selected, the smooth print function can be used.・When smooth print is enabled, dot density along the time axis increases by a
factor of 2, to achieve a smooth waveform shape. Print speed will decrease.・This option can be selected when using the memory recorder or recorder
function.
Method Screen: STATUS (page 1) in the memory recorder and recorder functions
1. Move the flashing cursor to the smooth print item.
2. Use the function key to make selection.
During real-time printing, the smooth print settinghas no effect.
12-04, 08

263────────────────────────────────────────────────────
12.4 Print Settings on SYSTEM Screen────────────────────────────────────────────────────
1
2
3
4
5
6
7
8
9
10
11
12
13
14
15
12.4 Print Settings on SYSTEM Screen
Set time axis display ( Section 11.4.5)
The time display as incremented from the trigger point can be changed.
Set grid display ( Section 11.4.3)
The type of grid to be used for printout can be changed.
Assign channel number to waveform for printout ( Section 11.4.4)
Waveforms can be printed out with channel markers.
Intermittent printing ( Section 11.4.10)
When interpolation is set to "line, intermittent printing can be carried out.
Add comment to printout ( Section 11.6)
Titles and channel comments can be appended to the printout.

264────────────────────────────────────────────────────
12.5 Printing Procedure────────────────────────────────────────────────────
12.5.1 Normal Print (Manual) (All Functions)
12.5 Printing Procedure
The following seven printing modes are available:
(1) Normal print (manual) ( PRINT key, DISPLAY screen)
(2) Normal print (auto) (set with STATUS screen)
(3) Real-time print (set with STATUS screen)
(4) Partial print (A/B cursors, PRINT key, display screen)
(5) Screen hard copy ( COPY key)
(6) A4 print ( FEED key + COPY key)
(7) List print ( PRINT key, any screen except display screen)
This mode serves to print waveform data from the internal memory or stored onMO disk, or processing results.
・Memory recorder
Measurement data from one measurement (entire recording length) areprinted.
・Recorder
If recording on tape MO disk was carried out:Data read from tape (entire recording length) are printed.
If recording on tape MO disk was not carried out:Last data set stored in memory before the end of measurement is printed.
・FFT
Processing results for one processing run are printed.
SYSTEM screen "Setup" can be used to set:
・Time axis display ( Section 11.4.5)
・Grid ( Section 11.4.3)
・Channel number for waveform ( Section 11.4.4)
・Intermittent print ( Section 11.4.10)
・Comment ( Section 11.6)

265────────────────────────────────────────────────────
12.5 Printing Procedure────────────────────────────────────────────────────
1
2
3
4
5
6
7
8
9
10
11
12
13
14
15
Print example
After measurementend or data read
12-09
Waveformscan/12.2wav
Numericscan/12.2num
NOTE
Method Screen: DISPLAY
After the measurement is completed, press the PRINT key.
Memory, FFT Data for one measurement are printed.
Recorder Last data in memory before end of measurement are printed.
After measurement data have been read from tape, press the PRINT key at thedisplay screen.
Memory, FFT Measurement results, processing results stored on tape areprinted.
Recorder Measurement data (entire recording length) stored on tapeare printed.
・Since data are stored, they can be printed as often as desired.・When magnification/compression was used, the printout reflects this condition.
If gauge print was selected at the SYSTEM screen, the number of gauges forthe X axis of the X-Y plot is restricted to 2 channels.

266────────────────────────────────────────────────────
12.5 Printing Procedure────────────────────────────────────────────────────
12.5.2 Normal Print (Auto) (Memory Recorder, FFT)
Memory Recorder Function
FFT Function
1
2
2
1
Function keydisplay Meaning 12-g04
: Disable auto print
: Enable auto print
: When trigger mode is AUTO orAUTO STOP, printing is carried outonly if recording was started throughtriggering. (In trigger modes SINGLEand REPEAT, function is same asregular auto print.)
NOTE
Printing is carried out automatically when a measured waveform is displayedon the screen.
Method Screen: STATUS 12-05, 061. Move the flashing cursor to the auto print item.
2. Use the function keys to make the selection.
3. Press the DISP key to call up the displayscreen.
4. Press the START key to start the measurement.
Printout starts when waveform is displayed onscreen.
If gauge print was selected at the SYSTEM screen,the number of gauges for the X axis of the X-Y plotis restricted to 2 channels.

267────────────────────────────────────────────────────
12.5 Printing Procedure────────────────────────────────────────────────────
12.5.3 Real-Time Print (Recorder Function)
Function keydisplay Meaning 12-g05###
: Disable store (screen display only)
: Print data on paper
: Record data on MO disk
NOTE
Time Axis Magnification for Real-time Print
Time axis range(/DIV)
Magnification of the time axis(maximum value)
1.25 ms2 ms2.5 ms5 ms10 ms20 ms50 ms100 ms200 ms500 ms1 s2 s5 s10 s20 s1 min2 min5 min10 min20 min1 h
1/8001/500
1/400 (unsettable for 1/500)1/2001/1001/501/201/101/5111111111111
The input waveform is printed out continuously in real time.
Method Screen: STATUS, DISPLAY 12-07 ###1. Move the flashing cursor to the recording medium
item.
2. Press F2 [ PRINTER ] for the recording target.
3. When measurement starts, waveform appears onscreen and printout starts.
Printer recording format: WAVE・ When real-time printing is used, magnification on the time axis is fixed, as
shown below.・ When a larger value is set, the setting is automatically corrected at the start
of measurement, according to the values shown below.

268────────────────────────────────────────────────────
12.5 Printing Procedure────────────────────────────────────────────────────
Time Axis Magnification, Output Interval (minimum value) for Real-time Print
Magnifi-cation
Time axis range ( /DIV)
1.25ms
2ms
2.5ms
5ms
10ms
20ms
50ms
100ms
200ms
500ms
1s
2s
5s
10s
20s
1 minor more
×1 - - - - - - - - - 100 100 50 20 10 5 1
×1/2 - - - - - - - - - 100 50 25 10 5 2 1
×1/5 - - - - - - - - 100 25 20 10 2 2 1 1
×1/10 - - - - - - - 100 50 20 10 5 2 1 1 1
×1/20 - - - - - - 100 50 25 10 5 2 1 1 1 1
×1/50 - - - - - 100 25 20 10 2 1 1 1 1 1 1
×1/100 - - - - 100 50 20 10 5 2 1 1 1 1 1 1
×1/200 - - - 100 50 25 10 5 2 1 1 1 1 1 1 1
×1/400 - - 100 50 25 10 5 2 1 1 1 1 1 1 1 1
×1/500 - 100 - 25 20 10 2 1 1 1 1 1 1 1 1 1
×1/800 100 50 50 25 10 5 2 1 1 1 1 1 1 1 1 1
×1/1000 25 50 25 20 10 5 2 1 1 1 1 1 1 1 1 1
×1/2000 25 25 20 10 5 2 1 1 1 1 1 1 1 1 1 1
×1/5000 10 10 5 2 2 1 1 1 1 1 1 1 1 1 1 1
×1/10000 5 5 2 2 1 1 1 1 1 1 1 1 1 1 1 1
×1/20000 2 2 2 1 1 1 1 1 1 1 1 1 1 1 1 1
×1/50000- 1 1 1 1 1 1 1 1 1 1 1 1 1 1 1 1
・The waveform color for real-time printing can be normal or light only. (Darkbecomes normal, and medium dark become light.)
・During real-time printing, the smooth print function has no effect.・During real-time printing, setting interpolation to DOT has no effect (LINE will
be used).
Printer recording format: LOGGING (numerical value)
・When magnification/compression is set to 1/2 or lower, the output value is theenvelope maximum value, not the instantaneous value.
・During real-time printing, the magnification/compression and outputincrement (minimum value) are limited by the time axis setting, as shownbelow. (If a smaller value is set, the setting is automatically corrected at thestart of measurement, according to the values shown below.)
・The output interval is for time axis/magnification ratio.
ExampleWhen 20 ms/DIV, ×1/100:Because of 50 sampling interval; 20 ms÷1/100 = 2 s/DIV (1 DIV = 100sampling), the data of 1 second interval is output.

269────────────────────────────────────────────────────
12.5 Printing Procedure────────────────────────────────────────────────────
12.5.4 Partial Print (Memory Recorder, Recorder)
This function prints the waveform between the A and B cursors (vertical or tracecursors).
・Memory recorderSpecified range (out of entire data recorded from a measurement) is printed.
・RecorderIf recording on MO was carried out:Specified range (out of entire data read from tape MO) is printed.
If recording on MO was not carried out:Specified range (out of last set of data in memory) is printed.
The function is available also when the A/B cursors are currently outside therange displayed on screen.For details regarding the use of the A/B cursors, refer to section 19.2.Printing is possible also when the print format is currently set to "numeric".If data were stored on MO disk, data are read from MO disk( Section 13.6).

270────────────────────────────────────────────────────
12.5 Printing Procedure────────────────────────────────────────────────────
Print example
scan/12.5.4wavscan/12.5.4num
12-10
Waveform Numerical Value
NOTE
Method Screen: DISPLAY
1. Position cursor A at the start point of the range to be printed.
2. Move cursor B to the right. When the cursor is at the rightmost edge of thescreen, the waveform scrolls to the left, and cursor B scrolls with it.
3. Specify the end point of the range with cursor B. Then press the PRINT key.The specified range is printed, also if cursor A is currently off screen.
・ If gauge print was selected at the SYSTEM screen, the number of gauges forthe X axis of the X-Y plot is restricted to 2 channels.・ The range is printed also if the positions of cursor A and cursor B are
reversed.・ If the horizontal cursor is selected, it is printed along with the waveform.
(Partial print is not carried out.)・ When real-time printing is carried out, the waveform is printed together with
the cursor. (Partial print is not carried out.)

271────────────────────────────────────────────────────
12.5 Printing Procedure────────────────────────────────────────────────────
12.5.5 Screen Hard Copy (All Functions)
Print example
12-09##
NOTE
・The display contents of the STATUS screen, CHANNEL screen, displayscreen, SYSTEM screen, and MO control screen can be printed out as is.
・The output destination of screen hard copy is set to printer. ( Section11.4.11)
Method 1. Call up the desired screen.
2. Press the COPY key.
The screen hard copy function is not available during measurement or duringplayback of data from MO.

272────────────────────────────────────────────────────
12.5 Printing Procedure────────────────────────────────────────────────────
12.5.6 A4 Print (Memory Recorder, Recorder)
Print example
scan/12.5.6
12-09
A 15 DIV segment of the waveformshown on the display is printed.
・This function prints the waveform range shown on the display, along with theactive settings, on an A4 size (210 × 297 mm, 8.27 × 11.69 in.) printout.
・If the A and B cursors are displayed on the screen, they are also printed.
Method Screen: DISPLAY
Call up the desired display screen and press the FEED key and COPY keysimultaneously. (Press and hold the FEED key and then press the COPY
key.)

273────────────────────────────────────────────────────
12.5 Printing Procedure────────────────────────────────────────────────────
12.5.7 List Print (All Functions)
Print example
scan/12.5.7##
12-11##
The settings for the various functions made with the STATUS screen,CHANNEL screen etc. can be printed out in list format.
Method Screen: Respective function setting screen, except DISPLAY Screen
While the setting screen (STATUS, CHANNEL, SYSTEM, DAT) is displayed,press the PRINT key.

274────────────────────────────────────────────────────
12.5 Printing Procedure────────────────────────────────────────────────────
12.5.8 Paper Change During Printing
NOTE
If the paper runs out during printing, or if the printer lever is raised, thefollowing action should be performed.
Method
1. Insert new printer paper and raise the printerlever ( Section 4.6)
2. Press the PRINT key.
・ During normal print (manual), partial print, screen hard copy, A4 print, andlist print, printing resumes from the point where it was stopped.・ During real-time printing, the data that were captured during the time when
the printer is stopped are not printed.・ During normal print (auto) with trigger mode set to REPEAT, no data recording
is carried out during the time when the printer is stopped. After paper hasbeen inserted and the PRINT key pressed, the rest of the data is printed, andthen the measurement resumes.

275────────────────────────────────────────────────────
12.6 Reading the Display and Printout────────────────────────────────────────────────────
Graph 1
Graph 2
12.6 Reading the Display and PrintoutThe relationship between the display indication and printout for the variousfunctions is shown in this section.
Memory recorder function
(1) Y-T screen (dual in this example)
・Display 12-12###

276────────────────────────────────────────────────────
12.6 Reading the Display and Printout────────────────────────────────────────────────────
Graph 1
Graph 2
Input channel settings
Indicates upperand lower limit ofwaveform
15 DIV segment (same as on display) is printed.
・Normal print scan/12.6-YT
・A4 print scan/12.6-YTA

277────────────────────────────────────────────────────
12.6 Reading the Display and Printout────────────────────────────────────────────────────
Graph 1
Graph 2
Graph 1, 3
Graph 2, 4
(2) X-Y screen (X-Y dual)・Display 12-13###
・Normal print scan/12.6-XY

278────────────────────────────────────────────────────
12.6 Reading the Display and Printout────────────────────────────────────────────────────
Graph 1, 3
Graph 2, 4
Input channel settingsscan/12.6-XYA
Indicates upperand lower limit ofwaveform
Logic
・A4 print
(3) Numeric printout scan/12.6-XYN

279────────────────────────────────────────────────────
12.6 Reading the Display and Printout────────────────────────────────────────────────────
Graph 1
Graph 2
Graph 1
Graph 2
Recorder function
(1) Y-T screen (dual in this example)
・Display 12-14###
・Normal print, real time print scan/R1 OK

280────────────────────────────────────────────────────
12.6 Reading the Display and Printout────────────────────────────────────────────────────
15 DIV segment (same as on display) is printed.
Input channel settings
Indicates upperand lower limitof waveform
Logic
・A4 print scan/12.6-RA
(2) Numerical recording scan/12.6-RN

281────────────────────────────────────────────────────
12.6 Reading the Display and Printout────────────────────────────────────────────────────
Graph 1
Graph 2
Graph 1
Graph 2
FFT function
・Display 12-15 ###
・Normal print scan/12.6-F

282────────────────────────────────────────────────────
12.6 Reading the Display and Printout────────────────────────────────────────────────────
Graph 2
scan/12.6-FN1
Graph 1
scan/12.6-FN
・Numeric printout

283────────────────────────────────────────────────────
13.1 Overview────────────────────────────────────────────────────
1
2
3
4
5
6
7
8
9
10
11
12
13
14
15
Chapter 13Storing Data on MO/
Reading Data From MO
13.1 Overview
・Data can be stored on magneto optical disk (MO).
・Waveform data, measurement setting data, and waveform parameterevaluation data can be stored in separate files.
・There are two formats for storing waveform data: binary format and textformat.
・Stored data can be used in two ways: "data read" or "playback".

284────────────────────────────────────────────────────
13.2 About the MO Disk────────────────────────────────────────────────────
Back side of disk
Write protect
Write enable
Write enableWrite protect 13-0102
13.2 About the MO Disk
MO type
・Use only commercially 3.5-inch MO disks (128, 230, 540, 640 MB: rewritable )with this unit.
Write protection
・The DDS tapes have a provision for write protection which serves to preventaccidental erasure or overwriting of data.
・When wishing to record or erase data, the tab on the tape must be set to writeenable first.
The write protect or write enable status of the tape is shown on the MOscreen, below the function key display.
FormatBefore use the MO disk to record the data with the unit, always format usingthe 8846.For details on formatting, see Section 13.10.4, "Formatting the MO Disk".

285────────────────────────────────────────────────────
13.3 MO Drive Operation────────────────────────────────────────────────────
1
2
3
4
5
6
7
8
9
10
11
12
13
14
15
Arrow mark
Manual eject holeBUSY lamp
NOTE
NOTE
13.3 MO Drive Operation
Inserting the MO disk
Insert the MO disk into the disk slot with the arrow mark facing to the right,as shown in the illustration.
The lid to the disk slot has a two-layer construction. Note that it is notpossible to insert a disk when the outer panel is closed.
Removing the MO disk
Method (MO screen)1. Press the FILE key to call up the MO screen.
2. Press the [ disk ope ] function key ( HELP key) for tape operation.
3. Press the [ eject ] function key.
・ Even if the eject button of the MO drive is pressed, the disk is not ejected.・ Do not turn the unit off during the BUSY lamp is lit. The disk may be
damaged or data may be cleared.・ If for any reason it should be impossible to remove the disk by the above
method, power off the unit and insert a pin of diameter approximately 1 mminto the manual eject hole of the MO drive, to eject the disk.
Drive head cleaning
Use a commercially available cleaning disk. For details, see Section 23.1 (3)"MO drive head".

286────────────────────────────────────────────────────
13.3 MO Drive Operation────────────────────────────────────────────────────
NOTE
Power failure backup function
・This function protects files on the MO disk as far as possible against thepossibility of a power failure occurring while recording on the MO disk.
・To use this function, note the following:
(1) Use a disk formatted on the 8846 itself (normal format).
(2) On an MO disk to be used on the 8846, do not add, delete, or rename filesusing a separate computer.
(File operations on the disk using a personal computer invalidate the backupfunction.)
・ The backup data is written to the disk at regular intervals, so in the recorderfunction the screen display may stop operating during the recording.・ If a power failure occurs immediately after measurement starts, in some cases
it may not be possible to restore saved data.・ Using Scandisk on the MO disk in either Windows 95 or Windows NT disables
the backup function.・ When reading the file in Windows 95 or Windows NT, make the disk write-
protected. Reading a file in while the disk is not write-protected again disablesthe backup function.・ Do not write to or amend the backup data (in hidden files).・ If a disk on which the power failure backup function cannot be used is
inserted in the drive, a message to that effect appears just once in the recorderfunction display. (But is not displayed if the disk is write-protected.)
Initial operation after powering on
・Immediately after power on, the MO drive carries out a self-diagnosis. TheBUSY indicator lights for about 8 seconds during the self-diagnosis operation,and goes off when the operation ends. If a fault is found, the BUSY indicatorflashes.
・If a fault appears, refer to your retail service representative.
System position during MO drive operation
During an MO drive operation (when saving or reading data), do not tilt thesystem more than 10 degrees from its horizontal or vertical position. (Do notuse the stand located at the rear of the system.)

287────────────────────────────────────────────────────
13.4 Displaying File List and File Information────────────────────────────────────────────────────
1
2
3
4
5
6
7
8
9
10
11
12
13
14
15
13.4.1 Displaying a File List
File type
2
NOTE
Function keydisplay Meaning
: Close the current directory anddisplay the above directory
: Display the files in directory
13.4 Displaying File List and File Information
・You can display a list of files contained on a MO disk.・You can check the contents of stored files.
File name, the date and time are displayed when the data is stored in a file.
Method Screen: MO 13-03, 04##1. Press the FILE key to call up the MO screen.
2. Insert a disk.The data stored on MO disk is automaticallylisted.
Up to 1000 files can be displayed in a singledirectory.
File type (mode) display・Waveform data, measurement settings XXX.MEM (memory recorder, binary format) XXX.REC(recorder, binary format) XXX.FFT(FFT, binary format) XXX.TXT(text format) XXX.SEQ (sequential save file) XXX.MUL (multiblock file)・Measurement settings XXX.SET・Evaluation area XXX.ARE
Opening and closing directories
1. Move the flashing cursor to the <DIR> file.
2. Press the F1 and F2 key to open or close thedirectory.

288────────────────────────────────────────────────────
13.4 Displaying File List and File Information────────────────────────────────────────────────────
13.4.2 Displaying File Information
Up
To next page
Down
To previous page
Up Down
Flashing cursor 13-03 13-05
2
NOTE
The measurement settings that were used to store the file and title commentscan be displayed.
Method Screen: MO
1. Display the file list ( Section 13.4.1).
2. Move the flashing cursor to the desired file, and press F1 [ file info ].
Moving the flashing cursorCURSOR keys JOG/SHUTTLE control
STOP key: To first file
START key: To last file
Depending on the usage condition of the tape, up to 3 minutes may elapsebefore the information is displayed.

289────────────────────────────────────────────────────
13.5 Storing Data on a MO Disk────────────────────────────────────────────────────
1
2
3
4
5
6
7
8
9
10
11
12
13
14
15
13.5.1 Storing Memory Recorder and FFT Data
NOTE
4
13-03
・ 1/2 (or 1/3)Function key
display Meaning FILE
: Display file information ( 13.4.2)
: Read data ( 13.6)
: Store data
: Switch to 2/2
13.5 Storing Data on a MO Disk
The following three store types are available.
・Storing data on MO disk after measurement is completed.・Storing data automatically during measurement (auto store).・Storing data between cursors after measurement is completed (memory
recorder function only)
There is a limit of 10,000 on the number of files that can be stored in a singledirectory Automatic saving, however, continues as long as there is space onthe disk (512 files in the root directory, including hidden files).
(1) Storing data on MO disk after measurement is completed
・Waveform data gained with the memory recorder or FFT function are storedon MO disk .
・Measurement setting data and evaluation area data are stored in separatefiles.
Method Screen: Memory recorder or FFT→MO
1. Record the waveform with the memory recorderor FFT function.
2. Insert a MO disk in the unit.
3. Without changing the measurement function,press the FILE key.
4. When the directory in which the data is stored isdisplayed, press F3 [ SAVE ].

290────────────────────────────────────────────────────
13.5 Storing Data on a MO Disk────────────────────────────────────────────────────
5
Function keydisplay Meaning 13-g04
:Store recorded waveform data andsome measurement settings (.MEM,FFT, or .TXT file)
: Store current settings (.SET file)
: Store only evaluation area recordedin memory (.ARE file)
: Return to the previous setting item.
NOTE
Function keydisplay Meaning 13-G27
: Store only waveform data selected.
: Store all waveform data recorded ineach blocks.
6
Function keydisplay Meaning 13-G28
: Store data
: Activate file name input mode
: Recall up to the last ten file namesconfirmed or deleted.
: Delete a file name
: Return to the previous setting item
5. Select the file type with the function keys.
・The waveform data, settings, and evaluation areaare stored only for the currently selectedfunction.
・The stored data content depends on the file type( Section 13.5.4).
When the memory is segmented in the memory recorder function.Press F1 [ WAVE ] to select the type of save.
When F2 [ all blocks ] is selected, files for all blocks as well as a file for readingthe data in one operation (.SEQ for sequential save and .MUL for multi-blocksave) are created.
6. Enter the file name.
・Move the flashing cursor to the file name item( Section 11.6.1).
・The file name can be entered up to 8 characters.・If no file name is entered, a file name is assigned
automatically ( Section 13.5.3). Input the filename.

291────────────────────────────────────────────────────
13.5 Storing Data on a MO Disk────────────────────────────────────────────────────
7
Function keydisplay Meaning 13-G29
: Execute the store data
: Save in binary format
: Save in text format
Function keydisplay Meaning 13-G30へんこう
: Execute the store data
: Do not store header
: Store header data (for Excel)
: Store header data (for DADiSP)
Function keydisplay Meaning 13-G31
: Execute the store data
OFF, 1/2, 1/5, 1/10, 1/20, 1/50, 1/100,1/200, 1/500 1/10000
NOTE
7. When "waveform data" was selected, select thetype of storing data.
Data in binary format is not directly accessible ona personal computer, but is much more compact.Text data can be read directly into spreadsheetor other software on the computer.
13-08・When the text format is selected:
When the header presence or absence selection is madeThe header includes the date and time of saving, the channels saved, andother information.
Select the data intermittent.
The setting cannot be made in FFT function.

292────────────────────────────────────────────────────
13.5 Storing Data on a MO Disk────────────────────────────────────────────────────
Function keydisplay Meaning 13-G32
: Execute the store process
: Store data for selected channel
: Do not store data for selected channel
: Store data for all channels
: Return to file list screen
7
5
6Function key
display Meaning 13-G33
: Disable auto store
: Store memory data on MO
: Store only data recorded aftertriggering on MO
8. When "waveform data" was selected, move the flashing cursor to thechannel item and select the channel whose data are to be stored.○: store, ×: not store
9. Press the F1 [ exec ] to store the data on the MO.
(2) Storing data automatically on MO disk during measurement
・After storing the input waveform in memory and displaying it on the screen, itis stored automatically on MO disk (data are stored each time when awaveform is captured).
・Waveform data (all data in all units in use) and measurement settings (.MEM,.FFT, .TXT file) are stored.
Method Screen: STATUS in Memory recorder (page 1), FFT (page 3)
1. Insert the MO disk into the unit.
2. Press the FILE key to display the MO screen.
3. Make a display of directory in which the data isstored.
4. Press the STATUS key to select the function.
5. Move the flashing cursor to the auto save item onthe STATUS screen.
6. Use the function keys to make the selection.

293────────────────────────────────────────────────────
13.5 Storing Data on a MO Disk────────────────────────────────────────────────────
Function keydisplay Meaning 13-G34
: Save in binary format.
: Save in text format.
Function keydisplay Meaning 13-G35へんこう
: Do not store header
: Store header data (for Excel)
: Store header data (for DADiSP)
Function keydisplay Meaning 13-G36
OFF, 1/2, 1/5, 1/10, 1/20, 1/50, 1/100,1/200, 1/500 1/10000
NOTE
7. Move the flashing cursor to saving format item to select the type of storing.
・When the text format is selected:
When the header presence or absence selection is madeThe header includes the date and time of saving, the channels saved, andother information.
Select the data intermittent.
8. Start the measurement. Waveform data are recorded in memory, displayedon screen, and then stored automatically on MO disk.
The file name is assigned automatically. ( Section 13.5.3)

294────────────────────────────────────────────────────
13.5 Storing Data on a MO Disk────────────────────────────────────────────────────
The data between A and B cursors is stored13-40
(3) Select the data between cursors. (memory recorder function)・After recording the waveform data in memory recorder function, the data to be
stored is specified by the A and B cursors.・Using the vertical cursor or trace cursor specified range.
Method Screen: Memory recorder → MO screen)
1. Records the waveform data in memory recorderfunction.
2. Specify the range to be stored using the A and Bcursors (vertical or trace cursors).
3. Store data reffering to the step 3 to 8 in Section13.5.1 (1).

295────────────────────────────────────────────────────
13.5 Storing Data on a MO Disk────────────────────────────────────────────────────
13.5.2 Storing Recorder Data
6
5
7
Function keydisplay Meaning 13-G37
: Disable data recording
: Print waveform data
: Store waveform data on MO
Function keydisplay Meaning 13-G38
: Enter the file name input mode
: Recall up to the last ten file namesconfirmed or deleted.
: Delete a file name
There are following two methods of storing(1) Storing waveform data and measurement settings in real time(2) Storing settings only
(1) Storing waveform data and measurement settings・Waveform data are stored on MO disk at the same time as being displayed on
the screen.・Waveform data and measurement settings are stored (.REC file: binary format
only).・Up to 1000 files can be displayed in a single directory.
Method Screen: STATUS (page 1) 13-101. Insert the MO disk into the unit.
2. Press the FILE key to display the MO screen.
3. Make a display of directory in which the data isstored.
4. Press the STATUS key to select the recorderfunction.
5. Move the flashing cursor to the recording mediumitem.
6. Press F3 [ MO ].
7. Move the flashing cursor to the file name item to enter the file name. (11.6.1 "Comment and File Name Entry Procedure")
・The file name can be entered up to 8 characters.・If no file name is entered, a file name is assigned automatically ( Section
13.5.3). Input the file name.

296────────────────────────────────────────────────────
13.5 Storing Data on a MO Disk────────────────────────────────────────────────────
NOTE
4
・ 1/2 (or 1/3)Function key
display Meaning com/file
: Display file information
: Read data
: Store data
: Switch to page 2/2
8. Start the measurement. Waveform data are displayed on screen andsimultaneously stored on MO disk.
・ It is not possible to store only waveform data recorded in memory after themeasurement is completed.・ The backup data is written to the disk at regular intervals, so in the recorder
function the screen display may stop operating during the recording.・ When carrying out measurement with a fast time axis range, use an MO disk
which has been newly formatted by the 8846. (If the MO disk has hadfrequent file additions and deletions made, the resulting fragmentation maycause recording to be lost, and the measurement to stop. Appendix 3)・ The MO disk defect may also cause recording to be lost, and the measurement
to stop.
Event mark
・So-called "event marks" can be placed in the file, denoting the date and timeand the elapsed time since the start of recording.
・When playing back a waveform, playback can be started or stopped at thesepoints.
・It is useful to search the display position after loading a waveform.( Section 20.4)・The event marks can be used up to 1000.
Method 1 During recording (while START key LED is lit), press the START key. Method 2 Apply a signal to the START connector ( Section 21.2).
(2) Storing measurement settings only
Only the settings at the current point are stored on MO disk (.SET file).
Method Screen: MO (recorder function) 13-11, 121. Make the settings for the recorder function.
2. Insert a tape into the MO drive.
3. Press the FILE key.
4. When the directory in which the data is stored isdisplayed, press F4 [ SAVE ].

297────────────────────────────────────────────────────
13.5 Storing Data on a MO Disk────────────────────────────────────────────────────
5
6
13.5.3 Automatic File Name Assignment
!(Function) (File type)-(File number) M(Memory recorder) W (Waveform data) Number from the first of theR(Recorder) F (Setting conditions) same file 1F (FFT) A (Evaluation area) 0000 to 9999
5. Enter the file name ( Section 11.6.1).
If no file name is entered, a file name is assignedautomatically ( Section 13.5.3).
6. Press the F1 [ exec ] key to store the currentsettings on MO disk.
If no file name is input when storing data, the file name is assignedautomatically, as follows.

298────────────────────────────────────────────────────
13.5 Storing Data on a MO Disk────────────────────────────────────────────────────
13.5.4 File Contents and Size
Memory recorder
Setting item Mode WAVE FUNC AREA
Function
Time axis range
Recording length
Display format
Interpolation
Roll mode
Superimpose
Printout format
Logging cycle
Smooth print
Auto print
Auto save
Trigger setting
Memory segmentation Sequential
Multi-block
Averaging
Waveform evaluation Setting
Evaluation area
Waveform parameter Calculation
Evaluation
Waveform processing
・The contents of a file depend on the file type (WAV, SET, or ARE) and thefunction of the 8846.
・The size of a file can be roughly calculated, using the equations shown in thisSection.
(1) File contents
: Items stored in the file are marked with a circle
STATUS screen settings

299────────────────────────────────────────────────────
13.5 Storing Data on a MO Disk────────────────────────────────────────────────────
Recorder
Setting item Mode WAVE FUNC
Function
Time axis range
Recording time
Display format
Interpolation
Recording target DAT
Printout format
Logging cycle
Microphone channel
Trigger setting
Waveform parameter Calculation
Evaluation
FFT
Setting item Mode WAVE FUNC AREA
Function
FFT channel mode
Frequency range
Window function
Display format
Averaging
Reference data
Peak display
FFT analysis mode
Analysis channel
X-axis, Y-axis
Display scale
Octave filter
Trigger setting
Interpolation
Printout format
Auto print
Auto store
Waveform evaluation Setting
Evaluation area

300────────────────────────────────────────────────────
13.5 Storing Data on a MO Disk────────────────────────────────────────────────────
FunctionSetting item
Memory recorder Recorder
WAVE FUNC AREA WAVE FUNC
Time axis magnification/compression
FunctionSetting item
Memory recorder Recorder FFT
WAVE FUNC AREA WAVE FUNC WAVE FUNC AREA
Input format
Display color - - -
Display position - - -
Voltage range
Input coupling
Range magnification/compression
Zero position
Variable setting
Filter
Thermocouple type
Vernier function
FunctionSetting item
Memory recorder Recorder FFT
WAVE FUNC AREA WAVE FUNC WAVE FUNC AREA
Number of units inuse
Start backup
Grid
Channel marker
Time axis display
List and gauge
Backlight saver
Display color pattern
Volume
Intermittent print
Scaling
Comment Setting
Characters
Interface
Display screen settings
CHANNEL screen settings
SYSTEM screen settings

301────────────────────────────────────────────────────
13.5 Storing Data on a MO Disk────────────────────────────────────────────────────
NOTE
NOTE
(2) File size calculation
・The approximate file size can be calculated as follows.・The "file number" is the number of the stored file or the file to be stored, as
counted from the first file.When the remaining space on the disk drops to about 1 M bytes in recorderfunction, new data cannot be stored.
WAVE (waveform) file
・Memory recorder functionBinary format
File size (bytes) = number of channels in use×recording length (DIV)×200+28k
Text formatFile size (bytes) = (number of channels in use × 16 + 16)×
recording length (DIV)×100+header length(When using logic)File size (bytes) = (number of channels in use × 16 + 48)×
recording length (DIV)×100+header lengthHeader length no headers: 0 byte, headers on: less than 1 kbytes
・Recorder functionBinary format(when using the 128 MB, 230 MB MO disk)
File size (bytes) = number of units in use ×2N×recording time (s)/time axis (s/DIV) ×100+36k
(when using the 540 MB MO disk)File size (bytes) = number of units in use ×2N×recording time (s)/
time axis (s/DIV) ×100+40k
(when using the 640 MB MO disk)File size (bytes) = number of units in use ×2N×recording time (s)/
time axis (s/DIV) ×100+48k
When only 8916 - 8919 units are used, or when one 8927 unit is used in onechannel: N=1When only 8916 - 8919 units and 8927 units are used together, or only 8927units are used: N=2
・FFT functionBinary format: 48.9 KBText format: 14 KB approx.
Func (setting ) fileMemory recorder: 25.5 KBRecorder: 23.5 KBFFT:23KB
AREA (evaluation area) fileMemory recorder: 32.7 KB
FFT: 32.7 KB
The above figures may change slightly when new versions are introduced.

302────────────────────────────────────────────────────
13.6 Reading Data From MO Disk────────────────────────────────────────────────────
13.6.1 Reading Stored Data
3
・ 1/2 (or 1/3)Function key
display Meaning com/file
: Display file information (13.4.2)
: Read data
: Store data (13.5)
: Switch to page 2/2
13.6 Reading Data From MO Disk
This procedure reads data that were stored with the memory recorder,recorder, or FFT function.
Method Screen: MO 13-031. Insert the disk with the desired files into the MO
drive.
2. Press the FILE key.
3. Select the file to read and press the F2 [ LOAD ]
key.
4. The file information is displayed.

303────────────────────────────────────────────────────
13.6 Reading Data From MO Disk────────────────────────────────────────────────────
(2)
(3)
When .MEM
When other than .MEM(Example: REC file)
Function keydisplay Meaning 13-g18
: Normal reading is performed.
: The screen for overwrite and readingsettings appears.
Function keydisplay Meaning 13-g18
: Execute the overwrite process
: Increase channel number
: Decrease channel number
: Return to file list screen
NOTE
.MEM file(1) Select either (exec) or overwrite
(exec) The saved data, time axis, and recordlength are read. (The data saved inmemory is discarded.)
overwrite Data saved in memory is overwrittenwith the new data being read. (Datais read using the most-recently settime axis and record length.)
(2) When "overwrite" is selectedMove the flashing cursor to select the channelinto which to read the data.If reading is not performed, decrease the channelnumber and display X.
(3) After specifying the channel, press theF1 [overwrite] key to read.
・If the same number channel was selected, data inchannels with lower numbers are overwritten. (IfCH1 → 1, CH2 → 1 was selected, CH1 data areoverwritten by CH2 data.)
Files other than .MEM files
Press the F1 [ exec ] key.
5. When read-in is completed, the respectivefunction display appears on the screen.

304────────────────────────────────────────────────────
13.6 Reading Data From MO Disk────────────────────────────────────────────────────
13.6.2 Playback of Stored Data
NOTE
3
・ 2/2Function key
display Meaning 13-G40
: Play back data
:Record data stored on a MO in thememory recorder function, FFTfunction. (13.7)
: Change the file name (13.9)
: Delete the file (13.8)
: Switch to page 1/2
・Playback the waveform data (.REC file) stored in recorder function.・If the D/A output unit 9539 is installed, the analog waveform can be displayed
in real time ( Chapter 22).
The following data cannot be played back:1. Waveform data recorded with external sampling2. Waveform data recorded with a sampling frequency of 40 kHz or above
(2.5 ms/DIV)During playback, the waveform is not displayed.
Method (MO screen) ##13-151. Insert the MO disk with the desired files into the
MO drive.
2. Press the FILE key.
3. Select .REC file and press the F2 [ PLAYBACK ] key(3/3).
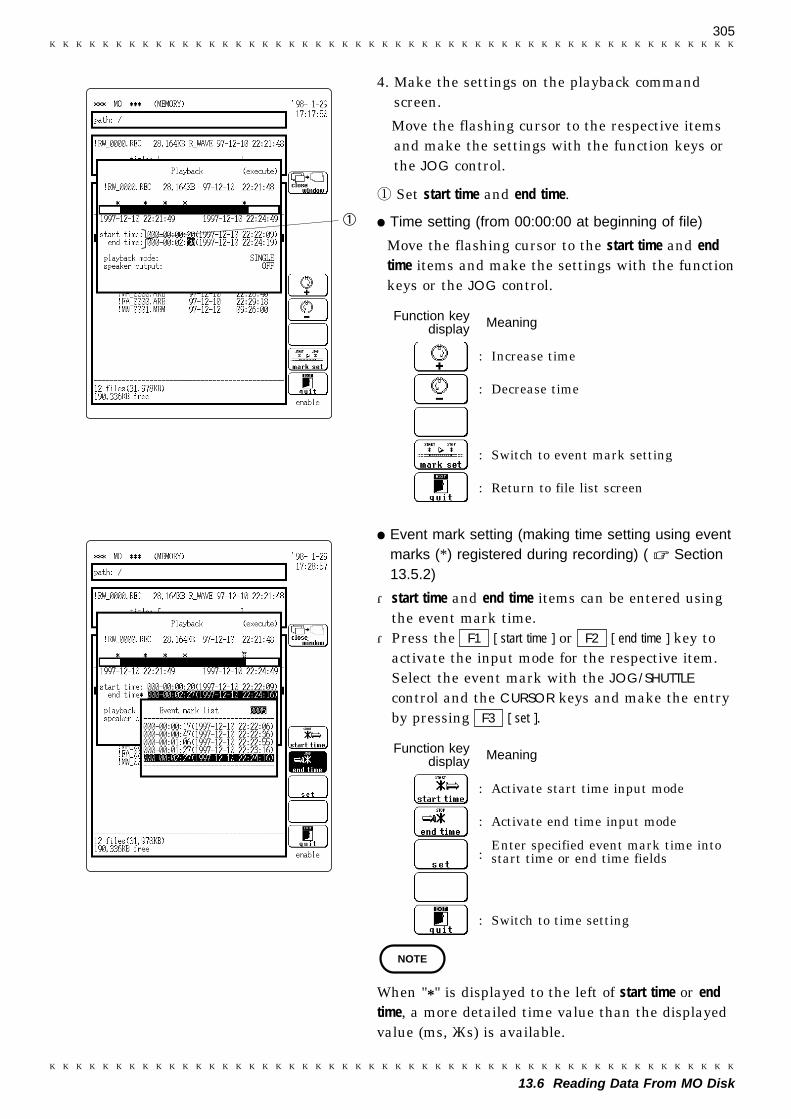
305────────────────────────────────────────────────────
13.6 Reading Data From MO Disk────────────────────────────────────────────────────
13-16
Function keydisplay Meaning 13-g11
: Increase time
: Decrease time
: Switch to event mark setting
: Return to file list screen
13-17
START TIME
STOP TIME
Function keydisplay Meaning 13-g12
: Activate start time input mode
: Activate end time input mode
:Enter specified event mark time intostart time or end time fields
: Switch to time setting
NOTE
4. Make the settings on the playback commandscreen.
Move the flashing cursor to the respective itemsand make the settings with the function keys orthe JOG control.
Set start time and end time.
Time setting (from 00:00:00 at beginning of file)
Move the flashing cursor to the start time and endtime items and make the settings with the functionkeys or the JOG control.
Event mark setting (making time setting using eventmarks (*) registered during recording) ( Section13.5.2)
・start time and end time items can be entered usingthe event mark time.
・Press the F1 [ start time ] or F2 [ end time ] key toactivate the input mode for the respective item.Select the event mark with the JOG/SHUTTLE
control and the CURSOR keys and make the entryby pressing F3 [ set ].
When "*" is displayed to the left of start time or endtime, a more detailed time value than the displayedvalue (ms, μs) is available.

306────────────────────────────────────────────────────
13.6 Reading Data From MO Disk────────────────────────────────────────────────────
13-18
Function keydisplay Meaning 13-g13
: Play back specified range once
: Play back specified range repeatedly
: Return to file list screen
Function keydisplay Meaning com/jog11.1
: Increase channel number
: Decrease channel number
: Return to file list screen
Function keydisplay Meaning
: Increase channel number
: Decrease channel number
: Return to the previous setting item
Make "Playback mode" settings.
Set speaker output.
・Select the channel data which are to be outputfrom the speaker.
・Channels for which a voice memo is recorded aremarked with microphone.
・The volume can be set using the volume optionunder "SETUP" on the SYSTEM screen( Section 11.4.9).
Set monitor output (monitor output channel 1, 2)
・This option appears when the D/A output unit9539 is installed.
・The maximum waveform output from the outputchannel is ±6.4 V.
・The setting determines whether the data areoutput from channel 1 or channel 2 of the D/Aoutput unit.

307────────────────────────────────────────────────────
13.6 Reading Data From MO Disk────────────────────────────────────────────────────
13- 20
5
NOTE
Point to interrupt playback#13
5. Move the flashing cursor to the execute positionand press the F1 [ exec ] key.The voice is played back and then waveform isoutput from the D/A output unit withoutchanging the screen.
6. When playback mode is set to REPEAT, press theSTOP key when you wish to stop playback.
When playing back waveform data as sound fromthe speaker, the waveform will not be recreatedfaithfully, due to limitations such as D/A resolution(8 bit), post- filtering (cutoff frequency≒ 8 kHz,-48 dB/oct), and characteristics of the built-in poweramplifier and speaker.
Set the point to interrupt playback to start and stop times
Playback and the point to interrupt playback can be set to start and stoptimes.
1. Follow the steps 1 to 4 in Section 13.6.2,"Playback of Stored Data."
2. Move the flashing cursor to the execute positionand press the F1 [ exec ] key.
3. After playback has started, press the STOP keyat a desired point to interrupt playback.A mark is placed at that point.
4. Move the flashing cursor to the start and stoptime items.
5. Pressing the [ to pause ] key changes the start andstop time to the point to interrupt playback.

308────────────────────────────────────────────────────
13.6 Reading Data From MO Disk────────────────────────────────────────────────────
13- 20
2
13-21
2
Read data from playback screen・Select the point for reading data.・Set the point for reading data as start time.・Carry out playback. The data of point where playback is interrupted can be
read.
Method 1 Read data of point where start time is set ..
1. Follow the steps 1 to 4 in Section 13.6.2,"Playback of Stored Data." (The stop time settingis not necessary.)
2. Move the flashing cursor to the execute positionand press the F3 [ LOAD ] key.The data of point as start time setting is read.
Method 2 Playback and read data point to interrupt playback.
1. Follow the steps 1 to 4 in Section 13.6.2,"Playback of Stored Data."
2. Move the flashing cursor to the execute positionand press the F1 [ exec ] key.
3. After playback has started, press the STOP keyat a desired point to interrupt playback.A mark is placed at that point.
4. Move the flashing cursor to the execute positionand press the F3 [ LOAD ] key.

309────────────────────────────────────────────────────
13.7 Recording the Recorder Waveform Data Stored on MO in Memory Recorder Function/FFT Function────────────────────────────────────────────────────
##13- 15
##13- 23
3
4
・ 2/2)Function key
display
##13-G40Meaning
: Playback data (13.6.2)
:Record a data stored on MO disk inmemory recorder function or FFTfunction.
: Change the file name (13.9)
: Delete the file (13.8)
: Switch to 1/2
Function keydisplay
##Meaning 13-g11
: Increase the time
: Decrease the time
: Switch to the event mark setting
: Return to the file list screen
13.7 Recording the Recorder Waveform Data Stored on
MO in Memory Recorder Function/FFT Function
(FILEtoMEM/FFTT)Recorder waveform data stored on MO disk (.REC file) are recorded using thememory recorder function or FFT function.
Method (MO→ Memory recorder function or FFT function)
1. Insert a MO disk into the unit.
2. Press the FILE key.
3. Select ".REC " file item using the cursor keys,and press the F3 [ FIILE → MEM・FFT ] key (2/2).
4. Set on the FILEtoMEM・FFT command screen.Set the start time and stop time.
Time setting(Specify the start of the file as the time point00:00:00. )
Move the flashing cursor to the start time or stoptime item to set using the jog control or functionkeys.

310────────────────────────────────────────────────────
13.7 Recording the Recorder Waveform Data Stored on MO in Memory Recorder Function/FFT Function────────────────────────────────────────────────────
##13- 24
##13- 25
5
7
6
7
Function keydisplay
##13-gMeaning
: Enter the start time input mode
: Enter the stop time input mode
: "Start time" and "Stop time" use thetime where an event mark wasplaced.
: Switch to the time setting
NOTE
NOTE
Event mark settingSet the time where an event mark (*) was placedduring recording. (See Section 13.5.2)・"Start time" and "Stop time" use the time where
an event mark was placed.・Press the "Start time" or "Stop time" function key
to activate the respective input mode, select theevent mark with the jog control or CURSORkeys, and enter the time by pressing F3 [ set ].
An asterisk to the left of the "Start time" or "Stoptime" indicates that the actual time point isspecified to a higher resolution (ms, μs) than thedisplayed value.
5. Select the function to be recorded.Move the flashing cursor to the set end item andpress the F1 [ set end → MEM ] [ set end → FFT ]
key to enter the specified function.
6. Press the START key to start measurement.Data are read from MO and recorded by thespecified function.
7. To release the FILEtoMEM/FFT function, movethe flashing cursor to the FILEtoMEM or FILEtoFFTand then press the F1 [ OFF ] key.
・ The sampling cycle for the memory recorderfunction becomes the same as for the datarecorded on MO. (Time axis setting is notpossible.)
・ The frequency range in FFT function correspondswith the time axis range of data recorded on MO.(Section 8.2.3, "Setting the Frequency Range")
・ When using the FILE to MEM/FFT function,operation is always "Continuous", also when thetrigger is set to "Auto".

311────────────────────────────────────────────────────
13.8 Deleting Stored Data (directory and file deleting)────────────────────────────────────────────────────
2
3
・ 2/2Function key
display
##13-G41Meaning
: Change the file name (13.9)
: Delete the directory
: Switch to 1/2
NOTE
13.8 Deleting Stored Data (directory and file deleting)
・This function erases all file data stored on a MO disk.・Deleting a directory deletes the directory and all files that it contains.・Deleting a file deletes only the data of the specified file.
Deleting a directory
Method (MO screen) ##13-261. Press the FILE key to display the file list..
2. Move the flashing cursor to the DIR directory tobe deleted.
3. Call up screen 2/2 with the function keys, andthen press the F4 [ DEL DIR ] key.
4. Press the F1 [ exec ] key. Press this key again to delete a directory and allfiles which belongs to the directory.
If the directory contains a large number of files, deletion may take some time(about 12 minutes for 1000 files).

312────────────────────────────────────────────────────
13.8 Deleting Stored Data (directory and file deleting)────────────────────────────────────────────────────
2
3
・ 2/2 (or 2/3)Function key
display
##13-G42Meaning
: Change the file name (13.9)
: Delete the file
: Switch to 1/2
Deleting a file
Method (MO screen) ##13-271. Press the FILE key to display the file list.
2. Move the flashing cursor to the file to be deleted.
3. Call up screen 2/2 with the function keys, andthen press the F4 [ DEL FILE ] key.
4. Press the F1 [ exec ] key. Press this key again todelete a file.

313────────────────────────────────────────────────────
13.9 Renaming File (file name and directory name)────────────────────────────────────────────────────
##13- 27
##13- 28
5
4
2
3
Function keydisplay
##13-G41Meaning
: Rename the directory name
: Delete the directory (13.8)
: Switch to 1/2
・ 2/2Function key
display
##13-G42Meaning
: Rename the file
: Delete the file (13.8)
: Switch to 1/2
Function keydisplay Meaning ##13-G43
: Rename the file or directory
: Enter character input mode
: Recall up to the last ten file namesconfirmed or deleted.
: Delete characters
: Returns to file list screen
13.9 Renaming File (file name and directory name)
Renames the directory name and file name.
Method (MO screen)1. Display the file list on the MO screen.
2. Move the flashing cursor to the directory or fileto rename.
3. Press the F3 [ RENAME ] key on the functionindication 2/2.
When the flashing cursor is on the directory name.
When the flashing cursor is on the file name.
4. Press F2 [ enter ] key to input a new file name.(See Section 11.6.1, "Comment and File NameEntry Procedure")
5. Press F1 [ exec ] key to rename the directory or file.

314────────────────────────────────────────────────────
13.10 Operating the Disk/ Deleting the Window (HELP key)────────────────────────────────────────────────────
##13- 29
4
・ 1/2Function key
display
##13-G44Meaning
: Eject a disk (13.3)
: Make a directory (13.10.1)
: Search data (13.10.2)
: Switch to 2/2
: Return to the file list screen
・ 2/2Function key
display
##13-G45Meaning
: Sort a file (13.10.3)
: Format a file (13.10.4)
: Format a MO disk physically(13.10.5)
: Switch to 1/2
: Return to the file list screen
13.10 Operating the Disk/ Deleting the Window
(HELP key)
Disk operationFormats the MO disk, makes a directory, and searches and sorts files.Deleting windowsIt is possible to delete all windows opened in the file list display in a singleoperation.
Disk operation
Method (MO screen)
1. Press the FILE key to display the file list.
2. Press the HELP [ disk ope ] key.
3. Select the each item.

315────────────────────────────────────────────────────
13.10 Operating the Disk/ Deleting the Window (HELP key)────────────────────────────────────────────────────
##13-30,31 Deletes all the windows ina single operation
Deleting a window
When a window is open in the file list display, press the HELP [ close windows ]
key to delete all the windows in a single operation.

316────────────────────────────────────────────────────
13.10 Operating the Disk/ Deleting the Window (HELP key)────────────────────────────────────────────────────
13.10.1 Creating a Directory
##13-32
3
4
・ 1/2Function key
display
##13-G44Meaning
: Eject a disk
: Make a directory
: Search a file (13.10.2)
: Switch to 2/2
: Return to the file list screen
Function keydisplay
##13-G46Meaning
: Make a directory
: Enter character input mode
: Recall up to the last ten file namesconfirmed or deleted.
: Delete a file name
: Return to the previous setting item
Method (MO screen)
1. Press the FILE key to display the file list.
2. Press the HELP [ disk ope ] key and then press theF2 [ MAKE DIR ] key.
3. Input the directory name. ( Section 11.6.1)Upto 8 characters can be input.
4. Press the F1 [ exec ] key.

317────────────────────────────────────────────────────
13.10 Operating the Disk/ Deleting the Window (HELP key)────────────────────────────────────────────────────
13.10.2 Searching file
##13- 33,34
5
3
4
When searching for a name
・ 1/2Function key
display
##13-G44Meaning
: Eject a disk
: Make a directory (13.10.1)
: Search data
: Switch to 2/2
: Return to the file list screen
Function keydisplay Meaning ##13-G47
: Search directory or file name
: Search for a file creation date
: Return to the previous setting item
Function keydisplay Meaning ##13-G48
: Search a file.
: Enter character input mode
: Recall up to the last ten file namesconfirmed or deleted.
: Delete the input character
: Return to the previous setting
Searches directory or file.
Method (MO screen)
1. Press the FILE key to display the file list.
2. Press the HELP [ disk ope ] key and then press theF3 [ SEARCH ] key on the function indication.
3. Select the method of searching
When the [ NAME ] is selected:・ Press the F2 [ enter ] key to input the character
to search. ( Section 11.6.1)・ Up to 8 characters can be used.

318────────────────────────────────────────────────────
13.10 Operating the Disk/ Deleting the Window (HELP key)────────────────────────────────────────────────────
##13- 35,36
7
6
When searching for a date
5
4
Function keydisplay Meaning ##13-G49
: Search a file.
: Increase the numerical value.
: Decrease the numerical value.
: Copy the date and time where theflashing cursor is not present.
: Return to the previous setting item.
NOTE
Function keydisplay Meaning ##13-G50
: Search a file.
: Search in the currently displayeddirectory.
: Search in the currently displayeddirectory and recursively in allsubdirectories.
When [ DATE ] is selected:Specify the date and time when the directory orfile is made.Move the flashing cursor and set.
Enter the older date and time values above and thenewer values below.If the order is reversed, both upper and lower itemswill be set to the new date and time.
4. Select the range to search.Move the flashing cursor to select.
5. Pressing the F1 [ exec ] key carries out thesearch, and displays, starting from the olderfiles.
6. Pressing the F2 [↑] or F3 [↓] key displays thefiles found by the search in order.
7. Pressing the F1 [ jump ] key moves the flashingcursor to the displaying file.
8. To stop searching file, press the STOP key.

319────────────────────────────────────────────────────
13.10 Operating the Disk/ Deleting the Window (HELP key)────────────────────────────────────────────────────
13.10.3 Sorting files
##13- 37
##13- 38
3
4
・ 2/2Function key
display
##13-G45Meaning
: Sort a file
: Format a file (13.10.4)
: Format a MO disk physically (13.10.5)
: Switch to 1/2
: Return to the file list screen
This sorts the files in a directory according to their type.
Method (MO screen)
1. Press the FILE key to display the file list.
2. Press the HELP [ disk ope ] key.
3. Call up screen 2/2 with the function keys, andthen press the F1 [ SORT ] key.
4. Select the type of sorting using the cursor keys.Pressing the F1 [ exec ] key sorts the files.
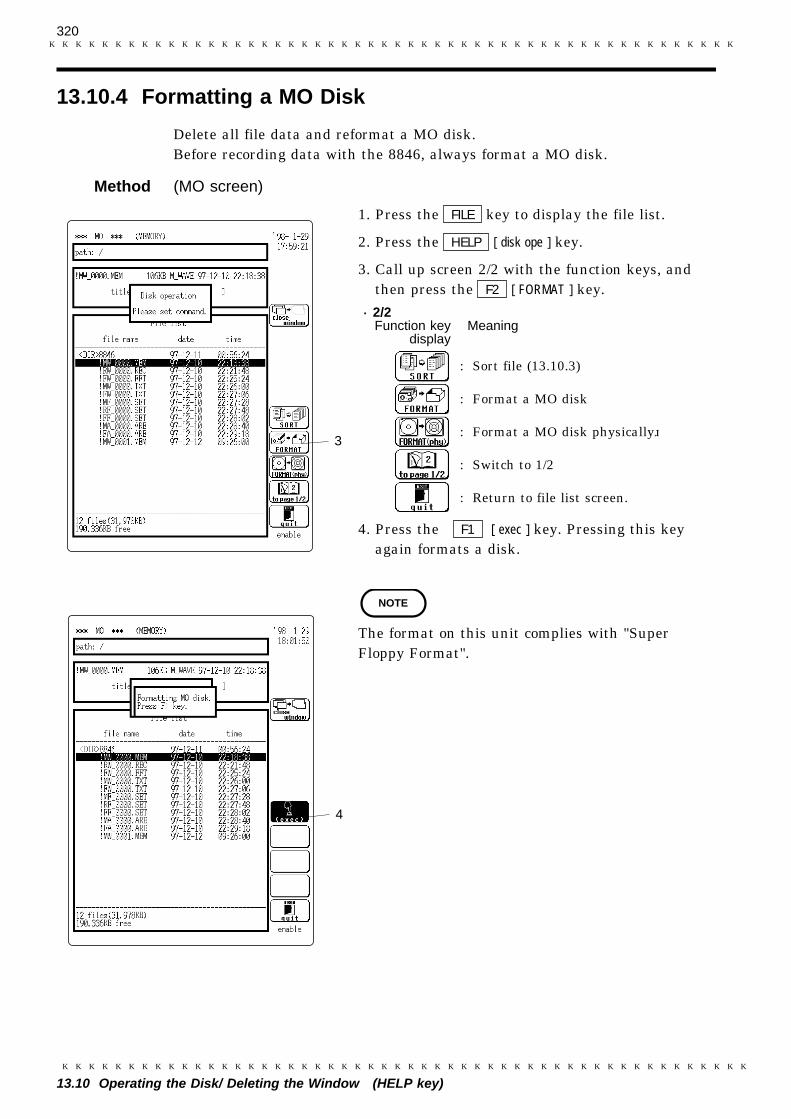
320────────────────────────────────────────────────────
13.10 Operating the Disk/ Deleting the Window (HELP key)────────────────────────────────────────────────────
13.10.4 Formatting a MO Disk
##13- 37
##13- 39
3
4
・ 2/2Function key
displayMeaning 13-G45
: Sort file (13.10.3)
: Format a MO disk
: Format a MO disk physically
: Switch to 1/2
: Return to file list screen.
NOTE
Delete all file data and reformat a MO disk.Before recording data with the 8846, always format a MO disk.
Method (MO screen)
1. Press the FILE key to display the file list.
2. Press the HELP [ disk ope ] key.
3. Call up screen 2/2 with the function keys, andthen press the F2 [ FORMAT ] key.
4. Press the F1 [ exec ] key. Pressing this keyagain formats a disk.
The format on this unit complies with "SuperFloppy Format".

321────────────────────────────────────────────────────
13.10 Operating the Disk/ Deleting the Window (HELP key)────────────────────────────────────────────────────
13.10.5 Formatting a MO Disk Physically (Physical Format)
##13-
3
・ 2/2Function key
displayMeaning 13-G
: Sort file (13.10.3)
: Format a MO disk (13.10.4)
: Format a MO disk physically
: Switch to 1/2
: Return to file list screen.
Format a disk which cannot be read by the 8846.Under normal circumstances, do not physically format a MO disk.
Method (MO screen)
1. Press the FILE key to display the file list.
2. Press the HELP [ disk ope ] key.
3. Call up screen 2/2 with the function keys, andthen press the F2 [ FORMAT (phy) ] key.
4. Press the F1 [ exec ] key. Pressing this keyagain formats a disk.

322────────────────────────────────────────────────────
13.10 Operating the Disk/ Deleting the Window (HELP key)────────────────────────────────────────────────────

323────────────────────────────────────────────────────
14.1 Overview────────────────────────────────────────────────────
1
2
3
4
5
6
7
8
9
10
11
12
13
14
15
Chapter 14Calculating Waveform Data
14.1 Overview
Waveform processing is possible only for the memory recorder function.
The following operators can be used to define processing equations.・Arithmetic operators (+, -, *, /)・Absolute value (ABS)・Exponent (EXP)・Logarithm (LOG)・Square root (SQR)・Displacement average (MOV)・Parallel displacement on time axis (SLI)・1st and 2nd differential (DIF, DIF2)・1st and 2nd integral (INT, INT2)・Trigonometric functions (SIN, COS, TAN)・Reverse trigonometric functions (ASIN, ACOS, ATAN)
Processing results are displayed as a waveform.
Vertical display scale can be set manually or automatically.

324────────────────────────────────────────────────────
14.2 Preparing for Waveform Processing────────────────────────────────────────────────────
Press STATUS key to call upSTATUS screen
1 62
3 5
4
14-01
Function keydisplay Meaning
: Disable waveform processing
: Enable waveform processing
14.2 Preparing for Waveform Processing
・The settings are available on the STATUS screen (page 4), only when usingthe memory recorder function.
・Press the STATUS key to call up the STATUS screen (page 4).
Method Screen: STATUS (page 4)
1. Move the flashing cursor to the wave calculationitem and select ON.The various setting items are displayed.
2. Select the processing equation ( Section 14.3).Eight processing equations (Z1 - Z8) can be set.
3. Determine in which channel (CH1 - CH16) todisplay the processing results (Z1 - Z8)( Section 14.4).
4. If the function "MOV" or "SLI" was selected instep 2, set the number of moving points( Section 14.3.1).
5. Set the vertical axis display scale( Section 14.5).The setting can be made automatically or bymanual input.

325────────────────────────────────────────────────────
14.2 Preparing for Waveform Processing────────────────────────────────────────────────────
1
2
3
4
5
6
7
8
9
10
11
12
13
14
15
Capturewaveform
data
Measurementstart
( START key)
ProcessingDisplay
processingresults
Waveformdata storedin memory
Executeprocessing
ProcessingDisplay
processingresults
NOTE
6. Perform waveform processing.There are two methods for starting waveform processing
Waveform processing while capturing the waveform
1. Set wave calculation to ON and make the required settings.2. Press the START key.3. Processing is carried out on the captured waveform, and the result is
displayed on the screen.4. When auto print is set to ON, the processing results are printed out.
Waveform processing of data in internal memory (loaded from MO oralready captured with memory recorder function)
1. Set wave calculation to ON and make the required settings.2. Move the flashing cursor to the execute position at the top right of the screen
and press the F1 [ exec ] key.3. Processing is carried on the data stored in memory, and the result is
displayed on the screen.
・ When recording length is more than 1000 DIV, waveform processing is notpossible.・ When the memory segmentation function is used, waveform processing is not
possible.・ When scaling is set for the channel in which the processing result is to be
stored, scaling is not carried out and only the unit is valid.

326────────────────────────────────────────────────────
14.3 Defining the Processing Equation────────────────────────────────────────────────────
14.3.1 Entering the Equation
Cursor (movewith JOG control)
14-09, 02
Flashing cursor (move with CURSOR keys)
2
1
Function keydisplay Meaning 14-g01
: Enter equation
: Delete equation ( Section 14.3.2)
: Copy equation ( Section 14.3.3)
Function keydisplay Meaning 14-g02
:Enter channel (CH1 - Ch16), equation (Z1- Z7), constant (a - p), value (0 - 9, E) intoselected equation.
: Delete character to left of cursor inequation (backspace key)
: Delete character under cursor in equation(delete key)
: Terminate equation input
14.3 Defining the Processing Equation
・Set wave calculation to ON.・Eight equations (Z1 - Z8) can be defined.
Method
1. Move the flashing cursor to Z1 to Z8.
2. Press F1 [ enter eqn] for equation entry.
3. Move the flashing cursor to the operator (ABS,EXP,...), channel (CH1 - CH16), equation (Z1 -Z7), constant (a - p), value (0 - 9, E: exponent)and make the entry with the F1 [ set ] key.
・The movement range of the flashing cursor isindicated by a border.
・Use the JOG control to move the cursor withinthe equation.

327────────────────────────────────────────────────────
14.3 Defining the Processing Equation────────────────────────────────────────────────────
1
2
3
4
5
6
7
8
9
10
11
12
13
14
15
NOTE
Operators For details, see Section 14.8, (2) to (17).
ABS Absolute value (2)EXP Exponential (3)LOG Logarithm (4)SQR Square root (5)MOV Displacement average (6)SLI Parallel displacement on time axis (7)DIF 1st differential (8)INT 1st integral (9)DIF2 2nd differential (10)INT2 2nd integral (11)SIN Sine (12)COS Cosine (13)TAN Tangent (14)ASIN Arc-sine (15)ACOS Arc-cosine (16)ATAN Arc-tangent (17)
・ For multiplication, always use the "*" sign.・ Out of the MOV, SLI, DIF, DIF2, INT, and INT2 operators, up to two can be
used in the same equation (for example two MOV operators or one MOV andone SLI operator, etc.).・ The maximum number of digits for a constant is 30.・ If division by 0 is specified (1/0), an overflow value is output.・ Equations are calculated in ascending order, from Z1 to Z8.・ The following data (channel data, equation calculation results) can be used in
equations (when 8 units, 16 channels are used).
Z1 CH1 - CH16Z2 CH1 - CH16, Z1Z3 CH1 - CH16, Z1, Z2Z4 CH1 - CH16, Z1 - Z3Z5 CH1 - CH16, Z1 - Z4Z6 CH1 - CH16, Z1 - Z5Z7 CH1 - CH16, Z1 - Z6Z8 CH1 - CH16, Z1 - Z7

328────────────────────────────────────────────────────
14.3 Defining the Processing Equation────────────────────────────────────────────────────
Correct error
No syntax error is presentSyntax error is present 14-03, 04, 05
5
6Function key
display Meaning
0 to 9( -9 to +9 for the most significantdigit, -29 to +29 for exponent.)
4. When the equations have been input, press the F5 [ exit ] key.
If there are any syntax errors in the equations (incomplete bracketing, missing"*", more than two MOV, SLI, DIF, DIF2, INT, INT2 operators, etc.), a "?" isdisplayed, and the cursor rests on the error, so that the problem can becorrected. When there are no syntax errors, a "=" is displayed.
5. Enter the constant values.・Select the equation with the CURSOR keys, move
the flashing cursor to the desired digit, and usethe function keys or the JOG control to enter thevalue.
・The setting range is -9.9999E+29 to +9.9999E+29(exponent: -29 to +29).
6. Specify the floating decimal point.
If MOV or SLI was used in step 3, the floatingdecimal point must be specified ( Section14.8.(6), (7)).

329────────────────────────────────────────────────────
14.3 Defining the Processing Equation────────────────────────────────────────────────────
1
2
3
4
5
6
7
8
9
10
11
12
13
14
15
Function key display Meaning com/jog3: For MOV (moving average): 1 to 4000
For SLI (parallel displacement): -4000 to +4000:
14.3.2 Deleting an Equation
2
1
14-10, 113
Function keydisplay Meaning 14-g01
: Enter equation (14.3.1)
: Delete equation
: Copy equation (14.3.3)
Function keydisplay Meaning 14-g17
: Clear equation
: Do not clear equation
Method
1. Move the flashing cursor to one of the Z1 - Z8items.
2. Press P3 [ clear eqn ].
3. The equation can be deleted.

330────────────────────────────────────────────────────
14.3 Defining the Processing Equation────────────────────────────────────────────────────
14.3.3 Copying an Equation
2
1
3
14-12, 13
Function keydisplay Meaning 14-g01
: Enter equation (14.3.1)
: Delete equation (14.3.2)
: Copy equation
Function keydisplay Meaning 14-g08
: Display copy source (display only)
: Increase equation number
: Decrease equation number
: Quit copy mode
: Execute copy
NOTE
An equation to which an equation number has been assigned (copy source) canbe copied to another equation number (copy target).
Method
1. Move the flashing cursor to one of the Z1 - Z8items.
2. Press F5 [ copy eqn ].
3. Use the function keys or the JOG control tospecify the number of the equation to be copied.
4. Press the F5 [ exec ] key. The copy sourceequation is copied to the copy target.
When the equation in the copy source contains acalculation number that is higher than in the copytarget, the copy function is not carried out.

331────────────────────────────────────────────────────
14.4 Setting the Channel for Recording Processing Results────────────────────────────────────────────────────
14-06
Function keydisplay Meaning
NONE, CH1 to CH6
NOTE
14.4 Setting the Channel for Recording Processing
Results
・The calculation result of equations Z1 - Z8 can be recorded and displayed in aspecified channel.
・Processing results can be recorded also in channels where no input unit isinstalled (but the range of the "number of units in use" setting cannot beexceeded).
Method
Move the flashing cursor to the position shown inthe illustration and make the setting with thefunction keys or the JOG control.
Equations not to be used should be set to NONE(calculation result is not recorded).
・ If the same channel is selected as source in the equation and as target forrecording, the waveform data in the source channel are overwritten by theequation calculation result.・ In the following cases, the calculation result is displayed with in the same
color set as the channel number for the first processing run:
If results are recorded in a channel where no input unit is installed.If the display color for the channel selected for recording is set to OFF.
When wishing to change the display color set, perform calculation once andthen use the CHANNEL screen to make the setting.

332────────────────────────────────────────────────────
14.5 Setting the Display Scale────────────────────────────────────────────────────
flashing cursor
14-07
Function keydisplay Meaning com/manu
: Set display scale manually
: Set display scale automatically
NOTE
14.5 Setting the Display Scale
・Display scale can be set automatically or manually.・The channel selected for recording is automatically set to variable display
( Section 9.6.10).
Method
Move the flashing cursor to the position shown inthe illustration and make the setting with thefunction keys.
Automatic setting
After calculation, the upper and lower limit is determined from the result, andthe variable display settings are made accordingly.
Depending on the type of calculation, automatically display scale setting maynot be satisfactory. In such a case, use the manual setting procedure.
Manual setting
Use the variable display setting function on the CHANNEL screen (page 2) toset the upper and lower limit ( Section 9.6.10).

333────────────────────────────────────────────────────
14.6 Specifying the Waveform Processing Range────────────────────────────────────────────────────
NOTE
Processing is carried out for this range
14-08
14.6 Specifying the Waveform Processing Range
・Use the A/B cursors (or trace cursor) to specify the processing range for thewaveform data.
・Processing is carried out only for data between the A/B cursors.・If the A/B cursors are turned off, or if a horizontal cursor is used, processing is
carried out for all data. (Waveform processing is not possible if recordinglength is more than 1000 DIV.)
・ When using the trace cursor, the trace point value is displayed as processedvalue.・ When the cursors overlap, processing is carried out for that point.・ When the A/B cursors are used, data outside of that range are considered
invalid.

334────────────────────────────────────────────────────
14.7 Setting Example for Waveform Processing────────────────────────────────────────────────────
10 μF
200 Ω1/4 W
10 V p-p
60 HzSine wave
CH1CH2
CH3Currentwaveform
Status Screen (page 1)14-14##
Status screen (page 3): all settings OFF
Status Screen (page 2)14-15
14.7 Setting Example for Waveform Processing
Example Using the circuit shown in the illustration, the voltage applied to the load ismeasured in CH1, the voltage at the resistor in CH2, the waveform of thecurrent flowing through the load in CH3, and instant power waveform data forthe load are determined and recorded in CH4.
Setting Make settings on the memory recorder STATUS screen as shown below( Section 5.2.1).

335────────────────────────────────────────────────────
14.7 Setting Example for Waveform Processing────────────────────────────────────────────────────
CHANNEL screen14-16###
14-17
1
2.
2.
4
5
3
Make settings for CH2 as for CH1.
Method
1. Set wave calculation on STATUS screen (page 4) toON.
2. Enter the processing equation.
Move the flashing cursor to Z1 and press the F1
[ enter ] key.
Enter the following equation:
Z1=CH2/a
Press the F5 [ exit ] key.
Move the flashing cursor to Z2 and enter thefollowing equation in the same way as for Z1:
Z2=CH1*Z1
3. Move the flashing cursor to the constant a andenter the resistance value.
a=+2.0000E+02
4. Set the result of Z1 to be recorded in channel 3and the result of Z2 in channel 4.
・Set Z3 - Z8 to NONE.
5. Set the upper and lower limit to AUTO.(The variable display setting for CH3 and CH4becomes ON. When wishing to make the settingmanually, use the CHANNEL screen (page 2).

336────────────────────────────────────────────────────
14.7 Setting Example for Waveform Processing────────────────────────────────────────────────────
14- 18
9.
6. Press the DISP key to activate the display screen.
7. Press the START key to start processing.
8. Press the STOP key to interrupt the measurement.
The processing results of CH3 and CH4 are shown with color set 3 for CH3and color set 4 for CH4. When wishing to change the color, make the settingfrom the CHANNEL screen (page 1).
9. Set the display unit for CH3 to A (ampere) andfor CH4 to VA (volt-ampere).
Press the SYSTEM key to call up the SYSTEMscreen and press the F3 [ SCALING ] function key.
Move the flashing cursor to the eu (unit name)item for CH3 and CH4 on the scaling settingscreen and enter A and VA respectively (Section 11.6.1).
10. Press the DISP key again to activate thedisplay screen and press the START key to startthe measurement.
11. Press the STOP key when wishing toterminate the measurement.

337────────────────────────────────────────────────────
14.8 Details on Operators────────────────────────────────────────────────────
14.8 Details on Operators
(1) The four arithmetical operations (+, ー, *, /)
According to the operators set, the four arithmetical operations are performed.
(2) Absolute value (ABS)
Equation:
bi = |di| (i = 1, 2, ...., n)
bi : i-th data of calculation resultdi : i-th data of source channel
(3) Exponential (EXP)
Equation:
bi = exp (di) (i = 1, 2, ...., n)
bi : i-th data of calculation resultdi : i-th data of source channel
(4) Common logarithm (LOG)
Equation:
bi = log10di when di > 0bi = -∞ when di = 0 (overflow value is output)bi = log10|di| when di < 0 (i = 1, 2, ...., n)
bi : i-th data of calculation resultdi : i-th data of source channel
(Reference)Use the following equation to convert to natural logarithm: log10X 1InX = logeX = ≒ 2.33E + 0 log10e log10e
(5) Square root (SQR)
Equation:
bi = when di ≧ 0
bi = when di < 0 (i = 1, 2, ...., n)
bi : i-th data of calculation resultdi : i-th data of source channel

338────────────────────────────────────────────────────
14.8 Details on Operators────────────────────────────────────────────────────
NOTE
NOTE
NOTE
(6) Moving average (MOV)
Equation:
bi = di (i = 1, 2, ...., n)
bi : i-th data of calculation resultdi : i-th data of source channelk : number of points for averaging (1 to 4000)
1 DIV = 100 points
(7) Parallel displacement on time axis (SLI)
Shifts the value on the time axis by a certain number of points.
Equation:
bi = di-k (i = 1, 2, ...., n)
bi : i-th data of calculation resultdi : i-th data of source channelk : number of points for averaging (-4000 to 4000)
・ After shifting the waveform, the part right or left without source channel databecomes 0 V.・ 1 DIV = 100 points
(8) Differentiation once (DIF)
(9) Differentiation twice (DIF2)
・1st and 2nd differential are calculated using the 5th-order Lagrangeinterpolation equation, whereby data from a range of five surrounding pointsare used to determine the value of the current point.
・Data corresponding to sample time t1 - tn are taken as d1 - dn and used forcalculating the differential.
When the input voltage becomes small, processing results will show littlevariation. In such a case, apply the MOV operator.

339────────────────────────────────────────────────────
14.8 Details on Operators────────────────────────────────────────────────────
・Equation for 1st differential: 1Point t1 b1 = ―――[-25d1 + 48d2 - 36d3 + 16d4 - 3d5] 12h
1Point t2 b2 = ―――[-3d1 - 10d2 + 18d3 - 6d4 + d5] 12h
1Point t3 b3 = ―――[d1 - 8d2 + 8d4 - d5] 12h
: 1Point ti bi = ―――[di-2 - 8di-1 + 8di+1 - di+2] 12h
: 1Point tn-2 bn-2 = ―――[dn-4 - 8dn-3 + 8dn-1 - dn] 12h
: 1Point tn-1 bn-1 = ―――[-dn-4 + 6dn-3 - 18dn-2 + 10dn-1 + 3dn] 12h
1Point tn bn = ―――[3dn-4 - 16dn-3 + 36dn-2 - 48dn-1 + 25dn] 12h
bi to bn: data of calculation resulth = Δt: sampling period ( Appendix 2.1)
・Equation for 2nd differential: 1Point t1 b1 = ――― [35d1 - 104d2 + 114d3 - 56d4 + 11d5] 12h2
1Point t2 b2 = ――― [11d1 - 20d2 + 6d3 + 4d4 - d5] 12h2
1Point t3 b3 = ――― [-d1 + 16d2 - 30d3 + 16d4 - d5] 12h2
: 1Point ti bi = ――― [-di-2 + 16di-1 - 30di + 16di+1 - di+2] 12h2
: 1Point tn-2 bn-2 = ――― [-dn-4 + 16dn-3 - 30dn-2 + 16dn-1 - dn] 12h2
: 1Point tn-1 bn-1 = ――― [-dn-4 + 4dn-3 + 6dn-2 - 20dn-1 + 11dn] 12h2
1Point tn bn = ――― [11dn-4 - 56dn-3 + 114dn-2 - 104dn-1 + 35dn] 12h2

340────────────────────────────────────────────────────
14.8 Details on Operators────────────────────────────────────────────────────
(10) 1st integral (INT)
(11) 2nd integral (INT2)
・The 1st and 2nd integral calculation uses the trapezoidal rule.・Data corresponding to sample time t1 - tn are taken as d1 - dn and used for
calculating the integral.
・Equation for 1st integral:
Point t1 I1 = 0
1Point t2 I2 = ―― (d1 + d2)h 2
1 1 1Point t3 I3 = ―― (d1 + d2)h + ―― (d2 + d3)h = I2 + ―― (d2 + d3)h 2 2 2 ・ 1Point tn In = In-1 + ―― (dn-1 + dn)h 2
I1 - In : processing result datah = Δt: sampling cycle ( Appendix 2.1)
・Equation for 2nd integral:
Point t1 II1 = 0
1Point t2 II2 = ―― (I1 + I2)h 2
1 1 1Point t3 II3 = ―― (I1 + I2)h + ―― (I2 + I3)h = II2 + ―― (I2 + I3)h 2 2 2 ・ 1Point tn IIn = IIn-1 + ―― (In-1 + In)h 2
II1 - IIn: processing result data
(12) Sine (SIN)
Equation:
bi = sin (di) (i = 1, 2, ...., n)
bi : i-th data of calculation resultdi : i-th data of source channel

341────────────────────────────────────────────────────
14.8 Details on Operators────────────────────────────────────────────────────
NOTE
(13) Cosine (SOS)
Equation:
bi = cos (di) (i = 1, 2, ...., n)
bi : i-th data of calculation resultdi : i-th data of source channel
(14) Tangent (TAN)
Equation:
bi = tan (di), and -10≦bi≦10 (i = 1, 2, ...., n)
bi : i-th data of calculation resultdi : i-th data of source channel
(15) Arc-sine (ASIN)
Equation:
πbi = when di > 1 2bi = asin(di) when -1≦di≦1
πbi = ー when di < -1 (i = 1, 2, ...., n) 2
bi : i-th data of calculation resultdi : i-th data of source channel
(16) Arc-cosine (ACOS)
Equation:
bi = 0 when di > 1bi = acos(di) when -1≦di≦1bi =π when di < -1 (i = 1, 2, ...., n)
bi: i-th data of calculation resultdi: i-th data of source channel
(17) Arc-tangent (ATAN)
Equation:
bi = atan(di) (i = 1, 2, ...., n)
bi : i-th data of calculation resultdi : i-th data of source channel
The unit for the Trigonometric and inverse trigonometric functions (12) - (17)is rad (radian).

342────────────────────────────────────────────────────
14.8 Details on Operators────────────────────────────────────────────────────

343────────────────────────────────────────────────────
15.1 Overview────────────────────────────────────────────────────
1
2
3
4
5
6
7
8
9
10
11
12
13
14
15
Chapter 15Determining Waveform
Parameters / EvaluatingParameter Values
15.1 Overview
Waveform parameter calculation
・Available for memory recorder and recorder functions.
・Parameters that were used for captured waveform data and for data afterwaveform processing can be determined. The result is shown in numeric form.
・The following 14 types of calculations are possible:Average value, RMS value, peak-to-peak valueMaximum value, time to reach maximum, minimum value,time to reach minimum, period, frequency, rise time, fall time,standard deviation, area, X-Y area
・The A/B cursors (vertical, trace) can be used to determine the parameters of acertain range.
Waveform parameter evaluation
・Available for memory recorder and recorder functions.
・The result of waveform parameter calculation is compared to a referencerange, for GO/NG evaluation.

344────────────────────────────────────────────────────
15.2 Making Settings for Waveform Parameter Calculation────────────────────────────────────────────────────
1
2
3
1
2
3
Function keydisplay Meaning
: Disable printout of parametercalculation results
: Enable printout of parametercalculation results
・ 1/4Function key
display Meaning 15-g02
: Disable calculation
: Average value ( Section 15.8 (1))
: RMS value ( Section 15.8 (2))
: Peak-to-peak value ( Section 15.8(3))
: Switch to 2/4
15.2 Making Settings for Waveform Parameter
Calculation
・Settings for waveform parameter calculation are made with the STATUSscreen (page 3).
・Press the STATUS key to call up the STATUS screen (page 3).
Method Screen: STATUS (page 3) 15-01, 06Move the flashing cursor to the items in the orderas shown in the illustration.
1. Move the flashing cursor to the measurement itemand press F2 [ ON ].
The various setting items are displayed.
2. Choose the setting for parameter calculationresult printout ( Section 15.6).
3. Parameter calculation settings・Up to four parameter calculations (no. 1 - 4) can
be set simultaneously.・Make the settings with the function keys.

345────────────────────────────────────────────────────
15.2 Making Settings for Waveform Parameter Calculation────────────────────────────────────────────────────
1
2
3
4
5
6
7
8
9
10
11
12
13
14
15
・ 2/4Function key
display Meaning 15-g03
: Maximum value ( Section 15.8 (4))
: Time to maximum value( Section 15.8 (5))
: Minimum value ( Section 15.8 (6))
: Time to minimum value ( Section 15.8 (7))
: Switch to 3/4
・ 3/4Function key
display Meaning 15-g04
: Period ( Section 15.8 (8))
: Frequency ( Section 15.8 (9))
: Rise time ( Section 15.8 (10))
: Fall time ( Section 15.8 (11))
: Switch to 4/4
・ 3/4Function key
display Meaning 15-g05
: Standard deviation ( Section 15.8 (12))
: Area ( Section 15.8 (13))
: X-Y area ( Section 15.8 (14))
: Switch to 1/4
For details on the various calculation functions, refer to Section 15.8.

346────────────────────────────────────────────────────
15.2 Making Settings for Waveform Parameter Calculation────────────────────────────────────────────────────
4
5 6
15-02
Function keydisplay Meaning
ALL, CH1 to CH16(ALL: Call channels, CH1 to CH16)
NOTE
Function key display Meaning 15-g07: Disable waveform parameter evaluation
: Return NG when result is outside of specifiedrange
: Return NG when result is inside specifiedrange (excluding upper and lower limit)
4. Calculation channel settings
Also when ALL is selected, channels where no unitsare installed and channels for which display/recordis set to OFF will not be calculated.
When "X-Y area" was selected
・Move the flashing cursor to the point shown in the illustration and specifythe channel for the X-axis and Y- axis.
・Use the function keys or the JOG control to make the setting.
5. Waveform parameter evaluation settings
For details, see Section 15.3.
6. Waveform parameter evaluation range (upper and lower limit) setting
For details, see Section 15.3.

347────────────────────────────────────────────────────
15.2 Making Settings for Waveform Parameter Calculation────────────────────────────────────────────────────
1
2
3
4
5
6
7
8
9
10
11
12
13
14
15
Capturewaveform
data
Measurementstart
( START key)
ProcessingDisplay
processingresults
Waveformdata storedin memory
Executeprocessing
ProcessingDisplay
processingresults
NOTE
7. Executing waveform parameter calculation
・There are two methods for starting parameter calculation.
Parameter calculation while capturing the waveform
1. Set measurement to ON and make the required settings.
2. Press the DISP key to activate the display screen, and then press theSTART key.
3. Calculation is performed using the captured waveform data, and thecalculation results are displayed.
4. If printer was set to ON, the calculation results are printed out.
Parameter calculation of measurement data loaded from MO disk or alreadypresent in internal memory
1. Set measurement to ON and make the required settings.
2. Move the flashing cursor to the execute position at the top right of the screenand press the F1 [ exec ] key.
3. Calculation is carried on the data stored in memory, and the result isdisplayed on the screen.
4. If printer was set to ON, the calculation results are printed out.
・ Calculation is carried out in the order no. 1 through no. 4.・ Also for channels where no input unit is installed, parameter calculation is
carried out if waveform processing results or data loaded from MO disk arestored in the channel.・ The scaling setting has no effect. (RMS value and area value are calculated
after scaling.)・ When wave calculation is set to ON, waveform data after waveform processing
are used for parameter calculation.

348────────────────────────────────────────────────────
15.3 Making Settings for Waveform Parameter Evaluation────────────────────────────────────────────────────
Lower limit value Upper limit value
GO resultNG result NG result
Out
In Lower limit value Upper limit value
NG resultGO result GO result
15.3 Making Settings for Waveform Parameter
Evaluation
Depending on the results of the waveform parameter calculation, a GO (pass)or NG (fail) result is returned.
Out NG is returned when result is outside of specified range.
In NG is returned when result is inside specified range (excluding upperand lower limit).
Evaluation criteria can be set independently for each of the calculation setsno. 1 - no. 4.

349────────────────────────────────────────────────────
15.3 Making Settings for Waveform Parameter Evaluation────────────────────────────────────────────────────
1
2
3
4
5
6
7
8
9
10
11
12
13
14
15
2 3
Function keydisplay Meaning 15-g07
: Disable evaluation function
: Return NG if result is outsidespecified range
: Return NG if result is inside specifiedrange
Function key display Meaning
0 to 9( -29 to +29 for the most significantdigit and exponent.)
NOTE
Method Screen: STATUS (page 1)
Move the flashing cursor to the items in the orderas shown in the illustration.
1. Make the settings for waveform parametercalculation ( Section 15.2).
2. Move the flashing cursor to the comparison itemand select OUT or IN.
3. Set the upper and lower limits.
・The setting range is -9.9999E+29 to +9.9999E+29 (exponent: -29 to +29).・Move the flashing cursor to the various digits and make the setting with the
function keys or the JOG control.
・ If the setting was made so that lower limit ≧ upper limit, the evaluationresult is always NG for the OUT setting and always GO for the IN setting.・ When the evaluation result is NG, the calculation value for that channel is
marked with an "*" (on the display and the printout).

350────────────────────────────────────────────────────
15.3 Making Settings for Waveform Parameter Evaluation────────────────────────────────────────────────────
Trigger mode: SINGLE
NG
GO
Measurementstart
Capturewaveform
Parametercalculation
Parameterevaluation
Operationstop
Measurementend
Trigger mode: REPEAT, AUTO
NG
GO
Measurementstart
Capturewaveform
Parametercalculation
Parameterevaluation
Operationstop
Measurementend
STOP key is pressed
Trigger mode: AUTO STOP
NG
GO
Measurementstart
Capturewaveform
Parametercalculation
Parameterevaluation
Operationstop
STOP key is pressed
Capture after 1 second
Capture whentriggering occurs
Measurementend
NOTE
Stop mode and trigger mode
・When waveform parameter evaluation has been set to OUT or IN, and theSTART key is pressed to start the measurement, operation will stop when the
evaluation result is NG.・When auto print is set to ON, the waveform is printed out when operation stops.・When auto save is set to ON, data are stored on MO disk when operation stops.・When memory segmentation (sequential save) is ON, data are stored in the
memory block only when operation stops.
When waveform parameter measurement and waveform evaluation are carriedout simultaneously, the waveform evaluation stop mode is given priority.

351────────────────────────────────────────────────────
15.4 Using the NG Output────────────────────────────────────────────────────
GND terminal NG output terminal
15.4 Using the NG Output
・When the evaluation result is NG, an NG output signal can be obtainedbetween the NG terminal and the GND terminal.
・For details, please refer to the Section 21.6.

352────────────────────────────────────────────────────
15.5 Specifying a Range for Waveform Parameter Calculation────────────────────────────────────────────────────
NOTE
Calculation result for databetween cursors is shown
Calculation range
15-04##
15.5 Specifying a Range for Waveform Parameter
Calculation
・The A/B cursors (vertical, trace) can be used to specify a range of waveformdata for processing.
・When a range is specified, waveform parameters are calculated only for thedata between the A/B cursors.
・When not using the A/B cursors, or when using the horizontal cursor,waveform parameter calculation is carried out for all data.
When the cursors overlap, calculation is carried out for that point.

353────────────────────────────────────────────────────
15.6 Printing Out Waveform Parameter Calculation Results────────────────────────────────────────────────────
Function keydisplay Meaning
: Disable printout of parametercalculation results
: Enable printout of parametercalculation results
Print Examplescan/15.6
15.6 Printing Out Waveform Parameter Calculation
Results
Calculation results can be printed out.
Method Screen: STATUS (page 3)
Move the flashing cursor to the printer item and setit to ON.

354────────────────────────────────────────────────────
15.7 Waveform Parameter Calculation and Waveform Parameter Evaluation Examples────────────────────────────────────────────────────
10 μF
200 Ω1/4 W
10 V p-p
60 HzSine wave
CH1CH2
15.7 Waveform Parameter Calculation and Waveform
Parameter Evaluation Examples
Example ・Using the circuit shown in the illustration, the voltage at the resistor is
measured in CH2, and the RMS (effective) voltage is determined.・Waveform parameter evaluation is carried out to determine whether the RMS
voltage is within the permissible range that can be applied to the resistor(1/4 W).
・When the waveform parameter evaluation result is NG, the measurement isterminated.
・The memory recorder function is used.

355────────────────────────────────────────────────────
15.7 Waveform Parameter Calculation and Waveform Parameter Evaluation Examples────────────────────────────────────────────────────
Status Screen (page 1)15-09##
Status Screen (page 2)15-10
Change the trigger mode to SINGLE so thatmeasurement stops when the evaluation result is NG.
Channel Screen (page 1)15-11##
Make settings for CH1 in the same wayas for CH1.
Setting Make the settings on the STATUS screen and the CHANNEL screen of thememory recorder function as follows ( Section 5.2.1).

356────────────────────────────────────────────────────
15.7 Waveform Parameter Calculation and Waveform Parameter Evaluation Examples────────────────────────────────────────────────────
1
2
4
3 5 6
15-05, 12##
Method 15-051. Set "Waveform parameter calculation" on the
STATUS screen (page 3) to ON by pressing theF2 .
2. Set the printer to OFF.
3. Move the flashing cursor to the No. 1 item andselect F3 [ RMS ].
4. Set the channel to CH2.
5. Select F2 [ OUT ] for waveform parameterevaluation.
6. Since the maximum RMS voltage that can beapplied to the 1/4 W 200 Ω resistor is 7.07 V, setthe evaluation range as follows.
0.0000E+0 - 7.0700E+0
7. Press the DISP key to activate the displayscreen.
8. Press the START key to start the measurement.When an NG result occurs, the measurement isterminated.
When wishing to terminate the measurementbeforehand, press the STOP key.

357────────────────────────────────────────────────────
15.8 Parameter Calculation Details────────────────────────────────────────────────────
15.8 Parameter Calculation Details
(1) Average value
・Calculates the average value (V) of the waveform data.
・Equation:
AVE: average valuen: number of data samplesdi : i-th data of the source channel
(2) RMS value
・Calculates the RMS (effective) value (V) of the waveform data.・When scaling is used, the value is calculated after scaling
・Equation:
RMS: effective valuen: number of data samplesdi : i-th data of the source channel
(3) Peak-to-peak value
Calculates the peak-to-peak (maximum-minimum) value of the waveform data.
(4) Maximum value
Calculates the maximum value of the waveform.
(5) Time to maximum value
・Calculates the time interval from the triggering point to the maximum valueof the waveform (in seconds).
・If there are two maximum value points, the time to the point nearest thetrigger point is calculated.
(6) Minimum value
Calculates the minimum value of the waveform.

358────────────────────────────────────────────────────
15.8 Parameter Calculation Details────────────────────────────────────────────────────
90%
10%
Fall timeRise time
(7) Time to minimum value
・Calculates the time interval from the triggering point to the minimum value ofthe waveform (in seconds).
・If there are two minimum value points, the time to the point nearest thetrigger point is calculated.
(8) Period
(9) Frequency
・Displays the period (s) and frequency (Hz) of the signal waveform.・The calculation is performed by determining the middle point of the signal
amplitude and then measuring the interval from the point when that level iscrossed (in rising or falling direction) to the point when it is next crossed.
(10) Rise time
(11) Fall time
・From the captured waveform data, the 0% and 100% level is determined, andthe rise time (s) is taken as the time required to go from 10% to 90% (falltime: from 90% to 10%).
・In the captured waveform data, the first rising slope (or falling slope) is usedto make the calculation.
・If the A/B cursors (vertical, trace) are used, the first rising slope (or fallingslope) within the range defined by the cursors is used.

359────────────────────────────────────────────────────
15.8 Parameter Calculation Details────────────────────────────────────────────────────
A cursor B cursor
Shaded area is calculated
(12) Standard deviation
・Calculates the standard deviation (V) of the waveform data.
・Equation:
σ: standard deviationAVE: average valuen : number of data samplesdi : i-th data of the source channel
(13) Area value
・Calculates the area bordered by the signal waveform and the zero position(potential 0 V).
・If the A/B cursors (vertical, trace) are used, the area between the cursors iscalculated.
・Equation:
S : Area valuen : number of data samplesdi : i-th data of the source channelh = Δt : sampling period

360────────────────────────────────────────────────────
15.8 Parameter Calculation Details────────────────────────────────────────────────────
X-Y waveform
X-Y waveform (no enclosed range)
Shaded area iscalculated
Line area iscalculated
NOTE
(14) X-Y area value
・Calculates the area (V2) after X-Y plotting.・The waveform is plotted on the X-Y screen, and the area enclosed by the plot
lines is calculated.・In single, dual, quad, or octo screen, the A/B cursors (vertical, trace) can be
used to specify the range (see Section on cursor use) for X-Y plotting and areacalculation.
・On the X-Y screen of the memory recorder function, it is not possible to specifythe range with the A/B cursors.
・ Depending on the signal waveform, values for parameters (8), (9), (10), and(11) may not be displayed.・ When the scaling function is used, scaling is first applied to waveform data,
and then the parameters are calculated. The parameter unit is determined bythe scaling unit ( Section 11.5).
361────────────────────────────────────────────────────
16.1 Overview────────────────────────────────────────────────────
16
17
18
19
5
6
7
8
9
10
11
12
13
14
A
Chapter 16Waveform GO/NG
Evaluation
16.1 Overview
・GO (pass) or NG (fail) evaluation of the input signal waveform can beperformed using an evaluation area specified by the user.
・This can serve to detect irregular waveforms.
・When the evaluation result is NG, an NG signal is output from the NGterminal.
・The waveform evaluation function can be used from the following screens:
Memory recorder (single screen, X-Y single screen)FFT (single screen, Nyquist screen)

362────────────────────────────────────────────────────
16.2 Waveform Evaluation Settings────────────────────────────────────────────────────
1
3
2
Memory recorder function16-01, 02
FFT function
1
3
2
Function keydisplay Meaning 16-g01
: Disable waveform evaluation
: Return NG if any part of thewaveform leaves the evaluation area
: Return NG if the entire waveformleaves the evaluation area
:Activate editor for setting upevaluation area
Function keydisplay Meaning 16-g02
: Stop recording on GO result
: Stop recording on NG result
: Stop recording on GO or NG result
16.2 Waveform Evaluation SettingsThe waveform evaluation function can be used from the following functionsand screens:
・Memory recorder function (single screen, X-Y single screen)・FFT (single screen, Nyquist screen)
Method Screen: STATUS (page 3) in the memory recorder and FFT functions
Display the respective page of the STATUS screen and move the flashingcursor to the wave comparison item.
1. Waveform evaluation mode setting (wavecomparison)
Select the waveform evaluation conditions (Out,All- Out).
2. Setting up the waveform evaluation area( Section 16.3)
・Define the area to be used as reference forwaveform evaluation.
・Press the F5 [ Edit ] key to activate the editor andcreate the area.
3. Setting the GO/NG stop mode・When waveform evaluation is activated (Out or
All-Out setting is selected), the stop mode itemappears.
・This setting determines whether operation isstopped on the GO or NG result.

363────────────────────────────────────────────────────
16.2 Waveform Evaluation Settings────────────────────────────────────────────────────
16
17
18
19
5
6
7
8
9
10
11
12
13
14
A
OUTReturn NG if any part of waveformleaves evaluation area
GOStop on GO result
NGStop on NG result
ALL-OUTReturn NG if entire waveform leavesevaluation area
GO&NGStop on GO or NG result
Waveform evaluation mode Stop mode
GOStop on GO result
NGStop on NG result
GO&NGStop on GO or NG result
Waveform evaluation mode and stop mode

364────────────────────────────────────────────────────
16.2 Waveform Evaluation Settings────────────────────────────────────────────────────
NG
GO
Evaluation
When Evaluation mode: OUT Stop mode: NG
Measurementstart
Capturewaveform Operation stop Measurement
end
NG
GO
EvaluationMeasurement
startCapture
waveform Operation stop Measurementend
STOP key is pressed
When Evaluation mode: OUT Stop mode: NG
Stop mode and trigger mode
・When the evaluation mode and stop mode conditions are fulfilled,measurement operation stops.
・When auto print is set to ON, the waveform is printed out when operation stops.・When auto store is set to ON, data are stored on MO disk when operation stops.・When memory segmentation (sequential save) is ON, data are stored in the
memory block only when operation stops.
Trigger mode: SINGLE
Measurement continues until stop mode conditions are fulfilled and thenstops.
Trigger mode REPEAT, AUTO
・Recording and waveform evaluation is carried out continuously.・Press the STOP key to terminate the measurement.

365────────────────────────────────────────────────────
16.2 Waveform Evaluation Settings────────────────────────────────────────────────────
16
17
18
19
5
6
7
8
9
10
11
12
13
14
A
NG
GO
Measurementstart
Capturewaveform Operation stop Measurement
end
Capture after 1 second
When Evaluation mode: OUT Stop mode: NG
Capture whentriggering occurs
STOP key is pressed
NOTE
Number ofevaluationchannels
Time axis(ms/DIV)
Recordinglength(DIV)
Magnification/compre
ssion
Dot/lineindication
Evaluationperiod
(s)
1 1 25 ×1 Dot Approx. 1.83
1 1 25 ×1 Line Approx. 1.75
2 1 25 ×1 Line Approx. 1.78
Trigger mode: AUTO STOP
Measurement stops when trigger mode conditions are fulfilled and triggeringoccurs.
・Waveform evaluation consists of two actions, namely capturing data andperforming the evaluation. These two actions are carried out in sequence, notsimultaneously. Therefore data are not captured while the evaluation is inprogress, which means that the input signal is not being continuouslymonitored. The time required for evaluation is on the order of 20 ms.・For reference, the table below shows the evaluation period when evaluating
about two cycles of a sine wave on one screen.
(Input waveform so that result is always GO in evaluation mode OUT)
・If a high setting is chosen for recording length or if compression is used, theevaluation cycle becomes slower.
・When waveform parameter measurement and waveform evaluation are carriedout simultaneously, the waveform evaluation stop mode is given priority.

366────────────────────────────────────────────────────
16.3 Creating the Evaluation Area────────────────────────────────────────────────────
16-21, 22
1
2
・ 1/3Function key
display Meaning 16-g03
: Fill in a closed area
: Parallel shift
: Draw a straight line
: Erase
: Switch to 2/3
・ 2/3Function key
display Meaning 16-g04
: Import waveform into editor
: Display filled-in area in reverse
: Clear screen
: Clear area
: Switch to 3/3
16.3 Creating the Evaluation Area
・The graphics editor serves to create the waveform evaluation area.・The area is created by drawing it on screen.
Method Screen: STATUS (page 3) in the memory recorder and FFT functions
1. Activating the editor
・Move the flashing cursor to the wave comparisonitem.
・Press F5 [ Edit ].
2. Editor commands
When the editor is active, the followingcommands are assigned to the function keys.

367────────────────────────────────────────────────────
16.3 Creating the Evaluation Area────────────────────────────────────────────────────
16
17
18
19
5
6
7
8
9
10
11
12
13
14
A
・ 3/3Function key display Meaning 16-g05
: Undo immediately precedingcommand
: Store area in memory
: Quit editor
: Switch to 1/3
NOTE
For details see Section 16.4.
3. Use these commands to create the evaluation area.
4. When the area has been stored in memory, it can be used for waveformevaluation.
5. Press the F4 [ end ] function key to terminate the editor.
When the message "printing" or a warning message is displayed on the screen,the immediately preceding command is canceled (same as the undo command).

368────────────────────────────────────────────────────
16.4 Editor Command Details────────────────────────────────────────────────────
F1
16-g11
16-03, 04
F1
2
3
4
Function keydisplay Meaning 16-g06
: Execute paint
: Terminate paint mode
NOTE
16.4 Editor Command Details■ Paint Function key display: 1/3
Fills in an enclosed area.
Method
1. Press F1 [ paint ].
2. Use the CURSOR keys to move the mark tothe area to be filled in.
3. Press the F1 [ exec ] key. The area completelyenclosed by lines is filled in.
4. Press the F5 [ exit ] key to terminate the paintmode.
If the area is not completely enclosed, adjacentareas will also be filled in.

369────────────────────────────────────────────────────
16.4 Editor Command Details────────────────────────────────────────────────────
F1
16-g12
16-05, 06
F2
2
4
3
Function Screen Movement
Memory recorderSingle
0.04X-Y single
FFTSingle
0.05Nyquist
Function keydisplay Meaning 16-g07
: Increase shift amount
: Decrease shift amount
: Cycle the cursor throughup/down/right/left
: Execute parallel shift
: Terminate parallel shift mode
■ Parallel shift Function key display: 1/3
Shifts the line pattern in parallel direction, to create an area.
Method
1. Press F2 [ parallel ].
2. Set the amount of shift.
・Use the function keys or the JOG control to setthe value.
・Use the F3 [ move csr ] key (or the CURSOR keys)to set the shift amount in the up/down/right/leftdirections.
・Minimum shift increments are shown in thefollowing table.
3. Press the F4 [ exec ] key. The parallel shift iscarried, thereby creating the evaluation area.
4. Press the F5 [ exit ] key to terminate theparallel shift mode.

370────────────────────────────────────────────────────
16.4 Editor Command Details────────────────────────────────────────────────────
F1
16-g13
16-07, 08
F3
2
3
4
5
7
Function keydisplay Meaning 16-g08
: Set the point under the mark asstart/end point
: Cancel the immediately preceding setpoint
: Terminate line mode
■ Line Function key display: 1/3
Serves to draw a straight or polygonal line.
Method
1. Press F3 [ line ].
2. Use the CURSOR keys to move the mark to thestart point of the line.
3. Press F1 [ set ].
4. Move the mark. A line is drawn between theset point and the mark.
5. Press the F1 [ set ] key again. The color of theline changes, and it is fixed.
6. Repeat steps 4 and 5 when wishing to draw apolygonal line.
7. Press the F5 [ exit ] key to terminate the linemode.

371────────────────────────────────────────────────────
16.4 Editor Command Details────────────────────────────────────────────────────
F1
16-g14
16-09, 10
F4
2
3
4
5
Function keydisplay Meaning 16-g09
: Set the eraser
: Terminate erase mode
■ Erase Function key display: 1/3
Serves to erase unwanted sections.
Method
1. Press F4 [ erase ].
2. Use the CURSOR keys to move the mark tothe start point of the section to be erased.
3. Press F1 [ set ].
4. Move the mark to erase the unwantedsection.
5. Press the F5 [ exit ] key to terminate the erasemode.

372────────────────────────────────────────────────────
16.4 Editor Command Details────────────────────────────────────────────────────
16-11, 12
F1
16-g15
F1
NOTE
■ Import waveform Function key display: 2/3
Loads a waveform already stored in memory into the editor.
Method
Press F1 [ storage ].
The waveform that was displayed on the screen isloaded into the editor.
The imported waveform is shown in a differentcolor from the original setting.

373────────────────────────────────────────────────────
16.4 Editor Command Details────────────────────────────────────────────────────
16-13, 14
F1
16-g16
F2
■ Reverse Function key display: 2/3
Reverses the colors of a filled-in area and the surrounding area.
Method
Press F2 [ reverse ].
Displays filled in area in reverse.

374────────────────────────────────────────────────────
16.4 Editor Command Details────────────────────────────────────────────────────
16-15, 16
F1
16-g16
F3
■ Clear screen Function key display: 2/3
Clears the entire editor screen.
Method
Press F3 [ all clear ].

375────────────────────────────────────────────────────
16.4 Editor Command Details────────────────────────────────────────────────────
F1
16-g18
16-17, 18
F4
4
3
5
6
Function keydisplay Meaning 16-g09
: Set start/end corner
: Terminate clear area mode
■ Clear area Function key display: 2/3
Clears a specified rectangular area of the editor screen.
Method
1. Press F4 [ clear area ].
2. Use the CURSOR keys to move the mark to thestart corner of the area to be erased.
3. Press F1 [ set ].
4. Move the mark to the end corner of the areato be erased.
5. Press the F1 [ set ] key again. The rectangulararea is cleared.
6. Press the F5 [ exit ] key to terminate the cleararea mode.

376────────────────────────────────────────────────────
16.4 Editor Command Details────────────────────────────────────────────────────
16-19, 20
F1
16-g19
F1
Screen before "clear screen" is restored.
Clears the editorscreen
■ Undo Function key display: 3/3
・Serves to undo the immediately preceding command.・Undo is applicable to all commands except STORE and QUIT EDITOR.
Method
Press F1 [ undo ].

377────────────────────────────────────────────────────
16.4 Editor Command Details────────────────────────────────────────────────────
Created evaluationarea Stored in
memory16-g20
F1F3
Store createdarea in memory
Discard createdarea
Editorterminates
16-g21
F1F416-g22
F1F3
16-g23
F1F5
NOTE
Store area in memory (function key display: 3/3)
・Serves to store the created area in memory.・After an area has been stored, it can be used for waveform evaluation.
Method Press the F3 [ save area ] key.
Quit editor (function key display: 3/3)
Terminates the editor.
Method Store evaluation area in memory and quit editor
・Press the F4 [ end ] key and then the F3 [ save area ] key.・The stored area can be used for waveform evaluation.
Quit editor without storing evaluation area in memory
・Press the F4 [ end ] key and then the F5 [ kill area ] function key.・The created area will be discarded. 1.
If the F4 [ end ] key is pressed without having done any editing orimmediately after using the store command, the editor is terminated withoutconfirmation.
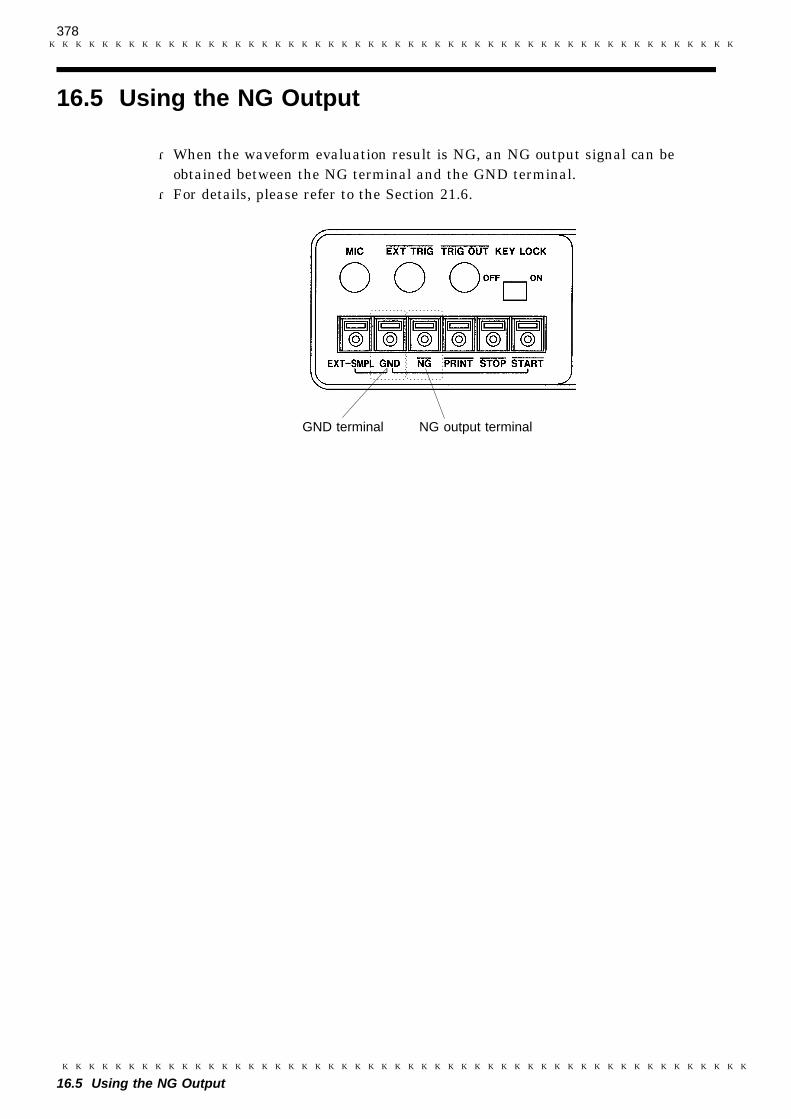
378────────────────────────────────────────────────────
16.5 Using the NG Output────────────────────────────────────────────────────
GND terminal NG output terminal
16.5 Using the NG Output
・When the waveform evaluation result is NG, an NG output signal can beobtained between the NG terminal and the GND terminal.
・For details, please refer to the Section 21.6.

379────────────────────────────────────────────────────
16.6 Setting Example for Waveform Evaluation────────────────────────────────────────────────────
10 μF
200 Ω1/4 W
10 V p-p
60 HzSine wave
CH1
Status Screen (page 1)16-23##
Status Screen (page 2)16-24
Change the trigger mode to SINGLE so thatmeasurement stops when the evaluation result is NG.
16.6 Setting Example for Waveform Evaluation
Example Using the circuit shown in the illustration, the power supply voltage ismonitored in CH1, and the measurement is stopped if noise spikes cause thevoltage to exceed the prescribed range.
Setting Make settings on the memory recorder STATUS screen as shown below( Section 5.2.1).
・Set all items on STATUS screen (page 3) to OFF. (Settings for waveformparameter calculation and evaluation are to be made later.)
・Set all items on STATUS screen (page 4) to OFF.

380────────────────────────────────────────────────────
16.6 Setting Example for Waveform Evaluation────────────────────────────────────────────────────
Channel Screen (page 1)
16-25###
Method 16-26###
1. After having established the settings describedabove, record the waveform to be used asreference.

381────────────────────────────────────────────────────
16.6 Setting Example for Waveform Evaluation────────────────────────────────────────────────────
2
3
5
16-27, 28
2. Move the flashing cursor to the waveformcomparison item on the STATUS screen (page 3).
3. Set waveform evaluation to OUT ( F2 ) and thestop mode to NG ( F2 ).
4. Move the flashing cursor to the waveformcomparison item and press F5 [ Edit ].
5. Press F1 [ storage ] (2/3) to import the referencewaveform into the editor.
6. Press F2 [ parallel ] (1/3).
・Shift the displayed waveform vertically andhorizontally to create the evaluation area.

382────────────────────────────────────────────────────
16.6 Setting Example for Waveform Evaluation────────────────────────────────────────────────────
7
8
9
16-28, 29
7. Use the F3 [ move csr ] key or the CURSOR keysto set the amount of up/down/right/left shift inDIV units.
・Since the scale is 1 V/DIV, make the followingsettings to obtain a 1.0 V range in the up/downdirections.
Up: 1.0Down: 1.0Left: 0Right: 0
8. Press F4 [ exec ] to carry out the parallel shift.
9. Press F5 [ exit ] to terminate the parallel shiftmode.
10. Press F4 [ end ] (3/3) and press F3 [ save area ]
to quit the editor after storing the waveform.
11. Press the DISP key to activate the displayscreen.
12. Press the START key to start waveformevaluation (do not change the measurementparameters). If the input waveform leaves theevaluation area at any point, the measurementis terminated.

383────────────────────────────────────────────────────
17.1 Overview────────────────────────────────────────────────────
16
17
18
19
5
6
7
8
9
10
11
12
13
14
A
Chapter 17Memory Segmentation
Function
17.1 Overview・This function divides the memory into separate blocks, each of which can be
used for waveform recording.・The memory segmentation function has two modes: sequential save and multi-
block.
Sequential save function
・Memory space is divided into blocks.
・Input signal capture is carried out continuously using the trigger, storingwaveform data successively in each block.
・During recording, no display or printout is carried out.
・This reduces dead time (non-sensitivity periods due to display and printingdelays).
Multi-block function
・Memory space is divided into blocks.
・Waveform data can be stored in a selected block.

384────────────────────────────────────────────────────
17.2 Using the Sequential Save Function────────────────────────────────────────────────────
NOTE
Recording length
Brief phenomena may not register
・・・Dead time (interval in which no sampling occurs due to displayand print processing)
Recording length Recording length
Data are divided into blocks and recorded in memory.
Recording length Recording length Recording length Recording length
17.2 Using the Sequential Save Function・Input signal capture is carried out continuously using the trigger, storing
waveform data successively in each block.・Any block in which an input signal is recorded can be called up on the display.
During measurement, the display and print functions are totally disabled untildata have been recorded in all blocks.
・When continuous print (auto print) is being performed in REPEAT trigger mode
・Using sequential save

385────────────────────────────────────────────────────
17.2 Using the Sequential Save Function────────────────────────────────────────────────────
16
17
18
19
5
6
7
8
9
10
11
12
13
14
A
1
2
3
Function keydisplay Meaning 17-g01
: Disable memory segmentation
: Enable sequential save function
: Enable multi-block function( Section 17.3)
Function key display Meaning
2 to maximum number of memoryblocks
Method Screen: STATUS (page 3) 17-01
1. Memory segmentation settings
Select F2 [ SEQUEN ].
2. Number of memory blocks
・The number of available memory blocks (3, 7, 15, 31, 63) is automatically set,depending on the recording length and the number of units in use (see"Relation between recording length (DIV), number of units, and maximumnumber of memory blocks" on the next page).
・The user can select how many blocks to use out of the total available number.
・Use the function keys or the JOG control to make this setting.
3. Display block setting
・Set the number of the memory block to display on screen.
・Make the setting in the same way as in step 2.

386────────────────────────────────────────────────────
17.2 Using the Sequential Save Function────────────────────────────────────────────────────
Number ofunits
Recordinglength (DIV)
1 unit 2 units 4 units 8 units
1 ch 2 ch 1 ch 2 ch 1 ch 2 ch 1 ch 2 ch
20000100005000200010005002001005025
1137
153163636363
ー11371531636363
ーー113715316363
ーーー1137153163
ーーーー1137
1531
1 ch (one channel) : only 8916 - 8919, 8928
2 ch (two channels) : 8916 - 8919, 8927, and 8928 used together, or only 8927
(For the 8928, one channel corresponds to one unit.)
Measurement start Block 1 Block 2 Specified block End
・・・Trigger
Record Record Record
Relation between recording length (DIV), number of units, andmaximum number of memory blocks
When using the sequential save function, recording length has priority overthe number of memory blocks. When the recording length is changed, thenumber of memory blocks may automatically be adjusted.
Reference The HELP key can be used to change the displayed memory block or to callup information about the usage status of memory blocks ( Section 20.4).
Relation between trigger mode and sequential save
Trigger mode SINGLE
・When the START key is pressed, waveform data are stored sequentially fromblock 1 onwards.
・When the specified number of memory blocks has been recorded, measurementstops.
・After measurement is completed, the waveform of the block selected fordisplay is shown on the screen.

387────────────────────────────────────────────────────
17.2 Using the Sequential Save Function────────────────────────────────────────────────────
16
17
18
19
5
6
7
8
9
10
11
12
13
14
A
・・・Trigger
Measurement ends at specified block when STOP key was pressed.
Record Record Record Record
Measurement start Block 1 Block 2 Specified block Block 1
▽
・・・Trigger
Record Record Record Record
or after1 second
▽
or after1 second
▽
or after1 second
▽
or after1 second
Measurement start Block 1 Block 2 Specified block Block 1
Measurement ends at specified block when STOP key was pressed.
Trigger mode REPEAT
・When the START key is pressed, waveform data are stored sequentially fromblock 1 onwards.
・When the specified number of memory blocks has been recorded, storing ofwaveform data returns to block 1, and data continue to be recorded from block1 onwards, overwriting the earlier data.
・After the specified number of memory blocks has been recorded, the waveformof the block selected for display is shown on the screen. (If auto print is ON,printing is carried out.)
・Pressing the STOP key once during measurement causes measurement tostop after the specified number memory blocks.
・Pressing the STOP key twice during measurement causes measurement tostop immediately.
Trigger mode AUTO
・When the START key is pressed, waveform data are stored sequentially fromblock 1 onwards, not only for waveforms captured by triggering but alsowaveforms captured at regular intervals.
・When the specified number of memory blocks has been recorded, storing ofwaveform data returns to block 1, and data continue to be recorded from block1 onwards, overwriting the earlier data.
・After the specified number of memory blocks has been recorded, the waveformof the block selected for display is shown on the screen. (If auto print is ON,printing is carried out.)
・Pressing the STOP key once during measurement causes measurement tostop after the specified number memory blocks.
・Pressing the STOP key twice during measurement causes measurement tostop immediately.

388────────────────────────────────────────────────────
17.2 Using the Sequential Save Function────────────────────────────────────────────────────
・・・Trigger
Record Record Record
Measurement start Block 1 Block 2 Specified block End
Measurement ends at specified block (waveform data capturedafter 1-second interval has elapsed are not recorded).
Trigger mode AUTO STOP
・When the START key is pressed, only waveform data which were captured bytriggering are stored sequentially from block 1 onwards (not waveformscaptured at regular intervals).
・When the specified number of memory blocks has been recorded, measurementstops.
・After measurement is completed, the waveform of the block selected fordisplay is shown on the screen.

389────────────────────────────────────────────────────
17.3 Using the Multi-Block Function────────────────────────────────────────────────────
16
17
18
19
5
6
7
8
9
10
11
12
13
14
A
Any block can be called upon display
Superimposed display ofdata from 2 blocks
Store in memory
Measurement
1234
Function keydisplay Meaning 17-g01
: Disable memory segmentation
: Enable sequential save function( Section 17.2)
: Enable multi-block function
17.3 Using the Multi-Block Function・Memory is divided into blocks which can be freely selected by the user for
storing measurement data.・Data stored in any block can be called up on the display.・Data from two different blocks can be superimposed on screen for easy
comparison. (it can be printed out)
Method Screen: STATUS (page 3) 17-021. Memory segmentation setting
Select F3 [ MULTI ].

390────────────────────────────────────────────────────
17.3 Using the Multi-Block Function────────────────────────────────────────────────────
Function keydisplay Meaning
3, 7, 15, 31, 63
NOTE
Function keydisplay Meaning
1 to highest memory block number
Function keydisplay Meaning
OFF, 1 to highest memory block number
2. Number of memory blocks setting
・Determine into how many blocks the memory is to be divided.・Use the function keys or the JOG control to make this setting.
The recording length per block depends on the number of memory blocks andthe number of units in use (see "Relation between number of memory blocks,number of units, and maximum recording length (DIV)" on the next page).
3. Number of memory block to use setting
・Select the number of the memory block for display and recording of the inputsignal waveform..
・Use the function keys or the JOG control to make this setting.
4. Reference memory block
・Select a memory block whose waveform data are to be superimposed on screenwith the memory block selected for display.
・Use the function keys or the JOG control to make this setting.

391────────────────────────────────────────────────────
17.3 Using the Multi-Block Function────────────────────────────────────────────────────
NOTE
Number of unitsto be used
Number ofmemory blocks
1 2 4 8
1 ch 2 ch 1 ch 2 ch 1 ch 2 ch 1 ch 2 ch
37153163
500020001000500200
20001000500200100
100050020010050
5002001005025
2001005025-
1 ch (one channel) : only 8916 - 8919, 8928
2 ch (two channels) : 8916 - 8919, 8927, 8928 used together, or only 8927
Reference Scrolling can be carried out while the superimpose function is used( Section 19.3).
It is not possible to superimpose two memory blocks of different recordinglength.
Relation between number of memory blocks, number of units, andmaximum recording length (DIV)
When using the multi-block function, the number of memory blocks haspriority over the recording length (DIV). When the number of memory blocksis changed, the recording length may automatically be adjusted.
(For the 8928, one channel corresponds to one unit.)
Reference The HELP key can be used to change the displayed memory block or to callup information about the usage status of memory blocks ( Section 20.4).

392────────────────────────────────────────────────────
17.3 Using the Multi-Block Function────────────────────────────────────────────────────

393────────────────────────────────────────────────────
18.1 Overview────────────────────────────────────────────────────
16
17
18
19
5
6
7
8
9
10
11
12
13
14
A
Time axis waveform averaging
Averagingresult
Chapter 18Waveform Averaging
18.1 Overview
・The averaging function allows capturing several instances of a waveform anddetermining the average.
・This makes it possible to eliminate noise and irregular signal components.・Averaging is available for the memory recorder and FFT functions.・Time axis waveform averaging (memory recorder, FFT)・Frequency axis waveform averaging (FFT)・Frequency axis waveform peak hold (FFT)・The higher the number of averaging instances, the more effectively will noise
be suppressed.
18-01, 02

394────────────────────────────────────────────────────
18.1 Overview────────────────────────────────────────────────────
Frequency axis waveform averaging
Averagingresult
18-03, 04

395────────────────────────────────────────────────────
18.2 Setting the Averaging Function────────────────────────────────────────────────────
16
17
18
19
5
6
7
8
9
10
11
12
13
14
A
18.2.1 When Using Memory Recorder Function
Averaging time Specified numberof times
1
2
Function keydisplay Meaning
OFF, 2, 4, 8, 16, 32, 64, 128, 256
NOTE
18.2 Setting the Averaging Function
(1) Setting the averaging count
Method Screen: STATUS (page 3) 18-05, 06###1. Move the flashing cursor to the average item.
2. Use the JOG control or the function keys to setthe averaging count.
After starting the measurement, the averagingcount and the current waveform data count areshown on the screen.
・Averaging does not apply to logic input channels,which simply show the last captured value.
・When the memory segmentation function is used,averaging is not available.
・Averaging and waveform processing cannot becarried out simultaneously.
・Waveform processing can be carried out for anaveraged waveform after measurement iscompleted.

396────────────────────────────────────────────────────
18.2 Setting the Averaging Function────────────────────────────────────────────────────
Inputsignal
Averaging(summing
averaging)
Waveformcapture Display End
Triggerconditionsfulfilled
Waveform averaging count = less than specified number
Waveform averaging count= specified number
(for recording length)
Inputsignal
Waveformcapture (for
recording length)Display End
Triggerconditionsfulfilled
Before specified count
STOP key is pressedAfter specified count
Averaging(summing
averaging)
Averaging(exponentialaveraging)
(for recording length)
NOTE
Averaging and trigger mode
Trigger mode: SINGLE
1. After the START key was pressed, data are captured whenever the triggerconditions are fulfilled, and summing averaging (*1) is carried out.
2. When the specified number of data has been captured, measurement stopsautomatically.
3. If the measurement was stopped prematurely with the STOP key, theaveraging result up to that point is displayed.
Trigger mode: REPEAT
1. After the START key was pressed, data are captured whenever the triggerconditions are fulfilled, and summing averaging (*1) is carried out until thespecified averaging count. The averaging result is shown on the display.
2. After the specified averaging count was reached, exponential averaging (*2) iscarried out whenever data are captured, and the averaging result is shown onthe display.
3. If the measurement was stopped prematurely with the STOP key, theaveraging result up to that point is displayed.
Trigger mode: AUTO and AUTO STOP
When the START key is pressed, data are captured even if trigger conditionsare not fulfilled after a certain interval. If averaging is applied tounsynchronized input signals, the result will be meaningless.
For details on summing averaging (*1) and exponential averaging (*2), refer toSection 18.3.

397────────────────────────────────────────────────────
18.2 Setting the Averaging Function────────────────────────────────────────────────────
16
17
18
19
5
6
7
8
9
10
11
12
13
14
A
Number of units1 2 4 8
1 ch 2 ch 1 ch 2 ch 1 ch 2 ch 1 ch 2 ch
Maximumrecording
length (DIV)5000 2000 1000 500 200
1ch: Only 8916 - 8919, 8928 can be used.
2ch: 8916 - 8919, 8927, and 8928 can coexist, or 8927 can be used exclusively.
(For the 8928, one channel corresponds to one unit.)
Recording length limit
The maximum recording length that can be set for averaging depends on thenumber of units.

398────────────────────────────────────────────────────
18.2 Setting the Averaging Function────────────────────────────────────────────────────
18.2.2 When Using FFT Function
1, 2
3, 4
1, 2
3, 4
・ 1/2Function key
display Meaning 18-g02
: Disable averaging
: Perform time axis waveformsumming averaging
: Perform time axis waveformexponential averaging
: Perform frequency axis waveformsumming averaging (*3)
: Switch to 2/2
・ 2/2Function key
display Meaning 18-g03
: Perform frequency axis waveformexponential averaging (*4)
: Frequency axis waveform peak hold(*5)
: Switch to 1/2
NOTE
Select whether to use time axis waveform averaging or frequency axiswaveform averaging and set the averaging count.
・Time axis waveform averagingCaptured waveform data are averaged, and the averaged value is used forFFT processing.
・Frequency axis waveform averagingFFT processing is performed first, and the resulting data are averaged.
Method Screen: STATUS (page 1), DISPLAY 18-07, 081. Move the flashing cursor to the average item on
the STATUS screen or the average item on thedisplay screen.
2. Use the function keys to select the type ofaveraging.
For details on frequency axis waveform summingaveraging (*3), exponential averaging (*4), andpeak hold (*5), refer to Section 18.3.
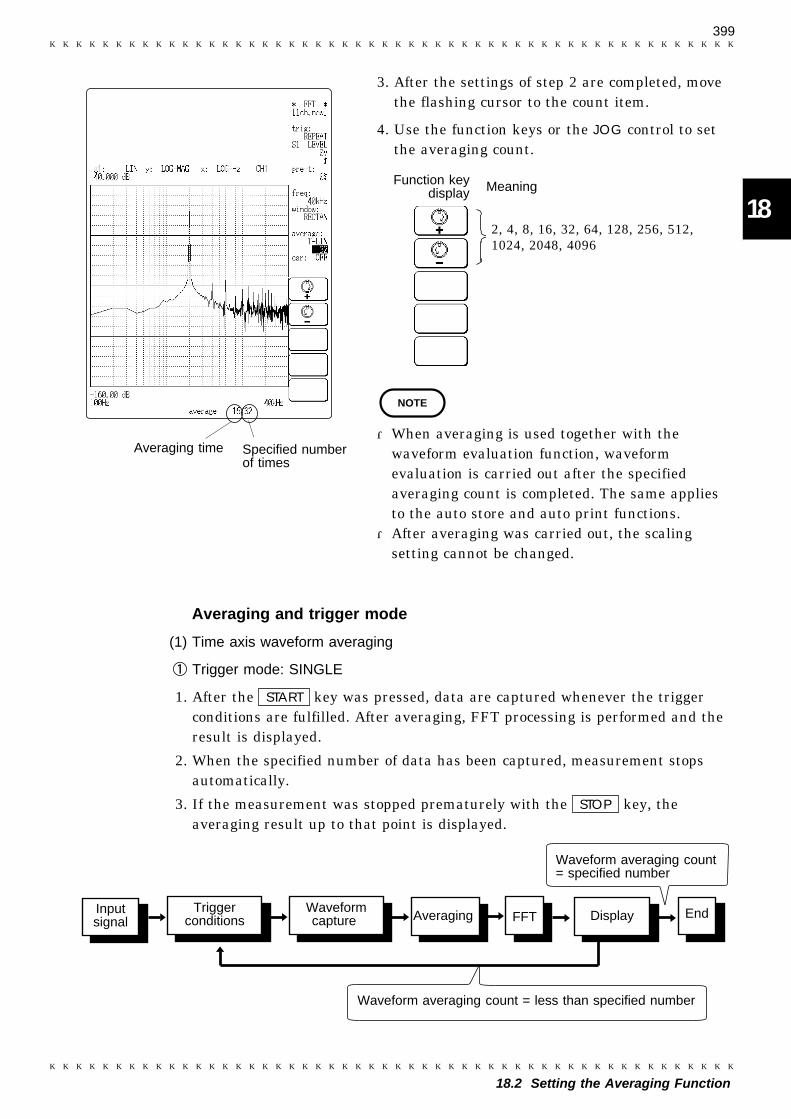
399────────────────────────────────────────────────────
18.2 Setting the Averaging Function────────────────────────────────────────────────────
16
17
18
19
5
6
7
8
9
10
11
12
13
14
A
18-09Averaging time Specified number
of times
Function keydisplay Meaning
2, 4, 8, 16, 32, 64, 128, 256, 512,1024, 2048, 4096
NOTE
Triggerconditions
Waveformcapture
Inputsignal
EndDisplayAveraging FFT
Waveform averaging count= specified number
Waveform averaging count = less than specified number
3. After the settings of step 2 are completed, movethe flashing cursor to the count item.
4. Use the function keys or the JOG control to setthe averaging count.
・When averaging is used together with thewaveform evaluation function, waveformevaluation is carried out after the specifiedaveraging count is completed. The same appliesto the auto store and auto print functions.
・After averaging was carried out, the scalingsetting cannot be changed.
Averaging and trigger mode
(1) Time axis waveform averaging
Trigger mode: SINGLE
1. After the START key was pressed, data are captured whenever the triggerconditions are fulfilled. After averaging, FFT processing is performed and theresult is displayed.
2. When the specified number of data has been captured, measurement stopsautomatically.
3. If the measurement was stopped prematurely with the STOP key, theaveraging result up to that point is displayed.

400────────────────────────────────────────────────────
18.2 Setting the Averaging Function────────────────────────────────────────────────────
Triggerconditions
Waveformcapture
Inputsignal
EndDisplayAveraging FFT
STOP key is pressed
Data are cleared after specifiednumber of samples were taken
Triggerconditions
Waveformcapture
Inputsignal EndDisplay
Waveform averaging count= specified number
Waveform averaging count = less than specified number
AveragingFFT
Trigger mode: REPEAT
1. After the START key was pressed, data are captured whenever the triggerconditions are fulfilled and averaging is carried out for the specified count.FFT processing is performed and the result is displayed.
2. When the specified averaging count is reached, data up to that point arediscarded, and new data are captured for averaging.
3. If the measurement was stopped prematurely with the STOP key, theaveraging result up to that point is displayed.
Trigger mode: AUTO and AUTO STOP
When the START key is pressed, data are captured even if trigger conditionsare not fulfilled after a certain interval. If averaging is applied tounsynchronized input signals, the result will be meaningless.
(2) Frequency axis waveform averaging
・Captured data first undergo FFT processing. Then averaging is performed andthe result is displayed.
・Unlike time axis averaging, the results are valid also if no triggersynchronization is used. But if the characteristics of the input waveform allowtriggering, using the trigger for synchronization is recommended.
Trigger mode: SINGLE

401────────────────────────────────────────────────────
18.2 Setting the Averaging Function────────────────────────────────────────────────────
Waveformcapture
Inputsignal
EndDisplay
STOP key is pressed
Data are cleared after specifiednumber of samples were taken
AveragingFFT
Waveformcapture
Inputsignal End
If triggeringdoes not occur,press STOPkey
Display
If triggering occurred at least onceWaveform averaging count = specified number
Data are cleared after specifiednumber of samples were taken
AveragingFFT
If no triggering occurred
Trigger mode: REPEAT or AUTO
Trigger mode: AUTO STOP
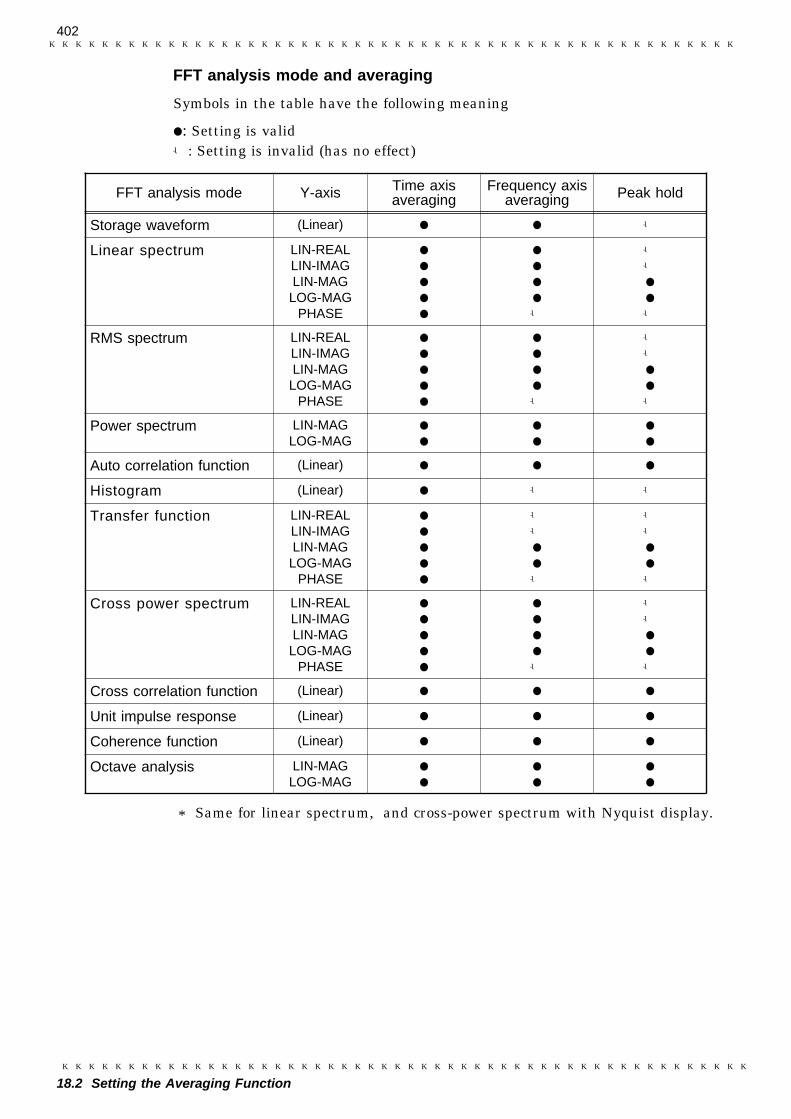
402────────────────────────────────────────────────────
18.2 Setting the Averaging Function────────────────────────────────────────────────────
FFT analysis mode Y-axis Time axisaveraging
Frequency axisaveraging Peak hold
Storage waveform (Linear) -
Linear spectrum LIN-REALLIN-IMAGLIN-MAG
LOG-MAGPHASE -
--
-
RMS spectrum LIN-REALLIN-IMAGLIN-MAG
LOG-MAGPHASE -
--
-
Power spectrum LIN-MAGLOG-MAG
Auto correlation function (Linear)
Histogram (Linear) - -
Transfer function LIN-REALLIN-IMAGLIN-MAG
LOG-MAGPHASE
--
-
--
-
Cross power spectrum LIN-REALLIN-IMAGLIN-MAG
LOG-MAGPHASE -
--
-
Cross correlation function (Linear)
Unit impulse response (Linear)
Coherence function (Linear)
Octave analysis LIN-MAGLOG-MAG
FFT analysis mode and averaging
Symbols in the table have the following meaning
: Setting is valid-: Setting is invalid (has no effect)
* Same for linear spectrum, and cross-power spectrum with Nyquist display.

403────────────────────────────────────────────────────
18.3 Averaging Equations────────────────────────────────────────────────────
18.3 Averaging Equations
Time axis waveform averaging (memory recorder, FFT)
For time axis averaging, summing averaging is synchronized by the trigger.If trigger synchronization is not performed, the results will be meaningless.
(*1) Summing averaging
Captured data are added sequentially and the sum is divided by the numberof samples.
Equation:
n: Averaging countAn: Result of n times averagingZn: nth measurement data
(*2) Exponential averaging
Most recent data are given greatest weighting, and the weighting of older datais reduced with an exponential function.
Equation
N: Specified averaging countn: Averaging countAn: Result of n times averagingZn: nth measurement data
Frequency axis waveform averaging (FFT)
Unlike time axis averaging, results are valid also if no trigger synchronizationis used. But if the characteristics of the input waveform allow triggering,using the trigger for synchronization is recommended.
(*3) Summing averaging
Equation is the same as for time axis averaging.
(*4) Exponential averaging
Equation is the same as for time axis averaging.
(*5) Peak hold (frequency axis: FFT)
The specified number of samples are captured, and the peak value is held(stored) for each frequency.

404────────────────────────────────────────────────────
18.3 Averaging Equations────────────────────────────────────────────────────

405────────────────────────────────────────────────────
19.1 Overview────────────────────────────────────────────────────
16
17
18
19
5
6
7
8
9
10
11
12
13
14
A
Chapter 19Using the A/B Cursors /
Waveform Scrolling
19.1 Overview
The following three types of A/B cursors are available:
・Line cursor (vertical)
・Line cursor (horizontal)
・Trace cursor
For FFT, only the trace cursor is available.
The scroll function can be used to view a waveform (not available for FFT).

406────────────────────────────────────────────────────
19.2 Using the A/B Cursors────────────────────────────────────────────────────
Value Vertical cursor Horizontal cursor
A or Bt time from the trigger point v voltage difference from 0 V
or temperature differencefrom ℃
1/t frequency taking t as theperiod
B - A
t time interval between theA and B cursors
v voltage difference ortemperature differencebetween the A and Bcursors.
1/t frequency taking t as theperiod
B
A
Cursors
Line Cursors (vertical)19-01, 02
Line Cursors (horizontal)
CursorsA B
19.2 Using the A/B Cursors
The A/B cursors can be used to read a time difference, frequency difference,potential difference, or temperature difference on screen. (When scaling isused, the difference is displayed in the scaling value. See the section onscaling.)
The following three types of A/B cursors are available:
・Line cursor (vertical) (not available for FFT)
・Line cursor (horizontal) (not available for FFT)
・Trace cursor
(1) Line cursor (vertical, horizontal) (not available for FFT)
The value at cursor A and cursor B, and the value between the two cursorscan be determined.
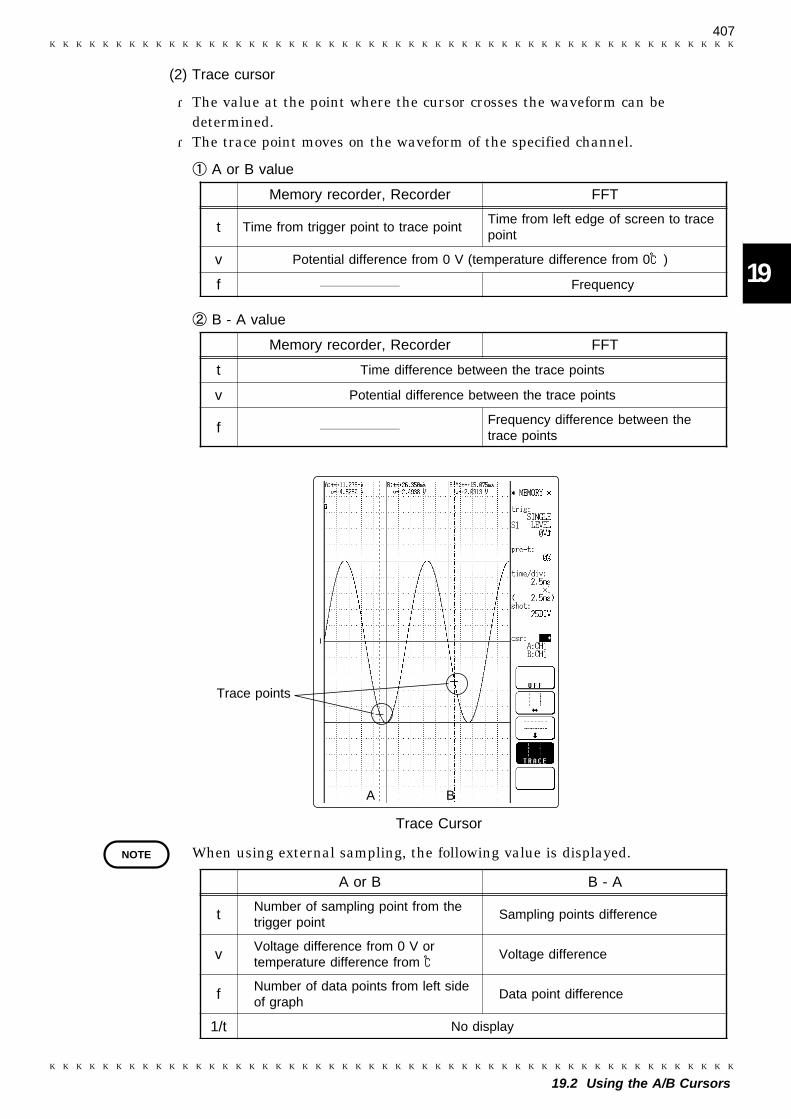
407────────────────────────────────────────────────────
19.2 Using the A/B Cursors────────────────────────────────────────────────────
16
17
18
19
5
6
7
8
9
10
11
12
13
14
A
Memory recorder, Recorder FFT
t Time from trigger point to trace pointTime from left edge of screen to tracepoint
v Potential difference from 0 V (temperature difference from 0℃)
f Frequency
Memory recorder, Recorder FFT
t Time difference between the trace points
v Potential difference between the trace points
f Frequency difference between thetrace points
Trace Cursor
Trace points
19-03
A B
NOTE
A or B B - A
t Number of sampling point from thetrigger point
Sampling points difference
v Voltage difference from 0 V ortemperature difference from ℃ Voltage difference
f Number of data points from left sideof graph
Data point difference
1/t No display
(2) Trace cursor
・The value at the point where the cursor crosses the waveform can bedetermined.
・The trace point moves on the waveform of the specified channel.
A or B value
B - A value
When using external sampling, the following value is displayed.

408────────────────────────────────────────────────────
19.2 Using the A/B Cursors────────────────────────────────────────────────────
2
1
3
Function keydisplay Meaning 19-g01
: Disable A/B cursors
: Line cursor (vertical: t, 1/t) (notdisplayed for FFT)
: Line cursor (horizontal: v)
: Trace cursor (not displayed forrecorder)
Method Screen: DISPLAY 19-04, 05
1. Move the flashing cursor to the csr item.
2. The function key display changes as follows.
3. Specify the cursor shape.
To use the line cursor (vertical)
Select F2 [ ] (Line cursor,vertical) key.

409────────────────────────────────────────────────────
19.2 Using the A/B Cursors────────────────────────────────────────────────────
16
17
18
19
5
6
7
8
9
10
11
12
13
14
A
19-06, 07
Function keydisplay Meaning
CH1 to CH16
NOTE
Function keydisplay Meaning
CH1 to CH16
To use the line cursor (horizontal)
Select F3 [ ] (Line cursor, horizontal) key.
The channel select option appears under the csritem. If 2 or more channels are being displayed,use the flashing cursor to select the channel forwhich you want to read the voltage(temperature) value with the A/B cursors.
・This item does not appear when using thevertical line cursor.
・Only channels for which a waveform is beingdisplayed can be specified.
・By specifying a different channel for the A and Bcursors, a potential difference between thewaveforms in the respective channels can bedetermined.
To use the trace cursor
Select F4 [ TRACE ].
The channel select option appears under the csritem. Use the flashing cursor to select thechannel for which you want to read the voltage(temperature) value with the A/B cursors. Youcan specify different channels for the twocursors.

410────────────────────────────────────────────────────
19.2 Using the A/B Cursors────────────────────────────────────────────────────
Select key
Cursor type shown in reversewill be moved
Channel of cursor shown in reversecan be selected
6
7
Function keydisplay Meaning 19-g02
: Move cursor A
: Move cursor B
CH1 - CH16(invalid with vertical cursor)
:Switch to waveform scroll mode( Section 19.3)
4. Press the SELECT key so that the WAVE A.B CSRLED lights up. The JOG/SHUTTLE control now canbe used for waveform scrolling and for operatingthe A/B cursors.
5. Each push of the function key F5 togglesbetween the waveform scroll mode and the A/Bcursors mode. The display becomes as follows.
6. Use the function keys to select the cursor to bemoved.
Press the desired function key, so that thedisplay is shown in reverse. The respectivecursor will be moved. Press the function keyagain to cancel.
7. The channel for the current cursor (shown inreverse) can be changed with the function keys(for horizontal and trace cursor).
19-16, 17

411────────────────────────────────────────────────────
19.2 Using the A/B Cursors────────────────────────────────────────────────────
16
17
18
19
5
6
7
8
9
10
11
12
13
14
A
Right
Line cursor (vertical), Trace cursor
Left
Up
Line cursor (horizontal)
Down
8. Rotate the JOG control to move the cursor.
・t, 1/t, v or f at the cursor position can be determined.・When the vertical cursor or trace cursor is used, cursor measurements are
possible also when one of the cursors is currently off screen.

412────────────────────────────────────────────────────
19.2 Using the A/B Cursors────────────────────────────────────────────────────
NOTE
When cursor B is moved further, waveform scrollsto the left. Cursor A moves with waveform to the left.
A cursor B cursor A cursor B cursor
Cursor B is moved to the right
19-08, 09
Cursor movement and waveform scrolling
・ Waveform scrolling behavior when the A/B cursors are moved differs,depending on whether the vertical/trace cursor or the horizontal cursor isused.・ The FFT screen does not allow scrolling.
Vertical cursor or trace cursor (Example: trace cursor)When cursor B is moved:
・When cursor B reaches the edge of the screen, the waveform scrolls to the left.・Cursor A moves together with the waveform.

413────────────────────────────────────────────────────
19.2 Using the A/B Cursors────────────────────────────────────────────────────
Cursor A is moved down Waveform does not scroll also whenattempting to move cursor A further
B cursor
A cursor
A cursor
19-10, 11
Horizontal cursorWhen cursor A is moved:
When cursor A reaches the edge of the screen, the waveform does not scroll.
Reference When the vertical cursor or the trace cursor is off screen while using thememory recorder or recorder function, the HELP key can be used to check thecursor position within the total recording length ( Section 20.4).

414────────────────────────────────────────────────────
19.3 Scrolling the Waveform────────────────────────────────────────────────────
Select key
Horizontal Scrolling
19-18
Function keydisplay Meaning 19-g03
: Horizontal scroll
: Vertical scroll
:Show next screen (15 DIV).(Position of current screen withinrecording length is also shown.)
:Show previous screen (15 DIV).(Position of current screen withinrecording length is also shown.)
: Switch to A/B cursor operation screen( Section 19.2).
19.3 Scrolling the Waveform
・The waveform on the display can be scrolled horizontally and vertically.・The FFT screen does not allow scrolling.
Method Screen: DISPLAY
1. Press the SELECT key so that the WAVE A.B CSRLED lights up. The JOG/SHUTTLE control now canbe used for waveform scrolling and for operatingthe A/B cursors.
2. Each push of the function key F5 togglesbetween the waveform scroll mode and the A/Bcursors mode. Set the display as follows to usethe scroll mode.
When horizontal scrolling is selected

415────────────────────────────────────────────────────
19.3 Scrolling the Waveform────────────────────────────────────────────────────
Vertical Scrolling
Channel of currently scrolled waveformis displayed
19-19
Function keydisplay Meaning 19-g04
: Horizontal scroll
: Vertical scroll
: Increase channel number
: Decrease channel number
: Switch to A/B cursor operation screen( Section 19.2).
Vertical Scrolling
Move waveformto left
Move waveformto right
Horizontal Scrolling
Move waveform up
Move waveform down
When vertical scrolling is selected
3. Use the function key display to select eithervertical or horizontal scrolling. When verticalscrolling is selected, the channel of the scrolledwaveform is shown.
4. Use the JOG/SHUTTLE control to scroll the waveform.

416────────────────────────────────────────────────────
19.3 Scrolling the Waveform────────────────────────────────────────────────────
Auto scroll(also when control is released)
Turn SHUTTLEcontrol and hold fora few seconds
Slow down
Rotate control once morein same direction
Accelerate
Rotate control in opposite direction
Auto scroll
Method (To scroll the waveform to the left)
1. Move the SHUTTLE control in the direction intowhich you want to scroll the waveform and holdthe control for a few seconds.
2. When the indication Auto scroll appears on thefunction key display, release the SHUTTLE control.The waveform continues to scroll.
3. By turning the SHUTTLE control once more in thesame direction, you can increase the speed of thescrolling process.
Turning the control in the other direction reducesthe scrolling speed. If you hold the control, thewaveform will eventually scroll in the oppositedirection.

417────────────────────────────────────────────────────
19.3 Scrolling the Waveform────────────────────────────────────────────────────
NOTE
Waveform is moved to the left Waveform moves to left. Cursor also moves to left.
19-12, 13,19-14, 15
A and B cursors A and B cursors
The behavior of the A/B cursors during scrolling depends on whether thevertical/trace cursor or the horizontal cursor is used.
When vertical or trace cursor is used (Example: vertical cursor)
When the waveform is scrolled, the cursor moves off screen together with thewaveform.

418────────────────────────────────────────────────────
19.3 Scrolling the Waveform────────────────────────────────────────────────────
Waveform moves down. Cursor does not move
B cursors
A cursorsWaveform is moved down
When horizontal cursor is used
Cursor position on screen does not change, also when waveform is scrolled.

419────────────────────────────────────────────────────
20.1 Overview────────────────────────────────────────────────────
16
17
18
19
20
6
7
8
9
10
11
12
13
14
A
Chapter 20LEVEL MON. / CH.SET /
HELP Keys
20.1 Overview
This chapter explains the use of the following three keys:
・LEVEL MON. key (input level check)
・CH.SET key (input channel setting)
・HELP key (waveform display position check)

420────────────────────────────────────────────────────
20.2 Checking the Input Level (LEVEL MON. Key)────────────────────────────────────────────────────
NOTE
20.2 Checking the Input Level (LEVEL MON. Key)
・The levels of all input waveforms can be monitored in real time.・Levels are displayed separately for CH1 - CH16 and logical CH A - CH D.・To select the input channel, use the CH.SET key. ( Section 20.3 )・This function is available in all modes.
Method 1. Press the LEVEL MON. key.
The level monitor function can be activated from any screen (STATUS,CHANNEL, display, SYSTEM, DAT, etc.).
2. The CH.SET key can be used to select the input channel while using thelevel monitor function ( Section 20.3).
3. Press the LEVEL MON. key once more to terminate the function.
For the following channels, analog input level is not displayed:・Channels where no unit is installed・Channels outside the "units in use" range・Channels specified as logic input channels

421────────────────────────────────────────────────────
20.2 Checking the Input Level (LEVEL MON. Key)────────────────────────────────────────────────────
16
17
18
19
20
6
7
8
9
10
11
12
13
14
A
Displays trigger level
If the input waveform isout of the display screen,the color of the frame ischanged.
Display range
CH1 CH2 CH3 CH4
CHA
Fixed to High level
Alternates between High and Low
Fixed to Low level
20-01##
Analog input display
Logic input level display
Logic inputs are displayed as follows.

422────────────────────────────────────────────────────
20.3 Selecting the Input Channel on the Display Screen and Level Monitor Screen (CH.SET Key)────────────────────────────────────────────────────
NOTE
20.3 Selecting the Input Channel on the Display Screen
and Level Monitor Screen (CH.SET Key)
Channel settings can be made while a waveform is displayed on screen.
Method Screen: DISPLAY
1. Press the CH.SET key while the display screen or level monitor screen isshown. The channel setting screen appears.
2. The display content changes with each push of the CH.SET key.
3. Move the flashing cursor to the item you want to change and make thesetting.For details on settings, refer to Chapter 9.
・ During use of the FFT function, logic input settings cannot be made.・ During use of the STATUS screen (page 2) and the CHANNEL screen,
the CH.SET key serves to switch the display between CH1 - CH8 and CH9 -CH16.・ When the input channel setting screen was called up with the CH.SET key,
the following functions are not available:
(1) Copying channel settings(2) Input waveform selection(3) Switching the variable function on and off

423────────────────────────────────────────────────────
20.3 Selecting the Input Channel on the Display Screen and Level Monitor Screen (CH.SET Key)────────────────────────────────────────────────────
16
17
18
19
20
6
7
8
9
10
11
12
13
14
A
Analog input settings ( Section 9.6)
CH number
Display color
Display graph
Magnification/compression
Input coupling
Voltage, temperature.strain axes ranges
Display range
Zero position
Antialiasing filter orthermocouple type
Low-pass filter
Display color Display range Zero position
Display color Lower limit Upper limit
CH.SET key
CH.SET key
Variable function settings ( Section 9.6.10)
(Channels for which variable is set to ON)
Logic input settings ( Section 9.5)
When the logic input is specified.
20-02, 03 CHANGE, 04
Display color Display position

424────────────────────────────────────────────────────
20.3 Selecting the Input Channel on the Display Screen and Level Monitor Screen (CH.SET Key)────────────────────────────────────────────────────
2
Channel for which the Vernier function isactivated
NOTE
2
Function keydisplay Meaning
: Increase the channel number
: Copy source channel
: Decrease the channel number
: Copy
: Exit copy mode
Adjusting the input voltage to any desired voltage (Vernier function)
・Using fine adjustment, the input voltage can be matched to a desired reading.・For example, an actual input voltage of 1.2 V can be converted to a 1.0 V
reading.
Method Screen: DISPLAY, level monitor 20-171. Press CH.SET key on the DISPLAY screen or the
level monitor screen, to display the channelsetting screen.
2. Move the flashing cursor to the channel number.
3. Adjust the channel by using the jog control.
The Vernier function is not applicable to awaveform after waveform processing.
Copying the Vernier setting
Method Screen: DISPLAY, level monitor 20-191. Move the flashing cursor to the channel number
of the copy destination.
2. Press the F5 [ copy mode] key.
3. Using the [ CH↑] or [ CH↓] jog control, selectchannel of the copy source.
4. Press the F4 [ exec ] key to copy the settings.

425────────────────────────────────────────────────────
20.4 Checking the Waveform Display Position (HELP Key)────────────────────────────────────────────────────
16
17
18
19
20
6
7
8
9
10
11
12
13
14
A
NOTE
20.4 Checking the Waveform Display Position (HELP Key)
The HELP key serves to check the following items:
(1) Position display
Shows the position of the currently displayed waveform within the entirerecording length (memory recorder, recorder).
(2) Bar graph
Shows the display position within the entire recorded waveform along thevoltage axis (shown at the same time as the position display).
(3) Block display
Shows the memory segmentation status (memory recorder).
Method Screen: DISPLAY
1. Press the HELP key. The position display appears.
2. With each push of the F5 [ block position ] key, the display switches betweenthe block display and the position display.
・ The memory segmentation function can only be used with the memoryrecorder.・ When memory segmentation is disabled, the block display is not shown.
(For details on memory segmentation, see Chapter 17.)

426────────────────────────────────────────────────────
20.4 Checking the Waveform Display Position (HELP Key)────────────────────────────────────────────────────
Position display 20-08, 09 Block display (Memory recorder only)
Position display
Bar graph
When the recordinglength is 100 DIV:
Trigger position A cursor B cursor
T
A BDisplay portion (15 DIV)
Recording length 100 DIV
Display portion
Display portion
Time axis magnification×1
×2
×1/2
3. To terminate the position display mode or block display mode, press theHELP key once more.
Position display
・Indicates the position of the currently displayed waveform within the entirerecording length.
・When the trigger position and A/B cursors are used, their positions are alsoshown.
・The position display mode can be used to rapidly shift the displayed waveform.

427────────────────────────────────────────────────────
20.4 Checking the Waveform Display Position (HELP Key)────────────────────────────────────────────────────
NOTE
Current display position
Time and dateat left edge ofdisplay
Total recordinglength
Time at rightedge of display
Shift point
20-10
1/3 PositionFunction key
displayMeaning 20-g02
: (Display only)
Specify shift position
: Execute shift
: Switch to page 2/4
Total recording timeCurrent displayposition Time and date
at shift point
Time at rightedge of display
Shift point
Time and dateat left edge ofdisplay
Total recordinglength
2/3 TimeFunction key
display
(Recorder only)Meaning 20-g03
: (Display only)
Specify time (h:min:s)
: Execute shift
: Switch to page 3/4
Shifting the display position
The waveform display position can be specified in three ways.
(1) PositionSpecify the position of the shift point.
(2) TimeSpecify the time (from recording start) of the shift point.
(3) Event markSpecify the event mark of the shift point (For information on how to setevent marks, refer to Section 13.5.2.)
Methods (2) and (3) can be used only with the recorder function.
1. Record a waveform or read it from tape.
2. Press the HELP key.
3. Specify the part to be shown on the display. (The part is shown in detail.)
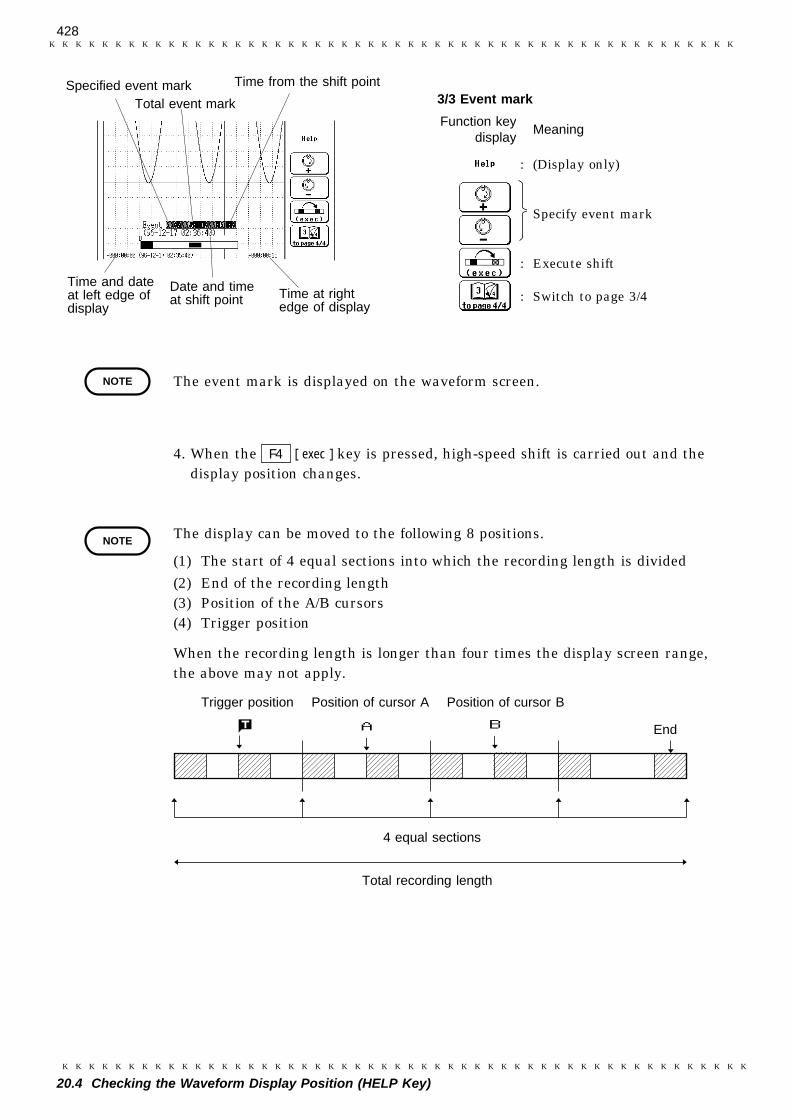
428────────────────────────────────────────────────────
20.4 Checking the Waveform Display Position (HELP Key)────────────────────────────────────────────────────
Specified event mark Time from the shift point
Total event mark
20-11, 12
Time at rightedge of display
Time and dateat left edge ofdisplay
Date and timeat shift point
3/3 Event mark
Function keydisplay
Meaning 20-g04
: (Display only)
Specify event mark
: Execute shift
: Switch to page 3/4
NOTE
NOTE
Trigger position Position of cursor A Position of cursor B
A B End
4 equal sections
Total recording length
The event mark is displayed on the waveform screen.
4. When the F4 [ exec ] key is pressed, high-speed shift is carried out and thedisplay position changes.
The display can be moved to the following 8 positions.
(1) The start of 4 equal sections into which the recording length is divided(2) End of the recording length(3) Position of the A/B cursors(4) Trigger position
When the recording length is longer than four times the display screen range,the above may not apply.

429────────────────────────────────────────────────────
20.4 Checking the Waveform Display Position (HELP Key)────────────────────────────────────────────────────
4/4Function key
displayMeaning 20-g06
: (Display only)
Specify shift position
: Search trigger
: Switch to page 1/4
Trigger searching
From waveforms recorded in memory or on MO disk, you can search for pointswhich satisfy the current trigger conditions.
Method Screen: DISPLAY 20-18
1. Record a waveform, or read it from MOdisk.
2. Press the HELP key.
3. Switch to the function key indication 4/4.
4. Use the CURSOR keys to move the flashingcursor and select the range in which triggersearching is to be carried out.Use the jog control or function keys tospecify the range, starting from the datastart, cursor A position, cursor B position,left edge of current screen, or data end.
5. Press the F4 [ exec ] key to startsearching.

430────────────────────────────────────────────────────
20.4 Checking the Waveform Display Position (HELP Key)────────────────────────────────────────────────────
Single, dual, quad, oct screen :
Channel number → 1
3
2
4 5
X-Y single screen, X-Y dual screen :
432Graph number → 1
Display section 20 DIVFull-scale point(voltage range × ±25.6 DIV)
Display portion
Y-axis full scale
X-axis full scale
1 2 3 4 5 6 7 8 9 10 11 12 13 14 15
Memory segmentation, 15 blocks, 9 used
Indicates currently displayed memory block.
Bar graph
・In position display mode, the bar graph indication is also shown.・The bar graph indicates which part of the recorded waveform is currently
being shown on the screen.・For all displayed waveforms, the bar graph is shown with the channel
number.
Block display (memory recorder function only)
・When memory segmentation is being used, the memory block status is shown.・In block display mode, the memory block that is currently being shown on
screen can be changed. (For details on memory segmentation, see Chapter 17.)・Display shift can be carried out in the same way as in position display mode.

431────────────────────────────────────────────────────
20.4 Checking the Waveform Display Position (HELP Key)────────────────────────────────────────────────────
Function keydisplay
Meaning 20-g05
: (Display only)
Specify shift position
: Execute shift
: Toggle position display and blockdisplay
Changing the currently displayed memory block
Method 20-14, 15, 16
1. When block display is selected, the currentlydisplayed memory block is indicated.
2. Use the F2 [ → ] and F3 [ ← ] keys to move the□ mark and specify the memory block you wishto display.
3. Press the F4 [ exec ] key to shift the display tothe selected memory block.

432────────────────────────────────────────────────────
20.4 Checking the Waveform Display Position (HELP Key)────────────────────────────────────────────────────

433────────────────────────────────────────────────────
21.1 Overview────────────────────────────────────────────────────
16
17
18
19
20
21
7
8
9
10
11
12
13
14
A
Microphone connector
External trigger connector
Trigger output connector
Key lock switch
External start/stop/print terminals
NG output terminal
Ground terminal
External sampling signal terminal
Chapter 21External Input/Output
Connectors / Key LockFunction
21.1 Overview
The input/output connectors of the 8846 serve the following functions:
・Measurement start/stop, printer output control
・Trigger signal input/output
・Sampling rate control via external signal
・Waveform evaluation NG output
・Microphone input
The KEY LOCK switch can be used to temporarily disable the other controlsof the 8846.

434────────────────────────────────────────────────────
21.2 Using the External Start, Stop, and Print Terminals────────────────────────────────────────────────────
CAUTION To prevent damage to the unit, take care never to exceed the voltage rating ofthe inputs.
min. 20 ms
min. 10 ms
High2.5 to 5.0 V
Low0 to 1.0 V
3.3 kΩ
470 Ω
5 V
21.2 Using the External Start, Stop, and Print Terminals
Using the external input terminals, recording start/stop and printer outputcan be controlled for all functions.
START terminal Measurement starts when a signal is input here.
STOP terminal Measurement stops when a signal is input here.
PRINT terminal Printing starts when a signal is input here.
Signal input method
・Short the terminal to ground, or input a pulse signal (High level: 2.5 - 5.0 V,Low level: 0 - 1.0 V) or a square wave signal.
・Control is activated at the falling edge of the input waveform (active Low).
Voltage range High level: 2.5 - 5.0 V Low level: 0 - 1.0 V
Pulse width High level: min. 20 ms Low level: min. 10 ms
Maximum input rating -5 to 10 V

435────────────────────────────────────────────────────
21.2 Using the External Start, Stop, and Print Terminals────────────────────────────────────────────────────
16
17
18
19
20
21
7
8
9
10
11
12
13
14
A
Single strand
Multi-strand
1.0 mm diameter
(can be used 0.3 to 1.0 mm dia.)10 mm
10 mm
0.75 mm2
(can be used 0.3 to 0.75 mm2)
Diameter per strand:minimum 0.18 mm dia.
Using the terminals
1. Push the tab with a flatblade screwdriver orsimilar.
2. While keeping the tab depressed, insert astripped wire into the connector opening.
3. Release the tab to lock the wire.
Recommended wire Single strand: 1.0 mm dia. (AWG #18) Multi-strand: 0.75 mm2
Usable limits Single strand: 0.3 to 1.0 mm dia. (AWG #26 to #18) Multi-strand: 0.3 to 0.75 mm2 (AWG #22 to #20) Strand diameter: minimum 0.18 mm
Standard insulation 10 mmstripping length

436────────────────────────────────────────────────────
21.3 Using the External Trigger Input (EXT TRIG)────────────────────────────────────────────────────
CAUTION To prevent damage to the unit, take care never to exceed the voltage rating ofthe EXT TRIG input.
min. 5 μs
High2.5 to 5.0 V
Low0 to 1.0 V
3.3 kΩ
470 Ω
5 V
21.3 Using the External Trigger Input (EXT TRIG)
・An external signal can be used as trigger source.・Several 8846 units can be synchronized for parallel operation.
Signal input method
・Short the terminal to ground, or input a pulse signal (High level: 2.5 - 5.0 V,Low level: 0 - 1.0 V) or a square wave signal.
・Triggering is activated at the falling edge of the input waveform (active Low).
Voltage range High level: 2.5 - 5.0 V Low level: 0 - 1.0 V
Pulse width Low level: min. 5 μs
Maximum input rating -5 to 10 V
Connector type miniature phone jack, 3.5 mm dia.

437────────────────────────────────────────────────────
21.4 Using the External Trigger Output (TRIG OUT)────────────────────────────────────────────────────
16
17
18
19
20
21
7
8
9
10
11
12
13
14
A
CAUTION To prevent damage to the unit, take care never to exceed the voltage rating ofthe TRIG OUT input.
NOTE
4.7 kΩ
5 V
10 kΩ
4.7 kΩ
High4.5 to 5.0 V
Low0 to 0.5 V Approx. 1.5 ms
21.4 Using the External Trigger Output (TRIG OUT)
・When triggering occurs, a signal is output from this connector.・Several 8846 units can be synchronized for parallel operation.
Trigger output signal
Signal type open-collector signal, active Low
Output voltage High level: 4.5 - 5.0 Vrange Low level: 0 - 0.5 V
Pulse width approx. 1.5 ms
Maximum input rating -20 to +30 V, max. 500 mA, max. 200 mW
Connector type miniature phone jack, 3.5 mm dia.
When the auto range function is activated by pressing the AUTO key, atrigger output signal is generated. This should be taken into considerationwhen using both the trigger output and the auto range function (memoryrecorder, recorder).

438────────────────────────────────────────────────────
21.5 Using the External Sampling Input (EXT SMPL)────────────────────────────────────────────────────
CAUTION To prevent damage to the unit, take care never to exceed the voltage rating ofthe EXT SMPL input.
Number of unitsin use
1 2 4 8
1 ch 2 ch 1 ch 2 ch 1 ch 2 ch 1 ch 2 ch
kHz max. 80 40 20 10 5
1ch: Only 8916 - 8919, 8928 can be used.2ch: 8916 - 8919, 8927, 8928 can coexist, or 8927 can be used
exclusively. (For the 8928, one channel corresponds to oneunit.)
min. 5.6 μs (frequency 180 kHz)
1 μs at least
High2.5 to 5.0 V
Low0 to 1.0 V
3.3 kΩ
470 Ω
5 V
21.5 Using the External Sampling Input (EXT SMPL)
An external signal can be used to set the sampling rate.
Signal input method
・Between the terminal and ground, input a pulse signal (High level: 2.5 - 5.0 V,Low level: 0 - 1.0 V) or a square wave signal.
・Sampling is activated at the falling edge of the input waveform (active Low).
Voltage range High level: 2.5 - 5.0 V Low level: 0 - 1.0 V
Pulse width Low level: min. 1 μs
Frequency Memory recorder, FFT function max. 180 kHz max. 90 kHz (when 8927 is used) Recorder function
Maximum input rating -5 to 10 V
Connection method
Refer to Section 21.2.

439────────────────────────────────────────────────────
21.6 Using the NG Evaluation Output (NG)────────────────────────────────────────────────────
16
17
18
19
20
21
7
8
9
10
11
12
13
14
A
CAUTION To prevent damage to the unit, take care never to exceed the voltage rating ofthe NG output.
4.7 kΩ
5 V
10kΩ
4.7 kΩ
High4.5 to 5.0 V
Low0 to 0.5 V Approx. 70 ms
Approx. 20 ms
GO GO
NG NG
High4.5 to 5.0 V
Low0 to 0.5 V
70 ms at least 20 ms approx.
21.6 Using the NG Evaluation Output (NG)
When waveform evaluation or waveform parameter evaluation is used, asignal is output from this connector when the result is NG (fail).
NG output signal
Signal type open-collector signal, active Low
Output voltage High level: 4.5 - 5.0 Vrange Low level: 0 - 0.5 V
Maximum input rating -20 to +30 V, max. 500 mA, max. 200 mW
Evaluation output interval (min. 70 ms)
When the evaluation result is GO (pass), the output is High level, and whenthe result is NG (fail), the output is Low level. Between these states, there isan interval during which the next data are read and waveform data arecreated. The duration of this interval is inversely proportional to the time axisand proportional to the recording length.
Evaluation interval (approx. 20 ms)
The output is High level. Evaluation is carried out during this interval.

440────────────────────────────────────────────────────
21.6 Using the NG Evaluation Output (NG)────────────────────────────────────────────────────
NOTE
Connection method
Refer to section 21.2.
Setting the output to be active on GO result
(1) When waveform evaluation is used
1. Set the waveform evaluation mode to "All out".
2. Use the area editor to create the GO area.
3. Use the "reverse" command to reverse the evaluation area, so that the GOarea is shown in white.
Now start the measurement. A signal will be output from the NG terminalwhen the waveform evaluation result is GO.
(2) When waveform parameter evaluation is used
1. Set the upper and lower limit.
2. When lower limit < GO range < upper limit, set the evaluation mode to "In".When GO range < lower limit, upper limit<GO range, set the evaluation modeto "Out".
Now start the measurement. A signal will be output from the NG terminalwhen the waveform parameter evaluation result is GO.
If the result of either waveform evaluation or waveform parameter evaluationis NG, NG is output.

441────────────────────────────────────────────────────
21.7 Using the Microphone Input (MIC)────────────────────────────────────────────────────
CAUTION ・To prevent damage to the unit, take care never to exceed the voltage ratingof the MIC output.
・Do not connect any other equipment besides a microphone to this jack.
NOTE
21.7 Using the Microphone Input (MIC)
・This input serves for recording a voice memo when using the recorderfunction.
・For details on how to record a voice memo, refer to Section 7.2.7.
Maximum input rating: 0 to 5.0 V DC + AC peak
Connector type: miniature phone jack, 3.5 mm dia.
Input configuration: mono
・ When using a stereo microphone, a stereo-to-mono adapter should be used.・ For microphones with standard-size phone plugs (6.3 mm dia.) or with other
plugs, a suitable plug adapter should be used.・ The 8846 does not provide a microphone power supply.
Microphone types
The following microphone types can be used:
Dynamic microphoneElectret condenser microphone (with internal battery)
The following microphone models have been verified to work with the 8846.
・Dynamic microphonesDM-H110 (Aiwa)AT-K40 (Audio Technica)F-V310 (Sony)MV-K2 (JVC)RP-VK2 (Matsushita)
・Electret condenser microphonesAT9820 (Audio Technica)ECM-Z70 (Sony)ECM-T110 (Sony)RP-VC3 (Matsushita)

442────────────────────────────────────────────────────
21.8 Using the Key Lock Function────────────────────────────────────────────────────
21.8 Using the Key Lock Function
・This function disables all front-panel controls of the 8846.・The function serves to prevent unintended changes to settings during a
measurement.
Method 1. Set the KEY LOCK switch to ON.
2. To cancel the function, set the KEY LOCK switch to OFF.(The key lock function will not be canceled by turning the power off and on.)
・When the key lock function is active, the indication "Key Lock" is shown onthe display.
・If the backlight saver function is used and the display backlight turns off, itcan be turned on again by touching any key. The function assigned to thekey will not be activated.

443────────────────────────────────────────────────────
22.1 Overview────────────────────────────────────────────────────
16
17
18
19
20
6
22
8
9
10
11
12
13
14
A
9539D/A OUTPUT UNIT
Display screen
Sampling period
Analog waveform output
+6.4 V
-6.4 V
25.6 DIV
-25.6 DIV
Zero position
Voltage range/DIV(magnification/compression ×1)
0 V
0 V
Chapter 22Using the D/A Output Unit
9539 (Option)
22.1 Overview
The D/A output unit 9539 can be used to convert the waveform data capturedwith the recorder function into an analog voltage waveform (step waveform)with a range of +6.4 V to -6.4 V.

444────────────────────────────────────────────────────
22.2 Specifications────────────────────────────────────────────────────
Output voltage when measured with 8916, 8917, 8919, 8927, 8928 : ±6.4 V (250mV/DIV)when measured with 8918 : 125 mV/DIV
Temperaturerange (℃/DIV)
Recordingrange (℃)
Output voltage (V)
102050
-90 to 421-90 to 842-90 to 1200
-1.1359 (*1), -1.125 to 5.2625 (*2)-1.1359 (*1), -0.5625 to 5.2625 (*2)-1.1359 (*1), -0.225 to 3, 5.2625 (*2)
*1: For recorded values lower than -90℃, -1.1359 V is output.*2: In the following cases +5.2625 V (DC) is output:・Recorded value exceeds the measurement range of the
thermocouple.・Recorded value exceeds the upper limit of the measurement range.・Recorded value was taken in burnout condition of thermocouple.
Maximum output voltage ±6.4 V (open-load condition)
DC amplitude precision ±0.2%f.s. (open-load condition)
DC offset precision ±0.1%f.s. (open-load condition)
Temperaturecharacteristics
DC amplitude: ±0.02% f.s./℃(typ.)DC offset: ±0.02% f.s./℃(typ.)
Output format Unbalanced output (one side grounded), output ground directlyconnected to frame ground
Output impedance 50 Ω±10% (DC)
Load impedance 1 kΩ or more (DC), 10000 pF or less (possible drive range)
Output waveform Step waveform (no smoothing filter)
Output resolution 12 bit (for output of data measured with 8916, 8917, 8918, 8919,8928)14 bit (for output of data measured with 8927)
Update rate 20 kS/s(max.) (corresponding to sampling rate of recording function)
Number of outputchannels
2 channels
Output connector type BNC
Dimensions and mass 29.8(W)×106.8(H)×108(D)mm (not including projection), 110g
22.2 Specifications
Specifications measured at 23℃±5℃, relative humidity 35% - 80%, one hourafter power-on. Guarantee period is 6 months.

445────────────────────────────────────────────────────
22.2 Specifications────────────────────────────────────────────────────
16
17
18
19
20
6
22
8
9
10
11
12
13
14
A
NOTE
Measured voltage
0 V
Voltage range,Strain range /DIV×25.6 DIV(magnification/compression:×1)
Output voltage
+6.4 V
0 V
-6.4 V
Measurement range,output range NOTE
When magnification/compression is ×1,the D/A output voltage per 1 DIV ofmeasured voltage is 250 mV.
Example
When 20 mV DC was measured usingthe 20 mV/DIV range, the D/A output is250 mV DC.
Voltage range,Strain range /DIV×-25.6 DIV(magnification/compression:×1)
421℃
10℃/DIV range
+6.4 V
0 V
-1.125 V-90℃
+5.2625 V
-1.1359 V
-6.4 V
Lower than-90℃
0℃
842℃
20℃/DIV range
+6.4 V
0 V
-0.5625 V-90℃
+5.2625 V
-1.1359 V
-6.4 V
0℃
Higher than1200℃
50℃/DIV range
+6.4 V
0 V
-0.225 V-90℃
+5.2625 V
-1.1359 V
-6.4 V
1200℃ +3 V
Output voltage
0℃
Lower than-90℃
Lower than-90℃
NOTE
When magnification/compression is ×1, theD/A output voltage per 1 DIV of measuredtemperature is 125 mV.
Example
When 10℃ was measured using the 10℃/DIVrange, the D/A output is 125 mV DC.
Measuredtemperature
Measuredtemperature
MeasuredtemperatureOutput voltage Output voltage
Output voltage
The relation between the measured voltage (temperature) and the outputvoltage is shown.
・ The output voltage of ±6.4 V (max.) applies to the open-load condition.Use the unit with load impedances of 1 kΩ or less. (At higher outputimpedances, the waveform will be distorted.)・ The output voltage can be checked (see system). ( Section 11.7.7)
Using the 8916, 8917, 8919, 8927, 8928
Using the 8918

446────────────────────────────────────────────────────
22.3 Usage Precautions────────────────────────────────────────────────────
DANGER The output connector ground of the D/A output unit 9539 is directlyconnected to the frame ground of the 8846. Therefore it is essential toconnect the protective ground terminal of the 8846 to a good ground.Otherwise, a potential may exist between the output connector andexposed metal parts of the 8846.
Do not apply an external voltage to the output connectors, to preventthe risk of electric shock and damage.
WARNING When power to the 8846 is turned on or off, voltage spikes may bepresent in the D/A output. Ensure that no equipment is connected to theD/A output unit 9539 when turning the 8846 on or off.
For reference, the intensity of the voltage spikes is shown below.
Power ON: approx. 6 Vp-p (approx. 100 ms)Power OFF: approx. 4 Vp-p (approx. 100 ms)
CAUTION The D/A output unit 9539 is designed only for use with the 8845 and 8846MEMORY HiCORDERs. Do not use it for any other purpose.
NOTE
22.3 Usage Precautions
・ When the D/A output is used, do not connect other equipment or measurementobjects to the input of the 8927 unit. Otherwise noise currents flowing in theground line may cause signal noise.・ To minimize susceptibility to external noise, use a BNC-BNC cable.

447────────────────────────────────────────────────────
22.4 Replacing Units────────────────────────────────────────────────────
16
17
18
19
20
6
22
8
9
10
11
12
13
14
A
WARNING To prevent the risk of electric shock, be sure to turn the power to the8846 OFF before inserting or removing the unit.
Fasten the screw securely, to prevent the risk of performancedegradation or damage.
22.4 Replacing Units
This section describes how to install the D/A output unit 9539. To remove theunit, reverse the procedure described below.
1. Disconnect all input cables and the thermocouple connection.
2. Turn power of the 8846 off and disconnect the power cord.
3. Grasp the BNC connectors on the D/A output unit and insert the unit into theexpansion slot.
4. Secure the unit by fastening the screw with a Phillips screwdriver, as shownin the illustration.

448────────────────────────────────────────────────────
22.5 Output of a Waveform Recorded With the Memory Recorder or Recorder Function────────────────────────────────────────────────────
NOTE
Specify output rangewith A/B cursors
9539
A B
Read data
22.5 Output of a Waveform Recorded With the Memory
Recorder or Recorder Function
A waveform recorded can be output in two ways:
(1) Outputting data in memory on the unit or data read into the unit, specifyingthe range for output, using the A/B cursors (vertical or trace).
(2) Using the "playback" function and supplying the data side to the output.(Recorder function only)
・ Waveform data recorded with a sampling frequency of 40 kS/s (2.5 ms/DIV) orabove for the time axis are output in intermittent form. (At 2.5 ms/DIV, 1point is output for every 2 points, and at 2 ms/DIV and 1.25 ms/DIV 1 pointfor every 4 points.・ Waveform data gathered with external sampling cannot be output.・ The waveform data recorded with the maximum recording length in memory
recorder function can not be replayed. (Section 6.2.3)・ For the waveform data measured by one channel, recording length of 10000
divisions, and range lower than 5mS/DIV time axis in memory recorderfunction, it is not replayed when the data between A and B cursors is morethan 5000 divisions.
(1) Specifying output range with A/B cursors

449────────────────────────────────────────────────────
22.5 Output of a Waveform Recorded With the Memory Recorder or Recorder Function────────────────────────────────────────────────────
16
17
18
19
20
6
22
8
9
10
11
12
13
14
A
Record the waveform in Memoryrecorder or Recorder function or
read MEM, RECfile from MO
22-01, 02###
7
5
6
23
4
Display screen inMemory recorderor recorder function
Status screen inMemory recorderor recorder function
Function keydisplay Meaning
OFF, CH1 to CH16 (channel wherewaveform data are recorded)
Function keydisplay Meaning 22-g02
: Output cursor-specified range once
: Output cursor-specified rangecontinuously
Method 1. Record the waveform data in memory recorder or
recorder function or read the data from MO disk.(.MEM, .REC file)( Section 13.6).
2. The data in the specified function are shown onthe display when the data is read.
3. Scroll the waveform and use the A/B cursors(vertical or trace) to specify the range for output( Section 19.2).
4. Press the STATUS key to activate the STATUSscreen (memory or recorder).
・When the D/A output unit is installed, the settingitem A/B cursor playback appears.
5. Move the flashing cursor to the Output channelitem and specify the channel of the waveform tobe output.
6. Move the flashing cursor to the mode item andselect the output mode.

450────────────────────────────────────────────────────
22.5 Output of a Waveform Recorded With the Memory Recorder or Recorder Function────────────────────────────────────────────────────
Function key display Meaning 22-g03: Output cursor-specified range
Analog waveform9593
Real-timeplayback
NOTE
7. Move the flashing cursor to the execute item of "A/B cursor playback".
8. Press the F1 [ exec ] key. The specified waveform range is output.9. If "Output mode" is set to REPEAT, press the STOP key when wishing to
stop the output.
(2) Using the "playback" function and supplying the data side to the output. (Recorderfunction only)
Output of data in real time from D/A output unit
For details on playback, refer to Section 13.6.2.
If the STOP key was pressed to force measurement stop while the D/A output(A/B cursors, playback) is active, 0 V is output.

451────────────────────────────────────────────────────
23.1 Cleaning of the Unit and Parts────────────────────────────────────────────────────
16
17
18
19
20
6
7
23
9
10
11
12
13
14
A
CAUTION Gently wipe dirt from the surface of the unit with a soft cloth moistened with asmall amount of water or mild detergent.Do not try to clean the unit using cleaners containing organic solvents such asbenzine, alcohol, acetone, ether, ketones, thinners, or gasoline. They maycause discoloration or damage.
Chapter 23Maintenance
23.1 Cleaning of the Unit and Parts
(1) Main unit

452────────────────────────────────────────────────────
23.1 Cleaning of the Unit and Parts────────────────────────────────────────────────────
Moisten this side with cleaning alcohol
NOTE
(2) Printer head
In normal use, the printer does not require periodic maintenance. However,depending on usage conditions, the thermal head may become contaminatedby dust or paper scraps. If the print seems light or if there are droppedsections, clean the head as described below.
Method 1 1. Press the SYSTEM key to call up the SYSTEM screen.
2. Press the [ SELF CHECK ] function key.
3. Move the flashing cursor to the Printer check item.
4. Press the F5 [ CLEANING ] key for about 5 seconds. During this interval, theprinter prints 100% black section.
5. If this method does not alleviate the problem, perform the steps of cleaningmethod 2 as described below.
Method 2 1. Moisten printer paper on the rear with dehydrated alcohol, and set thepaper in the printer. (If the front side of the paper is moistened, discoloringwill occur.)
2. Raise the head-up lever and move the printer paper back and forth to cleanthe head.
・ Do not use organic solvents such as thinners.・ After using alcohol, be sure that the printer is completely dry.・ After extended use, paper residue (visible as a white powder-like substance)
may accumulate on the roller. While a small amount of residue has no adverseeffect, the roller can be cleaned using a air-blow brush (such as sold as acamera accessory).・ Always use the paper cutter integrated in the printer cover to cut printer
paper. If the paper is cut near the thermal head, a large amount of paperresidue may accumulate on the roller.

453────────────────────────────────────────────────────
23.1 Cleaning of the Unit and Parts────────────────────────────────────────────────────
16
17
18
19
20
6
7
23
9
10
11
12
13
14
A
NOTE
CAUTION When disconnecting a BNC connector, be sure to release the lock first, thenhold the connector and pull carefully. Using force to pull the connector withoutreleasing the lock, or pulling on the cable instead of the connector maydamage the connector.
(3) MO drive head
・ As a precautionary measure, the drive should be cleaned about every sixmonths of use.・ Use the commercial MO drive head cleaner for cleaning.
Cleaning procedure
1. Turn the power of the unit off and insert the head cleaner disk into the diskslot.
2. The MO drive automatically recognizes the disk as a cleaning disk and cleans.
3. After 10 seconds, cleaning is completed and the disk is automatically ejected.

454────────────────────────────────────────────────────
23.2 Replacing the DC Power Supply Fuse────────────────────────────────────────────────────
WARNING If the fuse has blown, an internal defect in the power supply section ofthe 8846 may be cause. Check for defects before replacing the fuse.
To prevent the risk of electric shock when replacing the fuse, turnpower to the 8846 OFF and disconnect the power cord from the ACoutlet. Also disconnect any input cables from measurement objects.
Use only a fuse of exactly the specified rating and type. Never use adifferent fuse or short-circuit the fuse holder, since this involves asevere risk of electric shock and injury.
Type A melting fuse (NM), 12 A/250 V
Size: 6.4 dia. × 31.8 mm
Type A melting fuse (NM), 12 A/250 VSize: 6.4 dia. × 31.8 mm
Close
Open
23.2 Replacing the DC Power Supply Fuse
・When the unit is powered from a DC source, and the DC power supply fusehas blown, replace the fuse as described below.
・The fuse for the AC power supply is integrated in the unit and cannot bereplaced by the user. When the unit does not operate normally using the ACpower supply, contact a HIOKI service representative.
Replacement procedure
1. Set the power switch of the 8846 and the intermediate switch on the DCpower supply cable to OFF.
2. Disconnect the AC power cord and the DC power cord.
3. Remove the old fuse from the fuse holder.
4. Insert a new fuse.
5. Reconnect the power cord and other cables.

455────────────────────────────────────────────────────
23.3 Removing the Battery Before Discarding the 8846────────────────────────────────────────────────────
16
17
18
19
20
6
7
23
9
10
11
12
13
14
A
WARNING To avoid the risk of electric shock, be sure that all cables and the powercord are disconnected before removing the battery.
Dispose of the battery as prescribed in your community.
23.3 Removing the Battery Before Discarding the 8846
・The 8846 incorporates a lithium battery for memory backup.・Before final disposal of the 8846, remove the battery as described below.
Removing the battery
1. Verify that the power is switched OFF.
2. Disconnect all input cables and the power cord.
3. Remove the 8 screws which fasten the rear panel, using a Phillips screwdriver.

456────────────────────────────────────────────────────
23.3 Removing the Battery Before Discarding the 8846────────────────────────────────────────────────────
Pull up
Negative terminal
Cut
Positive terminal
4. Remove the rear panel. The battery is located near the center of the PCB.
5. Pull the battery up and cut the positive terminal with a wire cutter.
6. Pull the battery further up.
7. Cut the negative terminal (under the battery) with a wire cutter.

457────────────────────────────────────────────────────
23.4 Troubleshooting────────────────────────────────────────────────────
16
17
18
19
20
6
7
23
9
10
11
12
13
14
A
Problem Check Ref. page
LED does not light when theunit is turned on.
Is power cord connected properly?45, 46
The screen and indicators donot light when using the DCpower supply.
Has the fuse for the DC power supply blown?454
There is absolutely no variationin the recorded waveform.
Is the "Pretrigger stanby" message displayed?(When pretriggering is activated, triggeringdoes not occur until the current waveform isfully captured.)
202
Has the "Waiting for trigger" messageappeared?Check the trigger settings.
200
Are all of the channels switched off on thedisplay? 181
Has the timer trigger been set? 215
There is absolutely no variationin the recorded waveform.
Is the measurement range settingappropriate? 184
Has a low pass filter been set? 191, 193
The printed recording is non-existent.
Is the recording paper back to front?54, 57
The printed recording is veryfaint
Are you using the correct (thermal) recordingpaper? 21, 57
During memory recorderoperation, the apparentfrequency of the recording ismuch lower than the expectedfrequency.
This is likely to be an aliasing error.Either switch to envelope mode, or make thetime axis range setting faster.
84, 109,Appendix 6
Recording lines are dense orblurred.
Input signal contains ripple components.Make suitable filter settings at input unit.
191
The keys are dead and do notrespond.
Has the unit been put into the key lockcondition (message "KEY LOCK" appeared?Press the KEY LOCK key to clear the keylock condition.
442
Is the unit being remotely controlled ("GP-IBREMOTE" is displayed), if the GP-IBinterface is being used?
23.4 Troubleshooting
If the unit does not seem to operate normally, check the following pointsbefore requesting service.
If none of the above conditions apply, and the cause of the problem is notunderstood, try performing a SYSTEM RESET.All the settings will revert to the factory settings.Try the following operation, 1 or 2.

458────────────────────────────────────────────────────
23.4 Troubleshooting────────────────────────────────────────────────────
Turn unit on while pressing
STOP key.
CAUTION If the unit is not functioning properly, check the "Troubleshooting" list. If aproblem is found, contact your dealer or HIOKI representative. Pack the unitcarefully so that it will not be damaged during transport, and write a detaileddescription of the problem. HIOKI cannot bear any responsibility for damagethat occurs during shipment.
System reset
Method 1 1. Press the SYSTEM key to call up the SYSTEM screen, and select theInitialize item.
2. Move the flashing cursor to the (3) Initialize settings item and press the[ exec ] function key.
For details, refer to Section 11.3.3.
Method 2 Turn the unit on while holding down the STOP key.
Service

459────────────────────────────────────────────────────
24.1 Overview────────────────────────────────────────────────────
16
17
18
19
20
6
7
8
24
10
11
12
13
14
A
Chapter 24Error and Warning
Messages
24.1 Overview
Error messages
・Error messages are shown at the bottom of the screen.
・Error messages are displayed until the cause of the error is removed or a keyis pressed (in some instances, only the STOP key can be used).
・If the volume setting is ON (High, Medium, Low), an intermittent beep soundis heard along with the error message.
Warning messages
・Warning messages are shown at the bottom of the screen.
・Warning messages are displayed only once when the cause occurs.
・Warning messages disappear when a key is pressed.
・If the volume setting is ON (High, Medium, Low), a single beep sound is heardalong with the warning message.

460────────────────────────────────────────────────────
24.2 Error Messages────────────────────────────────────────────────────
Error no. Message and explanation Reference
1 Set printer paperPrinter paper has run out. Load paper.Then keep the PRINT key depressed for a while.
54
2 Set printer leverHead up/down lever is raised. Lower the lever.Then keep the PRINT key depressed for a while.
54
3 No Waveform dataThere are no waveform data to be printed.
41 Bad A/B cursor positionMove A/B cursors to appropriate position.
406
24.2 Error Messages

461────────────────────────────────────────────────────
24.3 Warning Messages────────────────────────────────────────────────────
16
17
18
19
20
6
7
8
24
10
11
12
13
14
A
Warning no. Message and explanation Reference
201 Set printer paperPrinter paper has run out. Load paper.Then keep the PRINT key depressed for a while.
54
202 Set printer leverHead up/down lever is raised. Lower the lever.Then keep the PRINT key depressed for a while.
54
205 Invalid key (measurement in progress)Pressed key is invalid, because measurement is being carried out.
207 Auto setting failedAutomatic range setting was not completed successfully.
100, 123
211 Auto store failed
212 Bad A/B cursor positionMove A/B cursors to appropriate position.
406
213 Invalid key (MEASUREMENT)Pressed key is invalid, because ’measurement’ is ON.
300 Cannot startCannot start measurement from SYSTEM screen.
301 Invalid key (SYSTEM screen)Pressed key is invalid, because SYSTEM screen is beingdisplayed.
302 Invalid key (MO screen)Pressed key is invalid, because MO screen is being displayed.
303 Invalid key (monitor screen)Pressed key is invalid, because monitor screen is being displayed.
324 Waveform processing not possible (averaging)Waveform processing cannot be carried out, because averaging isbeing used.
327 Invalid key (evaluation)Pressed key is invalid, because waveform evaluation is beingcarried out.
328 Invalid key (superimpose)Pressed key is invalid, because superimpose function is active.
329 Invalid key (display format)Waveform evaluation cannot be carried out, because display formatis not single screen or X-Y single screen.
24.3 Warning Messages

462────────────────────────────────────────────────────
24.3 Warning Messages────────────────────────────────────────────────────
Warning no. Message and explanation Reference
330 Invalid key (recording length)Memory segmentation and waveform processing cannot be carriedout, because recording length is too long.
325, 386
331 Invalid keyRecording length setting too high for averaging.
397
332 Invalid key (display format)Waveform evaluation cannot be carried out, because display formatis not single screen or Nyquist display.
335 Invalid key (sequential save)Waveform processing cannot be carried out, because sequentialsave is active.
336 Invalid key (multi-block)Waveform processing cannot be carried out, because multi-blockfunction is active.
337 Invalid key (roll mode)Superimpose and waveform processing cannot be carried out,because roll mode is active.
339 Invalid key (STATUS screen)Pressed key is invalid, because STATUS screen is beingdisplayed.
340 Invalid keyRecording length not set.
341 Invalid key (multi-block)Multi-block function is active. Number of units cannot be changed.
342 Invalid keyRecording length exceeds the remaining disk capacity. Use arecording length within the available capacity.
351 Invalid key (trigger)Pretrigger setting cannot be made, because all trigger sources areOFF (free-run condition).
202
352 Invalid key (CHANNEL screen)Pressed key is invalid, because CHANNEL screen is beingdisplayed.
353 Invalid key (trigger)Pretrigger cannot be used with external sampling.
361 Cannot printChoose a shorter logging cycle.
94, 268

463────────────────────────────────────────────────────
24.3 Warning Messages────────────────────────────────────────────────────
16
17
18
19
20
6
7
8
24
10
11
12
13
14
A
Warning no. Message and explanation Reference
380 No data in reference memory blockThere are no data in the reference memory block for the multi-block function.
381 Same setting for reference memory block and current blockReference memory block and currently used block are set to thesame values.
382 No waveform dataDisplay screen cannot be used because there are no waveformdata.
383 No memory waveform dataRecord waveform data with FFT processing using memoryfunction.
384 Invalid reference memory block recording lengthThe recording length of the reference memory block is differentfrom the recording length of the current block. Record data withsame recording length.
385 Invalid key (FFT)Pressed key is invalid, because FFT function is being used.
386 Invalid key (recorder)Pressed key is invalid, because recorder function is being used.
388 No waveform evaluation areaCreate waveform evaluation area.
366
390 Invalid key (upper limit)Setting cannot be higher than upper limit.
391 Invalid key (lower limit)Setting cannot be lower than lower limit.
392 Invalid key (2 units use)Recording length cannot be set to higher value because 2 units arebeing used. Reduce number of units.
85
393 Invalid key (4 units use)Recording length cannot be set to higher value because 4 units arebeing used. Reduce number of units.
85
394 Invalid key (8units use)Recording length cannot be set to higher value because 8 units arebeing used. Reduce number of units.
85
396 Out of rangeSetting range of variable function is exceeded.
85
397 Out of rangeSetting range of scaling function is exceeded.
243
398 Out of rangeSetting range of variable function after scaling is exceeded.
244
405 File access errorFile access during store or format operation failed
408 Cannot recordA disk access could not be made rapidly enough. Either the filesare excessively fragmented or there is another fault on the disk.
296

464────────────────────────────────────────────────────
24.3 Warning Messages────────────────────────────────────────────────────
Warning no. Message and explanation Reference
418 Cannot playback (external sampling)Playback cannot be carried out, because waveform was recordedwith external sampling.
419 Cannot playback (not a loaded waveform)
420 Invalid key (X-Y display)Pressed key is invalid,, because current display format is X-Ydisplay.
421 Syntax errorEquation contains a syntax error. Correct equation.
327, 328
422 Cannot copy equationCopy function cannot be carried out, because the copy sourceequation contains a Z number higher than the copy targetequation.
330
423 Halt the calculation.Pressing the stop key halts calculation.
424 Octave processing errorOctave processing cannot be carried out, because the frequencyrange uses external sampling.
440 Invalid keyOther unit set to logic input.
445 Data with faster range than 5 ms/DIV cannot be played back.
446 A trigger filter could not be set with current time axis range. Thefilter is invalid.
207
447 Data cannot be loadedIn multi-block mode, waveform cannot be loaded into an emptyblock.
389
450 No waveform dataTransfer could not be carried out, because there are no waveformdata.
451 Adjustment of auto-balance failed
452 Cannot transfer.Too long recording length in memory recorder function.The waveform data is measured by time axis range; 1.25 or 2ms/DIV, using the 8927 1 unit.
119
454 Invalid keyThe time axis cannot be set differently from the original recorderwaveform.
455 Cannot start."FILEtoMEM" has already been executed up to the end.

465────────────────────────────────────────────────────
24.3 Warning Messages────────────────────────────────────────────────────
16
17
18
19
20
6
7
8
24
10
11
12
13
14
A
Warning no. Message and explanation Reference
500 Cannot read. (MO)There are more files than can be handled by the 8846, andtherefore correct information cannot be displayed.
287
501 Cannot write (write protect)MO disk is write protected.
284
502 Cannot be created (path name)The directory cannot be created because the path name is toolong.
503 Cannot be created (no name)A directory cannot be created without a name. Enter name.
504 Cannot be created (same file)The specified file already exists.
505 Cannot be created (reserved device name)This file name is a reserved device name. Select another name.
506 Cannot store (same name)The directory cannot be saved with an existing directory name.
507 Cannot store (reserved device name)This file name is a reserved device name. Select another name.
508 Cannot store (read only)The specified file is read only. Cannot overwrite.
509 The file is read only.This command cannot be executed for the file or read only
510 Cannot change (no name)Enter name
511 Cannot change (same file)The specified file already exists
512 Cannot change (reserved device name)This file name is a reserved device name. Select another name.
513 Cannot readCannot read this file data.
514 Cannot readCannot read the file information
515 No waveform dataStore could not be carried out, because there are no waveformdata.
516 No waveform evaluation areaStore could not be carried out, because there is no waveformevaluation area.
517 This medium is not supported.
518 Cannot read this mediaThis disk is not formatted, or has a format which cannot be read bythe 8846.
320
519 File read error occursThe file may be corrupted.

466────────────────────────────────────────────────────
24.3 Warning Messages────────────────────────────────────────────────────
Warning no. Message and explanation Reference
520 Cannot make a fileNo more files can be created in the current directory.
289295
521 Version mismatchThis file was created on a later version of the 8846 and cannot beloaded.
522 File error occursThis file format is different from the correct format.
523 Cannot playbackThis file data is not recorder waveform data.
524 A FILEtoMEM operation is not possibleBecause this file contains recorder function waveform data.
525 Insufficient capacity of mediaNo more recorder waveform data can be recorded, because thereis not enough remaining capacity on the media.
301
526 Cannot playback (external sampling)Playback cannot be carried out, because waveform was recordedwith external sampling.
304
527 Invalid key (start time)Start time cannot be later than end time.
528 Invalid key (end time)End time cannot be earlier than start time.
529 Cannot formatThe disk is write protected.
284
530 Cannot store (number of files)The number of files in the current directory exceeds 10,000.
531 Cannot make (number of files)The number of files in the current directory exceeds 10,000.
532 Saving is not possible.Either there is no disk in the drive, or the disk is not formattedcorrectly. A screen bitmap file cannot be saved.
533 The MO disk is not installed.Insert the MO disk.
534 MO disk drive error.An unrecoverable hardware error was detected on the MO drive.
535 Completed successfully with retryThe MO disk has defects, or the heads need cleaning.
453
536 Insufficient MO capacityWriting a file was abandoned. This file has not been savedcorrectly.
301
537 Cannot playback.Playback could not be carried out, because there are no waveformdata.
538 Cannot playbackRecording length setting too high for playback.
448
539 Cannot start’FILEtoFFT’ has already been, executed up to the end.

APPENDIX 1────────────────────────────────────────────────────
Appendix 1 Glossary────────────────────────────────────────────────────
1
2
3
4
5
6
7
8
9
10
11
12
13
14
15
APP
- % RH Relative humidity (relative amount vs. saturation amount ofmoisture vapor in one cubic meter)
A
A/D Conversion of an analog quantity into a digital quantity
A/D converter Device for analog-to-digital conversion
AC Abbreviation of "alternating current".
Active Low An action is performed when the signal voltage state changesfrom High to Low.
Aliasing Phantom signal components; a phenomenon that occurs ifsampling frequency is low in relation to the frequency of thesampled signal ( Appendix 2.1, 2.2).
Analog Continuous physical quantity such as voltage or current
ANSI American National Standards Institute; also used for standardsissued by this institute.
Attenuator Device for reducing the level of a signal
Averaging Determining the mean of a certain number of data.
B
Bit Smallest unit of binary information
Byte Unit of information. 1 byte is made up of 8 bits.
Appendix
Appendix 1 Glossary

APPENDIX 2────────────────────────────────────────────────────
Appendix 1 Glossary────────────────────────────────────────────────────
C
Channel (CH) Input signal route
Channel crosstalk Interference between signals in adjacent channels
Chart Printout of recorded waveform
Chart speed Paper feed rate at which the chart was created
Chassis Metal frame of the unit
Comment A string input by the user. Also measurement conditions andother information printed for all functions.
Common mode Voltage between ground and measurement input line
CPU Abbreviation of "central processing unit", the central componentof a computer
Crest factor Peak value/rms value
Cutoff frequency Point where the filter output amplitude is 1/ of the input.
D
D/A Conversion of a digital quantity into an analog quantity
D/A converter Device for digital-to-analog conversion
dB (decibel) Unit for expressing the ratio of attenuation or gain, for voltage,current, power etc.
DC Direct current
Digital Discrete physical quantity
DIV (division) Increment on display or printout
Dot One display point on the LCD screen. Also, a point on awaveform without interpolation.
Dynamic range Ratio of maximum vs. minimum amplitude that can bedisplayed
E
Envelope A curve connecting the peaks of successive cycles of a signal
F
FFT Abbreviation of "Fast Fourier Transform" ( Appendix 2.2)
File A collection of data on a medium such as tape
Floating Electrical circuits that are configured separately and kept apart
Full-span voltage Voltage range that can be expressed by 20 DIV
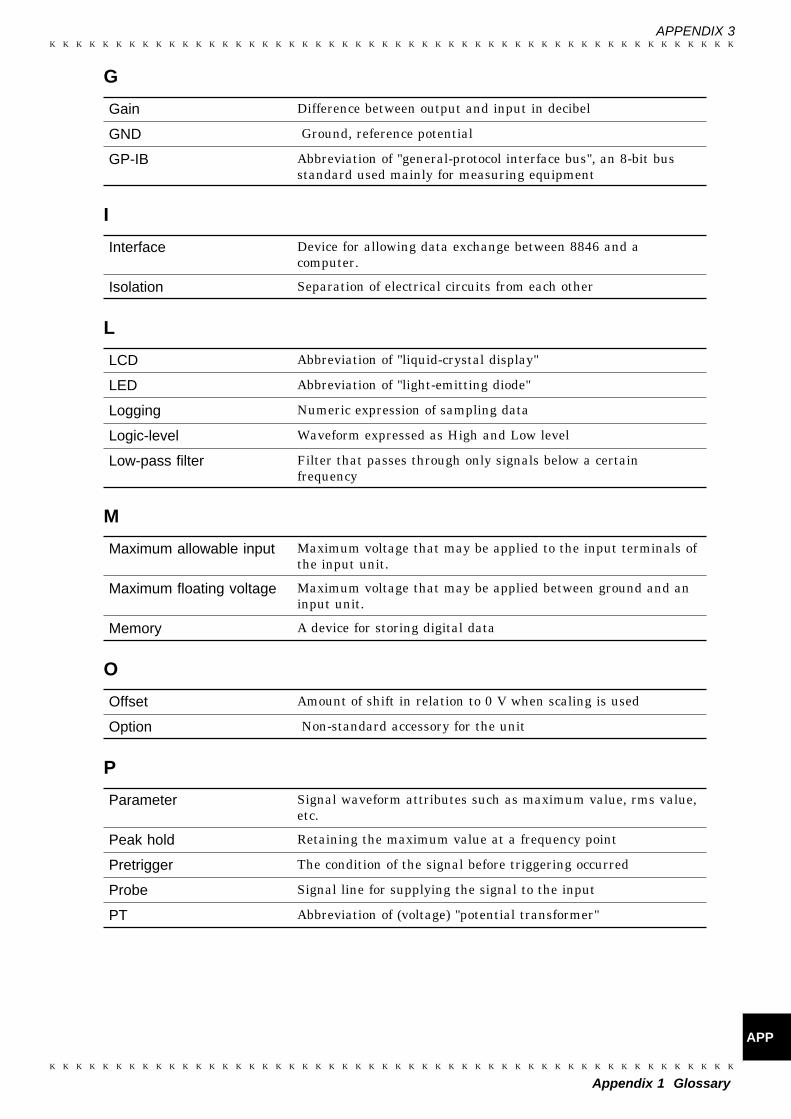
APPENDIX 3────────────────────────────────────────────────────
Appendix 1 Glossary────────────────────────────────────────────────────
1
2
3
4
5
6
7
8
9
10
11
12
13
14
15
APP
G
Gain Difference between output and input in decibel
GND Ground, reference potential
GP-IB Abbreviation of "general-protocol interface bus", an 8-bit busstandard used mainly for measuring equipment
I
Interface Device for allowing data exchange between 8846 and acomputer.
Isolation Separation of electrical circuits from each other
L
LCD Abbreviation of "liquid-crystal display"
LED Abbreviation of "light-emitting diode"
Logging Numeric expression of sampling data
Logic-level Waveform expressed as High and Low level
Low-pass filter Filter that passes through only signals below a certainfrequency
M
Maximum allowable input Maximum voltage that may be applied to the input terminals ofthe input unit.
Maximum floating voltage Maximum voltage that may be applied between ground and aninput unit.
Memory A device for storing digital data
O
Offset Amount of shift in relation to 0 V when scaling is used
Option Non-standard accessory for the unit
P
Parameter Signal waveform attributes such as maximum value, rms value,etc.
Peak hold Retaining the maximum value at a frequency point
Pretrigger The condition of the signal before triggering occurred
Probe Signal line for supplying the signal to the input
PT Abbreviation of (voltage) "potential transformer"

APPENDIX 4────────────────────────────────────────────────────
Appendix 1 Glossary────────────────────────────────────────────────────
R
RAM Abbreviation of "random access memory"
Recording length Total amount of sampling data expressed as number ofincrements
Ripple component AC component of noise
RMS (rms) Abbreviation of "root mean square" value, also called effectivevalue. For alternating current, the value identical to the directcurrent work.
ROM Abbreviation of "read-only memory"
S
Sampling Measuring an analog waveform at regular intervals( Appendix 2.1)
Sampling data Data gained by measuring an analog waveform at regularintervals and converting the results into digital data
Sampling rate Rate at which sampling carried out; sampling frequency
Scaling Conversion of voltage value into a specified unit
Scroll Moving data shown on screen up/down or right/left
Slope Slanted section of a rising or falling voltage
Storage Storing measurement data in the internal memory
T
TFT Abbreviation of "thin film transistor"
Thermal head Print head of thermal printer
Threshold value When turning an analog signal into a logic signal, the level atwhich the measured value is divided between High and Low.
Trigger An event that causes a certain action (such as starting orstopping a measurement) to happen.
Trigger source Signal that serves as trigger
U
Unbalanced input Using a two-pole input in such a way that one pole carries thesignal referenced to the other pole
W
Word A unit for expressing digital data. The digital data for one inputsignal point after conversion.
Z
Zero adjust Matching of zero position and actual ground level

APPENDIX 5────────────────────────────────────────────────────
Appendix 2 Reference────────────────────────────────────────────────────
1
2
3
4
5
6
7
8
9
10
11
12
13
14
15
APP
Appendix 2.1 Memory Recorder Function, Recorder Function
Sampling period
Time
Measurement
Appendix 2 Reference
Sampling
・The 8846 converts the input signal (analog value) into digital form andperforms all internal processing in the digital domain. The analog-to-digitalconversion is achieved by sampling, that is measuring the signal level atregular intervals.
・The interval between the measurement instances is called the sampling cycle(unit: seconds).
・The number of measurement instances per second is called the sampling rateor sampling frequency. It is the reciprocal value of the sampling cycle (unit:samples per second, or Hz)

APPENDIX 6────────────────────────────────────────────────────
Appendix 2 Reference────────────────────────────────────────────────────
Sampling period
Actual inputsignal
Observed waveformAliasing occurs because sampling period islonger than input signal period.
Aliasing
When the frequency of the signal to be measured approaches the samplingfrequency, beyond a certain point the measured signal frequency will be lowerthan the actual signal frequency.
・This phenomenon is called aliasing, and it occurs if sampling is carried out ata frequency lower than the so- called Nyquist frequency determined byNyquist’s sampling theorem.
・Sampling theorem
Fs = 2・Fmax
Fmax: Highest frequency component to be measuredFs: Sampling frequency (Nyquist frequency)
・In order to be able to restore the original waveform from the sampling data,the sampling frequency must be at least twice as high as the signal frequency.

APPENDIX 7────────────────────────────────────────────────────
Appendix 2 Reference────────────────────────────────────────────────────
1
2
3
4
5
6
7
8
9
10
11
12
13
14
15
APP
123・
2524
23・
・
Signal cycle
・
TIME/DIV(s/DIV)
Sampling period(s)
Measurement limitfrequency
(Hz)
500 μ1 m1.25 m2 m2.5 m5 m10 m20 m50 m100 m200 m500 m12510205060 (1min)120 (2min)300 (5min)600 (10min)1200 (20min)3600 (1h)
5 μ10 μ12.5 μ20 μ25 μ50 μ100 μ200 μ500 μ1 m2 m5 m10 m20 m50 m100 m200 m500 m600 m1.2361236
8 k4 k3.2 k2 k1.6 k8004002008040208420.80.40.20.080.0670.0330.0130.0070.0030.001
Measurement limit frequency
・The sampling theorem says that the sampling frequency must be twice as highas the signal frequency in order to be able to restore the original waveform.
・But in order to reproduce a sine waveform with peaks intact, about 25sampling points per cycle are required.
・Because the time axis range setting determines the measurement limitfrequency, this setting should be set as high as possible.

APPENDIX 8────────────────────────────────────────────────────
Appendix 2 Reference────────────────────────────────────────────────────
Appendix 2.2 FFT Function
Time domain
Frequency domain
t
f
FFT
FFT stands for Fast Fourier Transformation, which is a calculation methodused to decompose a time-domain waveform into frequency components.By performing FFT calculation, various calculations can be performed.
Concept of time domain and frequency domain
The signals measured by this memory recorder have values which correspondto time, that is the signals are functions of time.
Waveform in the figure below is an example of such a signal.Signals which are expressed as a function of time are called time domainsignals.In reality, a signal consists of a number of sine-waves of different frequencies,called frequency components, which combine to create the final shape of thewaveform. Expressing waveform the source signal, as a function of itsfrequency components yields a frequency domain representation.Often, the characteristics of a signal which cannot be easily analyzed in thetime domain, can be clearly revealed by the frequency domain representation.

APPENDIX 9────────────────────────────────────────────────────
Appendix 2 Reference────────────────────────────────────────────────────
φ(ω)
Imaginal
Real
F(ω)
|F(ω)|
Fourier transformation and the Inverse Fourier transformation
The following equations define the Fourier transformation and the InverseFourier transformation.
F(ω) = |f(t)| = f(t)・exp(-jωt)dt
f(t) =-1
|F(ω)| = F(ω)・exp(jωt)dω
The function F(ω)generally results in a complex number, and can beexpressed as follows.
F(ω) = |F(ω)|・exp(jφ(ω)) = |F(ω)|∠φ(ω)
|F(ω)|: Absolute value spectrum of f(t)φ(ω): Unit spectrum of the phase of f(t)
When conversion is made from the time domain to the frequency domain, themagnitude information and phase information are clearly expressed asindicated in equation ( ). The figure below shows F(ω) in vector form.

APPENDIX 10────────────────────────────────────────────────────
Appendix 2 Reference────────────────────────────────────────────────────
h(t)
H(ω)
fout(t)
Fout(ω)
Output
fin(t)
Fin(ω)
Input
Stationary Linear System
Application of Fourier transform (transfer function, unit-impulseresponse)
As an application of Fourier transform, this section describes a steady-stateresponse in a static linear system.
fin(t): time function of input (source signal)fout(t): time function of output (response function)h(t): unit impulse response of linear systemt ,τ: time
fout(t) = fin(τ)・h(t-τ)dτ
The relationship between the input and output is expressed as follows:This indicates that the response of the linear system can be determined justby knowing the unit impulse response h(t) of the system.
In the frequency domain, Fin(ω), Fout(ω), H(ω), and ω are defined as follows
Fin(ω): Fourier transformation of fin(t)Fout(ω): Fourier transformation of fout(t)H(ω): Fourier transformation of h(t)ω: Angular frequency
Fout (ω) = Fin(ω)・H(ω)
Therefore, when fin(t) and fout(t) are measured, the system transfer functionH (ω) and the unit impulse response h(t) can be obtained by performing anFFT operation and an inverse FFT operation.

APPENDIX 11────────────────────────────────────────────────────
Appendix 2 Reference────────────────────────────────────────────────────
f(t)
Input signal
Time domain Frequency domain
t
ω
F(ω)
0 Fmax
Samplingfunction
Fs > 2・Fmax t
Fs > 2・Fmax
tFs > 2・Fmax
Samplingfunction
Fs < 2・Fmax t
Fs < 2・Fmax
tFs < 2・Fmax
Overlapped parts seem folded back
Fs/2
Sectionobserved onscreen
Aliasing
When the frequency of the signal to be measured approaches the samplingfrequency, beyond a certain point the measured signal frequency will be lowerthan the actual signal frequency. In such a case, frequency components thatdo not exist will appear in the waveform along the frequency axis. Thisphenomenon is called aliasing, and it occurs if sampling is carried out at afrequency lower than the so-called Nyquist frequency determined by Nyquist’ssampling theorem.
Sampling theorem
Fs = 2・Fmax Fmax: Highest frequency component to be measuredFs: Sampling frequency (Nyquist frequency)
・In order to be able to restore the original waveform from the sampling data,the sampling frequency must be at least twice as high as the signal frequency.
・If sampling is carried out at a frequency lower than the Nyquist frequency,frequency components above 1/2 of the sampling frequency will be aliased tolower frequencies, and the measured signal will appear to contain frequencycomponents that actually do not exist.

APPENDIX 12────────────────────────────────────────────────────
Appendix 2 Reference────────────────────────────────────────────────────
Anti-aliasing filterFrequency components more than1/2 of sampling frequency are cut.
Input signal FFT
Input signal
FFT
Spectrum where frequency components higher than1/2 of sampling frequency cause aliasing. Componentsthat do not actually exist are observed.
FU-01.tifFU-02.tif
Anti-aliasing filter
・In FFT processing, when the frequency bandwidth of the input signal isunlimited, frequency spectrum components that do not exist will appear, dueto aliasing. To prevent this, a low-pass filter is required which cuts off theinput waveform at 1/2 of the sampling frequency. Such a low-pass filter iscalled an anti-aliasing filter.
・The 8919 FFT analog unit incorporates an anti- aliasing filter and thereforeallows the 8846 to perform FFT analysis without being subject to aliasing.
Example 1 When an anti-aliasing filter is not used.

APPENDIX 13────────────────────────────────────────────────────
Appendix 2 Reference────────────────────────────────────────────────────
Input signal
Aliasing spectrum components are effectively removed.
Anti-aliasing filterAnti-aliasing filter
Anti-aliasing filterFFT
Example 2 When an anti-aliasing filter is used.

APPENDIX 14────────────────────────────────────────────────────
Appendix 2 Reference────────────────────────────────────────────────────
Input waveform
1000 points
Stored waveform
Waveform as calculatedby FFT processing
Window processing
Fourier transform is defined as the integration from negative infinity topositive infinity, but in actual measurement this calculation is not possible.Therefore only a limited segment of the continuous signal is taken forprocessing. This is called window processing.
The FFT algorithm assumes that the data of that limited segment arerepeated and defines the input signal using a periodic function for determiningthe frequency spectrum.Depending on the phase at the start and end of the stored waveform, theremay be a difference between the waveform as calculated by FFT processingand the actual input waveform.

APPENDIX 15────────────────────────────────────────────────────
Appendix 2 Reference────────────────────────────────────────────────────
Input signal
FFT
Spectrum having small leakage
Input signal
Spectrum having large leakage
FU-05.tifFU-06.tifFU-07.tifFU-08.tif
Leakage error
When the signal waveform as assumed by the FFT algorithm and the actualwaveform are different, the processing result will contain an error. This erroris called the leakage error.

APPENDIX 16────────────────────────────────────────────────────
Appendix 2 Reference────────────────────────────────────────────────────
Input waveform
Stored waveform
Waveform assumed byFFT processing
Rectangular window
Waveform after windowprocessing
Window function
・When a limited segment of the input signal is captured, a function can beapplied to reduce the leakage error.
・This function is called the window function.・To minimize the leakage error, a suitable window should be chosen which
matches the type of input signal.・Possible window types include rectangular, Hanning, exponential, flat-top,
minimum, force, etc. In the 8846, three window functions (rectangular,Hanning, exponential) are available.
・Generally, the rectangular window function is most useful for singlewaveforms, the Hanning window function for continuous waveforms, and theexponential window function for attenuated waveforms.
・Rectangular window

APPENDIX 17────────────────────────────────────────────────────
Appendix 2 Reference────────────────────────────────────────────────────
Waveform assumed byFFT processing
Input waveform
Hanning window
Waveform after windowprocessing
Waveform assumed byFFT processing
Input waveform
Exponential window
Waveform after windowprocessing
・Hanning window
・Exponential window

APPENDIX 18────────────────────────────────────────────────────
Appendix 3 Reference Table────────────────────────────────────────────────────
(Unit: ms/DIV)
MO diskThe number of channels to be used
1 ch 2 ch 4 ch 8 ch 16 ch
128 M230 M540 M640 M
20105
2.5
5020105
100502010
20010050
50 (20)
500200
100 (50)100 (50)
( ): when overwriting
Appendix 3 Reference Table
When carrying out measurement with a time axis range faster than that offollowing table using the MO disk which has had frequent file additions anddeletions made, the resulting fragmentation may cause recording to be lost,and the measurement to stop.
The fastest time axis range which the fragmented file does not cause recordingto be lost.

INDEX 1
Index───────────────────────────────────────────────────────
────────────────────────────────────────────────────────
1
2
3
4
5
6
7
8
9
10
11
12
13
14
15
IND
Index
- A -
A4 print 272
ABS 337
AND/OR 201, 210, 216
Absolute value 337
AC power connector 45
AC power supply 44
AC power switch 44
Accessories 21
Aliasing A1, A6, A11
ACOS 341
ACR 143, 158
All out 363
Analog input 7, 23, 178, 181
Analog trigger 14, 204
Analysis channel 17, 141
Anti-aliasing filter 32, 130, 193
Arc-cosine 341
Arc-sine 341
Arc-tangent 342
Area value 359
ASIN 341
ATAN 342
AUTO 14, 200
Auto correlation function 143, 158
AUTO key 5, 100, 123
Auto range function 100, 123
Auto save 292
Auto scroll 416
AUTO STOP 14, 200
Average value 357
Averaging 18, 393
- B -
Backlight saver 234
Block display 425, 430
BUSY 7
- C -
CCR 143, 164
CH.SET 179, 422
CH.SET key 179, 422
CHAN key 5, 59
Channel selection 227
Clock setting 60, 221
Coherence function 143, 168
Comment input 247
Common logarithm 335
COH 143,168
COPY 5, 271, 272
COPY key 5, 271, 272
COS 341
Creating a directory 316
Cross power spectrum 143, 162
Cross-correlation function 143, 164
CSP 143, 162
CURSOR 5, 62
CURSOR keys 5, 62
Cutoff frequency 25, 27, 29, 32, 34, 191, A2

INDEX 2
Index───────────────────────────────────────────────────────
────────────────────────────────────────────────────────
- D -
Dark 181, 268
DC power supply 44
DC power supply connector 9
Deleting a file 312
Dileting a directory 311
DIF 328, 338
DIF2 328, 338
DISP 5, 59
DISP key 5, 59
Display check 254
Display format 15-17, 86, 113, 134
Display graph 183
Display scale 144, 332
Dynamic range 17, A2
- E -
Editor 362, 368
EJECT button 285
end time 305
Equation input 326
Equation number 330
Eraser 371
Error 459, 460
Evaluation period 365
Event mark 296, 305, 428
EXP 337
Exponential 337
Exponential averaging 396, 403
EXT SMPL 13, 438
EXT TRIG 13, 436
External trigger 14, 436
eu 240
- F -
FEED 5, 264, 272
FEED key 5, 264, 272
FFT 17, 74, 127
FFT analysis mode 17, 140
FFT channel mode 17, 129
File information 288
File key 5,59
File list 287
FILE to FFT function 309
FILE to MEM function 309
Filter width 205
Floating decimal point 328
Format 320
Four arithmetical operation 337
Fourier transform A9
Frequency 358
Frequency range 130
Function keys 62
Fuse 12, 21, 34, 39, 44, 454
Fuse holder 9, 39, 454
Fuse replacement 454
- G -
General specification 11
GO 348, 362, 439, 440
GO&NG 362
Grid setting 229
Ground terminal 7, 44
- H -
HELP 5, 425, 314
HELP key 5, 425, 314
Handle 9
Hard copy 271
Head up/down lever 54
Histogram 143, 159

INDEX 3
Index───────────────────────────────────────────────────────
────────────────────────────────────────────────────────
1
2
3
4
5
6
7
8
9
10
11
12
13
14
15
IND
- I -
IMP 129, 143, 166
IN 348
INT 327, 340
INT2 327, 340
Initialization of setting item 221
Initialize setting 458
Input cable 39
Input coupling 187
Input unit slot 7
Installation environment 43
Installation orientation 41
Interface 257
Intermittent print 237
Interpolation function 15-17, 93, 116, 147
Inverse trigonometric 342
- J -
JOG control 5, 60, 61
- K -
Key check 253
KEY LOCK 9, 442
Key lock 9, 442
- L -
LCD backlight ON/OFF 234
LCD backlight saver 19, 234
LCD screen 5
LED check 251
LEVEL MON. 5, 420
LEVEL MON. key 5, 420
Leakage error A15
Level monitor screen 420
Level trigger 205
LIN 143, 152
Light 181
Line cursor (horizontal) 406, 409
Line cursor (vertical) 406, 408
Linear spectrum 143, 152
List and gauge function 233
List print 19, 273
LOG 337
Logic input 23, 178-180
Logic probe 24, 48
Logic probe connection 48
Logic trigger 14, 211
Low-pass filter 25, 27, 29, 32, 34, 191, A3
- M -
Maximum allowable input 3, 13, 25-29, 32, 34, 58
Maximum floating voltage 3, 25-30, 32, 58
Maximum sampling speed 11, 25, 27, 29, 32, 34
Maximum value 357
Measurement limit frequency A7
Medium dark 181
MIC 13, 115, 441
Minimum value 357
MO 284
MO check 255
MO drive head clean 453
MO drive operation 285
MO key 5, 59
MOV 324, 328, 338
Moving average 338
- N -
Natural logarithm 337
New data 136
NG 9, 13, 348, 362, 439
NG evaluation output 439
Normal 181
Normal print 264
Nyquist frequency A6, A11

INDEX 4
Index───────────────────────────────────────────────────────
────────────────────────────────────────────────────────
- O -
OCT 143, 170
Octave analysis 143, 170
Octave filter 146
Option 21, A3
Optional accessories 21
Out 348, 362
- P -
Paint 368
Partial print 15, 16, 269
Peak hold 398, 403
Peak value display 138
Period 358
Physical format 321
Playback 304, 448
Position display 425, 426
Power spectrum 143, 156
Pre-trigger 14, 202, A3
PRINT 5, 13, 264, 434
PRINT key 5, 264
Printer 7, 267
Printer check 252
Printer head cleaning 452
Printer recording format 260
PSP 143, 156
- R -
Reading stored data 302
Real time print 279
Recording a voice memo 115, 441
Recording length 15, 85
Recording medium 117
Recording time 112
Reference data 136
Remote terminal 9
Rename 313
Repeat 14, 200, 306
Reverse 373
RMS 143, 154, 187, 357
RMS spectrum 143, 154
RMS value 357
Roll mode 94
ROM/RAM check 250
Root 337
- S -
Safety symbol
Sampling 84, 107, A4, A5
Sampling frequency A5
Sampling rate A4, A5
Sampling speed 11
Scaling 19, 240, A4
Scroll 414, A4
Searching file 317
Select key 5, 60
Self check 249
Sequential save function 384
SHUTTLE control 5, 60
SIN 340
Sine 340
Single 14, 200, 306
SLI 324, 328, 338
Slope 206
Smooth print 15, 262
Sorting files 319
Source channel 204
SQR 337
Stand 7, 42
Standard deviation 359
Start time 215, 305
START 5, 13, 62, 295, 433
START key 5, 62, 296
STATUS 5, 59
STATUS key 5, 59
Stop mode 18, 350, 362, 364
Stop operation 104, 125
Stop time 215
Storage waveform 151
Storing data 289
STOP 5, 13, 62, 434
STOP key 5, 62

INDEX 5
Index───────────────────────────────────────────────────────
────────────────────────────────────────────────────────
1
2
3
4
5
6
7
8
9
10
11
12
13
14
15
IND
Store area 377
STR 151
Superimpose 95
Symbols ,
SYSTEM 5, 59, 220
SYSTEM key 5, 59, 220
System reset 223, 458
- T -
TAN 341
Tangent 341
Thermocouple connect 50
Time axis magnification 98, 109
Time axis range 84, 107
Time interval 215
Time to maximum value 357
Time to minimum value 358
Timer trigger 14, 215
Trace cursor 407
Transferring data 119
TRF 143, 160
TRIG OUT 9, 13, 437
Trigger 14, 199, A4
Trigger filter 14, 205
Trigger level 14, 205
Trigger mode 14, 200
Trigger slope 205
Trigger source 14, 201
Trigonometric function 340
- U -
Undo 376
Unit impulse response 143, 166
Using the A/B cursor 406
- V -
VALUE 5, 61
Variable display fun 15, 16, 195
Voltage axis range 184
Volume setting 236
- W -
Warning 461
Waveform evaluation 18, 361-366
Waveform parameter calculation 344
Waveform parameter evaluation 348
Waveform processing 19, 323-325
Window 132, 157
Window function 132, A16, A17
Window-in trigger 14, 208
Window-out trigger 14, 208
Write protect 284
w1 141
w2 141
- X -
X-Y area 343, 360
X-Y plotting 90
- Z -
Zero adjustment 190
Zero position 189, 195
- Others -
1st differential 327, 339
1st integral 327, 340
2nd differential 327, 339
2nd integral 327, 340
8916 ANALOG UNIT 25
8917 DC/RMS UNIT 27
8918 TEMPERATURE UNIT 29
8927 ANALOG UNIT 32
8928 STRAIN UNIT 36
9437 CONNECTION CABLE 39
9574 INPUT CABLE 39

INDEX 6
Index───────────────────────────────────────────────────────
────────────────────────────────────────────────────────