Mediating role of television time, diet patterns, physical activity and sleep duration in the...
10
RESEARCH Open Access Mediating role of television time, diet patterns, physical activity and sleep duration in the association between television in the bedroom and adiposity in 10 year-old children Michael M Borghese 1,2* , Mark S Tremblay 1,2,3,4 , Peter T Katzmarzyk 5 , Catrine Tudor-Locke 5 , John M Schuna Jr 5 , Geneviève Leduc 1 , Charles Boyer 1 , Allana G LeBlanc 1,4 and Jean-Philippe Chaput 1,2,3,4 Abstract Background: Having a TV in the bedroom is associated with adiposity in children. It is not known how lifestyle behaviours (television viewing time, diet patterns, physical activity, and sleep duration) mediate this association. The objective of this study was to examine the mediating role of these lifestyle behaviours in the association between TV in the bedroom and percent body fat (% BF). Methods: Cross-sectional data from 1 201 children (57.3 % female; mean age = 9.8 years) from Ottawa, Canada and Baton Rouge, USA were examined. % BF was directly measured. Accelerometers were used to determine physical activity and sleep duration (24-h, 7-day protocol). Questionnaires were used to assess TV viewing time and healthy/unhealthy diet patterns (derived using factor analysis from food frequency questionnaire data). Results: Canadian boys and girls with a TV in their bedroom had a higher % BF, watched more TV and had unhealthier diets. American boys and girls with a TV in their bedroom watched more TV, while boys had a higher % BF and a more unhealthy diet, and girls had less MVPA. In Canadian girls, TV viewing time mediated the association between having a TV in the bedroom and adiposity, independent of diet patterns, MVPA, and sleep duration. Other lifestyle mediators were not significant in Canadian boys or in US children. Conclusion: TV viewing is a mediating lifestyle behaviour in the association between TV in the bedroom and adiposity in Canadian girls. Future research is needed to identify lifestyle behaviours as intermediate mediators. Keywords: Diet, Lifestyle habits, Mediation, Obesity, Screen-based media Introduction Young people now spend more time with media than they do in school and, other than sleeping, TV viewing is the leading activity for children and adolescents [1]. Previous work has shown a clear link between increased TV viewing time and poor health indicators in children and youth, in- cluding decreased fitness, lowered scores for self-esteem and pro-social behaviour as well as unfavorable body composition [2]. The omnipresence of screens (especially TV) in children’ s lives poses a potential health risk, and society as a whole has a role to play to mitigate these risks. Interventions that may be capable of addressing this risk by reducing children’ s screen time are being tested [3, 4]. Recent estimates suggest that 71 % of American children and adolescents have a TV in their bedroom [5]. The American Academy of Pediatrics suggested in 2013 that parents should remove TVs from children’ s bedrooms (along with internet connected electronic devices), thereby reducing their access [6]. This is largely because evidence suggests that the presence of a TV in children’ s bedrooms increases TV viewing time [7], risk of substance use, and * Correspondence: [email protected] 1 Healthy Active Living and Obesity Research Group, Children’s Hospital of Eastern Ontario Research Institute, 401 Smyth Road, Ottawa K1H 8L1ON, Canada 2 School of Human Kinetics, Faculty of Health Sciences, University of Ottawa, Ottawa, ON, Canada Full list of author information is available at the end of the article © 2015 Borghese et al.; licensee BioMed Central. This is an Open Access article distributed under the terms of the Creative Commons Attribution License (http://creativecommons.org/licenses/by/4.0), which permits unrestricted use, distribution, and reproduction in any medium, provided the original work is properly credited. The Creative Commons Public Domain Dedication waiver (http://creativecommons.org/publicdomain/zero/1.0/) applies to the data made available in this article, unless otherwise stated. Borghese et al. International Journal of Behavioral Nutrition and Physical Activity (2015) 12:60 DOI 10.1186/s12966-015-0221-5
-
Upload
independent -
Category
Documents
-
view
1 -
download
0
Transcript of Mediating role of television time, diet patterns, physical activity and sleep duration in the...
Borghese et al. International Journal of Behavioral Nutritionand Physical Activity (2015) 12:60 DOI 10.1186/s12966-015-0221-5
RESEARCH Open Access
Mediating role of television time, diet patterns,physical activity and sleep duration in theassociation between television in the bedroomand adiposity in 10 year-old childrenMichael M Borghese1,2*, Mark S Tremblay1,2,3,4, Peter T Katzmarzyk5, Catrine Tudor-Locke5, John M Schuna Jr5,Geneviève Leduc1, Charles Boyer1, Allana G LeBlanc1,4 and Jean-Philippe Chaput1,2,3,4
Abstract
Background: Having a TV in the bedroom is associated with adiposity in children. It is not known how lifestylebehaviours (television viewing time, diet patterns, physical activity, and sleep duration) mediate this association. Theobjective of this study was to examine the mediating role of these lifestyle behaviours in the association betweenTV in the bedroom and percent body fat (% BF).
Methods: Cross-sectional data from 1 201 children (57.3 % female; mean age = 9.8 years) from Ottawa, Canada andBaton Rouge, USA were examined. % BF was directly measured. Accelerometers were used to determine physical activityand sleep duration (24-h, 7-day protocol). Questionnaires were used to assess TV viewing time and healthy/unhealthy dietpatterns (derived using factor analysis from food frequency questionnaire data).
Results: Canadian boys and girls with a TV in their bedroom had a higher % BF, watched more TV and had unhealthierdiets. American boys and girls with a TV in their bedroom watched more TV, while boys had a higher % BF and a moreunhealthy diet, and girls had less MVPA. In Canadian girls, TV viewing time mediated the association between having a TVin the bedroom and adiposity, independent of diet patterns, MVPA, and sleep duration. Other lifestyle mediators were notsignificant in Canadian boys or in US children.
Conclusion: TV viewing is a mediating lifestyle behaviour in the association between TV in the bedroom and adiposity inCanadian girls. Future research is needed to identify lifestyle behaviours as intermediate mediators.
Keywords: Diet, Lifestyle habits, Mediation, Obesity, Screen-based media
IntroductionYoung people now spend more time with media than theydo in school and, other than sleeping, TV viewing is theleading activity for children and adolescents [1]. Previouswork has shown a clear link between increased TV viewingtime and poor health indicators in children and youth, in-cluding decreased fitness, lowered scores for self-esteemand pro-social behaviour as well as unfavorable body
* Correspondence: [email protected] Active Living and Obesity Research Group, Children’s Hospital ofEastern Ontario Research Institute, 401 Smyth Road, Ottawa K1H 8L1ON,Canada2School of Human Kinetics, Faculty of Health Sciences, University of Ottawa,Ottawa, ON, CanadaFull list of author information is available at the end of the article
© 2015 Borghese et al.; licensee BioMed CentrCommons Attribution License (http://creativecreproduction in any medium, provided the orDedication waiver (http://creativecommons.orunless otherwise stated.
composition [2]. The omnipresence of screens (especiallyTV) in children’s lives poses a potential health risk, andsociety as a whole has a role to play to mitigate theserisks. Interventions that may be capable of addressingthis risk by reducing children’s screen time are beingtested [3, 4].Recent estimates suggest that 71 % of American children
and adolescents have a TV in their bedroom [5]. TheAmerican Academy of Pediatrics suggested in 2013 thatparents should remove TVs from children’s bedrooms(along with internet connected electronic devices), therebyreducing their access [6]. This is largely because evidencesuggests that the presence of a TV in children’s bedroomsincreases TV viewing time [7], risk of substance use, and
al. This is an Open Access article distributed under the terms of the Creativeommons.org/licenses/by/4.0), which permits unrestricted use, distribution, andiginal work is properly credited. The Creative Commons Public Domaing/publicdomain/zero/1.0/) applies to the data made available in this article,
Borghese et al. International Journal of Behavioral Nutrition and Physical Activity (2015) 12:60 Page 2 of 10
adiposity [6, 8], as well as other health risks. While it mayseem intuitive that bedroom TVs exert their effect on chil-dren’s adiposity through increased TV viewing time, thereis evidence to suggest that this effect exists beyond thatwhich can be explained by TV viewing time alone [9, 10].Having a TV in the bedroom is also associated with un-healthy food choices [11], lower levels of moderate-to-vigorous physical activity (MVPA) [12], and poor sleephabits [13, 14] in children. However, this evidence is mixed[10], and the mechanisms behind the association betweenTV in the bedroom and adiposity in children are unclear.Previous studies have focused primarily on the associ-
ation of bedroom TVs and a specified outcome measurewithout considering potential mediating or moderating ef-fects of other factors, despite the fact that these variablesare generally interrelated. We are aware of two other stud-ies that have examined the potential mediating effects ofchildren’s lifestyle behaviours on the association betweenhaving a TV in the bedroom and adiposity. However, nei-ther of these studies used objective measures of physicalactivity and sleep duration, and both used BMI as a meas-ure of obesity instead of adiposity [7, 15]. While these ana-lyses provide many insights, the literature is limited inexamining the influence of TV in the bedroom on dietpatterns in children; studies have examined the link withsugar-sweetened beverage consumption [7, 11], but the as-sociation with children’s habitual diet patterns has notbeen addressed. Thus, a comprehensive evaluation of thepotential associations between having a TV in the bed-room and lifestyle behaviours using objective measures iswarranted.Accordingly, the purpose of this study was to examine
the association between having a TV in the bedroom andpercent body fat (% BF) in both Canadian and Americanchildren, considering the following lifestyle behaviours asmediating factors: TV viewing time, diet patterns, MVPA,and sleep duration. It was hypothesized that children with aTV in their bedroom would have higher % BF and total TVviewing time, poorer diet patterns, lower MVPA, andshorter sleep duration than those with no TV in their bed-room. It was also hypothesized that the aforementionedlifestyle behaviours would independently mediate the asso-ciation between TV in the bedroom and % BF in children.It is crucial that mediation analyses using cross-sectionaldata have a strong theoretical/conceptual foundation. Theconceptual model for the mediating role of lifestyle behav-iours in the association between having a TV in the bed-room and adiposity in children is based on previousevidence from longitudinal [9 ,10, 14, 16, 17] and interven-tion studies [18, 19]. Furthermore, this mediation ap-proach has previously been used with cross-sectional datato answer similar research questions [15, 20]. While cross-sectional mediation analysis can be informative in the con-text of existing conceptual models, potential mediating
factors should not be interpreted as being causal, but ra-ther informative for further hypothesis generation.
MethodsParticipantsThe International Study of Childhood Obesity, Lifestyleand the Environment (ISCOLE) is a multi-national,cross-sectional study conducted in 12 countries. The pri-mary purpose of ISCOLE is to construct a statisticalmodel which can predict adiposity in children based ondietary habits and physical activity, as well as other en-vironmental variables. Data from the NHANES 2005/2006 informed an a priori power calculation which indi-cated that a sample size of 500 participants from each ofthe 12 international sites would allow for statistical powerof 97 %, when alpha = 0.05 and variance in adiposity (R2)explained by either dietary habits or physical activity = 3 %.The targeted overall sample included 6000 10-year-old chil-dren from 12 countries in five major geographic regions ofthe world (Europe, Africa, the Americas, South-East Asia,and the Western Pacific). Further details pertaining to thestudy design and methods can be found elsewhere [21].Analyses herein include data from the Canadian andAmerican ISCOLE sites.In Canada, data were collected in 26 schools on 567
children (mean age = 10.0, 57.8 % female) from Ottawa,Ontario between September 2012 and May 2013. Schoolswere stratified into four groups: 1) English Public (n = 393;69.3 %), 2) French Public (n = 60; 10.6 %), 3) EnglishCatholic (n = 75; 13.2 %), and 4) French Catholic (n =39; 6.8 %). In the United States, data were collected in21 schools on 651 children (mean age = 9.5, 56.8 % fe-male) from Baton Rouge, Louisiana between August2012 and May 2013. Schools were stratified into 5groups: 1) Public – 95.0-100 % on free and reducedprice meals (n = 142; 21.8 %), 2) Public – 85.5-95.0 % onfree and reduced price meals (n = 44; 6.8 %), 3) Public –73.4-85.5 % on free and reduced price meals (n = 115;17.7 %), 4) Public – 1.4-73.4 % on free and reducedprice meals (n = 181; 27.8 %), and 5) Private (n = 169;26.0 %). The cities from each country were selectedbased on their proximity to the country-specific studysite, and the data collected are not intended to form arepresentative sample of the country or region specificto the study site. At both the Canadian and US sites,schools within each stratum were invited to participateand the first to respond were enrolled in the study, inagreement with the local research ethics or institutionalreview boards. In all schools children (and their parents/guardians) were invited to participate on a volunteer basis.They were recruited through letters sent home to the par-ents. This project was approved by the research ethicsboard at the Children’s Hospital of Eastern Ontario(Canada) and the Pennington Biomedical Research Center
Borghese et al. International Journal of Behavioral Nutrition and Physical Activity (2015) 12:60 Page 3 of 10
(USA) as well as the participating school boards (Canadiansite) or other school authority (American site). Written in-formed parental consent and child assent were obtainedfor all participants.
Demographic informationDemographic questionnaires completed by parents wereused to determine children’s age (from date of birth), sex,ethnicity (White/Caucasian, African American, Asian, FirstNations, East Indian, Pacific Islander, “don’t know”, or“other”), total household annual income (4 levels based onsite-specific household annual income), and the highestlevel of parental education (less than high school, somehigh school, high school diploma/GED, diploma or 1–3years of college, bachelor’s degree, or graduate degree[master’s or PhD]/professional degree).
AdiposityTrained study staff collected anthropometric data inschools during school hours, following standardized proce-dures [21]. % BF was measured to the nearest 0.1 % using aportable Tanita SC-240 Body Composition Analyzer(Arlington Heights, IL, USA). The Tanita SC-240showed acceptable accuracy for estimating % BF in chil-dren when compared with dual-energy X-ray absorpti-ometry (error = −1.0 %), supporting its use in fieldstudies [22].
Screen timeDuring the school visit, participants completed a diet andlifestyle questionnaire which included a self-reported meas-ure of having a TV in the bedroom (“Do you have a televi-sion in your bedroom?”, with response options of “yes” or“no”). Also, children were asked how many hours/day theyengaged in sedentary behaviours (TV, video games, andcomputers) on a typical school day and on a typical week-end day, based on a question adapted from the US YouthRisk Behaviour Surveillance System (YRBSS) [23]. The TVviewing time question derived from the YRBSS was shownto have adequate reliability with a one week test-retestinterval (spearman correlation = 0.55-0.68) and validity ascompared to 7-day TV time use logs (spearman correlation= 0.47) [24]. Furthermore, self-report methods of quantify-ing screen time have been shown to have acceptable reli-ability and validity in children [25]. The response optionsincluded: no use, <1 h, 1 h, 2 h, 3 h, 4 h, and ≥5 h/day. Aweighted mean hours/day of TV viewing was calculated asfollows: [(hours of TV on weekdays x 5) + (hours of TV onweekend days x 2)]/7. This method of determining dailyamount of TV viewing has been used elsewhere [26]. Thisapproach was also applied for determining computer andvideo game time (not including tablets or smartphones).Weighted means were then summed to provide an estimateof total screen time over an entire week (derived from daily
screen time) for meeting or not meeting the sedentary be-haviour guidelines of no more than 2 h/day [27]. All chil-dren provided data for the presence of a TV in theirbedroom and their screen-based sedentary behaviours.
Diet patternsChildren in ISCOLE were asked to complete a food fre-quency questionnaire (FFQ) as part of a diet and lifestylequestionnaire. The FFQ was adapted from the HealthBehaviours in School-age Children study [28], and is areliable questionnaire (test-retest reliability spearmancorrelation = 0.52-0.82) that can be used for ranking thefrequency of consumption of most food items in chil-dren [29]. Also, the relative validity (agreement) of thisFFQ was established against a food behaviour checklistand a 7-day food diary [29]. The FFQ asked the partici-pants how often they consumed 23 food items in a usualweek. There were 7 response options ranging from‘never’ to ‘every day, more than once’. In total, 1 195children responded to each and every one of the 23 FFQitems. This FFQ does not provide an estimate of energyintake or other indicators of the amount of food con-sumed. Instead, principal component analysis was usedto identify diet patterns in the sample with the food itemsas input variables. Eigenvalues and a scree plot analysiswere used to determine the appropriate number of factors.Two factors were chosen for analysis: a “healthy diet” fac-tor and an “unhealthy diet” factor. Higher values on thehealthy diet score indicate a more healthy diet, and highervalues on the unhealthy diet score indicate a more un-healthy diet. These were rotated with an orthogonal vari-max transformation and standardized to ensure normality.
Physical activity and sedentary timeTime spent in MVPA was measured using the ActiGraphGT3X+ accelerometer (ActiGraph LLC, Pensacola, FL,USA) [21]. Study staff instructed children to wear the de-vice on a belt around the waist at the right hip (mid-axillaryline) 24 h/day for 7 consecutive days. Children were askedto remove the device for aquatic activities and showering/bathing. To increase wear time compliance, study staffconducted an in-school check after initialization to en-sure the child was following the accelerometer wearprotocol. Up to two compliance phone calls were alsomade to the parents/guardians (one weekday call andone weekend call) to ensure that the device was beingworn properly. Data were collected at sampling rate of80 Hz, integrated to 1-s epochs, and further aggregatedto 15 s epochs for analysis [30]. MVPA was defined asall minutes showing ≥574 counts/15 s, consistent withwidely used cut-points for accelerometry output [30].Time spent in MVPA included only minutes from wak-ing wear time (wear time minus time spent sleeping) onvalid days. A valid recording required at least 4 days
Borghese et al. International Journal of Behavioral Nutrition and Physical Activity (2015) 12:60 Page 4 of 10
(including at least one weekend day) of at least 10 h ofwear time per day [31, 32]. Complete and valid acceler-ometer data were available for 1 014 children. Childrenwithout complete accelerometry data differed in their eth-nicity, total annual household income and the highest levelof parental education (data not shown). These childrenwere predominantly African American, while childrenwith complete data were predominantly Caucasian. Fur-ther, children without complete data were more likely tolive in households with lower total annual household in-come and where the highest level of parental educationwas lower than those with complete data. These variableswere considered as covariates in all analyses herein.
Sleep durationNocturnal sleep time was objectively assessed using thesame ActiGraph GT3X+ for a 7-day period. A fully auto-mated algorithm for 24-h waist-worn accelerometry wasrecently validated for ISCOLE and used for the presentstudy [33,34]. This new algorithm captures sleep periodtime from sleep onset to the end of sleep, including allepochs and wakefulness after onset [33]. The weeklytotal sleep time averages were calculated using only dayswhere valid sleep was accumulated (total sleep periodtime ≥160 min) and only for participants with at least 3nights of valid sleep, including 1 weekend night (Fridayor Saturday). Accelerometer-based sleep duration datawere available from 1 008 children. Children who didnot meet the criteria for valid sleep data (either missingor invalid) differed in their ethnicity, total annual house-hold income and the highest level of parental educationin the same direction as those who did not provide validphysical activity data (data not shown).
Statistical analysisAll statistical analyses were performed using SAS 9.3(SAS Institute, Cary NC). The school-based recruitmentstrategy was not accounted for in the current analysisbecause the majority of the variance in adiposity was ex-plained at the individual level, rather than the schoollevel. Furthermore, the primary variable of interest, TVin the bedroom, is a home-based characteristic which isnot thought to differ by school. Independent samples t-tests for continuous variables and chi-square or Fisher’sexact tests for categorical variables (as appropriate) wereused to determine significant differences in demographiccharacteristics and lifestyle behaviours between childrenwho had a TV in their bedroom vs. those who did not.Multiple mediation analysis was also conducted to de-
termine if the association between having a TV in thebedroom and % BF was mediated by TV viewing time,diet patterns, MVPA, and/or sleep duration (Fig. 1). Me-diation models evaluate the effect of a mediator (M) onthe association between the independent variable (X)
and dependent variable (Y). By convention, a representsthe association between X and M, and b represents theassociation between M and Y while partitioning out theeffect of X. The multiple mediation model described byPreacher and Hayes [35] allows one to determine thetotal effect of X on Y (c), the direct effect of X on Y (c’)(excluding the effects of mediators), the total indirect ef-fect (∑ab) of X on Y through all of the mediators, andthe effects of each mediator independent of one anotherand covariates (specific indirect effect, (ab) [35]. Weused bootstrapping to assess both the total and specificindirect effects using 5000 bootstrapped samples [35].Age, country, ethnicity, total household annual incomeand highest level of parental education were included ascovariates in the model based on the known effect ofthese variables with the independent, dependent, andsome mediating variables from the literature, as well asthe plausibility of a potential confounding effect. Themediation effects observed were moderated by sex andcountry, thus the results for mediation are presentedseparately for boys and girls of each country. Path a andpath b were considered statistically significant if p < 0.05,and path ab was considered statistically significant if the95 % bias-corrected and accelerated (BCA) CI did notinclude zero [36].
ResultsData were available for 1 201 children from the Canad-ian (n = 567) and American (n = 634) sites of ISCOLE.Canadian boys and girls with a TV in their bedroom didnot differ in age or ethnicity, but were more likely to livein households with a lower annual income and lower levelof parental education (Table 1). Furthermore, Canadianboys and girls with a TV in their bedroom had a higher %BF, watched more TV/day, were less likely to meet sed-entary behaviour guidelines, and had unhealthier diets(Table 2).American boys and girls with a TV in their bedroom
did not differ in age, but were more likely to live inhouseholds with a lower annual income and lower levelof parental education (Table 3). A higher proportion ofthose children with a TV in their bedroom were AfricanAmerican, while a higher proportion of those childrenwithout a TV in their bedroom were Caucasian. BothAmerican boys and girls with a TV in their bedroomwatched more TV/day. Boys with a TV in their bedroomalso had a higher % BF and a more unhealthy diet, whilegirls with a TV in their bedroom were less likely to meetsedentary behaviour guidelines and had less MVPA(Table 4).In Canadian girls, only TV viewing time was a signifi-
cant mediator of the association between having a TV inthe bedroom and adiposity (Table 5). That is, the pres-ence of a TV in the bedroom was associated with more
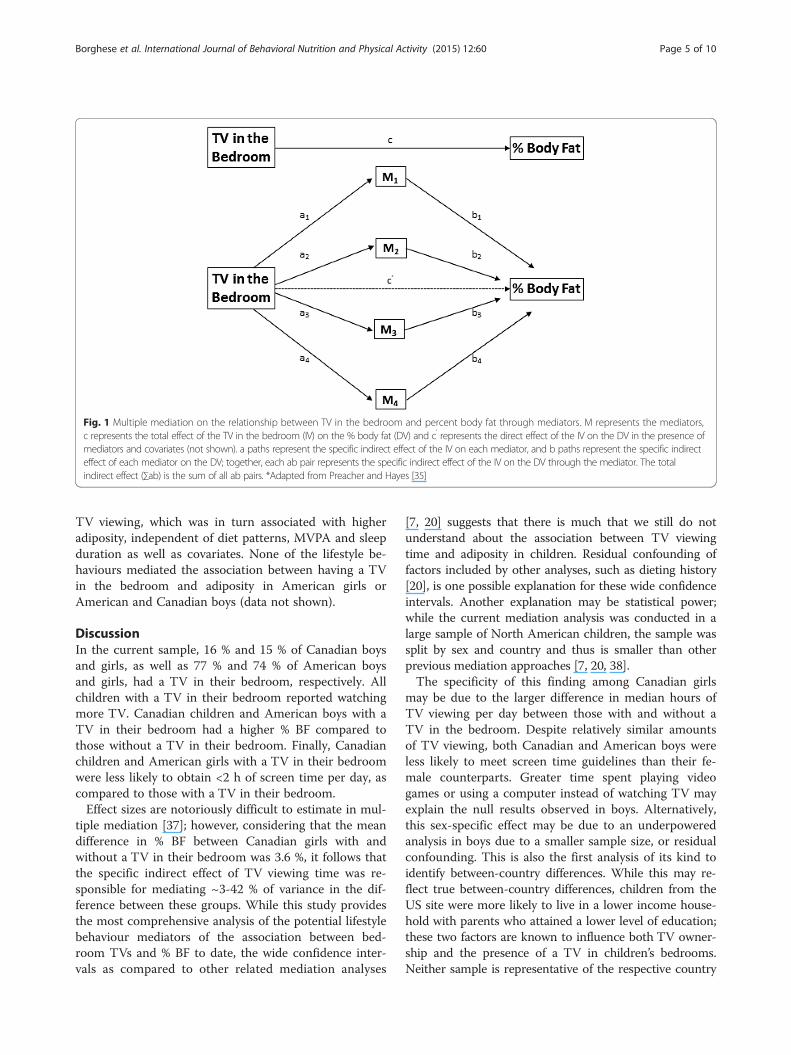
Fig. 1 Multiple mediation on the relationship between TV in the bedroom and percent body fat through mediators. M represents the mediators,c represents the total effect of the TV in the bedroom (IV) on the % body fat (DV) and c’ represents the direct effect of the IV on the DV in the presence ofmediators and covariates (not shown). a paths represent the specific indirect effect of the IV on each mediator, and b paths represent the specific indirecteffect of each mediator on the DV; together, each ab pair represents the specific indirect effect of the IV on the DV through the mediator. The totalindirect effect (∑ab) is the sum of all ab pairs. *Adapted from Preacher and Hayes [35]
Borghese et al. International Journal of Behavioral Nutrition and Physical Activity (2015) 12:60 Page 5 of 10
TV viewing, which was in turn associated with higheradiposity, independent of diet patterns, MVPA and sleepduration as well as covariates. None of the lifestyle be-haviours mediated the association between having a TVin the bedroom and adiposity in American girls orAmerican and Canadian boys (data not shown).
DiscussionIn the current sample, 16 % and 15 % of Canadian boysand girls, as well as 77 % and 74 % of American boysand girls, had a TV in their bedroom, respectively. Allchildren with a TV in their bedroom reported watchingmore TV. Canadian children and American boys with aTV in their bedroom had a higher % BF compared tothose without a TV in their bedroom. Finally, Canadianchildren and American girls with a TV in their bedroomwere less likely to obtain <2 h of screen time per day, ascompared to those with a TV in their bedroom.Effect sizes are notoriously difficult to estimate in mul-
tiple mediation [37]; however, considering that the meandifference in % BF between Canadian girls with andwithout a TV in their bedroom was 3.6 %, it follows thatthe specific indirect effect of TV viewing time was re-sponsible for mediating ~3-42 % of variance in the dif-ference between these groups. While this study providesthe most comprehensive analysis of the potential lifestylebehaviour mediators of the association between bed-room TVs and % BF to date, the wide confidence inter-vals as compared to other related mediation analyses
[7, 20] suggests that there is much that we still do notunderstand about the association between TV viewingtime and adiposity in children. Residual confounding offactors included by other analyses, such as dieting history[20], is one possible explanation for these wide confidenceintervals. Another explanation may be statistical power;while the current mediation analysis was conducted in alarge sample of North American children, the sample wassplit by sex and country and thus is smaller than otherprevious mediation approaches [7, 20, 38].The specificity of this finding among Canadian girls
may be due to the larger difference in median hours ofTV viewing per day between those with and without aTV in the bedroom. Despite relatively similar amountsof TV viewing, both Canadian and American boys wereless likely to meet screen time guidelines than their fe-male counterparts. Greater time spent playing videogames or using a computer instead of watching TV mayexplain the null results observed in boys. Alternatively,this sex-specific effect may be due to an underpoweredanalysis in boys due to a smaller sample size, or residualconfounding. This is also the first analysis of its kind toidentify between-country differences. While this may re-flect true between-country differences, children from theUS site were more likely to live in a lower income house-hold with parents who attained a lower level of education;these two factors are known to influence both TV owner-ship and the presence of a TV in children’s bedrooms.Neither sample is representative of the respective country
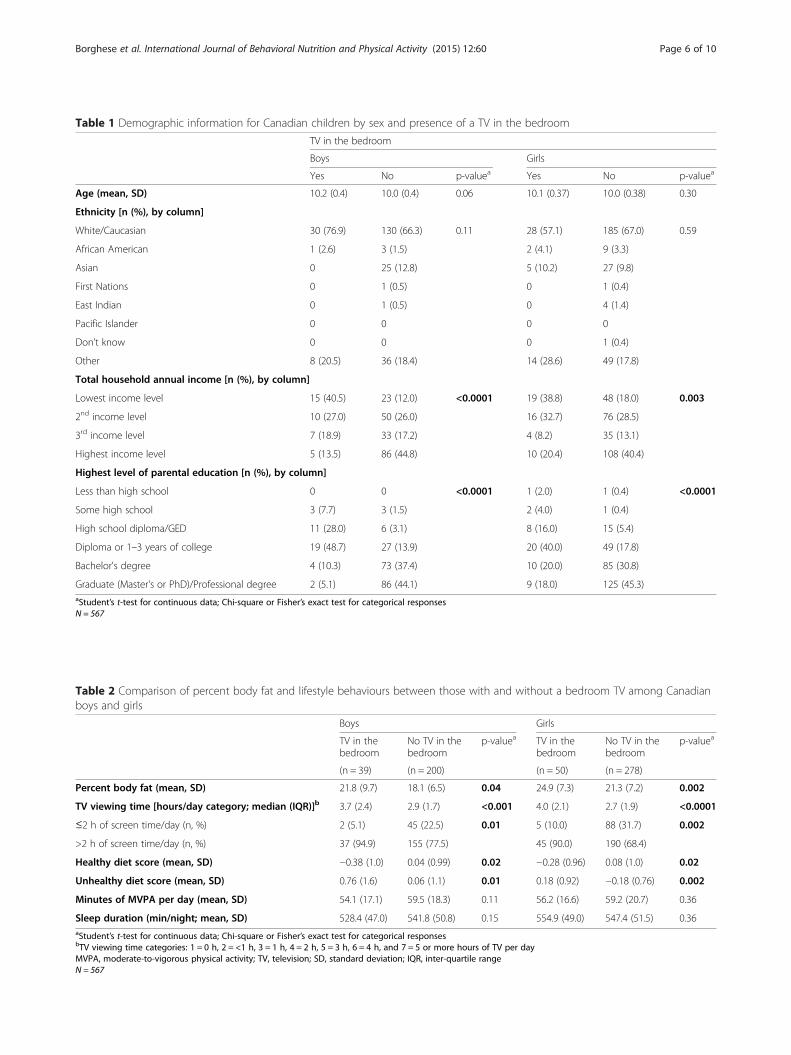
Table 1 Demographic information for Canadian children by sex and presence of a TV in the bedroom
TV in the bedroom
Boys Girls
Yes No p-valuea Yes No p-valuea
Age (mean, SD) 10.2 (0.4) 10.0 (0.4) 0.06 10.1 (0.37) 10.0 (0.38) 0.30
Ethnicity [n (%), by column]
White/Caucasian 30 (76.9) 130 (66.3) 0.11 28 (57.1) 185 (67.0) 0.59
African American 1 (2.6) 3 (1.5) 2 (4.1) 9 (3.3)
Asian 0 25 (12.8) 5 (10.2) 27 (9.8)
First Nations 0 1 (0.5) 0 1 (0.4)
East Indian 0 1 (0.5) 0 4 (1.4)
Pacific Islander 0 0 0 0
Don’t know 0 0 0 1 (0.4)
Other 8 (20.5) 36 (18.4) 14 (28.6) 49 (17.8)
Total household annual income [n (%), by column]
Lowest income level 15 (40.5) 23 (12.0) <0.0001 19 (38.8) 48 (18.0) 0.003
2nd income level 10 (27.0) 50 (26.0) 16 (32.7) 76 (28.5)
3rd income level 7 (18.9) 33 (17.2) 4 (8.2) 35 (13.1)
Highest income level 5 (13.5) 86 (44.8) 10 (20.4) 108 (40.4)
Highest level of parental education [n (%), by column]
Less than high school 0 0 <0.0001 1 (2.0) 1 (0.4) <0.0001
Some high school 3 (7.7) 3 (1.5) 2 (4.0) 1 (0.4)
High school diploma/GED 11 (28.0) 6 (3.1) 8 (16.0) 15 (5.4)
Diploma or 1–3 years of college 19 (48.7) 27 (13.9) 20 (40.0) 49 (17.8)
Bachelor's degree 4 (10.3) 73 (37.4) 10 (20.0) 85 (30.8)
Graduate (Master's or PhD)/Professional degree 2 (5.1) 86 (44.1) 9 (18.0) 125 (45.3)aStudent’s t-test for continuous data; Chi-square or Fisher’s exact test for categorical responsesN = 567
Table 2 Comparison of percent body fat and lifestyle behaviours between those with and without a bedroom TV among Canadianboys and girls
Boys Girls
TV in thebedroom
No TV in thebedroom
p-valuea TV in thebedroom
No TV in thebedroom
p-valuea
(n = 39) (n = 200) (n = 50) (n = 278)
Percent body fat (mean, SD) 21.8 (9.7) 18.1 (6.5) 0.04 24.9 (7.3) 21.3 (7.2) 0.002
TV viewing time [hours/day category; median (IQR)]b 3.7 (2.4) 2.9 (1.7) <0.001 4.0 (2.1) 2.7 (1.9) <0.0001
≤2 h of screen time/day (n, %) 2 (5.1) 45 (22.5) 0.01 5 (10.0) 88 (31.7) 0.002
>2 h of screen time/day (n, %) 37 (94.9) 155 (77.5) 45 (90.0) 190 (68.4)
Healthy diet score (mean, SD) −0.38 (1.0) 0.04 (0.99) 0.02 −0.28 (0.96) 0.08 (1.0) 0.02
Unhealthy diet score (mean, SD) 0.76 (1.6) 0.06 (1.1) 0.01 0.18 (0.92) −0.18 (0.76) 0.002
Minutes of MVPA per day (mean, SD) 54.1 (17.1) 59.5 (18.3) 0.11 56.2 (16.6) 59.2 (20.7) 0.36
Sleep duration (min/night; mean, SD) 528.4 (47.0) 541.8 (50.8) 0.15 554.9 (49.0) 547.4 (51.5) 0.36aStudent’s t-test for continuous data; Chi-square or Fisher’s exact test for categorical responsesbTV viewing time categories: 1 = 0 h, 2 = <1 h, 3 = 1 h, 4 = 2 h, 5 = 3 h, 6 = 4 h, and 7 = 5 or more hours of TV per dayMVPA, moderate-to-vigorous physical activity; TV, television; SD, standard deviation; IQR, inter-quartile rangeN = 567
Borghese et al. International Journal of Behavioral Nutrition and Physical Activity (2015) 12:60 Page 6 of 10
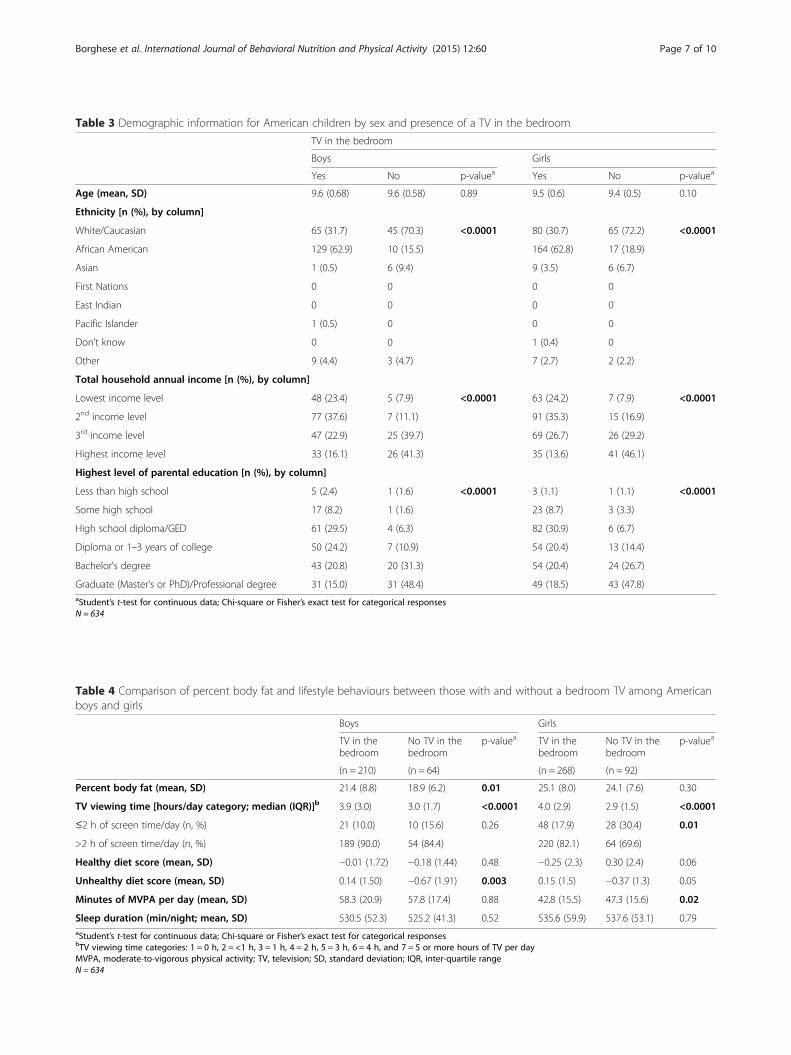
Table 3 Demographic information for American children by sex and presence of a TV in the bedroom
TV in the bedroom
Boys Girls
Yes No p-valuea Yes No p-valuea
Age (mean, SD) 9.6 (0.68) 9.6 (0.58) 0.89 9.5 (0.6) 9.4 (0.5) 0.10
Ethnicity [n (%), by column]
White/Caucasian 65 (31.7) 45 (70.3) <0.0001 80 (30.7) 65 (72.2) <0.0001
African American 129 (62.9) 10 (15.5) 164 (62.8) 17 (18.9)
Asian 1 (0.5) 6 (9.4) 9 (3.5) 6 (6.7)
First Nations 0 0 0 0
East Indian 0 0 0 0
Pacific Islander 1 (0.5) 0 0 0
Don’t know 0 0 1 (0.4) 0
Other 9 (4.4) 3 (4.7) 7 (2.7) 2 (2.2)
Total household annual income [n (%), by column]
Lowest income level 48 (23.4) 5 (7.9) <0.0001 63 (24.2) 7 (7.9) <0.0001
2nd income level 77 (37.6) 7 (11.1) 91 (35.3) 15 (16.9)
3rd income level 47 (22.9) 25 (39.7) 69 (26.7) 26 (29.2)
Highest income level 33 (16.1) 26 (41.3) 35 (13.6) 41 (46.1)
Highest level of parental education [n (%), by column]
Less than high school 5 (2.4) 1 (1.6) <0.0001 3 (1.1) 1 (1.1) <0.0001
Some high school 17 (8.2) 1 (1.6) 23 (8.7) 3 (3.3)
High school diploma/GED 61 (29.5) 4 (6.3) 82 (30.9) 6 (6.7)
Diploma or 1–3 years of college 50 (24.2) 7 (10.9) 54 (20.4) 13 (14.4)
Bachelor's degree 43 (20.8) 20 (31.3) 54 (20.4) 24 (26.7)
Graduate (Master's or PhD)/Professional degree 31 (15.0) 31 (48.4) 49 (18.5) 43 (47.8)aStudent’s t-test for continuous data; Chi-square or Fisher’s exact test for categorical responsesN = 634
Table 4 Comparison of percent body fat and lifestyle behaviours between those with and without a bedroom TV among Americanboys and girls
Boys Girls
TV in thebedroom
No TV in thebedroom
p-valuea TV in thebedroom
No TV in thebedroom
p-valuea
(n = 210) (n = 64) (n = 268) (n = 92)
Percent body fat (mean, SD) 21.4 (8.8) 18.9 (6.2) 0.01 25.1 (8.0) 24.1 (7.6) 0.30
TV viewing time [hours/day category; median (IQR)]b 3.9 (3.0) 3.0 (1.7) <0.0001 4.0 (2.9) 2.9 (1.5) <0.0001
≤2 h of screen time/day (n, %) 21 (10.0) 10 (15.6) 0.26 48 (17.9) 28 (30.4) 0.01
>2 h of screen time/day (n, %) 189 (90.0) 54 (84.4) 220 (82.1) 64 (69.6)
Healthy diet score (mean, SD) −0.01 (1.72) −0.18 (1.44) 0.48 −0.25 (2.3) 0.30 (2.4) 0.06
Unhealthy diet score (mean, SD) 0.14 (1.50) −0.67 (1.91) 0.003 0.15 (1.5) −0.37 (1.3) 0.05
Minutes of MVPA per day (mean, SD) 58.3 (20.9) 57.8 (17.4) 0.88 42.8 (15.5) 47.3 (15.6) 0.02
Sleep duration (min/night; mean, SD) 530.5 (52.3) 525.2 (41.3) 0.52 535.6 (59.9) 537.6 (53.1) 0.79aStudent’s t-test for continuous data; Chi-square or Fisher’s exact test for categorical responsesbTV viewing time categories: 1 = 0 h, 2 = <1 h, 3 = 1 h, 4 = 2 h, 5 = 3 h, 6 = 4 h, and 7 = 5 or more hours of TV per dayMVPA, moderate-to-vigorous physical activity; TV, television; SD, standard deviation; IQR, inter-quartile rangeN = 634
Borghese et al. International Journal of Behavioral Nutrition and Physical Activity (2015) 12:60 Page 7 of 10
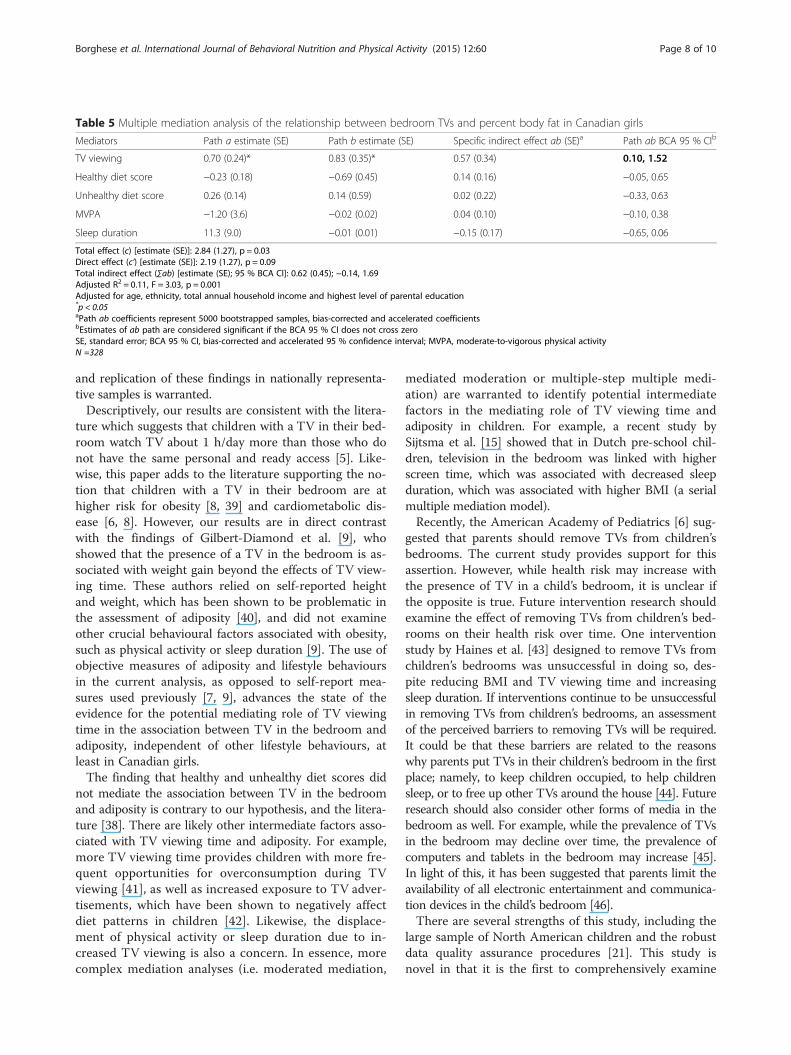
Table 5 Multiple mediation analysis of the relationship between bedroom TVs and percent body fat in Canadian girls
Mediators Path a estimate (SE) Path b estimate (SE) Specific indirect effect ab (SE)a Path ab BCA 95 % CIb
TV viewing 0.70 (0.24)* 0.83 (0.35)* 0.57 (0.34) 0.10, 1.52
Healthy diet score −0.23 (0.18) −0.69 (0.45) 0.14 (0.16) −0.05, 0.65
Unhealthy diet score 0.26 (0.14) 0.14 (0.59) 0.02 (0.22) −0.33, 0.63
MVPA −1.20 (3.6) −0.02 (0.02) 0.04 (0.10) −0.10, 0.38
Sleep duration 11.3 (9.0) −0.01 (0.01) −0.15 (0.17) −0.65, 0.06
Total effect (c) [estimate (SE)]: 2.84 (1.27), p = 0.03Direct effect (c’) [estimate (SE)]: 2.19 (1.27), p = 0.09Total indirect effect (∑ab) [estimate (SE); 95 % BCA CI]: 0.62 (0.45); −0.14, 1.69Adjusted R2 = 0.11, F = 3.03, p = 0.001Adjusted for age, ethnicity, total annual household income and highest level of parental education*p < 0.05aPath ab coefficients represent 5000 bootstrapped samples, bias-corrected and accelerated coefficientsbEstimates of ab path are considered significant if the BCA 95 % CI does not cross zeroSE, standard error; BCA 95 % CI, bias-corrected and accelerated 95 % confidence interval; MVPA, moderate-to-vigorous physical activityN =328
Borghese et al. International Journal of Behavioral Nutrition and Physical Activity (2015) 12:60 Page 8 of 10
and replication of these findings in nationally representa-tive samples is warranted.Descriptively, our results are consistent with the litera-
ture which suggests that children with a TV in their bed-room watch TV about 1 h/day more than those who donot have the same personal and ready access [5]. Like-wise, this paper adds to the literature supporting the no-tion that children with a TV in their bedroom are athigher risk for obesity [8, 39] and cardiometabolic dis-ease [6, 8]. However, our results are in direct contrastwith the findings of Gilbert-Diamond et al. [9], whoshowed that the presence of a TV in the bedroom is as-sociated with weight gain beyond the effects of TV view-ing time. These authors relied on self-reported heightand weight, which has been shown to be problematic inthe assessment of adiposity [40], and did not examineother crucial behavioural factors associated with obesity,such as physical activity or sleep duration [9]. The use ofobjective measures of adiposity and lifestyle behavioursin the current analysis, as opposed to self-report mea-sures used previously [7, 9], advances the state of theevidence for the potential mediating role of TV viewingtime in the association between TV in the bedroom andadiposity, independent of other lifestyle behaviours, atleast in Canadian girls.The finding that healthy and unhealthy diet scores did
not mediate the association between TV in the bedroomand adiposity is contrary to our hypothesis, and the litera-ture [38]. There are likely other intermediate factors asso-ciated with TV viewing time and adiposity. For example,more TV viewing time provides children with more fre-quent opportunities for overconsumption during TVviewing [41], as well as increased exposure to TV adver-tisements, which have been shown to negatively affectdiet patterns in children [42]. Likewise, the displace-ment of physical activity or sleep duration due to in-creased TV viewing is also a concern. In essence, morecomplex mediation analyses (i.e. moderated mediation,
mediated moderation or multiple-step multiple medi-ation) are warranted to identify potential intermediatefactors in the mediating role of TV viewing time andadiposity in children. For example, a recent study bySijtsma et al. [15] showed that in Dutch pre-school chil-dren, television in the bedroom was linked with higherscreen time, which was associated with decreased sleepduration, which was associated with higher BMI (a serialmultiple mediation model).Recently, the American Academy of Pediatrics [6] sug-
gested that parents should remove TVs from children’sbedrooms. The current study provides support for thisassertion. However, while health risk may increase withthe presence of TV in a child’s bedroom, it is unclear ifthe opposite is true. Future intervention research shouldexamine the effect of removing TVs from children’s bed-rooms on their health risk over time. One interventionstudy by Haines et al. [43] designed to remove TVs fromchildren’s bedrooms was unsuccessful in doing so, des-pite reducing BMI and TV viewing time and increasingsleep duration. If interventions continue to be unsuccessfulin removing TVs from children’s bedrooms, an assessmentof the perceived barriers to removing TVs will be required.It could be that these barriers are related to the reasonswhy parents put TVs in their children’s bedroom in the firstplace; namely, to keep children occupied, to help childrensleep, or to free up other TVs around the house [44]. Futureresearch should also consider other forms of media in thebedroom as well. For example, while the prevalence of TVsin the bedroom may decline over time, the prevalence ofcomputers and tablets in the bedroom may increase [45].In light of this, it has been suggested that parents limit theavailability of all electronic entertainment and communica-tion devices in the child’s bedroom [46].There are several strengths of this study, including the
large sample of North American children and the robustdata quality assurance procedures [21]. This study isnovel in that it is the first to comprehensively examine
Borghese et al. International Journal of Behavioral Nutrition and Physical Activity (2015) 12:60 Page 9 of 10
the association of TV in the bedroom with % BF, TVviewing time, diet patterns, MVPA, and sleep durationusing multiple mediation analysis. Also unique to this ana-lysis is the use of objectively measured MVPA, sedentarytime, and sleep duration. There are also several limitationsto the current analysis. First, although we used a largesample of children, the sample is not nationally represen-tative of either country, and therefore results may not begeneralizable. Second, the FFQ is limited in its ability toassess food intake as it does not account for food quantityor energy intake. Third, the FFQ and screen time ques-tionnaire are subject to recall and social desirability biases;however, these measures maximize feasibility for studieswith large sample sizes and reduce participant burden.Fourth, this study did not measure TV time in the bed-room specifically, which should be considered in designingfuture studies on the health effects of bedroom TVs.Fifthly, cross-sectional studies cannot provide informationabout causality and there is always the possibility ofresidual and incomplete confounding. As previously men-tioned, the mediation model tested in the current study isbased on existing evidence from longitudinal and experi-mental studies. Nevertheless, these results should be inter-preted with caution until replicated using a longitudinaldesign. Finally, the school-based recruitment strategy wasnot considered in the current analysis because the major-ity of variance in adiposity was explained at the individuallevel, rather than the school level. While it is thought thatthe link between TV in the bedroom and adiposity is morestrongly affected/mediated by home-based characteristics,future research should investigate the effect of school-based characteristics as well.In conclusion, the association between TV in the bed-
room and adiposity was mediated by TV viewing time, butnot diet patterns, MVPA, or sleep duration, in Canadiangirls only. Similar findings were not observed in Canadianboys or American girls or boys. While this study providesa comprehensive picture of the lifestyle behaviours associ-ated with having a TV in the bedroom of a child, as wellas potential mediating factors for the association with %BF, the effects of TVs in the bedroom on children’s overallhealth risk is far from clear. Following advice from theAmerican Academy of Pediatrics, removing TVs fromchildren’s bedroom has the potential to reduce TV viewingtime and adiposity in future intervention studies, at leastin Canadian girls.
AbbreviationsTV: Television; MVPA: Moderate-to-vigorous physical activity; BMI: Body massindex; % BF: Percent body fat; ISCOLE: International study of childhoodobesity, lifestyle and the environment; US: United States; GED: Graduateequivalent diploma; FFQ: Food frequency questionnaire; 95 % BCA CI: 95percent bias-corrected and accelerated confidence intervals.
Competing interestsThe authors declare that they have no competing interests.
Authors’ contributionsMB participated in study coordination, data collection and was primarilyresponsible for the analyses, writing of the manuscript and generation oftables and figures. MST conceived of the study design, oversaw Canadiansite coordination, and contributed to interpretation of the study results. PTKconceived of the study design, oversaw the overall study coordination, andcontributed to interpretation of the study results. CTL conceived of the studydesign, oversaw American site coordination, and contributed tointerpretation of the study results. JMS Jr participated in study coordination,data collection, and contributed to interpretation of study results. GL wasprimarily responsible for the management of the study at the Canadian site,and was involved in data collection and data cleaning. CB and AGLparticipated in study coordination and management, data collection anddata cleaning. JPC conceived of the study design, oversaw Canadian sitecoordination, contributed to data analysis and interpretation of the studyresults. All authors reviewed and provided critical input into this manuscript.All authors read and approved the final manuscript.
AcknowledgementsWe would like to thank Priscilla Bélanger, Jessica McNeil, Claire Francis,Hadiza Amedu-Ode and Nina Azoug-Boneault for their role in data collectionfor the Canadian site of ISCOLE, and the Coordinating Center for ISCOLE inBaton Rouge, Louisiana. We would also like to thank the study participantsalong with their parents, teachers and school principals for their involvementin the study. ISCOLE was funded by the Coca-Cola Company. The funder hadno role in study design, data collection and analysis, decision to publish, orpreparation of this manuscript.
Author details1Healthy Active Living and Obesity Research Group, Children’s Hospital ofEastern Ontario Research Institute, 401 Smyth Road, Ottawa K1H 8L1ON,Canada. 2School of Human Kinetics, Faculty of Health Sciences, University ofOttawa, Ottawa, ON, Canada. 3Department of Pediatrics, Faculty of Medicine,University of Ottawa, Ottawa, ON, Canada. 4Population Health, Faculty ofGraduate and Postdoctoral Studies, University of Ottawa, Ottawa, ON,Canada. 5Pennington Biomedical Research Center, Baton Rouge, LA, USA.
Received: 26 August 2014 Accepted: 1 May 2015
References1. Strasburger VC, Jordan AB, Donnerstein E. Health effects of media on
children and adolescents. Pediatrics. 2010;125:756–67.2. Tremblay M, LeBlanc A, Kho M, Saunders T, Larouche R, Colley R, et al.
Systematic review of sedentary behaviour and health indicators in school-aged children and youth. Int J Behav Nutr Phys Act. 2011;8:98.
3. Maniccia DM, Davison KK, Marshall SJ, Manganello JA, Dennison BA.A meta-analysis of interventions that target children’s screen time forreduction. Pediatrics. 2011;128:e193–210.
4. Wahi G, Parkin PC, Beyene J, Uleryk EM, Birken CS. Effectiveness ofinterventions aimed at reducing screen time in children: a systematicreview and meta-analysis of randomized controlled trials. Arch PediatrAdolesc Med. 2011;165:979–86.
5. Rideout V, Foehr U, Roberts D: Generation M2: Media in the Lives of 8- to18-Year-Olds. Kaiser Family Foundation 2010.
6. American Academy of Pediatrics C on CA: Children, Adolescents, and theMedia. Pediatrics 2013:peds.2013–2656.
7. Cameron AJ, van Stralen MM, Brug J, Salmon J, Bere E, Chinapaw MJM, et al.Television in the bedroom and increased body weight: potentialexplanations for their relationship among European schoolchildren. PediatrObes. 2013;8:130–41.
8. Staiano AE, Harrington DM, Broyles ST, Gupta AK, Katzmarzyk PT. Television,adiposity, and cardiometabolic risk in children and adolescents. Am J PrevMed. 2013;44:40–7.
9. Gilbert-Diamond D, Li Z, Adachi-Mejia AM, McClure AC, Sargent JD. Associationof a television in the bedroom with increased adiposity gain in a nationallyrepresentative sample of children and adolescents. JAMA Pediatr.2014;168:427–34.
10. Delmas C, Platat C, Schweitzer B, Wagner A, Oujaa M, Simon C. Associationbetween television in bedroom and adiposity throughout adolescence.Obesity (Silver Spring). 2007;15:2495–503.
Borghese et al. International Journal of Behavioral Nutrition and Physical Activity (2015) 12:60 Page 10 of 10
11. Demissie Z, Lowry R, Eaton DK, Park S, Kann L. Electronic media andbeverage intake among United States high school students–2010. J NutrEduc Behav. 2013;45:756–60.
12. O’Connor TM, Chen T-A, Baranowski J, Thompson D, Baranowski T. Physicalactivity and screen-media-related parenting practices have differentassociations with children’s objectively measured physical activity. Child Obes.2013;9:446–53.
13. Cain N, Gradisar M. Electronic media use and sleep in school-aged childrenand adolescents: a review. Sleep Med. 2010;11:735–42.
14. Nuutinen T, Ray C, Roos E. Do computer use, TV viewing, and the presenceof the media in the bedroom predict school-aged children’s sleep habits ina longitudinal study? BMC Public Health. 2013;13:684.
15. Sijtsma A, Koller M, Sauer PJJ, Corpeleijn E. Television, sleep, outdoor playand BMI in young children: the GECKO Drenthe cohort. Eur J Pediatr.2014:1–9.
16. De Jong E, Visscher TLS, HiraSing RA, Heymans MW, Seidell JC, Renders CM.Association between TV viewing, computer use and overweight,determinants and competing activities of screen time in 4- to 13-year-oldchildren. Int J Obes (Lond). 2013;37:47–53.
17. Lumeng JC, Rahnama S, Appugliese D, Kaciroti N, Bradley RH. Televisionexposure and overweight risk in preschoolers. Arch Pediatr Adolesc Med.2006;160:417–22.
18. Epstein LH, Roemmich JN, Robinson JL, Paluch RA, Winiewicz DD, FuerchJH, et al. A randomized trial of the effects of reducing television viewingand computer use on body mass index in young children. Arch PediatrAdolesc Med. 2008;162:239–45.
19. Robinson TN. Reducing children’s television viewing to prevent obesity:a randomized controlled trial. JAMA. 1999;282:1561–7.
20. Carson V, Janssen I. The mediating effects of dietary habits on therelationship between television viewing and body mass index amongyouth. Pediatric Obesity. 2012;7:391–8.
21. Katzmarzyk PT, Barreira T, Broyles ST, Champagne C, Chaput J, Fogelholm M,et al. The International Study of Childhood Obesity, Lifestyle and theEnvironment (ISCOLE): design and methods. BMC Public Health.2013;13:900.
22. Barreira TV, Staiano AE, Katzmarzyk PT. Validity assessment of a portablebioimpedance scale to estimate body fat percentage in white and African-American children and adolescents. Pediatr Obes. 2013;8:e29–32.
23. Centers for Disease Control and Prevention - YRBSS - Youth Risk BehaviorSurveillance System - Adolescent and School Health. [http://www.cdc.gov/HealthyYouth/yrbs/].
24. Schmitz KH, Harnack L, Fulton JE, Jacobs DR, Gao S, Lytle LA, et al. Reliabilityand validity of a brief questionnaire to assess television viewing andcomputer use by middle school children. J Sch Health. 2004;74:370–7.
25. Lubans DR, Hesketh K, Cliff DP, Barnett LM, Salmon J, Dollman J, et al. Asystematic review of the validity and reliability of sedentary behaviourmeasures used with children and adolescents. Obes Rev. 2011;12:781–99.
26. Herman KM, Paradis G, Mathieu M-E, O’Loughlin J, Tremblay A, Lambert M.Association Between Accelerometer-Measured Physical Activity Intensities andSedentary Time in 8–10 Year Old Children. Pediatr Exerc Sci. 2013, epub.
27. Tremblay M, Leblanc A, Janssen I, Kho M, Hicks A, Murumets K, et al.Canadian sedentary behaviour guidelines for children and youth. ApplPhysiol Nutr Metab. 2011;36:59–64.
28. Currie C, Nic Gabhainn S, Godeau E, Roberts C, Smith R, Currie D, et al.Inequalities in Children’s Health: HBSC International Report from the 2005/2006 Survey. Geneva: World Health Organization; 2008.
29. Vereecken CA, Maes L. A Belgian study on the reliability and relative validity ofthe health behaviour in school-aged children food-frequency questionnaire.Public Health Nutr. 2003;6:581–8.
30. Evenson KR, Catellier DJ, Gill K, Ondrak KS, McMurray RG. Calibration of twoobjective measures of physical activity for children. J Sports Sci.2008;26:1557–65.
31. Colley R, Gorber S, Tremblay M. Quality control and data reductionprocedures for accelerometry-derived measures of physical activity.Health Rep. 2010;21:63–9.
32. Troiano RP, Berrigan D, Dodd KW, Mâsse LC, Tilert T, McDowell M. Physicalactivity in the United States measured by accelerometer. Med Sci SportsExerc. 2008;40:181–8.
33. Tudor-Locke C, Barreira TV, Schuna JM, Mire EF, Katzmarzyk PT. Fullyautomated waist-worn accelerometer algorithm for detecting children’s
sleep-period time separate from 24-h physical activity or sedentarybehaviors. Appl Physiol Nutr Metab. 2014;39:53–7.
34. Barreira TV, Schuna Jr JM, Mire E, Katzmarzyk PT, Chaput J, Leduc G, et al.Identifying children’s nocturnal sleep using 24-hour waist accelerometry.Med Sci Sports Exerc. 2015;47:937–43.
35. Preacher KJ, Hayes AF. Asymptotic and resampling strategies for assessingand comparing indirect effects in multiple mediator models. Behav ResMethods. 2008;40:879–91.
36. Preacher KJ, Hayes AF. SPSS and SAS procedures for estimating indirecteffects in simple mediation models. Behav Res Methods Instrum Comput.2004;36:717–31.
37. Hayes AF. Beyond Baron and Kenny: statistical mediation analysis in thenew millennium. Commun Monogr. 2009;76:408–20.
38. Fuller-Tyszkiewicz M, Skouteris H, Hardy LL, Halse C. The associationsbetween TV viewing, food intake, and BMI. A prospective analysis of datafrom the Longitudinal Study of Australian Children. Appetite. 2012;59:945–8.
39. Adachi-Mejia AM, Longacre MR, Gibson JJ, Beach ML, Titus-Ernstoff LT,Dalton MA. Children with a TV in their bedroom at higher risk for beingoverweight. Int J Obes (Lond). 2007;31:644–51.
40. Shields M, Gorber S, Janssen I, Tremblay M. Obesity estimates for childrenbased on parent-reported versus direct measures. Health Rep. 2011;22:47–58.
41. Chaput, Klingenberg L, Astrup A, Sjödin AM. Modern sedentary activitiespromote overconsumption of food in our current obesogenic environment.Obes Rev. 2011;12:e12–20.
42. Hastings G, Stead M, McDermott L, Forsyth A, MacKintosh A, Rayner M, et al.Review of Research on the Effects of Food Promotion to Children. FinalReport to the UK Food Standards Agency. University of Strathclyde; 2003.
43. Haines J, McDonald J, O’Brien A, et al. Healthy habits, happy homes:Randomized trial to improve household routines for obesity preventionamong preschool-aged children. JAMA Pediatr. 2013;167:1072–9.
44. Taveras EM, Hohman KH, Price S, Gortmaker SL, Sonneville K. Televisions inthe Bedrooms of Racial/Ethnic Minority Children: How Did They Get Thereand How Do We Get Them Out? CLIN PEDIATR. 2009;48:715–9.
45. Atkin AJ, Corder K. Sluijs EMF van: Bedroom media, sedentary time andscreen-time in children: a longitudinal analysis. Int J Behav Nutr Phys Act.2013;10:137.
46. Chahal H, Fung C, Kuhle S, Veugelers PJ. Availability and night-time use ofelectronic entertainment and communication devices are associated withshort sleep duration and obesity among Canadian children. Pediatr Obes.2013;8:42–51.
Submit your next manuscript to BioMed Centraland take full advantage of:
• Convenient online submission
• Thorough peer review
• No space constraints or color figure charges
• Immediate publication on acceptance
• Inclusion in PubMed, CAS, Scopus and Google Scholar
• Research which is freely available for redistribution
Submit your manuscript at www.biomedcentral.com/submit