
MECT-411-CAPSTONE TEAM PROJECT Eastern ...
48
1 MECT-411-CAPSTONE TEAM PROJECT Eastern Mediterranean University Faculty of Engineering Department of Mechanical Engineering Automotive Care (Reem) Course Coordinator: Assist.prof.Dr. Mostafa Ranjbar Supervisor: Assist. Prof. Dr. Rasime Uyguroğlu Lec. Cafer Kizilors Team Members: 127204/ Mohamad Khaled Qamery 127895/ Victor Chimankpam Capstone Team Project Fall 2015-2016 Date of Submission : Jan.2016
-
Upload
khangminh22 -
Category
Documents
-
view
4 -
download
0
Transcript of MECT-411-CAPSTONE TEAM PROJECT Eastern ...

1
MECT-411-CAPSTONE TEAM PROJECT
Eastern Mediterranean University
Faculty of Engineering
Department of Mechanical Engineering
Automotive Care (Reem)
Course Coordinator:
Assist.prof.Dr. Mostafa Ranjbar
Supervisor:
Assist. Prof. Dr. Rasime Uyguroğlu
Lec. Cafer Kizilors
Team Members:
127204/ Mohamad Khaled Qamery
127895/ Victor Chimankpam
Capstone Team Project Fall 2015-2016
Date of Submission : Jan.2016
Jury Members

2
Name Signature
Lec.Cafer Kizilors
Assist. Prof. Dr. Rasime Uyguroğlu
Dr.Davut Solyali

3
ABSTRACT
Drinking alcohol and driving simply do not go together. The human brain has
to deal with many things and process countless data all the time. Alcohol affects
attentiveness and one’s ability to make quick decisions on the road, react to changes
in the environment and execute specific, often difficult maneuvers behind the
wheel. When drinking alcohol, driving becomes dangerous – and is potentially
lethal! Motor vehicle accidents are the leading cause of death among people in the
world and are responsible for more than one in three deaths of the world’s adult
population.
Of the drivers killed on the road, 31% had been drinking, according to the National
Highway Traffic Safety Administration. The risk of a driver under the influence of
alcohol being killed in a vehicle accident is at least eleven times that of drivers
without alcohol in their system. With the association of medical sciences and
engineering, the development of alcohol sensors was made possible. These sensors
are being used every day by police officers to detect a substantial proportion of
alcohol in impaired drivers during traffic enforcement.
The idea of the project was to employ the innovation of these sensors into a more
practical device that can be installed in vehicles. The device could increase the
driving-under-the-influence (DUI) arrest rate and maybe if we look at it from another
perspective, decrease or bring the number of drunk drivers to an end.
Keywords: Sensors, Alcohol, Installment, Vehicles, substantial proportion of
alcohol, Impaired drivers.

4
Acknowledgement
It is a genuine pleasure to express our deep sense of thanks and gratitude to our
mentors, philosophers, guides and supervisors: Assist. Prof. Dr. Rasime Uyguroglu
& Lec. Cafer Kizilors. Without their participation and assistance, the completion of
this undertaking wouldn’t have been possible. They have provided us with all the
necessary facilities needed for our research.
We would also like to place on the record our sincere thanks to Assist. Prof. Dr.
Neriman Özada, for her continues encouragement.

5
LIST OF SYMBOLS/ABBREVIATIONS
PIV : Peak Inverse Voltage.
V : Volts.
T : Time.
I : Current.
C: Capacitor.
Vr : Ripple Voltage.
LI : Load Current.
Vref : Voltage Reference.
PAS: Passive Alcohol Sensor.
ABI: American Beverage Institute.
CPU: Central Processing Unit.
DUI: Driving Under Influence.

6
TABLE OF CONTENTS:
LIST OF FIGURES:..........................................................................................................1
LIST OF TABLES:............................................................................................................2 CHAPTER1:...................................................................................................................3 Objectives and organization of the report:..................................................................4
1.1 Introduction :.........................................................................................................5
1.2 Objectives and organization of the report:............................................................6
1.3 An Increasing Demand for efficient applications of alcohol sensors:....................7
1.4 Passive alcohol sensors:........................................................................................8 1.5 The idea of “alcohol free roads”:..........................................................................9 CHAPTER2:.................................................................................................................10 2.1 Related Projects:..................................................................................................11 2.2 The methods employed:......................................................................................12 2.2.1 Method 1:.........................................................................................................13 2.2.2 Method 2:.........................................................................................................14

7
CHAPTER 3:................................................................................................................15 3.1 The structural configuration of the sensors:........................................................16
3.1.1 Gas Sensor:.......................................................................................................17
3.1.2 Finger print Sensor:..........................................................................................18
3.2 Microcontroller:……………………………………………….…………………………………...………..19 3.3 The main developed idea:………………………………………………………………………………..20
CHAPTER 4:……...……………………………………………………..……………………………..…..………..21
4.1 Calculations:….………………..…………………………………..………………………..…………….....22 4.2 Basic Principles and figures:.................................................................................23 4.3 Design procedure:..….……………………………………………………….…………………………....24 4.4 Power source:..….……………………………………………………….…………………………...........25
CHAPTER 5:………………………………………………………………………………………......................26
5.1 Technical difficulties …………….……….………………………………………………………………27
5.2Results….………………………………………………………………………………………………………….28
CHAPTER 6:…………………………………………………………………………………………………………29
6.1Conclusion………………………………………………………………………………………………….….30

8
6.2Future work…………………..………………………………………………………….……………….….31
REFFERENCE:…………………………………………………………………………………………………………32 Appendices:……………….…………………………………………………………….……………………………33

9

10
LIST OF FIGURES:
Figure 1: Passive Alcohol sensor
Figure 2: Street sign
Figure 3: Breath sensor
Figure 4:Components of an alcohol sensonr and how it works Figure 5:MQ-3 Alcohol sensor Figure 6: Gas sensor and structure Figure 7: Sensitivity Figure 8: Fingertip sensor Figure 9 : Microcontroller Figure 10:Sim chip Figure 11: Microcontroller Module Figure 12: Power Supply Module Figure 13: Internal block diagram of IC 555 Figure 14: Waveforms for Power supply module Figure 15: PIN CONFIGURATION 40-lead PDIP Figure 16: Architecture of the microcontroller Figure 17: Etching

11
LIST OF TABLES:
Table 1: Alcohol Impairment Chart.
Table 2: Time table.
Table 3: Time table for assembly part.
Table 4 : Microcontroller pins.
Table 5 : Gas sensor Specification.

12
Chapter 1
1.1 INTRODUCTION:
The aim of this project is to design and construct an alcohol detecting device that has some new properties and techniques needed to decrease the dangers of driving under the influence of alcohol. It will all be explained in (chapter 2) which includes the methods employed and the components of the alcohol sensor . In the following chapter,(chapter 3) some types of sensors and the way they are functioned will be mentioned. After that in chapter, (chapter 4) will include the main ideas behind the project and how it will be processed, In the following chapter,(chapter 5) the results and the discussion of the project Finally , in the last chapter, (chapter 6) the conclusion and the future work.

13
1.2 Objectives and organization of the report:
Objectives:
Marking the fact that car accidents caused by drivers under the influence of
alcohol have been increasing.
Explaining the processing that occurred to get to the idea.
The methods followed to design and construct an alcohol detecting device.
Highlighting the new properties and techniques available in the device.
Organization:
1. The first chapter provides a brief summary of the effects of
driving under the influence of alcohol. It also provides some
information about the passive alcohol sensors used by traffic
officers.
2. The second chapter includes a literature review of the main
problem and the paths taken to reach to a complete
understanding of the problem. It also includes an explanation of
the processes and the main devices used.
3. The third chapter is used to support the second chapter by
providing information about the sensors, how they function.. etc.
4. The forth will include the main ideas behind the project, how it
will be processed and how long it will take us to do it. It will also
include the steps taken by us to structure our idea into a tangible
functioning device.
5. The fifth will include presentation and discussion about the
results and technical difficulyies or innovation of the final
product.
6. Finally , this chapter includes the conclusion and the future
work.

14
1.3 An Increasing Demand for efficient applications of alcohol
sensors.
Nowadays, the world is facing some problems on the road caused by some reckless drivers, without realizing the negative effects on the surrounding people. It has almost been a challenge to stop drunken people from driving around in their car threatening the lives of civilians around them. Each crash, each death, each injury impacts not only the person in the crash, but family, friends, classmates, coworkers and more. Even those who have not been directly touched help pay the $132 billion yearly price tag of drunk driving. Drinking alcohol and driving simply do not go together. The human brain has to deal with many things and process countless data all the time. Alcohol affects attentiveness and one’s ability to make quick decisions on the road, react to changes in the environment and execute specific, often difficult maneuvers behind the wheel. When drinking alcohol, driving becomes dangerous – and is potentially lethal! All these numbers, facts and statistics show that there is an increasing demand for efficient alcohol sensors. As we can see in the (Table 1) below, the levels of alcohol, on the vertical column is the number of drinks corresponding to the body weight that are allowed while driving are listed in order of increasing levels of danger.
Table 1: Alcohol Impairment Chart.[1]

15
1.4 Passive alcohol sensors
The Passive alcohol sensors (PAS),that are being used by the traffic officers to
reduce the risk of having some drunk drivers by their pop check. They are small
electronic devices, usually built into police flashlights or clipboards that can detect
alcohol in the ambient air of a vehicle.
The sensors are quick, objective, and provide another source of detection to the
officer which may aid in the identification of drunken drivers. PAS do not require
“active” cooperation by the suspect because an officer needs only to place the device
within several feet of the inside of the vehicle to obtain a reading. The results from
the PAS lack the precision or accuracy of a traditional breathalyzer but serve well as
another means for an officer to detect the presence of alcohol much like blood-shot
eyes, slurred speech or other known personal indicators.
These methods of primary alcohol detection provide reasonable suspicion to alert
the officer to investigate further. PAS provide an officer with a range of alcohol in
the air of the vehicle as shown in (Figure 1), acting much like an electronic nose.
Whereas a human nose can be deceived by other smells (perfume, gasoline, body
odor); the electronic nature of the PAS can be more accurate. Research has shown
passive alcohol sensors to be effective in identifying persons with BACs of 0.10 and
greater with detection rates of 70% or higher.

16
1.5 The idea of “alcohol free roads”
The goal of these passive sensors is merely to aid an officer in the detection of
alcohol during a stop, but we thought that some people are lucky to pass without this
checkup. So the idea was to develop a new system that would help us marks safe all
the people on the roads.
The aim was to demonstrate it through designing a device that is installed into the
vehicle, this device will activate upon the results of the check done by the driver.
the main design of the device includes a couple of alcohol sensors that make the
main purpose of our Project valid. These sensors were set to detect the percentage of
alcohol present in the body of the driver. Body of the driver.
Their main aim was set to block the activation of the car. First before the car starts
running and secondly if the sensors detect alcohol present in the body of the driver
while the vehicle is running. The main objective is to apply a device to the car that
would have control over the drivers’ alcohol consumption. And that would retard the
activation or the movement of the car if unwanted or negative results were detected
by the sensors through the driving period.
So in conclusion our target is to estimate the risk of the drunk people on the roads as
we clarified in (Figure 2) below.

17
Chapter 2
LITERATURE REVIEW
2.1 Related Projects In a research paper it was discovered that multiple alcohol detection sensors
could be installed within a car.
The paper demonstrates that the alcohol concentration can be detected even if the air
conditioning is ON and the windows are half down. Multiple devices that are able to
detect the alcohol level within the air of the car are mounted on the steering wheel,
the driver’s chair above the shoulder and above the right hand side’s window.
The devices are able to sense and calculate the concentration within 2-3 seconds and
blocking the engine start if the concentration proved to be too high. American
Beverage most widely used alcohol sensors are electrochemical including breath and
sweat sensors.
They usually generate color change in reactance with alcohol and the output is given
by the change measurements in the chemical composition of the device. The breath
analyzer is widely used in automotive industry, especially by law forces to perform
checks on drivers. Another car company has demonstrated the use of such a system
by integrating a 17 breathalyzer-ignition system on their cars.
The device was wirelessly connected to the central computer of the car having a
response on a few seconds. possibility of integration of such systems. engineers had
an attempt to implement a breath analyzer into the key’s system, but it failed as it
was very practical. Again an effort was made to show the importance of such a
system.
Another research was made on transdermal alcohol sensors that measure the alcohol
concentration in the driver’s sweat. Currently there are body-worn devices that could
be worn by the drivers and connect wirelessly to the car’s electrical circuit. This
solution proved to not be very efficient as is believed that it’s not comfortable to
wear such a device and not many would use it. An alternative came from a car
company which implemented a similar sensor in the gear shift of the car.

18
2.2 The methods employed
There are two main alternatives applied according to the type of sensors
used:
2.2.1 Method 1:
The first one is through the use of breath sensors, which is usually abundant
among the traffic officers. As shown in the figure below (Figure 3),This method is
basically dependent upon the detection of the percentage of alcohol present in one’s
breath. İt is usually demonstrated through blowing into tubes adjusted on the device
where the sensors are installed. This system contains sampling system and the fuel
cell sensor with an electronic amplifier after that the result will be displayed as
shown in (Figure 4),

19
2.2.2 Method 2:
The second one is through the use of sensors that detect the luminescence of some alcohol containing blood reflecting absorbance of others. The detectors read these reflected rays , this method is used in most types of the new vehicles it is adjusted on the start button of the vehicle or on the steering wheel. As well as the gas or sniff sensor this type of sensor is used to detect alcohol gas,as shown in (Figure 5) : one of the most popular ones is MQ-3 Semiconductor Sensor for Alcohol.
Sensitive material of MQ-3 gas sensor is SnO2, with lower conductivity in clean air. When the target alcohol gas exists, the sensor’s conductivity is higher along with the gas concentration rising, the sensor has good resistance to disturb of gasoline, smoke and vapor. The sensor could be used to detect alcohol with different concentration, it is with low cost and suitable for different application. Character Configuration: * Good sensitivity to alcohol gas. * Long life and low cost. * Simple drive circuit. Application : * Vehicel alcohol detector. * Portable alcohol detector.

20
Chapter 3
Sensors Types & the Microcontroller
3.1 The structural configuration of the sensors
It is important to have some knowledge about the mechanism behind the sensors intended for application in the device before going further in explaining the purpose and mechanism of the project.
3.1.1 Gas Sensor
A gas detector is a device that detects the presence of gases in an area, often as part
of a safety system, This type of equipment is used to detect a gas leak and interface
with a control system so a process can be automatically shut down.this type of
sensors as shown in (Fiqure 6) in this project will be used to detect the alcoholic gas.
Character
* High sensitivity
* Fast response and resume
* Long life and low cost
* Mini Size
Figure 6:Gas sensor.[7]

21
Application:
It is semiconductor sensor is for Alcohol detection,
it has good sensitivity and fast response to alcohol,
suitable for portable alcohol detector. As shown in the following table (table 5).
Table 5: gas sensor specification.[8]

22
Sensitivity :
Figure 7: Sensitivity.[9]
Typical Sensitivity Characteristics of sensor for several gases (figure 7). Temp: 20 deg C . Humidity: 65% Oxygen concentration: 21% RL = 10K Ohm Ro = Sensor resistance at 0.4mg/L of Alcohol in clean air. Rs = Sensor resistance at various concentrations of gases.
3.1.2 Fingertips Sensor Alcohol absorbs specific wavelengths light. By measuring the light’s intensity, the system can precisely pinpoint the driver’s blood alcohol level.

23
3.2 Microcontroller There are several microcontrollers available for student’s project development.
The most common are PIC, AVR, PsoC and Arduino.
The Arduino development is excluded because of the ease of development. The
online community is very vast and working with this microcontroller would not bring
much knowledge in terms of engineering to the author of the project .Therefore, the
microcontroller chosen for the Intelligent Alcohol Sensing Device project is
PIC18F4520 (Figure 9).
Figure 9 : Microcontroller chip.[11]
This type of microcontroller will be used in the project because the author possesses
working knowledge on the Microchip microcontroller and this particular device
provides 13 ADC channels on a 10 bit resolution, enough to process all the sensors
used. It comes with a maximum frequency of 40MHz which will be enough to
communicate with the wireless device.
The PIC can be easily mounted on a PCB without soldering making it more practical
for testing. This type of microcontroller was extensively used during the previous
year’s projects simplifying the amount of work that has to be done when interfacing
sensors with the microcontroller.
The libraries for most of the functionalities are already prebuilt and there is enough,
the programming of the microcontroller is done in C language using MPLAB IDE.
The development software is fully licensed by the University and the compilation
tools such as ICD3 are also provided.
For the testing purpose the microcontroller used will be mounted on a development
board provided in the lab. The board has a connector to the computer via USB,
comes with a reset button and provides access to all the ports via male sockets. Two
pins under male format are also provided for the power supply connection as shown
in (Table 4).

24
Table 4 : Microcontroller pins.
Pin no. description Pin no. Description
P0.0 LCD Pin no. 7 P2.0 Not Connected
P0.1 LCD Pin no. 8 P2.1 Not Connected
P0.2 LCD Pin no. 9 P2.2 Not Connected
P0.3 LCD Pin no. 10 P2.3 Not Connected
P0.4 LCD Pin no. 11 P2.4 Not Connected
P0.5 LCD Pin no. 12 P2.5 Not Connected
P0.6 LCD Pin no. 13 P2.6 LCD Pin no. 4
P0.7 LCD Pin no. 14 P2.7 LCD Pin no. 6
P1.0 ADC Data bus 1 P3.0 Not Connected
P1.1 ADC Data bus 2 P3.1 Not Connected
P1.2 ADC Data bus 3 P3.2 Not Connected
P1.3 ADC Data bus 4 P3.3 Not Connected
P1.4 ADC Data bus 5 P3.4 ADC ctrl pin 1
P1.5 ADC Data bus 6 P3.5 ADC ctrl pin 2
P1.6 ADC Data bus 7 P3.6 ADC ctrl pin 3
P1.7 ADC Data bus 8 P3.7 ADC ctrl pin 4

25
3.3 The main developed idea.
In this Project the alcohol sensors have been constructed in the vehicle and
were connected it to a programmed detector (microcontroller) which reads the
incoming data, from the previous blow test and after that the chip decides whether
the result is accepted or not,
If the microcontroller detects high percentage of alcohol it will not start the engine
and the system will reset to the blow test again.
Otherwise the car will start normally , now after this step, the new part of this
project it was assumed that the driver might drink alcohol while driving his vehicle,
For this problem some extra sensors will be added to the main board and the aim of
it is to detect alcohol randomly using the Rand*function* in C programming,
Once the system detects high levels of alcohol, it will notify the driver and tell him to
stop pull aside, it will give the driver 1-3 min to stop the car otherwise we will add a
Sim chip (Figure 10), that contacts the police and to provide data about the vehicle,
the plate number and the location using GPS.
Figure 10: Sim chip

26
Chapter 4
Design and manufacturing:
3.4 Calculations:
For diode design:- PIV = Vm ………………………………………………………………………..(1) Vm = E0 max + 2 Vf = 10.7 + 1.4 V = 12.1 V I0 = Il/2 = 116.2 mA/ 2 = 58.1 mA Where Peak repetitive current, prc= [Il (t1+t2)]/t2 …………………………………………………………………..(2) T2 = time for 90° - time for θ1 ..…………………………………………………………..(3) = 5ms - 3.4ms =1.2ms = 116.2mA( 8.6ms+1.2ms) /1.2ms = 833mA From above specification diode 1N4007 is selected *from the specification sheet*.
For filter capacitor design :- C= (I1 * t1)/Vr ………………………………………….………………..(4)
Vr= ripple voltage Il = load curren t1= time during which the capacitor being discharge by load current Vr = ripple voltage 10% of output voltage Vr = 1.0 V Frequency 50 H T1 = 1/50 = 20 ms T for 360° = 20ms For 180°= 10ms For 60°= 20ms * (60°/360) = 3.4ms

27
For bridge :-
T1 = *time for 90° + time for θ1+ = 5ms + 3.4ms = 8.4ms I1 = load current supplied to various IC I1 = current required for LCD + o/p current of 89S51 + o/p current of max232 + current required for LM35 + + Current required for heart beat sensor + current required For GPS SR-87 = 3mA + 40mA + 8mA + 0.060mA + 22mA + 40mA = 113.06Ma C = I1 * T1/ Vr …………………………………………………………………………..(5) = 113.06 * 8.4 * 10^-6 / 1 = 949.704 µF This 949.704 µF value can be approximated to 1000 µF. Thus we will use 1000 µF
capacitor before IC 7805, which is used for improving Frequency Response.
Transformer selection:
It requires 12V for min input for IC 7805 = Drop across IC 7805 + Required Output voltage = 3 V+ 5V = 8 V
So at Input of 7805 we required 8 V with margin Consider drop across diode 0.7V so 2 diode conducts drop is 1.4 V = 1.4 V +8 V = 9.4 V
So at secondary we required 10 V Fixed voltage regulator IC 7805 produces +5V regulated output voltage with respect to the ground.
Calculating Step Size: ADC 0808 is an 8 bit ADC i.e. it divides the voltage applied at Vref+ & Vref- into 28 i.e. 256 steps. Step Size = (Vref+ -Vref-)/256 …………………………………………………………..(6) Suppose Vref+ is connected to Vcc i.e. 5V & Vref- is connected to the Gnd then the step size will be Step size= (5 - 0)/256= 19.53 mV.

28
Calculating Dout: The obtained data at the D0 - D7 depends upon the step size & the Input voltage i.e. Vin. Dout = Vin /step Size. ……………………………………………………………...……………………..(7) If you want to interface sensors like LM35 which has output 10mv/°C then I would suggest that you set the Vref+ to 2.56v so that the step size will be Step size= (2.56 - 0)/256= 10 mV. So now whatever reading that you get from the ADC will be equal to the actual temperature.
Then the base resistor (RB) was calculated, If the input is taken from a component (possible an IC) that uses the same power supply as the transistor (that is Vs), then the form is:
RB = 0.2 X RL X hFE ………..………………………………………………………………………..(8)
Otherwise, if the component uses another power source (like VCC) then the form is as given in the following equation.
The protective diode could be the 1N4001 or any general purpose diode. The output from a 89s51 IC is required to operate a relay with a 160 Ohm coil. The supply voltage is 12V for the transistor and 5V for the IC. The IC can supply a max current of 2mA. IL = Vs / RL => IL = 12 / 160 = 75mA …………………………………………………..(10)
The transistor must have an hFE greater than 5 X 75 / 2 => hFE > 187.5. So we have chosen a transistor with hFE = 200 and IC = 100mA.
RB = VCC X hFE
5 X IL

29
Now for the RB resistor. Because the power supplies of transistor and IC are different, we use formula (9).
RB = VCC X hFE
5 X IL
This will produce RB = 1333.3 Ohm. We have chosen the closest resistor possible to this value. RB = 1000 Ohm = 1 K Ohm.
30
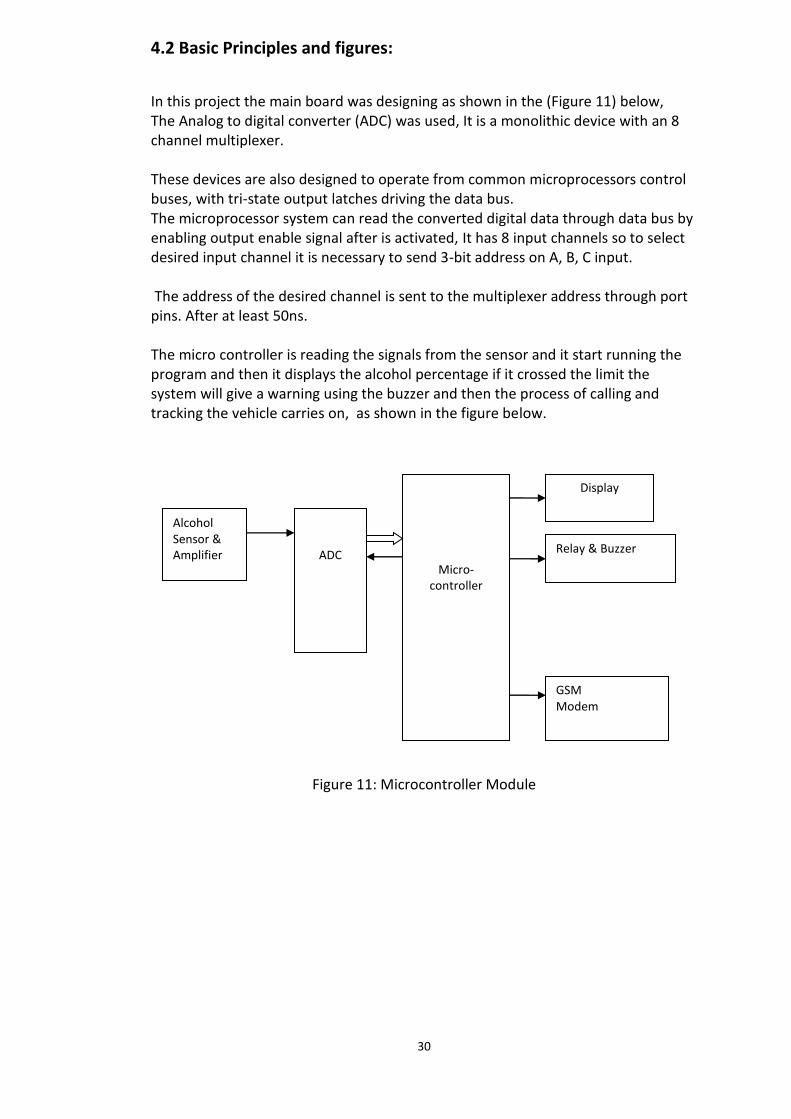
4.2 Basic Principles and figures:
In this project the main board was designing as shown in the (Figure 11) below, The Analog to digital converter (ADC) was used, It is a monolithic device with an 8 channel multiplexer. These devices are also designed to operate from common microprocessors control buses, with tri-state output latches driving the data bus. The microprocessor system can read the converted digital data through data bus by enabling output enable signal after is activated, It has 8 input channels so to select desired input channel it is necessary to send 3-bit address on A, B, C input. The address of the desired channel is sent to the multiplexer address through port pins. After at least 50ns. The micro controller is reading the signals from the sensor and it start running the program and then it displays the alcohol percentage if it crossed the limit the system will give a warning using the buzzer and then the process of calling and tracking the vehicle carries on, as shown in the figure below.
Figure 11: Microcontroller Module
Alcohol Sensor & Amplifier
ADC
Micro-controller
Display
Relay & Buzzer
GSM Modem

31
4.3 power source: The power supply gives +5v and +12v supply to the circuit as shown in (Figure 12) The power supply consists of four stages namely transformer, rectifier, filter, and regulator. Transformer is a step-down transformer taking input of 230v AC and giving output of 15v at the secondary. This 15v AC is rectified by bridge rectifier consisting of four diodes, which converts the AC wave into fully rectified
wave. The next stage is the filter stage consisting of capacitor, which converts the fully rectified wave into the DC wave with some ripple. Last stage is the regulator stage. Regulator removes the entire ripple and gives pure DC as shown in the following figure, (Figure 13)The LED is connected to indicate that power supply is on.
Figure 12: Power Supply Module
Filter Capacitor
Transformer Rectifier (Bridge)
Voltage Regulator
5VDC

32
There is 230 volts A.C. supply from the power grid (Electricity board). The voltage amplitude is of 230 volts and the frequency is 50 Hz.
By using a Step down transformer it is lowering the 230 volt AC supply to a lower value (e.g., 15 V) using a transformer. This lower voltage is still AC. The voltage amplitude is reduced but the frequency is same, which is 50 Hz
Then rectification is done by a set of 4 diodes (Bridge rectifier), this rectifier transforms this AC voltage into pulsating voltage. The negative half cycles of transformer output are converted to positive half cycles.
The next step is filtering, which is done by an electrolytic capacitor of 100microF, this filter capacitor transforms this pulsating voltage into almost DC. This is having ripples.
The voltage obtained after the capacitor oscillates a little bit (this oscillation is called ripple), so a voltage regulating stage is necessary, done by a voltage regulator IC. After this stage the output is true DC voltage
Figure 13: Waveforms for Power supply module

33
Ic555: The LM555/NE555/SA555 is a highly stable controller capable of producing accurate timing pulses. With mono-stable operation, the time delay is controlled by one external resistor and one capacitor. With a-stable operation, it is used to generate the square wave of frequency 38 KHz which is given to ADC0808.
Figure 14: Internal block diagram of IC 555

34
MICROCONTROLLER:
The main controlling unit of this all .This Microcontroller as shown in (Figure 15) reads the alcohol percentage in air though alcohol sensor and ADC then displays it on the LCD.
Design specification of Microcontroller 89S51: Features:- • Compatible with MCS-51 tm products. • 4k bytes of I system reprogrammable flash memory. • Endurance: 1000 write/erase cycles. • Fully static operation: 0Hz to 24 MHz. • Three level program memory lock. • 128*8 bit internal ram. • 32 programmable I/O lines. • Two 16 bit timers/counters. • Six interrupt sources. • Programmable serial channel. • Low power idle and power down modes.
Figure 15: PIN CONFIGURATION 40-lead PDIP

35
Figure 16: Architecture of the microcontroller

36
Atmel AT89S52 : The device is manufactured using Atmel’s high-density nonvolatile memory technology and is compatible with the industry- standard 80C51 instruction set and pin-out. The on-chip Flash allows the program memory to be reprogrammed in-system or by a conventional nonvolatile memory programmer. By combining a versatile 8-bit CPU with in-system programmable Flash on a monolithic chip, the Atmel AT89S52 is a powerful microcontroller which provides a highly-flexible and cost-effective solution to many embedded control applications. The AT89S52 provides the following standard features: 8K bytes of Flash, 256 bytes of RAM, 32 I/O lines, Watchdog timer, two data pointers, three 16-bit timer/counters, a six-vector two-level interrupt architecture, a full duplex serial port, on-chip oscillator, and clock circuitry. In addition, the AT89S52 is designed with static logic for operation down to zero frequency and supports two software selectable power saving modes. The Idle Mode stops the CPU while allowing the RAM, timer/counters, serial port, and interrupt system to continue functioning. The Power-down mode saves the RAM contents but freezes the oscillator, disabling all other chip functions until the next interrupt or hardware reset.

37
4.3 Design procedure: The circuit includes three parts. The first part comprises of the op-amps and sensors, the second part comprises of the processing and displaying part i.e. the microcontroller, ADC, and the LCD. The third part comprise of the output i.e. the relays through which the controlling action is taken. The first board consists of two operational amplifiers and three sensors. The operational amplifier used is LM324. It is a 14 pin IC and each IC consists of 4 op-amps each. Since our requirement is of 6 op-amps hence two IC’s are used. The first op-amp is used as a unity gain op-amp whereas the second op-amp is used as an amplifier. There are other options also available which can be use instead of the LM324 like µA741, LM124, LM224 etc. the problem with 741 is that each IC consists of only one op-amp. Therefore we would require 6 IC741 which would make the circuit bigger and complicated. As far as LM224 and LM124 are concerned the operating temperature range is much more than what is required. We designed the main board after that we made the final sketch of it As shown below and then we started the manufacturing process.

38
Step 1: Drawing the electronic schematic .We used a software to simulate the board and to check if the voltage and the microcontroller is reacting as required.
Step 2: Pcb layout A printed circuit board, or PCB, is used to mechanically support and electrically connect electronic components using conductive pathways, tracks or traces etched from copper sheets laminated onto a non-conductive substrate. It is also referred to as printed wiring board (PWB) or etched wiring board. A PCB populated with electronic components is a printed circuit assembly (PCA), also known as a printed circuit board assembly (PCBA).
Step 3: Etching
The copper clad PCB is etched as shown in (Figure 17)with ferrous chloride solution containing a small amount of Hydro Chloric Acid for increasing activeness of Ferric Chloride in etching. Wherever the varnish coating is there the copper remains. Then it is washed with water and Oxalic Acid.
Figure 17: Etching
The vast majority of printed circuit boards are made by bonding a layer of
copper over the entire substrate, sometimes on both sides, (creating a "blank PCB") then removing unwanted copper after applying a temporary mask (e.g. by etching), leaving only the desired copper traces. A few PCBs are made by adding traces to the bare substrate (or a substrate with a very thin layer of copper) usually by a complex process of multiple electroplating steps.

39
Step 4: Drilling
Drilling The Holes through a PCB are typically drilled with tiny drill bits made of solid tungsten carbide. The drilling is performed by automated drilling machines with placement controlled by a drill tape or drill file. These computer-generated files are also called numerically controlled drill (NCD) files or "Excellon files". The drill file describes the location and size of each drilled hole. These holes are often filled with annular rings (hollow rivets) to create vias. allow the electrical and thermal connection of conductors on opposite sides of the PCB
Step 5:Plating and Coating
PCBs are plated with Solder, Tin, or Gold over Nickel as a resist for etching (removal) away the (unneeded after plating) underlying copper. Matte solder is usually fused to provide a better bonding surface or stripped to bare copper. Treatments, such as benzimidazolethiol, prevent surface oxidation of bare copper. The places to which components will be mounted are typically plated, because untreated bare copper oxidizes quickly, and therefore is not readily solderable. Traditionally, any exposed copper was coated with solder by hot air solder levelling (HASL). This solder was a tin-lead alloy, however new solder compounds are now used to achieve compliance with the RoHS directive in the EU and US, which restricts the use of lead. One of these lead-free compounds is SN100CL, made up of 99.3% tin, 0.7% copper, 0.05% nickel, and a nominal of 60ppm germanium.
Step 6: Soldering
Soldering is the process of joining of two metals using an alloy solder
consisting of Tin and Lead (Sn-Pb). Tin determines the melting whereas the Lead is used to reduce the cost. After the PCB fabrication is done, the various components are arranged at proper locations on the PCB and then the soldering is done.
All liquids consist of particles which attract each other. The surface is always trying to shrink and this is because of surface tension. The principle behind soldering is that when liquid particles are brought in contact with the walls of the solid surface, it may happen that the solid attracts the liquid surface.
This property is called adhesive property. Care must be taken that the melting point of solder is below that of the metal so that its surface is melted without melting without the metal.

40
CHAPTER 5
5.1technical difficulties: -Problem crop up:
• Microcontroller at AT89C51 was not providing the results or was giving errors
• The pot used in the LCD circuit for adjusting the brightness/contract of LCD display was not giving the appropriate results.
• MQ-3 had a delay it needed time until it reaches the proper temperature.
-How problems are rectified:
• The microcontroller was replaced by the AT89S51 as the AT89C51 does not have In System Programmer.
• Potentiometer was adjusted to a certain level to get the required contrast on LCD display
• MQ-3 replacement.
5.2 Results:
As a result in this project the system was working great we programmed the alcohol limit and it was 0.30% the standard rate for the traffic police. The engine was stopped by the Microcontroller the GPS gave the proper location and the buzzer was working as well as the LCD.

41
CHAPTER 6
6.1 CONCLUSION :
In conclusion this project will help the traffic to get more organized and less
crowded so the rate of accidents will decrease for a better and safer roads, it will
support some police departments by helping with tracking the drivers with high
alcohol level and the car insurance companies with their accident reports because if
the driver is under the influence of alcohol the company is obliged to fix the
vehicles upon the signed agreements or the contracts.
6.2Future work :
This project the main board was designed with 2 extra sensor ports as mentioned
in the previous chapters that the driver might drink alcohol after the test period In
this case another sensor can be added for more efficiency it could be alcohol skin
sensor for example this sensor should be adjusted in the (start engine) button so
that is will test the driver before he starts the engine,
Another sensor can be added the (breath alcohol sensor) this sensor could make the
test very accurate but it is not practical for the drive and the reason is that the
driver must do the test himself but the ideas mentioned before didn’t need any
interact from the driver which makes it better.

42
REFERENCES:
[1] Alcohol imparment chart, http://www.lcshockey.com/issues/114/114alco.asp, Retriewed at 25th
November,2014
[2] PAS, http://www.dailymail.co.uk/news/article-2882273/Festive-drivers-drugalyse-threat.htmlRetriewed
at 8th jan,2013
[3] Alcohol free zone,https://www.ballina.nsw.gov.au/cp_themes/default/page.asp?p=DOC-LNV-48-34-07Retriewed at 6th march,2008
[4] Alcohol breath sensor https://www.steppingstonecenter.org/blog/wp-content/uploads/2012/06/alcohol-sensors-a-new-approach-to-fight-drunk-driving.jpg,Retriewed
at 25th dec,2014
[5] Components of alcohol sensor,http;//www.rhydolabz.com/wiki/?p=736,Retriewed
at 22th November,2011
[6]MQ-3 senor, http://tr.aliexpress.com/item/MQ-3-Gas-sensor-ethanol/433747428.html,Retriewed
at 25th may,2006
[7]MQ-3 senor, http://tr.aliexpress.com/item/MQ-3-Gas-sensor-ethanol/433747428.html,Retriewed
at 25th may,2006
[8]Specification, http://www.alibaba.com/product-detail/MQ-3-alcohol- sensor_170482887.htmlRetriewed at 11th jzn,2009
[9] Sensitivity, http://www.seeedstudio.com/wiki/Grove_-_Gas_Sensor(MQ3), Retriewed at 22th April,2001
[10] Fingertip sensor http://techno-stream.net/booting-up-built-in-alcohol-sensors-could-end-drunken-driving/ Retriewed at 2th dec,2008
[11] Micro.chip https://www.elprocus.com/8051-microcontroller-architecture-and-applications/,Retriewed at 5th Feb,2014

43
APPENDICES

44
APPENDIX A:
Time management table :
Task# Task name Duration *in Days* Members
1 Gantt chart & Logs 1 Mohamad & victor
2 Abstract 18 Mohamad & victor
Introduction 12 Mohamad & victor
3 Literature review 13 Mohamad & victor
4 Design &
manufacturing
19 Mohamad & victor
5 Reference and appendix
and Tables
17 Mohamad & victor
Finishing and final steps 5 Mohamad & victor
Time table for assembly part:
Task name Duration *in Days* Members
Design and manufacturing
48 Mohamad & victor
Equations and calculations
5 Mohamad & victor
Manufacturing process
33 Mohamad & victor
Equipments 11 Mohamad & victor
Reference and appendix
8 Mohamad & victor
Drawings 8 Mohamad & victor
Assembly 5 Mohamad & victor
Finishing of the project
5 Mohamad & victor

45
APPENDIX-B:
Gantt Chart: Task
Start date Days to complete
Task 1
22-sep
25 Task 2
24-oct
18
Task 3
14-nov
15 Task 4
13-dec
25
Task 5
9-jan
16
0 5 10 15 20 25
Task 1
Task 2
Task 3
Task 4
Task 5
Days to complete
Start date

46
APPENDIX-C: Drawings

47

48