Mechanism of ricin-induced apoptosis in human cervical cancer cells
11
Mechanism of ricin-induced apoptosis in human cervical cancer cells P.V. Lakshmana Rao a, * , R. Jayaraj a , A.S.B. Bhaskar a , Om Kumar a , R. Bhattacharya a , Parag Saxena b , P.K. Dash b , R. Vijayaraghavan a a Division of Pharmacology and Toxicology, Defence Research and Development Establishment, Jhansi Road, Gwalior 474002, India b Virology Division, Defence Research and Development Establishment, Jhansi Road, Gwalior 474002, India Received 6 September 2004; accepted 8 November 2004 Abstract The mechanism of ricin-induced apoptosis in human cervical cancer cell line HeLa was studied. The present study demonstrated that ricin induces apoptosis of human cervical cancer cells (HeLa) in a time dependent manner with an IC 50 for cell viability of 1 mg/ml. Ricin treatment resulted in a time dependent increase in LDH leakage, DNA fragmentation, percent apoptotic cells, generation of reactive oxygen species and depletion of intracellular glutathione levels. DNA agarose gel electrophoresis showed typical oligonucleosomal length DNA fragmentation. Additionally, DNA diffusion assay was performed to confirm DNA damage and apoptosis. Ricin activated caspase-3 as evidenced by both proteolytic cleavage of procaspase-3 into 20 and 18 kDa subunits, and increased protease activity. Caspase activity was maximum at 4 h and led to the cleavage of 116 kDa poly(ADP-ribose) polymerase (PARP), resulting in the 85 kDa cleavage product. Ricin-induced caspase-3 activation also resulted in cleavage of DNA fragmentation factor-45 (DFF45/ICAD) and DFF40 or caspase- activated DNase in HeLa cells. Activation of caspase-3, cleavage of PARP and DNA fragmentation was blocked by pre-treatment with caspase-3 specific inhibitor Ac-DEVD-CHO (100 mM) and broad-spectrum caspase inhibitor Z-VAD-FMK (40 mM). Ricin-induced DNA fragmentation was inhibited by pre-treatment with PARP inhibitors 3-aminobenzamide (100 mM) and DPQ (10 mM). Our results indicate that ricin-induced cell death was mediated by generation of reactive oxygen species and subsequent activation of caspase-3 cascade followed by down stream events leading to apoptotic mode of cell death. # 2004 Elsevier Inc. All rights reserved. Keywords: Ricin; HeLa cells; Apoptosis; Caspase-3; DNA fragmentation factor; Caspase inhibitors 1. Introduction Ricin is a potent protein toxin isolated from the seeds of castor bean plant Ricinus communis. The ricin molecule is comprised of two glycoprotein chains A and B, of equal size (MW: ca. 62 kDa) that are joined by disulfide bond [1]. The B chain binds to galactose residues present on various cell surface glycoproteins and glycolipids and triggering endocytosis of toxin. The A chain reaches cytosol through Golgi complex after the reduction of the disulfide bond. Ricin A chain exhibits an RNA N-glycosidase activity which hydrolyses a specific adenine residue from a highly conserved loop region of 28S rRNA [2,3]. This RNA N- glycosidase activity results in loss of protein elongation and presumably subsequent death of the exposed cell. Ricin endocytosis may also occur through another recog- nition process which involves the interaction of mannose- containing carbohydrate side-chains of the toxin with mannose receptors. Ricin or it’s A chain has been used to synthesize immunotoxins which show specific anti- cancer and anti-AIDS activities in vitro and in vivo [4]. Ricin is known to have diverse effects on cells of different organs like liver, kidney, pancreas, intestines and parathyroid [5]. The mechanisms of ricin toxicity www.elsevier.com/locate/biochempharm Biochemical Pharmacology 69 (2005) 855–865 Abbreviations: Ac-DEVD-CHO, acetyl-Asp-Glu-Val-Asp aldehyde; Z- VAD-FMK, N-benzoyloxy-carbonyl-Val-Ala-Asp (O-me)-fluoromethyl ketone; GSH, glutathione; PARP, poly(ADP-ribose) polymerase; PMSF, phenylmethylsulfonyl fluoride; DTT, dithiothreitol; OPT, orthopthaldialde- hyde; PBS, phosphate buffered saline; DCF-DA, 2,7-dichlorofluorescein diacetate; CHAPS, (3[(3-cholamidopropyl) dimethlylammonio]-1-propa- nesulfate); DFF/ICAD, DNA fragmentation factor/inhibitor of caspase- activated DNAse; CAD, caspase-activated DNAse * Corresponding author. Tel.: +91 751 2341980; fax: +91 751 2341148. E-mail address: [email protected] (P.V. Lakshmana Rao). 0006-2952/$ – see front matter # 2004 Elsevier Inc. All rights reserved. doi:10.1016/j.bcp.2004.11.010
-
Upload
independent -
Category
Documents
-
view
2 -
download
0
Transcript of Mechanism of ricin-induced apoptosis in human cervical cancer cells

www.elsevier.com/locate/biochempharm
Biochemical Pharmacology 69 (2005) 855–865
Mechanism of ricin-induced apoptosis in
human cervical cancer cells
P.V. Lakshmana Raoa,*, R. Jayaraja, A.S.B. Bhaskara, Om Kumara,R. Bhattacharyaa, Parag Saxenab, P.K. Dashb, R. Vijayaraghavana
aDivision of Pharmacology and Toxicology, Defence Research and Development Establishment, Jhansi Road, Gwalior 474002, IndiabVirology Division, Defence Research and Development Establishment, Jhansi Road, Gwalior 474002, India
Received 6 September 2004; accepted 8 November 2004
Abstract
The mechanism of ricin-induced apoptosis in human cervical cancer cell line HeLa was studied. The present study demonstrated that
ricin induces apoptosis of human cervical cancer cells (HeLa) in a time dependent manner with an IC50 for cell viability of 1 mg/ml. Ricin
treatment resulted in a time dependent increase in LDH leakage, DNA fragmentation, percent apoptotic cells, generation of reactive
oxygen species and depletion of intracellular glutathione levels. DNA agarose gel electrophoresis showed typical oligonucleosomal length
DNA fragmentation. Additionally, DNA diffusion assay was performed to confirm DNA damage and apoptosis. Ricin activated caspase-3
as evidenced by both proteolytic cleavage of procaspase-3 into 20 and 18 kDa subunits, and increased protease activity. Caspase activity
was maximum at 4 h and led to the cleavage of 116 kDa poly(ADP-ribose) polymerase (PARP), resulting in the 85 kDa cleavage product.
Ricin-induced caspase-3 activation also resulted in cleavage of DNA fragmentation factor-45 (DFF45/ICAD) and DFF40 or caspase-
activated DNase in HeLa cells. Activation of caspase-3, cleavage of PARP and DNA fragmentation was blocked by pre-treatment with
caspase-3 specific inhibitor Ac-DEVD-CHO (100 mM) and broad-spectrum caspase inhibitor Z-VAD-FMK (40 mM). Ricin-induced
DNA fragmentation was inhibited by pre-treatment with PARP inhibitors 3-aminobenzamide (100 mM) and DPQ (10 mM). Our results
indicate that ricin-induced cell death was mediated by generation of reactive oxygen species and subsequent activation of caspase-3
cascade followed by down stream events leading to apoptotic mode of cell death.
# 2004 Elsevier Inc. All rights reserved.
Keywords: Ricin; HeLa cells; Apoptosis; Caspase-3; DNA fragmentation factor; Caspase inhibitors
1. Introduction
Ricin is a potent protein toxin isolated from the seeds of
castor bean plant Ricinus communis. The ricin molecule is
comprised of two glycoprotein chains A and B, of equal
size (MW: ca. 62 kDa) that are joined by disulfide bond [1].
The B chain binds to galactose residues present on various
Abbreviations: Ac-DEVD-CHO, acetyl-Asp-Glu-Val-Asp aldehyde; Z-
VAD-FMK, N-benzoyloxy-carbonyl-Val-Ala-Asp (O-me)-fluoromethyl
ketone; GSH, glutathione; PARP, poly(ADP-ribose) polymerase; PMSF,
phenylmethylsulfonyl fluoride; DTT, dithiothreitol; OPT, orthopthaldialde-
hyde; PBS, phosphate buffered saline; DCF-DA, 2,7-dichlorofluorescein
diacetate; CHAPS, (3[(3-cholamidopropyl) dimethlylammonio]-1-propa-
nesulfate); DFF/ICAD, DNA fragmentation factor/inhibitor of caspase-
activated DNAse; CAD, caspase-activated DNAse
* Corresponding author. Tel.: +91 751 2341980; fax: +91 751 2341148.
E-mail address: [email protected] (P.V. Lakshmana Rao).
0006-2952/$ – see front matter # 2004 Elsevier Inc. All rights reserved.
doi:10.1016/j.bcp.2004.11.010
cell surface glycoproteins and glycolipids and triggering
endocytosis of toxin. The A chain reaches cytosol through
Golgi complex after the reduction of the disulfide bond.
Ricin A chain exhibits an RNA N-glycosidase activity
which hydrolyses a specific adenine residue from a highly
conserved loop region of 28S rRNA [2,3]. This RNA N-
glycosidase activity results in loss of protein elongation
and presumably subsequent death of the exposed cell.
Ricin endocytosis may also occur through another recog-
nition process which involves the interaction of mannose-
containing carbohydrate side-chains of the toxin with
mannose receptors. Ricin or it’s A chain has been used
to synthesize immunotoxins which show specific anti-
cancer and anti-AIDS activities in vitro and in vivo [4].
Ricin is known to have diverse effects on cells of
different organs like liver, kidney, pancreas, intestines
and parathyroid [5]. The mechanisms of ricin toxicity

P.V.L. Rao et al. / Biochemical Pharmacology 69 (2005) 855–865856
may include ribosome inactivation, disturbance in cal-
cium-magnesium balance, release of cytokines, acute
phase reactions, oxidative stress in the liver and apoptosis
[3]. Ricin binds to cells, internalises through surface
clathrin-coated pits into endosomes, and eventually trans-
locates through intracellular membranes into the cytosol,
where it irreversibly inactivates ribosomes inhibiting pro-
tein synthesis [6]. Ricin induces apoptosis in a wide variety
of cells like bovine endothelial cells [7], MDCK cells [8]
by mechanisms other than protein synthesis inhibition.
Time and concentration dependent effects of ricin on some
biomarkers of cellular toxicity including production of
superoxide anion (O2�), nitric oxide, and DNA damage
as well as cellular death have been examined in macro-
phage cell culture [9]. Ricin-induced hepatic lipid perox-
idation, glutathione depletion and DNA single-strand
breaks were reported by Muldoon et al. [10] in mice.
We have recently reported ricin-induced oxidative stress
associated hepatic and renal toxicity in mice [11].
Apoptosis is induced by a variety of stimuli, such as
genotoxic compounds, toxins, tumour necrosis factor,
various environmental stress. Cells undergoing apoptosis
exhibit specific morphological changes, which include
membrane blebbing, cytoplasm and chromatin condensa-
tion, nuclear breakdown, formation of apoptotic bodies
eventually subjected to phagocytosis [12]. Caspases have
emerged as the main players of the cell death programme,
with apoptotic caspases been divided into executioner
caspases (caspase-3, 6, 7) and initiator caspases (cas-
pase-2, 8, 9, 10). Caspases initiate destruction of the
nucleus, where a huge variety of different proteins are
cleaved. By 2D-gel electrophoresis it has been recently
determined that approximately 70 nuclear proteins are
consistently degraded or translocated during apoptosis,
irrespective of the cell type or apoptotic stimulus [13].
Recent studies have demonstrated that ricin induces cyto-
toxicity and apoptotic cell death in various cell types [14–
16] but detailed mechanism is still unclear. To gain insight
into mechanism of ricin-induced apoptosis in the present
study, we investigated the role of oxidative stress and
caspase-3 activation cascade in the apoptotic process in
ricin-treated human cervical cancer (HeLa) cells.
2. Materials and methods
2.1. Materials
R. communis seeds used for ricin purification were
obtained locally. HeLa cells were obtained from National
Centre for Cell Science (NCCS), University of Pune.
Proteinase K, RNAse, propidium iodide, GSH, caspase
inhibitor peptides Ac-DEVD-CHO, Z-VAD-FMK,
CHAPS, DTT, PMSF, were obtained from Sigma Chemical
Co. 2,7-dichlorofluorescein diacetate, Hoechst 33342,
OPT were purchased from Fluka. YOYO-1 was obtained
from Molecular Probes. Low melting point agarose from
BDH.
2.2. Ricin purification
Ricin was purified in the laboratory from R. communis
seeds as described elsewhere [11]. Briefly, defatted castor
seed meal was treated with 5% acetic acid and crude ricin
was extracted. It was further purified by affinity chroma-
tography performed on acid-treated Sepharose 4B (0.1 M
HCl, 3 h, at 50 8C in 0.5 M sodium chloride solution)
according to Griffiths et al. [17]. Under these conditions
lectins bind to the gel matrix (to galactose residues avail-
able on the partially acid-hydrolysed matrix). The matrix
bound proteins was eluted with b-D-galactose. These lec-
tins were separated on the basis of their size difference
using Bio-Gel1 A-0.5m gel (Bio-Rad). The protein con-
taining fractions were pooled separately, concentrated, and
used for all experiments. PAGE under reduced and non-
reduced conditions was performed each time to assess the
purity of ricin.
2.3. Cell culture and treatment
HeLa cells (passage 104) obtained from NCCS, were
grown in minimum essential medium (Eagle) without
tryptose phosphate broth and supplemented with 2 mM
L-glutamine, Earle’s BSS adjusted to contain 1.5 g/L
sodium bicarbonate, 0.1 mM non-essential amino acids,
and 1.0 mM sodium pyruvate, 90%; fetal calf serum, 10%
and gentamycin (80 mg/ml). Cells were maintained at
37 8C in a humidified atmosphere of 95% air and 5%
CO2 in a incubator. Viability of the cells was determined
by Trypan blue dye exclusion. To study the effect of ricin
on various parameters, HeLa cells were grown in serum
free medium in either 24-well tissue culture plates or
25 mm2 tissue culture flasks (Greiner) and treated with
ricin (diluted in PBS) for different durations. The cells after
treatment for specified duration were processed for various
biochemical end points following procedures described
below.
2.4. Cell viability assay
For IC50 determination HeLa cells were grown in (1–
2 � 106 cells/well) in 24-well tissue culture plates and
were exposed to various concentration of ricin for 12 h.
The 50% inhibitory concentration (IC50) of ricin was
determined from the plots of viability of HeLa cells by
crystal violet dye exclusion (CVDE) assay [18]. For all
subsequent time course studies IC50 of ricin was used.
Lactate dehydrogenase (LDH) activity in the culture media
was measured spectrophotometrically as an index of
plasma membrane damage and loss of membrane integrity
[19]. Enzyme activity was expressed as the percentage of
extra cellular LDH activity of the total LDH activity of the
P.V.L. Rao et al. / Biochemical Pharmacology 69 (2005) 855–865 857
cells. For time course studies on cell viability and LDH
leakage treatment duration was 24 h.
2.5. Morphological determination of apoptosis
Following various treatments, apoptotic nuclei were
quantified using fluorescence staining [20]. Briefly, at
designated time points, media were removed and cells
were washed once with PBS. The cells were then incubated
with 10 mg/ml Hoechst 33342 (used to identify nuclear
fragmentation) and 5 mg/ml propidium iodide (to identify
non-viable cells) in PBS for 30 min at 37 8C. Cells were
then visualized with fluorescence microscope (Carl Zeiss,
Axiomot 2) and fragmented nuclei in viable cells were
counted. For each treatment group, 800–1000 nuclei were
counted. Data were expressed as percentage of viable cells
with apoptotic nuclei.
2.6. DNA diffusion assay
DNA diffusion assay was done according to Singh [21]
with slight modifications. Briefly, a layer of 0.5% low
melting point (LMP) agarose was layered on a microslide
and spread uniformly and dried at room temperature. Ten
microlitres of either control or treated cell samples washed
in PBS were mixed with 70 ml of 0.5% LMP agarose and
layered on pre-coated slide. A cover glass was kept on the
slide to get a uniform layering and cooled on a cold plate
for 2 min. Cover glass was removed and 150 ml of 2%
LMP agarose was layered above the previous layer and
kept on cold plate. Lysis was done in a buffer containing
2.5 M NaCl, 2 mM tetrasodium-EDTA, 10 mM Tris base
pH 10.0 with freshly added 1% Triton X-100 for 1 h at
room temperature. After lysis, slides were kept in a freshly
made solution containing 0.3 NaOH and 0.2% DMSO
(pH > 13.5) for 10 min at room temperature. Slides were
neutralized in 100 mM Tris–HCl pH 7.4 for 20 min. Slides
were subsequently immersed in 5 mM spermine in 75%
ethanol for 20 min. Staining was done in 1 mM of YOYO-1
in 2% DMSO and 0.5% sucrose. The nuclei were visua-
lized under fluorescence microscope and photographed.
2.7. DNA fragmentation analysis
Quantitative analysis of DNA fragmentation was carried
out as reported earlier [19]. The cells were lysed in ice-cold
lysis buffer (10 mM Tris, 20 mM EDTA, 0.5% Triton X-
100, pH 8.0) prior to centrifugation at 27,000 � g for
30 min. Both pellet (intact chromatin) and supernatant
(DNA fragments) fractions were assayed for DNA content
fluorimetrically. The percentage of DNA fragmented was
defined as the ratio of the DNA content of the supernatant
obtained at 27,000 � g to the total DNA in the lysate [22].
DNA fragmentation was qualitatively analysed by agar-
ose gel electrophoresis [23]. Briefly, 2 � 106 cells were
pelleted from the medium, washed once with Hank’s
balanced salt solution (HBSS), resuspended in 1 ml of
HBSS, diluted with 10 ml of ice-cold 70% ethanol, and
stored at �20 8C for 24 h. The cells were then pelleted by
centrifugation (800 � g for 10 min) and ethanol was
removed completely. The pellet was resuspended and
the cells were lysed in 50 ml of phosphate–citrate buffer
(192 parts of 0.2 M Na2HPO4 and eight parts of 0.1 M
citric acid, pH 7.8). After incubation at room temperature
for 30 min, the cell lysate was centrifuged (1000 � g for
5 min) and the supernatant was concentrated using a Speed
Vac concentrator. A 5 ml 0.25% NP-40 in distilled water
was added to each sample followed by 3 ml of RNAse A
(1 mg/ml in water) and the suspension was incubated at
37 8C for 30 min followed by 5 ml of proteinase K (1 mg/
ml) and incubated for further 30 min at 37 8C. DNA
extracted from control and treated cells were electrophor-
esed on a 1.6% agarose gel impregnated with ethidium
bromide. DNA ladder (1 kb; Promega) served as molecular
size standard.
2.8. Measurement of intracellular ROS
Intracellular ROS was estimated using a fluorescent
probe, 2,7-dichlorofluorescein diacetate (DCFH-DA).
DCFH-DA diffuses through the cell membrane readily
and is enzymatically hydrolysed by intracellular esterases
to non-fluorescent dichlorofluorescin (DCFH), which is
then rapidly oxidized to highly fluorescent DCF in the
presence of ROS. Ricin was added at 1 mg/ml concentra-
tion simultaneously with DCFH-DA (final concentration
5 mM) and incubated at 37 8C up to 4 h. DCF fluorescence
intensity was detected at different time intervals with
excitation wave-length 485 nm and emission wavelength
at 530 nm. The DCF fluorescence intensity is proportional
to the amount of ROS formed intra-cellularly [24].
2.9. Measurement of intracellular GSH
Intracellular levels of GSH were determined using the
method of Hisin and Hilf [25]. Cells after treatment were
washed with PBS and scrapped into 6.5% trichloroacetic
acid. Phosphate–EDTA buffer (4.5 ml) of pH 8.0 was
added to 0.5 ml of 100,000 � g supernatant. The final
assay mixture (2 ml) contained 100 ml of the diluted super-
natant, 1.8 ml phosphate–EDTA buffer pH 8.0, and 100 ml
o-phthalaldehyde solution containing 100 mg of OPT.
After thorough mixing and incubation at room temperature
for 15 min fluorescence was read at EM 420 and EX
350 nm in Shimadzu RF 5000 spectrofluorophotometer.
The reduced form of GSH was used as a standard. Data
were expressed as nanomole GSH per 106 cells.
2.10. Assay of caspase-3 activity
The activities of the caspase-3 like protease were mea-
sured in a fluorimetric assay modified from Nicholson et al.
P.V.L. Rao et al. / Biochemical Pharmacology 69 (2005) 855–865858
[26]. After different treatments, cells were harvested with
phosphate-buffered saline and centrifuged at 1500 rpm for
5 min. Cell pellets were resuspended in 2 ml buffer con-
taining 59 mM Tris–HCl, 1 mM EDTA, 10 mM EGTA,
and lysed with 10 mM digitonin. After incubation at 37 8Cfor 10 min, the lysates were centrifuged at 1000 � g for
5 min and the supernatants were stored at �70 8C till
assayed. Protein concentration was estimated by Bio-
Rad DC protein assay kit (Bio-Rad) and lysates (100 mg
protein) were assayed in caspase assay buffer (312.5 mM
HEPES (pH 7.5), 31.25% sucrose and 0.3125% CHAPS).
The reaction was started with addition of 50 mM caspase-3
substrate, acetyl-Asp-Glu-Val-Asp aminomethylcoumarin
(Ac-DEVD-AMC), and the reaction was followed for
60 min. Fluorescence was measured at excitation
360 nm and emission 460 nm in spectrofluorophotometer
(Shimadzu RF 5000). Fluorescence intensity was cali-
brated with standard concentrations of AMC. Protease
activity was calculated from the slope of the curve and
expressed as pmol/min/mg protein.
2.11. Preparation of cell lysates for immunoblotting
For studies on caspase, DFF45/ICAD cleavage and
DFF40/CAD, control and ricin-treated cells grown in
25 cm2 tissue culture flasks were lysed in lysis buffer
(10 mM HEPES pH 7.4, 42 mM KCl, 5 mM MgCl2,
0.1 mM EDTA, 0.1 mM EGTA, 5 mM DTT, 2 mM PMSF,
1� complete protease inhibitor cocktail) containing 0.5%
CHAPS. Cellular debris were spun down at 1440 � g for
20 min, and the supernatants were used as whole cell
protein extracts. For PARP cleavage, cell extracts were
prepared following the procedure of Shah et al. [27].
Briefly, Control and ricin-treated cells grown in 25 cm2
tissue culture flasks were washed once with PBS, sus-
pended at �5 � 106 cells/ml in sample buffer (6 M urea,
62.5 mM Tris–HCl, pH 6.8, 10% glycerol, 5% b-mercap-
toethanol (freshly added), 2% SDS, 0.00125% bromophe-
nol blue), sonicated for 15 s, and incubated at 65 8C for
15 min.
2.12. Western blotting analysis
Protein concentration of cell extracts was determined by
Bio-Rad DC protein assay (Bio-Rad). Fifty micrograms
protein from each sample was separated on SDS–PAGE
and electrophoretically transferred onto a nitrocellulose
membrane filter, using an electro-blotting apparatus (Bio-
Rad). Membranes were incubated in blocking solution
containing 5% non-fat dry milk in PBST buffer (PBS
buffer containing 0.1% Tween-20) for 1 h at room tem-
perature, followed by incubation for over night at 5 8C in
platform shaker with various primary antibodies: mono-
clonal anti-PARP antibody at 1:2000 (clone C-2-10,
Sigma) directed against uncleaved (116 kDa) and the
cleaved form of PARP (85 kDa), anti-caspase-3, rabbit
polyclonal antiserum (Calbiochem) recognizing whole
caspase-3 (34 kDa) as well as large (20 kDa) and small
sub units (18 kDa) diluted at 1:2000, and anti-DFF 45/
ICAD, purified IgG fraction of polyclonal rabbit antiserum
(Calbiochem) diluted to 1:2000 which recognizes
uncleaved (45 kDa) and cleaved forms, and DFF40/CAD
rabbit polyclonal IgG (Calbiochem) diluted to 1:2000.
Monoclonal anti-b-actin (Clone AC-74, Sigma) which
detects b-actin (42 kDa) is used as protein loading control.
All antibodies are diluted in PBST with 5% milk powder.
The membranes were washed four times in PBST for
15 min, followed by incubation for 2 h in horseradish
peroxidase-conjugated rabbit anti-mouse or goat anti-rab-
bit secondary antibody (Dako) used at 1:150,000 dilution.
The membranes were washed again and developed using
an enhanced chemiluminescent detection system (Pro-
teoQwestTM Chemiluminescent Western blotting kit,
Sigma) according to manufacturer’s protocol and the
image was taken on Pierce CL-XPosureTM X-ray films.
2.13. Caspase and PARP inhibitor studies
For caspase-3 inhibition studies HeLa cells were pre-
incubated with caspase-3 specific inhibitor, acetyl-Asp-
Glu-Val-Asp-aldehyde (Ac-DEVD-CHO) at 100 mM and
Z-VAD-FMK, 40 mM concentration 2 h prior to toxin
treatment. The PARP inhibitors 3-amino-benzamide
(100 mM) and DPQ {3,4-dihydro-5[4-(1-piperindinyl)bu-
toxy]-1(2H)-isoquinoline} at 10 mM dissolved in DMSO
were added to cells 2 h before ricin treatment. Cells were
then incubated for 12 h. Inhibitor-treated cells were pro-
cessed for DNA agarose gel electrophoresis and Western
blot analysis for PARP cleavage.
2.14. Statistical analysis
Statistical analysis of the experimental data was carried
out by Student’s t-test. Values of p � 0.05 were considered
to be significant, and results were expressed as mean
� S.E. of four replicates. Each experiment is repeated at
least three times.
3. Results
3.1. Ricin-induced cytotoxicity
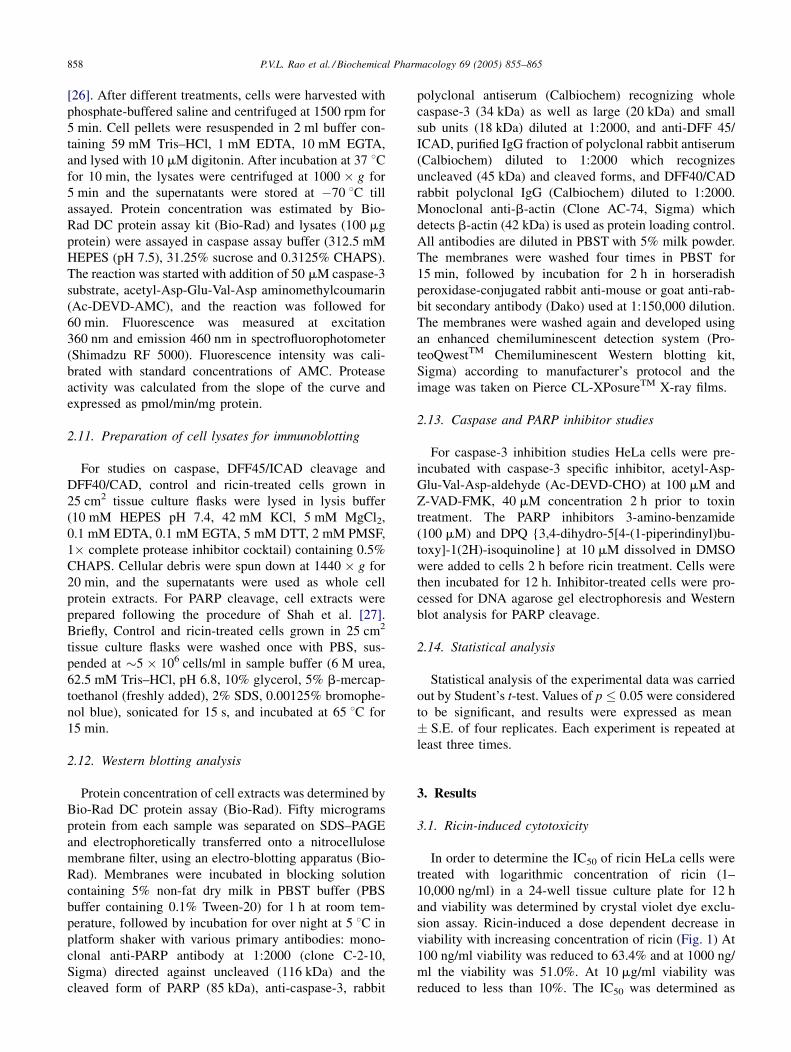
In order to determine the IC50 of ricin HeLa cells were
treated with logarithmic concentration of ricin (1–
10,000 ng/ml) in a 24-well tissue culture plate for 12 h
and viability was determined by crystal violet dye exclu-
sion assay. Ricin-induced a dose dependent decrease in
viability with increasing concentration of ricin (Fig. 1) At
100 ng/ml viability was reduced to 63.4% and at 1000 ng/
ml the viability was 51.0%. At 10 mg/ml viability was
reduced to less than 10%. The IC50 was determined as
P.V.L. Rao et al. / Biochemical Pharmacology 69 (2005) 855–865 859
Fig. 1. Effect of ricin on viability of HeLa cells and determination of IC50.
HeLa cells (1 � 105 cells/well) grown in 24-well tissue culture plates were
treated with logarithmic concentration of ricin for 12 h. The values are
mean � S.E. of four replicates. Significantly different from control at
p � 0.05 by Student’s t-test. Each experiment is repeated at least three
times.
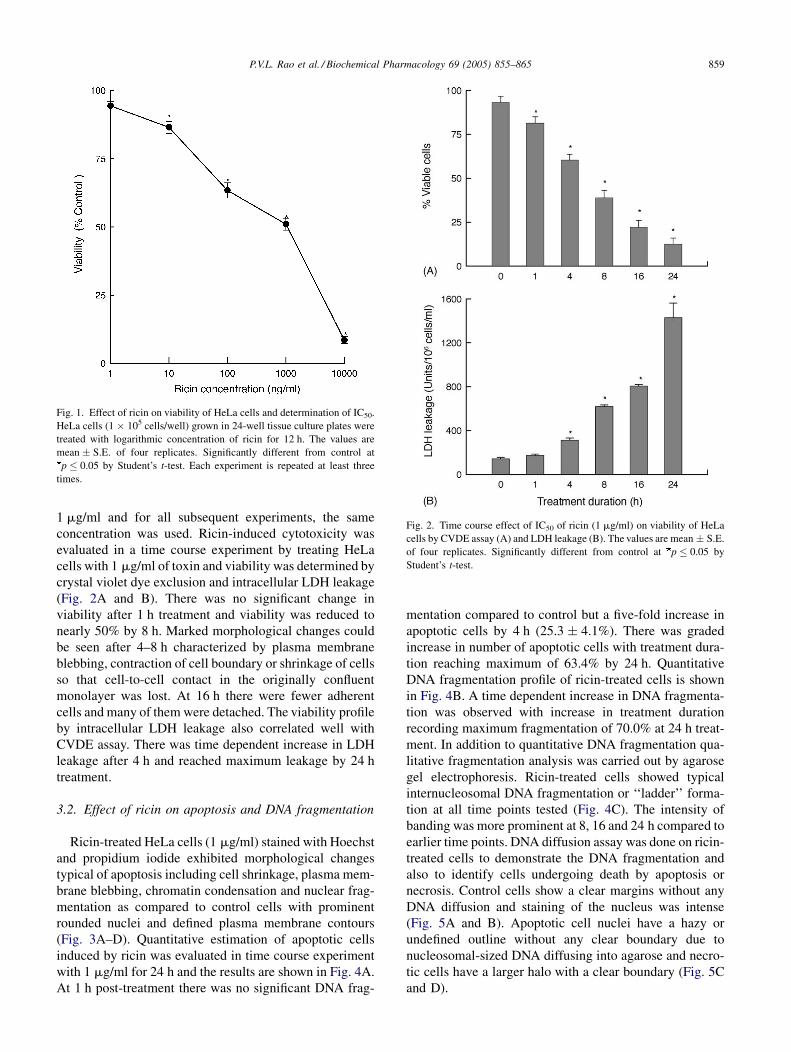
Fig. 2. Time course effect of IC50 of ricin (1 mg/ml) on viability of HeLa
cells by CVDE assay (A) and LDH leakage (B). The values are mean � S.E.
of four replicates. Significantly different from control at p � 0.05 by
Student’s t-test.
1 mg/ml and for all subsequent experiments, the same
concentration was used. Ricin-induced cytotoxicity was
evaluated in a time course experiment by treating HeLa
cells with 1 mg/ml of toxin and viability was determined by
crystal violet dye exclusion and intracellular LDH leakage
(Fig. 2A and B). There was no significant change in
viability after 1 h treatment and viability was reduced to
nearly 50% by 8 h. Marked morphological changes could
be seen after 4–8 h characterized by plasma membrane
blebbing, contraction of cell boundary or shrinkage of cells
so that cell-to-cell contact in the originally confluent
monolayer was lost. At 16 h there were fewer adherent
cells and many of them were detached. The viability profile
by intracellular LDH leakage also correlated well with
CVDE assay. There was time dependent increase in LDH
leakage after 4 h and reached maximum leakage by 24 h
treatment.
3.2. Effect of ricin on apoptosis and DNA fragmentation
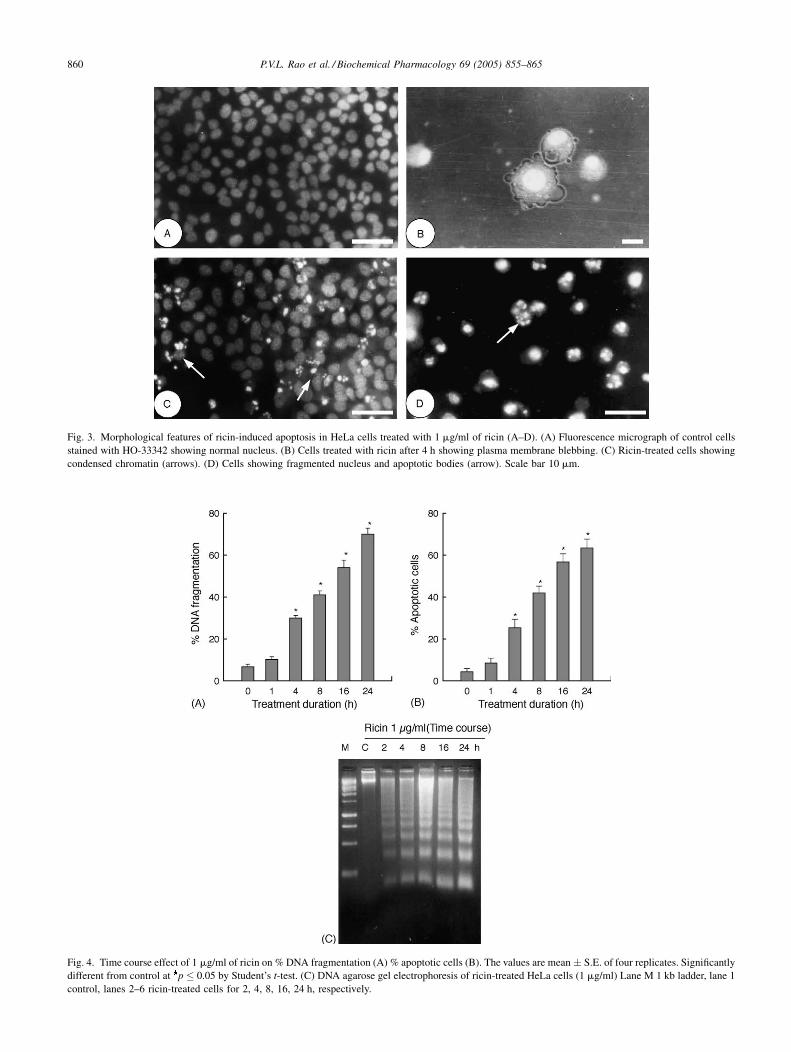
Ricin-treated HeLa cells (1 mg/ml) stained with Hoechst
and propidium iodide exhibited morphological changes
typical of apoptosis including cell shrinkage, plasma mem-
brane blebbing, chromatin condensation and nuclear frag-
mentation as compared to control cells with prominent
rounded nuclei and defined plasma membrane contours
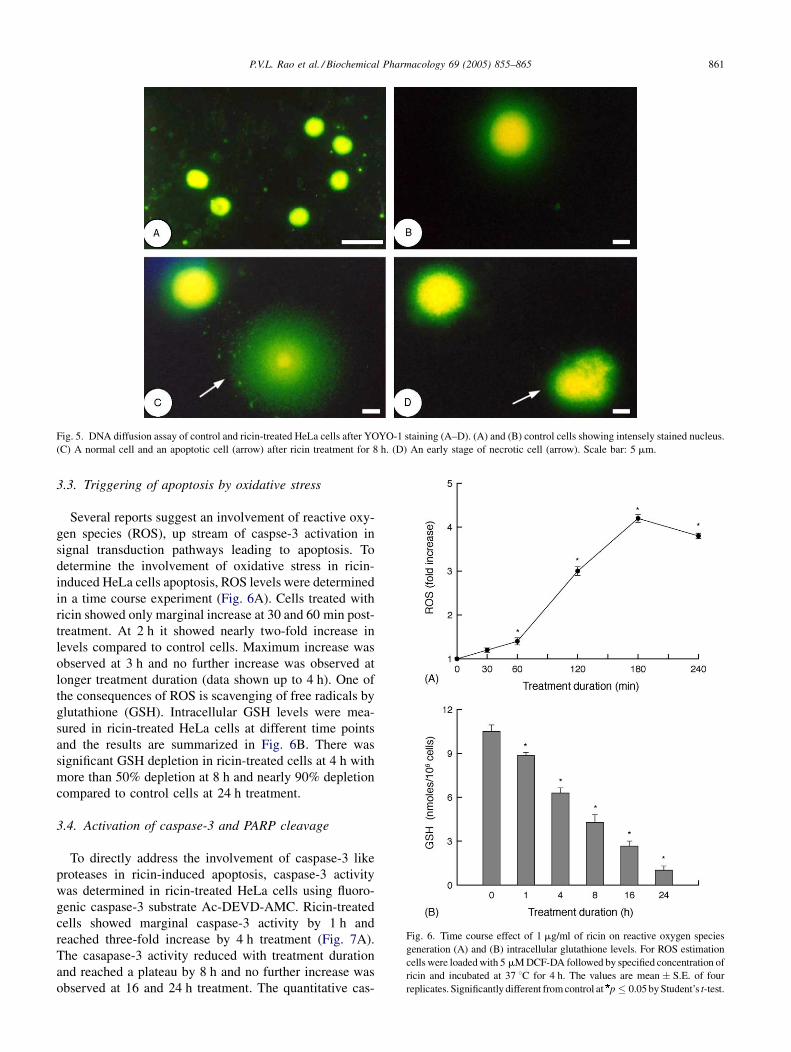
(Fig. 3A–D). Quantitative estimation of apoptotic cells
induced by ricin was evaluated in time course experiment
with 1 mg/ml for 24 h and the results are shown in Fig. 4A.
At 1 h post-treatment there was no significant DNA frag-
mentation compared to control but a five-fold increase in
apoptotic cells by 4 h (25.3 � 4.1%). There was graded
increase in number of apoptotic cells with treatment dura-
tion reaching maximum of 63.4% by 24 h. Quantitative
DNA fragmentation profile of ricin-treated cells is shown
in Fig. 4B. A time dependent increase in DNA fragmenta-
tion was observed with increase in treatment duration
recording maximum fragmentation of 70.0% at 24 h treat-
ment. In addition to quantitative DNA fragmentation qua-
litative fragmentation analysis was carried out by agarose
gel electrophoresis. Ricin-treated cells showed typical
internucleosomal DNA fragmentation or ‘‘ladder’’ forma-
tion at all time points tested (Fig. 4C). The intensity of
banding was more prominent at 8, 16 and 24 h compared to
earlier time points. DNA diffusion assay was done on ricin-
treated cells to demonstrate the DNA fragmentation and
also to identify cells undergoing death by apoptosis or
necrosis. Control cells show a clear margins without any
DNA diffusion and staining of the nucleus was intense
(Fig. 5A and B). Apoptotic cell nuclei have a hazy or
undefined outline without any clear boundary due to
nucleosomal-sized DNA diffusing into agarose and necro-
tic cells have a larger halo with a clear boundary (Fig. 5C
and D).
P.V.L. Rao et al. / Biochemical Pharmacology 69 (2005) 855–865860
Fig. 3. Morphological features of ricin-induced apoptosis in HeLa cells treated with 1 mg/ml of ricin (A–D). (A) Fluorescence micrograph of control cells
stained with HO-33342 showing normal nucleus. (B) Cells treated with ricin after 4 h showing plasma membrane blebbing. (C) Ricin-treated cells showing
condensed chromatin (arrows). (D) Cells showing fragmented nucleus and apoptotic bodies (arrow). Scale bar 10 mm.
Fig. 4. Time course effect of 1 mg/ml of ricin on % DNA fragmentation (A) % apoptotic cells (B). The values are mean � S.E. of four replicates. Significantly
different from control at p � 0.05 by Student’s t-test. (C) DNA agarose gel electrophoresis of ricin-treated HeLa cells (1 mg/ml) Lane M 1 kb ladder, lane 1
control, lanes 2–6 ricin-treated cells for 2, 4, 8, 16, 24 h, respectively.
P.V.L. Rao et al. / Biochemical Pharmacology 69 (2005) 855–865 861
Fig. 5. DNA diffusion assay of control and ricin-treated HeLa cells after YOYO-1 staining (A–D). (A) and (B) control cells showing intensely stained nucleus.
(C) A normal cell and an apoptotic cell (arrow) after ricin treatment for 8 h. (D) An early stage of necrotic cell (arrow). Scale bar: 5 mm.
Fig. 6. Time course effect of 1 mg/ml of ricin on reactive oxygen species
generation (A) and (B) intracellular glutathione levels. For ROS estimation
cells were loaded with 5 mM DCF-DA followed by specified concentration of
ricin and incubated at 37 8C for 4 h. The values are mean � S.E. of four
replicates. Significantly different from control at p � 0.05 by Student’s t-test.
3.3. Triggering of apoptosis by oxidative stress
Several reports suggest an involvement of reactive oxy-
gen species (ROS), up stream of caspse-3 activation in
signal transduction pathways leading to apoptosis. To
determine the involvement of oxidative stress in ricin-
induced HeLa cells apoptosis, ROS levels were determined
in a time course experiment (Fig. 6A). Cells treated with
ricin showed only marginal increase at 30 and 60 min post-
treatment. At 2 h it showed nearly two-fold increase in
levels compared to control cells. Maximum increase was
observed at 3 h and no further increase was observed at
longer treatment duration (data shown up to 4 h). One of
the consequences of ROS is scavenging of free radicals by
glutathione (GSH). Intracellular GSH levels were mea-
sured in ricin-treated HeLa cells at different time points
and the results are summarized in Fig. 6B. There was
significant GSH depletion in ricin-treated cells at 4 h with
more than 50% depletion at 8 h and nearly 90% depletion
compared to control cells at 24 h treatment.
3.4. Activation of caspase-3 and PARP cleavage
To directly address the involvement of caspase-3 like
proteases in ricin-induced apoptosis, caspase-3 activity
was determined in ricin-treated HeLa cells using fluoro-
genic caspase-3 substrate Ac-DEVD-AMC. Ricin-treated
cells showed marginal caspase-3 activity by 1 h and
reached three-fold increase by 4 h treatment (Fig. 7A).
The casapase-3 activity reduced with treatment duration
and reached a plateau by 8 h and no further increase was
observed at 16 and 24 h treatment. The quantitative cas-
P.V.L. Rao et al. / Biochemical Pharmacology 69 (2005) 855–865862
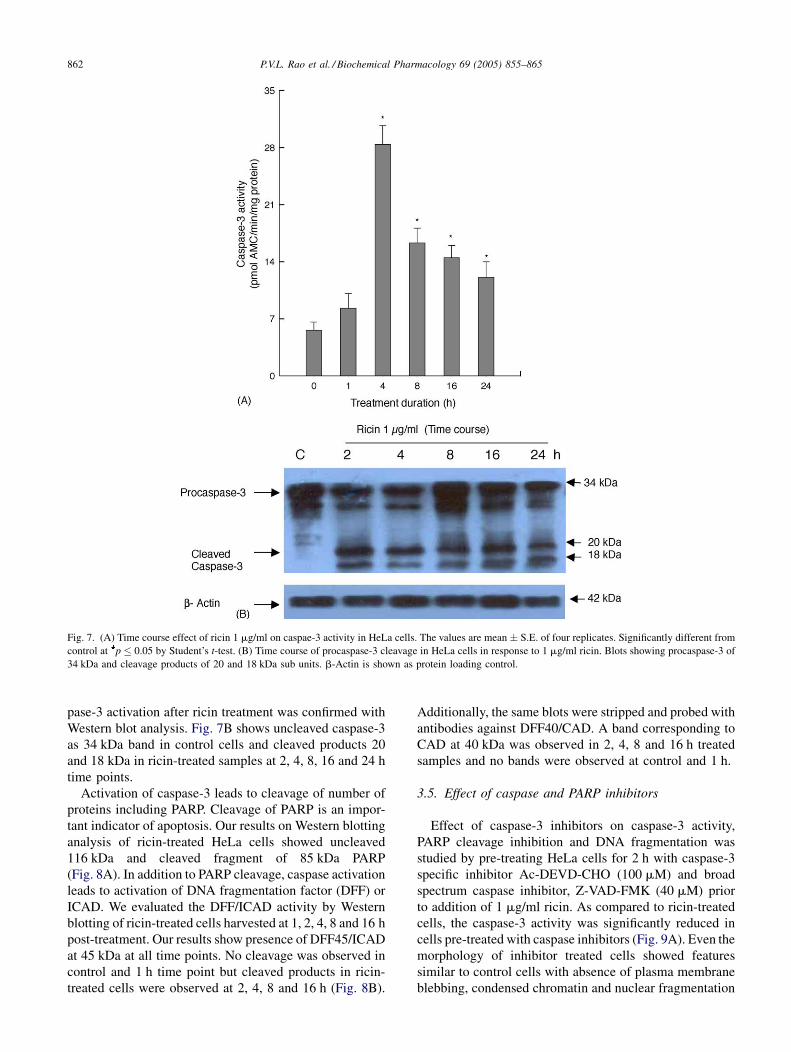
Fig. 7. (A) Time course effect of ricin 1 mg/ml on caspae-3 activity in HeLa cells. The values are mean � S.E. of four replicates. Significantly different from
control at p � 0.05 by Student’s t-test. (B) Time course of procaspase-3 cleavage in HeLa cells in response to 1 mg/ml ricin. Blots showing procaspase-3 of
34 kDa and cleavage products of 20 and 18 kDa sub units. b-Actin is shown as protein loading control.
pase-3 activation after ricin treatment was confirmed with
Western blot analysis. Fig. 7B shows uncleaved caspase-3
as 34 kDa band in control cells and cleaved products 20
and 18 kDa in ricin-treated samples at 2, 4, 8, 16 and 24 h
time points.
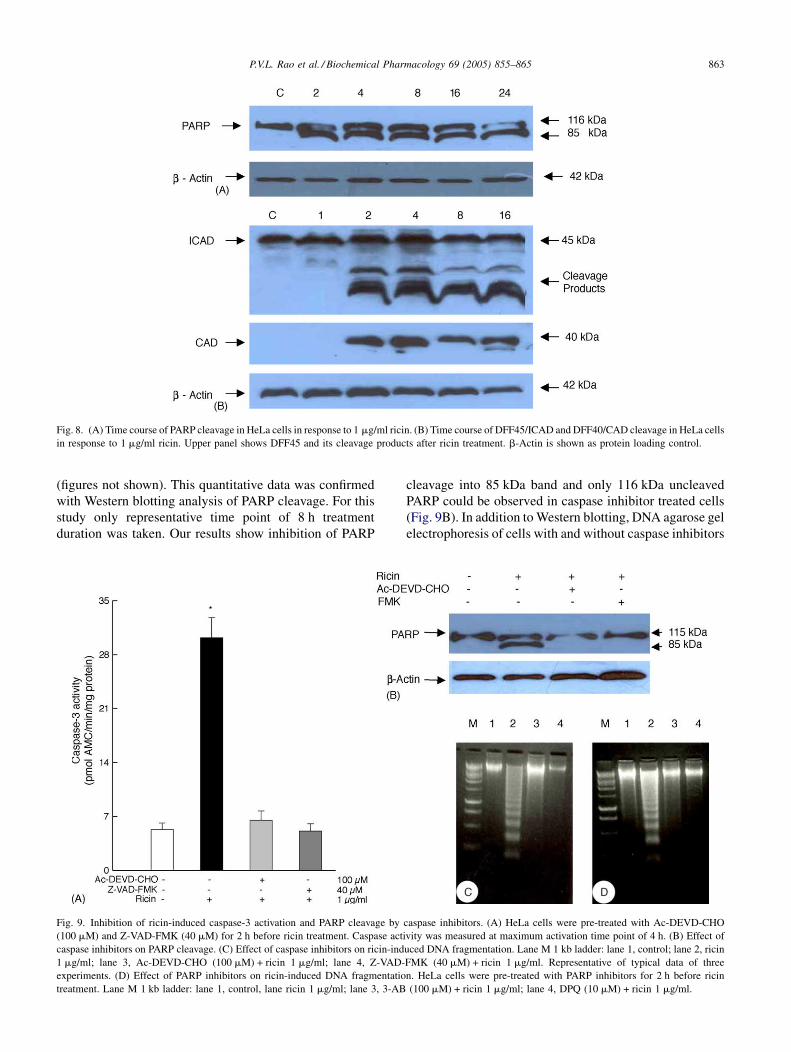
Activation of caspase-3 leads to cleavage of number of
proteins including PARP. Cleavage of PARP is an impor-
tant indicator of apoptosis. Our results on Western blotting
analysis of ricin-treated HeLa cells showed uncleaved
116 kDa and cleaved fragment of 85 kDa PARP
(Fig. 8A). In addition to PARP cleavage, caspase activation
leads to activation of DNA fragmentation factor (DFF) or
ICAD. We evaluated the DFF/ICAD activity by Western
blotting of ricin-treated cells harvested at 1, 2, 4, 8 and 16 h
post-treatment. Our results show presence of DFF45/ICAD
at 45 kDa at all time points. No cleavage was observed in
control and 1 h time point but cleaved products in ricin-
treated cells were observed at 2, 4, 8 and 16 h (Fig. 8B).
Additionally, the same blots were stripped and probed with
antibodies against DFF40/CAD. A band corresponding to
CAD at 40 kDa was observed in 2, 4, 8 and 16 h treated
samples and no bands were observed at control and 1 h.
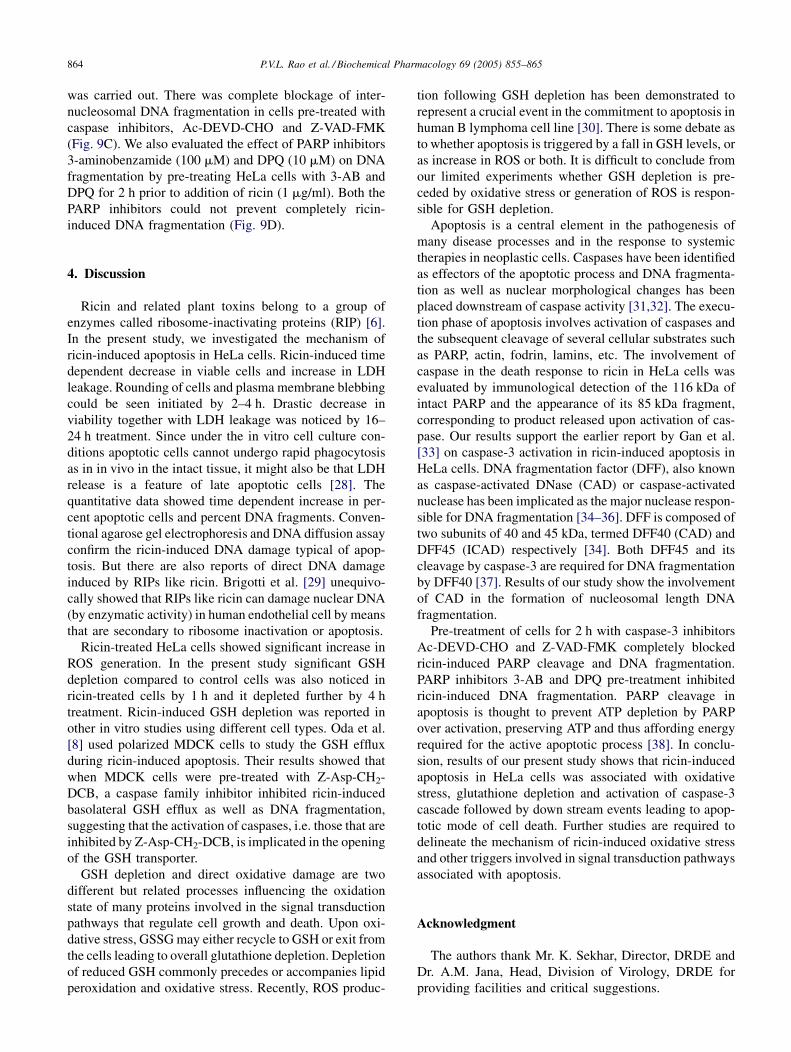
3.5. Effect of caspase and PARP inhibitors
Effect of caspase-3 inhibitors on caspase-3 activity,
PARP cleavage inhibition and DNA fragmentation was
studied by pre-treating HeLa cells for 2 h with caspase-3
specific inhibitor Ac-DEVD-CHO (100 mM) and broad
spectrum caspase inhibitor, Z-VAD-FMK (40 mM) prior
to addition of 1 mg/ml ricin. As compared to ricin-treated
cells, the caspase-3 activity was significantly reduced in
cells pre-treated with caspase inhibitors (Fig. 9A). Even the
morphology of inhibitor treated cells showed features
similar to control cells with absence of plasma membrane
blebbing, condensed chromatin and nuclear fragmentation
P.V.L. Rao et al. / Biochemical Pharmacology 69 (2005) 855–865 863
Fig. 8. (A) Time course of PARP cleavage in HeLa cells in response to 1 mg/ml ricin. (B) Time course of DFF45/ICAD and DFF40/CAD cleavage in HeLa cells
in response to 1 mg/ml ricin. Upper panel shows DFF45 and its cleavage products after ricin treatment. b-Actin is shown as protein loading control.
(figures not shown). This quantitative data was confirmed
with Western blotting analysis of PARP cleavage. For this
study only representative time point of 8 h treatment
duration was taken. Our results show inhibition of PARP
Fig. 9. Inhibition of ricin-induced caspase-3 activation and PARP cleavage by
(100 mM) and Z-VAD-FMK (40 mM) for 2 h before ricin treatment. Caspase acti
caspase inhibitors on PARP cleavage. (C) Effect of caspase inhibitors on ricin-ind
1 mg/ml; lane 3, Ac-DEVD-CHO (100 mM) + ricin 1 mg/ml; lane 4, Z-VAD-
experiments. (D) Effect of PARP inhibitors on ricin-induced DNA fragmentatio
treatment. Lane M 1 kb ladder: lane 1, control, lane ricin 1 mg/ml; lane 3, 3-AB
cleavage into 85 kDa band and only 116 kDa uncleaved
PARP could be observed in caspase inhibitor treated cells
(Fig. 9B). In addition to Western blotting, DNA agarose gel
electrophoresis of cells with and without caspase inhibitors
caspase inhibitors. (A) HeLa cells were pre-treated with Ac-DEVD-CHO
vity was measured at maximum activation time point of 4 h. (B) Effect of
uced DNA fragmentation. Lane M 1 kb ladder: lane 1, control; lane 2, ricin
FMK (40 mM) + ricin 1 mg/ml. Representative of typical data of three
n. HeLa cells were pre-treated with PARP inhibitors for 2 h before ricin
(100 mM) + ricin 1 mg/ml; lane 4, DPQ (10 mM) + ricin 1 mg/ml.
P.V.L. Rao et al. / Biochemical Pharmacology 69 (2005) 855–865864
was carried out. There was complete blockage of inter-
nucleosomal DNA fragmentation in cells pre-treated with
caspase inhibitors, Ac-DEVD-CHO and Z-VAD-FMK
(Fig. 9C). We also evaluated the effect of PARP inhibitors
3-aminobenzamide (100 mM) and DPQ (10 mM) on DNA
fragmentation by pre-treating HeLa cells with 3-AB and
DPQ for 2 h prior to addition of ricin (1 mg/ml). Both the
PARP inhibitors could not prevent completely ricin-
induced DNA fragmentation (Fig. 9D).
4. Discussion
Ricin and related plant toxins belong to a group of
enzymes called ribosome-inactivating proteins (RIP) [6].
In the present study, we investigated the mechanism of
ricin-induced apoptosis in HeLa cells. Ricin-induced time
dependent decrease in viable cells and increase in LDH
leakage. Rounding of cells and plasma membrane blebbing
could be seen initiated by 2–4 h. Drastic decrease in
viability together with LDH leakage was noticed by 16–
24 h treatment. Since under the in vitro cell culture con-
ditions apoptotic cells cannot undergo rapid phagocytosis
as in in vivo in the intact tissue, it might also be that LDH
release is a feature of late apoptotic cells [28]. The
quantitative data showed time dependent increase in per-
cent apoptotic cells and percent DNA fragments. Conven-
tional agarose gel electrophoresis and DNA diffusion assay
confirm the ricin-induced DNA damage typical of apop-
tosis. But there are also reports of direct DNA damage
induced by RIPs like ricin. Brigotti et al. [29] unequivo-
cally showed that RIPs like ricin can damage nuclear DNA
(by enzymatic activity) in human endothelial cell by means
that are secondary to ribosome inactivation or apoptosis.
Ricin-treated HeLa cells showed significant increase in
ROS generation. In the present study significant GSH
depletion compared to control cells was also noticed in
ricin-treated cells by 1 h and it depleted further by 4 h
treatment. Ricin-induced GSH depletion was reported in
other in vitro studies using different cell types. Oda et al.
[8] used polarized MDCK cells to study the GSH efflux
during ricin-induced apoptosis. Their results showed that
when MDCK cells were pre-treated with Z-Asp-CH2-
DCB, a caspase family inhibitor inhibited ricin-induced
basolateral GSH efflux as well as DNA fragmentation,
suggesting that the activation of caspases, i.e. those that are
inhibited by Z-Asp-CH2-DCB, is implicated in the opening
of the GSH transporter.
GSH depletion and direct oxidative damage are two
different but related processes influencing the oxidation
state of many proteins involved in the signal transduction
pathways that regulate cell growth and death. Upon oxi-
dative stress, GSSG may either recycle to GSH or exit from
the cells leading to overall glutathione depletion. Depletion
of reduced GSH commonly precedes or accompanies lipid
peroxidation and oxidative stress. Recently, ROS produc-
tion following GSH depletion has been demonstrated to
represent a crucial event in the commitment to apoptosis in
human B lymphoma cell line [30]. There is some debate as
to whether apoptosis is triggered by a fall in GSH levels, or
as increase in ROS or both. It is difficult to conclude from
our limited experiments whether GSH depletion is pre-
ceded by oxidative stress or generation of ROS is respon-
sible for GSH depletion.
Apoptosis is a central element in the pathogenesis of
many disease processes and in the response to systemic
therapies in neoplastic cells. Caspases have been identified
as effectors of the apoptotic process and DNA fragmenta-
tion as well as nuclear morphological changes has been
placed downstream of caspase activity [31,32]. The execu-
tion phase of apoptosis involves activation of caspases and
the subsequent cleavage of several cellular substrates such
as PARP, actin, fodrin, lamins, etc. The involvement of
caspase in the death response to ricin in HeLa cells was
evaluated by immunological detection of the 116 kDa of
intact PARP and the appearance of its 85 kDa fragment,
corresponding to product released upon activation of cas-
pase. Our results support the earlier report by Gan et al.
[33] on caspase-3 activation in ricin-induced apoptosis in
HeLa cells. DNA fragmentation factor (DFF), also known
as caspase-activated DNase (CAD) or caspase-activated
nuclease has been implicated as the major nuclease respon-
sible for DNA fragmentation [34–36]. DFF is composed of
two subunits of 40 and 45 kDa, termed DFF40 (CAD) and
DFF45 (ICAD) respectively [34]. Both DFF45 and its
cleavage by caspase-3 are required for DNA fragmentation
by DFF40 [37]. Results of our study show the involvement
of CAD in the formation of nucleosomal length DNA
fragmentation.
Pre-treatment of cells for 2 h with caspase-3 inhibitors
Ac-DEVD-CHO and Z-VAD-FMK completely blocked
ricin-induced PARP cleavage and DNA fragmentation.
PARP inhibitors 3-AB and DPQ pre-treatment inhibited
ricin-induced DNA fragmentation. PARP cleavage in
apoptosis is thought to prevent ATP depletion by PARP
over activation, preserving ATP and thus affording energy
required for the active apoptotic process [38]. In conclu-
sion, results of our present study shows that ricin-induced
apoptosis in HeLa cells was associated with oxidative
stress, glutathione depletion and activation of caspase-3
cascade followed by down stream events leading to apop-
totic mode of cell death. Further studies are required to
delineate the mechanism of ricin-induced oxidative stress
and other triggers involved in signal transduction pathways
associated with apoptosis.
Acknowledgment
The authors thank Mr. K. Sekhar, Director, DRDE and
Dr. A.M. Jana, Head, Division of Virology, DRDE for
providing facilities and critical suggestions.
P.V.L. Rao et al. / Biochemical Pharmacology 69 (2005) 855–865 865
References
[1] Olsnes S, Phil A. Different biological properties of two constituent
peptide chain of ricin, a toxic protein inhibiting protein synthesis.
Biochemistry 1973;12:3121–6.
[2] Endo Y, Tsurugi K. RNA N-glycosidase activity of ricin A-chain. J
Biol Chem 1987;262:8128–30.
[3] Olsnes S. The history of ricin, abrin and related toxins. Toxicon
2004;44:361–70.
[4] Vitetta ES, Thorpe PE. Immunotoxins containing ricin or it’s A chain.
Semin Cell Biol 1991;2:47–58.
[5] Sadani GR, Soman CS, Deodhar K, Nadkarni GD. Reactive oxygen
species involvement in ricin-induced thyroid toxicity in rat. Hum Exp
Toxicol 1997;16:254–6.
[6] Barbieri L, Batteli MG, Stripe F. Ribosome-inactivating proteins from
plants. Biochim Biophys Acta 1993;1154:237–82.
[7] Hughes JN, Lindsay CD, Griffiths GD. Morphology of ricin and abrin
exposed endothelial cells is consistent with apoptotic cell death. Hum
Exp Toxicol 1996;15:443–51.
[8] Oda T, Sadakata N, Komatsu N, Muramatsu T. Specific efflux of
glutathione from the basolateral membrane domain in polarized
MDCK cells during ricin-induced apoptosis. J Biochem
1999;126:715–21.
[9] Hassoun EA, Wang X. Time and concentration dependent production
of superoxide anion, nitric oxide, DNA damage, and cellular death by
ricin in the J774A.1 macrophage cells. J Biochem Mol Toxicol
1999;13:179–85.
[10] Muldoon DF, Hassoun EA, Stohs SJ. Ricin-induced hepatic lipid
peroxidation, glutathione depletion and DNA single-strand breaks
in mice. J Biochem Toxicol 1994;9:311–8.
[11] Kumar O, Sugendran K, Vijayaraghavan R. Oxidative stress associated
hepatic and renal toxicity induced by ricin in mice. Toxicon
2003;41:333–8.
[12] Kerr JF, Wyllie AH, Currie AR. Apoptosis: a basic biological phe-
nomenon with wide-ranging implications in tissue kinetics. Br J
Cancer 1972;26:239–57.
[13] Gerner C, Gotzmann J, Frohwein U, Schamberger C, Ellinger A,
Sauermann G. Proteome analysis of nuclear matrix proteins during
apoptotic chromatin condensation. Cell Death Differ 2002;9:671–81.
[14] Griffiths GD, Leek MD, Gee DJ. The toxic proteins ricin and abrin
induce apoptotic change in mammalian lymphoid tissues and intestine.
J Pathol 1987;151:221–9.
[15] Komatsu N, Nakagawa M, Oda T, Muramatsu T. Depletion of intra-
cellular NAD+ and ATP levels during ricin-induced apoptosis through
specific ribosomal inactivation results in cytolysis of U937 cells. J
Biochem 2000;128:463–70.
[16] Tamura T, Sadakat N, Oda T, Muramatsu T. Role of zinc ions in ricin-
induced apoptosis in U937 cells. Toxicol Lett 2002;132:141–51.
[17] Griffiths GD, Lindsay CD, Allenby AC, Bailey SC, Scawin JW, Rice P,
et al. Protection against inhalation toxicity of ricin and abrin by
immunisation. Human Exp Toxicol 1995;14:155–64.
[18] Wang CY, Mayo MW, Baldwin AS. TNF-a and cancer therapy-
induced apoptosis: potentiation by inhibition of NF-kB. Science
1996;274:784–7.
[19] Rao PVL, Bhattacharya R, Parida MM, Jana AM, Bhaskar ASB.
Freshwater cyanobacterium Microcystis aeruginosa (UTEX2385)
induced DNA damage in vivo and in vitro. Environ Toxicol Pharmacol
1998;5:1–6.
[20] Rao PVL, Bhattacharya R, Nidhi G, Parida MM, Bhaskar ASB, Dubey
R. Involvement of caspase and reactive oxygen species in cyanobac-
terial toxin anatoxin-a-induced cytotoxicity and apoptosis in rat
thymocytes and Vero cells. Arch Toxicol 2002;76:227–35.
[21] Singh NP. A simple method for accurate estimation of apoptotic cells.
Exp Cell Res 2000;256:328–37.
[22] Wyllie AH. Glucocorticoid-induced thymocytes apoptosis is asso-
ciated with endogenous endonuclease activation. Nature 1980;284:
555–6.
[23] Gong J, Trganos F, Darzynkiewicz Z. A selective procedure for DNA
extraction from apoptotic cells applicable for gel electrophoresis and
flow cytometry. Anal Biochem 1994;218:314–9.
[24] LeBel CP, Ischiopoulos H, Bondy SC. Evaluation of the probe 2,7-
dichlorofluorescin as indicator of reactive oxygen species formation
and oxidative stress. Chem Res Toxicol 1992;5:227–31.
[25] Hisin PJ, Hilf R. A fluorometric method for determination of oxidised
and reduced glutathione in tissues. Anal Biochem 1976;74:214–26.
[26] Nicholson DW, Ali A, Thornberry NA, Vaillancourt JP, Ding CK,
Gallant M, et al. Identification and inhibition of the IEC/CED-3
protease necessary for mammalian apoptosis. Nature 1995;376:
37–43.
[27] Shah GM, Poirier D, Duchaine C, Brochu G, Desnoyers S, Laguenx J,
et al. Methods for biochemical study of poly(ADP-ribose) metabolism
in vitro and in vivo. Anal Biochem 1995;227:1–13.
[28] Grub S, Persohn E, Trommer W, Wolf A. Mechanisms of cyclospor-
ine-A induced apoptosis in rat hepatocytes primary cultures. Toxicol
Appl Phramacol 2000;163:209–20.
[29] Brigotti M, Alfieri R, Sestili P, Bonelli M, Petronini PG, Guidarelli A,
et al. Damage to nuclear DNA induced by Shiga toxin 1 and ricin in
human endothelial cells. FASEB J 2002;16:365–72.
[30] Armstrong JS, Steinauer KK, Hornung B, Irish JM, Lecane P, Birrell
GW, et al. Role of glutathione depletion and reactive oxygen species
generation in apoptosis signalling in a human lymphoma cell line. Cell
Death Differ 2002;9:252–63.
[31] Janicke RU, Sprengart ML, Wati MR, Porter AG. Caspase-3 is
required for DNA fragmentation and morphological changes asso-
ciated with apoptosis. J Biol Chem 1998;273:935–60.
[32] Fisher U, Janicke RU, Schulz-Osthof K. Many cuts to ruin: a com-
prehensive update of caspase substrates. Cell Death Differ 2003;10:
76–100.
[33] Gan YH, Peng SQ, Liu HY. Molecular mechanism of apoptosis
induced by ricin in HeLa cells. Acta Pharmacol Sin 2000;21:
243–8.
[34] Liu X, Zou H, Slaughter C, Wang X. DFF, a heterodimeric protein that
functions downstream of caspase-3 to trigger DNA fragmentation
during apoptosis. Cell 1997;89:175–84.
[35] Enari M, Sakahira H, Yokoyama H, Okkawa K, Iwamastsu A, Nagata
S. A caspase-activated DNAse that degrades DNA during apoptosis,
and its inhibitor ICAD. Nature 1998;391:43–50.
[36] Halenbeck R, MacDonald H, Roulston A, Chen TT, Conroy L,
Williams LT. CPAN, a human nuclease regulated by the caspase-
sensitive inhibitor DFF45. Curr Biol 1998;8:537–40.
[37] Laszlo V, Szabo C. The therapeutic potential of poly(ADP-ribose)
polymerase inhibitors. Pharmacol Rev 2002;54:375–429.
[38] Boulares AH, Zoltoski AJ, Sherif ZA, Yakovlev A, Smulson ME.
Roles of DNA fragmentation factor and poly(ADP-ribose)polymer-
ase-1 in sensitisation of fibroblasts to tumour necrosis factor-induced
apoptosis. Biochem Biophys Res Commun 2002;290:796–801.