The DEAD box protein p68: a novel transcriptional coactivator of the p53 tumour suppressor
doi:10.1016/j.jmb.2011.04.004 J. Mol. Biol. (2011) 409, 399–414
Contents lists available at www.sciencedirect.com
Journal of Molecular Biologyj ourna l homepage: ht tp : / /ees.e lsev ie r.com. jmb
Mechanism of Mss116 ATPase Reveals FunctionalDiversity of DEAD-Box Proteins
Wenxiang Cao1, Maria Magdalena Coman1, Steve Ding1, Arnon Henn1,Elizabeth R. Middleton2, Michael J. Bradley1, Elizabeth Rhoades1,David D. Hackney3, Anna Marie Pyle1, 4 and Enrique M. De La Cruz1⁎1Department of Molecular Biophysics and Biochemistry, Yale University, 260 Whitney Avenue, New Haven,CT 06520-8114, USA2Department of Chemistry, Yale University, New Haven, CT 06520, USA3Department of Biological Sciences, Carnegie Mellon University, 4400 Fifth Avenue, Pittsburgh, PA 15213, USA4The Howard Hughes Medical Institute, Chevy Chase, MD, USA
Received 7 February 2011;received in revised form31 March 2011;accepted 1 April 2011Available online9 April 2011
Edited by D. E. Draper
Keywords:RNA helicase;ATPase cycle;kinetics;fluorescence correlationspectroscopy
*Corresponding author. E-mail [email protected] address: M.M. Coman, De
Laboratory, Yale University, New HAbbreviations used: Pi, inorganic
fluorescence correlation spectroscop
0022-2836/$ - see front matter © 2011 E
Mss116 is a Saccharomyces cerevisiaemitochondrial DEAD-box RNA helicaseprotein that is essential for efficient in vivo splicing of all group I and groupII introns and for activation of mRNA translation. Catalysis of intronsplicing by Mss116 is coupled to its ATPase activity. Knowledge of thekinetic pathway(s) and biochemical intermediates populated during RNA-stimulated Mss116 ATPase is fundamental for defining how Mss116 ATPutilization is linked to in vivo function. We therefore measured the rate andequilibrium constants underlying Mss116 ATP utilization and nucleotide-linked RNA binding. RNA accelerates the Mss116 steady-state ATPase ∼7-fold by promoting rate-limiting ATP hydrolysis such that inorganicphosphate (Pi) release becomes (partially) rate-limiting. RNA bindingdisplays strong thermodynamic coupling to the chemical states of theMss116-bound nucleotide such that Mss116 with bound ADP-Pi binds RNAmore strongly thanMss116 with bound ADP or in the absence of nucleotide.The predominant biochemical intermediate populated during in vivosteady-state cycling is the strong RNA-binding Mss116–ADP-Pi state.Strong RNA binding allows Mss116 to fulfill its biological role in thestabilization of group II intron folding intermediates. ATPase cycling allowsfor transient population of the weak RNA-binding ADP state of Mss116 andlinked dissociation from RNA, which is required for the final stages ofintron folding. In cases where Mss116 functions as a helicase, the datacollectively favor a model in which ATP hydrolysis promotes a weak-to-strong RNA binding transition that disrupts stable RNA duplexes. Thesubsequent strong-to-weak RNA binding transition associated with Pirelease dissociates Mss116–RNA complexes, regenerating free Mss116.
© 2011 Elsevier Ltd. All rights reserved.
ess:
partment of Medicineaven, CT 06520, USA.phosphate; FCS,y.
lsevier Ltd. All rights reserve
Introduction
DEAD-box proteins are a family of RNA-stimulatedATPase enzymes that couple ATP utilization to a localconformational rearrangement of RNA1–6 at all levelsof RNA metabolism, including transcription andreplication, protein translation, pre-mRNA splicing
d.

400 RNA-Stimulated ATPase of Mss116
and editing, ribosome biogenesis, RNA export to thecytoplasm, and RNA degradation.7–13 Mss116 is anessentialSaccharomyces cerevisiaemitochondrialDEAD-box protein that is required for the splicing of all groupI and group II introns14–19 and for active mRNAtranslation.14,17,20 The ability of Mss116 to stimulategroup I and group II intron splicing correlates withRNA unwinding activity,20 although efficient helixunwinding is neither essential15 nor sufficient18 forsplicing activity.14–16,21,22 These data indicate thatMss116 has multiple mechanistic roles during thecourse of intron splicing and that it may have differentfunctions in different types of RNA substrates.22,23
Quantitative determination of the discrete stepsassociated with RNA-stimulated Mss116 ATPaseactivity is essential for understanding its biologicalrole in stimulating the efficient splicing of all group Iand group II introns and in activating mitochondrialmRNA translation. However, mechanistic detailsregarding Mss116 ATPase enzymology—includingthe kinetic and equilibrium constants defining ATPutilization, the biochemical intermediates populatedduring catalytic cycling, and the coupling betweenATP consumption and RNA interactions along thereaction pathway—are lacking.
Fig. 1. Steady-state ATPase activity of Mss116. (a) [Mss116]RNA and in the presence of 10 mMMgATP with RNase A (filleThe slope yields kcat values of 0.26 s−1 Mss116−1 without RNdependence of Mss116 steady-state ATPase rate in the presence(10). The inset shows the time courses of steady-state ADPprodsample of 50 nMMss116 and (top to bottom) 0 nM, 50 nM, 200 nthe best fits to a line. (c) [ATP] dependence of Mss116 steady-stKm,ATP values obtained from the best fits to the hyperbolic formin Table 1. (d) [RNA] dependence of Mss116 steady-state ATpresence of 2.4 mM MgATP for stoichiometry determination. Tbimolecular binding equation (Supplementary Material B), wi
Here, we present a quantitative kinetic and equilib-rium analysis of the RNA-stimulated ATPase andnucleotide-linked RNA binding activities of Mss116.Bound RNA stimulates Mss116 ATPase by promotingATP hydrolysis. RNA binding is nucleotide-depen-dent, yielding “weak” and “strong” RNA bindingstates. The RNA binding affinity of Mss116 progres-sively increases with ATP binding and subsequenthydrolysis, and thenweakens bymore than 2 orders ofmagnitude after phosphate is released. This knowl-edge advances our understanding of the molecularmechanism of coupling between Mss116 ATP utiliza-tion and RNA conformational rearrangement, andpermits the development of predictive ATPase-de-pendent models of Mss116-catalyzed group I andgroup II intron splicing and mRNA translation.
Results
Steady-state ATPase activity of Mss116
RNA enhances the maximal Mss116 steady-stateATPase activity (kcat)∼7-fold from0.26 s− 1Mss116−1
dependence of intrinsic ATPase activity in the absence ofd triangles; red) and without RNase A (filled circle; black).ase A and 0.29 s−1 Mss116−1 with RNase A. (b) [RNA]of 10 mMMgATP. The continuous line is the best fit to Eq.
uction upon addition of 10mMMgATP to a preequilibratedM, 400 nM, and 5000 nMRNA. The smooth lines representate ATPase rate in the presence of 2 μMRNA. The kcat andof the Briggs–Haldane equation (continuous line) are listedPase rate measured with 2 μM (≫Km,RNA) Mss116 in thehe continuous line is the best fit of the data to the implicitth the stoichiometry unconstrained during the fitting.
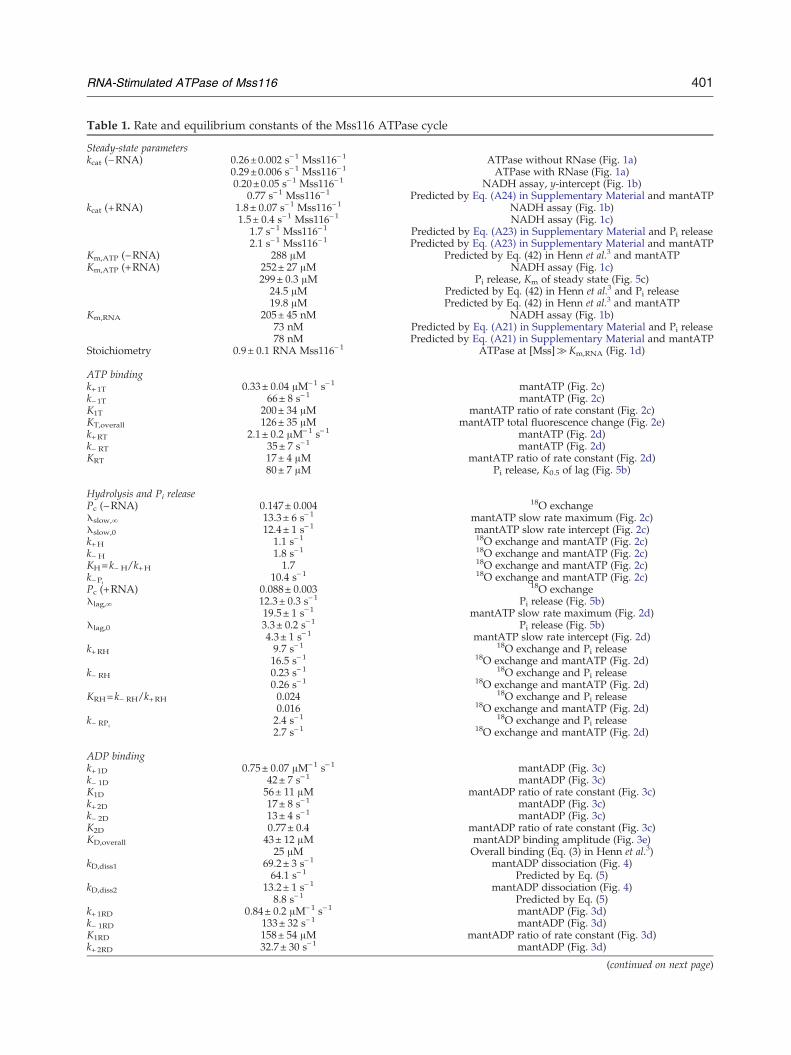
Table 1. Rate and equilibrium constants of the Mss116 ATPase cycle
Steady-state parameterskcat (−RNA) 0.26±0.002 s−1 Mss116−1 ATPase without RNase (Fig. 1a)
0.29±0.006 s−1 Mss116−1 ATPase with RNase (Fig. 1a)0.20±0.05 s−1 Mss116−1 NADH assay, y-intercept (Fig. 1b)
0.77 s−1 Mss116−1 Predicted by Eq. (A24) in Supplementary Material and mantATPkcat (+RNA) 1.8± 0.07 s−1 Mss116−1 NADH assay (Fig. 1b)
1.5± 0.4 s−1 Mss116−1 NADH assay (Fig. 1c)1.7 s−1 Mss116−1 Predicted by Eq. (A23) in Supplementary Material and Pi release2.1 s−1 Mss116−1 Predicted by Eq. (A23) in Supplementary Material and mantATP
Km,ATP (−RNA) 288 μM Predicted by Eq. (42) in Henn et al.3 and mantATPKm,ATP (+RNA) 252± 27 μM NADH assay (Fig. 1c)
299± 0.3 μM Pi release, Km of steady state (Fig. 5c)24.5 μM Predicted by Eq. (42) in Henn et al.3 and Pi release19.8 μM Predicted by Eq. (42) in Henn et al.3 and mantATP
Km,RNA 205± 45 nM NADH assay (Fig. 1b)73 nM Predicted by Eq. (A21) in Supplementary Material and Pi release78 nM Predicted by Eq. (A21) in Supplementary Material and mantATP
Stoichiometry 0.9± 0.1 RNA Mss116−1 ATPase at [Mss]≫Km,RNA (Fig. 1d)
ATP bindingk+1T 0.33± 0.04 μM−1 s−1 mantATP (Fig. 2c)k−1T 66± 8 s−1 mantATP (Fig. 2c)K1T 200± 34 μM mantATP ratio of rate constant (Fig. 2c)KT,overall 126± 35 μM mantATP total fluorescence change (Fig. 2e)k+RT 2.1± 0.2 μM−1 s−1 mantATP (Fig. 2d)k− RT 35± 7 s−1 mantATP (Fig. 2d)KRT 17± 4 μM mantATP ratio of rate constant (Fig. 2d)
80± 7 μM Pi release, K0.5 of lag (Fig. 5b)
Hydrolysis and Pi releasePc (−RNA) 0.147± 0.004 18O exchangeλslow,∞ 13.3± 6 s−1 mantATP slow rate maximum (Fig. 2c)λslow,0 12.4± 1 s−1 mantATP slow rate intercept (Fig. 2c)k+H 1.1 s−1 18O exchange and mantATP (Fig. 2c)k− H 1.8 s−1 18O exchange and mantATP (Fig. 2c)KH=k− H/k+H 1.7 18O exchange and mantATP (Fig. 2c)k−Pi
10.4 s−1 18O exchange and mantATP (Fig. 2c)Pc (+RNA) 0.088± 0.003 18O exchangeλlag,∞ 12.3± 0.3 s−1 Pi release (Fig. 5b)
19.5± 1 s−1 mantATP slow rate maximum (Fig. 2d)λlag,0 3.3± 0.2 s−1 Pi release (Fig. 5b)
4.3± 1 s−1 mantATP slow rate intercept (Fig. 2d)k+RH 9.7 s−1 18O exchange and Pi release
16.5 s−1 18O exchange and mantATP (Fig. 2d)k− RH 0.23 s−1 18O exchange and Pi release
0.26 s−1 18O exchange and mantATP (Fig. 2d)KRH=k− RH/k+RH 0.024 18O exchange and Pi release
0.016 18O exchange and mantATP (Fig. 2d)k− RPi
2.4 s−1 18O exchange and Pi release2.7 s−1 18O exchange and mantATP (Fig. 2d)
ADP bindingk+1D 0.75± 0.07 μM−1 s−1 mantADP (Fig. 3c)k− 1D 42± 7 s−1 mantADP (Fig. 3c)K1D 56± 11 μM mantADP ratio of rate constant (Fig. 3c)k+2D 17± 8 s−1 mantADP (Fig. 3c)k− 2D 13± 4 s−1 mantADP (Fig. 3c)K2D 0.77± 0.4 mantADP ratio of rate constant (Fig. 3c)KD,overall 43± 12 μM mantADP binding amplitude (Fig. 3e)
25 μM Overall binding (Eq. (3) in Henn et al.3)kD,diss1 69.2± 3 s−1 mantADP dissociation (Fig. 4)
64.1 s−1 Predicted by Eq. (5)kD,diss2 13.2± 1 s−1 mantADP dissociation (Fig. 4)
8.8 s−1 Predicted by Eq. (5)k+1RD 0.84± 0.2 μM−1 s−1 mantADP (Fig. 3d)k− 1RD 133± 32 s−1 mantADP (Fig. 3d)K1RD 158± 54 μM mantADP ratio of rate constant (Fig. 3d)k+2RD 32.7± 30 s−1 mantADP (Fig. 3d)
(continued on next page)
401RNA-Stimulated ATPase of Mss116

k− 2RD 26.5± 7 s−1 mantADP (Fig. 3d)K2RD 0.81± 0.7 mantADP ratio of rate constant (Fig. 3d)KRD,overall 91.6± 8 μM mantADP binding total amplitude
70.9 μM Overall binding (Eq. (3) in Henn et al.3)kRD,diss1 194.0± 51 s−1 mantADP dissociation (Fig. 4)
172 s−1 Predicted by Eq. (5)kRD,diss2 16.9± 2 s−1 mantADP dissociation (Fig. 4)
20.5 s−1 Predicted by Eq. (5)
Three-dimensional diffusionτRNA 0.27± 0.008 ms FCS, global fit with two species (Fig. 6a)τRNA,ADP 0.26± 0.008 ms FCS, global fit with two speciesτ Mss116–RNA 0.69± 0.04 ms FCS, global fit with two species (Fig. 6a)τ Mss116–ADP–RNA 0.56± 0.08 ms FCS, global fit with two speciesτMss116 0.52 ms FCS, fit one species
Duplex RNA strand displacementksd (+ATP) 2.1± 0.01 s−1 Unwinding, fast phase with ATP (Fig. 8)ksd (−ATP) 0.11± 0.0004 s−1 Unwinding, slow phase with ATP (Fig. 8)
0.18± 0.0009 s−1 Unwinding without ATP (Fig. 8)
RNA bindingKR 117± 21 nM FCS, fractional complex fit (Fig. 6b)
122± 22 nM FCS, average diffusing time fitKTR 47 nM Calculated from detailed balancea
KDPiR 0.67 nM Calculated from detailed balanceb
KDR1 328 nM Calculated from detailed balancec
KDR2 345 nM Calculated from detailed balanced
KDR, overall 775± 316 nM FCS, fractional complex fit (Fig. 6b)848± 91 nM FCS, average diffusing time fit336 nM Calculated from detailed balancee
Ki=k− i/k+ i represents dissociation equilibrium constants.a Calculated from KTR=KRTKR/KT.b Calculated from KDPiR=KRHKTR/KH.c Calculated from K1DR=K1RDKR/K1D.d Calculated from K2DR=K2RDK1DR/K2D.e Calculated from KDR,overall=KRD,overallKR/KD,overall.
Table 1. (continued)
402 RNA-Stimulated ATPase of Mss116
to 1.5–1.8 s−1 Mss116−1 (Fig. 1, Table 1), within therange of 0.17–3.5 s−1 Mss116−1 measured for full-length and truncated Mss116 using different assayswith various RNA substrates under slightly differenttemperature and buffer conditions.16,21,24 TheATPase of Mss116 alone is not due to contaminatingRNA in our preparation, as identical rates areobtained in the presence of RNase A (Fig. 1) Theapparent Michaelis constant for RNA (Km,RNA) inthe presence of saturating ATP (10 mM) is ∼200 nM(Fig. 1b, Table 1). The Michaelis constant for ATP(Km,ATP) in the presence of near-saturating RNA(2 μM) is ∼250 μM (Fig. 1c, Table 1), also within therange of values (88–633 μM) reported for full-lengthMss116with variousRNA substrates.16,18 The [RNA]dependence of the steady-state ATPase measuredwith 2 μM Mss116 (≫Km,RNA) yields an ATPase
Scheme 1. Minimal reaction scheme for Mss116 ATPase cycare ATP and ADP, respectively. Pi is phosphate.
activation stoichiometry of 0.9 RNA Mss116− 1
(Fig. 1d, Table 1).
Minimal Mss116 ATPase cycle
The minimal reaction scheme of discrete reactionsteps (Scheme 1) was used to model the RNA-activated ATPase of Mss116 and to analyze exper-imental data acquired from the transient kinetic andequilibrium binding experiments presented in sub-sequent sections. In Scheme 1, Mss116 helicase existsin free (H) and RNA-bound (RH) forms either withor without bound adenine nucleotide ATP (T) orADP (D). Pi is inorganic phosphate. We assume thatproduct release is sequential, with Pi dissociationpreceding ADP dissociation. Scheme 1 includes twostable Mss116–ADP states (see nucleotide binding
ling.H is Mss116:HR is Mss116 bound with RNA. T andD

403RNA-Stimulated ATPase of Mss116
section) and, for simplicity, does not includenonspecific collision complexes that precede stablecomplex formation.25,26 It is also likely that ATPhydrolysis is limited by a conformational changepreceding the chemical cleavage of the γ phosphatebond of ATP;3,4 for simplicity, we treat this activatedATP-bound state and the hydrolysis reaction as asingle biochemical species since they are kineticallyequivalent. We emphasize that Scheme 1 is aminimal ATPase cycle scheme analogous to thatused to model other lattice-activated ATPases (e.g.,myosin27) and that a more complex scheme withadditional intermediates could potentially apply.
Nucleotide binding to Mss116
Binding of ATP and ADP to Mss116 andMss116–RNA was measured from the fluorescence
Fig. 2. Kinetics of mantATP binding to Mss116 and Mss116range of [mantATP] with 2 μMMss116 (a) or Mss116–RNA (b).of exponentials. [mantATP] dependence of the observed rateRNA (d). The continuous line through the data represents the50 μM mantATP binding to Mss116 and Mss116–RNA. (f) Thamplitude associated with mantATP binding to Mss116. The cpresents the overall mantATP–Mss116 equilibrium binding co
enhancement associated with Förster resonanceenergy transfer from Mss116 to bound mant-nucleotides.3,28,29 Mss116 possesses five tyrosineresidues between the Walker A sequence motif andthe Walker B sequence motif of the nucleotidebinding site and no tryptophan residues; energytransfer presumably occurs from Mss116 tyrosinesto mant-nucleotides.The time courses of fluorescence enhancement
after mixing mantATP or mantADP with Mss116 orMss116–RNA are multiphasic and best fitted to afour-exponential function (Figs. 2a and b, and 3aand b). The two fast relaxations (λ1 and λ2) dependon [mant-nucleotide] (Figs. 2c and d, and 3c and d),while the two slow relaxations (λ3=1–4 s−1 andλ4=0.1–0.4 s−1) are independent over the rangeexamined and are similar for mantATP and man-tADP, both with and without RNA. We limit our
–RNA. Time courses of fluorescence change after mixing aThe smooth lines through the data are the best fits to a sumconstants of mantATP binding to Mss116 (c) or Mss116–best fit to Eq. (1).3 (e) Comparison of the time courses of
e [mantATP] dependence of the total fluorescence changeontinuous line is the best fit to a hyperbola, for which K0.5nstant.

Fig. 3. Kinetics of mantADP binding to Mss116 and Mss116–RNA. Time courses of fluorescence change after mixing arange of [mantADP] with 2 μM Mss116 (a) or Mss116–RNA (b). The smooth lines through the data are the best fits to asum of exponentials. [mantADP] dependence of the observed rate constants of mantADP binding to Mss116 (c) orMss116–RNA (d). The continuous line through the data represents the best fit to quadratic equations (Eq. (4))3,25 for two-step binding. (e) Comparison of the time courses of 50 μM mantADP binding to Mss116 and Mss116–RNA. (f) The[mantADP] dependence of the total fluorescence change amplitude associated with mantATP binding to Mss116. Thecontinuous line is the best fit to a hyperbola, for which K0.5 presents the overall mantADP–Mss116 equilibrium bindingconstant.
404 RNA-Stimulated ATPase of Mss116
analysis and discussion to the two fast [mant-nucleotide]-dependent phases. We do not includean analysis of the slow components because they aretoo slow to be ATPase on-pathway reactions (i.e.,λbkcat) and/or they have small and variableamplitudes that preclude a reliable quantitativeanalysis. Future studies are needed to identify thenature of the biochemical transitions associated withthese spectroscopic changes, although they mayreflect off-pathway isomerization reactions,25 minorprotein or nucleotide impurities, and/or mant-isoform-specific interaction kinetics.30
We interpret the fastest observed mantATP phase(λ1T) as binding process because [mantATP] depen-dence is approximately linear3,25 (Fig. 2b and c).Mss116 possesses ATPase activity (Fig. 1) even in
the absence of RNA, so the second relaxation (λ2T)after ATP binding includes contributions frombinding, hydrolysis, and subsequent productrelease.3 We therefore globally fitted the [mantATP]dependence of the two observed rate constantsusing the following equations that account forcontributions from ATP binding, hydrolysis, andphosphate release:3
E1T;2T =12
kþRT T½ � + k−RT + E2T;l
FffiffiffiffiffiffiffiffiffiffiffiffiffiffiffiffiffiffiffiffiffiffiffiffiffiffiffiffiffiffiffiffiffiffiffiffiffiffiffiffiffiffiffiffiffiffiffiffiffiffiffiffiffiffiffiffiffiffiffiffiffiffiffikþRT T½ � + k−RT + E2T;l� �2− 4 kþRT T½ �E2T;l + k−RTE2T;0� �
vuut! ð1Þ

Fig. 4. Kinetics of mantADP dissociation from Mss116with and without RNA. Time courses of irreversiblemantADP dissociation from Mss116 and Mss116–RNAaftermixing 2mMADPwith 2μMMss116 orMss116–RNApreequilibrated with 50 μM mantADP. The smooth linesthrough the data are the best fits to a sum of exponentials.
405RNA-Stimulated ATPase of Mss116
with
E2T;l = kþRH + k−RH + k−RPi ð2Þand
E2T;0 =k−RTk−RH + k−RTk−RPi + k+RHk−RPi
k−RTð3Þ
where λ2T,∞ is the maximum value of λ2T atsaturating ATP concentration and λ2T,0 is approxi-mately equal to the initial value of λ2T (i.e.,extrapolated to zero ATP).3 The values of λ2T,∞and λ2T,0, together with isotopic exchange andtransient Pi release data, are used to obtain theATP hydrolysis, resynthesis, and Pi release rateconstants3 (see Pi release section). These expressionsalso apply to no-RNA conditions, since Mss116possesses an intrinsic ATPase activity.RNA accelerates ATP binding to Mss116 by
almost an order of magnitude (k+RT=2.1 μM−1 s−1
and k+T=0.33 μM−1 s−1) and slows ATP dissociation
∼2-fold (k−RT=35 s−1 and k−T=66 s−1), therebyyielding an overall tighter ATP binding constant(K=k−/k+; KRT∼17 μM and KT∼200 μM). Theamplitude of fluorescence change yields a compa-rable value of 125 μM for KT (Fig. 2f, Table 1).mantADP binding also displays two fast concen-
tration-dependent phases (λ1D and λ2D). The ob-served relaxations in this case have a meaningdifferent from that of mantATP binding, sincehydrolysis and product release reactions are absent.The [mantADP] dependence of λ1D and λ2D (Fig. 3cand d) is modeled as a consecutive two-step bindingreaction (ignoring collision complex formation26)and is globally fitted to the following quadraticequations for reversible two-step binding:3,25
E1D;2D =12
k+1RD D½ � + k−1RD + k+2RD + k−2RD
Fffiffiffiffiffiffiffiffiffiffiffiffiffiffiffiffiffiffiffiffiffiffiffiffiffiffiffiffiffiffiffiffiffiffiffiffiffiffiffiffiffiffiffiffiffiffiffiffiffiffiffiffiffiffiffiffiffiffiffiffiffiffiffiffiffiffiffiffiffiffiffik+1RD D½ � + k−1RD + k+2RD + k−2RDð Þ2− 4
�k−2RDk−1RD + k−2RDk+1RD D½ �
+ k+2RDk+1RD D½ ��vuuuut
!ð4Þ
to obtain the fundamental ADP binding rateconstants (Table 1).The overall mantADP binding affinities for
Mss116 (KD,overall) and Mss116–RNA (KRD,overall)estimated from the total amplitude of fluorescencechange are ∼43 μM (Fig. 3f) and ∼92 μM (data notshown; Table 1), respectively, comparable to thepredicted values of ∼25 μM and ∼70 μM (Table 1)calculated from the individual stepwise ADPequilibrium binding constants.3,25
Time courses of irreversible mantADP release fromMss116 andMss116–RNA also displaymultiple phases(Fig. 4), in accord with the time courses of association
(Figs. 2 and 3). The two fast relaxations (λdiss,1 andλdiss,2) with Mss116 alone are ∼69 s−1 and ∼13 s−1,which correlate with the values of ∼64 s−1 and ∼9 s−1
respectively, predicted from mantADP associationusing the following expression:3,25
Ediss1;diss2 =12
�k−1D + k+2D + k−2D
Fffiffiffiffiffiffiffiffiffiffiffiffiffiffiffiffiffiffiffiffiffiffiffiffiffiffiffiffiffiffiffiffiffiffiffiffiffiffiffiffiffiffiffiffiffiffiffiffiffiffiffiffiffiffiffiffiffiffiffiffiffiffiffiffiffiffik−1D+k+2D+k−2Dð Þ2−4k−1Dk−2D
q �ð5Þ
indicating internal consistency in association data anddissociation data. Similarly, the fast relaxations withMss116–RNAare∼194 s−1 and∼17 s−1, comparable tothe predicted values of∼172 s−1 and∼20 s−1 (Table 1).
Oxygen isotopic exchange
18O isotopic exchange31,32 was used to measure thereversibility of ATP hydrolysis by Mss116 andMss116–RNAduring steady-state cycling. The revers-ibility of ATP hydrolysis is indicated by the partitioncoefficient Pc, which reflects the probability of ATPresynthesis from bound ADP and Pi (k−H or k−RH)relative to Pi release (k−Pi
or k−RPi) and is given by:31,32
Pc −RNAð Þ = k−Hk−H + k−Pi
or Pc + RNAð Þ = k−RHk−RH + k−RPi
ð6Þ
The Pc values for the reversibility of ATP hydrolysisby Mss116 and Mss116–RNA are 0.147 and 0.088,respectively (Table 1). The low Pc values indicate asmall number of hydrolysis reversals during steady-state ATPase cycling. The number of reversals in thepresence of RNA, however, is smaller than that in itsabsence.

406 RNA-Stimulated ATPase of Mss116
Phosphate release
Transient Pi release from Mss116–RNA uponaddition of ATP was measured with the fluores-cently labeled mutant of phosphate binding protein(MDCC-PiBP). Time courses of Pi release fromMss116–RNA display a lag phase, followed by alinear regime (Fig. 5a). The observed lag phase arisesfrom the formation of at least one biochemicalintermediate(s) prior to Pi release on the first cycle
Fig. 5. Kinetics of transient Pi release from ATPhydrolysis by Mss116–RNA. (a) Time courses of Pi releasefrom ATP hydrolysis by Mss116–RNA (preequilibratedsample of 1 μMMss116 and 2 μMRNA) after mixing with20 μM, 120 μM, 300 μM, 500 μM, and 1000 μM MgATP(top to bottom). The smooth lines through the data are thebest fits to the phosphate release equation (Eq. (7)), and thered dashed lines represent simulated time courses usingScheme 1 and the rate and equilibrium constants tabulatedin Table 1. (b) [ATP] dependence of the observed lag phaserate constant. The smooth line is the best fit to a hyperbola.(c) [ATP] dependence of the steady-state rate obtainedfrom the linear regime of time courses. The continuous linethrough the data represents the best fit to a hyperbola,yielding Km,ATP of 300 μM (Table 1).
pass (i.e., approach to steady-state turnover) with arate constant comparable to or slower than that of Pirelease3 (i.e., two transitions in series with compa-rable rate constants must exist). The prominent lagand lack of a Pi release burst phase25 indicate thatADP release is not rate-limiting during steady-stateATPase turnover (i.e., kcat), and that either hydroly-sis, Pi release, or both limit Mss116 cycling in thepresence of RNA.Scheme 1 predicts that time courses of irreversible
Pi release (fulfilled in the presence of phosphatebinding protein) follow an exponential decay (λlag)preceding a linked linear regime (C) given by:3
Pi½ � = C1
Elage−Elagt − 1� �
+ t� �
ð7Þ
The observed lag phase rate constant (λlag; equiva-lent to λ2T in the mantATP association presentedearlier3) depends hyperbolically on [ATP] (Fig. 5b),displaying a lower limit (λlag,0) of ∼3 s−1, andapproaches a maximum (λlag,∞ ) of ∼12 s−1 atsaturating ATP that is proportional to the sum ofATP hydrolysis (k+RH or more likely a conforma-tional change preceding rapid ATP hydrolysis3 andthese are kinetically equivalent), ATP resynthesis(k−RH), and Pi release (k−RPi
) rate constants (Eq. (2)3).The values of λlag,∞ and λlag,0 are comparable to thevalues of λ2T,0 (∼4 s−1) and λ2T,∞ (∼20 s−1) obtainedwith mantATP (Fig. 2d, Table 1), as predicted fromScheme 1. The [ATP] at which λlag reaches half-maximal value (K0.5∼80 μM) approximates the ATPbinding constant of Mss116–RNA:3
K0:5 = KRT =k−RTk+RT
ð8Þ
The KRT value for mantATP (KRT∼16 μM; Table 1) is∼5 times tighter than that of ATP, presumably dueto favorable interactions with the mant moiety.3,28,29
The slope of the linear phase reflects steady-stateATP turnover and thus depends hyperbolically on[ATP] (Fig. 5c), yielding a Km,ATP of ∼300 μM,comparable to the value of ∼250 μMmeasured withthe NADH-coupled assay (Table 1).The experimental values of Pc from
18O exchange,λlag,∞ and λlag,0 of the Pi release lag phase (in theabsence of RNA, using λ2T,0 and λ2T,∞ from mantATPbinding instead), and k−RT and k−T from mantATPbinding permit determination3 of the ATP hydrolysis(k+RH=9.7 s−1 and k+H=1.1 s−1), ATP resynthesis(k−RH=0.23 s−1 and k−H=1.8 s−1), and Pi release(k−RPi
=2.4 s−1 and k−Pi=10.4 s−1) fundamental rate
constants. In the presence of RNA, the rate constantsdiffer slightly with mantATP (calculated using λ2T,0and λ2T,∞ rather than λlag,∞ and λlag,0 from Pirelease): k+RH= 16.5 s− 1, k− RH= 0.26 s− 1, andk−RPi
=2.7 s−1, indicating that mant labeling acceler-ates ATP hydrolysis ∼2-fold without affecting ATPresynthesis or Pi release.

Fig. 6. FCS measurements of equilibrium RNA bindingto Mss116 and Mss116–ADP. (a) Normalized autocorrela-tion curves of 20 nM fluorescein-labeled RNA in thepresence of (from left to right) 0 nM, 43 nM, 107 nM, or202 nM Mss116. The smooth lines through the datarepresent a global fit to a two-species autocorrelationfunction (Eq. (11)). (b) [Mss116] and [Mss116–ADP]dependence of the fraction of total bound RNA obtainedfrom a global fit of the autocorrelation curves of differentMss116 concentrations to standard two-species autocor-relation function. The continuous line through the datarepresents the best fit to the quadratic function forequilibrium bimolecular binding (Eq. (12)), with themaximum value constrained to unity. The nucleotide-dependent RNA binding affinities are summarized inTable 1. Analysis of the average diffusion time (τaverage)yielded comparable results (Table 1).
407RNA-Stimulated ATPase of Mss116
Since mantATP binds more tightly than ATP, thek−RT and k−T values used for analysis couldintroduce uncertainty. To estimate possible devia-tion, we evaluated how the values of k−RT and k−Tinfluence the rate constant output. When the valuesof k−RT and k−T are varied from 20 s−1 to 200 s−1, theresults deviate by ±0.2–0.6 s−1 for ATP hydrolysis,by ±0.03–0.05 s−1 for ATP resynthesis, and by ±0.1–0.6 s−1 for phosphate release. Therefore, uncer-tainties in the ATP dissociation rate constantsminimally affect the ATP hydrolysis, ATP resynth-esis, and Pi release rate constant values.
Equilibrium binding of Mss116 and RNA byfluorescence correlation spectroscopy
Equilibrium binding of Mss116 and Mss116–ADPto RNA, measured by fluorescence anisotropy,suggested the possibility of light scattering at highprotein concentrations, possibly caused by proteinaggregation (see the text below). Therefore, equilib-rium binding of Mss116 and Mss116–ADP to RNAwas measured by fluorescence correlation spectros-copy (FCS) to directly visualize the solution mobilityof the complexes. The observed decay time of thefluorescence autocorrelation of RNA increases with[Mss116] (Fig. 6a). Global fitting of the time coursesto a two-component autocorrelation function (Eq.(11))33–35 yields diffusion times (Table 1) for freeRNA (τRNA=0.27 ms and 0.26 ms in the presence of10 mM ADP) and Mss116–RNA (τcomplex=0.69 ms)or Mss116–ADP–RNA (τcomplex,ADP=0.56 ms). The[Mss116] dependence of the bound RNA fraction(Eq. (12)) yields overall RNA binding affinities of117 nM for Mss116 and 775 nM for Mss116–ADP(Table 1). Comparable affinities (122 nM for Mss116and 848 nM forMss116–ADP) are obtained (Eq. (14))from fitting the [Mss116] dependence of the averagediffusion time (τaverage) from a single-componentautocorrelation function (Eq. (11)).33–35 Detailedbalance yields binding affinities of ∼47 nM forMss116–ATP and 0.67 nM for Mss116–ADP-Pi(Table 1). The overall affinity of Mss116–ADP(accounting for both ADP-bound states) calculatedfrom detailed balance is ∼340 nM (Table 1), about afactor of 2 with the value measured by FCS. Thediffusion time of Alexa488-labeledMss116 is 0.52 ms(Table 1), slightly shorter than that of the Mss116–RNA complex, as expected.We note that autocorrelation time courses deviate
between consecutive measurements, such that theydisplay a lower total number of molecules (N) and alonger diffusion time (τ) with [Mss116] N200 nMand [Mss116–ADP] N500 nM, and a low (20 nM)RNA, characteristic of slow protein oligomerization.Oligomerization is observed only at [Mss116]≫[RNA] and is weakened by ADP. While self-association may play a role in Mss116 activity, thecharacterization is beyond the scope of the current
work, and we reserve investigation for future work.Throughout the current study, Mss116 was main-tained at concentrations where oligomerization didnot occur or with [RNA]N [Mss116].
Kinetic simulations and modeling
Simulated time courses of steady-state phosphaterelease from Mss116–RNA using Scheme 1 and thereaction constants obtained in this work (Table 1)account for the experimental time courses oftransient and steady-state Pi release (red dashedline in Fig. 5a), demonstrating that the rate constantsand equilibrium constants obtained from the differ-ent measurements and assays are consistent with theobserved Mss116–RNA ATPase cycling behavior.Furthermore, the macroscopic steady-state pa-
rameters (kcat and Km) predicted from the rate andequilibrium constants agree well with the experi-mentally determined values (Table 1), further
408 RNA-Stimulated ATPase of Mss116
strengthening the validity of the ATPase cyclemodel (Scheme 1) and experimental constants(Table 1). In the absence of RNA, Mss116 has alow but detectable ATPase activity with a kcat valueof∼0.3 s−1 Mss116−1 (Fig. 1a, Table 1). The kcat valuepredicted (Eq. (A29) in Supplementary Material)from the rate and equilibrium constants derived inthis study (Table 1) is 0.8 s−1 Mss116−1. The 3-fold-difference and higher predicted value is likely aconsequence of using mantATP binding parameters.If we assume that ATP hydrolysis occurs 2-foldmore slowly than mantATP in the absence of RNA,as was observed with Mss116–RNA (Table 1), thepredicted kcat value with ATP is 0.4 s−1 Mss116−1,significantly closer to the experimentally observedvalue. The predicted kcat value in the presence ofRNA (Eq. (A23) in Supplementary Material) is1.7 s−1 Mss116−1, similar to the experimental valueof 1.5–1.8 s−1 Mss116−1 (Fig. 1b, Table 1). In thesecalculations and in the forthcoming calculations ofKm,ATP and Km,RNA, we use the overall ADP bindingand dissociation rate constants at steady state.The Km,RNA and Km,ATP values predicted from Eq.
(A21) in Supplementary Material and from Eq. (42)in the appendix of Henn et al., respectively,however, differ from those measured experimental-ly: ∼3-fold for Km,RNA and ∼10-fold for Km,ATP(Table 1).3 While this may result from experimentaluncertainty, the large discrepancy with Km,ATPcould reflect weaker ATP binding during steady-state cycling than ATP binding to the initial
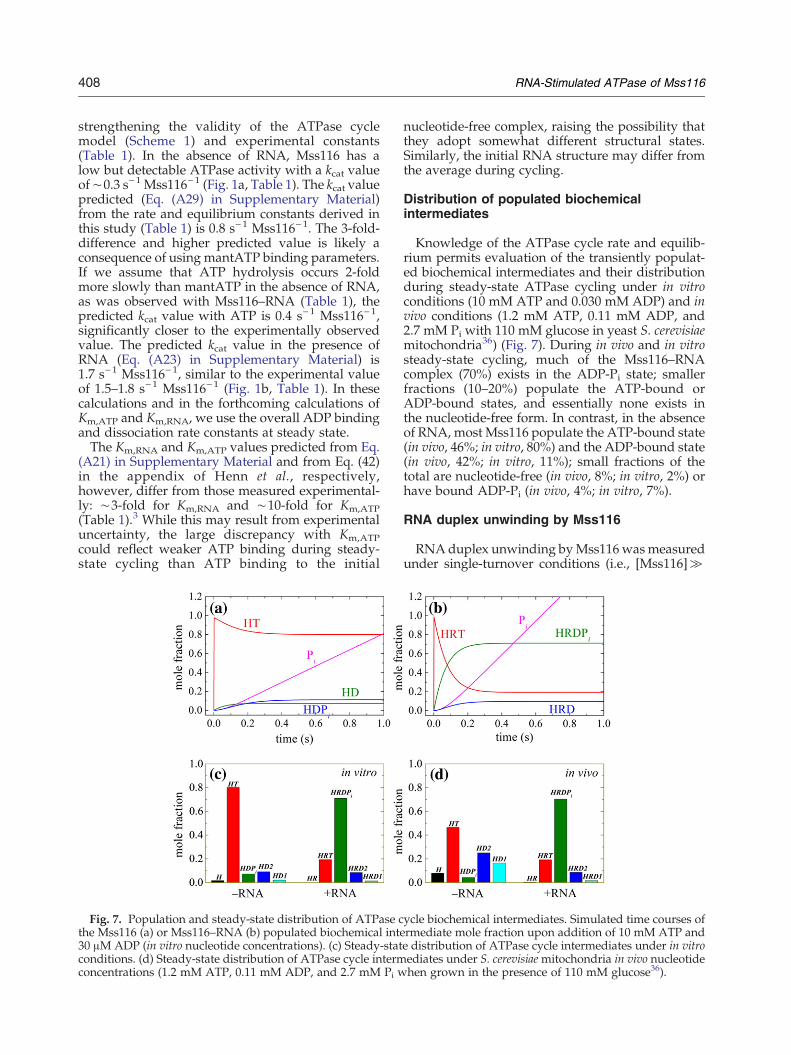
Fig. 7. Population and steady-state distribution of ATPase cthe Mss116 (a) or Mss116–RNA (b) populated biochemical inte30 μM ADP (in vitro nucleotide concentrations). (c) Steady-statconditions. (d) Steady-state distribution of ATPase cycle intermconcentrations (1.2 mM ATP, 0.11 mM ADP, and 2.7 mM Pi w
nucleotide-free complex, raising the possibility thatthey adopt somewhat different structural states.Similarly, the initial RNA structure may differ fromthe average during cycling.
Distribution of populated biochemicalintermediates
Knowledge of the ATPase cycle rate and equilib-rium permits evaluation of the transiently populat-ed biochemical intermediates and their distributionduring steady-state ATPase cycling under in vitroconditions (10 mM ATP and 0.030 mM ADP) and invivo conditions (1.2 mM ATP, 0.11 mM ADP, and2.7 mM Pi with 110 mM glucose in yeast S. cerevisiaemitochondria36) (Fig. 7). During in vivo and in vitrosteady-state cycling, much of the Mss116–RNAcomplex (70%) exists in the ADP-Pi state; smallerfractions (10–20%) populate the ATP-bound orADP-bound states, and essentially none exists inthe nucleotide-free form. In contrast, in the absenceof RNA, most Mss116 populate the ATP-bound state(in vivo, 46%; in vitro, 80%) and the ADP-bound state(in vivo, 42%; in vitro, 11%); small fractions of thetotal are nucleotide-free (in vivo, 8%; in vitro, 2%) orhave bound ADP-Pi (in vivo, 4%; in vitro, 7%).
RNA duplex unwinding by Mss116
RNAduplex unwinding byMss116wasmeasuredunder single-turnover conditions (i.e., [Mss116]≫
ycle biochemical intermediates. Simulated time courses ofrmediate mole fraction upon addition of 10 mM ATP ande distribution of ATPase cycle intermediates under in vitroediates under S. cerevisiaemitochondria in vivo nucleotidehen grown in the presence of 110 mM glucose36).
409RNA-Stimulated ATPase of Mss116
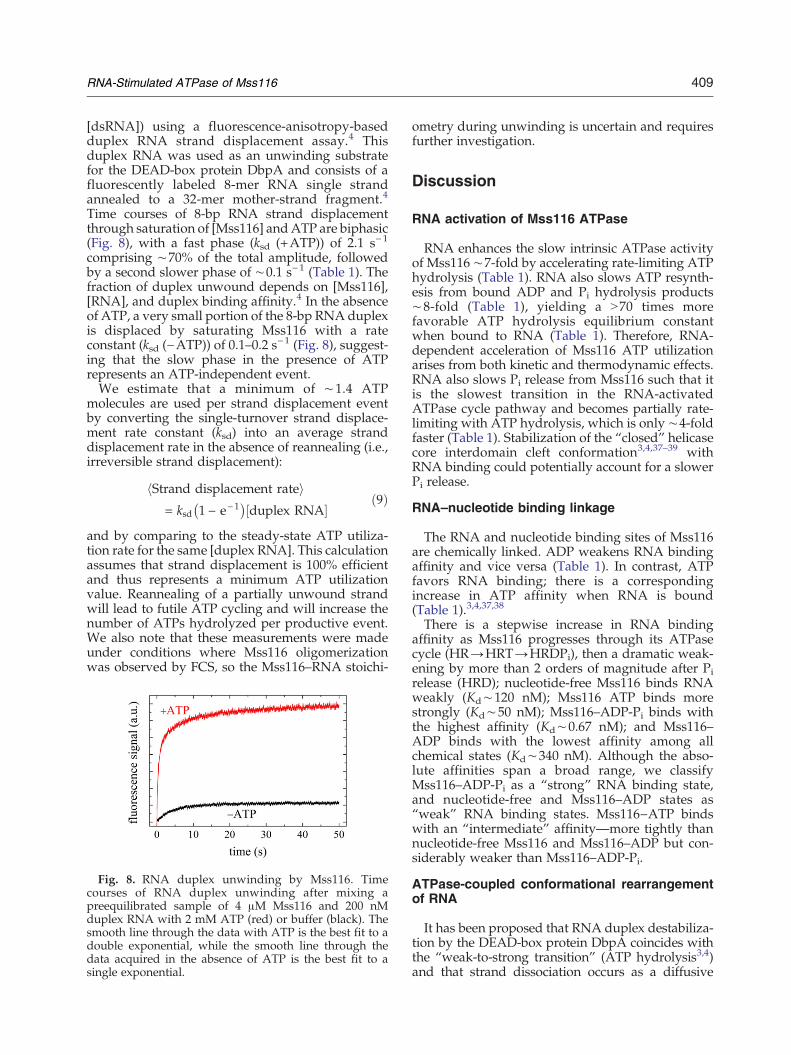
[dsRNA]) using a fluorescence-anisotropy-basedduplex RNA strand displacement assay.4 Thisduplex RNA was used as an unwinding substratefor the DEAD-box protein DbpA and consists of afluorescently labeled 8-mer RNA single strandannealed to a 32-mer mother-strand fragment.4
Time courses of 8-bp RNA strand displacementthrough saturation of [Mss116] andATP are biphasic(Fig. 8), with a fast phase (ksd (+ATP)) of 2.1 s−1
comprising ∼70% of the total amplitude, followedby a second slower phase of ∼0.1 s−1 (Table 1). Thefraction of duplex unwound depends on [Mss116],[RNA], and duplex binding affinity.4 In the absenceof ATP, a very small portion of the 8-bp RNA duplexis displaced by saturating Mss116 with a rateconstant (ksd (−ATP)) of 0.1–0.2 s−1 (Fig. 8), suggest-ing that the slow phase in the presence of ATPrepresents an ATP-independent event.We estimate that a minimum of ∼1.4 ATP
molecules are used per strand displacement eventby converting the single-turnover strand displace-ment rate constant (ksd) into an average stranddisplacement rate in the absence of reannealing (i.e.,irreversible strand displacement):
hStrand displacement ratei= ksd 1 − e−1� �
duplex RNA½ � ð9Þ
and by comparing to the steady-state ATP utiliza-tion rate for the same [duplex RNA]. This calculationassumes that strand displacement is 100% efficientand thus represents a minimum ATP utilizationvalue. Reannealing of a partially unwound strandwill lead to futile ATP cycling and will increase thenumber of ATPs hydrolyzed per productive event.We also note that these measurements were madeunder conditions where Mss116 oligomerizationwas observed by FCS, so the Mss116–RNA stoichi-
Fig. 8. RNA duplex unwinding by Mss116. Timecourses of RNA duplex unwinding after mixing apreequilibrated sample of 4 μM Mss116 and 200 nMduplex RNA with 2 mM ATP (red) or buffer (black). Thesmooth line through the data with ATP is the best fit to adouble exponential, while the smooth line through thedata acquired in the absence of ATP is the best fit to asingle exponential.
ometry during unwinding is uncertain and requiresfurther investigation.
Discussion
RNA activation of Mss116 ATPase
RNA enhances the slow intrinsic ATPase activityof Mss116 ∼7-fold by accelerating rate-limiting ATPhydrolysis (Table 1). RNA also slows ATP resynth-esis from bound ADP and Pi hydrolysis products∼8-fold (Table 1), yielding a N70 times morefavorable ATP hydrolysis equilibrium constantwhen bound to RNA (Table 1). Therefore, RNA-dependent acceleration of Mss116 ATP utilizationarises from both kinetic and thermodynamic effects.RNA also slows Pi release from Mss116 such that itis the slowest transition in the RNA-activatedATPase cycle pathway and becomes partially rate-limiting with ATP hydrolysis, which is only ∼4-foldfaster (Table 1). Stabilization of the “closed” helicasecore interdomain cleft conformation3,4,37–39 withRNA binding could potentially account for a slowerPi release.
RNA–nucleotide binding linkage
The RNA and nucleotide binding sites of Mss116are chemically linked. ADP weakens RNA bindingaffinity and vice versa (Table 1). In contrast, ATPfavors RNA binding; there is a correspondingincrease in ATP affinity when RNA is bound(Table 1).3,4,37,38
There is a stepwise increase in RNA bindingaffinity as Mss116 progresses through its ATPasecycle (HR→HRT→HRDPi), then a dramatic weak-ening by more than 2 orders of magnitude after Pirelease (HRD); nucleotide-free Mss116 binds RNAweakly (Kd∼120 nM); Mss116 ATP binds morestrongly (Kd∼50 nM); Mss116–ADP-Pi binds withthe highest affinity (Kd∼0.67 nM); and Mss116–ADP binds with the lowest affinity among allchemical states (Kd∼340 nM). Although the abso-lute affinities span a broad range, we classifyMss116–ADP-Pi as a “strong” RNA binding state,and nucleotide-free and Mss116–ADP states as“weak” RNA binding states. Mss116−ATP bindswith an “intermediate” affinity—more tightly thannucleotide-free Mss116 and Mss116–ADP but con-siderably weaker than Mss116–ADP-Pi.
ATPase-coupled conformational rearrangementof RNA
It has been proposed that RNA duplex destabiliza-tion by the DEAD-box protein DbpA coincides withthe “weak-to-strong transition” (ATP hydrolysis3,4)and that strand dissociation occurs as a diffusive
410 RNA-Stimulated ATPase of Mss116
process from the strongly boundADP-Pi intermediate.4
ATP binding and RNA binding are weakly coupledin DbpA, so ATP binding per se does not promotesignificant displacement of an 8-mer RNA duplexstrand.4 The large free-energy change in ATPbinding promotes a conformational change in theDbpA–RNA complex.3,4,37,38
The coupling, albeit weak, between ATP bindingand RNA binding observed for Mss116 (Table 1)raises the possibility that ATP binding can promotelocal reorganization and/or partial unwinding ofbound duplex RNA, given that this transition islinked to stronger RNA binding. RNA duplexunwinding with ATP binding (i.e., hydrolysis-independent) has been reported for Cyt196 andDED1,5 suggesting that ATP and RNA binding maybe strongly coupled in these DEAD-box proteinfamily members. However, the AMPPNP state ofDbpA and other DEAD-box proteins bind RNAstrongly without any detectable strand displace-ment, indicating that additional reactions contributeto productive duplex RNA strand displacement.Local partial reorganization, however, could con-ceivably displace short (b8 bp) duplex fragments.40
Implications for intron splicing activity
ATP utilization cycles Mss116 vectorially througha series of nucleotide-linked structural states withvarying RNA affinities. ATPase cycling predomi-nantly maintains Mss116 in the strong-RNA-bind-ing and duplex-RNA-destabilizing ADP-Piconformation during steady state under in vitroand in vivo conditions, but also allows it totransiently populate states that bind RNA weakly.These nucleotide-dependent oscillations in Mss116–RNA binding activity are suited for facilitation ofintron splicing and are consistent with recent studiesinvestigating Mss116-catalyzed group II intronfolding23,41—Mss116 with bound ADP-Pi stronglybinds and reorganizes RNA structure; subsequent Pirelease promotes weak RNA binding, therebydissociating the complex, allowing intron self-splicing and regenerating free Mss116 for additionalrounds of catalysis.Mss116-stimulated intron splicing is extremely
slow, displaying a second-order rate constant ofb0.001 nM− 1s− 1, considerably slower than theunwinding and strand displacement rates of variousduplex RNAs15,16,20–22,24,42 and the short 8-bpduplex evaluated in this study, which consumes∼1–2 ATPs per displacement event. This largedifference between the rate constant for splicingand the rate constant for duplex unwinding sug-gests that multiple ATP molecules are hydrolyzedper productive splicing event. Multiple ATP hydro-lysis events could arise if catalysis of intron splicingrequires large-scale reorganization of the RNA(potentially occurring through mechanical remodel-
ing of many RNA segments), or it may arise fromfutile cycling of Mss116 prior to its release duringthe final stage of intron assembly.
Functional diversity of DEAD-box proteinfunction and ATPase
Numerous advances concerning the molecularmechanism of DEAD-box protein helicase and RNAchaperone activity have been made in recent years(reviewed by Cordin et al.,1 Pyle,2 Pan andRussell43). Large bodies of these works havefocused on the structures, unwinding and chaper-one activities, and biological functions of this familyof enzymes. Although the linkage between nucle-otide and RNA interactions in DEAD-box proteinsis established,3–6,37,38,44–46 considerably less knowl-edge of the ATPase cycle enzymology, particularlythe significance and role of transiently populatedATPase cycle biochemical intermediates, is avail-able. To the best of our knowledge, the ATPasecycles of only two DEAD-box proteins, DbpA3 andMss116 (this study), have been characterizedcompletely at the kinetic and thermodynamiclevels. Despite the limited sampling, evidence forDEAD-box protein ATPase cycle adaptations con-tributing to specific biological functions is begin-ning to emerge.The reaction pathway for the ATPase cycle
appears to be conserved for DbpA and Mss116 inthat the kinetic intermediates and the order in whichthese intermediates are populated are similar. TheATPase cycles of DbpA and Mss116 are bothpartially limited by ATP hydrolysis and subsequentPi release, with Pi release being the slower of the twotransitions. As a result, the predominantly populat-ed biochemical intermediate during steady-statecycling under in vitro conditions is the ADP-Pistate for both DbpA and Mss116.The distribution of populated intermediates under
in vivo conditions differs between DbpA andMss116. DbpA exists predominantly in ADP-formin vivo nucleotide concentrations, whereas Mss116largely populates the ADP-Pi state. DbpA has beensuggested to promote the conformational rearrange-ment of hairpin 92 of 23S ribosomal RNA,47 therebycontributing to ribosome biogenesis and/orassembly.48 It has been suggested that populationof the weak(er) RNA-binding ADP nucleotide stateof DbpA allows for the transfer of unwound rRNAproduct to ribosomal proteins and/or assemblycofactors in vivo.3
In contrast, Mss116 largely populates the strongRNA-binding ADP-Pi conformation under in vivoconditions. It is likely that strong RNA bindingallows Mss116 to fulfill its biological role instimulating intron splicing, as reported for facilitat-ed group II intron folding.23 ATPase cycling allowsfor transient population of the (very) weak RNA-

411RNA-Stimulated ATPase of Mss116
binding ADP state of Mss116 and linked dissocia-tion from RNA,23 at which point the unconstrainedintrons undergo self-splicing.
Materials and Methods
Reagents
All reagents were of the highest purity commerciallyavailable (Sigma), unless otherwise noted. Solutions wereprepared using MilliQ dispensed water that had beentreated for 8 h with diethyl pyrocarbonate at 1 mL L−1,then autoclaved. RNase activity was undetectable in allreagents, buffers, and protein preparations. Mixed 2′-O-mant and 3′-O-mant (N-methylanthraniloyl) nucleotideswere purchased from Invitrogen. A molar equivalent ofMgCl2 was added to nucleotides immediately before use.
Protein
The Mss116 protein used in this study is a truncatedconstruct with the C-terminal basic tail (residues 598–664of full-length Mss116) and the N-terminus (residues 1–72,including the mitochondrial signal sequence24) removed.The rationale for the use of this construct has beencarefully considered. Full-length Mss116 was partiallyinsoluble at the concentrations needed for the biochemicalstudies presented in this study, presumably due to largelyunstructured N-terminal and C-terminal extensions, assuggested by secondary structure prediction algorithms(Jpred 3 secondary structure prediction server†49). Limitedproteolysis yielded a soluble Mss116 protein core region(Ser73-Tyr597) that retains RNA-stimulated ATPase ac-tivity (see ATPase section) and robust catalysis of modelgroup II intron splicing (data not shown). This construct isslightly larger than the available atomic resolutionstructure (Ser88-Asp59650).Truncated Mss116 was cloned into pETSUMO (Invitro-
gen) and overexpressed in Rosetta 2(DE3) cells (Novagen).Overnight cultures were freshly diluted 1:100 into LBmedia and grown at 37 °C to an OD600 of 0.5–0.6. Thecultures were allowed to grow for 30min at 16 °C, inducedwith 0.25 mM IPTG, and incubated for an additional 20 h.Cells were harvested by centrifugation at 6000g for 10 min,resuspended in lysis buffer [25 mMHepes–KOH, 500 mMKCl, 10% glycerol, 5 mM β-mercaptoethanol, and 10 mMimidazole (pH 8.0)], and lysed by three passes through aMicroFluidizer at 15,000 psi. The lysate was cleared bycentrifugation at 15,000g for 30 min, and the supernatantwas allowed to batch-bind Ni-NTA beads (Qiagen) for 1 h.Beads were washed with 10 resin volumes of lysis buffer,followed by 10 column volumes of wash buffer (lysisbuffer with 20 mM imidazole). Bound Mss116 was elutedfrom beads with 4 column volumes of elution buffer (lysisbuffer with 160 mM imidazole). The eluate was diluted3-fold using storage buffer (lysis buffer without imidaz-ole), treated with glutathione-S-transferase-tagged SUMOprotease (construct generously provided by Mark Hoch-strasser, Yale University), and purified to remove the
†http://www.compbio.dundee.ac.uk/jpred
SUMO tag. After proteolysis, the solution was passed overtandem glutathione-S-transferase–Ni2+ columns to re-move SUMO protease and cleaved SUMO tag. Mss116protein was concentrated using an Amicon Ultra 50-kDacutoff centrifugal filter (Millipore) and gel-filtered overSuperdex 200 equilibrated in storage buffer.
RNA
Measurements were made with the folded3 28-merRNA substrate (Dharmacon, Thermo Fisher Scientific,Inc.) GCCUCGCUGCCCUUCGGGGCAGCGAGGC.RNA structure prediction by RNAstructure (by Mathewslaboratory‡) indicates that this sequence adopts a blunt-end 12-bp hairpin conformation with a UUCG tetraloopfor enhanced stability; no self-association or other second-ary structures are predicted.
Steady-state ATPase activity
The steady-state ATPase activity of Mss116 (50 nM) wasmeasured at 25 °C in KMg75 buffer [75 mM KCl, 20 mMK-Hepes (pH 7.5), 5 mM MgCl2, and 1 mM DTT] byabsorbance at 340 nm using the ATP-regenerating NADH-coupled assay3,51 supplemented with saturating MgATP(10 mM) while varying [RNA], or with near-saturatingRNA (2 μM) while varying [MgATP]. [ADP] under ourconditions is∼10–30 μM.3,51Where indicated, RNaseA (upto ∼0.2 Kunitz mL−1 final) was included in the reactionmixture. The [ATP] dependence of the steady-state ratewasfitted to the hyperbolic form of the Briggs–Haldaneequation since [ATP]≫ [Mss116–RNA]. The [RNA] depen-dence of the steady-state ATPase rate (v) was fitted to thequadratic form (Supplementary Material A):
v = k0 + kcat − k0ð Þ
�Htot + Rtot + Km;RNA −
ffiffiffiffiffiffiffiffiffiffiffiffiffiffiffiffiffiffiffiffiffiffiffiffiffiffiffiffiffiffiffiffiffiffiffiffiffiffiffiffiffiffiffiffiffiffiffiffiffiffiffiffiffiffiffiffiffiffiffiffiffiffiffiffiffiffiffiffiffiffiffiffiHtot + Rtot + Km;RNA� �2 − 4HtotRtot
q2Htot
ð10Þ
whereHtot is the total [Mss116], Rtot is the total [RNA], k0 isthe intrinsic ATPase rate in the absence of RNA, kcat is theATPase rate at saturating RNA, andKm,RNA is the apparentMichaelis constant for RNA stimulation. This equationassumes a 1:1 binding stoichiometry, which has beenconfirmed in this study (forthcoming data) using FCS andRNA-stimulated Mss116 ATPase. The stoichiometry forRNA-stimulatedMss116ATPasewas determined by fittingthe [RNA] dependence of Mss116 steady-state ATPaseunder the condition [Mss116]≫Km,RNA to the numericalsolutions of the implicit bimolecular binding equation(Supplementary Material B), with stoichiometry as theunconstrained fitting parameter.
Pre-steady-state kinetic analysis
All transient kinetic measurements were made inKMg75 buffer using an Applied Photophysics SX-20
‡http://rna.urmc.rochester.edu/RNAstructure.html
412 RNA-Stimulated ATPase of Mss116
stopped-flow apparatus thermostated at 25±0.1 °C. Theconcentrations stated are final after mixing. An average offive to eight time courses was fitted to a sum ofexponentials by nonlinear least squares fitting procedure.Uncertainties are reported as standard errors in the fits,unless stated otherwise.Nucleotide (ATP and ADP) binding to Mss116 and
Mss116–RNA was measured from the fluorescence en-hancement associated with Förster resonance energytransfer from Mss116 (λex=280 nm) to bound mant-nucleotides.3,28,29 Fluorescence was monitored at 90°through a 400-nm long-pass colored glass filter. Associa-tion kinetic traces were recorded after rapidly mixing2 μM Mss116 in the presence or in the absence of 2.2 μMRNA with varying amounts of mant-nucleotide underpseudo-first-order conditions (i.e., [mant-nucleotide]≫[Mss116]).3,29 mantADP dissociation was measured byrapid addition of excess (5 mM) unlabeled ADP topreequilibrated samples of 2 μM Mss116 or Mss116–RNA and 50 μM mantADP.3,29
Transient Pi release was measured by mixing 1 μMMss116 or Mss116–RNA with varying [ATP] and 5 μM ofthe fluorescently labeled mutant of phosphate bindingprotein (MDCC-PiBP), as described.3 Background Pi wasremoved from all solutions, syringes, and the instrumentwith MOP solution containing 7-methylguanosine(50–250 μM) and purine nucleoside phosphorylase (0.1–0.3 U mL−1). There was approximately 5-fold enhance-ment in the fluorescence of MDCC-PiBP with Pi binding(λex=436 nm; 460-nm long-pass emission filter). The rateand equilibrium constants of Pi binding to MDCC-PiBPunder experimental conditions comparable to those usedin this study are as follows: k+=117 μM−1 s−1, k−=24 s−1,and Kd=0.20 μM.52
Measurement of oxygen isotopic exchange duringATP hydrolysis
18O isotopic exchange was used to determine thereversibility of ATP hydrolysis during steady-statecycling.31,32,53 Measurements were performed in KMg75buffer containing 50% [18O]H2O supplementedwith 5mMATP, 5 mM phosphoenolpyruvate, and 50 U mL−1
pyruvate kinase to regenerate ATP. Reactions werequenched with HCl, and liberated Pi was isolated andanalyzed for 18O content.3,31,53
Fluorescence correlation spectroscopy
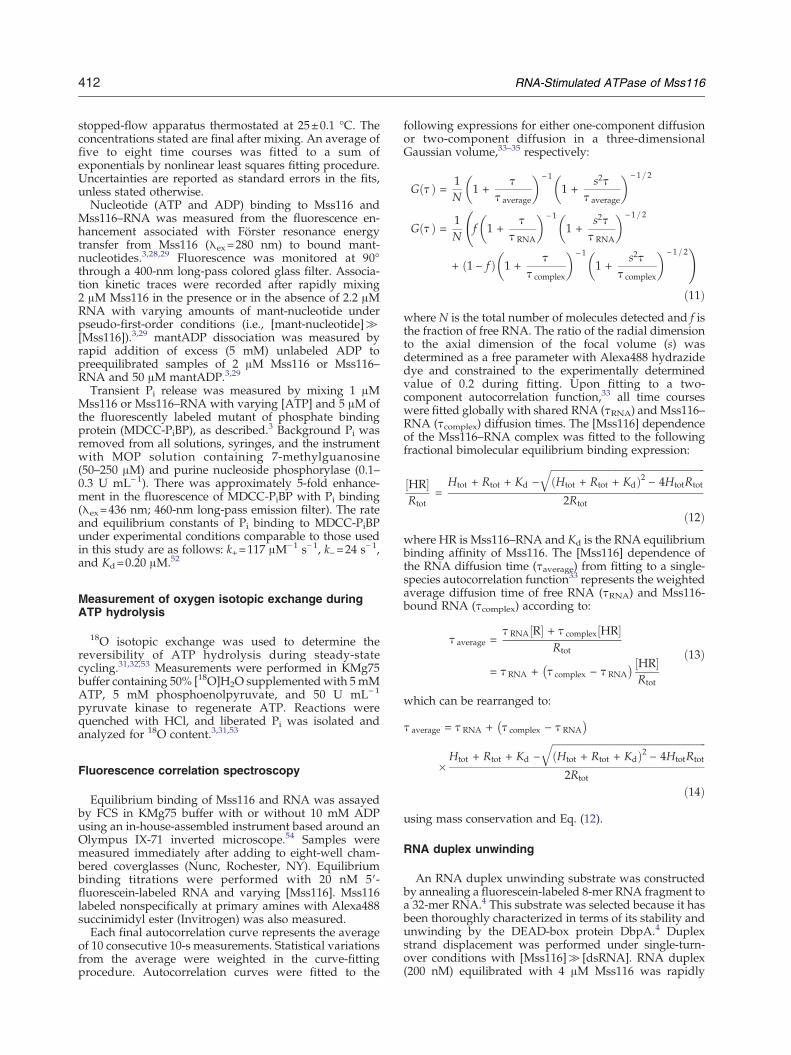
Equilibrium binding of Mss116 and RNA was assayedby FCS in KMg75 buffer with or without 10 mM ADPusing an in-house-assembled instrument based around anOlympus IX-71 inverted microscope.54 Samples weremeasured immediately after adding to eight-well cham-bered coverglasses (Nunc, Rochester, NY). Equilibriumbinding titrations were performed with 20 nM 5′-fluorescein-labeled RNA and varying [Mss116]. Mss116labeled nonspecifically at primary amines with Alexa488succinimidyl ester (Invitrogen) was also measured.Each final autocorrelation curve represents the average
of 10 consecutive 10-s measurements. Statistical variationsfrom the average were weighted in the curve-fittingprocedure. Autocorrelation curves were fitted to the
following expressions for either one-component diffusionor two-component diffusion in a three-dimensionalGaussian volume,33–35 respectively:
G Hð Þ = 1N
1 +H
H average
� �−1
1 +s2H
H average
� �−1=2
G Hð Þ = 1N
f 1 +
HH RNA
� �−1
1 +s2HH RNA
� �−1= 2
+ 1 − fð Þ 1 +H
H complex
� �−1
1 +s2H
H complex
� �−1= 2!
ð11Þwhere N is the total number of molecules detected and f isthe fraction of free RNA. The ratio of the radial dimensionto the axial dimension of the focal volume (s) wasdetermined as a free parameter with Alexa488 hydrazidedye and constrained to the experimentally determinedvalue of 0.2 during fitting. Upon fitting to a two-component autocorrelation function,33 all time courseswere fitted globally with shared RNA (τRNA) andMss116–RNA (τcomplex) diffusion times. The [Mss116] dependenceof the Mss116–RNA complex was fitted to the followingfractional bimolecular equilibrium binding expression:
HR½ �Rtot
=Htot + Rtot + Kd −
ffiffiffiffiffiffiffiffiffiffiffiffiffiffiffiffiffiffiffiffiffiffiffiffiffiffiffiffiffiffiffiffiffiffiffiffiffiffiffiffiffiffiffiffiffiffiffiffiffiffiffiffiffiffiffiffiffiffiffiffiffiffiHtot + Rtot + Kdð Þ2 − 4HtotRtot
q2Rtot
ð12Þwhere HR is Mss116–RNA and Kd is the RNA equilibriumbinding affinity of Mss116. The [Mss116] dependence ofthe RNA diffusion time (τaverage) from fitting to a single-species autocorrelation function33 represents the weightedaverage diffusion time of free RNA (τRNA) and Mss116-bound RNA (τcomplex) according to:
H average =H RNA R½ � + H complex HR½ �
Rtot
= H RNA + H complex − H RNA� � HR½ �
Rtot
ð13Þ
which can be rearranged to:
H average = H RNA + H complex − H RNA� �
�Htot + Rtot + Kd −
ffiffiffiffiffiffiffiffiffiffiffiffiffiffiffiffiffiffiffiffiffiffiffiffiffiffiffiffiffiffiffiffiffiffiffiffiffiffiffiffiffiffiffiffiffiffiffiffiffiffiffiffiffiffiffiffiffiffiffiffiffiffiHtot + Rtot + Kdð Þ2 − 4HtotRtot
q2Rtot
ð14Þ
using mass conservation and Eq. (12).
RNA duplex unwinding
An RNA duplex unwinding substrate was constructedby annealing a fluorescein-labeled 8-mer RNA fragment toa 32-mer RNA.4 This substrate was selected because it hasbeen thoroughly characterized in terms of its stability andunwinding by the DEAD-box protein DbpA.4 Duplexstrand displacement was performed under single-turn-over conditions with [Mss116]≫ [dsRNA]. RNA duplex(200 nM) equilibrated with 4 μM Mss116 was rapidly
413RNA-Stimulated ATPase of Mss116
mixed with 2 mM ATP or buffer, and the labeled 8-merstrand displacement was monitored from changes influorescence intensity and anisotropy.4
Kinetic modeling
Kinetic simulations were performed with Tenua (avail-able free§) or Kintek Global Kinetic Explorer (Kintek Co.,La Marque, TX).Supplementary materials related to this article can be
found online at doi:10.1016/j.jmb.2011.04.004
Acknowledgements
This work was supported by National ScienceFoundation CAREER Award MCB-0546353 to E.M.D.L.C. E.M.D.L.C. is an American Heart Associationestablished investigator (0940075 N) and a HellmanFamily fellow. W.C. was supported, in part, byAmerican Heart Association postdoctoral fellow-ship award X0625997T. E.R. was supported by theEllison Medical Foundation. E.R.M. acknowledgessupport from National Institutes of Health institu-tional training grant GM08203.
References
1. Cordin, O., Banroques, J., Tanner, N. K. & Linder, P.(2006). The DEAD-box protein family of RNAhelicases. Gene, 367, 17–37.
2. Pyle, A. M. (2008). Translocation and unwindingmechanisms of RNA and DNA helicases. Annu. Rev.Biophys. 37, 317–336.
3. Henn, A., Cao,W., Hackney, D. D. &De LaCruz, E.M.(2008). The ATPase cycle mechanism of the DEAD-boxrRNA helicase, DbpA. J. Mol. Biol. 377, 193–205.
4. Henn, A., Cao, W., Licciardello, N., Heitkamp, S. E.,Hackney, D. D. & De La Cruz, E. M. (2010). Pathwayof ATP utilization and duplex rRNA unwinding bythe DEAD-box helicase, DbpA. Proc. Natl Acad. Sci.USA, 107, 4046–4050.
5. Liu, F., Putnam, A. & Jankowsky, E. (2008). ATPhydrolysis is required for DEAD-box protein recyclingbut not for duplex unwinding. Proc. Natl Acad. Sci.USA, 105, 20209–20214.
6. Chen, Y., Potratz, J. P., Tijerina, P., Del Campo, M.,Lambowitz, A. M. & Russell, R. (2008). DEAD-boxproteins can completely separate an RNA duplexusing a single ATP. Proc. Natl Acad. Sci. USA, 105,20203–20208.
7. Staley, J. P. & Guthrie, C. (1999). An RNA switch at the5′ splice site requires ATP and the DEAD box proteinPrp28p. Mol. Cell, 3, 55–64.
§http://bililite.com/tenua/
8. Wassarman, D. A. & Steitz, J. A. (1991). RNA splicing.Alive with DEAD proteins. Nature, 349, 463–464.
9. Iggo, R. D., Jamieson, D. J., MacNeill, S. A., Southgate,J., McPheat, J. & Lane, D. P. (1991). p68 RNA helicase:identification of a nucleolar form and cloning ofrelated genes containing a conserved intron in yeasts.Mol. Cell. Biol. 11, 1326–1333.
10. Schmid, S. R. & Linder, P. (1992). D-E-A-D proteinfamily of putative RNA helicases. Mol. Microbiol. 6,283–291.
11. Rubin, G. M., Yandell, M. D., Wortman, J. R., GaborMiklos, G. L., Nelson, C. R., Hariharan, I. K. et al.(2000). Comparative genomics of the eukaryotes.Science, 287, 2204–2215.
12. Liu, Z. P., Nakagawa, O., Nakagawa,M., Yanagisawa,H., Passier, R., Richardson, J. A. et al. (2001). CHAMP,a novel cardiac-specific helicase regulated by MEF2C.Dev. Biol. 234, 497–509.
13. Rocak, S. & Linder, P. (2004). DEAD-box proteins: thedriving forces behind RNAmetabolism.Nat. Rev. Mol.Cell Biol. 5, 232–241.
14. Huang, H. R., Rowe, C. E., Mohr, S., Jiang, Y.,Lambowitz, A. M. & Perlman, P. S. (2005). Thesplicing of yeast mitochondrial group I and group IIintrons requires a DEAD-box protein with RNAchaperone function. Proc. Natl Acad. Sci. USA, 102,163–168.
15. Solem, A., Zingler, N. & Pyle, A. M. (2006). A DEADprotein that activates intron self-splicing withoutunwinding RNA. Mol. Cell, 24, 611–617.
16. Halls, C., Mohr, S., Del Campo, M., Yang, Q.,Jankowsky, E.& Lambowitz, A.M. (2007). Involvementof DEAD-box proteins in group I and group II intronsplicing. Biochemical characterization of Mss116p, ATPhydrolysis-dependent and -independent mechanisms,and general RNA chaperone activity. J. Mol. Biol. 365,835–855.
17. Seraphin, B., Simon, M., Boulet, A. & Faye, G. (1989).Mitochondrial splicing requires a protein from a novelhelicase family. Nature, 337, 84–87.
18. Bifano, A. L., Turk, E. M. & Caprara, M. G. (2010).Structure-guided mutational analysis of a yeastDEAD-box protein involved in mitochondrial RNAsplicing. J. Mol. Biol. 398, 429–443.
19. Niemer, I., Schmelzer, C. & Borner, G. V. (1995).Overexpression of DEAD box protein pMSS116 pro-motes ATP-dependent splicing of a yeast group IIintron in vitro. Nucleic Acids Res. 23, 2966–2972.
20. Del Campo, M., Mohr, S., Jiang, Y., Jia, H., Jankowsky,E. & Lambowitz, A. M. (2009). Unwinding by localstrand separation is critical for the function of DEAD-box proteins as RNA chaperones. J. Mol. Biol. 389,674–693.
21. Del Campo, M., Tijerina, P., Bhaskaran, H., Mohr, S.,Yang, Q., Jankowsky, E. et al. (2007). Do DEAD-boxproteins promote group II intron splicing withoutunwinding RNA? Mol. Cell, 28, 159–166.
22. Zingler, N., Solem, A. & Pyle, A. M. (2010). Dual rolesfor the Mss116 cofactor during splicing of theai5gamma group II intron. Nucleic Acids Res. 38,6602–6609.
23. Karunatilaka, K. S., Solem, A., Pyle, A. M. & Rueda, D.(2010). Single-molecule analysis of Mss116-mediatedgroup II intron folding. Nature, 467, 935–939.

414 RNA-Stimulated ATPase of Mss116
24. Mohr, G., Del Campo, M., Mohr, S., Yang, Q., Jia, H.,Jankowsky, E. & Lambowitz, A. M. (2008). Function ofthe C-terminal domain of the DEAD-box proteinMss116p analyzed in vivo and in vitro. J. Mol. Biol. 375,1344–1364.
25. Hannemann, D. E., Cao, W., Olivares, A. O., Robblee,J. P. & De La Cruz, E. M. (2005). Magnesium, ADP,and actin binding linkage of myosin V: evidence formultiple myosin V-ADP and actomyosin V-ADPstates. Biochemistry, 44, 8826–8840.
26. Robblee, J. P., Cao, W., Henn, A., Hannemann, D. E. &De La Cruz, E. M. (2005). Thermodynamics ofnucleotide binding to actomyosin V and VI: a positiveheat capacity change accompanies strong ADP bind-ing. Biochemistry, 44, 10238–10249.
27. De La Cruz, E. M. & Ostap, E. M. (2009). Kinetic andequilibrium analysis of the myosin ATPase. MethodsEnzymol. 455, 157–192.
28. Moore, K. J. & Lohman, T. M. (1994). Kineticmechanism of adenine nucleotide binding to andhydrolysis by the Escherichia coli Rep monomer: 1. Useof fluorescent nucleotide analogues. Biochemistry, 33,14550–14564.
29. Talavera, M. A. & De La Cruz, E. M. (2005).Equilibrium and kinetic analysis of nucleotide bind-ing to the DEAD-box RNA helicase DbpA. Biochem-istry, 44, 959–970.
30. Chin, H. F., Cai, Y., Menon, S., Ferro-Novick, S.,Reinisch, K. M. & De La Cruz, E. M. (2009). Kineticanalysis of the guanine nucleotide exchange activity ofTRAPP, a multimeric Ypt1p exchange factor. J. Mol.Biol. 389, 275–288.
31. Hackney, D. D. (2005). The tethered motor domain ofa kinesin–microtubule complex catalyzes reversiblesynthesis of bound ATP. Proc. Natl Acad. Sci. USA,102, 18338–18343.
32. Hackney, D. D., Stempel, K. E. & Boyer, P. D. (1980).Oxygen-18 probes of enzymic reactions of phosphatecompounds. Methods Enzymol. 64, 60–83.
33. Rhoades, E., Ramlall, T. F., Webb, W. W. & Eliezer, D.(2006). Quantification of alpha-synuclein binding tolipid vesicles using fluorescence correlation spectros-copy. Biophys. J. 90, 4692–4700.
34. Thompson, N. L. (1991). Fluorescence correlationspectroscopy. In (Lakowicz, J. R., ed.), pp. 337–378,Plenum Press, New York, NY.
35. Rigler, R., Mets, Ü., Widengren, J. & Kask, P. (1993).Fluorescence correlation spectroscopy with highcount rate and low background: analysis of transla-tional diffusion. Eur. Biophys. J. 22, 169–175.
36. Sheldon, J. G., Williams, S. P., Fulton, A. M. & Brindle,K. M. (1996). 31P NMRmagnetization transfer study ofthe control of ATP turnover in Saccharomyces cerevisiae.Proc. Natl Acad. Sci. USA, 93, 6399–6404.
37. Aregger, R. & Klostermeier, D. (2009). The DEAD boxhelicase YxiNmaintains a closed conformation duringATP hydrolysis. Biochemistry, 48, 10679–10681.
38. Theissen, B., Karow, A. R., Kohler, J., Gubaev, A. &Klostermeier, D. (2008). Cooperative binding of ATPandRNA induces a closed conformation in aDEADboxRNA helicase. Proc. Natl Acad. Sci. USA, 105, 548–553.
39. Appleby, T. C., Anderson, R., Fedorova, O., Pyle,A. M., Wang, R., Liu, X. et al. (2011). Visualizing ATP-dependent RNA translocation by the NS3 helicasefrom HCV. J. Mol. Biol. 405, 1139–1153.
40. Jarmoskaite, I. & Russell, R. (2011). DEAD-boxproteins as RNA helicases and chaperones. WIREsRNA, 2, 135–152.
41. Fedorova, O., Solem, A. & Pyle, A. M. (2010). Protein-facilitated folding of group II intron ribozymes. J. Mol.Biol. 397, 799–813.
42. Bifano, A. L. & Caprara, M. G. (2008). A DExH/D-boxprotein coordinates the two steps of splicing in agroup I intron. J. Mol. Biol. 383, 667–682.
43. Pan, C. & Russell, R. (2010). Roles of DEAD-boxproteins in RNA and RNP folding. RNA Biol. 7, 28–37.
44. Lorsch, J. R. & Herschlag, D. (1998). The DEAD boxprotein eIF4A: 2. A cycle of nucleotide and RNA-dependent conformational changes. Biochemistry, 37,2194–2206.
45. Lorsch, J. R. & Herschlag, D. (1998). The DEAD boxprotein eIF4A: 1. A minimal kinetic and thermody-namic framework reveals coupled binding of RNAand nucleotide. Biochemistry, 37, 2180–2193.
46. Polach, K. J. & Uhlenbeck, O. C. (2002). Cooperativebinding of ATP and RNA substrates to the DEAD/Hprotein DbpA. Biochemistry, 41, 3693–3702.
47. Sharpe Elles, L. M., Sykes, M. T., Williamson, J. R. &Uhlenbeck, O. C. (2009). A dominant negative mutantof the E. coliRNAhelicase DbpAblocks assembly of the50S ribosomal subunit.Nucleic Acids Res. 37, 6503–6514.
48. Fuller-Pace, F. V., Nicol, S. M., Reid, A. D. & Lane,D. P. (1993). DbpA: a DEAD box protein specificallyactivated by 23S rRNA. EMBO J. 12, 3619–3626.
49. Cole, C., Barber, J. D. & Barton, G. J. (2008). The Jpred3 secondary structure prediction server. Nucleic AcidsRes. 36, W197–W201.
50. Del Campo, M. & Lambowitz, A. M. (2009). Structureof the yeast DEAD box protein Mss116p reveals twowedges that crimp RNA. Mol. Cell, 35, 598–609.
51. De La Cruz, E. M., Sweeney, H. L. & Ostap, E. M.(2000). ADP inhibition of myosin V ATPase activity.Biophys. J. 79, 1524–1529.
52. Henn, A. & De La Cruz, E. M. (2005). Vertebratemyosin VIIb is a high duty ratio motor adapted forgenerating and maintaining tension. J. Biol. Chem. 280,39665–39676.
53. Olivares, A. O., Chang,W., Mooseker, M. S., Hackney,D. D. & De La Cruz, E. M. (2006). The tail domainof myosin Va modulates actin binding to one head.J. Biol. Chem. 281, 31326–31336.
54. Elbaum-Garfinkle, S., Ramlall, T. & Rhoades, E.(2010). The role of the lipid bilayer in tau aggregation.Biophys. J. 98, 2722–2730.
Copyright © 2022 FDOKUMEN