Measuring Women and Men's Work - ILO
68
Measuring Women and Men’s Work Main Findings from a Joint ILO and World Bank Study in Sri Lanka
-
Upload
khangminh22 -
Category
Documents
-
view
2 -
download
0
Transcript of Measuring Women and Men's Work - ILO

Measuring Women and Men’s WorkMain Findings from a Joint ILO and World Bank Study in Sri Lanka


Prepared by:The International Labor Organization and the World Bank
Main authors:Antonio Rinaldo Discenza, International Labour OrganizationIsis Gaddis, World BankAmparo Palacios-Lopez, World BankKieran Walsh, International Labour Organization
Measuring Women and Men’s WorkMain Findings from a Joint ILO and World Bank Study in Sri Lanka

Copyright © 2021 The World Bank.
Rights and Permissions
This work is available under the Creative Commons Attribution 3.0 IGO license (CC BY 3.0 IGO)
http://creativecommons.org/licenses/ by/3.0/igo. Under the Creative Commons Attribution
license, you are free to copy, distribute, transmit, and adapt this work, including for commercial
purposes, under the following condition:
Attribution—Please cite the work as follows:
Discenza, A., Gaddis, I., Palacios-Lopez, A., Walsh, K. (2021). Measuring Women and Men’s Work:
Main Findings from a Joint ILO and World Bank Study in Sri Lanka. Washington DC: World Bank.
Disclaimer
The findings, interpretations, and conclusions expressed in this report are entirely those
of the authors. They do not necessarily represent the views of the International Bank for
Reconstruction and Development/World Bank and its affiliated organizations, or those of the
Executive Directors of the World Bank or the governments they represent or the International
Labour Organization.
Cover image: ©Lakshman Nadaraja / World Bank
Acknowledgements ................................................................................................. v
1. Background and Summary ................................................................................. 1
1.1 Background ........................................................................................................................11.2 Measuring Women and Men’s Work: the 19th ICLS ...........................................3
1.2.1 Summary of findings: identification of employment ..................................................................................41.2.2 Summary of findings: the identification of other unpaid activities ..............................................5
2. Main Findings........................................................................................................ 8
2.1 Achieving the Comprehensive Measurement of Employment ................. 12
2.2 The Measurement Of Unpaid Working Activities ............................................. 172.2.1 Own-use production of goods ........................................................................................................................................182.2.2 Own-use provision of services ........................................................................................................................................22
2.3 Concurrent Work Activities and the Total Burden of Work..........................27
2.4 Work in Agriculture and Fishing ..............................................................................32
2.5 Labour Underutilization ............................................................................................. 33
2.6 Other Issues of Note .................................................................................................... 34
3. Summary Conclusions ..................................................................................... 36
References ...............................................................................................................40
Annex 1. 19th ICLS Statistical Standards ............................................................................. 42
Annex 2. Methodology of the Pilot Study ............................................................................45
Annex 3. Identifying Employment in the LFS and MLSS Questionnaires ........................ 51
Table of Contents

iv
Measuring Women and Men’s Work | Main Findings from a Joint ILO and World Bank Study in Sri Lanka
v
Measuring Women and Men’s Work | Main Findings from a Joint ILO and World Bank Study in Sri Lanka
Acknowledgements
This report is a co-publication of the International Labour Organization and the World Bank based on a methodological study that was conducted in partnership with the Sri Lanka Department of Census and Statistics (DCS). This work was made possible by generous funding and support from the William and Flora Hewlett Foundation and Data2X under the Women’s Work and Employment Partnership. Akuffo Amankwah, Theophiline Bose-Duker and Peter Buwembo were members of the core team conducting the methodological study.
The authors wish to thank Kathleen Beegle, Peter Betts, Michael Frosch, Yeon Soo Kim, Gayatri Koolwal, Michael Weber, and, Alberto Zezza for comments and guidance over the course of the study. Special thanks go to Indu Bandara, Gero Carletto, Rafael Diez de Medina, Caren Grown, K.A. Sajeewa Kodikara, Idah Pswarayi-Riddihough, Ritash Sarna, Asitha Seneviratne, and Simrin Singh for supporting the study and to all the dedicated staff at the DCS, especially Dhanushka Nanayakkara and Chandani Wijebandara, without whom this work would not have been possible. This report was proofread by Robert Zimmermann, and layout design was by studio Pietro Bartoleschi.
1Background and Summary

1
1. Background and Summary
1.1 Background
Between 2017 and 2019, the International Labour Organization (ILO) and the World Bank, in collaboration with the Department of Census and Statistics (DCS) of Sri Lanka, completed a pilot study in Sri Lanka with the goal of developing guidance on good practice in the measurement of women and men’s work through household surveys. The study was designed to enable a comparison of the outcomes of two types of household surveys, namely, the labour force survey (LFS) and the multitopic living standards survey (MLSS). It was completed under the Women’s Work and Employment Partnership hosted by Data2X with the support of the William and Flora Hewlett Foundation. The motivation for the study was the 19th International Conference of Labour Statisticians (ICLS) in October 2013, which introduced major changes to the framework of definitions used to produce statistics on work and the labour market (ILO 2013, see also Annex 1). Relative to the standards of 1982, it reduced the scope of the statistical definition of employment to work done for pay or profit and applied a wider definition of work, along with the forms of work framework, to support the analysis of participation in paid and unpaid productive activities. This new framework recognizes that people may be engaged in multiple working activities within the same period, thereby enabling a complete accounting of all work performed. An additional important development was the adoption of an extended set of labour underutilization indicators to
supplement the unemployment rate. Enabling more meaningful gender analysis was a key objective of these various updates but this can only be achieved when the standards and good measurement practices are applied through household surveys.
It is important to highlight from the outset that the two household survey types that are the focus of this study fulfil different primary objectives. LFSs are the primary data source for the computation of labour market indicators, while MLSSs are designed to allow broader measurement and analysis of living standards and poverty. While the absolute comparability of the results of the two types of surveys should not be expected given the different primary objectives and methodologies, the classification of respondents, their working activities and their engagement with the labour market should be as consistent as possible. This is all the more important in developing country contexts, where surveys are often conducted infrequently and many analytic studies (for example, to understand drivers of changes in poverty and living standards) draw on various types of surveys on the assumption that they are each generating coherent and consistent information.
The sensitivity of statistics to survey design, particularly statistics on labour, is well documented, often with a focus on the impacts observed if the content of a survey is altered (for example, see Bardasi et al. 2011). Studies have also been undertaken on the effects of different survey types on measurement that
2
Measuring Women and Men’s Work | Main Findings from a Joint ILO and World Bank Study in Sri Lanka
focus on the ex post comparison of results, such as a study in Egypt showing a substantial impact of the survey type on estimates of women’s work (Langsten and Salen 2008). Similarly, Floro and Komatsu (2011) show that household surveys can easily miss temporary or casual forms of employment. Among the concerns is that, especially in countries with strong social norms and/or culturally assigned gender roles, women working in family businesses may not consider the activity as employment (or work) and therefore not report the activity in response to standard questions about labour market engagement (Müller and Sousa 2020). While these studies demonstrate the sensitivity of measurement to survey design, they do not provide specific solutions for any given survey beyond those they cover. This requires more direct investigation specific to the surveys under review, namely, the LFS and MLSS.
To address these issues, the ILO and World Bank conducted a joint pilot study in Sri Lanka, in collaboration with the Sri Lanka Department of Census and Statistics (DCS). The study had four broad objectives, i.e. to (i) support the operationalization of the 19th ICLS standards in LFS and MLSS type surveys, (ii) assess and, if identified, reduce the undermeasurement of women’s employment and work (as documented by the previous academic literature mentioned above and earlier ILO pilot studies) in these surveys, (iii) gain a better understanding of the comparability of labour market indicators obtained from LFS vs MLSS type surveys, and (iv) pilot changes in either questionnaire that could narrow differences
in estimates of work and the labour market between the MLSS and the LFS.
To isolate the effect of survey type and differences in survey content on measures of work and employment, this study was conducted as a split-sample randomized experiment whereby the only differences between the two groups of households randomly assigned to one of two treatment arms were the questionnaire content and implementation. This study design permits conclusions to be drawn on the scale of differences, if any, and the possible cause of these differences. This allows guidance to be developed on good measurement practices.
This pilot study builds on previous rounds of studies completed by the ILO (Benes and Walsh 2018b) and the World Bank (Gaddis et al. 2020b), as well as a range of related research papers (Desiere and Costa 2019; Koolwal 2019). In addition to extending the scope of the available guidance, the experiences will be used to update published ILO model LFS questionnaires and a World Bank model labour module for MLSS questionnaires, have informed the new Living Standards Measurement Study (LSMS) Guidebook for measuring labor in MLSS-type surveys (Durazo et al. 2021).
This report presents a first summary set of the findings of the pilot study. The findings are being used to generate guidance on the measurement of labour across different types of household surveys. While the primary target audience of the guidance
3
1. Background and Summary
will be those individuals tasked with the completion of household surveys that measure labour, the findings should also attract a wider audience, including data users who are interested in the measurement practices behind the statistics or, more generally, in the improvement of the data available on women and men’s work. While highlighting issues of measurement, the report also emphasizes the valuable data that can be generated if the guidelines and standards are implemented, such as the more comprehensive measurement of all the working contributions of men and women.
1.2 Measuring Women and Men’s Work: the 19th ICLS
The background of the study is related to the international statistical standards adopted by the international community at the 19th ICLS in October 2013. The revised standards represent a framework for work and labour market statistics and replace the standards adopted at the 13th ICLS in 1982. The latter standards had been in use in many countries for decades and had become synonymous with labour statistics on a worldwide basis, providing, for instance, definitions of key concepts, such as employment, unemployment and labour force participation.
The 1982 standards have been vital, but there had been a growing realization – as occurs in many statistical domains – that updates were
needed to meet user needs more effectively. These updates took the form of Resolution I of the 19th ICLS: Resolution concerning statistics of work, employment, and labour underutilization.
The 19th ICLS standards revised the definitions of employment and unemployment and also established a much wider framework for statistics on paid and unpaid work and on labour underutilization. This has created a basis for a much wider range of analyses of the working lives of individuals. A key motivation of the changes was a desire to explain differences in the working contributions and experiences of women and men and to achieve a related understanding of labour market engagement. The objective is to achieve the mainstreaming of the measurement of all working activities in order to enable deeper insights into the relationship between the performance of work and interactions with the labour market.
The survey questionnaires covered a mix of paid and unpaid working activities, namely, employment, the production of goods for own-use and the provision of services for own-use, as defined in the standards. The LFS questionnaire used for the study was developed by the ILO by building on the published model LFS questionnaires. The MLSS questionnaire was developed by the World Bank using the multitopic household surveys with a focus on poverty measurements, such as the ones supported by the World Bank through the

4
Measuring Women and Men’s Work | Main Findings from a Joint ILO and World Bank Study in Sri Lanka
Living Standards Measurement Study, as a reference.1 The questionnaires both included similar numbers of questions to identify the labour force status of individuals, but the LFS questionnaire contained more detailed questions on supplementary labour–related factors, such as detailed characteristics of jobs, while the MLSS questionnaire contained questions on a range of other topics related to living standards.
A message of this report is that the measurement of diverse forms of work adds immense value and provides a clearer perspective on gender differences than statistics on employment alone. For example, three quarters of the total working time among employed male respondents across the three forms of work activities – employment, the own-use production of goods and the own-use provision of services – was accounted for by employment. Among employed women, the corresponding share was less than half, and women spent more than half their average reported working time in unpaid household services, regardless of their status as employed. As a result, a gap of ten hours working time per week in favour of men if only employment is considered becomes a gap of over ten hours in favour of women if the three forms of work activities are considered together, irrespective of the survey used to measure work.
1 The MLSS questionnaire is not based on the Sri Lanka Household Income and Expenditure Survey, because the latter does not include a dedicated module on household members’ labour market engagement.
The study in Sri Lanka sits within the context of ongoing efforts to provide support to countries in the implementation of the 19th ICLS standards through household surveys that measure labour. The data have been analysed following the completion of the first and second waves of data collection, which took place in March to April 2019 and September to October 2019, respectively. The main findings are summarized below and detailed in the main body of the report.
1.2.1 Summary of findings: identification of employment
The measurement of employment, particularly employment among women, is sensitive to survey design and content. This finding is consistent with the conclusions of many earlier studies and repeated across many settings (see Anker and Anker 1989; Boserup 1970; Comblon and Robilliard 2017; Mahmud and Tasneem 2011). While the contexts of the studies referenced varied substantially and even though these studies generally pre-date the adoption of the 19th ICLS standards, a similar pattern of undercounting women’s work was identified.
The results of the Sri Lanka study demonstrate that a clear risk continues to exist of undercounting various types of working activities, or of misclassification between paid and unpaid activities when the 19th ICLS standards are applied. In the first wave of data collection, the LFS identified

5
1. Background and Summary
22 percent more employed women than the MLSS (equivalent to an 8.1 percentage point difference in measured employment to population ratios). It also identified approximately 3 percent more employed men (a 2.4-percentage point difference in the employment-to-population ratios), leading to a gap of 10 percent overall between the surveys (a 5.5 percentage point difference in employment-to-population ratios). In-depth analysis of the data led to a conclusion that the gap emanated from the fact that the MLSS, which, unlike the LFS, initially did not include any recovery questions, identified fewer people engaged in employment in three particular groups, namely (1) those with more casual, low-hours jobs, (2) helpers in family businesses and farms and (3) others involved in informal working activities, with all of these groups being primarily women.2
Changes to address these issues were successful in partially closing the gap in the second wave of data collection (6 percent gap for both men and women, equivalent to a 3.5-percentage point difference in employment to population ratios).
This finding that risks of misclassification of work are most concentrated among certain types or groups of workers corroborates earlier findings of the ILO (Benes and Walsh 2018b), that these risks are greater among
2 Recovery questions are here defined as questions whose purpose is to “recover” persons who were not classified as employed during the core questioning designed to capture employment, even though they were engaged in activities that count as employment.
women than among men. These conclusions support the development of guidance on good measurement practices to avoid the risks, such as the need for recovery questions, careful wording and translations into local language, to ensure that people with “small” jobs or helping in family businesses or farms are identified in the survey. These revisions to the MLSS instrument, while important for the measurement of employment, also improve the measurement of own-use production work in agriculture (described below).3
1.2.2 Summary of findings: the identification of other unpaid activities
The Sri Lanka study also included questions on unpaid working activities. Specifically, work done to produce goods for own-consumption (called the own-use production of goods in the standards), which covers, but is not limited to subsistence farming, and unpaid work to provide services to the household (called the own-use provision of services in the standards), such as housework, childcare and other activities predominantly carried out by women. In combination, the standards refer to these two types of activity as own-use production
3 In the MLSS, a common set of questions is used to identify employment in agriculture (that is, agricultural work for pay or profit) and own-use production work in agriculture (that is, for own or family consumption). The distinction between these two concepts is fleshed out in subsequent questions, which seek information on the intended use of the agricultural outputs (for pay or profit or for own or family consumption). Any revisions that improve the ability of the MLSS to capture employment in agriculture will thus also enhance the ability of the survey to measure own-use production work in agriculture.

6
Measuring Women and Men’s Work | Main Findings from a Joint ILO and World Bank Study in Sri Lanka
work. The other forms of work covered by the standards, namely, unpaid trainee work and volunteer work, were not examined in the Sri Lanka pilot study.
In the first wave of data collection, relative to the MLSS, the LFS recorded a greater prevalence of both forms of unpaid work. The difference was concentrated in crop-farming, while there was relatively less difference across other types of activities. This reflects the fact that – as described above – the MLSS identified fewer family helpers and other marginal workers in farming. The updates undertaken after wave 1 caused a reduction in the recorded gap. The difference observed in wave 2 was relatively minimal, suggesting that the additional questions and updates in wording
were successful in narrowing the gap between the MLSS and the LFS.
Even more notable was the sensitivity of the data on hours worked in own-use provision of services. While the MLSS identified fewer people engaged in these activities in wave 1, it showed a substantially higher average number of hours worked (34.2 versus 24.8 in the LFS). Analysis narrowed this down to care work (care of children or dependent adults), and a review of practices identified the source as a difference in implementation between the two surveys. While the two surveys used similar questions to identify individuals engaged in care work for adults and children, the LFS emphasized active caregiving (and included a descriptive text to be read by LFS interviewers). In contrast, there was no

7
1. Background and Summary
explicit emphasis on active caregiving in the MLSS. As a consequence, the MLSS estimate for caring activities in wave 1 was nearly three times the LFS estimate (43.8 versus 16.1).
During the wave 2 training, both sets of interviewers were instructed to read the additional text. The impact on results was clear. The LFS result was relatively consistent with wave 1, while the MLSS estimate fell by half, leaving a much smaller gap and resulting in a minimal gap in the overall estimate of the time spent in the own-use provision of services in wave 2 (26.1 hours per week in the MLSS and 25.3 hours in the LFS).
The study also shows that measured weekly hours spent on the own-use provision of services are significantly lower if the survey relies on only one question (seeking information on the hours worked during the previous week) rather than two questions (on the days worked during the previous week and the average hours worked per day). In wave 2, both the LFS and the MLSS administered to half the samples the one-question approach and to the other half the two-question approach. The results in both surveys were highly consistent. The two-question approach yielded weekly hours spent on own-use production of services that were approximately 30 percent higher than weekly hours based on only one question. This pattern was repeated among both men and women albeit with slightly different gaps. A possible explanation is that the rounding of the daily averages in the two-question approach leads to an overestimation relative
to the single question. However, while the direction and scale of the impact is quite consistent, which of the two sets of results is more valid is not certain.
The study covered many other issues, the analysis of which enhances the understanding of good practices in the measurement of work, employment and labour underutilization, as framed by the 19th ICLS standards. Perhaps a general summary should highlight, as above, that the measurement of work can be sensitive to questionnaire design, implementation and context, and the study has allowed an identification of the areas in which the misclassification risks appear greatest.
Another general point is the need for good questionnaire development and testing practices to establish a solid survey footing. This is true at the international level in the activities of international agencies and at the national level among national statistical compilers. In the absence of appropriate testing, the degree of sensitivity of measurement may never truly become visible, leaving open the possibility that the statistics generated may not capture reality in the way desired, for example the differences between women and men’s working lives. Activities at the international level can provide a major support to countries, but not entirely replace the need for sound translation and the adaptation of questionnaires to the national context, a process that needs to be supported by testing at the national level.

2MainFindings

9
2. Main Findings
The measurement of employment and other working activities is sensitive to survey design; this is particularly true in the case of women. A clear risk exists of undercounting the various types of working activities or misclassifying paid and unpaid activities. This risk can be reduced by careful survey design, testing and training. Misclassifications, if they occur, can seriously limit the analysis of the variations across the experiences and contributions of women and men to productive activities, as well as the barriers and constraints they face to changing their situation. This hampers the identification or evaluation of appropriate policies, including those seeking to promote women’s economic empowerment.
This is one of a number of key findings of a pilot study completed in Sri Lanka in a cooperative effort of the DCS of Sri Lanka, the ILO, and the World Bank. The pilot study was completed through the Women’s Work and Employment Partnership hosted by Data2X with the support of the William and Flora Hewlett Foundation.
The findings of the pilot study will advance the cause of the proper measurement and reporting of paid and unpaid work across household surveys (particularly the LFS and the MLSS) focused on measuring welfare by identifying measurement difficulties in the domain of work and the related solutions and good practices. This endeavour has been carried out in the context of the need for support in implementing the latest international statistical standards, especially
those adopted at the 19th ICLS. A primary objective of the revised standards was to address gender biases in the basic concepts used to measure employment and economic activity, as well as to promote a much wider range of statistics on paid and unpaid work and engagement with the labour market, relative to previous standards. (See Annex 1 for a description of the 19th ICLS standards.)
The implementation of the revised standards needs to be accompanied by good measurement practices to achieve an improvement in the data on women and men’s engagement in employment and other forms of work. The Sri Lanka study is part of a longer-term series of studies designed to provide comprehensive guidance to countries on the implementation of the standards. In the ILO case, this builds on an earlier round of pilot studies that focused on the implementation of key elements of the standards through the LFS (Benes and Walsh 2018a). This work had been used to develop model LFS questionnaires that were the starting point for the LFS questionnaire used in the Sri Lanka study.4 For the World Bank, the study builds on previous methodological studies conducted under the umbrella of the Living Standards Measurement Study Program to improve labour measurement in household surveys. While this study reiterated some of the findings of the earlier rounds of
4 See Labour Force Survey (LFS) Resources (dashboard), ILOSTAT, International Labour Organization, Geneva, https://ilostat.ilo.org/resources/lfs-resources/.ttps://ilostat.ilo.org/resources/lfs-resources/.
10
Measuring Women and Men’s Work | Main Findings from a Joint ILO and World Bank Study in Sri Lanka
studies, it is unique because it was explicitly designed to allow a comparison of the labour indicators generated by two different survey instruments (the LFS and the MLSS). In addition, the study added substantially to the understanding of some topics, such as the measurement of agricultural work and of the time spent on unpaid household service work. It also highlighted areas where more study would be beneficial.
The lessons learned will inform more rounds of questionnaire development and testing on key related issues, such as the use of time-use approaches to improve the measurement of unpaid household service work. The ultimate objective will be a comprehensive guidance covering the full range of issues touched on by the 19th ICLS standards, namely, the performance of paid and unpaid work and labour market engagement.
The Sri Lanka pilot study involved multiple rounds of data collection, allowing comparisons across the outcomes at different times. The first round of testing involved cognitive interviews among 20 respondents for each questionnaire. This was followed by a quantitative test based on a representative sample of households in three districts of Sri Lanka, namely, Anuradhapura, Galle and Kurunegala. The quantitative test was based on a total sample of 980 households per survey type and per wave across 98 primary sampling units (PSUs). The households were selected from the census blocks of the continuous LFS in the selected districts. The modus
operandi of the quantitative test was to administer a “typical” LFS questionnaire and a “typical” MLSS questionnaire to a similar sample of households through a split-sample randomized design. Within each PSU, 10 households were randomly assigned to the LFS, and 10 to the MLSS treatment arms.5 (See Annex 2 for a description of the methodology of the pilot study.) 6
As proposed by Presser et al. (2004), such a split-sample approach can be used if the objective is to compare the outcomes of different survey questionnaires and if all aspects of the sampling, methodology and implementation, other than the questionnaires, are the same. In line with approaches proposed by Fowler (2004) statistics are generated and compared for the concepts covered by both questionnaires. If differences were observed, for example, in the proportion of working-age respondents identified as employed, a more in-depth analysis was undertaken to try to isolate the source of the differences. This type of experimental approach is being increasingly used and has been found to be valuable in generating improvements in questionnaire design (for instance, see Beaman and Dillon 2012; Beegle et al. 2012; Benes and Walsh 2018b; Gaddis et al. 2020a; Heath et al. 2020; Kilic and Sohnesen 2017).
5 This implies that, within each household, all individuals were administered the same questionnaire.
6 All estimates of labour market indicators reported in this document use post-stratification weights to benchmark the MLSS and LFS samples to a common reference population.

11
2. Main Findings
For example, when a difference was identified in the proportion of working-age respondents in employment in wave 1, a detailed analysis took place of the characteristics of employment and working time of respondents to each questionnaire, as well as the contribution of the various questions to the total measured level of employment. This analysis then supported a conclusion that the difference emanated from a greater emphasis in the LFS questionnaire on the recovery of small jobs and helpers in family businesses and farms, as revealed by differences in working time, industry, occupation, and so on. An analysis across the three districts showed that a similar scale of variation was observed in each district, further supporting a conclusion that the difference could be related to questionnaire content given that it appeared to be systematic.
In the absence of a split-sample randomized study design, it would have been difficult to rigorously isolate the effects of the questionnaire used on the outcomes of interest, detect the sources of differences with any degree of specificity, and identify ways to close measurement gaps. The multiple wave approach also performed an important function, insofar as it gave the study team the opportunity to make changes to the questionnaires before a second wave of field data collection with the same households, and to assess the impact of these changes on labour indicators generated by both survey types during the second wave. This enabled an analysis of
the impact of the solutions identified. The order of the report broadly follows the study design. Thus, the findings of wave 1 are generally described initially for any given issue. This is followed by a description of the changes made to the survey instrument in wave 2 and the results of wave 2, along with the conclusions drawn.
Despite the above, achieving absolute consistency between the LFS and MLSS, or any other household survey, in the measurement of work and labour is not a realistic goal. Absolute consistency will be unlikely because of differences in the primary objectives and many aspects of the design of various household surveys. For instance, the LFS will typically be administered to a larger sample of households and be focused primarily on the labour market and work-related issues to generate a wide range of indicators on these topics. The MLSS may involve smaller samples and will cover a wide range of topics relevant to the analysis of poverty and living standards. While information on the engagement of each household member in different forms of paid and unpaid work is key to the analysis of poverty and living standards, MLSSs inevitably include fewer questions on labour and capture less detail on the topic than a dedicated LFS. The outputs of the two surveys will therefore vary substantially in scope, focus, the type of the disaggregations, and so on. Nonetheless, improving the consistency in measurement, to the extent possible, will be valuable. Regardless of the survey, it is desirable that a person who is employed (as defined by the

12
Measuring Women and Men’s Work | Main Findings from a Joint ILO and World Bank Study in Sri Lanka
standards) be classified as employed, likewise for unemployment or other key concepts. Differences in classification have implications for coherence across surveys. This is especially important in developing countries, where surveys may be conducted infrequently and labour market information systems may have to draw on various types of surveys on the assumption they are each generating coherent and consistent information.
2.1 Achieving the Comprehensive Measurement of Employment
In the first wave of field data collection, the LFS questionnaire identified one tenth more employed respondents than the MLSS questionnaire. The two surveys generated employment to population ratios of 57.0 percent and 51.5 percent, respectively (see Figure 1). This difference was particularly acute and statistically significant among female respondents. The LFS identified 22.5 percent more employed women (a ratio of employment to population of 44.1 percent versus 36.0 percent), while a small difference was also recorded among men (72.4 percent versus 70.0 percent).7
7 The indicators of work and the labour market shown in this report refer to the working-age population (WAP). In line with para. 65 of the 19th ICLS resolution (ILO 2013) this includes all persons aged 15 years and above.
Deeper analysis of this result suggested that the greatest gap centred on people helping in family businesses or farms, people with more casual jobs or jobs with lower average working hours. These findings are consistent with the results of several previous studies. Müller and Sousa (2020) note, in particular, the tendency of women working in family businesses to self-identify as housewives, which was often seen by the respondents as mutually exclusive with employment. Consequently, these respondents did not report their activities when they were asked about their jobs or businesses. Benes and Walsh (2018b) find that dedicated recovery questions were required to target more casual jobs or the work of those helping in family businesses. A similar conclusion was reached by Sudarshan and Bhattacharya (2008), who show that these types of undercounts can be addressed by intensive probing.
The types of working activities at greatest risk of undercount are predominantly performed by women. In the case of the Sri Lanka study, this was confirmed by an assessment of the differences between the surveys in the distribution of jobs by status in employment, sector and average hours worked. More specifically, the LFS identified larger numbers of contributing family workers, own-account workers and persons with low-hours jobs. Changes were made to the MLSS questionnaire used during wave 2 of the field data collection to reflect these conclusions. In particular, the wordings of some questions were changed, and

13
2. Main Findings
recovery questions were added to target people engaged in the types of activities apparently missed by wave 1 (see Annex 3 for details). Further in-depth analysis of the MLSS wave 2 data, presented in Annex 3, Figure 3.1, shows that without the recovery questions, 9 percent of employed women would not have been captured as employed. For men, all four recovery questions combined identified only slightly more than 2 percent of total employment.
In wave 2, the gap between surveys was reduced among women (43.8 percent in the LFS versus 41.3 percent in the MLSS), while it slightly increased among men (73.5 percent versus 68.9 percent).
This meant that, in wave 2, the LFS was identifying 6.5 percent more employed than the MLSS (or an employment to population ratio that was 3.5 percentage points higher). This suggests the changes made were at least partially successful and were especially important for women, reducing the gap from 22.5 percent to 6.0 percent. It is worth noting that, while the difference in estimates of total employment remained statistically significant the difference for women was no longer statistically significant in wave 2.The remaining gaps observed in wave 2, as in wave 1, were repeated across the three districts covered by the pilot study and nearly all age groups, supporting the conclusion that the difference was relatively systematic.
Source: Joint DCS, ILO, and World Bank pilot study in Sri Lanka, Wave 1 and Wave 2, March–October 2019.
Wave 157.0
57.4
53.9
51.5
FEM
ALE
SM
ALE
STO
TAL
Wave 1
Wave 1
Wave 2
Wave 2
Wave 2
0 10 20 30 40 50 60 70 80
Figure 1 Employment to population ratio (% of working-age population (WAP)), by sex, wave of data collection and survey
72.4
73.5
68.9
44.1
43.8
41.3
36.0
70.0
LFS MLSS
14
Measuring Women and Men’s Work | Main Findings from a Joint ILO and World Bank Study in Sri Lanka
The fact that the LFS identified more employed respondents in this context than the MLSS may be attributed to the fact that the LFS design is centred on a comprehensive identification and description of employment and labour market engagement, while the MLSS has a primary focus on poverty, thus dedicating fewer questions to the overall topic of labour. This may be seen in the questionnaires presented in Annex 3.
The LFS questionnaire used for the study dedicated early questions to the comprehensive identification of employment, without seeking to categorize employment by industry, occupation, and so on. This additional detail was captured through the later sections of the questionnaire. The answer to a single question might identify a respondent as employed, or several might be needed. Benes and Walsh (2018b) show that, if well designed and implemented, this approach can be efficient in minimizing the survey burden on most employed respondents, while capturing more difficult cases (for instance, casual jobs) through additional questions.
By contrast, the MLSS questionnaire combined the objective of identification and a certain level of classification of the employment though the initial questions on labour, reflecting the fact that it dedicates fewer questions to the topic overall. Also, respondents to the MLSS tended to answer all the initial questions and thus provided a categorization of all the employment and own-use production of foodstuffs undertaken by the respondent. (See the questionnaire in
Annex 3.) This approach is consistent with guidance provided by Grosh and Glewwe (2000). It also reflects long-standing practice in MLSSs and helps maintain a degree of comparability over time.
These variations in approach reflect the important differences in the objectives of the surveys, and it is unsurprising that the results are not completely consistent. Nonetheless, the finding of the pilot study that relatively minor adjustments to questionnaires can reduce, if not eliminate, gaps is useful for any household survey covering labour-related issues.8
The differences observed in wave 2, while smaller in magnitude, were concentrated, as follows:
� The differences in wave 2 were concentrated among the self-employed (17.5 percent higher in the LFS), largely, but not exclusively in the agriculture sector.
� The LFS also recorded a larger number of employees in wave 2, but the difference was less substantial than the gap for the self-employed.
8 Because the LFS is dedicated to the measurement of employment and work and has been extensively tested in previous rounds of methodological investigation, the analysis generally considers the LFS estimates as a benchmark against which the MLSS is evaluated. Of course, there is still also the possibility of some degree of under- or overcounting or of mismeasurement more broadly in the LFS that the study was not designed to assess comprehensively, even if some misclassification issues could have been observed. Moreover, we assume that seasonality, as captured by differences in labour market indicators between waves 1 and 2, would affect the two survey instruments proportionately (and this is one of the reasons this report emphasizes relative, rather than absolute gaps, between the two instruments).

15
2. Main Findings
� In wave 2, the MLSS identified a slightly higher number of respondents who, as a main job, were working without pay in family businesses and farms (that is, they were contributing family workers).
The implications of these differences are important because they have an obvious and direct impact on many of the indicators describing the prevalence and characteristics of paid work and on any analysis that builds upon such indicators. This includes analysis of economic sectors, status in employment, occupation, informality, working time, and so on. These aspects exhibit high gender relevance
because they cover the dimensions that typically distinguish women and men’s experiences in the labour market.
Another implication of the differences in the identification of employment is evident in the analysis of the data on working time. The MLSS picked up fewer jobs with low working hours than the LFS in wave 1 (see Figure 2), leading to higher average working time (41.4 versus 38.3). By wave 2, this gap had narrowed because of the improved recovery of people with casual or low-hours jobs, but a gap still remained (39.8 versus 37.9), supporting the conclusion that the changes made in the surveys may not have fully closed the gap.
Source: Joint DCS, ILO, and World Bank pilot study in Sri Lanka, Wave 1 and Wave 2, March–October 2019.Note: The red diamond indicates the gender gap in working time in the activities covered. The diamond is included on the bar of the gender with less working time. If it is included on the bar for women, this thus shows the amount by which the average working time of women in the activity was less than among males and vice versa if it shown on the bar for men.
Figure 2 Average hours actually worked per week in employment (in all jobs) and the gender gap, by sex, wave of data collection and survey
LFS MLSS GENDER GAP
Wave 138.3
37.9
39.8
41.4
FEM
ALE
SM
ALE
STO
TAL
Wave 1
Wave 1
Wave 2
Wave 2
Wave 2
0 10 20 30 40 50
42.5
42.2
44.2
32.410.1
10.4
10.8
10.4
31.8
33.8
34.7
45.5

16
Measuring Women and Men’s Work | Main Findings from a Joint ILO and World Bank Study in Sri Lanka
Figure 3 illustrates this additionally, showing how respondents in each survey were distributed by hours worked in the two waves. In both wave 1 and wave 2, almost identical numbers of respondents had actual working time in all jobs of 40 hours or more in the reference week.9 This suggests that both surveys were able to capture full-time employment. The differences were observed in the lower bands of working time in both wave 1 and wave 2. However, the gaps between the two surveys were smaller in wave 2 than in wave 1. For example, in
9 The actual number of respondents to each questionnaire was slightly different; so, the results were reweighted to impose a common total number of respondents for each survey and wave. This allows a direct comparison of the number of respondents in different groups across the two surveys and the two waves.
Figure 3 Distribution of employed respondents, by bands of hours actually worked per week (in all jobs) and by wave of data collection and survey
1600
1400
1200
1000
800
600
400
200
0LFS
Wave 1LFS
Wave 2MLSS
Wave 1MLSS
Wave 2
Source: Joint DCS, ILO, and World Bank pilot study in Sri Lanka, Wave 1 and Wave 2, March–October 2019.Note: The LFS had 10 and the MLSS 11 missing/don’t know values for the hours worked in wave 1.
Missing/Don’t know Temporarily absent 1 to < 10 10 to < 30 30 to < 40 40 or more
wave 1, the LFS identified 23 percent more respondents who had worked between 10 and 30 hours in the reference week (314 compared with 256 in the MLSS). By wave 2, there was still a gap, but it had decreased to 13 percent (334 compared with 296).
One area of consistency between the two surveys was the gap in average actual working time between male and female respondents (see Figure 2). Across both waves and in both surveys the average
1508
1363
15181423
800 804 797 799
191
164
181156
314256
334296
118 78 140 11874 51 64 52
17
2. Main Findings
working time in employment was approximately 10 hours greater among men than among women with an identical gap of 10.4 hours in wave 2 in both surveys. One possible conclusion from this finding is that, even if some difference in estimates existed across the surveys, the difference was not particularly sex differentiated, at least not in the case of working time in employment. Put differently, it was as likely to influence the reporting of working time in employment among both men and women.
The gender gap in working time is shown by the red diamonds in Figure 2 (and other figures containing information on working time). The diamonds are presented on the bar of the gender with lower average working time in the activity. For example, in Figure 2, the diamond for wave 2 in both surveys is on the bar for women with the number 10.4, indicating that the average working time of female respondents in employment was 10.4 hours less than the average among men.
2.2 The Measurement Of Unpaid Working Activities
An important development associated with the adoption of the 19th ICLS standards is the creation of a coherent framework identifying different forms of unpaid work, alongside employment. One goal is to mainstream the measurement of unpaid working activities, and in a way that allows the activities to
be related to paid work and labour market engagement. Another advancement is the recognition of the reality that people can be engaged in multiple forms of work in a single reference period, for instance, employed, but also engaged in the production of goods for family consumption, and so on. This is a contrast relative to the 1982 standards, which excluded unpaid services within households from the concept of economic activity and, at the same time, assigned people to one category only (employed, unemployed, or not economically active).
The new framework promotes the measurement of the different forms of work to enable indicators to be generated on the prevalence of participation and the time spent in each of them, as well as the interaction between the various forms of work, the total work burden and how these activities are distributed across household members.
The pilot study included different sets of questions and flows to identify people carrying out unpaid working activities and the time spent on these activities. As with employment, the intention is to draw conclusions on good measurement practices for household surveys. Specifically, the questionnaires both covered the own-use production of goods and the own-use provision of services. (See Annex 1 for a description of the 19th ICLS standards.)
18
Measuring Women and Men’s Work | Main Findings from a Joint ILO and World Bank Study in Sri Lanka
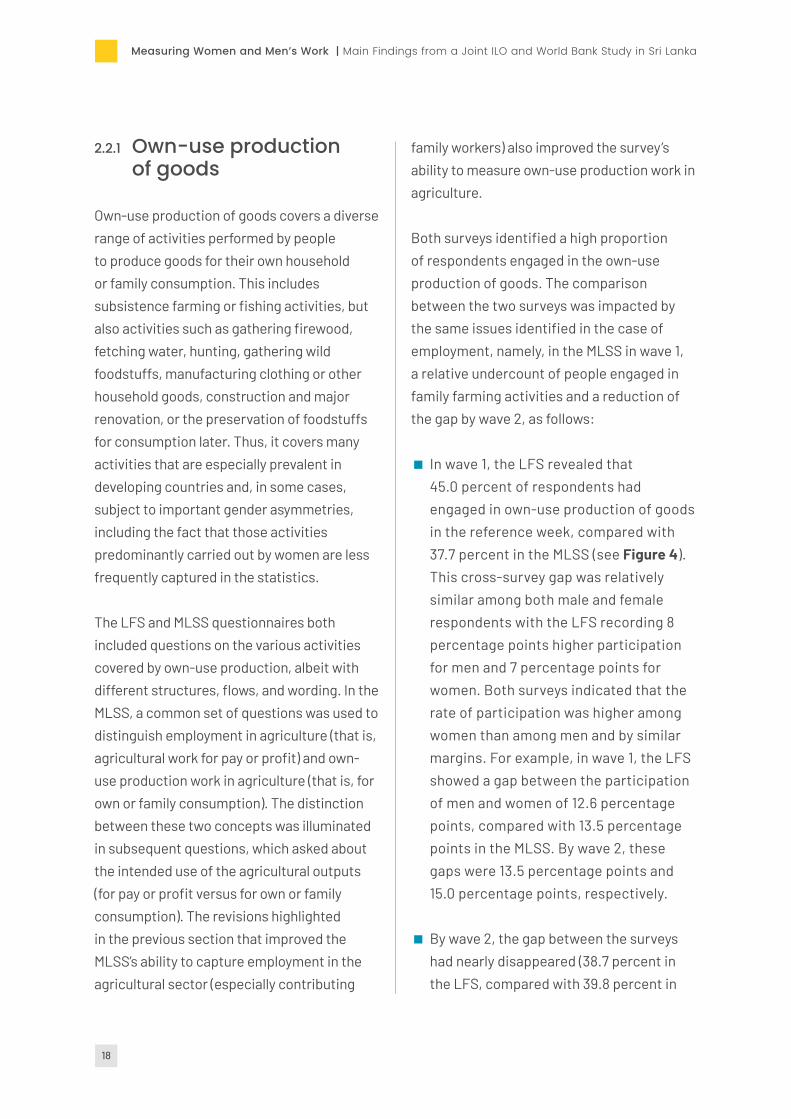
2.2.1 Own-use production of goods
Own-use production of goods covers a diverse range of activities performed by people to produce goods for their own household or family consumption. This includes subsistence farming or fishing activities, but also activities such as gathering firewood, fetching water, hunting, gathering wild foodstuffs, manufacturing clothing or other household goods, construction and major renovation, or the preservation of foodstuffs for consumption later. Thus, it covers many activities that are especially prevalent in developing countries and, in some cases, subject to important gender asymmetries, including the fact that those activities predominantly carried out by women are less frequently captured in the statistics.
The LFS and MLSS questionnaires both included questions on the various activities covered by own-use production, albeit with different structures, flows, and wording. In the MLSS, a common set of questions was used to distinguish employment in agriculture (that is, agricultural work for pay or profit) and own-use production work in agriculture (that is, for own or family consumption). The distinction between these two concepts was illuminated in subsequent questions, which asked about the intended use of the agricultural outputs (for pay or profit versus for own or family consumption). The revisions highlighted in the previous section that improved the MLSS’s ability to capture employment in the agricultural sector (especially contributing
family workers) also improved the survey’s ability to measure own-use production work in agriculture.
Both surveys identified a high proportion of respondents engaged in the own-use production of goods. The comparison between the two surveys was impacted by the same issues identified in the case of employment, namely, in the MLSS in wave 1, a relative undercount of people engaged in family farming activities and a reduction of the gap by wave 2, as follows:
� In wave 1, the LFS revealed that 45.0 percent of respondents had engaged in own-use production of goods in the reference week, compared with 37.7 percent in the MLSS (see Figure 4). This cross-survey gap was relatively similar among both male and female respondents with the LFS recording 8 percentage points higher participation for men and 7 percentage points for women. Both surveys indicated that the rate of participation was higher among women than among men and by similar margins. For example, in wave 1, the LFS showed a gap between the participation of men and women of 12.6 percentage points, compared with 13.5 percentage points in the MLSS. By wave 2, these gaps were 13.5 percentage points and 15.0 percentage points, respectively.
� By wave 2, the gap between the surveys had nearly disappeared (38.7 percent in the LFS, compared with 39.8 percent in

19
2. Main Findings
the MLSS). In addition, the differences between survey instruments are for the most part no longer statistically significant. The rate found by the LFS fell substantially between wave 1 and wave 2, which can be linked to the timing of the surveys; wave 2 took place during a period of higher rainfall and thus greater restriction on movement and outdoor work. However, the participation levels reported in the MLSS rose moderately, illustrating the success of the updates made to the MLSS questionnaire.10
10 As mentioned earlier, we assume that seasonal changes affected the LFS and MLSS proportionately, and therefore did not have a strong influence on the gap (in relative terms) between the two surveys. However, it remains a possibility that seasonality affected one survey instrument more than the other and thus contributed to the narrowing of the gap between the two surveys.
Source: Joint DCS, ILO, and World Bank pilot study in Sri Lanka, Wave 1 and Wave 2, March–October 2019.
Figure 4 Participation rate (% of WAP) in own-use production of goods, by sex, wave of data collection and survey
Wave 145.0
38.7
39.8
37.7
FEM
ALE
SM
ALE
STO
TAL
Wave 1
Wave 1
Wave 2
Wave 2
Wave 2
0 10 20 30 40 50 60
38.2
33.1
31.6
50.8
43.5
46.6
43.9
30.4
LFS MLSS
The average hours worked in own-use production of goods (see Figure 5) by those engaged in that form of work were quite similar between the surveys in both waves, for example 6.3 hours per week in wave 2 of the LFS, compared with 6.2 hours in the MLSS. This highlights that, while own-use production of goods was a common activity, it was a low intensity activity relative to employment in this setting.

20
Measuring Women and Men’s Work | Main Findings from a Joint ILO and World Bank Study in Sri Lanka
In both the LFS and the MLSS, there were gender gaps in both waves. The average hours worked were higher among male respondents, though the size of the gap was somewhat different across the two survey types. This suggests there is some volatility or sensitivity in the reporting on hours related to differences in the questionnaire content, but, on balance, this was not substantial.
In wave 2, splitting own-use production of goods into the various activities covered, one may note interesting patterns (see Table 1).
� The LFS identified more respondents who were engaged in crop farming to produce foodstuffs for family or household use compared with the MLSS (10.2 percent versus 7.2 percent). This may be linked to the structural differences in the questionnaires, particularly the additional sets of questions in the LFS to ensure the complete coverage of this group. Evidently, this becomes important in the analysis of total labour input to agriculture, the identification of agricultural households, or various other analyses relying on measures of agricultural work (see below).
Source: Joint DCS, ILO, and World Bank pilot study in Sri Lanka, Wave 1 and Wave 2, March–October 2019.Note: The red diamond indicates the gender gap in working time in the activities covered. The diamond is included on the bar of the gender with lower working time. If it is included on the bar for women, this shows the amount by which the average working time of women in the activity was lower than among men and vice versa if it shown on the bar for men.
Wave 16.6
6.2
6.3
6.3
FEM
ALE
SM
ALE
STO
TAL
Wave 1
Wave 1
Wave 2
Wave 2
Wave 2
0 1.0 2.0 3.0 4.0 5.0 6.0 7.0 8.0
Figure 5 Average hours actually worked per week in own-use production of goods, by sex, wave of data collection and survey
7.6
6.7
7.5
6.01.6
0.6
1.0
2.1
6.1
5.5
5.9
6.9
LFS MLSS GENDER GAP

21
2. Main Findings
� In some of the other activities covered, variations were observed despite the fact the surveys included identical questions. For example, the LFS identified more respondents engaged in the gathering of wild fruits. The difference was entirely among women (15.3 percent versus 11.4 percent). This situation was reversed in the engagement in the collection of firewood, a common activity in the survey areas. The MLSS identified more respondents who were engaged in this activity, all women (33.4 percent versus 27.2 percent).
In both these activities, the number of men participating was essentially identical. No obvious explanation for these inconsistencies is available, indicating that the measurement of some own-use production activities may be sensitive to issues other than the wording of survey questions, such as interviewer effects, question placement and order, the context effect, and so on. However, this is not universal. There is a fairly high degree of consistency in the case of fetching water and other activities covered by own-use production of goods.
Table 1Shares of respondents of working age engaged in own-use production of goods in wave 2, by sex, type of activity and survey
TOTAL MALES FEMALES
Shar
es o
f W
AP (%
)
Std.
Err
.
Coef
f. of
va
r. (%
)
Diff
LFS
-M
LSS
(pps
)
Sign
. Lev
el
Shar
es o
f W
AP (%
)
Std.
Err
.
Coef
f. of
va
r. (%
)
Diff
LFS
-M
LSS
(pps
)
Sign
. Lev
el
Shar
es o
f W
AP (%
)
Std.
Err
.
Coef
f. of
va
r. (%
)
Diff
LFS
-M
LSS
(pps
)
Sign
. Lev
el
Crop farming
LFS 10.2 1.0 10.23.0 **
12.0 1.2 10.24.2 ***
8.8 1.1 12.62.0 *
MLSS 7.2 0.7 9.1 7.7 0.9 12.2 6.7 0.6 9.6
Rearing of livestock
LFS 1.1 0.3 25.9-0.7
1.1 0.4 31.3-0.5
1.1 0.4 32.3-0.8 **
MLSS 1.8 0.4 20.0 1.6 0.4 25.8 1.9 0.4 21.9
FishingLFS 0.2 0.1 62.6
0.20.3 0.2 62.6
0.30.0 0.0
0.0MLSS 0.0 0.0 0.0 0.0 0.0 0.0
Hunting and GatheringLFS 11.3 1.1 9.5
2.16.6 1.0 14.6
0.015.3 1.5 9.6
3.9 **MLSS 9.2 0.8 8.9 6.6 0.8 11.7 11.4 1.1 9.7
Preserving food
LFS 1.7 0.3 16.10.4
1.1 0.3 29.90.5
2.2 0.4 18.10.3
MLSS 1.3 0.2 18.7 0.6 0.2 36.6 1.9 0.4 20.6
Fetching water
LFS 10.3 1.0 9.7-0.5
9.9 1.1 11.1-1.4
10.5 1.2 11.60.2
MLSS 10.8 0.9 7.9 11.3 1.1 9.6 10.3 1.0 9.3
Collecting firewood
LFS 21.6 1.3 5.9-3.4 **
14.9 1.3 8.6-0.2
27.2 1.7 6.2-6.1 ***
MLSS 25.0 1.2 4.9 15.1 1.2 8.2 33.3 1.6 4.9Manufacturing of other household goods
LFS 2.8 0.4 15.60.4
1.2 0.5 41.70.5
4.1 0.6 15.40.4
MLSS 2.3 0.3 12.8 0.7 0.3 41.3 3.7 0.5 13.5
Building and major renovations
LFS 2.1 0.4 17.2-0.5
2.6 0.4 17.3-0.3
1.6 0.4 25.20.7
MLSS 2.6 0.5 19.5 2.8 0.6 22.4 2.3 0.5 20.3Source: Joint DCS, ILO, and World Bank pilot study in Sri Lanka, Wave 1 and Wave 2, March–October 2019.Significance levels: * = 10 percent ** = 5 percent *** = 1 percent

22
Measuring Women and Men’s Work | Main Findings from a Joint ILO and World Bank Study in Sri Lanka
2.2.2 Own-use provision of services
Own-use provision of services refers to the many services people provide to their own households or families without pay, including housework, gardening, small repairs, arranging services, caring for children, the elderly or other dependent family members, and so on. It aligns with the scope of Sustainable Development Goal Indicator 5.4.1 – the proportion of time spent on unpaid domestic and care work, by sex, age and location – meaning that statistics compiled on own-use provision of services can form the basis for this indicator. In addition, it forms part of the analysis of the total burden of work and is critical in understanding the differences between women and men in the contributions to household well-being, often misrepresented if only employment is counted.
Before addressing the lessons learned on the measurement of this form of work, it is useful to show the value these data can generate, especially in highlighting gender gaps that are often not visible because of infrequent measurement. Female respondents in the study in Sri Lanka had approximately three times as much working time per week on average in the provision of services for own use than male respondents engaged in the activity. This was true in both surveys, in both waves and in applying any of the different measurement approaches tested. If the differences in participation are combined with average working hours,
women contributed approximately four fifths of all the time spent in own-use provision of services. In the past, such gaps often went unreported.
The results of wave 1 of the Sri Lanka pilot study highlighted how sensitive the measurement of time spent in unpaid household and care work is to questionnaire design and survey implementation. Both surveys used the same approach and sequence of questions. However, there were some slight differences in wording and implementation. These differences may seem minor from a designer’s perspective, but they were evidently substantial from the respondent’s perspective.
The LFS showed a higher level of participation in wave 1 (87 percent of the working-age population (WAP) versus 81.1 percent in the MLSS). The difference was entirely associated with the male respondents; the levels among women were essentially equivalent (see Figure 6). Closer analysis of the data showed that the difference among men was concentrated in only one of the three districts covered by the survey, suggesting some type of local effect that may be related to inconsistencies in interviewer practices or instructions, making it less likely that male respondents to the MLSS would report these activities.
During the preparations for wave 2, interviewer training was used to emphasize the need to ask all respondents about the full list of activities exhaustively, and this

23
2. Main Findings
seems to have been successful in reducing the gap. Notably, the estimates between wave 1 and wave 2 of the LFS were consistent among both men and women and among women responding to the MLSS. However, the participation of men recorded in the MLSS rose between the two waves of data collection, thus narrowing the overall gap between the surveys.
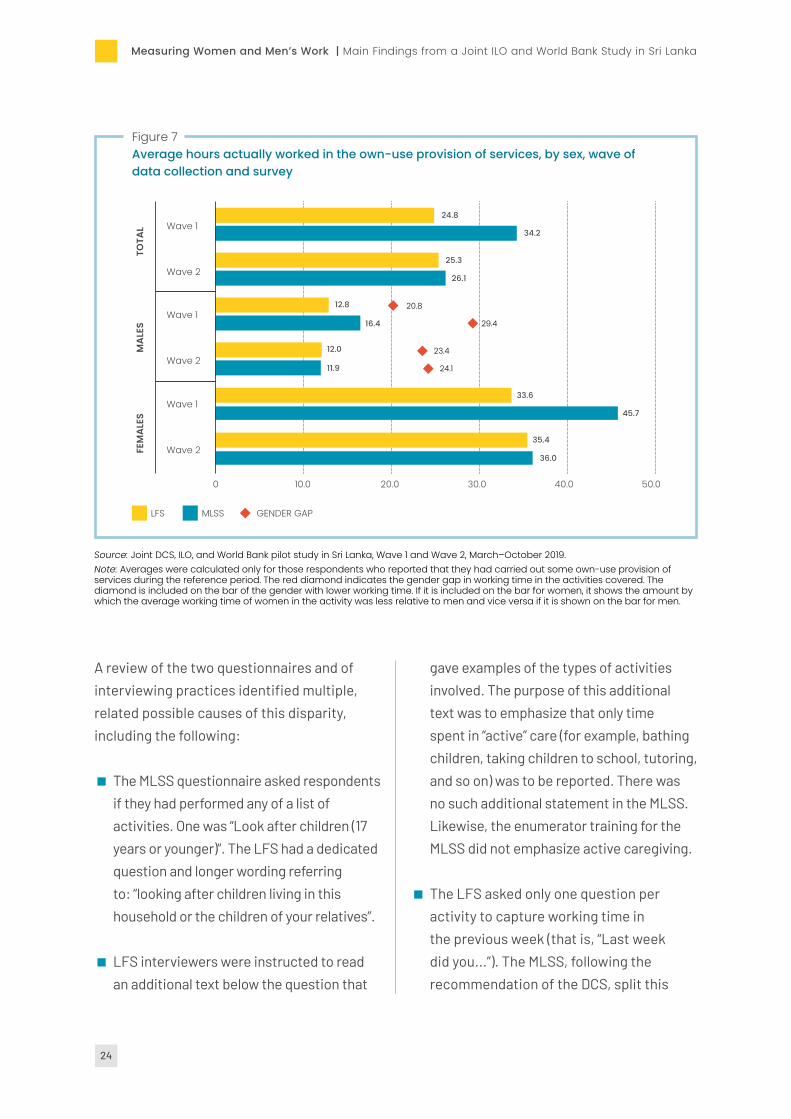
The sensitivity of measurement was even more obvious in the reporting on the time spent in various unpaid household service activities. In the first wave of data collection, the average hours captured by the MLSS (34.2) were 38.0 percent higher
relative to the LFS (24.8) (see Figure 7). The average hours calculation excluded those respondents who did not report that they had undertaken any own-use provision of services during the reference period (that is, zero hours reported).
Disaggregation by activity showed that the difference was concentrated in childcare and adult care (see Table 2). The number of hours spent in other activities, including cleaning, cooking, and so on, were comparable between the two surveys. For example, the MLSS showed average reported hours in childcare of 42.5 hours in wave 1, compared with 15.4 hours in the LFS.
Source: Joint DCS, ILO, and World Bank pilot study in Sri Lanka, Wave 1 and Wave 2, March–October 2019.
Wave 187.0
84.6
81.1
87.6
FEM
ALE
SM
ALE
STO
TAL
Wave 1
Wave 1
Wave 2
Wave 2
Wave 2
0 20 40 60 80 100
Figure 6 Participation rate (% of WAP) in own-use provision of services, by sex, wave of data collection and survey
81.5
82.3
75.8
91.5
92.0
91.9
90.7
69.6
LFS MLSS
24
Measuring Women and Men’s Work | Main Findings from a Joint ILO and World Bank Study in Sri Lanka
A review of the two questionnaires and of interviewing practices identified multiple, related possible causes of this disparity, including the following:
� The MLSS questionnaire asked respondents if they had performed any of a list of activities. One was “Look after children (17 years or younger)”. The LFS had a dedicated question and longer wording referring to: “looking after children living in this household or the children of your relatives”.
� LFS interviewers were instructed to read an additional text below the question that
gave examples of the types of activities involved. The purpose of this additional text was to emphasize that only time spent in “active” care (for example, bathing children, taking children to school, tutoring, and so on) was to be reported. There was no such additional statement in the MLSS. Likewise, the enumerator training for the MLSS did not emphasize active caregiving.
� The LFS asked only one question per activity to capture working time in the previous week (that is, “Last week did you...”). The MLSS, following the recommendation of the DCS, split this
Source: Joint DCS, ILO, and World Bank pilot study in Sri Lanka, Wave 1 and Wave 2, March–October 2019.Note: Averages were calculated only for those respondents who reported that they had carried out some own-use provision of services during the reference period. The red diamond indicates the gender gap in working time in the activities covered. The diamond is included on the bar of the gender with lower working time. If it is included on the bar for women, it shows the amount by which the average working time of women in the activity was less relative to men and vice versa if it is shown on the bar for men.
Wave 124.8
26.1
34.2
25.3
FEM
ALE
SM
ALE
STO
TAL
Wave 1
Wave 1
Wave 2
Wave 2
Wave 2
0 10.0 20.0 30.0 40.0 50.0
Figure 7 Average hours actually worked in the own-use provision of services, by sex, wave of data collection and survey
12.8
12.0
11.9
33.6
20.8
23.4
29.4
24.1
35.4
36.0
45.7
16.4
LFS MLSS GENDER GAP

25
2. Main Findings
into two questions: first, on the number of days, and, then, the average hours per day. As discussed further below, the number of measured hours worked in the own-use production of services tend to be greater in the two-question approach than in the one-question approach.
The two questionnaires were harmonized in wave 2, adopting the question wording and approach of the LFS. In addition, both surveys included an experiment to assess the impact of the use of one question on the hours reported for work during the previous week versus the two-question approach (number of days and hours per day). Both approaches were administered to half the sample for each of the questionnaires in wave 2 to ensure that the effect of the one- versus the two-question
approach could be isolated from possible implementation differences between the two survey types.
Harmonizing the two questionnaires reduced the gap between the two survey types (see Table 2). The estimates produced by the LFS were relatively stable between wave 1 and wave 2 (for instance, the average time spent in care activities of 16.1 hours in wave 1 versus 15.1 hours in wave 2). The estimates of the MLSS fell by half, from 43.8 hours on average on all care activities to 21.9 hours. While a statistically significant gap between the surveys remained, there was a far higher degree of consistency, and the knock-on effect was that the estimates of time spent on all own-use provision of services in wave 2 were similar between the two surveys (see Figure 7).
Table 2Average hours actually worked during the reference week by respondents engaged in care activities, by sex, wave of data collection and survey
AVERAGE HOURS ACTUALLY WORKED IN THE REFERENCE WEEK
TOTAL MALES FEMALES
Hour
s
Std.
Err
.
Coef
f. of
va
r. (%
)
Diff
LF
S-M
LSS
Sign
. Lev
el
Hour
s
Std.
Err
.
Coef
f. of
va
r. (%
)
Diff
LF
S-M
LSS
Sign
. Lev
el
Hour
s
Std.
Err
.
Coef
f. of
va
r. (%
)
Diff
LF
S-M
LSS
Sign
. Lev
el
WAVE 2
Care ActivitiesLFS 15.1 0.5 3.5
-6.7 ***9.3 0.6 6.5
-2.6 ***18.5 0.7 3.6
-8.3 ***MLSS 21.9 0.7 3.2 11.8 0.7 5.6 26.8 1.0 3.6
of which
Care for adults
LFS 11.2 0.9 8.0-3.4 **
12.1 2.0 16.52.1
10.6 0.8 7.2-6.0 ***
MLSS 14.5 1.3 9.0 10.1 1.5 14.4 16.7 1.7 10.3
Care of children
LFS 14.6 0.5 3.5-6.7 ***
8.0 0.4 5.6-3.5 ***
18.3 0.7 3.8-7.7 ***
MLSS 21.3 0.7 3.2 11.4 0.7 6.3 26.0 0.9 3.6
WAVE 1
Care ActivitiesLFS 16.1 0.6 3.5
-27.6 ***10.3 0.5 5.3
-18.4 ***19.6 0.8 3.9
-31.6 ***MLSS 43.8 1.1 2.5 28.7 1.4 4.9 51.2 1.5 2.8
of which
Care for adults
LFS 11.6 0.9 8.1-21.6 ***
9.5 1.6 16.4-17.5 ***
12.8 1.0 7.7-23.5 ***
MLSS 33.2 2.7 8.2 27.0 4.0 14.9 36.3 3.0 8.3
Care of children
LFS 15.4 0.6 3.8-27.1 ***
9.5 0.5 5.3-17.2 ***
18.8 0.8 4.2-31.6 ***
MLSS 42.5 1.3 3.0 26.7 1.5 5.7 50.3 1.6 3.2Source: Joint DCS, ILO, and World Bank pilot study in Sri Lanka, Wave 1 and Wave 2, March–October 2019.Significance levels: * = 10 percent ** = 5 percent *** = 1 percent
26
Measuring Women and Men’s Work | Main Findings from a Joint ILO and World Bank Study in Sri Lanka
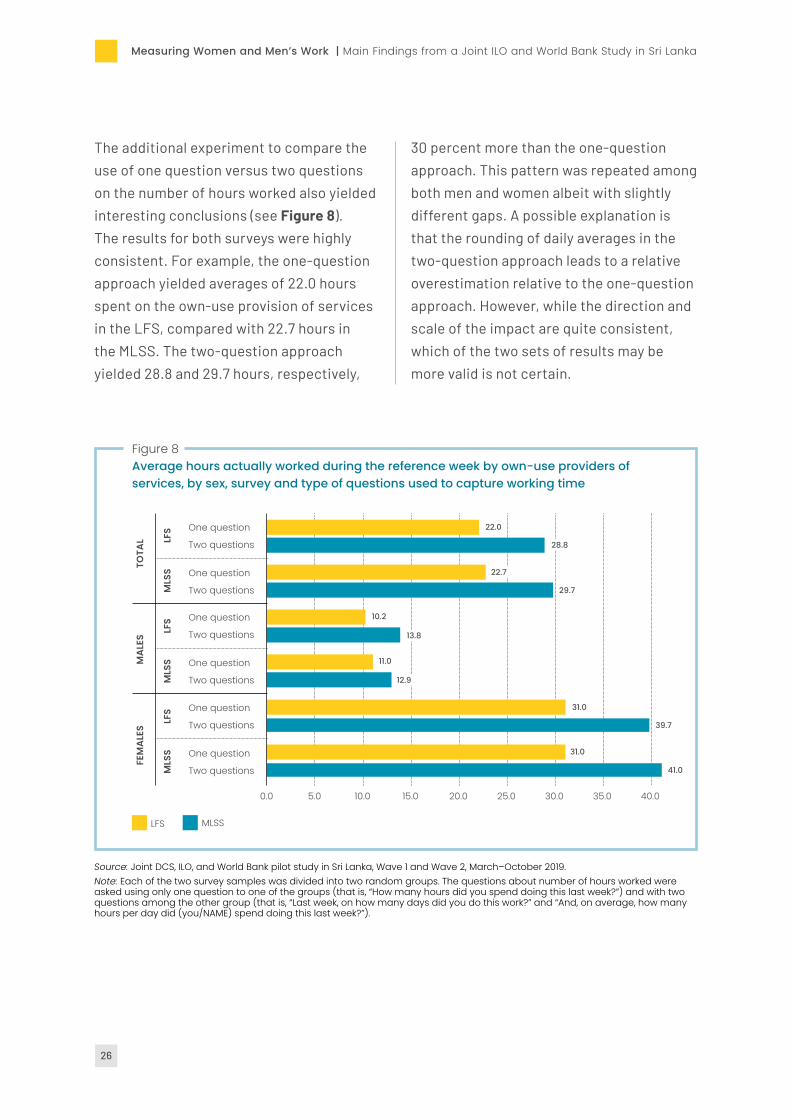
The additional experiment to compare the use of one question versus two questions on the number of hours worked also yielded interesting conclusions (see Figure 8). The results for both surveys were highly consistent. For example, the one-question approach yielded averages of 22.0 hours spent on the own-use provision of services in the LFS, compared with 22.7 hours in the MLSS. The two-question approach yielded 28.8 and 29.7 hours, respectively,
30 percent more than the one-question approach. This pattern was repeated among both men and women albeit with slightly different gaps. A possible explanation is that the rounding of daily averages in the two-question approach leads to a relative overestimation relative to the one-question approach. However, while the direction and scale of the impact are quite consistent, which of the two sets of results may be more valid is not certain.
Source: Joint DCS, ILO, and World Bank pilot study in Sri Lanka, Wave 1 and Wave 2, March–October 2019.Note: Each of the two survey samples was divided into two random groups. The questions about number of hours worked were asked using only one question to one of the groups (that is, “How many hours did you spend doing this last week?”) and with two questions among the other group (that is, “Last week, on how many days did you do this work?” and “And, on average, how many hours per day did (you/NAME) spend doing this last week?”).
One question
Two questions
One question
Two questions
One question
Two questions
One question
Two questions
One question
Two questions
One question
Two questions
22.0
29.7
28.8
22.7
FEM
ALE
SM
ALE
STO
TAL
MLS
SLF
SM
LSS
LFS
MLS
SLF
S
0.0 5.0 10.0 15.0 20.0 25.0 30.0 35.0 40.0
Figure 8 Average hours actually worked during the reference week by own-use providers of services, by sex, survey and type of questions used to capture working time
10.2
11.0
12.9
31.0
31.0
41.0
39.7
13.8
LFS MLSS
27
2. Main Findings
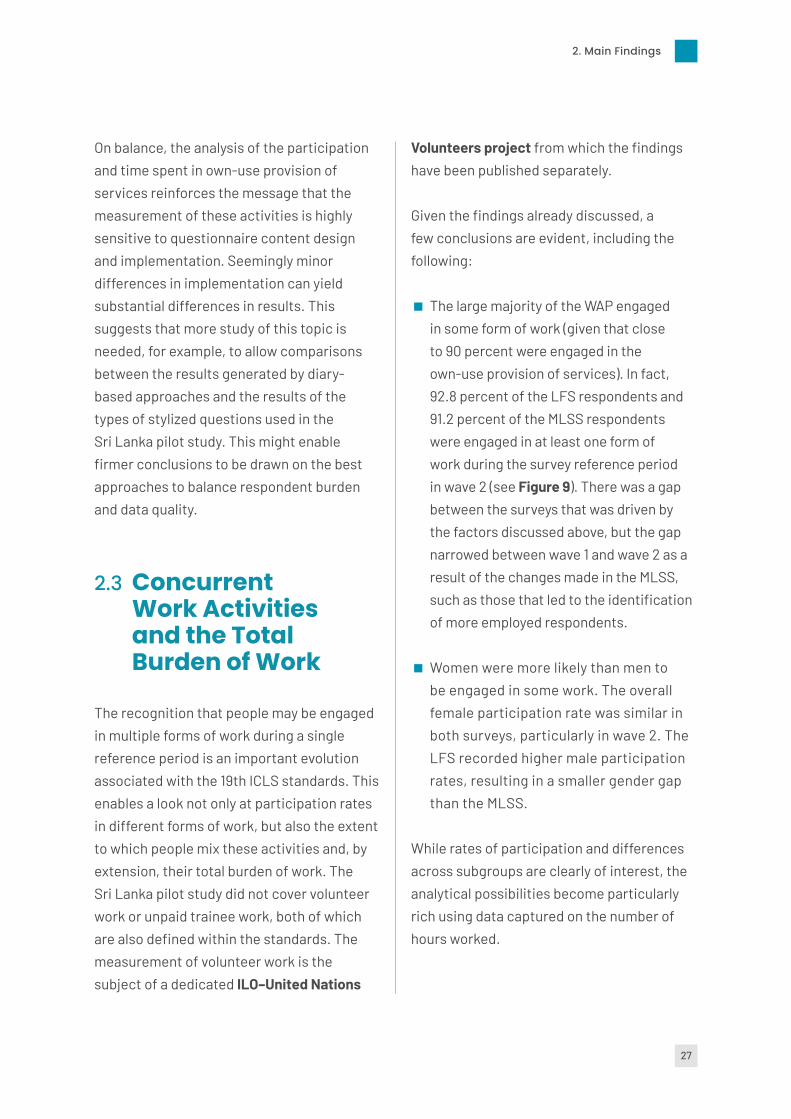
On balance, the analysis of the participation and time spent in own-use provision of services reinforces the message that the measurement of these activities is highly sensitive to questionnaire content design and implementation. Seemingly minor differences in implementation can yield substantial differences in results. This suggests that more study of this topic is needed, for example, to allow comparisons between the results generated by diary-based approaches and the results of the types of stylized questions used in the Sri Lanka pilot study. This might enable firmer conclusions to be drawn on the best approaches to balance respondent burden and data quality.
2.3 Concurrent Work Activities and the Total Burden of Work
The recognition that people may be engaged in multiple forms of work during a single reference period is an important evolution associated with the 19th ICLS standards. This enables a look not only at participation rates in different forms of work, but also the extent to which people mix these activities and, by extension, their total burden of work. The Sri Lanka pilot study did not cover volunteer work or unpaid trainee work, both of which are also defined within the standards. The measurement of volunteer work is the subject of a dedicated ILO–United Nations
Volunteers project from which the findings have been published separately.
Given the findings already discussed, a few conclusions are evident, including the following:
� The large majority of the WAP engaged in some form of work (given that close to 90 percent were engaged in the own-use provision of services). In fact, 92.8 percent of the LFS respondents and 91.2 percent of the MLSS respondents were engaged in at least one form of work during the survey reference period in wave 2 (see Figure 9). There was a gap between the surveys that was driven by the factors discussed above, but the gap narrowed between wave 1 and wave 2 as a result of the changes made in the MLSS, such as those that led to the identification of more employed respondents.
� Women were more likely than men to be engaged in some work. The overall female participation rate was similar in both surveys, particularly in wave 2. The LFS recorded higher male participation rates, resulting in a smaller gender gap than the MLSS.
While rates of participation and differences across subgroups are clearly of interest, the analytical possibilities become particularly rich using data captured on the number of hours worked.

28
Measuring Women and Men’s Work | Main Findings from a Joint ILO and World Bank Study in Sri Lanka
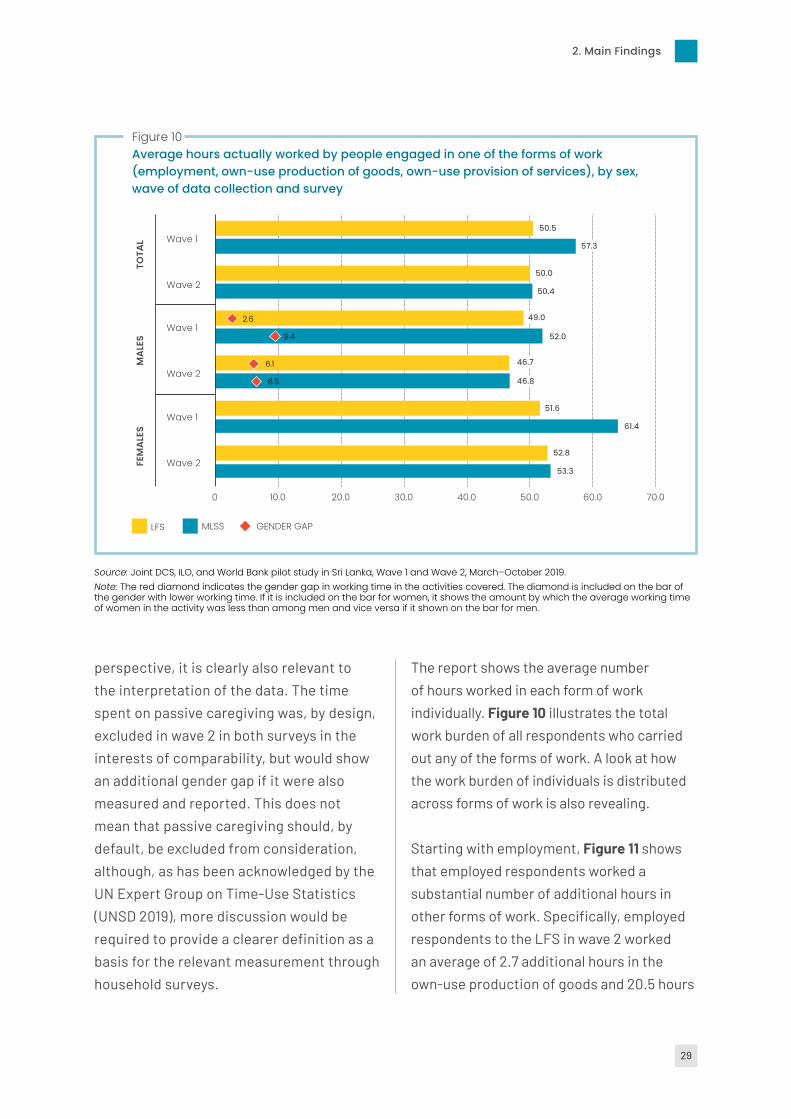
Figure 10 shows the average hours spent on all the forms of work by respondents who had engaged in any of these forms of work (that is, 92.8 percent of all respondents to the LFS in wave 2 and 91.2 percent in the case of the MLSS). The total work burden (across the different forms of work) was, on average, over 50 hours per week in both waves in both surveys. In wave 1, there was a clear gap between the LFS (50.5 hours) and the MLSS (57.3 hours). Following the various changes described above, the gap disappeared in wave 2.
Another conclusion that may be drawn is that, in both waves in both surveys, women
exhibited a greater average number of working hours than men. In wave 1, the gap was quite wide in the MLSS (61.4 hours among women versus 52 hours among men), but, by wave 2, both surveys showed an almost identical gap, with women reporting an average of approximately 6 hours more working time per week than men (53.3 hours versus 46.8 hours in the MLSS). The reduction in the gender gap in the MLSS between the two waves partly reflects the emphasis on active caregiving in wave 2, implying that at least part of the additional hours reported in wave 1 reflected the reporting of passive caregiving. While this is obviously important from a measurement
Source: Joint DCS, ILO, and World Bank pilot study in Sri Lanka, Wave 1 and Wave 2, March–October 2019.
Wave 192.4
91.2
89.8
92.8
FEM
ALE
SM
ALE
STO
TAL
Wave 1
Wave 1
Wave 2
Wave 2
Wave 2
80.0 82.0 84.0 86.0 88.0 90.0 92.0 94.0 96.0
Figure 9 Shares (% of WAP) of respondents engaged in one of the forms of work (employment, own-use production of goods, own-use provision of services), by sex, wave of data collection and survey
91.1
92.4
89.2
93.4
93.2
92.8
92.2
87.0
LFS MLSS
29
2. Main Findings
perspective, it is clearly also relevant to the interpretation of the data. The time spent on passive caregiving was, by design, excluded in wave 2 in both surveys in the interests of comparability, but would show an additional gender gap if it were also measured and reported. This does not mean that passive caregiving should, by default, be excluded from consideration, although, as has been acknowledged by the UN Expert Group on Time-Use Statistics (UNSD 2019), more discussion would be required to provide a clearer definition as a basis for the relevant measurement through household surveys.
The report shows the average number of hours worked in each form of work individually. Figure 10 illustrates the total work burden of all respondents who carried out any of the forms of work. A look at how the work burden of individuals is distributed across forms of work is also revealing.
Starting with employment, Figure 11 shows that employed respondents worked a substantial number of additional hours in other forms of work. Specifically, employed respondents to the LFS in wave 2 worked an average of 2.7 additional hours in the own-use production of goods and 20.5 hours
Source: Joint DCS, ILO, and World Bank pilot study in Sri Lanka, Wave 1 and Wave 2, March–October 2019.Note: The red diamond indicates the gender gap in working time in the activities covered. The diamond is included on the bar of the gender with lower working time. If it is included on the bar for women, it shows the amount by which the average working time of women in the activity was less than among men and vice versa if it shown on the bar for men.
Wave 150.5
50.4
57.3
50.0
FEM
ALE
SM
ALE
STO
TAL
Wave 1
Wave 1
Wave 2
Wave 2
Wave 2
0 10.0 20.0 30.0 40.0 50.0 60.0 70.0
Figure 10 Average hours actually worked by people engaged in one of the forms of work (employment, own-use production of goods, own-use provision of services), by sex, wave of data collection and survey
49.0
46.7
46.8
51.6
2.6
6.1
9.4
6.5
52.8
53.3
61.4
52.0
LFS MLSS GENDER GAP

30
Measuring Women and Men’s Work | Main Findings from a Joint ILO and World Bank Study in Sri Lanka
in the own-use provision of services. The results of the MLSS in wave 2 were similar. Overall, this meant that employed respondents to the LFS worked 61.1 hours per week overall across the three forms of work, compared with 63.6 hours in the MLSS. This gap was created by the relatively minor remaining differences in employment and own-use provision of services. The gaps between the surveys were much less than those found in wave 1, demonstrating that the various questionnaire changes were at least partially successful in improving the consistency between the two surveys.
As emphasized throughout the report, the analysis of working time is highly relevant from a gender perspective and never more so than in the analysis of total working time across forms of work. Taking the wave 2 data of the MLSS to illustrate (see Figure 11), employed men worked 43.9 hours in employment on average, an additional 2.6 hours in own-use production of goods and 11.4 hours in the own-use provision of services. The results of the LFS were relatively similar. Over three quarters of all working time among employed men was thus in employment.
Source: Joint DCS, ILO, and World Bank pilot study in Sri Lanka, Wave 1 and Wave 2, March–October 2019.Note: The averages for working time in employment are not identical to those in Figure 2 because some employed respondents did not provide information on time spent on the own-use production of goods or the own-use provision of services and are thus excluded from the analysis in Figure 12. The red diamond indicates the gender gap in working time in the activities covered. The diamond is included on the bar of the gender with lower working time. If it is included on the bar for women, it shows the amount by which the average working time of women in the activity was lower than among men and vice versa if it shown on the bar for men.
Figure 11 Average hours worked by respondents in employment and additional hours worked in the own-use production of goods and services, by sex, wave of data collection and survey
LFS
MLSS
LFS
MLSS
LFS
MLSS
LFS
MLSS
LFS
MLSS
LFS
MLSS
FEM
ALE
SM
ALE
STO
TAL
WA
VE
2W
AV
E 1
WA
VE
2W
AV
E 1
WA
VE
2W
AV
E 1
Hours worked in employment (all jobs)
Additional hours worked in own-use provision of services
Additional hours worked in own-use production of goods
0.0 20.0 40.0 60.0 80.0
GENDER GAP
10.9
12.8
16.1
15.2
38.4 19.73.2 61.4
39.3 21.92.5 63.6
39.9 26.42.4 68.7
37.9 20.52.7 61.1
42.7 11.03.0 56.7
42.2 10.32.3 54.8
43.9 11.42.6 57.8
32.5 31.73.5 67.7
31.8 34.83.3 70.0
33.8 34.42.5 70.6
34.1 41.32.5 77.9
44.3 15.22.3 61.8
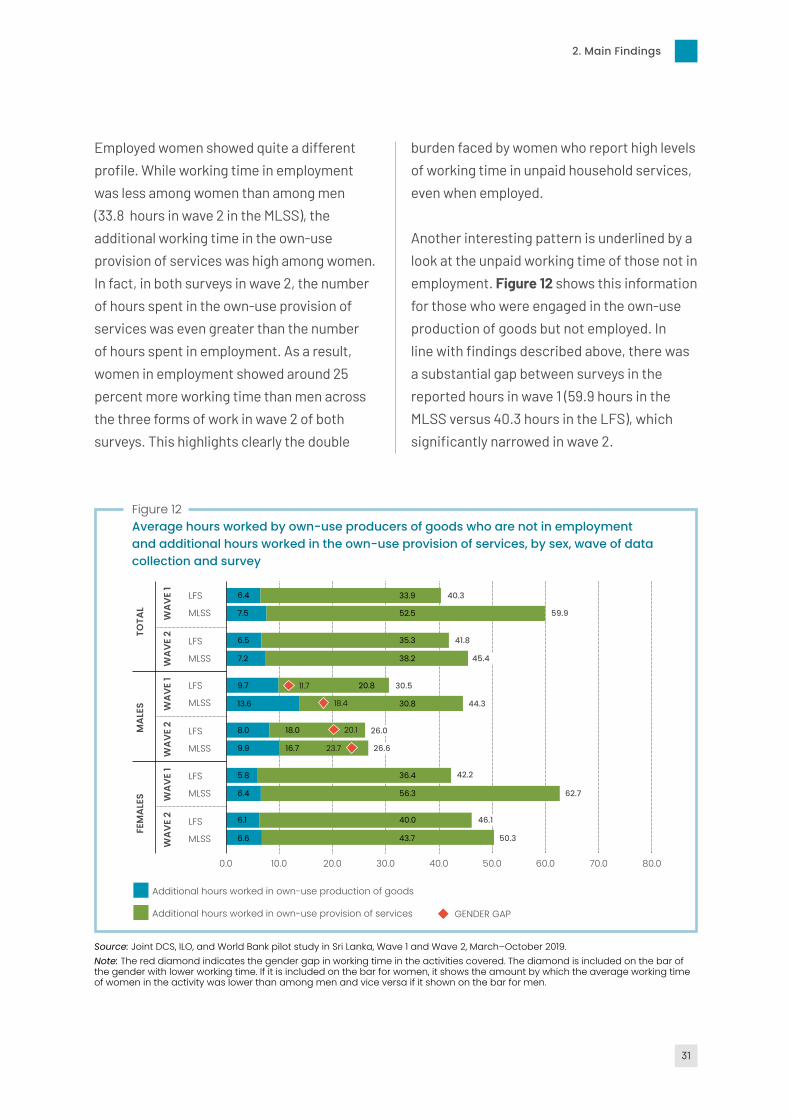
31
2. Main Findings
Employed women showed quite a different profile. While working time in employment was less among women than among men (33.8 hours in wave 2 in the MLSS), the additional working time in the own-use provision of services was high among women. In fact, in both surveys in wave 2, the number of hours spent in the own-use provision of services was even greater than the number of hours spent in employment. As a result, women in employment showed around 25 percent more working time than men across the three forms of work in wave 2 of both surveys. This highlights clearly the double
burden faced by women who report high levels of working time in unpaid household services, even when employed.
Another interesting pattern is underlined by a look at the unpaid working time of those not in employment. Figure 12 shows this information for those who were engaged in the own-use production of goods but not employed. In line with findings described above, there was a substantial gap between surveys in the reported hours in wave 1 (59.9 hours in the MLSS versus 40.3 hours in the LFS), which significantly narrowed in wave 2.
Source: Joint DCS, ILO, and World Bank pilot study in Sri Lanka, Wave 1 and Wave 2, March–October 2019.Note: The red diamond indicates the gender gap in working time in the activities covered. The diamond is included on the bar of the gender with lower working time. If it is included on the bar for women, it shows the amount by which the average working time of women in the activity was lower than among men and vice versa if it shown on the bar for men.
Figure 12 Average hours worked by own-use producers of goods who are not in employment and additional hours worked in the own-use provision of services, by sex, wave of data collection and survey
Additional hours worked in own-use provision of services
Additional hours worked in own-use production of goods
GENDER GAP
LFS
MLSS
LFS
MLSS
LFS
MLSS
LFS
MLSS
LFS
MLSS
LFS
MLSS
40.3
45.4
59.9
41.8
FEM
ALE
SM
ALE
STO
TAL
WA
VE
2W
AV
E 1
WA
VE
2W
AV
E 1
WA
VE
2W
AV
E 1
30.5
26.0
26.6
42.2
46.1
50.3
62.7
44.3
0.0 20.010.0 40.030.0 50.0 60.0 70.0 80.0
11.7
23.7
18.4
20.1
6.4
7.2 38.2
7.5 52.5
33.9
6.5 35.3
9.7 20.8
8.0 18.0
9.9 16.7
5.8 36.4
6.1 40.0
6.6 43.7
6.4 56.3
13.6 30.8

32
Measuring Women and Men’s Work | Main Findings from a Joint ILO and World Bank Study in Sri Lanka
The gender disparity shown in Figure 12 is striking. A look at wave 2 data reveals that, in the LFS, women in this situation (not employed, but performing the own-use production of goods) worked 6.1 hours on average per week in the own-use production of goods. Men, by comparison, worked 8 hours per week on average. However, women did an additional 40 hours of work in the own-use provision of services, compared with 18 hours among men. The pattern was relatively similar in the MLSS, again showing that women, to a greater extent than men, retained a high number of working hours in unpaid forms of work, regardless of their employment status.
2.4 Work in Agriculture and Fishing
Improving sectoral analysis is one important objective of the 19th ICLS standards. Specifically, the labour input to any sector or grouping of working activities is a combination of paid and unpaid work. This is particularly important in certain sectors. Agriculture and fishing are key examples, while care work is another example. In rural areas of developing countries, a large proportion of the population is typically engaged in some type of agricultural work. Some, possibly a large part, of this work will be performed with the intention of producing goods for consumption by the household or family, while another part involves producing goods for sale. Indeed, households often engage in mixed production, keeping some and selling the rest.
The revised standards differentiate between employment and own-use production work in agriculture and other sectors. This enables a wide range of analyses and may allow for more meaningful policy interventions, for example by recognizing that people engaged in subsistence farming may be seeking or available for paid work, which was not reflected in the old standards. Distinguishing between employment and own-use production work in agriculture can also be challenging in contexts where mixed agriculture prevails (Gaddis et al. 2020b).
One of the more straightforward indicators that can be generated within this new framework is the total number or proportion of people engaged in agricultural or fishing activities. Figure 13 illustrates the difficulty in capturing some of the agricultural work in wave 1 of the MLSS, and the improvement in wave 2. While the proportion of agriculture and fishing workers identified by the LFS remained relatively stable (close to 30 percent), the proportion identified by the MLSS rose from 20.4 percent to 26.0 percent. The increase in the MLSS was greater among female than among male respondents.
There will be many other indicators of interest for those seeking to understand the agricultural sector, such as the proportion of agricultural households. Evidently, any issues in the measurement of agricultural work directly impact indicators on the number of agricultural households if the classification of households is based on the presence of agricultural workers in the household.
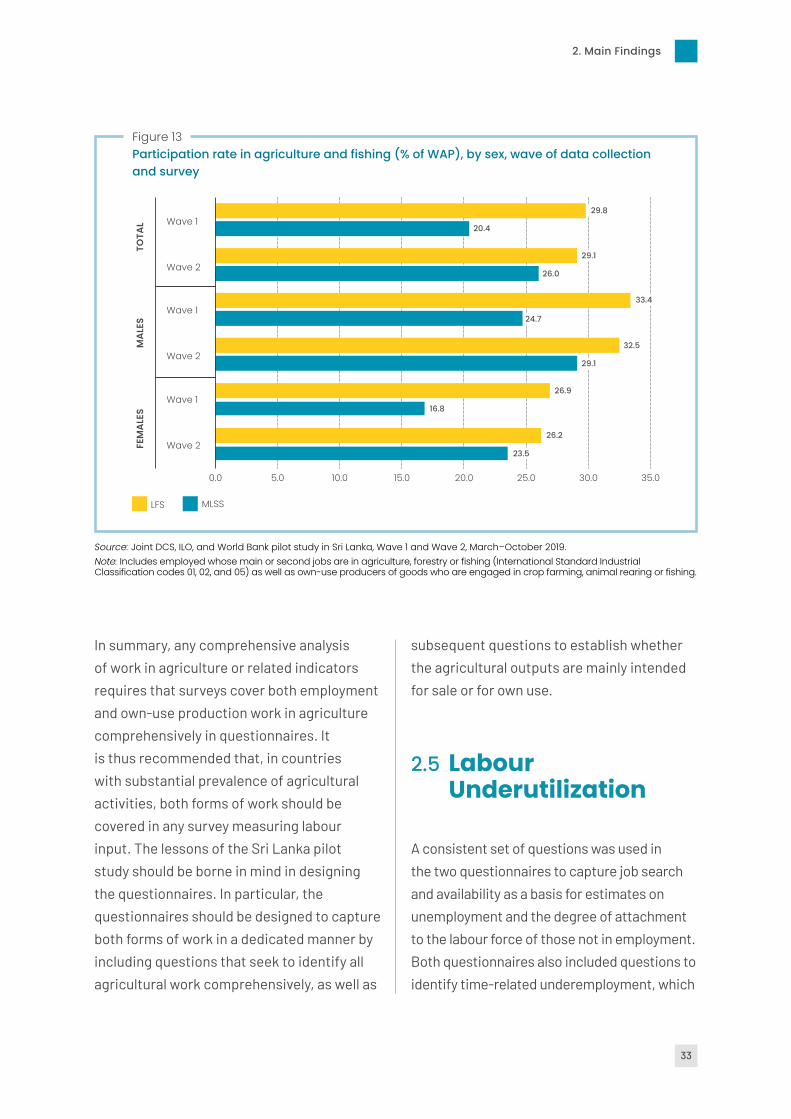
33
2. Main Findings
In summary, any comprehensive analysis of work in agriculture or related indicators requires that surveys cover both employment and own-use production work in agriculture comprehensively in questionnaires. It is thus recommended that, in countries with substantial prevalence of agricultural activities, both forms of work should be covered in any survey measuring labour input. The lessons of the Sri Lanka pilot study should be borne in mind in designing the questionnaires. In particular, the questionnaires should be designed to capture both forms of work in a dedicated manner by including questions that seek to identify all agricultural work comprehensively, as well as
subsequent questions to establish whether the agricultural outputs are mainly intended for sale or for own use.
2.5 Labour Underutilization
A consistent set of questions was used in the two questionnaires to capture job search and availability as a basis for estimates on unemployment and the degree of attachment to the labour force of those not in employment. Both questionnaires also included questions to identify time-related underemployment, which
Source: Joint DCS, ILO, and World Bank pilot study in Sri Lanka, Wave 1 and Wave 2, March–October 2019.Note: Includes employed whose main or second jobs are in agriculture, forestry or fishing (International Standard Industrial Classification codes 01, 02, and 05) as well as own-use producers of goods who are engaged in crop farming, animal rearing or fishing.
Figure 13 Participation rate in agriculture and fishing (% of WAP), by sex, wave of data collection and survey
Wave 1 29.8
26.0
20.4
29.1
FEM
ALE
SM
ALE
STO
TAL
Wave 1
Wave 1
Wave 2
Wave 2
Wave 2
33.4
32.5
29.1
26.9
26.2
23.5
16.8
24.7
LFS MLSS
0.0 10.05.0 20.015.0 25.0 30.0 35.0

34
Measuring Women and Men’s Work
suitable and can be recommended as a basis for the development of questionnaires covering these variables.
2.6 Other Issues of Note
In line with earlier pilot studies, the importance of translation and national adaptation was evident in the Sri Lanka pilot study. For example, some of the difficulties in the measurement of farming work in wave 1 of data collection in the MLSS can be linked to difficulties in identifying appropriate everyday terminology in Sinhalese for some of the farming-related questions. These issues were addressed in wave 2.
highlights people who report that they have an insufficient volume of paid work relative to their preferences.
The LFS identified more respondents in time-related underemployment, and the MLSS identified more unemployed respondents. The most obvious explanation for this is the difference between the surveys in the number of employed respondents identified. Given a higher number of employed respondents, particularly among those with low hours of work, it is unsurprising that the LFS identified more people willing and available to work additional hours (the time-related underemployed).
Similarly, because the MLSS identified fewer employed respondents than the LFS and, especially, seemed to undercount respondents with low working hours, it is not surprising that it identified more people seeking and available for work who were not identified as employed.
The gaps noted above were lower in wave 2 than in wave 1, indicating that the primary driver of the gaps was the inconsistency in the measurement of employment. Also given that the questions used to capture labour underutilization were the same across the two surveys, any additional survey-specific impacts cannot be identified.
Furthermore, the sets of questions used, which were based on published ILO model questionnaires, operated well in the field. This suggests that the questions were

35
2. Main Findings
For example, based on the experiences in wave 1, the MLSS questionnaire in wave 2 avoided more abstract terminology (e.g. own account crop farming) and instead opted for simpler terms with examples (e.g. work on a family farm to prepare or maintain the land, or to plant, grow or harvest any crops vegetables or fruits). (See Annex 3, Table 3.2 for additional examples.) This presumably contributed to the improvements in the consistency of the wave 2 results.
The analysis in this report focuses on indicators of participation in various forms of work. A related, important topic is the measurement and analysis of the characteristics of jobs, including the number of jobs held. Various important
differences were noted between the LFS and the MLSS, such as the number of respondents with multiple jobs and variations in the identification of work in agriculture as main or secondary jobs. Conclusions can be drawn on some of the sources of the differences, but, for others, the conclusions are not straightforward. However, it is clear that the greatest measurement issues centre on people in informal employment, particularly those in own-account activities in both agriculture and other sectors. This suggests a need to undertake studies on appropriate questionnaire content to identify and describe properly the full range of people’s jobs and businesses, particularly in the case of informal employment.
3Summary Conclusions

37
3. Summary Conclusions
The first key conclusion is that the field experiment undertaken in Sri Lanka generated a wealth of rich data that may be used to identify good practices in questionnaire design and apply the latest standards in the domain of labour statistics. The design of the study enables the existing guidance to be extended to surveys other than the LFS, although absolute consistency between the LFS and other household surveys remains unlikely given the differences in design and in objectives. The depth and breadth of conclusions generated through the study would not realistically have been possible through another mechanism.
From a gender perspective, the value of the study is difficult to overstate. As highlighted in this report, a much larger part of women’s (compared to men’s) work tends to be invisible or at risk of being underreported or simply not measured at all in official statistics. The value of the data is the subject of additional reports (Discenza and Walsh 2020a, 2020b), but it is already clear that pilot studies such as this one are extremely valuable in improving the measurement of paid and unpaid work. This is the subject of a long, ongoing process, which gained significant momentum through the adoption of the 19th ICLS standards and has been the main focus of the ILO and World Bank agenda to operationalize the 19th ICLS standards and improve survey methods on labour through the Women’s Work and Employment Partnership.
On the measurement side, the Sri Lanka study revealed important cross-survey
differences in the measurement of key labour-related variables, particularly participation in the various forms of paid and unpaid work. The impact of the changes made to the MLSS before wave 2 of data collection suggests that some of the differences can be reduced if not removed entirely through relatively minor changes in questionnaire content or survey implementation.
A variety of other sensitivities could be identified, such as the sensitivity of the measurement of working time in unpaid work to the measurement approach (for example, one or two questions). This was especially evident in unpaid care work. In addition, all surveys should emphasize good translation and national adaptation, as well as interviewer training and supervision, to promote consistency in measurement.
The risks of misclassification and measurement difficulties were concentrated in the case of people engaged in certain types of activities. For instance, the higher risk of misclassification or undercounting was clear among people engaged in casual, low-hours work or people helping on family farms or businesses. This is highly relevant in the measurement of outcomes by sex given that these types of activities were more common among women than among male respondents, which is likely to be true in many settings.
The questionnaires were successful in capturing a range of paid and unpaid working
38
Measuring Women and Men’s Work | Main Findings from a Joint ILO and World Bank Study in Sri Lanka
activities. This has unlocked great analytical potential through, for example, the deeper understanding of gender gaps in working activities and labour market engagement. An important future goal, urged forward by this study and the related work to develop guidance on good measurement practices, is the mainstreaming of the measurement of unpaid working activities to enable this type of analysis on a regular, wide-scale basis.
The harmonization of questionnaire content represents a way to improve the consistency of measurement, but it cannot be assumed that absolute consistency can be achieved or that the need for a national process of adaptation and testing can be avoided. Differences in surveys and across countries mean that questionnaires should be adapted to context and fully tested to enhance the quality of the statistics generated. Other differences in survey objectives or aspects of methodology, such as sample size, mean that full comparability across surveys is unlikely.
Nonetheless, the model questionnaires, guidance and tools now or soon to become available are an excellent reference for those facing the task of designing a questionnaire to capture work- and labour-related issues through a household survey. The appropriate choice of content for a particular survey involves a balance among the objectives of the survey, the desired outputs and the appropriate level of respondent burden, ranging from minimal approaches typically included in population censuses to the most detailed content one expects from the LFS.
The findings presented in this report are a subset of the many findings possible from such studies. The findings will be used to generate guidance and additional technical notes to be published at a later date, as well as to facilitate updates to the guidance, tools and support provided by the ILO for LFSs and the World Bank for the next round of household surveys supported by the Living Standards Measurement Study team.

39
3. Summary Conclusions
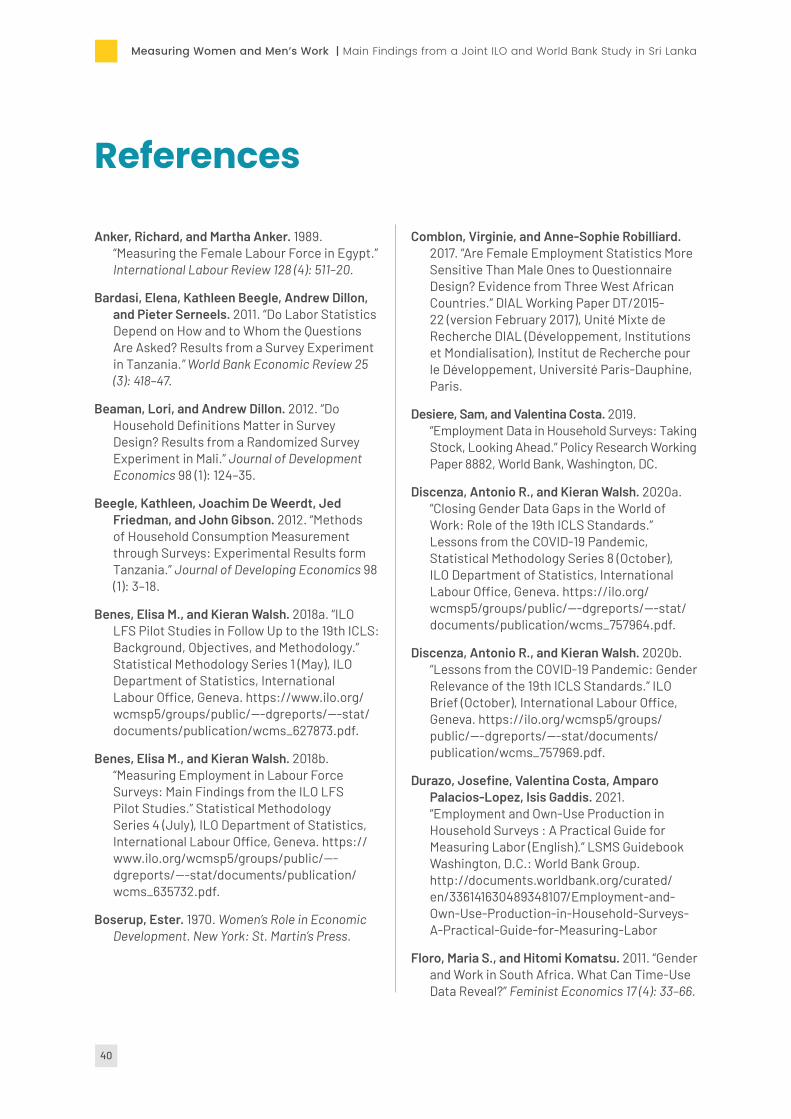
40
Measuring Women and Men’s Work | Main Findings from a Joint ILO and World Bank Study in Sri Lanka
References
Anker, Richard, and Martha Anker. 1989. “Measuring the Female Labour Force in Egypt.” International Labour Review 128 (4): 511–20.
Bardasi, Elena, Kathleen Beegle, Andrew Dillon, and Pieter Serneels. 2011. “Do Labor Statistics Depend on How and to Whom the Questions Are Asked? Results from a Survey Experiment in Tanzania.” World Bank Economic Review 25 (3): 418–47.
Beaman, Lori, and Andrew Dillon. 2012. “Do Household Definitions Matter in Survey Design? Results from a Randomized Survey Experiment in Mali.” Journal of Development Economics 98 (1): 124–35.
Beegle, Kathleen, Joachim De Weerdt, Jed Friedman, and John Gibson. 2012. “Methods of Household Consumption Measurement through Surveys: Experimental Results form Tanzania.” Journal of Developing Economics 98 (1): 3–18.
Benes, Elisa M., and Kieran Walsh. 2018a. “ILO LFS Pilot Studies in Follow Up to the 19th ICLS: Background, Objectives, and Methodology.” Statistical Methodology Series 1 (May), ILO Department of Statistics, International Labour Office, Geneva. https://www.ilo.org/wcmsp5/groups/public/---dgreports/---stat/documents/publication/wcms_627873.pdf.
Benes, Elisa M., and Kieran Walsh. 2018b. “Measuring Employment in Labour Force Surveys: Main Findings from the ILO LFS Pilot Studies.” Statistical Methodology Series 4 (July), ILO Department of Statistics, International Labour Office, Geneva. https://www.ilo.org/wcmsp5/groups/public/---dgreports/---stat/documents/publication/wcms_635732.pdf.
Boserup, Ester. 1970. Women’s Role in Economic Development. New York: St. Martin’s Press.
Comblon, Virginie, and Anne-Sophie Robilliard. 2017. “Are Female Employment Statistics More Sensitive Than Male Ones to Questionnaire Design? Evidence from Three West African Countries.” DIAL Working Paper DT/2015-22 (version February 2017), Unité Mixte de Recherche DIAL (Développement, Institutions et Mondialisation), Institut de Recherche pour le Développement, Université Paris-Dauphine, Paris.
Desiere, Sam, and Valentina Costa. 2019. “Employment Data in Household Surveys: Taking Stock, Looking Ahead.” Policy Research Working Paper 8882, World Bank, Washington, DC.
Discenza, Antonio R., and Kieran Walsh. 2020a. “Closing Gender Data Gaps in the World of Work: Role of the 19th ICLS Standards.” Lessons from the COVID-19 Pandemic, Statistical Methodology Series 8 (October), ILO Department of Statistics, International Labour Office, Geneva. https://ilo.org/wcmsp5/groups/public/---dgreports/---stat/documents/publication/wcms_757964.pdf.
Discenza, Antonio R., and Kieran Walsh. 2020b. “Lessons from the COVID-19 Pandemic: Gender Relevance of the 19th ICLS Standards.” ILO Brief (October), International Labour Office, Geneva. https://ilo.org/wcmsp5/groups/public/---dgreports/---stat/documents/publication/wcms_757969.pdf.
Durazo, Josefine, Valentina Costa, Amparo Palacios-Lopez, Isis Gaddis. 2021. “Employment and Own-Use Production in Household Surveys : A Practical Guide for Measuring Labor (English).” LSMS Guidebook Washington, D.C.: World Bank Group. http://documents.worldbank.org/curated/en/336141630489348107/Employment-and-Own-Use-Production-in-Household-Surveys-A-Practical-Guide-for-Measuring-Labor
Floro, Maria S., and Hitomi Komatsu. 2011. “Gender and Work in South Africa. What Can Time-Use Data Reveal?” Feminist Economics 17 (4): 33–66.

41
Fowler, Floyd Jackson, Jr. 2004. “The Case for More Split-Sample Experiments in Developing Survey Instruments.” In Methods for Testing and Evaluating Survey Questionnaires, edited by Stanley Presser, Jennifer M. Rothgeb, Mick P. Couper, Judith T. Lessler, Elizabeth Martin, Jean Martin, and Eleanor Singer, 173–88. New York: Wiley.
Gaddis, Isis, Gbemisola Oseni, Amparo Palacios-Lopez, and Janneke Pieters. 2020a. “Measuring Farm Labor: Survey Experimental Evidence from Ghana.” World Bank Economic Review. Published ahead of print, May 21, 2020. https://doi.org/10.1093/wber/lhaa012.
Gaddis, Isis, Gbemisola Oseni, Amparo Palacios-Lopez, and Janneke Pieters. 2020b. “Who Is Employed? Evidence from Sub-Saharan Africa on Redefining Employment.” Policy Research Working Paper 9370, World Bank, Washington, DC.
Grosh, Margaret E., and Paul W. Glewwe, eds. 2000. Designing Household Survey Questionnaires for Developing Countries. Lessons from 15 Years of the Living Standards Measurement Study. 3 vols. Washington, DC: World Bank.
Heath, Rachel, Ghazala Mansuri, Bob Rijkers, William Seitz, and Dhiraj Sharma. 2020. “Measuring Employment: Experimental Evidence from Urban Ghana.” World Bank Economic Review. Published ahead of print, June 12, 2020. https://doi.org/10.1093/wber/lhaa014.
ILO (International Labour Organization). 2013. “Resolution Concerning Statistics of Work, Employment, and Labour Underutilization, Adopted by the Nineteenth International Conference of Labour Statisticians (October 2013).” International Labour Organization, Geneva. https://www.ilo.org/global/statistics-and-databases/meetings-and-events/international-conference-of-labour-statisticians/19/WCMS_230304/lang--en/index.htm.
Kilic, Talip, and Thomas Pave Sohnesen. 2017. “Same Question But Different Answer: Experimental Evidence on Questionnaire Design’s Impact on Poverty Measured by Proxies.” Review of Income and Wealth 65 (1): 144–65.
Koolwal, Gayatri. 2019. “Improving the Measurement of Rural Women’s Employment: Global Momentum and Survey Research Priorities.” Policy Research Working Paper 8840, World Bank, Washington, DC.
Langsten, Ray, and Rania Salen. 2008. “Two Approaches to Measuring Women’s Work in Developing Countries: A Comparison of Survey Data from Egypt.” Population and Development Review 34 (2): 283–305.
Mahmud, Simeen, and Sakiba Tasneem. 2011. “The Under Reporting of Women’s Economic Activity in Bangladesh: An Examination of Official Statistics.” BDI Working Paper 01 (February), BRAC Development Institute, BRAC University, Dhaka, Bangladesh.
Müller, Miriam, and Liliana Do Couto Sousa. 2020. “‘She Helps Me All the Time’: Underestimating Women’s Economic Engagement in Rural Honduras.” Policy Research Working Paper 9217, World Bank, Washington, DC.
Presser, Stanley, Jennifer M. Rothgeb, Mick P. Couper, Judith T. Lessler, Elizabeth Martin, Jean Martin, and Eleanor Singer, eds. 2004. Methods for Testing and Evaluating Survey Questionnaires. New York: Wiley.
Sudarshan, Ratna M., and Shrayana Bhattacharya. 2008. “Through the Magnifying Glass: Women’s Work and Labour Force Participation in Urban Delhi.” ILO Asia-Pacific Working Paper (May), Subregional Office for South Asia, International Labour Organization, New Delhi. https://www.ilo.org/newdelhi/whatwedo/publications/WCMS_123539/lang--en/index.htm.
UNSD (United Nations Statistics Division). 2019. “Conclusions and Recommendations: Third Meeting of the Expert Group on Innovative and Effective Ways to Collect Time-Use Statistics (EG-TUS), New York, USA, 4–6 November 2019.” Document ESA/STAT/AC.372/L3, Statistics Division, Department of Economic and Social Affairs, United Nations, New York. https://unstats.un.org/unsd/demographic-social/meetings/2019/newyork-egm-tus-nov/3rd_EGM-Conclusions_and_recommendations-FINAL%20posted.pdf.
References

42
Measuring Women and Men’s Work | Main Findings from a Joint ILO and World Bank Study in Sri Lanka
Annex 1. 19th ICLS Statistical Standards
Resolution I of the 19th ICLS introduced major changes to the framework of definitions used to produce statistics on work and the labour market (ILO 2013). Relative to the 13th ICLS standards of 1982, it reduced the scope of the statistical definition of employment to work done for pay or profit and applied a wider definition of work, along with the forms of work framework, to support the analysis of participation in paid and unpaid productive activities.
Among the various innovations within the 19th ICLS standards is the recognition that: (a) different forms of work can be defined based on the intended destination of the output and the motivation underlying the work (see Figure 1.1), (b) people can be engaged in different forms of work simultaneously in
a particular reference period, and (c) these different work activities should be measured and reported.
This means that, unlike in the previous standards, it is possible to capture fully the participation, contributions and working conditions of persons in, for example, employment, volunteer work and own-use production work. This enables an analysis of the total amount of hours spent by individuals “for the production of goods and services for use by others or for own use” (across paid work, housework, work to produce foodstuffs, or other goods for own use, volunteer work, and so on) and, if analysed at the household level, can show the different contributions of household members to overall household livelihoods and well-being.
Figure 1.1 The forms of work framework
Intended destination of production
for own final use
for use by others
Forms of work own-use production work
employment(work for pay or profit)
other* unpaid trainee work
volunteer work
of services
of goods
in market & non-market units
in households producing
goods services
Relation to 2008 SNA
within SNA production boundary
inside SNA General production boundary
* Includes compulsory work performed without pay for others, not covered in the draft resolution.
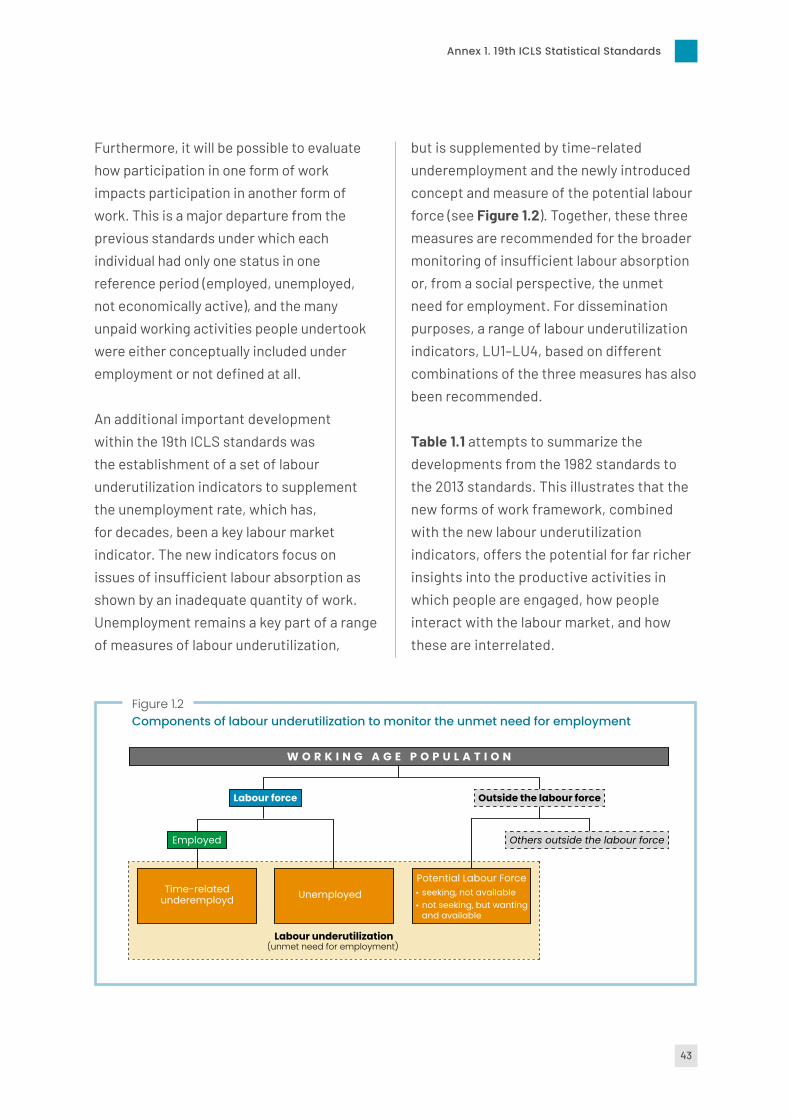
43
Annex 1. 19th ICLS Statistical Standards
Furthermore, it will be possible to evaluate how participation in one form of work impacts participation in another form of work. This is a major departure from the previous standards under which each individual had only one status in one reference period (employed, unemployed, not economically active), and the many unpaid working activities people undertook were either conceptually included under employment or not defined at all.
An additional important development within the 19th ICLS standards was the establishment of a set of labour underutilization indicators to supplement the unemployment rate, which has, for decades, been a key labour market indicator. The new indicators focus on issues of insufficient labour absorption as shown by an inadequate quantity of work. Unemployment remains a key part of a range of measures of labour underutilization,
but is supplemented by time-related underemployment and the newly introduced concept and measure of the potential labour force (see Figure 1.2). Together, these three measures are recommended for the broader monitoring of insufficient labour absorption or, from a social perspective, the unmet need for employment. For dissemination purposes, a range of labour underutilization indicators, LU1–LU4, based on different combinations of the three measures has also been recommended.
Table 1.1 attempts to summarize the developments from the 1982 standards to the 2013 standards. This illustrates that the new forms of work framework, combined with the new labour underutilization indicators, offers the potential for far richer insights into the productive activities in which people are engaged, how people interact with the labour market, and how these are interrelated.
Figure 1.2 Components of labour underutilization to monitor the unmet need for employment
W O R K I N G A G E P O P U L A T I O N
Labour force
Employed
Time-related underemployd
Potential Labour Force• seeking, not available• not seeking, but wanting
and available
Labour underutilization(unmet need for employment)
Others outside the labour force
Outside the labour force
Unemployed
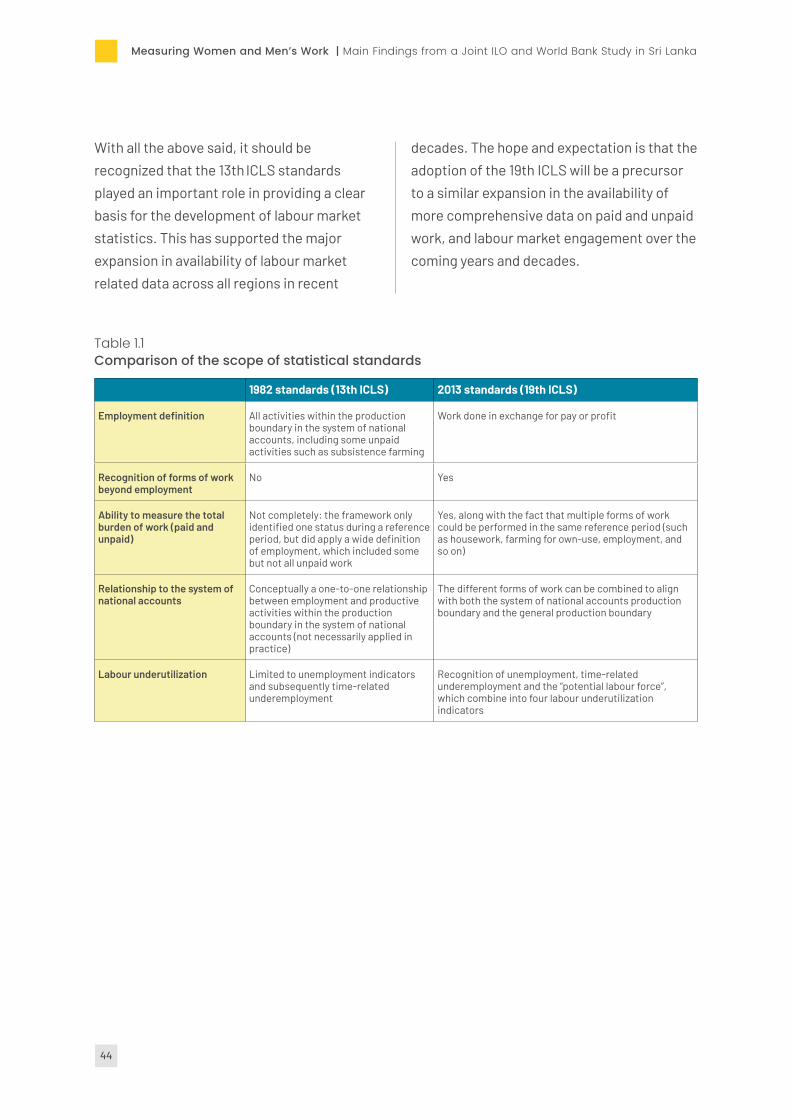
44
Measuring Women and Men’s Work | Main Findings from a Joint ILO and World Bank Study in Sri Lanka
Table 1.1 Comparison of the scope of statistical standards
1982 standards (13th ICLS) 2013 standards (19th ICLS)
Employment definition All activities within the production boundary in the system of national accounts, including some unpaid activities such as subsistence farming
Work done in exchange for pay or profit
Recognition of forms of work beyond employment
No Yes
Ability to measure the total burden of work (paid and unpaid)
Not completely: the framework only identified one status during a reference period, but did apply a wide definition of employment, which included some but not all unpaid work
Yes, along with the fact that multiple forms of work could be performed in the same reference period (such as housework, farming for own-use, employment, and so on)
Relationship to the system of national accounts
Conceptually a one-to-one relationship between employment and productive activities within the production boundary in the system of national accounts (not necessarily applied in practice)
The different forms of work can be combined to align with both the system of national accounts production boundary and the general production boundary
Labour underutilization Limited to unemployment indicators and subsequently time-related underemployment
Recognition of unemployment, time-related underemployment and the “potential labour force”, which combine into four labour underutilization indicators
With all the above said, it should be recognized that the 13th ICLS standards played an important role in providing a clear basis for the development of labour market statistics. This has supported the major expansion in availability of labour market related data across all regions in recent
decades. The hope and expectation is that the adoption of the 19th ICLS will be a precursor to a similar expansion in the availability of more comprehensive data on paid and unpaid work, and labour market engagement over the coming years and decades.
45
Annex 2. Methodology of the Pilot Study
The pilot study in Sri Lanka was organized as a comparative test of an LFS and a MLSS questionnaire. While the two surveys have different primary objectives (the generation of labour indicators versus the measurement of living standards and poverty), both overlap in their coverage of labour and work. In the case of the LFS, the primary objective is to generate labour market and work-related indicators, while the primary focus of the MLSS is on the use of work-related information in the broader analysis of poverty and living standards. The objectives differ, but it nonetheless remains important to ensure that, to the extent possible, respondents are consistently classified across the two surveys in line with labour-related statistical standards, for example to ensure that a respondent who is employed, as defined in the standards, is classified as employed regardless of the survey.
In the case of the pilot study in Sri Lanka, the focus was on the implementation of the standards adopted at the 19th ICLS. (See Annex 1 for more details.) Specifically, both questionnaires were designed to cover employment, labour underutilization, the own-use production of goods, and the own-use provision of services as defined in Resolution I of the 19th ICLS (ILO 2013).
The aim of the study was to assess any differences in results and to yield evidence to allow the development of guidance on the implementation of the 19th ICLS standards in different types of household surveys. This guidance will supplement and be used to update supporting materials already available from the ILO for the LFS and from the World Bank for the MLSS.
To allow different types of assessment of the questionnaires, the study included both qualitative and quantitative stages. The qualitative stage took the form of cognitive interviews, while the quantitative stage involved the field testing of the questionnaires with samples of households. These stages are described below. Each stage was heavily supported through training, supervision and remote technical assistance by ILO and World Bank experts with the full support of staff from the DCS. DCS staff were engaged as interviewers and supervisors and to provide all other support and management required during the process. The cognitive interviews were further supported by an expert of the UK’s Office for National Statistics (ONS).

46
Measuring Women and Men’s Work | Main Findings from a Joint ILO and World Bank Study in Sri Lanka
Cognitive interviewing
Cognitive interviews were carried out in the rural areas of Kalutara and Negombo on 22–27 October 2018. They aimed at verifying how respondents understood the questions from the two different questionnaires, the LFS-type questionnaire developed by the ILO and the MLSS-type labour module developed by the World Bank. It was a small-scale test carried out with about 20 respondents for each questionnaire, involving an in-depth probe of a small number of crucial questions.
The cognitive interviewing stage was useful in identifying possible areas of difficulty and enabled both questionnaires to be updated in various ways. An important challenge faced was the fact that the cognitive interviewing evidently required that the questionnaires, originally prepared in English by the ILO and
the World Bank, be translated into Sinhalese. This proved useful and prompted updates to both the English and Sinhalese versions of the questionnaires.
Field testing
Given the general measurement objectives of the study and the need to assess the outcomes under different conditions of agricultural work intensity, the study protocol envisaged two waves of data collection. The two waves were intended to take place at two different points of an agricultural or fishing season, that is, a peak period in agricultural or fishing work (planting or harvesting staple food, and so on) and a period with much lower intensity of agricultural or fishing activity (e.g. either when crops are growing or after the harvest when farmers are waiting for the new season of planting).

47
However, identifying the most suitable districts and periods for data collection while taking into account the requirements of the study and the time constraints was challenging because of the different crop calendars and seasons across the districts of Sri Lanka. The most important aspect was that, in Sri Lanka, there are three agricultural systems (dry, wet and intermediate zones); this means that: (a) different products are produced in different districts (for instance, rice, rubber, maize, groundnuts, tea, vegetables, and so on) and (b) similar products have different seasonality in different districts (that is, planting and harvesting can start earlier in some districts and later in others). In addition, recent climate change is making the start and end of the various agricultural seasons less predictable.
After an evaluation of several alternatives and taking into account also the organization
of the fieldwork and the concurrent work schedule of the pilot and other surveys, it was decided to undertake the pilot study in three administrative districts outside the capital, Colombo, namely, Anuradhapura (the centre-north of the country), Galle (the southwest), and Kurunegala (centre).
The sample included all the PSUs – corresponding to census enumeration areas – used for the current LFS in the fourth quarter of 2018, giving a total of 98 PSUs. From each PSU, ten new households (not interviewed for the regular LFS) were selected for the LFS and ten for the MLSS using a randomized approach, generating a total sample size of approximately 980 households for each of the two questionnaires.
Interviews were administered through computer assisted personal interviews (CAPI) on tablets. The CAPI questionnaires were built using the World Bank’s Survey Solutions software.
Fieldwork in wave 1 of the pilot study took place in the three districts selected for the study from 18 March to 7 April 2019, a period with high intensity of agricultural work at the end of the main agricultural season. In-depth training was delivered by ILO and World Bank officials during the previous week. ILO and World Bank officers supervised the three initial days of fieldwork and provided feedback. Across the two surveys, 1,937 household interviews were completed: 964 for the LFS and 973 for the MLSS. This led to data being captured for 2,588 and
Annex 2. Methodology of the Pilot Study
48
Measuring Women and Men’s Work | Main Findings from a Joint ILO and World Bank Study in Sri Lanka
2,701 individuals of working age, respectively (see Table 2.1, which also shows detailed breakdown by sex, age group and education).
Additional balance tests show that households were well balanced across treatment arms for most individual-level characteristics, with no significant differences in the share of males, average age and the share of household members aged 15+ without any schooling (Table 2.2). However, the share of household members aged 15+ who had passed at least grade 10 is signficantly higher in the MLSS (67.8 percent) than in the LFS (50 percent), which suggests that – despite the randomization approach – some differences in educational attainment across the two samples remained. In terms of household characteristics, there are no significant differences in household size, the number of children in the household, the share of households headed by a male, head’s marital status and ethno-religious group affiliation, and access to electricity. However, households in the LFS sample have, on average, slightly more bedrooms than households in the MLSS sample (2.63 vs. 2.54) and are less likely to use an improved source of drinking water (4.6 percent vs. 6.5 percent). Both differences are marginally statistically significant (e.g. at 10 percent). In the view of the authors, these differences are unlikely to have substantially impacted the analysis presented in this report, given the re-weighting procedures used (as described below) and the fact that the differences across the two samples are not substantial.
Between wave 1 and wave 2, some updates were made to both questionnaires based on observations of the operation of the questionnaires in the field, feedback from interviewers and analysis of the data.
The fieldwork for wave 2 took place from 8 September to 7 October 2019, a period of low intensity of work in agriculture between the two high agricultural seasons. The households interviewed in wave 1 were reinterviewed. The number of household interviews completed for the LFS in wave 2 were 956, and 960 for the MLSS; giving a total of 2,604 and 2,643 respondents of working age, respectively.
The teams of interviewers from wave 1 were retained, with few changes. The week before the fieldwork, the ILO and World Bank officers delivered a five-day in-depth face-to-face refresher training course to the respective teams, which also familiarized the interviewers with the changes made to the questionnaires between waves 1 and 2.
The use of CAPI allowed data to be transmitted to the DCS each day. Data were processed by the DCS and subsequently shared with the ILO and the World Bank for analysis. To facilitate a direct comparison of the figures and estimates from the two samples, it was decided to use grossing weights to benchmark the sample results to a common reference population. Poststratification weights were calculated for the two sets of microdata using the distribution by district, sex and age group obtained as averages of the two sample distributions.

49
Table 2.1Basic characteristics of the two samples in wave 1 and Pearson Chi Square test
SEX BY AGE-GROUP LFS MLSS TOTALMALES 0-14 447 431 878
MALES 15-24 208 267 475
MALES 25-34 164 171 335
MALES 35-44 205 207 412
MALES 45-54 206 219 425
MALES 55-64 204 196 400
MALES 65 + 186 181 367
FEMALES 0-14 417 413 830
FEMALES 15-24 233 254 487
FEMALES 25-34 222 216 438
FEMALES 35-44 280 273 553
FEMALES 45-54 233 252 485
FEMALES 55-64 216 221 437
FEMALES 65 + 231 245 476
TOTAL 3452 3546 6998
Person chi2 test (13) = 9.450 p-value = 0.738
SEX BY RELATIONSHIP TO HEAD LFS MLSS TOTALMALES - REFERENCE PERSON/HEAD 710 707 1417
MALES - SPOUSE/PARTNER 18 23 41
MALES - SON/DAUGHTER 657 707 1364
MALES - MOTHER/FATHER 23 22 45
MALES - OTHER 212 213 425
FEMALES - REFERENCE PERSON/HEAD 254 266 520
FEMALES - SPOUSE/PARTNER 631 631 1262
FEMALES - SON/DAUGHTER 609 591 1200
FEMALES - MOTHER/FATHER 68 69 137
FEMALES - OTHER 270 317 587
TOTAL 3452 3546 6998
Person chi2 test (9) = 5.529 p-value = 0.786
EDUCATIONAL LEVEL LFS MLSS TOTALSTUDYING IN GRADE 1 65 73 138
PASSED GRADE 1 77 78 155
PASSED GRADE 2 120 123 243
PASSED GRADE 3 107 117 224
PASSED GRADE 4 173 152 325
PASSED GRADE 5 192 173 365
PASSED GRADE 6 137 135 272
PASSED GRADE 7 179 163 342
PASSED GRADE 8 212 222 434
PASSED GRADE 9 146 143 289
Annex 2. Methodology of the Pilot Study
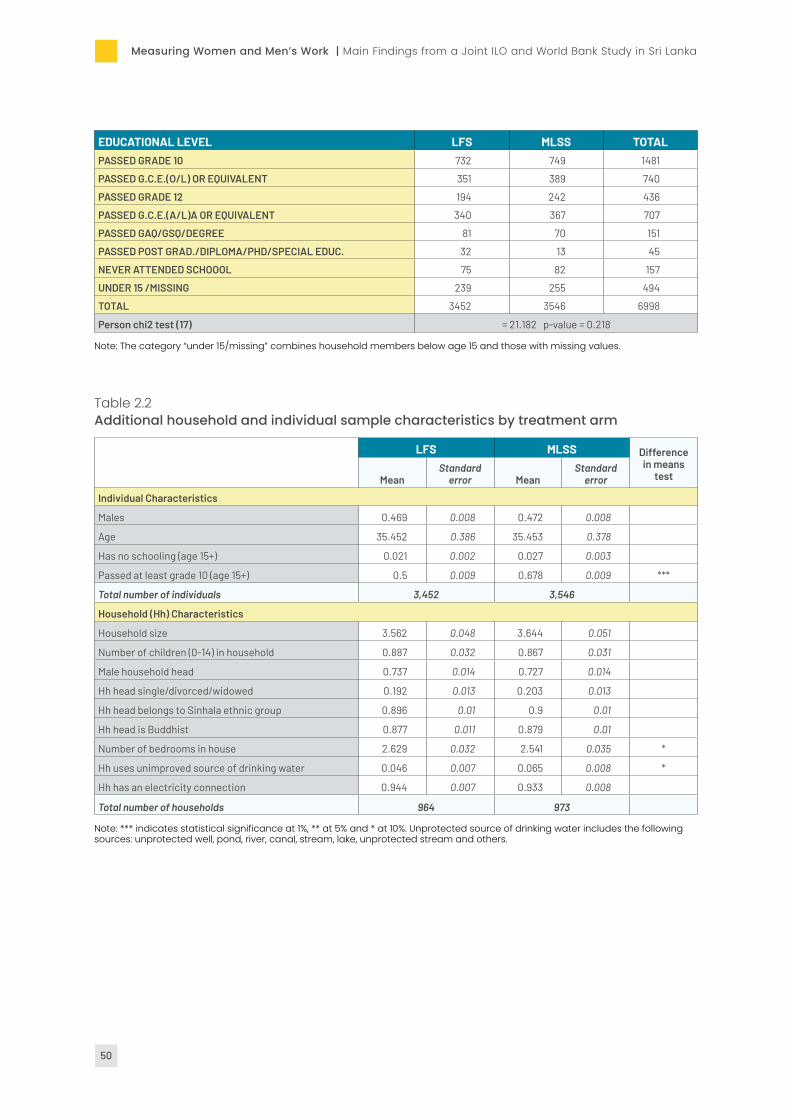
50
Measuring Women and Men’s Work | Main Findings from a Joint ILO and World Bank Study in Sri Lanka
Table 2.2Additional household and individual sample characteristics by treatment arm
LFS MLSS Difference in means
testMeanStandard
error MeanStandard
error
Individual Characteristics
Males 0.469 0.008 0.472 0.008
Age 35.452 0.386 35.453 0.378
Has no schooling (age 15+) 0.021 0.002 0.027 0.003
Passed at least grade 10 (age 15+) 0.5 0.009 0.678 0.009 ***
Total number of individuals 3,452 3,546
Household (Hh) Characteristics
Household size 3.562 0.048 3.644 0.051
Number of children (0-14) in household 0.887 0.032 0.867 0.031
Male household head 0.737 0.014 0.727 0.014
Hh head single/divorced/widowed 0.192 0.013 0.203 0.013
Hh head belongs to Sinhala ethnic group 0.896 0.01 0.9 0.01
Hh head is Buddhist 0.877 0.011 0.879 0.01
Number of bedrooms in house 2.629 0.032 2.541 0.035 *
Hh uses unimproved source of drinking water 0.046 0.007 0.065 0.008 *
Hh has an electricity connection 0.944 0.007 0.933 0.008
Total number of households 964 973
Note: *** indicates statistical significance at 1%, ** at 5% and * at 10%. Unprotected source of drinking water includes the following sources: unprotected well, pond, river, canal, stream, lake, unprotected stream and others.
EDUCATIONAL LEVEL LFS MLSS TOTALPASSED GRADE 10 732 749 1481
PASSED G.C.E.(O/L) OR EQUIVALENT 351 389 740
PASSED GRADE 12 194 242 436
PASSED G.C.E.(A/L)A OR EQUIVALENT 340 367 707
PASSED GAQ/GSQ/DEGREE 81 70 151
PASSED POST GRAD./DIPLOMA/PHD/SPECIAL EDUC. 32 13 45
NEVER ATTENDED SCHOOOL 75 82 157
UNDER 15 /MISSING 239 255 494
TOTAL 3452 3546 6998
Person chi2 test (17) = 21.182 p-value = 0.218
Note: The category “under 15/missing” combines household members below age 15 and those with missing values.
51
Annex 3. Identifying Employment in the LFS and MLSS Questionnaires
This annex illustrates – in a simplified way – the sequence of questions used in the two questionnaires to identify persons in employment in both wave 1 and wave 2. While the flow and wording differ, the overall intention of the sequences is the same, namely, to identify comprehensively all employed respondents to the survey. Any changes between wave 1 and wave 2 are highlighted in red (see Tables 3.1 and 3.2).
Changes were not made to the LFS sequence (Table 3.1) as no evident misclassification issues were identified in the wave 1 data. The changes made to the MLSS questionnaire, as discussed in the report, are shown in Table 3.2. In each table, the last two rows show the total number of employed respondents identified in each wave in each survey to show the relative importance of the different questions. In the interests of comparability, these data only include those respondents who were at work during the reference week and exclude those who were temporarily absent from work (about 4 percent of all employed).
The LFS questionnaire
In the LFS questionnaire, the only purpose of the employment identification sequence is to classify whether the respondent is employed or not. Thus, once respondents are identified as employed, they will not be asked more questions from the sequence and will continue with other parts of the questionnaire covering characteristics of their job, time worked, and so on. This differs from the approach in the MLSS questionnaire as outlined below.
Table 3.1 illustrates the employment identification questions used in the LFS questionnaire for both wave 1 and wave 2. The table shows four main profiles covering the main situations encountered in the field.
� Profile 1 includes respondents who reported “work for pay” in the first question; in this case, respondents are immediately classified as employed, and all the other screening questions are skipped. This accounted for 63 percent of the employed respondents in wave 1 and 58 percent in wave 2.

52
Measuring Women and Men’s Work | Main Findings from a Joint ILO and World Bank Study in Sri Lanka
� Profile 2 includes respondents who report “own-account work” in the second question (having not reported “work for pay” in the first place). In a follow up question, it is determined that at least some of the work was in businesses other than “agricultural/fishing”: these respondents are classified as employed and skip all the other questions in the sequence. In wave 1, 20 percent of all employed respondents were covered by this profile (22 percent in wave 2).
� Profile 3 is similar to profile 2 and includes respondents who report “helping” with the business or a job of a family member in the third question. This type of question has been shown to be important in avoiding an undercount of contributing family workers who may not view themselves as working for pay or doing any kind of business. As with profile 2, once it is confirmed that this involved work in a non-agricultural business, the respondent is identified as employed and skips remaining questions in the sequence. This covered 4 percent of employed respondents in wave 1 and 2 percent in wave 2.
� Profile 4 includes respondents who report work activities that are subsequently identified as activities in agriculture or fishing. Based on the 19th ICLS standards, it is necessary to determine if the output from the work is mainly intended for sale (employment) or for own use (the own-use production of goods). In wave 1, 14 percent of all employed respondents came through
this route and were identified as employed based on the criteria on the main intended destination of the output produced (18 percent in wave 2).
As covered in the report, the number of employed respondents identified by the LFS questionnaire was consistent between the two waves: 1,459 in wave 1 and 1,451 in wave 2. The proportions of respondents identified as fitting the various profiles varied somewhat, possibly reflecting the seasonal differences in activities at the time of the two waves.
The MLSS questionnaire
In the MLSS questionnaire, the screening questions are used both to identify persons in employment and to collect information an all the different jobs held by respondents, including the time worked in each of them during the reference week. They serve a dual purpose: to identify employed respondents and to generate statistics on the engagement in different working activities (which, by comparison, is captured later in the LFS questionnaire). Therefore, the questions in the sequence are asked of all respondents of working age. This is common practice in labour modules in MLSSs.
Table 3.2 illustrates the main questions used in the MLSS questionnaire to identify employment. Based on the analysis of the results from wave 1 (as described in the report), several changes were made to the

53
Annex 3. Identifying Employment in the LFS and MLSS Questionnaires
Table 3.1Sequence of screening questions used in the LFS to capture employment
LFS WAVE 1 and WAVE 2
Questions for identification of persons in emplyment (at work)
PROFILES WAVE 1 PROFILES WAVE 2
1 2 3 4 TOTAL 1 2 3 4 TOTAL
ATW_PAYLast week, that is from Monday (DATE) up to (last Sunday), did NAME do any work for someone else for pay, even if only for one hour? "
• •
ATW_PFTLast week, did NAME run or do any kind of business, farming or other activity to generate any income?READ ONLY IF NEEDED: For example: [making things for sale, buying and reselling things, provided paid services, growing products, raising animals or catching fish for sale, and [OTHER EXAMPLES RELEVANT IN NATIONAL CONTEXT]
• • • •
ATW_FAMOr, did NAME help with the business, farm or paid job of a household or family member?"
• • • •
AGF_ANYLast week, that is from Monday (DATE) up to (last Sunday), did NAME do any work in farming, rearing animals, [fishing or fish farming]?"
• •
AGF_CROP_CHKThe work that you mentioned, was it farming of crops, vegetables or fruits? for example: rice, tea, rubber, flowers?"
• •
AGF_LIV_CHKWas it rearing or tending farm animals?"
• •
AGF_FISH_CHKWas it fishing, [FISH FARMING] or collecting shellfish?"
• •
AGF_OTHER_CHKWas it another type of job, business or activity?"
• • • •
AGF_MKTThinking about all the (farming products, animals or fish) NAME worked on, are they intended…"
• •
AGF_MKT_MAINThinking about those (farming products, animals or fish), is it intended to sell...?"
• •
AGF_HISIn general, in the past have these products been mainly sold or mainly kept for family consumption?"
• •
AGF_HIRWas NAME hired or paid by someone else to do this work?"
• •
EMPLOYED identified by different profiles 914 292 52 201 1459 835 322 35 259 1451
EMPLOYED % from the different profiles 63% 20% 4% 14% 100% 58% 22% 2% 18% 100%

54
Measuring Women and Men’s Work | Main Findings from a Joint ILO and World Bank Study in Sri Lanka
questions for wave 2; these are highlighted in red in the table. Changes were made to the wording of some questions (that is, S2Q7aa, S2Q7ba, S2Q7ca); other questions, similar to those used in the LFS, were also added at the end of the sequence (that is, S2Q8a, S2Q8aa) to verify whether these would “recover” other employed respondents not captured by previous questions. Despite these additional recovery questions, the average interview length for the MLSS labour module did not increase between waves 1 and 2. This shows that the recovery questions, which were only asked of a small subset of household members who responded negatively to some of the previous questions, do not need to signficantly increase the interview burden of the survey.11
11 In wave 1, the average interview duration for the MLSS labour module (per eligible household member) was 17.7 minutes, compared to 16.5 minutes in wave 2. The slight decline in the length of the interview, despite the fact that additional questions were added, probably reflects that the enumerators were more familiar with the survey instrument and CAPI application in wave 2.
All the questions are asked of all respondents. The questionnaire is thus structurally quite different from the LFS questionnaire. Nonetheless, it was still possible to build respondent profiles that are broadly comparable with the LFS profiles highlighted above. In both waves, the first four profiles shown in Table 3.2 are logically identical to those identified in the LFS. A fifth profile was added in wave 2 to capture respondents who were identified as employed by the new recovery questions that had been added to the end of the sequence.
Given the number of changes made to the questionnaire, it is useful to look at the number of respondents identified under the various profiles (the last two rows of the table). The overall number of employed respondents identified increased, as discussed in detail in the report (1,303 in wave 1 to 1,372 in wave 2) meaning that the gap relative to the LFS was narrower in wave 2. This suggests that the changes introduced

55
were successful, even if they did not eliminate the gap entirely. The increases came in profiles 2 to 5 of the second wave, which supports the general conclusion of the report that these questions were more effective in identifying respondents engaged in own-account farming for the market, those helping in family businesses or farms and those with small or casual jobs as outlined in the report.
The importance of the recovery questions for capturing women’s employment in the MLSS instrument is further illustrated in Figure 3.1, which shows that 98 percent of employed men, but only 91 percent of employed women were identified by the core question sequence used to identify the employed population (these are the questions that were already included in wave 1, e.g. S2Q3a,
S2Q5a, S2Q6a, S2Q7aa, S2Q7ba, S2Q7ca). Two recovery questions on helping on a family farm in terms of crop farming (S2Q7aaa) and livestock production (S2Q7baa) identified an additional 4 and 2 percent of employed women, while the final two recovery questions (S2Q8a and S2Q8aa combined) identified only slightly less than 3 percent of employed women. Thus, without using the recovery questions, 9 percent of employed women would not have been captured as employed. For men, all four recovery questions combined identified only slightly more than 2 percent of total employment. This pattern of greater importance of recovery questions for women than men is consistent with earlier literature referenced in this report and findings from previous pilot studies by the ILO.
Annex 3. Identifying Employment in the LFS and MLSS Questionnaires
Figure 3.1Share of employed women and men identified by recovery questions, MLSS wave 2
Core questions to identify employed population
S2Q7aaa: … did [NAME] help on a family farm to prepare or maintain the land or to plant, grow or harvest any crops, vegetables, or fruits …?
S2Q7baa: … did [NAME] help on a family farm to raise or tend animals, such as heep, goats, pigs, chicken or cattle …?
S2Q8a: … did [NAME] run or do any kind of business, farming, or other activity to generate an income …?
S2Q8aa: … did [NAME] help with the business, farm or paid jobs of a household or family member …?
FEMALE
MALE
0% 30% 60%20% 50% 80% 90% 100%10% 40% 70%
91.1%
4.4% 1.8%
0.7%
2.1%
97.9%

56
Measuring Women and Men’s Work | Main Findings from a Joint ILO and World Bank Study in Sri Lanka
Table 3.2Sequence of screening questions used in the MLSS to capture employment
MLSS WAVE 1Questions for identification of persons in emplyment (at work) PROFILES WAVE 1
1 2 3 4 TOTAL
S2Q3a'Last week, that is from Monday [DATE] up to Sunday [DATE], did NAME do any work for someone else for pay, even if only for one hour?INCLUDES PAID APPRENTICESHIPS AND PAID INTERNSHIPS.”
•
S2Q5a'Last week, did [NAME] work in a non-farm family business that [NAME] operates, even if only for one hour?"
•
S2Q6a'Last week, did [NAME] help in a non-farm family business that is operated by another family member, even if only for one hour?"
•
S2Q7aa'Last week, did [NAME] work on own account crop farming, even if only for one hour?"
•
S2Q7ba'Last week, did [NAME] work on raising animals, even if only for one hour?EXAMPLES: COWS, CHICKEN, GOATS”
S2Q7ca'Last week, did [NAME] work on own account fishing or collecting shellfish, even if only for one hour?"
•
S2Q7eThinking about all the [farming products/animals/fish] [NAME] worked on, are they intended...
•
S2Q7fThinking about those [products/animals/fish], is it intended to sell...?"
•
S2Q7gIn general, in the past have these products been mainly sold or mainly kept for family consumption?"
•
EMPLOYED identified by different profiles 868 223 58 154 1303
EMPLOYED % from the different profiles 67% 17% 4% 12% 100%

57
MLSS WAVE 2Questions for identification of persons in emplyment (at work) PROFILES WAVE 2
1 2 3 4 5 TOTAL
S2Q3a'Last week, that is from Monday [DATE] up to Sunday [DATE], did [NAME] do any work for someone else for pay, even if only for one hour?INCLUDES PAID APPRENTICESHIPS AND PAID INTERNSHIPS.”
•
S2Q5a'Last week, did [NAME] work in a non-farm family business that [NAME] operates, even if only for one hour?"
•
S2Q6a'Last week, did [NAME] help in a non-farm family business that is operated by another family member, even if only for one hour?"
•
S2Q7aa'Last week, did [NAME] do any work on a family farm [or in a kitchen garden] to prepare or maintain the land, or to plant, grow or harvest any crops, vegetable or fruits, even if only for one hour?
•
S2Q7aaa'Last week, did [NAME] help on a family farm [or in a kitchen garden] preparing or maintaining the land, planting, growing or harvesting any crops, vegetable, fruits or other agricultural products, even if only for one hour?
•
S2Q7ba'Last week, did [NAME] spend any time on a family farm raising or tending animals such as sheep, goats, pigs, chickens or cattle, even if only for one hour?
•
S2Q7baa'Last week, did [NAME] spend any time helping on a family farm raising or tending animals such as sheep, goats, pigs, chickens or cattle, even if only for one hour?
•
S2Q7ca'Last week, did [NAME] spend time in family fishing, pond fishing or collecting shellfish, even if only for one hour?
•
S2Q7eThinking about all the family [farming products/animals/fish] [NAME] worked on, are they intended…"
•
S2Q7fThinking about those [products/animals/fish], is it intended to sell...?"
•
S2Q7gIn general, in the past have these products been mainly sold or mainly kept for family consumption?"
•
S2Q8aLast week, did [NAME] run or do any kind of business, farming or other activity to generate income?READ ONLY IF NEEDED: For example: making things for sale, buying or reselling things, provided paid services, growing products, raising animals or catching fish for sale.
•
S2Q8aaOr, did [NAME] help with the business, farm or paid job of a household or family member?
•
Annex 3. Identifying Employment in the LFS and MLSS Questionnaires
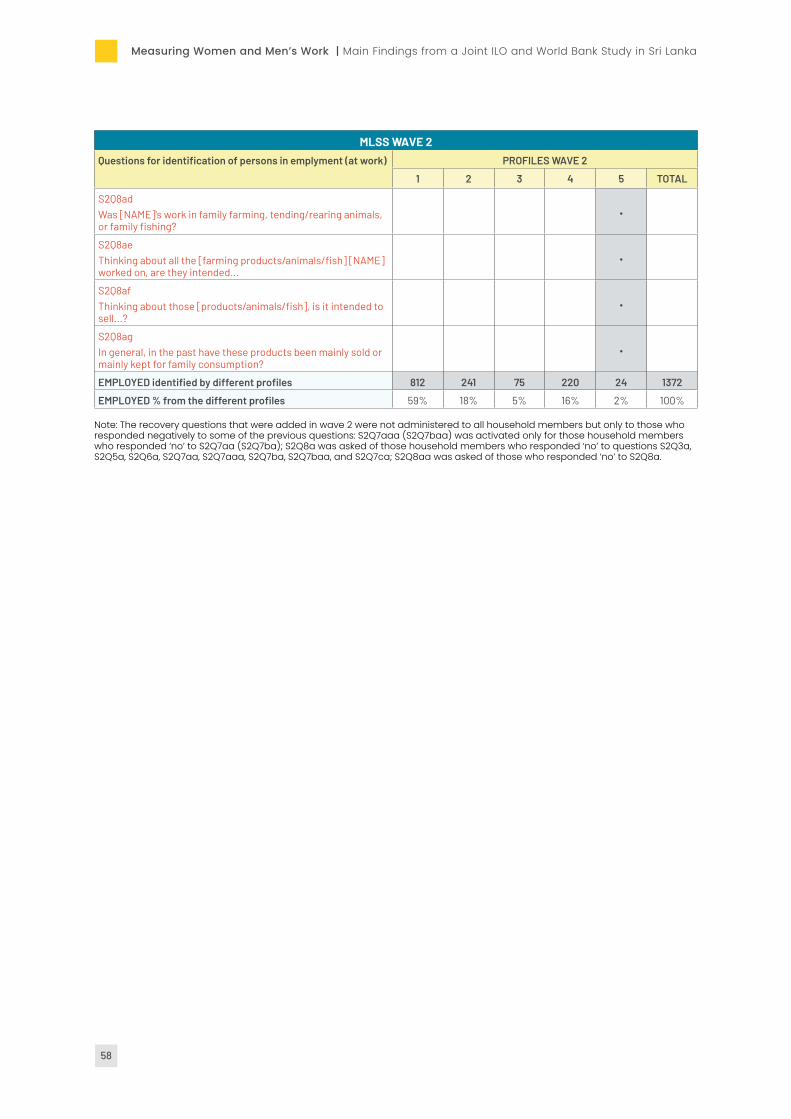
58
Measuring Women and Men’s Work | Main Findings from a Joint ILO and World Bank Study in Sri Lanka
MLSS WAVE 2Questions for identification of persons in emplyment (at work) PROFILES WAVE 2
1 2 3 4 5 TOTAL
S2Q8adWas [NAME]'s work in family farming, tending/rearing animals, or family fishing?
•
S2Q8aeThinking about all the [farming products/animals/fish] [NAME] worked on, are they intended...
•
S2Q8afThinking about those [products/animals/fish], is it intended to sell...?
•
S2Q8agIn general, in the past have these products been mainly sold or mainly kept for family consumption?
•
EMPLOYED identified by different profiles 812 241 75 220 24 1372
EMPLOYED % from the different profiles 59% 18% 5% 16% 2% 100%
Note: The recovery questions that were added in wave 2 were not administered to all household members but only to those who responded negatively to some of the previous questions: S2Q7aaa (S2Q7baa) was activated only for those household members who responded ‘no’ to S2Q7aa (S2Q7ba); S2Q8a was asked of those household members who responded ‘no’ to questions S2Q3a, S2Q5a, S2Q6a, S2Q7aa, S2Q7aaa, S2Q7ba, S2Q7baa, and S2Q7ca; S2Q8aa was asked of those who responded ‘no’ to S2Q8a.

CONTACTS
Living Standards Measurement Studywww.worlbank.org/[email protected] International Labor [email protected]