Measuring the Impact of West Bengal Drinking Water Sector ...
73
ASIAN DEVELOPMENT BANK MEASURING THE IMPACT OF WEST BENGAL DRINKING WATER SECTOR IMPROVEMENT PROJECT A BASELINE STUDY Aniceto C. Orbeta, Neeta Pokhrel, Saswati Ghosh Belliappa, Saugata Dasgupta, and Arati Nandi ADB SOUTH ASIA WORKING PAPER SERIES NO. 77 December 2020
-
Upload
khangminh22 -
Category
Documents
-
view
4 -
download
0
Transcript of Measuring the Impact of West Bengal Drinking Water Sector ...

ASIAN DEVELOPMENT BANK
ASIAN DEVELOPMENT BANK6 ADB Avenue, Mandaluyong City1550 Metro Manila, Philippineswww.adb.org
Measuring the Impact of West Bengal Drinking Water Sector Improvment ProjectA Baseline Study
Access to safe drinking water is a fundamental right of people. The West Bengal Drinking Water Sector Improvement Project is assisting the Government of West Bengal to provide safe, sustainable, and inclusive drinking water services to over 1.65 million people in the arsenic, fluoride, and salinity-affected areas of Bankura, North and South 24 Parganas, and Purba Medinipur districts. This publication sets the baseline of the project by providing the benchmark comparison of primary outcomes for the project and non-project households, before implementation, so that an impact evaluation can be carried out at project completion.
About the Asian Development Bank
ADB is committed to achieving a prosperous, inclusive, resilient, and sustainable Asia and the Pacific, while sustaining its efforts to eradicate extreme poverty. Established in 1966, it is owned by 68 members —49 from the region. Its main instruments for helping its developing member countries are policy dialogue, loans, equity investments, guarantees, grants, and technical assistance.
MEASURING THE IMPACT OF WEST BENGAL DRINKING WATER SECTOR IMPROVEMENT PROJECTA BASELINE STUDYAniceto C. Orbeta, Neeta Pokhrel, Saswati Ghosh Belliappa, Saugata Dasgupta, and Arati Nandi
ADB SOUTH ASIAWORKING PAPER SERIES
NO. 77
December 2020

ASIAN DEVELOPMENT BANK
ADB South Asia Working Paper Series
Measuring the Impact of West Bengal Drinking Water Sector Improvement Project: A Baseline Study
Aniceto C. Orbeta, Neeta Pokhrel, Saswati Ghosh Belliappa, Saugata Dasgupta, and Arati Nandi
No. 77 | December 2020
Aniceto C. Orbeta, Jr. is a senior research fellow at the Philippine Institute for Development Studies and professorial lecturer at the School of Economics, University of the Philippines. Neeta Pokhrel is project o�cer at the West Bengal Drinking Water Sector Improvement Project and Unit Head, Urban Development and Water Division (SAUW), South Asia Department, Asian Development Bank (ADB). Saswati Ghosh Belliappa is a safeguards specialist, SAUW, SARD. Saugata Dasgupta is a project management specialist, Nepal Resident Mission. Arati Nandi is a social safeguards specialist and ADB consultant.

Creative Commons Attribution 3.0 IGO license (CC BY 3.0 IGO)
© 2020 Asian Development Bank6 ADB Avenue, Mandaluyong City, 1550 Metro Manila, PhilippinesTel +63 2 8632 4444; Fax +63 2 8636 2444www.adb.org
Some rights reserved. Published in 2020. Printed in the Philippines
ISSN 2313-5867 (print), 2313-5875 (electronic)Publication Stock No. WPS200410-2DOI: http://dx.doi.org/10.22617/WPS200410-2
The views expressed in this publication are those of the authors and do not necessarily reflect the views and policies of the Asian Development Bank (ADB) or its Board of Governors or the governments they represent.
ADB does not guarantee the accuracy of the data included in this publication and accepts no responsibility for any consequence of their use. The mention of specific companies or products of manufacturers does not imply that they are endorsed or recommended by ADB in preference to others of a similar nature that are not mentioned.
By making any designation of or reference to a particular territory or geographic area, or by using the term “country” in this document, ADB does not intend to make any judgments as to the legal or other status of any territory or area.
This work is available under the Creative Commons Attribution 3.0 IGO license (CC BY 3.0 IGO) https://creativecommons.org/licenses/by/3.0/igo/. By using the content of this publication, you agree to be bound by the terms of this license. For attribution, translations, adaptations, and permissions, please read the provisions and terms of use at https://www.adb.org/terms-use#openaccess.
This CC license does not apply to non-ADB copyright materials in this publication. If the material is attributed to another source, please contact the copyright owner or publisher of that source for permission to reproduce it. ADB cannot be held liable for any claims that arise as a result of your use of the material.
Please contact [email protected] if you have questions or comments with respect to content, or if you wish to obtain copyright permission for your intended use that does not fall within these terms, or for permission to use the ADB logo.
The ADB South Asia Working Paper Series is a forum for ongoing and recently completed research and policy studies undertaken in ADB or on its behalf. It is meant to enhance greater understanding of current important economic and development issues in South Asia, promote policy dialogue among stakeholders, and facilitate reforms and development management.
The ADB South Asia Working Paper Series is a quick-disseminating, informal publication whose titles could subsequently be revised for publication as articles in professional journals or chapters in books. The series is maintained by the South Asia Department. The series will be made available on the ADB website and on hard copy.
Corrigenda to ADB publications may be found at http://www.adb.org/publications/corrigenda.
Notes: In this publication, “$” refers to United States dollars.

CONTENTS
TABLES AND FIGURES ........................................................................................................................................... iv ACKNOWLEDGMENTS ........................................................................................................................................... v ABBREVIATIONS ...................................................................................................................................................... vi EXECUTIVE SUMMARY ......................................................................................................................................... vii I. INTRODUCTION ............................................................................................................................................ 1 II. BACKGROUND ................................................................................................................................................ 1 A. Theory of Change ............................................................................................................................................... 1
B. Proposed Impact Evaluation Design ........................................................................................................... 2 C. Data Generation ................................................................................................................................................. 4 D. Limitations of Study .......................................................................................................................................... 5
III. BASELINE SURVEY RESULTS ..................................................................................................................... 5 A. Geographic Distribution of the Sample ..................................................................................................... 5
B. Background Information ................................................................................................................................. 6 C. Intermediate and Final Outcomes .............................................................................................................. 9
IV. OVERALL RESULTS SUMMARY ............................................................................................................. 35 V. RECOMMENDATIONS FOR POST-PROJECT EVALUATION ................................................... 38 APPENDIXES ............................................................................................................................................................ 40 1 Baseline Survey Questionnaire .................................................................................................................. 40 2 Sampling Scheme ............................................................................................................................................. 51 3 Calculating Power and Sample Size for the West Bengal Drinking Water ................................ 52
Sector Improvement Project 4 Government Order Number HF/0/MS/ 984/W-10/2001, October 2014, .............................. 55
Department of Health and Family Welfare, Government of West Bengal 5 Questionnaire for Household Survey ...................................................................................................... 59 GLOSSARY .................................................................................................................................................................. 61 REFERENCES ............................................................................................................................................................. 63

TABLES AND FIGURES
TABLES 1 Distribution of Sample by Districts and Gram Panchayats ......................................................................... 6 2 Demographic Characteristics of the Sample ................................................................................................... 7 3 Demographic Characteristics of the Household Head ................................................................................ 7 4 Distribution of Respondents by Classes ............................................................................................................ 8 5 Housing Characteristics .......................................................................................................................................... 9 6 Sources of Water in Project and Non-Project Areas by Type of Use .................................................. 12 7 Assessment of Water Pressure ........................................................................................................................... 14 8 Hours of Supply Per Week ................................................................................................................................... 16 9 Frequency of Water Supply Breakdowns, 2018 ............................................................................................ 16 10 Motorized Water Pump ........................................................................................................................................ 17 11 Frequency of Fetching Water Per Day ............................................................................................................. 18 12 Travel and Waiting Times at Source by Water Use .................................................................................... 18 13 Characteristics of Household Members who Fetch Water ..................................................................... 20 14 Other Information on Water Outside the Premises ................................................................................... 21 15 Water Treatment of Drinking Water ................................................................................................................ 21 16 Storing Water ........................................................................................................................................................... 22 17 Sanitation Facility ................................................................................................................................................... 23 18 Health Outcomes ................................................................................................................................................... 25 19 Awareness and Incidence of Arsenic Poisoning, Fluorosis, .................................................................... 28
and Water Salinity-Related Diseases 20 Attendance Rates ................................................................................................................................................... 29 21 School Absences, Days in a Month .................................................................................................................. 30 22 Housework and Community Work, Past Week ............................................................................................ 31 23 Productive Work and Income ............................................................................................................................ 33 24 Expenditures ............................................................................................................................................................. 35 A2 Sampling Allocation ................................................................................................................................................ 51 A3 Power and Sample Size Calculation Summary ............................................................................................. 54 FIGURES 1 Theory of Change—West Bengal Drinking Water Sector Improvement Project .............................. 3 A3.1 Effect Size and Number of Clusters for Diarrhea for Children ............................................................. 53
0-59 Months Old A3.2 Effect Size and Number of Clusters for School Attendance
for Children 6-17 Years Old ................................................................................................................................ 53

ACKNOWLEDGMENTS This report is prepared under the West Bengal Drinking Water Sector Improvement Project (WBDWSIP) of the government of West Bengal, India, supported by the Asian Development Bank (ADB). ADB South Asia Regional Department’s Neeta Pokhrel, Saswati Belliappa, and Saugata Dasgupta led the preparation of this report; and Elvie Jane Tirano provided support. ADB Economic Research and Regional Cooperation Department’s Takashi Yamano and ADB Strategy, Policy and Partnerships Department Murat Jadraliyev peer reviewed the report and provided valuable inputs at all stages. Aniceto Orbeta, Jr. led the team of consultants and survey firms preparing the report, with support from Arati Nandi and Abar Conceil Pty Ltd in data collection. The project team would like to thank the officials of the project management unit, project implementation units, districts, and blocks; the gram panchayats being supported by the WBDWSIP; and the project beneficiaries—who all generously gave their advice, time, and inputs for the report. Norio Saito, Director, ADB South Asia Urban Development and Water Division, provided the overall guidance.

ABBREVIATIONS
ADB − Asian Development Bank LPG − liquefied petroleum gas mg/l − milligrams per liter NFHS − National Family Health Survey PHED − Public Health Engineering Department WBDWSIP − West Bengal Drinking Water Sector Improvement Project

EXECUTIVE SUMMARY A baseline evaluation survey was designed, planned, and executed taking into account the intended impact, outcomes, and outputs of the West Bengal Drinking Water Sector Improvement Project (WBDWSIP), which is expected to be completed by 2024. The project areas have been selected based on a combination of two factors: (i) prevalence of water source-related health issues and (ii) lack of piped water supply. The baseline survey covers 2,013 households from randomly selected 28 project gram panchayats and 29 non-project gram panchayats (village-level local administrative unit) in the four project districts: Bankura, Purba Medinipur, and North (and South) 24 Parganas. It provides pre-intervention information on both project and non-project households. A sampling proportional to size of the project districts was used with size determined by the number of households in project areas. The sample size was determined by power calculation using data on primary outcomes from the National Family Health Survey (NFHS-4) 2015–2016. The household survey data was gathered using a structured questionnaire administered in face-to-face interviews with selected respondents and was supplemented by a set of qualitative data. The purpose of the baseline survey is to provide the benchmark comparison of primary outcomes for the treatment and comparison households before the project was introduced. It is ideally required that treatment and comparison areas be balanced so that whatever difference in primary outcomes found in the endline evaluation can be attributed to the project. The survey finds that the three major sources of drinking water for the sample households include tube well or bore well (42%), public hand pump (34%), and private hand pump (13%). Lower proportion of households in project areas use public handpumps compared to non-project areas (28% vs. 41%) and a higher proportion of households in project areas are using tube well/bore well (46% vs. 40%) and bottled water (6% vs. 2%). Public water supply is available from 40 to 44 hours per week and is lower in project areas compared to non-project areas. Households without water sources within premises, of both project and non-project areas, fetch water from sources located outside the premises on an average of 2.7 times a day. Average travel time is 6.4 minutes per trip and another 7.9 minutes for waiting at the sources. There is no difference between project and non-project areas. While almost all members of the household fetch water, male head and female spouse of the head are mostly engaged in collecting water. The households in project areas are spending more than double in purchasing water compared to non-project areas (₹309 vs. ₹132 per month) and more (18% vs. 6%) are complaining about muscle strain from carrying water. The estimated incidence of arsenic poisoning, fluorosis, water salinity, and health-related issues is comparable to the documented estimates found during project preparation. Overall, 9.24% population of the project areas were arsenic- and fluoride-affected. The survey finds that 8% of the currently and previously affected population in North and South 24 Parganas are affected by arsenic contamination, 22% of the population in Bankura are fluoride-affected, and 7% of the population in Purba Medinipur has high blood pressure. The incidence of arsenic or fluoride contamination is more visible in project blocks than in non-project blocks.

Majority of the households have their own toilet facility (96%), with pit latrine being the predominant type of toilet. On hygiene habits of after-toilet use 43% people in project gram panchayats practice handwashing with soap compared to 31% people of non-project gram panchayats. The incidence of diarrhea among children under five years old is lower (2.3%) compared to 5.9% reported in the NFHS-4. The treatment households reportedly have higher incidence of diarrhea among children under five years old compared to comparison households (3.7% vs. 1%). On average, more than two members are engaged in economically productive and paid work in a family. The reported average monthly labor market income is ₹12,909. There is no significant difference between project and non-project households in the number of working members and in labor market income. The survey also finds that households spend an average of ₹8,233 per month. Project households were found to spend more, and their expenditure shares are also significantly different from non-project households except for education, water, and house rent. The post-project impact evaluation survey will use both qualitative and quantitative methods and enable an assessment of impact of proposed interventions against the baseline data presented in this report.
Water fetched from roadside government hand pump, South 24 Parganas (photo by ABAR Conseil Private Limited).
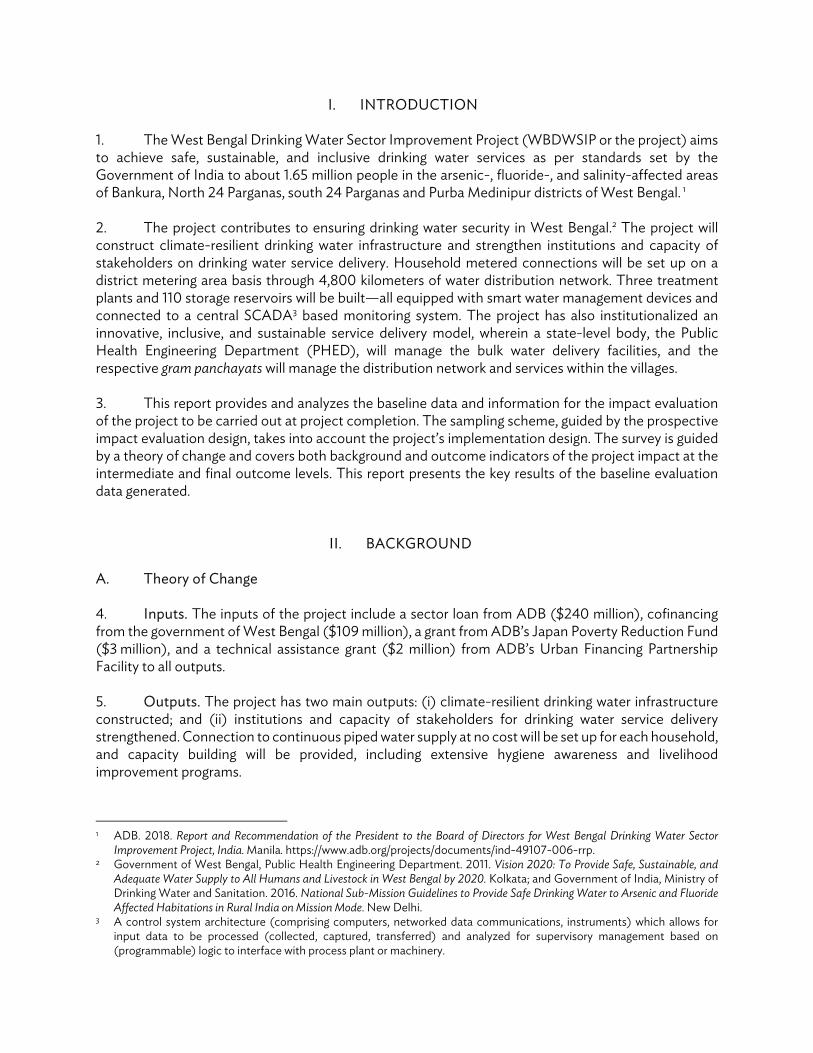
I. INTRODUCTION 1. The West Bengal Drinking Water Sector Improvement Project (WBDWSIP or the project) aims to achieve safe, sustainable, and inclusive drinking water services as per standards set by the Government of India to about 1.65 million people in the arsenic-, fluoride-, and salinity-affected areas of Bankura, North 24 Parganas, south 24 Parganas and Purba Medinipur districts of West Bengal. 1 2. The project contributes to ensuring drinking water security in West Bengal.2 The project will construct climate-resilient drinking water infrastructure and strengthen institutions and capacity of stakeholders on drinking water service delivery. Household metered connections will be set up on a district metering area basis through 4,800 kilometers of water distribution network. Three treatment plants and 110 storage reservoirs will be built—all equipped with smart water management devices and connected to a central SCADA3 based monitoring system. The project has also institutionalized an innovative, inclusive, and sustainable service delivery model, wherein a state-level body, the Public Health Engineering Department (PHED), will manage the bulk water delivery facilities, and the respective gram panchayats will manage the distribution network and services within the villages. 3. This report provides and analyzes the baseline data and information for the impact evaluation of the project to be carried out at project completion. The sampling scheme, guided by the prospective impact evaluation design, takes into account the project’s implementation design. The survey is guided by a theory of change and covers both background and outcome indicators of the project impact at the intermediate and final outcome levels. This report presents the key results of the baseline evaluation data generated.
II. BACKGROUND A. Theory of Change 4. Inputs. The inputs of the project include a sector loan from ADB ($240 million), cofinancing from the government of West Bengal ($109 million), a grant from ADB’s Japan Poverty Reduction Fund ($3 million), and a technical assistance grant ($2 million) from ADB’s Urban Financing Partnership Facility to all outputs. 5. Outputs. The project has two main outputs: (i) climate-resilient drinking water infrastructure constructed; and (ii) institutions and capacity of stakeholders for drinking water service delivery strengthened. Connection to continuous piped water supply at no cost will be set up for each household, and capacity building will be provided, including extensive hygiene awareness and livelihood improvement programs.
1 ADB. 2018. Report and Recommendation of the President to the Board of Directors for West Bengal Drinking Water Sector
Improvement Project, India. Manila. https://www.adb.org/projects/documents/ind-49107-006-rrp. 2 Government of West Bengal, Public Health Engineering Department. 2011. Vision 2020: To Provide Safe, Sustainable, and
Adequate Water Supply to All Humans and Livestock in West Bengal by 2020. Kolkata; and Government of India, Ministry of Drinking Water and Sanitation. 2016. National Sub-Mission Guidelines to Provide Safe Drinking Water to Arsenic and Fluoride Affected Habitations in Rural India on Mission Mode. New Delhi.
3 A control system architecture (comprising computers, networked data communications, instruments) which allows for input data to be processed (collected, captured, transferred) and analyzed for supervisory management based on (programmable) logic to interface with process plant or machinery.

2 ADB South Asia Working Paper Series No. 77
6. Outcomes. The project aims to achieve safe, sustainable, and inclusive drinking water services as per standards set by the Government of India to about 1.65 million people in the arsenic-, fluoride-, and salinity-affected areas of Bankura, North 24 Parganas, and Purba Medinipur districts of West Bengal. Among the intermediate results expected are time saved from water fetching and a decline in arsenic, fluoride, and salinity concentration in water supply. These in turn will improve school attendance and reduce absences, prevent water borne diseases minimizing medical expenses, and decrease workdays lost due to morbidity. Eventually, all of these are anticipated to raise income, consumption, morbidity-free days, education attainment, and life expectancy. It should be noted that educational attainment and life expectancy are longer-term outcomes that maybe outside the scope of the impact evaluation. 7. Assumptions. For the outcomes to be realized, it is assumed that (i) project implementers will spend loan, grant, and technical assistance funds for the planned improvement of water supply and sanitation facilities and the conduct of sanitation awareness programs; (ii) the piped water supply will indeed reduce the arsenic, fluoride contamination in water supply; (iii) households exposed to sanitation awareness intervention will convert what they learned into desired sanitation practices; and (iv) the time saved from piped water connection and lower morbidity incidence will be used by children to be in school and by working age adults to engage in productive work (Figure 1). B. Proposed Impact Evaluation Design
8. Considering the project’s implementation plan, the impact evaluation will use a matched difference-in-difference method. It will require baseline and follow-up surveys of households residing in project and matched non-project villages. There will be double matching—one at the block and/or the gram panchayat level and another at the household level—using pre-intervention characteristics. In addition to the matching of the block and/or gram panchayat during sampling, households in project and non-project gram panchayats will also be matched based on their baseline characteristics at estimation. 9. Impact evaluation requires a counterfactual observation to provide information on the outcomes of interest in the absence of the intervention. It is therefore critical that appropriate counterfactual observation units be identified preferably before project implementation. As designed, the project areas have been pre-selected, and implementation will not be done randomly. Hence, a randomized control trial, the gold standard in identifying the counterfactual for impact evaluations, cannot be implemented for this project. It was also mentioned that households in project villages will be connected to the water system all at once on a village-by-village basis upon completion of the construction of the water facilities. Connection to the water system will be done at no cost to the households. However, as mentioned earlier, not all blocks in each project district will be covered by the project. Households in non-project blocks therefore are the best potential subject for counterfactual observation. To identify the counterfactual households, a two-level matching was done. First, non-project blocks that closely match the project blocks were selected. Secondly, the gram panchayats within the selected non-project blocks were matched with selected gram panchayats in project blocks. The matching uses block and gram panchayats characteristics such as number of households, total land area, number of villages (only at the block level), population density, proportion of area irrigated, proportion of the population in scheduled caste, proportion of the population in scheduled tribe, proportion of illiterate population, proportion of working population, and proportion of the households with tap water. The treatment households will be randomly selected from the randomly selected villages in the treatment blocks. Similarly, from the randomly selected villages in the matched counterfactual blocks, the counterfactual households will be selected.

M
easu
ring t
he Im
pact
of W
est B
enga
l Drin
king
Wat
er S
ecto
r Im
prov
emen
t Pro
ject
: A B
asel
ine
Stud
y
3
Figu
re 1:
The
ory
of C
hang
e—W
est B
enga
l Drin
king
Wat
er S
ecto
r Im
prov
emen
t Pro
ject
Sour
ce: A
sian
Dev
elop
men
t Ban
k.
INPU
TS
Inco
mes
incr
ease
d
Con
sum
ptio
nin
crea
sed
Imm
edia
te o
utpu
tIm
med
iate
out
com
eIn
term
edia
te o
utpu
tIn
term
edia
te o
utco
me
Fina
l out
com
e
OU
TPU
TSO
UTC
OM
ESIM
PACT
Inve
stm
ent
Sect
or lo
anto
finan
ce p
hysic
alim
prov
emen
ts
Tech
nica
las
sista
nce
Loca
law
aren
ess
cam
paig
n
Wat
er d
istrib
utio
nne
twor
k bu
ilt
Pilo
tfec
al/s
ludg
ese
ptag
e pl
ant
built
a
Wat
er tr
eatm
ent
plan
tsco
nstr
ucte
d
Loca
ltra
ined
/mad
eaw
are
ofw
ater
sani
tatio
n an
dhy
giene
b
Ass
umpt
ions
and
issue
s
a Onl
y one
dist
rict a
s pilo
t -in
tere
stin
g ang
le b
ut n
ot m
uch
rela
ted
to th
e bu
lkof
the
proj
ect.
Con
sider
if n
eede
d
bTh
isco
mpo
nent
is n
oted
byot
her i
mpa
ct e
valu
atio
ns as
ave
ry im
porta
ntco
nditi
onfo
r the
succ
esso
f sim
ilar o
pera
tions
c Built
on
assu
mpt
ion
that
pipe
dw
ater
is in
deed
bet
ter o
nflu
orid
e, a
rsen
ic an
d sa
linit
y.N
eeds
to b
eco
nfirm
edby
dat
a
dO
nly
rele
vant
if p
arto
f stu
dy
e Cur
rent
des
ign
has
very
limite
d nu
mbe
rof p
eopl
e (5
00)
f Can
this
be in
crea
sed?
Ass
umin
g the
ycan
affo
rd th
ese
rvic
es an
d se
e ad
vant
age
asop
pose
dto
fetc
hing
wat
er fr
omha
nd p
ump
g Onl
yre
leva
nt if
par
tof s
tudy
and
assu
min
g pop
ulat
ion
sees
the
adva
ntag
e an
d ha
ve n
oso
cial/s
ecur
ity b
arrie
rsfo
rus
ing t
hefa
cilit
ies
hA
ssum
ing c
urre
nt se
t up
invo
lves
leng
thy t
ripst
ofe
tch
wat
er fr
om p
umps
i Thes
e m
ay o
nly b
e ob
serv
edin
long
-ter
m -
we
may
not b
e ab
leto
see
anyr
esul
ts in
few
year
s - m
ay h
ave
focu
s on
wat
erbo
rne
dece
ases
onl
y.H
ouse
hold
surv
ey b
e su
pple
men
ted
by d
ata f
rom
loca
l hos
pita
ls
j To b
e su
pple
men
ted
by d
ata
othe
r tha
n H
H su
rvey
- da
tafro
m lo
cal s
choo
ls
Hou
seho
lds
conn
ecte
dto
bette
r qua
lityc
pipe
dw
ater
Hou
seho
lds
conn
ecte
dto
bet
tert
oile
tfa
cilit
iesd
Loca
l pop
ulat
ion
repo
rted
incr
ease
daw
aren
esso
fsa
nita
tion
and
hygie
nee
Design and implementation
Uptake by local population
Hou
seho
lds u
sef
bette
r qua
lity
and
mor
e ac
cess
ible
pipe
dw
ater
Hou
seho
lds u
sebe
ttert
oile
tfa
cilit
iesg
Tim
e sp
ent
(and
cost
?)to
acc
ess
wat
er d
ecre
ased
h
Inci
denc
eof
arse
nic/
fluor
idei o
rot
herw
ater
born
edi
seas
es d
ecre
ased
Inci
denc
eof
sani
tatio
n-re
late
ddi
seas
es d
ecre
ased
Living conditionsSc
hool
atte
ndan
cej
impr
oved
Med
ical
expe
nses
ofho
useh
olds
decr
ease
d
Wor
kday
s los
tde
crea
sed

4 ADB South Asia Working Paper Series No. 77
C. Data Generation
10. To come up with indicators of interest for the prospective impact evaluation, a household survey on the treatment and comparison households was designed prior to project implementation. A survey questionnaire was prepared taking into account the following general factors: demography, education, health, household or community work, job market work, water supply, sanitation facilities, income, expenditure, housing characteristics and assets (Appendix 1). 11. A local survey firm was contracted to conduct the survey.4 The survey field work was implemented from January to August 2019. A tablet-based survey was undertaken with two teams working simultaneously within the same block to complete the survey within time frame. Each surveyor was given a hands-on training on conducting tablet-based survey to avoid error in the field as much as possible. The survey teams were accompanied by gram panchayat members in charge of each of the constituent villages of the surveyed gram panchayats.5
Women compelled to draw water from contaminated hand pump (photo by ABAR Conseil Private Limited).
4 ABAR Conseil. 5 The tablet-based survey provides some lessons on its definite advantage: (i) GPS locations of households are
simultaneously taken and household survey is made faster, (ii) each field has to be filled, thus there is no chance of skipping a field and/or no room for manipulating the data, (iii) considerable time in data entry could be saved, (iv) automated database generation, and (v) real time updates. However, the lack of internet connection in many interior rural areas has posed a problem in operation.
Measuring the Impact of West Bengal Drinking Water Sector Improvement Project: A Baseline Study 5
D. Limitations of Study 12. The baseline evaluation survey was conducted with expected project outcomes and outputs in view. The survey design, scheduling, and survey enumerator selection and training were done accordingly. The following hurdles were encountered during the conduct of the survey:
(i) The survey schedule had to be postponed due to impending general election in the country and the state; and post-poll violence also hindered smooth survey operation—causing some changes in the selection of gram panchayats and non-project blocks.
(ii) Tablet-based survey had suffered unintended difficulty in android device operation in interior rural areas where network was either absent or frequently interrupted. Lack of basic technical knowledge among the surveyors on water supply sources and sanitation system and its health-related issues posed difficulty in understanding basic issues prevalent in the study area.
(iii) Briefing by a public health expert would have facilitated quicker understanding of the survey tool by the surveyors.
III. BASELINE SURVEY RESULTS
13. The baseline survey results are described with relevant background and outcome indicators by domain. To provide a benchmark of how the survey respondents compare with reference households of interest, indicators are compared with known household surveys conducted for the area. For this, the survey team used the latest version of the NFHS-4 for West Bengal (2015–2016).6 Since the baseline survey will be prospectively used for a rigorous impact evaluation in the future, the balance of the project and non-project households in the indicators of interests are also discussed. A test of a difference in means are conducted for all indicators to determine if there are significant differences between project and non-project areas. A. Geographic Distribution of the Sample
14. The sampling targeted around 2,000 households distributed proportionately according to the number of households across randomly selected gram panchayats in project districts and their matched counterparts in non-project districts (Appendix 2).7 The survey covered a smaller number of gram panchayats in the project areas than what has been planned, but this reduction was compensated by increasing the number of sample households by constituent villages of each gram panchayat. Adjustments were made in the field to consider existing situations in the survey areas.
6 International Institute for Population Sciences (IIPS) Mumbai and ICF. 2017. National Family Health Survey (NFHS-4), India,
2015-16: West Bengal. Mumbai. 7 The sampling units are gram panchayats.

6 ADB South Asia Working Paper Series No. 77
Table 1: Distribution of Sample by Districts and Gram Panchayats
Project Non-Project Total
District Gram
Panchayats Households Gram
Panchayats Households Gram
Panchayats Households North (and South) 24 Parganas 11 438 11 424 22 862
Bankura 5 150 5 155 10 305
Purba Medinipur 12 420 13 426 25 846
Total 28 1,008 29 1,005 57 2,013
Source: Asian Development Bank.
15. Table 1 shows the distribution of sample households and gram panchayats by district. The survey covered a total of 57 gram panchayats and 2,013 households distributed as follows: (i) 28 gram panchayats with a total of 1,008 households in project areas, and (ii) 29 gram panchayats with 1,005 households in non-project areas. B. Background Information
B1. Demographic Characteristics
16. Household Composition. The sample shows an average household size of 4.15 members (Table 2). This average is slightly smaller than the 2015–2016 NFHS-4 reported average family size of 4.3 members. Project areas show a significantly higher average household size of 4.22 compared to 4.08 in non-project areas. For this the survey team used the latest version of NFHS-4 for West Bengal (2015–2016).
17. There is a slightly higher proportion of males (54.0%) compared to females. This is slightly different from the 2015–2016 NFHS-4 data which reported a higher proportion of females (50.3%). However, there is no significant difference in the proportion of males to females between project and non-project areas (footnote 6).
18. About 19% of the population is under 15 years old. This proportion is smaller than those reported in the 2015–2016 NFHS-4 (26%). Five percent of the population is 65 years old and above with no significant difference between project and non-project areas. This proportion is also smaller than the 2015–2016 NFHS-4 data (7%).
19. Majority of the sample either had education up to class 4 (27%) or class 8 (21%). Eighteen percent is illiterate. About 9% finished up to class 12. Only 4% completed a college degree or higher. Slightly over 6% completed technical education. There appears to be a significantly higher proportion of college graduates or higher in the project areas compared to non-project areas.

Measuring the Impact of West Bengal Drinking Water Sector Improvement Project: A Baseline Study 7
Table 2: Demographic Characteristics of the Sample
Variable Mean Total
Obs. Total
Mean Project
Obs. Project
Mean Non-
Project
Obs. Non-
Project Diff. T-Val. P-Val. Household size 4.154 2,013 4.225 1,008 4.083 1,005 0.143 2.362 0.018
Members, male 0.537 8,362 0.544 4,259 0.529 4,103 0.015 1.344 0.179
Under 15 years old 0.192 8,362 0.189 4,259 0.194 4,103 –0.006 –0.664 0.507
65 years old and over 0.054 8,362 0.056 4,259 0.052 4,103 0.003 0.656 0.512
Illiterate 0.180 8,284 0.179 4,241 0.182 4,043 –0.003 –0.333 0.739
Educ. Up to class 4 0.273 8,284 0.265 4,241 0.280 4,043 –0.015 –1.530 0.126
Educ. Up to class 8 0.212 8,284 0.214 4,241 0.211 4,043 0.003 0.374 0.708
Educ. Up to class 10 0.140 8,284 0.145 4,241 0.134 4,043 0.012 1.532 0.126
Educ. Up to class 12 0.086 8,284 0.083 4,241 0.089 4,043 –0.007 –1.059 0.289
Educ. Bachelors and above
0.043 8,284 0.049 4,241 0.037 4,043 0.012 2.673 0.008
Educ. Technology 0.063 8,284 0.063 4,241 0.064 4,043 0.000 –0.070 0.944
Diff. = difference, Educ. = education, Obs. = observed, P-Val.= probability value, T-Val = T-value. Source: Asian Development Bank. 20. Characteristics of the household head. Majority of the household heads are male (92%) and between 41 to 64 years old (59%) or on average, 50 years old (Table 3). Most of them either completed up to class 4 (31%), class 8 (21%), or are illiterate (28%). It is noteworthy that except for the proportion with bachelor’s degrees and above where project areas show a significantly higher proportion compared to non-project areas (6% vs. 3%), the other characteristics of the household heads are similar.
Table 3: Demographic Characteristics of the Household Head
Variable Mean Total
Obs. Total
Mean Project
Obs. Project
Mean Non-
Project
Obs. Non-
Project Diff. T-Val. P-Val. Members, male 0.922 2,013 0.925 1,008 0.919 1,005 0.005 0.435 0.664 Age 50.211 2,013 50.419 1,008 50.002 1,005 0.417 0.737 0.461 Age 16–40 0.260 2,013 0.254 1,008 0.266 1,005 –0.012 –0.598 0.550 Age 41–64 0.589 2,013 0.595 1,008 0.583 1,005 0.012 0.554 0.580 65 years old and over 0.151 2,013 0.151 1,008 0.151 1,005 0.000 –0.028 0.978 Illiterate 0.286 1,981 0.277 1,004 0.296 977 –0.019 –0.931 0.352 Educ. up to class 4 0.313 1,981 0.302 1,004 0.324 977 –0.023 –1.088 0.277 Educ. up to class 8 0.213 1,981 0.211 1,004 0.214 977 –0.003 –0.150 0.881 Educ. up to class 10 0.098 1,981 0.107 1,004 0.089 977 0.018 1.312 0.190 Educ. up to class 12 0.045 1,981 0.047 1,004 0.043 977 0.004 0.411 0.681 Educ. Bachelors and above
0.044 1,981 0.057 1,004 0.031 977 0.026 2.835 0.005
Educ. Technology 0.000 1,981 0.000 1,004 0.000 977 0.000
Diff. = difference, Educ. = education, Obs. = observed, P-Val =probability value, T-Val = T-value. Source: Asian Development Bank.

8 ADB South Asia Working Paper Series No. 77
21. Distribution across classes. Table 4 shows the distribution of the sample by classes. Majority of the households in the sample (44%) belong to the general class. Twenty one percent are members of scheduled caste, 12% classify themselves under other backward classes.8 While 2% are members of scheduled tribe, 22% are classified as others. There is a significant difference between the project and non-project areas in terms of the proportion of members belonging to the general class (39% vs. 49%) and those belonging to scheduled class (24% vs. 18%). This may have some effects on the outcomes and will be used to discuss whatever differences will be found subsequently.
Table 4: Distribution of Respondents by Classes
Variable Mean Total
Obs. Total
Mean Project
Obs. Project
Mean Non-
Project
Obs. Non-
Project Diff. T-Val. P-Val. General 0.438 2,013 0.390 1,008 0.486 1,005 –0.096 –4.345 0.000 Scheduled caste 0.212 2,013 0.241 1,008 0.183 1,005 0.058 3.188 0.001 Scheduled tribe 0.016 2,013 0.021 1,008 0.012 1,005 0.009 1.571 0.116 Other backward classes
0.118 2,013 0.131 1,008 0.104 1,005 0.026 1.843 0.065
Others 0.216 2,013 0.217 1,008 0.215 1,005 0.002 0.127 0.899
Diff. = difference, Educ. = education, Obs. = observed, P-Val =probability value, T-Val = T-value. Source: Asian Development Bank.
B2. Housing Characteristics
22. The average house area is 43 square meters with an average value of ₹297,000 (Table 5). The average number of rooms is a little over two, 5% have a garden, while 56% have a separate kitchen. By type of house, 41% of the houses are permanent, the other 33% are temporary, and the rest are semi-permanent (26%).
23. Comparing projects and non-project areas shows that there is no significant difference in the house value and proportion with garden. There are, however, significant differences in house area, the number of rooms, and the proportion with separate kitchen. Households in project areas have houses with smaller sizes but have more rooms and have a higher proportion with separate kitchen.
24. Cooking fuel used. The most common fuel used for cooking are cow dung, firewood, and/or dry leaves (78%). This is followed by liquefied petroleum gas (LPG) (19%). A much smaller proportion of households use kerosene (2%).
25. Comparing project and non-project households shows no significant difference in most cooking fuel used except for LPG and kerosene. A higher proportion of households in project areas uses LPG and a lesser proportion uses kerosene.
8 “Other backward class” (OBC) is a collective term used by the Government of India to classify castes which are
educationally or socially backward.

Measuring the Impact of West Bengal Drinking Water Sector Improvement Project: A Baseline Study 9
Table 5: Housing Characteristics
Variable Mean Total
Obs. Total
Mean Project
Obs. Project
Mean Non-
Project
Obs. Non-
Project Diff. T-Val. P-Val. House area (sq. m.) 42.873 2,009 39.309 1,007 46.455 1,002 –7.145 –2.944 0.003 House value (₹) 296,911.548 2,001 282,541.757 1,006 311,440.201 995 –28,898.444 –1.197 0.231 Number of rooms 2.335 2,010 2.414 1,008 2.256 1,002 0.157 3.474 0.001 With garden 0.048 1,973 0.046 1,008 0.050 965 –0.004 -0.428 0.669 With separate kitchen
0.559 2,010 0.602 1,007 0.515 1,003 0.086 3.910 0.000
Type of house Permanent 0.410 2,011 0.423 1,008 0.397 1,003 0.026 1.177 0.240 Temporary 0.335 2,011 0.334 1,008 0.335 1,003 –0.001 –0.032 0.975 Semi-permanent 0.256 2,011 0.243 1,008 0.268 1,003 –0.025 -1.292 0.196
Type of cooking fuel used Cow dung, firewood, dry leaves
0.784 2,008 0.769 1,007 0.800 1,001 –0.032 –1.721 0.085
LPG 0.188 2,008 0.215 1,007 0.161 1,001 0.055 3.139 0.002 Kerosene 0.023 2,008 0.012 1,007 0.035 1,001 –0.023 –3.424 0.001 Coal 0.002 2,008 0.004 1,007 0.001 1,001 0.003 1.337 0.182 Biogas 0.001 2,008 0.000 1,007 0.002 1,001 –.002 –1.419 0.156 Electricity 0.000 2,008 0.000 1,007 0.001 1,001 –0.001 –1.003 0.316
Diff. = difference, Educ. = education, LPG = liquified petroleum gas, Obs. = observed, P-Val =probability value, T-Val = T-value. Source: Asian Development Bank.
C. Intermediate and Final Outcomes
C.1 Water Supply Source
C.1.1 Water for potable uses 26. Drinking water. The three major sources of drinking water for the sample households include tube well or bore well (42%), public hand pump (34%), and private hand pump (13%) (Table 6). The other sources include public tap/stand post (5%) and bottled water (4%). Public tap/stand posts are part of rural water supply system initiatives of gram panchayats and the PHED. Under this system, water is drawn from ground water sources such as tube well, borewell, and small-scale reservoirs built with pipelines carrying water to certain designated locations for the households to get water from pipes/stand posts. This is predominantly found in Purba Medinipur and also in North 24 Parganas district. These water supply lines provide untreated water at regular and fixed intervals to the receiving points. Apart from this piped water supply, another important source is surface water.9 Significant differences between project and non-project areas are found with respect to three sources of drinking water. For public tube well, a lower proportion of households depends on it as a source in project areas than in non-project areas—a difference by 13 percentage points. For tube well, the proportion of households using it is higher by 6 percentage points in project areas than in non-project areas. For bottled water, the proportion is higher by 4 percentage points in project areas.
9 Surface water is the water located above ground and includes rivers, dams, lakes, ponds, streams, canals, and irrigation
channels. In the present context, ponds, rivers, tanks, and nalas are included in the Surface Water category. These are untreated water sources.

10 ADB South Asia Working Paper Series No. 77
Interview using tablet (photo from ABAR Conseil Private Limited).
27. Handwashing. The most dominant source of water for handwashing is also tube well or bore well (32%). The next prevalent source is surface water (30%), followed by private hand pump (21%). A few households use water from public hand pump (13%).10 Significant differences between project and non-project areas are in all sources except for use of water supplied through tankers. On handwashing, comparison of project and non-project gram panchayats indicates that more people in project gram panchayats (43%) practice hygienic handwashing with soap after use of toilet, than in non-project gram panchayats (31%). On usage of soap, 49% of the population wash hands without soap and 36% wash their hands with soap.
28. Cooking. For cooking, the primary sources are the same as those for drinking water, namely tube well/bore well (43%), public hand pump (30%), and private hand pump (17%). Significant differences exist between project and non-project areas for most sources except for public tap/stand post, tanker, and bottled water.
10 Tube wells and hand pumps are bore holes used for extracting ground water. When a pump is operated by electric power, it is called a tube well, and when operated manually, it is known as a handpump. See Ministry of Statistics and Programme Implementation, National Statistical Office, Government of India. 2018. Drinking Water, Sanitation, Hygiene and Housing Condition in India. Report No. 584 (76/1.2/1). NSS 76th Round. July-December.

Measuring the Impact of West Bengal Drinking Water Sector Improvement Project: A Baseline Study 11
C.1.2 Water for non-potable uses
29. Toilet. Surface water is the primary source of water for toilet use by households (55%). The two other major sources include private hand pump (22%) and tube well/bore well (15%). Significant differences between project and non-project areas are found in most sources including tube well/bore well, dug well, surface water, and public and private tube well.
C.1.3 Water for other uses
30. Gardening. For gardening, a large proportion of households (66%) uses untreated surface water from ponds, tanks, and nalas (canals). The other popular sources among households include tube well/bore well (18%) and private hand pump (9%). There are no significant differences in all sources between project and non-project areas. Very few of the households in Purba Medinipur with nursery as main livelihood are reportedly dependent on bottled water instead of locally available saline water.
31. Other domestic uses. As with toilet use and gardening, surface water is also the primary source of water for other domestic uses (55%). The other major sources include private tube well (22%) and tube well/bore well (14%). There are significant differences in most sources of water between project and non-project areas except for public tap/stand post and bottled water.
32. Livestock. Surface water is also the primary source of water used for livestock (63%). Other major sources include private hand pump (19%) and tube well/bore well (11%). There are no significant differences in most sources between project and non-project areas except for dug well, surface, and private tube well.
33. It is also very likely that the water use and sources will be affected by the community’s water and sanitation habits, which can be influenced by religion, customs, and practices. While this may not be evident in the survey data, it came out during the survey interviews. For example, people of water scarce villages, such as in Bankura, cannot always afford to practice proper hygiene and sanitation. The lack of water may act as a deterrent to behavioral change. In this context, a few outlier cases, such as the unorthodox use of bottled water, have surfaced in the survey. The survey also encountered a few households whose main livelihood is animal rearing (e.g., dog breeding or goat rearing for sale); they assert to use bottled water for the animals as contaminated drinking water might be detrimental for commercial enterprises. Similarly, a few floriculturists in Purba Medinipur claim to use bottled water for the nursery as local saline water could harm the crop growth.

12 ADB South Asia Working Paper Series No. 77
Table 6: Sources of Water in Project and Non-Project Areas by Type of Use
Variable Mean Total
Obs. Total
Mean Project
Obs. Project
Mean Non-
Project
Obs. Non-
Project Diff. T-Val. P-Val. Potable uses
Drinking Tap, pipe in yard, plot (supply system)
0.004 2,010 0.002 1,008 0.007 1,002 –0.005 –1.680 0.093
Public tap, stand post (supply system)
0.055 2,010 0.064 1,008 0.045 1,002 0.020 1.930 0.054
Tube well or bore well
0.430 2,010 0.460 1,008 0.399 1,002 0.061 2.771 0.006
Dug wella 0.000 2,010 0.001 1,008 0.000 1,002 0.001 0.997 0.319
Tanker (supply system)
0.001 2,010 0.002 1,008 0.000 1,002 0.002 1.411 0.158
Surface 0.000 2,010 0.000 1,008 0.001 1,002 –0.001 –1.003 0.316
Bottled (supply mode)
0.040 2,010 0.061 1,008 0.020 1,002 0.041 4.645 0.000
Public hand pumpb 0.341 2,010 0.276 1,008 0.407 1,002 –0.131 –6.269 0.000
Private hand pumpc 0.127 2,010 0.134 1,008 0.121 1,002 0.013 0.885 0.376
Handwashing Tap, pipe in yard, plot (supply system)
0.005 1,995 0.001 999 0.008 996 –0.007 –2.345 0.019
Public tap, stand post (supply system)
0.030 1,995 0.038 999 0.021 996 0.017 2.237 0.025
Tube well or bore well
0.317 1,995 0.356 999 0.278 996 0.078 3.766 0.000
Dug well 0.012 1,995 0.024 999 0.000 996 0.024 4.949 0.000
Tanker (supply system)
0.001 1,995 0.001 999 0.000 996 0.001 0.998 0.318
Surface 0.296 1,995 0.258 999 0.333 996 –0.075 –3.684 0.000
Public hand pump 0.128 1,995 0.075 999 0.182 996 –0.107 –7.210 0.000
Private hand pump 0.212 1,995 0.246 999 0.178 996 0.069 3.756 0.000
Tap, pipe in yard, plot (supply system
0.005 1,977 0.001 981 0.008 996 –0.007 –2.318 0.021
Public tap, stand post (supply system)
0.053 1,977 0.062 981 0.044 996 0.018 1.785 0.074
Tube well or bore well
0.431 1,977 0.484 981 0.380 996 0.105 4.723 0.000
Dug well 0.008 1,977 0.016 981 0.000 996 0.016 4.062 0.000
Tanker (supply system)
0.001 1,977 0.001 981 0.000 996 0.001 1.008 0.314
Surface 0.032 1,977 0.018 981 0.046 996 –0.028 –3.506 0.000
Bottled (supply mode)
0.003 1,977 0.005 981 0.001 996 0.004 1.654 0.098
Public hand pump 0.295 1,977 0.203 981 0.387 996 –0.184 –9.134 0.000
Private hand pump 0.171 1,977 0.209 981 0.135 996 0.074 4.409 0.000
continued on next page

Measuring the Impact of West Bengal Drinking Water Sector Improvement Project: A Baseline Study 13
Table 6 continued
Variable Mean Total
Obs. Total
Mean Project
Obs. Project
Mean Non-
Project
Obs. Non-
Project Diff. T-Val. P-Val. Non-potable uses
Toilet Tap, pipe in yard, plot (supply system)
0.002 1,911 0.001 930 0.002 981 –0.001 –0.5315 0.595
Public tap, stand post (supply system)
0.011 1,911 0.014 930 0.008 981 0.006 1.2204 0.222
Tube well or bore well
0.152 1,911 0.194 930 0.112 981 0.081 4.9879 0.000
Dug well 0.013 1,911 0.026 930 0.000 981 0.026 5.0951 0.000
Tanker (supply system)
0.001 1,911 0.001 930 0.000 981 0.001 1.0271 0.305
Surface 0.547 1,911 0.469 930 0.621 981 –0.152 –6.7462 0.000
Bottled (Supply mode)
0.001 1,911 0.000 930 0.001 981 –0.001 –0.9736 0.330
Public handpump 0.060 1,911 0.038 930 0.081 981 –0.043 –3.9715 0.000
Private hand pump 0.215 1,911 0.258 930 0.174 981 0.084 4.4748 0.000
Gardening Tap, pipe in yard, plot (supply system)
0.011 94 0.017 58 0.000 36 0.017 0.786 0.434
Tube well or bore well
0.181 94 0.224 58 0.111 36 0.113 1.383 0.170
Dug well 0.043 94 0.069 58 0.000 36 0.069 1.616 0.110
Surface 0.660 94 0.603 58 0.750 36 –0.147 –1.459 0.148
Bottled (supply mode)
0.011 94 0.000 58 0.028 36 –0.028 –1.274 0.206
Public hand pump 0.011 94 0.017 58 0.000 36 0.017 0.786 0.434
Private hand pump 0.085 94 0.069 58 0.111 36 –0.042 –0.706 0.482
Other domestic uses Public tap, stand post (supply system)
0.011 1,855 0.013 910 0.010 945 0.004 0.745 0.456
Tube well or bore well
0.140 1,855 0.175 910 0.106 945 0.069 4.299 0.000
Dug well 0.011 1,855 0.022 910 0.000 945 0.022 4.606 0.000 Surface 0.551 1,855 0.487 910 0.613 945 –0.126 –5.490 0.000
Bottled (supply mode)
0.002 1,855 0.002 910 0.001 945 0.001 0.610 0.542
Public hand pump 0.064 1,855 0.037 910 0.090 945 –0.053 –4.645 0.000
Private hand pump 0.222 1,855 0.264 910 0.181 945 0.083 4.311 0.000
Livestock Tap, pipe in yard, plot (supply system)
0.005 643 0.003 360 0.007 283 –0.004 –0.791 0.429
Public tap, stand post (supply system)
0.009 643 0.014 360 0.004 283 0.010 1.356 0.176
Tube well or bore well
0.107 643 0.125 360 0.085 283 0.040 1.636 0.102
continued on next page

14 ADB South Asia Working Paper Series No. 77
Table 6 continued
Variable Mean Total
Obs. Total
Mean Project
Obs. Project
Mean Non-
Project
Obs. Non-
Project Diff. T-Val. P-Val. Dug well 0.019 643 0.033 360 0.000 283 0.033 3.119 0.002
Surface 0.633 643 0.578 360 0.703 283 –0.125 –3.297 0.001
Bottled (supply mode)
0.002 643 0.003 360 0.000 283 0.003 0.886 0.376
Public hand pump 0.034 643 0.025 360 0.046 283 –0.021 –1.450 0.148
Private hand pump 0.191 643 0.219 360 0.155 283 0.064 2.051 0.041
Diff. = difference, Educ. = education, Obs. = observed, P-Val =probability value, T-Val = T value. a Dug well has head wall built around the well with concrete drainage platform and a drainage channel, and a bucket with hand pump or
windlass. b Public hand pump is the one constructed by the government, community, or organization, usually on government or community land or with
the permission of some private individuals into their private-owned land. Everybody can draw water from it. c. Private hand pumps are usually owned by an individual and it is within their private-owned land. The cost of construction and the
maintenance is borne by the private individual. The private owner has the sole right over it and may not allow anybody outside to take water from it.
Source: Asian Development Bank.
C.2 Water Pressure
34. Before going into details of water pressure, some local infrastructure set up for piped water supply may be elaborated to describe existing rural water supply system. In rural Bengal, piped water supply system is usually minimum. The PHED has recently started providing some piped water schemes at the community level or at stand posts. In some cases, the gram panchayats have taken the initiative to provide piped water supply to designated points in a village, generally at a public stand post, by drawing ground water from tube wells/bore wells, constructing small scale reservoirs, and supplying untreated water to some designated localities through pipelines. People from surrounding areas collect water from these points/stand posts mostly for drinking, cooking, and handwashing purposes. Some other uncommon uses are also visible. Water supply is restricted to a fixed schedule according to capacity of the reservoirs. While discussing water pressure and related issues, this piped water supply has been taken into consideration. Majority of the respondents who had their water tap near their premises indicated that they have good water pressure particularly for drinking water, handwashing, cooking, and livestock (Table 7). There are no significant differences in the assessment of water pressure in project and non-project areas except in handwashing and cooking, and for livestock.
Table 7: Assessment of Water Pressure
Variable Mean Total
Obs. Total
Mean Project
Obs. Project
Mean Non-
Project
Obs. Non-
Project Diff. T-Val. P-Val. Drinking
Good 0.64 5 547 0.651 355 0.635 192 0.015 0.356 0.722
Fair 0.307 547 0.313 355 0.297 192 0.016 0.382 0.703
Poor 0.048 547 0.037 355 0.068 192 –0.031 –1.632 0.103
continued on next page

Measuring the Impact of West Bengal Drinking Water Sector Improvement Project: A Baseline Study 15
Table 7 continued
Variable Mean Total
Obs. Total
Mean Project
Obs. Project
Mean Non-
Project
Obs. Non-
Project Diff. T-Val. P-Val. Handwashing
Good 0.617 376 0.667 243 0.526 133 0.140 2.695 0.007
Fair 0.335 376 0.317 243 0.368 133 –0.052 –1.011 0.313
Poor 0.048 376 0.016 243 0.105 133 –0.089 –3.924 0.000
Cooking
Good 0.622 497 0.640 317 0.589 180 0.051 1.137 0.256
Fair 0.330 497 0.331 317 0.328 180 0.003 0.079 0.937
Poor 0.048 497 0.028 317 0.083 180 –0.055 –2.762 0.006
Toilet
Good 0.466 133 0.530 66 0.403 67 0.127 1.473 0.143
Fair 0.353 133 0.379 66 0.328 67 0.050 0.605 0.547
Poor 0.180 133 0.091 66 0.269 67 –0.178 –2.719 0.007
Gardening
Good 0.444 18 0.462 13 0.400 5 0.062 0.222 0.827
Fair 0.389 18 0.385 13 0.400 5 –0.015 –0.057 0.956
Poor 0.167 18 0.154 13 0.200 5 –0.046 –0.222 0.827
Other domestic uses
Good 0.476 105 0.482 56 0.469 49 0.013 0.129 0.897
Fair 0.362 105 0.393 56 0.327 49 0.066 0.700 0.485
Poor 0.162 105 0.125 56 0.204 49 –0.079 –1.093 0.277
Livestock
Good 0.645 31 0.727 22 0.444 9 0.283 1.500 0.144
Fair 0.194 31 0.273 22 0.000 9 0.273 1.777 0.086
Poor 0.161 31 0.000 22 0.556 9 –0.556 –5.072 0.000
Diff. = difference, Obs. = observed, P-Val = probability value, T-Val = T-value. Source: Asian Development Bank.
C.3 Hours of Water Availability
35. For those depending on public water supply sources, water available for a variety of uses ranges from 20 to 44 hours per week (Table 8). For both potable and non-potable uses of water, such as handwashing, drinking, toilet use, cooking, washing and cleaning, water is available for 40 to 44 hours per week. For other uses such as for livestock and other domestic purposes, the availability of water supply is lower, ranging from 20 to 31 hours per week. The number of available hours for water supply is significantly lower in project areas compared to non-project areas particularly for drinking, handwashing, and cooking. Use of piped water from local pipeline network for livestock is very limited for a few of the households engaged in specialized commercial enterprises like dog breeding.

16 ADB South Asia Working Paper Series No. 77
Table 8: Hours of Supply Per Week
Variable Mean Total
Obs. Total
Mean Project
Obs. Project
Mean Non-
Project
Obs. Non-
Project Diff. T-Val. P-Val. Drinking 42.01 177 23.448 96 64.012 81 –40.56 –5.610 0.000 Handwashing 43.75 106 23.967 60 69.565 46 –45.60 –4.806 0.000 Cooking 39.78 165 24.674 89 57.474 76 –32.80 –4.455 0.000 Toilet 40.80 25 51.500 16 21.778 9 29.72 1.499 0.147 Other domestic uses 31.00 23 37.385 13 22.700 10 14.68 1.126 0.273 Livestock 19.78 9 20.500 8 14.000 1 6.50 NA NA
Diff. = difference, Obs. = observed, NA = not applicable, P-Val =probability value, T-Val = T-value. Source: Asian Development Bank.
C.4 Water Supply Breakdowns 36. On the use of water for drinking and cooking, the highest number of breakdowns (average of two) occurred in 2018 (Table 9). Water supply for livestock use and gardening had the least frequency of breakdowns. There are no significant differences between the number of breakdowns in project and non-project areas for most uses except in gardening and livestock.
Table 9: Frequency of Water Supply Breakdowns, 2018
Variable Mean Total
Obs. Total
Mean Project
Obs. Project
Mean Non-
Project
Obs. Non-
Project Diff. T-Val. P-Val. Drinking 2.068 812 2.298 490 1.717 322 0.581 1.295 0.196 Handwashing 1.473 778 1.611 457 1.277 321 0.333 0.731 0.465 Cooking 1.831 793 1.925 469 1.694 324 0.231 0.510 0.610 Toilet 1.053 617 1.263 334 0.806 283 0.458 0.818 0.413 Gardening 0.130 461 0.217 235 0.040 226 0.177 2.358 0.019 Other domestic uses 1.084 595 1.355 321 0.766 274 0.589 1.014 0.311 Livestock 0.369 488 0.482 255 0.245 233 0.238 2.018 0.044
Diff. = difference, Educ. = education, Obs. = observed, P-Val =probability value, T-Val = T-value. Source: Asian Development Bank.
C.5 Use of Motorized Water Pump
37. About 6% of the respondents have a motorized water pump, and they spend an average of ₹315 per month, 58% of which is for pumping water and the rest for pump maintenance (Table 10).
38. Project areas have a smaller proportion of households with motorized water pump than non-project areas (4% vs. 8%). Similarly, the average monthly household expenditure for pumping water in project areas is significantly lower (₹142) compared to those in non-project areas (₹203). Only 112 out of 1,998 sample households who own a motorized water pump responded to the question of monthly expenditure on pump.

Measuring the Impact of West Bengal Drinking Water Sector Improvement Project: A Baseline Study 17
Table 10: Motorized Water Pump
Variable Mean Total
Obs. Total
Mean Project
Obs. Project
Mean Non-
Project
Obs. Non-
Project Diff. T-Val. P-Val. Households with motorized water pump
0.058 1,998 0.038 1,001 0.078 997 –0.040 –3.861 0.000
Expenditure per month, pumping water
182.884 112 142.297 37 202.907 75 –60.609 –2.658 0.009
Expenditure per month, pump maintenance
131.682 110 112.571 35 140.600 75 –28.029 –1.456 0.148
Diff. = difference, Educ. = education, Obs. = observed, P-Val =probability value, T-Val = T-value. Source: Asian Development Bank.
C.6 Time Taken, Frequency, and Characteristics of Fetching Water
39. Frequency. Fetching of water ranges from two times a day for livestock, other domestic uses, and gardening to over four times a day for toilet use (Table 11). Comparing project and non-project areas, there is no significant difference except for handwashing and cooking. Focus group discussion with women respondents reveals that in water scarce villages, the number of trips to the water source is significantly greater—three to four times a day—as observed in Bankura and South 24 Parganas. In these villages, fetching water for toilet use causes additional burden and compels people, particularly men, to go out for toilet purposes (open defecation).11
Typical house of a below-the-poverty-line household. Storing water in open vessels in Purba Medinipur (photo from ABAR Conseil Private Limited).
11 Footnote 6, p. 10. Sigma Foundation 2019. Gender Aspects in Accessing WASH Services: A Study in four Blocks of Bankura
District of West Bengal.

18 ADB South Asia Working Paper Series No. 77
40. Travel and waiting time. In terms of travel time to the water source, water for drinking took the longest (a little over 6 minutes) closely followed by water for cooking (nearly 6 minutes); while water for livestock, other domestic uses, and toilet use took the shortest, about 3 minutes (Table 12). The waiting time at source is also the longest for drinking water (over 7 minutes) and shortest for livestock, other domestic uses, and toilet use (under 2 minutes). Comparing project and non-project areas, there are significant differences in travel times for water for toilet, gardening, and other domestic uses. Significant differences are also found for waiting time at source for water used for cooking, toilet, gardening, and other domestic uses.
Table 11: Frequency of Fetching Water Per Day
Variable Mean Total
Obs. Total
Mean Project
Obs. Project
Mean Non-
Project
Obs. Non-
Project Diff. T-Val. P-Val. Drinking 2.712 1,606 2.668 737 2.749 869 –0.082 –0.912 0.362
Handwashing 2.845 1,243 3.002 550 2.720 693 0.282 2.438 0.015
Cooking 2.464 1,503 2.351 643 2.548 860 –0.196 –2.179 0.029
Toilet 4.182 1,038 4.165 472 4.196 566 –0.031 –0.229 0.819
Gardening 1.907 43 1.333 21 2.455 22 –1.121 –0.770 0.446
Other domestic uses 1.888 912 1.887 425 1.889 487 –0.002 –0.014 0.989
Livestock 1.881 294 2.053 133 1.739 161 0.314 1.317 0.189
Diff. = difference, Educ. = education, Obs. = observed, P-Val =probability value, T-Val = T-value. Source: Asian Development Bank.
Table 12: Travel and Waiting Times at Source by Water Use
Variable (minutes) Mean Total
Obs. Total
Mean Project
Obs. Project
Mean Non-
Project
Obs. Non-
Project Diff. T-Val. P-Val. Drinking
Travel time to source 6.362 1,373 6.257 607 6.445 766 –0.188 –0.600 0.549
Waiting time at source 7.892 1,227 7.658 570 8.096 657 –0.438 –1.043 0.297
Handwashing
Travel time to source 4.324 1,005 4.238 442 4.393 563 –0.155 –0.562 0.575
Waiting time at source 3.874 827 3.566 380 4.136 447 –0.571 –1.518 0.129
Cooking
Travel time to source 5.914 1,299 5.768 544 6.019 755 –0.250 –0.841 0.401
Waiting time at source 7.338 1,150 6.737 513 7.823 637 –1.086 –2.629 0.009
Toilet
Travel time to source 2.880 749 2.419 360 3.306 389 –0.886 –2.847 0.005
Waiting time at source 1.993 613 1.436 291 2.497 322 –1.060 –3.065 0.002
continued on next page

Measuring the Impact of West Bengal Drinking Water Sector Improvement Project: A Baseline Study 19
Table 12 continued
Variable (minutes) Mean Total
Obs. Total
Mean Project
Obs. Project
Mean Non-
Project
Obs. Non-
Project Diff. T-Val. P-Val. Gardening
Travel time to source 3.778 45 2.500 24 5.238 21 –2.738 –1.968 0.055
Waiting time at source 3.932 44 4.957 23 2.810 21 2.147 1.211 0.233
Other domestic uses
Travel time to source 2.727 648 2.354 333 3.121 315 –0.766 –2.410 0.016
Waiting time at source 1.982 545 1.341 287 2.694 258 -1.352 -3.758 0.000
Livestock
Travel time to source 2.561 212 2.517 118 2.617 94 –0.100 –0.160 0.873
Waiting time at source 1.617 193 1.909 110 1.229 83 0.680 1.063 0.289
Diff. = difference, Educ. = education, Obs. = observed, P-Val =probability value, T-Val = T-value. Source: Asian Development Bank.
41. Characteristics of those who fetch water. The survey team identified the household members who are tasked to fetch water for different uses (Table 13). About two to three persons in the household comprising 62% of all members are involved in fetching water. Among the household members, women take the lead role (33%) followed closely by men (29%). Household heads (15%), mostly the male heads (14%) and spouse of heads, particularly the female spouse (18%), form the majority of those fetching water. The children of the head equally share the responsibility (18%), and of them, the sons (13%) are more involved while the daughters (5%) follow. Among other members who take part in fetching water are sons-in-law (7%) and daughters-in-law (7%). 42. Contrary to common tradition observed in other rural areas, men also share the burden of fetching water in some areas. According to an interview with Panchayat heads (of some gram panchayats in blocks with predominantly Muslim population of North and South 24 Parganas), women typically do not go beyond their villages to fetch water, since boys can carry more buckets on a cycle from far away drinking water sources. Findings of a study in Bankura conclude that the burden of fetching water for domestic use falls on the shoulder of women and girls, with 66% of the total water collected by them. However, in water scarce villages, men also participate in fetching water from faraway water sources (footnote 11). When some water sources dry up in the summer months, all able bodied men and women of the family take part in collecting water or at least stand in the queue at water source.

20 ADB South Asia Working Paper Series No. 77
Table 13: Characteristics of Household Members who Fetch Water
Variable Mean Total
Obs. Total
Mean Project
Obs. Project
Mean Non-
Project
Obs. Non-
Project Diff. T-Val. P-Val. Number of members fetching water
2.577 2,013 2.461 1,008 2.694 1,005 –0.232 –3.385 0.001
Prop. of members fetching water
0.620 8,361 0.583 4,259 0.660 4,102 –0.077 –7.313 0.000
Prop. of male in household
0.291 8,361 0.278 4,259 0.305 4,102 –0.027 –2.715 0.007
Prop. of female in household
0.329 8,361 0.304 4,259 0.355 4,102 –0.050 –4.911 0.000
Prop. of household head 0.153 8,361 0.142 4,259 0.165 4,102 –0.023 –2.979 0.003
Prop. of male household head
0.140 8,361 0.130 4,259 0.150 4,102 –0.020 –2.680 0.007
Prop. of female household head
0.013 8,361 0.012 4,259 0.015 4,102 –0.003 –1.250 0.211
Prop. of spouse of head 0.187 8,361 0.168 4,259 0.206 4,102 –0.038 –4.420 0.000
Prop. of male spouse 0.003 8,361 0.003 4,259 0.004 4,102 –0.001 –0.659 0.510
Prop. of female household spouse
0.183 8,361 0.165 4,259 0.202 4,102 –0.037 –4.352 0.000
Prop. of child of head 0.180 8,361 0.174 4,259 0.187 4,102 –0.013 –1.545 0.122
Prop. of son of head 0.132 8,361 0.130 4,259 0.134 4,102 –0.004 –0.605 0.545
Prop. of daughter of head
0.048 8,361 0.044 4,259 0.052 4,102 –0.009 –1.818 0.069
Prop. of son-in-law 0.002 8,361 0.002 4,259 0.003 4,102 –0.001 –0.771 0.441
Prop. of daughter-in-law 0.068 8,361 0.067 4,259 0.070 4,102 –0.003 –0.508 0.611
Prop. of grandchild 0.019 8,361 0.017 4,259 0.020 4,102 –0.003 –1.045 0.296
Prop. of grandson 0.010 8361 0.009 4,259 0.012 4,102 –0.003 –1.476 0.140
Prop. of granddaughter 0.008 8,361 0.008 4,259 0.008 4,102 0.000 0.082 0.934
Prop. of other members 0.011 8,361 0.013 4,259 0.010 4,102 0.003 1.477 0.140
Diff. = difference, Educ. = education, Obs. = observed, P-Val =probability value, T-Val = T-value. Source: Asian Development Bank. 43. Other information on water outside the premises. The survey team asked about the main use of water if it is not available in the premises, how much does a household spend per month if they buy water, and whether they experience muscle pain from carrying water. The average distance from the water source is 0.75 kilometer (Table 14). Households spend, on average, ₹241 per month if they buy water. About 11% of households revealed that their members experience muscle strain from carrying water.
44. A comparison of project and non-project areas reveals that there is no significant difference in the distance to the source of water. There is, however, significant differences in the amount spent for buying water and the proportion of households who had a member experiencing muscle pain, with project areas spending more on buying water and having more households reporting muscle strain from carrying water.

Measuring the Impact of West Bengal Drinking Water Sector Improvement Project: A Baseline Study 21
Table 14: Other Information on Water Outside the Premises
Variable Mean Total
Obs. Total
Mean Project
Obs. Project
Mean Non-
Project
Obs. Non-
Project Diff. T-Val. P-Val. Approximate distance from source (kilometer)
0.753 396 0.760 120 0.750 276 0.010 0.066 0.947
Amount spent to purchase water (per month)
241.569 102 309.206 63 132.308 39 176.899 3.260 0.002
Experience muscle strain from carrying water
0.115 1,717 0.181 790 0.059 927 0.122 8.009 0.000
Diff. = difference, Obs. = observed, P-Val =probability value, T-Val = T-value. Source: Asian Development Bank.
C.7 Water Purification at Household Level
45. About 5% of the sample households treat their water to make it safe for drinking (Table 15). The most common method used is to let it stand and settle (51%); this is a common water treatment practice in rural Bengal where safe piped water supply is almost absent. It would be of interest to find any difference in water treatment practices in post-project implementation period. The other common methods are boiling (14%), the use of water filter (10%), and the use of electric purifier (5%). The water treatment facilities are acquired by the well-off families. There is no significant difference in the incidence of water treatment and the method of treating water between project and non-project areas.
Table 15: Water Treatment of Drinking Water
Variable Mean Total
Obs. Total
Mean Project
Obs. Project
Mean Non-
Project
Obs. Non-
Project Diff. T-Val. P-Val. Treat water 0.0521 1,766 0.057 826 0.048 940 0.009 0.852 0.395
Method of treatment
Boil 0.1410 78 0.200 40 0.079 38 0.121 1.539 0.128
Add bleach, chlorine
0.0256 78 0.000 40 0.053 38 –0.053 –1.471 0.145
Strain through cloth 0.0128 78 0.025 40 0.000 38 0.025 0.974 0.333
Use water filter 0.1026 78 0.100 40 0.105 38 –0.005 –0.076 0.940
Use electric purifier 0.0513 78 0.075 40 0.026 38 0.049 0.968 0.336
Let it stand and settle
0.5128 78 0.575 40 0.447 38 0.128 1.122 0.265
Other 0.1538 78 0.025 40 0.289 38 –0.264 –3.433 0.001
Diff. = difference, Educ. = education, Obs. = observed, P-Val =probability value, T-Val = T-value. Source: Asian Development Bank.

22 ADB South Asia Working Paper Series No. 77
C.8 Storing Water
46. About 95% of the respondents store their water (Table 16). The most common method is storing water in containers (96%). Storage in roof tanks and in underground tanks are also practiced by a small proportion of households (3% and 0.4%, respectively). Comparing project and non-project areas shows that the proportion of storing water is significantly different, with project areas showing a higher percentage (97%) compared to non-project areas (94%). There is also significant difference in the method of storage, wherein, in project areas, storage in containers is more common and storage in roof tank is less prevalent.
Table 16: Storing Water
Variable Mean Total
Obs. Total
Mean Project
Obs. Project
Mean Non-
Project
Obs. Non-
Project Diff. T-Val. P-Val. Store water 0.953 1,899 0.969 924 0.937 975 0.031 3.203 0.001
Method of storage
In containers 0.962 1,804 0.987 891 0.939 913 0.048 5.377 0.000
In roof tank 0.034 1,804 0.012 891 0.055 913 –0.042 –5.015 0.000
In underground tank
0.004 1,804 0.001 891 0.007 913 –0.005 –1.862 0.063
Diff. = difference, Educ. = education, Obs. = observed, P-Val =probability value, T-Val = T-value. Source: Asian Development Bank.
C.9 Sanitation Facilities at Household Level 47. Toilet facilities. Around 94% of households have toilet facilities; and among those who have toilet facilities, 96% are for their own use (Table 17). The most common type of toilet facility is pit latrine (59%) followed by open pit (24%). About 6% do not have any toilet facility. The National Sample Survey reports that 83.7% of rural households in West Bengal have access to a latrine.12 48. A comparison of project and non-project areas indicates a significant difference in the availability of toilet facilities, with project areas having a lower proportion of households that have toilet facilities (93% vs. 96%). There is no significant difference in the most common type of toilet facility (pit latrine). Significant differences are found with respect to open pit which is more prevalent in non-project areas than in project areas (27% vs. 20%). There is also a significant difference in the case of no toilet—more households in project areas reported as having no toilet compared to those in non-project areas (7% vs. 4%).
49. Health habits after toilet use. The most common habit is washing hands without soap (49%) followed by washing hands with soap or cleaning agent (36%). Other less popular habits include cleaning the toilet (8%), bathing (3%), and changing clothes (2%). The popularity of washing of hand without soap could be because of two reasons: (i) soap may be unaffordable for some families, and (ii) using soap will consume more water which might be scarce in some areas, such as in Bankura district. It will be significant
12 Ministry of Statistics and Programme Implementation, National Statistical Office, Government of India. 2018. Drinking Water,
Sanitation, Hygiene and Housing Condition in India. Report No. 584. NSS 76th Round. July–December. Statement 12.1. p. 99.

Measuring the Impact of West Bengal Drinking Water Sector Improvement Project: A Baseline Study 23
to compare health habits after use of toilets in the post-project implementation period. Comparing project and non-project villages indicate that there are no significant differences in habits after using the toilet.
50. On-site wastewater disposal facilities. Around 94% of the households are connected to an on-site sanitation system, while 6% of the households have no sanitation facility (Table 17). The most common wastewater disposal/treatment system among households is leach pit (72 %), followed by a soak pit (12%). About 6% of the sample households are connected to an open drain and another 4% with underground drain. About 6% are not connected with any type of sanitation system. As of September 2018, the state has achieved 95% toilet coverage in its rural areas, however, 5% of the population still practices open defecation.13 51. Comparing project and non-project areas shows that there is no significant difference for underground drains and open drains but there is a significant difference in the use of soak pit, with project areas having lower proportion (10%) compared to non-project areas (14%). The use of leach pit in both project and non-project areas have similar proportion, 71% and 72%, respectively.
52. Attendance to hygiene and sanitation sessions. Around 28% of households have members who attended hygiene and sanitation sessions (Table 17). A comparison between project and non-project areas indicates that there is no significant difference in the proportion of households attending hygiene and sanitation sessions.
Table 17: Sanitation Facility
Variable Mean Total
Obs. Total
Mean Project
Obs. Project
Mean Non-
Project
Obs. Non-
Project Diff. T-Val. P-Val. With toilet 0.942 2,008 0.929 1,007 0.956 1,001 –0.028 –2.648 0.008 Toilet for own use 0.955 1,892 0.951 935 0.958 957 –0.007 –0.772 0.440 Type of toilet facility
Flush 0.097 2,008 0.111 1,007 0.083 1,001 0.028 2.143 0.032 Pit latrine 0.586 2,008 0.589 1,007 0.583 1,001 0.005 0.248 0.804 Open pit 0.236 2,008 0.201 1,007 0.272 1,001 –0.071 –3.764 0.000 Others 0.023 2,008 0.028 1,007 0.018 1,001 0.010 1.471 0.141 No toilet 0.058 2,008 0.071 1,007 0.044 1,001 0.028 2.648 0.008
Health habits on toilet use Wash hand with soap/cleansing material
0.365 1,810 0.425 881 0.308 929 0.117 5.189 0.000
Wash hand without soap 0.493 1,810 0.434 881 0.549 929 –0.115 –4.938 0.000 Clean toilet 0.076 1,810 0.075 881 0.078 929 –0.003 –0.207 0.836 Change clothes 0.020 1,810 0.022 881 0.018 929 0.003 0.497 0.619 Bathe 0.031 1,810 0.035 881 0.028 929 0.007 0.876 0.381 Others 0.015 1,810 0.010 881 0.019 929 –0.009 –1.607 0.108
Connected to sanitation system
0.944 1,757 0.912 825 0.973 932 –0.062 –5.669 0.000
continued on next page
13 Ministry of Drinking Water and Sanitation, Ministry of Housing and Urban Affairs, Government of West Bengal. 2018.

24 ADB South Asia Working Paper Series No. 77
Table 17 continued
Variable Mean Total
Obs. Total
Mean Project
Obs. Project
Mean Non-
Project
Obs. Non-
Project Diff. T-Val. P-Val. Type of sanitation system
Underground drains 0.042 1,757 0.047 825 0.038 932 0.010 1.012 0.312 Open drains 0.064 1,757 0.059 825 0.069 932 –0.009 –0.791 0.429 Soak pit 0.121 1,757 0.096 825 0.144 932 –0.048 –3.084 0.002 Leach pita 0.717 1,757 0.709 825 0.723 932 –0.014 –0.654 0.514 Not connected 0.056 1,757 0.088 825 0.027 932 0.062 5.669 0.000
Household member attend hygiene and sanitation sessions
0.284 1,626 0.287 762 0.280 864 0.007 0.326 0.744
Diff. = difference, Educ. = education, Obs. = observed, P-Val =probability value, T-Val = T-value. a Leach pits are used for containment of raw sludge. These are used in conjunction with low-flush or pour-flush toilets. Source: Asian Development Bank.
Women collecting water from government stand post at scheduled time slot (photo from ABAR Conseil Private Limited).

Measuring the Impact of West Bengal Drinking Water Sector Improvement Project: A Baseline Study 25
C.10 Health Outcomes
53. Diarrhea. Diarrhea incidence is 1.7% for all ages and 2.3% for children under 5 years old in the last 4 weeks (Table 18). This is much lower than those reported in the 2015–2016 NFHS-4 of 5.9% for children under 5 years old, although the reference period in the latter is shorter—last 2 weeks. In terms of the number of episodes per day, diarrhea incidence is reported to be about six times for all ages and similarly for children under 5 years old. Of those who reported with diarrhea, 4% had blood on the stool, 65% experienced vomiting, 66% had fever, and 68% had abdominal pain. The leading presumed causes of the diarrhea are water (45%) and food poisoning (36%). The other causes have very much lower proportions. The average number of days off (i.e., unable to do regular activities) due to diarrhea was a little over 5 days. According to the national level health survey, the incidence of diarrhea in West Bengal is 2.3% of the population with only 167 deaths recorded in 2018.14 The focus group discussion held among the women respondents and the accredited social health activist15 workers in some gram panchayats of North 24 Parganas discloses that consumption of unhygienic food in social gatherings and fair grounds is one major cause of diarrhea among all age groups. However, that occurrence could not be captured in the timeline of last 4 weeks preceding the survey. 54. The project and non-project areas show similar characteristics among diarrhea afflicted persons and inability to do regular activities. However, project areas have higher diarrhea incidence for all ages (2.3%) compared to non-project areas (1.2%). For children under 5 years old, the incidence is 3.7% in project areas compared with 1% in non-project areas. In terms of the number of days of productive work, those with diarrhea were not able to do regular activities; the project areas have lower number of days lost (4.8 days) compared to non-project areas (6.6 days).
Table 18: Health Outcomes
Variable Mean Total
Obs. Total
Mean Project
Obs. Project
Mean Non-
Project
Obs. Non-
Project Diff. T-Val. P-Val. Diarrhea incidence, all ages 0.017 8,344 0.023 4,258 0.012 4,086 0.011 3.927 0.000
Diarrhea incidence, 0 to 5 years old
0.023 565 0.037 273 0.010 292 0.026 2.092 0.037
Diarrhea episodes per day, all ages
5.712 146 5.439 98 6.271 48 –0.832 –1.524 0.130
Diarrhea episodes per day, 0 to 5 years old
5.538 13 5.700 10 5.000 3 0.700 0.479 0.641
Diarrhea with blood, all ages 0.043 141 0.042 95 0.043 46 –0.001 –0.038 0.970
Diarrhea with vomiting, all ages
0.648 145 0.643 98 0.660 47 –0.017 –0.196 0.845
Diarrhea with fever, all ages 0.658 146 0.643 98 0.688 48 –0.045 –0.531 0.596
Diarrhea with abdominal pain, all ages
0.685 143 0.670 97 0.717 46 –0.047 –0.565 0.573
continued on next page
14 Central Bureau of Health Intelligence, Ministry of Health and Family Welfare, Government of India. 2019. National Health
Profile. 14. 15 An accredited social health activist (ASHA) is a grassroot level health care provider in rural areas under the National Rural
Health Mission.
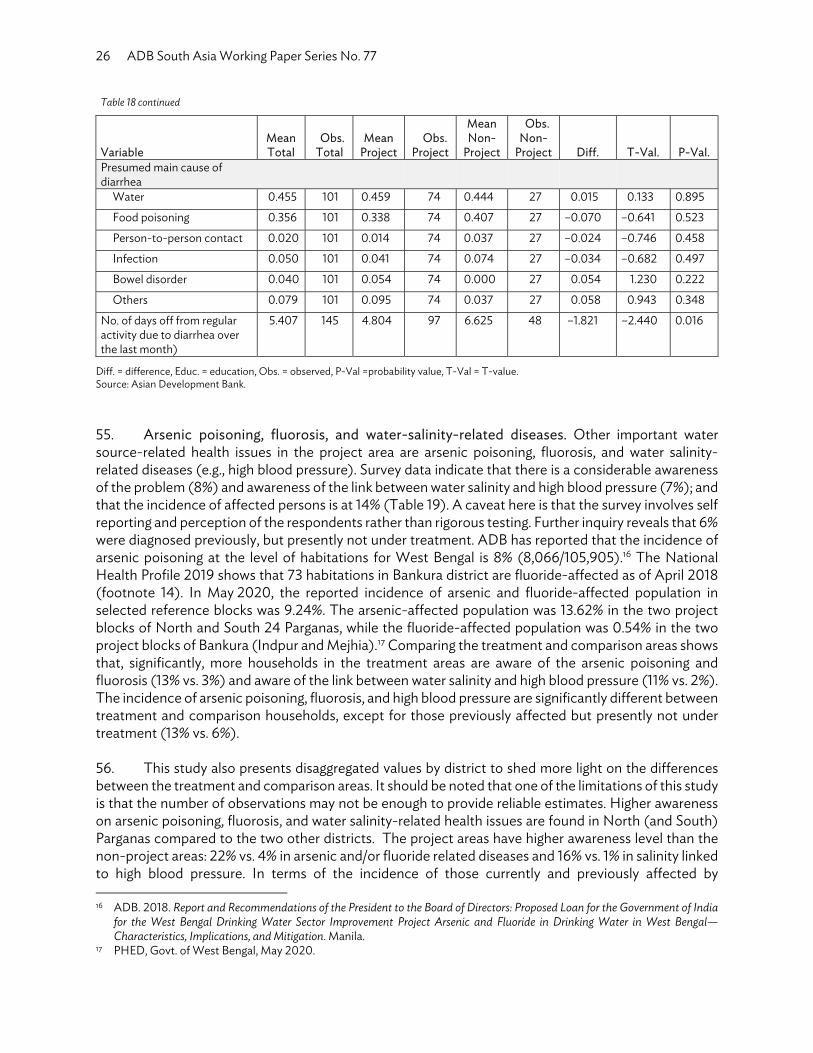
26 ADB South Asia Working Paper Series No. 77
Table 18 continued
Variable Mean Total
Obs. Total
Mean Project
Obs. Project
Mean Non-
Project
Obs. Non-
Project Diff. T-Val. P-Val. Presumed main cause of diarrhea
Water 0.455 101 0.459 74 0.444 27 0.015 0.133 0.895
Food poisoning 0.356 101 0.338 74 0.407 27 –0.070 –0.641 0.523
Person-to-person contact 0.020 101 0.014 74 0.037 27 –0.024 –0.746 0.458
Infection 0.050 101 0.041 74 0.074 27 –0.034 –0.682 0.497
Bowel disorder 0.040 101 0.054 74 0.000 27 0.054 1.230 0.222
Others 0.079 101 0.095 74 0.037 27 0.058 0.943 0.348
No. of days off from regular activity due to diarrhea over the last month)
5.407 145 4.804 97 6.625 48 –1.821 –2.440 0.016
Diff. = difference, Educ. = education, Obs. = observed, P-Val =probability value, T-Val = T-value. Source: Asian Development Bank. 55. Arsenic poisoning, fluorosis, and water-salinity-related diseases. Other important water source-related health issues in the project area are arsenic poisoning, fluorosis, and water salinity-related diseases (e.g., high blood pressure). Survey data indicate that there is a considerable awareness of the problem (8%) and awareness of the link between water salinity and high blood pressure (7%); and that the incidence of affected persons is at 14% (Table 19). A caveat here is that the survey involves self reporting and perception of the respondents rather than rigorous testing. Further inquiry reveals that 6% were diagnosed previously, but presently not under treatment. ADB has reported that the incidence of arsenic poisoning at the level of habitations for West Bengal is 8% (8,066/105,905).16 The National Health Profile 2019 shows that 73 habitations in Bankura district are fluoride-affected as of April 2018 (footnote 14). In May 2020, the reported incidence of arsenic and fluoride-affected population in selected reference blocks was 9.24%. The arsenic-affected population was 13.62% in the two project blocks of North and South 24 Parganas, while the fluoride-affected population was 0.54% in the two project blocks of Bankura (Indpur and Mejhia).17 Comparing the treatment and comparison areas shows that, significantly, more households in the treatment areas are aware of the arsenic poisoning and fluorosis (13% vs. 3%) and aware of the link between water salinity and high blood pressure (11% vs. 2%). The incidence of arsenic poisoning, fluorosis, and high blood pressure are significantly different between treatment and comparison households, except for those previously affected but presently not under treatment (13% vs. 6%).
56. This study also presents disaggregated values by district to shed more light on the differences between the treatment and comparison areas. It should be noted that one of the limitations of this study is that the number of observations may not be enough to provide reliable estimates. Higher awareness on arsenic poisoning, fluorosis, and water salinity-related health issues are found in North (and South) Parganas compared to the two other districts. The project areas have higher awareness level than the non-project areas: 22% vs. 4% in arsenic and/or fluoride related diseases and 16% vs. 1% in salinity linked to high blood pressure. In terms of the incidence of those currently and previously affected by
16 ADB. 2018. Report and Recommendations of the President to the Board of Directors: Proposed Loan for the Government of India
for the West Bengal Drinking Water Sector Improvement Project Arsenic and Fluoride in Drinking Water in West Bengal—Characteristics, Implications, and Mitigation. Manila.
17 PHED, Govt. of West Bengal, May 2020.

Measuring the Impact of West Bengal Drinking Water Sector Improvement Project: A Baseline Study 27
arsenic/fluoride contamination, higher values are found in Bankura (22%), while Purba Medinipur and the North (and South) 24 Parganas have experienced less incidence (7% and 8%, respectively). The incidence of arsenic or fluoride contamination is more visible in project blocks than in the non-project blocks. 57. The incidence of arsenic-affected persons is predominant in North and South 24 Parganas, while Bankura is affected mostly by the fluoride in water. The extent of arsenic and fluoride has been derived from the results of the water quality test by the PHED. In the two project blocks of North and South 24 Parganas district, the presence of total arsenic measures an average of 0.14 milligrams per liter (mg/l), while the seven blocks of both project and non-project category in Bankura show an average fluoride content of 17.95 mg/l.18 There is no data recorded on either total arsenic or fluoride content in water in Purba Medinipur in 2019. 58. Findings of the focus group discussion held in North 24 Parganas suggest the complexity of water use in arsenic prone areas. People in some of the gram panchayats, women particularly, have confessed that although they are aware of the consequences of using water from contaminated tube well/handpump in their locality, they have no other choice but to use it since the safe water sources are far away. While water from these tube wells/handpumps is used for household chores like washing and cleaning, safe water from a distant source is drawn by men for drinking and cooking only. The gram panchayats, however, claim that all known contaminated sources of water are immediately sealed off once the water is tested and found to contain arsenic or fluoride above the permissive level. 59. Comparing treatment and comparison groups in terms of awareness on arsenic poisoning and fluorosis, North (and South) 24 Parganas show higher awareness among the treatment households relative to comparison households. All the three districts show that the treatment households compared to the comparison households have significantly higher awareness of the relationship between water salinity and high blood pressure. In terms of disease incidence, treatment households compared to comparison households have significantly higher cases in all the districts. In Bankura, it is 30% vs. 13%, while Purba Medinipur recorded 9% vs. 5%. In North (and South) 24 Parganas, the disease incidence in treatment households compared to comparison households is 13% vs. 3%. In comparing incidence of diseases, only those presently diagnosed and/or under treatment were considered.
C.11 Education Outcomes
C.11.1 School attendance
60. School attendance for 6 to 17 years old is 90% (Table 20), 5% higher than what is reported in the 2015–2016 NFHS-4 of 85%. Attendance rate is highest for the youngest age group 6–10 years old (98%), followed by age group 11–14 years old (96%); and it is lowest for age group 15–17 years old (75%). The t-test shows that the attendance rates are nearly identical between project and non-project areas.
18 The affected gram panchayats are Haroa, Gopalpur I & II, Borjuri, Salipur, Sonapukur-Sankarpur, Kulti of Haroa Block, North
24 Parganas; Benota I & II of Bhangar II block, South 24 Parganas; and Indpur, Fulmoti, Lachhmanpur, Ramchandrapur, Purba Nabasan, Gelia, Deshrakoalpara of Indpur, Taldangra, Gangajalghati, Mejhia, Sonamukhi, Jaypur & Kotulpur Blocks, Bankura district. See Public Health Engineering Department, Government of West Bengal. Major Water Supply Projects. www.wbphed.gov.in (accessed December 2019).

28 ADB South Asia Working Paper Series No. 77
Table 19: Awareness and Incidence of Arsenic Poisoning, Fluorosis, and Water Salinity-Related Diseases
Variable Mean Total
Obs. Total
Mean Project
Obs. Project
Mean Non-
Project
Obs. Non-
Project Diff. T-Val. P-Val. Aware of arsenic poisoning, fluorosis 0.083 2,013 0.132 1,008 0.034 1,005 0.098 8.105 0.000
Aware that drinking water salinity is linked to high blood pressure
0.066 2,013 0.113 1,008 0.019 1,005 0.094 8.659 0.000
Member currently diagnosed with arsenic poisoning, fluorosis or high blood pressure
0.038 2,013 0.043 1,008 0.033 1,005 0.010 1.156 0.248
Member previously affected but presently not under treatment
0.059 2,013 0.094 1,008 0.024 1,005 0.070 6.766 0.000
Member currently diagnosed or previously affected but not under treatment
0.097 2,013 0.137 1,008 0.057 1,005 0.080 6.135 0.000
Bankura
Aware of arsenic poisoning, fluorosis 0.056 305 0.053 150 0.058 155 –0.005 0.179 0.858
Aware that drinking water salinity is linked to high blood pressure
0.056 305 0.100 150 0.013 155 0.087 3.365 0.001
Member currently diagnosed with arsenic poisoning, fluorosis or high blood pressure
0.046 305 0.013 150 0.077 155 –0.064 –2.697 0.007
Member previously affected but presently not under treatment
0.170 305 0.287 150 0.058 155 0.229 5.553 0.000
Member currently diagnosed or previously affected but not under treatment
0.216 305 0.300 150 0.135 155 0.165 3.548 0.000
Purba Medinipur
Aware of arsenic poisoning, fluorosis 0.047 846 0.074 420 0.021 426 0.053 3.634 0.000
Aware that drinking water salinity is linked to high blood pressure
0.048 846 0.071 420 0.026 426 0.046 3.102 0.002
Member currently diagnosed with arsenic poisoning, fluorosis or high blood pressure
0.057 846 0.076 420 0.038 426 0.039 2.434 0.015
Member previously affected but presently not under treatment
0.013 846 0.010 420 0.016 426 –0.007 –0.886 0.376
Member currently diagnosed or previously affected but not under treatment
0.070 846 0.086 420 0.054 426 0.032 1.813 0.070
North (and South) 24 Parganas
Aware of arsenic poisoning, fluorosis 0.128 862 0.215 438 0.038 424 0.177 8.060 0.000
Aware that drinking water salinity is linked to high blood pressure
0.087 862 0.158 438 0.014 424 0.143 7.712 0.000
Member currently diagnosed with arsenic poisoning, fluorosis or high blood pressure
0.016 862 0.021 438 0.012 424 0.009 1.016 0.310
Member previously affected but presently not under treatment
0.065 862 0.110 438 0.019 424 0.091 5.490 0.000
Member currently diagnosed or previously affected but not under treatment
0.081 862 0.130 438 0.031 424 0.099 5.430 0.000
Diff. = difference, Educ. = education, Obs. = observed, P-Val =probability value, T-Val = T-value. Source: Asian Development Bank.
61. Disaggregating school attendance by sex shows a higher attendance rate for females compared to males. For instance, for school age 6–17 years old, the attendance rate of females is 94% compared to 87% for males. Similar high attendance rates for females compared to males are reflected with age-disaggregated subpopulations. Again, there is no significant difference in sex-disaggregated attendance rates between project and non-project areas.
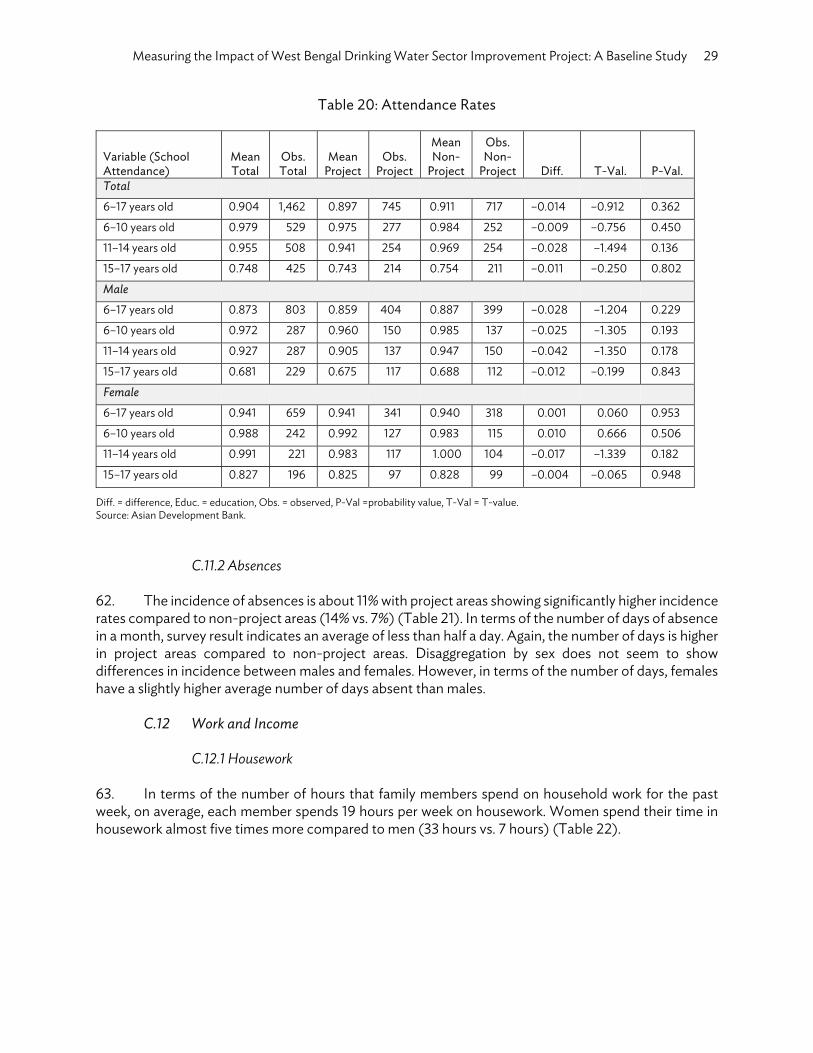
Measuring the Impact of West Bengal Drinking Water Sector Improvement Project: A Baseline Study 29
Table 20: Attendance Rates
Variable (School Attendance)
Mean Total
Obs. Total
Mean Project
Obs. Project
Mean Non-
Project
Obs. Non-
Project Diff. T-Val. P-Val. Total
6–17 years old 0.904 1,462 0.897 745 0.911 717 –0.014 –0.912 0.362
6–10 years old 0.979 529 0.975 277 0.984 252 –0.009 –0.756 0.450
11–14 years old 0.955 508 0.941 254 0.969 254 –0.028 –1.494 0.136
15–17 years old 0.748 425 0.743 214 0.754 211 –0.011 –0.250 0.802
Male
6–17 years old 0.873 803 0.859 404 0.887 399 –0.028 –1.204 0.229
6–10 years old 0.972 287 0.960 150 0.985 137 –0.025 –1.305 0.193
11–14 years old 0.927 287 0.905 137 0.947 150 –0.042 –1.350 0.178
15–17 years old 0.681 229 0.675 117 0.688 112 –0.012 –0.199 0.843
Female
6–17 years old 0.941 659 0.941 341 0.940 318 0.001 0.060 0.953
6–10 years old 0.988 242 0.992 127 0.983 115 0.010 0.666 0.506
11–14 years old 0.991 221 0.983 117 1.000 104 –0.017 –1.339 0.182
15–17 years old 0.827 196 0.825 97 0.828 99 –0.004 –0.065 0.948
Diff. = difference, Educ. = education, Obs. = observed, P-Val =probability value, T-Val = T-value. Source: Asian Development Bank.
C.11.2 Absences
62. The incidence of absences is about 11% with project areas showing significantly higher incidence rates compared to non-project areas (14% vs. 7%) (Table 21). In terms of the number of days of absence in a month, survey result indicates an average of less than half a day. Again, the number of days is higher in project areas compared to non-project areas. Disaggregation by sex does not seem to show differences in incidence between males and females. However, in terms of the number of days, females have a slightly higher average number of days absent than males.
C.12 Work and Income
C.12.1 Housework
63. In terms of the number of hours that family members spend on household work for the past week, on average, each member spends 19 hours per week on housework. Women spend their time in housework almost five times more compared to men (33 hours vs. 7 hours) (Table 22).

30 ADB South Asia Working Paper Series No. 77
Table 21: School Absences, Days in a Month
Variable Mean Total
Obs. Total
Mean Project
Obs. Project
Mean Non-
Project
Obs. Non-
Project Diff. T-Val. P-Val. Total: Absence incidence
6–17 years old 0.107 1,321 0.142 668 0.072 653 0.070 4.144 0.000
6–10 years old 0.104 518 0.144 270 0.060 248 0.084 3.148 0.002
11–14 years old 0.111 485 0.142 239 0.081 246 0.061 2.139 0.033
15–17 years old 0.107 318 0.138 159 0.075 159 0.063 1.818 0.070
Total: Absent days over the past month
6–17 years old 0.416 1,313 0.585 665 0.242 648 0.343 3.833 0.000
6–11 years old 0.388 515 0.569 269 0.191 246 0.378 2.603 0.010
11–14 years old 0.434 482 0.609 238 0.262 244 0.347 2.456 0.014
15–17 years old 0.434 316 0.576 158 0.291 158 0.285 1.499 0.135
Male absence incidence
6–17 years old 0.110 701 0.147 347 0.073 354 0.074 3.130 0.002
6–10 years old 0.097 279 0.125 144 0.067 135 0.058 1.649 0.100
11–14 years old 0.109 266 0.145 124 0.077 142 0.068 1.771 0.078
15 to 17 years old 0.135 156 0.190 79 0.078 77 0.112 2.063 0.041
Male: Absent days over the past month
6–17 years old 0.372 696 0.539 345 0.208 351 0.331 3.190 0.001
6–11 years old 0.324 278 0.424 144 0.216 134 0.207 1.393 0.165
11–14 years old 0.379 264 0.577 123 0.206 141 0.372 2.209 0.028
15–17 years old 0.448 154 0.692 78 0.197 76 0.495 1.925 0.056
Female absence incidence
6–17 years old 0.105 620 0.137 321 0.070 299 0.067 2.726 0.007
6–10 years old 0.113 239 0.167 126 0.053 113 0.114 2.803 0.005
11–14 years old 0.114 219 0.139 115 0.087 104 0.053 1.221 0.224
15–17 years old 0.080 162 0.088 80 0.073 82 0.014 0.334 0.739
Female: Absent days over the past month
6–17 years old 0.465 617 0.634 320 0.283 297 0.352 2.342 0.019
6–11 years old 0.464 237 0.736 125 0.161 112 0.575 2.191 0.029
11–14 years old 0.500 218 0.643 115 0.340 103 0.304 1.275 0.204
15–17 years old 0.420 162 0.463 80 0.378 82 0.084 0.302 0.763
Diff. = difference, Educ. = education, Obs. = observed, P-Val =probability value, T-Val = T-value. Source: Asian Development Bank.

Measuring the Impact of West Bengal Drinking Water Sector Improvement Project: A Baseline Study 31
64. In terms of the type of housework, the biggest shares are in house cleaning, laundry, dishwashing, and cooking (37%). This is closely followed by marketing (29%) and fetching water (21%). For female members, cleaning the house, laundry, dishwashing, and cooking constitute the bulk of housework (67%). For male members, marketing (56%) accounts for the largest share of housework. Fetching water comes next for both male and female, although males spend more time on it (24% vs. 19%).
65. There is a significant difference in the number of hours spent in housework between men in project areas and those in non-project areas. Males in project areas spend one more hour in household work compared to those in non-project areas (7 hours vs. 6 hours). There is also a significant difference in the shares by types of housework between project and non-project areas. For both male and female members of families, the share in making mats, knitting, weaving, and tailoring is higher in project areas than in non-project areas (0.8% vs 0.2%). The same is true with caring for the elderly/sick/disabled and babysitting (3% vs. 2%). In marketing, the opposite happens with project areas having a lower share compared to non-project areas (28% vs. 30%).
Table 22: Housework and Community Work, Past Week
Variable Mean Total
Obs. Total
Mean Project
Obs. Project
Mean Non-
Project
Obs. Non-
Project Diff. T-Val. P-Val. Housework, both, total hours
19.072 7,905 18.875 4,043 19.279 3,862 –0.405 –0.788 0.430
Housework, male, total hours
6.711 4,242 7.156 2,197 6.233 2,045 0.923 2.864 0.004
Housework, female, total hours
33.388 3,663 32.822 1,846 33.963 1,817 –1.141 –1.395 0.163
Share, All
Collecting firewood/fodder/grass, care of animals
0.092 5,731 0.092 2,788 0.092 2,943 0.001 0.172 0.864
Fetching water 0.214 5,727 0.215 2,788 0.212 2,939 0.003 0.462 0.644
Making mats, knitting, weaving, tailoring
0.005 5,723 0.008 2,788 0.002 2,935 0.005 4.461 0.000
Processing preserved food/snacks
0.004 5,723 0.004 2,788 0.004 2,935 0.000 0.205 0.838
Caring for the elderly/sick/disabled and babysitting
0.022 5,722 0.026 2,788 0.018 2,934 0.009 3.274 0.001
Cleaning house, laundry, dishwashing, cooking
0.370 5,723 0.372 2,788 0.369 2,935 0.003 0.318 0.750
Marketing 0.289 5,728 0.277 2,788 0.300 2,940 –0.023 –2.415 0.016
Other volunteer work, SHG, community activities
0.005 5,723 0.005 2,788 0.005 2,935 0.000 0.383 0.702
Share, Male
Collecting firewood/fodder/grass, care of animals
0.125 2,844 0.118 1,350 0.130 1,494 –0.012 –1.624 0.104
Fetching water 0.237 2,841 0.242 1,350 0.234 1,491 0.008 0.755 0.450
continued on next page

32 ADB South Asia Working Paper Series No. 77
Table 22 continued
Variable Mean Total
Obs. Total
Mean Project
Obs. Project
Mean Non-
Project
Obs. Non-
Project Diff. T-Val. P-Val. Making mats, knitting, weaving, tailoring
0.003 2,840 0.003 1,350 0.002 1,490 0.002 0.965 0.334
Processing preserved food/snacks
0.000 2,839 0.000 1,350 0.001 1,489 –0.001 –2.300 0.022
Caring for the elderly/sick/disabled and babysitting
0.009 2,839 0.012 1,350 0.006 1,489 0.006 2.105 0.035
Cleaning house, laundry, dishes, cooking
0.068 2,837 0.073 1,350 0.064 1,487 0.009 1.259 0.208
Marketing 0.556 2,843 0.547 1,350 0.564 1,493 -0.016 -1.280 0.201
Other volunteer work, SHG, community activities
0.003 2,839 0.005 1,350 0.001 1,489 0.004 2.638 0.008
Share, Female
Collecting firewood/fodder/grass, care of animals
0.060 2,887 0.069 1,438 0.052 1,449 0.017 4.047 0.000
Fetching water 0.190 2,886 0.191 1,438 0.190 1,448 0.000 0.042 0.966
Making mats, knitting, weaving, tailoring
0.007 2,883 0.012 1,438 0.003 1,445 0.009 5.036 0.000
Processing preserved food/snacks
0.008 2,884 0.008 1,438 0.007 1,446 0.001 0.421 0.674
Caring for the elderly/sick/disabled and babysitting
0.034 2,883 0.039 1,438 0.029 1,445 0.010 2.315 0.021
Cleaning house, laundry, dishwashing, cooking
0.668 2,886 0.653 1,438 0.682 1,448 –0.029 –3.019 0.003
Marketing 0.026 2,885 0.024 1,438 0.029 1,447 –0.005 –1.388 0.165
Other volunteer work, SHG, community activities
0.007 2,884 0.005 1,438 0.009 1,446 –0.004 –2.049 0.041
Diff. = difference, Educ. = education, Obs. = observed, P-Val =probability value, SHG = self-help group, T-Val = T-value. Source: Asian Development Bank.
C.12.2 Economically productive work
66. In terms of productive work, only 38% are engaged in paid work for both sexes (Table 23). The proportion employed is more than 10 times higher for males (65%) compared to females (6%). In terms of hours spent on market work, males spend 46 hours while females spend 40 hours if they do market work.
67. The work distribution across sectors shows that non-agriculture has the biggest share (33%) followed by agriculture (24%), own business (17%), and private sector employment (14%). In terms of the nature of employment, being a paid employee accounts for the biggest share (54%). Having own business/farm with employees follows next (35%). Having own business/farm without employees and family without pay account for only 3% and 1%, respectively. In terms of the nature of payment, the daily wage earners constitute 61% of the workers; followed by those that are paid long-term and paid monthly (19% and 18%, respectively). The daily average cash payment is ₹338, with males being paid higher than females (₹345 vs. ₹251).

Measuring the Impact of West Bengal Drinking Water Sector Improvement Project: A Baseline Study 33
68. There is no significant difference between the project and non-project areas in the proportion employed and the number of work hours per week. The significant difference occurs in the sector distribution for most sectors, the nature of employment, and the nature of payment.
C.12.3 Productive work income
69. On average, more than two household members earning a labor income has an average income of ₹12,909 per month (Table 23). There is no significant difference in the number of members with labor income and in the total household labor income between project and non-project areas.
Table 23: Productive Work and Income
Variable Mean Total
Obs. Total
Mean Project
Obs. Project
Mean Non-
Project
Obs. Non-
Project Diff. T-Val. P-Val. Proportion employed, both
0.381 7,770 0.383 3,944 0.380 3,826 0.003 0.281 0.779
Proportion employed, male
0.653 4,197 0.646 2,162 0.660 2,035 –0.014 –0.971 0.331
Proportion employed, female
0.062 3,573 0.063 1,782 0.060 1,791 0.003 0.317 0.751
Number of hours per week
45.440 2,960 45.047 1,509 45.848 1,451 –0.801 –1.546 0.122
Number of hours per week, male
45.912 2,740 45.475 1,397 46.366 1,343 –0.891 –1.677 0.094
Number of hours per week, female
39.559 220 39.705 112 39.407 108 0.298 0.145 0.885
Sector of employment Agriculture 0.239 2,961 0.236 1,509 0.243 1,452 –0.007 –0.459 0.647 Allied agriculture 0.025 2,961 0.032 1,509 0.018 1,452 0.014 2.424 0.015 Household industry 0.011 2,961 0.013 1,509 0.010 1,452 0.003 0.764 0.445 Non-agriculture 0.330 2,961 0.302 1,509 0.359 1,452 –0.057 –3.320 0.001 Family business 0.018 2,961 0.025 1,509 0.010 1,452 0.016 3.223 0.001 Own business 0.172 2,961 0.186 1,509 0.158 1,452 0.029 2.054 0.040 Private sector employment
0.141 2,961 0.129 1,509 0.154 1,452 –0.026 –2.009 0.045
Public sector employment
0.037 2,961 0.048 1,509 0.027 1,452 0.021 2.990 0.003
Others 0.026 2,961 0.030 1,509 0.021 1,452 0.010 1.690 0.091 Nature of employment
Paid employee 0.539 2,961 0.533 1,509 0.544 1,452 –0.011 –0.579 0.563 Own business/farm without employees
0.032 2,961 0.050 1,509 0.013 1,452 0.037 5.711 0.000
Own business/farm with employees
0.351 2,961 0.326 1,509 0.376 1,452 –0.050 –2.853 0.004
Family without pay 0.011 2,961 0.013 1,509 0.010 1,452 0.003 0.764 0.445 Nature of payment
Daily 0.608 2,961 0.564 1,509 0.653 1,452 –0.089 –4.974 0.000 Long-term 0.192 2,961 0.206 1,509 0.178 1,452 0.028 1.962 0.050
continued on next page
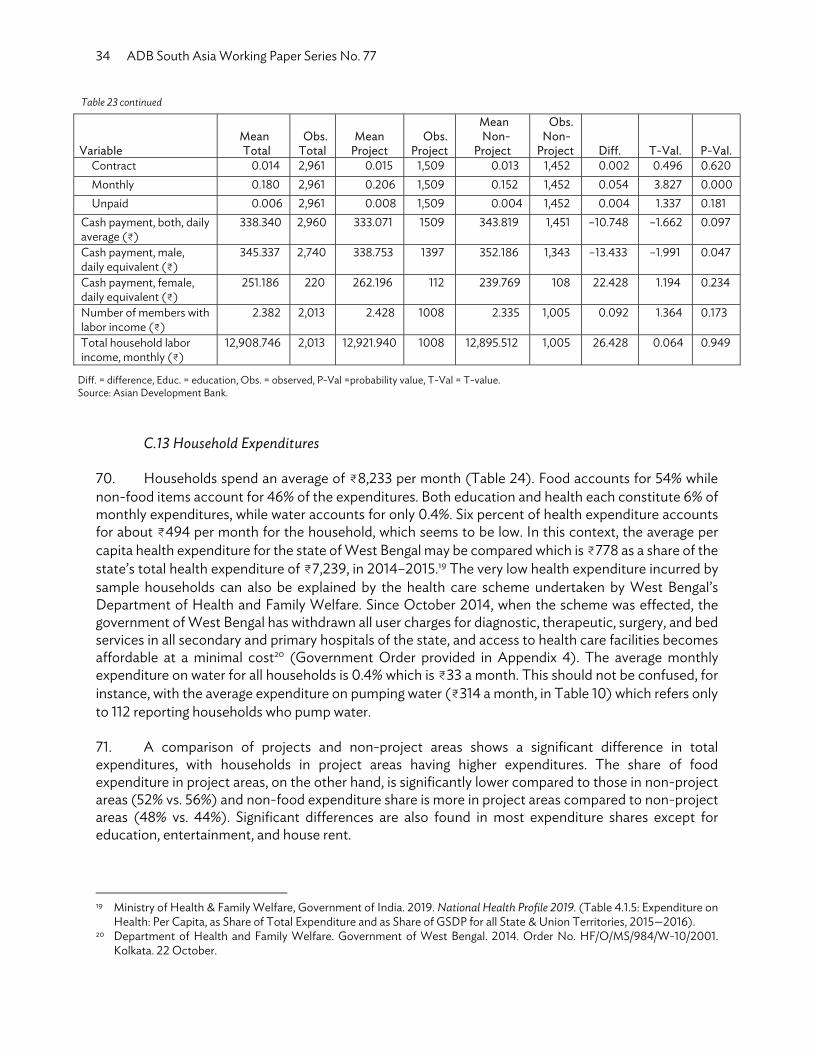
34 ADB South Asia Working Paper Series No. 77
Table 23 continued
Variable Mean Total
Obs. Total
Mean Project
Obs. Project
Mean Non-
Project
Obs. Non-
Project Diff. T-Val. P-Val. Contract 0.014 2,961 0.015 1,509 0.013 1,452 0.002 0.496 0.620 Monthly 0.180 2,961 0.206 1,509 0.152 1,452 0.054 3.827 0.000 Unpaid 0.006 2,961 0.008 1,509 0.004 1,452 0.004 1.337 0.181
Cash payment, both, daily average (₹)
338.340 2,960 333.071 1509 343.819 1,451 –10.748 –1.662 0.097
Cash payment, male, daily equivalent (₹)
345.337 2,740 338.753 1397 352.186 1,343 –13.433 –1.991 0.047
Cash payment, female, daily equivalent (₹)
251.186 220 262.196 112 239.769 108 22.428 1.194 0.234
Number of members with labor income (₹)
2.382 2,013 2.428 1008 2.335 1,005 0.092 1.364 0.173
Total household labor income, monthly (₹)
12,908.746 2,013 12,921.940 1008 12,895.512 1,005 26.428 0.064 0.949
Diff. = difference, Educ. = education, Obs. = observed, P-Val =probability value, T-Val = T-value. Source: Asian Development Bank.
C.13 Household Expenditures
70. Households spend an average of ₹8,233 per month (Table 24). Food accounts for 54% while non-food items account for 46% of the expenditures. Both education and health each constitute 6% of monthly expenditures, while water accounts for only 0.4%. Six percent of health expenditure accounts for about ₹494 per month for the household, which seems to be low. In this context, the average per capita health expenditure for the state of West Bengal may be compared which is ₹778 as a share of the state’s total health expenditure of ₹7,239, in 2014–2015.19 The very low health expenditure incurred by sample households can also be explained by the health care scheme undertaken by West Bengal’s Department of Health and Family Welfare. Since October 2014, when the scheme was effected, the government of West Bengal has withdrawn all user charges for diagnostic, therapeutic, surgery, and bed services in all secondary and primary hospitals of the state, and access to health care facilities becomes affordable at a minimal cost20 (Government Order provided in Appendix 4). The average monthly expenditure on water for all households is 0.4% which is ₹33 a month. This should not be confused, for instance, with the average expenditure on pumping water (₹314 a month, in Table 10) which refers only to 112 reporting households who pump water. 71. A comparison of projects and non-project areas shows a significant difference in total expenditures, with households in project areas having higher expenditures. The share of food expenditure in project areas, on the other hand, is significantly lower compared to those in non-project areas (52% vs. 56%) and non-food expenditure share is more in project areas compared to non-project areas (48% vs. 44%). Significant differences are also found in most expenditure shares except for education, entertainment, and house rent.
19 Ministry of Health & Family Welfare, Government of India. 2019. National Health Profile 2019. (Table 4.1.5: Expenditure on
Health: Per Capita, as Share of Total Expenditure and as Share of GSDP for all State & Union Territories, 2015 2016). 20 Department of Health and Family Welfare. Government of West Bengal. 2014. Order No. HF/O/MS/984/W-10/2001.
Kolkata. 22 October.

Measuring the Impact of West Bengal Drinking Water Sector Improvement Project: A Baseline Study 35
72. The difference in household spending between project and non-project areas may be explained by the socioeconomic characteristics of the sample households. The general (non-minority) class constituting 44% of the sample (Table 4) and indicating significant difference between treatment and comparison households also shows significantly higher total household expenditure (₹9,431 vs. ₹7,257). The scheduled caste group also showed statistically significant difference between treatment and comparison households (Table 4). But this group did not show statistically significant difference in expenditures, counteracting the hypothesis that the difference in socioeconomic characteristics explains the differences in expenditures.
Table 24: Expenditures
Variable Mean Total
Obs. Total
Mean Project
Obs. Project
Mean Non-
Project
Obs. Non-
Project Diff. T-Val. P-Val. Total expenditure, monthly 8,233.29 2,010 8,854.02 1,007 7,610.08 1,003 1,243.93 2.794 0.005
Share
Food 0.539 2,010 0.520 1,007 0.557 1,003 –0.036 –5.552 0.000
Non-food 0.461 2,010 0.480 1,007 0.443 1,003 0.036 5.552 0.000
Education 0.055 2,010 0.055 1,007 0.055 1,003 0.000 0.142 0.887
Health 0.056 2,010 0.065 1,007 0.047 1,003 0.018 5.053 0.000
Water 0.004 2,010 0.003 1,007 0.005 1,003 –0.001 –1.592 0.111
Beverage and tobacco 0.015 2,010 0.013 1,007 0.017 1,003 –0.004 –4.244 0.000
Clothing 0.080 2,010 0.087 1,007 0.073 1,003 0.013 4.673 0.000
Fuel and light 0.050 2,010 0.047 1,007 0.053 1,003 –0.006 –3.817 0.000
Transportation and communication
0.070 2,010 0.066 1,007 0.073 1,003 –0.006 –2.823 0.005
Entertainment 0.015 2,010 0.014 1,007 0.016 1,003 –0.002 –2.448 0.014
Housing repairs 0.018 2,010 0.025 1,007 0.010 1,003 0.014 3.952 0.000
House rent 0.000 2,010 0.000 1,007 0.000 1,003 0.000 1.411 0.158
Others 0.099 2,010 0.104 1,007 0.095 1,003 0.009 2.799 0.005
Diff. = difference, Educ. = education, Obs. = observed, P-Val =probability value, T-Val = T-value. Source: Asian Development Bank.
IV. OVERALL RESULTS SUMMARY 73. The baseline survey covered 2,013 households from randomly selected 28 project gram panchayats and 29 non-project gram panchayats in three project districts: Bankura, Purba Medinipur, and North (and South) 24 Parganas.21 The survey covers the primary indicators for establishing the project impact at the household level. Project gram panchayats were randomly selected from the list of gram panchayats where the project will be implemented. The non-project gram panchayats were selected based on matching at two levels: block and gram panchayats. The matching used characteristics
21 One neighboring block in South 24 Parganas was also included in North 24 Parganas drinking water scheme based on need
and economy of scale.
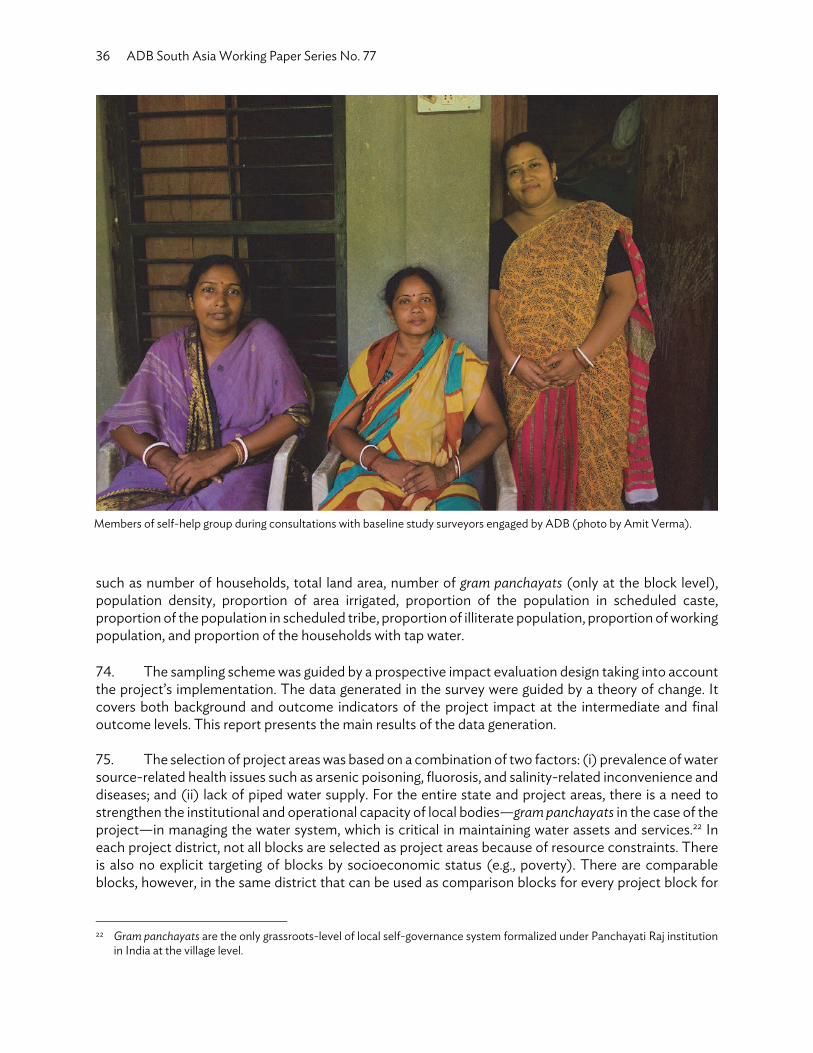
36 ADB South Asia Working Paper Series No. 77
such as number of households, total land area, number of gram panchayats (only at the block level), population density, proportion of area irrigated, proportion of the population in scheduled caste, proportion of the population in scheduled tribe, proportion of illiterate population, proportion of working population, and proportion of the households with tap water. 74. The sampling scheme was guided by a prospective impact evaluation design taking into account the project’s implementation. The data generated in the survey were guided by a theory of change. It covers both background and outcome indicators of the project impact at the intermediate and final outcome levels. This report presents the main results of the data generation. 75. The selection of project areas was based on a combination of two factors: (i) prevalence of water source-related health issues such as arsenic poisoning, fluorosis, and salinity-related inconvenience and diseases; and (ii) lack of piped water supply. For the entire state and project areas, there is a need to strengthen the institutional and operational capacity of local bodies—gram panchayats in the case of the project—in managing the water system, which is critical in maintaining water assets and services.22 In each project district, not all blocks are selected as project areas because of resource constraints. There is also no explicit targeting of blocks by socioeconomic status (e.g., poverty). There are comparable blocks, however, in the same district that can be used as comparison blocks for every project block for
22 Gram panchayats are the only grassroots-level of local self-governance system formalized under Panchayati Raj institution
in India at the village level.
Members of self-help group during consultations with baseline study surveyors engaged by ADB (photo by Amit Verma).

Measuring the Impact of West Bengal Drinking Water Sector Improvement Project: A Baseline Study 37
the purpose of impact evaluation. Moreover, the treatment and comparison villages have been randomly selected from treatment and comparison blocks, respectively. 76. The indicators generated in the survey were benchmarked, when comparable statistics are available, with those also generated in the 2015–2016 National Family Health Survey (NFHS-4) for West Bengal. These were found to be comparable even though the survey covers specific districts while the NFHS-4 is statewide. For instance, the average household size in the survey is 4.15 members while in the NFHS-4, it is 4.3 members. The proportion of males in the household is 54% compared to 50.3% in NFHS-4. 77. The survey finds that the three major sources of drinking water for the sample households include tube well or borehole (43%), public hand pump (34%), and private handpump (13%). Between project and non-project areas, there is a lower proportion of households using public handpump in project areas (28% vs. 41%) and a higher proportion of households using tube well/bore hole (46% vs. 40%) and bottled water (6% vs. 2%). 78. For those with public water supply sources, water supply for human consumption (e.g., handwashing, drinking, toilet use, and cooking), is available from 40 to 44 hours per week and is lower in project areas compared to non-project areas. A lower proportion of households use motorized pumps in project areas compared to non-project areas (4% vs. 8%). 79. For those who have no water source in the premises, the frequency of fetching water for drinking is on average 2.7 times per day, and in this, there is no significant difference between project and non-project areas. The average travel time per trip is 6.4 minutes and another 7.9 minutes waiting time at the source. Again, there is no difference between project and non-project areas. While almost everybody fetches water, the male head of households and female spouse are the most reported as the ones fetching water. The qualitative interviews reveal that in blocks with predominantly Muslim population, women typically do not go beyond 50 meters away from their residence. Instead, men fetch drinking water from far away sources by bicycle and carry more buckets per trip. The reported average distance to the water source is 0.75 kilometers. The households in project areas are spending more than double compared to non-project areas to purchase water (₹309 vs. ₹132 per month) and more (18% vs. 6%) are complaining about muscle strain from carrying water. 80. The estimated incidence of arsenic poisoning, fluorosis, and water salinity health-related issues is comparable to some of the documented estimates found during the project preparation. For instance, the survey finds that the reported incidence of arsenic poisoning, fluorosis, and water-salinity-related diseases, such as high blood pressure, is 14% while ADB’s Report and Recommendation of the President reported 8% for arsenic at the habitation level. Since the survey result is based on self reporting of the respondents, statistical error for interpretation of the results is possible. This may imply the need for more technical measurement to substantiate the incidence level reported. 81. The incidence of diarrhea for children under five years old, as reported in the survey, is lower (2.3%) compared to the 5.9% as reported in the NFHS-4. Comparing the treatment and comparison households, the incidence of diarrhea among children under five years old is higher in treatment compared to comparison households (3.7% vs. 1%).

38 ADB South Asia Working Paper Series No. 77
82. Households reported to have, on average, more than two members engaged in market work with income. The reported average monthly labor market income is ₹12,909. There is no significant difference between project and non-project households in the number of members working and in labor market income. The survey also finds that households spend an average of ₹8,216 per month. Food accounts for 54% of the household expenditure. Education and health accounts for 6% each while water accounts for only 0.4 %. Households in project areas were found to spend more, and their expenditure shares are also significantly different from non-project areas except for education, entertainment, and house rent. 83. Finally, what do these comparisons between characteristics of treatment and comparison households mean for subsequent impact evaluation? As already mentioned, many of the background and outcome characteristics are similar for project and non-project areas. There are, however, a considerable number of characteristics that are significantly different based on a test in the difference of means.23 This is to be expected because random assignment of project and non-project areas was not feasible under the project’s implementation design. The prospective impact evaluation needs to consider the differences between project and non-project areas, as reported in this study.
V. RECOMMENDATIONS FOR POST-PROJECT EVALUATION 84. The baseline evaluation survey was designed, planned, and executed taking into account the intended impact, outcomes, and outputs of the WBDWSIP. The project is expected to be completed by 2024, and the post-project impact evaluation survey conducted by the end of 2024 or by 2025. The baseline evaluation study experience has brought out some lessons wherein the following recommendations are drawn upon:
The baseline survey questionnaire was designed to cover key intermediate and final outcomes of a water project as described in the theory of change (Figure 1). As a baseline study this report focuses on identifying similarities and differences between treatment and comparison areas that would be useful for impact analysis at the end of project. The post-project evaluation should consider including other methodologies and data generation methods that could provide a more holistic view of what happens in the ground.
For post-completion impact analysis, secondary data, such as those of the National Sample Survey and the NFHS, should be used at all possible levels to substantiate and validate survey data. In addition, qualitative methods and social analysis would enrich the quantitative aspect of the post-project evaluation.
It is important to involve a public health specialist whose inputs on public health issues related to water quality and sanitation would be a key contribution in identifying project objectives and principles. The public health specialist could provide those inputs during the post-project impact assessment, and in the qualitative aspects of the evaluation survey.
The post-project impact assessment report should include impact stories that will bring in the social aspects of the study, such as how project interventions have changed individuals' lives to a better future, and how they have uplifted the quality of life of people from all socioeconomic strata. Apart from providing documentary evidence of project interventions, these stories will
23 The mean values for treatment and comparison groups are considered different.
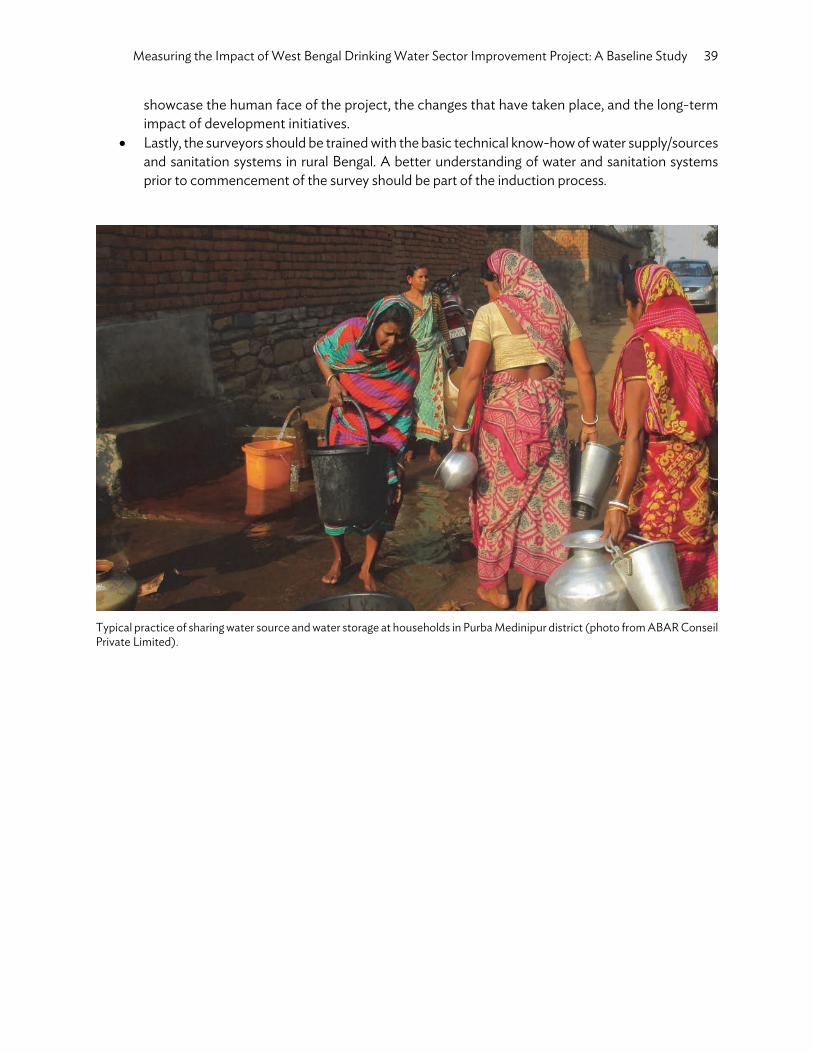
Measuring the Impact of West Bengal Drinking Water Sector Improvement Project: A Baseline Study 39
showcase the human face of the project, the changes that have taken place, and the long-term impact of development initiatives.
Lastly, the surveyors should be trained with the basic technical know-how of water supply/sources and sanitation systems in rural Bengal. A better understanding of water and sanitation systems prior to commencement of the survey should be part of the induction process.
Typical practice of sharing water source and water storage at households in Purba Medinipur district (photo from ABAR Conseil Private Limited).

APPENDIX 1
Baseline Survey Questionnaire
All information collected will be held strictly confidential on behalf of the Asian Development Bank West Bengal Drinking Water Sector Improvement Project
HOUSEHOLD SURVEY (Public Health Engineering Department, Government of West Bengal)/ADB/(Survey Firm xxxx)
Informed Consent My name is………………. I am here from (Name of Survey Firm) to collect data for a research study in coordination with (name of implementing department), and ADB. During this study, I will ask you some questions related to water supply, sanitation, health, hygiene, income, and expenditure. We would very much appreciate your participation in this survey. This survey will take about XX minutes. Your participation in this survey depends on your wish. The information given by you will be strictly treated as confidential. If we come to any questions that you don’t want to answer, just let me know and I will go to the next question or you can stop the interview at that time. However, I hope that you will participate in this survey and make it a success by providing honest answers to all the questions. Would you like to ask me any questions about this survey? May I begin the interview now? Signature of the interviewer: _____________________________ Date:_______________ MM/DD/YYYY Respondent agrees for interview … 1 Respondent does not agree for interview … 2
A. HOUSEHOLD ID AND LOCATION (HI) HI1. Household Type: 1. Project 2. Non-Project HI2. Geographic Location: Name Code/Number HI2A. DISTRICT HI2B. BLOCK HI2C. PANCHAYAT HI2D. VILLAGE Information on the respondent: HI3. Name of respondent: HI4. Address: HI7. Date of interview (MM/DD/YYYY) _ _ / _ _ / _ _ _ _
HI8. Interview start time HH:MM___:____ Survey Personnel Information (to be entered later) Name Code HI9. Enumerator HI10. Supervisor HI11. Data encoder (In office)
Questionnaire Check Date: _____/____/____
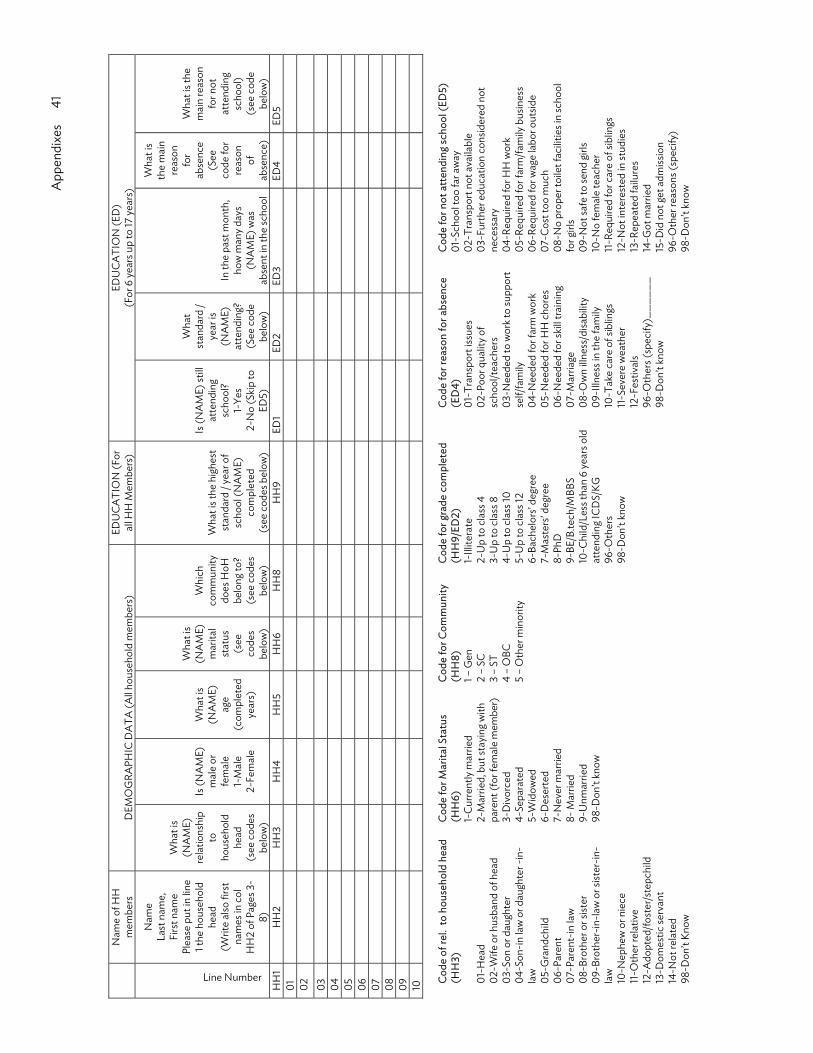
A
ppen
dixe
s
41
Nam
e of
HH
m
embe
rs
DEM
OG
RAPH
IC D
ATA
(All h
ouse
hold
mem
bers
) ED
UC
ATI
ON
(For
al
l HH
Mem
bers
) ED
UC
ATI
ON
(ED
) (F
or 6
year
s up
to 17
year
s)
Line Number
Nam
e La
st n
ame,
Fi
rst n
ame
Plea
se p
ut in
line
1 the
hou
seho
ld
head
(W
rite
also
firs
t na
mes
in c
ol
HH
2 of
Pag
es 3
-8)
Wha
t is
(NA
ME)
re
latio
nshi
p to
ho
useh
old
head
(s
ee c
odes
be
low
)
Is (N
AM
E)
mal
e or
fe
mal
e 1-
Mal
e 2-
Fem
ale
Wha
t is
(NA
ME)
ag
e (c
ompl
eted
ye
ars)
Wha
t is
(NA
ME)
m
arita
l st
atus
(s
ee
code
s be
low
)
Whi
ch
com
mun
ity
does
HoH
be
long
to?
(see
cod
es
belo
w)
Wha
t is t
he h
ighe
st
stan
dard
/ ye
ar o
f sc
hool
(NA
ME)
co
mpl
eted
(s
ee c
odes
bel
ow)
Is (N
AM
E) st
ill at
tend
ing
scho
ol?
1-Ye
s 2-
No
(Ski
p to
ED
5)
Wha
t st
anda
rd /
year
is
(NA
ME)
at
tend
ing?
(S
ee c
ode
belo
w)
In th
e pa
st m
onth
, ho
w m
any d
ays
(NA
ME)
was
ab
sent
in th
e sc
hool
Wha
t is
the
mai
n re
ason
fo
r ab
senc
e (S
ee
code
for
reas
on
of
abse
nce)
Wha
t is t
he
mai
n re
ason
fo
r not
at
tend
ing
scho
ol)
(see
cod
e be
low
) H
H1
HH
2 H
H3
HH
4 H
H5
HH
6 H
H8
HH
9 ED
1 ED
2 ED
3 ED
4 ED
5 01
02
03
04
05
06
07
08
09
10
Cod
e of
rel.
to h
ouse
hold
hea
d (H
H3)
01
-Hea
d 02
-Wife
or h
usba
nd o
f hea
d 03
-Son
or d
augh
ter
04-S
on-in
law
or d
augh
ter -
in-
law
05
-Gra
ndch
ild
06-P
aren
t 07
-Par
ent-
in la
w
08-B
roth
er o
r sist
er
09-B
roth
er-in
-law
or s
ister
-in-
law
10
-Nep
hew
or n
iece
11
-Oth
er re
lativ
e 12
-Ado
pted
/fost
er/s
tepc
hild
13
-Dom
estic
serv
ant
14-N
ot re
late
d 98
-Don
’t Kn
ow
Cod
e fo
r Mar
ital S
tatu
s (H
H6)
1-
Cur
rent
ly m
arrie
d 2-
Mar
ried,
but
stay
ing w
ith
pare
nt (f
or fe
mal
e m
embe
r)
3-D
ivor
ced
4-
Sepa
rate
d 5-
Wid
owed
6-
Des
erte
d 7-
Nev
er m
arrie
d 8-
Mar
ried
9-U
nmar
ried
98-D
on’t
know
Cod
e fo
r Com
mun
ity
(HH
8)
1 – G
en
2 –
SC
3 –
ST
4 –
OBC
5
– O
ther
min
ority
Cod
e fo
r gra
de c
ompl
eted
(H
H9/
ED2)
1-
Illite
rate
2-
Up
to c
lass
4
3-U
p to
cla
ss 8
4-
Up
to c
lass
10
5-U
p to
cla
ss 12
6-
Bach
elor
s’ de
gree
7-
Mas
ters
’ deg
ree
8-Ph
D
9-BE
/B.te
ch/M
BBS
10-C
hild
/Les
s tha
n 6
year
s old
at
tend
ing I
CDS/
KG
96-O
ther
s 98
-Don
’t kn
ow
Cod
e fo
r rea
son
for a
bsen
ce
(ED
4)
01-T
rans
port
issue
s 02
-Poo
r qua
lity o
f sc
hool
/teac
hers
03
-Nee
ded
to w
ork t
o su
ppor
t se
lf/fa
mily
04
-Nee
ded
for f
arm
wor
k 05
-Nee
ded
for H
H c
hore
s 06
-Nee
ded
for s
kill t
rain
ing
07
-Mar
riage
08
-Ow
n illn
ess/
disa
bilit
y 09
-Illn
ess i
n th
e fa
mily
10
-Tak
e ca
re o
f sib
lings
11
-Sev
ere
wea
ther
12
-Fes
tival
s 96
-Oth
ers (
spec
ify)_
____
_ 98
-Don
’t kn
ow
Cod
e fo
r not
att
endi
ng sc
hool
(ED
5)
01-S
choo
l too
far a
way
02
-Tra
nspo
rt no
t ava
ilabl
e 03
-Fur
ther
edu
catio
n co
nsid
ered
not
ne
cess
ary
04-R
equi
red
for H
H w
ork
05-R
equi
red
for f
arm
/fam
ily b
usin
ess
06-R
equi
red
for w
age
labo
r out
side
07
-Cos
t too
muc
h 08
-No
prop
er to
ilet f
acilit
ies i
n sc
hool
fo
r girl
s 09
-Not
safe
to se
nd gi
rls
10-N
o fe
mal
e te
ache
r 11
-Req
uire
d fo
r car
e of
sibl
ings
12
-Not
inte
rest
ed in
stud
ies
13-R
epea
ted
failu
res
14-G
ot m
arrie
d 15
-Did
not
get a
dmiss
ion
96-O
ther
reas
ons (
spec
ify)
98-D
on’t
know

42
App
endi
xes
Hea
lth (H
E) 1
(Do
not a
sk fo
r the
hou
seho
ld m
embe
rs w
ho a
re c
ontin
uous
ly li
ving
in o
ther
tow
n or
abr
oad
over
the
last
two
mon
ths o
r mor
e)
Line Number
Nam
e (C
opy
from
H
H2)
Has
(NA
ME)
had
di
arrh
ea /d
ysen
tery
in
the
past
four
w
eeks
? 1-
Yes
2-N
o (N
ext
mem
ber,
or n
ext
sect
ion
for l
ast
mem
ber)
98
-Don
’t kn
ow
If ye
s in
HE1
-1
How
m
any
times
pe
r day
du
ring
the
episo
de?
Was
th
ere
bloo
d in
th
e st
ools?
1-
Yes
2-N
o 98
-D
on’t
know
Did
(N
AM
E)
vom
ited?
1-
Yes
2-N
o 98
-Don
’t kn
ow
Did
(N
AM
E)
also
hav
e fe
ver?
1-
Yes
2-N
o 98
-Don
’t kn
ow
Did
(N
AM
E)
had
abdo
min
al
cram
ps?
feve
r?
1-Ye
s 2-
No
98-D
on’t
know
Wha
t do
you
thin
k was
the
mai
n ca
use
of th
e di
arrh
ea?
(see
cod
es
belo
w)
Dur
ing t
he la
st
mon
th, h
ow
man
y day
s __
coul
d no
t do
the
usua
l ac
tiviti
es d
ue to
di
arrh
ea?
(00
if no
ne)
Did
(N
AM
E)
seek
ad
vice
or
treat
men
t?
1-Ye
s 2-
No
(Ski
p to
H
E1-1
2)
If ye
s, w
here
di
d (N
AM
E)
seek
adv
ice
or
treat
men
t?
(see
cod
es
belo
w)
How
muc
h di
d yo
u sp
end
for
the
treat
men
t?
Rs.
If no
(in
HE1
-9),
why
not
se
ek a
dvic
e / t
reat
men
t?
(see
cod
es
belo
w)
HH
1 H
H2
HE1
-1
HE1
-2
HE1
-3
HE1
-4
HE1
-5
HE1
-6
HE1
-7
HE1
-8
HE1
-9
HE1
-10
HE1
-11
HE1
-12
01
02
03
04
05
06
07
08
09
10
Cod
e fo
r mai
n ca
use
(HE1
-7)
Cod
e fo
r whe
re se
ek tr
eatm
ent (
HE1
-10)
C
ode
for w
hy n
ot se
ek a
dvic
e / t
reat
men
t (H
E1-1
2)
01-W
ater
02
-Foo
d po
isoni
ng
03-P
erso
n-to
-per
son
04-A
nim
al c
onta
ct
05-N
on-s
peci
fic in
fect
ion
06-P
regn
ancy
/men
stru
atio
n 07
-Med
icat
ion
08-A
lcoh
ol
09-B
owel
diso
rder
10
-Che
mot
hera
py /
radi
othe
rapy
96
-Oth
er, s
peci
fy
____
____
____
___
98-D
on’t
know
01-H
P/H
C 02
-Gov
ernm
ent h
ospi
tal
03-M
unic
ipal
ity h
ospi
tal
04-G
over
nmen
t doc
tor/
para
med
ic in
priv
ate
capa
city
05
-Priv
ate
doct
or/p
rivat
e cl
inic
06
-Priv
ate
hosp
ital
07-P
harm
acist
08-H
omeo
path
09
-Fai
th h
eale
r 96
-Oth
ers
(spe
cify
)___
____
____
___
98 -
Don
’t kn
ow
01-I
llnes
s not
serio
us e
noug
h to
seek
adv
ice
/ tre
atm
ent
02-L
ack m
oney
for t
reat
men
t 03
- Hea
lth fa
cilit
y/do
ctor
etc
. too
far
04-B
elie
ves n
o on
e av
aila
ble
to se
ek a
dvic
e /
treat
men
t fro
m
96-O
ther
s (sp
ecify
) ___
____
____
____
____
98
-Don
’t kn
ow

A
ppen
dixe
s
43
HEA
LTH
(CO
NTI
NU
ED)
HE2
-1
Hav
e yo
u ev
er h
eard
of a
rsen
ic p
oiso
ning
, flu
oros
is (a
ffect
ing b
ones
and
teet
h)
and
othe
r dise
ases
that
are
mai
nly
attri
bute
d to
con
sum
ptio
n of
gro
und
wat
er
with
hig
h ar
seni
c an
d flu
orid
e co
nten
t?
1. Ye
s 2. N
o
HE2
-2
Are
you
aw
are
that
the
re is
evi
denc
e th
at d
rinki
ng w
ater
sal
inity
is li
nked
to
high
er b
lood
pre
ssur
e?
1. Ye
s 2. N
o
HE2
-3
Hav
e an
y of
you
r fa
mily
mem
bers
bee
n di
agno
sed
with
ars
enic
poi
soni
ng,
fluor
osis
or h
igh
bloo
d pr
essu
re?
1. Ye
s 2. N
o
HE2
-4
If ye
s in
HE2
-3, w
hat t
ype
of d
iseas
e?* (
Plea
se ti
ck w
hich
ever
is a
pplic
able
) 1.
Ars
enic
poi
soni
ng re
late
d di
seas
es 2
. Ske
leta
l flu
oros
is
3. D
enta
l flu
oros
is 4.
Hig
h bl
ood
pres
sure
5. S
kin
dise
ase
HE2
-5
Wha
t kin
d of
sym
ptom
s hav
e pro
mpt
ed yo
u to
seek
med
ical
coun
sel in
the p
ast?
HE2
-6
Whi
ch h
ouse
hold
mem
ber (
s) is
/are
affe
cted
? Co
de n
o. o
f rel
. to
HoH
may
be
men
tione
d
HE2
-7
Is th
e af
fect
ed h
ouse
hold
mem
ber c
ontin
uing
with
the
treat
men
t/med
icat
ion?
1.
Yes 2
. No
3. In
term
itten
t *I
nstr
uctio
n fo
r enu
mer
ator
: Ple
ase
chec
k la
st p
resc
riptio
n if
avai
labl
e.

44
App
endi
xes
H
OU
SEH
OLD
OR
CO
MM
UN
ITY
WO
RK (H
W) R
ecor
d on
ly th
e un
paid
/vol
unta
ry a
ctiv
ities
mea
nt fo
r the
hou
seho
ld o
r com
mun
ity.
(Do
not a
sk fo
r the
hou
seho
ld m
embe
rs w
ho a
re c
ontin
uous
ly li
ving
in o
ther
tow
n or
abr
oad
over
the
last
two
mon
ths o
r mor
e)
Line Number
Nam
e (C
opy f
rom
H
H2)
Co
de n
o. o
f re
l. to
HoH
m
ay b
e m
entio
ned
For 5
yea
rs a
nd o
ver.
How
man
y hou
rs d
id (N
AM
E) sp
end
doin
g the
follo
win
g act
iviti
es in
the
past
7 d
ays
(Zer
o if
did
not w
ork f
or sp
ecifi
ed a
ctiv
ity)
Colle
ctin
g fir
ewoo
d,
fodd
er,
gras
s/
Taki
ng c
are
of a
nim
als
Fetc
hing
w
ater
for
hous
ehol
d
Mak
ing m
ats,
knitt
ing,
wea
ving
, ta
ilorin
g (t
hese
can
be
for i
ncom
e)
Proc
essin
g pr
eser
ved
food
/sna
cks
(pic
kle,
jam
, w
ine,
puf
fed
rice,
Bod
i) (C
an b
e fo
r in
com
e)
Carin
g for
eld
erly
, sic
k, di
sabl
ed/B
abys
ittin
g
Clea
ning
ho
use,
la
undr
y, di
shw
ashi
ng,
cook
ing
Mar
ketin
g/
(incl
sale
of
HH
pr
oduc
ts)
Oth
er
volu
ntee
r/ SH
G
activ
ities
/ co
mm
unity
se
rvic
es
Tota
l hou
rs
in th
e la
st 7
da
ys
(HW
1 to
HW
8)
HH
1 H
H2
HW
1 H
W2
HW
3 H
W4
HW
5 H
W6
HW
7 H
W8
HW
9 01
02
03
04
05
06
07
08
09
10

A
ppen
dixe
s
45
JO
B M
ARK
ET W
ORK
(5 y
ears
and
old
er) (
MW
) (D
o no
t ask
for h
ouse
hold
mem
bers
who
hav
e be
en c
ontin
uous
ly li
ving
in o
ther
tow
n or
abr
oad
over
the
last
2 m
onth
s or m
ore)
Line Number
Nam
e /C
ode
of
Rel. t
o H
oH
(Cop
y fro
m
HH
2)
Did
(NA
ME)
do
any
wor
k fo
r pay
, for
pr
ofit,
or f
or
fam
ily ga
in o
r in
ow
n en
terp
rise
in
the
past
wee
k?
1-Ye
s 2-
No
(Ski
p to
M
W11
)
If ye
s in
MW
1 If
not
Wha
t is (
NA
ME)
type
of
wor
k per
form
ed (s
pent
m
ost t
ime)
1-
Agr
icul
ture
2-
Allie
d A
gric
ultu
re
3 –
HH
Indu
stry
4
– N
on-a
gr (D
ay la
bor)
5
– Fa
mily
bus
ines
s 6
– O
wn
busin
ess
7 –
Oth
ers
8 –
Priv
ate
sect
or jo
b 9
– G
ovt.
sect
or jo
b
Wha
t is
(NA
ME)
na
ture
of
mai
n em
ploy
men
t?
(See
cod
es
belo
w)
Wha
t is
(NA
ME)
in
stitu
tion
al se
ctor
of
empl
oym
ent
? (S
ee c
odes
be
low
)
How
is (N
AM
E)
paid
in th
is jo
b?
1-D
aily
bas
is 2-
Long
term
ba
sis
3-Co
ntra
ct,
piec
e-ra
te
4-M
onth
ly b
asis
5 - N
ot p
aid
How
muc
h di
d (N
AM
E)
get i
n ca
sh
per d
ay
equi
vale
nt
for t
his j
ob?
How
muc
h is
the
valu
e of
pa
ymen
t in
kind
(N
AM
E)
get p
er d
ay
equi
vale
nt
for t
his
job?
How
man
y ho
urs i
n a
wee
k doe
s (N
AM
E)
usua
lly
spen
d in
th
is jo
b?
If (N
AM
E) h
as
an e
nter
prise
, ho
w m
any
empl
oyee
s?
(incl
udin
g fa
mily
m
embe
rs a
nd
hire
d)
(00
if no
ne o
r ha
ve n
o en
terp
rise)
Ave
rage
nu
mbe
r of
hour
s per
w
eek a
n em
ploy
ee is
en
gage
d?
(00,
if n
ot
empl
oyee
s)**
Did
(N
AM
E)
look
for
wor
k du
ring t
he
past
7
days
? 1-
Yes
2-N
o
Wha
t is t
he
mai
n re
ason
fo
r not
lo
okin
g for
jo
b (I
f ‘no
’ in
MW
11) o
r no
t wor
king
(I
f ‘ye
s’ in
M
W11
)?
(See
cod
es
belo
w)
HH
1 H
H2
MW
1 M
W2
MW
3 M
W4
MW
5 M
W6
MW
7 M
W8
MW
9 M
W10
M
W11
M
W12
01
02
03
04
05
06
07
08
09
10
**
(Ple
ase
add
up w
ith h
omew
ork (
HW
9) to
det
erm
ine
the
plau
sibilit
y of t
otal
hou
rs sp
ent i
n ho
me
and
mar
ket w
ork a
gain
st to
tal a
vaila
ble
hour
s of 1
68 p
er w
eek)
C
ode
for n
atur
e of
em
ploy
men
t (M
W3)
1-
Paid
em
ploy
ee
2-O
pera
ting o
wn
busin
ess o
r far
m w
ith re
gula
r pai
d em
ploy
ees
3-O
pera
ting
own
busin
ess o
r far
m w
ithou
t reg
ular
pa
id e
mpl
oyee
s 4-
Cont
ribut
ing f
amily
mem
ber w
ithou
t pay
96
-Oth
ers,
spec
ify _
____
(e
.g.,
teac
her,
prie
st,
law
yer,
priv
ate
med
ical
pr
actit
ione
r)
Cod
e fo
r ins
titut
iona
l sec
tor o
f em
ploy
men
t (M
W4)
1-
Gov
ernm
ent s
ervi
ces
2-Pu
blic
sect
or/c
orpo
ratio
n 3-
Priv
ate
sect
or/c
orpo
ratio
n 4-
NG
O
5-Pr
ivat
e/in
form
al se
ctor
(Bric
k kiln
) 6-
Gov
t. sc
hem
e jo
b/ n
on-r
egul
ar (M
GN
REG
S)
7-U
nem
ploy
ed
Cod
e fo
r rea
son
for n
ot w
orki
ng n
ow /
look
ing
for w
ork
(MW
12):
01-W
aitin
g to
st
art
arra
nged
jo
b/bu
sines
s 02
-Stu
dent
03
-Hou
se d
utie
s 04
-Disa
bilit
y/Lo
ng-t
erm
illne
ss
05-R
etire
d
06-W
ork n
ot a
vaila
ble
07-W
aitin
g for
job
inqu
iries
08
-Off
seas
on
09-T
oo yo
ung
96-O
ther
s (s
peci
fy)_
____
____
____

46
App
endi
xes
WA
TER
SUPP
LY (W
S)
D
rinki
ng
Han
d w
ashi
ng
Cook
ing
Toile
t G
arde
ning
O
ther
do
mes
tic
uses
(b
athi
ng, la
undr
y, et
c.)
Live
stoc
k T ot al
W
S1
Wha
t is t
he m
ain
sour
ce o
f (Se
e co
des b
elow
) If
sour
ce is
not
on p
rem
ises,
skip
to W
S15
If so
urce
is o
n pr
emise
s (N
A fo
r wat
er so
urce
not
on
prem
ises)
WS2
H
ow m
any h
ours
supp
ly of
tap
wat
er p
er w
eek?
W
S3
How
is th
e pr
essu
re o
f the
wat
er s
uppl
y? 1-
Goo
d, 2
-Fa
ir, 3
-Poo
r
WS4
H
ow m
any t
imes
did
the
supp
ly b
reak
dow
n la
st ye
ar?
WS5
H
ow q
uick
ly a
re b
reak
dow
ns f
ixed
(1-S
ame
day,
2-W
ithin
2 d
ays,
3-W
ithin
a w
eek,
4-O
ther
WS6
D
o yo
u ha
ve m
otor
ized
pum
p to
pum
p w
ater
? 1-
Yes
2- N
o If
2-N
o,
Skip
W
S15
WS7
If,
yes h
ow m
uch
do yo
u sp
end
per m
onth
for p
umpi
ng w
ater
?
WS8
H
ow m
uch
do yo
u sp
end
per m
onth
on
mai
nten
ance
of p
ump?
If no
t ava
ilabl
e on
pre
mise
s or s
ourc
e ou
tsid
e th
e pr
emise
s is a
lso
used
Drin
king
H
and
was
hing
Co
okin
g To
ilet
Gar
deni
ng
Oth
er
dom
estic
us
es
(bat
hing
, laun
dry e
tc.)
Live
stoc
k T ot al
W
S9
Line
num
ber (
HH
1) o
f who
usu
ally
goe
s to
fetc
h w
ater
for
each
wat
er u
se
WS1
0 H
ow m
any t
imes
in a
day
doe
s hou
seho
ld fe
tch
wat
er
H
ow m
uch
time
(min
utes
) it
take
s to
fet
ch w
ater
, on
av
erag
e?
WS1
1 Tr
avel
tim
e
W
S12
Wai
ting t
ime
at th
e so
urce
W
S13
How
is w
ater
usu
ally
tran
spor
ted
from
sour
ce?
1-By
foot
, 2-B
icyc
le, 3
-Mot
orcy
cle,
4-
Oth
er p
rivat
e m
otor
ized
vehi
cle,
5-O
ther
s

A
ppen
dixe
s
47
C
ode
for m
ain
sour
ce o
f wat
er (W
S1)
W
ATE
R SU
PPLY
(WS)
(con
tinue
d)
WS1
4 W
hat
is th
e ap
prox
imat
e di
stan
ce (
in k
ilom
eter
s) t
o th
e m
ain
sour
ce o
f wat
er
WS1
5 D
o yo
u pu
rcha
se w
ater
? If
yes,
how
muc
h do
you
pay
per
m
onth
?
WS1
6 D
o an
y of
the
fam
ily m
embe
rs s
uffe
r fro
m m
uscl
e st
rain
, bl
ister
s or b
acka
che
from
car
ryin
g wat
er fr
om so
urce
? 1-
Yes
2-N
o 9-
Don
’t kn
ow
The
follo
win
g qu
estio
ns a
pply
to a
ll ho
useh
olds
W
S17
Do
you
treat
wat
er to
mak
e it
safe
r to
drin
k?
1-Ye
s 2-
No
If N
o, S
kip
to W
S20
WS1
8 If
yes,
wha
t do
you
usua
lly d
o to
mak
e w
ater
safe
r to
drin
k 1-
Boil
2-U
se a
lum
3-
Add
ble
ach
/ chl
orin
e
4-St
rain
thro
ugh
a cl
oth
5-U
se w
ater
filte
r (ce
ram
ic, s
and,
com
posit
eetc
.) 6-
Use
ele
ctro
nic
purif
ier
7-Le
t it s
tand
and
settl
e 8-
Oth
ers (
spec
ify)_
____
____
____
__
WS1
9 H
ow m
uch
do yo
u sp
end
for t
reat
men
t per
mon
th?
Rs.
WS2
0 D
o yo
u st
ore
your
drin
king
wat
er?
1-Ye
s 2-
No
(Ski
p to
WS2
6)
WS2
1 If
yes:
How
do
you
stor
e dr
inki
ng w
ater
? 1-
In c
onta
iner
s/ve
ssel
s 2-
Roof
tank
or c
ister
n 3-
Und
ergr
ound
tank
4-O
ther
s (sp
ecify
) ___
____
____
WS2
2 A
ny m
easu
res t
aken
to a
void
cont
amin
atio
n of
stor
ed w
ater
? 1-
Non
e 2-
Cove
r the
cont
aine
rs
3-U
se c
up/la
dle
with
long
han
dle
4-Cl
ean
vess
el re
gula
rly
5-Ke
ep ve
ssel
in a
cle
an p
lace
6-
Oth
ers,
spec
ify _
____
____
____
_
Qua
lity
of W
ater
D
rinki
ng
Han
d w
ashi
ng
Cook
ing
Toile
t G
arde
ning
O
ther
do
mes
tic
uses
(b
athi
ng, la
undr
y, et
c.)
Live
stoc
k
WS2
3 Co
lor (
1-Cl
ear,
2-Fa
ir, 3
-Dirt
y)
W
S24
Odo
r (1
-Non
e, 2
-Som
e sm
ell,
3-St
rong
smel
l)
WS2
5 Ta
ste
(1-G
ood,
2-F
air,
3-Ba
d)
W
S26
Are
you
satis
fied
with
the
qual
ity o
f w
ater
supp
lied
(1-S
atisf
ied,
2-F
airly
Sa
tisfie
d, 3
-Not
satis
fied)

48
App
endi
xes
SA
NIT
ATI
ON
FA
CIL
ITIE
S A
ND
PRA
CTI
CES
(SP)
SP1
Wha
t kin
d of
toile
t fac
ility d
o m
embe
rs o
f you
r ho
useh
old
usua
lly u
se?
01-F
lush
or p
our t
oile
t to
pipe
d se
wer
syst
em
02-F
lush
or p
our t
oile
t to
sept
ic ta
nk
03-F
lush
to p
it la
trine
04
-Flu
sh o
r pou
r toi
let t
o so
mew
here
else
05
-Flu
sh o
r pou
r toi
let t
o do
n’t k
now
whe
re
06-V
entil
ated
impr
oved
pit
latri
ne
07-P
it la
trine
with
slab
08
-Pit
latri
ne w
ithou
t sla
b/op
en p
it 09
-Tw
in p
it/Co
mpo
stin
g toi
let
10-D
ry to
ilet
11-N
o to
ilet f
acilit
y
if 11
, Ski
p to
SP5
SP
2 Is
it fo
r you
r ow
n us
e or
shar
ed w
ith o
ther
ho
useh
olds
? 1-
Ow
n us
e 2-
Shar
ed
SP3
Do
you/
fam
ily m
embe
rs fo
llow
hea
lthy h
abits
afte
r co
min
g fro
m to
ilet?
1-
Was
hing
han
ds w
ith so
ap/c
lean
sing m
ater
ials
2-W
ashi
ng h
ands
with
out s
oap
3-Cl
eani
ng to
ilet
3-
Chan
ging
clo
thes
4-B
athi
ng 5
-Any
oth
er
SP 4
A
re yo
u co
nnec
ted
to a
sani
tary
syst
em fo
r liq
uid
was
tes?
1-
Und
ergr
ound
dra
ins
2-O
pen
drai
ns
3-S
oak p
it
4
-No
98-
Don
’t kn
ow
SP 5
H
ave
any o
f you
r chi
ldre
n m
issed
scho
ol d
ue to
la
ck o
f poo
r toi
let f
acilit
ies
1-Ye
s, in
dica
te lin
e nu
mbe
r in
rost
er 2
-No
(Sch
ool h
as fa
cilit
y)
3-D
on’t
have
scho
ol go
ing c
hild
ren
96-
Oth
er (s
peci
fy)_
____
____
__
SP 6
H
as a
ny fa
mily
mem
ber a
ttend
ed h
ygie
ne a
nd
sani
tatio
n ed
ucat
ion
sess
ions
? 1–
Yes 2
–No
3-N
ever
hea
rd. I
f yes
, who
org
anize
d? 1-
NG
O 2
-Sch
ool
3-A
SHA
/AN
M st
aff 4
–Gov
ernm
ent h
ealth
dep
artm
ent 9
6–O
ther
s (sp
ecify
)
SP 7
W
ho a
ttend
ed th
ese
sess
ions
? 1-
Adu
lt m
ale
2-A
dult
fem
ale
3-Sc
hool
goin
g boy
4-S
choo
l goi
ng gi
rl

A
ppen
dixe
s
49
IN
Inco
me
(mon
thly
ave
rage
) of m
embe
rs w
orki
ng in
the
job
mar
ket (
refe
r to
Job
Mar
ket W
ork
[MW
] mod
ule)
Li
ne
No.
(H
H1)
N
ame
(HH
2)
Ave
rage
mon
thly
inco
me
from
wag
es
Pay p
er d
ay
(MW
6)
Avg
no.
of d
ays w
orke
d pe
r mon
th p
aid
in c
ash
Tota
l pay
in
cash
per
m
onth
Paym
ent i
n ki
nd p
er d
ay
(MW
7)
Avg
no.
of d
ays
wor
ked
per m
onth
pa
id in
kind
Tota
l pay
in
kind
per
m
onth
Re
mar
ks
HH
1 H
H2
IN1
IN2
IN3=
IN1*
IN2
IN4
IN5
IN6=
IN4*
IN5
Tota
l
EX
Expe
nditu
re (T
otal
HH
Exp
endi
ture
per
mon
th/y
ear)
(A
) Am
ount
per
mon
th (A
) O
r (B)
tota
l am
ount
per
yea
r (B=
A*1
2)
EX0
Tota
l
EX
1 Fo
od
EX2
Beve
rage
s and
toba
cco
EX
3 C
loth
es a
nd p
erso
nal c
are
item
s
EX
4 M
edic
al
EX5
Educ
atio
n
EX6
Wat
er
EX7
Fuel
and
light
ing
EX8
Tran
spor
t and
com
mun
icat
ions
(lan
dlin
e, m
obile
pho
ne)
EX9
Ente
rtain
men
t
EX
10
Hou
sing r
epai
rs
EX11
Re
nt (r
ent o
r im
pute
d re
nt o
f ow
n ho
me)
EX
12
Oth
ers
To
tal
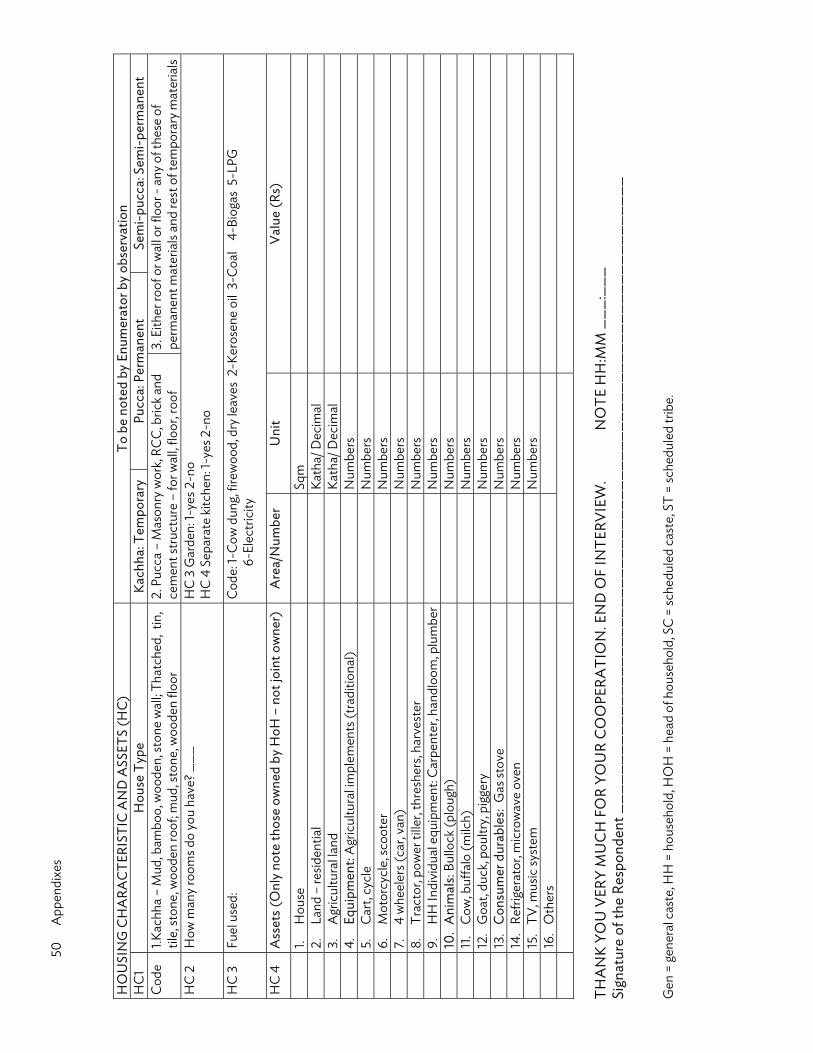
50
App
endi
xes
H
OU
SIN
G C
HA
RAC
TERI
STIC
AN
D A
SSET
S (H
C)
To b
e no
ted
by E
num
erat
or b
y ob
serv
atio
n H
C1
Hou
se T
ype
Kach
ha: T
empo
rary
Pu
cca:
Per
man
ent
Sem
i-puc
ca: S
emi-p
erm
anen
t Co
de
1.Kac
hha
– M
ud, b
ambo
o, w
oode
n, st
one
wal
l; Tha
tche
d, t
in,
tile,
ston
e, w
oode
n ro
of; m
ud, s
tone
, woo
den
floor
2.
Puc
ca –
Mas
onry
wor
k, RC
C, b
rick a
nd
cem
ent s
truct
ure
– fo
r wal
l, flo
or, r
oof
3. E
ither
roof
or w
all o
r flo
or -
any o
f the
se o
f pe
rman
ent m
ater
ials
and
rest
of t
empo
rary
mat
eria
ls
HC
2
How
man
y roo
ms d
o yo
u ha
ve? _
__
H
C 3
Gar
den:
1-ye
s 2-n
o H
C 4
Sepa
rate
kitc
hen:
1-ye
s 2-n
o
HC
3 Fu
el u
sed:
Co
de: 1
-Cow
dun
g, fir
ewoo
d, d
ry le
aves
2-K
eros
ene
oil 3
-Coa
l 4
-Bio
gas
5-LP
G
6-
Elec
trici
ty
HC
4 A
sset
s (O
nly
note
thos
e ow
ned
by H
oH –
not
join
t ow
ner)
A
rea/
Num
ber
Uni
t Va
lue
(Rs)
1.
Hou
se
Sq
m
2.
Land
– re
siden
tial
Ka
tha/
Dec
imal
3.
A
gric
ultu
ral la
nd
Ka
tha/
Dec
imal
4.
Eq
uipm
ent:
Agr
icul
tura
l impl
emen
ts (t
radi
tiona
l)
Num
bers
5.
Ca
rt, c
ycle
Num
bers
6.
M
otor
cycl
e, sc
oote
r
Num
bers
7.
4
whe
eler
s (ca
r, va
n)
N
umbe
rs
8.
Trac
tor,
pow
er ti
ller,
thre
sher
s, ha
rves
ter
N
umbe
rs
9.
HH
Indi
vidu
al e
quip
men
t: Ca
rpen
ter,
hand
loom
, plu
mbe
r
Num
bers
10
. A
nim
als:
Bullo
ck (p
loug
h)
N
umbe
rs
11.
Cow
, buf
falo
(milc
h)
N
umbe
rs
12.
Goa
t, du
ck, p
oultr
y, pi
gger
y
Num
bers
13
. C
onsu
mer
dur
able
s: G
as st
ove
N
umbe
rs
14.
Refri
gera
tor,
mic
row
ave
oven
Num
bers
15
. TV
, mus
ic sy
stem
Num
bers
16
. O
ther
s
THA
NK
YOU
VER
Y M
UC
H F
OR
YOU
R C
OO
PERA
TIO
N. E
ND
OF
INTE
RVIE
W.
NO
TE H
H:M
M _
__:_
__
Sign
atur
e of
the
Resp
onde
nt _
____
____
____
____
____
____
____
____
____
____
____
____
____
____
____
____
G
en =
gene
ral c
aste
, HH
= h
ouse
hold
, HO
H =
hea
d of
hou
seho
ld, S
C =
sche
dule
d ca
ste,
ST
= sc
hedu
led
tribe
.

APPENDIX 2
Sampling Scheme
The sampling scheme is a clustered design with gram panchayats (GP) as clusters and households in those GPs as observation units. A cluster sample size of 30 households was used. Given the number of households per cluster, the number of sample GPs per district was determined proportional to the number of households per district. Two outcomes were used to compute the sample size: diarrhea incidence and school attendance. These two outcomes are among the primary outcome variables the project is interested in that are available in the dataset. The sample size was determined using 0.05 significance level and 0.8 power (Appendix 3). This sample size can detect as small as 0.15 standard deviation for diarrhea and 0.20 standard deviation for school attendance. The determined cluster sample size of 30 translates to about 66 GPs or 33 treatment and 33 comparison GPs, or a total estimated sample size of about 2,000 households. The distribution of the sample GPs across the three districts (Bankura, East Medinipur, and North 24 and South 24 Parganas) is shown in column 7 of Table 2-A.
Table A2: Sampling Allocation
District
Total No. of GPs*
Total No. of GPs with Codes**
No. of Households*
Prop. to Total
No. of Sample
GPs
Code- Adjusted Sample
GPs
Total No. of Sample
Households
(1) (2) (3) (4) (5) (6) (7) (8)=(7)*30*2
Bankura 31 30 120,170 0.1317 4 5 300
Purba Medinipur 17 16 331,054 0.3629 12 14 840 North (and South) 24 Paraganas 18 14 461,109 0.5054 17 14 840
Total 66 60 912,333 1.0000 33 33 1,980
* Based on Census Annexure files. ** Some gram panchayats (GP) did not have clear codes needed for merging data from different sources to do matching based on characteristics Source: Census of India, 2011. The treatment GPs per district were randomly selected from the identified project GPs. The selection of matching comparison GPs for each of the treatment GP was done in two steps. The blocks in each project district were matched first, and within those matched blocks, the matched GPs were selected. The characteristics used for matching blocks include number of households, total land area, number of villages (only at block level), population density, proportion of area irrigated, proportion of the population in scheduled caste, proportion of the population in scheduled tribe, proportion of illiterate population, proportion of working population, and proportion of the households with tap water. The same characteristics, depending on the availability of data, were used to match GPs, except for the number of GPs.

APPENDIX 3
Calculating Power and Sample Size for the West Bengal Drinking Water Sector Improvement Project
Preliminaries
1. This note describes the power and sample size calculation for the West Bengal Drinking Water Sector Improvement Project (WBDWSIP).
2. The data set used to compute power and sample size is the Demographic and Health Survey dataset for West Bengal officially called the National Family Health Survey (NFHS-4) for 2015–2016.1 The choice of the dataset is based on two considerations: (i) it has data on the primary outcomes of the project such as incidence of diarrhea and school attendance for the area of interest (i.e., West Bengal), and (ii) it is recent.
3. As mentioned in the initial evaluation design note, the project has pre-selected 66 project GPs that will receive the interventions. The evaluation will then identify matching GPs to the pre-selected project GPs as the counterfactual GPs. Gram panchayat characteristics will be used to match treatment and comparison GPs. Hence, the sampling will be a clustered design with GPs as clusters and households in those GPs as observation units.
4. The clustering variable that will be used in the subsequent calculation is the primary sampling unit (PSU) (hv021)2 of the NFHS-4.
5. Two outcomes will be used to compute the sample size: diarrhea incidence and school attendance. These are among the primary outcome variables the project is interested in that are available in the dataset.
6. The power and sample size estimation use the power routine in Stata. Given the nature of the outcomes that will be used (i.e. proportions), and since the sample will be used for impact evaluation, the estimation will use a difference in two proportions to determine the sample size.
7. The parameters of the estimation are the commonly accepted ones such as 0.05 level of significance and 0.8 power. The cluster sample size is 30 households.
Diarrhea
8. The NFHS-4 estimates the incidence of diarrhea among children 0 to 59 months old in West Bengal to be 0.061 with a standard deviation of 0.239. The intra-cluster correlation is estimated to be 0.028.
9. Given the aforementioned parameters, the power curve (Figure A3.1) shows that the corresponding number of clusters needed for reducing diarrhea by 0.1SD, 0.15SD, or 0.20SD are 77, 31, and 15, respectively, for each treatment arm.
School Attendance
10. The NFHS-4 data estimates the school attendance of children 6-17 years old to be 0.891 with standard deviation (SD) of 0.312. The ICC is estimated to be 0.055.
1 International Institute for Population Sciences (IIPS) and ICF. 2017. Ministry of Health and Family Welfare, Government of
India: National Family Health Survey (NFHS-4), India, 2015-16: West Bengal. Mumbai. 2 hv021 is the variable name of the primary sampling unit in NFSH-4.
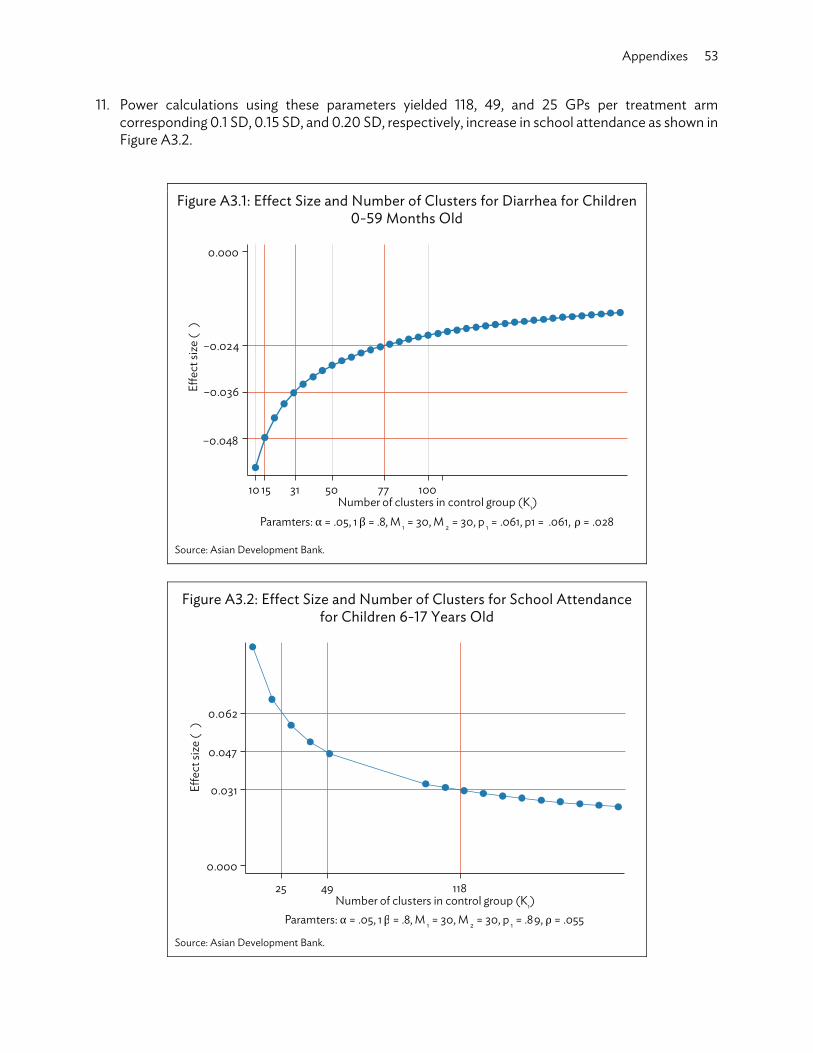
Appendixes 53
11. Power calculations using these parameters yielded 118, 49, and 25 GPs per treatment arm corresponding 0.1 SD, 0.15 SD, and 0.20 SD, respectively, increase in school attendance as shown in Figure A3.2.
Figure A3.1: Effect Size and Number of Clusters for Diarrhea for Children 0-59 Months Old
Source: Asian Development Bank.
Figure A3.2: Effect Size and Number of Clusters for School Attendance for Children 6-17 Years Old
Source: Asian Development Bank.
0.000
–0.024
–0.036Effe
ct si
ze (�
)
–0.048
10 15 31 50 77 100Number of clusters in control group (K1)
Paramters: α = .05, 1β = .8, M 1 = 30, M 2 = 30, p 1 = .061, p1 = .061, ρ = .028
Effe
ct si
ze (�
)
0.000
0.031
0.047
0.062
25 49 118Number of clusters in control group (K1)
Paramters: α = .05, 1β = .8, M 1 = 30, M 2 = 30, p 1 = .89, ρ = .055

54 Appendixes
Summary
12. Table A3 shows the summary of the power and sample size calculations at significance level of 0.05, power of 0.8, and cluster sample size of 30. It shows that the required number of GPs at 0.10𝜎, 0.15𝜎, and 0.20𝜎 for diarrhea representing a change of –0.024, –0.036, and –0.048 are 154, 62, and 30 GPs, respectively. In the case of school attendance, the required number of GPs for a change of 0.031, 0.047, and 0.062 are 236, 98, and 50, respectively.
13. Even though the 0.10𝜎 effect size of –0.024 for diarrhea appears to be small, this already represents 39% of the current diarrhea incidence rate of 0.061. This is a change that may already be challenging to achieve. Given this, it can be considered as a binding constraint to sample size estimation (i.e., the recommended minimum number of GPs to sample is 154 or 77 in each of the project and comparison GPs). However, the total number of treatment GPs identified for the project is 66. This means that there is a need to include all the 66 GPs identified for the project and identify another 66 non-project GPs in the districts as comparison GPs. With 66 GPs for each treatment arm, the study will be able to detect as low as 0.032 difference in diarrhea incidence and a 0.041 difference in school attendance. This translates to a total of 3,960 households at 30 households per GP.
Table A3: Power and Sample Size Calculation Summary
Diarrhea Attendance Effect size .10𝜎 0.024 0.031 .15𝜎 0.036 0.047 .20𝜎 0.048 0.062 Parameters Control mean 0.061 0.891 Control SD 0.239 0.312 ICC 0.028 0.055 Cluster size (30) Sig (.05) Power (.8) Villages needed .10𝜎 154 236 .15𝜎 62 98 .20𝜎 30 50 Sample size needed .10𝜎 4,620 7,080 .15𝜎 1,860 2,940 .20𝜎 900 1,500
ICC =intra-cluster correlation, SD = standard deviation. Source: Asian Development Bank.

APPENDIX 4
56 Appendixes

Appendixes 57

58 Appendixes

Appendixes 59
APPENDIX 5
Questionnaire for Household Survey
1. Basic Details Surveyor ID (email) Surveyor Name Date and Time of Survey Package No. GPS Location of House (long. and lat.)
2. Property Details Property ID No./ Khasara/Khatauni No.
Street / Gali No./ Name:
House No. Name of Village: GP Ward No. District Name of GP Name of Property Owner Block Relation of the
Respondent with Owner
Name of Resident (If different from owner)
3. General Information Use Purpose of the Building Fully Residential
Fully Commercial Partly Residential / Commercial
Clinic / Hospital School / College Office /
Institution Rental Use
Building Type Semi Pucca House w. Mud Walls &Thatched
Roof
Kachcha Pucca
House Type Single Storey Building Bungalow/Haveli Others
Double Storey Building
No. of Persons Living Ordinarily in the House
Male nos.: Female nos.:
Other In-House Facilities Facility of Sanitary Toilets Yes / No Electricity Yes / No
Existing Water Supply System Source of Water Supply
Wells Piped Water Supply Others (Please Specify)
Handpump Borewell Ponds
Type of Existing Connection, if any Personal Household Connection
Shared Connection
Group Connection Public Stand Post (PSP)
Type of Existing Connection – part II
Connection is metered Yes No Connection Pipeline Size Nil
< 20 mm 20-50 mm >50 mm
Approximate Consumption in L / Day Approximate Monthly Expenditure in Rs

60 Appendixes
Storage Capacity Ground Tank Roof Tank
Others
Poverty Mapping: BPL APL
None
Measure of Social Vulnerability SC ST
OBC General
Measure of Social Vulnerability – part II
Differently Abled Persons
Women Headed HH Single Elderly Woman
Single Elderly Man Orphan Child Nil
4. Photo Capture BPL (It will show if user belongs to BPL)
House / Building (GeoTag) Others (Optional) Aadhar Pan Card Ration
card E-bill T-Bill
Submit (The surveyor will submit using app and internet connection. When done in the field, data is synchronized to server. If not, then data is stored offline, and after getting the internet connection, the offline data will be synchronized to server.) Surveyor will receive receipt for submission when using app version (e.g., by receiving email, same as surveyor ID).
BPL = below poverty line, GP = gram panchayat, HH =household.

GLOSSARY
accredited social health activist (ASHA)
one of the key components of the National Rural Health Mission is to provide every village in the country with a trained female community health activist (ASHA); selected from the village itself and being accountable to it, the ASHA workers are trained to work as an interface between the community and the public health system
below poverty line (BPL)
a benchmark used by the Government of India to indicate economic disadvantage and identify individuals and households in need of government assistance; an expert panel set up by the Government of India in 2015 put the poverty line as ₹32 a day in rural areas and ₹47 in towns and cities
block or community development block (CD Block)
a rural area administratively earmarked for development, consisting of several gram panchayats
comparison block / households matching blocks / households outside project area
gram panchayat an elected local administrative unit at village- or small-town level in line with local self-governance system formalized under Panchayati Raj Institution
household a group of persons who normally live together and take food from a common kitchen
leach pit used for containment of raw sludge; leach pits are used in conjunction with low-flush or pour-flush toilets; leach pits are dug up pits which serve a dual function: (i) storage and digestion of excreted solids and (ii) infiltration of the waste liquids; as per the practice of Swachh Bharat Mission, twin leach pits are provided so that when one gets filled up, the other one can be used
on-site sanitation a sanitation system in which excreta and wastewater are collected, stored, or treated at the same location (or on the same plot) where they are generated
other backward class (OBC) A collective term used by the Government of India to classify castes which are educationally or socially disadvantaged, other than scheduled caste and scheduled tribe

62 | Glossary
out-of-pocket expenditure payments made by an individual at the point of receiving healthcare services or goods and usually incurred when an individual’s visit to healthcare provider (i.e., clinic, hospital, pharmacy, laboratory) is not provided for free in a government health facility or a facility run by a non-profit organization, or if this individual is not covered by a social protection scheme (i.e., government or private health insurance)
RRP Report and Recommendation of the President to the Board of Directors
SCADA is a control system architecture (comprising computers, networked data communications, instruments) which allows for input data to be processed (collected, captured, transferred) and analyzed for supervisory management based on (programmable) logic to interface with process plant or machinery
scheduled caste regarded as socially disadvantaged group officially enlisted in Constitution (Scheduled Castes) Order, 1950 of India, First Schedule.
Scheduled tribe synonymous to indigenous people and defined by the Constitution of India as "such tribes or tribal communities or parts of or groups within such tribes or tribal communities as are deemed under Article 342 to be Scheduled Tribes for the purposes of the Constitution”
soak pits porous-walled chambers dug up to allow the partially treated wastewater from septic tanks to slowly soak into the ground. Soak pits are also filled with brick bats / graded sand at times for filtration.
surface water water located above ground and includes rivers, dams, lakes, ponds, streams, canals, and irrigation channels
treatment block / households blocks / households within project area
tube well, bore well, hand pump, dug well
tube well and hand pump are bore wells used for extracting ground water for drinking purpose; a bore well’s pump operated by animal, wind, electric, diesel or solar means is known as tube well; the pump operated manually or mechanically to lift ground water is known as hand pump; dug wells have a head wall built around the well with concrete drainage platform, a drainage channel, and a bucket with hand pump or windlass.

REFERENCES Asian Development Bank. 2018. Report and Recommendations of the President to the Board of Directors:
Proposed Loan for the Government of India for the West Bengal Drinking Water Sector Improvement Project. Arsenic and Fluoride in Drinking Water in West Bengal—Characteristics, Implications, and Mitigation. Manila.
Central Bureau of Health Intelligence, DG of Health Services, Ministry of Health and Family Welfare, Government of India. 2018. National Health Profile. 13. New Delhi.
————. 2019. National Health Profile. 14. www.cbhidghs.nic.inshowfile.phplid.
District-wise Distribution in Water Supply and Sanitation Services in West Bengal: Role of Panchayati Raj Institutions. 2006. shodhganga.inflibnet.ac.in › bitstream.
Government of India. Ministry of Statistics and Programme Implementation. National Sample Survey Office. 2017. Swachhta Status Report 2016. New Delhi.
Healthcare Financing Division, National Health Systems Resource Centre, Ministry of Health and Family Welfare, Government of India. 2014. Household Healthcare Utilization and Expenditure in India. State Fact Sheets: West Bengal. pp. 60–61. nhsrcindia.org.
Ministry of Health and Family Welfare, Government of India, International Institute of Population Sciences. 2017. National Family Health Survey (NFHS-4), 2015-2016: West Bengal. Mumbai.
Ministry of Statistics and Programme Implementation, National Statistical Office, Government of India. 2018. Drinking Water, Sanitation, Hygiene and Housing Condition in India. NSS 76th Round. July-December. New Delhi.
Public Health Engineering Department, Government of West Bengal. Major Water Supply Projects. www.wbphed.gov.in.
Sigma Foundation. 2019. Gender Aspects in Accessing Wash Services: A Study in Four Blocks of Bankura District of West Bengal. Kolkata.
SuSanA. www.susana.org/en/about.
ASIAN DEVELOPMENT BANK
ASIAN DEVELOPMENT BANK6 ADB Avenue, Mandaluyong City1550 Metro Manila, Philippineswww.adb.org
Measuring the Impact of West Bengal Drinking Water Sector Improvement ProjectA Baseline Study
Access to safe drinking water is a fundamental right of people. The West Bengal Drinking Water Sector Improvement Project is assisting the Government of West Bengal to provide safe, sustainable, and inclusive drinking water services to over 1.65 million people in the arsenic, fluoride, and salinity-affected areas of Bankura, North and South 24 Parganas, and Purba Medinipur districts. This publication sets the baseline of the project by providing the benchmark comparison of primary outcomes for the project and non-project households, before implementation, so that an impact evaluation can be carried out at project completion.
About the Asian Development Bank
ADB is committed to achieving a prosperous, inclusive, resilient, and sustainable Asia and the Pacific, while sustaining its efforts to eradicate extreme poverty. Established in 1966, it is owned by 68 members —49 from the region. Its main instruments for helping its developing member countries are policy dialogue, loans, equity investments, guarantees, grants, and technical assistance.
MEASURING THE IMPACT OF WEST BENGAL DRINKING WATER SECTOR IMPROVEMENT PROJECTA BASELINE STUDYAniceto C. Orbeta, Neeta Pokhrel, Saswati Ghosh Belliappa, Saugata Dasgupta, and Arati Nandi
ADB SOUTH ASIAWORKING PAPER SERIES
NO. 77
December 2020