Measuring the Impact of Customer Loyalty Programs and ...
292
Measuring the Impact of Customer Loyalty Programs and Mediating Factors on Customer Loyalty: The Beauty & Health Retailing Stores in Hong Kong by Mr. Mohammed Sardaran Khan Student No. 3118692 A thesis submitted to the Faculty of Business and Law In Partial Fulfillment of the Requirements for the degree of Doctorate of Business Administration Newcastle Business School The University of Newcastle Australia 2019 September
-
Upload
khangminh22 -
Category
Documents
-
view
4 -
download
0
Transcript of Measuring the Impact of Customer Loyalty Programs and ...
Measuring the Impact of Customer Loyalty Programs and Mediating
Factors on Customer Loyalty: The Beauty & Health Retailing Stores in
Hong Kong
by
Mr. Mohammed Sardaran Khan
Student No. 3118692
A thesis submitted to the
Faculty of Business and Law
In Partial Fulfillment of the Requirements for the degree of
Doctorate of Business Administration
Newcastle Business School
The University of Newcastle
Australia
2019 September

Declaration
I hereby certify that the content of this dissertation is the result of original research
and has not been submitted for a higher degree to any other universities or tertiary
institutions.
Candidate Signature:
Date: 2019 September 1

iii
Acknowledgments
I wish to express my deep appreciation to all those who have supported and
encourage me to finish this doctoral journey.
First, I would like to express my sincere gratitude to my supervisor and lecturers
from the University of Newcastle, Australia, for their teaching and advice
throughout the programme of the Doctorate of Business Administration.
I am also thankful for the support and understanding of my classmates, colleagues,
friends.
Finally, I would like to express sincere appreciation to all members of my family
where a lot of “together time” was scarified. Without the support and
encouragement from all of them, I do not believe I could have completed this DBA
journey.
iv
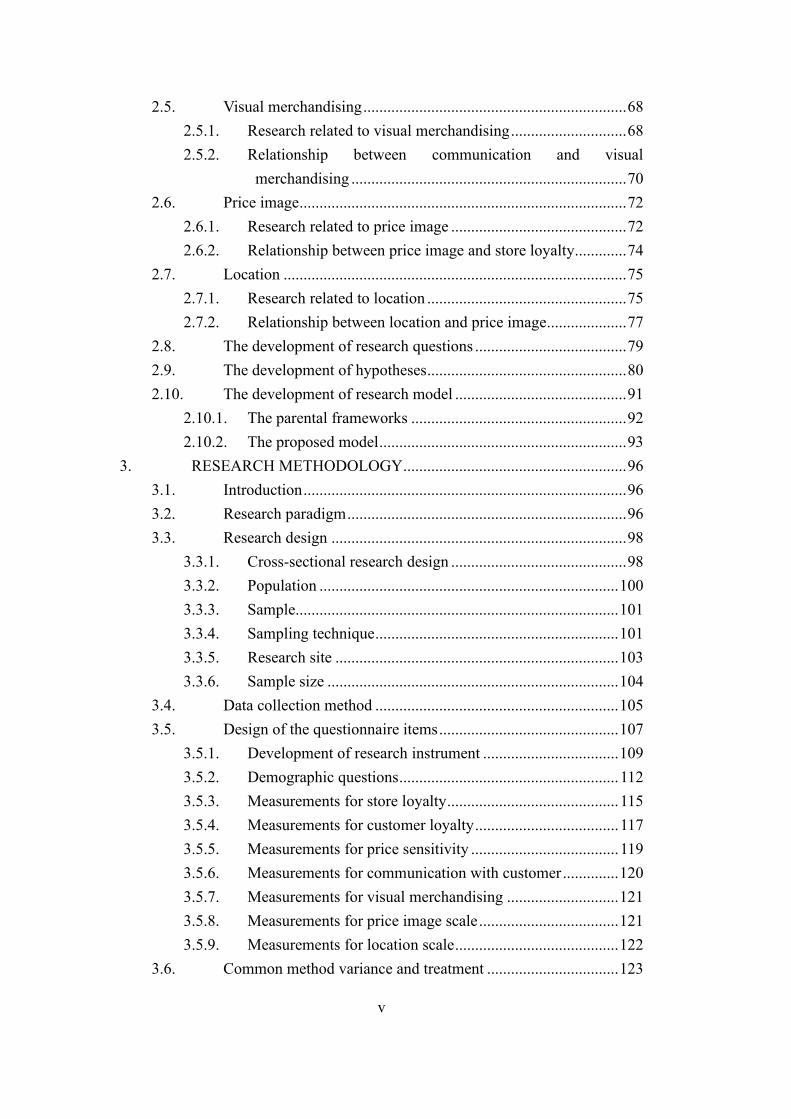
Table of contents Declaration ..............................................................................................................ii Acknowledgments................................................................................................. iii List of Tables .......................................................................................................... ix
List of Figures ........................................................................................................ xi Abstract …… ........................................................................................................xii 1. INTRODUCTION ................................................................................ 1
1.1. Research background .................................................................... 3
1.1.1. Hong Kong Special Administrative Region ............................ 4
1.1.2. Culture in Hong Kong ............................................................. 5
1.1.3. The context of beauty & healthcare Products ......................... 8
1.1.4. Distribution channels in Hong Kong .................................... 10
1.1.5. The shifting market focus amongst major Hong Kong retailers ............................................................................................. 12
1.2. Mechanism of customer loyalty programs .................................. 14
1.2.1. Importance of customer loyalty programs in Hong Kong .... 14
1.2.2. Price sensitivity in the Chinese society ................................. 16
1.3. Research justification .................................................................. 18
1.4. Research questions ...................................................................... 19
1.5. Research methodology ................................................................ 20
2. LITERATURE REVIEW .................................................................... 22
2.1. Store loyalty ................................................................................ 24
2.1.1. Behavioural action ................................................................ 31
2.1.2. Word-of-mouth...................................................................... 34
2.1.3. Commitment ......................................................................... 38
2.2. Customer loyalty programmes .................................................... 42
2.2.1. Evolution of CLP .................................................................. 42
2.2.2. Hard attributes ....................................................................... 47
2.2.3. Soft attributes ........................................................................ 50
2.2.4. Relationships between loyalty program and store loyalty .... 52
2.3. Price sensitivity ........................................................................... 59
2.3.1. Research related to price sensitivity ..................................... 59
2.3.2. The moderation effect of price sensitivity factor .................. 61
2.4. Communications with customers ................................................ 64
2.4.1. Research related to communication with customers ............. 65
2.4.2. Relationship between communication and store loyalty ...... 66
v
2.5. Visual merchandising .................................................................. 68
2.5.1. Research related to visual merchandising ............................. 68
2.5.2. Relationship between communication and visual merchandising ..................................................................... 70
2.6. Price image .................................................................................. 72
2.6.1. Research related to price image ............................................ 72
2.6.2. Relationship between price image and store loyalty............. 74
2.7. Location ...................................................................................... 75
2.7.1. Research related to location .................................................. 75
2.7.2. Relationship between location and price image.................... 77
2.8. The development of research questions ...................................... 79
2.9. The development of hypotheses .................................................. 80
2.10. The development of research model ........................................... 91
2.10.1. The parental frameworks ...................................................... 92
2.10.2. The proposed model .............................................................. 93
3. RESEARCH METHODOLOGY ........................................................ 96
3.1. Introduction ................................................................................. 96
3.2. Research paradigm ...................................................................... 96
3.3. Research design .......................................................................... 98
3.3.1. Cross-sectional research design ............................................ 98
3.3.2. Population ........................................................................... 100
3.3.3. Sample................................................................................. 101
3.3.4. Sampling technique ............................................................. 101
3.3.5. Research site ....................................................................... 103
3.3.6. Sample size ......................................................................... 104
3.4. Data collection method ............................................................. 105
3.5. Design of the questionnaire items ............................................. 107
3.5.1. Development of research instrument .................................. 109
3.5.2. Demographic questions ....................................................... 112
3.5.3. Measurements for store loyalty ........................................... 115
3.5.4. Measurements for customer loyalty .................................... 117
3.5.5. Measurements for price sensitivity ..................................... 119
3.5.6. Measurements for communication with customer .............. 120
3.5.7. Measurements for visual merchandising ............................ 121
3.5.8. Measurements for price image scale ................................... 121
3.5.9. Measurements for location scale ......................................... 122
3.6. Common method variance and treatment ................................. 123
vi
3.7. Statistical data analysis ............................................................. 124
3.7.1. Data screening and data coding .......................................... 124
3.7.2. Descriptive analysis ............................................................ 125
3.7.3. Measurement assessment – reliability test .......................... 126
3.7.4. Measurement assessment – validity tests ............................ 127
3.8. Structural equation modelling and applications ........................ 129
3.8.1. The measurement model ..................................................... 130
3.8.2. The structural model ........................................................... 130
3.8.3. The fit indices in structural equation modelling ................. 131
3.8.4. The test on mediation variables .......................................... 132
3.8.5. The test of the moderation construct ................................... 133
3.9. Limitation of methodology used ............................................... 134
3.10. Ethical considerations ............................................................... 135
3.11. Significance and limitation of current work ............................. 136
4. DATA ANALYSIS ............................................................................ 137
4.1. Introduction ............................................................................... 137
4.2. Naming of variables and constructs .......................................... 137
4.3. Data screening ........................................................................... 138
4.4. Descriptive analysis .................................................................. 139
4.4.1. Descriptive analysis of demographic data .......................... 140
4.4.2. Descriptive analysis for behavioural action ........................ 145
4.4.3. Descriptive analysis for word-of-mouth ............................. 145
4.4.4. Descriptive analysis for commitment ................................. 146
4.4.5. Descriptive analysis for hard attributes............................... 147
4.4.6. Descriptive analysis for soft attributes ................................ 148
4.4.7. Descriptive analysis for price sensitivity ............................ 148
4.4.8. Descriptive analysis for communication with customers ... 149
4.4.9. Descriptive analysis for visual merchandising ................... 150
4.4.10. Descriptive analysis for price image ................................... 150
4.4.11. Descriptive analysis for location ......................................... 151
4.5. Measurement assessment .......................................................... 152
4.5.1. Kaiser-Meyer-Olkin and Bartlett’s Test of Sphericity ........ 153
4.5.2. Exploratory factor analysis ................................................. 154
4.5.3. Communalities .................................................................... 154
4.5.4. Total variance and eigen values .......................................... 155
4.5.5. Content validity ................................................................... 156
4.5.6. Convergent validity ............................................................. 157
vii
4.5.7. Confirmatory factor analysis............................................... 159
4.5.8. Reliability statistics ............................................................. 164
4.5.9. Discriminant validity .......................................................... 166
4.5.10. Common method variance .................................................. 166
4.6. Structural equation modelling ................................................... 167
4.7. Testing of moderation construct ................................................ 172
4.7.1. Moderation effect of PS on HA and BA ............................. 176
4.7.2. Moderation effect of PS on HA and WOM ......................... 176
4.7.3. Moderation effect of PS on HA and COM .......................... 176
4.7.4. Moderation effect of PS on SA and BA .............................. 177
4.7.5. Moderation effect of PS on SA and WOM ......................... 177
4.7.6. Moderation effect of PS on SA and COM .......................... 178
4.7.7. Testing results summary ..................................................... 178
4.8. Testing of the mediation constructs .......................................... 179
4.8.1. Mediation effect of CWC on VM and BA .......................... 180
4.8.2. Mediation effect of CWC on VM and WOM ..................... 180
4.8.3. Mediation effect of CWC on VM and COM ...................... 181
4.8.4. Mediation effect of PI on LOC and BA .............................. 182
4.8.5. Mediation effect of PI on LOC and WOM ......................... 183
4.8.6. Mediation effect of PI on LOC and COM .......................... 184
4.8.7. Testing results summary ..................................................... 185
4.9. Summary ................................................................................... 186
5. DISCUSSION AND CONCLUSION ............................................... 189
5.1. Introduction ............................................................................... 189
5.2. Discussion of analysis results ................................................... 189
5.2.1. Findings from the structural model assessment .................. 190
5.2.2. The answer to research question 1 ...................................... 192
5.2.3. The answer to research question 2 ...................................... 194
5.2.4. The answer to research question 3 ...................................... 195
5.2.5. The answer to research question 4 ...................................... 197
5.2.6. The rejected hypotheses ...................................................... 198
5.3. Integrating the findings from existing literature ....................... 204
5.3.1. Implications of the findings ................................................ 204
5.3.2. Implications for the researchers .......................................... 205
5.4. Theoretical implications ............................................................ 205
5.5. Implications for managerial practice ........................................ 207
5.6. Limitations ................................................................................ 209
viii
5.6.1. Quantitative research method ............................................. 210
5.6.2. Cross-sectional research design .......................................... 210
5.6.3. Data collection method ....................................................... 211
5.6.4. Measurement instrument ..................................................... 212
5.7. Recommendations for future research ...................................... 213
5.8. Summary and conclusion .......................................................... 213
REFERENCES ................................................................................................... 215
Appendix 3-01 Invitation Letter (English) ......................................................... 231
Appendix 3-02 Invitation Letter (Traditional Chinese) ...................................... 232
Appendix 3-03 Information Statement (English) ............................................... 233
Appendix 3-04 Information Statement (Traditional Chinese) ............................ 235
Appendix 3-05 Questionnaire (English) ............................................................. 237
Appendix 3-06 Questionnaire (Traditional Chinese) .......................................... 245
Appendix 4-01 Naming Convention of the Questionnaire Items ....................... 252
Appendix 4-02: Descriptive analysis of all constructs’ items ............................. 258
Appendix 4-03: Communalities .......................................................................... 262
Appendix 4-04: Total variance explained ........................................................... 263
Appendix 4-05: Pattern matrix table for all 42 items ......................................... 264
Appendix 4-06: Fit indices of the measurement model ...................................... 265
Appendix 4-07: AMOS - Modification indices of the measurement model ....... 267
Appendix 4-08: Fit indices of the enhanced measurement model ...................... 274
Appendix 4-09: Comparison between constrained and unconstrained models .. 276
Appendix 4-10: Structural model fit indices ....................................................... 278
ix
List of Tables
Table 1-1: Hong Kong culture ................................................................................ 7
Table 2-1: Dick and Basu (1994) loyalty model ................................................... 28
Table 2-2: Effectiveness of word-of-mouth from Villanueva et al. (2008)........... 35
Table 3-1: Mapping of research constructs and questions .................................. 112
Table 3-2: Demographic questions ..................................................................... 114
Table 3-3: Measuring items for store loyalty ...................................................... 116
Table 3-4: Measuring items for customer loyalty program ................................ 118
Table 3-5: Measuring items for price sensitivity ................................................ 120
Table 3-6: Measuring items for communication with customer ......................... 120
Table 3-7: Measuring items for visual merchandising ........................................ 121
Table 3-8: Measuring items for price image ....................................................... 122
Table 3-9: Measuring items for location ............................................................. 122
Table 3-10: Cronbach's alpha measurement ....................................................... 127
Table 3-11: Kaiser-Meyer-Olkin (KMO) measurement ...................................... 129
Table 3-12: Measure of sampling adequacy ....................................................... 129
Table 3-13: The fit indices in structural equation modelling .............................. 132
Table 3-14: The conditions for different types of mediators ............................... 133
Table 4-1: The precondition questions ................................................................ 140
Table 4-2: Respondent demographics details ..................................................... 142
Table 4-3: Statistics of the favourite beauty & healthcare products retailers ..... 143
Table 4-4: Frequency of visit and memberships ................................................. 144
Table 4-5: Kaiser-Meyer-Olkin and Bartlett’s Test of Sphericity ....................... 153
Table 4-6: Factor loading in relation to sample size ........................................... 154
x
Table 4-7: Factor & Items Mapping .................................................................... 158
Table 4-8: Measurement model fit indices and acceptance levels summary ...... 163
Table 4-9: Reliability test result of all customer loyalty constructs .................... 165
Table 4-10: The convergent validity and discriminant validity results ............... 166
Table 4-11: Structural model’s model fit indices and the acceptance values ...... 170
Table 4-12: Regression weights summary .......................................................... 171
Table 4-13: The regression weights of the model with moderator(s) added ....... 175
Table 4-14: Moderating interactive test results summary ................................... 178
Table 4-15: The requirement for a mediation relationship ................................. 179
Table 4-16: The mediation effect of CWC on VM and BA ................................ 180
Table 4-17: The mediation effect of CWC on VM and WOM ........................... 181
Table 4-18: The mediation effect of CWC on VM and COM ............................ 182
Table 4-19: The mediation effect of PI on LOC and BA .................................... 183
Table 4-20: The mediation effect of PI on LOC and WOM ............................... 184
Table 4-21: The mediation effect of PI on LOC and COM ................................ 185
Table 5-1: Hypothesis result of the relationships among the variables .............. 190
xi
List of Figures Figure 1-1: Distribution channel of healthcare & beauty product in Hong Kong 11
Figure 2-1: Store loyalty construct ....................................................................... 29
Figure 2-2: Store loyalty construct ....................................................................... 30
Figure 2-3: Customer loyalty program constructs ................................................ 46
Figure 2-4: Framework model .............................................................................. 92
Figure 2-5: Framework model .............................................................................. 93
Figure 2-6: Research framework used in current study ........................................ 94
Figure 2-7: The research framework with hypothesis items ................................. 95
Figure 4-1: The components of measurement model.......................................... 159
Figure 4-2: Path diagram of the measurement model ......................................... 160
Figure 4-3: The coefficient of the enhanced measurement model ...................... 162
Figure 4-4: The research framework of the proposed model .............................. 168
Figure 4-5: The proposed structural model ......................................................... 169
Figure 4-6: The components of structural model and the legend for AMOS ..... 169
Figure 4-7: The overall model with moderation constructs ................................ 173
Figure 4-8: The plots two-way interaction effects for the variables ................... 177
xii
Abstract
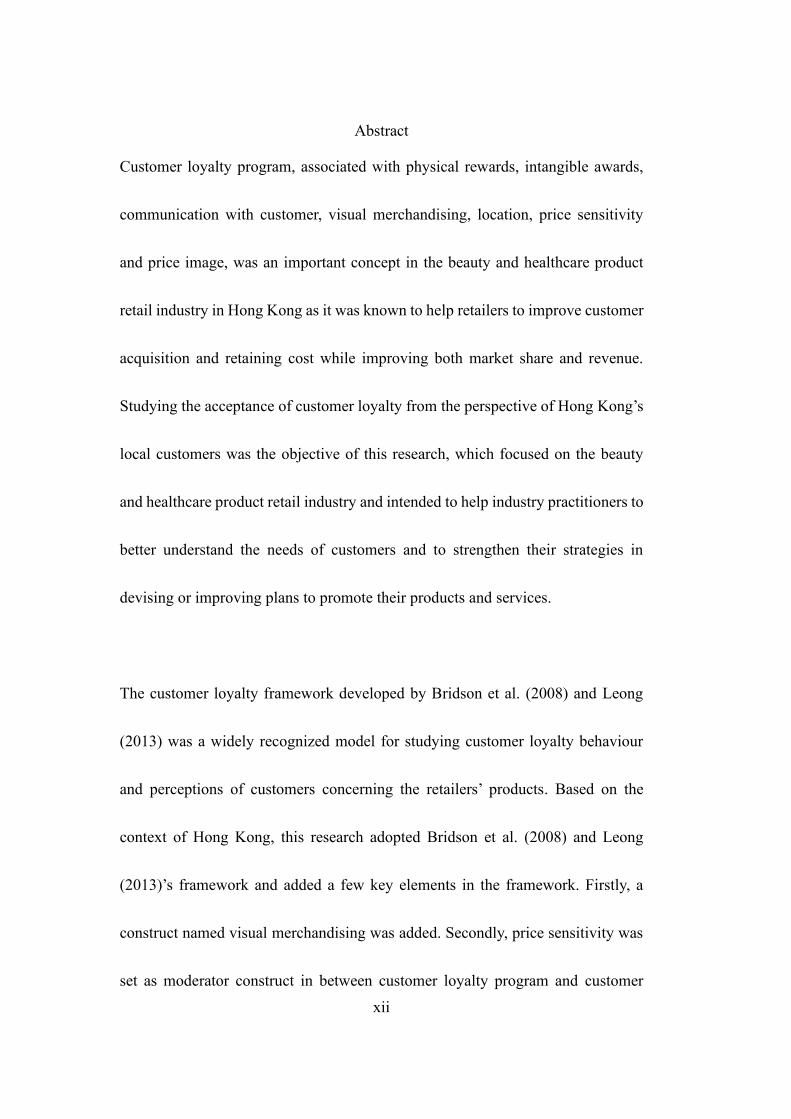
Customer loyalty program, associated with physical rewards, intangible awards,
communication with customer, visual merchandising, location, price sensitivity
and price image, was an important concept in the beauty and healthcare product
retail industry in Hong Kong as it was known to help retailers to improve customer
acquisition and retaining cost while improving both market share and revenue.
Studying the acceptance of customer loyalty from the perspective of Hong Kong’s
local customers was the objective of this research, which focused on the beauty
and healthcare product retail industry and intended to help industry practitioners to
better understand the needs of customers and to strengthen their strategies in
devising or improving plans to promote their products and services.
The customer loyalty framework developed by Bridson et al. (2008) and Leong
(2013) was a widely recognized model for studying customer loyalty behaviour
and perceptions of customers concerning the retailers’ products. Based on the
context of Hong Kong, this research adopted Bridson et al. (2008) and Leong
(2013)’s framework and added a few key elements in the framework. Firstly, a
construct named visual merchandising was added. Secondly, price sensitivity was
set as moderator construct in between customer loyalty program and customer
xiii
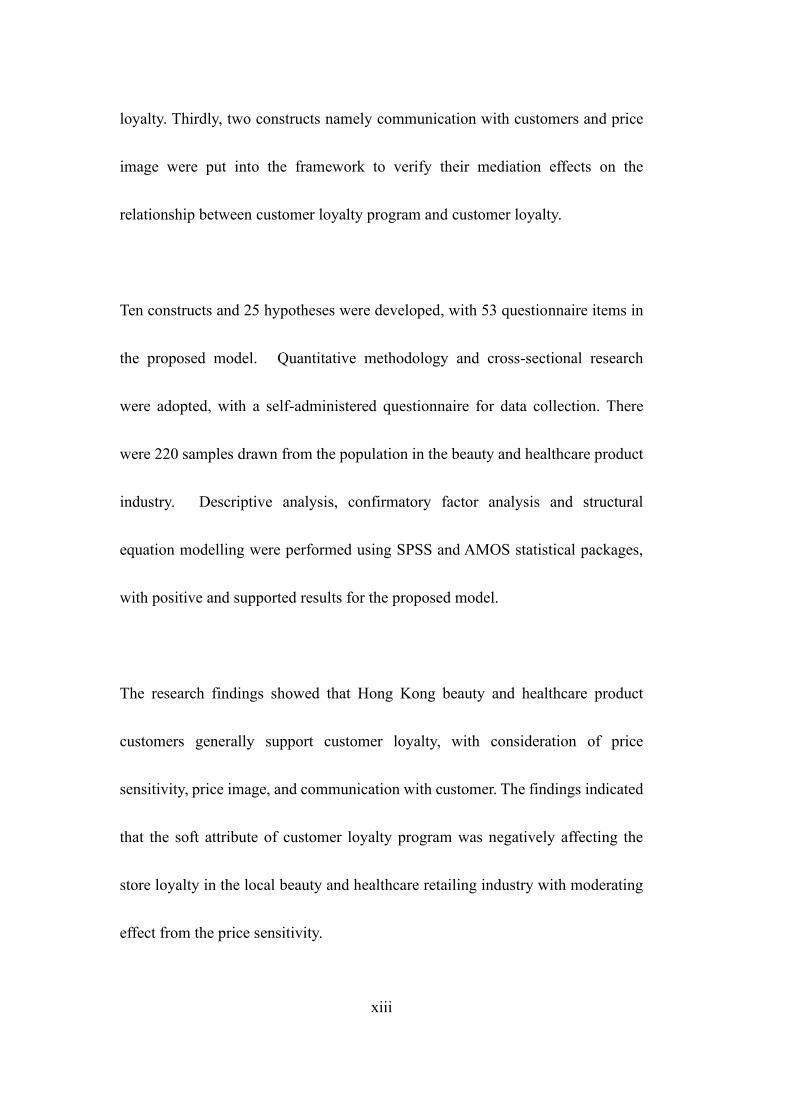
loyalty. Thirdly, two constructs namely communication with customers and price
image were put into the framework to verify their mediation effects on the
relationship between customer loyalty program and customer loyalty.
Ten constructs and 25 hypotheses were developed, with 53 questionnaire items in
the proposed model. Quantitative methodology and cross-sectional research
were adopted, with a self-administered questionnaire for data collection. There
were 220 samples drawn from the population in the beauty and healthcare product
industry. Descriptive analysis, confirmatory factor analysis and structural
equation modelling were performed using SPSS and AMOS statistical packages,
with positive and supported results for the proposed model.
The research findings showed that Hong Kong beauty and healthcare product
customers generally support customer loyalty, with consideration of price
sensitivity, price image, and communication with customer. The findings indicated
that the soft attribute of customer loyalty program was negatively affecting the
store loyalty in the local beauty and healthcare retailing industry with moderating
effect from the price sensitivity.
1
1. INTRODUCTION
Crossover shopping, sharing of products to friends through social media, upgraded
mall shopping experience, local shoppers’ propensity to consume more on online
shop, China’s economic downturn and the long-lasting China’s fight against
corruption environment are uncertainties affecting Hong Kong beauty and
healthcare product retailers and distributors. They are under the pressure to shift
the focus of their sales strategies from the Chinese mainland shoppers to the Hong
Kong local shoppers to protect their business (HKGCC, 2017). In order to generate
a more diversified revenue streams and build solid portfolio of Hong Kong local
shoppers on the less expensive product range from the renowned beauty and
healthcare product brands in Hong Kong, most of the distributors of beauty and
healthcare products encouraged their sales to look for paths leading to stable
business growth based on customer relationship management.
Relationship marketing, meeting customers’ needs through supplier-customer
interaction and exceeding customers’ expectations are part of customer relationship
management that go through a wide range of customer retaining campaigns
(Ahmad & Buttle, 2001; Philippus Brink, & van Rensburg, 2017). A review of
2
customer loyalty literature reveals that there are several factors that influence
customer loyalty. Satisfaction, rewards, quality, visual merchandising, trust and
word-of-mouth are amongst the most cited factors that are seen to play a major role
in determining customer loyalty (Agrawal, Gaur, & Narayanan, 2012; Philippus
Brink, & van Rensburg, 2017). While a mix of factors suiting a specific context
has been generally studied when determining customer loyalty program, no
comprehensive framework comprising key variables such as price sensitivity,
communication with customer, price image, visual merchandising, location,
rewards, word-of-mouth, commitment and actions is currently being studied in the
Hong Kong beauty and healthcare products retail industry.
With the driving forces of customer loyalty in the Hong Kong beauty and
healthcare product retail market, this paper explores the connection between the
customer loyalty program and the store loyalty - especially for the moderation
effect of price sensitivity, the mediation effect of communication with customers,
and the mediation effect of price image such that the findings of the results could
provide an understanding for the practitioners in the field to recognize their target
local customer groups as well as to benefit the local customers by having their
expectations fulfilled via the services provided by retailers.
3
This chapter is divided into five sections. Section 1.1 covers the background of
customer loyalty program in Hong Kong. Section 1.2 describes the mechanism of
customer loyalty programs that affect store loyalty. Section 1.3 provides the
justification of this research. Section 1.4 describes the research questions, and
Section 1.5 provides the research methodology.
1.1. Research background
The beauty and healthcare products retail market in Hong Kong is facing an
intensified competition as it has a wide range of parties involved in the sales
channels. Most of the distributors in the industry are traders who act as agents for
international cosmetics brands looking to sell to the Chinese mainland, Macau and
Southeast Asia markets and many of these distributors are experienced and well
versed in regional markets and regulations (HKTDC, 2018). Also, most of the
distributors are dedicated for the function of marketing and sales (Australian Trade
Commission, 2014) as Hong Kong has only a small cosmetics and toiletries
manufacturing sector (HKTDC, 2018). The lack of local manufacturers heated the
competition due to the similarity of functions (Australian Trade Commission,
2014). To stand out, many of the distributors encouraged their sales to provide
4
customer retaining campaigns (Oliaee, et al., 2016). The following subsections
summarized the development of the Hong Kong beauty and healthcare products
retailing industry into five unique aspects namely, Hong Kong Special
Administrative Region, Hong Kong’s culture, the context of beauty and healthcare
products, the shifting market focus amongst some Hong Kong retailers and the
distribution channels in Hong Kong respectively.
1.1.1. Hong Kong Special Administrative Region
Hong Kong Special Administrative Region (‘Hong Kong’) is an area located in
Southern China (Floyd, 1998) with 1,104- square-kilometre and living with over
7.4 million people of diverse nationalities (Hong Kong Fact Sheet, 2015).
Therefore, Hong Kong was ranked the 4th densely populated area on earth
(Wikipedia, 2018). Hong Kong and the mainland of China (the Mainland) have
maintained a close trading relationship with each other for many years as Hong
Kong has played an important role in the external trade of the Mainland (CSD,
2018). In 2014, Hong Kong hosted 60 million tourists, of which an estimated 47
million came from China (ITA, 2016). Chinese was the majority ethnic group in
Hong Kong.
5
1.1.2. Culture in Hong Kong
In Kroeber and Parsons (1958, p.583), the word culture was described as
“……Transmitted and created content and patterns of values, ideas, and other
symbolic-meaningful systems as factors in the shaping of human behaviour and the
artifacts produced through behaviour.” Frey (2005, p.1) described the effect of
culture values as “Learned, relatively enduring, emotionally charged,
epistemologically grounded and represented moral conceptualizations that assist
us in making judgments and in preparing us to act. In other words, the priorities
we set and the choices we make are significantly based on the (cultural) values we
hold.”
Hong Kong was also an attractive location for foreign branded beauty products such
as Europe, the US and Japan (Australian Trade Commission, 2014). Many Hong Kong
people strive to stay young and beautiful amidst societal expectations (Fan, 2016;
Hongkongbusiness, 2018). For every 1165 female, there was 1000 male (Hong Kong
Fact Sheet, 2015). South Korean beauty and healthcare product sales’ rise is found
being attributed to the increasing popularity of Korean-pop culture among young Hong
Kong women (ITA, 2016) and men (HKTDC, 2017). Some of the success factors of
South Korean cosmetic are attributed to its fair-coloured image of these skin care
6
products to the Asian skin type and skin colour (ITA, 2016), the seeing of well-
groomed South Korean actors in television dramas and movies, and the use of online
influencers, social selling and user generated content (Deloitte, 2017).
Furthermore, Hong Kong had fallen as a colony of Great Britain and the western
believes of individualism impacted the Confucianism culture and thinking, and the
living style of the Hong Kong people (De Mooij, 2005). Traditional Chinese culture
or confucianism dominated Hong Kong before mid-19th century till the invasion of
Great Britain (Siu, et al., 2003). Chinese values emphasised the importance of family
unity over individualism (Abelmann, 1997). For example, studies on the content
analyses of Hong Kong media such as Hong Kong home-made television dramas,
commercials and print advertisements have found that women were frequently
portrayed in stereotyped roles (i.e. predominantly in family and home-oriented,
decorative and non-functioning entities) and men were more likely to be authoritative
and as central-figure (Chan & Cheng, 2012). Both gender advocate Chinese values
associated with personal courtesy and “face-giving” (Siu, et al., 2003) which may
interpret as “dignity” but not aptly covering all face-giving’s detail nuances.
7
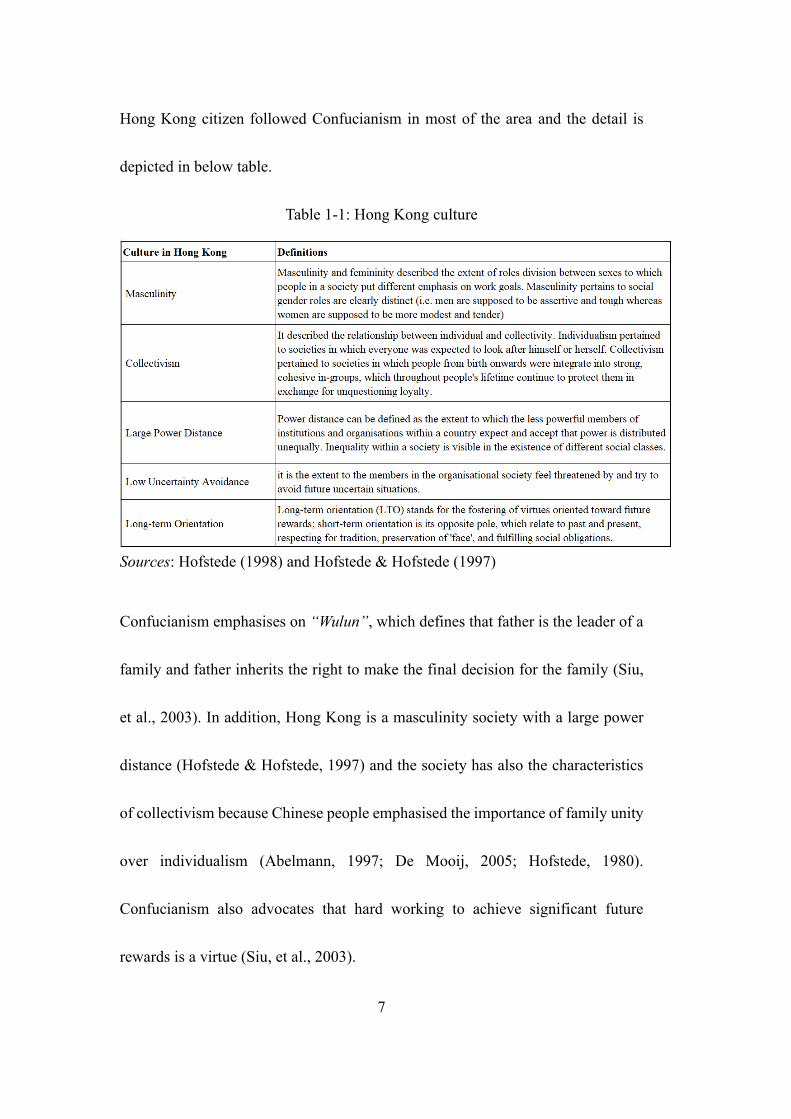
Hong Kong citizen followed Confucianism in most of the area and the detail is
depicted in below table.
Table 1-1: Hong Kong culture
Sources: Hofstede (1998) and Hofstede & Hofstede (1997)
Confucianism emphasises on “Wulun”, which defines that father is the leader of a
family and father inherits the right to make the final decision for the family (Siu,
et al., 2003). In addition, Hong Kong is a masculinity society with a large power
distance (Hofstede & Hofstede, 1997) and the society has also the characteristics
of collectivism because Chinese people emphasised the importance of family unity
over individualism (Abelmann, 1997; De Mooij, 2005; Hofstede, 1980).
Confucianism also advocates that hard working to achieve significant future
rewards is a virtue (Siu, et al., 2003).
8
As a result of the aformentioned diverse cultural background and confucianism
belief, Hong Kong people like to seek new experience including trying new
products from different countries and to sacrifice short-term interests so as to
achieve long-term rewards (Siu, et al., 2003; Hofstede & Hofstede, 1997). Given
this cultural background and the tendency to try new products from various
retailers from time to time, the store loyalty of Hong Kong people on beauty and
healthcare products was one of the important issues to the beauty and healthcare
products retailers especially those retailers who offered one or more customer
loyalty programmes in Hong Kong.
1.1.3. The context of beauty & healthcare Products
Beauty products shared the similar meaning with cosmetics, skin-care and toiletry
products, while it was defined as the externally applied preparations for skin, nails,
hair, lips, and eyes, etc. so as to change or modify the appearance and personal
hygiene in enhancing the overall beauty (The Columbia Encyclopaedia, 2013;
Barel, et al., 2001).
9
On the other hand, healthcare products include prescription, over-the-counter,
medical product diagnosis or restoration, improvement or modification of the
organism's physiological functions with the properties of prevention or treatment
of diseases (Hys, 2018).
In a recent consumer health consumption research written by PWCHK (2017),
beauty and healthcare product consumers were more engaged than ever in their
healthcare, fitness and wellness. In the Hong Kong market, beauty and healthcare
products such as whitening and anti-ageing products remained popular and they
were targeting the women segment (Parry, 2005; Wood, 2010, HKTDC, 2018).
Furthermore, the demand for men’s grooming and skincare products was found
increased in recent years (Fan, 2016; HKTDC, 2018). As the types and choices
available for selection has increased so much that would give customers an
alternative of beauty and healthcare products, it is therefore of critical importance
for the industry players to outsmart their competitors through a variety of
relationship marketing strategies and tactics. One such tactic would be the speeding
up of ‘loyalty program’ such that companies have the ways and means to prevent
the customer from switching over to the competing beauty and healthcare products
and services.
10
1.1.4. Distribution channels in Hong Kong
In Hong Kong, the beauty, healthcare, cosmetics and toiletries manufacturing
sector were small as it had only a few number of companies producing mid-priced
beauty and healthcare products under their own brands such as Choi Fung Hong
and Joseristine, for instance, were made in Hong Kong (HKTDC 2018). Lately, a
few Hong Kong beauty and healthcare product brands which emphasised their
products were “made in Hong Kong”, such as JaneClare, The Happiest
Things and iSUM. However, international brands were still playing the dominant
role in Hong Kong market (Nielsen, 2018).
Hong Kong had been hosting most of the renowned beauty and healthcare product
brands in the world and these products dominated the most expensive and
prominent areas in the popular shopping malls, shopping districts and stores
(Hongkongbusiness, 2018). The distribution channel of beauty and healthcare
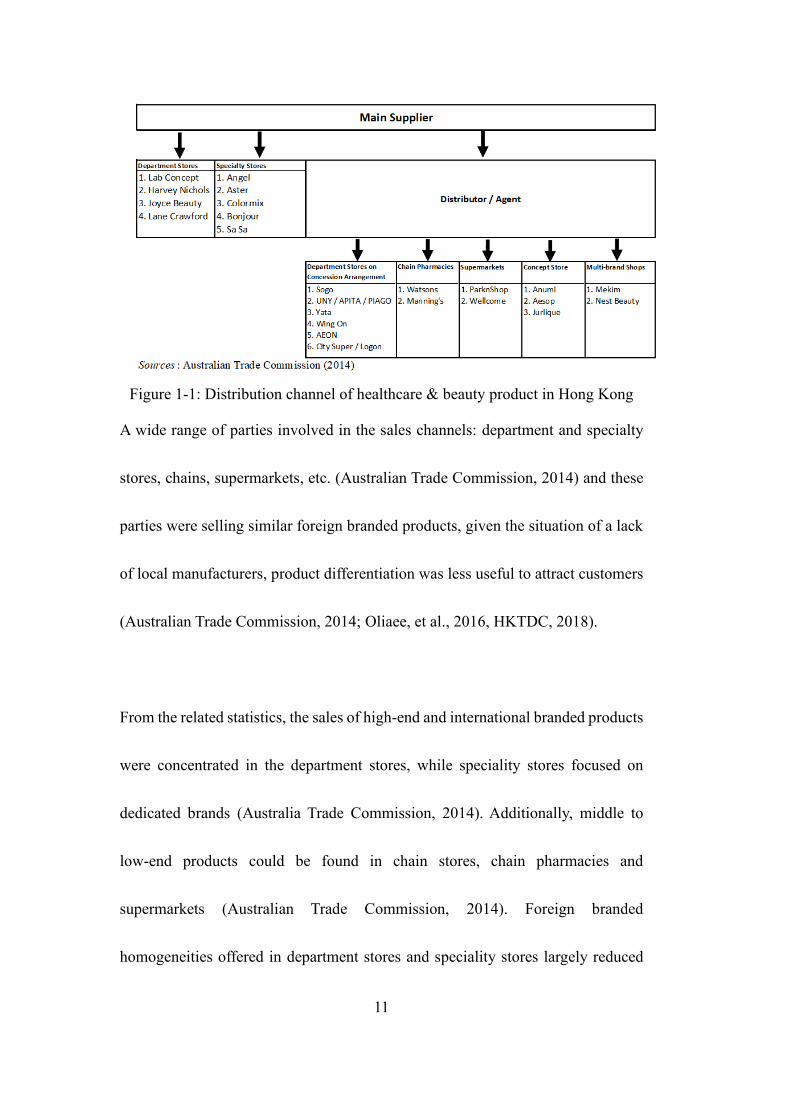
products had been developed in local market and was summarised in Figure 1-1.
11
Figure 1-1: Distribution channel of healthcare & beauty product in Hong Kong
A wide range of parties involved in the sales channels: department and specialty
stores, chains, supermarkets, etc. (Australian Trade Commission, 2014) and these
parties were selling similar foreign branded products, given the situation of a lack
of local manufacturers, product differentiation was less useful to attract customers
(Australian Trade Commission, 2014; Oliaee, et al., 2016, HKTDC, 2018).
From the related statistics, the sales of high-end and international branded products
were concentrated in the department stores, while speciality stores focused on
dedicated brands (Australia Trade Commission, 2014). Additionally, middle to
low-end products could be found in chain stores, chain pharmacies and
supermarkets (Australian Trade Commission, 2014). Foreign branded
homogeneities offered in department stores and speciality stores largely reduced
12
the switching costs of customers (Australian Trade Commission, 2014; Oliaee, et
al., 2016).
Due to the complicated processes from the suppliers to the end-consumers as well
as the scratted consumption in nature (Harris, 2000; Johnson, 1999), this structure
of distribution channel, as illustrated in Figure 1-1, was common in the relationship
among department stores and speciality stores (Hoch, et al., 1999; Zboja &
Voorhees, 2006; Mitchell, 2008).
1.1.5. The shifting market focus amongst major Hong Kong retailers
In the past decade, Chinese mainland shoppers and tourists accounted for almost
one third of the luxury spending of goods in Hong Kong and created high-volume
sales for many traditional beauty and healthcare product retailers (HKTDC, 2018;
Hongkongbusiness, 2018). However, several incidents including the financial
crisis, the anti-corruption in the Mainland including the clampdown in gift giving
China’s three-year anti-corruption campaign (Cendrowski, 2015), the aggressive
Mainland firms that courted high-end Mainland shoppers with online beauty and
healthcare retail websites and applications stocked with beauty and healthcare
13
products which they previously could only purchase by travelling to Hong Kong
or other countries. Although, the market of the Mainland shoppers slumped in the
past few years (Hongkongbusiness, 2018), this provided an opportunity to
traditional retailers to lower their rental cost on shop as the rent on major street
shops in Hong Kong was dropped significantly.
In addition, a recent study by KPMG found that Hong Kong consumers had plan
to increase the number of online purchases in the coming years (KPMG, 2016) and
their target products to be purchased were less-expensive products.
(Hongkongbusiness, 2018). In addition, studies found that consumers’ tendency to
use digital devices for shopping-related activities before or during their most recent
trip to the store is increasing (Gao & Su, 2016; Kim, Park, & Lee, 2017) and Hong
Kong local shoppers’ propensity to consume via their mobile phones than they had
previously is also expanding (Brennan, 2016).
Given the push by the Hong Kong economic downturn in the last few years, and
the pull by the awareness of digital disruption, many major beauty and healthcare
products retailers had shifted their sales focus to local Hong Kong people who had
becoming a strong segment for the retail industry and these retailers executed
14
customer loyalty programmes and marketing plans to meet both the online and
offline demands of new and current customers in order to sustain their business.
1.2. Mechanism of customer loyalty programs
Gaining the understanding about the effect of customer loyalty in the retention of
the loyalty was valuable to the operators of the related companies. Additionally,
due to the switching of the target shoppers from Chinese mainland shoppers to
Hong Kong local shoppers for the sellers of the local beauty and healthcare
products (Hongkongbusiness, 2018), the repurchasing was one of the key issues to
the practitioners, while it also highlighted the importance of the study for the
customer loyalty program as a way to extend their reach in different markets.
1.2.1. Importance of customer loyalty programs in Hong Kong
Customer loyalty could be interpreted as a consistent re-patronize behaviour from
a customer in the same store or to the same brand disregarding competitors
marketing to effort to attract customer to switch to other brand and location on the
one hand and on the others that customer was willing to recommend the brand and
location among friends and colleagues (Oliver, 1999; McIlroy & Barnett, 2000).
Customer loyalty stimulated consistent re-patronize behaviour because loyal
15
customers were less vulnerable to negative word-of-mouth to their loyal brand and
store location and they were hard to be attracted by other alternatives (Ou, et al.,
2011).
Nonetheless, the growth of the beauty and healthcare market was highly affected
by the economic factors (Viola, et al., 2013). Therefore, the improved customer
loyalty was an essential way for the companies in retaining the clients so as to keep
their market share (Oliver, 1999; Bhattacharya & Sen, 2003). Given the highly
competitive distribution channels of retailing industry, beauty and healthcare
products were without exception, while they should maintain the local customers
so as to stay their market occupancy (HKTDC, 2018, Hongkongbusiness, 2018).
Product differentiation was less useful to attract customers when foreign branded
homogeneities offered by distributors largely reduced the switching costs of
customers (Australian Trade Commission, 2014; Oliaee, et al., 2016); therefore,
most of the distributors encouraged sales with a wide range of customer retaining
campaigns and marketing techniques such as: customer loyalty program, visual
merchandising and selection of suitable location (Australian Trade Commission,
2014; Oliaee, et al., 2016) to improve customer loyalty to store (Bhattacharya &
Sen, 2003; Oliver, 1999).
16
One of the tactics adopted was providing reward or discount to the returned
customers (Barlow, 1996; Capizzi & Furguson, 2005), while the special treatment
for the repurchasing consumers could be observed as well (Barlow, 1996; Harris,
2000). The aim was to keep the customers and their consumption of the retailers’
products. Although quality and price may be two of the keys, these two factors
were hard to be alternated due to the high competition. As a result, the customer
retention programs and marketing techniques seem to be the last resort for the
owners in beauty and healthcare products retailing industry to compete with the
store loyalty among the customer base.
1.2.2. Price sensitivity in the Chinese society
Price was a cue/indicator to measure quality of products and services in different
societies (Dawar & Parker, 1994; Probert & Lasserre, 1997; McGowan &
Sternquist, 1998), but the degree to which buyers depend on price to measure
quality was different (Le Claire, 1992; Tan & McCullough’s, 1985) as well as the
value for quality (Kim, et al., 2002). In the examination of the relationship between
product quality and patronise decision in apparel retailing, Chinese customers
preferred products with more functions compare to South Korean customers (Kim,
17
et al., 2002). Kim et al. (2002) attributed the result to the difference in culture.
Chinese customers had less individualistic values than those of South Korean
customers; therefore, the extrinsic value was more important to attract customer in
the Chinese society.
Given that collective culture relied heavily on word-of-mouth feedbacks from
interpersonal networks to valuate a product, higher extrinsic values (products of a
lower price with the same function or more functions) rasied the chances of
positive word-of-mouth in Chinese society that gradually translated to higher
degree of acceptance to buy the product (Schutte & Ciarlante, 1998).
Moreover, in the study of Le Claire (1992) and Tan & McCullough’s (1985), a
society like Hong Kong which shared deeper Chinese beliefs was found more price
oriented in making patronise decision. As a result, price sensitivity can be viewed
as a part of the mechanism of customer loyalty programs that affect store loyalty
of a brand.
18
1.3. Research justification
Understanding the effect of customer loyalty in the retention of the loyalty is
valuable to the retailers. In Hong Kong, the shifting of beauty and healthcare
products market from Chinese mainland shoppers to local Hong Kong people
pushed retailers to go deeper to explain many facets of the market. Additionally,
due to the switching of the target consumers for the sellers of the local beauty
products, the repurchasing has become one of the key issues to the practitioners in
the industry.
Although a review on relevant customer loyalty programme and loyalty literatures
revealed the direct influence of customer loyalty programme on customer loyalty,
it also revealed that there was a dearth of studies on the mediating roles played by
communication with customers and price image on the relationship between
customer loyalty programme and store loyalty in Hong Kong. For example, Chang
and Chieng’s study (2006) revealed that brand image mediate the relationship
between experience and consumer relationship at coffee chain stores in Shanghai
and Taiwan only. Also, Gao, Zhang and Mittal’s study (2017) found that sacrifice
mindset mediates the relationship between a consumer’s local identity and price
sensitivity in the food product industry from over 142 countries. There findings
19
reviewed that there was a general lack of studies on the moderating roles played
by price sensitivity on the relationship between customer loyalty programme and
store loyalty in the beauty and healthcare products industry in Hong Kong.
Being an important source market for local consumers, Hong Kong’s beauty and
healthcare product market awaits more academic attention. Thus, the current study
was conducted using the customer loyalty program constructs from Bridson et al.
(2008) and Leong (2013) to fill the knowledge gaps. It aimed at exploring the
factors leading to the store loyalty behavioural actions by Hong Kong local beauty
and healthcare product customers, and helping the industry players to strengthen
their strategies to improve the customer loyalty programmes to promote
repurchasing.
1.4. Research questions
The primary objective of this research is to identify factors leading to customer
loyalty in Hong Kong’s beauty and healthcare products industry. The key
outcome of the research will provide statistically reliable and significant factors on
strategy forming for beauty and healthcare product industry retailers and
20
distributors to optimize their investments to meet customers’ expectations. Hence,
the main focus of the research question (RQ) is:
“What are the mediating roles of two drivers of customer loyalty in the
customer loyalty programs—store loyalty relationship and the moderating role of
price sensitivity on the linkage between customer loyalty programs and store
loyalty?”
1.5. Research methodology
The current study began with a review of the customer loyalty program and store
loyalty literature so as to sort out suitable constructs for building a model to explore
the relationship between customer retention program and the store loyalty (Nguyen,
et al., 2017). The primary study powered by the questionnaire-based was conducted
so as to verify the model with the help of the statistical tools (Oliaee, et al., 2016;
Resnick, et al., 2016; Strategic Direction, 2012). Quantitative methodology and
cross-sectional research design were adopted in this research. Self-administrated
online questionnaires were developed for the collection of the responses. There
were pre-condition questions in the survey for the participants’ selection, according
to which non-local beauty and healthcare products consumers were by passed in
the systems. Invitation scripts were sent to potential participants via Internet social
21
networks through Facebook messenger and Whatsapp. The data collection period
was run from 7 September 2017 to 14 November 2017 and a total 220
questionnaires was received. SPSS was used to run analysis with reliability and
validity test performed to check if collected data was suitable for structural
equation modelling (Braganza, et al., 2017; Fu, 2016). Finally, with the evidence
from the primary research (Tsai, et al., 2016; Virgona, Helene, 2012), the findings
and related suggestions would be valuable.
22
2. LITERATURE REVIEW
Following the introduction chapter that described the aims, scope and approach
taken in the study, this chapter provided an exhaustive literature review of previous
customer loyalty program and store loyalty scholarly journals to support the
research study.
A customer loyalty program refers to set of actions devised to keep up with target
customers so as to minimise the rate of lost customers, and increase the amount of
repurchases. These programs often consist in issuing loyalty memberships. Prior
literature has extensively study on the customers’ relation to suppliers. For instance,
many researchers associated customer loyalty with some variables such as
consumption behaviour (Brown, 2001; Cunningham, 1961), attitude (Dunkovic &
Petkovic, 2015; Jacoby & Olson 1977; Jacoby 1971), mixed behaviours and
attitudes (Šapić, Kocić, & Radaković, 2018; Jacoby & Olson, 1971), satisfaction
(Oliver 1999; Barnes, 1997; Oliver 1997), dependence (Barnes, 1997), trust
(Philippus Brink, & van Rensburg, 2017; Agrawal, Gaur, & Narayanan, 2012;
Hennig-Thurau & Klee 1997), commitment (Marshall, 2010; Bansal, et al., 2004;
Fullerton, 2003; Pritchard, et al., 1999) or even relation to the brand (Šapić, Kocić,
23
& Radaković, 2018; Fournier and Yao 1997). Yet the researcher found that on the
empirical level, few studies emphasised the moderation role of price sensitivity,
the mediation role of communications with customer, and the mediation role of
price image. The purpose of this literature review was to establish a theoretical
basis for the research model and associated hypotheses, to identify gaps from
existing literature especially on the relationship among the ten constructs (i.e. price
image, price sensitivity, soft attributes, hard attributes, commitment, behavioural
activities, word-of-mouth, location, communication with customer, and visual
merchandising), two mediators and moderator.
This chapter was divided into the following sections. Section 2.1 began with a
review on store loyalty literature. Section 2.2 examined the customer loyalty
programmes and its impact on store loyalty. Section 2.3 elaborated the price
sensitivity variable and reviewed its moderation interactive effect on some
variables. Section 2.4 described the communication-with-customers variable and
its mediating interactive effect. Section 2.5 described the visual merchandising and
its connection with other variables. Section 2.6 elaborated the price image variable
and its linkage with store loyalty. Section 2.7 described the location and its
relationship with price image. Section 2.8 explained the development of research
24
questions. Section 2.9 elaborated the development of hypotheses. Section 2.10
explained the development of research model and the last section summarized the
chapter.
2.1. Store loyalty
Cunningham (1961) referred the brand loyalty as the degree of behavioural loyalty
towards a choice brand. In Cunningham's studies on brand loyalty, he measured the
share of purchase devoted to the physical store to accounts for the biggest, second
biggest, third biggest, etc. According to Cunningham (1961), brand loyalty had
very little relationship with prices and the proportion of purchase devoted by a
customer to the main brand among a category was used to classify the customers
as loyal customers or non-loyal customers. Customers with a high proportion of
purchase above a percentage were regarded as loyal customers and those with a
relatively low proportion of purchase were regarded as un-loyal customers. Brand
loyalty was different from customer loyalty as brand loyalty measured everything
that due with how customers perceive the store's brand (McIlroy & Barnett, 2000).
Whereas customer loyalty was mostly related to the overall spending capacity of
the customer and was measured by the re-patronize pattern of the customers and
the emotional attachment of customer toward the brand (Day, 1969). In this paper,
25
the term “store loyalty” was not only related to those customers that keep coming
back to the brand including both physical store and online store, but also interpreted
as a consistent re-patronize behaviour from a customer in the same brand, which
had products available in either physical retail store or product images being
displayed in online store, disregarding competitors marketing to effort to allure
he/she to switch to other brand and location on the one hand and on the others that
customer was willing to recommend the brand and location among friends and
colleagues (Oliver, 1999; McIlroy & Barnett, 2000).
The re-patronize pattern was considered as customer’s loyal action by Oliver (1999)
“…. a deeply held commitment to re-buy or re-patronize a preferred
product/service consistently in the future, thereby causing repetitive same-brand
or same brand-set purchasing….”. Oliver (1999) defined the development of
customer loyalty from the degree of loyalty:
1) Cognitive loyalty was the most surface level of loyalty when the decision was
made on the cost and benefit of the offerings but not the brand of the company;
therefore, customers would switch to other providers when a more cost-effective
offering was available (Olive, 1999).
26
2) Affective loyalty was the second level of loyalty when the customers attained
satisfactory experienced with the company (Olive, 1999). Satisfaction was an
emotional factor that was found harder to be replicated by providers; however, in
the study of Reichheld, Markey and Hopton (2000), a significant proportion of
loyal customers swapped to other brand was found being satisfied with their
previous products and services provider; therefore, both cognitive and affective
loyalty could be viewed as vulnerable to competition (Olive, 1999).
3) Conative loyalty was the third level of loyalty (Olive, 1999). Customers
intended to plan for re-patronise from the same company. It could be achieved
when frequent positive experiences translated into a positive attachment towards a
company; however, negative experiences like continuous product failure, would
lead to customers’ avoidance to the brand or defection to other companies (Olive,
1999).
4) Action loyalty was the deepest level of loyalty (Olive, 1999). Customers were
satisfied with previous experiences and positively attached to the company;
therefore, customers were acting more consciously to approach the companies by
themselves even with a high approaching cost (Olive, 1999).
27
Oliver (1999) elaborated the expression to loyalty as a purchase behaviror. The
attitudinal/emotional attachment could only be translated into repeated purchasing
behaviour and a longer time frame of this behaviour; Oliver (1999) contributed to
a clear demonstration of loyalty development.
In Dick and Basu’s (1994) study, customer loyalty to the company was measured
by the degree of repeat patronage and relative attitude. Their study referred the
trust loyalty to a company was a result of the combination of high degree re-
patronize behaviour and relatively high degree of positive view towards the
company compare to others (Dick & Basu, 1994). Repeat patronage was simply
the degree of repeat purchase to the same store (Dick & Basu, 1994; Oliver, 1999;
McIlroy & Barnett, 2000). The relative attitude was the attitudinal judgement
between different companies; a relatively high positive attitude towards one
company over the others could be viewed as an emotional attachment towards that
the most favoured store (Dick & Basu, 1994). Furthermore, Dick and Basu (1994)
identified spurious loyalty, which referred to the behaviour of customers
repurchased frequently not from the favoured store and latent loyalty, which was
related to the customer behaviour when repurchased less frequent from their most
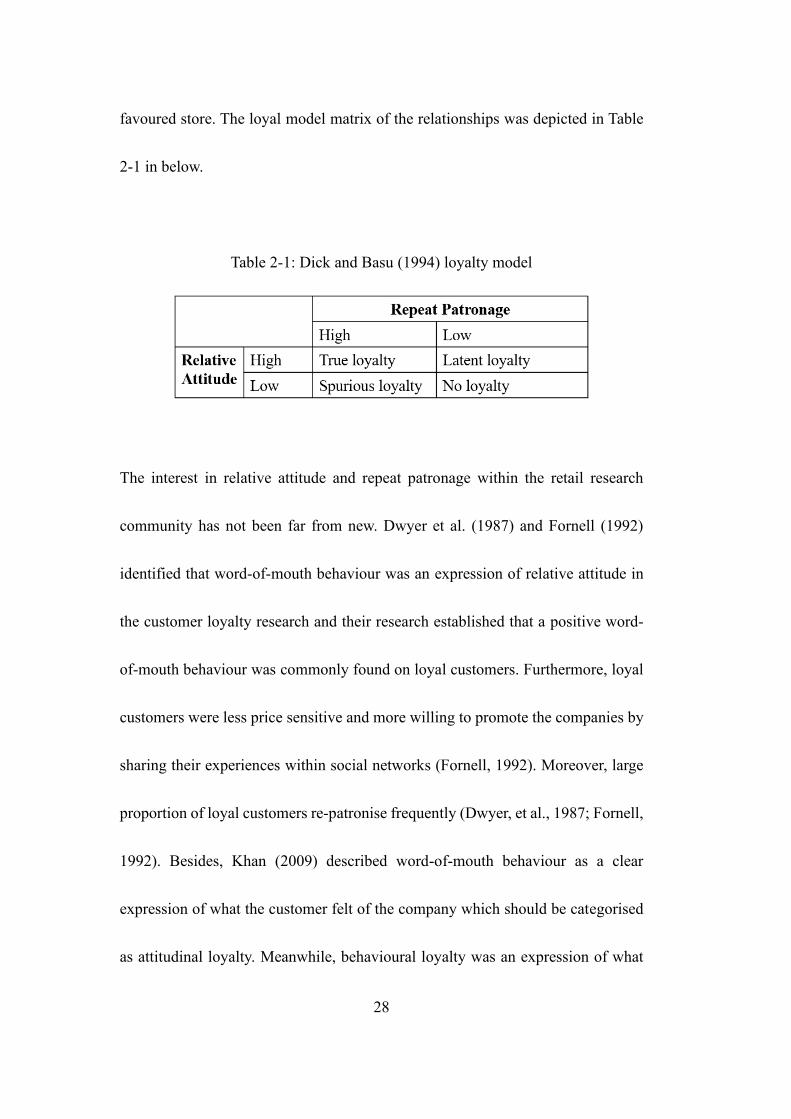
28
favoured store. The loyal model matrix of the relationships was depicted in Table
2-1 in below.
Table 2-1: Dick and Basu (1994) loyalty model
The interest in relative attitude and repeat patronage within the retail research
community has not been far from new. Dwyer et al. (1987) and Fornell (1992)
identified that word-of-mouth behaviour was an expression of relative attitude in
the customer loyalty research and their research established that a positive word-
of-mouth behaviour was commonly found on loyal customers. Furthermore, loyal
customers were less price sensitive and more willing to promote the companies by
sharing their experiences within social networks (Fornell, 1992). Moreover, large
proportion of loyal customers re-patronise frequently (Dwyer, et al., 1987; Fornell,
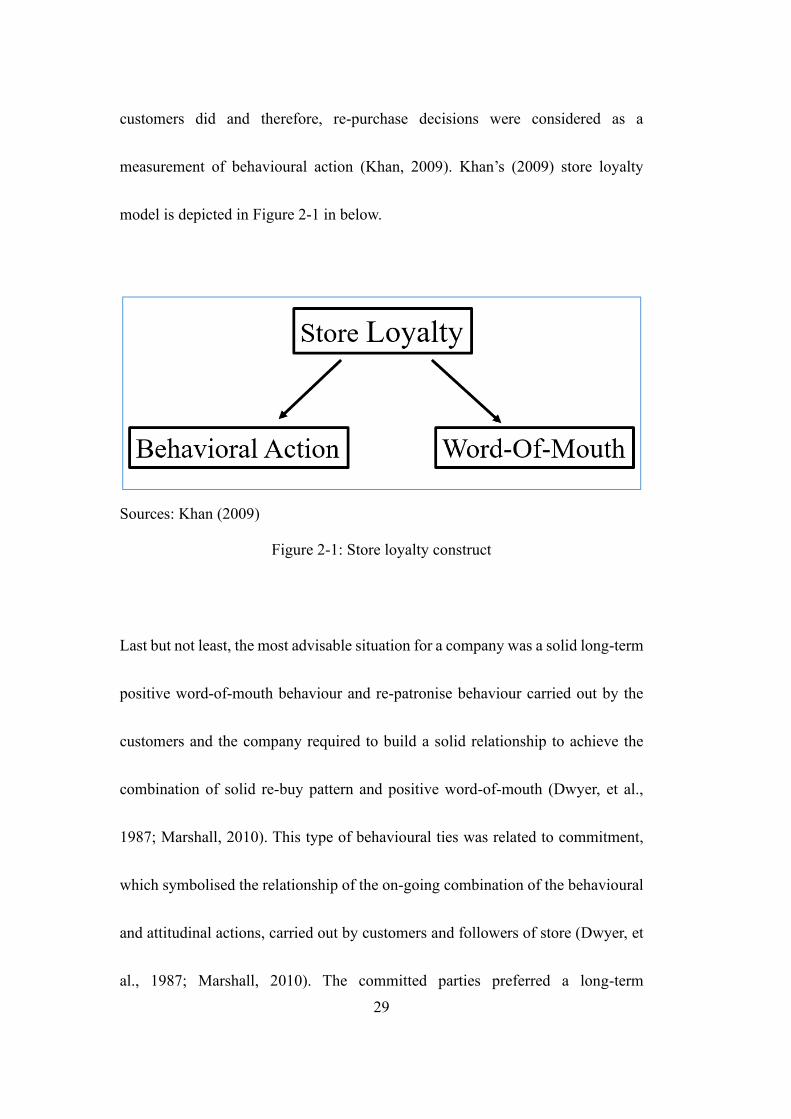
1992). Besides, Khan (2009) described word-of-mouth behaviour as a clear
expression of what the customer felt of the company which should be categorised
as attitudinal loyalty. Meanwhile, behavioural loyalty was an expression of what
29
customers did and therefore, re-purchase decisions were considered as a
measurement of behavioural action (Khan, 2009). Khan’s (2009) store loyalty
model is depicted in Figure 2-1 in below.
Sources: Khan (2009)
Figure 2-1: Store loyalty construct
Last but not least, the most advisable situation for a company was a solid long-term
positive word-of-mouth behaviour and re-patronise behaviour carried out by the
customers and the company required to build a solid relationship to achieve the
combination of solid re-buy pattern and positive word-of-mouth (Dwyer, et al.,
1987; Marshall, 2010). This type of behavioural ties was related to commitment,
which symbolised the relationship of the on-going combination of the behavioural
and attitudinal actions, carried out by customers and followers of store (Dwyer, et
al., 1987; Marshall, 2010). The committed parties preferred a long-term
30
relationship for the sake to reduce full costs which included the cost of swapping
to other location, uncertainty on quality of new products and an anticipated high
switching costs in long-run (Dwyer, et al., 1987; Achrol, 1991; Marshall, 2010).
Moreover, customer loyalty stimulated consistent re-patronize behaviour because
loyal customers were less vulnerable to negative word-of-mouth to their loyal
brand and store location. Therefore, loyal customers were hard to be allured by
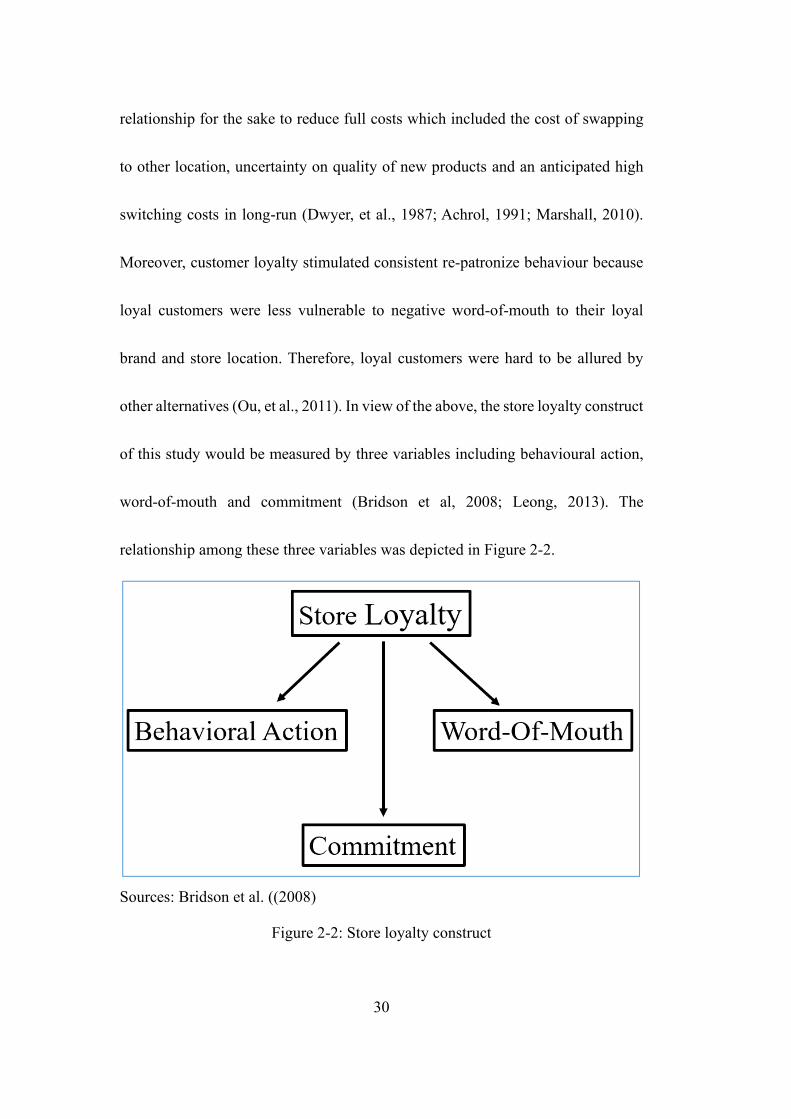
other alternatives (Ou, et al., 2011). In view of the above, the store loyalty construct
of this study would be measured by three variables including behavioural action,
word-of-mouth and commitment (Bridson et al, 2008; Leong, 2013). The
relationship among these three variables was depicted in Figure 2-2.
Sources: Bridson et al. ((2008)
Figure 2-2: Store loyalty construct
31
From the brief review of the store loyalty literature in the retail industry, it could
be seen that wide range of contents was involved. Nonetheless, for the purpose of
yielding controllable and manageable scope for the discussion and the development
of the related factors, the concept of store loyalty was limited to the three aspects,
namely, behavioural action, word-of-mouth and commitment, while they were
illustrated in the following subsections with the corresponding subtitles.
2.1.1. Behavioural action
First, the behavioural action or behavioural loyalty was defined by the behavioural
conducts of the loyalty customers of a store (Kaur & Soch, 2013). According to the
findings by Kaur and Soch (2013), they identified that a loyal customer would like
to maintain a positive interaction with the firm, while they would like to re-
patronize consistently in the same company. Besides, some of the researchers,
including Bowen and Chen (2001), utilised a number of re-purchasing behaviour
as a measure of the intensity of customer loyalty to a brand. Forasmuch as aa
behavioural loyalty referred to the purchasing behaviour of the consumer, while
particular preference would be dedicated to the favoured brand.
32
Although the number of returning to the store yielded the benefits of simplicity, the
criticism for the oversimplification can be observed from the research field. For
example, Dick & Basu (1994) disagreed to treat re-patronization as a sole indicator
of customer loyalty due to the ignorance to the situational constraints of customers.
Different reasons can alternate the continuous decision of purchasing for a
customer, such as, the common stock level for certain product in the retailing
location, while the low re-patronization may be contributed by the different
constraints, i.e. the specific usage of certain product, the inadequacy of the product
stock, etc. (Back, 2001; Bass, 1974; Hoyer, 1984; Jacoby & Chestnut, 1978).,
instead of lack of support to the company or the brand loyalty.
Moreover, repeated purchases could be an outcome of high switching costs and
customers’ inertia (Jacoby and Kyner, 1973; Reichheld, 2003). Kuusik (2007)
partitioned behavioural actions by the faithfulness of the customers and conditions.
Customers were forced to be loyal when they patronized certain products or brands
unwillingly; it was conditioned to either product was sold by monopoly, tough exit
constraints which forced customers to stay loyal and a budget constraint that kept
customers away from alternatives (Kuuisk, 2007). Therefore, customers were
forced to be inertia and resulted in loyalty to store.
33
However, customers were willing to be inertia when they found convenience to re
patronize from the same location and the products valued less important to them
(Kuuisk, 2007). Given that the customers could easily patronize from the same
location in the first hand, customers were unwilling to spend time to seek for
alternatives when the value of the product and service were low (Kuuisk, 2007).
This kind of customers’ inertia was in line with the values of cognitive loyalty:
Cognition could be built by earlier or current experiences which was an ongoing
standard behaviour like garbage pick-up (Oliver, 1999; Kuuisk, 2007). It was
simply an execution that had no relationship with satisfaction and loyalty (Oliver,
1999).
Lastly, functional loyalty was a subjective loyalty to certain values: like brand,
price, quality, distribution channels, convenience of usage and loyalty program
(Wernerfelt, 1991); however, these values were easily replicable and therefore, the
functional effect could be neutralized by replicas when time went on (Kuuisk,
2007). Therefore, it could be observed that the behavioural action may be a simple
indicator of the loyalty, but a comprehensive indicator should include diversified
34
components in the measuring scale so as to yield the better characterisation to the
related phenomenon.
2.1.2. Word-of-mouth
Apart from the behavioural action, the attitudinal loyalty referring to the emotional
awareness of the favour or preference of the brand might be another dimension in
showing the loyalty to a brand instead of behavioural conduct, such as,
repurchasing, while it could be commonly observed as word-of-mouth promotion
to certain products. The customers would normally promote and persuade their
relatives and friends in using the related products if they found attitudinal loyal to
the products. Therefore, word-of-mouth might be a good indicator of the attitudinal
loyalty (Lumpkin & McConkey, 1984).
Katz & Lazarsfeld (1955) discovered that receivers were more easily affected by
informal advice from the personal network rather than from the traditional formal
mass media advertising like television advertising, etc. and this personal network
could be utilised as a promotion tool to sell consumer products (Brooks, 1957).
Later, this kind of informal advice-message created, received and delivered from
personal network which aimed at the promotion of products, consumption, and
35
store loyalty were categorised as word-of-mouth effect (Keller, 2007). According
to Keller’s (2007) study, there were three and a half billion word-of-mouth
conversations per day; meanwhile, brands were discussed by Americans more than
2 billion times per day. Hence, word-of-mouth effect could be treated as a common
phenomenon in a society and word-of-mouth was a common behaviour among
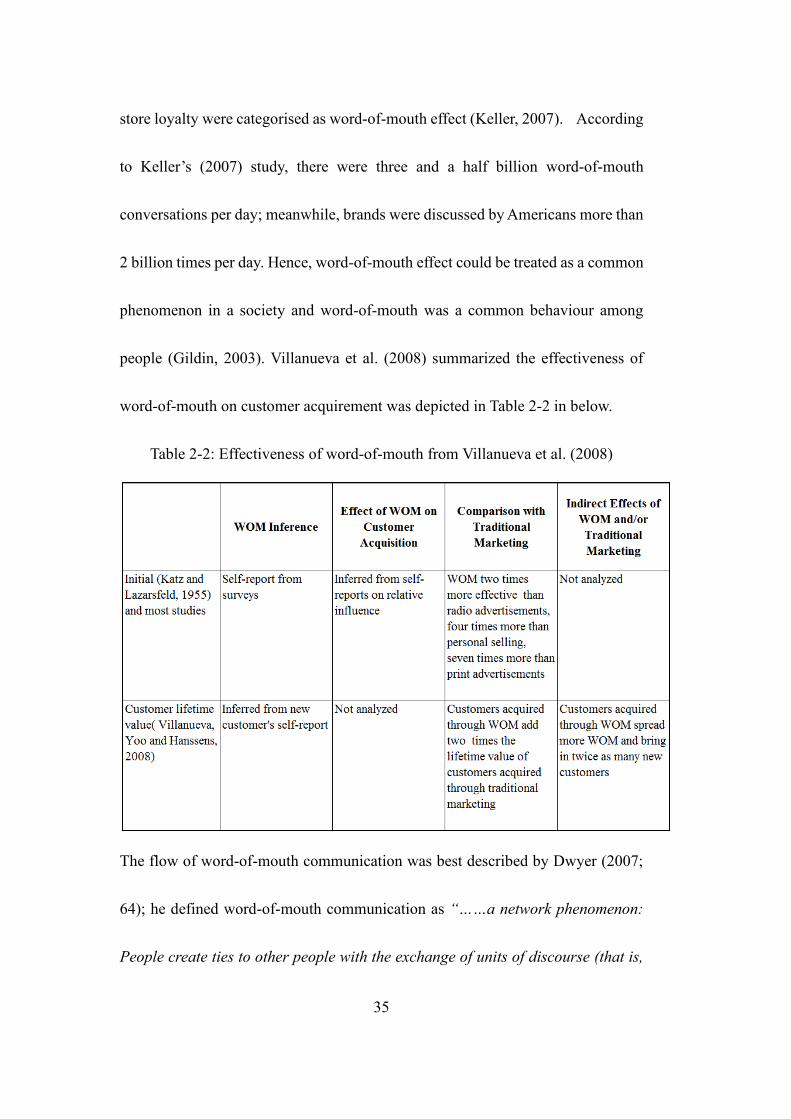
people (Gildin, 2003). Villanueva et al. (2008) summarized the effectiveness of
word-of-mouth on customer acquirement was depicted in Table 2-2 in below.
Table 2-2: Effectiveness of word-of-mouth from Villanueva et al. (2008)
The flow of word-of-mouth communication was best described by Dwyer (2007;
64); he defined word-of-mouth communication as “……a network phenomenon:
People create ties to other people with the exchange of units of discourse (that is,
36
messages) that link to create an information network while the people create a
social network.”. When people exchanged messages, they were creating a social
network, the messages could positively or negatively affect brand or product image
of the receivers within this information network and at the same time, the
exchanged messages would be seen as an informal advice on the decision-making
process by receivers that affect the receivers’ purchasing patterns and decisions
(Brooks, 1957; Dwyer, 2007; Helm, 2000; Katz & Lazarsfeld, 1955). Positive
word-of-mouth could be a result of satisfactory experiences from store or being
affected by positive word-of-mouth form others and vice versa (Brooks, 1957;
Dwyer, 2007; Helm, 2000; Katz & Lazarsfeld, 1955).
Positive word-of-mouth happened when people exchanged positive messages and
it was treasured by companies because positive word-of-mouth was a very effective
tool to promote brand, sales and customer life time value compare to traditional
marketing (please see table 2.2). Conversely, negative word-of-mouth resulted in
a spread of negative image and gradually, encouraged customer disloyal to brand
and deteriorating life time value (Cowley, 2014; Donthu & Carl, 2013; Li, et. al.,
2010).
37
Arndt (1967) discovered that the impact of positive word-of-mouth on patronise
decision of a particular brand was 50% weaker than that of negative word-of-mouth.
Other scholars found similar results in their research (Skowronski & Carlston, 1989;
Assael, 2004; Kroloff, 1988; Fiske, 1980). The results could be attributed to the
perceived value of message receivers. Positive message was commonly found in
different communication channels and therefore, it was perceived as a normal, a
more frequent and a lot more casual message to the audiences while negative
messages were found less in public. As a result, negative messages drove more
alert to audiences and lastly, it was perceived as more important to the
consideration of choice (Skowronski & Carlston, 1989; Assael, 2004; Kroloff,
1988; Fiske, 1980).
However, East et. al., (2008) empirically supported that the negative impact created
by negative word-of-mouth was less harmful to loyal customers because loyal
customers refused to accept and resisted negative word-of-mouth on their favour
brands. Therefore, the perceived brand loyalty could be viewed as a pre-posited
factor that affected the effectiveness of positive and negative messages to the
receivers. To sum up, word-of-mouth was considered as the behaviour in
38
promoting the service or product of the company, while the advantage or the
preference of the products may be conveyed to the consumers.
2.1.3. Commitment
Finally, the commitment was the composite dimension symbolised the relationship
of the on-going combination of the behavioural and attitudinal actions carried out
by customers and followers of the store, while it was the most advisable situation
for the company or the retailer (Dwyer, et al., 1987; Marshall, 2010).
The committed parties preferred a longer-term relationship for the sake to reduce
full costs (Marshall, 2010). Full costs included the cost of a swap of location,
uncertainties of the quality of new products and an anticipated high switching costs
of repeated purchases (Dwyer, et al., 1987; Achrol, 1991; Marshall, 2010).
Moreover, the committed parties preferred the feeling of being valued by the
company and other committed parties within his/her own interpersonal networks
(Pritchard, et al., 1999; Fullerton, 2003; Bansal, et al., 2004; Marshall, 2010).
Therefore, commitment could be divided into two types, namely, calculative
commitment and affective commitment. The calculative commitment was based
on the rational determination of switching costs and benefits, while the affective
39
commitment was based on the emotional attachment to committed parties (Dwyer,
et al., 1987; Achrol, 1991; Pritchard, et al., 1999; Fullerton, 2003; Bansal, et al.,
2004; Marshall, 2010).
The calculative commitment could be viewed as the willingness to commit long-
term behavioural and attitudinal actions under the considerations of long-term
nominal net benefits (Dwyer, et al., 1987; Achrol, 1991; Marshall, 2010). More
committed parties could be found in monopoly and oligopoly markets when no
alternatives were found or the costs involved in a change were too high that they
could not offset by the benefits from a swap (Evanschitzky, et al., 2006; Marshall,
2010). As a result, the market structure was a prepositioned factor in building up
calculative commitment. Therefore, no significant relationship was found between
calculative commitment to both behavioural and attitudinal loyalty in the study of
Marshall (2010); however, in the study of Fullerton (2003), a weaker positive effect
of the calculative commitment on customer retention/ behavioural loyalty was
found. To sum up, no evidence showed that the calculative committed customers
were willing to commit to long-term attitudinal actions to store (Fullerton, 2003;
Marshall, 2010).
40
The affective commitment could be viewed as the willingness to commit long-term
behavioural and attitudinal actions under the consideration of how depth was the
relationship between the company and its’ followers (Dick & Basu, 1994; Marshall,
2010). The most favourable condition was the followers considered the retailer as
a close partner that required frequent promising responses. Frequent promising
responds were frequent re patronise and positive word-of-mouth behaviour (Dick
& Basu, 1994; Evanschitzky, et al., 2006; Marshall, 2010; Garbarino & Johnson,
1999; Morgan & Hunt, 1994). On the one hand, the affective commitment could
be pre-positioned by the customers when customers’ choice to be loyal on their
wishes (Dick & Basu, 1994; Marshall, 2010). On the other hand, the affective
commitment could be translated as an emotional attachment beyond the
considerations of facts (Dick & Basu, 1994; Marshall, 2010).
Positive and significant effect of affective commitment to both behavioural and
attitudinal loyalty were found in the study of Marshall (2010); unlike calculative
commitment, the value of emotion benefit helped to build up partnership relations
and gradually, strengthened the intangible status and image of a brand in the view
of the customers and at the same time, attracted more frequent patronise behaviour.
Therefore, the tighter the partnership, the more promising actions like positive
41
word-of-mouth and re-patronise behaviour guaranteed by customers (Evanschitzky,
et al., 2006; Garbarino & Johnson, 1998; Marshall, 2010). As a result, the
affective commitment was emotional based and affected attitudinal loyalty on one
hand and the value of partnership creation could be viewed as “extra” benefit
placed on top of tangible quality that gradually translated in to an “extra” gave up
if the affective committed customers swapped to other shops (Dick & Basu, 1994;
Morgan & Hunt, 1994; Garbarino & Johnson, 1998; Evanschitzky, et al., 2006;
Marshall, 2010).
In conclusion, the commitment was the most advisable situation for the retailer
because the related consumer would not only pay for the product with their pocket
but also influence others in adopting the product (Kaur & Soch, 2013; Gronroos,
1995). In the most extreme situation, the consumer would commit to the related
brand so that they would exclusively adopt the product from the particular
company (Gounaris & Stathakopoulos, 2004; Kaur & Soch, 2013). More
importantly, the users would affect the persons in the social circle in adopting the
related products (Gounaris & Stathakopoulos, 2004; Kaur & Soch, 2013).
Therefore, the commitment concerns about the influence and pressure of others
42
within the social circle, while the friends and relatives of the consumer might be
affected in adopted the service and product eventually.
2.2. Customer loyalty programmes
This section would describe the function of the customer loyalty programmes and
campaigns in enhancing the loyalty variables. This current section was divided into
five subsections, namely, history of customer loyalty programme, hard attributes,
soft attributes, and impacts of customer loyalty programmes (CLP) on store loyalty
in order to provide the general classification of the programmes with the support
of the development of it. Additionally, the impact of the programmes on the store
loyalty was included so as to provide the support for the connection between them
and the necessity for the investigation of them.
2.2.1. Evolution of CLP
From the 80s, a wide range of investment could be observed from the firms
dedicated to the development of customer loyalty program (Lacey & Sneath, 2006)
because an attractive loyalty program was able to keep customer repeatedly
patronise in the same store, that was customer loyalty to the store or store loyalty
(Reichheld & Teal, 1996). However, in the following study, the related topic had
43
been considered as axillary factors under marketing and consumer behaviour. Till
the study of Leong (2013), the related topic has been considered formally in the
research topic, while he defined customer loyalty program as a marketing tool that
often carries rewards to customers in order to build a better relationship between
firm and customer.
In conducting of the related program, the prolong lifetime of loyalty to the firm
could result (Leong, 2013). In the latter development, the program has been
escalated to the topic related to customer retention (Lacey & Sneath, 2006;
O’Malley, 1998). Under the related definition, some of the scholars shared the
similar point of views, while they considered customer loyalty program was a
marketing practice tailored to tighten the relationship between companies and
customers by the provision of the rewards in motivating the customers in
purchasing so as to yield the improved revenue in covering the expense devolved
in the program (Lacey & Sneath, 2006; O’Malley, 1998). Rather than attracting
new customers, the scholars would have the repeated patronization to the same
store so as to yield the reduction to the expense in promotion (Lacey & Sneath,
2006; Yi & Jeon, 2003; O’Malley, 1998) as well as the marketing efforts
(Narasimham, 1984; Shapiro & Varian, 1998).
44
In the empirical study conducted by Demoulin & Zidda (2009), the customer
retention was achieved with the launching of the customer loyalty program, while
the stimulation to the sales could be observed. Therefore, the function of the loyalty
program in the customer retention was confirmed though the effects might vary in
different industries. In fact, similar observation could be seen in the studies related
to the customer retention by the conducting the customer loyalty program (Meyer-
Waarden, 2004; Demoulin & Zidda, 2008; Dowling & Uncles, 1997; Gronroos,
1995; Sharp & Sharp, 1997; Yi & Jeon, 2003).
More than 90% of population in America, Britain and Canada participated actively
in single and multiple customer loyalty programs (Berman, 2006). Customer
loyalty programs prolonged a one-time decision-making process to multiple
considerations of the same store by strengthening competitive values through hard
and soft rewards (Hanover Research, 2011; Yi & Jeon, 2003). The rewards were
made effective to strengthened loyalty when the rewards fulfilled the expectation
of the program holders (Hanover Research, 2011; Yi & Jeon, 2003).
45
The hard rewards were easily and actively replicable as the value of economic
benefits could be objectively ascertained by quality, face value and functions of
rewards; therefore, the effect on customer retention could be neutralised by replica
from competitors easily (Hanover Research, 2011; Yi & Jeon, 2003). Conversely,
the soft rewards were intangible and less likely to be ascertained objectively by
holders as the value towards communication quality, service precisions and value
of interpersonal relationship varied among different individuals; therefore, soft
rewards were less likely to be replicated entirely. It could be attributed to the
variables like manners and communication skills of employees, precision of given
rewards and preference of holders were less replicable (Bridson, et al., 2008; Leong,
2013; Yi & Jeon, 2003). Moreover, quality of employees and customer data base
were different between companies (Hanover Research, 2011; Yi & Jeon, 2003).
Soft rewards were useful because providing personal service was a chance to
interact and gain deeper understanding of the holders on the surface level. The
deeper level was to gain trust through frequent satisfactory interaction between
companies and holders (Hanover Research, 2011; Yi & Jeon, 2003). However, the
soft rewards were often neglected as a vital part of customer loyalty program. In
this study, customer loyalty program construct would be measured by Hard and
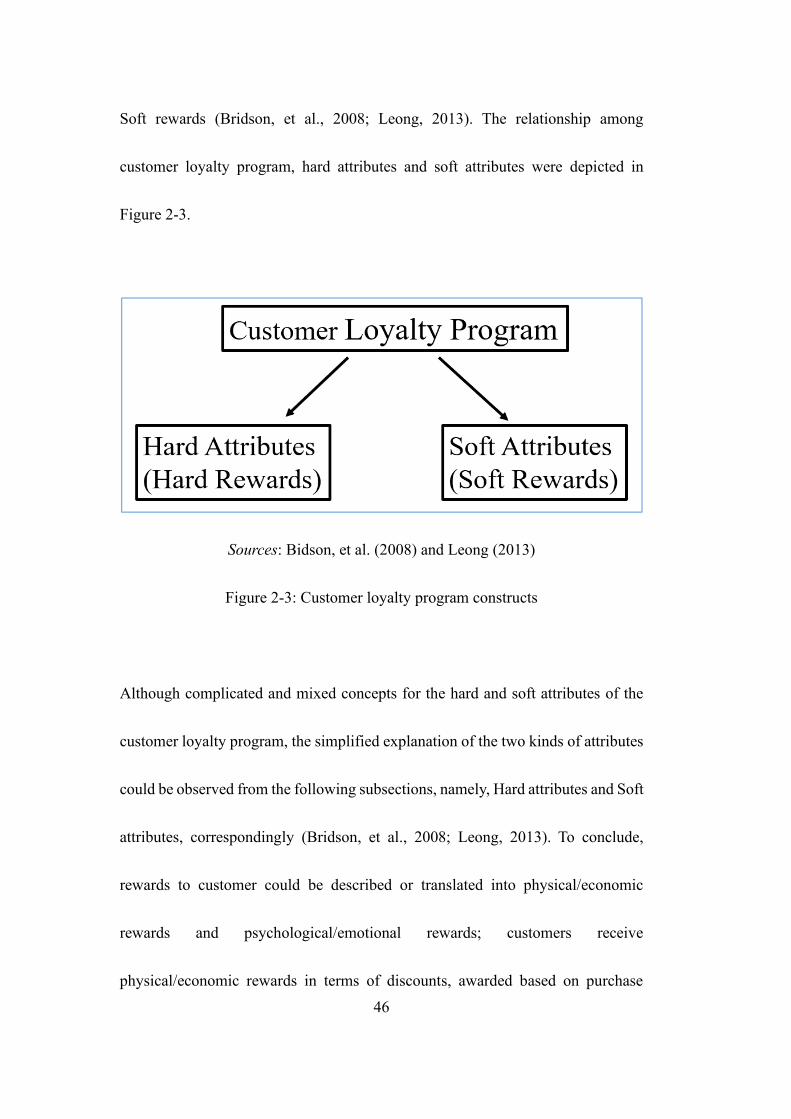
46
Soft rewards (Bridson, et al., 2008; Leong, 2013). The relationship among
customer loyalty program, hard attributes and soft attributes were depicted in
Figure 2-3.
Sources: Bidson, et al. (2008) and Leong (2013)
Figure 2-3: Customer loyalty program constructs
Although complicated and mixed concepts for the hard and soft attributes of the
customer loyalty program, the simplified explanation of the two kinds of attributes
could be observed from the following subsections, namely, Hard attributes and Soft
attributes, correspondingly (Bridson, et al., 2008; Leong, 2013). To conclude,
rewards to customer could be described or translated into physical/economic
rewards and psychological/emotional rewards; customers receive
physical/economic rewards in terms of discounts, awarded based on purchase
47
volume or value, gifts which could be calculated in dollars while psychological /
emotional rewards were delivered as special recognition and services (Bridson, et
al., 2008; Leong, 2013; Yi & Jeon, 2003).
2.2.2. Hard attributes
The hard attributes of a customer loyalty program referred to the inclusion of the
physical and substantial reward to the consumer, while it referred to the economic
benefits commonly (Capizzi & Furguson, 2005; Bridson, et al., 2008). Economic
rewards were given on patronising frequency of customers or in the other words,
economic rewards were given at specific times of purchases, the common examples
of the related rewards were rebates, prizes, gifts, discount, and buy one get two, etc
(Berman, 2006; Charania, 2011; Hoogenberg, 2010; Zeidler, 2009; Analysys
Mason, 2011). In the case of mobile phone service, loyalty program members were
given free minutes when they recharged the plan for a certain amount or they would
receive bonus internet package or a brand-new mobile phone when they upgraded
their plan (Furinto, et al., 2009).
48
Moreover, tangible rewards were commonly found in the market (Arantola, 2003).
Competitors used to offer similar rebates, prizes, gifts, discount to their loyalty
members so as to neutralise the effect from tangible rewards loyalty programs
launched by competitors (Whyte, 2004; Yi & Jeon, 2003); therefore, scholars
stressed on correct mix of hard and soft rewards in a customer loyalty program
(Rosenbaum et al. 2005; Capizzai & Ferguson, 2005; Liu 2007). One of it is Roehm
et al. (2002), and they found that hard reward itself attract the customer, but it could
not stimulate the loyalty of that customer to the brand after the program ended. As
a result, tangible rewards/hard attributes became a discount but failed to create
sustainable loyalty to the store (Roehm, et al., 2002).
Arantola (2013) stressed that concentration on shopping was a presupposition of
the effectiveness of tangible rewards offered by customer loyalty program.
Tangible rewards offered by customer loyalty program became attractive when
consumers were highly concentrated on shopping. Furthermore, Arantola (2003)
questioned the perceptions of consumers towards tangible rewards and found that
the perceptions of tangible rewards were different between consumers, given a
similar background or the same age group. Tangible rewards were made useful
when the consumer believed that the rewards offered by the customer loyalty
49
program were important to them, then they would follow that customer loyalty
program. Customers refused to enter loyalty programs if they did not find the
tangible rewards important (Arantola, 2003). As a result, stimulating customer
concentration on shopping and picking correct tangible rewards were two factors
that made hard attributes succeed.
In addition, Melancon et al. (2010) investigated the effect of rewards had on
customers’ commitment to the rewards suppliers. They discovered that perceived
economic rewards lead to continuous re-purchased behaviour of customers, but the
relationship was not intrinsic, once the rewards suppliers changed, cut-off and
reduced the amount of economical rewards, the customers would swap to others
because they were loyal to the rewards but not to the brand, the store, or the
company (Melancon, et al., 2010). Therefore, tangible rewards/hard attributes
could not create emotional binding between customers and store, so tangible
rewards/hard attributes enhanced calculative commitment only, not affective
commitment (Marshall, 2010).
50
2.2.3. Soft attributes
On the other hand, the soft attributes of a customer loyalty program referred to the
special treatment to the consumer, while it connected to the intangible rewards to
the consumers commonly (Keh & Lee, 2006; Meyer-Waarden & Benavent, 2008;
O’Malley & Tynan, 2000; O’Malley, 1998). Lacey, Suh & Morgan (2007)
described intangible rewards as prestige rewards, the rewards were not valued for
money or having practical functions which tangibly benefits the receivers. Furinto
et al. (2009) simply described soft attributes or privileges programs as a special
treatment; members were given special rewards like invitations and access to
special events (Analysys Mason, 2011).
These special rewards/soft attributes were more effective in building longer term
binding relationship with customer loyalty program holders because hard attributes
were excessively offered by different companies in different sectors; instead of
rewarding customers on the base of their purchase amount and discount, companies
were suggested to build the feeling of having relationship with loyalty program
holders (Arantola, 2003; Berry, 1995). It could be attributed to the sense of
recognition, which was a social reward (Arantola 2003, 126-127). The social
reward was a recognition of being identical and being remembered by the loyalty
51
program providers (Arantola, 2003; Berry, 1995). The effectiveness of recognition
was remarkable in high volume and low switching cost industry like supermarket
(Bhattachraya & Sen, 2003; Leong, 2013). Moreover, in the study of Melancon et
al. (2010), recognition improved customers’ commitment to store, unlike
economical rewards which the effect on commitment was uncertain, customers
could commit to the company, to the economical rewards or to both.
Normally, loyalty programs providers held a comprehensive database of the
holders’ demographic and patronise data in order to provide the specific messages,
communications and rewards to the target loyalty program holders (Berman, 2006).
The common instances for the related rewards were a qualification of very
important people (VIP), special rewards triggered their emotions, feeling of
acknowledgement, feeling of superiority, feeling of exceptional, feeling of
different from other customers, etc (Analysys Mason, 2011; Chandon, Wansink &
Laurent, 2000; Feinberg, Krishna & Zhang, 2002; Furinto, et al., 2009; Kivetz &
Simonson, 2002) and among these rewards, generally, loyalty program holders
were more satisfaction with services related to improved services and saving time;
differentiate return policies for loyalty members were also valued by loyalty
program holders in retailing industry (Arantola, 2003).
52
To conclude, soft rewards or soft attributes were said to be intangible; however, it
could arouse similar feelings of having tangible or monetary rewards but less
practical and more emotional; when loyalty holders engage in word-of-mouth
behaviour on intangible or soft rewards, the discussion would be more emotional
as well because they were expressing their feelings on a more subjective
perspective; discussion of monetary and tangible rewards would be less emotion
in most of the case because tangible rewards were valued more objectively by their
price and intrinsic values (Arantola, 2003).
2.2.4. Relationships between loyalty program and store loyalty
The study conducted by Bloemer & de Ruyter (1998) provided an empirical
demonstration of the connection between customer loyalty program and store
loyalty in the configuration of a department store, while the positive significant
effect of the program was recorded, customer loyalty programmes improved store
loyalty. Taylor and Neslin (2005) investigated the twenty-four months patronise
data of household in the USA and they discovered positive impacts of customer
loyalty programs to store loyalty in both short and long term respectively. Instant
impact was found when customers raised patronise volume in order to gain points
53
for exchanging rewards. Gradually, more repeated purchased were found after
rewards were given. Seeking for points to exchange rewards motivated instant
purchased and rewards itself attracted commitment for delay purchased (Blattberg
& Neslin, 1990; Rothchild & Gaidis, 1981).
However, Dekimpe & Hanssens (1999) argued that customers were unlikely to
commit to re-patronising after rewards were given to them because customers were
unlikely to spend more for the same reward. Therefore, the rewards earned by
points accumulation could be viewed as discount on regular price. As result,
customers ‘commitment to re-buy on regular price was uncertain. But Cortiñas et
al. (2008) found that program holders were less reluctant to regular price products
on one hand and they bought more variety of items and contributed more on sales
to compare to non-program holders. Investigation on share-of-wallet and customer
lifetime could further explain the relation between rewards and store loyalty
(Leenheer et al., 2007; Meyer-Waarden., 2007).
Leenheer et al. (2007) investigated the twenty-four months’ grocery patronise data
of nineteen hundred families in Netherlands and they discovered a weak positive
impact of customer loyalty program on share-of-wallet. Loyalty programs
54
improved the spending proportion of the customer to the retailer. Meyer-Waarden
(2007) found a positive effect of loyalty programs had on share-of-wallet and
consumer lifetime. The study was taken in France. Customers who engaged in a
single loyalty program or holding a single loyalty card of the company were found
more loyal compare to non-program and non-card holder; however, the degree of
loyalty deteriorated with the number of loyalty programs engaged and loyalty cards
held by the customers. The more the programs and cards held by the same holder,
the shorter the duration of usage of each program (Meyer-Waarden, 2007).
Therefore, offering similar loyalty cards and programs to competitors’ loyal
customers were useful to neutralise their loyalty to competitors (Meyer-Waarden.,
2007). Moreover, given that loyalty program holders were more willing to re-
patronise than non-loyalty program holders, the peak of re-buy behaviour
happened in the beginning of participation in a loyalty program. Re-buy started to
fall in the sixth-ninth months of participation (Meyer-Waarden, 2007).
Also, the study conducted by Leong (2013) showed a similar result with the
mediator of customer satisfaction in the local retailing industry dedicated for a
supermarket. Customer loyalty program improved customer satisfaction to store
and gradually, customer satisfaction to store improved customer loyalty to store
55
(Leong, 2013). Demoulin & Zidda (2008) found that instead of customer
satisfaction to store, customer satisfaction to the rewards offered by customer
loyalty programs was vital to the contribution to store loyalty. In their study of
grocery retailer in Belgium, satisfied program holders were more affected by
instant rewards and more committed to longer term loyalty to the company.
Moreover, all program holders were less reluctant to regular price products offered
by the company and the aggregate sold items and sales volume contributed by
program holders were found more than that of non-program holders (Cortiñas, et
al., 2008). An attractive loyalty program could keep customer repeatedly patronise
in the same store, that was customer loyalty to the store or store loyalty (Reichheld
& Teal, 1996). When the program stopped customers from swapping to other stores,
that was differentiation loyalty; consequently, the retailer could charge a higher
price for loyalty customers, and more revenue could be achieved by more cross-
selling and upselling because loyalty customers were not switching to other
competitors (Reichheld & Teal, 1996). To conclud, the conduction of loyalty
program yielded two significant advantages namely, attracting old customers and
the reduction of possibility in joint other program provided the other companies
(Meyer-Waarden & Benavent, 2008).
56
In contrast to the above study, Sharp and Sharp (1997) discovered that there was
no difference in the degree of loyalty between loyalty card holder and non-holder
in the study of grocery retailing in Australia. Moreover, Mägi (2003) discovered a
mixed result in Sweden, loyalty program positively impact loyalty on chain level
but not particular store; these results could be attributed to excess supply of loyalty
programs (Leong, 2013). Competition on loyalty programs raised more channels
for customers to gain points to exchange for rewards on one hand and on the other
hand, similar rewards or even homogeneous rewards would be given to customers
from different companies; therefore, the positive effect of the program was
neutralised (Mägi, 2003; Meyer-Waarden., 2007; Leong, 2013).
Furthermore, Dowling and Uncles (1997) argued that keen competition of
marketing strategies between companies forced all companies to replicate the best
offered in the market in order to maintain their positions and gradually, the yielding
of program dropped while cost of it remained the same for all companies (Uncle,
1994). As a result, loyalty program was effective to raise customer’s spending, to
prolong duration of shopping and to attract more revisit to store when customer
57
held no other program from its’ competitors (Mägi, 2003; Meyer-Waarden., 2007;
Leong, 2013).
However, Wright and Sparks (1999) argued that excess supply of loyalty programs
caused no neutralisation effect on store loyalty because coexistence of attractive
programs was commonly found in the highly competitive market but it resulted in
identification problem. Customers failed to store all loyalty cards in the wallet and
gradually, customers forgot those programs when the cards were not in the wallet
(Wright & Sparks, 1999). But Leong (2013) disagreed with it. Leong (2013)
discovered that loyal card was replaced by computer record of customer’s cell
phone numbers, therefore, no card was required reduce the cost to hold a program
which became a merit to attract more customers to join the program. Moreover,
demand and competition on rewards (both physical and non-physical) changed
from time to time, either factor changed could impact on the defection of customers
and store loyalty (Leong, 2013). As a result, neutralisation effect did happen
between loyalty program but the degree of effect changed frequently because the
demand and supply for rewards changed from time to time (Leong, 2013).
58
Furthermore, earlier studies discovered that companies did not pay attention to the
arrangement and design of the loyalty program (Wirtz & Chew, 2002). Therefore,
the loyalty program could not separate itself from another program when
competitors offered similar rewards in their program (Keh & Lee, 2006; Kim, et
al., 2013; Meyer-Waarden & Benavent, 2008; O’Malley & Tynan, 2000; O’Malley,
1998). Sophisticated programs raised difficulties for customers to understand it and
to apply it (Dowling & Uncles, 1997). As a result, customers were reluctant to join
and to use sophisticated programs unless extra efforts could generate excess
fulfilment/enjoyment through experiencing the program (Dowling & Uncles, 1997;
Keh & Lee, 2006).
Last but not least, Mauri (2003) found that large proportion of loyalty card holders
was not loyal to the supermarket in Italy and in Benavent and Crie’s (1998, 2000),
the growth of loyalty cards offered did not generate excessive yielding on sales and
earnings, more customers’ revisit and a bigger basket size. Loyalty cards were
found useless to motivate customers to revisit the store (Mägi, 2003; Liebermann,
1999; Passingham, 1998). As a result, loyalty card itself could not generate store
loyalty.
59
To sum up, regarding on the mixed results found by different scholars, the study
posited that the customer loyalty program influenced store satisfaction directly and
linearly because of the substantial evidence collected from different industry
(Blattberg & Neslin, 1990; Rothchild & Gaidis, 1981; Reichheld & Teal, 1996;
Taylor & Neslin, 2005; Demoulin & Zidda, 2008; Bridson, et al., 2008; Leong,
2013). Hence, the customer loyalty program would affect the store satisfaction of
the consumer, while the proportional association could be observed. It should be
no exception to the industry related to the beauty and healthcare product retailing
(Bloemer & de Ruyter, 1998; Leong, 2013).
2.3. Price sensitivity
Then, the price sensitivity as a moderator between the customer loyalty
programmes and store loyalty was investigated, while the corresponding
illustration was started with a general definition so as to provide the discussion for
the moderation effect of price sensitivity among customer in affecting the store
loyalty under the influence of customer loyalty programmes.
2.3.1. Research related to price sensitivity
60
In the customer loyalty program, the rewards to the customer were illustrated as
the translation of benefits and advisable behaviour of the customers to the firm (Yi
& Jeon, 2003). However, the resistance or assistance of the customers in
conducting the advisable behaviour should be different after receiving the related
rewards (Narasimham, 1984; Shapiro & Varian, 1998). Therefore, the
consideration of the price sensitivity should be included so as to investigate the
difference between price sensitive customers and less/non-price sensitive
customers (Narasimham, 1984; Shapiro & Varian, 1998).
Price sensitivity could be viewed as the reaction of customers to a change of price
and to regular price (Goldsmith & Newell, 1997). Generally, given the same quality
of products, the lower the regular price, the more discount offered, the more
attractive to customers (Gabor, 1988). Price was a cue/implication on quality
when customers faced imperfect/asymmetric information on quality of product:
branding, building materials, location of store and manufacturers, etc. and new
products: lack of past experiences and competitions to do comparison (Nagle &
Holden, 2003). Therefore, customers were more willing to accept regular price
(less/non-price sensitive) and to purchase more on regular price (Suri &
Manchanda, 2001; Nagle & Holden, 2003).
61
However, in a competitive market which information on the quality of products
could be easily attained, high price sensitive customers would like to repurchase
on discount through a loyalty program (Gabor, 1988; Suri & Manchanda, 2001;
Nagle & Holden, 2003). On the other hand, the customers with relatively lower
price sensitivity would consider the related rewards could be spotted in the future,
so they would be unlikely in committing for the repurchasing due to the provision
of the discount offered (Narasimham, 1984; Shapiro & Varian, 1998; Shugan,1995).
Nonetheless, it should be noted that the price sensitivity only affected the decision
of purchasing under the alternation of the price. Therefore, the company who
offered the rewards to the customers might not yield the same effect to the price
discount. As a result, the marketers were advised to provide the mix marketing
strategy so as to suit the related needs for the customers (Narasimham, 1984;
Shapiro & Varian, 1998).
2.3.2. The moderation effect of price sensitivity factor
The researchers also found that the price sensitive people would like to shop after
receiving a discount, while the price-insensitive people would like to purchase after
getting rewards instead of price reduction (Leong, 2013). Price sensitive customers
62
were more likely to repeatedly purchase when the firm offered discount through
loyalty program and price-insensitive customers or customers who treasured
rewards other than discount would not be affected by the discount scheme offered
by the loyalty program; therefore, marketer could change their marketing mix and
offerings to cope with the needs of different kind of customers: physical/economic
rewards on price sensitive customers and more psychological/emotional rewards
on price-insensitive customers (Narasimham, 1984; Shapiro & Varian, 1998). As a
result, there was a possibility that it was true that price sensitivity had a strong
moderation effect to the store loyalty after a customer received the discount from
a customer loyalty program (Leong, 2013; Narasimham, 1984; Shapiro & Varian,
1998).
In the study of Cortiñas et al. (2008) and Demoulin & Zidda (2008) on the effect
of a loyalty program, they discovered a significant difference in price sensitivity
between program holders and non-holders. Holders who satisfied with rewards
achieved from loyalty program were found price insensitive to regular price, and
they also patronised bigger basket size and more varieties (Cortiñas, et al., 2008;
Demoulin & Zidda, 2008). This result could be attributed to customer satisfaction
to rewards, customers received higher level of satisfaction on rewards in turn
63
generated extra values which gradually converted to an acceptance of a high price.
Similarly, inverse relationship between customer satisfaction and price sensitivity
was found in the study of Stock (2005) and Blackwell et al. (2006) while positive
relationship between price acceptance level and patronise behaviour was found in
Herrmann et al. (2001) and Homburg et al. (2005). Moreover, holders who were
not satisfied or less satisfied with the rewards were found a relatively lower price
sensitivity than non-holders (Cortiñas, et al., 2008; Demoulin & Zidda, 2008). To
conclude, customer loyalty program holders were low in price sensitivity and they
were loyal to store (Cortiñas, et al., 2008; Demoulin & Zidda, 2008).
Moreover, price sensitivity was different across culture. In the study of examining
the relationship between product quality and patronise decision in apparel retailing,
Chinese preferred products with more functions compare to South Korean (Kim,
et al., 2002). Kim et al. (2002) attributed the result to the difference in culture.
Chinese were less individualistic compare to South Korean; therefore, higher
extrinsic values (products of a lower price with the same function or more functions)
rasied the chances of positive word-of-mouth in Chinese society that gradually
translated to higher degree of acceptance to buy the product (Schutte & Ciarlante,
64
1998). As a result, the extrinsic value was more important to attract customer in
Chinese society.
Furthermore, in the study of Le Claire (1992) and Tan & McCullough’s (1985), a
society like Hong Kong which shared deeper Chinese beliefs was found more price
oriented in making patronise decision. Although the related results were not
conducted for the beauty and healthcare product industry, the similar effect should
be observed in the current study.
Additionally, the diversity for the construct of the loyalty program also yielded
different effects, while the outcomes were unpredictable and unexplored. For
instance, it could be seen that accumulation of reward points or stamps might yield
the repeated consuming in short burst, while the membership program might have
prolonged but gradual effects to the loyalty of customers (Shugan, 2005).
2.4. Communications with customers
The communication with customers was related to store loyalty as positive
communication would allow retailers to understand their customer better and
enhance the retailers’ brand (Kuan-Yin, et al., 2010). The improvement of the store
65
loyalty resulted from the enhanced communication was assessed and described in
the current section. For the sake of having a comprehensive analysis of the related
dynamics, the current section started from a review of literature on communication
especially for the communication with customers, while the connection and linkage
with store loyalty were included in the later subsection of the current section.
2.4.1. Research related to communication with customers
Further to the illustration to the price sensitivity, the mediation effect of
communication with customers was investigated, while the related factor should
take an important role in the persuasion of the customer in engaging the
consumption of the product. In essence, the factor was defined as the message that
would like to share with the customers, while the companies would commonly use
advertisement and propagator in convoy the related message (Kuan-Yin, et al.,
2010; Lalos & Cestre, 2009; Carpenter & Fairhurst, 2003) so as to yield the desired
results, such as, improving the brand image, encouraging the consumption,
introducing the new products to the market, etc. (Boulding, et al., 1993). As a result,
it was the flow of information or messages from the company to the customers
(Bridson, et al., 2008; Leong, 2013) while van Staden et al. (2002) expanded it as
66
a process that companies could deliver a message and customer would gradually
respond by feedbacks.
Moreover, van Staden et al. (2002) stated successful communication could result
in building up a better relationship with customers, raising the probability of
impulsive buying and reducing information costs for solutions. In the case of the
products related to healthcare and beauty, the factor in corresponding to the
communication with customers would outweigh importance particularly as the
related medicines and items highly relied on the trustworthiness of the retailers;
therefore, the personal consultancy service promoted by some companies were
welcomed as it encouraged the communication between the store and the
customers (Mannings, 2015).
2.4.2. Relationship between communication and store loyalty
From the definition mentioned above, it could be seen that the factor of
communication with customers measured the connection between the store and the
clients in the delivery of products and service. Therefore, it should be with a strong
association with the store loyalty (Keh & Lee, 2006; Kim, et al., 2013; Meyer-
Waarden & Benavent, 2008; O’Malley & Tynan, 2000; O’Malley, 1998).
67
Essentially, the improved communication would trigger the good perception
among the clients, while the communication also enabled the users to release the
true potential and efficiency of the purchased products because of the availability
of the information and knowledge obtained from the store (Keh & Lee, 2006; Kim,
et al., 2013; Meyer-Waarden & Benavent, 2008; O’Malley & Tynan, 2000;
O’Malley, 1998).
Moreover, Duncan (2002) highlighted communication was part of relationship
marketing that could eventually translate into perceived value of customers that
gradually strengthened commitment to store (Rensburg & Cant, 2003) if the
messages were being received by customers successfully (Rouse & Rouse, 2002).
Surface level of a message was the contend like price and variety of products which
could only strengthen calculative commitment (Dwyer, et al, 1987; Marshall, 2010);
while in-depth level message was the implied information like the sense of
superiority and uniqueness by matching receivers with the brand and the products
which gradually, raised affected commitment to store (Dick & Basu, 1994;
Marshall, 2010; Rouse & Rouse, 2002).
68
To conclude, communication with customers enhanced the user experience and the
perceived quality assurance for the brands from the surface level and raised
emotional attachment from the in-dept level, while they were the stepping stone of
the store loyalty. As a result, the communication with customers was selected as a
mediator linking visual merchandising and store loyalty.
2.5. Visual merchandising
Visual merchandising had been considered as one of the essential elements in
contributing the customer loyalty and the communication with customers
(Strategic Direction, 2012; Virgona, Helene, 2012). Therefore, the related
association and the content of the related factor was explained in the following
subsections.
2.5.1. Research related to visual merchandising
From the general definition, visual merchandising could be considered an
aesthetics of science, while it laid the foundation for the retail industry (Law, et al.,
2012) and it was without exception to the retailers of beauty and healthcare product
(Wu, et al., 2013). The approach adopted the hidden techniques to channel the
products to the market (Morgan, 2010) so that the number of employee and the
69
areas for the selling would be reduced along with the maximisation of the
attractiveness of the products (Strategic Direction, 2012; Virgona, Helene, 2012).
In common application, these activities were referring to the development of the
unified floor plan and the window displays so as to attract eye-browsing from
window shoppers and customers (Sebastian, 2008; Rowe, 2014). Visual
merchandise displays attempted to grab their customer attention and to alter their
customer perceptions to store by the design of floor plan and windows display
(Sebastian, 2008; Rowe, 2014). If customers were satisfied, they would be
gradually being attracted to shop in store; therefore, visual merchandising
optimised sales at last (Rowe, 2014).
Building attractive windows and sales floor display required excellent presentation
skills and extra efforts to rebalance the window displays and shopping floor which
resulted in higher costs for layouts on one hand and on the other hand, extra
spending on skilled visual merchandisers (Bustos, 2004a). But Dawes (2008)
argued that given strong competition from localization, visual merchandise
displays were vital to attracting attentions from customers in similar location.
Moreover, it was an instant message of the first sight of visitors which impact the
positioning of store in customers’ mind directly (Maier, 2009). With the
70
highlighting of the features and benefits of the goods and service, the visual
merchandising was able to attract the engagement of the consumer along with the
motivation for the purchasing behaviour (Ha & Lennon, 2010). Therefore, it could
be seen that the close connection could be expected to the consumer experience in
purchasing (Trigoni, 2016), and it was worthy of the inspection of the related
impact on the customer satisfaction and loyalty to the store (Bashford, 2011;
Cervellon & Coudriet, 2013).
2.5.2. Relationship between communication and visual merchandising
Apart from the strong suspicious in the connection between the visual
merchandising and the store loyalty, the visual merchandising, like other promotion
and advertisement in other media, should have a message to deliver to the
customers (Kuan-Yin, et al., 2010; Lalos & Cestre, 2009; Carpenter & Fairhurst,
2003). Therefore, visual merchandising should have a function in facilitating the
communication with customers so as to yield the improvement to the store loyalty
as well as to enable the returned customers (Garvey, 2010). Garvey (2010) defined
the visual merchandising as an attractive tailored message delivered to receivers in
an attempt to guide receivers’ feel as what the marketers tailored for. Moreover,
Storms (2006) discovered that the role of visual themes and first sight on visual
71
themes had a large impact on patronise decision and behaviours in the study of
shop decoration. Passive visual images travelled through first sight on the themes
approached to receivers and the feeling retained in the memory of receivers for a
longer period of time compare to active messages through verbal communications
(Storm, 2006). Therefore, it could be observed that a mediating role of
communication with customers act between visual merchandising and store loyalty.
To conclude, visual merchandising delivered in-depth level message in the first
glance of receivers that possibly altered perception on positioning of store and
gradually, raised commitment to store (Dick & Basu, 1994; Marshall, 2010; Rouse
& Rouse, 2002; Storm, 2006). As a result, in the current study, the exploration of
the mediation effect of communication customers between the visual
merchandising and store loyalty was included and conducted so as to construct the
model in explaining the interaction between the customer's loyalty program and
store loyalty.
Furthermore, communication with customer has been found moderating the
relationship between visual merchandising and behavioural action, the relationship
72
between visual merchandising and word-of-mouth, and the relationship between visual
merchandising and commitment.
2.6. Price image
Similarly, the illustration to the price image was included in the presentation for
the content of visual merchandising, while the brief history and the development
of the concept and understanding of price image among customers were contained
so as to yield the common ground for the development of the current study along
with the linkage to the store loyalty.
2.6.1. Research related to price image
In essence, price image was defined as the perceived value of a product and it could
be viewed as casual conviction of costs to deal with specific retailer (Alba, et al.,
1994; Gewal & Marmorstein, 1994; Bell & Lattin, 1998; Buyukkurt, 1986) as
while it was affected by diversified contributors, such as, the quality of the product
(Hoch, et al., 1999; Lumpkin & McConkey, 1984; van Herpen & Pieters, 2002),
received customer service in purchasing the related products (Brown, 2001; King
& Ring, 1980; Lumpkin & McConkey, 1984), the brand of the product (Bowen &
Chen, 2001; Gounaris & Stathakopoulos, 2004), the location of purchasing
73
(Strategic Direction, 2012; Virgona, Helene, 2012), etc. It was not a precise
calculation in terms of dollar, but a scale measurement made by comparison of
perceived expensiveness on offered products and perceived expenditure to a
retailer (Alba, et al., 1994; Gewal & Marmorstein, 1994; Bell & Lattin, 1998;
Buyukkurt, 1986; Srivastava & Lurie, 2001; 2004). Therefore, a wide range of
factors would affect the resultant perception, while the commonly agreed approach
was to measure the dimension from the customers directly (Marketing Science
Institute, 2017). Thus, the function and influence of price image on the customers
in the related factors were illustrated.
In the study conducted by Miranda et al. (2005), the price image was confirmed as
one of the essential elements for the store satisfaction, while the factor would
interfere the customers in selection the store of purchasing and the customer choice
of the products. On the other hand, due to the persistent behaviour of the consumers,
the store would provide a response to the related desire, and it would eventually
alter the physical location or decoration of the branches (Cox & Cox, 1990; Desai
& Talukdar, 2003). For instance, if a customer would like to enjoy the low-priced
products, they would like to shop in the branch with simple decoration instead of
the heavily decorated shop (Baltas & Papastathopoulou, 2003). Hence, in suiting
74
the identity of the store, the operators of the store would change the decoration and
physical feature according so as to fulfil the expectation of the customers.
Consequently, in the retailing industry of beauty and healthcare products, the
customers would like to shop in discount stores and department stores rather than
specialty stores (Paulins & Geistfeld, 2003) so as to enjoy the discount and the low
price.
2.6.2. Relationship between price image and store loyalty
As aforementioned the price image construct was an essential component of store
loyalty, while the mediation effect of it had been confirmed from the perceived
worthiness, quality and services (Bolton, 1998; Fornell, et al., 1996; Lemon &
Lemon, 1999). Under the contexts related to retailing industry, the price image also
contributed to the returned purchasing (Fornell, et al., 1996) and the positive image
of the shop (Singh & Sirdeshmukh, 2000; Bauer, et al., 2002; Flavian, et al., 2006),
while it was a prerequisite for the cultivation of loyalty. Imperfect/asymmetric
information on price of certain items offered from different retailers resulted in
loyalty behaviour from customers based on casual conviction on price to retailer.
As a result, price image overruled the actual price strategies of different retailers
but it was not applicable to individual who could cheaply and easily attain
75
information on actual price and to those who had strong desire to seek for the
lowest actual price (Grewal & Marmorstein, 1994; Bell & Lattin, 1998; Byukkurt,
1986).
Moreover, scholars discovered that customers with less spending power acted
loyalty to stores with perceived low-price images; meanwhile, loyalty towards
price image would deteriorate when similar perceived value was found in
competitors (Alba, et al., 1994; Burton, et al., 1994; Singh, et al., 2006). Therefore,
it could be supported that the price image was closely related to the store loyalty,
while the mediation effect of it may exist in different parameters.
2.7. Location
Finally, after the illustration to the role of the price image in affecting the store
loyalty, the meaning and the concept of location were explored, while the related
contents were included in the subsequent subsections so that the related value and
the linkage with price image were explained in detail in the current section.
2.7.1. Research related to location
76
Location of a branch was an important consideration to the purchasing intention
along with the subsequent loyalty to the store. Nonetheless, the mechanism of the
effect to the loyalty from the geographical difference had not been established
clearly, especially for the local situation related to the beauty and healthcare
products (Strategic Direction, 2012; Virgona, Helene, 2012). The studies of
Christaller (1935) and Losch (1954) provided the observation to the predictable
sales volume related to location, while it was investigated related to the transaction
costs of the customers. For example, the customers would like to shop nearby so
as to minimize the traffic cost and time so that the loyalty could be cultivated in
the repeated purchasing. The related consideration might contribute partially to the
impact of the store loyalty, but it could not fully explain the diversity of sales with
the population of the related regions (Christaller, 1935; Losch. 1954).
In the observation of Losch (1954), it could be seen that the areas with the
population of relatively low income would yield lower sales, while some of the
customers were willing to spend in a remote location to them, such as, downtown
or cosmopolitan, etc. Therefore, it could be revealed the absolute location of a
branch instead of the relative location of the customers might have a certain value,
while it would contribute to the culmination of loyalty even the place was not
77
convenience for them (Oliver, 1997). As a result, the mediation effect of price
image was suspected, while it would be investigated in the current study.
2.7.2. Relationship between location and price image
Scholars discovered that customers with less spending power acted loyalty to stores
with perceived low-price images; meanwhile, loyalty towards price image would
deteriorate when similar perceived value was found in competitors (Alba, et al.,
1994; Burton, et al., 1994; Singh, et al., 2006). In fact, the connection between the
price image and the value of location were spotted by Leong (2013) along with the
observation to the mega stores established in the blooming regions of a city, while
the positive price image to the related products or brands were transferred to the
store loyalty ultimately. In addition, the study conducted by Leong (2013) also
statistically and empirically confirm the positive effect to the price image and store
satisfaction from the selection of the particular place of store establishment.
Moreover, Mägi (1995) studied the relationship between travel distance to store
and store loyalty in Sweden and found that sixty percent of customers viewed their
favourite store was not located near their residential area but eighty-six percent of
customers repeated patronise in the store near their home. As a result, location
78
affected behavioural loyalty and calculative commitment but not attitudinal loyalty
to store (Dwyer, et al., 1987; Achrol, 1991; Marshall, 2010).
Furthermore, Bell et al. (1998) examined the relationship between location and
different cost incurred to shop in a location and they discovered that customers
were calculative, customers were willing to travel longer distances to shop in low
price image location for the sake of cost benefit unless no dollar surplus could
generate from patronising in low price image location. Therefore, low price image
reduced the awareness of traveling cost. As a result, price image could have
mediating effect between location and attitudinal loyalty to store and calculative
commitment to store (Dwyer, et al., 1987; Achrol, 1991; Marshall, 2010).
Nonetheless, due to the geographical similarity of Hong Kong in different regions,
the related difference among the shops in dissimilar places could not be observed,
even though the related study was dedicated for the local supermarket. The related
effect should happen in the study of beauty and healthcare products due to the
labeling effects. For instance, Hong Kong local people would purchase computers
and notebooks in Sham Shui Po, while aquatic lovers would like to go to Goldfish
Market, etc. (Hong Kong Tourism Board, 2017). Hence, for the high-end beauty
79
and healthcare products, the consumers would like to go the places with relatively
high price image.
2.8. The development of research questions
In spite of the plethora of studies on customer loyalty program and store loyalty
models, there was a dearth of studies examining the interrelationships among the
ten variables. Hence, the following research questions were posed:
RQ1: What are the moderating effects of price sensitivity with respect to the
relationship between hard attribute and behavioural action, the
relationship between hard attribute and word-of-mouth and the
relationship between hard attribute and commitment in the local beauty
and healthcare retailing industry?
RQ2: What are the moderating effects of price sensitivity with respect to the
relationship between soft attribute and behavioural action, the
relationship between soft attribute and word-of-mouth and the
relationship between soft attribute and commitment in the local beauty
and healthcare retailing industry?
80
RQ3: What are the mediating effects of communication with customer with
respect to the relationship between virtual merchandising and
behavioural action, the relationship between virtual merchandising and
word-of-mouth and the relationship between virtual merchandising and
commitment in the local beauty and healthcare retailing industry?
RQ4: What are the mediating effects of communication with customer with
respect to the relationship between location and behavioural action, the
relationship between location and word-of-mouth and the relationship
between location and commitment in the local beauty and healthcare
retailing industry?
2.9. The development of hypotheses
Along with the development and the illustration for the building blocks of current
study, the hypotheses to be verified and reviewed in the current work were
developed in the above sections in order to support the invention of the research
instrument and the related methods of the analysis.
81
Bloemer & de Ruyter (1998) provided an empirical demonstration of the
connection between customer loyalty program and store loyalty in the department
store, while the positive significant effect of the program was recorded, customer
loyalty programmes improved store loyalty. Taylor and Neslin (2005) discovered
positive short term and long term impact of customer loyalty programs to store
loyalty; customers were found to raise their patronise volume to gain points for
rewards which was viewed as the instant impact and gradually, more repeated
purchased were found after rewards were given; it could be viewed as seeking for
rewards motivated instant purchased and rewards itself attracted commitment of
delay purchased (Blattberg & Neslin, 1990; Rothchild & Gaidis, 1981). Moreover,
Cortiñas et al. (2008) and Demoulin & Zidda (2008) found that program holders
were less reluctant to regular price products and they bought more variety of items
and contributed more on total sales to company to non-program holders. Hence,
the customer loyalty program would affect the store satisfaction of the consumer,
while the proportional association could be observed. It should be no exception to
the industry related to the beauty and healthcare product retailing (Bloemer & de
Ruyter, 1998; Leong, 2013).
82
Therefore, the study posited that the customer loyalty program influenced store
loyalty directly and linearly with moderating effect from price sensitivity because
of the substantial evidence collected from different industries (Blattberg & Neslin,
1990; Rothchild & Gaidis, 1981; Reichheld & Teal, 1996; Taylor & Neslin, 2005;
Demoulin & Zidda, 2008; Bridson, et al., 2008; Leong, 2013; Cortiñas, et al., 2008;
Demoulin & Zidda, 2008) and so H1 was drawn as: Customer loyalty program is
directly and positive contributing to the store loyalty in the local beauty and
healthcare retailing industry with moderating effect from the price sensitivity. With
reference to Bridson et al. (2008)’s study and Leong (2013)’s, the hypotheses for
the theoretical framework to examine the customer loyalty in Hong Kong are as
follows:
H1a: Hard attribute is positively associated with price sensitivity in the local beauty
and healthcare retailing industry.
H1b: Hard attribute is positively associated with behavioural action in the local
beauty and healthcare retailing industry.
H1c: Hard attribute is positively associated with word-of-mouth in the local beauty
and healthcare retailing industry.
H1d: Hard attribute is positively associated with commitment in the local beauty and
healthcare retailing industry.
83
H1a, H1b, H1c and H1d were related to the direct influence of hard attribute on
price sensitivity, behavioural action, word-of-mouth and commitment, indicating
the salience of hard attribute to retail store sustainability specifically associate with
customer loyalty concepts that are relevant to local beauty and healthcare retailing
industry.
Visual merchandising, like other promotion and advertisement in other media,
should have a message to deliver to the customers (Kuan-Yin, et al., 2010; Lalos
& Cestre, 2009; Carpenter & Fairhurst, 2003). Therefore, visual merchandising
should have a function in facilitating the communication with customers so as to
yield the improvement to the store loyalty as well as to enable the returned
customers (Garvey, 2010). Storms (2006) discovered that the role of visual themes
and first sight on visual themes had a large impact on patronise decision and
behaviours. Passive visual images travelled through the sights and retained in the
memory of receivers for a longer period of time compare to active messages
through verbal communications (Storm, 2006); therefore, it could be observed that
a mediating role of communication with customers act between visual
merchandising and store loyalty; visual merchandising delivered in-depth level
message in the first glance of receivers and possibly altered the store positioning
84
and gradually raised commitment to store (Dick & Basu, 1994; Marshall, 2010;
Rouse & Rouse, 2002; Storm, 2006). As a result, the exploration of the mediation
effect of communication customers between the visual merchandising and store
loyalty was included in this study. Therefore, H2 was drawn as: The relationship
between visual merchandising and store loyalty is affected by the mediation of
communication with customers. The hypotheses listed below were developed from
the adapted Bridson et al. (2008) and Leong (2013).
H2a: Soft attribute is positively associated with price sensitivity in the local beauty
and healthcare retailing industry.
H2b: Soft attribute is positively associated with behavioural action in the local
beauty and healthcare retailing industry.
H2c: Soft attribute is positively associated with word-of-mouth in the local beauty
and healthcare retailing industry.
H2d: Soft attribute is positively associated with commitment in the local beauty and
healthcare retailing industry.
H2a, H2b, H2c and H2d relate to the direct influence of soft attribute on price
sensitivity, behavioural action, word-of-mouth and commitment, indicating the
salience of soft attribute to retail store sustainability specifically associate with
85
customer loyalty concepts that are relevant to local beauty and healthcare retailing
industry.
Scholars discovered that customers with less spending power acted loyalty to stores
with perceived low-price images; loyalty towards price image would deteriorate
when similar perceived value was found in competitors (Alba, et al., 1994; Burton,
et al., 1994; Singh, et al., 2006). In fact, the connection between the price image
and the value of location were spotted by Leong (2013) along with the observation
to the mega stores established in the blooming regions of a city, while the positive
price image to the related products or brands were transferred to the store loyalty
ultimately.
In addition, the study conducted by Leong (2013) also statistically and empirically
confirmed the positive effect to the price image and store satisfaction from the
selection of the particular place of store establishment. Bell et al. (1998) examined
the relationship between location and different cost incurred to shop in a location
and discovered that customers were calculative, they were willing to travel longer
distances to shop in low price image location for the sake of cost benefit, unless no
dollar surplus could generate from patronising in low price image location, low
86
price image reduced the awareness of traveling cost; therefore, price image could
have mediating effect between location and attitudinal loyalty to store and
calculative commitment to store (Dwyer, et al., 1987; Achrol, 1991; Marshall,
2010). Therefore, H3 is drawn as: The relationship between location and store
loyalty is affected by the mediation of price image. The hypotheses listed below
were developed from the adapted Bridson et al. (2008) and Leong (2013).
H3a: Visual merchandising is positively associated with behavioural action in the
local beauty and healthcare retailing industry.
H3b: Visual merchandising is positively associated with word-of-mouth in the local
beauty and healthcare retailing industry.
H3c: Visual merchandising is positively associated with commitment in the local
beauty and healthcare retailing industry.
H3d: Visual merchandising is positively associated with communication with
customer in the local beauty and healthcare retailing industry.
H3a, H3b, H3c and H3d relate to the direct influence of visual merchandising on
behavioural action, word-of-mouth and commitment, indicating the salience of
visual merchandising to retail store sustainability specifically associate with
customer loyalty concepts that are relevant to local beauty and healthcare retailing
industry.
87
With reference to Bridson et al. (2008)’s study and Leong (2013)’s study, the
hypotheses listed below were developed from the adapted Bridson et al. (2008) and
Leong (2013).
H4a: Location is positively associated with behavioural action in the local beauty
and healthcare retailing industry.
H4b: Location is positively associated with word-of-mouth in the local beauty and
healthcare retailing industry.
H4c: Location is positively associated with commitment in the local beauty and
healthcare retailing industry.
H4d: Location is positively associated with price image in the local beauty and
healthcare retailing industry.
H4a, H4b, H4c and H4d relate to the direct influence of price image on behavioural
action, word-of-mouth and commitment, indicating the salience of price image to
retail store sustainability specifically associate with customer loyalty concepts that
are relevant to local beauty and healthcare retailing industry.
H5a: Price sensitivity is positively associated with behavioural action in the local
beauty and healthcare retailing industry.
H5b: Price sensitivity is positively associated with word-of-mouth in the local
88
beauty and healthcare retailing industry.
H5c: Price sensitivity is positively associated with commitment in the local beauty
and healthcare retailing industry.
H5a, H5b, and H5c relate to the direct influence of price sensitivity on behavioural
action, word-of-mouth and commitment, indicating the salience of price sensitivity
to retail store sustainability specifically associate with customer loyalty concepts
that are relevant to local beauty and healthcare retailing industry.
H6a: Communication with customer is positively associated with behavioural
action in the local beauty and healthcare retailing industry.
H6b: Communication with customer is positively associated with word-of-mouth
in the local beauty and healthcare retailing industry.
H6c: Communication with customer is positively associated with commitment in
the local beauty and healthcare retailing industry.
H6a, H6b, and H6c relate to the direct influence of communication with customer
on behavioural action, word-of-mouth and commitment, indicating the salience of
communication with customer to retail store sustainability specifically associate
with customer loyalty concepts that are relevant to local beauty and healthcare
retailing industry.
H7a: Price image is positively associated with behavioural action in the local beauty
89
and healthcare retailing industry.
H7b: Price image is positively associated with word-of-mouth in the local beauty
and healthcare retailing industry.
H7c: Price image is positively associated with commitment in the local beauty and
healthcare retailing industry.
H7a, H7b and H7c relate to the direct influence of price image on behavioural
action, word-of-mouth and commitment, indicating the salience of price image to
retail store sustainability specifically associate with customer loyalty concepts that
are relevant to local beauty and healthcare retailing industry.
H8a: Hard attribute is positively associated with behavioural action in the local
beauty and healthcare retailing industry with moderating effect from the price
sensitivity.
H8b: Hard attribute is positively associated with word-of-mouth in the local
beauty and healthcare retailing industry with moderating effect from the price
sensitivity.
H8c: Hard attribute is positively associated with commitment in the local beauty
and healthcare retailing industry with moderating effect from the price
sensitivity.
H9a: Soft attribute is positively associated with behavioural action in the local
90
beauty and healthcare retailing industry with moderating effect from the price
sensitivity.
H9b: Soft attribute is positively associated with word-of-mouth in the local beauty
and healthcare retailing industry with moderating effect from the price
sensitivity.
H9c: Soft attribute is positively associated with commitment in the local beauty
and healthcare retailing industry with moderating effect from the price
sensitivity.
H10a: Visual merchandising is positively associated with behavioural action in the
local beauty and healthcare retailing industry with mediating effect from the
communication with customer.
H10b: Visual merchandising is positively associated with word-of-mouth in the
local beauty and healthcare retailing industry with mediating effect from the
communication with customer.
H10c: Visual merchandising is positively associated with commitment in the local
beauty and healthcare retailing industry with mediating effect from the
communication with customer.
H11a: Location is positively associated with behavioural action in the local beauty
and healthcare retailing industry with mediating effect from the price image.
91
H11b: Location is positively associated with word-of-mouth in the local beauty
and healthcare retailing industry with mediating effect from the price image.
H11c: Location is positively associated with commitment in the local beauty and
healthcare retailing industry with mediating effect from the price image.
These hypotheses are used to formulate a questionnaire for the research, as
described in later chapter.
2.10. The development of research model
After the illustration to the hypotheses studied in the current study, the summary
of them was included so as to ease the referring. Along with the comparison with
the models used in the previous studies related to the store loyalty in the retail
industry, the highlight and contrasting of the model adopted in the current work
could be achieved. In order to specify the contribution and uniqueness of the model
proposed, the current section was developed into two subsections, namely, The
parental frameworks and The proposed model , so as to start the development of
framework with a review of the existing models and to end with the newly
proposed model in suiting the local context of the beauty and healthcare retailing
industry.
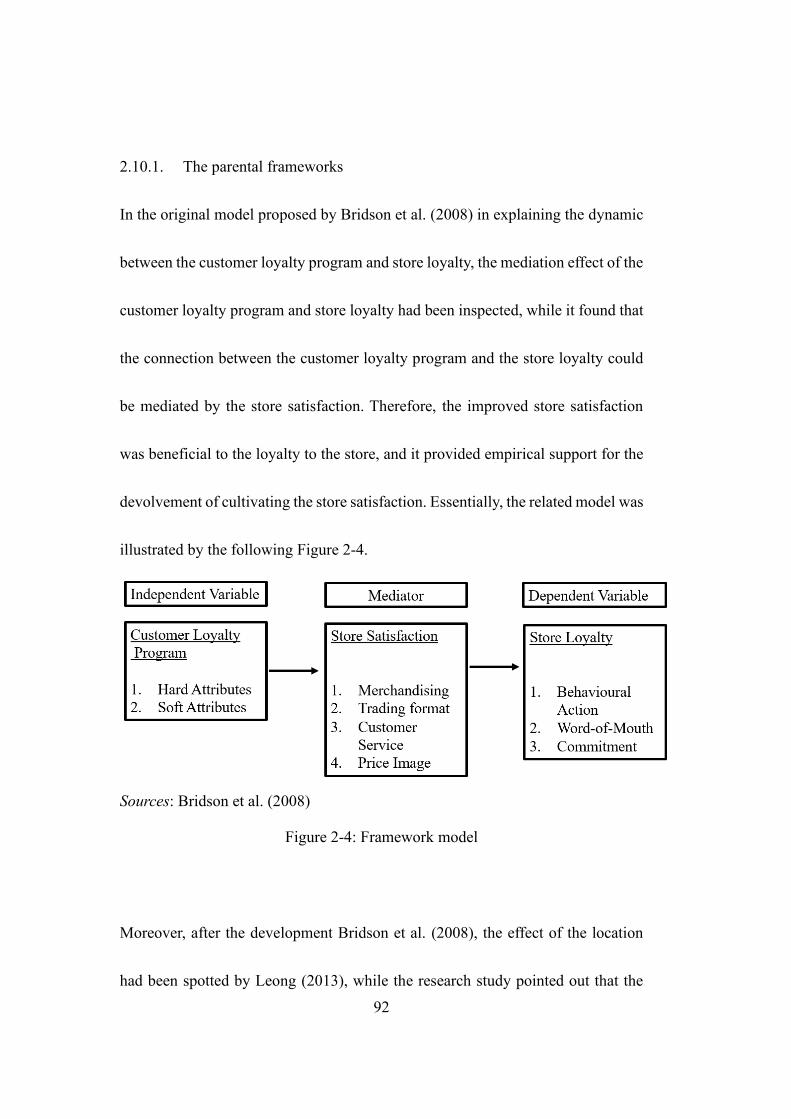
92
2.10.1. The parental frameworks
In the original model proposed by Bridson et al. (2008) in explaining the dynamic
between the customer loyalty program and store loyalty, the mediation effect of the
customer loyalty program and store loyalty had been inspected, while it found that
the connection between the customer loyalty program and the store loyalty could
be mediated by the store satisfaction. Therefore, the improved store satisfaction
was beneficial to the loyalty to the store, and it provided empirical support for the
devolvement of cultivating the store satisfaction. Essentially, the related model was
illustrated by the following Figure 2-4.
Sources: Bridson et al. (2008)
Figure 2-4: Framework model
Moreover, after the development Bridson et al. (2008), the effect of the location
had been spotted by Leong (2013), while the research study pointed out that the
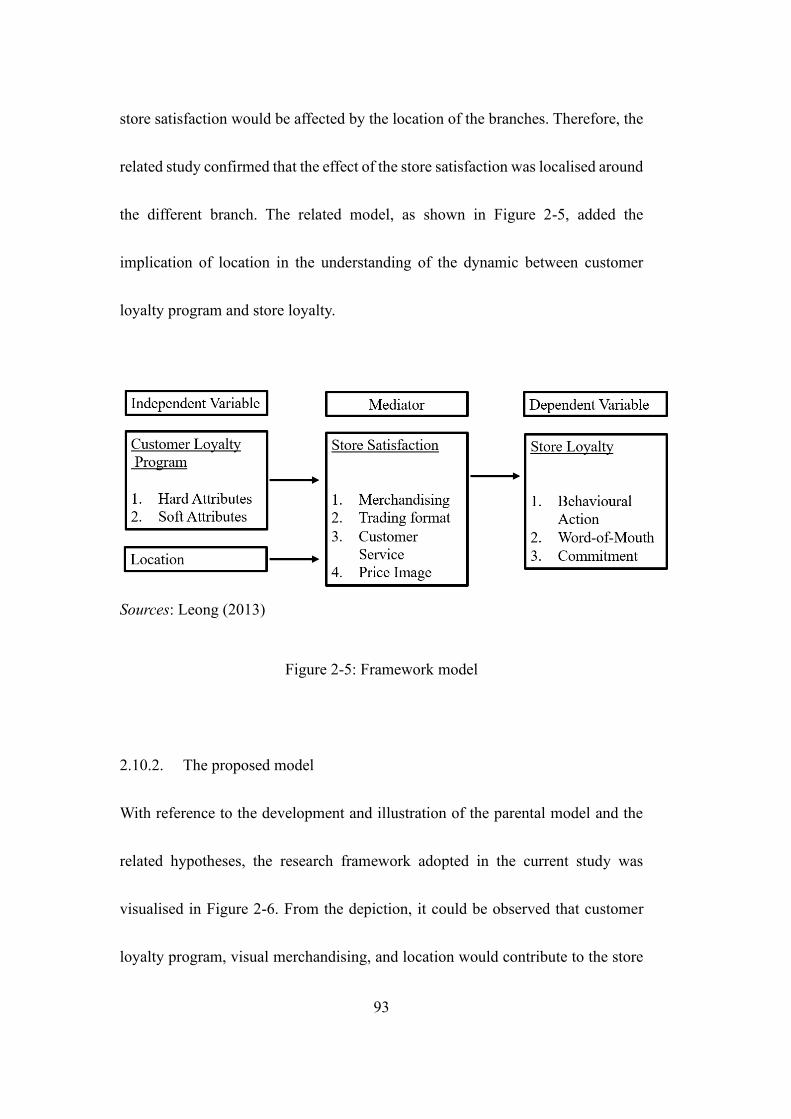
93
store satisfaction would be affected by the location of the branches. Therefore, the
related study confirmed that the effect of the store satisfaction was localised around
the different branch. The related model, as shown in Figure 2-5, added the
implication of location in the understanding of the dynamic between customer
loyalty program and store loyalty.
Sources: Leong (2013)
Figure 2-5: Framework model
2.10.2. The proposed model
With reference to the development and illustration of the parental model and the
related hypotheses, the research framework adopted in the current study was
visualised in Figure 2-6. From the depiction, it could be observed that customer
loyalty program, visual merchandising, and location would contribute to the store
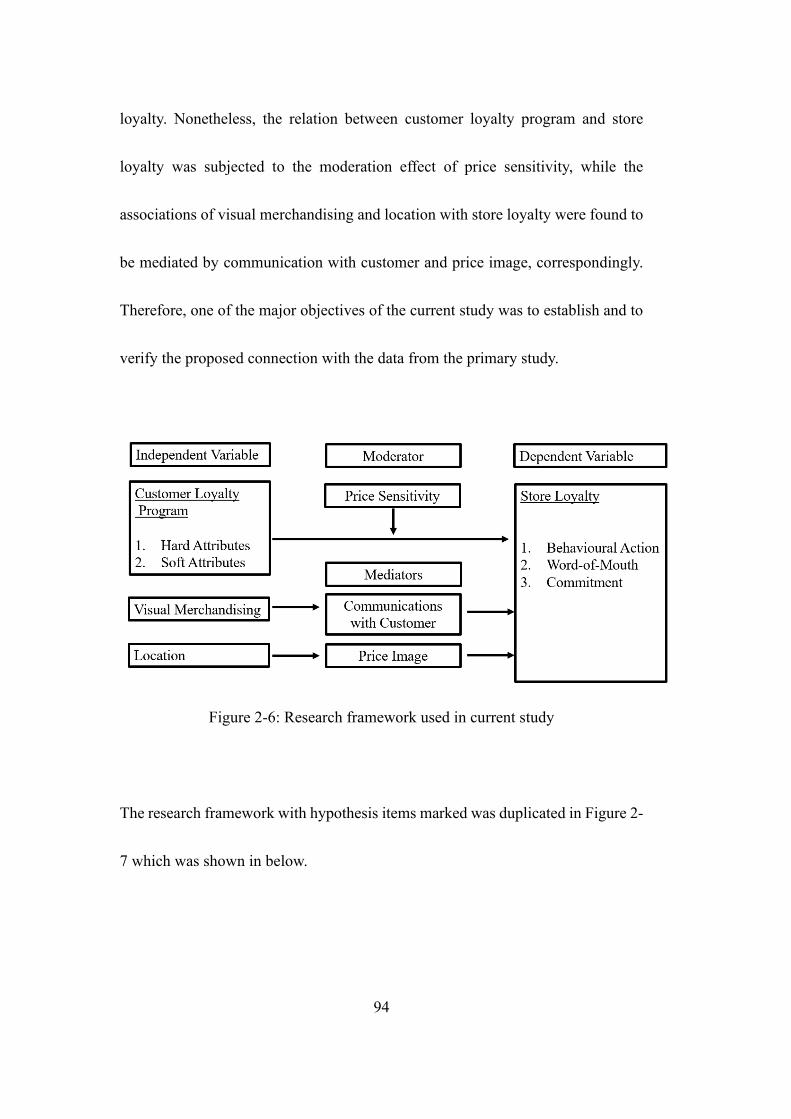
94
loyalty. Nonetheless, the relation between customer loyalty program and store
loyalty was subjected to the moderation effect of price sensitivity, while the
associations of visual merchandising and location with store loyalty were found to
be mediated by communication with customer and price image, correspondingly.
Therefore, one of the major objectives of the current study was to establish and to
verify the proposed connection with the data from the primary study.
Figure 2-6: Research framework used in current study
The research framework with hypothesis items marked was duplicated in Figure 2-
7 which was shown in below.
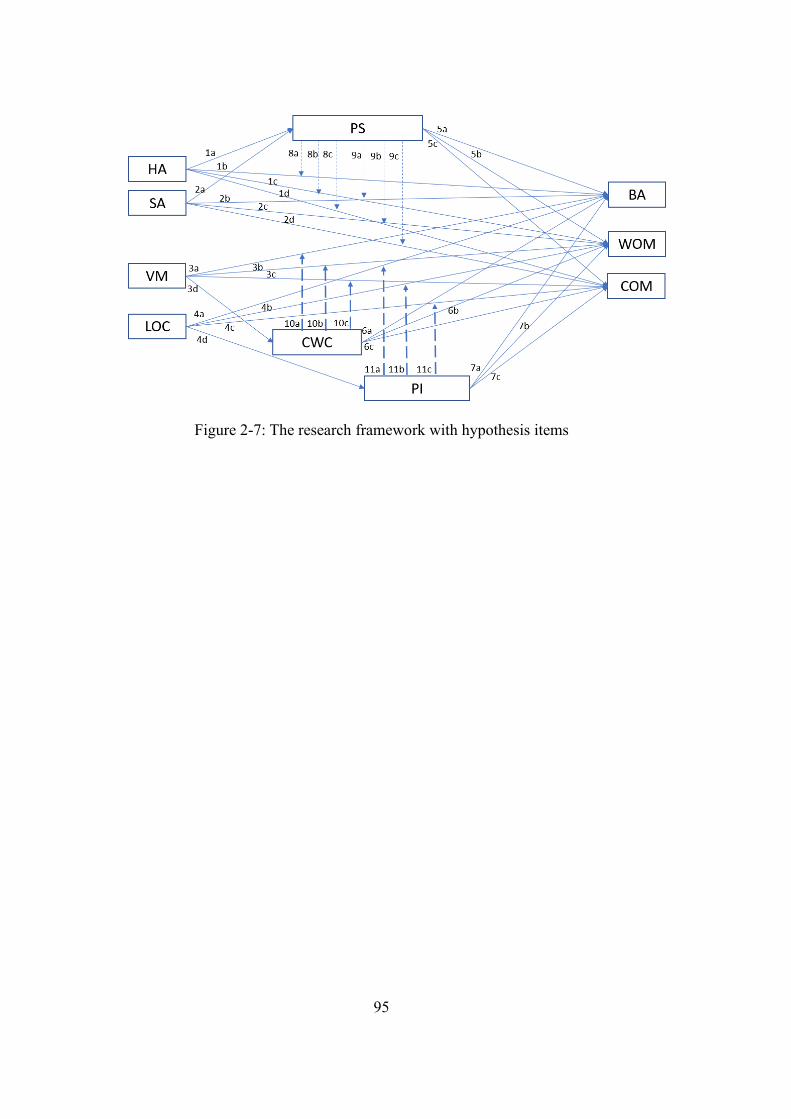
95
Figure 2-7: The research framework with hypothesis items
96
3. RESEARCH METHODOLOGY
3.1. Introduction
In the last chapter, the main literatures relevant to customer loyalty program, store
loyalty, price sensitivity, communication with customer and price image were
reviewed and highlighted. Based upon the discussion of customer loyalty
knowledge, the research questions were developed and the research framework
was established with corresponding hypotheses. This chapter focused on the
rationale and the choices of research design and research methodology and
describes the sampling frame, sample, research instruments and measurement, data
collection method and data analysis. The limitation in relation to research design
and ethical issues were explained together in the final part of the chapter.
3.2. Research paradigm
This study followed a research paradigm that guided the way to identify the
required factors and proposed model for characterising the interaction between the
customer loyalty program and store loyalty. A research paradigm provided a set of
common beliefs, values and guides on research methods which focused on analysis
and surveys development (Brand, 2009; Bryman, 2003; Cavana, Delahaye, &
97
Sekaran, 2001). According to Brand (2009), there were many types of research
paradigms and the two major types of research orientation were ontological and
epistemological.
The ontological orientation was a term referred to the study of the fundamental
nature of existence where the social world or the way people viewed topics from
their perceptions, whereas the epistemological orientation was referred to the ways
of knowing the discipline of the social world and the questions on whether or not
a study on the social world should be following the principles (Bryman, & Bell,
2015). The epistemological framework encompassed two predominant research
paradigms, namely interpretivism and positivism (Cohen, & Manion, 1994).
The interpretive paradigm applied scientific methods to interpret inductively the
social phenomena and construed the human behaviour and social theory (Cohen,
& Manion, 1994). As information on the phenomena was collected from the
research participants and was verified before generating the theories, the
interpretive paradigm was to suit the study of qualitative analysis. Differently,
the positivism paradigm referred to a deterministic philosophy that tests a theory
98
or describes a personal experience from observation or measurement which would
have no interfering with the phenomena being studied (Levin, 1988).
As the ground theory this study was based on the identified customer loyalty
models, applying the positivism paradigm was suitable to this study and for testing
the theory objectively. Therefore, the proposed modified model would be used to
explore the relationships amongst different customer loyalty constructs and
customer store loyalty behaviours.
3.3. Research design
3.3.1. Cross-sectional research design
According to Bryman and Bell (2015), cross-sectional and longitudinal research
designs were the two common research designs for observational social and
business studies. A cross-sectional design did not provide definite facts about the
cause-and-effect associations and did not consider the changes that happened
before or after a snapshot in time (Bryman & Bell, 2015). However, a longitudinal
design would provide definite information related to the cause-and-effect
relationships as the changes that happened at two or more different snapshots
would be collected for analysis (Bryman & Bell, 2015). The current study aimed
99
at identifying the behaviours of beauty and healthcare product consumers and their
relationships with different store loyalty factors in Hong Kong, i.e., a research that
studies the relationships between facts and outcomes. As prior literatures such as
Praharsi, Wee, Sukwadi, & Padilan (2014)'s study on loyalty program in
Indonesian as well as Izogo (2015)’s study on attitudinal loyalty in Nigerian
telecom service sector had adopted cross-sectional research, therefore cross-
sectional research design was adopted in this research to yield the impact of the
responses from research participants (Hunt, 2002) at one snapshot in time.
In addition, a single cross-sectional design was adopted as the population was the
residents of Hong Kong and only one set of samples was drawn from the population.
The collected information would be scrutinized and brought forward the results of
the effect of different attributes (e.g. soft attributes and hard attributes) on customer
loyalty behaviour which would relate to the comparison of opinions expressed
from the viewpoint of research participants in the theoretical framework, it was
beneficial to employ a single cross-sectional research design to compare all the
variables at the same time.
100
3.3.2. Population
Hong Kong, ranking the 4th densely populated area on earth, had 7.24 million
residents living in less than 1100 sq km (Hong Kong Fact Sheet, 2015). In April
2018, it was expected that Hong Kong would have hosted more than 60 million
tourists and Chinese was the majority ethnic group in Hong Kong (SCMP, 2018).
As healthcare and beauty products can be imported duty free from Hong Kong into
the mainland China, a significant portion of healthcare and beauty products
imported into Hong Kong were repackaged and processed for the Chinese
mainland market (ITA, 2016). Therefore, Hong Kong was an attractive location for
foreign branded healthcare and beauty products import and was one of the
primarily important launch pads for marketing healthcare and beauty products into
the Chinese mainland.
The target population of this study was the local Hong Kong residents over the age
of 18 who had experience in purchasing beauty and healthcare products in Hong
Kong. To keep the population focused, only those adults who were capable to read
and understand either Chinese or English were considered.
101
3.3.3. Sample
According to Sekaran and Bougie (2013), a sample would be a manageable subset
of a population and the sample in this research was Hong Kong residents who were
over the age of 18, had capability to read either Chinese or English, and had
experience in purchasing beauty and healthcare products in Hong Kong.
3.3.4. Sampling technique
In behavioural science studies, non-probability sampling techniques which include
judgmental, quota sampling, snowballing and convenience, are commonly adopted
sampling processes that do not give all the individual in the population equal
chances of being selected (Hair Jr et al., 2010). The next few paragraphs provided
a brief description on each of these sampling techniques and the approach adopted
in this research.
Hair Jr et al. (2010) provided description on the judgmental sampling method,
which was a sampling technique that a researcher was required to select sample
units based on the researcher’s professional judgment and knowledge of the people,
and the quota sampling method, which was a sampling skill that a researcher was
required to identify representative individuals out of a specific subgroup such as a
102
sample of 50 males, or 50 individuals with monthly income of HK$ 15,000 or more.
Both of these two sampling methods were purposive sampling and researchers
might not be able to avoid conscious and unconscious personal bias going into the
data collection process (Cavana, Delahaye, Sekaran, 2001). Hence, the researcher
did not consider these methods as the needs to weighing several pieces of evidence
of selection and making statements about how sure the researcher that it was right
or how accurate the researcher was about somethings at the same time was too
complex and not as well developed to simple formulas.
For the convenience sampling technique, where the research participants were
selected because of their convenient accessibility to the researcher, and the
snowballing sampling technique, where the researcher encouraged the researcher
participants to recruit other research participants from among their acquaintances
across different social media, they were non-probability sampling techniques as the
research subjects were not selected by chance (Nardi, 2013; Hair Jr et al., 2010;
Morgan, 2008; Goodman, 1961).
In this study, both convenience sampling and snowballing techniques were
employed as the sample was drawn from the researcher’s social network and the
103
research participants would invite other research participants from among their
acquaintances. The rationale behind choosing these two techniques was the easy
access to research participants and the simplicity to carry out with few rules
governing how the research sample should be collected from the population. In
addition, the snowball chain referral process allowed the researcher to reach
population that might not be easy to sample when using other sampling methods.
For example, some people do not like to be asked about their age in the street. It
was not cost-efficient to stand in a street corner to pick up pedestrians to ask them
if they were adult and whether they had purchased healthcare and beauty products
in Hong Kong. With snowball sampling, each research participants will
recommend others who were adult and might be interested in taking part in the
survey. However, there was a disadvantage to adopt this approach as it might not
be possible to determine the sampling error about a population based on the
obtained samples.
3.3.5. Research site
Research sample was come from the researcher personal network and the social
media network. The questionnaire of this study was built using the Qualtrics and
invitations were sent to potential participants via internet social networks
104
(Facebook and Whatsapp) through Facebook messenger and Whatsapp (Neuman,
1997; Rundle-Thiele, 2005). Samples were gathered from more than one source.
As the research participants were anonymous while filling the survey, the
researcher could not run comparison on the difference from the two sources. Hence,
some research participants might receive invitations from three sources; one email
invitation from researcher, one invitation from the post in Facebook, and one
invitation from Whatsapp groups.
3.3.6. Sample size
To determine the sample size of this research, this study was based on Sekaran and
Bougie’s (2013) study which suggested that a multivariate research such as a
multiple regression analysis should have a sample size several times (preferably
ten times or more) as large as the number of variables in the study. As this study
had ten major constructs including behavioural action, word-of-mouth,
commitment, hard attributes, soft attributes, price sensitivity, communication with
customer, visual merchandising, price image, and location, a minimum of ten
responses per questionnaire item in a complex construct is recommended (Hair et
al., 2010). Therefore, the estimated minimum number of research participants
needed for the sample should be greater than 100. Having considered the available
105
resources such as cost and time and the need to have the representative sample to
be generalizable to make estimation and inferences about the population (Bryman
& Bell, 2011), this study was designed to have a sample size of 200 or more to
ensure the sample statistics would be acceptable to estimate and reflect the
population parameters as closely as possible (Sekaran & Bougie, 2013).
3.4. Data collection method
Self-administrated online questionnaires were developed for the collection of the
responses due to the benefits of online data collection and the benefits include ease
of data gathering, minimal cost and increase in response rate (Bryman & Bell,
2015). The online questionnaire of this research was available between 7
September 2017 and 14 November 2017 inclusively and it was powered by
Qualtrics. The English version of the invitation script was attached in Appendix 3-
01 and the Traditional Chinese version of the invitation script was attached in
Appendix 3-01. Both of these invitation scripts were sent to potential participants
via Internet social networks through Facebook messenger and Whatsapp (Neuman,
1997; Rundle-Thiele, 2005).
106
Potential participants were presented a copy of the information statement which
was attached on the survey explaining the scope of the study and the rights of the
participants. The English version of the information statement was attached in
Appendix 3-03 and the Traditional Chinese version of the information statement
was attached in Appendix 3-04 in this thesis. The potential participants were asked
if they were willing to participate voluntarily in this research by completing an
online questionnaire. The completed questionnaires would be considered as the
implied consent from research participants. The English version of the
questionnaire was attached in Appendix 3-05 and the Traditional Chinese version
of the questionnaire was attached in Appendix 3-06 in this thesis. As both Chinese
and English were the official languages adopted in Hong Kong, the invitation letter,
information statement and questionnaire, were available in both Traditional
Chinese and English language. It would take approximately 10 minutes to complete.
Participation was voluntary and participants could exit the questionnaire at any
time prior to submission.
The questionnaire did not ask for any personal information from the research
participants and this was to preserve anonymity. All information was exported from
Qualtrics and stored within the computers of the supervisor and the student
107
researcher for scientific analysis. All information from Qualtrics and the computer
was removed at the completion of analysis and one single copy would be securely
stored on the researcher’s own Cloud secure for 5 years.
Once the research participants completed the online questionnaire, the participants
were given a chance to invite their friends to participate in the same questionnaire
based interview so as to achieve the expected number of the responses of 200 in
suiting the population of 7.2 million in Hong Kong (Hong Kong Census and
Statistic Department, 2014). In essence, snowball sampling (Morgan, 2008, p. 816
– 817; Goodman, 1961) was adopted in the conduction of current study.
3.5. Design of the questionnaire items
From a practical point of view, the respondents were invited to give their responses
in relation to the purchasing behaviour of the beauty related items. Therefore, the
questions were designed to study the response on the factors that reflect the
customer behaviour. In particular, the demographic information and their perceived
importance of the components in a customer loyalty program were accessed with
the questions which were based on validated literature and research articles.
108
Multiple choice questions were adopted in the collection of data related to the
personal information of the participants, while they were invited to state their level
of acceptance to the corresponding statements in corresponding to the importance
of different components of the loyalty program.
A seven-point Likert scale (Likert, 1932; Likert, 1961; Wuensch, 2009) was
employed in facilitating the expression of the opinion. Furthermore, store
satisfaction, location, visual merchandising, store loyalty, and price sensitivity
were accessed with similar configuration, but the research participants were invited
to answer the related questions with reference to the most favour or the most
frequently purchased retailer.
The questionnaire was designed to have nine sections. Part 1 was the pre-condition
questions. Part 2 was a list of demographic questions. Part 3 was a list of store
loyalty questions. Part 4 was a list of customer loyalty program questions. Part 5
was a list of price sensitivity questions. Part 6 was a list of communication with
customer questions. Part 7 was a list of visual merchandising questions. Part 8 was
a list of price image questions. Part 9 was a list of location related questions. In
order to give the justification and evidence for the development of the research
109
instrument, details of the research instrument were explained in the next few
sections.
3.5.1. Development of research instrument
Four pre-conditions questions were asked in the beginning to identify if the
participants were Hong Kong residents over the age of 18 who had experience in
purchasing beauty and healthcare products in Hong Kong. With reference to the
research instrument developed by Leong (2013) and Bridson, et al. (2008) as well
as the customization in suiting the purpose of the current study, the research
instrument was defined. As there was a total of 53 questions in the survey, the
questions were put into several categories to ease the collection of responses from
the participants.
The first eleven questions were dedicated in clarifying the demographic
background of the respondents, i.e. gender, age, marital status, monthly income,
received education along with the research participants’ favourite stores, the
frequency of visiting the store (in-person and online) and the participation to the
loyalty program and membership. The questions along with the related options
were provided so that the participants can opt the most proper answers out of the
110
options. Then, from the question number 12 and onwards, the question items in
measuring the related research constructs were included and all of these questions
were encapsulated into positively coded statements. Thus, the participants could
express their level of agreeing to the statements with 7-point Likert scale (Likert,
1932; Likert, 1961; Wuensch, 2009) with the related options of “Strongly
Disagree”, “Disagree”, “Slightly Disagree”, “Neural”, “Slightly Agree”, “Agree”,
and “Strongly Agree”. Furthermore, the related arrangement also facilitated the
analysis of the related results, as the related opinion could be quantized by the
assignment of numbers ranging from 1 to 7 respectively.
In the second part of accessing the factors involved in the current study, the
questions related to store loyalty were asked, while behavioural action, word-of-
mouth, and commitment were considered as the components of it, and 16
statements were assigned in accessing the research participants’ point of view
related to store loyalty of them. Then, in the following part, the questions of
customer loyalty program containing the hard and soft attributes were included,
while 14 statements were dedicated to accessing the related item. Finally, price
sensitivity, communication with the customer, visual merchandising, price image,
and location were contained in the remaining parts of the questionnaire, while three
111
questions each were assigned to price sensitivity and location and two questions
each were allocated to communication with the customer, visual merchandising
and price image.
The detailed mapping between the measures of each construct and question could
be seen from below table, while it summarised the corresponding for the questions
and the intended measures.
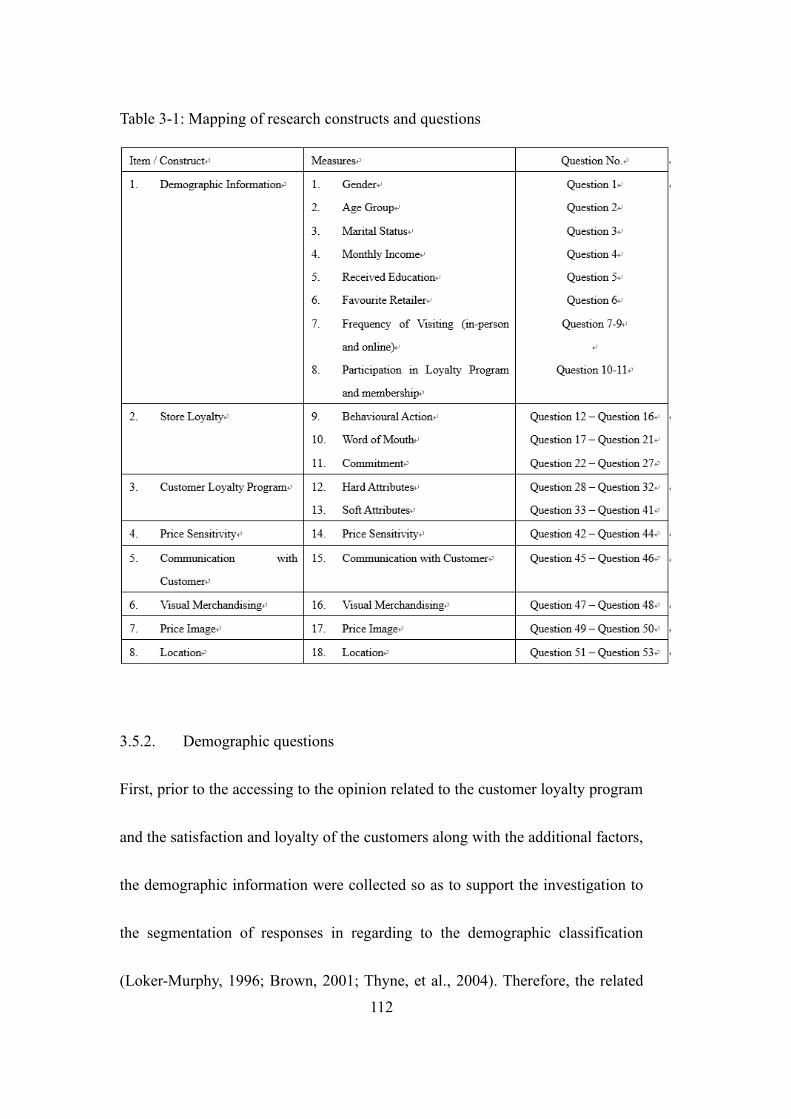
112
Table 3-1: Mapping of research constructs and questions
3.5.2. Demographic questions
First, prior to the accessing to the opinion related to the customer loyalty program
and the satisfaction and loyalty of the customers along with the additional factors,
the demographic information were collected so as to support the investigation to
the segmentation of responses in regarding to the demographic classification
(Loker-Murphy, 1996; Brown, 2001; Thyne, et al., 2004). Therefore, the related

113
seven pieces of information, namely, gender, age, marital status, monthly income,
received education, the frequency of visiting the favour store, and participation in
loyalty program was accessed with the corresponding questions shown in below
table.
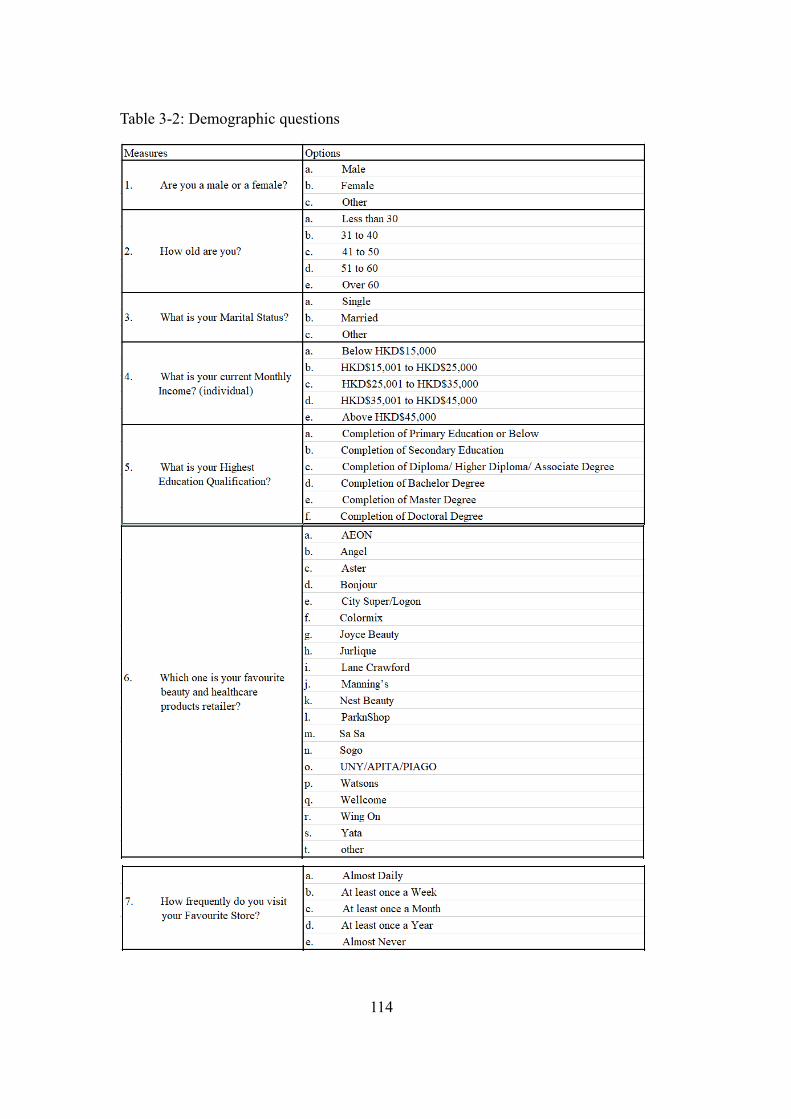
114
Table 3-2: Demographic questions
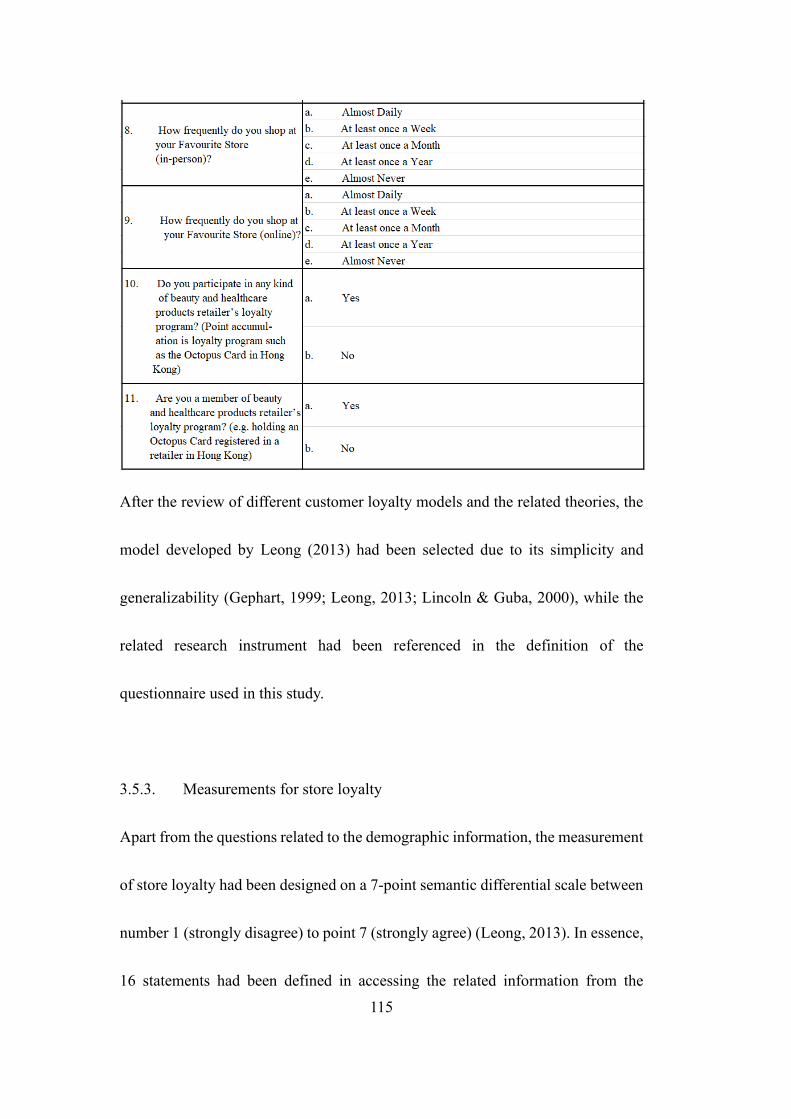
115
After the review of different customer loyalty models and the related theories, the
model developed by Leong (2013) had been selected due to its simplicity and
generalizability (Gephart, 1999; Leong, 2013; Lincoln & Guba, 2000), while the
related research instrument had been referenced in the definition of the
questionnaire used in this study.
3.5.3. Measurements for store loyalty
Apart from the questions related to the demographic information, the measurement
of store loyalty had been designed on a 7-point semantic differential scale between
number 1 (strongly disagree) to point 7 (strongly agree) (Leong, 2013). In essence,
16 statements had been defined in accessing the related information from the
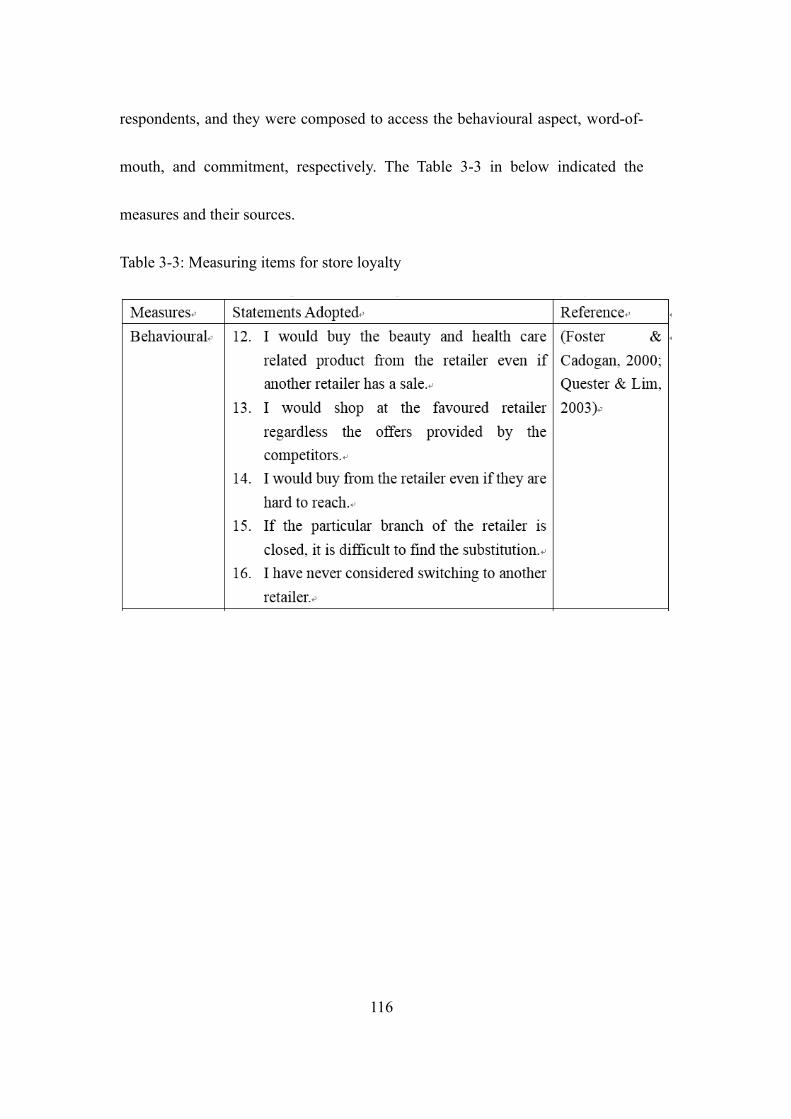
116
respondents, and they were composed to access the behavioural aspect, word-of-
mouth, and commitment, respectively. The Table 3-3 in below indicated the
measures and their sources.
Table 3-3: Measuring items for store loyalty
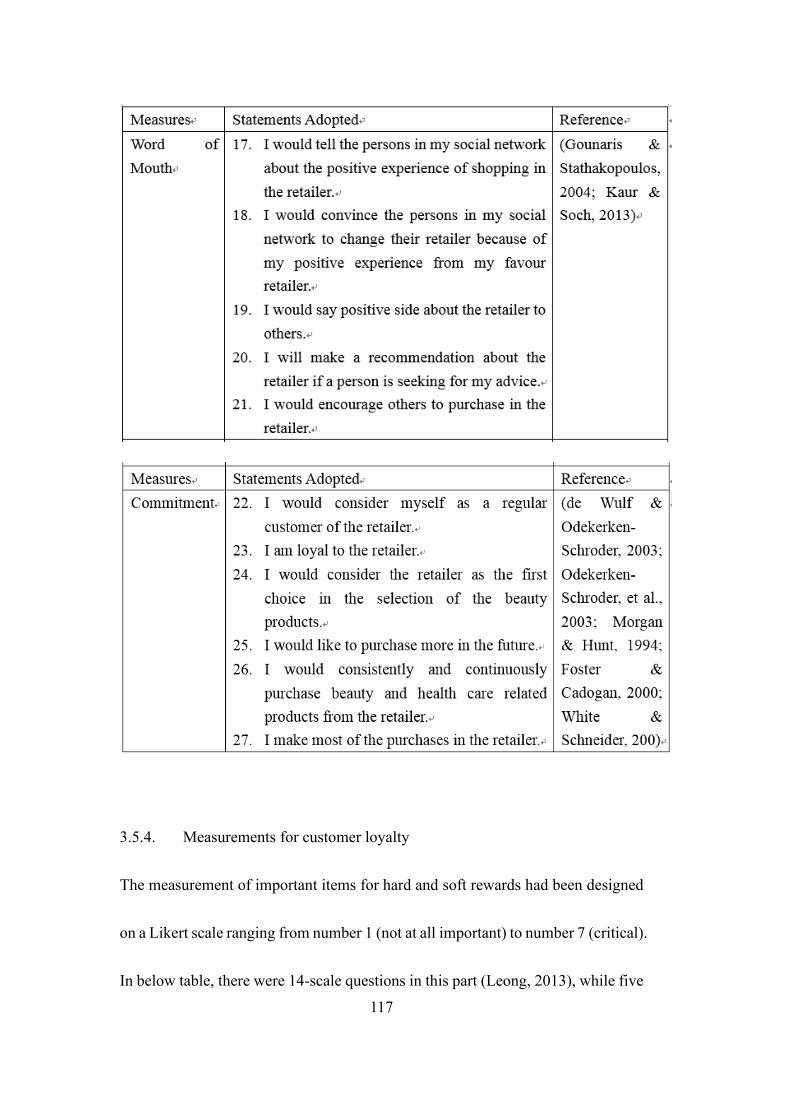
117
3.5.4. Measurements for customer loyalty
The measurement of important items for hard and soft rewards had been designed
on a Likert scale ranging from number 1 (not at all important) to number 7 (critical).
In below table, there were 14-scale questions in this part (Leong, 2013), while five
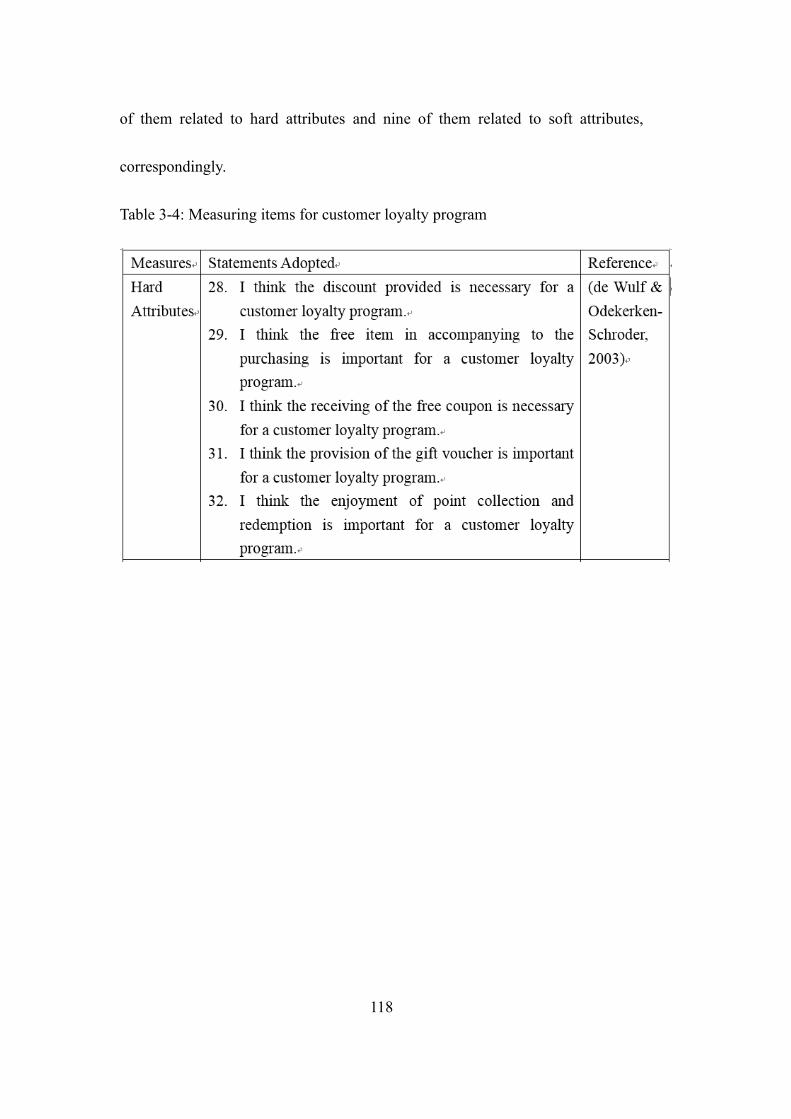
118
of them related to hard attributes and nine of them related to soft attributes,
correspondingly.
Table 3-4: Measuring items for customer loyalty program
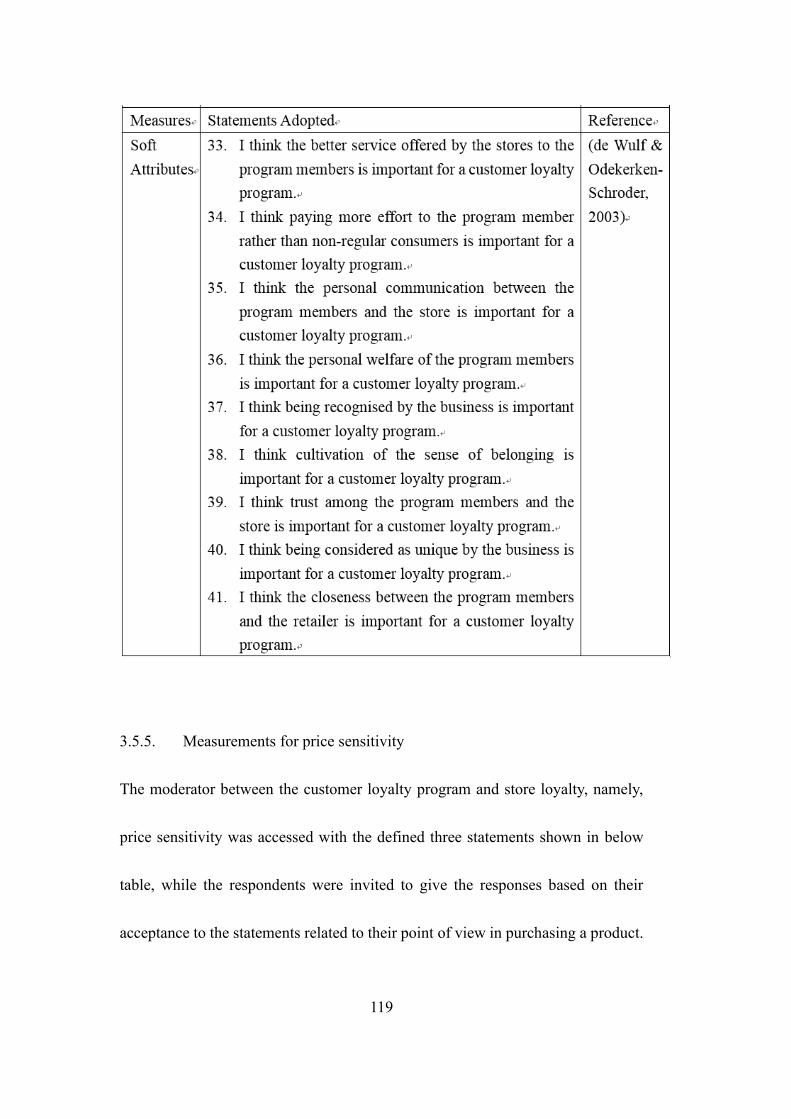
119
3.5.5. Measurements for price sensitivity
The moderator between the customer loyalty program and store loyalty, namely,
price sensitivity was accessed with the defined three statements shown in below
table, while the respondents were invited to give the responses based on their
acceptance to the statements related to their point of view in purchasing a product.
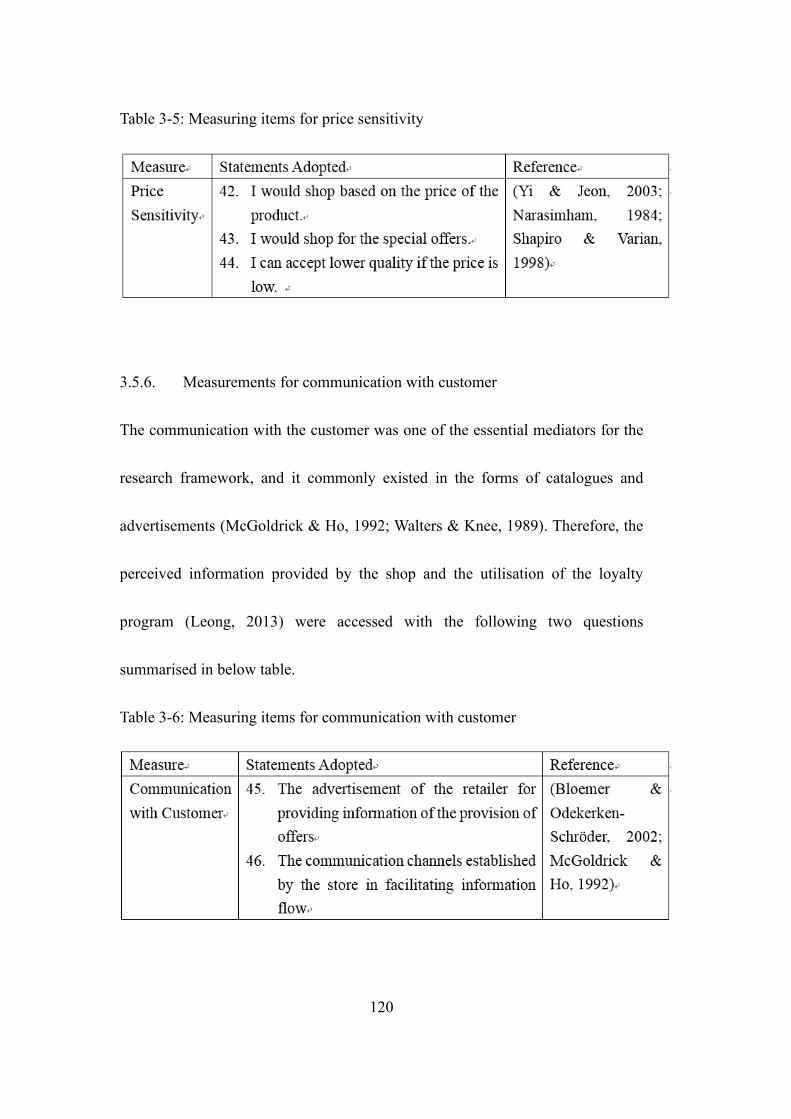
120
Table 3-5: Measuring items for price sensitivity
3.5.6. Measurements for communication with customer
The communication with the customer was one of the essential mediators for the
research framework, and it commonly existed in the forms of catalogues and
advertisements (McGoldrick & Ho, 1992; Walters & Knee, 1989). Therefore, the
perceived information provided by the shop and the utilisation of the loyalty
program (Leong, 2013) were accessed with the following two questions
summarised in below table.
Table 3-6: Measuring items for communication with customer
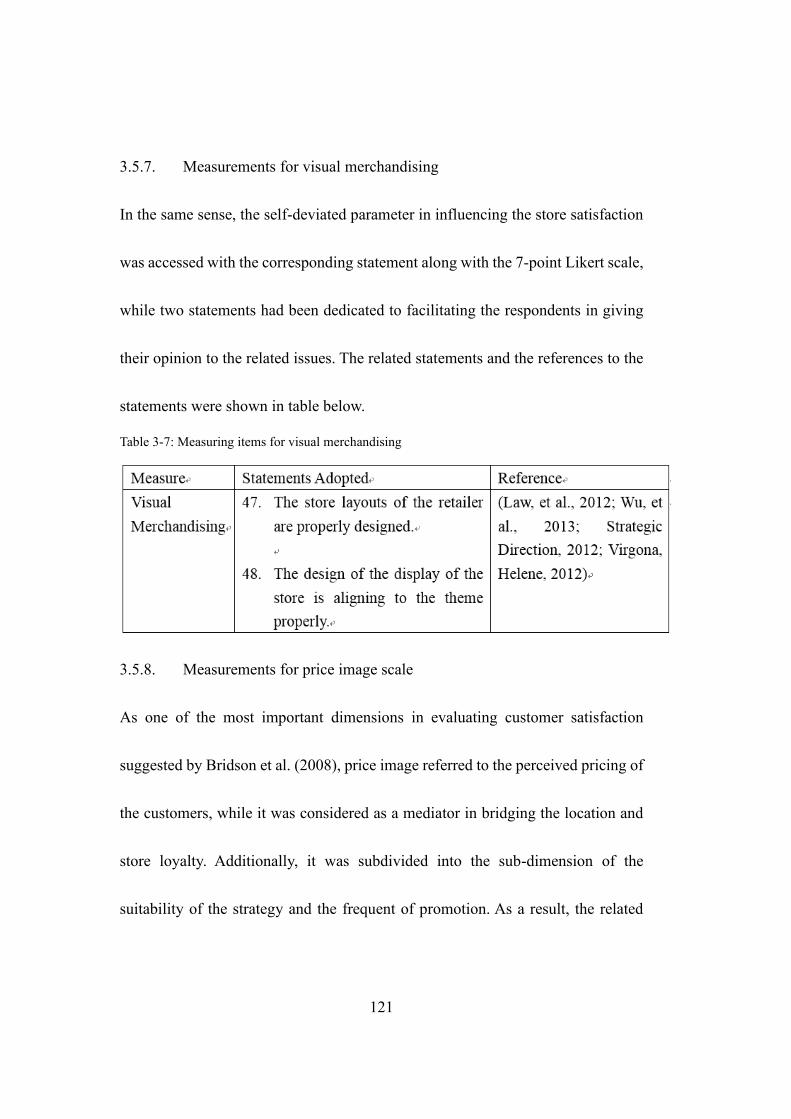
121
3.5.7. Measurements for visual merchandising
In the same sense, the self-deviated parameter in influencing the store satisfaction
was accessed with the corresponding statement along with the 7-point Likert scale,
while two statements had been dedicated to facilitating the respondents in giving
their opinion to the related issues. The related statements and the references to the
statements were shown in table below.
Table 3-7: Measuring items for visual merchandising
3.5.8. Measurements for price image scale
As one of the most important dimensions in evaluating customer satisfaction
suggested by Bridson et al. (2008), price image referred to the perceived pricing of
the customers, while it was considered as a mediator in bridging the location and
store loyalty. Additionally, it was subdivided into the sub-dimension of the
suitability of the strategy and the frequent of promotion. As a result, the related
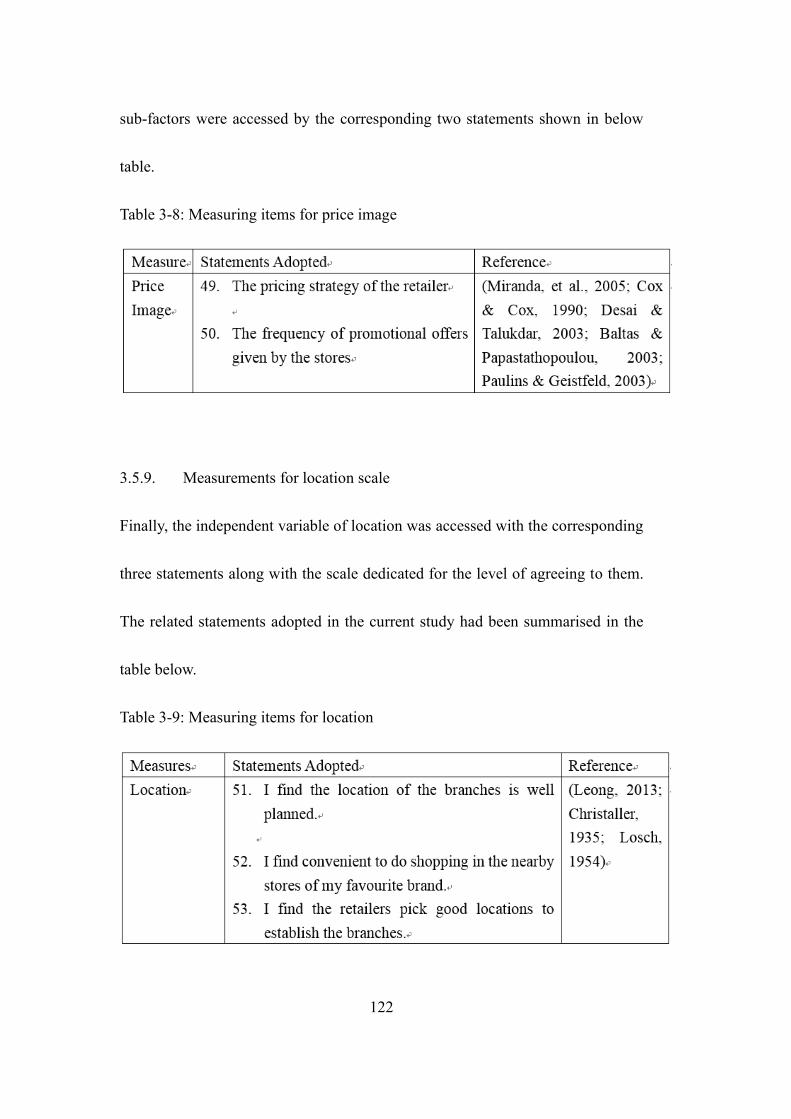
122
sub-factors were accessed by the corresponding two statements shown in below
table.
Table 3-8: Measuring items for price image
3.5.9. Measurements for location scale
Finally, the independent variable of location was accessed with the corresponding
three statements along with the scale dedicated for the level of agreeing to them.
The related statements adopted in the current study had been summarised in the
table below.
Table 3-9: Measuring items for location
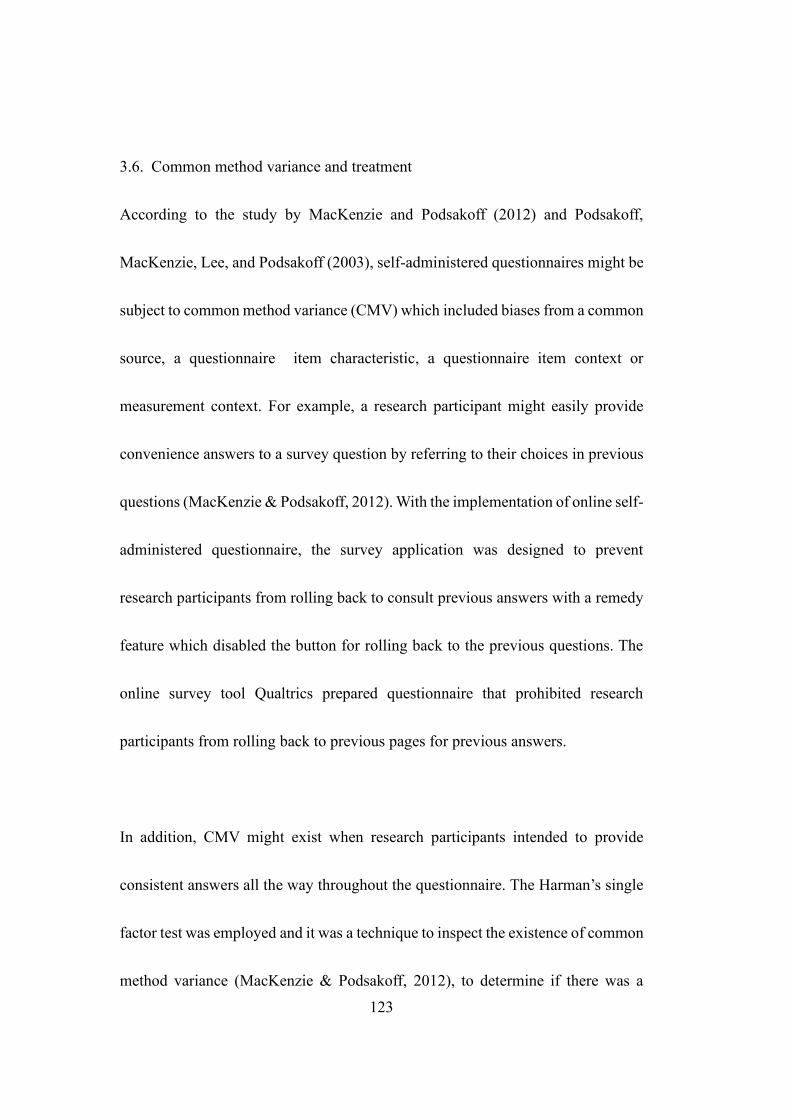
123
3.6. Common method variance and treatment
According to the study by MacKenzie and Podsakoff (2012) and Podsakoff,
MacKenzie, Lee, and Podsakoff (2003), self-administered questionnaires might be
subject to common method variance (CMV) which included biases from a common
source, a questionnaire item characteristic, a questionnaire item context or
measurement context. For example, a research participant might easily provide
convenience answers to a survey question by referring to their choices in previous
questions (MacKenzie & Podsakoff, 2012). With the implementation of online self-
administered questionnaire, the survey application was designed to prevent
research participants from rolling back to consult previous answers with a remedy
feature which disabled the button for rolling back to the previous questions. The
online survey tool Qualtrics prepared questionnaire that prohibited research
participants from rolling back to previous pages for previous answers.
In addition, CMV might exist when research participants intended to provide
consistent answers all the way throughout the questionnaire. The Harman’s single
factor test was employed and it was a technique to inspect the existence of common
method variance (MacKenzie & Podsakoff, 2012), to determine if there was a
124
single factor emerged that would account for the majority of the covariance among
the measures. The result of Harman single factor test was illustrated in the ‘Total
variance explained’ table in Appendix 4-04 and there was no single factor account
for the majority of the variance.
3.7. Statistical data analysis
After the completion of the data collection, the raw data was exported into
Microsoft Excel file and then converted into Statistical Package for the Social
Sciences (SPSS) data file. Researcher ran data analysis by five stages data screening,
data coding, descriptive analysis, validity and reliability measurement assessments,
confirmatory factor analysis and structural equation model. The next few sections
explained the process.
3.7.1. Data screening and data coding
The raw data was coded with unique identification number and screened using SPSS
to check for data accuracy, data completeness, response range and outliers. In the
online survey tool Qualtrics, all questions were made mandatory, where none of
the questions could be skipped. Hence, missing value cases would not occur. In
125
addition, when a research participant closed the survey site before completing the
questionnaire, the records of incomplete data were not accepted for analysis.
3.7.2. Descriptive analysis
Descriptive statistic provided a quantitative description of the raw data and this
description included the frequency, percentage, mean, skewness value, kurtosis
value and standard deviation. Furthermore, it provided an overall picture of the
normality of data (Hair et al, 2010) and the distribution might depend on the
variable type, ordinal scale and nominal scale.
Both skewness and kurtosis measurements had been used to assess the normality
of data distribution. For Likert scale measurements, a positive skewness value
indicated that more research respondents “strongly disagree” or “disagree” with
the implication of statement in the question, whereas a negative skewness value
implied that more research respondents “strongly agree” or “agree” (Hair Jr et al.,
2010). For nominal scale measurement, kurtosis was employed to measure the
thickness of the tails of a distribution. Positive kurtosis value indicated a
relatively peaked distribution of responses, whereas negative value indicated a
relatively flat distribution.
126
3.7.3. Measurement assessment – reliability test
Data validity tests were conducted to assess the diversity of the different
demographic group and to verify the causal relationship along with the moderation
effect. In this thesis, Cronbach’s alpha (α) was conducted to perform the reliability
test.
Reliability test measured the consistency of a measuring instrument for a concept
or perceived value of a statement or item, and validity was the measurement of
how well the instrument could measure that particular concept which was intended
to measure (Sekaran & Bougie, 2013). Reliability tests had been used to evaluate
the consistency of research participants’ understanding of the questionnaire items.
Measuring stability and consistency were concerned with Cronbach’s alpha test
reliability.
To compute the inter-correlations among the questionnaire items for the proposed
model, SPSS was employed. The closer Cronbach’s alpha was to 1.0, the higher
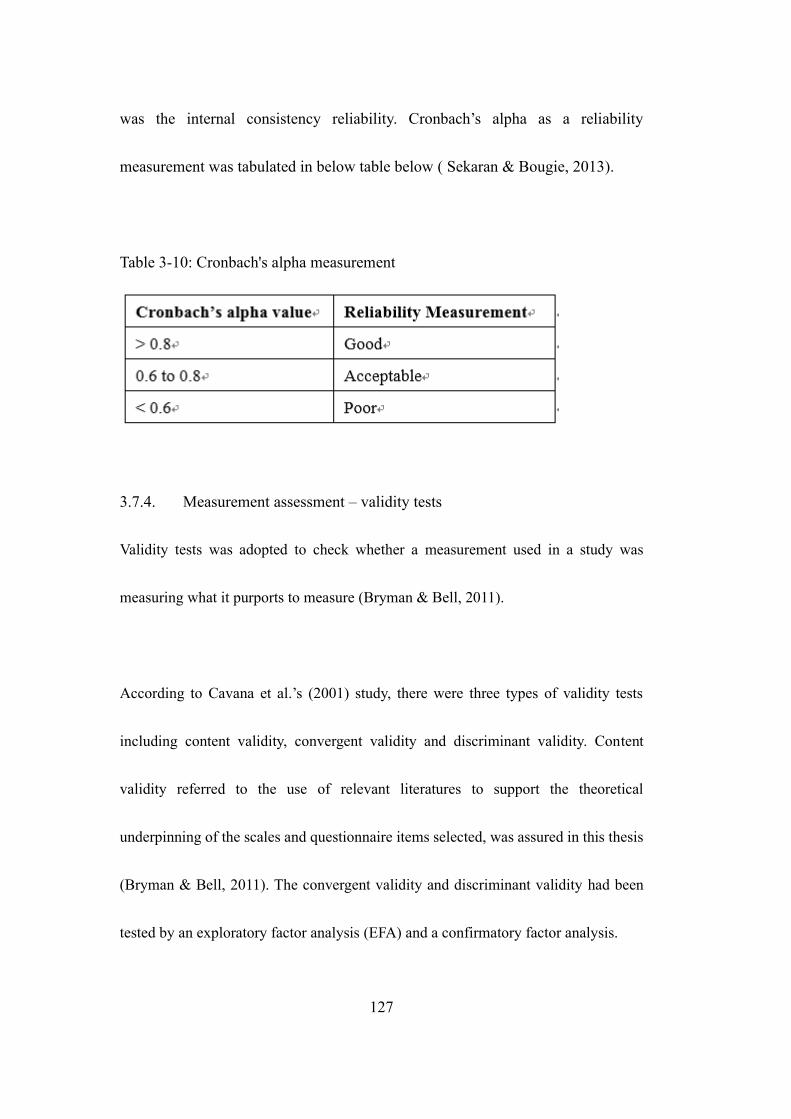
127
was the internal consistency reliability. Cronbach’s alpha as a reliability
measurement was tabulated in below table below ( Sekaran & Bougie, 2013).
Table 3-10: Cronbach's alpha measurement
3.7.4. Measurement assessment – validity tests
Validity tests was adopted to check whether a measurement used in a study was
measuring what it purports to measure (Bryman & Bell, 2011).
According to Cavana et al.’s (2001) study, there were three types of validity tests
including content validity, convergent validity and discriminant validity. Content
validity referred to the use of relevant literatures to support the theoretical
underpinning of the scales and questionnaire items selected, was assured in this thesis
(Bryman & Bell, 2011). The convergent validity and discriminant validity had been
tested by an exploratory factor analysis (EFA) and a confirmatory factor analysis.
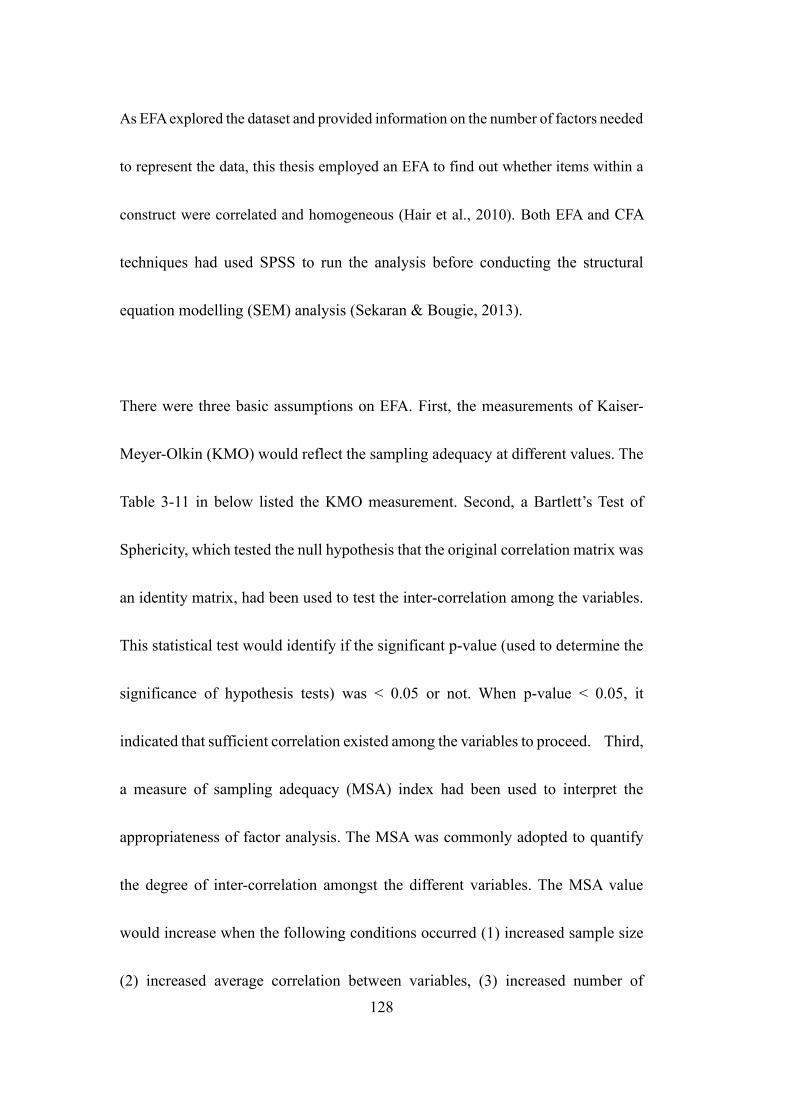
128
As EFA explored the dataset and provided information on the number of factors needed
to represent the data, this thesis employed an EFA to find out whether items within a
construct were correlated and homogeneous (Hair et al., 2010). Both EFA and CFA
techniques had used SPSS to run the analysis before conducting the structural
equation modelling (SEM) analysis (Sekaran & Bougie, 2013).
There were three basic assumptions on EFA. First, the measurements of Kaiser-
Meyer-Olkin (KMO) would reflect the sampling adequacy at different values. The
Table 3-11 in below listed the KMO measurement. Second, a Bartlett’s Test of
Sphericity, which tested the null hypothesis that the original correlation matrix was
an identity matrix, had been used to test the inter-correlation among the variables.
This statistical test would identify if the significant p-value (used to determine the
significance of hypothesis tests) was < 0.05 or not. When p-value < 0.05, it
indicated that sufficient correlation existed among the variables to proceed. Third,
a measure of sampling adequacy (MSA) index had been used to interpret the
appropriateness of factor analysis. The MSA was commonly adopted to quantify
the degree of inter-correlation amongst the different variables. The MSA value
would increase when the following conditions occurred (1) increased sample size
(2) increased average correlation between variables, (3) increased number of
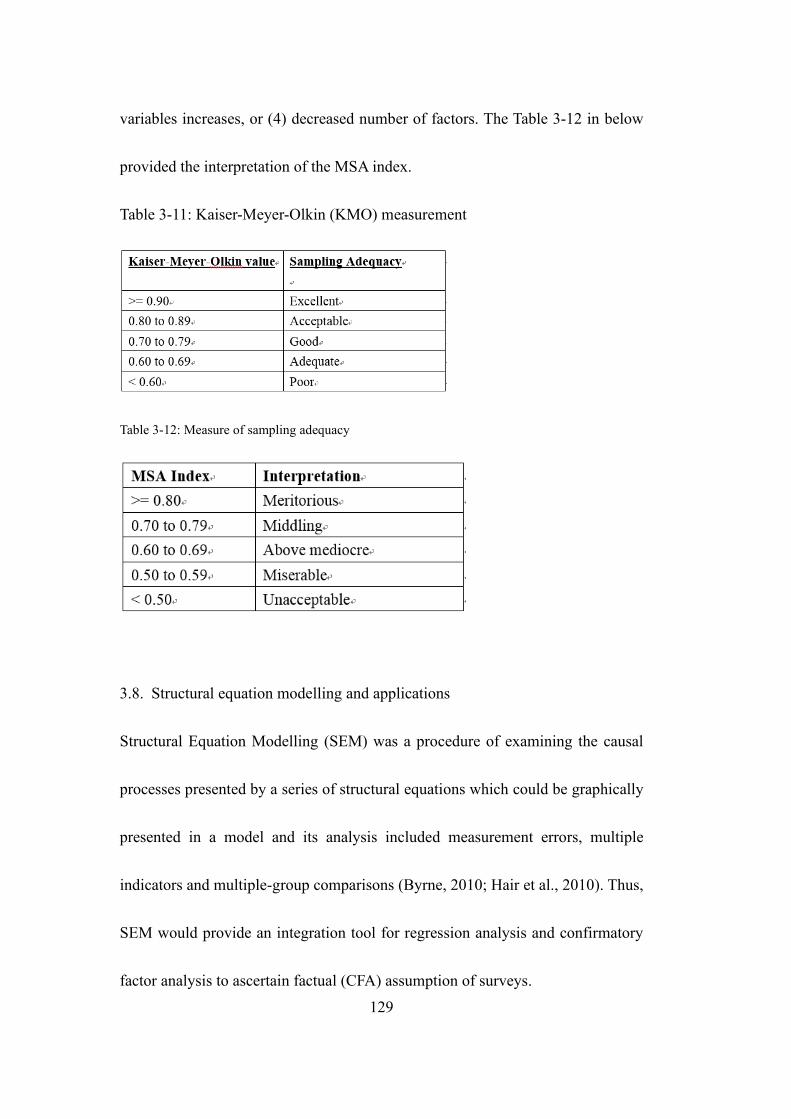
129
variables increases, or (4) decreased number of factors. The Table 3-12 in below
provided the interpretation of the MSA index.
Table 3-11: Kaiser-Meyer-Olkin (KMO) measurement
Table 3-12: Measure of sampling adequacy
3.8. Structural equation modelling and applications
Structural Equation Modelling (SEM) was a procedure of examining the causal
processes presented by a series of structural equations which could be graphically
presented in a model and its analysis included measurement errors, multiple
indicators and multiple-group comparisons (Byrne, 2010; Hair et al., 2010). Thus,
SEM would provide an integration tool for regression analysis and confirmatory
factor analysis to ascertain factual (CFA) assumption of surveys.
130
The conceptual framework of this research was modelled into the SEM statistical
software package (i.e., AMOS) in order to ensure that the exogenous and
endogenous variables were all distinct. In SEM, any changes in the values of
exogenous variables would not be explained by the model, but they were
influenced by other factors external to the model. For the endogenous variables,
any fluctuation in the values had been explained by the model since all the latent
variables were embedded in the model (Byrne, 2010)
3.8.1. The measurement model
The measurement model in SEM had been evaluated through CFA which assumed
that all constructs had interrelationships with each other, and CFA would also be
used to determine and strengthen the validity of constructs and data respectively
(Hair Jr et al., 2010; Kline, 2010).
3.8.2. The structural model
The structural model had been composed of theoretical networks of relationships
among constructs (Hair Jr et al., 2010; Kline, 2010), based on the modified
Customer Loyalty model in this research. As the researcher had defined the
131
hypotheses between constructs in the proposed model, the structural model would
specify a fewer number of relationships among constructs when compared with the
measurement model. The AMOS was employed to formulate the relationships
among hypothesized constructs.
3.8.3. The fit indices in structural equation modelling
The fit indices of SEM were used to determine the level of acceptance of the
measurement model and the structural model and these fit indices had been taken
referenced on the Afthanorhan’s study (2013) which summarized different
measurement indices from different scholars and grouped the indices into three
main categories, namely absolute fit, incremental fit and parsimonious fit. The
Table in below listed the descriptions and level of acceptance of these indices.
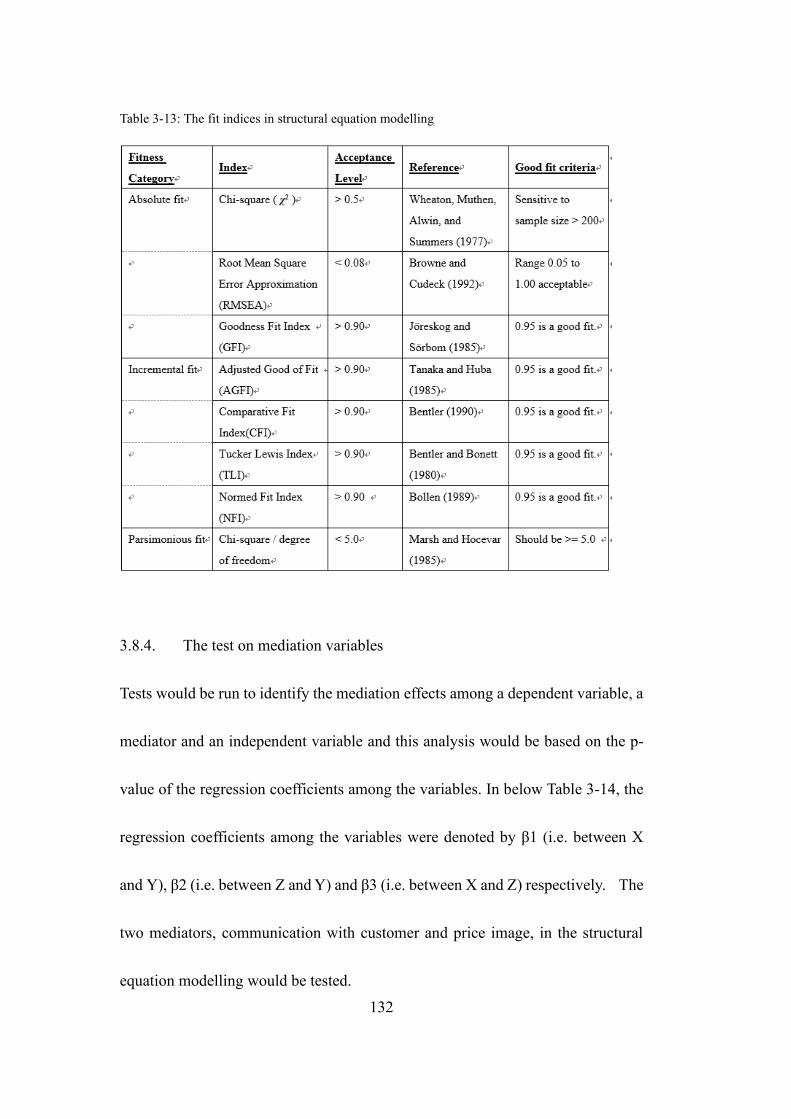
132
Table 3-13: The fit indices in structural equation modelling
3.8.4. The test on mediation variables
Tests would be run to identify the mediation effects among a dependent variable, a
mediator and an independent variable and this analysis would be based on the p-
value of the regression coefficients among the variables. In below Table 3-14, the
regression coefficients among the variables were denoted by β1 (i.e. between X
and Y), β2 (i.e. between Z and Y) and β3 (i.e. between X and Z) respectively. The
two mediators, communication with customer and price image, in the structural
equation modelling would be tested.
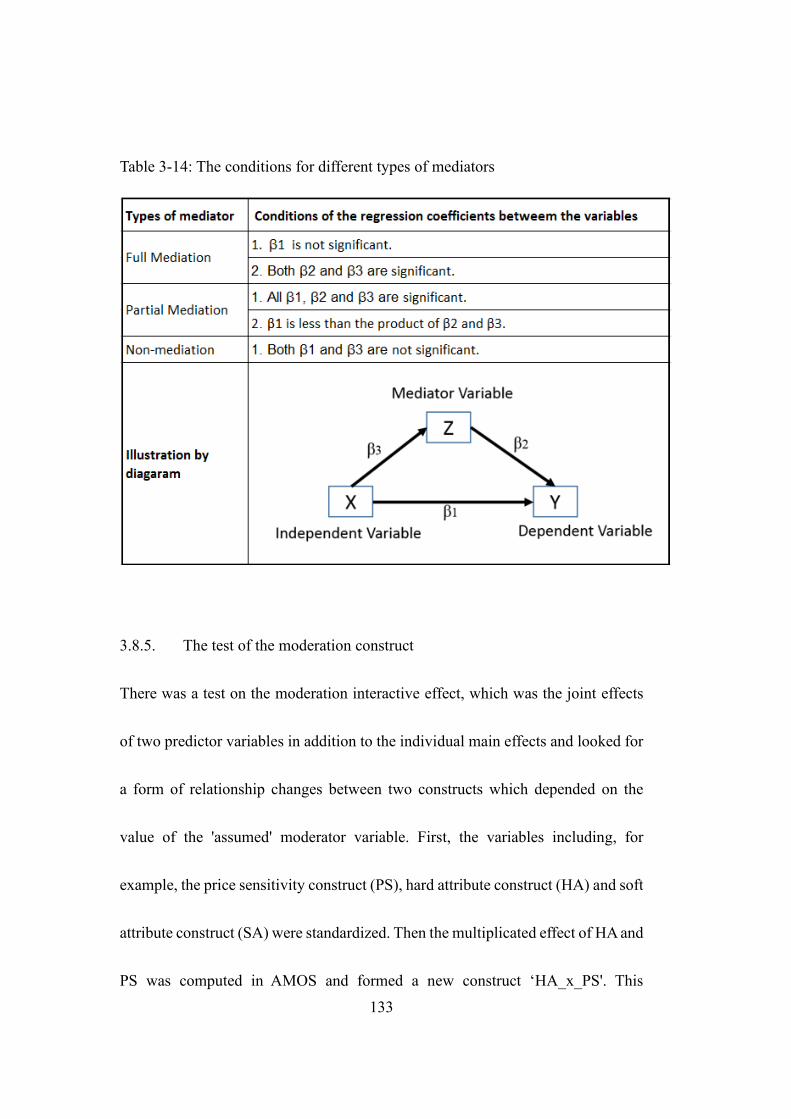
133
Table 3-14: The conditions for different types of mediators
3.8.5. The test of the moderation construct
There was a test on the moderation interactive effect, which was the joint effects
of two predictor variables in addition to the individual main effects and looked for
a form of relationship changes between two constructs which depended on the
value of the 'assumed' moderator variable. First, the variables including, for
example, the price sensitivity construct (PS), hard attribute construct (HA) and soft
attribute construct (SA) were standardized. Then the multiplicated effect of HA and
PS was computed in AMOS and formed a new construct ‘HA_x_PS'. This
134
construct had been put into the structural model as indicated for running regression
test in AMOS. Finally, from the AMOS output, the structural model's regression
weights among the constructs and the p-values had been listed in a table. The
construct relationships would be evaluated based on whether the p-values are
significant (<0.05) or not (>0.05).
The explanation could be a positive-to-negative sign change or negative-to-
positive sign change or stronger sign change or weaker sign change.
3.9. Limitation of methodology used
First, in this research, the theoretical framework was based on customer loyalty
program model, which was mainly based on the perceptions of customers.
However, their perceptions and past experience on purchasing different types of
healthcare and beauty products might have relevant to their perceptions.
Second, in a self-administered questionnaire, there was no direct way to prove that
a research participant was really a customer of a healthcare and beauty products. It
was assumed all these research participants were real customers.
135
3.10. Ethical considerations
The study was complied with the Universities Australia/National Health and
Medical Research Council (UA/NHMRC) Australian Code for the Responsible
Conduct of Research, which has been accepted by the University of Newcastle.
The student researcher had ensured that all collected data was kept strictly
confidential. All information collected would be used only for the purpose of this
research.
The collected data was stored securely in a password-protected device and was
accessible only by the research team. Data would be retained for a minimum of
five years and destroyed in accordance with guidelines of the University of
Newcastle.
All the responses made by research participants contributed to the survey results,
and might be published as part of the researcher’s DBA dissertation or as part of
research papers in academic journals or conference proceedings. The data was non-
identifiable and would be shared with other parties to encourage scientific scrutiny,
and to contribute to further research and public knowledge, or as required by law.
136
3.11. Significance and limitation of current work
Last but not least, the current study would provide an updated access to the local
retailing market related to beauty and healthcare product, while the suggestion on
the devolvement of the customer loyalty program and the resulted effectiveness
could be revealed so as to yield a practical precaution for the practitioners in the
related industry.
Although the necessary measures in preventing the failure of the conclusion and
the conduction of the current work, certain limitations of the current study were
unavoidable. First, the current study was designed as a cross-sectional base, but the
causal relation between the program and the store loyalty. Second, the direct and
positivism were assumed, so the separated effects from the hard and soft attributes
cannot be resolved. Third, there was a miss on the analysis to the probability
improvement brought by the program, while the recommendation may not be
sufficient enough for the decision making. Finally, the holistic overview of the
dynamics between the factors may not be covered, while the hidden factors may
alternate the casual relation.
137
4. DATA ANALYSIS
4.1. Introduction
This chapter described the characteristics of the samples collected from the
questionnaire-based study, tested the measurement assessment and ran the
structural equation modelling (SEM) and followed by the significance test of the
assumed path relationship in the proposed model. SPSS was used to analysis
descriptive data and conduct factor analysis. To test the measurement model, the
structural model and the mediation and moderator constructs, AMOS was
employed.
4.2. Naming of variables and constructs
In the SPSS package, there were certain rules applying to the naming of variables
to facilitate the loading and testing of data file (IBM Knowledge Center, 2015). A
naming convention was adopted to assign a set of characters to the source code of
the constructs, questionnaire items and demographic data. The naming convention
was listed in Appendix 4-01.
138
4.3. Data screening
A total of 220 completed records was collected from a web-based survey software
named Qualtrics and the data record was downloaded into Microsoft Excel file
format.
A data cleansing process was performed on the downloaded data as it was an
important process before analysis (Salkind, 2010) and the data was screened for
extracting both missing values and outliers by using Microsoft Excel. As the
Qualtrics survey tool would prompt the research participants when there were
missing values in any questionnaire item, the completed questionnaires would have
no missing value. The collected data was checked and was found having no missing
values and no outliers. From eMarketer (2014)’s study, the response rate of a survey
using snowball sampling technique would be approximately equal to or less than
20% and prior literature found similar result for survey using online and email for
data collection (Han, Fang, Ye, Chen, Wan, & Qian, 2019). As the response
representativeness was more essential than the response rate in any organisation
survey research (Cook, Heath, & Thompson, 2000) and there was a snowball
sampling technique involved, the study therefore did not take into account the
139
actual return rate of the consent form in the data analysis as it is not relevant in this
study.
4.4. Descriptive analysis
Descriptive statistic was used to provide a quantitative description of the samples
and an overview of the characteristics of the key variables (Mann, 2013). This
research had both nominal and ordinal types of measurement to collect the
respondents’ demographic data and their perception on the values of their favourite
stores’ customer loyalty program. Also, there were four precondition questions, 11
demographic questions and 42 customer loyalty questions.
The precondition questions were set up in a way to allow the survey tool to evaluate
the research participants’ precondition. If any one of the preconditions was not
fulfilled or responded with a ‘No’, then the application would stop generating the
remaining questions and informed the research participants not to proceed the
filling of questionnaire. If the preconditions were fulfilled, then the tool would
generate the questions in the pages following. The precondition questions allowed
the researcher to collect data only from adult research participants who permanent
residents were at Hong Kong and had the experience in purchasing beauty and
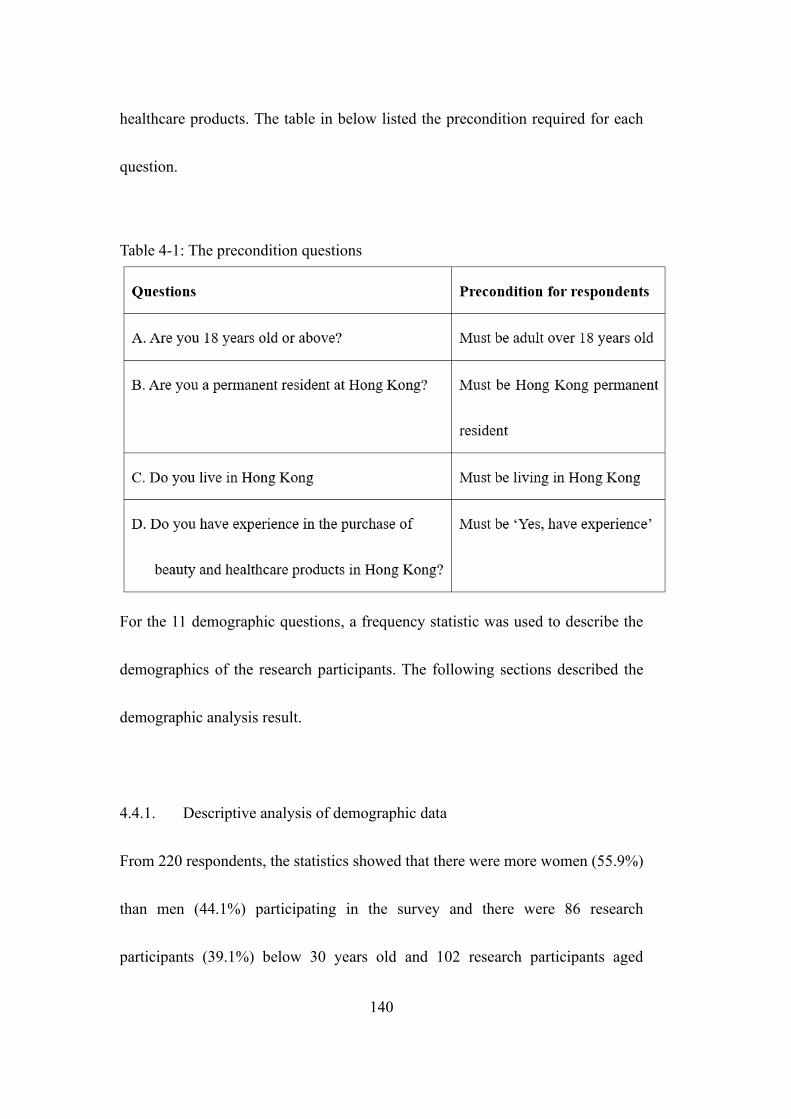
140
healthcare products. The table in below listed the precondition required for each
question.
Table 4-1: The precondition questions
For the 11 demographic questions, a frequency statistic was used to describe the
demographics of the research participants. The following sections described the
demographic analysis result.
4.4.1. Descriptive analysis of demographic data
From 220 respondents, the statistics showed that there were more women (55.9%)
than men (44.1%) participating in the survey and there were 86 research
participants (39.1%) below 30 years old and 102 research participants aged
141
between 31 and 40 years old. In addition, the findings indicated that 35.9% and
24.1% of the research participants have monthly income ranged from $15,001-
$25,000 and $25,001-$35,000 respectively. This meant that more than half of the
research participants had monthly income over $15,000. Furthermore, most of the
research participants had a bachelor degree as there were 137 of them (62.3% of
the total number of participants). The second highest education level obtained
among the research participants was diploma/high diploma/associate degree and
there were 43 research participants. The statistics of the demographics were
extracted into Table 4-2.
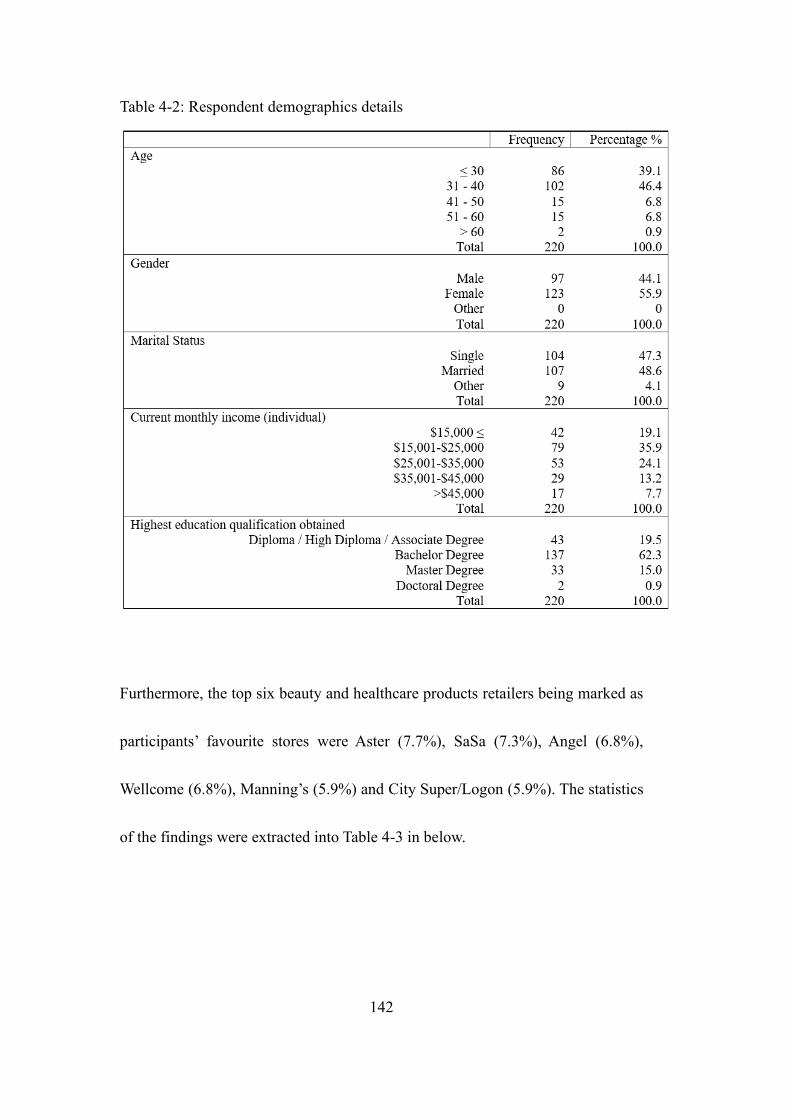
142
Table 4-2: Respondent demographics details
Furthermore, the top six beauty and healthcare products retailers being marked as
participants’ favourite stores were Aster (7.7%), SaSa (7.3%), Angel (6.8%),
Wellcome (6.8%), Manning’s (5.9%) and City Super/Logon (5.9%). The statistics
of the findings were extracted into Table 4-3 in below.
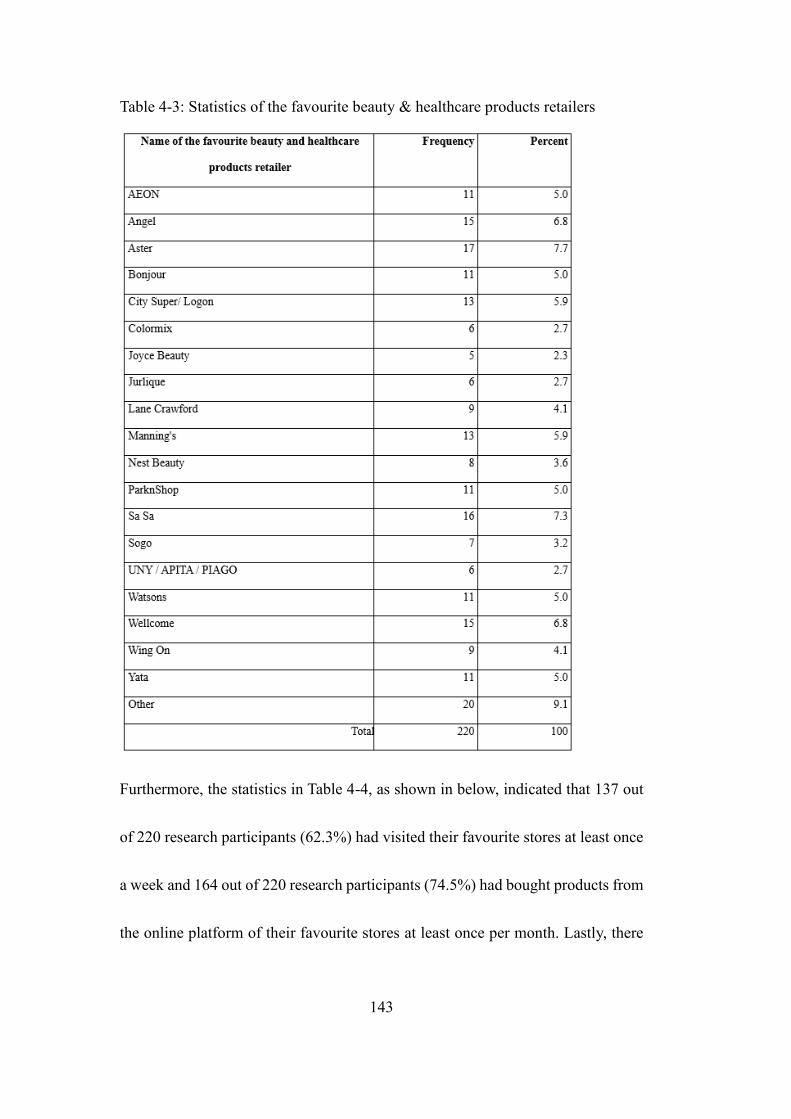
143
Table 4-3: Statistics of the favourite beauty & healthcare products retailers
Furthermore, the statistics in Table 4-4, as shown in below, indicated that 137 out
of 220 research participants (62.3%) had visited their favourite stores at least once
a week and 164 out of 220 research participants (74.5%) had bought products from
the online platform of their favourite stores at least once per month. Lastly, there
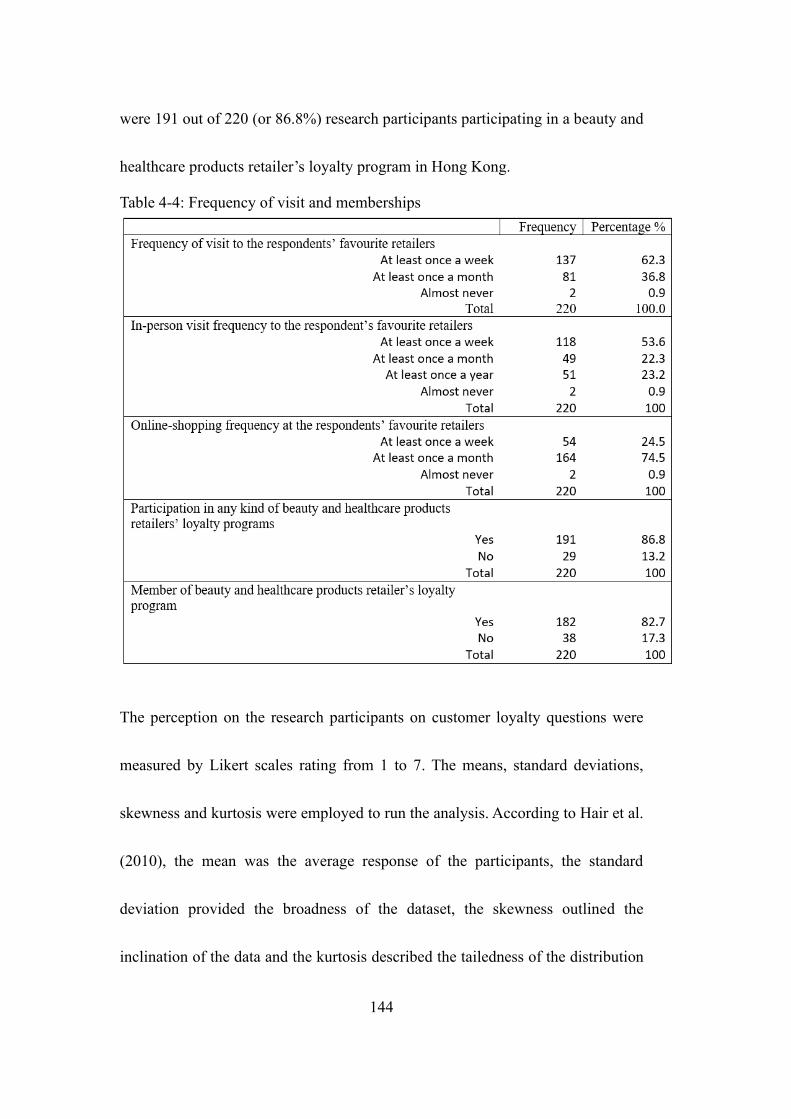
144
were 191 out of 220 (or 86.8%) research participants participating in a beauty and
healthcare products retailer’s loyalty program in Hong Kong.
Table 4-4: Frequency of visit and memberships
The perception on the research participants on customer loyalty questions were
measured by Likert scales rating from 1 to 7. The means, standard deviations,
skewness and kurtosis were employed to run the analysis. According to Hair et al.
(2010), the mean was the average response of the participants, the standard
deviation provided the broadness of the dataset, the skewness outlined the
inclination of the data and the kurtosis described the tailedness of the distribution
145
of the response. The next few sections provided descriptive analysis of the
customer loyalty constructs.
4.4.2. Descriptive analysis for behavioural action
The results of descriptive analysis for the behaviour construct, which was defined
as the behavioural conducts of the loyalty customers of a store (Wulf & Odekerken-
Schröder, 2001) was tabulated in Appendix 4-02. The average of all five items’
mean was approximately 6.04, which indicated that the research participants were
strongly in agreement with their decisions to purchase beauty and healthcare
related product from their favourite retailers. The standard deviations were high in
value which meant a high dispersion of the responses around the mean. The
skewness values lied within ±2.0, which indicated that there were no abnormalities,
and the responses were normally distributed (Zikmund et al., 2013) and the
distribution of responses was at the right of the mean. The kurtosis values were
positive which indicated the distribution of responses had heavier tails and a
sharper peak than the normal distribution.
4.4.3. Descriptive analysis for word-of-mouth
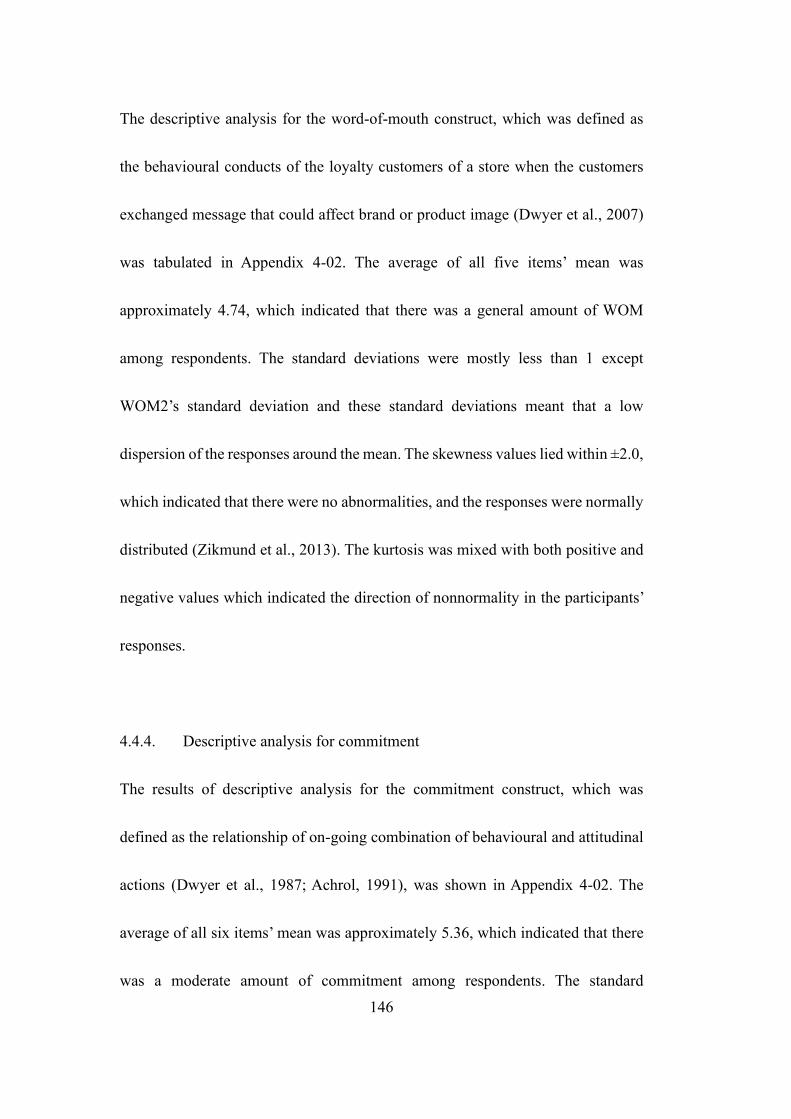
146
The descriptive analysis for the word-of-mouth construct, which was defined as
the behavioural conducts of the loyalty customers of a store when the customers
exchanged message that could affect brand or product image (Dwyer et al., 2007)
was tabulated in Appendix 4-02. The average of all five items’ mean was
approximately 4.74, which indicated that there was a general amount of WOM
among respondents. The standard deviations were mostly less than 1 except
WOM2’s standard deviation and these standard deviations meant that a low
dispersion of the responses around the mean. The skewness values lied within ±2.0,
which indicated that there were no abnormalities, and the responses were normally
distributed (Zikmund et al., 2013). The kurtosis was mixed with both positive and
negative values which indicated the direction of nonnormality in the participants’
responses.
4.4.4. Descriptive analysis for commitment
The results of descriptive analysis for the commitment construct, which was
defined as the relationship of on-going combination of behavioural and attitudinal
actions (Dwyer et al., 1987; Achrol, 1991), was shown in Appendix 4-02. The
average of all six items’ mean was approximately 5.36, which indicated that there
was a moderate amount of commitment among respondents. The standard
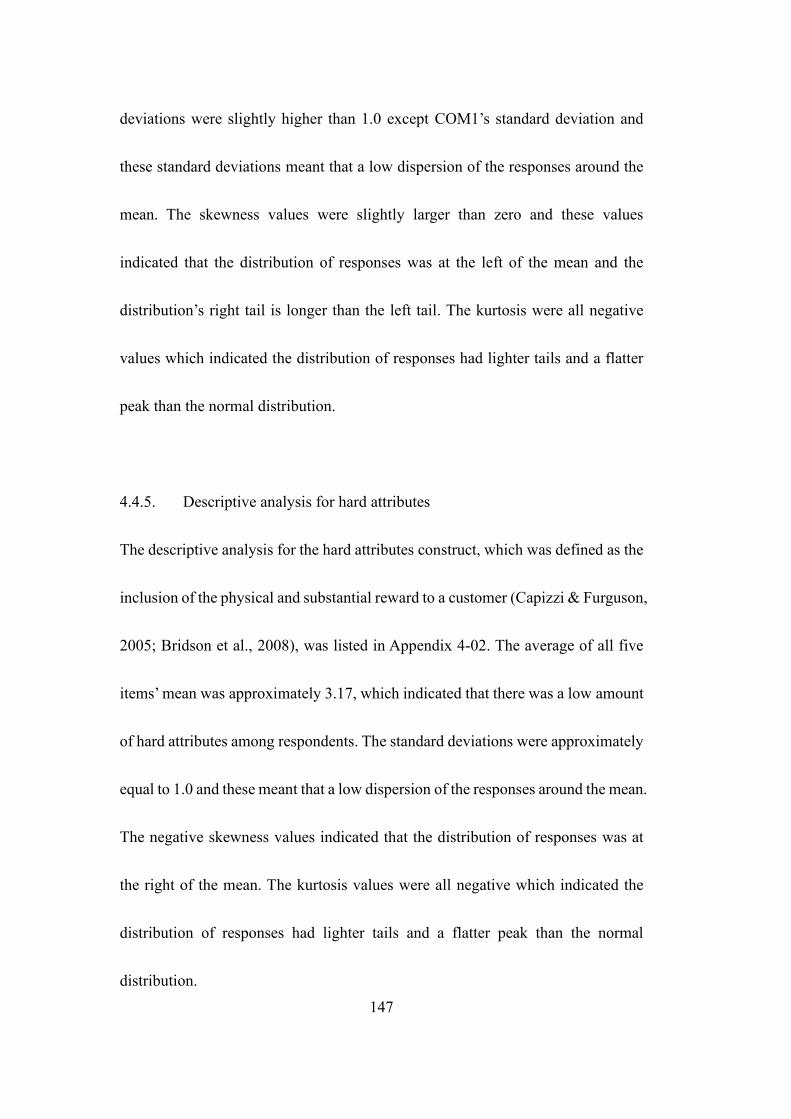
147
deviations were slightly higher than 1.0 except COM1’s standard deviation and
these standard deviations meant that a low dispersion of the responses around the
mean. The skewness values were slightly larger than zero and these values
indicated that the distribution of responses was at the left of the mean and the
distribution’s right tail is longer than the left tail. The kurtosis were all negative
values which indicated the distribution of responses had lighter tails and a flatter
peak than the normal distribution.
4.4.5. Descriptive analysis for hard attributes
The descriptive analysis for the hard attributes construct, which was defined as the
inclusion of the physical and substantial reward to a customer (Capizzi & Furguson,
2005; Bridson et al., 2008), was listed in Appendix 4-02. The average of all five
items’ mean was approximately 3.17, which indicated that there was a low amount
of hard attributes among respondents. The standard deviations were approximately
equal to 1.0 and these meant that a low dispersion of the responses around the mean.
The negative skewness values indicated that the distribution of responses was at
the right of the mean. The kurtosis values were all negative which indicated the
distribution of responses had lighter tails and a flatter peak than the normal
distribution.
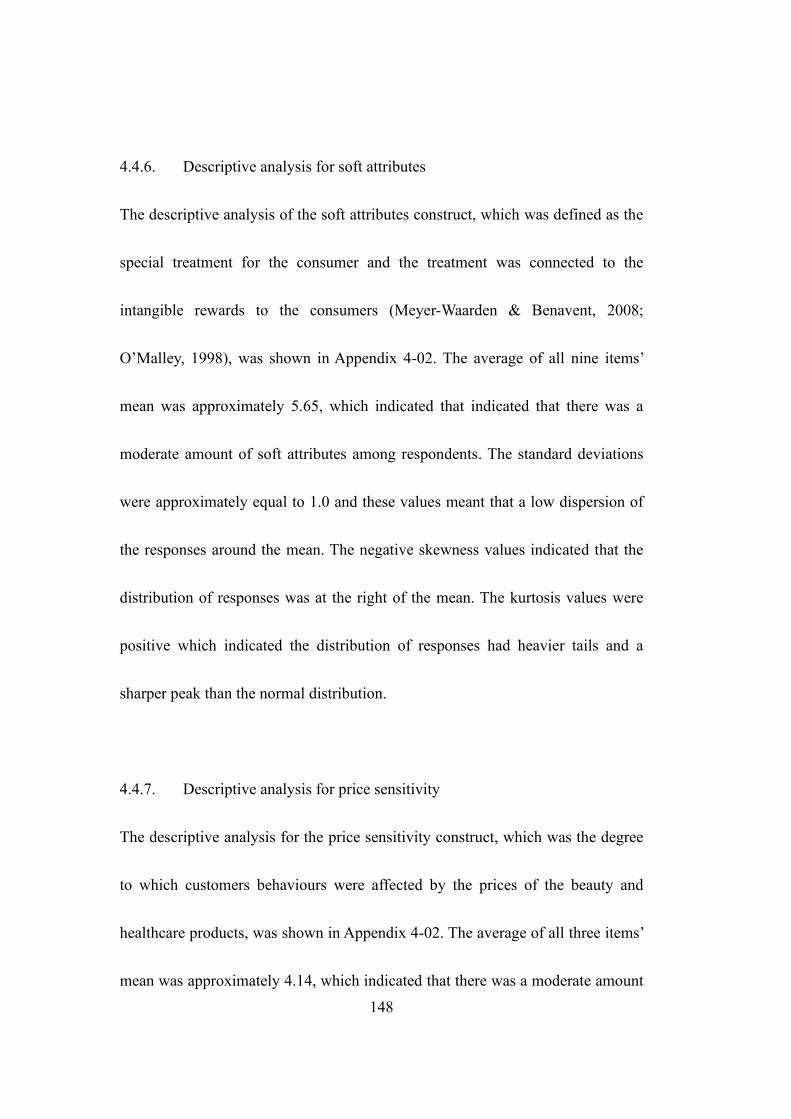
148
4.4.6. Descriptive analysis for soft attributes
The descriptive analysis of the soft attributes construct, which was defined as the
special treatment for the consumer and the treatment was connected to the
intangible rewards to the consumers (Meyer-Waarden & Benavent, 2008;
O’Malley, 1998), was shown in Appendix 4-02. The average of all nine items’
mean was approximately 5.65, which indicated that indicated that there was a
moderate amount of soft attributes among respondents. The standard deviations
were approximately equal to 1.0 and these values meant that a low dispersion of
the responses around the mean. The negative skewness values indicated that the
distribution of responses was at the right of the mean. The kurtosis values were
positive which indicated the distribution of responses had heavier tails and a
sharper peak than the normal distribution.
4.4.7. Descriptive analysis for price sensitivity
The descriptive analysis for the price sensitivity construct, which was the degree
to which customers behaviours were affected by the prices of the beauty and
healthcare products, was shown in Appendix 4-02. The average of all three items’
mean was approximately 4.14, which indicated that there was a moderate amount
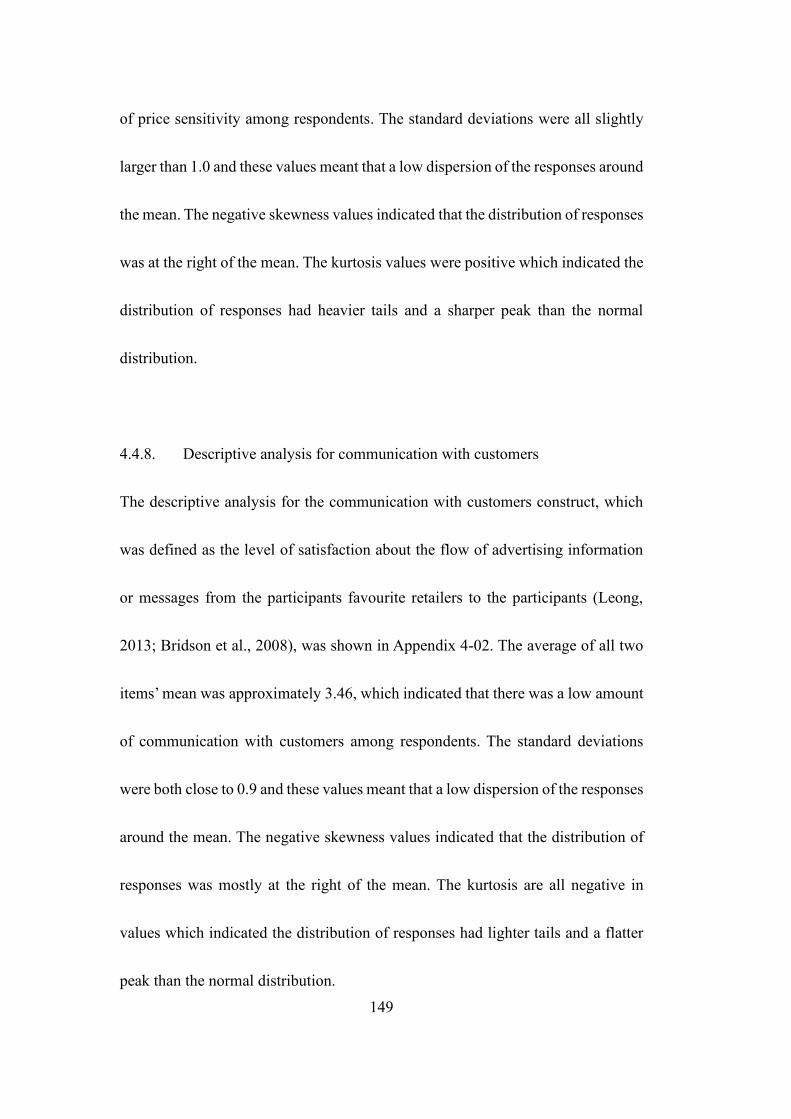
149
of price sensitivity among respondents. The standard deviations were all slightly
larger than 1.0 and these values meant that a low dispersion of the responses around
the mean. The negative skewness values indicated that the distribution of responses
was at the right of the mean. The kurtosis values were positive which indicated the
distribution of responses had heavier tails and a sharper peak than the normal
distribution.
4.4.8. Descriptive analysis for communication with customers
The descriptive analysis for the communication with customers construct, which
was defined as the level of satisfaction about the flow of advertising information
or messages from the participants favourite retailers to the participants (Leong,
2013; Bridson et al., 2008), was shown in Appendix 4-02. The average of all two
items’ mean was approximately 3.46, which indicated that there was a low amount
of communication with customers among respondents. The standard deviations
were both close to 0.9 and these values meant that a low dispersion of the responses
around the mean. The negative skewness values indicated that the distribution of
responses was mostly at the right of the mean. The kurtosis are all negative in
values which indicated the distribution of responses had lighter tails and a flatter
peak than the normal distribution.
150
4.4.9. Descriptive analysis for visual merchandising
The descriptive analysis for the visual merchandising construct, which was defined
as the level of agreement about the retailers’ floor plan and the window displays
that attract eye-browsing from window shoppers (Sebastian, 2008; Rowe, 2014),
was shown in Appendix 4-02. The average of all two items’ mean was
approximately 4.6, which indicated that there was a moderate amount of visual
merchandising among respondents. The standard deviations were close to 0.9 and
these values meant that a low dispersion of the responses around the mean. The
negative skewness values indicated that the distribution of responses was at the
right of the mean. The kurtosis values were positive which indicated the
distribution of responses had heavier tails and a sharper peak than the normal
distribution.
4.4.10. Descriptive analysis for price image
The descriptive analysis for the price image construct, which was defined as the
perceived value of a product (Alba, et al., 1994; Gewal & Marmorstein, 1994; Bell
& Lattin, 1998; Buyukkurt, 1986), was depicted in Appendix 4-02. The average of
two items was approximately 4.47, which indicated that there was a moderate
151
amount of price image among respondents. The standard deviations were both over
1.2 and these values meant that a normal dispersion of the responses around the
mean. The negative skewness values indicated that the distribution of responses
was at the right of the mean. The kurtosis values were mixed with both positive
and negative values which indicated the direction of nonnormality in the
participants’ responses.
4.4.11. Descriptive analysis for location
The descriptive analysis for the location construct, which was defined as the value
of the branch location that the beauty and healthcare products retailers provided
(Oliver, 1997; Losch, 1954), was shown in Appendix 4-02. The average of all three
items’ mean was approximately 5.65, which indicated that there was a moderate
amount of branch location value among respondents. The standard deviations were
close to 1.0 and these values meant that a low dispersion of the responses around
the mean. The negative skewness values indicated that the distribution of responses
was at the right of the mean. The kurtosis values were positive which indicated the
distribution of responses had heavier tails and a sharper peak than the normal
distribution.
152
4.5. Measurement assessment
Most of the measurement scales used in this research paper had not been used in
the Hong Kong beauty and healthcare products industry, therefore all questionnaire
items were tested for validity and reliability even though the measurement scales
were taken from well-established literatures. The assessment of the collected data
was based on reliability tests, KMO sample adequacy and exploratory factory
analysis (EFA) and then verified by the confirmatory factor analysis (CFA).
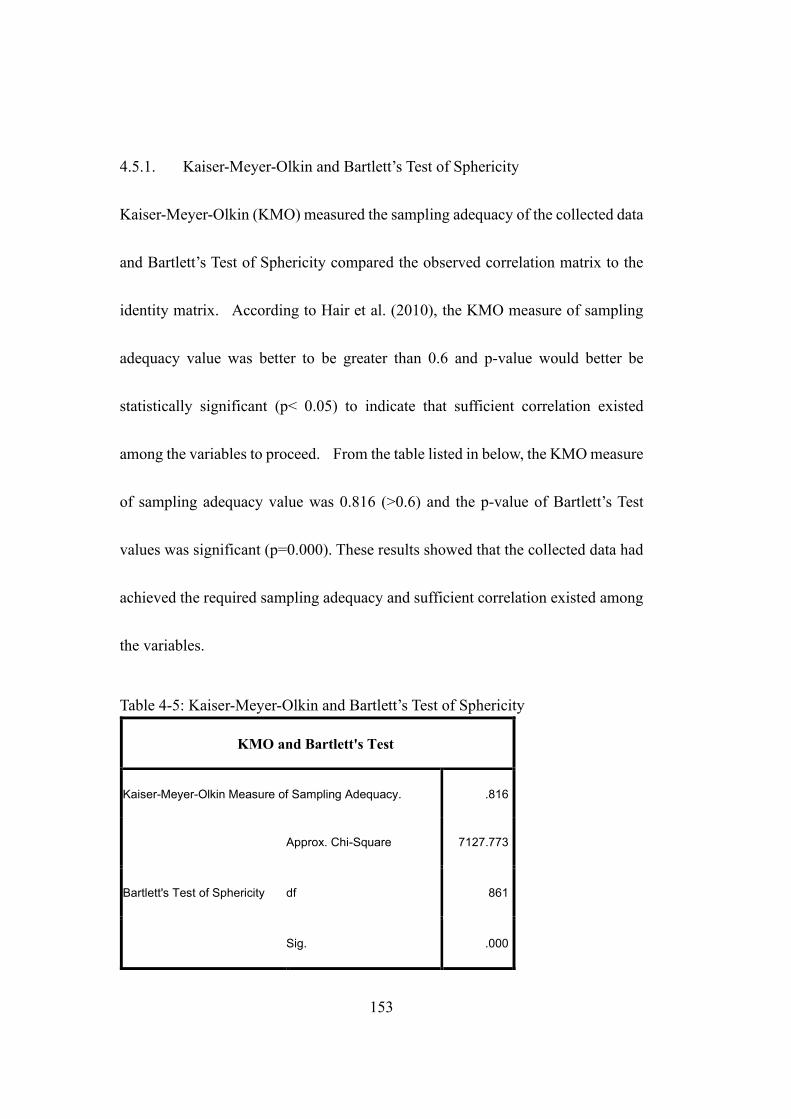
153
4.5.1. Kaiser-Meyer-Olkin and Bartlett’s Test of Sphericity
Kaiser-Meyer-Olkin (KMO) measured the sampling adequacy of the collected data
and Bartlett’s Test of Sphericity compared the observed correlation matrix to the
identity matrix. According to Hair et al. (2010), the KMO measure of sampling
adequacy value was better to be greater than 0.6 and p-value would better be
statistically significant (p< 0.05) to indicate that sufficient correlation existed
among the variables to proceed. From the table listed in below, the KMO measure
of sampling adequacy value was 0.816 (>0.6) and the p-value of Bartlett’s Test
values was significant (p=0.000). These results showed that the collected data had
achieved the required sampling adequacy and sufficient correlation existed among
the variables.
Table 4-5: Kaiser-Meyer-Olkin and Bartlett’s Test of Sphericity
KMO and Bartlett's Test
Kaiser-Meyer-Olkin Measure of Sampling Adequacy. .816
Bartlett's Test of Sphericity
Approx. Chi-Square 7127.773
df 861
Sig. .000
154
4.5.2. Exploratory factor analysis
After the reliability tests, KMO and the Bartlett’s Test of Sphericity were passed,
the EFA was used to determine the correlation and assess the factor structure of the
items. This research adopted the maximum likelihood approach and selected
promax rotation and suppressed loadings below 0.5. The table in below showed the
significant factor loading 0.40 was acceptable when the sample size was above 200
(Hair et al., 2010).
Table 4-6: Factor loading in relation to sample size
Factor Loading value Sample size
0.30 350 0.35 250 0.40 200 0.50 150
The p-value is significant at 0.05 (adapted from Hair et al. (2010))
4.5.3. Communalities
The communalities which indicated the total amount of variance an original
variable shared with all other variables in an analysis was attached in Appendix 4-
03. The initial communalities, which were the estimates of the variance in each
variable accounted for by all factors, and the extraction communalities, which were
the estimates of the variance in each variable accounted for by the factors in the
155
factor solution, were both checked (Hair et al., 2010). All extraction communalities
were above 0.4 except HA5 (0.352) and the results indicated that each variable
could load significantly on a factor except the HA5 which might be difficult to load
significantly on a factor.
4.5.4. Total variance and eigen values
While conducting the factor analysis, each factor or questionnaire item in this
survey explained a certain amount of total variance percentage. The total variance
table, as attached in Appendix 4-04, indicated that there were four columns namely
factor, initial eigenvalues, extraction sums of squared loadings and rotation sums
of squared loadings.
The ‘Factor’ column listed out all the 42 variables used in the analysis. The ‘Initial
Eigenvalues’ (i.e., the variance of the factors) column listed out the eigenvalue for
a given factor and it measured the variance in all the variables which was accounted
for by that factor. From this column, there were 10 factors which had eigenvalues
greater than 1.0 and this result matched the expected number of factors in the
proposed model. The ‘Extraction Sums of Squared Loadings’ column listed out ten
rows in each sub-column and these ten rows correspond to the number of factors
156
retained. The values in this column were lower than the values in the ‘Initial
Eigenvalues’ column because common variance was used for this column whereas
total variance was used for the initial eigenvalues. The ‘Rotation Sums of
Squared Loadings’ was the column representing the distribution of the variance
after the ‘promax’ rotation. ‘Promax’ rotation attempted to maximize the
variance of each of the factors such that the total amount of variance was
redistributed over the ten extracted factors. From the Appendix 4-04, the
“Extraction Sums of Squared Loadings” column indicated that the first factor
represented approximately 4.859% of the total variance explained, and the
cumulative variance for the first ten factors was approximately 70% which met the
criteria (above 60%).
4.5.5. Content validity
For content validity, this study had covered extensive literature on the measuring scale
and the scales had been reviewed in Chapter Two, therefore content validity was also
affirmed.
157
4.5.6. Convergent validity
The results of Rotated Factor Matrix, extracted from factor analysis, was shown in
Appendix 4-05. It had the rotated factor loadings which represented not only how
the 42 items were weighted under the factors but also the correlation between the
items and the factor. The matrix indicated that the loading values were ranging
from -1 to +1. Based on Hair et al. (2010), the minimum factor loading value was
0.4 for a sample size of 200. To ensure clear loading between items, all coefficient
values that were less than 0.50 were suppressed, on the assumption that each item
should load highly (>0.50) on one factor for meaningful for interpretation.
From the loading pattern in Appendix 4-05, it indicated that all 42 items of the
questionnaire were distributed into ten factors accordingly and no cross-loading of
an item to more than one factor was found. This result indicated that convergent
validity was achieved as the items/variables within a single factor were highly
correlated. For example, WOM1, WOM2, WOM3, WOM4 and WOM5 had
loading values 0.836, 0.811, 0.802, 0.692 and 0.770 respectively and these loadings
were all greater than 0.5.
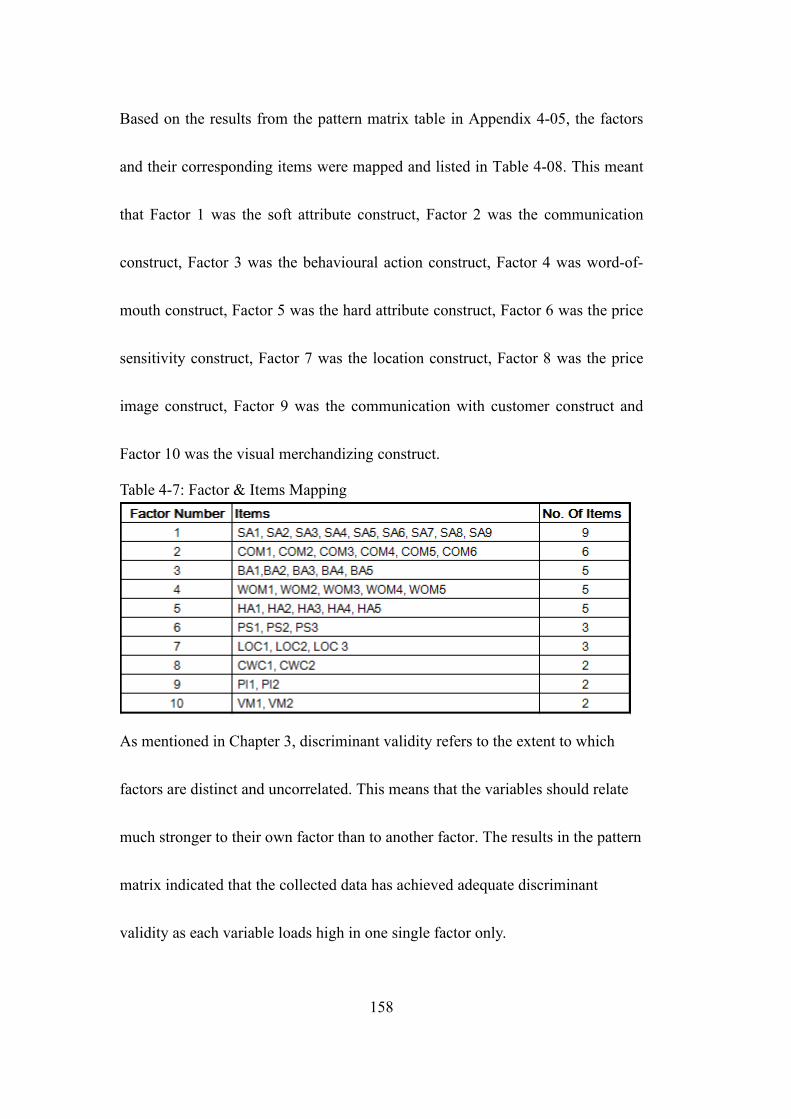
158
Based on the results from the pattern matrix table in Appendix 4-05, the factors
and their corresponding items were mapped and listed in Table 4-08. This meant
that Factor 1 was the soft attribute construct, Factor 2 was the communication
construct, Factor 3 was the behavioural action construct, Factor 4 was word-of-
mouth construct, Factor 5 was the hard attribute construct, Factor 6 was the price
sensitivity construct, Factor 7 was the location construct, Factor 8 was the price
image construct, Factor 9 was the communication with customer construct and
Factor 10 was the visual merchandizing construct.
Table 4-7: Factor & Items Mapping
As mentioned in Chapter 3, discriminant validity refers to the extent to which
factors are distinct and uncorrelated. This means that the variables should relate
much stronger to their own factor than to another factor. The results in the pattern
matrix indicated that the collected data has achieved adequate discriminant
validity as each variable loads high in one single factor only.
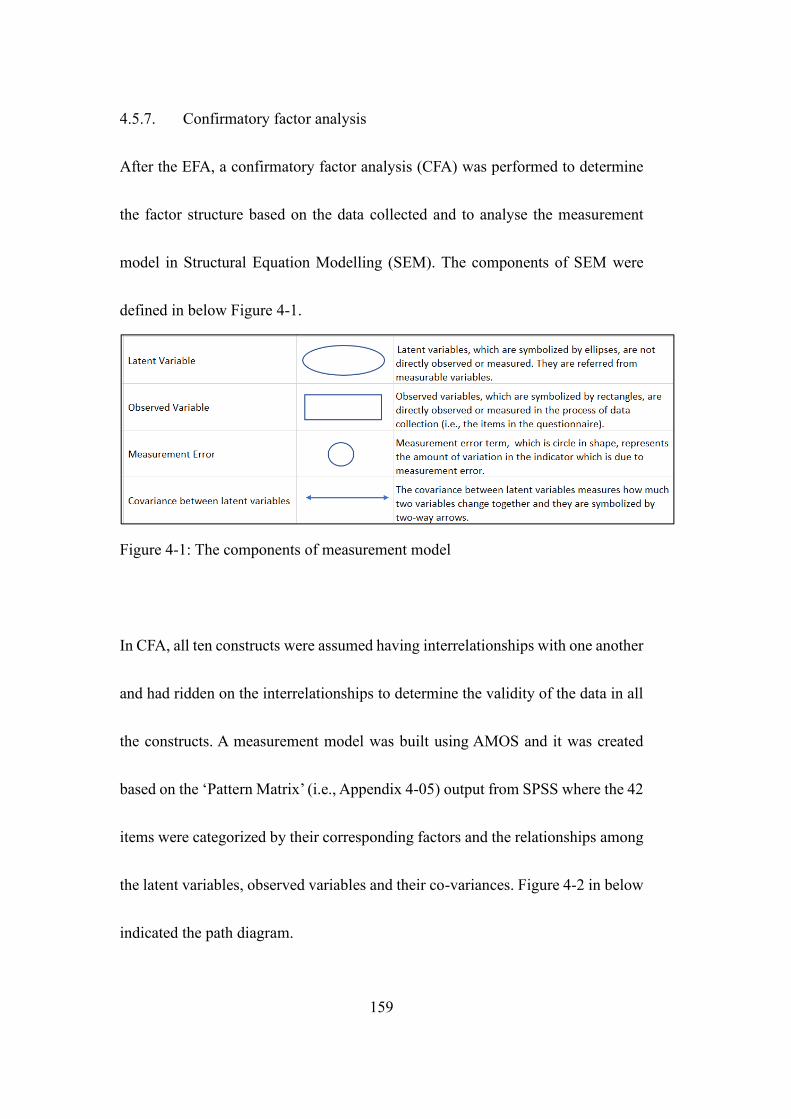
159
4.5.7. Confirmatory factor analysis
After the EFA, a confirmatory factor analysis (CFA) was performed to determine
the factor structure based on the data collected and to analyse the measurement
model in Structural Equation Modelling (SEM). The components of SEM were
defined in below Figure 4-1.
Figure 4-1: The components of measurement model
In CFA, all ten constructs were assumed having interrelationships with one another
and had ridden on the interrelationships to determine the validity of the data in all
the constructs. A measurement model was built using AMOS and it was created
based on the ‘Pattern Matrix’ (i.e., Appendix 4-05) output from SPSS where the 42
items were categorized by their corresponding factors and the relationships among
the latent variables, observed variables and their co-variances. Figure 4-2 in below
indicated the path diagram.
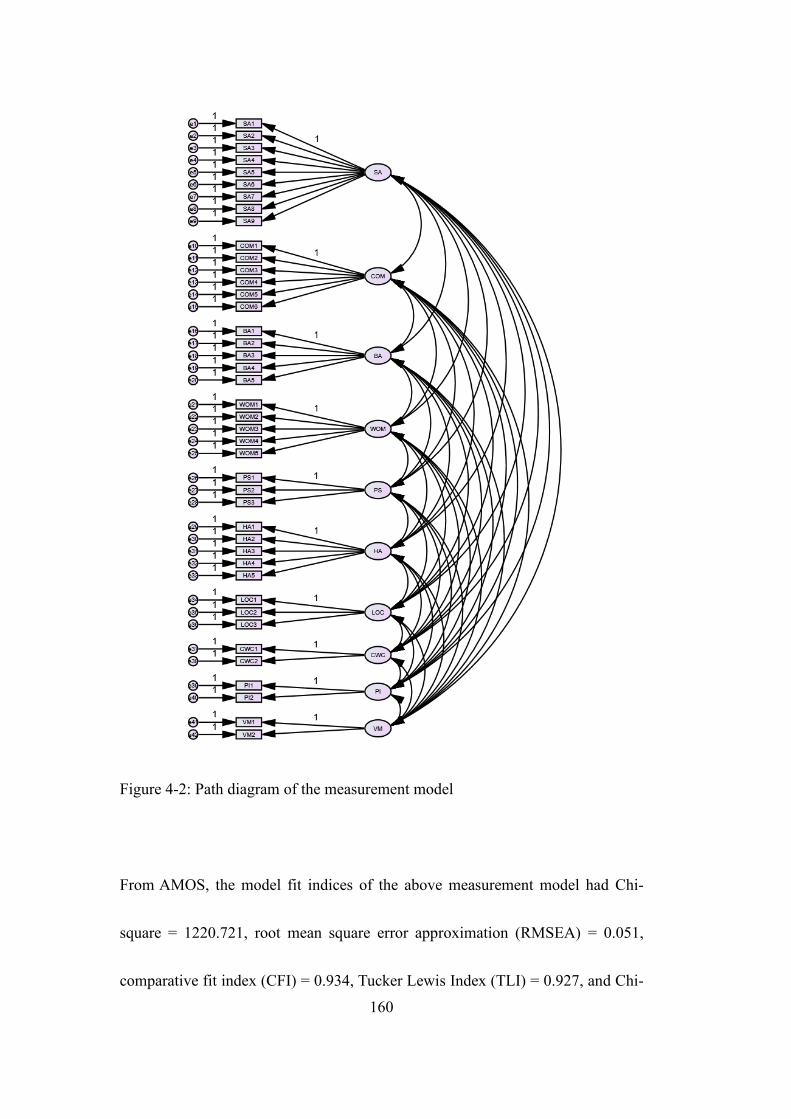
160
Figure 4-2: Path diagram of the measurement model
From AMOS, the model fit indices of the above measurement model had Chi-
square = 1220.721, root mean square error approximation (RMSEA) = 0.051,
comparative fit index (CFI) = 0.934, Tucker Lewis Index (TLI) = 0.927, and Chi-
161
square/degree of freedom = 1.577. The full model fit indices table of the
measurement model was attached in Appendix 4-06. Next, the AMOS was
employed to generate modification indices which were summarized in a covariance
table listing out the covariance among all the measurement error terms. Based on
the modification indices table, which was attached in Appendix 4-07, the
measurement model was improved by defining the covariance (i.e. manual addition
of a two-way arrow) between measurement error terms within a construct until no
further covariance could be defined among the measurement error terms. The
enhanced measurement model was shown in Figure 4-3 in below.
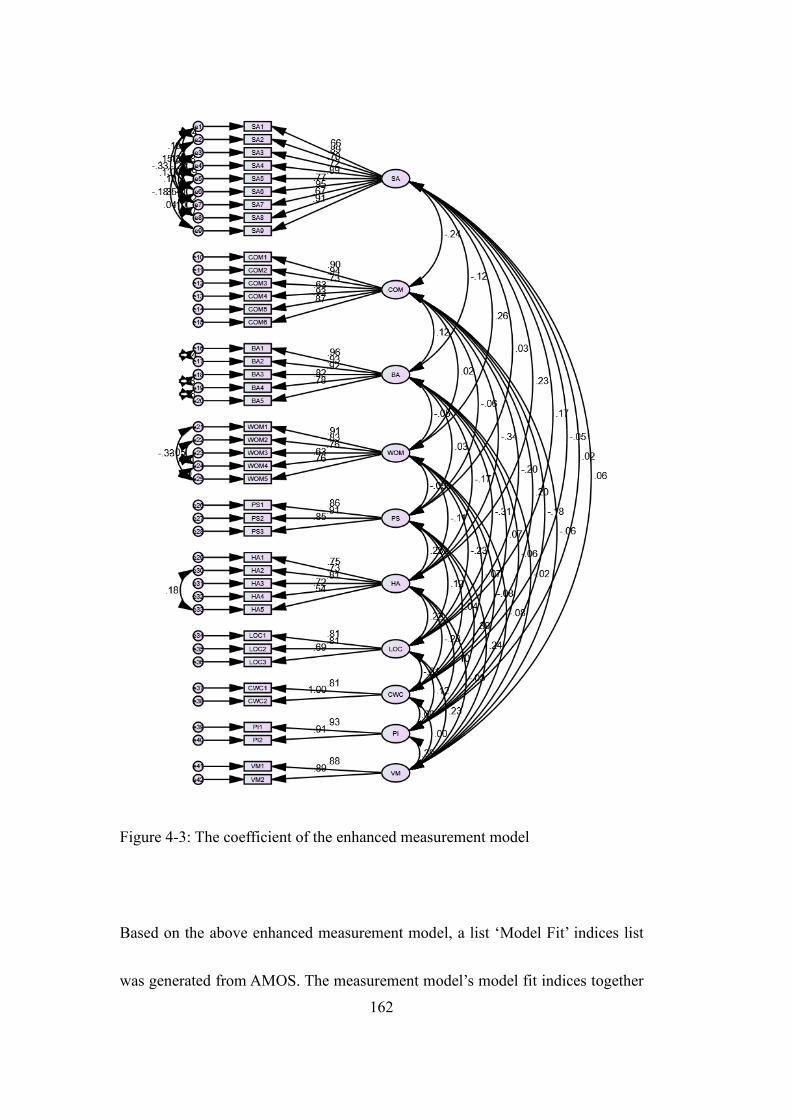
162
Figure 4-3: The coefficient of the enhanced measurement model
Based on the above enhanced measurement model, a list ‘Model Fit’ indices list
was generated from AMOS. The measurement model’s model fit indices together
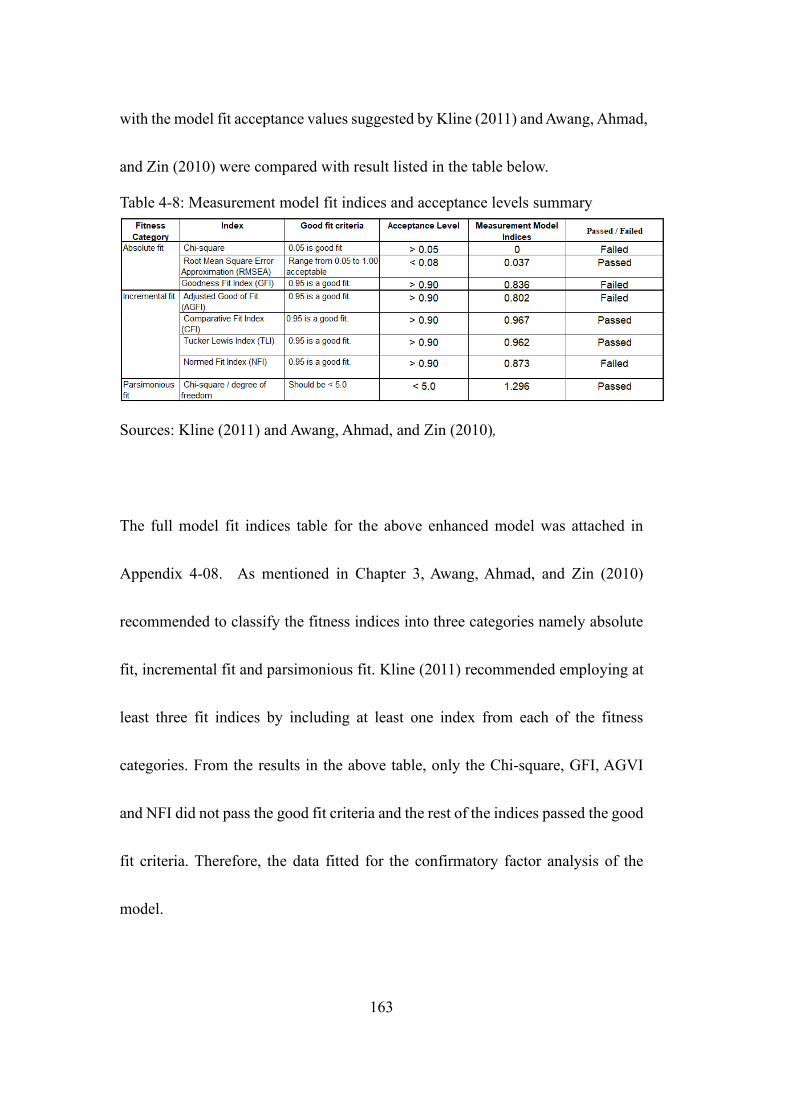
163
with the model fit acceptance values suggested by Kline (2011) and Awang, Ahmad,
and Zin (2010) were compared with result listed in the table below.
Table 4-8: Measurement model fit indices and acceptance levels summary
Sources: Kline (2011) and Awang, Ahmad, and Zin (2010),
The full model fit indices table for the above enhanced model was attached in
Appendix 4-08. As mentioned in Chapter 3, Awang, Ahmad, and Zin (2010)
recommended to classify the fitness indices into three categories namely absolute
fit, incremental fit and parsimonious fit. Kline (2011) recommended employing at
least three fit indices by including at least one index from each of the fitness
categories. From the results in the above table, only the Chi-square, GFI, AGVI
and NFI did not pass the good fit criteria and the rest of the indices passed the good
fit criteria. Therefore, the data fitted for the confirmatory factor analysis of the
model.
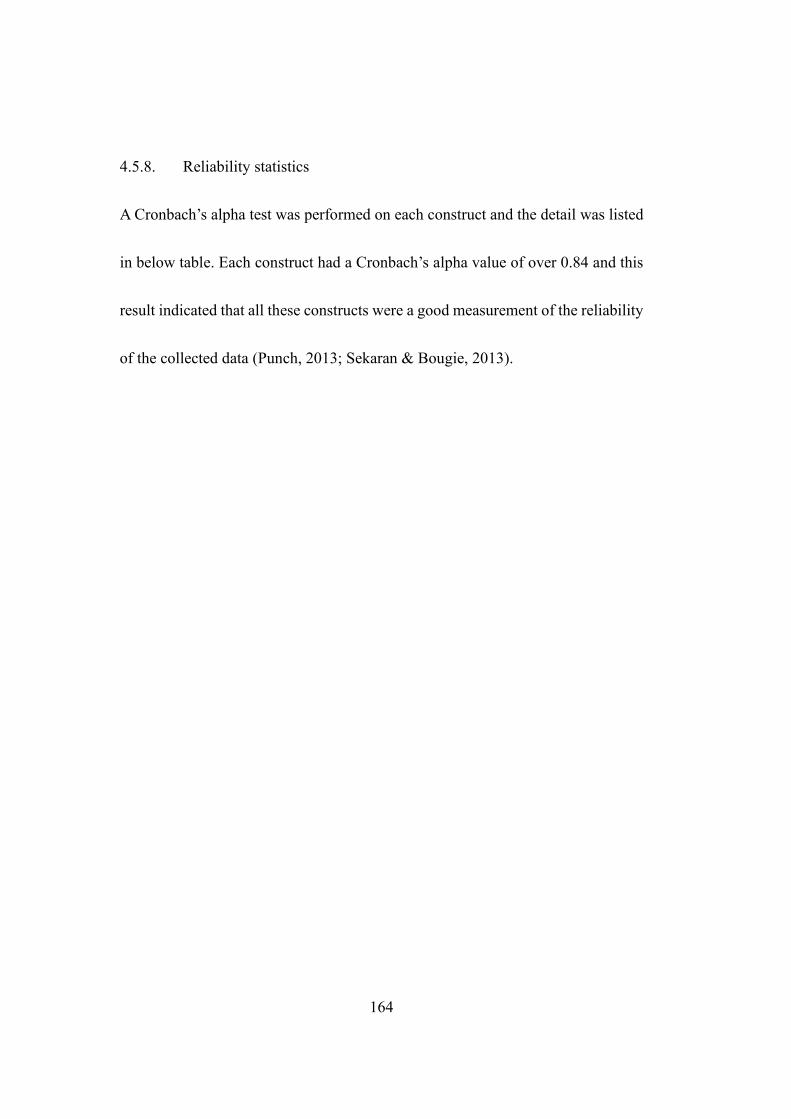
164
4.5.8. Reliability statistics
A Cronbach’s alpha test was performed on each construct and the detail was listed
in below table. Each construct had a Cronbach’s alpha value of over 0.84 and this
result indicated that all these constructs were a good measurement of the reliability
of the collected data (Punch, 2013; Sekaran & Bougie, 2013).
165
Table 4-9: Reliability test result of all customer loyalty constructs
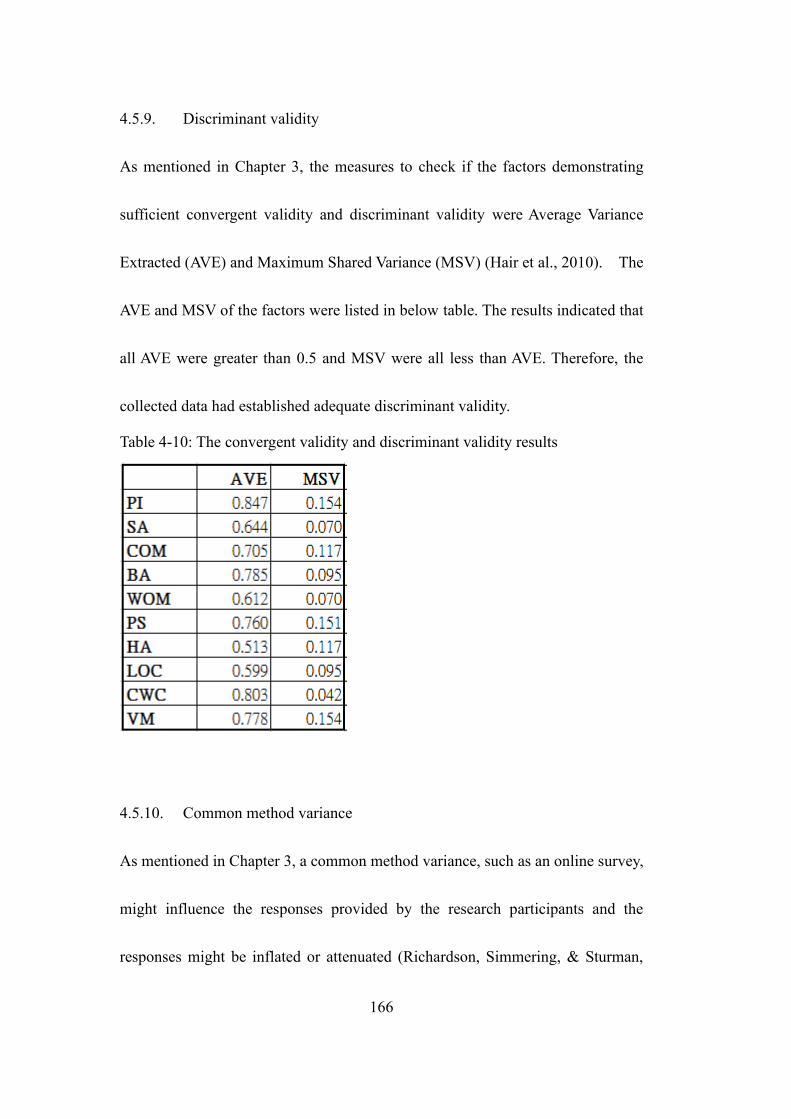
166
4.5.9. Discriminant validity
As mentioned in Chapter 3, the measures to check if the factors demonstrating
sufficient convergent validity and discriminant validity were Average Variance
Extracted (AVE) and Maximum Shared Variance (MSV) (Hair et al., 2010). The
AVE and MSV of the factors were listed in below table. The results indicated that
all AVE were greater than 0.5 and MSV were all less than AVE. Therefore, the
collected data had established adequate discriminant validity.
Table 4-10: The convergent validity and discriminant validity results
4.5.10. Common method variance
As mentioned in Chapter 3, a common method variance, such as an online survey,
might influence the responses provided by the research participants and the
responses might be inflated or attenuated (Richardson, Simmering, & Sturman,
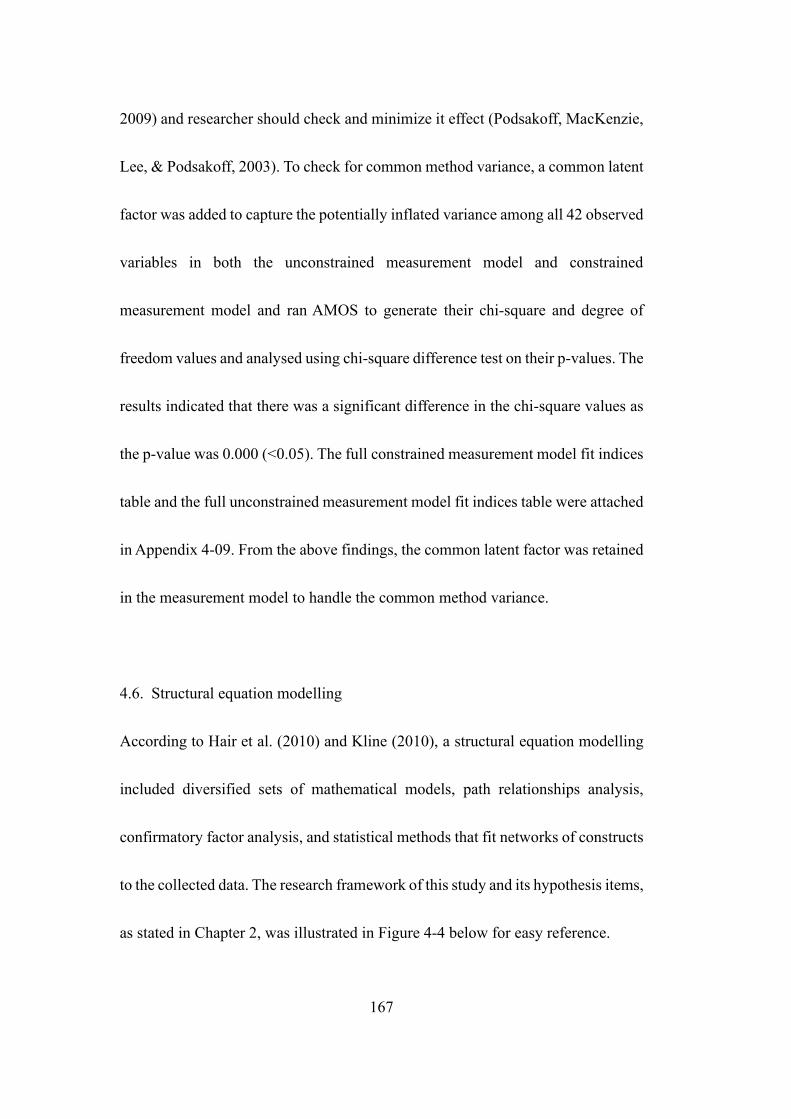
167
2009) and researcher should check and minimize it effect (Podsakoff, MacKenzie,
Lee, & Podsakoff, 2003). To check for common method variance, a common latent
factor was added to capture the potentially inflated variance among all 42 observed
variables in both the unconstrained measurement model and constrained
measurement model and ran AMOS to generate their chi-square and degree of
freedom values and analysed using chi-square difference test on their p-values. The
results indicated that there was a significant difference in the chi-square values as
the p-value was 0.000 (<0.05). The full constrained measurement model fit indices
table and the full unconstrained measurement model fit indices table were attached
in Appendix 4-09. From the above findings, the common latent factor was retained
in the measurement model to handle the common method variance.
4.6. Structural equation modelling
According to Hair et al. (2010) and Kline (2010), a structural equation modelling
included diversified sets of mathematical models, path relationships analysis,
confirmatory factor analysis, and statistical methods that fit networks of constructs
to the collected data. The research framework of this study and its hypothesis items,
as stated in Chapter 2, was illustrated in Figure 4-4 below for easy reference.
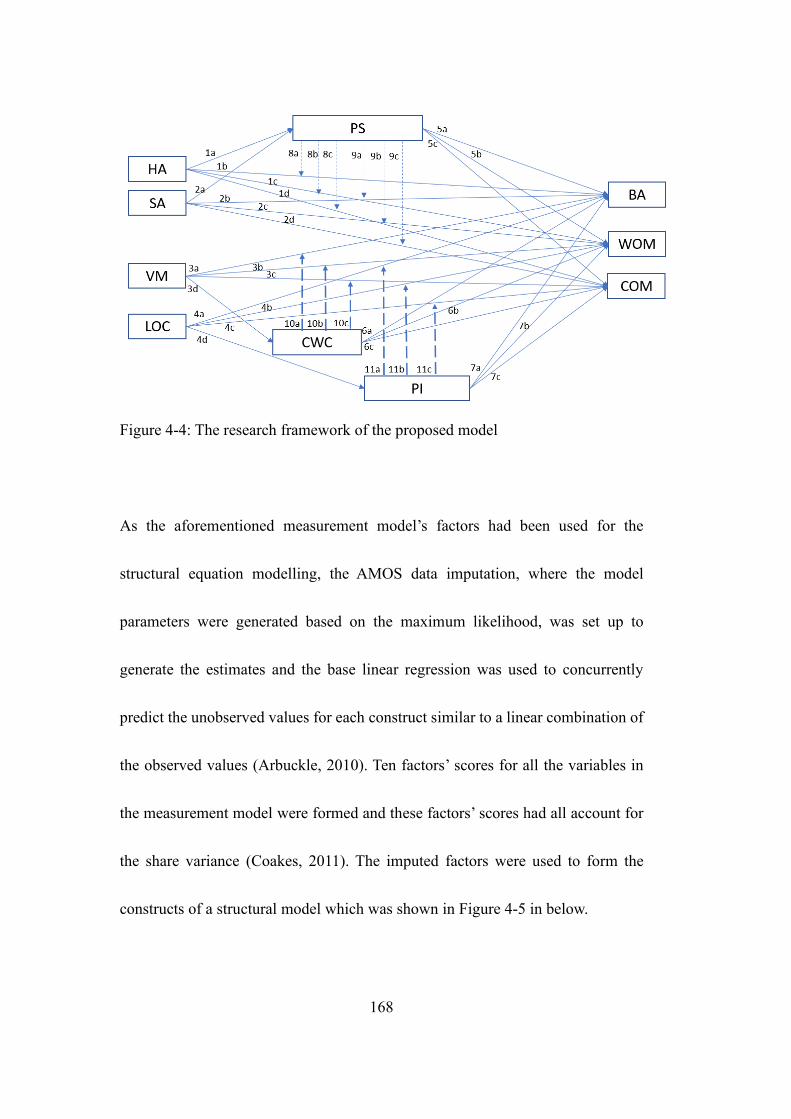
168
Figure 4-4: The research framework of the proposed model
As the aforementioned measurement model’s factors had been used for the
structural equation modelling, the AMOS data imputation, where the model
parameters were generated based on the maximum likelihood, was set up to
generate the estimates and the base linear regression was used to concurrently
predict the unobserved values for each construct similar to a linear combination of
the observed values (Arbuckle, 2010). Ten factors’ scores for all the variables in
the measurement model were formed and these factors’ scores had all account for
the share variance (Coakes, 2011). The imputed factors were used to form the
constructs of a structural model which was shown in Figure 4-5 in below.
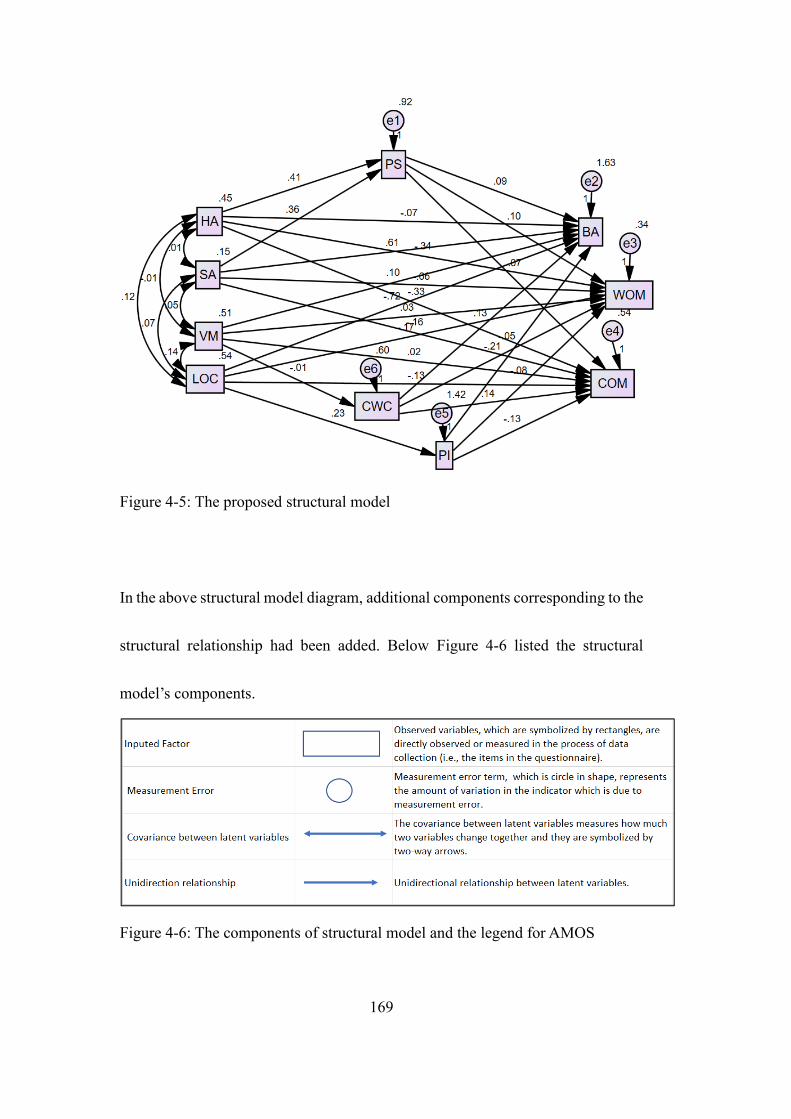
169
Figure 4-5: The proposed structural model
In the above structural model diagram, additional components corresponding to the
structural relationship had been added. Below Figure 4-6 listed the structural
model’s components.
Figure 4-6: The components of structural model and the legend for AMOS
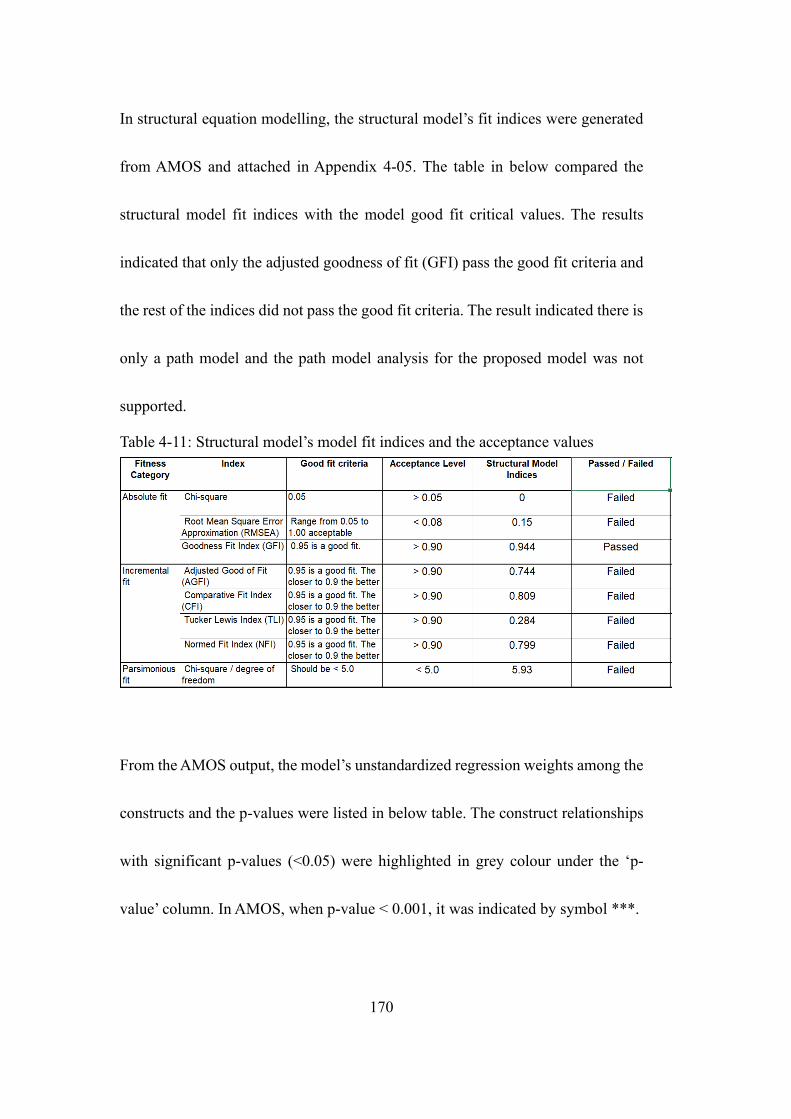
170
In structural equation modelling, the structural model’s fit indices were generated
from AMOS and attached in Appendix 4-05. The table in below compared the
structural model fit indices with the model good fit critical values. The results
indicated that only the adjusted goodness of fit (GFI) pass the good fit criteria and
the rest of the indices did not pass the good fit criteria. The result indicated there is
only a path model and the path model analysis for the proposed model was not
supported.
Table 4-11: Structural model’s model fit indices and the acceptance values
From the AMOS output, the model’s unstandardized regression weights among the
constructs and the p-values were listed in below table. The construct relationships
with significant p-values (<0.05) were highlighted in grey colour under the ‘p-
value’ column. In AMOS, when p-value < 0.001, it was indicated by symbol ***.
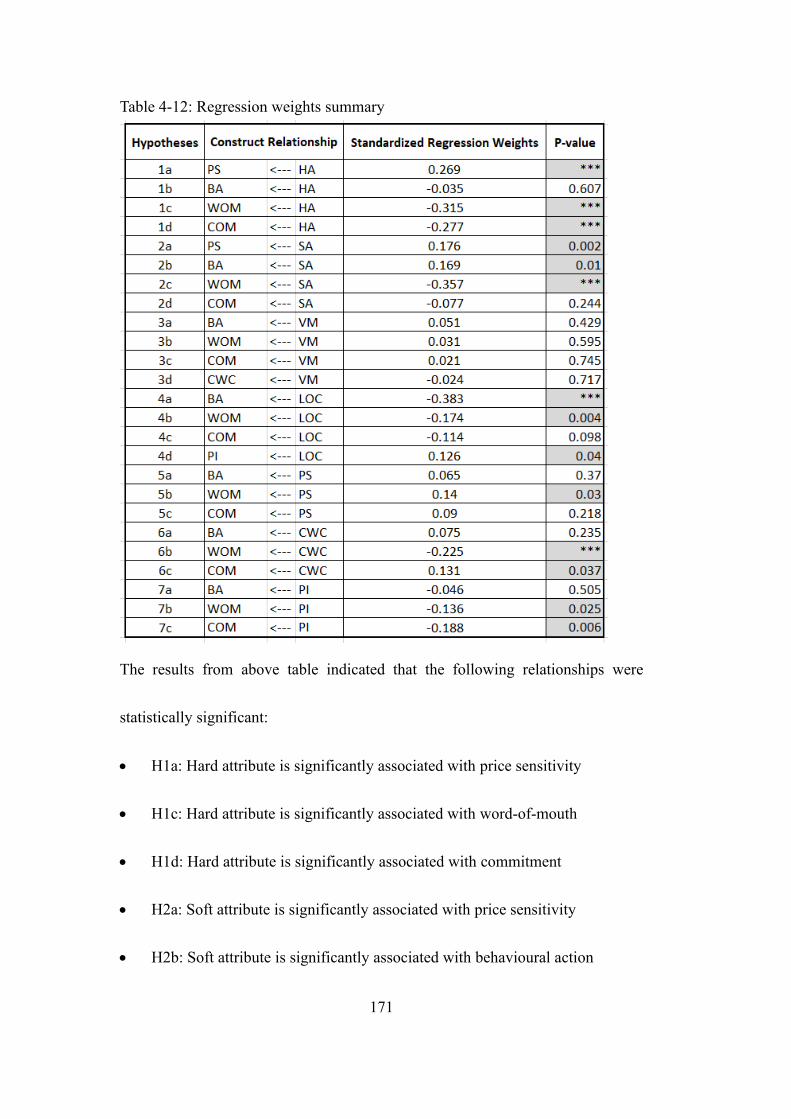
171
Table 4-12: Regression weights summary
The results from above table indicated that the following relationships were
statistically significant:
• H1a: Hard attribute is significantly associated with price sensitivity
• H1c: Hard attribute is significantly associated with word-of-mouth
• H1d: Hard attribute is significantly associated with commitment
• H2a: Soft attribute is significantly associated with price sensitivity
• H2b: Soft attribute is significantly associated with behavioural action
172
• H2c: Soft attribute is significantly associated with word-of-mouth
• H4a: Location is significantly associated with behaviour action
• H4b: Location is significantly associated with word-of-mouth
• H4d: Location is significantly associated with price image
• H5b: Price sensitivity is significantly associated with word-of-mouth
• H6b: Communication with customer is significantly associated with word-of-
mouth
• H6c: Communication with customer is significantly associated with
commitment
• H7b: Price image is significantly associated with word-of-mouth
• H7c: Price image is significantly associated with commitment
4.7. Testing of moderation construct
As described in Chapter 3, the moderation effect was the joint effects of two
predictor variables in addition to the individual main effects. A form of relationship
changes between two constructs which depended on the value of the ‘assumed’
moderator variable was what this study was looking for. For instance, if price
sensitivity was a moderator between soft attribute and word-of-mouth, the study
looked for more precise explanation of causal effects by providing a mathematical
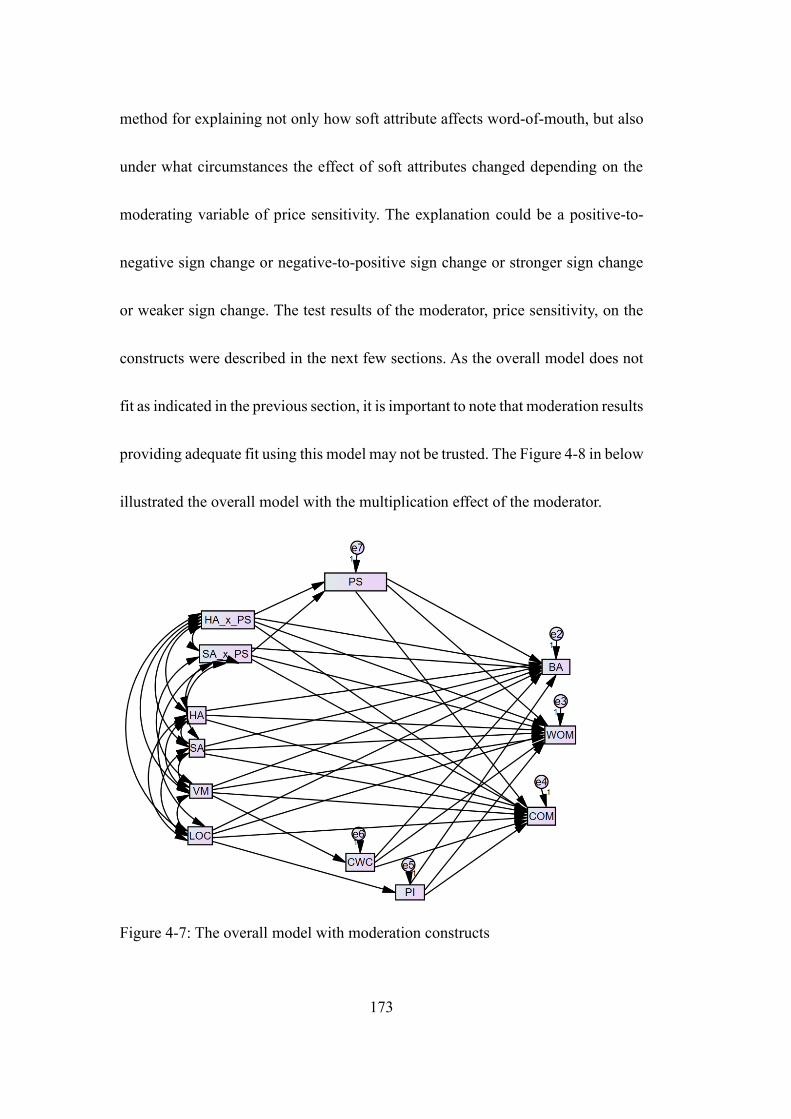
173
method for explaining not only how soft attribute affects word-of-mouth, but also
under what circumstances the effect of soft attributes changed depending on the
moderating variable of price sensitivity. The explanation could be a positive-to-
negative sign change or negative-to-positive sign change or stronger sign change
or weaker sign change. The test results of the moderator, price sensitivity, on the
constructs were described in the next few sections. As the overall model does not
fit as indicated in the previous section, it is important to note that moderation results
providing adequate fit using this model may not be trusted. The Figure 4-8 in below
illustrated the overall model with the multiplication effect of the moderator.
Figure 4-7: The overall model with moderation constructs
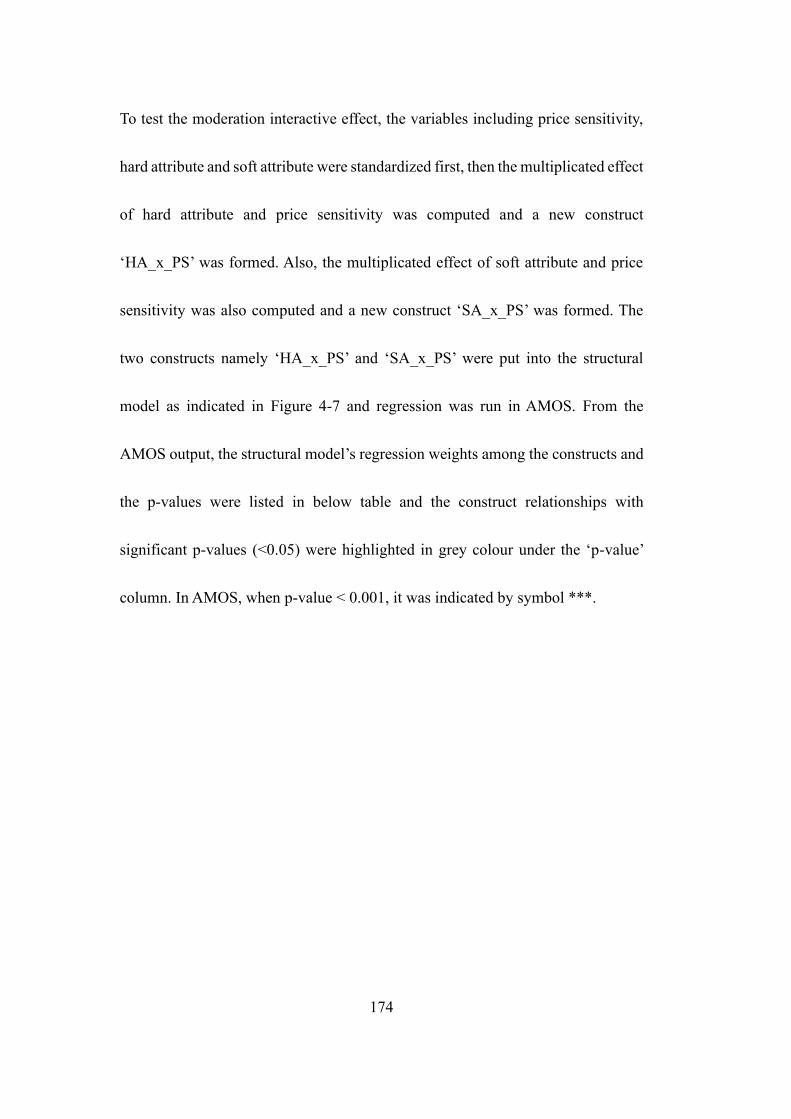
174
To test the moderation interactive effect, the variables including price sensitivity,
hard attribute and soft attribute were standardized first, then the multiplicated effect
of hard attribute and price sensitivity was computed and a new construct
‘HA_x_PS’ was formed. Also, the multiplicated effect of soft attribute and price
sensitivity was also computed and a new construct ‘SA_x_PS’ was formed. The
two constructs namely ‘HA_x_PS’ and ‘SA_x_PS’ were put into the structural
model as indicated in Figure 4-7 and regression was run in AMOS. From the
AMOS output, the structural model’s regression weights among the constructs and
the p-values were listed in below table and the construct relationships with
significant p-values (<0.05) were highlighted in grey colour under the ‘p-value’
column. In AMOS, when p-value < 0.001, it was indicated by symbol ***.
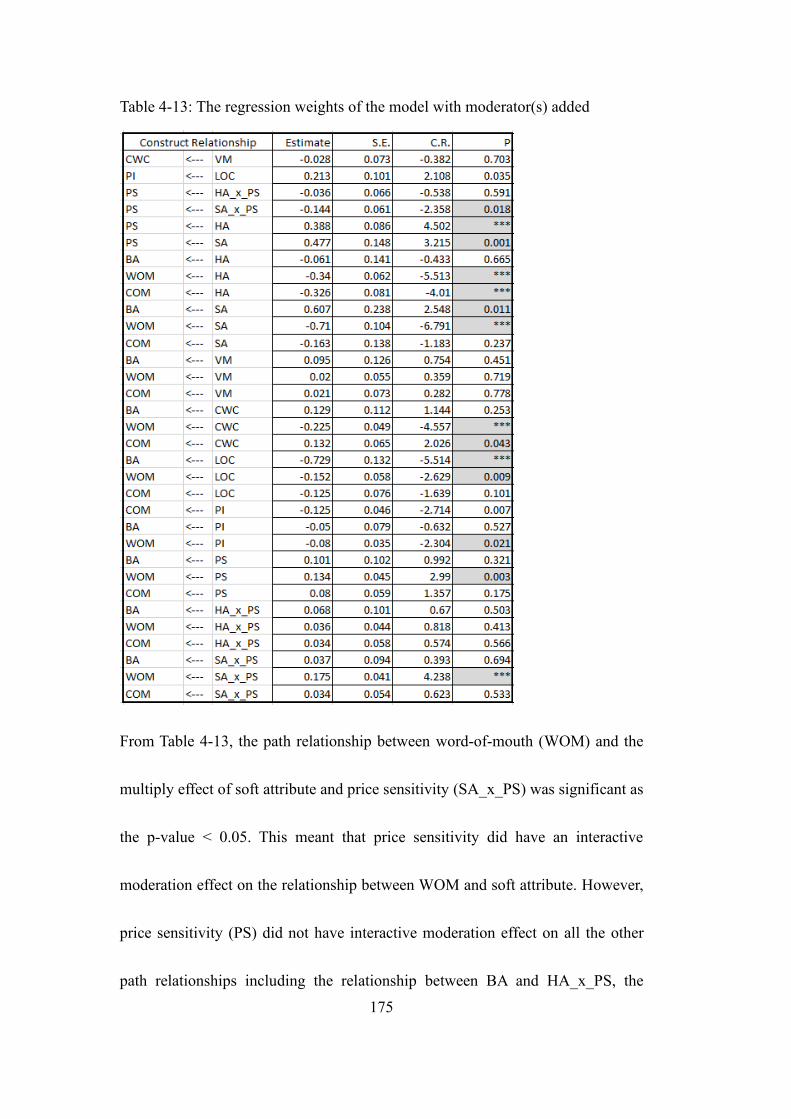
175
Table 4-13: The regression weights of the model with moderator(s) added
From Table 4-13, the path relationship between word-of-mouth (WOM) and the
multiply effect of soft attribute and price sensitivity (SA_x_PS) was significant as
the p-value < 0.05. This meant that price sensitivity did have an interactive
moderation effect on the relationship between WOM and soft attribute. However,
price sensitivity (PS) did not have interactive moderation effect on all the other
path relationships including the relationship between BA and HA_x_PS, the
176
relationship between WOM and HA_x_PS, the relationship between COM and
HA_x_PS, the relationship between BA and SA_x_PS, and the relationship
between COM and SA_x_PS. Detail finding were listed in the following sections.
4.7.1. Moderation effect of PS on HA and BA
From the Table 4-13, the path relationship between behavioural attitude (BA) and
the multiply effect of hard attribute and price sensitivity (HA_x_PS) was
insignificant as the p-value was 0.503 (>0.05).
4.7.2. Moderation effect of PS on HA and WOM
From the Table 4-13, the path relationship between word-of-mouth (WOM) and
the multiply effect of hard attribute and price sensitivity (HA_x_PS) was
insignificant as the p-value was 0.413 (>0.05).
4.7.3. Moderation effect of PS on HA and COM
From the Table 4-13 above, the path relationship between commitment (COM) and
the multiply effect of hard attribute and price sensitivity (HA_x_PS) was
insignificant as the p-value was 0.566 (>0.05).
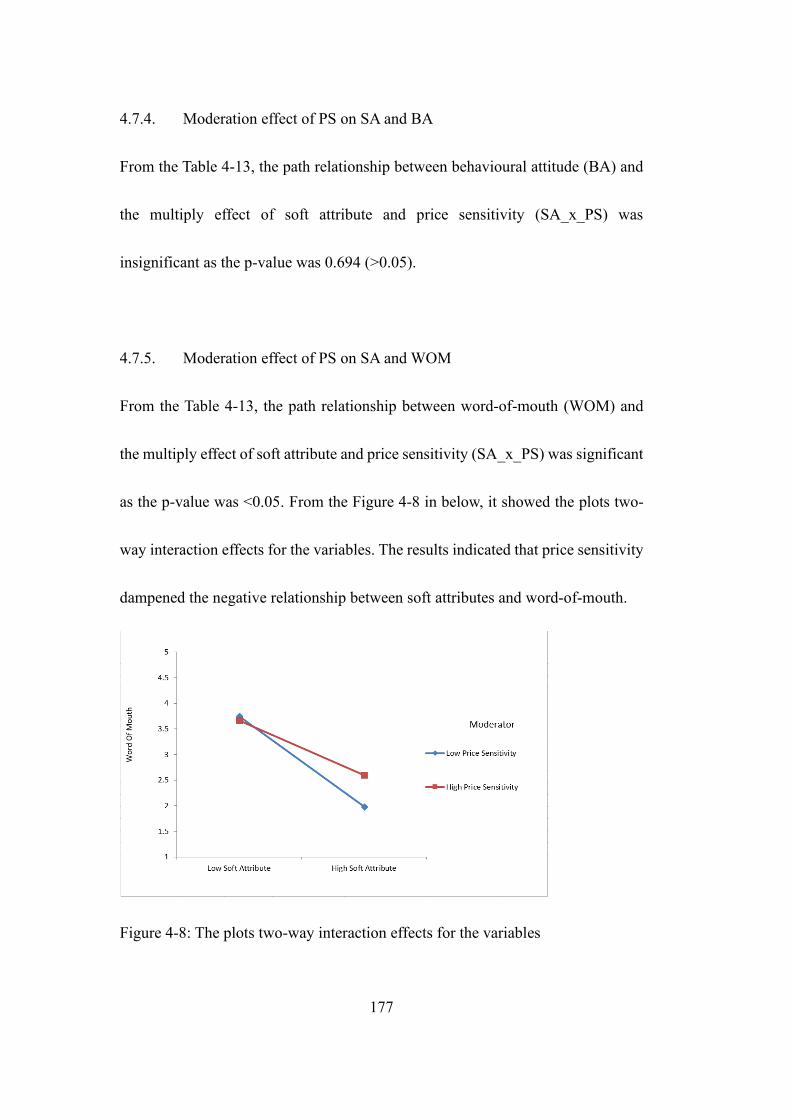
177
4.7.4. Moderation effect of PS on SA and BA
From the Table 4-13, the path relationship between behavioural attitude (BA) and
the multiply effect of soft attribute and price sensitivity (SA_x_PS) was
insignificant as the p-value was 0.694 (>0.05).
4.7.5. Moderation effect of PS on SA and WOM
From the Table 4-13, the path relationship between word-of-mouth (WOM) and
the multiply effect of soft attribute and price sensitivity (SA_x_PS) was significant
as the p-value was <0.05. From the Figure 4-8 in below, it showed the plots two-
way interaction effects for the variables. The results indicated that price sensitivity
dampened the negative relationship between soft attributes and word-of-mouth.
Figure 4-8: The plots two-way interaction effects for the variables
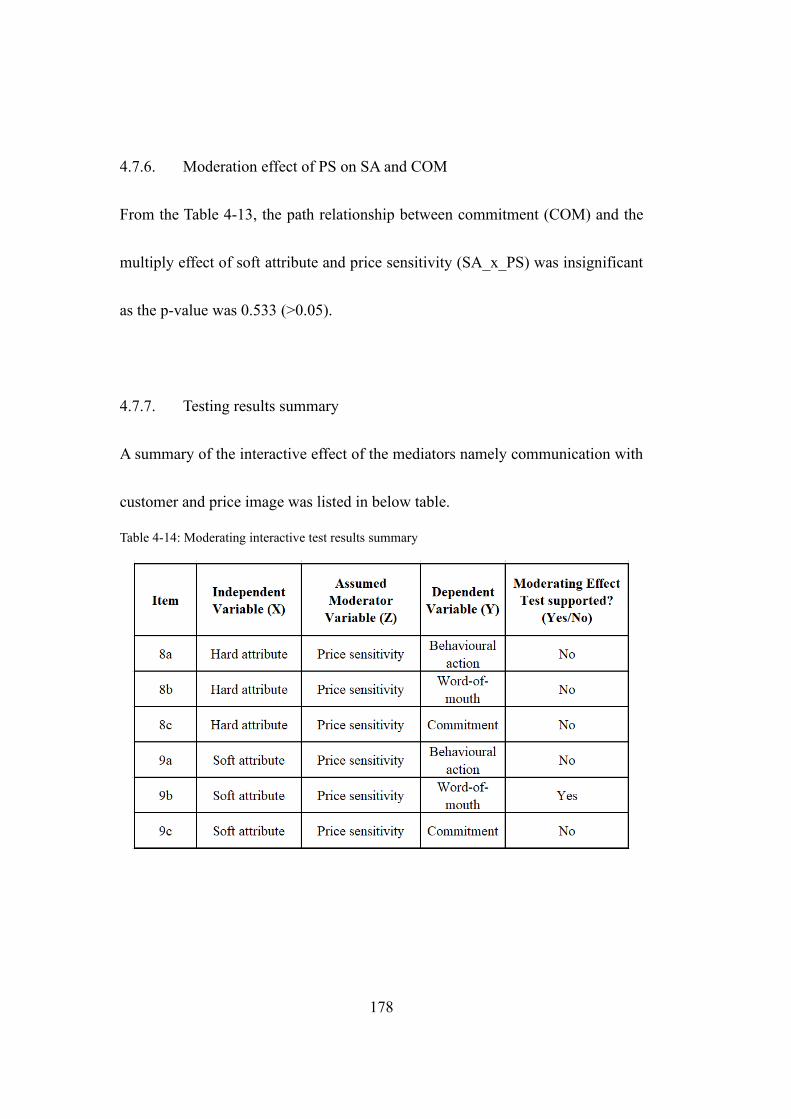
178
4.7.6. Moderation effect of PS on SA and COM
From the Table 4-13, the path relationship between commitment (COM) and the
multiply effect of soft attribute and price sensitivity (SA_x_PS) was insignificant
as the p-value was 0.533 (>0.05).
4.7.7. Testing results summary
A summary of the interactive effect of the mediators namely communication with
customer and price image was listed in below table.
Table 4-14: Moderating interactive test results summary
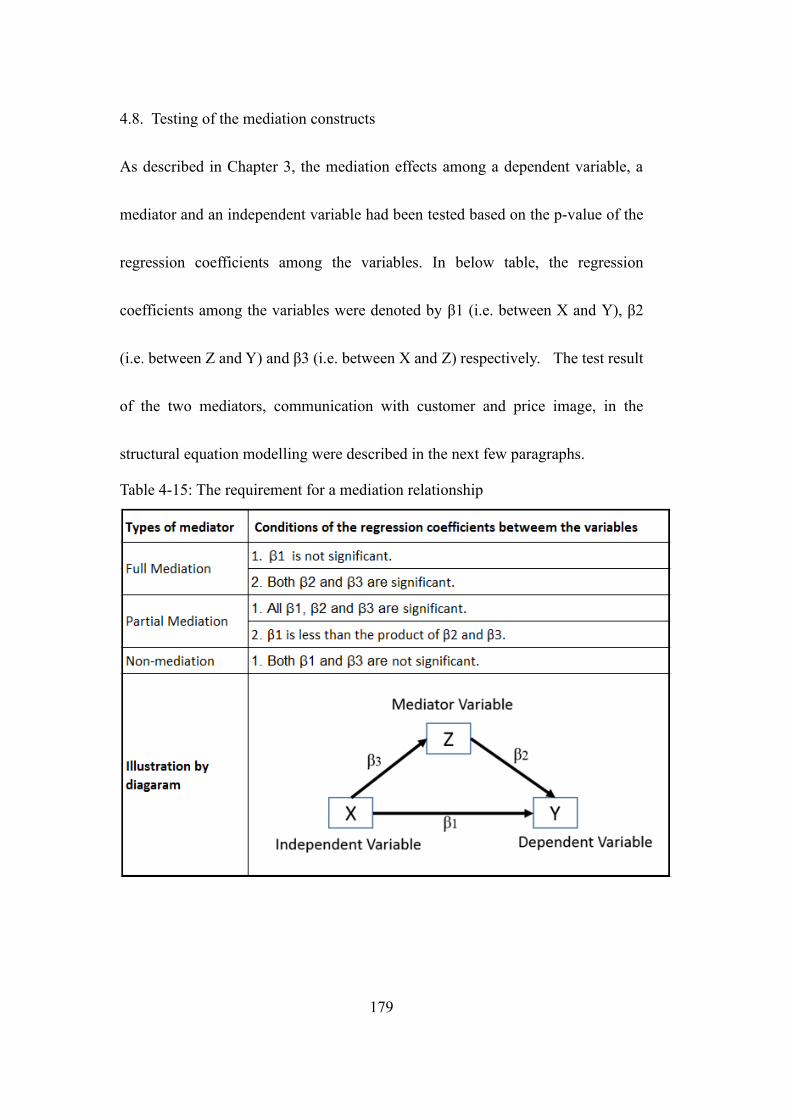
179
4.8. Testing of the mediation constructs
As described in Chapter 3, the mediation effects among a dependent variable, a
mediator and an independent variable had been tested based on the p-value of the
regression coefficients among the variables. In below table, the regression
coefficients among the variables were denoted by β1 (i.e. between X and Y), β2
(i.e. between Z and Y) and β3 (i.e. between X and Z) respectively. The test result
of the two mediators, communication with customer and price image, in the
structural equation modelling were described in the next few paragraphs.
Table 4-15: The requirement for a mediation relationship
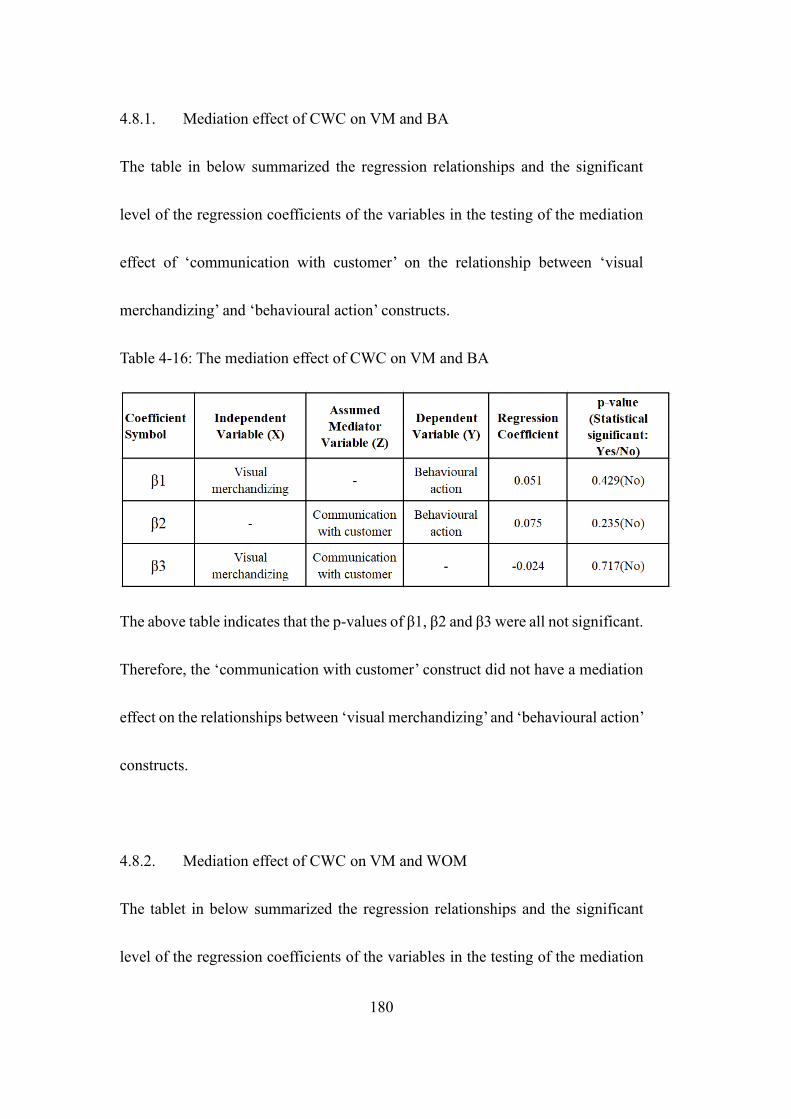
180
4.8.1. Mediation effect of CWC on VM and BA
The table in below summarized the regression relationships and the significant
level of the regression coefficients of the variables in the testing of the mediation
effect of ‘communication with customer’ on the relationship between ‘visual
merchandizing’ and ‘behavioural action’ constructs.
Table 4-16: The mediation effect of CWC on VM and BA
The above table indicates that the p-values of β1, β2 and β3 were all not significant.
Therefore, the ‘communication with customer’ construct did not have a mediation
effect on the relationships between ‘visual merchandizing’ and ‘behavioural action’
constructs.
4.8.2. Mediation effect of CWC on VM and WOM
The tablet in below summarized the regression relationships and the significant
level of the regression coefficients of the variables in the testing of the mediation
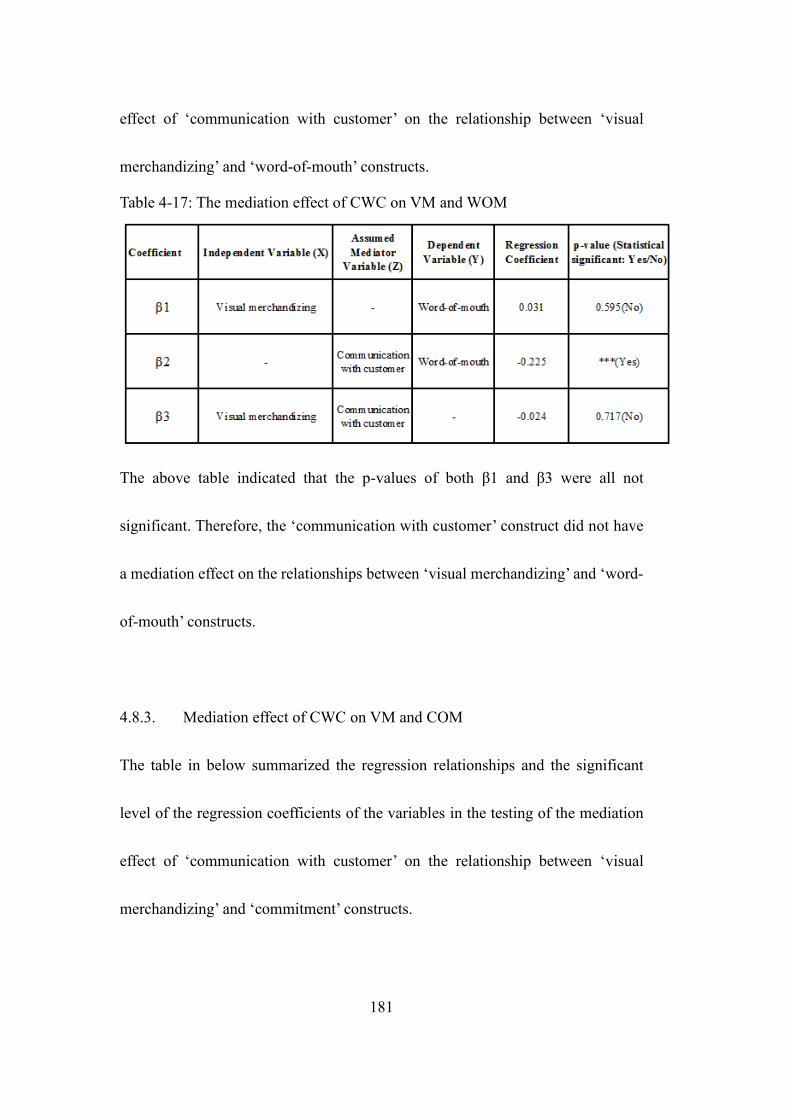
181
effect of ‘communication with customer’ on the relationship between ‘visual
merchandizing’ and ‘word-of-mouth’ constructs.
Table 4-17: The mediation effect of CWC on VM and WOM
The above table indicated that the p-values of both β1 and β3 were all not
significant. Therefore, the ‘communication with customer’ construct did not have
a mediation effect on the relationships between ‘visual merchandizing’ and ‘word-
of-mouth’ constructs.
4.8.3. Mediation effect of CWC on VM and COM
The table in below summarized the regression relationships and the significant
level of the regression coefficients of the variables in the testing of the mediation
effect of ‘communication with customer’ on the relationship between ‘visual
merchandizing’ and ‘commitment’ constructs.
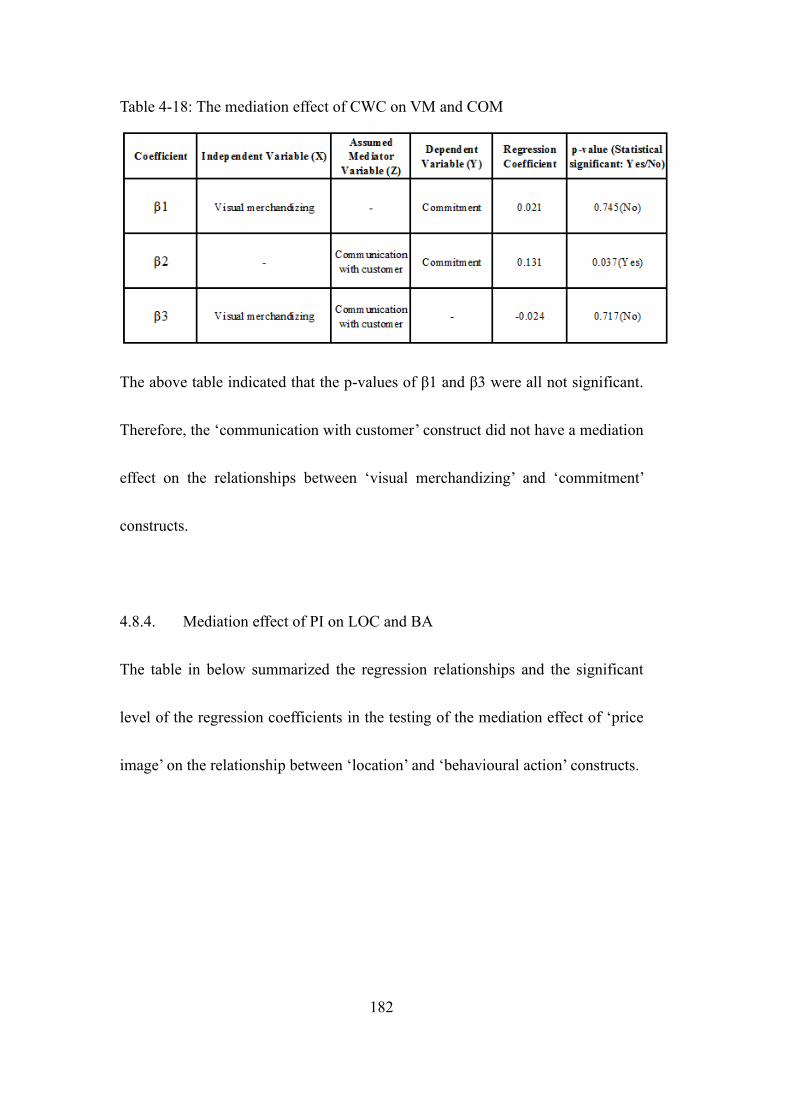
182
Table 4-18: The mediation effect of CWC on VM and COM
The above table indicated that the p-values of β1 and β3 were all not significant.
Therefore, the ‘communication with customer’ construct did not have a mediation
effect on the relationships between ‘visual merchandizing’ and ‘commitment’
constructs.
4.8.4. Mediation effect of PI on LOC and BA
The table in below summarized the regression relationships and the significant
level of the regression coefficients in the testing of the mediation effect of ‘price
image’ on the relationship between ‘location’ and ‘behavioural action’ constructs.
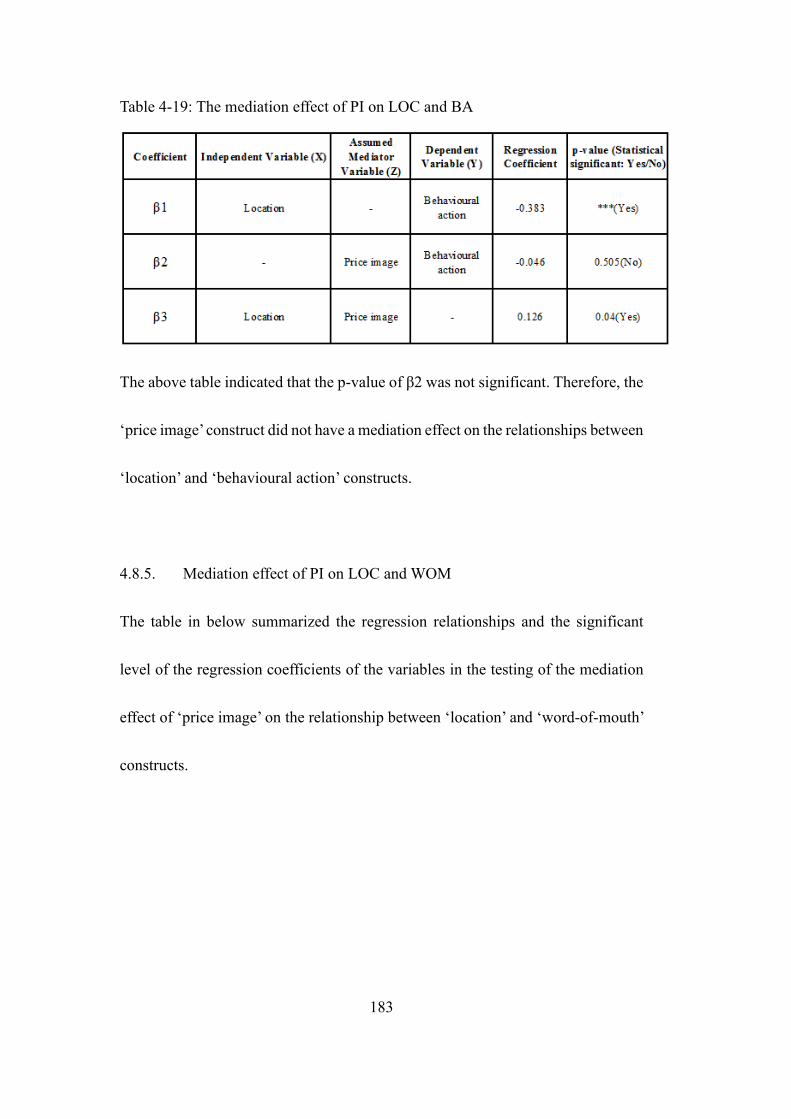
183
Table 4-19: The mediation effect of PI on LOC and BA
The above table indicated that the p-value of β2 was not significant. Therefore, the
‘price image’ construct did not have a mediation effect on the relationships between
‘location’ and ‘behavioural action’ constructs.
4.8.5. Mediation effect of PI on LOC and WOM
The table in below summarized the regression relationships and the significant
level of the regression coefficients of the variables in the testing of the mediation
effect of ‘price image’ on the relationship between ‘location’ and ‘word-of-mouth’
constructs.
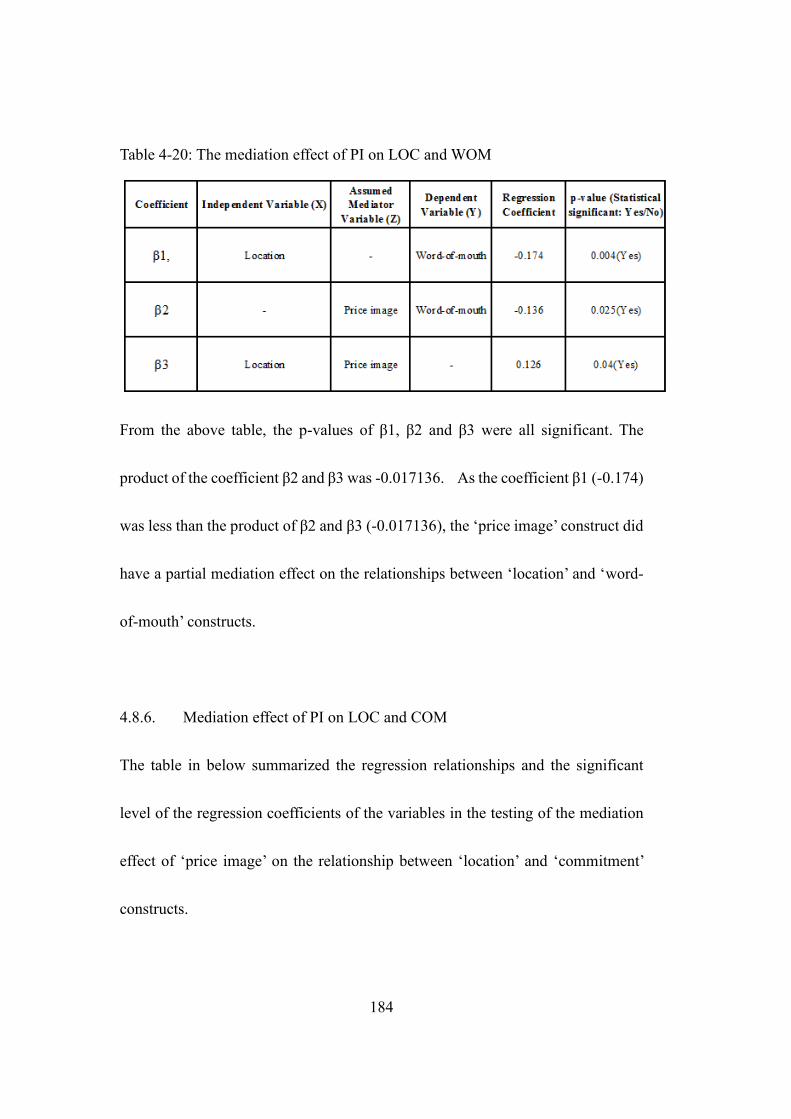
184
Table 4-20: The mediation effect of PI on LOC and WOM
From the above table, the p-values of β1, β2 and β3 were all significant. The
product of the coefficient β2 and β3 was -0.017136. As the coefficient β1 (-0.174)
was less than the product of β2 and β3 (-0.017136), the ‘price image’ construct did
have a partial mediation effect on the relationships between ‘location’ and ‘word-
of-mouth’ constructs.
4.8.6. Mediation effect of PI on LOC and COM
The table in below summarized the regression relationships and the significant
level of the regression coefficients of the variables in the testing of the mediation
effect of ‘price image’ on the relationship between ‘location’ and ‘commitment’
constructs.
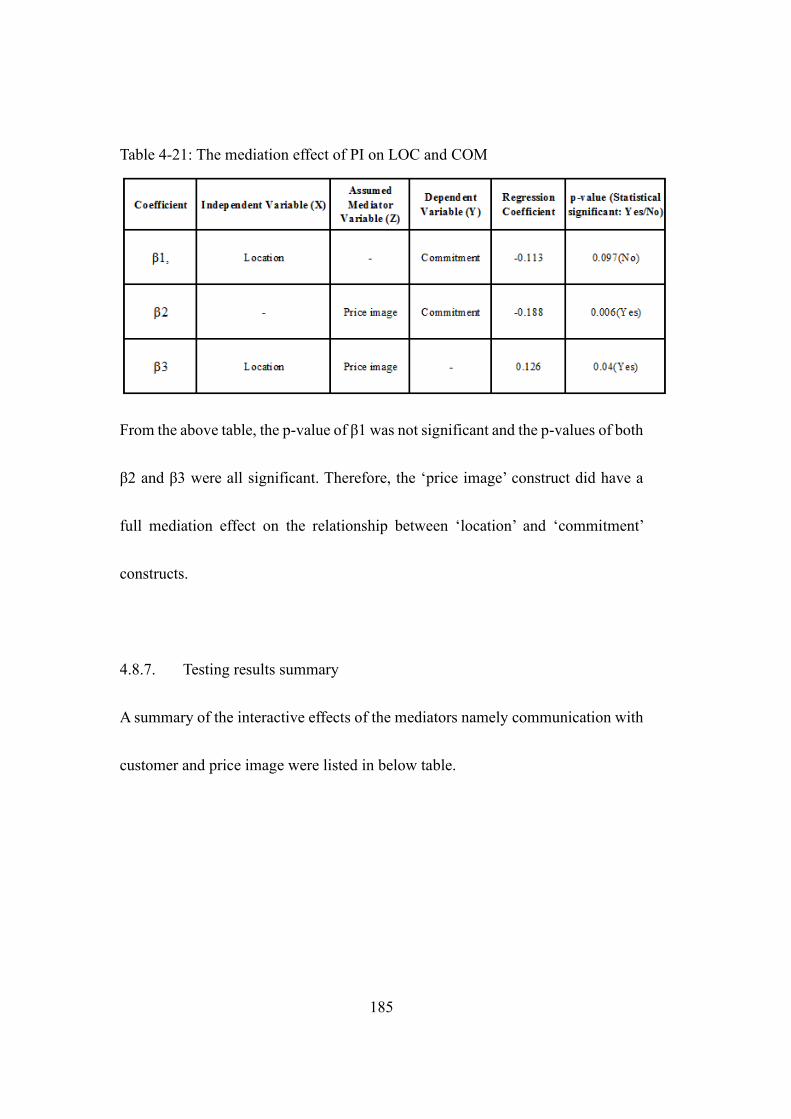
185
Table 4-21: The mediation effect of PI on LOC and COM
From the above table, the p-value of β1 was not significant and the p-values of both
β2 and β3 were all significant. Therefore, the ‘price image’ construct did have a
full mediation effect on the relationship between ‘location’ and ‘commitment’
constructs.
4.8.7. Testing results summary
A summary of the interactive effects of the mediators namely communication with
customer and price image were listed in below table.
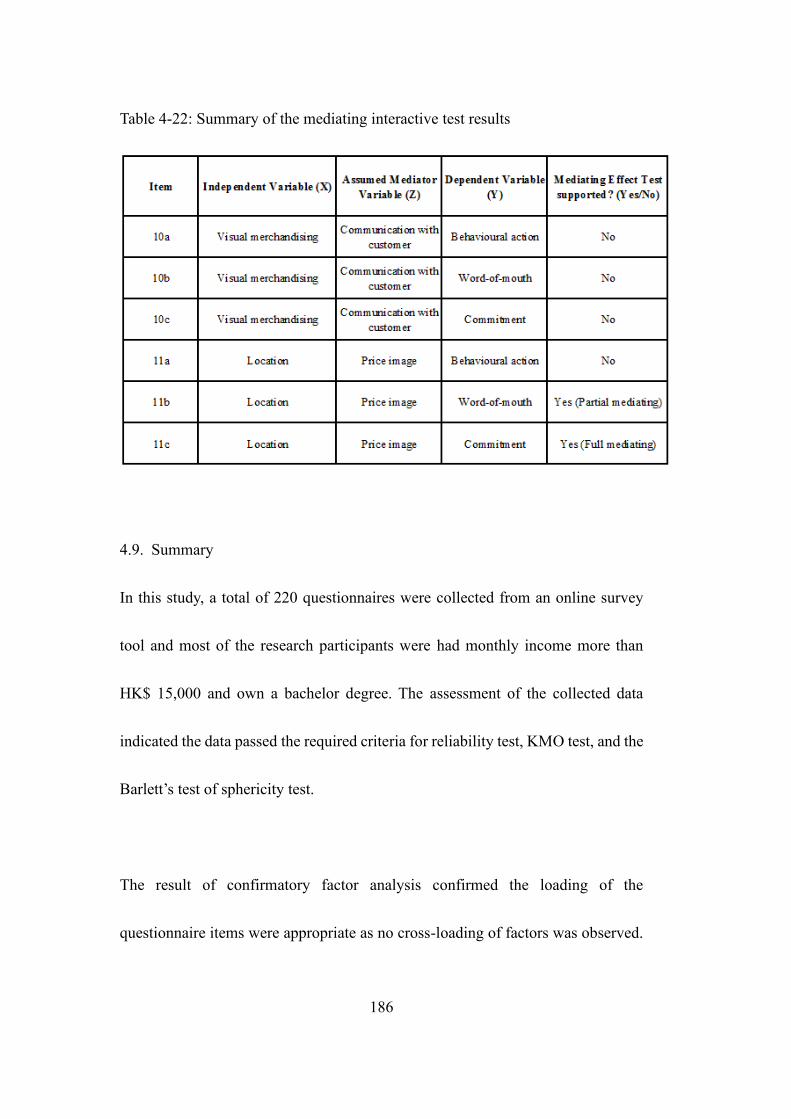
186
Table 4-22: Summary of the mediating interactive test results
4.9. Summary
In this study, a total of 220 questionnaires were collected from an online survey
tool and most of the research participants were had monthly income more than
HK$ 15,000 and own a bachelor degree. The assessment of the collected data
indicated the data passed the required criteria for reliability test, KMO test, and the
Barlett’s test of sphericity test.
The result of confirmatory factor analysis confirmed the loading of the
questionnaire items were appropriate as no cross-loading of factors was observed.
187
Furthermore, model fit analysis of the proposed structural model passed the
acceptance criteria of model fit.
The structural equation modelling had results of the regression weights and
significant levels of the hypotheses and the results indicated that H1a, H1c, H1d,
H2a, H2b, H2c, H4a, H4b, H4d, H5b, H6b, H6c, H7b and H7c were all having
significant p-values and they were all statistically supported. However, the
hypotheses H1b, H2d, H3a, H3b, H3c, H3d, H4c, H5a, H5c, H6a, and H7a were
not statistically supported as all their p-values were insignificant.
In addition, the mediating test results found that the assumed mediator
‘communication with customer’ was not having any mediation effect on the
relationships between the ‘visual merchandizing’ and the three store loyalty
constructs namely behaviour action, word-of-mouth and commitment. However,
the mediator ‘price image’ was identified as having a partial mediating effect on
the relationships between ‘location’ and ‘word-of-mouth’ constructs. Furthermore,
the ‘price image’ construct was found having a full mediation effect on the
relationship between ‘locations’ and ‘commitment’ constructs.
188
Moreover, the interactive moderation test identified that the path relationship
between word-of-mouth and the multiply effect of soft attribute and price
sensitivity (SA_x_PS) was significant. The result indicated that price sensitivity
dampened the negative relationship between soft attributes and word-of-mouth.
The detail results were discussed in Chapter 5 and this chapter provided a
conclusion to the study and included limitations and contributions of the study with
suggestions for future related research.
189
5. DISCUSSION AND CONCLUSION
5.1. Introduction
This chapter presented the implication of this study on the association between
customer loyalty constructs, namely hard attributes and soft attributes, and the store
loyalty constructs including behavioural action, word-of-mouth and commitment.
This chapter began with a brief outline of the research findings on the hypotheses,
the mediation effect and moderation effect of the constructs. Then a brief review
on both the customer loyalty and store loyalty models was integrated with the
findings from the literature on the measurement assessment. Next, the implication
of this study was discussed in both the theoretical and practical aspect. The final
section would cover the limitation of this study and the future direction for related
research.
5.2. Discussion of analysis results
This thesis adopted a modified extended customer loyalty model and store loyalty
model and associated hypotheses as the main research framework. SPSS and
AMOS were employed to run statistical analysis on the 220 completed
questionnaires. The structural equation modelling was run and the model did not
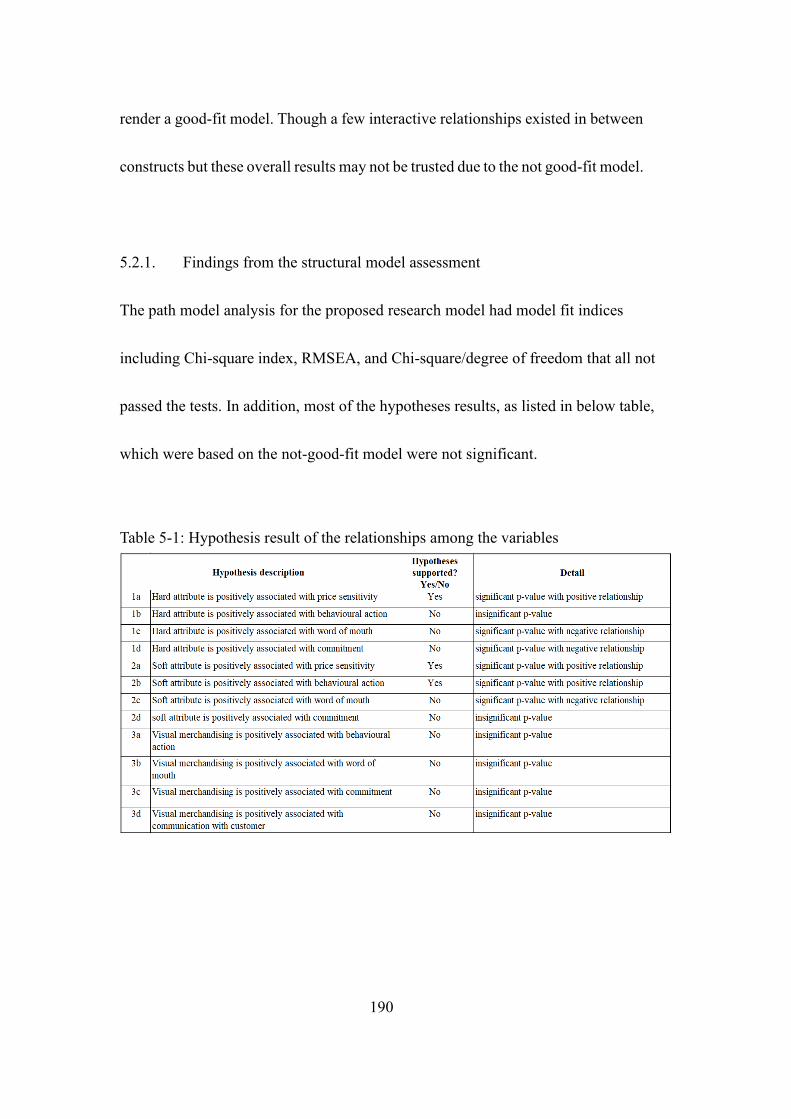
190
render a good-fit model. Though a few interactive relationships existed in between
constructs but these overall results may not be trusted due to the not good-fit model.
5.2.1. Findings from the structural model assessment
The path model analysis for the proposed research model had model fit indices
including Chi-square index, RMSEA, and Chi-square/degree of freedom that all not
passed the tests. In addition, most of the hypotheses results, as listed in below table,
which were based on the not-good-fit model were not significant.
Table 5-1: Hypothesis result of the relationships among the variables
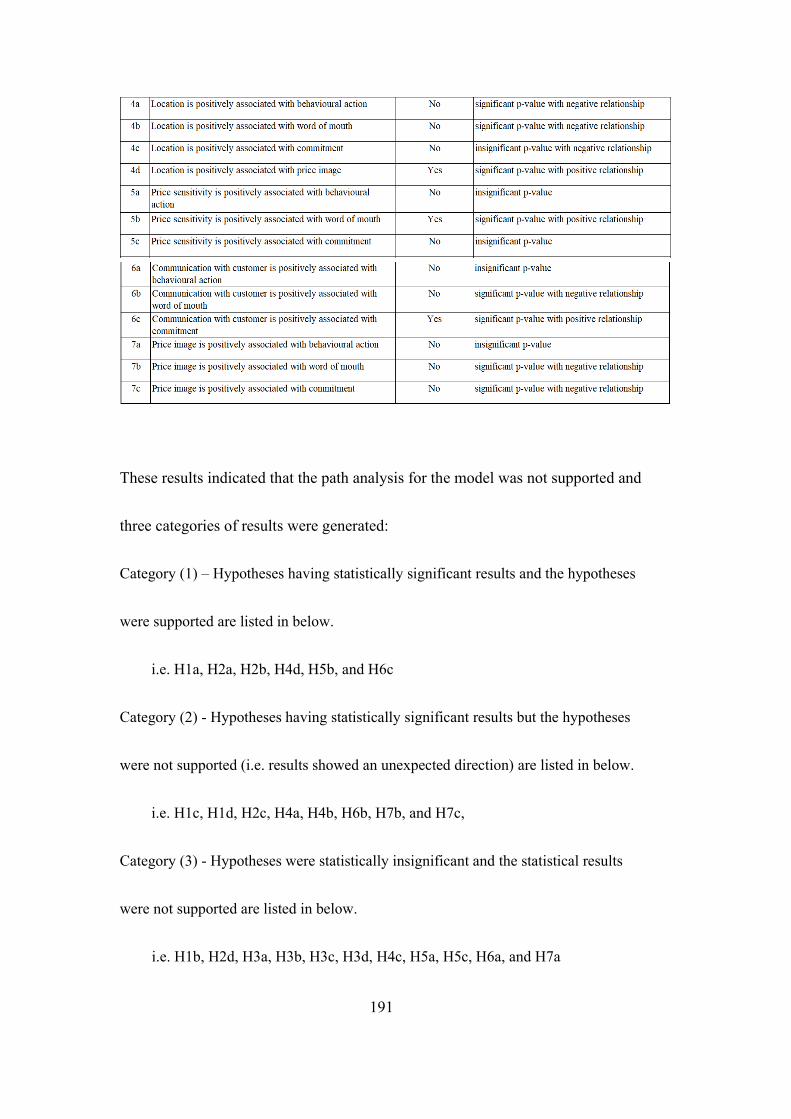
191
These results indicated that the path analysis for the model was not supported and
three categories of results were generated:
Category (1) – Hypotheses having statistically significant results and the hypotheses
were supported are listed in below.
i.e. H1a, H2a, H2b, H4d, H5b, and H6c
Category (2) - Hypotheses having statistically significant results but the hypotheses
were not supported (i.e. results showed an unexpected direction) are listed in below.
i.e. H1c, H1d, H2c, H4a, H4b, H6b, H7b, and H7c,
Category (3) - Hypotheses were statistically insignificant and the statistical results
were not supported are listed in below.
i.e. H1b, H2d, H3a, H3b, H3c, H3d, H4c, H5a, H5c, H6a, and H7a
192
Though the path model analysis was supported by the model fit indices, there were
only six hypotheses out of 25 hypotheses found being supported. Some
relationships are in the opposite direction than hypothesised. This is potentially
quite interesting. For example, the negative association between hard attributes and
word-of-mouth may be the result of different types of hard attributes had different
impacts on the evaluation of word-of-mouth. This could happen in some studies,
where the potential buyers may get discount or rewards if they would refer their
friends and relatives toward a store/brand; however, the potential buyers might
have an impression that the store/brand has enticed friends into profiting from their
relationship and this higher social costs associated with money offset the hard
attribute (benefit) gained further render hard attribute an inferior incentive (Jin &
Huang, 2014).
5.2.2. The answer to research question 1
RQ1: What are the moderating effects of price sensitivity with respect to the
relationship between hard attribute and behavioural action, the
relationship between hard attribute and word-of-mouth and the
relationship between hard attribute and commitment in the local beauty
and healthcare retailing industry?

193
The moderator effect test results indicated the followings:
1. Price sensitivity was not a moderator with respect to the relationship
between hard attribute and behavioural action as there was no significant
association identified.
2. Price sensitivity was not a moderator with respect to the relationship
between hard attribute and word-of-mouth as there was no significant
association identified.
3. Price sensitivity was not a moderator with respect to the relationship
between hard attribute and commitment as there was no significant
association
From above results, the hard attribute was not associated with the store loyalty
construct as the hypotheses related to hard attribute were all rejected. The findings
supported Roehm et al.’s (2002) findings that hard reward or hard attribute itself
could not stimulate the loyalty of customer to the brand after a promotion program
ended. Therefore, the study had found that price sensitivity was not having any
moderating effect in the relationship between hard attribute and customer loyalty.
Also, when price sensitivity was inserted as a moderator in the model, store loyalty

194
program was found not directly positively contributing to the store loyalty in the
local beauty and healthcare retailing industry.
5.2.3. The answer to research question 2
RQ2: What are the moderating effects of price sensitivity with respect to the
relationship between soft attribute and behavioural action, the
relationship between soft attribute and word-of-mouth and the
relationship between soft attribute and commitment in the local beauty
and healthcare retailing industry?
The moderator effect test results indicated the followings:
1. Price sensitivity was not a moderator with respect to the relationship
between soft attribute and behavioural action as there was no significant
association identified.
2. Price sensitivity was a moderator with respect to the relationship between
soft attribute and word-of-mouth as there was a significant association
identified.
3. Price sensitivity was not a moderator with respect to the relationship
between soft attribute and commitment as there was no significant
association
195
From above results, two out of three of the relationships between soft attribute and
the store loyalty factors were not significant as the hypotheses related to soft
attribute were not all supported. Firstly, price sensitivity was only found as a
moderator with respect to the relationship between soft attribute and word-of-
mouth. This finding supported prior literature (Arantola, 2003) as loyalty program
customers did engage in word-of-mouth behaviour on tangible award or soft
attribute. This could be explained that loyalty program customers expressed their
feelings through word-of-mouth in a subjective perspective with a much more
emotional indication than the feelings they had when discussing about monetary
rewards which would be less emotional in most of the cases because tangible
rewards were usually valued objectively. (Arantola, 2003). Secondly, price
sensitivity was found dampening the negative relationship between soft attribute
and word-of-mouth. Therefore, the findings from this result indicated that the soft
attribute of customer loyalty program was only negatively affecting the store
loyalty in the local beauty and healthcare retailing industry with moderating effect
from the price sensitivity.
5.2.4. The answer to research question 3
196
RQ3: What are the mediating effects of communication with customer with
respect to the relationship between virtual merchandising and
behavioural action, the relationship between virtual merchandising and
word-of-mouth and the relationship between virtual merchandising and
commitment in the local beauty and healthcare retailing industry?
The mediating effect test results indicated the followings:
1. Communication with customer was not a mediator with respect to the
relationship between virtual merchandising and behavioural action as there
was no significant association identified.
2. Communication with customer was not a mediator with respect to the
relationship between virtual merchandising and word-of-mouth as there
was a significant association identified.
3. Communication with customer was not a mediator with respect to the
relationship between virtual merchandising and commitment as there was
no significant association
From the above results, all hypotheses were not supported. There were three
findings from these results. Firstly, this study identified that the relationship
between visual merchandising and store loyalty was not affected by the mediation
effect of communication with customers. Though the communication with
197
customer was not a mediator, however, this study identified that it was positively
and significantly associated with commitment to store and this result matched with
Duncan’s (2002) and Rensburg and Cant’s (2003) study. Secondly, the
communication with customers was not significantly associated with word-of-
mouth. This finding contradicted with the prior studies (Bridson et al., 2008 and
Leong, 2013) as their studies indicated that communication with customer could
enhance customer experience and the quality assurance perceived for the brands
would increase emotional attachment to brands and expressed through word-of-
mouth. Thirdly, the communication with customers was not significantly
associated with behavioural action. This finding indicated that the communication
with customer might be able to enhance customer experience and the perceived
quality of the brand but it could not form a stepping stone of purchase or
behavioural action.
5.2.5. The answer to research question 4
RQ4: What are the mediating effects of communication with customer with
respect to the relationship between location and behavioural action, the
relationship between location and word-of-mouth and the relationship
198
between location and commitment in the local beauty and healthcare
retailing industry?
The mediating effect test results indicated the followings:
1. Price image was not a mediator with respect to the relationship between
location and behavioural action as there was no significant association
identified.
2. Price image was a partial mediator with respect to the relationship between
location and word-of-mouth as there was a significant association identified.
3. Price image was a full mediator with respect to the relationship between
location and commitment as there was no significant association
From above results, only two of the path relationships between location and loyalty
store construct were significant. As not all of the path relationships between
location and loyalty store construct were significant, this study identified that the
relationship between visual location and store loyalty was only partially affected
by the mediation effect of price image.
5.2.6. The rejected hypotheses
199
As there were nineteen hypotheses, namely H1b, H1c, H1d, H2c, H2d, H3a, H3b,
H3c, H3d, H4a, H4b, H4c, H5a, H5c, H6a, H6b, H7a, H7b and H7s rejected, the
researcher would like to emphasize that this could be the result of the small sample
size (220) in the survey. Though the researcher could not find significant results in
some of the hypotheses, the results did not suggest the relationship among the
constructs did not exist, but rather the researcher could not find them from the data
collected.
The rejected hypotheses H1b, H1c and H1d were all related to the hard attribute
construct. Hard attribute was one of the customer loyalty rewards and it was
originally defined in the trade literature as things like free gifts, discount and free
vouchers (Barlow, 1996). According to Barlow (1996), free discount was a tangible
element of reward which had positive effect on customers’ purchasing behaviour
(i.e. behavioural action) as customers could purchase more products at a lower
price. Also, customers receiving retail stores’ discount offer might spread the words
to friends (i.e. Word-of-mouth) in their social group and might plan to purchase the
goods in the offer promotional period (i.e. Committed to purchase). Therefore, hard
attribute was perceived as positively related to and behavioural action word-of-
mouth. The rejection of these hypothesis testing results seemed to imply two things.
200
First, the hard attributes offered by beauty and healthcare retail stores were not
attractive enough to trigger positive association with customers’ behaviour action.
Second, the hard attributes offer by beauty and healthcare retail stores were not
perceived positively and could only had negative effect on word-of-mouth and
commitment.
The rejected hypotheses H2c and H2d were related to soft attributes. As explained
in Chapter 2, soft attribute was one of the customer loyalty intangible rewards and
it was originally defined in the trade literature as a sense of recognition and
preferential treatment of merchandising service which did not carry economic
value (Barlow, 1996). As soft attribute did not provide direct cost saving value to
customers, it was perceived that the positive impact of soft attribute on customer
purchasing behaviour, word-of-mouth and commitment to purchase would be less
effective than hard attribute but still. The rejection of these hypothesis testing
results seemed to imply two things. First, the soft attributes offered by beauty and
healthcare retail stores were not attractive enough to trigger positive association
with customers’ word-of-mouth, only a significantly negatively word-of-mouth
was affected. Second, the soft attributes offer by beauty and healthcare retail stores
had no effect customers’ long-term commitment to purchase.
201
Hypotheses H3a, H3b, H3c and H3d, regarding visual merchandising, were all
rejected. The visual merchandising construct, which was theorized from
merchandising literature, was concerned with the attractiveness of the visual
merchandise displays that result in grabbing customers attention and altering the
customers’ perception to the beauty and healthcare store (Strategic Direction, 2012;
Virgona, 2012). The result of the rejection of these hypothesis testing results seemed
to imply two things. First, the visual merchandise displays designed by stores were
not attractive enough to trigger strong attention from customers with the motivation
for the purchasing behaviour and the spread of words to friends (Sebastian, 2008;
Rowe, 2014). Second, there were studies identified that visual merchandising would
be able to catch customers’ engagement when the features and benefits of the goods
and services provided by the retail stores were highlighted (Ha & Lennon, 2010).
The other rejected hypotheses namely H4a, H4b, H4c, were related to location. For
cost saving purpose, customers would have preference on goods available in a
nearby store and this might contribute partially to store loyalty (Christaller, 1935).
The result of the rejection of these hypotheses seemed to imply three things. First,
the location of retail stores were not attractive enough to trigger strong attention
202
from customers with the motivation for the purchasing behaviour and the spread
of words to friends (Sebastian, 2008; Rowe, 2014). Second, Hong Kong was a city
with a high population density and most of the people lived in cosmopolitan area where
locations of beauty and healthcare stores might be within acceptable distance. Third,
the transaction cost saving for customers to purchase goods from a nearby stores or to
purchase them from an online stores might not have significant difference. If the stores’
good and services provided sufficient contribution to trigger the culmination of store
loyalty behaviour, then the store locations would not have any significant convenience
for these customers to alter their store loyalty behaviours (Oliver, 1997).
The rejected hypotheses H5a and H5c were related to price sensitivity. The price
sensitivity construct was referring to the resistance or assistance of the customers
in conducting a behaviour after receiving a related reward (Shapiro & Varian, 1998).
These rejected hypotheses might imply that price sensitivity was not related to
customer purchasing behaviours. Therefore, people with different price sensitivity
might need different kinds of rewards to suit their needs.
Hypotheses H6a and H6b regarding communication with customers, were rejected.
The communication with customers construct, originally theorized from the
203
adaptation level theory, was being applied in customer store loyalty behaviour
study to investigate the effect of communication strategies on the customers’
products evaluations (Gotlieb & Sarel, 1991). The communication strategies
included letters, emails, design elements of a store environment, and promotional
marketing displays, etc. These strategies were part of stores’ brand presentation
aiming at influencing the customers’ perception of the stores. The result of these
hypotheses indicated that communication with customers had no influence on
customers’ patronise behaviour and communication with customers might be
dependence on the customers’ prior experience on the stores’ brand. Also, as
aforementioned this study did not identify any association between visual
merchandising displays and store loyalty (Garvey, 2010). Therefore, it was unclear
any way to have communication with customers influence customer purchase
intentions. Store managers should find better way to yield the improvement on
customers’ store loyalties.
The last set of rejected hypotheses H7a, H7b and H7c were related to price image.
The price image was defined as the perceived value of a product (Bell & Lattin,
1998) and the value was not in precise calculation of dollars but it was essential
elements of store satisfaction. These hypothesis results contradicted with the
204
studies by Miranda et al. (2005) as the price image was found interfere with
customers’ behaviour in the selection of products and services. This meant that
customers who like to buy low-priced products might like to shop in stores which
had simple low-cost decoration. As the hypotheses result were not supported, this
implied that customers would buy products disregard the price image and the
identity of stores.
5.3. Integrating the findings from existing literature
5.3.1. Implications of the findings
This paper empirically examined the extent to which loyalty program attributes
explained variations in customers store loyalty behaviours. A two-dimension of
loyalty program attributes were produced to include hard attributes and soft
attributes. Store loyalty was examined in terms of the purchasing behaviours,
word-of-mouth and commitment. The results of this study showed that
emphasising too much on hard and soft attributes to enhance customer loyalty or
satisfaction of the store might not be successful to attract and retain customers.
Retailers of beauty and healthcare products who would like to strengthen their store
brands should also look into the store location as store location was found
significantly associated with price image which was branded with the store image.
205
In addition, retailers should also identify correct communication with customers
attribute as this was found significantly related to the customers’ commitment.
5.3.2. Implications for the researchers
In an increasingly competitive environment, beauty and healthcare retailers seldom
used one influence strategy to guide the preferable behaviours of their customers
(Lal & Matutes, 1994). As both hard attributes and soft attributes had significant
influence on price sensitivity and the direction of influence were both positive,
little was known about what constituted an appropriate reward nor had their effect
on consumers been thoroughly examined. This unknown area should be further
studied.
This study examined the customer loyalty program attributes and the store loyalty
attributes in the beauty and healthcare industries in Hong Kong. Hence, identifying
factors of customers perception on loyalty program and store loyalty, which is a
gap that differentiates this study from past research projects.
5.4. Theoretical implications
206
According to the literature review, prior research had found positive relationship
between hard attributes and behavioural action, word-of-mouth and commitment
respectively. Furthermore, prior study also found a positive relationship between
soft attributes and behavioural action, word-of-mouth and commitment
respectively. However, this research had some findings giving conflicting results.
For instance, this research empirically found that hard attributes were not
significantly associated with behavioural action but soft attributes were. One of the
interpretation of this result could be that the potential buyers might have an
impression that the store/brand has enticed friends into profiting from their
relationship and this higher social costs associated with money offset the hard
attribute (benefit) gained (Jin & Huang, 2014). Therefore, the theoretical
implications of the result is that marketer of the band loyalty have to be aware of
the impression of the “implied” message associated with the hard attributes
delivered when applying hard attributes on customer loyalty program.
In the business world, retailers seldom use only one influence strategy to guide the
preferable behaviour of their customers. They might employ influence strategies
which they consider effective targeting their customers. Therefore, this research
207
could be extended by testing the combined effect of hard attributes and soft
attributes on different segment of customers.
In addition, there were other customer loyalty attributes, such as visual
merchandising and word-of-mouth were found having significant but opposite
direction relationships with store loyalty attributes. Also, price sensitivity was a
moderator with respect to the relationship between soft attribute and word-of-
mouth as there was a significant association identified. Furthermore, other factors
such as satisfaction, trust and many contextual factors could also be used for further
examination. Overall, this study shed light on the effective use of customer loyalty
program attributes in different situations in the beauty and healthcare products
industry in Hong Kong.
5.5. Implications for managerial practice
From practitioners’ point of view, the finding of this research enables retailers to
understand the effective use of hard attributes and soft attributes under different
store loyalty strategies. In the beauty and healthcare products industry, hard
attribute, location and communication with customers are vital and any sudden
changes in the customer rewards, discount offers and communication with
208
customer may lead to negative impact to the customer store loyalty. Therefore,
selecting correct hard attributes and soft attributes to influence the customers is
crucial in order to act quickly to the dynamic change and to market the beauty and
healthcare products to the target segment customers faster than the competitors
(Lieberman, 2005). Failure to manage the customer loyalty programs and store
loyalty relationship properly will inexorably cause detrimental consequences
leading to healthcare products quickly becoming obsolete in the market.
This study was dedicated to investigating the beauty and healthcare products, and
it is assumed that the findings can be applicable to similar contexts. In the beauty
and healthcare products industry, online and offline shopping channels change their
strategies quickly. The retailers are expected to use different customer loyalty
program strategies. The implication of the evidence that hard attributes has more
significant impact than soft attributers on price sensitive customers would be very
important for retailers and brand managers because they are highly interested in
classifying consumers and understanding the way that different market segments
perceive, evaluate, and ultimately purchase their store products.
209
According to the study conducted by Miranda et al. (2005), the price image was
one of the essential elements for the store satisfaction, while the factor would
interfere the customers in selection the store of purchasing and the customer choice
of the products. This study identified that price image was a significant full
mediator on the relationship between location and commitment. In the current
digital age, where the price images are predominant and most powerful, the
knowledge of how to use price images to manage store customers’ perceptions are
important. This will be particular true for the retail store managers and offline or
online retailers who wish to launch, develop, or even rebranding their store
identifies in the luxury beauty and healthcare product markets.
Although the findings of this study are mixed in comparison to prior customer
loyalty program studies in similar research subjects, this study gives profound
implications for store retailers on customer loyalty programs and insightful
practicable implications.
5.6. Limitations
With constraints in this research design, resources and the tight schedule of this
doctorate degree, a few limitations were inevitable. These limitations would be
210
identified in five sections namely: quantitative research method, cross-sectional
research design, data collection method, common method variance, and lack of
generalizability. Therefore, when evaluating the contributions of this research, these
limitations must be examined.
5.6.1. Quantitative research method
. Quantitative methods are known to be less comprehensive than qualitative methods
and are likely to discard any anticipated answers from the research participants
(Burns, 1997). The researcher might have overlooked the concerns that the research
participants have and these might be their subjective’ values, healthcare product
purchasing behaviour pattern as well as belief system. Qualitative methods thus
provided a broader perspective for the researcher to find a deeper context of the
research participants.
5.6.2. Cross-sectional research design
As a cross-sectional research does not explore and collect the change or development
before and after the investigation that is held at a single point of time (Cavana et al.,
2001), the researcher may not be able to investigate and record the changes of the
211
characteristics in the samples and generate observations either as a group or
individually. Thus, this kind of research design limit the researcher to find the cause-
and-effect relationships among the factors.
Owing to the constraints of time and resources, this research was a cross-sectional one.
It was difficult to infer the cause-effect relationships between hard attributes and store
loyalty behaviours as well as the cause-effect relationships between soft attributes and
price sensitivity (Cavana et al., 2001). However, as digital technology are changing the
way we live and work, these customer loyalty program and store loyalty variables are
sporadic in nature and changed over time. Although the research questions should
determine the research design, cross-sectional research incorporating a longitudinal
study could provide a better picture of the observations. Therefore, the researcher
suggests to ride on the result of a cross-sectional study first to establish the correlations
between different variables and undertake a longitudinal study to examine the cause-
and-effect relationship afterwards.
5.6.3. Data collection method
This was the first study aiming to identify a suitable, reliable, and valid model to predict
the relationships among customer loyalty program and store loyalty variables in Hong
212
Kong. This research adopted e-questionnaires to gather data only from the perspective
of beauty and healthcare customers and this might have given rise to a few limitations.
For example, when the respondents had queries about the contents of the questions, it
was hard for them to ask for explanations of the true meaning of the questions.
Furthermore, with such a methodological strategy, it is difficult to rule out respondent
bias interpretations of the findings.
In addition, with snowball sampling, each research participants will recommend others
who are adult and might be interested in taking part in the survey. However, it might
not be possible to determine the sampling error about a population based on the
obtained samples.
5.6.4. Measurement instrument
In this research, price image and price sensitivity were measured using research
participants’ perceptions of uncertainty regarding the external environment. Therefore,
future research can include more dimensional characteristics of uncertainty in the
research to evaluate the relationship more objectively. For example, different types of
beauty product may have different frequency of store visiting needs.
213
5.7. Recommendations for future research
If the sample size can be enlarged, flexible methods can be adopted to measure the
relationships among testable variables and researcher might be able to obtain better
reliable analysis to warrant future research. A mixed method which combines both
quantitative and qualitative methods can elicit a wider and deeper understanding
of the target populations. Also, employing different instrument measurements can
highlight the specific characteristics of the ten constructs adopted in this study.
5.8. Summary and conclusion
This research used a positivist approach and a quantitative research method to
explore the relationship among ten customer loyalty program attributes and store
loyalty attributes. The findings from this research had mixed results and revealed
that hard attributes had more significant impact than soft attributes on price
sensitivity. Price sensitivity was identified as a moderator on the relationship
between soft attribute and word-of-mouth. Also, price image was found having
mediating effect on the relationship between location and commitment. The
research findings have provided the answers to the four research questions
developed in Chapter 2 although the conceptual model and the hypotheses were
only partially supported.
214
In the future research, a better research design can allow the researchers to overcome
the limitations mentioned previously. In conclusion, this research had made a
contribution to the significant theoretical and managerial implications regarding the
relationship between customer loyalty program attributes and store loyalty attributes
and the moderating role and mediating roles played by price sensitivity, price image
and communication with customers in the beauty and healthcare industry in Hong
Kong.
215
REFERENCES Abelmann, N. (1997). Women’s Class Mobility and Identities in South Korea: A
Gendered, Transnational, Narrative approach, Journal of Asian Studies, 56(2), 398-420.
Achrol, R., S. (1991). Evolution of the marketing organization: New forms for dynamic environments,55(October), 77-93.
Afthanorhan, W. (2013). A comparison of partial least square structural equation modeling (PLS-SEM) and covariance based structural equation modeling (CB-SEM) for confirmatory factor analysis. International Journal of Engineering Science and Innovative Technology, 2(5), 198–205.
Agrawal, R., Gaur, S., & Narayanan, A. (2012). Determining customer loyalty: Review and model. The Marketing Review, 12(10).
Ahmad, R. & Buttle, F. (2001).Customer retention: A potentially potent marketing management strategy. Journal of Strategic Marketing, 9, 29-45.
Alba, J. W., Broniarczyk, S.M., Shimp, T.A., & Urbany, J.E., (1994). The Influence of Prior Beliefs, Frequency Cues, and Magnitude Cues on Consumers' Perceptions of Comparative Price Data. Journal of Consumer Research, 21(2), 19-35.
Analysys Mason Research. (2011). Mobile Loyalty Schemes: Much More than a Good Price. Retrieved 29 May 2017 from http://www.analysysmason.com/About-Us/News/Insight/Insight_Mobile_loyalty_Oct2011/
Australian Trade Commission. (2014). Hong Kong Health and Beauty Retail Stores. Retrieved 11 Oct 2016, from https://www.austrade.gov.au/ArticleDocuments/3690/Hong%20Kong%20Health%20and%20
Beauty%20Retail%20Guide%20-%20December%202014_Final.pdf.aspx
Arbuckle, J. L. (2010). IBM SPSS Amos 19 user’s guide. Crawfordville, FL: Amos Development Corporation, 635.
Awang, Z., Ahmad, J. H., & Zin, N. M. (2010). Modelling job satisfaction and work commitment among lecturers: a case of UiTM Kelantan. Journal of Statistical Modeling and Analytics, 1(2), 45–59.
Back, K. (2001). The Effects of Image Congruence on Customer Satisfaction and Brand Loyalty in the Lodging Industry. s.l.: The Pennsylvania State University, U.S..
216
Baltas, G. & Papastathopoulou, P. (2003). Shopper characteristics, product and store choice criteria: a survey in the Greek grocery sector. International Journal of Retail and Distribution Management, 31(10), 498-507.
Barlow, R. (1996). Agencies to consumers: can we relate?. Brandweek, 37(41), 40- 42. Barnes, J.G. (1997). Closeness, Strength, and Satisfaction : Examining the Nature
of Relationships between Providers of Financial Services and Their Retail Customers. Psychology and Marketing,14, 765-790.
Bashford, S. (2011). Brands go back to the shop floor. Marketing, 33-36. Bass, F. M. (1974). The Theory of Stochastic Preference and Brand Switching. Journal of Marketing Research, 11(1), 1-20. Bauer, H., Grether, M. & Leach, M. (2002). Building Customer Relations Over the Internet. Industrial Marketing Management, 31(2), 155-163. Bhattacharya, C. & Sen, S. (2003). Consumer-company identification: a
framework for understanding consumers' relationships with companies. Journal of Marketing, 67(2), 76-88.
Bentler, P. M. (1990). Comparative fit indexes in structural models. Psychological Bulletin, 107(2), 238. Bentler, P. M., & Bonett, D. G. (1980). Significance tests and goodness of fit in the analysis of covariance structures. Psychological Bulletin, 88(3), 588. Bloemer, J. & de Ruyter, K., 1998. On the relationship between store image, store satisfaction and store loyalty. European Journal of Marketing, 32(5),
499-513. Bloemer, J. & Odekerken-Schröder, G., 2002. Store satisfaction and store loyalty
explained by customer- and store-related factors. Journal of Consumer Satisfaction, Dissatisfaction and Complaining Behavior, 15, 68-80.
Bollen, K. A. (1989). A new incremental fit index for general structural equation models. Sociological Methods & Research, 17(3), 303–316. Bolton, R. N. (1998). A Dynamic Model of the Duration of the Customer’s
Relationship with a Continuous Service Provider: The Role of Satisfaction. Marketing Science, 17(1), 45-65.
Boulding, W., Kalra, A., Staelin, R. & Zeithaml, V. A. (1993). A Dynamic Process Model of Service Quality: From Expectations to Behavioral Intentions. Journal of Marketing Research, 30(1), 7-27.
Bowen, J. T. & Chen, S. (2001). The Relationship between Customer Loyalty and Customer Satisfaction. International Journal of Contemporary Hospitality Management, 13(5), 213-217.
217
Braganza, A. et al. (2017). Resource management in big data initiatives: Processes and dynamic capabilities. Journal of Business Research, 70, 328. Bray, C. (2012). Analyst named in IBM-SPSS insider case.(Trent Martin)(Case overview). The Wall Street Journal Eastern Edition, 0(0), C3(1). Brennan, J. (2016). Outlook for e-commerce in Hong Kong, CEO and Consumer
Perspectives. Klynveld Peat Marwick Goerdeler. Retrieved on 5 July 2017 from https://assets.kpmg.com/content/dam/kpmg/cn/pdf/en/2016/11/outlook-for-e-commerce-in-hong-kong.pdf
Bridson, K., Evans, J. & Hickman, M. (2008). Assessing the relationship between loyalty program attributes, store satisfaction and store loyalty. Journal of Retailing and Consumer Services, 15(5), 364-374.
Brown, J. D. (2001). Segmentation correlates for small grocery chain preference. Journal of Food Products Marketing, 6(4), 53-62. Browne, M. W., & Cudeck, R. (1992). Alternative Ways of Assessing Model Fit. Sociological Methods & Research, 21(2), 230–258. Burns, R. B. (1997). Introduction to research methods. Addison Wesley Longman. Byrne, B. M. (2010). Structural equation modeling with AMOS: Basic concepts, applications, and programming. Routledge. Byukkurt, B. K. (1986). Integration of Serially Sampled Information: Modelling
and Some Findings. Journal of Consumer , 13(December 1986), 357–373.
Capizzi, M. T. & Furguson, R., 2005. Loyalty trends for the twenty-first century. Journal of Consumer Marketing, 22(2), 72-80. Carpenter, J. & Fairhurst, A. (2003). An examination of the relationships between
consumer benefits, satisfaction, and loyalty in the purchase of retail store branded products, s.l.: ProQuest Dissertations and Theses.
Cavana, R., Delahaye, B. & Sekaran, U. (2001). Applied Business Research: Qualitative and Quantitative Method. Australia: John Wiley & Sons Australia Ltd.
Cendrowski, S. (2015).The Worst May Be Over for Luxury Goods in China. Fortune. Retrieved 5 January, 2016 from https://fortune.com/2015/12/07/luxury-goods-china-corruption-probe/
Cervellon, M.-C. & Coudriet, R. (2013). Brand social power in luxury retail; Manifestations of brand dominance over clients in the store. International Journal of Retail & Distribution Management, 41(11/12), 869-884.
218
Chan, K., & Cheng, Y. (2012). Portrayal of females in magazine advertisements in Hong Kong. Journal of Asian Pacific Communication,22 (1), 78-96.
Chang, P.-L., & Chieng, M.-H. (2006). Building consumer–brand relationship: A
cross-cultural experiential view. Psychology & Marketing, 23(11), 927–959. https://doi-org.ezproxy.newcastle.edu.au/10.1002/mar.20140 Christaller, W. (1935). Die zentralen Orte in Suddeutschland. Germany: Gustav Fischer.
Coakes, S. J. (2012). SPSS: Analysis Without Anguish: version 20 for Windows/ Sheridan Coakes. Milton, Queensland: John Wiley & Sons Australia. Cohen, J., Cohen, P., A., L. S. & West, S. H. (2003). Applied multiple
regression/correlation analysis for the behavioral sciences. Hillsdale, N.J: L. Erlbaum Associates.
Cox, A. D. & Cox, D. (1990). Competing on Price: The Role on Retail Price in Shaping Store-Price Image. Journal of Retailing, 66(4), 428-445. Cronbach, L. J. (1951). Coefficient alpha and the internal structure of tests. Psychometrika, 16(3), 297-334. Cunningham, R.M. (1961), Customer Loyalty to Store and Brand. Harvard
Business Review. November-December, 127-137. de Wulf, K. & Odekerken-Schroder, G. (2003). Assessing the impact of a retailer’s
relationship efforts on consumers’ attitudes and behavior. Journal of Retailing and Consumer Services, 10(2), 95-108.
Deloitte Touche Tohmatsu Limited (“DTTL”). (2017). Shades for success | Influence in the beauty market. Deloitte Touche Tohmatsu Limited. Deloitte Touche Tohmatsu Limited. Retrieved on 20 August 2018 from https://www2.deloitte.com/content/dam/Deloitte/cn/Documents/international-business-support/deloitte-cn-ibs-france-beauty-market-en-2017.pdf
Demoulin, N. T. M. & Zidda, P. (2008). On the impact of loyalty cards on store loyalty: Does the customers’ satisfaction with the reward scheme matter?. Journal of Retailing and Consumer Services, 15(5), 386-398.
Demoulin, N. T. M. & Zidda, P. (2009). Drivers of Customers’ Adoption and Adoption Timing of a New Loyalty Card in the Grocery Retail Market. Journal of Retailing, 85(3), 391-405.
Desai, K. K. & Talukdar, D. (2003). Relationship between product groups' price perceptions, shopper's basket size, and grocery store's overall store price image. Psychology & Marketing, 20(10), 903-933.
219
Dick, A. S. & Basu, K. (1994). Customer loyalty: Toward an integrated conceptual framework. Journal of the academy of marketing science, 22(2), 99-113. Dicolo, J. A. (2009). IBM to acquire SPSS, adding to acquisitions. (Company overview). The Wall Street Journal Eastern Edition, 0(0), B6(1). Dowling, G. R. & Uncles, M. (1997). Do customer loyalty programmes really
work?. Sloan Management Review, 20(4), 71-82. Dunkovic, D., & Petkovic, G. (2015). Loyalty Programs in Grocery Retailing: Do
Customers Provoke a Tiered Rewarding System? Poslovna Izvrsnost/Business Excellence, 9(1), 9–26.
Fan, R. (2016). Striving for Perfection. Varsity. School of Journalism and Communication at the Chinese University of Hong Kong. Retrieved on 4 Aug 2017 from
http://varsity.com.cuhk.edu.hk/index.php/2016/11/male-body-image/ Flavian, C., Guinaliu, M. & Gurrea, R. (2006). The Role Played by Perceived
Usability, Satisfaction and Consumer Trust on Website Loyalty. Information and Management, 43(1), 1-14.
Fornell, C. et al. (1996). The American customer satisfaction index: Nature, purpose and findings. Journal of Marketing, 60(4), 7-18.
Foster, B. D. & Cadogan, J. W. (2000). Relationship selling and customer loyalty: an empirical investigation. Marketing Intelligence & Planning, 18(4), 185-199.
Fournier, S. & Yao J.L. (1997). Reviving Brand Loyalty: A Reconceptualization within the Framework of Consumer-Brand Relationships. International Journal of Research in Marketing,14. 451-72.
Fu, J. S. (2016). Leveraging Social Network Analysis for Research on Journalism in the Information Age. Journal of Communication, 66(2), 299-313.
Gao, F. & Su, X. (2016). Omnichannel Retail Operations with Buy-Online-and-Pick-up-in-Store. Management Science. 63. 10.1287/mnsc.2016.2473.
Gao, H., Zhang, Y., & Mittal, V. (2017). How Does Local-Global Identity Affect Price Sensitivity? Journal of Marketing, 81(3), 62–79. https://doi-org.ezproxy.newcastle.edu.au/10.1509/jm.15.0206
Gephart, R. (1999). Paradigms and Research Methods. Research Methods Forum, 4 (Summer). Retrieved 28 Oct 2016 from
http://division.aomonline.org/rm/1999_RMD_Forum_Paradigms_and_Research_Methods.htm
Gonzalez-Rodriguez, G., Colubi, A. & Gil, M. A. (2012). Fuzzy data treated as
220
functional data: A one-way ANOVA test approach. Computational Statistics and Data Analysis, 56(4), 943-1013.
Goodman, L., 1961. Snowball sampling. Annals of Mathematical Statistics, 32(1), 148-170. Gotlieb, J.B. & Sarel, D. (1991). Comparative advertising effectiveness: The role
of involvement and source credibility. Journal of Advertising 20(1), 38–45.
Gounaris, S. & Stathakopoulos, V. (2004). Antecedents and consequences of brand loyalty: An empirical study. Henry Stewart Publications 1479-1803 Brand Management, 11(4), 283-306.
Grewal, D. & Marmorstein, H. (1994) Market Price Variation, Perceived Price Variation and Consumers’ Price Search Decisions for Durable Goods. Journal of Consumer Research, 21, 452-460.
Grimm, L. G. (1993). Statistical Applications for the Behavioural Sciences. s.l.: John Wiley & Sons, Inc.
Gronroos, C., (1995). From marketing mix to relationship marketing: towards a paradigm shift in Marketing. Management Decision, 32(2), 4-20. Hair Jr, J. F., Black, W. C., Babin, B. J., & Anderson, R. E. (2006). Multivariate
data analysis (6th ed). Upper Saddle, NJ: Pearson Prentice Hall. Han, J., Fang, M., Ye, S. L., Chen, C.S., Wan, Q., & Qian, X. Y. (2019). Using
Decision Tree to Predict Response Rates of Consumer Satisfaction, Attitude, and Loyalty Surveys. Sustainability, (8), 2306.
Harris, E. (2000). Recognize, reward, reap the benefits. Sales and Marketing Management, 152(9), 109-119. Ha, Y. & Lennon, S. J. (2010). Online visual merchandising (VMD) cues and
consumer pleasure and arousal: Purchasing versus browsing situation. Psychology and Marketing, 27(2), 141-165.
Hennig-Thurau, T. & Klee, A. (1997). The Impact of Customer Satisfaction and Relationship Quality on Customer Retention: A Critical Reassessment and Model Development. Psychology and Marketing,14(8), 737-764.
Hoch, S. J., Bradlow, E. T. & Wansink, B. (1999). The variety of an assortment. Marketing Science, 18(4), 527-546. Hong Kong Business. (2018). The changing face of Hong Kong's retail. Hongkongbusiness.com. Retrieved on 18 Jan 2018 from
https://hongkongbusiness.hk/retail/in-focus/changing-face-hong-kongs-retail
Hong Kong Census and Statistic Department (2014). The Profile of Hong Kong
221
Population Analysed by District Council District. Hong Kong Census and Statistics Department. Retrieved on 28 Oct 2016 from http://www.censtatd.gov.hk/hkstat/sub/so20.jsp
Hong Kong Census and Statistics Department. (2018). Hong Kong Monthly Digest of Statistics, Featured Article on Trade between Hong Kong and the Mainland of China. Hong Kong Census and Statistics Department. Retrieved on 1 Jul 2018 from
https://www.censtatd.gov.hk/hkstat/sub/sp230.jsp?productCode=FA100252
Hong Kong General Chamber of Commerce (HKGCC). (2017). Businesses Optimistic about Prospects for 2018. Hong Kong General Chamber of Commerce. Retrieved on 15 Jan 2018 from https://www.chamber.org.hk/en/media/press-releases_detail.aspx?ID=3599
Hong Kong Tourism Board (2017). Plan Your Trip. Retrieved on 17 Feb 2017 from http://www.discoverhongkong.com/eng/plan-your-trip/index.jsp Hong Kong Trade Development Council (HKTDC). (2018). Cosmetics and
Toiletries Industry in Hong Kong. Hong Kong Trade Development Council. Retrieved on 15 Sept 2018 from
http://hong-kong-economy-research.hktdc.com/business-news/article/Hong-Kong-Industry-Profiles/Cosmetics-and-Toiletries-Industry-in-Hong-Kong/hkip/en/1/1X000000/1X006S6I.htm
Hong Kong Trade Development Council (HKTDC). (2017). Men’s Most-Purchased Cosmetics Brands: Mainland and European. Hong Kong Trade Development Council. Retrieved on 12 Feb 2018 from
https://hkmb.hktdc.com/en/1X0A5R0R/hktdc-research/Cosmetics-Products-in-China-Characteristics-of-Male-Consumers
Hoyer, W. D. (1984). An Examination of Consumer Decision Making for a Common Repeat Purchase Product. Journal of Consumer Research, 11(3), 822-829.
Hunt, S. D. (2002). Foundations of Marketing Theory: Toward a General Theory of Marketing. Armonk, NY: Sharpe.
Hys, K. k. hys@po. opole. p. (2018). Healthcare products and food supplements in Poland - a comparison. MATEC Web of Conferences, 183, 1–6. https://doi-org.ezproxy.newcastle.edu.au/10.1051/matecconf/201818301006
222
IBM Knowledge Center. (2015). Knowledge Center Variable Names. Retrieved on 18 May 2017 from
https://www.ibm.com/support/knowledgecenter/en/SSLVMB_23.0.0/spss/base/syn_variables_variable_names.html
International Trade Administration. U.S. Department of Commerce. (2016). Asia Personal Care & Cosmetics Market Guide. Retrieved on Jan 2017 from
https://www.trade.gov/industry/materials/AsiaCosmeticsMarketGuide.pdf
International Trade Administration (2016). Personal Care & Cosmetics Products Country Guide: Hong Kong, U.S. The International Trade Administration, Department of Commerce, US. Retrieved on 8 Jan 2017 from
https://build.export.gov/build/idcplg?IdcService=DOWNLOAD_PUBLIC_FILE&RevisionSelectionMethod=Latest&dDocName=eg_us_ca_107855
Izogo, E. E. (2015). Determinants of attitudinal loyalty in Nigerian telecom service sector: Does commitment play a mediating role? Journal of Retailing and Consumer Services, 23, 107–117.
Jacoby, J. (1971). A Brand Loyalty Concept: Comments on a Comment. Journal of Marketing Research, 12, 484-487
Jacoby, J. & Chestnut, R. (1978). Brand Loyalty Measurement and Management. New York: Wiley.
Jacoby. J, & Olson, J. C. (1971), A Construct Validation Study of Brand Loyalty, Proceedings 79th American Psychological Association Convention. 657-680.
Jin, L. & Huang, Y.H. (2014). When giving money does not work: The differential effects of monetary versus in-kind rewards in referral reward programs. International Journal of Research in Marketing, 31(1). 107-116
Johnson, K. (1999). Making loyalty programs more rewarding. Direct Marketing, 61(11), 24-27. Johnson, P. & Harris, D. (2002). Qualitative and Quantitative Issue in Research Design. In: Essential Skills for management Research. London: SAGE. Jöreskog, K. G., & Sörbom, D. (1985). LISREL VI: Analysis of Linear Structural
Relationships by Maximum Likelihood, Instrumental Variables, and Least Squares Methods. Mooresville, Ind. : Scientific Software, Inc.,
223
Kaur, H. & Soch, H. (2013). Mediating roles of commitment and corporate image in the formation of customer loyalty. Journal of Indian Business Research, 5(1), 33-51.
Keh, H. T. & Lee, Y. H. (2006). Do Reward Programs Build Loyalty for Services? The Moderating Effect of Satisfaction on Type and Timing of Rewards.
Journal of Retailing, 82(2), 127-136. Kemp, A., Green, B. L., Hovanitz, C. & Rawlings, E. I. (1995). Incidence and
correlates of posttraumatic stress disorder in battered women: Shelter and community samples. Journal of Interpersonal Violence, 10, 43-55.
Kim, H. Y., Ji, Y., Lee, C. D., Wu, J., Kim, K. P. & Johnson, K. (2013). Perceived benefits of retail loyalty programs: Their effects on program loyalty and customer loyalty. Journal of Relationship Marketing, 12(2), 95-113.
Kim, E. & Park, M. C. & Lee, J. (2017). Determinants of the Intention to Use Buy-Online, Pickup In-Store (BOPS): The Moderating Effects of Situational Factors and Product Type. Telematics and Informatics. 34. 10.1016/j.tele.2017.08.006.
King, C. W. & Ring, L. J. (1980). Market positioning across retail fashion institutions: a comparative analysis of store types. Journal of Retailing, 56(1), 37-55.
Kline, R. B. (2011). Principles and practices of structural equation modeling (3rd ed.). London: Guilford Press. Kuan-Yin, L., Hsu, Y.-C., Mei-Hui, C. & Hui-Ling, H. (2010). How Collaborative
Communication to Promote the Satisfaction and Loyalty of Franchisees: Exploring the Moderating Effect of Net Profit. Asia Pacific Management Review, 15(4).
Lacey, R. & Sneath, J. Z. (2006). Mediating roles of commitment and corporate image in the formation of customer loyalty. Journal of Indian Business Research, 5(1), 33-51.
Lal, R., & Matutes, C. (1994). Retail Pricing and Advertising Strategies. The Journal of Business, 67(3), 345-370. Retrieved from http://www.jstor.org/stable/2353132
Lalos, M. & Cestre, G. (2009). The Consequences of Retailer Vs. Media Communication About the Use of Intrusive Marketing Practices on
Customer Attitudes, Satisfaction, Trust and Loyalty. Advances in Consumer Research, 36, 968.
224
Law, D., Wong, C. & Yip, J. (2012). How does visual merchandising affect consumer affective response?; An intimate apparel experience. European Journal of Marketing, 46(1/2), 112-133.
Lemon, K. & Lemon, N. (1999). A Dynamic Model of Customers’ Usage of Services: Usage as an Antecedent and Consequence of Satisfaction. Journal of Marketing Research, 36(3), 171-186.
Leong, K. W. (2013). The impact of customer loyalty programs and mediating factors on store loyalty in the supermarket industry. , s.l.: Doctor of Business Administration dissertation paper, University of Newcastle.
Levesque, R. (2007). SPSS Programming and Data Management: A Guide for SPSS and SAS Users. (4th ed). Chicago Ill: SPSS Inc.
Levin, D. M. (1988). The opening of vision: Nihilism and the postmodern situation. London: Routledge.
Lieberman, M. B. (2005). Did first-mover advantage survive the dot-com crash. Unpublished working paper, UCLA. Likert, R., 1932. A Technique for the Measurement of Attitudes, 140, Archives of Psychology, 140, 1-15. Likert, R., 1961. New Patterns of Management. New York: McGraw-Hill. Lincoln, Y. S. & Guba, E. G. (2000). Paradigmatic Controversies, Contradictions,
and Emerging Confluences. In: N. K. Denzin & Y. S. Lincoln, eds. Handbook of
Qualitative Research. (2nd ed) s.l.: Sage, 163-188. Loker-Murphy, L. (1996). Backpackers in Australia: A motivation-based
segmentation study. Journal of Travel & Tourism Marketing, 5(4), 23-45. Losch, A. (1954). The Economics of Location. New Haven: Yale University Press. Lumpkin, J. R. & McConkey, C. W. (1984). Identifying determinants of store
choice of fashion shoppers. Akron Business and Economic Review, 15(4), 36-55.
MacKenzie, S. B., & Podsakoff, P. M. (2012). Common Method Bias in Marketing: Causes, Mechanisms, and Procedural Remedies. Journal of Retailing,
88(4), 542-555. MacKinnon, D. P. (2008). Introduction to Statistical Mediation Analysis. New York: Erlbaum. Mannings, (2015). Mannings Registered Pharmacist – Your professional health
guardian!. Retrieved on 17 Feb 2017 from http://www.mannings.com.hk/index.aspx?page=SERVICES&lang=EN
225
Marketing Science Institute (2017). Price Image Is Not Just about Pricing. Retrieved on 17 Feb 2017 from http://www.msi.org/articles/price-image-is-not-just-about-
pricing/ Marsh, H. W., & Hocevar, D. (1985). Application of confirmatory factor analysis
to the study of self-concept: First-and higher order factor models and their invariance across groups. Psychological Bulletin, 97(3), 562.
McGoldrick, P. J. & Ho, S. L. (1992). International positioning: Japanese department stores in Hong Kong. European Journal of Marketing, 26(8/9), 61-73.
McIlroy, A. & Barnett, S. (2000). Building customer relationships: do discount cards work?. Managing Service Quality, 10(6), 347-355.
Meyer-Waarden, L. (2004). La fidelisation client: strategies, pratiques etefficacite des outils du marketing relationnel [Customer Loyalty: Strategies, Practice and Efficiency of Customer Loyalty Programs]. Paris: VuibertEds.
Meyer-Waarden, L. & Benavent, C. (2008). Grocery retail loyalty program effects: Self-selection or purchase behavior change?. Journal of the Academy of Marketing Science, 37(3), 345-358.
Miranda, M. J., Konya, L. & Havrila, I. (2005). Shoppers' satisfaction levels are not the only key to store loyalty. Marketing Intelligence and Planning, 23(2), 220-232.
Mitchell, P. H. (2008). Discovery-Based Retail. s.l.: Bascom Hill Publishing Group. Morgan, D. L. (2008). The SAGE Encyclopedia of Qualitative Research Methods.
s.l.: SAGE Publications, Inc. Morgan, R. M. & Hunt, S. D. (1994). The Commitment-Trust Theory of
Relationship Marketing. Journal of Marketing, 58(3), 20-38. Morgan, T. (2010). Window display: new visual merchandising. London: Laurence King. Narasimham, R. (1984). A price discrimination theory of coupons. Marketing
Science,3(2), 128-147. Nardi, P. M. (2013). Doing Survey Research: A Guide to Quantitative Methods (3rd ed). Boulder; London: Paradigm Publishers. Nielsen. (2017). Hong Kong Female Consumers Spend Over Hk$4,000 On
Skincare And Cosmetic Products. Nielsen.com. Retrieved on 5 Sep 2017 from https://www.nielsen.com/hk/en/insights/news/2017/hong-
226
kong-female-consumers-spend-over-4000-on-skincare-and-cosmetic-products.html
Neuman, W. L. (1997). Social Research Methods - Qualitative and Quantitative Approaches. Boston: Allyn & Bacon. Nguyen, T., Mia, L., Winata, L. & Chong, V. (2017). Effect of transformational-
leadership style and management control system on managerial performance. Journal of Business Research, 70, 202.
O’Malley, L. (1998). Can loyalty schemes really build loyalty?. Marketing Intelligence & Planning, 16(1), 47-55. O’Malley, L. & Tynan, C. (2000). Relationship marketing in consumer markets: rhetoric or reality. European Journal of Marketing, 34(7), 797-815. Odekerken-Schroder, G., De Wulf, K. & Schumacher, P. (2003). Strengthening
outcomes of retailer-consumer relationships, the dual impact of relationship marketing tactics and consumer personality. Journal of Business Research, 56, 177-190.
Oliaee, Z., Jabbari, A. & Ehsanpour, S. (2016). An investigation on the quality of midwifery services from the viewpoint of the clients in Isfahan through SERVQUAL model. Iranian journal of nursing and midwifery research, 21(3), 291-296.
Oliver, R. L., 1997. Satisfaction: A Behavioral Perspective on the Consumer. Boston: McGraw-Hill.
Oliver, R. L. (1999). Whence consumer loyalty?. Journal of Marketing, 63(5), 33-45.
Ou, W. M., Shih, C. M., Chen, C. Y. & Wang, K. C. (2011). Relationships among customer loyalty programs, service quality, relationship quality and loyalty. Chinese Management Studies, 5(2), 194-206.
Pallant, J. (2013). SPSS Survival Manual (5th ed). Berkshire, England: Open University Press McGraw‐Hill Education. Paulins, V. A. & Geistfeld, L. V. (2003). The effect of consumer perceptions of
store attributes on apparel store preference. Journal of Fashion Marketing and Management, 7(4), 371-385.
Pearson, M. (2007). Book Review: E. Huizingh Applied Statistics with SPSS. London: Sage.
Philippus Brink, M. & van Rensburg, A. (2017). An approach to improving marketing campaign effectiveness and customer experience using geospatial analytics. South African Journal of Industrial Engineering.
Podsakoff, P.M., MacKenzie, S.B., Lee, J.Y., and Podsakoff, N.P. (2003). Common
227
method biases in behavioral research: a critical review of the literature and recommended remedies. Journal of Applied Psychology, 88(5).
Praharsi, Y., Wee, H.-M., Sukwadi, R., & Padilan, M. V. (2014). Small-independent retailers vs. organized retailers: An empirical study in Indonesian economics of service industries. Journal of Retailing and Consumer Services, 21(2), 108–117.
PWCHK. (2017). New Entrants, New Health Economy" Survey Findings. PricewaterhouseCoopers Hong Kong. Retrieved on 5 May 2018 from
https://www.pwchk.com/en/healthcare/publications/healthcare-new-entrants-new-health-economy-en.pdf
Quester, P. & Lim, L. A. (2003). Product involvement/brand loyalty: Is there a link?. The journal of Product and Brand Management, 12(1), 22-38. Ratner, B. (2013). The Correlation Coefficient: Definition. Retrieved on 27 Nov
2013 from http://www.dmstat1.com/res/TheCorrelationCoefficientDefined.html
Reichheld, F. & Teal, T. (1996). The Loyalty Effect, the Hidden Force behind Growth, Profits and Lasting Value. Boston, MA: Harvard Business School Press.
Resnick, S. M., Cheng, R., Simpson, M. & Lourenço, F. (2016). Marketing in SMEs: a "4Ps" self-branding model. International Journal of Entrepreneurial Behaviour & Research, 22(1), 155-174.
Roehm, M. L., Pullins, E. B., Jr., R. & A., H. (2002). Designing loyalty building programs for packaged goods brands. Journal of Marketing Research,
39(2), 202-213. Rowe, J. (2014). Visual merchandising: The image of selling. Visual Studies, 29(1), 122. Rundle-Thiele, S. (2005). Loyalty: An Empirical Exploration of Theoretical
Structure in Two Service Markets. Australia: University of South Australia.
Sa Sa International Holdings Limited. (2016). Interim Results FY15/16. Retrieved on 12 Oct 2016 from http://www.todayir.com/webcasting/sasa_15ir/ppt.pdf
Šapić, S., Kocić, M., & Radaković, K. (2018). The Effect of a Product’s Country of Origin on the Customer Loyalty Creation Process. TEME: Casopis Za Društvene Nauke, 12(4), 1297–1317.
South China Morning Post. (2018). Hong Kong visitor numbers continue to rise, with 5 million tourists in March. Retrieved on 15 Apr 2018 from
228
http://www.scmp.com/news/hong-kong/hong-kong-economy/article/2144090/hong-kong-visitor-numbers-continue-rise-5-million
Shapiro, C. & Varian, H. (1998). Information Rules: A Strategic Guide to the Network Economy. Cambridge, MA: Harvard Business School Press.
Sharp, B. & Sharp, A. (1997). Loyalty programs and their impact on repeat-purchase loyalty patterns. International Journal of Research in Marketing, 14(5), 473-486.
Shugan, S. M. (2005). Brand Loyalty Programs: Are They Shams?. Marketing Science, 24(2), 185-194. Singh, J. & Sirdeshmukh, D. (2000). Agency and Trust Mechanisms in Consumer
Satisfaction and Loyalty Judgment. Journal of Academy of Marketing Science, 28(1), 150-168.
Strategic Direction (2012). Visual merchandising strategies; Stimulating a positive affective response from consumers. Strategic Direction, 28(10), 12-14. Survey Monkey (2016). Privacy Policy. Retrieved on 2Nov 2016 from http://www.surveymonkey.com/mp/policy/privacy-policy/ Székely, G. J., Rizzo, M. L. & Bakirov, N. K. (2007). Measuring and testing independence by correlation of distances. Annals of Statistics, 35(6),
2769–2794. Tanaka, J. S., & Huba, G. J. (1985). A fit index for covariance structure models
under arbitrary GLS estimation. British Journal of Mathematical and Statistical Psychology, 38(2), 197–201.
Tantarpale, V. T. & Gracy, R. A. (2012). Hemoglobin status observed in women of Amravati India by using Anova test. Bioscience Discovery, 3(1), 67. The Columbia Electronic Encyclopedia (2013). Beauty products. Retrieved on 17
Feb 2017 from http://encyclopedia2.thefreedictionary.com/Beauty+products
Thyne, M., Davies, S. & Nash, R. (2004). A lifestyle segmentation analysis of the backpacker market in Scotland: A case study of the Scottish Youth Hostel Association. Journal of Quality Assurance in Hospitality & Tourism, 5(2-4), 95.
Trading Economics (2016). Hong Kong Retailer Sales YOY. Retrieved on 12 Oct 2016 from http://www.tradingeconomics.com/hong-kong/retail-sales-
annual Trigoni, M. (2016). Visual research methodologies, branding and magazine
229
readerships. Journal of Fashion Marketing and Management, 20(3), 339-366.
Tsai, W.-H., Yang, C.-H., Chang, J.-C. & Lee, H.-L. (2016). An Activity-Based Costing decision model for life cycle assessment in green building projects. European Journal of Operational Research, 238(2), p. 607.
van Herpen, E. & Pieters, R. (2002). Research note: the variety of an assortment: an extension to the attribute-based approach. Marketing Science, 21(3), 331-341.
Viola, D. et al. (2013). Overweight and obesity: Can we reconcile evidence about supermarkets and fast food retailers for public health policy?. Journal of Public Health Policy, 34, 424-438.
Virgona, H. (2012). Improve Your Merchandising Strategy. Food Management, 47(11), 24.
Walters, D. & Knee, D. (1989). Competitive strategies in retailing. Long Range Planning, 22(6), 74-84. Weaver, B. & Dubois, S. (2012). SPSS macros to compare any two fitted values
from a regression model. Behavior Research Methods, 44(4), 1175-1190.
Wheaton, B., Muthen, B., Alwin, D. F., & Summers, G. F. (1977). Assessing reliability and stability in panel models. Sociological Methodology, 8,
84–136. White, S. S. & Schneider, B., 200. Climbing the Commitment Ladder The Role of Expectations Disconfirmation on Customers’ Behavioral Intentions.
Journal of Services Research, 2(3), 240-253. Wikipedia. (2018). List of countries and dependencies by population density.
Retrieved on 15 May 2018 from https://en.wikipedia.org/wiki/List_of_countries_and_dependencies_by_population_density
Wirtz, J. & Chew, P. (2002). The effects of incentives, deal proneness, satisfaction and tie strength on word-of-mouth behavior. International Journal of Service Industry Management, 13(2), 141-162.
Wuensch, K. (2009). What is a Likert Scale/and How do you pronounce “Likert”?, s.l.: East Carolina University. Wu, J. et al. (2013). Fashion product display; An experiment with Mockshop
investigating colour, visual texture, and style coordination. International Journal of Retail & Distribution Management, 41(10), 765-789.
230
Yi, Y. & Jeon, H. (2003). Effects of Loyalty Programs on Value Perception, Program Loyalty, and Brand Loyalty. Journal of the Academy of Marketing Science, 31(3), 229-240.
Zboja, J. J. & Voorhees, C. M. (2006). The impact of brand trust and satisfaction on retailer repurchase intentions. Journal of Services Marketing, 20(5), 381-390.
Zeidler, C. (2009). Mobile Support in Customer Loyalty Management: An Architectural Framework (1st ed). Gabler, Wiesbaden, German.
231
Appendix 3-01 Invitation Letter (English)
Hi,
I am writing to invite you to participate in an anonymous, voluntary and brief online
questionnaire conducted by Mr. Mohammed Sardaran KHAN, a research student from the
Faculty of Business and Law at the University of Newcastle.
The purpose of the questionnaire is to examine the Mechanism Between Customer Loyalty
Programs and Store Loyalty of Beauty and Health retailers in Hong Kong.
We would greatly appreciate your help with this. The questionnaire will take no more than
10 minutes to complete and is approved by the University’s Human Research Ethics
Committee (H-2017-0180). The questionnaire is available here:
[The link to the questionnaire will be placed right here.]
Your help with this will be very much appreciated: our aim is to inform marketers on factors
affecting customer loyalty so that they could make a better decision on loyalty projects.
If you would like further information, please contact the Chief Investigator, Dr Stacey
BAXTER, on [email protected], or +61 (4) 4921 6279.
Many thanks,
Mr Mohammed Sardaran KHAN
Research Student of University of Newcastle
Tel: +852 6419 1922
Email: [email protected]
232
Appendix 3-02 Invitation Letter (Traditional Chinese)
你好,
我想邀請你參加一個匿名的,自願的,簡短的網上調查問卷,由紐卡斯爾大學商業與法律學
院的 Mohammed Sardaran KHAN 先生發起。
調查問卷的目的是在香港美容保健零售業內,研究客戶忠誠度計畫和商店忠誠度之間的機制。
我們將非常感謝您的幫助。完成問卷的時間將不會超過 10 分鐘,該問卷已獲得大學人類研
究倫理委員會的許可(h-2017-0180)。
調查問卷可在這裡找到: [調查問卷的鏈接將放在這裏。]
我們將非常感謝您的幫助:我們的目標是告知行銷人員影響顧客忠誠度的因素,從而使他們
能在忠誠度專案中做出更好的決定。
如果您需要進一步的資訊,請與首席調查員聯繫 , Dr Stacey BAXTER,聯繫方式:
[email protected],或 +61 (4) 4921 6279.
萬分感謝,
Mohammed Sardaran KHAN 先生
紐卡斯爾大學研究生
電話: +852 6419 1922
電子郵箱: [email protected]
233
Appendix 3-03 Information Statement (English)
234
235
Appendix 3-04 Information Statement (Traditional Chinese)
236
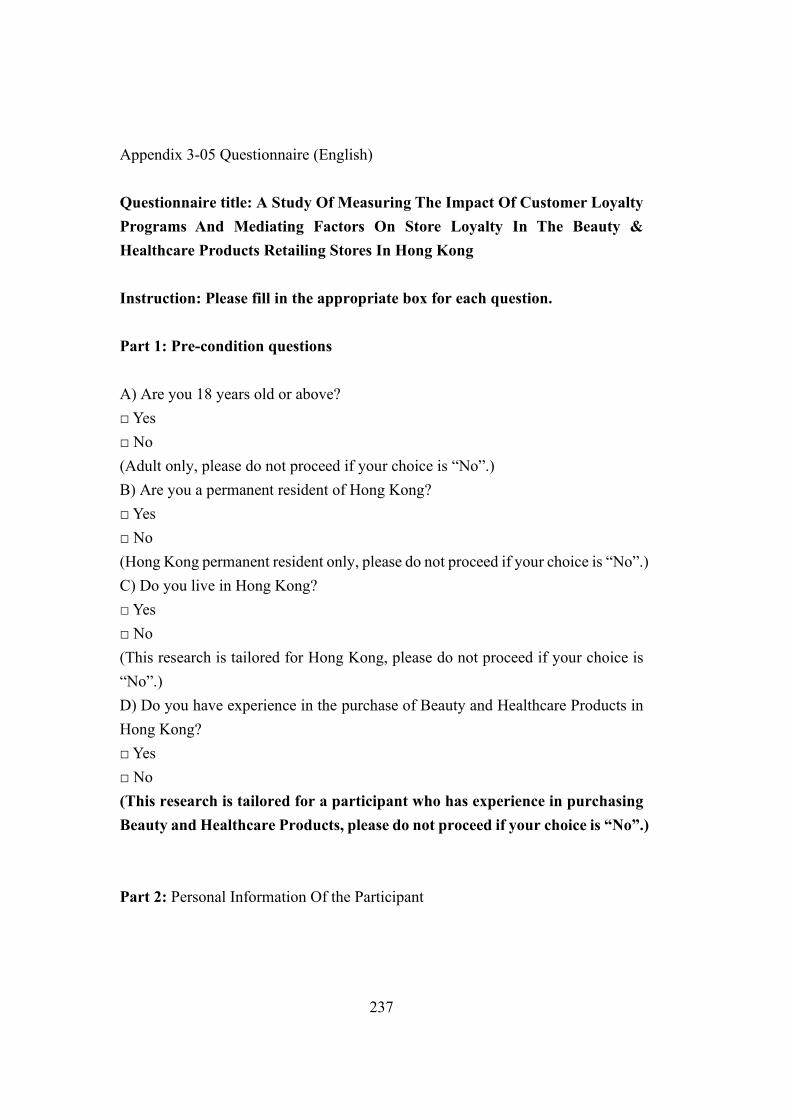
237
Appendix 3-05 Questionnaire (English)
Questionnaire title: A Study Of Measuring The Impact Of Customer Loyalty Programs And Mediating Factors On Store Loyalty In The Beauty & Healthcare Products Retailing Stores In Hong Kong Instruction: Please fill in the appropriate box for each question. Part 1: Pre-condition questions A) Are you 18 years old or above? □ Yes □ No (Adult only, please do not proceed if your choice is “No”.) B) Are you a permanent resident of Hong Kong? □ Yes □ No (Hong Kong permanent resident only, please do not proceed if your choice is “No”.) C) Do you live in Hong Kong? □ Yes □ No (This research is tailored for Hong Kong, please do not proceed if your choice is “No”.) D) Do you have experience in the purchase of Beauty and Healthcare Products in Hong Kong? □ Yes □ No (This research is tailored for a participant who has experience in purchasing Beauty and Healthcare Products, please do not proceed if your choice is “No”.) Part 2: Personal Information Of the Participant
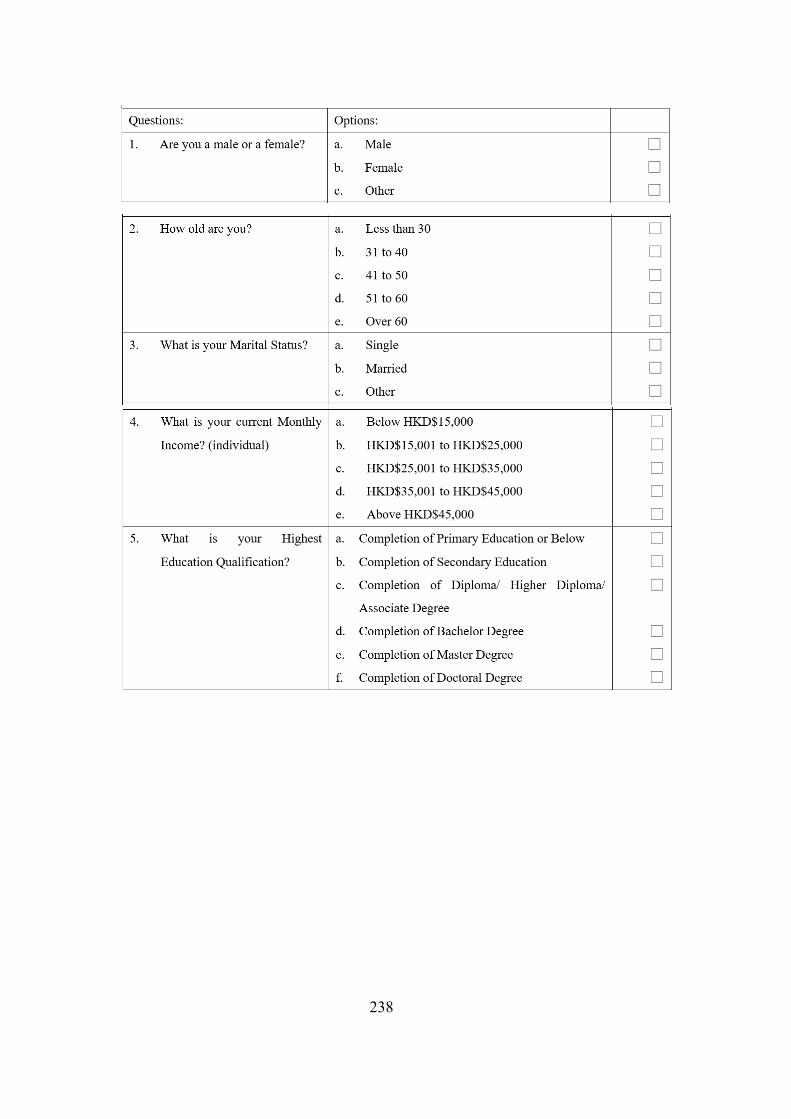
238
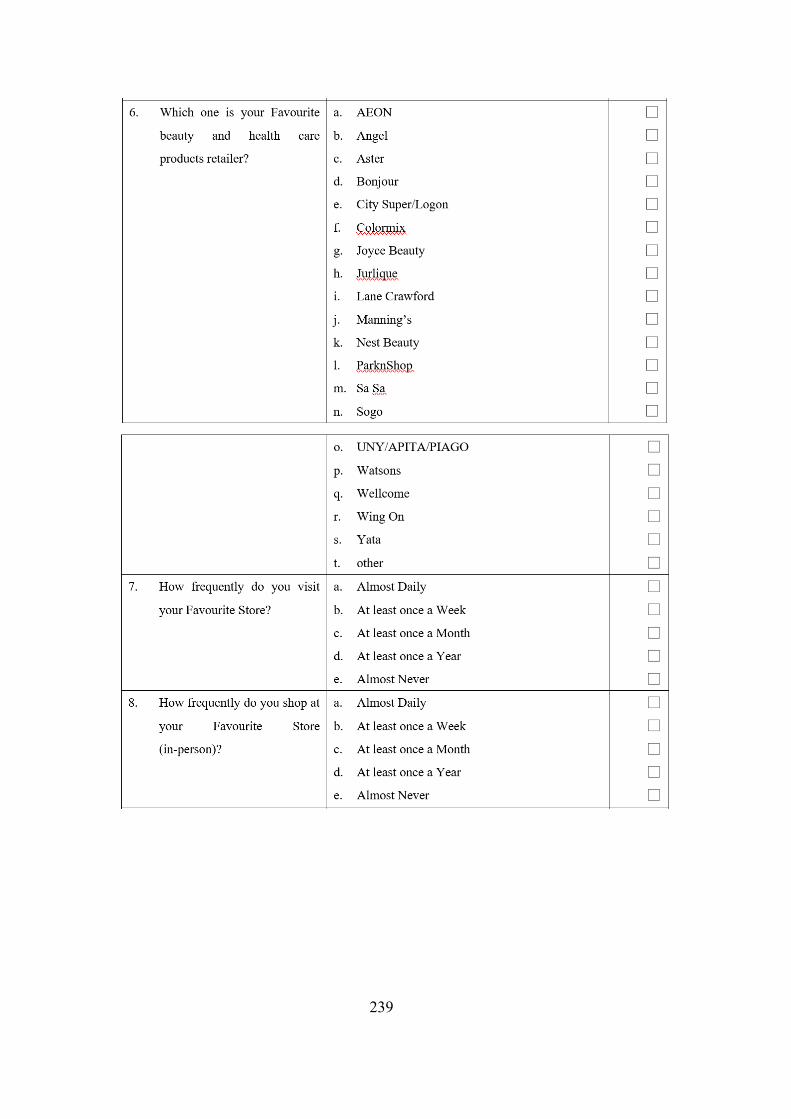
239
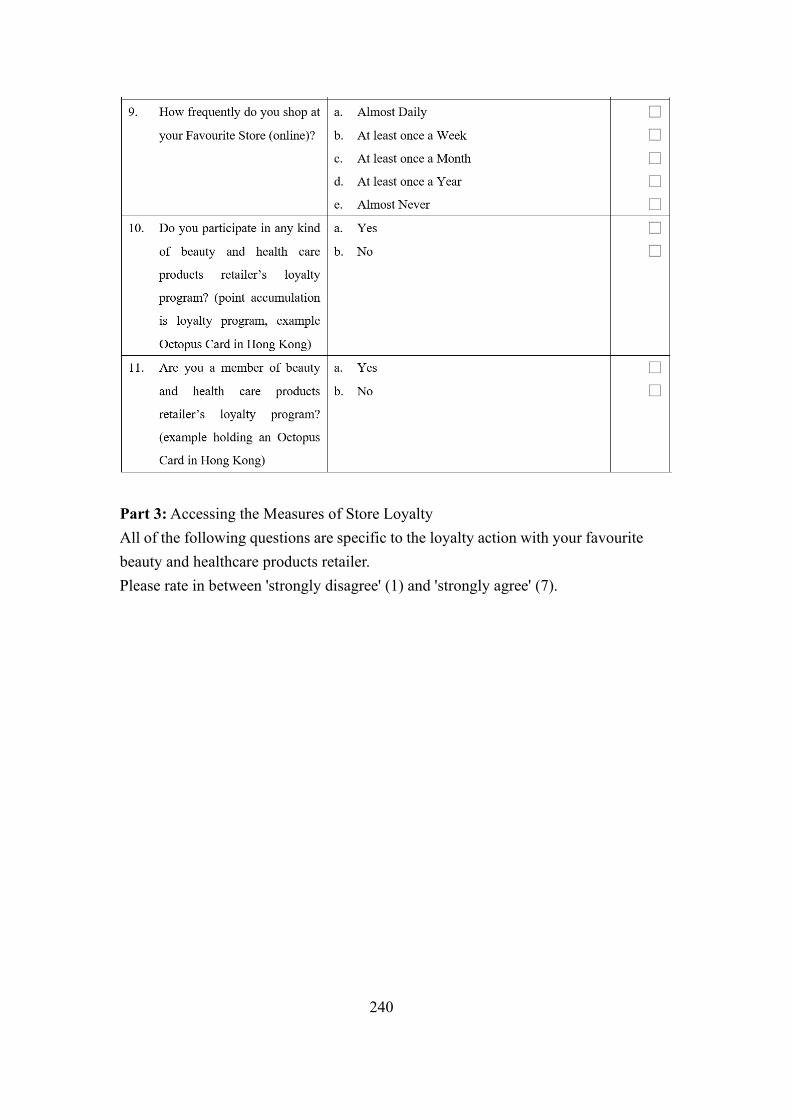
240
Part 3: Accessing the Measures of Store Loyalty All of the following questions are specific to the loyalty action with your favourite beauty and healthcare products retailer. Please rate in between 'strongly disagree' (1) and 'strongly agree' (7).
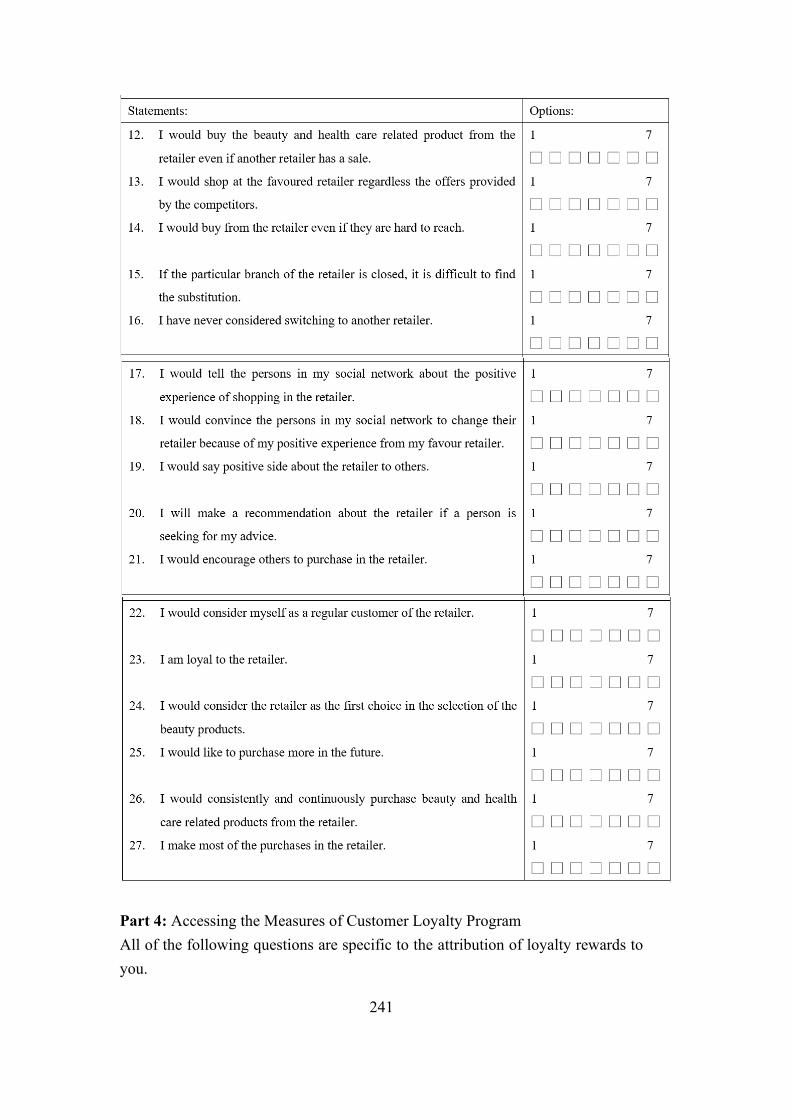
241
Part 4: Accessing the Measures of Customer Loyalty Program All of the following questions are specific to the attribution of loyalty rewards to you.

242
How important are the following rewards to you? Please rate between 'not at all important' (1) to 'extremely important' (7).
Part 5: Accessing the Measures of Price Sensitivity All of the following questions are specific to price sensitivity. Please rate in between 'strongly disagree' (1) and 'strongly agree' (7).
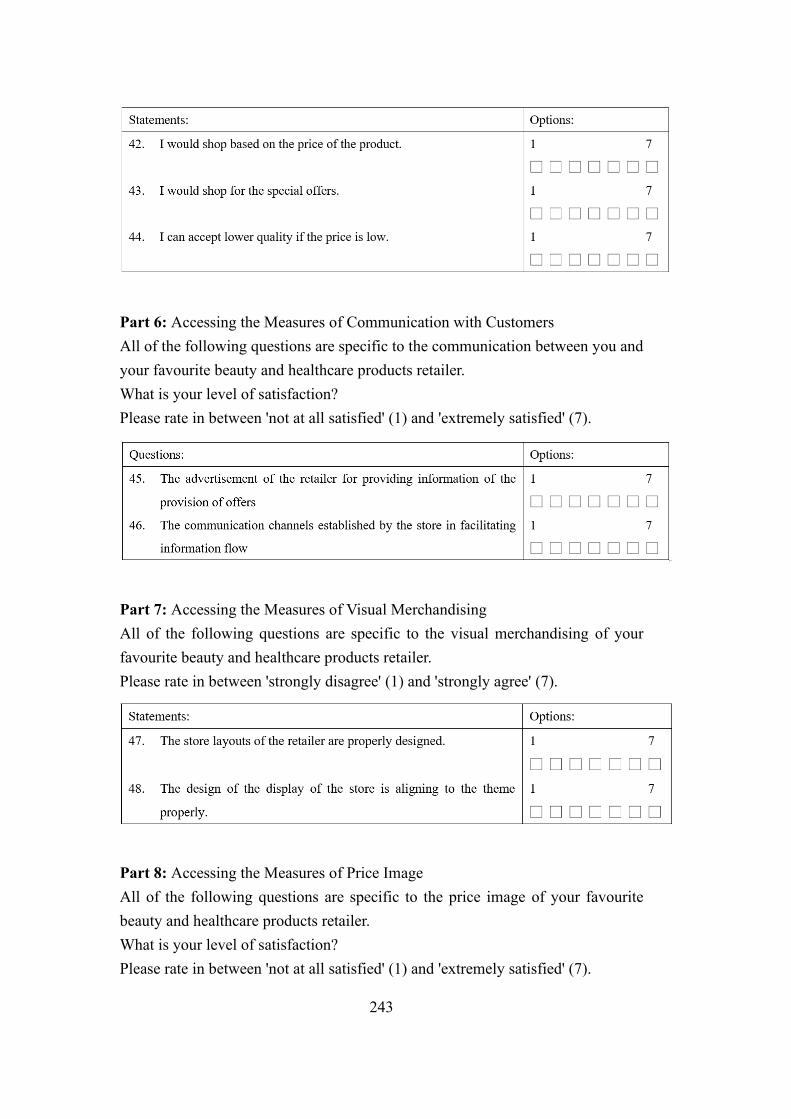
243
Part 6: Accessing the Measures of Communication with Customers All of the following questions are specific to the communication between you and your favourite beauty and healthcare products retailer. What is your level of satisfaction? Please rate in between 'not at all satisfied' (1) and 'extremely satisfied' (7).
Part 7: Accessing the Measures of Visual Merchandising All of the following questions are specific to the visual merchandising of your favourite beauty and healthcare products retailer. Please rate in between 'strongly disagree' (1) and 'strongly agree' (7).
Part 8: Accessing the Measures of Price Image All of the following questions are specific to the price image of your favourite beauty and healthcare products retailer. What is your level of satisfaction? Please rate in between 'not at all satisfied' (1) and 'extremely satisfied' (7).
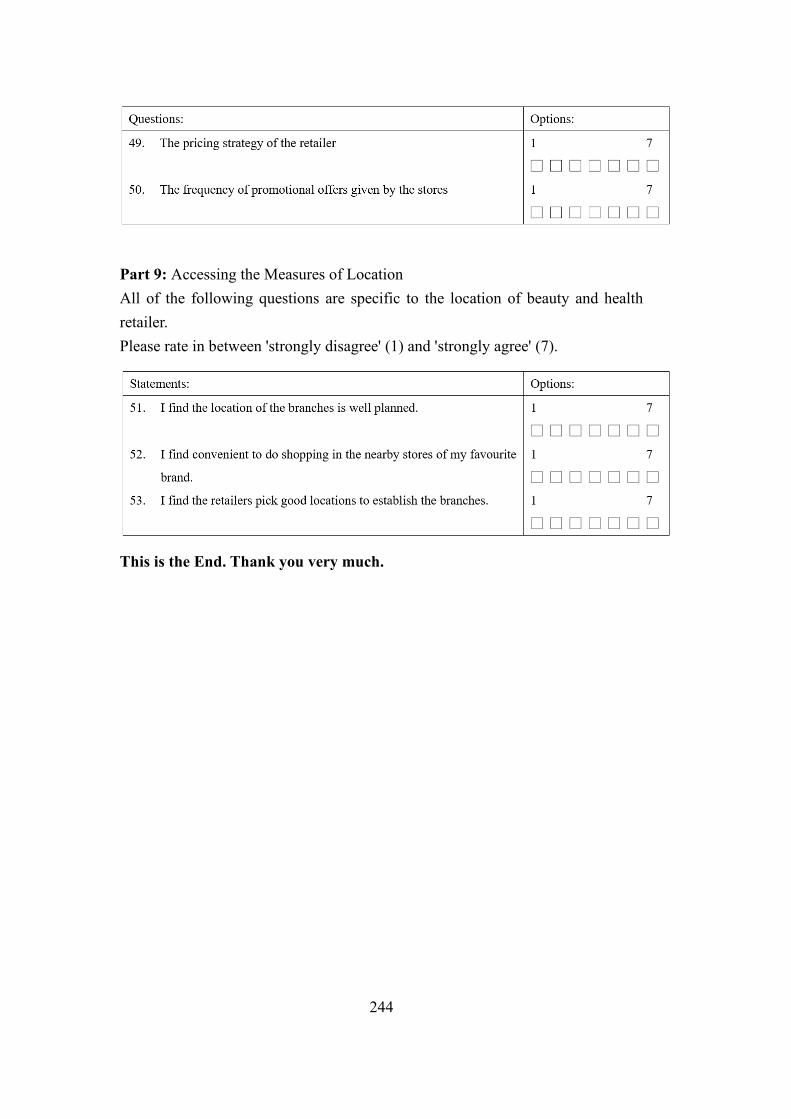
244
Part 9: Accessing the Measures of Location All of the following questions are specific to the location of beauty and health retailer. Please rate in between 'strongly disagree' (1) and 'strongly agree' (7).
This is the End. Thank you very much.
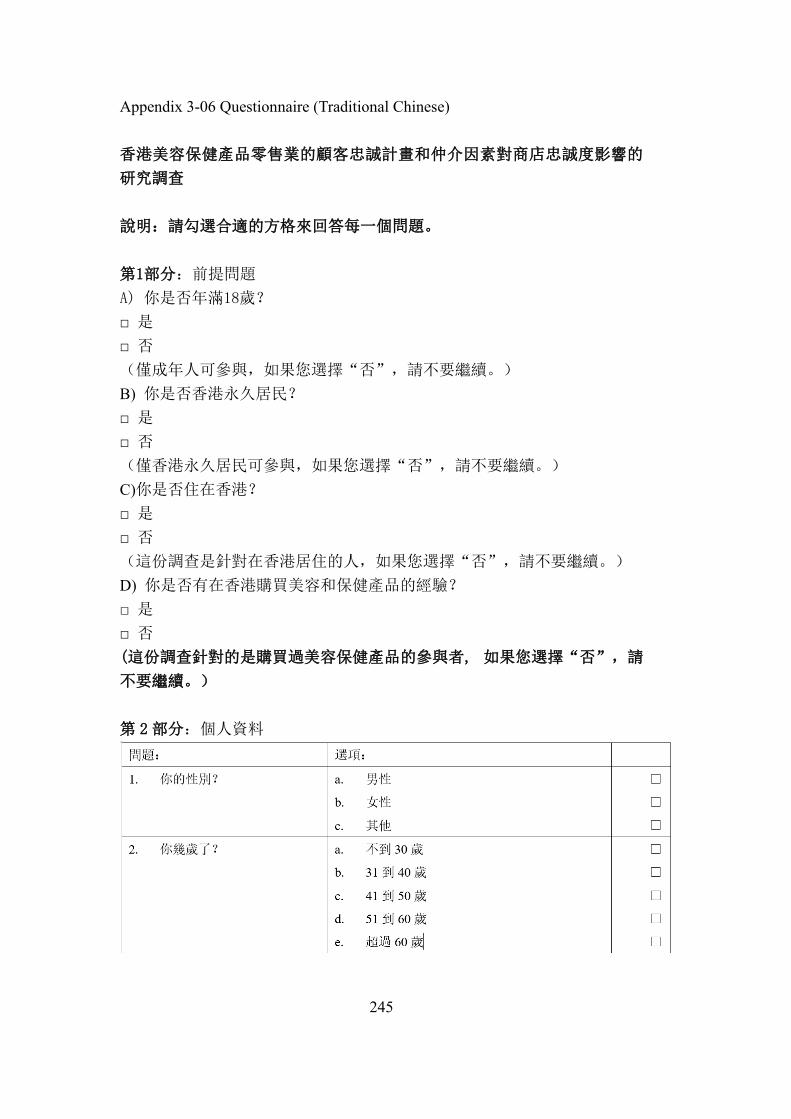
245
Appendix 3-06 Questionnaire (Traditional Chinese) 香港美容保健產品零售業的顧客忠誠計畫和仲介因素對商店忠誠度影響的
研究調查
說明:請勾選合適的方格來回答每一個問題。
第1部分:前提問題
A) 你是否年滿18歲?
□ 是 □ 否 (僅成年人可參與,如果您選擇“否”,請不要繼續。) B) 你是否香港永久居民? □ 是 □ 否 (僅香港永久居民可參與,如果您選擇“否”,請不要繼續。) C)你是否住在香港? □ 是 □ 否 (這份調查是針對在香港居住的人,如果您選擇“否”,請不要繼續。) D) 你是否有在香港購買美容和保健產品的經驗? □ 是 □ 否 (這份調查針對的是購買過美容保健產品的參與者, 如果您選擇“否”,請
不要繼續。)
第 2部分:個人資料
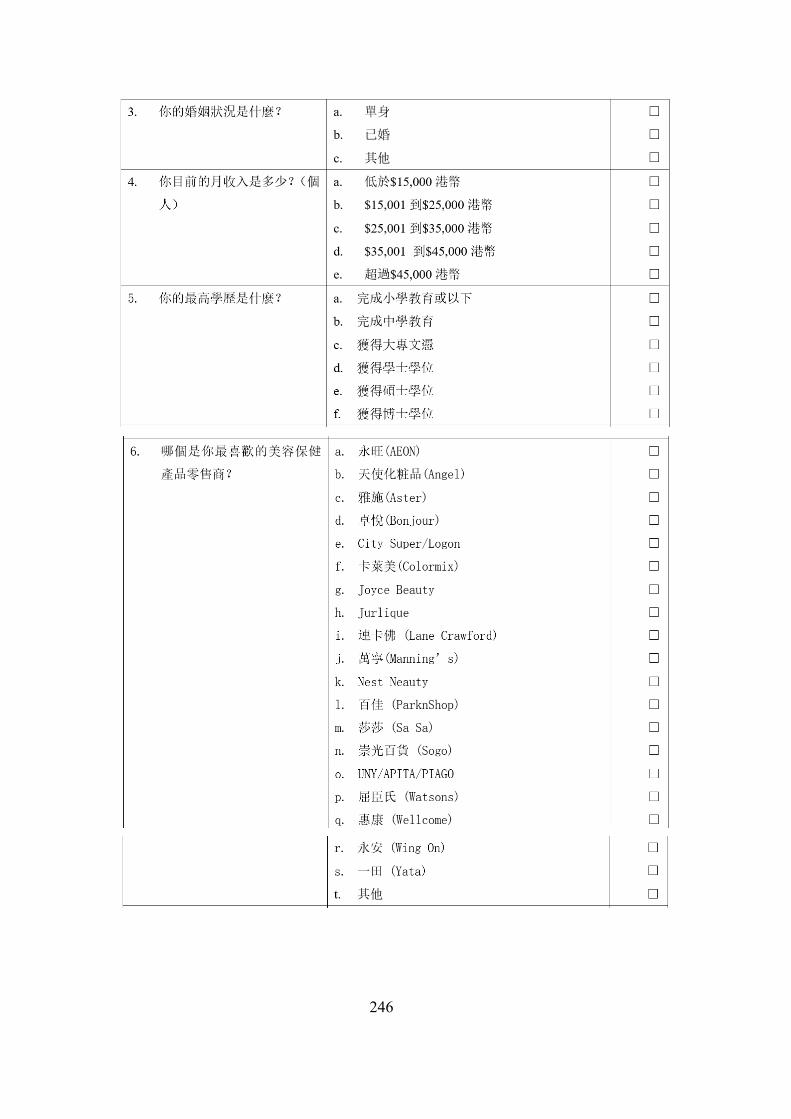
246
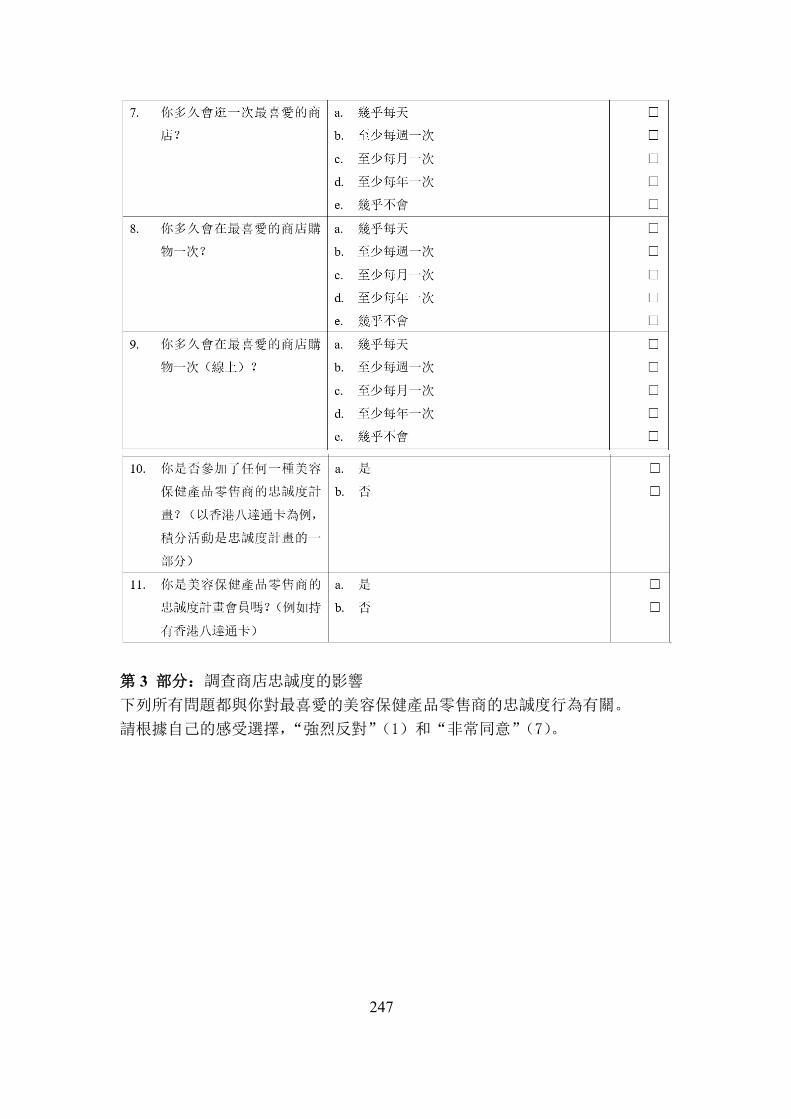
247
第 3 部分:調查商店忠誠度的影響
下列所有問題都與你對最喜愛的美容保健產品零售商的忠誠度行為有關。
請根據自己的感受選擇,“強烈反對”(1)和“非常同意”(7)。
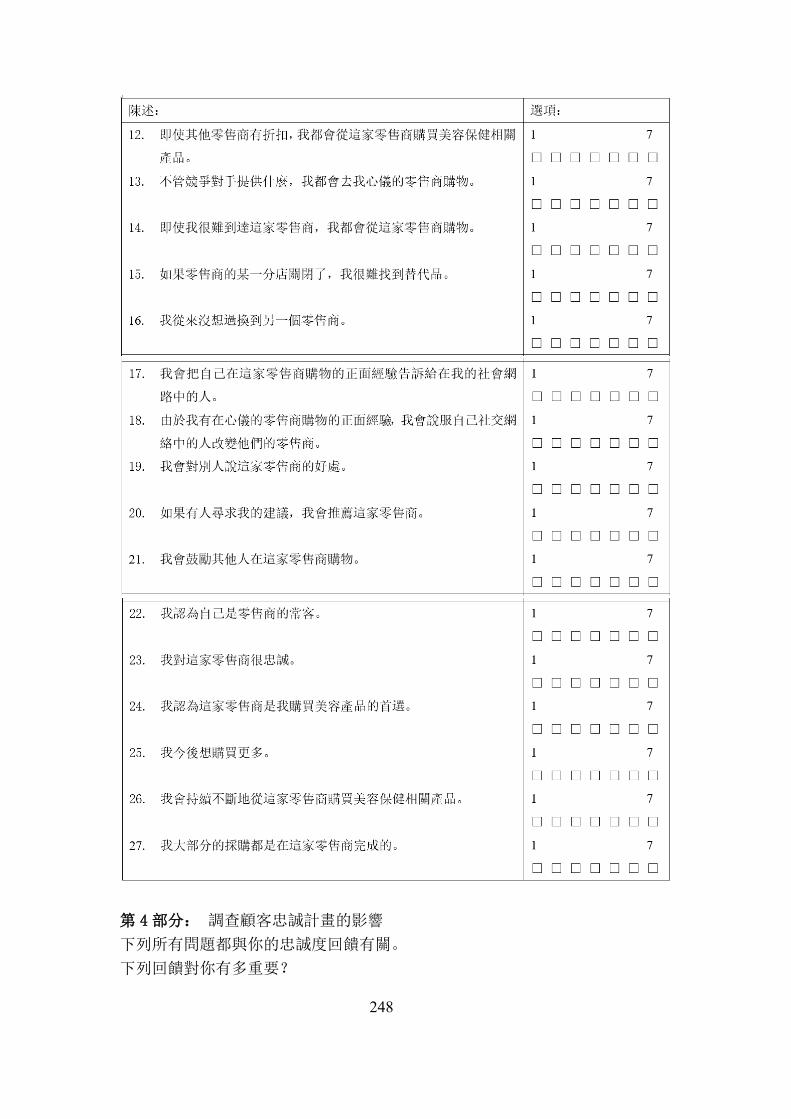
248
第 4部分: 調查顧客忠誠計畫的影響 下列所有問題都與你的忠誠度回饋有關。 下列回饋對你有多重要?
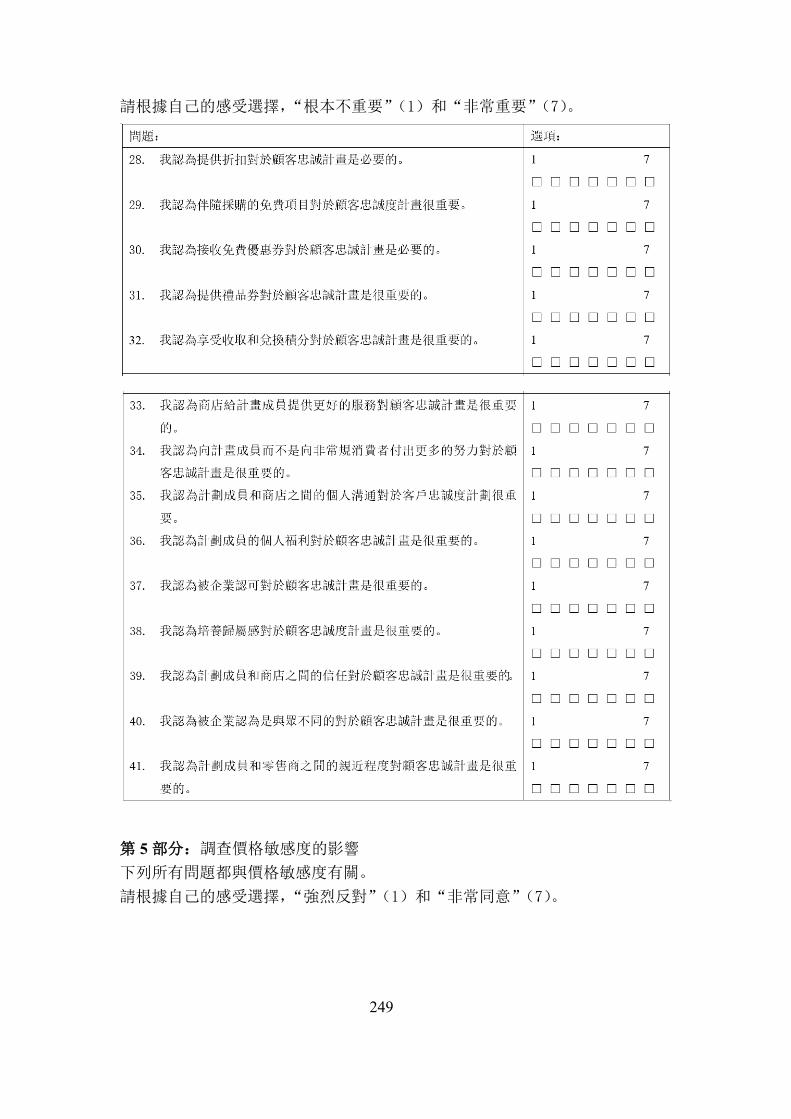
249
請根據自己的感受選擇,“根本不重要”(1)和“非常重要”(7)。
第 5 部分:調查價格敏感度的影響 下列所有問題都與價格敏感度有關。 請根據自己的感受選擇,“強烈反對”(1)和“非常同意”(7)。
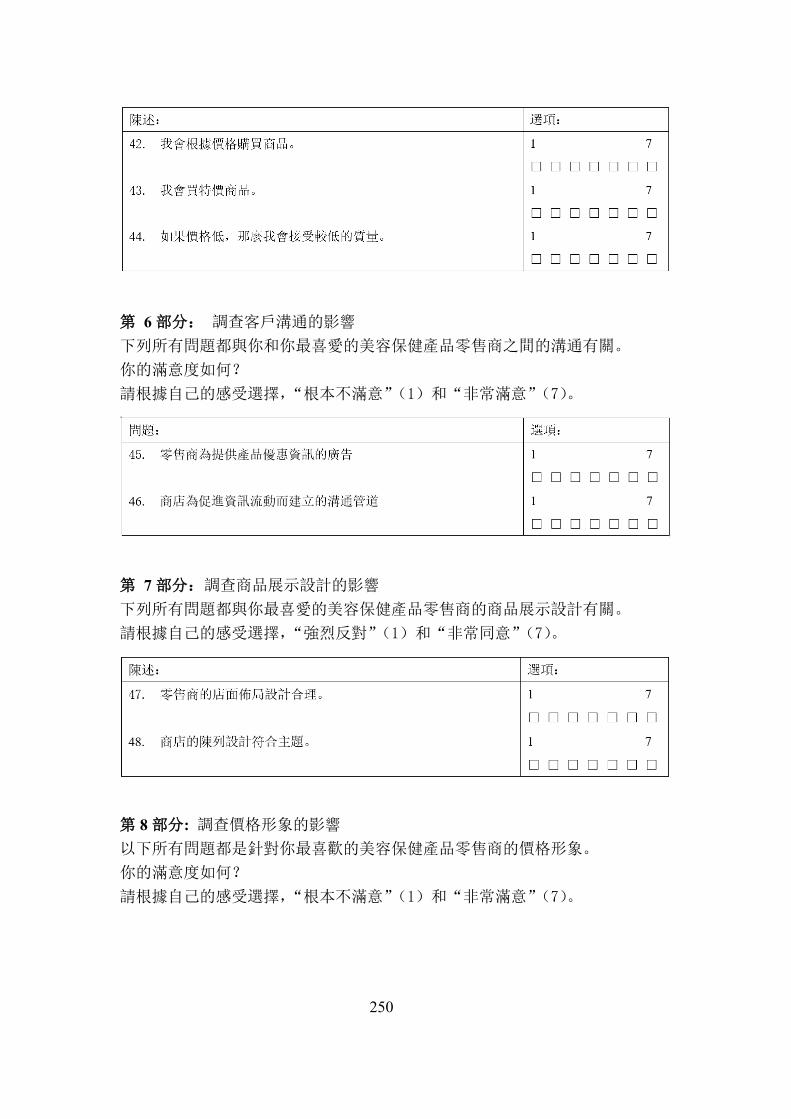
250
第 6 部分: 調查客戶溝通的影響 下列所有問題都與你和你最喜愛的美容保健產品零售商之間的溝通有關。 你的滿意度如何? 請根據自己的感受選擇,“根本不滿意”(1)和“非常滿意”(7)。
第 7 部分:調查商品展示設計的影響
下列所有問題都與你最喜愛的美容保健產品零售商的商品展示設計有關。 請根據自己的感受選擇,“強烈反對”(1)和“非常同意”(7)。
第 8 部分: 調查價格形象的影響 以下所有問題都是針對你最喜歡的美容保健產品零售商的價格形象。
你的滿意度如何? 請根據自己的感受選擇,“根本不滿意”(1)和“非常滿意”(7)。
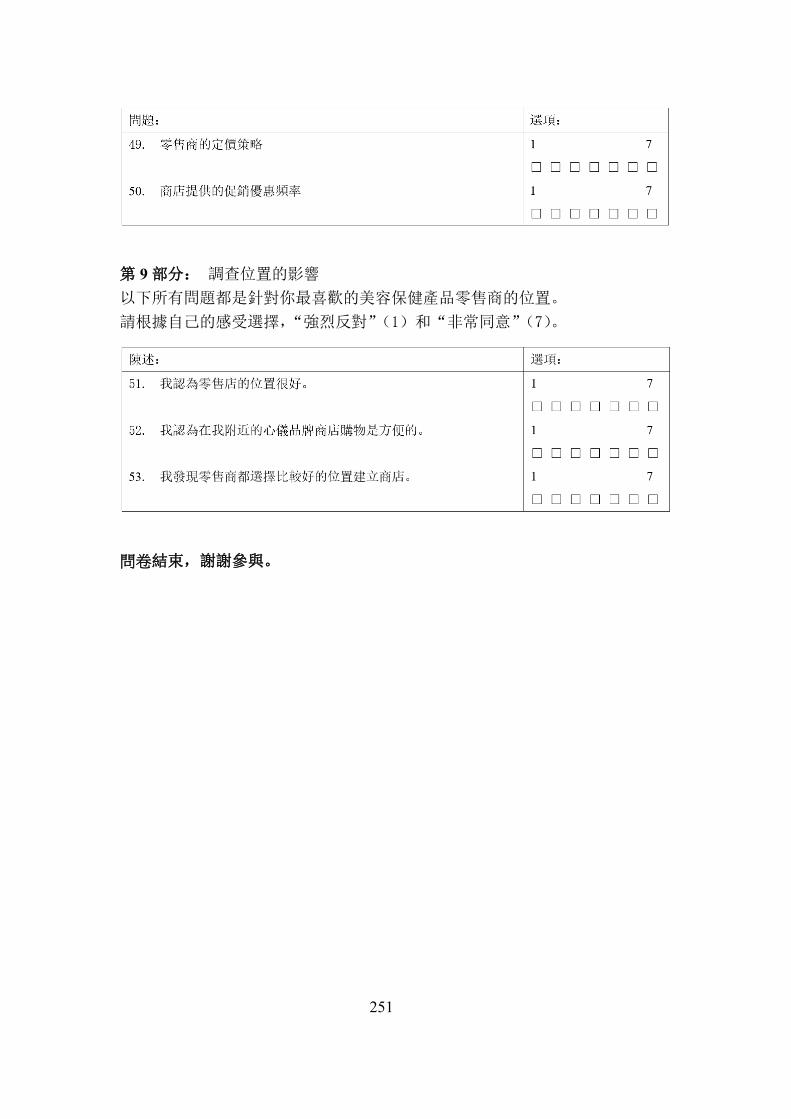
251
第 9 部分: 調查位置的影響 以下所有問題都是針對你最喜歡的美容保健產品零售商的位置。
請根據自己的感受選擇,“強烈反對”(1)和“非常同意”(7)。
問卷結束,謝謝參與。
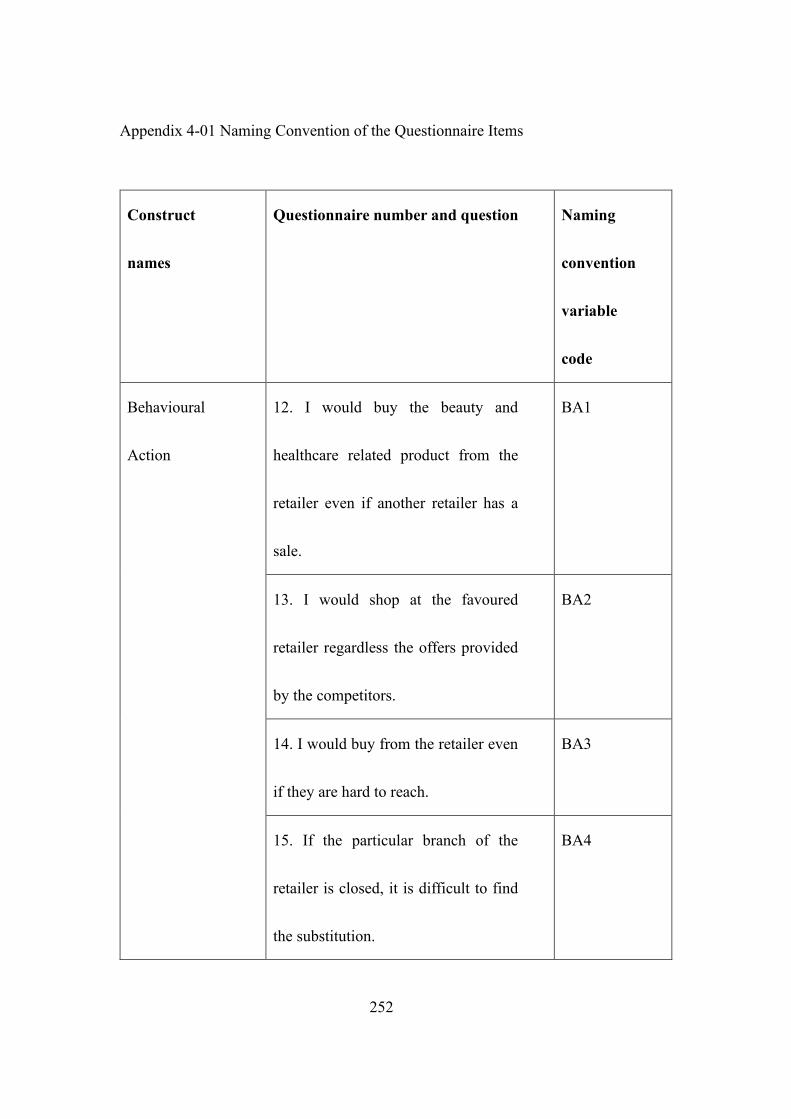
252
Appendix 4-01 Naming Convention of the Questionnaire Items
Construct
names
Questionnaire number and question Naming
convention
variable
code
Behavioural
Action
12. I would buy the beauty and
healthcare related product from the
retailer even if another retailer has a
sale.
BA1
13. I would shop at the favoured
retailer regardless the offers provided
by the competitors.
BA2
14. I would buy from the retailer even
if they are hard to reach.
BA3
15. If the particular branch of the
retailer is closed, it is difficult to find
the substitution.
BA4
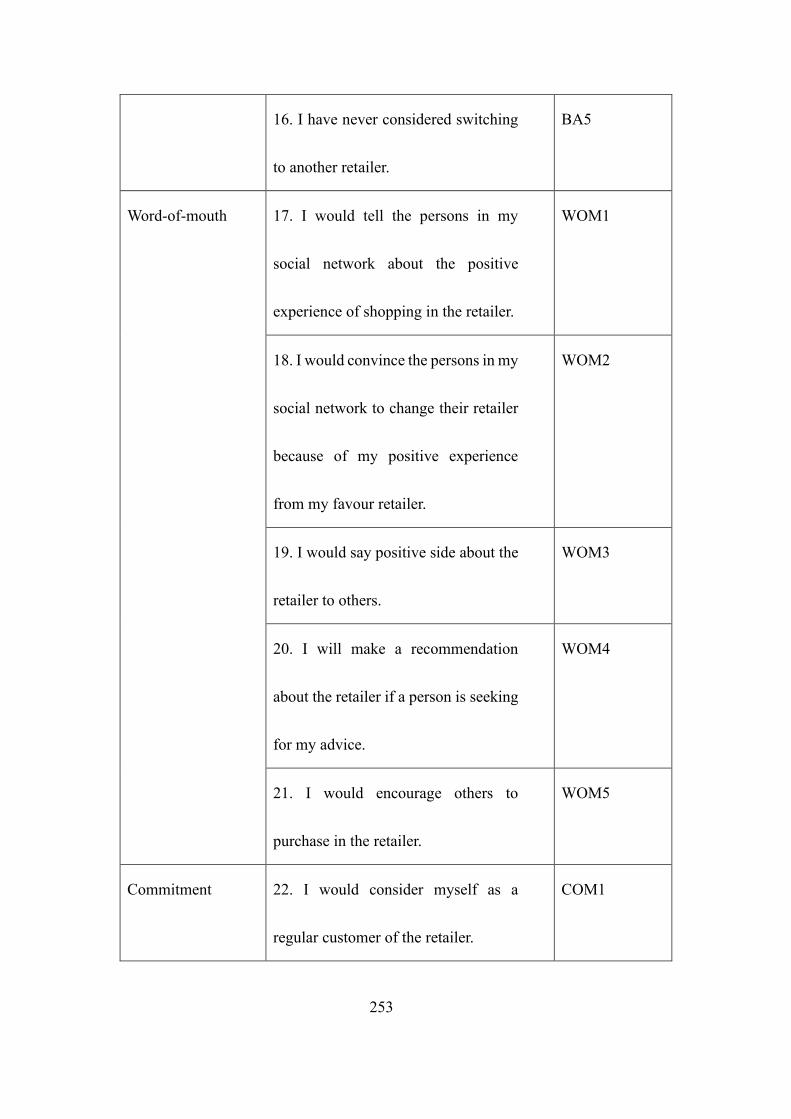
253
16. I have never considered switching
to another retailer.
BA5
Word-of-mouth 17. I would tell the persons in my
social network about the positive
experience of shopping in the retailer.
WOM1
18. I would convince the persons in my
social network to change their retailer
because of my positive experience
from my favour retailer.
WOM2
19. I would say positive side about the
retailer to others.
WOM3
20. I will make a recommendation
about the retailer if a person is seeking
for my advice.
WOM4
21. I would encourage others to
purchase in the retailer.
WOM5
Commitment 22. I would consider myself as a
regular customer of the retailer.
COM1
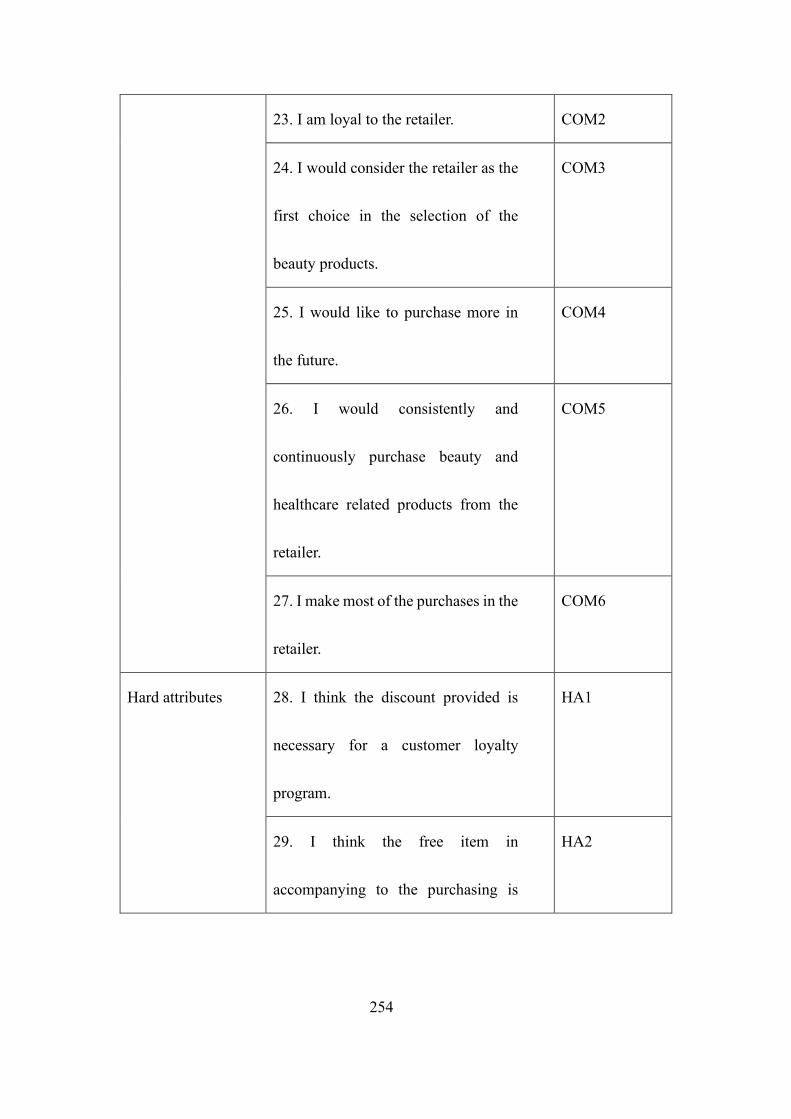
254
23. I am loyal to the retailer. COM2
24. I would consider the retailer as the
first choice in the selection of the
beauty products.
COM3
25. I would like to purchase more in
the future.
COM4
26. I would consistently and
continuously purchase beauty and
healthcare related products from the
retailer.
COM5
27. I make most of the purchases in the
retailer.
COM6
Hard attributes 28. I think the discount provided is
necessary for a customer loyalty
program.
HA1
29. I think the free item in
accompanying to the purchasing is
HA2
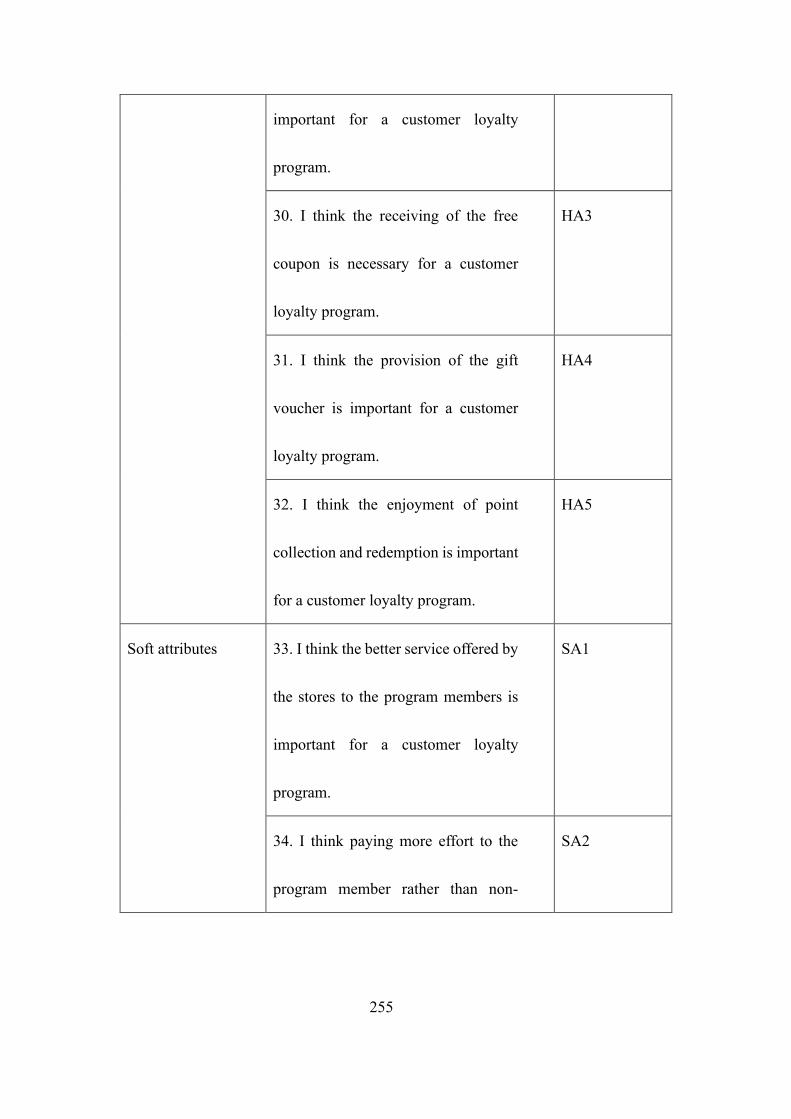
255
important for a customer loyalty
program.
30. I think the receiving of the free
coupon is necessary for a customer
loyalty program.
HA3
31. I think the provision of the gift
voucher is important for a customer
loyalty program.
HA4
32. I think the enjoyment of point
collection and redemption is important
for a customer loyalty program.
HA5
Soft attributes 33. I think the better service offered by
the stores to the program members is
important for a customer loyalty
program.
SA1
34. I think paying more effort to the
program member rather than non-
SA2
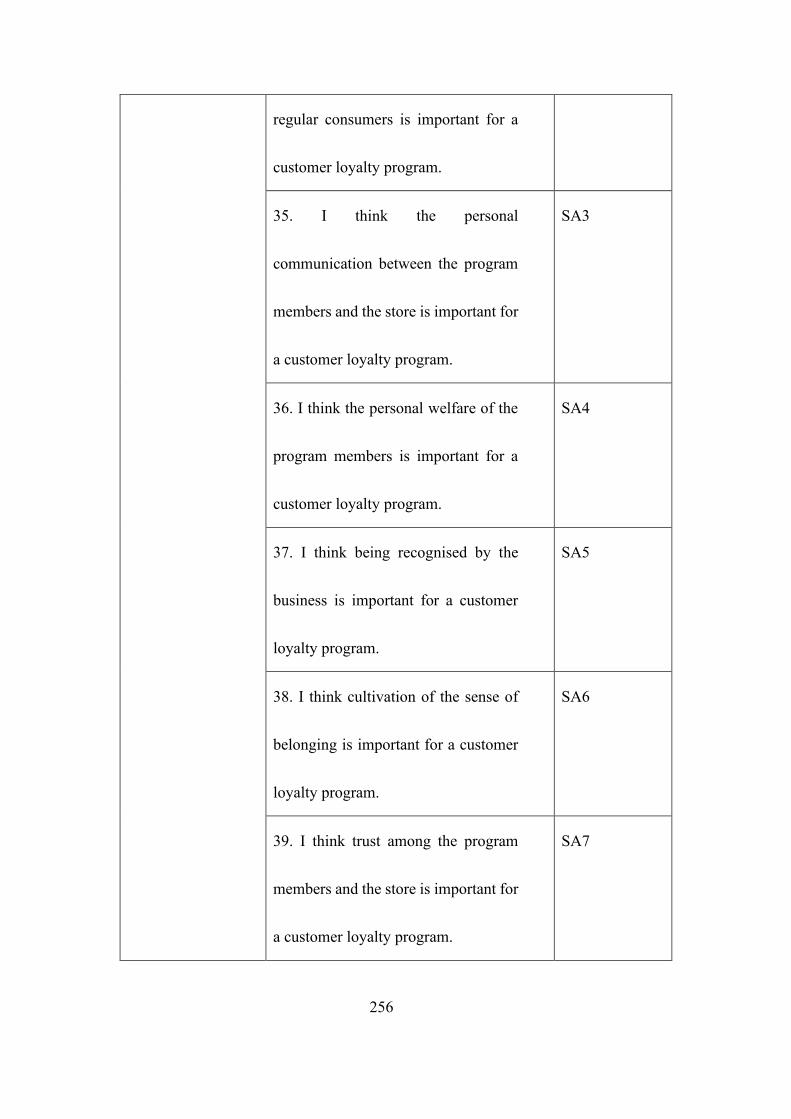
256
regular consumers is important for a
customer loyalty program.
35. I think the personal
communication between the program
members and the store is important for
a customer loyalty program.
SA3
36. I think the personal welfare of the
program members is important for a
customer loyalty program.
SA4
37. I think being recognised by the
business is important for a customer
loyalty program.
SA5
38. I think cultivation of the sense of
belonging is important for a customer
loyalty program.
SA6
39. I think trust among the program
members and the store is important for
a customer loyalty program.
SA7
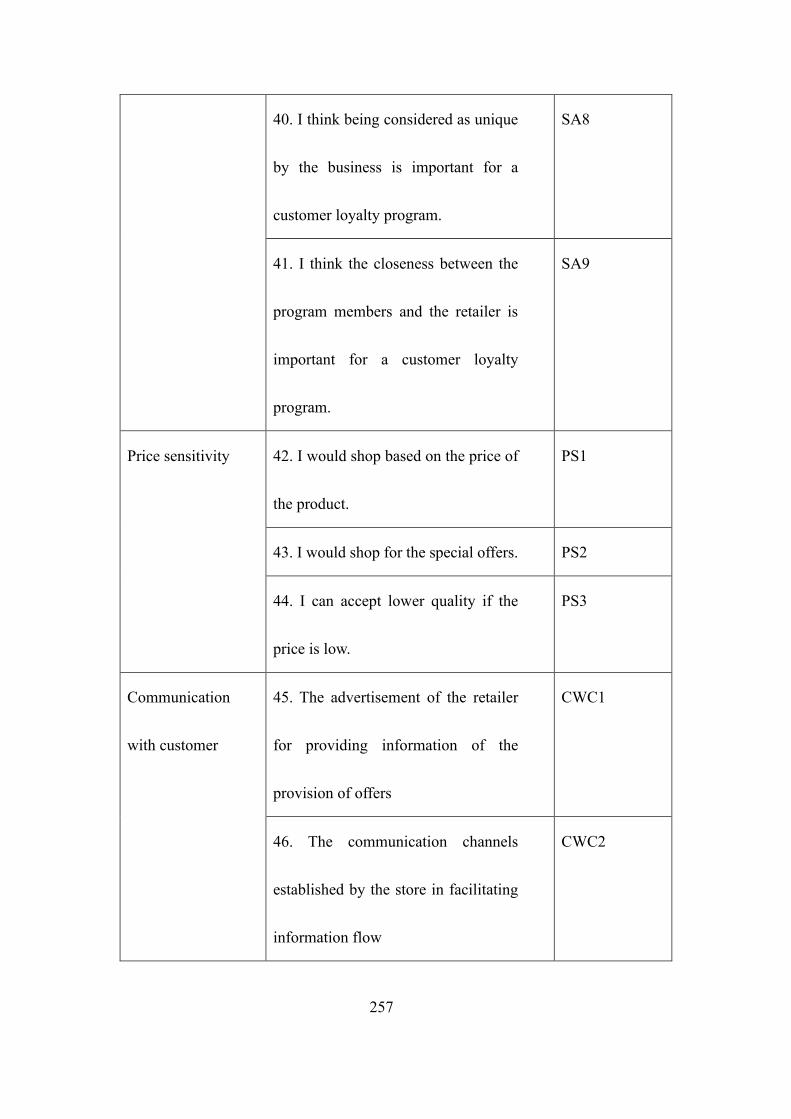
257
40. I think being considered as unique
by the business is important for a
customer loyalty program.
SA8
41. I think the closeness between the
program members and the retailer is
important for a customer loyalty
program.
SA9
Price sensitivity 42. I would shop based on the price of
the product.
PS1
43. I would shop for the special offers. PS2
44. I can accept lower quality if the
price is low.
PS3
Communication
with customer
45. The advertisement of the retailer
for providing information of the
provision of offers
CWC1
46. The communication channels
established by the store in facilitating
information flow
CWC2
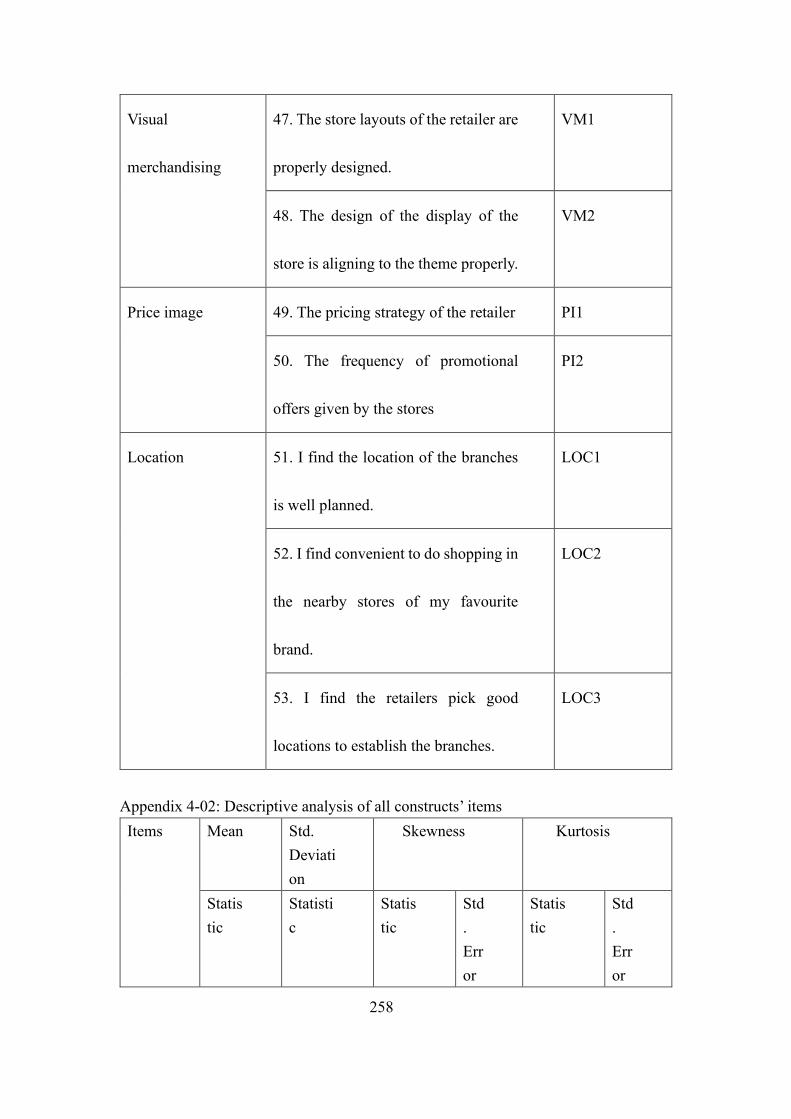
258
Visual
merchandising
47. The store layouts of the retailer are
properly designed.
VM1
48. The design of the display of the
store is aligning to the theme properly.
VM2
Price image 49. The pricing strategy of the retailer PI1
50. The frequency of promotional
offers given by the stores
PI2
Location 51. I find the location of the branches
is well planned.
LOC1
52. I find convenient to do shopping in
the nearby stores of my favourite
brand.
LOC2
53. I find the retailers pick good
locations to establish the branches.
LOC3
Appendix 4-02: Descriptive analysis of all constructs’ items Items Mean Std.
Deviation
Skewness Kurtosis
Statistic
Statistic
Statistic
Std. Error
Statistic
Std. Error
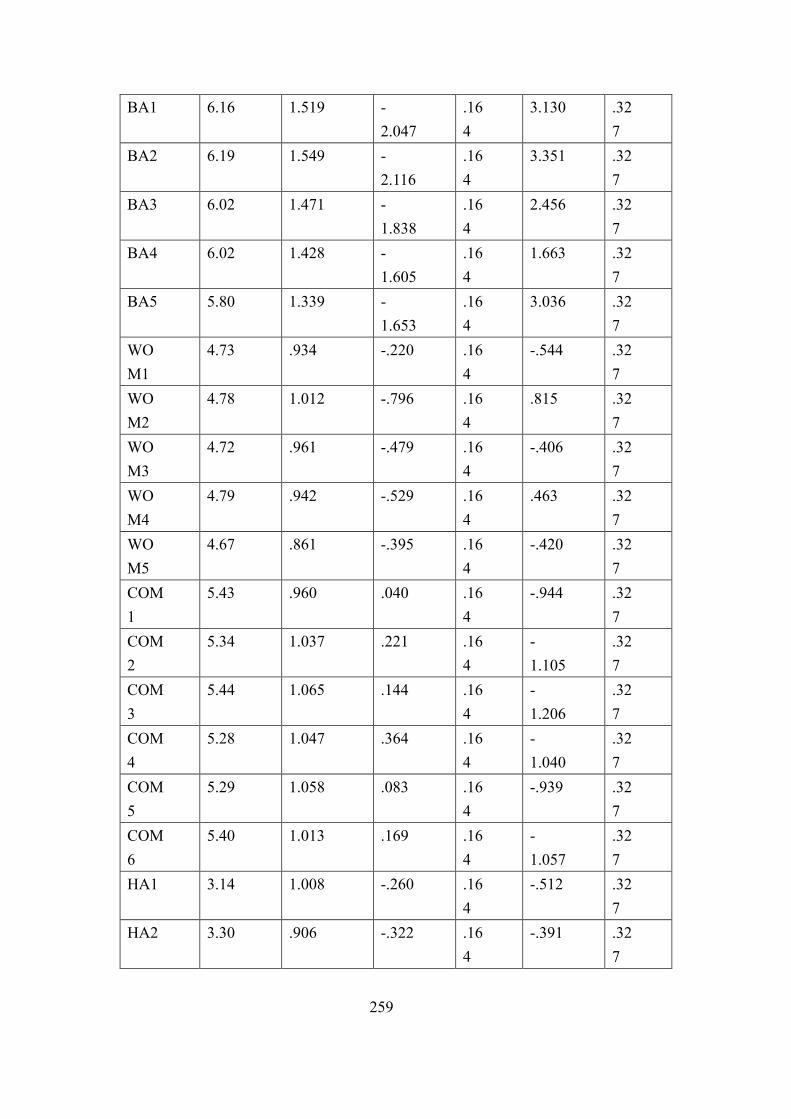
259
BA1 6.16 1.519 -2.047
.164
3.130 .327
BA2 6.19 1.549 -2.116
.164
3.351 .327
BA3 6.02 1.471 -1.838
.164
2.456 .327
BA4 6.02 1.428 -1.605
.164
1.663 .327
BA5 5.80 1.339 -1.653
.164
3.036 .327
WOM1
4.73 .934 -.220 .164
-.544 .327
WOM2
4.78 1.012 -.796 .164
.815 .327
WOM3
4.72 .961 -.479 .164
-.406 .327
WOM4
4.79 .942 -.529 .164
.463 .327
WOM5
4.67 .861 -.395 .164
-.420 .327
COM1
5.43 .960 .040 .164
-.944 .327
COM2
5.34 1.037 .221 .164
-1.105
.327
COM3
5.44 1.065 .144 .164
-1.206
.327
COM4
5.28 1.047 .364 .164
-1.040
.327
COM5
5.29 1.058 .083 .164
-.939 .327
COM6
5.40 1.013 .169 .164
-1.057
.327
HA1 3.14 1.008 -.260 .164
-.512 .327
HA2 3.30 .906 -.322 .164
-.391 .327
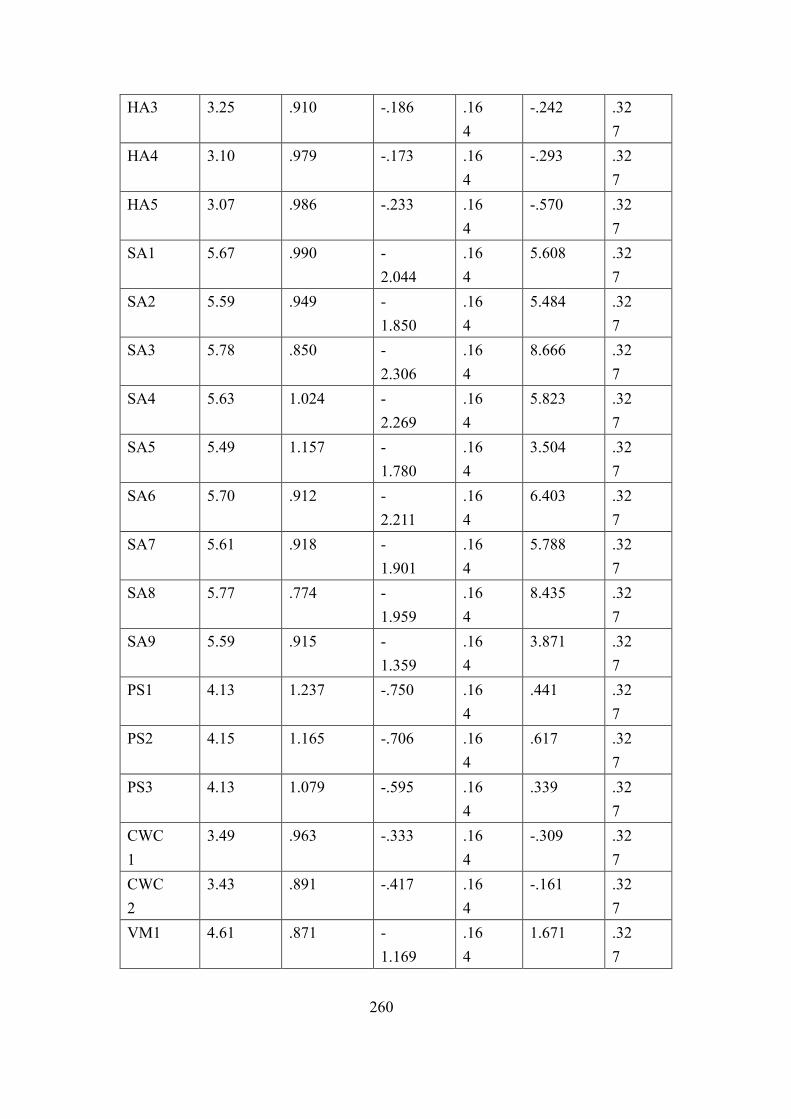
260
HA3 3.25 .910 -.186 .164
-.242 .327
HA4 3.10 .979 -.173 .164
-.293 .327
HA5 3.07 .986 -.233 .164
-.570 .327
SA1 5.67 .990 -2.044
.164
5.608 .327
SA2 5.59 .949 -1.850
.164
5.484 .327
SA3 5.78 .850 -2.306
.164
8.666 .327
SA4 5.63 1.024 -2.269
.164
5.823 .327
SA5 5.49 1.157 -1.780
.164
3.504 .327
SA6 5.70 .912 -2.211
.164
6.403 .327
SA7 5.61 .918 -1.901
.164
5.788 .327
SA8 5.77 .774 -1.959
.164
8.435 .327
SA9 5.59 .915 -1.359
.164
3.871 .327
PS1 4.13 1.237 -.750 .164
.441 .327
PS2 4.15 1.165 -.706 .164
.617 .327
PS3 4.13 1.079 -.595 .164
.339 .327
CWC1
3.49 .963 -.333 .164
-.309 .327
CWC2
3.43 .891 -.417 .164
-.161 .327
VM1 4.61 .871 -1.169
.164
1.671 .327
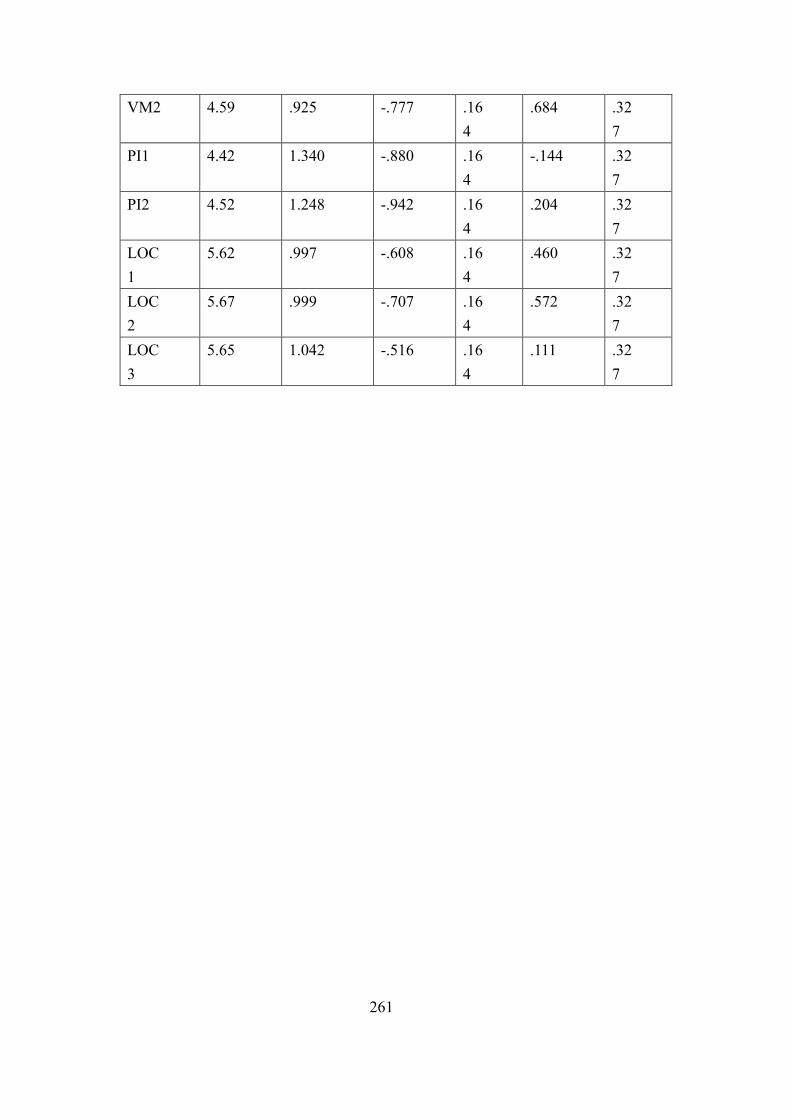
261
VM2 4.59 .925 -.777 .164
.684 .327
PI1 4.42 1.340 -.880 .164
-.144 .327
PI2 4.52 1.248 -.942 .164
.204 .327
LOC1
5.62 .997 -.608 .164
.460 .327
LOC2
5.67 .999 -.707 .164
.572 .327
LOC3
5.65 1.042 -.516 .164
.111 .327
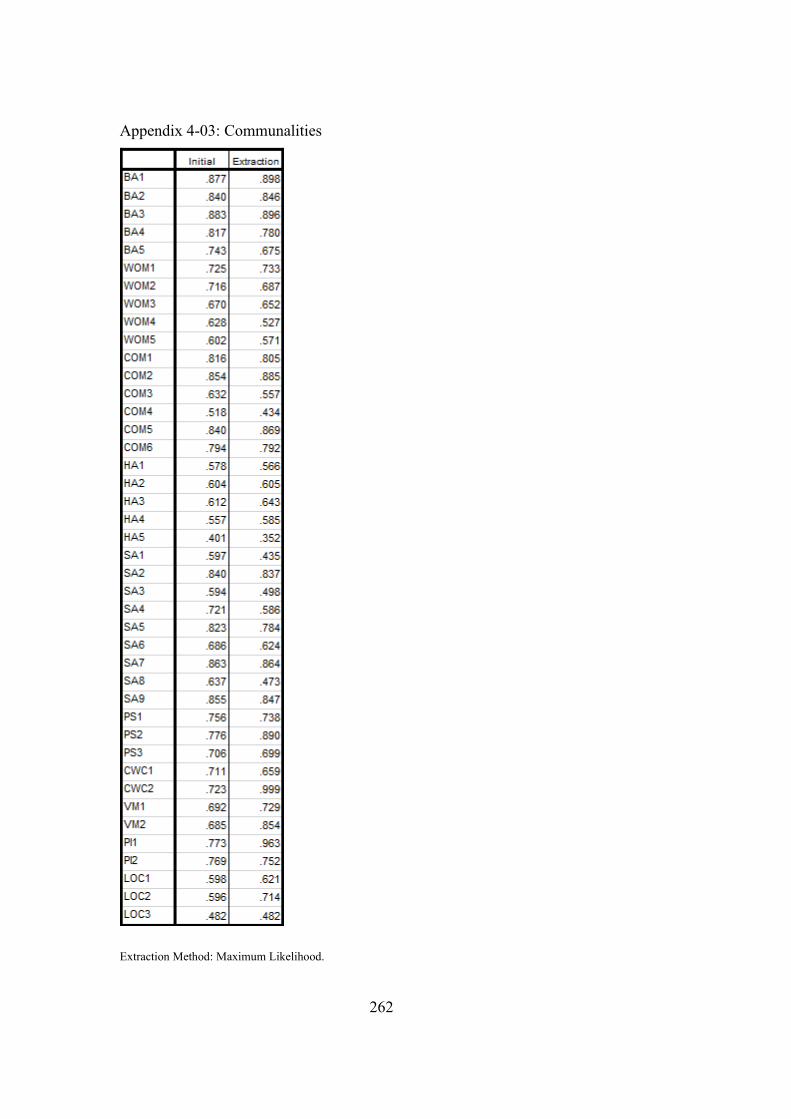
262
Appendix 4-03: Communalities
Extraction Method: Maximum Likelihood.
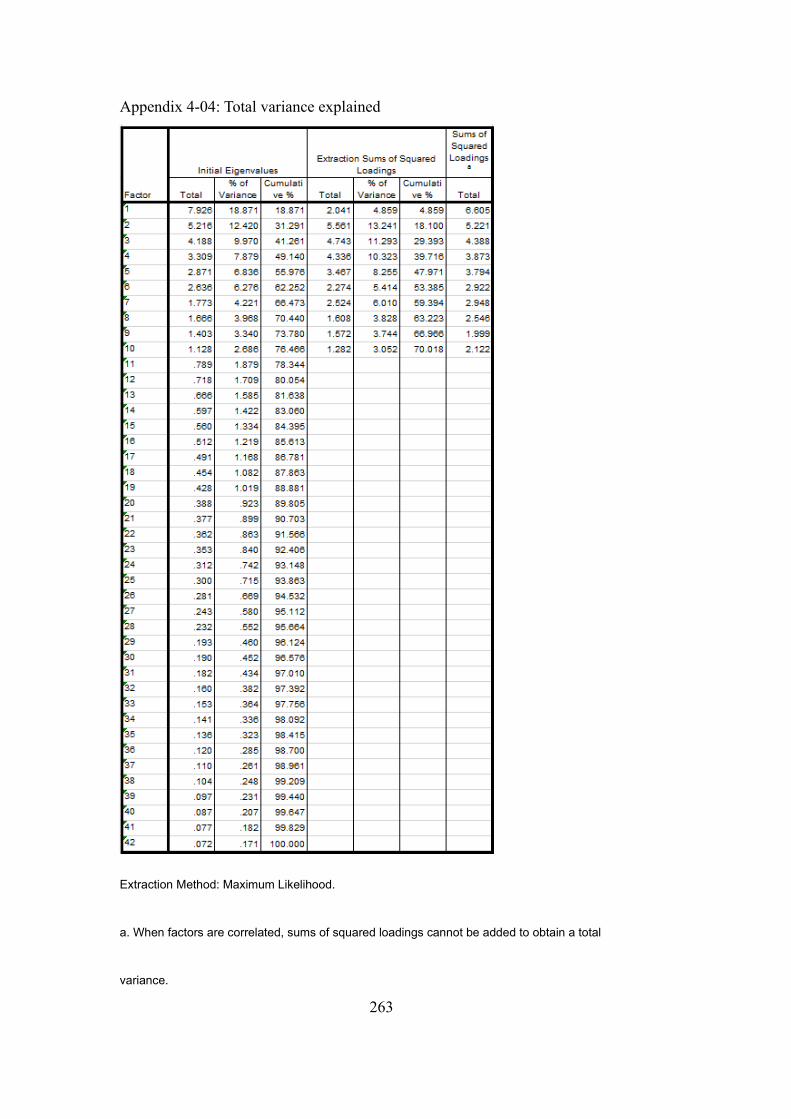
263
Appendix 4-04: Total variance explained
Extraction Method: Maximum Likelihood.
a. When factors are correlated, sums of squared loadings cannot be added to obtain a total
variance.
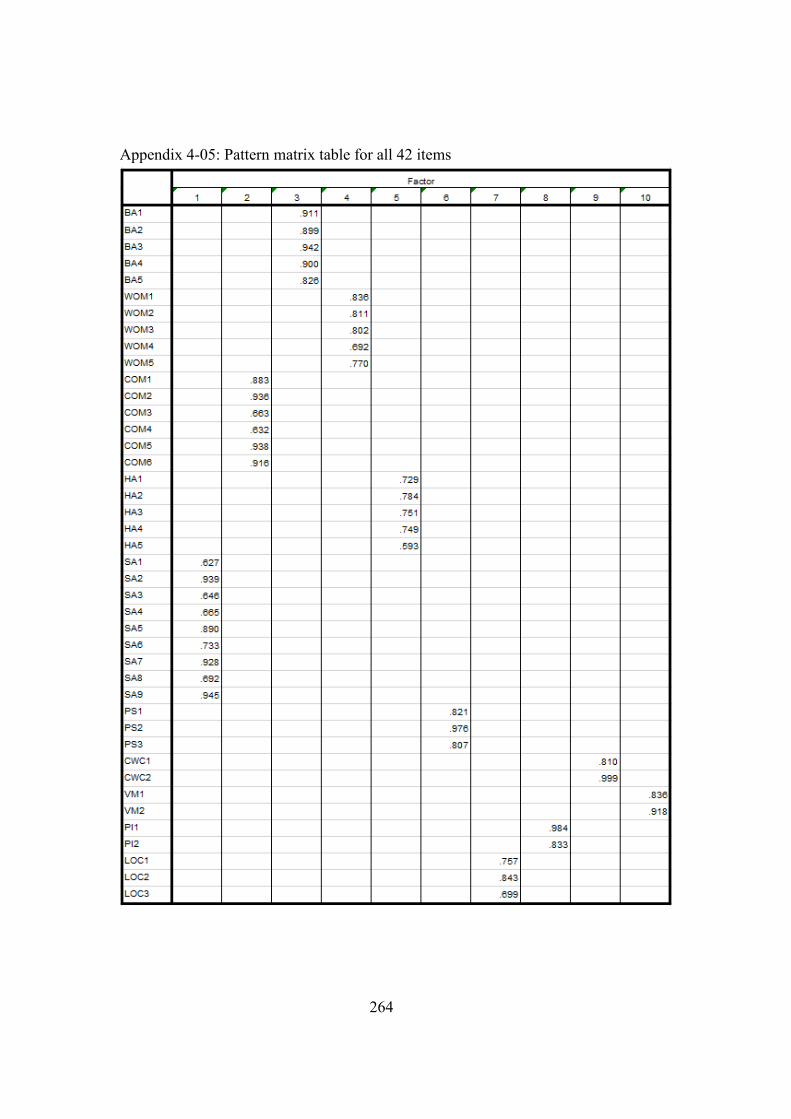
264
Appendix 4-05: Pattern matrix table for all 42 items
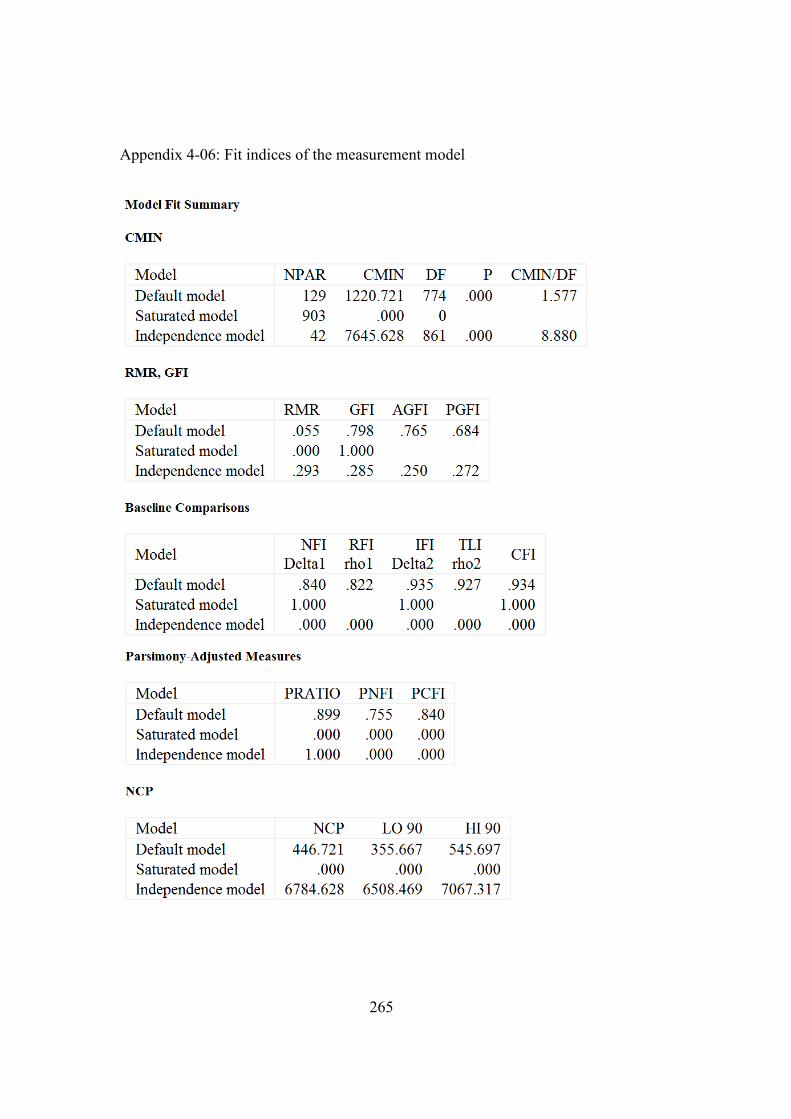
265
Appendix 4-06: Fit indices of the measurement model
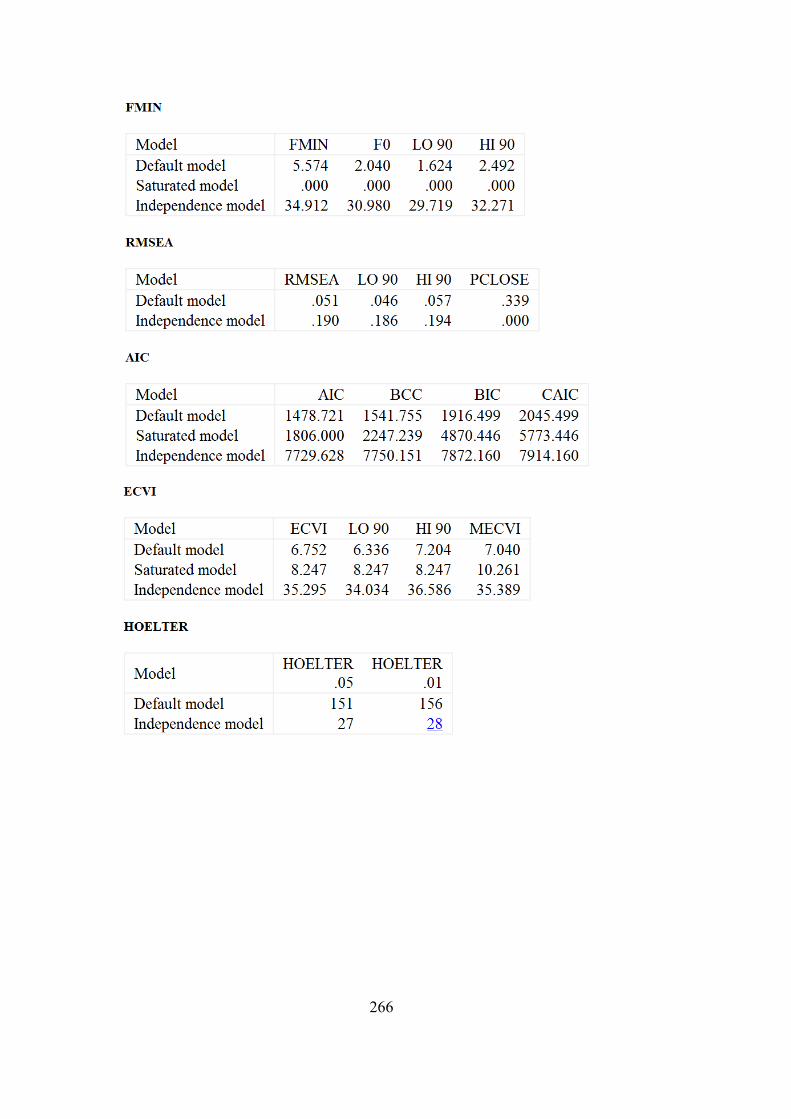
266
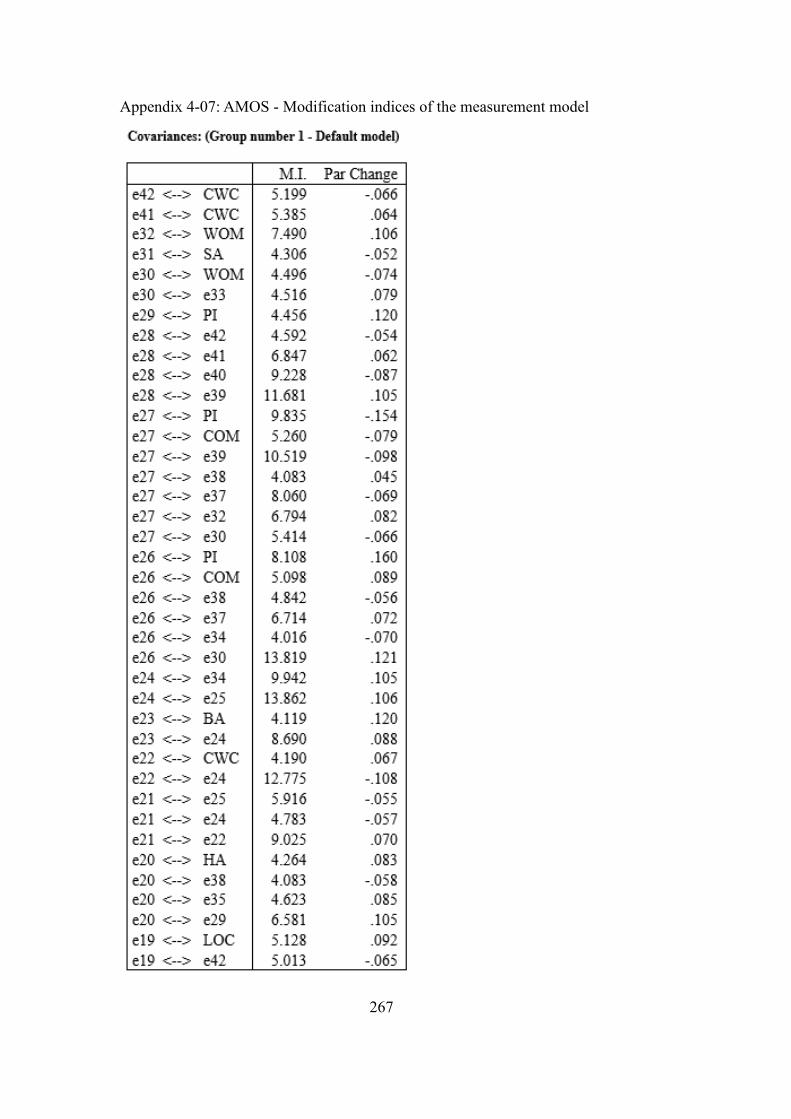
267
Appendix 4-07: AMOS - Modification indices of the measurement model
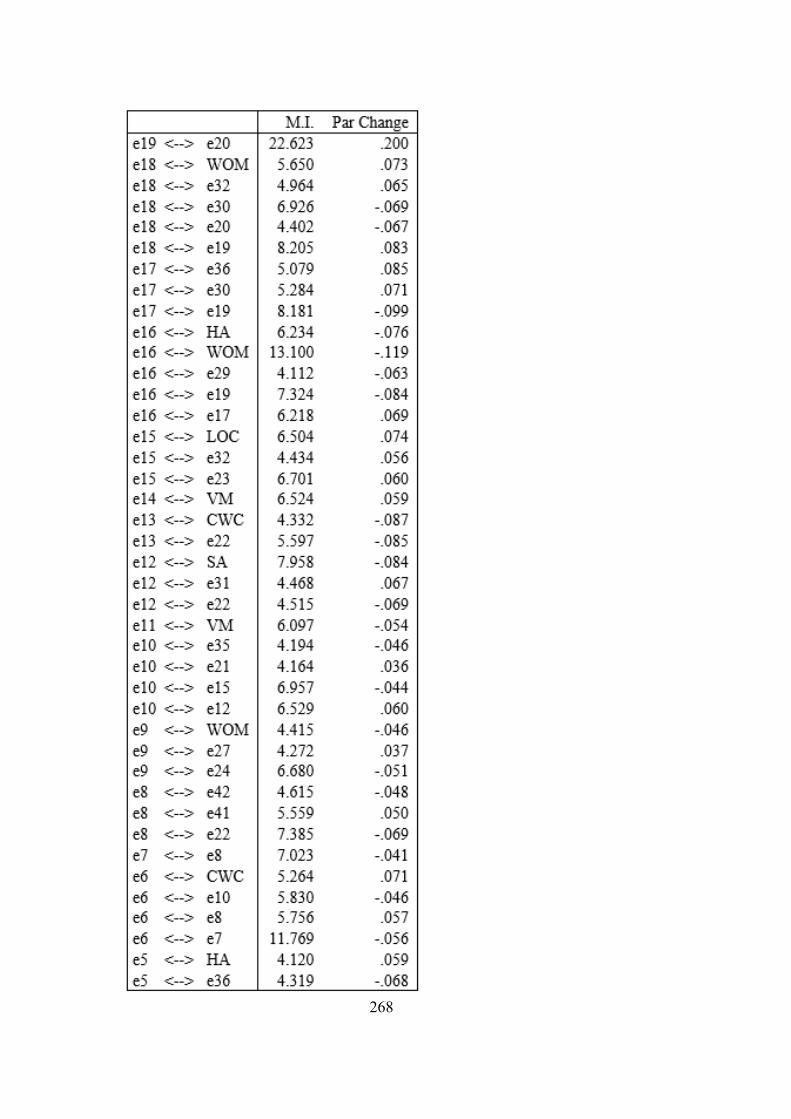
268
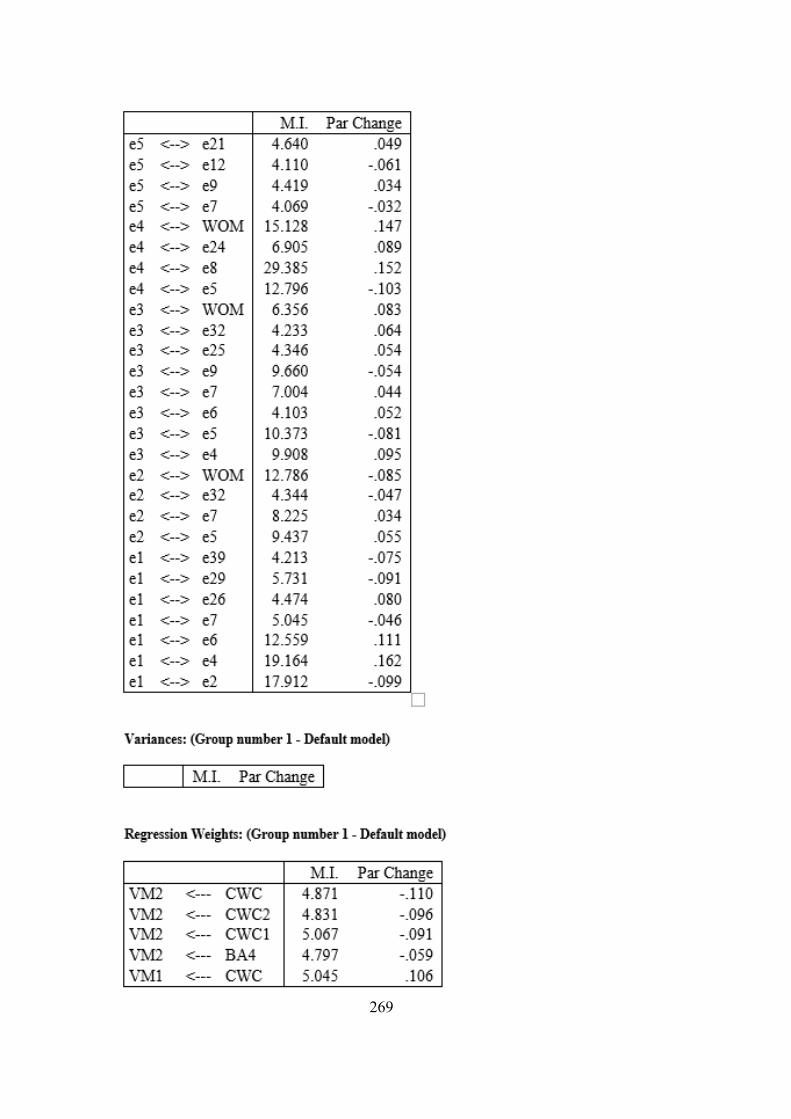
269
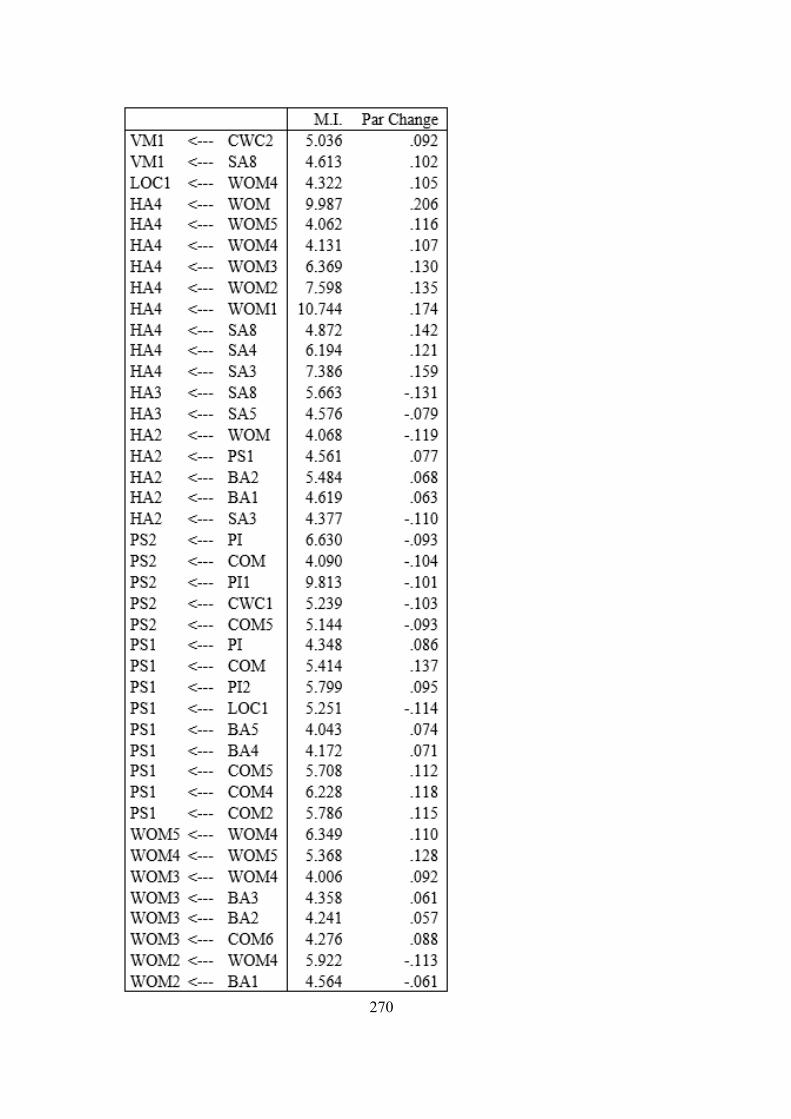
270
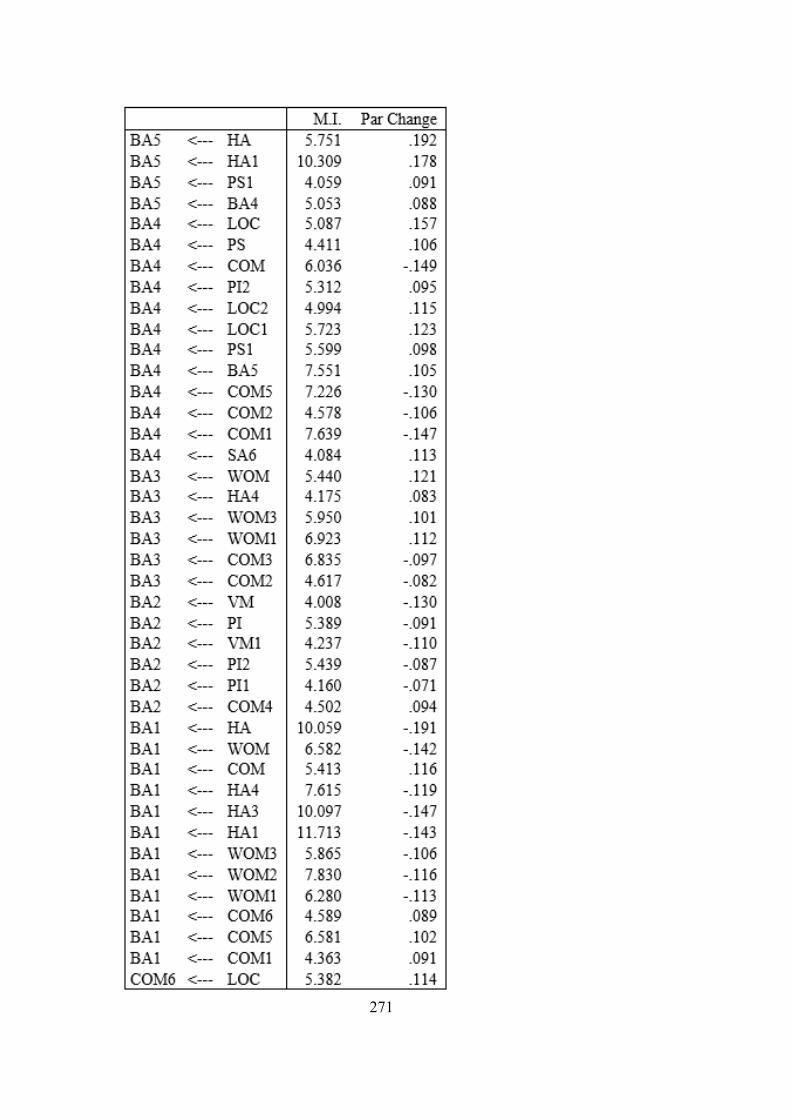
271
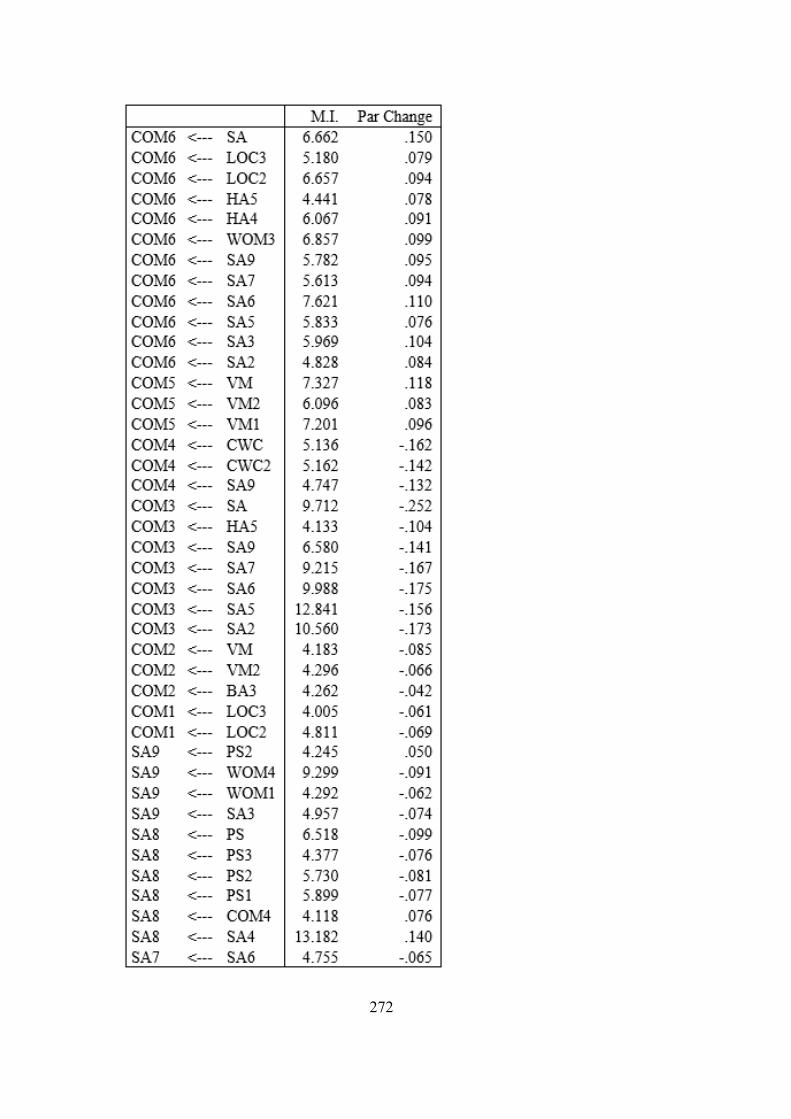
272
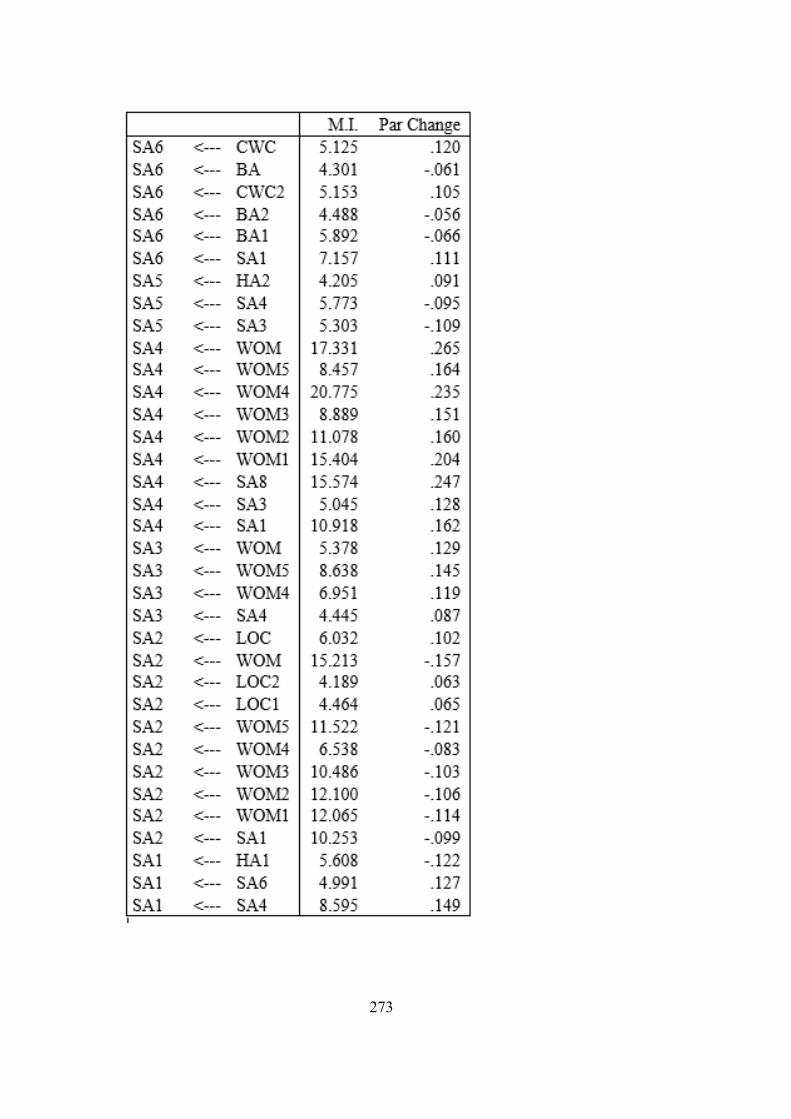
273
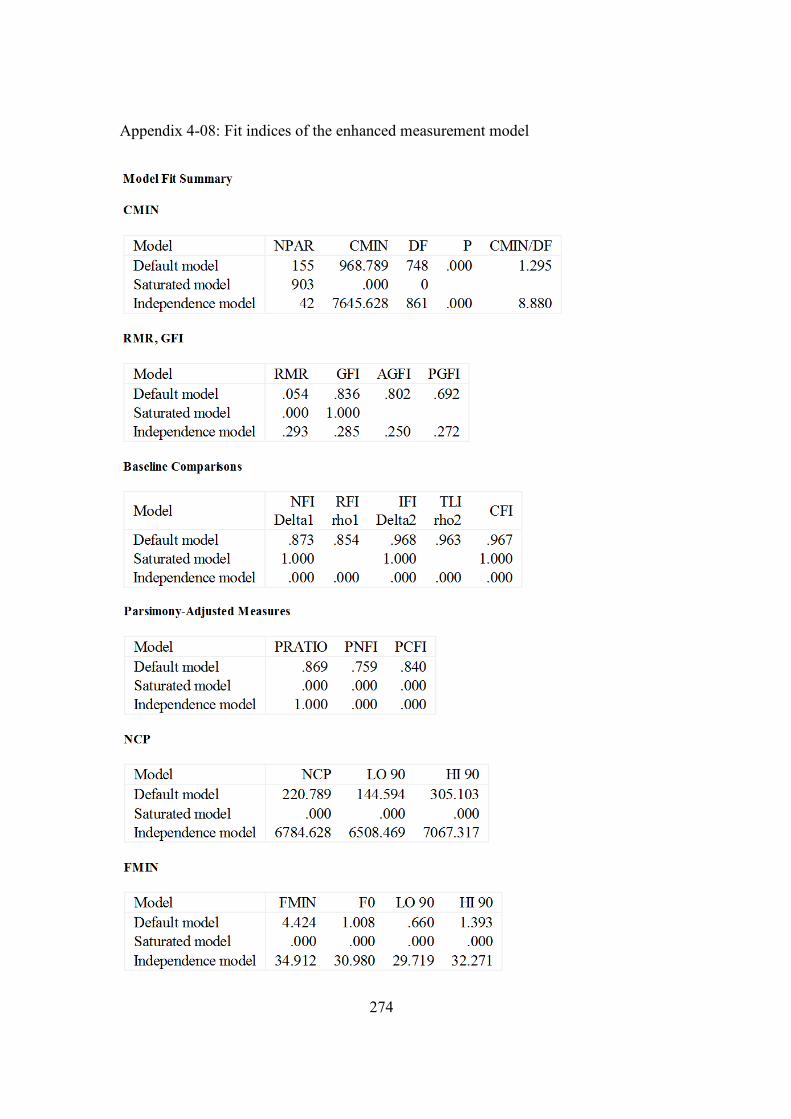
274
Appendix 4-08: Fit indices of the enhanced measurement model
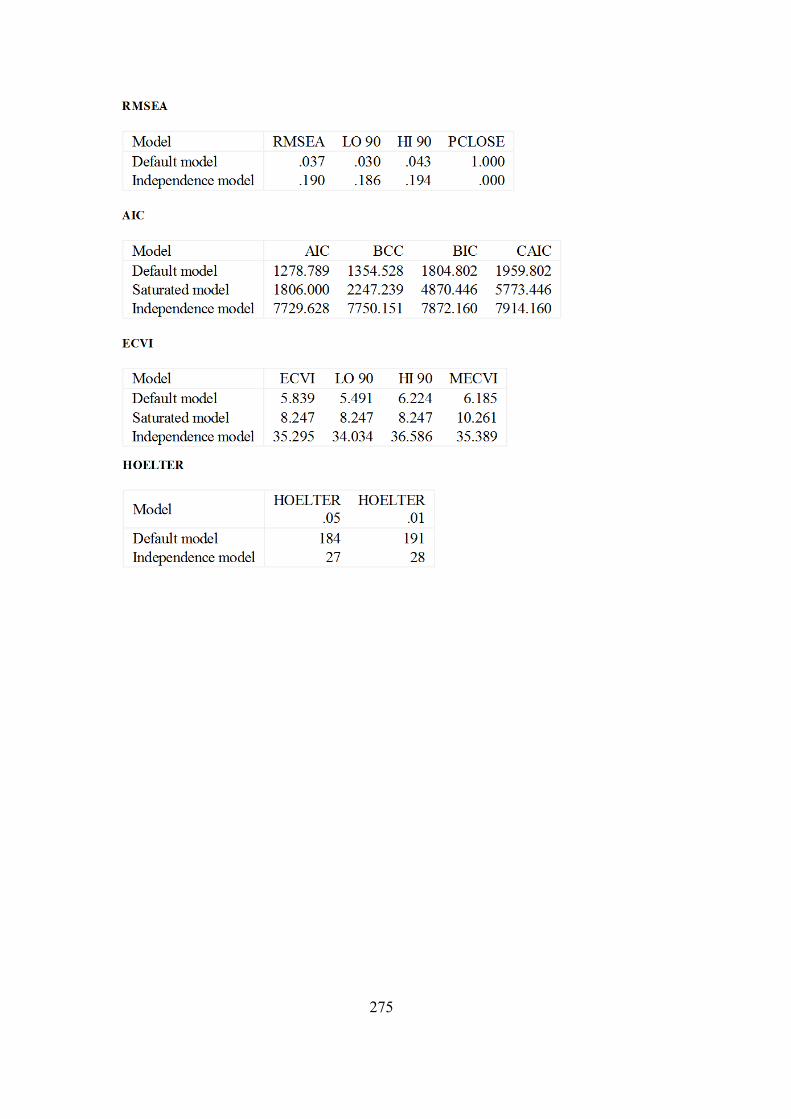
275
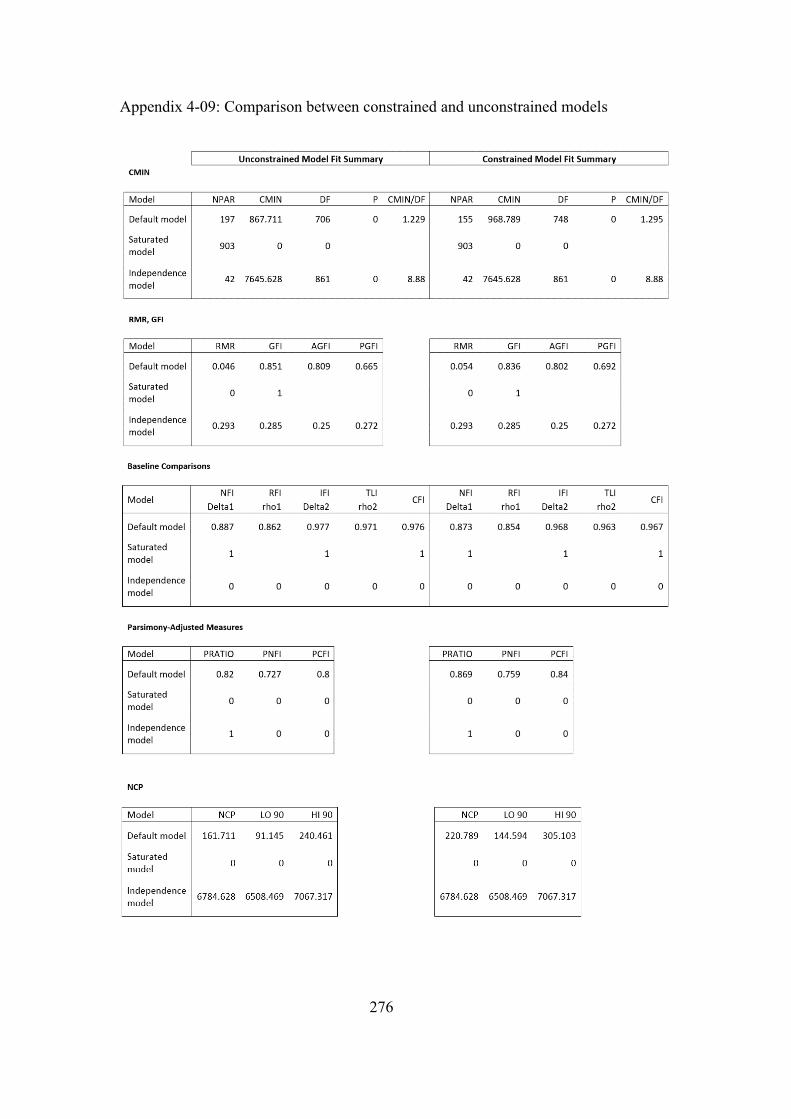
276
Appendix 4-09: Comparison between constrained and unconstrained models
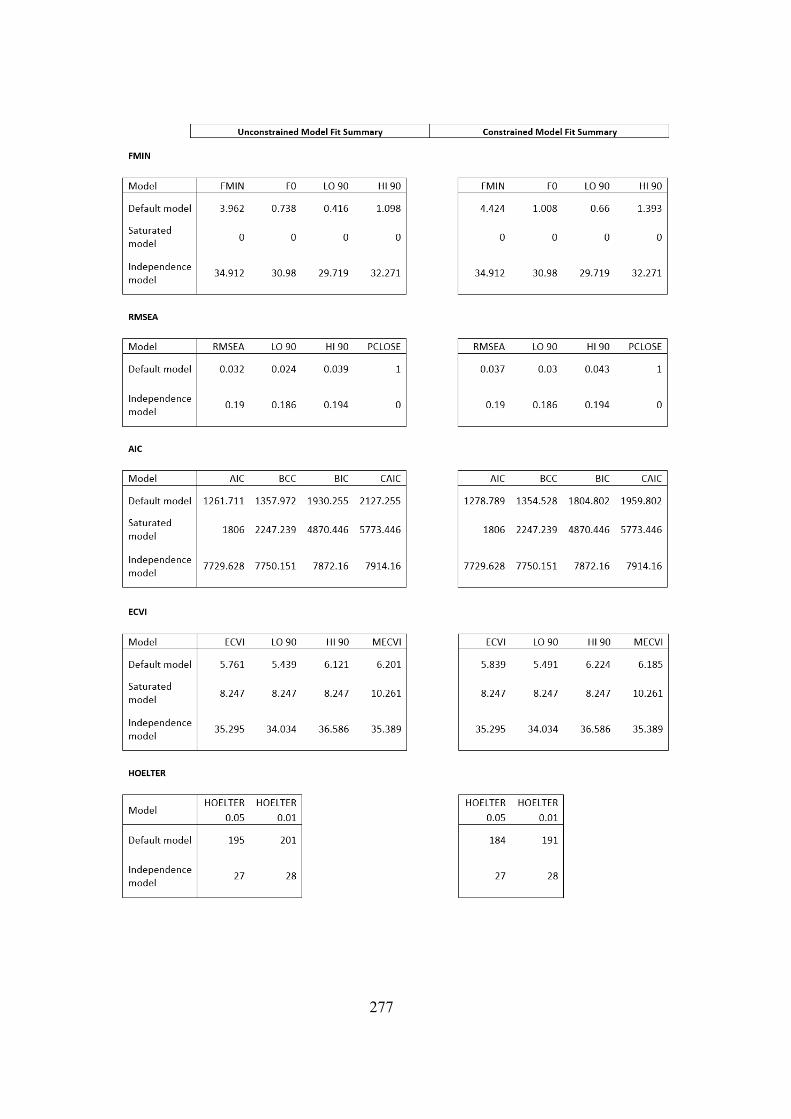
277
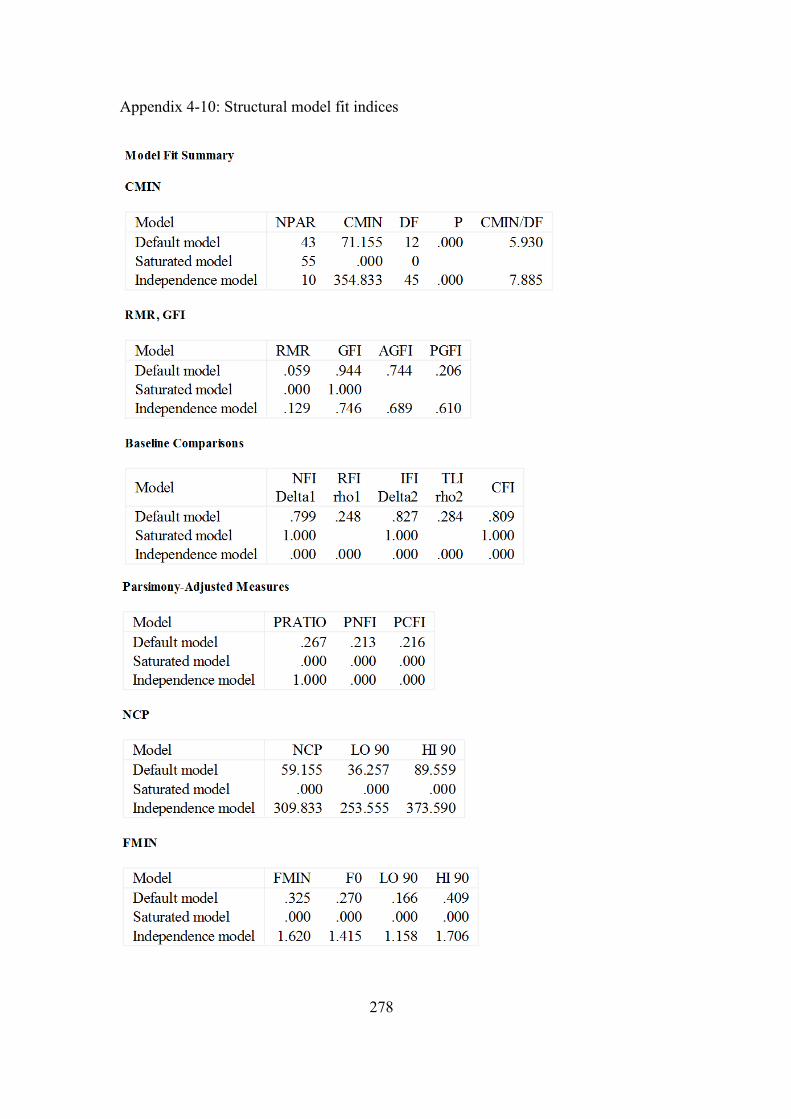
278
Appendix 4-10: Structural model fit indices
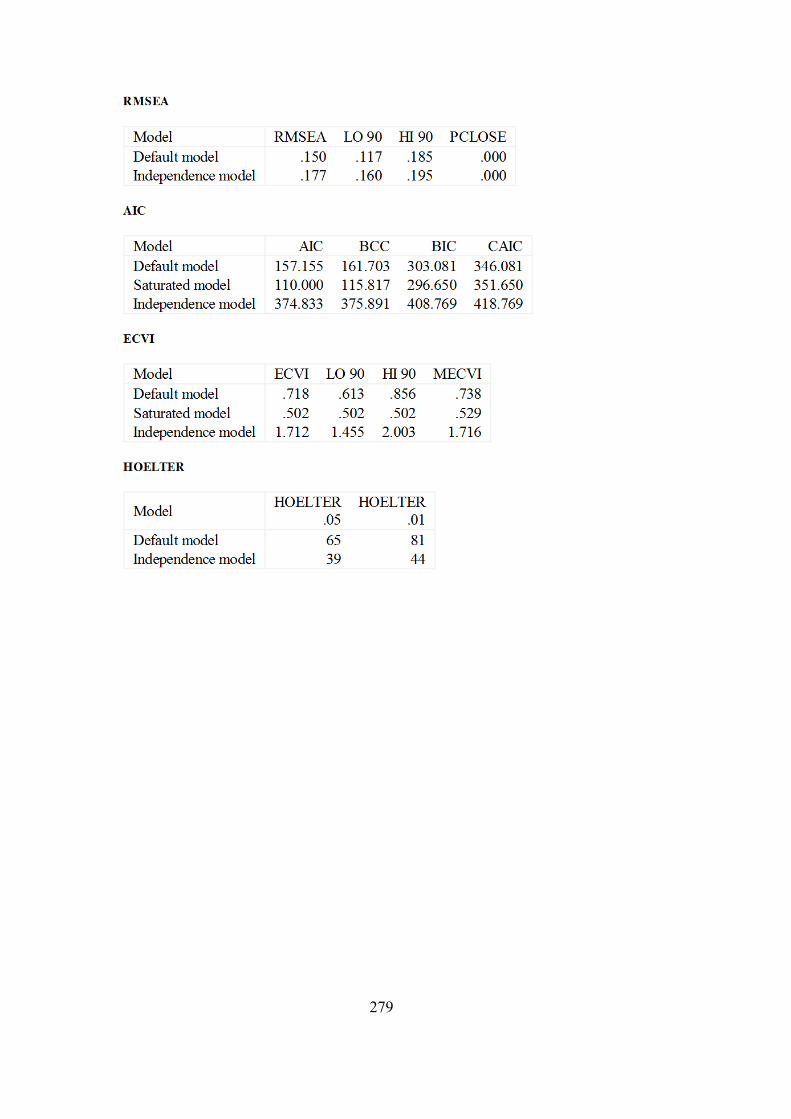
279