MEASURING PROGRESS IN URBAN CLIMATE CHANGE ...
42
MEASURING PROGRESS IN URBAN CLIMATE CHANGE ADAPTATION Monitoring - Evaluating - Reporting Framework January 2019
-
Upload
khangminh22 -
Category
Documents
-
view
0 -
download
0
Transcript of MEASURING PROGRESS IN URBAN CLIMATE CHANGE ...
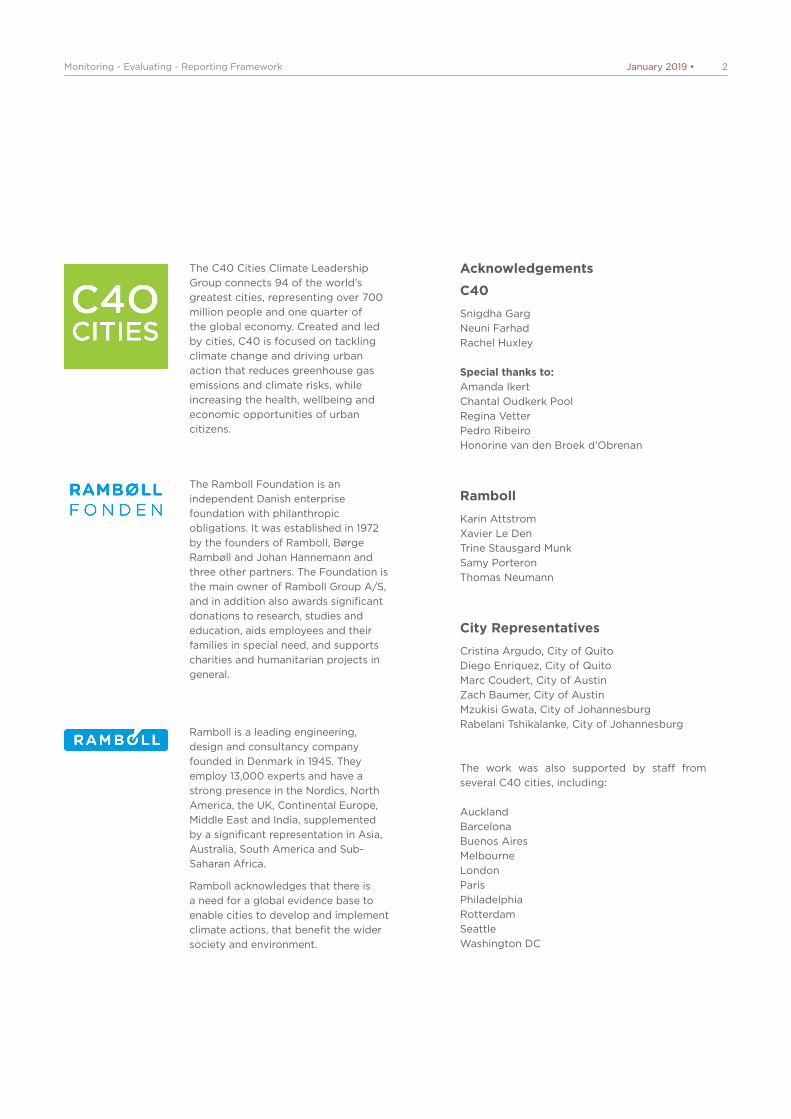
MEASURING PROGRESS IN URBAN CLIMATE CHANGE ADAPTATIONMonitoring - Evaluating - Reporting Framework
January 2019
2Monitoring - Evaluating - Reporting Framework January 2019 •
The C40 Cities Climate Leadership Group connects 94 of the world’s greatest cities, representing over 700 million people and one quarter of the global economy. Created and led by cities, C40 is focused on tackling climate change and driving urban action that reduces greenhouse gas emissions and climate risks, while increasing the health, wellbeing and economic opportunities of urban citizens.
The Ramboll Foundation is an independent Danish enterprise foundation with philanthropic obligations. It was established in 1972 by the founders of Ramboll, Børge Rambøll and Johan Hannemann and three other partners. The Foundation is the main owner of Ramboll Group A/S, and in addition also awards significant donations to research, studies and education, aids employees and their families in special need, and supports charities and humanitarian projects in general.
Acknowledgements
C40
Snigdha GargNeuni FarhadRachel Huxley
Special thanks to:Amanda IkertChantal Oudkerk PoolRegina VetterPedro RibeiroHonorine van den Broek d’Obrenan
Ramboll
Karin AttstromXavier Le DenTrine Stausgard MunkSamy PorteronThomas Neumann
City Representatives
Cristina Argudo, City of QuitoDiego Enriquez, City of QuitoMarc Coudert, City of AustinZach Baumer, City of AustinMzukisi Gwata, City of JohannesburgRabelani Tshikalanke, City of Johannesburg
The work was also supported by staff from several C40 cities, including:
AucklandBarcelonaBuenos AiresMelbourneLondonParisPhiladelphiaRotterdamSeattleWashington DC
Ramboll is a leading engineering, design and consultancy company founded in Denmark in 1945. They employ 13,000 experts and have a strong presence in the Nordics, North America, the UK, Continental Europe, Middle East and India, supplemented by a significant representation in Asia, Australia, South America and Sub-Saharan Africa.
Ramboll acknowledges that there is a need for a global evidence base to enable cities to develop and implement climate actions, that benefit the wider society and environment.
3Monitoring - Evaluating - Reporting Framework January 2019 •
01 Purpose of the framework 6
02 The Climate Change Adaptation MER framework 7
2.1 Purposes of CCA MER 9
2.2 Challenges of CCA MER 9
03 How to develop a CCA MER framework in your city 11
3.1 Target hazards 12
3.2 Formulate impact 13
3.3 Develop intervention logic 14
3.4 Define indicators 16
3.5 Collect data 17
3.6 Report 18
3.7 Evaluate 19
04 Key considerations when implementing CCA MER framework in your city 21
4.1 Governance 22
4.2 Resources 22
4.3 Inclusivity 22
05 Conclusion 23
References 24
Indicator Matrix Manual 25
Indicator Matrix 33
CONTENTS
FiguresFigure 1 | Climate Adaptation Planning and MER
Figure 2 | Objectives of monitoring, evaluation and reporting on urban climate adaptation
Figure 3 | Steps of the MER
Figure 4 | Five common climate change hazards
Figure 5 | Definitions of risk, exposure, vulnerability and adaptive capacity.
Figure 6 | Intervention Logic – Unpacking the Logic
Figure 7 | Definition and example of intervention logic components
Figure 8 | Examples of intervention logics, and illustration of the risk of missing logical steps
Figure 9 | Example of an intervention logic with indicators for output, outcome and impact
Figure 10 | Data Collection Matrix, example from Quito action in ravines with draining systems
Figure 11 | Example of a reporting tool for results monitoring
Figure 12 | Evaluation criteria and related evaluation questions

4Monitoring - Evaluating - Reporting Framework January 2019 •
C40 C40 Cities Climate Leadership Group.
CCA Climate Change Adaptation.
MER Monitoring, Evaluating and Reporting.
Action Any policy, programme, or investment initiated by urban public officials with the intention of contributing to climate adaptation.
Adaptive The combination of all the strengths, attributes and resources available within an organization, capacity community or society to manage and reduce disaster risks and strengthen resilience.
Evaluating Evaluation helps city officials to understand the changes identified over time, in line with the defined indicators and against the baseline. Contrary to monitoring, which is an ongoing activity, evaluation should be conducted periodically.
Exposure The situation of people, infrastructure, housing, production capacities and other tangible human assets located in hazard-prone areas.
Impact The medium- or long-term effect of the outcome.
Monitoring Monitoring is a continuous function that uses the systematic collection of data on specified indicators to provide management of an ongoing intervention.
Outcome The change generated by the output or multiple outputs. It is necessary for the intended impact to occur and is generally not under the direct control of the projector intervention.
Output The circumstance produced by an action, such as a service, facility, infrastructure or financial tool. The output is an improvement from the initial situation or baseline.
Reporting Reporting on CCA means presenting the data and analysis compiled during the monitoring to stakeholders for information or knowledge-sharing.
Risk Risk depends on the likelihood (sometimes referred as probability) of an event, multiplied with the hazards impacts (sometimes referred as consequences).
Vulnerability The conditions determined by physical, social, economic and environmental factors or processes that increase the susceptibility of an individual, a community, assets or systems to the impacts of hazards.
GLOSSARY

5Monitoring - Evaluating - Reporting Framework January 2019 •B
arce
lona
, Erw
an H
esry
, Uns
pla
h
6Monitoring - Evaluating - Reporting Framework January 2019 •
01 PURPOSE OF THE FRAMEWORK
In order to assess the impacts and success of their climate change adaptation plans, cities must monitor and evaluate the results of their adaptation actions. Indeed, one of the crucial components of C40’s Deadline 2020 climate action planning programme is the monitoring and evaluation of cities’ climate change actions. However, the outcomes and impacts of climate change adaptation actions are difficult to track and monitor, and there is a lack of sufficient adaptation monitoring tools. As a result, cities face a significant challenge in determining the success or failure of their adaptation actions. This presents a barrier to making a case for adaptation, securing funding and implementing plans as effectively as possible.
C40’s Climate Change Adaptation Monitoring, Evaluation and Reporting (CCA MER) Framework paves the way towards this goal. It is intended to help cities “make the case” for climate adaptation and assist and incentivise targeted climate change adaptation initiatives for C40 and non-C40 cities. The Framework consists of three main components – a guide to measuring progress in Climate Change Adaptation, an indicator matrix and a manual on using the matrix.
The Guide provides step-by-step guidance on the process of developing and implementing a MER framework for city practitioners. There is no prescriptive, one-size-fits all solution for designing and implementing a CCA MER framework. This guide is based on a review of several guidelines and approaches that have been developed in the past years.1 It is neither intended to replace nor copy those guidelines, but rather to complement them by providing concrete guidance to cities to structure their process for developing and implementing a CCA MER.
A guiding principle of the CCA MER is that it should help cities ensure Inclusive Climate Action, through addressing the Inclusivity of Impact: equitable distribution of the impact of climate programmes, actions and policies together with indicators that support monitoring and evaluation.
The Indicator Matrix presents a list of key adaptation actions undertaken by cities across the globe. It provides example indicators to track the success of these actions. These are intended as a support to C40 cities in the development of their own city-specific indicators. Where cities adopt
the same indicators, it may also be possible to collect and compare data across cities, should this be deemed relevant and feasible by the participants.
The Indicator Matrix Manual is a user manual for the indicator matrix to help cities apply the matrix to their city.
Importantly, the framework has been developed in collaboration with cities and for cities. Initial interviews were conducted with C40 cities engaged in adaptation monitoring to collect the lessons learned and explore the different approaches used. The guidance material and process has been piloted in three C40 cities – Quito (Ecuador), Johannesburg (South Africa), and Austin (USA). The framework and indicators address and acknowledge the high level of diversity in C40 Cities. A wide variety of cities should therefore be able to use these tools and guidelines to create an appropriate framework for their unique situation, capacities (technical skills, data availability and resources) and information needs.
How the framework is structured
This framework is structured as follows:
> Chapter 2 introduces the CCA MER Framework
> Chapter 3 takes the reader through key steps in developing a MER framework
> Chapter 4 presents key considerations in developing a CCA MER framework
> Chapter 5 provides lessons learned and ways forward
> The Indicator matrix manual provides step by step guidance to use the indicator matrix
> The indicator matrix provides a list of indicators for different hazards and guidance on using them.
1 See references
7Monitoring - Evaluating - Reporting Framework January 2019 •Q
uito
, Xen
akia
, i-s
tock
.
02 THE CLIMATE CHANGE ADAPTATION MER FRAMEWORK
8Monitoring - Evaluating - Reporting Framework January 2019 •
02 THE CLIMATE CHANGE ADAPTATION MER FRAMEWORK
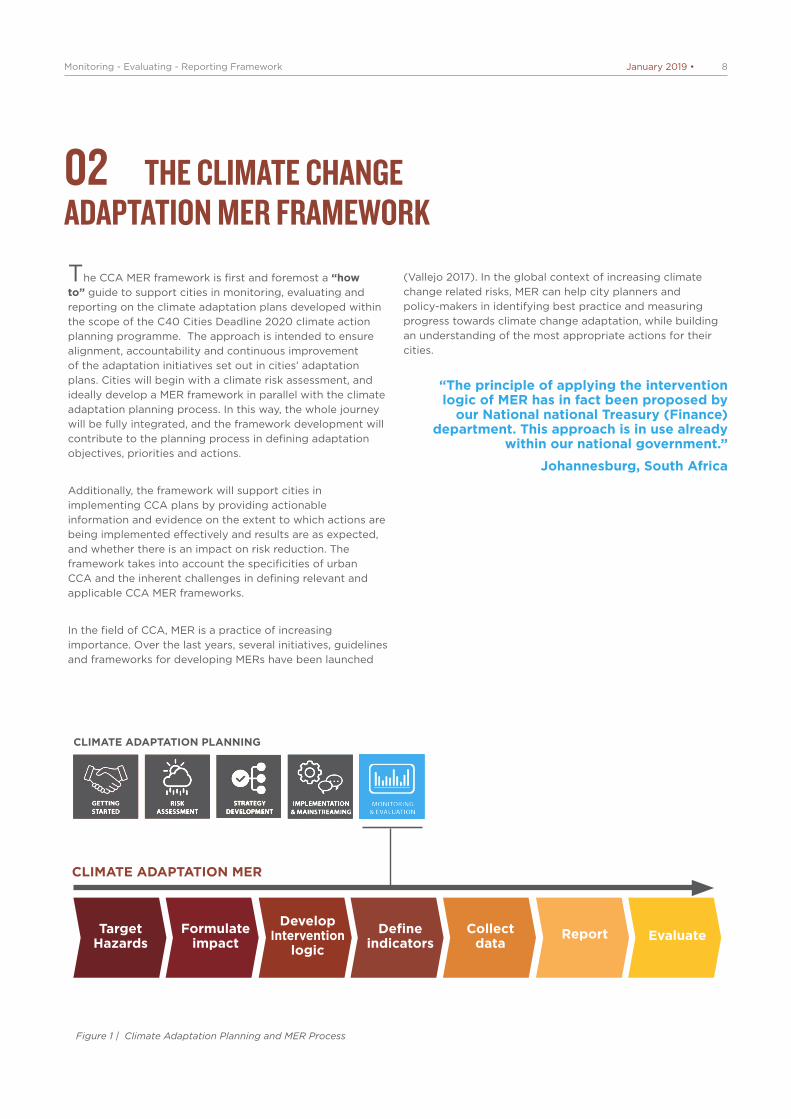
The CCA MER framework is first and foremost a “how to” guide to support cities in monitoring, evaluating and reporting on the climate adaptation plans developed within the scope of the C40 Cities Deadline 2020 climate action planning programme. The approach is intended to ensure alignment, accountability and continuous improvement of the adaptation initiatives set out in cities’ adaptation plans. Cities will begin with a climate risk assessment, and ideally develop a MER framework in parallel with the climate adaptation planning process. In this way, the whole journey will be fully integrated, and the framework development will contribute to the planning process in defining adaptation objectives, priorities and actions.
Additionally, the framework will support cities in implementing CCA plans by providing actionable information and evidence on the extent to which actions are being implemented effectively and results are as expected, and whether there is an impact on risk reduction. The framework takes into account the specificities of urban CCA and the inherent challenges in defining relevant and applicable CCA MER frameworks.
In the field of CCA, MER is a practice of increasing importance. Over the last years, several initiatives, guidelines and frameworks for developing MERs have been launched
(Vallejo 2017). In the global context of increasing climate change related risks, MER can help city planners and policy-makers in identifying best practice and measuring progress towards climate change adaptation, while building an understanding of the most appropriate actions for their cities.
CLIMATE ADAPTATION MER
CLIMATE ADAPTATION PLANNING
Figure 1 | Climate Adaptation Planning and MER Process
“The principle of applying the intervention logic of MER has in fact been proposed by
our National national Treasury (Finance) department. This approach is in use already
within our national government.”
Johannesburg, South Africa
Target Hazards
Formulate impact
Develop Intervention
logicDefine
indicatorsCollect
dataReport Evaluate
9Monitoring - Evaluating - Reporting Framework January 2019 •
1 | Purposes of CCA MER
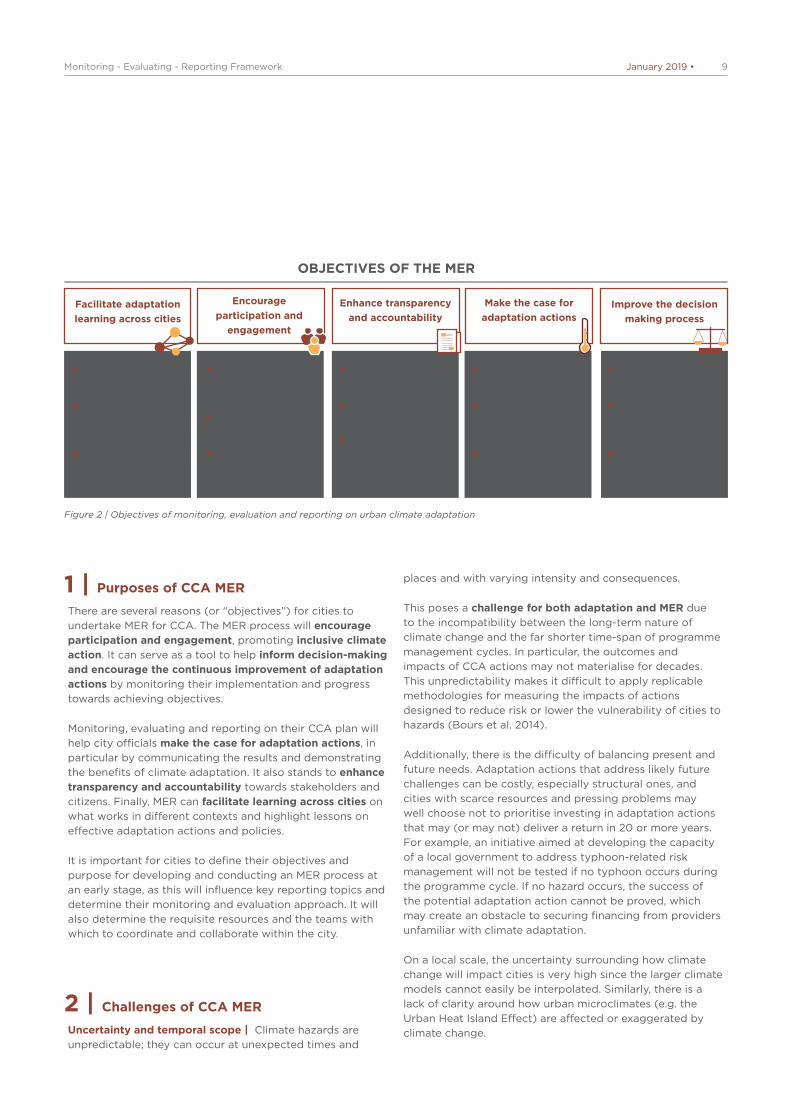
There are several reasons (or “objectives”) for cities to undertake MER for CCA. The MER process will encourage participation and engagement, promoting inclusive climate action. It can serve as a tool to help inform decision-making and encourage the continuous improvement of adaptation actions by monitoring their implementation and progress towards achieving objectives.
Monitoring, evaluating and reporting on their CCA plan will help city officials make the case for adaptation actions, in particular by communicating the results and demonstrating the benefits of climate adaptation. It also stands to enhance transparency and accountability towards stakeholders and citizens. Finally, MER can facilitate learning across cities on what works in different contexts and highlight lessons on effective adaptation actions and policies.
It is important for cities to define their objectives and purpose for developing and conducting an MER process at an early stage, as this will influence key reporting topics and determine their monitoring and evaluation approach. It will also determine the requisite resources and the teams with which to coordinate and collaborate within the city.
2 | Challenges of CCA MER
Uncertainty and temporal scope | Climate hazards are unpredictable; they can occur at unexpected times and
places and with varying intensity and consequences.
This poses a challenge for both adaptation and MER due to the incompatibility between the long-term nature of climate change and the far shorter time-span of programme management cycles. In particular, the outcomes and impacts of CCA actions may not materialise for decades. This unpredictability makes it difficult to apply replicable methodologies for measuring the impacts of actions designed to reduce risk or lower the vulnerability of cities to hazards (Bours et al. 2014).
Additionally, there is the difficulty of balancing present and future needs. Adaptation actions that address likely future challenges can be costly, especially structural ones, and cities with scarce resources and pressing problems may well choose not to prioritise investing in adaptation actions that may (or may not) deliver a return in 20 or more years. For example, an initiative aimed at developing the capacity of a local government to address typhoon-related risk management will not be tested if no typhoon occurs during the programme cycle. If no hazard occurs, the success of the potential adaptation action cannot be proved, which may create an obstacle to securing financing from providers unfamiliar with climate adaptation.
On a local scale, the uncertainty surrounding how climate change will impact cities is very high since the larger climate models cannot easily be interpolated. Similarly, there is a lack of clarity around how urban microclimates (e.g. the Urban Heat Island Effect) are affected or exaggerated by climate change.
Figure 2 | Objectives of monitoring, evaluation and reporting on urban climate adaptation
Facilitate adaptation learning across cities
> Engage city departments and key actors in the process
> Promote inclusive climate action
> Facilitate cross sectoral adaptation policy
> Provide a platform for knowledge exchange
> Understand actions and results from different cities
> Draw lessons learned from around the world
> Identify successful adaptation approaches
> Collect lessons learned to make informed decisions
> Contribute to building an evidence base
> Monitor the use of city resources
> Communicate on what has been achieved
> Hold the city accountable towards citizens and stakeholders
> Communicate on results
> Demonstrate the end-benefits of invest in adaptation
> Unlock budget for adaptation
Make the case for adaptation actions
Encourage participation and
engagement
Improve the decision making process
Enhance transparency and accountability
OBJECTIVES OF THE MER

10Monitoring - Evaluating - Reporting Framework January 2019 •
This poses a significant challenge to adaptation efforts linked directly to the uncertain nature of climate change at local level, since effective adaptation must be based on a good understanding of what makes cities and citizens either vulnerable or resilient to particular climate change impacts (United Nations Human Settlements Programme 2011).
Diversity of adaptation actions | As climate change impacts nearly every sector of society, adaptation actions must offer a high level of diversity. In addition to the adaptation actions outlined within a city’s adaptation plan, several city departments (and other actors such as the private sector or residents) may undertake actions that influence climate risks – knowingly or unknowingly. The city department responsible for the Climate Adaptation Plan’s MER will not necessarily be aware of those actions. This renders city-wide monitoring of changes in risk difficult, as it may not be possible to attribute any positive changes to the actions within the Climate Adaptation Plan. This makes it harder to definitively state whether an initiative has been successful. For this reason, it is crucial to involve relevant city departments in the MER process to understand how their activities can impact on CCA actions, their outputs, outcomes and impacts.
No single metric | Compared to climate change mitigation, adaptation cannot be measured with a single metric such as greenhouse gas emission reduction. Each CCA action has its own specific outputs and outcomes, requiring tailored indicators, as suggested by Brooks et al. (2011). In order to support cities in addressing this challenge, a set of indicators is provided with this guide. These can be used or tailored to monitor various CCA actions and their results.
Overall, these challenges make the role of MER all the more crucial. Using an appropriate set of MER tools and resources, cities can overcome a significant portion of these challenges and contribute towards making their city more adaptable to the impacts of climate change.
Monitoring, Evaluating and Reporting Workshop in Austin, US.
‘‘The collaborative process with other cities was informative, productive and made the work
easier.” Austin, USA

11Monitoring - Evaluating - Reporting Framework January 2019 •Jo
hann
esb
urg
, Fra
nk v
an d
en B
erg
h
03 HOW TO DEVELOP A CCA MER FRAMEWORK IN YOUR CITY
12Monitoring - Evaluating - Reporting Framework January 2019 •
03 HOW TO DEVELOP A CCA MER FRAMEWORK IN YOUR CITY
While this guide presents a step-by-step approach to developing a CCA MER framework, it is important to emphasise that the development of a MER framework is an iterative process. It is vital to allow enough time and space for the development process to go back and forth between the steps, in order to ensure that the final CCA MER framework really adds value to the adaptation work in the city.
Hazards should be monitored on an ongoing basis. Information about past and future hazards should also be collected when creating a city’s MER. This helps to understand the severity of the events relative to the level of damage observed, whether the risk could be reduced to acceptable levels due to adaptation actions, and evaluate their effectiveness.
For guidance in developing a city risk assessment please in line with Global Covenant of Mayors and C40 Cities requirements, please see: C40’s Climate Risk Assessment Guide.
Austin, USA has an adaptation plan structured on operations and assets. The MER development process was considered almost ‘‘seamless” and the city’s adaptation plan could easily be integrated into the suggested MER framework.
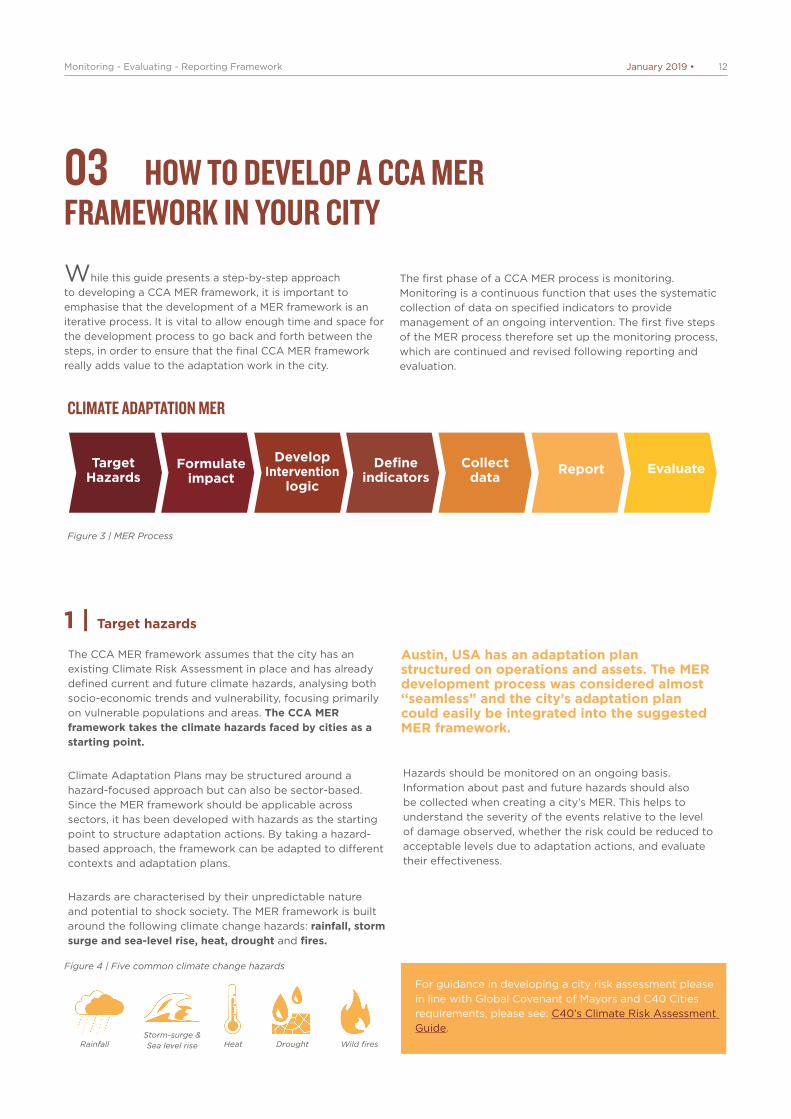
1 | Target hazards
The CCA MER framework assumes that the city has an existing Climate Risk Assessment in place and has already defined current and future climate hazards, analysing both socio-economic trends and vulnerability, focusing primarily on vulnerable populations and areas. The CCA MER framework takes the climate hazards faced by cities as a starting point.
Climate Adaptation Plans may be structured around a hazard-focused approach but can also be sector-based. Since the MER framework should be applicable across sectors, it has been developed with hazards as the starting point to structure adaptation actions. By taking a hazard-based approach, the framework can be adapted to different contexts and adaptation plans.
Hazards are characterised by their unpredictable nature and potential to shock society. The MER framework is built around the following climate change hazards: rainfall, storm surge and sea-level rise, heat, drought and fires.
Figure 3 | MER Process
RainfallStorm-surge & Sea level rise Heat Drought Wild fires
Figure 4 | Five common climate change hazards
CLIMATE ADAPTATION MER
Target Hazards
Formulate impact
Develop Intervention
logic
Define indicators
Collect data Report Evaluate
The first phase of a CCA MER process is monitoring. Monitoring is a continuous function that uses the systematic collection of data on specified indicators to provide management of an ongoing intervention. The first five steps of the MER process therefore set up the monitoring process, which are continued and revised following reporting and evaluation.

13Monitoring - Evaluating - Reporting Framework January 2019 •
2 | Formulate intended impact
Impact is defined by the long-term positive effects that the city wants to achieve by implementing its adaptation actions, i.e. the risk reduction achieved by the actions. It is important that the CCA MER framework measures the achievements of adaptation in relation to the city’s most serious climate risks.
Adaptation actions should aim to reduce risk from climate hazards. The C40 CCA MER framework defines risk based on the IPCC terminology on AR5 Climate Change 2014 and hazards impacts on UNISDR terminology on disaster risk reduction (2017). Risk depends on the likelihood (also sometimes referred to as probability) of an event, multiplied with the hazards impacts (also sometimes referred as consequences), as represented in the graphic below.
Climate adaptation actions are designed to reduce the “consequence” of climate change, and are either targeted at the exposure, vulnerability or capacity or a combination thereof. It is useful to consider the primary purpose or
Definitions | Developed by Ramboll based on IPCC (2014) and UNISDR (2017)
Climate Risk Hazard Exposure VulnerabilityAdaptive capacity
Exposure : The situation of people, infrastructure, housing, production capacities and other tangible human assets located in hazard-prone areas. There are various ways to reduce exposure: eg. the extent, the velocity, the degree, etc...
Climate risk: Risk depends on the likelihood (also sometimes referred as probability) of an event, multiplied with the hazards impacts (also sometimes referred as consequences).
Vulnerability : The conditions determined by physical, social, economic and environmental factors or processes that increase the susceptibility of an individual, a community, assets or systems to the impacts of hazards. There are various ways to reduce exposure: eg. improving structural stability or material, flood-proofing assets, etc...
Adaptive capacity : The combination of all the strengths, attributes and resources available within an organization, community or society to manage and reduce disaster risks and strengthen resilience : eg. early warning systems, emergency response, awareness, etc...
intended impact of the adaptation actions planned when developing the MER framework. Most CCA plans will require actions targeted at all three components to be effective, in order to reduce exposure, decrease vulnerability and strengthen capacity (see below), and each area or city will require a unique portfolio and combination of actions.
The MER framework should align with a city’s adaptation plan to clearly define the intended impact of the adaptation actions in terms of the reduction of the risks to the city’s people, assets or environment. Particular attention should be paid to the most vulnerable population groups, assets and the areas. Importantly, cities should take a risk-based approach to prioritising the most important impacts, to target through MER. It may be a high-level impact in terms of damages and loss of life due to the hazard, or a more narrowly defined impact relative to geographic locations, specific populations or economic activities. The priorities should reflect key considerations such as social equality and including the most vulnerable populations.

14Monitoring - Evaluating - Reporting Framework January 2019 •
3 | Develop the intervention logic
To develop a CCA MER framework, cities must define the “intervention logic” of the planned adaptation actions, based on their city’s adaptation plan. Sometimes also called a “theory of change” or “logic model”, the intervention logic clearly defines what an intervention or action aims to achieve and presents the causal chains for change to take place in a step-by-step approach, moving from one or multiple action(s) to their immediate output(s), followed by their outcome(s), and final impact(s).
The intervention logic supports the monitoring of how change occurs by making it possible to identify specific indicators to measure the intended output, outcome and impact. The intervention logic is the “backbone” of the CCA MER framework.
Developing a MER focused on risk reduction in Quito, Ecuador, helped officials to establish a link between adaptation actions and positive impacts in the city. This was unprecendented, as initiatives had previously been monitored using indicators with no connection to risk and vulnerability reduction.
In the CCA MER framework, the intervention logic is used to show the intended link from the climate-related hazard to the reduced risk of harmful effects through implementation of urban adaptation actions. The intervention logic contains the following key steps.
Figure 6 | Intervention Logic – Unpacking the Logic
CLIMATE ACTION IMPACT FRAMEWORK
Any policy, programme, or investment initiated by urban public officials with the intention of contributing to climate adaptation. (C40 & Ramboll 2018)
The circumstance produced by an action, such as a service, facility, infrastructure or financial tool. It should be under the direct control of the project, e.g. if the action is implemented, the output will occur. The output is an improvement from the initial situation or baseline. The city’s adaptation plan or supporting technical documentation should already define how outputs are designed, using a set of qualitative and quantitative specifications. (C40 & Ramboll 2018)
The change generated by the output or multiple outputs. It is necessary for the intended impact to occur and is generally not under the direct control of the projector intervention. At the outcome level, it is important to have conducted a climate hazard risk assessment for hazards to be effectively monitored and to evaluate the outcomes of adaptation actions with respect to the hazard. (C40 & Ramboll 2018)
The medium- or long-term effect of the outcome. Impacts of hazards can be categorised under the three pillars of sustainability, (World Summit 2005, Resolution 60/1 of the UN General Assembly) defined for the purpose of this framework as society (people), the economy (assets) and/or the environment (nature, including its intrinsic value as well the services it provides to society). (UNISDR, 2017, Terminology on disaster risk reduction)
ACTION OUPUT OUTCOME IMPACTS (Risk reduction)
The framework considers several types of impacts:
> As part of the societal impacts of climate hazards, cities should consider hazard impacts on people’s health. The incidence of diseases, injuries or fatalities is an example of health impacts on the population, and should be monitored.
> Economic impacts encompass the damage to assets
and related economic consequences of climate hazards, for instance the repair of these assets or disruption to their normal functions or services.
> Environmental impacts of climate hazards include negative effects on environmental quality, including flora and fauna, which may have an indirect social or economic impact.
15Monitoring - Evaluating - Reporting Framework January 2019 •
It is important that cities consider inclusivity and equity when defining the intervention logic, e.g. consider the distribution of impacts (who should be benefitting) and to what extent the actions planned are inclusive and take into account the needs of vulnerable groups.
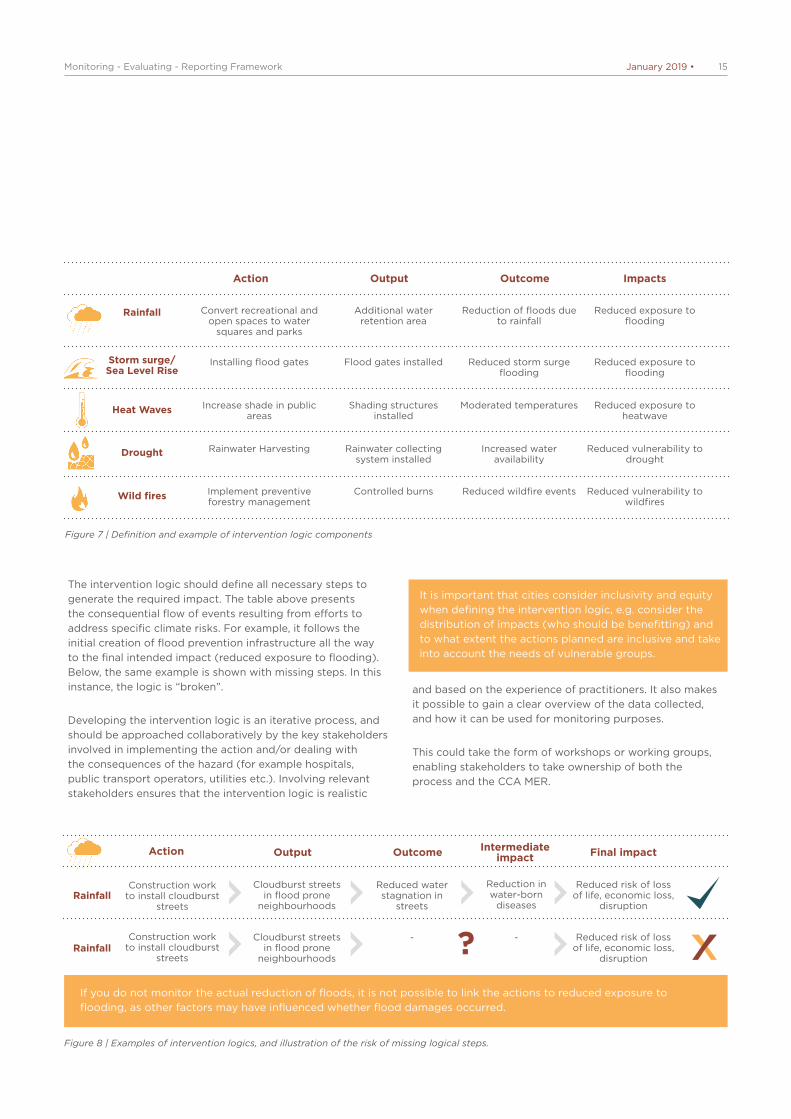
The intervention logic should define all necessary steps to generate the required impact. The table above presents the consequential flow of events resulting from efforts to address specific climate risks. For example, it follows the initial creation of flood prevention infrastructure all the way to the final intended impact (reduced exposure to flooding). Below, the same example is shown with missing steps. In this instance, the logic is “broken”.
Developing the intervention logic is an iterative process, and should be approached collaboratively by the key stakeholders involved in implementing the action and/or dealing with the consequences of the hazard (for example hospitals, public transport operators, utilities etc.). Involving relevant stakeholders ensures that the intervention logic is realistic
and based on the experience of practitioners. It also makes it possible to gain a clear overview of the data collected, and how it can be used for monitoring purposes.
This could take the form of workshops or working groups, enabling stakeholders to take ownership of both the process and the CCA MER.
Figure 8 | Examples of intervention logics, and illustration of the risk of missing logical steps.
Action
Construction work to install cloudburst
streets
Construction work to install cloudburst
streets
Cloudburst streets in flood prone
neighbourhoods
Cloudburst streets in flood prone
neighbourhoods
Reduced water stagnation in
streets
Reduction in water-born
diseases
- -
Reduced risk of loss of life, economic loss,
disruption
Reduced risk of loss of life, economic loss,
disruption
Rainfall
?Rainfall
Output Outcome Intermediate impact Final impact
Figure 7 | Definition and example of intervention logic components
Action
Convert recreational and open spaces to water
squares and parks
Additional water retention area
Reduction of floods due to rainfall
Reduced exposure to flooding
Increase shade in public areas
Shading structures installed
Moderated temperatures Reduced exposure to heatwave
Implement preventive forestry management
Controlled burns Reduced wildfire events Reduced vulnerability to wildfires
Installing flood gates Flood gates installed Reduced storm surge flooding
Reduced exposure to flooding
Rainwater Harvesting Rainwater collecting system installed
Increased water availability
Reduced vulnerability to drought
Rainfall
Storm surge/ Sea Level Rise
Drought
Heat Waves
Wild fires
Output Outcome Impacts
If you do not monitor the actual reduction of floods, it is not possible to link the actions to reduced exposure to flooding, as other factors may have influenced whether flood damages occurred.

16Monitoring - Evaluating - Reporting Framework January 2019 •
4 | Define the indicators
When the intervention logic has been defined, indicators to measure outputs, outcomes and impact must be developed and agreed. Indicators are the measures used to collect data on the achievements of the adaptation actions. Changes in output indicators are directly related to the implementation of adaptation actions and are important to assessing progress.
Outcome and impact indicators are less directly related to the adaptation actions, but strongly related to the hazards targeted by the adaptation actions. The outcome indicator must therefore be relative to the hazard, for example the percentage of rainfall that leads to unacceptable flooding.
The quality of indicators can be assessed through a structured rating, called CREAM. This entails recommends that indicators should be:
> Clear (precise and unambiguous);
> Relevant (appropriate to the subject at hand);
> Economic (available at reasonable cost);
> Accepted (Accepted as a relevant measure by stakeholders);
> Monitorable (Amenable to independent validation).
Figure 9 | Example of an intervention logic with indicators for output, outcome and impact.
Action
Volume of increased storage capacity m3
Measure of the outputs created by the action: -
Conversion of recreational and open
spaces to water squares and parks
% of heavy rainfall leading to unacceptable
flooding
May be a city-wide number or percentage decrease compared to
an initial baseline:
Additional water retention area
Reduced unacceptable flooding from heavy
rainfall
# of people displaced# of assets damaged
Cost of assets damaged ($)
Measure of avoided effects on people’s health and on assets or ecosystems. Effects can be
monetised:
Reduced exposure to flooding
Corresponding Indicator
Rainfall
Outputs Outcomes Impacts
When defining indicators, cities must consider data availability, and the potential associated challenges of performing MER when data is fragmented across various departments in the city.
As far as possible, cities should strive to use existing data already collected by different departments, as this may considerably ease the burden of data collection. To facilitate this, cities should involve stakeholders (relevant departments, utilities etc.) when developing and deciding on indicators.
In Quito, Ecuador, officials developed a set of indicators corresponding to the actions prioritised as well as their resources and capacity. Ideally, there should be sufficient indicators to reflect the impact of the actions and allow decision-makers to report the results with confidence. There is no recommended number of indicators as this depends on the city.
Target setting | While it can be challenging to set concrete targets due to changing climate variables and vulnerabilities, defining a clear goal is highly effective in gaining political support and adopting a focused approach to delivery.
Melbourne’s Urban Forest Strategy seeks to cool the city by 4°C. To deliver this outcome, the city has set a target to double its tree canopy cover by 2040, which is equivalent to 40% canopy cover in public spaces. To achieve this, city officials have estimated that it will be necessary to plant at least 3,000 trees annually.
Cities should therefore set targets for the output and outcome indicators. The targets should be considered indicative and should be viewed in relation to climate developments when analysing the results of the adaptation actions. The targets should, when relevant, include considerations regarding inclusiveness and equality. It is important to set realistic targets, and revise targets periodically, as the situation develops.
17Monitoring - Evaluating - Reporting Framework January 2019 •
5 | Data collection
To conduct the monitoring effectively, a plan should be developed to collect data in line with the indicators defined through the CCA MER framework. The plan will provide a complete overview for each indicator of what is being measured, the baseline and target, data sources and methods. It also specifies who will be collecting data, how frequently and to whom it will be reported.
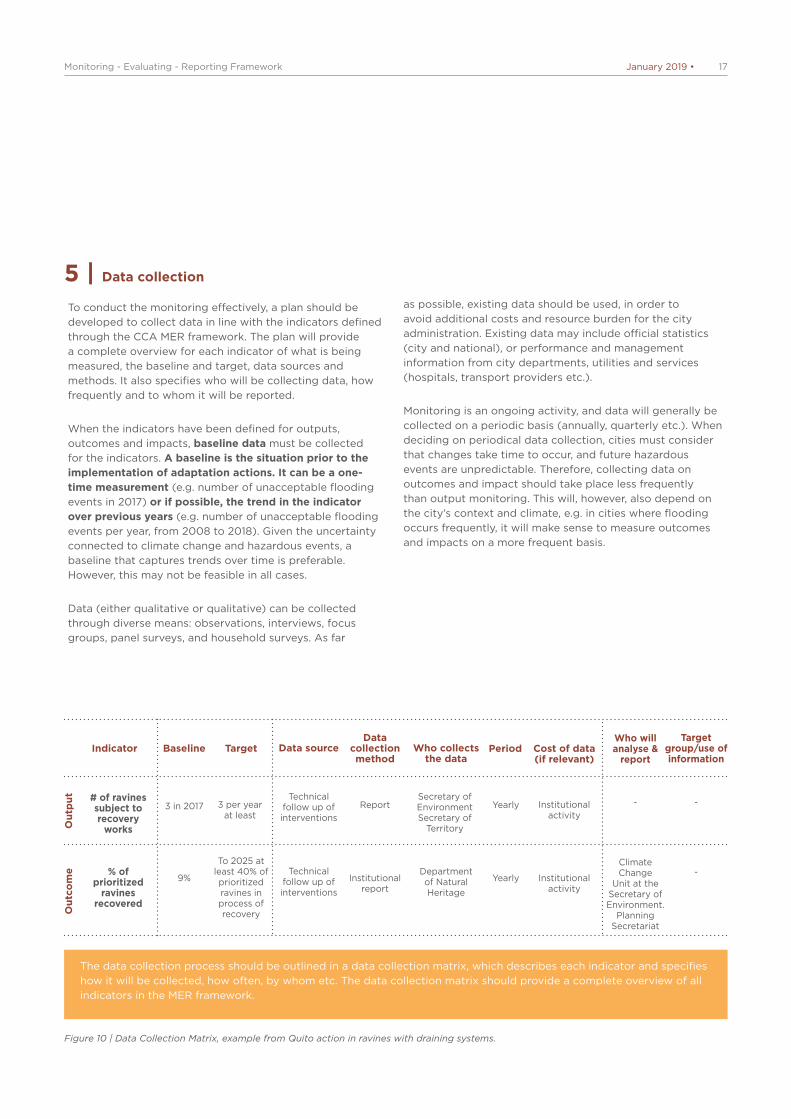
When the indicators have been defined for outputs, outcomes and impacts, baseline data must be collected for the indicators. A baseline is the situation prior to the implementation of adaptation actions. It can be a one-time measurement (e.g. number of unacceptable flooding events in 2017) or if possible, the trend in the indicator over previous years (e.g. number of unacceptable flooding events per year, from 2008 to 2018). Given the uncertainty connected to climate change and hazardous events, a baseline that captures trends over time is preferable. However, this may not be feasible in all cases.
Data (either qualitative or qualitative) can be collected through diverse means: observations, interviews, focus groups, panel surveys, and household surveys. As far
as possible, existing data should be used, in order to avoid additional costs and resource burden for the city administration. Existing data may include official statistics (city and national), or performance and management information from city departments, utilities and services (hospitals, transport providers etc.).
Monitoring is an ongoing activity, and data will generally be collected on a periodic basis (annually, quarterly etc.). When deciding on periodical data collection, cities must consider that changes take time to occur, and future hazardous events are unpredictable. Therefore, collecting data on outcomes and impact should take place less frequently than output monitoring. This will, however, also depend on the city’s context and climate, e.g. in cities where flooding occurs frequently, it will make sense to measure outcomes and impacts on a more frequent basis.
Figure 10 | Data Collection Matrix, example from Quito action in ravines with draining systems.
# of ravines subject to recovery
works
Technical follow up of interventions
Secretary of Environment Secretary of
Territory
3 in 2017 3 per year at least
Report Yearly Institutional activity
- -
-% of prioritized
ravines recovered
Technical follow up of interventions
Department of Natural Heritage
9%
To 2025 at least 40% of prioritized ravines in process of recovery
Institutional report
Yearly Institutional activity
Climate Change
Unit at the Secretary of Environment.
Planning Secretariat
Out
put
Indicator Data source Who collects the data
Baseline TargetData
collection method
Period Cost of data (if relevant)
Who will analyse &
report
Target group/use of information
Out
com
e
The data collection process should be outlined in a data collection matrix, which describes each indicator and specifies how it will be collected, how often, by whom etc. The data collection matrix should provide a complete overview of all indicators in the MER framework.
18Monitoring - Evaluating - Reporting Framework January 2019 •
6 | Reporting
Reporting on CCA means presenting the data and analysis compiled during the monitoring to stakeholders for information or knowledge-sharing. Many diverse stakeholders are implicated by CCA, ranging from citizens and politicians to funders. It is therefore beneficial for cities to consider who their main target audience(s) is/are and how MER should be used. Depending on the target audience of the reporting, it can have different purposes:
> Public reporting communicates progress on CCA, making the city accountable for its activities to the public and helping to increase investors’ confidence. It can allow for knowledge-sharing between cities and with experts, potentially allowing comparisons across different years and/or different cities, depending on the level of detail.
> Internal or direct reporting informs city stakeholders (such as other city departments) and can facilitate cross-departmental exchanges and collaboration on CCA actions. It also stimulates institutional learning and improvement.
Reporting can be pre-determined under a reporting plan detailing the reporting structure and process or procedures. The plan should include in what format data should be reported, to whom, at what intervals and for what purpose. The reporting plan can be part of the city’s Climate Adaptation Plan, as its objective is to consistently inform stakeholders on the progress on the adaptation plan. Ideally, cities should aim to integrate the MER reporting within their strategic planning and reporting systems.
In Austin, Texas, city officials have merged the MER indicators into the city’s Strategic Direction 2023 plan, in order to make sure the council is aware of the CCA efforts and staff are held accountable.
The content or form of the reporting can vary. It can include reports on the implementation of CCA, or regular (quarterly/biannual/annually) monitoring reports on results of CCA actions.
The real value of MER is visible over time, when performance against baselines and targets has been tracked and reported for a number of years. It is therefore important to establish and maintain a robust data reporting plan, in order to maximise the benefits of keeping historical datasets. However, the frequency and content of reporting should not be excessive, in order to avoid reporting fatigue.
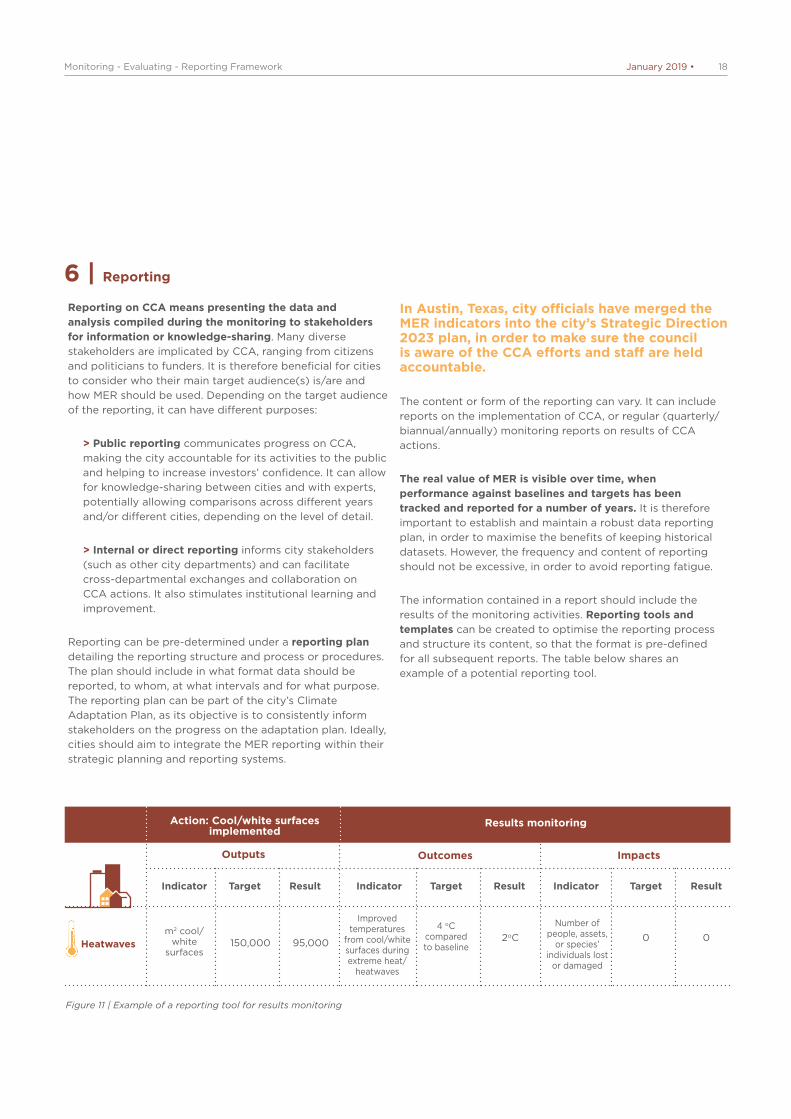
The information contained in a report should include the results of the monitoring activities. Reporting tools and templates can be created to optimise the reporting process and structure its content, so that the format is pre-defined for all subsequent reports. The table below shares an example of a potential reporting tool.
Indicator
m2 cool/white
surfaces
Indicator
Improved temperatures
from cool/white surfaces during extreme heat/
heatwaves
Indicator
Number of people, assets,
or species’ individuals lost
or damaged
Target
150,000
Target
4 oC compared to baseline
Target
0
Result
95,000
Result
2oC
Result
0Heatwaves
Outputs Outcomes Impacts
Figure 11 | Example of a reporting tool for results monitoring
Action: Cool/white surfaces implemented
Results monitoring

19Monitoring - Evaluating - Reporting Framework January 2019 •
7 | Evaluation : data processing
Evaluation helps city officials to understand the changes identified over time, in line with the defined indicators and against the baseline. Contrary to monitoring, which is an ongoing activity, evaluation should be conducted periodically and answers questions such as “how and why did the change occur?” as well as “did the change occur due to the action or to other factors?”.
In this sense, evaluation goes deeper than monitoring to assess causality between the action and the effects observed. To draw out the benefits of CCA, attention must be paid to the baseline, targets, metrics and methodology of the monitoring and evaluation framework, all of which should be tailored to the context and support a specific set of objectives. Given the unpredictability of climate-related events and their unpredictable impacts, evaluation should be conducted based on the monitoring of hazard events, in order to compare their intensity with other similar events. To understand the potential benefits of actions in the absence of a hazard, modelling can be used to predict different scenarios of actions and potential impacts for hazards of variable intensities. For instance, this could entail comparing scenarios where no action would be taken (and the associated consequences), with scenarios of actions of varying scales (and the consequent benefits).
Evaluation also provides the opportunity to analyse outputs and outcomes at the wider city level. For example, to address extreme heat a city may implement multiple actions to increase green cover such as tree planting or creating more parks. However the overall change in city’s green cover will also depend on individual and private sector actions. Citizens may also plant trees within their gardens and private companies may convert brownfield sites to green
spaces. These are actions which a local city government may not have control over, but still contribute to the overall green cover of a city. Therefore, evaluation is a stage where the city could assess the green cover of the whole city, which includes city and private sector actions. This would also account for any losses to green cover within the city and provide an overall picture of progress.
Evaluating an action also provides an opportunity to assess its inclusivity by determining its impacts on different population groups affected by climate hazards and adaptation actions. In particular, the evaluation can assess the impact on the populations most vulnerable to hazards, who are often among the most disadvantaged citizens (the poor, elderly, etc.). In this way, the evaluation should seek to identify the extent to which the action has contributed to improving or worsening the situation of vulnerable populations. This may be related to reducing their exposure to risk, or assessing the broader (non-climate related) impacts of the actions on these populations.
Evaluation often takes the form of a dedicated study and follows a different process to the one used for monitoring. The evaluation process should be participatory in the sense that it collects the voices of stakeholders implementing or affected by the action in order to understand whether the action achieved its effects “on the ground”. Stakeholder participation can take the form of surveys or interviews, focus groups or other consultation methods.
Evaluation should be conducted when sufficient data has been collected during monitoring, such that trends emerge, allowing city officials to identify change, or stakeholders are
Bar
celo
ma,
And
rey
Kir
ow, U
nsp
lash
20Monitoring - Evaluating - Reporting Framework January 2019 •
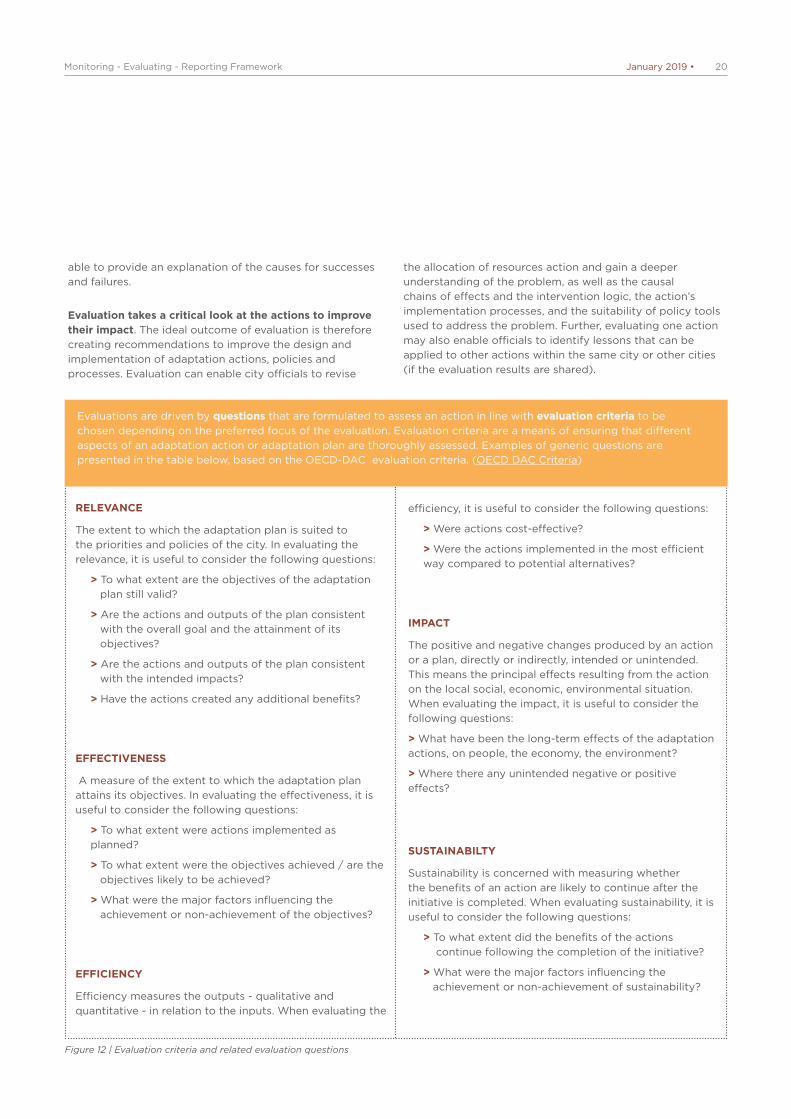
Evaluations are driven by questions that are formulated to assess an action in line with evaluation criteria to be chosen depending on the preferred focus of the evaluation. Evaluation criteria are a means of ensuring that different aspects of an adaptation action or adaptation plan are thoroughly assessed. Examples of generic questions are presented in the table below, based on the OECD-DAC evaluation criteria. (OECD DAC Criteria)
RELEVANCE
The extent to which the adaptation plan is suited to the priorities and policies of the city. In evaluating the relevance, it is useful to consider the following questions:
> To what extent are the objectives of the adaptation plan still valid?
> Are the actions and outputs of the plan consistent with the overall goal and the attainment of its objectives?
> Are the actions and outputs of the plan consistent with the intended impacts?
> Have the actions created any additional benefits?
EFFECTIVENESS
A measure of the extent to which the adaptation plan attains its objectives. In evaluating the effectiveness, it is useful to consider the following questions:
> To what extent were actions implemented as planned?
> To what extent were the objectives achieved / are the objectives likely to be achieved?
> What were the major factors influencing the achievement or non-achievement of the objectives?
EFFICIENCY
Efficiency measures the outputs - qualitative and quantitative - in relation to the inputs. When evaluating the
efficiency, it is useful to consider the following questions:
> Were actions cost-effective?
> Were the actions implemented in the most efficient way compared to potential alternatives?
IMPACT
The positive and negative changes produced by an action or a plan, directly or indirectly, intended or unintended. This means the principal effects resulting from the action on the local social, economic, environmental situation. When evaluating the impact, it is useful to consider the following questions:
> What have been the long-term effects of the adaptation actions, on people, the economy, the environment?
> Where there any unintended negative or positive effects?
SUSTAINABILTY
Sustainability is concerned with measuring whether the benefits of an action are likely to continue after the initiative is completed. When evaluating sustainability, it is useful to consider the following questions:
> To what extent did the benefits of the actions continue following the completion of the initiative?
> What were the major factors influencing the achievement or non-achievement of sustainability?
Figure 12 | Evaluation criteria and related evaluation questions
able to provide an explanation of the causes for successes and failures.
Evaluation takes a critical look at the actions to improve their impact. The ideal outcome of evaluation is therefore creating recommendations to improve the design and implementation of adaptation actions, policies and processes. Evaluation can enable city officials to revise
the allocation of resources action and gain a deeper understanding of the problem, as well as the causal chains of effects and the intervention logic, the action’s implementation processes, and the suitability of policy tools used to address the problem. Further, evaluating one action may also enable officials to identify lessons that can be applied to other actions within the same city or other cities (if the evaluation results are shared).

21Monitoring - Evaluating - Reporting Framework January 2019 •A
usti
n, P
hoto
by
Tom
ek B
agin
ski o
n U
nsp
lash
04 KEY CONSIDERATIONS WHEN IMPLEMENTING A CCA MER FRAMEWORK IN YOUR CITY
22Monitoring - Evaluating - Reporting Framework January 2019 •
04 KEY CONSIDERATIONS WHEN IMPLEMENTING A CCA MER FRAMEWORK IN YOUR CITY
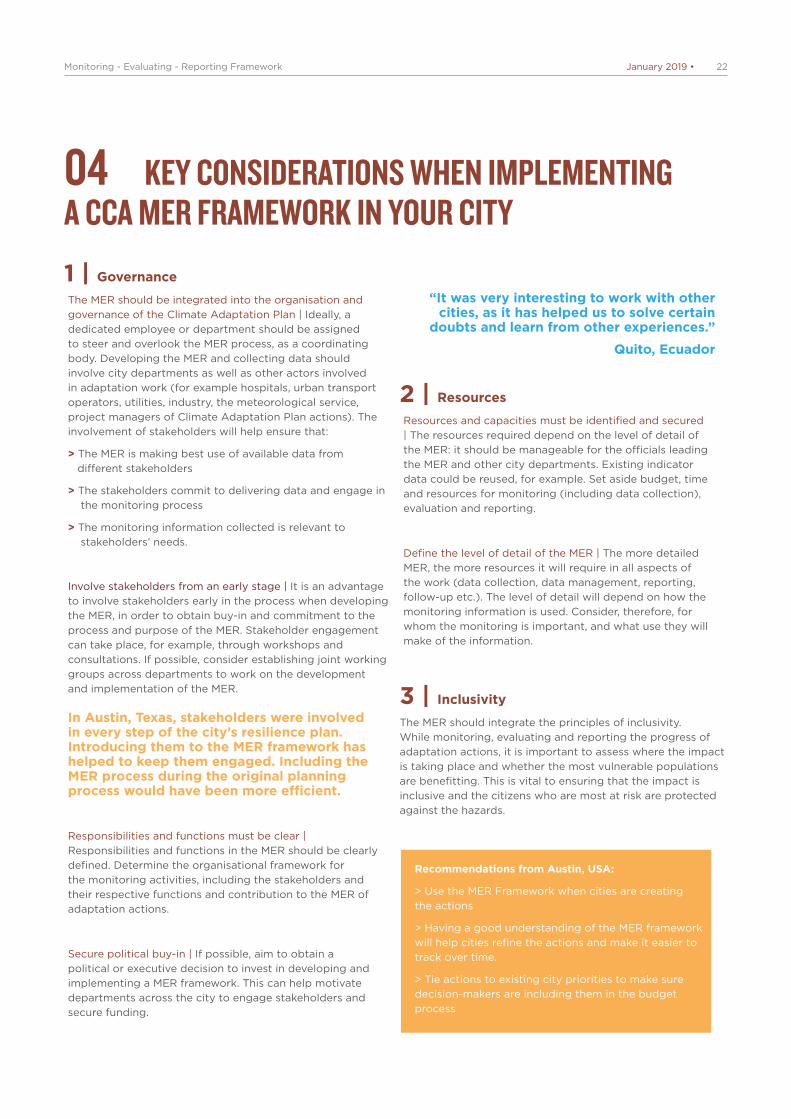
1 | Governance
The MER should be integrated into the organisation and governance of the Climate Adaptation Plan | Ideally, a dedicated employee or department should be assigned to steer and overlook the MER process, as a coordinating body. Developing the MER and collecting data should involve city departments as well as other actors involved in adaptation work (for example hospitals, urban transport operators, utilities, industry, the meteorological service, project managers of Climate Adaptation Plan actions). The involvement of stakeholders will help ensure that:
> The MER is making best use of available data from different stakeholders
> The stakeholders commit to delivering data and engage in the monitoring process
> The monitoring information collected is relevant to stakeholders’ needs.
Involve stakeholders from an early stage | It is an advantage to involve stakeholders early in the process when developing the MER, in order to obtain buy-in and commitment to the process and purpose of the MER. Stakeholder engagement can take place, for example, through workshops and consultations. If possible, consider establishing joint working groups across departments to work on the development and implementation of the MER.
In Austin, Texas, stakeholders were involved in every step of the city’s resilience plan. Introducing them to the MER framework has helped to keep them engaged. Including the MER process during the original planning process would have been more efficient.
Responsibilities and functions must be clear | Responsibilities and functions in the MER should be clearly defined. Determine the organisational framework for the monitoring activities, including the stakeholders and their respective functions and contribution to the MER of adaptation actions.
Secure political buy-in | If possible, aim to obtain a political or executive decision to invest in developing and implementing a MER framework. This can help motivate departments across the city to engage stakeholders and secure funding.
2 | Resources
Resources and capacities must be identified and secured | The resources required depend on the level of detail of the MER: it should be manageable for the officials leading the MER and other city departments. Existing indicator data could be reused, for example. Set aside budget, time and resources for monitoring (including data collection), evaluation and reporting.
Define the level of detail of the MER | The more detailed MER, the more resources it will require in all aspects of the work (data collection, data management, reporting, follow-up etc.). The level of detail will depend on how the monitoring information is used. Consider, therefore, for whom the monitoring is important, and what use they will make of the information.
3 | Inclusivity
The MER should integrate the principles of inclusivity. While monitoring, evaluating and reporting the progress of adaptation actions, it is important to assess where the impact is taking place and whether the most vulnerable populations are benefitting. This is vital to ensuring that the impact is inclusive and the citizens who are most at risk are protected against the hazards.
Recommendations from Austin, USA:
> Use the MER Framework when cities are creating the actions
> Having a good understanding of the MER framework will help cities refine the actions and make it easier to track over time.
> Tie actions to existing city priorities to make sure decision-makers are including them in the budget process
“It was very interesting to work with other cities, as it has helped us to solve certain
doubts and learn from other experiences.”
Quito, Ecuador

23Monitoring - Evaluating - Reporting Framework January 2019 •
Par
is, D
an N
ovac
, Uns
pla
sh
05 CONCLUSION
Monitoring and evaluation climate adaptation actions is challenging and there is no ‘one-size-fits-all’ solution. However, engaging in robust monitoring, evaluation and reporting can help cities significantly in amplifying ambitions and gaining political support for adaptation. This is a complex process requiring dedicated resources and collaboration across city departments and wider stakeholders. The process of MER must be well planned throughout the CCA planning process, in order to ensure that actions are accompanied by a sufficient assessment methodology.
The objective of the MER framework is to support cities in monitoring, evaluating and reporting on the effectiveness of their adaptation actions. In particular, the framework is designed to support cities in developing their CCA monitoring, evaluation and reporting, through an inclusive process based on the city’s context, capacity and priorities. The MER process should be thoroughly integrated into a city’s climate adaptation planning process, with due consideration given to how adaptation actions will be monitored and evaluated, while they are being defined. This will enable city officials to develop the actions in a way that makes for a smooth and feasible monitoring process.
The three pilot cities (Quito, Austin and Johannesburg) confirmed the importance of ensuring that the MER framework reflects cities’ priorities, institutional structures and capacities. In this way, the insights gained through monitoring add real value and can become integrated within day-to-day policy development and implementation. Capacity and resources remain key challenges for cities to overcome, both in the implementation of the adaptation plans and in the monitoring of progress and achievements. As part of this project, materials and templates have been developed to support cities in developing their CCA MER. Cities are strongly encouraged to adapt the materials to their individual context. The various components of the framework – the guide, the indicator matrix and the indicator matrix manual – should be used together, in order to derive the maximum benefit from the framework.
Finally, the MER and the framework represents the first major attempt to help cities assess the success of CCA initiatives, compare their progress on a global and regional level and strengthen the case for adaptation actions. It also allows cities to leverage existing data, as much as possible. As cities gather more evidence on the impacts of adaptation actions, the framework and more specifically the indicator matrix will continue to evolve to meet their needs.

24Monitoring - Evaluating - Reporting Framework January 2019 •
Bibliography
Adaptation Committee. (2016). Inventory of ongoing monitoring and evaluation work of adaptation prepared under the Nairobi work programme on impacts, vulnerability and adaptation to climate change. Report of Agenda item 5 (b) of the Tenth meeting of the Adaptation Committee Bonn, Germany, 13-16 September 2016. UNFCCC. Bonn. Available online at https://unfccc.int/event/tenth-meeting-adaptation-committee-ac10, checked on 5/29/2018.
Adaptation Fund. (2012). Results Framework and Baseline Guidance. Project-level, checked on 01-Jun-18.
Bours, Dennis; McGinn, Colleen; Pringle, Patrick. (2014). Monitoring & evaluation for climate change adaptation and resilience: A synthesis of tools, frameworks and approaches. 2nd ed. SEA Change CoP, Phnom Penh and UKCIP, Oxford. Available online at https://ukcip.ouce.ox.ac.uk/wp-content/PDFs/SEA-Change-UKCIP-MandE-review-2nd-edition.pdf.
Brooks, Nick; Anderson, Simon; Ayers, Jessica; Burton, Ian; Tellam, Ian. (2011). Tracking adaptation and measuring development. IIED, checked on 31-May-18.
Brooks, Nick; Fisher, Susannah. (2014). TAMD -Tracking Adaptation and Measuring Development. a step-by-step guide. IIED. London, checked on 01-Jun-18.
C40, Ramboll. (2018). Urban Climate Action Impacts Framework. A Framework for Describing and Measuring the Wider Impacts of Urban Climate Action.
CARE. (2014). Participatory Monitoring, Evaluation, Reflection and Learning for Community-based Adaptation. A revised manual for local practitioners.
Dinshaw, Ayesha; Fisher, Susannah; McGray, Heather; Rai, Neha; Schaar, Johan. (2014). Monitoring and Evaluation of Climate Change Adaptation (74). DOI: 10.1787/5jxrclr0ntjd-en.
GIZ. (2014). Saved health, saved wealth: an approach to quantifying the benefits of climate change adaptation. Practical application in coastal protection projects in Viet Nam, checked on 31-May-18.
Grafakos, Stelios; Gianoli, Alberto; Olivotto, Veronica; Kaczmarski, Christopher. (2018). Measuring the Immeasurable: Towards an Integrated Evaluation Framework of Climate Change Adaptation Projects. In Christian N. Madu, Chu-hua Kuei (Eds.). Handbook of disaster risk reduction & management. Singapore: World Scientific Publishing Co. Pte Ltd, pp. 295–327.
Intergovernmental Panel on Climate Change. (2014). AR5 climate change 2014: impacts, adaptation, and vulnerability. Annex ii glossary. Available online at https://www.ipcc.ch/site/assets/uploads/2018/02/wgiiar5-annexii_final.pdf.
C40, Bloomberg Philanthropies, ARUP. (2015). City Climate Hazard Taxonomy. Retrieved from: https://www.c40.org/researches/city-climate-hazard-taxonomy
C40, Ramboll. (2019). Measuring progress on urban climate change adaptation. Monitoring – evaluation – reporting framework.
Miljo Metropolen. (2012). City of Copenhagen Cloudburst management plan 2012. Retrieved from: https://en.klimatilpasning.dk/media/665626/cph_-_cloudburst_management_plan.pdf
National Drought Mitigation Center from the University of Nebraska. https://drought.unl.edu/ranchplan/DroughtBasics/WeatherandDrought/MeasuringDrought.aspx
United Nations Office for Disaster Risk Reduction. (2017). TERMINOLOGY ON DISASTER RISK REDUCTION. (Web). Retrieved from: https://www.unisdr.org/we/inform/terminology. Available in multiple languages.
Picture creditsQuito, Dezalb, PixabayBarcelona, Erwan Hesry, UnsplahQuito, Xenakia, i-stockMonitoring, Evaluating and Reporting Workshop in Austin, US.Johannesburg, Frank van den BerghAustin, Photo by Tomek Baginski on UnsplashBarcelona, Andrey Kirov, UnsplashParis, Dan Novac, UnsplashJohannesburg, ShutterstockAuckland, Dan Freeman, Unsplash.Seattle, i-stock. Austin, Carlos Delgado, Unsplash
REFERENCES

MEASURING PROGRESS IN URBAN CLIMATE CHANGE ADAPTATIONMonitoring - Evaluating - Reporting | Indicator Matrix Manual
January 2019
26Monitoring - Evaluating - Reporting | Indicator Matrix Manual January 2019 • 2
01 Introduction 3
02 Hazards 4
03 Actions 5
04 Formulating impact : impact indicators 6
05 Intervention logic : output and outcome indicators 7
5.1 Outputs (including recommended indicators) 7
5.2 Outcomes (including recommended indicators) 7
CONTENTS
Figures Indicator matrix manualFigure 1 | Five common climate change hazards
Figure 2 | Intervention Logic – Unpacking the Logic
Example 1 | Green infrastructure in reducing heat exposure
Example 2 | Implementing emergency management plans to increase adaptive capacity
Example 3 | Elevating homes to reduce vulnerability to storm surge flooding

27Monitoring - Evaluating - Reporting | Indicator Matrix Manual January 2019 •
01 INTRODUCTION
This document is intended to serve as a manual for cities to navigate the C40 Cities Monitoring, Evaluation and Reporting (MER) Indicator Matrix document. It outlines the key principles that underpin the indicators and draws on examples from the matrix throughout to demonstrate how it can be practically applied to cities. It should be used alongside the Indicator Matrix and as an extension to the C40 Cities MER Framework.
The MER Indicator Matrix provides a list of intervention logics accompanied by indicators developed through the framework process outlined in the guidance document. For each hazard, the most commonly implemented actions in an urban environment have been outlined, with corresponding outputs, outcomes and predicted impacts.
Widespread adoption of these indicators could enable benchmarking and standardisation of climate adaptation
reporting among the world’s cities, helping to build a more comprehensive picture of urban progress on climate adaptation. It will, however, remain a challenge to compare reported findings across cities due to the unavoidable differences in data and methods at participating cities’ disposal.
This guidance provides recommendations on best practice in monitoring hazards, actions, outputs, outcomes and impacts under the MER framework. In understanding the key principles behind these indicators, city officials will be able to develop their own indicators and/or use those provided, adapting them to the city’s context and situation. Ultimately, this will help to determine whether risks arising from climate hazards have been reduced, and enable cities to build climate resilience.
Auc
klan
d, D
an F
reem
an, U
nsp
lash
3
28Monitoring - Evaluating - Reporting | Indicator Matrix Manual January 2019 •
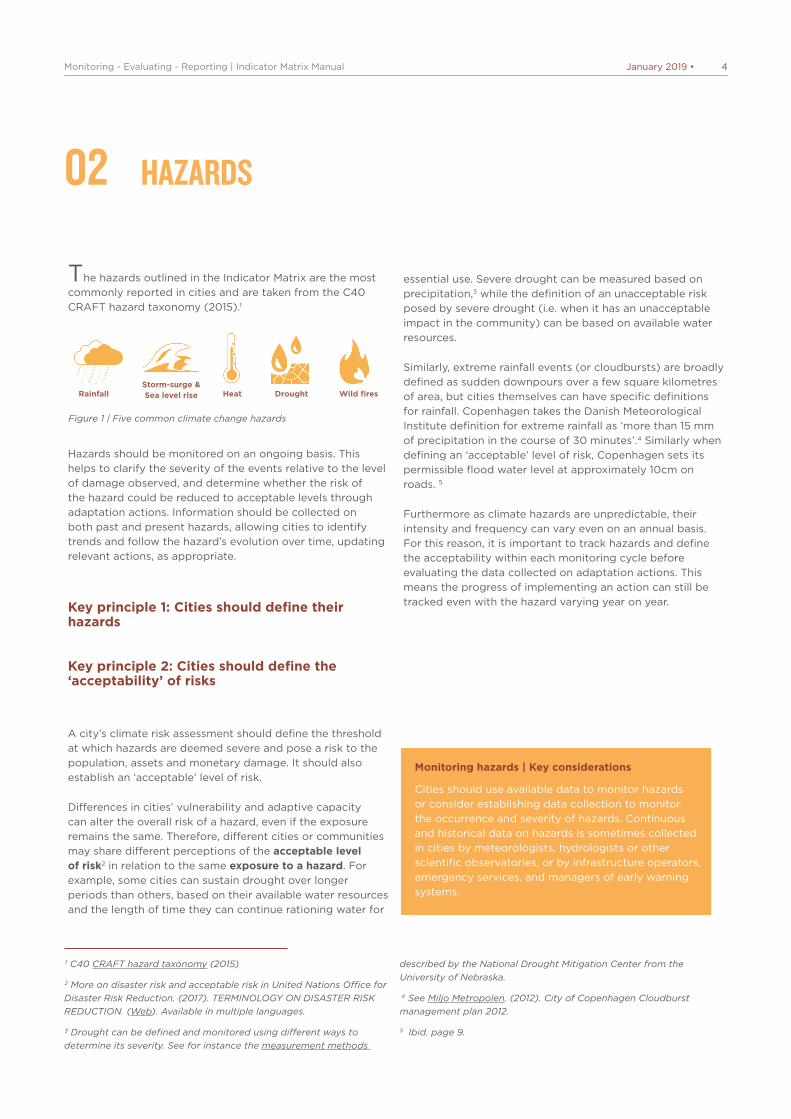
02 HAZARDS
The hazards outlined in the Indicator Matrix are the most commonly reported in cities and are taken from the C40 CRAFT hazard taxonomy (2015).1
Hazards should be monitored on an ongoing basis. This helps to clarify the severity of the events relative to the level of damage observed, and determine whether the risk of the hazard could be reduced to acceptable levels through adaptation actions. Information should be collected on both past and present hazards, allowing cities to identify trends and follow the hazard’s evolution over time, updating relevant actions, as appropriate.
Key principle 1: Cities should define their hazards
Key principle 2: Cities should define the ‘acceptability’ of risks
A city’s climate risk assessment should define the threshold at which hazards are deemed severe and pose a risk to the population, assets and monetary damage. It should also establish an ‘acceptable’ level of risk.
Differences in cities’ vulnerability and adaptive capacity can alter the overall risk of a hazard, even if the exposure remains the same. Therefore, different cities or communities may share different perceptions of the acceptable level of risk2 in relation to the same exposure to a hazard. For example, some cities can sustain drought over longer periods than others, based on their available water resources and the length of time they can continue rationing water for
essential use. Severe drought can be measured based on precipitation,3 while the definition of an unacceptable risk posed by severe drought (i.e. when it has an unacceptable impact in the community) can be based on available water resources.
Similarly, extreme rainfall events (or cloudbursts) are broadly defined as sudden downpours over a few square kilometres of area, but cities themselves can have specific definitions for rainfall. Copenhagen takes the Danish Meteorological Institute definition for extreme rainfall as ‘more than 15 mm of precipitation in the course of 30 minutes’.4 Similarly when defining an ‘acceptable’ level of risk, Copenhagen sets its permissible flood water level at approximately 10cm on roads. 5
Furthermore as climate hazards are unpredictable, their intensity and frequency can vary even on an annual basis. For this reason, it is important to track hazards and define the acceptability within each monitoring cycle before evaluating the data collected on adaptation actions. This means the progress of implementing an action can still be tracked even with the hazard varying year on year.
1 C40 CRAFT hazard taxonomy (2015)
2 More on disaster risk and acceptable risk in United Nations Office for Disaster Risk Reduction. (2017). TERMINOLOGY ON DISASTER RISK REDUCTION. (Web). Available in multiple languages.
3 Drought can be defined and monitored using different ways to determine its severity. See for instance the measurement methods
described by the National Drought Mitigation Center from the University of Nebraska.
4 See Miljo Metropolen. (2012). City of Copenhagen Cloudburst management plan 2012.
5 Ibid. page 9.
Monitoring hazards | Key considerations
Cities should use available data to monitor hazards or consider establishing data collection to monitor the occurrence and severity of hazards. Continuous and historical data on hazards is sometimes collected in cities by meteorologists, hydrologists or other scientific observatories, or by infrastructure operators, emergency services, and managers of early warning systems.
4
Figure 1 | Five common climate change hazards
RainfallStorm-surge & Sea level rise Heat Drought Wild fires

29Monitoring - Evaluating - Reporting | Indicator Matrix Manual January 2019 •
03 ACTIONS
Importantly, while the Indicator Matrix provides a comprehensive list of actions, it is not exhaustive. These actions are the most commonly implemented in cities. They have been selected in consultation with cities participating in C40 adaptation networks and based on cities’ adaptation plans. Referring to the examples, cities are advised to focus on the action/s that correspond best to their own proposed adaptation actions, in order to identify potential output, outcome and impact indicators.
Key principle 3: Actions determine how to formulate impact
The adaptation actions outlined in the matrix address the diverse components of risk: exposure, vulnerability and
adaptive capacity, as defined in the guidance document. By considering these three components, cities can better define their adaptation actions, and ultimately, formulate the impact they expect to see from implementing these actions (see Section 4).
6 United Nations Office for Disaster Risk Reduction. (2017). TERMINOLOGY ON DISASTER RISK REDUCTION (Web). Available in multiple languages.
Sea
ttle
, i-s
tock
5
30Monitoring - Evaluating - Reporting | Indicator Matrix Manual January 2019 •
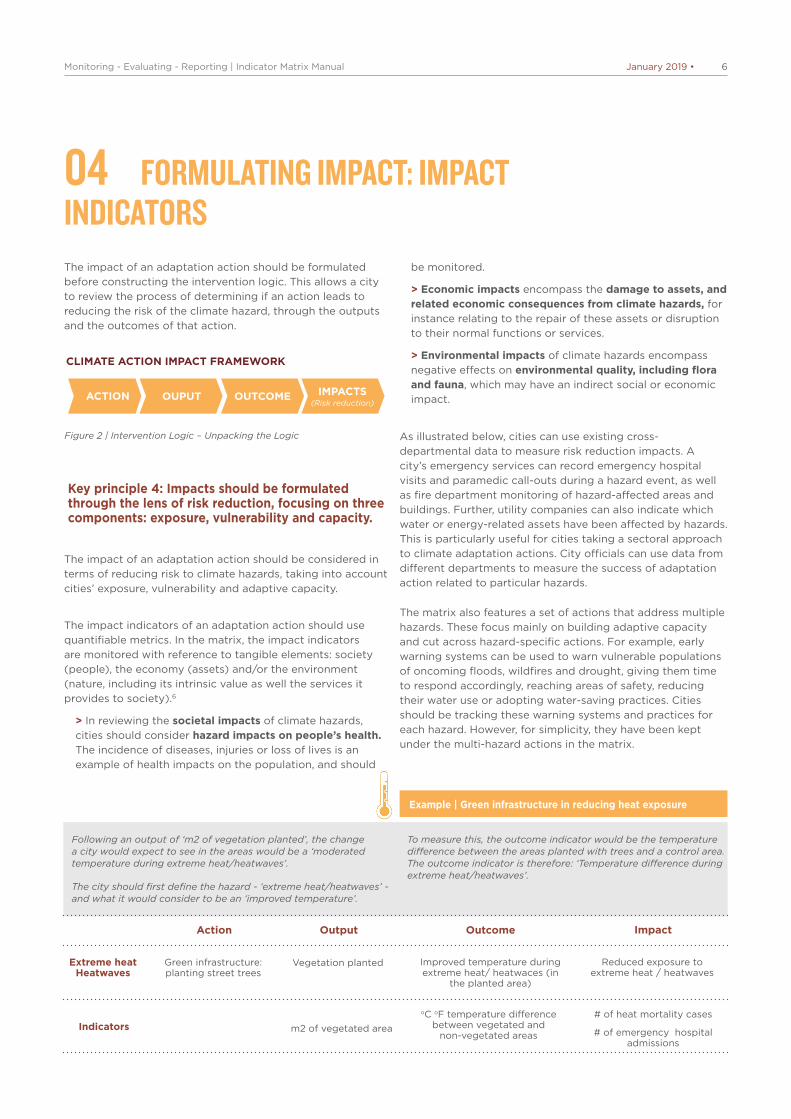
04 FORMULATING IMPACT: IMPACT INDICATORS The impact of an adaptation action should be formulated before constructing the intervention logic. This allows a city to review the process of determining if an action leads to reducing the risk of the climate hazard, through the outputs and the outcomes of that action.
Key principle 4: Impacts should be formulated through the lens of risk reduction, focusing on three components: exposure, vulnerability and capacity.
The impact of an adaptation action should be considered in terms of reducing risk to climate hazards, taking into account cities’ exposure, vulnerability and adaptive capacity.
The impact indicators of an adaptation action should use quantifiable metrics. In the matrix, the impact indicators are monitored with reference to tangible elements: society (people), the economy (assets) and/or the environment (nature, including its intrinsic value as well the services it provides to society).6
> In reviewing the societal impacts of climate hazards, cities should consider hazard impacts on people’s health. The incidence of diseases, injuries or loss of lives is an example of health impacts on the population, and should
be monitored.
> Economic impacts encompass the damage to assets, and related economic consequences from climate hazards, for instance relating to the repair of these assets or disruption to their normal functions or services.
> Environmental impacts of climate hazards encompass negative effects on environmental quality, including flora and fauna, which may have an indirect social or economic impact.
As illustrated below, cities can use existing cross-departmental data to measure risk reduction impacts. A city’s emergency services can record emergency hospital visits and paramedic call-outs during a hazard event, as well as fire department monitoring of hazard-affected areas and buildings. Further, utility companies can also indicate which water or energy-related assets have been affected by hazards. This is particularly useful for cities taking a sectoral approach to climate adaptation actions. City officials can use data from different departments to measure the success of adaptation action related to particular hazards.
The matrix also features a set of actions that address multiple hazards. These focus mainly on building adaptive capacity and cut across hazard-specific actions. For example, early warning systems can be used to warn vulnerable populations of oncoming floods, wildfires and drought, giving them time to respond accordingly, reaching areas of safety, reducing their water use or adopting water-saving practices. Cities should be tracking these warning systems and practices for each hazard. However, for simplicity, they have been kept under the multi-hazard actions in the matrix.
Following an output of ‘m2 of vegetation planted’, the change a city would expect to see in the areas would be a ‘moderated temperature during extreme heat/heatwaves’.
The city should first define the hazard - ‘extreme heat/heatwaves’ - and what it would consider to be an ‘improved temperature’.
To measure this, the outcome indicator would be the temperature difference between the areas planted with trees and a control area. The outcome indicator is therefore: ‘Temperature difference during extreme heat/heatwaves’.
Example | Green infrastructure in reducing heat exposure
Action
Green infrastructure: planting street trees
Vegetation planted
m2 of vegetated area
Improved temperature during extreme heat/ heatwaces (in
the planted area)
oC oF temperature difference between vegetated and
non-vegetated areas
Reduced exposure to extreme heat / heatwaves
Output Outcome Impact
Extreme heat Heatwaves
Indicators# of heat mortality cases
# of emergency hospital admissions
6
CLIMATE ACTION IMPACT FRAMEWORK
ACTION OUPUT OUTCOME IMPACTS (Risk reduction)
Figure 2 | Intervention Logic – Unpacking the Logic
31Monitoring - Evaluating - Reporting | Indicator Matrix Manual January 2019 •
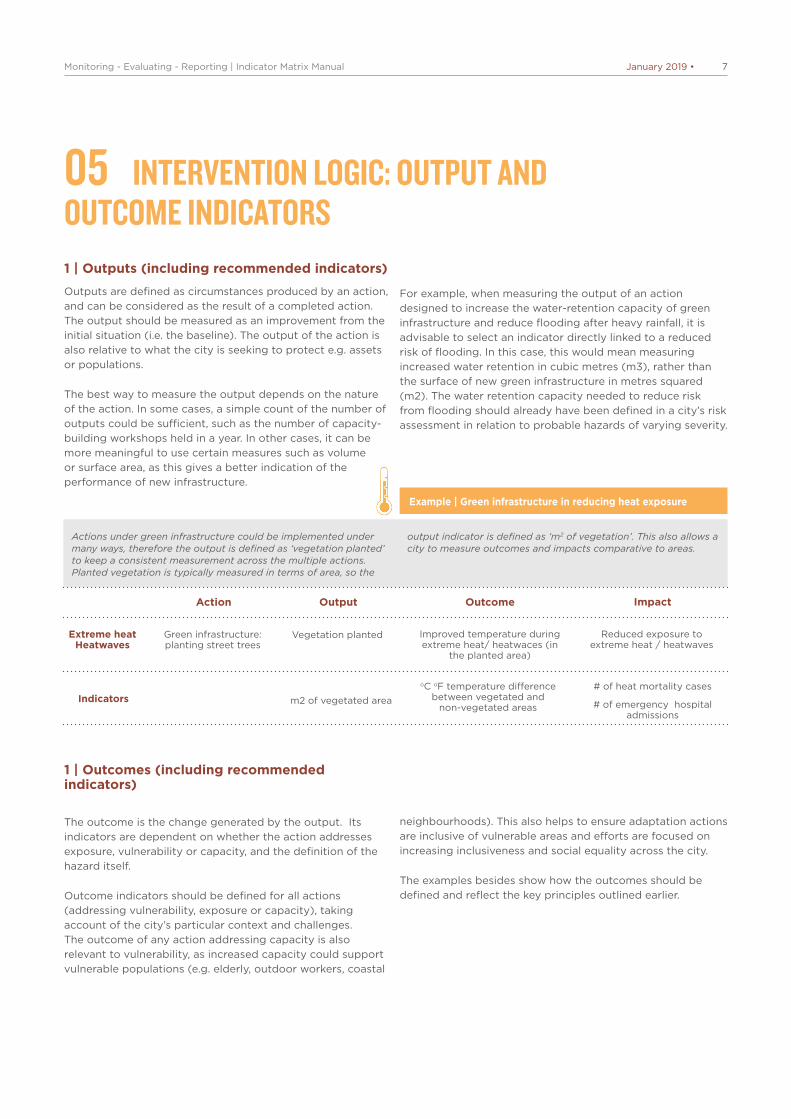
05 INTERVENTION LOGIC: OUTPUT AND OUTCOME INDICATORS1 | Outputs (including recommended indicators)
Outputs are defined as circumstances produced by an action, and can be considered as the result of a completed action. The output should be measured as an improvement from the initial situation (i.e. the baseline). The output of the action is also relative to what the city is seeking to protect e.g. assets or populations.
The best way to measure the output depends on the nature of the action. In some cases, a simple count of the number of outputs could be sufficient, such as the number of capacity-building workshops held in a year. In other cases, it can be more meaningful to use certain measures such as volume or surface area, as this gives a better indication of the performance of new infrastructure.
1 | Outcomes (including recommended indicators)
The outcome is the change generated by the output. Its indicators are dependent on whether the action addresses exposure, vulnerability or capacity, and the definition of the hazard itself.
Outcome indicators should be defined for all actions (addressing vulnerability, exposure or capacity), taking account of the city’s particular context and challenges. The outcome of any action addressing capacity is also relevant to vulnerability, as increased capacity could support vulnerable populations (e.g. elderly, outdoor workers, coastal
For example, when measuring the output of an action designed to increase the water-retention capacity of green infrastructure and reduce flooding after heavy rainfall, it is advisable to select an indicator directly linked to a reduced risk of flooding. In this case, this would mean measuring increased water retention in cubic metres (m3), rather than the surface of new green infrastructure in metres squared (m2). The water retention capacity needed to reduce risk from flooding should already have been defined in a city’s risk assessment in relation to probable hazards of varying severity.
neighbourhoods). This also helps to ensure adaptation actions are inclusive of vulnerable areas and efforts are focused on increasing inclusiveness and social equality across the city.
The examples besides show how the outcomes should be defined and reflect the key principles outlined earlier.
Actions under green infrastructure could be implemented under many ways, therefore the output is defined as ‘vegetation planted’ to keep a consistent measurement across the multiple actions. Planted vegetation is typically measured in terms of area, so the
output indicator is defined as ‘m2 of vegetation’. This also allows a city to measure outcomes and impacts comparative to areas.
Example | Green infrastructure in reducing heat exposure
7
Action
Green infrastructure: planting street trees
Vegetation planted
m2 of vegetated area
Improved temperature during extreme heat/ heatwaces (in
the planted area)
oC oF temperature difference between vegetated and
non-vegetated areas
Reduced exposure to extreme heat / heatwaves
Output Outcome Impact
Extreme heat Heatwaves
Indicators# of heat mortality cases
# of emergency hospital admissions
32Monitoring - Evaluating - Reporting | Indicator Matrix Manual January 2019 •
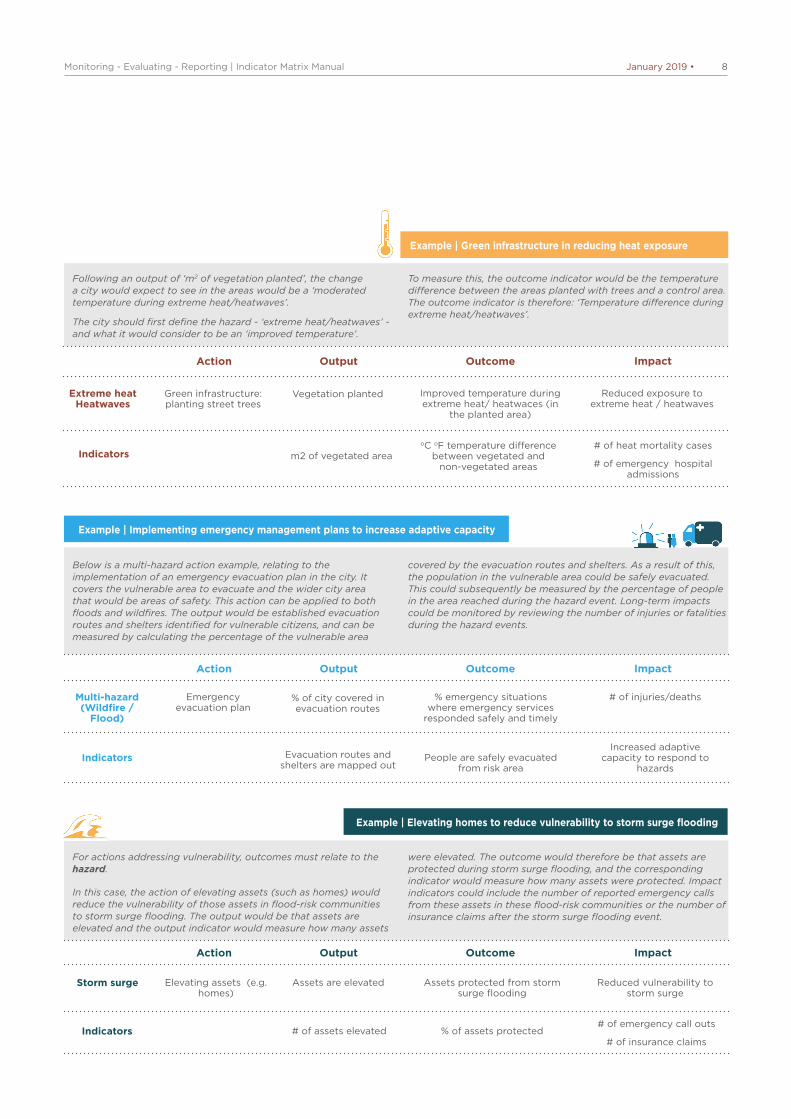
Following an output of ‘m2 of vegetation planted’, the change a city would expect to see in the areas would be a ‘moderated temperature during extreme heat/heatwaves’.
The city should first define the hazard - ‘extreme heat/heatwaves’ - and what it would consider to be an ‘improved temperature’.
For actions addressing vulnerability, outcomes must relate to the hazard.
In this case, the action of elevating assets (such as homes) would reduce the vulnerability of those assets in flood-risk communities to storm surge flooding. The output would be that assets are elevated and the output indicator would measure how many assets
Below is a multi-hazard action example, relating to the implementation of an emergency evacuation plan in the city. It covers the vulnerable area to evacuate and the wider city area that would be areas of safety. This action can be applied to both floods and wildfires. The output would be established evacuation routes and shelters identified for vulnerable citizens, and can be measured by calculating the percentage of the vulnerable area
Elevating assets (e.g. homes)
Emergency evacuation plan
Assets are elevated
Evacuation routes and shelters are mapped out
# of assets elevated
% of city covered in evacuation routes
Assets protected from storm surge flooding
People are safely evacuated from risk area
% of assets protected
% emergency situations where emergency services
responded safely and timely
Reduced vulnerability to storm surge
Increased adaptive capacity to respond to
hazards
# of emergency call outs
# of insurance claims
# of injuries/deaths
To measure this, the outcome indicator would be the temperature difference between the areas planted with trees and a control area. The outcome indicator is therefore: ‘Temperature difference during extreme heat/heatwaves’.
were elevated. The outcome would therefore be that assets are protected during storm surge flooding, and the corresponding indicator would measure how many assets were protected. Impact indicators could include the number of reported emergency calls from these assets in these flood-risk communities or the number of insurance claims after the storm surge flooding event.
covered by the evacuation routes and shelters. As a result of this, the population in the vulnerable area could be safely evacuated. This could subsequently be measured by the percentage of people in the area reached during the hazard event. Long-term impacts could be monitored by reviewing the number of injuries or fatalities during the hazard events.
Example | Green infrastructure in reducing heat exposure
Example | Elevating homes to reduce vulnerability to storm surge flooding
Example | Implementing emergency management plans to increase adaptive capacity
Storm surge
Multi-hazard (Wildfire /
Flood)
Indicators
Indicators
8
Action
Action
Action
Green infrastructure: planting street trees
Vegetation planted
m2 of vegetated area
Improved temperature during extreme heat/ heatwaces (in
the planted area)
oC oF temperature difference between vegetated and
non-vegetated areas
Reduced exposure to extreme heat / heatwaves
Output
Output
Output
Outcome
Outcome
Outcome
Impact
Impact
Impact
Extreme heat Heatwaves
Indicators# of heat mortality cases
# of emergency hospital admissions

33Monitoring - Evaluating - Reporting | Indicator Matrix January 2019 •
MEASURING PROGRESS IN URBAN CLIMATE CHANGE ADAPTATIONMonitoring - Evaluating - Reporting | Indicator Matrix Manual
January 2019
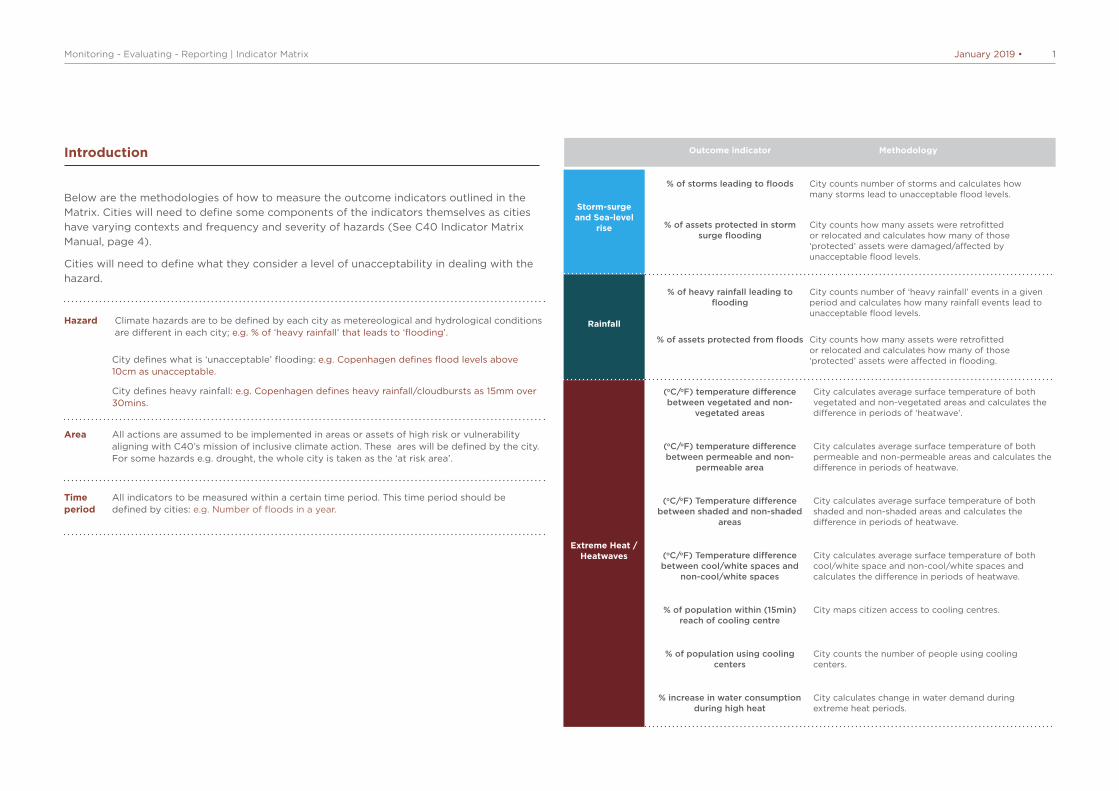
34Monitoring - Evaluating - Reporting | Indicator Matrix January 2019 •
Introduction
Below are the methodologies of how to measure the outcome indicators outlined in the Matrix. Cities will need to define some components of the indicators themselves as cities have varying contexts and frequency and severity of hazards (See C40 Indicator Matrix Manual, page 4).
Cities will need to define what they consider a level of unacceptability in dealing with the hazard.
Hazard Climate hazards are to be defined by each city as metereological and hydrological conditions are different in each city; e.g. % of ‘heavy rainfall’ that leads to ‘flooding’.
City defines what is ‘unacceptable’ flooding: e.g. Copenhagen defines flood levels above 10cm as unacceptable.
City defines heavy rainfall: e.g. Copenhagen defines heavy rainfall/cloudbursts as 15mm over 30mins.
Area All actions are assumed to be implemented in areas or assets of high risk or vulnerability aligning with C40’s mission of inclusive climate action. These ares will be defined by the city. For some hazards e.g. drought, the whole city is taken as the ‘at risk area’.
Time All indicators to be measured within a certain time period. This time period should be period defined by cities: e.g. Number of floods in a year.
Storm-surge and Sea-level
rise
Rainfall
Outcome indicator Methodology
% of storms leading to floods
% of heavy rainfall leading to flooding
% of assets protected in storm surge flooding
% of assets protected from floods
City counts number of storms and calculates how many storms lead to unacceptable flood levels.
City counts number of ‘heavy rainfall’ events in a given period and calculates how many rainfall events lead to unacceptable flood levels.
City counts how many assets were retrofitted or relocated and calculates how many of those ‘protected’ assets were damaged/affected by unacceptable flood levels.
City counts how many assets were retrofitted or relocated and calculates how many of those ‘protected’ assets were affected in flooding.
Extreme Heat / Heatwaves
(oC/oF) temperature difference between vegetated and non-
vegetated areas
(oC/oF) temperature difference between permeable and non-
permeable area
(oC/oF) Temperature difference between shaded and non-shaded
areas
(oC/oF) Temperature difference between cool/white spaces and
non-cool/white spaces
% of population within (15min) reach of cooling centre
% of population using cooling centers
% increase in water consumption during high heat
City calculates average surface temperature of both vegetated and non-vegetated areas and calculates the difference in periods of ‘heatwave’.
City calculates average surface temperature of both permeable and non-permeable areas and calculates the difference in periods of heatwave.
City calculates average surface temperature of both shaded and non-shaded areas and calculates the difference in periods of heatwave.
City calculates average surface temperature of both cool/white space and non-cool/white spaces and calculates the difference in periods of heatwave.
City maps citizen access to cooling centres.
City counts the number of people using cooling centers.
City calculates change in water demand during extreme heat periods.
1
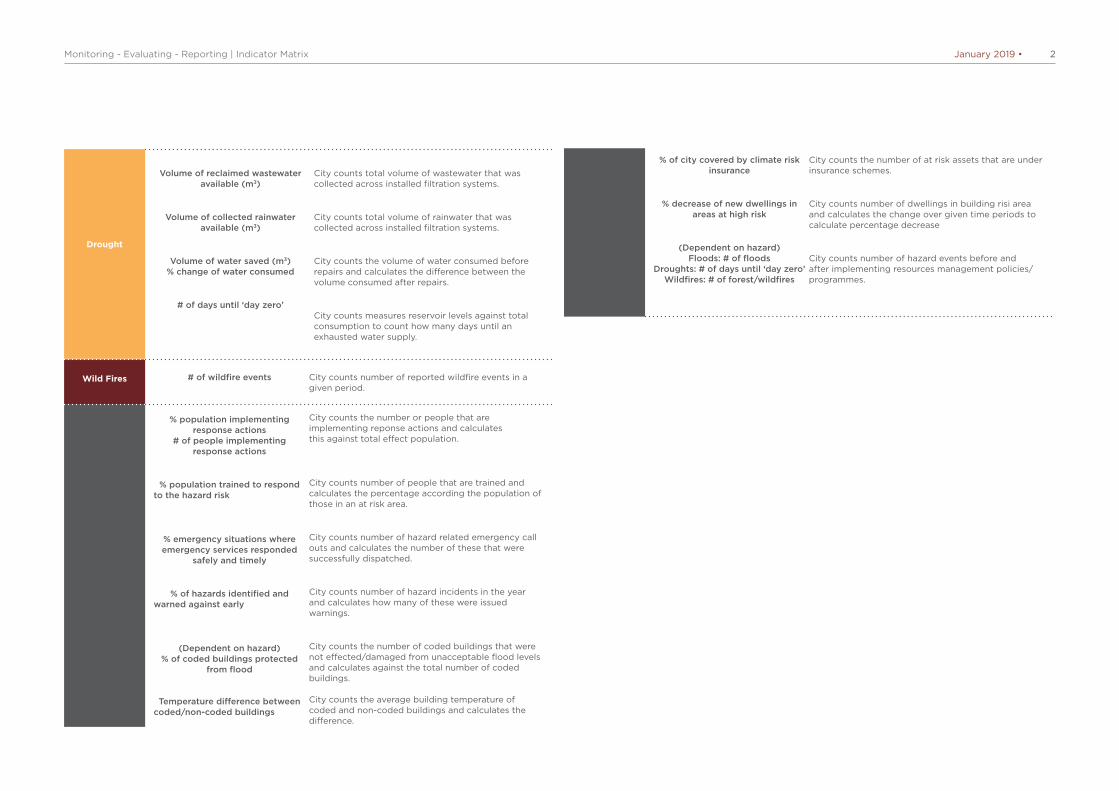
35Monitoring - Evaluating - Reporting | Indicator Matrix January 2019 •
Wild Fires
Multi hazard action
Multi hazard action
# of wildfire events
% of city covered by climate risk insurance
% decrease of new dwellings in areas at high risk
(Dependent on hazard) Floods: # of floods
Droughts: # of days until ‘day zero’ Wildfires: # of forest/wildfires
% population implementing response actions
# of people implementing response actions
% population trained to respond to the hazard risk
% emergency situations where emergency services responded
safely and timely
% of hazards identified and warned against early
(Dependent on hazard) % of coded buildings protected
from flood Temperature difference between
coded/non-coded buildings
City counts number of reported wildfire events in a given period.
City counts the number of at risk assets that are under insurance schemes.
City counts number of dwellings in building risi area and calculates the change over given time periods to calculate percentage decrease
City counts number of hazard events before and after implementing resources management policies/programmes.
City counts the number or people that are implementing reponse actions and calculates this against total effect population.
City counts number of people that are trained and calculates the percentage according the population of those in an at risk area.
City counts number of hazard related emergency call outs and calculates the number of these that were successfully dispatched.
City counts number of hazard incidents in the year and calculates how many of these were issued warnings.
City counts the number of coded buildings that were not effected/damaged from unacceptable flood levels and calculates against the total number of coded buildings. City counts the average building temperature of coded and non-coded buildings and calculates the difference.
Drought
Volume of reclaimed wastewater available (m3)
Volume of collected rainwater available (m3)
Volume of water saved (m3) % change of water consumed
# of days until ‘day zero’
City counts total volume of wastewater that was collected across installed filtration systems.
City counts total volume of rainwater that was collected across installed filtration systems.
City counts the volume of water consumed before repairs and calculates the difference between the volume consumed after repairs.
City counts measures reservoir levels against total consumption to count how many days until an exhausted water supply.
2

36Monitoring - Evaluating - Reporting | Indicator Matrix January 2019 •
Action
Storm surge and Sea-level rise
Installing floodgates
Stabilize river bank (vegetation: seeded,
transplanted and matted / non-
vegetation: reinforced with concrete)
Relocation of assets
Adapting assets (hardening, elevating)
Permanent coastline protection
(Dikes or seawalls)
Floodgates installed
Slopes around river banks stabilised
Assets at risk relocated
Assets at risk retrofitted
Dikes or seawalls built
Number of floodgates installed
Area of river banks stabilised (m2 / km2)
Number of assets retrofitted
Area of coastline protection created (m2/
km2)
Number of assets relocated
Reduced storm surge flooding
Reduced storm surge flooding
Reduced river bank collapse during strom
surge flooding/ from sea level rise
Protection of assets from storm surge flooding
Protection of assets from storm surge flooding
% of storms leading to floods
% of storms leading to floods
% floods that lead to river bank collapse/erosion
% of assets protected in storm surge flooding
% of assets protected in storm surge flooding
Reduced exposure to flooding
Reduced exposure to flooding
Reduced vulnerability to erosion/mass movement
Reduced exposure to flooding
Reduced vulnerability to flooding
People: Displaced, injured or deaths
Assets: Number of assets affected/damaged, Cost of repairs, Cost to services, Cost to
economic productivity (or $ damage)
People: Displaced, injured or deaths, number of A&E admissions from injuries
People: Injured or deaths
Assets: Number of assets affected/damaged, Cost of repairs, Cost to services, Cost to
economic productivity (or $ damage)
People: Displaced, injured or deaths
Assets: Number of assets affected/damaged, Cost of repairs, Cost to services, Cost to
economic productivity (or $ damage)
People: Displaced, injured or deaths
Assets (physical and natural): Number effected/damaged
Monetary damage: Cost of repairs, Cost to services, Cost to economic productivity
Output Output indicator Outcome Outcome indicator Impact Impact indicator
3

37Monitoring - Evaluating - Reporting | Indicator Matrix January 2019 •
Rainfall (includes actions for fluvial flooding) 1/2
Action Output Output indicator Outcome Outcome indicator Impact
Convert recreational and open spaces to water squares and
parks
Green infrastructure (Plant beds, green roofs, green walls,
street trees, canopy cover etc.)
Implementing permeable surfaces (bioswales/rainbeds/pervious pavement)
Installing floodgates
Adapting assets (hardening, elevating)
Additional water retention areas
Vegetation planted
Additional permeable surface area
Floodgates installed
Assets at risk retrofitted
Volume of water retention capacity created (m3)
Area of vegetated area created (m2)
Volume of water retention capacity created (m3)
Number of floodgates installed
Number of assets retrofitted
Reduced flooding from heavy rainfall
Reduced flooding from heavy rainfall
Reduced flooding from heavy rainfall
Reduced flooding from heavy rainfall
Protection of assets from flooding
Protection of assets from flooding
% of heavy rainfall leading to flooding
% of heavy rainfall leading to flooding
% of heavy rainfall leading to flooding
% of heavy rainfall leading to flooding
% of assets protected from floods
% of assets protected from floods
Reduced exposure to flooding
Reduced exposure to flooding
Reduced exposure to flooding
Reduced exposure to flooding
Reduced exposure to flooding
Reduced vulnerability to flooding
People: Displaced, injured or deaths
Assets: Number of assets affected/damaged, Cost of repairs, Cost to economic productivity
(or $ damage)
People: Displaced, injured or deaths
Assets: Number of assets affected/damaged, Cost of repairs, Cost to economic productivity
(or $ damage)
People: Displaced, injured or deaths
Assets: Number of assets affected/damaged, Cost of repairs, Cost to economic productivity
(or $ damage)
People: Displaced, injured or deaths
Assets: Number of assets affected/damaged, Cost of repairs, Cost to economic productivity
(or $ damage)
People: Displaced, injured or deaths
Assets: Number of assets affected/damaged, Cost of repairs, Cost to economic productivity
(or $ damage)
People: Displaced, injured or deaths
Assets: Number of assets affected/damaged, Cost of repairs, Cost to economic productivity
(or $ damage)
Impact indicator
Relocation of assets Assets at risk relocated Number of assets relocated
4
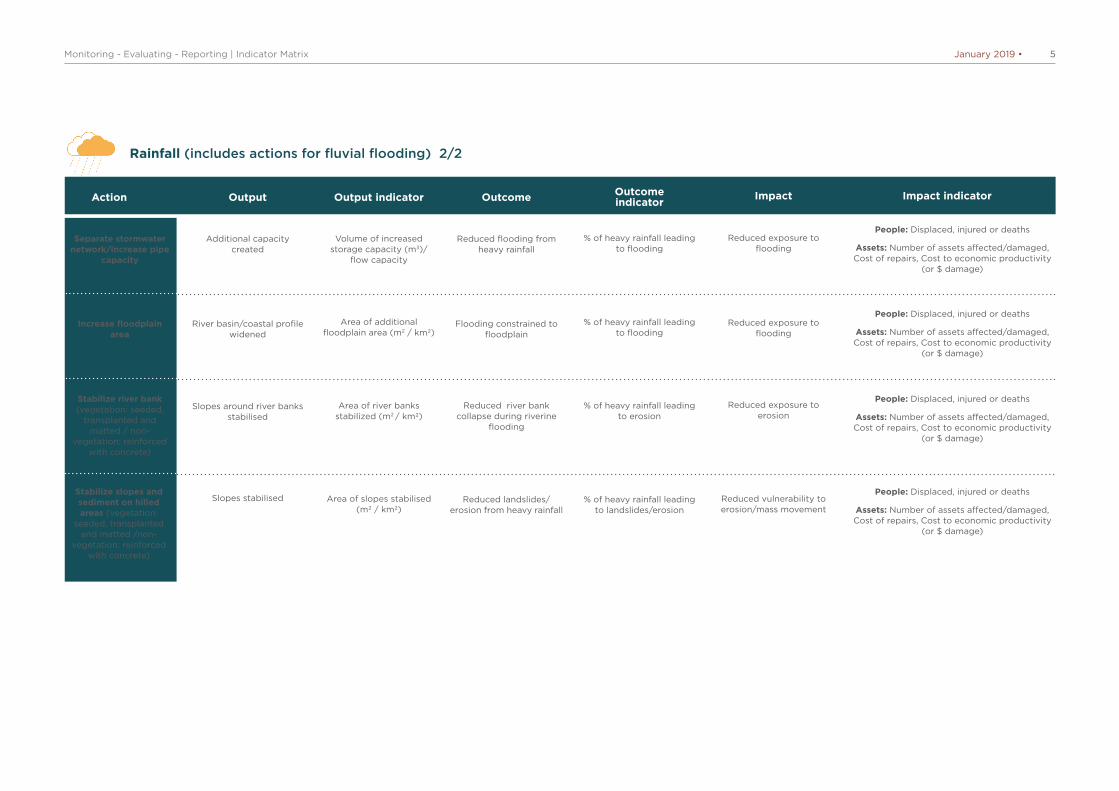
38Monitoring - Evaluating - Reporting | Indicator Matrix January 2019 •
Separate stormwater network/increase pipe
capacity
Increase floodplain area
Stabilize river bank (vegetation: seeded,
transplanted and matted / non-
vegetation: reinforced with concrete)
Stabilize slopes and sediment on hilled areas (vegetation:
seeded, transplanted and matted /non-
vegetation: reinforced with concrete)
Additional capacity created
River basin/coastal profile widened
Slopes around river banks stabilised
Slopes stabilised
Volume of increased storage capacity (m3)/
flow capacity
Area of additional floodplain area (m2 / km2)
Area of river banks stabilized (m2 / km2)
Area of slopes stabilised (m2 / km2)
Reduced flooding from heavy rainfall
Flooding constrained to floodplain
Reduced river bank collapse during riverine
flooding
Reduced landslides/erosion from heavy rainfall
% of heavy rainfall leading to flooding
% of heavy rainfall leading to flooding
% of heavy rainfall leading to erosion
% of heavy rainfall leading to landslides/erosion
Reduced exposure to flooding
Reduced exposure to flooding
Reduced exposure to erosion
Reduced vulnerability to erosion/mass movement
People: Displaced, injured or deaths
Assets: Number of assets affected/damaged, Cost of repairs, Cost to economic productivity
(or $ damage)
People: Displaced, injured or deaths
Assets: Number of assets affected/damaged, Cost of repairs, Cost to economic productivity
(or $ damage)
People: Displaced, injured or deaths
Assets: Number of assets affected/damaged, Cost of repairs, Cost to economic productivity
(or $ damage)
People: Displaced, injured or deaths
Assets: Number of assets affected/damaged, Cost of repairs, Cost to economic productivity
(or $ damage)
Rainfall (includes actions for fluvial flooding) 2/2
Action Output Output indicator Outcome Outcome indicator Impact Impact indicator
5
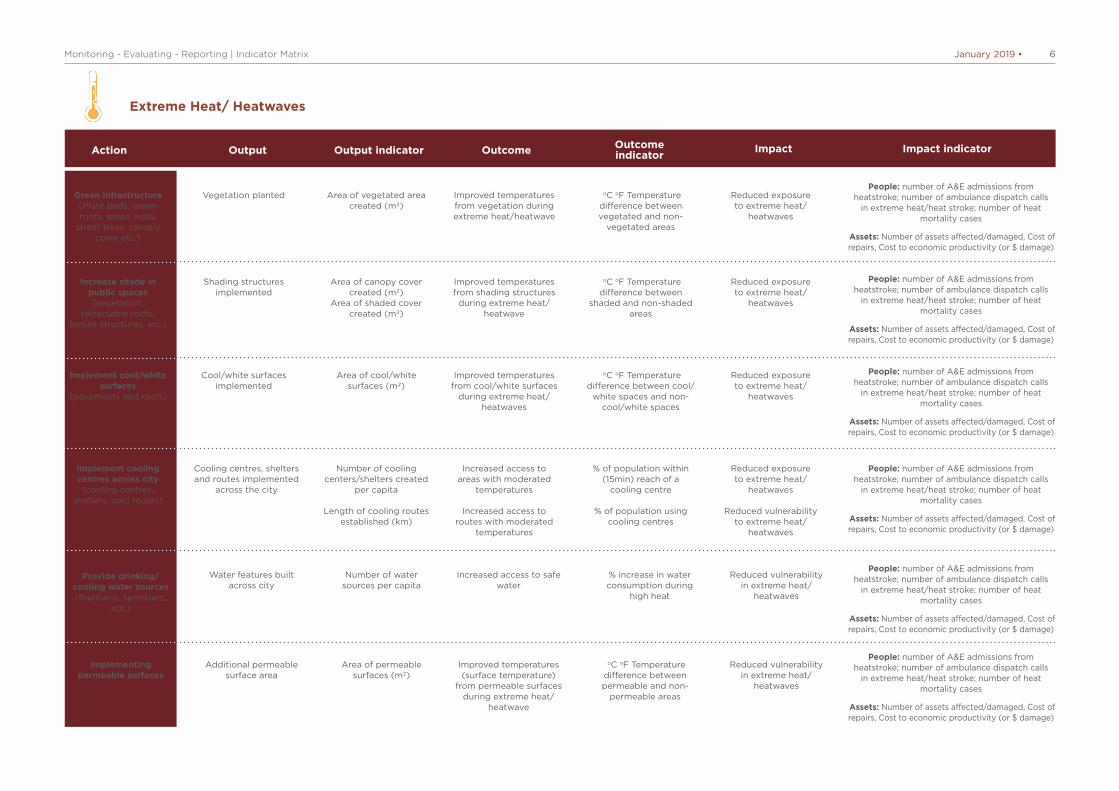
39Monitoring - Evaluating - Reporting | Indicator Matrix January 2019 •
Extreme Heat/ Heatwaves
Action Output Output indicator Outcome Outcome indicator Impact Impact indicator
Green infrastructure (Plant beds, green roofs, green walls,
street trees, canopy cover etc.)
Increase shade in public spaces (vegetation,
retractable roofs, tensile structures, etc.)
Implement cool/white surfaces
(pavements and roofs)
Implement cooling centres across city (cooling centres,
shelters, cool routes)
Vegetation planted
Shading structures implemented
Cool/white surfaces implemented
Cooling centres, shelters and routes implemented
across the city
Area of vegetated area created (m2)
Area of canopy cover created (m2)
Area of shaded cover created (m2)
Area of cool/white surfaces (m2)
Number of cooling centers/shelters created
per capita
Length of cooling routes established (km)
Improved temperatures from vegetation during extreme heat/heatwave
Improved temperatures from shading structures
during extreme heat/heatwave
Improved temperatures from cool/white surfaces
during extreme heat/ heatwaves
Increased access to areas with moderated
temperatures
Increased access to routes with moderated
temperatures
oC oF Temperature difference between vegetated and non-
vegetated areas
oC oF Temperature difference between
shaded and non-shaded areas
oC oF Temperature difference between cool/
white spaces and non-cool/white spaces
% of population within (15min) reach of a
cooling centre
% of population using cooling centres
Reduced exposure to extreme heat/
heatwaves
Reduced exposure to extreme heat/
heatwaves
Reduced exposure to extreme heat/
heatwaves
Reduced exposure to extreme heat/
heatwaves
Reduced vulnerability to extreme heat/
heatwaves
People: number of A&E admissions from heatstroke; number of ambulance dispatch calls
in extreme heat/heat stroke; number of heat mortality cases
Assets: Number of assets affected/damaged, Cost of repairs, Cost to economic productivity (or $ damage)
People: number of A&E admissions from heatstroke; number of ambulance dispatch calls
in extreme heat/heat stroke; number of heat mortality cases
Assets: Number of assets affected/damaged, Cost of repairs, Cost to economic productivity (or $ damage)
People: number of A&E admissions from heatstroke; number of ambulance dispatch calls
in extreme heat/heat stroke; number of heat mortality cases
Assets: Number of assets affected/damaged, Cost of repairs, Cost to economic productivity (or $ damage)
People: number of A&E admissions from heatstroke; number of ambulance dispatch calls
in extreme heat/heat stroke; number of heat mortality cases
Assets: Number of assets affected/damaged, Cost of repairs, Cost to economic productivity (or $ damage)
People: number of A&E admissions from heatstroke; number of ambulance dispatch calls
in extreme heat/heat stroke; number of heat mortality cases
Assets: Number of assets affected/damaged, Cost of repairs, Cost to economic productivity (or $ damage)
People: number of A&E admissions from heatstroke; number of ambulance dispatch calls
in extreme heat/heat stroke; number of heat mortality cases
Assets: Number of assets affected/damaged, Cost of repairs, Cost to economic productivity (or $ damage)
Provide drinking/cooling water sources (fountains, sprinklers,
etc.)
Implementing permeable surfaces
Water features built across city
Additional permeable surface area
Number of water sources per capita
Area of permeable surfaces (m2)
Increased access to safe water
Improved temperatures (surface temperature)
from permeable surfaces during extreme heat/
heatwave
% increase in water consumption during
high heat
oC oF Temperature difference between permeable and non-
permeable areas
Reduced vulnerability in extreme heat/
heatwaves
Reduced vulnerability in extreme heat/
heatwaves
6
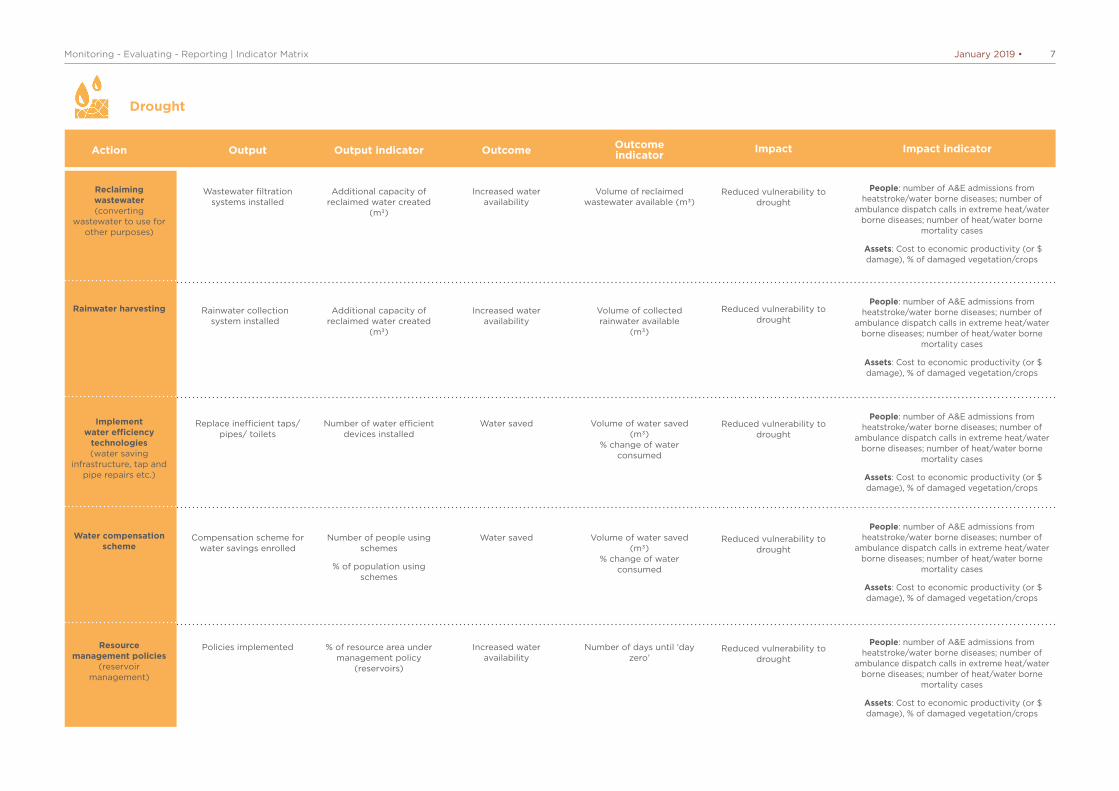
40Monitoring - Evaluating - Reporting | Indicator Matrix January 2019 •
Drought
Action Output Output indicator Outcome Outcome indicator Impact Impact indicator
Reclaiming wastewater (converting
wastewater to use for other purposes)
Rainwater harvesting
Implement water efficiency
technologies (water saving
infrastructure, tap and pipe repairs etc.)
Water compensation scheme
Resource management policies
(reservoir management)
Wastewater filtration systems installed
Rainwater collection system installed
Replace inefficient taps/pipes/ toilets
Compensation scheme for water savings enrolled
Policies implemented
Additional capacity of reclaimed water created
(m3)
Additional capacity of reclaimed water created
(m3)
Number of water efficient devices installed
Number of people using schemes
% of population using schemes
% of resource area under management policy
(reservoirs)
Increased water availability
Increased water availability
Water saved
Water saved
Increased water availability
Volume of reclaimed wastewater available (m3)
Volume of collected rainwater available
(m3)
Volume of water saved (m3)
% change of water consumed
Volume of water saved (m3)
% change of water consumed
Number of days until ‘day zero’
Reduced vulnerability to drought
Reduced vulnerability to drought
Reduced vulnerability to drought
Reduced vulnerability to drought
Reduced vulnerability to drought
People: number of A&E admissions from heatstroke/water borne diseases; number of
ambulance dispatch calls in extreme heat/water borne diseases; number of heat/water borne
mortality cases
Assets: Cost to economic productivity (or $ damage), % of damaged vegetation/crops
People: number of A&E admissions from heatstroke/water borne diseases; number of
ambulance dispatch calls in extreme heat/water borne diseases; number of heat/water borne
mortality cases
Assets: Cost to economic productivity (or $ damage), % of damaged vegetation/crops
People: number of A&E admissions from heatstroke/water borne diseases; number of
ambulance dispatch calls in extreme heat/water borne diseases; number of heat/water borne
mortality cases
Assets: Cost to economic productivity (or $ damage), % of damaged vegetation/crops
People: number of A&E admissions from heatstroke/water borne diseases; number of
ambulance dispatch calls in extreme heat/water borne diseases; number of heat/water borne
mortality cases
Assets: Cost to economic productivity (or $ damage), % of damaged vegetation/crops
People: number of A&E admissions from heatstroke/water borne diseases; number of
ambulance dispatch calls in extreme heat/water borne diseases; number of heat/water borne
mortality cases
Assets: Cost to economic productivity (or $ damage), % of damaged vegetation/crops
7
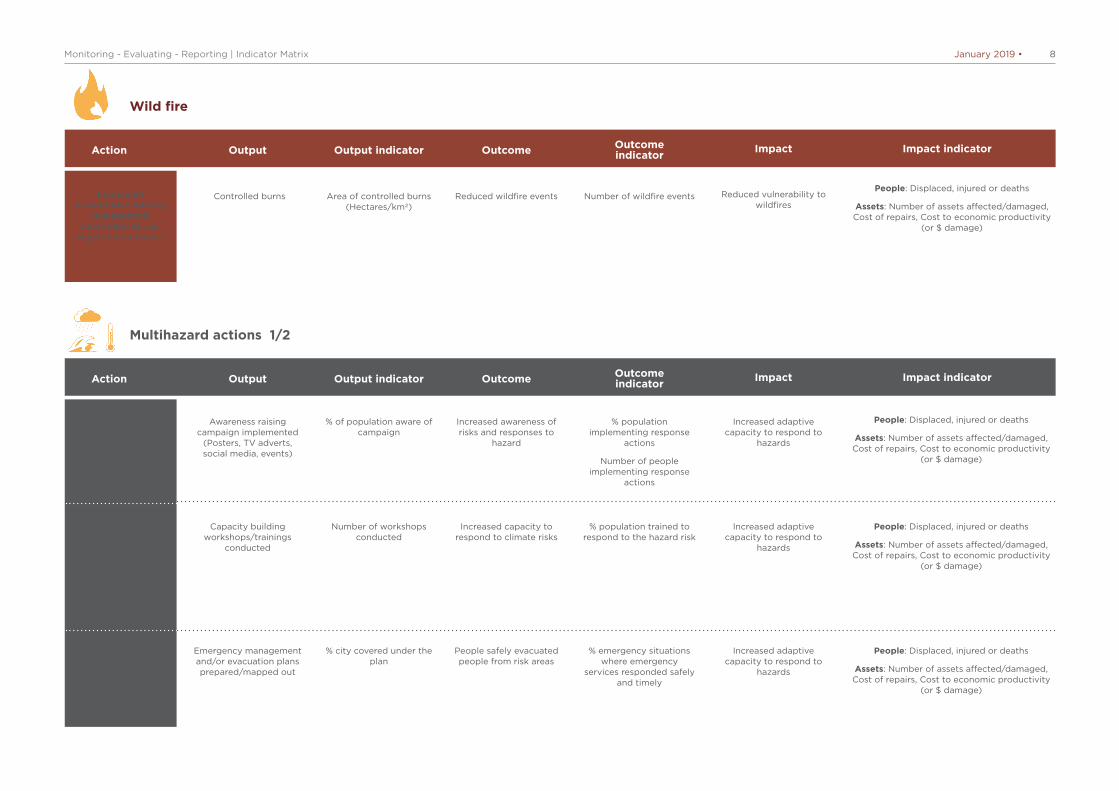
41Monitoring - Evaluating - Reporting | Indicator Matrix January 2019 •
Wild fire
Multihazard actions 1/2
Action
Action
Output
Output
Output indicator
Output indicator
Outcome
Outcome
Outcome indicator
Outcome indicator
Impact
Impact
Impact indicator
Impact indicator
Implement preventative forestry
management (controlled burns/
vegetation removal)
Controlled burns Area of controlled burns (Hectares/km2)
Reduced wildfire events Number of wildfire events Reduced vulnerability to wildfires
People: Displaced, injured or deaths
Assets: Number of assets affected/damaged, Cost of repairs, Cost to economic productivity
(or $ damage)
People: Displaced, injured or deaths
Assets: Number of assets affected/damaged, Cost of repairs, Cost to economic productivity
(or $ damage)
People: Displaced, injured or deaths
Assets: Number of assets affected/damaged, Cost of repairs, Cost to economic productivity
(or $ damage)
People: Displaced, injured or deaths
Assets: Number of assets affected/damaged, Cost of repairs, Cost to economic productivity
(or $ damage)
Conduct awareness raising campaigns
(water saving campaign, drought
prevention campaign, heatwave awareness
campaign)
Implement emergency management and evacuation plans
(Flash floods, storms, and wildfires)
Capacity building workshops (collective/
community teaching on hazard prevention
or management, includes: workshops on evacuation procedures,
communicating risks etc.)
Awareness raising campaign implemented
(Posters, TV adverts, social media, events)
Emergency management and/or evacuation plans prepared/mapped out
Capacity building workshops/trainings
conducted
% of population aware of campaign
% city covered under the plan
Number of workshops conducted
Increased awareness of risks and responses to
hazard
People safely evacuated people from risk areas
Increased capacity to respond to climate risks
% population implementing response
actions
Number of people implementing response
actions
% emergency situations where emergency
services responded safely and timely
% population trained to respond to the hazard risk
Increased adaptive capacity to respond to
hazards
Increased adaptive capacity to respond to
hazards
Increased adaptive capacity to respond to
hazards
8
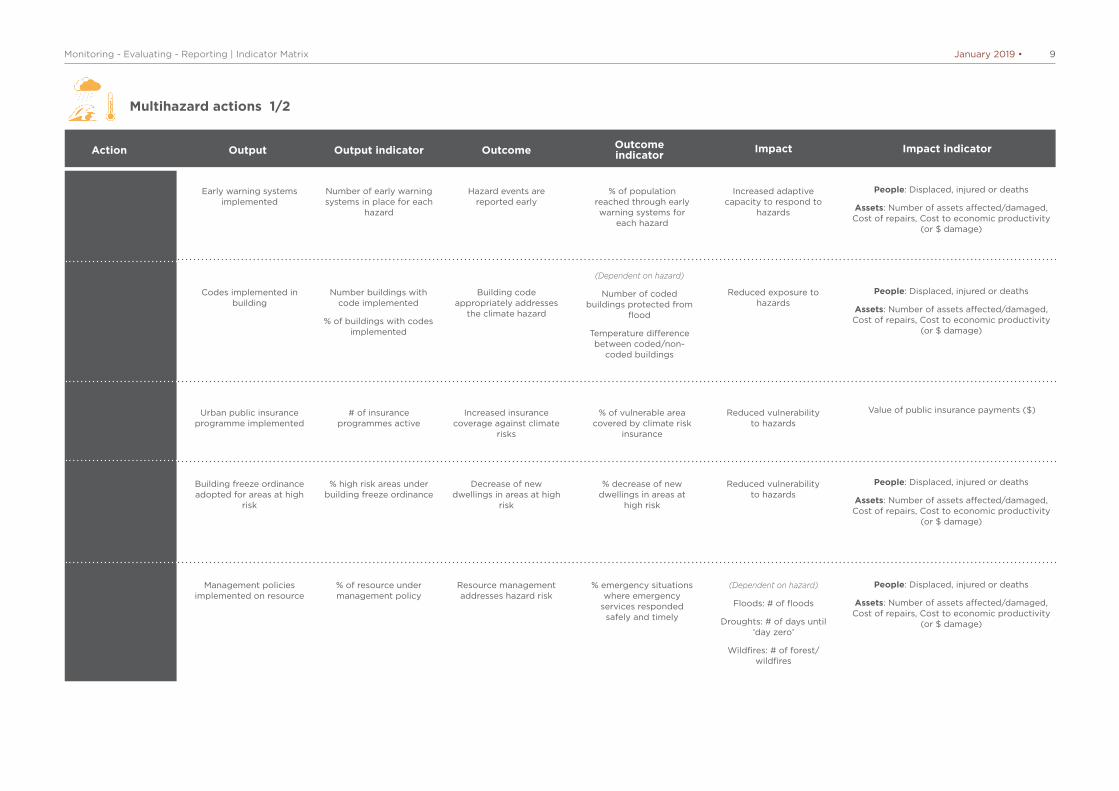
42Monitoring - Evaluating - Reporting | Indicator Matrix January 2019 •
Implement early warning systems
(Flash floods, storms, heatwaves, droughts
and wildfires)
Implement building codes (Codes to
protect and prevent multi-hazard effects, e.g. heat insulation,
flood resistent materials etc.)
Early warning systems implemented
Codes implemented in building
Number of early warning systems in place for each
hazard
Number buildings with code implemented
% of buildings with codes implemented
Hazard events are reported early
Building code appropriately addresses
the climate hazard
% of population reached through early warning systems for
each hazard
(Dependent on hazard)
Number of coded buildings protected from
flood
Temperature difference between coded/non-
coded buildings
Increased adaptive capacity to respond to
hazards
Reduced exposure to hazards
Set up insurance (or micro-insurance)
schemes
Resource management action
(Forests/ water reservoirs)
Land-use planning policy (Freeze or restrict city
development in risk prone areas)
Urban public insurance programme implemented
Management policies implemented on resource
Building freeze ordinance adopted for areas at high
risk
# of insurance programmes active
% of resource under management policy
% high risk areas under building freeze ordinance
Increased insurance coverage against climate
risks
Resource management addresses hazard risk
Decrease of new dwellings in areas at high
risk
% of vulnerable area covered by climate risk
insurance
% emergency situations where emergency
services responded safely and timely
% decrease of new dwellings in areas at
high risk
Reduced vulnerability to hazards
(Dependent on hazard)
Floods: # of floods
Droughts: # of days until ‘day zero’
Wildfires: # of forest/wildfires
Reduced vulnerability to hazards
Value of public insurance payments ($)
Multihazard actions 1/2
Action Output Output indicator Outcome Outcome indicator Impact Impact indicator
9
People: Displaced, injured or deaths
Assets: Number of assets affected/damaged, Cost of repairs, Cost to economic productivity
(or $ damage)
People: Displaced, injured or deaths
Assets: Number of assets affected/damaged, Cost of repairs, Cost to economic productivity
(or $ damage)
People: Displaced, injured or deaths
Assets: Number of assets affected/damaged, Cost of repairs, Cost to economic productivity
(or $ damage)
People: Displaced, injured or deaths
Assets: Number of assets affected/damaged, Cost of repairs, Cost to economic productivity
(or $ damage)