Measuring perceived quality of social space in distributed learning groups
26
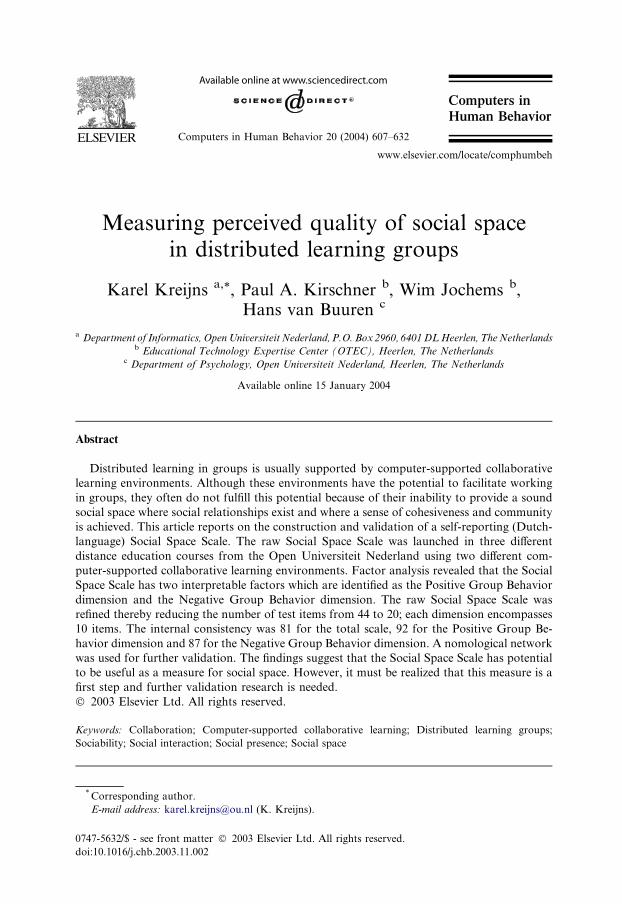
Measuring perceived quality of social space in distributed learning groups Karel Kreijns a, * , Paul A. Kirschner b , Wim Jochems b , Hans van Buuren c a Department of Informatics, Open Universiteit Nederland, P.O. Box 2960, 6401 DL Heerlen, The Netherlands b Educational Technology Expertise Center (OTEC), Heerlen, The Netherlands c Department of Psychology, Open Universiteit Nederland, Heerlen, The Netherlands Available online 15 January 2004 Abstract Distributed learning in groups is usually supported by computer-supported collaborative learning environments. Although these environments have the potential to facilitate working in groups, they often do not fulfill this potential because of their inability to provide a sound social space where social relationships exist and where a sense of cohesiveness and community is achieved. This article reports on the construction and validation of a self-reporting (Dutch- language) Social Space Scale. The raw Social Space Scale was launched in three different distance education courses from the Open Universiteit Nederland using two different com- puter-supported collaborative learning environments. Factor analysis revealed that the Social Space Scale has two interpretable factors which are identified as the Positive Group Behavior dimension and the Negative Group Behavior dimension. The raw Social Space Scale was refined thereby reducing the number of test items from 44 to 20; each dimension encompasses 10 items. The internal consistency was 81 for the total scale, 92 for the Positive Group Be- havior dimension and 87 for the Negative Group Behavior dimension. A nomological network was used for further validation. The findings suggest that the Social Space Scale has potential to be useful as a measure for social space. However, it must be realized that this measure is a first step and further validation research is needed. Ó 2003 Elsevier Ltd. All rights reserved. Keywords: Collaboration; Computer-supported collaborative learning; Distributed learning groups; Sociability; Social interaction; Social presence; Social space * Corresponding author. E-mail address: [email protected] (K. Kreijns). 0747-5632/$ - see front matter Ó 2003 Elsevier Ltd. All rights reserved. doi:10.1016/j.chb.2003.11.002 www.elsevier.com/locate/comphumbeh Computers in Human Behavior Computers in Human Behavior 20 (2004) 607–632
Transcript of Measuring perceived quality of social space in distributed learning groups
Computers inHuman Behavior
www.elsevier.com/locate/comphumbeh
Computers in Human Behavior 20 (2004) 607–632
Measuring perceived quality of social spacein distributed learning groups
Karel Kreijns a,*, Paul A. Kirschner b, Wim Jochems b,Hans van Buuren c
a Department of Informatics, OpenUniversiteit Nederland, P.O. Box 2960, 6401DLHeerlen, TheNetherlandsb Educational Technology Expertise Center (OTEC), Heerlen, The Netherlands
c Department of Psychology, Open Universiteit Nederland, Heerlen, The Netherlands
Available online 15 January 2004
Abstract
Distributed learning in groups is usually supported by computer-supported collaborative
learning environments. Although these environments have the potential to facilitate working
in groups, they often do not fulfill this potential because of their inability to provide a sound
social space where social relationships exist and where a sense of cohesiveness and community
is achieved. This article reports on the construction and validation of a self-reporting (Dutch-
language) Social Space Scale. The raw Social Space Scale was launched in three different
distance education courses from the Open Universiteit Nederland using two different com-
puter-supported collaborative learning environments. Factor analysis revealed that the Social
Space Scale has two interpretable factors which are identified as the Positive Group Behavior
dimension and the Negative Group Behavior dimension. The raw Social Space Scale was
refined thereby reducing the number of test items from 44 to 20; each dimension encompasses
10 items. The internal consistency was 81 for the total scale, 92 for the Positive Group Be-
havior dimension and 87 for the Negative Group Behavior dimension. A nomological network
was used for further validation. The findings suggest that the Social Space Scale has potential
to be useful as a measure for social space. However, it must be realized that this measure is a
first step and further validation research is needed.
� 2003 Elsevier Ltd. All rights reserved.
Keywords: Collaboration; Computer-supported collaborative learning; Distributed learning groups;
Sociability; Social interaction; Social presence; Social space
*Corresponding author.
E-mail address: [email protected] (K. Kreijns).
0747-5632/$ - see front matter � 2003 Elsevier Ltd. All rights reserved.
doi:10.1016/j.chb.2003.11.002
608 K. Kreijns et al. / Computers in Human Behavior 20 (2004) 607–632
1. Introduction
The effectiveness of group learning in an asynchronous distributed learning group
depends largely on the social interaction that takes place during the collaborative
activities in a computer-supported collaborative learning (CSCL) environment
(Hiltz, 1994; Kearsley, 1995; Muirhead, 2000; Wagner, 1994; Wagner, 1997; Swan,2002). Social interaction encourages critical thinking (Garrison, Anderson, & Ar-
cher, 2000; Newman, Johnson, Webb, & Cochrane, 1997), is a prerequisite for
shared understanding amongst group members (Clark & Brennan, 1991), allows the
social construction of knowledge (Bednar, Cunningham, Duffy, & Perry, 1995;
Glaserfeld, 1995; Jonassen, 1994; Palincsar, 1998), and supports the acquisition of
competences (Keen, 1992; Short, 1984). All these notions confirm that social inter-
action is a �conditio sine qua non� for group learning (Vygotsky, 1978).
Social interaction is not only important for cognitive processes for learning, but isequally important for socio-emotional processes such as affiliation and impression
formation, the development of social relationships and the creation of a sense of
cohesiveness and community (Harasim, 1991; Henri, 1992). These qualities deter-
mine the existence of a sound social space which is essential for reinforcing social
interaction. We define a social space to be the network of social relationships
amongst the group members embedded in group structures of norms and values,
rules and roles, beliefs and ideals. We designate a social space to be �sound� if it ischaracterized by affective work relationships, strong group cohesiveness, trust, re-spect and belonging, satisfaction, and a strong sense of community. A sound social
space determines, reinforces and sustains the social interaction that is taking place
amongst the group members and enables open critical dialogues that neither harm
nor offend group members because they know and trust each other (Rourke, 2000).
These feelings of community can increase the flow of information between (all)
learners while encouraging support, commitment to group goals, cooperation among
members, and satisfaction with group efforts. In other words, a sound social space
promotes positive feelings between group members such that learners benefit byexperiencing a greater sense of well-being and having a larger set of willing indi-
viduals to call on for support (Rovai, 2001). Finally, a sound social space contributes
to a positive social climate/online-atmosphere within the group (Brandon & Hol-
lingshead, 1999; Rourke, 2000; Rourke & Anderson, 2002).
The two dimensions of social interaction – educational and (social) psychological –
are depicted in Fig. 1 (Kreijns, Kirschner, & Jochems, 2003). This is in line with Hare
and Davis, 1994; (see also Brown & Yule, 1983) who categorized interaction as either
task-driven or socio-emotional. Learning performance encompasses variables likeefficiency and effectiveness relative to the task outcome, retention of what is learned,
and degree of shared understanding. Social performance encompasses variables like
the degree of established social space, sense of community, and degree of trust. As can
be seen from Fig. 1, learning performance and social performance not only �reinforce�(see arrows) their direct precursors cognitive processes (e.g., critical thinking) and
socio-emotional/social performances (e.g., formation of group structures) respec-
tively, but also �cross-reinforce�. For example, if the group is successful in achieving
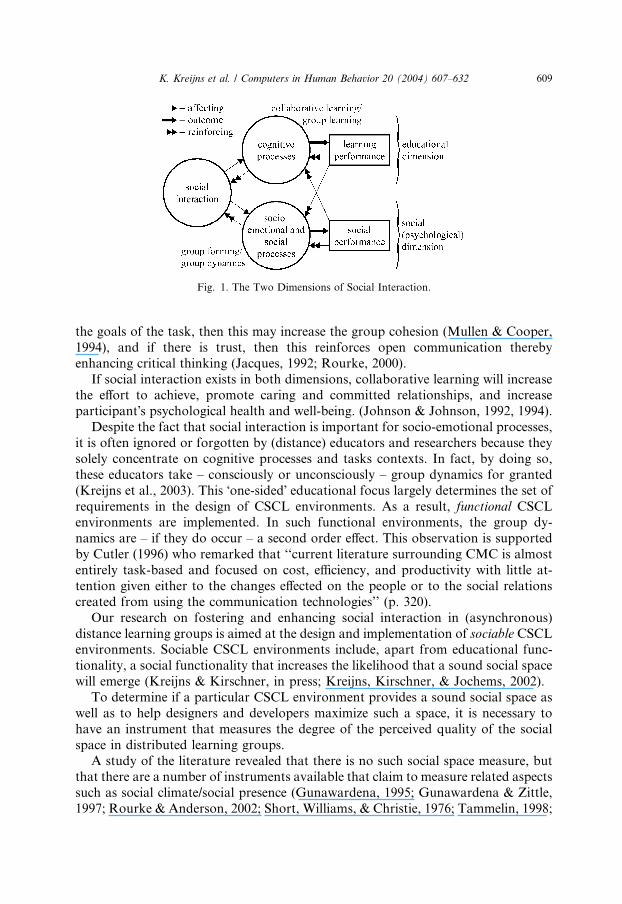
Fig. 1. The Two Dimensions of Social Interaction.
K. Kreijns et al. / Computers in Human Behavior 20 (2004) 607–632 609
the goals of the task, then this may increase the group cohesion (Mullen & Cooper,
1994), and if there is trust, then this reinforces open communication thereby
enhancing critical thinking (Jacques, 1992; Rourke, 2000).
If social interaction exists in both dimensions, collaborative learning will increasethe effort to achieve, promote caring and committed relationships, and increase
participant�s psychological health and well-being. (Johnson & Johnson, 1992, 1994).
Despite the fact that social interaction is important for socio-emotional processes,
it is often ignored or forgotten by (distance) educators and researchers because they
solely concentrate on cognitive processes and tasks contexts. In fact, by doing so,
these educators take – consciously or unconsciously – group dynamics for granted
(Kreijns et al., 2003). This �one-sided� educational focus largely determines the set of
requirements in the design of CSCL environments. As a result, functional CSCLenvironments are implemented. In such functional environments, the group dy-
namics are – if they do occur – a second order effect. This observation is supported
by Cutler (1996) who remarked that ‘‘current literature surrounding CMC is almost
entirely task-based and focused on cost, efficiency, and productivity with little at-
tention given either to the changes effected on the people or to the social relations
created from using the communication technologies’’ (p. 320).
Our research on fostering and enhancing social interaction in (asynchronous)
distance learning groups is aimed at the design and implementation of sociable CSCLenvironments. Sociable CSCL environments include, apart from educational func-
tionality, a social functionality that increases the likelihood that a sound social space
will emerge (Kreijns & Kirschner, in press; Kreijns, Kirschner, & Jochems, 2002).
To determine if a particular CSCL environment provides a sound social space as
well as to help designers and developers maximize such a space, it is necessary to
have an instrument that measures the degree of the perceived quality of the social
space in distributed learning groups.
A study of the literature revealed that there is no such social space measure, butthat there are a number of instruments available that claim to measure related aspects
such as social climate/social presence (Gunawardena, 1995; Gunawardena & Zittle,
1997; Rourke & Anderson, 2002; Short, Williams, & Christie, 1976; Tammelin, 1998;
610 K. Kreijns et al. / Computers in Human Behavior 20 (2004) 607–632
Tu, 2000, 2002; Tu & Isaacs, 2002). Social presence is the degree of illusion that the
other in the communication appears to be a �real� physical person. Close study to these
existing instruments (see next section) led us to the conclusion that these instruments
measure aspects of social space, social climate, social presence, sociability (see for
sociability, Kreijns et al., 2002), and the effects of using certain pedagogical tech-
niques in varying degrees (see for an overview of these pedagogical techniques,Kreijns et al., 2003). None of them, however, measured what we consider to be social
space. For this reason, we have developed and validated our own measurement
instrument: the Social Space Scale.
2. Existing instruments
A number of existing instruments purport to measure social climate/social pres-ence. Rourke and Anderson (2002) measured the social climate of computer confer-
encing by using six, 5-point bipolar (semantic differential) scale items (see Appendix
1). These bipolar scale items are commonly used to measure the degree of social
presence. Short et al. (1976) used four, 7-point bipolar scale items (see Appendix 1)
for measuring social presence. These four scale items were, and still are, the domi-
nant social presence measure for many researchers. Gunawardena (1995) extended
these four scale items with 13 new scale items, resulting in a questionnaire of 17, 5-
point bipolar scale items (see Appendix 1). She used the scale, here referred to asSocial Presence Indicators, for soliciting the students� reactions on a range of feelings
toward the medium of CMC. Gunawardena and Zittle (1997) developed an alterna-
tive social presence measure, called the Social Presence Scale, consisting of 14, 4-
point Likert-scale items (e.g., �The moderators created a feeling of an on-line com-
munity� and �I felt that my point of view was acknowledge by other participants in
GlobalEd�; GlobalEd is a listserv based discussion board). They contended that the
Social Presence Indicators measure the �intimacy� dimension of social presence (in-
timacy: see Argyle & Dean, 1965) whilst, in contrast, the Social Presence Scalemeasures the �immediacy� dimension of it (immediacy: see Wiener & Mehrabian,
1968).
From our study we conclude that it is not clear what all these instruments are
actually measuring since the items tend to overlap (see Appendix 1) or are not within
the space of interest associated with the construct. Gunawardena and Zittle�s (1997)Social Presence Scale, for example, includes items such as �Discussions using the
medium of CMC tend to be more impersonal than face-to-face discussions�. Thus,the question arises whether these instruments measure social climate, social presence,feelings of the learners towards CMC, and/or the intimacy or immediacy dimension
of social presence. The authors of these instruments also add to the confusion.
Rourke and Anderson (2002) are not consistent in using the term social climate.
They also use the term �social environment� and, when referring to the instrument
measuring social climate, they use the term social presence (we also have to take into
account that their definition of social presence is different than that of Short et al.
(1976)). Gunawardena (1995) stated that the 17, 5-point bipolar scale items (the
K. Kreijns et al. / Computers in Human Behavior 20 (2004) 607–632 611
Social Presence Indicators) measures the students� perception of computer mediated
communication (CMC) as a social medium although she defined social presence as
‘‘the degree to which a person is perceived as a �real person� in mediated commu-
nication’’ (p. 151). This is not the same thing! Gunawardena also suggested a rela-
tionship between social climate and social presence, yet this relationship is not clearly
described. Finally, Gunawardena and Zittle (1997) stated, for example, that theirSocial Presence Scale measures the immediacy dimension of social presence. How-
ever they also state that the Social Presence Scale measures the ‘‘Perceived sense of
�online community�, the degree of social comfort with CMC’’ (p. 14). In sum, we
conclude that these existing instruments measure varying degrees of aspects of an
amorphous set of variables, including social space, social climate, social environ-
ment, social presence, sociability, feelings toward CMC, and the effects of using
certain pedagogical techniques, but not social space as total concept. Moreover, not
all the measurements instruments have construct validity nor do they present data (ifany exists) as to their internal reliability. This confounding situation led us to the
conviction that we need to develop our own social space measure. The (refined)
Social Space Scale is discussed in the next section.
3. The social space scale
The Social Space Scale is a self-reporting measure for assessing the perceivedquality of the social space that exists in distributed learning group and consists of
two parts. The first part assesses the students� feelings regarding their own behavior
and/or the other group members� behavior in the group. This part contains Likert
scale items with 1¼ �not applicable at all� to 5¼ �totally applicable�. The second
part assesses perceived frequency of specific group members� behaviors in the group.
That part contains Likert scales with 1¼ �very rarely or never� to 5¼ �always or veryoften�. The (refined) Social Space Scale is depicted in Table 1. The four last columns
show statistical data discussed in Section 5.
4. Method
4.1. Participation
Data was collected from a total of 186 students in three distance education
courses at the OUNL. The first �course� is the Virtual Environmental Consultancy(VEC) of the Department of Natural Sciences. VEC is a Virtual Company Inno-
vation Project aimed to deliver authentic contexts to students. Thirty-five students
(25 males, 10 females) from four higher education institutions participated in VEC:
the OUNL (8 males, 2 females), the University Maastricht (UM; 3 males, 6 females),
the University Twente (UT; 7 males, 1 female), and the Fontys University of Pro-
fessional Education (Fontys; 7 males, 1 female). OUNL- and UM students were
assigned to one of five groups; four groups had four participants, the remaining
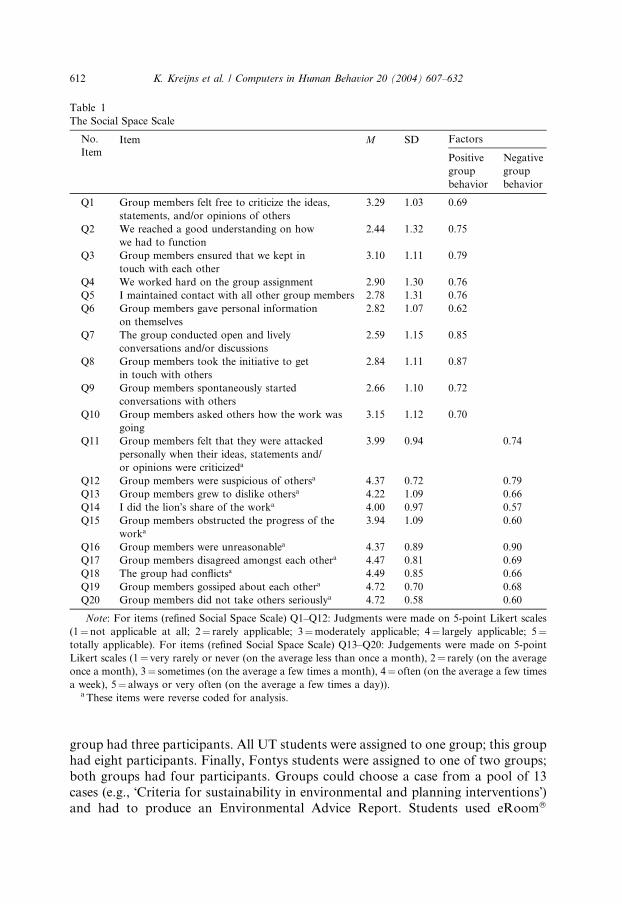
Table 1
The Social Space Scale
No.
ItemItem M SD Factors
Positive
group
behavior
Negative
group
behavior
Q1 Group members felt free to criticize the ideas,
statements, and/or opinions of others
3.29 1.03 0.69
Q2 We reached a good understanding on how
we had to function
2.44 1.32 0.75
Q3 Group members ensured that we kept in
touch with each other
3.10 1.11 0.79
Q4 We worked hard on the group assignment 2.90 1.30 0.76
Q5 I maintained contact with all other group members 2.78 1.31 0.76
Q6 Group members gave personal information
on themselves
2.82 1.07 0.62
Q7 The group conducted open and lively
conversations and/or discussions
2.59 1.15 0.85
Q8 Group members took the initiative to get
in touch with others
2.84 1.11 0.87
Q9 Group members spontaneously started
conversations with others
2.66 1.10 0.72
Q10 Group members asked others how the work was
going
3.15 1.12 0.70
Q11 Group members felt that they were attacked
personally when their ideas, statements and/
or opinions were criticizeda
3.99 0.94 0.74
Q12 Group members were suspicious of othersa 4.37 0.72 0.79
Q13 Group members grew to dislike othersa 4.22 1.09 0.66
Q14 I did the lion�s share of the worka 4.00 0.97 0.57
Q15 Group members obstructed the progress of the
worka
3.94 1.09 0.60
Q16 Group members were unreasonablea 4.37 0.89 0.90
Q17 Group members disagreed amongst each othera 4.47 0.81 0.69
Q18 The group had conflictsa 4.49 0.85 0.66
Q19 Group members gossiped about each othera 4.72 0.70 0.68
Q20 Group members did not take others seriouslya 4.72 0.58 0.60
Note: For items (refined Social Space Scale) Q1–Q12: Judgments were made on 5-point Likert scales
(1¼not applicable at all; 2¼ rarely applicable; 3¼moderately applicable; 4¼ largely applicable; 5¼totally applicable). For items (refined Social Space Scale) Q13–Q20: Judgements were made on 5-point
Likert scales (1¼ very rarely or never (on the average less than once a month), 2¼ rarely (on the average
once a month), 3¼ sometimes (on the average a few times a month), 4¼ often (on the average a few times
a week), 5¼ always or very often (on the average a few times a day)).a These items were reverse coded for analysis.
612 K. Kreijns et al. / Computers in Human Behavior 20 (2004) 607–632
group had three participants. All UT students were assigned to one group; this group
had eight participants. Finally, Fontys students were assigned to one of two groups;
both groups had four participants. Groups could choose a case from a pool of 13
cases (e.g., �Criteria for sustainability in environmental and planning interventions�)and had to produce an Environmental Advice Report. Students used eRoom�

K. Kreijns et al. / Computers in Human Behavior 20 (2004) 607–632 613
version 5.4 (http://www.eroom.com) as their CSCL environment that contains a
collection of collaborative work tools including a file storage system, voting system,
real-time chat, and forum groups. Folders are used to organize the collaborative
work tools.
The two other courses were taken from the Statistics Education Innovation
Project (Van Buuren & Giesbertz, 1999) at the Department of Psychology at theOUNL. Thirty-eight adult undergraduates (all OUNL students; 6 male and 32 fe-
male) enrolled in the first course (in this study designated as �Stat 1�) and were as-
signed to one of seven groups consisting of five or six members each. However, two
female students were non-starters and did not participate from the very beginning of
the course. During the course 10 students (2 males, 8 females) dropped out. Con-
sequently, group sizes were decreased; four groups had three participants, one group
had four participants and the remaining two groups had five participants. All seven
groups had to study the same study-material emphasizing practicing psychologicalexperimentation and the use of ANOVA. Groups had to produce a prototype of a
research paper. The groups made use of Studynet, the CSCL environment of the
OUNL. In Studynet, asynchronous communication takes place through newsgroups
and real-time communication via Microsoft Netmeeting�. Telephone and e-mail use
were prohibited.
One hundred and thirteen adult undergraduates (all OUNL students, 34 male and
79 female) enrolled in the second course (in this study designated as �Stat 2�). Stu-dents were assigned to one of eight �slow� groups, eight �fast� groups, or two �free�groups. Slow and free groups had approximately twice the time of fast groups to
complete the course (10 and 6 months, respectively). Collaboration was compulsory
for the slow and fast groups, and voluntary for the free groups. Half of the slow
groups and half of the fast groups had four members; the remaining slow and fast
groups had eight members. The group sizes of the two free groups were respectively 5
and 12 members. However, this course had six female students that were non-
starters. During the course, due to practical issues, a few changes with respect to
group membership occurred. In addition, one slow group discontinued and one newfree group was formed. All groups had to study the same study-material emphasizing
the use of questionnaires, moderation analysis with ANOVA, and regression
methods. Stat2 groups used Studynet CSCL environment as well. Here too, e-mail
and telephone were prohibited.
4.2. Procedure
The VEC course started at the beginning of March, 2002 and lasted 14 weeks inwhich there were three face-to-face meetings, namely a kick-off meeting at the start
of the course, an evaluation meeting halfway through the course, and a closing
meeting at the end of the course. The questionnaire including all the measures, was
administered electronically (using Dipolar Professional Quest software, release 2.2:
see www.dipolar.com.au) just after the second face-to-face meeting. From the total
of 35 students only 11 students (31.4%) responded to the questionnaire from which
nine students (25.7%) responded to all items. All respondents were either OUNL- or
614 K. Kreijns et al. / Computers in Human Behavior 20 (2004) 607–632
UM students. Although response was low, we had agreed with those responsible for
the course that students were to be asked only once for filling in the questionnaire.
Stat 1 started at the end of November, 2001. The course lasted 18 weeks in which
two face-to-face meetings were organized: an introduction and an evaluation
meeting. The same electronic questionnaire as in the VEC was launched here. From
the number of students that actually started (26 students; 38 initial students less twonon-starters and less 10 drop-outs), 18 (69.2%) students responded. The distribution
is as follows: one group had one response, three groups had two responses, one
group had three responses, and two groups had four responses.
Stat 2 started in the middle of January, 2002. The same questionnaire was
launched too at the students of Stat 2. From the number of students that still par-
ticipated (93 students; 113 initial students less 6 non-starters and less 14 drop-outs),
50 (53.8%) students responded. Two students who dropped out also returned the
questionnaire. The total number of respondents is, therefore, 52. In more detail:from the 29 students of the fast groups, 20 (69.0%) students responded; from the 41
students of the slow groups, also 20 (48.8%) students responded and one student who
dropped out. From the 23 students of the free groups, 10 (43.5%) students responded
and one student who dropped out. The distribution of the responses in the fast
groups is as follows: three groups had only one response, one group had two re-
sponses, two groups had three responses, one group had four responses, and one
group had five responses. The distribution in the slow groups is as follows: one group
had only one response, three groups had two responses, two groups had four re-sponses, and one group had six responses. Finally, the distribution of the responses
in the free groups is as follows: one group had two responses, one group had three
responses, and one group had six responses.
4.3. Instruments
To validate the Social Space Scale, we selected four measures dealing with con-
structs related to social space, or to aspects of it, as reference measures namely:1. Social Presence Indicators (Gunawardena, 1995)
2. Social Presence Scale (Gunawardena & Zittle, 1997)
3. Work-Group Cohesiveness Index (Price & Mueller, 1986)
4. Group Atmosphere Scale (Fiedler, 1962; Fiedler, 1967)
For validation we used Campbell and Fiske�s (1959) criterion that related con-
structs in a nomological network (Cronbach & Meehl, 1955) should exhibit mod-
erate to high correlations, but not too high since extreme correlation could be
interpreted as equivalency.
4.3.1. The Gunawardena social presence indicators
We already addressed Gunawardena�s (1995) Social Presence Indicators in the
previous section. She used this measure for assessing a range of feelings students have
toward the medium of CMCwhich she implicitly sees as the degree of perceived social
presence. Her Social Presence Indicators actually measure, amongst other things,
varying degrees of social climate, social presence, social space, and sociability.
K. Kreijns et al. / Computers in Human Behavior 20 (2004) 607–632 615
The constructs underlying these variables are all part of a nomological network not
only because they have a relationship with social space but also because one of them is
social space. However, we believe the items of the Social Presence Indicators measure
many aspects of sociability, less of the social presence aspects, and even lesser on the
social space aspects. We, therefore, expect a low to moderate correlation between the
Social Presence Indicators and the Social Space Scale with respect to the PositiveGroup Behavior dimension.
It is difficult to predict the correlation between the Social Presence Indicators and
the Negative Group Behavior dimension of the Social Space Scale. It is unclear what
the effects of a CSCL environment low in sociability and social presence are on group
behavior in the negative dimension. On the one hand, past research on social
presence theory have suggested that CMC low in social presence may cause de-in-
dividuation and depersonalization effects, possibly leading to uninhibited behavior
(Jessup, Connolly, & Tansik, 1990). On the other hand, Walther�s (1992) social in-formation processing (SIP) theory rebuts these suggestions. Therefore, we leave this
correlation for the moment aside. In our study we have translated the items of the
Social Presence Indicators into Dutch.
4.3.2. The Gunawardena and Zittle Social Presence Scale
We have also addressed the Gunawardena and Zittle (1997) Social Presence Scale
in the previous section. They construct validated the Social Presence Scale using a bi-
variate correlation analysis between the aggregated scores of the items of the SocialPresence Scale and six selected bi-polar items of the Social Presence Indicators. The
authors, therefore, argued that the Social Presence Scale can be used to ‘‘accurately
measure the intended social presence parameters’’ (p. 17). Because Social Presence
Indicators and Social Presence Scale measure the same phenomena, the same rea-
soning as with the Social Presence Indicators is valid here. Thus, here too we do
expect a low to moderate correlation between this Social Presence Scale and our
Social Space Scale with respect to the Positive Group Behavior dimension. With
respect to the correlation between the Social Presence Scale and the Negative GroupBehavior dimension of the Social Space Scale, the same considerations as with the
Social Presence Indicators on this aspect, is here applicable. Thus, we here also leave
this correlation for the moment aside. We slightly adapted their Social Presence Scale
to fit our particular setting and then translated it into Dutch.
4.3.3. The Price and Mueller Work Group Cohesion Index
Price and Mueller (1986) developed their Work Group Cohesion Index to mea-
sure work-group cohesion in an organizational context. They define work-groupcohesion as ‘‘the extent to which employees have close friends in their immediate
work units’’ (p. 252). We consider a distributed learning group to be similar to
�employees in their immediate work unit�. The Work Group Cohesion Index consists
of five, 5-point Likert scale items (�To what extent: were the other team mates
friendly?� �. . . were the other team mates helpful?�, �. . . did other team mates take a
personal interest in you?�, �. . . do you trust the other team mates?�, and �. . . do you
look forward to work again with the same team mates?�). Social cohesiveness is an
616 K. Kreijns et al. / Computers in Human Behavior 20 (2004) 607–632
attribute of social space and, therefore, social cohesiveness as a construct is part of
the nomological network. We expect a high correlation between the Work Group
Cohesion Index and the Positive Group Behavior dimension of the Social Space
Scale. If social cohesiveness is low then this may indicate, for example, that a sense
of community is failing or that affective relationships could not developed. One
reason (amongst many others) could be negative behavior in the group, for example,trust is violated by group members. Based upon this reasoning, we expect a (very)
low correlation with the Work Group Cohesion Index and the Negative Group
Behavior dimension of the Social Space Scale. Here too, all items were translated
into Dutch.
4.3.4. Fiedler’s Group Atmosphere Scale
Fiedler (1967) developed the Group Atmosphere Scale, a semantic differential
scale with 8-point bipolar scales (see Appendix 1). Although Fiedler�s Group At-mosphere Scale is used for leaders in contiguous groups, we use this scale for
distributed learning groups where each members rate the group atmosphere which
we consider to be an alternative term for social climate. Instead of using 8-point
scales we used 5-point scales. A sound social space contributes to (a positive) group
atmosphere and social climate. For this reason the construct group atmosphere
is part of the nomological network. The correlation between the Group Atmo-
sphere Scale and the Social Space Scale in the Positive Group Behavior dimension
is expected to be moderate because a sound social space contributes to a positivegroup atmosphere (i.e., social climate) and vice versa. If the group atmosphere is
low then this is possibly due to problems within the group but other reasons may
be valid as well. We, therefore, expect a (very) low correlation between the Group
Atmosphere scale and the Social Space Scale in the Negative Group Behavior
dimension.
However, the Group Atmosphere Scale is also very similar to the Social Presence
Indicators (which adds to our belief that the Social Presence Indicators are indeed
measuring aspects of social climate). We, therefore, actually expect the correlation tobe somewhat lower than the magnitude of the correlation between the Social Space
Scale and the Social Presence Indicators.
4.4. Construction, dimension, and refinement of the Raw Social Space Scale
4.4.1. Constructing the Raw Social Space Scale
When we constructed the Raw Social Space Scale, we had no systematic ap-
proach in mind other than that we were guided by the literature about what thecharacteristics of a good or bad social space might be. As a result, 44 items were
constructed that deliberately overrepresented the social space construct. We in-
tended to remove redundant items in a later refinement process which will also
remove those items that are psychometrically �rejected�. The advantage of such a
method is that we could postpone the decision of which items to include in the
final Social Space Scale up to the moment that we would have gained a clearer
picture of the meaning of the various items.

K. Kreijns et al. / Computers in Human Behavior 20 (2004) 607–632 617
4.5. Determining the dimensionality of the Social Space Scale
In order to determine the dimensionality of the Social Space Scale we applied a
factor analysis (Principal Component Analysis using Varimax rotation) on the scores
of all 174 items of the questionnaire. The questionnaire contained, amongst others,
the raw Social Space Scale, the Social Presence Indicators, the Social Presence Scale,the Group Atmosphere Scale, and the Work Group Cohesion Index. The raw Social
Space Scale contained 44 items and was considered to be one-dimensional. The total
sample was 79 students, which is relatively low considering a total of 174 items of the
questionnaire. This means that results should be interpreted with some reservation.
The factor analysis was used to:
1. reject the preposition of one-dimensionality of the social space construct
2. determine interpretable factors, and
3. help select items of the raw Social Space Scale that can be removed (see the next,second, phase).
The analysis revealed 37 components possessing eigenvalues of 1.0 or greater
(Kaiser–Gutman Rule). However, according to Hofstee (1999) the criterion of 1.0 is
too liberal and argued that only components possessing eigenvalues of 4.0 should be
considered (p. 126–127). That latter criterion revealed six components. A scree test
(Catell, 1966) revealed a clear break after the third component. These three com-
ponents were interpretable (i.e., at least one measure was able to produce an inter-
pretation for each one of the three factors).The majority of initial items of the raw Social Space Scale loaded higher than 0.40
(see Stevens, 1992; for this criterion) exclusively on component two or three. This
means that the social space construct is not one-dimensional. These two components
are interpreted as the Positive Group Behavior-dimension (component two) and the
Negative Group Behavior-dimension (component three) of the social space construct
(see Table 1).
4.6. Removing test items of raw social space scale
The raw Social Space Scale, consisting of the 44 items, was refined in four steps.
The first step was to remove those items who�s load on component two or three were
less than 40 (5 items), or that did load higher on the other components than on
component two or three (2 items). The second step was a careful semantic exami-
nation on the items. Items that show similarities with or were (semantically) identical
to items on the other scales were removed (11 items). The third step was removal of
items not associated with positive or negative group behavior (4 items), or werealmost (semantically) identical to another item within the raw Social Space Scale (1
item).
The fourth and final step was aimed to balance the items in the dimensions Po-
sitive Group Behavior and Negative Group Behavior with no more than 10 items in
each dimension (removed 1 item).
The items removed in the second and third step were those items that we consider
to be redundant. The refinement process did not create a scale that under represented
618 K. Kreijns et al. / Computers in Human Behavior 20 (2004) 607–632
the social space construct. The refined Social Space Scale is depicted in Table 1 along
with mean and standard deviation. With respect to the loadings, a second factor
analysis (Principal Component Analysis using Varimax rotation) was performed on
the final 20 items thereby focusing on a two factor solution. The screeplot revealed a
clear break after the second component, confirming the two-dimensionality of the
Social Space Scale and legitimating the two factor solution. Both components showstrong loadings. The two factor solution explained 54.59% of the total variance (the
first component explained 30.14% and the second 24.45%).
5. Results
5.1. Internal consistency and validity
Cronbach�s alpha was calculated for this refined Social Space Scale and for each
factor. The resultant of the calculation is 0.81 (Social Space Scale), 0.92 (factor
representing the Positive Group Behavior-dimension), and 0.87 (factor representing
the Negative Group Behavior-dimension) respectively, showing that the Social Space
Scale has a high internal consistency.
The content validity of the Social Space Scale was established via face-validity.
The items were developed based upon a search in the literature regarding social
interaction via CMC, group development and group dynamics, social presence, trustbuilding, and creating sense of community.
5.2. Pearson bi-variate correlations
We applied a Pearson bi-variate correlation (two-tailed) analysis on the aggregate
scores of the items of the Social Space Scale and the other measures (see Table 2).
Our predictions on how the Social Space Scale would correlate with the other
measures – with respect to both strength as the direction – seem to be fulfilled withrespect to the Positive Group Behavior-dimension. The low correlations with respect
to the Negative Group Behavior-dimension are explained by the fact that the other
measures address positive experiences rather than negative ones (i.e., more social
presence, better group atmosphere); these measures have, therefore, no relationship
with the Negative Group Behavior dimension of the Social Space Scale.
5.3. Factor analysis involving the other scales
Finally, we applied factor analysis (Principal Component Analysis using Varimax
rotation) on the 20 items of the refined Social Space Scale together with the items of
each of the other scales, thus, factor analysis was applied four times. Each time, we
restricted the extraction to a fixed number of factors because the purpose of this
analysis was not to reveal components, but rather to examine the extent to which the
other scales measured the same phenomenon as the Social Space Scale.
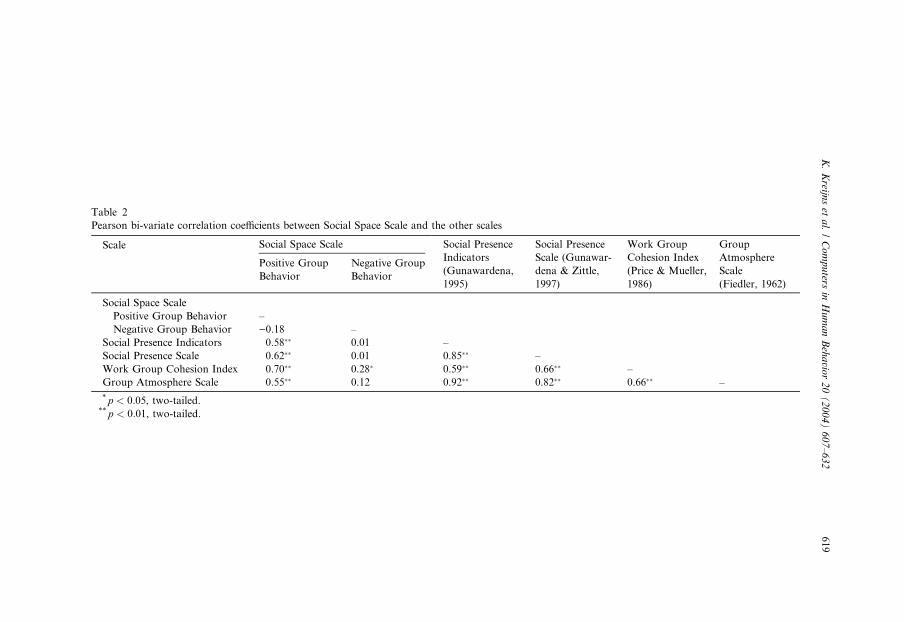
Table 2
Pearson bi-variate correlation coefficients between Social Space Scale and the other scales
Scale Social Space Scale Social Presence
Indicators
(Gunawardena,
1995)
Social Presence
Scale (Gunawar-
dena & Zittle,
1997)
Work Group
Cohesion Index
(Price & Mueller,
1986)
Group
Atmosphere
Scale
(Fiedler, 1962)
Positive Group
Behavior
Negative Group
Behavior
Social Space Scale
Positive Group Behavior –
Negative Group Behavior )0.18 –
Social Presence Indicators 0.58�� 0.01 –
Social Presence Scale 0.62�� 0.01 0.85�� –
Work Group Cohesion Index 0.70�� 0.28� 0.59�� 0.66�� –
Group Atmosphere Scale 0.55�� 0.12 0.92�� 0.82�� 0.66�� –
* p < 0:05, two-tailed.** p < 0:01, two-tailed.
K.Kreijn
set
al./Computers
inHumanBehavio
r20(2004)607–632
619
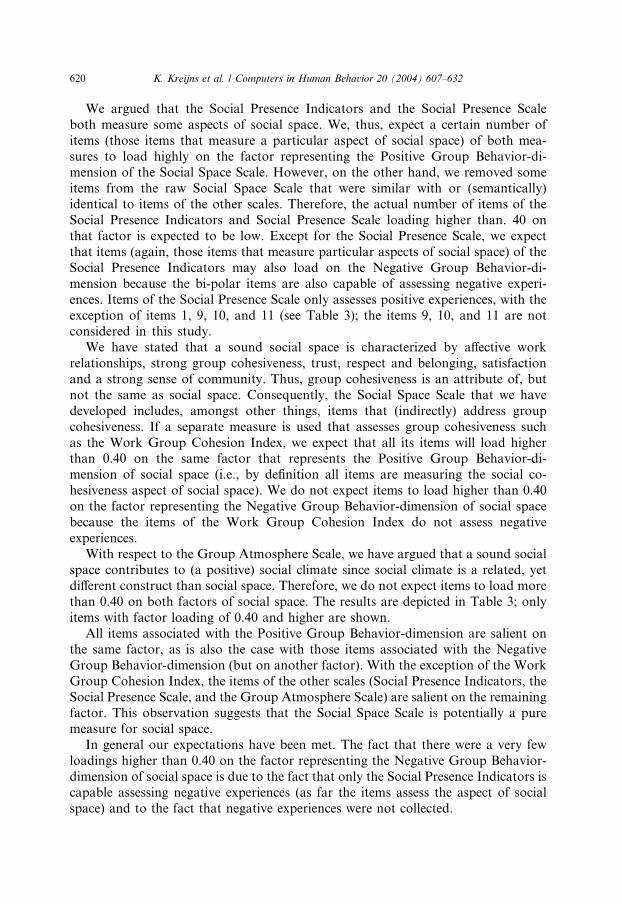
620 K. Kreijns et al. / Computers in Human Behavior 20 (2004) 607–632
We argued that the Social Presence Indicators and the Social Presence Scale
both measure some aspects of social space. We, thus, expect a certain number of
items (those items that measure a particular aspect of social space) of both mea-
sures to load highly on the factor representing the Positive Group Behavior-di-
mension of the Social Space Scale. However, on the other hand, we removed some
items from the raw Social Space Scale that were similar with or (semantically)identical to items of the other scales. Therefore, the actual number of items of the
Social Presence Indicators and Social Presence Scale loading higher than. 40 on
that factor is expected to be low. Except for the Social Presence Scale, we expect
that items (again, those items that measure particular aspects of social space) of the
Social Presence Indicators may also load on the Negative Group Behavior-di-
mension because the bi-polar items are also capable of assessing negative experi-
ences. Items of the Social Presence Scale only assesses positive experiences, with the
exception of items 1, 9, 10, and 11 (see Table 3); the items 9, 10, and 11 are notconsidered in this study.
We have stated that a sound social space is characterized by affective work
relationships, strong group cohesiveness, trust, respect and belonging, satisfaction
and a strong sense of community. Thus, group cohesiveness is an attribute of, but
not the same as social space. Consequently, the Social Space Scale that we have
developed includes, amongst other things, items that (indirectly) address group
cohesiveness. If a separate measure is used that assesses group cohesiveness such
as the Work Group Cohesion Index, we expect that all its items will load higherthan 0.40 on the same factor that represents the Positive Group Behavior-di-
mension of social space (i.e., by definition all items are measuring the social co-
hesiveness aspect of social space). We do not expect items to load higher than 0.40
on the factor representing the Negative Group Behavior-dimension of social space
because the items of the Work Group Cohesion Index do not assess negative
experiences.
With respect to the Group Atmosphere Scale, we have argued that a sound social
space contributes to (a positive) social climate since social climate is a related, yetdifferent construct than social space. Therefore, we do not expect items to load more
than 0.40 on both factors of social space. The results are depicted in Table 3; only
items with factor loading of 0.40 and higher are shown.
All items associated with the Positive Group Behavior-dimension are salient on
the same factor, as is also the case with those items associated with the Negative
Group Behavior-dimension (but on another factor). With the exception of the Work
Group Cohesion Index, the items of the other scales (Social Presence Indicators, the
Social Presence Scale, and the Group Atmosphere Scale) are salient on the remainingfactor. This observation suggests that the Social Space Scale is potentially a pure
measure for social space.
In general our expectations have been met. The fact that there were a very few
loadings higher than 0.40 on the factor representing the Negative Group Behavior-
dimension of social space is due to the fact that only the Social Presence Indicators is
capable assessing negative experiences (as far the items assess the aspect of social
space) and to the fact that negative experiences were not collected.
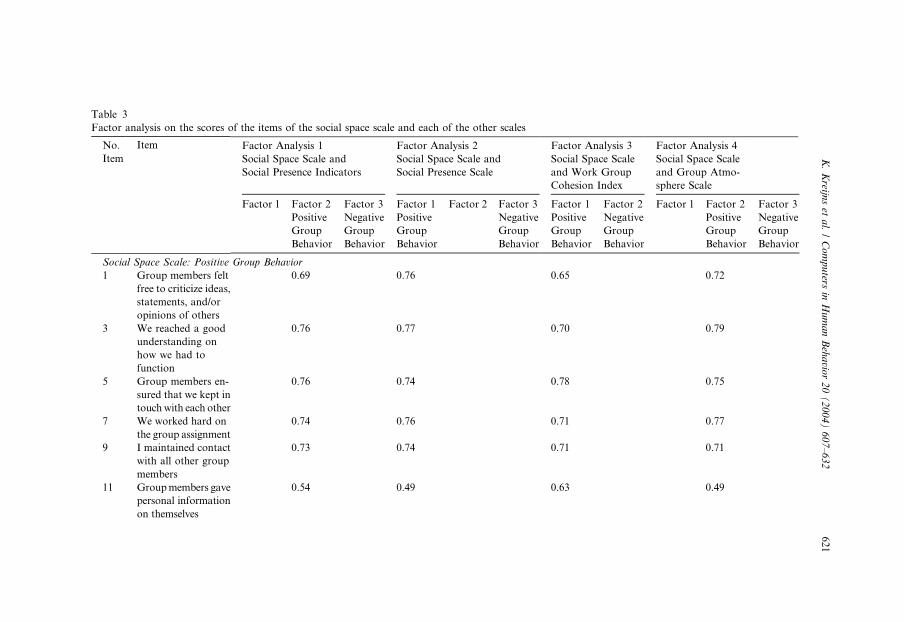
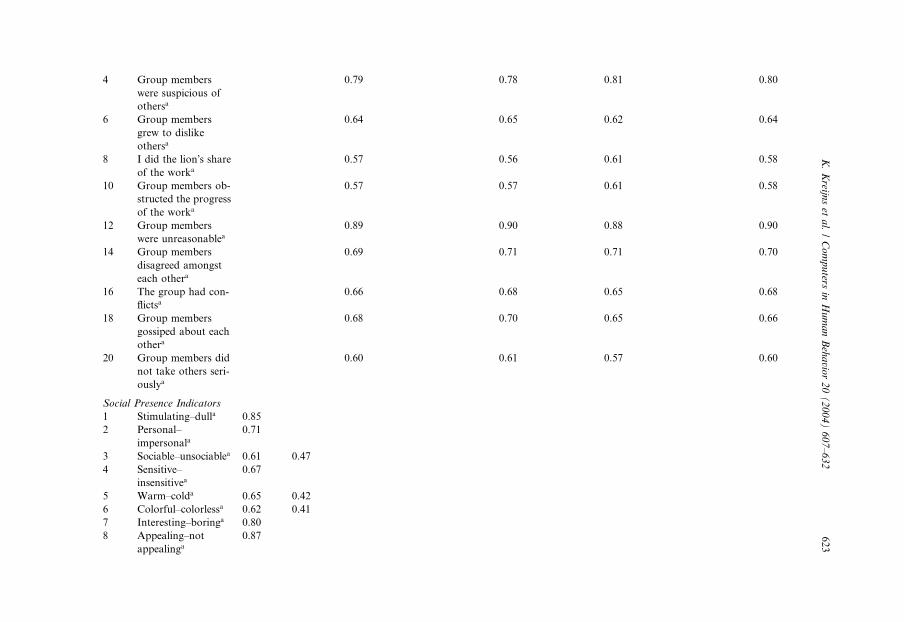
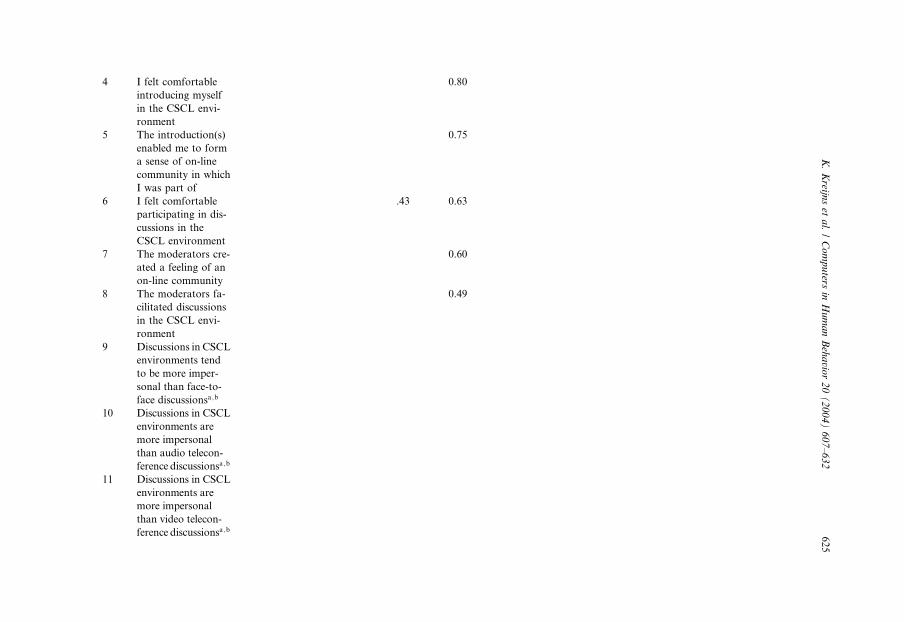
Table 3
Factor analysis on the scores of the items of the social space scale and each of the other scales
No.
Item
Item Factor Analysis 1
Social Space Scale and
Social Presence Indicators
Factor Analysis 2
Social Space Scale and
Social Presence Scale
Factor Analysis 3
Social Space Scale
and Work Group
Cohesion Index
Factor Analysis 4
Social Space Scale
and Group Atmo-
sphere Scale
Factor 1 Factor 2
Positive
Group
Behavior
Factor 3
Negative
Group
Behavior
Factor 1
Positive
Group
Behavior
Factor 2 Factor 3
Negative
Group
Behavior
Factor 1
Positive
Group
Behavior
Factor 2
Negative
Group
Behavior
Factor 1 Factor 2
Positive
Group
Behavior
Factor 3
Negative
Group
Behavior
Social Space Scale: Positive Group Behavior
1 Group members felt
free to criticize ideas,
statements, and/or
opinions of others
0.69 0.76 0.65 0.72
3 We reached a good
understanding on
how we had to
function
0.76 0.77 0.70 0.79
5 Group members en-
sured that we kept in
touchwith each other
0.76 0.74 0.78 0.75
7 We worked hard on
the group assignment
0.74 0.76 0.71 0.77
9 I maintained contact
with all other group
members
0.73 0.74 0.71 0.71
11 Groupmembers gave
personal information
on themselves
0.54 0.49 0.63 0.49
K.Kreijn
set
al./Computers
inHumanBehavio
r20(2004)607–632
621
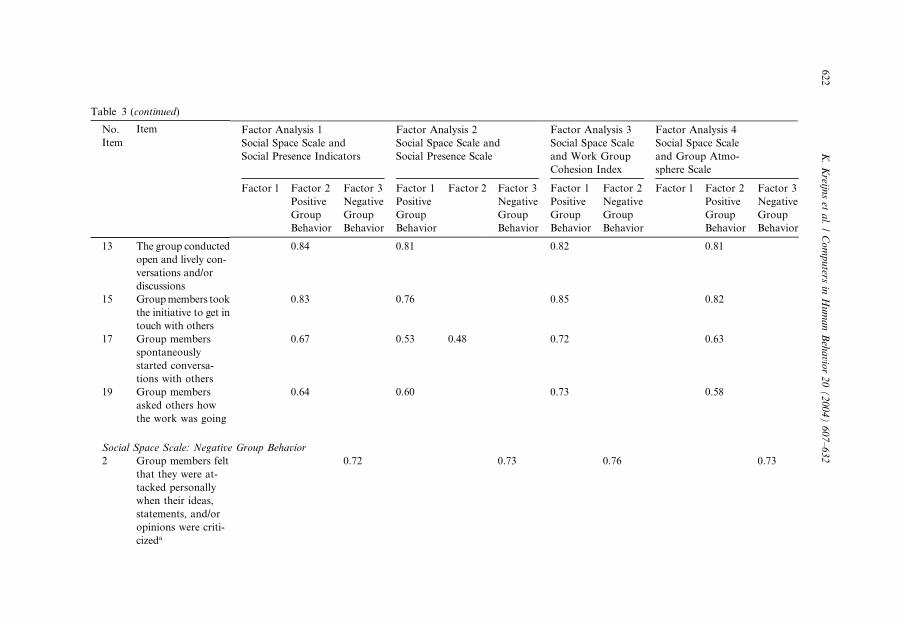
Table 3 (continued)
No.
Item
Item Factor Analysis 1
Social Space Scale and
Social Presence Indicators
Factor Analysis 2
Social Space Scale and
Social Presence Scale
Factor Analysis 3
Social Space Scale
and Work Group
Cohesion Index
Factor Analysis 4
Social Space Scale
and Group Atmo-
sphere Scale
Factor 1 Factor 2
Positive
Group
Behavior
Factor 3
Negative
Group
Behavior
Factor 1
Positive
Group
Behavior
Factor 2 Factor 3
Negative
Group
Behavior
Factor 1
Positive
Group
Behavior
Factor 2
Negative
Group
Behavior
Factor 1 Factor 2
Positive
Group
Behavior
Factor 3
Negative
Group
Behavior
13 The group conducted
open and lively con-
versations and/or
discussions
0.84 0.81 0.82 0.81
15 Groupmembers took
the initiative to get in
touch with others
0.83 0.76 0.85 0.82
17 Group members
spontaneously
started conversa-
tions with others
0.67 0.53 0.48 0.72 0.63
19 Group members
asked others how
the work was going
0.64 0.60 0.73 0.58
Social Space Scale: Negative Group Behavior
2 Group members felt
that they were at-
tacked personally
when their ideas,
statements, and/or
opinions were criti-
cizeda
0.72 0.73 0.76 0.73
622
K.Kreijn
set
al./Computers
inHumanBehavio
r20(2004)607–632
4 Group members
were suspicious of
othersa
0.79 0.78 0.81 0.80
6 Group members
grew to dislike
othersa
0.64 0.65 0.62 0.64
8 I did the lion�s shareof the worka
0.57 0.56 0.61 0.58
10 Group members ob-
structed the progress
of the worka
0.57 0.57 0.61 0.58
12 Group members
were unreasonablea0.89 0.90 0.88 0.90
14 Group members
disagreed amongst
each othera
0.69 0.71 0.71 0.70
16 The group had con-
flictsa0.66 0.68 0.65 0.68
18 Group members
gossiped about each
othera
0.68 0.70 0.65 0.66
20 Group members did
not take others seri-
ouslya
0.60 0.61 0.57 0.60
Social Presence Indicators
1 Stimulating–dulla 0.85
2 Personal–
impersonala0.71
3 Sociable–unsociablea 0.61 0.47
4 Sensitive–
insensitivea0.67
5 Warm–colda 0.65 0.42
6 Colorful–colorlessa 0.62 0.41
7 Interesting–boringa 0.80
8 Appealing–not
appealinga0.87
K.Kreijn
set
al./Computers
inHumanBehavio
r20(2004)607–632
623
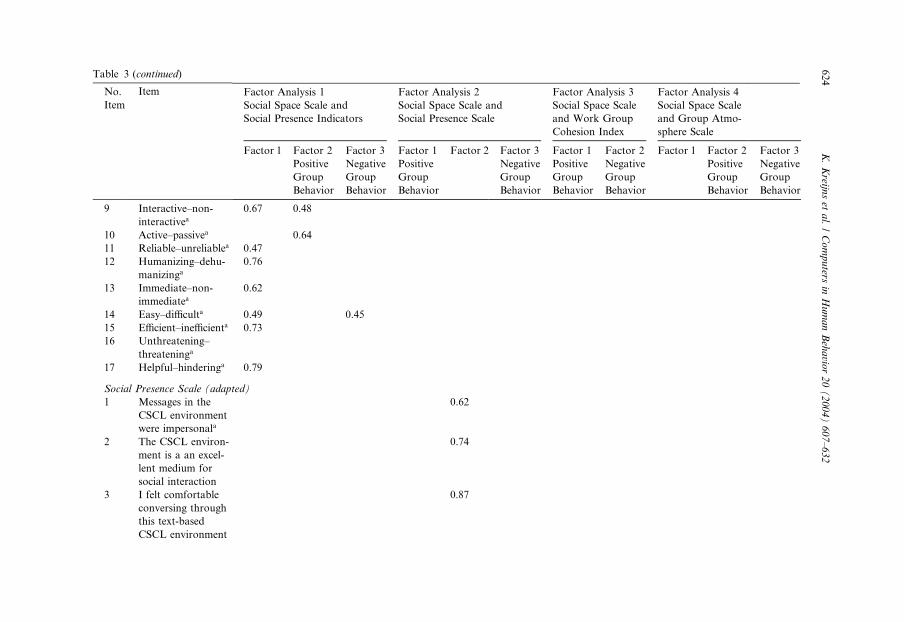
Table 3 (continued)
No.
Item
Item Factor Analysis 1
Social Space Scale and
Social Presence Indicators
Factor Analysis 2
Social Space Scale and
Social Presence Scale
Factor Analysis 3
Social Space Scale
and Work Group
Cohesion Index
Factor Analysis 4
Social Space Scale
and Group Atmo-
sphere Scale
Factor 1 Factor 2
Positive
Group
Behavior
Factor 3
Negative
Group
Behavior
Factor 1
Positive
Group
Behavior
Factor 2 Factor 3
Negative
Group
Behavior
Factor 1
Positive
Group
Behavior
Factor 2
Negative
Group
Behavior
Factor 1 Factor 2
Positive
Group
Behavior
Factor 3
Negative
Group
Behavior
9 Interactive–non-
interactivea0.67 0.48
10 Active–passivea 0.64
11 Reliable–unreliablea 0.47
12 Humanizing–dehu-
manizinga0.76
13 Immediate–non-
immediatea0.62
14 Easy–difficulta 0.49 0.45
15 Efficient–inefficienta 0.73
16 Unthreatening–
threateninga
17 Helpful–hinderinga 0.79
Social Presence Scale (adapted)
1 Messages in the
CSCL environment
were impersonala
0.62
2 The CSCL environ-
ment is a an excel-
lent medium for
social interaction
0.74
3 I felt comfortable
conversing through
this text-based
CSCL environment
0.87
624
K.Kreijn
set
al./Computers
inHumanBehavio
r20(2004)607–632
4 I felt comfortable
introducing myself
in the CSCL envi-
ronment
0.80
5 The introduction(s)
enabled me to form
a sense of on-line
community in which
I was part of
0.75
6 I felt comfortable
participating in dis-
cussions in the
CSCL environment
.43 0.63
7 The moderators cre-
ated a feeling of an
on-line community
0.60
8 The moderators fa-
cilitated discussions
in the CSCL envi-
ronment
0.49
9 Discussions in CSCL
environments tend
to be more imper-
sonal than face-to-
face discussionsa ;b
10 Discussions in CSCL
environments are
more impersonal
than audio telecon-
ference discussionsa ;b
11 Discussions in CSCL
environments are
more impersonal
than video telecon-
ference discussionsa ;b
K.Kreijn
set
al./Computers
inHumanBehavio
r20(2004)607–632
625
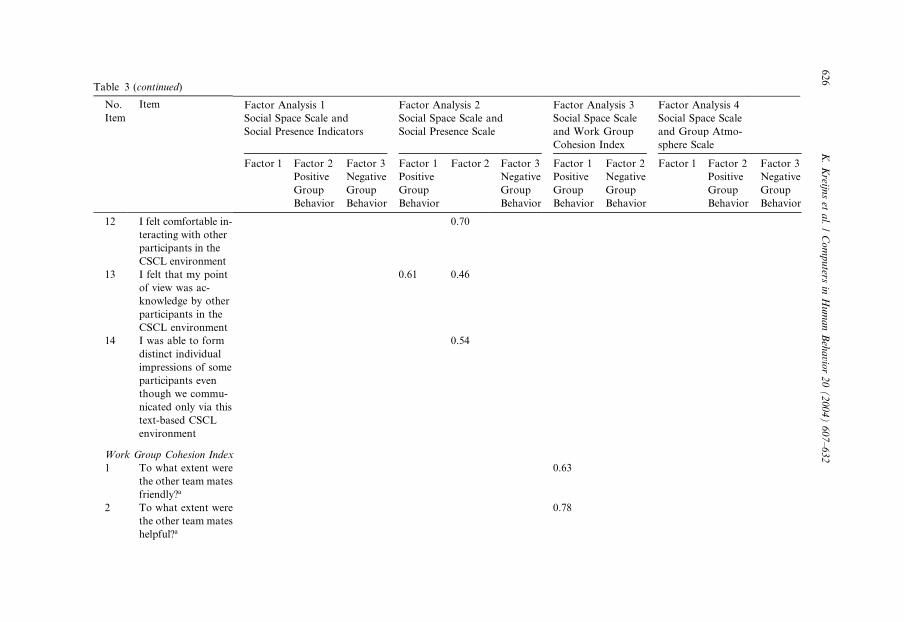
Table 3 (continued)
No.
Item
Item Factor Analysis 1
Social Space Scale and
Social Presence Indicators
Factor Analysis 2
Social Space Scale and
Social Presence Scale
Factor Analysis 3
Social Space Scale
and Work Group
Cohesion Index
Factor Analysis 4
Social Space Scale
and Group Atmo-
sphere Scale
Factor 1 Factor 2
Positive
Group
Behavior
Factor 3
Negative
Group
Behavior
Factor 1
Positive
Group
Behavior
Factor 2 Factor 3
Negative
Group
Behavior
Factor 1
Positive
Group
Behavior
Factor 2
Negative
Group
Behavior
Factor 1 Factor 2
Positive
Group
Behavior
Factor 3
Negative
Group
Behavior
12 I felt comfortable in-
teracting with other
participants in the
CSCL environment
0.70
13 I felt that my point
of view was ac-
knowledge by other
participants in the
CSCL environment
0.61 0.46
14 I was able to form
distinct individual
impressions of some
participants even
though we commu-
nicated only via this
text-based CSCL
environment
0.54
Work Group Cohesion Index
1 To what extent were
the other team mates
friendly?a
0.63
2 To what extent were
the other team mates
helpful?a
0.78
626
K.Kreijn
set
al./Computers
inHumanBehavio
r20(2004)607–632
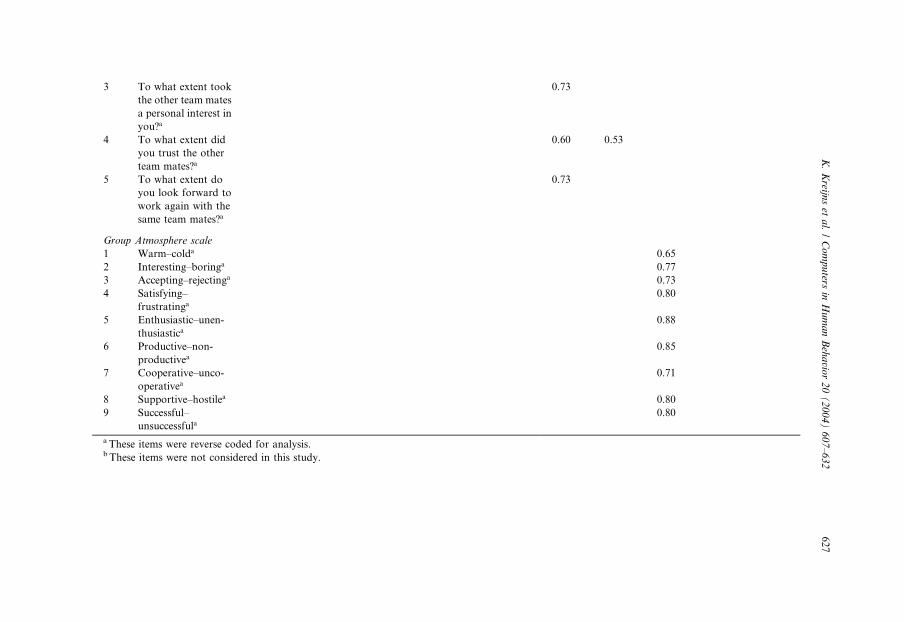
3 To what extent took
the other team mates
a personal interest in
you?a
0.73
4 To what extent did
you trust the other
team mates?a
0.60 0.53
5 To what extent do
you look forward to
work again with the
same team mates?a
0.73
Group Atmosphere scale
1 Warm–colda 0.65
2 Interesting–boringa 0.77
3 Accepting–rejectinga 0.73
4 Satisfying–
frustratinga0.80
5 Enthusiastic–unen-
thusiastica0.88
6 Productive–non-
productivea0.85
7 Cooperative–unco-
operativea0.71
8 Supportive–hostilea 0.80
9 Successful–
unsuccessfula0.80
a These items were reverse coded for analysis.b These items were not considered in this study.
K.Kreijn
set
al./Computers
inHumanBehavio
r20(2004)607–632
627
628 K. Kreijns et al. / Computers in Human Behavior 20 (2004) 607–632
6. Discussion of possible limits
The validation of the Social Space Scale has some weak points that limit the
study. First, the number of cases was 79. A general rule of the thumb is that there
must be at least five (Gorsuch, 1983) to 10 cases (Nunnally, 1978) per item. The raw
Social Space Scale contained 44 items, meaning that we actually needed 220 up to440 cases to derive this measure.
Second, there were five samples (VEC, Stat 1, Stat 2 fast, Stat 2 slow, and Stat 2
free) that have been collapsed in order to obtain the 79 cases. We agree these samples
have different characteristics (e.g., time aspects, CSCL environments, task type)
which mean that they actually cannot be collapsed into one big sample. Indeed, a
series of one-way ANOVA�s revealed that the samples VEC and Stat 1 are compa-
rable, as are the samples Stat 2 fast, Stat 2 slow, and Stat 2 free; the samples VEC
and Stat 1 are not comparable to the samples Stat 2 fast, Stat 2 slow, and Stat 2.However, as this study is explorative, we did collapse the samples to obtain a high
number of cases.
Third, we are aware that the factor structure of the Social Space Scale might be
affected because of the incomparable samples. However, the limited number of
cases (79 cases) relative to the number of samples (five samples), and the number
of groups (33 groups) prohibits a detailed analysis on the group level. Therefore,
we have to rely on the analyses on the individual level. Again, we point that this
study is explorative and that issues at the group level will be examined in futureresearch.
Finally, we used the same cases for the factor analysis on the items of the refined
Social Space Scale and the other scales: Social Presence Indicators, Social Presence
Scale, Work Group Cohesion Index, and Group Atmosphere Scale. This implicates
that the result (Table 3) might take advantage of the chance characteristic of the 79
cases from which the Social Space Scale was derived.
Taken together these weak points, we must stress that the findings in this study
only suggest that the Social Space Scale has the potential to be useful as measures forsocial space.
7. Conclusion
Socio-emotional processes underlie group forming, group dynamics, and the
building of group structures, leading to the establishment of a sound social space.
Such sound social space is important since it facilitates and reinforces social inter-action and, in turn, influences the effectiveness of collaborative learning. Though this
is true in both contiguous and distributed learning groups, socio-emotional processes
in the latter are far more difficult to achieve and to sustain than in contiguous groups
due to its mediation via CSCL environments.
In order to examine socially enhanced environments there is also a need for an
instrument that measured the perceived quality of the social space that exists in a
distributed learning group. This article presented the Social Space Scale. It must

K. Kreijns et al. / Computers in Human Behavior 20 (2004) 607–632 629
be realized that this measure is a preliminary �first step�. More experiments are
needed for corroborating the findings thus far. In fact, we just doing content
analysis on the postings of a discussion board of the course Stat 1 using the
community of inquiry model developed by Garrison et al. (2000) and related
instruments for assessing teaching presence, cognitive presence and in particular
social presence (see, Rourke, Anderson, Garrison, & Archer, 1999). It would gobeyond the scope of this article to discuss this model and relate the three kinds of
presences with social space. However, future articles will report on this issue and
present results.
Acknowledgements
The authors thank Hans van der Vleugel, Rolf van Geel, and two anonymous
reviewers for their comments on the methodological and statistical sections of
the draft version of this paper, which have contributed to the quality of thisarticle.
Appendix 1. Three social presence scales and the group atmosphere scale
Item SocialPresence
Indicators
(Gunawar-
dena, 1995)
SocialPresence
(Short
et al., 1976)
SocialClimate/
Social
Presence
(Rourke &
Anderson,
2002)
GroupAtmo-
sphere
Scale
(Fiedler,
1962)
Stimulating–dull �Personal–impersonal � � �Sociable–unsociable � �Sensitive–insensitive � �Warm–cold � � � �Colorful–colorless �Interesting–boring � �Appealing–not appealing �Interactive–non-interactive �Active–passive �Reliable–unreliable �Humanizing–dehumanizing �Immediate–non-immediate �Easy–difficult �Efficient–inefficient �
Appendix 1 (continued )
Unthreatening–threatening �Helpful–hindering �Trusting–untrusting �Disinhibiting–inhibiting �Close–distant �Friendly–unfriendly � �Accepting–rejecting �Satisfying–frustrating �Enthusiastic–unenthusias-
tic
�
Productive–non-productive �Cooperative–uncooperative �Supportive–hostile �Successful–unsuccessful �
630 K. Kreijns et al. / Computers in Human Behavior 20 (2004) 607–632
References
Argyle, M., & Dean, J. (1965). Eye contact, distance and affiliation. Sociometry, 28, 289–304.
Bednar, A. K., Cunningham, D., Duffy, T. M., & Perry, J. D. (1995). Theory into practice: How do we
link?. In G. J. Anglin (Ed.), Instructional technology (second ed., pp. 100–112). Englewood, CO:
Libraries Unlimited, Inc.
Brandon, D. P., & Hollingshead, A. B. (1999). Collaborative learning and computer-supported groups.
Communication Education, 18(2), 109–126.
Brown, G., & Yule, G. (1983). Discourse analysis. New York: Cambridge University Press.
Campbell, D. T., & Fiske, D. W. (1959). Convergent and discriminant validation by the multi-trait-
multimethod matrix. Psychological Bulletin, 56, 81–105.
Catell, R. B. (1966). The scree test for number of factors. Multivariate Behavioral Research, 1, 245–276.
Clark, H. H., & Brennan, S. E. (1991). Grounding in communication. In L. B. Resnick, J. M. Levine, & S.
D. Teasley (Eds.), Perspectives on socially shared cognition (pp. 127–149). Washington, DC: American
Psychological Association.
Cronbach, L. J., & Meehl, P. E. (1955). Construct validity in psychological tests. Psychological Bulletin,
52(4), 281–302.
Cutler, R. H. (1996). Technologies, relations, and selves. In L. Strate, R. Jacobson, & S. B. Gibson (Eds.),
Communication and cyberspace: Social interaction in an electronic environment (pp. 317–333). Cresshill,
NJ: Hampton Press.
Fiedler, F. E. (1962). Leader attitudes, group climate, and group creativity. Journal of Abnormal and Social
Psychology, 65, 308–318.
Fiedler, F. E. (1967). A theory of leadership effectiveness. New York: McGraw-Hill.
Garrison, D. R., Anderson, T., & Archer, W. (2000). Critical thinking in a text-based environment:
Computer conferencing in higher education. Internet and Higher Education, 11(2), 1–14.
von Glaserfeld, E. (1995). A constructivist approach to teaching. In L. Steffe & J. Gale (Eds.),
Constructivism in education (pp. 369–384). Hillsdale, NJ: Lawrence Erlbaum.
Gorsuch, R. L. (1983). Factor analysis. Hillsdale, NJ: Lawrence Erlbaum.
Gunawardena, C. N. (1995). Social presence theory and implications for interaction and collaborative
learning in computer conferences. International Journal of Educational Telecommunications, 1(2/3),
147–166.

K. Kreijns et al. / Computers in Human Behavior 20 (2004) 607–632 631
Gunawardena, C. N., & Zittle, F. (1997). Social presence as a predictor of satisfaction within a computer
mediated conferencing environment. American Journal of Distance Education, 11(3), 8–25.
Hare, A. P., & Davis, M. F. (1994). Social interaction. In A. P. Hare, H. H. Blumberg, M. F. Davies, &
Kent (Eds.), Small group research: A handbook (pp. 169–193). Norwood, NJ: Ablex.
Harasim, L. (1991) Teaching by computer conferencing. In A. J. Miller (Ed.), Applications of computer
conferencing to teacher education andhuman resource development (pp. 23–33). Proceedings from an
international symposium on computer conferencing at the Ohio State University. Columbus, OH. (ERIC
Document Reproduction Service No. ED 337705).
Henri, F. (1992). Computer conferencing and content analysis. In A. R. Kaye (Ed.), Collaborative learning
through computer conferencing: The Najaden papers (pp. 136–177). Berlin: Springer-Verlag.
Hiltz, S. R. (1994). The virtual classroom: Learning without limits via computer networks. Norwood, NJ:
Ablex.
Hofstee, W. K. B. (1999). Principes van beoordeling: Methodiek en ethiek van selectie, examinering en
evaluatie [Principles of assessment: Methods and ethics of selections, testing and evaluation]. Lisse, The
Netherlands: Swets & Zeitlinger BV.
Jacques, D. (1992). Learning in groups (second ed.). London: Kogen Page.
Jessup, L. M., Connolly, T., & Tansik, D. A. (1990). Toward a theory of automated group work: The
deindividuating effects of anonimity. Small Group Research, 21(3), 333–348.
Johnson, D. W., & Johnson, R. T. (1992). Positive interdependence: Key to effective cooperation. In R.
Herz-Lazarowitz & N. Miller (Eds.), nteraction in cooperative groups: The theoretical anatomy of group
learning (pp. 174–199). New York: Cambridge University Press.
Johnson, D. W., & Johnson, R. T. (1994). Learning together and alone: Cooperative, competitive, and
individualistic Learning (4th ed.). Needham Heights, MA: Allyn & Bacon.
Jonassen, D. H. (1994). Toward a constructivists design model. Educational Technology, 34(4), 34–
37.
Keen, K. (1992). Competence: What is it and how can it be developed?. In J. Lowyck, P. de Potter, & J.
Elen (Eds.), Instructional design: Implementation issues (pp. 111–122). Brussels, Belgium: IBM
Education Center.
Kearsley, G. (1995). The nature and value of interaction in distance learning. (ACSDE Research
Monograph No. 12, pp. 83–92). University Park, PA: Pennsylvania State University, American Center
for the Study of Distance Education.
Kreijns, K., & Kirschner, P. A. (in press). Designing sociable CSCL environments: Applying interaction
design principles. In: P. Dillenbourg (series Ed.) & J. W. Strijbos, P. A. Kirschner, & R. L. Martens
(vol. Eds.), Computer-supported collaborative learning: Vol. 3. What we know about CSCL. . . and
implementing it in higher education (pp. 221–244). Boston, MA: Kluwer Academic Publishers.
Kreijns, K., Kirschner, P. A., & Jochems, W. (2002). The sociability of computer-supported collaborative
learning environments. Journal of Education Technology and Society, 5(1), 8–22, Retrieved February 2,
2003 from http://ifets.ieee.org/periodical/vol_1_2002/v_1_2002.html.
Kreijns, K., Kirschner, P. A., & Jochems, W. (2003). Identifying the pitfalls for social interaction in
computer-supported collaborative learning environments: A review of the research. Computers in
Human Behavior, 19(3), 335–353.
Mullen, B., & Cooper, C. (1994). The relation between group cohesiveness and performance: An
integration. Psychological Bulletin, 115(2), 210–227.
Muirhead, B. (2000). Enhancing social interaction in computer-mediated distance education. Journal of
Educational Technology and Society, 3(4), 4–11.
Newman, D. R., Johnson, C., Webb, B., & Cochrane, C. (1997). Evaluating the quality of learning in
computer supported co-operative learning. Journal of the American Society for Information Science,
48(6), 484–495.
Nunnally, J. C. (1978). Psychometric theory. New York: McGraw-Hill.
Palincsar, A. S. (1998). Social constructivist perspectives on teaching and learning. Annual Review of
Psychology, 49, 345–347.
Price, J. L., & Mueller, C. W. (1986). Handbook of organizational measurement. Marshfield, MA: Pitman
Publishing.
632 K. Kreijns et al. / Computers in Human Behavior 20 (2004) 607–632
Rourke, L. (2000). Operationalizing social interaction in computer conferencing. In Proceedings of the
16th a nnual conference of the Canadian Association for Distance Education. Quebec City, Canada.
Retrieved February 2, 2003 from the World Wide Web: http://www.ulaval.ca/aced2000cade/english/
proceedings.html.
Rourke, L., & Anderson, T. (2002). Exploring social communication in asynchronous, text-based
computer conferencing. Journal of Interactive Learning Research, 13(3), 259–275.
Rourke, L., Anderson, T., Garrison, D. R., & Archer, W. (1999). Assessing social presence in
asynchronous text-based computer conferencing. Journal of Distance Education, 14(2), 50–71.
Rovai, A. P. (2001). Classroom community at a distance: A comparative analysis of two ALN-based
university programs. Internet and Higher Education, 4(2001), 105–118.
Short, E. C. (Ed.). (1984). Competences: Inquiries into its meaning and acquisition in educational settings.
Lanham, MD: University Press of America.
Short, J., Williams, E., & Christie, B. (1976). The social psychology of telecommunications. London: John
Wiley & Sons, Ltd.
Stevens, J. P. (1992). Applied multivariate statistics for the social sciences (2nd ed.). Hillsdale, NJ: Lawrence
Erlbaum.
Swan, K. (2002). Building learning communities in online courses: The importance of interaction.
Education, Communication and Information, 2(1), 23–50.
Tammelin, M. (1998). From telepresence to social presence : The role of presence in a network-based
learning environment. In S. Tella (Ed.), Strategic imperatives in the information age: Vol. 8. Aspects of
media education (pp. 219–231). Helsinki, Finland: Media Education Centre, University of Helsinki,
Media Education Publications.
Tu, C. H. (2000). On-line learning migration: from social learning theory to social presence theory in a
CMC environment. Journal of Network and Computer Application, 23(1), 27–37.
Tu, C. H. (2002). The measurement of social presence in an online learning environment. International
Journal of Educational Telecommunications, 1(2), 34–45.
Tu, C. H., & Isaacs, M. (2002). An examination of social presence to increase interaction in online classes.
American Journal of Distance Education, 16(3), 131–150.
Van Buuren, H., & Giesbertz, W. (1999). Naar een virtueel onderzoekcentrum: Innovatie van het
onderwijs in methoden en technieken van onderzoek [Towards a Virtual Research Center: Innovation
of Research Methods and Statistics Education]. In K. Schlusmans, R. Slotman, C. Nagtegaal, G.
Kinkhorst (Eds.), Competentiegerichte leeromgevingen (pp. 137–150). Utrecht, the Netherlands:
Lemma.
Vygotsky, L. (1978). Mind in society. Cambridge, MA: Harvard University Press.
Wagner, E. D. (1994). In support of a functional definition of interaction. American Journal of Distance
Education, 8(2), 6–29.
Wagner, E. D. (1997). Interactivity: From agents to outcomes. New Directions for Teaching and Learning,
71, 19–26.
Walther, J. B. (1992). Interpersonal effects in computer-mediated interaction: A relational perspective.
Communication Research, 19(1), 52–90.
Wiener, M., & Mehrabian, A. (1968). Language within language: Immediacy, a channel in verbal
communication. New York: Appleton-Century-Crofts.