Measuring leadership in self-managed teams using the competing values framework
10
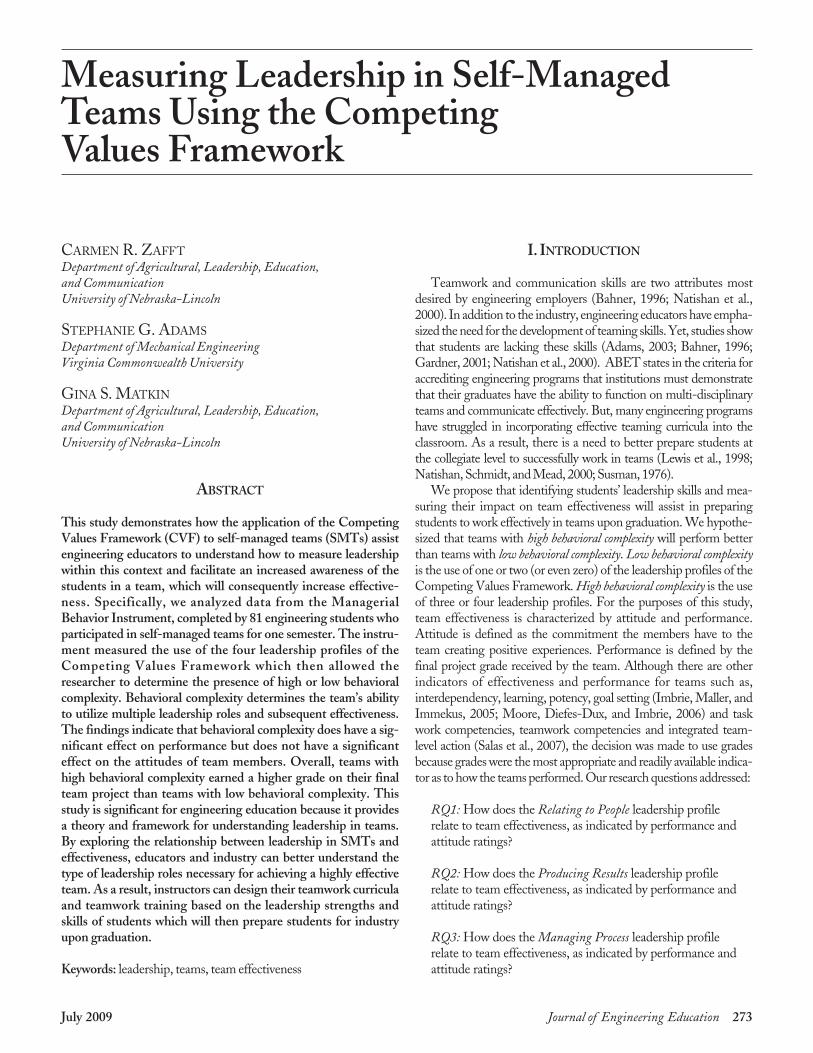
July 2009 Journal of Engineering Education 273 Measuring Leadership in Self-Managed Teams Using the Competing Values Framework CARMEN R. ZAFFT Department of Agricultural, Leadership, Education, and Communication University of Nebraska-Lincoln STEPHANIE G. ADAMS Department of Mechanical Engineering Virginia Commonwealth University GINA S. MATKIN Department of Agricultural, Leadership, Education, and Communication University of Nebraska-Lincoln ABSTRACT This study demonstrates how the application of the Competing Values Framework (CVF) to self-managed teams (SMTs) assist engineering educators to understand how to measure leadership within this context and facilitate an increased awareness of the students in a team, which will consequently increase effective- ness. Specifically, we analyzed data from the Managerial Behavior Instrument, completed by 81 engineering students who participated in self-managed teams for one semester. The instru- ment measured the use of the four leadership profiles of the Competing Values Framework which then allowed the researcher to determine the presence of high or low behavioral complexity. Behavioral complexity determines the team’s ability to utilize multiple leadership roles and subsequent effectiveness. The findings indicate that behavioral complexity does have a sig- nificant effect on performance but does not have a significant effect on the attitudes of team members. Overall, teams with high behavioral complexity earned a higher grade on their final team project than teams with low behavioral complexity. This study is significant for engineering education because it provides a theory and framework for understanding leadership in teams. By exploring the relationship between leadership in SMTs and effectiveness, educators and industry can better understand the type of leadership roles necessary for achieving a highly effective team. As a result, instructors can design their teamwork curricula and teamwork training based on the leadership strengths and skills of students which will then prepare students for industry upon graduation. Keywords: leadership, teams, team effectiveness I. INTRODUCTION Teamwork and communication skills are two attributes most desired by engineering employers (Bahner, 1996; Natishan et al., 2000). In addition to the industry, engineering educators have empha- sized the need for the development of teaming skills. Yet, studies show that students are lacking these skills (Adams, 2003; Bahner, 1996; Gardner, 2001; Natishan et al., 2000). ABET states in the criteria for accrediting engineering programs that institutions must demonstrate that their graduates have the ability to function on multi-disciplinary teams and communicate effectively. But, many engineering programs have struggled in incorporating effective teaming curricula into the classroom. As a result, there is a need to better prepare students at the collegiate level to successfully work in teams (Lewis et al., 1998; Natishan, Schmidt, and Mead, 2000; Susman, 1976). We propose that identifying students’ leadership skills and mea- suring their impact on team effectiveness will assist in preparing students to work effectively in teams upon graduation. We hypothe- sized that teams with high behavioral complexity will perform better than teams with low behavioral complexity. Low behavioral complexity is the use of one or two (or even zero) of the leadership profiles of the Competing Values Framework. High behavioral complexity is the use of three or four leadership profiles. For the purposes of this study, team effectiveness is characterized by attitude and performance. Attitude is defined as the commitment the members have to the team creating positive experiences. Performance is defined by the final project grade received by the team. Although there are other indicators of effectiveness and performance for teams such as, interdependency, learning, potency, goal setting (Imbrie, Maller, and Immekus, 2005; Moore, Diefes-Dux, and Imbrie, 2006) and task work competencies, teamwork competencies and integrated team- level action (Salas et al., 2007), the decision was made to use grades because grades were the most appropriate and readily available indica- tor as to how the teams performed. Our research questions addressed: RQ1: How does the Relating to People leadership profile relate to team effectiveness, as indicated by performance and attitude ratings? RQ2: How does the Producing Results leadership profile relate to team effectiveness, as indicated by performance and attitude ratings? RQ3: How does the Managing Process leadership profile relate to team effectiveness, as indicated by performance and attitude ratings?
-
Upload
un-lincoln -
Category
Documents
-
view
1 -
download
0
Transcript of Measuring leadership in self-managed teams using the competing values framework
July 2009 Journal of Engineering Education 273
Measuring Leadership in Self-ManagedTeams Using the Competing Values Framework
CARMEN R. ZAFFT
Department of Agricultural, Leadership, Education, and CommunicationUniversity of Nebraska-Lincoln
STEPHANIE G. ADAMS
Department of Mechanical EngineeringVirginia Commonwealth University
GINA S. MATKIN
Department of Agricultural, Leadership, Education, and CommunicationUniversity of Nebraska-Lincoln
ABSTRACT
This study demonstrates how the application of the CompetingValues Framework (CVF) to self-managed teams (SMTs) assistengineering educators to understand how to measure leadershipwithin this context and facilitate an increased awareness of thestudents in a team, which will consequently increase effective-ness. Specifically, we analyzed data from the ManagerialBehavior Instrument, completed by 81 engineering students whoparticipated in self-managed teams for one semester. The instru-ment measured the use of the four leadership profiles of theCompeting Values Framework which then allowed theresearcher to determine the presence of high or low behavioralcomplexity. Behavioral complexity determines the team’s abilityto utilize multiple leadership roles and subsequent effectiveness.The findings indicate that behavioral complexity does have a sig-nificant effect on performance but does not have a significanteffect on the attitudes of team members. Overall, teams withhigh behavioral complexity earned a higher grade on their finalteam project than teams with low behavioral complexity. Thisstudy is significant for engineering education because it providesa theory and framework for understanding leadership in teams.By exploring the relationship between leadership in SMTs andeffectiveness, educators and industry can better understand thetype of leadership roles necessary for achieving a highly effectiveteam. As a result, instructors can design their teamwork curriculaand teamwork training based on the leadership strengths andskills of students which will then prepare students for industryupon graduation.
Keywords: leadership, teams, team effectiveness
I. INTRODUCTION
Teamwork and communication skills are two attributes most
desired by engineering employers (Bahner, 1996; Natishan et al.,
2000). In addition to the industry, engineering educators have empha-
sized the need for the development of teaming skills. Yet, studies show
that students are lacking these skills (Adams, 2003; Bahner, 1996;
Gardner, 2001; Natishan et al., 2000). ABET states in the criteria for
accrediting engineering programs that institutions must demonstrate
that their graduates have the ability to function on multi-disciplinary
teams and communicate effectively. But, many engineering programs
have struggled in incorporating effective teaming curricula into the
classroom. As a result, there is a need to better prepare students at
the collegiate level to successfully work in teams (Lewis et al., 1998;
Natishan, Schmidt, and Mead, 2000; Susman, 1976).
We propose that identifying students’ leadership skills and mea-
suring their impact on team effectiveness will assist in preparing
students to work effectively in teams upon graduation. We hypothe-
sized that teams with high behavioral complexity will perform better
than teams with low behavioral complexity. Low behavioral complexityis the use of one or two (or even zero) of the leadership profiles of the
Competing Values Framework. High behavioral complexity is the use
of three or four leadership profiles. For the purposes of this study,
team effectiveness is characterized by attitude and performance.
Attitude is defined as the commitment the members have to the
team creating positive experiences. Performance is defined by the
final project grade received by the team. Although there are other
indicators of effectiveness and performance for teams such as,
interdependency, learning, potency, goal setting (Imbrie, Maller, and
Immekus, 2005; Moore, Diefes-Dux, and Imbrie, 2006) and task
work competencies, teamwork competencies and integrated team-
level action (Salas et al., 2007), the decision was made to use grades
because grades were the most appropriate and readily available indica-
tor as to how the teams performed. Our research questions addressed:
RQ1: How does the Relating to People leadership profile
relate to team effectiveness, as indicated by performance and
attitude ratings?
RQ2: How does the Producing Results leadership profile
relate to team effectiveness, as indicated by performance and
attitude ratings?
RQ3: How does the Managing Process leadership profile
relate to team effectiveness, as indicated by performance and
attitude ratings?
RQ4: How does the Leading Change leadership profile
relate to team effectiveness, as indicated by performance and
attitude ratings?
Because certain terms carry different meanings, or because the
terms might be unfamiliar, we provide brief descriptions of four key
terms used throughout this article. The definitions for teams and
leadership are derived predominately from the management, lead-
ership, teaming, and human relations literature.
First, a self-managed team (SMT) is made up of individuals
who are self-regulated and responsible for a number of operations
and responsibilities such as planning, scheduling, evaluating, and
continual improvement. In the context of this study, students of
SMTs are given the autonomy to lead, share responsibility and
goals, manage resources, and create meeting schedules for the
development of their class project. Second, shared leadership is
distributed among all individuals within the team. The diversity of
ideas and abilities of each team member allows them to carry out a
variety of leadership roles throughout the team experience (Pearce
and Conger, 2003). Third, the Competing Values Framework(CVF) is designed to reflect the complex and paradoxical roles
demonstrated by leaders and the framework used to measure
shared leadership (Quinn, 1988). In this article, at times we inter-
changeably use the terms leadership profiles and leadership quad-rants. The profiles/quadrants make up the CVF and reflect the
leadership roles performed by the team member. Lastly, Behav-ioral Complexity (BC) is the theoretical framework of the CVF
and accounts for the competing demands experienced by leaders in
teams (Lawrence et al., 2003).
For this article, we are primarily interested in the use of shared
leadership in self-managed teams. Using the CVF to measure
shared leadership in teams is an exploratory investigation. The CVF
has not been used as a way of identifying leadership skills within en-
gineering education teams; instead the framework has been used in
business contexts. While Bealsen (1997) and Barry (1991) both
proposed the idea of applying the framework to SMTs, they did not
test it. This study will test this application. We also take the stance
that engineering students have unique leadership skills and when
used within a team, the effectiveness of the team will ultimately be
enhanced. Through our investigation, this has not been widely re-
searched. In the next section we will provide a brief review of the
literature involving self-managed teams and the Competing Values
Framework. We will then discuss the methods of the study, results,
limitations that surfaced, and lastly, recommendations for
engineering educators who desire to replicate this study in the
engineering classroom.
II. LITERATURE REVIEW
Research on leadership in SMTs has typically focused on the
emergent or external leader of the team. However, the research has
evolved over the years. Once concentrating on the emergent and ex-
ternal leader, researchers such as Manz, Sims, and Pearce have
identified a different type of leadership in SMT that is mutually
shared and focuses on the various roles of team members. This form
of leadership is called, shared leadership.
Research in the area of self-managed teams and shared leader-
ship is minimal and still developing. Even in its infancy, shared
leadership is an important condition in SMTs that can determine
effectiveness. In its simplest form, shared leadership as defined by
Cox, Pearce, and Perry (2003) as a condition in which teams collec-
tively exert influence, and leadership is distributed among all team
members depending on their skills, abilities, and the task. Although
useful, the shared leadership theory is difficult to measure. In re-
sponse to this issue, Belasen (1997) proposed the application of the
Competing Values Framework to provide explanation to shared
leadership within SMTs.
A. Theoretical FrameworkThe CVF clarifies leadership roles and expectations. This clarifi-
cation minimizes ambiguity and avoids interpersonal conflicts
within teams. The competing values approach accounts for the
complexities inherent in SMTs. It provides an understanding of
how a team is effective through the use of different roles and skills
and adopts the need for a balanced approach to leadership. Behav-
ioral complexity (BC) is the theoretical foundation for this frame-
work. For a leader to be effective in a team, it is essential that the
leader engage in a wide range of behaviors. A leader who is deemed
to behave in this way is a leader with high behavioral complexity. A
leader operating in low behavioral complexity does not have the
ability to engage in a wide range of behaviors and as a result, will be
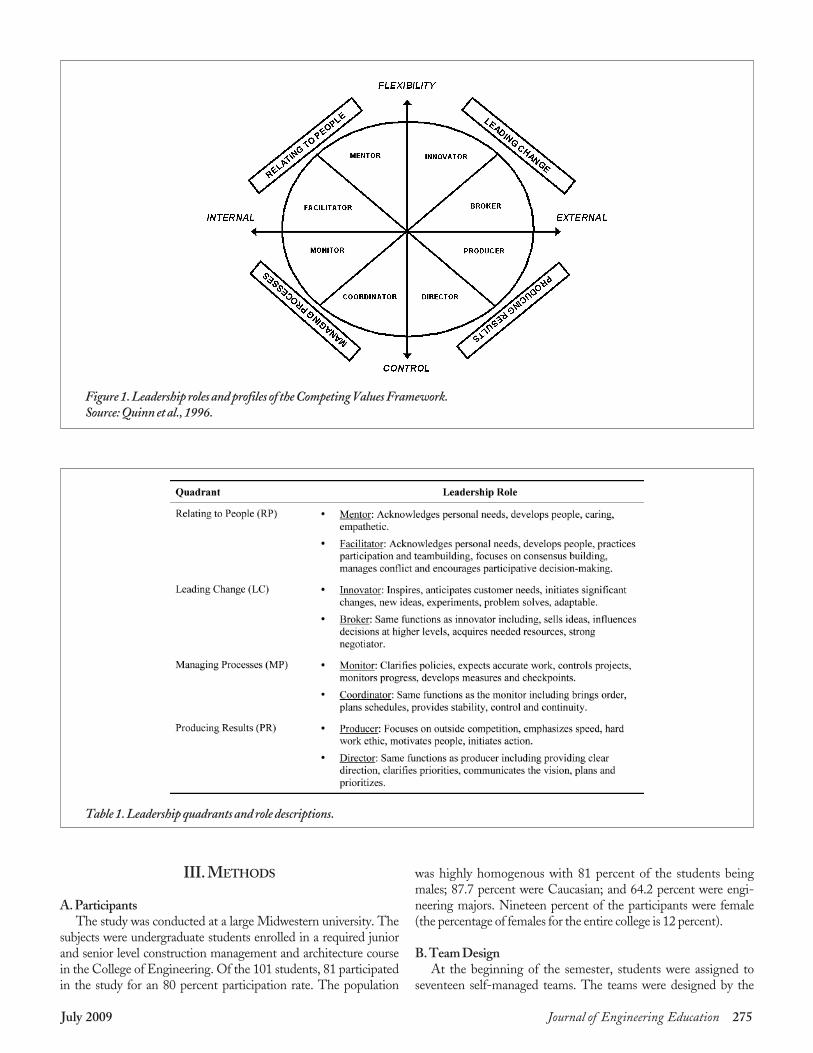
less effective (Zaccaro, 2001). Figure 1 provides an illustration of
the framework.
Each continuum of the CVF highlights a value that is opposite
from the value at the other end of the range, i.e., flexibility vs. con-
trol and internal vs. external (Cameron and Quinn, 1999). The
horizontal axis demonstrates the level of organizational focus; ei-
ther internal or external. The vertical axis demonstrates the level
of adaptability; either flexible or controlled (Lawrence et al., 2003;
Quinn, 1988; Quinn et al., 1996). These axes readily demonstrate
the competing values experienced in organizations. Each quad-
rant has a competing opposite. For instance, the Relating to Peoplequadrant emphasizes a flexible structure and an internal focus. Its
exact opposite is the Producing Results quadrant that emphasizes a
stable structure and an external focus. This example demonstrates
the complexity that occurs for leaders. Leaders should value
relationships within the organization and make certain that the
organization is flexible to support these relationships. In contrast,
results are an important element of any organization and
maintaining a stable structure is a significant factor in producing
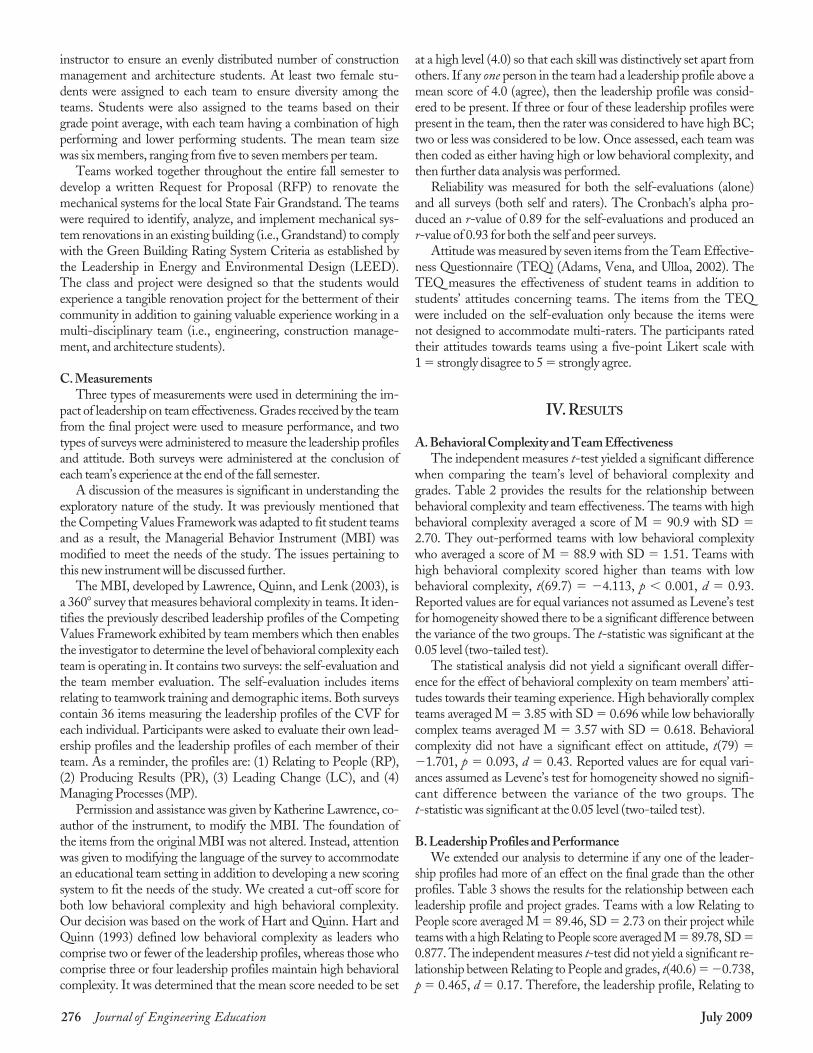
results (Quinn, 1988). For further review, Table 1 provides a de-
scription of each quadrant and a description of its accompanying
leadership role.
While a number of studies have focused on teams and the use-
fulness of them in a classroom setting, the specific hypotheses this
study proposes offer some insights into the needs of engineering
students and perhaps students in general in regards to both the
usefulness of teams and the effectiveness of outcomes. The
hypotheses are:
H1a. Teams with high behavioral complexity will have a
higher academic grade than teams with low behavioral
complexity.
H1b. Teams with high behavioral complexity will have
higher attitude scores than teams with low behavioral
complexity.
274 Journal of Engineering Education July 2009
III. METHODS
A. ParticipantsThe study was conducted at a large Midwestern university. The
subjects were undergraduate students enrolled in a required junior
and senior level construction management and architecture course
in the College of Engineering. Of the 101 students, 81 participated
in the study for an 80 percent participation rate. The population
was highly homogenous with 81 percent of the students being
males; 87.7 percent were Caucasian; and 64.2 percent were engi-
neering majors. Nineteen percent of the participants were female
(the percentage of females for the entire college is 12 percent).
B. Team DesignAt the beginning of the semester, students were assigned to
seventeen self-managed teams. The teams were designed by the
July 2009 Journal of Engineering Education 275
Figure 1. Leadership roles and profiles of the Competing Values Framework. Source: Quinn et al., 1996.
Table 1. Leadership quadrants and role descriptions.
instructor to ensure an evenly distributed number of construction
management and architecture students. At least two female stu-
dents were assigned to each team to ensure diversity among the
teams. Students were also assigned to the teams based on their
grade point average, with each team having a combination of high
performing and lower performing students. The mean team size
was six members, ranging from five to seven members per team.
Teams worked together throughout the entire fall semester to
develop a written Request for Proposal (RFP) to renovate the
mechanical systems for the local State Fair Grandstand. The teams
were required to identify, analyze, and implement mechanical sys-
tem renovations in an existing building (i.e., Grandstand) to comply
with the Green Building Rating System Criteria as established by
the Leadership in Energy and Environmental Design (LEED).
The class and project were designed so that the students would
experience a tangible renovation project for the betterment of their
community in addition to gaining valuable experience working in a
multi-disciplinary team (i.e., engineering, construction manage-
ment, and architecture students).
C. MeasurementsThree types of measurements were used in determining the im-
pact of leadership on team effectiveness. Grades received by the team
from the final project were used to measure performance, and two
types of surveys were administered to measure the leadership profiles
and attitude. Both surveys were administered at the conclusion of
each team’s experience at the end of the fall semester.
A discussion of the measures is significant in understanding the
exploratory nature of the study. It was previously mentioned that
the Competing Values Framework was adapted to fit student teams
and as a result, the Managerial Behavior Instrument (MBI) was
modified to meet the needs of the study. The issues pertaining to
this new instrument will be discussed further.
The MBI, developed by Lawrence, Quinn, and Lenk (2003), is
a 360� survey that measures behavioral complexity in teams. It iden-
tifies the previously described leadership profiles of the Competing
Values Framework exhibited by team members which then enables
the investigator to determine the level of behavioral complexity each
team is operating in. It contains two surveys: the self-evaluation and
the team member evaluation. The self-evaluation includes items
relating to teamwork training and demographic items. Both surveys
contain 36 items measuring the leadership profiles of the CVF for
each individual. Participants were asked to evaluate their own lead-
ership profiles and the leadership profiles of each member of their
team. As a reminder, the profiles are: (1) Relating to People (RP),
(2) Producing Results (PR), (3) Leading Change (LC), and (4)
Managing Processes (MP).
Permission and assistance was given by Katherine Lawrence, co-
author of the instrument, to modify the MBI. The foundation of
the items from the original MBI was not altered. Instead, attention
was given to modifying the language of the survey to accommodate
an educational team setting in addition to developing a new scoring
system to fit the needs of the study. We created a cut-off score for
both low behavioral complexity and high behavioral complexity.
Our decision was based on the work of Hart and Quinn. Hart and
Quinn (1993) defined low behavioral complexity as leaders who
comprise two or fewer of the leadership profiles, whereas those who
comprise three or four leadership profiles maintain high behavioral
complexity. It was determined that the mean score needed to be set
at a high level (4.0) so that each skill was distinctively set apart from
others. If any one person in the team had a leadership profile above a
mean score of 4.0 (agree), then the leadership profile was consid-
ered to be present. If three or four of these leadership profiles were
present in the team, then the rater was considered to have high BC;
two or less was considered to be low. Once assessed, each team was
then coded as either having high or low behavioral complexity, and
then further data analysis was performed.
Reliability was measured for both the self-evaluations (alone)
and all surveys (both self and raters). The Cronbach’s alpha pro-
duced an r-value of 0.89 for the self-evaluations and produced an
r-value of 0.93 for both the self and peer surveys.
Attitude was measured by seven items from the Team Effective-
ness Questionnaire (TEQ) (Adams, Vena, and Ulloa, 2002). The
TEQ measures the effectiveness of student teams in addition to
students’ attitudes concerning teams. The items from the TEQ
were included on the self-evaluation only because the items were
not designed to accommodate multi-raters. The participants rated
their attitudes towards teams using a five-point Likert scale with
1 � strongly disagree to 5 � strongly agree.
IV. RESULTS
A. Behavioral Complexity and Team EffectivenessThe independent measures t-test yielded a significant difference
when comparing the team’s level of behavioral complexity and
grades. Table 2 provides the results for the relationship between
behavioral complexity and team effectiveness. The teams with high
behavioral complexity averaged a score of M � 90.9 with SD �2.70. They out-performed teams with low behavioral complexity
who averaged a score of M � 88.9 with SD � 1.51. Teams with
high behavioral complexity scored higher than teams with low
behavioral complexity, t(69.7) � �4.113, p � 0.001, d � 0.93.
Reported values are for equal variances not assumed as Levene’s test
for homogeneity showed there to be a significant difference between
the variance of the two groups. The t-statistic was significant at the
0.05 level (two-tailed test).
The statistical analysis did not yield a significant overall differ-
ence for the effect of behavioral complexity on team members’ atti-
tudes towards their teaming experience. High behaviorally complex
teams averaged M � 3.85 with SD � 0.696 while low behaviorally
complex teams averaged M � 3.57 with SD � 0.618. Behavioral
complexity did not have a significant effect on attitude, t(79) ��1.701, p � 0.093, d � 0.43. Reported values are for equal vari-
ances assumed as Levene’s test for homogeneity showed no signifi-
cant difference between the variance of the two groups. The
t-statistic was significant at the 0.05 level (two-tailed test).
B. Leadership Profiles and PerformanceWe extended our analysis to determine if any one of the leader-
ship profiles had more of an effect on the final grade than the other
profiles. Table 3 shows the results for the relationship between each
leadership profile and project grades. Teams with a low Relating to
People score averaged M � 89.46, SD � 2.73 on their project while
teams with a high Relating to People score averaged M � 89.78, SD �0.877. The independent measures t-test did not yield a significant re-
lationship between Relating to People and grades, t(40.6) � �0.738,
p � 0.465, d � 0.17. Therefore, the leadership profile, Relating to
276 Journal of Engineering Education July 2009
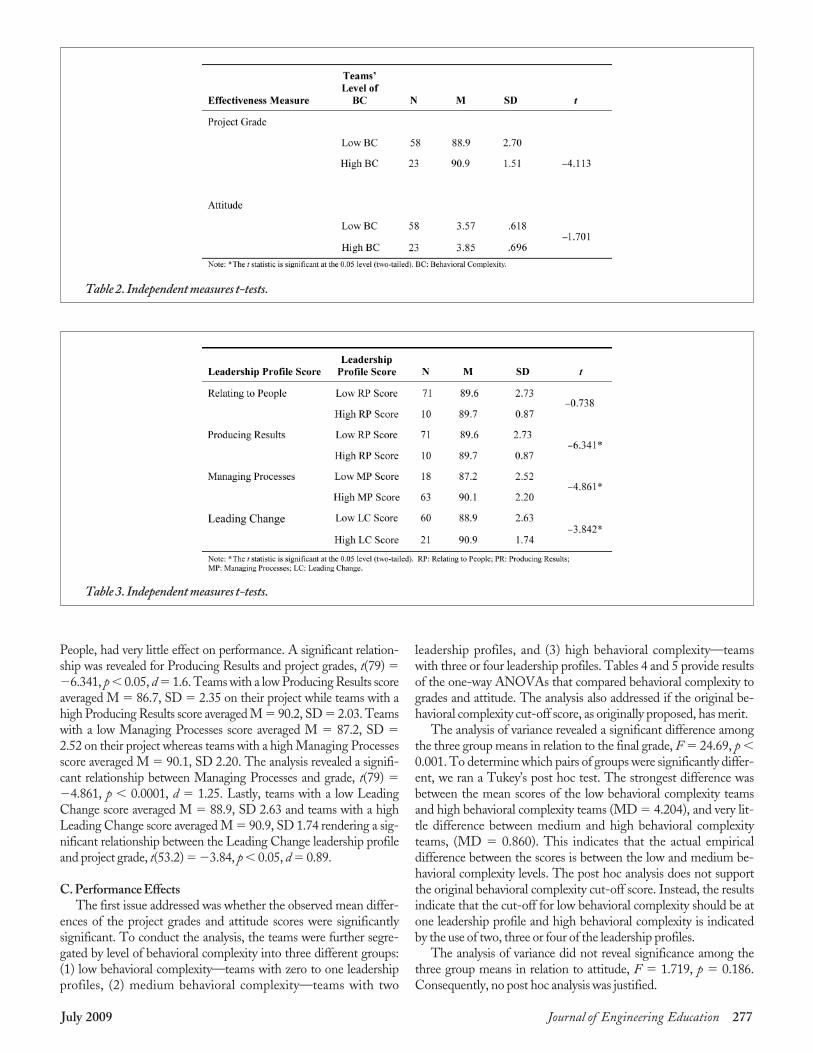
People, had very little effect on performance. A significant relation-
ship was revealed for Producing Results and project grades, t(79) ��6.341, p � 0.05, d � 1.6. Teams with a low Producing Results score
averaged M � 86.7, SD � 2.35 on their project while teams with a
high Producing Results score averaged M � 90.2, SD � 2.03. Teams
with a low Managing Processes score averaged M � 87.2, SD �2.52 on their project whereas teams with a high Managing Processes
score averaged M � 90.1, SD 2.20. The analysis revealed a signifi-
cant relationship between Managing Processes and grade, t(79) ��4.861, p � 0.0001, d � 1.25. Lastly, teams with a low Leading
Change score averaged M � 88.9, SD 2.63 and teams with a high
Leading Change score averaged M � 90.9, SD 1.74 rendering a sig-
nificant relationship between the Leading Change leadership profile
and project grade, t(53.2) � �3.84, p � 0.05, d � 0.89.
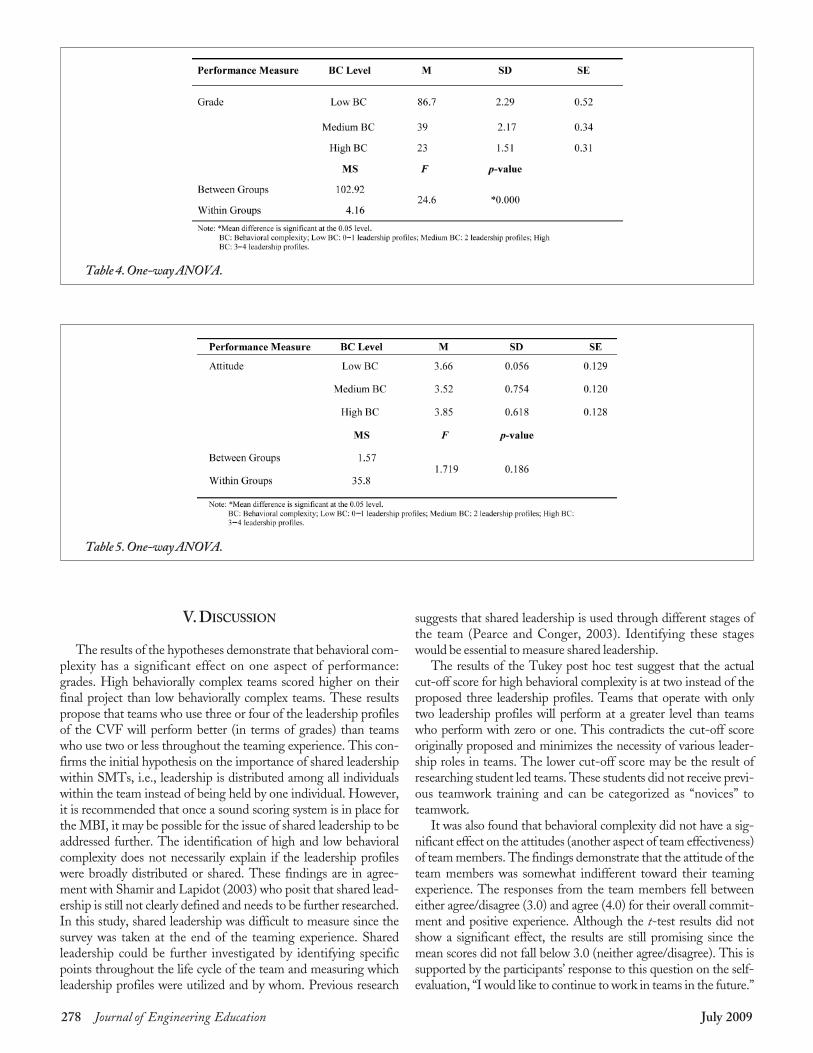
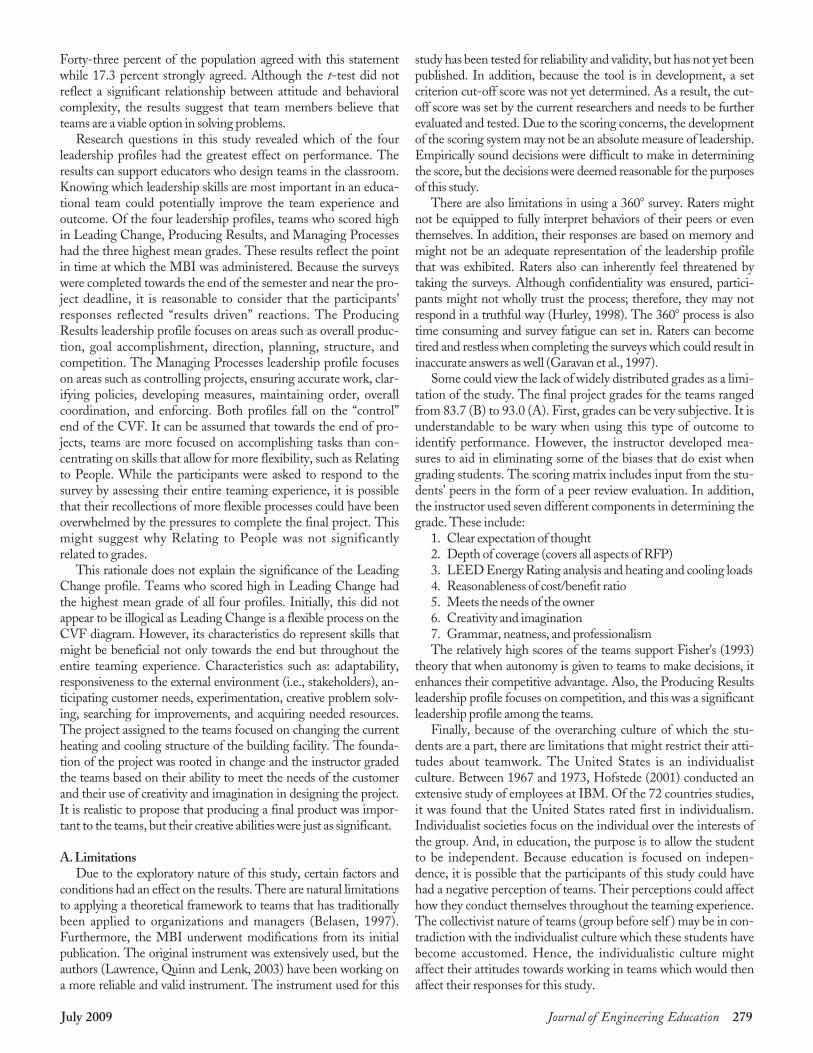
C. Performance EffectsThe first issue addressed was whether the observed mean differ-
ences of the project grades and attitude scores were significantly
significant. To conduct the analysis, the teams were further segre-
gated by level of behavioral complexity into three different groups:
(1) low behavioral complexity—teams with zero to one leadership
profiles, (2) medium behavioral complexity—teams with two
leadership profiles, and (3) high behavioral complexity—teams
with three or four leadership profiles. Tables 4 and 5 provide results
of the one-way ANOVAs that compared behavioral complexity to
grades and attitude. The analysis also addressed if the original be-
havioral complexity cut-off score, as originally proposed, has merit.
The analysis of variance revealed a significant difference among
the three group means in relation to the final grade, F � 24.69, p �0.001. To determine which pairs of groups were significantly differ-
ent, we ran a Tukey’s post hoc test. The strongest difference was
between the mean scores of the low behavioral complexity teams
and high behavioral complexity teams (MD � 4.204), and very lit-
tle difference between medium and high behavioral complexity
teams, (MD � 0.860). This indicates that the actual empirical
difference between the scores is between the low and medium be-
havioral complexity levels. The post hoc analysis does not support
the original behavioral complexity cut-off score. Instead, the results
indicate that the cut-off for low behavioral complexity should be at
one leadership profile and high behavioral complexity is indicated
by the use of two, three or four of the leadership profiles.
The analysis of variance did not reveal significance among the
three group means in relation to attitude, F � 1.719, p � 0.186.
Consequently, no post hoc analysis was justified.
July 2009 Journal of Engineering Education 277
Table 2. Independent measures t-tests.
Table 3. Independent measures t-tests.
V. DISCUSSION
The results of the hypotheses demonstrate that behavioral com-
plexity has a significant effect on one aspect of performance:
grades. High behaviorally complex teams scored higher on their
final project than low behaviorally complex teams. These results
propose that teams who use three or four of the leadership profiles
of the CVF will perform better (in terms of grades) than teams
who use two or less throughout the teaming experience. This con-
firms the initial hypothesis on the importance of shared leadership
within SMTs, i.e., leadership is distributed among all individuals
within the team instead of being held by one individual. However,
it is recommended that once a sound scoring system is in place for
the MBI, it may be possible for the issue of shared leadership to be
addressed further. The identification of high and low behavioral
complexity does not necessarily explain if the leadership profiles
were broadly distributed or shared. These findings are in agree-
ment with Shamir and Lapidot (2003) who posit that shared lead-
ership is still not clearly defined and needs to be further researched.
In this study, shared leadership was difficult to measure since the
survey was taken at the end of the teaming experience. Shared
leadership could be further investigated by identifying specific
points throughout the life cycle of the team and measuring which
leadership profiles were utilized and by whom. Previous research
suggests that shared leadership is used through different stages of
the team (Pearce and Conger, 2003). Identifying these stages
would be essential to measure shared leadership.
The results of the Tukey post hoc test suggest that the actual
cut-off score for high behavioral complexity is at two instead of the
proposed three leadership profiles. Teams that operate with only
two leadership profiles will perform at a greater level than teams
who perform with zero or one. This contradicts the cut-off score
originally proposed and minimizes the necessity of various leader-
ship roles in teams. The lower cut-off score may be the result of
researching student led teams. These students did not receive previ-
ous teamwork training and can be categorized as “novices” to
teamwork.
It was also found that behavioral complexity did not have a sig-
nificant effect on the attitudes (another aspect of team effectiveness)
of team members. The findings demonstrate that the attitude of the
team members was somewhat indifferent toward their teaming
experience. The responses from the team members fell between
either agree/disagree (3.0) and agree (4.0) for their overall commit-
ment and positive experience. Although the t-test results did not
show a significant effect, the results are still promising since the
mean scores did not fall below 3.0 (neither agree/disagree). This is
supported by the participants’ response to this question on the self-
evaluation, “I would like to continue to work in teams in the future.”
278 Journal of Engineering Education July 2009
Table 4. One-way ANOVA.
Table 5. One-way ANOVA.
Forty-three percent of the population agreed with this statement
while 17.3 percent strongly agreed. Although the t-test did not
reflect a significant relationship between attitude and behavioral
complexity, the results suggest that team members believe that
teams are a viable option in solving problems.
Research questions in this study revealed which of the four
leadership profiles had the greatest effect on performance. The
results can support educators who design teams in the classroom.
Knowing which leadership skills are most important in an educa-
tional team could potentially improve the team experience and
outcome. Of the four leadership profiles, teams who scored high
in Leading Change, Producing Results, and Managing Processes
had the three highest mean grades. These results reflect the point
in time at which the MBI was administered. Because the surveys
were completed towards the end of the semester and near the pro-
ject deadline, it is reasonable to consider that the participants’
responses reflected “results driven” reactions. The Producing
Results leadership profile focuses on areas such as overall produc-
tion, goal accomplishment, direction, planning, structure, and
competition. The Managing Processes leadership profile focuses
on areas such as controlling projects, ensuring accurate work, clar-
ifying policies, developing measures, maintaining order, overall
coordination, and enforcing. Both profiles fall on the “control”
end of the CVF. It can be assumed that towards the end of pro-
jects, teams are more focused on accomplishing tasks than con-
centrating on skills that allow for more flexibility, such as Relating
to People. While the participants were asked to respond to the
survey by assessing their entire teaming experience, it is possible
that their recollections of more flexible processes could have been
overwhelmed by the pressures to complete the final project. This
might suggest why Relating to People was not significantly
related to grades.
This rationale does not explain the significance of the Leading
Change profile. Teams who scored high in Leading Change had
the highest mean grade of all four profiles. Initially, this did not
appear to be illogical as Leading Change is a flexible process on the
CVF diagram. However, its characteristics do represent skills that
might be beneficial not only towards the end but throughout the
entire teaming experience. Characteristics such as: adaptability,
responsiveness to the external environment (i.e., stakeholders), an-
ticipating customer needs, experimentation, creative problem solv-
ing, searching for improvements, and acquiring needed resources.
The project assigned to the teams focused on changing the current
heating and cooling structure of the building facility. The founda-
tion of the project was rooted in change and the instructor graded
the teams based on their ability to meet the needs of the customer
and their use of creativity and imagination in designing the project.
It is realistic to propose that producing a final product was impor-
tant to the teams, but their creative abilities were just as significant.
A. LimitationsDue to the exploratory nature of this study, certain factors and
conditions had an effect on the results. There are natural limitations
to applying a theoretical framework to teams that has traditionally
been applied to organizations and managers (Belasen, 1997).
Furthermore, the MBI underwent modifications from its initial
publication. The original instrument was extensively used, but the
authors (Lawrence, Quinn and Lenk, 2003) have been working on
a more reliable and valid instrument. The instrument used for this
study has been tested for reliability and validity, but has not yet been
published. In addition, because the tool is in development, a set
criterion cut-off score was not yet determined. As a result, the cut-
off score was set by the current researchers and needs to be further
evaluated and tested. Due to the scoring concerns, the development
of the scoring system may not be an absolute measure of leadership.
Empirically sound decisions were difficult to make in determining
the score, but the decisions were deemed reasonable for the purposes
of this study.
There are also limitations in using a 360� survey. Raters might
not be equipped to fully interpret behaviors of their peers or even
themselves. In addition, their responses are based on memory and
might not be an adequate representation of the leadership profile
that was exhibited. Raters also can inherently feel threatened by
taking the surveys. Although confidentiality was ensured, partici-
pants might not wholly trust the process; therefore, they may not
respond in a truthful way (Hurley, 1998). The 360� process is also
time consuming and survey fatigue can set in. Raters can become
tired and restless when completing the surveys which could result in
inaccurate answers as well (Garavan et al., 1997).
Some could view the lack of widely distributed grades as a limi-
tation of the study. The final project grades for the teams ranged
from 83.7 (B) to 93.0 (A). First, grades can be very subjective. It is
understandable to be wary when using this type of outcome to
identify performance. However, the instructor developed mea-
sures to aid in eliminating some of the biases that do exist when
grading students. The scoring matrix includes input from the stu-
dents’ peers in the form of a peer review evaluation. In addition,
the instructor used seven different components in determining the
grade. These include:
1. Clear expectation of thought
2. Depth of coverage (covers all aspects of RFP)
3. LEED Energy Rating analysis and heating and cooling loads
4. Reasonableness of cost/benefit ratio
5. Meets the needs of the owner
6. Creativity and imagination
7. Grammar, neatness, and professionalism
The relatively high scores of the teams support Fisher’s (1993)
theory that when autonomy is given to teams to make decisions, it
enhances their competitive advantage. Also, the Producing Results
leadership profile focuses on competition, and this was a significant
leadership profile among the teams.
Finally, because of the overarching culture of which the stu-
dents are a part, there are limitations that might restrict their atti-
tudes about teamwork. The United States is an individualist
culture. Between 1967 and 1973, Hofstede (2001) conducted an
extensive study of employees at IBM. Of the 72 countries studies,
it was found that the United States rated first in individualism.
Individualist societies focus on the individual over the interests of
the group. And, in education, the purpose is to allow the student
to be independent. Because education is focused on indepen-
dence, it is possible that the participants of this study could have
had a negative perception of teams. Their perceptions could affect
how they conduct themselves throughout the teaming experience.
The collectivist nature of teams (group before self ) may be in con-
tradiction with the individualist culture which these students have
become accustomed. Hence, the individualistic culture might
affect their attitudes towards working in teams which would then
affect their responses for this study.
July 2009 Journal of Engineering Education 279
B. Recommendations for Further ResearchTaking into consideration the results of the study and the limita-
tions, four recommendations are presented to consider when
replicating this study in the engineering classroom.
1) Population: The researcher should participate in the design
and implementation of the SMTs before collecting data. If imple-
menting this study in the classroom, a collaborative effort should be
made between the investigator and the instructor to create an envi-
ronment that allows for data collection and training throughout the
entire team experience. It should also be determined whether the
findings would be replicated in a class that has a diverse set of engi-
neering disciplines. In this study, the population was vastly similar.
While the results from an analogous population are useful, it would
be worthwhile to discern how team members interact and employ
their leadership skills when placed in teams with individuals from
different disciplines.
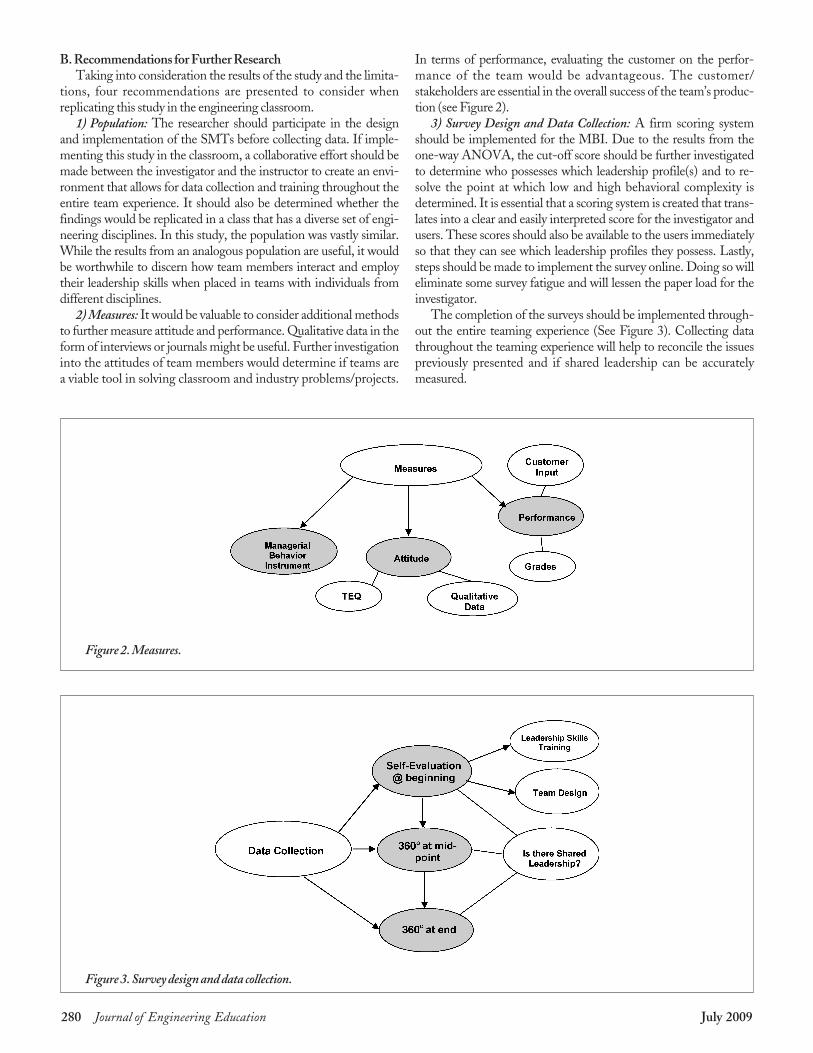
2) Measures: It would be valuable to consider additional methods
to further measure attitude and performance. Qualitative data in the
form of interviews or journals might be useful. Further investigation
into the attitudes of team members would determine if teams are
a viable tool in solving classroom and industry problems/projects.
In terms of performance, evaluating the customer on the perfor-
mance of the team would be advantageous. The customer/
stakeholders are essential in the overall success of the team’s produc-
tion (see Figure 2).
3) Survey Design and Data Collection: A firm scoring system
should be implemented for the MBI. Due to the results from the
one-way ANOVA, the cut-off score should be further investigated
to determine who possesses which leadership profile(s) and to re-
solve the point at which low and high behavioral complexity is
determined. It is essential that a scoring system is created that trans-
lates into a clear and easily interpreted score for the investigator and
users. These scores should also be available to the users immediately
so that they can see which leadership profiles they possess. Lastly,
steps should be made to implement the survey online. Doing so will
eliminate some survey fatigue and will lessen the paper load for the
investigator.
The completion of the surveys should be implemented through-
out the entire teaming experience (See Figure 3). Collecting data
throughout the teaming experience will help to reconcile the issues
previously presented and if shared leadership can be accurately
measured.
280 Journal of Engineering Education July 2009
Figure 2. Measures.
Figure 3. Survey design and data collection.
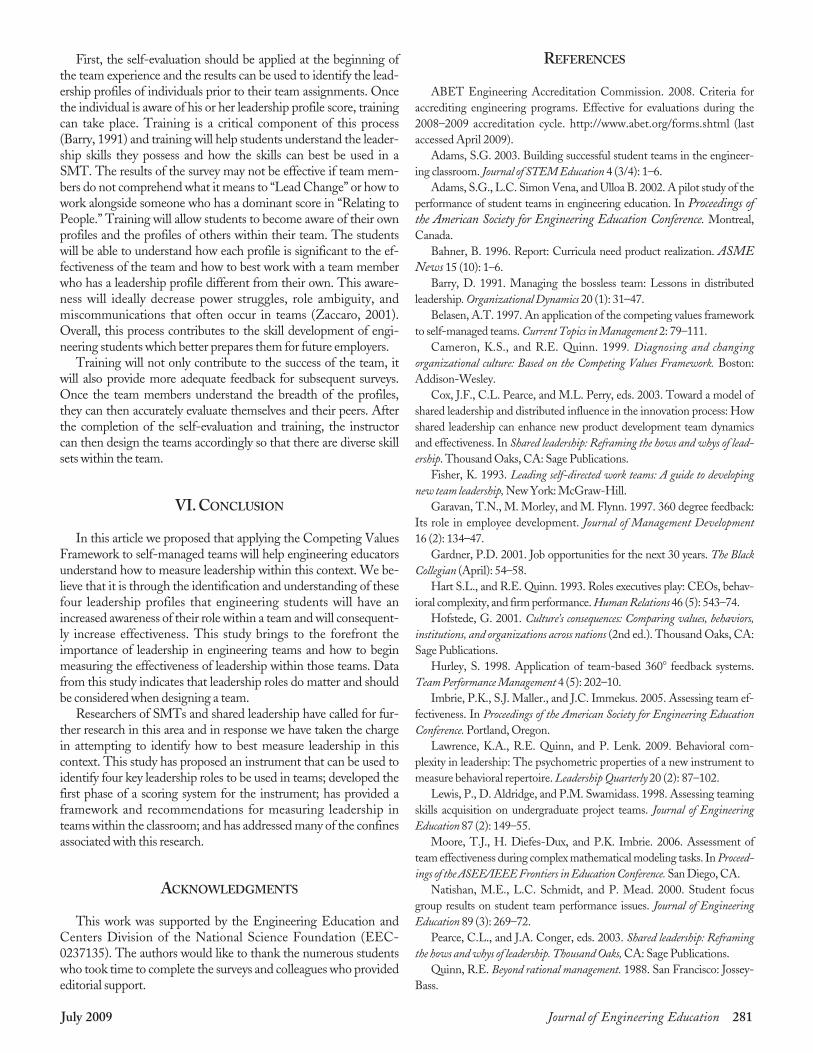
First, the self-evaluation should be applied at the beginning of
the team experience and the results can be used to identify the lead-
ership profiles of individuals prior to their team assignments. Once
the individual is aware of his or her leadership profile score, training
can take place. Training is a critical component of this process
(Barry, 1991) and training will help students understand the leader-
ship skills they possess and how the skills can best be used in a
SMT. The results of the survey may not be effective if team mem-
bers do not comprehend what it means to “Lead Change” or how to
work alongside someone who has a dominant score in “Relating to
People.” Training will allow students to become aware of their own
profiles and the profiles of others within their team. The students
will be able to understand how each profile is significant to the ef-
fectiveness of the team and how to best work with a team member
who has a leadership profile different from their own. This aware-
ness will ideally decrease power struggles, role ambiguity, and
miscommunications that often occur in teams (Zaccaro, 2001).
Overall, this process contributes to the skill development of engi-
neering students which better prepares them for future employers.
Training will not only contribute to the success of the team, it
will also provide more adequate feedback for subsequent surveys.
Once the team members understand the breadth of the profiles,
they can then accurately evaluate themselves and their peers. After
the completion of the self-evaluation and training, the instructor
can then design the teams accordingly so that there are diverse skill
sets within the team.
VI. CONCLUSION
In this article we proposed that applying the Competing Values
Framework to self-managed teams will help engineering educators
understand how to measure leadership within this context. We be-
lieve that it is through the identification and understanding of these
four leadership profiles that engineering students will have an
increased awareness of their role within a team and will consequent-
ly increase effectiveness. This study brings to the forefront the
importance of leadership in engineering teams and how to begin
measuring the effectiveness of leadership within those teams. Data
from this study indicates that leadership roles do matter and should
be considered when designing a team.
Researchers of SMTs and shared leadership have called for fur-
ther research in this area and in response we have taken the charge
in attempting to identify how to best measure leadership in this
context. This study has proposed an instrument that can be used to
identify four key leadership roles to be used in teams; developed the
first phase of a scoring system for the instrument; has provided a
framework and recommendations for measuring leadership in
teams within the classroom; and has addressed many of the confines
associated with this research.
ACKNOWLEDGMENTS
This work was supported by the Engineering Education and
Centers Division of the National Science Foundation (EEC-
0237135). The authors would like to thank the numerous students
who took time to complete the surveys and colleagues who provided
editorial support.
REFERENCES
ABET Engineering Accreditation Commission. 2008. Criteria for
accrediting engineering programs. Effective for evaluations during the
2008–2009 accreditation cycle. http://www.abet.org/forms.shtml (last
accessed April 2009).
Adams, S.G. 2003. Building successful student teams in the engineer-
ing classroom. Journal of STEM Education 4 (3/4): 1–6.
Adams, S.G., L.C. Simon Vena, and Ulloa B. 2002. A pilot study of the
performance of student teams in engineering education. In Proceedings ofthe American Society for Engineering Education Conference. Montreal,
Canada.
Bahner, B. 1996. Report: Curricula need product realization. ASMENews 15 (10): 1–6.
Barry, D. 1991. Managing the bossless team: Lessons in distributed
leadership. Organizational Dynamics 20 (1): 31–47.
Belasen, A.T. 1997. An application of the competing values framework
to self-managed teams. Current Topics in Management 2: 79–111.
Cameron, K.S., and R.E. Quinn. 1999. Diagnosing and changing
organizational culture: Based on the Competing Values Framework. Boston:
Addison-Wesley.
Cox, J.F., C.L. Pearce, and M.L. Perry, eds. 2003. Toward a model of
shared leadership and distributed influence in the innovation process: How
shared leadership can enhance new product development team dynamics
and effectiveness. In Shared leadership: Reframing the hows and whys of lead-
ership. Thousand Oaks, CA: Sage Publications.
Fisher, K. 1993. Leading self-directed work teams: A guide to developing
new team leadership, New York: McGraw-Hill.
Garavan, T.N., M. Morley, and M. Flynn. 1997. 360 degree feedback:
Its role in employee development. Journal of Management Development
16 (2): 134–47.
Gardner, P.D. 2001. Job opportunities for the next 30 years. The Black
Collegian (April): 54–58.
Hart S.L., and R.E. Quinn. 1993. Roles executives play: CEOs, behav-
ioral complexity, and firm performance. Human Relations 46 (5): 543–74.
Hofstede, G. 2001. Culture’s consequences: Comparing values, behaviors,
institutions, and organizations across nations (2nd ed.). Thousand Oaks, CA:
Sage Publications.
Hurley, S. 1998. Application of team-based 360� feedback systems.
Team Performance Management 4 (5): 202–10.
Imbrie, P.K., S.J. Maller., and J.C. Immekus. 2005. Assessing team ef-
fectiveness. In Proceedings of the American Society for Engineering Education
Conference. Portland, Oregon.
Lawrence, K.A., R.E. Quinn, and P. Lenk. 2009. Behavioral com-
plexity in leadership: The psychometric properties of a new instrument to
measure behavioral repertoire. Leadership Quarterly 20 (2): 87–102.
Lewis, P., D. Aldridge, and P.M. Swamidass. 1998. Assessing teaming
skills acquisition on undergraduate project teams. Journal of Engineering
Education 87 (2): 149–55.
Moore, T.J., H. Diefes-Dux, and P.K. Imbrie. 2006. Assessment of
team effectiveness during complex mathematical modeling tasks. In Proceed-
ings of the ASEE/IEEE Frontiers in Education Conference. San Diego, CA.
Natishan, M.E., L.C. Schmidt, and P. Mead. 2000. Student focus
group results on student team performance issues. Journal of Engineering
Education 89 (3): 269–72.
Pearce, C.L., and J.A. Conger, eds. 2003. Shared leadership: Reframing
the hows and whys of leadership. Thousand Oaks, CA: Sage Publications.
Quinn, R.E. Beyond rational management. 1988. San Francisco: Jossey-
Bass.
July 2009 Journal of Engineering Education 281
Quinn, R.E., S.R. Faerman, M.P. Thompson, and M.R. McGrath.
1996. Becoming a master manager: A competency framework. New York: John
Wiley & Sons.
Salas, E., K.C. Stagl, C.S. Burke, and G.F. Goodwin. 2007. Fostering
team effectiveness in organizations: Toward an integrative theoretical
framework. In Modeling complex systems, eds. J.W. Shuart, B. Shuart, W.
Spaulding, and J. Poland. Lincoln: University of Nebraska Press.
Shamir, B., and Y. Lapidot. 2003. Shared leadership in the manage-
ment of group boundaries: A study of expulsions from officers’ training
courses. In Shared leadership: Reframing the hows and whys of leadership, eds.
C.L. Pearce and J.A. Conger. Thousand Oaks, CA: Sage Publications.
Susman, G.I. 1976. Autonomy at work: A socio-technical analysis of partic-
ipative management. New York: Praeger.
Zaccaro, S.J. 2001. The nature of executive leadership: A conceptual and
empirical analysis of success. Washington, DC: American Psychological
Association.
AUTHORS’ BIOGRAPHIES
Carmen R. Zafft is a Ph.D. student in Human Sciences with a
specialization in Leadership Studies at the University of Nebraska-
Lincoln. She obtained a Master of Science in Leadership Educa-
tion from the University of Nebraska-Lincoln in 2007 and a
Bachelor of Science in Criminal Justice from the University of
Nebraska-Lincoln in 1999. She has also served in various manage-
ment and program development roles for non-profit and
educational agencies both in Pennsylvania and Nebraska.
Address: University of Nebraska-Lincoln, 114 Othmer
Hall/820 N 16th St., P.O. Box 880642, Lincoln, NE 68588-0642;
telephone: (�1) 402.472.4940; e-mail: [email protected].
Stephanie G. Adams is the associate dean of Undergraduate
Studies and an associate professor of Mechanical Engineering at
Virginia Commonwealth University. She previously spent ten
years as a professor of Industrial and Management Systems Engi-
neering at the University of Nebraska-Lincoln. She received her
Ph.D. in Interdisciplinary Engineering from Texas A&M University
in August of 1998. Dr. Adams is an honor graduate of North
Carolina Agricultural and Technical State University where she
earned her B.S. in Mechanical Engineering in 1988. In 1991 she
was awarded the Master of Engineering degree in Systems Engi-
neering from the University of Virginia. Her areas of concentration
were Industrial Engineering and Management. Her research in-
terests include Team Effectiveness, Collaborative and Active
Learning, Engineering Education and Pedagogy, and Quality
Control and Management.
Address: Virginia Commonwealth University, 601 West Main
Street, P.O. Box 843068, Richmond, VA 23284-3068; telephone:
(�1) 804.828.3925; e-mail: [email protected].
Gina S. Matkin is an assistant professor of Human Sciences/
Leadership Studies at the University of Nebraska-Lincoln. She
received her Ph.D. in Human Sciences with a specialization in
Leadership Studies at the University of Nebraska-Lincoln in
August of 2005. She graduated Magna cum Laude from Southeast
Missouri State with a B.S. in Biology Education in 1982. In 1989
she was awarded a Master of Science in General Graduate Studies
with emphases in Sociology, Adult Education, and Women’s
Studies. Her research interests include outcomes of intercultural
sensitivity in organizations and communities, diversity and leader-
ship, helping leaders/teachers develop critical thinking in them-
selves and others, and outcomes of using and developing teams in
the classroom.
Address: University of Nebraska-Lincoln, Department of Agri-
cultural Leadership Education and Communication, 300 Ag Hall,
Lincoln, NE 68583-0709; telephone: (�1) 402.472.4454; e-mail:
282 Journal of Engineering Education July 2009