Measuring Conduct and Cost Parameters in the Spanish Airline Market
27
DOCUMENTS DE TREBALL DE LA FACULTAT DE CIÈNCIES ECONÒMIQUES I EMPRESARIALS Col·lecció d’Economia MEASURING CONDUCT AND COST PARAMETERS IN THE SPANISH AIR TRANSPORT MARKET Xavier Fageda* September 2004 Address for correspondence: University of Barcelona (Department of Economic Policy). Av. Diagonal 690. 08034 Barcelona (Spain). E-mail: [email protected] * The author would like to thank all members of the Research Unit on Public Policies and Economic Regulation (University of Barcelona), Javier Campos, Ginés de Rus, Pedro Marín, Anna Matas, Eugenio Miravete and Gustavo Nombela for their useful suggestions. The usual disclaimer applies.
Transcript of Measuring Conduct and Cost Parameters in the Spanish Airline Market
DOCUMENTS DE TREBALL DE LA FACULTAT
DE CIÈNCIES ECONÒMIQUES
I EMPRESARIALS
Col·lecció d’Economia
MEASURING CONDUCT AND COST PARAMETERS IN THE
SPANISH AIR TRANSPORT MARKET
Xavier Fageda*
September 2004
Address for correspondence: University of Barcelona (Department of Economic Policy).
Av. Diagonal 690. 08034 Barcelona (Spain). E-mail: [email protected]
* The author would like to thank all members of the Research Unit on Public Policies
and Economic Regulation (University of Barcelona), Javier Campos, Ginés de Rus,
Pedro Marín, Anna Matas, Eugenio Miravete and Gustavo Nombela for their useful
suggestions. The usual disclaimer applies.
ABSTRACT: This paper estimates a model of airline competition for the Spanish air
transport market. I test the explanatory power of alternative oligopoly models with
capacity constraints. In addition, I analyse the degree of density economies. Results
show that Spanish airlines conduct follows a price-leadership scheme so that it is less
competitive than the Cournot solution. I also find evidence that thin routes can be
considered as natural monopolies.
RESUMEN: Este artículo estima un modelo de competencia para el mercado español
de transporte aéreo. Se contrasta la capacidad explicativa de modelos alternativos de
oligopolio con restricciones de capacidad. Adicionalmente, se analiza el alcance de las
economías de densidad. Los resultados de la estimación muestran que la conducta de las
compañías aéreas españolas sigue un esquema de liderazgo en precios, de tal modo que
dicha conducta es menos competitiva que la solución de Cournot. También se halla
evidencia de que las rutas de baja densidad de tráfico son un monopolio natural.
JEL classification: D43, L13, L93, C30
Keywords: Oligopoly, Air Transportation, Multiple Equation Models
I. Introduction
The worldwide liberalisation of air transport services has been considered one of the most
successful experiences in the wider process of regulatory reform. However, there is a consensus in
the academic literature that benefits of liberalisation depend fundamentally on the existence of an
effective competition on the markets where airlines compete; the air routes that link city pairs. In
this context, the two typical market structures that have emerged in the domestic markets of the
European Union are monopolies and asymmetric oligopolies. The primary objective of this paper is
to examine airlines behaviour under these market structures
Route traffic density normally determines the particular strategic scenario. Indeed, oligopoly
with a dominant firm is the predominant market structure in thick routes. In addition, airlines
(especially non flag carriers) face capacity constraints as long as main European airports are
currently congested.1
Kreps and Scheinkman (1983) show that the equilibrium in a two-stage oligopoly competition
model with endogenous capacity constraints is equivalent to the traditional one-stage Cournot
model. In this model, firms choose simultaneously capacities in a first stage and then they both
choose simultaneously prices. However, Deneckere and Kovenock (1992) find that oligopoly
competition with capacity constraints can lead to an outcome less competitive than predicted by a
Cournot model, regardless there is implicit or explicit collusion. In their model, one firm emerges as
a natural price leader due to its relatively large size, so that the price setting moves from a
simultaneous to a leader-follower scheme. In addition, the assumptions of Deneckere and Kovenock
rely on exogenous capacity constraints and an aggregate demand that is high with respect to
aggregate capacity. In spite of the fact that airlines can operate with capacity constraints, service
frequency is a crucial competition variable in a context where demand is fluctuating, so that airlines
usually have excess of capacity. Taking into account that European flag carriers tend to dominate to
great extent their domestic markets, it can be claimed that the European airline industry for
domestic markets can meet the assumptions of Deneckere and Kovenock model. Thus, it is relevant
to test the explanatory power of these two alternative models on oligopoly routes.
Monopoly is the predominant market structure in thin air routes. In this way, it is generally
accepted the existence of density economies in the air transport industry; unit costs fall when route
traffic increases (Caves et al., 1984). The degree of density economies determine whether thin
routes should be considered as natural monopolies. In that case, Braeutigam (1989) suggests that it
is needed to assess if some form of competition for the market, such as potential competition or
1
intermodal competition, could guarantee an efficient allocation of resources. Indeed, air transport
services were considered a paradigmatic example of the contestability hypothesis for their
proponents (Baumol et al. (1982)) and the majority of routes in the European domestic markets are
short-haul routes. Thus, it is of interest to analyse density economies and the influence of
competition for the market on monopoly routes.
We deal with all these issues through an empirical model of oligopoly competition that is
estimated for the Spanish air transport market in the period 2001-2002. It is needed to mention that
the results of this particular study can be expanded to the rest of the European Union because the
Spanish market is the largest domestic market in this area, as it is shown in table 1. This is due to
the fact that major cities in Spain are far from each other and to the relevance of connections to the
islands. In addition, quality of service of alternative transport modes is relatively low. The large size
of the Spanish market, along with the strong tradition of charter airlines, allows claiming that the
Spanish market is an upper bound in terms of competition opportunities in the European context.
Additionally, this market shows a high stability since 1997 so that an oligopoly static framework
should not be biased.
Table 1. Number of seats per week supplied in domestic markets. 2000
Market Seats
Spain Italy
France Germany
United Kingdom Norway Sweden Portugal
776,435 742,074 733,479 652,241 564,961 412,040 265,034 97,121
Source: Official Airlines Guide (Reported in Williams, 2003)
It is useful to mention here some facts of the Spanish air transport market. The main competitor
of the Spanish flag carrier, Iberia, is Spanair, an airline that is mainly owned by the Scandinavian
airline, SAS. The third Spanish competitor, Air Europa, is owned by a firm devoted to tourist
activities. Iberia has been privatized in a gradual process that finished in 2001. British Airways is
currently one of the Iberia’s major shareholders.2 According to the General Directorate of Civil
Aviation (Ministry of Transports), the Spanish market is composed by about 100 routes,
1 In Europe, the allocation of slots in the airports is based on the grandfather right. According to this right, airlines that have traditionally made use of slots are their “owners”. Thus, flag carriers, the airlines that had the monopoly (duopoly) in the provision of domestic (international) services in the regulation period, can use the majority of the slots in most airports of their national network. 2 There is also Air Nostrum, a regional airline that operates as a franchise of Iberia. This airline does not have an independent pricing policy with respect to Iberia.
2
maintaining Iberia the monopoly on half of them. In routes where Spanair and/or Air Europa offer
services, the Iberia’s market share lies between 50 and 90 per cent.
The remainder of this paper is organised as follows. In the second section, it is stated the main
contribution of this study with regard to the previous literature. In the third section, we develop a
model of airline competition in a static framework. In the fourth section, we specify the data used in
the empirical analysis. In the fifth section, we proceed to comment the results of the estimation.
Finally, the last section focuses on the implications of the results.
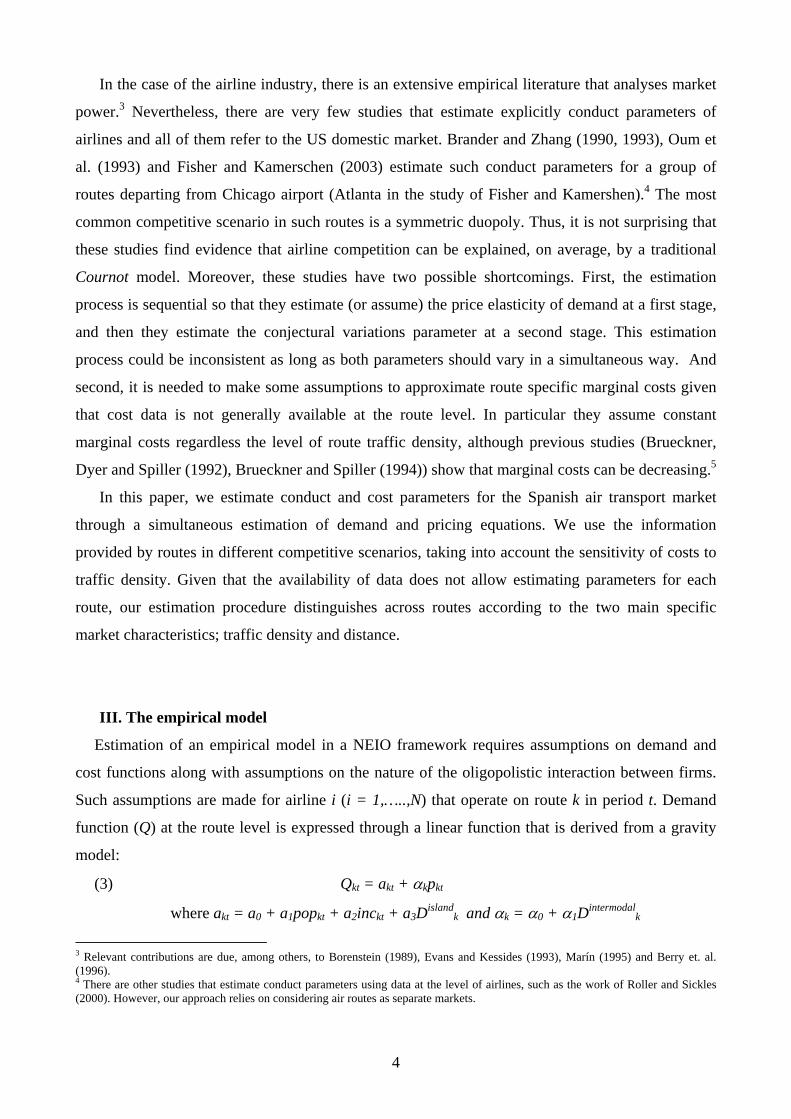
II. Literature review
One of the main advances of the New Empirical Industrial Organization (NEIO) is to provide
econometric techniques to estimate conduct and cost parameters of firms, even when full data on
costs is not available. In this way, the conjectural variations approach allows dealing with several
relevant questions, such as measuring the degree of market power or analysing the technology of
the industry. The parameter of conjectural variations of the firm i (vi) can be estimated through the
following equation:
(1) vi = (p – ci)η/(psi) – 1,
where vi is the expected variation of rivals output when output of firm i varies, p is the market
price, ci and si are the individual marginal costs and market share respectively, and η is the price
elasticity of demand.
The conjectural variations approach has been criticized for capturing a dynamic concept in a
static framework. However, Bresnahan (1989) argues that the interpretation of the conduct
parameter in empirical models does not refer to an expectative but an indicator of the average
degree of collusion in the market. Although Corts (1999) replies Bresnahan’s argument through the
distinction between marginal and average degree of collusion, the conjectural variations approach is
still considered a useful tool to measure the degree of market power. In this way, Genovese and
Mullin (1998) test the validity of the NEIO in an oligopoly static framework for the refining
industry in the period 1890-1914. They show that NEIO approximates reasonably well the mark-ups
on marginal costs, even when full data on costs is not available. The results of Genovese and Mullin
are robust to different functional forms of demand. Klay and Troesken (2003) obtain similar results
for the whiskey industry at the turn of century XIX.
3
In the case of the airline industry, there is an extensive empirical literature that analyses market
power.3 Nevertheless, there are very few studies that estimate explicitly conduct parameters of
airlines and all of them refer to the US domestic market. Brander and Zhang (1990, 1993), Oum et
al. (1993) and Fisher and Kamerschen (2003) estimate such conduct parameters for a group of
routes departing from Chicago airport (Atlanta in the study of Fisher and Kamershen).4 The most
common competitive scenario in such routes is a symmetric duopoly. Thus, it is not surprising that
these studies find evidence that airline competition can be explained, on average, by a traditional
Cournot model. Moreover, these studies have two possible shortcomings. First, the estimation
process is sequential so that they estimate (or assume) the price elasticity of demand at a first stage,
and then they estimate the conjectural variations parameter at a second stage. This estimation
process could be inconsistent as long as both parameters should vary in a simultaneous way. And
second, it is needed to make some assumptions to approximate route specific marginal costs given
that cost data is not generally available at the route level. In particular they assume constant
marginal costs regardless the level of route traffic density, although previous studies (Brueckner,
Dyer and Spiller (1992), Brueckner and Spiller (1994)) show that marginal costs can be decreasing.5
In this paper, we estimate conduct and cost parameters for the Spanish air transport market
through a simultaneous estimation of demand and pricing equations. We use the information
provided by routes in different competitive scenarios, taking into account the sensitivity of costs to
traffic density. Given that the availability of data does not allow estimating parameters for each
route, our estimation procedure distinguishes across routes according to the two main specific
market characteristics; traffic density and distance.
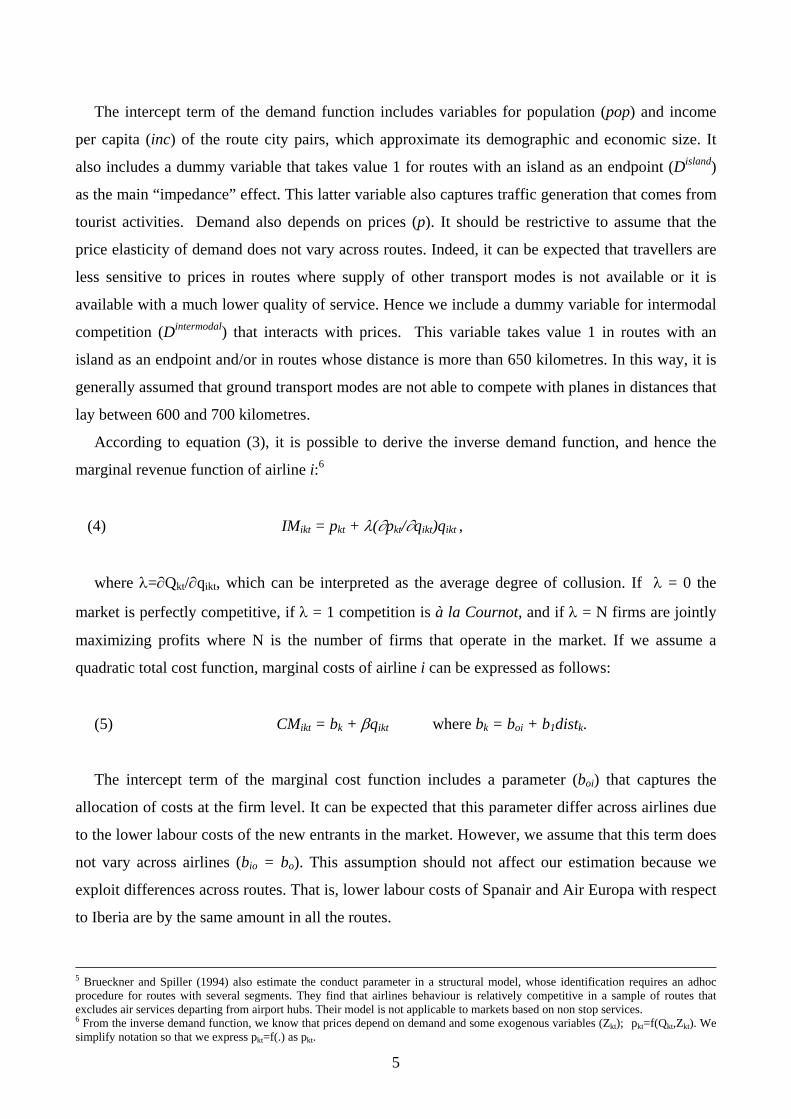
III. The empirical model
Estimation of an empirical model in a NEIO framework requires assumptions on demand and
cost functions along with assumptions on the nature of the oligopolistic interaction between firms.
Such assumptions are made for airline i (i = 1,…..,N) that operate on route k in period t. Demand
function (Q) at the route level is expressed through a linear function that is derived from a gravity
model:
(3) Qkt = akt + αkpkt
where akt = a0 + a1popkt + a2inckt + a3Dislandk and αk = α0 + α1Dintermodal
k
3 Relevant contributions are due, among others, to Borenstein (1989), Evans and Kessides (1993), Marín (1995) and Berry et. al. (1996). 4 There are other studies that estimate conduct parameters using data at the level of airlines, such as the work of Roller and Sickles (2000). However, our approach relies on considering air routes as separate markets.
4
The intercept term of the demand function includes variables for population (pop) and income
per capita (inc) of the route city pairs, which approximate its demographic and economic size. It
also includes a dummy variable that takes value 1 for routes with an island as an endpoint (Disland)
as the main “impedance” effect. This latter variable also captures traffic generation that comes from
tourist activities. Demand also depends on prices (p). It should be restrictive to assume that the
price elasticity of demand does not vary across routes. Indeed, it can be expected that travellers are
less sensitive to prices in routes where supply of other transport modes is not available or it is
available with a much lower quality of service. Hence we include a dummy variable for intermodal
competition (Dintermodal) that interacts with prices. This variable takes value 1 in routes with an
island as an endpoint and/or in routes whose distance is more than 650 kilometres. In this way, it is
generally assumed that ground transport modes are not able to compete with planes in distances that
lay between 600 and 700 kilometres.
According to equation (3), it is possible to derive the inverse demand function, and hence the
marginal revenue function of airline i:6
(4) IMikt = pkt + λ(∂pkt/∂qikt)qikt ,
where λ=∂Qkt/∂qikt, which can be interpreted as the average degree of collusion. If λ = 0 the
market is perfectly competitive, if λ = 1 competition is à la Cournot, and if λ = N firms are jointly
maximizing profits where N is the number of firms that operate in the market. If we assume a
quadratic total cost function, marginal costs of airline i can be expressed as follows:
(5) CMikt = bk + βqikt where bk = boi + b1distk.
The intercept term of the marginal cost function includes a parameter (boi) that captures the
allocation of costs at the firm level. It can be expected that this parameter differ across airlines due
to the lower labour costs of the new entrants in the market. However, we assume that this term does
not vary across airlines (bio = bo). This assumption should not affect our estimation because we
exploit differences across routes. That is, lower labour costs of Spanair and Air Europa with respect
to Iberia are by the same amount in all the routes.
5 Brueckner and Spiller (1994) also estimate the conduct parameter in a structural model, whose identification requires an adhoc procedure for routes with several segments. They find that airlines behaviour is relatively competitive in a sample of routes that excludes air services departing from airport hubs. Their model is not applicable to markets based on non stop services. 6 From the inverse demand function, we know that prices depend on demand and some exogenous variables (Zkt); pkt=f(Qkt,Zkt). We simplify notation so that we express pkt=f(.) as pkt.
5
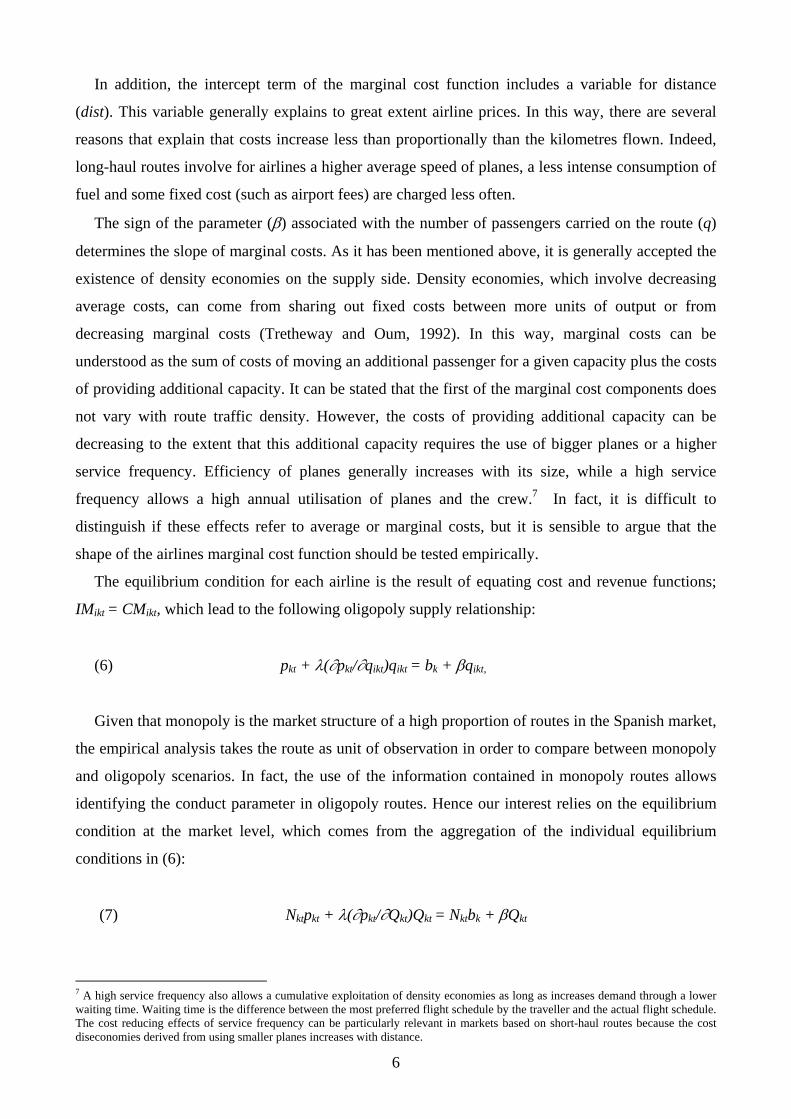
In addition, the intercept term of the marginal cost function includes a variable for distance
(dist). This variable generally explains to great extent airline prices. In this way, there are several
reasons that explain that costs increase less than proportionally than the kilometres flown. Indeed,
long-haul routes involve for airlines a higher average speed of planes, a less intense consumption of
fuel and some fixed cost (such as airport fees) are charged less often.
The sign of the parameter (β) associated with the number of passengers carried on the route (q)
determines the slope of marginal costs. As it has been mentioned above, it is generally accepted the
existence of density economies on the supply side. Density economies, which involve decreasing
average costs, can come from sharing out fixed costs between more units of output or from
decreasing marginal costs (Tretheway and Oum, 1992). In this way, marginal costs can be
understood as the sum of costs of moving an additional passenger for a given capacity plus the costs
of providing additional capacity. It can be stated that the first of the marginal cost components does
not vary with route traffic density. However, the costs of providing additional capacity can be
decreasing to the extent that this additional capacity requires the use of bigger planes or a higher
service frequency. Efficiency of planes generally increases with its size, while a high service
frequency allows a high annual utilisation of planes and the crew.7 In fact, it is difficult to
distinguish if these effects refer to average or marginal costs, but it is sensible to argue that the
shape of the airlines marginal cost function should be tested empirically.
The equilibrium condition for each airline is the result of equating cost and revenue functions;
IMikt = CMikt, which lead to the following oligopoly supply relationship:
(6) pkt + λ(∂pkt/∂qikt)qikt = bk + βqikt,
Given that monopoly is the market structure of a high proportion of routes in the Spanish market,
the empirical analysis takes the route as unit of observation in order to compare between monopoly
and oligopoly scenarios. In fact, the use of the information contained in monopoly routes allows
identifying the conduct parameter in oligopoly routes. Hence our interest relies on the equilibrium
condition at the market level, which comes from the aggregation of the individual equilibrium
conditions in (6):
(7) Nktpkt + λ(∂pkt/∂Qkt)Qkt = Nktbk + βQkt
7 A high service frequency also allows a cumulative exploitation of density economies as long as increases demand through a lower waiting time. Waiting time is the difference between the most preferred flight schedule by the traveller and the actual flight schedule. The cost reducing effects of service frequency can be particularly relevant in markets based on short-haul routes because the cost diseconomies derived from using smaller planes increases with distance.
6
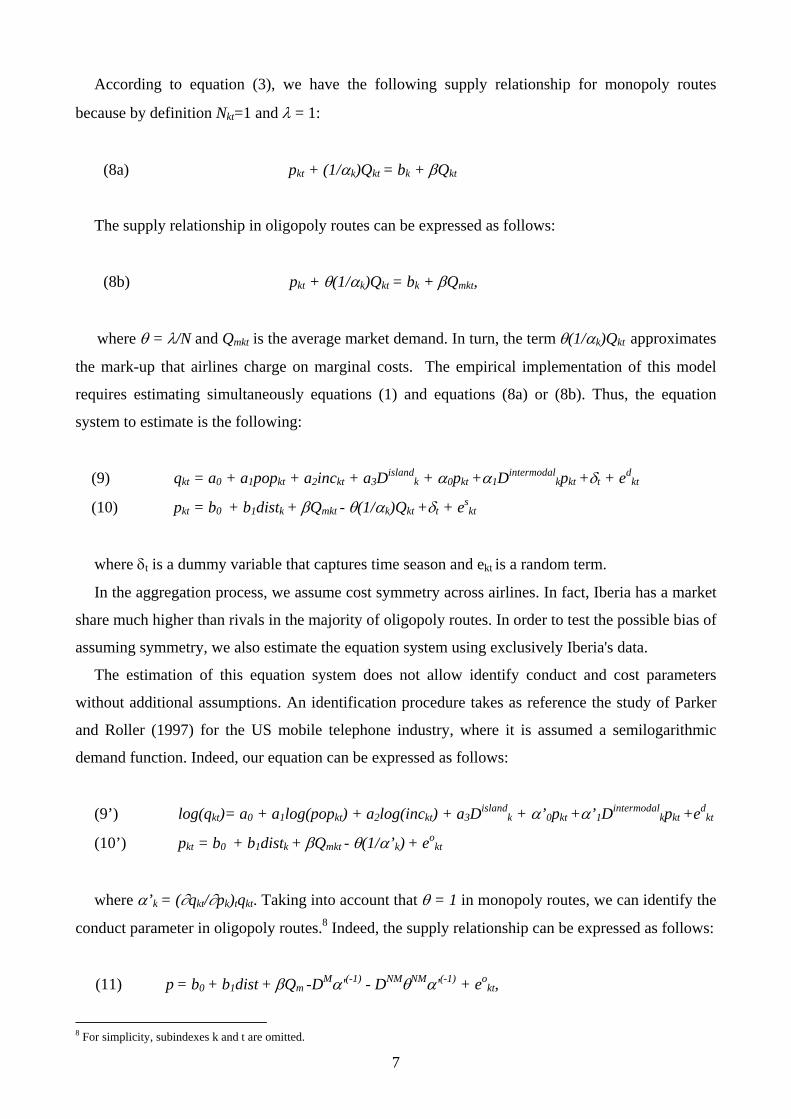
According to equation (3), we have the following supply relationship for monopoly routes
because by definition Nkt=1 and λ = 1:
(8a) pkt + (1/αk)Qkt = bk + βQkt
The supply relationship in oligopoly routes can be expressed as follows:
(8b) pkt + θ(1/αk)Qkt = bk + βQmkt,
where θ = λ/N and Qmkt is the average market demand. In turn, the term θ(1/αk)Qkt approximates
the mark-up that airlines charge on marginal costs. The empirical implementation of this model
requires estimating simultaneously equations (1) and equations (8a) or (8b). Thus, the equation
system to estimate is the following:
(9) qkt = a0 + a1popkt + a2inckt + a3Dislandk + α0pkt +α1Dintermodal
kpkt +δt + edkt
(10) pkt = b0 + b1distk + βQmkt - θ(1/αk)Qkt +δt + eskt
where δt is a dummy variable that captures time season and ekt is a random term.
In the aggregation process, we assume cost symmetry across airlines. In fact, Iberia has a market
share much higher than rivals in the majority of oligopoly routes. In order to test the possible bias of
assuming symmetry, we also estimate the equation system using exclusively Iberia's data.
The estimation of this equation system does not allow identify conduct and cost parameters
without additional assumptions. An identification procedure takes as reference the study of Parker
and Roller (1997) for the US mobile telephone industry, where it is assumed a semilogarithmic
demand function. Indeed, our equation can be expressed as follows:
(9’) log(qkt)= a0 + a1log(popkt) + a2log(inckt) + a3Dislandk + α’0pkt +α’1Dintermodal
kpkt +edkt
(10’) pkt = b0 + b1distk + βQmkt - θ(1/α’k) + eokt
where α’k = (∂qkt/∂pk)tqkt. Taking into account that θ = 1 in monopoly routes, we can identify the
conduct parameter in oligopoly routes.8 Indeed, the supply relationship can be expressed as follows:
(11) p = b0 + b1dist + βQm -DMα'(-1) - DNMθNMα'(-1) + eokt,
8 For simplicity, subindexes k and t are omitted.
7
where DM and DNM are dummy variables that refer to monopoly and oligopoly routes
respectively. The intercept term (co) in monopoly routes is coM = b0 - α'(-1), whereas it is co
NM = b0 in
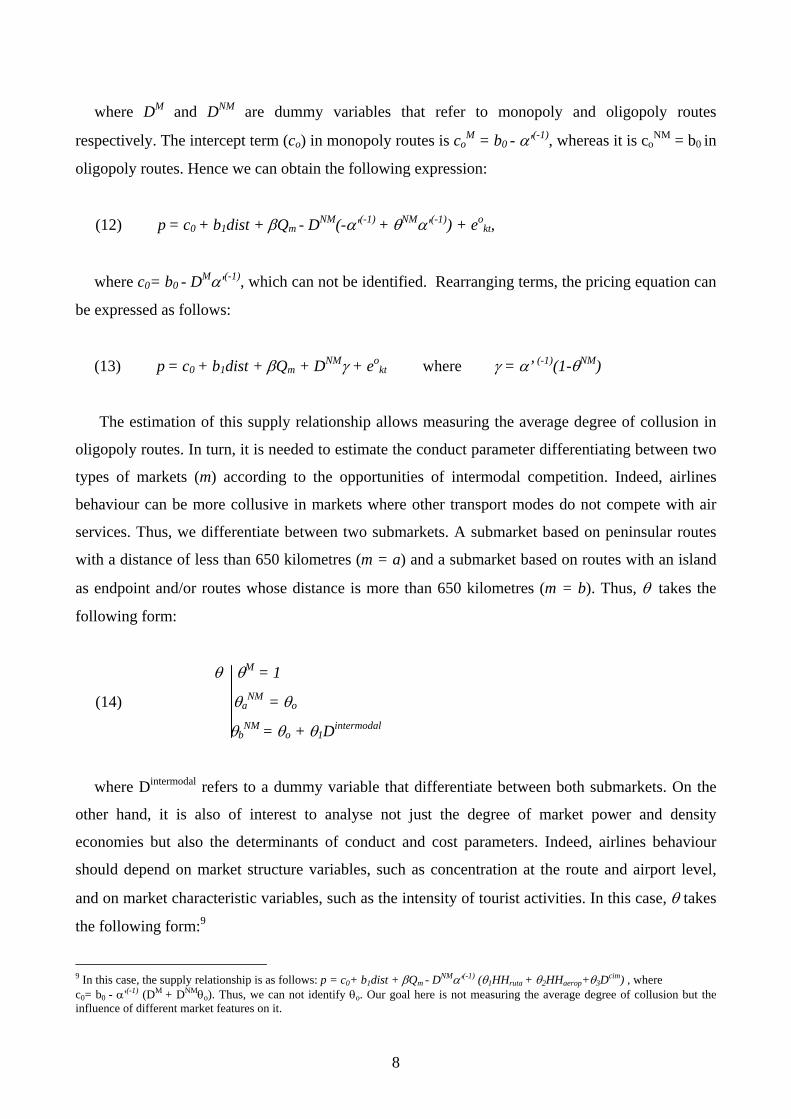
oligopoly routes. Hence we can obtain the following expression:
(12) p = c0 + b1dist + βQm - DNM(-α'(-1) + θNMα'(-1)) + eokt,
where c0= b0 - DMα'(-1), which can not be identified. Rearranging terms, the pricing equation can
be expressed as follows:
(13) p = c0 + b1dist + βQm + DNMγ + eokt where γ = α’ (-1)(1-θNM)
The estimation of this supply relationship allows measuring the average degree of collusion in
oligopoly routes. In turn, it is needed to estimate the conduct parameter differentiating between two
types of markets (m) according to the opportunities of intermodal competition. Indeed, airlines
behaviour can be more collusive in markets where other transport modes do not compete with air
services. Thus, we differentiate between two submarkets. A submarket based on peninsular routes
with a distance of less than 650 kilometres (m = a) and a submarket based on routes with an island
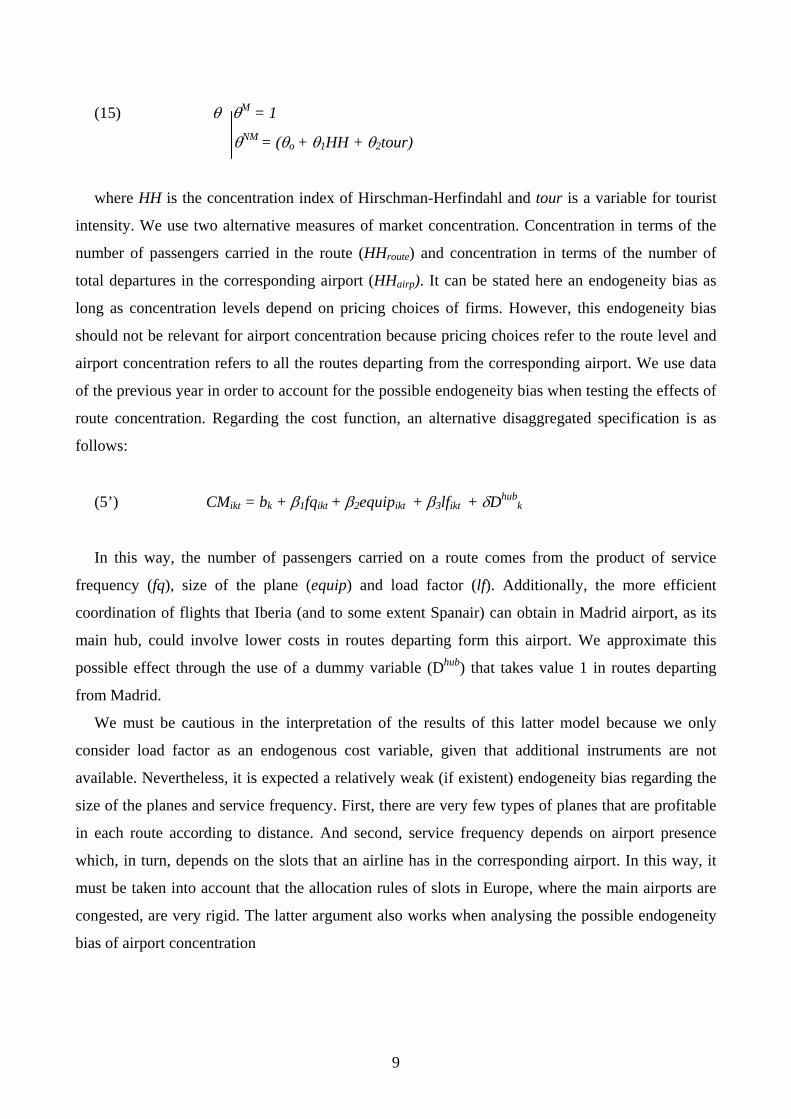
as endpoint and/or routes whose distance is more than 650 kilometres (m = b). Thus, θ takes the
following form:
θ θM = 1
(14) θaNM = θo
θbNM = θo + θ1Dintermodal
where Dintermodal refers to a dummy variable that differentiate between both submarkets. On the
other hand, it is also of interest to analyse not just the degree of market power and density
economies but also the determinants of conduct and cost parameters. Indeed, airlines behaviour
should depend on market structure variables, such as concentration at the route and airport level,
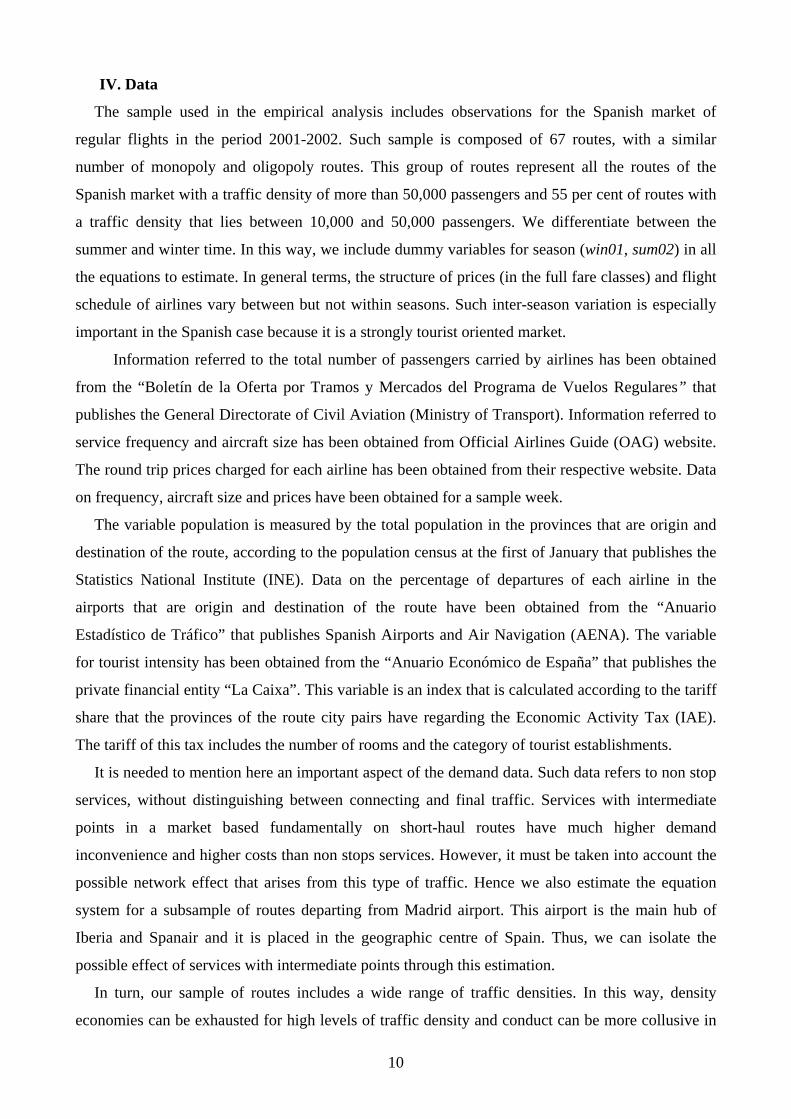
and on market characteristic variables, such as the intensity of tourist activities. In this case, θ takes
the following form:9
9 In this case, the supply relationship is as follows: p = c0+ b1dist + βQm - DNMα'(-1) (θ1HHruta + θ2HHaerop+θ3Dcim) , where c0= b0 - α'(-1) (DM + DNMθo). Thus, we can not identify θo. Our goal here is not measuring the average degree of collusion but the influence of different market features on it.
8
(15) θ θM = 1
θNM = (θo + θ1HH + θ2tour)
where HH is the concentration index of Hirschman-Herfindahl and tour is a variable for tourist
intensity. We use two alternative measures of market concentration. Concentration in terms of the
number of passengers carried in the route (HHroute) and concentration in terms of the number of
total departures in the corresponding airport (HHairp). It can be stated here an endogeneity bias as
long as concentration levels depend on pricing choices of firms. However, this endogeneity bias
should not be relevant for airport concentration because pricing choices refer to the route level and
airport concentration refers to all the routes departing from the corresponding airport. We use data
of the previous year in order to account for the possible endogeneity bias when testing the effects of
route concentration. Regarding the cost function, an alternative disaggregated specification is as
follows:
(5’) CMikt = bk + β1fqikt + β2equipikt + β3lfikt + δDhubk
In this way, the number of passengers carried on a route comes from the product of service
frequency (fq), size of the plane (equip) and load factor (lf). Additionally, the more efficient
coordination of flights that Iberia (and to some extent Spanair) can obtain in Madrid airport, as its
main hub, could involve lower costs in routes departing form this airport. We approximate this
possible effect through the use of a dummy variable (Dhub) that takes value 1 in routes departing
from Madrid.
We must be cautious in the interpretation of the results of this latter model because we only
consider load factor as an endogenous cost variable, given that additional instruments are not
available. Nevertheless, it is expected a relatively weak (if existent) endogeneity bias regarding the
size of the planes and service frequency. First, there are very few types of planes that are profitable
in each route according to distance. And second, service frequency depends on airport presence
which, in turn, depends on the slots that an airline has in the corresponding airport. In this way, it
must be taken into account that the allocation rules of slots in Europe, where the main airports are
congested, are very rigid. The latter argument also works when analysing the possible endogeneity
bias of airport concentration
9
IV. Data
The sample used in the empirical analysis includes observations for the Spanish market of
regular flights in the period 2001-2002. Such sample is composed of 67 routes, with a similar
number of monopoly and oligopoly routes. This group of routes represent all the routes of the
Spanish market with a traffic density of more than 50,000 passengers and 55 per cent of routes with
a traffic density that lies between 10,000 and 50,000 passengers. We differentiate between the
summer and winter time. In this way, we include dummy variables for season (win01, sum02) in all
the equations to estimate. In general terms, the structure of prices (in the full fare classes) and flight
schedule of airlines vary between but not within seasons. Such inter-season variation is especially
important in the Spanish case because it is a strongly tourist oriented market.
Information referred to the total number of passengers carried by airlines has been obtained
from the “Boletín de la Oferta por Tramos y Mercados del Programa de Vuelos Regulares” that
publishes the General Directorate of Civil Aviation (Ministry of Transport). Information referred to
service frequency and aircraft size has been obtained from Official Airlines Guide (OAG) website.
The round trip prices charged for each airline has been obtained from their respective website. Data
on frequency, aircraft size and prices have been obtained for a sample week.
The variable population is measured by the total population in the provinces that are origin and
destination of the route, according to the population census at the first of January that publishes the
Statistics National Institute (INE). Data on the percentage of departures of each airline in the
airports that are origin and destination of the route have been obtained from the “Anuario
Estadístico de Tráfico” that publishes Spanish Airports and Air Navigation (AENA). The variable
for tourist intensity has been obtained from the “Anuario Económico de España” that publishes the
private financial entity “La Caixa”. This variable is an index that is calculated according to the tariff
share that the provinces of the route city pairs have regarding the Economic Activity Tax (IAE).
The tariff of this tax includes the number of rooms and the category of tourist establishments.
It is needed to mention here an important aspect of the demand data. Such data refers to non stop
services, without distinguishing between connecting and final traffic. Services with intermediate
points in a market based fundamentally on short-haul routes have much higher demand
inconvenience and higher costs than non stops services. However, it must be taken into account the
possible network effect that arises from this type of traffic. Hence we also estimate the equation
system for a subsample of routes departing from Madrid airport. This airport is the main hub of
Iberia and Spanair and it is placed in the geographic centre of Spain. Thus, we can isolate the
possible effect of services with intermediate points through this estimation.
In turn, our sample of routes includes a wide range of traffic densities. In this way, density
economies can be exhausted for high levels of traffic density and conduct can be more collusive in
10
thinner routes as long as entrants have more difficulties to obtain a scale of operation sufficiently
high to be competitive. In order to account for these differences, we estimate the equation system
for a subsample of routes with less than 200,000 passengers carried per season, which is the mean
number of passengers carried in the full sample.
A special attention is needed for the fare class used to approximate the average prices charged by
airlines. First, it must be said that it is not available the weighted distribution of passengers carried
for the different fare classes paid. This fact could affect our results if this distribution varies
substantially across routes and airlines. The use of variables that make reference to route
characteristics can help in controlling for these differences. In any case, the interpretation of the
results should take this possible bias into account.
In general terms, we can distinguish between three different fare classes; the lowest fare class,
the (unrestricted) economy class and the business class.10 The lowest fare class and the business
class are commonly understood as a discount and mark-up on the economy class respectively, so
that prices in the economy class can be considered as a reference for all fare classes. In addition, the
amount of that discount and mark-up is determined on demand rather than cost features. Hence the
use of prices in the economy class would seem to be suitable to approximate the mark-up that
airlines try to charge on marginal costs. However, the majority of passengers obtain some discount
when purchasing air fares. Thus, we use average prices in the lowest fare class and the economy
class in order to have the closest available approximation to the mark-ups that airlines effectively
charge on marginal costs.11
Table 2 show the 67 non-stop routes used in the empirical analysis. Tables 3 and 4 show the
descriptive statistics and correlation matrix of the variables used in the empirical analysis.
10There is a high variability in the prices charged by airlines in the lowest fare class. In order to account for this variability, we have obtained this data in homogeneous conditions for each airline. That is, data have been collected one month before travelling, the price refers to the first trip of the week and the return is on Sunday. 11 It must be said that estimation results are reported using the simple average of prices across airlines. There are no significant changes in case of using the weighted average of prices across airlines according to their market share.
11
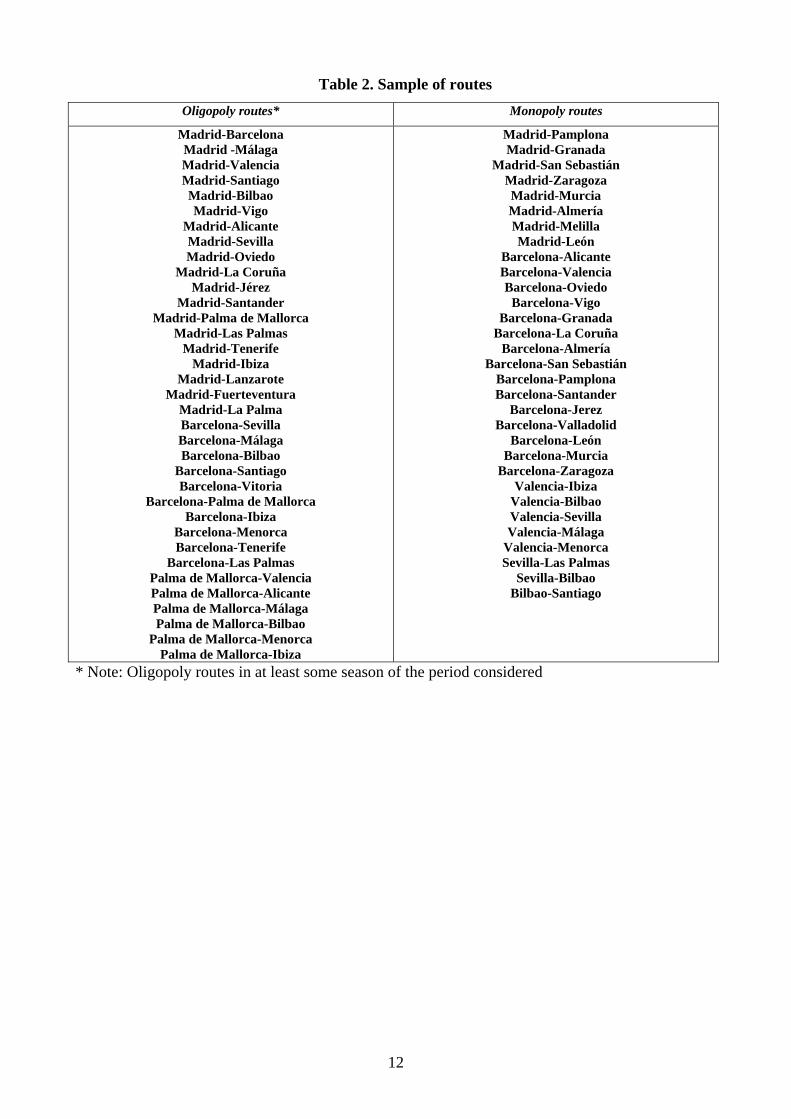
Table 2. Sample of routes Oligopoly routes* Monopoly routes
Madrid-Barcelona Madrid -Málaga Madrid-Valencia Madrid-Santiago Madrid-Bilbao Madrid-Vigo
Madrid-Alicante Madrid-Sevilla Madrid-Oviedo
Madrid-La Coruña Madrid-Jérez
Madrid-Santander Madrid-Palma de Mallorca
Madrid-Las Palmas Madrid-Tenerife
Madrid-Ibiza Madrid-Lanzarote
Madrid-Fuerteventura Madrid-La Palma Barcelona-Sevilla Barcelona-Málaga Barcelona-Bilbao
Barcelona-Santiago Barcelona-Vitoria
Barcelona-Palma de Mallorca Barcelona-Ibiza
Barcelona-Menorca Barcelona-Tenerife
Barcelona-Las Palmas Palma de Mallorca-Valencia Palma de Mallorca-Alicante Palma de Mallorca-Málaga Palma de Mallorca-Bilbao
Palma de Mallorca-Menorca Palma de Mallorca-Ibiza
Madrid-Pamplona Madrid-Granada
Madrid-San Sebastián Madrid-Zaragoza Madrid-Murcia Madrid-Almería Madrid-Melilla Madrid-León
Barcelona-Alicante Barcelona-Valencia Barcelona-Oviedo
Barcelona-Vigo Barcelona-Granada
Barcelona-La Coruña Barcelona-Almería
Barcelona-San Sebastián Barcelona-Pamplona Barcelona-Santander
Barcelona-Jerez Barcelona-Valladolid
Barcelona-León Barcelona-Murcia
Barcelona-Zaragoza Valencia-Ibiza
Valencia-Bilbao Valencia-Sevilla Valencia-Málaga
Valencia-Menorca Sevilla-Las Palmas
Sevilla-Bilbao Bilbao-Santiago
* Note: Oligopoly routes in at least some season of the period considered
12
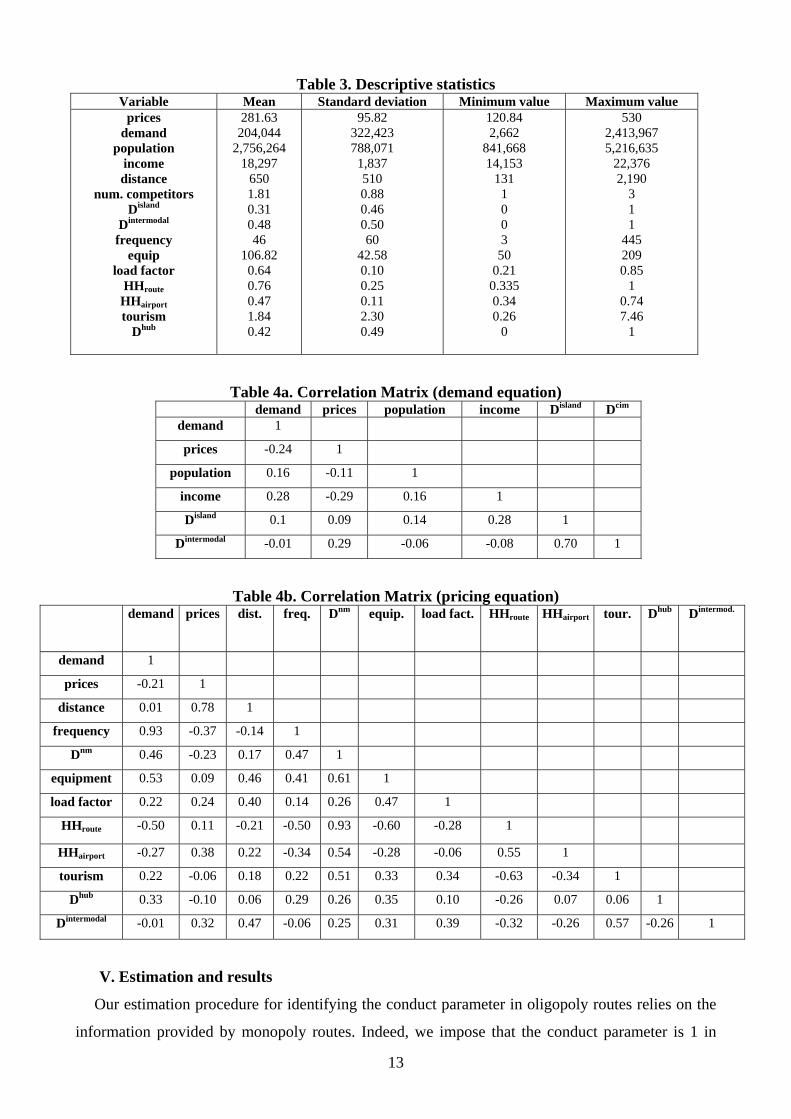
Table 3. Descriptive statistics Variable Mean Standard deviation Minimum value Maximum value
prices demand
population income distance
num. competitors Disland
Dintermodal
frequency equip
load factor HHroute
HHairport tourism
Dhub
281.63 204,044
2,756,264 18,297
650 1.81 0.31 0.48 46
106.82 0.64 0.76 0.47 1.84 0.42
95.82 322,423 788,071
1,837 510 0.88 0.46 0.50 60
42.58 0.10 0.25 0.11 2.30 0.49
120.84 2,662
841,668 14,153
131 1 0 0 3
50 0.21 0.335 0.34 0.26
0
530 2,413,967 5,216,635
22,376 2,190
3 1 1
445 209 0.85
1 0.74 7.46
1
Table 4a. Correlation Matrix (demand equation) demand prices population income Disland Dcim
demand 1
prices -0.24 1
population 0.16 -0.11 1
income 0.28 -0.29 0.16 1
Disland 0.1 0.09 0.14 0.28 1
Dintermodal -0.01 0.29 -0.06 -0.08 0.70 1
Table 4b. Correlation Matrix (pricing equation) demand prices dist. freq. Dnm equip. load fact. HHroute HHairport tour. Dhub Dintermod.
demand 1
prices -0.21 1
distance 0.01 0.78 1
frequency 0.93 -0.37 -0.14 1
Dnm 0.46 -0.23 0.17 0.47 1
equipment 0.53 0.09 0.46 0.41 0.61 1
load factor 0.22 0.24 0.40 0.14 0.26 0.47 1
HHroute -0.50 0.11 -0.21 -0.50 0.93 -0.60 -0.28 1
HHairport -0.27 0.38 0.22 -0.34 0.54 -0.28 -0.06 0.55 1
tourism 0.22 -0.06 0.18 0.22 0.51 0.33 0.34 -0.63 -0.34 1
Dhub 0.33 -0.10 0.06 0.29 0.26 0.35 0.10 -0.26 0.07 0.06 1
Dintermodal -0.01 0.32 0.47 -0.06 0.25 0.31 0.39 -0.32 -0.26 0.57 -0.26 1
V. Estimation and results
Our estimation procedure for identifying the conduct parameter in oligopoly routes relies on the
information provided by monopoly routes. Indeed, we impose that the conduct parameter is 1 in
13
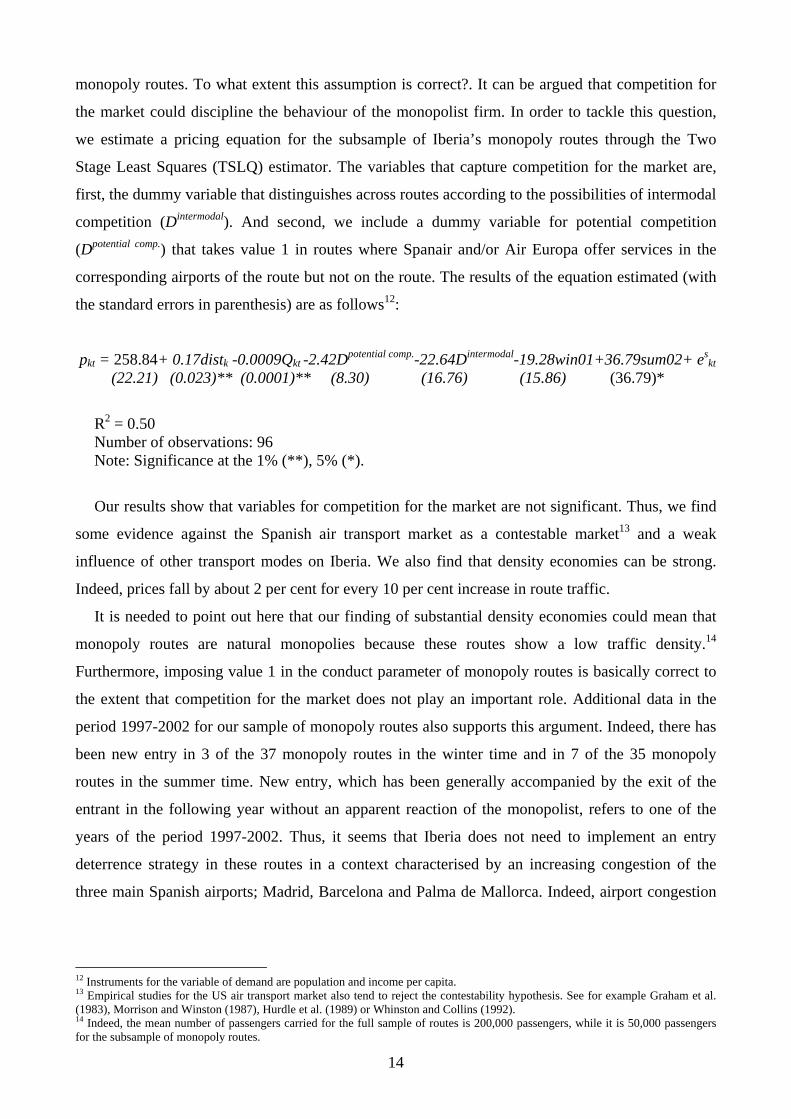
monopoly routes. To what extent this assumption is correct?. It can be argued that competition for
the market could discipline the behaviour of the monopolist firm. In order to tackle this question,
we estimate a pricing equation for the subsample of Iberia’s monopoly routes through the Two
Stage Least Squares (TSLQ) estimator. The variables that capture competition for the market are,
first, the dummy variable that distinguishes across routes according to the possibilities of intermodal
competition (Dintermodal). And second, we include a dummy variable for potential competition
(Dpotential comp.) that takes value 1 in routes where Spanair and/or Air Europa offer services in the
corresponding airports of the route but not on the route. The results of the equation estimated (with
the standard errors in parenthesis) are as follows12:
pkt = 258.84+ 0.17distk -0.0009Qkt -2.42Dpotential comp.-22.64Dintermodal-19.28win01+36.79sum02+ eskt
(22.21) (0.023)** (0.0001)** (8.30) (16.76) (15.86) (36.79)*
R2 = 0.50 Number of observations: 96 Note: Significance at the 1% (**), 5% (*).
Our results show that variables for competition for the market are not significant. Thus, we find
some evidence against the Spanish air transport market as a contestable market13 and a weak
influence of other transport modes on Iberia. We also find that density economies can be strong.
Indeed, prices fall by about 2 per cent for every 10 per cent increase in route traffic.
It is needed to point out here that our finding of substantial density economies could mean that
monopoly routes are natural monopolies because these routes show a low traffic density.14
Furthermore, imposing value 1 in the conduct parameter of monopoly routes is basically correct to
the extent that competition for the market does not play an important role. Additional data in the
period 1997-2002 for our sample of monopoly routes also supports this argument. Indeed, there has
been new entry in 3 of the 37 monopoly routes in the winter time and in 7 of the 35 monopoly
routes in the summer time. New entry, which has been generally accompanied by the exit of the
entrant in the following year without an apparent reaction of the monopolist, refers to one of the
years of the period 1997-2002. Thus, it seems that Iberia does not need to implement an entry
deterrence strategy in these routes in a context characterised by an increasing congestion of the
three main Spanish airports; Madrid, Barcelona and Palma de Mallorca. Indeed, airport congestion
12 Instruments for the variable of demand are population and income per capita. 13 Empirical studies for the US air transport market also tend to reject the contestability hypothesis. See for example Graham et al. (1983), Morrison and Winston (1987), Hurdle et al. (1989) or Whinston and Collins (1992). 14 Indeed, the mean number of passengers carried for the full sample of routes is 200,000 passengers, while it is 50,000 passengers for the subsample of monopoly routes.
14
along with density economies prevents entrants to develop a scale of operations sufficiently high to
be competitive in thin routes.15
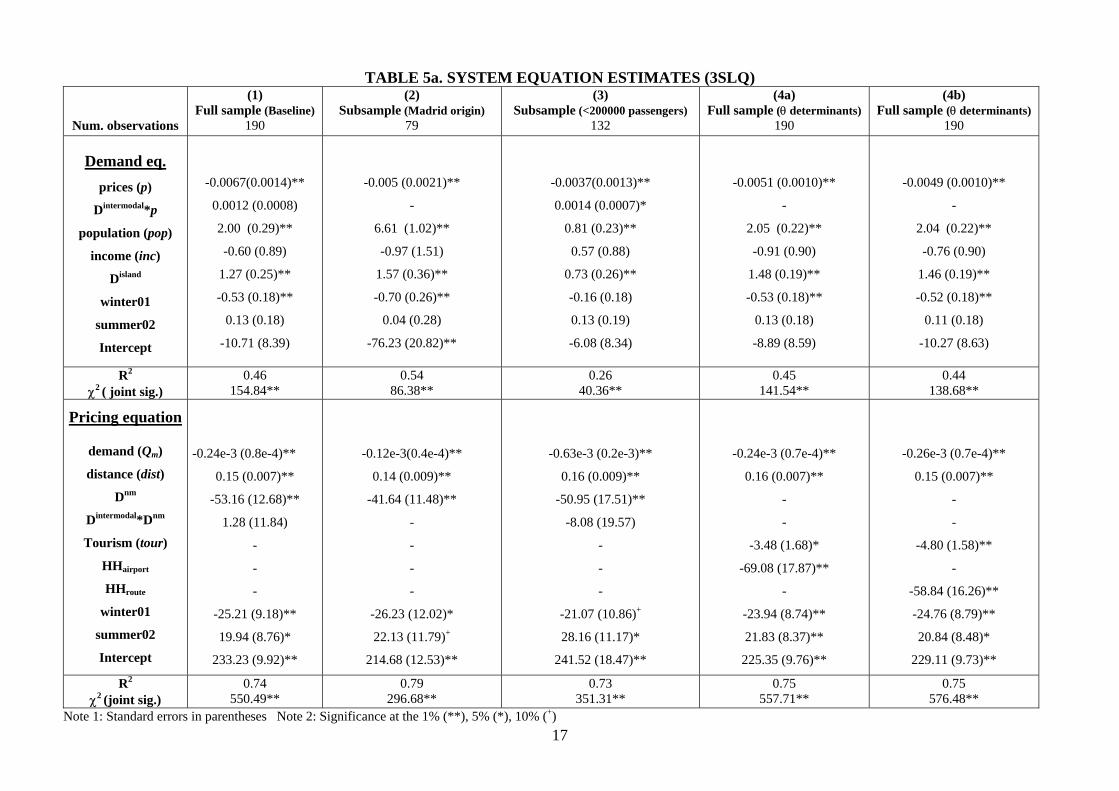
We estimate the demand and pricing equation system through the Three Stage Least Squares
(3SLS) estimator. Table 5 shows the results for different models of the equation system. Table 6
shows the corresponding structural parameters that can be inferred from estimates.
15It must be said that airlines also must develop a high scale of operations in terms of quality because service frequency is the main
15

determinant of such quality.
16
17
TABLE 5a. SYSTEM EQUATION ESTIMATES (3SLQ)
Num. observations
(1) Full sample (Baseline)
190
(2) Subsample (Madrid origin)
79
(3) Subsample (<200000 passengers)
132
(4a) Full sample (θ determinants)
190
(4b) Full sample (θ determinants)
190
Demand eq. prices (p)
Dintermodal*p
population (pop)
income (inc)
Disland
winter01
summer02
Intercept
-0.0067(0.0014)**
0.0012 (0.0008)
2.00 (0.29)**
-0.60 (0.89)
1.27 (0.25)**
-0.53 (0.18)**
0.13 (0.18)
-10.71 (8.39)
-0.005 (0.0021)**
-
6.61 (1.02)**
-0.97 (1.51)
1.57 (0.36)**
-0.70 (0.26)**
0.04 (0.28)
-76.23 (20.82)**
-0.0037(0.0013)**
0.0014 (0.0007)*
0.81 (0.23)**
0.57 (0.88)
0.73 (0.26)**
-0.16 (0.18)
0.13 (0.19)
-6.08 (8.34)
-0.0051 (0.0010)**
-
2.05 (0.22)**
-0.91 (0.90)
1.48 (0.19)**
-0.53 (0.18)**
0.13 (0.18)
-8.89 (8.59)
-0.0049 (0.0010)**
-
2.04 (0.22)**
-0.76 (0.90)
1.46 (0.19)**
-0.52 (0.18)**
0.11 (0.18)
-10.27 (8.63)
R2
χ2 ( joint sig.) 0.46
154.84** 0.54
86.38** 0.26
40.36** 0.45
141.54** 0.44
138.68**
Pricing equation
demand (Qm)
distance (dist)
Dnm
Dintermodal*Dnm
Tourism (tour)
HHairport
HHroute
winter01
summer02
Intercept
-0.24e-3 (0.8e-4)**
0.15 (0.007)**
-53.16 (12.68)**
1.28 (11.84)
-
-
-
-25.21 (9.18)**
19.94 (8.76)*
233.23 (9.92)**
-0.12e-3(0.4e-4)**
0.14 (0.009)**
-41.64 (11.48)**
-
-
-
-
-26.23 (12.02)*
22.13 (11.79)+
214.68 (12.53)**
-0.63e-3 (0.2e-3)**
0.16 (0.009)**
-50.95 (17.51)**
-8.08 (19.57)
-
-
-
-21.07 (10.86)+
28.16 (11.17)*
241.52 (18.47)**
-0.24e-3 (0.7e-4)**
0.16 (0.007)**
-
-
-3.48 (1.68)*
-69.08 (17.87)**
-
-23.94 (8.74)**
21.83 (8.37)**
225.35 (9.76)**
-0.26e-3 (0.7e-4)**
0.15 (0.007)**
-
-
-4.80 (1.58)**
-
-58.84 (16.26)**
-24.76 (8.79)**
20.84 (8.48)*
229.11 (9.73)**
R2
χ2 (joint sig.) 0.74
550.49** 0.79
296.68** 0.73
351.31** 0.75
557.71** 0.75
576.48** Note 1: Standard errors in parentheses Note 2: Significance at the 1% (**), 5% (*), 10% (+)

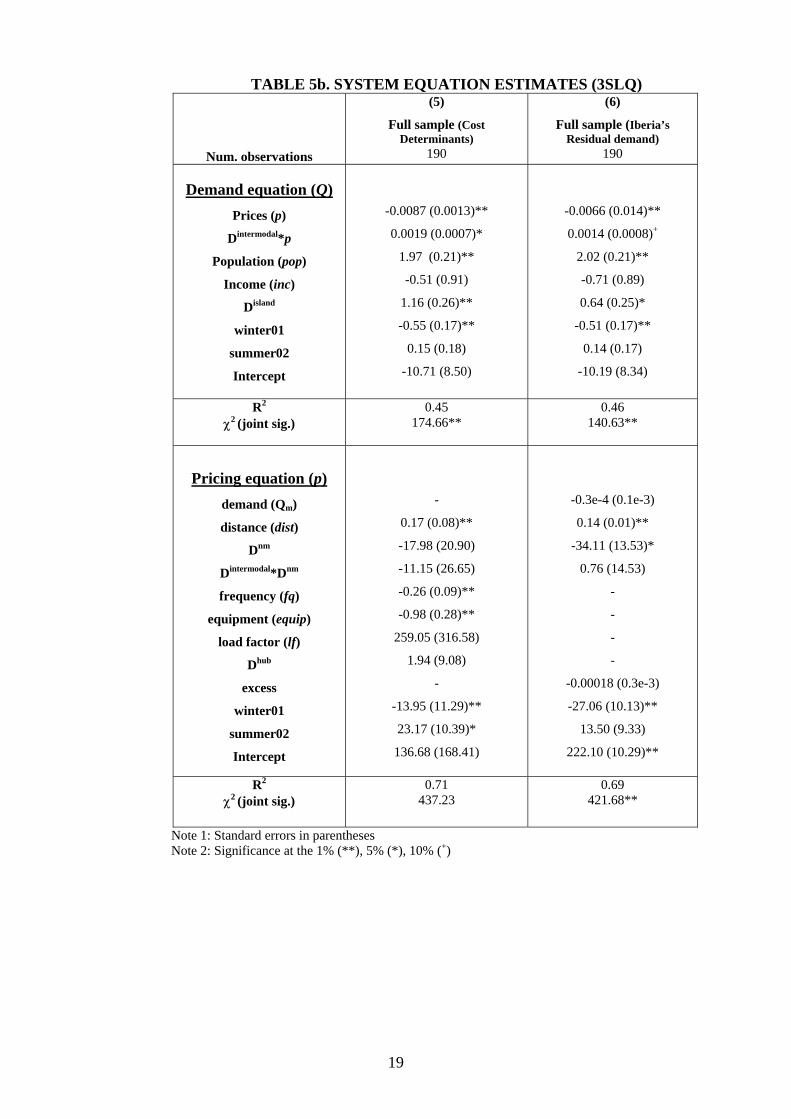
TABLE 5b. SYSTEM EQUATION ESTIMATES (3SLQ)
Num. observations
(5)
Full sample (Cost Determinants)
190
(6)
Full sample (Iberia’s Residual demand)
190
Demand equation (Q) Prices (p)
Dintermodal*p
Population (pop)
Income (inc)
Disland
winter01
summer02
Intercept
-0.0087 (0.0013)**
0.0019 (0.0007)*
1.97 (0.21)**
-0.51 (0.91)
1.16 (0.26)**
-0.55 (0.17)**
0.15 (0.18)
-10.71 (8.50)
-0.0066 (0.014)**
0.0014 (0.0008)+
2.02 (0.21)**
-0.71 (0.89)
0.64 (0.25)*
-0.51 (0.17)**
0.14 (0.17)
-10.19 (8.34)
R2
χ2 (joint sig.) 0.45
174.66** 0.46
140.63**
Pricing equation (p) demand (Qm)
distance (dist)
Dnm
Dintermodal*Dnm
frequency (fq)
equipment (equip)
load factor (lf)
Dhub
excess
winter01
summer02
Intercept
-
0.17 (0.08)**
-17.98 (20.90)
-11.15 (26.65)
-0.26 (0.09)**
-0.98 (0.28)**
259.05 (316.58)
1.94 (9.08)
-
-13.95 (11.29)**
23.17 (10.39)*
136.68 (168.41)
-0.3e-4 (0.1e-3)
0.14 (0.01)**
-34.11 (13.53)*
0.76 (14.53)
-
-
-
-
-0.00018 (0.3e-3)
-27.06 (10.13)**
13.50 (9.33)
222.10 (10.29)**
R2
χ2 (joint sig.)
0.71 437.23
0.69 421.68**
Note 1: Standard errors in parentheses Note 2: Significance at the 1% (**), 5% (*), 10% (+)
19
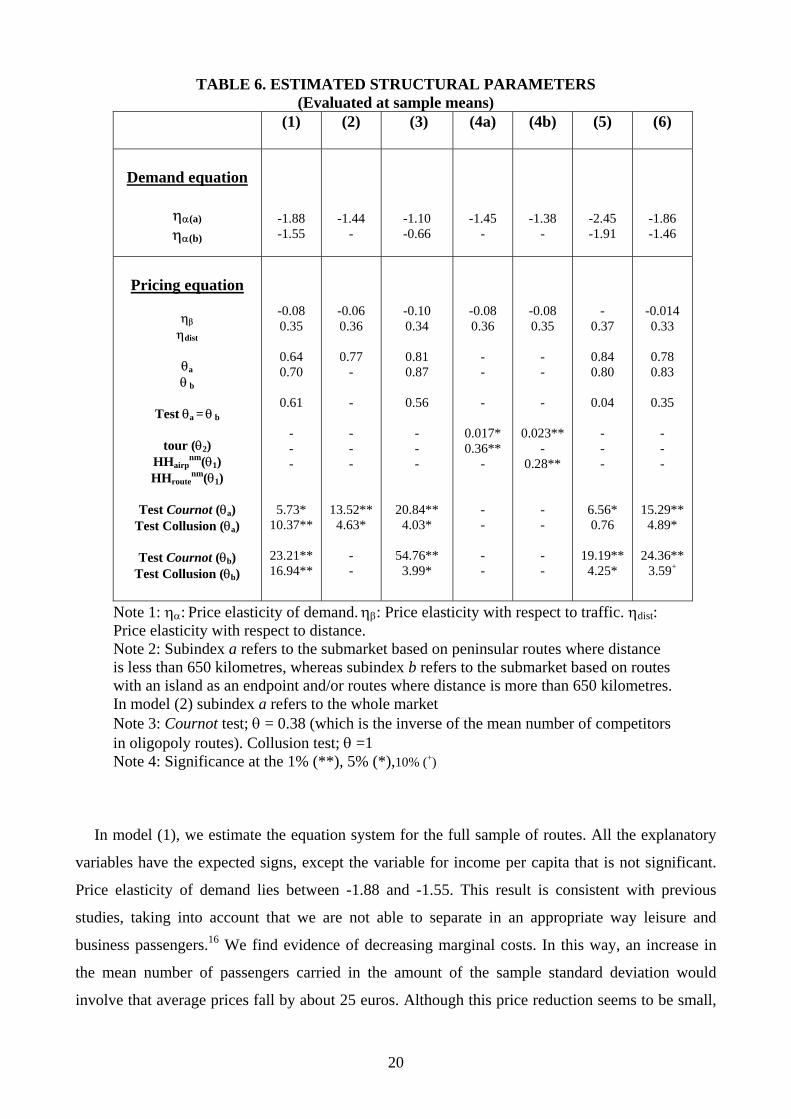
TABLE 6. ESTIMATED STRUCTURAL PARAMETERS (Evaluated at sample means)
(1)
(2) (3) (4a) (4b) (5) (6)
Demand equation
ηα(a)
ηα(b)
-1.88 -1.55
-1.44 -
-1.10 -0.66
-1.45 -
-1.38 -
-2.45 -1.91
-1.86 -1.46
Pricing equation
ηβ
ηdist θa
θ b
Test θa = θ b
tour (θ2)
HHairpnm(θ1)
HHroutenm(θ1)
Test Cournot (θa)
Test Collusion (θa)
Test Cournot (θb) Test Collusion (θb)
-0.08 0.35
0.64 0.70
0.61
- - -
5.73* 10.37**
23.21** 16.94**
-0.06 0.36
0.77
- - - - -
13.52** 4.63*
- -
-0.10 0.34
0.81 0.87
0.56
- - -
20.84** 4.03*
54.76** 3.99*
-0.08 0.36
- - -
0.017* 0.36**
- - - - -
-0.08 0.35
- - -
0.023** -
0.28** - - - -
-
0.37
0.84 0.80
0.04
- - -
6.56* 0.76
19.19** 4.25*
-0.014 0.33
0.78 0.83
0.35
- - -
15.29** 4.89*
24.36**
3.59+
Note 1: ηα: Price elasticity of demand. ηβ: Price elasticity with respect to traffic. ηdist: Price elasticity with respect to distance. Note 2: Subindex a refers to the submarket based on peninsular routes where distance is less than 650 kilometres, whereas subindex b refers to the submarket based on routes with an island as an endpoint and/or routes where distance is more than 650 kilometres. In model (2) subindex a refers to the whole market Note 3: Cournot test; θ = 0.38 (which is the inverse of the mean number of competitors in oligopoly routes). Collusion test; θ =1 Note 4: Significance at the 1% (**), 5% (*),10% (+)
In model (1), we estimate the equation system for the full sample of routes. All the explanatory
variables have the expected signs, except the variable for income per capita that is not significant.
Price elasticity of demand lies between -1.88 and -1.55. This result is consistent with previous
studies, taking into account that we are not able to separate in an appropriate way leisure and
business passengers.16 We find evidence of decreasing marginal costs. In this way, an increase in
the mean number of passengers carried in the amount of the sample standard deviation would
involve that average prices fall by about 25 euros. Although this price reduction seems to be small,
20
it must be said that this is a conservative measure of density economies. Indeed, we are not able to
capture how fixed costs are shared between more units of output and so our results indicate that
density economies can be substantial. In turn, we also find evidence of distance economies so that
costs increase less than proportionally to the kilometres flown. The elasticity estimated is 0.35 that
is similar to the result obtained in Brueckner and Spiller (1994) but lower than the estimates in Oum
et al. (1993). The conduct parameter estimates, which is larger than 0.60, shows that market power
of Spanish airlines is strong. In particular, their behaviour is less competitive than predicted by a
Cournot model but more competitive than the joint profit maximization case. We do not find
significant differences between the two submarkets considered so that opportunities of intermodal
competition do not seem influence airlines behaviour.
In model (2), we estimate the equation system for a subsample of routes with origin in Madrid
airport 17 in order to identify any network effect that could distortion results in model (1). Although
results are not substantially different to model (1), conduct seems to be slightly more collusive for
this subsample of routes. A possible explanation of this result is that Iberia can charge higher mark-
ups in routes departing from its main hub and rivals take advantage of it.
In model (3), we estimate the equation system for a subsample of routes with less than 200,000
passengers in order to analyse if low traffic density routes have different conduct and cost
parameters. The fare reduction from an increase in route traffic is slightly larger than in model (1)
and conduct is much more collusive. However, we reject the joint profit maximization hypothesis.
In model (4), we estimate the equation system including market specific variables in the pricing
equation as possible determinants of airlines behaviour. We find that conduct is slightly more
collusive in tourist oriented routes. This result could be explained by the fact that most tourist routes
have an island as an endpoint, taking into account that we do not control for price elasticity in this
model. We also find that measures of market concentration, both at the airport and route level,
influence to great extent airlines conduct. Given that market shares at the route level are
fundamentally determined by airport presence, it can be claimed that concentration at the airport
level is the main determinant of airlines behaviour.
In model (5), we estimate the equation system including different cost variables in the pricing
equation. We find that bigger planes influences to greater extent than a higher service frequency in
the cost reducing effect that arises from providing additional capacity. However, it is needed to
point out the fact that a high service frequency (which depends fundamentally on airport presence)
16 See Oum et al. (1992). 17 We do not differentiate between submarkets according to the opportunities of intermodal competition because the number of observations is scarce.
21
has a cost reducing effect because it is a major determinant of service quality. The variables for load
factor and the hub effect are not significant.18
In the aggregation process of the individual equilibrium conditions, we make the assumption of
symmetry across airlines. In model (6), we use exclusively data of Iberia in order to estimate the
(inverse) demand function of Iberia through a similar procedure as it is developed in Baker and
Bresnahan (1988).19 The residual demand function is understood as the relationship between prices
and output of a firm, given the possible reaction of rivals. In our model, this function can be
estimated including a variable for excess of capacity (excess), which is the difference between the
supply of seats and the number of passengers carried by Spanair and Air Europa. This variable
shows a high correlation with the variable for Iberia’s demand, which explains that both variables
are not significant. However, the main interest of this model is to estimate the conduct parameter.
We find that conduct of Iberia is more collusive than the average of Spanish airlines. In fact,
Iberia’s behaviour is near to the joint profit maximization hypothesis.20
In short, Iberia’s dominance of a market much thinner than the US market can explain that our
results differ from those obtained in previous studies. In this way, it is sensible to claim that Iberia
is the airline that really has market power, while rivals behave as followers. The excellent financial
performance of Iberia since 1999 also could support this argument.
VI. Concluding remarks
In this paper, we analyse Spanish airlines behaviour in monopoly and oligopoly strategic
scenarios. In this way, we make a simultaneous estimation of demand and pricing equations, using
the cost and demand information that provides a representative sample of routes.
We find evidence that conduct of Spanish airlines in oligopoly routes is less competitive than
predicted by a Cournot model. In addition to this, airport concentration arises as the main
determinant of airlines mark-ups. The results of our analysis also show that density economies are
substantial. Thus, routes with a low traffic density can be considered as natural monopolies.
Furthermore, the two main forms of competition for the market in the air transport industry,
potential competition or intermodal competition, does not seem to impose a disciplining effect on
airlines behaviour.
18 It must be said that airlines normally operate with an average load factor that lies between 60 and 70 per cent. High load factors reduce average costs but at the same time reduce the probability of capturing last minute travellers who are price insensitive. 19 Given that our conduct parameter identification is based on the information provided by monopoly routes, we are not able to identify it for Spanair and Air Europa. Spanair does not offer exclusively services in any route and Air Europa has the monopoly in a reduced group of routes characterised by a very low and fluctuating traffic. We consider that it would be biased to identify the conduct parameter for Spanair and Air Europa using data of Iberia’s monopoly routes. 20 It must be taken into account that we make the implicit assumption b0
NM = b0M
in previous estimates (eg; the intercept term of the marginal cost function is equal in oligopoly and monopoly routes). This assumption could involve an underestimation of market power in oligopoly routes to the extent that b0
NM < b0M.
22
The result that conduct of Spanish airlines is not generally competitive can be surprising. In fact,
travellers that purchase air tickets in advance can obtain significant discounts. We argue that
airlines, particularly entrants in the post-liberalisation period, operate with capacity constraints due
to the limits that airport access imposes. Nevertheless, service frequency is a crucial competition
variable in a context with fluctuating demand, so that airlines usually operate with excess of
capacity. This fact explains that airlines charge reduced prices in the first seats that sell of a
particular flight. Indeed, they need to obtain load factors that make profitable their services in the
corresponding route.
The argument that airlines operate with capacity constraints along with excess of capacity seems
to be a contradiction. The main point here is that rigidities in the allocation (and expansion) of space
in airports prevent that rivals of the largest airline can increase substantially their capacity. Thus, it
is not rational for them to be involved in some form of war prices when the best possible outcome
would be selling its capacity, in any case limited, to lower prices. What is really relevant is that just
the largest airline can absorb a high proportion of demand. However, this argument depends on the
relationship between demand and capacity. In particular, it depends on the degree of airport
congestion. In the Spanish case, recent forecasts for the main airports predict an important traffic
increase for the period 2000-2015. In this way, it is planned to double the capacity of the main
airports of the Spanish network and, therefore, competition conditions can change in this market.
A well known result in the industrial organization literature is that oligopoly competition in
markets characterised by capacity constraints leads to Cournot outcomes. In fact, previous empirical
studies about air transport competition find that, on average, airlines compete à la Cournot.
However, the most frequent oligopoly setting in those studies is a symmetric duopoly. Deneckere y
Kovenock (1992) show that oligopoly competition in a market with capacity constraints but with a
natural leader in prices can lead to an equilibrium less competitive than the Cournot solution. Our
findings could be capturing the prediction of the model of Deneckere and Kovenock.
The existence of a natural monopoly in thin routes along with a conduct generally not
competitive of airlines could justify economic regulation in the former case and a more proactive
competition policy in the latter case. Regardless the suitability of these two policy measures, we
claim that the improvement of competition conditions in the Spanish market requires fundamentally
a more balanced allocation of the airport slots. In turn, given that a high proportion of monopoly
routes are short-haul routes it is desirable to promote intermodal competition.
VII. References
• Baker, J. B. and T. F. Bresnahan, (1988), "Estimating the residual demand curve facing a single
firm", International Journal of Industrial Organization, 6 (3), pp. 283-300.
23
• Baumol, W. J., J.C Panzar and R.D. Willig (1982), Contestable markets and the theory of
industrial structure (Harcourt Brace Jovanovich, New York).
• Berry, S., M. Carnall, and P. Spiller, (1996), “Airline hubs: costs, markups and the implications
of customer heterogeneity”, NBER Working Paper, 5561, pp. 1-38.
• Borenstein, S. (1989), “Hubs and high fares: dominance and market power in the U.S airline”,
Rand Journal of Economics, 20 (3), pp. 344-365.
• Braeutigam, R.R. (1989), “Optimal policies for natural monopolies”, en R.Schamalensee y R.D.
Willig, eds, Handbook of Industrial Organization, Vol.2, (North Holland, New York)
• Brander, J. A and A. Zhang (1993), "Dynamic oligopoly behaviour in the airline industry",
International Journal of Industrial Organization, 11(3), pp. 407-433.
• Brander, J.A and A. Zhang (1990), “A market conduct in the airline industry: An empirical
investigation”, Rand Journal of Economics, 21(4), pp. 567-583.
• Bresnahan, T. F. (1989), “Empirical studies in industries with market power” en R.
Schmalensee and R. D. Willig (eds.), Handbook of Industrial Organization, (North Holland, New
York)
• Brueckner, J.K and P. Spiller, (1994), “Economies of traffic density in the deregulated airline
industry”, Journal of Law and Economics, vol. 37, pp.379-415.
• Brueckner, J.K., N.Dyer and P. Spiller, (1992), ‘Fare determination in airline hub-and-spoke
networks’, Rand Journal of Economics, 23 (3), pp. 309-333.
• Caves, D.W, L.R. Christensen and M.W. Tretheway (1984), “Economies of density versus
Economies of Scale: Why trunk and locals service airline costs differ”, Rand Journal of Economics,
vol. 15(4), pp. 471-489.
• Clay, K. and W. Troesken (2003), "Further tests of static oligopoly models: Whiskey, 1882-
1898", The Journal of Industrial Economics, 51(2), pp. 151-166.
• Corts, K. S. (1999), “Conduct parameters and the measurement of market power”, Journal of
Econometrics, 88 (2), pp. 227-250.
• Deneckere, R. J. and D. Kovenock (1992), “Price leadership”, Review of Economic Studies, 59
(1), pp. 143-162.
• Evans, W.N. and I. Kessides, (1993), “Localized market power in the U.S. airline industry”, The
Review of Economics and Statistics, 75 (1), pp. 66-75.
• Fisher, T. and D.R. Kamerschen (2003), “Price-cost margins in the U.S airline industry using a
conjectural variation approach”, Journal of Transport Economics and Policy, 37 (2), 227-259.
• Genesove, D. and W.P. Mullin (1998), “Testing static oligopoly models: conduct and cost in the
sugar industry, 1890-1914”, Rand Journal of Economics, 29 (2), pp. 355-377.
24
• Graham, D.R, D.P. Kaplan and D.S. Sibley (1983), “Efficiency and competition in the airline
industry”, Bell Journal of Economics, 14 (1), pp. 118-138.
• Hurdle, G., R. L. Johnson, A. S. Joskow, G. J. Werden and M. A. (1989), “Concentration,
potential entry, and performance in the airline industry”, The Journal of Industrial Economics, 38
(2), pp. 119-139.
• Kreps, D. and J. Scheinkman (1983), “Quantity precommitment and Bertrand competition yield
Cournot outcomes”, Bell Journal of Economics, 14 (2), pp. 326-337.
• Marin, P.L. (1995), “Competition in European Aviation: Pricing policy and market structure”,
The Journal of Industrial Economics, 43 (2), pp. 141-159.
• Morrison, S. and C. Winston (1987), “Empirical implications and tests of the contestability
hypothesis”, Journal of Law & Economics, 30, pp. 53-66.
• Parker, P. M. and L.H. Roller (1997), “Collusive conduct in duopolies: multimarket contact and
cross-ownership in the mobile telephone industry”, Rand Journal of Economics, 28 (2), pp. 304-
322.
• Roller, L. H. y R. C. Sickles (2000), “Capacity and product market competition: measuring
market power in a ·puppy-dog· industry”, International Journal of Industrial Organization, 18 (6),
pp. 845-865.
• Oum, T.H, W.G. Waters and Y.J Say (1992), “Concepts of price elasticities of transport demand
and Recent empirical estimates”, Journal of Transport Economics and Policy, 26 (2), pp. 139-154.
• Oum,T.H, A. Zhang and Y. Zhang (1993). “Interfirm rivalry and firm-specific price elasticities
in deregulated airline markets”, Journal of Transports Economic and Policy, 27 (2), pp. 171-192.
• Whinston, M. and S.C. Collins (1992), “Entry and competitive structure in deregulated airline
markets: an event study analysis of People Express”, Rand Journal of Economics, 23 (4), pp. 445-
462.
• Williams, G. (2003), Airline competition: Deregulation’s mixed legacy (Ashgate, London).
25