Measuring Accuracy of Two 3D Printing Materials - ScholarWorks ...
67
Bowling Green State University Bowling Green State University ScholarWorks@BGSU ScholarWorks@BGSU Master of Technology Management Plan II Graduate Projects College of Technology, Architecture and Applied Engineering Spring 5-17-2016 Measuring Accuracy of Two 3D Printing Materials Measuring Accuracy of Two 3D Printing Materials Mudassir Ali Bowling Green State University Follow this and additional works at: https://scholarworks.bgsu.edu/ms_tech_mngmt Part of the Electrical and Computer Engineering Commons, Materials Chemistry Commons, Mechanical Engineering Commons, Other Engineering Commons, and the Polymer Chemistry Commons Recommended Citation Recommended Citation Ali, Mudassir, "Measuring Accuracy of Two 3D Printing Materials" (2016). Master of Technology Management Plan II Graduate Projects. 20. https://scholarworks.bgsu.edu/ms_tech_mngmt/20 This Thesis is brought to you for free and open access by the College of Technology, Architecture and Applied Engineering at ScholarWorks@BGSU. It has been accepted for inclusion in Master of Technology Management Plan II Graduate Projects by an authorized administrator of ScholarWorks@BGSU.
-
Upload
khangminh22 -
Category
Documents
-
view
3 -
download
0
Transcript of Measuring Accuracy of Two 3D Printing Materials - ScholarWorks ...
Bowling Green State University Bowling Green State University
ScholarWorks@BGSU ScholarWorks@BGSU
Master of Technology Management Plan II Graduate Projects
College of Technology, Architecture and Applied Engineering
Spring 5-17-2016
Measuring Accuracy of Two 3D Printing Materials Measuring Accuracy of Two 3D Printing Materials
Mudassir Ali Bowling Green State University
Follow this and additional works at: https://scholarworks.bgsu.edu/ms_tech_mngmt
Part of the Electrical and Computer Engineering Commons, Materials Chemistry Commons,
Mechanical Engineering Commons, Other Engineering Commons, and the Polymer Chemistry Commons
Recommended Citation Recommended Citation Ali, Mudassir, "Measuring Accuracy of Two 3D Printing Materials" (2016). Master of Technology Management Plan II Graduate Projects. 20. https://scholarworks.bgsu.edu/ms_tech_mngmt/20
This Thesis is brought to you for free and open access by the College of Technology, Architecture and Applied Engineering at ScholarWorks@BGSU. It has been accepted for inclusion in Master of Technology Management Plan II Graduate Projects by an authorized administrator of ScholarWorks@BGSU.
MEASURING ACCURACY OF TWO 3D PRINTING MATERIALS
Mudassir Ali
Major Project
Submitted to the Graduate College of
Bowling Green State University to fulfill the requirements of the
Degree of Masters in Technology Management-Engineering Technologies
May 2016
Committee:
Dr. Sudershan Jetley (Chair)
Dr. Todd C Waggoner

ii
© 2016
Mudassir Ali
All Rights Reserved

iii
ACKNOWLEDGMENT
I would like to express my deep sense of gratitude and thanks to my father Prof. Qazi Mazhar
Ali. His invaluable support and encouragement, scholarly advice and inspiration have enabled me
to complete my Master’s degree.
I am extremely thankful to my advisor Dr. Sudershan Jetley for all of his support and
guidance through this project. His keen interest in the research and timely suggestions with kindness
have helped in accomplishing this task. I would like to thank Dr. Todd C Waggoner for his immense
support, advice and motivation throughout my master’s degree. I am deeply indebted to Dr.
Mohamad Mayyas for allowing me to use his research lab and equipment’s to perform the research.
I am grateful for his kindness and help he extended throughout my Master’s program.
A special thanks goes to all of my colleagues and department staff in keeping the
environment as stress free and lighthearted as possible. I humbly extent my thanks to all concerned
persons who co-operated with me in this regard.

iv
Table of Contents
ACKNOWLEDGMENT ............................................................................................................ iii
LIST OF FIGURES ................................................................................................................... vii
LIST OF TABLES.....................................................................................................................viii
Chapter I: Introduction............................................................................................................... 1
Context of the Problem ......................................................................................................... 1
Statement of the Problem ...................................................................................................... 3
Objectives of the study .......................................................................................................... 3
Significance of the Study ....................................................................................................... 4
Assumptions/Limitations ...................................................................................................... 4
Definitions of Terms .............................................................................................................. 4
Chapter II: Review of Literature ................................................................................................ 6
Introduction to 3D Printing .................................................................................................. 6
Significance of Layers ........................................................................................................... 7
Fused Deposition Modelling (FDM)...................................................................................... 9
Selective Laser Sintering ....................................................................................................... 9
STL File ............................................................................................................................... 10
Factors Affecting Accuracy................................................................................................. 12
Raw Materials ..................................................................................................................... 13
Thermoplastics .................................................................................................................... 14
ABS ...................................................................................................................................... 14
PLA ...................................................................................................................................... 16
Support Material ................................................................................................................. 17
Recent Development and Forecast ...................................................................................... 18
Equipment and Print Materials .......................................................................................... 19

v
Conclusion ........................................................................................................................... 20
Chapter III: Procedures ............................................................................................................ 21
Restatement of the problem ................................................................................................ 21
Re statement of Objectives of the study .............................................................................. 21
Research Design Methodology ............................................................................................ 21
Data Analysis ....................................................................................................................... 28
F and t-tests ...................................................................................................................... 28
Coefficient of Variation ..................................................................................................... 30
Chapter IV: Results & Findings ............................................................................................... 31
Results ................................................................................................................................. 31
Analysis................................................................................................................................ 34
Analyzing the length of Prism 1 ......................................................................................... 34
Analyzing the width of Prism 1 .......................................................................................... 35
Analyzing the length of Prism 2 ......................................................................................... 36
Analyzing the width of Prism 2 .......................................................................................... 37
Analyzing the diameter (D1) of Sphere 1 ........................................................................... 39
Analyzing the diameter (D2) of Sphere 1 ........................................................................... 40
Analyzing the diameter (D3) of Sphere 1 ........................................................................... 41
Analyzing the diameter (D1) of Sphere 2 ........................................................................... 43
Analyzing the diameter (D2) of Sphere 2 ........................................................................... 44
Analyzing the diameter (D3) of Sphere 2 ........................................................................... 45
Findings ............................................................................................................................... 47

vi
Coefficient of Variation ....................................................................................................... 47
Chapter V: Summary and Discussion ....................................................................................... 49
Future Work........................................................................................................................ 50
References................................................................................................................................... 51
APPENDIX A: LIST OF TABLES ........................................................................................... 54

vii
LIST OF FIGURES
Figure 1: Block Diagram of 3D Printing process ................................................................... 7
Figure 2: Layer by Layer printing (Courtesy: simplify3d.com) ............................................ 8
Figure 3: Solid Model of Bracket designed in our CAD lab. .............................................. 11
Figure 4: Depiction of STL file of Bracket .......................................................................... 12
Figure 5 Flashfroge Creator Pro ............................................................................................ 20
Figure 6: Rectangular Prism and its measurement notations. ............................................. 22
Figure 7: CAD drawing of rectangular prism type 1. .......................................................... 23
Figure 8: Sphere and its measurement notations. ................................................................. 23
Figure 9: CAD drawing of sphere type 1.............................................................................. 24
Figure 10: 3D CAD Model of Rectangular Prism 1 ............................................................ 26
Figure 11: Depiction of STL file of the rectangular prism. ................................................. 26
Figure 12: 3D model for sphere. ........................................................................................... 27
Figure 13: Depiction of STL file for sphere. ........................................................................ 27
viii
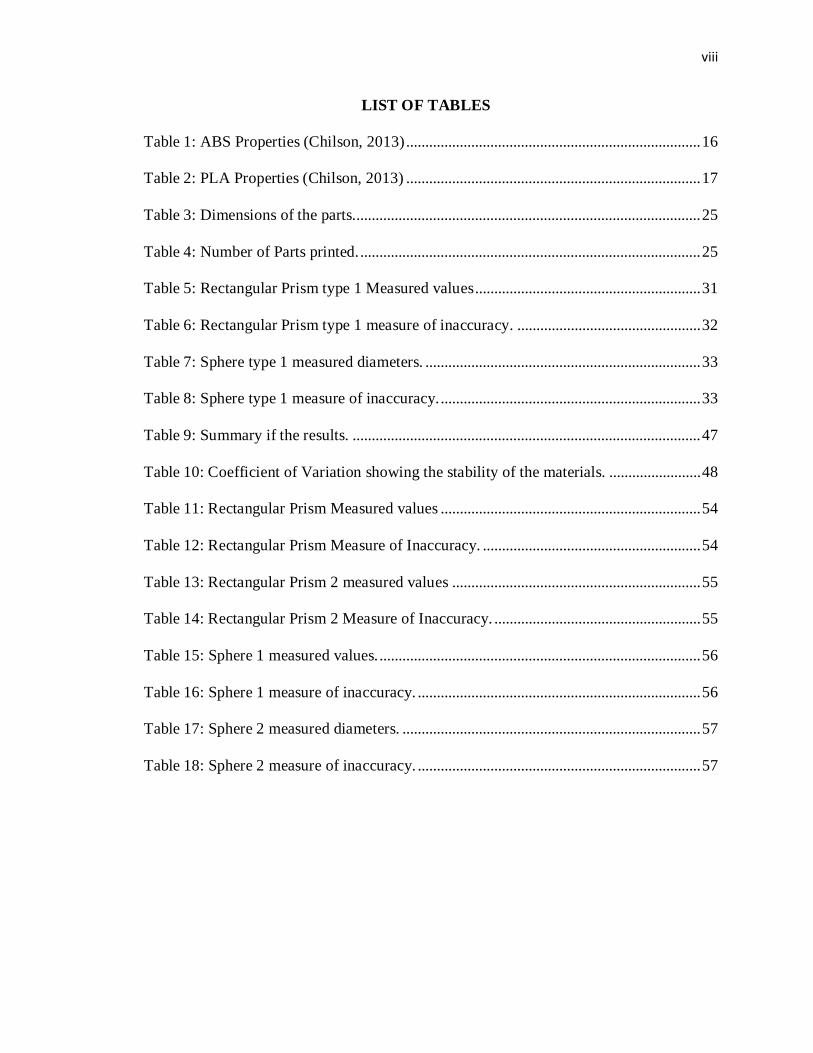
LIST OF TABLES
Table 1: ABS Properties (Chilson, 2013) ............................................................................. 16
Table 2: PLA Properties (Chilson, 2013) ............................................................................. 17
Table 3: Dimensions of the parts........................................................................................... 25
Table 4: Number of Parts printed. ......................................................................................... 25
Table 5: Rectangular Prism type 1 Measured values ........................................................... 31
Table 6: Rectangular Prism type 1 measure of inaccuracy. ................................................ 32
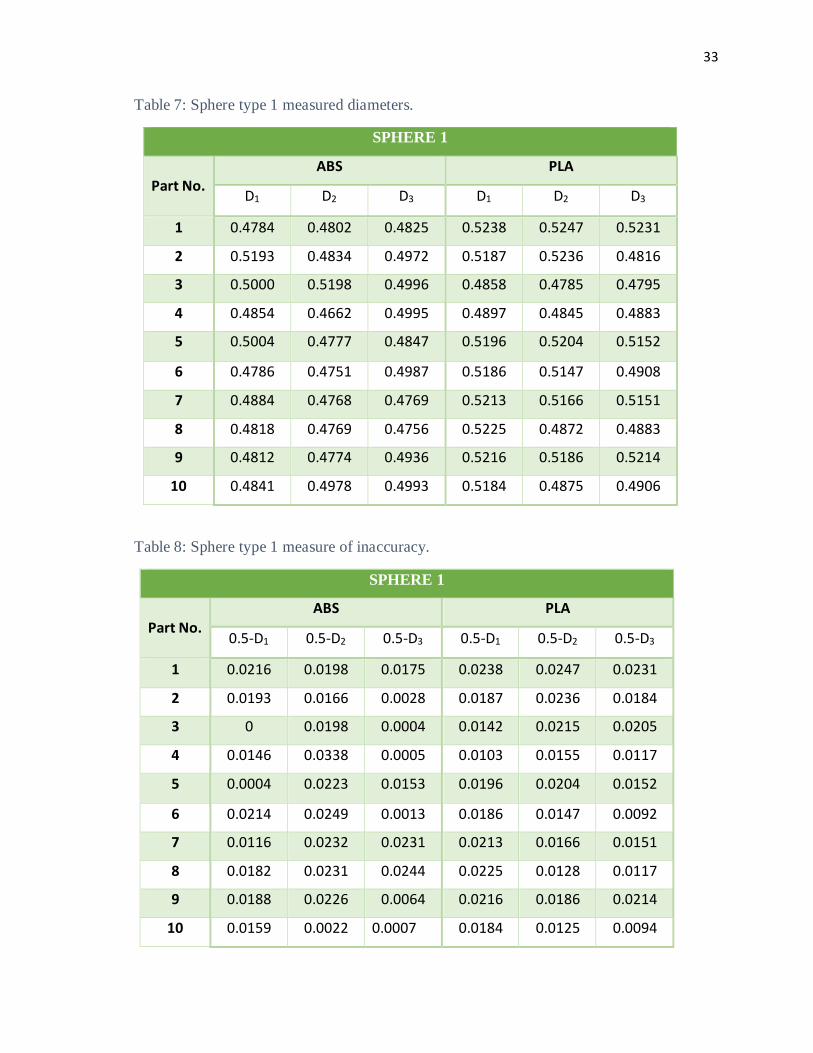
Table 7: Sphere type 1 measured diameters. ........................................................................ 33
Table 8: Sphere type 1 measure of inaccuracy. .................................................................... 33
Table 9: Summary if the results. ........................................................................................... 47
Table 10: Coefficient of Variation showing the stability of the materials. ........................ 48
Table 11: Rectangular Prism Measured values .................................................................... 54
Table 12: Rectangular Prism Measure of Inaccuracy. ......................................................... 54
Table 13: Rectangular Prism 2 measured values ................................................................. 55
Table 14: Rectangular Prism 2 Measure of Inaccuracy. ...................................................... 55
Table 15: Sphere 1 measured values. .................................................................................... 56
Table 16: Sphere 1 measure of inaccuracy. .......................................................................... 56
Table 17: Sphere 2 measured diameters. .............................................................................. 57
Table 18: Sphere 2 measure of inaccuracy. .......................................................................... 57
Chapter I: Introduction
Context of the Problem
There are variety of manufacturing technologies generally called Rapid Prototyping (RP).
These technologies include Stereolithography, Selective Laser Sintering (SLS), Fused Deposition
Manufacturing (FDM) and Three Dimensional Printing (3D Printing). These technologies are
capable of directly generating physical objects from computer-aided design (CAD) files. A common
feature in these technologies are that the part is produced by adding materials instead of removing
materials as practiced in traditional manufacturing technologies. This simplifies the 3D part
producing processes to 2D layer adding processes such that a part can be produced directly from its
model. The machines using many of the RP technologies to build parts are often known as 3D
printers.
3D printing is now revolutionized with the technology of additive manufacturing. Additive
manufacturing (AM) is the formalized term for what used to be called rapid prototyping and is
popularly called 3D Printing. The term rapid prototyping (RP) is used in a variety of industries to
describe a process for rapidly creating a system or part before finalizing it. (Ian Gibson, 2010)
Part accuracy is one of the important aspect in the manufacturing industry. Though all the
printing materials come with specifications, but the suppliers and manufactures does not specify the
accuracy of the materials. They seldom talk about which material is more accurate when it comes
to part accuracy. In this study we established a study which compares the accuracy of the materials
in consideration and performed an experiment to establish the superiority of a material in terms of
accuracy over each other. The overall inaccuracy of the parts being built by RP technology has been
one of the major challenges that need to be overcome. Errors due to warpage and shrinking dominate
2
the inaccuracy of the part. The thermoplastic ABS material used in FDM machines experiences a
volume change when it is heated and then extruded onto a build platform. (B Fritz, 2001)
Our RP manufacturing Lab has several RP machines namely 3D sense, MakerBot replicator,
XYZ Davinci, Flashforge Creator Pro, Solidoodle and an industrial scale Stratasys 768. These RP
machines are used to give an insight of industrial application of Computer Aided Design and
Computer Aided Manufacturing (CAD-CAM) to the students. The students design their part in CAD
software mainly Solidworks, the part file or the object is later printed in one of the RP machines.
The printed object is physically analyzed from the design, dimensional accuracy, durability and
fineness point of view. One of the main challenges in the RP industry is the part accuracy that must
be improved upon. It has been observed in the earlier research project that parts being
printed/manufactured tend to warp and shrink from their intended original dimensions. Many factors
are to be blamed for the in warping and shrinkage which will be discussed following sections.
Earlier the materials used to manufacture had low yield strength. With the advancement in
material science, the photopolymers and thermoplastics used now have much higher yield strength
and durability. The strength of RP materials is sufficient for small scale applications, but does not
always satisfy the strength and accuracy requirements for large scale applications for industrial
purposes such as printing car spare parts. The use of stronger materials with more accuracy and
strength will enable RP to produce parts to satisfy the requirements of heavy industrial applications.
The Department of Engineering Technologies in Bowling Green State University have
recently added a research RP machine Flashforge Creator in its 3D printers. It is desirable to evaluate
the accuracy of the materials we will be using for the printing. The department is likely use two
different materials namely ABS and PLA. The machine’s general specifications for accuracy is
provided by the manufacturer and is discussed in the section II. However since we are using different

3
materials it’s desirable to analyze the accuracy of the said materials for their optimal utilization and
it should help the students to design their parts considering the accuracy as one of the factors.
Statement of the Problem
The purpose of this project was to compare the dimensional accuracy of 3D printed parts of
Polylactic Acid (PLA) and Acrylonitrile Butadiene Styrene (ABS) when compared with dimensions
of the CAD models from which these parts are printed. The parts were printed using the Rapid
Prototyping machine Creator Pro Dual Extension built by Flashforge. The parts consisted of small
rectangular prisms and spheres.
Objectives of the study
In order to conduct this project following objectives will be achieved.
1. Design the Sphere and a rectangular prism in CAD_CAM software Solidworks.
2. Print models in Creator, ten each of PLA and ABS.
3. Print models in two different sets of dimensions.
4. Measure the dimension of the printed models using micrometers.
5. Compare them against the ideal dimension given in CAD model drawing and also compare
them against each other.
4
Significance of the Study
The goal is to evaluate the limitations of the printing material, to rule out factors that do not
contribute significantly to print accuracy, and to provide a practical, quantitative guide for accuracy
measurement as an engineering tool. A methodology or a practical approach for calculating accuracy
of a material will be developed which can be used in future to test accuracy. It will establish which
material is more accurate and what is the reason behind it. Future students will get a guideline of
conducting a research in RP FDM technology and will overcome the limitations this study has.
Assumptions/Limitations
1. The research is limited to the use of ABS and PLA, since they are the most common
materials used for 3D printing and due to availability restrictions.
2. The RP machine Flashforge Creator Pro will be used because this is the new machine of
interest to the Department and is one of the industrial scale RP machine.
3. Due to budgetary limitations only ten parts of each type will be printed.
Definitions of Terms
3D Printing
It is a process of making a prototype from a three-dimensional digital model by laying down
several consecutive thin layers of a material.
Additive Manufacturing
Additive manufacturing is the process of building object by adding layer upon layer of the
material. (LaMonica, 2013)
STL Files

5
STL (StereoLithography) is a file format native to the stereolithography CAD software
created by 3D Systems. STL file format is a polyhedral representation of a surface model with
triangular facets which facets must obey the vertex to vertex rule and facet orientation rule. The first
commercial rapid prototyping technology was developed by Charles “Chuck” Hull. (M. Vatani,
2009).
PLA
Polylactic Acid is a thermoplastic and one of the most dominant plastic in 3D printing
industry. It is a biodegradable polymer. (Chilson, 2013)
ABS
Acrylonitrile butadiene styrene (ABS) is a thermoplastic and dominant printing material in
the 3D printing industry. (Chilson, 2013)
Plastic Filament
It is the print material which is wound over the coil and supplies the material to the extruder
while printing the job.
Fused deposition modeling
This technology builds layer-by-layer from the bottom up by heating and extruding
thermoplastic filament. (Sratasys, 1990)
Rafts or Support Material
It provides the support base or the contact surface so that the model being printed sticks to
the print bed and the print material does not start warping upwards.
6
Chapter II: Review of Literature
Introduction to 3D Printing
On February 12, 2013, President Obama gave his State of the Union address from the
America Makes - National Additive Manufacturing Innovation Institute (NAMII) in Youngstown,
Ohio and said "A once-shuttered warehouse is now a state-of-the art lab where new workers are
mastering the 3-D printing that has the potential to revolutionize the way we make almost
everything." (Stephanie M. Santoso, 2013)
It was in 1984 that Charles Hull, co-founder of 3D systems invented stereolithography, a
printing process that enables a tangible 3D object to be created from digital data. (Xue Yan, 1996)
The basic principle of Additive Manufacturing (AM) technology is that a model, initially generated
using a three-dimensional Computer-Aided Design (3D CAD) system, can be fabricated directly
without the need for process planning.
The key to how AM works is that parts are made by adding material in layers, each layer is
a thin cross-section of the part derived from the original CAD data. Obviously in the physical world,
each layer must have a finite thickness to it and so the resulting part will be an approximation of the
original data. The thinner each layer is, the closer the final part will be to the original. All
commercialized AM machines use a layer-based approach, they differ mainly in the materials that
can be used, how the layers are created, and how the layers are bonded to each other. Such
differences determine factors like the accuracy of the final part plus its material properties and
mechanical properties. They also determine factors like the time taken for the part to be printed,
how much post-processing is required, the size of the AM machine used, amount of material used
and the overall expenses of the machine and process. (Ian Gibson, 2010)
7
AM technology has developed over time as materials, accuracy, and the overall quality of
the output improved. Models were quickly employed to supply information about what is known as
the “3 Fs” of Form, Fit, and Function. The initial models were used to help fully appreciate the shape
and general purpose of a design (Form). Improved accuracy in the process meant that components
were capable of being built to the tolerances required for assembly purposes (Fit). Improved material
properties meant that parts could be properly handled so that they could be assessed according to
how they would eventually work (Function). (Ian Gibson, 2010)
AM is now frequently referred to as one of a series of disruptive technologies that are
changing the way we design products and set up new businesses.
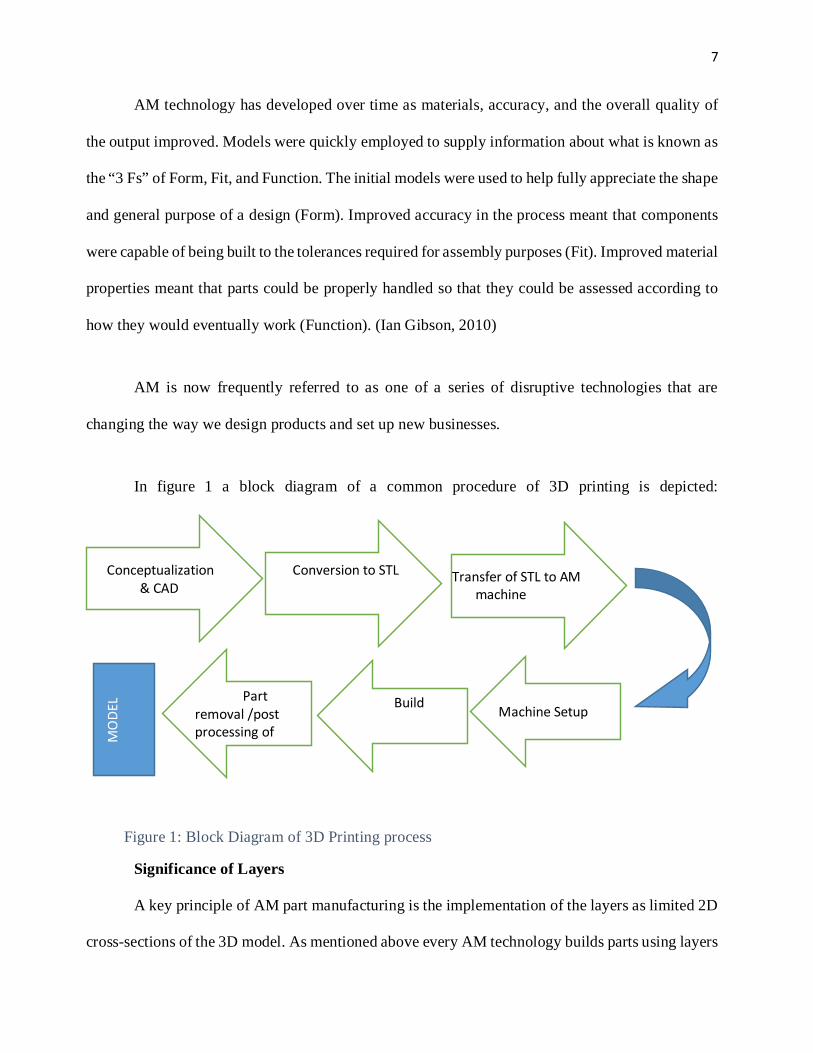
In figure 1 a block diagram of a common procedure of 3D printing is depicted:
Significance of Layers
A key principle of AM part manufacturing is the implementation of the layers as limited 2D
cross-sections of the 3D model. As mentioned above every AM technology builds parts using layers
Conceptualization & CAD
Conversion to STL Transfer of STL to AM machine
Machine Setup Build Part removal /post processing of
M
ODE
L
Figure 1: Block Diagram of 3D Printing process

8
of material added together, and certainly all commercial systems work on this principle, probably
due to the simplification of building 3D objects. Using 2D representations to represent cross-
sections of a more complex 3D feature has been common in many applications outside AM. For
cartographers use a line of constant height to represent hills and other geographical reliefs. These
contour lines, can be used as plates that can be stacked to form representations of geographical
regions. The gaps between these 2D cross-sections cannot be precisely represented and are therefore
approximated, or interpolated, in the form of continuity curves connecting these layers. Such
techniques can also be used to provide a 3D representation of other physical properties, like isobars
or isotherms on weather maps. Layered approach is one of the basic component which defines the
accuracy of the part. Layer by layer printing is depicted in the figure 2. (Ian Gibson, 2010)
Figure 2: Layer by Layer printing (Courtesy: simplify3d.com)
9
Fused Deposition Modelling (FDM)
FDM is the most common extrusion based additive manufacturing technology, produced and
developed by Stratasys. FDM uses a heating chamber where the raw material is fed and it gets
liquefied. It is commonly known as extruder where the material is fed in and a liquefied
thermoplastic is extruded on the print bed. Parts made using FDM are among the strongest for any
polymer-based additive manufacturing process. (Heller, 2015)
The most common materials used for FDM are Acrylonitrile butadiene styrene (ABS) and
Polylactide (PLA), with their characteristics of becoming a liquid substance with predictable flow
properties in response to heat, while forming a reliable solid once cooled.
This process of heating and cooling plastic, is prone to random variation, with undesirable results
depending on the size of the object being modeled. Differences in material properties across
manufacturers and even among different material from the same manufacturer can result in very
different printing results. (Hernandez, 2015)
In FDM technology accuracy which is ability to meet precise physical dimensions,
consistent shapes, and predictable surface finish is important in the case of engineered mechanical
devices. 3D printing, being an additive manufacturing technology in nature, provides an opportunity
to create unique components that was not possible in the traditional subtractive technologies to
replicate the part.
Selective Laser Sintering
Selective laser Sintering is a layer manufacturing process which allows user to generate
complex 3D structures by consolidating successive layers of powder material on top of each other.
Consolidation is obtained by processing the selected areas using the thermal energy supplied by a
focused laser beam. (J P Kruth, 2004)
10
STL File
Stereo lithography file format is widely used as standard in the rapid prototyping industry.
Layer-by-layer fabrication method plays an important role in improving the accuracy of the
manufacturing. There are many existing interfaces for graphics exchange such as initial graphics
exchange Specification (IGES), standard for the exchange of product model data (STEP),
computerized tomography (CT), Layer exchange ASCII Format (LEAF) etc.
STL file format because of its simple topology and powerful nature in tessellation of almost
all surfaces is widely accepted and supported by most commercial Computer Aided Geometric
Design (CAGD) software and layer fabrication equipment. STL file format is made up of only one
type of element, a triangular facet, which is defined by its normal and three vertices. All the
triangular facets described in a STL format file constitute a triangular mesh to approximate
Modeling surfaces. In other words STL file format is a polyhedral representation of a surface model
with triangular facets. STL is reasonably suitable to be the interface between object modeling and
layer-by layer fabrication. (M. Vatani, 2009)
11
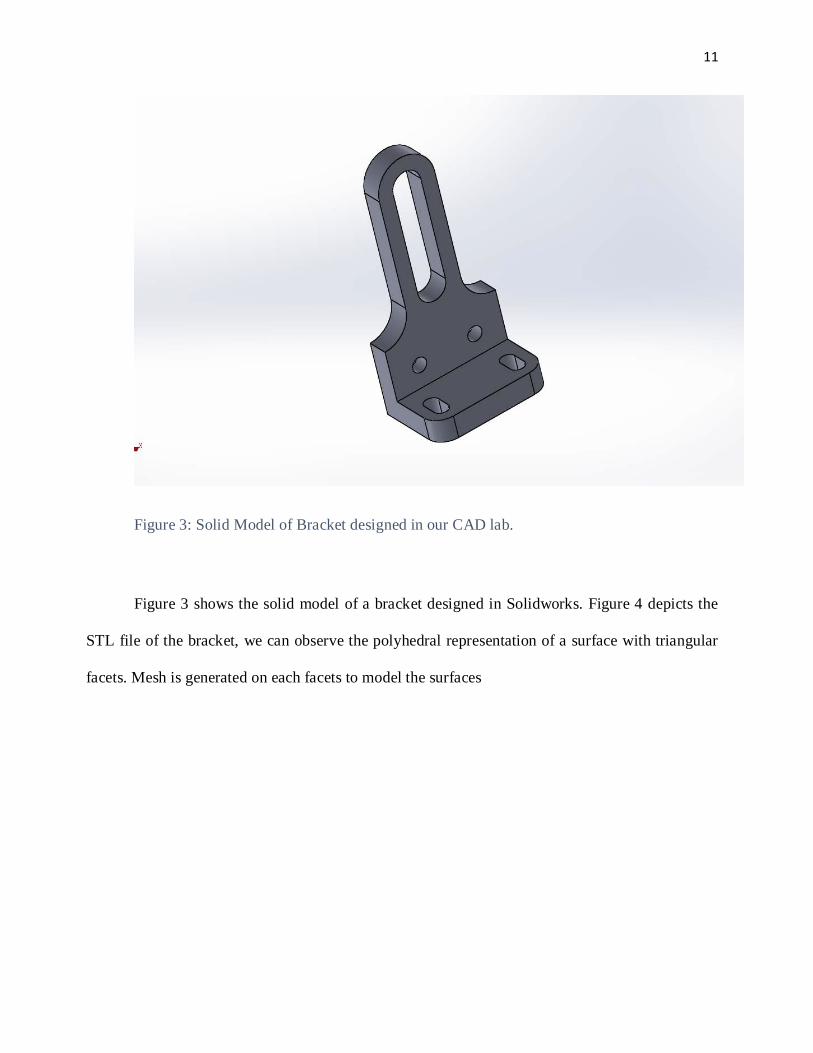
Figure 3: Solid Model of Bracket designed in our CAD lab.
Figure 3 shows the solid model of a bracket designed in Solidworks. Figure 4 depicts the
STL file of the bracket, we can observe the polyhedral representation of a surface with triangular
facets. Mesh is generated on each facets to model the surfaces

12
Figure 4: Depiction of STL file of Bracket
Factors Affecting Accuracy
As already mentioned the most common materials used for FDM are ABS and PLA, with
their property of becoming a liquid substance when heated, while forming a reliable solid once
cooled. This process of heating and cooling plastic, is still prone to random variation, with
unpredictable results depending on the shape and size of the object being printed. Differences in
material properties across manufacturers and even across different material lots from the same
manufacturer can result in very different printing results. It requires user intervention to modify few
printer parameters until required prints are achieved. (Hernandez, 2015)
13
There are a number of factors, which affect achievable accuracy in different manner. At first
there are the basic process parameters such as the scaling factor and the saturation value. Those
factors are recommended by the system manufacturer with different values for different materials
and purposes and should be checked for every new build. Some other factors have much higher
impact on the accuracy and these are: (Beer, 2006)
• Material used
• Nominal dimensions, small, medium, large.
• Build orientation.
• Geometric features and their topology e.g. open or Closed contours.
• Wall thickness shell, rafts, solid.
• Post treatment procedures.
• Infiltrating agent.
Raw Materials
Plastics engineers divide plastics into two main classifications: thermoplastics and
thermosetting plastics. Thermoplastics melt when heated and do not change their internal
composition when heated, and they can be melted and re-melted several times. Thermosetting
polymers solidify when heated and they are only used once, because their internal composition
modifies when heated, thermosetting polymers cannot be melted back down into a reusable liquid
form.
Most consumer printers use a type of thermoplastic called ABS, the same kind used in LEGO
bricks. STL based 3D printers use light-sensitive thermosetting polymers. Printers that use laser
sintering use powdered thermoplastic. (Hod Lipson, 2013)
14
3D printers can also work with another category of plastics, soft plastics, known
as elastomers. These rubber like materials have various elastic properties. Some of these materials,
like silicone, can be squeezed through a syringe and then air-dried. Other soft, rubbery objects can
be printed by melting a thermoplastic elastomer, similar to the process used to fabricate hard plastic.
(Hod Lipson, 2013)
Glass, one of the most common materials used by humans, has been one of the slowest
materials to gain popularity in 3D printing. Glass being hydrophobic, results in not adhering well.
Powdered glass is unpredictable when exposed to heat. Researchers in University of Washington
have successfully printed objects made of recycled glass in the research lab (Grant Marchelli,
2011). Commercial application of glass printing is still mostly for art and jewelry. (Hod Lipson,
2013)
Thermoplastics
There are dozens of kinds of thermoplastics, with varying degree of in crystallinity and
density. Some types that are commonly produced today are polyurethane, polypropylene,
polycarbonate, and acrylic. Celluloid which is considered the first thermoplastic, made its
appearance in the mid-1800s and reigned in the industry for approximately 100 years. The most
common 3D printing material used nowadays are PLA and ABS. These are further discussed in the
following sections. (Maier, 2016)
ABS
ABS as a polymer can take numerous forms and can be modified to have multiple properties.
It is a strong plastic with some flexibility. It has excellent impact strength at low temperatures.
15
Natural ABS before being processed is a soft milky beige in color. The flexibility of ABS makes it
favorable in creating interlocking components or connected pieces. ABS is soluble in Acetone,
which allows welding of parts together with a few drops, and create high gloss by brushing or
dipping full pieces in Acetone. Its strength, flexibility, machinability, and higher temperature
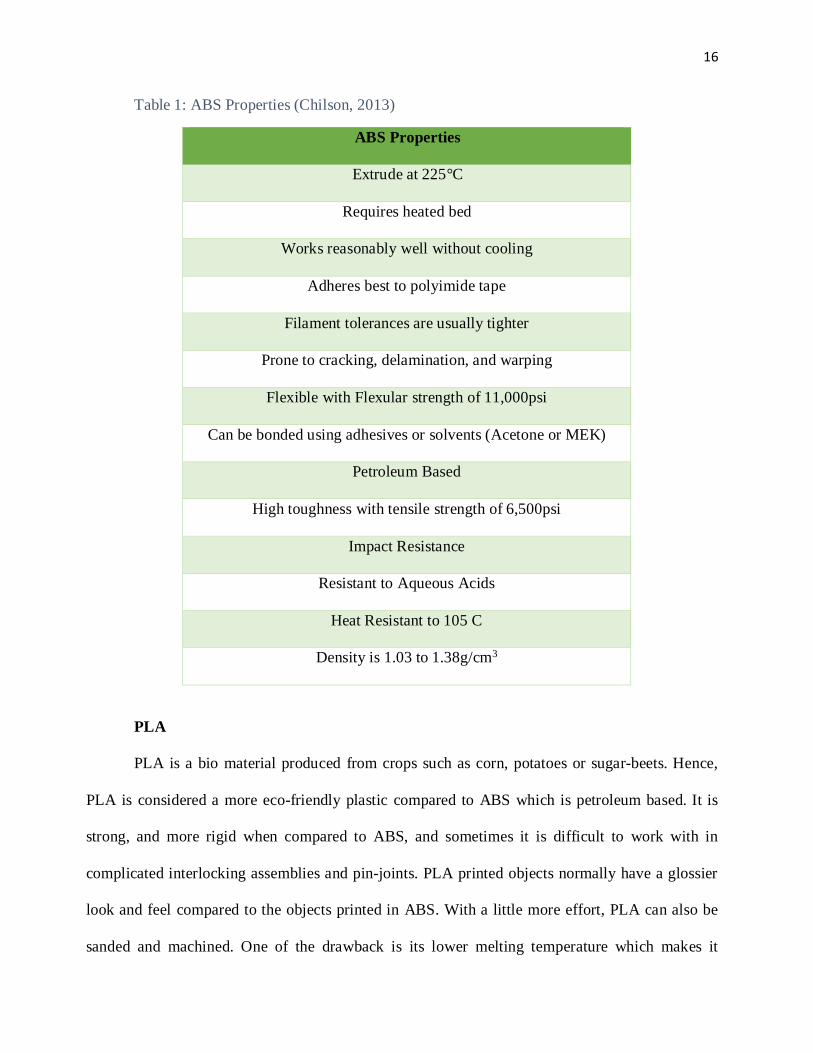
resistance makes it most preferred plastic in the 3D industry. (Chilson, 2013). The specific properties
of ABS are shown in Table 1.
ABS softens at a higher temperature than PLA, which makes parts printed in ABS more
resistant to warping under higher temperatures. It tends to warp and peel, and often will not stick
well to an unheated, or under-heated print-bed.
While printing the single greatest hurdle in ABS is tendency of curling upwards from the
surface in direct contact with the 3D Printer's print bed. Various solutions can be used to overcome
this problem such as applying Acetone on the print bed prior to printing.
Generally, it is easier for manufacturers to attain better tolerances with ABS than with PLA.
However, the extrusion characteristics of PLA allow for finer feature detail on a well-tuned machine.
16
Table 1: ABS Properties (Chilson, 2013)
ABS Properties
Extrude at 225°C
Requires heated bed
Works reasonably well without cooling
Adheres best to polyimide tape
Filament tolerances are usually tighter
Prone to cracking, delamination, and warping
Flexible with Flexular strength of 11,000psi
Can be bonded using adhesives or solvents (Acetone or MEK)
Petroleum Based
High toughness with tensile strength of 6,500psi
Impact Resistance
Resistant to Aqueous Acids
Heat Resistant to 105 C
Density is 1.03 to 1.38g/cm3
PLA
PLA is a bio material produced from crops such as corn, potatoes or sugar-beets. Hence,
PLA is considered a more eco-friendly plastic compared to ABS which is petroleum based. It is
strong, and more rigid when compared to ABS, and sometimes it is difficult to work with in
complicated interlocking assemblies and pin-joints. PLA printed objects normally have a glossier
look and feel compared to the objects printed in ABS. With a little more effort, PLA can also be
sanded and machined. One of the drawback is its lower melting temperature which makes it
17
unsuitable for many applications. For example if a PLA part is left in a closed car for a day in the
sun the object can droop and deform. PLA is used primarily in food packaging and containers. It is
naturally transparent and can be colored to various degrees of translucency and opacity. (Chilson,
2013)
Accuracy of parts is much less in PLA when compared to ABS. PLA undergoes a phase-
change when heated and becomes much more liquid. If actively cooled, much sharper details can be
seen on printed corners without the risk of cracking or warping. The increased flow can also lead to
stronger binding between layers, improving the strength of the printed part. If compared to PLA, it
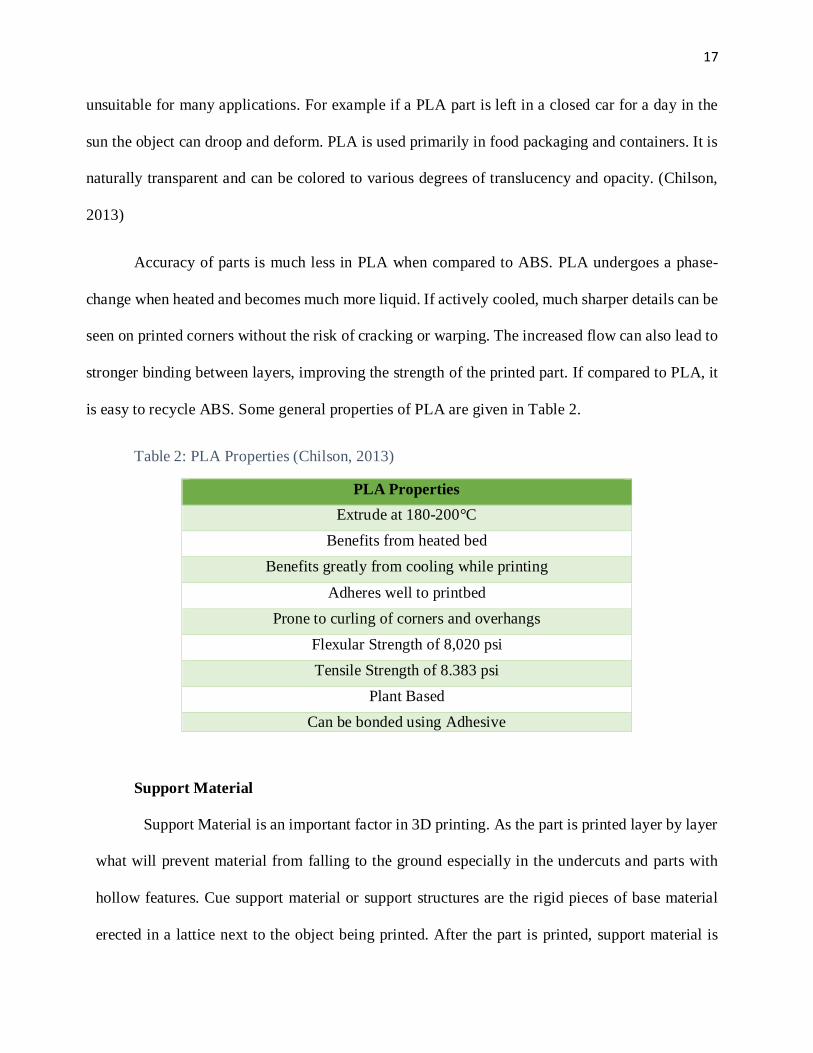
is easy to recycle ABS. Some general properties of PLA are given in Table 2.
Table 2: PLA Properties (Chilson, 2013)
PLA Properties Extrude at 180-200°C
Benefits from heated bed Benefits greatly from cooling while printing
Adheres well to printbed Prone to curling of corners and overhangs
Flexular Strength of 8,020 psi Tensile Strength of 8.383 psi
Plant Based Can be bonded using Adhesive
Support Material
Support Material is an important factor in 3D printing. As the part is printed layer by layer
what will prevent material from falling to the ground especially in the undercuts and parts with
hollow features. Cue support material or support structures are the rigid pieces of base material
erected in a lattice next to the object being printed. After the part is printed, support material is
18
removed by aggressive sanding or clipping it away with scrapper. It is a time consuming process
and can cause dimensional inaccuracies. Moreover, many parts have features that simply cannot
be accessed by hand or machine. In these particular cases, support structures will remain in those
areas as removing them can cause deformation. Technologies like FDM and have introduced a
support material that dissolves when placed in a bath of chemicals. Direct Metal Laser Sintering
(DMLS) and Selective Laser Sintering (SLS) use the surrounding powder itself to support the
printed part. (Armbruster, 2012)
Recent Development and Forecast
In today’s manufacturing industry be it large scale or at Nano scale 3D printing or Additive
Manufacturing has founded its place. In a recent Price water Cooper survey of more than hundred
industrial manufacturers, two-thirds were already using 3-D printing. (Alan Earls, 2014)
As mentioned above 3D printing is being implemented and experimented in every possible
field. From medical to electrical, it is being experimented wherever simple manufacturing is
involved. For example Nano Dimension founded in 2012 develops advanced 3D printed electronics
and a printer for multilayer Printed Circuit Boards (PCBs). PCBs is an integral part of our daily life.
PCBs are used everywhere from microwaves to heating system displays and from smartphones to
our car keys. (Dimension, 2015)
In a recently held National Plastic Expo in March 2015 at Orlando Florida where 3D printed
cars were displayed. An extreme 3D printed model was of Shelby Cobra where Techmer a Polymer
Suppliers who supplied the carbon fiber compounds to print the car where they used large scale
STL. (Techmer, 2015)
19
The key materials science challenge is to create materials often called inks that can be the
basis for printing different types of products, be it sensors, electronics or iron nails. For example,
Xerox PARC is developing inks so circuits, antennas, and RFID (radio frequency identification)
tags can be printed and applied directly to a product. (Ready S E, 2013)
The renowned name in the 3D printing industry Stratasys showcased the Dental Selection
3D printer in recently held International Dental Show in March 2015 in Cologne, Germany. The
triple-jetting technology was best used for the purpose of orthodontic labs. The printer is named as
Object260. (Ollig, 2015)
Canalys, a market research firm, forecast changes ahead and predicts the worldwide business
sector for 3D printers and its related services will develop from $2.5 billion in 2013 to $16.2 billion
in 2018, an annual growth rate of 45.7 percent. (Alto, 2014)
Equipment and Print Materials
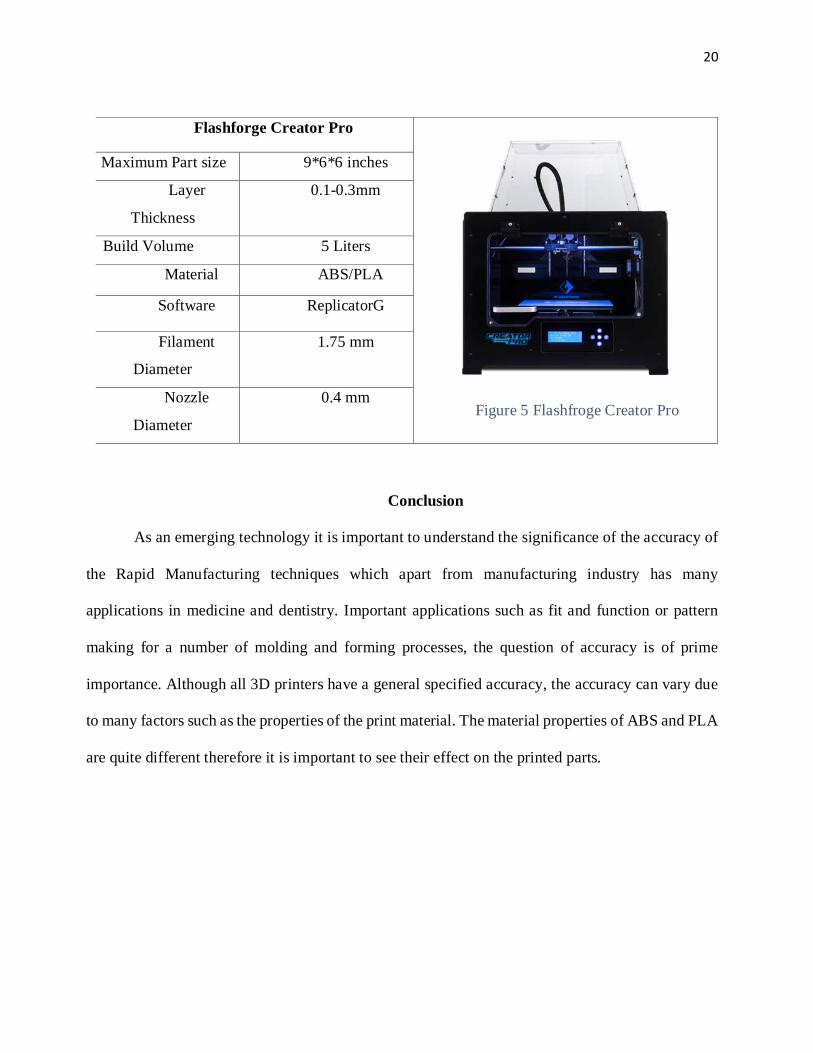
The printer used in this study is Creator Pro made by Flashforge, as shown in Figure 5. It is
capable of printing objects with build volume of 9 x 6 x 6 inches, using a layer resolution of as high
as 0.007 inches (0.17mm). It uses thermoplastic ABS but for our study we will be using ABS and
PLA. The CAD/CAM software used is Solidworks 2016 release in designing the objects. The
Solidworks interface allows user to make a STL file of the object providing a preview of sliced
version of the part file.
20
Conclusion
As an emerging technology it is important to understand the significance of the accuracy of
the Rapid Manufacturing techniques which apart from manufacturing industry has many
applications in medicine and dentistry. Important applications such as fit and function or pattern
making for a number of molding and forming processes, the question of accuracy is of prime
importance. Although all 3D printers have a general specified accuracy, the accuracy can vary due
to many factors such as the properties of the print material. The material properties of ABS and PLA
are quite different therefore it is important to see their effect on the printed parts.
Flashforge Creator Pro
Maximum Part size 9*6*6 inches
Layer
Thickness
0.1-0.3mm
Build Volume 5 Liters
Material ABS/PLA
Software ReplicatorG
Filament
Diameter
1.75 mm
Nozzle
Diameter
0.4 mm Figure 5 Flashfroge Creator Pro
21
Chapter III: Procedures
Restatement of the problem
The purpose of this project was to compare the dimensional accuracy of 3D printed parts of
Polylactic Acid (PLA) and Acrylonitrile Butadiene Styrene (ABS) when compared with dimensions
of the CAD models from which these parts are printed. The parts were printed using the Rapid
Prototyping machine Creator Pro Dual Extension built by Flashforge. The parts consisted of small
rectangular prisms and spheres.
Re statement of Objectives of the study
In order to conduct this project following objectives will be achieved.
1. Design the Sphere and a rectangular prism in CAD -CAM software Solidworks.
2. Print models in Creator, ten each of PLA and ABS.
3. Print models in three different dimensions.
4. Measure the dimension of the printed models using micrometers.
5. Compare the dimensions of parts printed with ABS to that of PLA printed parts.
Research Design Methodology
We designed the solid model in Solidworks 2015-2016. Solidworks is Computer Aided
Design software based on Microsoft windows. The software has many built in features like
Automatic interference and collision detection which makes sure all parts fit together before printing
a physical prototype. (Solidworks, 2015) The CAD models designed for the research consisted of
Rectangular prisms and spheres.
It has been observed from the previous experience that slight sagging and bending occurs
at the bottom edges of the rectangular prisms. Therefore we measured the height away from the

22
edges of the rectangular prism. Rectangular prism length and width corresponding to the diagram
shown in Figure 6, was measured about half way along the height. The CAD drawing of
rectangular prism type 1 is shown in Figure 7.
Figure 6: Rectangular Prism and its measurement notations.

23
Figure 7: CAD drawing of rectangular prism type 1.
The spheres require supporting material during printing. This causes the bottom point of
the sphere to become roughened and so measurements cannot be taken from this point. Therefore
the measurement were taken from different points away from the base. Diameter was measure
from thee different points as shown in Figure 8. The CAD drawing of sphere type 1 is shown in
Figure 9.
Figure 8: Sphere and its measurement notations.
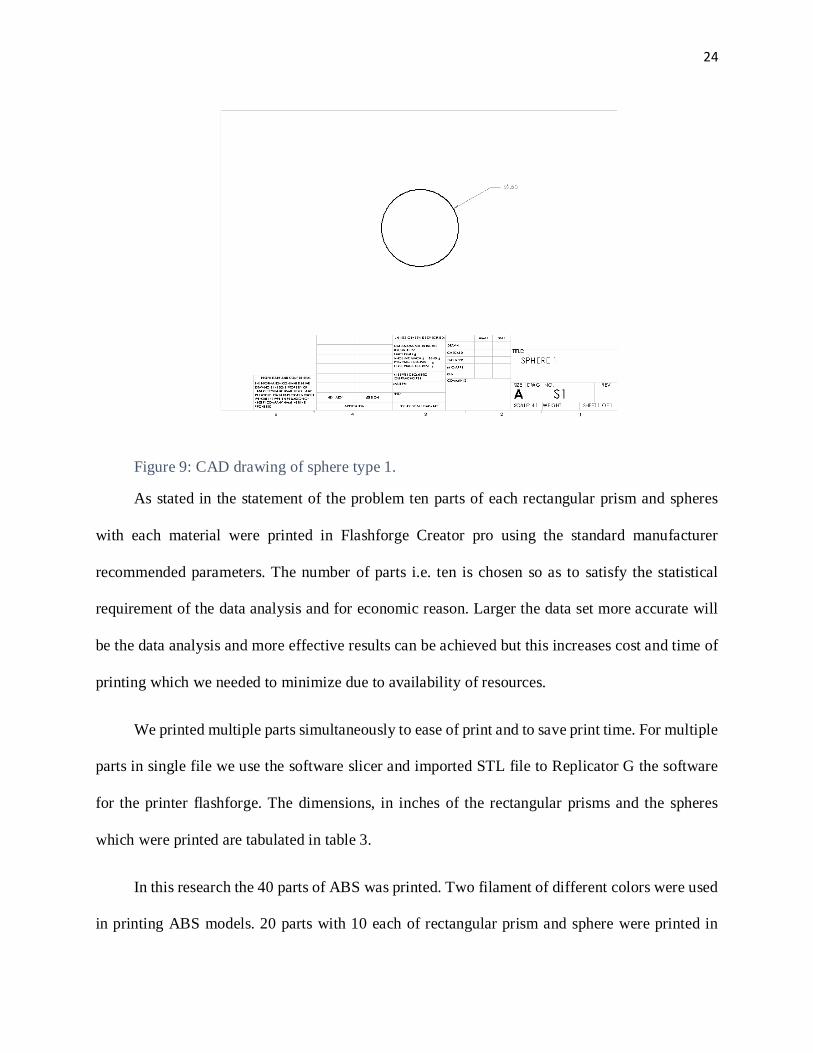
24
Figure 9: CAD drawing of sphere type 1.
As stated in the statement of the problem ten parts of each rectangular prism and spheres
with each material were printed in Flashforge Creator pro using the standard manufacturer
recommended parameters. The number of parts i.e. ten is chosen so as to satisfy the statistical
requirement of the data analysis and for economic reason. Larger the data set more accurate will
be the data analysis and more effective results can be achieved but this increases cost and time of
printing which we needed to minimize due to availability of resources.
We printed multiple parts simultaneously to ease of print and to save print time. For multiple
parts in single file we use the software slicer and imported STL file to Replicator G the software
for the printer flashforge. The dimensions, in inches of the rectangular prisms and the spheres
which were printed are tabulated in table 3.
In this research the 40 parts of ABS was printed. Two filament of different colors were used
in printing ABS models. 20 parts with 10 each of rectangular prism and sphere were printed in

25
white color and in blue color respectively. It was assumed that this would not cause any significant
difference in the accuracy of the parts printed.
Table 3: Dimensions of the parts.
Part Type Length Width Height Diameter Rectangular Prism type 1 1 0.5 0.5 -- Rectangular Prism type 2 0.75 0.5 0.5 --
Sphere type 1 -- -- -- 0.5 Sphere type 2 -- -- -- 0.75
These dimension are selected so that the parts easily fit the work envelope of the machine
and to save the build material. The length and width of the printed rectangular prisms and the
diameters of the printed spheres were measured using a 1 inch caliper micrometer which can
measure to the accuracy of 0.0001 inches.
The sizes, materials and the number of parts printed are summarized in Table 3 and Table 4.
As can be seen from table 4 a total of 80 parts were printed. The 3D drawings of the rectangular
prisms and sphere modeled in Solidworks and their depicted STL files which were printed in the
creator pro are shown in Figure 6 & 8 and Figure 7 & 9 respectively.
Table 4: Number of Parts printed.
Part Type Number of Parts Printed Total ABS PLA
Prism Type 1 10 10 20 Prism Type 2 10 10 20 Sphere Type 1 10 10 20 Sphere Type 2 10 10 20
80

26
Figure 10: 3D CAD Model of Rectangular Prism 1
Figure 11: Depiction of STL file of the rectangular prism.

27
Figure 12: 3D model for sphere.
Figure 13: Depiction of STL file for sphere.

28
By measuring the length and width of each part of rectangular prism type 1 we get 40
readings as tabulated in Appendix A Table 5. Similar measurement was taken for the rectangular
prism type 2 which can be viewed in Appendix A Table 7. Making the total readings of 80
measurements.
In case of sphere, as stated above, the diameter was measured at three different points as
shown in Figure 7 so the total of 60 readings were recorded for each type of sphere. The diameters
(D1, D2 and D3) measured for sphere types 1 are shown in the Appendix A Table 9. Similar
measurement was taken for the sphere 2 which can be viewed in Appendix A Table 11 making the
total readings of 120 measurements.
Data Analysis
F and t-tests
Mean and standard deviation of the length, width and the diameter were calculated from the
data. Following analysis were followed:
Let us define a variable Ig(x) = |L – x | as the magnitude of inaccuracy.
Where L is the ideal i.e. designed length of rectangular prism and x is the measured length
of the prism. The value of L and W will change with the part in consideration, as per Table 3. In case
of Prism type 1 L will be 1 inch for Prism type 2 L will be 0.75 inch and for Spheres type 1 & 2 the
diameter (D) will 0.5” and 0.75” respectively.
With reference to the reading tables in Appendix A we define the measure of accuracy as:
ILABS = |1.0 – LABS| inch
ILPLA = | 0.5 – LPLA| inch
29
IWABS = |0.5 – WABS| inch
IWPLA = | 0.5 –WPLA| inch
IDABS = | 0.5 –DABS| inch
IDPLA = |0.5– DPLA| inch
Ideally, the values for these IL, IW and ID should be zero. Their departure from zero, in
either direction, is an inaccuracy in printing. In order to determine any significant difference in
accuracy due to the two materials we used the student’s t-tests.
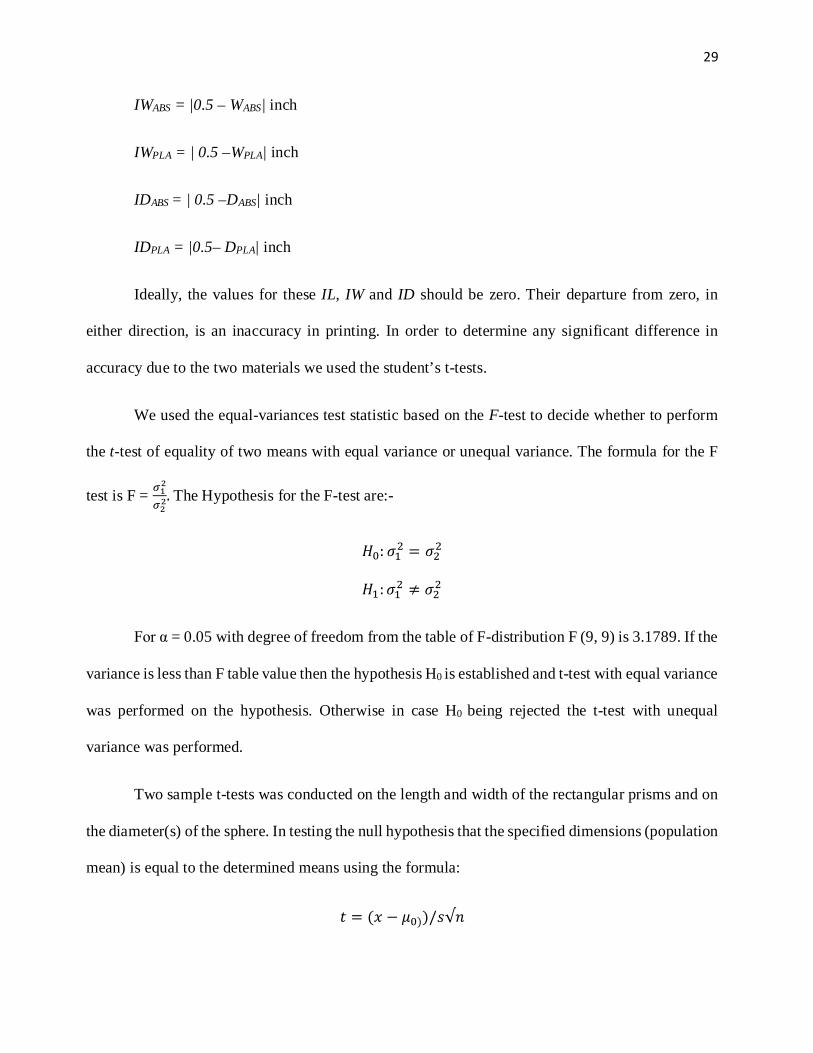
We used the equal-variances test statistic based on the F-test to decide whether to perform
the t-test of equality of two means with equal variance or unequal variance. The formula for the F
test is F = 𝜎𝜎12
𝜎𝜎22. The Hypothesis for the F-test are:-
𝐻𝐻0: 𝜎𝜎12 = 𝜎𝜎22
𝐻𝐻1:𝜎𝜎12 ≠ 𝜎𝜎22
For α = 0.05 with degree of freedom from the table of F-distribution F (9, 9) is 3.1789. If the
variance is less than F table value then the hypothesis H0 is established and t-test with equal variance
was performed on the hypothesis. Otherwise in case H0 being rejected the t-test with unequal
variance was performed.
Two sample t-tests was conducted on the length and width of the rectangular prisms and on
the diameter(s) of the sphere. In testing the null hypothesis that the specified dimensions (population
mean) is equal to the determined means using the formula:
𝑡𝑡 = (𝑥𝑥 − 𝜇𝜇0))/𝑠𝑠√𝑛𝑛

30
Two sample t-test was performed so as to get the desired p-value whether the means are
different for the two materials i.e. PLA and ABS using the formula:
𝑡𝑡 = (𝑋𝑋1����� − 𝑋𝑋2)/𝑠𝑠𝑋𝑋1𝑋𝑋2 .√1𝑛𝑛
To compare two material we used two sample t-test and the hypothesis of no difference:
H0: 𝜇𝜇1 = 𝜇𝜇2
H1: 𝜇𝜇1 ≠ 𝜇𝜇2
Where H0 states that the mean (mean of length/width/diameter) of both material are equal
and H1 hypothesis is the state of inequality. p-value were calculated from the t-test considering that
if p < 0.05 we rejected the null hypothesis H0 and establish the H1 hypothesis.
Coefficient of Variation
The coefficient of variation is defined as the ratio of standard deviation and mean. It is
measured in the percentage as the ratio is multiplied by 100. We calculated the coefficient of
variance of the magnitude of inaccuracy in the length, width and diameter of between the ABS and
PLA to observe the common trend in the variation. Lesser the variation more stable the material
accuracy is reported. The formula for coefficient of variance is
CV = 𝜎𝜎µ
* 100

31
Chapter IV: Results & Findings
Results
We measured the length and width of the printed rectangular prisms and the diameter of the
spheres. Length and width of Rectangular prism type 1 were measured from the surface as depicted
in Figure 6 and 7. For both the materials the measured values are tabulated in Table 5 and
corresponding values of magnitude of inaccuracy are tabulated in table 6. The measured values for
rectangular prism type 2 can be read in the Appendix A Table 13.
Table 5: Rectangular Prism type 1 Measured values
RECTANGULAR PRISM 1 [P1] Part No.
ABS PLA L W L W
1 0.9853 0.5002 1.0203 0.5201
2 0.9883 0.5003 1.0021 0.5180
3 0.9856 0.5009 1.0193 0.5182
4 0.9853 0.5000 0.9855 0.5070
5 0.9842 0.5009 1.0228 0.5196
6 0.9825 0.5192 1.0204 0.5196
7 0.9855 0.5003 1.0192 0.5198
8 0.9859 0.5187 1.0152 0.5213
9 0.9852 0.5007 1.0193 0.5204
10 0.9856 0.5181 1.0225 0.5183
32
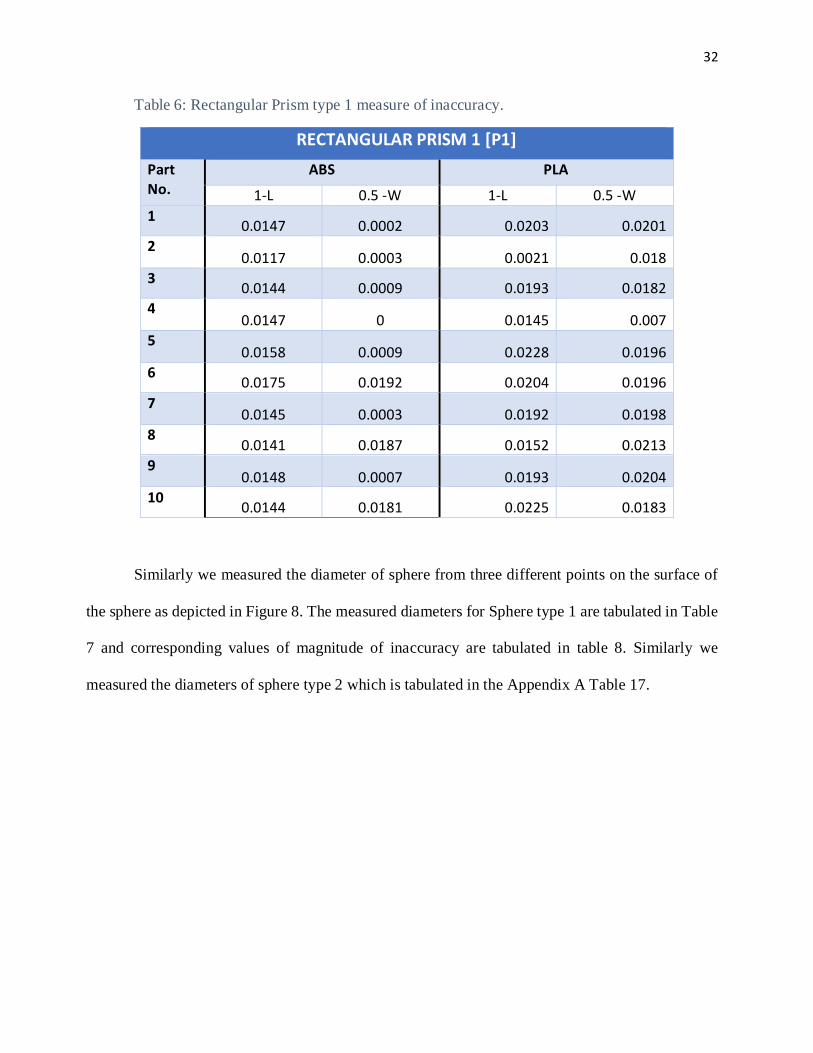
Table 6: Rectangular Prism type 1 measure of inaccuracy.
RECTANGULAR PRISM 1 [P1] Part No.
ABS PLA
1-L 0.5 -W 1-L 0.5 -W 1
0.0147 0.0002 0.0203 0.0201 2
0.0117 0.0003 0.0021 0.018 3
0.0144 0.0009 0.0193 0.0182 4
0.0147 0 0.0145 0.007 5
0.0158 0.0009 0.0228 0.0196 6
0.0175 0.0192 0.0204 0.0196 7
0.0145 0.0003 0.0192 0.0198 8
0.0141 0.0187 0.0152 0.0213 9
0.0148 0.0007 0.0193 0.0204 10
0.0144 0.0181 0.0225 0.0183
Similarly we measured the diameter of sphere from three different points on the surface of
the sphere as depicted in Figure 8. The measured diameters for Sphere type 1 are tabulated in Table
7 and corresponding values of magnitude of inaccuracy are tabulated in table 8. Similarly we
measured the diameters of sphere type 2 which is tabulated in the Appendix A Table 17.
33
Table 7: Sphere type 1 measured diameters.
SPHERE 1
Part No.
ABS PLA
D1 D2 D3 D1 D2 D3
1 0.4784 0.4802 0.4825 0.5238 0.5247 0.5231
2 0.5193 0.4834 0.4972 0.5187 0.5236 0.4816
3 0.5000 0.5198 0.4996 0.4858 0.4785 0.4795
4 0.4854 0.4662 0.4995 0.4897 0.4845 0.4883
5 0.5004 0.4777 0.4847 0.5196 0.5204 0.5152
6 0.4786 0.4751 0.4987 0.5186 0.5147 0.4908
7 0.4884 0.4768 0.4769 0.5213 0.5166 0.5151
8 0.4818 0.4769 0.4756 0.5225 0.4872 0.4883
9 0.4812 0.4774 0.4936 0.5216 0.5186 0.5214
10 0.4841 0.4978 0.4993 0.5184 0.4875 0.4906
Table 8: Sphere type 1 measure of inaccuracy.
SPHERE 1
Part No.
ABS PLA
0.5-D1 0.5-D2 0.5-D3 0.5-D1 0.5-D2 0.5-D3
1 0.0216 0.0198 0.0175 0.0238 0.0247 0.0231
2 0.0193 0.0166 0.0028 0.0187 0.0236 0.0184
3 0 0.0198 0.0004 0.0142 0.0215 0.0205
4 0.0146 0.0338 0.0005 0.0103 0.0155 0.0117
5 0.0004 0.0223 0.0153 0.0196 0.0204 0.0152
6 0.0214 0.0249 0.0013 0.0186 0.0147 0.0092
7 0.0116 0.0232 0.0231 0.0213 0.0166 0.0151
8 0.0182 0.0231 0.0244 0.0225 0.0128 0.0117
9 0.0188 0.0226 0.0064 0.0216 0.0186 0.0214
10 0.0159 0.0022 0.0007 0.0184 0.0125 0.0094
34
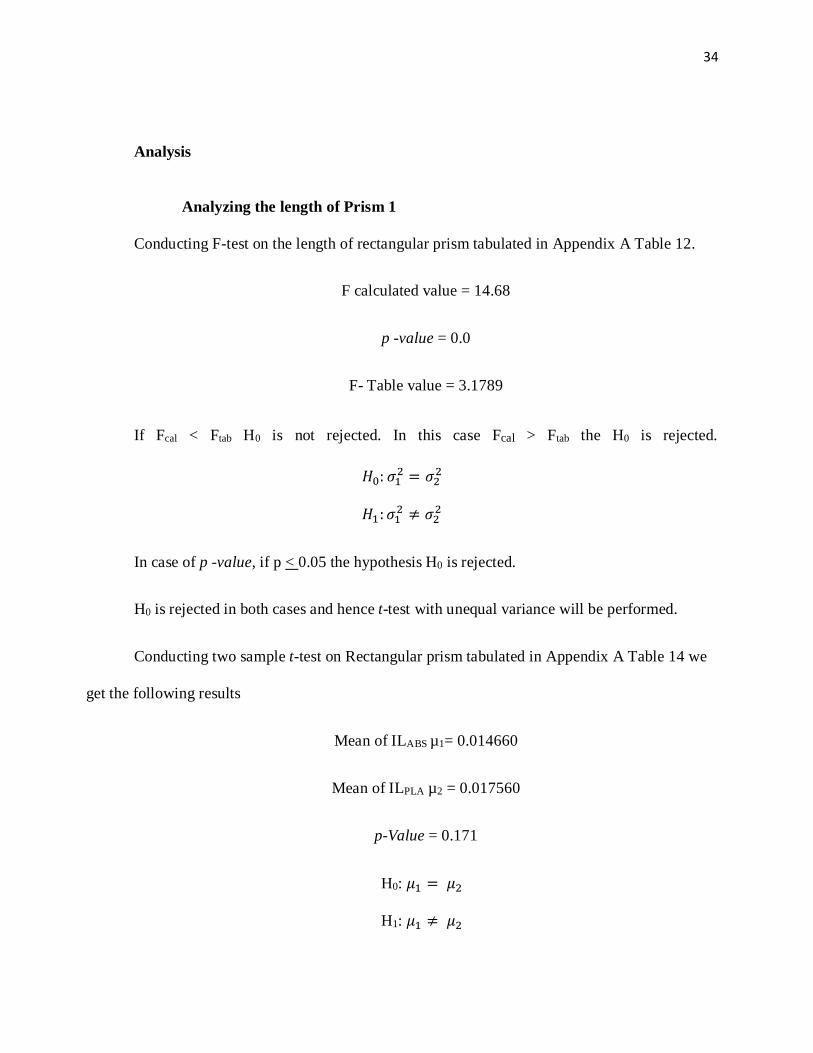
Analysis
Analyzing the length of Prism 1
Conducting F-test on the length of rectangular prism tabulated in Appendix A Table 12.
F calculated value = 14.68
p -value = 0.0
F- Table value = 3.1789
If Fcal < Ftab H0 is not rejected. In this case Fcal > Ftab the H0 is rejected.
𝐻𝐻0: 𝜎𝜎12 = 𝜎𝜎22
𝐻𝐻1:𝜎𝜎12 ≠ 𝜎𝜎22
In case of p -value, if p < 0.05 the hypothesis H0 is rejected.
H0 is rejected in both cases and hence t-test with unequal variance will be performed.
Conducting two sample t-test on Rectangular prism tabulated in Appendix A Table 14 we
get the following results
Mean of ILABS µ1= 0.014660
Mean of ILPLA µ2 = 0.017560
p-Value = 0.171
H0: 𝜇𝜇1 = 𝜇𝜇2
H1: 𝜇𝜇1 ≠ 𝜇𝜇2
35
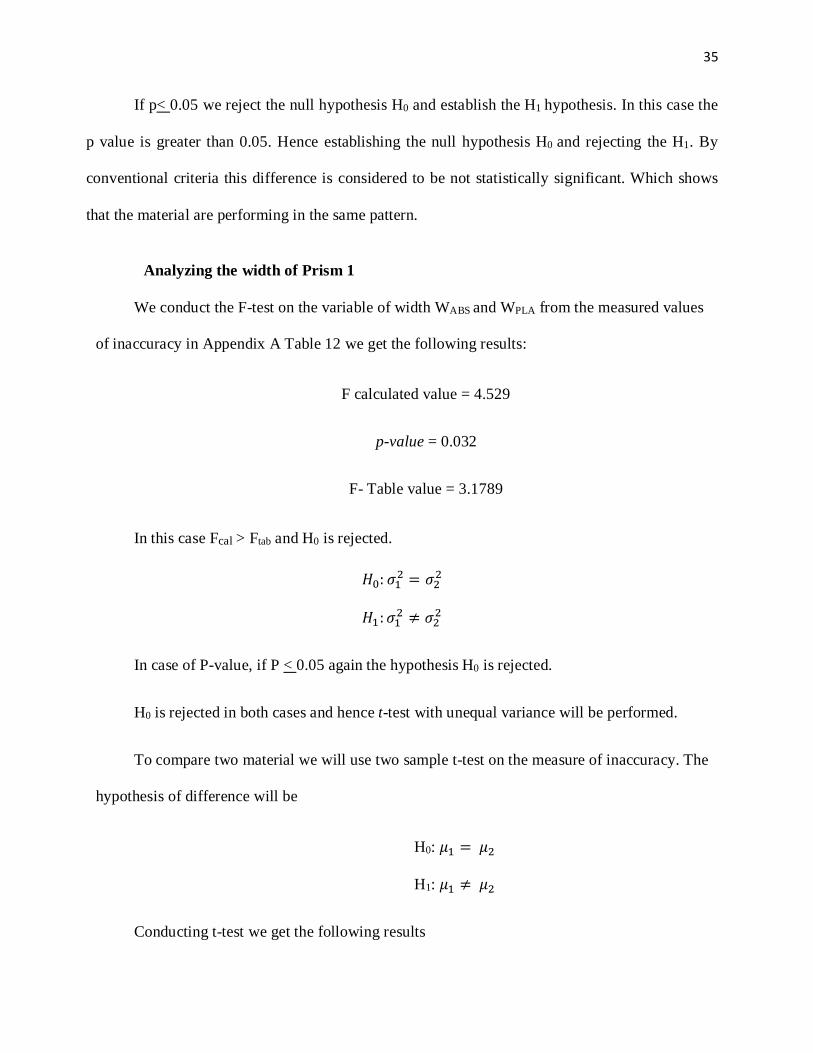
If p< 0.05 we reject the null hypothesis H0 and establish the H1 hypothesis. In this case the
p value is greater than 0.05. Hence establishing the null hypothesis H0 and rejecting the H1. By
conventional criteria this difference is considered to be not statistically significant. Which shows
that the material are performing in the same pattern.
Analyzing the width of Prism 1
We conduct the F-test on the variable of width WABS and WPLA from the measured values
of inaccuracy in Appendix A Table 12 we get the following results:
F calculated value = 4.529
p-value = 0.032
F- Table value = 3.1789
In this case Fcal > Ftab and H0 is rejected.
𝐻𝐻0: 𝜎𝜎12 = 𝜎𝜎22
𝐻𝐻1:𝜎𝜎12 ≠ 𝜎𝜎22
In case of P-value, if P < 0.05 again the hypothesis H0 is rejected.
H0 is rejected in both cases and hence t-test with unequal variance will be performed.
To compare two material we will use two sample t-test on the measure of inaccuracy. The
hypothesis of difference will be
H0: 𝜇𝜇1 = 𝜇𝜇2
H1: 𝜇𝜇1 ≠ 𝜇𝜇2
Conducting t-test we get the following results
36
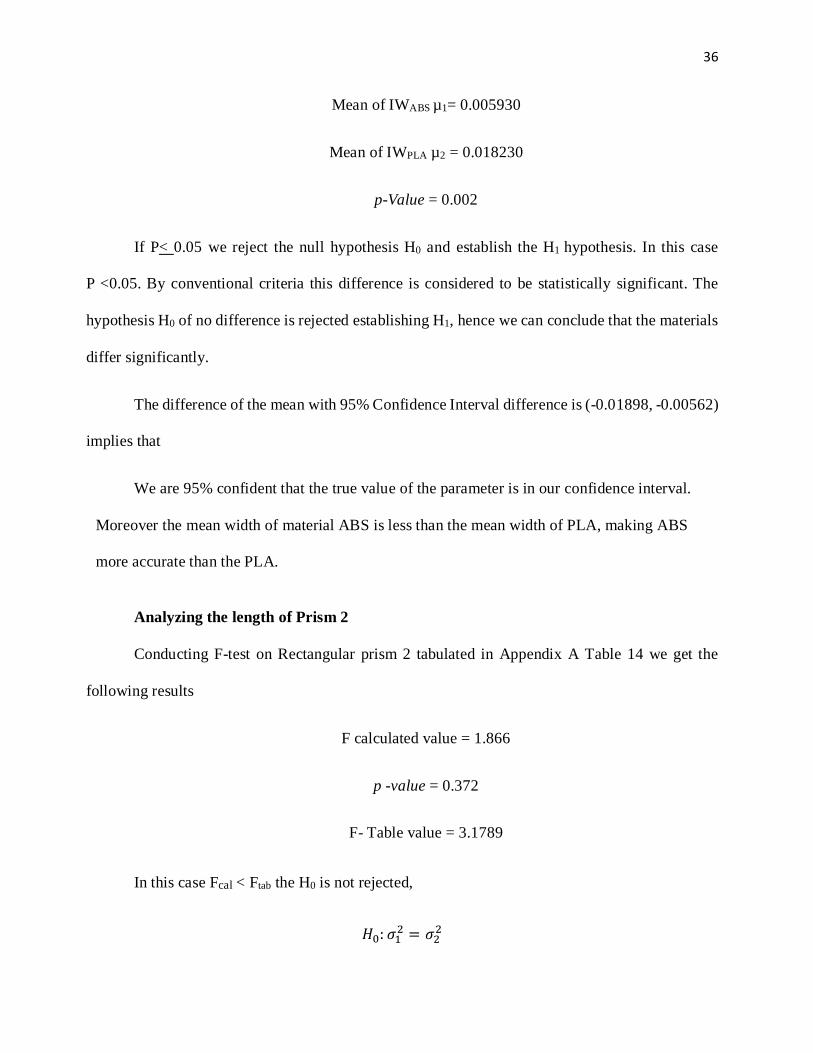
Mean of IWABS µ1= 0.005930
Mean of IWPLA µ2 = 0.018230
p-Value = 0.002
If P< 0.05 we reject the null hypothesis H0 and establish the H1 hypothesis. In this case
P <0.05. By conventional criteria this difference is considered to be statistically significant. The
hypothesis H0 of no difference is rejected establishing H1, hence we can conclude that the materials
differ significantly.
The difference of the mean with 95% Confidence Interval difference is (-0.01898, -0.00562)
implies that
We are 95% confident that the true value of the parameter is in our confidence interval.
Moreover the mean width of material ABS is less than the mean width of PLA, making ABS
more accurate than the PLA.
Analyzing the length of Prism 2
Conducting F-test on Rectangular prism 2 tabulated in Appendix A Table 14 we get the
following results
F calculated value = 1.866
p -value = 0.372
F- Table value = 3.1789
In this case Fcal < Ftab the H0 is not rejected,
𝐻𝐻0: 𝜎𝜎12 = 𝜎𝜎22

37
𝐻𝐻1:𝜎𝜎12 ≠ 𝜎𝜎22
In case of p -value, if p < 0.05 the hypothesis H0 is rejected. In this case H0 is not rejected.
H0 is not rejected in both cases and hence t-test with equal variances will be performed.
Performing t-test on the length of rectangular Prism 2 with the hypotheses
H0: 𝜇𝜇1 = 𝜇𝜇2
H1: 𝜇𝜇1 ≠ 𝜇𝜇2
Mean of ILABS µ1= 0.01776
Mean of ILPLA µ2 = 0.01455
p-Value = 0.386
If p< 0.05 we reject the null hypothesis H0 and establish the H1 hypothesis. In this case the
p value is greater than 0.05. By conventional criteria this difference is considered to be not
statistically significant.
Hence establishing the H0 hypothesis and concluding that the materials have no difference
in this case.
Analyzing the width of Prism 2
We conduct the F test and apply the same hypothesis on the variable of width WABS and
WPLA from the measured values of inaccuracy in Appendix A Table 14
F calculated value = 14
p-value = 0.001

38
F- Table value = 3.1789
In this case Fcal > Ftab and H0 is rejected.
𝐻𝐻0: 𝜎𝜎12 = 𝜎𝜎22
𝐻𝐻1:𝜎𝜎12 ≠ 𝜎𝜎22
In case of p-value, if p < 0.05 again the hypothesis H0 is rejected.
H0 is rejected in both cases and hence t-test with unequal variance will be performed.
Conducting t-test on Rectangular prism 2 tabulated in Appendix A Table 6 we get the
following results
Mean of IWABS µ1= 0.00593
Mean of IWPLA µ2 = 0.01823
p- Value = 0.155
If p< 0.05 we reject the null hypothesis H0 and establish the H1 hypothesis. In this case the
p value is greater than 0.05. By conventional criteria this difference is considered to be not
statistically significant.
H0: 𝜇𝜇1 = 𝜇𝜇2
H1: 𝜇𝜇1 ≠ 𝜇𝜇2
Hence establishing the H0 hypothesis and concluding that the materials have no difference
in this case.

39
Analyzing the diameter (D1) of Sphere 1
We conduct the F-test and apply the hypothesis on the variable of diameter D1ABS and D1PLA
from the Table 16 in Appendix A.
F calculated value = 4
p-value = 0.056
F- Table value = 3.1789
In this case Fcal > Ftab and H0 is rejected.
𝐻𝐻0: 𝜎𝜎12 = 𝜎𝜎22
𝐻𝐻1:𝜎𝜎12 ≠ 𝜎𝜎22
In case of p-value, if p < 0.05 again the hypothesis H0 is rejected.
H0 is rejected in both cases and hence t-test with unequal variance will be performed.
To compare two materials we will use two sample t-test and the hypothesis of no difference
will be
H0: 𝜇𝜇1 = 𝜇𝜇2
H1: 𝜇𝜇1 ≠ 𝜇𝜇2
Where H0 is the hypothesis that mean (μ) of IDABS is equal to the mean of IDPLA and H1
hypothesis states the means are not equal and there is a significant difference in terms of inaccuracy
in length of rectangular prism.
After conducting t-test on we get the following results
Mean of ID1ABS µ1= 0.01418

40
Mean of ID1PLA µ2 = 0.01890
p-value = 0.119
If p< 0.05 we reject the null hypothesis H0 and establish the H1 hypothesis. In this case the
p value is greater than 0.05. By conventional criteria this difference is considered to be not
statistically significant. Hence establishing the H0 hypothesis and concluding that the materials have
no difference in this case.
Analyzing the diameter (D2) of Sphere 1
We conduct the F-test and with the same hypothesis on the variable of width ID2ABS and
ID2PLA from the Table 16 in Appendix A.
F calculated value = 3.315
p-value = 0.088
F- Table value = 3.1789
In this case Fcal > Ftab and H0 is rejected.
𝐻𝐻0: 𝜎𝜎12 = 𝜎𝜎22
𝐻𝐻1:𝜎𝜎12 ≠ 𝜎𝜎22
In case of p-value, if p < 0.05 again the hypothesis H0 is rejected.
H0 is rejected in both cases and hence t-test with unequal variance will be performed.
To compare two materials we will use two sample t-test and the hypothesis of no difference
will be
H0: 𝜇𝜇1 = 𝜇𝜇2

41
H1: 𝜇𝜇1 ≠ 𝜇𝜇2
where H0 is the hypothesis that mean (μ) of IDABS is equal to the mean of IDPLA and H1
hypothesis states the means are not equal and there is a significant difference in terms of
inaccuracy in length of rectangular prism.
After conducting t-test on we get the following results
Mean of ID2ABS µ1= 0.02083
Mean of ID2PLA µ2 = 0.01809
p-value = 0.356
If p< 0.05 we reject the null hypothesis H0 and establish the H1 hypothesis. In this case the
p value is greater than 0.05. By conventional criteria this difference is considered to be not
statistically significant. Hence establishing the H0 hypothesis and concluding that the materials have
no difference in this case.
Analyzing the diameter (D3) of Sphere 1
We conduct the F-test with hypothesis on the variable of width ID3ABS and ID3PLA. The
measured values of inaccuracy are tabulated in Table 16 Appendix A. We get the following results
after applying the F-test
F calculated value = 3.692
p -value = 0.063
F- Table value = 3.1789
In this case Fcal > Ftab and H0 is rejected.
42
𝐻𝐻0: 𝜎𝜎12 = 𝜎𝜎22
𝐻𝐻1:𝜎𝜎12 ≠ 𝜎𝜎22
In case of p-value, if p < 0.05 again the hypothesis H0 is rejected.
H0 is rejected in both cases and hence t-test with unequal variance will be performed.
To compare two material we will use two sample t-test and the hypothesis of no difference
will be
H0: 𝜇𝜇1 = 𝜇𝜇2
H1: 𝜇𝜇1 ≠ 𝜇𝜇2
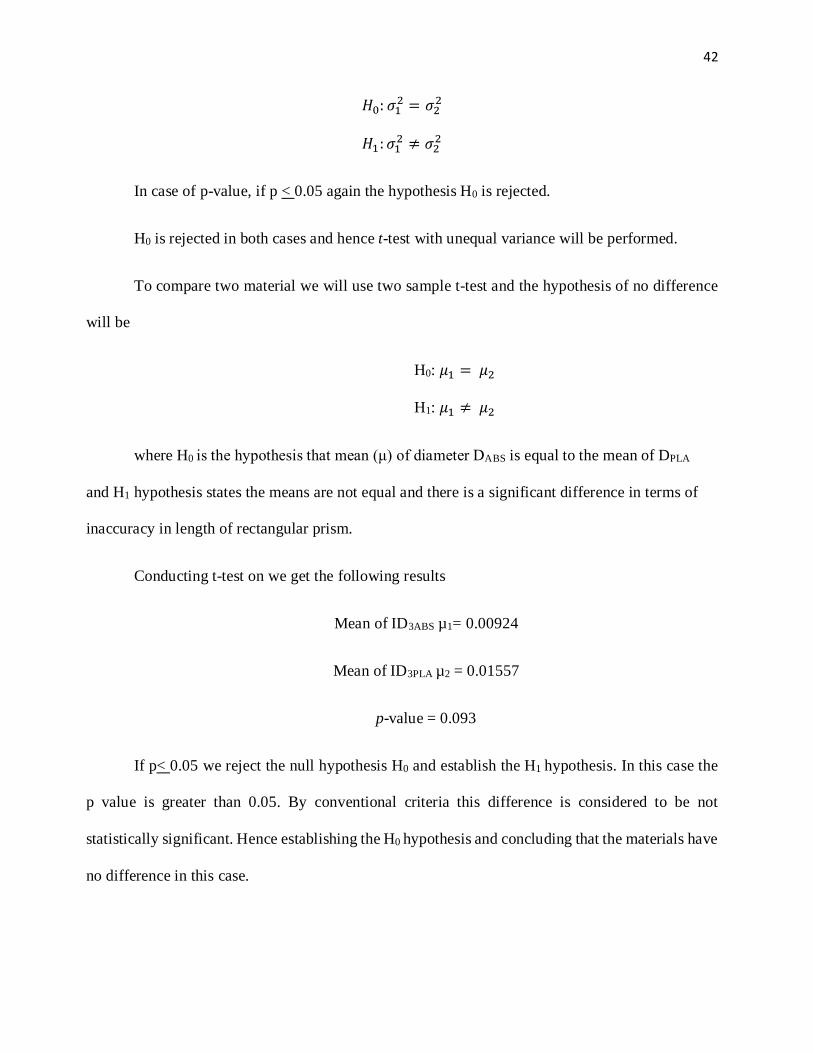
where H0 is the hypothesis that mean (μ) of diameter DABS is equal to the mean of DPLA
and H1 hypothesis states the means are not equal and there is a significant difference in terms of
inaccuracy in length of rectangular prism.
Conducting t-test on we get the following results
Mean of ID3ABS µ1= 0.00924
Mean of ID3PLA µ2 = 0.01557
p-value = 0.093
If p< 0.05 we reject the null hypothesis H0 and establish the H1 hypothesis. In this case the
p value is greater than 0.05. By conventional criteria this difference is considered to be not
statistically significant. Hence establishing the H0 hypothesis and concluding that the materials have
no difference in this case.

43
Analyzing the diameter (D1) of Sphere 2
We conduct the F-test with the hypothesis on the variable of width ID1ABS and ID1PLA. The
measured values of inaccuracy are tabulated in Table 18 Appendix A.
F calculated value = 1.508
P-value = 0.553
F- Table value = 3.1789
In this case Fcal < Ftab and H0 is not rejected.
𝐻𝐻0: 𝜎𝜎12 = 𝜎𝜎22
𝐻𝐻1:𝜎𝜎12 ≠ 𝜎𝜎22
In case of p -value, if p < 0.05 the hypothesis H0 is rejected but in this case H0 is not
rejected.
H0 is not rejected in both cases and hence t-test with equal variance will be performed in
this case.
To compare two material we will use two sample t-test and the hypothesis of no difference
will be
H0: 𝜇𝜇1 = 𝜇𝜇2
H1: 𝜇𝜇1 ≠ 𝜇𝜇2
where H0 is the hypothesis that mean (μ) of ID1ABS is equal to the mean of ID1PLA and H1
hypothesis states the means are not equal and there is a significant difference in terms of
inaccuracy in length of rectangular prism.

44
Conducting t-test we get the following results
Mean of ID1ABS µ1= 0.01735
Mean of ID1PLA µ2 = 0.01241
p- Value = 0.208
If p< 0.05 we reject the null hypothesis H0 and establish the H1 hypothesis. In this case the
p value is greater than 0.05. By conventional criteria this difference is considered to be not
statistically significant. Hence establishing the H0 hypothesis and concluding that the materials have
no difference in this case.
Analyzing the diameter (D2) of Sphere 2
We conduct the F- test and apply with same hypothesis on the variable of width ID2ABS and
ID2PLA from the Table 18 in Appendix A.
F calculated value = 6.533
p-value = 0.01
F- Table value = 3.1789
In this case Fcal > Ftab and H0 is rejected.
𝐻𝐻0: 𝜎𝜎12 = 𝜎𝜎22
𝐻𝐻1:𝜎𝜎12 ≠ 𝜎𝜎22
In case of p -value, if p < 0.05 again the hypothesis H0 is rejected.
H0 is rejected in both cases and hence t-test with unequal variance will be performed in this
case.
45
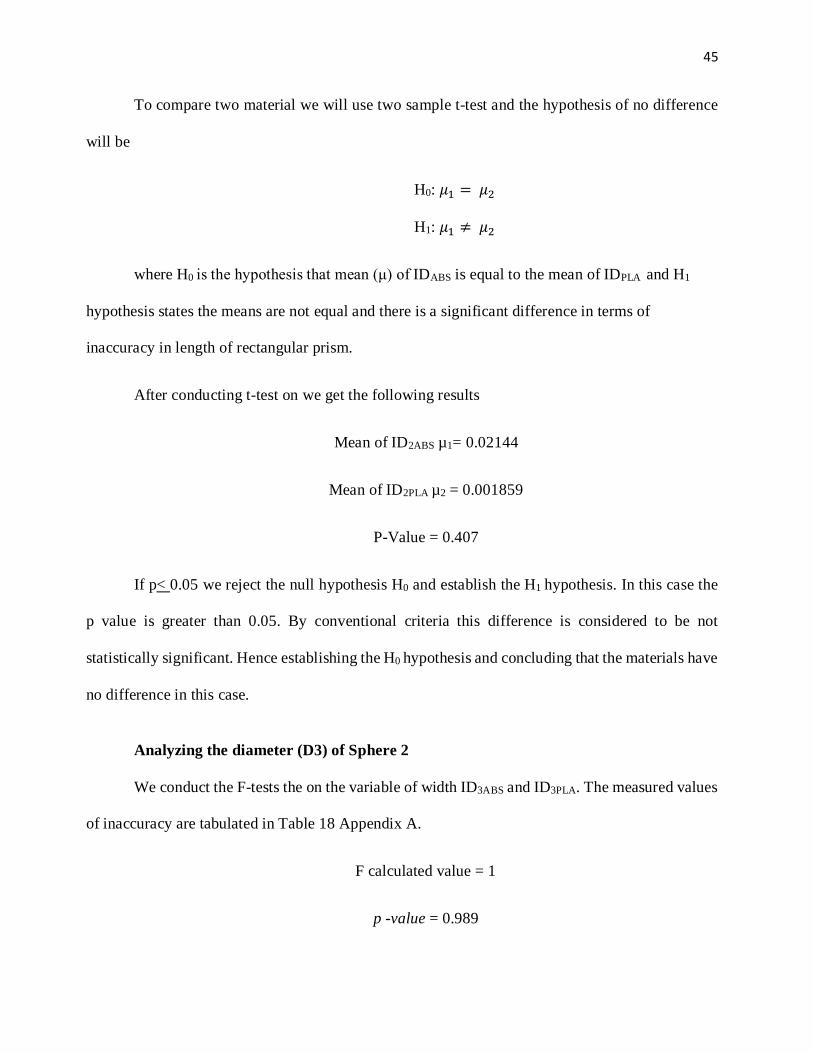
To compare two material we will use two sample t-test and the hypothesis of no difference
will be
H0: 𝜇𝜇1 = 𝜇𝜇2
H1: 𝜇𝜇1 ≠ 𝜇𝜇2
where H0 is the hypothesis that mean (μ) of IDABS is equal to the mean of IDPLA and H1
hypothesis states the means are not equal and there is a significant difference in terms of
inaccuracy in length of rectangular prism.
After conducting t-test on we get the following results
Mean of ID2ABS µ1= 0.02144
Mean of ID2PLA µ2 = 0.001859
P-Value = 0.407
If p< 0.05 we reject the null hypothesis H0 and establish the H1 hypothesis. In this case the
p value is greater than 0.05. By conventional criteria this difference is considered to be not
statistically significant. Hence establishing the H0 hypothesis and concluding that the materials have
no difference in this case.
Analyzing the diameter (D3) of Sphere 2
We conduct the F-tests the on the variable of width ID3ABS and ID3PLA. The measured values
of inaccuracy are tabulated in Table 18 Appendix A.
F calculated value = 1
p -value = 0.989

46
F- Table value = 3.1789
In this case Fcal < Ftab and H0 is not rejected.
𝐻𝐻0: 𝜎𝜎12 = 𝜎𝜎22
𝐻𝐻1:𝜎𝜎12 ≠ 𝜎𝜎22
In case of P-value, if P < 0.05 again the hypothesis H0 is not rejected.
H0 is not rejected in both cases and hence t-test with equal variances will be performed in
this case.
To compare two material we will use two sample t-test and the hypothesis of will be
H0: 𝜇𝜇1 = 𝜇𝜇2
H1: 𝜇𝜇1 < 𝜇𝜇2
Conducting t-test on the diameter of Sphere 2 D3 we get the following results
Mean of ID3ABS µ1= 0.02193
Mean of ID3PLA µ2 = 0.01229
p -value = 0.002
If p< 0.05 we reject the null hypothesis H0 and establish the H1 hypothesis. In this case the
p value is less than 0.05. By conventional criteria this difference is considered to be statistically
significant. Hence rejecting the H0 hypothesis and concluding that the materials have difference in
this case.
H0: 𝜇𝜇1 = 𝜇𝜇2
H1: 𝜇𝜇1 < 𝜇𝜇2

47
We can observe from the given values:
ID3ABS µ1 > ID3PLA µ2
From the hypothesis H1 we can conclude that PLA is more accurate than ABS in this case.
Findings
From the analysis we observed that in eight cases there is no significant difference in the
print accuracy of the material. There is significant difference in two cases, from the result of t-test
to establish the superiority of a material over each other we observed that ABS is more accurate in
one case and PLA is more accurate in the other. The results of the analysis is tabulated in the table
9.
Table 9: Summary if the results.
S No. Part type Difference in material 1 Prism Type 1 Length (P1L) No significant Difference 2 Prism Type 1 Width (P1W) ABS is more accurate 3 Prism Type 2 Length (P2L) No significant Difference 4 Prism Type 2 Width (P2W) No significant Difference 5 Sphere Type 1 Diameter 1 (S1D1) No significant Difference 6 Sphere Type 1 Diameter 2 (S1D2) No significant Difference 7 Sphere Type 1 Diameter 3 (S1D3) No significant Difference 8 Sphere Type 2 Diameter 1 (S2D1) No significant Difference 9 Sphere Type 2 Diameter 2 (S2D2) No significant Difference 10 Sphere Type 2 Diameter 3 (S2D3) PLA is more accurate
Coefficient of Variation
We calculated the coefficient of variation of the magnitude of inaccuracy in the length, width
and diameter of between the ABS and PLA to observe the common trend in the variation. Lesser
the variation more stable the material accuracy is reported. The formula for coefficient of variance
is:

48
CV = 𝜎𝜎µ
* 100
Table 10: Coefficient of Variation showing the stability of the materials.
Part ABS PLA CV OF ABS CV OF PLA STABILITY
SD Mean SD MEAN P1L 0.001439 0.1466 0.006056 0.1756 0.981582538 3.448747153 ABS
P1W 0.008798 0.00593 0.004083 0.01823 148.3642496 22.39714756 PLA
P2L 0.009177 0.01776 0.006743 0.01455 51.6722973 46.34364261 PLA
P2W 0.001846 0.01177 0.006451 0.01503 15.68394223 42.92082502 ABS
S1D1 0.13055 0.48976 0.01398 0.514 26.6559131 2.719844358 PLA
S1D2 0.015132 0.48313 0.018638 0.50563 3.132076253 3.686094575 ABS
S1D3 0.009815 0.49076 0.017167 0.49939 1.999959247 3.437593865 ABS
S2D1 0.009273 0.01735 0.007561 0.01241 53.44668588 60.92667204 ABS
S2D2 0.009883 0.02144 0.003875 0.01859 46.09608209 20.84454008 PLA
S2D3 0.005904 0.02193 0.005933 0.1229 26.92202462 4.827502034 PLA
From the Table 10 we can compare the stability of materials on the basis of coefficient of
variation. We observe that in five cases the ABS is more stable and PLA is similarly stable in five
cases. In this analysis of coefficient of variation we conclude that both material does not depict any
variation from each other and are behaving in the same manner in terms of stability in inaccuracy.
49
Chapter V: Summary and Discussion
In this research we presented an approach on testing the accuracy of the two printing
materials ABS and PLA. We printed ten rectangular prism and spheres of each material in two
different set of measurements. The length and width and diameter of the printed rectangular prisms
parts and sphere was then measured with micrometer respectively. The readings of the both
materials were tabulated and compared against each other to measure the inaccuracy in the length
and width of the measured values. The comparison was carried out calculating the standard deviation
and the mean of the inaccuracy of each compared length and width with respect to the material.
Corresponding F-test and t-test was performed to analyze the data measured.
Based on statistical analysis of the inaccuracies of length, width and diameter of the parts
we concluded that both the material in our experiment are behaving in the same manner. There is
no significant difference in accuracy between ABS and PLA. Accuracy also varies with machine
and the manufacturers. The Flashforge creator pro 3D printer is an average prototype machine. We
anticipate better results if the research is conducted on an industrial grade prototype machine.
The coefficient of variance tabled in table 10 shows that the accuracy or stability of the
materials is uniform. The number of cases which shows ABS is more accurate is equivalent to the
number of cases where PLA is stable. It shows that there is no significant difference in the accuracy
of the two materials. Moreover if there is any significant difference found, it is in a uniform pattern.
PLA as mentioned earlier is plant based and uses less temperature for extrusion, it flows
more smoothly than ABS this is the reason it gives better results in printing sharp corners, stronger
binding between layers. The glow texture and other properties varies from vendors to vendors. The
strength, flexibility, machinability, and higher temperature resistance make ABS often a preferred
plastic by mechanical engineers. The difference of the print temperatures plays an important role

50
that affects the accuracy, strength and resilience of the material. In other words PLA is good for
hobbyist printing needs while ABS is better option for industrial requirements.
It was observed that ABS parts printed in white color appeared to have greater roughness
than the parts printed in blue color. In a future study the effect of color on texture can be investigated.
It all comes down to what is the requirement of the printed part. For example if a user wants to print
machine parts one will go for ABS as it has longer lifespan and more sturdy in nature but if a user
wants to print utensil to use it for storing food one will go for PLA as it is plant based and bio-
degradable. The finish and glow is more in PLA and it takes less time as compared to ABS. There
are many factors that affect the printing time such as the temperature of the extruder and the
temperature of the printbed. PLA requires less temperature as compared to ABS in both extrusion
and printbed. It can be printed on cold surface. While printing in PLA the ventilation of the printbed
is required as it smells differently and it is recommended to allow more air to flow for printing. ABS
does not have any air flow restrictions.
Future Work
The work described in this project has been concerned to establish the superiority of 3D
printing materials over one another. Although the results presented here have demonstrated the
difference on accuracy between the two 3D printing materials ABS and PLA, it could be developed
in a number of ways by overcoming the limitations we had in this research such as number of parts
printed was 40 for each case. The larger sample data with more degree of freedom will give us
reliable results. The plastic filaments can be compared with other material like wood and steel to
establish the comparable study which can be used at industrial level. The further research on
industrial grade machine would give better results.

51
References (n.d.). Retrieved from www.simplify3d.com.
3DPBlog. (2014, Nov 18). Retrieved from http://3dplatform.com/using-support-structures-3d-
printing/
Alan Earls, V. B. (2014). The road ahead for 3-D printers. Retrieved from
https://www.pwc.com/us/en/technology-forecast/2014/3d-printing/features/future-3d-
printing.html: https://www.pwc.com/us/en/technology-forecast/2014/3d-
printing/features/future-3d-printing.html
Alto, P. (2014). 3D printing market to grow to US$16.2 billion in 2018. Retrieved from
http://www.canalys.com/newsroom/3d-printing-market-grow-us162-billion-
2018#sthash.gQ68vurl.dpuf
Armbruster, M. (2012, 07 18). http://www.pddnet.com/blog/2012/07/3d-printing-understanding-
support-material. Retrieved from http://www.pddnet.com/:
http://www.pddnet.com/blog/2012/07/3d-printing-understanding-support-material
B Fritz, S. J. (2001). ACCURACY IMPROVEMENT IN RAPID PROTOTYPING MACHINE
(FDM-1650). pp. 77-84.
Beer, D. D. (2006). Investigating the achivable accuracy of three dimensional printing. Rapid
Prototyping Journal, 12(1), 42-52. Retrieved from
http://dx.doi.org/10.1108/13552540610637264
Chilson, L. (2013). The difference between ABS and PLA for 3D Printing. Retrieved from
http://www.protoparadigm.com/news-updates/the-difference-between-abs-and-pla-for-
3d-printing/

52
Dimension, N. (2015). Retrieved from http://www.nano-di.com/.
Grant Marchelli, R. P. (2011). The Guide to Glass 3D Printing: Developments, Methods,
Diagnostics and Results. Rapid Prototyping Journal, 187-194.
Hernandez, D. D. (2015, 9 21). Factors Affecting Dimensional Precision of Consumer 3D printing.
International Journal of Aviation, Aeronautics and Aerospace, 2(4).
Hod Lipson, M. K. (2013). Fabricated: The New World of 3D Printing. John Wiley & Sons Inc.
Ian Gibson, D. W. (2010). Additive ManufacturingTechnologies. Springer.
J P Kruth, P. M. (2004). Binding Mechanisms in Selective Laser Sintering and Selective Laser
Melting.
M. Vatani, A. R. (2009). An Enhanced Slicing Algorithm Using Nearest Distnace analysis for
layer manufacturing. World Acdemy of Science, Engineeirng and Technology.
Maier, K. (2016). Retrieved from wisegeek.com: http://www.wisegeek.com/what-is-
thermoplastic.htm
Ollig, M. (2015). Retrieved from http://www.herald-
journal.com/archives/2015/columns/m0031615.html.
Ready S E, E. F. (2013). 3D printed Electronics. Society for Imaging Science & technology.
Solidworks. (2015). Productivity. Retrieved from www.solidworks.com:
http://www.solidworks.com/sw/why-solidworks/solidworks-productivity.htm
Sratasys. (1990). Retrieved from http://www.stratasys.com/3d-printers/technologies/fdm-
technology
53
Stephanie M. Santoso, B. D. (2013). Destroying by Creating: Exploring the Creative Destruction
of 3D Printing Through Intellectual Property. Retrieved from
http://www.truststc.org/education/reu/13/Papers/HorneB_Paper.pdf
Techmer. (2015). http://www.techmerpm.com/2015/03/10/techmer-pm-to-showcase-3-d-printed-
shelby-cobra-at-npe2015-booth/. Retrieved from http://www.techmerpm.com/.
Xue Yan, P. G. (1996). A review of Rapid Prototyping technologies and systems. Computer-Aided
Design, 307-318.

54
APPENDIX A: LIST OF TABLES
Table 11: Rectangular Prism Measured values
RECTANGULAR PRISM 1 [P1] Part No.
ABS PLA L W L W
1 0.9853 0.5002 1.0203 0.5201
2 0.9883 0.5003 1.0021 0.5180
3 0.9856 0.5009 1.0193 0.5182
4 0.9853 0.5000 0.9855 0.5070
5 0.9842 0.5009 1.0228 0.5196
6 0.9825 0.5192 1.0204 0.5196
7 0.9855 0.5003 1.0192 0.5198
8 0.9859 0.5187 1.0152 0.5213
9 0.9852 0.5007 1.0193 0.5204
10 0.9856 0.5181 1.0225 0.5183
Table 12: Rectangular Prism Measure of Inaccuracy.
RECTANGULAR PRISM 1 [P1] |LW| Part No. ABS PLA
1-L 0.5 -W 1-L 0.5 -W 1
0.0147 0.0002 0.0203 0.0201 2
0.0117 0.0003 0.0021 0.018 3
0.0144 0.0009 0.0193 0.0182 4
0.0147 0 0.0145 0.007 5
0.0158 0.0009 0.0228 0.0196 6
0.0175 0.0192 0.0204 0.0196 7
0.0145 0.0003 0.0192 0.0198 8
0.0141 0.0187 0.0152 0.0213 9
0.0148 0.0007 0.0193 0.0204 10
0.0144 0.0181 0.0225 0.0183
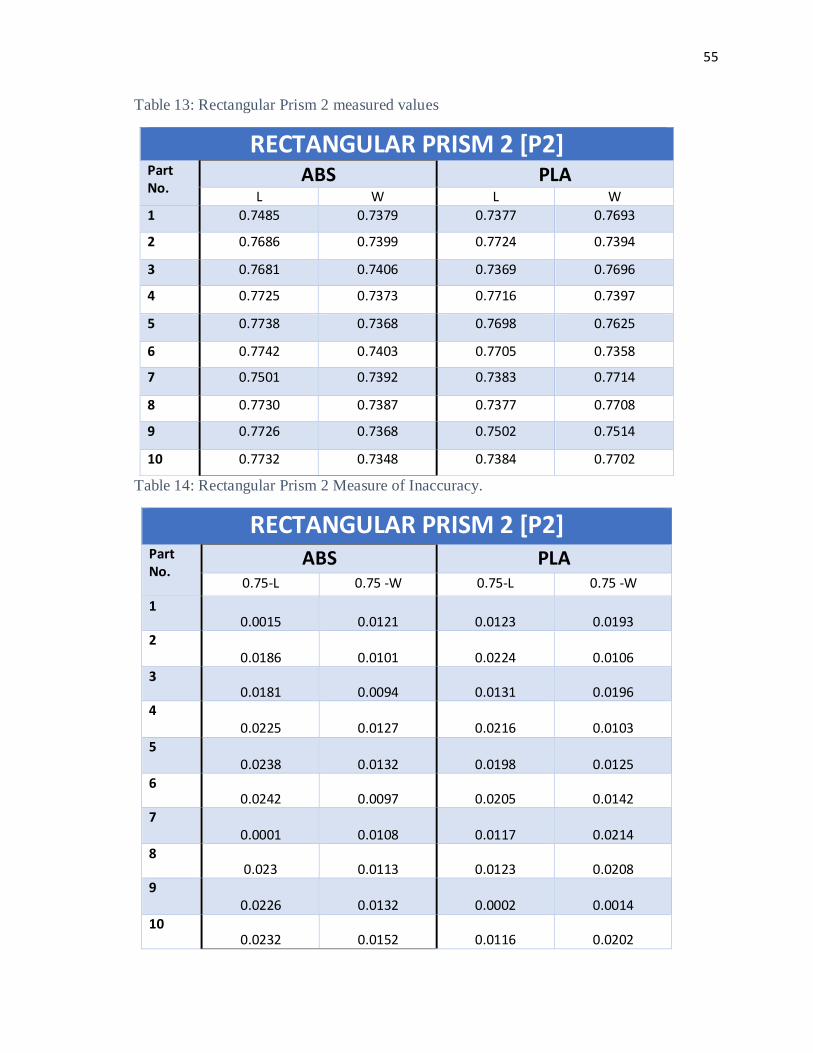
55
Table 13: Rectangular Prism 2 measured values
RECTANGULAR PRISM 2 [P2] Part No.
ABS PLA L W L W
1 0.7485 0.7379 0.7377 0.7693
2 0.7686 0.7399 0.7724 0.7394
3 0.7681 0.7406 0.7369 0.7696
4 0.7725 0.7373 0.7716 0.7397
5 0.7738 0.7368 0.7698 0.7625
6 0.7742 0.7403 0.7705 0.7358
7 0.7501 0.7392 0.7383 0.7714
8 0.7730 0.7387 0.7377 0.7708
9 0.7726 0.7368 0.7502 0.7514
10 0.7732 0.7348 0.7384 0.7702
Table 14: Rectangular Prism 2 Measure of Inaccuracy.
RECTANGULAR PRISM 2 [P2]
Part No.
ABS PLA 0.75-L 0.75 -W 0.75-L 0.75 -W
1 0.0015 0.0121 0.0123 0.0193
2 0.0186 0.0101 0.0224 0.0106
3 0.0181 0.0094 0.0131 0.0196
4 0.0225 0.0127 0.0216 0.0103
5 0.0238 0.0132 0.0198 0.0125
6 0.0242 0.0097 0.0205 0.0142
7 0.0001 0.0108 0.0117 0.0214
8 0.023 0.0113 0.0123 0.0208
9 0.0226 0.0132 0.0002 0.0014
10 0.0232 0.0152 0.0116 0.0202

56
Table 15: Sphere 1 measured values.
SPHERE 1
Part No.
ABS PLA
D1 D2 D3 D1 D2 D3
1 0.4784 0.4802 0.4825 0.5238 0.5247 0.5231
2 0.5193 0.4834 0.4972 0.5187 0.5236 0.4816
3 0.5000 0.5198 0.4996 0.4858 0.4785 0.4795
4 0.4854 0.4662 0.4995 0.4897 0.4845 0.4883
5 0.5004 0.4777 0.4847 0.5196 0.5204 0.5152
6 0.4786 0.4751 0.4987 0.5186 0.5147 0.4908
7 0.4884 0.4768 0.4769 0.5213 0.5166 0.5151
8 0.4818 0.4769 0.4756 0.5225 0.4872 0.4883
9 0.4812 0.4774 0.4936 0.5216 0.5186 0.5214
10 0.4841 0.4978 0.4993 0.5184 0.4875 0.4906
Table 16: Sphere 1 measure of inaccuracy.
SPHERE 1
Part No.
ABS PLA
0.5-D1 0.5-D2 0.5-D3 0.5-D1 0.5-D2 0.5-D3
1 0.0216 0.0198 0.0175 0.0238 0.0247 0.0231
2 0.0193 0.0166 0.0028 0.0187 0.0236 0.0184
3 0 0.0198 0.0004 0.0142 0.0215 0.0205
4 0.0146 0.0338 0.0005 0.0103 0.0155 0.0117
5 0.0004 0.0223 0.0153 0.0196 0.0204 0.0152
6 0.0214 0.0249 0.0013 0.0186 0.0147 0.0092
7 0.0116 0.0232 0.0231 0.0213 0.0166 0.0151
8 0.0182 0.0231 0.0244 0.0225 0.0128 0.0117
9 0.0188 0.0226 0.0064 0.0216 0.0186 0.0214
10 0.0159 0.0022 0.0007 0.0184 0.0125 0.0094
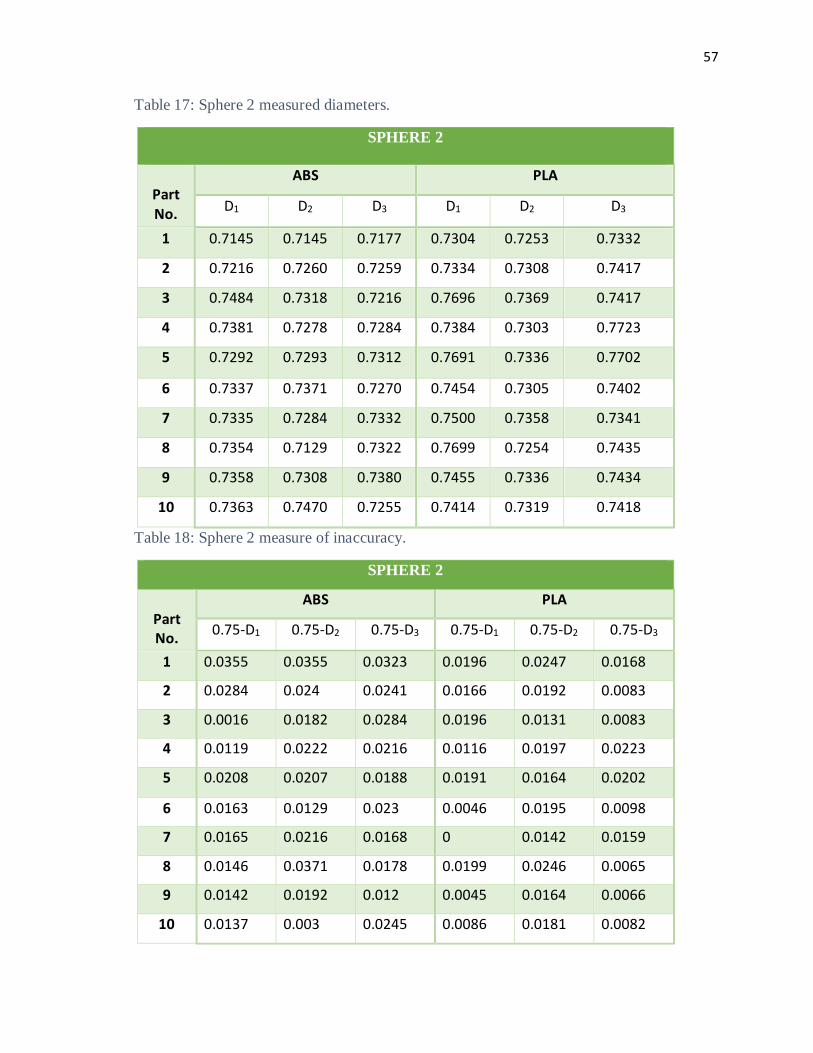
57
Table 17: Sphere 2 measured diameters.
SPHERE 2
Part No.
ABS PLA
D1 D2 D3 D1 D2 D3
1 0.7145 0.7145 0.7177 0.7304 0.7253 0.7332
2 0.7216 0.7260 0.7259 0.7334 0.7308 0.7417
3 0.7484 0.7318 0.7216 0.7696 0.7369 0.7417
4 0.7381 0.7278 0.7284 0.7384 0.7303 0.7723
5 0.7292 0.7293 0.7312 0.7691 0.7336 0.7702
6 0.7337 0.7371 0.7270 0.7454 0.7305 0.7402
7 0.7335 0.7284 0.7332 0.7500 0.7358 0.7341
8 0.7354 0.7129 0.7322 0.7699 0.7254 0.7435
9 0.7358 0.7308 0.7380 0.7455 0.7336 0.7434
10 0.7363 0.7470 0.7255 0.7414 0.7319 0.7418
Table 18: Sphere 2 measure of inaccuracy.
SPHERE 2
Part No.
ABS PLA
0.75-D1 0.75-D2 0.75-D3 0.75-D1 0.75-D2 0.75-D3
1 0.0355 0.0355 0.0323 0.0196 0.0247 0.0168
2 0.0284 0.024 0.0241 0.0166 0.0192 0.0083
3 0.0016 0.0182 0.0284 0.0196 0.0131 0.0083
4 0.0119 0.0222 0.0216 0.0116 0.0197 0.0223
5 0.0208 0.0207 0.0188 0.0191 0.0164 0.0202
6 0.0163 0.0129 0.023 0.0046 0.0195 0.0098
7 0.0165 0.0216 0.0168 0 0.0142 0.0159
8 0.0146 0.0371 0.0178 0.0199 0.0246 0.0065
9 0.0142 0.0192 0.012 0.0045 0.0164 0.0066
10 0.0137 0.003 0.0245 0.0086 0.0181 0.0082

58