Measures of Job Satisfaction WHAT MAKES A GOOD JOB? EVIDENCE FROM OECD COUNTRIES
43
Please cite this paper as: Clark, A. E. (1998), “Measures of Job Satisfaction: What Makes a Good Job? Evidence from OECD Countries”, OECD Labour Market and Social Policy Occasional Papers, No. 34, OECD Publishing. http://dx.doi.org/10.1787/670570634774 OECD Labour Market and Social Policy Occasional Papers No. 34 Measures of Job Satisfaction WHAT MAKES A GOOD JOB? EVIDENCE FROM OECD COUNTRIES Andrew E. Clark
-
Upload
independent -
Category
Documents
-
view
3 -
download
0
Transcript of Measures of Job Satisfaction WHAT MAKES A GOOD JOB? EVIDENCE FROM OECD COUNTRIES

Please cite this paper as:
Clark, A. E. (1998), “Measures of Job Satisfaction: WhatMakes a Good Job? Evidence from OECD Countries”,OECD Labour Market and Social Policy OccasionalPapers, No. 34, OECD Publishing.http://dx.doi.org/10.1787/670570634774
OECD Labour Market and SocialPolicy Occasional Papers No. 34
Measures of JobSatisfaction
WHAT MAKES A GOOD JOB? EVIDENCE FROMOECD COUNTRIES
Andrew E. Clark

Unclassified DEELSA/ELSA/WD(98)5
Organisation de Coopération et de Développement Economiques OLIS : 13-Aug-1998Organisation for Economic Co-operation and Development Dist. : 14-Aug-1998__________________________________________________________________________________________
Or. Eng.DIRECTORATE FOR EDUCATION, EMPLOYMENT, LABOUR AND SOCIAL AFFAIRSEMPLOYMENT, LABOUR AND SOCIAL AFFAIRS COMMITTEE
LABOUR MARKET AND SOCIAL POLICY - OCCASIONAL PAPERS No. 34
MEASURES OF JOB SATISFACTIONWHAT MAKES A GOOD JOB? EVIDENCE FROM OECD COUNTRIES
Andrew E. Clark
68187
Document complet disponible sur OLIS dans son format d’origine
Complete document available on OLIS in its original format
Unclassified
DE
EL
SA/E
LSA
/WD
(98)5 O
r. Eng.
Cancels & replaces the same document:distributed 07-Aug-1998
DEELSA/ELSA/WD(98)5
2
DIRECTORATE FOR EDUCATION,EMPLOYMENT, LABOUR AND SOCIAL AFFAIRS
OCCASIONAL PAPERS
This series is designed to make available to a wider readership selected labour market and social policystudies prepared for use within the OECD. Authorship is usually collective, but principal writers arenamed. The papers are generally available only in their original language -- English or French -- with asummary in the other.
Comment on the series is welcome, and should be sent to the Directorate for Education, Employment,Labour and Social Affairs, 2, rue André-Pascal, 75775 PARIS CEDEX 16, France. Additional, limitedcopies are available on request.
The opinions expressed and arguments employed here are the responsibilityof the author(s) and do not necessarily reflect those of the OECD
Applications for permission to reproduce or translateall or part of this material should be made to:
Head of Publications ServiceOECD
2, rue André-Pascal75775 Paris, CEDEX 16
France
Copyright OECD 1998

DEELSA/ELSA/WD(98)5
3
SUMMARY
Most taxonomies of "good jobs" and "bad jobs" are centred around pay and hours of work. Thispaper uses uses information on 7 000 workers in OECD countries (emanating from the 1989 wave of theInternational Social Survey Programme) to complement traditional measures of job quality with worker-supplied information regarding a wide variety of characteristics of the current job. The responses totwenty different questions are collapsed into six summary variables measuring workers’ evaluations of:
− Pay;− Hours of work;− Future Prospects (promotion and job security);− How hard or difficult the job is;− Job content: interest, prestige and independence; and− Interpersonal relationships (with co-workers and with management).
An advantage of asking workers about these job attributes is that many of them, such asinterpersonal relationships, job interest and job difficulty, are not measurable in the way that income andhours are. Another is that items may not have a linear relationship with job quality: a 35 hour per week jobmay be too long for some and too short for others; there is no way of knowing without actually asking theworkers concerned.
The first part of the report looks at workers’ values. In this sample of 7 000 workers, pay is saidto be one of the least important job characteristics. On the contrary, the most important facets are said tobe job security and whether the job is interesting. These rankings are very consistent across gender andcountry.
The six summary measures above are then used to provide an answer to the question "who hasgot the good jobs"? Overall, women do somewhat better than men, and older workers do better thanyounger workers. These generalisations cover up more complex patterns at the disaggregated level: forsome individual measures of job quality the opposite relationships are observed. The joint analysis of jobvalues and job outcomes shows that workers sort themselves into jobs which offer the rewards that theyvalue: those who say that pay is very important tend to be in jobs that pay well, for example.
The last part of the report considers the relation between these many job quality variables andjob satisfaction. Regression analysis shows that overall job satisfaction is strongly correlated with all ofthe job quality measures: as such it acts as a useful summary measure of a number of job characteristicsthat are typically not observed. Breaking down this analysis by sex and by age, it can be shown that jobsatisfaction is more strongly correlated with income for men, and more strongly correlated with hours ofwork for women, that hard or difficult work is not correlated with younger workers’ job satisfaction, andthat income becomes more important with age whereas promotion opportunities become less important.
DEELSA/ELSA/WD(98)5
4
TABLE OF CONTENTS
SUMMARY.................................................................................................................................................... 3
INTRODUCTION.......................................................................................................................................... 5
WHAT MAKES A GOOD JOB?................................................................................................................... 7
Pay............................................................................................................................................................... 9Hours of work ............................................................................................................................................. 9Future prospects - promotion and job security ......................................................................................... 10How difficult is the job? ........................................................................................................................... 11Job content: interest, prestige and independence...................................................................................... 11Interpersonal relationships ........................................................................................................................ 12Values and Outcomes ............................................................................................................................... 12
THE DISTRIBUTION OF GOOD JOBS..................................................................................................... 13
REGRESSION ANALYSIS......................................................................................................................... 14
MULTIPLE DEPRIVATION....................................................................................................................... 16
OVERALL MEASURES OF JOB QUALITY ............................................................................................ 17
CONCLUSION............................................................................................................................................. 19
NOTES ......................................................................................................................................................... 21
REFERENCES ............................................................................................................................................. 23
VARIABLE DEFINITIONS ........................................................................................................................ 25
ANNEX - TABLES...................................................................................................................................... 28
DEELSA/ELSA/WD(98)5
5
INTRODUCTION
1. Consideration of the worker’s lot has until recently been concentrated on his/her remuneration. Arecent literature, driven in part by the observed disparity between North American and European hours ofwork, has introduced an additional emphasis on the length of the working week; a related strand haslooked at involuntary part-time work. The current report uses comparable survey data across nine differentOECD countries to extend the above to a number of other job characteristics which workers say theyvalue.
2. This report examines the distribution of "good jobs" and "bad jobs", not as defined by an outsideobserver but as experienced and reported by workers themselves. A (partial) taxonomy of six componentsof a good job, as viewed by workers, is presented: pay; hours of work (both overwork and underwork);future prospects (promotion and job security); how hard or difficult the job is; job content (interest,prestige and independence); and interpersonal relationships. These are all argued to be importantcorrelates of a good job, from the worker’s point of view, or of job satisfaction.
3. Job satisfaction is important in its own right as a part of social welfare, and this (simple)taxonomy allows a start to be made on such questions as "In what respects are older workers’ jobs betterthan those of younger workers?" (and vice-versa), "Who has the good jobs?" and "Are good jobs beingreplaced by bad jobs?". In addition, measures of job quality seem to be useful predictors of future labourmarket behaviour. Workers’ decisions about whether to work or not, what kind of job to accept or stay in,and how hard to work are all likely to depend in part upon the worker’s subjective evaluation of theirwork, in other words on their job satisfaction.
4. A small body of research in economics and psychology has considered these questions byrelating satisfaction scores to subsequent observable labour market behaviour. Perhaps the most obviousexpected correlation is with quits: workers who are dissatisfied should be more likely to quit (ifsatisfaction can be compared between individuals). Freeman (1978) uses American panel data to showthat job satisfaction is a significant predictor of quits, with an effect which is, in two of the three datasetsexamined, at least as powerful as that of wages. Similar results using American data are found in Akerlof,Rose and Yellen (1988) and McEvoy and Cascio (1985), and by Clark, Georgellis and Sanfey (1998)using ten waves of German panel data. Other research has found that job satisfaction is negativelycorrelated with absenteeism (Clegg, 1983) and non-productive and counter-productive work (Mangioneand Quinn, 1975)1 . Last, Clark (1997) concludes that potential job satisfaction may help to explain thedecision to work itself: dissatisfying and/or unpleasant jobs discourage labour force participation. Animplication is that we only observe a sub-sample of potential workers - there are some who don’t find thejobs on offer attractive enough to participate. One can argue that this phenomenon will be more importantfor women than for men, and for older rather than for middle-aged individuals. It may also be relevant foryounger age-groups where some can choose to stay on in school.
DEELSA/ELSA/WD(98)5
6
5. This report suggests that there are more aspects of a good or satisfying job than just pay andhours. Concentration on only one or two of these aspects is likely to give a misleading picture both ofwhere the good jobs are2 and of workers’ behaviour.
DEELSA/ELSA/WD(98)5
7
WHAT MAKES A GOOD JOB?
6. Analysis of the labour market typically emphasises pay and hours of work. For example, studiesof differences in labour market outcomes between different groups (males and females; blacks and whites)focus almost exclusively on wages, with a subsidiary interest in hours of work. However, it seems likelythat many different aspects of a job, in addition to wages and hours of work, are valuable to workers.
7. Some supporting evidence for this view comes from the 1989 International Social SurveyProgramme (ISSP) dataset. The ISSP is a continuing program of cross-national collaboration carried outby a group of national research institutes. Each year the ISSP surveys focus on a different area. The mostuseful for the analysis of the different components of job quality is that of 1989 on "Work Orientation", inwhich workers provide information on a wide range of job attributes. The 1989 survey containsinformation on nine OECD countries3 . Restricting the sample to those aged between 16 and 65 years old,the numbers of workers interviewed in each country is as follows:
Number of workers interviewed in OECD countries:1989 International Social Survey Programme (ISSP) dataset.
Austria 864Hungary 596Ireland 467Italy 576Netherlands 691Norway 1 175United Kingdom 1 051USA 846West Germany 636Total 6 902
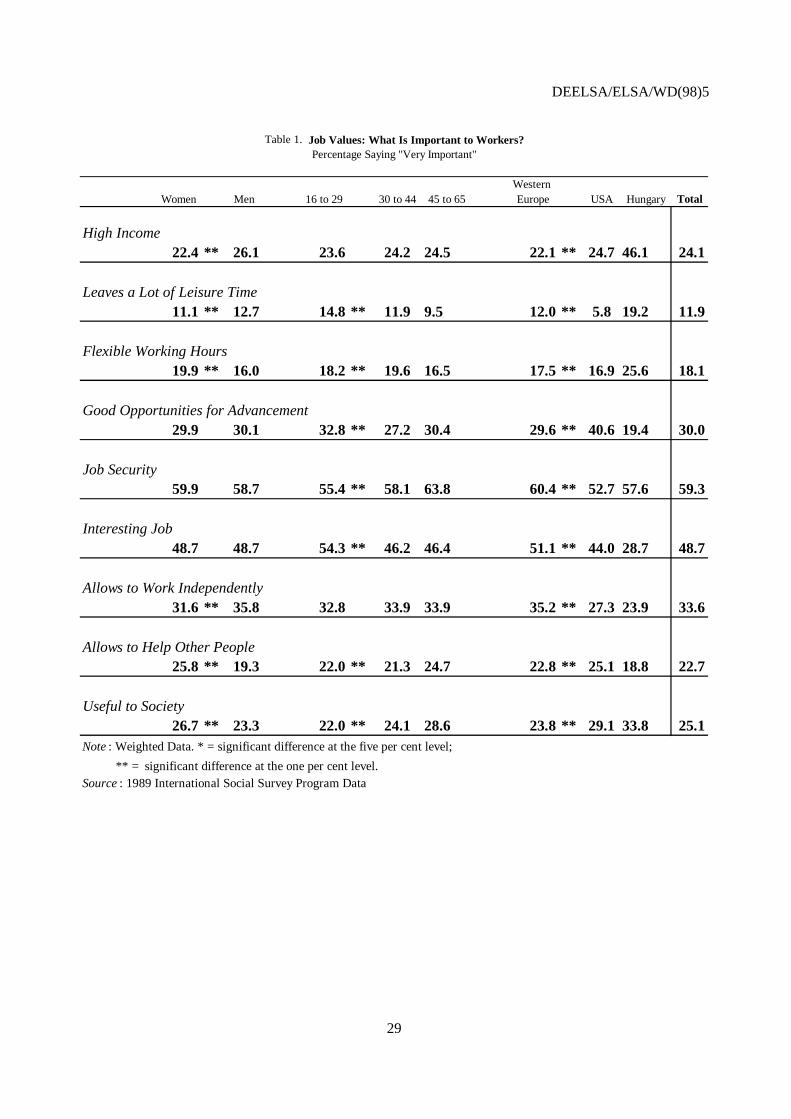
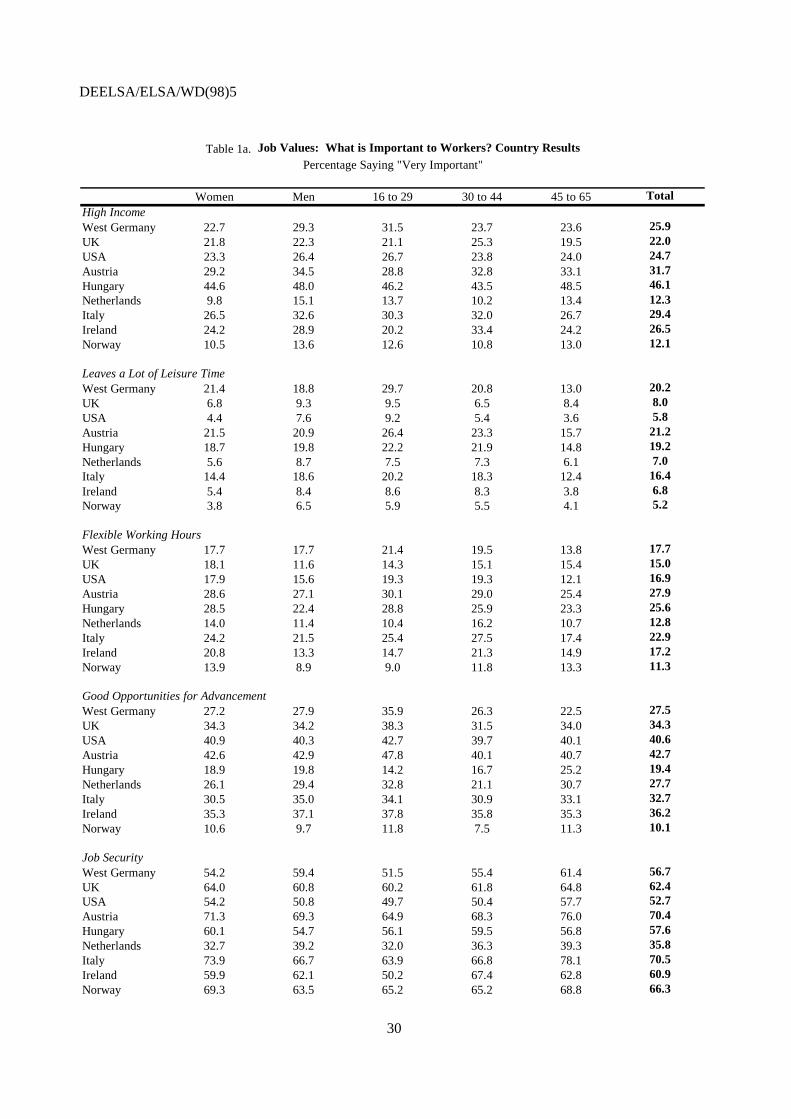
8. Workers in the 1989 ISSP were asked to evaluate nine different aspects of a job, using fiverankings from "Not at all important" to "Very Important". The job aspects presented were: High income;Leaves a lot of leisure time; Flexible working hours; Good opportunities for advancement; Job security;Interesting job; Allows to work independently; Allows to help other people; and Useful to society. Table 1shows the percentage of workers across all countries who ranked the aspect in question as "VeryImportant" (results for individual countries are to be found in Table 1A). As for most of the data presentedhere, figures are presented separately for men and women, for three age-groups (16 to 29, 30 to 44, and 45to 65), and for the USA, Hungary, and Western Europe (the latter being the weighted average of the sevenWestern European countries above)4. The *’s to the right of the figures for women indicate whether thereis a significant difference in the percentage saying a job aspect is very important between men andwomen. Similarly, the *’s to the right of the figures for 16-29 year olds indicate whether there is asignificant difference in the percentage saying a job aspect is very important across the three age groups.Last, the *’s to the right of the figures for Western Europe indicate whether there is a significant difference

DEELSA/ELSA/WD(98)5
8
in the percentage saying a job aspect is very important between Western Europe, Hungary and the UnitedStates.
9. Table 1 shows that, with the exception of Hungary, pay is ranked as one of the least importantaspects of a job. In addition, the two job aspects pertaining to hours of work (flexible hours and leaves alot of leisure time) are the lowest-rated of the nine characteristics considered. The highest-ranked aspects(across all countries) are job security and job interest, then promotion opportunities and the ability to workindependently. There is remarkable consistency between men and women and across age groups withrespect to what is important in a job5 . There is some evidence that American workers are more interestedin promotion opportunities than are Western Europeans, and less interested in job security and leisuretime.
10. Based partly on the job aspects listed in Table 1, and partly on standard categories of job qualityused in Management and Work Psychology (see Warr, 1998, for example), the six following broad groupsof job attributes have been identified:
− Pay.
− Hours of work.
− Future Prospects.
− How hard or difficult the job is.
− Job content: interest, prestige and independence.
− Interpersonal relationships.
These categories are not exhaustive, but serve to summarise many of the job characteristics that workersfind important6 .
11. The key question is what information we have about these attributes. A general point is thatsome of these characteristics are not measurable in the way that income and hours are. This applies tointerpersonal relationships, job interest and job difficulty, among others. For these types of items, we haveto pass via the worker him/herself to have any idea of their level and distribution. In addition, many ofthem do not appear in the kind of large-scale surveys upon which economists (and governments) dependfor much of their statistical information. Another point is that other items in the list can be measured, butit is not clear that they have a linear relationship with job quality. Most would agree that, ceteris paribus,a higher-paid job is a better job (at least up to a certain point), but the situation with respect to hours, forexample, is less clear-cut. A 35-hour-per-week job may be too long for some people and too short forothers. There is no way of knowing without asking workers how many hours they would prefer to work.Thinking of job security, which is one of the components of future prospects, the same qualification canbe applied to temporary jobs: some workers want them and others do not 7.
12. The approach used in this report is to complement the cross-national information obtained fromnational statistical agencies with a wide range of measures reported by workers in the 1989 ISSP data8 .The full details of the ISSP questions used below, and of the variables constructed from them, arecontained in Annex A. The remainder of this section discusses each of the six job quality categories listedabove in turn.

DEELSA/ELSA/WD(98)5
9
Pay
13. Income is typically found to be positively correlated with overall job satisfaction (seeBlanchflower, Oswald and Warr, 1993, for example). There is probably more information available aboutpay than about any other job characteristic, and no attempt at a synthesis will be made here. In the OECD,some countries, such as Canada, Switzerland and the United States, are considered to have (on average)higher wages than others, such as the Czech Republic, Hungary, Mexico, Poland and Turkey (see OECDNational Accounts data). The contentious issue of the distribution of low pay between countries andbetween groups of workers was treated in OECD (1996b).
14. One strand of research has suggested that relative, as well as absolute, income matters toworkers. In this formulation, workers care about their rank or relative position in some incomedistribution, as well as about the dollar amount of their paycheck (see Frank, 1985 and 1993). Attempts tofind supporting empirical evidence have had to tackle the thorny question of "Relative to whom?", i.e.Who is in the reference group? Some recent work has considered the reference group as those with thesame characteristics as the individual and who do the same type of job. Workers’ job satisfaction has beenshown to fall as the pay of this reference group rises: see Clark and Oswald (1996), Lévy-Garboua andMontmarquette (1997) and Donohue and Heywood (1997) for results using British, Canadian andAmerican data respectively.
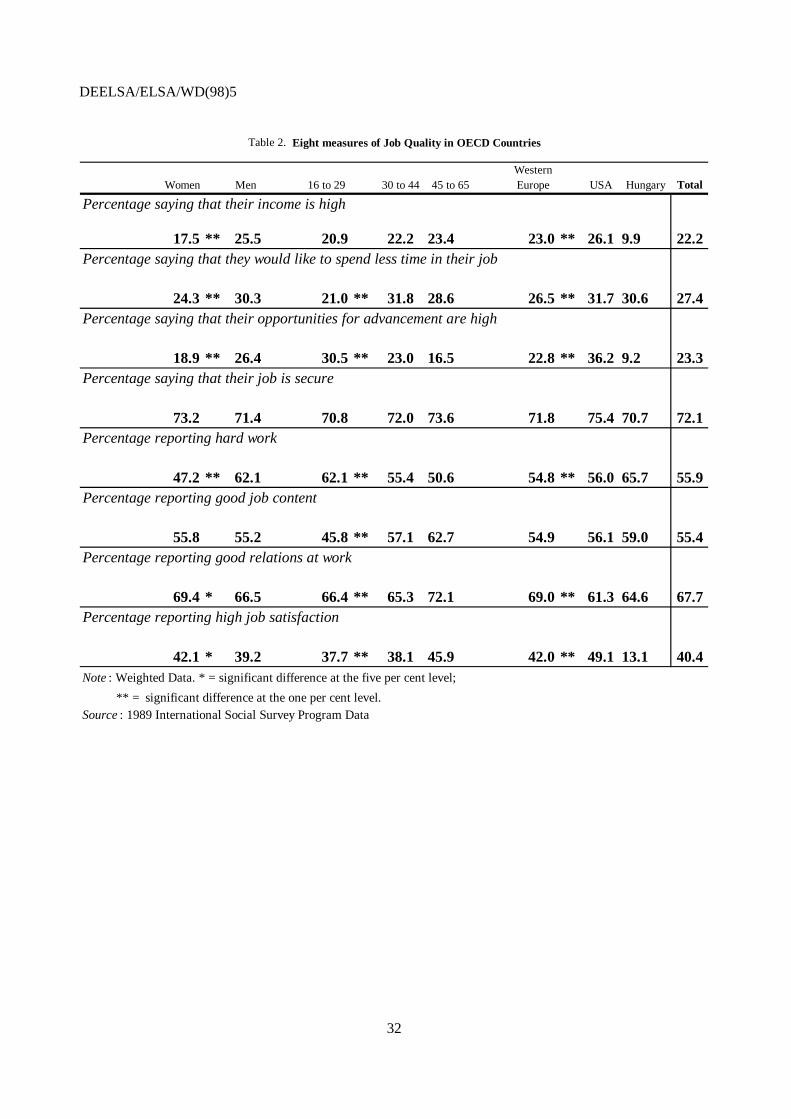
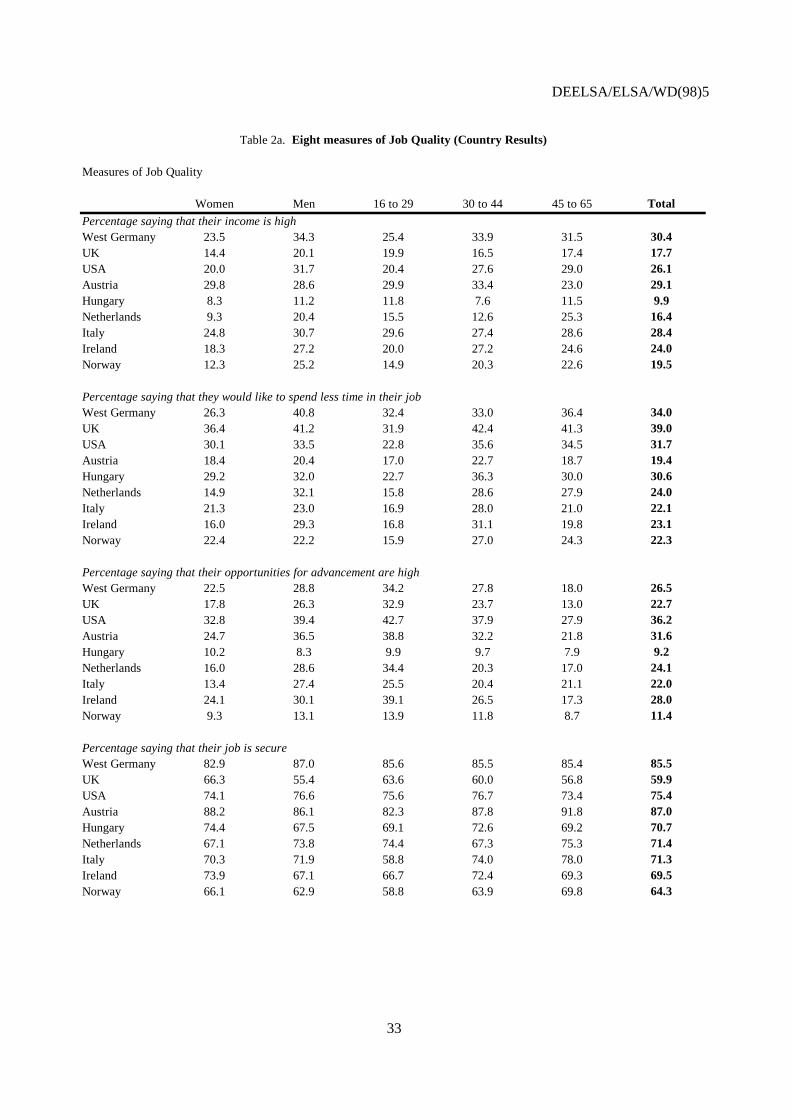
15. The ISSP data contain a measure of workers' income which may pick up both absolute andrelative components: the response to the question "Is your income high?". The percentage who evaluatetheir income as high is presented in the first panel of Table 2. Overall, less than a quarter of workers agreewith this statement. The figures in Annex B show that workers in Austria, Italy, the USA and WestGermany are most likely to consider their income as high, with the lowest figure being found in Hungary.Men are more likely than women to rate their income as high, and there is a positive correlation with age.
16. The wage is typically only part of a job's financial rewards. A complete picture of theremuneration received by the employee would have to take into account non-pecuniary or fringe benefits.Unfortunately, no information on these benefits is available in the current dataset.
Hours of work
17. Hours of work have recently become an important policy issue, figuring in debates over bothpotential cures for Europe's high unemployment and discussions of overwork. OECD figures show that thehighest average hours figures are found in the Czech Republic, Ireland, Japan, Mexico, Turkey and theUSA, while Northern European countries (France, Germany, Netherlands, Norway and Sweden) post thelowest. OECD (1997b) provides information about both cross-country differences in average hoursworked and developments over time (downward in almost all countries, except for the USA). Men worklonger hours than women, and younger workers work longer hours than older workers.
18. An alternative approach is to consider the percentage working part-time. In OECD countries in1996, this reached a maximum of 32 per cent of workers in Australia and was 25 per cent or more inIceland, the Netherlands, Norway and Switzerland. At the other end of the scale, this figure was 3 per centin the Czech Republic and Hungary, and between 6 and 10 per cent in Finland, Greece, Korea, Portugal,Spain and Turkey. Less than 3 per cent of men in Austria, the Czech Republic, Hungary, Luxembourg,Spain and Turkey work part-time. In general, the percentage working part-time is much higher for womenthan for men.

DEELSA/ELSA/WD(98)5
10
19. It is important to bear in mind the caveat evoked above when considering this information:actual hours have to be considered in terms of their relation to workers’ desired hours. At the same time asaverage hours have been falling in most countries, the percentage of workers classified as involuntarypart-time has risen from its trough level in 1990. The figures in OECD (1995) show that involuntary part-time work is more common for women than for men (affecting over eight per cent of female workers inAustralia, Canada, the Netherlands and New Zealand, compared to figures of around two per cent for menin most countries), and reaches its highest level for younger workers. There is some evidence of a U-shaped relationship with age for men, with a higher incidence of involuntary part-time work being foundfor workers nearing retirement age.
20. On the opposite side of the coin from involuntary part-time work (which might be considered asunderwork) is overwork9 . Here we have a relevant question in the ISSP data: the percentage of workerswho would like to spend less time in their job. The single country numbers show that 40 per cent of allworkers in the United Kingdom wish to reduce their hours of work. At the other end of the scale, a desirefor fewer hours is expressed by less than 20 per cent of workers in Austria. Within countries, the desire forfewer hours is strongly negatively correlated with the worker’s actual hours of work. However, acrosscountries there is no such relationship. The average figure for the percentage wishing to work fewer hoursis low for the countries with the lowest actual average hours worked in the 1989 ISSP (the Netherlandsand Norway), as might be imagined, but is also low for the countries with the highest hours workedfigures (Austria and Ireland). In Table 2, women and younger workers are less likely to want to workfewer hours. Overall, a somewhat higher percentage of American workers than European workers wish toreduce their hours of work.
21. Another aspect which falls under the general rubric of hours of work, but for which no numbersare presented here, is the time taken to travel to work (and the public transport available, number ofchanges etc.). This question sometimes appears in surveys, of the labour force or otherwise 10 .
Future prospects - promotion and job security
22. Income and hours provide (as, indeed, do job difficulty, job content and interpersonalrelationships) a snapshot of a job at a point in time. As Table 1 made clear, of interest also are the job’sfuture prospects. Broadly speaking, these may be summarised as "What is the job going to be like in thefuture?" and "What are my chances of still being in this job in the future?".
23. Regarding promotion, workers in the ISSP are asked to rate their opportunities for advancementin their current job; the third panel of Table 2 shows the percentage of workers who say that theseopportunities are high. Overall, less than a quarter of workers find that their promotion opportunities arehigh (which is very close to the figure saying that their income is high). Women are less likely than mento report high promotion opportunities, perhaps reflecting their perception of the "Glass ceiling";promotion opportunities seem to decline with age. This is one of the few aspects of a good job presentedin this report for which younger workers do better than older workers.
24. With respect to job security, there has recently been a great deal of interest in the question ofwhether jobs have become less stable; job security is also the aspect of a job which the highest percentageof workers rate as very important in Table 1. Although evidence is mixed at best regarding recentdevelopments in the likelihood of job loss, one possibility is that the consequences of separation havebecome more unpleasant (see OECD, 1997a). A related issue is that of temporary employment. OECD(1996a) presents figures showing that temporary employment is more widespread for men than forwomen, and that its incidence falls sharply with age. In OECD countries, the largest figures for temporary
DEELSA/ELSA/WD(98)5
11
employment incidence are in Spain (34 per cent) and Australia (24 per cent); the lowest figures are in theUSA (2 per cent), Belgium (5 per cent), and Italy and the UK (both 7 per cent). Over the period 1983 to1994 there was a noticeable rise in temporary employment in Australia, France, Spain and theNetherlands, but little evidence of a generalised increase in incidence across all OECD countries.
25. In the ISSP survey, workers are asked whether their job is secure. The percentage agreeing withthis statement is shown in the fourth panel of Table 2. It is noticeable that over seventy per cent ofworkers agree or strongly agree that their job is secure. There is little variation by sex or by age in thismeasure of workers’ reported job security, nor is there much difference in its level between the UnitedStates and Western Europe11 .
26. Another element which could enter into this rubric of future prospects, but about which the ISSPdoes not contain any information, is the training that the worker receives at their current job.
How difficult is the job?
27. The second half of the list of six attributes of a good job moves into territory that has been less-well studied. The next indicator is that of the difficulty or "toughness" of a job. This is something whichwould be very difficult for an outside observer to measure, except in the most rigorous of case-studies;again, it becomes almost essential to obtain information from the workers themselves. An additionalargument for doing so is that certain jobs may be considered difficult by some workers, but not by others;or difficult in some combination of work conditions, but not in others. We cannot know unless we askthose who are doing the jobs.
28. The ISSP contains information concerning exhaustion, hard physical work, stress, dangerousconditions of work, unhealthy conditions, and physically unpleasant conditions. For example, 31 per centof the sample report stress at work always or often, and 77 per cent report it at least sometimes. Thefigures for physically unpleasant conditions of work are 15 per cent and 35 per cent respectively. Bothstress and physically unpleasant work conditions are reported more often by men than by women, and theincidence of stressful work rises with age, whereas that in physically unpleasant conditions declines withage.
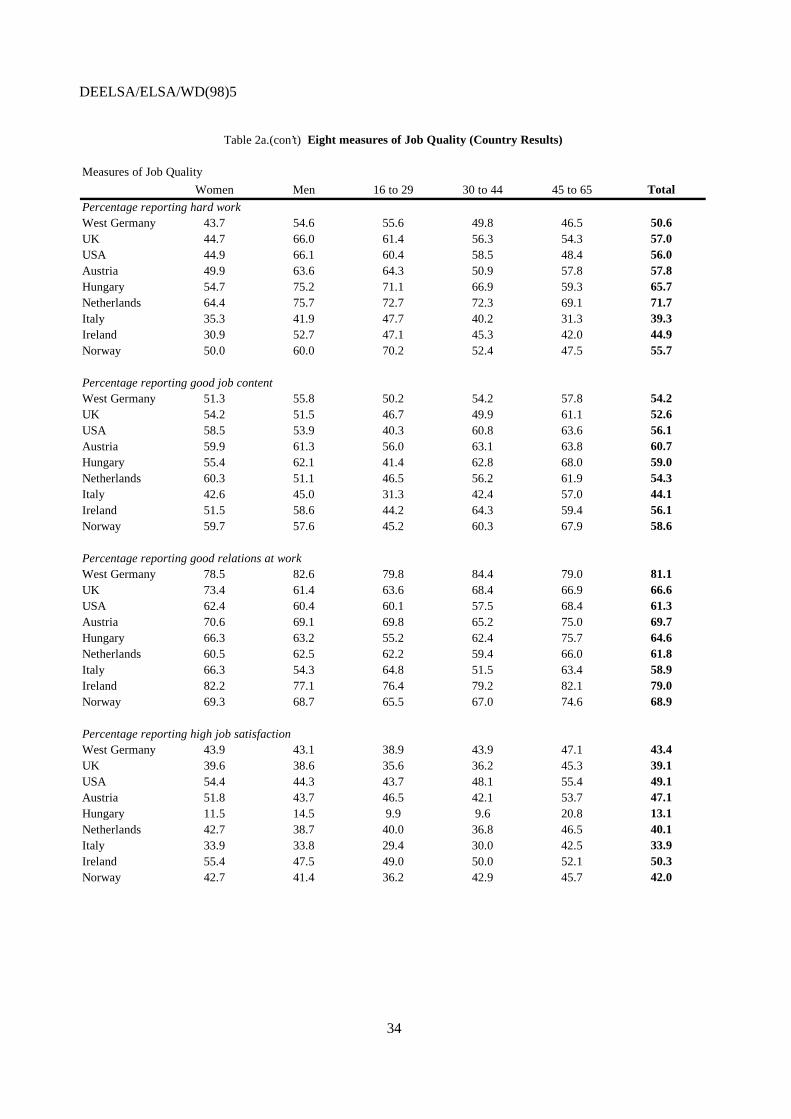
29. Information regarding the six measures above has been combined to construct a (1, 0) dummyvariable for "hard work" (see Annex A for details). This measure turns out to be that for which there is thegreatest difference between the sexes. Just under half of women report hard work (according to thedefinition used here), compared to nearly two-thirds of men, with the overall average figure being 56 percent. There is also a strong negative correlation between the incidence of hard work and age. Last,workers in Hungary are more likely to report hard work than workers in the other European countries inthis sample or workers in the United States.
Job content: interest, prestige and independence
30. The next composite indicator is one which concentrates more on the psychological aspects of thejob, rather than on its mechanics. As above, a single (1,0) measure, of "good job content" (for want of abetter expression) has been created from disparate information regarding boredom at work, whether thejob is interesting, whether the job helps other people, whether it is useful to society, if the respondent canwork independently, and if the respondent is free to plan his/her own work. These last two items measurethe job’s autonomy, often considered by Psychologists to be one of the key aspects of a job’s

DEELSA/ELSA/WD(98)5
12
attractiveness. Some of these six measures pick up the extent to which the job contributes to the worker’spersonal development.
31. Fifty five per cent of workers in the ISSP sample report good job content. For this measure, thereis no appreciable difference by sex. There is a strong positive correlation with age: it is again the youngerworkers who do worst on this measure. The country figures show little sharp differences, although it isnoticeable that, for this measure, the highest percentage reporting good job content is found amongstHungarian workers.
Interpersonal relationships
32. The last attribute of the job on which information is available in the ISSP dataset concernsrelations at work, both with co-workers and with management. Unfortunately, workers were not askedhow important relations at work are (in the battery of questions whose responses are summarised in Table1), but casual observation suggests that how well the individual "gets on" with the other people at work isa key part of how that job is perceived.
33. Workers were asked to evaluate both relations between management and employees, andrelations between workmates / colleagues. A job was characterised as having "good relations" if theworker reported that both were either quite or very good. Overall, two-thirds of workers in this datasethave jobs characterised by good relations. Women are slightly more likely to report good relations thanare men, and there is a noticeable positive correlation with age. Workers in the United States have thelowest figure for this measure of job quality.
Values and Outcomes
34. It is of interest to ask whether those who say that a certain characteristic of a job is veryimportant are more likely to have a job displaying that characteristic. Such a relationship might be takenas evidence of self-selection of workers into jobs which suit their preferences. Table 3 presents the resultsfor those job characteristics where we have information on both workers’ values and job outcomes.
35. The numbers in Table 3 should be read as follows. In the first row, 24.9 per cent of those whosaid that income was very important (see Table 1) had jobs in which they said their income was high, asopposed to 21.5 per cent of those who did not say that income was very important. As it turns out, this isone of the smallest percentage point differences in the table. Very large differences are found between thepercentages with jobs which are interesting/offer independence/useful/helpful, as a function of whetherthe worker said that the job characteristic in question was very important. All of these differences arestatistically significant at the one per cent level. As one might expect, workers seem to have a tendency tosort themselves into the jobs which offer the rewards that they value highly.
DEELSA/ELSA/WD(98)5
13
THE DISTRIBUTION OF GOOD JOBS
36. Having the above information on many different job characteristics available simultaneously fora large number of individuals allows us to say something about different types of dissatisfying jobs. Forexample, across the nine OECD countries in the 1989 ISSP, 37 per cent of workers report, according tothe definitions in section 2, both low income and low job content. This percentage is almost identical formales and females, but shows a strong negative correlation with age: 46 per cent of 16 to 29 year oldsreport such a combination, as opposed to 36 per cent of those aged 30 to 44 and 31 per cent of those aged45 to 65. Similarly, 45 per cent of workers report both hard work and poor job content. This is split up into39 per cent of female workers but 49 per cent of male workers, and there is again a negative correlationwith age.
37. One way of bringing all of this information together is to ask workers to do it for us. A summarymeasure available in the 1989 ISSP is that of overall job satisfaction. The last row of Table 2 shows thepercentage of workers who report that they are completely or very satisfied in their current job(respondents choose between seven possible answers, ranging from completely satisfied to completelydissatisfied). The numbers show that a somewhat higher percentage of women than men report high jobsatisfaction, and that there is a positive correlation with age, workers in the 45 to 65 age group being themost likely to have satisfying jobs. Workers in the United States are more likely than those in WesternEurope to report satisfying work, whereas by far the lowest percentage of satisfied workers is to be foundin Hungary12 .
38. Relating this summary measure to the individual components identified in Section 2, it can beseen from Table 2 that, on a broad canvas, more women than men do worse on the financial rewards of ajob (income and promotion), but that women are more likely to report better jobs in terms of how hard thejob is and relations at work. With respect to age, 16 to 29 year olds do worse than 45 to 65 year olds onfive measures out of seven in the first seven panels of Table 2, coming out better only in terms of hoursworked and promotion prospects.
39. The country distribution of good jobs is also somewhat mixed. Workers in the United States dobetter than their Western European counterparts in terms of income, promotion and job security; worse interms of hours worked and relations at work. The differences here are generally rather small though. Thelargest differences are found between Hungary and all other countries for the measures of income,promotion opportunities and hard work. However, Hungarian workers do roughly as well as those in othercountries in terms of their hours, job security and relations at work, and better in terms of job content,which shows to what extent generalisations can cover up more complex patterns at the more disaggregatedlevel.
DEELSA/ELSA/WD(98)5
14
REGRESSION ANALYSIS
40. To formalise the relationship of overall job satisfaction to the constituent parts described above,we can use regression analysis. Table 4 presents the results of a regression of the overall job satisfactionmeasure on the seven dummy variables described in Section 2. As the dependent variable takes on ordinalvalues from one to seven (i.e. someone with job satisfaction of four is not twice as satisfied as someonewith job satisfaction of two), ordered probit regression techniques have been used13 . Results are presentedfor all workers (for whom information on all of Section 2’s measures is available), and separately by sexand by age group14 .
41. The estimated coefficients show that all seven measures of job quality are significantlycorrelated with overall job satisfaction. As all of the right-hand side variables are (1,0) dummies, we candirectly compare the size of their estimated coefficients. The largest impact on overall job satisfactioncomes from having good relations at work, followed by good job content. High income and goodpromotion opportunities have roughly the same effect on satisfaction, while the smallest (although stillsignificant) effect comes from job security.
42. It is not possible to compare the estimated coefficients across the equations for men and women,as the underlying distributions of the dependent variable are not the same. However, we can note that theeffect of high income on job satisfaction is more significant for men than for women, while the effect ofhours is more significant for women. These tie in with men’s higher evaluation of income, and lowerevaluation of hours, as an important aspect of the job in Table 1. With respect to age, the importance ofincome seems to rise with age, while that of promotion opportunities falls. Hard work is not correlatedwith overall job satisfaction for workers aged under thirty, whereas it is for older workers. Across all agegroups and both sexes, good relations at work remains the most important predictor of overall jobsatisfaction.
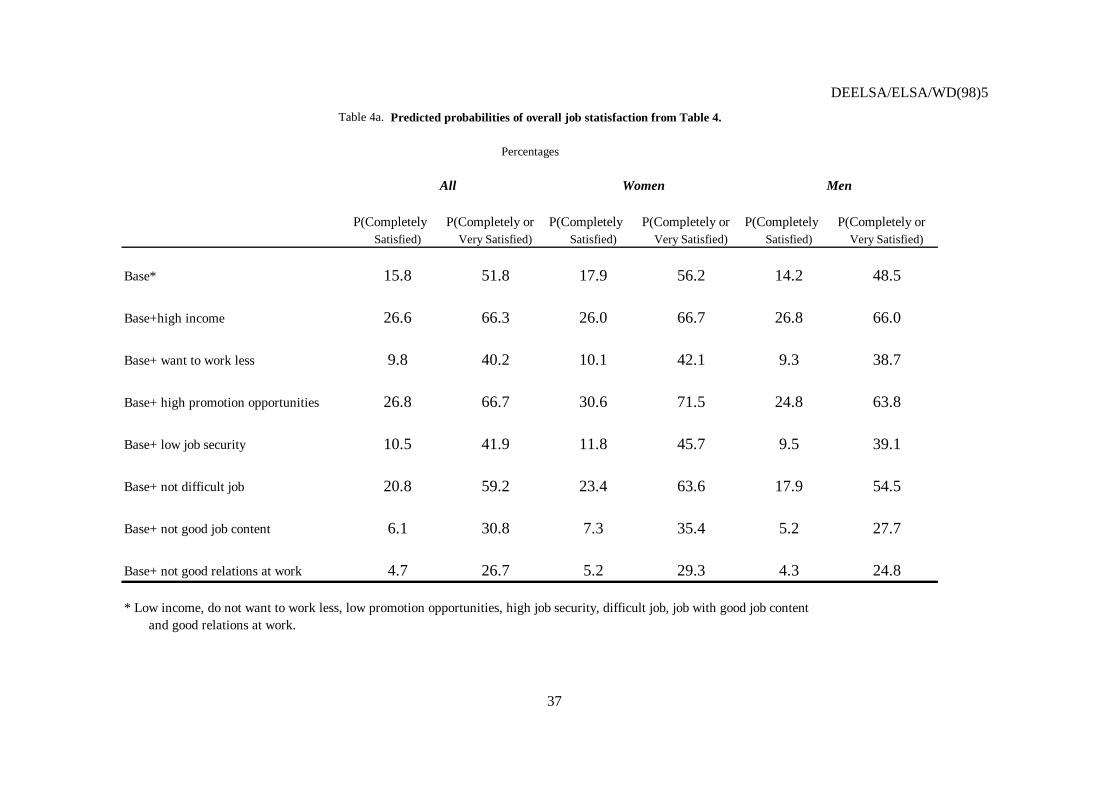
43. To aid with the interpretation of Table 4’s Ordered Probit estimates, the predicted probabilitiesof an individual replying "Completely satisfied" (the highest score) or either "Completely satisfied" or"Very satisfied" have been calculated. These are presented in Table 4a both for the overall regression incolumn one of Table 4 and for the separate regressions for men and women. The first row of Table 4ashows the predicted probabilities for a "baseline" individual, here defined as having a job with lowincome, in which do not want to work less, low promotion opportunities, high job security, which isdifficult, but with good job content and good relations at work15 . An individual with this type of job has a16 per cent probability of being completely satisfied and a 52 per cent chance of being completely or verysatisfied. A woman with this baseline job has somewhat higher probability of being satisfied than a man,as can be seen from the separate results by sex.
44. The effect of the different job quality measures on job satisfaction can then be calculated bychanging one of the job’s characteristics and seeing how these predicted probabilities change. The largesteffects come from giving the job poor job content or bad relations at work. Both of these cut theprobability of being completely or very satisfied from over fifty per cent to just over twenty five per cent.Their effect is of the same magnitude for women and for men. Giving this baseline job high income orhigh promotion opportunities raises the probability that a worker will be satisfied with it, although theimpact is smaller than those for job content or relations at work. Here there is a noticeable difference bysex. Men have a lower probability than women of being satisfied with the baseline job. However, if weadd high income, men and women now have an equal probability of being satisfied.
DEELSA/ELSA/WD(98)5
15
45. One natural experiment here is to continue with the analysis presented in Table 3 and askwhether income, for example, has a greater effect on job satisfaction when the worker values it highly.This interpretation of job satisfaction as a weighted sum of various different job characteristics, with theweights being provided by the importance which the worker attaches to the aspect in question, comesdirectly from the definition of job satisfaction proposed by Locke (1976).
46. Pairs of values and outcomes were tested on a one-by-one basis in Table 4’s job satisfactionregression. For example, concerning income, an additional dummy variable was entered representing highincome when the worker says income is very important. The dummies for thinking that an interesting job,a job with independence, a helpful job and a useful job are very important are interacted with the Table 4’sdummy variable for "Good Job Content", which summarises a number of such job characteristics (seeAnnex A).
47. The estimated coefficients from the interaction terms in these eight separate equations arepresented in Table 4b. The coefficients on the other variables in the regression are unchanged by theintroduction of interactions and remain very significant. Five out of the eight interactions tested yieldsignificant results. For example, in the second panel, wanting to work fewer hours is much more stronglyassociated with lower job satisfaction when the individual says that having a lot of leisure time is veryimportant. Similarly, having a secure job is more strongly associated with higher job satisfaction when theindividual values job security as very important. Significant results are also found for having good jobcontent and valuing either of an interesting job, a helpful job or a useful job as very important. Theseresults are consistent with a model where job satisfaction results from a combination of what the job islike, in terms of the characteristics listed in Section 2, and of how much the worker cares about thesecharacteristics.
DEELSA/ELSA/WD(98)5
16
MULTIPLE DEPRIVATION
48. The previous sections have considered the separate components of a good job and their relationto overall job satisfaction. The current section changes the focus slightly by asking whether an individualwho does badly on one aspect of a job is more likely to do badly on another. In other words, are therecertain types of workers who experience "multiple deprivation"?
49. It turns out that the measures of job quality are correlated amongst themselves. For example,from Table 2, across all countries 22 per cent of workers say that their income is high. However, thisfigure is 46 per cent for those who also say that they have good opportunities for promotion, compared to15 per cent for those who do not. One way of summarising the relationships between the individual jobquality measures is to look at the coefficient of correlation between them. This is presented in Table 5.
50. The numbers in Table 5 show significant relationships between the seven individual measures:only two out of the twenty one correlation coefficients are not significant at the one per cent level. Theodd man out, to some extent, is the desire to work fewer hours, which is correlated somewhat less stronglywith the other measures. This may show that the desire to work fewer hours is more a function of theindividual than of the job’s other qualities. In particular, there is no correlation between wanting to reducework hours and saying that the job is well-paid.
51. Although most correlations are significant, they are not noticeably high. The largest correlationcoefficient is 0.31 between high income and high promotion, and over two-thirds are less than 0.15 inabsolute value. One interpretation is that there may well be a trade-off between certain characteristics, inthe manner of a compensating differential. A job might be difficult or boring, but pay well, whereasanother might be both easy and boring. This will tend to reduce the correlation between the job qualitycomponents.

DEELSA/ELSA/WD(98)5
17
OVERALL MEASURES OF JOB QUALITY
52. This last section presents another approach to answering the question "Who’s got the goodjobs?", taking into account the correlations between the different constituent parts of job quality discussedabove.
53. Two measures of overall Job Quality are presented here. The first is overall job satisfaction, asalready discussed in Section 3. The second is based on the seven dummy variables for income, promotion,hard work etc. presented in Section 2. To calculate a composite measure of job quality, the informationcontained in these seven needs to be combined. One simple way of doing so is to count the number ofaspects, out of the seven above, for which an individual has a "good job". The resulting scale runs fromzero, for someone whose job is dissatisfying on all seven of the measures listed in Section 2 (i.e. in thefirst seven panels of Table 2), to seven for someone whose job is of "good quality" on all seven measures.Intermediate scores represent the varying degrees of job quality. For want of a better term, this has beencalled the Job Quality Count. Over the 5 600 individuals for whom all of the relevant information isavailable, the distribution of this indicator is as follows.
The Distribution of the Job Quality Count
Value Frequency Percentage Cumulative0 135 2.41 2.411 446 7.96 10.372 905 16.15 26.523 1 272 22.70 49.214 1 305 23.29 72.505 946 16.88 89.386 460 8.21 97.597 135 2.41 100.00
Total 5 604 100.00
54. Both the median and the modal value of this variable are four, and its mean is 3.5. The averageworker in this dataset has a job that is of good quality on between three and four of the criteria listed in thefirst seven panels of Table 2. Minorities of ten per cent have jobs that are of high quality on less than twocriteria or more than five criteria out of the seven.
55. Table 6 reports the results of a regression of these two measures of overall job quality on sex,three age dummies, and country dummies (the omitted category for the latter is West Germany). Thistable can be seen as the multivariate equivalent of Table 2. Ordered Probit techniques are used to estimatethe Overall Job Satisfaction and Job Quality Count equations16 (although an argument can be made that thelatter variable is cardinal).

DEELSA/ELSA/WD(98)5
18
56. The results are consistent across the regressions. For both measures of job quality, males haveworse jobs than do women, and workers aged 45 to 65 have jobs of significantly higher quality than doyounger workers17 . The worst jobs, holding the sex- and age-mix of workers constant, are found inHungary, whereas the best ones are found in Austria and Ireland18 . It is notable how much worse (in termsof the pseudo-R2) these regressions of job quality measures on sex, age and country do compared to theregression of overall job satisfaction on the constituent parts of a good job presented in Table 4.
57. Using the same methodology as in Section 4, a "baseline" worker who is female, aged between16 and 29 and lives in West Germany, has a predicted probability of 12 per cent of being completelysatisfied and 39 per cent of being completely or very satisfied. Changing the baseline person to a malereduces these probabilities slightly to 10 and 35 per cent respectively, whereas increasing her age tobetween 45 and 65 raises the probabilities to 18 and 50 per cent respectively. Last, the predictedsatisfaction probabilities of the baseline worker in Hungary are 5 and 22 per cent, whereas in Ireland theyare 17 and 50 per cent.
58. There are some notable differences in country estimates between the two equations. Ireland, theNetherlands, Norway, the United Kingdom and the United States all do worse on the Job Quality Countthan in terms of overall job satisfaction. This could well result from aspects of the job that matter toworkers (and which therefore affect job satisfaction) but for which we do not have separate measures inthe ISSP data (and which thus do not appear in the Job Quality Count).
DEELSA/ELSA/WD(98)5
19
CONCLUSION
59. Nearly twenty five years ago, Flanagan et al. (1974) argued persuasively that, to avoid workerdiscontent, firms need to provide the right mix of wages and non-pecuniary job characteristics. They alsonoted that the preferred mix likely differs between workers and may change as income rises.
60. Much of the analysis of the labour market that has appeared since Flanagan et al. seems to havepaid only scarce attention to the non-wage aspects of a job. One of the findings of this report is that, on thecontrary, nearly seven thousand workers in OECD countries say that the monetary rewards from workingcome a long way behind other aspects of the job such as job security, job interest, promotion opportunitiesand autonomy.
61. Turning from values to outcomes, six broad groups of attributes characterising good jobs wereidentified: pay; hours of work; future prospects; how hard or difficult the job is; job content; andinterpersonal relationships. It was shown that there is a tendency for workers to be in jobs that exhibitqualities the worker thinks are very important; to this extent, there is self-sorting of workers into jobs. Allof these outcome variables are shown to be significant components of workers’ job satisfaction. Oneimplication is that job satisfaction seems to summarise a great deal of information about jobs that is onlyrarely measured in surveys. The analysis of job satisfaction information therefore likely provides a usefulcomplement to the standard analysis of wages and worker behaviour.
62. As these six job attributes are correlated amongst themselves (those doing badly on one measureof job quality being more likely to do badly on others too), two summary job quality measures wereproposed. These provided consistent pictures with respect to the distribution of good jobs in the datasetanalysed: males have worse jobs than do women, and workers aged 45 to 65 have jobs of significantlyhigher quality than do younger workers. Workers in Hungary have worse jobs than workers in Austria andIreland.
63. One advantage of the approach taken here, which consists in identifying the constituent parts ofgood jobs, is that it allows us to say which aspects of work are dissatisfying for different groups ofworkers. This is of importance if, as has been suggested above, (potentially) dissatisfied workers are lesslikely to participate in the labour market, to stay in their job, and to be productive. In particular, we canuse some of the above results to the phenomenon of women’s increasing labour force participation: whatwas satisfying for a largely male workforce may become less so as more women become active in thelabour market. Table 2 showed that women are less likely to report high pay and promotion opportunities,but are also less likely to consider their job as difficult. One way of improving women’s jobs is thus tomake their pay and promotion more like men’s. However, Table 1 shows that this is not the whole story.Women attach less importance than men to pay, but more importance to the social aspects of the job(whether it is useful or helps others), and to flexible working hours. The mix of wages and non-pecuniaryaspects of the job may need to be revised to reflect women’s increasing participation.
64. A second policy implication concerns the encouragement of continuing participation by olderworkers (in the context of ageing populations). The differences in job values and outcomes between
DEELSA/ELSA/WD(98)5
20
workers over the age of 45 and those under 45 can be read off from Tables 1 and 2 (the same differencesare found comparing the over-55’s to the under-55’s). Older workers, as is true for all age groups, care themost about job security. Relative to younger workers, they think that leisure time is less important, butthat job security and the social aspects of the job are more important. With respect to job outcomes, olderworkers do relatively badly with respect to promotion opportunities (only 13 per cent of 55-65 year oldsrank these as high), but better with respect to hard work and good job content (reported by 47 and 70 percent of 55-65 year olds respectively). Continued participation by older workers will depend crucially onthe individuals concerned finding the jobs on offer attractive; and there is evidence that this attraction maywell depend upon a great deal more than wages and hours of work.
DEELSA/ELSA/WD(98)5
21
NOTES
1. A recent summary of the literature linking job satisfaction to behaviour is provided in Warr (1998); an
interesting investigation using both individual and national time series data can be found in Flanagan et al.(1974).
2. Some evidence is presented that overall job satisfaction acts as a summary measure of these differentaspects of job quality, a number of which are difficult to observe or measure. As such, the use of suchsatisfaction information may help to explain workers’ behaviour better than data on, for example, pay andhours. It is likely that there are trade-offs between wages and some of the other job quality components,which implies omitted variable biases in the estimation of wages.
3. Israel was also surveyed in 1989, but this data is not used in the current analysis.
4. The separate job values figures for each of the nine individual countries are presented in Annex B, as aretheir figures for the job outcome variables which will be discussed in Section 2. The figures by sex and byage within each country turn out to be rather similar, which reduces worries about pooling data from thedifferent countries.
5. The same similarity in responses is found if we look at the percentage saying a job aspect is very importantor important (Table 1 reports the percentage saying "very important" only).
6. Two characteristics which do not immediately fall into the above taxonomy, but which would seemimportant are the local environment in which job is located (not of the workplace, but of theregion/town/local area), and the degree of work-family conflict, although this may be partly picked up inthe different measures of hours of work.
7. In British data there is no difference in overall job satisfaction between workers with temporary jobs andthose with permanent job (see Clark, 1996).
8. The Eurobarometer survey 44.3 (carried out in February 1996) asked workers in 15 European countries abroad set of questions about which parts of their job they liked and disliked. The data are unfortunately notyet available.
9. Clark (1996) uses British Household Panel Survey (BHPS) data to show that those who wish to change theirhours of work (given their current hourly wage) are, ceteris paribus, far less satisfied than are those who arecontent with their current hours. This is equally true whether the desired change is upward or downward.
10. Information on time taken to travel to work is contained in the BHPS dataset. It is negatively correlatedwith several measures of job satisfaction; see Clark (1997).
11. Some more recent data, in Table 5.1 of OECD (1997a), does find higher reported job insecurity in theUnited States than in most European countries.
DEELSA/ELSA/WD(98)5
22
12. More detail on inter-country differences in job satisfaction scores using this dataset can be found in
Blanchflower and Freeman (1997).
13. For ease of representation, the estimated "cut points" (which are used to calculate the probabilities that eachindividual, as a function of his or her characteristics, will give the answers one through seven) are notpresented. The Ordered Probit technique is presented in Zavoina and McKelvey (1975).
14. The log-likelihood is a measure of how well the model explains the data. The "likelihood" is usuallyconsidered to be between zero (for a model which explains nothing) and one (for perfect prediction); the logof the likelihood thus varies from minus infinity to zero. The log-likelihood at zero (or L0) is that from amodel with no explanatory variables (only a constant), whereas the log-likelihood of the model with theexplanatory variables included (or L1) is less negative (i.e. the likelihood of the model explaining the data ishigher). The pseudo-R2 is just 1-L1/L0. If the model explains none of the variation in the data then L1=L0and the pseudo-R2 is 0, whereas in the case of perfect prediction L1=0 and the pseudo-R2 equals 1.
15. As can be seen from the last column of Table 2, these are the mean characteristics for the sample, in thesense that each of them describes more than fifty per cent of respondents.
16. For ease of representation, the estimated cut-points for the Ordered Probit equations have been left out ofthis table.
17. Most of the econometric work on job satisfaction has found that women report higher levels of jobsatisfaction than men (for example, Blanchflower and Oswald, 1998; Meng, 1990; Kalleberg and Loscocco,1983; and Clark, 1997). Older workers are typically more satisfied than younger workers (Warr, 1992 andKalleberg and Loscocco, 1983), with evidence in the BHPS dataset of a U-shaped relationship between jobsatisfaction and age, minimising in the mid-thirties (Clark, Oswald and Warr, 1996).
18. It would obviously be of interest to introduce other variables, such as income and education, here. Thereare, however, significant problems of inter-country comparability with these variables, rendering such aninvestigation problematic.
DEELSA/ELSA/WD(98)5
23
REFERENCES
AKERLOF, G.A., ROSE, A.K. AND YELLEN, J.L. (1988), "Job Switching and Job Satisfaction in theU.S. Labor Market", Brookings Papers on Economic Activity, 2, pp.495-582.
BLANCHFLOWER, D.G. AND FREEMAN, R.B. (1997), "The Attitudinal Legacy of Communist LaborRelations", Industrial and Labor Relations Review, 50, pp.438-459.
BLANCHFLOWER, D.G. AND OSWALD, A.J. (1998), "What Makes an Entrepreneur?", Journal ofLabor Economics, 16, pp.26-60.
BLANCHFLOWER, D.G., OSWALD, A.J. AND WARR, P.B. (1993), "Well-Being Over Time in Britainand the USA", Dartmouth College, mimeo.
CLARK, A.E. (1996), "Job Satisfaction in Britain", British Journal of Industrial Relations, 34, pp.189-217.
CLARK, A.E. (1997), "Job Satisfaction and Gender: Why Are Women So Happy At Work?", LabourEconomics, 4, pp.341-372.
CLARK, A.E., GEORGELLIS, Y. AND SANFEY, P. (1998), "Job Satisfaction, Wages and Quits:Evidence from German Panel Data", Research in Labor Economics, forthcoming.
CLARK, A.E. AND OSWALD, A.J. (1996), "Satisfaction and Comparison Income", Journal of PublicEconomics, 61, pp.359-81.
CLARK, A.E., OSWALD, A.J. AND WARR, P.B. (1996), "Is Job Satisfaction U-shaped In Age?",Journal of Occupational and Organizational Psychology, 69, pp. 57-81.
CLEGG, C.W. (1983), "Psychology of Employee Lateness, Absence and Turnover: A MethodologicalCritique and an Empirical Study", Journal of Applied Psychology, 68, pp.88-101.
DONOHUE, S.M. AND HEYWOOD, J.S. (1997), "Job Satisfaction and Comparison Income: Are theU.S. and Britain Different?", University of Wisconsin-Milwaukee, mimeo.

DEELSA/ELSA/WD(98)5
24
FLANAGAN, R.J., STRAUSS, G. AND ULMAN, L. (1974), "Worker Discontent and Work PlaceBehaviour", Industrial Relations, 13, pp.101-123.
FRANK, R.H. (1985), Choosing the Right Pond: Human Behaviour and the Quest for Status, OxfordUniversity Press, London and New York.
FRANK, R.H. (1993), "Local Status, Fairness and Wage Compression Revisited", Cornell University,mimeo.
FREEMAN, R. (1978), "Job Satisfaction as an Economic Variable", American Economic Review, 68,pp.135-141.
KALLEBERG, A.L. AND LOSCOCCO, K.A. (1983), "Aging, Values and Rewards: Explaining AgeDifferences in Job Satisfaction", American Sociological Review, 48, pp.78-90.
LÉVY-GARBOUA, L. AND MONTMARQUETTE, C. (1997), "Reported Job Satisfaction: What Does ItMean?", LAMIA, Université de Paris I, Discussion Paper 1997-1.
LOCKE, E.A. (1976), "The Nature and Causes of Job Satisfaction", in Dunnette, M.D. (ed.), Handbook ofIndustrial and Organizational Psychology, Rand-McNally, Chicago.
MANGIONE, T.W. AND QUINN, R.P. (1975), "Job Satisfaction, Counterproductive Behavior, and DrugUse at Work", Journal of Applied Psychology, 60, pp.114-16.
MCEVOY, G.M. AND CASCIO, W.F. (1985), "Strategies for Reducing Employee Turnover: A Meta-Analysis", Journal of Applied Psychology, 70, pp.342-53.
MENG, R. (1990), "The Relationship Between Unions and Job Satisfaction", Applied Economics, 22,pp.1635-48.
OECD (1995), "Supplementary measures of labour market slack: an analysis of discouraged andinvoluntary part-time workers", OECD Employment Outlook.
OECD (1996a), "Recent Labour Market Developments and Prospects", OECD Employment Outlook.
OECD (1996b), "Earnings Inequality, Low-Paid Employment and Earnings Mobility", OECDEmployment Outlook.
OECD (1997a), "Is Job Insecurity on the Rise in OECD Countries?", OECD Employment Outlook.
OECD (1997b), "Working Time: Trends and Policy Issues", DEELSA, OECD, mimeo.
WARR, P.B. (1992), "Age and Occupational Well-Being", Psychology and Aging, 7, pp.37-45.
WARR, P.B. (1998), "Well-Being and the Workplace", in Kahneman, D., Diener, E. and Schwartz, N.(eds.), Understanding Quality of Life: Scientific Perspectives on Enjoyment and Suffering, NewYork: Russell Sage, forthcoming.
ZAVOINA, R. AND MCKELVEY, W. (1975), "A Statistical Model for the Analysis of Ordinal LevelDependent Variables", Journal of Mathematical Sociology, Summer, pp.103-20.
DEELSA/ELSA/WD(98)5
25
VARIABLE DEFINITIONS
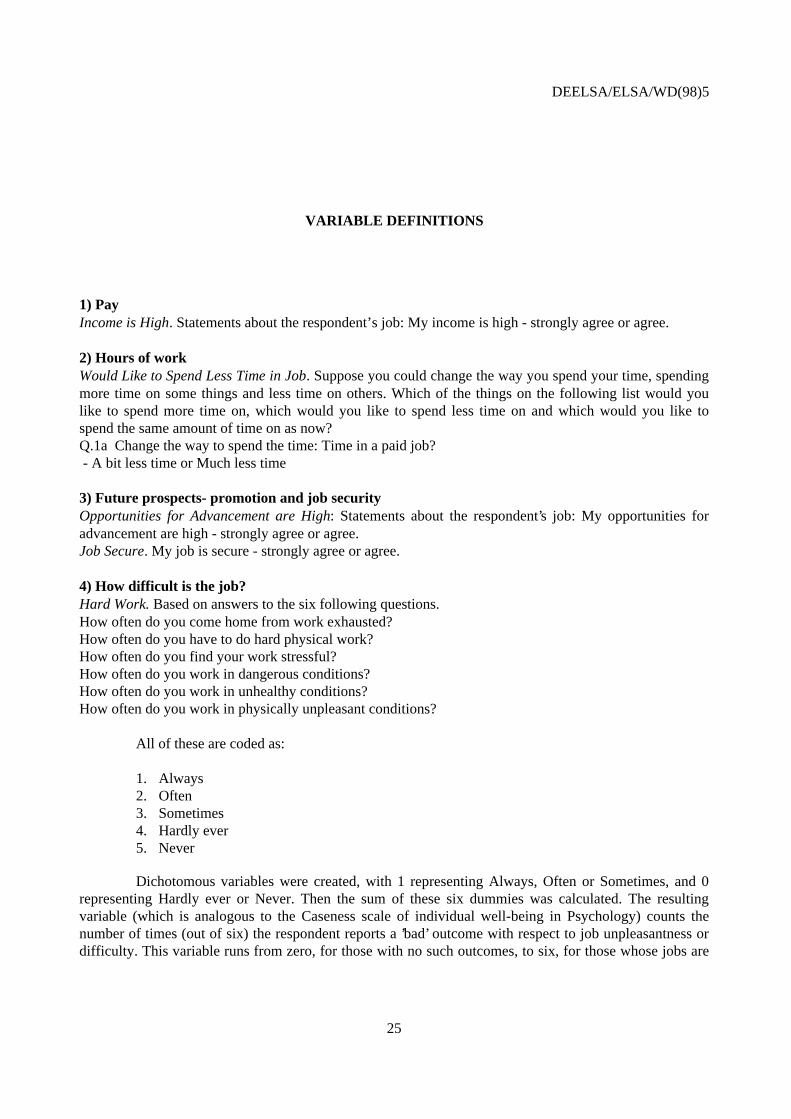
1) PayIncome is High. Statements about the respondent’s job: My income is high - strongly agree or agree.
2) Hours of workWould Like to Spend Less Time in Job. Suppose you could change the way you spend your time, spendingmore time on some things and less time on others. Which of the things on the following list would youlike to spend more time on, which would you like to spend less time on and which would you like tospend the same amount of time on as now?Q.1a Change the way to spend the time: Time in a paid job? - A bit less time or Much less time
3) Future prospects- promotion and job securityOpportunities for Advancement are High: Statements about the respondent’s job: My opportunities foradvancement are high - strongly agree or agree.Job Secure. My job is secure - strongly agree or agree.
4) How difficult is the job?Hard Work. Based on answers to the six following questions.How often do you come home from work exhausted?How often do you have to do hard physical work?How often do you find your work stressful?How often do you work in dangerous conditions?How often do you work in unhealthy conditions?How often do you work in physically unpleasant conditions?
All of these are coded as:
1. Always2. Often3. Sometimes4. Hardly ever5. Never
Dichotomous variables were created, with 1 representing Always, Often or Sometimes, and 0representing Hardly ever or Never. Then the sum of these six dummies was calculated. The resultingvariable (which is analogous to the Caseness scale of individual well-being in Psychology) counts thenumber of times (out of six) the respondent reports a ’bad’ outcome with respect to job unpleasantness ordifficulty. This variable runs from zero, for those with no such outcomes, to six, for those whose jobs are

DEELSA/ELSA/WD(98)5
26
at least sometimes unpleasant on all of the six criteria above. This method allows six separate, but related,job measures to be combined into one1 . The distribution of this variable is as follows:
Value Frequency Percentage CumulativePercentage
0 242 3.64 3.641 704 10.59 14.232 1 986 29.88 44.113 1 470 22.12 66.234 941 14.16 80.385 679 10.22 90.606 625 9.40 100.00Total 6 647 100.00
The majority of workers report jobs which are hard on 2 or 3 measures out of the six. Twenty per centhave jobs which are hard on four or more measures.
Last, a dummy variable was created from this summary measure for those workers reportingthree or more such bad outcomes. This dummy hence achieves a value of one for 56 per cent of thesample.
5) Job content: interest, prestige and independenceGood Job Content. Based on answers to the six following questions.How often are you bored at work? This variable has been recoded as follows:
1. Never2. Hardly ever3. Sometimes4. Often5. Always
Statements about the respondent’s job: My job is interestingStatements about the respondent’s job: In my job I can help other peopleStatements about the respondent’s job: My job is useful to societyStatements about the respondent’s job: I can work independentlyAll coded as:
1. Strongly agree2. Agree3. Neither agree nor disagree4. Disagree5. Strongly disagree
And which of the following statements about your work is most true?1. My job allows me to design or plan most of my daily work
1. If factor analysis is used to create the first principal component, which is a linear combination of the six
measures, all six measures are given almost equal weighting. This supports the simple adding-up inherent inthe calculation of the Caseness-type measure. In addition, the results with the individual components werealways consistent with those using the summary measure.

DEELSA/ELSA/WD(98)5
27
2. My job allows me to design or plan parts of my daily work3. My job does not really allow me to design or plan my daily work
As above, dichotomous variables were created, with 1 representing (for bored at work) Never orHardly ever, (for the four statement questions) Strongly Agree or Agree, and (for the design of dailywork) the designing of most or part of daily work. The sum of these six dummies, which runs from zero tosix, is a positive measure of job content. The distribution of this variable is as follows:
Value Frequency Percentage CumulativePercentage
0 99 1.49 1.491 308 4.64 6.132 460 6.93 13.063 751 11.31 24.374 1 349 20.32 44.705 1 747 26.32 71.026 1 924 28.98 100.00Total 6 638 100.00
Almost thirty per cent of workers have jobs which are satisfying on all six content measures; on the otherhand a quarter have jobs which are satisfying on three or less measures.
A dummy variable was created from this summary measure for those workers reporting more than fourpositive personal control, interest and usefulness aspects of their job. This dummy has a value of one for55 per cent of the sample.
6) Interpersonal relationshipsGood Relations at Work. The sum of two dichotomous variables based on answers to the following twoquestions:Relations at the respondent’s workplace: Between management and employeesRelations at the respondent’s workplace: Between workmates / colleaguesBoth of these are coded as:
1. Very good2. Quite good3. Neither good nor bad4. Quite bad5. Very bad
A dummy variable was created for those reporting Very Good or Quite Good relations with bothmanagement and with colleagues (68 per cent of the sample). Nine per cent of the sample reported worsethan quite good relations with both management and with colleagues, and 23 per cent reported worse thanquite good relations with either management or with colleagues but not with both.

DEELSA/ELSA/WD(98)5
28
ANNEX - TABLES
DEELSA/ELSA/WD(98)5
29
Table 1. Job Values: What Is Important to Workers?Percentage Saying "Very Important"
Western Women Men 16 to 29 30 to 44 45 to 65 Europe USA Hungary Total
High Income22.4 ** 26.1 23.6 24.2 24.5 22.1 ** 24.7 46.1 24.1
Leaves a Lot of Leisure Time11.1 ** 12.7 14.8 ** 11.9 9.5 12.0 ** 5.8 19.2 11.9
Flexible Working Hours19.9 ** 16.0 18.2 ** 19.6 16.5 17.5 ** 16.9 25.6 18.1
Good Opportunities for Advancement29.9 30.1 32.8 ** 27.2 30.4 29.6 ** 40.6 19.4 30.0
Job Security59.9 58.7 55.4 ** 58.1 63.8 60.4 ** 52.7 57.6 59.3
Interesting Job48.7 48.7 54.3 ** 46.2 46.4 51.1 ** 44.0 28.7 48.7
Allows to Work Independently31.6 ** 35.8 32.8 33.9 33.9 35.2 ** 27.3 23.9 33.6
Allows to Help Other People25.8 ** 19.3 22.0 ** 21.3 24.7 22.8 ** 25.1 18.8 22.7
Useful to Society26.7 ** 23.3 22.0 ** 24.1 28.6 23.8 ** 29.1 33.8 25.1
Note : Weighted Data. * = significant difference at the five per cent level;
** = significant difference at the one per cent level.Source : 1989 International Social Survey Program Data
DEELSA/ELSA/WD(98)5
30
Table 1a. Job Values: What is Important to Workers? Country ResultsPercentage Saying "Very Important"
Women Men 16 to 29 30 to 44 45 to 65 TotalHigh IncomeWest Germany 22.7 29.3 31.5 23.7 23.6 25.9UK 21.8 22.3 21.1 25.3 19.5 22.0USA 23.3 26.4 26.7 23.8 24.0 24.7Austria 29.2 34.5 28.8 32.8 33.1 31.7Hungary 44.6 48.0 46.2 43.5 48.5 46.1Netherlands 9.8 15.1 13.7 10.2 13.4 12.3Italy 26.5 32.6 30.3 32.0 26.7 29.4Ireland 24.2 28.9 20.2 33.4 24.2 26.5Norway 10.5 13.6 12.6 10.8 13.0 12.1
Leaves a Lot of Leisure TimeWest Germany 21.4 18.8 29.7 20.8 13.0 20.2UK 6.8 9.3 9.5 6.5 8.4 8.0USA 4.4 7.6 9.2 5.4 3.6 5.8Austria 21.5 20.9 26.4 23.3 15.7 21.2Hungary 18.7 19.8 22.2 21.9 14.8 19.2Netherlands 5.6 8.7 7.5 7.3 6.1 7.0Italy 14.4 18.6 20.2 18.3 12.4 16.4Ireland 5.4 8.4 8.6 8.3 3.8 6.8Norway 3.8 6.5 5.9 5.5 4.1 5.2
Flexible Working HoursWest Germany 17.7 17.7 21.4 19.5 13.8 17.7UK 18.1 11.6 14.3 15.1 15.4 15.0USA 17.9 15.6 19.3 19.3 12.1 16.9Austria 28.6 27.1 30.1 29.0 25.4 27.9Hungary 28.5 22.4 28.8 25.9 23.3 25.6Netherlands 14.0 11.4 10.4 16.2 10.7 12.8Italy 24.2 21.5 25.4 27.5 17.4 22.9Ireland 20.8 13.3 14.7 21.3 14.9 17.2Norway 13.9 8.9 9.0 11.8 13.3 11.3
Good Opportunities for AdvancementWest Germany 27.2 27.9 35.9 26.3 22.5 27.5UK 34.3 34.2 38.3 31.5 34.0 34.3USA 40.9 40.3 42.7 39.7 40.1 40.6Austria 42.6 42.9 47.8 40.1 40.7 42.7Hungary 18.9 19.8 14.2 16.7 25.2 19.4Netherlands 26.1 29.4 32.8 21.1 30.7 27.7Italy 30.5 35.0 34.1 30.9 33.1 32.7Ireland 35.3 37.1 37.8 35.8 35.3 36.2Norway 10.6 9.7 11.8 7.5 11.3 10.1
Job SecurityWest Germany 54.2 59.4 51.5 55.4 61.4 56.7UK 64.0 60.8 60.2 61.8 64.8 62.4USA 54.2 50.8 49.7 50.4 57.7 52.7Austria 71.3 69.3 64.9 68.3 76.0 70.4Hungary 60.1 54.7 56.1 59.5 56.8 57.6Netherlands 32.7 39.2 32.0 36.3 39.3 35.8Italy 73.9 66.7 63.9 66.8 78.1 70.5Ireland 59.9 62.1 50.2 67.4 62.8 60.9Norway 69.3 63.5 65.2 65.2 68.8 66.3

DEELSA/ELSA/WD(98)5
31
Table 1a.(con’t) Job Values: What is Important to Workers? Country Results
Women Men 16 to 29 30 to 44 45 to 65 Total
Interesting JobWest Germany 58.0 54.2 64.1 55.4 51.2 56.2UK 47.3 48.9 49.2 47.8 47.5 48.1USA 44.7 43.2 48.9 42.1 42.4 44.0Austria 60.9 63.9 69.9 62.4 56.4 62.3Hungary 26.4 31.3 31.6 26.2 29.0 28.7Netherlands 37.4 42.0 45.6 33.8 40.6 39.5Italy 48.9 53.7 56.8 52.8 45.8 51.2Ireland 46.6 44.0 50.0 46.2 40.8 45.4Norway 57.7 47.7 58.3 48.8 50.4 52.5
Allows to Work IndependentlyWest Germany 43.7 47.0 47.7 46.8 42.4 45.3UK 19.6 21.3 19.6 18.5 22.9 20.4USA 26.2 28.8 27.8 27.4 26.8 27.3Austria 59.3 62.1 62.2 66.4 55.3 60.6Hungary 19.0 29.5 18.0 28.2 23.8 23.9Netherlands 26.9 36.0 26.3 29.9 37.9 31.1Italy 27.0 40.2 36.6 36.2 28.5 33.3Ireland 24.2 23.9 22.3 27.6 21.8 24.1Norway 28.3 29.6 25.2 30.8 31.2 29.0
Allows to Help Other PeopleWest Germany 23.1 16.5 25.8 18.5 16.9 19.9UK 22.0 19.1 21.7 18.1 22.3 20.6USA 27.4 22.4 25.3 23.0 27.6 25.1Austria 38.7 29.4 31.8 37.4 34.3 34.4Hungary 16.8 21.1 16.0 18.0 21.4 18.8Netherlands 25.9 18.2 16.6 20.7 30.6 22.3Italy 26.2 22.1 23.3 25.2 24.1 24.2Ireland 24.2 15.4 18.1 21.4 20.1 20.0Norway 22.6 11.2 16.9 12.4 21.5 16.7
Useful to SocietyWest Germany 22.0 20.8 25.0 20.3 19.7 21.4UK 24.8 20.5 21.8 20.4 25.8 22.8USA 28.7 29.5 29.0 27.8 30.6 29.1Austria 32.9 30.0 27.7 31.1 34.9 31.6Hungary 31.5 36.4 24.5 34.8 38.9 33.8Netherlands 22.9 17.7 11.8 19.7 30.7 20.5Italy 30.8 28.8 32.3 30.6 27.4 29.8Ireland 25.8 17.0 17.0 25.4 21.2 21.6Norway 23.3 16.2 15.8 15.9 28.0 19.6
DEELSA/ELSA/WD(98)5
32
Table 2. Eight measures of Job Quality in OECD Countries
WesternWomen Men 16 to 29 30 to 44 45 to 65 Europe USA Hungary Total
Percentage saying that their income is high
17.5 ** 25.5 20.9 22.2 23.4 23.0 ** 26.1 9.9 22.2Percentage saying that they would like to spend less time in their job
24.3 ** 30.3 21.0 ** 31.8 28.6 26.5 ** 31.7 30.6 27.4Percentage saying that their opportunities for advancement are high
18.9 ** 26.4 30.5 ** 23.0 16.5 22.8 ** 36.2 9.2 23.3Percentage saying that their job is secure
73.2 71.4 70.8 72.0 73.6 71.8 75.4 70.7 72.1Percentage reporting hard work
47.2 ** 62.1 62.1 ** 55.4 50.6 54.8 ** 56.0 65.7 55.9Percentage reporting good job content
55.8 55.2 45.8 ** 57.1 62.7 54.9 56.1 59.0 55.4Percentage reporting good relations at work
69.4 * 66.5 66.4 ** 65.3 72.1 69.0 ** 61.3 64.6 67.7Percentage reporting high job satisfaction
42.1 * 39.2 37.7 ** 38.1 45.9 42.0 ** 49.1 13.1 40.4Note : Weighted Data. * = significant difference at the five per cent level;
** = significant difference at the one per cent level.Source : 1989 International Social Survey Program Data
DEELSA/ELSA/WD(98)5
33
Table 2a. Eight measures of Job Quality (Country Results)
Measures of Job Quality
Women Men 16 to 29 30 to 44 45 to 65 Total
Percentage saying that their income is highWest Germany 23.5 34.3 25.4 33.9 31.5 30.4UK 14.4 20.1 19.9 16.5 17.4 17.7USA 20.0 31.7 20.4 27.6 29.0 26.1Austria 29.8 28.6 29.9 33.4 23.0 29.1Hungary 8.3 11.2 11.8 7.6 11.5 9.9Netherlands 9.3 20.4 15.5 12.6 25.3 16.4Italy 24.8 30.7 29.6 27.4 28.6 28.4Ireland 18.3 27.2 20.0 27.2 24.6 24.0Norway 12.3 25.2 14.9 20.3 22.6 19.5
Percentage saying that they would like to spend less time in their jobWest Germany 26.3 40.8 32.4 33.0 36.4 34.0UK 36.4 41.2 31.9 42.4 41.3 39.0USA 30.1 33.5 22.8 35.6 34.5 31.7Austria 18.4 20.4 17.0 22.7 18.7 19.4Hungary 29.2 32.0 22.7 36.3 30.0 30.6Netherlands 14.9 32.1 15.8 28.6 27.9 24.0Italy 21.3 23.0 16.9 28.0 21.0 22.1Ireland 16.0 29.3 16.8 31.1 19.8 23.1Norway 22.4 22.2 15.9 27.0 24.3 22.3
Percentage saying that their opportunities for advancement are highWest Germany 22.5 28.8 34.2 27.8 18.0 26.5UK 17.8 26.3 32.9 23.7 13.0 22.7USA 32.8 39.4 42.7 37.9 27.9 36.2Austria 24.7 36.5 38.8 32.2 21.8 31.6Hungary 10.2 8.3 9.9 9.7 7.9 9.2Netherlands 16.0 28.6 34.4 20.3 17.0 24.1Italy 13.4 27.4 25.5 20.4 21.1 22.0Ireland 24.1 30.1 39.1 26.5 17.3 28.0Norway 9.3 13.1 13.9 11.8 8.7 11.4
Percentage saying that their job is secureWest Germany 82.9 87.0 85.6 85.5 85.4 85.5UK 66.3 55.4 63.6 60.0 56.8 59.9USA 74.1 76.6 75.6 76.7 73.4 75.4Austria 88.2 86.1 82.3 87.8 91.8 87.0Hungary 74.4 67.5 69.1 72.6 69.2 70.7Netherlands 67.1 73.8 74.4 67.3 75.3 71.4Italy 70.3 71.9 58.8 74.0 78.0 71.3Ireland 73.9 67.1 66.7 72.4 69.3 69.5Norway 66.1 62.9 58.8 63.9 69.8 64.3
DEELSA/ELSA/WD(98)5
34
Table 2a.(con’t) Eight measures of Job Quality (Country Results)
Measures of Job Quality
Women Men 16 to 29 30 to 44 45 to 65 Total
Percentage reporting hard workWest Germany 43.7 54.6 55.6 49.8 46.5 50.6UK 44.7 66.0 61.4 56.3 54.3 57.0USA 44.9 66.1 60.4 58.5 48.4 56.0Austria 49.9 63.6 64.3 50.9 57.8 57.8Hungary 54.7 75.2 71.1 66.9 59.3 65.7Netherlands 64.4 75.7 72.7 72.3 69.1 71.7Italy 35.3 41.9 47.7 40.2 31.3 39.3Ireland 30.9 52.7 47.1 45.3 42.0 44.9Norway 50.0 60.0 70.2 52.4 47.5 55.7
Percentage reporting good job contentWest Germany 51.3 55.8 50.2 54.2 57.8 54.2UK 54.2 51.5 46.7 49.9 61.1 52.6USA 58.5 53.9 40.3 60.8 63.6 56.1Austria 59.9 61.3 56.0 63.1 63.8 60.7Hungary 55.4 62.1 41.4 62.8 68.0 59.0Netherlands 60.3 51.1 46.5 56.2 61.9 54.3Italy 42.6 45.0 31.3 42.4 57.0 44.1Ireland 51.5 58.6 44.2 64.3 59.4 56.1Norway 59.7 57.6 45.2 60.3 67.9 58.6
Percentage reporting good relations at workWest Germany 78.5 82.6 79.8 84.4 79.0 81.1UK 73.4 61.4 63.6 68.4 66.9 66.6USA 62.4 60.4 60.1 57.5 68.4 61.3Austria 70.6 69.1 69.8 65.2 75.0 69.7Hungary 66.3 63.2 55.2 62.4 75.7 64.6Netherlands 60.5 62.5 62.2 59.4 66.0 61.8Italy 66.3 54.3 64.8 51.5 63.4 58.9Ireland 82.2 77.1 76.4 79.2 82.1 79.0Norway 69.3 68.7 65.5 67.0 74.6 68.9
Percentage reporting high job satisfactionWest Germany 43.9 43.1 38.9 43.9 47.1 43.4UK 39.6 38.6 35.6 36.2 45.3 39.1USA 54.4 44.3 43.7 48.1 55.4 49.1Austria 51.8 43.7 46.5 42.1 53.7 47.1Hungary 11.5 14.5 9.9 9.6 20.8 13.1Netherlands 42.7 38.7 40.0 36.8 46.5 40.1Italy 33.9 33.8 29.4 30.0 42.5 33.9Ireland 55.4 47.5 49.0 50.0 52.1 50.3Norway 42.7 41.4 36.2 42.9 45.7 42.0

DEELSA/ELSA/WD(98)5
35
Table 3. Job Values and Job Outcomes
Income very important?No Yes
Percentage withhigh income 21.5 24.9
Leisure time very important?No Yes
Percentage wantingto work less hours 26.6 33.5
Promotion very important?No Yes
Percentage with highpromotion opportunities 19.6 33.1
Job security very important?No Yes
Percentage with high job security 69.1 74.4
Interesting job very important?No Yes
Percentage notbored at work 72.7 77.7
Interesting job very important?No Yes
Percentage withinteresting job 70.0 82.2
Independent work very important?No Yes
Percentage who planworking day 72.7 78.9
Independent work very important?No Yes
Percentage whowork independently 73.1 86.5
Job which helps others very important?No Yes
Percentage with job which helps others 61.1 79.3
Useful job very important?No Yes
Percentage with job which is useful 65.6 83.9Note : Weighted Data.Source : 1989 International Social Survey Program Data

DEELSA/ELSA/WD(98)5
36
Table 4. Overall Job Satisfaction Regressions on the Separate Components of Job Quality
All Women Men 16-29 30-44 45-65
High Income 0.376 0.276 0.450 0.269 0.355 0.479(0.037) (0.062) (0.046) (0.068) (0.059) (0.068)
Want to Spend Less Time In Job -0.293 -0.355 -0.250 -0.357 -0.260 -0.301(0.031) (0.048) (0.040) (0.059) (0.047) (0.057)
Good Promotion Opportunities 0.385 0.412 0.390 0.457 0.464 0.263(0.036) (0.060) (0.046) (0.062) (0.058) (0.076)
Job Secure 0.250 0.264 0.241 0.251 0.250 0.243(0.033) (0.053) (0.043) (0.060) (0.052) (0.063)
Hard Work -0.188 -0.194 -0.150 -0.077 -0.201 -0.249(0.030) (0.046) (0.040) (0.054) (0.046) (0.056)
Good Job Content 0.547 0.530 0.556 0.539 0.543 0.492(0.031) (0.047) (0.040) (0.056) (0.048) (0.058)
Good Relations at Work 0.669 0.701 0.643 0.601 0.704 0.691
(0.033) (0.052) (0.043) (0.058) (0.051) (0.064)
N 5593 2334 3259 1671 2301 1621Log Likelihood -7037.27 -2920.67 -4100.52 -2199.75 -2820.82 -1978.89Log Likelihood at zero -7908.88 -3265.97 -4631.84 -2452.45 -3203.14 -2215.81
Pseudo-R2 0.110 0.106 0.115 0.103 0.119 0.107
Source : 1989 International Social Survey Program Data
DEELSA/ELSA/WD(98)5
37
Table 4a. Predicted probabilities of overall job statisfaction from Table 4.
Percentages
All Women Men
P(Completely P(Completely or P(Completely P(Completely or P(Completely P(Completely orSatisfied) Very Satisfied) Satisfied) Very Satisfied) Satisfied) Very Satisfied)
Base* 15.8 51.8 17.9 56.2 14.2 48.5
Base+high income 26.6 66.3 26.0 66.7 26.8 66.0
Base+ want to work less 9.8 40.2 10.1 42.1 9.3 38.7
Base+ high promotion opportunities 26.8 66.7 30.6 71.5 24.8 63.8
Base+ low job security 10.5 41.9 11.8 45.7 9.5 39.1
Base+ not difficult job 20.8 59.2 23.4 63.6 17.9 54.5
Base+ not good job content 6.1 30.8 7.3 35.4 5.2 27.7
Base+ not good relations at work 4.7 26.7 5.2 29.3 4.3 24.8
* Low income, do not want to work less, low promotion opportunities, high job security, difficult job, job with good job content and good relations at work.
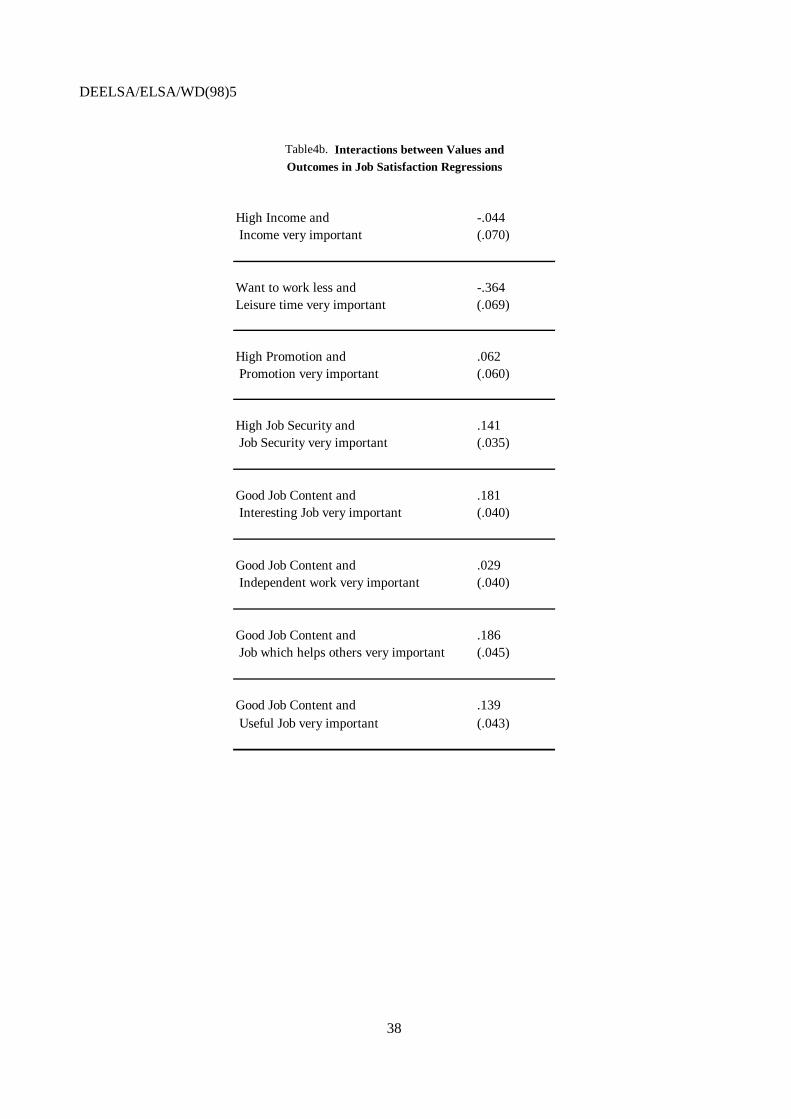
DEELSA/ELSA/WD(98)5
38
Table4b. Interactions between Values and Outcomes in Job Satisfaction Regressions
High Income and -.044 Income very important (.070)
Want to work less and -.364Leisure time very important (.069)
High Promotion and .062 Promotion very important (.060)
High Job Security and .141 Job Security very important (.035)
Good Job Content and .181 Interesting Job very important (.040)
Good Job Content and .029 Independent work very important (.040)
Good Job Content and .186 Job which helps others very important (.045)
Good Job Content and .139 Useful Job very important (.043)

DEELSA/ELSA/WD(98)5
39
Table 5. Correlations Between Measures of Job Quality
High Income Want to Spend Good Promotion Job Secure Hard Work Good Job Good Relations
Less Time In Job Opportunities Content at Work
High Income 1
Want to Spend Less Time In Job 0.021 1
Good Promotion Opportunities 0.3103** -0.0363** 1
Job Secure 0.1711** -0.0271* 0.1582** 1
Hard Work -0.0862** 0.0499** -0.0480** -0.0720** 1
Good Job Content 0.1208** -0.0403** 0.1561** 0.1357** -0.0620** 1
Good Relations at Work 0.1110** -0.0893** 0.1161** 0.1328** -0.1598** 0.1888** 1
Note: * significant at the five per cent level; ** significant at the one per cent level.Source : 1989 International Social Survey Program Data
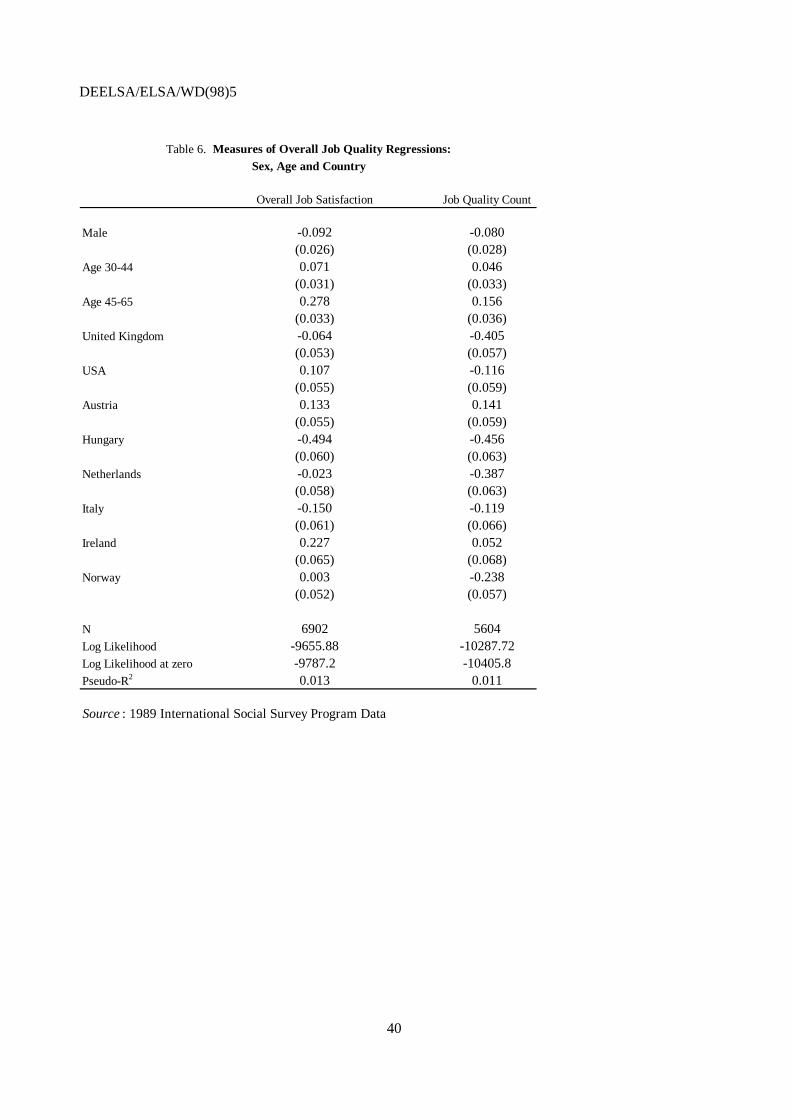
DEELSA/ELSA/WD(98)5
40
Table 6. Measures of Overall Job Quality Regressions:Sex, Age and Country
Overall Job Satisfaction Job Quality Count
Male -0.092 -0.080(0.026) (0.028)
Age 30-44 0.071 0.046(0.031) (0.033)
Age 45-65 0.278 0.156(0.033) (0.036)
United Kingdom -0.064 -0.405(0.053) (0.057)
USA 0.107 -0.116(0.055) (0.059)
Austria 0.133 0.141(0.055) (0.059)
Hungary -0.494 -0.456(0.060) (0.063)
Netherlands -0.023 -0.387(0.058) (0.063)
Italy -0.150 -0.119(0.061) (0.066)
Ireland 0.227 0.052(0.065) (0.068)
Norway 0.003 -0.238(0.052) (0.057)
N 6902 5604Log Likelihood -9655.88 -10287.72Log Likelihood at zero -9787.2 -10405.8Pseudo-R2 0.013 0.011
Source : 1989 International Social Survey Program Data

DEELSA/ELSA/WD(98)5
41
LABOUR MARKET AND SOCIAL POLICY OCCASIONAL PAPERSMost recent releases are:
No. 33 SOCIAL AND HEALTH POLICIES IN OECD COUNTRIES: A SURVEY OF CURRENT PROGRAMMESAND RECENT DEVELOPMENTS [Text and Annex] (1998) (D.W. Kalisch, T. Aman and L. A. Buchele)
No. 32 THE GROWING ROLE OF PRIVATE SOCIAL BENEFITS (1998) Willem Adema and Marcel Einerhand
No. 31 KEY EMPLOYMENT POLICY CHALLENGES FACED BY OECD COUNTRIES (1998) OECDSUBMISSION TO THE G8 GROWTH, EMPLOYABILITY AND INCLUSION CONFERENCE - London, 21-22 February 1998
No. 30 PRIVATE PENSIONS IN OECD COUNTRIES - FRANCE (1997) Emmanuel Reynaud (available in French)
No. 29 OECD SUBMISSION TO THE UK LOW PAY MISSION (1997)
No. 28 OECD SUBMISSION TO THE IRISH NATIONAL MINIMUM WAGE COMMISSION (1997)
No. 27 CHILDCARE AND ELDERLY CARE: WHAT OCCUPATIONAL OPPORTUNITIES FOR WOMEN? (1997)(Susan Christopherson)
No. 26 THE CONCENTRATION OF WOMEN’S EMPLOYMENT AND RELATIVE OCCUPATIONAL PAY: ASTATISTICAL FRAMEWORK FOR COMPARATIVE ANALYSIS (1997) (Damian Grimshaw and Jill Rubery)
No. 25 MAKING THE PUBLIC EMPLOYMENT SERVICE MORE EFFECTIVE THROUGH THE INTRODUCTIONOF MARKET SIGNALS (1997) (Robert G. Fay)
No. 24 TRENDS IN SECRETARIAL OCCUPATIONS IN SELECTED COUNTRIES (1980-95) (H. Steedman) (1997)
No. 23 PRIVATE PENSIONS IN OECD COUNTRIES - AUSTRALIA (1997) (Hazel Bateman and John Piggott)
No. 22 THE DEFINITION OF PART-TIME WORK FOR THE PURPOSE OF INTERNATIONAL COMPARISONS(1997) (Alois van Bastelaer, Eurostat; Georges Lemaître, OECD; Pascal Marianna, OECD) (available inFrench)
No. 21 PRIVATE PENSIONS IN OECD COUNTRIES - THE UNITED KINGDOM (1997) (E. Philip Davis)
No. 20 OCCUPATIONAL CLASSIFICATION (ISCO-88): CONCEPTS, METHODS, RELIABILITY, VALIDITYAND CROSS-NATIONAL COMPARABILITY (1997) (Peter Elias)
No. 19 NET PUBLIC SOCIAL EXPENDITURE (1996) (Willem Adema, Marcel Einerhand, Bengt Eklind, JórgenLotz and Mark Pearson)
No. 18 ENHANCING THE EFFECTIVENESS OF ACTIVE LABOUR MARKET POLICIES: EVIDENCE FROMPROGRAMME EVALUATIONS IN OECD COUNTRIES (1996) (Robert G. Fay)
A complete list of available papers can be found on the internet site: http://www.oecd.org/els/papers/papers.htm, through whichrecent papers can be accessed directly. To receive a paper copy of this list or any particular papers, please send your name,organisation and full address to:
Labour Market and Social Policy Occasional PapersDirectorate for Education, Employment, Labour and Social AffairsOECD, 2, rue André-Pascal, 75775 PARIS CEDEX 16, FRANCE
Mailing List for free of charge Labour Market and Social Policy Occasional PapersPlease include the following name on the mailing list:
(write in capitals)
Name -------------------------------------------------------------------------------------------
Organisation -------------------------------------------------------------------------------------------
Address -------------------------------------------------------------------------------------------
-------------------------------------------------------------------------------------------

DEELSA/ELSA/WD(98)5
42
RECENT OECD PUBLICATIONS IN THIS FIELD INCLUDE:
"OECD SOCIAL POLICY STUDIES" SERIES
No. 21 FAMILY, MARKET AND COMMUNITY: EQUITY AND EFFICIENCY IN SOCIAL POLICY (1997)
No. 20 AGEING IN OECD COUNTRIES: A CRITICAL POLICY CHALLENGE (1996)
No. 19 CARING FOR FRAIL ELDERLY PEOPLE: POLICIES IN EVOLUTION (1996)
No. 18 INCOME DISTRIBUTION IN OECD COUNTRIES (1995)
HEALTH POLICY STUDIES
No. 8 HEALTH CARE REFORM: THE WILL TO CHANGE (1996)
No. 7 NEW DIRECTIONS IN HEALTH CARE POLICY (1995)
No. 6 INTERNAL MARKETS IN THE MAKING: HEALTH SYSTEMS IN CANADA, ICELAND AND UNITEDKINGDOM (1995)
MISCELLANEOUS
MAINTAINING PROSPERITY IN AN AGEING SOCIETY (1998)
OECD HEALTH DATA (1997)available in English or French on diskettes (Windows 3.11) or CD-ROM (Windows 95/NT or 3.11).
THE BATTLE AGAINST EXCLUSIONSocial Assistance in Australia, Finland, Sweden and the United Kingdom (1998)
OECD EMPLOYMENT OUTLOOK June 1998 (published annually)
BENEFIT SYSTEMS AND WORK INCENTIVES (1998)
THE OECD JOBS STRATEGY:Making Work Pay: Taxation, Benefits, Employment and Unemployment (1997)
THE OECD JOBS STRATEGY:Enhancing the Effectiveness of Active Labour Market Policies (1996)
TRENDS IN INTERNATIONAL MIGRATION - ANNUAL REPORT 1996, 1997 Edition
For a full list, consult the OECD On-Line Bookstore on: http://www.oecd.org or write for a free writtencatalogue to the following address:
OECD Publications Service2, rue André-Pascal, 75775 PARIS CEDEX 16
or to the OECD Distributor in your country