Influence of the edge rounding process on the behaviour of ...
MEASUREMENT ROUNDING ERRORS IN AN ASSESSMENT MODEL OF PROJECT LED ENGINEERING EDUCATION
Measurement Rounding Errors in an Assessment Model of Project Led Engineering Education
doi:10.3991/ijoe.v5s2.1092
F. Moreira, R. M. Sousa, C. P. Leão, A. Alves and R. M. Lima University of Minho, Guimarães, Portugal
Abstract—This paper analyzes the rounding errors that occur in the assessment of an interdisciplinary Project-Led Education (PLE) process implemented in the Integrated Master degree on Industrial Management and Engineering (IME) at University of Minho. PLE is an innovative educa-tional methodology which makes use of active learning, promoting higher levels of motivation and students’ auton-omy. The assessment model is based on multiple evaluation components with different weights. Each component can be evaluated by several teachers involved in different Project Supporting Courses (PSC). This model can be affected by different types of errors, namely: (1) rounding errors, and (2) non-uniform criteria of rounding the grades. A rigorous analysis of the assessment model was made and the round-ing errors involved on each project component were charac-terized and measured. This resulted in a global maximum error of 0.308 on the individual student project grade, in a 0 to 100 scale. This analysis intended to improve not only the reliability of the assessment results, but also teachers’ awareness of this problem. Recommendations are also made in order to improve the assessment model and reduce the rounding errors as much as possible.
Index Terms—Active learning, assessment, project-led edu-cation, rounding errors.
I. INTRODUCTION In the University of Minho, since 2004/05, a team of
teachers and educational researchers has been applying an innovative project-based educational methodology with students from the first year of the Integrated Master De-gree on Industrial Management and Engineering (IME). The main purposes are: improve students’ motivation and autonomy; develop students’ and teachers’ team work competencies and give relevance to course content’s learning. The Bologna process promoted this agenda on higher education courses and, in this context, the Head of the University of Minho has supported this initiative. The approach proposed was based on the PLE concept [1], integrating most of the semester courses in a project that should be developed by teams of 6 to 8 students. These project supporting courses (PSC) are associated to differ-ent knowledge areas: engineering and base-sciences.
In an academic context, assessment is an intrinsic com-ponent of a teaching-learning process. Normally, assess-ment relates to the process of measuring the knowledge, skills and attitudes that result from specific learning proc-esses. It may also be used to improve student learning tasks and teaching effort [2, 3]. It is often divided into two categories: formative and summative, according to the objectives defined for assessment practices.
In the PLE approach, formative assessment assumes an important role for monitoring and assessing students’ learning process. The main purpose of this type of as-sessment is to regulate and support learning by helping students in issues like self-control, self-assessment and self-regulation of learning. In this context, students ac-quire a more central role, as active student involvement in formative assessment is increasingly encouraged. Never-theless, summative assessment is being noticed as having a crucial impact on students’ and teachers’ perceptions about the overall process [4] but as referred in [5] “…assessment improves the quality of the products, but creates a lot of stress as well”.
The assessment model for this project approach is based on continuous assessment of PSCs and on final project grade. These two summative components have several elements of evaluation with different weights. In this as-sessment process rounding errors are introduced, propa-gated and accumulated.
Due to the complexity of the assessment model, the analysis of the effect of rounding errors associated to each component grade and on the use of non-uniform criteria for rounding the grades by different evaluators must be carried out in order to reduce the error as much as possi-ble. The source data for this analysis comes from the 2008/09 IME PLE edition. The main objectives are the improvement of assessment results’ reliability and the increase of teachers’ awareness of the assessment process.
Measurement can be expressed as a process of knowing the magnitude of a quantity. It can also refer to the result of performing the process [6]. In the present work, the measurement process is related to the application of the assessment model in order to obtain a result, i.e. the stu-dents’ final grade.
The paper is structured in five sections. Section I intro-duces the context, the problem and the objectives of the paper. Section II briefly characterizes the PLE approach implemented at IME (IME PLE). The IME PLE assess-ment model is described in section III along with the analysis of how the grade of each evaluation component is obtained. Section IV develops the analysis of the effect of the rounding errors propagation. Finally, on section V, some concluding remarks are outlined.
II. IME PLE PROCESS CHARACTERIZATION The PLE concept has been implemented over a tradi-
tional engineering degree curriculum structure, i.e. over a number of independent Course Units (CU). It was imple-mented on the first year, first semester, of the IME degree over the last five years. The semester includes five CU, representing a total of 30 ECTS (European Credit Transfer
iJOE – Volume 5, Special Issue 2: "IRF'09", November 2009 39
MEASUREMENT ROUNDING ERRORS IN AN ASSESSMENT MODEL OF PROJECT LED ENGINEERING EDUCATION
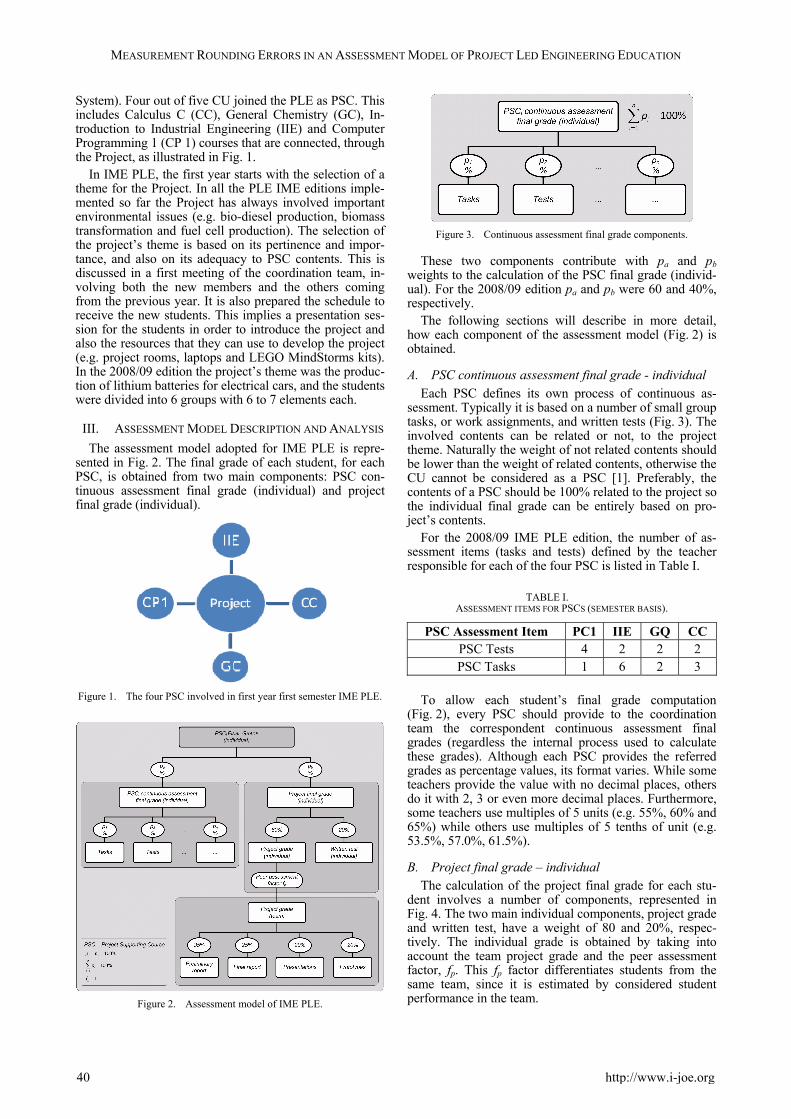
System). Four out of five CU joined the PLE as PSC. This includes Calculus C (CC), General Chemistry (GC), In-troduction to Industrial Engineering (IIE) and Computer Programming 1 (CP 1) courses that are connected, through the Project, as illustrated in Fig. 1.
In IME PLE, the first year starts with the selection of a theme for the Project. In all the PLE IME editions imple-mented so far the Project has always involved important environmental issues (e.g. bio-diesel production, biomass transformation and fuel cell production). The selection of the project’s theme is based on its pertinence and impor-tance, and also on its adequacy to PSC contents. This is discussed in a first meeting of the coordination team, in-volving both the new members and the others coming from the previous year. It is also prepared the schedule to receive the new students. This implies a presentation ses-sion for the students in order to introduce the project and also the resources that they can use to develop the project (e.g. project rooms, laptops and LEGO MindStorms kits). In the 2008/09 edition the project’s theme was the produc-tion of lithium batteries for electrical cars, and the students were divided into 6 groups with 6 to 7 elements each.
III. ASSESSMENT MODEL DESCRIPTION AND ANALYSIS The assessment model adopted for IME PLE is repre-
sented in Fig. 2. The final grade of each student, for each PSC, is obtained from two main components: PSC con-tinuous assessment final grade (individual) and project final grade (individual).
Figure 1. The four PSC involved in first year first semester IME PLE.
Figure 2. Assessment model of IME PLE.
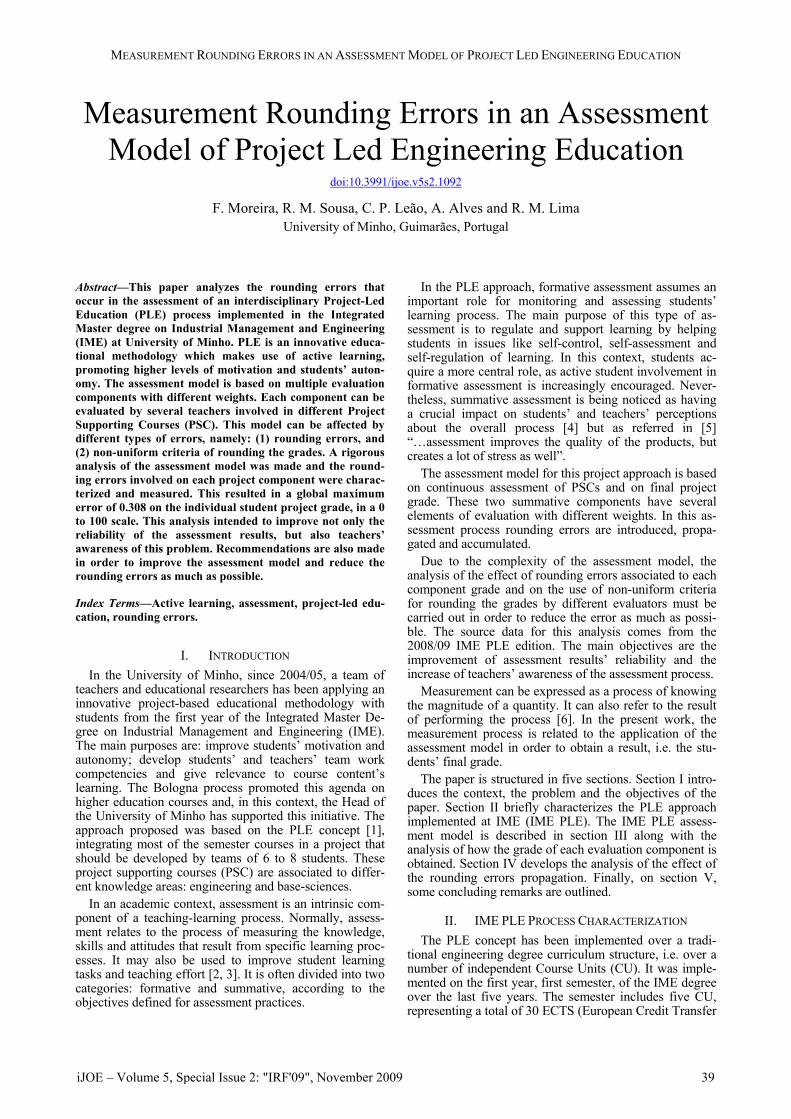
Figure 3. Continuous assessment final grade components.
These two components contribute with pa and pb weights to the calculation of the PSC final grade (individ-ual). For the 2008/09 edition pa and pb were 60 and 40%, respectively.
The following sections will describe in more detail, how each component of the assessment model (Fig. 2) is obtained.
A. PSC continuous assessment final grade - individual Each PSC defines its own process of continuous as-
sessment. Typically it is based on a number of small group tasks, or work assignments, and written tests (Fig. 3). The involved contents can be related or not, to the project theme. Naturally the weight of not related contents should be lower than the weight of related contents, otherwise the CU cannot be considered as a PSC [1]. Preferably, the contents of a PSC should be 100% related to the project so the individual final grade can be entirely based on pro-ject’s contents.
For the 2008/09 IME PLE edition, the number of as-sessment items (tasks and tests) defined by the teacher responsible for each of the four PSC is listed in Table I.
TABLE I. ASSESSMENT ITEMS FOR PSCS (SEMESTER BASIS).
PSC Assessment Item PC1 IIE GQ CC PSC Tests 4 2 2 2 PSC Tasks 1 6 2 3
To allow each student’s final grade computation
(Fig. 2), every PSC should provide to the coordination team the correspondent continuous assessment final grades (regardless the internal process used to calculate these grades). Although each PSC provides the referred grades as percentage values, its format varies. While some teachers provide the value with no decimal places, others do it with 2, 3 or even more decimal places. Furthermore, some teachers use multiples of 5 units (e.g. 55%, 60% and 65%) while others use multiples of 5 tenths of unit (e.g. 53.5%, 57.0%, 61.5%).
B. Project final grade – individual The calculation of the project final grade for each stu-
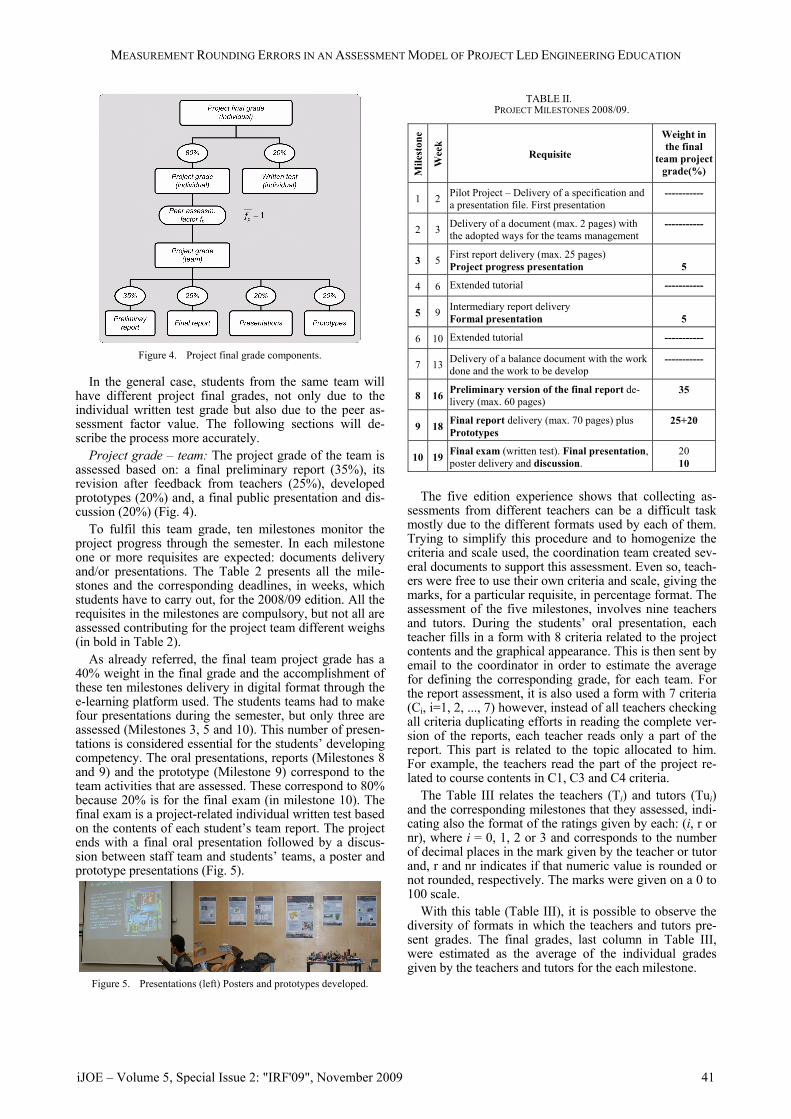
dent involves a number of components, represented in Fig. 4. The two main individual components, project grade and written test, have a weight of 80 and 20%, respec-tively. The individual grade is obtained by taking into account the team project grade and the peer assessment factor, fp. This fp factor differentiates students from the same team, since it is estimated by considered student performance in the team.
40 http://www.i-joe.org
MEASUREMENT ROUNDING ERRORS IN AN ASSESSMENT MODEL OF PROJECT LED ENGINEERING EDUCATION
Figure 4. Project final grade components.
In the general case, students from the same team will have different project final grades, not only due to the individual written test grade but also due to the peer as-sessment factor value. The following sections will de-scribe the process more accurately.
Project grade – team: The project grade of the team is assessed based on: a final preliminary report (35%), its revision after feedback from teachers (25%), developed prototypes (20%) and, a final public presentation and dis-cussion (20%) (Fig. 4).
To fulfil this team grade, ten milestones monitor the project progress through the semester. In each milestone one or more requisites are expected: documents delivery and/or presentations. The Table 2 presents all the mile-stones and the corresponding deadlines, in weeks, which students have to carry out, for the 2008/09 edition. All the requisites in the milestones are compulsory, but not all are assessed contributing for the project team different weighs (in bold in Table 2).
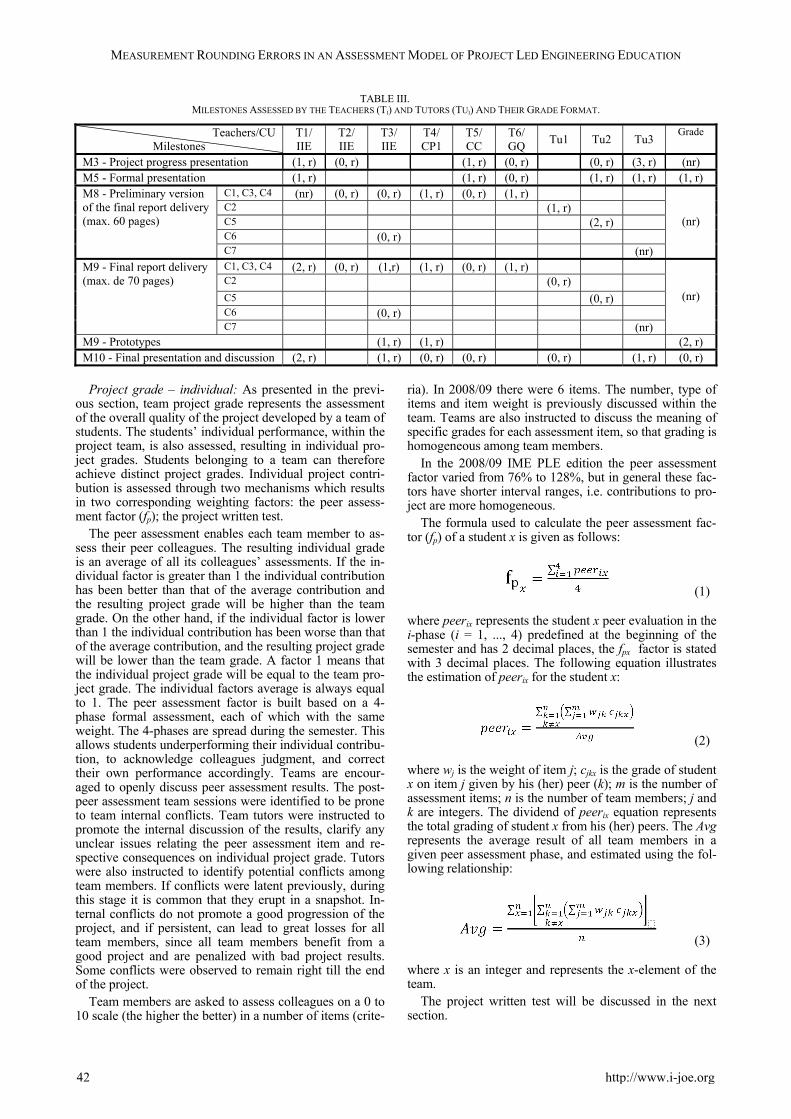
As already referred, the final team project grade has a 40% weight in the final grade and the accomplishment of these ten milestones delivery in digital format through the e-learning platform used. The students teams had to make four presentations during the semester, but only three are assessed (Milestones 3, 5 and 10). This number of presen-tations is considered essential for the students’ developing competency. The oral presentations, reports (Milestones 8 and 9) and the prototype (Milestone 9) correspond to the team activities that are assessed. These correspond to 80% because 20% is for the final exam (in milestone 10). The final exam is a project-related individual written test based on the contents of each student’s team report. The project ends with a final oral presentation followed by a discus-sion between staff team and students’ teams, a poster and prototype presentations (Fig. 5).
Figure 5. Presentations (left) Posters and prototypes developed.
TABLE II. PROJECT MILESTONES 2008/09.
Mile
ston
e
Wee
k
Requisite
Weight in the final
team project grade(%)
1 2 Pilot Project – Delivery of a specification and a presentation file. First presentation
-----------
2 3 Delivery of a document (max. 2 pages) with the adopted ways for the teams management
-----------
3 5 First report delivery (max. 25 pages) Project progress presentation
5
4 6 Extended tutorial -----------
5 9 Intermediary report delivery Formal presentation
5
6 10 Extended tutorial -----------
7 13 Delivery of a balance document with the work done and the work to be develop
-----------
8 16 Preliminary version of the final report de-livery (max. 60 pages)
35
9 18 Final report delivery (max. 70 pages) plus Prototypes
25+20
10 19 Final exam (written test). Final presentation, poster delivery and discussion.
20 10
The five edition experience shows that collecting as-
sessments from different teachers can be a difficult task mostly due to the different formats used by each of them. Trying to simplify this procedure and to homogenize the criteria and scale used, the coordination team created sev-eral documents to support this assessment. Even so, teach-ers were free to use their own criteria and scale, giving the marks, for a particular requisite, in percentage format. The assessment of the five milestones, involves nine teachers and tutors. During the students’ oral presentation, each teacher fills in a form with 8 criteria related to the project contents and the graphical appearance. This is then sent by email to the coordinator in order to estimate the average for defining the corresponding grade, for each team. For the report assessment, it is also used a form with 7 criteria (Ci, i=1, 2, ..., 7) however, instead of all teachers checking all criteria duplicating efforts in reading the complete ver-sion of the reports, each teacher reads only a part of the report. This part is related to the topic allocated to him. For example, the teachers read the part of the project re-lated to course contents in C1, C3 and C4 criteria.
The Table III relates the teachers (Ti) and tutors (Tui) and the corresponding milestones that they assessed, indi-cating also the format of the ratings given by each: (i, r or nr), where i = 0, 1, 2 or 3 and corresponds to the number of decimal places in the mark given by the teacher or tutor and, r and nr indicates if that numeric value is rounded or not rounded, respectively. The marks were given on a 0 to 100 scale.
With this table (Table III), it is possible to observe the diversity of formats in which the teachers and tutors pre-sent grades. The final grades, last column in Table III, were estimated as the average of the individual grades given by the teachers and tutors for the each milestone.
iJOE – Volume 5, Special Issue 2: "IRF'09", November 2009 41
MEASUREMENT ROUNDING ERRORS IN AN ASSESSMENT MODEL OF PROJECT LED ENGINEERING EDUCATION
TABLE III. MILESTONES ASSESSED BY THE TEACHERS (TI) AND TUTORS (TUI) AND THEIR GRADE FORMAT.
Teachers/CU Milestones
T1/ IIE
T2/ IIE
T3/ IIE
T4/ CP1
T5/ CC
T6/ GQ Tu1 Tu2 Tu3
Grade
M3 - Project progress presentation (1, r) (0, r) (1, r) (0, r) (0, r) (3, r) (nr) M5 - Formal presentation (1, r) (1, r) (0, r) (1, r) (1, r) (1, r)
C1, C3, C4 (nr) (0, r) (0, r) (1, r) (0, r) (1, r) C2 (1, r) C5 (2, r) C6 (0, r)
M8 - Preliminary version of the final report delivery (max. 60 pages)
C7 (nr)
(nr)
C1, C3, C4 (2, r) (0, r) (1,r) (1, r) (0, r) (1, r) C2 (0, r) C5 (0, r) C6 (0, r)
M9 - Final report delivery (max. de 70 pages)
C7 (nr)
(nr)
M9 - Prototypes (1, r) (1, r) (2, r) M10 - Final presentation and discussion (2, r) (1, r) (0, r) (0, r) (0, r) (1, r) (0, r)
Project grade – individual: As presented in the previ-ous section, team project grade represents the assessment of the overall quality of the project developed by a team of students. The students’ individual performance, within the project team, is also assessed, resulting in individual pro-ject grades. Students belonging to a team can therefore achieve distinct project grades. Individual project contri-bution is assessed through two mechanisms which results in two corresponding weighting factors: the peer assess-ment factor (fp); the project written test.
The peer assessment enables each team member to as-sess their peer colleagues. The resulting individual grade is an average of all its colleagues’ assessments. If the in-dividual factor is greater than 1 the individual contribution has been better than that of the average contribution and the resulting project grade will be higher than the team grade. On the other hand, if the individual factor is lower than 1 the individual contribution has been worse than that of the average contribution, and the resulting project grade will be lower than the team grade. A factor 1 means that the individual project grade will be equal to the team pro-ject grade. The individual factors average is always equal to 1. The peer assessment factor is built based on a 4-phase formal assessment, each of which with the same weight. The 4-phases are spread during the semester. This allows students underperforming their individual contribu-tion, to acknowledge colleagues judgment, and correct their own performance accordingly. Teams are encour-aged to openly discuss peer assessment results. The post-peer assessment team sessions were identified to be prone to team internal conflicts. Team tutors were instructed to promote the internal discussion of the results, clarify any unclear issues relating the peer assessment item and re-spective consequences on individual project grade. Tutors were also instructed to identify potential conflicts among team members. If conflicts were latent previously, during this stage it is common that they erupt in a snapshot. In-ternal conflicts do not promote a good progression of the project, and if persistent, can lead to great losses for all team members, since all team members benefit from a good project and are penalized with bad project results. Some conflicts were observed to remain right till the end of the project.
Team members are asked to assess colleagues on a 0 to 10 scale (the higher the better) in a number of items (crite-
ria). In 2008/09 there were 6 items. The number, type of items and item weight is previously discussed within the team. Teams are also instructed to discuss the meaning of specific grades for each assessment item, so that grading is homogeneous among team members.
In the 2008/09 IME PLE edition the peer assessment factor varied from 76% to 128%, but in general these fac-tors have shorter interval ranges, i.e. contributions to pro-ject are more homogeneous.
The formula used to calculate the peer assessment fac-tor (fp) of a student x is given as follows:
(1)
where peerix represents the student x peer evaluation in the i-phase (i = 1, ..., 4) predefined at the beginning of the semester and has 2 decimal places, the fpx factor is stated with 3 decimal places. The following equation illustrates the estimation of peerix for the student x:
(2)
where wj is the weight of item j; cjkx is the grade of student x on item j given by his (her) peer (k); m is the number of assessment items; n is the number of team members; j and k are integers. The dividend of peerix equation represents the total grading of student x from his (her) peers. The Avg represents the average result of all team members in a given peer assessment phase, and estimated using the fol-lowing relationship:
(3)
where x is an integer and represents the x-element of the team.
The project written test will be discussed in the next section.
42 http://www.i-joe.org
MEASUREMENT ROUNDING ERRORS IN AN ASSESSMENT MODEL OF PROJECT LED ENGINEERING EDUCATION
Project written test – individual: The project written test is an individual written examination on individual team projects and accounts for 20% of the individual pro-ject grade. A team-specific exam is prepared by the 4 PSC teachers (typically 2 questions per PSC) based on the solu-tions and proposals found in team project deliverables. There is also a global question which addresses the issue of project interdisciplinarity. This is a mechanism that reinforces the correct assessment of team members within the context of the work developed for the project. Students having higher grades clearly demonstrate the mastery of their own project contents. Students not demonstrating such mastery will have an onus on their individual project grade. This mechanism intends to identify and penalize students that did not contribute enough to the development of team project, but somehow, were not penalized by peer assessment. The tests were graded by 5 teachers in a scale of 0 to 100%. The number of decimal places was not pre-viously discussed, but results show that there were differ-ent criteria on grading process: PSC1 grades exhibit 3 decimal places, PSC2 grades exhibit decimal rounding (no decimal places), PSC3 grades exhibit no rounding and, PSC4 grades exhibit 1 decimal place. The last question to be evaluated is global one and due to the question objec-tive, the evaluation was made in a global way and given by using a multiple of 5 points scale. As in the team pro-ject grade, it is also possible to observe the diversity of formats in which the teachers present their grades.
IV. ROUNDING ERRORS ANALYSIS In this section, the analysis of the effect of the rounding
errors on the assessment model is presented. The signifi-cant decimal places of a measured or estimated number are the meaningful decimal places in it. The last signifi-cant decimal place is usually rounded according to the adopted rounding rule and is expected to have some un-certainty. All measurement values have errors associated with them and all calculated results have an error associ-ated with it. This last error can be determined by taking into account the errors associated with the individual measurement. In the present work, the approach used to estimate the error associated was the limit of the absolute error. For this analysis, the component concerning to the PSC individual continuous assessment final grade would not be considered since it depends on the PSC’ teachers. So, the error analysis will concern three components only: team project grade, peer assessment factor and individual writing test.
The team project grade could have more influence on the error propagation since for its calculation, four evalua-tions from nine different persons, teachers and tutors, must be considered.
The team project grade could be represented by the fol-lowing equation,
(4) i=1, ..., k
where k represents the number of teams, wn correspond to the weight for the n component (as illustrated in Fig. 4), PR the preliminary report, FR the final report, Ps the pres-entations and P the prototypes. The Ps grade is obtained as a weighted average of three presentations (M3, M5 and M10):
(5)
Each term in (4) is also subject to rounding errors, since, as explained before, it is obtained from different formats. Using the information in Table 3 and in (4), the maximum rounding error that could be found is 0.191.
For the project individual grade, the estimation of the peer assessment factor for a particular student should be analyzed. In equations 2 and 3, the numerators are integer since they are a sum of integer values, and the Avg term that is represented with 3 decimal places could introduce some errors. However, this last value is estimated in such a way that the sum of the peerx, in the team, equals to 1. The maximum rounding error was estimated to be 0.332.
The individual project written test grade was estimated as an average of the four PSC teachers and tutors (as de-scribed in section 3.2.3). The maximum rounding error that could be found is 0.210.
At the end, the project final grade (individual - INDpfg) could be estimated as:
(6)
The final maximum rounding error is 0.308. This value
becomes more significant when the grade is near the limit of change to the integer, i.e., when the final grade is 74.30 this results in 74.30 ± 0.308 = [73.992; 74.608]. The Pro-ject final grade is subsequently affected by a 0.4 weight which results in a final maximum rounding error of 0.4 x 0.308 = 0.1232. Final PSC grades are affected by such a rounding error plus PSC continuous assessment grade eventual rounding errors, which were not considered in the present study.
The spreadsheet used to estimate the maximum limit rounding error, was afterwards used to simulate uniform grading criteria under a set of predefined minimum of significant decimal places. For example, two significant decimal places would give a maximum rounding error of about 0.3670, while three significant decimal places would improve radically the maximum rounding error to about 0.0367.
V. CONCLUSIONS In summative assessment a grade is given to measure
students’ performance. Such grades include a rounding error to some extent. To obtain the final grade, intermedi-ate calculations are needed, thus propagating the rounding errors. This work conducts a detailed analysis of the rounding errors on the assessment of an Interdisciplinary Project Led Education project. Non-uniform use of grad-ing criteria was observed on the main milestones of the Team Project. From the analysis developed in this work, based on 2008/09 PLE process in the first year of IME, it was found that the final maximum rounding error within the assessment of the Project Component is pb × 0.308. These results could be improved to pb × 0.0367 if an uni-form grading criteria was used by all teachers to grade all items of the team project. This assumes a rounding of the grades to a minimum of 3 decimal places.
The use of uniform rounding rules is highly recom-mended to improve the reliability of students’ results on the project individual grade. Since project grades affect all
iJOE – Volume 5, Special Issue 2: "IRF'09", November 2009 43

MEASUREMENT ROUNDING ERRORS IN AN ASSESSMENT MODEL OF PROJECT LED ENGINEERING EDUCATION
the PSC final grades, it is desirable that such grades would be less susceptible to rounding errors. As a complement, the assessment model could be made available as a shared on-line platform where each teacher inputs the grades. This could be less distressing, namely for the team coor-dinator who has the duty to compile all grades from all project components, within the context of the current as-sessment model. This work also contributed to clarify grading components and the corresponding impact on final grades.
REFERENCES [1] P. C. Powell and W. Weenk, Project-led engineering education,
Utrecht: Lemma, 2003. [2] M. Scriven, “The Methodology of Evaluation,” in Perspectives of
Curriculum Evaluation, R. Tyler, R. M. Gagné and M. Scriven, Eds., AERA Monograph Series on Curriculum Evaluation (1),. Chicago: Rand Mac Nally, 1967, pp. 39–83.
[3] P. Black and D. Wiliam, “Assessment and classroom learning,” Assessment in Education, 5 (1), 1998, pp. 7–74. (doi:10.1080/ 0969595980050102)
[4] R. M. Lima, D. Carvalho, M. A. Flores and N. Van Hattum-Janssen, “A case study on project led education in engineering: students' and teachers' perceptions,” European Journal of Engi-neering Education, 32 (3), 2007, pp. 337–347. (doi:10.1080/ 03043790701278599)
[5] W. Weenk, E. Govers and H. Vlas, “Training in project-based education: practise as you preach”, European Journal of Engineer-ing Education, 29 (4), 2004, pp. 465–475. (doi:10.1080/030 43790410001716301)
[6] D. Hubbard, How to Measure Anything: Finding the Value of "Intangibles" in Business, New Jersey: Wiley, 2007.
AUTHORS F. Moreira is with the Production and Systems Engi-
neering Department, Engineering School of University of Minho, Campus of Azurém, 4800-058 Guimarães, Portu-gal (e-mail: [email protected]).
R. M. Sousa is with the Production and Systems Engi-neering Department, Engineering School of University of Minho, Campus of Azurém, 4800-058 Guimarães, Portu-gal (e-mail: [email protected]).
C. P. Leão is with the Production and Systems Engi-neering Department (Numerical Methods and Statistical Group), Engineering School of University of Minho, Campus of Gualtar, 4710-057 Braga, Portugal (e-mail: [email protected]).
A. C. Alves is with the Production and Systems Engi-neering Department, Engineering School of University of Minho, Campus of Azurém, 4800-058 Guimarães, Portu-gal (e-mail: [email protected]).
R. M. Lima is with the Production and Systems Engi-neering Department, Engineering School of University of Minho, Campus of Azurém, 4800-058 Guimarães, Portu-gal (e-mail: [email protected]).
This article was modified from a presentation at the IRF'2009 confer-ence in Porto, Portugal, July 2009. Submitted 09 October 2009. Pub-lished as resubmitted by the authors on 20 October 2009.
44 http://www.i-joe.org
Copyright © 2022 FDOKUMEN