
Measurement of $\Gamma (Z^{0} \to b\overline{b}) / \Gamma (Z^{0} \to$ Hadrons using Impact...
32
Transcript of Measurement of $\Gamma (Z^{0} \to b\overline{b}) / \Gamma (Z^{0} \to$ Hadrons using Impact...

EUROPEAN ORGANISATION FOR PARTICLE PHYSICS
CERN-PPE/93-46
9 March 1993
Measurement of
�(Z0! bb)/�(Z0
! hadrons) using Leptons
The OPAL Collaboration
Abstract
The fraction of bb events in hadronic Z0 decays has been measured from the yield of leptons in the
data samples collected by OPAL in 1990 and 1991. A sample enriched in events containing Z0 ! bb
decays was obtained by requiring the presence of an electron or muon with high momentum and high
momentum component transverse to the associated hadronic jet. After accounting for backgrounds
and acceptances, a value of
�(Z0 ! bb)
�(Z0 ! hadrons)= 0:220� 0:002� 0:006� 0:011
was obtained. The �rst two errors re ect the data statistics and the systematic uncertainties arising
from detector modelling uncertainties, respectively. The third error includes systematic e�ects from
b and c fragmentation and decay uncertainties.
(Submitted to Zeitschrift f�ur Physik C)
The OPAL Collaboration
P.D.Acton25, G.Alexander23, J. Allison16, P.P.Allport5, K.J. Anderson9, S.Arcelli2 , A.Astbury28,
D.Axen29, G.Azuelos18;a, G.A.Bahan16, J.T.M.Baines16, A.H.Ball17, J. Banks16, R.J. Barlow16,
S.Barnett16, J.R.Batley5, G.Beaudoin18, A.Beck23, G.A.Beck13, J. Becker10, T.Behnke27,
K.W.Bell20, G.Bella23, P. Bentkowski18, P. Berlich10, S. Bethke11, O.Biebel3 , U. Binder10,
I.J.Bloodworth1, P.Bock11, B.Boden3, H.M.Bosch11, H. Breuker8, P. Bright-Thomas25,
R.M.Brown20, A. Buijs8, H.J.Burckhart8, C.Burgard27, P. Capiluppi2 , R.K. Carnegie6, A.A.Carter13,
J.R. Carter5, C.Y.Chang17, D.G.Charlton8, S.L.Chu4, P.E.L.Clarke25, I.Cohen23, J.C.Clayton1,
W.J.Collins5, J.E.Conboy15, M.Cooper22, M.Coupland14, M.Cu�ani2, S.Dado22, G.M.Dallavalle2,
S. De Jong13, L.A. del Pozo5, H.Deng17, A. Dieckmann11, M.Dittmar4, M.S.Dixit7, E. do Couto e
Silva12, J.E. Duboscq8, E.Duchovni26, G.Duckeck11, I.P.Duerdoth16, D.J.P.Dumas6, P.A.Elcombe5,
P.G.Estabrooks6, E.Etzion23, H.G.Evans9, F.Fabbri2, M.Fierro2, M.Fincke-Keeler28 , H.M.Fischer3,
D.G.Fong17, M.Foucher17, A.Gaidot21, O.Ganel26, J.W.Gary4, J.Gascon18, R.F.McGowan16,
N.I. Geddes20, C.Geich-Gimbel3 , S.W.Gensler9, F.X.Gentit21, G.Giacomelli2, R.Giacomelli2,
V.Gibson5, W.R.Gibson13, J.D.Gillies20 , J.Goldberg22, M.J.Goodrick5, W.Gorn4, C.Grandi2,
F.C.Grant5, J.Hagemann27, G.G.Hanson12, M.Hansroul8, C.K.Hargrove7, P.F.Harrison13, J. Hart8,
P.M.Hattersley1, M.Hauschild8, C.M.Hawkes8, E.He in4, R.J.Hemingway6, R.D.Heuer8, J.C.Hill5 ,
S.J.Hillier8 , T.Hilse10, D.A.Hinshaw18, J.D.Hobbs8, P.R. Hobson25, D.Hochman26, R.J.Homer1,
A.K.Honma28;a, R.E.Hughes-Jones16, R. Humbert10, P. Igo-Kemenes11, H. Ihssen11, D.C. Imrie25,
A.C. Janissen6, A. Jawahery17, P.W. Je�reys20, H. Jeremie18, M. Jimack2, M. Jobes1, R.W.L. Jones13,
P. Jovanovic1, C. Jui4, D.Karlen6, K.Kawagoe24, T.Kawamoto24, R.K.Keeler28, R.G.Kellogg17,
B.W.Kennedy15, S.Kluth5, T.Kobayashi24, D.S.Koetke8, T.P.Kokott3, S. Komamiya24, L. K�opke8,
J.F.Kral8, R.Kowalewski6, J. von Krogh11, J. Kroll9, M.Kuwano24, P.Kyberd13, G.D.La�erty16,
R. Lahmann17, F. Lamarche18, J.G.Layter4, P. Leblanc18, A.M.Lee17, M.H.Lehto15, D. Lellouch26,
C. Leroy18, J. Letts4, S. Levegr�un3, L. Levinson26, S.L. Lloyd13, F.K.Loebinger16, J.M.Lorah17,
B. Lorazo18, M.J. Losty7, X.C.Lou12, J. Ludwig10, M.Mannelli8, S.Marcellini2 , G.Maringer3,
C.Markus3, A.J.Martin13, J.P.Martin18, T.Mashimo24, P.M�attig3, U.Maur3, J.McKenna28,
T.J.McMahon1, J.R.McNutt25, F.Meijers8, D.Menszner11, F.S.Merritt9, H.Mes7, A.Michelini8 ,
R.P.Middleton20, G.Mikenberg26, J.Mildenberger6, D.J.Miller15, R.Mir12, W.Mohr10, C.Moisan18,
A.Montanari2, T.Mori24, M.Morii24, T.Mouthuy12;b, B. Nellen3, H.H.Nguyen9, M.Nozaki24,
S.W.O'Neale1, F.G.Oakham7, F.Odorici2 , H.O.Ogren12, C.J.Oram28;a, M.J.Oreglia9, S.Orito24,
J.P. Pansart21, B. Panzer-Steindel8 , P. Paschievici26, G.N.Patrick20, N. Paz-Jaoshvili23, P.P�ster10,
J.E.Pilcher9 , J. Pinfold31, D.Pitman28, D.E.Plane8, P.Po�enberger28, B. Poli2, A.Pouladdej6,
T.W.Pritchard13, H.Przysiezniak18, G.Quast27, M.W.Redmond9, D.L.Rees8, G.E.Richards16,
D.Robinson8, A.Rollnik3 , J.M.Roney28;c, E.Ros8, S. Rossberg10, A.M.Rossi2, M.Rosvick28,
P.Routenburg6, K.Runge10, O. Runolfsson8, D.R.Rust12, M. Sasaki24, C. Sbarra8, A.D.Schaile10,
O. Schaile10, W. Schappert6, P. Schar�-Hansen8, P. Schenk4, B. Schmitt3, H. von der Schmitt11,
S. Schreiber3, C. Schwick27, J. Schwiening3 , W.G. Scott20, M. Settles12, T.G.Shears5, B.C. Shen4,
C.H. Shepherd-Themistocleous7 , P. Sherwood15, R. Shypit29, A. Simon3, P. Singh13, G.P.Siroli2 ,
A. Skuja17, A.M.Smith8, T.J. Smith28, G.A. Snow17, R. Sobie28;c, R.W.Springer17, M. Sproston20,
K. Stephens16, J. Steuerer28, R. Str�ohmer11, D. Strom30, T.Takeshita24;d, P.Taras18, S. Tarem26,
M.Tecchio9, P.Teixeira-Dias11, N.Tesch3, N.J.Thackray1, M.A.Thomson15, E.Torrente-Lujan22,
G.Transtromer25, N.J.Tresilian16, T.Tsukamoto24, M.F.Turner8, G.Tysarczyk-Niemeyer11, D.Van
den plas18, R. Van Kooten27, G.J.VanDalen4, G.Vasseur21, C.J.Virtue7, A.Wagner27, D.L.Wagner9,
C.Wahl10, J.P.Walker1, C.P.Ward5, D.R.Ward5, P.M.Watkins1, A.T.Watson1, N.K.Watson8,
M.Weber11, P.Weber6, P.S.Wells8, N.Wermes3, M.A.Whalley1, G.W.Wilson4, J.A.Wilson1,
V-H.Winterer10, T.Wlodek26, S.Wotton11, T.R.Wyatt16, R.Yaari26, A. Yeaman13, G.Yekutieli26,
M.Yurko18, W.Zeuner8, G.T.Zorn17.
1

1School of Physics and Space Research, University of Birmingham, Birmingham, B15 2TT, UK2Dipartimento di Fisica dell' Universit�a di Bologna and INFN, Bologna, 40126, Italy3Physikalisches Institut, Universit�at Bonn, D-5300 Bonn 1, FRG4Department of Physics, University of California, Riverside, CA 92521 USA5Cavendish Laboratory, Cambridge, CB3 0HE, UK6Carleton University, Dept of Physics, Colonel By Drive, Ottawa, Ontario K1S 5B6, Canada7Centre for Research in Particle Physics, Carleton University, Ottawa, Ontario K1S 5B6, Canada8CERN, European Organisation for Particle Physics, 1211 Geneva 23, Switzerland9Enrico Fermi Institute and Department of Physics, University of Chicago, Chicago Illinois 60637,
USA10Fakult�at f�ur Physik, Albert Ludwigs Universit�at, D-7800 Freiburg, FRG11Physikalisches Institut, Universit�at Heidelberg, Heidelberg, FRG12Indiana University, Dept of Physics, Swain Hall West 117, Bloomington, Indiana 47405, USA13Queen Mary and West�eld College, University of London, London, E1 4NS, UK14Birkbeck College, London, WC1E 7HV, UK15University College London, London, WC1E 6BT, UK16Department of Physics, Schuster Laboratory, The University, Manchester, M13 9PL, UK17Department of Physics, University of Maryland, College Park, Maryland 20742, USA18Laboratoire de Physique Nucl�eaire, Universit�e de Montr�eal, Montr�eal, Quebec, H3C 3J7, Canada20Rutherford Appleton Laboratory, Chilton, Didcot, Oxfordshire, OX11 0QX, UK21DAPNIA/SPP, Saclay, F-91191 Gif-sur-Yvette, France22Department of Physics, Technion-Israel Institute of Technology, Haifa 32000, Israel23Department of Physics and Astronomy, Tel Aviv University, Tel Aviv 69978, Israel24International Centre for Elementary Particle Physics and Dept of Physics, University of Tokyo,
Tokyo 113, and Kobe University, Kobe 657, Japan25Brunel University, Uxbridge, Middlesex, UB8 3PH UK26Nuclear Physics Department, Weizmann Institute of Science, Rehovot, 76100, Israel27Universit�at Hamburg/DESY, II Inst f�ur Experimental Physik, 2000 Hamburg 52, Germany28University of Victoria, Dept of Physics, P O Box 3055, Victoria BC V8W 3P6, Canada29University of British Columbia, Dept of Physics, 6224 Agriculture Road, Vancouver BC V6T 1Z1,
Canada30University of Oregon, Dept of Physics, Eugene, Oregon 97403, USA31University of Alberta, Dept of Physics, Edmonton AB T6G 2J1, Canada
aAlso at TRIUMF, Vancouver, Canada V6T 2A3bNow at Centre de Physique des Particules de Marseille, Facult�e des Sciences de Luminy, MarseillecAnd IPP, University of Victoria, Dept of Physics, P O Box 3055, Victoria BC V8W 3P6, CanadadAlso at Shinshu University, Matsumoto 390, Japan
2
1 Introduction
The partial decay widths of the Z0 via the di�erent quark and lepton channels are predicted in
the Standard Model. The leptonic partial widths and the total hadronic width have been measured
with about 1% precision at LEP [1] and are in good agreement with prediction. The decay widths
to quarks, on the other hand, are measured with much larger errors. For b quarks, the partial decay
width, �(Z0 ! bb), has been measured with typically 10% precision [2{8]. Electroweak corrections
involving the top quark a�ect the partial decay width of the Z0 to b quarks di�erently from the decay
widths to lighter quarks. This results in a reduced dependence of the Z0 ! bb decay width on the top
quark mass. Precise measurements of this decay width would therefore be a way to test the Standard
Model with less sensitivity to the uncertainty on the top mass [9].
Leptons with high momentum and large momentum component transverse to jets are a well estab-
lished signature for b quarks. A large fraction of such leptons are expected to come from semileptonic
decays of b hadrons, because of the relatively large mass and hard fragmentation of the b quark. Since
at LEP essentially all b quarks produced originate from Z0 decays, the yield of these leptons allows
the fraction�(Z0 ! bb)
�(Z0 ! hadrons)�
�b�b
�had
to be measured. Since �had is known precisely from the hadronic Z0 cross-section, this provides a
measurement of �b�b. Good knowledge of the semileptonic branching ratio B(b! `)1 (` denotes e
or �) and of the lepton momentum spectrum in the semileptonic decay is essential, and ultimately
determines the precision of the �b�b=�had measurement for this \single lepton tag" technique. These
di�culties can be avoided using double tagging techniques [7], but such measurements are statistically
limited at present.
This analysis used the data collected by the OPAL experiment in 1990 and 1991, considering
both electrons and muons. It supersedes the previously published measurements [2, 3] based on 1990
OPAL data. Various improvements in understanding the data have been made, and the treatment of
systematic uncertainties improved. Measurements of the semileptonic branching ratios of b hadrons
made at the �(4S) using di�erent theoretical models of b hadron decays were treated consistently in
extracting �b�b=�had. The e�ects of di�erent mixes of b hadron species at LEP compared to the �(4S),
and the corresponding uncertainties, were considered.
The analysis technique is described in the next section. The most important features of the OPAL
detector for the analysis are described brie y in section 3. Section 4 reviews the event samples used,
both from the experiment and from simulation. The electron and muon identi�cation schemes are
discussed in sections 5 and 6 respectively. Section 7 describes the treatment of heavy hadron decay
model and branching ratio uncertainties. The results obtained applying the technique to data are
given in section 8.
2 Analysis Method
The analysis technique consisted of counting the number of leptons and breaking this number
down in terms of contributions from di�erent sources. The fraction of leptons from b hadron decays
was enhanced by requiring that identi�ed lepton candidates pass minimum momentum and transverse
momentum thresholds (the exact de�nition of transverse momentum employed is given in section 4).
The values of these thresholds were selected to give a small total error on �b�b=�had, and di�er for
electrons and muons because of di�erent backgrounds and e�ciencies in the two samples. For each
sample, the number of leptons expected from hadronic backgrounds was subtracted, as was the pre-
1A reference to a particle or reaction is intended also to refer to the corresponding antiparticle equivalent.
3

dicted contribution from electrons from photon conversions. The remaining prompt lepton2 candidates
are expected to arise from decays of b- avoured and c- avoured hadrons, with some electrons also
arising from Dalitz decays of �0 and �.
For either lepton avour, the number of candidates, N`, resulting from this procedure can be
expressed
N` = Nb` +N c
` +Nother` ;
where Nb` , N
c` are the numbers of prompt leptons from Z0 decays to bb or cc pairs respectively. Nother
`
is signi�cant only for electrons, and includes all other sources of prompt electrons, mainly Dalitz
decays. Leptons arising from heavy quark-antiquark pair creation in the fragmentation process were
also included.
The number of prompt electrons or muons from bb events can be written
Nb` = 2Nhad
�b�b
�had
P(B � �)b;
where Nhad is the number of hadronic Z0 decays,
P(B � �)b represents the prompt lepton contribution
from direct or indirect b hadron decay, expressed as a sum of products of branching ratios B and
acceptances � for the di�erent decay chains from b hadron to electron or muon. The sumP(B � �)b is
so written because the di�erent decay chains from b hadron to lepton have di�erent branching ratios
and acceptances, with di�erent, but correlated, uncertainties. The acceptances � include kinematic
and geometrical e�ciencies for each decay mode as well as the e�ciency for a Z0 decay to bb to pass
the hadronic event selection cuts.
The division by decay mode in the sumP(B � �)b is made as follows:
� The direct semileptonic decay of a hadron containing a b quark to products including an electron
or muon (b! `).
� The cascade decay of a b hadron to a c hadron, which then decays semileptonically to products
including an electron or muon (b! c! `). Both c quark or antiquark can be produced in the
decay of a b hadron: the former from a direct decay, the latter from a virtual W.
� The production and leptonic decay of J/ particles from b decay (b! J= ! `) is considered
separately, and not included in the previous category. It can be expected to be a�ected di�erently
by uncertainties in modelling heavy avour decays, since the kinematics of the two-body decay
J/ ! `+`� should be well modelled.
� The decay of a b hadron to a � lepton plus other products, where the � subsequently decays to
an electron or muon (b! � ! `).
The analysis technique of selecting only leptons with high momentum and transverse momentum
results in a sample dominated by direct b! ` decays.
Analogously, the number of prompt leptons from cc events can be written:
N c` = 2Nhad
�c�c
�had(B � �)c;
where now the product (B � �)c represents direct semileptonic decays of charm quarks (c! `) only.
Leptons from direct c decays are also suppressed relative to those from direct b decays by the kinematic
cuts.
2A \prompt" lepton is one that originates from the decay of a particle which has a lifetime of less than 10�11 s.
Prompt leptons thus include those from decays of heavy hadrons and short-lived particles such as �0 and � but exclude
those from decays of long-lived particles such as K� and ��, and those from photon conversions to electron-positron
pairs in the detector material. The division is made based on whether a decaying particle has any chance of interacting
with the detector before it decays.
4

The measurement of �b�b=�had by this method requires good knowledge of the di�erent branching
ratios B and acceptances �. The main experimental challenge is to understand well the identi�cation
e�ciencies and backgrounds for electrons and muons, as discussed in sections 5 and 6. The fragmen-
tation of the b quark must be modelled adequately. Understanding the b! ` decay, which is the
dominant source of leptons in the �nal sample, is a critical issue. Detailed consideration was given to
the momentum spectrum of the lepton in the decaying b hadron rest frame, and to the question of how
this a�ects both the branching ratio measurements made at lower energies and the acceptance of this
analysis. The most precise measurements of the branching ratios B have been made at lower energy
experiments in �(4S) decays. The results [10] from the CLEO Collaboration were taken, because the
uncertainties in the momentum spectrum were explicitly considered. Section 7 explains how these
results are treated for this analysis.
3 The OPAL Detector
The OPAL detector has been described elsewhere [11], and only the components important for this
analysis are reviewed. The OPAL coordinate system is de�ned to have its origin at the geometrical
centre of the detector. The positive z axis lies along the electron beam direction and � and � are
the polar and azimuthal angles. The x direction points towards the centre of the LEP ring and the y
direction points upwards.
The central charged particle tracking detector is made up of a precision vertex detector, a large
volume jet chamber, and thin surrounding z-chambers. The vertex detector is a high resolution drift
chamber with both axial and stereo wires. In addition, a silicon microvertex detector was installed
inside the vertex detector for the 1991 data-taking period. The jet chamber, approximately 4 m
long and 3.7 m in diameter, provides up to 159 space points per track, and measures the ionization
energy loss of charged particles [12]. It is subdivided azimuthally into 24 sectors. The central tracking
chambers are maintained at a gas pressure of four atmospheres in a pressure vessel, surrounded by a
solenoidal coil providing a magnetic �eld of 0.435 T which is uniform within the volume of the central
tracking chambers. The z coordinates of jet chamber hits are determined using charge division. The
precision of determination of track polar angles is improved by the z-chambers, which provide up to
six measurements of the z coordinate on each track. The z-chambers cover 94% of the solid angle in
the polar angle range jcos �j < 0:72. For the combined central detector, the resolution, �(pxy), of the
momentum in the bending plane of the magnetic �eld is given by �(pxy)=pxy =q(0:02)2+ (0:0015pxy)2
for pxy in GeV/c. The average resolution on the azimuthal track angle is 0.25 mrad. The polar angle
resolution varies from 0.25 mrad for tracks with z-chamber hits to 20 mrad for tracks with only
jet chamber information and constrained to the interaction point in z. The ionization energy loss
measurement has a resolution of 3.5% for tracks with the maximum 159 samples.
A lead-glass electromagnetic calorimeter with a presampler surrounds the magnet coil. The
calorimeter is divided into a cylindrical barrel, covering the polar angle range jcos �j < 0:82, and
annular endcaps, covering the range 0:81 < jcos �j < 0:98. The barrel calorimeter consists of 9440
lead-glass blocks arranged in a nearly projective geometry. The barrel presampler, positioned be-
tween the coil and the lead-glass, consists of two nested cylinders of limited streamer tubes covering
the polar angle range jcos �j < 0:81. In the barrel electromagnetic calorimeter, the energy resolu-
tion, �E , for beam-momentum electrons from e+e� ! e+e� events is determined to be approximately
�E=E ' 2:3%. For low-energy electrons from the process e+e� ! e+e� with momenta between 2
and about 3 GeV, the resolution is given approximately by �E=E ' 11%. Particles penetrating to the
electromagnetic calorimeter at � = 90� traverse 1.7 radiation lengths of material before reaching it.
The e�ects of this material in front of the calorimeter are included in the energy resolutions quoted.
The electromagnetic calorimeter is typically 22 radiation lengths deep, and lead-glass blocks at � = 90�
subtend 40 by 40 mrad2.
Outside the electromagnetic calorimeter lies the iron return yoke of the magnet, instrumented
5

with streamer tubes as a hadron calorimeter. The muon detectors are placed outside the hadron
calorimeter. In total, at least seven, and in most regions eight, absorption lengths of material lie
between the interaction point and the muon detectors. This material is su�cient that muons produced
at the vertex with momenta of less than 2 GeV/c nearly always range out in the absorber, but muons
with momenta above 3 GeV/c usually penetrate to the muon detectors. The muon chambers are
constructed as two di�erent detector subsystems in the barrel and endcap parts of the detector. They
cover 93% of the full solid angle, with gaps for the support structure of the detector, for readout
cabling of the inner detector components, and for the beam pipe.
The muon barrel detector covers the polar angle range jcos �j < 0:7. It has a cylindrical geometry,
composed of 110 planar drift chambers each 1.2 m wide and up to 10.4 m long, positioned at approx-
imately 5 m from the beam axis. The chambers are oriented such that the sense wires lie parallel to
the beam axis, so that the drift time provides an r-� coordinate with an accuracy of 1.5 mm. The
chambers are arranged with four layers in depth, and are staggered to resolve left-right ambiguities.
The z coordinate of hits is measured using charge division between cathode pads as well as the pulse
heights at the ends of the sense wires. The overall z resolution obtained is about 2 mm.
The muon endcap detector covers the polar angle range 0:67 < j cos�j < 0:98. It is composed of two
separated planes of limited streamer tube arrays at each end of the detector, approximately 6 m from
the interaction point. Each plane contains a set of horizontal and vertical wires each instrumented
with horizontal and vertical readout strips with 1 cm pitch. Resolutions of 1{3 mm are obtained on
the x and y coordinates of hits using the sharing of charge between strips, and the z coordinate is
obtained from the surveyed positions of the chambers.
4 Event Selection and Simulated Data Samples
The data analysed were collected in the 1990 and 1991 data-taking runs of LEP, with centre-of-mass
energies ranging between 88.2 GeV and 94.2 GeV. Hadronic Z0 events were selected using an algorithm
described elsewhere [13], additionally requiring that there be at least seven charged tracks in each event.
Tracks were counted only if they were reconstructed using at least 20 jet chamber hits, had a measured
momentum component in the x-y plane of at least 0.15 GeV/c, a total momentum measured to be
less than 65 GeV/c, a distance of closest approach to the beam axis of less than 5 cm, and satis�ed
other minor quality cuts. The extra track multiplicity requirement is predicted to remove most of
the low level of background, particularly Z0 decays to tau pairs, remaining in the standard hadronic
event selection. The hadronic Z0 event selection e�ciency of these requirements is (98.1�0.5)%, witha background of less than 0.1%. In addition, the tracking chambers and electromagnetic calorimeters
were required to be operating properly when the data were recorded, as were the barrel presampler for
the electron analysis, and the muon detectors for the muon analysis. A total of 483 071 and 458 286
hadronic Z0 decays were selected for the electron and muon analyses respectively.
Three main Monte Carlo samples were used for evaluating acceptances and backgrounds. Events
were simulated with the JETSET 7.3 Monte Carlo [14] in conjunction with a computer program that
imitated the response of the OPAL detector [15]. Simulated events were processed through the same
reconstruction and selection algorithms as data from the detector. The Monte Carlo samples were:
� A sample of 140 000 Z0 decays to bb quarks, used for evaluating the acceptance for muons
originating from such events. The fragmentation of the b- avoured quarks was described by the
fragmentation function of Peterson et al. [16], with �b = 0:0035.
� A sample of 56 000 Z0 decays to cc quarks, used for evaluating the background from muons
from decays of charm hadrons in the data. The Peterson fragmentation function was used for
c- avoured quarks, with �c = 0:06.
� A sample of 554 000 hadronic Z0 decays containing a mixture of all �ve primary quark avours.
These events were used for evaluating the kinematic acceptance for electrons originating from
6

bb and cc decays, for the calculation of the probability of an observed charged track being
misidenti�ed as a muon, and to estimate the production rate of prompt leptons produced in
events with primary u, d or s quarks. The hadronization properties of all quark avours were
described by the Lund fragmentation function [14]. For b and c quarks a correction was evaluated
to account for the di�erent acceptances for the Lund and Peterson fragmentation functions.
The same Monte Carlo samples were also used for determining changes in acceptances for di�er-
ent fragmentation and decay modelling parameters using a reweighting technique. The models and
parameter ranges used are discussed in more detail in section 7.
Clusters in the barrel (endcap) electromagnetic calorimeter were associated to a charged track if
the track pointed to the cluster centroid within 150 mrad (50 mrad) in � and 80 mrad (50 mrad) in
�. Charged tracks and electromagnetic calorimeter clusters with no associated track were clustered
into jets using the JADE algorithm [17] with the E0 recombination scheme [18]. The invariant mass-
squared cut-o� was set to xmin = 49 (GeV=c2)2. Monte Carlo studies indicated that in order for the
jet direction to provide an accurate estimate of the ight direction of the decaying b hadron a cut on
xmin was more e�ective than a cut on the invariant mass-squared scaled by the visible energy (ycut).
These studies also led to the speci�c value of the cut-o� taken. The jet axis was found including
the momenta of any lepton candidates. The transverse momentum, pt, of a lepton candidate was
determined relative to the axis of the jet containing it.
5 Electron Identi�cation and Backgrounds
Selection Requirements
The electron identi�cation requirements closely followed those used in a previous publication [2].
Charged tracks reconstructed in the central detector were considered as electron candidates in the
kinematic and geometrical region de�ned by
� p > 2 GeV/c, pt > 0:8 GeV/c and jcos �j < 0:7,
where p is the reconstructed lepton momentum. The requirements on p and pt were made to enhance
the contribution from semileptonic decays of b hadrons. The cos � requirement restricted the angu-
lar range for identifying electrons to the uniform barrel region of the detector. Tracks passing these
cuts were extrapolated to the lead-glass calorimeter after demanding that at least three hits in the
z-chambers were associated to the track to improve the track pointing resolution in �. This and the
remaining electron identi�cation criteria have been motivated in detail elsewhere [2]. The electromag-
netic energy included in the cluster associated to the track and contained in the lead-glass blocks with
centres lying within a 30 mrad cone around the extrapolated track was found. This energy, Econe, was
required to satisfy
� 0:7 < Econe=p < 1:4.
A further requirement on the lateral spread of the electromagnetic shower was made:
� Econe=(Econe+ �E) > 0:85 or �E < 2 GeV,
where �E is the energy contained in all lead-glass blocks adjacent3 to those de�ning Econe.
To ensure a reliable measurement of track ionization per unit length, dE/dx, the track was required
to have at least 40 jet chamber charge samples used in the calculation of dE/dx. It was then demanded
that
� N�dE=dx > �2:0,
3The sum Econe +�E was denoted Econe2 in the previous publication [2].
7

where N�dE=dx is a normalized dE/dx value de�ned as
N�dE=dx =
[dE/dx� (dE/dx)0]
�(dE/dx);
(dE/dx)0 being the average dE/dx for electrons, about 10 keV/cm, and �(dE/dx) an estimate of the
resolution on dE/dx for the candidate track assuming that the track is an electron. Finally, a signal
in the presampler with amplitude consistent with an electron was required:
� Npres > Ncut,
where Npres is the presampler amplitude associated to the track (normalized to a value of 2 for beam-
energy muons) and Ncut is a momentum dependent cut de�ned as
Ncut = 2:5 + p=(2 GeV=c) for p < 15 GeV=c and Ncut = 10 for p > 15 GeV=c:
After applying all these cuts, the number of identi�ed electrons was N tage = 6721.
Background
The electron signal is composed of electrons produced in decays of hadrons containing b and c
quarks, and also some from electromagnetic decays of light hadrons. The background consists of
hadron tracks misidenti�ed as electrons and electrons produced in photon conversions. The hadronic
background was poorly modelled by the detector simulation program, and so it was determined from
the data.
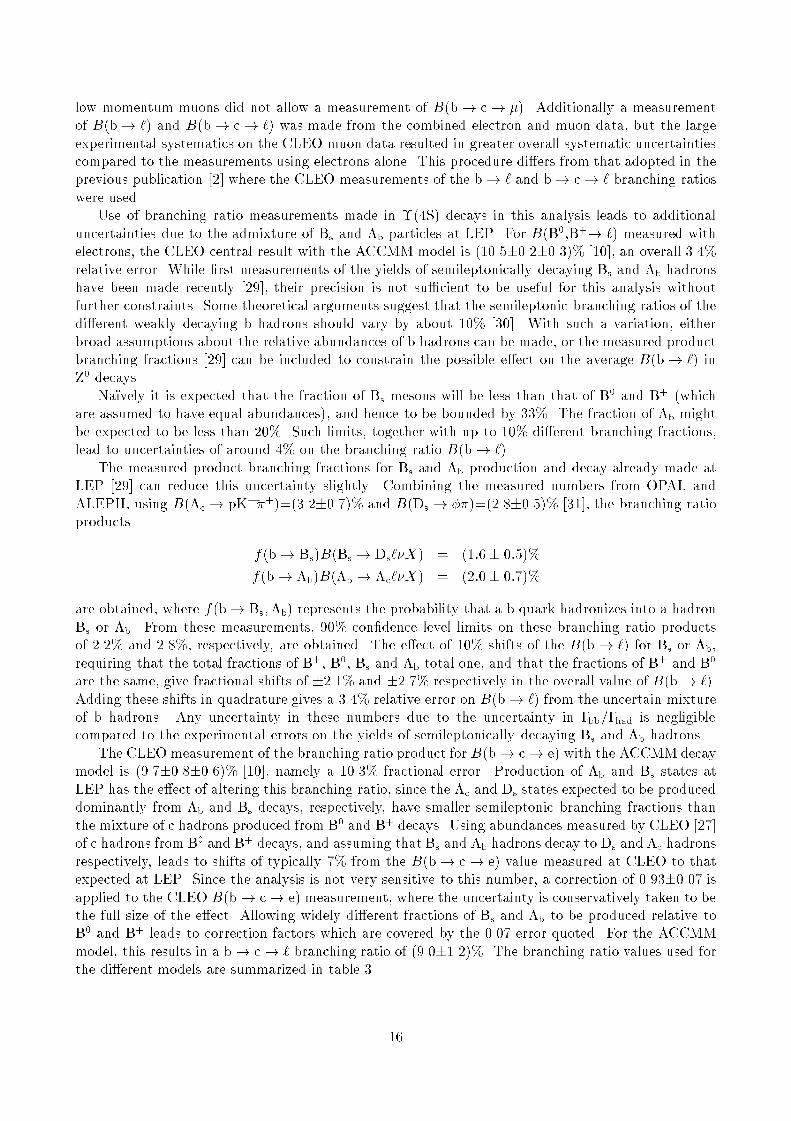
The hadronic background was determined from the data in two di�erent ways by �tting the N�dE=dx
and Econe=p distributions obtained after applying all selection requirements except the N�dE=dx and
Econe=p cut, respectively. In both cases, the �tting functions were the sum of a background histogram
and a Gaussian function approximating the electron signal. The background histogram was obtained
directly from the data by making appropriate requirements intended to remove electrons. In the
N�dE=dx case, the main requirement that biased against electrons was 0:1 < Econe=p < 0:6 and in the
Econe=p case, N�dE=dx < �3:0. The parameters of the Gaussian function used to describe the electron
N�dE=dx distribution were chosen to obtain an optimum description of the data, and no signi�cant
momentum dependence of these parameters was detected within present statistics. To obtain the
hadronic background only two parameters, the normalization of the background histogram and the
normalization of the Gaussian describing the electron signal, were allowed to vary. The number of
background events was obtained by counting the number of events in the normalized background
histogram inside the region de�ned by the electron selection cuts. Similar �ts were repeated on the
Econe=p distributions, but a signi�cant momentum dependence of the mean and width of the Gaussian
used to describe the electron Econe=p distribution was included. Both �ts, to N�dE=dx and Econe=p,
yielded compatible background values within errors and the average values were calculated. Examples
of the �ts are shown in �gure 1. The background was calculated in several momentum bins because
the hadronic background contamination rises signi�cantly with momentum. The averaged numbers of
background tracks, N fakee , are listed in table 1. The background fractions were calculated separately
for 1990 and 1991 data because the addition of the silicon microvertex detector between the two data-
taking periods particularly a�ected the number of photon conversions. The quoted errors include �t
normalization errors and errors induced by the uncertainty in the mean and width of the Gaussian
distributions. These errors, obtained from independent N�dE=dx and Econe=p �ts, were determined to
be uncorrelated, justifying taking the average of the results of the two �ts. The background histogram
selection requirements were chosen to reduce any possible correlations, and the data themselves were
used to check that any correlation was indeed negligible. In the highest momentum bin, an additional
error was added to account for a possible systematic di�erence between the two �ts. Additional
systematic errors were studied with di�erent �t ranges and by using slightly di�erent background
8
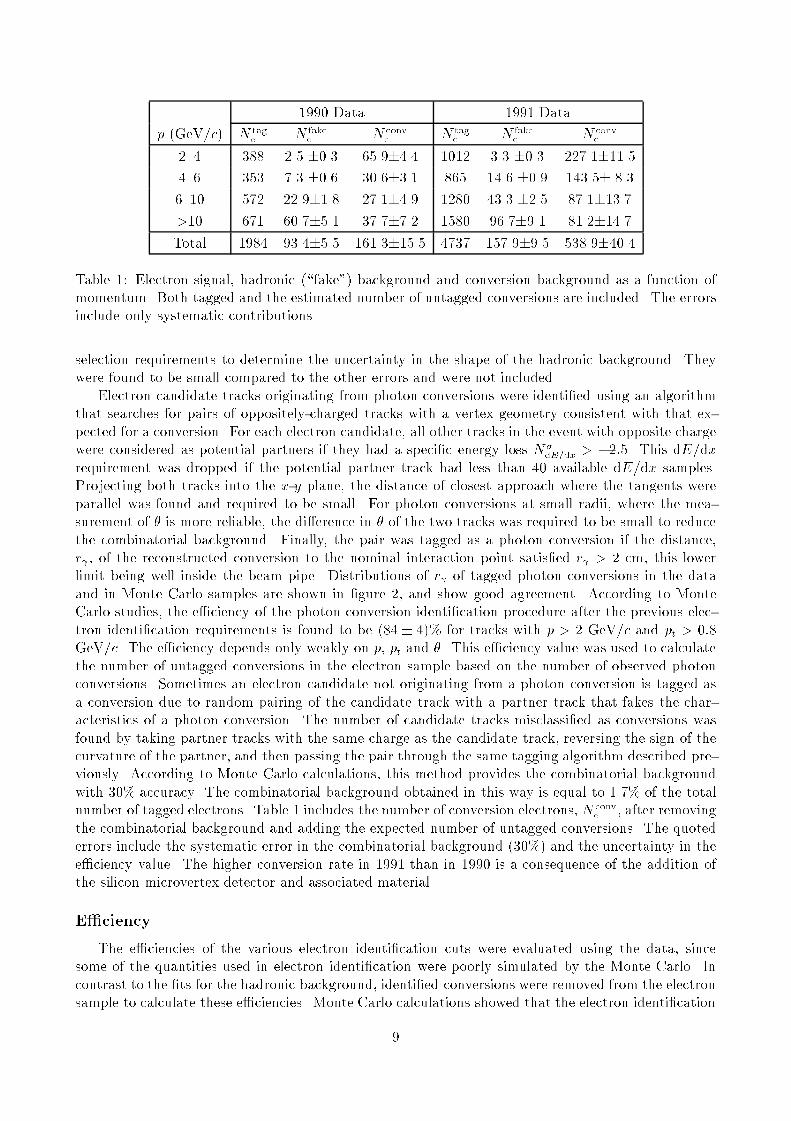
1990 Data 1991 Data
p (GeV/c) N tage N fake
e N conve N tag
e N fakee N conv
e
2{4 388 2.5 �0.3 65.9�4.4 1012 3.3 �0.3 227.1�11.5
4{6 353 7.3 �0.6 30.6�3.1 865 14.6 �0.9 143.5� 8.3
6{10 572 22.9�1.8 27.1�4.9 1280 43.3 �2.5 87.1�13.7
>10 671 60.7�5.1 37.7�7.2 1580 96.7�9.1 81.2�14.7
Total 1984 93.4�5.5 161.3�15.5 4737 157.9�9.5 538.9�40.4
Table 1: Electron signal, hadronic (\fake") background and conversion background as a function of
momentum. Both tagged and the estimated number of untagged conversions are included. The errors
include only systematic contributions.
selection requirements to determine the uncertainty in the shape of the hadronic background. They
were found to be small compared to the other errors and were not included.
Electron candidate tracks originating from photon conversions were identi�ed using an algorithm
that searches for pairs of oppositely-charged tracks with a vertex geometry consistent with that ex-
pected for a conversion. For each electron candidate, all other tracks in the event with opposite charge
were considered as potential partners if they had a speci�c energy loss N�dE=dx > �2:5. This dE/dx
requirement was dropped if the potential partner track had less than 40 available dE/dx samples.
Projecting both tracks into the x-y plane, the distance of closest approach where the tangents were
parallel was found and required to be small. For photon conversions at small radii, where the mea-
surement of � is more reliable, the di�erence in � of the two tracks was required to be small to reduce
the combinatorial background. Finally, the pair was tagged as a photon conversion if the distance,
r , of the reconstructed conversion to the nominal interaction point satis�ed r > 2 cm, this lower
limit being well inside the beam pipe. Distributions of r of tagged photon conversions in the data
and in Monte Carlo samples are shown in �gure 2, and show good agreement. According to Monte
Carlo studies, the e�ciency of the photon conversion identi�cation procedure after the previous elec-
tron identi�cation requirements is found to be (84 � 4)% for tracks with p > 2 GeV/c and pt > 0:8
GeV/c. The e�ciency depends only weakly on p, pt and �. This e�ciency value was used to calculate
the number of untagged conversions in the electron sample based on the number of observed photon
conversions. Sometimes an electron candidate not originating from a photon conversion is tagged as
a conversion due to random pairing of the candidate track with a partner track that fakes the char-
acteristics of a photon conversion. The number of candidate tracks misclassi�ed as conversions was
found by taking partner tracks with the same charge as the candidate track, reversing the sign of the
curvature of the partner, and then passing the pair through the same tagging algorithm described pre-
viously. According to Monte Carlo calculations, this method provides the combinatorial background
with 30% accuracy. The combinatorial background obtained in this way is equal to 1.7% of the total
number of tagged electrons. Table 1 includes the number of conversion electrons, N conve , after removing
the combinatorial background and adding the expected number of untagged conversions. The quoted
errors include the systematic error in the combinatorial background (30%) and the uncertainty in the
e�ciency value. The higher conversion rate in 1991 than in 1990 is a consequence of the addition of
the silicon microvertex detector and associated material.
E�ciency
The e�ciencies of the various electron identi�cation cuts were evaluated using the data, since
some of the quantities used in electron identi�cation were poorly simulated by the Monte Carlo. In
contrast to the �ts for the hadronic background, identi�ed conversions were removed from the electron
sample to calculate these e�ciencies. Monte Carlo calculations showed that the electron identi�cation
9

e�ciencies di�er signi�cantly for each individual source of electrons. The numbers given, determined
from the data, are average e�ciencies over the various electron sources. Since correlations may exist
between the various selection requirements, the e�ciency of each was de�ned as the e�ciency of this
requirement after all previous cuts have been applied, the order of application being the same as
given below. This procedure ensures that the total e�ciency is simply the product of all individual
e�ciencies. The results are listed in table 2, for di�erent momentum intervals. No strong dependence
of the e�ciencies on p or pt was observed.
Track Lateralp (GeV/c) quality N�
dE=dx Econe=p spread Pres. Totalcuts cut cut cut cut e�ciency
2{4 86.0�2.6 95.7�0.8 89.6�0.6 97.8�0.5 80.8�1.2 58.3�2.1
4{6 85.3�2.3 94.8�0.8 94.6�0.8 92.8�1.0 82.4�1.3 58.5�2.1
6{10 82.6�1.9 94.1�0.8 95.9�1.1 91.2�0.9 82.3�1.1 55.9�1.8
>10 83.0�2.1 94.1�0.8 96.1�1.5 90.6�1.2 76.3�1.4 51.9�2.0
Table 2: E�ciencies, in per cent, of all electron identi�cation requirements as a function of momentum,
as evaluated for the 1991 data sample. The errors include both statistical and systematic contributions.
Similar e�ciencies were obtained for 1990 data.
The e�ciency of the additional track quality requirements of z-chamber hit association and number
of dE/dx hits was determined for tracks passing no other electron identi�cation cut. For this purpose
a sample of tracks identi�ed as muons within hadronic events was employed, selected using only the
angular deviation between tracks and muon segments described in the next section. Muons are an
ideal sample to calculate this e�ciency, since the underlying physics processes resulting in muons and
electrons are similar once the background has been removed. A correction was applied to account for
the background contained in this muon sample. The quoted error includes both the statistical error
and the dominant error induced by this background correction.
In the calculation of the e�ciency of theN�dE=dx requirement, it was found that theN
�dE=dx distribu-
tion depends signi�cantly on the track environment. For this reason, a variable Ntrk was de�ned as the
average number of additional tracks within the same jet chamber sector as a given track. The average
value of Ntrk is 1.9 for electrons within the kinematic cuts, with a signi�cant momentum dependence.
Low momentum pions have a very similar N�dE=dx distribution
4 to electrons in the selected kinematic
region. At low momenta, a pure pion sample can easily be isolated since the mean dE/dx values
for di�erent particle species are well separated. The e�ciency as a function of Ntrk was calculated
using this sample of pions, and is about 98% for Ntrk < 1 and decreases below 90% for Ntrk > 4.
The electron e�ciencies were obtained by convoluting these e�ciency values with the electron Ntrk
distribution. The errors account for uncertainties in the Ntrk distributions for electrons and also for
possible di�erences between electron and pion N�dE=dx distributions.
The e�ciency of the Econe=p requirement was measured with electrons with p < 20 GeV/c, selected
in events with only one good quality track, with N�dE=dx > �1:0, and no hadronic energy or muon
segments associated to the track. This N�dE=dx cut was varied between �2:0 and 0:0 and no signi�cant
change was observed in the e�ciency derived. This event selection, dominated by radiative Bhabha
events and two photon processes, provides an almost 100% pure electron sample. To take into account
the high multiplicity environment of hadronic events, the extra energy deposited in the calorimeter
by surrounding particles was estimated from a distribution of the extra energy surrounding muon
candidates in hadronic data events and Econe was corrected appropriately. The correction to the
e�ciency introduced by this extra energy is smaller than 1%. The e�ect of incorrect matching of
4The quantity N�dE=dx was de�ned for pions by replacing the average electron dE/dx value with the expected average
dE/dx value for pions.
10
charged tracks to calorimeter energy clusters in hadronic events was also evaluated using Monte Carlo
calculations, and found to occur at the level of 2%. The error on this e�ciency accounts for the
statistical contribution of the single electron sample and the uncertainties from incorrect matching.
To obtain the e�ciency of the requirement on the spread of the electromagnetic shower, the
hadronic background contained in the electron sample, N fakee , was calculated using a �t, as described
earlier, with and without the lateral spread cut, but with all other selection requirements made. The
e�ciency was de�ned as:
�(lateral spread) =(N tag
e �N fakee )lateral spread cut
(N tage �N fake
e )no lateral spread cut:
Since the presampler requirement was made after the lateral spread requirement, it had to be released
for the calculation of this e�ciency. This procedure yields satisfactory results at low momenta, but
not at high momenta since the background increases considerably after releasing both presampler
and lateral spread requirements. For this reason, the presampler cut was applied as well, assuming
no correlation between the presampler and lateral spread requirements. It was checked that at low
momenta both procedures yielded identical results. At high momenta the check was performed with
single electrons as for the Econe=p requirement. The method was applied to both N�dE=dx and Econe=p
distributions and compatible results were found. The total error is the sum of the dominant statistical
error, common to both �ts, and of the various �t errors, independent for the two methods.
A similar procedure was also used for the determination of the e�ciency and error of the presampler
requirement.
6 Muon Identi�cation and Backgrounds
Selection Requirements
Charged tracks reconstructed in the central detector were extrapolated through the outer detectors
during event reconstruction. Such tracks were considered as possible muon candidates for this analysis
only if they satis�ed:
� p > 3 GeV/c, pt > 1:1 GeV/c and jcos �j < 0:9.
The p and pt requirements enhance the contribution from semileptonic b hadron decays. The numerical
values of these cuts di�er from those applied to electron candidates because of the di�erent e�ciency
and background for muon identi�cation. The restriction on polar angle was made to ensure that
the tracks were well measured in the central tracking chambers. Tracks were also required to have
an impact parameter in the x-y plane, d0, to the interaction point satisfying jd0j < 0:5 cm. This
requirement is expected to have a negligible ine�ciency for prompt muons, and rejects some secondary
muons from decays of pions and kaons.
The points of closest approach of each extrapolated track to track segments reconstructed inde-
pendently in the muon detectors were examined. The angular separation of these points and the muon
segments was calculated in azimuthal and polar angle. The sum in quadrature of these deviations,
normalized by their errors, was calculated, and is denoted �pos. In case of ambiguous multiple matches
between extrapolated tracks and muon segments, the muon segment with the lowest �pos for a given
track was associated to that track. In the case where this still left several tracks matched to a single
muon segment, only the track extrapolating closest in angle to the segment was considered. The
distribution of the �pos measure is shown in �gure 3 for low-multiplicity muon pair events, and for
hadronic Z0 decays. Muon candidates were required to satisfy:
� �pos < 3.
11

� No more than twenty muon segments should be found in an azimuthal slice of 300 mrad around
the track. This requirement rejected preferentially detector noise and hadronic showers pene-
trating to the muon chambers.
� dE/dx, measured in the jet chamber, must be consistent with that of a muon. Candidates
were rejected only if they had at least 20 jet chamber charge samples used in the calculation
of dE/dx, and the dE/dx measured was lower than a value corresponding to two standard
deviations below that expected for a muon. This energy loss requirement removes mostly K�
tracks matched to muon segments|the ionization losses of muon and charged pion tracks are
not su�ciently separated in the momentum range of interest.
A total of 7249 muon candidates passed all these requirements.
Background
Hadronic background to the prompt muon signal originates predominantly, in this analysis, from
the decays in ight of light hadrons, particularly �� and K�. Additional contributions arise from
leakage of hadronic showers through to the muon detectors (\punchthrough"), hadrons which pass
through the detector material without interacting strongly (\sailthrough"), and from random incorrect
association of a charged track with a reconstructed muon segment caused by some other particle. All
these processes together are referred to as the hadronic background to the prompt muon signal.
The amount of hadronic background in the muon sample was evaluated in a two-step process.
Monte Carlo simulated events were used to measure the probability that a track reconstructed in the
central tracking chambers was incorrectly identi�ed as a prompt muon. This fake probability per track
was then multiplied by the number of charged tracks seen in the data to obtain the total hadronic
background in the sample. This procedure largely removes sensitivity to the Monte Carlo simulation of
the p and pt distributions of all tracks. The Monte Carlo modelling of the fake probabilities was tested
using various samples of tracks with low prompt muon content, described below. Small corrections
to the fake probabilities were derived from these studies, as was the uncertainty on the amount of
background.
In the sample of muons selected by the cuts listed above, the level of hadronic background was
estimated to be approximately 11%. Of this, roughly two-thirds is expected to come from decays
in ight, 15% from punchthrough, and the remainder from sailthrough and incorrect associations.
Approximately 75% of the background tracks are predicted to be charged pions, and 20% to be
charged kaons.
The accuracy of the Monte Carlo modelling of the fake probability per track was studied by
comparing Monte Carlo predictions with data in various control samples. The same selections were
applied to data and simulated events for each of the samples, and the accuracy of modelling of
track yields and matching distributions was tested. The background from charged pions was tested
with identi�ed K0 ! �+�� decays, complemented by � ! 3� decays in Z0 ! �+�� events. The
�pos distribution of a track sample enhanced in kaons and protons was studied with a sample of
tracks passing all the muon identi�cation requirements, except failing the dE/dx cut. The modelling
of tracks matched incorrectly between central tracking chambers and muon detectors was studied
with samples passing the muon identi�cation cuts except failing the �pos< 3 requirement, or failing
the criteria used to resolve matching ambiguities. The corrections derived from these studies were
typically less than 10%. While a wide range of control samples was available, not all components of
the hadronic background could be tested individually, so the quoted uncertainty contains an estimate
of the remaining ambiguity, as well as contributions from the statistical precision of the test samples.
The most important background components for this analysis, namely pion and kaon decays in ight,
were assigned relative errors of about �10%. Punchthrough background, which predominates only at
very high momentum, was attributed a �50% error. This is the most di�cult background to simulate,
because it depends on details of hadronic shower development through the detector material.
12

The modelling of the relative yields of �� and K� by the Monte Carlo is a possible additional
source of uncertainty. However, with the muon identi�cation criteria listed above, this is not expected
to be a signi�cant source of error, because after the dE/dx requirement the fake probabilities per track
for the two particle types are the same to within 30%. The background prediction is more sensitive to
the modelling of the relative yield of proton tracks, but the relatively small number of protons means
that this too is assessed not to be an important source of error.
For the sample used in this analysis, the overall fake probability predicted by the Monte Carlo
was corrected by multiplying by 0.98, and was assigned a relative error of �14%. The average fake
probability per charged track was found to be (0.45�0.06)%, varying rather slowly with p and pt. Thisgave a total hadronic background in the muon sample of 769�104 tracks, where the error includes
systematic uncertainties.
E�ciency
The modelling of muons in the OPAL detector was studied using muon-pair events, and was found
to be well reproduced by the detector simulation. This allowed the muon identi�cation e�ciency in
hadronic events to be determined from Monte Carlo events processed through the detector simulation
program. Indeed the overall value of the muon identi�cation e�ciency did not need to be calculated
for this analysis, rather muon candidates in simulated events were counted in the same way as data,
to derive overall acceptances with the muon identi�cation e�ciencies folded in. Nevertheless, studies
of the reproducibility of the data by the Monte Carlo simulation were made in order to assess the
systematic uncertainty on the identi�cation e�ciency.
The matching requirement, �pos< 3, removes roughly 20% of prompt muons passing the p, pt and
j cos �j cuts. The ine�ciency arises largely from the geometrical acceptance of the muon chambers, and
also includes multiple scattering and calibration e�ects. The simulation of the e�ect of the �pos cut was
checked using muon pairs from two-photon scattering processes, and Z0 ! �+�� decays. These tests
provide good control of the combined e�ects of modelling of multiple scattering, of gaps in the muon
chamber acceptance and of chamber calibration. Events from two-photon scattering processes with
�+�� �nal states were selected by requiring exactly two charged tracks with two-particle invariant
mass above 2 GeV/c2, and that one track be identi�ed as a muon. The same criteria were applied
to data and simulated two-photon events, and the modelling of the e�ciency of identifying the other
track as a muon was evaluated. Decays of the type Z0 ! �+�� were identi�ed using a standard
selection procedure described elsewhere [13]. This algorithm has an e�ciency very close to 100% with
very low backgrounds, resulting in negligible selection biases, so that both muons could be used to
test the accuracy of the muon identi�cation modelling. For these well-isolated muon candidates, the
detector simulation was found to model the e�ciency of the �pos cut well, with a relative error of
2.5%. In hadronic Z0 decays there are additional small ine�ciencies expected from possible incorrect
association of tracks to muon segments, and from failure to reconstruct muons as charged tracks. The
sizes of these e�ects were estimated using Monte Carlo simulation to be an additional 2% and less
than 1% e�ciency loss respectively. A 2.5% additional uncertainty was ascribed due to these e�ects.
With perfect calibration, the dE/dx requirement would remove 2.5% of the remaining prompt
muons. Modelling of dE/dx, and thus the actual e�ect of the cut, was studied using identi�ed charged
pion samples. Corrections for the e�ects of nearby tracks on the measured dE/dx were obtained from
a data sample of low momentum pions. They were applied to the data as a function of Ntrk. In
addition, it was found that a degradation of the resolution was needed for a small fraction of tracks in
simulated events in order to reproduce the dE/dx distributions as a function of Ntrk seen in the data.
After applying these corrections, the systematic uncertainty remaining on the e�ect of the dE/dx cut
was estimated with identi�ed K0 ! �+�� decays. A residual systematic uncertainty of 1% was found,
compared to the 2.5% of muons rejected by the dE/dx cut.
The muon segment multiplicity and d0 cuts are estimated to be more than 99% e�cient for prompt
muons, with uncertainties negligible compared to those of the �pos and dE/dx cuts. Overall, the muon
13

identi�cation e�ciency was found to be approximately 76%, although as discussed above, the precise
value of this number is not used in this analysis. Overall, the muon identi�cation e�ciency was
assessed to have a relative systematic uncertainty of �3.7%.
7 Modelling and Branching Ratio Studies
This measurement of �b�b=�had requires a good understanding of heavy quark fragmentation, the
momentum spectra of leptons from the semileptonic decay of b and c hadrons, and the corresponding
semileptonic branching ratios. These are discussed in turn, the latter two in some detail because they
potentially give rise to the largest systematic uncertainties on the �nal result.
In addition, a value of �c�c=�had is needed to extract �b�b=�had. Measurements available [3,4,8,19{21]
are consistent with Standard Model predictions, namely 0.171 as obtained from the ZFITTER program
[22] (with top quark and Higgs boson masses of 150 and 300 GeV/c2 respectively, and �s = 0:12). The
most precise published measurement [19] comes from the yield of high momentum D� mesons, and has
a fractional error of �22%. Since D� mesons are also produced in b hadron decays, this measurement
also depends on �b�b=�had. To remove the consequent circularity, for this measurement of �b�b=�had the
Standard Model value of �c�c=�had = 0:171 was used. A fractional error of 22% was taken on this
number, to represent the accuracy of current measurements of �c�c=�had.
Heavy Quark Fragmentation
The fragmentation of the heavy quark (b or c) a�ects mostly the acceptance of the lepton mo-
mentum cut. The acceptance of this cut is large for both the electron and muon channels when the
pt requirements have been made. The fragmentation functions for both b and c quarks have been
measured at LEP, using charged leptons [3{5, 7, 23] and reconstructed D� mesons [19, 20]. These re-
sults are usually expressed in terms of the mean fraction of the beam energy carried by the heavy
hadron produced in the fragmentation process, hxEi. The measurements listed above are averaged
to obtain hxEi = 0:51 � 0:02 for c quarks, and hxEi = 0:70 � 0:02 for b quarks. The ranges cor-
respond to �c = 0:05� 0:02 and �b = 0:0055+0:0040�0:0030 when interpreting the measurements in terms of
the Peterson fragmentation function inside the JETSET 7.3 framework. Other forms of fragmentation
function were not considered explicitly because the uncertainty on �b�b=�had resulting from heavy quark
fragmentation is small (see below).
Models of Semileptonic Heavy Hadron Decays
The kinematic acceptances of the p and pt cuts for prompt leptons produced by di�erent heavy
hadron decays depend, for each channel, on the lepton momentum spectrum in the rest frame of the
decaying heavy hadron. Several models predict these spectra, and were used to estimate the size
of the resulting systematic uncertainties. The e�ects of di�erent lepton spectra are important not
only at LEP, but also in experiments at lower energies which make measurements of the semileptonic
branching ratios. For this analysis the b! ` and b! c! ` branching ratios measured by the CLEO
Collaboration [10] were taken because they repeated their analysis with di�erent decay spectra and
quote the separate results explicitly. The measurements were made using decays of the �(4S), which
produce only B0 and B+ mesons. Employment of these results therefore needs special consideration of
the extra particles Bs and �b produced at LEP. The �(4S) decays to B mesons which are practically
at rest in the CLEO detector. Experimental di�culties identifying low momentum electrons and
muons mean that the CLEO analysis is most sensitive to leptons with rest-frame momenta in the
upper half of the decay momentum spectrum. This introduces a strong correlation between measured
branching ratios and decay model. In the analysis described here the requirement of high transverse
momentum introduces an acceptance similarly biased towards high lepton momenta in the decaying
b hadron rest frame. Inclusion of the CLEO branching ratio measurements appropriate to each decay
14

model therefore results in a reduced overall uncertainty on the acceptance for b decays, because of this
sensitivity of the CLEO and OPAL analyses to the same region of the lepton rest-frame momentum
spectrum.
Following CLEO, two models of heavy avour decays were considered, referred to as ACCMM and
ISGW. The ACCMM model [24] is a free-quark model re�ned by inclusion of QCD corrections. It has
two input parameters, a Fermi momentum parameter, pF , and the mass, m, of the quark produced
in the heavy quark decay. For semileptonic decays of b hadrons, the same values of these parameters
were adopted as in the CLEO analysis (pF = 298 MeV/c, mc = 1673 MeV/c2). The ISGW model [25]
is based on a form-factor calculation of an explicit sum of spectra calculated for individual three-body
�nal states. There are no free parameters in the model. In addition to these two models, CLEO also
measured B(b ! `) with a modi�ed version of the ISGW model, referred to as ISGW**. In �tting
this modi�ed model to the CLEO data, the fraction of semileptonic b! ` decays via the reaction
B ! D��`� was allowed to oat freely, where D�� represents a sum over the four excited D states
with one unit of orbital angular momentum. In the unmodi�ed ISGW model the fraction of these D��
decays is 11%. The ISGW** model contains a 32% D�� fraction from the result of this �t.
The e�ect of uncertainties in the momentum spectrum of leptons from semileptonic c decays was
also included. The spectra predicted by the ACCMM (with pF = 282 MeV/c, ms = 50 MeV/c2, from
a �t [10] to DELCO data [26]) and ISGW models were considered. Compared to the DELCO data,
the rest-frame momentum spectrum for c! ` decays predicted by JETSET was found to be too soft,
largely due to an excessive fraction of 4- and 5-body semileptonic D decays in the JETSET decay
tables.
Cascade decays b! c! ` require a more involved treatment, because reliable models do not exist
for the inclusive b ! c decay. The b! c! ` spectra were derived [10] using a CLEO measurement
of the momentum spectrum of D mesons reconstructed in B decays [27], folded with the ACCMM
or ISGW predictions for the momentum spectrum of the lepton in the decaying c hadron rest frame.
When �tting the predicted lepton spectra to their data, CLEO consistently took either both ACCMM
b! ` and b! c! ` predictions, or both ISGW spectra. The same pairing of b! ` and b! c! `
spectra was taken for this analysis. When considering the ISGW** model for b! ` decays, the
b! c! ` decay spectrum was taken to be that predicted by the ISGW model for the c! ` decays.
In practice, di�erent decay models were simulated by reweighting from the rest-frame momentum
spectrum obtained from the JETSET Monte Carlo to the desired spectrum. A reweighting technique
was necessary because full detector simulation of su�cient events according to the di�erent models
would have required more computer resources than were available. For b! ` and b! c! ` decays,
leptons were reweighted according to their momentum in the decaying b hadron rest frame. The rest-
frame momentum spectra of both semileptonic and cascade b decays were simultaneously reweighted
to each model. Bs and �b hadron decays were reweighted by the same momentum-dependent factors
as B+ and B0 decays. The masses of Bs and �b particles were taken to be 5.48 and 5.62 GeV/c2,
respectively. The variation of the c semileptonic decay model was considered independently from the
b! ` decay model and the c! ` branching ratio, since correlated measurements have not been made
of any of the di�erent quantities. The e�ects on the momentum spectra of radiative corrections in the
heavy hadron decay [28], di�erent for electrons and muons, are included in the reweighting procedure.
Also included in the b! ` decay spectrum are the contributions of b! u`� decays, normalized by
branching ratios measured by CLEO in the �ts described above. The momentum spectra of muons in
the decaying b or c hadron rest frame are shown in �gure 4 for the b! `, b! c! ` and c! ` decay
chains, for di�erent models.
The b! ` and b! c! ` Branching Ratios
The CLEO measurements ofB(b ! e) and B(b! c! e) were adopted, assuming that the branch-
ing ratios for b! e and b! �, and for b! c! e and b! c! �, are equal. CLEO also mea-
sured B(b! �) from their muon momentum spectrum, but experimental di�culties in identifying
15
low momentum muons did not allow a measurement of B(b! c! �). Additionally a measurement
of B(b! `) and B(b! c! `) was made from the combined electron and muon data, but the large
experimental systematics on the CLEO muon data resulted in greater overall systematic uncertainties
compared to the measurements using electrons alone. This procedure di�ers from that adopted in the
previous publication [2] where the CLEO measurements of the b! ` and b! c! ` branching ratios
were used.
Use of branching ratio measurements made in �(4S) decays in this analysis leads to additional
uncertainties due to the admixture of Bs and �b particles at LEP. For B(B0,B+! `) measured with
electrons, the CLEO central result with the ACCMM model is (10.5�0.2�0.3)% [10], an overall 3.4%
relative error. While �rst measurements of the yields of semileptonically decaying Bs and �b hadrons
have been made recently [29], their precision is not su�cient to be useful for this analysis without
further constraints. Some theoretical arguments suggest that the semileptonic branching ratios of the
di�erent weakly decaying b hadrons should vary by about 10% [30]. With such a variation, either
broad assumptions about the relative abundances of b hadrons can be made, or the measured product
branching fractions [29] can be included to constrain the possible e�ect on the average B(b! `) in
Z0 decays.
Na��vely it is expected that the fraction of Bs mesons will be less than that of B0 and B+ (which
are assumed to have equal abundances), and hence to be bounded by 33%. The fraction of �b might
be expected to be less than 20%. Such limits, together with up to 10% di�erent branching fractions,
lead to uncertainties of around 4% on the branching ratio B(b! `).
The measured product branching fractions for Bs and �b production and decay already made at
LEP [29] can reduce this uncertainty slightly. Combining the measured numbers from OPAL and
ALEPH, using B(�c ! pK��+)=(3.2�0.7)% and B(Ds ! ��)=(2.8�0.5)% [31], the branching ratio
products
f(b! Bs)B(Bs ! Ds`�X) = (1:6� 0:5)%
f(b! �b)B(�b ! �c`�X) = (2:0� 0:7)%
are obtained, where f(b! Bs;�b) represents the probability that a b quark hadronizes into a hadron
Bs or �b. From these measurements, 90% con�dence level limits on these branching ratio products
of 2.2% and 2.8%, respectively, are obtained. The e�ect of 10% shifts of the B(b ! `) for Bs or �b,
requiring that the total fractions of B+, B0, Bs and �b total one, and that the fractions of B+ and B0
are the same, give fractional shifts of �2.1% and �2.7% respectively in the overall value of B(b ! `).
Adding these shifts in quadrature gives a 3.4% relative error on B(b! `) from the uncertain mixture
of b hadrons. Any uncertainty in these numbers due to the uncertainty in �b�b=�had is negligible
compared to the experimental errors on the yields of semileptonically decaying Bs and �b hadrons.
The CLEO measurement of the branching ratio product for B(b ! c! e) with the ACCMM decay
model is (9.7�0.8�0.6)% [10], namely a 10.3% fractional error. Production of �b and Bs states at
LEP has the e�ect of altering this branching ratio, since the �c and Ds states expected to be produced
dominantly from �b and Bs decays, respectively, have smaller semileptonic branching fractions than
the mixture of c hadrons produced from B0 and B+ decays. Using abundances measured by CLEO [27]
of c hadrons from B0 and B+ decays, and assuming that Bs and �b hadrons decay to Ds and �c hadrons
respectively, leads to shifts of typically 7% from the B(b ! c! e) value measured at CLEO to that
expected at LEP. Since the analysis is not very sensitive to this number, a correction of 0.93�0.07 isapplied to the CLEO B(b ! c! e) measurement, where the uncertainty is conservatively taken to be
the full size of the e�ect. Allowing widely di�erent fractions of Bs and �b to be produced relative to
B0 and B+ leads to correction factors which are covered by the 0.07 error quoted. For the ACCMM
model, this results in a b! c! ` branching ratio of (9.0�1.2)%. The branching ratio values used for
the di�erent models are summarized in table 3.
16

Decay mode ACCMM ISGW ISGW**
b! ` 10.50 � 0.50 10.1 11.1
b! c! ` 9.0 � 1.2 10.3 8.6
b! J= ! ` 0.14 � 0.04
b! � ! ` 0.5 � 0.2
c! ` 9.6 � 1.1
Table 3: Branching ratios, in per cent, derived for the di�erent b and c hadron decays in Z0 decays,
for di�erent semileptonic decay models. The ACCMM model is used to obtain the central result.
The b! J= ! ` Branching Ratio
Combining the measured branching ratios for B0;B+ ! J= and J= ! `+`� decays [31] gives for
`+`� and inclusively for leptons `:
B(B0;B+ ! J= ! `+`�) = (0:07� 0:01)%
B(B0;B+ ! J= ! `) = (0:14� 0:02)%:
The unknown e�ect of Bs and �b decays is included by adding an additional 25% uncertainty to this
branching ratio. The overall branching ratio, B(b ! J= ! `) = (0:14� 0:04)%, gives only a small
uncertainty on �b�b=�had.
The b! � ! ` Branching Ratio
The branching ratio of b to � relative to b to e is predicted by the quark model [32] from phase space
arguments. Allowing b and c quark masses to vary in the ranges 4.8{5.2 GeV/c2 and 1.3{1.7 GeV/c2,
respectively, gives a prediction for the relative � and e branching ratios of (25�10)%. More so-
phisticated form-factor calculations [33] do not change this conclusion. Using the well-measured
B(� ! e) = (17:9� 0:3)% [31] gives B(b ! � ! `) = (0:5� 0:2)%, where di�erences between mea-
surements of B(b ! `) for di�erent decay models have been neglected. These numbers are consistent
with a recent measurement of the branching ratio for b ! ���X by the ALEPH collaboration [34].
The uncertainty on �b�b=�had resulting from the uncertainty on B(b! � ! `) is small.
The c! ` Branching Ratio
For semileptonic decays of c hadrons, the overall branching ratio is calculated considering the
measured branching ratios and lifetimes of the separate hadron types. The semileptonic branching
ratios and lifetimes of D0 and D+ mesons are well measured [31], and the lifetimes of Ds and �c
states are also known with better than 10% precision. If the semileptonic partial widths of all these
c hadrons are assumed to be the same, the semileptonic branching ratios are just proportional to the
particle lifetimes. Combining the di�erent measurements with the JETSET prediction for the relative
abundances D+:D0:Ds:�c of 25:54:12:8 gives a predicted average semileptonic branching ratio for a
c hadron from Z0 decay to be (9.6�0.9)%, including the errors on the measured branching fractions
and lifetimes. Varying the vector to scalar meson production ratio in the range 2.5:1 to 4:1, and
the fractions of produced Ds and �c hadrons between 10{20% and 5{15% respectively, leads to an
additional error of �0.6% on the average B(c! `). Overall, this gives B(c! `)=(9.6�1.1)%. Thevariation of the c! ` branching ratio is considered independently of the b! c! ` branching ratio,
because di�erent mixtures of c hadrons are involved.
17

8 Results
Electrons
As discussed above, the electron identi�cation e�ciency was determined from the data themselves,
as an average over all prompt electron sources. The background-subtracted number of identi�ed
electrons in the data was therefore corrected for the identi�cation e�ciency before subdivision into
the contributions from the di�erent prompt electron sources. The number of electrons inside the
kinematic and geometrical cuts de�ned above was calculated in the four momentum bins introduced
in section 5 by subtracting the hadronic and conversion background (N fakee and N conv
e ), and correcting
for the electron identi�cation e�ciency (�elec):
N corre = (N tag
e �N fakee �N conv
e )=�elec:
Using the values listed in tables 1 and 2 and adding all momentum bins, a rate of prompt electrons
passing the p, pt and cos � cuts of
N corre =Nhad = (2:070� 0:028� 0:063)%
was derived, where the �rst error is statistical and the second systematic, and where Nhad is the
number of Z0 decays selected by the hadronic event selection, 483071, divided by the e�ciency of
that selection, namely (98.1�0.5)%. Some systematic errors are correlated from momentum bin to
momentum bin. This correlation was taken into account to obtain the total systematic error. The
approximate expected breakdown of the various prompt electron sources is given in table 4. The
distributions of p and pt for prompt electrons, after correction for backgrounds and e�ciency, are
shown in �gure 5.
b! e 74 %
b! c! e 13 %
b! J= ! e 1 %
b! � ! e 1 %
c! e 9 %
others 2 %
Table 4: Expected fractions of di�erent sources of prompt electrons passing the momentum and
transverse momentum cuts.
The rate of electrons from c! ` decays was estimated to be
N ce=Nhad = (0:183� 0:051)%:
For the value of Nothere =Nhad the following value, obtained from JETSET 7.3 simulated events, was
taken:
Nothere =Nhad = (0:043� 0:010)%;
where the error includes e�ects such as the uncertainties in the �0 and � yields [35], and a �100%uncertainty on the small number of leptons originating from b and c quarks produced in fragmentation
processes. The Dalitz decays contributing to Nothere =Nhad are more likely to be agged as photon
conversions than prompt electrons from other sources, and have been scaled down by 20% to account
for this e�ect, according to Monte Carlo predictions.
One source of experimental systematic uncertainty speci�c to the electron channel concerned the
e�ect of radiation losses of electrons inside the tracking chamber volumes. Such losses reduce the
18

electron momentum, and thus lead to a reduced kinematic e�ciency for electrons to pass the p and ptcuts. This e�ect amounts to an 8% correction for electrons, evaluated using the detailed simulation
of the detector performed for Monte Carlo events. The e�ects of the material within the tracking
chambers were simulated with an accuracy of about 10%, leading to an error of 0.8% on �b�b=�had from
this source.
The value of �b�b=�had was calculated from
�b�b
�had
����e
=N corr
e �N ce �Nother
e
2Nhad
P(B � �)b
:
The sumP(B � �)b was calculated from Monte Carlo to be (4.25�0.24)%. The central value was ob-
tained with the ACCMMmodel for semileptonic decays, and using the central values of fragmentation
parameters and branching ratios listed in section 7. The error includes branching ratio, fragmentation,
and decay model uncertainties. The result obtained was:
�b�b
�had
����e
= 0:216� 0:003� 0:007� 0:012;
where the �rst error is statistical, the second arises from detector performance uncertainties, and
the third from uncertainties from fragmentation, branching ratios and decay models. The detector
performance systematic error includes electron identi�cation and background uncertainties, that from
electron radiation losses, and those from the hadronic Z0 event selection and Monte Carlo statistics.
The error sources are summarized in table 5, where they are explicitly divided into those uncorrelated
or correlated between the electron and muon analyses.
Muons
Unlike for the electron channel, the muon identi�cation e�ciencies are calculated folded in with
the kinematic and geometrical acceptances, using simulated events. The number of tracks passing all
cuts, Nb� , expected from prompt muons in Z0 ! bb decay events is calculated from the number of
observed muon candidates in the data, N tag� :
Nb� = N tag
� �N fake� �N c
� �Nother� :
A total of N tag� = 7249 identi�ed muon candidates passed all cuts. The predicted contribution from
hadronic background to the prompt muon signal wasN fake� = 769�104 tracks. Decays of the type c! `
were predicted to contribute N c� = 332�82 tracks, where the error is the full systematic uncertainty.
An estimate of Nother� = 25�25 muons was obtained from the simulated JETSET 7.3 events for
the contribution from b and c quarks produced in fragmentation processes. Subtraction of these
contributions left an estimated
Nb� = 6123� 85� 135
prompt muons in the data coming from Z0 ! bb decay events, where the �rst error is statistical and
the second systematic. The estimated fractions of muon candidates in the sample from the di�erent
sources are given in table 6. The p and pt distributions of the muon candidates are shown in �gure 6.
The accuracy of detector modelling by the simulation program is re ected in the muon identi�cation
e�ciency and background uncertainties, as well as in the error on the hadronic Z0 event selection
e�ciency. An additional source of systematic uncertainty on the kinematic acceptance arose due to
the description of the polar angle resolution of tracks, and was estimated to lead to a small additional
uncertainty of �0.4%. This error does not apply to the electron analysis because z-chamber hits are
required as part of the electron identi�cation requirements.
The fraction of hadronic Z0 decays to bb pairs was calculated from
�b�b
�had
�����
=Nb
�
2Nhad
P(B � �)b
;
19

Error source Electrons Muons Combined
Lepton ID e�ciency 2.9 3.7 2.3
Hadronic backgrounds 0.2 1.7 0.8
Conversion background 0.9 - 0.5
Monte Carlo statistics 1.1 1.2 0.8
Electron radiation losses 0.8 - 0.4
Polar angle determination - 0.4 0.2
Total uncorrelated 3.3 4.3 2.7
Hadronic Z0 selection 0.5 0.5 0.5
�c�c=�had 1.9 1.2 1.6
c! ` branching ratio 1.0 0.6 0.8
c quark decay model 0.9 0.5 0.7
c quark fragmentation 0.8 0.3 0.6
CLEO b! ` branching ratio 2.8 3.0 2.9
B(b ! `) from �b and Bs 2.8 3.0 2.9
b! c! ` branching ratio 1.9 1.0 1.5
b! J= ! ` 0.5 0.4 0.5
b! � ! ` 0.6 0.4 0.5
b quark decay model 0.5 0.3 0.4
b quark fragmentation 1.4 1.2 1.3
Other lepton sources 0.5 0.4 0.5
Total correlated 5.4 4.9 5.1
Total systematic 6.3 6.5 5.7
Statistical 1.4 1.4 1.0
Table 5: Summary of e�ects, in per cent, of the di�erent error sources on the electron, muon and
combined �bb=�had results.
b! � 76 %
b! c! � 7 %
b! J= ! � 1 %
b! � ! � 1 %
c! � 5 %
hadronic background 11 %
Table 6: Expected fractions of muon candidates from di�erent sources in the �nal sample.
where, unlike in the electron case, the acceptances � include the muon identi�cation e�ciency as well
as the kinematic and geometrical e�ects. The number of hadronic Z0 decays, Nhad, was calculated
from the number selected in the data, 458 286, divided by the selection e�ciency, (98.1�0.5)%. Thesum
P(B � �)b was calculated to be (2.92�0.17)% from Monte Carlo studies, taking the same central
20

assumptions and errors as for the electron channel. The �nal result obtained using muons was:
�b�b
�had
�����
= 0:224� 0:003� 0:010� 0:011;
where the �rst error re ects the statistics of the data, the second the systematic errors arising directly
from OPAL detector-related uncertainties, and the third includes all systematic e�ects due to b and
c quark and hadron modelling. The individual systematic uncertainties are listed in table 5. The
detector-related uncertainty quoted includes the errors due to muon background and identi�cation,
hadronic Z0 decay acceptance, detector simulation uncertainties, and Monte Carlo statistics.
Further Checks of Results
The selection cuts on the p and pt of lepton candidates were chosen to give a small total fractional
error on �b�b=�had. Lowering the momentum cut results in an increase in the background fraction, and
increasing the momentum cut results in an increase of the fragmentation errors. A lower pt cut has
the e�ect of increasing the cascade and fragmentation errors as well as those from charm, and a higher
cut rapidly results in loss of statistics. For both channels it was checked that changes in the cuts over
wide ranges did not lead to signi�cant changes in the result.
Consistent results were obtained when the sample was divided into the two data-taking years, 1990
and 1991. The e�ect of including the data taken with collision energies not at the Z0 mass, but up to
3 GeV away, was assessed to be less than 0.4%, and was neglected.
Combination of Results
The central values from the electron and muon analyses, 0.216 and 0.224 respectively, di�er by
less than one standard deviation of the uncorrelated errors, and so are compatible. The results were
combined by weighting by the inverse of the square of the total error on each. Other methods of
combining the muon and electron numbers gave the same result for �b�b=�had within 0.3%. Errors
on the combined measurement were derived by uctuating the individual electron and muon results
by each error in turn, taking into account whether errors are correlated or not between the two
analyses. The lepton identi�cation e�ciencies, the conversion and hadronic background contributions,
Monte Carlo statistical errors, the error due to simulation of radiation in the central detector volume
(electrons), and the polar angle resolution error (muons) were assumed to be uncorrelated between
the two channels. All other uncertainties, namely branching ratio, semileptonic decay modelling, and
fragmentation errors, were treated as completely correlated between the two channels. This is a slightly
conservative assumption for some error sources, since the two channels used di�erent kinematic cuts.
The combined errors are given in table 5. The combined result obtained was:
�b�b
�had= 0:220� 0:002� 0:006� 0:011;
where the �rst error is statistical, the second arises from detector uncertainties and the third from
b and c modelling and branching ratio uncertainties. The total error, including both statistical and
systematic uncertainties, corresponds to �5.8% of the measurement.
9 Conclusions
The fraction of hadronic Z0 decays to bb pairs, �b�b=�had, has been measured from the yield of high
momentum, high transverse momentum electrons and muons in hadronic Z0 decay events. A value
�b�b
�had= 0:220� 0:002� 0:006� 0:011
21

was obtained, where the �rst error is statistical, the second arises from detector performance un-
certainties and the third from b and c quark modelling and branching ratio uncertainties. The
measurement is completely limited by systematic errors. This result supersedes previous published
OPAL measurements of �b�b . Together with the OPAL measurement of the hadronic width of the Z0,
�had = 1738� 12 MeV [1], this result gives a value of
�b�b = 382� 22 MeV:
The result is in good agreement with the Standard Model prediction for �b�b=�had. The ZFITTER
program [22], with the latest OPAL Z0 lineshape parameters [1], predicts �b�b=�had = 0:217 for a top
quark mass of 150 GeV/c2, a Higgs boson mass of 300 GeV/c2, and �s = 0:12. Varying the top
quark mass between 50 and 230 GeV/c2 results in predictions varying between 0.219 and 0.213. The
corresponding range for �b�b is 378{374 MeV, with a central prediction of 376 MeV.
The prospects for further reduction of the systematic errors on the measurement of �b�b using
this approach are limited. With increasing data statistics, double-tag methods of measuring �b�b , in
which branching ratio, modelling, and fragmentation uncertainties largely cancel, will provide further
improvements.
Acknowledgements
It is a pleasure to thank the SL Division for the e�cient operation of the LEP accelerator, the pre-
cise information on the absolute energy, and their continuing close cooperation with our experimental
group. In addition to the support sta� at our own institutions we are pleased to acknowledge the
Department of Energy, USA,
National Science Foundation, USA,
Texas National Research Laboratory Commission, USA,
Science and Engineering Research Council, UK,
Natural Sciences and Engineering Research Council, Canada,
Fussefeld Foundation,
Israeli Ministry of Energy,
Israeli Ministry of Science,
Minerva Gesellschaft,
Japanese Ministry of Education, Science and Culture (the Monbusho) and a grant under the Mon-
busho International Science Research Program,
German Israeli Bi-national Science Foundation (GIF),
Direction des Sciences de la Mati�ere du Commissariat �a l'Energie Atomique, France,
Bundesministerium f�ur Forschung und Technologie, FRG,
National Research Council of Canada, Canada,
A.P. Sloan Foundation and Junta Nacional de Investiga�c~ao Cient�i�ca e Tecnol�ogica, Portugal.
22

References
[1] The LEP Collaborations, ALEPH, DELPHI, L3 and OPAL, Phys. Lett. B276 (1992) 247;
OPAL Collaboration, P.D.Acton et al., Precision Measurements of the Neutral Current from
Hadron and Lepton Production at LEP, to be published in Z. Phys. C., CERN-PPE/93-003.
[2] OPAL Collaboration, P.D.Acton et al., Z. Phys. C55 (1992) 191.
[3] OPAL Collaboration, M.Z.Akrawy et al., Phys. Lett. B263 (1991) 311.
[4] ALEPH Collaboration, D.Decamp et al., Phys. Lett. B244 (1990) 551.
[5] DELPHI Collaboration, P.Abreu et al., Z. Phys. C56 (1992) 47;
L3 Collaboration, B. Adeva et al., Phys. Lett. B241 (1990) 416.
[6] DELPHI Collaboration, P.Abreu et al., Phys. Lett. B281 (1992) 383;
MARK II Collaboration, J.F.Kral et al., Phys. Rev. Lett. 64 (1990) 1211;
MARK II Collaboration, R.G. Jacobsen et al., Phys. Rev. Lett. 67 (1991) 3347.
[7] L3 Collaboration, B. Adeva et al., Phys. Lett. B261 (1991) 177.
[8] DELPHI Collaboration, P.Abreu et al., Phys. Lett. B295 (1992) 383.
[9] See, for example,
J.H.K�uhn, P.M.Zerwas, in: Z Physics at LEP 1, eds. G.Altarelli, R.Kleiss and C.Verzegnassi,
Vol. 1 (CERN 89-08, 1989) pp.271{275.
[10] CLEO Collaboration, S.Henderson et al., Phys. Rev. D45 (1992) 2212;
M.Worris, CLNS Thesis 91-05, Cornell University, 1991.
[11] OPAL Collaboration, K.Ahmet et al., Nucl. Instrum. Methods A305 (1991) 275.
[12] M.Hauschild et al., Nucl. Instrum. Methods A314 (1992) 74;
O.Biebel et al., Nucl. Instrum. Methods A323 (1992) 169.
[13] OPAL Collaboration, G.Alexander et al., Z. Phys. C52 (1991) 175.
[14] T. Sj�ostrand, PYTHIA 5.6 and JETSET 7.3: Physics and Manual, CERN-TH.6488/92;
OPAL optimized parameters were used, as described in
OPAL Collaboration, M.Z.Akrawy et al., Z. Phys. C47 (1990) 505.
[15] J.Allison et al., Nucl. Instrum. Methods A317 (1992) 47.
[16] C.Peterson, D. Schlatter, I. Schmitt, P. Zerwas, Phys. Rev. D27 (1983) 105.
[17] JADE Collaboration, W.Bartel et al., Z. Phys. C33 (1986) 23;
JADE Collaboration, S. Bethke et al., Phys. Lett. B213 (1988) 235.
[18] OPAL Collaboration, M.Z.Akrawy et al., Z. Phys. C49 (1991) 375.
[19] OPAL Collaboration, G.Alexander et al., Phys. Lett. B262 (1991) 341.
[20] ALEPH Collaboration, D.Decamp et al., Phys. Lett. B266 (1991) 218.
[21] DELPHI Collaboration, P.Abreu et al., Phys. Lett. B252 (1990) 140.
[22] D.Bardin et al., ZFITTER: An Analytical Program for Fermion Pair Production in e+e� Anni-
hilation, CERN-TH 6443/92, May 1992.
23
[23] L3 Collaboration, B. Adeva et al., Phys. Lett. B288 (1992) 412.
[24] G.Altarelli et al., Nucl. Phys. B208 (1982) 365.
[25] N. Isgur, D. Scora, B.Grinstein, M.B.Wise, Phys. Rev. D39 (1989) 799.
[26] DELCO Collaboration, W.Bacino et al., Phys. Rev. Lett. 43 (1979) 1073.
[27] CLEO Collaboration, D.Bortoletto et al., Phys. Rev. D45 (1992) 21.
[28] D.Atwood and W.J.Marciano, Phys. Rev. D41 (1990) 1736.
[29] ALEPH Collaboration, D.Buskulic et al., Phys. Lett. B294 (1992) 145;
ALEPH Collaboration, D.Buskulic et al., A Measurement of the b Baryon Lifetime, submitted
to Phys. Lett. B, CERN-PPE/92-138;
OPAL Collaboration, P.D.Acton et al., Phys. Lett. B281 (1992) 394;
OPAL Collaboration, P.D.Acton et al., Phys. Lett. B295 (1992) 357;
A preliminary OPAL measurement of f(b! �b)B(�b ! �c`�X) = (1:5� 0:35� 0:26)% derived
using B(�c ! pK��+)=(4.3�1.0)% is taken from
X.C.Lou, XXVI International Conference on High Energy Physics (ICHEP 92), Dallas, 6{12 Aug
1992.
[30] See, for example,
R.R�uckl, in: Z Physics at LEP 1, eds. G.Altarelli, R. Kleiss and C.Verzegnassi, Vol. 1 (CERN
89-08, 1989) pp. 311{317.
[31] Particle Data Group, K.Hikasa et al., Phys. Rev. D45 (1992) 1.
[32] C.Quigg and J.L. Rosner, Phys. Rev. D19 (1979) 1532.
[33] P.Heiliger and L.M.Sehgal, Phys. Lett. B229 (1989) 409.
[34] ALEPH Collaboration, D.Buskulic et al., Phys. Lett. B298 (1993) 479.
[35] L3 Collaboration, B. Adeva et al., Phys. Lett. B259 (1991) 199;
L3 Collaboration, O.Adriani et al., Phys. Lett. B286 (1992) 403.
24

Figure Captions
Figure 1: N�dE=dx distributions in four momentum bins for tracks in the 1991 data passing the other
electron identi�cation selection requirements. The �ts to a Gaussian and a background histogram are
superimposed. The background distribution is hatched.
Figure 2: Radius of reconstructed photon conversions (a) for 1990 data and (b) for 1991 data (points
with error bars). The Monte Carlo distribution is superimposed (continuous line). The e�ect of the
additional material introduced at small radii due to the installation of the microvertex detector in
1991 (inner beam pipe and two layers of silicon at radii 5.3 cm, 6.3 cm and 7.6 cm respectively) is
evident, and is well modelled by the Monte Carlo simulation. The additional structure is due to the
outer beam pipe at a radius of 8.0 cm and a carbon �bre tube at 23.5 cm separating the vertex and
jet chamber.
Figure 3: (a) Distribution of the muon matching variable �pos for muon pairs produced by two-
photon scattering processes e+e� ! e+e��+��, and for Z0 decays to �+��. (b) The �pos distribution
for muon candidates in hadronic Z0 decays for data and simulated events. The hatched histogram
represents the prompt muons in simulated events.
Figure 4: Rest-frame momentum spectra for (a) b! � (b) b! c! � and (c) c! � decays, for
the models indicated. The e�ects of b! u`� decays (for (a) and (b)) and radiative corrections are
included. The momentum spectra for electrons di�er in the e�ects of radiative corrections. The
momentum spectra of D mesons in B meson decays measured by CLEO was used in deriving the
ACCMM and ISGW b! c! ` model spectra.
Figure 5: The (a) momentum and (b) pt distributions for electron candidates passing all the selec-
tion cuts, after subtraction of hadronic and conversion background, and correction for the electron
identi�cation e�ciency. The errors shown on the data points are statistical only|the statistical errors
on the simulated events are not shown, but are comparable to those on the data. Since the electron
background and e�ciency corrections are not done bin-by-bin in the same bins as those shown here,
these plots should be considered illustrative.
Figure 6: The (a) momentum and (b) pt distributions for muon candidates passing all the selection
cuts except that on p or pt respectively. The positions of the p and pt cuts are indicated by arrows.
The errors shown on the data points are statistical only|the statistical errors on the simulated events
are not shown, but are comparable to those on the data. There is also a �14% error on the level of
hadronic background.
25
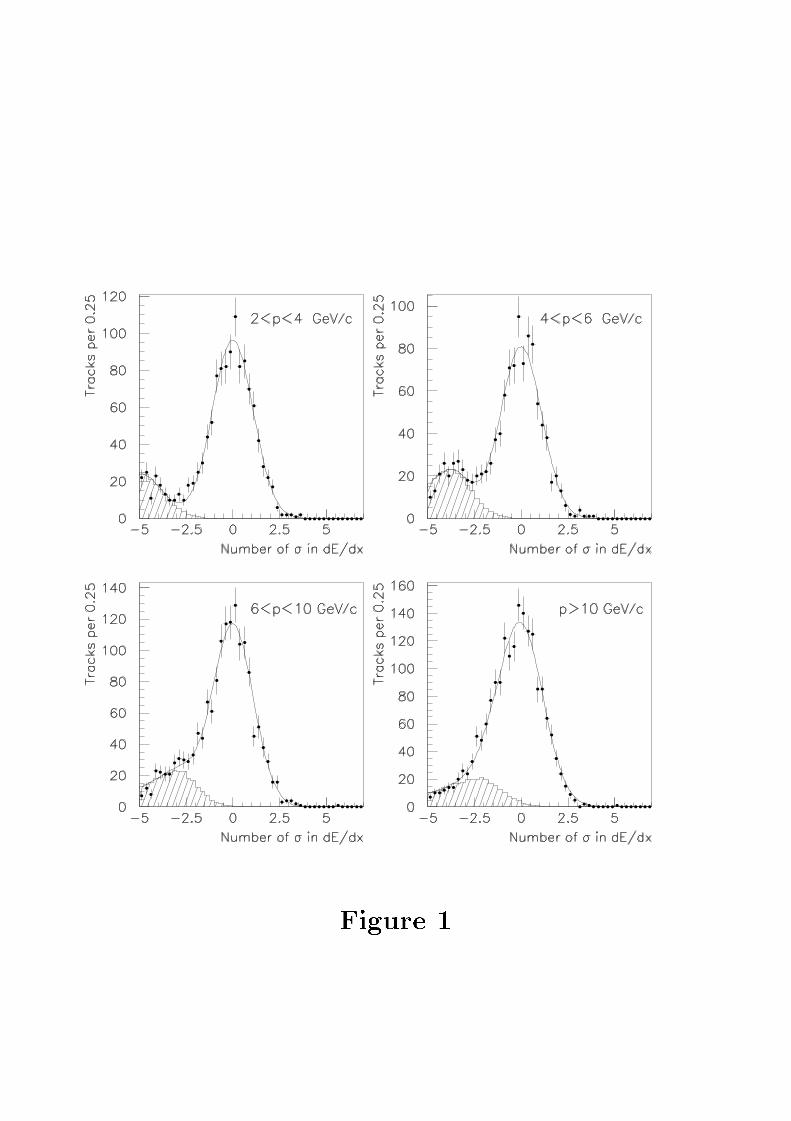
Figure 1

Figure 2

Figure 3
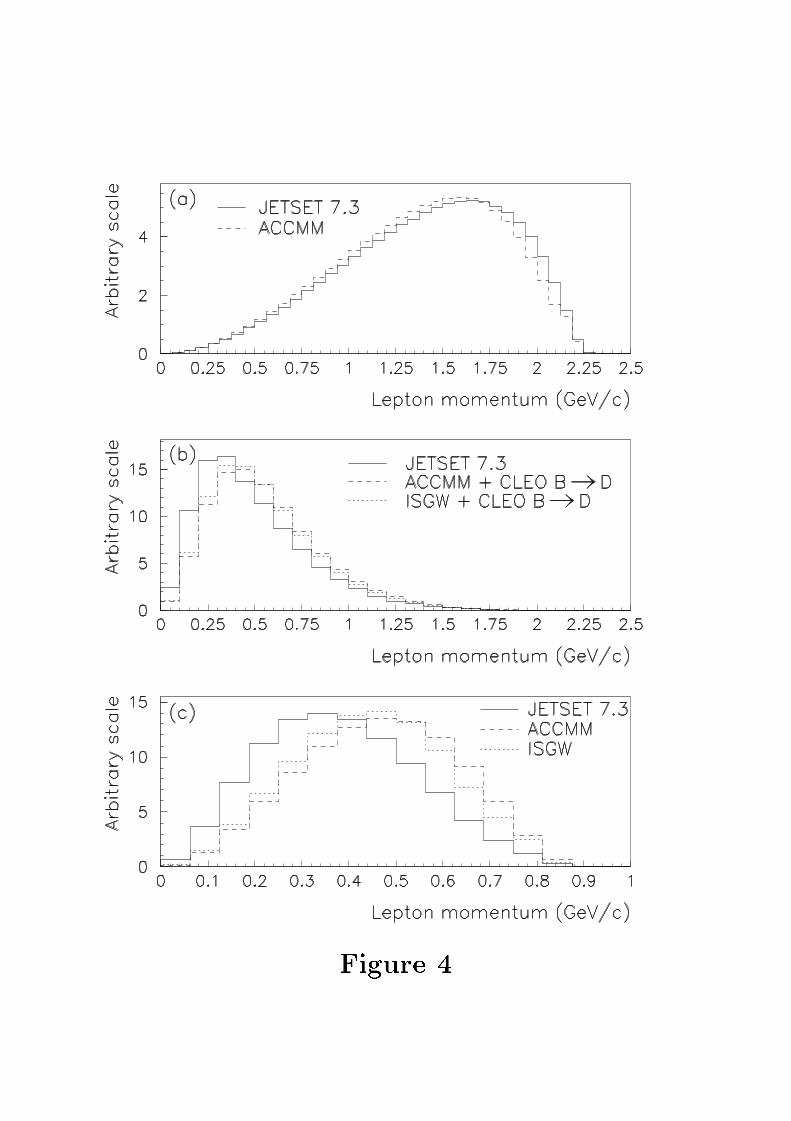
Figure 4

Figure 5
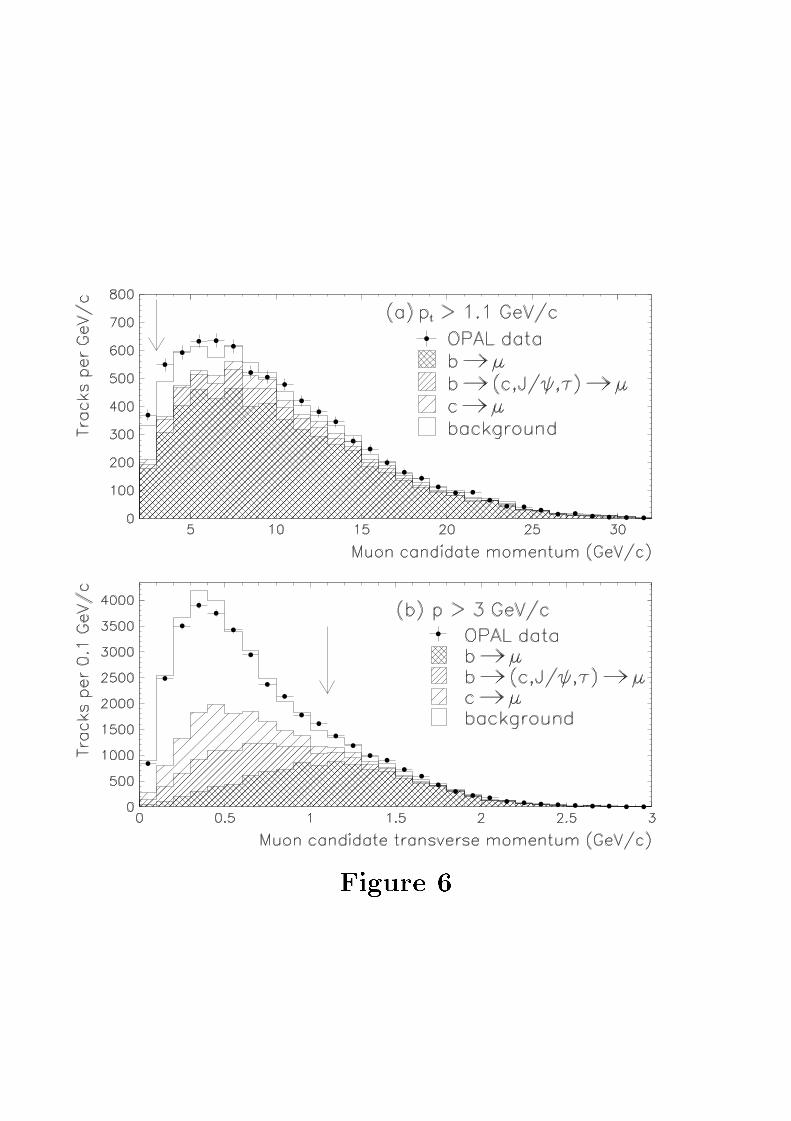
Figure 6