Measurement and Analysis of Truck Tire Pressures in Oregon
11
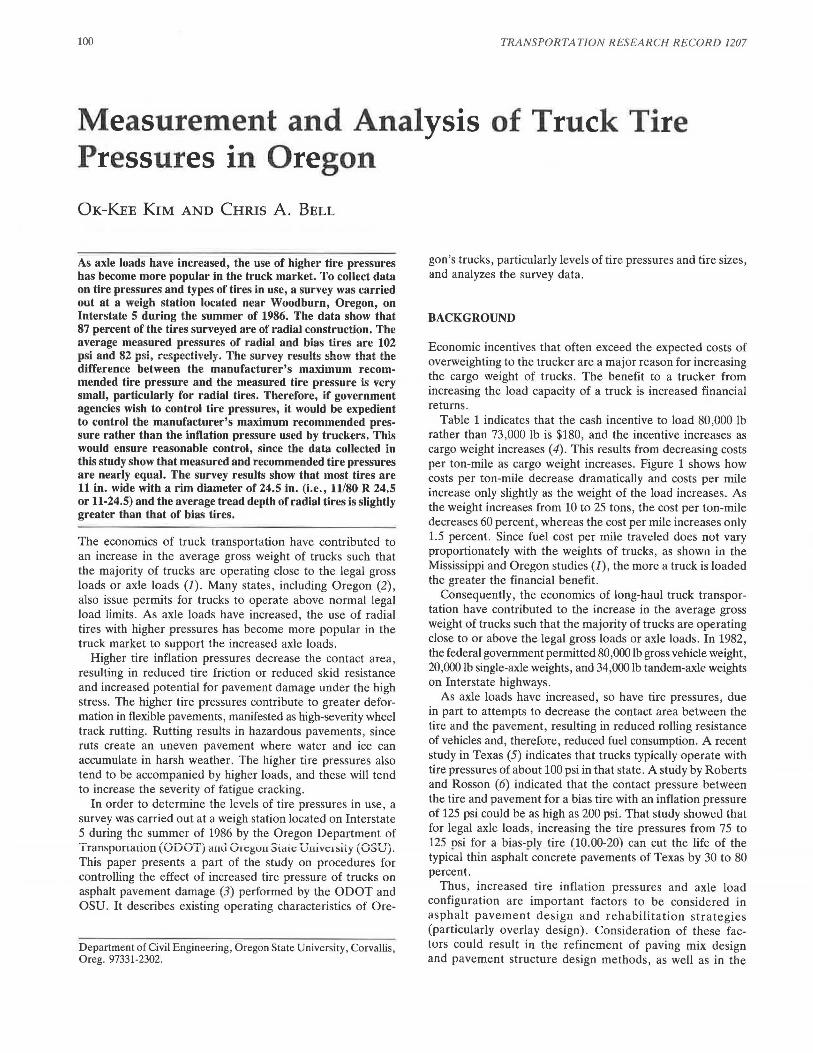
100 TRANSPORTATION RESEARCH RECORD 1207 Measurement and Analysis of Truck Tire Pressures in Oregon OK-KEE KIM AND CHRIS A. BELL As axle loads have increased, the use of higher tire pressures has become more popular in the truck market. To collect data on tire pressures and types of tires in use, a survey was carried out at a weigh station located near Woodburn, Oregon, on Interstate 5 during the summer of 1986. The data show that 87 percent of the tires surveyed are of radial construction. The average measured pressures of radial and bias tires are 102 psi and 82 psi, respectively. The survey results show that the difference between the manufacturer's maximum recom- mended tire pressure and the measured tire pressure is very small, particularly for radial tires. Therefore, if government agencies wish to control tire pressures, it would be expedient to control the manufacturer's maximum recommended pres- sure rather than the inflation pressure used by truckers. This would ensure reasonable control, since the data collected in this study show that measured and recommended tire pressures are nearly equal. The survey results show that most tires are 11 in. wide with a rim diameter of 24.5 in. (i.e., 11/80 R 24.5 or 11-24.5) and the average tread depth ofradial tires is slightly greater than that of bias tires. The economics of truck transportation have contributed to an increase in the average gross weight of trucks such that the majority of trucks are operating close to the legal gross loads or axle loads (J). Many states, including Oregon (2), also issue permits for trucks to operate above normal legal load limits. As axle loads have increased, the use of radial tires with higher pressures has become more popular in the truck market to support the increased axle loads. Higher tire inflation pressures decrease the contact area, resulting in reduced tire friction or reduced skid resistance and increased potential for pavement damage under the high stress. The higher tire pressures contribute to greater defor- mation in flexible pavements, manifested as high-severity wheel track rutting. Rutting results in hazardous pavements, since ruts create an uneven pavement where water and ice can accumulate in harsh weather. The higher tire pressures also tend to be accompanied by higher loads, and these will tend to increase the severity of fatigue cracking. In order to determine the levels of tire pressures in use, a survey was carried out at a weigh station located on Interstate 5 during the summer of 1986 by the Oregon Department of Transpunatiun (ODOT) auu 01cgu11 Siaic (GSu). This paper presents a part of the study on procedures for controlling the effect of increased tire pressure of trucks on asphalt pavement damage (3) performed by the ODOT and OSU. It describes existing operating characteristics of Ore- Department of Civil Engineering, Oregon State University, Corvallis, Oreg. 97331-2302. gon's trucks, particularly levels of tire pressures and tire sizes, and analyzes the survey data. BACKGROUND Economic incentives that often exceed the expected costs of overweighting to the trucker are a major reason for increasing the cargo weight of trucks. The benefit to a trucker from increasing the load capacity of a truck is increased financial returns. Table 1 indicates that the cash incentive to load 80,000 lb rather than 73,000 lb is $180, and the incentive increases as cargo weight increases ( 4). This results from decreasing costs per ton-mile as cargo weight increases. Figure 1 shows how costs per ton-mile decrease dramatically and costs per mile increase only slightly as the weight of the load increases. As the weight increases from 10 to 25 tons, the cost per ton-mile decreases 60 percent, whereas the cost per mile increases only 1.5 percent. Since fuel cost per mile traveled does not vary proportionately with the weights of trucks, as shown in the Mississippi and Oregon studies (J), the more a truck is loaded the greater the financial benefit. Consequently, the economics of long-haul truck transpor- tation have contributed to the increase in the average gross weight of trucks such that the majority of trucks are operating close to or above the legal gross loads or axle loads. In 1982, the federal government permitted 80,000 lb gross vehicle weight, 20,000 lb single-axle weights, and 34,000 lb tandem-axle weights on Interstate highways. As axle loads have increased, so have tire pressures, due in part to attempts to decrease the contact area between the tire and the pavement, resulting in reduced rolling resistance of vehicles and, therefore, reduced fuel consumption. A recent study in Texas (5) indicates that trucks typically operate with tire pressures of about 100 psi in that state. A study by Roberts and Rosson (6) indicated that the contact pressure between the tire and pavement for a bias tire with an inflation pressure of 125 psi could be as high as 200 psi. That study showed that for legal axle loads, increasing the tire pressures from 75 to 125 psi for a bias-ply tire (10.00-20) can cut the life of the typical thin asphalt concrete pavements of Texas by 30 to 80 percent. Thus, increased tire inflation pressures and axle load configuration are important factors to be considered in pavement design and rehabilitation strategies (part1cularly overlay design). Consideration of these fac- tors could result in the refinement of paving mix design and pavement structure design methods, as well as in the
-
Upload
khangminh22 -
Category
Documents
-
view
1 -
download
0
Transcript of Measurement and Analysis of Truck Tire Pressures in Oregon
100 TRANSPORTATION RESEARCH RECORD 1207
Measurement and Analysis of Truck Tire Pressures in Oregon
OK-KEE KIM AND CHRIS A. BELL
As axle loads have increased, the use of higher tire pressures has become more popular in the truck market. To collect data on tire pressures and types of tires in use, a survey was carried out at a weigh station located near Woodburn, Oregon, on Interstate 5 during the summer of 1986. The data show that 87 percent of the tires surveyed are of radial construction. The average measured pressures of radial and bias tires are 102 psi and 82 psi, respectively. The survey results show that the difference between the manufacturer's maximum recommended tire pressure and the measured tire pressure is very small, particularly for radial tires. Therefore, if government agencies wish to control tire pressures, it would be expedient to control the manufacturer's maximum recommended pressure rather than the inflation pressure used by truckers. This would ensure reasonable control, since the data collected in this study show that measured and recommended tire pressures are nearly equal. The survey results show that most tires are 11 in. wide with a rim diameter of 24.5 in. (i.e., 11/80 R 24.5 or 11-24.5) and the average tread depth ofradial tires is slightly greater than that of bias tires.
The economics of truck transportation have contributed to an increase in the average gross weight of trucks such that the majority of trucks are operating close to the legal gross loads or axle loads (J). Many states, including Oregon (2), also issue permits for trucks to operate above normal legal load limits. As axle loads have increased, the use of radial tires with higher pressures has become more popular in the truck market to support the increased axle loads.
Higher tire inflation pressures decrease the contact area, resulting in reduced tire friction or reduced skid resistance and increased potential for pavement damage under the high stress. The higher tire pressures contribute to greater deformation in flexible pavements, manifested as high-severity wheel track rutting. Rutting results in hazardous pavements, since ruts create an uneven pavement where water and ice can accumulate in harsh weather. The higher tire pressures also tend to be accompanied by higher loads, and these will tend to increase the severity of fatigue cracking.
In order to determine the levels of tire pressures in use, a survey was carried out at a weigh station located on Interstate 5 during the summer of 1986 by the Oregon Department of Transpunatiun (ODOT) auu 01cgu11 Siaic u11ivc1~iiy (GSu). This paper presents a part of the study on procedures for controlling the effect of increased tire pressure of trucks on asphalt pavement damage (3) performed by the ODOT and OSU. It describes existing operating characteristics of Ore-
Department of Civil Engineering, Oregon State University , Corvallis, Oreg. 97331-2302.
gon's trucks, particularly levels of tire pressures and tire sizes, and analyzes the survey data.
BACKGROUND
Economic incentives that often exceed the expected costs of overweighting to the trucker are a major reason for increasing the cargo weight of trucks . The benefit to a trucker from increasing the load capacity of a truck is increased financial returns .
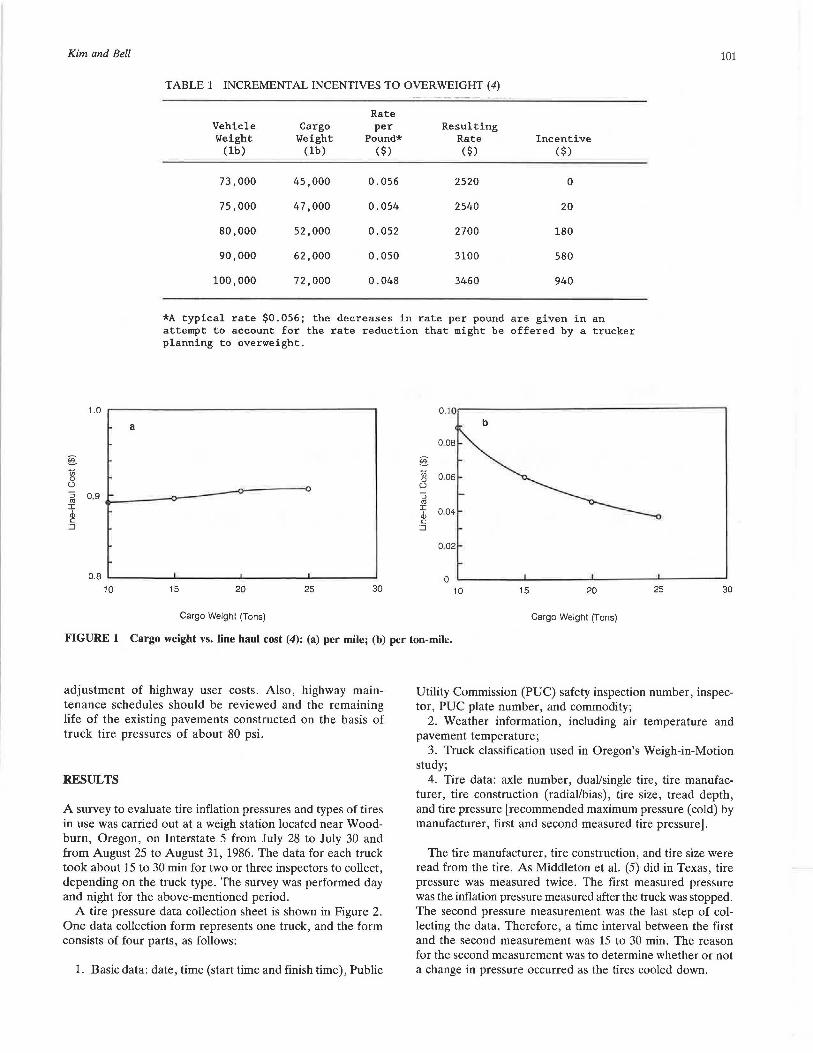
Table 1 indicates that the cash incentive to load 80,000 lb rather than 73,000 lb is $180, and the incentive increases as cargo weight increases ( 4). This results from decreasing costs per ton-mile as cargo weight increases. Figure 1 shows how costs per ton-mile decrease dramatically and costs per mile increase only slightly as the weight of the load increases. As the weight increases from 10 to 25 tons, the cost per ton-mile decreases 60 percent, whereas the cost per mile increases only 1.5 percent. Since fuel cost per mile traveled does not vary proportionately with the weights of trucks, as shown in the Mississippi and Oregon studies (J), the more a truck is loaded the greater the financial benefit.
Consequently, the economics of long-haul truck transportation have contributed to the increase in the average gross weight of trucks such that the majority of trucks are operating close to or above the legal gross loads or axle loads. In 1982, the federal government permitted 80,000 lb gross vehicle weight, 20,000 lb single-axle weights, and 34,000 lb tandem-axle weights on Interstate highways .
As axle loads have increased, so have tire pressures, due in part to attempts to decrease the contact area between the tire and the pavement, resulting in reduced rolling resistance of vehicles and, therefore, reduced fuel consumption. A recent study in Texas (5) indicates that trucks typically operate with tire pressures of about 100 psi in that state. A study by Roberts and Rosson (6) indicated that the contact pressure between the tire and pavement for a bias tire with an inflation pressure of 125 psi could be as high as 200 psi. That study showed that for legal axle loads, increasing the tire pressures from 75 to 125 psi for a bias-ply tire (10.00-20) can cut the life of the typical thin asphalt concrete pavements of Texas by 30 to 80 percent.
Thus , increased tire inflation pressures and axle load configuration are important factors to be considered in asph~lt pavement design and rehabilitation strategies (part1cularly overlay design). Consideration of these factors could result in the refinement of paving mix design and pavement structure design methods, as well as in the
Kim and Bell 101
TABLE 1 INCREMENTAL INCENTIVES TO OVERWEIGHT (4)
Rate Vehicle Cargo per Resulting Weight Weight Pound* Rate Incentive
(lb) (lb) ($) ($) ($)
73,000 45,000 0.056 2520 0
75,000 47,000 0.054 2540 20
80,000 52,000 0.052 2700 180
90,000 62,000 0.050 3100 580
100,000 72,000 0.048 3460 940
*A typical rate $0.056; the decreases in rate per pound are given in an attempt to account for the rate reduction that might be offered by a trucker planning to overweight.
1.0 0.1 0
a b
0.08
§: §: Ul 0 t)
Ul 0.06 0 t)
:; 0.9 "' I di c
::::;
:;
"' I 0.04 di c
::::;
0.02
0.8 ,__ ___ __..__ _ _ _ ____.._ _ __ ____.,__ _ _ _ ___, 0
10 15 20 25 30 10 15 20 25 30
Cargo Weight (Tons) Cargo Weight (Tons)
FIGURE 1 Cargo weight vs. line haul cost (4): (a) per mile; (b) per ton-mile.
adjustment of highway user costs. Also, highway maintenance schedules should be reviewed and the remaining life of the existing pavements constructed on the basis of truck tire pressures of about 80 psi.
RESULTS
A survey to evaluate tire inflation pressures and types of tires in use was carried out at a weigh station located near Woodburn, Oregon, on Interstate 5 from July 28 to July 30 and from August 25 to August 31, 1986. The data for each truck took about 15 to 30 min for two or three inspectors to collect, depending on the truck type. The survey was performed day and night for the above-mentioned period.
A tire pressure data collection sheet is shown in Figure 2. One data collection form represents one truck, and the form consists of four parts, as follows:
1. Basic data: date, time (start time and finish time), Public
Utility Commission (PUC) safety inspection number, inspector, PUC plate number, and commodity;
2. Weather information, including air temperature and pavement temperature;
3. Truck classification used in Oregon's Weigh-in-Motion study;
4. Tire data: axle number, dual/single tire, tire manufacturer, tire construction (radial/bias), tire size, tread depth, and tire pressure [recommended maximum pressure (cold) by manufacturer, first and second measured tire pressure].
The tire manufacturer, tire construction, and tire size were read from the tire. As Middleton et al. (5) did in Texas, tire pressure was measured twice. The first measured pressure was the inflation pressure measured after the truck was stopped. The second pressure measurement was the last step of collecting the data. Therefore, a time interval between the first and the second measurement was 15 to 30 min. The reason for the second measurement was to determine whether or not a change in pressure occurred as the tires cooled down.

llASlC DA.TA: Teot llo. (no entry requlrctd): llaf-•-; Qp[/::z.6Ml Start Tl""': cr-104=-·· PUC S•fety lMpectloo No.: O(;, 'i:S'~70J Plue of l"Jf"ctlon: W'ootJ..bli~\'OE ln.opector: ----------
TUI! PUSSURK DATA OJl.LECUOH Sl!E.eT
PUC rtm 1111.: A A.X b 7 $" c_..itty: For"' I 1Jte:.i-h eo-nt•: _
~· (tlclt one) Hot ' Cool ' Hot & Cool & lntenalttent Frequent Penistcnt
a) Sunny_; b) Sunny ){,; c) Cloudy __; d) Cloudy__; e) Showen __; f) ~ti _; g) RAln
•A.Ir t...,..rature •r •Pave•nt t...,.rature 7Jl.•r •Record hnedlately after atort ti•
TRUCK CLASSIFICATION: (lick one)
A SJngle Units:
_e)SU-2
~ __ b) SU-3
~ _c) SU-4
M B .Trucks§. Jrpl)ers:
_ d) 2-2 _ e) 2-3 _ f) 3-2
flMI fllMI ...w c. Troe tors&. Semllroilers
- J> 2- SI
f-r-11 _k) 3-SI
f-JWlll _ 1) 2-52 K_ m) 3-52
~~ o. Tr11ctors, Semi\rpi)ers e. Trellers .
_ n) 2-S 1-2 _ o) 3-5 1-2 _ p) 2-51-3 _ q) 3-52-2 - r) 3-52-3
~ ~ *""""' foNJlll tMJlll -- s) 3-52-4 _ l) 2-51-2-2 _ u) 3-5 1-2-2 _ v) 2-52-3-2 - w) 3-S 1-2-3
tMW f-JIMIMlll ~ ~ tl'9'11W TIRF.ow:;--
.. _ ...... .. ... __________ --- .. ------- _________ .. _____ A. Left Side - ().Jter Tlrea e. R.!ght Side - ().Jter Tires
Hfr, Hfr. l\rin/ Rec/Hait llMI/ Pressure Twin/ Rec/Hax Rad/ P["essure
Axle Single Pressure Blas (psi) Tre•d Axle Single PressuC'e Blas (psi) Tre.Jd
' Tire Name <est) (R/B) Size lst•/zndu 0ecc111 ' Tire N.1me <c• ll (R/ll) Size lst•/2nd " <>:cthl (I) s I 1 l.O
~ A 1Qi/1rJO l:S (I) s 12..0 R A 110/110 I 0 (st rg)
D :l. 100 ~ IO~~ l I (strg) 100 i i
q ( 2) 12..0 (2) g :t. m· ()) [) l
100 g & q cto 10 (3) ~ 1:.W q ~ 7
(4) 0 lf ~o/;16 ~ (4) D b 'IS (S) 0 s rOO g 6 q" '/'t'f g (5) D 7 ~s ts q ?co :l (6) (6) 'h qq 7 (7) (7) (II) (8) (9) (9)
•measured at beglnnlng of 1nspectlon; •• llll!aoured at end of inspection; I l/J2nd in.
Flnloh .time: __ q_-_~_S_~A....._ _ _
6 7
FIGURE 2 Tire pressure data collection sheet.
I 1R~2.5 10.00-A.O

Kim and Bell 103
TABLE 2 NUMBER OF TRUCKS BY TYPE IN THE SAMPLE
Single Units
Trucks and Trailers
Tractors and Semi-Trailers
Tractors, Semi-Trailers and Trailers
Unknown
TOTAL
Truck Types
Trucks were classified as shown in Figure 2. As presented in Table 2, of the 270 trucks surveyed, 55.9 percent were 3-S2 (18-wheelers), 7.4 percent were single-unit trucks, and 13 percent were trucks with tractors, semitrailers, and trailers.
Tire Construction
The tires surveyed were divided into three groups:
1. Single tires used for steering axles, 2. Single tires for nonsteering axles, and 3. Dual tires for nonsteering axles.
As presented in Table 3 the data collected show that the majority of tires are radials, i.e., 87 percent of total tires (total is 2,704 tires). Radial tires constitute 91 percent of tires used for steering axles, which is the greatest percentage among the three groups.
Truck Type Frequency x
SU-2 11 4.1
SU-3 9 3.3
2-3 2 0.7
3-2 16 5.9
3-3 4 1. 5
3-4 3 1.1
4-4 1 0.4
2-Sl 12 4.4
3-Sl 3 1.1
2-S2 11 4.1
3-S2 151 55.9
4-S2 1 0.4
2-S3 1 0.4
3-S3 1 0.4
2-Sl-2 10 3.7
3-Sl-2 11 4.1
3-S2-2 3 1.1
3-S2-3 3 1.1
3-S2-4 1 0.4
2-Sl-2-2 4 1. 5
3-Sl-2-2 2 0.7
2-Sl-2-1 1 0.4
9 3.3
270 100
Recommended Maximum Tire Pressure
Figure 3 shows the distribution of the recommended maximum tire pressure (cold) by manufacturers for three groups of radial and bias tires, and Table 3 presents the mean value and one standard deviation. The averages of recommended maximum pressure for dual radial and bias tires are 101 psi and 81 psi, respectively.
Measured Tire Pressure
Figure 4 shows the distribution of the first measured tire pressure for three groups of radial and bias tires. Table 3 presents the mean value and one standard deviation of the first measured tire pressure and the difference between the first and the second measured tire pressures. The averages of the first measured pressure of dual radial and bias tires are 102 and 82 psi, respectively. The first measured tire pressures are slightly higher by 1.2 to 2.4 psi than the second measured pressures.
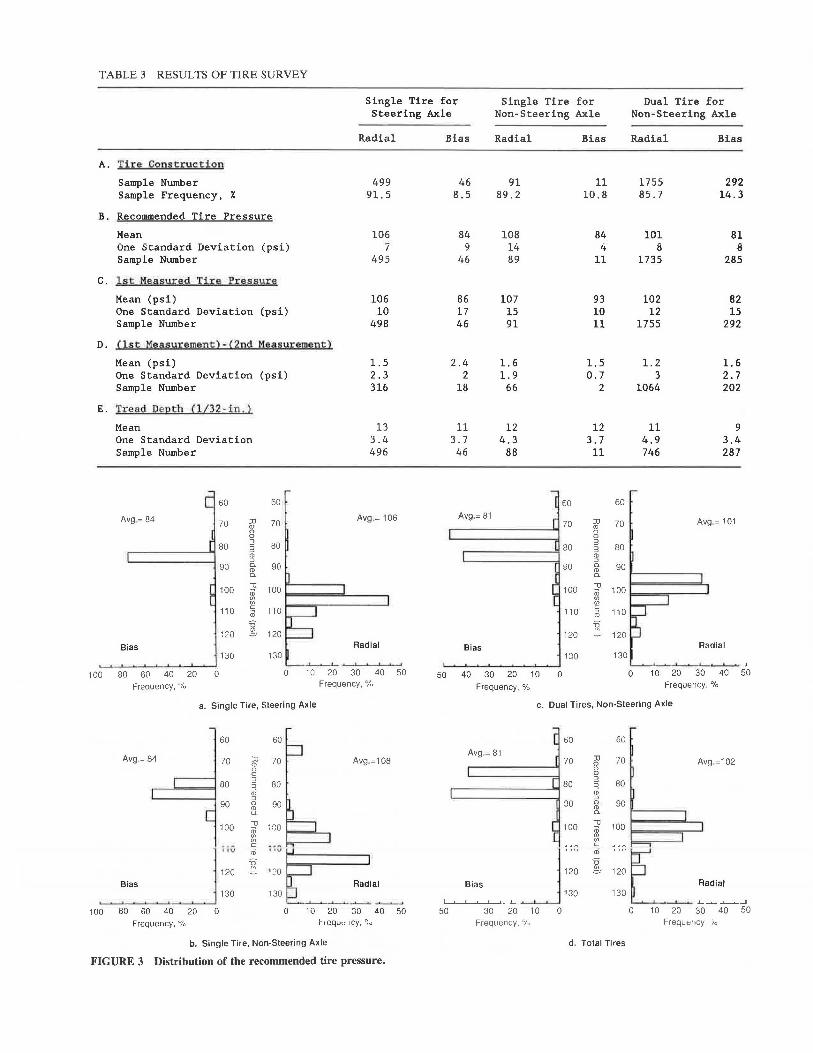
TABLE 3 RESULTS OF TIRE SURVEY
Single Tire for Single Tire for Dual Tire for Steering Axle Non-Steering Axle Non-Steering Axle
Radial Bias Radial Bias Radial Bias
A. Tii;e Qonsi;;i;:u!;lt!on
Sample Number 499 46 91 11 1755 292 Sample Frequency, x 91. 5 8.5 89.2 10.8 85.7 14.3
B. Recommended Tire Pressure
Mean 106 84 108 84 101 81 One Standard Deviation (psi) 7 9 14 4 8 8 Sample Number 495 46 89 11 1735 285
c. 1st Mea1;u:i;:ed 'J;'.ire Pressure
Mean (psi) 106 86 107 93 102 82 One Standard Deviation (psi) 10 17 15 10 12 15 Sample Number 498 46 91 11 1755 292
D. (!st Measurement)-(2nd Measurement)
Mean (psi) 1. 5 2.4 1. 6 1. 5 1. 2 1. 6 One Standard Deviation (psi) 2.3 2 1. 9 0.7 3 2.7 Sample Number 316 18 66 2 1064 202
E. Tread De~th (1~32 -in,)
Mean 13 11 12 12 11 9 One Standard Deviation 3.4 3.7 4.3 3.7 4.9 3.4 Sample Number 496 46 88 11 746 287
60 60 I 60 60
Avg= 84 :Il 70 Avg .= 106 Avg.= 81
[ 70 :Il Avg= 101 70 CD CD 70
" I " 0 0
80 3 80 I 80 3
80 3 3 CD I CD :J :J
90 Q. 90 ~o Q. 90 CD CD Q. Q.
100 -u 100 II 100 -u
100 CD CD U> U> U> U>
110 c 110 110 c
110 CD CD
u ~ ~20 ~ 120 120 120
Bias Radial Bias Radial 130 130 130 130
,____.__.._ .J
100 80 60 40 20 0 0 10 20 30 40 50 50 40 30 20 10 0 0 10 20 30 40 50
Frequency,% Frequency, % frequency. % Frequency,%
a. Single Tire, Steering Axle c. Dual Tires, Non-Steering Axle
60 60 60 60
Avg.= 84 :Il Avg.=108 Avg.= 81
:Il lO 70 CD 70 70 CD Avg .=102
" " ) 0 0
80 3 80 80 3 80 3 3
CD CD :J :J
90 Q. 90 90 a. 90 CD CD Ll. a. I
100 -u ~co 100
-u 100 I
CD CD
"' U> I U> U>
l"' c
J::: c
al "E ro '"[ ~ u ' '.:0 '!' 120
Bias Radial Bias Radial 120
130 130 130 130 .......___ ............... ~ - L ---..&..--. ..L ......_ ....L........-_J
100 80 60 40 20 0 0 10 20 30 40 50 50 30 20 10 0 0 10 20 30 40 50
Frequency, % hequ~11cy, C:o Frequency, % Freque11cy. ~o
b. Single Tire, Non-Steering Axle d. Total Tires
FIGURE 3 Distribution of the recommended tire pressure.

Kim and Bell
50 50
60 60
Avg.= B6 70 70 Avg.= 106
s: BO "' BO
"' "' c
90 Cil 90 a_
-a 100 Cil 100
"' "' c 110 Cil 110
TI" 120
~-120
Bias 130 130
Radial
140 140 __, 50 40 30 20 10 0 0 10 20 30 40 50
Frequency, % Frequency.%
a. Single Tire, Steering Axle
50 50
60 60
Avg.= 93 70 70 Avg.=107
s: 80 80 "' Ill
"' c Cil 90 90 a_
-a 100 Cil
"' 100
"' c
110 Cil 110 TI
120 ~ .
120
Bias Radial 130 130
............... _.__ 140 50 40 30 20 10 0 10 20 30 40 50
Frequ<!ncy, % Frequency, %
b. Single Tire, Non-Steering Axle
FIGURE 4 Distribution of the measured tire pressure.
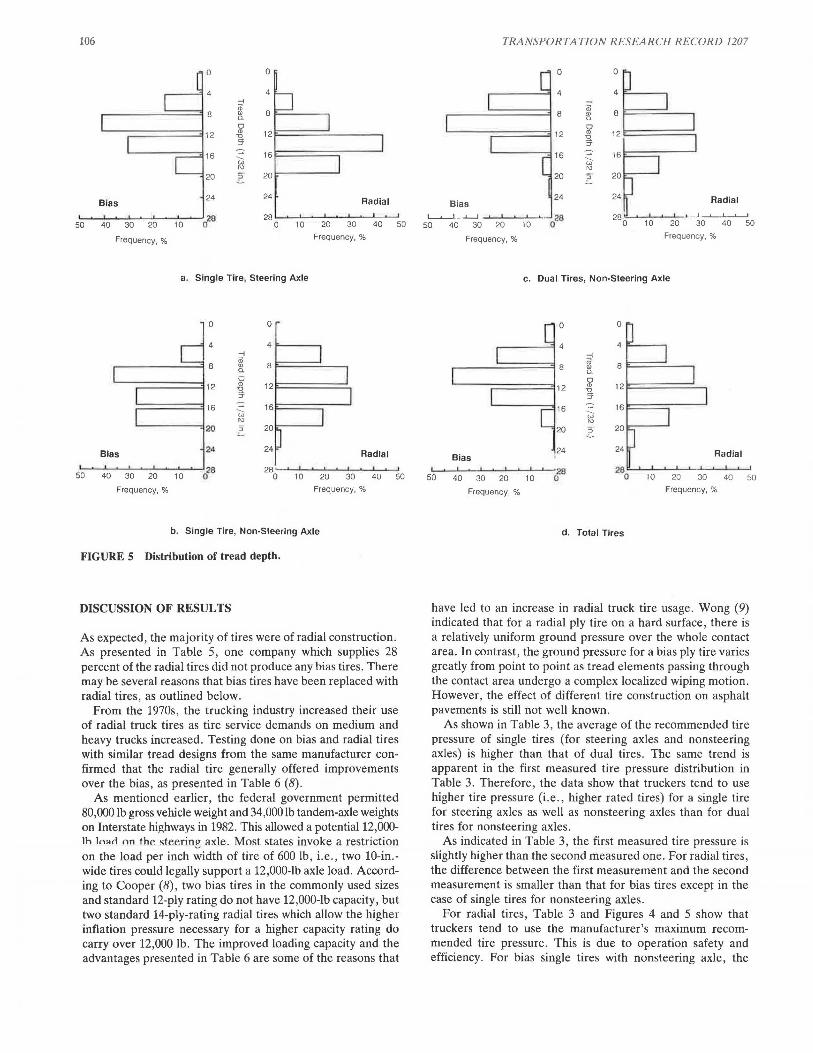
Tread Depth
Figure 5 and Table 3 present the results of the tread depth survey. The average tread depth for radial tires used for steering axles is 13/32 in. This is the highest tread depth among the groups. The average tread depth for bias dual tires used for nonsteering axles is o/32 in. This is the lowest measured tread depth.
Tire Size
Table 4 presents the distribution of tire size for radial and bias tires. The major tire size for radials is 11/80 R 24.5. However, for the single tire for nonsteering axles, the major tire size is 12 R 22.5, which is slightly wider than 11180 R 24.5. The major tires sizes for bias are 11-24.5 and 10.00-20 as presented in Table 4b. It should be noted that 13.2 percent of single radial tires used for nonsteering axles are 15 R 22.5,
105
50 50
60 60
Avg.= B2 70 70 Avg.= 102
s: BO "' BO
"' "' c
90 Cil 90 a_
-a 100 Cil 100
"' "' c 110 Cil 110
TI 120 ~- 120
Blas Radial 130 130
140 140 -'--'----' 50 40 30 20 10 0 0 10 20 30 40 50
Frequency, % Frequency. c/O
c. Dual Tires, Non-Steering Axle
50 50
60 60
Avg.= B3 70 70 Avg.=103
s: 80 "' 80
Ill
"' c Cil 90 90 a_
-a 100 Cil 100
"' "' c
110 m 110
120 ~.
120
Blas Rad la I 130 130
~• .. • 140 140 50 40 30 20 10 lj 0 10 20 30 40 50
Frequency,% Frequency, %
d. Total Tires
i.e ., 15-in.-wide tires, which are wider than the major tire sizes.
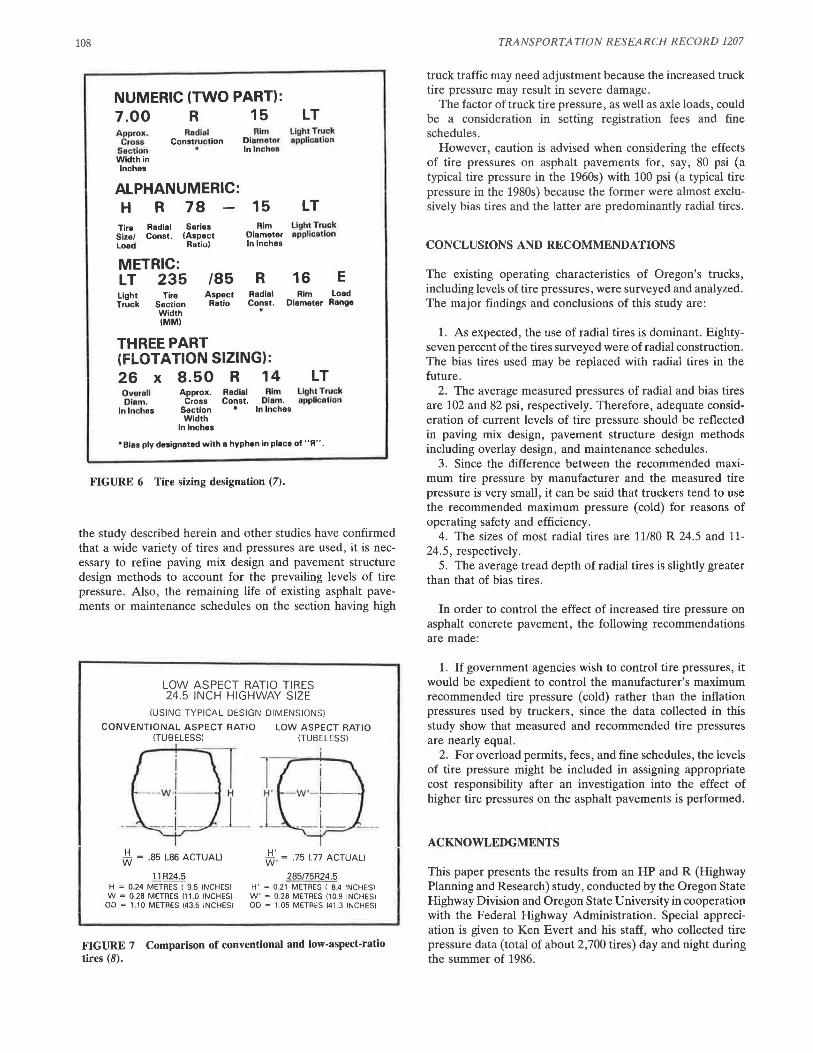
Figure 6 (7) shows the description of tire dimensional information used in truck tire sizing nomenclature. For example, 11180 R 24.5 means that the size of the tire is 11 in . wide , has an aspect ratio of 0.8 (section height/section width, see Figure 7), radial, and rim diameter of 24.5 in . Bias ply tires are designated with a hyphen in place of the R.
More detailed data on tire size are presented by Kim et al. (3) .
Manufacturer
Table 5 presents the distribution of the eight manufacturers surveyed for radial and bias tires. One company, which supplies 28 percent of the radial tires, did not produce any bias tires . More detailed data on tire manufacturers are presented by Kim et al. (3).
106
0 0
4 4
g 8 8 .,
c. D
12 Cl) 12 -g_ ::r
16 -:: 16 ---"' "' 20 5 20
Blas 24 24 Radial
028 28 50 40 30 20 10 0 10 20 30 40 50
Frequency, % Frequency, %
a. Single Tire , Steering Axle
0 0
4 4 ~ iii
8 8 ., c. 0
12 Cl) 12 -g ::r -:: 16 16 ---w
"' 20 ~ 20
Bias 24 24 Radial
50 40 30 20 10 028 28 0 10 20 30 40 50
Frequency, % Frequency, %
b. Single Tire, Non-Steering Axle
FIGURE 5 Distribution of tread depth.
DISCUSSION OF RESULTS
As expected, the majority of tires were of radial construction . As presented in Table 5, one company which supplies 28 percent of the radial tires did not produce any bias tires. There may be several reasons that bias tires have been replaced with radial tires, as outlined below.
From the 1970s, the trucking industry increased their use of radial truck tires as tire service demands on medium and heavy trucks increased. Testing done on bias and radial tires with similar tread designs from the same manufacturer confirmed that the radial tire generally offered improvements over the bias, as presented in Table 6 (8) .
As mentioned earlier, the federal government permitted 80,000 lb gross vehicle weight and 34,000 lb tandem-axle weights on Interstate highways in 1982. This allowed a potential 12,000-lh lm1<i nn the steerine axle. Most states invoke a restriction on the load per inch width of tire of 600 lb, i.e., two 10-in.wide tires could legally support a 12,000-lb axle load. According to Cooper (8), two bias tires in the commonly used sizes and standard 12-ply rating do not have 12,000-lb capacity, but two standard 14-ply-rating radial tires which allow the higher inflation pressure necessary for a higher capacity rating do carry over 12,000 lb. The improved loading capacity and the advantages presented in Table 6 are some of the reasons that
TRANSPORTATION RESEARCH RECORD 1207
0 0
4 4
g 8 8 .,
c. 0
12 Cl) 12 -g ::r
16 -:: 16 ---w
"' 20 I 20
24 24 Radial Bias '---'---1- .L.....J 028 280
50 40 30 20 10 10 20 30 40 50
Frequency, % Frequency, %
c. Dual Tires, Non-Steering Axle
0 0
4 4
g 8 8 .,
c. 0
"' 12 12 % -:: 16 ---
16
"' "' i 20
24 24 Radial Bias
28 28 50 40 30 20 10 0 0 10 20 30 40 50
Frequency, % Frequency, %
d. Total Tires
have led to an increase in radial truck tire usage. Wong (9) indicated that for a radial ply tire on a hard surface, there is a relatively uniform ground pressure over the whole contact area . In contrast, the ground pressure for a bias ply tire varies greatly from point to point as tread elements passing through the contact area undergo a complex localized wiping motion. However, the effect of different tire construction on asphalt pavements is still not well known.
As shown in Table 3, the average of the recommended tire pressure of single tires (for steering axles and nonsteering axles) is higher than that of dual tires. The same trend is apparent in the first measured tire pressure distribution in Table 3. Therefore, the data show that truckers tend to use higher tire pressure (i.e ., higher rated tires) for a single tire for steering axles as well as nonsteering axles than for dual tires for nonsteering axles .
As indicated in Table 3, the first measured tire pressure is slightly higher than the second measured one. For radial tires, the difference between the first measurement and the second measurement is smaller than that for bias tires except in the case of single tires for nonsteering axles .
For radial tires, Table 3 and Figures 4 and 5 show that truckers tend to use the manufacturer's maximum recommended tire pressure. This is due to operation safety and efficiency. For bias single tires with nonsteering axle, the

Kim and Bell 107
TABLE 4 TIRE SIZE DISTRIBUTION(%)
(a) Radial Tire
Single Tire on Tire Size Steering Axle
11/80 R 24.5 46.5
11 R 22.5 22.2
285/75 R 24.5 9.6
275/80 R 24.5 6.1
275/80 R 22.5 3.9
12 R 22.5 2.0
10.00 R 22 2.0
15 R 22.5
Others 7.7
Number in Sample 490
Single Tire on Non-Steering Axle
15.4
19.8
1.1
3.3
33.0
13.2
14.2
91
Dual Tire on Non-Steering Axle
49.1
21.1
7.1
3.9
4.1
2.2
3 . 9
8.6
1737
(b) Bias Tire
Single Tire on Tire Size Steering Axle
11-24.5 30.8
10.00-20 15.4
10.00-22 11. 5
11-22 . 5 17.3
9.00-20 3.8
Others 21. 2
Number in Sample 52
average of the measured pressure is higher by about 10 psi than that of the recommended maximum pressure , but the sample size of 11 tires is very small.
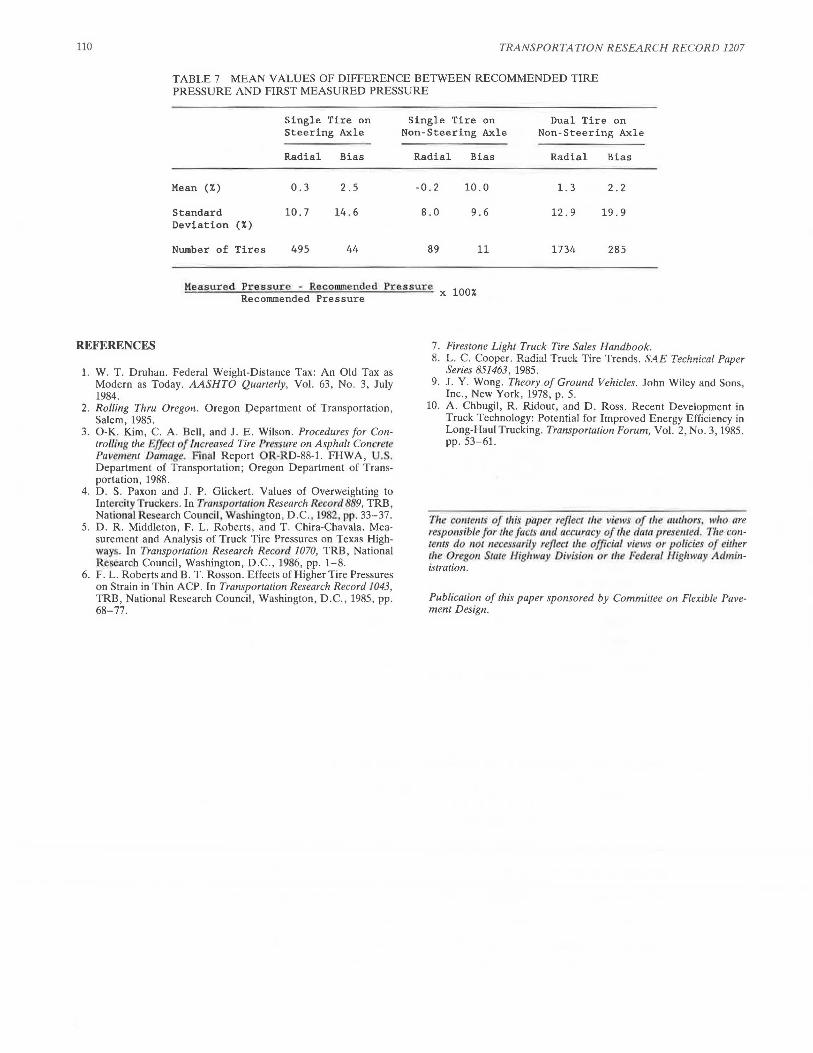
As shown in Table 7, the difference between recommended pressure and measured pressure for radial tires is almost zero. However, for bias tires, the inflated pressure is greater than the recommended pressure. As presented in Table 3, radial tire pressure is higher by 20 psi than bias tire pressure. The study performed by Middleton et al. (5) indicated that radial tires on the average showed 12 to 21 psi higher pressure than did bias tires.
If government agencies wish to control tire pressures, it would be expedient to control the manufacturer's maximum recommended pressure rather than the inflation pressure used by truckers. This would ensure reasonable control, since the data collected in this study show that measured and recommended tire pressures are nearly equal.
In general, higher-inflation-pressure tires have deeper tread depth as presented in Table 3. This implies that operators may use higher pressures with newer tires.
Recently, the trucking and tire industries have started to
Single Tire on Dual Tire on Non-Steering Axle Non-Steering Axle
30.8
36.4 29.8
18.1 21. 2
9.9
45.5 2.6
0.0 5.8
11 302
promote super single radials and new low-profile (or lowaspect-ratio) tubeless tires. The concept of replacing dual tires with a wide single is not new but has gained popularity recently in the long-haul market. As mentioned in the earlier section, 13.2 percent of single tires used for nonsteering axles are 15 R 22.5 (Table 4a). According to the restriction of 600 lb per in. width of tire, two tires 15 in. wide can support 18,000 lb, that is, the equivalent standard single-axle load used in pavement design by many states.
New super single radial tires are claimed to have 10 percent or better tread mileage and 8 to 10 percent better fuel economy than conventional dual radials (JO). Also, the lighter weight of the wide-base single tire assembly permits higher payloads. The reduced tire aspect ratio decreases tire deflection, thereby improving vehicle handling and stability while increasing tread life and fuel economy. However, the effect of the super single tire on the performance of asphalt pavement needs more study. The pressure data collected indicate that the mean pressure of the whole sample is similar to that found in the Texas study (5) and is considerably higher than that traditionally used in pavement design (i.e., 80 psi). Since
108
NUMERIC (TWO PART): 7.00 R Approx . Radial Cross Construction
Sec1ion . Width in Inches
ALPHANUMERIC: H R 78
Tire Radial Series Size/ Const. (Aspect Lo ell Ratio)
METRIC: LT 235 /85 Light Tire Truck Section
Width (MMl
Aspect Ratio
15 Rim
Diometor In Inches
15 Rim
Diameter In Inches
R Radial Const. .
THREE PART (FLOTATION SIZING): 26 x 8.50 R 14
LT Light Truck appll.catlon
LT Light Truck appllcatlon
16 E Rim Load
Diameter Range
LT Overall Diam.
Approx. Radial Const.
Rim Light Truck
In lnchos Cross
Section Width
In Inches
Diam. application . In Inches
•Bies ply designated with a hyphen in piece of "R".
FIGURE 6 Tire sizing designation (7).
the study described herein and other studies have confirmed that a wide variety of tires and pressures are used, it is necessary to refine paving mix design and pavement structure design methods to account for the prevailing levels of tire pressure. Also, the remaining life of existing asphalt pavements or maintenance schedules on the section having high
LOW ASPECT RATIO TIRES 24.5 INCH HIGHWAY SIZE
!USING TYPICAL DESIGN DIMENSIONS)
CONVENTIONAL ASPECT RATIO ITUBELESSI
LOW ASPECT RATIO !TUBELESS)
H -W - .85 (.86 ACTUAL)
11R24.5 H = 0 24 METRES I 9 5 INCHES! W = 0.28 METRES 111 ,0 INCHES)
OD = 1.10 METRES 143,5 INCHES)
H' W' = .75 1.77 ACTUAL)
285/75R24.5 H' = 0 21 METRES I 8.4 INCHES! W' = 0.28 METRES 110,9 INCHES! OD = 1.05 METRES 141 .3 INCHES!
FIGURE 7 Comparison of conventional and low-aspect-ratio tires (8).
TRANSPORTATION RESEARCH RECORD 1207
truck traffic may need adjustment because the increased truck tire pressure may result in severe damage.
The factor of truck tire pressure , as well as axle loads, could be a consideration in setting registration fees and fine schedules.
However, caution is advised when considering the effects of tire pressures on asphalt pavements for, say, 80 psi (a typical tire pressure in the 1960s) with 100 psi (a typical tire pressure in the 1980s) because the former were almost exclusively bias tires and the latter are predominantly radial tires .
CONCLUSIONS AND RECOMMENDATIONS
The existing operating characteristics of Oregon's trucks, including levels of tire pressures , were surveyed and analyzed. The major findings and conclusions of this study are:
1. As expected, the use of radial tires is dominant. Eightyseven percent of the tires surveyed were of radial construction. The bias tires used may be repiaced with radial tires in the future.
2. The average measured pressures of radial and bias tires are 102 and 82 psi, respectively. Therefore, adequate consideration of current levels of tire pressure should be reflected in paving mix design, pavement structure design methods including overlay design, and maintenance schedules.
3. Since the difference between the recommended maximum tire pressure by manufacturer and the measured tire pressure is very small, it can be said that truckers tend to use the recommended maximum pressure (cold) for reasons of operating safety and efficiency.
4. The sizes of most radial tires are 11/80 R 24.5 and 11-24.5, respectively .
5. The average tread depth of radial tires is slightly greater than that of bias tires.
In order to control the effect of increased tire pressure on asphalt concrete pavement, the following recommendations are made:
1. If government agencies wish to control tire pressures, it would be expedient to control the manufacturer's maximum recommended tire pressure (cold) rather than the inflation pressures used by truckers, since the data collected in this study show that measured and recommended tire pressures are nearly equal.
2. For overload permits, fees, and fine schedules, the levels of tire pressure might be included in assigning appropriate cost responsibility after an investigation into the effect of higher tire pressures on the asphalt pavements is performed.
ACKNOWLEDGMENTS
This paper presents the results from an HP and R (Highway Planning and Research) study, conducted by the Oregon State Highway Division and Oregon State University in cooperation with the Federal Highway Administration. Special appreciation is given to Ken Evert and his staff, who collected tire pressure data (total of about 2,700 tires) day and night during the summer of 1986.
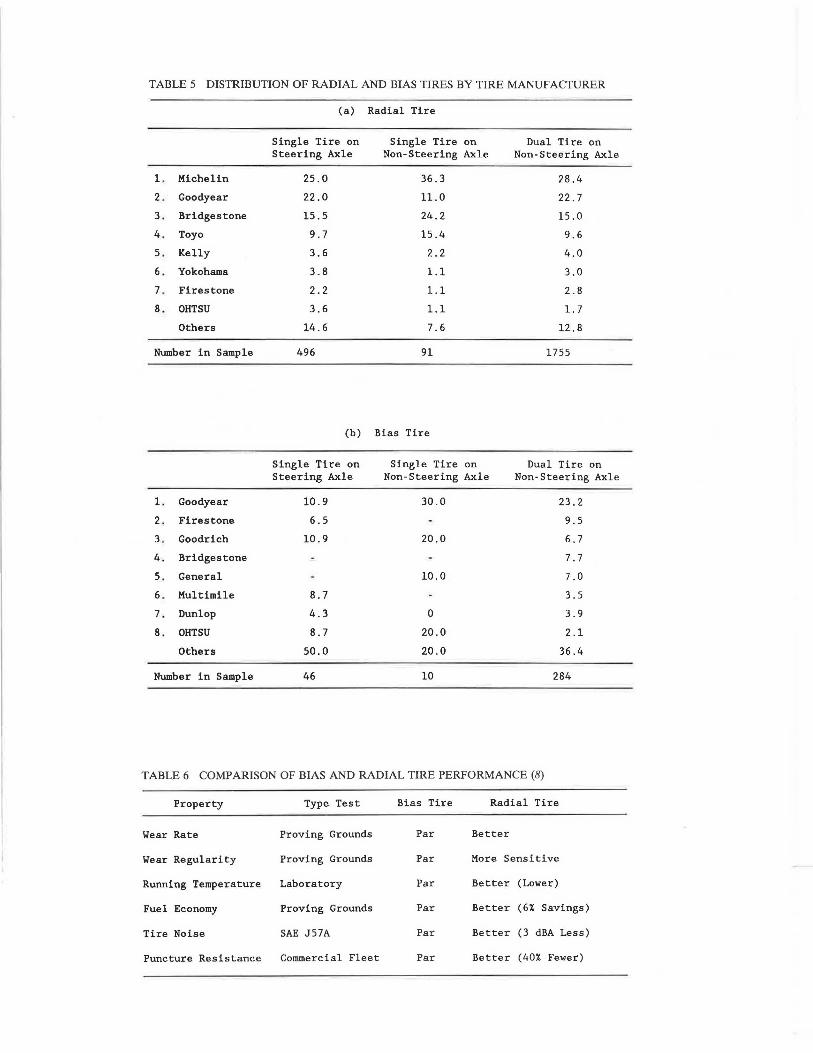
TABLE 5 DISTRIBUTION OF RADIAL AND BIAS TIRES BY TIRE MANUFACTURER
(a) Radial Tire
Single Tire on Single Tire on Dual Tire on Steering Axle Non-Steering Axle Non-Steering Axle
1. Michelin 25.0 36.3 28.4
2 . Goodyear 22.0 11.0 22 . 7
3. Bridgestone 15.5 24.2 15.0
4 . Toyo 9.7 15.4 9.6
5 . Kelly 3.6 2.2 4.0
6 . Yokohama 3.8 1.1 3.0
7 . Firestone 2.2 1.1 2.8
8. OHTSU 3.6 1.1 1. 7
Others 14.6 7.6 12.8
Number in Sample 496 91 1755
(b) Bias Tire
Single Tire on Single Tire on Dual Tire on Steering Axle Non-Steering Axle Non-Steering Axle
1. Goodyear 10.9 30 . 0 23.2
2 . Firestone 6.5 9.5
3. Goodrich 10.9 20.0 6.7
4. Bridgestone 7.7
5 . General 10.0 7.0
6. Multimile 8.7 3.5
7. Dunlop 4.3 0 3.9
8 . OHTSU 8.7 20.0 2.1
Others 50.0 20.0 36.4
Number in Sample 46 10 284
TABLE 6 COMPARISON OF BIAS AND RADIAL TIRE PERFORMANCE (8)
Property Type Test Bias Tire Radial Tire
Wear Rate Proving Grounds Par Better
Wear Regularity Proving Grounds Par More Sensitive
Running Temperature Laboratory Par Better (Lower)
Fuel Economy Proving Grounds Par Better (6% Savings)
Tire Noise SAE J57A Par Better (3 dBA Less)
Puncture Resistance Commercial Fleet Par Better (40% Fewer)
110 TRA NSPORTATION R ESEA RCH RECOR D 1207
TABLE 7 MEAN VALUES OF DIFFERENCE BETWEEN RECOMMENDED TIRE PRESSURE AND FIRST MEASURED PRESSURE
Single Tire on Single Tire on Dual Tire on Steering Axle Non-Steering Axle Non-Steering Axle
Radial Bias Radial Bias Radial Bias
Mean (X) 0.3 2 . 5 -0 . 2 10.0 1. 3 2.2
Standard 10.7 14.6 8.0 9.6 12.9 19.9 Deviation (%)
Number of Tires 495 44 89 11 1734 285
Measured Pressure - Recommended Pressure x lOOX Recommended Pressure
REFERENCES
1. W. T. Druhan. Federal Weight-Distance Tax: An Old Tax as Modern as Today. AASHTO Quarterly, Vol. 63, No . 3, July 1984.
2. Rolling Thru Oregon. Oregon .Qepartment of Transportation, Salem, 1985.
3. 0-K. Kim, C. A. Bell, and J. E . Wilson. Procedures for Controlling the Effect of Increased Tire Pressure on Asphalt Concrete Pavement Damage. Final Report OR-RD-88-1. FHWA, U.S. Department of Transportation ; Oregon Department of Transportation, 1988.
4. D. S. Paxon and J. P. Glickert. Values of Overweighting to Intercity Truckers. In Tra11spor1atio11 Research Record889, TRB, National Research Council Washington, D .C. , 1982, pp. 33-37.
5. D . R. Middleton, F. L. Roberts, and T. Chira-Chavala. Measurement and Analysis of Truck Tire Pressures on Texas Highways. In Transportation Research Record 1070, TRB, National Research Council, Washington, D.C., 19 6, pp. 1-8.
6. F. L. Roberts and B. T. Rosson. Effects of Higher Tire Pressures on Strain in Thin ACP. In Transportation Research Record 1043, TRB, National Research Council, Washington, D.C., 1985, pp. 68-77.
7. Firestone Light Truck Tire Sales Handbook. 8. L. C. Cooper. Radial Truck Tire Trends. SAE Technical Paper
Series 851463 , 1985. 9. J . Y. Wong. Theory of Ground Vehicles . John Wiley and Sons,
Inc., New York, 1978, p. 5. 10. A. Chbugil, R. Ridout, and D. Ross . Recent Development in
Truck Technology: Potential for Improved Energy Efficiency in Long-Haul Trucking. Transportation Forum, Vol. 2, No . 3, 1985. pp. 53-61.
T/11: co111e111s of tlris paper reflect tire views of the flllthm~r. who are responsible for the fact.1 mvl uccuracy of the data presented. Tire contents do 1101 necessarily reflect c/ie official views or policies of either tire Oregon State Highway Di11isio11 or tire Federal Highway Administration.
Publication of this paper sponsored by Committee on Flexible Pavement Design.