MCOM-101_Project Mgt_MCOM.pdf - VENKATESHWARA
194
VENKATESHWARA OPEN UNIVERSITY www.vou.ac.in PROJECT MANAGEMENT MCOM [MCOM-101]
-
Upload
khangminh22 -
Category
Documents
-
view
2 -
download
0
Transcript of MCOM-101_Project Mgt_MCOM.pdf - VENKATESHWARA
PROJECT MANAGEMENT
VENKATESHWARAOPEN UNIVERSITY
www.vou.ac.in
VENKATESHWARAOPEN UNIVERSITY
www.vou.ac.in
PROJECT MANAGEMENT
MCOM[MCOM-101]
PROJECT MANAGEM
ENT
8 MM

PROJECT MANAGEMENT
MCOM
[MCOM-101]

AuthorsBhavesh M Patel, Dean, Amrut Mody School of Management, Ahmedabad UniversityUnits (1.2.6, 1.3-1.3.2, 1.4-1.5, 2.2, 2.4 -2.8, 3.2-3.4.1, 4.2, 4.4-4.4.5, 5.5, 5.6.1) © Bhavesh M Patel, 2019Vikas Publishing HouseUnits (1.0-1.2.5, 1.3.3-1.3.4, 1.6-1.10, 2.0-2.1, 2.3, 2.9-2.13, 3.0-3.1, 3.4.2-3.12, 4.0-4.1, 4.3, 4.4.6, 4.5-4.9, 5.0-5.4, 5.6, 5.7-5.11) © Reserved, 2019
All rights reserved. No part of this publication which is material protected by this copyright noticemay be reproduced or transmitted or utilized or stored in any form or by any means now known orhereinafter invented, electronic, digital or mechanical, including photocopying, scanning, recordingor by any information storage or retrieval system, without prior written permission from the Publisher.
Information contained in this book has been published by VIKAS® Publishing House Pvt. Ltd. and hasbeen obtained by its Authors from sources believed to be reliable and are correct to the best of theirknowledge. However, the Publisher and its Authors shall in no event be liable for any errors, omissionsor damages arising out of use of this information and specifically disclaim any implied warranties ormerchantability or fitness for any particular use.
Vikas® is the registered trademark of Vikas® Publishing House Pvt. Ltd.
VIKAS® PUBLISHING HOUSE PVT LTDE-28, Sector-8, Noida - 201301 (UP)Phone: 0120-4078900 Fax: 0120-4078999Regd. Office: A-27, 2nd Floor, Mohan Co-operative Industrial Estate, New Delhi 1100 44Website: www.vikaspublishing.com Email: [email protected]
BOARD OF STUDIES
Prof Lalit Kumar SagarVice Chancellor
Dr. S. Raman IyerDirectorDirectorate of Distance Education
SUBJECT EXPERT
Dr. Babar Ali KhanDr. Mahendra KumarRavi Mihu
Professor in CommerceAssociate ProfessorAssistant Professor
CO-ORDINATOR
Mr. Tauha KhanRegistrar
Unit 1: Introduction toProject Management
(Pages 3-52)
Unit 2: Project Analysisand Selection
(Pages 53-112)
Unit 3: Project Planningand Scheduling
(Pages 113-148)
Unit 4: Implementationand Control
(Pages 149-165)
Unit 5: Project Completionand Evaluation
(Pages 167-182)
SYLLABI-BOOK MAPPING TABLEProject Management
Syllabi Mapping in Book
Unit 1Project Management: Meaning and scope, Need of project management,Life cycle of a project - conception and selection, planning and scheduling,implementation and control, evaluation and termination.
Unit 2Project Analysis and SelectionIdentification of investment opportunities, projectinitiation, Market and Demand Analysis, Technical Analysis, Economicand Financial Analysis, Social Cost and Benefit Analysis, Formulation ofDetailed project report.
Unit 3Project Planning & SchedulingPlanning Resources, Planning of Physical Resources, Planning of HumanResources, Planning Financial Resources, Project organizing, PlanningTime Scales-Network/PERT Analysis.
Unit 4Implementation and ControlProject Management Information System, Monitoring and ReportingPhysical resources, human resources, and financial resources-cost control.
Unit 5Project Completion and EvaluationIntegrated Project Management Control System, managing Transition forproject to operation, project completion and evaluation, project review,project termination.

CONTENTSINTRODUCTION 1
UNIT 1 INTRODUCTION TO PROJECT MANAGEMENT 3-521.0 Introduction1.1 Objectives1.2 Project Management: Meaning, Scope and Need
1.2.1 Characteristics of Project Management1.2.2 Successful Project Management1.2.3 Principles of Project Management1.2.4 Project Management: Scope and Importance1.2.5 Requirement for Project Management1.2.6 Need of Project Management
1.3 Life Cycle of a Project: Conception and Selection1.3.1 Stages of the Life Cycle Concept1.3.2 Project Selection and Formulation1.3.3 Greenfield’s Project1.3.4 Special Economic Zone Projects
1.4 Project Planning1.4.1 Objectives of Project Planning1.4.2 Process of Project Planning1.4.3 Project Construction Alternatives1.4.4 Project Scheduling
1.5 Project Implementation and Control1.5.1 Goals of Project Implementation1.5.2 Monitoring and Control1.5.3 Review Meetings and Reports1.5.4 Project Evaluation and Termination
1.6 Summing Up1.7 Key Terms1.8 Answers to ‘Check Your Progress’1.9 Questions and Exercises
1.10 References and Suggested Readings
UNIT 2 PROJECT ANALYSIS AND SELECTION 53-1122.0 Introduction2.1 Objectives2.2 Identification of Investment Opportunities
2.2.1 Projects and Alternative Projects2.2.2 Sources of Project Ideas
2.3 Project Initiation2.4 Market and Demand Analysis
2.4.1 General Economic Indicators2.4.2 Demand and Supply Estimate2.4.3 Demand Forecasting Techniques
2.5 Technical Analysis2.5.1 Selection of Site of a Project
2.6 Economic and Financial Analysis2.6.1 Cost of Capital and Cut-off Decision2.6.2 Cut-off Rate (Required Rate of Return) Decision2.6.3 Project Cash Flow Estimate
2.6.4 Financial Evaluation2.6.5 Capital Budgeting Evaluation Techniques
2.7 Social Cost and Benefit Analysis2.7.1 Non-Quantifiable Cost-Benefits in Projects2.7.2 United Nations International Development Organization (UNIDO) Approach to SCBA2.7.3 SCBA in India
2.8 Project Report and Audit2.8.1 Types of Project Reports2.8.2 Feasibility and Detailed Project Report2.8.3 Project Completion Report
2.9 Summing Up2.10 Key Terms2.11 Answers to ‘Check Your Progress’2.12 Questions and Exercises2.13 References and Suggested Readings
UNIT 3 PROJECT PLANNING AND SCHEDULING 113-1483.0 Introduction3.1 Objectives3.2 Planning Resources
3.2.1 Planning of Physical Resources Equipment Supply3.2.2 Planning of Human Resources Manpower Planning3.2.3 Planning of Financial Resources Budgeting
3.3 Project Organizing3.3.1 Types of Organization Structure
3.4 Project Scheduling3.4.1 CATS and RATS3.4.2 Scheduling Techniques3.4.3 Gantt Chart
3.5 Critical Path Method (CPM)3.5.1 An Example of CPM Project Analysis3.5.2 Total Cost-Time Trade-Off3.5.3 Planning Time Scales-Network/PERT Analysis
3.6 Project Evaluation and Review Technique (PERT)3.6.1 PERT: Single Time Estimate3.6.2 PERT System of Three-Time Estimates3.6.3 PERT Process
3.7 Investment Decisions: Management, Approval and Sanctioning3.8 Summing Up3.9 Key Terms
3.10 Answers to ‘Check Your Progress’3.11 Questions and Exercises3.12 References and Suggested Readings
UNIT 4 IMPLEMENTATION AND CONTROL 149-1654.0 Introduction4.1 Objectives4.2 Project Management Information System4.3 Monitoring and Reporting Human and Physical Resources
4.3.1 Human Resources4.3.2 Physical Resources

4.4 Financial Resources4.4.1 Types of Ownership Securities4.4.2 Venture Capitalists4.4.3 Charitable Venture Capitalists4.4.4 Preference Shares4.4.5 Subsidy and Tax Incentives4.4.6 Cost Control
4.5 Summing Up4.6 Key Terms4.7 Answers to ‘Check Your Progress’4.8 Questions and Exercises4.9 References and Suggested Readings
UNIT 5 PROJECT COMPLETION AND EVALUATION 167-1825.0 Introduction5.1 Objectives5.2 Integrated Project Management Control System5.3 Managing Transition for Project to Operation5.4 Project Completion and Termination
5.4.1 Project Completion5.4.2 Project Closing and Termination
5.5 Project Evaluation5.5.1 Objectives and Essentials of Project Evaluation5.5.2 Need for Project Evaluation5.5.3 Qualities of a Project Evaluator5.5.4 Approach to Project Evaluation5.5.5 Methodology and Timing of Evaluation5.5.6 Scope of Project Evaluation
5.6 Project Review5.6.1 Precautions for Project Review
5.7 Summing Up5.8 Key Terms5.9 Answers to ‘Check Your Progress’
5.10 Questions and Exercises5.11 References and Suggested Readings

Self LearningMaterial 1
Introduction
NOTES
INTRODUCTION
A large number of business entities do not hire project managers on their payrolls and itis not new to set up a project team to fulfill a certain requirement. Though most of thepeople may not have the prescribed skills in a project methodology, being part of aproject team is a wonderful opportunity to learn and can provide new dimensions to aperson’s career graph.
The following main points define what project management actually is:• Project management is not a diminutive job• It has a scheduled beginning and end• It is not an ongoing process• Project management employs a variety of tools to determine endeavours and
keep track of project milestones• Projects are in regular need of resources on an impromptu basis unlike
organizations that have only dedicated permanent posts• Project management lessens risk and lowers the prospect of successThe three most important factors in project management are time, cost and scope,
which are collectively addressed as the triple constraint. These form the edges withquality as a chief theme.
A successful project management discipline will not get rid of all threats, flawsand shocks, but will provide benchmark methods and measures to cope up with themand help thwart the following:
• Projects crossing the deadline, going beyond the budget or failing to meetcustomer expectations
• Irregularity between the processes and procedures practiced by projectsmanagers, causing a few to be favoured more than others
• Projects thriving well, regardless of lack of planning, accomplished throughextreme levels of stress, goodwill and noteworthy measures of overtime
• Project management regarded as providing no value add and as a waste oftime and funds
• Unpredicted in-house and/or outside events affecting the projectProject management is about building an atmosphere and situation in which a
definite aim or objective can be realized in a streamlined way by a team of people.The learning material in this book, Project Management, has been presented in
the self-learning format, wherein each unit begins with an Introduction to the topicfollowed by an outline of Objectives. The detailed content is then presented in a simple,structured and easy-to-grasp style interspersed with ‘Check Your Progress’ questionsto test the student’s understanding. At the end of each unit, Summing Up and a list ofQuestions and Exercises have been provided for recapitulation.

Self LearningMaterial 3
Introduction toProject Management
NOTES
UNIT 1 INTRODUCTION TOPROJECT MANAGEMENT
Structure1.0 Introduction1.1 Objectives1.2 Project Management: Meaning, Scope and Need
1.2.1 Characteristics of Project Management1.2.2 Successful Project Management1.2.3 Principles of Project Management1.2.4 Project Management: Scope and Importance1.2.5 Requirement for Project Management1.2.6 Need of Project Management
1.3 Life Cycle of a Project: Conception and Selection1.3.1 Stages of the Life Cycle Concept1.3.2 Project Selection and Formulation1.3.3 Greenfield’s Project1.3.4 Special Economic Zone Projects
1.4 Project Planning1.4.1 Objectives of Project Planning1.4.2 Process of Project Planning1.4.3 Project Construction Alternatives1.4.4 Project Scheduling
1.5 Project Implementation and Control1.5.1 Goals of Project Implementation1.5.2 Monitoring and Control1.5.3 Review Meetings and Reports1.5.4 Project Evaluation and Termination
1.6 Summing Up1.7 Key Terms1.8 Answers to ‘Check Your Progress’1.9 Questions and Exercises
1.10 References and Suggested Readings
1.0 INTRODUCTION
A project is temporary. It has a defined beginning and end in time, and therefore definedscope and resources. A project is unique in that it is not a routine operation, but a specificset of operations designed to accomplish a singular goal. A project team often includespeople who don’t usually work together – sometimes from different organizations andacross multiple geographies.
The development of software for an improved business process, the constructionof a building or bridge, the relief effort after a natural disaster, the expansion of sales intoa new geographic market — all are projects. And all must be expertly managed todeliver the on-time, on-budget results, learning and integration that organizations need.
Project management, then, is the application of knowledge, skills and techniquesto execute projects effectively and efficiently. It’s a strategic competency for organizations,enabling them to tie project results to business goals — and thus, better compete in theirmarkets.
Self Learning4 Material
Introduction toProject Management
NOTES
Project management is concerned with achieving a specific goal in a given timeby using the resources available for that specific period. In order to achieve successwith project management, the essential requirements are— adequate project formulation,availability of resources, proper implementation planning before commencing the actualimplementation, effective monitoring of the emerging problems and taking correctivemeasures. All these measures need to be undertaken to get the project ready on time.
1.1 OBJECTIVES
After going through this unit, you will be able to:• Explain the concept of project management• Discuss the need of project management• Describe the phases involved in the life cycle of a system• Discuss the process involved in project planning• Explain the concept of project implementation and control
1.2 PROJECT MANAGEMENT: MEANING, SCOPEAND NEED
Project management is the art of directing and coordinating human and material resourcesthroughout the project by using modern management techniques. The main purpose ofproject management is to achieve the predetermined objectives of scope, cost, time,quality and the satisfaction of the participant.
Project management includes developing and implementing a plan for the projectwhile considering the available resources such as manpower, material and cost in theorganization. Project management involves the following activities:
• Planning and analysing the objectives of the project• Measuring and controlling the risk-involved in the project• Estimating the organizational resources required in the project• Assigning tasks to the employees related to the project• Directing and motivating employees to improve their performance• Organizing project activities• Formulating the project• Forecasting trends in the project• Completing the project on time• Keeping up the quality of the project
1.2.1 Characteristics of Project Management
Project management requires attention for goal-oriented systems, the environment, sub-systems and their relationships. This is what makes project management a ‘systemsapproach’ to the management.
The application of principles and practices from the classical and behavioural andsystems viewpoints to the unique requirements of projects has led to a new set of concepts
Self LearningMaterial 5
Introduction toProject Management
NOTES
which may be called the ‘project viewpoint’. Cleland and Kind have identified thefollowing characteristics of project management:
• The project manager is the single focal point for bringing together all the necessaryresources for achieving the project objectives. He/she formally heads the projectorganization and operates independently the normal chain of commands. Theproject organization reflects the cross-functional, goal-oriented nature of the project.
• Since each project requires a variety of skills and resources, many functionalareas may perform the work in a combined form. The project manager isresponsible for integrating the people from different functional disciplines workingon the project.
• The project manager will negotiate directly with the functional managers for support.The functional managers are responsible for the activities of the individuals andfor the personnel coming under the scope of their functional groups. However,the project manager has to concentrate on integrating all the project activities andoverseeing the activities from the beginning to end.
• The project manager focuses on delivering a particular product or service at acertain point of time and cost to the satisfaction of the technical requirements. Incontrast, the functional units must maintain an ongoing pool of resources to reachthe ultimate organizational goals instead of the limited project goals. Thus, conflictsmay often arise between the project and functional managers over the optimumallocation of resources to a project.
• A project in an organizational structure has two chains of command. One is thevertical, functional reporting relationship and the other is the horizontal, projectreporting mechanism.
• For rewarding incentives and distributing responsibilities, the decision making,accountability, outcomes and rewards should be shared among all the membersof the project team and the supporting functional units.
• Though the project organization is temporary, the functional units from which it isformed are permanent. Thus, when a project ends, the project team is scatteredand the project personnel either return to their functional units or they are reassignedto new projects. Projects may originate from different areas of the organization.Product development and related projects tend to emerge from marketing whereastechnological applications originate in Research and Development (R&D).
• Project management sets into motion numerous other support functions such aspersonnel evaluation, accounting and information systems.
1.2.2 Successful Project Management
In order to reduce the cost of constructing a project, organizations should consider variousfactors such as cost and time for the successful competition among projects. Followingare the key factors essential for a successful project management:
• Adequate project formulation: Project formulation is the process of convertingproject ideas into project proposals in a structured manner. Generally, projectformulation suffers from the following shortcomings:o Use of informal methods for estimating the costs and benefits, such as
maintaining paper records instead of using computerso Deliberate overestimation of benefits and underestimation of cost of
constructing a projecto Faulty judgements due to lack of experienced managers and employees
Self Learning6 Material
Introduction toProject Management
NOTES
It is essential for an organization to avoid these shortcomings in order to haveadequate and meaningful project formulation.
• Project organization: A sound organization possesses the followingcharacteristics:o Proper working environment for employeeso Well-defined working methods and systemso Proper rewards and penalties to employees for their performances and faults
• Implementation planning: After taking investment-related decisions, it isnecessary for an organization to do proper implementation planning beforecommencing the actual implementation. Proper implementation planning includesthe following steps:o Developing a plan for various activities such as land acquisition, tender
evaluation, recruitment of the staff, construction of buildings and creation ofan industrial plant
o Estimation of the resource requirements such as manpower, materials andmoney in project
• Availability of funds on time: It is important to have funds on time for takingadvanced actions in the project activities. Timely availability of funds facilitatesthe organization to negotiate the cost of the project with suppliers and contractors.
• Effective monitoring: In order to have a successful management of the project,a project monitoring system must be established in the organization. This is becauseeffective monitoring helps in analysing the emerging problems and taking correctiveactions for the project activities. Following are the factors that should be kept inmind while developing an effective system of monitoring:o It should emphasize on the critical aspects such as the finance of the project
management.o It should be simple and not overcomplicated as it may result in a lot of
documentation and wastage of resources.
1.2.3 Principles of Project Management
Successful project management can be achieved by proper application of principlesinstead of implementing different kinds of techniques. Following are the seven principlesof project management:
• To identify the project type that is suitable for the business. One needs to selectthe projects that are good for business.
• To understand the needs and expectations of the customers.• To prepare the reasonable plans which defines the scope, cost and approach of
the project. This helps in reducing unplanned areas in the project.• To establish a good team with a good leader. This principle conveys that there
should be proper working environment and communication flow between theproject managers and team members.
• To define the status of the project. This helps improving the project quality andrecognizing the various problems in it.
• To make a proper assumption for the project. This principle focuses on theverification of the critical items used in the project in order to reduce the risk.
• To take proactive actions in the problems of the project. This is because theproblem usually gets worse over time which in turn increases the chances of risk.
Self LearningMaterial 7
Introduction toProject Management
NOTES
1.2.4 Project Management: Scope and Importance
The scope of a project is determined by using product scope and project scope. Productscope explains all the functions and features that are to be included in a product orservice of the project. On the other hand, project scope deals with the deeds to be donefor delivering the needed product. The tools and techniques to manage the productscope change with the nature of the project.
The project manager uses various tools and techniques such as product and cost-benefit analysis for developing the scope of a project. Once the project has been selected,the project manager and the client jointly prepare the scope of the project and deliverables.
Importance
Organizations have to manage their projects effectively in order to create and maintaintheir reputation in the market. Many organizations fail to manage their projects properlydue to the following reasons:
• Project is completed late or without fulfilling the demands of the client• Project is not giving any valuable information• Project lacks proper planning and organization of the activities• The techniques and standards used are not advanced
A good project management offers various techniques and guidelines to manageemployees and workloads. Project management provides the following benefits in anorganization:
• Saving cost: Project management offers a common methodology for managingthe project, i.e., if the processes and procedures are planned once, then they canbe used in all the future projects again. Consequently, it helps in saving the costand time required in completing the project.
• Improving working conditions: If the projects are successful, the client will bemore involved in the projects. This helps in improving the working environment ofthe organization, which in turn encourages the morale and confidence of theproject team.
• Improving financial management: Better estimation of the actual costs involvedin the project helps in managing the budget of the organization. This results inbetter financial predictability and cost control.
• Resolving problems: Team members in a project spend a lot of time and energyin dealing with project problems. This is because the project team members donot know how to resolve the project problems. If the project is properly managedand planned, then the process of project management helps in solving the projectproblems quickly.
• Determining risk: The process of project management helps in identifying andmanaging risks in the near future.
• Improving the product quality: The process of the project management helpsteam members understand the needs of customers. Once customer needs arerecognized, team members can implement quality control and assurance techniquesto fulfil customer demands.
Self Learning8 Material
Introduction toProject Management
NOTES
1.2.5 Requirement for Project Management
Modern project management ideas originated in the construction and aerospace industriesin the USA and Western countries. This was because the environment and activities inthose industries demanded flexible and imaginative forms of management. The spreadof project management ideas has come about due to necessity rather than desire. Themajor reason for its slow growth can be attributed to the reluctance in accepting newapproaches and techniques. The major problems identified by the managers, whoattempted the new system, revolve around conflicts in authority and resources. Thethree major problems identified are as follows:
• Project priorities and competition for talent would interrupt the stability of theorganization and interfere with its long-range interests by upsetting the normalbusiness of the functional organizations.
• Long-range planning would suffer if the company gets more involved in meetingthe schedules and fulfilling the requirements of temporary projects.
• Shifting people from project to project would disrupt the training of new employeesand specialists.
Let us briefly consider some of the organizational factors influencing the need for projectmanagement.
(i) The first is the size of the organization. A small organization such as a consultingfirm, an engineering office or a small contractor who has a budget, a scheduleand limited requirements to control quality and production could get along withoutany formal project organizational system. However, the quantitative methods andprocedures of the project management approach are still necessary. On the otherhand, a large organization executing a prestigious, complex, multi-disciplinary andcapital-intensive project would certainly require a formal project managementorganizational system as well as quantitative techniques.
(ii) The second factor is the style of management needed to meet the complexities ofa rapidly changing business environment. Most industrial, public service andgovernment organizations have solved the problem of complexity due to ahierarchical management structure inherited from the military. The top managementhas been very comfortable with the hierarchy because of its simple ‘one boss’reporting system. The hierarchy also lends itself to convenient subdivision of theorganization into groups or departments, each of which represents a speciality, adiscipline or a function.While these so-called line, functional or disciplinary divisions often enhanceefficiency and maximize productivity, they suffer from the following flaws:o The ability of a specialized organization to work together and coordinate
effectively with external agencies such as the clients, vendors and regulatoryagencies is critical to the success of the project. Line managers often sufferfrom ‘tunnel vision’ or lack of knowledge of the overall organizational goals.In addition, competition between line divisions may result in inefficiency orfailure to communicate vital information.
o The responsibility for important external coordination may become mixed-upbecause of overlapping or inadequately defined roles. The allocation ofresponsibility for a job that overlaps several functional divisions in a projectcomplicates the process of decision-making affecting the entire project. Thismay increase the possibility of inadequate or tardy responses to changing
Self LearningMaterial 9
Introduction toProject Management
NOTES
conditions which could make all the differences between the success or failureof a project.
o As an organization grows in size and complexity, it becomes increasinglydifficult for the top management to connect itself with the day-to-day problemsof each project.
A chief executive may face a project failure for any of these reasons, and in an attemptto determine the cause for the failure, the executive may find the divisional managersblaming each other. It can be a very disturbing experience for the top management torealize their inattentiveness over the official issues. A chief executive needs a singlepoint of information and control if complex projects are to be successfully completed.In determining the need for project management, one should examine the project andorganization carefully and ask the following questions:
• Is the job very large?• Is the job technically very complex?• Is the job a true system in which it has many separate parts or sub-systems that
must be integrated to complete the whole operation?• Is the job a part of a larger system and must be closely integrated, especially if the
larger system has a project-oriented organization?• Does the top management really feel the need for a single point of information
and responsibility for the total job?• Are strong budgetary and fiscal controls required?• Are tight schedules and budgetary constraints foreseen?• Are quick responses to changing conditions necessary?• Does the job cross many disciplinary and organizational boundaries?• Will the proposed job drastically disrupt the present organizational structure?• Are more than two divisions involved? Is more than one division going to deal
directly with the client or customer?• Are there other complex projects being conducted concurrently with this one?• Is there scope for a conflict between the line managers concerning this project?• Is the organization committed to a firm completion date?• Is it likely that changing conditions may seriously affect the project before its
completion?• Are there major items to be procured from outside the company?• Are there major portions of the system which must be sub-contracted outside the
organization?• Is it necessary to have the project reviewed or approved by government regulatory
agencies? Will these review processes and approvals generate problems andcontroversy?
The answers to the above questions help in the various project management considerationsfor an organization. From the above discussions, it can be concluded that projectmanagement can be applied to any ad hoc undertaking. This includes a broad range ofactivities such as writing a research paper, remodelling a house or constructing a children’spark. There are two situations in which project management should be used:
Self Learning10 Material
Introduction toProject Management
NOTES
• The more unfamiliar or unique the undertaking, the greater the need for projectmanagement to ensure that nothing gets overlooked.
• The more numerous, interdisciplinary and interdependent activities in theundertaking, the greater the need for a project manager to ensure that everythingis coordinated, integrated and completed.
Cleland and King have suggested five general criteria to decide when to use projectmanagement techniques and the corresponding organizational structures. These criteriaare briefly described below:
• Effort: The magnitude of the effort should be more when the job requires moreresources in an organization and for this purpose the project managementtechniques are necessary. For example, the Atlas missile programme requiresmajor undertakings in the defence, aerospace, space, energy and transportationsectors. However, micro-level industrial activities may also need formal projectmanagement, e.g., in the case of relocation of facilities, merger of two companies,placing of a new product on the market etc.
• Coordination: Even when a job lies primarily in one functional area, the task ofcoordinating its work with the other functional area is necessary. For example,the task of computer installation in a company may seem to be the sole concernof the Electronic Data Processing (EDP) department, as many corporateexecutives thought during the last two decades in India. Only a few smart executivesand organizations realized early on in the game that during the process ofcomputerization, there will be a continuous meshing of policies, procedures andresources of all the departments affected by computer installation. Often hundredsof people may be involved and the required coordination and integration might bemore than what a single department such as EDP can tackle efficiently andeffectively.
• Modification: A project always requires modifications from time to time. Minorchanges in products such as annual automobile design changes can usually beaccomplished without setting up a project team. On the other hand, undertakingthe modernization of an automobile plant calls for non-routine efforts such asrevising the facilities layout, modifying the assembly line, replacing equipment,retraining employees and altering policies and work procedures. For this, projectmanagement requires to bring all the functional areas together. In a changingenvironment with rapid changes taking place in the economic, social andtechnological environment, more and more industrial organizations are seekingcreative, innovative and flexible forms of management. Companies that operatein the computers, communications, electronics and pharmaceutical sectors areexposed to high innovations, rapid product changes, shifting markets and consumerbehaviour. Other industries, such as those in biotechnology, petrochemicals andceramics, though less volatile, also have highly competitive and dynamicenvironments.
• Changing environment: Another aspect of the changing environment that isparticularly relevant for the Indian economy is the government’s policy ofliberalization and transition to the free market mode. Changing environments presentopportunities that organizations must capture swiftly. Project management providesflexibility and diversity needed to deal with changing goals and new opportunities.When a joint effort is required, project management attempts to build lateralrelationships between functional areas in order to accelerate work and reconcile
Self LearningMaterial 11
Introduction toProject Management
NOTES
the conflicts inherent in multi-functional and multi-disciplinary organizations. Theproject manager links and coordinates the efforts of the divisions within the parentorganization as well as those of the outside — sub-contractors, suppliers andcustomers.
• Reputation: The reputation of the undertaking and what is at stake may determinethe need for project management. An unsuccessful project will result in either aloss of future contracts, damaged reputation, loss of market share or, in the worstcase, financial ruin; therefore, there is a strong case for utilizing formal projectmanagement techniques and organizational form. For example, in the launchingof American multinational Pepsi soft drinks and snack food operations in India orintroduction of its new 1000 c.c. car by Maruti Udyog Ltd or setting up of its jointventure in the form of Tata-IBM by IBM Corporation formally, each of theundertakings warranted the adoption of a formal project management approach.The obvious reason, in each of the above cases, is that the likelihood of successfullycompleting the undertaking is increased when a single competent individual isassigned responsibility for overseeing it. The project manager, with the assistanceof technical support groups, can do much to reduce the problems inherent inlarge, complex undertakings.
1.2.6 Need of Project Management
Most enterprises require project management, at some point of time in order to convertstrategical decisions into operations and set goals. A large number of organizations areproject-intensive, such as construction, aerospace, engineering design and softwaredevelopment. In the public domain too, project management has a defining role intranslating ideas into reality.Identification of goals requires an organized system and application of methodicalprocesses particularly in light of contemporary times marked with intense competition,rapid technological developments, socio-cultural milieu, government regulations andeconomic issues. A number of researches have concluded that substantial entrepreneurialdevelopment as well as further organizational efforts often lead to the following risks indeployment of strategies to administer the endeavours:
• Deferment because of ineffectual planning, monitoring, coordination, risk-management and follow-through of the project
• Economic inconsistency because of ineffectual management and staff utilization/accountability
• Consumer discontent because of lack of responsiveness and communicationbarriers
Therefore, the fundamental idea for a large number of organizations is to strive forexcellence in a growing market facilitated by the best delivery capacity and driven byconsistent and effectual procedures, structures, planning and monitoring.A proficient system of project management aids in the management of variouscomplications with favourable outcomes, and lowers doubts and expenses. The followingare certain examples of organizational weaknesses that can be risky but can be controlledthrough proper managerial techniques:
• Lack of integration concerning schedules managed in silos and dependencies• Delays attributed to inefficient allocation of resources due to lack of communication
between departments
Self Learning12 Material
Introduction toProject Management
NOTES
• Lack of long-term forecasts in scheduling• Failure in identification of critical areas like non-working time and estimation of
defects• Improper documentation of information due to informal mode of communication• Lack of accountability in issues concerning decision-making• Failure of proactive risk classification and administration• Inadequate reporting - lack of visibility / insight into the true status of the projects• Frequently forgotten or delayed activities and decisions
The skill of handling projects constitutes uniformity in reaching set goals in time, with noextra expenses simultaneously maintaining good client relationships. This is acquired bythe successful management and coordination of human and material resources. Thedomain of project management propels towards improved cooperation, control,implementation, receptiveness, and positioning of entrepreneurial aspects as well asprocesses with the characteristics of the product and operation. Project managementtechniques vary in technical aspects; engineering or construction skills generally alignedwith a number of projects and include elements not included in the range of the technicalaspects, which are required to be properly controlled in order to meet the goals of theproject. Further, project management varies from conventional management as itintroduces cross-functional cooperation, management, implementation, receptiveness,and placement of entrepreneurial aspects and processes with characteristics of theresult of the projects. Project management aids in bringing novelty and progress basedon the alterations in the external conditions.Proper application of project management for positioning of strategical processes andobjectives can offer the following benefits:
• Profits due to consistent meeting of organizational objectives, excellent use ofresources and knowledge based decision-making.
• Competitive edge attributed to the human resource based on a background ofcooperation, goal achievement and customer satisfaction.
Project management also presents substantial advantages to people at differentorganizational layers. Project management aids:
• Executives in obtaining precise and correct knowledge in order to reach correctentrepreneurial conclusions in order to remain ahead in the market
• The management in drawing attention towards the ultimate objective of theentrepreneurial efforts. With marked decrease in conflicts and confusions andeffectual communication processes, the organization is bound to witness an increasein productivity.
Thus, we can conclude that project management as a managerial subject, structures alarger percentage of financial aspects and entails numerous benefits. The special functionof project management in introducing expertise in organizational processes byincorporating innovation can in no way be overlooked.
1.3 LIFE CYCLE OF A PROJECT: CONCEPTIONAND SELECTION
Each product passes through four phases during its life cycle, which is called a productlife cycle (PLC). The four stages include introduction, growth, maturity and decline.
Check Your Progress
1. Define projectmanagement.
2. State the mainpurpose behindprojectmanagement.
Self LearningMaterial 13
Introduction toProject Management
NOTES
When a product is newly introduced in the market, the initial sales and sales growth willbe low. It will be followed by a natural growth in demand of the product before itreaches the plateau for stabilized sales and then, starts declining.
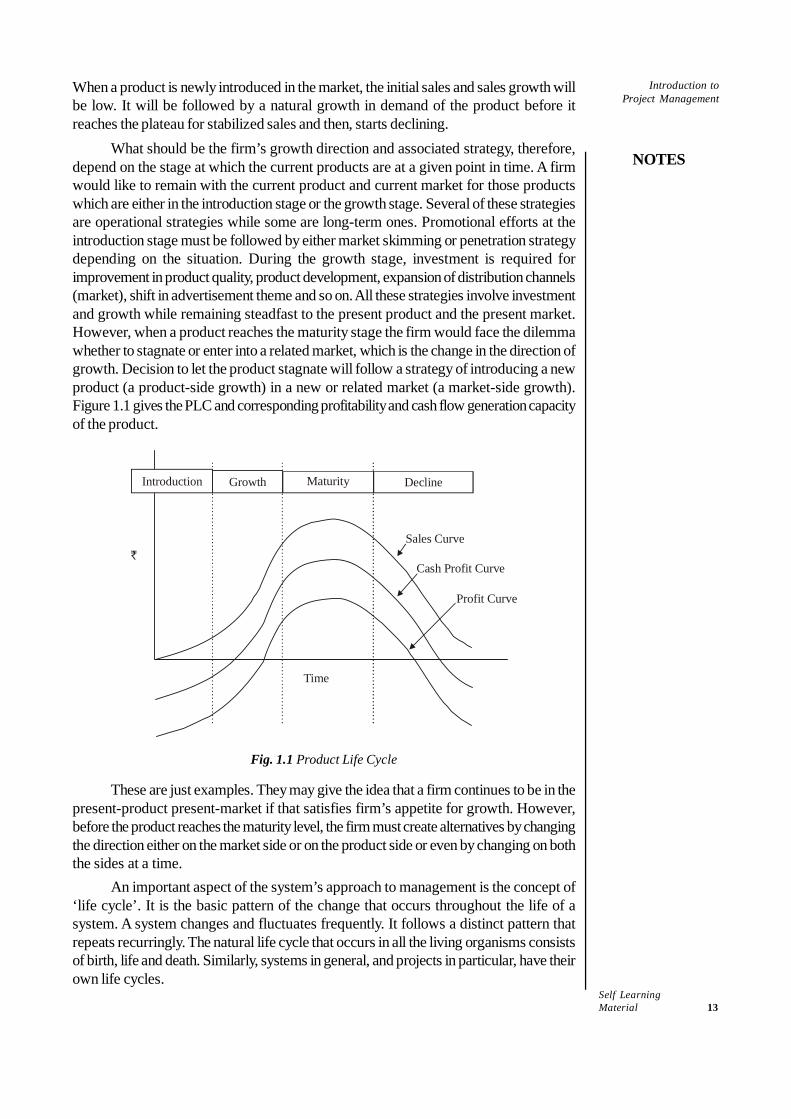
What should be the firm’s growth direction and associated strategy, therefore,depend on the stage at which the current products are at a given point in time. A firmwould like to remain with the current product and current market for those productswhich are either in the introduction stage or the growth stage. Several of these strategiesare operational strategies while some are long-term ones. Promotional efforts at theintroduction stage must be followed by either market skimming or penetration strategydepending on the situation. During the growth stage, investment is required forimprovement in product quality, product development, expansion of distribution channels(market), shift in advertisement theme and so on. All these strategies involve investmentand growth while remaining steadfast to the present product and the present market.However, when a product reaches the maturity stage the firm would face the dilemmawhether to stagnate or enter into a related market, which is the change in the direction ofgrowth. Decision to let the product stagnate will follow a strategy of introducing a newproduct (a product-side growth) in a new or related market (a market-side growth).Figure 1.1 gives the PLC and corresponding profitability and cash flow generation capacityof the product.
`
Time
Sales Curve
Cash Profit Curve
Profit Curve
Introduction Growth Maturity Decline
Fig. 1.1 Product Life Cycle
These are just examples. They may give the idea that a firm continues to be in thepresent-product present-market if that satisfies firm’s appetite for growth. However,before the product reaches the maturity level, the firm must create alternatives by changingthe direction either on the market side or on the product side or even by changing on boththe sides at a time.
An important aspect of the system’s approach to management is the concept of‘life cycle’. It is the basic pattern of the change that occurs throughout the life of asystem. A system changes and fluctuates frequently. It follows a distinct pattern thatrepeats recurringly. The natural life cycle that occurs in all the living organisms consistsof birth, life and death. Similarly, systems in general, and projects in particular, have theirown life cycles.
Self Learning14 Material
Introduction toProject Management
NOTES
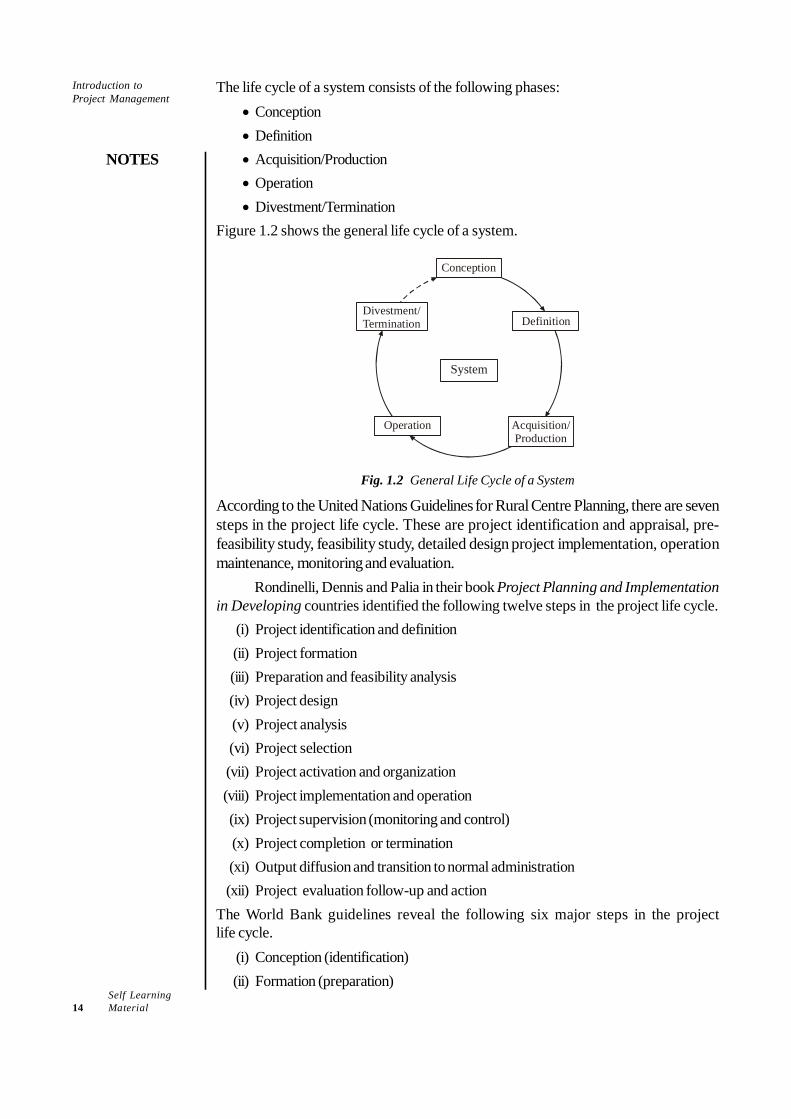
The life cycle of a system consists of the following phases:• Conception• Definition• Acquisition/Production• Operation• Divestment/Termination
Figure 1.2 shows the general life cycle of a system.
Definition
System
Operation
Conception
Divestment/Termination
Acquisition/Production
Fig. 1.2 General Life Cycle of a System
According to the United Nations Guidelines for Rural Centre Planning, there are sevensteps in the project life cycle. These are project identification and appraisal, pre-feasibility study, feasibility study, detailed design project implementation, operationmaintenance, monitoring and evaluation.
Rondinelli, Dennis and Palia in their book Project Planning and Implementationin Developing countries identified the following twelve steps in the project life cycle.
(i) Project identification and definition(ii) Project formation(iii) Preparation and feasibility analysis(iv) Project design(v) Project analysis(vi) Project selection(vii) Project activation and organization(viii) Project implementation and operation(ix) Project supervision (monitoring and control)(x) Project completion or termination(xi) Output diffusion and transition to normal administration(xii) Project evaluation follow-up and action
The World Bank guidelines reveal the following six major steps in the projectlife cycle.
(i) Conception (identification)(ii) Formation (preparation)
Self LearningMaterial 15
Introduction toProject Management
NOTES
(iii) Analysis (appraisal)(iv) Implementation (supervision)(v) Operation(vi) Evaluation
1. Conception/Formation Phase
The conceptual phase involves the preliminary evaluation of an idea. This includesrecognition and acceptance of a problem or a need, analysing the requirements andfinding out the ways to fulfil the need or to solve the problem. Some of the importantactions are: preliminary analysis of risk and their impact on time, cost, and performancerequirements.
The conception phase of a system focuses on the analysis of the needs (of anorganization) that the system is designed to fulfil these needs. This phase corresponds tothe ‘birth’ of a system. Similarly, in terms of the life cycle of a project and technology/product, the conception phase is equivalent to the project formation phase and basicresearch phase, respectively. Some of the specific steps involved in this phase are outlinedbelow:
• Determining the existing need or problem, or potential deficiencies of the existingsystem
• Examining alternative ways of meeting the need for solving the problem• Estimating the approximate resources, human and others, required for the system• Explaining the basic concept of the system• Preparing the initial estimates of the time, cost and performances of the conceived
system• Determining the initial feasibility and practicability—technical, financial and
environmental.
2. Definition/Build-Up Phase
The system conceived in the preceding phase is now investigated in greater detail. Thedefinition phase of a system is mainly a refinement of the ideas described in the conceptionphase. The sub-systems of the main system are defined and examined. This requires aconfident identification of the resources required and the establishment of time, cost andperformance parameters. It also includes the initial preparation of all the documentsnecessary to support the system such as policies, procedures, bid documents, jobdescriptions, budgets and funding papers. The system definition phase is equivalent to aproject build-up phase. The project team is expanded to enable it to identify resourceand system performance requirements, major sub-systems, elements, etc. Projectmanagement plans to create the activities, schedules, costs and resources are needed todesign, build and implement the system. The specific activities and steps in the definitionphase of a system can be summarized as:
• Determination of time, cost and performance requirements of the system• Identification of estimates of human and non-human resources required• Determination of necessary sub-systems including detailed plans required to support
the main system• Defining the inter-system and intra-system interfaces
Self Learning16 Material
Introduction toProject Management
NOTES
• Identification and preparation of the documents required to support the system,such as policies, procedures, bid documents, job descriptions, budgets and fundingpapers
This phase of system definition corresponds to the stages of growth of a living organismand applied research for a product, technology, etc. At this stage, the system expert orproject manager will decide in terms of men, money and other resources whether tocontinue with the system of a project or to cancel it. If the decision is one to continue,then the next phase to move on is the acquisition/production phase.
3. Acquisition/Production Phase
The acquisition phase is named such because, at the end of it, the user acquires thesystem. This phase is also referred to as the production phase as the system is nowproduced. The efforts are now focused on the standardization, testing and evaluation ofthe alternative detailed designs and production based on the acceptable detailed design.In case of a living organism, this phase is the maturity phase; in case of the technology/product life cycle, this phase corresponds to the design development and manufacturingphase of the technology/product. The production phase of a system and a project aresimilar to each other. Production involves either production of a single item or massproduction. Project management oversees and controls resources, motivates the workersand reports the progress to the users of the system. All the documentations must becompleted in this phase. At the end of this phase, the system moves out from the controlof the project. The specific tasks and activities in the acquisition/ production phaseshould be to:
• Update the detailed plans and specifications of the definition phase• Identify detailed resource requirements and managerial procedures, e.g., inventory,
scheduling, accounting, bookkeeping, etc.• Begin the production, construction and installation of the actual system• Verify system specifications with performance• Prepare policy and procedural documents• Develop plans to hand over the system to the user and to provide supporting
services such as training during the operational phaseThe system that was conceived and defined earlier is now ready for delivery to the userfor its deployment and operation.
4. Operation Phase
The system has come a long way from the conception phase and is now deployed by theuser who integrates its products/services into the existing organizational system. Theuser takes over, operates the system and evaluates its performance in terms of its abilityto meet the need or to solve the problem for which it was designed. The system manager/contractor may still be involved in providing services such as commissioning, trialevaluations, operational assistance, maintenance, training, etc. The operation phase alsoincludes the provision of feedback to the system planner/designer so that systemimprovements can be achieved. The operation phase of a project is identical to that of asystem except that in many projects ‘one-shot’ systems are used which either succeedor fail. The specific activities and steps in the operation phase of a system are as follows:
• Using the system (by the client or the customer)• Integrating the products/services into the existing organizational system
Self LearningMaterial 17
Introduction toProject Management
NOTES
• Evaluating the system performance vis-à-vis the specifications made in thedefinition phase with respect to technical, economic, social and environmentalparameters
• Providing feedback to the system designer/planner about the efficiency andeffectiveness of the system
• Providing training support and maintenance services
5. Divestment/Termination Phase
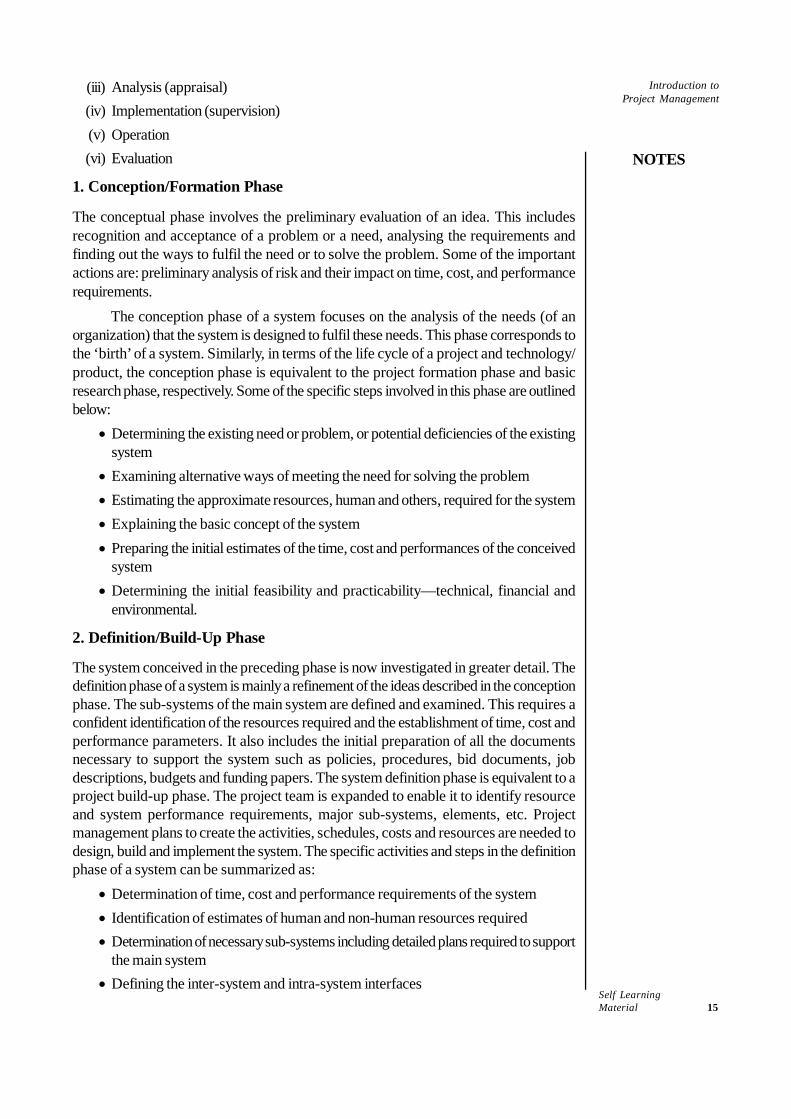
This is the last phase of the system and in many cases overlaps with the precedingoperation phase. The senior management of the organization will now be looking at themeans of divestment and reallocation of resources. This can also be understood with thehelp of a figure. Figure 1.3 shows the life cycle of a project.
Phase-out/Termination
ProjectBuild-up
Project
ProductionProject
Operation
ProjectFormation
Fig. 1.3 Life Cycle of a Project
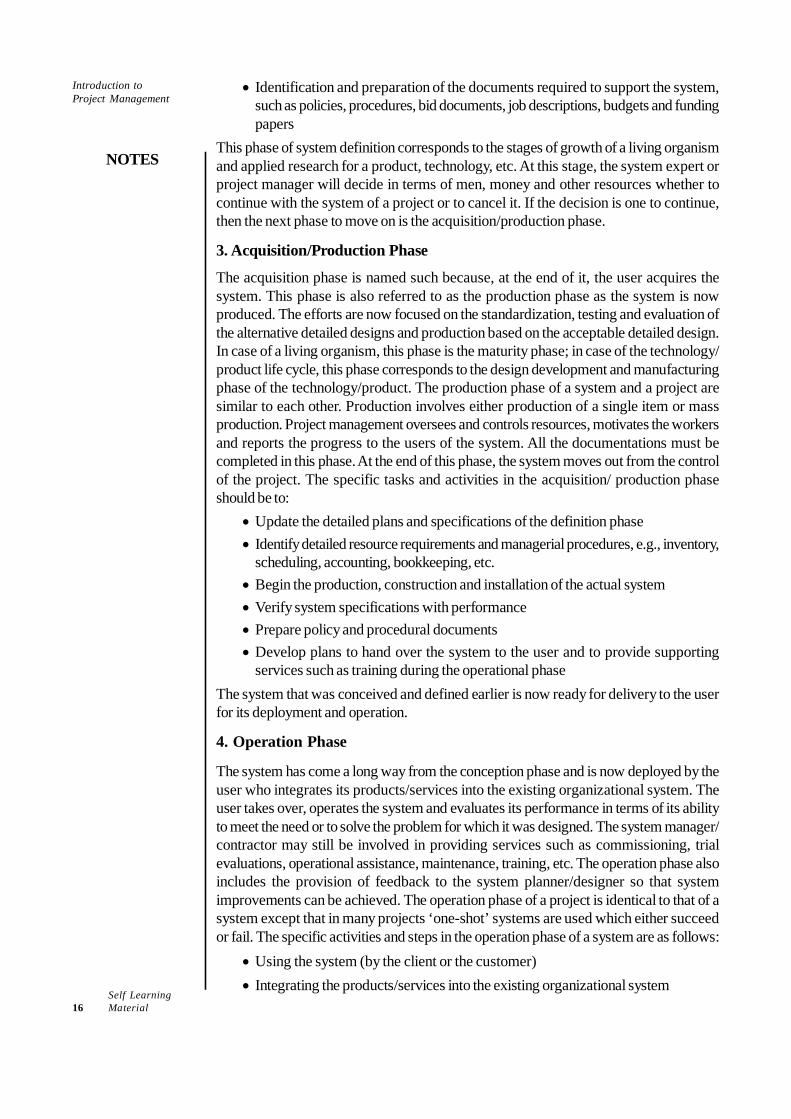
This figure corresponds to the phase-out and termination of a project. Similarly, comparedto the technology/product life cycle, divestment corresponds to the deterioration anddeath phases of the technology or the product. Figure 1.4 shows the life cycle of atechnology product.
Death MarketIntroduction
Technology/Product
GrowthDeterioration
Research &Development
Maturity
Fig. 1.4 Life Cycle of a Technology Product
As one product out of several in an organization enters the deterioration and deathphases of its life cycle, other new products or projects must be conceived and developed.Most of the organizations require more than one product or project for survival. Inaddition to it, new products or projects should be undertaken in such a rate that the totalrevenue will increase and the organization will acquire the desired growth profile. Priorto the phase-out and termination of a project, senior management makes a comprehensive
Self Learning18 Material
Introduction toProject Management
NOTES
evaluation of the project so that the lessons learned can be used as inputs for newprojects. The divestment phase also affects other ongoing projects in a multi-projectorganization in terms of availability and release of additional common resources. If apriority project is being phased out and terminated, other projects will now creep up inthe priority list. The divestment/termination phase of a system/project involves the followingfinal steps and activities:
• Phasing out the system or project• Transferring responsibility to supporting organizations• Transferring resources to other systems• Re-configuring the project group to work on new projects• Developing the lessons learnt from the system or project for further utility
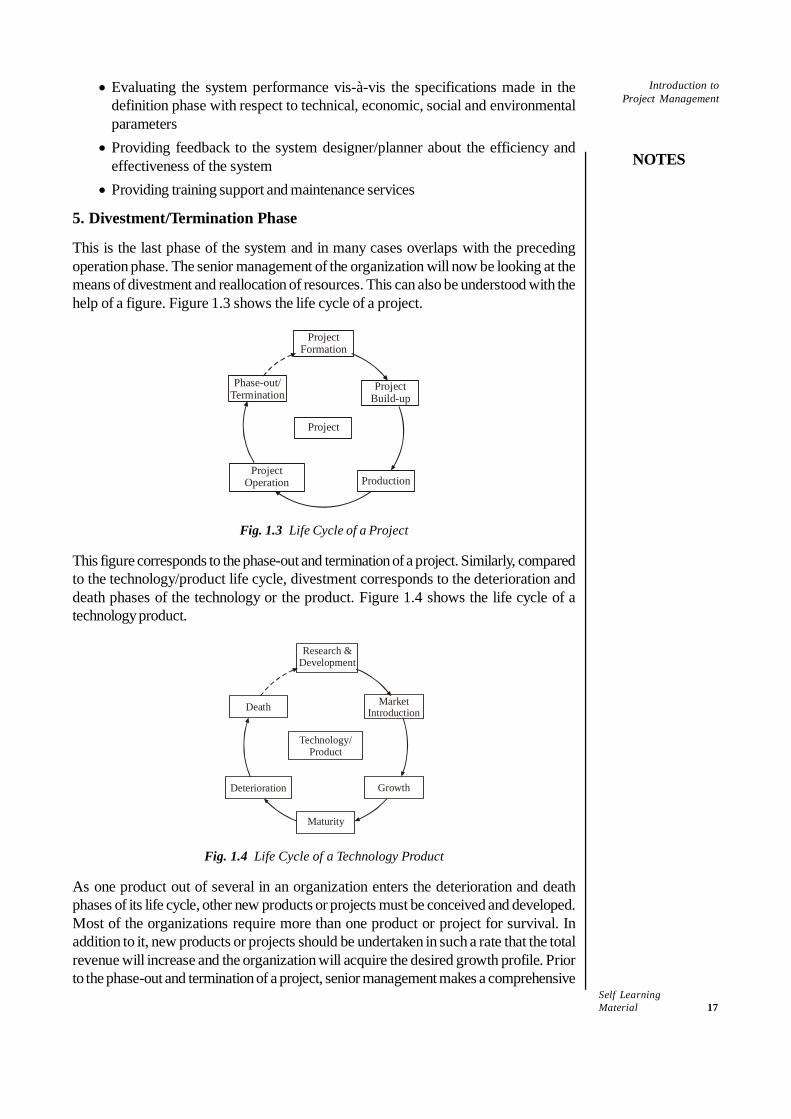
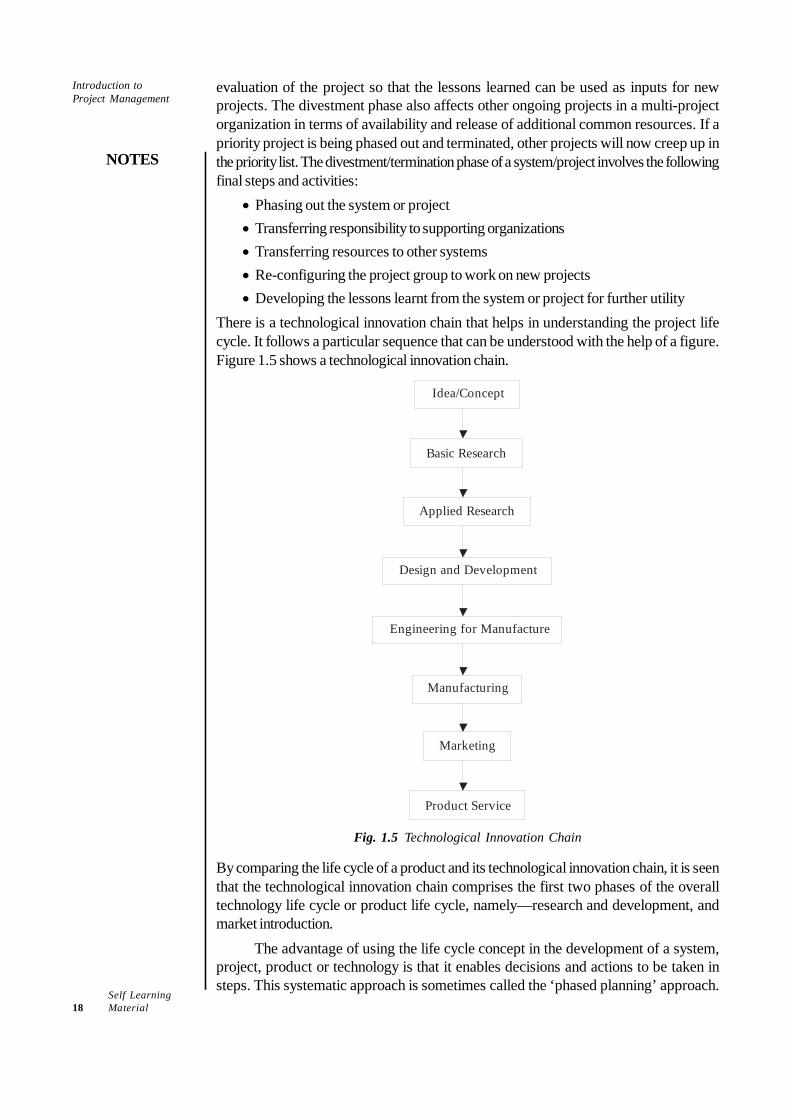
There is a technological innovation chain that helps in understanding the project lifecycle. It follows a particular sequence that can be understood with the help of a figure.Figure 1.5 shows a technological innovation chain.
Idea/Concept
Basic Research
Applied Research
Design and Development
Engineering for Manufacture
Manufacturing
Marketing
Product Service
Fig. 1.5 Technological Innovation Chain
By comparing the life cycle of a product and its technological innovation chain, it is seenthat the technological innovation chain comprises the first two phases of the overalltechnology life cycle or product life cycle, namely—research and development, andmarket introduction.
The advantage of using the life cycle concept in the development of a system,project, product or technology is that it enables decisions and actions to be taken insteps. This systematic approach is sometimes called the ‘phased planning’ approach.
Self LearningMaterial 19
Introduction toProject Management
NOTES
Decisions can be taken at various stages and the system objectives and results are re-evaluated at progressively intensive levels while moving towards the final solution. Thisreduces the risk of committing resources without a proper assessment of all the relevantfactors.
1.3.1 Stages of the Life Cycle Concept
The various stages of the life cycle concept are:
1. Theoretical FrameworkDuring the planning stage, sub-contracts are given, teams and sub-teams are formed,team leaders are appointed, coordination is established, documentations are designedand a reporting system is developed. Now is the time to execute the projects. Projectexecution is a very active stage in project management. It involves activities like actualconstruction of work packages, action and coordination and monitoring and control.
2. Constructing Work PackagesA project team will start constructing different work packages (activities) as per thenetwork plan prepared in the detailed project report. The sub-teams in the project, eachwith their own expertise, are engaged in the construction of work packages. Theseactivities are visible, and create enthusiasm and excitement, which may sometimes takethe eyes off the scope of the project.
3. Action and CoordinationThere are several sub-teams on the job at any given point in time. Progress on theirwork together with resources consumed and required have a bearing on what other sub-teams are doing and would do in the future. Someone has to provide strong leadershipfor the effective coordination among all sub-teams and subcontractors, and alsocoordination for resource allocation on various sub-teams.
4. Monitoring and ControlTroubleshooting becomes a daily event, review of several configurations and activitiestakes place and the need for design change is felt. During implementation, there isalways a very high chance that the project may go in the wrong trajectory due to theinvolvement of several people, difficulty in coordination or loss of focus and the projectmay become unviable or may get delayed. Therefore, a project control mechanism isextremely important. A good project control mechanism would efficiently balance thecost, time and performance aspects, where performance aspects cover quantitative aswell as qualitative targets.
Risk Analysis and Utility TheoryOnce the design of the project is ready, statistical risk analysis for the project begins.This stage involves the following activities:
• Identifying the main sources of risk• Measuring the risk• Incorporating the risk in the decision-making process
Sensitivity analysis is the prescribed tool for identifying the important sources of risk.Various statistical techniques, which measure dispersion value are employed for
Self Learning20 Material
Introduction toProject Management
NOTES
quantifying the risk and then some statistically convincing rules, are applied for decisionmaking. The risk can be incorporated in either the cash flow or in the discount rate sothat the right choice of project is made.
1. Identifying Critical Sources of Risk (Sensitivity Analysis)
Management by exception is the rule. Many variables may be uncertain but only a fewmay matter. The endeavour of the management should be to first identify the sources ofrisk that matter. This task is performed at various stages. However, if critical sources ofrisk are identified at the project feasibility stage, the project planning team would derivevaluable guidance for the management of risk, in deciding which part of the risk totransfer or leverage out. This may also help in deciding whether market survey is neededor not and if needed, then what should be surveyed.Sensitivity analysis: Initially, only one value is estimated for each variable and theprofit (or NPV-Net Present Value or IRR-Internal Rate of Return) of the project isdetermined. What if any one variable may actually turn out to be different? What will bethe effect of it on profit? The sensitivity analysis technique asks this question for eachvariable and calculates the project profit each time. It may be noticed at the end of theprocess that many variables are trivial and have a very negligible impact on the project’sviability and only few variables are vital from the project viability angle. Thus, sensitivityanalysis identifies a ‘vital few’ variables that need management’ attention for risk mitigation.This ‘what if’ analysis can be done using several methods, some of which are listed asfollows:
• Percentage change approach• Accounting break-even point approach• NPV break-even point approach• Pay-off matrix
The first three approaches do not require prior knowledge of the key factors for aproject. Rather, in those approaches, first important factors are identified based on thesensitivity of NPV to them and then, the question is asked ‘to what extent any of thosefactors are likely to change?’ In the following section, we will describe the first threemethods in brief but the pay-off matrix in a reasonable detail.
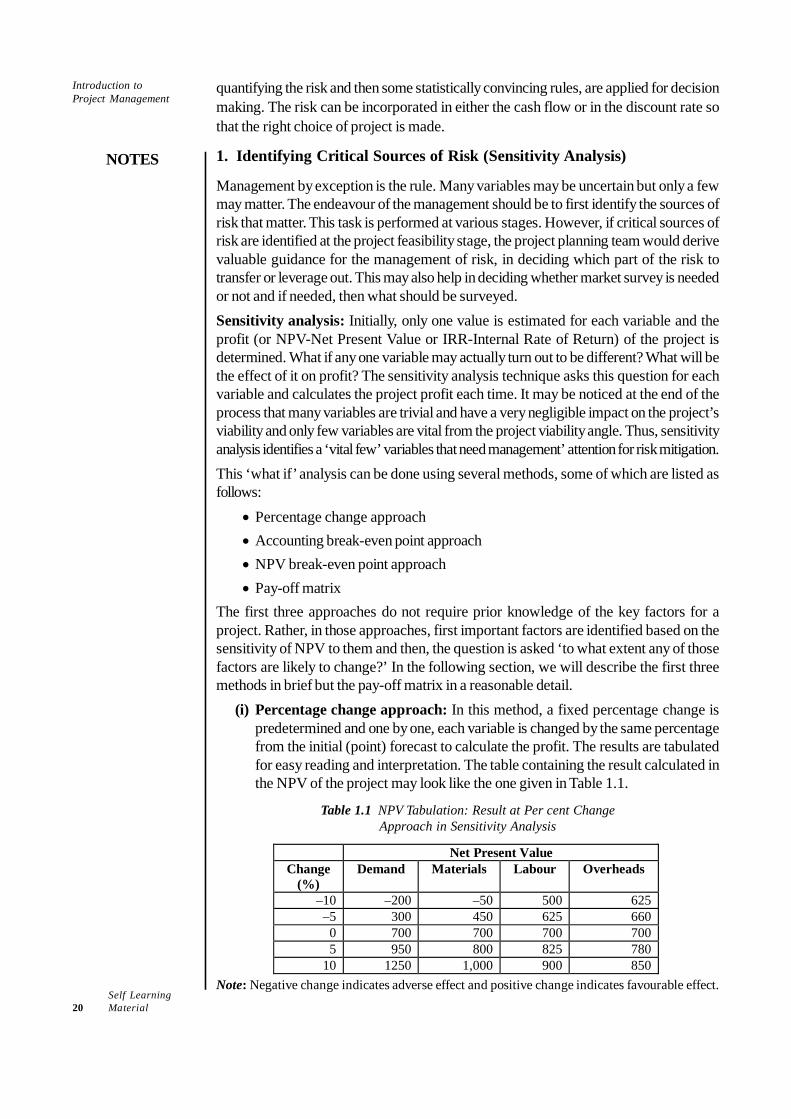
(i) Percentage change approach: In this method, a fixed percentage change ispredetermined and one by one, each variable is changed by the same percentagefrom the initial (point) forecast to calculate the profit. The results are tabulatedfor easy reading and interpretation. The table containing the result calculated inthe NPV of the project may look like the one given in Table 1.1.
Table 1.1 NPV Tabulation: Result at Per cent ChangeApproach in Sensitivity Analysis
Net Present Value Change
(%) Demand Materials Labour Overheads
–10 –200 –50 500 625 –5 300 450 625 660 0 700 700 700 700 5 950 800 825 780
10 1250 1,000 900 850 Note: Negative change indicates adverse effect and positive change indicates favourable effect.
Self LearningMaterial 21
Introduction toProject Management
NOTES
It appears clearly that labour and overheads do not pose much risk becauseNPVs do not vary much and even at 10 per cent adverse change, the NPV ispositive in both variables. Between demand and material cost, clearly demand isan important variable that the management would like to watch because variationin demand has a greater variation on the NPV of the project.
(ii) Accounting break-even approach in sensitivity analysis: Accounting break-even point is the point (level) of a particular variable at which the accountingprofit (ARR) from the project will be zero. The result could be like the one givenbelow:Per cent change required for accounting break-even
• Demand reduced by 30 per cent• Material cost increased by 50 per cent• Labour cost increased by 120 per cent• Overheads increased by 250 per cent
One can observe here that the viability of a project, measured in accounting rateof return terms, is more sensitive to demand and least sensitive to overheads.
(iii) NPV break-even approach in sensitivity analysis: Those who use NPV orIRR as the method of evaluation of a project may calculate the breakeven (zero)NPV or breakeven IRR for each variable. The results of a hypothetical problemmay be as follows:Per cent change required for zero (break-even) net present value or IRR
• Demand reduced by 33 per cent• Material cost increased by 62 per cent• Labour cost increased by 110 per cent• Overheads increased by 200 per cent• Project cost increased by 40 per cent
We can read here that the project is more sensitive to demand and project costand least sensitive to overheads.In these three approaches of sensitivity analysis, after the calculation is done,managers have to ask a question: to what extent is it possible that demand willdrop by a percentage that would result in either negative NPV or operating belowthe breakeven point (either accounting or NPV-IRR)? If there is any such chance,then one may like to study that variable more in detail.
(iv) Pay-off matrix and sensitivity analysis: The previous three methods are usefulfor carrying out sensitivity analysis at the stage of preparing the project feasibilityreport. Variables are not studied in-depth at that stage. Those methods serve theprimary purpose of forming a first opinion about the importance of variables. Therealistic range in which those important factors may vary is a matter of furtherstudy. Collection of reliable secondary data, cross verification and if need be,market survey for studying the selected variables could be the logical steps tofollow the application of any of the first three methods described earlier.A study of those variables would give enough data on the basis of which managersmay form a judgement regarding the most favourable and the most unfavourableoutcome of important variables. Now, the pay-off matrix approach of sensitivityanalysis becomes relevant. The pay-off result of an imaginary example is given inTable 1.2.
Self Learning22 Material
Introduction toProject Management
NOTES
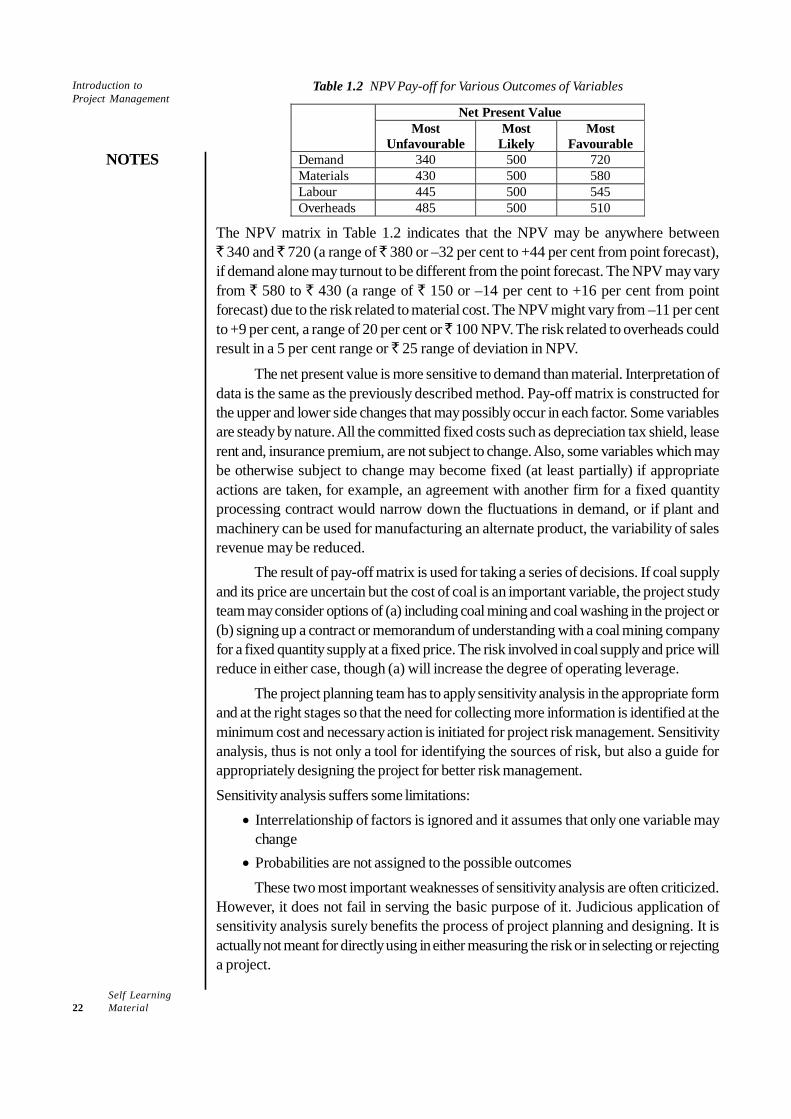
Table 1.2 NPV Pay-off for Various Outcomes of Variables
Net Present Value Most
Unfavourable Most
Likely Most
Favourable Demand 340 500 720 Materials 430 500 580 Labour 445 500 545 Overheads 485 500 510
The NPV matrix in Table 1.2 indicates that the NPV may be anywhere between` 340 and ̀ 720 (a range of ̀ 380 or –32 per cent to +44 per cent from point forecast),if demand alone may turnout to be different from the point forecast. The NPV may varyfrom ` 580 to ` 430 (a range of ` 150 or –14 per cent to +16 per cent from pointforecast) due to the risk related to material cost. The NPV might vary from –11 per centto +9 per cent, a range of 20 per cent or ̀ 100 NPV. The risk related to overheads couldresult in a 5 per cent range or ̀ 25 range of deviation in NPV.
The net present value is more sensitive to demand than material. Interpretation ofdata is the same as the previously described method. Pay-off matrix is constructed forthe upper and lower side changes that may possibly occur in each factor. Some variablesare steady by nature. All the committed fixed costs such as depreciation tax shield, leaserent and, insurance premium, are not subject to change. Also, some variables which maybe otherwise subject to change may become fixed (at least partially) if appropriateactions are taken, for example, an agreement with another firm for a fixed quantityprocessing contract would narrow down the fluctuations in demand, or if plant andmachinery can be used for manufacturing an alternate product, the variability of salesrevenue may be reduced.
The result of pay-off matrix is used for taking a series of decisions. If coal supplyand its price are uncertain but the cost of coal is an important variable, the project studyteam may consider options of (a) including coal mining and coal washing in the project or(b) signing up a contract or memorandum of understanding with a coal mining companyfor a fixed quantity supply at a fixed price. The risk involved in coal supply and price willreduce in either case, though (a) will increase the degree of operating leverage.
The project planning team has to apply sensitivity analysis in the appropriate formand at the right stages so that the need for collecting more information is identified at theminimum cost and necessary action is initiated for project risk management. Sensitivityanalysis, thus is not only a tool for identifying the sources of risk, but also a guide forappropriately designing the project for better risk management.Sensitivity analysis suffers some limitations:
• Interrelationship of factors is ignored and it assumes that only one variable maychange
• Probabilities are not assigned to the possible outcomesThese two most important weaknesses of sensitivity analysis are often criticized.
However, it does not fail in serving the basic purpose of it. Judicious application ofsensitivity analysis surely benefits the process of project planning and designing. It isactually not meant for directly using in either measuring the risk or in selecting or rejectinga project.
Self LearningMaterial 23
Introduction toProject Management
NOTES
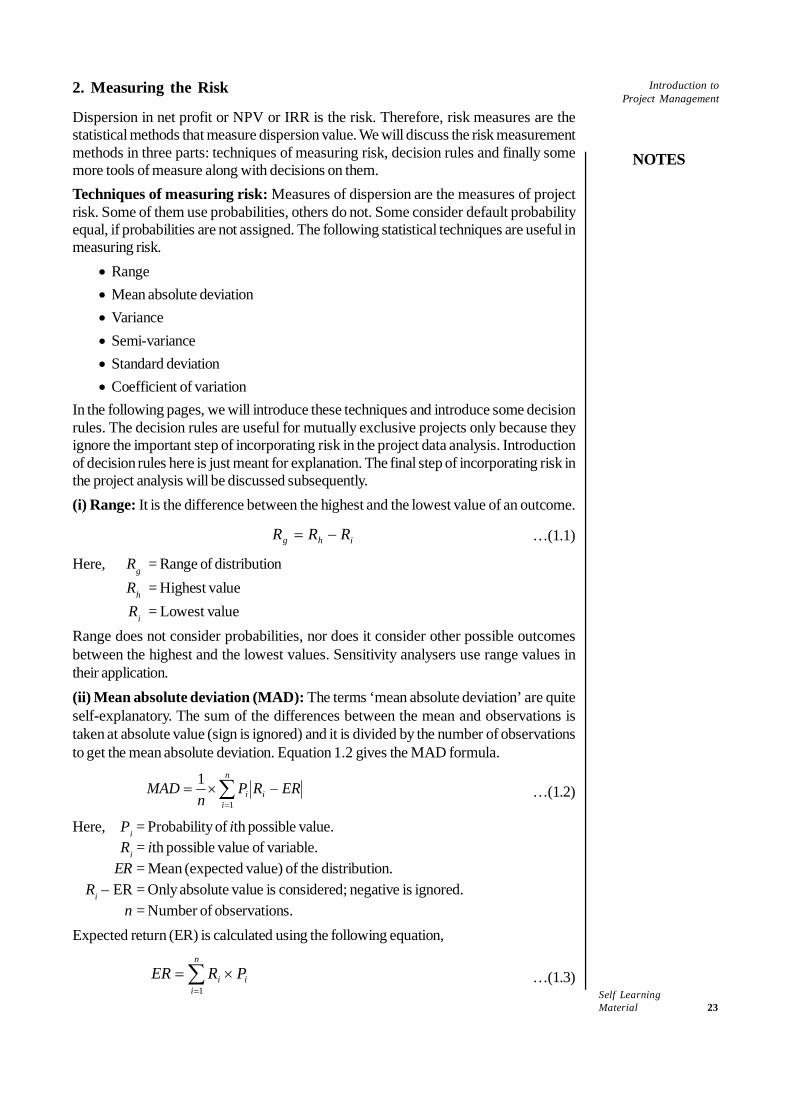
2. Measuring the Risk
Dispersion in net profit or NPV or IRR is the risk. Therefore, risk measures are thestatistical methods that measure dispersion value. We will discuss the risk measurementmethods in three parts: techniques of measuring risk, decision rules and finally somemore tools of measure along with decisions on them.Techniques of measuring risk: Measures of dispersion are the measures of projectrisk. Some of them use probabilities, others do not. Some consider default probabilityequal, if probabilities are not assigned. The following statistical techniques are useful inmeasuring risk.
• Range• Mean absolute deviation• Variance• Semi-variance• Standard deviation• Coefficient of variation
In the following pages, we will introduce these techniques and introduce some decisionrules. The decision rules are useful for mutually exclusive projects only because theyignore the important step of incorporating risk in the project data analysis. Introductionof decision rules here is just meant for explanation. The final step of incorporating risk inthe project analysis will be discussed subsequently.(i) Range: It is the difference between the highest and the lowest value of an outcome.
ihg RRR −= …(1.1)
Here, Rg = Range of distributionRh = Highest valueRi = Lowest value
Range does not consider probabilities, nor does it consider other possible outcomesbetween the highest and the lowest values. Sensitivity analysers use range values intheir application.(ii) Mean absolute deviation (MAD): The terms ‘mean absolute deviation’ are quiteself-explanatory. The sum of the differences between the mean and observations istaken at absolute value (sign is ignored) and it is divided by the number of observationsto get the mean absolute deviation. Equation 1.2 gives the MAD formula.
∑=
−×=n
iii ERRP
nMAD
1
1…(1.2)
Here, Pi = Probability of ith possible value.Ri = ith possible value of variable.
ER = Mean (expected value) of the distribution.Ri – ER = Only absolute value is considered; negative is ignored.
n = Number of observations.Expected return (ER) is calculated using the following equation,
∑=
×=n
iii PRER
1…(1.3)
Self Learning24 Material
Introduction toProject Management
NOTES
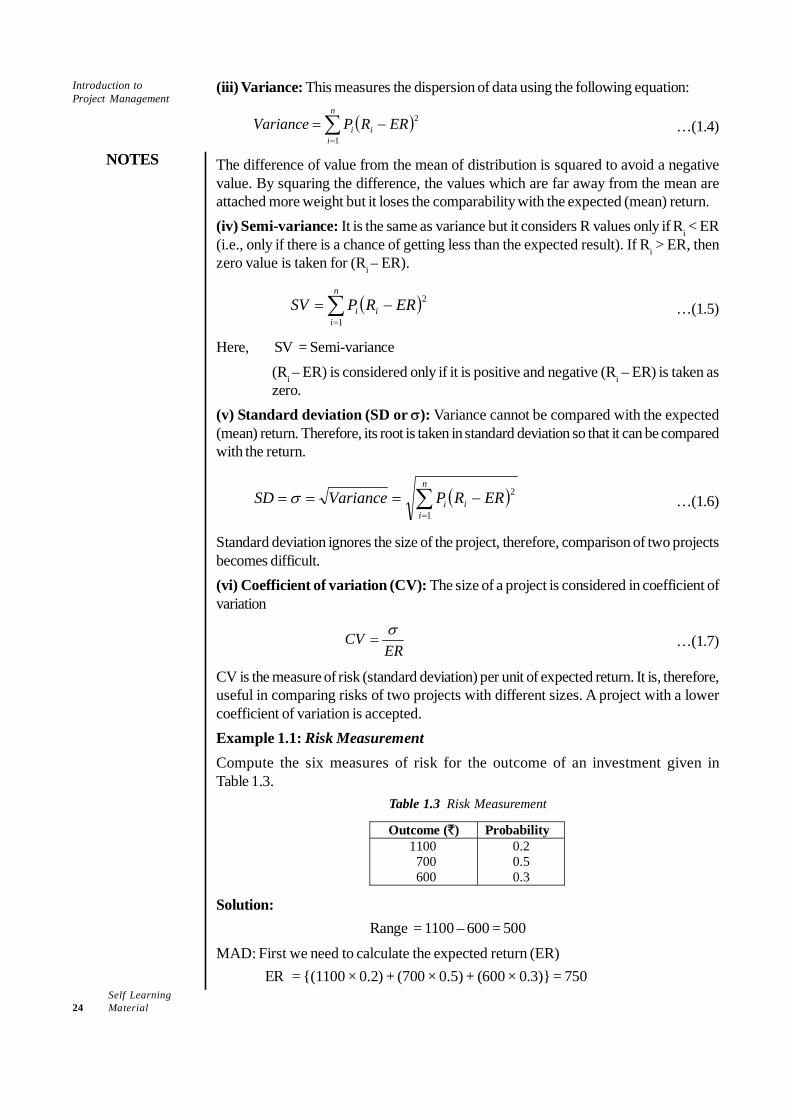
(iii) Variance: This measures the dispersion of data using the following equation:
( )∑=
−=n
iii ERRPVariance
1
2…(1.4)
The difference of value from the mean of distribution is squared to avoid a negativevalue. By squaring the difference, the values which are far away from the mean areattached more weight but it loses the comparability with the expected (mean) return.(iv) Semi-variance: It is the same as variance but it considers R values only if Ri < ER(i.e., only if there is a chance of getting less than the expected result). If Ri > ER, thenzero value is taken for (Ri – ER).
( )∑=
−=n
iii ERRPSV
1
2…(1.5)
Here, SV = Semi-variance(Ri – ER) is considered only if it is positive and negative (Ri – ER) is taken aszero.
(v) Standard deviation (SD or σ): Variance cannot be compared with the expected(mean) return. Therefore, its root is taken in standard deviation so that it can be comparedwith the return.
( )∑=
−===n
iii ERRPVarianceSD
1
2σ …(1.6)
Standard deviation ignores the size of the project, therefore, comparison of two projectsbecomes difficult.(vi) Coefficient of variation (CV): The size of a project is considered in coefficient ofvariation
ERCV σ
= …(1.7)
CV is the measure of risk (standard deviation) per unit of expected return. It is, therefore,useful in comparing risks of two projects with different sizes. A project with a lowercoefficient of variation is accepted.Example 1.1: Risk MeasurementCompute the six measures of risk for the outcome of an investment given inTable 1.3.
Table 1.3 Risk Measurement
Outcome (`) Probability 1100 700 600
0.2 0.5 0.3
Solution:Range = 1100 – 600 = 500
MAD: First we need to calculate the expected return (ER)ER = {(1100 × 0.2) + (700 × 0.5) + (600 × 0.3)} = 750
Self LearningMaterial 25
Introduction toProject Management
NOTES
MAD = 0.2 |1,100 – 750 | 0.5 |1,100 – 750 | 0.3 |1,100 – 750 |
3× + × + ×
=0.2 350 0.5 350 0.3 350 70 175 105 350
3 3 3× + × + × + +
= = = 116.67
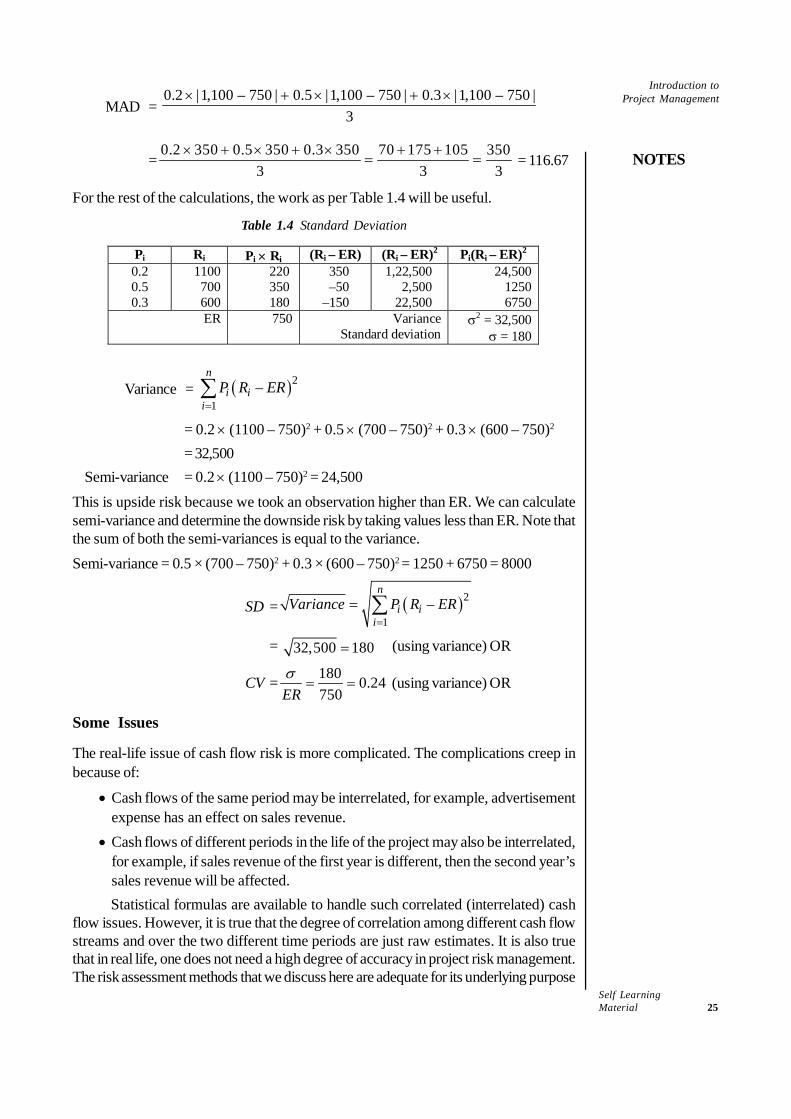
For the rest of the calculations, the work as per Table 1.4 will be useful.
Table 1.4 Standard Deviation
Pi Ri Pi × Ri (Ri – ER) (Ri – ER)2 Pi(Ri – ER)2
0.2 0.5 0.3
1100 700 600
220 350 180
350 –50
–150
1,22,500 2,500
22,500
24,500 1250 6750
ER 750 Variance Standard deviation
σ2 = 32,500 σ = 180
Variance = ( )21
–n
i ii
P R ER=∑
= 0.2 × (1100 – 750)2 + 0.5 × (700 – 750)2 + 0.3 × (600 – 750)2
= 32,500Semi-variance = 0.2 × (1100 – 750)2 = 24,500
This is upside risk because we took an observation higher than ER. We can calculatesemi-variance and determine the downside risk by taking values less than ER. Note thatthe sum of both the semi-variances is equal to the variance.Semi-variance = 0.5 × (700 – 750)2 + 0.3 × (600 – 750)2
= 1250 + 6750 = 8000
SD = ( )21
–n
i ii
Variance P R ER=
= ∑
= 32,500 180= (using variance) OR
CV = 180 0.24750ER
σ= = (using variance) OR
Some Issues
The real-life issue of cash flow risk is more complicated. The complications creep inbecause of:
• Cash flows of the same period may be interrelated, for example, advertisementexpense has an effect on sales revenue.
• Cash flows of different periods in the life of the project may also be interrelated,for example, if sales revenue of the first year is different, then the second year’ssales revenue will be affected.Statistical formulas are available to handle such correlated (interrelated) cash
flow issues. However, it is true that the degree of correlation among different cash flowstreams and over the two different time periods are just raw estimates. It is also truethat in real life, one does not need a high degree of accuracy in project risk management.The risk assessment methods that we discuss here are adequate for its underlying purpose
Self Learning26 Material
Introduction toProject Management
NOTES
of deriving managerial guidance for appropriate action, needed for mitigating risk at theproject planning stage.
Decision Rules
Two different decision rules are discussed in this section. They include: (a) EV rule and(b) coefficient of variation. A decision tree approach uses these two rules. These ruleshave their own limitations justifying the application of simulation method, which is alsodiscussed later.
EV rule or mean variance rule
The expected return and variance (or standard deviation) are compared for taking thedecision. It is also called ‘mean-variance’ rule. As per the mean-variance rule, the decisionis taken by evaluating the investment on the basis of their expected return and variance.Standard deviation is also used in place of variance.
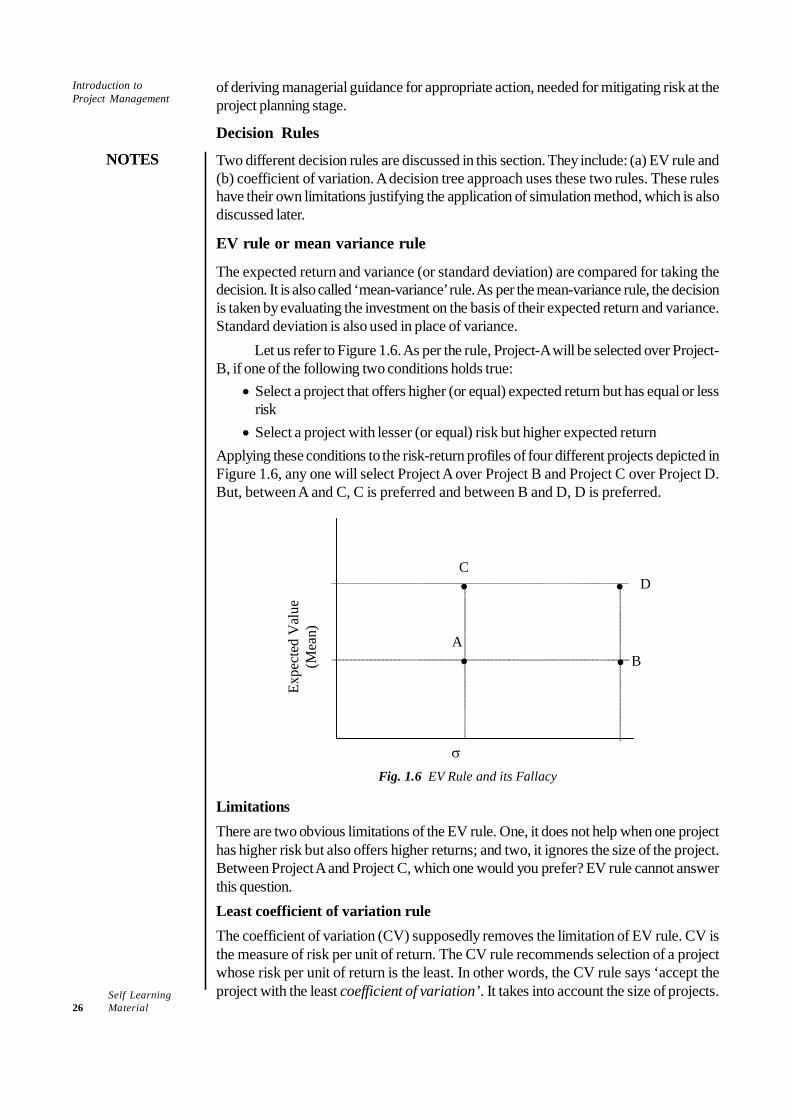
Let us refer to Figure 1.6. As per the rule, Project-A will be selected over Project-B, if one of the following two conditions holds true:
• Select a project that offers higher (or equal) expected return but has equal or lessrisk
• Select a project with lesser (or equal) risk but higher expected returnApplying these conditions to the risk-return profiles of four different projects depicted inFigure 1.6, any one will select Project A over Project B and Project C over Project D.But, between A and C, C is preferred and between B and D, D is preferred.
•
•
•
• C
A
D
B
Expe
cted
Val
ue
(Mea
n)
σ Fig. 1.6 EV Rule and its Fallacy
LimitationsThere are two obvious limitations of the EV rule. One, it does not help when one projecthas higher risk but also offers higher returns; and two, it ignores the size of the project.Between Project A and Project C, which one would you prefer? EV rule cannot answerthis question.Least coefficient of variation ruleThe coefficient of variation (CV) supposedly removes the limitation of EV rule. CV isthe measure of risk per unit of return. The CV rule recommends selection of a projectwhose risk per unit of return is the least. In other words, the CV rule says ‘accept theproject with the least coefficient of variation’. It takes into account the size of projects.
Self LearningMaterial 27
Introduction toProject Management
NOTES
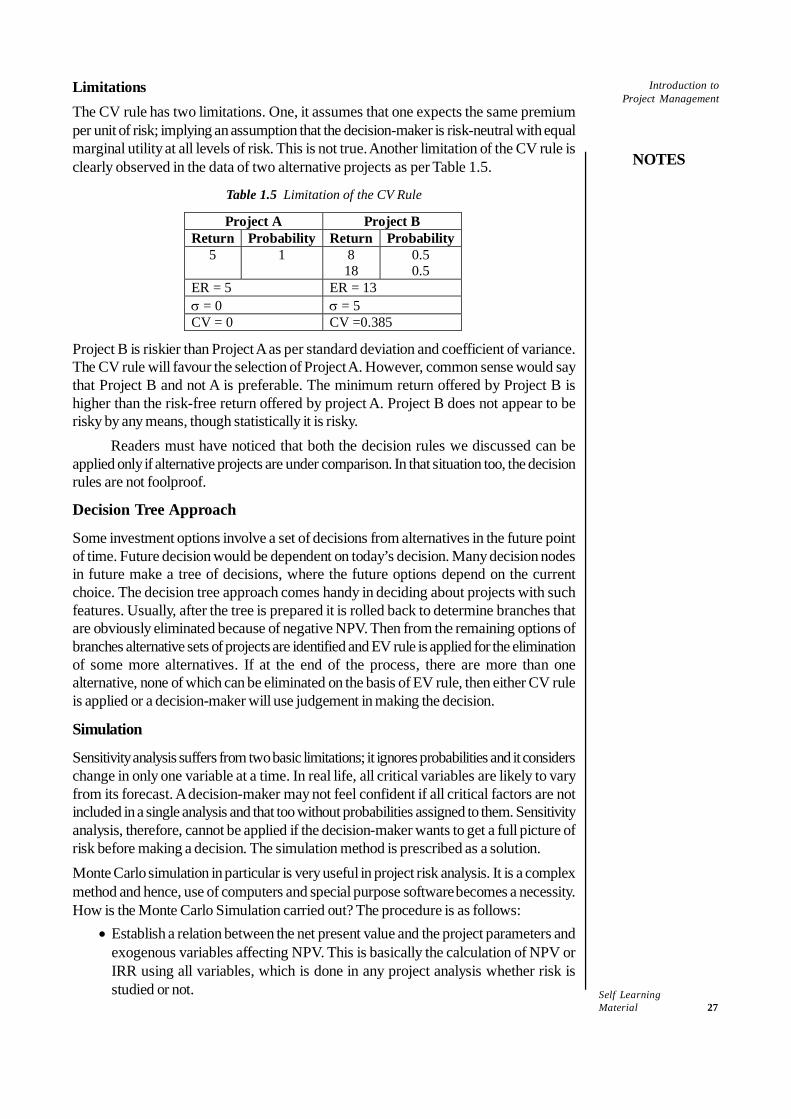
LimitationsThe CV rule has two limitations. One, it assumes that one expects the same premiumper unit of risk; implying an assumption that the decision-maker is risk-neutral with equalmarginal utility at all levels of risk. This is not true. Another limitation of the CV rule isclearly observed in the data of two alternative projects as per Table 1.5.
Table 1.5 Limitation of the CV Rule
Project A Project B Return Probability Return Probability
5 1 8 18
0.5 0.5
ER = 5 ER = 13 σ = 0 σ = 5 CV = 0 CV =0.385
Project B is riskier than Project A as per standard deviation and coefficient of variance.The CV rule will favour the selection of Project A. However, common sense would saythat Project B and not A is preferable. The minimum return offered by Project B ishigher than the risk-free return offered by project A. Project B does not appear to berisky by any means, though statistically it is risky.
Readers must have noticed that both the decision rules we discussed can beapplied only if alternative projects are under comparison. In that situation too, the decisionrules are not foolproof.
Decision Tree Approach
Some investment options involve a set of decisions from alternatives in the future pointof time. Future decision would be dependent on today’s decision. Many decision nodesin future make a tree of decisions, where the future options depend on the currentchoice. The decision tree approach comes handy in deciding about projects with suchfeatures. Usually, after the tree is prepared it is rolled back to determine branches thatare obviously eliminated because of negative NPV. Then from the remaining options ofbranches alternative sets of projects are identified and EV rule is applied for the eliminationof some more alternatives. If at the end of the process, there are more than onealternative, none of which can be eliminated on the basis of EV rule, then either CV ruleis applied or a decision-maker will use judgement in making the decision.
Simulation
Sensitivity analysis suffers from two basic limitations; it ignores probabilities and it considerschange in only one variable at a time. In real life, all critical variables are likely to varyfrom its forecast. A decision-maker may not feel confident if all critical factors are notincluded in a single analysis and that too without probabilities assigned to them. Sensitivityanalysis, therefore, cannot be applied if the decision-maker wants to get a full picture ofrisk before making a decision. The simulation method is prescribed as a solution.Monte Carlo simulation in particular is very useful in project risk analysis. It is a complexmethod and hence, use of computers and special purpose software becomes a necessity.How is the Monte Carlo Simulation carried out? The procedure is as follows:
• Establish a relation between the net present value and the project parameters andexogenous variables affecting NPV. This is basically the calculation of NPV orIRR using all variables, which is done in any project analysis whether risk isstudied or not.
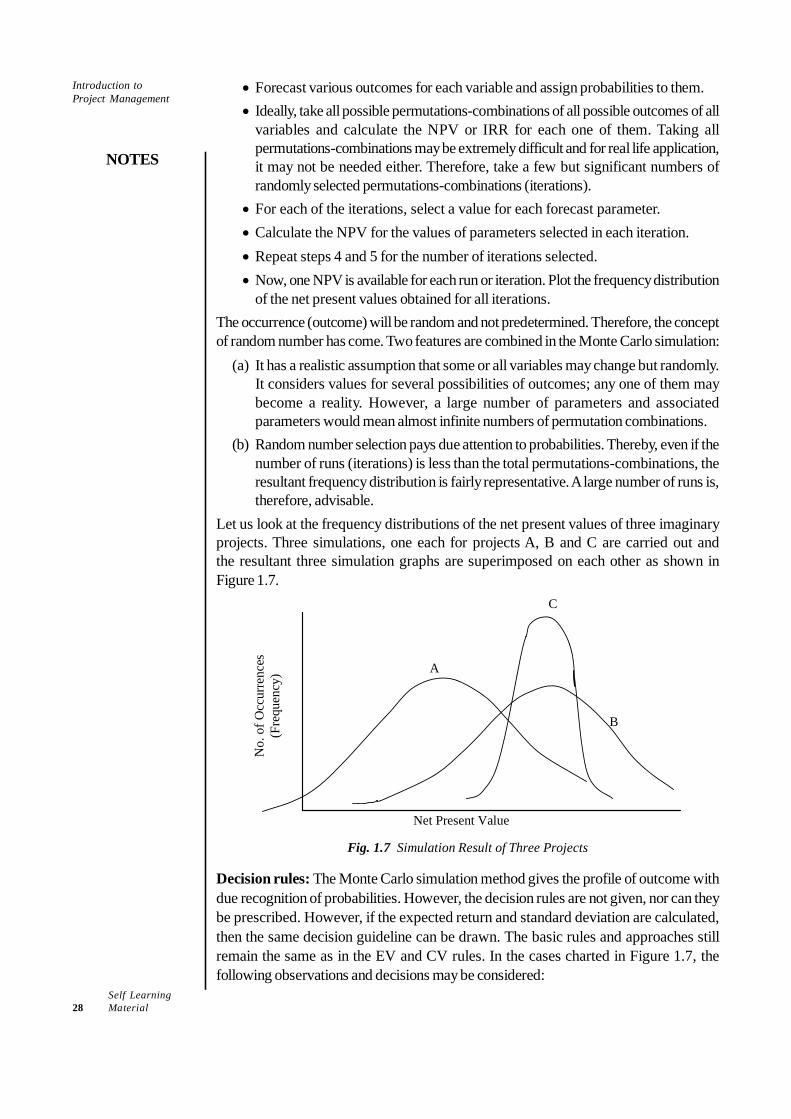
Self Learning28 Material
Introduction toProject Management
NOTES
• Forecast various outcomes for each variable and assign probabilities to them.• Ideally, take all possible permutations-combinations of all possible outcomes of all
variables and calculate the NPV or IRR for each one of them. Taking allpermutations-combinations may be extremely difficult and for real life application,it may not be needed either. Therefore, take a few but significant numbers ofrandomly selected permutations-combinations (iterations).
• For each of the iterations, select a value for each forecast parameter.• Calculate the NPV for the values of parameters selected in each iteration.• Repeat steps 4 and 5 for the number of iterations selected.• Now, one NPV is available for each run or iteration. Plot the frequency distribution
of the net present values obtained for all iterations.The occurrence (outcome) will be random and not predetermined. Therefore, the conceptof random number has come. Two features are combined in the Monte Carlo simulation:
(a) It has a realistic assumption that some or all variables may change but randomly.It considers values for several possibilities of outcomes; any one of them maybecome a reality. However, a large number of parameters and associatedparameters would mean almost infinite numbers of permutation combinations.
(b) Random number selection pays due attention to probabilities. Thereby, even if thenumber of runs (iterations) is less than the total permutations-combinations, theresultant frequency distribution is fairly representative. A large number of runs is,therefore, advisable.
Let us look at the frequency distributions of the net present values of three imaginaryprojects. Three simulations, one each for projects A, B and C are carried out andthe resultant three simulation graphs are superimposed on each other as shown inFigure 1.7.
B
A
C
No.
of O
ccur
renc
es
(Fre
quen
cy)
Net Present Value
Fig. 1.7 Simulation Result of Three Projects
Decision rules: The Monte Carlo simulation method gives the profile of outcome withdue recognition of probabilities. However, the decision rules are not given, nor can theybe prescribed. However, if the expected return and standard deviation are calculated,then the same decision guideline can be drawn. The basic rules and approaches stillremain the same as in the EV and CV rules. In the cases charted in Figure 1.7, thefollowing observations and decisions may be considered:
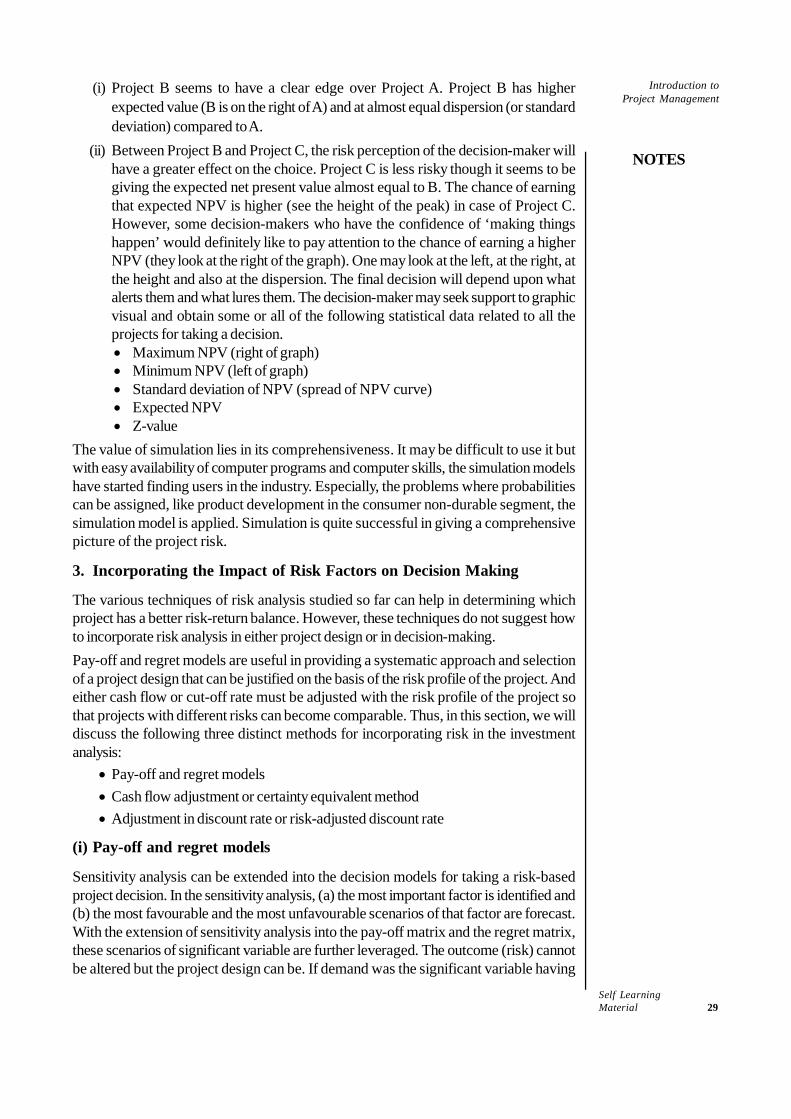
Self LearningMaterial 29
Introduction toProject Management
NOTES
(i) Project B seems to have a clear edge over Project A. Project B has higherexpected value (B is on the right of A) and at almost equal dispersion (or standarddeviation) compared to A.
(ii) Between Project B and Project C, the risk perception of the decision-maker willhave a greater effect on the choice. Project C is less risky though it seems to begiving the expected net present value almost equal to B. The chance of earningthat expected NPV is higher (see the height of the peak) in case of Project C.However, some decision-makers who have the confidence of ‘making thingshappen’ would definitely like to pay attention to the chance of earning a higherNPV (they look at the right of the graph). One may look at the left, at the right, atthe height and also at the dispersion. The final decision will depend upon whatalerts them and what lures them. The decision-maker may seek support to graphicvisual and obtain some or all of the following statistical data related to all theprojects for taking a decision.• Maximum NPV (right of graph)• Minimum NPV (left of graph)• Standard deviation of NPV (spread of NPV curve)• Expected NPV• Z-value
The value of simulation lies in its comprehensiveness. It may be difficult to use it butwith easy availability of computer programs and computer skills, the simulation modelshave started finding users in the industry. Especially, the problems where probabilitiescan be assigned, like product development in the consumer non-durable segment, thesimulation model is applied. Simulation is quite successful in giving a comprehensivepicture of the project risk.
3. Incorporating the Impact of Risk Factors on Decision Making
The various techniques of risk analysis studied so far can help in determining whichproject has a better risk-return balance. However, these techniques do not suggest howto incorporate risk analysis in either project design or in decision-making.Pay-off and regret models are useful in providing a systematic approach and selectionof a project design that can be justified on the basis of the risk profile of the project. Andeither cash flow or cut-off rate must be adjusted with the risk profile of the project sothat projects with different risks can become comparable. Thus, in this section, we willdiscuss the following three distinct methods for incorporating risk in the investmentanalysis:
• Pay-off and regret models• Cash flow adjustment or certainty equivalent method• Adjustment in discount rate or risk-adjusted discount rate
(i) Pay-off and regret models
Sensitivity analysis can be extended into the decision models for taking a risk-basedproject decision. In the sensitivity analysis, (a) the most important factor is identified and(b) the most favourable and the most unfavourable scenarios of that factor are forecast.With the extension of sensitivity analysis into the pay-off matrix and the regret matrix,these scenarios of significant variable are further leveraged. The outcome (risk) cannotbe altered but the project design can be. If demand was the significant variable having
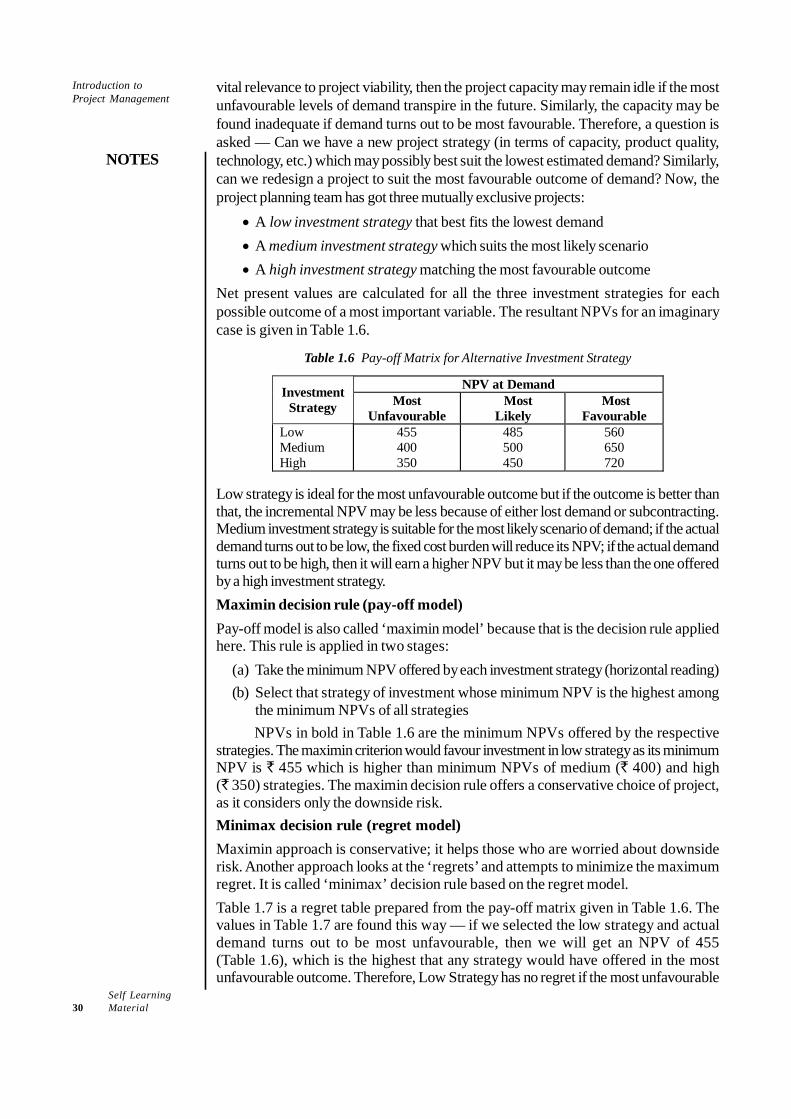
Self Learning30 Material
Introduction toProject Management
NOTES
vital relevance to project viability, then the project capacity may remain idle if the mostunfavourable levels of demand transpire in the future. Similarly, the capacity may befound inadequate if demand turns out to be most favourable. Therefore, a question isasked — Can we have a new project strategy (in terms of capacity, product quality,technology, etc.) which may possibly best suit the lowest estimated demand? Similarly,can we redesign a project to suit the most favourable outcome of demand? Now, theproject planning team has got three mutually exclusive projects:
• A low investment strategy that best fits the lowest demand• A medium investment strategy which suits the most likely scenario• A high investment strategy matching the most favourable outcome
Net present values are calculated for all the three investment strategies for eachpossible outcome of a most important variable. The resultant NPVs for an imaginarycase is given in Table 1.6.
Table 1.6 Pay-off Matrix for Alternative Investment Strategy
NPV at Demand Investment Strategy Most
Unfavourable Most Likely
Most Favourable
Low Medium High
455 400 350
485 500 450
560 650 720
Low strategy is ideal for the most unfavourable outcome but if the outcome is better thanthat, the incremental NPV may be less because of either lost demand or subcontracting.Medium investment strategy is suitable for the most likely scenario of demand; if the actualdemand turns out to be low, the fixed cost burden will reduce its NPV; if the actual demandturns out to be high, then it will earn a higher NPV but it may be less than the one offeredby a high investment strategy.Maximin decision rule (pay-off model)Pay-off model is also called ‘maximin model’ because that is the decision rule appliedhere. This rule is applied in two stages:
(a) Take the minimum NPV offered by each investment strategy (horizontal reading)(b) Select that strategy of investment whose minimum NPV is the highest among
the minimum NPVs of all strategiesNPVs in bold in Table 1.6 are the minimum NPVs offered by the respective
strategies. The maximin criterion would favour investment in low strategy as its minimumNPV is ` 455 which is higher than minimum NPVs of medium (` 400) and high(` 350) strategies. The maximin decision rule offers a conservative choice of project,as it considers only the downside risk.Minimax decision rule (regret model)Maximin approach is conservative; it helps those who are worried about downsiderisk. Another approach looks at the ‘regrets’ and attempts to minimize the maximumregret. It is called ‘minimax’ decision rule based on the regret model.Table 1.7 is a regret table prepared from the pay-off matrix given in Table 1.6. Thevalues in Table 1.7 are found this way — if we selected the low strategy and actualdemand turns out to be most unfavourable, then we will get an NPV of 455(Table 1.6), which is the highest that any strategy would have offered in the mostunfavourable outcome. Therefore, Low Strategy has no regret if the most unfavourable
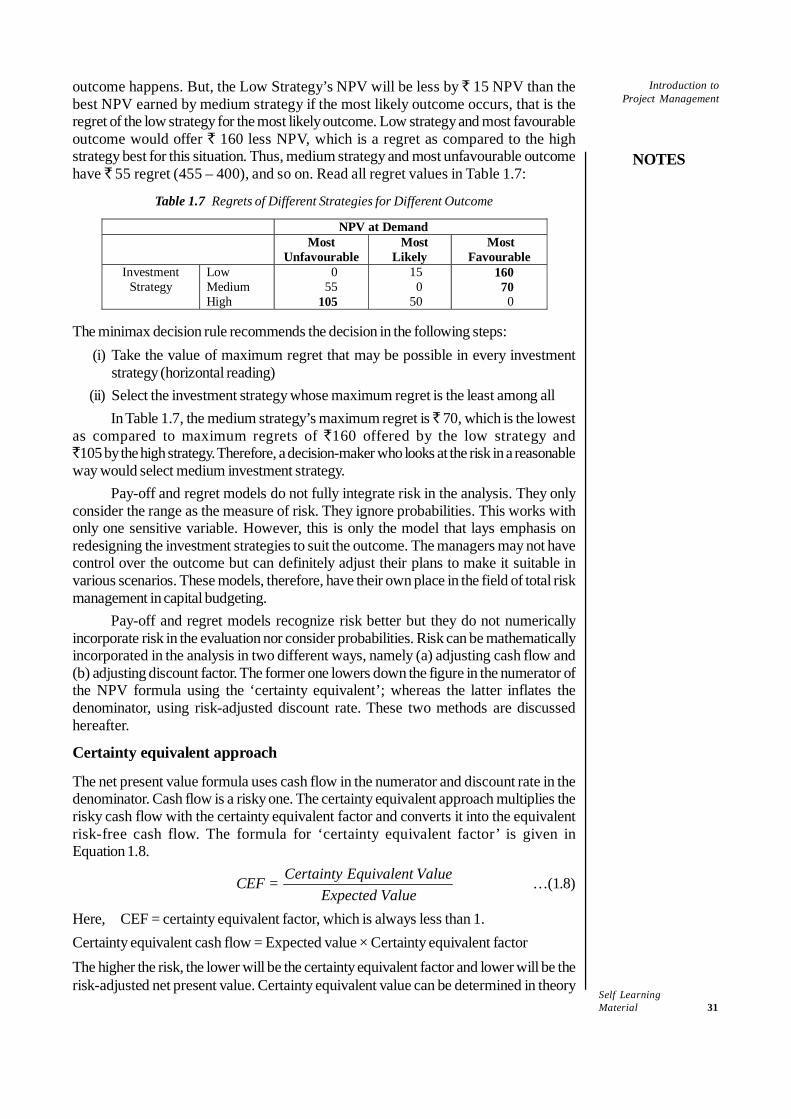
Self LearningMaterial 31
Introduction toProject Management
NOTES
outcome happens. But, the Low Strategy’s NPV will be less by ` 15 NPV than thebest NPV earned by medium strategy if the most likely outcome occurs, that is theregret of the low strategy for the most likely outcome. Low strategy and most favourableoutcome would offer ` 160 less NPV, which is a regret as compared to the highstrategy best for this situation. Thus, medium strategy and most unfavourable outcomehave ̀ 55 regret (455 – 400), and so on. Read all regret values in Table 1.7:
Table 1.7 Regrets of Different Strategies for Different Outcome
NPV at Demand Most
Unfavourable Most Likely
Most Favourable
Investment Strategy
Low Medium High
0 55 105
15 0 50
160 70 0
The minimax decision rule recommends the decision in the following steps:(i) Take the value of maximum regret that may be possible in every investment
strategy (horizontal reading)(ii) Select the investment strategy whose maximum regret is the least among all
In Table 1.7, the medium strategy’s maximum regret is ̀ 70, which is the lowestas compared to maximum regrets of `160 offered by the low strategy and`105 by the high strategy. Therefore, a decision-maker who looks at the risk in a reasonableway would select medium investment strategy.
Pay-off and regret models do not fully integrate risk in the analysis. They onlyconsider the range as the measure of risk. They ignore probabilities. This works withonly one sensitive variable. However, this is only the model that lays emphasis onredesigning the investment strategies to suit the outcome. The managers may not havecontrol over the outcome but can definitely adjust their plans to make it suitable invarious scenarios. These models, therefore, have their own place in the field of total riskmanagement in capital budgeting.
Pay-off and regret models recognize risk better but they do not numericallyincorporate risk in the evaluation nor consider probabilities. Risk can be mathematicallyincorporated in the analysis in two different ways, namely (a) adjusting cash flow and(b) adjusting discount factor. The former one lowers down the figure in the numerator ofthe NPV formula using the ‘certainty equivalent’; whereas the latter inflates thedenominator, using risk-adjusted discount rate. These two methods are discussedhereafter.
Certainty equivalent approach
The net present value formula uses cash flow in the numerator and discount rate in thedenominator. Cash flow is a risky one. The certainty equivalent approach multiplies therisky cash flow with the certainty equivalent factor and converts it into the equivalentrisk-free cash flow. The formula for ‘certainty equivalent factor’ is given inEquation 1.8.
CEF = Certainty Equivalent ValueExpected Value
…(1.8)
Here, CEF = certainty equivalent factor, which is always less than 1.Certainty equivalent cash flow = Expected value × Certainty equivalent factorThe higher the risk, the lower will be the certainty equivalent factor and lower will be therisk-adjusted net present value. Certainty equivalent value can be determined in theory
Self Learning32 Material
Introduction toProject Management
NOTES
by looking at the slope of the utility curve. However, the utility curve is more of animagination and therefore, the certainty equivalent value will at most be judgemental andcannot be accurate.
Risk-adjusted discount rate
It is practically easy to adjust risk in the discount rate; rather than in the cash flow. Thismeans that, the cash flow of the project should be discounted at the rate that incorporatesrisk in it, rather than at the risk-free rate.
RADR = Rf + Rp …(1.9)Here, Rf = Risk-free rate
Rp = Risk premiumThe ‘adjusted weighted average cost of capital’ method is used for determining the risk-adjusted discount rate. If we use risk-adjusted discount rate, then cash flow should notbe adjusted.
Thus, use of pay-off matrix or regret matrix for redesigning of projects and thenselecting the one among them is one step that must be followed by risk adjustment inNPV calculation.
1.3.2 Project Selection and Formulation
Earlier, firms considered projects as a part of their strategy and functions; but now-a-days firms are getting specialized in executing projects. Each and every project isimportant for the firm and requires proper development and implementation strategies.Project manager should select only those projects that ensure returns in the near future.This is because it helps in allocating the resources that aim at ensuring better returns.Therefore, proper decision-making process is essential for the selection of the project.While selecting a project, the following considerations should be kept in mind:
• Realism: The project selection model should consider all the risk factors such asthe cost and time that influence the decisions of a project manager. The modelshould also explain the objectives of the project manager and the firm.
• Capability: The selection model should help the project manager take appropriatedecisions by considering the risk and constraints involved in the project. Theselection model should be capable of evaluating the future project proposals onthe basis of the expected returns of the project.
• Cost: The various costs associated with the right project selection model shouldbe kept at the minimum level. The costs incurred in designing a project selectionmodel consists of data generation, processing and storage expenses. The objectivehere is to identify the best project selection model.
• Flexibility: The project selection model provides the desired results within thestated conditions of the firm. The model should be flexible enough to adjust withthe environmental changes of the firm.
• Easy usage: The project selection model is convenient enough to implementinside the firm.
Project Selection Models
Project selection models help the project manager in selecting a project. There are twotypes of project selection models-numeric and non-numeric.
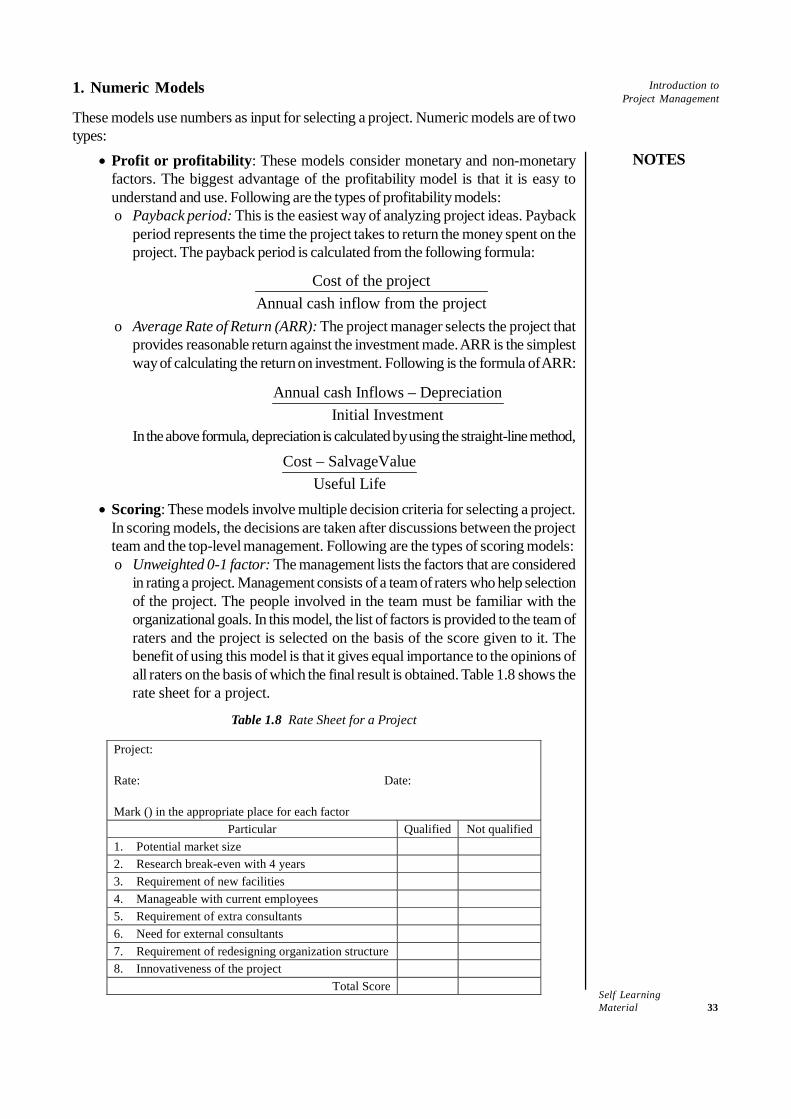
Self LearningMaterial 33
Introduction toProject Management
NOTES
1. Numeric Models
These models use numbers as input for selecting a project. Numeric models are of twotypes:
• Profit or profitability: These models consider monetary and non-monetaryfactors. The biggest advantage of the profitability model is that it is easy tounderstand and use. Following are the types of profitability models:o Payback period: This is the easiest way of analyzing project ideas. Payback
period represents the time the project takes to return the money spent on theproject. The payback period is calculated from the following formula:
Cost of the projectAnnual cash inflow from the project
o Average Rate of Return (ARR): The project manager selects the project thatprovides reasonable return against the investment made. ARR is the simplestway of calculating the return on investment. Following is the formula of ARR:
Annual cash Inflows – DepreciationInitial Investment
In the above formula, depreciation is calculated by using the straight-line method,
Cost – SalvageValueUseful Life
• Scoring: These models involve multiple decision criteria for selecting a project.In scoring models, the decisions are taken after discussions between the projectteam and the top-level management. Following are the types of scoring models:o Unweighted 0-1 factor: The management lists the factors that are considered
in rating a project. Management consists of a team of raters who help selectionof the project. The people involved in the team must be familiar with theorganizational goals. In this model, the list of factors is provided to the team ofraters and the project is selected on the basis of the score given to it. Thebenefit of using this model is that it gives equal importance to the opinions ofall raters on the basis of which the final result is obtained. Table 1.8 shows therate sheet for a project.
Table 1.8 Rate Sheet for a Project
Project: Rate: Date: Mark () in the appropriate place for each factor
Particular Qualified Not qualified 1. Potential market size 2. Research break-even with 4 years 3. Requirement of new facilities 4. Manageable with current employees 5. Requirement of extra consultants 6. Need for external consultants 7. Requirement of redesigning organization structure 8. Innovativeness of the project
Total Score
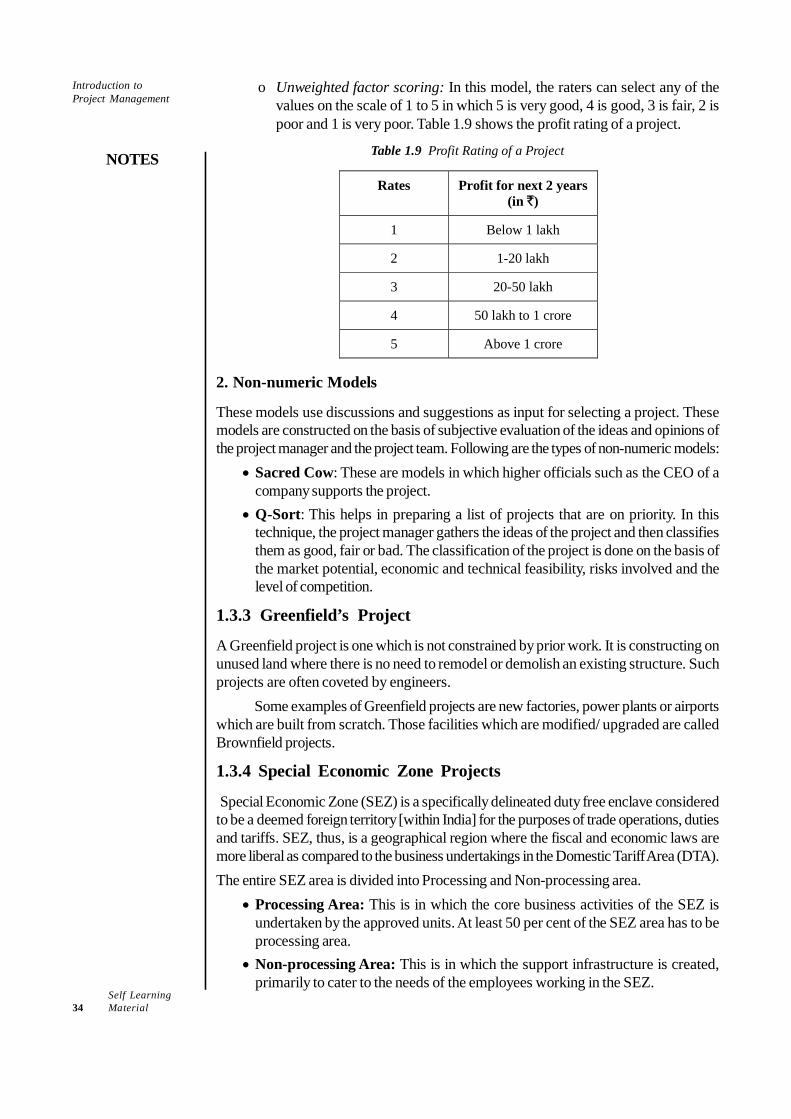
Self Learning34 Material
Introduction toProject Management
NOTES
o Unweighted factor scoring: In this model, the raters can select any of thevalues on the scale of 1 to 5 in which 5 is very good, 4 is good, 3 is fair, 2 ispoor and 1 is very poor. Table 1.9 shows the profit rating of a project.
Table 1.9 Profit Rating of a Project
Rates Profit for next 2 years (in `)
1 Below 1 lakh
2 1-20 lakh
3 20-50 lakh
4 50 lakh to 1 crore
5 Above 1 crore
2. Non-numeric Models
These models use discussions and suggestions as input for selecting a project. Thesemodels are constructed on the basis of subjective evaluation of the ideas and opinions ofthe project manager and the project team. Following are the types of non-numeric models:
• Sacred Cow: These are models in which higher officials such as the CEO of acompany supports the project.
• Q-Sort: This helps in preparing a list of projects that are on priority. In thistechnique, the project manager gathers the ideas of the project and then classifiesthem as good, fair or bad. The classification of the project is done on the basis ofthe market potential, economic and technical feasibility, risks involved and thelevel of competition.
1.3.3 Greenfield’s Project
A Greenfield project is one which is not constrained by prior work. It is constructing onunused land where there is no need to remodel or demolish an existing structure. Suchprojects are often coveted by engineers.
Some examples of Greenfield projects are new factories, power plants or airportswhich are built from scratch. Those facilities which are modified/ upgraded are calledBrownfield projects.
1.3.4 Special Economic Zone Projects
Special Economic Zone (SEZ) is a specifically delineated duty free enclave consideredto be a deemed foreign territory [within India] for the purposes of trade operations, dutiesand tariffs. SEZ, thus, is a geographical region where the fiscal and economic laws aremore liberal as compared to the business undertakings in the Domestic Tariff Area (DTA).The entire SEZ area is divided into Processing and Non-processing area.
• Processing Area: This is in which the core business activities of the SEZ isundertaken by the approved units. At least 50 per cent of the SEZ area has to beprocessing area.
• Non-processing Area: This is in which the support infrastructure is created,primarily to cater to the needs of the employees working in the SEZ.
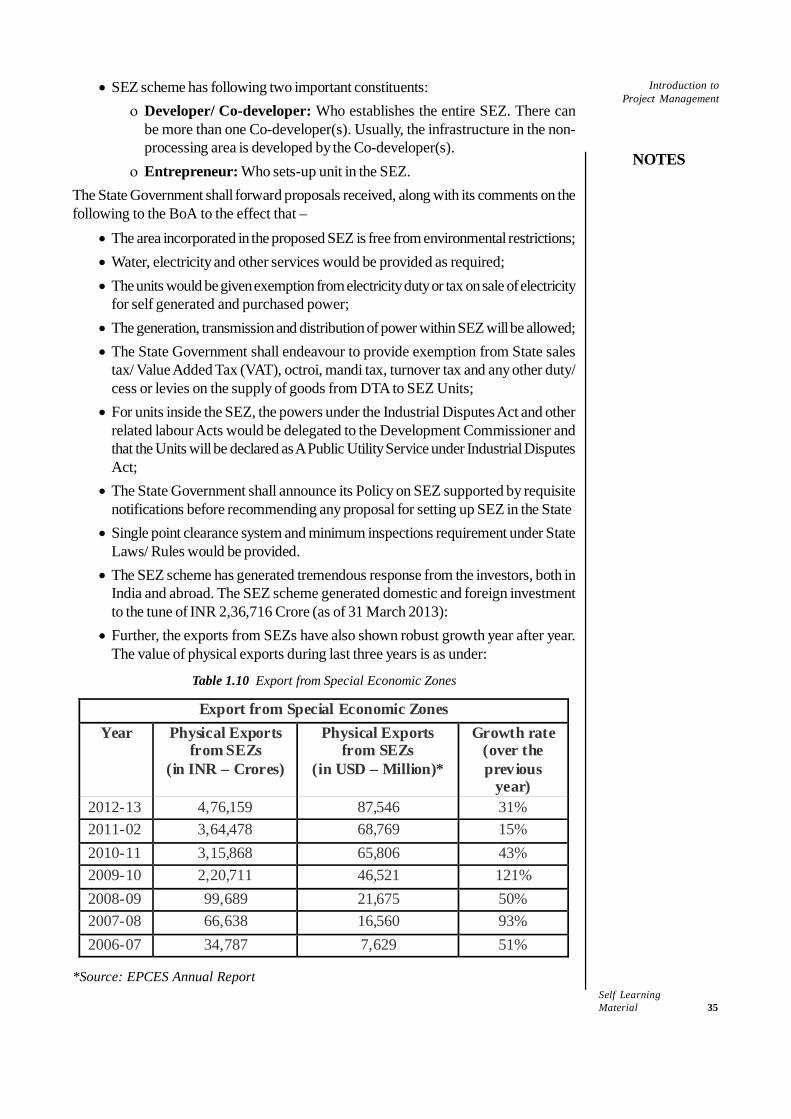
Self LearningMaterial 35
Introduction toProject Management
NOTES
• SEZ scheme has following two important constituents:ο Developer/ Co-developer: Who establishes the entire SEZ. There can
be more than one Co-developer(s). Usually, the infrastructure in the non-processing area is developed by the Co-developer(s).
ο Entrepreneur: Who sets-up unit in the SEZ.The State Government shall forward proposals received, along with its comments on thefollowing to the BoA to the effect that –
• The area incorporated in the proposed SEZ is free from environmental restrictions;• Water, electricity and other services would be provided as required;• The units would be given exemption from electricity duty or tax on sale of electricity
for self generated and purchased power;• The generation, transmission and distribution of power within SEZ will be allowed;• The State Government shall endeavour to provide exemption from State sales
tax/ Value Added Tax (VAT), octroi, mandi tax, turnover tax and any other duty/cess or levies on the supply of goods from DTA to SEZ Units;
• For units inside the SEZ, the powers under the Industrial Disputes Act and otherrelated labour Acts would be delegated to the Development Commissioner andthat the Units will be declared as A Public Utility Service under Industrial DisputesAct;
• The State Government shall announce its Policy on SEZ supported by requisitenotifications before recommending any proposal for setting up SEZ in the State
• Single point clearance system and minimum inspections requirement under StateLaws/ Rules would be provided.
• The SEZ scheme has generated tremendous response from the investors, both inIndia and abroad. The SEZ scheme generated domestic and foreign investmentto the tune of INR 2,36,716 Crore (as of 31 March 2013):
• Further, the exports from SEZs have also shown robust growth year after year.The value of physical exports during last three years is as under:
Table 1.10 Export from Special Economic Zones
Export from Special Economic ZonesYear Physical Exports
from SEZs (in INR – Crores)
Physical Exports from SEZs
(in USD – Million)*
Growth rate (over the previous
year) 2012-13 4,76,159 87,546 31% 2011-02 3,64,478 68,769 15%2010-11 3,15,868 65,806 43%2009-10 2,20,711 46,521 121% 2008-09 99,689 21,675 50% 2007-08 66,638 16,560 93% 2006-07 34,787 7,629 51%
*Source: EPCES Annual Report
Self Learning36 Material
Introduction toProject Management
NOTES
Adoption of Technology
If there is an ample market demand without enough supply, the focus should shift over totechnology. The following inquiries must be made with respect to technology analysis:
(a) Availability of commercially exploitable technology and its alternatives.(b) Transferability of those technologies(c) Other inquiries about the technologies
• Normal capacity utilization• Requirement of plant and equipment and fabrication facility• Production process needed• Possible product mix• Possible alternate usage• Flexibility• Rate of change• Waste disposal
(d) Risk implications(e) Resource availability
Investment Planning
Over the past few decades project management has been introduced into knowledgeworkplaces to enable increased discipline to the way investments are shaped and managed.Project management methodologies were originally developed to increase the certaintythat a defined solution would be implemented as planned. In doing this, project managementenables the following questions to be answered:
• Will the project complete within budget?• Will it deliver to its planned schedule?• Were the expected products delivered?
From the perspective of the investor, what is missing are answers to the following:Before an investment decision is made
• Is the logic for the planned investment clear?• Is there a sound case to invest?
After the project is delivered• Were the expected benefits delivered?
Investment management and project management are complementary disciplines that,together, enable an investor to shape and implement good investments.
1.4 PROJECT PLANNING
Project planning refers to a procedural step in project management. During projectplanning, required documentation is created to ensure successful project completion. Allactions required to define, prepare, integrate and coordinate additional plans are includedin documentation. The project plan clearly defines how the project is executed, monitored,controlled and closed. Project planning requires an in-depth analysis and structuring ofthe following activities:
Check Your Progress
3. What isconception/formation phase?
4. Which is the lastphase of theproject life cycle?
5. Mention theadvantage of usinglife cycle conceptin the developmentof a system.
Self LearningMaterial 37
Introduction toProject Management
NOTES
• Formulation of project goals• Identification of project deliverables• Creation of project schedules• Creation of supporting plans
These activities are discussed ahead under the project planning process.At the end of the project planning stage, the following are identified:• Obstacles in the project• Minimum time required for the completion of the project• Major deliverables of the project• Work required for the completion of the project• People involved in the project and their key responsibilities• Required milestones of the projectProject planning is never really complete until a project is done. The project plan
may return to the planning stage many times before it is accomplished. Usually, thelength of the project planning stage is determined by project complexity.
1.4.1 Objectives of Project Planning
It is essential to clearly set the objectives of project planning. Clear objectives result in ahigher rate of project success. Once you have defined the objectives of your project, thetasks leading towards these objectives can easily be identified. If a sailor, for example,knows where the fish are, he can direct his boat to the proper spot. So is the case withproject planning.
Setting Good Objectives
Since good project plans require good objectives, it is imperative to know how to writegood objectives. Good objectives are finite in scope and duration. They can be measured.They are realistic. They are clear and they require actions to complete. They haveevery element of being achievable if the project plan is followed. Thus, good objectivesare specific, measurable, action-driven, realistic and time-bound (SMART).
Examples of Bad Objectives
Below is a list of some poorly written objectives:• To increase the number of clients• To make customers happy• To create some sort of new product• To find funding• To eliminate quality problems• To make more money• To achieve success• To share knowledge
These objectives are bad because they lack specifics, they do not rely upon actions,or they focus upon a means to an end rather than an end.
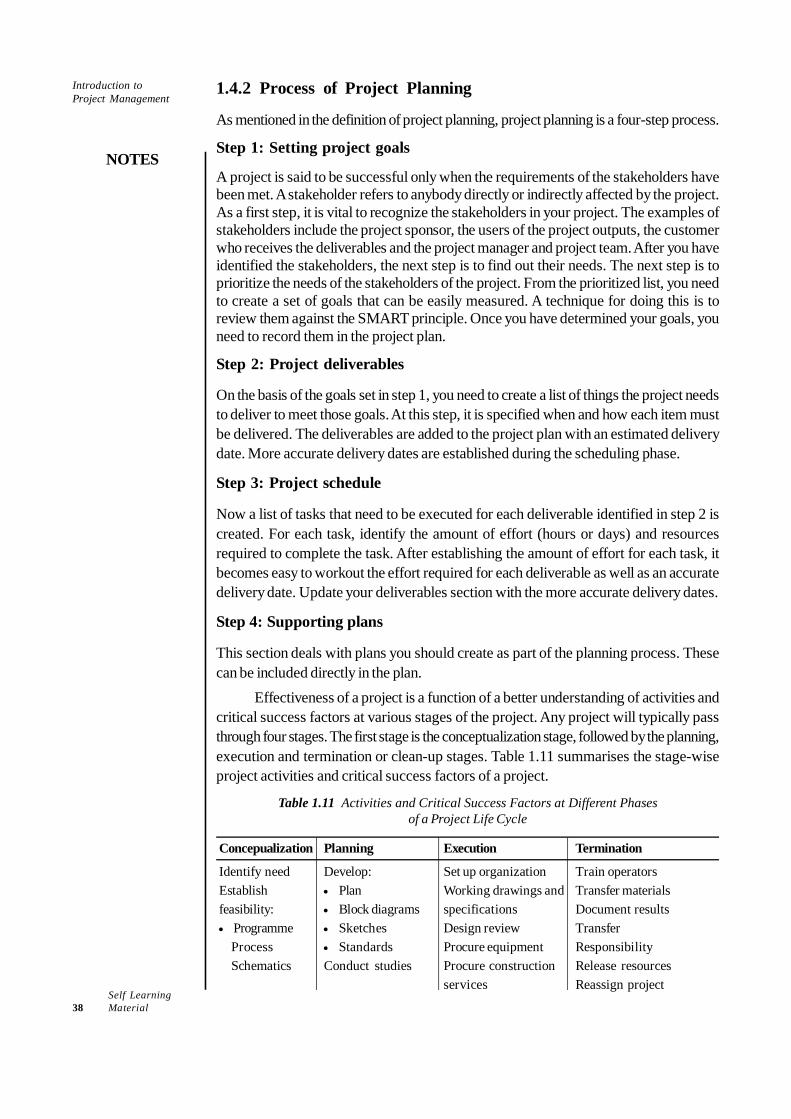
Self Learning38 Material
Introduction toProject Management
NOTES
1.4.2 Process of Project Planning
As mentioned in the definition of project planning, project planning is a four-step process.
Step 1: Setting project goals
A project is said to be successful only when the requirements of the stakeholders havebeen met. A stakeholder refers to anybody directly or indirectly affected by the project.As a first step, it is vital to recognize the stakeholders in your project. The examples ofstakeholders include the project sponsor, the users of the project outputs, the customerwho receives the deliverables and the project manager and project team. After you haveidentified the stakeholders, the next step is to find out their needs. The next step is toprioritize the needs of the stakeholders of the project. From the prioritized list, you needto create a set of goals that can be easily measured. A technique for doing this is toreview them against the SMART principle. Once you have determined your goals, youneed to record them in the project plan.
Step 2: Project deliverables
On the basis of the goals set in step 1, you need to create a list of things the project needsto deliver to meet those goals. At this step, it is specified when and how each item mustbe delivered. The deliverables are added to the project plan with an estimated deliverydate. More accurate delivery dates are established during the scheduling phase.
Step 3: Project schedule
Now a list of tasks that need to be executed for each deliverable identified in step 2 iscreated. For each task, identify the amount of effort (hours or days) and resourcesrequired to complete the task. After establishing the amount of effort for each task, itbecomes easy to workout the effort required for each deliverable as well as an accuratedelivery date. Update your deliverables section with the more accurate delivery dates.
Step 4: Supporting plans
This section deals with plans you should create as part of the planning process. Thesecan be included directly in the plan.
Effectiveness of a project is a function of a better understanding of activities andcritical success factors at various stages of the project. Any project will typically passthrough four stages. The first stage is the conceptualization stage, followed by the planning,execution and termination or clean-up stages. Table 1.11 summarises the stage-wiseproject activities and critical success factors of a project.
Table 1.11 Activities and Critical Success Factors at Different Phasesof a Project Life Cycle
Concepualization Planning Execution Termination
Identify need Develop: Set up organization Train operatorsEstablish • Plan Working drawings and Transfer materialsfeasibility: • Block diagrams specifications Document results• Programme • Sketches Design review Transfer
Process • Standards Procure equipment ResponsibilitySchematics Conduct studies Procure construction Release resources
services Reassign project
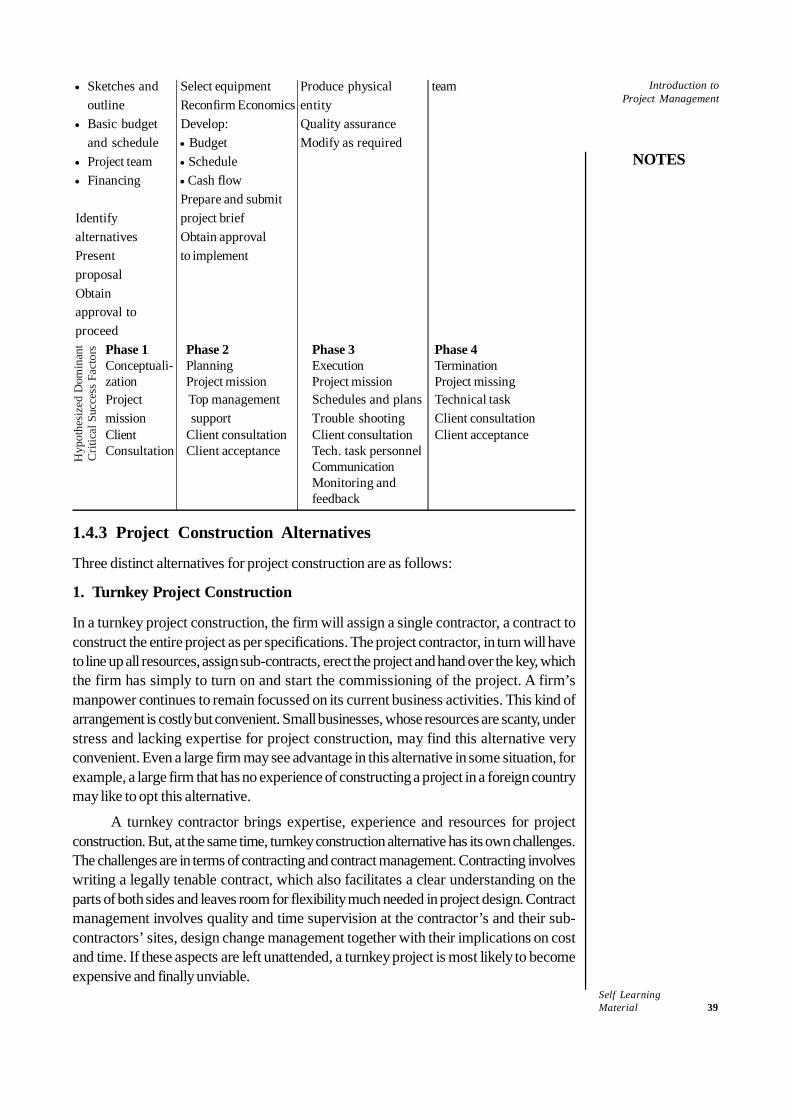
Self LearningMaterial 39
Introduction toProject Management
NOTES
• Sketches and Select equipment Produce physical teamoutline Reconfirm Economics entity
• Basic budget Develop: Quality assuranceand schedule • Budget Modify as required
• Project team • Schedule• Financing • Cash flow
Prepare and submitIdentify project briefalternatives Obtain approvalPresent to implementproposalObtainapproval toproceed
Phase 1 Phase 2 Phase 3 Phase 4Conceptuali- Planning Execution Terminationzation Project mission Project mission Project missing
Hyp
othe
size
d D
omin
ant
Crit
ical
Suc
cess
Fac
tors
Project Top management Schedules and plans Technical taskmission support Trouble shooting Client consultationClient Client consultation Client consultation Client acceptanceConsultation Client acceptance Tech. task personnel
CommunicationMonitoring andfeedback
1.4.3 Project Construction Alternatives
Three distinct alternatives for project construction are as follows:
1. Turnkey Project Construction
In a turnkey project construction, the firm will assign a single contractor, a contract toconstruct the entire project as per specifications. The project contractor, in turn will haveto line up all resources, assign sub-contracts, erect the project and hand over the key, whichthe firm has simply to turn on and start the commissioning of the project. A firm’smanpower continues to remain focussed on its current business activities. This kind ofarrangement is costly but convenient. Small businesses, whose resources are scanty, understress and lacking expertise for project construction, may find this alternative veryconvenient. Even a large firm may see advantage in this alternative in some situation, forexample, a large firm that has no experience of constructing a project in a foreign countrymay like to opt this alternative.
A turnkey contractor brings expertise, experience and resources for projectconstruction. But, at the same time, turnkey construction alternative has its own challenges.The challenges are in terms of contracting and contract management. Contracting involveswriting a legally tenable contract, which also facilitates a clear understanding on theparts of both sides and leaves room for flexibility much needed in project design. Contractmanagement involves quality and time supervision at the contractor’s and their sub-contractors’ sites, design change management together with their implications on costand time. If these aspects are left unattended, a turnkey project is most likely to becomeexpensive and finally unviable.
Self Learning40 Material
Introduction toProject Management
NOTES
2. Completely Self-executed Project
In a completely self-executed project, a firm will deploy its own internal manpower orhire experts to construct every work structure of the project. Resources are bought andplant is erected without the help of any external expert. It only involves supply contracts,and therefore, contract and contract management are of less significance in thisalternative. However, it puts a tremendous amount of stress on the current manpower ofthe firm. People’s energy will be split between routine operations of current businessactivities and non-routine project construction activities with multiple reporting in thehierarchy of the organization. Conflict in priorities and absence of necessary skills maycause more harmful effects on project efficiency. However, small projects can best beconstructed like this as it offers the best possible control over all the resources andactivities.
3. Self-executed Project with Several Contracts for Sub-activities
Most projects, in normal circumstances, are self-executed projects with several sub-activities contracted out to expert agencies. The balance between hiring expertconstruction agent and use of own manpower depends on the availability of internalmanpower, their skill set and the ability to manage several external contractors. Contractingand contract management is surely an issue here, but additionally the issue is of coordinationamong all contractors and self-executed activities. This alternative offers an opportunityfor efficient construction if coordination is achieved.
Planning, monitoring and coordination tasks significantly vary depending upon theproject construction alternative selected by the company.
Factors in the Choice of Project Construction Alternatives
There are advantages and disadvantages of each project construction alternative. Thechoice should be made after weighing several factors, some of which are listed asfollows:
• Type of project• Cost of alternative• Internal availability of resources and expertise• Existing management information system• Organization structure of the company• Company’s strategic route and growth rate requirement
Turnkey contracts may be little costly, as the turnkey construction. Contractingsmaller work packages may be less expensive but coordination among contractors wouldrequire solid legal and management skills. A self-constructed project could be cost effectivebut demands special skills and expertise in project management. If the firm does notpossess them, then venturing into construction of a project on its own may turnout to becatastrophic. Self-construction may not be favoured even if resources are internallyavailable, if the company’s management information system (data capturing, processingand reporting) is not geared up to meet the needs of project construction. A weak MISmay be prove to be expensive. The most important factor is a company’s organizationstructure. Strong functional structure with hierarchical awareness and a strong line of
Self LearningMaterial 41
Introduction toProject Management
NOTES
command leave no scope for self-execution of a project. Inflexible, rule-oriented anddemotivated workforce implies that the firm is not capable to handle the project on self-construction basis.
In case of external growth strategy, where the growth of the firm is sought viamergers and takeover, the firm’s options are limited. Merchant bankers may be hired forarranging merger and takeover, but post-merger activities have to be managed on ones’own, no agency support is available. A fast growth company is less likely to go for self-execution of projects, though we have seen Reliance Industries growing leaps and boundwith internal growth options.
A firm must weigh each of factors before selecting the most suitable alternativefor the construction of the project.
Whatever be the project construction alternative selected, a project manager hasto rely largely on one or more contractors, many of whom would be project managementprofessional companies. In case of a turnkey project construction option, one has toselect a professional company that specializes in the construction of type of projects onhand. In other cases, one may have to select several professional companies expert invarious fields such as engineering design, engineering services, engineering erections,fabrication and transportation, civil construction, interior design, project coordinationservices and others.
1.4.4 Project Scheduling
Project scheduling enables a project team in assessing the time available to complete aproject. It facilitates the project manager in assigning responsibilities and getting tasksaccomplished. Hence, a large number of project managers depend upon project schedulesto set deadline limitations for projects.
Project scheduling takes into consideration the tasks need to be carried out for aproject and allocates time limit for their completion. The project scheduler fixes thesedeadlines by estimating the time given to each task. Scheduling requires an elaborateinsight of which action needs to get taken and when. This is discussed in detail in Unit 3.
1.5 PROJECT IMPLEMENTATION AND CONTROL
Project implementation is the most difficult and challenging task in project management.Project execution or implementation it involves several people and teams with differentskills, abilities and priorities, constant coordination and adjustment in planned activities,conflict with routine operations of business because of overlapping project organizationstructure and several such issues. In the following section, we will discuss the topicsvery essential for care and caution during project execution.
1.5.1 Goals of Project Implementation
The implementation of a project must aim at the following:• Efficient coordination among all sub-units of project teams and their activities• Enabling changes in project design appropriate for the final outcome of the projects• Discouraging those changes in a project design that may not be essential for the
final outcome of the project
Check Your Progress
6. Define projectplanning.
7. When is a projectconsidered to besuccessful?
8. Mention the fourstages that anyproject passesthrough.
Self Learning42 Material
Introduction toProject Management
NOTES
• Completing the project within the targeted cost and time• Minimizing variations in the standards of performance
Action
Each project sub-team is on action at this stage. Resources are acquired and collectedat the site on time; the project sub-teams follow the technical volume of the DPR, buildthe work package assigned to them and keep records as expected from them. More oftechnical tasks and resource acquisition tasks are done at this stage.
Possible Mistakes During Execution
The complexities of activities, their interdependence for time, cost and performance andempowered sub-units of project teams often create situations where some unintendedmistakes may be made during the execution stage. Many of these mistakes may not benoticed until it is too late. The following is the list of potential mistakes often made duringthe execution of projects:
• Design change of non-essential nature which may cause delay and extra costs.• Adding new features and provisions, though they may not have much added
value. This occurs more often in support and peripheral assets of the project andnot so much in the core assets of the project
• Slow response to unfolding unexpected event, which may delay the project andadd to the cost
• Very fast responses to unfolding events, even if the activity is not on the criticalpath and there is enough slack time
• Excessive cost consciousness that may cause adverse impact on completion timeand project performance
These common mistakes can be minimized through better project organization and througha proper system for execution and control of projects.
1.5.2 Monitoring and Control
A detailed project report (DPR) gives a full description of work packages, time scheduleand cost budget. In the control process, information on actual cost, time and performanceis compared with these estimates. The comparison may be made either on reachingevery designated milestone in the project or at specified time intervals. In the formercase, there is the problem of matching time and in the latter case, there is the problemof matching work packages to the work actually done. It is likely that some work packageswill be partially complete on the reporting date and this makes it necessary to estimatetheir percentage of completion as a basis for comparing the actual time with the scheduledtime. A similar procedure must be used for cost comparisons.Management is concerned with the following three basic questions during the executionstage:
(a) Is the project likely to be finished by the scheduled completion date?(b) Is the completed work likely to meet the specifications prescribed at the time of
approval of the project?(c) Is the work likely to be done within the estimated cost?
Self LearningMaterial 43
Introduction toProject Management
NOTES
If at any time during the course of project execution, the answer to any of these questionsis negative, the management would like to know the reasons and alternative correctiveactions, if any. These three questions cannot be considered separately from one another,for it is sometimes desirable to make trade-off among time, quality and cost, for example,overtime might be authorized in order to achieve timely completion of work but thiswould add to the costs; or some of the specifications might be relaxed in order to reducecosts. In any case, a project control system must be structured for effective handling ofthese three dimensions.
It is desirable to identify the relative importance of quality, time and cost for eachwork package at the planning stage, so that the project team members can use theirjudgement regarding what can be compromised and what cannot be.
In addition to the key areas, there has to be provisions for reports and reviewmeetings in the project control exercise.
The Monitoring System
A monitoring system must be objective-oriented. The objectivity can be embedded byinitially identifying the key factors to be monitored at various stages of project construction.It helps in defining exactly activities, specifications and costs that needs to be controlled.For example,
• Activities on a critical path are essential for monitoring time.• Technical specifications of critical work packages are important to monitor the
project to avoid failure. Usually, some core assets are important in theirspecifications, and there may be very little tolerance in constructing these workpackages. Some support assets are also critical for the success of projects. Forexample, the design and specifications of a factory building is more critical thanthat of an office building.
• Some work packages are more sensitive to price. They must be monitored forcosts even if they are not on the critical path.
It would help to define the tolerance limit (acceptable variances) in terms of specifications,schedule (time) and costs for various important work packages to make it easier foradding objectivity in information system; it would also help in the review of progress.Later, in the MIS reports the activities whose variances are beyond the tolerance limitmust be flagged to draw the attention of the user.
Some important issues must be addressed in advance of undertaking a project.For example,
(a) When the data must be collected and communicated to the data processing centrefor generating reports. Some data is easily available and some need special effortsin documenting them, whereas, some data is not available at the time they have tobe communicated. How are such non-availability situations handled?
(b) Several types of data must be collected for measuring the progress of a project.In addition to the financial data (rupee value information), one would need data onpercentage work done, inspection results to report technical performance data,information about changes in specifications if any, with supportive evidences andobservance of procedures and implications of change on the subsequent projectactivities, if any, and so on. The list may be endless.
(c) Some data is just narrative information but need documentation and communication.
Self Learning44 Material
Introduction toProject Management
NOTES
(d) Some subjective information has to be reported a standardized numeral ratingformat. What are they, how should the management information assign numericrating and report them?
(e) One of the most important issue is designing the data collection system, includingformat design and procedure.
Thus, a well-focussed project information management system will have a clearly definedfocus, a well-designed approach for data collection and data reporting. These issues arefurther explained in the subsequent sections.
Key Areas of MonitoringKey areas of monitoring are the same as the key elements of projects. They are(i) time, (ii) cost and (iii) performance. Performance has two dimensions; namely workquantity and work quality. There should be constant monitoring of these elements duringthe project execution phase. These three are interrelated, still it is difficult to put all thesethree together and develop a single parameter for their monitoring. Earned value (EV)project management is useful here.
Management Information System (MIS) for Project ControlGoals of project review are achieved through the measurement of actual progress ofproject construction and comparison with the original plan. A well-designed managementinformation system is needed for doing this job. Every firm is likely to have some formaland informal management information systems for its business operations. The samemanagement information system cannot be relied upon for the project management,because the information system issues in project management are completely different.Project activities are different from the routine operating activities, procedures aredifferent, locations of activities are different, priorities are different, stakes are high,need for quick corrective steps is strong; these and many other factors make essential tohave a specially designed management information system for project management.
The management information system for a project would initially serve the purposeof project monitoring and control and also the purpose of project reviews.
1.5.3 Review Meetings and Reports
Reports are studied and interpreted to find out the need for taking corrective actions.Review meetings are essential for brainstorming on the highlights of reports. The objectivesof review meeting are listed as follows:
Objectives of Review Meetings
• Controlling multidisciplinary activities at the higher level• Involvement of all key personnel• Comprehensive understanding of project situation and potential problem• Cross-validation of current data for true picture of project status• Interactive mode, therefore early identification of potential problem• Action oriented; corrective action can be defined and assigned• Synergism, unifying force
Self LearningMaterial 45
Introduction toProject Management
NOTES
There are three types of reviews needed:(i) Technical review: This review is carried out at the task level. The task
leader calls a technical review meeting and it is attended by all task forcemembers. It is held regularly and frequently. Task status review is the mainpurpose of technical review. It checks the appropriateness of technology,equipment, etc., so that if need be, some specifications can be changed witha view to make the project viable.
(ii) Design review: This review meeting is held at the sub-system level andsystem level. The design of the project often undergoes change duringexecution. The reasons are plenty. The existing constraints of land, building,local environment, non-availability of equipment, change in raw materialspecifications, local weather conditions, energy supply condition, quality ofwater available, change in government regulations, etc., may require theproject team to consider the changes in design in the midway course.
(iii) Programme review: This review is a high-level review which involveskey personnel from all functional areas. The firm that is proactive may liketo review the suitability of the project in the total scheme of the firm interms of capacity and need. A project may be dropped or modified in thelight of new situation.
Results of Review Meetings
A review meeting would obviously make policy decisions about changes, if required.Changes in design, scale, schedule, staffing, and delegation of power, and so on could bethe outcome of review meeting. A review meeting must review the viability of a projectin the light of experiences in project execution and changes that might have occurred inthe environmental factors during the period. Such a review would essentially involve re-calculation of financial parameters. If the project is found to be unviable, then it must bethoroughly reviewed and even the option of abandonment must be considered.
Government projects often become victims of time and cost overruns. Still theygo on and continue eating up valuable resources of the nation. The Central Governmenthas for the first time in April 1999 taken a decision to abandon 48 core sector projectscosting over ` 4500 crore, after the zero-based review of 471 Central projects. Thatwould save about ` 100 crore every year on token provision in the budget. It appearsthat the Finance Ministry has taken a policy decision that a project with 60 per cent timeoverrun and 20 per cent cost overrun be axed.
Earned Value Management
This is one of the reporting tools but looking into its significance in monitoring all thethree dimensions (time, cost and quality) of the project, it has been discussed as a separatetopic in this section. The significance of the earned value concept lies in its severalimportant features. The concept of ‘earned value’ is widely in practice today. Earnedvalue can provide any project manager with an early warning tool that sends out a signalfrom as early as the 15 per cent completion of a project. This signal allows projectmanagers to forecast the final required funds needed to finish the project within a narrowrange of values. The forecast results enable the project manager to judge whether they
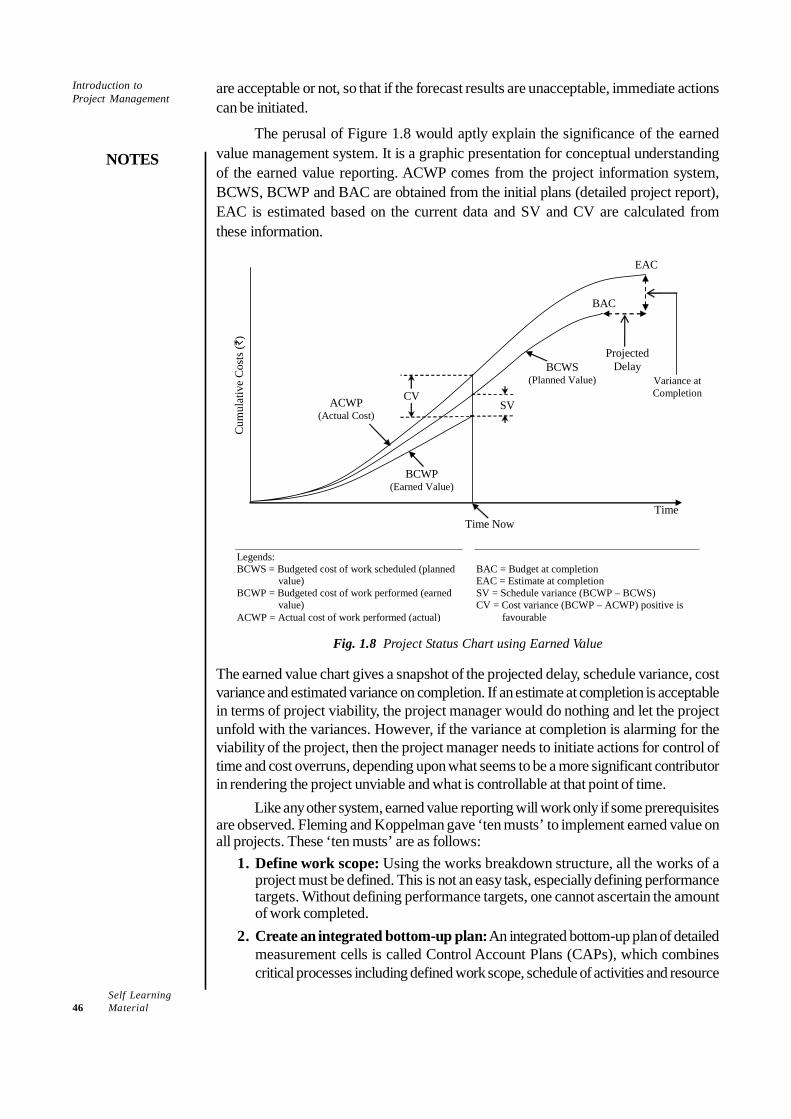
Self Learning46 Material
Introduction toProject Management
NOTES
are acceptable or not, so that if the forecast results are unacceptable, immediate actionscan be initiated.
The perusal of Figure 1.8 would aptly explain the significance of the earnedvalue management system. It is a graphic presentation for conceptual understandingof the earned value reporting. ACWP comes from the project information system,BCWS, BCWP and BAC are obtained from the initial plans (detailed project report),EAC is estimated based on the current data and SV and CV are calculated fromthese information.
Cum
ulat
ive
Cos
ts (`
)
SV
BCWP (Earned Value)
BCWS (Planned Value)
Time Now Time
Projected Delay
BAC
EAC
Variance at Completion
ACWP (Actual Cost)
CV
Legends: BCWS = Budgeted cost of work scheduled (planned
value) BCWP = Budgeted cost of work performed (earned
value) ACWP = Actual cost of work performed (actual)
BAC = Budget at completion EAC = Estimate at completion SV = Schedule variance (BCWP – BCWS) CV = Cost variance (BCWP – ACWP) positive is
favourable
Fig. 1.8 Project Status Chart using Earned Value
The earned value chart gives a snapshot of the projected delay, schedule variance, costvariance and estimated variance on completion. If an estimate at completion is acceptablein terms of project viability, the project manager would do nothing and let the projectunfold with the variances. However, if the variance at completion is alarming for theviability of the project, then the project manager needs to initiate actions for control oftime and cost overruns, depending upon what seems to be a more significant contributorin rendering the project unviable and what is controllable at that point of time.
Like any other system, earned value reporting will work only if some prerequisitesare observed. Fleming and Koppelman gave ‘ten musts’ to implement earned value onall projects. These ‘ten musts’ are as follows:
1. Define work scope: Using the works breakdown structure, all the works of aproject must be defined. This is not an easy task, especially defining performancetargets. Without defining performance targets, one cannot ascertain the amountof work completed.
2. Create an integrated bottom-up plan: An integrated bottom-up plan of detailedmeasurement cells is called Control Account Plans (CAPs), which combinescritical processes including defined work scope, schedule of activities and resource
Self LearningMaterial 47
Introduction toProject Management
NOTES
plans. The performance measure takes place within the detailed CAPs which arethen added to get the total project’s performance.
3. Formally schedule CAPs: Each defined CAP must be planned and scheduledwith a formal scheduling system with a specific time frame. As performancetakes place on the project, the portion of the planned value actually accomplishedbecomes the earned value. Both the planned value and earned value use thesame matrix to measure their performance.
4. Assign each CAP to an Executive for Performance: Each CAP must beassigned to a project sub-team with a leader, who should also be empoweredaccording to the criticality of the CAP.
5. Establish a baseline that summarizes CAPs: A total baseline against which aproject performance may be measured is formed at this stage. This may be simplya sum of all CAP performance goals, if management reserve is held by a seniormanager committee and not assigned to CAP executives or the project manager.
6. Measure performance against schedule: The value of the work scheduledand the value of the work accomplished in a given time frame are collected forperformance measurement. Each behind-schedule task must be evaluated in termsof criticality to the project. If the late task is on the critical path or if the taskcarries a high risk, efforts must be made to put the task back on schedule even ifmore costs have to be incurred.
7. Measure cost efficiency against costs incurred: Here, cost efficiency ismeasured. The difference between value of work performed and the costs incurredto accomplish the work is the measure of cost efficiency.
8. Forecast final costs based on performance: Periodically, during projectexecution, using the zero base approach, one must forecast the total estimatedcost at completion. As time passes and activities performed are more accurate,forecasting becomes possible, indicating the viability of the project.
9. Manage remaining work: The expenses incurred on the project up to the pointof a review time are sunk cost but future activities must be reviewed forimprovement, if any.
10. Manage baseline changes: The baseline must be adjusted for any changesmade in the remaining work.
This earned value management concept has its roots in industrial engineering, wherefactory managers were concerned about the three dimensions of performance, time,cost and quality. A method of status index number was developed to encompass all thethree dimensions in one single index. The development of PERT/Cost in the 1960s latergot combined to develop the earned value management system. It began with the USDepartment of Defence mandating in 1967, the use of cost/schedule control systemscriteria on all private industrial firms participating in major government systems. Now,this is practised by most firms for monitoring their projects, including software projects.The benefits are tremendous as an eye on ultimate viability of the project brings objectivityin the project execution tasks.
Corrective Actions
Control reports must be read and interpreted for corrective actions, if needed. Thetimeliness of an action is extremely important in project management because the decision-maker has to balance among time, cost and quality for ensuring viability of projects. In
Self Learning48 Material
Introduction toProject Management
NOTES
addition, there may be some additional information outside the project reports, whichmay lead to change in specifications or design of the sub-projects. Some changes maybe desirable for project efficiency and some other changes may look good at the face ofit, but may cause unjustifiable cost and time overrun without adding any efficiency valueto the project. Review meetings on reports and other information pertaining to a projectare significant.
Control reports and review meetings bring to the notice of the decision-makersimpending problems, if any. The necessary actions must be initiated without loss of time;otherwise, it may prove to be costly. The level at which the required decision is takenwill depend upon the type of organization and delegation of power in the project team.Irrespective of the type of project organization and other procedures, the most importantis the speed and quality of corrective actions. The following are the prerequisites forachieving effectiveness in decision-making in this matter:
• Knowledge of critical aspects of the project• Dynamic response cycle
These two points are now explained in brief.Critical aspects of a project: The firm identifies the critical aspects of a project at theplanning stage. For each work package and its component, the firm must identify whatis most crucial, i.e., how much slack time is available, what are the cost implications ofdelay vs the cost of alternate course of action for timely completion of a work packageand what will be the cost implications of changed quality of work. The person in chargemust be aware of these so that she can respond to the situation and take a right decisionwhenever a deviation is found or a problem is noticed. The knowledge of critical pathand activities on it, the idea about the total cost implication together with the right degreeof delegation of power can facilitate better management of overruns. This facilitatesdynamic response expected from the project team to the externality.Dynamic response cycle: Control encompasses all phases of the project fromconception to completion. It is a cycle which begins with setting objectives and ends onlywhen the last activity has been completed. Throughout each phase of the operation, thesystem must provide the management with the capacity to respond to any situationwhich arises.
The first element in the cycle is preparation of the PERT chart and identificationof critical paths. At this stage, various options of priorities and restraints are identifiedand divided. These are then combined to produce a range of plans reflecting variousexpenditures of time and money. These plans are summarized on the total project costcurves, showing direct and indirect, and combined time and costs. When the managementhas selected one of these, the resource needs and the order of commitment will beknown. At this point, resources are allocated to project activities in order to produce aschedule.
Once the management has approved a schedule, a time scale diagram is producedwhich provides immediate visual assimilation of the project at all levels of management.Progress reports can be superimposed on the diagram at regular intervals. The actualresults are compared with the estimates. The management is, thus, equipped with specificknowledge of the situation and is in a position to act. The project team is also equippedwith sufficient powers for handling the crisis situation.
The company management should also develop some decision norms regardingdesign change. The proposals for changes come from all levels and in all types of assets.
Self LearningMaterial 49
Introduction toProject Management
NOTES
The policy of review of change in design or change in core assets (plants and equipment)can be developed with its strong linkage with the objective parameters. Review anddecision are found to be weak with regard to the proposed changes in non-core assets.They cannot be evaluated on an objective basis. Such types of changes should bediscouraged in general. Some companies make the mistake of delegating decision powersregarding changes in non-core assets. The purpose behind it is to ensure that the seniormanagement can focus on the crucial aspects of the project. But, unwanted changes innon-core assets can cause a lot of worries later.
Systems of planning, scheduling and dynamic control are the tools. Much dependson the managers who use them. They help in providing information on which to basedecisions. The concerned team will quickly take an alternative course of action, even atextra cost, keeping in mind the criticality of the matters, for example, in one case, a sub-team was in charge of getting machines fabricated and installed at the site of the project.This activity was on the critical path. Soon after the machine fabrication started, theworkers at the fabricator’s factory went on strike. The team was watching the fabricatorand drew conclusion that the strike may last longer, jeopardizing the delivery schedule.They used the contract term and shifted the semi-fabricated work to other fabricatorsand completed it within time. In yet another case, some machinery was to be transportedfrom a US port in California. Around the time of shipment, the port was closed down dueto glitch in the union negotiation. The strike was expected to take long, followed by dockcongestion problem, which could delay the shipment of machinery and the whole project.The project team swung into action and diverted the machinery to another port, negotiatedwith another ship-liner for immediate pick-up and transportation of the machinery andavoided time delay though they spent some more cost. The contract terms in both thecases were clearly defined to handle such eventualities, which made the job easier.Thus, two issues are important — (i) contact terms to deal with unexpected events and(ii) creative alternate solutions as the dynamic response cycle, if the activity does nothave enough cushion time.
1.5.4 Project Evaluation and Termination
Project evaluation is defined as the methodical examination of a project’s worth orvalue. The technique is used in projects and programs as well as policies. At the projectlevel, assessment involves practices like discussing a practicable evaluation plan withstakeholders; designing and planning the evaluation; gathering, classifying and scrutinizinginformation and data; probing the details and dispensing the findings to determine orcomprehend the project and/or to make project-associated decisions.
Termination of a project takes place when work on the processes of the projecthas come to a halt or decelerated to such an extent that there is no probability for furtheradvancement. Project evaluation and termination are discussed in detail in Unit 5.
1.6 SUMMING UP
• Project management is the art of directing and coordinating the human and materialresources throughout the project by using modern management techniques. Themain purpose of project management is to achieve the predetermined objectivesof scope, cost, time, quality and the satisfaction of the participant.
• An important aspect of the systems approach to management is the concept of‘life cycle’. It is the basic pattern of the change that occurs throughout the life ofa system.
Check Your Progress
9. What is projectimplementation?
10. What are the keyareas ofmonitoring?
11. Why is timelinessof an actionconsidered to beextremelyimportant inprojectmanagement?
Self Learning50 Material
Introduction toProject Management
NOTES
• The life cycle of a system consists of the following phases — Conception, definition,acquisition/production, operation, divestment/termination.
• The advantage of using the life cycle concept in the development of a system,project, product or technology is that it enables decisions and actions to be takenin steps.
• Sensitivity analysis is the prescribed tool for identifying the important sources ofrisk. Various statistical techniques, which measure dispersion value are employedfor quantifying the risk and then some statistically convincing rules, are appliedfor decision making.
• Project selection models help the project manager in selecting a project. Thereare two types of project selection models-numeric and non-numeric.
• Project planning refers to a procedural step in project management. During projectplanning, required documentation is created to ensure successful project completion.All actions required to define, prepare, integrate and coordinate additional plansare included in documentation.
• Any project will typically pass through four stages. The first stage is theconceptualization stage, followed by the planning, execution and termination orclean-up stages.
• Project execution is the most difficult and challenging task in project management.t involves several people and teams with different skills, abilities and priorities,constant coordination and adjustment in planned activities, conflict with routineoperations of business because of overlapping project organization structure andseveral such issues.
• A monitoring system must be objective-oriented. The objectivity can be embeddedby initially identifying the key factors to be monitored at various stages of projectconstruction. It helps in defining exactly activities, specifications and costs thatneeds to be controlled.
• Key areas of monitoring are the same as the key elements of projects. They are(i) time, (ii) cost and (iii) performance.
• Reports are studied and interpreted to find out the need for taking correctiveactions. Review meetings are essential for brainstorming on the highlights ofreports.
• Control reports must be read and interpreted for corrective actions, if needed.The timeliness of an action is extremely important in project management becausethe decision-maker has to balance among time, cost and quality for ensuringviability of projects.
1.7 KEY TERMS
• Project Management: Project management is the art of directing andcoordinating the human and material resources throughout the project by usingmodern management techniques.
• Project planning: Project planning refers to a procedural step in projectmanagement.
Self LearningMaterial 51
Introduction toProject Management
NOTES
1.8 ANSWERS TO ‘CHECK YOUR PROGRESS’
1. Project management is the art of directing and coordinating the human and materialresources throughout the project by using modern management techniques.
2. The main purpose of project management is to achieve the predetermined objectivesof scope, cost, time, quality and the satisfaction of the participant.
3. The conceptual phase involves the preliminary evaluation of an idea. This includesrecognition and acceptance of a problem or a need, analysing the requirementsand finding out the ways to fulfil the need or to solve the problem.
4. The Divestment/Termination phase is the last phase of the system.5. The advantage of using the life cycle concept in the development of a system,
project, product or technology is that it enables decisions and actions to be takenin steps.
6. Project planning refers to a procedural step in project management. During projectplanning, required documentation is created to ensure successful project completion.
7. A project is said to be successful only when the requirements of the stakeholdershave been met.
8. Any project will typically pass through four stages. The first stage is theconceptualization stage, followed by the planning, execution and termination orclean-up stages.
9. Project execution or implementation involves several people and teams withdifferent skills, abilities and priorities, constant coordination and adjustment inplanned activities, conflict with routine operations of business because ofoverlapping project organization structure and several such issues.
10. The key areas of monitoring are— (i) Time (ii) Cost, and (iii) Performance.11. The timeliness of an action is extremely important in project management because
the decision-maker has to balance among time, cost and quality for ensuringviability of projects.
1.9 QUESTIONS AND EXERCISES
Short-Answer Questions
1. Discuss the short comings of a project formulation.2. What are the limitations of sensitivity analysis?3. Write a short note on turnkey project construction.4. What are the goals of project implementation?
Long-Answer Questions
1. Discuss the characteristics of project management.2. Describe the reasons behind the need of project management by most enterprises.3. Discuss the five phases in the life cycle of a system.4. Explain the four-step process of project planning.5. Discuss in detail the monitoring system.

Self Learning52 Material
Introduction toProject Management
NOTES
1.10 REFERENCES AND SUGGESTED READINGS
Chandra, Prasanna. 1995. Projects: Planning, Analysis, Selection, Implementation,and Review. Delhi: Tata McGraw-Hill.
Kerzner, Harold, R. 2013. Project Management: A Systems Approach to Planning,Scheduling, and Controlling. New Jersey: John Wiley and Sons.
Singh, Narendra. 2000. Project Management and Control. Delhi: Himalaya PublishingHouse.
Self LearningMaterial 53
Project Analysisand Selection
NOTES
UNIT 2 PROJECT ANALYSISAND SELECTION
Structure2.0 Introduction2.1 Objectives2.2 Identification of Investment Opportunities
2.2.1 Projects and Alternative Projects2.2.2 Sources of Project Ideas
2.3 Project Initiation2.4 Market and Demand Analysis
2.4.1 General Economic Indicators2.4.2 Demand and Supply Estimate2.4.3 Demand Forecasting Techniques
2.5 Technical Analysis2.5.1 Selection of Site of a Project
2.6 Economic and Financial Analysis2.6.1 Cost of Capital and Cut-off Decision2.6.2 Cut-off Rate (Required Rate of Return) Decision2.6.3 Project Cash Flow Estimate2.6.4 Financial Evaluation2.6.5 Capital Budgeting Evaluation Techniques
2.7 Social Cost and Benefit Analysis2.7.1 Non-Quantifiable Cost-Benefits in Projects2.7.2 United Nations International Development Organization (UNIDO)
Approach to SCBA2.7.3 SCBA in India
2.8 Project Report and Audit2.8.1 Types of Project Reports2.8.2 Feasibility and Detailed Project Report2.8.3 Project Completion Report
2.9 Summing Up2.10 Key Terms2.11 Answers to ‘Check Your Progress’2.12 Questions and Exercises2.13 References and Suggested Readings
2.0 INTRODUCTION
Project analysis is the assessment of every expense or problem related to a project, priorto the commencement of work on it. After evaluating the profitability of a project, theselection process is undertaken.
The decisions made during selection of a project directly affect and frame aproject’s requirements analysis. It is a trend that requirements analysis begins once aproject has been selected. Mere existence of a market is not enough for a company ora project to succeed. The company should also be able to sell the product. In this unit,different analytical methods used to evaluate a project— market and demand analysis,technical analysis, economic and financial analysis and social cost and benefit analysis—have been discussed.
Self Learning54 Material
Project Analysisand Selection
NOTES
2.1 OBJECTIVES
After going through this unit, you will be able to:• Identify investment opportunities• Explain project initiation• Discuss the enquiries that are made with respect to technical analysis• Discuss economic and financial analysis• Explain social cost and benefit analysis• Assess how project reports are formulated
2.2 IDENTIFICATION OF INVESTMENTOPPORTUNITIES
The investment proposal, which originates from various departments, is the opportunity.Those who conceive the idea or sense the opportunity are likely to see only a part of thewhole investment requirement. There may be some technically or economically dependentinvestment requirements (opportunities) that the proposers may not visualize. For example,technological upgradation may require expensive retraining of employees, or may requirea sequential change in upstream or downstream activities.
Opportunity is usually incomplete due to the economic dependence of oneopportunity on the other. In addition, an alternative opportunity may serve an equal orbetter purpose. A firm should have a mechanism where (a) opportunities are received,(b) alternatives are searched, (c) economic dependence is studied and then (d) projectsare formed before detailed cash flows are estimated. These four actions are the essentialingredients of efficient investment analysis.
Two opportunities are (said to be) economically dependent, if the adoption ofone of the opportunities affects the profitability or the ability to adopt the other opportunity.Economic dependence can be in four forms:
1. Positive synergy emanating from the acceptance of two or more opportunities.2. Negative synergy, when more than one opportunity is simultaneously accepted.3. Acceptance of one automatically results in rejection of the other, even if the other
is profitable.4. Stochastic dependence, where uncertainty is considered.
Only positive and negative synergy and mutually exclusive characteristics are consideredfor the efficient investment analysis at the initial stage.
2.2.1 Projects and Alternative Projects
The process of grouping opportunities is called formation of projects. A project is a set ofone or more investment opportunities with the following characteristics:
• Each opportunity included in a project is independent of all other opportunities notincluded in that project
• Acceptance of any opportunity included in a project (an alternative) is conditionalon the acceptance of the (alternative) project itself
• Every opportunity is included in some project
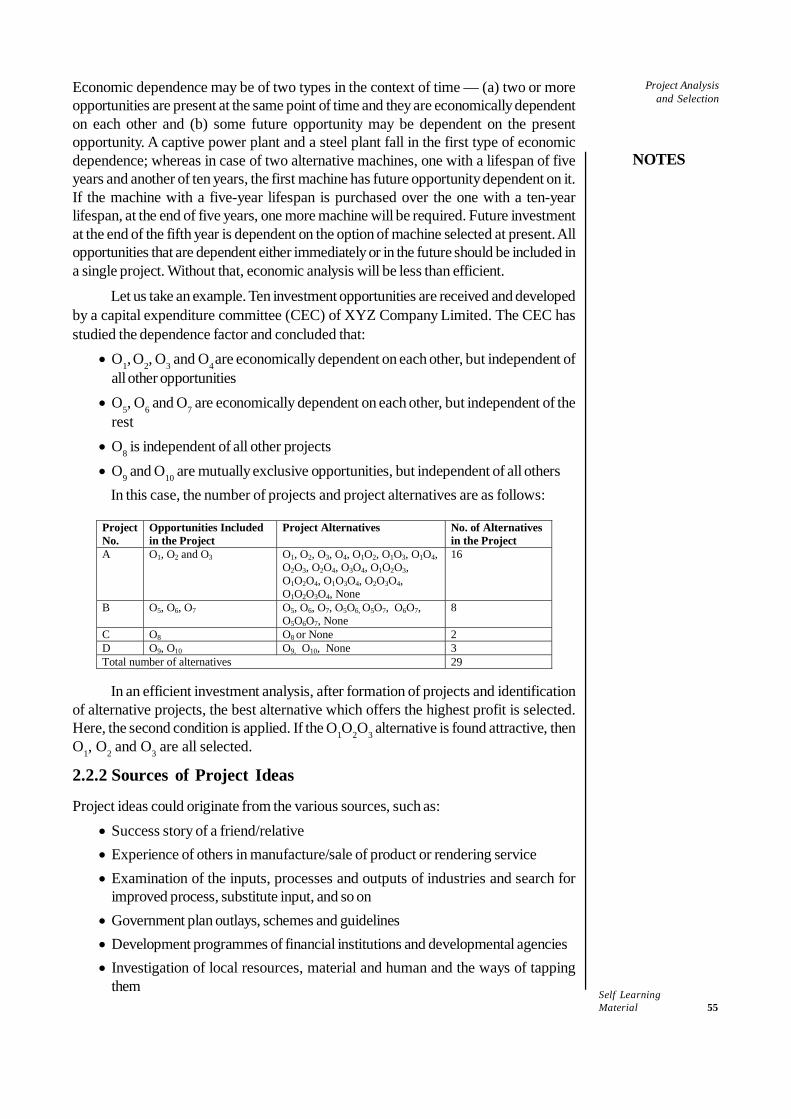
Self LearningMaterial 55
Project Analysisand Selection
NOTES
Economic dependence may be of two types in the context of time — (a) two or moreopportunities are present at the same point of time and they are economically dependenton each other and (b) some future opportunity may be dependent on the presentopportunity. A captive power plant and a steel plant fall in the first type of economicdependence; whereas in case of two alternative machines, one with a lifespan of fiveyears and another of ten years, the first machine has future opportunity dependent on it.If the machine with a five-year lifespan is purchased over the one with a ten-yearlifespan, at the end of five years, one more machine will be required. Future investmentat the end of the fifth year is dependent on the option of machine selected at present. Allopportunities that are dependent either immediately or in the future should be included ina single project. Without that, economic analysis will be less than efficient.
Let us take an example. Ten investment opportunities are received and developedby a capital expenditure committee (CEC) of XYZ Company Limited. The CEC hasstudied the dependence factor and concluded that:
• O1, O2, O3 and O4 are economically dependent on each other, but independent ofall other opportunities
• O5, O6 and O7 are economically dependent on each other, but independent of therest
• O8 is independent of all other projects• O9 and O10 are mutually exclusive opportunities, but independent of all others
In this case, the number of projects and project alternatives are as follows:
Project No.
Opportunities Included in the Project
Project Alternatives No. of Alternatives in the Project
A O1, O2 and O3 O1, O2, O3, O4, O1O2, O1O3, O1O4, O2O3, O2O4, O3O4, O1O2O3, O1O2O4, O1O3O4, O2O3O4, O1O2O3O4, None
16
B O5, O6, O7 O5, O6, O7, O5O6, O5O7, O6O7, O5O6O7, None
8
C O8 O8 or None 2 D O9, O10 O9, O10, None 3 Total number of alternatives 29
In an efficient investment analysis, after formation of projects and identificationof alternative projects, the best alternative which offers the highest profit is selected.Here, the second condition is applied. If the O1O2O3 alternative is found attractive, thenO1, O2 and O3 are all selected.
2.2.2 Sources of Project Ideas
Project ideas could originate from the various sources, such as:• Success story of a friend/relative• Experience of others in manufacture/sale of product or rendering service• Examination of the inputs, processes and outputs of industries and search for
improved process, substitute input, and so on• Government plan outlays, schemes and guidelines• Development programmes of financial institutions and developmental agencies• Investigation of local resources, material and human and the ways of tapping
them
Self Learning56 Material
Project Analysisand Selection
NOTES
• Economic and social changes of the economy• B2B advertisements, C2B communications, and so on• Project profiles and industrial potential surveys• Visits to trade fairs, industrial exhibitions• Unfulfilled human needs• Possibility of reviving and rehabilitating sick units• New inventions and patents, and new technological developments and business
opportunities around them• Tender notifications of businesses, government departments, universities, etc.• Liberalization, privatization and globalization policy drives by governments, as this
means new business opportunities for private sector, MNCs, etc.Let us briefly discuss these sources of project ideas.
• Analysis of the performance of existing industries: A study of existingindustries in terms of their profitability and capacity utilization is helpful. Theanalysis of profitability and break-even level of various industries could indicatepromising investment opportunities. An examination of capacity utilization of variousindustries provides information about the potential for further investment. Such astudy becomes more useful if it is done region-wise, particularly for productswhich have high transportation costs.
• Examination of the inputs, process and outputs of industries: An analysisof the inputs required for various industries may throw up project ideas.Opportunities exist when (i) materials and supplies are presently being procuredfrom different sources with attendant time lag and transportation costs and (ii)several firms produce internally some components/parts which can be supplied ata lower cost by a single manufacturer who can enjoy economies of scale. A studyof the output structure of existing industries may reveal opportunities for furtherprocessing of output or even processing of waste. A study of the processes followedmay reveal opportunities for improving the process, with time and cost advantages.
• Examination of volume, value and direction of imports and exports: Ananalysis of import statistics for a period of five to seven years is helpful inunderstanding the trend of imports of various goods and the potential for importsubstitution. Indigenous manufacturing of goods currently imported is advantageousfor several reasons:o It improves the balance of payments situation.o It provides market for supporting industries and services.o It generates employment.Likewise, an examination of export statistics is useful in learning about the exportpossibilities of various products in various countries.
• Plan outlays and government guidelines: The government plays a veryimportant role in many economies. Government’s proposed outlays in differentsectors provide useful pointers toward investment opportunities. For instance, theschemes of distribution of free colour TVs, gas stoves, dhoties and sarees, bicycles,books, etc. are providing new opportunities for businesses. They indicate thepotential demand for goods and service required by different sectors.
• Developmental schemes of financial institutions and developmentalagencies: In a bid to promote development of industries in their respective states,state financial corporations, state industrial development corporations and other
Self LearningMaterial 57
Project Analysisand Selection
NOTES
developmental bodies conduct studies, prepare feasibility reports and offersuggestions to potential entrepreneurs. The developmental schemes suggestedby them lead to new project ideas.
• Investigation of local resources (material and human): A search for projectideas may begin with an investigation into local resources and skills, various waysof adding value to the locally available materials. Similarly, the skills of local artisansmay suggest products that may be profitably produced and marketed.
• Analysis of economic and social changes: A study of economic and socialchanges is helpful in projecting demand for various goods and services, identifyingshifts in demand for goods and services, and so on. Changing economic conditionsprovide new business opportunities. A great awareness of the value of time isdawning on the public. Hence, the demand for time saving products like packagedfood items, ovens and powered vehicles has been increasing. Another changethat we are witnessing is that the desire for leisure and recreational activities hasbeen increasing. This has caused a growth in the market for recreational products,fitness products and services.
• Exploration of the possibility of reviving and rehabilitating sick units:Industrial sickness does happen in developed and developing countries. Sick unitsare either closed or face the prospect of closure. A significant proportion of sickunits, however, can be nursed back to health by sound management, infusion offurther capital and provision of complementary inputs. Hence, there is a fairlygood scope for investment in this area. Such investments typically have a shortergestation period because one does not have to begin from scratch. Indeed, inmany cases, marginal efforts would suffice to revive such units.
• Identification of unfulfilled human needs: For well established, multi-brandproduct groups like bathing soaps, detergents, cosmetics and tooth pastes, thequestion to be asked is not whether there is an opportunity to manufacturesomething to satisfy an actual physical need but whether there are certainpsychological needs of consumers which are presently unfulfilled. To find whethersuch an opportunity exists, the technique of spectrum analysis may be followed.This analysis is done somewhat as follows.o Important factors influencing brand choice are identifiedo Gaps which exist in relation to consumer psychological needs are identified
• Visit to trade fairs: Attending the national and international trade fairs/exhibitions/conventions/conferences provides an excellent opportunity to know about newproducts/services and their development.
• B2B advertisements, C2B communications, Yellow page ads, and so on:B2B advertisements, C2B communications, and so on give out business solicitations,joint venture opportunities and the like. Trade journals and business dailies alsoprovide business solicitations.
• Government agencies, credit institutions, non-governmentalorganizations, village panchayats and public: Project ideas may be generatedby the government agencies, credit institutions, non-governmental organizationsand also by public. The government has the largest resources and has the necessaryinformation to generate project ideas and it plays a predominant role in this sphere.The government has the required facilities and manpower to conduct detailed
Self Learning58 Material
Project Analysisand Selection
NOTES
studies which may lead to making investment decisions. Banks and other financialinstitutions are actively involved in sharing the social responsibility of achievingthe national objectives of economic development. The cooperatives and non-governmental organizations as well as individual entrepreneurs now activelyparticipate in identification of projects. The awareness of involving the people orthe beneficiaries in project identification is now increasing fast. Since the localpeople have the first hand knowledge of the potentials and problems of the areato which they belong, more realistic project identification has become possiblewith their involvement. It needs no emphasis that the project ideas would begenerated in better manner both in the qualitative as well as quantitative termswhen the knowledge and ideas of the government functionaries, people, financialinstitutions and other experts are pooled together.
2.3 PROJECT INITIATION
The purpose of project initiation is to evaluate proposed projects and to reach a consensuson the projects that are to be selected. During project initiation, the project charter ispresented, the strength of a project’s business case and the viability of the proposedsolution are evaluated. A determination is made as to whether the project is consistentwith the institution’s business and/or strategic plan, and if the budget of the projectplanning (high level) is affordable.
In project initiation, all the necessary analysis is undertaken to allow the project tobe planned. It usually involves a considerable amount of work, and expenditure. Projectinitiation is considered to be a stage in its own right i.e., it should be formally givenapproval to go ahead and should be planned and budgeted for as a phase of the project.
Project Initiation Document (PID) is the single most important piece ofdocumentation that is produced at this stage, and probably during the course of the entireproject. The Project Initiation Document starts with the business Case, if it exists, andcapitalizes on it using the information and analysis data produced during the initiationactivities.A Project Initiation Document (PID) should include:
• Detailed project goals and objectives and the critical success factors on the basisof which the achievement of the objectives will be judged.
• Details of the scope of the project in relation to the organization, functional areasand time as well as a statement about any related areas that are considered to beout of scope.
• Details of identified risks and any constraints affecting the project.• Details of any kind of assumptions made about the project. These assumptions
might be based on the support you will receive from other parts of the institutionor, if you are working with a third party supplier, assumptions about what thesupplier will deliver.
The project initiation document is the ‘contract’ for the project (between the projectmanager and the project board.) It sets out:
• What does the project aim to achieve?• Why it is important to achieve it?
Check Your Progress
1. List the differentforms of economicdependence.
2. Why is indigenousmanufacturing ofgoodsadvantageous?
Self LearningMaterial 59
Project Analysisand Selection
NOTES
• Who will be involved in managing the process and what are their responsibilities?• How and when will the project be undertaken?
The PID has to answer the above questions to a sufficient level of detail to help maintaincontrol of the project.
2.4 MARKET AND DEMAND ANALYSIS
Market analysis aims at assessing the potential sales revenue from a proposed project.It is also known as market-feasibility study.Approach for conducting a market-feasibility study would vary depending on the type ofproposed product. For instance:
• In case of a novel product idea, a market-feasibility check has to be based onindicators of buyer behaviour (in terms of their response to ‘new’ or ‘dream’products) for estimating potential demand.
• If a proposed product is new in an economy, but is successfully marketed in someother economy, its market feasibility is assessed through a meaningful comparisonof some broad economic and cultural indicators in the two economies.
• Per-capita income, income disparity level, pattern-indicating shift in choice forconsumption, literacy level and such other economic factors can indicate thepotential of demand for a particular proposed product.
• If the proposed project is for addition in the capacity existing in the economy, thetask of market-feasibility study will be historical data analysis and study of factors,which influence consumption trends. The following discussion is centred arounda market-feasibility study for that product which is already selling in the market.
2.4.1 General Economic Indicators
The demand potential of any product is likely to have some kind of association withsome economic indicators. Changes in demand and changes in a particular or someeconomic indicators may take place simultaneously or with lead or lag. Some of theimportant economic indicators include gross domestic product, per capita income, incomedisparity, rate of urbanization, population growth rate, literacy rate, government spending,money supply and others.
Situational Analysis
Situational analysis is, especially, important if the project proposal is for enhancing thecapacity. It is important where the project proposal involves production and sale of newproducts and services—new for the company but not new in the market.
The situational analysis framework is primarily designed for preparing marketingplan. It can also be used as a part of market analysis in project planning. Mere existenceof a market is not enough for a company or a project to succeed. The company shouldalso be able to sell the product. Situational analysis studies some internal factors in thelight of some external factors with a view to judge whether the company can sell theproduct in the market. The factors studied in situational analysis are called five Cs.These factors and a sample of items studied in each of them are as follows:
Check Your Progress
3. What is thepurpose of projectinitiation?
4. Which questionsdoes the projectinitiationdocument answer?
Self Learning60 Material
Project Analysisand Selection
NOTES
1. Company: The assessment of a company can be done with an opinion-basedevaluation of the following factors:• Number of products• Market perception of the company• Company’s strategic plans and goals• Company’s culture and values• Company’s current technology and technology gap, if any• Overall financial positionNo one else would know the company better than the internal management.However, a frank review is required. If one is in a mode of denial and attempts tojustify everything, he is more likely to ignore the mistakes.
2. Collaborators (or partners): A company’s collaborators include:• Major customers• Distributors• Major suppliers• Joint ventures, management agreements and other alliances, if anyA lot of this information can be obtained without much difficulty from published orpaid sources.
3. Customers: This is about the potential markets for the product that will beproduced as a part of the project.• Size of the market along with segments• Expected rate of growth of the market• Current demand–supply gap• Potential customers’ expected behaviour and factors affecting their choice of
product• The decision-maker and the decision unit• The current market of the product• Method of product purchase (impulse buys, the Internet, etc.)• Trends in consumer tastes• Company’s distributorsIndustry data is available for existing products. For new products, one may needto conduct a survey and sometimes, test marketing. A lot depends on judgementtoo. For a foreign market, a country report can be used.
4. Competitors: Know your rivals:• Who are your actual and potential competitors?• What are their products, positioning, market shares, strengths, weaknesses
and marketing strategies?• Who competes indirectly with you, because they produce competing products?• Is the quality of competition, healthy or unhealthy?Those who keep their eyes open know their competitors well. One can hire aconsulting firm too to get a balanced view of the competitive scenario.
5. Climate (or environment): Economic environments, political scenario, regulatorysystem, all have effect on markets:• What is the political environment like? Who is in the government? Is the
government and its policies stable? How does the bureaucracy work?• What are the regulations and their implementations?• What are the macroeconomic factors (like business cycle, inflation, interest
rate) and which are likely to affect the market?
Self LearningMaterial 61
Project Analysisand Selection
NOTES
• What are the social and cultural trends? (This may go with the ‘customer’factor also.)
• What is the technological environment?By combining analyses of customers, competitors and climate with the company’sstrengths and collaborators, a firm can identify market opportunities and can prepareworkable marketing strategies to include them in the marketing plan.
2.4.2 Demand and Supply Estimate
Demand projection is one of the most important steps in a project feasibility study. Thefollowing are the important points related to demand estimation:
• A product may have different usages and different end-users. The total demandof a product is constituted by different end-users like government and non-government or urban and rural. For example, demand for cement can be dividedinto some broad categories, namely housing, business and rehabilitation activitiesand infrastructure projects. In case of plastic, a whole market of packaging iswide open with newer applications, which may affect and in fact, has affectedthe tinplate-packaging industry.
• Product demand may have influencing factors as well. The demand of someproducts may be direct, while for some others it may be derived. For example,demand of tyre depends upon the sale of automobiles, a fertilizer sale is dependenton monsoon and sales of steel and industrial growth have some association.
• The market potential of a product in different segments may be different forseveral reasons because there may be regional imbalances. For example, Indiahas a large demand for electric power but due to inadequate infrastructure for itsdistribution, some states are power-surplus, whereas some others have powershortage. International relations, import and export barriers in respective countriesand such other factors also affect demand.
• Infrastructure impacts market. For example, Indian cement’s exportability is lessdue to high cost of transportation.
• Growth in demand in the past can be indicative of the future demand.
Supply estimate
The past trend of supply of goods can be studied and further extrapolated. Projectionsso made need to be adjusted with the help of additional information like new projectsplanned by businesses in the economy, import possibility as governed by import policy,import tariff and international prices. Information regarding entry barrier is also useful.Long gestation period and high capital to labour ratio in an industry may create naturalentry barriers. Government licensing policy, non-availability of the required input likematerial and skilled labour also create entry barriers.
Estimating Demand–Supply Gap
Demand and supply estimates, fine-tuned with the changing factors, are now comparedwith each other for finding a gap. A demand–supply gap for a relevant geographicalterritory only is meaningful. Multiple-point forecast for demand–supply gap gives themost adverse, most likely and most favourable forecasts. Table 2.1 shows calculation ofdemand–supply gap for a particular product in the next five years.
Self Learning62 Material
Project Analysisand Selection
NOTES
Table 2.1 Demand–Supply Gap Calculation for Five Years
Cement Demand Cement Supply Demand Surplus Year Min. Likely Max. Likely Max. Min. Likely Max. 1 2 3 4 5
48.00 49.44 51.66 54.76 58.60
48.00 50.40 53.93 58.78 65.25
48.00 51.36 56.50 63.84 74.69
48.00 50.70 53.38 61.03 62.45
48.00 50.70 63.24 65.46 53.38
0.00 –1.26
–11.58 –10.70
5.22
0.00 –0.30
0.55 –2.25
2.80
0.00 0.66 3.12 2.81
12.24Demand Surplus: Minimum = Min demand – Max supply Likely = Likely demand – Likely supply Maximum = Max demand – Likely supply Note: All the confirmed capacity additions constitute ‘likely supply scenario’, while
‘maximum supply scenario’ assumes another capacity addition in the third year to the fifth year. It is assumed that firms will be able to operate at 80 per cent capacity.
In case supply shortage is sufficiently large, the market feasibility of the productis said to be positive.
SWOT Analysis
Strategic plans, budgets and operating plans must be backed up by an analysis of thesituation. An element of situational analysis makes plans realistic and achievable. Ageneric model of situational analysis is popularly known as SWOT analysis, where
S = Strength; W = Weakness; O = Opportunities; T = ThreatsStrength and weaknesses pertain to factors internal to the business. The external
environment offers opportunities or poses threats. A careful and balanced study ofopportunities, threats, strengths and weaknesses help the process of efficient resourceallocation.
SWOT is neither a tool nor technique. It is an approach. Therefore, a SWOTanalysis could be based on certain perceptions. The following statements will serve tocreate a better understanding of a SWOT analysis:
• SWOT is a perception.• An apparent weakness of the firm may actually be a result of some strength. For
example, better quality also means higher costs.• External or internal threats need not endanger chances of survival and growth.
Co-survival with threatening factors is possible. It is not always necessary tofight a threat.
• Everyone possesses certain weaknesses. All weaknesses need not be removed.One has to learn to live with many of them.
• Remove selected weaknesses if they are likely to become an obstacle to survivaland growth and simultaneously build strengths.
• Oppose and vanquish threatening factors if they are likely to obstruct growth.• Identify those opportunities which can be tapped with the firm’s strengths, and
channelise the strengths in that direction.A good understanding of the situation would be helpful in planning a viable fit
between the firm’s resources and changing opportunities. These firms stand a betterchance of forming the winning habit.
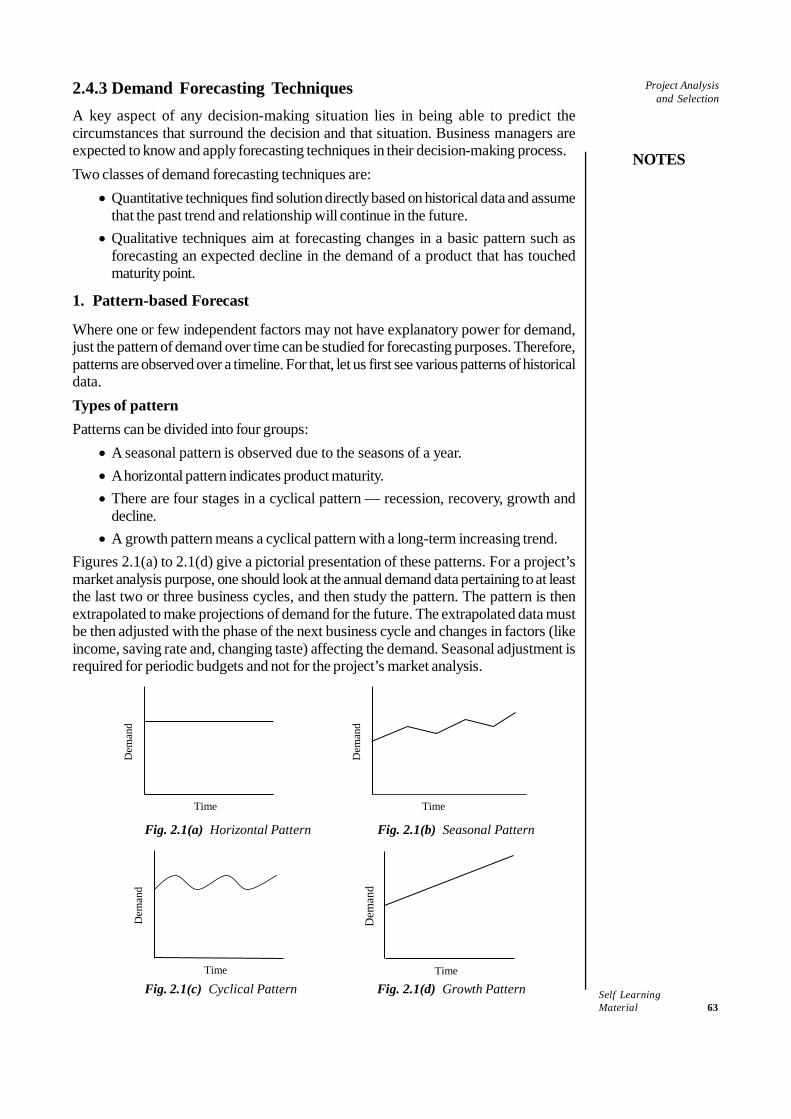
Self LearningMaterial 63
Project Analysisand Selection
NOTES
2.4.3 Demand Forecasting TechniquesA key aspect of any decision-making situation lies in being able to predict thecircumstances that surround the decision and that situation. Business managers areexpected to know and apply forecasting techniques in their decision-making process.Two classes of demand forecasting techniques are:
• Quantitative techniques find solution directly based on historical data and assumethat the past trend and relationship will continue in the future.
• Qualitative techniques aim at forecasting changes in a basic pattern such asforecasting an expected decline in the demand of a product that has touchedmaturity point.
1. Pattern-based Forecast
Where one or few independent factors may not have explanatory power for demand,just the pattern of demand over time can be studied for forecasting purposes. Therefore,patterns are observed over a timeline. For that, let us first see various patterns of historicaldata.Types of patternPatterns can be divided into four groups:
• A seasonal pattern is observed due to the seasons of a year.• A horizontal pattern indicates product maturity.• There are four stages in a cyclical pattern — recession, recovery, growth and
decline.• A growth pattern means a cyclical pattern with a long-term increasing trend.
Figures 2.1(a) to 2.1(d) give a pictorial presentation of these patterns. For a project’smarket analysis purpose, one should look at the annual demand data pertaining to at leastthe last two or three business cycles, and then study the pattern. The pattern is thenextrapolated to make projections of demand for the future. The extrapolated data mustbe then adjusted with the phase of the next business cycle and changes in factors (likeincome, saving rate and, changing taste) affecting the demand. Seasonal adjustment isrequired for periodic budgets and not for the project’s market analysis.
Dem
and
Time
Dem
and
Time
Fig. 2.1(a) Horizontal Pattern Fig. 2.1(b) Seasonal Pattern
Dem
and
Time
Dem
and
Time
Fig. 2.1(c) Cyclical Pattern Fig. 2.1(d) Growth Pattern
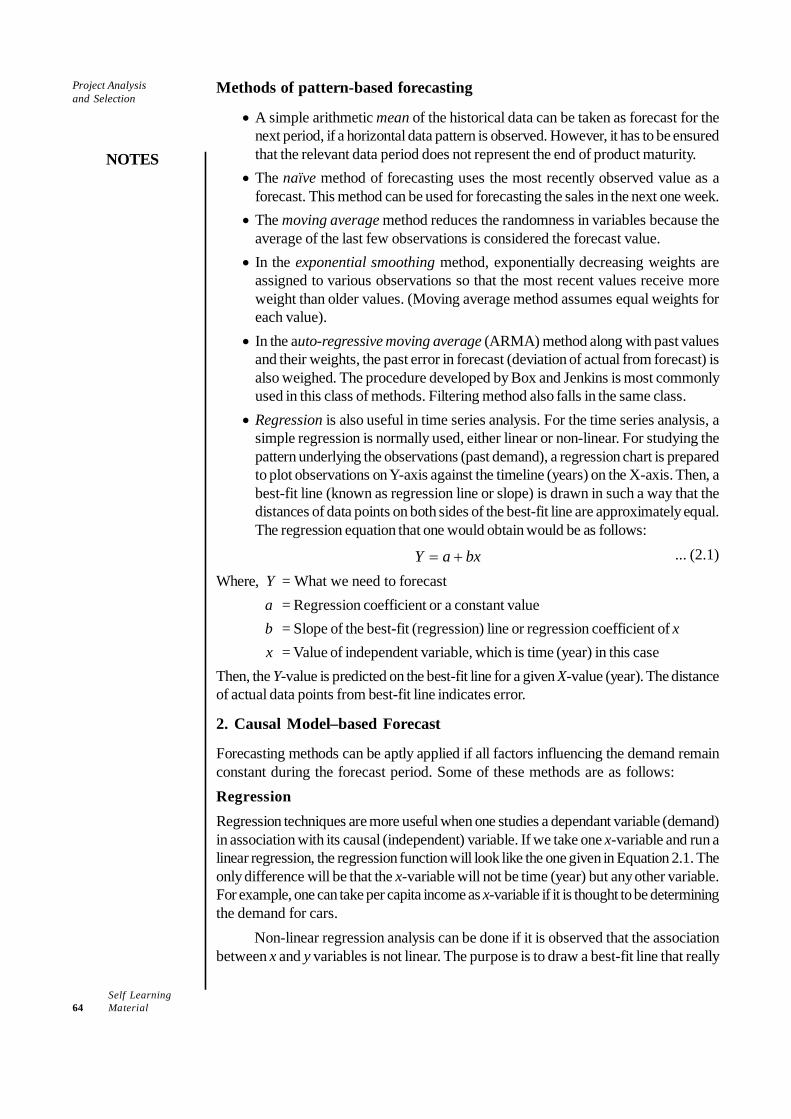
Self Learning64 Material
Project Analysisand Selection
NOTES
Methods of pattern-based forecasting
• A simple arithmetic mean of the historical data can be taken as forecast for thenext period, if a horizontal data pattern is observed. However, it has to be ensuredthat the relevant data period does not represent the end of product maturity.
• The naïve method of forecasting uses the most recently observed value as aforecast. This method can be used for forecasting the sales in the next one week.
• The moving average method reduces the randomness in variables because theaverage of the last few observations is considered the forecast value.
• In the exponential smoothing method, exponentially decreasing weights areassigned to various observations so that the most recent values receive moreweight than older values. (Moving average method assumes equal weights foreach value).
• In the auto-regressive moving average (ARMA) method along with past valuesand their weights, the past error in forecast (deviation of actual from forecast) isalso weighed. The procedure developed by Box and Jenkins is most commonlyused in this class of methods. Filtering method also falls in the same class.
• Regression is also useful in time series analysis. For the time series analysis, asimple regression is normally used, either linear or non-linear. For studying thepattern underlying the observations (past demand), a regression chart is preparedto plot observations on Y-axis against the timeline (years) on the X-axis. Then, abest-fit line (known as regression line or slope) is drawn in such a way that thedistances of data points on both sides of the best-fit line are approximately equal.The regression equation that one would obtain would be as follows:
bxaY += ... (2.1)
Where, Y = What we need to forecasta = Regression coefficient or a constant valueb = Slope of the best-fit (regression) line or regression coefficient of xx = Value of independent variable, which is time (year) in this case
Then, the Y-value is predicted on the best-fit line for a given X-value (year). The distanceof actual data points from best-fit line indicates error.
2. Causal Model–based Forecast
Forecasting methods can be aptly applied if all factors influencing the demand remainconstant during the forecast period. Some of these methods are as follows:RegressionRegression techniques are more useful when one studies a dependant variable (demand)in association with its causal (independent) variable. If we take one x-variable and run alinear regression, the regression function will look like the one given in Equation 2.1. Theonly difference will be that the x-variable will not be time (year) but any other variable.For example, one can take per capita income as x-variable if it is thought to be determiningthe demand for cars.
Non-linear regression analysis can be done if it is observed that the associationbetween x and y variables is not linear. The purpose is to draw a best-fit line that really
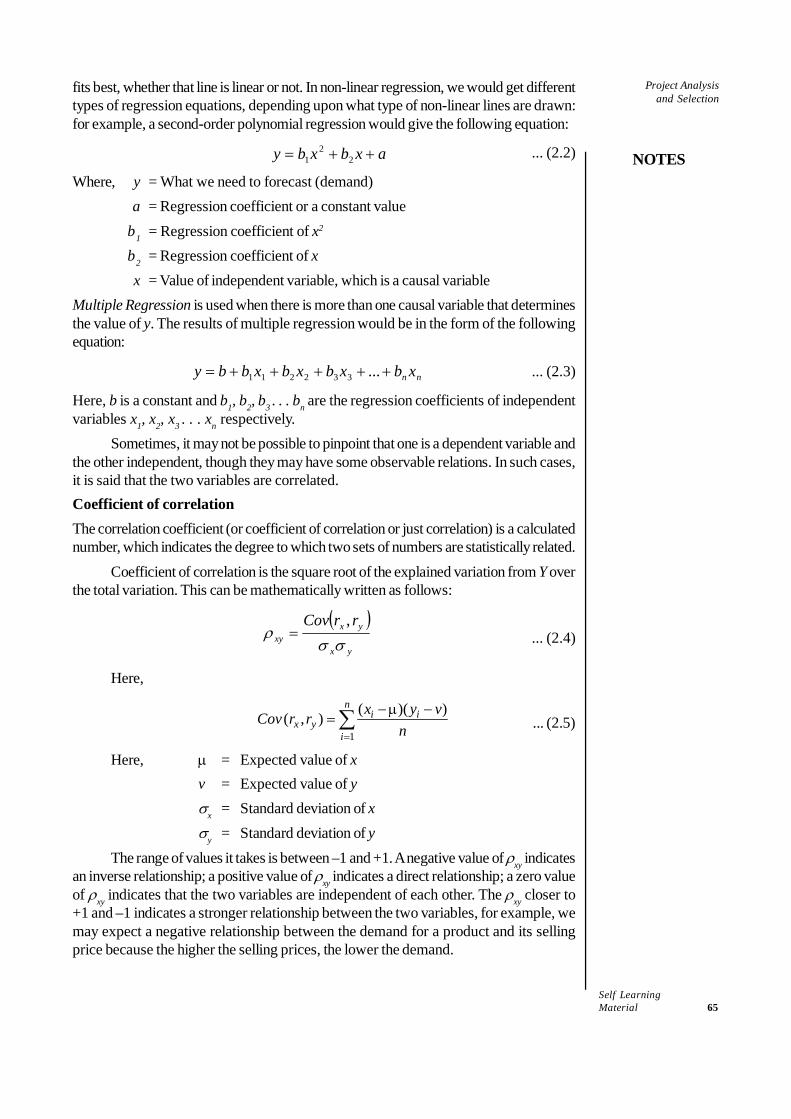
Self LearningMaterial 65
Project Analysisand Selection
NOTES
fits best, whether that line is linear or not. In non-linear regression, we would get differenttypes of regression equations, depending upon what type of non-linear lines are drawn:for example, a second-order polynomial regression would give the following equation:
axbxby ++= 22
1 ... (2.2)
Where, y = What we need to forecast (demand)a = Regression coefficient or a constant value
b1 = Regression coefficient of x2
b2 = Regression coefficient of xx = Value of independent variable, which is a causal variable
Multiple Regression is used when there is more than one causal variable that determinesthe value of y. The results of multiple regression would be in the form of the followingequation:
nn xbxbxbxbby +++++= ...332211 ... (2.3)
Here, b is a constant and b1, b2, b3 . . . bn are the regression coefficients of independentvariables x1, x2, x3 . . . xn respectively.
Sometimes, it may not be possible to pinpoint that one is a dependent variable andthe other independent, though they may have some observable relations. In such cases,it is said that the two variables are correlated.Coefficient of correlationThe correlation coefficient (or coefficient of correlation or just correlation) is a calculatednumber, which indicates the degree to which two sets of numbers are statistically related.
Coefficient of correlation is the square root of the explained variation from Y overthe total variation. This can be mathematically written as follows:
( )yx
yxxy
rrCovσσ
ρ,
= ... (2.4)
Here,
1
( )( )( , )n
i ix y
i
x y vCov r rn=
−μ −=∑ ... (2.5)
Here, μ = Expected value of xv = Expected value of yσx = Standard deviation of xσy = Standard deviation of y
The range of values it takes is between –1 and +1. A negative value of ρxy indicatesan inverse relationship; a positive value of ρxy indicates a direct relationship; a zero valueof ρxy indicates that the two variables are independent of each other. The ρxy closer to+1 and –1 indicates a stronger relationship between the two variables, for example, wemay expect a negative relationship between the demand for a product and its sellingprice because the higher the selling prices, the lower the demand.
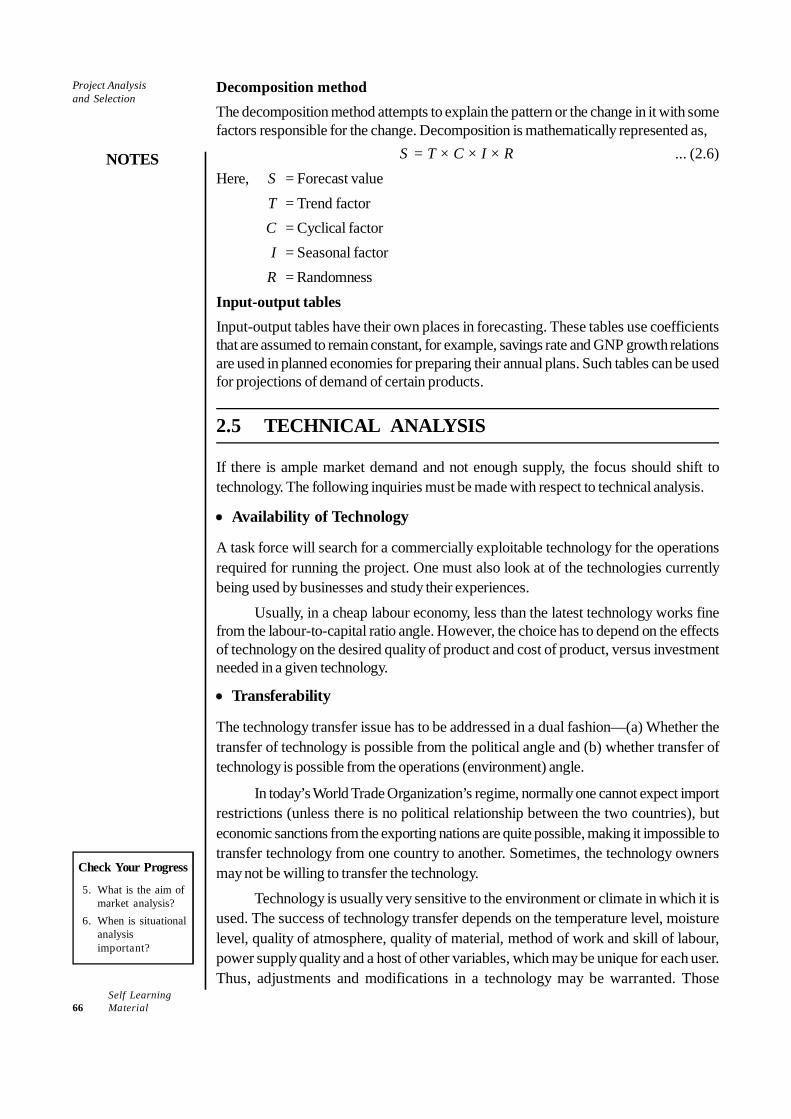
Self Learning66 Material
Project Analysisand Selection
NOTES
Decomposition methodThe decomposition method attempts to explain the pattern or the change in it with somefactors responsible for the change. Decomposition is mathematically represented as,
S = T × C × I × R ... (2.6)Here, S = Forecast value
T = Trend factorC = Cyclical factorI = Seasonal factor
R = RandomnessInput-output tablesInput-output tables have their own places in forecasting. These tables use coefficientsthat are assumed to remain constant, for example, savings rate and GNP growth relationsare used in planned economies for preparing their annual plans. Such tables can be usedfor projections of demand of certain products.
2.5 TECHNICAL ANALYSIS
If there is ample market demand and not enough supply, the focus should shift totechnology. The following inquiries must be made with respect to technical analysis.
• Availability of Technology
A task force will search for a commercially exploitable technology for the operationsrequired for running the project. One must also look at of the technologies currentlybeing used by businesses and study their experiences.
Usually, in a cheap labour economy, less than the latest technology works finefrom the labour-to-capital ratio angle. However, the choice has to depend on the effectsof technology on the desired quality of product and cost of product, versus investmentneeded in a given technology.
• Transferability
The technology transfer issue has to be addressed in a dual fashion—(a) Whether thetransfer of technology is possible from the political angle and (b) whether transfer oftechnology is possible from the operations (environment) angle.
In today’s World Trade Organization’s regime, normally one cannot expect importrestrictions (unless there is no political relationship between the two countries), buteconomic sanctions from the exporting nations are quite possible, making it impossible totransfer technology from one country to another. Sometimes, the technology ownersmay not be willing to transfer the technology.
Technology is usually very sensitive to the environment or climate in which it isused. The success of technology transfer depends on the temperature level, moisturelevel, quality of atmosphere, quality of material, method of work and skill of labour,power supply quality and a host of other variables, which may be unique for each user.Thus, adjustments and modifications in a technology may be warranted. Those
Check Your Progress
5. What is the aim ofmarket analysis?
6. When is situationalanalysisimportant?
Self LearningMaterial 67
Project Analysisand Selection
NOTES
modifications add to the project cost and sometimes, a few of the modifications may notbe feasible at all.• Normal Capacity UtilizationEvery technology has its own capacity and rate of normal utilization. In addition, a ratedcapacity is usually not available fully, depending upon the environment in which it isused. Capacity utilization has a direct impact on available production and cost ofproduction. Therefore, an inquiry about a potential ‘normal’ capacity utilization of agiven capacity assumes great importance.• Requirement of Plant and Equipment and Fabrication FacilitiesTechnology comes with knowledge. However, machines for operations have to befabricated separately. The following questions are essential:
• What type of plant, machines and equipment would be required for the operations?• Are there machine fabricators who can make the required machines as per
specifications?• Can the fabricated machines be transported easily from the fabrication site to the
project site?• Can the required sequencing of processes, synchronization of machines and
balancing of machines be attained?• Production Process NeededEfficiency of technology depends on process design. The following questions would beappropriate:
• What type of process design will be required?• Can we build those processes in a desired sequence?• Are there any site limitations (in terms of size and existing design of building, etc.)
and can the required processes be arranged with or without modifications?• Whether the company currently has one or more of the processes required in the
new technology and if yes, can we use the same with expanded capacity?
• Possible Product Mix
A project may involve production of goods and services in a particular range and therefore,the technology and processes should be able to produce them in an appropriate mix.
• Possible Alternate Usage
A technology that has an alternate use is better because if the company is not able toachieve its sales target, it can always change the product and establish in a differentmarket. For example, a company engaged in the business of manufacturing glass-liningequipment for chemical industry can use several of its processes to manufacture concrete-mixing machines.
• Flexibility
The tastes of the customers change fast and the rate of change is becoming faster everyday. If the product from the new project is closer to the consumer and has very littleroom for alternative use, then the processes must be flexible, so that the firm can adaptto changes quickly. Thus, if the market analysis indicates shorter lifespan of demand of
Self Learning68 Material
Project Analysisand Selection
NOTES
the current product and a potential change is envisaged, then one has to look for thetechnology, processes and machines that can easily adapt to the changes, for example,in the world-recessionary situation of the year 2008, Nissan Motors shifted its sizeableoperations to Japan, because their plant in Japan is capable of producing sixty differentmodels of passenger cars.• Rate of ChangeIt is important to know and estimate the rate of change in technology. For example,information technology changes fast, requiring firms to buy latest technologies as far aspossible.• Waste Disposal ProblemsWaste disposal is a legal as well as a moral issue. Some technologies have the problemof waste disposal and may prove costly, for example, nuclear power plants.
• Resource Availability
Can we have access to the required quality of resources needed by the selectedtechnology? For example, a cold-roll mill (CRM) technology in the steel industry requireshigh-quality coal with low moisture content and high carbon content. Long-term accessto coal mines that have large reserves of coal at different levels of depth is essential. Atask force may even consider visiting shortlisted coal mines, take samples from differentdepths and conduct lab tests to determine suitability of the coal for the technology beingconsidered.
• Risk Implications
Every technology has its own consequential fixed and variable costs during operations.A technology that ensues in high fixed cost but low variable cost creates a higher degreeof operating leverage. A higher degree of operating leverage would enlarge the effect ofchange in sales revenue on operating profits. High degree of operating leverage is stillgood if demand is increasing because increase in sales revenue will increase operatingprofit faster but if sales revenue declines, then operating profit will decline faster.Therefore, if there is any uncertainty about the sales revenue trend, then one must selecta technology that has a low fixed cost even if its variable cost may be high.
One must study the technology in such a way that simultaneous commercialexploitability of a technology, in the environment that can be created in the company, canbe evaluated.
• Identifying Critical Success Factors
Success of a project depends on the actual outcome of some key variables called criticalsuccess factors. Inaccuracy and uncertainty surrounding these factors may render theproject unattractive. Each industry has its own critical success factors identified fromthe experience of businesses. For example, in case of a cement project, availability oflimestone, availability of wagons, freight charges, supply of power and supply of coal arethe key success factors, as they generally constitute 65 per cent of the variable cost and40 per cent of realization. Critical success factors are product and region specific. Riskis studied in the light of possible variations in the critical success factors.
2.5.1 Selection of Site of a Project
Site selection involves measuring the needs of a new project against the merits of potentiallocations. The site selection process includes a detailed evaluation of project needs
Self LearningMaterial 69
Project Analysisand Selection
NOTES
which are then measured against the merits of potential locations. The process typicallyincludes selecting and evaluating communities, real estate site analysis and acquisition,and may include negotiating tax incentives. According to the U.S. General Services Administration, site selection considerationsshould begin early in the capital development process and play a significant role in pre-planning discussions. The process includes the following steps:
• Define project criteria• Evaluate communities• Create short list of communities based upon project criteria• Identify real estate sites within each finalist community• Real estate analysis• Negotiate tax incentives• Site acquisition
Detailed site selection typically requires nine months for federal projects and four to sixmonths for private sector projects. The National Environmental Protection Act may extendthe site selection timeline for federal agencies, depending on the level of environmentalanalysis required.
2.6 ECONOMIC AND FINANCIAL ANALYSIS
Before any financial analysis is carried out, four basic decisions must be in place. Thesebasic decisions are briefly explained as follows:
1. Period of analysis• Usually, the period of forecast is a matter of the company’s policy based
on the considerations of factors like product life cycle, business cycle,rate of change in technology, and taste, managerial ability to foresee in thefuture and database available to support the forecast.
• Information technology projects typically can be planned for about threeyears due to the technological development rate, short product life cycleand uncertainty caused by low entry barrier.
• Project report for the purpose of loans will be prepared for the period ofthe loan. This limits the life of a forecast.
• Time-value based evaluation techniques are sensitive to the cut-off rateand length of time and their results become less relevant for decision-making with the increasing span of time in analysis, especially when thecut-off rate is high. One can give a thumb rule that for a cut-off rate ofaround 15 per cent, about a 10-year analysis will be fine if time-value-based techniques are used.
• If the length of analysis is less than the approximate project life, then it isappropriate to forecast the resale value of all assets at the end of theterminal period and incorporate the terminal value in the last year’s cashflow for the project.
2. At the stage of financing mix and cost, the firm might not have raised capital forfinancing the project. The financing mix decision has three purposes:
Check Your Progress
7. The success oftechnologytransfer depends oncertain factors.Which are thesefactors?
8. Why is it better toopt for atechnology thathas an alternativeuse?
Self Learning70 Material
Project Analysisand Selection
NOTES
(i) Investigating the effect of new project financing on the company’s capitalstructure. Sometimes, a capital-intensive project may not be feasible if itmay result into a very high debt as the only possible way of financing theproject.
(ii) Approximating the cost of each type of new funds that will be raised forfinancing the new project.
(iii) Approximating the weighted average cost of capital, which can be used inderiving the cut-off rate required for accepting the new project.
3. Cut-off criterion• The cut-off decision is a benchmark against which the project cash flow
stream is compared to determine whether the project would attain its financialgoal.
• A cut-off rate is sometimes called a go-no-go criterion, hurdle rate or requiredrate of return.
• If time-value-based evaluation techniques are used, the cut-off rate will bedetermined on the basis of cost of capital.
• For other techniques where time value concept is not used, the appropriatecut-off must be decided.
• There is a general belief that one has to use the cost of capital as the cut-offpoint when time-value-based techniques are used. However in the followingsituations, a cut-off rate must be determined separately:
o If the new project is likely to change the risk profile of the company,the cut-off rate will be different from the cost of capital.
o In most cases, a firm undertakes more than one project and makes afinancial plan for a group of projects. The risk associated with eachproject in the group will be different, warranting different cut-off ratesfor different types of projects.
• An ideal cut-off rate can be calculated in many alternative ways such aso Adding risk premium in the risk-free rate of return. The risk-free rate
is usually drawn from treasury bonds. The amount of risk premium isdecided on the basis of change in the risk profile of the business as aresult of accepting the new project.
o Using the capital asset pricing model (CAPM). The CAPM is onlyrhetorically appropriate in determining the rate of expected returnsfrom a project.
o Calculating a risk-adjusted rate of return. By adding/subtracting thedifferential risk from the weighted average cost of capital.
4. There are many techniques for the evaluation of investment proposals. Somefocus on capital recovery, some measure profitability and some take into accountthe time value of money. For instance:
• A project for establishing a new market territory may be evaluated on thebasis of accounting rate of return but replacement of machines on the basisof net present value.
• An appropriate evaluation technique is one that may be justifiably applied toa given investment proposal for the attainment of financial and non-financialgoals within the constraints in which the firm operates.
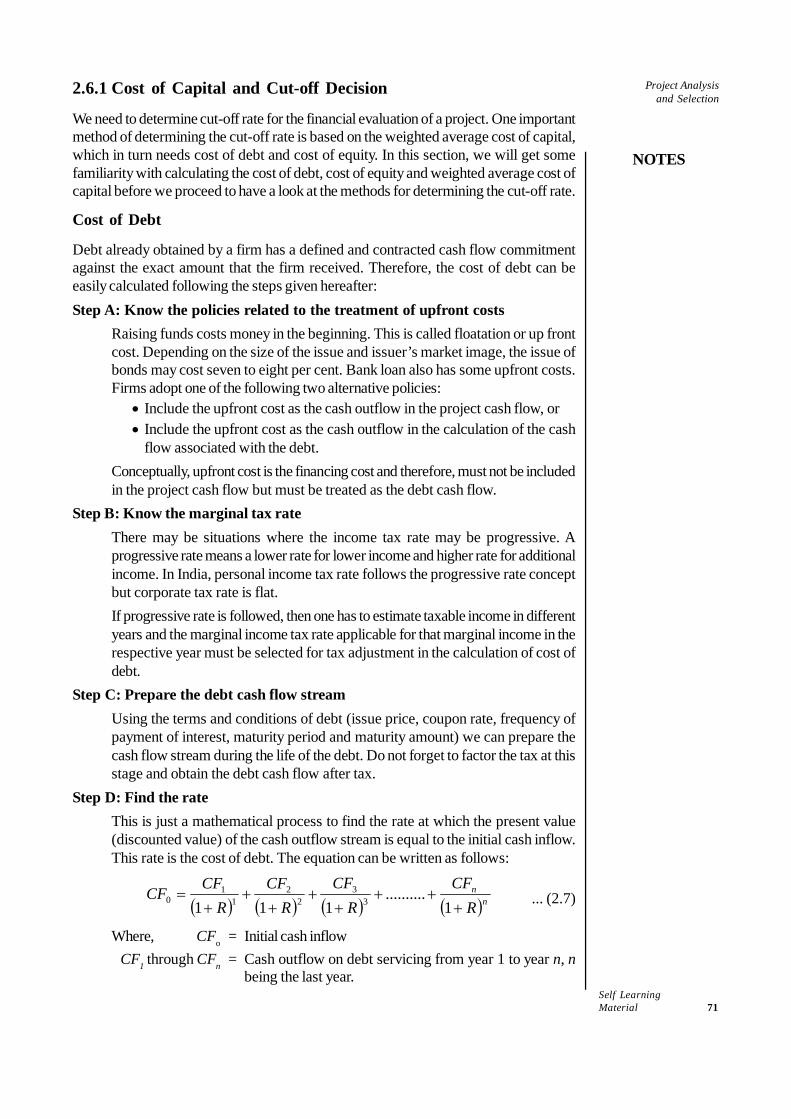
Self LearningMaterial 71
Project Analysisand Selection
NOTES
2.6.1 Cost of Capital and Cut-off Decision
We need to determine cut-off rate for the financial evaluation of a project. One importantmethod of determining the cut-off rate is based on the weighted average cost of capital,which in turn needs cost of debt and cost of equity. In this section, we will get somefamiliarity with calculating the cost of debt, cost of equity and weighted average cost ofcapital before we proceed to have a look at the methods for determining the cut-off rate.
Cost of Debt
Debt already obtained by a firm has a defined and contracted cash flow commitmentagainst the exact amount that the firm received. Therefore, the cost of debt can beeasily calculated following the steps given hereafter:Step A: Know the policies related to the treatment of upfront costs
Raising funds costs money in the beginning. This is called floatation or up frontcost. Depending on the size of the issue and issuer’s market image, the issue ofbonds may cost seven to eight per cent. Bank loan also has some upfront costs.Firms adopt one of the following two alternative policies:
• Include the upfront cost as the cash outflow in the project cash flow, or• Include the upfront cost as the cash outflow in the calculation of the cash
flow associated with the debt.Conceptually, upfront cost is the financing cost and therefore, must not be includedin the project cash flow but must be treated as the debt cash flow.
Step B: Know the marginal tax rateThere may be situations where the income tax rate may be progressive. Aprogressive rate means a lower rate for lower income and higher rate for additionalincome. In India, personal income tax rate follows the progressive rate conceptbut corporate tax rate is flat.If progressive rate is followed, then one has to estimate taxable income in differentyears and the marginal income tax rate applicable for that marginal income in therespective year must be selected for tax adjustment in the calculation of cost ofdebt.
Step C: Prepare the debt cash flow streamUsing the terms and conditions of debt (issue price, coupon rate, frequency ofpayment of interest, maturity period and maturity amount) we can prepare thecash flow stream during the life of the debt. Do not forget to factor the tax at thisstage and obtain the debt cash flow after tax.
Step D: Find the rateThis is just a mathematical process to find the rate at which the present value(discounted value) of the cash outflow stream is equal to the initial cash inflow.This rate is the cost of debt. The equation can be written as follows:
( ) ( ) ( ) ( )nn
RCF
RCF
RCF
RCFCF
+++
++
++
+=
1..........
111 33
22
11
0 ... (2.7)
Where, CFo = Initial cash inflowCF1 through CFn = Cash outflow on debt servicing from year 1 to year n, n
being the last year.
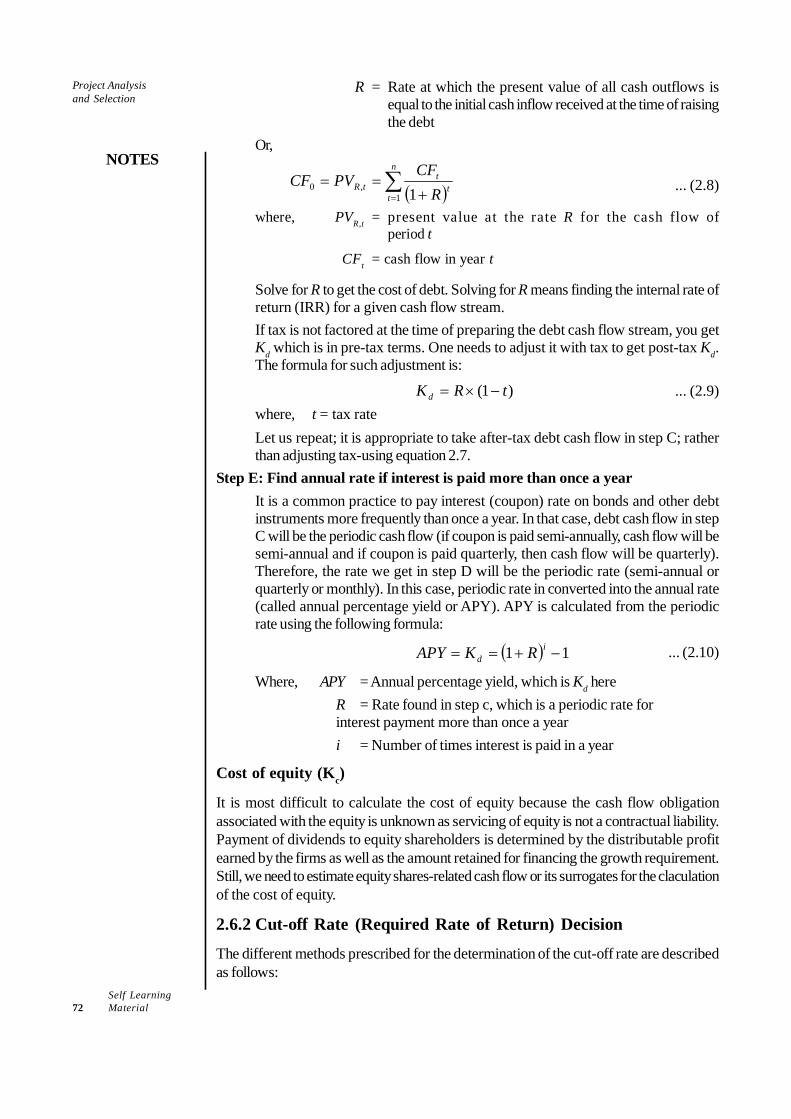
Self Learning72 Material
Project Analysisand Selection
NOTES
R = Rate at which the present value of all cash outflows isequal to the initial cash inflow received at the time of raisingthe debt
Or,
( )∑= +
==n
tt
ttR R
CFPVCF1
,0 1 ... (2.8)
where, PVR,t = present value at the rate R for the cash flow ofperiod t
CFt = cash flow in year t
Solve for R to get the cost of debt. Solving for R means finding the internal rate ofreturn (IRR) for a given cash flow stream.If tax is not factored at the time of preparing the debt cash flow stream, you getKd which is in pre-tax terms. One needs to adjust it with tax to get post-tax Kd.The formula for such adjustment is:
)1( tRKd −×= ... (2.9)where, t = tax rateLet us repeat; it is appropriate to take after-tax debt cash flow in step C; ratherthan adjusting tax-using equation 2.7.
Step E: Find annual rate if interest is paid more than once a yearIt is a common practice to pay interest (coupon) rate on bonds and other debtinstruments more frequently than once a year. In that case, debt cash flow in stepC will be the periodic cash flow (if coupon is paid semi-annually, cash flow will besemi-annual and if coupon is paid quarterly, then cash flow will be quarterly).Therefore, the rate we get in step D will be the periodic rate (semi-annual orquarterly or monthly). In this case, periodic rate in converted into the annual rate(called annual percentage yield or APY). APY is calculated from the periodicrate using the following formula:
( ) 11 −+== id RKAPY ... (2.10)
Where, APY = Annual percentage yield, which is Kd hereR = Rate found in step c, which is a periodic rate forinterest payment more than once a yeari = Number of times interest is paid in a year
Cost of equity (Kc)
It is most difficult to calculate the cost of equity because the cash flow obligationassociated with the equity is unknown as servicing of equity is not a contractual liability.Payment of dividends to equity shareholders is determined by the distributable profitearned by the firms as well as the amount retained for financing the growth requirement.Still, we need to estimate equity shares-related cash flow or its surrogates for the claculationof the cost of equity.
2.6.2 Cut-off Rate (Required Rate of Return) Decision
The different methods prescribed for the determination of the cut-off rate are describedas follows:
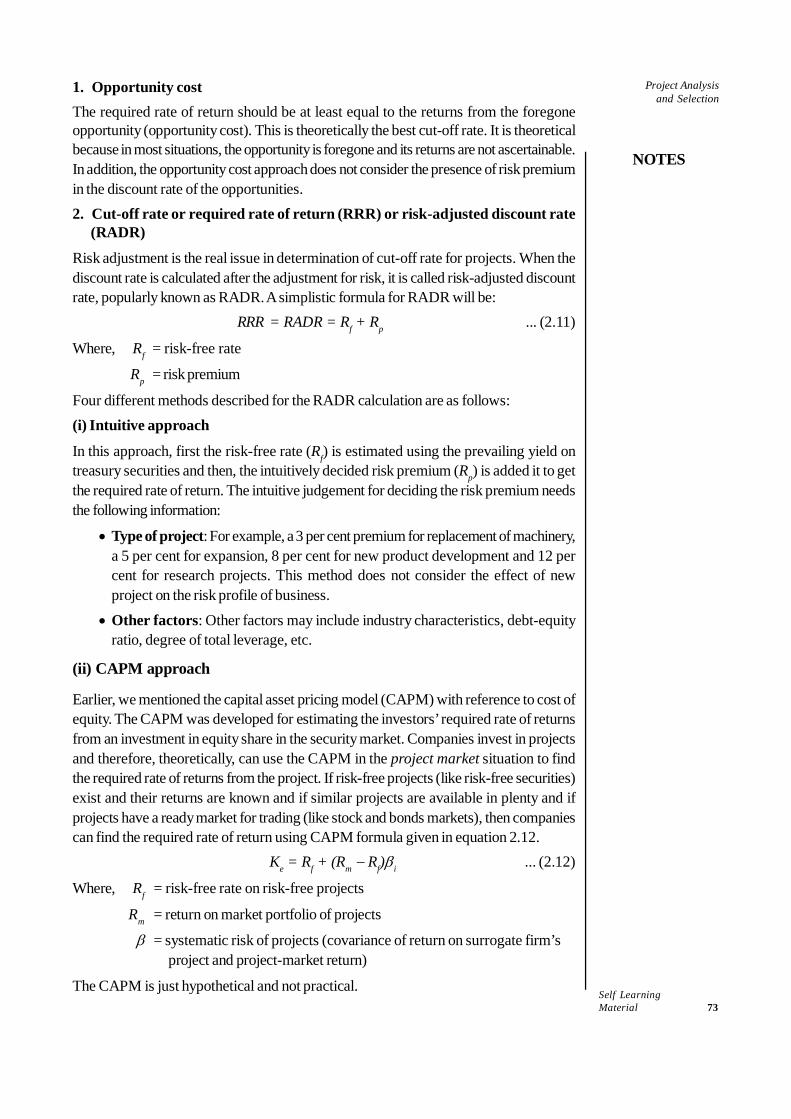
Self LearningMaterial 73
Project Analysisand Selection
NOTES
1. Opportunity costThe required rate of return should be at least equal to the returns from the foregoneopportunity (opportunity cost). This is theoretically the best cut-off rate. It is theoreticalbecause in most situations, the opportunity is foregone and its returns are not ascertainable.In addition, the opportunity cost approach does not consider the presence of risk premiumin the discount rate of the opportunities.2. Cut-off rate or required rate of return (RRR) or risk-adjusted discount rate
(RADR)
Risk adjustment is the real issue in determination of cut-off rate for projects. When thediscount rate is calculated after the adjustment for risk, it is called risk-adjusted discountrate, popularly known as RADR. A simplistic formula for RADR will be:
RRR = RADR = Rf + Rp ... (2.11)
Where, Rf = risk-free rate
Rp = risk premium
Four different methods described for the RADR calculation are as follows:(i) Intuitive approach
In this approach, first the risk-free rate (Rf) is estimated using the prevailing yield ontreasury securities and then, the intuitively decided risk premium (Rp) is added it to getthe required rate of return. The intuitive judgement for deciding the risk premium needsthe following information:
• Type of project: For example, a 3 per cent premium for replacement of machinery,a 5 per cent for expansion, 8 per cent for new product development and 12 percent for research projects. This method does not consider the effect of newproject on the risk profile of business.
• Other factors: Other factors may include industry characteristics, debt-equityratio, degree of total leverage, etc.
(ii) CAPM approach
Earlier, we mentioned the capital asset pricing model (CAPM) with reference to cost ofequity. The CAPM was developed for estimating the investors’ required rate of returnsfrom an investment in equity share in the security market. Companies invest in projectsand therefore, theoretically, can use the CAPM in the project market situation to findthe required rate of returns from the project. If risk-free projects (like risk-free securities)exist and their returns are known and if similar projects are available in plenty and ifprojects have a ready market for trading (like stock and bonds markets), then companiescan find the required rate of return using CAPM formula given in equation 2.12.
Ke = Rf + (Rm − Rf)βi ... (2.12)
Where, Rf = risk-free rate on risk-free projects
Rm = return on market portfolio of projects
β = systematic risk of projects (covariance of return on surrogate firm’sproject and project-market return)
The CAPM is just hypothetical and not practical.
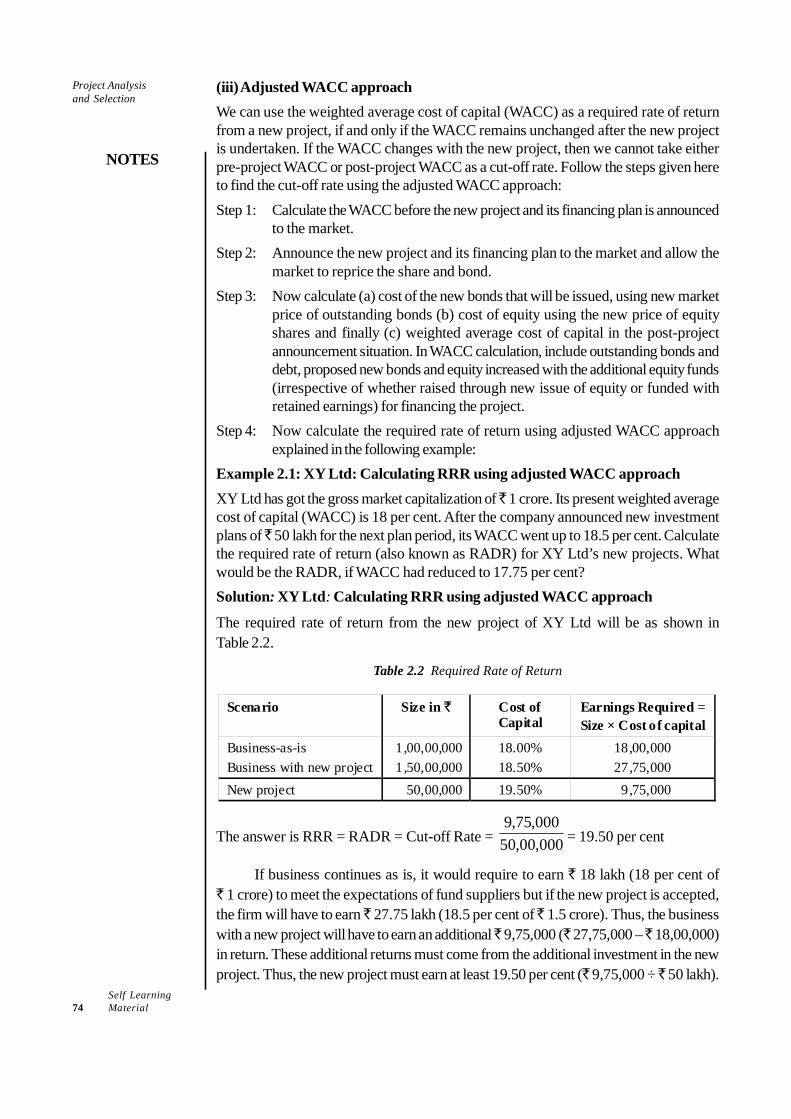
Self Learning74 Material
Project Analysisand Selection
NOTES
(iii) Adjusted WACC approachWe can use the weighted average cost of capital (WACC) as a required rate of returnfrom a new project, if and only if the WACC remains unchanged after the new projectis undertaken. If the WACC changes with the new project, then we cannot take eitherpre-project WACC or post-project WACC as a cut-off rate. Follow the steps given hereto find the cut-off rate using the adjusted WACC approach:Step 1: Calculate the WACC before the new project and its financing plan is announced
to the market.Step 2: Announce the new project and its financing plan to the market and allow the
market to reprice the share and bond.Step 3: Now calculate (a) cost of the new bonds that will be issued, using new market
price of outstanding bonds (b) cost of equity using the new price of equityshares and finally (c) weighted average cost of capital in the post-projectannouncement situation. In WACC calculation, include outstanding bonds anddebt, proposed new bonds and equity increased with the additional equity funds(irrespective of whether raised through new issue of equity or funded withretained earnings) for financing the project.
Step 4: Now calculate the required rate of return using adjusted WACC approachexplained in the following example:
Example 2.1: XY Ltd: Calculating RRR using adjusted WACC approachXY Ltd has got the gross market capitalization of ̀ 1 crore. Its present weighted averagecost of capital (WACC) is 18 per cent. After the company announced new investmentplans of ̀ 50 lakh for the next plan period, its WACC went up to 18.5 per cent. Calculatethe required rate of return (also known as RADR) for XY Ltd’s new projects. Whatwould be the RADR, if WACC had reduced to 17.75 per cent?Solution: XY Ltd: Calculating RRR using adjusted WACC approach
The required rate of return from the new project of XY Ltd will be as shown inTable 2.2.
Table 2.2 Required Rate of Return
Scenario Size in ` Cost of Capital
Earnings Required = Size × Cost of capital
Business-as-is Business with new project
1,00,00,0001,50,00,000
18.00% 18.50%
18,00,000 27,75,000
New project 50,00,000 19.50% 9,75,000
The answer is RRR = RADR = Cut-off Rate = 000,00,50000,75,9
= 19.50 per cent
If business continues as is, it would require to earn ` 18 lakh (18 per cent of` 1 crore) to meet the expectations of fund suppliers but if the new project is accepted,the firm will have to earn ̀ 27.75 lakh (18.5 per cent of ̀ 1.5 crore). Thus, the businesswith a new project will have to earn an additional ̀ 9,75,000 (` 27,75,000 – ̀ 18,00,000)in return. These additional returns must come from the additional investment in the newproject. Thus, the new project must earn at least 19.50 per cent (` 9,75,000 ÷ ̀ 50 lakh).
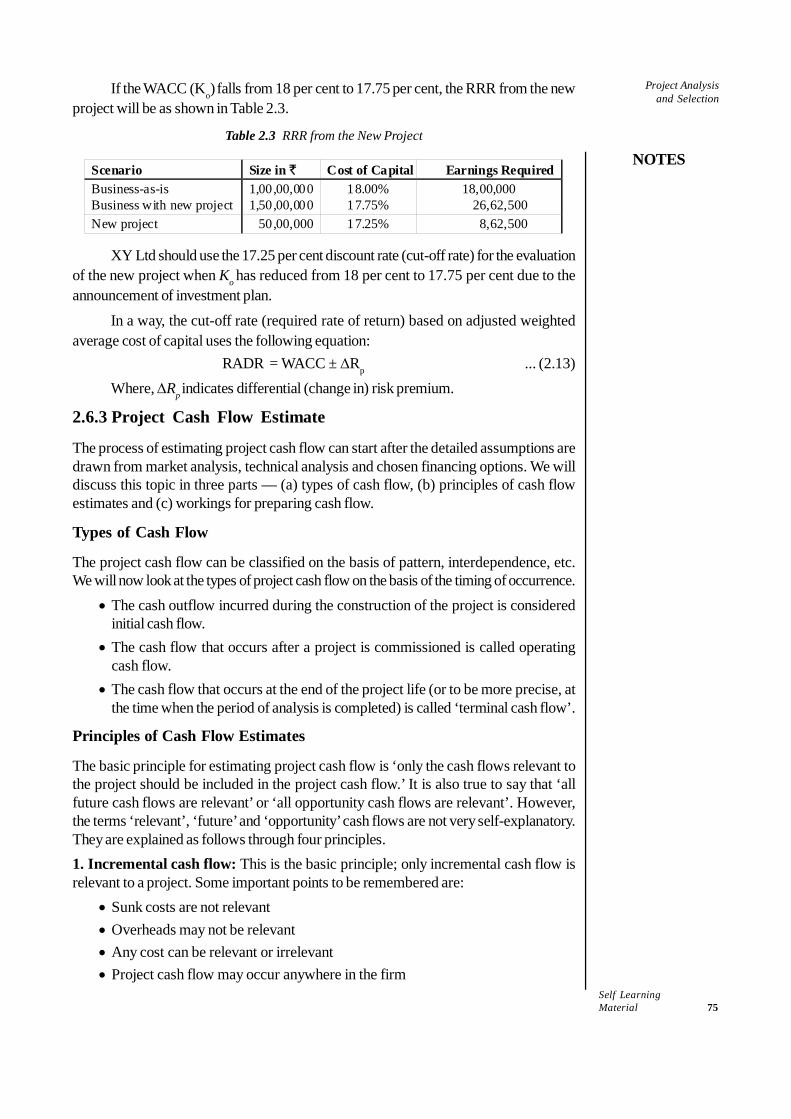
Self LearningMaterial 75
Project Analysisand Selection
NOTES
If the WACC (Ko) falls from 18 per cent to 17.75 per cent, the RRR from the newproject will be as shown in Table 2.3.
Table 2.3 RRR from the New Project
Scenario Size in ̀ Cost of Capital Earnings Required Business-as-is Business with new project
1,00,00,000 1,50,00,000
18.00% 17.75%
18,00,000 26,62,500
New project 50,00,000 17.25% 8,62,500
XY Ltd should use the 17.25 per cent discount rate (cut-off rate) for the evaluationof the new project when Ko has reduced from 18 per cent to 17.75 per cent due to theannouncement of investment plan.
In a way, the cut-off rate (required rate of return) based on adjusted weightedaverage cost of capital uses the following equation:
RADR = WACC ± ΔRp ... (2.13)Where, ΔRp indicates differential (change in) risk premium.
2.6.3 Project Cash Flow Estimate
The process of estimating project cash flow can start after the detailed assumptions aredrawn from market analysis, technical analysis and chosen financing options. We willdiscuss this topic in three parts — (a) types of cash flow, (b) principles of cash flowestimates and (c) workings for preparing cash flow.
Types of Cash Flow
The project cash flow can be classified on the basis of pattern, interdependence, etc.We will now look at the types of project cash flow on the basis of the timing of occurrence.
• The cash outflow incurred during the construction of the project is consideredinitial cash flow.
• The cash flow that occurs after a project is commissioned is called operatingcash flow.
• The cash flow that occurs at the end of the project life (or to be more precise, atthe time when the period of analysis is completed) is called ‘terminal cash flow’.
Principles of Cash Flow Estimates
The basic principle for estimating project cash flow is ‘only the cash flows relevant tothe project should be included in the project cash flow.’ It is also true to say that ‘allfuture cash flows are relevant’ or ‘all opportunity cash flows are relevant’. However,the terms ‘relevant’, ‘future’ and ‘opportunity’ cash flows are not very self-explanatory.They are explained as follows through four principles.1. Incremental cash flow: This is the basic principle; only incremental cash flow isrelevant to a project. Some important points to be remembered are:
• Sunk costs are not relevant• Overheads may not be relevant• Any cost can be relevant or irrelevant• Project cash flow may occur anywhere in the firm
Self Learning76 Material
Project Analysisand Selection
NOTES
2. Salvage value: The salvage value of assets, along with any tax implications, on thedate of project termination must be included as cash inflow.
3. Working capital: Working capital is the net investment in circulating assets (likecash, raw material, semi-finished goods, finished goods and receivables) minus currentliabilities (like creditors and other payables). In most cases, capital investment proposalsrequire additional (incremental) working capital, without which the wheels of fixed assetscannot operate.
Any increase (decrease) in core or permanent working capital is an initial cashoutflow (inflow) and is held through the project life (no effect on operating cash flow).Upon the termination of the project, the working capital changes back to the originallevel and therefore, results in the decrease (increase) of the working capital, incurringcash inflow (outflow) as the terminal cash flow. That means, the change in workingcapital affects the initial cash flow as well as the terminal cash flow but with oppositesigns (inflow vs outflow).
However, note that as per the ‘long-term funds principle’, fluctuating workingcapital requirement, together with the source funds and cost of funds, is considered apart of the operating cash flow of the project.4. Tax implications: Incremental tax is usually the largest single component in theproject cash flow. The government provides incentives and disincentives for investmentin selected areas of business and location. Central and state tax structures (direct andindirect) must be appropriately considered at realistic level, that is, the extent to which itis applicable to the firm.
Working for Preparing the Project Cash Flow
The following statements are prepared for every year in the life of the project:• Projected cash flow statement• Projected income statements• Projected balance sheets
For preparing the above statements, one needs to prepare several schedules.Some of the important schedules for preparing a project cash flow include:
• Debt servicing schedule (interest payment and principal repayment schedule forloans)
• Working capital schedule• Working capital loan, interest and repayment schedule• Depreciation schedule for income tax purpose• Depreciation schedule for the purpose of reporting under the Companies Act,
1956 (if depreciation policy is different from the income tax rules)All these statements and schedules are prepared in two sets: (i) assuming business
as it is and (ii) business with the new project. The difference between the two projectedcash flow statements is the project cash flow used for the financial evaluation.
2.6.4 Financial Evaluation
Financial evaluation approaches may be classified into selected accounting ratios andcapital budgeting evaluation techniques.
Self LearningMaterial 77
Project Analysisand Selection
NOTES
Useful ratios: Based on the projected income statements and projected balancesheets, some important financial indicators are calculated for a quick viability check.For this purpose, all the data are taken on an annual average basis to reflect morethan one year’s life of the project. Important financial indicators are discussedhereafter.
1. Interest Cover RatioInterest cover ratio, also known as times interest earned (TIE), indicates the potentialsafety and timely payment of interest to the lenders of money. The following formula isused:
+ +=
PAT Depreciation Interest ExpenseInterest Cover RatioInterest Expense ... (2.14)
Where, PAT = profit after taxLease rental, if any, is also added in the numerator as well as the denominator.
The interest cover ratio shows how many times the operating cash flow is earnedagainst the interest expense. Usually, the interest cover ratio of three and more isconsidered desirable. Though this ratio is useful in determining the health of the earningpower of the project, it is not a very important measure of overall project viability. Thisratio is useful to lenders in evaluating the default risk, if any.2. Debt Service Coverage Ratio (DSCR)Debt service coverage ratio (DSCR) uses the same numerator as interest cover ratiobut in the denominator, the principal sum repayment is added to the interest expense.The formula for DSCR calculation is:
+ +=
+PAT Depreciation Interest ExpenseDSCR
Interest Expense Principal Sum Payment ... (2.15)
Academically and as per several financial institutions, an average DSCR of 1.5or higher is considered good. A firm that attains 1.5 or greater DSCR is considered tohave preserved credit worthiness. Even a minimum DSCR of 1.33 is accepted, especiallyin financing a sick business in its effort of turning around. The DSCR is a safety indicator;safety of not only the interest but also of the principal sum. DSCR also indicates whetherthe project is self-sustainable. A project that generates enough funds to repay all loansalong with interest during the period of loan taken for the project is considered goodfrom the business prudence perspective.
2.6.5 Capital Budgeting Evaluation Techniques
There are several capital budgeting evaluation techniques, some of which use accountinginformation and others use cash flow information. Some cash-flow-based techniquesuse time value concepts as well. We shall discuss important techniques in this sectionthrough example 2.2.Example 2.2: HVBB Ltd is considering an option of buying a new machine with aninvestment of ` 1,00,000. The investment will last for six years, after which it can besalvaged at ̀ 3,000. It would also require an additional investment of ̀ 15,000 in workingcapital items like spares. The firm’s cost accountant estimated the incremental operatingcash inflow after tax for the life of the machine as shown in Table 2.4.
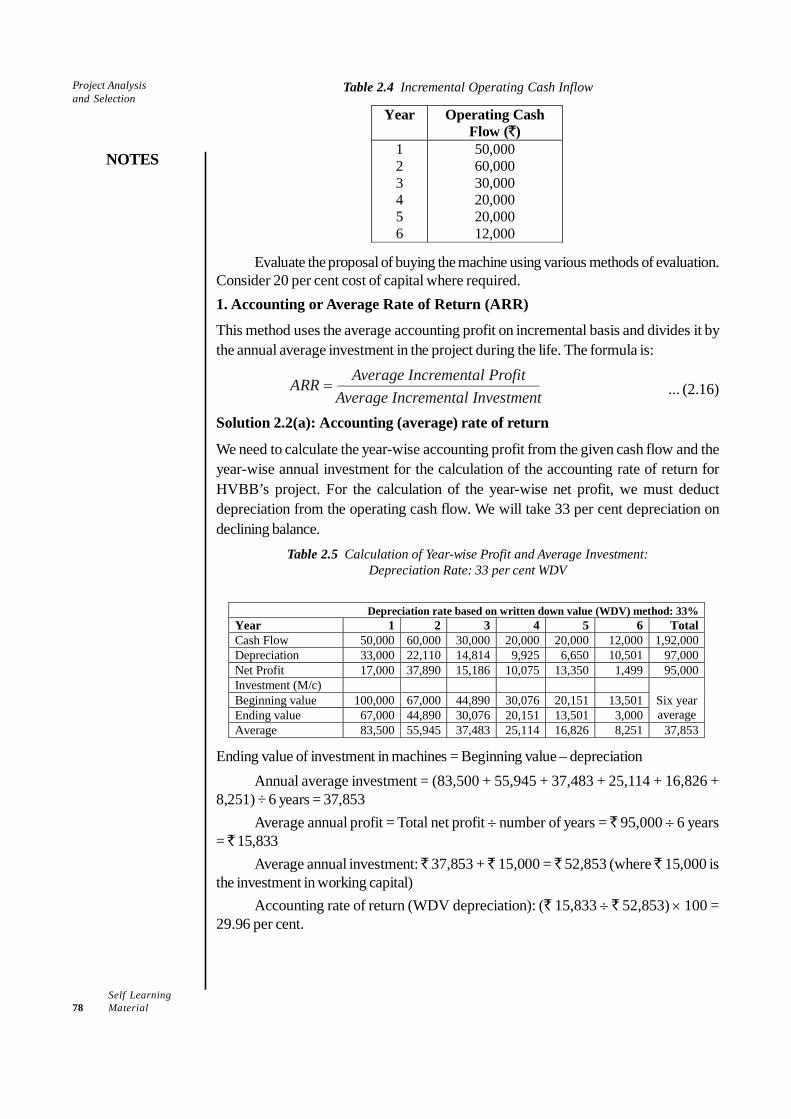
Self Learning78 Material
Project Analysisand Selection
NOTES
Table 2.4 Incremental Operating Cash Inflow
Year Operating Cash Flow (`)
1 2 3 4 5 6
50,000 60,000 30,000 20,000 20,000 12,000
Evaluate the proposal of buying the machine using various methods of evaluation.Consider 20 per cent cost of capital where required.1. Accounting or Average Rate of Return (ARR)
This method uses the average accounting profit on incremental basis and divides it bythe annual average investment in the project during the life. The formula is:
Average Incremental InvestmentAverage Incremental ProfitARR = ... (2.16)
Solution 2.2(a): Accounting (average) rate of return
We need to calculate the year-wise accounting profit from the given cash flow and theyear-wise annual investment for the calculation of the accounting rate of return forHVBB’s project. For the calculation of the year-wise net profit, we must deductdepreciation from the operating cash flow. We will take 33 per cent depreciation ondeclining balance.
Table 2.5 Calculation of Year-wise Profit and Average Investment:Depreciation Rate: 33 per cent WDV
Depreciation rate based on written down value (WDV) method: 33% Year 1 2 3 4 5 6 TotalCash Flow 50,000 60,000 30,000 20,000 20,000 12,000 1,92,000Depreciation 33,000 22,110 14,814 9,925 6,650 10,501 97,000Net Profit 17,000 37,890 15,186 10,075 13,350 1,499 95,000Investment (M/c) Beginning value 100,000 67,000 44,890 30,076 20,151 13,501 Ending value 67,000 44,890 30,076 20,151 13,501 3,000
Six year average
Average 83,500 55,945 37,483 25,114 16,826 8,251 37,853
Ending value of investment in machines = Beginning value – depreciationAnnual average investment = (83,500 + 55,945 + 37,483 + 25,114 + 16,826 +
8,251) ÷ 6 years = 37,853Average annual profit = Total net profit ÷ number of years = ̀ 95,000 ÷ 6 years
= ̀ 15,833Average annual investment: ̀ 37,853 + ̀ 15,000 = ̀ 52,853 (where ̀ 15,000 is
the investment in working capital)Accounting rate of return (WDV depreciation): (` 15,833 ÷ ̀ 52,853) × 100 =
29.96 per cent.
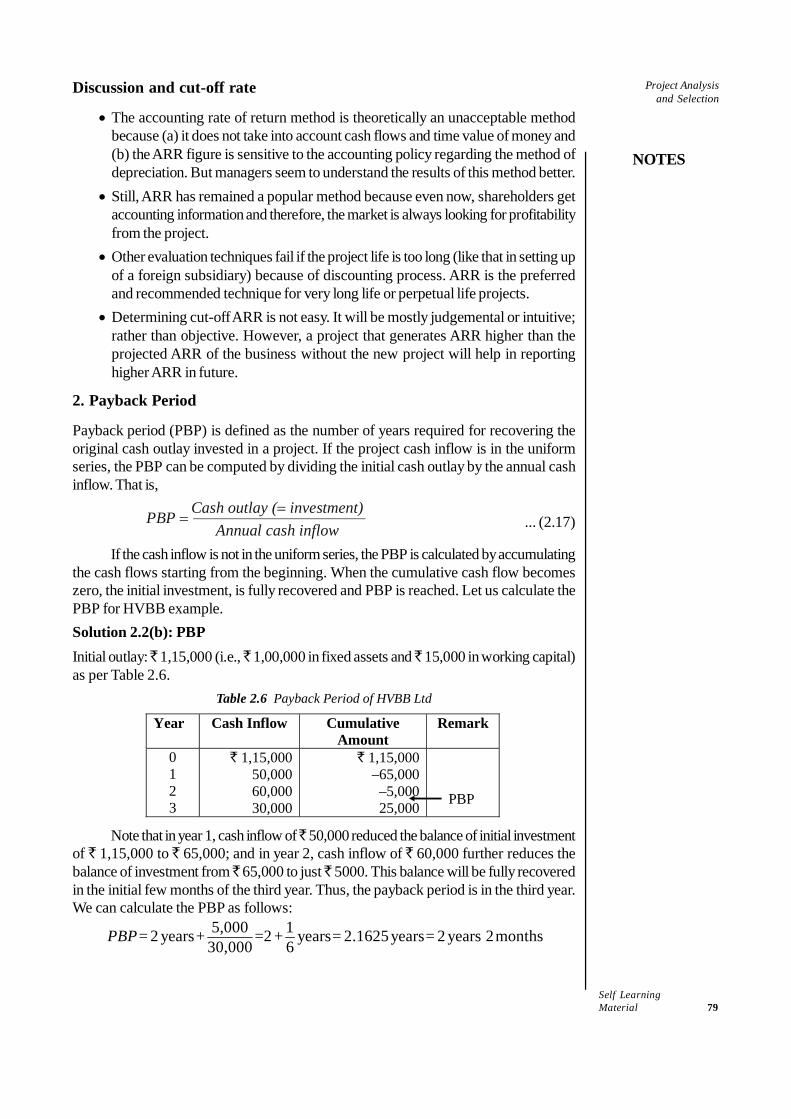
Self LearningMaterial 79
Project Analysisand Selection
NOTES
Discussion and cut-off rate
• The accounting rate of return method is theoretically an unacceptable methodbecause (a) it does not take into account cash flows and time value of money and(b) the ARR figure is sensitive to the accounting policy regarding the method ofdepreciation. But managers seem to understand the results of this method better.
• Still, ARR has remained a popular method because even now, shareholders getaccounting information and therefore, the market is always looking for profitabilityfrom the project.
• Other evaluation techniques fail if the project life is too long (like that in setting upof a foreign subsidiary) because of discounting process. ARR is the preferredand recommended technique for very long life or perpetual life projects.
• Determining cut-off ARR is not easy. It will be mostly judgemental or intuitive;rather than objective. However, a project that generates ARR higher than theprojected ARR of the business without the new project will help in reportinghigher ARR in future.
2. Payback Period
Payback period (PBP) is defined as the number of years required for recovering theoriginal cash outlay invested in a project. If the project cash inflow is in the uniformseries, the PBP can be computed by dividing the initial cash outlay by the annual cashinflow. That is,
Annual ash c inflowPBP Cash outlay ( investment= )
= ... (2.17)
If the cash inflow is not in the uniform series, the PBP is calculated by accumulatingthe cash flows starting from the beginning. When the cumulative cash flow becomeszero, the initial investment, is fully recovered and PBP is reached. Let us calculate thePBP for HVBB example.Solution 2.2(b): PBPInitial outlay: ̀ 1,15,000 (i.e., ̀ 1,00,000 in fixed assets and ̀ 15,000 in working capital)as per Table 2.6.
Table 2.6 Payback Period of HVBB Ltd
Year Cash Inflow Cumulative Amount
Remark
0 1 2 3
` 1,15,000 50,000 60,000 30,000
` 1,15,000 –65,000 –5,000 25,000
PBP
Note that in year 1, cash inflow of ̀ 50,000 reduced the balance of initial investmentof ` 1,15,000 to ` 65,000; and in year 2, cash inflow of ` 60,000 further reduces thebalance of investment from ̀ 65,000 to just ̀ 5000. This balance will be fully recoveredin the initial few months of the third year. Thus, the payback period is in the third year.We can calculate the PBP as follows:
5,000 12 years 2 years 2.1625years 2 years 2months30,000 6
PBP= + = + = =
Self Learning80 Material
Project Analysisand Selection
NOTES
Discussion and cut-off rate• This is a simple method but (a) it ignores the total life of the project (b) it neither
measures the value creation nor the profitability. It just measures the time takento recover the initial investment.
• The firm has to predetermine the acceptable payback period. If project PBP isshorter than the acceptable one, the project is accepted; otherwise, it is rejected.But, a cut-off PBT could be at the most, a raw judgement.
• Despite all obvious limitations of the PBP method, it has remained very popular.• PBP is useful where, (a) the firm is anticipating liquidity crisis in the time to come
and (b) the proposed project is considered risky. Low PBP indicates fast cashflow coming in, easing the liquidity problem and mitigating the risky.
3. Net Present Value (NPV)This is a discounted-cash-flow-based method of project evaluation. NPV is the excessof the present value of cash inflow over the present value of cash outflow of the project.The present value is calculated by applying the cut-off rate as the discount rate. We cancalculate the present value of each single cash flow using equation 2.18a and then, addup all the present values to get the NPV.
( )tt
RRRCFPV+
=1 ... (2.18a)
Alternatively, we can express Equation 2.18a for a multi-period cash flow and call it asNPV, as shown in equation 2.18b:
( )∑=
−+
=n
tt
t CK
CFNPV1 1 ... (2.18b)
Where, PV = present valueNPV = net present valueCFt = cash flow in period t
RRR = required rate of return or discount rateC = initial outlay
Discussion and cut-off rate• The NPV method of project evaluation is consistent with the corporate financial
objective of value creation. The net present value is the value that the project iscreating for the shareholders.
• Accept the project if the NPV is positive. Reject it if the NPV is negative. Adecision-maker will be indifferent to a project that offers zero NPV.
• Some managers are uncomfortable with the NPV method because the NPV isan absolute amount of value and they are more comfortable with per cent figures.
• Some believe that since the NPV is in absolute amount, two mutually exclusiveprojects of different sizes cannot be compared based on NPV. This is not true. Itcan be proved that NPV remains a better measure even in the evaluation ofmutually exclusive projects.
Solution 2.2(c): NPVThe investment proposal of HVBB Ltd is evaluated on NPV basis in the calculationshown in Table 2.7.
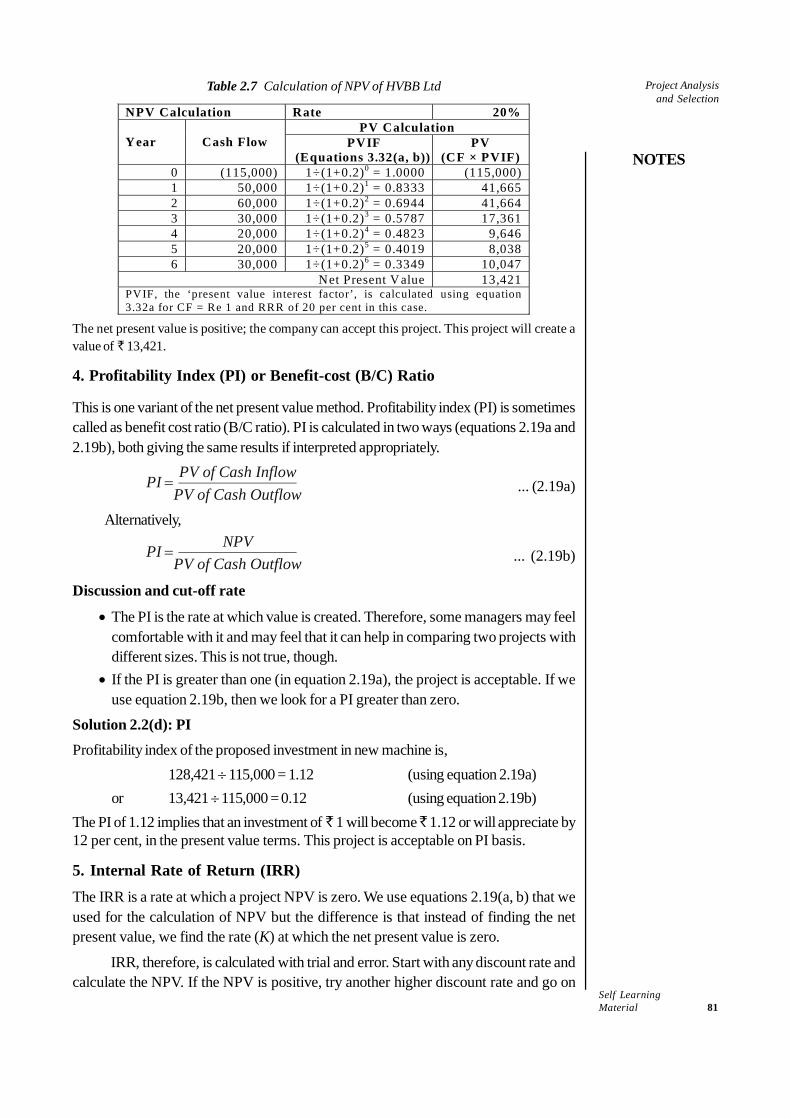
Self LearningMaterial 81
Project Analysisand Selection
NOTES
Table 2.7 Calculation of NPV of HVBB Ltd
NPV Calculation Rate 20%PV Calculation
Year
Cash Flow PVIF (Equations 3.32(a, b))
PV (CF × PVIF)
0 (115,000) 1÷(1+0.2)0 = 1.0000 (115,000)1 50,000 1÷(1+0.2)1 = 0.8333 41,665 2 60,000 1÷(1+0.2)2 = 0.6944 41,664 3 30,000 1÷(1+0.2)3 = 0.5787 17,361 4 20,000 1÷(1+0.2)4 = 0.4823 9,646 5 20,000 1÷(1+0.2)5 = 0.4019 8,038 6 30,000 1÷(1+0.2)6 = 0.3349 10,047
Net Present Value 13,421PVIF, the ‘present value interest factor’, is calculated using equation 3.32a for CF = Re 1 and RRR of 20 per cent in this case.
The net present value is positive; the company can accept this project. This project will create avalue of ` 13,421.
4. Profitability Index (PI) or Benefit-cost (B/C) Ratio
This is one variant of the net present value method. Profitability index (PI) is sometimescalled as benefit cost ratio (B/C ratio). PI is calculated in two ways (equations 2.19a and2.19b), both giving the same results if interpreted appropriately.
PV of Cash Ou tflowPV of Cash In flowPI = ... (2.19a)
Alternatively,
PV of Cash Ou tflowNPVPI = ... (2.19b)
Discussion and cut-off rate
• The PI is the rate at which value is created. Therefore, some managers may feelcomfortable with it and may feel that it can help in comparing two projects withdifferent sizes. This is not true, though.
• If the PI is greater than one (in equation 2.19a), the project is acceptable. If weuse equation 2.19b, then we look for a PI greater than zero.
Solution 2.2(d): PI
Profitability index of the proposed investment in new machine is,128,421 ÷ 115,000 = 1.12 (using equation 2.19a)
or 13,421 ÷ 115,000 = 0.12 (using equation 2.19b)The PI of 1.12 implies that an investment of ` 1 will become ̀ 1.12 or will appreciate by12 per cent, in the present value terms. This project is acceptable on PI basis.
5. Internal Rate of Return (IRR)The IRR is a rate at which a project NPV is zero. We use equations 2.19(a, b) that weused for the calculation of NPV but the difference is that instead of finding the netpresent value, we find the rate (K) at which the net present value is zero.
IRR, therefore, is calculated with trial and error. Start with any discount rate andcalculate the NPV. If the NPV is positive, try another higher discount rate and go on
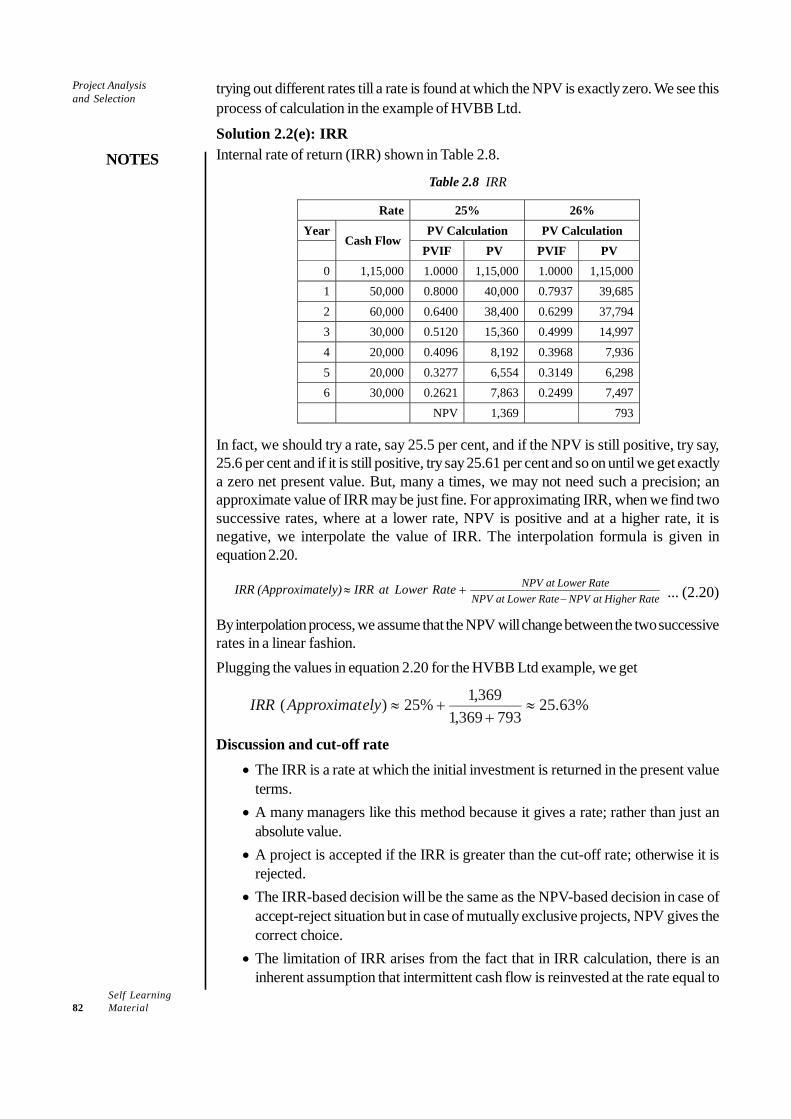
Self Learning82 Material
Project Analysisand Selection
NOTES
trying out different rates till a rate is found at which the NPV is exactly zero. We see thisprocess of calculation in the example of HVBB Ltd.
Solution 2.2(e): IRRInternal rate of return (IRR) shown in Table 2.8.
Table 2.8 IRR
Rate 25% 26% Year PV Calculation PV Calculation
Cash Flow PVIF PV PVIF PV
0 1,15,000 1.0000 1,15,000 1.0000 1,15,000 1 50,000 0.8000 40,000 0.7937 39,685 2 60,000 0.6400 38,400 0.6299 37,794 3 30,000 0.5120 15,360 0.4999 14,997 4 20,000 0.4096 8,192 0.3968 7,936 5 20,000 0.3277 6,554 0.3149 6,298 6 30,000 0.2621 7,863 0.2499 7,497
NPV 1,369 793
In fact, we should try a rate, say 25.5 per cent, and if the NPV is still positive, try say,25.6 per cent and if it is still positive, try say 25.61 per cent and so on until we get exactlya zero net present value. But, many a times, we may not need such a precision; anapproximate value of IRR may be just fine. For approximating IRR, when we find twosuccessive rates, where at a lower rate, NPV is positive and at a higher rate, it isnegative, we interpolate the value of IRR. The interpolation formula is given inequation 2.20.
NPV at Lower RateNPV at Lower Rate NPV at Higher Rate
IRR (Approximately) IRR at Lower Rate−
≈ + ... (2.20)
By interpolation process, we assume that the NPV will change between the two successiverates in a linear fashion.Plugging the values in equation 2.20 for the HVBB Ltd example, we get
%63.25793369,1
369,1%25)( ≈+
+≈elyApproximatIRR
Discussion and cut-off rate
• The IRR is a rate at which the initial investment is returned in the present valueterms.
• A many managers like this method because it gives a rate; rather than just anabsolute value.
• A project is accepted if the IRR is greater than the cut-off rate; otherwise it isrejected.
• The IRR-based decision will be the same as the NPV-based decision in case ofaccept-reject situation but in case of mutually exclusive projects, NPV gives thecorrect choice.
• The limitation of IRR arises from the fact that in IRR calculation, there is aninherent assumption that intermittent cash flow is reinvested at the rate equal to
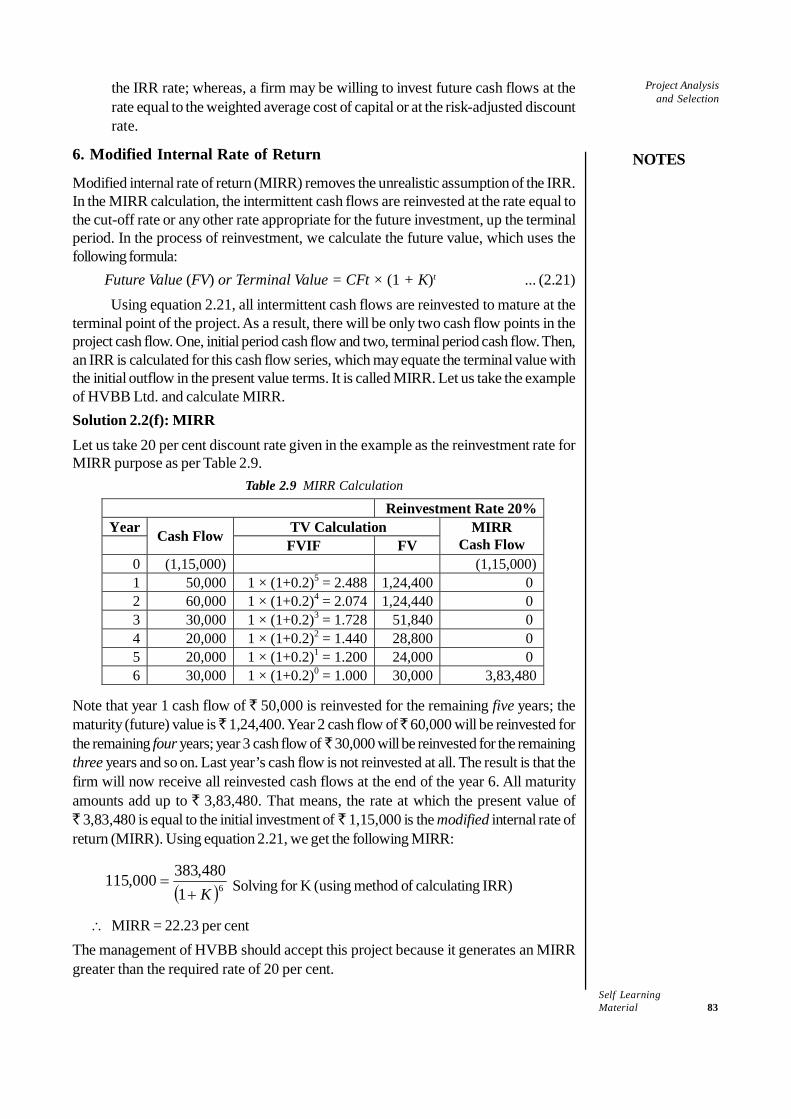
Self LearningMaterial 83
Project Analysisand Selection
NOTES
the IRR rate; whereas, a firm may be willing to invest future cash flows at therate equal to the weighted average cost of capital or at the risk-adjusted discountrate.
6. Modified Internal Rate of Return
Modified internal rate of return (MIRR) removes the unrealistic assumption of the IRR.In the MIRR calculation, the intermittent cash flows are reinvested at the rate equal tothe cut-off rate or any other rate appropriate for the future investment, up the terminalperiod. In the process of reinvestment, we calculate the future value, which uses thefollowing formula:
Future Value (FV) or Terminal Value = CFt × (1 + K)t ... (2.21)Using equation 2.21, all intermittent cash flows are reinvested to mature at the
terminal point of the project. As a result, there will be only two cash flow points in theproject cash flow. One, initial period cash flow and two, terminal period cash flow. Then,an IRR is calculated for this cash flow series, which may equate the terminal value withthe initial outflow in the present value terms. It is called MIRR. Let us take the exampleof HVBB Ltd. and calculate MIRR.Solution 2.2(f): MIRRLet us take 20 per cent discount rate given in the example as the reinvestment rate forMIRR purpose as per Table 2.9.
Table 2.9 MIRR Calculation
Reinvestment Rate 20%Year TV Calculation Cash Flow FVIF FV
MIRR Cash Flow
0 (1,15,000) (1,15,000)1 50,000 1 × (1+0.2)5 = 2.488 1,24,400 0 2 60,000 1 × (1+0.2)4 = 2.074 1,24,440 0 3 30,000 1 × (1+0.2)3 = 1.728 51,840 0 4 20,000 1 × (1+0.2)2 = 1.440 28,800 0 5 20,000 1 × (1+0.2)1 = 1.200 24,000 0 6 30,000 1 × (1+0.2)0 = 1.000 30,000 3,83,480
Note that year 1 cash flow of ` 50,000 is reinvested for the remaining five years; thematurity (future) value is ̀ 1,24,400. Year 2 cash flow of ̀ 60,000 will be reinvested forthe remaining four years; year 3 cash flow of ` 30,000 will be reinvested for the remainingthree years and so on. Last year’s cash flow is not reinvested at all. The result is that thefirm will now receive all reinvested cash flows at the end of the year 6. All maturityamounts add up to ` 3,83,480. That means, the rate at which the present value of` 3,83,480 is equal to the initial investment of ` 1,15,000 is the modified internal rate ofreturn (MIRR). Using equation 2.21, we get the following MIRR:
( )61480,383000,115K+
= Solving for K (using method of calculating IRR)
∴ MIRR = 22.23 per centThe management of HVBB should accept this project because it generates an MIRRgreater than the required rate of 20 per cent.
Self Learning84 Material
Project Analysisand Selection
NOTES
Discussion and cut-off rate• MIRR is surely a better method than IRR because it gives a per cent without
limitation of inappropriate assumption of reinvestment rate.• Accept the project if the MIRR is greater than the cut-off rate.• We can prove that when it comes to mutually exclusive projects, MIRR may fail
and the NPV method will be proved reliable.At the cost of repetition, note that in case of accept-reject situation, NPV, PI,
IRR and MIRR will all give the same decision but in case of mutually exclusive projectswith size disparity, pattern disparity or life disparities, one should use NPV.
Real Life Application
What is the most pragmatic approach for the application of financial evaluation methodsin real life? The answer is:
• Firms have conflicting goals like, liquidity needs, the need to report year-to-yearprofitability and to create value. Therefore, it is advisable to use a two-layeredapproach for the financial evaluation of projects, for example, at the first stage,use either ARR or PBP as a first screening method and further apply NPV orMIRR only if a project is cleared in the first screening.
• In case of acute liquidity situation or very high uncertainty situation, use PBPmethod.
• If the project life is too long, either rely on ARR or just look at the potential marketsize and do not bother about financial evaluations. Many multinational firms haveset up successful foreign subsidiaries with calculated negative NPV; they simplyrelied on potential market size.
• Remember, there could have been several costs and benefits that were nottranslated into financial numbers. To that extent, financial analysis is incompleteand therefore, before any project is either accepted or rejected on financial grounds,we have to consider the strategic and other aspects of the project.
Risk Assessment
The process of building logic (also known as information or knowledge through marketresearch, test marketing, etc.) is also the process of reducing risk. Thus, some risk canbe mitigated at the stage of the designing of the project. After an initial design is ready,one does a financial analysis. However, financial analysis uses single point forecastvalues, which may be subject to risk or uncertainty. Therefore, an analysis is not completewithout the systematic study of risk. A project risk is studied initially with sensitivityanalysis to identify the critical success factors, so that those selected few factors can bestudied further to identify probabilities and various outcomes. Then, the project design isreviewed to develop alternative designs to match each possible outcome. This processhelps in selecting the right project alternative from the risk-return perspective.
In addition to the project risk, one must study the project portfolio risk. A projectthat is independently risky may be desired if its cash flow is negatively associated withthe cash flow of the rest of the business. In that case the new project offers diversificationadvantages and therefore may be preferable from the overall risk-return angle.
Check Your Progress
9. What is cut-offdecision infinancial analysisof a project?
10. Define yield tomaturity (YTM).
Self LearningMaterial 85
Project Analysisand Selection
NOTES
2.7 SOCIAL COST AND BENEFIT ANALYSIS
The concept of economic rate of return can be expanded to encompass the social costand benefits, thereby, calculate the social rate of return. This method of project evaluationis also popularly known as Social Cost-Benefit Analysis (SCBA). Government and socialprojects are evaluated on the line of social cost-benefit analysis. Many internationalfunding agencies would finance a social project based on its social rate of return.
SCBA is a very subjective method but conceptually sound. The following brieftext gives a conceptual explanation. The details are kept out of the domain of this book.The readers who are interested in reading authentic material on SCBA should readManual for the Evaluation of Industrial Projects, UNIDO publication, 1980. A Guideto the Economic Appraisal of Projects in Developing Countries, by the Ministry ofOverseas Development is also useful.
2.7.1 Non-Quantifiable Cost-Benefits in Projects
Financial cost-benefit is from the angle of a firm; economic cost-benefit is from theangle of a nation’s economy. Both involve assessment of identifiable rupee value ofcosts and benefits for either the firm or for the nation. Economic cost-benefit analysiswill be done by government and government agencies in determining incentives anddisincentives to businesses either in terms of concessional rate of power supply or supplyof cheap paper or guaranteed supply of scarce resources or offering guarantees such asrate-guarantee, and so on.
Some projects, private or government, generate non-quantifiable cost-benefits.Many such projects are initiated to provide economic impetus and not for tapping thecurrently available opportunities, for example, construction of a dam has several socialcosts like displacement of habitants, loss of agricultural land, potential effect on ecology,and so on, against many social benefits such as irrigation, flood control, beautificationand tourism potential. In economically backward areas, social infrastructure projectslike literacy programmes, education initiatives and family planning programmes createconditions for economic growth. The non-quantifiable costs and benefits in such projectsare plenty.
In private projects, a type of social cost-benefit analysis would help in shapinggovernment policies and policies of foundations who work for the community. For example,the impact of global warming may not be felt in the foreseeable future, but at least all(beyond scientific community) have started agreeing now that global warming is a seriousissue. Therefore, any project that affects the ozone layer is less desirable and deservesdisincentives and other projects like research for alternate energy or projects usingalternative energy deserve incentives. Thus, today, the environment effect must be builtinto the social cost-benefits.
Therefore, all agencies that aim at social welfare, such as government andinternational institutions like the World Bank, International Monetary Fund and UNIDOuse social cost-benefit analysis for the evaluation of projects.
Social projects of the government and those financed by the government will beappraised on SCBA lines. The following factors warrant social cost-benefit analysis:
• Market imperfection• Taxes and subsidies• Concern for savings• Concern for redistribution
Self Learning86 Material
Project Analysisand Selection
NOTES
Most of the markets are imperfect. The degree of market imperfection is high inunderdeveloped and developing nations. Market imperfection is manifested in immobilityof resources or in mobility-shy resources. Land is not mobile; lack of infrastructurekeeps away the business from faraway places where land may be very cheap. Labouris mobility shy due to family and social reasons, coupled with inadequate communicationfacilities and immigration laws. For such reasons, market prices do not reflect trueeconomic prices, requiring the use of shadow price for the valuation of costs and benefits.
Typical low savings investment rates and unequal distribution of income and income-generating opportunities are the matters of concern for such nations. A project, whichresults in effective redistribution of income, is more valuable than those projects whereincome is concentrated in a few hands. These factors must be assigned a higher valueas they are the immediate concerns of developing nations.
2.7.2 United Nations International Development Organization(UNIDO) Approach to SCBA
As in any project evaluation, SCBA also involves (a) estimating costs and benefits interms of cash flow and (b) determining discount rate for calculation of the project’s netpresent value.
Estimating Social Cash Flow
United Nations International Development Organization (UNIDO) follows three stepsin estimating cash flow in the SCBA approach.
Step 1: Calculate financial cost-benefits
The first step of measuring the financial profitability of a project at market price, involvesevaluation of the project from the company’s angle only. When it is translated into theeconomic cost-benefits, (a) some costs and benefits are excluded because they onlyamount to change of hand in the economy as stated in the discussion on ERR and(b) the economic cost and benefits are priced at economic rates, rather than marketsrates.
Step 2: Calculate economic cost benefits
Goods produced and consumed by the project must be handled in three sub-steps, namely• Separate non-economic cost benefits from economic benefits• Identify tradable goods and price them• Identify non-tradable goods and price them
Some flow of money in financial cost-benefits may not involve any economiccosts or benefits. These cash flows must be excluded from the social cost benefit analysis.UNIDO has developed application models for different economies.
There are three alternative prices possible for goods and services, namely:• Market (producer’s) price• Free-trade price (world price)• Shadow and second best shadow price
For determining prices, goods and services are grouped into two categories:• Goods that are imported or exported or close to being imported or exported
are tradable goods. Because of market distortions one cannot take marketprice for tradable goods. Therefore, tradable goods are priced at the
Self LearningMaterial 87
Project Analysisand Selection
NOTES
international price of goods. Resources consumed are priced at and resourcesproduced.
• There are also some non-tradable goods; for example, value of lives saved,value of time saved, cost of pollution, etc. Also included in non-traded goodsare land, buildings, electricity, transportation and others, which are not tradedinternationally. As a result, international prices are not available as economicprices. These non-tradable goods are valued at shadow prices. Some basesfor shadow prices are suggested as follows:
Step 3: Adjustment for social concerns: Developing nations have three major socialconcerns:
1. Impact on savings2. Impact on income distribution3. Goods that may be merit or demerit ones
The economic values derived at the end of the second step explained earlier mustbe adjusted for these three concerns. The adjustment is based on the extent the projectcontributes in achieving the goals of social concerns.
Incorporating impact on savings
The impact on savings is measured as per equation 2.22.
i tImpact on Savings y MPS= ΣΔ × ... (2.22)
Where, Δyi = Change in savings in year iMPS = Marginal propensity of savings in year i
The value of rupee of savings is the present value of additional consumptionstream produced when that rupee of saving is invested at the margin. As a thumb rule, itis believed that one rupee invested in agriculture generates, say ` 7, industry ` 10,infrastructure projects, ̀ 30, and social infrastructure generates a net value of ̀ 70.
Incorporating impact on income redistribution
The impact on income redistribution is measured in terms of willingness to pay. Varioussectors or parties, such as other businesses, government, workers, consumers and others,may gain or lose due to the project. Their willingness to pay (or charge) for goods theyreceive (or lose) is estimated. However, the methods of estimation may be much lessobjective. For example, a survey method, which involves administration of questionnairemay not offer reliable shadow price because of lack of experience of goods and alsobecause of psychological issues if they are the loser of goods. One can determine weight(price) by using elasticity of marginal utility of income based on equation 2.23.
n
ii
BWC
⎛ ⎞= ⎜ ⎟⎝ ⎠
... (2.23)
Where Wi = Weight assigned to income at the level of Ci
B = Base-level income, with weight of 1n = Elasticity of marginal utility of income
Incorporating importance of goods
Merit goods are ones whose social value is greater than economic value, for example,conservation of oil and generation of employment are more valued items. Energy is
Self Learning88 Material
Project Analysisand Selection
NOTES
merit goods. Some others are demerit goods, where social value is less than economicvalue. Cosmetics are demerit goods. The list of merit and demerit goods and theirimportance may vary from nation to nation.
Economic prices of resources are adjusted upward or downward, as the casemay be, on the consideration of savings, income distribution and merit or demerit goods.The adjustment factors for various resources are generally pre-decided by the agency,like UNIDO for each country. These factors are periodically reviewed in the light ofchanged conditions.
The stream of social costs and benefits is obtained after the three steps describedabove.
Little–Mirrlees Approach to SCBA
In the field of social cost-benefit analysis, the other approach that is more discussed isthe Little–Mirrlees (LM) approach or manual. Little–Mirrlees wrote this approach andsubsequently redefined it. This approach created several controversies, which resultedin many authors attempting an explanation.
The basic concepts of SCBA in both UNIDO approach and LM approach arethe same. Most approaches are also the same, but some countries and the World Bankuse the LM approach because it gives a ready-to-use detailed procedure for computationof difficult shadow prices. The main contribution of LM is in bringing simplicity by theway of using ‘world prices’ or ‘real foreign exchange prices’ as shadow prices for allgoods, whether tradable or non-tradable. It is based on the assumption that internationalmarket is perfect or efficient. LM approach suggests:
1. Use CIF (Cost-Insurance-and-Freight or Import) price if the goods producedin the economy reduces import, or
2. Use FOB (Free-on-Board or Export) price if the goods produced in theeconomy are available for export.
One can see a similarity with the UNIDO approach in these suggestions, but thedifference is that these suggestions are even applicable to the pricing of non-tradablegoods. However, the Little–Mirrlees approach is less widely used than was initially expected.
Comparison between UNIDO and LM ApproachesThe following similarities can be cited:
• Both approaches use shadow (accounting) prices especially for foreignexchange savings and unskilled labour
• Both consider factor of equity• Both use the discounted cash flow (DCF) method
UNIDO LM
Uses domestic currency basis Uses ‘world price’ for cost-benefitsIs based on the consumption Is based on ‘uncommitted social income’value of costs and benefit
Is a stage-by-stage analysis Is an integrated analysis
Let us look at the differences in details of approach through a hypothetical example.For example, a project consumes electricity. How should we determine the social costof the consumption of electricity? As per the UNIDO approach, the marginal social costis calculated by taking the material costs involved in generation of electricity and each
Self LearningMaterial 89
Project Analysisand Selection
NOTES
material cost is priced at international price; and the wages component is taken at socialwage rates. Wages may be categorised and an appropriate rate may be applied for eachcategory. In the LM approach, the cost will be divided into three categories—tradablegoods, labour and other expenses consumed in the generation of electricity. Thesecomponents are converted into the social cost by applying social conversion factors,which are based on international prices.
Estimating Social Discount Rate
One needs to determine the rate at which cash flow must be discounted for calculatingthe net present value. Alternatively, one can calculate the internal rate of returns for agiven cash flow. The internal rate of return in the SCBA is known as social rate of return(SRR). At SRR, the present value of cash inflow outflow becomes equal. However,SRR has to be compared with a benchmark, which is social discount rate (or socialrequired rate of return). Thus, whether it is NPV that is calculated or SRR, one needs toknow the social discount rate.
Applying the opportunity cost rule, the SRR from the project foregone in favourof this project should be taken as a social required rate of return or social discount rate.Some alternatives are:
• After-tax interest rate• Consumption rate of interest• Foreign exchange in the hands of governmentAfter-tax interest rate is more appropriate from the firm’s point of view in calculating
financial rate of return. In absence of the opportunity return, the consumption rate ofinterest can be taken as cut-off rate, as done in the UNIDO approach. The LM approachis in favour of using ‘investment discount rate’. The discount rate would be thecomparative value of future and present foreign exchange held by the government.
It is said that marginal foreign exchange held by the government in a developingeconomy would be utilized for investment. That is why discount rate in such an economywould be called investment discount rate instead of consumption discount rate. Someothers argue and recommend integrating equity concerns because the funds used by thegovernments, especially have intergenerational equity effect. Intergenerational equityoccurs in deficit financing activity, because the burden of deficit financing is on thefuture generation, implying that the cost of equity in the future is relevant as a discountrate. Thus, intergenerational equity cost should be considered as the social required rateof return.
Difficulties in SCBA
• Elements of subjectivity may creep in while determining economic prices.• Shadow prices are always subject to criticism as are ‘world prices’.• The theoretical solution for shadow price that uses the consumers’ willingness to
pay as a shadow price causes more difficulties in practical life.• A survey method and its results for determining the ‘willingness to pay’ can be
extremely subjective largely because intangibles are being evaluated here.• Determining weights assigned to savings, redistribution of income and merit goods
can only be judgemental.• The cut-off rate or the social required rate of return also becomes a matter of
debate.

Self Learning90 Material
Project Analysisand Selection
NOTES
2.7.3 SCBA in India
SCBA is carried out in detail in India. All developmental agencies do SCBA while fundingmajor private projects. State governments also carry out SCBA when luring and approvingnew mega projects for the state. For example, development banks like ICICI, IDBII andIFCI used a modified LM approach for appraising projects costing more than five crorerupees.
SCBA is available for several projects in India, including the Delhi Metro Projectand the Watershed Development Project in Karnataka.
The following example is the NCAER study of a POSCO project in Orissa.
An example of SCBAThe NCAER study broadly used the ADB/World Bank methodology on the socialcost-benefit with minor adjustments for the local parameters. Econometric modelswere used to project border prices for useful life of the project. The project’simpact from the state economy perspective—in terms of the impact on state GDP(output multiplier effects) and employment opportunities created within the state(employment multiplier effects) was also assessed.The output multiplier for iron ore was found to be 1.4 compared to 2.36 for steel. Inother words, every ` 1 lakh worth of output in the iron ore sector would result in` 1.4 lakh of output (including the ̀ 1 lakh output of iron ore) compared to ̀ 2.36lakh for every ̀ 1 lakh output of steel. The employment multipliers for iron ore andsteel work out to 0.35 and 0.69 man-years respectively. Therefore, in terms of bothoutput and employment, steel has a larger impact.These multipliers imply that the Posco project would create an additionalemployment of 50,000 person years annually for the next thirty years vis-à-vis870,000 person years in the steel project alternative. In terms of value addition, theiron ore and steel project alternatives would contribute 1.3 per cent and 11.5 percent to Orissa’s State Gross Domestic Product (or SGDP) by 2016-17 respectively.An important part of the study was the Least Cost Analysis of technology optionsin the steel-making, the Finex process that Posco purports to bring and thetraditional blast-furnace technology. The Average Incremental Economic Costwas used as the yardstick; this was followed by computing the economic IRR(internal rate of return) to examine whether the project was economically worthwhilefrom the national economy point of view.The EIRR for the Orissa project works out to 16.6 per cent for base case and evenin the worst case scenario, the EIRR at 13.9 per cent would remain above thehurdle rate of 12 per cent. The economic impact of the project was estimated at$2.5 billion at the test discount rate of 12 per cent.The significant feature of the study was the estimation of depletion premium orthe opportunity cost for depletable and non-renewable resource iron ore for thefollowing reasons:India’s high-grade ore (+ 65 per cent Fe content — Haematite) reserves, provenand probable, amount to only 0.58 billion tonnes. And even if we were to factor inindicative and inferred reserves (probable/feasible), the total reserves (provenand possibly future potential) would be only 0.92 billion tonnes.India’s medium-grade ore (+62 per cent Fe to 65 per cent Fe — Haematite) reserves,proven and probable, is only 1.3 billion tonnes. Here too, if we factor in indicativeand inferred (probable/feasible and pre-feasibility estimated) reserves, the totalreserves (proven and possibly future potential) will be only 2.8 billion tonnes.
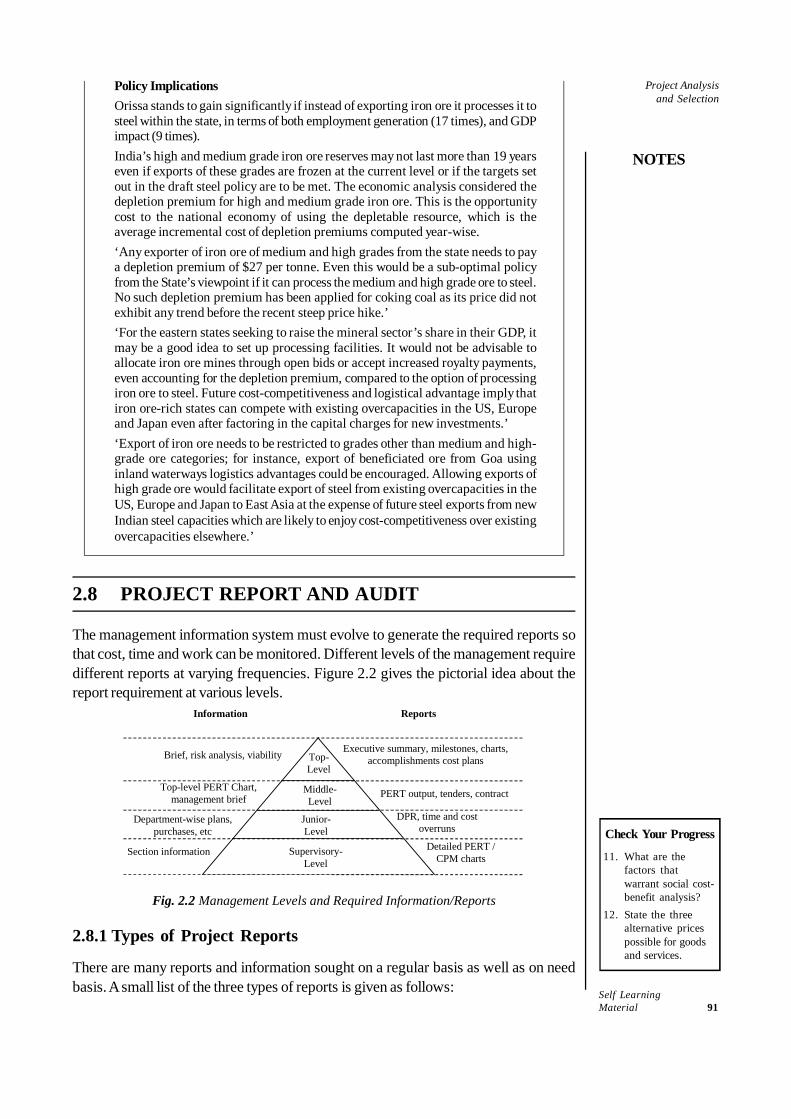
Self LearningMaterial 91
Project Analysisand Selection
NOTES
Policy ImplicationsOrissa stands to gain significantly if instead of exporting iron ore it processes it tosteel within the state, in terms of both employment generation (17 times), and GDPimpact (9 times).India’s high and medium grade iron ore reserves may not last more than 19 yearseven if exports of these grades are frozen at the current level or if the targets setout in the draft steel policy are to be met. The economic analysis considered thedepletion premium for high and medium grade iron ore. This is the opportunitycost to the national economy of using the depletable resource, which is theaverage incremental cost of depletion premiums computed year-wise.‘Any exporter of iron ore of medium and high grades from the state needs to paya depletion premium of $27 per tonne. Even this would be a sub-optimal policyfrom the State’s viewpoint if it can process the medium and high grade ore to steel.No such depletion premium has been applied for coking coal as its price did notexhibit any trend before the recent steep price hike.’‘For the eastern states seeking to raise the mineral sector’s share in their GDP, itmay be a good idea to set up processing facilities. It would not be advisable toallocate iron ore mines through open bids or accept increased royalty payments,even accounting for the depletion premium, compared to the option of processingiron ore to steel. Future cost-competitiveness and logistical advantage imply thatiron ore-rich states can compete with existing overcapacities in the US, Europeand Japan even after factoring in the capital charges for new investments.’‘Export of iron ore needs to be restricted to grades other than medium and high-grade ore categories; for instance, export of beneficiated ore from Goa usinginland waterways logistics advantages could be encouraged. Allowing exports ofhigh grade ore would facilitate export of steel from existing overcapacities in theUS, Europe and Japan to East Asia at the expense of future steel exports from newIndian steel capacities which are likely to enjoy cost-competitiveness over existingovercapacities elsewhere.’
2.8 PROJECT REPORT AND AUDIT
The management information system must evolve to generate the required reports sothat cost, time and work can be monitored. Different levels of the management requiredifferent reports at varying frequencies. Figure 2.2 gives the pictorial idea about thereport requirement at various levels.
Section information
Department-wise plans, purchases, etc
Top-level PERT Chart, management brief
Brief, risk analysis, viability Executive summary, milestones, charts, accomplishments cost plans
PERT output, tenders, contract
DPR, time and cost overruns
Detailed PERT / CPM charts
Junior-Level
Middle-Level
Top- Level
Supervisory- Level
Information Reports
Fig. 2.2 Management Levels and Required Information/Reports
2.8.1 Types of Project Reports
There are many reports and information sought on a regular basis as well as on needbasis. A small list of the three types of reports is given as follows:
Check Your Progress
11. What are thefactors thatwarrant social cost-benefit analysis?
12. State the threealternative pricespossible for goodsand services.
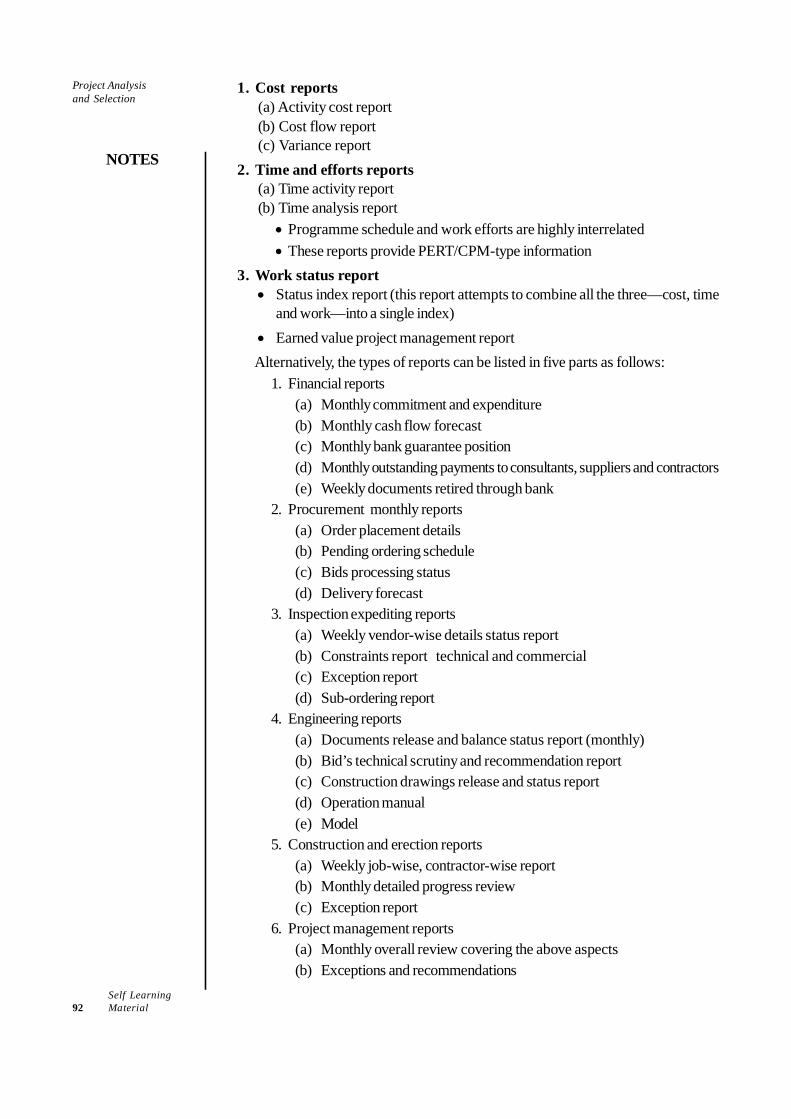
Self Learning92 Material
Project Analysisand Selection
NOTES
1. Cost reports(a) Activity cost report(b) Cost flow report(c) Variance report
2. Time and efforts reports(a) Time activity report(b) Time analysis report
• Programme schedule and work efforts are highly interrelated• These reports provide PERT/CPM-type information
3. Work status report• Status index report (this report attempts to combine all the three—cost, time
and work—into a single index)• Earned value project management reportAlternatively, the types of reports can be listed in five parts as follows:
1. Financial reports(a) Monthly commitment and expenditure(b) Monthly cash flow forecast(c) Monthly bank guarantee position(d) Monthly outstanding payments to consultants, suppliers and contractors(e) Weekly documents retired through bank
2. Procurement monthly reports(a) Order placement details(b) Pending ordering schedule(c) Bids processing status(d) Delivery forecast
3. Inspection expediting reports(a) Weekly vendor-wise details status report(b) Constraints report technical and commercial(c) Exception report(d) Sub-ordering report
4. Engineering reports(a) Documents release and balance status report (monthly)(b) Bid’s technical scrutiny and recommendation report(c) Construction drawings release and status report(d) Operation manual(e) Model
5. Construction and erection reports(a) Weekly job-wise, contractor-wise report(b) Monthly detailed progress review(c) Exception report
6. Project management reports(a) Monthly overall review covering the above aspects(b) Exceptions and recommendations

Self LearningMaterial 93
Project Analysisand Selection
NOTES
The frequency and the details of project control reports are very need specificand therefore, will vary from firm to firm and from project to project. Some generalpoints regarding the reports are outlined as follows.
Reports on Cost and TimeReports on actual cost comparison with the budgeted cost and actual time comparisonwith the budgeted time are relatively straightforward. The interpretation of time reportsis relatively easy. The interpretation of the cost report is somewhat different, for thepossibility that if actual costs are less than the budget, quality may have suffered. Forthis reason, mere comparison of actual cost with the budgeted cost would be oftenmisleading, unless we find a unique method of estimating the costs requirements, in thecontext of both time and quality.
In most cases, the cost reports compare ‘actual costs to-date’ with the ‘budgetedcosts for the work accomplished to-date’. The reports may also show the current estimateof costs for the entire project compared to the budgeted cost for the entire project. Thecurrent estimate is obtained by taking the ‘actual costs-to-date’ and adding in it anestimate of the costs required to complete the project. The latter type of report is calledreview report. It is a useful way of showing how the project is expected to come out.
It is important that actual costs is compared with the budgeted costs of the workdone, which is not necessarily the same as the budgeted costs for the time period. Thedanger of misinterpretation is illustrated in Table 2.10 which shows the actual and thebudgeted costs for a project. As of end September, the actual costs were ` 3,45,000compared to the budgeted cost of ̀ 3,00,000 which indicates a cost overrun of ̀ 45,000.However, the budgeted cost of the work actually completed through September wasonly ̀ 2,60,000, so the true overrun was ̀ 85,000.
Table 2.10 Cost Variances
Month Budgeted cost
Actual cost
Budgeted cost for work done
Spending variance
Schedule variance
Total variance
August 2,25,000 2,75,000 2,00,000 –50,000 –25,000 –75,000 September 3,00,000 3,45,000 2,60,000 –45,000 –40,000 –85,000 October 3,65,000 4,15,000 3,10,000 –50,000 –55,000 –105,000
Note: Negative variance means adverse variance.Spending variance = Budgeted Costs – Actual CostsScheduled Variance = Budgeted Costs for Work Done – Budgeted CostsTotal Variance = Budgeted Cost for Work Done – Actual Costs (or Spending Variance + Schedule Variance)
2.8.2 Feasibility and Detailed Project Report
Feasibility study report
Feasibility study report is prepared to support the investment proposal. Feasibilities relatedto technical, commercial and financial aspects are examined in detail by the experts.Feasibility study report is termed as a techno-economic feasibility study.
It is the primary report for the formulation of the investment proposal. Investmentdecisions are taken based on the details incorporated in the study. Thus feasibility isprepared only for the formulation and investment decision-making. The first step infeasibility study is the needs analysis. The purpose is to define overall objectives of thesystem proposed to be designed. The second and perhaps the most important thing issystem identification. This is referred to as activity analysis.
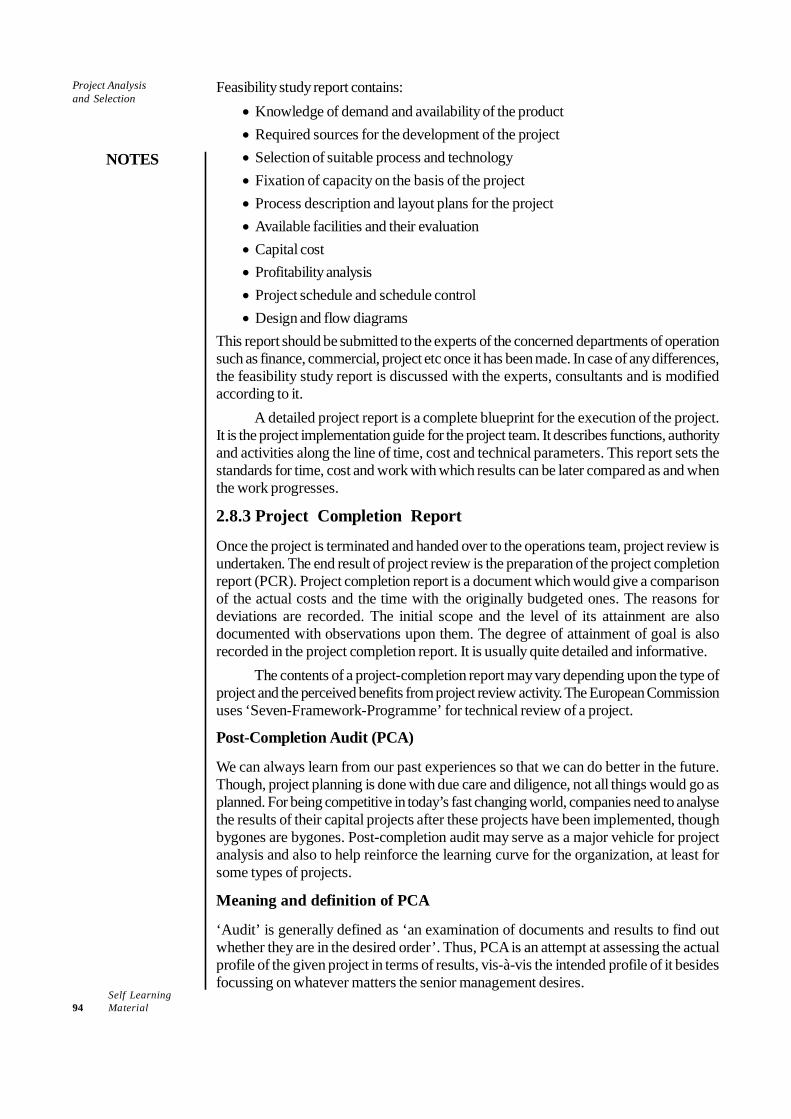
Self Learning94 Material
Project Analysisand Selection
NOTES
Feasibility study report contains:• Knowledge of demand and availability of the product• Required sources for the development of the project• Selection of suitable process and technology• Fixation of capacity on the basis of the project• Process description and layout plans for the project• Available facilities and their evaluation• Capital cost• Profitability analysis• Project schedule and schedule control• Design and flow diagrams
This report should be submitted to the experts of the concerned departments of operationsuch as finance, commercial, project etc once it has been made. In case of any differences,the feasibility study report is discussed with the experts, consultants and is modifiedaccording to it.
A detailed project report is a complete blueprint for the execution of the project.It is the project implementation guide for the project team. It describes functions, authorityand activities along the line of time, cost and technical parameters. This report sets thestandards for time, cost and work with which results can be later compared as and whenthe work progresses.
2.8.3 Project Completion Report
Once the project is terminated and handed over to the operations team, project review isundertaken. The end result of project review is the preparation of the project completionreport (PCR). Project completion report is a document which would give a comparisonof the actual costs and the time with the originally budgeted ones. The reasons fordeviations are recorded. The initial scope and the level of its attainment are alsodocumented with observations upon them. The degree of attainment of goal is alsorecorded in the project completion report. It is usually quite detailed and informative.
The contents of a project-completion report may vary depending upon the type ofproject and the perceived benefits from project review activity. The European Commissionuses ‘Seven-Framework-Programme’ for technical review of a project.
Post-Completion Audit (PCA)
We can always learn from our past experiences so that we can do better in the future.Though, project planning is done with due care and diligence, not all things would go asplanned. For being competitive in today’s fast changing world, companies need to analysethe results of their capital projects after these projects have been implemented, thoughbygones are bygones. Post-completion audit may serve as a major vehicle for projectanalysis and also to help reinforce the learning curve for the organization, at least forsome types of projects.
Meaning and definition of PCA
‘Audit’ is generally defined as ‘an examination of documents and results to find outwhether they are in the desired order’. Thus, PCA is an attempt at assessing the actualprofile of the given project in terms of results, vis-à-vis the intended profile of it besidesfocussing on whatever matters the senior management desires.
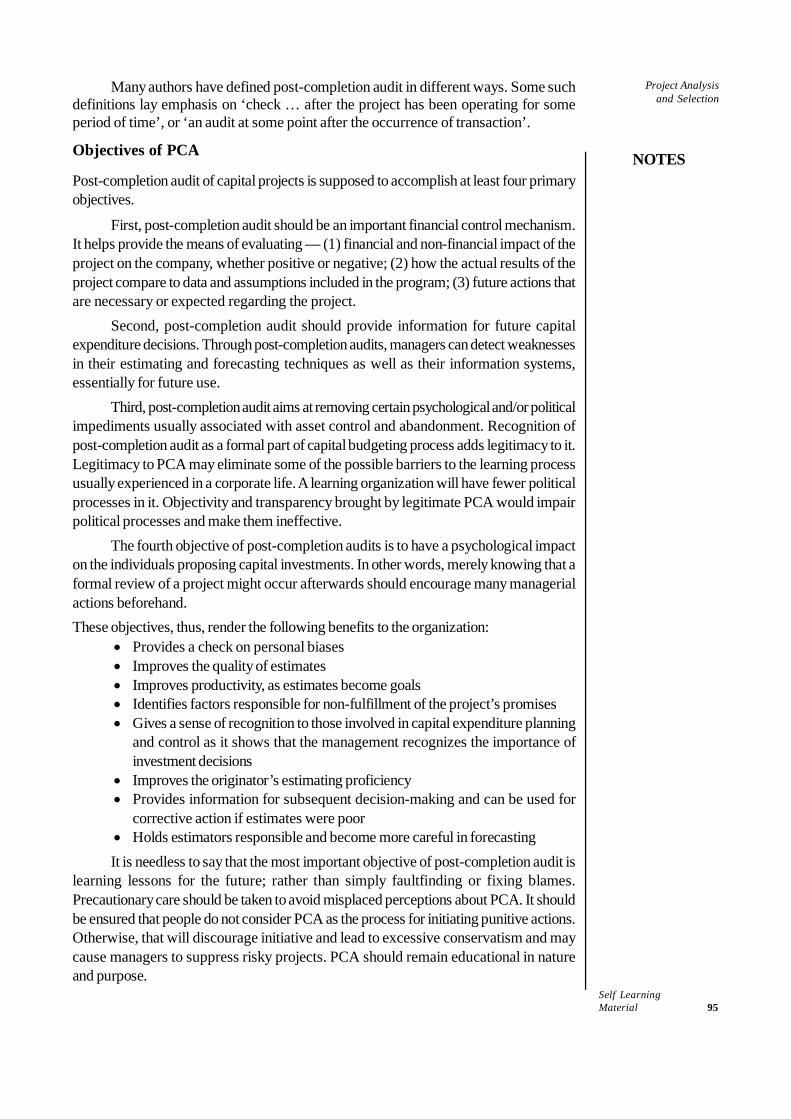
Self LearningMaterial 95
Project Analysisand Selection
NOTES
Many authors have defined post-completion audit in different ways. Some suchdefinitions lay emphasis on ‘check … after the project has been operating for someperiod of time’, or ‘an audit at some point after the occurrence of transaction’.
Objectives of PCA
Post-completion audit of capital projects is supposed to accomplish at least four primaryobjectives.
First, post-completion audit should be an important financial control mechanism.It helps provide the means of evaluating — (1) financial and non-financial impact of theproject on the company, whether positive or negative; (2) how the actual results of theproject compare to data and assumptions included in the program; (3) future actions thatare necessary or expected regarding the project.
Second, post-completion audit should provide information for future capitalexpenditure decisions. Through post-completion audits, managers can detect weaknessesin their estimating and forecasting techniques as well as their information systems,essentially for future use.
Third, post-completion audit aims at removing certain psychological and/or politicalimpediments usually associated with asset control and abandonment. Recognition ofpost-completion audit as a formal part of capital budgeting process adds legitimacy to it.Legitimacy to PCA may eliminate some of the possible barriers to the learning processusually experienced in a corporate life. A learning organization will have fewer politicalprocesses in it. Objectivity and transparency brought by legitimate PCA would impairpolitical processes and make them ineffective.
The fourth objective of post-completion audits is to have a psychological impacton the individuals proposing capital investments. In other words, merely knowing that aformal review of a project might occur afterwards should encourage many managerialactions beforehand.These objectives, thus, render the following benefits to the organization:
• Provides a check on personal biases• Improves the quality of estimates• Improves productivity, as estimates become goals• Identifies factors responsible for non-fulfillment of the project’s promises• Gives a sense of recognition to those involved in capital expenditure planning
and control as it shows that the management recognizes the importance ofinvestment decisions
• Improves the originator’s estimating proficiency• Provides information for subsequent decision-making and can be used for
corrective action if estimates were poor• Holds estimators responsible and become more careful in forecastingIt is needless to say that the most important objective of post-completion audit is
learning lessons for the future; rather than simply faultfinding or fixing blames.Precautionary care should be taken to avoid misplaced perceptions about PCA. It shouldbe ensured that people do not consider PCA as the process for initiating punitive actions.Otherwise, that will discourage initiative and lead to excessive conservatism and maycause managers to suppress risky projects. PCA should remain educational in natureand purpose.
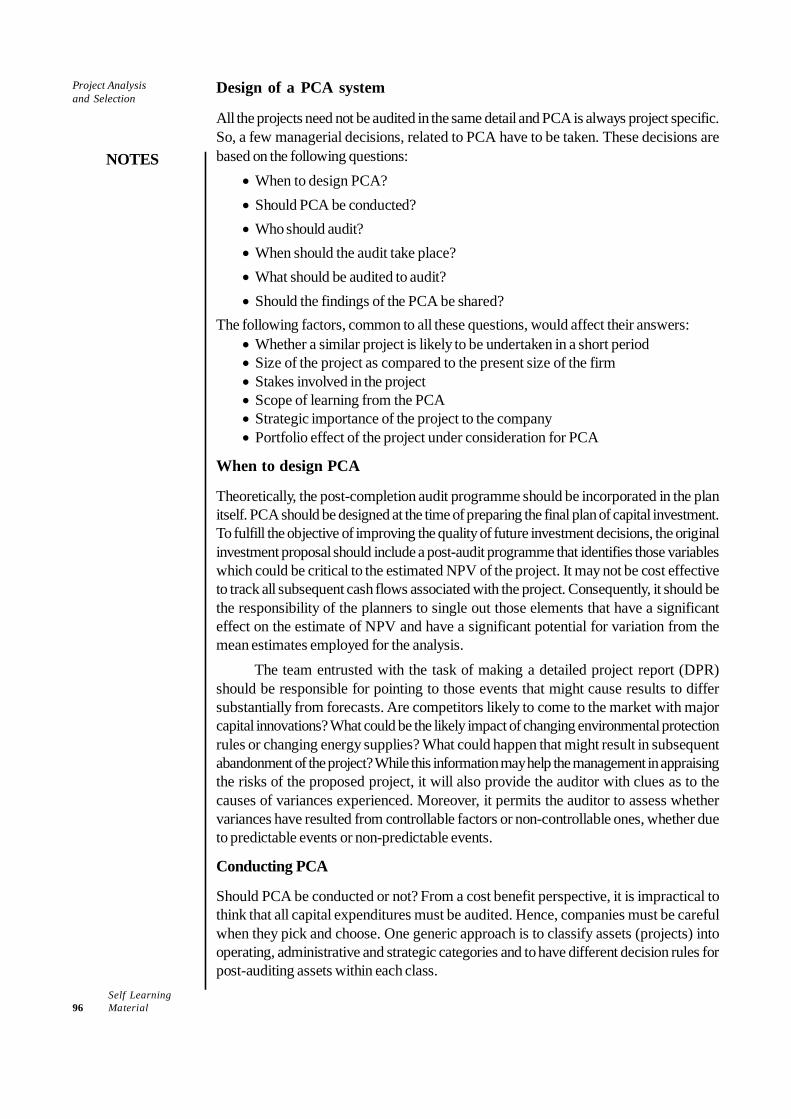
Self Learning96 Material
Project Analysisand Selection
NOTES
Design of a PCA system
All the projects need not be audited in the same detail and PCA is always project specific.So, a few managerial decisions, related to PCA have to be taken. These decisions arebased on the following questions:
• When to design PCA?• Should PCA be conducted?• Who should audit?• When should the audit take place?• What should be audited to audit?• Should the findings of the PCA be shared?
The following factors, common to all these questions, would affect their answers:• Whether a similar project is likely to be undertaken in a short period• Size of the project as compared to the present size of the firm• Stakes involved in the project• Scope of learning from the PCA• Strategic importance of the project to the company• Portfolio effect of the project under consideration for PCA
When to design PCA
Theoretically, the post-completion audit programme should be incorporated in the planitself. PCA should be designed at the time of preparing the final plan of capital investment.To fulfill the objective of improving the quality of future investment decisions, the originalinvestment proposal should include a post-audit programme that identifies those variableswhich could be critical to the estimated NPV of the project. It may not be cost effectiveto track all subsequent cash flows associated with the project. Consequently, it should bethe responsibility of the planners to single out those elements that have a significanteffect on the estimate of NPV and have a significant potential for variation from themean estimates employed for the analysis.
The team entrusted with the task of making a detailed project report (DPR)should be responsible for pointing to those events that might cause results to differsubstantially from forecasts. Are competitors likely to come to the market with majorcapital innovations? What could be the likely impact of changing environmental protectionrules or changing energy supplies? What could happen that might result in subsequentabandonment of the project? While this information may help the management in appraisingthe risks of the proposed project, it will also provide the auditor with clues as to thecauses of variances experienced. Moreover, it permits the auditor to assess whethervariances have resulted from controllable factors or non-controllable ones, whether dueto predictable events or non-predictable events.
Conducting PCA
Should PCA be conducted or not? From a cost benefit perspective, it is impractical tothink that all capital expenditures must be audited. Hence, companies must be carefulwhen they pick and choose. One generic approach is to classify assets (projects) intooperating, administrative and strategic categories and to have different decision rules forpost-auditing assets within each class.
Self LearningMaterial 97
Project Analysisand Selection
NOTES
• Operating assets usually are the responsibility of lower-level managers, are short-run and routine in nature, involve minor resource commitments and are oftenrepetitive. An example might be operating minor office equipment.
• Administrative assets usually are the responsibility of middle mangers, have amedium duration and require moderate resource commitments. An example wouldinclude replacements for manufacturing equipment.
• Strategic assets usually are the responsibility of senior managers, are long-runand non-routine in nature and require major organizational resource commitments.Example includes major plant and equipment, acquisition of an entire business,new R&D undertakings and major advertising campaigns.These criteria appear to acknowledge that the benefits from post-auditing certain
types of assets should surpass the costs in terms of money, time and effort. Also, a firmmay not conduct PCA in case of a particular project if there is no scope for learning, orif similar project is unlikely to be taken up again, or if project is too small, or for someother reasons specific to the project.
Who should audit
A person or a team who would conduct PCA need not be identified at the planning stage,but certain policy decisions must be taken beforehand. The alternative policy decisionsin this regard could be:
• The group that evaluates the project may conduct the PCA.• The project team may conduct the PCA.• Some other internal groups not associated with project planning and implementation
can conduct PCA.• A team representing the planning group, the execution group and the neutral
members can be assigned the task.• An external agency can be entrusted with the task.
In certain cases, a firm may decide to assign the task of performing PCA toa single person or to a team of persons. Each of these alternative policies regardingwho should conduct PCA has its own merits and demerits. We often hear the argumentthat individual(s) conducting a post-completion audit should not have been involved inthe process leading to selection of the capital asset under review. That way, accordingto this line of reasoning, the project can be assessed in an unbiased manner. In contrast,others would argue that managers who are associated with investment decisions arein a better position to interpret data for audit purpose than independent reviewers.Either way, if managers have to use the post-completion audit process as a learningtool for future investments and as a control device for the existing projects (includingthe possibility of abandoning some projects), then those individuals who are responsiblefor selecting projects need to be informed about the post-completion audit process. Infact, the choice should depend on the need and the situation of the firm.
When to audit
How often should capital projects be post-audited and at what point in its life the post-audit should be conducted? Deciding how often to post-audit capital projects is in largepart determined by the type of project under consideration: for example, because of theirimpact on a company, strategic projects should be post-audited over shorter intervalsthan either administrative or operating capital projects. The risk of an asset also should
Self Learning98 Material
Project Analysisand Selection
NOTES
partly determine post-audit frequency. Generally speaking, however, the overall emphasisof a post-audit programme should be on regular and periodic reviews as opposed to one-time, post-completion reviews.
The timing of post-audit partly depends upon the purpose of the audit. If theprimary purpose is to improve the quality of future investment decisions, then the trade-off between the cost of conducting the audit and the value of the lessons to be learnedwould suggest that the audit be delayed until an informative track record has beenestablished. The more the information available, the less costly should be the audit processand the higher the chance that the results of the audit may contribute to the improvementof future investment decisions.
However, if it is anticipated that the audit may set in motion corrective steps tochange the scope or the scale of the project, the audit should probably be moved forwardin time. The costs and the errors of estimate of the audit probably decline over time.Hence, the greater the cost of audit and the greater the increase over time in the expectedvalue of the information gained, the longer the audit should be delayed. However, thecost of corrective steps rises over time. Thus, greater the probability that a correctivestep will be taken and greater the expected impact of that corrective step on the presentvalue of the firm, the sooner the audit should be undertaken.
Moreover, multiple post-audits of investment project are justified primarily if thereis a potential corrective action to be undertaken. Given the information developed in thefirst audit, the desirability of further audits can be envisaged based on the fact that theinformation gained will generate a corrective step or would provide learning value forthe organization. Indian Railways follow the policy of triple post-audit programme andconduct post-completion audits in the sixth, eleventh and sixteenth years of the completionof major projects. The trend of projections coming true is the factor, which determinesthe next phase of the project. At the same time, as a result of the PCA, new projects ofsimilar type also gain in terms of quality of estimates.
What to audit
As cited earlier, factors such as size of the project, stake involved, scope of learning andstrategic importance of the project for the organization, should be taken into accountwhile deciding the details of the PCA. A full PCA will conduct inquiry about the strategicand policy decision along with questioning assumptions and MIS, so that the true reasonsfor the gap between the actual and the plan can be identified.
Sharing the findings of the PCA
Whether to share the findings of the PCA is one of the very sensitive decisions to be takenby the higher management to whom PCA report is submitted. It is not necessary that thefindings of the PCA be shared with all the concerned parties. The need and sensitivity ofthe matter must be taken into account while deciding on this issue. There may exist achance that the morale of the project team is badly affected if the PCA findings arerevealed. Such possibilities may be avoided by maintaining secrecy, but the required actionstill has to be initiated by the top authority so that future plans become more realistic. But,under such circumstances, the firm should get the post-auditing done by one senior singleofficer who was not associated with the project work. It may not be desirable to announcethe outcome of the PCA of the first modernization phase, especially if its finding is notencouraging, if the project has a strategic importance; rather than financial, and if the firm
Self LearningMaterial 99
Project Analysisand Selection
NOTES
has already planned a few more phases of modernization which are in the pipeline. Strategicprojects are such that financial estimates may not be reliable but still they are desirable.
PCA Procedure
The auditor of the completed project has to be very careful in carrying out the audit. He/she must ensure that all procedures are followed and that full justice is done to the work.Some points related to the PCA procedure are described as follows:
• Collection of appropriate information
The starting point for collecting post-audit information is the project completion report.Post-completion audits generally compare the projected data with the accounting datacollected through regular MIS. The MIS needs to be geared up so that projected cashflows from the original capital budget can be compared with the actual cash flowsrealized during the period elapsed before the PCA of the project has started. Anotherpoint that needs to be kept in mind is that the auditor needs to collect information aboutthe incremental cash flows or the cost, rather than the total cost figures. Incrementalcash flow figures are readily available for green-field projects but it is not so easy for theprojects in an existing plant. The data in the latter case needs to be appropriately dealtwith to arrive at the incremental cost figures.
• Recasting data
Either collected data or budgeted data should be recast before it is compared. Thesignificant time gap and a host of factors which were not considered at the budgetingstage would warrant the recasting of data, for example, inflation should be adjustedbefore variances are calculated. Sales mix difference due to external factors also shouldbe taken into account. In the absence of adjustment for those ‘external’ factors, thequality of audit would suffer. Inflation adjustment is explained subsequently in this section.
• Comparison of projected financial parameters with actuals
This is the next important step in the post-completion audit procedure. There are fourtechniques available for the comparison of the actual with the projected financialparameters. They are explained subsequently in this unit. Comparison is the startingpoint from which the real audit begins. Only comparable data is compared. Adjustmentsare first done for inflation and external factors before comparison is carried out underany method. Methods described later are not mutually exclusive. More than one methodmay be applied for the comparison if there are such requirements. A broad level ROI orNPV comparison can be done initially followed by a detailed cost variance or cash flowvariance analysis. Comparison is a step-by-step approach so that causes are identifiedsystematically with minimum cost, time and energy.
• Establish the possible causes of variance
Once the variance figures are calculated, if they are significant, the possible causes forthe same are searched. An auditor goes by exceptions and from there he tries to reachthe root causes of deviations. This process of investigation can be effective only if theauditor possesses skills of inquisitiveness and skills of persuasion and negotiation. Asummary report of the PCA findings should also be prepared.
• Final recommendations
Once the causes are ascertained, the post-completion auditor can give hisrecommendations based on which the manager may take decisions for cash flow
Self Learning100 Material
Project Analysisand Selection
NOTES
forecasting to reinvest or abandon the ongoing project. Hopefully, after post-completionaudit, cash flow prediction and project evaluation become more accurate.
• Inflation adjustment
Bare actual data cannot be easily compared with the original plan data because moreoften the planned data is at current price and do not factor the inflation in it. The differencebetween the two can be partly attributed to inflation. Inflation effect must be removedfrom the actual before the data analysis is further carried out. How is inflation effectremoved? A foolproof methodology for the adjustment of inflation is not available but thefollowing suggestions can be considered.
1. For a broad level analysis, inflation can be adjusted by calculating profits foractual period at base level margin. Alternatively, base level profit can be calculatedat actual period margin. One Indian company conducted a post-completion auditin 1986–87 for a project which was planned in 1980–81. As per common practice,inflation was ignored completely at the planning stage and all budget data wasbased on current price. Data collected for the PCA purpose was:
Gross margin of 1986–87 Gross margin of 1980–81 Capital expenditure ROI without inflation adjustment
` 21,135 lakh ` 5,122 lakh ` 36,849 lakh 43.46 per cent (21,135 – 5122) ÷ 36,849
Inflation can be adjusted in either the base value or in the current value to bringboth the values at the same time. If we adjust inflation in the base value to bringit to the current value, then we need to compound the base value at the rate ofinflation for the number of years. In this example, if we assume an inflation of 10per cent, the number of years is six (1986–87 less 1980–81).ROI with inflation adjustment:Gross margin of 1986–87 profit at 1980–81 profitability, using equation 2.24 (presentvalue equation):
( )niFVPV+
=1 ... (2.24)
( )930,11
1.01135,21
6 =+
=PV
ROI = (11,930 – 5,122) ÷ 36,849 = 18.48%Gross margin of 1980–81 profit at 1986–87 profitability using the future valueequation:FV = PV × (1 + i)n ... (2.25)
= 5,122 × (1 + 0.10)6 = 9,074ROI = (21,135 – 9,074) ÷ 36,849 = 32.73%It is the choice of the auditor whether to adjust inflation in base year values or invalues of the year when the PCA was conducted. The choice has influence onthe calculation of return on investment. It is implicitly assumed in this method ofinflation adjustment that, (a) the margin difference is only due to inflationaryeffect on income and expenses and (b) there was no change in the sales-mixduring the period.
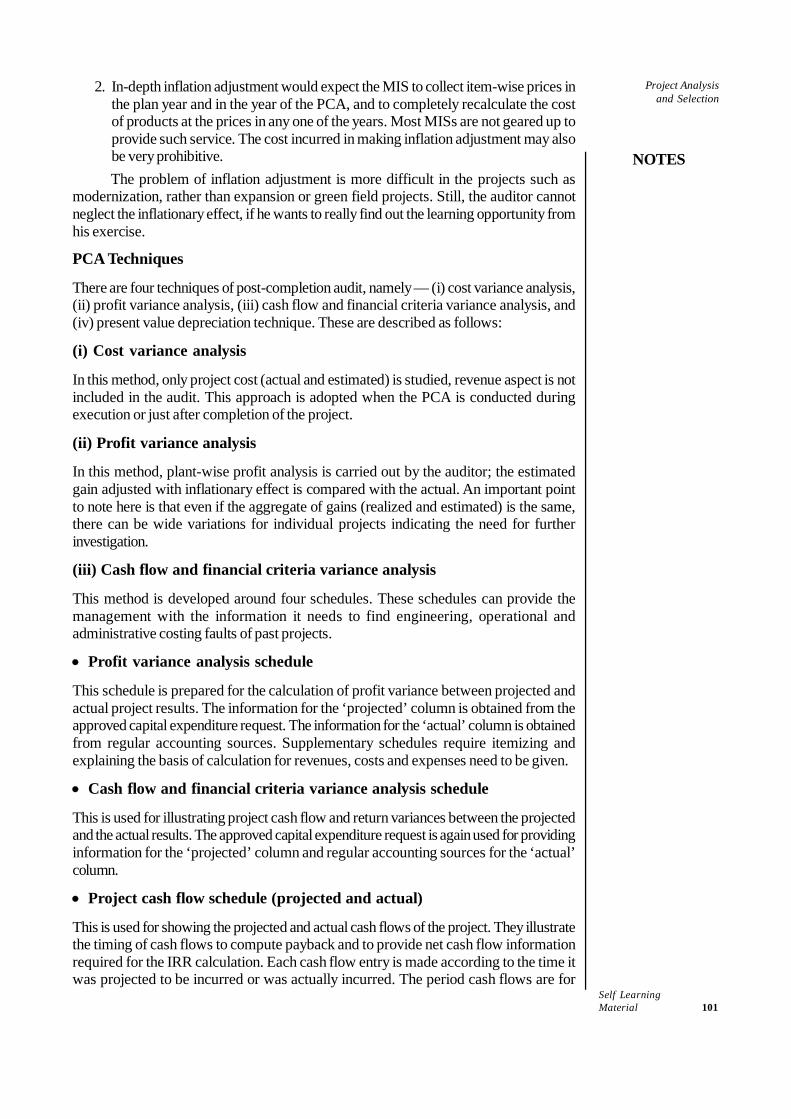
Self LearningMaterial 101
Project Analysisand Selection
NOTES
2. In-depth inflation adjustment would expect the MIS to collect item-wise prices inthe plan year and in the year of the PCA, and to completely recalculate the costof products at the prices in any one of the years. Most MISs are not geared up toprovide such service. The cost incurred in making inflation adjustment may alsobe very prohibitive.The problem of inflation adjustment is more difficult in the projects such as
modernization, rather than expansion or green field projects. Still, the auditor cannotneglect the inflationary effect, if he wants to really find out the learning opportunity fromhis exercise.
PCA Techniques
There are four techniques of post-completion audit, namely — (i) cost variance analysis,(ii) profit variance analysis, (iii) cash flow and financial criteria variance analysis, and(iv) present value depreciation technique. These are described as follows:
(i) Cost variance analysis
In this method, only project cost (actual and estimated) is studied, revenue aspect is notincluded in the audit. This approach is adopted when the PCA is conducted duringexecution or just after completion of the project.
(ii) Profit variance analysis
In this method, plant-wise profit analysis is carried out by the auditor; the estimatedgain adjusted with inflationary effect is compared with the actual. An important pointto note here is that even if the aggregate of gains (realized and estimated) is the same,there can be wide variations for individual projects indicating the need for furtherinvestigation.
(iii) Cash flow and financial criteria variance analysis
This method is developed around four schedules. These schedules can provide themanagement with the information it needs to find engineering, operational andadministrative costing faults of past projects.
• Profit variance analysis schedule
This schedule is prepared for the calculation of profit variance between projected andactual project results. The information for the ‘projected’ column is obtained from theapproved capital expenditure request. The information for the ‘actual’ column is obtainedfrom regular accounting sources. Supplementary schedules require itemizing andexplaining the basis of calculation for revenues, costs and expenses need to be given.
• Cash flow and financial criteria variance analysis schedule
This is used for illustrating project cash flow and return variances between the projectedand the actual results. The approved capital expenditure request is again used for providinginformation for the ‘projected’ column and regular accounting sources for the ‘actual’column.
• Project cash flow schedule (projected and actual)
This is used for showing the projected and actual cash flows of the project. They illustratethe timing of cash flows to compute payback and to provide net cash flow informationrequired for the IRR calculation. Each cash flow entry is made according to the time itwas projected to be incurred or was actually incurred. The period cash flows are for
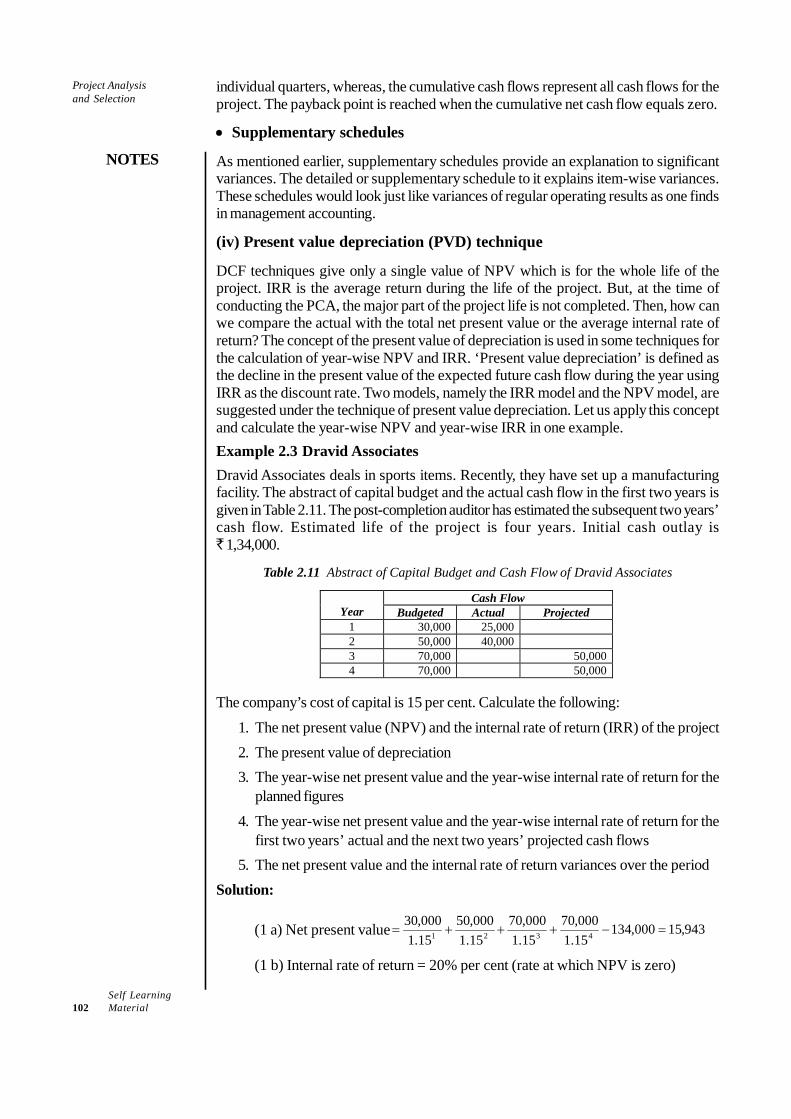
Self Learning102 Material
Project Analysisand Selection
NOTES
individual quarters, whereas, the cumulative cash flows represent all cash flows for theproject. The payback point is reached when the cumulative net cash flow equals zero.
• Supplementary schedules
As mentioned earlier, supplementary schedules provide an explanation to significantvariances. The detailed or supplementary schedule to it explains item-wise variances.These schedules would look just like variances of regular operating results as one findsin management accounting.
(iv) Present value depreciation (PVD) technique
DCF techniques give only a single value of NPV which is for the whole life of theproject. IRR is the average return during the life of the project. But, at the time ofconducting the PCA, the major part of the project life is not completed. Then, how canwe compare the actual with the total net present value or the average internal rate ofreturn? The concept of the present value of depreciation is used in some techniques forthe calculation of year-wise NPV and IRR. ‘Present value depreciation’ is defined asthe decline in the present value of the expected future cash flow during the year usingIRR as the discount rate. Two models, namely the IRR model and the NPV model, aresuggested under the technique of present value depreciation. Let us apply this conceptand calculate the year-wise NPV and year-wise IRR in one example.Example 2.3 Dravid AssociatesDravid Associates deals in sports items. Recently, they have set up a manufacturingfacility. The abstract of capital budget and the actual cash flow in the first two years isgiven in Table 2.11. The post-completion auditor has estimated the subsequent two years’cash flow. Estimated life of the project is four years. Initial cash outlay is` 1,34,000.
Table 2.11 Abstract of Capital Budget and Cash Flow of Dravid Associates
Cash Flow Year Budgeted Actual Projected
1 30,000 25,000 2 50,000 40,000 3 70,000 50,000 4 70,000 50,000
The company’s cost of capital is 15 per cent. Calculate the following:
1. The net present value (NPV) and the internal rate of return (IRR) of the project2. The present value of depreciation3. The year-wise net present value and the year-wise internal rate of return for the
planned figures4. The year-wise net present value and the year-wise internal rate of return for the
first two years’ actual and the next two years’ projected cash flows5. The net present value and the internal rate of return variances over the period
Solution:
(1 a) Net present value 943,15000,13415.1000,70
15.1000,70
15.1000,50
15.1000,30
4321 =−+++=
(1 b) Internal rate of return = 20% per cent (rate at which NPV is zero)
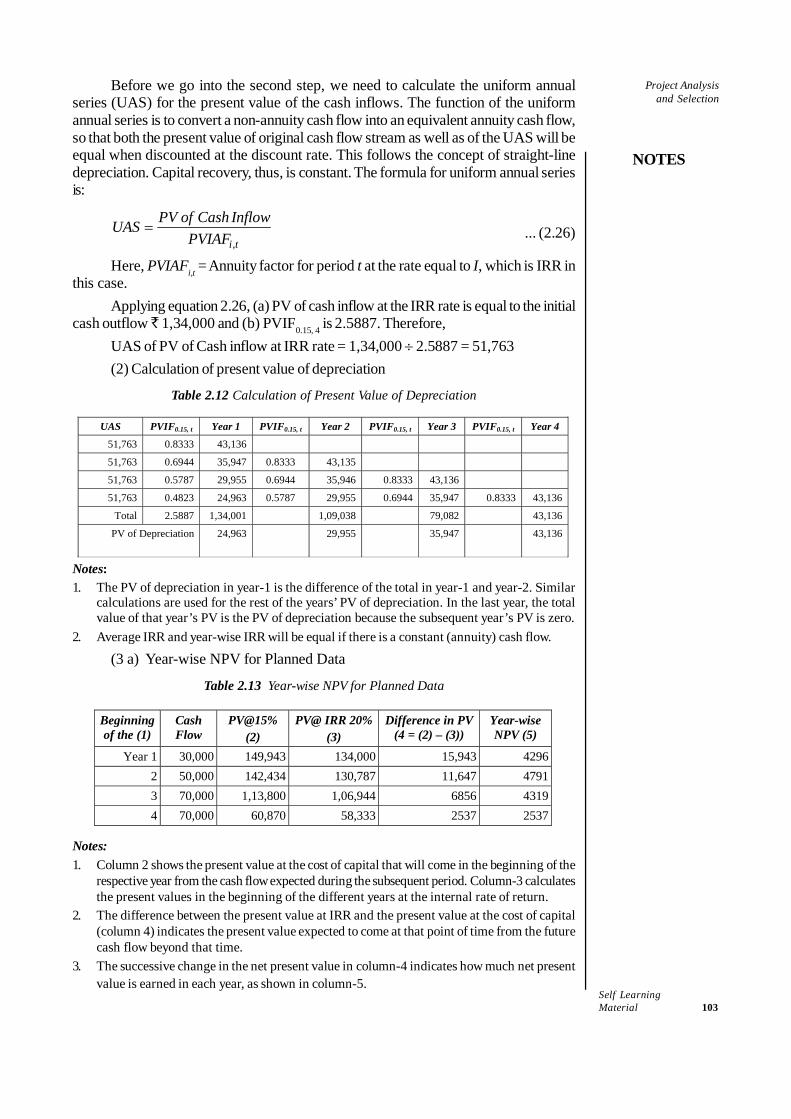
Self LearningMaterial 103
Project Analysisand Selection
NOTES
Before we go into the second step, we need to calculate the uniform annualseries (UAS) for the present value of the cash inflows. The function of the uniformannual series is to convert a non-annuity cash flow into an equivalent annuity cash flow,so that both the present value of original cash flow stream as well as of the UAS will beequal when discounted at the discount rate. This follows the concept of straight-linedepreciation. Capital recovery, thus, is constant. The formula for uniform annual seriesis:
,i t
PV of Cash InflowUASPVIAF
= ... (2.26)
Here, PVIAFi,t = Annuity factor for period t at the rate equal to I, which is IRR inthis case.
Applying equation 2.26, (a) PV of cash inflow at the IRR rate is equal to the initialcash outflow ̀ 1,34,000 and (b) PVIF0.15, 4 is 2.5887. Therefore,
UAS of PV of Cash inflow at IRR rate = 1,34,000 ÷ 2.5887 = 51,763(2) Calculation of present value of depreciation
Table 2.12 Calculation of Present Value of Depreciation
UAS PVIF0.15, t Year 1 PVIF0.15, t Year 2 PVIF0.15, t Year 3 PVIF0.15, t Year 4
51,763 0.8333 43,136
51,763 0.6944 35,947 0.8333 43,135
51,763 0.5787 29,955 0.6944 35,946 0.8333 43,136
51,763 0.4823 24,963 0.5787 29,955 0.6944 35,947 0.8333 43,136
Total 2.5887 1,34,001 1,09,038 79,082 43,136
PV of Depreciation
24,963 29,955 35,947 43,136
Notes:1. The PV of depreciation in year-1 is the difference of the total in year-1 and year-2. Similar
calculations are used for the rest of the years’ PV of depreciation. In the last year, the totalvalue of that year’s PV is the PV of depreciation because the subsequent year’s PV is zero.
2. Average IRR and year-wise IRR will be equal if there is a constant (annuity) cash flow.
(3 a) Year-wise NPV for Planned Data
Table 2.13 Year-wise NPV for Planned Data
Beginning of the (1)
Cash Flow
PV@15% (2)
PV@ IRR 20%(3)
Difference in PV (4 = (2) – (3))
Year-wise NPV (5)
Year 1 30,000 149,943 134,000 15,943 42962 50,000 142,434 130,787 11,647 47913 70,000 1,13,800 1,06,944 6856 43194 70,000 60,870 58,333 2537 2537
Notes:1. Column 2 shows the present value at the cost of capital that will come in the beginning of the
respective year from the cash flow expected during the subsequent period. Column-3 calculatesthe present values in the beginning of the different years at the internal rate of return.
2. The difference between the present value at IRR and the present value at the cost of capital(column 4) indicates the present value expected to come at that point of time from the futurecash flow beyond that time.
3. The successive change in the net present value in column-4 indicates how much net presentvalue is earned in each year, as shown in column-5.
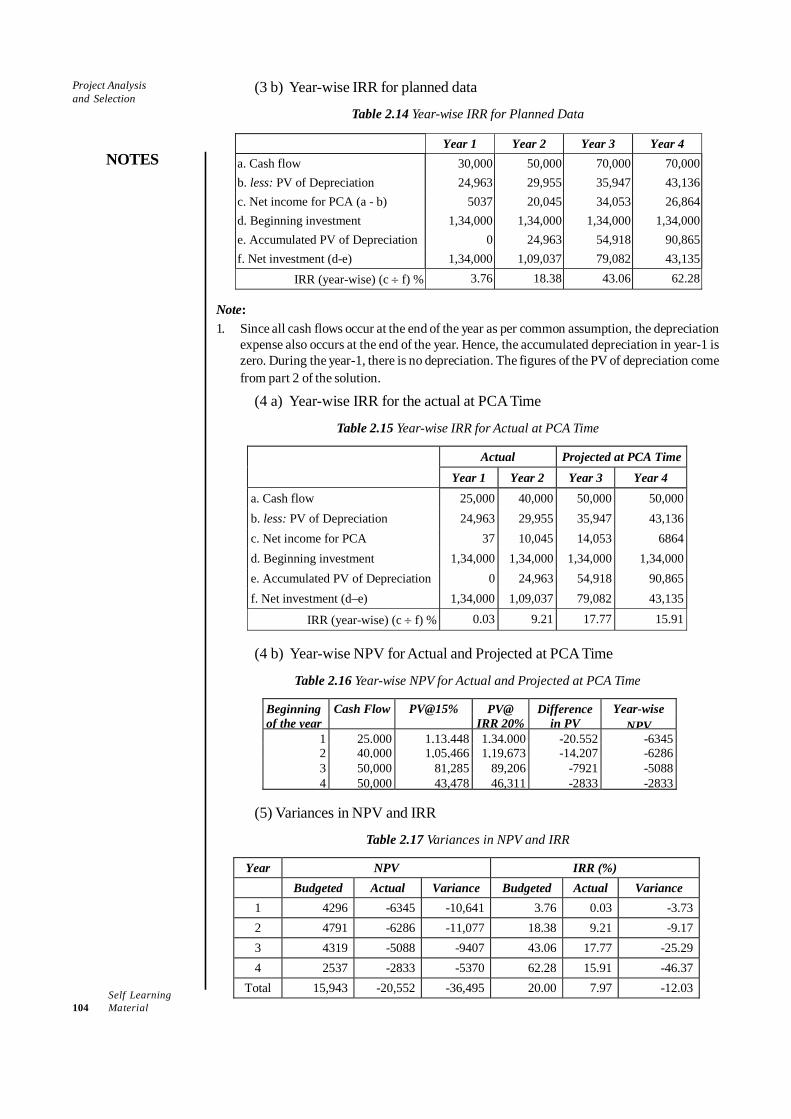
Self Learning104 Material
Project Analysisand Selection
NOTES
(3 b) Year-wise IRR for planned data
Table 2.14 Year-wise IRR for Planned Data
Year 1 Year 2 Year 3 Year 4 a. Cash flow 30,000 50,000 70,000 70,000b. less: PV of Depreciation 24,963 29,955 35,947 43,136c. Net income for PCA (a - b) 5037 20,045 34,053 26,864d. Beginning investment 1,34,000 1,34,000 1,34,000 1,34,000e. Accumulated PV of Depreciation 0 24,963 54,918 90,865f. Net investment (d-e) 1,34,000 1,09,037 79,082 43,135
IRR (year-wise) (c ÷ f) % 3.76 18.38 43.06 62.28
Note:1. Since all cash flows occur at the end of the year as per common assumption, the depreciation
expense also occurs at the end of the year. Hence, the accumulated depreciation in year-1 iszero. During the year-1, there is no depreciation. The figures of the PV of depreciation comefrom part 2 of the solution.
(4 a) Year-wise IRR for the actual at PCA Time
Table 2.15 Year-wise IRR for Actual at PCA Time
Actual Projected at PCA Time
Year 1 Year 2 Year 3 Year 4 a. Cash flow 25,000 40,000 50,000 50,000b. less: PV of Depreciation 24,963 29,955 35,947 43,136c. Net income for PCA 37 10,045 14,053 6864d. Beginning investment 1,34,000 1,34,000 1,34,000 1,34,000e. Accumulated PV of Depreciation 0 24,963 54,918 90,865f. Net investment (d–e) 1,34,000 1,09,037 79,082 43,135
IRR (year-wise) (c ÷ f) % 0.03 9.21 17.77 15.91
(4 b) Year-wise NPV for Actual and Projected at PCA Time
Table 2.16 Year-wise NPV for Actual and Projected at PCA Time
Beginning of the year
Cash Flow PV@15% PV@ IRR 20%
Difference in PV
Year-wise NPV
1 25,000 1,13,448 1,34,000 -20,552 -63452 40,000 1,05,466 1,19,673 -14,207 -62863 50,000 81,285 89,206 -7921 -50884 50,000 43,478 46,311 -2833 -2833
(5) Variances in NPV and IRR
Table 2.17 Variances in NPV and IRR
Year NPV IRR (%) Budgeted Actual Variance Budgeted Actual Variance
1 4296 -6345 -10,641 3.76 0.03 -3.732 4791 -6286 -11,077 18.38 9.21 -9.173 4319 -5088 -9407 43.06 17.77 -25.294 2537 -2833 -5370 62.28 15.91 -46.37
Total 15,943 -20,552 -36,495 20.00 7.97 -12.03
Self LearningMaterial 105
Project Analysisand Selection
NOTES
One may feel that the purpose of the PCA can be served by the comparison ofthe cash flow and an auditor need not carry out the cumbersome exercise of calculatingthe year-wise net present value or year-wise internal rate of return. But, how muchshareholder value is lost or gained every year till the date of conducting post-completionaudit, as compared to what was expected, can only be known if the year-wise NPVs orIRRs are compared. The difference in time value will also get reflected if discountedcash flow methods are used for the purpose of audit.
PCA Investigation
The project completion report will provide information on the deviations in the projectcost, time and performance parameters. The variance analysis report will provideinformation on the deviations in operating income and cash flows from the project.These reports provide pointers to the PCA auditor. The exception items draw her attention.The PCA auditor assumes the inquisitive posture for those exceptions and from there,she tries to get to the root of variances. For example:
(i) A low production volume and a low capacity utilization could be attributed tomany factors; some of these would include low demand, inadequate supply ofpower, inconsistent supply of raw materials, unavailability of trained workers, lowmorale of workers, unsuitable quality of resources, lack of maintenance facility,unavailability of spares, wrong assessment of technology, poor working conditions,and so on. The list can be long. If wrong assessment of technology is found to beone of the responsible factors, then the auditor will further investigate in that line.He/she may find that the assessment of technology went wrong because of manyfactors such as lack of expertise of the study group members, negligence of thestudy group, the study group studied the technology but the study sample was ofmuch less capacity than planned for the company, the study sample worked in adifferent environment but that aspect was not considered, the study group wasmore eager and biased for the proposal either because some members had vestedinterest in it or because the CEO had shown keen interest in the project.
(ii) The low order booking may have been the factor responsible for the low production.Further inquiry in this direction may reveal that one or some of the factors wereprimarily responsible for it, for example, low demand could be due to reasonssuch as wrong assessment of market and competition, unsuitability of quality,segmentation problem, weakness in deciding the marketing policies, non-recognitionof business politics, failure in estimating demand-sensitive factors, lack of efforton the part of marketing staff, lack of coordination between the advertising, othersales promotion efforts, sales promotion material, channel of distribution, trainingof sales staff and others. The auditor has to carefully isolate the factors primarilyresponsible for the lack of order booking.The auditor might as well have to question even the choice of project vis-à-vis its
alternatives. The auditor has to be careful at this stage. Though a broad-based opinionabout the appropriateness of the current choice over its alternatives can be possible ifthe project similar to the one not accepted by the firm is experimented by another firmand its data is available. Still it may be advisable to desist from such comparison. Anyamount of such comparison would be futile and inappropriate because the actual data ofthe foregone projects is just not available for comparison. Therefore, the auditor should
Self Learning106 Material
Project Analysisand Selection
NOTES
restrict his investigation to the project that is selected, implemented and commissionedand should not go into comparing the accepted project with the foregone projects.
The investigative skills of the PCA auditor may take her from the apparent causesrevealed in the post-completion report and the variance analysis report to the root ofcauses. The investigative skill of the auditor is of vital importance in carrying out thisimmensely important step of the audit. In the process of investigation, the auditor wouldquestion policies, factors considered in designing the policies, role of people and theirequations with other people, organizational system and culture, procedures, assumptionsand their basis, forecast and calculations. Everything and every one come under scrutiny.
Some Issues in PCA
The following issues are also important, though some of them are repeated:
1. Cost of PCA
• A PCA team will include some professional and supporting clerical staff. Salarypaid and other expenses borne on them would form a part of the PCA cost.
• Another cost element is associated with accumulation, storage and maintenanceof volumes of auditable data.
• As long as the post-completion audit is on, the project team is worried and anxiouspsychologically. It also leads to distraction from their project work.
• Another cost of PCA would be the dip in the morale of the project team if theaudit report were not written in a constructive tone. A vindictive approach wouldbe counterproductive.
2. Human issues
Most of the issues related to the human aspects of post-completion audit are raisedearlier while discussing the policy aspects of the post-completion audit. They are brieflymentioned here for laying emphasis.
• Faultfinding approach vs constructive approach: The post-completion auditorhas to ensure that people do not perceive his/her function as the faultfindingmission. A constructive approach is necessary for deriving the best out of thePCA activity.
• Whether the auditor should be independent of the project team or part ofit: Each has its own advantages and disadvantages. An external auditor is likelyto be objective and impartial. But, if the project is designed in phases, while auditingthe first phase, an auditor who is part of the project team can gain valuableinsights which will be beneficial in the succeeding phases.
• Whether to share audit findings: If the findings are adverse, care should betaken while sharing the audit findings so that it does not affect the project teammorale (who might be working on some other project). Further, the audit findingsof the projects of a strategic nature which are crucial to the future of a companyneed to be shared selectively.
• Whether one-member or multi-member audit team: This decision is oftenmade on the basis of whether the audit findings need to be shared with a few ormany.
Self LearningMaterial 107
Project Analysisand Selection
NOTES
• Fears of the project team members: As regards the external auditor, theymay fear that the auditor would not understand several intricate issues of practicalsignificance. For internal auditors, they may feel that the auditor has some personalmotive or an axe to grind.
• Sometimes, project team members may pursue their own individual motives thatmay be in conflict with the company goals.
• Auditors should avoid being embroiled in conflicts and rivalries among projectteam members.
3. Limitations of PCA
• Lack of incremental costing information, especially for projects in existing plants,is common. The regular MIS is geared to obtaining full costing information.
• For mutually exclusive projects, the actual data for the foregone alternative is notavailable. This makes comparison almost impossible. The auditor cannot reallyverify whether the chosen alternative was right as compared to the previous one.
• While comparing the realized data with the predicted performance of the project,ordinarily the performance realizable in the absence of the project is ignored. Thisleads to only one-sided operational comparisons.
• In many companies, discounted cash flow techniques are used during cash flowestimation, but the same is not used during the PCA. This discrepancy leads toinaccurate audit findings.
• If the intentions of the management while having the audit conducted is not bonafide or if they were defensive about the audit results, the audit would not serve itspurpose.
• Another obvious limitation of PCA is the credibility of the project team in the eyesof the management.
PCR and PCA Format
Comprehensiveness and readability of final report is important. The details in report willdepend on who gets the report.
Project Report for Obtaining Finance
A firm needs to prepare a business plan or a project report or a prospectus for obtainingfunds for financing a project. Lending institutions require submission of a detailed set ofdocuments for their evaluation so that they can take a decision whether to finance theproject or not. If public issue of security is planned, then one must prepare the ‘offerdocument’ or the ‘prospectus’ as per the guidelines issued by SEBI. Contents of reportssubmitted along with loan application to lending institutions and contents of prospectusare quite similar because both documents attempt to convince the potential supplier offunds about the worth of the project. Application for funds must provide the followinginformation:
1. About the promoters2. About the management and management structure3. Company background4. Activities and past performance of the company
Self Learning108 Material
Project Analysisand Selection
NOTES
5. Details of projects currently under implementation along with their financing6. About the project
• Type of project and project capacity• Technical arrangements• Location and site• Resource planning (material, labour, power)• Implementation schedule
7. Marketing plan• Demand analysis, domestic and export• Supply analysis• Market potential• Selling arrangement, if any
8. Production cost estimates and sales estimates, along with detailed assumptions9. Financial information
• Breakdown of project cost• Means of financing• Details on the proposal for raising share capital, loans and debentures
(including arrangements made so far)• Promoters’ contribution and list of people who will provide promoters' share• Details of securities proposed• If internal funds are planned, give estimates and the basis for estimates
10. Project cash flow projection on timeline (at least for the period of loan)• Depreciation schedule as per Companies Act and as per Income Tax Act• Amortization schedules, if any• Working capital schedule• Projected income statements for business without new project and with new
project• Projected balance sheets for business without new project and with new
project• Cash flow estimate
11. Financial evaluation• Break-even calculation• Interest cover ratio (times-interest-earned)• Debt-service cover ratio (DSCR)• Return on investment (ROI) calculation• Internal rate of return (IRR) calculation
12. Risk assessment• Sensitivity analysis
13. Socio-economic impact of the project with all details14. Environmental impact of the project15. Status of government consents
Please note that internal project evaluation and financial plan presented to thefunding agency need not be the same, for example, internal project evaluation is done forthe life of the project, whereas, loan agencies want financial projections for the period
Check Your Progress
13. What are thecomponents of afinancial report?
14. What is a detailedproject report?
Self LearningMaterial 109
Project Analysisand Selection
NOTES
equal to the loan period; for internal purposes one may use evaluation techniques likepayback period and net present value, whereas, funding agencies may want calculationof internal rate of return. There are several reasons why financial plan for internalpurpose and for funding purpose has to be different.
2.9 SUMMING UP
• Each opportunity of investment is considered ‘capital expenditure’ but not a project.In an efficient investment analysis, one should identify all opportunities, groupthem on the basis of their dependence on each other and then develop alternativesets of projects before taking a project decision.
• The investment proposal, which originates from various departments, is theopportunity.
• The process of grouping opportunities is called formation of projects.• Economic dependence may be of two types in the context of time: (a) two or
more opportunities are present at the same point of time and they are economicallydependent on each other and (b) some future opportunity may be dependent onthe present opportunity.
• The purpose of Project Initiation is to evaluate proposed projects and to reach aconsensus on the projects that are to be selected.
• Market analysis aims at assessing the potential sales revenue from a proposedproject. It is also known as market-feasibility study.
• Situational analysis is especially important if the project proposal is for enhancingthe capacity. It is important where the project proposal involves production andsale of new products and services—new for the company but not new in themarket.
• Demand projection is one of the most important steps in a project feasibility study.• The past trend of supply of goods can be studied and further extrapolated.
Projections so made need to be adjusted with the help of additional informationlike new projects planned by businesses in the economy, import possibility asgoverned by import policy, import tariff and international prices.
• A generic model of situational analysis is popularly known as SWOT analysis,whereS = Strength; W = Weakness; O = Opportunities; T = Threats
• A key aspect of any decision-making situation lies in being able to predict thecircumstances that surround the decision and that situation.
• Where one or few independent factors may not have explanatory power fordemand, just the pattern of demand over time can be studied for forecastingpurposes.
• If there is an ample market demand and not enough supply, the focus should shiftto technology.
• The technology transfer issue has to be addressed in a dual fashion—(a) Whetherthe transfer of technology is possible from the political angle and (b) whethertransfer of technology is possible from the operations (environment) angle.
Self Learning110 Material
Project Analysisand Selection
NOTES
• The required rate of return should be at least equal to the returns from the foregoneopportunity (opportunity cost). This is theoretically the best cut-off rate. It istheoretical because in most situations, the opportunity is foregone and its returnsare not ascertainable. In addition, the opportunity cost approach does not considerthe presence of risk premium in the discount rate of the opportunities.
• The process of building logic (also known as information or knowledge throughmarket research, test marketing, etc.) is also the process of reducing risk. Thus,some risk can be mitigated at the stage of the designing of the project.
• The concept of economic rate of return can be expanded to encompass the socialcost and benefits, thereby calculate the social rate of return. This method ofproject evaluation is also popularly known as social cost-benefit analysis (SCBA).
• All agencies that aim at social welfare, such as government and internationalinstitutions like the World Bank, International Monetary Fund and UNIDO usesocial cost-benefit analysis for the evaluation of projects.
• A project, which results in effective redistribution of income, is more valuablethan those projects where income is concentrated in a few hands.
• SCBA is carried out in detail in India. All developmental agencies do SCBA whilefunding major private projects. State governments also carry out SCBA whenluring and approving new mega projects for the state.
• Once the project is terminated and handed over to the operations team, projectreview is undertaken. The end result of project review is the preparation of theproject completion report (PCR). Project completion report is a document whichwould give a comparison of the actual costs and the time with the originallybudgeted ones.
• ‘Audit’ is generally defined as ‘an examination of documents and results to findout whether they are in the desired order’. Thus, PCA is an attempt at assessingthe actual profile of the given project in terms of results, vis-à-vis the intendedprofile of it besides focussing on whatever matters the senior management desires.
• There are four techniques of post-completion audit, namely: (i) cost varianceanalysis, (ii) profit variance analysis, (iii) cash flow and financial criteria analysis,and (iv) present value depreciation technique.
2.10 KEY TERMS
• Operating cash flow: The cash flow that occurs after a project is commissionedis called operating cash flow.
• Payback period (PBP): Payback period is defined as the number of yearsrequired for recovering the original cash outlay invested in a project.
• PCR: Project completion report is a document that gives a comparison of theactual costs and the time with the originally budgeted ones
2.11 ANSWERS TO ‘CHECK YOUR PROGRESS’
1. Economic dependence can be in four forms:(i) Positive synergy emanating from the acceptance of two or more opportunities.(ii) Negative synergy, when more than one opportunity is simultaneously
accepted.
Self LearningMaterial 111
Project Analysisand Selection
NOTES
(iii) Acceptance of one automatically results in rejection of the other, even if theother is profitable.
(iv) Stochastic dependence, where uncertainty is considered.2. Indigenous manufacturing of goods currently imported is advantageous for several
reasons:(i) It improves the balance of payments situation.(ii) It provides market for supporting industries and services.(iii) It generates employment.
3. The purpose of project initiation is to evaluate proposed projects and to reach aconsensus on the projects that are to be selected.
4. The project initiation document answers the following questions:(i) What does the project aim to achieve?(ii) Why it is important to achieve it?(iii) Who will be involved in managing the process and what are their
responsibilities?(iv) How and when will the project be undertaken?
5. Market analysis aims at assessing the potential sales revenue from a proposedproject.
6. Situational analysis is especially important if the project proposal is for enhancingthe capacity. It is important where the project proposal involves production andsale of new products and services—new for the company but not new in themarket.
7. The success of technology transfer depends on the temperature level, moisturelevel, quality of atmosphere, quality of material, method of work and skill of labour,power supply quality and a host of other variables, which may be unique for eachuser.
8. A technology that has an alternate use is better because if the company is notable to achieve its sales target, it can always change the product and establish itin a different market. For example, a company engaged in the business ofmanufacturing glass-lining equipment for chemical industry can use several of itsprocesses to manufacture concrete-mixing machines.
9. The cut-off decision is a benchmark against which the project cash flow streamis compared to determine whether the project would attain its financial goal.
10. The yield to maturity (YTM) is the yield (return) of an investor who buys theoutstanding bonds at the current price and holds them up to maturity.
11. The following factors warrant social cost-benefit analysis:(i) Market imperfection(ii) Taxes and subsidies(iii) Concern for savings(iv) Concern for redistribution
12. There are three alternative prices possible for goods and services, namely:(i) Market (producer’s) price(ii) Free-trade price (world price)(iii) Shadow and second best shadow price
Self Learning112 Material
Project Analysisand Selection
NOTES
13. The components of a financial report are the following:(i) Monthly commitment and expenditure(ii) Monthly cash flow forecast(iii) Monthly bank guarantee position(iv) Monthly outstanding payments to consultants, suppliers and contractors(v) Weekly documents retired through bank
14. A detailed project report is a complete blueprint for the execution of the project.It is the project implementation guide for the project team. It describes functions,authority and activities along the line of time, cost and technical parameters. Thisreport sets the standards for time, cost and work with which results can be latercompared as and when the work progresses.
2.12 QUESTIONS AND EXERCISES
Short-Answer Questions
1. What is leading indicator method?2. What are the three purposes of financing mix decision?3. Distinguish between operating cash flow and terminal cash flow.4. Write a short note on risk assessment.
Long-Answer Questions
1. Discuss some of the methods used in ‘Causal model-based forecast’.2. Explain the four basic decisions that should take place before any financial analysis
is carried out.3. Describe the UNIDO and LM approaches to SCBA.4. Explain the concept of Post-Completion Audit.
2.13 REFERENCES AND SUGGESTED READINGS
Chandra, Prasanna. 1995. Projects: Planning, Analysis, Selection, Implementation,and Review. Delhi: Tata McGraw-Hill.
Kerzner, Harold, R. 2013. Project Management: A Systems Approach to Planning,Scheduling, and Controlling. New Jersey: John Wiley and Sons.
Singh, Narendra. 2000. Project Management and Control. Delhi: Himalaya PublishingHouse.
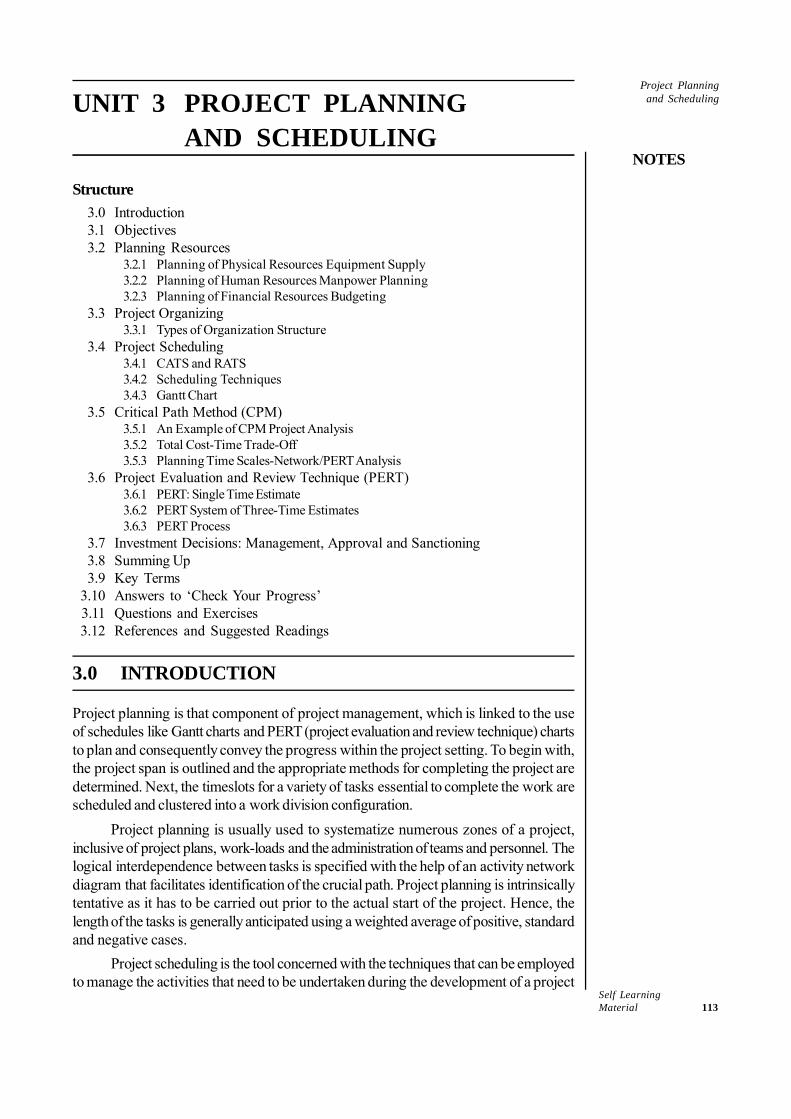
Self LearningMaterial 113
Project Planningand Scheduling
NOTES
UNIT 3 PROJECT PLANNINGAND SCHEDULING
Structure3.0 Introduction3.1 Objectives3.2 Planning Resources
3.2.1 Planning of Physical Resources Equipment Supply3.2.2 Planning of Human Resources Manpower Planning3.2.3 Planning of Financial Resources Budgeting
3.3 Project Organizing3.3.1 Types of Organization Structure
3.4 Project Scheduling3.4.1 CATS and RATS3.4.2 Scheduling Techniques3.4.3 Gantt Chart
3.5 Critical Path Method (CPM)3.5.1 An Example of CPM Project Analysis3.5.2 Total Cost-Time Trade-Off3.5.3 Planning Time Scales-Network/PERT Analysis
3.6 Project Evaluation and Review Technique (PERT)3.6.1 PERT: Single Time Estimate3.6.2 PERT System of Three-Time Estimates3.6.3 PERT Process
3.7 Investment Decisions: Management, Approval and Sanctioning3.8 Summing Up3.9 Key Terms
3.10 Answers to ‘Check Your Progress’3.11 Questions and Exercises3.12 References and Suggested Readings
3.0 INTRODUCTION
Project planning is that component of project management, which is linked to the useof schedules like Gantt charts and PERT (project evaluation and review technique) chartsto plan and consequently convey the progress within the project setting. To begin with,the project span is outlined and the appropriate methods for completing the project aredetermined. Next, the timeslots for a variety of tasks essential to complete the work arescheduled and clustered into a work division configuration.
Project planning is usually used to systematize numerous zones of a project,inclusive of project plans, work-loads and the administration of teams and personnel. Thelogical interdependence between tasks is specified with the help of an activity networkdiagram that facilitates identification of the crucial path. Project planning is intrinsicallytentative as it has to be carried out prior to the actual start of the project. Hence, thelength of the tasks is generally anticipated using a weighted average of positive, standardand negative cases.
Project scheduling is the tool concerned with the techniques that can be employedto manage the activities that need to be undertaken during the development of a project
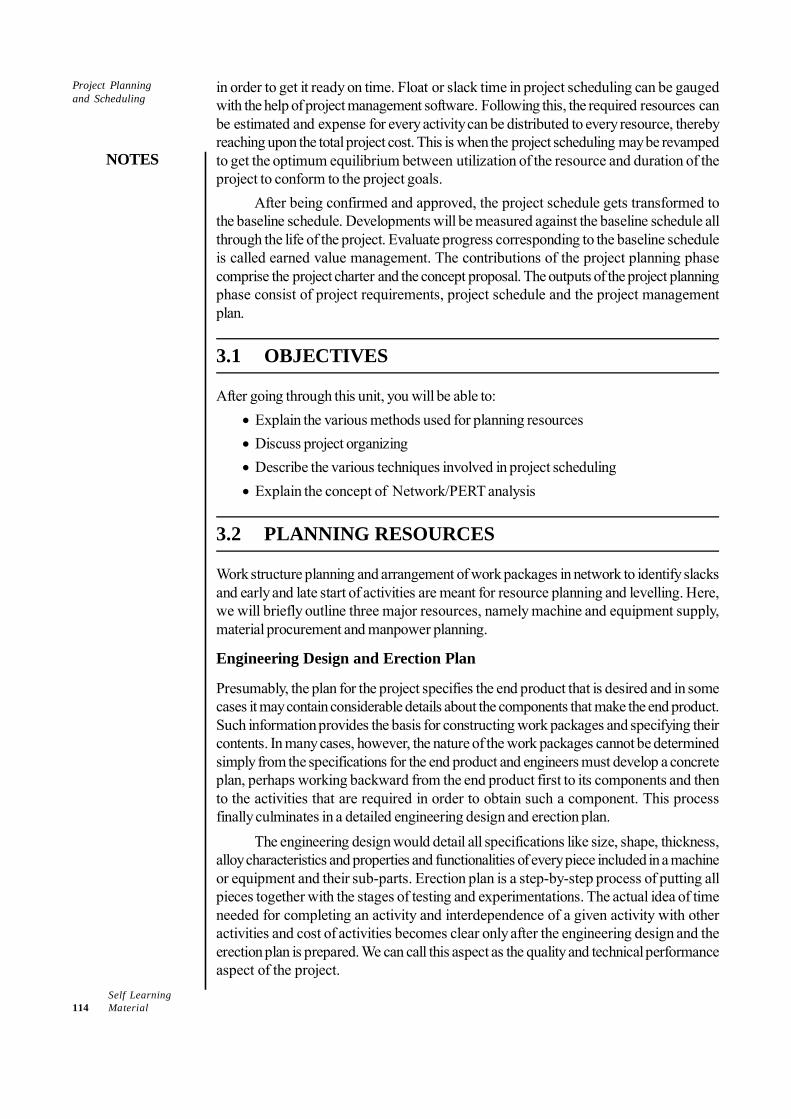
Self Learning114 Material
Project Planningand Scheduling
NOTES
in order to get it ready on time. Float or slack time in project scheduling can be gaugedwith the help of project management software. Following this, the required resources canbe estimated and expense for every activity can be distributed to every resource, therebyreaching upon the total project cost. This is when the project scheduling may be revampedto get the optimum equilibrium between utilization of the resource and duration of theproject to conform to the project goals.
After being confirmed and approved, the project schedule gets transformed tothe baseline schedule. Developments will be measured against the baseline schedule allthrough the life of the project. Evaluate progress corresponding to the baseline scheduleis called earned value management. The contributions of the project planning phasecomprise the project charter and the concept proposal. The outputs of the project planningphase consist of project requirements, project schedule and the project managementplan.
3.1 OBJECTIVES
After going through this unit, you will be able to:• Explain the various methods used for planning resources• Discuss project organizing• Describe the various techniques involved in project scheduling• Explain the concept of Network/PERT analysis
3.2 PLANNING RESOURCES
Work structure planning and arrangement of work packages in network to identify slacksand early and late start of activities are meant for resource planning and levelling. Here,we will briefly outline three major resources, namely machine and equipment supply,material procurement and manpower planning.
Engineering Design and Erection Plan
Presumably, the plan for the project specifies the end product that is desired and in somecases it may contain considerable details about the components that make the end product.Such information provides the basis for constructing work packages and specifying theircontents. In many cases, however, the nature of the work packages cannot be determinedsimply from the specifications for the end product and engineers must develop a concreteplan, perhaps working backward from the end product first to its components and thento the activities that are required in order to obtain such a component. This processfinally culminates in a detailed engineering design and erection plan.
The engineering design would detail all specifications like size, shape, thickness,alloy characteristics and properties and functionalities of every piece included in a machineor equipment and their sub-parts. Erection plan is a step-by-step process of putting allpieces together with the stages of testing and experimentations. The actual idea of timeneeded for completing an activity and interdependence of a given activity with otheractivities and cost of activities becomes clear only after the engineering design and theerection plan is prepared. We can call this aspect as the quality and technical performanceaspect of the project.
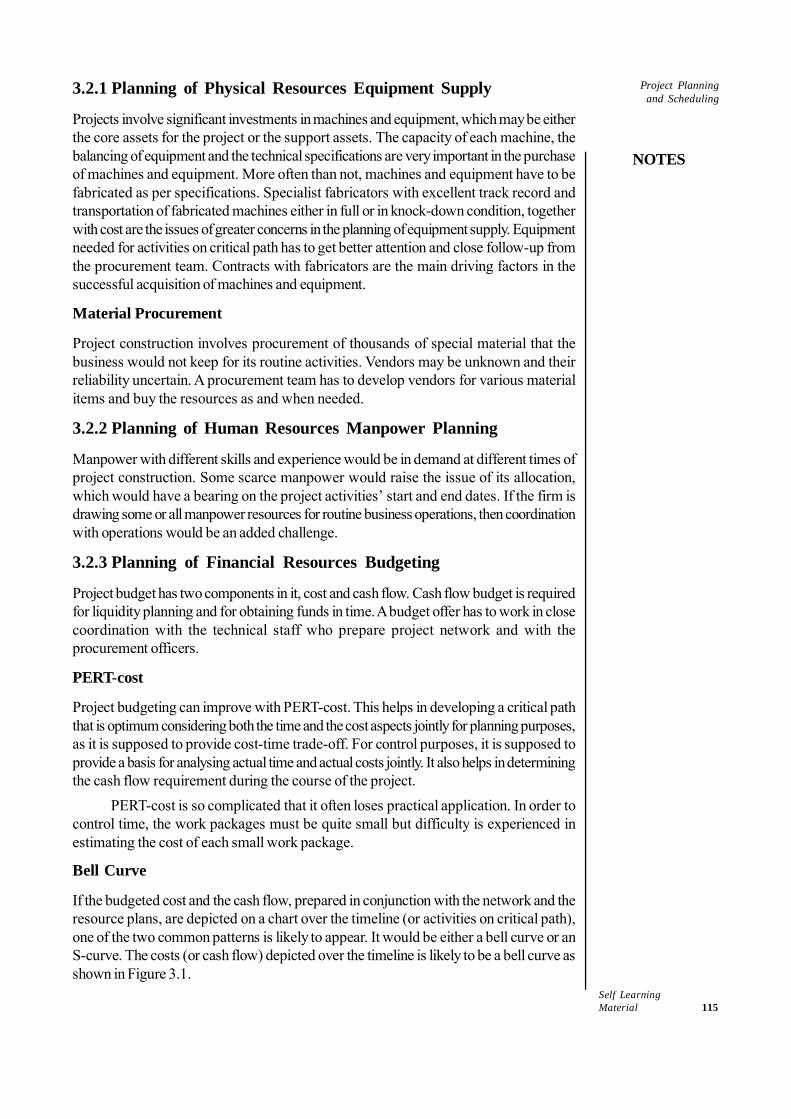
Self LearningMaterial 115
Project Planningand Scheduling
NOTES
3.2.1 Planning of Physical Resources Equipment Supply
Projects involve significant investments in machines and equipment, which may be eitherthe core assets for the project or the support assets. The capacity of each machine, thebalancing of equipment and the technical specifications are very important in the purchaseof machines and equipment. More often than not, machines and equipment have to befabricated as per specifications. Specialist fabricators with excellent track record andtransportation of fabricated machines either in full or in knock-down condition, togetherwith cost are the issues of greater concerns in the planning of equipment supply. Equipmentneeded for activities on critical path has to get better attention and close follow-up fromthe procurement team. Contracts with fabricators are the main driving factors in thesuccessful acquisition of machines and equipment.
Material Procurement
Project construction involves procurement of thousands of special material that thebusiness would not keep for its routine activities. Vendors may be unknown and theirreliability uncertain. A procurement team has to develop vendors for various materialitems and buy the resources as and when needed.
3.2.2 Planning of Human Resources Manpower Planning
Manpower with different skills and experience would be in demand at different times ofproject construction. Some scarce manpower would raise the issue of its allocation,which would have a bearing on the project activities’ start and end dates. If the firm isdrawing some or all manpower resources for routine business operations, then coordinationwith operations would be an added challenge.
3.2.3 Planning of Financial Resources Budgeting
Project budget has two components in it, cost and cash flow. Cash flow budget is requiredfor liquidity planning and for obtaining funds in time. A budget offer has to work in closecoordination with the technical staff who prepare project network and with theprocurement officers.
PERT-cost
Project budgeting can improve with PERT-cost. This helps in developing a critical paththat is optimum considering both the time and the cost aspects jointly for planning purposes,as it is supposed to provide cost-time trade-off. For control purposes, it is supposed toprovide a basis for analysing actual time and actual costs jointly. It also helps in determiningthe cash flow requirement during the course of the project.
PERT-cost is so complicated that it often loses practical application. In order tocontrol time, the work packages must be quite small but difficulty is experienced inestimating the cost of each small work package.
Bell Curve
If the budgeted cost and the cash flow, prepared in conjunction with the network and theresource plans, are depicted on a chart over the timeline (or activities on critical path),one of the two common patterns is likely to appear. It would be either a bell curve or anS-curve. The costs (or cash flow) depicted over the timeline is likely to be a bell curve asshown in Figure 3.1.
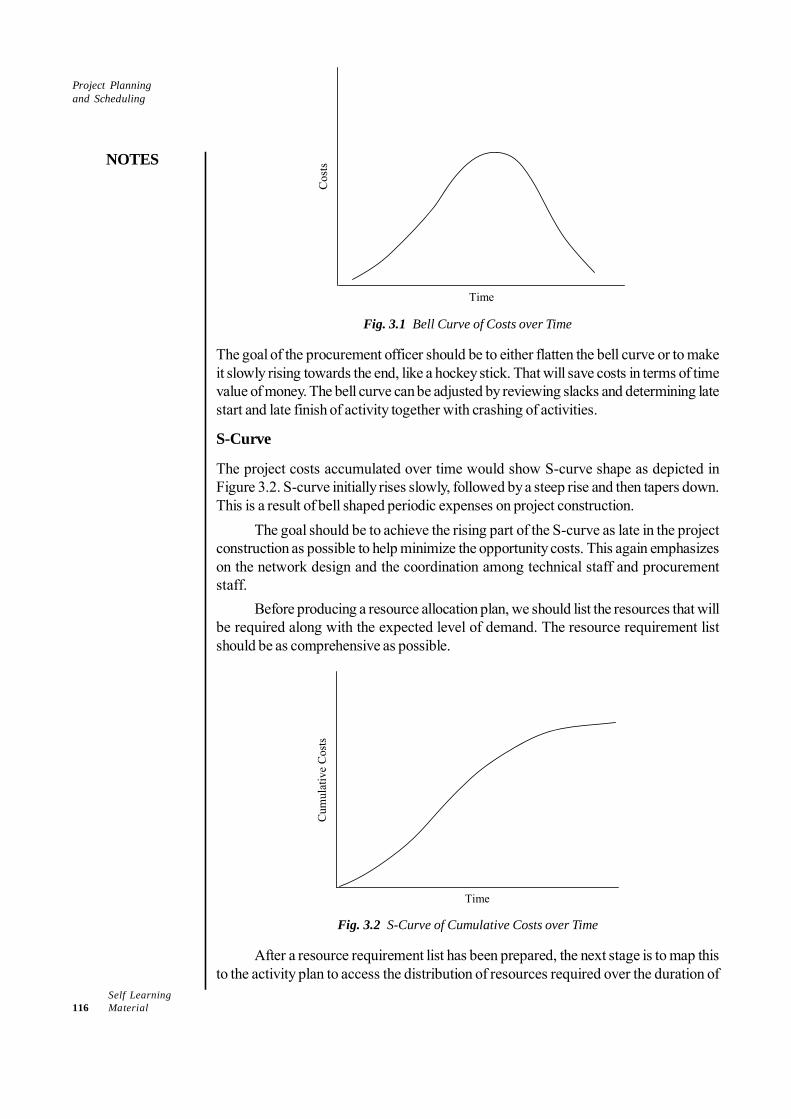
Self Learning116 Material
Project Planningand Scheduling
NOTES
Time
Cos
ts
Fig. 3.1 Bell Curve of Costs over Time
The goal of the procurement officer should be to either flatten the bell curve or to makeit slowly rising towards the end, like a hockey stick. That will save costs in terms of timevalue of money. The bell curve can be adjusted by reviewing slacks and determining latestart and late finish of activity together with crashing of activities.
S-Curve
The project costs accumulated over time would show S-curve shape as depicted inFigure 3.2. S-curve initially rises slowly, followed by a steep rise and then tapers down.This is a result of bell shaped periodic expenses on project construction.
The goal should be to achieve the rising part of the S-curve as late in the projectconstruction as possible to help minimize the opportunity costs. This again emphasizeson the network design and the coordination among technical staff and procurementstaff.
Before producing a resource allocation plan, we should list the resources that willbe required along with the expected level of demand. The resource requirement listshould be as comprehensive as possible.
Time
Cum
ulat
ive
Cos
ts
Fig. 3.2 S-Curve of Cumulative Costs over Time
After a resource requirement list has been prepared, the next stage is to map thisto the activity plan to access the distribution of resources required over the duration of
Self LearningMaterial 117
Project Planningand Scheduling
NOTES
the project. It is better to represent the activity plan as a bar chart and use this toproduce resource histogram for each resource.
In practice, resources have to be allocated to a project on an activity-by-activitybasis and finding the best allocation is time-consuming and difficult. As soon as a memberof the project team is allocated an activity, that activity acquires a start and finish dateson the schedule. Thus, allocating a resource to one activity limits the flexibility for resourceallocation and scheduling for other activities.
Resource Levelling
The network diagram drawn based on the work breakdown structure and the criticalpath identified on it, both are based on ideal condition of abundance of resources. Thenetwork plan is a time schedule and not the resource utilization plan. The resourcesrequirement determined by the ideal network plan is called resource loading withreference to time. The resource loading may face two situations:
• The need for a particular resource may vary over time. Often, the need for aresource may vary between 70 per cent and 120 per cent. This means that resourcemay remain idle sometime, whereas, some other time the same resource may besimply non-available for some task because it is more in demand. By adjusting theproject schedule (network plan) through the use of slack (early start and late startof non-critical activities) it may be possible to make efficient use of the resource.This is called resource smoothing. Resource smoothing does not delay theproject completion time, but it reallocates the resources as a result of whichschedule of activities change within the available slack time.
• Resource loading does not consider the cost implications. It is possible that theresources are available as per the loading needs, but the cost of resources maynot be at the minimum level. The resource levelling aims at reallocation of resources,and as a result the rescheduling of activities also, to minimize the cost of project.As a general rule, an early consumption of resources costs more than the lateconsumption. Even the cost-implications of delayed completion is considered andif late completion is found cost-effective, the network plan and critical path maybe changed.
Resource smoothing and levelling can be done using either the heuristic methods oroptimization models. Heuristic methods are judgmental and intuitive. They use thumbrules but are often effective in complex situation. Some examples of heuristic approachfor resource smoothing and levelling are the late or an early start of some activities,taking up short and simple activities first, completing those activities early which consumeless resource, assigning different resources, changing task dependency, removing oradding tasks, etc. Optimization models include mathematical models like linearprogramming, but it is very difficult to apply them in a complex activity structure. Mostproject planning software offer resource smoothing and resource levelling features.
3.3 PROJECT ORGANIZING
A firm, especially a large one, has to set up a system to facilitate the process of ideageneration, for testing ideas, evaluating them and subsequently executing them for bettereffectiveness.
Check Your Progress
1. What is erectionplan?
2. What are the twocomponents ofproject budget?
3. Define resourceloading.

Self Learning118 Material
Project Planningand Scheduling
NOTES
System for Idea Generation
A proactive organization builds a strong system for idea generation. An example is givenin Table 3.1.
Table 3.1 Systems for Idea Generation
Formal system → A management committee Planning department or group Strategy group Periodic strategic planning exercise Management audit (also cost audit and functional audit) Periodic consulting by external expert Target costing mechanism Slack management system
Semi-formal system → Suggestion box system and committees Innovation committees Joint departmental committees Quality circles Dialogue session and open house Value engineering groups Task forces and individual reports/proposals
Informal system → Individual experiments Individuals encouraged to work as task force
Formal and semi-formal systems would work better if a very clearly shared visionis evolved and if a strategic planning process is in place to provide a trickledown effectof strategic plans in the entire organization. In an informal system, individuals areempowered to think and act creatively. A large fertilizer firm in Gujarat created managerialslack and built a system for slack management, in which even individuals are encouragedto envision and work on their own ideas that can help the company.
Objectives of an Organizational System
Clarity of goals and objectives are prerequisites for organizational effectiveness. A largeorganization aims at the following objectives while designing the capital budgeting system:
• Delegating authority for timely decision without creating lack of harmony• Conducting efficient investment analysis by generating alternatives and making
proposed opportunities holistic• Studying the risk involved in the proposed project and deciding on the suitable
decision criteria• Removing bias in estimates, as those who propose projects are more likely to
show upward bias on benefits and downward bias on costs of the project• Bringing transparency in action
Process and Authorities Involved
Consider the example of company which has classified investment schemes as ‘majorschemes’ and ‘minor schemes’. The other two classifications, namely ‘equipment andfurniture scheme’ and ‘repair and maintenance scheme’ are delegated to the discretionof the concerned department. Figures 3.3(a) and 3.3(b) show the process and authoritiesinvolved in a major scheme and a minor scheme respectively.
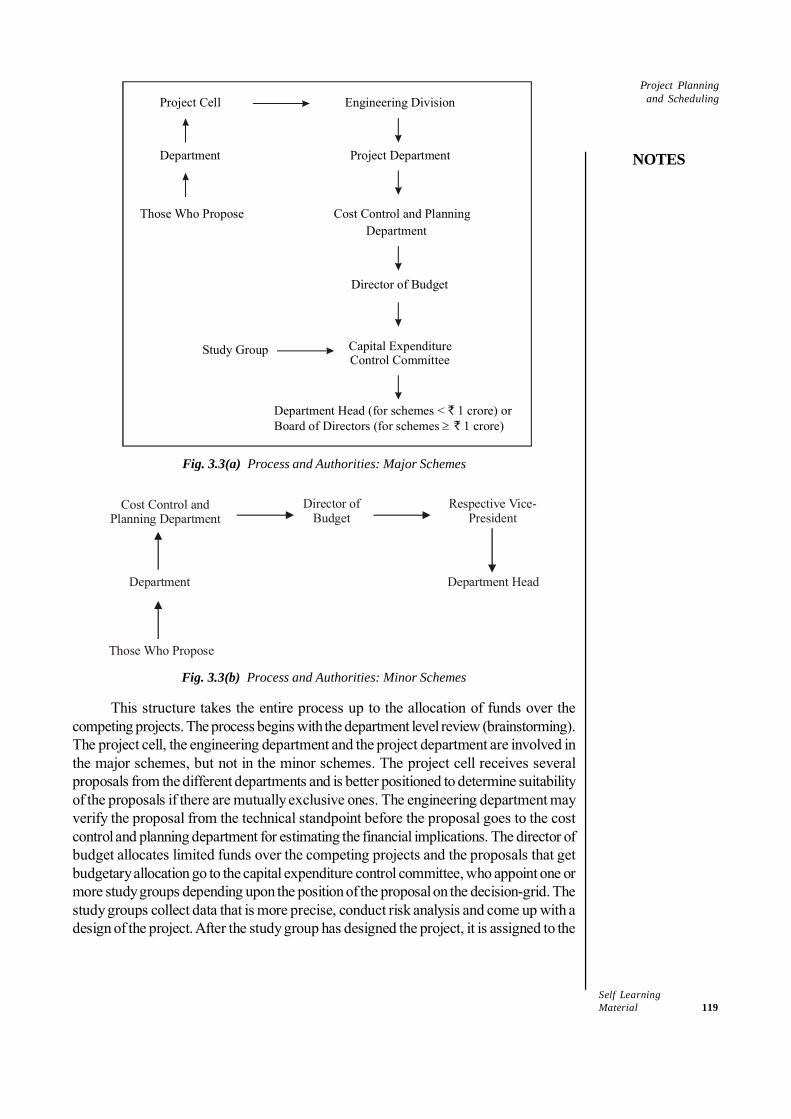
Self LearningMaterial 119
Project Planningand Scheduling
NOTES
Cost Control and Planning Department
Project Department
Engineering Division
Director of Budget
Capital Expenditure Control Committee
Study Group
Department Head (for schemes < 1 crore) or `Board of Directors (for schemes ≥ 1 crore)`
Project Cell
Department
Those Who Propose
Fig. 3.3(a) Process and Authorities: Major Schemes
Director ofBudget
Cost Control andPlanning Department
Respective Vice-President
Department HeadDepartment
Those Who Propose
Fig. 3.3(b) Process and Authorities: Minor Schemes
This structure takes the entire process up to the allocation of funds over thecompeting projects. The process begins with the department level review (brainstorming).The project cell, the engineering department and the project department are involved inthe major schemes, but not in the minor schemes. The project cell receives severalproposals from the different departments and is better positioned to determine suitabilityof the proposals if there are mutually exclusive ones. The engineering department mayverify the proposal from the technical standpoint before the proposal goes to the costcontrol and planning department for estimating the financial implications. The director ofbudget allocates limited funds over the competing projects and the proposals that getbudgetary allocation go to the capital expenditure control committee, who appoint one ormore study groups depending upon the position of the proposal on the decision-grid. Thestudy groups collect data that is more precise, conduct risk analysis and come up with adesign of the project. After the study group has designed the project, it is assigned to the
Self Learning120 Material
Project Planningand Scheduling
NOTES
respective department if the investment is less than the prescribed amount. Otherwise,it is referred to the board of directors for formal approval. Now, a detailed project reportis prepared and a project team is formed for the implementation of the project oftenapproved by the board of directors.
Project Management Organizations
A firm would require a right type of organization structure for the construction of aproject. The firm would have one organization structure, which would suit the needs ofroutine operations. Project structure is superimposed on the existing organization structure.The overlapping of the two structures does create problems.
Issues in Project Organization
The firm has to answer the following questions while making the choice of projectorganization:
• How much independence should be given to the project team?• Where should a project organization fit in the total organization?• How should people be assigned to the project?• What directive/authority should managers have (i.e., degree of empowerment)?
Answers to these questions will be somewhat different in different forms of organizations.A survey of the Fortune 500 companies in 1982 revealed the following regarding projectorganization and powers for project team:
• A majority of companies must obtain authorization for capital projects above certainlimits (limit averaged $136,000).
• In most others, all capital expenditures must have received corporate approval orhave been previously authorized in the budget.
• Only in a few cases, divisions were allowed to raise finances externally and thattoo only from short-term sources.
• The main reason given was that capital investment decisions were of suchimportance for the whole organization that they required central control.
• Divisional managers, however, do have substantial influence over projects submittedfor authorization and thus, formal authorization was seen as corporate monitoringof decisions that are essentially the responsibility of divisional managers (onaccount of the concept of ‘investment centres’ being followed).
• Informal concepts with central management assured great significance for theentrepreneurial spirit of divisional managers as it helped them know which proposalswould be accepted.
• The principle of ‘delegation within guidelines’ helped to maintain the balancementioned earlier.
3.3.1 Types of Organization Structure
Project organization can be set up in different forms. Various types of organization are:
• Functional organization• Divisionalized organization• Projectized organization
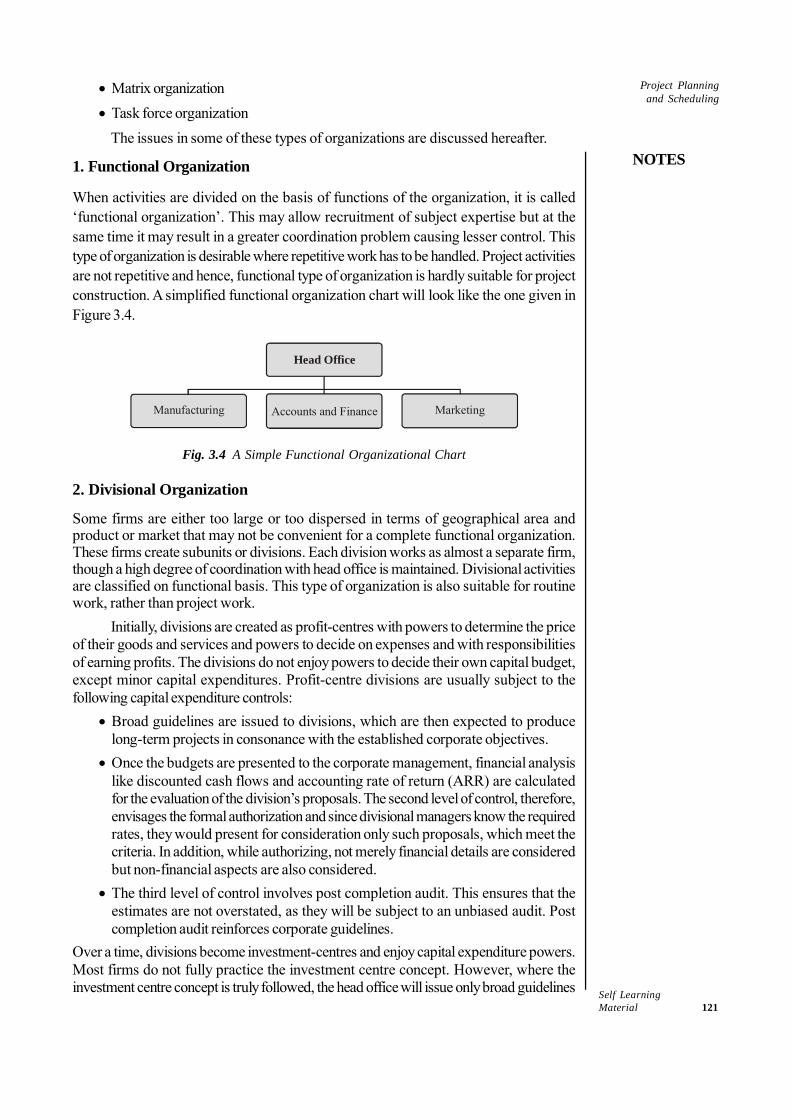
Self LearningMaterial 121
Project Planningand Scheduling
NOTES
• Matrix organization• Task force organization
The issues in some of these types of organizations are discussed hereafter.
1. Functional Organization
When activities are divided on the basis of functions of the organization, it is called‘functional organization’. This may allow recruitment of subject expertise but at thesame time it may result in a greater coordination problem causing lesser control. Thistype of organization is desirable where repetitive work has to be handled. Project activitiesare not repetitive and hence, functional type of organization is hardly suitable for projectconstruction. A simplified functional organization chart will look like the one given inFigure 3.4.
Head Office
Manufacturing Accounts and Finance Marketing
Fig. 3.4 A Simple Functional Organizational Chart
2. Divisional Organization
Some firms are either too large or too dispersed in terms of geographical area andproduct or market that may not be convenient for a complete functional organization.These firms create subunits or divisions. Each division works as almost a separate firm,though a high degree of coordination with head office is maintained. Divisional activitiesare classified on functional basis. This type of organization is also suitable for routinework, rather than project work.
Initially, divisions are created as profit-centres with powers to determine the priceof their goods and services and powers to decide on expenses and with responsibilitiesof earning profits. The divisions do not enjoy powers to decide their own capital budget,except minor capital expenditures. Profit-centre divisions are usually subject to thefollowing capital expenditure controls:
• Broad guidelines are issued to divisions, which are then expected to producelong-term projects in consonance with the established corporate objectives.
• Once the budgets are presented to the corporate management, financial analysislike discounted cash flows and accounting rate of return (ARR) are calculatedfor the evaluation of the division’s proposals. The second level of control, therefore,envisages the formal authorization and since divisional managers know the requiredrates, they would present for consideration only such proposals, which meet thecriteria. In addition, while authorizing, not merely financial details are consideredbut non-financial aspects are also considered.
• The third level of control involves post completion audit. This ensures that theestimates are not overstated, as they will be subject to an unbiased audit. Postcompletion audit reinforces corporate guidelines.
Over a time, divisions become investment-centres and enjoy capital expenditure powers.Most firms do not fully practice the investment centre concept. However, where theinvestment centre concept is truly followed, the head office will issue only broad guidelines
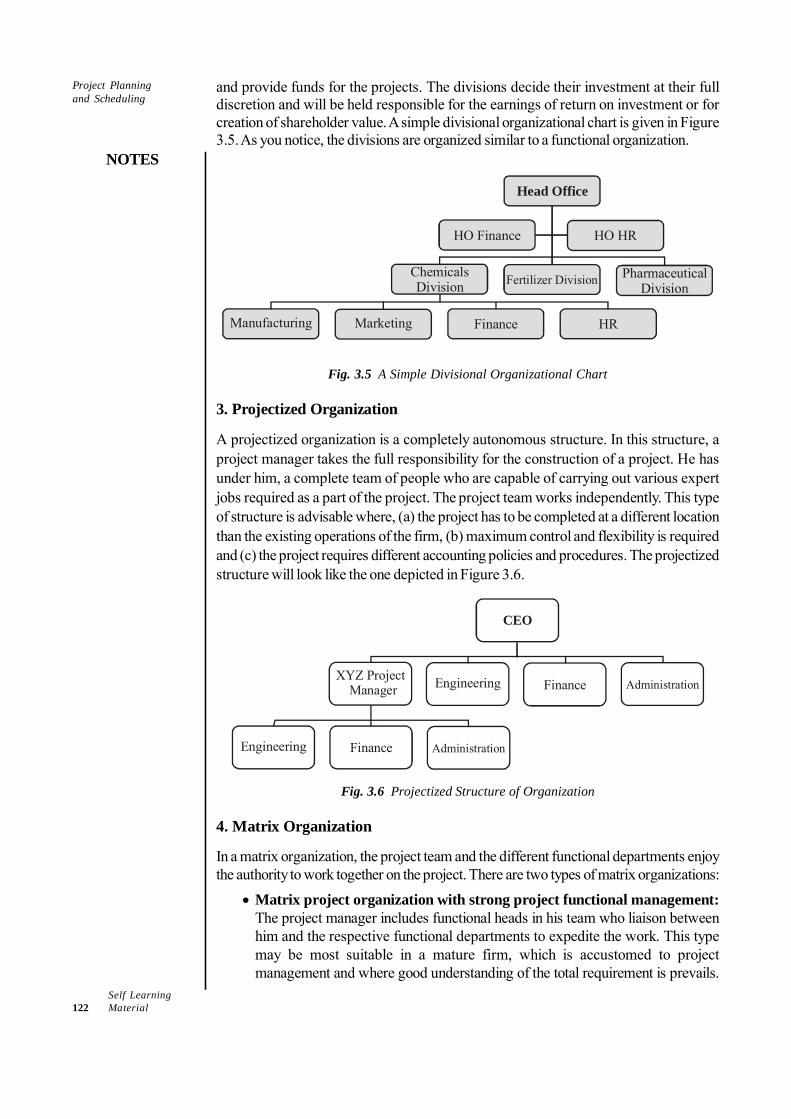
Self Learning122 Material
Project Planningand Scheduling
NOTES
and provide funds for the projects. The divisions decide their investment at their fulldiscretion and will be held responsible for the earnings of return on investment or forcreation of shareholder value. A simple divisional organizational chart is given in Figure3.5. As you notice, the divisions are organized similar to a functional organization.
Head Office
HO Finance HO HR
ChemicalsDivision Fertilizer Division Pharmaceutical
Division
Manufacturing Marketing Finance HR
Fig. 3.5 A Simple Divisional Organizational Chart
3. Projectized Organization
A projectized organization is a completely autonomous structure. In this structure, aproject manager takes the full responsibility for the construction of a project. He hasunder him, a complete team of people who are capable of carrying out various expertjobs required as a part of the project. The project team works independently. This typeof structure is advisable where, (a) the project has to be completed at a different locationthan the existing operations of the firm, (b) maximum control and flexibility is requiredand (c) the project requires different accounting policies and procedures. The projectizedstructure will look like the one depicted in Figure 3.6.
CEO
XYZ Project Manager Engineering Finance Administration
Engineering Finance Administration
Fig. 3.6 Projectized Structure of Organization
4. Matrix Organization
In a matrix organization, the project team and the different functional departments enjoythe authority to work together on the project. There are two types of matrix organizations:
• Matrix project organization with strong project functional management:The project manager includes functional heads in his team who liaison betweenhim and the respective functional departments to expedite the work. This typemay be most suitable in a mature firm, which is accustomed to projectmanagement and where good understanding of the total requirement is prevails.
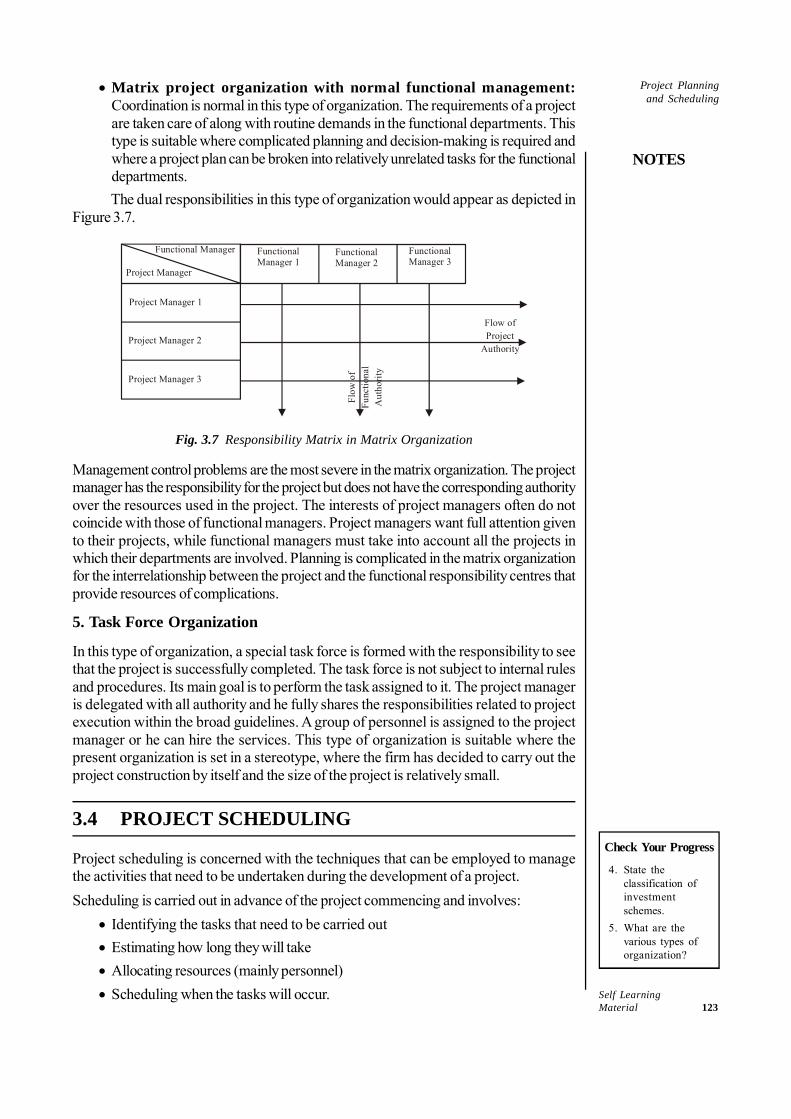
Self LearningMaterial 123
Project Planningand Scheduling
NOTES
• Matrix project organization with normal functional management:Coordination is normal in this type of organization. The requirements of a projectare taken care of along with routine demands in the functional departments. Thistype is suitable where complicated planning and decision-making is required andwhere a project plan can be broken into relatively unrelated tasks for the functionaldepartments.The dual responsibilities in this type of organization would appear as depicted in
Figure 3.7.
Functional Manager
Project Manager
Project Manager 1
Project Manager 2
Project Manager 3
FunctionalManager 1
FunctionalManager 3
Flow ofProject
AuthorityFl
ow o
fFu
nctio
nal
Aut
horit
y
FunctionalManager 2
Fig. 3.7 Responsibility Matrix in Matrix Organization
Management control problems are the most severe in the matrix organization. The projectmanager has the responsibility for the project but does not have the corresponding authorityover the resources used in the project. The interests of project managers often do notcoincide with those of functional managers. Project managers want full attention givento their projects, while functional managers must take into account all the projects inwhich their departments are involved. Planning is complicated in the matrix organizationfor the interrelationship between the project and the functional responsibility centres thatprovide resources of complications.
5. Task Force Organization
In this type of organization, a special task force is formed with the responsibility to seethat the project is successfully completed. The task force is not subject to internal rulesand procedures. Its main goal is to perform the task assigned to it. The project manageris delegated with all authority and he fully shares the responsibilities related to projectexecution within the broad guidelines. A group of personnel is assigned to the projectmanager or he can hire the services. This type of organization is suitable where thepresent organization is set in a stereotype, where the firm has decided to carry out theproject construction by itself and the size of the project is relatively small.
3.4 PROJECT SCHEDULING
Project scheduling is concerned with the techniques that can be employed to managethe activities that need to be undertaken during the development of a project.Scheduling is carried out in advance of the project commencing and involves:
• Identifying the tasks that need to be carried out• Estimating how long they will take• Allocating resources (mainly personnel)• Scheduling when the tasks will occur.
Check Your Progress
4. State theclassification ofinvestmentschemes.
5. What are thevarious types oforganization?
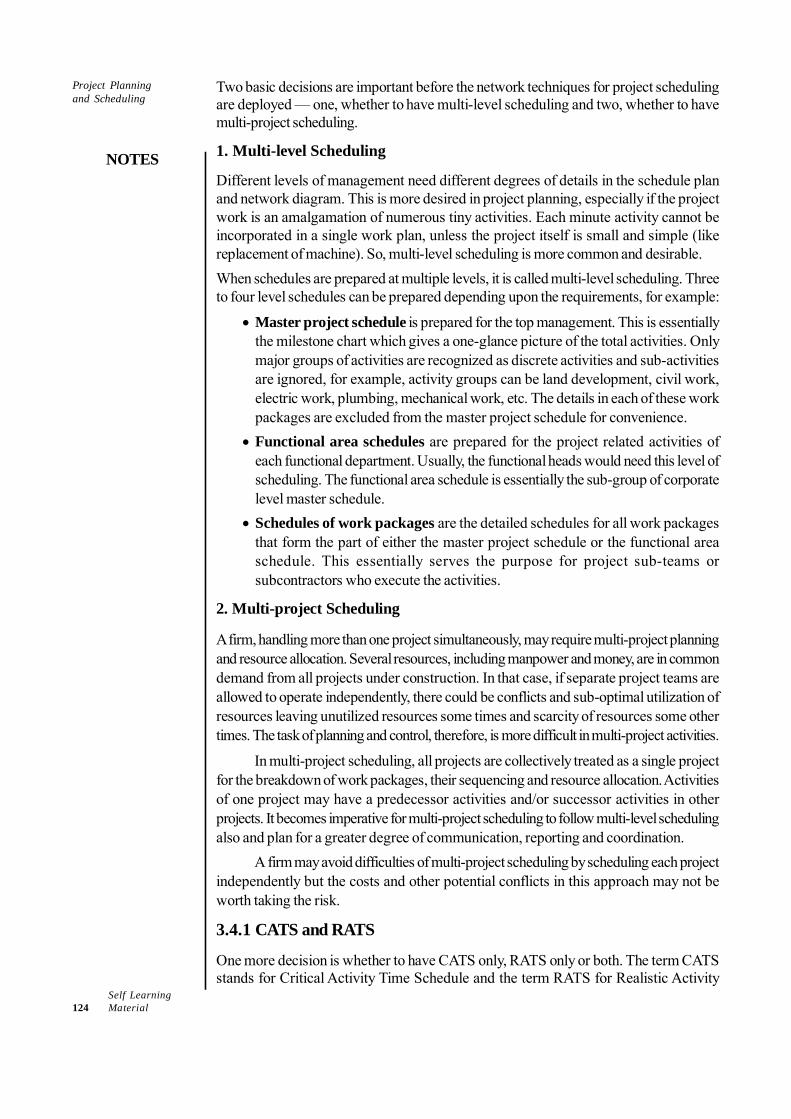
Self Learning124 Material
Project Planningand Scheduling
NOTES
Two basic decisions are important before the network techniques for project schedulingare deployed — one, whether to have multi-level scheduling and two, whether to havemulti-project scheduling.
1. Multi-level Scheduling
Different levels of management need different degrees of details in the schedule planand network diagram. This is more desired in project planning, especially if the projectwork is an amalgamation of numerous tiny activities. Each minute activity cannot beincorporated in a single work plan, unless the project itself is small and simple (likereplacement of machine). So, multi-level scheduling is more common and desirable.When schedules are prepared at multiple levels, it is called multi-level scheduling. Threeto four level schedules can be prepared depending upon the requirements, for example:
• Master project schedule is prepared for the top management. This is essentiallythe milestone chart which gives a one-glance picture of the total activities. Onlymajor groups of activities are recognized as discrete activities and sub-activitiesare ignored, for example, activity groups can be land development, civil work,electric work, plumbing, mechanical work, etc. The details in each of these workpackages are excluded from the master project schedule for convenience.
• Functional area schedules are prepared for the project related activities ofeach functional department. Usually, the functional heads would need this level ofscheduling. The functional area schedule is essentially the sub-group of corporatelevel master schedule.
• Schedules of work packages are the detailed schedules for all work packagesthat form the part of either the master project schedule or the functional areaschedule. This essentially serves the purpose for project sub-teams orsubcontractors who execute the activities.
2. Multi-project Scheduling
A firm, handling more than one project simultaneously, may require multi-project planningand resource allocation. Several resources, including manpower and money, are in commondemand from all projects under construction. In that case, if separate project teams areallowed to operate independently, there could be conflicts and sub-optimal utilization ofresources leaving unutilized resources some times and scarcity of resources some othertimes. The task of planning and control, therefore, is more difficult in multi-project activities.
In multi-project scheduling, all projects are collectively treated as a single projectfor the breakdown of work packages, their sequencing and resource allocation. Activitiesof one project may have a predecessor activities and/or successor activities in otherprojects. It becomes imperative for multi-project scheduling to follow multi-level schedulingalso and plan for a greater degree of communication, reporting and coordination.
A firm may avoid difficulties of multi-project scheduling by scheduling each projectindependently but the costs and other potential conflicts in this approach may not beworth taking the risk.
3.4.1 CATS and RATS
One more decision is whether to have CATS only, RATS only or both. The term CATSstands for Critical Activity Time Schedule and the term RATS for Realistic Activity
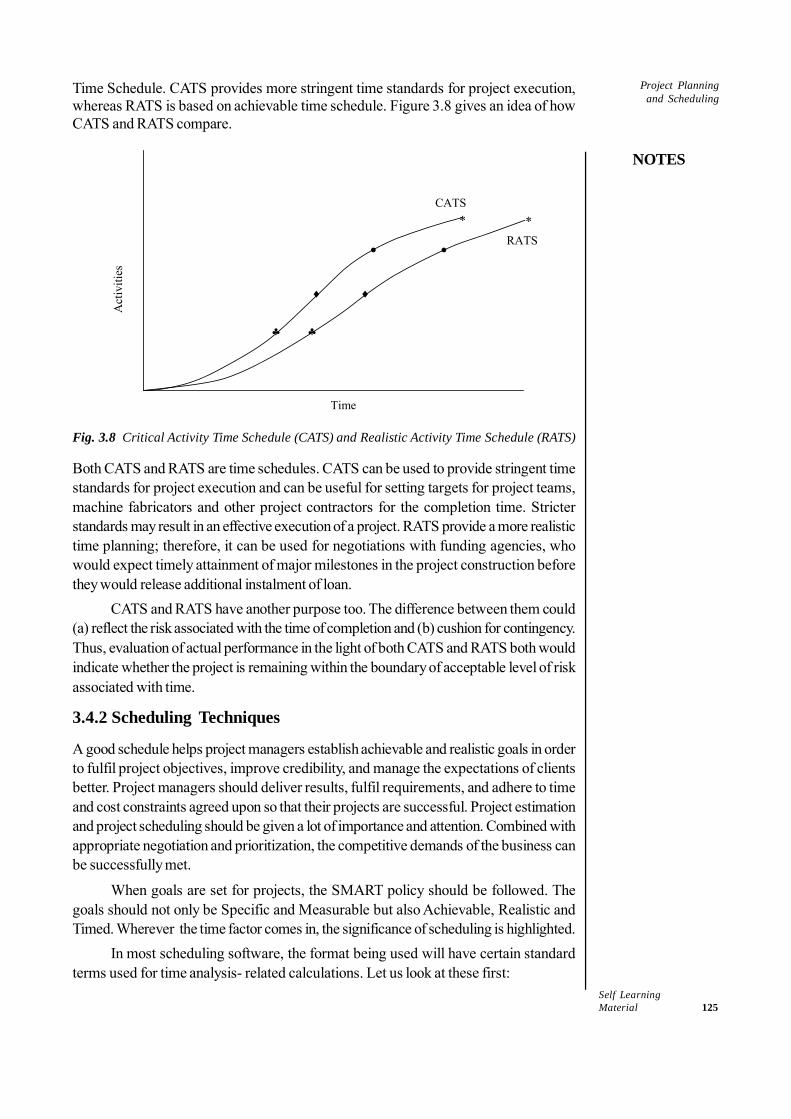
Self LearningMaterial 125
Project Planningand Scheduling
NOTES
Time Schedule. CATS provides more stringent time standards for project execution,whereas RATS is based on achievable time schedule. Figure 3.8 gives an idea of howCATS and RATS compare.
Act
iviti
es
*
•
♦
♣
•
♦
♣
*
Time
CATS
RATS
Fig. 3.8 Critical Activity Time Schedule (CATS) and Realistic Activity Time Schedule (RATS)
Both CATS and RATS are time schedules. CATS can be used to provide stringent timestandards for project execution and can be useful for setting targets for project teams,machine fabricators and other project contractors for the completion time. Stricterstandards may result in an effective execution of a project. RATS provide a more realistictime planning; therefore, it can be used for negotiations with funding agencies, whowould expect timely attainment of major milestones in the project construction beforethey would release additional instalment of loan.
CATS and RATS have another purpose too. The difference between them could(a) reflect the risk associated with the time of completion and (b) cushion for contingency.Thus, evaluation of actual performance in the light of both CATS and RATS both wouldindicate whether the project is remaining within the boundary of acceptable level of riskassociated with time.
3.4.2 Scheduling Techniques
A good schedule helps project managers establish achievable and realistic goals in orderto fulfil project objectives, improve credibility, and manage the expectations of clientsbetter. Project managers should deliver results, fulfil requirements, and adhere to timeand cost constraints agreed upon so that their projects are successful. Project estimationand project scheduling should be given a lot of importance and attention. Combined withappropriate negotiation and prioritization, the competitive demands of the business canbe successfully met.
When goals are set for projects, the SMART policy should be followed. Thegoals should not only be Specific and Measurable but also Achievable, Realistic andTimed. Wherever the time factor comes in, the significance of scheduling is highlighted.
In most scheduling software, the format being used will have certain standardterms used for time analysis- related calculations. Let us look at these first:
Self Learning126 Material
Project Planningand Scheduling
NOTES
• Activity Identifier (ID): This is a unique alphanumeric identifier allotted toeach scheduled activity.
• Duration (Dur): This is the total time period (hours, days, weeks, etc.) requiredto accomplish the work of the activity.
• Early Start Time (EST): This is the earliest point in time when a scheduledactivity can begin. It could also be referred to as ESD (early start date) or ES(early start)
• Early Finish Time (EFT): This is the earliest point in time when the scheduledactivity can be accomplished or completed.
• Late Start Time (LST): Keeping in mind the deadline for completion of project,this is the latest point in time when the schedule activity can begin without delayingthe project.
• Late Finish Time (LFT): This is the latest point in time when the scheduleactivity can finish that the project completion date is not defaulted. This is oftenreferred to as Late Finish Date (LFD) or Late Finish (LF)
• Free Float (FF): This is the time period by which an activity can be shiftedwithout affecting the Early Start of any other succeeding activity or event.
• Total Float (TF): This is the time period by which an activity can be shifted orrescheduled without affecting the date of completing the work.
• Critical Path: This is the longest sequence of activities from start to finish. Itcomprises the sequence of activities that will take the longest to complete or, thesequence of activities that will determine the earliest possible finish date.
In order to be able to schedule the project properly, the project manager usually keepstrack of all the bullet points mentioned and performs the following:
• Sits with the team and narrows down the objectives to something specific, concrete,measurable and achievable within a specific time.
• Enters each specific point on the project into the software being used or a generalcalendar software. Activates reminder systems to keep track of the progress ofthe project.
• Allows all members access to the schedule and the progress so that everyone isaware of the effort required to achieve the goal/deadline.
In the sections that follow, you will learn about the various methods or techniques adoptedby organizations to ensure that their projects are on track.
3.4.3 Gantt Chart
Gantt chart is a type of bar chart that illustrates a project schedule. Gantt charts illustratethe start and finish dates of terminal elements and summary elements of a project.These elements comprise the work breakdown structure of the project. Some Ganttcharts also show the dependency (i.e., precedence network) relationships betweenactivities. Gantt charts can be used to show the current schedule status using per cent-complete shadings and a vertical Today line as shown here.
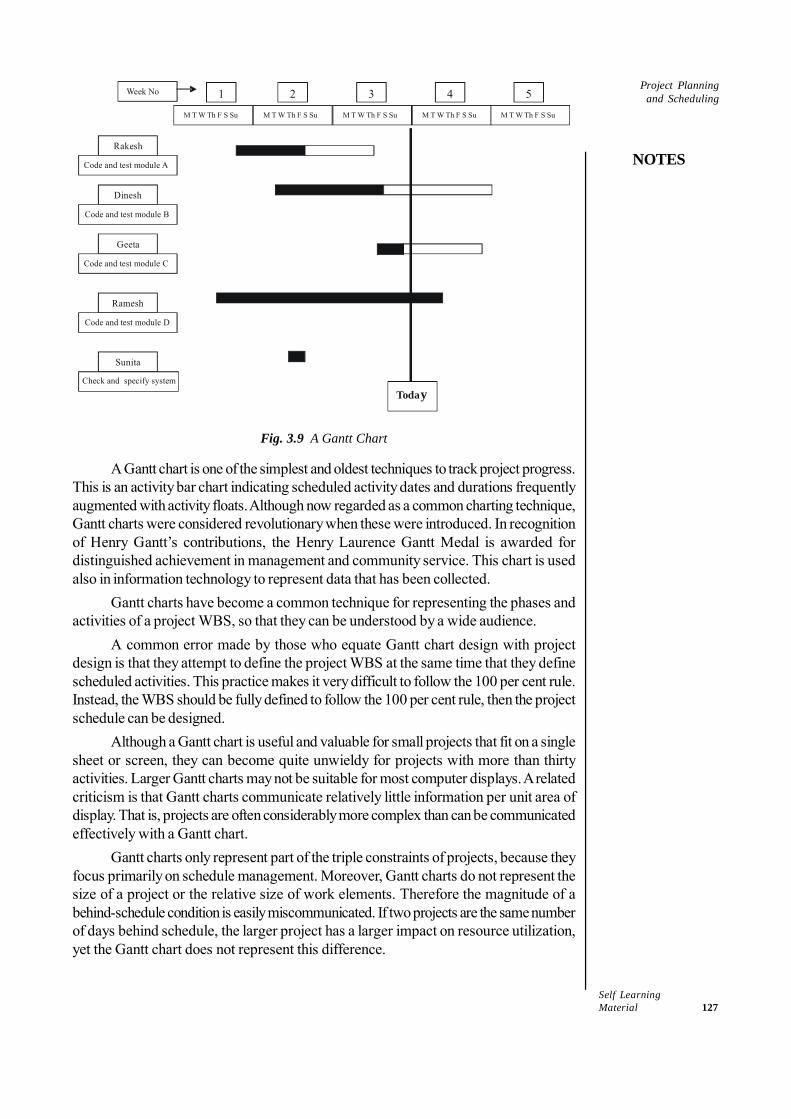
Self LearningMaterial 127
Project Planningand Scheduling
NOTES
M T W Th F S Su M T W Th F S Su M T W Th F S Su M T W Th F S Su M T W Th F S Su
Week No 1 2 3 4 5
Rakesh
Dinesh
Geeta
Ramesh
Sunita
Check and specify system
Code and test module D
Code and test module C
Code and test module B
Code and test module A
Today
Fig. 3.9 A Gantt Chart
A Gantt chart is one of the simplest and oldest techniques to track project progress.This is an activity bar chart indicating scheduled activity dates and durations frequentlyaugmented with activity floats. Although now regarded as a common charting technique,Gantt charts were considered revolutionary when these were introduced. In recognitionof Henry Gantt’s contributions, the Henry Laurence Gantt Medal is awarded fordistinguished achievement in management and community service. This chart is usedalso in information technology to represent data that has been collected.
Gantt charts have become a common technique for representing the phases andactivities of a project WBS, so that they can be understood by a wide audience.
A common error made by those who equate Gantt chart design with projectdesign is that they attempt to define the project WBS at the same time that they definescheduled activities. This practice makes it very difficult to follow the 100 per cent rule.Instead, the WBS should be fully defined to follow the 100 per cent rule, then the projectschedule can be designed.
Although a Gantt chart is useful and valuable for small projects that fit on a singlesheet or screen, they can become quite unwieldy for projects with more than thirtyactivities. Larger Gantt charts may not be suitable for most computer displays. A relatedcriticism is that Gantt charts communicate relatively little information per unit area ofdisplay. That is, projects are often considerably more complex than can be communicatedeffectively with a Gantt chart.
Gantt charts only represent part of the triple constraints of projects, because theyfocus primarily on schedule management. Moreover, Gantt charts do not represent thesize of a project or the relative size of work elements. Therefore the magnitude of abehind-schedule condition is easily miscommunicated. If two projects are the same numberof days behind schedule, the larger project has a larger impact on resource utilization,yet the Gantt chart does not represent this difference.
Self Learning128 Material
Project Planningand Scheduling
NOTES
Work Breakdown Structure (WBS)
A work breakdown structure (WBS), in project management and systems engineering,is a deliverable oriented decomposition of a project into smaller components. It definesand groups a project’s discrete work elements in a way that helps organize and definethe total work scope of the project.
A work breakdown structure element may be a product, data, a service, or anycombination. A WBS also provides the necessary framework for detailed cost estimatingand control along with providing guidance for schedule development and control.
The work breakdown structure is a tree structure, which shows a sub-division ofeffort required to achieve an objective; for example a programme, project, and contract.In a project or contract, the WBS is developed by starting with the end objective andsuccessively sub-dividing it into manageable components in terms of size, duration andresponsibility (e.g., systems, subsystems, components, tasks, subtasks, and workpackages), which include all steps necessary to achieve the objective.
The work breakdown structure provides a common framework for the naturaldevelopment of the overall planning and control of a contract and is the basis for dividingwork into definable increments from which the statement of work can be developed andtechnical, schedule, cost, and labour hour reporting can be established.
The concept of work breakdown structure developed with the ProgrammeEvaluation and Review Technique (PERT) in the United States Department of Defense(DoD).
A work breakdown structure permits summing of subordinate costs for tasks,materials, etc., into their successively higher level ‘parent’ tasks, materials, etc. Foreach element of the work breakdown structure, a description of the task to be performedis generated. This technique (sometimes called a system breakdown structure) is usedto define and organize the total scope of a project.
The WBS is organized around the primary products of the project (or plannedoutcomes) instead of the work needed to produce the products (planned actions). Sincethe planned outcomes are the desired ends of the project, they form a relatively stableset of categories in which the costs of the planned actions needed to achieve them canbe collected. A well-designed WBS makes it easy to assign each project activity to oneand only one terminal element of the WBS. In addition to its function in cost accounting,the WBS also helps map requirements from one level of system specification to another,for example, a requirements cross reference matrix mapping functional requirements tohigh level or low level design documents.
3.5 CRITICAL PATH METHOD (CPM)
In 1950, a joint venture between the Dupont Corporation and the Remington RandCorporation for managing plant maintenance projects led to the (CPM). Today, it iscommonly used with all forms of projects such as construction, software development,research projects, product development, engineering, plant maintenance and so on. Anyproject with interdependent activities can apply this method of scheduling. Whenever anactivity is scheduled by various planning techniques, the necessary resources such ascapital, equipment, labour or other inputs are needed for executing the work package oran activity. The fact is that necessary resources are not always available when desired;
Self LearningMaterial 129
Project Planningand Scheduling
NOTES
so, activities must be scheduled at time when resources are available. It is also importantto note that the cost and duration of the project are interdependent variables. Alteringproject schedules influences costs and it should be possible to alter the activity schedulesso as to achieve optimum trade-offs between the project cost and the scheduled completiondate.
The CPM is the graphical representation of the interrelationships between thetasks in a project to be performed in a well-defined sequence. It lays stress on thefollowing two aspects of a project:
• The effect of applying more men or other resources to shorten the duration ofgiven jobs
• The increased cost of these additional resourcesThe procedure of deciding the critical path is executed through the following
steps:• Firstly, the project is categorized into a series of labelled activities. These
activities are then arranged in a logical sequence and represented graphicallywith an arrow diagram.
• All the nodes and activities are then numbered. The time required for eachactivity is calculated and indicated in the arrow diagram.
• The earliest start and ending time along with the latest start and finish time arethen calculated and jotted down.
• The total float for each activity is then determined by taking the differencebetween the earliest and the latest time for each node.
• The critical activities (zero float activities) are then identified and connectedwith the beginning and the ending node in the network diagram by double linearrow. This gives the critical path.
• The total project duration is then calculated.• In case the total project duration needs to be reduced, the critical activities of
the network are crashed.• The cost is optimized and the network is then updated accordingly.
Since project schedules change on a regular basis, CPM allows continuous monitoringof the schedule. It enables the project manager to track the critical activities and ensuresthat the non-critical activities do not interfere along with the critical ones. The followingexample illustrates CPM in detail.A small maintenance project consists of the following jobs whose precedence relationshipsare given in Table 3.2.
Table 3.2 Precedence Relationships
Job 1–2 1–3 2–3 2–5 3–4 3–6 4–5 4–6 5–6 6–7
Duration (days)
15 15 3 5 8 12 1 14 3 14
1. Draw an arrow diagram representing the project2. Find the total float for each activity3. Find the critical path and the total project duration
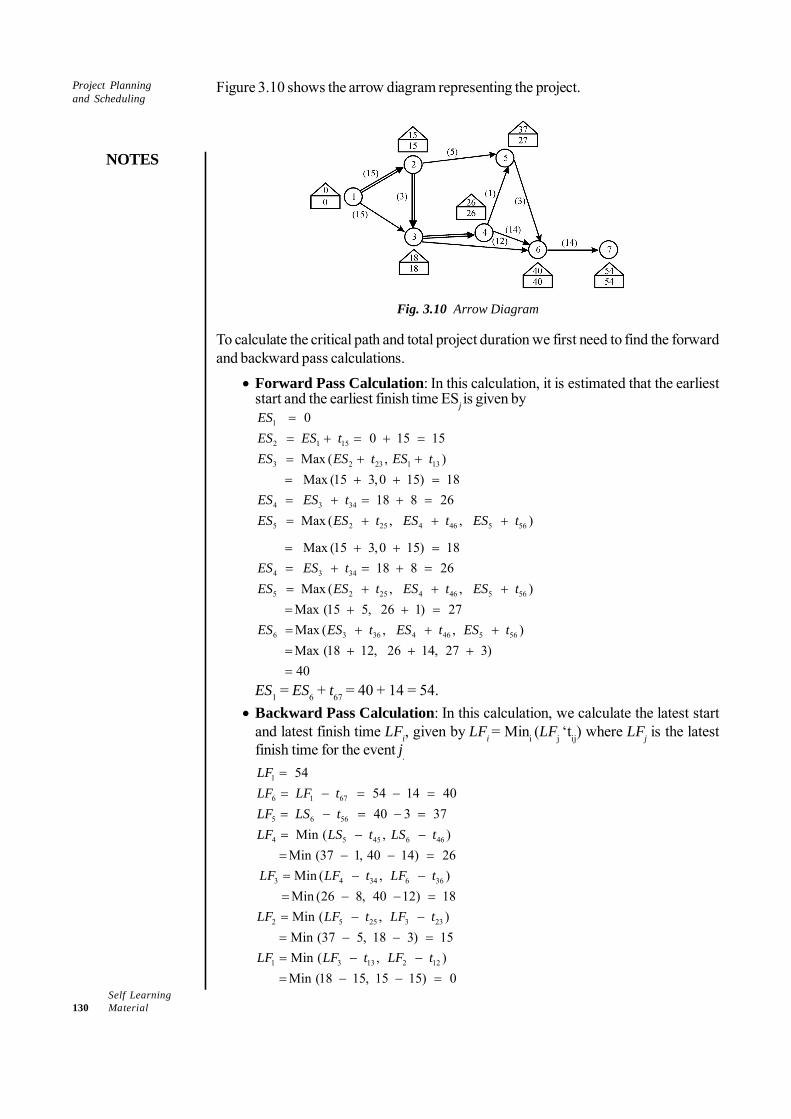
Self Learning130 Material
Project Planningand Scheduling
NOTES
Figure 3.10 shows the arrow diagram representing the project.
Fig. 3.10 Arrow Diagram
To calculate the critical path and total project duration we first need to find the forwardand backward pass calculations.
• Forward Pass Calculation: In this calculation, it is estimated that the earlieststart and the earliest finish time ESj is given by
1
2 1 15
3 2 23 1 13
4 3 34
5 2 25 4 46 5 56
0 0 15 15 Max ( , )
Max (15 3,0 15) 18 18 8 26
Max ( , , )
ESES ES tES ES t ES t
ES ES tES ES t ES t ES t
== + = + == + += + + == + = + == + + +
4 3 34
5 2 25 4 46 5 56
6
Max (15 3,0 15) 18 18 8 26
Max ( , , )Max (15 5, 26 1) 27Max (
ES ES tES ES t ES t ES t
ES
= + + == + = + == + + += + + == 3 36 4 46 5 56 , , )
Max (18 12, 26 14, 27 3) 40
ES t ES t ES t+ + += + + +=
ES1 = ES6 + t67 = 40 + 14 = 54.• Backward Pass Calculation: In this calculation, we calculate the latest start
and latest finish time LFi, given by LFi = Mini (LFj ‘tij) where LFj is the latestfinish time for the event j.
1
6 1 67
5 6 56
4 5 45 6 46
3 4 34 6 36
2 5 25 3
54 54 14 40 40 3 37 Min ( , )
Min (37 1, 40 14) 26Min ( , )Min (26 8, 40 12) 18Min ( ,
LFLF LF tLF LS tLF LS t LS t
LF LF t LF t
LF LF t LF
== − = − == − = − == − −= − − == − −= − − == − − 23
1 3 13 2 12
)Min (37 5, 18 3) 15Min ( , )Min (18 15, 15 15) 0
t
LF LF t LF t= − − == − −= − − =
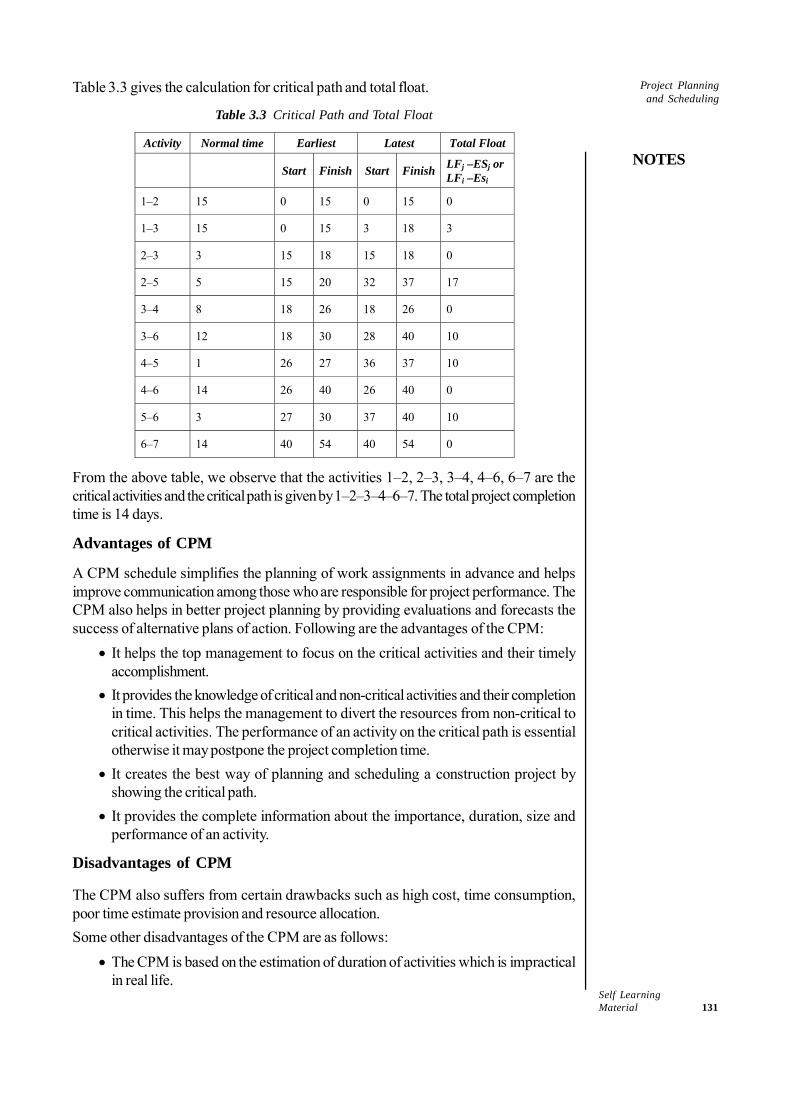
Self LearningMaterial 131
Project Planningand Scheduling
NOTES
Table 3.3 gives the calculation for critical path and total float.
Table 3.3 Critical Path and Total Float
Activity Normal time Earliest Latest Total Float
Start Finish Start Finish LFj –ESj or LFi –Esi
1–2 15 0 15 0 15 0
1–3 15 0 15 3 18 3
2–3 3 15 18 15 18 0
2–5 5 15 20 32 37 17
3–4 8 18 26 18 26 0
3–6 12 18 30 28 40 10
4–5 1 26 27 36 37 10
4–6 14 26 40 26 40 0
5–6 3 27 30 37 40 10
6–7 14 40 54 40 54 0
From the above table, we observe that the activities 1–2, 2–3, 3–4, 4–6, 6–7 are thecritical activities and the critical path is given by 1–2–3–4–6–7. The total project completiontime is 14 days.
Advantages of CPM
A CPM schedule simplifies the planning of work assignments in advance and helpsimprove communication among those who are responsible for project performance. TheCPM also helps in better project planning by providing evaluations and forecasts thesuccess of alternative plans of action. Following are the advantages of the CPM:
• It helps the top management to focus on the critical activities and their timelyaccomplishment.
• It provides the knowledge of critical and non-critical activities and their completionin time. This helps the management to divert the resources from non-critical tocritical activities. The performance of an activity on the critical path is essentialotherwise it may postpone the project completion time.
• It creates the best way of planning and scheduling a construction project byshowing the critical path.
• It provides the complete information about the importance, duration, size andperformance of an activity.
Disadvantages of CPM
The CPM also suffers from certain drawbacks such as high cost, time consumption,poor time estimate provision and resource allocation.Some other disadvantages of the CPM are as follows:
• The CPM is based on the estimation of duration of activities which is impracticalin real life.
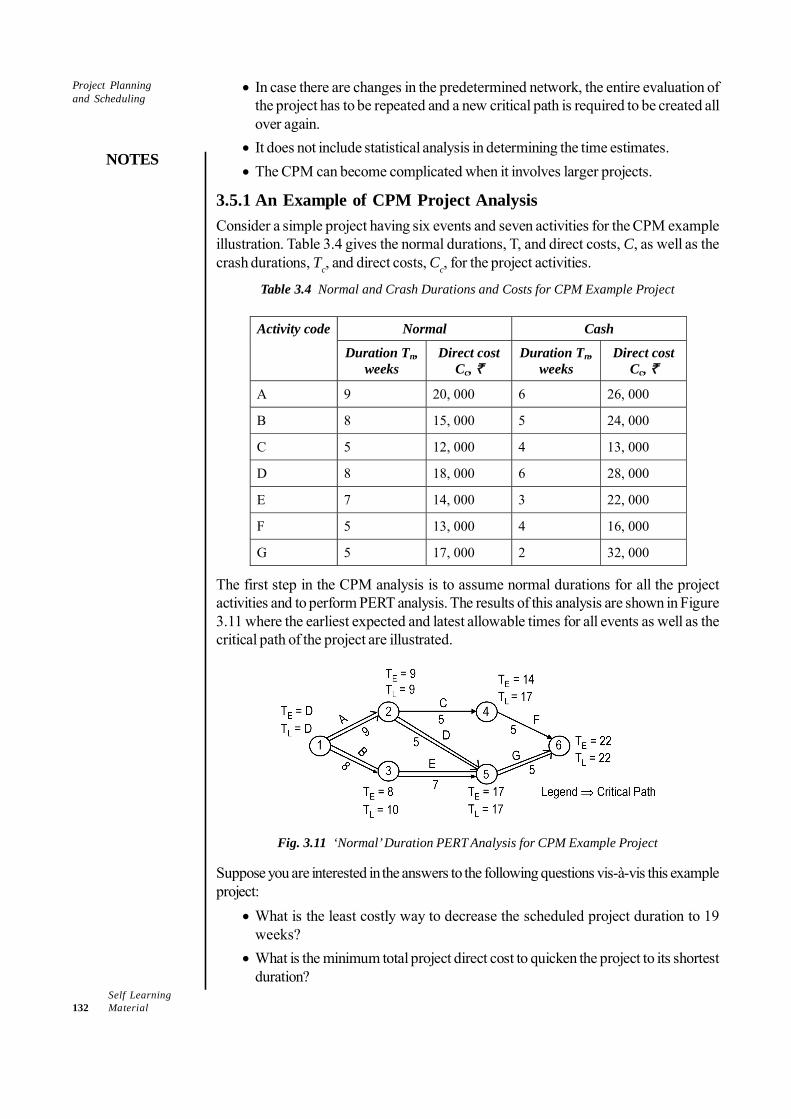
Self Learning132 Material
Project Planningand Scheduling
NOTES
• In case there are changes in the predetermined network, the entire evaluation ofthe project has to be repeated and a new critical path is required to be created allover again.
• It does not include statistical analysis in determining the time estimates.• The CPM can become complicated when it involves larger projects.
3.5.1 An Example of CPM Project AnalysisConsider a simple project having six events and seven activities for the CPM exampleillustration. Table 3.4 gives the normal durations, T, and direct costs, C, as well as thecrash durations, Tc, and direct costs, Cc, for the project activities.
Table 3.4 Normal and Crash Durations and Costs for CPM Example Project
Normal Cash Activity code
Duration Tn, weeks
Direct cost Cc, `
Duration Tn, weeks
Direct cost Cc, `
A 9 20, 000 6 26, 000
B 8 15, 000 5 24, 000
C 5 12, 000 4 13, 000
D 8 18, 000 6 28, 000
E 7 14, 000 3 22, 000
F 5 13, 000 4 16, 000
G 5 17, 000 2 32, 000
The first step in the CPM analysis is to assume normal durations for all the projectactivities and to perform PERT analysis. The results of this analysis are shown in Figure3.11 where the earliest expected and latest allowable times for all events as well as thecritical path of the project are illustrated.
Fig. 3.11 ‘Normal’ Duration PERT Analysis for CPM Example Project
Suppose you are interested in the answers to the following questions vis-à-vis this exampleproject:
• What is the least costly way to decrease the scheduled project duration to 19weeks?
• What is the minimum total project direct cost to quicken the project to its shortestduration?
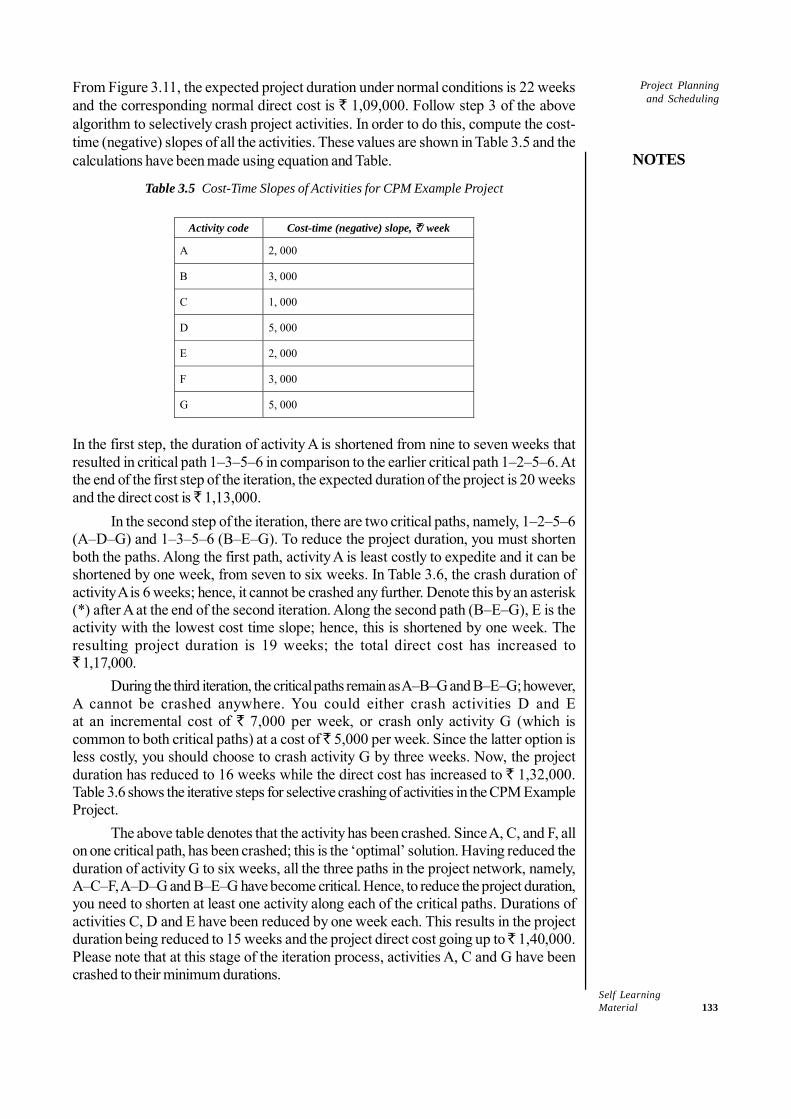
Self LearningMaterial 133
Project Planningand Scheduling
NOTES
From Figure 3.11, the expected project duration under normal conditions is 22 weeksand the corresponding normal direct cost is ` 1,09,000. Follow step 3 of the abovealgorithm to selectively crash project activities. In order to do this, compute the cost-time (negative) slopes of all the activities. These values are shown in Table 3.5 and thecalculations have been made using equation and Table.
Table 3.5 Cost-Time Slopes of Activities for CPM Example Project
Activity code Cost-time (negative) slope, `/ week
A 2, 000
B 3, 000
C 1, 000
D 5, 000
E 2, 000
F 3, 000
G 5, 000
In the first step, the duration of activity A is shortened from nine to seven weeks thatresulted in critical path 1–3–5–6 in comparison to the earlier critical path 1–2–5–6. Atthe end of the first step of the iteration, the expected duration of the project is 20 weeksand the direct cost is ̀ 1,13,000.
In the second step of the iteration, there are two critical paths, namely, 1–2–5–6(A–D–G) and 1–3–5–6 (B–E–G). To reduce the project duration, you must shortenboth the paths. Along the first path, activity A is least costly to expedite and it can beshortened by one week, from seven to six weeks. In Table 3.6, the crash duration ofactivity A is 6 weeks; hence, it cannot be crashed any further. Denote this by an asterisk(*) after A at the end of the second iteration. Along the second path (B–E–G), E is theactivity with the lowest cost time slope; hence, this is shortened by one week. Theresulting project duration is 19 weeks; the total direct cost has increased to` 1,17,000.
During the third iteration, the critical paths remain as A–B–G and B–E–G; however,A cannot be crashed anywhere. You could either crash activities D and Eat an incremental cost of ` 7,000 per week, or crash only activity G (which iscommon to both critical paths) at a cost of ̀ 5,000 per week. Since the latter option isless costly, you should choose to crash activity G by three weeks. Now, the projectduration has reduced to 16 weeks while the direct cost has increased to ` 1,32,000.Table 3.6 shows the iterative steps for selective crashing of activities in the CPM ExampleProject.
The above table denotes that the activity has been crashed. Since A, C, and F, allon one critical path, has been crashed; this is the ‘optimal’ solution. Having reduced theduration of activity G to six weeks, all the three paths in the project network, namely,A–C–F, A–D–G and B–E–G have become critical. Hence, to reduce the project duration,you need to shorten at least one activity along each of the critical paths. Durations ofactivities C, D and E have been reduced by one week each. This results in the projectduration being reduced to 15 weeks and the project direct cost going up to ̀ 1,40,000.Please note that at this stage of the iteration process, activities A, C and G have beencrashed to their minimum durations.
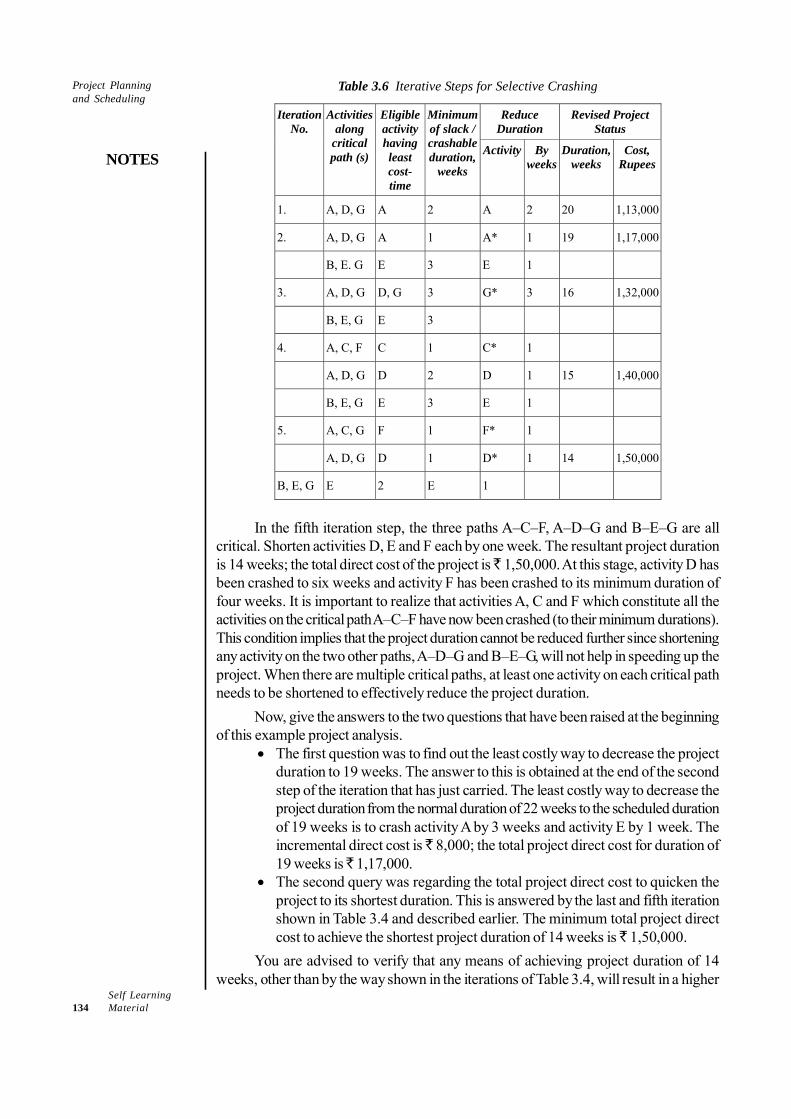
Self Learning134 Material
Project Planningand Scheduling
NOTES
Table 3.6 Iterative Steps for Selective Crashing
Reduce Duration
Revised Project Status
Iteration No.
Activities along
critical path (s)
Eligible activity having least cost-time
Minimum of slack / crashable duration,
weeks
Activity By weeks
Duration, weeks
Cost, Rupees
1. A, D, G A 2 A 2 20 1,13,000
2. A, D, G A 1 A* 1 19 1,17,000
B, E. G E 3 E 1
3. A, D, G D, G 3 G* 3 16 1,32,000
B, E, G E 3
4. A, C, F C 1 C* 1
A, D, G D 2 D 1 15 1,40,000
B, E, G E 3 E 1
5. A, C, G F 1 F* 1
A, D, G D 1 D* 1 14 1,50,000
B, E, G E 2 E 1
In the fifth iteration step, the three paths A–C–F, A–D–G and B–E–G are allcritical. Shorten activities D, E and F each by one week. The resultant project durationis 14 weeks; the total direct cost of the project is ̀ 1,50,000. At this stage, activity D hasbeen crashed to six weeks and activity F has been crashed to its minimum duration offour weeks. It is important to realize that activities A, C and F which constitute all theactivities on the critical path A–C–F have now been crashed (to their minimum durations).This condition implies that the project duration cannot be reduced further since shorteningany activity on the two other paths, A–D–G and B–E–G, will not help in speeding up theproject. When there are multiple critical paths, at least one activity on each critical pathneeds to be shortened to effectively reduce the project duration.
Now, give the answers to the two questions that have been raised at the beginningof this example project analysis.
• The first question was to find out the least costly way to decrease the projectduration to 19 weeks. The answer to this is obtained at the end of the secondstep of the iteration that has just carried. The least costly way to decrease theproject duration from the normal duration of 22 weeks to the scheduled durationof 19 weeks is to crash activity A by 3 weeks and activity E by 1 week. Theincremental direct cost is ̀ 8,000; the total project direct cost for duration of19 weeks is ̀ 1,17,000.
• The second query was regarding the total project direct cost to quicken theproject to its shortest duration. This is answered by the last and fifth iterationshown in Table 3.4 and described earlier. The minimum total project directcost to achieve the shortest project duration of 14 weeks is ̀ 1,50,000.
You are advised to verify that any means of achieving project duration of 14weeks, other than by the way shown in the iterations of Table 3.4, will result in a higher
Self LearningMaterial 135
Project Planningand Scheduling
NOTES
total direct cost of the project. For example, one obvious (and trivial) solution to theproblem of crashing the project duration would be to crash all the project activities totheir minimum (crash) durations. This would certainly result in the project being completedin 14 weeks but at an enhanced direct cost of ̀ 1,61,000. The reason for this additionaldirect cost of ̀ 11,000 over the optimal direct cost of ̀ 1,50,000 arrived at in the fifthiteration in Table 3.4 is that you will unnecessarily be crashing activities B and E by anadditional 3 weeks and 1 week, respectively. The ‘optimal’ solution of the selectivecrashing process indicates that activity B can be scheduled for 8 weeks and E for 4weeks. Rescheduling B to its crash duration of 5 weeks and E to 3 weeks does not resultin any gain in the project duration but only causes an additional direct cost of ̀ 11,000.This is the reason why you do a selective crashing of project activities rather than resortto an ‘indiscriminate’ crashing of all the activities in the project.
3.5.2 Total Cost-Time Trade-Off
The CPM analysis, so far, has only dealt with direct costs which are costs directlyassociated with individual project activities. The direct cost for an activity increaseslinearly as the project activity is expedited. You can plot the total project directcost versus the project duration by taking the values after each iteration step fromTable 3.4.
It is obvious that the cost of executing a project is more than just the directactivity costs. The other costs of the project include the indirect costs as well, such asthe costs of utilities, facilities, rents, administration, marketing, taxes, etc. As opposed tothe direct costs which vary inversely with project duration, indirect costs increase as theproject duration increases (because the indirect costs are per day or per week costswhich have to be met regardless of the level of the project activity for as long as theproject is scheduled). The mathematical function to express the indirect cost, CI, interms of the expected project duration, Te, can either be derived by estimation of actual(historical) costs or can be approximated by a formula. You can estimate the indirectcosts for the CPM example project to be as follows:Where
CI = 17,000 + 6,000 Te
CI = indirect project cost in Rupees
Te = expected project duration in weeks
The above equation implies that the start-up indirect cost, even for zero project duration,is ̀ 17,000. Thereafter, the indirect cost increases by ̀ 6,000 for every additional week’sincrease of the expected project duration.
The total project cost can be computed by summing up the direct and indirect costs. Thecurve, for most projects will be U-shaped with the trough of the curve representing theduration at which the total project cost is the minimum. Thus, if you have a choice inselecting the scheduled completion time, Ts, you should select this optimum durationpoint.
3.5.3 Planning Time Scales-Network/PERT Analysis
A systematic approach in planning the activities would include several steps and decisions.First, the firm has to decide whether they would want multi-level scheduling and multi-project scheduling or not. Then, the activities must be identified discretely, the time for
Self Learning136 Material
Project Planningand Scheduling
NOTES
each activity must be estimated, the resource requirement must be planned and theinterdependence must be determined. These activities should then be presented in amanner that will help grasp the complexities clearly and also help to determine slack, ifany. It will also help in effective resource allocation considering the time period. In thissection, we will discuss these issues.
Concept of Network
Conceptually, we can say that a network diagram is a graphical presentation of all theactivities of a project, arranged in a proper sequence and with clearly establishedinterdependencies. The network diagram provides a full picture of the project. Thediagram can be presented as:
(a) A Gantt chart(b) A PERT (programme evaluation and review technique) diagram
(c) A CPM (critical path method) diagramPERT and CPM are quite similar, except in the incorporation of uncertainty of
time needed for the completion of each activity.
Purpose of network analysis
The goals and purposes of network analysis can be listed as follows:1. Identifying discrete activities and sub-activities2. Identifying events signalling either the beginning or ending of the activities3. Estimating the time taken for completion of each activity, if possible on crash
basis, normal basis, worst-scenario basis4. Identifying interdependence, if any, of activities5. Identifying critical path, so that one may know the existence of slack time in any
activity6. Identifying slack for efficient resource allocation7. Determining economics of crashing of activities
3.6 PROJECT EVALUATION AND REVIEWTECHNIQUE (PERT)
The program (or project) evaluation and review technique, commonly abbreviated PERT,is an analytical means, used in project management, which was developed for the analysisand representation of tasks that were part of implementation a given project. Initiallydeveloped by the United States Navy in the 1950s, PERT is widely used together withthe critical path method (CPM). In addition to being used as a method to analyze theinvolved tasks in completing a given project, PERT is also used to calculate the timerequired for every task independently and to spot the least possible time required forcompleting the entire project.The PERT was created to handle such projects where the time estimate of activities isnon-deterministic. The PERT is used to organize and coordinate tasks within the project.The objective of the PERT chart is to determine critical path which comprises criticalactivities that should be completed on schedule. This chart is prepared with the help of
Check Your Progress
6. Define multi-levelscheduling.
7. What is GnattChart?
8. Define workbreakdownstructure.
9. What is the basicobjective of CPM?
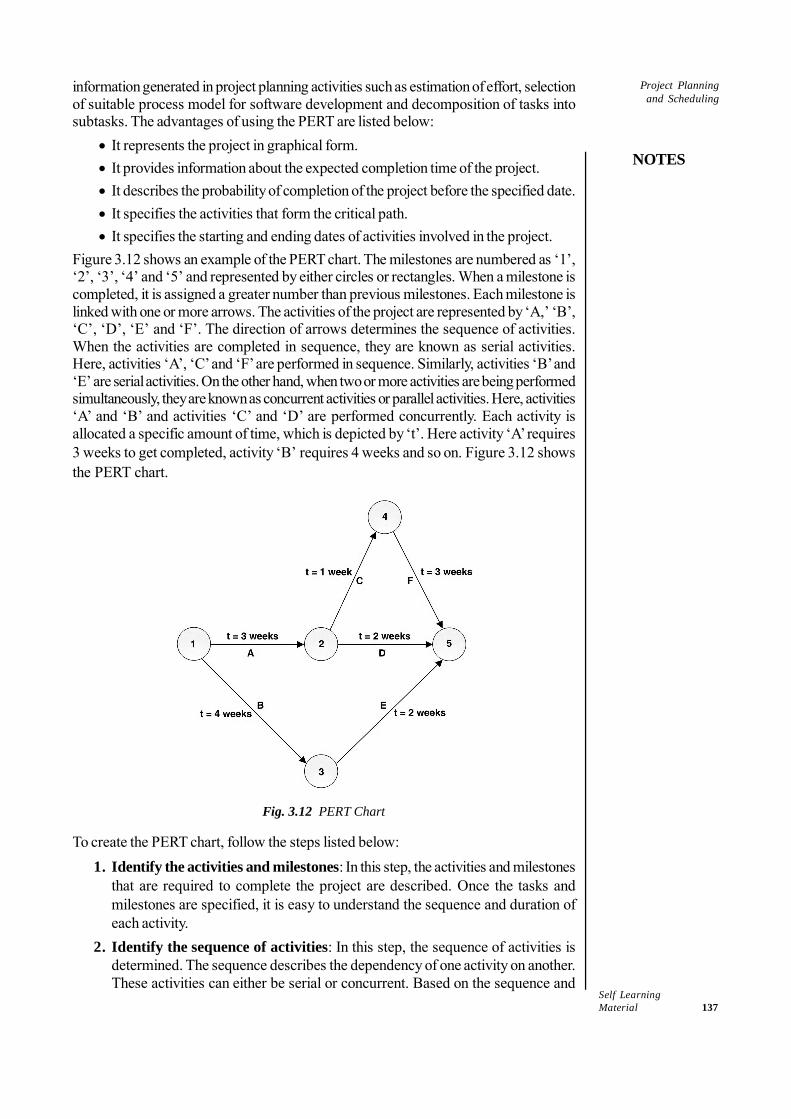
Self LearningMaterial 137
Project Planningand Scheduling
NOTES
information generated in project planning activities such as estimation of effort, selectionof suitable process model for software development and decomposition of tasks intosubtasks. The advantages of using the PERT are listed below:
• It represents the project in graphical form.• It provides information about the expected completion time of the project.• It describes the probability of completion of the project before the specified date.• It specifies the activities that form the critical path.• It specifies the starting and ending dates of activities involved in the project.
Figure 3.12 shows an example of the PERT chart. The milestones are numbered as ‘1’,‘2’, ‘3’, ‘4’ and ‘5’ and represented by either circles or rectangles. When a milestone iscompleted, it is assigned a greater number than previous milestones. Each milestone islinked with one or more arrows. The activities of the project are represented by ‘A,’ ‘B’,‘C’, ‘D’, ‘E’ and ‘F’. The direction of arrows determines the sequence of activities.When the activities are completed in sequence, they are known as serial activities.Here, activities ‘A’, ‘C’ and ‘F’ are performed in sequence. Similarly, activities ‘B’ and‘E’ are serial activities. On the other hand, when two or more activities are being performedsimultaneously, they are known as concurrent activities or parallel activities. Here, activities‘A’ and ‘B’ and activities ‘C’ and ‘D’ are performed concurrently. Each activity isallocated a specific amount of time, which is depicted by ‘t’. Here activity ‘A’ requires3 weeks to get completed, activity ‘B’ requires 4 weeks and so on. Figure 3.12 showsthe PERT chart.
Fig. 3.12 PERT Chart
To create the PERT chart, follow the steps listed below:1. Identify the activities and milestones: In this step, the activities and milestones
that are required to complete the project are described. Once the tasks andmilestones are specified, it is easy to understand the sequence and duration ofeach activity.
2. Identify the sequence of activities: In this step, the sequence of activities isdetermined. The sequence describes the dependency of one activity on another.These activities can either be serial or concurrent. Based on the sequence and
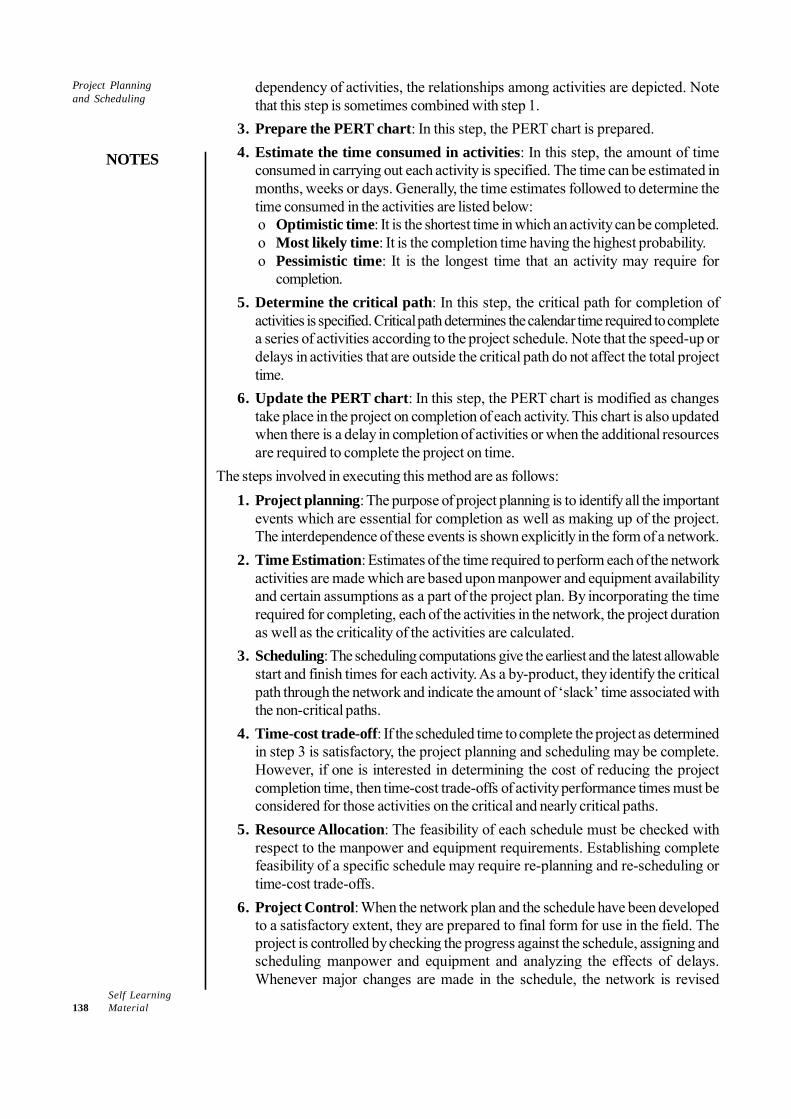
Self Learning138 Material
Project Planningand Scheduling
NOTES
dependency of activities, the relationships among activities are depicted. Notethat this step is sometimes combined with step 1.
3. Prepare the PERT chart: In this step, the PERT chart is prepared.4. Estimate the time consumed in activities: In this step, the amount of time
consumed in carrying out each activity is specified. The time can be estimated inmonths, weeks or days. Generally, the time estimates followed to determine thetime consumed in the activities are listed below:o Optimistic time: It is the shortest time in which an activity can be completed.o Most likely time: It is the completion time having the highest probability.o Pessimistic time: It is the longest time that an activity may require for
completion.5. Determine the critical path: In this step, the critical path for completion of
activities is specified. Critical path determines the calendar time required to completea series of activities according to the project schedule. Note that the speed-up ordelays in activities that are outside the critical path do not affect the total projecttime.
6. Update the PERT chart: In this step, the PERT chart is modified as changestake place in the project on completion of each activity. This chart is also updatedwhen there is a delay in completion of activities or when the additional resourcesare required to complete the project on time.
The steps involved in executing this method are as follows:1. Project planning: The purpose of project planning is to identify all the important
events which are essential for completion as well as making up of the project.The interdependence of these events is shown explicitly in the form of a network.
2. Time Estimation: Estimates of the time required to perform each of the networkactivities are made which are based upon manpower and equipment availabilityand certain assumptions as a part of the project plan. By incorporating the timerequired for completing, each of the activities in the network, the project durationas well as the criticality of the activities are calculated.
3. Scheduling: The scheduling computations give the earliest and the latest allowablestart and finish times for each activity. As a by-product, they identify the criticalpath through the network and indicate the amount of ‘slack’ time associated withthe non-critical paths.
4. Time-cost trade-off: If the scheduled time to complete the project as determinedin step 3 is satisfactory, the project planning and scheduling may be complete.However, if one is interested in determining the cost of reducing the projectcompletion time, then time-cost trade-offs of activity performance times must beconsidered for those activities on the critical and nearly critical paths.
5. Resource Allocation: The feasibility of each schedule must be checked withrespect to the manpower and equipment requirements. Establishing completefeasibility of a specific schedule may require re-planning and re-scheduling ortime-cost trade-offs.
6. Project Control: When the network plan and the schedule have been developedto a satisfactory extent, they are prepared to final form for use in the field. Theproject is controlled by checking the progress against the schedule, assigning andscheduling manpower and equipment and analyzing the effects of delays.Whenever major changes are made in the schedule, the network is revised
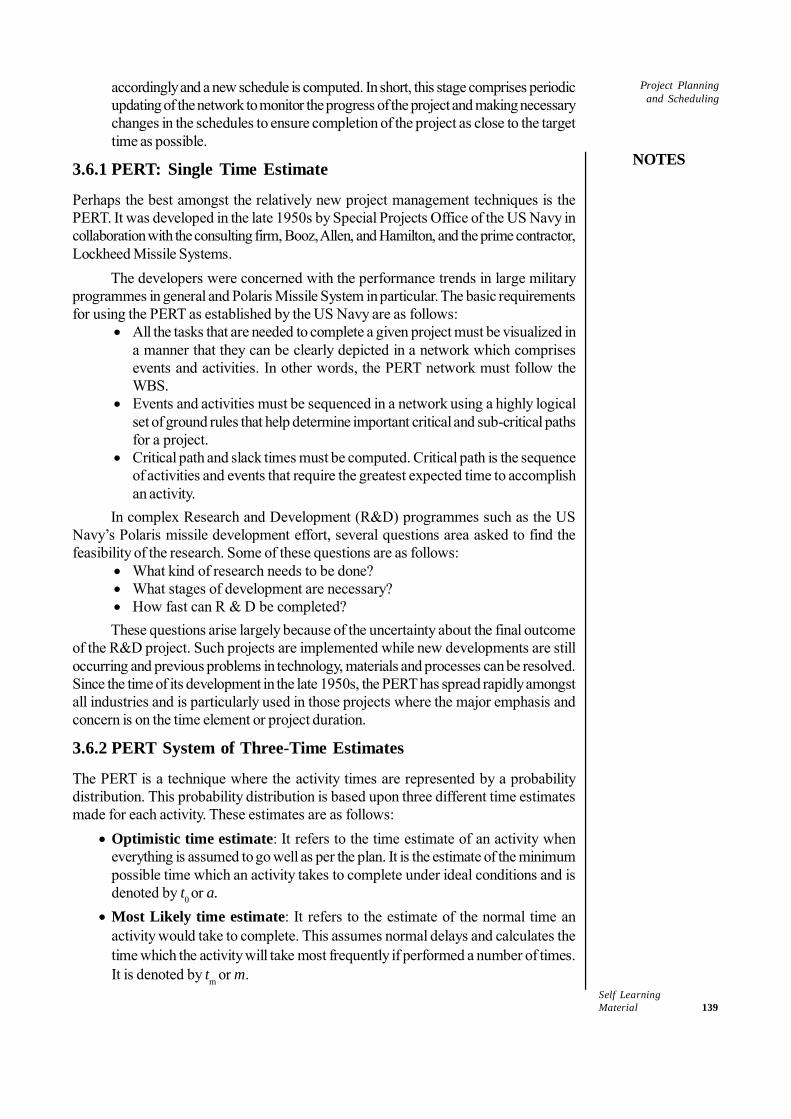
Self LearningMaterial 139
Project Planningand Scheduling
NOTES
accordingly and a new schedule is computed. In short, this stage comprises periodicupdating of the network to monitor the progress of the project and making necessarychanges in the schedules to ensure completion of the project as close to the targettime as possible.
3.6.1 PERT: Single Time Estimate
Perhaps the best amongst the relatively new project management techniques is thePERT. It was developed in the late 1950s by Special Projects Office of the US Navy incollaboration with the consulting firm, Booz, Allen, and Hamilton, and the prime contractor,Lockheed Missile Systems.
The developers were concerned with the performance trends in large militaryprogrammes in general and Polaris Missile System in particular. The basic requirementsfor using the PERT as established by the US Navy are as follows:
• All the tasks that are needed to complete a given project must be visualized ina manner that they can be clearly depicted in a network which comprisesevents and activities. In other words, the PERT network must follow theWBS.
• Events and activities must be sequenced in a network using a highly logicalset of ground rules that help determine important critical and sub-critical pathsfor a project.
• Critical path and slack times must be computed. Critical path is the sequenceof activities and events that require the greatest expected time to accomplishan activity.
In complex Research and Development (R&D) programmes such as the USNavy’s Polaris missile development effort, several questions area asked to find thefeasibility of the research. Some of these questions are as follows:
• What kind of research needs to be done?• What stages of development are necessary?• How fast can R & D be completed?These questions arise largely because of the uncertainty about the final outcome
of the R&D project. Such projects are implemented while new developments are stilloccurring and previous problems in technology, materials and processes can be resolved.Since the time of its development in the late 1950s, the PERT has spread rapidly amongstall industries and is particularly used in those projects where the major emphasis andconcern is on the time element or project duration.
3.6.2 PERT System of Three-Time Estimates
The PERT is a technique where the activity times are represented by a probabilitydistribution. This probability distribution is based upon three different time estimatesmade for each activity. These estimates are as follows:
• Optimistic time estimate: It refers to the time estimate of an activity wheneverything is assumed to go well as per the plan. It is the estimate of the minimumpossible time which an activity takes to complete under ideal conditions and isdenoted by t0 or a.
• Most Likely time estimate: It refers to the estimate of the normal time anactivity would take to complete. This assumes normal delays and calculates thetime which the activity will take most frequently if performed a number of times.It is denoted by tm or m.
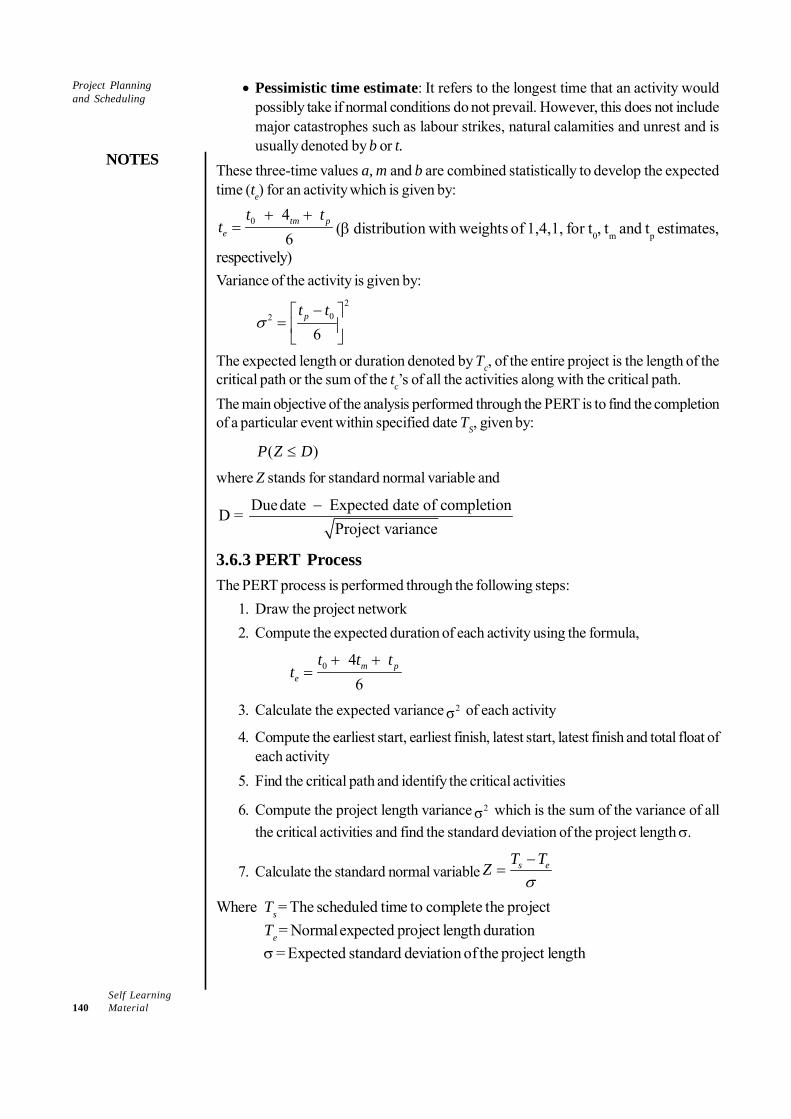
Self Learning140 Material
Project Planningand Scheduling
NOTES
• Pessimistic time estimate: It refers to the longest time that an activity wouldpossibly take if normal conditions do not prevail. However, this does not includemajor catastrophes such as labour strikes, natural calamities and unrest and isusually denoted by b or t.
These three-time values a, m and b are combined statistically to develop the expectedtime (te) for an activity which is given by:
0 4 6tm p
e
t tt
+ += (β distribution with weights of 1,4,1, for t0, tm and tp estimates,
respectively)Variance of the activity is given by:
202
6pt t
σ−⎡ ⎤
= ⎢ ⎥⎣ ⎦
The expected length or duration denoted by Tc, of the entire project is the length of thecritical path or the sum of the tc’s of all the activities along with the critical path.The main objective of the analysis performed through the PERT is to find the completionof a particular event within specified date TS, given by:
( )P Z D≤
where Z stands for standard normal variable and
Duedate Expected date of completionD = Project variance
−
3.6.3 PERT ProcessThe PERT process is performed through the following steps:
1. Draw the project network2. Compute the expected duration of each activity using the formula,
0 4 6
m pe
t t tt
+ +=
3. Calculate the expected variance 2σ of each activity
4. Compute the earliest start, earliest finish, latest start, latest finish and total float ofeach activity
5. Find the critical path and identify the critical activities
6. Compute the project length variance 2σ which is the sum of the variance of allthe critical activities and find the standard deviation of the project length σ.
7. Calculate the standard normal variable s eT TZσ−
=
Where Ts = The scheduled time to complete the projectTe = Normal expected project length durationσ = Expected standard deviation of the project length
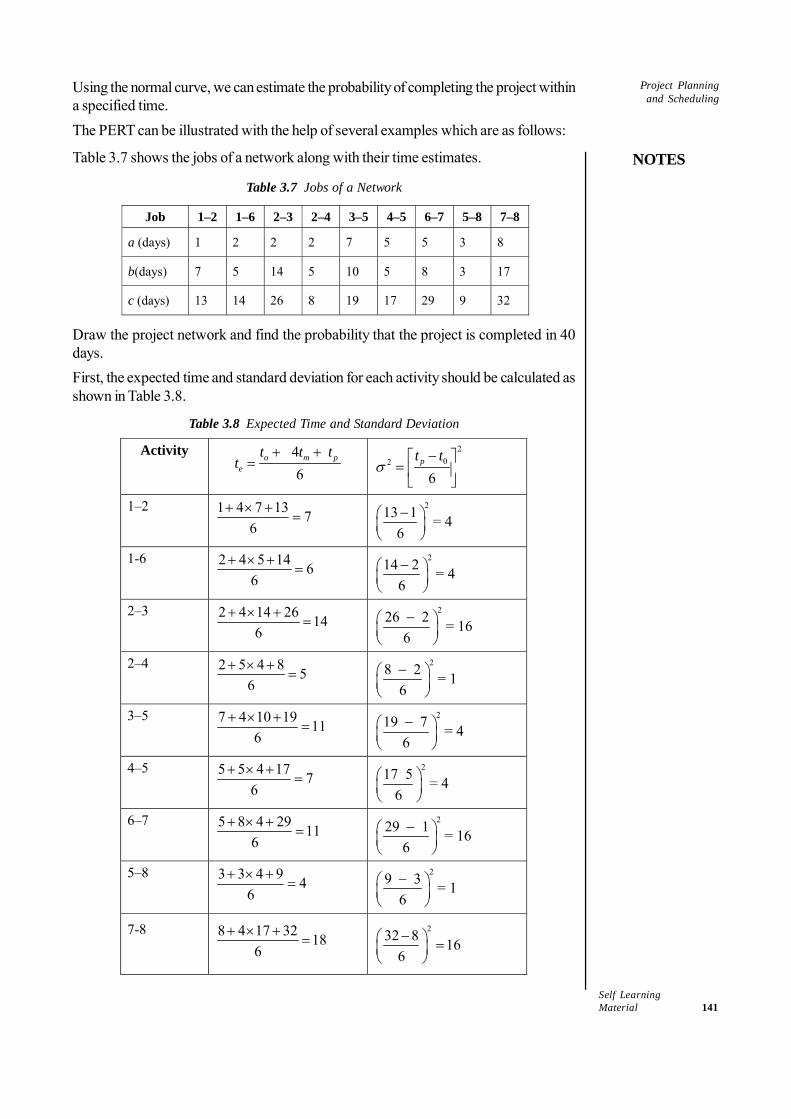
Self LearningMaterial 141
Project Planningand Scheduling
NOTES
Using the normal curve, we can estimate the probability of completing the project withina specified time.The PERT can be illustrated with the help of several examples which are as follows:
Table 3.7 shows the jobs of a network along with their time estimates.
Table 3.7 Jobs of a Network
Job 1–2 1–6 2–3 2–4 3–5 4–5 6–7 5–8 7–8
a (days) 1 2 2 2 7 5 5 3 8
b(days) 7 5 14 5 10 5 8 3 17
c (days) 13 14 26 8 19 17 29 9 32
Draw the project network and find the probability that the project is completed in 40days.First, the expected time and standard deviation for each activity should be calculated asshown in Table 3.8.
Table 3.8 Expected Time and Standard Deviation
Activity 4 6
o m pe
t t tt
+ +=
202
6pt t
σ−⎡ ⎤
= ⎢ ⎥⎣ ⎦
1–2 1 4 7 13 76
+ × +=
213 1 = 46−⎛ ⎞
⎜ ⎟⎝ ⎠
1-6 2 4 5 14 66
+ × +=
214 2 = 46−⎛ ⎞
⎜ ⎟⎝ ⎠
2–3 2 4 14 26 146
+ × +=
226 2 = 166−⎛ ⎞
⎜ ⎟⎝ ⎠
2–4 2 5 4 8 56
+ × +=
28 2 = 16−⎛ ⎞
⎜ ⎟⎝ ⎠
3–5 7 4 10 19 116
+ × +=
219 7 = 46−⎛ ⎞
⎜ ⎟⎝ ⎠
4–5 5 5 4 17 76
+ × +=
217 5 = 46
⎛ ⎞⎜ ⎟⎝ ⎠
6–7 5 8 4 29 116
+ × +=
229 1 = 166−⎛ ⎞
⎜ ⎟⎝ ⎠
5–8 3 3 4 9 46
+ × +=
29 3 = 16−⎛ ⎞
⎜ ⎟⎝ ⎠
7-8 8 4 17 32 186
+ × +=
232 8 166−⎛ ⎞ =⎜ ⎟
⎝ ⎠
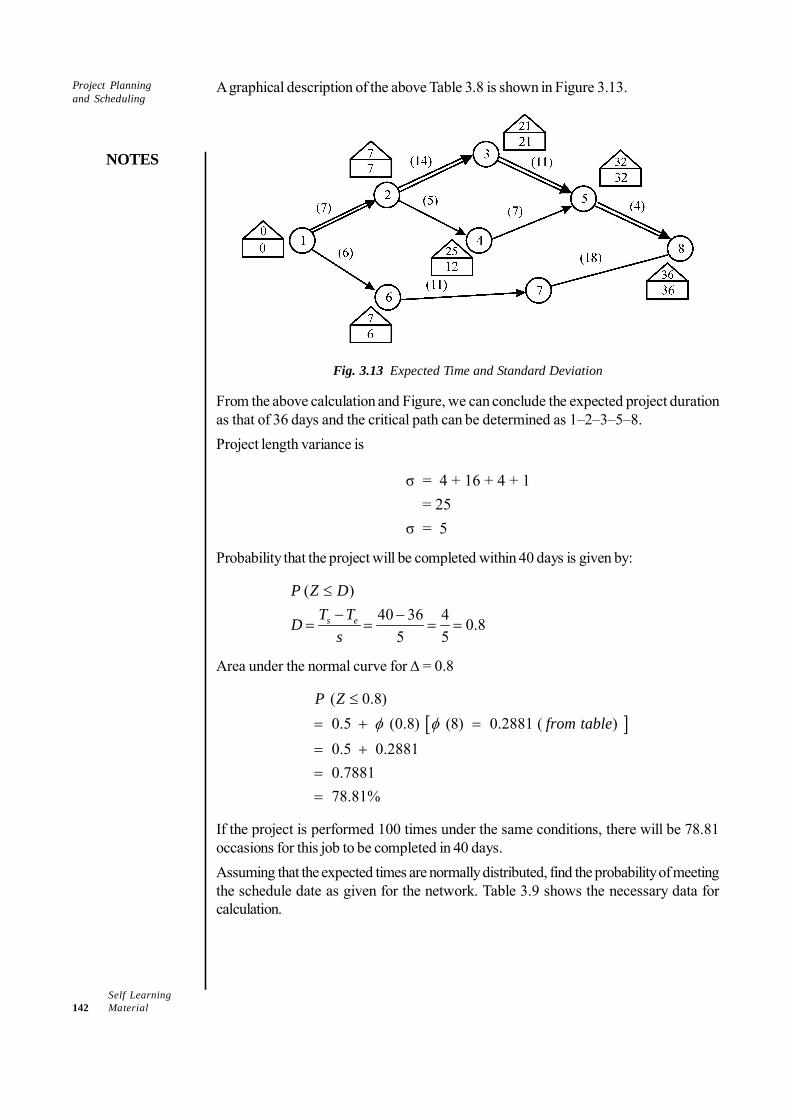
Self Learning142 Material
Project Planningand Scheduling
NOTES
A graphical description of the above Table 3.8 is shown in Figure 3.13.
Fig. 3.13 Expected Time and Standard Deviation
From the above calculation and Figure, we can conclude the expected project durationas that of 36 days and the critical path can be determined as 1–2–3–5–8.Project length variance is
σ = 4 + 16 + 4 + 1 = 25σ = 5
Probability that the project will be completed within 40 days is given by:
( )40 36 4 0.8
5 5s e
P Z DT TD
s
≤− −
= = = =
Area under the normal curve for Δ = 0.8
[ ] ( 0.8)0.5 (0.8) (8) 0.2881 ( )
0.5 0.2881 0.7881 78.81%
P Zfrom table
≤
= + =
= +==
φ φ
If the project is performed 100 times under the same conditions, there will be 78.81occasions for this job to be completed in 40 days.Assuming that the expected times are normally distributed, find the probability of meetingthe schedule date as given for the network. Table 3.9 shows the necessary data forcalculation.
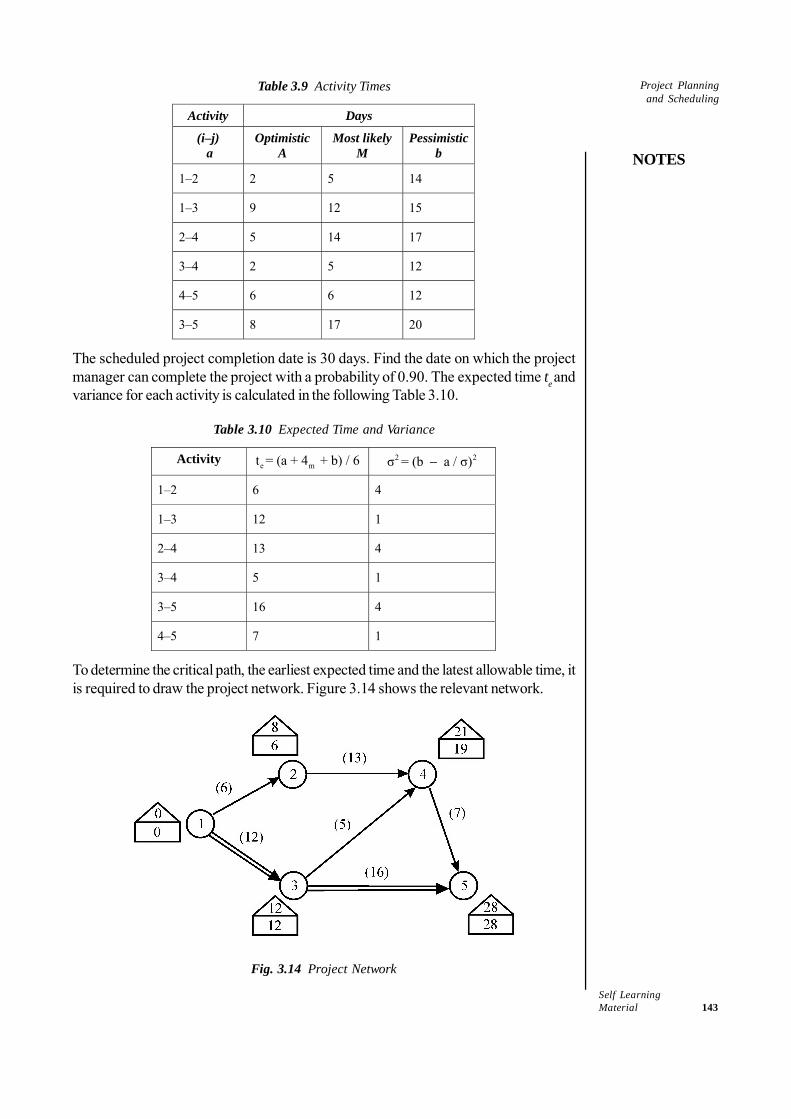
Self LearningMaterial 143
Project Planningand Scheduling
NOTES
Table 3.9 Activity Times
Activity Days
(i–j) a
Optimistic A
Most likely M
Pessimisticb
1–2 2 5 14
1–3 9 12 15
2–4 5 14 17
3–4 2 5 12
4–5 6 6 12
3–5 8 17 20
The scheduled project completion date is 30 days. Find the date on which the projectmanager can complete the project with a probability of 0.90. The expected time te andvariance for each activity is calculated in the following Table 3.10.
Table 3.10 Expected Time and Variance
Activity e mt = (a + 4 + b) / 6 2 2σ = (b a / σ)−
1–2 6 4
1–3 12 1
2–4 13 4
3–4 5 1
3–5 16 4
4–5 7 1
To determine the critical path, the earliest expected time and the latest allowable time, itis required to draw the project network. Figure 3.14 shows the relevant network.
Fig. 3.14 Project Network
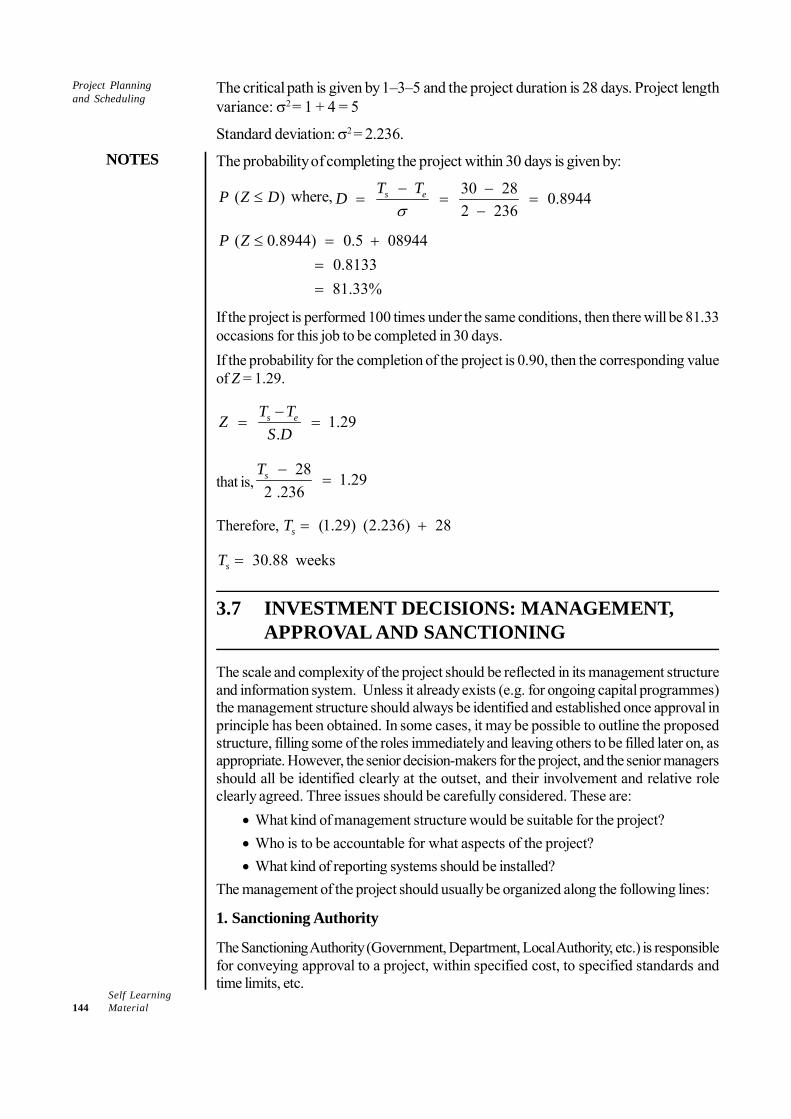
Self Learning144 Material
Project Planningand Scheduling
NOTES
The critical path is given by 1–3–5 and the project duration is 28 days. Project lengthvariance: σ2 = 1 + 4 = 5
Standard deviation: σ2 = 2.236.
The probability of completing the project within 30 days is given by:
( )P Z D≤ where, 30 28 0.89442 236
s eT TDσ− −
= = =−
( 0.8944) 0.5 08944 0.8133 81.33%
P Z ≤ = +==
If the project is performed 100 times under the same conditions, then there will be 81.33occasions for this job to be completed in 30 days.If the probability for the completion of the project is 0.90, then the corresponding valueof Z = 1.29.
1.29.
s eT TZS D−
= =
that is, 28
1.292 .236sT −
=
Therefore, (1.29) (2.236) 28sT = +
30.88 weekssT =
3.7 INVESTMENT DECISIONS: MANAGEMENT,APPROVAL AND SANCTIONING
The scale and complexity of the project should be reflected in its management structureand information system. Unless it already exists (e.g. for ongoing capital programmes)the management structure should always be identified and established once approval inprinciple has been obtained. In some cases, it may be possible to outline the proposedstructure, filling some of the roles immediately and leaving others to be filled later on, asappropriate. However, the senior decision-makers for the project, and the senior managersshould all be identified clearly at the outset, and their involvement and relative roleclearly agreed. Three issues should be carefully considered. These are:
• What kind of management structure would be suitable for the project?• Who is to be accountable for what aspects of the project?• What kind of reporting systems should be installed?
The management of the project should usually be organized along the following lines:
1. Sanctioning Authority
The Sanctioning Authority (Government, Department, Local Authority, etc.) is responsiblefor conveying approval to a project, within specified cost, to specified standards andtime limits, etc.

Self LearningMaterial 145
Project Planningand Scheduling
NOTES
2. Sponsoring Agency
The Sponsoring agency has overall responsibility for the proper management of theproject, including its detailed planning; for obtaining necessary approvals from theSanctioning Authority and for ensuring that the project proceeds along the lines approvedby the Sanctioning Authority. Usually, the Sponsoring Agency is the body with whom thecontractor(s)/supplier(s) will have a legal commitment.
3. Steering Group
A Steering Group has the responsibility for overseeing the execution of the project. ASteering Group will usually be required on a complex and large scale project andparticularly where a number of bodies are interested or involved in the project. It shouldusually be chaired by a representative of the Sponsoring Agency. The group shouldinclude appropriate professional staff e.g. architect/engineer/quantity surveyor. The Groupmay include a representative from the Sanctioning Authority and/or the Department ofPublic Expenditure and Reform.
4. Project Coordinator
The Project Coordinator is the person who is responsible for the execution, on time tothe requisite quality and within budget, of the decisions taken by the Steering Group, orby the Sponsoring Agency in the absence of a Steering Group (where the project issmall). For very large projects it may be necessary to appoint a professional firm to takeon the task of actually managing the project. It would report to the Project Coordinator(who in turn would report to the Steering Group, and/or Sponsoring Agency, as appropriate)and it would be responsible for ensuring that the project came in on time and within cost.
5. Design Team Leader
A Design Team Leader should normally be appointed for every project with more thanone technical consultant. The Design Team Leader would report to the Project Coordinatoror, where a project management firm had been appointed, to that firm.
When plans and designs have been finalised, the project proposal should bereviewed, taking into account any major changes in relevant circumstances and themore precise information generated by the design process. In particular, if the expectedtotal cost of the project has increased, then the project should be re-examined andreductions achieved without lowering the quality standard of the project below acceptablelevels, in order to bring the project within the approved limit. Works should not be omittedso as to achieve reductions if they will have to be reintroduced later as being essentialfor the completion of the project, or for the generation of its full benefits, or if theysignificantly change the nature of the project. The Sanctioning Authority should be notifiedof any significant changes.
The pre-tender review is necessary to provide the information required by theSponsoring Agency and the Sanctioning Authority to decide whether or not to approvethe project and to allow it to proceed to Request for Tender.
Check Your Progress
10. State the objectiveof PERT chart.
11. What is optimistictime estimate?
12. Why is pre-tenderreview necessary?
Self Learning146 Material
Project Planningand Scheduling
NOTES
3.8 SUMMING UP
• The actual idea of time needed for completing an activity and interdependence ofa given activity with other activities and cost of activities becomes clear onlyafter the engineering design and the erection plan is prepared.
• A budget offer has to work in close coordination with the technical staff whoprepare project network and with the procurement officers.
• The network diagram drawn based on the work breakdown structure and thecritical path identified on it, both are based on ideal condition of abundance ofresources. The network plan is a time schedule and not the resource utilizationplan. The resources requirement determined by the ideal network plan is calledresource loading with reference to time.
• Clarity of goals and objectives are prerequisites for organizational effectiveness.• A firm would require a right type of organization structure for the construction of
a project.• The various types of organization are— Functional organization, divisionalized
organization, Projectized organization, matrix organization and task forceorganization.
• Two basic decisions are important before the network techniques are deployed:one, whether to have multi-level scheduling and two, whether to have multi-projectscheduling.
• A firm may avoid difficulties of multi-project scheduling by scheduling each projectindependently but the costs and other potential conflicts in this approach may notbe worth taking the risk.
• A good schedule helps project managers establish achievable and realistic goalsin order to fulfil project objectives, improve credibility, and manage the expectationsof clients better.
• A work breakdown structure (WBS), in project management and systemsengineering, is a deliverable oriented decomposition of a project into smallercomponents. It defines and groups a project’s discrete work elements in a waythat helps organize and define the total work scope of the project.
• The CPM is the graphical representation of the interrelationships between thetasks in a project to be performed in a well-defined sequence.
• The basic objective of the CPM is to determine which time-cost trade-offs shouldbe used for each activity so as to achieve the maximum or scheduled speedproject at the minimum total direct cost.
• The PERT was created to handle such projects where the time estimate of activitiesis non-deterministic. It was developed by a Navy sponsored research team ofMessrs D.G. Malcolm in 1950. The PERT is used to organize and coordinatetasks within the project.
• The objective of the PERT chart is to determine critical path which comprisescritical activities that should be completed on schedule. This chart is preparedwith the help of information generated in project planning activities such as estimationof effort, selection of suitable process model for software development anddecomposition of tasks into subtasks.
Self LearningMaterial 147
Project Planningand Scheduling
NOTES
• The PERT is a technique where the activity times are represented by a probabilitydistribution. This probability distribution is based upon three different time estimatesmade for each activity.
• The sanctioning authority is responsible for conveying approval to a project, withinspecified cost, to specified standards and time limits.
3.9 KEY TERMS
• Resource loading: The resources requirement determined by the ideal networkplan is called resource loading with reference to time.
• Resource smoothing: By adjusting the project schedule (network plan) throughthe use of slack (early start and late start of non-critical activities) it may bepossible to make efficient use of the resource. This is called resource smoothing.
• Multi-level scheduling: When schedules are prepared at multiple levels, it iscalled multi-level scheduling.
• Multi-project scheduling: In multi-project scheduling, all projects are collectivelytreated as a single project for the breakdown of work packages, their sequencingand resource allocation.
3.10 ANSWERS TO ‘CHECK YOUR PROGRESS’
1. Erection plan is a step-by-step process of putting all pieces together with thestages of testing and experimentations.
2. Project budget has two components in it, cost and cash flow.3. The resources requirement determined by the ideal network plan is called resource
loading with reference to time.4. Investment schemes have been classified as ‘major schemes’ and ‘minor schemes’.
The other two classifications, namely ‘equipment and furniture scheme’ and ‘repairand maintenance scheme’ are delegated to the discretion of the concerneddepartment.
5. The various types of organization are— Functional organization, divisionalizedorganization, Projectized organization, matrix organization and task forceorganization.
6. When schedules are prepared at multiple levels, it is called multi-level scheduling.7. Gantt chart is a type of bar chart that illustrates a project schedule. Gantt charts
illustrate the start and finish dates of terminal elements and summary elements ofa project.
8. A work breakdown structure (WBS), in project management and systemsengineering, is a deliverable oriented decomposition of a project into smallercomponents. It defines and groups a project’s discrete work elements in a waythat helps organize and define the total work scope of the project.
9. The basic objective of the CPM is to determine which time-cost trade-offs shouldbe used for each activity so as to achieve the maximum or scheduled speedproject at the minimum total direct cost.
Self Learning148 Material
Project Planningand Scheduling
NOTES
10. The objective of the PERT chart is to determine critical path which comprisescritical activities that should be completed on schedule.
11. Optimistic time estimate refers to the time estimate of an activity when everythingis assumed to go well as per the plan. It is the estimate of the minimum possibletime which an activity takes to complete under ideal conditions and is denoted byt0 or a.
12. Pre-tender review is necessary to provide the information required by thesponsoring agency and the sanctioning authority to decide whether or not toapprove the project.
3.11 QUESTIONS AND EXERCISES
Short-Answer Questions
1. Mention the objectives of an organizational system.2. Distinguish between projectized and task force organization.3. Discuss the advantages of CPM.4. Mention the advantages of using the PERT analysis.5. What do you mean by ‘most likely time estimate’?
Long-Answer Questions
1. Explain Bell curve and S-curve with the help of diagrams.2. Discuss the various types of organization with the help of diagrams.3. ‘Two basic decisions are important before the network techniques are deployed’.
Discuss.4. Discuss the concept of CPM in detail.5. Explain the concept of PERT analysis with the help of PERT chart.
3.12 REFERENCES AND SUGGESTED READINGS
Chandra, Prasanna. 1995. Projects: Planning, Analysis, Selection, Implementation,and Review. Delhi: Tata McGraw-Hill.
Kerzner, Harold, R. 2013. Project Management: A Systems Approach to Planning,Scheduling, and Controlling. New Jersey: John Wiley and Sons.
Singh, Narendra. 2000. Project Management and Control. Delhi: Himalaya PublishingHouse.
Self LearningMaterial 149
Implementationand Control
NOTES
UNIT 4 IMPLEMENTATIONAND CONTROL
Structure4.0 Introduction4.1 Objectives4.2 Project Management Information System4.3 Monitoring and Reporting Human and Physical Resources
4.3.1 Human Resources4.3.2 Physical Resources
4.4 Financial Resources4.4.1 Types of Ownership Securities4.4.2 Venture Capitalists4.4.3 Charitable Venture Capitalists4.4.4 Preference Shares4.4.5 Subsidy and Tax Incentives4.4.6 Cost Control
4.5 Summing Up4.6 Key Terms4.7 Answers to ‘Check Your Progress’4.8 Questions and Exercises4.9 References and Suggested Readings
4.0 INTRODUCTION
The purpose of implementation and control is to give a standard strategy to the processof project management and universal measures for preparation, supervision, control andaccounting for the advancement of the project. The procedure directs the projectthroughout the development process to project conclusion and delivery.
The procedure will make certain that the controls listed as follows, are in place:• Minimum norms for reporting project performance• Determined and accepted instructions, cost plan and agenda, corresponding
to which, change can be assessed• Tracking of likely transformations and disparities• Controlling actual variations to ensure least bearing on the project deliverablesThis practice should be taken up simultaneously with the following project
procedures:• Planning management• Project management• Evaluation and approval
4.1 OBJECTIVES
After going through this unit, you will be able to:• Explain the salient features of a project management information system• Describe the monitoring and reporting of physical and human resources
Self Learning150 Material
Implementationand Control
NOTES
• Discuss the role of financial resources in implementation and control of projects• List ways of reducing costs pertaining to projects
4.2 PROJECT MANAGEMENT INFORMATIONSYSTEM
Information technology has made project management easy and also challenging.Effective use of information technology in project management can reduce cost, improvecommunication and coordination, help in timely completion, help in resource planningand allocation, facilitate monitoring and control, and provide opportunity for fast responsesto deviations. Information technology is the combination of (a) computer hardware andsoftware, (b) Internet services, (c) other tools such as artificial intelligence and neuralnetwork.
Computers and Project Management
The use of information technology was never so important before because today’s projectmanagement environment is quite complicated with features such as the following:
• A project is carried out at multiple sites.
• The size of project is usually large.• A firm simultaneously undertakes many projects, which share resources.• Multiple agencies are involved in project construction.• Fast pace of activities.• Intense competition puts pressure on completion in time and budget.
Project Planning Software
With computers becoming smaller in size but bigger in capabilities, an explosive growthwas observed in project management software during the 1990s. More than 500 projectmanagement software were developed in this period. The different types of projectmanagement software are capable of handling multi-project situations with several featuresfor planning, resource levelling, multi-level reporting, cost analysis, integration with word-processor, e-mailing, spreadsheet, database, graphics and even world-wide sharing ofproject information and multi-party intervention with the project management system.
Popular project management packages are MS Project, Intellisys Project, OpenMind, Project Kick Start, INSTAPLAN, PRISM and many others. The following websitereviews project management software and ranks them:
http://project-management-software-review.toptenreviews.com/Ranking is done based on several features and criteria including collaborations,
resource management, project management, remote capability, help/support and systemrequirements. The project management feature is further divided into several aspects ofproject management. A print screen view of the comparison of the major projectmanagement software is given in Figure 4.1.
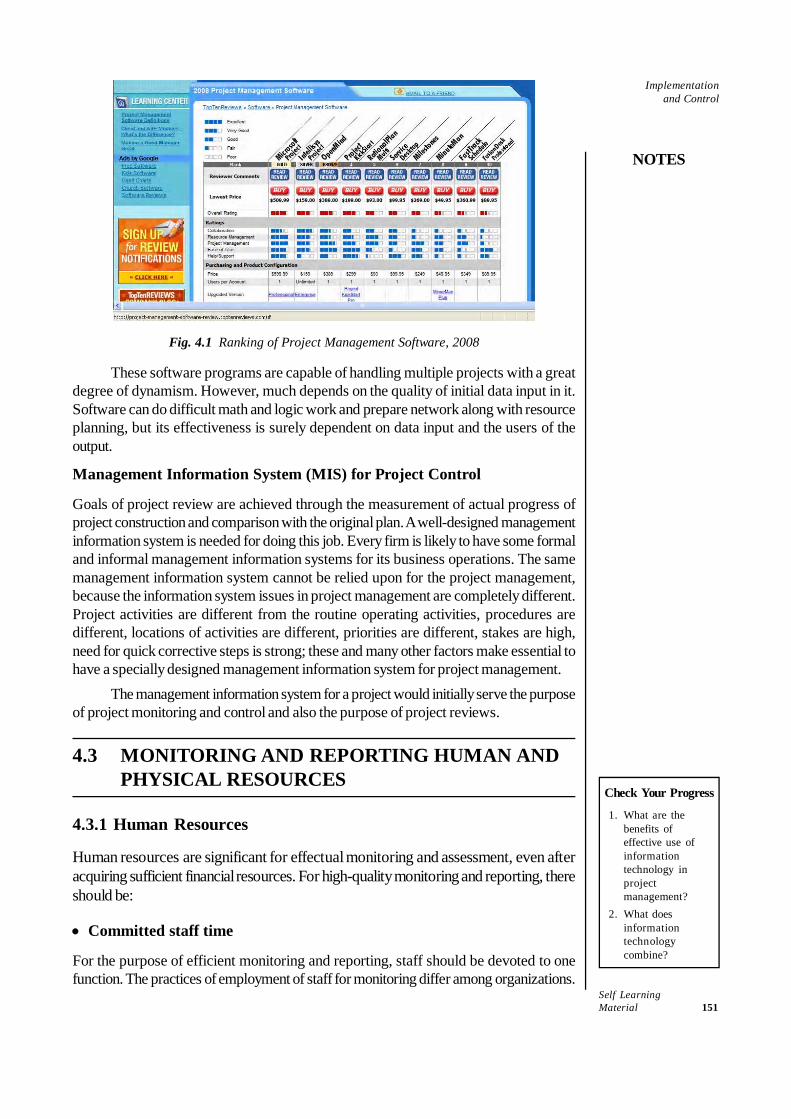
Self LearningMaterial 151
Implementationand Control
NOTES
Fig. 4.1 Ranking of Project Management Software, 2008
These software programs are capable of handling multiple projects with a greatdegree of dynamism. However, much depends on the quality of initial data input in it.Software can do difficult math and logic work and prepare network along with resourceplanning, but its effectiveness is surely dependent on data input and the users of theoutput.
Management Information System (MIS) for Project Control
Goals of project review are achieved through the measurement of actual progress ofproject construction and comparison with the original plan. A well-designed managementinformation system is needed for doing this job. Every firm is likely to have some formaland informal management information systems for its business operations. The samemanagement information system cannot be relied upon for the project management,because the information system issues in project management are completely different.Project activities are different from the routine operating activities, procedures aredifferent, locations of activities are different, priorities are different, stakes are high,need for quick corrective steps is strong; these and many other factors make essential tohave a specially designed management information system for project management.
The management information system for a project would initially serve the purposeof project monitoring and control and also the purpose of project reviews.
4.3 MONITORING AND REPORTING HUMAN ANDPHYSICAL RESOURCES
4.3.1 Human Resources
Human resources are significant for effectual monitoring and assessment, even afteracquiring sufficient financial resources. For high-quality monitoring and reporting, thereshould be:
• Committed staff time
For the purpose of efficient monitoring and reporting, staff should be devoted to onefunction. The practices of employment of staff for monitoring differ among organizations.
Check Your Progress
1. What are thebenefits ofeffective use ofinformationtechnology inprojectmanagement?
2. What doesinformationtechnologycombine?
Self Learning152 Material
Implementationand Control
NOTES
A few of the companies have set up monitoring and reporting divisions with certainterms of references (ToRs), committed and trained staff, work schedules and otherresources.
• Skilled workforce
Staff delegated with monitoring should have the required technical skills in the domain. Anumber of offices have a special monitoring and control specialist. Where required, skilllevels should be improved to fulfill requirements with continuing efforts in building suchcapacity within the office as needed.Every monitoring and control entity that works at various levels, for instance at theproject, programme or output level, should have clarity on the ToR specifying its taskand responsibilities. Generally, these tasks should involve:
• Establishing an organized supervisory scaffold and coming up with an evaluationplan
• Having timely meetings with the concerned partners and stakeholders to reportthe progress in the direction of achieving results
• Carrying out combined field monitoring and assessment assignments to reviewaccomplishments and limitations
• Classify any lessons or good practices• Identification of further capacity growth needs among stakeholders and associates• Reporting on a periodic basis to the lead members or groups for the key result
areas and exploring opportunities to inspire policy and decision-making processes• Ensuring the quality of monitoring and reporting work and offering support as
required• Monitoring and reporting the importance of the monitoring structure on a regular
basis, according to the rising development precedence and transforming perspective
4.3.2 Physical Resources
Physical resources can be explained as the assets that are made by man by means of hisabilities and expertise. Technology and structures in addition to the many products thatare made by man are all instances of physical resources.Physical resources pertaining to a project generally include the following:
• Personnel• Facilities• Equipment• Suppliers• Contracts• Travel
Let us discuss a few of these.
• Personnel
The most interesting, variable and costly resource a project manager is likely to workwith are people. People and their exchanges can significantly impact both, the successand failure of any project. For managing people there has to be a remarkable a human
Self LearningMaterial 153
Implementationand Control
NOTES
resource plan for a project in place and it should be decided as to how personnel andinterpersonal relationships in an organizational set up can be better comprehended.
Initially, the more direct way is to systematize the people who would be part ofthe project. This has to be preceded by creating a role and responsibility matrix for theproject charter. An organizational chart of a project should not be very differentfrom a normal organizational chart. This document should clearly specify the reportinghierarchy, on the basis of the role and responsibilities of every individual within theproject. The project manager should be at the top of the project organization chart andhold the final accountability and answerability for the success of the project.
• Equipment
The equipment that falls within the scope of the management of a project, as a constituentof the project is based on the nature of the project. For instance, a project to build a cold-storage food warehouse would require earth moving equipment, cranes and cement-mixers. In the case of a project to launch a new edition of a computer game, the equipmentwould comprise computers, test gear and replication and packaging machines. The projectmanagement input for equipment is similar to that of human resources. One has toensure that the right equipment is in the right place, at the right time and that it has theprovisions required for proper functioning.
Majority of the projects involve the purchase of material. In the case of a cold-storage food warehouse, this would be deep-freezers, the building HVAC machineryand the material management equipment. If the project is about launching a music DVDby a popular artist, it would involve blank DVDs, graphics designer equipment for thejewel case and press releases to be communicated to deejays. The project managementpredicament with provisions is to ensure that the right materials are available as andwhen required.
Every skill that goes in management of resources will be of no use, if the projectschedule is not adhered to. Time management is also a crucial factor in successfulproject management.
• Suppliers
Project management also requires the use suppliers to help facilitate the delivery ofprojects. However, managing supplier performance can be a difficult task at the best oftimes. A project management function is also to ensure that a supplier delivers the rightgoods, on time and of the right quality. Three steps to manage suppliers are as follows:
For efficient management of suppliers, one needs to have a procurementmanagement process in place. Procurement management is the practice of managingthe supplier’s supply of a scope of work within a project. By organizing the scope ofwork provided by suppliers from the output of the project management templates andproject management software, a project manager is able to:
o Ascertain that the delivery of suppliers is according to the contracto Categorize and work out supplier issues rapidly and effortlesslyo Get the best performance out of supplier associations
• Contracts
In general, the type of the contract used for a project differs according to the type of thework and industry. A contract is simply a detailed agreement between two or moreparties. One or more parties may supply goods or services in exchange for somethingsupplied by other party/parties.
Self Learning154 Material
Implementationand Control
NOTES
The type of contract between the parties involved in the project and the contracttype defines the risk involved. Let us see the most popularly used contract types.
(i) Fixed price (lump sum)
This is the most straightforward type among contracts. The terms are quite simple andclear to understand. In other words, the service provider commits the provision of aspecified service for a certain time period and the client agrees to pay a definite amountof money for the provided service. This contract type may mark out various landmarksfor the release as well as KPIs (Key Performance Indicators). Also, the contractormight have an approval standard defined for the target and the ultimate delivery. Themajor advantage of this type of contract is that the contractor is aware of the entireproject cost prior to commencement of the project.
(ii) Unit price
In this contract, the project is segregated into units and the cost of every unit is doneindependently. This contract type can be launched as one of the more accommodatingmethods when compared against fixed price contract. In general, the owner (contractor/client) of the project has the final say on the estimation. This is a good practice in thecase of different project units requiring a variety of skills to complete.
(iii) Cost plus
In this contract model, the service providers are compensated for their equipment,workforce and associated costs, along with the contractor paying a contracted fee to theservice provider. In this type of contract, the service provider should offer an elaborateschedule and resource allocation for the project. In addition to this, all costs should besystematically enumerated and reported to the contractor at regular intervals. Thecontractor may be paid after specific durations (such as monthly, quarterly) or at the endof the delivery of specific modules.
(iv) Incentive
Incentive contracts are typically used when there is a certain level of vagueness in theproject cost. Even though there are almost precise assessments, the technologicalchallenges may affect the resources in general in addition to the effort. This category ofcontract is widespread for the projects consisting of pilot programs or projects thatemploy new technologies. The core mechanism of incentive contract is to break up anytarget price overrun between the client and the service provider for the purpose ofreducing the business risks for both parties.
(v) Retainer (Time and Material - T&M)
This is one of the most ideal contracts that can bind two or more parties. This contracttype bears the least amount of risk, in which the time and material used for the projectare priced. The contractor only needs to be aware of the time and material for theproject, for the purpose of making payments. This type of contract has brief deliveryphases and for every cycle, individual quotes are sent. After the contractor accepts andapproves the estimate and Statement of Work (SOW), the service provider can beginthe project. Different from majority of the other contract types, retainer contracts arelargely employed in long-term business engagements.
Self LearningMaterial 155
Implementationand Control
NOTES
(vi) Percentage of Construction Fee
These types of contracts are used for engineering projects. On the basis of the resourcesand material needed, the cost for the construction is worked upon. Following this, theclient signs an agreement with a service provider and pays a percentage of the cost ofthe project in the form of the fee for the service provider.
In managing a project team, a project manager needs to possess excellent analyticaland organizational skills. A technical proficiency in the specialist area of the project isalso a distinct advantage. Remember, though, that projects achieve their outcomes throughpeople—a variety of people working together in a coordinated way to produce the desiredresults.
Effective teams are so much more productive than groups working on the sametask because they are able to leverage off each others’ strengths and compensate foreach others’ weaknesses. Making sure that we have the right mix of team members inour project team is therefore an important consideration. Conducting a team profilingexercise is also an effective method for getting each project team member to appreciatetheir respective strengths and weaknesses.
4.4 FINANCIAL RESOURCES
Ownership funds and debt funds are the two main classifications of sources of funds.Ownership securities are, as the name suggests to be used for funds by owners ofbusinesses at the time of need. Some securities are of hybrid type with some features ofownership securities and some features of debt securities. An owner of ownershipsecurities enjoys ownership rights; whereas an owner of debt security enjoys the rightsas a lender but an owner of a hybrid security enjoys mix of rights depending upon theterms and conditions.
One can include subsidy and tax incentives as sources of funds. These sourcesare available in a limited way, subject to qualification of projects and businesses. Usually,small entrepreneurs and export oriented units qualify for subsidy on their qualifiedinvestments. Tax incentives are also available to desired investments made by any firm.
4.4.1 Types of Ownership Securities
For non-corporate (sole-proprietorship and partnership) businesses there is a single typeof ownership security available and that is the owners’ capital. Owners (sole-proprietoror partners) bring capital and enjoy the rights to participate in managing business(depending upon agreement) and the right to share profit or loss (usually in the proportionof every partner’s share in capital). Therefore, the following material on the types ofownership security is more appropriate for corporate form of business.
1. Common or equity shares
In case of a company, total ownership fund is called a ‘stock’ and it is divided intosmaller units called ‘shares’ or ‘common shares’. This allows a company to obtain fundsfrom several owners, who are called ‘shareholders’ or ‘members’. However, a privatecompany can issue shares only privately through friends and relatives but a publiccompany can issue shares to the public. The salient rights and obligations of equityshareholders are listed as follows:
Check Your Progress
3. Define the termphysical resources.
4. What do physicalresourcespertaining to aproject generallyinclude?
Self Learning156 Material
Implementationand Control
NOTES
• Shareholders have dividend rights but getting it is uncertain depending upon theprofits of the company and decision of the company to distribute profits asdividends.
• Shareholders enjoy the right to vote on matters defined by the Companies Act,which includes right to elect their representatives on the board of directors. Rightto vote can be exercised in person or via proxy.
• Shareholders have preemptive right which means a right to get allotment of newissue of shares.
• Shareholders have residual right on surplus funds in the event of liquidation of thecompany.
• Shareholders have the right to transfer shares, albeit with restrictions if the sharesare in a private company.
• Shareholders’ liability for the debt of the company is limited to the par value ofshares held by them.A firm has to pay tax on its profit and when the profit is distributed as dividends,
the firm again pays dividend distribution tax, subject to law and the shareholders also paypersonal income tax on dividend income.
Equity shares give permanent funds to the business and put no pressure on theliquidity of the firm because dividends are payable only if profit is earned and capital isnever repayable. However, equity shares have other implications too. It is usually morecostly than debt funds and after the successful project, if the firm does not grow enoughor does not adjust the dividends policy, it can sit on a large cash balance. Demoralizedshareholders’ action of selling shares can create a situation where someone can takeoverthe firm.
Retained earnings also are a source of equity capital. Most firms distribute only apart of the profit and retain the rest. This is internal financing of capital. Retained earningsare a part of equity capital, because it belongs to the shareholders.
2. Types of common shares
Firms issue different types of common shares (so, common shares are not commonanymore). In India, the first time a different type of common share issue was opened atthe end of September 2008 by Tata Motors. Accordingly to Tata Motor’s announcement,they will issue two types of shares on preemptive right basis; one at ̀ 340 on one-vote-one-share basis and another at ̀ 305 with lower voting right (one-tenth vote per share)and 5 per cent extra dividends. This creates two categories or types of common shares.
In the West, some types of common shares are entitled to dividends from a particularstream of income stream. Similarly, other varieties or types of common stock are found.
The suppliers of common share capital are promoters, friends and relatives(sometimes termed as ‘love money’), general public, venture capitalists, angel capitalistsand charitable venture capitalists. Some of the sources are described in the following:
4.4.2 Venture Capitalists
Usually, start-up businesses with new ideas (like information technology businesses andbio-technology businesses are the current examples) are risky and therefore, it is unlikelythat regular suppliers of funds will fund such projects. Such ventures may be potentiallyquite profitable but very risky. Some investors (usually wealthy individuals, investment
Self LearningMaterial 157
Implementationand Control
NOTES
banks and other financial institutions) see an opportunity here. They pool their ownfunds to form a venture capital fund with the purpose of finding and providing equitycapital to such high potential growth firms. Venture capitalists also provide technical andmanagerial expertise and have a say in the firm’s decisions. In the initial agreement,venture capitalist inserts an exit clause, which is via taking the firm public or sale ofbusiness. As per this clause, after a predetermined number of years, the new venturewill ‘go public’ (means it will become a company and will make initial public offering ofshares), or sell the firm and the venture capitalist walks out with his share from theproceeds.
The entrepreneur, while getting the much-needed funds and technical andmanagerial expertise, faces the risk of interference in the activities of business and moreimportantly the risk of losing ownership and control of business upon going public.
Angel capitalists
Angel investors are those who ‘save struggling firms with both finance and know-howwhen no one else will’ (Van Osnabrugge and Robinson, 2004). Historically, it wasappropriate to say that angel investors were willing to accept more risk than venturecapitalists. There is hardly any angel investing in India but in the West this is morecommon. Angel capitalists and venture capitalists are quite similar in nature except forrisk taking. Angel funds can be considered for project investment as a part of turningaround a sick business, where venture capitalist is not available.
4.4.3 Charitable Venture Capitalists
Charitable venture capitalists are not present in the Indian market, but the West hasadopted this mechanism for regional growth. These are venture capitalists with a charitablepurpose, which fund the early-stage high potential small businesses. This kind of venturecapitalists are established privately as non-profit organizations with the support ofoperating funds from the government (like state governments and municipal corporations)and funds worth investing are provided by charitable organizations and foundations.Operating funds are used for the operating expenses of the fund and investible funds areused for financing different ventures in the region.
Charitable venture capitalists operate exactly like venture capitalists but have abroader list of businesses that they support (usually ones that are likely to result into apositive regional growth in terms of employment and tax revenue). Charitable venturecapitalists do make profit but reinvest the same for further investment purposes. Thosewho are interested to learn about such funding organizations may have a look at examplefrom the US. There is scope for such organizations in different regions of India also.
4.4.4 Preference Shares
Preference shares are also ownership shares but with a difference. Preferenceshareholders enjoy preferential rights over the rights of equity shareholders. They havea right to get dividends (subject to an upper limit specified in the issue document) beforeany dividend is paid to the equity shareholders. They also have a right to get their moneyback before anything is paid back to the equity shareholders in the event of winding upof the business and if there is a surplus of proceeds after paying all the liabilities of thecompany. In exchange of these two important rights (which protect their monetaryinterest to some extent), the preference shareholders forgo their voting rights on issuesthat are not concerning the preference shares directly. However, continuous non-payment
Self Learning158 Material
Implementationand Control
NOTES
of dividends will restore their voting right. Preference shares and their types under theheading ‘hybrid securities’ have been discussed because preference shares have a mixof characteristics of equity shares and bonds.
Deferred shares
Deferred shares are the type of ownership security that offers a more proportionateright of voting. The owner of one deferred share can have more than one vote, dependingupon the terms of issue. In exchange for these extraordinary voting rights, the deferredshareholders’ right to get dividend is deferred until a specified amount of dividend is paidto the equity shareholders. As a result of these disproportionate voting rights and deferreddividend rights, the owners of deferred shares can have a control over the managementof the company with less investment. Also, they stand a chance of earning windfalldividend income if the company makes extraordinary profits.
Deferred shares were innovated for promoters of businesses. Promoters haveideas and willingness to take risk but may not have enough money to preserve thecontrolling interest in the company promoted by them. By way of buying deferred shares,promoters can get controlling interest in the company with little investment. However,deferred shares are not allowed anymore.
Implications of deferred share capital on the firm’s cost of funds, liquidity andfuture growth options are the same as that of equity shares.
4.4.5 Subsidy and Tax Incentives
The central government and state governments offer incentives for investment throughsubsidies, tax incentives and concessions in land and utility prices. Schemes vary fromstate to state. Usually, subsidy and tax incentives are offered for encouraging smallentrepreneurs, women entrepreneurs and for encouraging investment in desired locationsand businesses.
For example, the central government developed a scheme for capital investmentsubsidy in 1997 for units in ‘growth centres’ for the north eastern region and other areas.The central government announces subsidy plans for different regions from time totime. One needs to read the current industrial policy of the Government of India, withspecial attention to learning about the applicable subsidy based on the classification ofthe zone in which business is set up.
Many states, through the state finance corporations or state industrial developmentcorporations provide subsidy to small scale industries (SSIs) for investment in plant andmachinery and provide industrial land, sheds, water and electricity at preferential rates.
Subsidy is shown as capital and is tax-free.The Government had approved a package of fiscal incentives and other concessions forthe North East Region namely the ‘North East Industrial and Investment PromotionPolicy (NEIIPP), 2007’, which envisaged the following:
(i) Coverage
The North East Industrial Policy (NEIP), 1997 announced on 24.12.1997 covered theStates of Arunachal Pradesh, Assam, Manipur, Meghalaya, Mizoram, Nagaland andTripura. Under NEIIPP, 2007, Sikkim will also be included. Consequently, the ‘NewIndustrial Policy and other concessions for the State of Sikkim’ announced vide O.M.No.14(2)/2002-SPS dated 23.12.2002 and the Schemes thereunder i.e. Central Capital
Self LearningMaterial 159
Implementationand Control
NOTES
Investment Subsidy Scheme, 2002, Central Interest Subsidy Scheme, 2002 and CentralComprehensive Insurance Scheme, 2002, notified vide Notifications No. F.No.14(2)/2002-SPS dated the 24.12.2002 will be discontinued from 1.4.2007.
(ii) Duration
All new units as well as existing units which go in for substantial expansion, unlessotherwise specified and which commence commercial production within the 10 yearperiod from the date of notification of NEIIPP, 2007 will be eligible for incentives for aperiod of ten years from the date of commencement of commercial production.
(iii) Neutrality of location
Incentives will be available to all industrial units, new as well as existing units on theirsubstantial expansion, located anywhere in the North Eastern Region. Consequently, thedistinction between ‘thrust’ and ‘non-thrust’ industries made in NEIP, 1997 will bediscontinued from 1.4.2007.
(iv) Substantial Expansion
Incentives on substantial expansion will be given to units effecting ‘an increase by notless than 25% in the value of fixed capital investment in plant and machinery for thepurpose of expansion of capacity/modernization and diversification’, as against an increaseby 33½ % which was prescribed in NEIP, 1997.
(v) Excise Duty Exemption
100% Excise Duty exemption will be continued, on finished products made in the NorthEastern Region, as was available under NEIP, 1997. However, in cases, where theCENVAT paid on the raw materials and intermediate products going into the productionof finished products (other than the products which are otherwise exempt or subject tonil rate of duty) is higher than the excise duties payable on the finished products, waysand means to refund such overflow of CENVAT credit will be separately notified by theMinistry of Finance.
(vi) Income Tax Exemption
100% Income Tax exemption will continue under NEIIPP, 2007 as was available underNEIP, 1997.
(vii) Capital Investment Subsidy
Capital Investment Subsidy will be enhanced from 15% of the investment in plant andmachinery to 30% and the limit for automatic approval of subsidy at this rate will be`1.5 crores per unit, as against `30 lakhs as was available under NEIP, 1997. Suchsubsidy will be applicable to units in the private sector, joint sector, cooperative sector aswell as the units set up by the State Governments of the North Eastern Region. Forgrant of Capital Investment Subsidy higher than ̀ 1.5 crore but upto a maximum of ̀ 30crores, there will be an Empowered Committee Chaired by Secretary, Department ofIndustrial Policy & Promotion with Secretaries of Department of Development of NorthEastern Region (DONER), Expenditure, Representative of Planning Commission andSecretary of the concerned Ministries of the Government of India dealing with thesubject matter of that industry as its members as also the concerned Chief Secretary/Secretary (Industry) of the North Eastern State where the claiming unit is to be located.
Self Learning160 Material
Implementationand Control
NOTES
Proposals which are eligible for a subsidy higher than ̀ 30 crores, will be placedby Department of Industrial Policy and Promotion before the Union Cabinet for itsconsideration and approval.
(viii) Interest Subsidy
Interest Subsidy will be made available @ 3% on working capital loan under NEIIPP,2007 as was available under NEIP, 1997.
(ix) Comprehensive Insurance
New industrial units as well as the existing units on their substantial expansion will beeligible for reimbursement of 100% insurance premium.
(x) Negative List
The following industries will not be eligible for benefits under NEIIPP, 2007:-• All goods falling under Chapter 24 of the First Schedule to the Central Excise
Tariff Act, 1985 (5 of 1986) which pertains to tobacco and manufactured tobaccosubstitutes.
• Pan Masala as covered under Chapter 21 of the First Schedule to the CentralExcise Tariff Act, 1985 (5 of 1986).
• Plastic carry bags of less than 20 microns as specified by Ministry of Environmentand Forests Notification No.S.O. 705(E) dated 02.09.1999 and S.O.698 (E) dated17.6.2003.
• Goods falling under Chapter 27 of the First Schedule to the Central Excise tariffAct, 1985 (5 of 1986) produced by petroleum oil or gas refineries.
(xi) Incentives for Service/other Sector Industries Incentives under NEIIPP,2007 will be applicable to the following service sector activities/industries:
I. Service Sector
• Hotels (not below Two Star category), adventure and leisure sports includingropeways
• Medical and health services in the nature of nursing homes with a minimumcapacity of 25 beds and old-age homes
• Vocational training institutes such as institutes for hotel management, cateringand food crafts, entrepreneurship development, nursing and para-medical, civilaviation related training, fashion, design and industrial training.
A number of tax concessions under the existing provisions of Section 10A and 10AA ofthe Income Tax Act are already available to the IT sector. However, one of the importantimpediments to the development of Software Technology Parks or IT related SEZs inthe North Eastern Region is the non-availability of trained human resources in the NorthEastern Region. Accordingly, tax benefits as is availed under Section 80 IC of the IncomeTax Act would be extended to IT related training centers and IT hardware units.
II. Incentives for Bio-technology industry
The biotechnology industry will be eligible for benefits under NEIIPP, 2007 as applicableto other industries.
Self LearningMaterial 161
Implementationand Control
NOTES
III. Incentives for Power Generating Industries
Power Generating plants will continue to get incentives as governed by the provisions ofSection 81A of the Income tax Act. In addition, power generating plants upto 10 MWbased on both conventional and non-conventional sources will also be eligible for capitalinvestment subsidy, interest subsidy and comprehensive insurance as applicable underNEIIPP, 2007.
(xii) Establishment of a monitoring mechanism for implementation of theNEIIPP, 2007
In order to establish a monitoring mechanism for implementation of NEIIPP, 2007, a‘High Level Committee’ / an ‘Advisory Committee’ under the Chairmanship of Secretary,Department of Industrial Policy and Promotion and comprising Secretaries of theMinistries/Departments of Revenue, Department of Development of North EasternRegion (DONER), Banking and Insurance, Representative of Planning Commission,CMD, NEDFi as well as major stakeholders including the industry associations of theNorth Eastern region would be constituted. In addition, an ‘Oversight Committee’ willbe constituted under the Chairmanship of the Union Commerce and Industry Ministerwith Industry Ministers of NE States as its members.
(xiii) Value Addition
In order to ensure genuine industrial activities in the North Eastern Region, benefitsunder NEIIPP, 2007 will not be admissible to goods in respect of which only peripheralactivities like preservation during storage, cleaning operations, packing, re-packing, labellingor re-labelling, sorting, alteration of retail sale price etc. take place.
(xiv) Transport Subsidy Scheme
The Transport Subsidy Scheme would continue beyond 31.3.2007, on the same termsand conditions. However, an early evaluation of the scheme will be carried out with aview to introducing necessary safeguards to prevent possible leakages and misuse.
(xv) Nodal agency
1. The North East Industrial Development Finance Corporation (NEDFi) will continueto act as the nodal agency for disbursal of subsidies under NEIIPP, 2007.
2. The ‘New Industrial Policy and other concession in the North Eastern Region’announced vide O.M. No.EA/1/2/96-IPD, dated 24.12.1997 (NEIP, 1997) willcease to operate with effect from 1.4.2007. Industrial Units which have commencedcommercial production on or before 31.3.2007 will continue to get benefits/incentives under NEIP, 1997.
3. Government reserves the right to modify any part of the Policy in public interest.4. All concerned Ministries/Departments of the Government of India are requested
to amend their respective Acts/rules/notifications etc. and issue necessaryinstructions for giving effect to these decisions.
4.4.6 Cost Control
Nearly every project has to be directed all the way through in order to get the necessaryand expected yield at the completion of the project. It is the team that is accountable forthe project and most prominently the project manager who is required to have the ability

Self Learning162 Material
Implementationand Control
NOTES
to execute effective management of the costs. There are, nevertheless, quite a fewmethods that can be used for this objective.
Besides the project goals that the project manager has to watch over, themanagement of a variety of costs is also a very significant task for any project. Projectmanagement would not be successful at all if a project manager does not succeed in thisdirection, as it would fundamentally establish whether or not a company would make aprofit or loss.
Cost Control Approaches
A few of the important and indispensable techniques used for effective project costcontrol are as follows:
1. Planning the project budget
One would need to ideally formulate a budget at the start of the planning session withreference to the project at hand. This is the budget that would be helpful for all meetingall payments and costs that are incurred all through the project life cycle. Hence, themaking of this budget involves a great deal of research and decisive judgment.
Similar to any other budget, adjustments would always have to be accounted, foras the costs would keep on undergoing changes all through the period of the project.Adhering to the project budget during all stages of the project can reap in profits fromproject.
2. Keeping track of costs
Keeping track of all actual expenditure is also as important as any other function. Interms of this, it is ideal to make a budget on the basis of time. This is helpful in keepingtrack of the budget of a project in every phase. The actual costs will have to be comparedwith the periodic targets that have been marked out within the budget. These targetscould be based on months, or weeks or even years, if the duration of the project islengthy.
This is much easier to work with instead of having one entire budget for thewhole period of the project. In case of any new work to be carried out, it would have tobe estimated and adjusted to find out whether it can be accommodated within the costsof the budget. If not, necessary arrangements would have to be made for ‘ChangeRequests’, where the client will pay for the additional work or the transformations.
3. Efficient time management
Another good technique would be efficient time management. Even though this techniqueis not applicable to a variety of management domains, its importance is very high withrespect to project cost control. This is due to the cost of project that may increase if theproject deadlines are not met; the more time the project takes, the more will be the costsincurred which in effect means that the budget will be exceeded. The project managerwould need to continuously remind his/her team of the critical targets of the project forthe purpose of ensuring that work is done on time.
4. Project change control
Project change control is also an important technique. Change control systems arenecessary for taking into consideration any probable changes that might take place
Self LearningMaterial 163
Implementationand Control
NOTES
through the course of the project. This is owing to the actuality that every alteration tothe span of the project will have a bearing on the cut-off dates of the deliverables.Therefore the changes may raise project cost by increasing the effort required for theproject.
5. Use of Earned Value
To find out the value of the work that has been done at a point of time, it is very helpfulto use the accounting method generally referred to as ‘Earned Value’. This is specificallyhelpful in the case of large projects and makes it possible to incorporate any quickchanges that are extremely important for the project to be successful.
Additional Steps for Project Cost Control
It is a good practice to regularly evaluate the budget and the development and otherfinancial details. Creating reports on project economics at standard intervals will alsohelp keep up with the progress of the project. This will ascertain that reckless spendingdoes not occur and if it does, it is rectified before time. The quicker the problem isspotted, the easier and faster it can be taken care of. All documentation should also bemade available at regular periods of time to auditors, who would be able to point out toyou any potential cost risks.
Simply coming up with a project budget is not sufficient during the project planningsessions. The project management team would have to keep a vigil on whether the costsstay closer to the figures in the first budget.
It always needs to be kept in mind that the risks are accompanied with costincreases and the necessity to prevent this in the best possible ways. To accomplish this,use of the discussed techniques should be accompanied with constant monitoring of theproject costs.
4.5 SUMMING UP
• Information technology has made project management easy and also challenging.• Information technology is the combination of
o Computer hardware and softwareo Internet serviceso Other tools such as artificial intelligence and neural network
• Today’s project management environment is quite complicated with features suchas the following:o A project is carried out at multiple siteso The size of project is usually largeo A firm simultaneously undertakes many projects, which share resourceso Multiple agencies are involved in project constructiono Fast pace of activitieso Intense competition puts pressure on completion in time and budget
• Different types of project management software are capable of handling multi-project situations with several features for planning, resource leveling, multi-levelreporting, cost analysis, integration with word-processor, e-mailing, spreadsheet,database, graphics and even world-wide sharing of project information and multi-party intervention with the project management system.
Check Your Progress
5. What are the twomain classificationsof sources offunds?
6. Who are Angelinvestors?
Self Learning164 Material
Implementationand Control
NOTES
• The management information system for a project would initially serve the purposeof project monitoring and control and also the purpose of project reviews.
• Physical resources can be explained as the assets that are made by man bymeans of his abilities and expertise.
• Technology and structures in addition to the many products that are made by manare all instances of physical resources.
• Physical resources pertaining to a project generally include the following:o Personnelo Facilitieso Equipmento Supplierso Contractso Travel
• Effective teams are so much more productive than groups working on the sametask because they are able to leverage off each others’ strengths and compensatefor each others’ weaknesses.
• Ownership funds and debt funds are the two main classifications of sources offunds.
4.6 KEY TERMS
• Metronics: An organization’s attempt to help people in reatring full life.• Empowerment: The process of giving power or authority to a team member, to
take decisions.• Deferred shares: The type of ownership security that offers a more proportionate
right of voting.
4.7 ANSWERS TO ‘CHECK YOUR PROGRESS’
1. Effective use of information technology in project management can reduce cost,improve communication and coordination, help in timely completion, help in resourceplanning and allocation, facilitate monitoring and control, and provide opportunityfor fast responses to deviations.
2. Information technology is a combination of (i) computer hardware and software,(ii) Internet services, (iii) other tools such as artificial intelligence and neural network.
3. Physical resources can be explained as the assets that are made by man bymeans of his abilities and expertise.
4. Physical resources pertaining to a project generally include the following:(i) Personnel(ii) Facilities(iii) Equipment(iv) Suppliers(v) Contracts(vi) Travel
Self LearningMaterial 165
Implementationand Control
NOTES
5. Ownership funds and debt funds are the two main classifications of sources offunds.
6. Angel investors are those who ‘save struggling firms with both finance and know-how when no one else will’.
4.8 QUESTIONS AND EXERCISES
Short-Answer Questions
1. What is the role of computers in project management?2. What is the importance of a project’s vision for the whole team?3. What are the motivation factors for people in a work environment?
Long-Answer Questions
1. Explain the role of information technology in project management.2. Discuss the role of financial resources in implementation and control of projects.3. Describe the various ways of reducing costs pertaining to projects.
4.9 REFERENCES AND SUGGESTED READINGS
Chandra, Prasanna. 1995. Projects: Planning, Analysis, Selection, Implementation,and Review. Delhi: Tata McGraw-Hill.
Kerzner, Harold, R. 2013. Project Management: A Systems Approach to Planning,Scheduling, and Controlling. New Jersey: John Wiley and Sons.
Singh, Narendra. 2000. Project Management and Control. Delhi: Himalaya PublishingHouse.

Self LearningMaterial 167
Project Completionand Evaluation
NOTES
UNIT 5 PROJECT COMPLETIONAND EVALUATION
Structure5.0 Introduction5.1 Objectives5.2 Integrated Project Management Control System5.3 Managing Transition for Project to Operation5.4 Project Completion and Termination
5.4.1 Project Completion5.4.2 Project Closing and Termination
5.5 Project Evaluation5.5.1 Objectives and Essentials of Project Evaluation5.5.2 Need for Project Evaluation5.5.3 Qualities of a Project Evaluator5.5.4 Approach to Project Evaluation5.5.5 Methodology and Timing of Evaluation5.5.6 Scope of Project Evaluation
5.6 Project Review5.6.1 Precautions for Project Review
5.7 Summing Up5.8 Key Terms5.9 Answers to ‘Check Your Progress’
5.10 Questions and Exercises5.11 References and Suggested Readings
5.0 INTRODUCTION
This unit takes a look at a few characteristics of bringing an intricate project to completion.There are numerous factors to be taken into account in the closing stages of a project.It is necessary to ascertain that the targets of the project have been accomplished andthat all the results and deliverables have been handed over to the client (or that anyinconsistencies have been dealt with). Delivery can comprise a variety of presentationsfor different types of outputs. It is likely that a physical object may be part of thedeliverables, but other deliverables may comprise, for instance, training the personnelfor enabling use of new technology or processes. The manner in which the output isdelivered is different for different projects. Whatever may be the case, there is anagreement to resolve any issues that come up at the time the control and responsibility ispassed on to the owners of the project.
Completion of a project is usually followed by an evaluation (even though evaluationsoccur throughout the life of a project).
Different types of evaluations have roles to play in the management of a project.Evaluations have a cost attached to them. However, there are a variety of ways inwhich they can be guided and designed to be cost-effective. Evaluation provides us theability to learn from studying what has happened and we look at topics like; managementof transition for project to operation, project completion and termination, review, etc.
Self Learning168 Material
Project Completionand Evaluation
NOTES
Project evaluation translates as the systematic investigation of an object’simportance or value. The technique is applicable to projects, programs and policies. Atthe project stage, evaluation entails processes like discussing a feasible evaluation planwith stakeholders; devising and setting up the evaluation; putting together, classifyingand probing information and facts; validating the information and dispensing the resultsto explain or provide clarity about the project and/or to make project-affiliated decisions.
Evaluation is necessary to validate the value or merit of a project and to identifyareas for improvement. It upholds suitable choices to select from, along with changes tothe project’s goal and approach. It is important to plan an evaluation with care. There isno single technique or one set of technique that is suitable for every type of project. Theevaluation method, design and methodologies should agree with the particular project.The focus and aim of an evaluation varies according to the needs of stakeholders thatmay involve project developers, financing agencies, local government, cooperation,academic staff and students. Stakeholders must be consulted at the time of selecting themost optimum approach. When the best features and the drawbacks of a project arehighlighted, evaluation gives rise to inferences that may impact potential decision-making.The results of evaluation reports, depending on exhaustive analysis, are indispensablecontribution to the planning processes. Evaluation aids learning and upgrading throughinclusion of suggestions into new projects, programs and plans.
5.1 OBJECTIVES
After going through this unit, you will be able to:• Explain integrated project management control system• Define the management of transition for project to operation• Discuss the concepts of project completion, termination and evaluation• Assess the importance of project review
5.2 INTEGRATED PROJECT MANAGEMENTCONTROL SYSTEM
An integrated project management control system consists of software tools for buildingof the project databases as well as the processes and procedures required to systematizeand administer the project. The integrated project management control system is designedto assist the management in:
• Knowing the status of the project• Drawing a comparative study of project status with respect to the threshold plan• Executing and controlling the change process• Track the Earned Value (EV) as and when required
The integrated approach to project planning and control is centralized and anticipative.Integrative means that every stage of the project and all the components of informationlisted above are connected with each other in a logical manner. Predictive implies that thesystem has the ability to foretell what will happen in the future, on the basis of existentplans and evaluations, with the tangible physical advancement and reported costs, continuallyupdating the to-do list and cost threshold for the potential forecasts.
Self LearningMaterial 169
Project Completionand Evaluation
NOTES
Effectual use of the robust computer-aided integrated project planning and controlsystems that are in the market today calls for the use of a single integrated system (oftenconsisting of project-oriented subsystems that are appropriately coupled collectively) foreach and every project running in the organization to:
• Identify and methodically regulate the project’s goals and range• Validate and take initiative in the management of every project risk,
simultaneously with the cumulative project portfolio risks• Characterize and manage the specification, quality, pattern and quantity of
transitional and ultimate products (or deliverables) of the project.• Analytically determine and streamline the work to be executed with the help
of the project/assignment itemization configuration (P/WBS) approach.• Approximate the workforce, material and others costs related to the project’s
final products and associated work components and every summary elementin the P/WBS.
• Plan and control the series and schedule of the project deliverables andinterrelated work components with the help of a senior-level project masterschedule in addition to a suitable configuration of schedules.
• Approve and take charge of the costs of funds and work hours needed tocarry out the project.
• Supply the information pertaining to both;o Actual development and costs ando Futuristic predictions required by project managers, department heads,
functional team leaders and work-package leaders on a regular andrealistically accurate basis
• Consistently appraise advancement and envisage and alleviate issues withquality, outlay, plan and risk with the help of earned value project managementtechniques.
• Update the management and clients on the existent status and future stanceof the project quality, cost and schedule conclusion, inclusive of post-completionreports.
5.3 MANAGING TRANSITION FOR PROJECTTO OPERATION
There have been instances where project teams have struggled in the process of supportinga newly installed application at the same time as running ensuing releases. There havebeen projects which have faced problems with project transition to operations. Enterpriseprojects and programs usually have quite a few releases to different countries and businessunits. Project teams encounter the threat of getting lost in the transition when the firstdelivery is not suitably transitioned to a process support model.
In this situation, the project team carries on working on the subsequent deliverywhile working hard on the production support role. The project team unproductivelyorganizes operational actions with significant project releases. Due to lack of definiteoperational functions and tasks, project teams imperil future deliveries in addition toputting up with role uncertainty. There are several suggestions to stay away from gettinglost in transition.
During a latest project, an IT organization was executing a new financial accountingpackage since six months with two releases in the pipeline. The initial release wasexecuted in 1/3 of the organization and the next release was scoped for the rest of the
Self Learning170 Material
Project Completionand Evaluation
NOTES
company. The first delivery was a tough launch because the system encounteredproduction support problems and the business partners were not at ease that the systemwas sufficiently durable to hold up to the remaining 2/3 of the organization. While theteam neared the launch resolve for the second release, the business partners and theproject team decided to delay the launch for a month.
The main cause was not the technical potential of the product or unresolved pettyproduction support occurrences. At the time of the launch decision meeting, the businesspartners elevated apprehensions pertaining to the unsteadiness of the application and theabsence of adequate operational aid. Following a deeper study, the instability was realizedto be an opinion instead of a reality. The application response time was good enough andthe Web server on no account went down. The system performed according toexpectations. However, the seeming instability was straightforwardly linked to the absenceof response from the support team. The main reason adding to the lack of response wasthat production support was given by the present project team. There was no transitionof operational support from the project team to another team or an individual.
The project team carried on responding to operational issues at the same time astrying to deliver the subsequent release of the software implementation. The projectissues log was a collection of operational issues and delivery-specific issues. The projectalso depended upon several vendors to manage incorporation with the software product.The variety of vendors elevated operations problems to several points of contact. Thefinal outcome was a chaos. After the decision to postpone the launch was confirmed,the project team members turned defensive and a bit discouraged as there was noownership and appreciation for the long hours that went into delivery of the secondphase and production support.
This whole ‘lost in transition’ phase could have been averted had the project teamincluded operations support planning and transition during the initial phases of the projectplanning and schedule development. The project team resolved the issue by executingthe following six simple steps to improve application governance and operational support.
1. Categorize support resources for the application
Even in companies where there is dearth of resources, there has to be an individualresource or team that is accountable for production support. On the basis of the volume,there may be role-sharing or it may be devoted to production support and applicationmanagement.
2. Set up an operations standing discussion with business associates andIT stakeholders
An operations status meeting is like a project status meeting barring the fact that thefocus is on operations of the IT application and the result being delivered to the business.The operations status meeting comprises business partners and the IT management tocollectively evaluate the improvement and working of the application.
3. Schedule a production issues and events meeting with businesssubject matter specialists and the technical team
By arranging an individual meeting to evaluate production problems and happenings, theproject team can concentrate on problems pertaining to the subsequent release while theoperations team focuses on the more pressing support concerns. Being unsuccessful insegregating production-related issues from project issues will consume the project teamin such a way that they will diverge from their core goals and objectives. This creates
Self LearningMaterial 171
Project Completionand Evaluation
NOTES
confusion in the end users as they have to exert a lot of effort in classifying a single pointof contact for support.
4. Create a change control team to administer constant changes in theoperational setting
Change management is a continuous operational process in addition to a domain ofproject management. Business requirements will undergo changes and new reports,fields, interfaces and modifications will be required. A few of these developments canbe attached to a future software release and others can be rolled on in the form of acycle as requested by the user. By introducing a change control board, the businesscustomer will have a means to ask for the incorporation of alterations to the applicationwithout dissuading the project team from their anticipated target. The alterations introducedto the change control board should also be examined and evaluated with the projectteam to ascertain there are no crashes or disputes.
5. Convey the control model to project stakeholders
After the members are finalized for every key operational meeting, the operationsgovernance model must be brought to the notice of and reviewed by business and ITstakeholders. When a solution of the manner in which issues, changes and operationalstatus will be reviewed will be presented, the business partners will have increasedconfidence in the IT manager’s role in providing services and supporting the business.
6. Facilitate knowledge transfer between project team and support team
One more key to a thriving operations process is the knowledge transfer facilitated bythe project team to the operational support team. In a few of the cases, project teammembers will become operational support and in others, new operations support teamswill be appointed, independent of the project. The project schedule should contain transitiondocumentation, tasks to communicate the course of the project and measures requiredto support the application. The process documentation can comprise batch schedules,help desk synchronization, escalation contacts, recognized issues and their resolutionsand disaster recovery measures.
It may come as astonishment to readers that even an experienced project teammay not be able to successfully manage transition. However, this usually happens thatwhen projects encounter a shortage of resources and difficult deadlines. The three-foldrestrictions of capacity, time and resources is attuned only after the time factor is fixed.By adhering to and putting into practice, the mentioned six steps, project teams can becertain of a better distribution of tasks between ongoing processes and future release ofthe application.
5.4 PROJECT COMPLETION AND TERMINATION
A project is said to be complete when all its stages have ended successfully.
5.4.1 Project Completion
The steps comprised in the completion of a project are as follows:
1. Final inspection
When the contractors inform the project manager that work has completed, the projectmanager carries out a final assessment to find out whether any work remains pending.
Check Your Progress
1. What does anintegrated projectmanagementcontrol systemconsist of?
2. In what way is theintegrated projectmanagementcontrol systemdesigned to assistthe management?
Self Learning172 Material
Project Completionand Evaluation
NOTES
This includes a quick walk through all stages of the project and discussing with theproject team members to find out anything that seems to be incomplete or half done. Theproject manager makes a note of all unfinished or inadequate aspects to be fixed alongwith an action plan to do the same.
2. Defects liability period
The defects liability period is the time assigned for rectifying faults and resolving problems.These faults and problems are the ones that are identified during the final inspection. Noalterations or additions can be made after the defects liability period is over, except ofcourse if they are covered by warranty. The defects liability period may vary for differentprojects.
3. Maintenance retention sum
Throughout the defects liability period, the maintenance retention sum (as specifiedwithin the contract), is kept on hold with respect to the final payment, for ensuring thatthe faults and problems are resolved and rectified. If the corrective work does not finishin a reasonable time, the project manager should adopt the general dispute resolutionprocesses. This might translate to hiring the services of another contractor to do thework, though this could affect the warranties, if any. The payment of retention is doneonly after all the work is completed as per the standards.
4. Final documentation
After completion of the project, the client needs all the final paperwork to close theproject and pay off the retention amount. Once this is done, the project is completed,signed off and closed.
5. Guarantees, warranties and product information
Guarantees and warranties are not too different. Characteristically, product manufacturersguarantee that their products will perform in a certain way for a specified time. Forinstance, a roofing manufacturer may guarantee that with proper maintenance, the roofwill be leak-proof for a period of 10 years. The majority of guarantees are only applicableif the product is maintained, as specified by the manufacturer. The project managercollates all the guarantee and maintenance care documents from the contractors andhands them over to the client.
6. Closing the project file
One of the final tasks is to close the project file. All the final documentation needs to partof the project file, which is to be stored securely. The file is important since it hascontains the relevant guarantees that are needed when the product malfunctions.
7. Discharge the project control group and project manager
The ultimate task is to release the project manager and disengage the project controlgroup. The board appraises the work of the project manager and reviews any non-performance issues. The project manager might be bound to a service contract with theboard and it is the discretion of the board, based on his/her performance, whether theywould continue or end it.
Self LearningMaterial 173
Project Completionand Evaluation
NOTES
5.4.2 Project Closing and Termination
Project closing down phase comprises evaluating and reporting findings and results ofthe project and the assessment of the project team’s performance (Luecke, 2004, pp.146). In addition to this, it is also the phase in which the managers can express theirappreciation towards the individuals involved and acknowledge their participation.
While the project is executed till its intended completion, the settlement of theresult of the project corresponding to the specifications statement and project scheduleis one of the most significant steps. According to this reconciliation, the project canessentially be closed. This process facilitates the project team to assess whether theproject was successful. Usually, the team is aware whether the targets have been achievedin time and within the range of the budget. However, this is a step about documenting theachievement and/or explaining any divergence from the intended goals. On the basis ofthis methodical report, the patron, the customer and any other stakeholder in charge willsign off the project and hence, the project will officially be closed. The formal projectclosing is varies from one project to another and the associated documentation.Nevertheless, it nearly always includes preparation of closure reports and acceptancedocumentation.
The scenario is not the same in the case where a project is terminated before itsformal closure date. There will be no settlement of capacity deliverables to be preparedinstead of reporting the causes for closure and the state of the project when the decisionto terminate it was taken. This needs to be prepared, irrespective of the reason forclosure and recorded for future reference. An important aspect of this process is thecorrect identification of the reason for termination: for instance, if the project isdiscontinued for shortage of funds, it needs to be determined whether the cause is thefinancial situation of the patron, or market trends, or faulty project’s budget estimates.Determining the actual reason behind terminating a project is vital for preparing a ‘lessonslearned’ report. It needs to be reinstated here that all of it must be systematicallydocumented and signed off by all the concerned individuals and groups.
In case of termination of the project, a procurement closure must also be carriedout. However, inevitably, process statement will not be verified, as the project has stoppedbefore the scheduled end date. The process adopted to close contracts in this case,depends on the contractual agreements. For instance, a key point is focusing on thecompensation and ways to make sure that the resources receive payment for the workthey have completed. In the same way, it is also important to ensure that the resourcesare not paid for the work that was scheduled to be done, but was suspended.
5.5 PROJECT EVALUATION
Project evaluation is the methodical appraisal of the procedures and/or results of aprogramme with the objective of promoting its advancement and betterment. By its verynature, it is a combined process in which evaluators put in their collective efforts insynchronization with the project team to design and put into practice an evaluation designthat is receptive to the requirements of the project. For instance, throughout theimplementation of the project, evaluators can offer decisive evaluation findings to enablethe project team to take prompt, data-based decisions pertaining to the implementationof the project and delivery. Also, evaluators can, at the conclusion of a project or on itscompletion, provide collective and comprehensive evaluation findings, usually required
Check Your Progress
3. What is defectsliability period?
4. What does aproject closingdown phasecomprise?
Self Learning174 Material
Project Completionand Evaluation
NOTES
by financing agencies and used to make decisions about continuation or expansion of theproject.
5.5.1 Objectives and Essentials of Project Evaluation
If a project is well formulated and thoroughly appraised, a good follow-through on thesubsequent stages of the project cycle will ensure the achievement of its goals. Evaluationinvolves a cautious examination of the basic data, assumptions and methodology used inproject preparation; an assessment of the project’s organizational and managementaspects; an in-depth review of the work plan, cost estimates and proposed financing;and finally the validity of the financial, economic and social benefits expected from theproject.
On the basis of these assessments, it can be ascertained whether the project isfinancially reasonable, technically sound and viable from the viewpoint of the economyas a whole. The exercise of project evaluation simply means the ‘assessment of aproject in terms of its economic, commercial, market, social and financial viability interms of returns and risk’. This exercise basically is aimed at determining the viability ofa project and sometimes also in reshaping the project so as to upgrade its viability.
In other words, it aims at sizing up the quality of projects and their long-termprofitability. Evaluation of projects by funding institutions is an important exercise for thefinancial institutions and investing companies in credit decisions. The art of projectevaluation puts more emphasis on the economic and technical soundness of the projectand its earning potential than on the adequacy and liquidity of the security offered.
Hence, the process of evaluation requires a dynamic approach as it is linked withthe present and future. Project evaluation is a scientific tool. It follows specific pattern.Evaluation can be referred to as ex-ante, on-going and ex-post.
The effectiveness of a project may be determined in several ways. It may rangefrom a one-off assessment, through a periodic independent review, to an on-going projectmanagement overview. As there exist many possibilities in the testing of the effectivenessof a project, it will be suitable to use the term project evaluation. The particular projectcircumstances determine the type of evaluation to be chosen.
5.5.2 Need for Project Evaluation
Project evaluation is a practical, constructive and essential diagnostic tool available forenhancing the capability of the sponsoring organization’s project management team. It ishelpful in providing information ranging from an informal enquiry to an extensive analysisof the effectiveness of every aspect of the project process. In the latter context it can beconducted to ferret out common failings of many project management arrangements.
Thus, project evaluation is helpful in:• Identification of the strengths of current practices in a project management
organization, or on an existing project• Establishment of various groups’ perception of the organization’s effectiveness
in managing projects• Examination of the effectiveness of project communication and documentation,
and clarification of the relationships between project scope, quality, time andcost
• Identification of barriers to better performance, or critical skills needed byproject managers or their supporting teams to increase their effectiveness
Self LearningMaterial 175
Project Completionand Evaluation
NOTES
• Immediate identification of specific aspects which require improvement andhence speed the achievement of results
• Facilitation of an exchange of ideas, information, problems, solutions andstrategies with project team members, which leads to development of a planof action for carrying out improvements
• Creation of a supportive environment focusing on project success, and theprofessional growth of project team members
Thus, project evaluation in a timely and favorable manner helps in identifyingpotential difficulties and bringing them out into the open for appropriate corrective action.Further, it may avoid potential problems altogether, if the concept and timing of projectevaluation is built into the project plan from the outset.
Identifying projects whose evaluation should be conducted
Project evaluation is most suitable for the projects involving significant risk of potentialdifficulties. It assumes that the sponsoring organization has recognized the potential forrisk on the project, and has, or will include risk management as a standard functionalcomponent of the project management effort. The sponsor involves the project evaluatorin the project risk identification stage of the project planning phase.
Intent of project evaluation
The intent of the project evaluation should be to avoid useless and unnecessary costs inthe future. Since avoided costs are not reflected in normal accounting procedures, it isoften difficult to justify this additional expenditure until management knows that it isalready in trouble.
Thus, the actual extent of an evaluation is determined by the following factors:• The size and complexity of the project• The extent of the concern that management has with the project• The duration for which the project has been running and the time it is expected
to take to complete• Whether or not previous enquiries have already been conductedIt is significant to the success of project evaluation that it be structured on the
basis of serving to advance the prospect of success of the project. Simply finding faultand pointing the finger at those responsible does not help.
5.5.3 Qualities of a Project Evaluator
Project evaluation should be carried out with a certain degree of independence to protectthe credibility and reliability of the resulting findings. In other words, it needs to becarried out by a third party. However, the third party may enjoy varying degrees ofindependence. For example, the evaluation may be carried out by someone from anotherdepartment or division of the sponsoring organization. On the other hand, a completelyindependent party commissioned for the purpose may conduct the evaluation.
Irrespective of the way of conducting the project evaluation, it is important toensure that the persons undertaking the evaluation have no direct personal, financial ororganizational ties with the management of the project. In addition, if the findings are tobe convincing, the evaluation must be done by people who are familiar with the technologyof the project, and/or who are thoroughly knowledgeable in managing the processes ofrealizing a capital project.
Self Learning176 Material
Project Completionand Evaluation
NOTES
The objective of the evaluator is to provide consistent and realistic advice to theowner or sponsor’s executive through a professional approach and a degree ofindependence. The evaluator must be recognized as being competent, fair, objective andthorough.
5.5.4 Approach to Project Evaluation
Project management experts are almost unanimous that the project evaluation should becarried out and the subsequent report written, in a strictly constructive way. If this basicprinciple is ignored, the morale of the project would be so undermined that it will be hardto obtain the required information for project evaluation purposes, and any potentialbenefit will be totally negated.
The project evaluation, whether conducted formally or informally, regularly orone-off, is fundamentally the development of a set of questions and answers foundthrough the examination of data or through personal interviews. It provides a currentsnapshot of the health of the project. In this sense, however, it is just like a company’sannual financial statement. It may possess many interesting information, but does notserve its full purpose so long as it is compared either with similar previous reviews orwith the governing project management plan.
In developing the set of questions, it needs to be ensured that each question hasbeen cross-referenced to the relevant section of the governing plan or procedure, thepotential concerns have been identified, and the persons to whom each question will beaddressed have been identified. The questions should also be most conveniently groupedaccording to the project management function. Essential to the success of the processare three considerations, namely the reporting level, a future orientation (not past) and aperceived net benefit to the members of the project team.
The project evaluator must not be responsible to any of the individuals who maybe referenced in the report. It does not mean that the draft findings need not be sharedwith those involved. They should certainly be. Early acknowledgement of this vital pointwill be in the interests of accuracy and honesty. This will also facilitate cooperationamong the evaluation team members and early implementation of the recommendations.The final project evaluation report must be presented to those who are in a position toact on the advice, or ensure that the recommendations are successfully executed.
5.5.5 Methodology and Timing of Evaluation
Evaluation methodology
Project evaluation process should demonstrate the following:• Potential problems are being identified earlier than they might otherwise be.• The presence of the project evaluator is welcomed by the project team.• Practical and timely recommendations for corrective action are being offered.
The methodology involved in the project evaluation involves the following steps:Step (i) Establishment of the project evaluation’s goal and scopeStep (ii) Acquisition of information
Step (iii) Examination and correlation of the information and, in the light of thereviewer’s experience, determination of its relevance, completenessand reliability
Self LearningMaterial 177
Project Completionand Evaluation
NOTES
Step (iv) Description of conclusions on the current status of the projectStep (v) Development of recommendations affecting the future project status
Step (vi) Discussion on the preliminary draft of the findings andrecommendations with those interviewed, and subsequent modification
Step (vii) Presentation of the final results for discussion with those whocommissioned the evaluation
Step (viii) Discharge of the evaluation team, until recalled
Timing of project evaluation
There may be both ‘planned’ and ‘spot’ evaluation s. However, a planned projectevaluation (concerned parties notified in advance) is much less unapproachable andmore positive. This helps in extraction or retention of information to serve as a basis forthe review, with the least interruption to on-going work.
The other advantage of such evaluation is that management is bound to setstandards of conduct and performance, while individuals remain mindful of these standardsin the course of their daily activities. In determining the timing for PMA, it is important torelate to the four basic phases in a typical project life cycle.
The first phase of a project involves its conceptualization, including preliminaryconfiguration, technical and economic feasibility, positive and negative social andenvironmental impacts, and examination of project alternatives. The second phase involvesstages in which the technical plans are developed, any required technical feasibilitystudies are conducted, and the resulting findings provide input to a thorough planningstage.
The third or execution phase of a construction project typically encompasses thestages of detailed design, procurement of construction services, i.e., tendering and awardof contract(s), followed by the major part of construction. The final or finishing phase ofa construction project not only involves the testing and startup of the facility, but typicallyincludes training of operating personnel, transfer of responsibility for the facility, releaseof project resources and closing of project documentation.
The project evaluation should be planned into the project early in the secondphase. The identification of the project evaluator and the establishment of a suitablemandate should be the first step. The evaluation can be carried out with advantagetowards the end of the second phase, which provides an opportunity to verify the variousrisks involved, and possibly identify additional risks, which can then be provided for inthe project brief. The project evaluation activity should usually be stepped up during theseveral stages of the third phase of the project and, like the various other project activities,trailed off in the final phase.
5.5.6 Scope of Project Evaluation
The scope of project evaluation may be as extensive or limited as circumstances indicate.However, it is important to note that there are at least three separate dimensions whichmay be covered by any evaluation of the project. Each dimension has equal importanceto its final outcome and success. The first consideration is related to the technicalobjectives of the project as represented by its scope and quality parameters, which needspecific attention of the management, both in terms of technological content and managingand controlling the development of the content, consistent with the overall objectives ofthe project.
Self Learning178 Material
Project Completionand Evaluation
NOTES
The second dimension of the project is related to the business managementobjectives as represented by its time and cost parameters. The third dimension is relatedto stakeholders’ satisfaction and their collective perception of the success of the project.Depending on the nature of the project, the stakeholders may be many and various.
Checklist for Determining Criteria for Project Evaluation
The checklist for project evaluation criteria may be prepared under the following heads:
• Relevance and importance
How substantially does your project support values, demands, programmes and prioritiesof the customer (Evaluation of the relevance of project objectives)?
• Validity of assumptions
How realistic and accurate are these characteristics? (Assessment of the validityof project assumptions)
• Methodology acceptability and feasibility
How well does the methodology support the project? How acceptable will it be to otherproject stakeholders? How reasonable and adequate will be its inputs and outputs?(Examination and prove/disprove of the logistic, economical acceptability and feasibilityof your project methodology)
• Stakeholder competence and credibility
How capable is the project team? What financial power can the sponsor provide to yourproject? How “deeply” can the customer be involved in the project? (Evaluation ofcompetence and credibility of key stakeholders including the owner, team and customer)
• Failure risk: How sensitive will the project be to changes occurring in the workingenvironment? How can undesirable factors and outcomes be mitigated?(Assessment of the risk and consequences of unexpected results or failure)
Components of an Evaluation Report
An evaluation report includes the following:• Executive Summary describing main findings and recommendations on improving
the project.• Subject of your evaluation, including a brief history and description of the project
and its cultural, technical, natural, economic, and social environments.• Description of the background of the evaluation, including purpose, methodology,
assumptions, limitations etc.• Name of the participants of the project and those who own and use the final
product.• Confirmation of your project to prioritized needs and demands of the customer.• Brief review of benefits of your project and how they correlate with costs (cost-
benefit analysis).• Report on the probability of achieving expected results and effectiveness of your
project.
Self LearningMaterial 179
Project Completionand Evaluation
NOTES
• List of factors that ensure sustainability and compatibility of the project goals.• List of factors that ensure economic and financial sustainability of the project
results.• Confirmation of appropriateness of technology used within the project.• Report on environmental impact (if any)
5.6 PROJECT REVIEW
Project review is an assessment of a project or activity with the following intent:• Re-examining the activities that took place• Assessment of the reasons for the activities and events that occurred• Formulating the right procedures to be taken to improve the outcome of the
following event or projectThere is no fixed time for a project review to take place in the process of a project. Theycan be used to validate the success of projects. They are learning tools created todevelop information and feedback that add to consistent improvement agenda in theplanning and release of all projects. While every review is essentially project-specific, itis vital that the results are brought to the notice of others within an organization andthose offering services to that organization.The salient features of a good project review are as follows:
• It categorizes important outcomes (positive as well as negative) to be shared, sothat future project delivery teams are able to:o Reproduce the exercises that have led to lucrative resultso Establish practices to avert, or manage in a better way, the issues that have
emerged in the past projects• It facilitates process owners to detect where present policies, practices and
benchmarks might be hindering better project performance;• It recognizes opportunities for additional organization-wide enhancement in design,
release and operations and• It sets up an organized plan of action to put these improvements into practice
Good project reviews provide the following advantages:• Helps in to the point evaluation of the suitability of the delivery method and results
achieved• Provides a opportunity for clear and straightforward discussions, beneficial
feedback and debate of sensitive matters• Provides end user input to the needs of upcoming projects• Creates a database of information from the whole stakeholder group;• Adds innovativeness to the delivery of projects;• Provides a base for a process of consistent improvement;
Results in numerous lessons learned, directed at ascertaining that faults or substandardfeatures are not repeated in future projects and constructive features are used to theirfull strength.
Self Learning180 Material
Project Completionand Evaluation
NOTES
5.6.1 Precautions for Project Review
Project review is likely to be misunderstood, especially because it is done by a teamother than a planning team and an execution team. The purpose of project review mustbe made explicit in the beginning. One must take precautions before the project reviewis undertaken. Some important precautions are listed below:
• Establish procedures and guidelines for the project review and make sure that allthe participants have understood them well and that they are available to all theparticipants prior to the event.
• Ensure that all the participants are convinced that the process will be positive andblame free.
• Provide an environment that fosters openness and candour.• Ensure that results are shared with all the concerned parties so that there is a
positive effect on the future projects.• Ensure that project review is conducted economically. It is an act of balancing
between the costs of project review and benefits. The depth of the project reviewhas to be decided judiciously as the review processes unfold.
• Provide a flexible set of tools and methods that will allow project teams of allsizes and complexity to analyse significant project events and synthesize the findingsinto a plan of action for remediation.
• A good project review will provide a feedback loop from the findings to the solutionsimplemented on future projects.
5.7 SUMMING UP
• An integrated project management control system consists of software tools forbuilding of the project databases as well as the processes and procedures requiredto systematize and administer the project.
• Transition is the move from project to work, with work being the state of operation.• Project review is the evaluation or assessment of a project.• A project is said to be complete when all is stages have ended successfully.• Project evaluation is the methodical appraisal of the procedures and/or results of
a programme with the objective of promoting its advancement and betterment.• When a project is faced to end, due to one or more factors, before its scheduled
end date, it is said to be terminated.
5.8 KEY TERMS
• Project evaluation: A systematic investigation of an object’s importance or value.• Change management: A continuous operational process in addition to a domain
of project management.• Defects liability period: The time assigned for rectifying faults and resolving
problems.• Termination of project: Forced end of a project due to certain difficulties, hurdles
or other problems.
Check Your Progress
5. What is thepurpose of aproject review?
Self LearningMaterial 181
Project Completionand Evaluation
NOTES
5.9 ANSWERS TO ‘CHECK YOUR PROGRESS’
1. An integrated project management control system consists of software tools forbuilding of the project databases as well as the processes and procedures requiredto systematize and administer the project.
2. The integrated project management control system is designed to assist themanagement in:
(i) Knowing the status of the project(ii) Drawing a comparative study of project status with respect to the threshold
plan(iii) Executing and controlling the change process(iv) Track the Earned Value (EV) as and when required
3. The defects liability period is the time assigned for rectifying faults and resolvingproblems.
4. Project closing down phase comprises evaluating and reporting findings and resultsof the project and the assessment of the project team’s performance.
5. A project review is carried out with the following purposes:• Re-examining the activities that took place• Assessment of the reasons for the activities and events that occurred• Formulating the right procedures to be taken to improve the outcome of the
following event or project
5.10 QUESTIONS AND EXERCISES
Short-Answer Questions
1. How can knowledge transfer be facilitated between the project team and thesupport team?
2. What are the steps involved in project completion?3. What are the objectives of project evaluation?4. What are the salient features of a good project review?
Long-Answer Questions
1. Explain the steps that may be taken to improve application governance andoperational support.
2. Differentiate between project closing and project termination.3. Discuss the scope of project evaluation.4. Give a detailed account of the precautions to be taken before undertaking a project
review.

Self Learning182 Material
Project Completionand Evaluation
NOTES
5.11 REFERENCES AND SUGGESTED READINGS
Chandra, Prasanna. 1995. Projects: Planning, Analysis, Selection, Implementation,and Review. Delhi: Tata McGraw-Hill.
Kerzner, Harold, R. 2013. Project Management: A Systems Approach to Planning,Scheduling, and Controlling. New Jersey: John Wiley and Sons.
Singh, Narendra. 2000. Project Management and Control. Delhi: Himalaya PublishingHouse.

NOTES
183

NOTES
184

PROJECT MANAGEMENT
VENKATESHWARAOPEN UNIVERSITY
www.vou.ac.in
VENKATESHWARAOPEN UNIVERSITY
www.vou.ac.in
PROJECT MANAGEMENT
MCOM[MCOM-101]
PROJECT MANAGEM
ENT8 MM