Mayo Children and Young People's Plan 2018-2020 - CYPSC
160
1
-
Upload
khangminh22 -
Category
Documents
-
view
4 -
download
0
Transcript of Mayo Children and Young People's Plan 2018-2020 - CYPSC
1
2
Contact
The Mayo Children and Young People’s Services Committee welcomes comments, views and
opinions about our Children and Young People’s Plan.
Please contact:
Thérèse Ruane, Mayo CYPSC Coordinator
Email: [email protected]
Mobile: 087-3506860
Landline: 094-9049097
Copies of this plan are available on http://www.cypsc.ie/your-county-cypsc/mayo.245.html
(Plan will be available here once approved)
3
Table of Contents
1 Introduction .................................................................................................................................. 14
Background to Children and Young People’s Services Committees ................................................. 15
1.1.1 Children and Young People’s Services Committees in Ireland. .................................... 15
1.1.2 Children and Young People’s Services Committee in Mayo ......................................... 15
1.1.3 Who we are ................................................................................................................... 15
Achievements to date ....................................................................................................................... 17
1.1.4 Family Support Subgroup .............................................................................................. 18
How the Children and Young People’s Plan (CYPP) was developed ................................................. 19
1.1.5 The socio-demographic profile ..................................................................................... 19
1.1.6 The audit of Services ..................................................................................................... 20
1.1.7 The local needs analysis ................................................................................................ 20
1.1.8 The identification of priorities, objectives and actions ................................................. 25
2 Socio Demographic Profile of Mayo ............................................................................................. 26
County Mayo ..................................................................................................................................... 26
Vital Indicators .................................................................................................................................. 28
Population ......................................................................................................................................... 29
2.1.1 Net Migration ................................................................................................................ 29
2.1.2 Births ............................................................................................................................. 29
2.1.3 Population aged 0-24 years .......................................................................................... 30
2.1.4 Young Dependency Ratio, 2016 .................................................................................... 31
2.1.5 Marital Status ................................................................................................................ 32
2.1.6 Irish Language ............................................................................................................... 32
Diversity and Ethnicity ...................................................................................................................... 32
2.1.7 Diversity ........................................................................................................................ 32
2.1.8 Ethnicity ........................................................................................................................ 34
2.1.9 Asylum Seekers ............................................................................................................. 35
Vulnerable Young People .................................................................................................................. 36
2.1.10 Young Carers ................................................................................................................. 36
2.1.11 Disabled Population aged 0-18 years ............................................................................ 36
Key Statistics ..................................................................................................................................... 37
2.1.12 Outcome 1: Active and Healthy .................................................................................... 37
2.1.13 Self-harm ....................................................................................................................... 39
2.1.14 Mindspace Mayo ........................................................................................................... 39
4
Outcome 2: Achieving full potential in learning and development .................................................. 40
2.1.15 Childcare and Early Years .............................................................................................. 40
2.1.16 Primary School Children ................................................................................................ 41
2.1.17 Post-primary schools ..................................................................................................... 42
2.1.18 Mother’s highest education achievement .................................................................... 44
Outcome 3: Safe and protected from harm ..................................................................................... 44
2.1.19 Referrals to Family Support Services ............................................................................ 45
2.1.20 Child Protection and Children in Care ........................................................................... 45
2.1.21 Juvenile Crime ............................................................................................................... 46
2.1.22 Drugs Task Force ........................................................................................................... 47
Outcome 4: Economic security and opportunity .............................................................................. 47
2.1.23 Live Register .................................................................................................................. 48
2.1.24 Child related Social Welfare Payments ......................................................................... 49
2.1.25 Housing ......................................................................................................................... 50
2.1.26 Deprivation.................................................................................................................... 51
Outcome 5: Connected, respected and contributing to their world ................................................ 52
2.1.27 Key findings from Socio Demographic Profile ............................................................... 54
3 Overview of services to Children and Families in County Mayo ................................................... 57
Outcome 1: Active and Healthy (physical and mental wellbeing) .................................................... 57
Outcome 2: Achieving full potential in learning and development .................................................. 59
Outcome 3: Safe and protected from harm..................................................................................... 61
Outcome 4: Economic security and opportunity ............................................................................. 63
Outcome 5: Connected, respected and contribution to their world ............................................... 65
3.1.1 Gaps identified .............................................................................................................. 67
4 Local Needs Analysis in County Mayo ........................................................................................... 68
Outcome 1: Active and healthy, physical and mental wellbeing .................................................. 68
4.1.1 Health and Wellbeing .................................................................................................... 68
4.1.2 Outdoor play 0-6 years ................................................................................................. 69
4.1.3 Child and Youth Mental Health ..................................................................................... 70
4.1.4 Parental Mental Health ................................................................................................. 71
Outcome 2: Achieving full potential in learning and development .............................................. 72
4.1.5 Young Asylum Seekers .................................................................................................. 73
4.1.6 Young Travellers ............................................................................................................ 74
4.1.7 Other Education Needs identified during the research process ................................... 75
5
4.1.8 Young People not attending school .............................................................................. 76
4.1.9 Lifeskills for young people............................................................................................. 77
Outcome 3: Safe and protected from harm ..................................................................................... 77
4.1.10 Responses from young people ...................................................................................... 77
4.1.11 Responses from parents Safety and Security ............................................................... 79
4.1.12 Responses from Service Providers ................................................................................ 81
4.1.13 Prevention, Partnership and Family Support ................................................................ 82
4.1.14 Parenting support and engagement ............................................................................. 82
4.1.15 Safeguarding Children and Young People ..................................................................... 82
Outcome 4: Economic security and opportunity ............................................................................. 83
4.1.16 Responses from young people ...................................................................................... 83
4.1.17 Responses from parents ............................................................................................... 85
4.1.18 Responses from Service Providers ................................................................................ 86
4.1.19 Young People not in Employment, Education or Training (NEETs) ............................... 86
Outcome 5: Connected, respected and contributing to their world ............................................... 87
4.1.20 Voice of children and young people ............................................................................. 87
4.1.21 Connecting and respecting young people .................................................................... 88
4.1.22 Rural Transport ............................................................................................................. 89
Change Management ........................................................................................................................ 89
4.1.23 Interagency Working and collaboration ....................................................................... 89
4.1.24 Information, Research and Communications ............................................................... 90
4.1.25 Advocacy and Influencing Policy ................................................................................... 91
5 Summary of Children and Young People’s Plan for Mayo ............................................................ 92
6 Monitoring and Review ............................................................................................................... 113
6
List of Tables
Table 1: Summary of consultations for Mayo Children and Young People’s Plan ............................... 20
Table 2: Focus Groups with Young People ........................................................................................... 23
Table 3: Process for identifying priorities and key dates ..................................................................... 25
Table 4: Vital Indicators for children and young people, Mayo and State .......................................... 28
Table 5: Annual Estimated Net Migration 2006 to 2016 per 1,000 of Average Population (Number)
by Intercensal Period, Census Year, Mayo and State . ......................................................................... 29
Table 6: Total births, Mayo and State, 2014, 2015 and 2016 .............................................................. 29
Table 7: Population aged 0 to 24, by single year of age, Mayo and State, 2016 ................................. 30
Table 8: Electoral Division with highest population aged 0-24 years (number and percentage), Mayo,
2016 ...................................................................................................................................................... 31
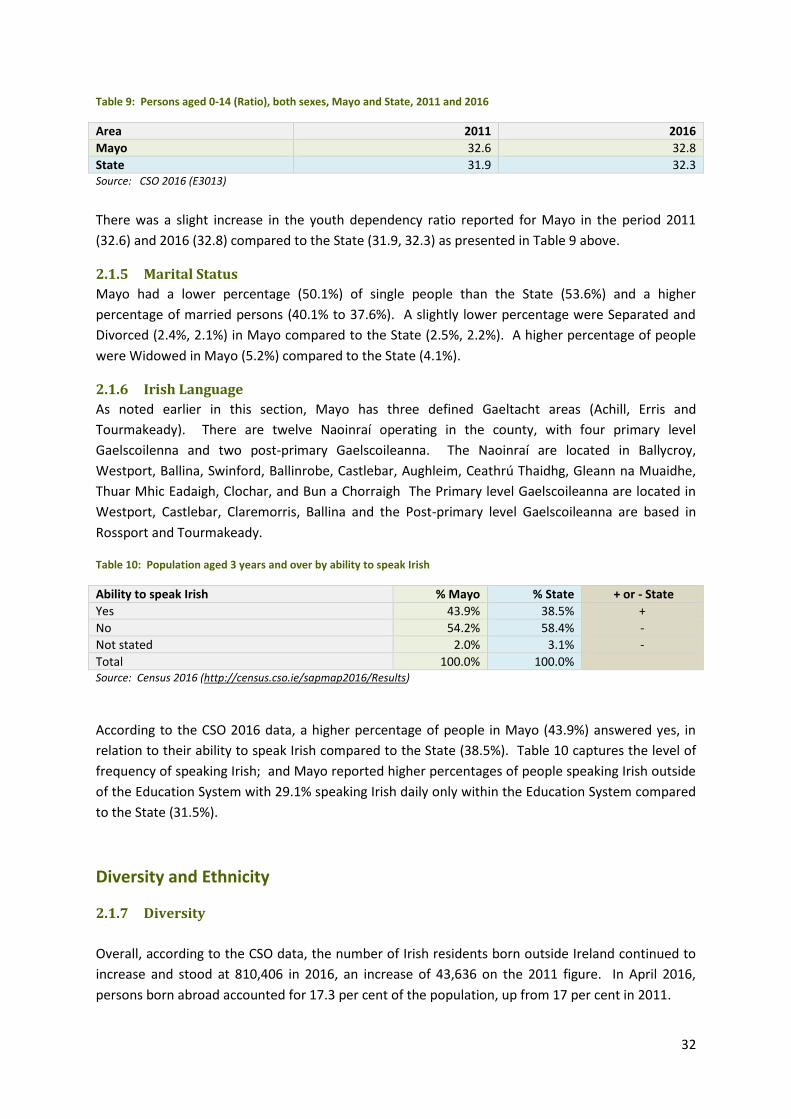
Table 9: Persons aged 0-14 (Ratio), both sexes, Mayo and State, 2011 and 2016 .............................. 32
Table 10: Population aged 3 years and over by ability to speak Irish .................................................. 32
Table 11: Population usually present and resident in the State by county of usual residence, age
group and nationality ............................................................................................................................ 33
Table 12: % Population Usually Resident and Present in the State 2016, nationality and town of
usual residence, Mayo .......................................................................................................................... 33
Table 13: Number and percentage of persons by language spoken, Mayo and State, 2011 .............. 34
Table 14: Population by Ethnicity, Mayo and State, 2016 ................................................................... 35
Table 15: Irish Travellers (total) and as a proportion (per 1,000) of the total population, Mayo and
State, 2016 ............................................................................................................................................ 35
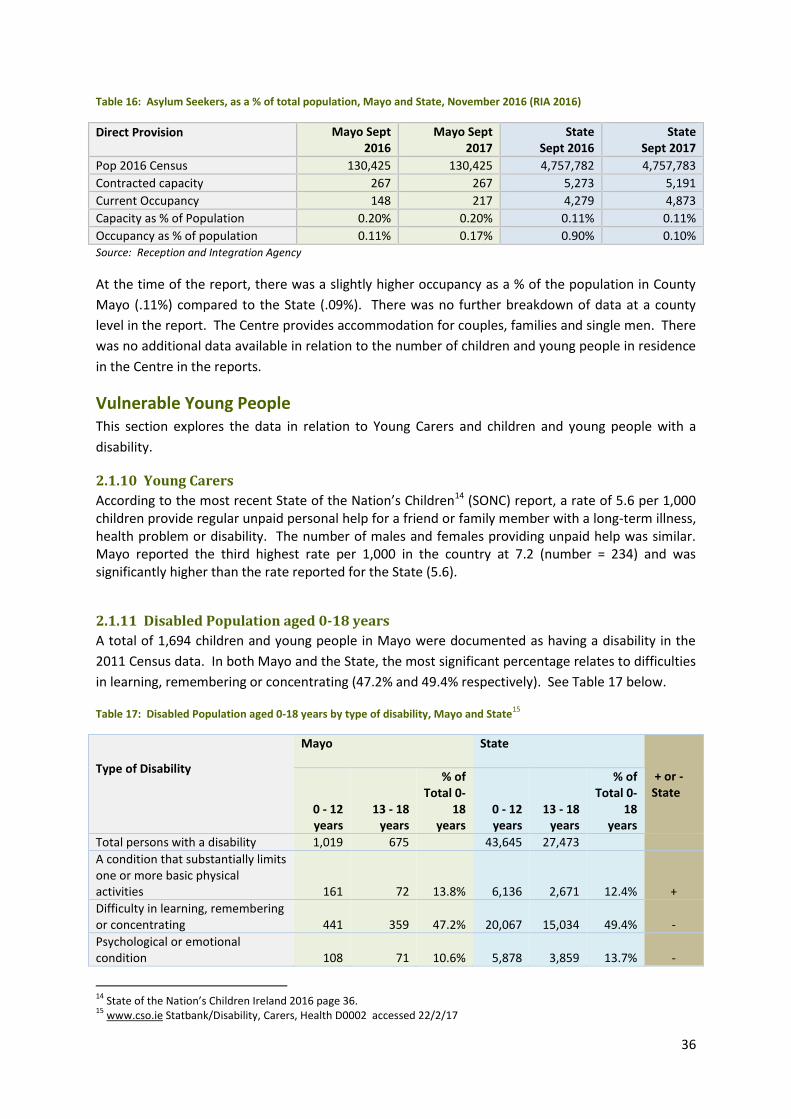
Table 16: Asylum Seekers, as a % of total population, Mayo and State, November 2016 (RIA 2016) 36
Table 17: Disabled Population aged 0-18 years by type of disability, Mayo and State ....................... 36
Table 18: Health of Children and Young People, 0-24 years, 2011 ...................................................... 37
Table 19: Percentage of infants who are breastfed (exclusive or combined) on discharge from
hospital, by mothers' county of residence (2015) ................................................................................ 38
Table 20: Number and percentage of live births that weigh <2,500g .................................................. 38
Table 21: Deliberate self-harm by age group and number, Mayo, 2014 (HSE 2015) .......................... 39
Table 22: Childcare services by type, Mayo (MCCC 2017) ................................................................... 40
Table 23: ECCE and CCS registrations, Mayo and State, 2015/16 (Pobal 2017) .................................. 41
Table 24: Highest level of Education Attainment of Mothers (2011) .................................................. 44
Table 25: Mayo Women’s Support Service, Jan-Sept 2016 ................................................................. 44
Table 26: Children referred to Family Support Services ...................................................................... 45
Table 27: Families referred to Family Support Services ....................................................................... 45
Table 28: Child Protection Referrals 2016 ........................................................................................... 45
Table 29: Children listed as 'Active' on CPNS per 10,000 populations 0-17 years Q1 2017 ................ 46
Table 30: Number of children in care and rate per 1,000 population 0-17 years Q4 2016 ................. 46
Table 31: Individuals who received treatment for drug or alcohol abuse, 2015 HSE Western Area .. 47
Table 32: Population aged 15 years and over by principal economic status and sex ......................... 47
Table 33: Persons (male and female) under and over 25 years, on the Live Register, Mayo (CSO
2017) ..................................................................................................................................................... 48
Table 34: Family units with children by size of family ......................................................................... 48
Table 35: Private households by type .................................................................................................. 49
Table 36: Child related payments, 2016 .............................................................................................. 49
7
Table 37: Social Welfare Payments by type of payment, Mayo and State, 2016 ................................ 50
Table 38: Private households by type of accommodation ................................................................... 50
Table 39: Irish Travellers in Private Households 2011 and 2016 by Type of Household, Mayo and
State ...................................................................................................................................................... 51
Table 40: Pobal HP Deprivation 2016, Mayo and Municipal District ................................................... 51
8
List of Charts
Chart 1: Percentage of children who have been vaccinated at 2 years of age (2014) ........................ 38
Chart 2: Average percentage of primary school children per county who are absent from school for
20 days or more in the school year 2015/16 ........................................................................................ 42
Chart 3: Leaving Certificate retention rates 2010 cohort .................................................................... 43
Chart 4: Average percentage of post-primary school children per school who are absent from school
for 20 days or more in the school year 2015/16 .................................................................................. 43
Chart 5: Level of importance, having your voice heard ....................................................................... 52
Chart 6: Children and Young People are involved in the planning of activities ................................... 53
Chart 7: Level of importance, Being Aware of Your Rights .................................................................. 53
Chart 8: What is very important to young people ................................................................................ 54
Chart 9: Importance of ‘a sense of accomplishment’ .......................................................................... 72
Chart 10: Importance of ‘a sense of belonging’ ................................................................................... 73
Chart 11: Feeling Safe and Secure ....................................................................................................... 78
Chart 12: Safe and protected from bullying and discrimination ......................................................... 78
Chart 13: Children and young people live in a secure, stable and caring environment ...................... 79
Chart 14: Children and young people are safe from abuse, neglect and exploitation ........................ 79
Chart 15: Children and young people are protected from bullying ..................................................... 80
Chart 16: Children and young people are exposed to unsuitable material on the internet/social
media .................................................................................................................................................... 80
Chart 17: Level of importance ‘financial stability’ ............................................................................... 84
Chart 18: Level of importance ‘living in a youth friendly community’................................................. 84
Chart 19: Most young people move away for work/education ........................................................... 85
Chart 20: There is a lack of supports for young people to progress to employment .......................... 85
Chart 21: Experience of Interagency Collaboration ............................................................................. 90
Chart 22: Service Levels on Hardiker Scale .......................................................................................... 90
Chart 23: Preferred communication tools ........................................................................................... 91
9
List of Pictures
Picture 1: Boards for “My wish for children in Mayo” at International Children’s Day ....................... 22
Picture 2: Youth Focus Group Session ‘Brick Wall’ .............................................................................. 24
Picture 3: Youth Focus Group Session ‘Opportunities Tree’ ................................................................ 24
Picture 4: My wish for children in County Mayo – post-it from GMIT Outdoor Play day .................... 69
10
List of Maps
Map 1: County Mayo with Electoral Divisions and Municipal Districts ............................................... 27
11
List of Appendices
Appendix I: Mayo CYPSC Youth Survey ............................................................................................... 115
Appendix II: Mayo CYPSC Parents’ Survey .......................................................................................... 124
Appendix III: Mayo CYPSC Service Providers Survey ........................................................................... 135
Appendix IV: Mayo CYPSC Youth Focus Group Question Schedule .................................................... 147
Appendix V: Service Providers Focus Group Question Schedule ........................................................ 149
Appendix VI: 8 Key Messages: What young people want adults to know. ........................................ 150
Appendix VII: Membership of Mayo CYPSC Subgroups ...................................................................... 151
Appendix VIII: Service Providers who participated in CYPSC Planning Workshop ............................ 154
Appendix IX: Service Providers (members of Child and Family Support Networks) who participated in
Mayo CYPSC Focus Groups ................................................................................................................. 156
Appendix X: Mayo CYPSC Discussion Document ............................................................................... 157
Appendix XI: Hardiker Model .............................................................................................................. 158
12
List of Acronyms
AIRO All Ireland Research Laboratory
CCS Community Childcare Subvention
COPMI Children of Parents with Mental Illness
CPC Child Protection Conference
CPNS Child Protection Notification System
CPP Child Protection Plan
CSO Central Statistics Office
CYPAG Children and Young People’s Advisory Group
CYPP Children and Young People’s Plan
CYPSC Children and Young People’s Services Committee
ECCE Early Childhood Care and Education
ED Electoral Division
ETB Education Training Board
FIS Family Income Supplement
FRC Family Resource Centre
HP Haase Pratschke
HSE Health Service Executive
IWA Irish Wheelchair Association
LDC Local Development Company
LEA Local Electoral Area
MCC Mayo County Council
MCCC Mayo County Childcare Committee
MD Municipal District
MIA Mayo Intercultural Action
MRCC Mayo Rape Crisis Centre
MSL ETB Mayo Sligo and Leitrim Education Training Board
MSP Mayo Sports Partnership
MTSG Mayo Travellers Support Group
MWSS Mayo Women’s Support Services
NPRS National Perinatal Reporting System
OMCYA Office of the Minister for Children and Youth Affairs
PHN Public Health Nurse
PPFS Prevention, Parenting and Family Support
PPN Public Participation Network
SA Small Area
SAPS Small Area Population Statistics
SONC State of the Nation’s Children
TEC Training and Employment Childcare
13
Foreword
As Chair of the Mayo Children and Young People’s Services Committee (CYPSC) I am delighted to see the publication of our first Children and Young People Plan 2018-2020. The CYPSC is an initiative of the Department of Children and Youth Affairs. It has a role of bringing together all the organisations involved in providing supports to children and young people. This includes the statutory, community and voluntary sectors. The key goal is to agree a strategic plan to improve the outcomes for children and young people. Better Outcomes, Brighter Futures, (The National Policy Framework for Children and Young People 2014-2020) identify these outcomes as:
Active and healthy.
Achieving in all areas of learning and development.
Safe and protected from harm.
Economic security and opportunity.
Connected, respected and contributing. The implementation of the plan will strengthen the support system around the child and young person and improve their outcomes. This strategic and collaborative approach has culminated in identifying the needs and priorities of children, young people and families in our area. I would like to thank all the agencies for their dedication, time and effort to ensure we have a realistic and achievable plan. I look forward to assessing its success through the established working groups and seeing the improved outcomes for children and young people becoming a reality.
14
1 Introduction
The purpose of the Children and Young People’s Services Committees (CYPSC) is to secure better
outcomes for children and young people through more effective integration of existing services and
interventions at local level.
CYPSCs work towards the five national outcomes for children and young people in Ireland. These are
that children and young people:
1. Are active and healthy, with positive physical and mental wellbeing
2. Are achieving full potential in all areas of learning and development
3. Are safe and protected from harm
4. Have economic security and opportunity
5. Are connected, respected and contributing to their world
15
Background to Children and Young People’s Services Committees
1.1.1 Children and Young People’s Services Committees in Ireland.
The Office of the Minister for Children and Youth Affairs (OMCYA), now the Department of Children
and Youth Affairs, established the Children and Young People’s Services Committees (formerly
Children’s Services Committees in four pilot areas) in 2007 with the purpose of improving outcomes
for children and families at local and community level. Since then CYPSCs have increased
incrementally in number and are a key structure identified by Government to plan and co-ordinate
services for children and young people, aged 0 – 24 years, in every county in Ireland.
CYPSCs bring a diverse group of agencies across the statutory, community and voluntary sectors in
local county areas together to engage in joint planning and coordination of services for children and
young people. All major organisations and agencies working locally on behalf of children and young
people are represented. These committees work to improve the lives of children, young people and
families at local and community level through integrated planning and improved service delivery.
Better Outcomes, Brighter Futures: the National Policy Framework for Children and Young People
2014 – 2020 underscores the necessity of interagency working and tasks Children and Young
People’s Services Committees with a key role in this regard.
1.1.2 Children and Young People’s Services Committee in Mayo
Mayo Children’s and Young People’s Services Committee was established in 2015. Initially, its work
focused on engaging relevant stakeholders, establishing a county committee, recruiting a CYPSC
Coordinator and information sharing regarding CYPSC as well as other relevant information among
its membership. Presentations were made to the Committee from relevant groups and agencies.
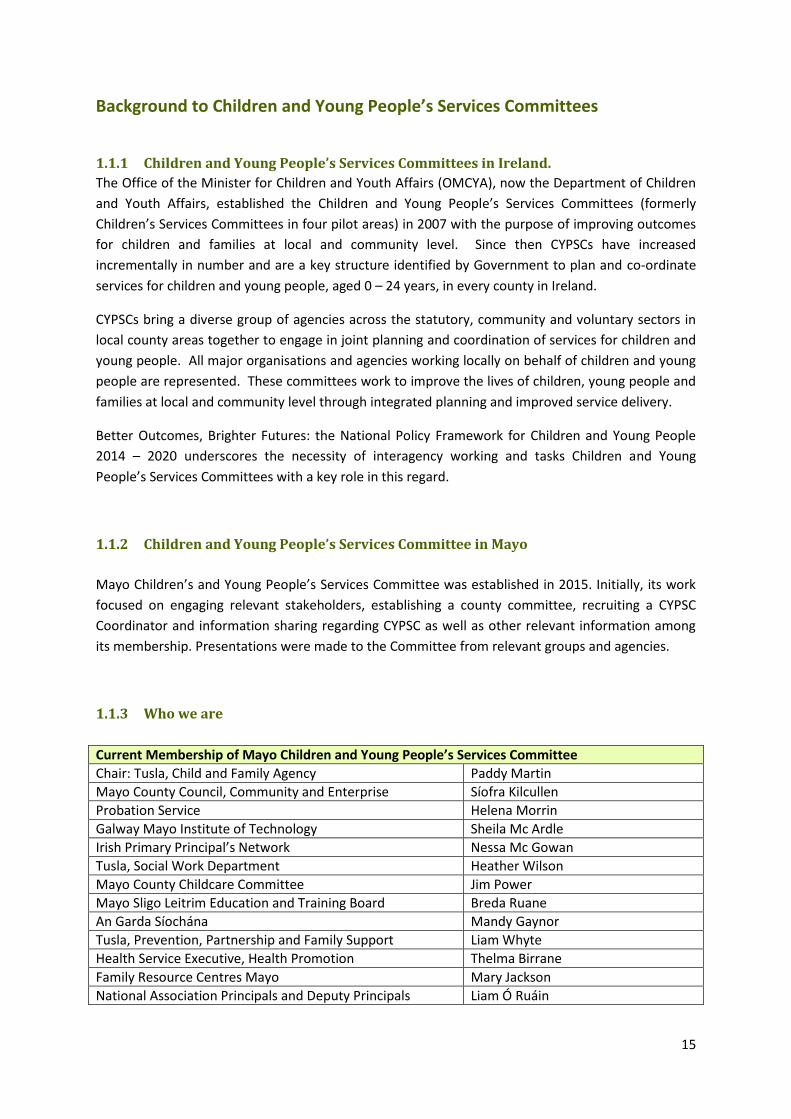
1.1.3 Who we are
Current Membership of Mayo Children and Young People’s Services Committee
Chair: Tusla, Child and Family Agency Paddy Martin
Mayo County Council, Community and Enterprise Síofra Kilcullen
Probation Service Helena Morrin
Galway Mayo Institute of Technology Sheila Mc Ardle
Irish Primary Principal’s Network Nessa Mc Gowan
Tusla, Social Work Department Heather Wilson
Mayo County Childcare Committee Jim Power
Mayo Sligo Leitrim Education and Training Board Breda Ruane
An Garda Síochána Mandy Gaynor
Tusla, Prevention, Partnership and Family Support Liam Whyte
Health Service Executive, Health Promotion Thelma Birrane
Family Resource Centres Mayo Mary Jackson
National Association Principals and Deputy Principals Liam Ó Ruáin
16
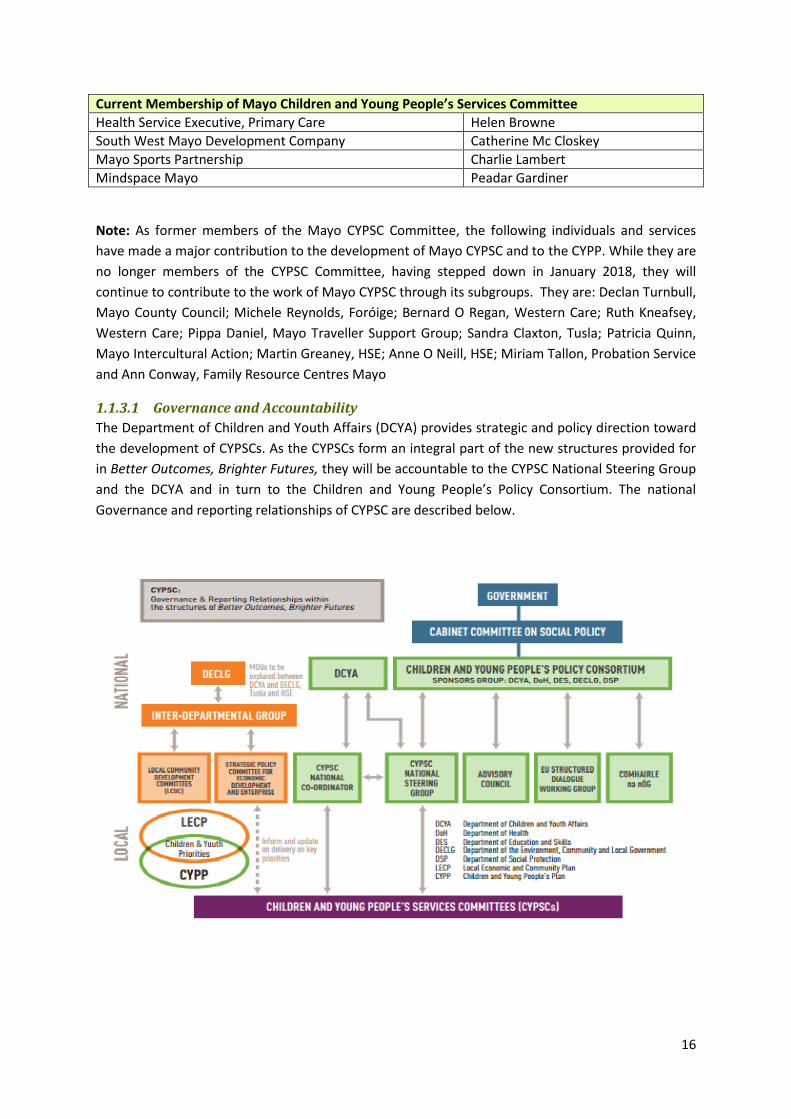
Current Membership of Mayo Children and Young People’s Services Committee
Health Service Executive, Primary Care Helen Browne
South West Mayo Development Company Catherine Mc Closkey
Mayo Sports Partnership Charlie Lambert
Mindspace Mayo Peadar Gardiner
Note: As former members of the Mayo CYPSC Committee, the following individuals and services
have made a major contribution to the development of Mayo CYPSC and to the CYPP. While they are
no longer members of the CYPSC Committee, having stepped down in January 2018, they will
continue to contribute to the work of Mayo CYPSC through its subgroups. They are: Declan Turnbull,
Mayo County Council; Michele Reynolds, Foróige; Bernard O Regan, Western Care; Ruth Kneafsey,
Western Care; Pippa Daniel, Mayo Traveller Support Group; Sandra Claxton, Tusla; Patricia Quinn,
Mayo Intercultural Action; Martin Greaney, HSE; Anne O Neill, HSE; Miriam Tallon, Probation Service
and Ann Conway, Family Resource Centres Mayo
1.1.3.1 Governance and Accountability
The Department of Children and Youth Affairs (DCYA) provides strategic and policy direction toward
the development of CYPSCs. As the CYPSCs form an integral part of the new structures provided for
in Better Outcomes, Brighter Futures, they will be accountable to the CYPSC National Steering Group
and the DCYA and in turn to the Children and Young People’s Policy Consortium. The national
Governance and reporting relationships of CYPSC are described below.
17
Achievements to date A Mayo CYPSC Coordinator was appointed in October 2016. The focus and achievements of the
Committee during 2017 was on the following:
Networking and building alliances
Raising the profile and build awareness of CYPSC locally
Developing the Children and Young People’s Plan
o Research and Information Working Group1 established
o Communications
o Consultation including involving children and young people
Established Early Years Subgroup2
o Coordinated events for International Children’s Day June 2017 as well
consultation with Early Years as part of planning process
Progressed Child, Youth and Family Services on mayo.ie LIVING section
Organised Social Media Workshops for CYPSC members
o Dedicated Facebook pages established for:
o Mayo CYPSC (https://www.facebook.com/MayoCYPSC )
o Mayo Parenting (https://www.facebook.com/mayoparenting/?fref=ts )
o Mayo Youth Network
(https://www.facebook.com/mayoyouthnetwork/?fref=ts)
o Guidelines for ‘dos and don’ts’ of good practice when posting online agreed
Healthy Mayo county status launched in October 2017
o Healthy Lough Lannagh learning story and Info-graphic presented by children
from Curious Minds preschool to Minister Byrne at launch and also to Castlebar
Municipal District council in December 2017
Healthy Ireland Fund
o Mayo CYPSC and Mayo LCDC submitted joint application
o Governance working group established3
Mayo Social Inclusion Awareness Week
o Participation on Working Group and schedule of events organised
o ‘Linking Generations in Mayo – Building a Socially Inclusive County’ seminar to
be delivered in March 20184
’This is Me’ and ‘Me and My Conference’:
o Two booklets have been designed, published and disseminated to support the
participation of children and young people so that their voice is heard in
different situations such as in school, child protection conferences etc.
o ‘Me and My Court’ booklet planned for 2018 to use as an aid to children’s
participation in Family Court.
1 See Appendix VII for list of members of Research and Information Working Group 2 See Appendix VII for list of members Early Years Subgroup
3 See Appendix VII for list of members of Healthy Mayo Governance Working Group
4 Postponed in October 2017 due to storm Ophelia
18
1.1.4 Family Support Subgroup
A Family Support Subgroup5 (FSS) was established in 2015 and the work of CYPSC was channelled
through this group (prior to the appointment of the CYPSC Coordinator) and included delivery on the
following initiatives:
Parental Participation Project:
Provision of universal information and advice to parents in Mayo
Increase participation of ethnic minority families in planning and delivery of child and family
services
Developed Info-graphic “10 free things to do with your child in Mayo”
Research project: Cultural diversity and parenting styles
Youth Participation Project:
Children and Young Peoples Advocacy Group established. A partnership between Tusla and
Foróige, its work centres on promoting the voice of young people in Tusla services.
o Research findings presented at Tusla Youth Participation Conference 2017
o Conference held in January 2018 “How young people are helped and heard”
o The research findings from the youth-led initiatives have been incorporated into the
Children and Young People’s Plan.
Family Support Website:
Child, Youth and Family directory of services developed and will be available on mayo.ie
LIVING section in 2018
Parenting the anxious child:
Working group established
Developing an information leaflet for parents
Online Virtual Child and Family Support Network for Erris/Ballina:
Virtual network established
First online meeting held in November 2017
5 See Appendix VII for membership of Family Support Subgroup
19
How the Children and Young People’s Plan (CYPP) was developed
This section details the work undertaken in developing the Mayo CYPP and includes information on
the following:
1. Socio-demographic profile of County Mayo
2. Audit of Services in County Mayo
3. Local Needs Analysis (including extensive consultation process)
4. Identification of priorities, objectives and actions for Mayo CYPSC
1.1.5 The socio-demographic profile
An initial socio-demographic profile was prepared in February 2017, drawing from the Central
Statistics Office (CSO) Census of Population Data 2011 and supplemented with additional data
sourced from the online SONC (State of our Nations Children) interactive report; and the Institute of
Public Health (healthwell.info). Online open source mapping tools provided by Pobal and the All
Island Research Observatory (AIRO) were used extensively to interrogate and extrapolate the data in
relation to the Small Area Population Statistics (SAPS). The Pobal HP Deprivation Index (Haase and
Pratschke, 2012) was used to identify the most disadvantaged areas at Electoral Division (ED) and
Small Area (SA) levels (same as Small Area Population Statistics). This was circulated to the
Research and Information Working Group to identify data gaps and potential local sources that
would enhance the profile.
Following the publication of the State of our Nation’s Children (Ireland 2016), a table was prepared
and circulated to all CYPSC members highlighting the vital indicators and other relevant statistics.
The table presented the data for Mayo and where possible compared with the State figures.
The socio-demographic profile was updated with the Central Statistics Office (CSO) Census of
Population Data 2016 to the end of September 2017 and with The 2016 Pobal HP Deprivation Index
focusing on data in relation to Children and Young People under the following headings:
Population
Migration, Ethnicity, Religion and Foreign Languages
Health
Education and Learning
Economic Indicators
Families and Households
Deprivation
A comparative analysis with the State level data is presented in the data tables where possible and
relevant. Sources include CSO 2016, CSO 2011, State of the Nation’s Children (SONC) 2016, Institute
of Public Health (IPH) – Community Profiles, HSE, Department of Employment Affairs and Social
20
Protection, and the 2015 Report on the effectiveness of the Garda Diversion Programme6. National
level data was provided by the Probation Services, Tusla Education Welfare Officers, and HSE West
Suicide Prevention Office. Local data sources include organisations such as Mindspace Mayo, Mayo
Women’s Support Services and the Western Region Alcohol and Drugs Task Force (WRADTF).
1.1.6 The audit of Services
A table was prepared documenting the services provided by statutory agencies and by community
and voluntary organisations covering
Health and Social Services
Education
Policing and Youth Justice
Local Authority Services
Social Welfare
Sports, Recreation, Arts and Culture
Youth
Other Services
Membership of CYPSC and the Children and Family Support Networks were referenced to ensure
that all services were included in the initial table. Each member was then emailed individually to
verify the data captured, and followed up by phone calls from the CYPSC Co-ordinator. The data are
presented in the Audit of Services by outcome.
1.1.7 The local needs analysis
This aspect of the planning was supported by the Research and Information Working Group and
mixed approaches to capturing a range of voices and opinions were agreed to ensure a
comprehensive and robust consultation process fed into the planning process. This included
consultations with Children, Young People, Parents/Guardians and Service Providers (See Table 1 for
summary of all consultations).
Table 1: Summary of consultations for Mayo Children and Young People’s Plan
Method Total
Surveys
Youth 13-24 572
Parents 248
Service Providers 97
Focus Groups
Young People x 7 groups 60
Pre-school children x 7 groups 42
Primary school children x 2 schools 20
6 http://www.iprt.ie/files/Annual_Report_of_the_Committee_Appointed_to_Monitor_the_Effectiveness_of_the_Diversion_Programme_2015.pdf
21
Method Total
East Mayo Child and Family Support Network 24
South Mayo Child and Family Support Network 26
Wish Board
International Children’s Day 96
Survey questions used by other CYPSCs helped inform the final design used by Mayo CYPSC. The
Youth Survey questions were reviewed by members of Comhairle na nÓg (local youth council) that
were representative of different age profiles, gender and geographic spread across the county.
Their input was invaluable and the questions amended based on their recommendations. All of the
online surveys were tested and changes made prior to circulation online (through Social Media and
email) and in hard copy.
The surveys were promoted online using the Mayo CYPSC Facebook page
(https://www.facebook.com/MayoCYPSC/), circulated to the CYPSC members as well as the Child
and Family Support Network members. In addition, the CYPSC Co-ordinator attended an interview
with Mid-West Radio (local radio station) to promote the work of CYPSC and encourage participation
in the online surveys.
1.1.7.1 Children
An Early Years Sub Group was established by CYPSC to support the research process with
membership from Mayo County Childcare Committee, Private Childcare Providers and GMIT Mayo
Campus.
Pre-school: Mayo County Childcare Committee distributed a short survey to Childcare Providers to
capture the voices of children in pre-school settings. The providers used the questions as a guide to
capture the responses from the children with 7 providers responding.
International Children’s Day: International Children’s Day was held on 1st June 2017 and an
outdoor event was organised by the Early Years Sub-Group and led by GMIT Mayo Campus. Over
300 children attended the event. A board with sticky notes was used to allow parents and their
children to feed into the planning process.
Primary Schools: Focus Groups were held with the children in St Angela’s National School and Scoil
Raiftearaí, Castlebar with ten children participating in each group.

22
Picture 1: Boards for “My wish for children in Mayo” at International Children’s Day
Source: Mayo CYPSC, GMIT Outdoor Play Day
1.1.7.2 Young People
A number of different approaches were used to capture the voice and opinions of children and
young people from pre-school to 24 years. This included Focus Groups and an online survey. Focus
Groups were held with a range of young people to capture the different needs and range of voices.
The survey design was based on surveys provided to the Co-ordinator from other CYPSCs that had
already been through the process. A draft was compiled and circulated to the Research and
Information Working Group for testing and feedback.
It was subsequently tested with a group of young people from Comhairle na nÓg (balanced in terms
of gender, age and location). Additional changes were made to the survey questions based on
feedback from the young people. The survey was then promoted online using the Mayo CYPSC
Facebook page and by circulating to Schools, Youth Clubs, Youth Services and Sports organisations to
encourage participation. A total of 572 young people responded to the survey. Focus Groups were
held with different groups of young people to ensure that their voices fed into the planning process.
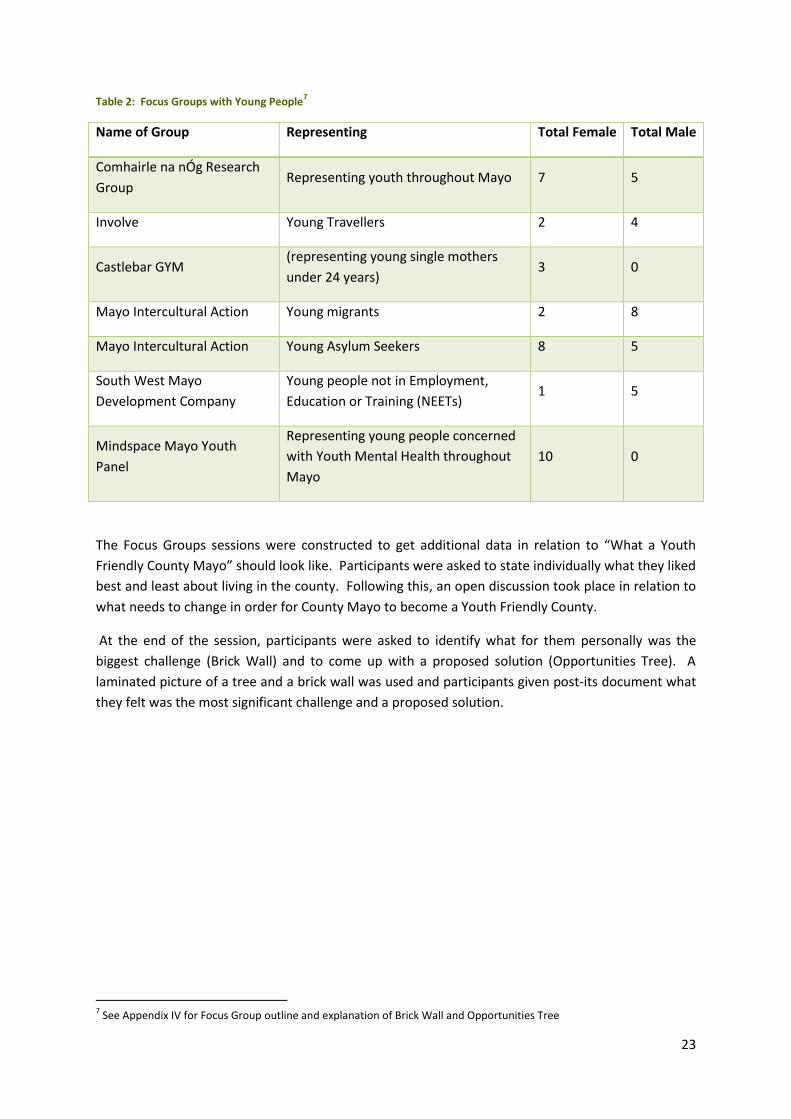
23
Table 2: Focus Groups with Young People7
Name of Group Representing Total Female Total Male
Comhairle na nÓg Research
Group Representing youth throughout Mayo 7 5
Involve Young Travellers 2 4
Castlebar GYM (representing young single mothers
under 24 years) 3 0
Mayo Intercultural Action Young migrants 2 8
Mayo Intercultural Action Young Asylum Seekers 8 5
South West Mayo
Development Company
Young people not in Employment,
Education or Training (NEETs) 1 5
Mindspace Mayo Youth
Panel
Representing young people concerned
with Youth Mental Health throughout
Mayo
10 0
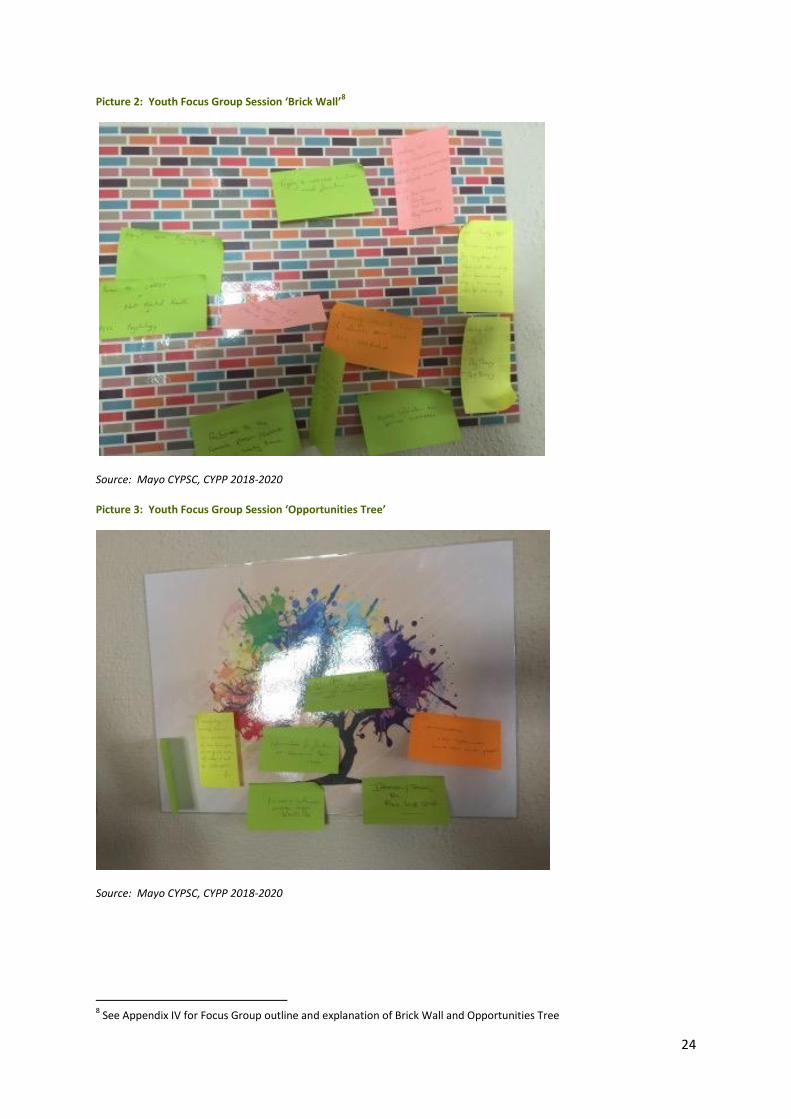
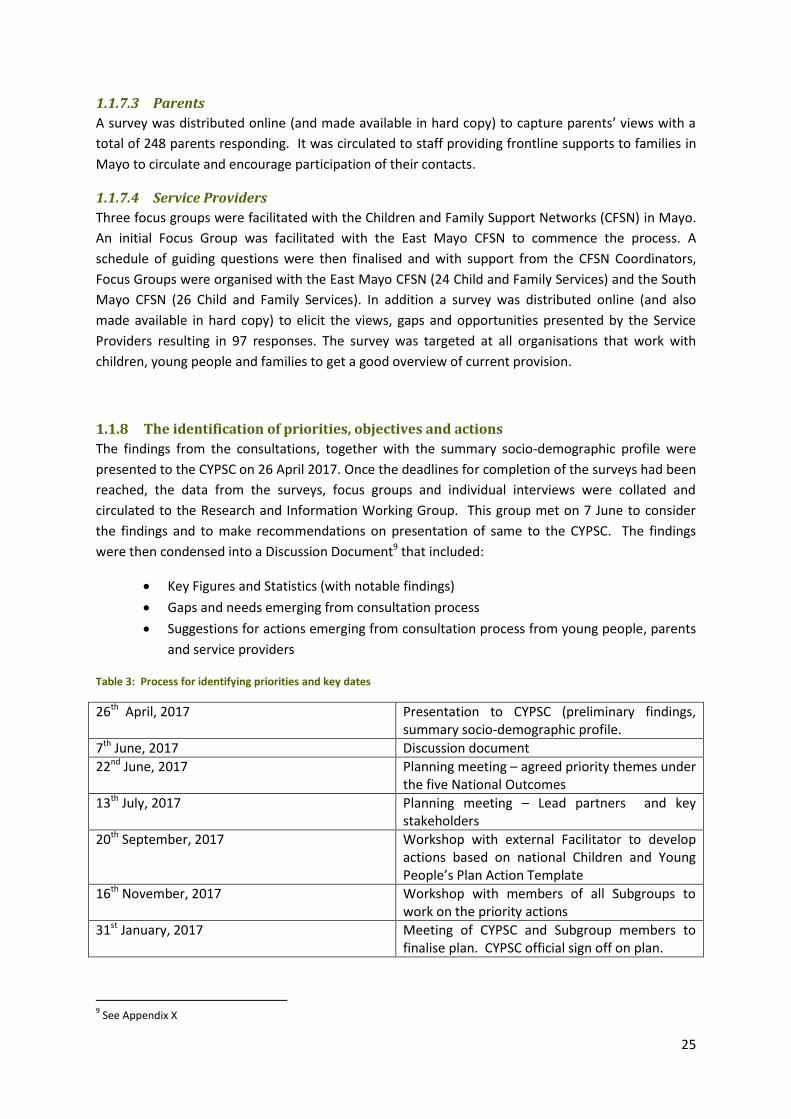
The Focus Groups sessions were constructed to get additional data in relation to “What a Youth
Friendly County Mayo” should look like. Participants were asked to state individually what they liked
best and least about living in the county. Following this, an open discussion took place in relation to
what needs to change in order for County Mayo to become a Youth Friendly County.
At the end of the session, participants were asked to identify what for them personally was the
biggest challenge (Brick Wall) and to come up with a proposed solution (Opportunities Tree). A
laminated picture of a tree and a brick wall was used and participants given post-its document what
they felt was the most significant challenge and a proposed solution.
7 See Appendix IV for Focus Group outline and explanation of Brick Wall and Opportunities Tree
24
Picture 2: Youth Focus Group Session ‘Brick Wall’8
Source: Mayo CYPSC, CYPP 2018-2020
Picture 3: Youth Focus Group Session ‘Opportunities Tree’
Source: Mayo CYPSC, CYPP 2018-2020
8 See Appendix IV for Focus Group outline and explanation of Brick Wall and Opportunities Tree
25
1.1.7.3 Parents
A survey was distributed online (and made available in hard copy) to capture parents’ views with a
total of 248 parents responding. It was circulated to staff providing frontline supports to families in
Mayo to circulate and encourage participation of their contacts.
1.1.7.4 Service Providers
Three focus groups were facilitated with the Children and Family Support Networks (CFSN) in Mayo.
An initial Focus Group was facilitated with the East Mayo CFSN to commence the process. A
schedule of guiding questions were then finalised and with support from the CFSN Coordinators,
Focus Groups were organised with the East Mayo CFSN (24 Child and Family Services) and the South
Mayo CFSN (26 Child and Family Services). In addition a survey was distributed online (and also
made available in hard copy) to elicit the views, gaps and opportunities presented by the Service
Providers resulting in 97 responses. The survey was targeted at all organisations that work with
children, young people and families to get a good overview of current provision.
1.1.8 The identification of priorities, objectives and actions
The findings from the consultations, together with the summary socio-demographic profile were
presented to the CYPSC on 26 April 2017. Once the deadlines for completion of the surveys had been
reached, the data from the surveys, focus groups and individual interviews were collated and
circulated to the Research and Information Working Group. This group met on 7 June to consider
the findings and to make recommendations on presentation of same to the CYPSC. The findings
were then condensed into a Discussion Document9 that included:
Key Figures and Statistics (with notable findings)
Gaps and needs emerging from consultation process
Suggestions for actions emerging from consultation process from young people, parents
and service providers
Table 3: Process for identifying priorities and key dates
26th April, 2017 Presentation to CYPSC (preliminary findings, summary socio-demographic profile.
7th June, 2017 Discussion document
22nd June, 2017 Planning meeting – agreed priority themes under the five National Outcomes
13th July, 2017 Planning meeting – Lead partners and key stakeholders
20th September, 2017 Workshop with external Facilitator to develop actions based on national Children and Young People’s Plan Action Template
16th November, 2017 Workshop with members of all Subgroups to work on the priority actions
31st January, 2017 Meeting of CYPSC and Subgroup members to finalise plan. CYPSC official sign off on plan.
9 See Appendix X
26
This document was circulated to the CYPSC members prior to a planning meeting on 22 June, 2017.
Feedback from the members was taken into consideration and additions made where recommended
to the socio-demographic data. The members then spent some time discussing gaps/needs
identified and agreeing priority themes under each of the five national outcomes. The next planning
workshop was on 13 July and members identified potential Lead Partners and other stakeholders to
be involved in the delivery of actions. A full-days planning was subsequently organised for 20
September with an external facilitator to develop the actions based on the CYPP template and agree
the subgroups for Mayo CYPSC. The work undertaken during the planning workshop was reviewed
by the RIWG, the draft plan was updated and circulated to the CYPSC and subgroup members prior
to the next workshop on 16th November. At this planning workshop, the attendees (included CYPSC
and subgroup members) worked within their assigned Subgroup on the CYPP Action Templates to
finalise same. Following this, the plan was updated and the revised plan was circulated to all CYPSC
and Subgroup members. A meeting was held on 31st January 2018 with all CYPSC and Subgroup
members to finalise the plan. The main CYPSC committee officially signed off on the plan and
agreed that it was ready for submission for approval.
2 Socio Demographic Profile of Mayo
This section presents an overview of the relevant socio-demographic information for County Mayo.
A summary of the Vital Statistics is presented at the beginning of the chapter and the more detailed
analysis of the socio-demographic data is then presented and includes the following sub-sections:
Population
Migration, Ethnicity, Religion and Foreign Languages
Health
Education and Learning
Economic Indicators
Families and Households
Deprivation
A comparative analysis with the State level data is presented in the data tables where possible and
relevant.
Sources include CSO 2016, CSO 2011, State of the Nation’s Children (SONC) 2016, Institute of Public
Health (IPH) – Community Profiles, HSE, Department of Employment Affairs and Social Protection.
Local data sources include Tusla PPFS, Mindspace Mayo, and Mayo Women’s Support Services.
County Mayo
County Mayo (Contae Mhaigh Eo, meaning "Plain of the yew trees") is located in the west of Ireland
in the province of Connaught and is the third largest county in terms of physical size in the state. The
27
size of the county is 2,159 square miles (5527 sq Km) which represents approximately 10% of the
land mass of the state.
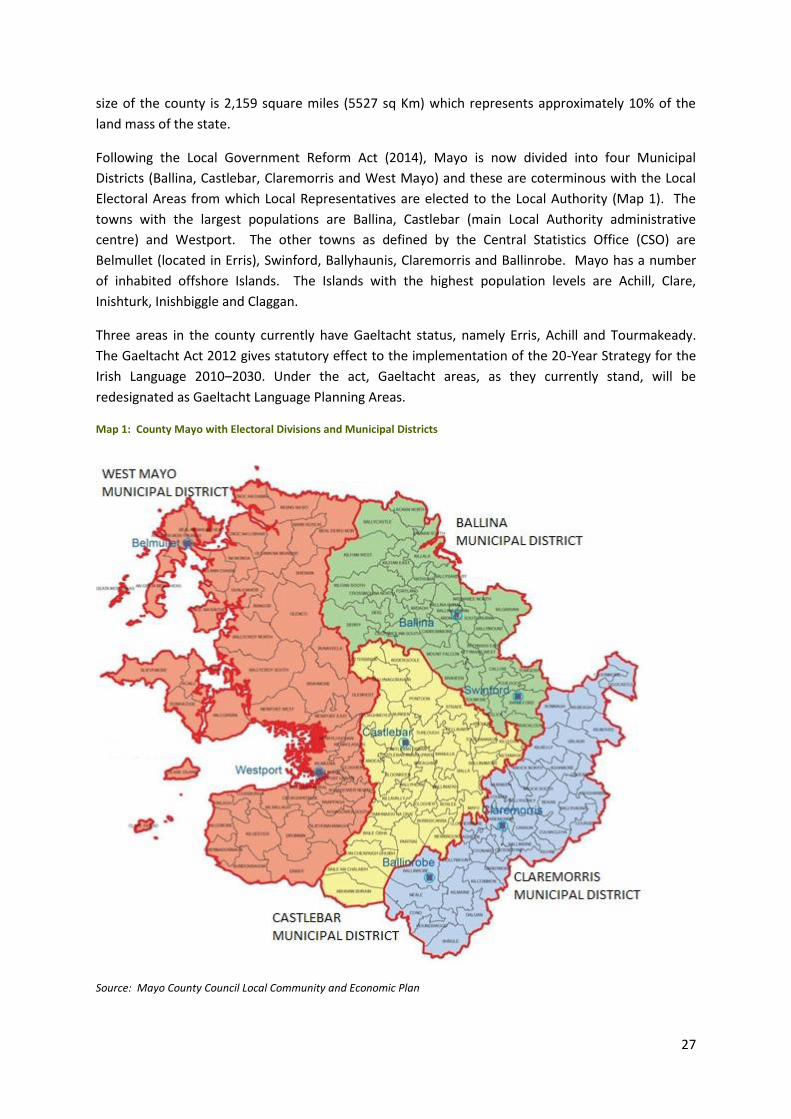
Following the Local Government Reform Act (2014), Mayo is now divided into four Municipal
Districts (Ballina, Castlebar, Claremorris and West Mayo) and these are coterminous with the Local
Electoral Areas from which Local Representatives are elected to the Local Authority (Map 1). The
towns with the largest populations are Ballina, Castlebar (main Local Authority administrative
centre) and Westport. The other towns as defined by the Central Statistics Office (CSO) are
Belmullet (located in Erris), Swinford, Ballyhaunis, Claremorris and Ballinrobe. Mayo has a number
of inhabited offshore Islands. The Islands with the highest population levels are Achill, Clare,
Inishturk, Inishbiggle and Claggan.
Three areas in the county currently have Gaeltacht status, namely Erris, Achill and Tourmakeady.
The Gaeltacht Act 2012 gives statutory effect to the implementation of the 20-Year Strategy for the
Irish Language 2010–2030. Under the act, Gaeltacht areas, as they currently stand, will be
redesignated as Gaeltacht Language Planning Areas.
Map 1: County Mayo with Electoral Divisions and Municipal Districts
Source: Mayo County Council Local Community and Economic Plan
28
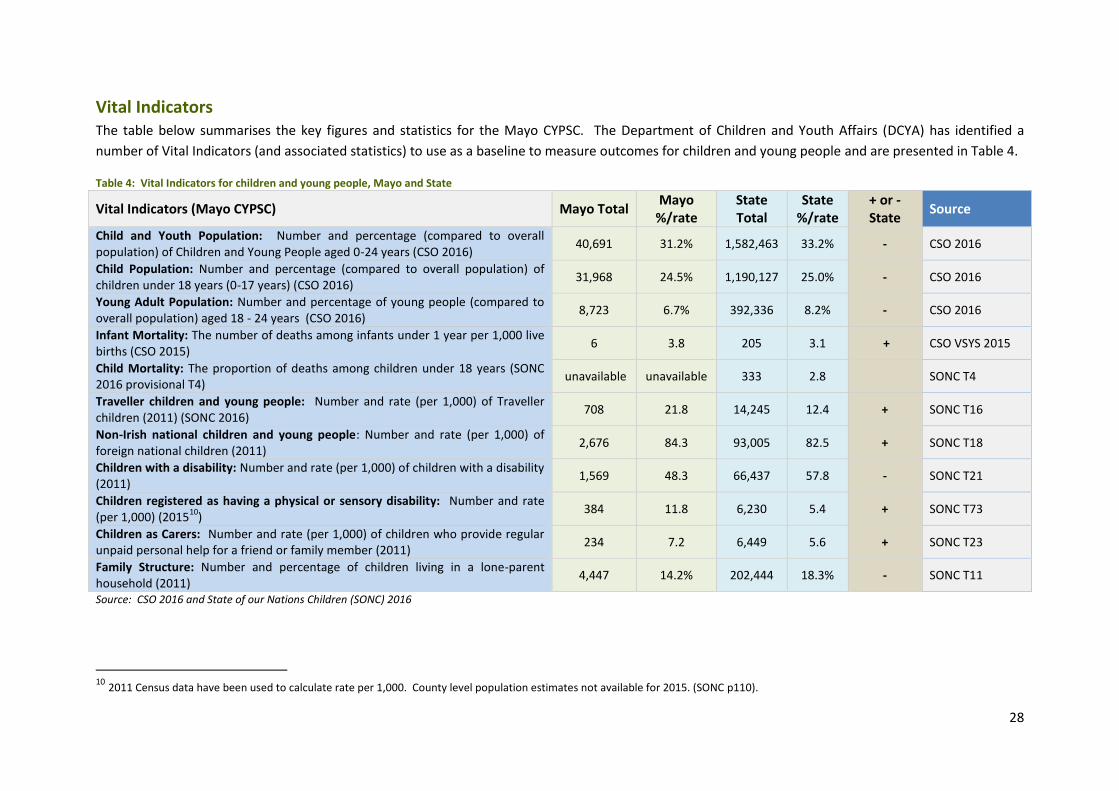
Vital Indicators The table below summarises the key figures and statistics for the Mayo CYPSC. The Department of Children and Youth Affairs (DCYA) has identified a
number of Vital Indicators (and associated statistics) to use as a baseline to measure outcomes for children and young people and are presented in Table 4.
Table 4: Vital Indicators for children and young people, Mayo and State
Vital Indicators (Mayo CYPSC) Mayo Total Mayo
%/rate State Total
State %/rate
+ or - State
Source
Child and Youth Population: Number and percentage (compared to overall population) of Children and Young People aged 0-24 years (CSO 2016)
40,691 31.2% 1,582,463 33.2% - CSO 2016
Child Population: Number and percentage (compared to overall population) of children under 18 years (0-17 years) (CSO 2016)
31,968 24.5% 1,190,127 25.0% - CSO 2016
Young Adult Population: Number and percentage of young people (compared to overall population) aged 18 - 24 years (CSO 2016)
8,723 6.7% 392,336 8.2% - CSO 2016
Infant Mortality: The number of deaths among infants under 1 year per 1,000 live births (CSO 2015)
6 3.8 205 3.1 + CSO VSYS 2015
Child Mortality: The proportion of deaths among children under 18 years (SONC 2016 provisional T4)
unavailable unavailable 333 2.8 SONC T4
Traveller children and young people: Number and rate (per 1,000) of Traveller children (2011) (SONC 2016)
708 21.8 14,245 12.4 + SONC T16
Non-Irish national children and young people: Number and rate (per 1,000) of foreign national children (2011)
2,676 84.3 93,005 82.5 + SONC T18
Children with a disability: Number and rate (per 1,000) of children with a disability (2011)
1,569 48.3 66,437 57.8 - SONC T21
Children registered as having a physical or sensory disability: Number and rate (per 1,000) (2015
10)
384 11.8 6,230 5.4 + SONC T73
Children as Carers: Number and rate (per 1,000) of children who provide regular unpaid personal help for a friend or family member (2011)
234 7.2 6,449 5.6 + SONC T23
Family Structure: Number and percentage of children living in a lone-parent household (2011)
4,447 14.2% 202,444 18.3% - SONC T11
Source: CSO 2016 and State of our Nations Children (SONC) 2016
10 2011 Census data have been used to calculate rate per 1,000. County level population estimates not available for 2015. (SONC p110).
29
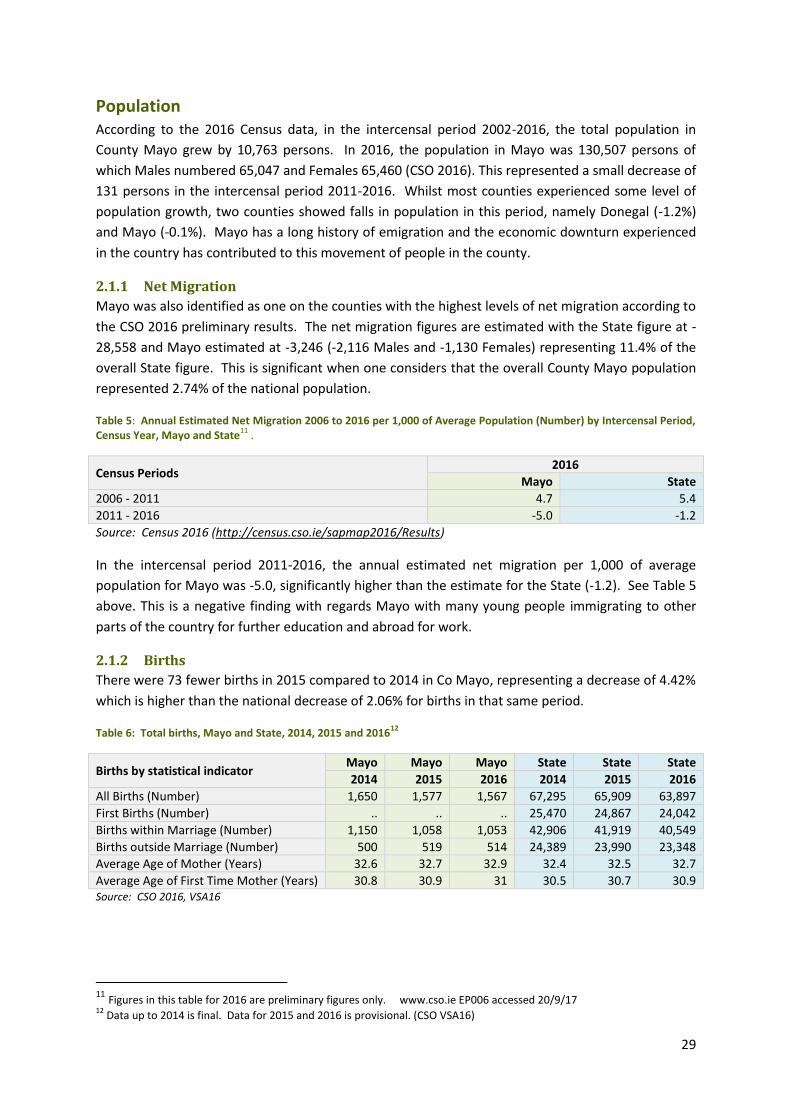
Population According to the 2016 Census data, in the intercensal period 2002-2016, the total population in
County Mayo grew by 10,763 persons. In 2016, the population in Mayo was 130,507 persons of
which Males numbered 65,047 and Females 65,460 (CSO 2016). This represented a small decrease of
131 persons in the intercensal period 2011-2016. Whilst most counties experienced some level of
population growth, two counties showed falls in population in this period, namely Donegal (-1.2%)
and Mayo (-0.1%). Mayo has a long history of emigration and the economic downturn experienced
in the country has contributed to this movement of people in the county.
2.1.1 Net Migration
Mayo was also identified as one on the counties with the highest levels of net migration according to
the CSO 2016 preliminary results. The net migration figures are estimated with the State figure at -
28,558 and Mayo estimated at -3,246 (-2,116 Males and -1,130 Females) representing 11.4% of the
overall State figure. This is significant when one considers that the overall County Mayo population
represented 2.74% of the national population.
Table 5: Annual Estimated Net Migration 2006 to 2016 per 1,000 of Average Population (Number) by Intercensal Period, Census Year, Mayo and State
11 .
Census Periods 2016
Mayo State
2006 - 2011 4.7 5.4
2011 - 2016 -5.0 -1.2
Source: Census 2016 (http://census.cso.ie/sapmap2016/Results)
In the intercensal period 2011-2016, the annual estimated net migration per 1,000 of average
population for Mayo was -5.0, significantly higher than the estimate for the State (-1.2). See Table 5
above. This is a negative finding with regards Mayo with many young people immigrating to other
parts of the country for further education and abroad for work.
2.1.2 Births
There were 73 fewer births in 2015 compared to 2014 in Co Mayo, representing a decrease of 4.42%
which is higher than the national decrease of 2.06% for births in that same period.
Table 6: Total births, Mayo and State, 2014, 2015 and 201612
Births by statistical indicator Mayo Mayo Mayo State State State
2014 2015 2016 2014 2015 2016
All Births (Number) 1,650 1,577 1,567 67,295 65,909 63,897
First Births (Number) .. .. .. 25,470 24,867 24,042
Births within Marriage (Number) 1,150 1,058 1,053 42,906 41,919 40,549
Births outside Marriage (Number) 500 519 514 24,389 23,990 23,348
Average Age of Mother (Years) 32.6 32.7 32.9 32.4 32.5 32.7
Average Age of First Time Mother (Years) 30.8 30.9 31 30.5 30.7 30.9 Source: CSO 2016, VSA16
11 Figures in this table for 2016 are preliminary figures only. www.cso.ie EP006 accessed 20/9/17 12
Data up to 2014 is final. Data for 2015 and 2016 is provisional. (CSO VSA16)
30
The average age of mothers in 2015 was comparable between Mayo and the State (32.7 years and
32.5 years) and the average age of First Time Mothers was also comparable (31 years and 30.9
years) respectively. See Table 6 above.
2.1.3 Population aged 0-24 years
There was a reduction of 1,660 persons in the population aged 0-24 years in the intercensal period
2011-2016 (42,351 in 2011 compared to 40,691 in 2016). According to the CSO, the three factors
determine population change (births, deaths and net migration) and that from an Irish perspective
net migration is by far the most influential, volatile and uncertain.
Table 7: Population aged 0 to 24, by single year of age, Mayo and State, 2016
Age Mayo State
Mayo + or - State Male Female Total
% of Total
Population
Male Female Total
% of Total
Population
0 855 754 1,609 1.20% 31,876 30,381 62,257 1.30% -
1 823 776 1,599 1.20% 32,824 31,205 64,020 1.30% -
2 861 810 1,671 1.30% 34,031 32,287 66,310 1.40% -
3 918 847 1,765 1.40% 34,785 33,291 68,070 1.40% 0
4 896 853 1,749 1.30% 36,215 34,620 70,830 1.50% -
5 923 893 1,816 1.40% 36,831 35,573 72,400 1.50% -
6 960 893 1,853 1.40% 37,033 35,484 72,510 1.50% -
7 918 892 1,810 1.40% 36,853 35,313 72,160 1.50% -
8 968 933 1,901 1.50% 36,444 35,080 71,520 1.50% 0
9 887 879 1,766 1.40% 34,309 32,641 66,950 1.40% 0
10 934 897 1,831 1.40% 33,167 31,626 64,700 1.40% 0
11 941 853 1,794 1.40% 33,016 30,998 64,000 1.30% +
12 896 900 1,796 1.40% 32,896 31,429 64,300 1.40% 0
13 928 894 1,822 1.40% 32,317 31,214 63,500 1.30% +
14 871 901 1,772 1.40% 31,982 30,831 62,800 1.30% +
15 885 923 1,808 1.40% 31,483 30,160 61,600 1.30% +
16 922 937 1,859 1.40% 31,183 29,806 60,900 1.30% +
17 899 848 1,747 1.30% 31,540 29,778 61,300 1.30% 0
18 861 776 1,637 1.30% 31,383 29,911 61,200 1.30% 0
19 675 619 1,294 1.00% 29,319 28,253 57,500 1.20% -
20-24 2,991 2,801 5,792 4.40% 137,584 136,052 273,636 5.70% -
Total aged 0-24 years
20,812 19,879 40,691 31.20% 807,071 775,933 1,582,463 33.20%
Total Population
65,047 65,460 130,507 2,354,428 2,407,437 4,761,865
Census 2016 (http://census.cso.ie/sapmap2016/Results)
The total population aged 0-24 years in Mayo (CSO 2016) was 40,691 (20,812 males and 19,879
females) as presented in Table 7. This age cohort represented 31.2% of the overall population in
31
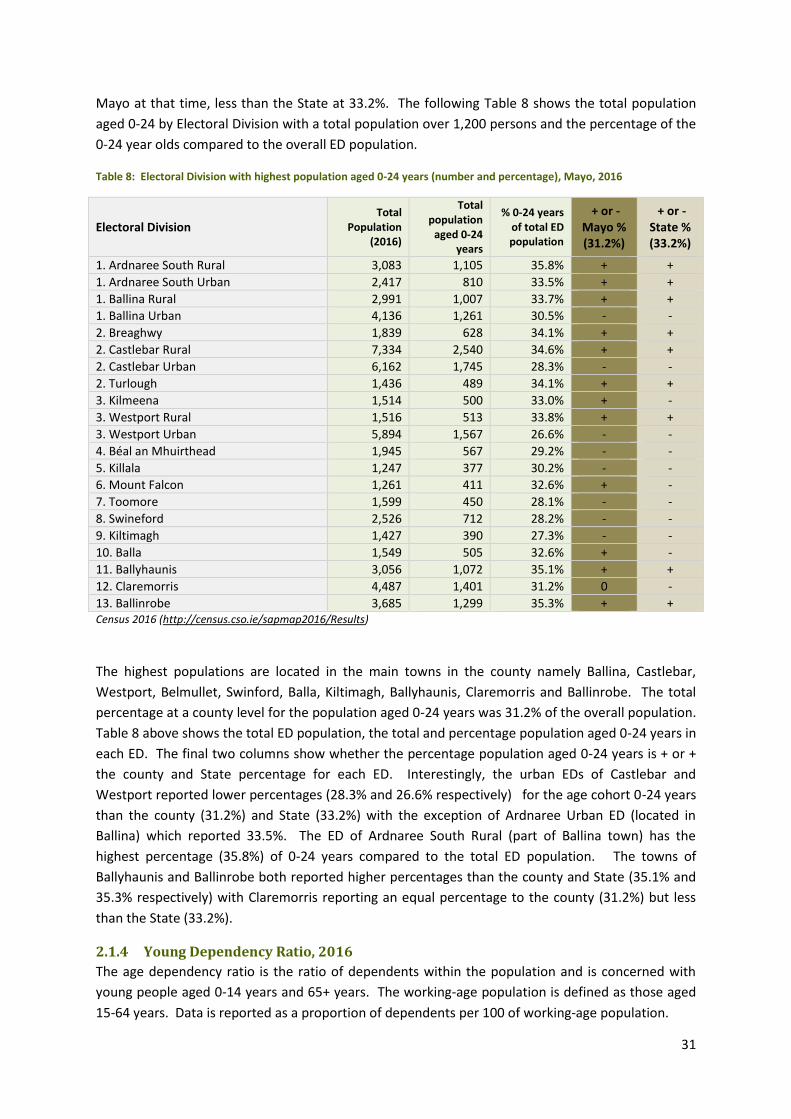
Mayo at that time, less than the State at 33.2%. The following Table 8 shows the total population
aged 0-24 by Electoral Division with a total population over 1,200 persons and the percentage of the
0-24 year olds compared to the overall ED population.
Table 8: Electoral Division with highest population aged 0-24 years (number and percentage), Mayo, 2016
Electoral Division Total
Population (2016)
Total population
aged 0-24 years
% 0-24 years of total ED population
+ or - Mayo % (31.2%)
+ or - State % (33.2%)
1. Ardnaree South Rural 3,083 1,105 35.8% + +
1. Ardnaree South Urban 2,417 810 33.5% + +
1. Ballina Rural 2,991 1,007 33.7% + +
1. Ballina Urban 4,136 1,261 30.5% - -
2. Breaghwy 1,839 628 34.1% + +
2. Castlebar Rural 7,334 2,540 34.6% + +
2. Castlebar Urban 6,162 1,745 28.3% - -
2. Turlough 1,436 489 34.1% + +
3. Kilmeena 1,514 500 33.0% + -
3. Westport Rural 1,516 513 33.8% + +
3. Westport Urban 5,894 1,567 26.6% - -
4. Béal an Mhuirthead 1,945 567 29.2% - -
5. Killala 1,247 377 30.2% - -
6. Mount Falcon 1,261 411 32.6% + -
7. Toomore 1,599 450 28.1% - -
8. Swineford 2,526 712 28.2% - -
9. Kiltimagh 1,427 390 27.3% - -
10. Balla 1,549 505 32.6% + -
11. Ballyhaunis 3,056 1,072 35.1% + +
12. Claremorris 4,487 1,401 31.2% 0 -
13. Ballinrobe 3,685 1,299 35.3% + + Census 2016 (http://census.cso.ie/sapmap2016/Results)
The highest populations are located in the main towns in the county namely Ballina, Castlebar,
Westport, Belmullet, Swinford, Balla, Kiltimagh, Ballyhaunis, Claremorris and Ballinrobe. The total
percentage at a county level for the population aged 0-24 years was 31.2% of the overall population.
Table 8 above shows the total ED population, the total and percentage population aged 0-24 years in
each ED. The final two columns show whether the percentage population aged 0-24 years is + or +
the county and State percentage for each ED. Interestingly, the urban EDs of Castlebar and
Westport reported lower percentages (28.3% and 26.6% respectively) for the age cohort 0-24 years
than the county (31.2%) and State (33.2%) with the exception of Ardnaree Urban ED (located in
Ballina) which reported 33.5%. The ED of Ardnaree South Rural (part of Ballina town) has the
highest percentage (35.8%) of 0-24 years compared to the total ED population. The towns of
Ballyhaunis and Ballinrobe both reported higher percentages than the county and State (35.1% and
35.3% respectively) with Claremorris reporting an equal percentage to the county (31.2%) but less
than the State (33.2%).
2.1.4 Young Dependency Ratio, 2016
The age dependency ratio is the ratio of dependents within the population and is concerned with
young people aged 0-14 years and 65+ years. The working-age population is defined as those aged
15-64 years. Data is reported as a proportion of dependents per 100 of working-age population.
32
Table 9: Persons aged 0-14 (Ratio), both sexes, Mayo and State, 2011 and 2016
Area 2011 2016
Mayo 32.6 32.8
State 31.9 32.3 Source: CSO 2016 (E3013)
There was a slight increase in the youth dependency ratio reported for Mayo in the period 2011
(32.6) and 2016 (32.8) compared to the State (31.9, 32.3) as presented in Table 9 above.
2.1.5 Marital Status
Mayo had a lower percentage (50.1%) of single people than the State (53.6%) and a higher
percentage of married persons (40.1% to 37.6%). A slightly lower percentage were Separated and
Divorced (2.4%, 2.1%) in Mayo compared to the State (2.5%, 2.2%). A higher percentage of people
were Widowed in Mayo (5.2%) compared to the State (4.1%).
2.1.6 Irish Language
As noted earlier in this section, Mayo has three defined Gaeltacht areas (Achill, Erris and
Tourmakeady). There are twelve Naoinraí operating in the county, with four primary level
Gaelscoilenna and two post-primary Gaelscoileanna. The Naoinraí are located in Ballycroy,
Westport, Ballina, Swinford, Ballinrobe, Castlebar, Aughleim, Ceathrú Thaidhg, Gleann na Muaidhe,
Thuar Mhic Eadaigh, Clochar, and Bun a Chorraigh The Primary level Gaelscoileanna are located in
Westport, Castlebar, Claremorris, Ballina and the Post-primary level Gaelscoileanna are based in
Rossport and Tourmakeady.
Table 10: Population aged 3 years and over by ability to speak Irish
Ability to speak Irish % Mayo % State + or - State
Yes 43.9% 38.5% +
No 54.2% 58.4% -
Not stated 2.0% 3.1% -
Total 100.0% 100.0% Source: Census 2016 (http://census.cso.ie/sapmap2016/Results)
According to the CSO 2016 data, a higher percentage of people in Mayo (43.9%) answered yes, in
relation to their ability to speak Irish compared to the State (38.5%). Table 10 captures the level of
frequency of speaking Irish; and Mayo reported higher percentages of people speaking Irish outside
of the Education System with 29.1% speaking Irish daily only within the Education System compared
to the State (31.5%).
Diversity and Ethnicity
2.1.7 Diversity
Overall, according to the CSO data, the number of Irish residents born outside Ireland continued to
increase and stood at 810,406 in 2016, an increase of 43,636 on the 2011 figure. In April 2016,
persons born abroad accounted for 17.3 per cent of the population, up from 17 per cent in 2011.
33
Table 11: Population usually present and resident in the State by county of usual residence, age group and nationality
Nationality
Mayo 2016 State %
of overall
0-24 years
+ or - State 0 - 14 years
15 - 24 years
Total 0-24 years
Mayo % of
overall 0-24
years
Totals 26,403 14,336 40,739
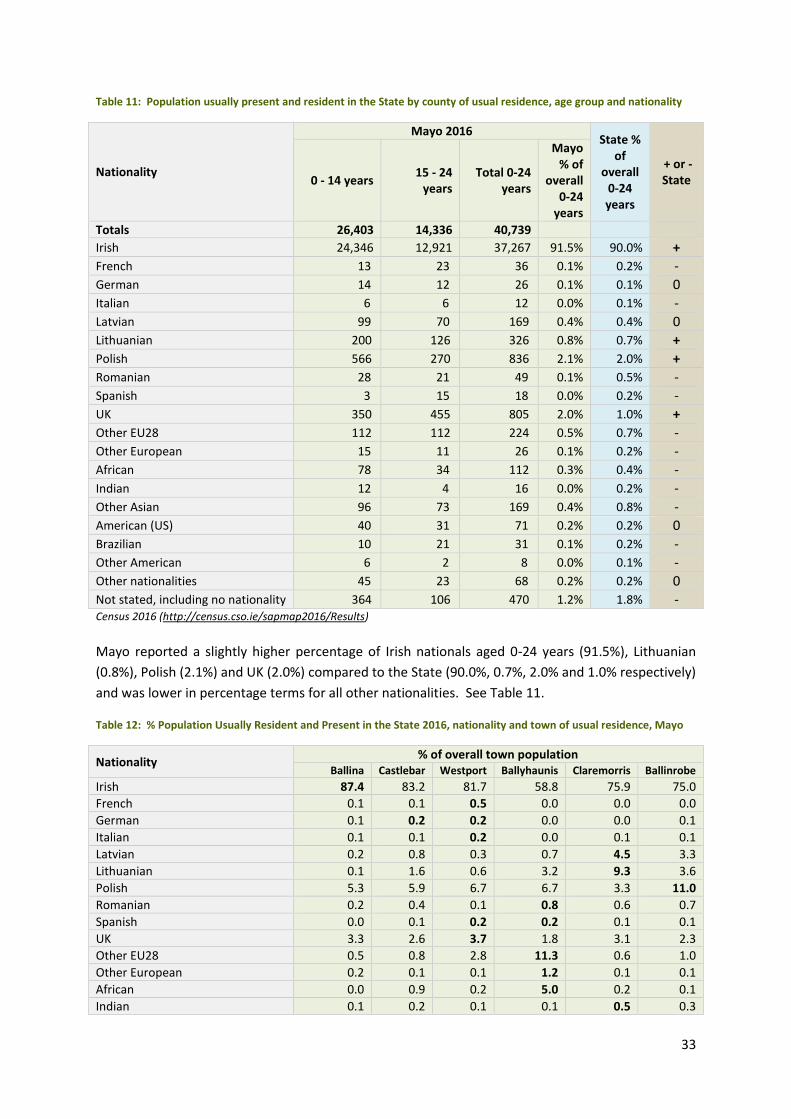
Irish 24,346 12,921 37,267 91.5% 90.0% + French 13 23 36 0.1% 0.2% - German 14 12 26 0.1% 0.1% 0 Italian 6 6 12 0.0% 0.1% - Latvian 99 70 169 0.4% 0.4% 0 Lithuanian 200 126 326 0.8% 0.7% + Polish 566 270 836 2.1% 2.0% + Romanian 28 21 49 0.1% 0.5% - Spanish 3 15 18 0.0% 0.2% - UK 350 455 805 2.0% 1.0% + Other EU28 112 112 224 0.5% 0.7% - Other European 15 11 26 0.1% 0.2% - African 78 34 112 0.3% 0.4% - Indian 12 4 16 0.0% 0.2% - Other Asian 96 73 169 0.4% 0.8% - American (US) 40 31 71 0.2% 0.2% 0 Brazilian 10 21 31 0.1% 0.2% - Other American 6 2 8 0.0% 0.1% - Other nationalities 45 23 68 0.2% 0.2% 0 Not stated, including no nationality 364 106 470 1.2% 1.8% - Census 2016 (http://census.cso.ie/sapmap2016/Results)
Mayo reported a slightly higher percentage of Irish nationals aged 0-24 years (91.5%), Lithuanian
(0.8%), Polish (2.1%) and UK (2.0%) compared to the State (90.0%, 0.7%, 2.0% and 1.0% respectively)
and was lower in percentage terms for all other nationalities. See Table 11.
Table 12: % Population Usually Resident and Present in the State 2016, nationality and town of usual residence, Mayo
Nationality % of overall town population
Ballina Castlebar Westport Ballyhaunis Claremorris Ballinrobe
Irish 87.4 83.2 81.7 58.8 75.9 75.0
French 0.1 0.1 0.5 0.0 0.0 0.0
German 0.1 0.2 0.2 0.0 0.0 0.1
Italian 0.1 0.1 0.2 0.0 0.1 0.1
Latvian 0.2 0.8 0.3 0.7 4.5 3.3
Lithuanian 0.1 1.6 0.6 3.2 9.3 3.6
Polish 5.3 5.9 6.7 6.7 3.3 11.0
Romanian 0.2 0.4 0.1 0.8 0.6 0.7
Spanish 0.0 0.1 0.2 0.2 0.1 0.1
UK 3.3 2.6 3.7 1.8 3.1 2.3
Other EU28 0.5 0.8 2.8 11.3 0.6 1.0
Other European 0.2 0.1 0.1 1.2 0.1 0.1
African 0.0 0.9 0.2 5.0 0.2 0.1
Indian 0.1 0.2 0.1 0.1 0.5 0.3
34
Nationality % of overall town population
Ballina Castlebar Westport Ballyhaunis Claremorris Ballinrobe
Other Asian 0.6 1.0 0.4 7.7 0.4 0.5
American (US) 0.2 0.2 0.3 0.0 0.3 0.2
Brazilian 0.4 0.1 0.1 0.3 0.2 0.2
Other American 0.0 0.1 0.1 0.0 0.1 0.1
Other nationalities 0.2 0.4 0.4 0.5 0.1 0.1
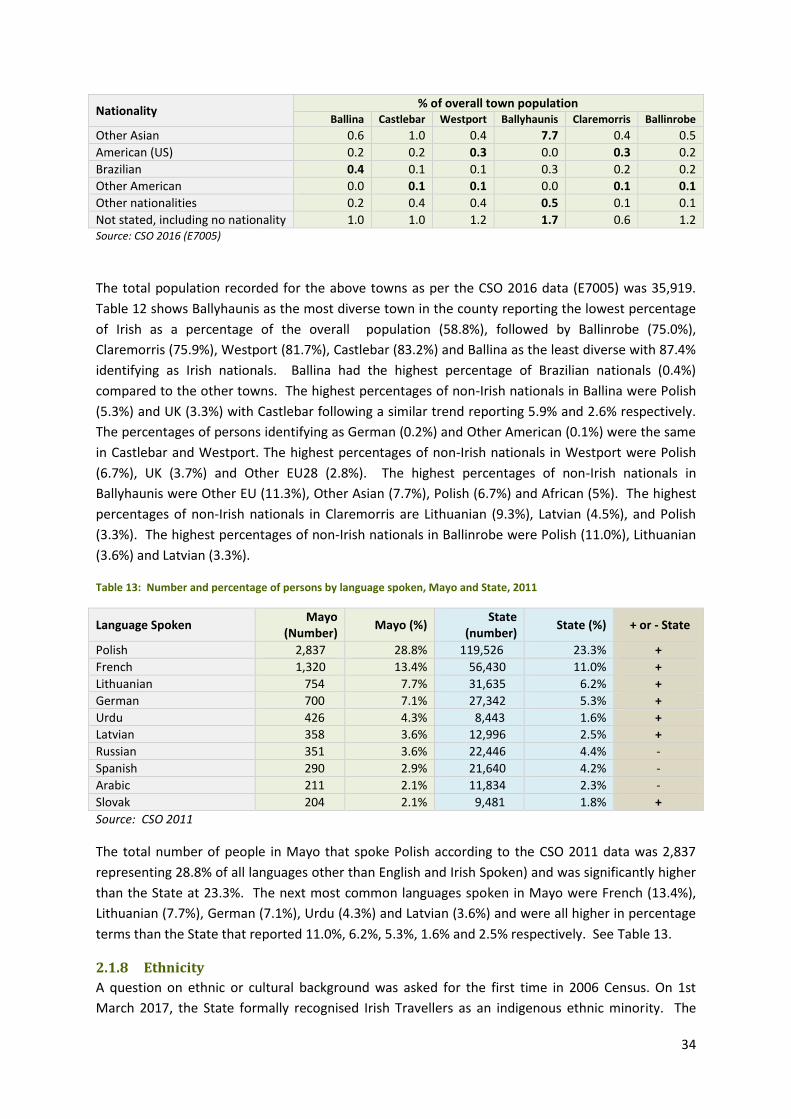
Not stated, including no nationality 1.0 1.0 1.2 1.7 0.6 1.2 Source: CSO 2016 (E7005)
The total population recorded for the above towns as per the CSO 2016 data (E7005) was 35,919.
Table 12 shows Ballyhaunis as the most diverse town in the county reporting the lowest percentage
of Irish as a percentage of the overall population (58.8%), followed by Ballinrobe (75.0%),
Claremorris (75.9%), Westport (81.7%), Castlebar (83.2%) and Ballina as the least diverse with 87.4%
identifying as Irish nationals. Ballina had the highest percentage of Brazilian nationals (0.4%)
compared to the other towns. The highest percentages of non-Irish nationals in Ballina were Polish
(5.3%) and UK (3.3%) with Castlebar following a similar trend reporting 5.9% and 2.6% respectively.
The percentages of persons identifying as German (0.2%) and Other American (0.1%) were the same
in Castlebar and Westport. The highest percentages of non-Irish nationals in Westport were Polish
(6.7%), UK (3.7%) and Other EU28 (2.8%). The highest percentages of non-Irish nationals in
Ballyhaunis were Other EU (11.3%), Other Asian (7.7%), Polish (6.7%) and African (5%). The highest
percentages of non-Irish nationals in Claremorris are Lithuanian (9.3%), Latvian (4.5%), and Polish
(3.3%). The highest percentages of non-Irish nationals in Ballinrobe were Polish (11.0%), Lithuanian
(3.6%) and Latvian (3.3%).
Table 13: Number and percentage of persons by language spoken, Mayo and State, 2011
Language Spoken Mayo
(Number) Mayo (%)
State (number)
State (%) + or - State
Polish 2,837 28.8% 119,526 23.3% +
French 1,320 13.4% 56,430 11.0% +
Lithuanian 754 7.7% 31,635 6.2% +
German 700 7.1% 27,342 5.3% +
Urdu 426 4.3% 8,443 1.6% +
Latvian 358 3.6% 12,996 2.5% +
Russian 351 3.6% 22,446 4.4% -
Spanish 290 2.9% 21,640 4.2% -
Arabic 211 2.1% 11,834 2.3% -
Slovak 204 2.1% 9,481 1.8% +
Source: CSO 2011
The total number of people in Mayo that spoke Polish according to the CSO 2011 data was 2,837
representing 28.8% of all languages other than English and Irish Spoken) and was significantly higher
than the State at 23.3%. The next most common languages spoken in Mayo were French (13.4%),
Lithuanian (7.7%), German (7.1%), Urdu (4.3%) and Latvian (3.6%) and were all higher in percentage
terms than the State that reported 11.0%, 6.2%, 5.3%, 1.6% and 2.5% respectively. See Table 13.
2.1.8 Ethnicity
A question on ethnic or cultural background was asked for the first time in 2006 Census. On 1st
March 2017, the State formally recognised Irish Travellers as an indigenous ethnic minority. The
35
Ombudsman for Children, Dr Niall Muldoon, meanwhile said the recognition of Traveller ethnicity
must be followed by real change by stating "The recognition of Traveller ethnicity must be followed
by concrete measures and timelines that will improve the situation for young Travellers”13.
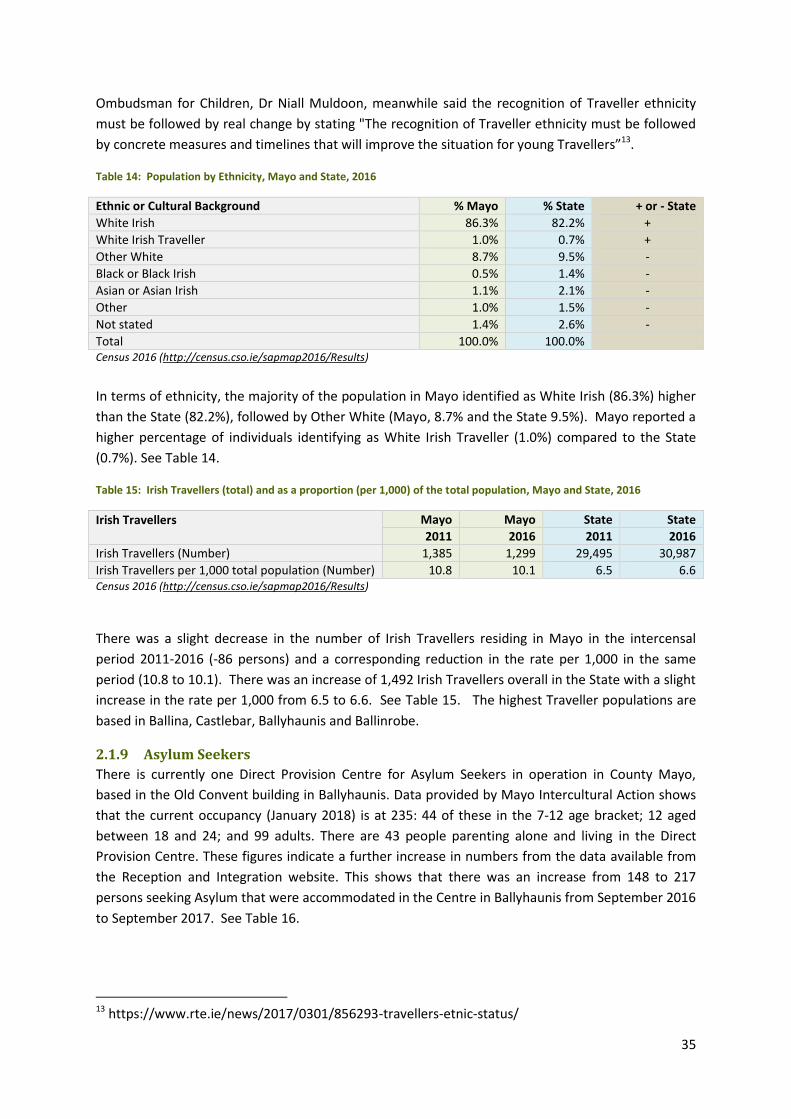
Table 14: Population by Ethnicity, Mayo and State, 2016
Ethnic or Cultural Background % Mayo % State + or - State
White Irish 86.3% 82.2% +
White Irish Traveller 1.0% 0.7% +
Other White 8.7% 9.5% -
Black or Black Irish 0.5% 1.4% -
Asian or Asian Irish 1.1% 2.1% -
Other 1.0% 1.5% -
Not stated 1.4% 2.6% -
Total 100.0% 100.0% Census 2016 (http://census.cso.ie/sapmap2016/Results)
In terms of ethnicity, the majority of the population in Mayo identified as White Irish (86.3%) higher
than the State (82.2%), followed by Other White (Mayo, 8.7% and the State 9.5%). Mayo reported a
higher percentage of individuals identifying as White Irish Traveller (1.0%) compared to the State
(0.7%). See Table 14.
Table 15: Irish Travellers (total) and as a proportion (per 1,000) of the total population, Mayo and State, 2016
Irish Travellers
Mayo Mayo State State
2011 2016 2011 2016
Irish Travellers (Number) 1,385 1,299 29,495 30,987
Irish Travellers per 1,000 total population (Number) 10.8 10.1 6.5 6.6 Census 2016 (http://census.cso.ie/sapmap2016/Results)
There was a slight decrease in the number of Irish Travellers residing in Mayo in the intercensal
period 2011-2016 (-86 persons) and a corresponding reduction in the rate per 1,000 in the same
period (10.8 to 10.1). There was an increase of 1,492 Irish Travellers overall in the State with a slight
increase in the rate per 1,000 from 6.5 to 6.6. See Table 15. The highest Traveller populations are
based in Ballina, Castlebar, Ballyhaunis and Ballinrobe.
2.1.9 Asylum Seekers
There is currently one Direct Provision Centre for Asylum Seekers in operation in County Mayo,
based in the Old Convent building in Ballyhaunis. Data provided by Mayo Intercultural Action shows
that the current occupancy (January 2018) is at 235: 44 of these in the 7-12 age bracket; 12 aged
between 18 and 24; and 99 adults. There are 43 people parenting alone and living in the Direct
Provision Centre. These figures indicate a further increase in numbers from the data available from
the Reception and Integration website. This shows that there was an increase from 148 to 217
persons seeking Asylum that were accommodated in the Centre in Ballyhaunis from September 2016
to September 2017. See Table 16.
13 https://www.rte.ie/news/2017/0301/856293-travellers-etnic-status/
36
Table 16: Asylum Seekers, as a % of total population, Mayo and State, November 2016 (RIA 2016)
Direct Provision Mayo Sept 2016
Mayo Sept 2017
State Sept 2016
State Sept 2017
Pop 2016 Census 130,425 130,425 4,757,782 4,757,783
Contracted capacity 267 267 5,273 5,191
Current Occupancy 148 217 4,279 4,873
Capacity as % of Population 0.20% 0.20% 0.11% 0.11%
Occupancy as % of population 0.11% 0.17% 0.90% 0.10% Source: Reception and Integration Agency
At the time of the report, there was a slightly higher occupancy as a % of the population in County
Mayo (.11%) compared to the State (.09%). There was no further breakdown of data at a county
level in the report. The Centre provides accommodation for couples, families and single men. There
was no additional data available in relation to the number of children and young people in residence
in the Centre in the reports.
Vulnerable Young People This section explores the data in relation to Young Carers and children and young people with a
disability.
2.1.10 Young Carers
According to the most recent State of the Nation’s Children14 (SONC) report, a rate of 5.6 per 1,000 children provide regular unpaid personal help for a friend or family member with a long-term illness, health problem or disability. The number of males and females providing unpaid help was similar. Mayo reported the third highest rate per 1,000 in the country at 7.2 (number = 234) and was significantly higher than the rate reported for the State (5.6).
2.1.11 Disabled Population aged 0-18 years
A total of 1,694 children and young people in Mayo were documented as having a disability in the
2011 Census data. In both Mayo and the State, the most significant percentage relates to difficulties
in learning, remembering or concentrating (47.2% and 49.4% respectively). See Table 17 below.
Table 17: Disabled Population aged 0-18 years by type of disability, Mayo and State15
Type of Disability
Mayo
State
+ or - State
0 - 12 years
13 - 18 years
% of Total 0-
18 years
0 - 12 years
13 - 18 years
% of Total 0-
18 years
Total persons with a disability 1,019 675 43,645 27,473
A condition that substantially limits one or more basic physical activities 161 72 13.8% 6,136 2,671 12.4% +
Difficulty in learning, remembering or concentrating 441 359 47.2% 20,067 15,034 49.4% -
Psychological or emotional condition 108 71 10.6% 5,878 3,859 13.7% -
14
State of the Nation’s Children Ireland 2016 page 36. 15
www.cso.ie Statbank/Disability, Carers, Health D0002 accessed 22/2/17
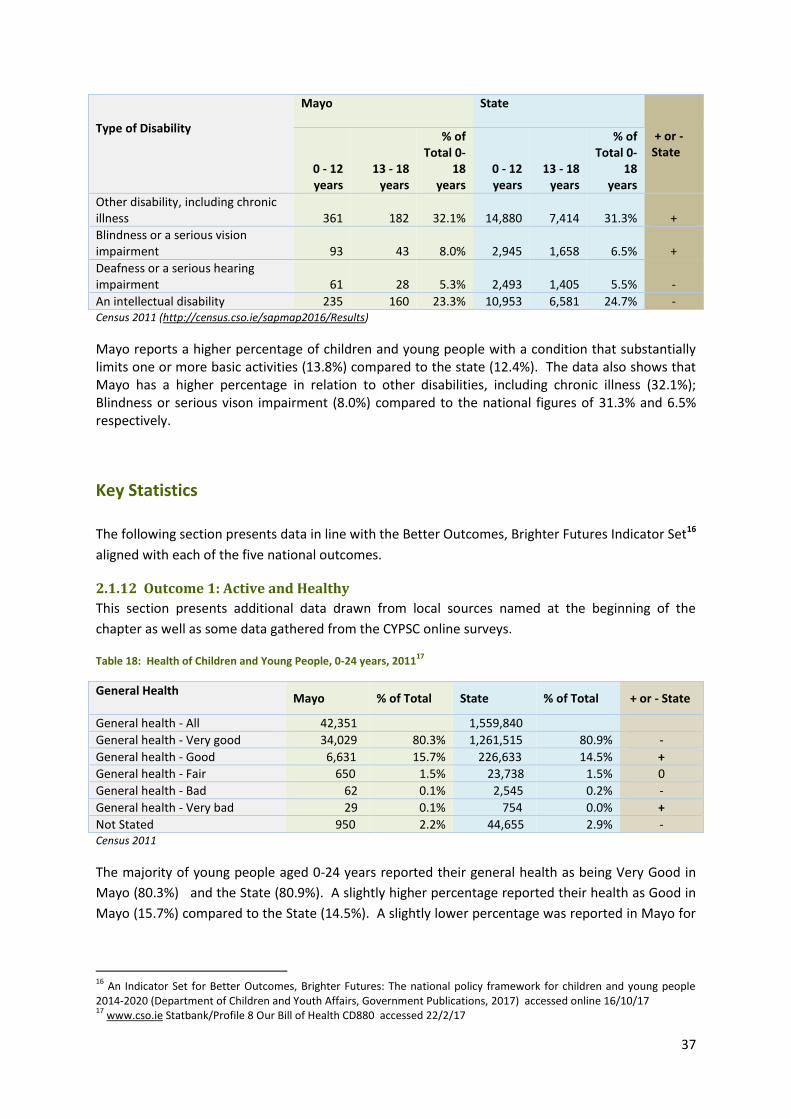
37
Type of Disability
Mayo
State
+ or - State
0 - 12 years
13 - 18 years
% of Total 0-
18 years
0 - 12 years
13 - 18 years
% of Total 0-
18 years
Other disability, including chronic illness 361 182 32.1% 14,880 7,414 31.3% +
Blindness or a serious vision impairment 93 43 8.0% 2,945 1,658 6.5% +
Deafness or a serious hearing impairment 61 28 5.3% 2,493 1,405 5.5% -
An intellectual disability 235 160 23.3% 10,953 6,581 24.7% - Census 2011 (http://census.cso.ie/sapmap2016/Results)
Mayo reports a higher percentage of children and young people with a condition that substantially limits one or more basic activities (13.8%) compared to the state (12.4%). The data also shows that Mayo has a higher percentage in relation to other disabilities, including chronic illness (32.1%); Blindness or serious vison impairment (8.0%) compared to the national figures of 31.3% and 6.5% respectively.
Key Statistics
The following section presents data in line with the Better Outcomes, Brighter Futures Indicator Set16
aligned with each of the five national outcomes.
2.1.12 Outcome 1: Active and Healthy
This section presents additional data drawn from local sources named at the beginning of the
chapter as well as some data gathered from the CYPSC online surveys.
Table 18: Health of Children and Young People, 0-24 years, 201117
General Health Mayo % of Total State % of Total + or - State
General health - All 42,351 1,559,840
General health - Very good 34,029 80.3% 1,261,515 80.9% -
General health - Good 6,631 15.7% 226,633 14.5% +
General health - Fair 650 1.5% 23,738 1.5% 0
General health - Bad 62 0.1% 2,545 0.2% -
General health - Very bad 29 0.1% 754 0.0% +
Not Stated 950 2.2% 44,655 2.9% - Census 2011
The majority of young people aged 0-24 years reported their general health as being Very Good in
Mayo (80.3%) and the State (80.9%). A slightly higher percentage reported their health as Good in
Mayo (15.7%) compared to the State (14.5%). A slightly lower percentage was reported in Mayo for
16
An Indicator Set for Better Outcomes, Brighter Futures: The national policy framework for children and young people 2014-2020 (Department of Children and Youth Affairs, Government Publications, 2017) accessed online 16/10/17 17
www.cso.ie Statbank/Profile 8 Our Bill of Health CD880 accessed 22/2/17
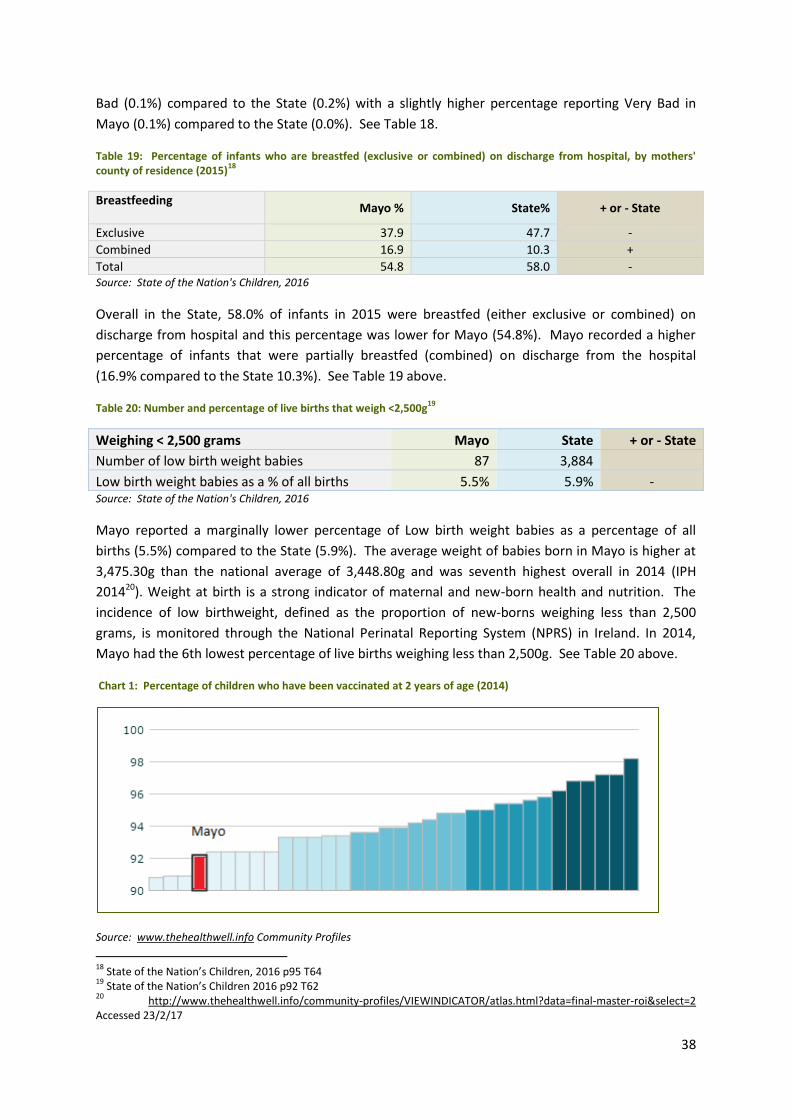
38
Bad (0.1%) compared to the State (0.2%) with a slightly higher percentage reporting Very Bad in
Mayo (0.1%) compared to the State (0.0%). See Table 18.
Table 19: Percentage of infants who are breastfed (exclusive or combined) on discharge from hospital, by mothers' county of residence (2015)
18
Breastfeeding Mayo % State% + or - State
Exclusive 37.9 47.7 -
Combined 16.9 10.3 +
Total 54.8 58.0 - Source: State of the Nation's Children, 2016
Overall in the State, 58.0% of infants in 2015 were breastfed (either exclusive or combined) on
discharge from hospital and this percentage was lower for Mayo (54.8%). Mayo recorded a higher
percentage of infants that were partially breastfed (combined) on discharge from the hospital
(16.9% compared to the State 10.3%). See Table 19 above.
Table 20: Number and percentage of live births that weigh <2,500g19
Weighing < 2,500 grams Mayo State + or - State
Number of low birth weight babies 87 3,884
Low birth weight babies as a % of all births 5.5% 5.9% - Source: State of the Nation's Children, 2016
Mayo reported a marginally lower percentage of Low birth weight babies as a percentage of all
births (5.5%) compared to the State (5.9%). The average weight of babies born in Mayo is higher at
3,475.30g than the national average of 3,448.80g and was seventh highest overall in 2014 (IPH
201420). Weight at birth is a strong indicator of maternal and new-born health and nutrition. The
incidence of low birthweight, defined as the proportion of new-borns weighing less than 2,500
grams, is monitored through the National Perinatal Reporting System (NPRS) in Ireland. In 2014,
Mayo had the 6th lowest percentage of live births weighing less than 2,500g. See Table 20 above.
Chart 1: Percentage of children who have been vaccinated at 2 years of age (2014)
Source: www.thehealthwell.info Community Profiles
18
State of the Nation’s Children, 2016 p95 T64 19
State of the Nation’s Children 2016 p92 T62 20
http://www.thehealthwell.info/community-profiles/VIEWINDICATOR/atlas.html?data=final-master-roi&select=2 Accessed 23/2/17
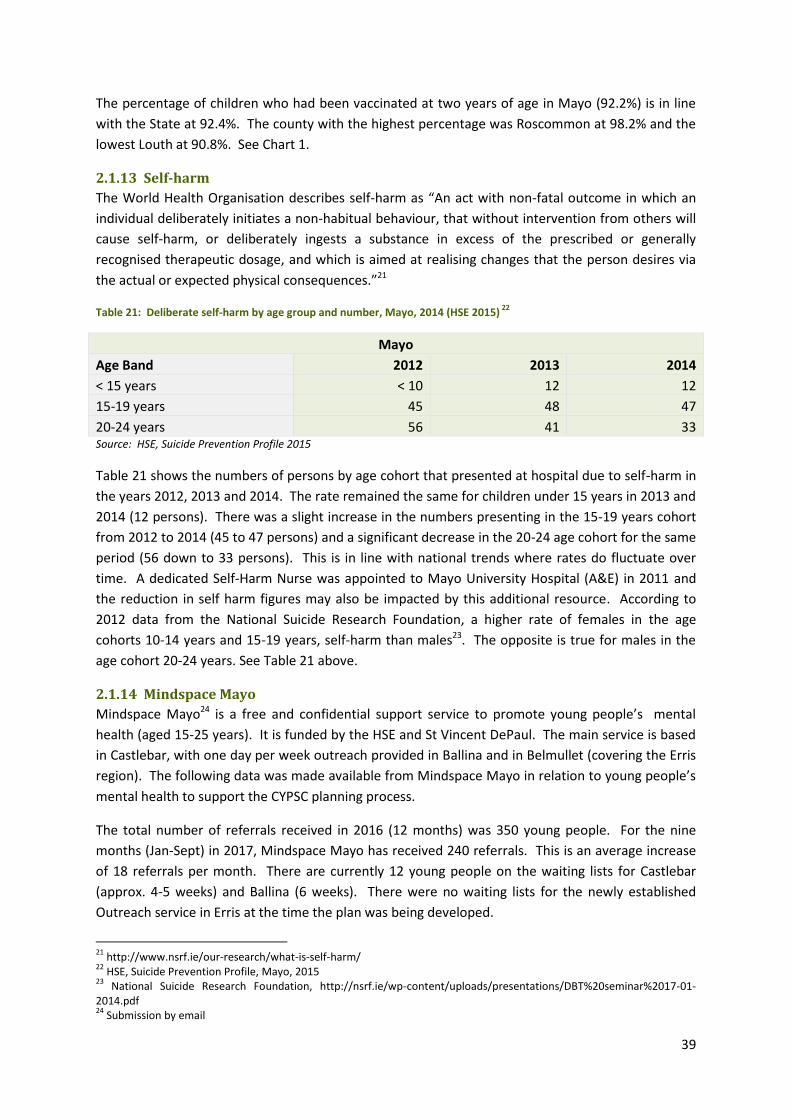
39
The percentage of children who had been vaccinated at two years of age in Mayo (92.2%) is in line
with the State at 92.4%. The county with the highest percentage was Roscommon at 98.2% and the
lowest Louth at 90.8%. See Chart 1.
2.1.13 Self-harm
The World Health Organisation describes self-harm as “An act with non-fatal outcome in which an
individual deliberately initiates a non-habitual behaviour, that without intervention from others will
cause self-harm, or deliberately ingests a substance in excess of the prescribed or generally
recognised therapeutic dosage, and which is aimed at realising changes that the person desires via
the actual or expected physical consequences.”21
Table 21: Deliberate self-harm by age group and number, Mayo, 2014 (HSE 2015) 22
Mayo
Age Band 2012 2013 2014
< 15 years < 10 12 12
15-19 years 45 48 47
20-24 years 56 41 33 Source: HSE, Suicide Prevention Profile 2015
Table 21 shows the numbers of persons by age cohort that presented at hospital due to self-harm in
the years 2012, 2013 and 2014. The rate remained the same for children under 15 years in 2013 and
2014 (12 persons). There was a slight increase in the numbers presenting in the 15-19 years cohort
from 2012 to 2014 (45 to 47 persons) and a significant decrease in the 20-24 age cohort for the same
period (56 down to 33 persons). This is in line with national trends where rates do fluctuate over
time. A dedicated Self-Harm Nurse was appointed to Mayo University Hospital (A&E) in 2011 and
the reduction in self harm figures may also be impacted by this additional resource. According to
2012 data from the National Suicide Research Foundation, a higher rate of females in the age
cohorts 10-14 years and 15-19 years, self-harm than males23. The opposite is true for males in the
age cohort 20-24 years. See Table 21 above.
2.1.14 Mindspace Mayo
Mindspace Mayo24 is a free and confidential support service to promote young people’s mental
health (aged 15-25 years). It is funded by the HSE and St Vincent DePaul. The main service is based
in Castlebar, with one day per week outreach provided in Ballina and in Belmullet (covering the Erris
region). The following data was made available from Mindspace Mayo in relation to young people’s
mental health to support the CYPSC planning process.
The total number of referrals received in 2016 (12 months) was 350 young people. For the nine
months (Jan-Sept) in 2017, Mindspace Mayo has received 240 referrals. This is an average increase
of 18 referrals per month. There are currently 12 young people on the waiting lists for Castlebar
(approx. 4-5 weeks) and Ballina (6 weeks). There were no waiting lists for the newly established
Outreach service in Erris at the time the plan was being developed.
21
http://www.nsrf.ie/our-research/what-is-self-harm/ 22
HSE, Suicide Prevention Profile, Mayo, 2015 23
National Suicide Research Foundation, http://nsrf.ie/wp-content/uploads/presentations/DBT%20seminar%2017-01-2014.pdf 24
Submission by email
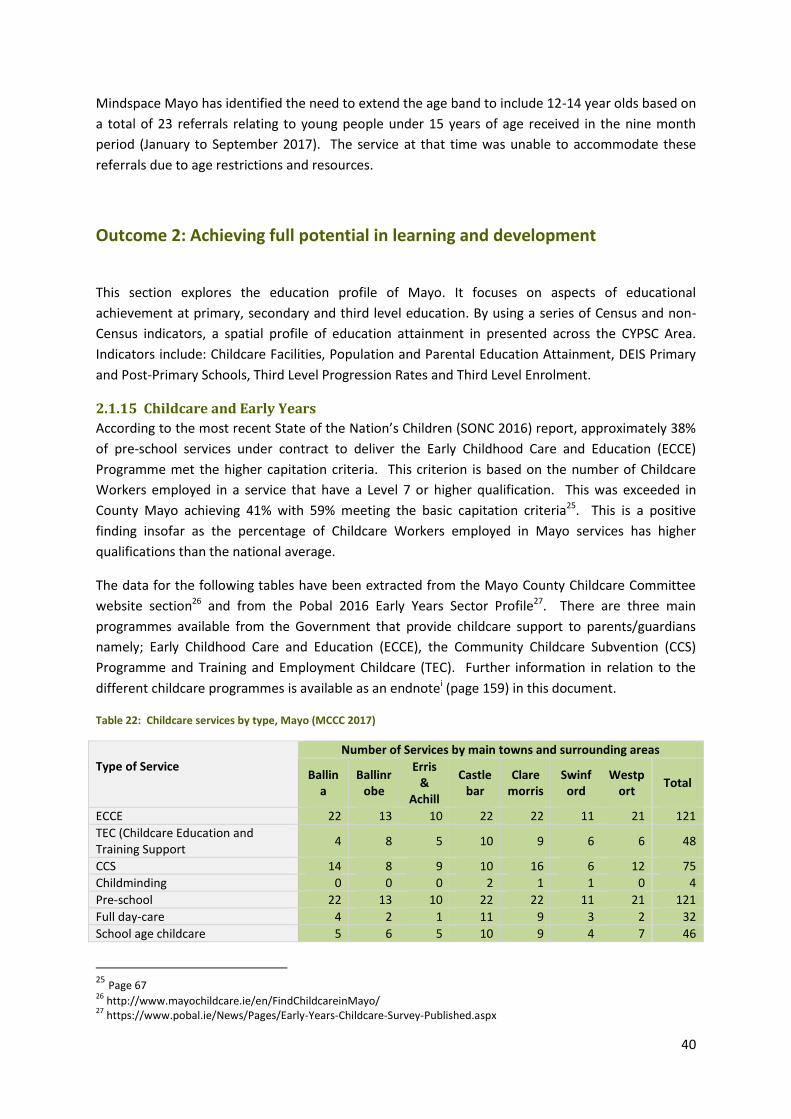
40
Mindspace Mayo has identified the need to extend the age band to include 12-14 year olds based on
a total of 23 referrals relating to young people under 15 years of age received in the nine month
period (January to September 2017). The service at that time was unable to accommodate these
referrals due to age restrictions and resources.
Outcome 2: Achieving full potential in learning and development
This section explores the education profile of Mayo. It focuses on aspects of educational
achievement at primary, secondary and third level education. By using a series of Census and non-
Census indicators, a spatial profile of education attainment in presented across the CYPSC Area.
Indicators include: Childcare Facilities, Population and Parental Education Attainment, DEIS Primary
and Post-Primary Schools, Third Level Progression Rates and Third Level Enrolment.
2.1.15 Childcare and Early Years
According to the most recent State of the Nation’s Children (SONC 2016) report, approximately 38%
of pre-school services under contract to deliver the Early Childhood Care and Education (ECCE)
Programme met the higher capitation criteria. This criterion is based on the number of Childcare
Workers employed in a service that have a Level 7 or higher qualification. This was exceeded in
County Mayo achieving 41% with 59% meeting the basic capitation criteria25. This is a positive
finding insofar as the percentage of Childcare Workers employed in Mayo services has higher
qualifications than the national average.
The data for the following tables have been extracted from the Mayo County Childcare Committee
website section26 and from the Pobal 2016 Early Years Sector Profile27. There are three main
programmes available from the Government that provide childcare support to parents/guardians
namely; Early Childhood Care and Education (ECCE), the Community Childcare Subvention (CCS)
Programme and Training and Employment Childcare (TEC). Further information in relation to the
different childcare programmes is available as an endnotei (page 159) in this document.
Table 22: Childcare services by type, Mayo (MCCC 2017)
Type of Service
Number of Services by main towns and surrounding areas
Ballina
Ballinrobe
Erris &
Achill
Castlebar
Claremorris
Swinford
Westport
Total
ECCE 22 13 10 22 22 11 21 121
TEC (Childcare Education and Training Support
4 8 5 10 9 6 6 48
CCS 14 8 9 10 16 6 12 75
Childminding 0 0 0 2 1 1 0 4
Pre-school 22 13 10 22 22 11 21 121
Full day-care 4 2 1 11 9 3 2 32
School age childcare 5 6 5 10 9 4 7 46
25 Page 67 26
http://www.mayochildcare.ie/en/FindChildcareinMayo/ 27
https://www.pobal.ie/News/Pages/Early-Years-Childcare-Survey-Published.aspx
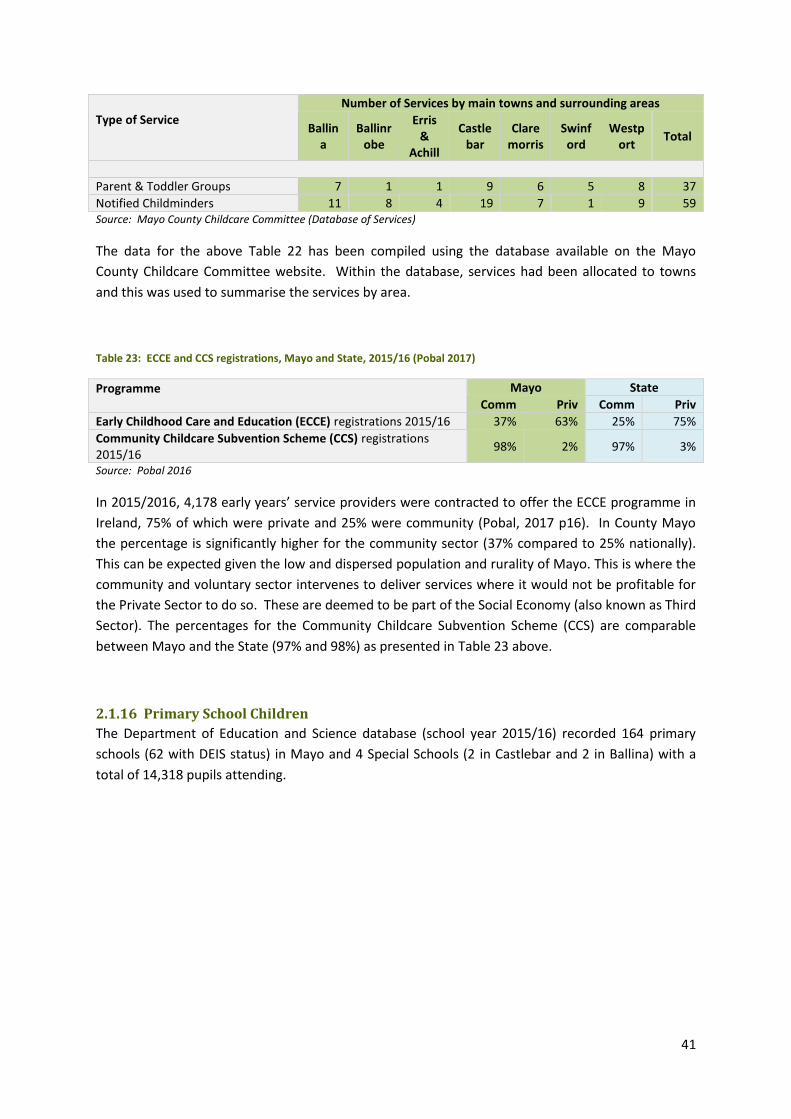
41
Type of Service
Number of Services by main towns and surrounding areas
Ballina
Ballinrobe
Erris &
Achill
Castlebar
Claremorris
Swinford
Westport
Total
Parent & Toddler Groups 7 1 1 9 6 5 8 37
Notified Childminders 11 8 4 19 7 1 9 59 Source: Mayo County Childcare Committee (Database of Services)
The data for the above Table 22 has been compiled using the database available on the Mayo
County Childcare Committee website. Within the database, services had been allocated to towns
and this was used to summarise the services by area.
Table 23: ECCE and CCS registrations, Mayo and State, 2015/16 (Pobal 2017)
Programme Mayo State
Comm Priv Comm Priv
Early Childhood Care and Education (ECCE) registrations 2015/16 37% 63% 25% 75%
Community Childcare Subvention Scheme (CCS) registrations 2015/16
98% 2% 97% 3%
Source: Pobal 2016
In 2015/2016, 4,178 early years’ service providers were contracted to offer the ECCE programme in
Ireland, 75% of which were private and 25% were community (Pobal, 2017 p16). In County Mayo
the percentage is significantly higher for the community sector (37% compared to 25% nationally).
This can be expected given the low and dispersed population and rurality of Mayo. This is where the
community and voluntary sector intervenes to deliver services where it would not be profitable for
the Private Sector to do so. These are deemed to be part of the Social Economy (also known as Third
Sector). The percentages for the Community Childcare Subvention Scheme (CCS) are comparable
between Mayo and the State (97% and 98%) as presented in Table 23 above.
2.1.16 Primary School Children
The Department of Education and Science database (school year 2015/16) recorded 164 primary
schools (62 with DEIS status) in Mayo and 4 Special Schools (2 in Castlebar and 2 in Ballina) with a
total of 14,318 pupils attending.
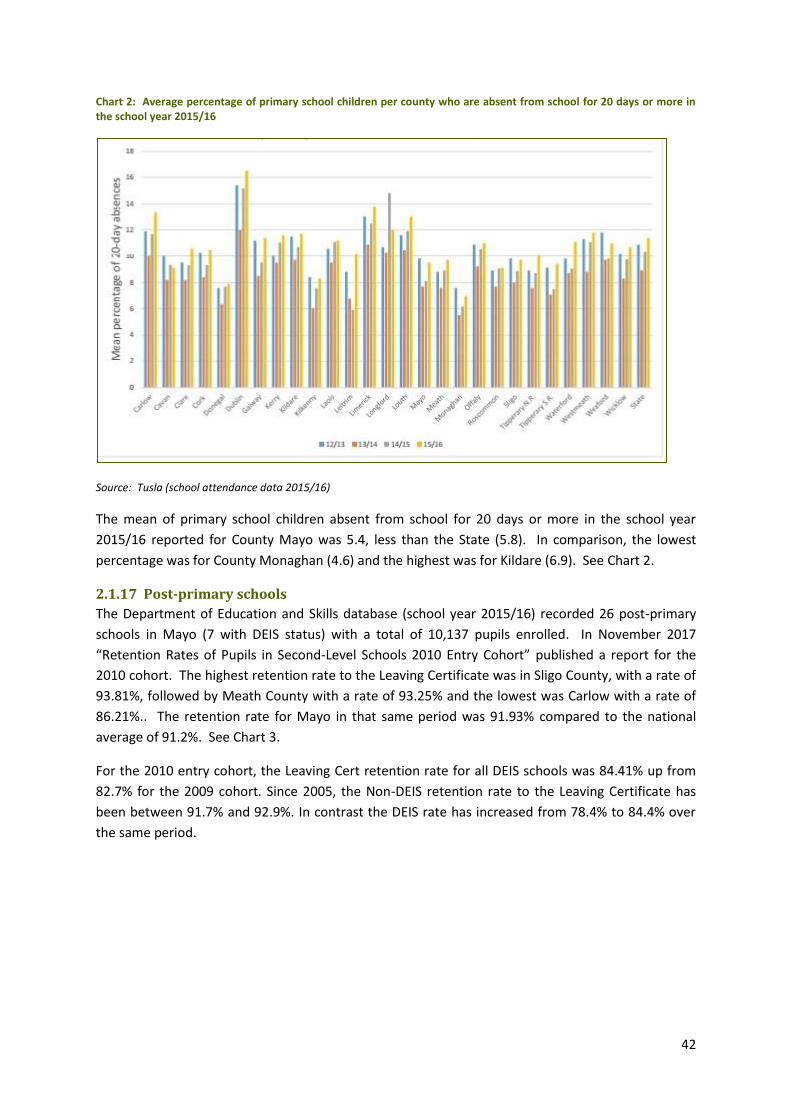
42
Chart 2: Average percentage of primary school children per county who are absent from school for 20 days or more in the school year 2015/16
Source: Tusla (school attendance data 2015/16)
The mean of primary school children absent from school for 20 days or more in the school year
2015/16 reported for County Mayo was 5.4, less than the State (5.8). In comparison, the lowest
percentage was for County Monaghan (4.6) and the highest was for Kildare (6.9). See Chart 2.
2.1.17 Post-primary schools
The Department of Education and Skills database (school year 2015/16) recorded 26 post-primary
schools in Mayo (7 with DEIS status) with a total of 10,137 pupils enrolled. In November 2017
“Retention Rates of Pupils in Second-Level Schools 2010 Entry Cohort” published a report for the
2010 cohort. The highest retention rate to the Leaving Certificate was in Sligo County, with a rate of
93.81%, followed by Meath County with a rate of 93.25% and the lowest was Carlow with a rate of
86.21%.. The retention rate for Mayo in that same period was 91.93% compared to the national
average of 91.2%. See Chart 3.
For the 2010 entry cohort, the Leaving Cert retention rate for all DEIS schools was 84.41% up from
82.7% for the 2009 cohort. Since 2005, the Non-DEIS retention rate to the Leaving Certificate has
been between 91.7% and 92.9%. In contrast the DEIS rate has increased from 78.4% to 84.4% over
the same period.
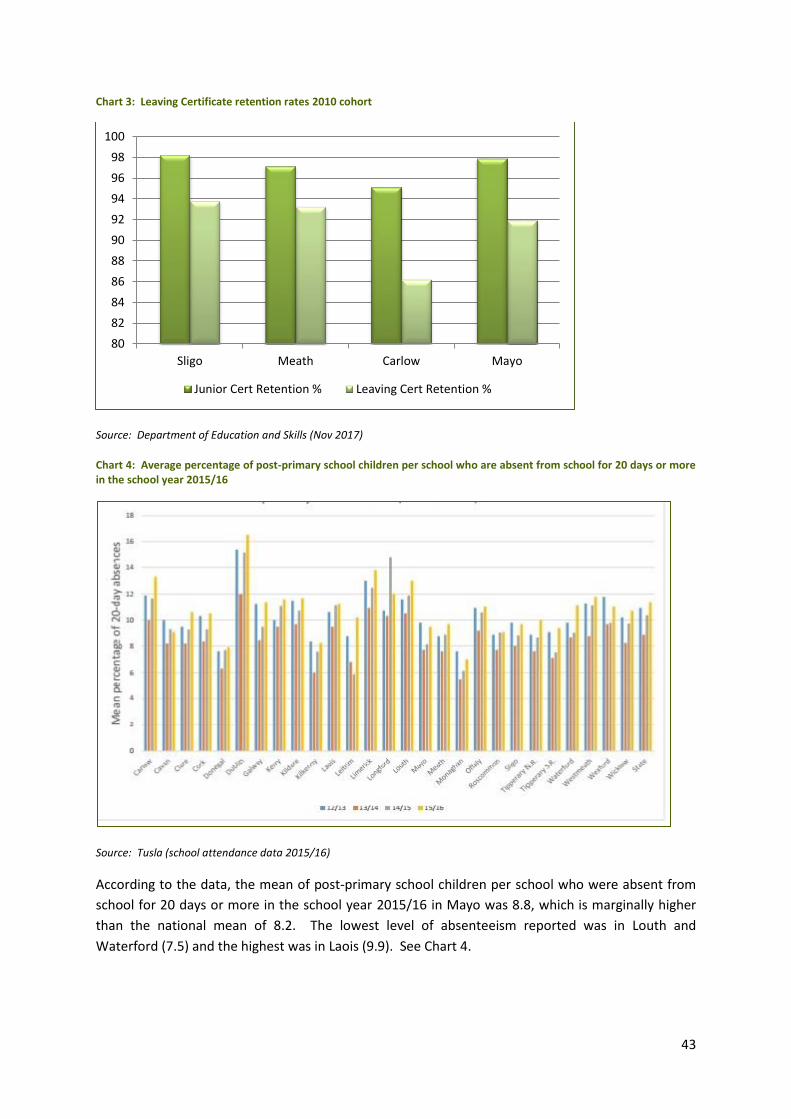
43
Chart 3: Leaving Certificate retention rates 2010 cohort
Source: Department of Education and Skills (Nov 2017)
Chart 4: Average percentage of post-primary school children per school who are absent from school for 20 days or more in the school year 2015/16
Source: Tusla (school attendance data 2015/16)
According to the data, the mean of post-primary school children per school who were absent from
school for 20 days or more in the school year 2015/16 in Mayo was 8.8, which is marginally higher
than the national mean of 8.2. The lowest level of absenteeism reported was in Louth and
Waterford (7.5) and the highest was in Laois (9.9). See Chart 4.
80
82
84
86
88
90
92
94
96
98
100
Sligo Meath Carlow Mayo
Junior Cert Retention % Leaving Cert Retention %
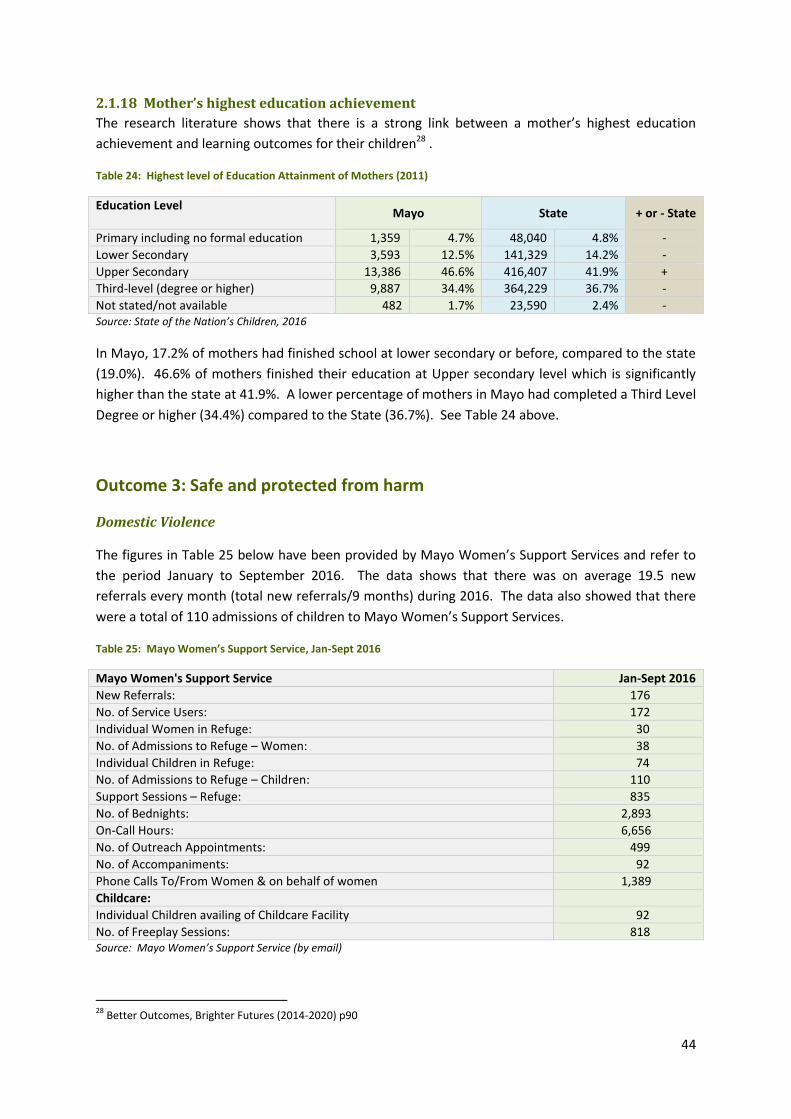
44
2.1.18 Mother’s highest education achievement
The research literature shows that there is a strong link between a mother’s highest education
achievement and learning outcomes for their children28 .
Table 24: Highest level of Education Attainment of Mothers (2011)
Education Level Mayo State + or - State
Primary including no formal education 1,359 4.7% 48,040 4.8% -
Lower Secondary 3,593 12.5% 141,329 14.2% -
Upper Secondary 13,386 46.6% 416,407 41.9% +
Third-level (degree or higher) 9,887 34.4% 364,229 36.7% -
Not stated/not available 482 1.7% 23,590 2.4% - Source: State of the Nation’s Children, 2016
In Mayo, 17.2% of mothers had finished school at lower secondary or before, compared to the state
(19.0%). 46.6% of mothers finished their education at Upper secondary level which is significantly
higher than the state at 41.9%. A lower percentage of mothers in Mayo had completed a Third Level
Degree or higher (34.4%) compared to the State (36.7%). See Table 24 above.
Outcome 3: Safe and protected from harm
Domestic Violence
The figures in Table 25 below have been provided by Mayo Women’s Support Services and refer to
the period January to September 2016. The data shows that there was on average 19.5 new
referrals every month (total new referrals/9 months) during 2016. The data also showed that there
were a total of 110 admissions of children to Mayo Women’s Support Services.
Table 25: Mayo Women’s Support Service, Jan-Sept 2016
Mayo Women's Support Service Jan-Sept 2016
New Referrals: 176
No. of Service Users: 172
Individual Women in Refuge: 30
No. of Admissions to Refuge – Women: 38
Individual Children in Refuge: 74
No. of Admissions to Refuge – Children: 110
Support Sessions – Refuge: 835
No. of Bednights: 2,893
On-Call Hours: 6,656
No. of Outreach Appointments: 499
No. of Accompaniments: 92
Phone Calls To/From Women & on behalf of women 1,389
Childcare:
Individual Children availing of Childcare Facility 92
No. of Freeplay Sessions: 818 Source: Mayo Women’s Support Service (by email)
28
Better Outcomes, Brighter Futures (2014-2020) p90
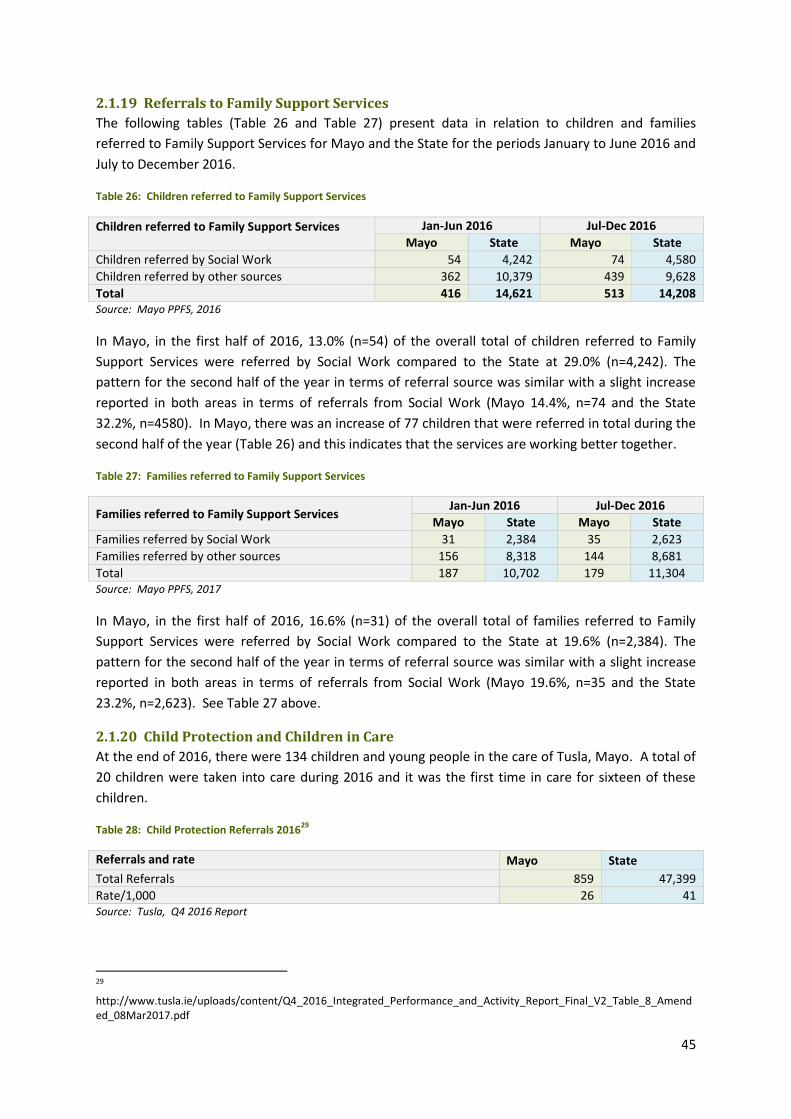
45
2.1.19 Referrals to Family Support Services
The following tables (Table 26 and Table 27) present data in relation to children and families
referred to Family Support Services for Mayo and the State for the periods January to June 2016 and
July to December 2016.
Table 26: Children referred to Family Support Services
Children referred to Family Support Services Jan-Jun 2016 Jul-Dec 2016
Mayo State Mayo State
Children referred by Social Work 54 4,242 74 4,580
Children referred by other sources 362 10,379 439 9,628
Total 416 14,621 513 14,208 Source: Mayo PPFS, 2016
In Mayo, in the first half of 2016, 13.0% (n=54) of the overall total of children referred to Family
Support Services were referred by Social Work compared to the State at 29.0% (n=4,242). The
pattern for the second half of the year in terms of referral source was similar with a slight increase
reported in both areas in terms of referrals from Social Work (Mayo 14.4%, n=74 and the State
32.2%, n=4580). In Mayo, there was an increase of 77 children that were referred in total during the
second half of the year (Table 26) and this indicates that the services are working better together.
Table 27: Families referred to Family Support Services
Families referred to Family Support Services Jan-Jun 2016 Jul-Dec 2016
Mayo State Mayo State
Families referred by Social Work 31 2,384 35 2,623
Families referred by other sources 156 8,318 144 8,681
Total 187 10,702 179 11,304 Source: Mayo PPFS, 2017
In Mayo, in the first half of 2016, 16.6% (n=31) of the overall total of families referred to Family
Support Services were referred by Social Work compared to the State at 19.6% (n=2,384). The
pattern for the second half of the year in terms of referral source was similar with a slight increase
reported in both areas in terms of referrals from Social Work (Mayo 19.6%, n=35 and the State
23.2%, n=2,623). See Table 27 above.
2.1.20 Child Protection and Children in Care
At the end of 2016, there were 134 children and young people in the care of Tusla, Mayo. A total of
20 children were taken into care during 2016 and it was the first time in care for sixteen of these
children.
Table 28: Child Protection Referrals 201629
Referrals and rate Mayo State
Total Referrals 859 47,399
Rate/1,000 26 41 Source: Tusla, Q4 2016 Report
29
http://www.tusla.ie/uploads/content/Q4_2016_Integrated_Performance_and_Activity_Report_Final_V2_Table_8_Amended_08Mar2017.pdf
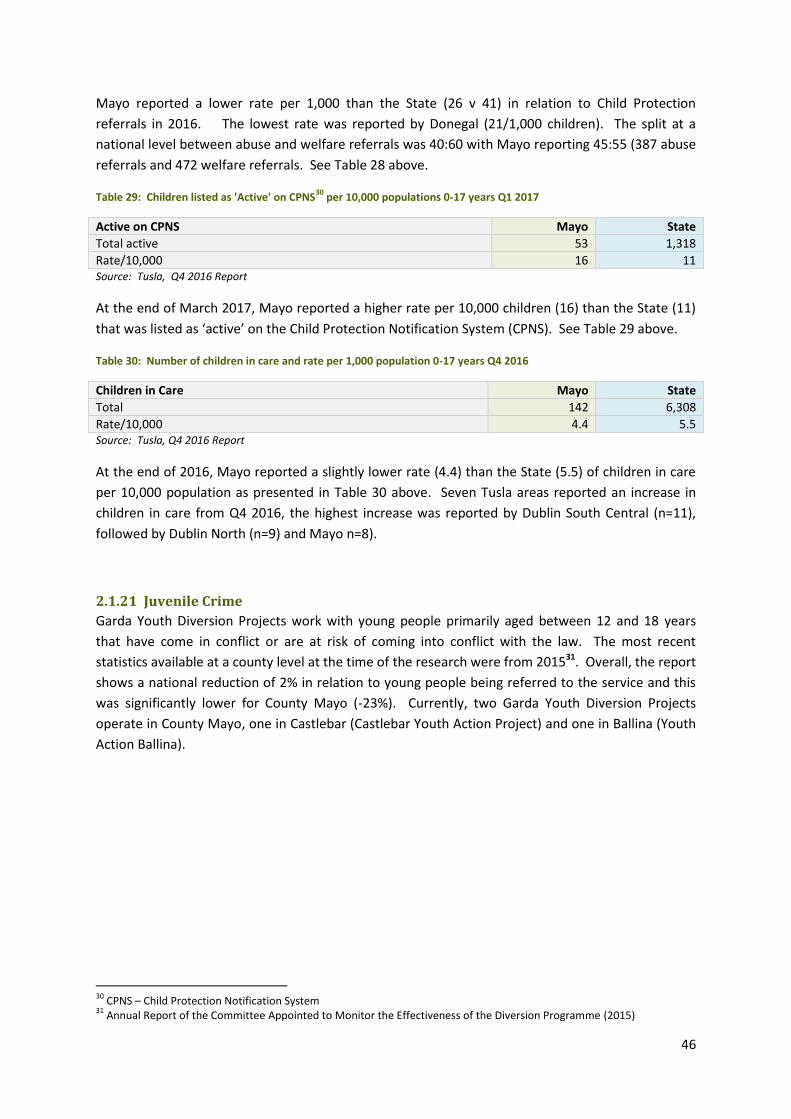
46
Mayo reported a lower rate per 1,000 than the State (26 v 41) in relation to Child Protection
referrals in 2016. The lowest rate was reported by Donegal (21/1,000 children). The split at a
national level between abuse and welfare referrals was 40:60 with Mayo reporting 45:55 (387 abuse
referrals and 472 welfare referrals. See Table 28 above.
Table 29: Children listed as 'Active' on CPNS30
per 10,000 populations 0-17 years Q1 2017
Active on CPNS Mayo State
Total active 53 1,318
Rate/10,000 16 11 Source: Tusla, Q4 2016 Report
At the end of March 2017, Mayo reported a higher rate per 10,000 children (16) than the State (11)
that was listed as ‘active’ on the Child Protection Notification System (CPNS). See Table 29 above.
Table 30: Number of children in care and rate per 1,000 population 0-17 years Q4 2016
Children in Care Mayo State
Total 142 6,308
Rate/10,000 4.4 5.5 Source: Tusla, Q4 2016 Report
At the end of 2016, Mayo reported a slightly lower rate (4.4) than the State (5.5) of children in care
per 10,000 population as presented in Table 30 above. Seven Tusla areas reported an increase in
children in care from Q4 2016, the highest increase was reported by Dublin South Central (n=11),
followed by Dublin North (n=9) and Mayo n=8).
2.1.21 Juvenile Crime
Garda Youth Diversion Projects work with young people primarily aged between 12 and 18 years
that have come in conflict or are at risk of coming into conflict with the law. The most recent
statistics available at a county level at the time of the research were from 201531. Overall, the report
shows a national reduction of 2% in relation to young people being referred to the service and this
was significantly lower for County Mayo (-23%). Currently, two Garda Youth Diversion Projects
operate in County Mayo, one in Castlebar (Castlebar Youth Action Project) and one in Ballina (Youth
Action Ballina).
30
CPNS – Child Protection Notification System 31
Annual Report of the Committee Appointed to Monitor the Effectiveness of the Diversion Programme (2015)
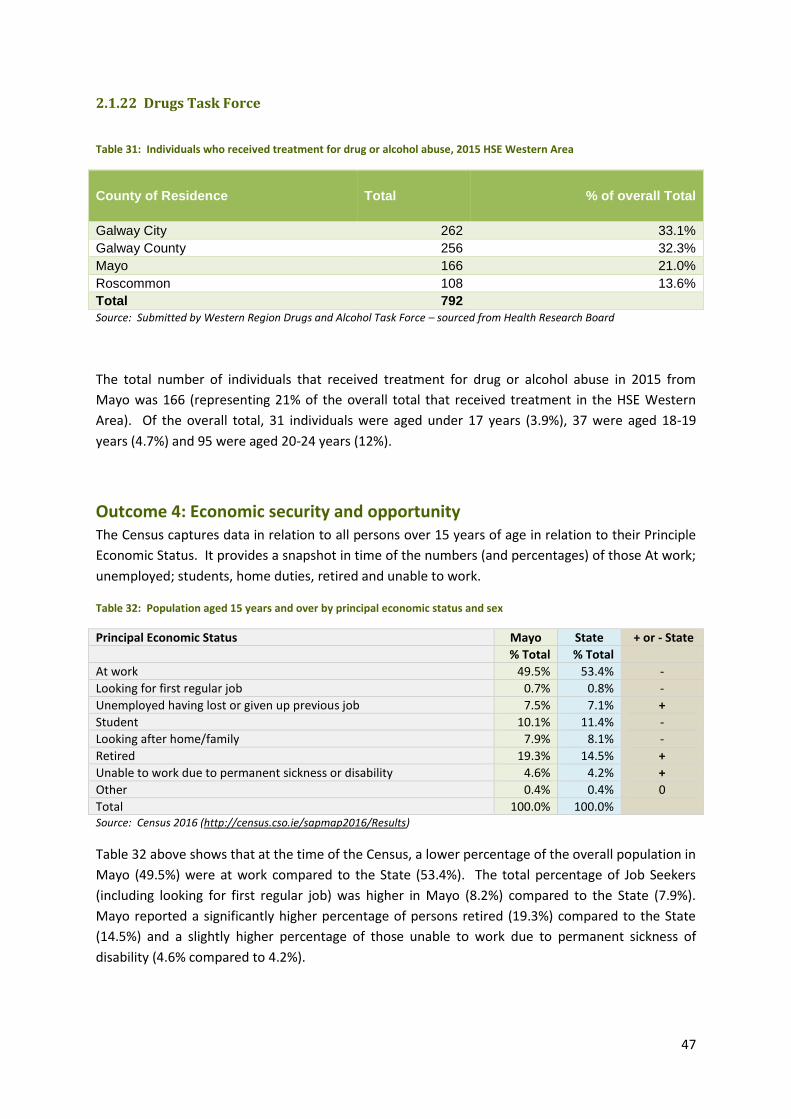
47
2.1.22 Drugs Task Force
Table 31: Individuals who received treatment for drug or alcohol abuse, 2015 HSE Western Area
County of Residence Total % of overall Total
Galway City 262 33.1%
Galway County 256 32.3%
Mayo 166 21.0%
Roscommon 108 13.6%
Total 792
Source: Submitted by Western Region Drugs and Alcohol Task Force – sourced from Health Research Board
The total number of individuals that received treatment for drug or alcohol abuse in 2015 from
Mayo was 166 (representing 21% of the overall total that received treatment in the HSE Western
Area). Of the overall total, 31 individuals were aged under 17 years (3.9%), 37 were aged 18-19
years (4.7%) and 95 were aged 20-24 years (12%).
Outcome 4: Economic security and opportunity The Census captures data in relation to all persons over 15 years of age in relation to their Principle
Economic Status. It provides a snapshot in time of the numbers (and percentages) of those At work;
unemployed; students, home duties, retired and unable to work.
Table 32: Population aged 15 years and over by principal economic status and sex
Principal Economic Status Mayo State + or - State
% Total % Total
At work 49.5% 53.4% -
Looking for first regular job 0.7% 0.8% -
Unemployed having lost or given up previous job 7.5% 7.1% +
Student 10.1% 11.4% -
Looking after home/family 7.9% 8.1% -
Retired 19.3% 14.5% +
Unable to work due to permanent sickness or disability 4.6% 4.2% +
Other 0.4% 0.4% 0
Total 100.0% 100.0% Source: Census 2016 (http://census.cso.ie/sapmap2016/Results)
Table 32 above shows that at the time of the Census, a lower percentage of the overall population in
Mayo (49.5%) were at work compared to the State (53.4%). The total percentage of Job Seekers
(including looking for first regular job) was higher in Mayo (8.2%) compared to the State (7.9%).
Mayo reported a significantly higher percentage of persons retired (19.3%) compared to the State
(14.5%) and a slightly higher percentage of those unable to work due to permanent sickness of
disability (4.6% compared to 4.2%).
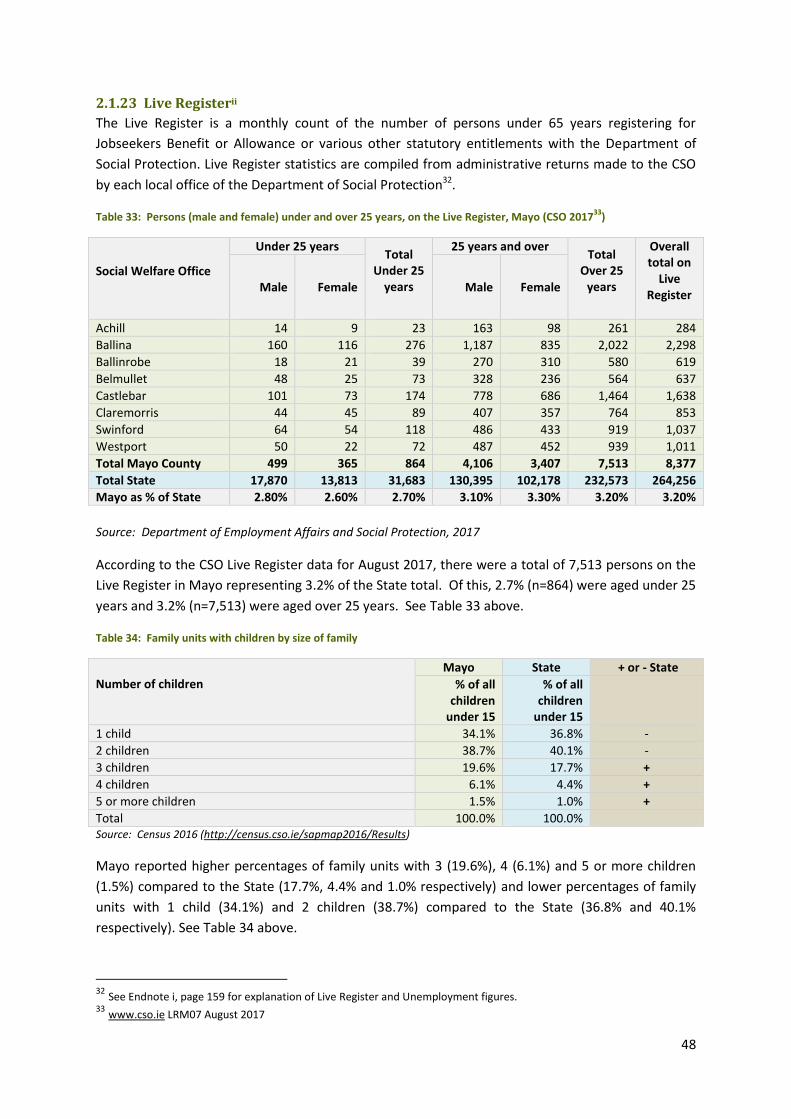
48
2.1.23 Live Registerii
The Live Register is a monthly count of the number of persons under 65 years registering for
Jobseekers Benefit or Allowance or various other statutory entitlements with the Department of
Social Protection. Live Register statistics are compiled from administrative returns made to the CSO
by each local office of the Department of Social Protection32.
Table 33: Persons (male and female) under and over 25 years, on the Live Register, Mayo (CSO 201733
)
Social Welfare Office
Under 25 years Total
Under 25 years
25 years and over Total
Over 25 years
Overall total on
Live Register
Male Female Male Female
Achill 14 9 23 163 98 261 284
Ballina 160 116 276 1,187 835 2,022 2,298
Ballinrobe 18 21 39 270 310 580 619
Belmullet 48 25 73 328 236 564 637
Castlebar 101 73 174 778 686 1,464 1,638
Claremorris 44 45 89 407 357 764 853
Swinford 64 54 118 486 433 919 1,037
Westport 50 22 72 487 452 939 1,011
Total Mayo County 499 365 864 4,106 3,407 7,513 8,377
Total State 17,870 13,813 31,683 130,395 102,178 232,573 264,256
Mayo as % of State 2.80% 2.60% 2.70% 3.10% 3.30% 3.20% 3.20%
Source: Department of Employment Affairs and Social Protection, 2017
According to the CSO Live Register data for August 2017, there were a total of 7,513 persons on the
Live Register in Mayo representing 3.2% of the State total. Of this, 2.7% (n=864) were aged under 25
years and 3.2% (n=7,513) were aged over 25 years. See Table 33 above.
Table 34: Family units with children by size of family
Number of children
Mayo State + or - State
% of all children
under 15
% of all children
under 15
1 child 34.1% 36.8% -
2 children 38.7% 40.1% -
3 children 19.6% 17.7% +
4 children 6.1% 4.4% +
5 or more children 1.5% 1.0% +
Total 100.0% 100.0% Source: Census 2016 (http://census.cso.ie/sapmap2016/Results)
Mayo reported higher percentages of family units with 3 (19.6%), 4 (6.1%) and 5 or more children
(1.5%) compared to the State (17.7%, 4.4% and 1.0% respectively) and lower percentages of family
units with 1 child (34.1%) and 2 children (38.7%) compared to the State (36.8% and 40.1%
respectively). See Table 34 above.
32 See Endnote i, page 159 for explanation of Live Register and Unemployment figures. 33 www.cso.ie LRM07 August 2017
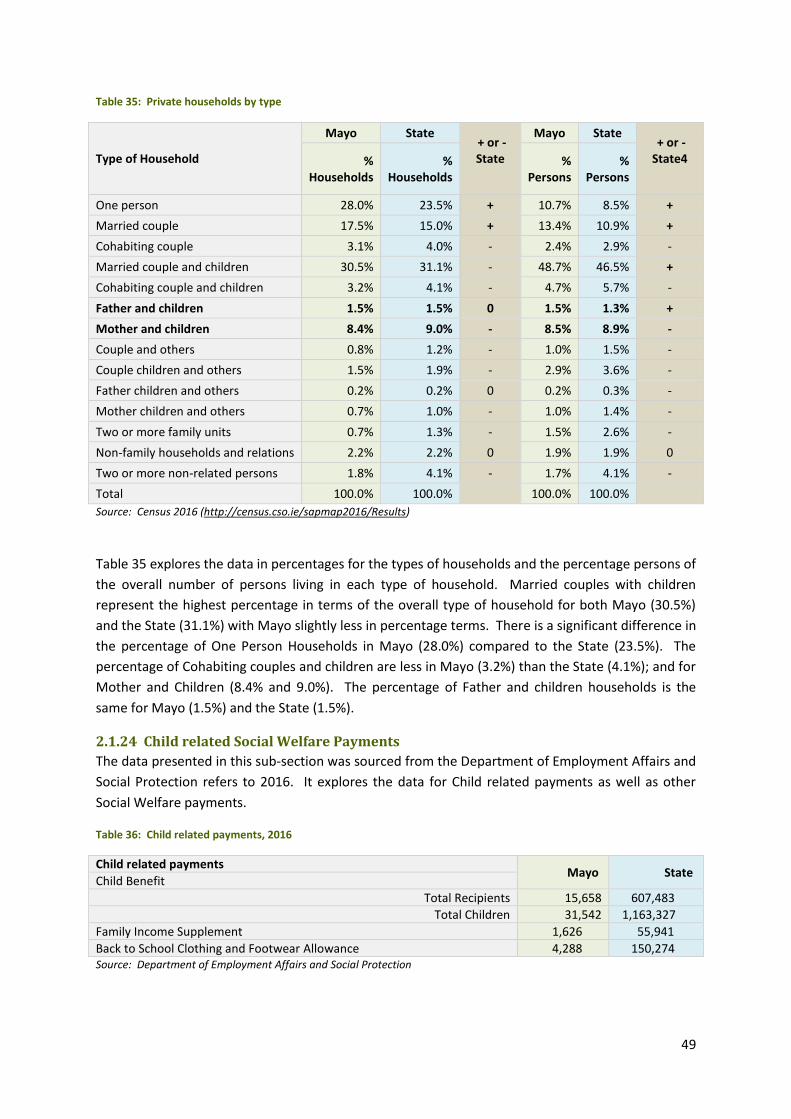
49
Table 35: Private households by type
Type of Household
Mayo State + or - State
Mayo State + or - State4
%
Households %
Households %
Persons %
Persons
One person 28.0% 23.5% + 10.7% 8.5% +
Married couple 17.5% 15.0% + 13.4% 10.9% +
Cohabiting couple 3.1% 4.0% - 2.4% 2.9% -
Married couple and children 30.5% 31.1% - 48.7% 46.5% +
Cohabiting couple and children 3.2% 4.1% - 4.7% 5.7% -
Father and children 1.5% 1.5% 0 1.5% 1.3% +
Mother and children 8.4% 9.0% - 8.5% 8.9% -
Couple and others 0.8% 1.2% - 1.0% 1.5% -
Couple children and others 1.5% 1.9% - 2.9% 3.6% -
Father children and others 0.2% 0.2% 0 0.2% 0.3% -
Mother children and others 0.7% 1.0% - 1.0% 1.4% -
Two or more family units 0.7% 1.3% - 1.5% 2.6% -
Non-family households and relations 2.2% 2.2% 0 1.9% 1.9% 0
Two or more non-related persons 1.8% 4.1% - 1.7% 4.1% -
Total 100.0% 100.0% 100.0% 100.0%
Source: Census 2016 (http://census.cso.ie/sapmap2016/Results)
Table 35 explores the data in percentages for the types of households and the percentage persons of
the overall number of persons living in each type of household. Married couples with children
represent the highest percentage in terms of the overall type of household for both Mayo (30.5%)
and the State (31.1%) with Mayo slightly less in percentage terms. There is a significant difference in
the percentage of One Person Households in Mayo (28.0%) compared to the State (23.5%). The
percentage of Cohabiting couples and children are less in Mayo (3.2%) than the State (4.1%); and for
Mother and Children (8.4% and 9.0%). The percentage of Father and children households is the
same for Mayo (1.5%) and the State (1.5%).
2.1.24 Child related Social Welfare Payments
The data presented in this sub-section was sourced from the Department of Employment Affairs and
Social Protection refers to 2016. It explores the data for Child related payments as well as other
Social Welfare payments.
Table 36: Child related payments, 2016
Child related payments Mayo State
Child Benefit
Total Recipients 15,658 607,483
Total Children 31,542 1,163,327
Family Income Supplement 1,626 55,941
Back to School Clothing and Footwear Allowance 4,288 150,274 Source: Department of Employment Affairs and Social Protection
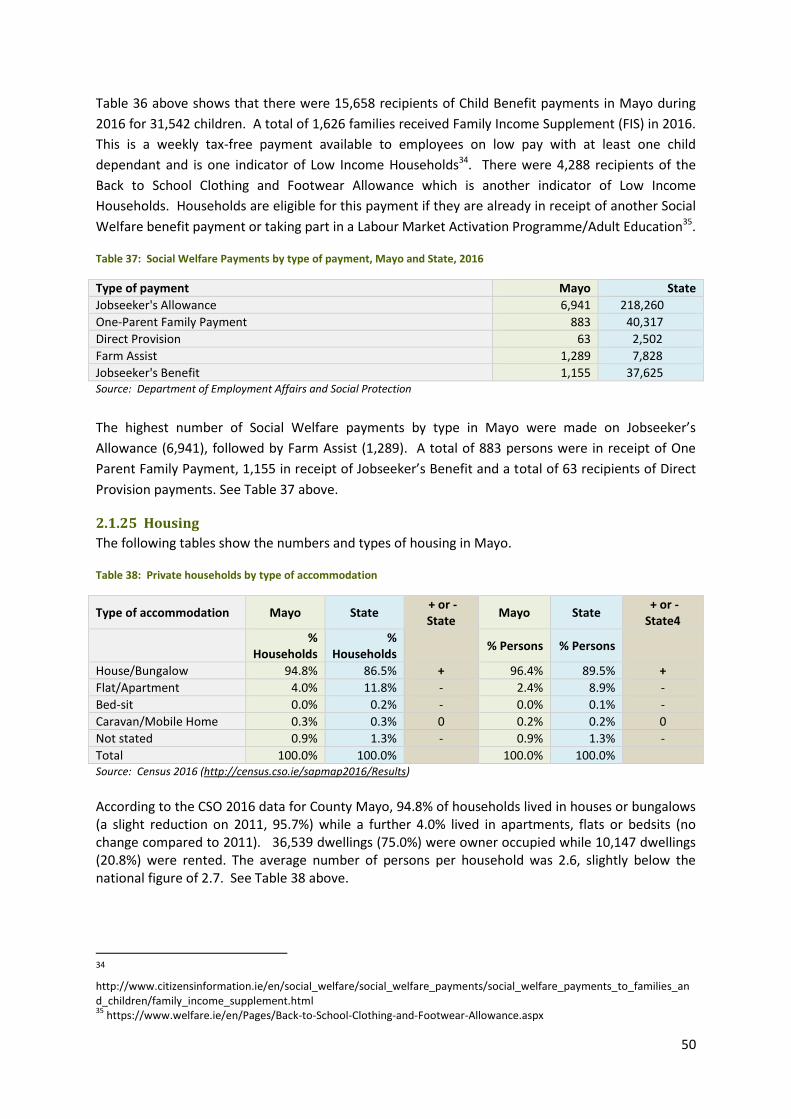
50
Table 36 above shows that there were 15,658 recipients of Child Benefit payments in Mayo during
2016 for 31,542 children. A total of 1,626 families received Family Income Supplement (FIS) in 2016.
This is a weekly tax-free payment available to employees on low pay with at least one child
dependant and is one indicator of Low Income Households34. There were 4,288 recipients of the
Back to School Clothing and Footwear Allowance which is another indicator of Low Income
Households. Households are eligible for this payment if they are already in receipt of another Social
Welfare benefit payment or taking part in a Labour Market Activation Programme/Adult Education35.
Table 37: Social Welfare Payments by type of payment, Mayo and State, 2016
Type of payment Mayo State
Jobseeker's Allowance 6,941 218,260
One-Parent Family Payment 883 40,317
Direct Provision 63 2,502
Farm Assist 1,289 7,828
Jobseeker's Benefit 1,155 37,625 Source: Department of Employment Affairs and Social Protection
The highest number of Social Welfare payments by type in Mayo were made on Jobseeker’s
Allowance (6,941), followed by Farm Assist (1,289). A total of 883 persons were in receipt of One
Parent Family Payment, 1,155 in receipt of Jobseeker’s Benefit and a total of 63 recipients of Direct
Provision payments. See Table 37 above.
2.1.25 Housing
The following tables show the numbers and types of housing in Mayo.
Table 38: Private households by type of accommodation
Type of accommodation Mayo State + or - State
Mayo State + or - State4
%
Households %
Households % Persons % Persons
House/Bungalow 94.8% 86.5% + 96.4% 89.5% +
Flat/Apartment 4.0% 11.8% - 2.4% 8.9% -
Bed-sit 0.0% 0.2% - 0.0% 0.1% -
Caravan/Mobile Home 0.3% 0.3% 0 0.2% 0.2% 0
Not stated 0.9% 1.3% - 0.9% 1.3% -
Total 100.0% 100.0% 100.0% 100.0% Source: Census 2016 (http://census.cso.ie/sapmap2016/Results)
According to the CSO 2016 data for County Mayo, 94.8% of households lived in houses or bungalows (a slight reduction on 2011, 95.7%) while a further 4.0% lived in apartments, flats or bedsits (no change compared to 2011). 36,539 dwellings (75.0%) were owner occupied while 10,147 dwellings (20.8%) were rented. The average number of persons per household was 2.6, slightly below the national figure of 2.7. See Table 38 above.
34 http://www.citizensinformation.ie/en/social_welfare/social_welfare_payments/social_welfare_payments_to_families_and_children/family_income_supplement.html 35
https://www.welfare.ie/en/Pages/Back-to-School-Clothing-and-Footwear-Allowance.aspx
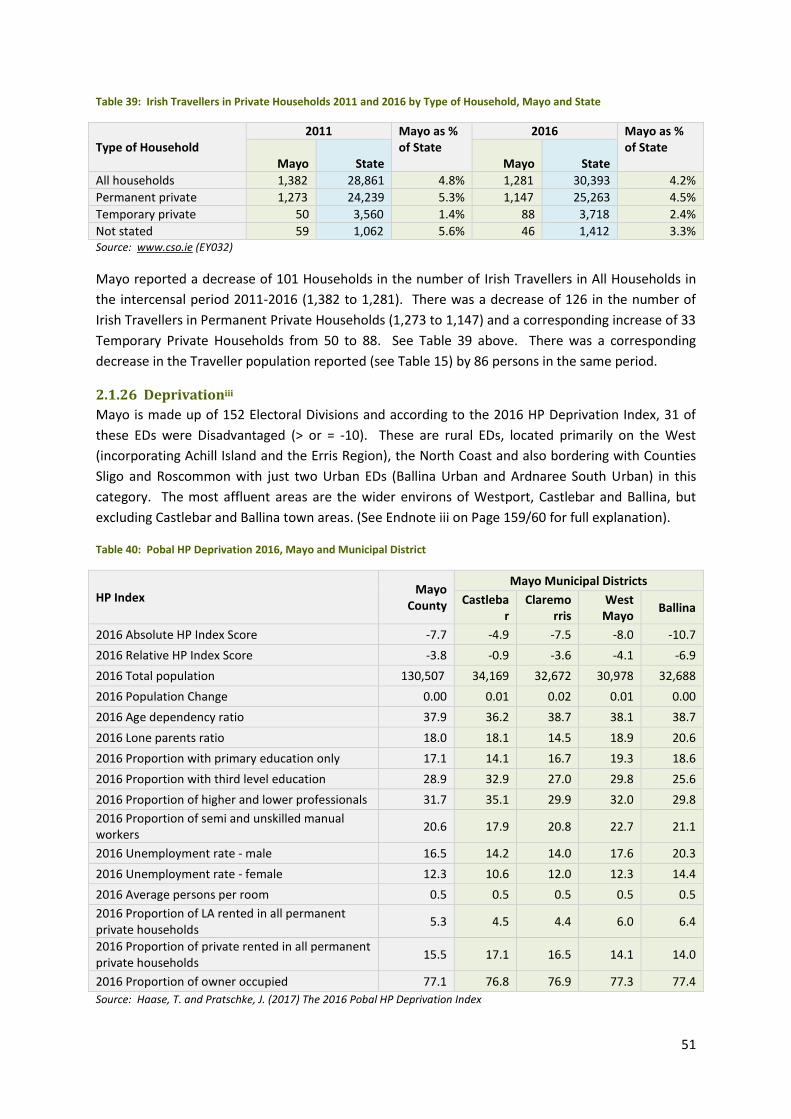
51
Table 39: Irish Travellers in Private Households 2011 and 2016 by Type of Household, Mayo and State
Type of Household
2011 Mayo as % of State
2016 Mayo as % of State
Mayo State Mayo State
All households 1,382 28,861 4.8% 1,281 30,393 4.2%
Permanent private 1,273 24,239 5.3% 1,147 25,263 4.5%
Temporary private 50 3,560 1.4% 88 3,718 2.4%
Not stated 59 1,062 5.6% 46 1,412 3.3% Source: www.cso.ie (EY032)
Mayo reported a decrease of 101 Households in the number of Irish Travellers in All Households in
the intercensal period 2011-2016 (1,382 to 1,281). There was a decrease of 126 in the number of
Irish Travellers in Permanent Private Households (1,273 to 1,147) and a corresponding increase of 33
Temporary Private Households from 50 to 88. See Table 39 above. There was a corresponding
decrease in the Traveller population reported (see Table 15) by 86 persons in the same period.
2.1.26 Deprivationiii
Mayo is made up of 152 Electoral Divisions and according to the 2016 HP Deprivation Index, 31 of
these EDs were Disadvantaged (> or = -10). These are rural EDs, located primarily on the West
(incorporating Achill Island and the Erris Region), the North Coast and also bordering with Counties
Sligo and Roscommon with just two Urban EDs (Ballina Urban and Ardnaree South Urban) in this
category. The most affluent areas are the wider environs of Westport, Castlebar and Ballina, but
excluding Castlebar and Ballina town areas. (See Endnote iii on Page 159/60 for full explanation).
Table 40: Pobal HP Deprivation 2016, Mayo and Municipal District
HP Index Mayo
County
Mayo Municipal Districts
Castlebar
Claremorris
West Mayo
Ballina
2016 Absolute HP Index Score -7.7 -4.9 -7.5 -8.0 -10.7
2016 Relative HP Index Score -3.8 -0.9 -3.6 -4.1 -6.9
2016 Total population 130,507 34,169 32,672 30,978 32,688
2016 Population Change 0.00 0.01 0.02 0.01 0.00
2016 Age dependency ratio 37.9 36.2 38.7 38.1 38.7
2016 Lone parents ratio 18.0 18.1 14.5 18.9 20.6
2016 Proportion with primary education only 17.1 14.1 16.7 19.3 18.6
2016 Proportion with third level education 28.9 32.9 27.0 29.8 25.6
2016 Proportion of higher and lower professionals 31.7 35.1 29.9 32.0 29.8
2016 Proportion of semi and unskilled manual workers
20.6 17.9 20.8 22.7 21.1
2016 Unemployment rate - male 16.5 14.2 14.0 17.6 20.3
2016 Unemployment rate - female 12.3 10.6 12.0 12.3 14.4
2016 Average persons per room 0.5 0.5 0.5 0.5 0.5
2016 Proportion of LA rented in all permanent private households
5.3 4.5 4.4 6.0 6.4
2016 Proportion of private rented in all permanent private households
15.5 17.1 16.5 14.1 14.0
2016 Proportion of owner occupied 77.1 76.8 76.9 77.3 77.4
Source: Haase, T. and Pratschke, J. (2017) The 2016 Pobal HP Deprivation Index
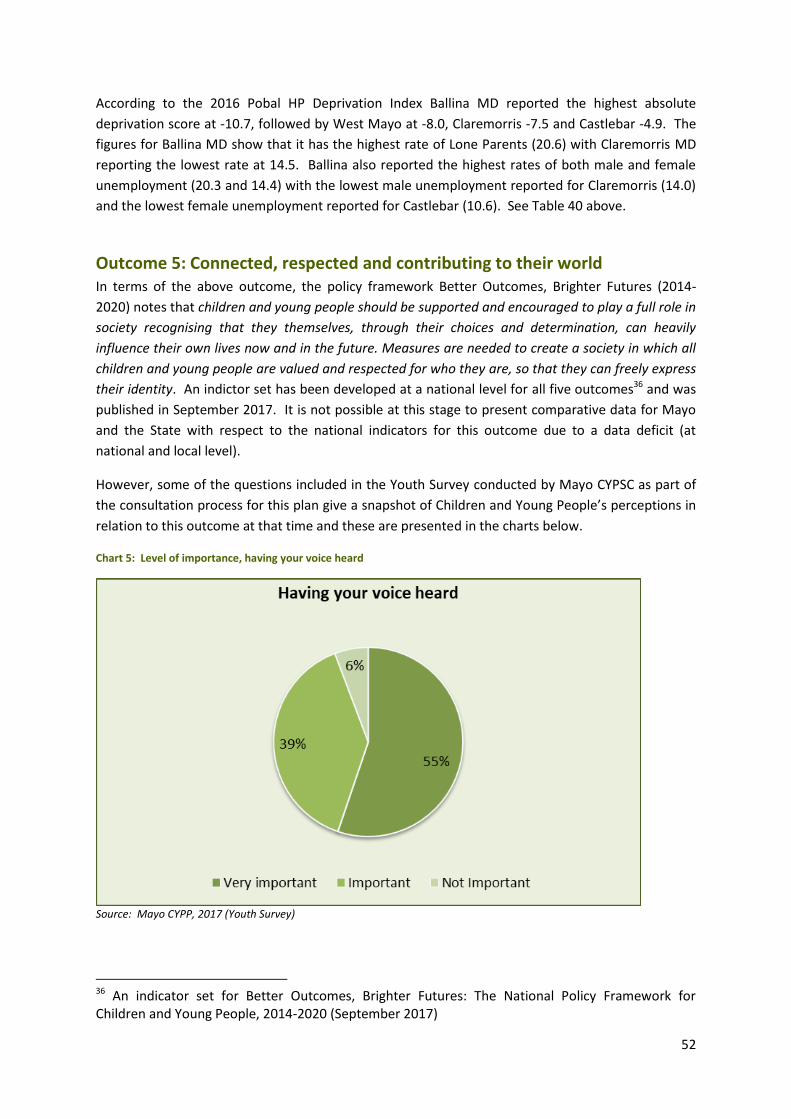
52
According to the 2016 Pobal HP Deprivation Index Ballina MD reported the highest absolute
deprivation score at -10.7, followed by West Mayo at -8.0, Claremorris -7.5 and Castlebar -4.9. The
figures for Ballina MD show that it has the highest rate of Lone Parents (20.6) with Claremorris MD
reporting the lowest rate at 14.5. Ballina also reported the highest rates of both male and female
unemployment (20.3 and 14.4) with the lowest male unemployment reported for Claremorris (14.0)
and the lowest female unemployment reported for Castlebar (10.6). See Table 40 above.
Outcome 5: Connected, respected and contributing to their world In terms of the above outcome, the policy framework Better Outcomes, Brighter Futures (2014-
2020) notes that children and young people should be supported and encouraged to play a full role in
society recognising that they themselves, through their choices and determination, can heavily
influence their own lives now and in the future. Measures are needed to create a society in which all
children and young people are valued and respected for who they are, so that they can freely express
their identity. An indictor set has been developed at a national level for all five outcomes36 and was
published in September 2017. It is not possible at this stage to present comparative data for Mayo
and the State with respect to the national indicators for this outcome due to a data deficit (at
national and local level).
However, some of the questions included in the Youth Survey conducted by Mayo CYPSC as part of
the consultation process for this plan give a snapshot of Children and Young People’s perceptions in
relation to this outcome at that time and these are presented in the charts below.
Chart 5: Level of importance, having your voice heard
Source: Mayo CYPP, 2017 (Youth Survey)
36 An indicator set for Better Outcomes, Brighter Futures: The National Policy Framework for Children and Young People, 2014-2020 (September 2017)
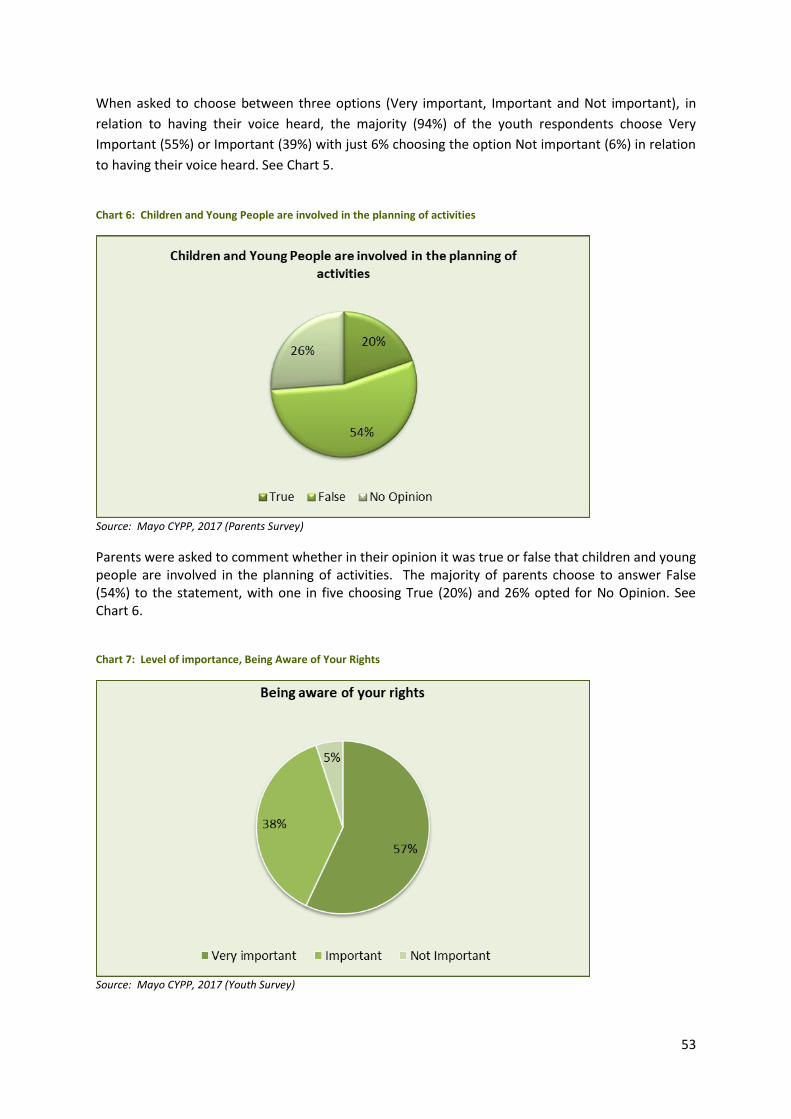
53
When asked to choose between three options (Very important, Important and Not important), in
relation to having their voice heard, the majority (94%) of the youth respondents choose Very
Important (55%) or Important (39%) with just 6% choosing the option Not important (6%) in relation
to having their voice heard. See Chart 5.
Chart 6: Children and Young People are involved in the planning of activities
Source: Mayo CYPP, 2017 (Parents Survey)
Parents were asked to comment whether in their opinion it was true or false that children and young people are involved in the planning of activities. The majority of parents choose to answer False (54%) to the statement, with one in five choosing True (20%) and 26% opted for No Opinion. See Chart 6. Chart 7: Level of importance, Being Aware of Your Rights
Source: Mayo CYPP, 2017 (Youth Survey)

54
When asked to choose between three options (Very important, Important and Not important), the
majority (95%) of the youth respondents choose Very Important (57%) or Important (38%) with just
5% choosing the option Not important (6%) in relation to being aware of their rights. See Chart 7.
Chart 8: What is very important to young people
Source: Mayo CYPSC Youth Survey, 2017
According to the young people that responded to the survey, Good physical and mental health is
very important to them, followed by Feeling safe and secure and Safe and protected from bullying
and harm.
2.1.27 Key findings from Socio Demographic Profile
Mayo reported a slightly lower percentage (of the overall population) of Children and Young People
aged 0-24 years (31.2%) compared to the State (33.2%) in 2016.
Mayo reported a lower percentage (of the overall population) of children aged 0-17 years (24.5%)
compared to the State (25.0%) in 2016.
Mayo reported a significantly lower percentage of young people (of the overall population) aged 18 -
24 years (6.7%) compared to the State (8.2%) in 2016.
The percentage of children and young people by ethnicity or cultural background was lower for Mayo
(14.1%) compared to the State (16.1%) in 2011.
Mayo reported a higher rate (per 1,000) of Traveller children (14.1) in 2011 compared to the State
(16.1) in 2011.
55
Mayo reported a higher rate (per 1,000) of foreign national children in 2011 (84.3) compared to the
State (82.5) in 2011.
Mayo reported a significantly higher rate (per 1,000) of children registered as having a physical or
sensory disability (11.8) compared to the State (5.4)
Mayo reported a lower percentage of children living in a lone-parent household (14.2%) compared to
the State (18.3%) in 2011.
Mayo reported a significantly higher annual estimated Net Migration in the intercensal period 2006
to 2016 per 1,000 of average population (-5.0) compared to the State (-1.2).
The Youth Dependency ratio was comparable between Mayo (32.8) and the State (32.3) in 2016.
Mayo reported the third highest rate per 1,000 of Young Carers in the country at 7.2 (number = 234)
and was significantly higher than the rate reported for the State (5.6).
There were 73 fewer births in 2015 compared to 2014 in Co Mayo, representing a decrease of 4.42%
which is higher than the national decrease of 2.06% for births in that same period.
Mayo reported a lower percentage of infants in 2015 that were breastfed (either exclusive or
combined) on discharge from hospital (54.8%) compared to the State (58.0%).
Mayo reported a marginally lower percentage of Low birth weight babies as a percentage of all
births (5.5%) compared to the State (5.9%) in 2014.
The percentage of children who had been vaccinated at two years of age in Mayo (92.2%) was in line
with the State (92.4%) in 2014.
In Mayo the percentage of Early Childhood Care Education contracts with community based
organisations was significantly higher than the State (37% compared to 25% respectively) in 2016.
The average percentage of primary school children absent from school for 20 days or more in the
school year 2015/16 was lower in Mayo (5.4) compared to the State (5.8).
The Leaving Certificate retention rates reported for Mayo in the school year 2014/15 was higher
than the State (91.4% and 90.2% respectively).
The mean of post-primary school children per school who were absent from school for 20 days or
more in the school year 2013/14 in Mayo was 8.8 which marginally higher than the State at 8.2.
The percentage of mothers that had finished school at lower secondary or before, was lower in
Mayo (17.2%) compared to the State (19.0%).
Mayo reported a significantly lower rate per 1,000 of Child Protection referrals in 2016 (26)
compared to the State (41).
At the end of March 2017, Mayo reported a higher rate per 10,000 children (16) than the State (11)
that was listed as ‘active’ on the Child Protection Notification System (CPNS).
56
At the end of 2016, Mayo reported a slightly lower rate (4.4) than the State (5.5) of children in care
per 10,000 population.
Nationally, there was a reduction of 2% in relation to young people being referred to Garda
Diversion Projects and this was significantly lower for County Mayo (-23%).
At the time of the 2016 Census, a lower percentage of the overall population in Mayo (49.5%) were
at work compared to the State (53.4%).
Mayo reported slightly higher percentages of family units with children by size of family with 4
children (4.6%) and 5 or more children (1.7%) compared to the State (3.9% and 1.2%).
In 2016, Mayo reported a significantly higher rate of Absolute Deprivation (-7.7) compared to the
State (-3.6) according to the Pobal HP Deprivation Index.
In 2016, Mayo reported a significantly higher rate of Relative Deprivation (-3.8) compared to the
State (-0.4) according to the Pobal HP Deprivation Index.
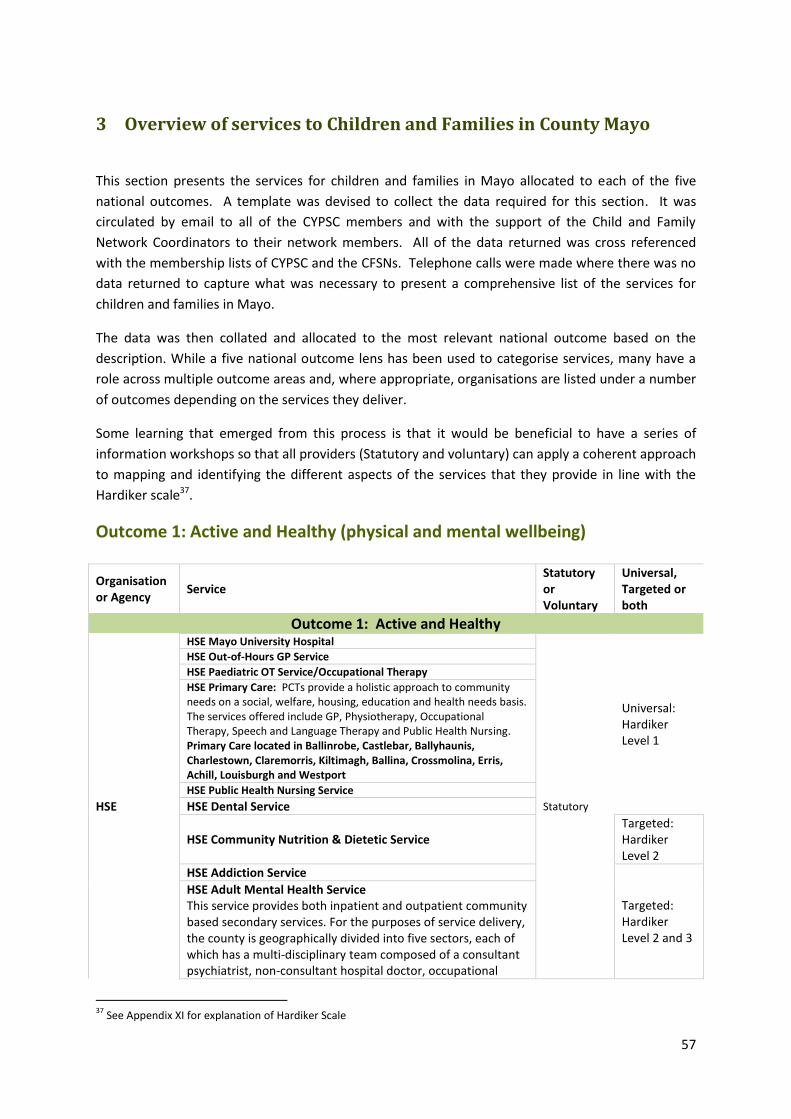
57
3 Overview of services to Children and Families in County Mayo
This section presents the services for children and families in Mayo allocated to each of the five
national outcomes. A template was devised to collect the data required for this section. It was
circulated by email to all of the CYPSC members and with the support of the Child and Family
Network Coordinators to their network members. All of the data returned was cross referenced
with the membership lists of CYPSC and the CFSNs. Telephone calls were made where there was no
data returned to capture what was necessary to present a comprehensive list of the services for
children and families in Mayo.
The data was then collated and allocated to the most relevant national outcome based on the
description. While a five national outcome lens has been used to categorise services, many have a
role across multiple outcome areas and, where appropriate, organisations are listed under a number
of outcomes depending on the services they deliver.
Some learning that emerged from this process is that it would be beneficial to have a series of
information workshops so that all providers (Statutory and voluntary) can apply a coherent approach
to mapping and identifying the different aspects of the services that they provide in line with the
Hardiker scale37.
Outcome 1: Active and Healthy (physical and mental wellbeing)
Organisation or Agency
Service Statutory or Voluntary
Universal, Targeted or both
Outcome 1: Active and Healthy
HSE
HSE Mayo University Hospital
Statutory
Universal: Hardiker Level 1
HSE Out-of-Hours GP Service
HSE Paediatric OT Service/Occupational Therapy
HSE Primary Care: PCTs provide a holistic approach to community needs on a social, welfare, housing, education and health needs basis. The services offered include GP, Physiotherapy, Occupational Therapy, Speech and Language Therapy and Public Health Nursing. Primary Care located in Ballinrobe, Castlebar, Ballyhaunis, Charlestown, Claremorris, Kiltimagh, Ballina, Crossmolina, Erris, Achill, Louisburgh and Westport
HSE Public Health Nursing Service
HSE Dental Service
HSE Community Nutrition & Dietetic Service Targeted: Hardiker Level 2
HSE Addiction Service
Targeted: Hardiker Level 2 and 3
HSE Adult Mental Health Service This service provides both inpatient and outpatient community based secondary services. For the purposes of service delivery, the county is geographically divided into five sectors, each of which has a multi-disciplinary team composed of a consultant psychiatrist, non-consultant hospital doctor, occupational
37
See Appendix XI for explanation of Hardiker Scale
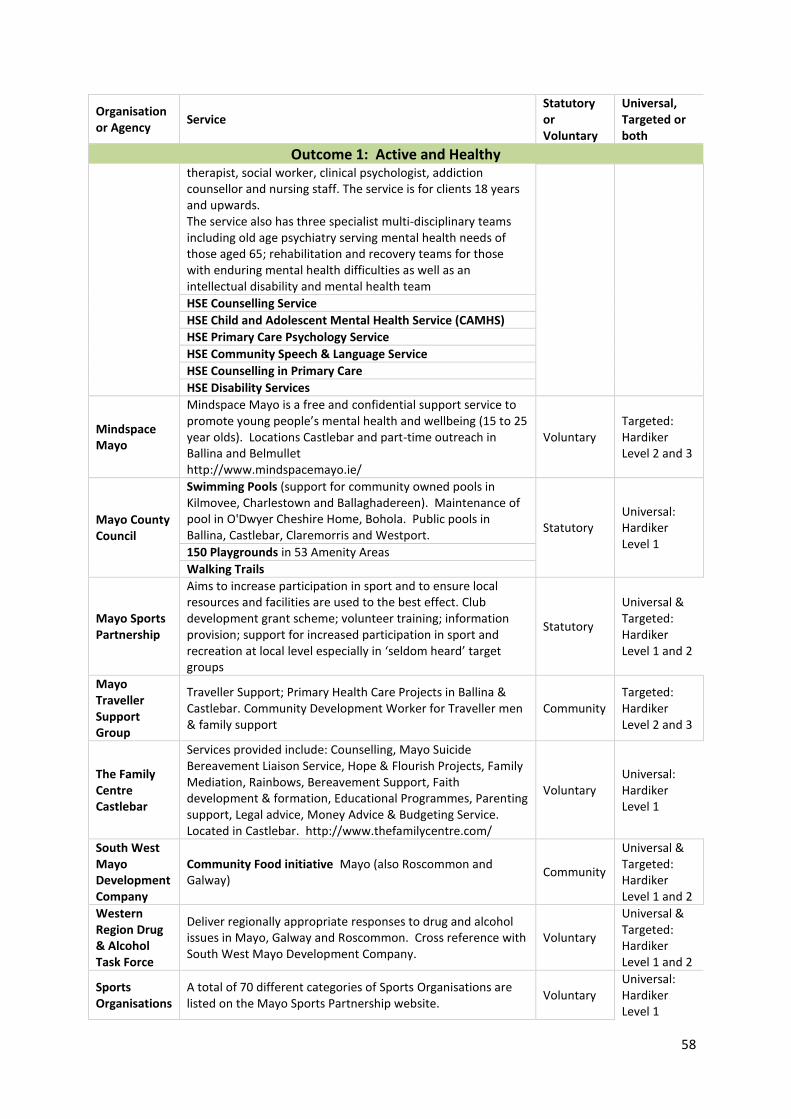
58
Organisation or Agency
Service Statutory or Voluntary
Universal, Targeted or both
Outcome 1: Active and Healthy
therapist, social worker, clinical psychologist, addiction counsellor and nursing staff. The service is for clients 18 years and upwards. The service also has three specialist multi-disciplinary teams including old age psychiatry serving mental health needs of those aged 65; rehabilitation and recovery teams for those with enduring mental health difficulties as well as an intellectual disability and mental health team
HSE Counselling Service
HSE Child and Adolescent Mental Health Service (CAMHS)
HSE Primary Care Psychology Service
HSE Community Speech & Language Service
HSE Counselling in Primary Care
HSE Disability Services
Mindspace Mayo
Mindspace Mayo is a free and confidential support service to promote young people’s mental health and wellbeing (15 to 25 year olds). Locations Castlebar and part-time outreach in Ballina and Belmullet http://www.mindspacemayo.ie/
Voluntary Targeted: Hardiker Level 2 and 3
Mayo County Council
Swimming Pools (support for community owned pools in Kilmovee, Charlestown and Ballaghadereen). Maintenance of pool in O'Dwyer Cheshire Home, Bohola. Public pools in Ballina, Castlebar, Claremorris and Westport.
Statutory Universal: Hardiker Level 1
150 Playgrounds in 53 Amenity Areas
Walking Trails
Mayo Sports Partnership
Aims to increase participation in sport and to ensure local resources and facilities are used to the best effect. Club development grant scheme; volunteer training; information provision; support for increased participation in sport and recreation at local level especially in ‘seldom heard’ target groups
Statutory
Universal & Targeted: Hardiker Level 1 and 2
Mayo Traveller Support Group
Traveller Support; Primary Health Care Projects in Ballina & Castlebar. Community Development Worker for Traveller men & family support
Community Targeted: Hardiker Level 2 and 3
The Family Centre Castlebar
Services provided include: Counselling, Mayo Suicide Bereavement Liaison Service, Hope & Flourish Projects, Family Mediation, Rainbows, Bereavement Support, Faith development & formation, Educational Programmes, Parenting support, Legal advice, Money Advice & Budgeting Service. Located in Castlebar. http://www.thefamilycentre.com/
Voluntary Universal: Hardiker Level 1
South West Mayo Development Company
Community Food initiative Mayo (also Roscommon and Galway)
Community
Universal & Targeted: Hardiker Level 1 and 2
Western Region Drug & Alcohol Task Force
Deliver regionally appropriate responses to drug and alcohol issues in Mayo, Galway and Roscommon. Cross reference with South West Mayo Development Company.
Voluntary
Universal & Targeted: Hardiker Level 1 and 2
Sports Organisations
A total of 70 different categories of Sports Organisations are listed on the Mayo Sports Partnership website.
Voluntary Universal: Hardiker Level 1
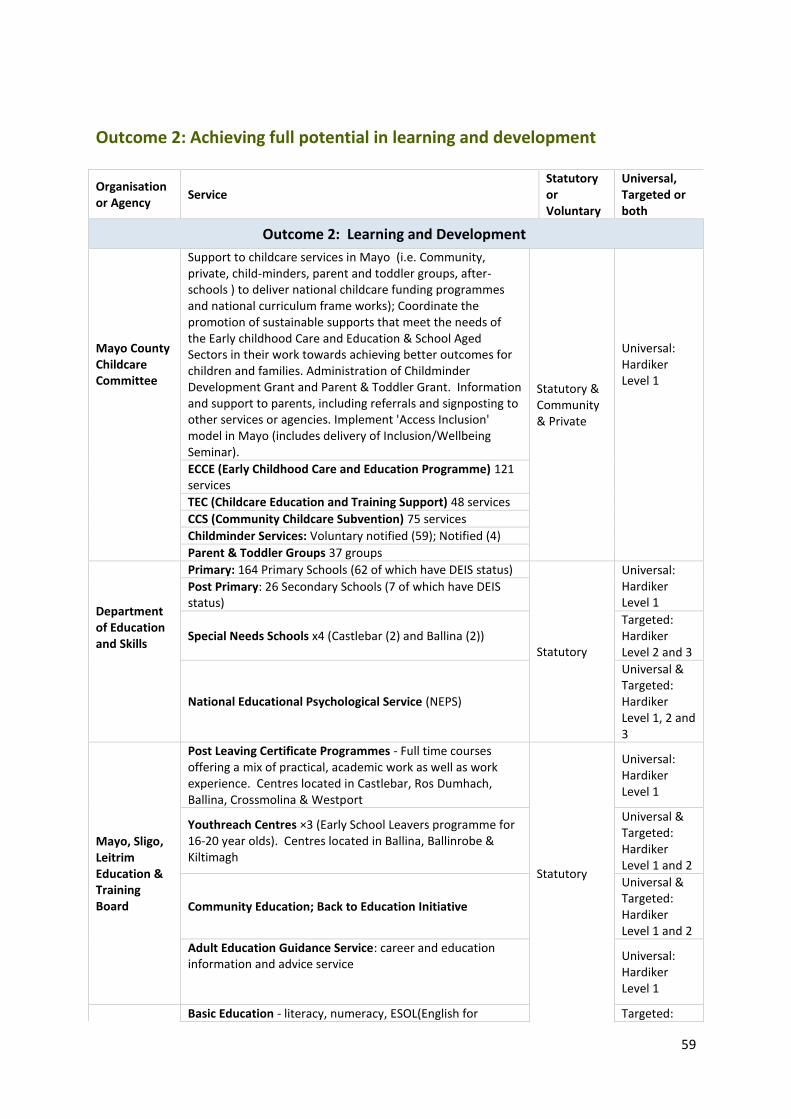
59
Outcome 2: Achieving full potential in learning and development
Organisation or Agency
Service Statutory or Voluntary
Universal, Targeted or both
Outcome 2: Learning and Development
Mayo County Childcare Committee
Support to childcare services in Mayo (i.e. Community, private, child-minders, parent and toddler groups, after-schools ) to deliver national childcare funding programmes and national curriculum frame works); Coordinate the promotion of sustainable supports that meet the needs of the Early childhood Care and Education & School Aged Sectors in their work towards achieving better outcomes for children and families. Administration of Childminder Development Grant and Parent & Toddler Grant. Information and support to parents, including referrals and signposting to other services or agencies. Implement 'Access Inclusion' model in Mayo (includes delivery of Inclusion/Wellbeing Seminar).
Statutory & Community & Private
Universal: Hardiker Level 1
ECCE (Early Childhood Care and Education Programme) 121 services
TEC (Childcare Education and Training Support) 48 services
CCS (Community Childcare Subvention) 75 services
Childminder Services: Voluntary notified (59); Notified (4)
Parent & Toddler Groups 37 groups
Department of Education and Skills
Primary: 164 Primary Schools (62 of which have DEIS status)
Statutory
Universal: Hardiker Level 1
Post Primary: 26 Secondary Schools (7 of which have DEIS status)
Special Needs Schools x4 (Castlebar (2) and Ballina (2)) Targeted: Hardiker Level 2 and 3
National Educational Psychological Service (NEPS)
Universal & Targeted: Hardiker Level 1, 2 and 3
Mayo, Sligo, Leitrim Education & Training Board
Post Leaving Certificate Programmes - Full time courses offering a mix of practical, academic work as well as work experience. Centres located in Castlebar, Ros Dumhach, Ballina, Crossmolina & Westport
Statutory
Universal: Hardiker Level 1
Youthreach Centres ×3 (Early School Leavers programme for 16-20 year olds). Centres located in Ballina, Ballinrobe & Kiltimagh
Universal & Targeted: Hardiker Level 1 and 2
Community Education; Back to Education Initiative
Universal & Targeted: Hardiker Level 1 and 2
Adult Education Guidance Service: career and education information and advice service
Universal: Hardiker Level 1
Basic Education - literacy, numeracy, ESOL(English for Targeted:
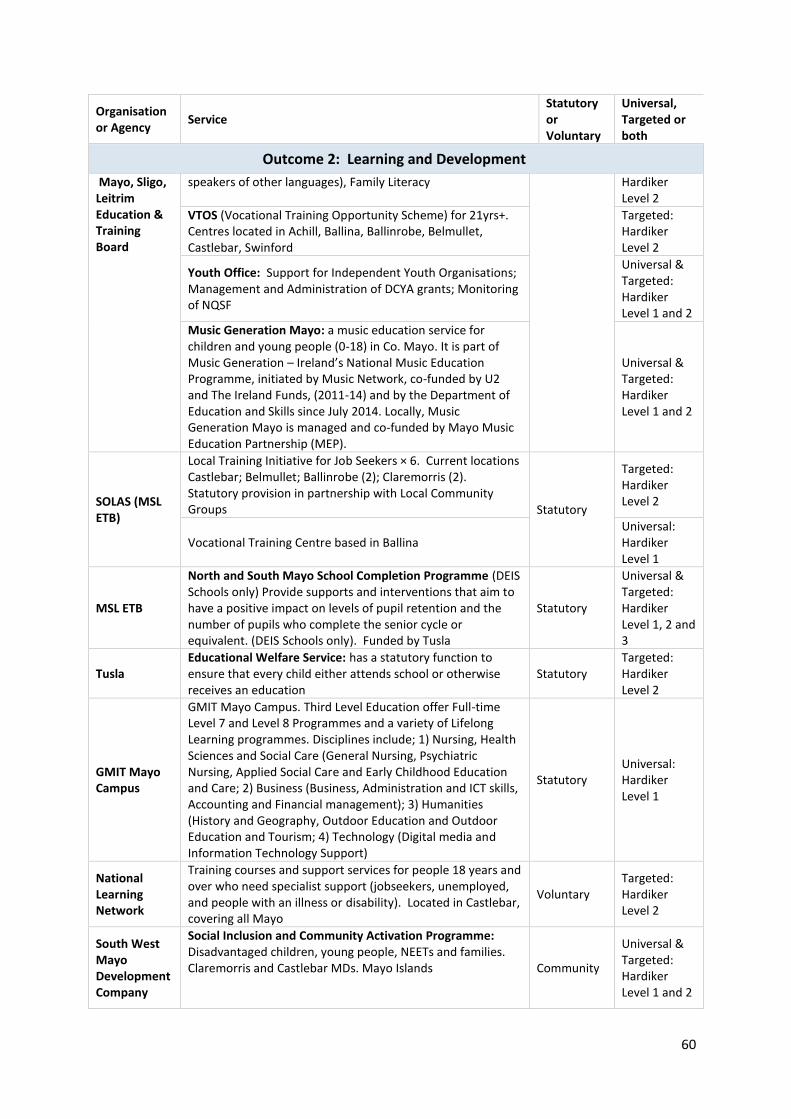
60
Organisation or Agency
Service Statutory or Voluntary
Universal, Targeted or both
Outcome 2: Learning and Development
Mayo, Sligo, Leitrim Education & Training Board
speakers of other languages), Family Literacy
Hardiker Level 2
VTOS (Vocational Training Opportunity Scheme) for 21yrs+. Centres located in Achill, Ballina, Ballinrobe, Belmullet, Castlebar, Swinford
Targeted: Hardiker Level 2
Youth Office: Support for Independent Youth Organisations; Management and Administration of DCYA grants; Monitoring of NQSF
Universal & Targeted: Hardiker Level 1 and 2
Music Generation Mayo: a music education service for children and young people (0-18) in Co. Mayo. It is part of Music Generation – Ireland’s National Music Education Programme, initiated by Music Network, co-funded by U2 and The Ireland Funds, (2011-14) and by the Department of Education and Skills since July 2014. Locally, Music Generation Mayo is managed and co-funded by Mayo Music Education Partnership (MEP).
Universal & Targeted: Hardiker Level 1 and 2
SOLAS (MSL ETB)
Local Training Initiative for Job Seekers × 6. Current locations Castlebar; Belmullet; Ballinrobe (2); Claremorris (2). Statutory provision in partnership with Local Community Groups Statutory
Targeted: Hardiker Level 2
Vocational Training Centre based in Ballina Universal: Hardiker Level 1
MSL ETB
North and South Mayo School Completion Programme (DEIS Schools only) Provide supports and interventions that aim to have a positive impact on levels of pupil retention and the number of pupils who complete the senior cycle or equivalent. (DEIS Schools only). Funded by Tusla
Statutory
Universal & Targeted: Hardiker Level 1, 2 and 3
Tusla Educational Welfare Service: has a statutory function to ensure that every child either attends school or otherwise receives an education
Statutory Targeted: Hardiker Level 2
GMIT Mayo Campus
GMIT Mayo Campus. Third Level Education offer Full-time Level 7 and Level 8 Programmes and a variety of Lifelong Learning programmes. Disciplines include; 1) Nursing, Health Sciences and Social Care (General Nursing, Psychiatric Nursing, Applied Social Care and Early Childhood Education and Care; 2) Business (Business, Administration and ICT skills, Accounting and Financial management); 3) Humanities (History and Geography, Outdoor Education and Outdoor Education and Tourism; 4) Technology (Digital media and Information Technology Support)
Statutory Universal: Hardiker Level 1
National Learning Network
Training courses and support services for people 18 years and over who need specialist support (jobseekers, unemployed, and people with an illness or disability). Located in Castlebar, covering all Mayo
Voluntary Targeted: Hardiker Level 2
South West Mayo Development Company
Social Inclusion and Community Activation Programme: Disadvantaged children, young people, NEETs and families. Claremorris and Castlebar MDs. Mayo Islands
Community
Universal & Targeted: Hardiker Level 1 and 2
61
Organisation or Agency
Service Statutory or Voluntary
Universal, Targeted or both
Outcome 2: Learning and Development
Mayo North East LEADER Partnership Company
Social Inclusion and Community Activation Programme: Disadvantaged children, young people, NEETs and families. Ballina and West Mayo Municipal Districts
Community
Universal & Targeted: Hardiker Level 1 and 2
Mayo County Council
Libraries: extends across the county. Achill, Ballina, Ballinrobe, Ballyhaunis, Belmullet, Castlebar, Charlestown, Claremorris, Clare Island, Crossmolina, Foxford, Kilkelly, Kiltimagh, Louisburgh, Swinford, Westport
Statutory
Universal: Hardiker Level 1
Community & Integrated Development: Mayo Science and Technology week (promoting STEM to young people)
Foróige
Voluntary Youth Clubs: Aughamore, Ballina, Ballyhaunis, Ballyheane, Belcarra, Brickens, Cloontia, Cong, Fahy, Foxford, Keenagh, Kilmovee, Kiltimagh, Louisburgh, Mayo Abbey, Moygownagh, Newport, Tooreen, Turlough
Voluntary Universal: Hardiker Level 1
Involve Youth Service Ballina
Support for Young Travellers located in Ballina town. Community Targeted: Hardiker Level 2 and 3
North Connaught Youth and Community Service
North Mayo Youth Project located in Ballina town. (c/f with An Garda Siochána Youth Action Projects
Voluntary
Universal & Targeted: Hardiker Level 1 and 2
Maple Youth Centre
Provides supports, services and advice to young people (including Youth Booth Café) located in Ballinrobe town.
Community
Universal & Targeted: Hardiker Level 1, 2 and 3
Outcome 3: Safe and protected from harm
Organisation or Agency
Service Statutory or Voluntary
Universal, Targeted or both
Outcome 3: Safe and protected from Harm
Tusla
Child Protection and Welfare
Tusla Children First Information and Advice Officer Statutory Universal: Hardiker Level 1
Tusla Social Work Department promotes the welfare and safety of children living in Mayo.
Statutory Targeted: Hardiker Level 4
Foster Care: Placement and Support for children, foster parents and parents/relatives. It assesses potential foster parents.
Statutory
Targeted: Hardiker Level 2, 3 and 4
62
Organisation or Agency
Service Statutory or Voluntary
Universal, Targeted or both
Outcome 3: Safe and protected from Harm
Alternative Care: Provide placements for children where parents are not able to manage and ask for assistance. Provide placements where a court has decided that a child needs to be in care to prevent them from harm.
Statutory
Targeted: Hardiker Level 2, 3 and 4
Tusla
Community & Family Based Support
The Edge: Works with young people aged 10-17 years who present with challenging and risky behaviours.
Statutory Targeted: Hardiker Level 2 and 3
Early Years’ Service: Works in partnership with parents of children aged 0 - 6 years where there is an identified child protection / welfare concern.
Statutory Targeted: Hardiker Level 2 and 3
Community Based Family Support Service: Through a partnership approach with parents, the service builds on families’ strengths, promotes positive behaviours through teaching social skills, develops positive relations and empowers parents to gain self-discipline and self-control. Located in Ballyhaunis; Ballina; Ballinrobe; Claremorris; Westport
Voluntary Targeted: Hardiker Level 2 and 3
Family Resource Centres (FRC); To combat disadvantage and to support families and build communities through the principles of community development. Located in Ballina; Ballinrobe; Ballyhaunis; Castlebar; Claremorris; Kilmovee and Westport. Core funding from Tusla.
Voluntary
Universal & Targeted: Hardiker Level 1, 2 and 3
Family Focus: Works in partnership with parents and young people in a family support context.
Statutory Targeted: Hardiker Level 2 and 3
Play Therapy: Provides a child with an opportunity to 'play out' their thoughts, feelings and problems.
Statutory Targeted: Hardiker Level 2 and 3
Meitheal is a National Practice Model which ensures that the needs and strengths of children and their families are effectively identified, understood and responded to in a timely way so that children and families get the help and support needed to improve children’s outcomes.
Statutory Targeted: Hardiker Level 2 and 3
Common Sense Parenting: Six week evidence informed parenting course supporting parents of children/young people aged 2- 5/6-16 years to increase positive behaviours
Statutory/voluntary
Universal & Targeted: Hardiker Level 1, 2 and 3
Foróige Youth and Family Support Service located in Ballina, Castlebar and Westport
Voluntary Targeted: Hardiker Level 2&3
Mayo Woman's Support Services
A free, confidential service to all women and children whose lives have been affected by domestic violence. Supports include refuge accommodation outreach appointments throughout the County, information on rights and entitlements (Legal, Financial and Housing). Core funding from Tusla (Domestic, Sexual and Gender Based Violence)
Voluntary
Universal & Targeted: Hardiker Level 1, 2 and 3
Mayo Rape Mayo Rape Crisis Centre offers free and confidential Voluntary Targeted:

63
Organisation or Agency
Service Statutory or Voluntary
Universal, Targeted or both
Outcome 3: Safe and protected from Harm
Crisis Centre counselling, support and advocacy to all victims of sexual violence (rape, sexual assault, and child sexual abuse). We also work with the partners, parents, siblings and friends of victims. We work with survivors of trafficking, prostitution and female mutilation. We also offer training, education and awareness raising workshops to other professionals and community groups.
Hardiker Level 2 and 3
ISPCC
Listening, supporting and protecting young people via ChildLine support line; Child and Family Support Service, Mentoring Programme for children and parents, Missing Children's Hotline and Advocacy on behalf of children in Ireland
Voluntary
Universal & Targeted: Hardiker Level 1, 2, 3 and 4
Probation Service
Community Services for 16 years and over as an alternative to custody. Individual placements and supervised placements.
Statutory
Targeted: Hardiker Level 3
Sex Offender Risk and Management Committee (SORAM): 6-weekly meeting of Gardaí, Probation & Tusla)
Targeted: Hardiker Level 4
An Garda Siochána
Garda Stations × 29 (full and part-time) (5 Districts - Ballina, Belmullet, Castlebar, Claremorris, and Westport)
Statutory
Universal: Hardiker Level 1
Garda Youth Diversion Projects are community based and supported youth development projects which aim to divert young people (aged 12-18 years) from becoming involved (or further involved) in anti-social or criminal behaviour. These projects are a partnership between the Irish Youth Justice Service, Gardaí and North Connaught Youth and Community Service. Youth Action Projects located in Ballina and Castlebar. Juvenile Liaison Officers (x 2) located in Castlebar & Swinford.
Targeted: Hardiker Level 2 and 3
Mayo County Council
Roads and Water Safety: Road Safety Officer - delivers safety awareness programmes with schools
Statutory Universal: Hardiker Level 1
Outcome 4: Economic security and opportunity
Organisation or Agency
Service Statutory or Voluntary
Universal, Targeted or both
Outcome 4: Economic Security and Opportunity
Western Care
Empowerment of people with a wide range of learning and associated disabilities in Co. Mayo to live full and satisfied lives as equal citizens. Western Care provides targeted support to children and adults with learning disabilities, and to their families
Voluntary Targeted: Hardiker Level 2
Rehab Care Social services for people with disabilities (18-65) and their Voluntary Targeted:
64
Organisation or Agency
Service Statutory or Voluntary
Universal, Targeted or both
Outcome 4: Economic Security and Opportunity
families. Located in Castlebar, covering all Mayo Hardiker Level 2 and 3
South West Mayo Development Company
Rural Development Programme (LEADER) South and West Mayo
Community
Universal: Hardiker Level 1
Western Region Drugs & Alcohol Task Force (WRDTF) funded posts. Mayo (Also Part of Roscommon)
Universal & Targeted: Hardiker Level 1 and 2
Labour Market Activation Programmes: Community Employment (CE); Tús South and West Mayo
Universal & Targeted: Hardiker Level 1 and 2
Rural Social Scheme for rural dwellers. South and West Mayo
Universal & Targeted: Hardiker Level 1 and 2
Foundation for Life: Activation and part-time training programme for NEETS.
Universal: Hardiker Level 1
Mayo North East LEADER Partnership Company
Rural Development Programme (LEADER). North County Mayo
Community
Universal: Hardiker Level 1
Local Employment Service (supports for Job Seekers)
Universal & Targeted: Hardiker Level 1 and 2
Job Club (Personal Development, CV and interview preparation for Job Seekers)
Universal: Hardiker Level 1
Labour Market Activation Programmes: Community Employment (CE); Tús (covering North County Mayo and Job Initiative Scheme (countywide).
Universal & Targeted: Hardiker Level 1 and 2
Rural Social Scheme for rural dwellers covering North County Mayo
Universal & Targeted: Hardiker Level 1 and 2
Department of Employment Affairs & Social Protection
Intreo offices (× 5): single point of contact for all employment & income supports located in Castlebar; Ballina; Westport; Belmullet; Achill.
Statutory
Universal & Targeted: Hardiker Level 1, 2 and 3
Community Services Programme (managed nationally by Pobal) supporting 32 Social Enterprises throughout Mayo.
Community
Universal & Targeted: Hardiker Level 1 and 2
Job Path (contracted to the private sector to deliver job activation supports to people that are unemployed)
Statutory
Universal & Targeted: Hardiker Level 1 and 2
65
Organisation or Agency
Service Statutory or Voluntary
Universal, Targeted or both
Outcome 4: Economic Security and Opportunity
Mayo County Council
Local Enterprise Office: Schools Enterprise Programme; Ireland's Best Young Entrepreneur
Statutory
Universal: Hardiker Level 1
Housing: Traveller Accommodation and Social Housing
Universal & Targeted: Hardiker Level 1 and 2
Outcome 5: Connected, respected and contribution to their world
Organisation or Agency
Service Statutory or Voluntary
Universal, Targeted or both
Outcome 5: Connected, respected and contributing to their world
Foróige
Voluntary Youth Clubs: Aughamore, Ballina, Ballyhaunis, Ballyheane, Belcarra, Brickens, Cloontia, Cong, Fahy, Foxford, Keenagh, Kilmovee, Kiltimagh, Louisburgh, Mayo Abbey, Moygownagh, Newport, Tooreen, Turlough
Universal: Hardiker Level 1
Comhairle na nÓg (Mayo Co. Co. & Foróige) Universal: Hardiker Level 1
Youth Participation Project. (Tusla & Foróige) Universal: Hardiker Level 1
Big Brother Big Sister Mentoring Programme
Universal & Targeted: Hardiker Level 1, 2 and 3
Young Mothers Group in Castlebar and Ballina. Targeted: Hardiker Level 2 and 3
LGBTI Support in Castlebar and Ballina. Targeted: Hardiker Level 2 and 3
North Connaught Youth and Community Service
North Mayo Youth Project located in Ballina town. (c/f with An Garda Siochána Youth Action Projects
Voluntary
Universal & Targeted: Hardiker Level 1 and 2
Maple Youth Centre
Provides supports, services and advice to young people (including Youth Booth Café) located in Ballinrobe town.
Community
Universal & Targeted: Hardiker Level 1, 2 and 3
66
Organisation or Agency
Service Statutory or Voluntary
Universal, Targeted or both
Outcome 5: Connected, respected and contributing to their world
Involve Youth Service Ballina
Support for Young Travellers located in Ballina town. Community Targeted: Hardiker Level 2 and 3
No Name Club
No Name Clubs respect the dignity, value and uniqueness of all young people by supporting, advocating and helping to safeguard their right to enjoy life, feel respected and to mature without a reliance on alcohol and other drugs. Locations: Achill, Ballinrobe, Castlebar, Claremorris, Crossmolina, Erris, Louisburgh, Swinford
Voluntary Universal: Hardiker Level 1
Family Resource Centres
Family Resource Centres (FRC); To combat disadvantage and to support families and build communities through the principles of community development. Located in Ballina; Ballinrobe; Ballyhaunis; Castlebar; Claremorris; Kilmovee and Westport. Core funding from Tusla.
Voluntary
Universal & Targeted: Hardiker Level 1, 2 and 3
Enable Ireland Mayo
The Children's service in Mayo offers a variety of services to children with a primary physical disability.
Voluntary Targeted: Hardiker Level 2
St. Vincent de Paul
Providing support and championing the rights of the poorest members of our society. Examples include a full-time office to meet with clients in financial need, a charity shop run by volunteers to fund their charitable work, and free classes in Computers, Cookery and Stress Management. Locations: Ballina, Castlebar, Ballyhaunis, Knock, Claremorris, Kiltimagh
Voluntary Universal: Hardiker Level 1
Cúram Family Centre
Provides a caring and confidential environment where individuals, families and groups can empower themselves through education, training, information, support and participation. Services offered include, Counselling, Bereavement Support, Family Support, Adult Education, Supports for Seniors, Citizen's Information Service, Local Employment Service, Community Playgroup, Parent and Toddler Club, A.A and Al-anon Support and many more. Location: Claremorris
Voluntary Universal: Hardiker Level 1
Citizens Information Service
Information, Advice and Advocacy on your rights and entitlements, Free Legal Advice Service (FLAC) monthly by appointment in Ballina and Castlebar and Threshold (housing) monthly drop in outreach. Locations: Ballina, Belmullet, Castlebar, Claremorris, Westport. Part-time outreach in Charlestown, Kiltimagh, Ballinrobe and Ballyhaunis
Voluntary Universal: Hardiker Level 1
Money and Advice Budgeting Services (MABS)
A free, confidential and independent money advice service. Locations: Ballina and Castlebar. Outreach facilities in Achill, Ballinrobe, Ballyhaunis, Belmullet, Claremorris, Charlestown, Kiltimagh, Louisburgh, Westport
Community Universal: Hardiker Level 1
Irish Wheelchair Association (IWA)
IWA provides services for those with limited mobility, promoting a quality of life to people with disabilities in Ireland. Locations: Belmullet and Castlebar
Voluntary Targeted: Hardiker Level 2 and 3
Arts Venues
A total of 14 Arts Venues are spread throughout the county, the majority of which are managed by Voluntary Groups
Voluntary Universal: Hardiker
67
Organisation or Agency
Service Statutory or Voluntary
Universal, Targeted or both
Outcome 5: Connected, respected and contributing to their world
Level 1
The Carers Association
Provides services to family Carers, including young Carers. Services include Home Respite service; information; training; advocacy, lobbying, promotional work and a care line.
Voluntary Universal: Hardiker Level 1
Mayo Volunteer Centre
Mayo Volunteer Centre is an independent organisation working with volunteers and volunteer involving organisations with offices in Ballina and Castlebar. The Volunteer Centre also provides an outreach services in other parts of the county where resources allow.
Voluntary Universal: Hardiker Level 1
South West Mayo Development Company
Mayo Intercultural Action - migrant support project
Community
Targeted: Hardiker Level 2 and 3
Mayo Syrian Resettlement Project. Locations Castlebar, Ballina, Westport & Claremorris
Targeted: Hardiker Level 2 and 3
Mayo Traveller Support Group
Traveller Support; Community Development Worker for Traveller men & family support
Community Targeted: Hardiker Level 2 and 3
Mayo County Council
Arts Office
Statutory Universal: Hardiker Level 1
Music Generation Mayo; support and grants to voluntary arts organisations and youth arts programmes
Mayo.ie online information hub
3.1.1 Gaps identified
There is a gap in relation to Family Support Services and Youth Service Provision in the following
areas:
Erris
Achill
East Mayo (Swinford and Ballyhaunis catchment areas)
Gaps were also identified in relation to childcare provision on Clare Island and in the remote rural
areas such as Erris due to low population densities.
68
4 Local Needs Analysis in County Mayo
This section highlights the main concerns and issues for Children and Young People in Mayo. The
priorities presented are informed by the consultation process, socio-demographic profile and audit
of services. It is also informed by related national, regional and local strategies and action plans
developed by the relevant service providers.
The data is presented under the five national outcomes:
1. Active and healthy, physical and mental wellbeing
2. Achieving full potential in learning and development
3. Safe and protected from harm
4. Economic security and opportunity
5. Connected, respected and contributing to their world
Outcome 1: Active and healthy, physical and mental wellbeing
The data in the socio-demographic profile shows that Mayo is doing well with regards to most health
outcome areas compared to the State. The youth survey included a question with a list of options
from which to choose what types of services and activities that they would like to have access to in
Mayo. The majority of respondents (54.5%, n=557) would like to see Adventure Activity Clubs for
young people, which is a positive finding in relation to Outcome 1: Active and Healthy and this was
supplemented by comments such as:
More focus on Forest Schools, outdoor learning, and adventure activities. (Youth
Survey Respondent)
Skate Park would be very communal and get youths more active and social.
(Youth Survey Respondent)
Other suggestions included: Gym (the majority of respondents from the Achill area), Hockey, Couch
to 5K for Teens, Cricket, Water-based Sports, Darts and Yoga.
Through the research, consultation and planning process based on the feedback from the surveys
and services mapping the following local priority areas were identified:
1. Health and Wellbeing
2. Outdoor play 0-6 years
3. Child and Youth Mental Health
4. Parental Mental Health
4.1.1 Health and Wellbeing
As a result of the consultation process, the Early Years Subgroup has prioritised the development of
a Health and Well Being Plan for 0-3 year olds. The research framework will include questions to
capture additional data in relation to the issues/gaps identified in the CYPSC research process such
as Breastfeeding, Anxiety, Parental Mental Health; Substance Misuse (drugs and alcohol) and where
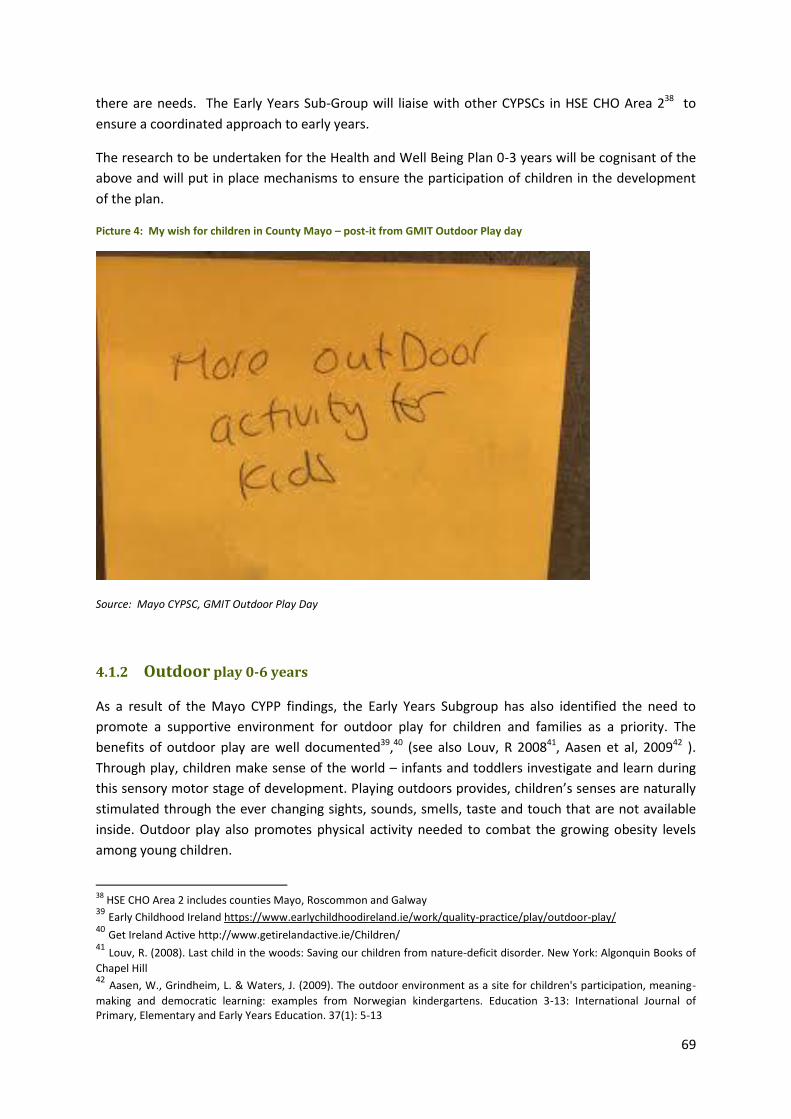
69
there are needs. The Early Years Sub-Group will liaise with other CYPSCs in HSE CHO Area 238 to
ensure a coordinated approach to early years.
The research to be undertaken for the Health and Well Being Plan 0-3 years will be cognisant of the
above and will put in place mechanisms to ensure the participation of children in the development
of the plan.
Picture 4: My wish for children in County Mayo – post-it from GMIT Outdoor Play day
Source: Mayo CYPSC, GMIT Outdoor Play Day
4.1.2 Outdoor play 0-6 years
As a result of the Mayo CYPP findings, the Early Years Subgroup has also identified the need to
promote a supportive environment for outdoor play for children and families as a priority. The
benefits of outdoor play are well documented39,40 (see also Louv, R 200841, Aasen et al, 200942 ).
Through play, children make sense of the world – infants and toddlers investigate and learn during
this sensory motor stage of development. Playing outdoors provides, children’s senses are naturally
stimulated through the ever changing sights, sounds, smells, taste and touch that are not available
inside. Outdoor play also promotes physical activity needed to combat the growing obesity levels
among young children.
38
HSE CHO Area 2 includes counties Mayo, Roscommon and Galway 39 Early Childhood Ireland https://www.earlychildhoodireland.ie/work/quality-practice/play/outdoor-play/ 40 Get Ireland Active http://www.getirelandactive.ie/Children/ 41 Louv, R. (2008). Last child in the woods: Saving our children from nature-deficit disorder. New York: Algonquin Books of
Chapel Hill 42 Aasen, W., Grindheim, L. & Waters, J. (2009). The outdoor environment as a site for children's participation, meaning-
making and democratic learning: examples from Norwegian kindergartens. Education 3-13: International Journal of Primary, Elementary and Early Years Education. 37(1): 5-13
70
Some of the gaps/needs identified by parents in the consultation process support the evidence in
the literature reviewed and include the following areas:
Outdoor pre-schools and non-denominational primary schools
Organised physical activities for children under 6
Outdoor play areas for children and families
One of the issues emerging from the parents’ survey that was carried out as part of the planning
process was the ‘lack of age appropriate activities’ as evidenced by comments from parents such as:
Many groups will only take 5 years and up. (Parents’ Survey Respondent)
Not a lot offered for preschool age! (Parents’ Survey Respondent)
One unmet need expressed by some parents, youth and service providers during the consultation
process was to ensure that there is inclusion of children who can be marginalised because of
disability, ethnicity and poverty. In addition, the cost of some activities acts as an inhibitor from
participating as well as the lack of a coherent rural transport network. Rural transport is addressed
in Outcome 5 of the CYPP. One comment in relation to these issues submitted a parent in the survey
was:
Not all inclusive. Our 4 year old can join in but not our 2 year old with cerebral
palsy. It's unfair on one to be able to join in and not the other. (Parents’ Survey
Respondent)
4.1.3 Child and Youth Mental Health
In Better Outcomes, Brighter Futures 2014-2020, it is recognised that good mental health is critical
for parents to be able to support their children and that there are a myriad of factors that can
impact negatively on a child’s or young person’s mental health. The document also states that
having an early diagnosis and access to support services in a timely manner is of critical importance
(p53).
The need for additional Mental Health Services was evident from the majority of survey respondents
in each of the three categories (parents, youth and service providers) as well as an issue raised in
some of the Focus Groups. A summary of the issues in relation to Children, Young People and
Parents is presented in the following sub-sections:
4.1.3.1 Children
Feedback from the service providers’ focus groups identified that there are an increasing number of
children (aged as young as seven) presenting with anxiety and that services need to be
developed/expanded to meet this need. One example given of the impact of the lack of supports
for children, who are presenting with anxiety around school, is that it is leading to ongoing school
refusal. This issue was raised by a number of providers in the focus groups and also by some of the
survey respondents (parents and providers). It was suggested that earlier identification and
71
engagement, with interventions coordinated around the child would help manage transitions to
post-primary level as well as giving the child the tools needed to cope with anxiety.
4.1.3.2 Young people
There is a deficit in relation to current provision for teenagers (Mindspace Mayo provides supports
for young people aged 15+ years). It has been recommended that rather than establishing a new
programme/organisation that Mindspace Mayo is supported/resourced to expand the age group to
include children aged 12+ years. In addition, it is recommended that Mindspace Mayo is resourced
to extend the geographic coverage in the county. At present, the organisation provides services in
Castlebar and on a part-time outreach basis in Belmullet and Ballina.
It was outside the scope of the planning and consultation process to comprehensively document the
different projects and supports delivered through schools that support transitions.
4.1.4 Parental Mental Health
Some of the survey responses and feedback from the service providers focus groups identified that
some parents are struggling with poor mental health and that this is impacting on their children. In
addition, some parents are also looking for support in ‘parenting the anxious child’.
Workshops for parents to improve their knowledge and skills to gain a greater understanding and to
recognise signs of poor mental health, developing skills to support the anxious child and referrals to
the most appropriate service will be addressed as part of this priority action. It is proposed to
develop a number of information workshops to look at areas identified in research such as youth
mental health; appropriate use of technology; cyber bullying; school refusal and coping with anxiety;
alcohol and drug misuse etc.
It is also proposed to continue to work together with Mayo Suicide Prevention Alliance and
Mindspace Advisory Group and the LCDC Health and Well Being Subgroup in achieving their
objectives as well as linking to regional plans such as the HSE Suicide Prevention Services Action Plan
and Connecting for Life.
Through the use of open questions in the parents’ survey, Mayo CYPSC was able to capture
additional data in relation to the needs identified by parents as follows:
More activities for parents and children to enjoy together
Workshops/initiatives to promote Health & Well Being (all ages)
Parenting Courses to incorporate Nutrition/Healthy Food
Develop inclusive activities for children with disabilities
Some of the comments submitted in the surveys in relation to Mental Health Services are as follows:
Mental health is a big problem and yet funding seems to cut any services
available for people dealing with mental health issues. Mindspace mayo seems to
be a good facility but yet limited to what it can do. One wish would be for young
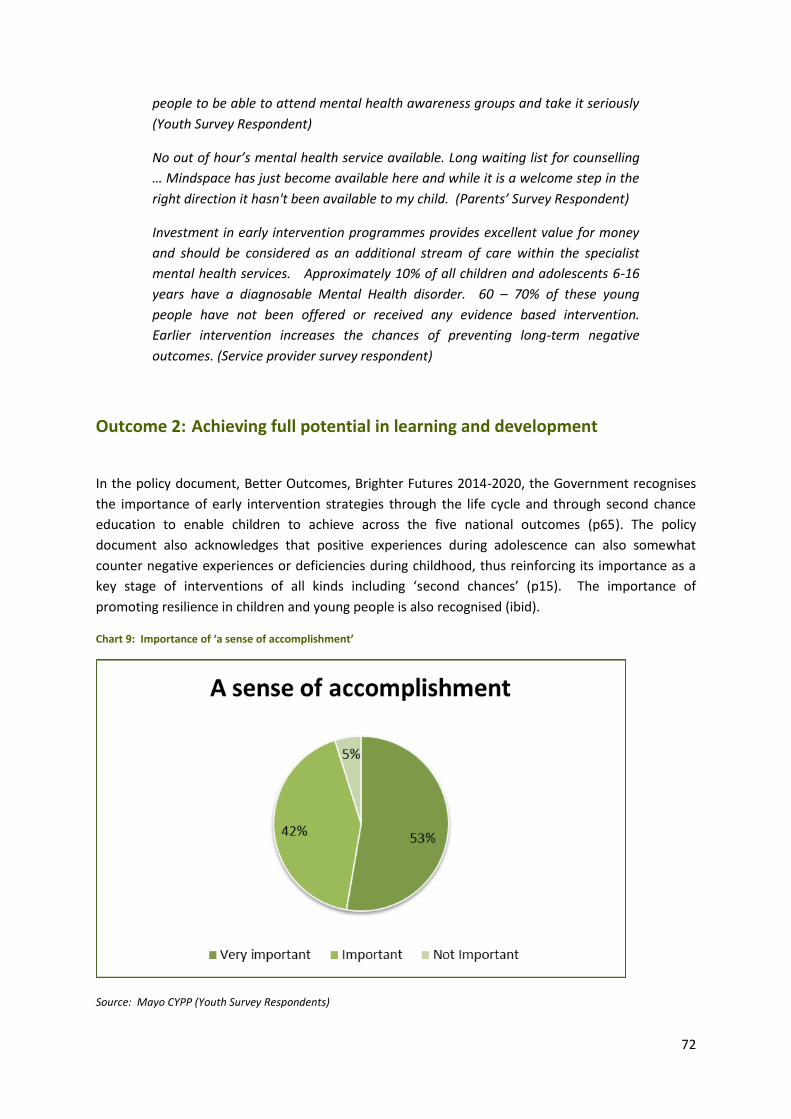
72
people to be able to attend mental health awareness groups and take it seriously
(Youth Survey Respondent)
No out of hour’s mental health service available. Long waiting list for counselling
… Mindspace has just become available here and while it is a welcome step in the
right direction it hasn't been available to my child. (Parents’ Survey Respondent)
Investment in early intervention programmes provides excellent value for money
and should be considered as an additional stream of care within the specialist
mental health services. Approximately 10% of all children and adolescents 6-16
years have a diagnosable Mental Health disorder. 60 – 70% of these young
people have not been offered or received any evidence based intervention.
Earlier intervention increases the chances of preventing long-term negative
outcomes. (Service provider survey respondent)
Outcome 2: Achieving full potential in learning and development
In the policy document, Better Outcomes, Brighter Futures 2014-2020, the Government recognises
the importance of early intervention strategies through the life cycle and through second chance
education to enable children to achieve across the five national outcomes (p65). The policy
document also acknowledges that positive experiences during adolescence can also somewhat
counter negative experiences or deficiencies during childhood, thus reinforcing its importance as a
key stage of interventions of all kinds including ‘second chances’ (p15). The importance of
promoting resilience in children and young people is also recognised (ibid).
Chart 9: Importance of ‘a sense of accomplishment’
Source: Mayo CYPP (Youth Survey Respondents)
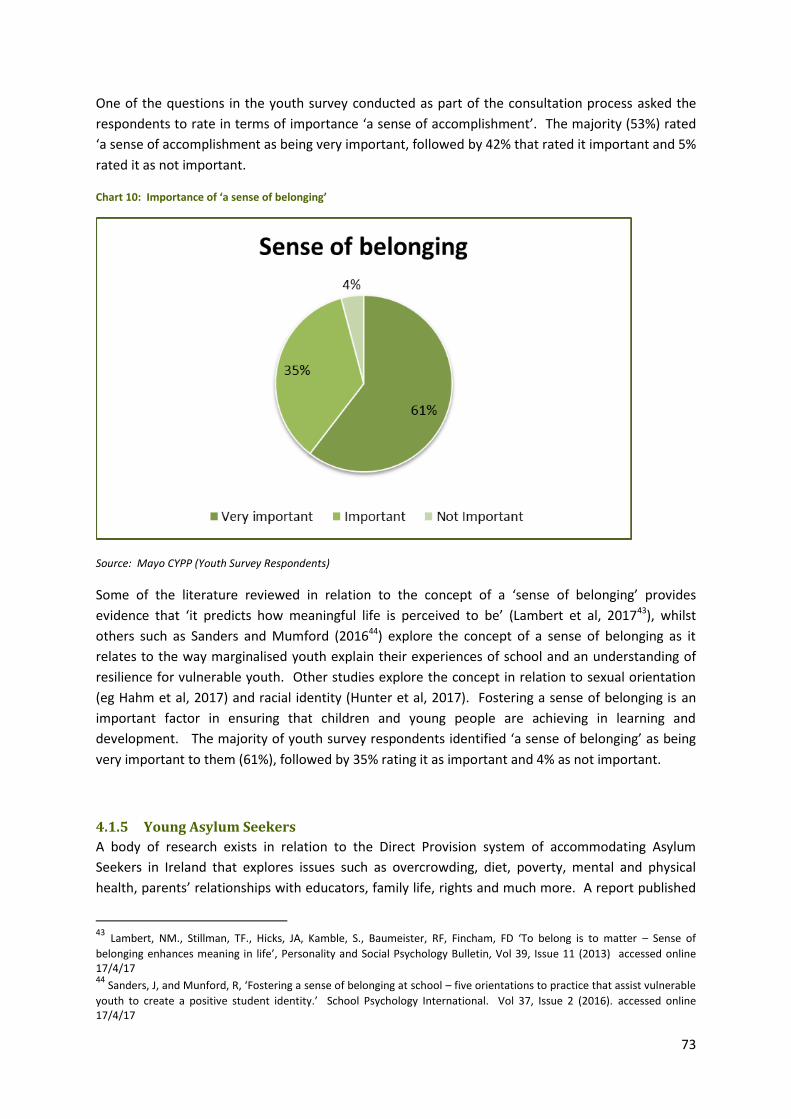
73
One of the questions in the youth survey conducted as part of the consultation process asked the
respondents to rate in terms of importance ‘a sense of accomplishment’. The majority (53%) rated
‘a sense of accomplishment as being very important, followed by 42% that rated it important and 5%
rated it as not important.
Chart 10: Importance of ‘a sense of belonging’
Source: Mayo CYPP (Youth Survey Respondents)
Some of the literature reviewed in relation to the concept of a ‘sense of belonging’ provides
evidence that ‘it predicts how meaningful life is perceived to be’ (Lambert et al, 201743), whilst
others such as Sanders and Mumford (201644) explore the concept of a sense of belonging as it
relates to the way marginalised youth explain their experiences of school and an understanding of
resilience for vulnerable youth. Other studies explore the concept in relation to sexual orientation
(eg Hahm et al, 2017) and racial identity (Hunter et al, 2017). Fostering a sense of belonging is an
important factor in ensuring that children and young people are achieving in learning and
development. The majority of youth survey respondents identified ‘a sense of belonging’ as being
very important to them (61%), followed by 35% rating it as important and 4% as not important.
4.1.5 Young Asylum Seekers
A body of research exists in relation to the Direct Provision system of accommodating Asylum
Seekers in Ireland that explores issues such as overcrowding, diet, poverty, mental and physical
health, parents’ relationships with educators, family life, rights and much more. A report published
43 Lambert, NM., Stillman, TF., Hicks, JA, Kamble, S., Baumeister, RF, Fincham, FD ‘To belong is to matter – Sense of
belonging enhances meaning in life’, Personality and Social Psychology Bulletin, Vol 39, Issue 11 (2013) accessed online 17/4/17 44
Sanders, J, and Munford, R, ‘Fostering a sense of belonging at school – five orientations to practice that assist vulnerable
youth to create a positive student identity.’ School Psychology International. Vol 37, Issue 2 (2016). accessed online 17/4/17
74
by The College of Psychiatry in Ireland (2006)45 noted that Asylum Seekers have higher levels of
psychopathology than the general population and that they suffer higher rates of anxiety and
depressive disorders than other sections of society with up to ten times the level of post-traumatic
disorders than other sections of society. Moran et al (2017)46 argue that ‘the Direct Provision system
adversely affects children’s resilience, stifling their educational, emotional and social development’.
The length of time spent by children and young people in Direct Provision compounds this. There is
one Direct Provision centre in Mayo, based in Ballyhaunis and a focus group was held with a group of
young people there as part of the consultation process. The majority of children attend primary
school in neighbouring villages which reduces their opportunity for interaction and contact with
children their own age in the town. This has always been the case since the Direct Provision Centre
was first opened. At post-primary level the young people attend the local community school, in
Ballyhaunis town. At the time of the Mayo CYPP being developed, there was no afterschool
provision in Ballyhaunis, including homework clubs.
The length of time spent by the focus group participants (ages ranged from 13 to 19 years) in the
Direct Provision centre ranged from just over 4 years to 3 weeks. Their collective wish as young
people living in Mayo could be summed up by one response which was “to get out of here if that’s
possible” (referring to the Direct Provision Centre) and their greatest fear was that of ‘deportation’.
The young people also spoke about their desire to learn more about the town and county where
they resided. The needs expressed primarily focused around outdoor activities and included ‘going
on trips around Mayo, hiking and mountain trekking, going to an activity centre to try new things like
zip wires, take swimming lessons and then have a day at the seaside’. Other interests vocalised were
‘music and singing lessons’.
4.1.6 Young Travellers
According to the National Traveller and Roma Inclusion Strategy (2017-2021), just 13% of Traveller
children complete second-level education, compared to 92% in the settled community. Of those
who drop out of second level, 55% have left by the age of 15 years, and the number of Traveller
children who progress to third level represents just 1% of their community. The National Plan for
Equity of Access to Higher Education 2015-2019 aims to more than double the number of Traveller
students attending part-time or full-time third-level courses from 35 to 80 by 2019. Over two thirds
(67.3%) of Traveller children lived in families where the mother had either no formal education or
only primary education (SONC, 2016)47. The low enrolment of Traveller children in pre-schools has
been noted by the Joint Oireachtas Committee on Health and Children, (2016)48 as a concern as
Traveller children are entering primary school already at a disadvantage and anecdotally is higher in
Mayo. This would warrant further investigation.
45
The mental health service requirements for Asylum Seekers and Refugees in Ireland, The College of Psychiatry of Ireland
(2009) accessed online 17/4/17 46 Moran, L., Garrity, S., McGregor, C., and Devaney, C., ‘Hoping for a better tomorrow: a qualitative study of stressors,
informal social support and parental coping in a Direct Provision Centre in the West of Ireland.’ Journal of Family Studies, Published online January 2017 accessed 16/7/17 47
State of our Nation’s Children (2016) 48 Houses of the Oireachtas, Joint Committee on Health and Children, Report on Affordable and Quality Childcare, January
2016. Accessed 17/4/17
75
Some of the findings emerging from the focus group with young Travellers would support the above.
All of the young Travellers that participated were early school leavers (ie they left school on reaching
16 years of age). The majority are what is termed a NEET (ie a young person Not in Education,
Employment or Training). Their stories and experiences of school and school life were all negative.
They did not feel that they belonged and one young person spoke of how depressed he was at
school and summed up his daily experience as “we’re there for forty minutes at a time – just four of
us – not understanding what they’re saying (referencing the teachers) and just having to sit there.
To be honest I’m depressed and bored to death at school. I don’t want to go no more. I’m not
learning anything. Imagine being stuck there for forty minutes and how bad that is, and then
imagine what it’s like when you have a double class!”. The young Travellers all discussed the
importance of having a qualification in order to get a job. According to them, the local Youthreach
provides a learning space that will allow them to get a qualification. However, there is currently a
waiting list to get into the Youthreach Centre (Ballina) and two of the young Travellers have been
out of school for the past two years and are on the waiting list. The young Travellers that
participated in the focus group are members of the local Involve Youth Service. They have taken
part in Nutrition and Cooking classes and regularly go to the gym. They also spoke about their
friends who have also left school and who are not involved in anything and how long the day seems
without a routine. They stated that if training was organised with them, they would be able to get
their friends involved. The discussion was also informed by their stories, negative in relation to
discrimination, treatment in shops and public places, and positive in relation to their association
with the Involve Youth Service and the supports, skills and confidence they gained as a result. Cross
reference Action 4.1.
4.1.7 Other Education Needs identified during the research process
In relation to this outcome, needs identified in the parents’ survey responses included comments
around the lack of choice with current curriculum; articulating that it is primarily focused on exam
grades and not enough around practical skills (such as critical thinking and life skills); not enough
emphasis on STEM (Science, Technology, Engineering and Maths) and a need to provide pathways to
apprenticeships. Additional needs in relation to this outcome that were identified by young people
during the research and consultation process was access to practical Life skills training that would
help them to prepare for independent living eg Budgeting; cookery/nutrition (transition from home
to college and/or work), cyberbullying and online safety; and sexual health.
Supports for students with differing learning needs e.g. Dyslexia was identified as a need by parents
and service providers. Children and young people need to be able to access timely and appropriate
supports to enable them to participate and achieve in education and to live a fuller life.
Local priority areas identified for CYPP 2018-2020
2.1 Young people not attending school
2.2 Life skills for young people
76
4.1.8 Young People not attending school
A number of meetings were facilitated by the CYPSC Coordinator and education providers to better
understand the data presented in the socio-demographic profile in relation to school absenteeism.
There has been an overall reduction in the levels of school absenteeism in the period 2010-2016.
Since 2013, there are two Educational Welfare Officers (EWOs) providing support in Mayo which is
positive. It has led to improved engagement with schools and more reporting which results in more
young people being targeted, but also results in an increase in the numbers. Post-primary schools
with DEIS status have the added advantage of getting support from the School Completion
Programme and from Home School Liaison. Reduced timetabling was raised by education providers
as a real issue, particularly in larger towns such as Ballina, which impacts negatively on young
people. It was also reported that some young people have difficulties coping at school, many are
presenting with anxiety and mental health issues with the issue of school refusal becoming more
common.
Feedback from the NEETs Focus Group and the Young Traveller Focus Group also informed the
planning process and identification of priorities. The CYPSC Education and Learning Subgroup will
explore factors influencing poor educational outcomes for young people and to agree and
implement appropriate solutions to address the following:
Early School Leaving49
Anxiety and poor mental health in the young person and school refusal
Guidance Counselling
Perceived inconsistencies in how data for the school absenteeism metric are being reported
by schools
Reduced timetabling
Impact of supports for DEIS versus non-DEIS schools
Difficulties in getting educational assessments for students presenting
with learning difficulties and challenging behaviour
Transitions programmes for all 6th class students to support the transition to second level
school. Programmes to support secondary to Further education or training.
Engaging and involving parents. Supporting parents in developing awareness around the
transition to third level and the many other options available. Thus, reducing the levels of
anxiety experienced by all.
One of the service provider survey responses summarised the issues in relation to school
absenteeism/early school leaving as follows:
[There is a] Huge gap in education services where mainstream school does not
suit certain young people, they may be too young for Youthreach. Alternative
education places for young people with challenging behaviour / those who really
struggle to conform to mainstream education. (Service provider survey
respondent)
49
Definition: Young person that has finished their education at the legal age but without any formal qualifications
77
4.1.9 Lifeskills for young people
Some of the young people consulted identified the need for Lifeskills training that would support
them in becoming more independent and better able to cope with new responsibilities once they
transitioned from post-primary school to college or work. A number of parents also raised the need
for Lifeskills training in the survey responses. Comments from the young people and parents in
relation to this need are presented below:
To have school education include things you will need to know in life, like first aid,
what's in the news? We need to be taught about other cultures, sexualities and
the difference between sexes and genders. (Youth survey respondent)
We need education about the practical side of going to college, like budgeting,
cooking, managing in a new learning environment as well as mental health and
cyberbullying (Youth Focus Group participant)
There is not enough education on general wellbeing including mental health, the
importance of nutrition & exercise, sexual health or appropriate online behaviours
or sexual behaviours. (Parents’ survey respondent)
Outcome 3: Safe and protected from harm
The nature and quality of family life influences not only how a child copes with life growing up, but
also helps determine the quality of their relationships (Better Outcomes, Brighter Futures 2014-2020
p77). The Government recognises the importance of supporting parents to deal with a changing and
technology driven world so that they can protect their children from harm and also recognises the
need to support children who experience trauma as a result of other life experiences such as their
parents’ relationship breakdown, bereavement, abuse, exposure to domestic violence or taken into
care (ibid). Providing support for parents is one of the six transformational goals.
The priority needs under this outcome have been informed by the socio-demographic data, the
survey responses (youth, parents and service providers) as well as the Focus Groups facilitated with
service providers and young people.
4.1.10 Responses from young people
In the youth survey, the respondents were asked in one question to identify how important it was to
them to ‘feel safe and secure’ and in a follow-on question, how important is was to ‘feel safe and
protected from bullying and discrimination’. The results are presented in charts 11 and 12 below.
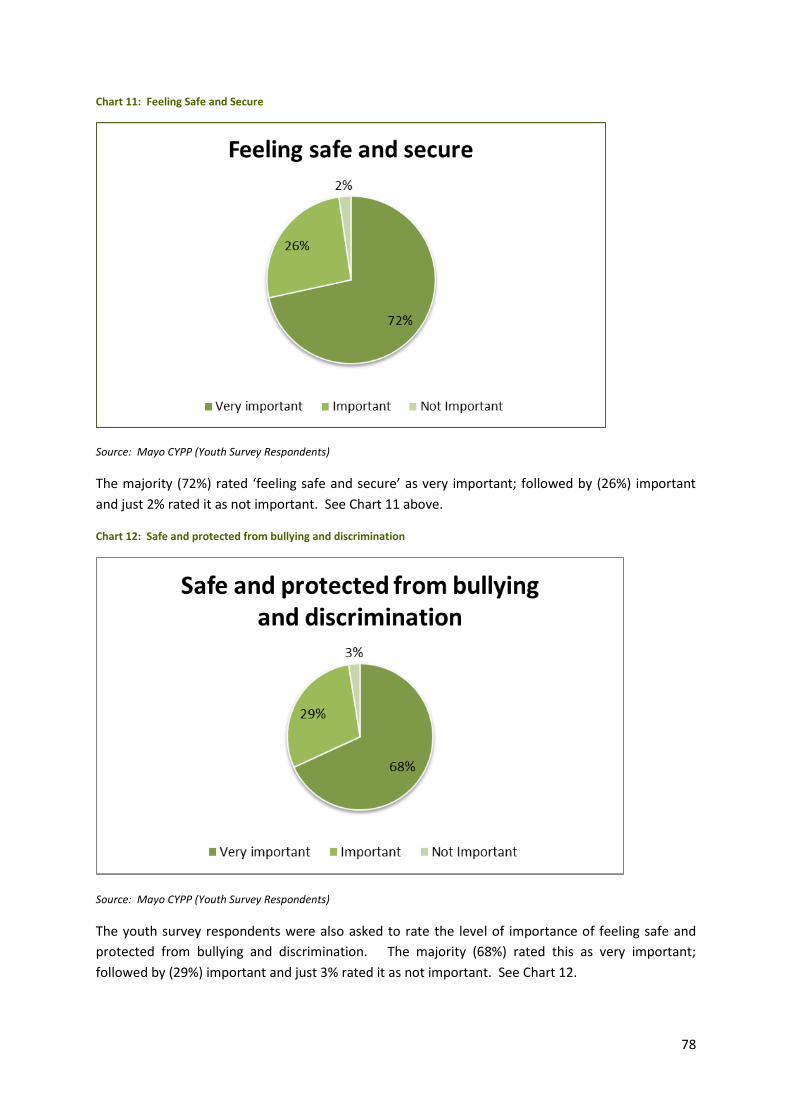
78
Chart 11: Feeling Safe and Secure
Source: Mayo CYPP (Youth Survey Respondents)
The majority (72%) rated ‘feeling safe and secure’ as very important; followed by (26%) important
and just 2% rated it as not important. See Chart 11 above.
Chart 12: Safe and protected from bullying and discrimination
Source: Mayo CYPP (Youth Survey Respondents)
The youth survey respondents were also asked to rate the level of importance of feeling safe and
protected from bullying and discrimination. The majority (68%) rated this as very important;
followed by (29%) important and just 3% rated it as not important. See Chart 12.
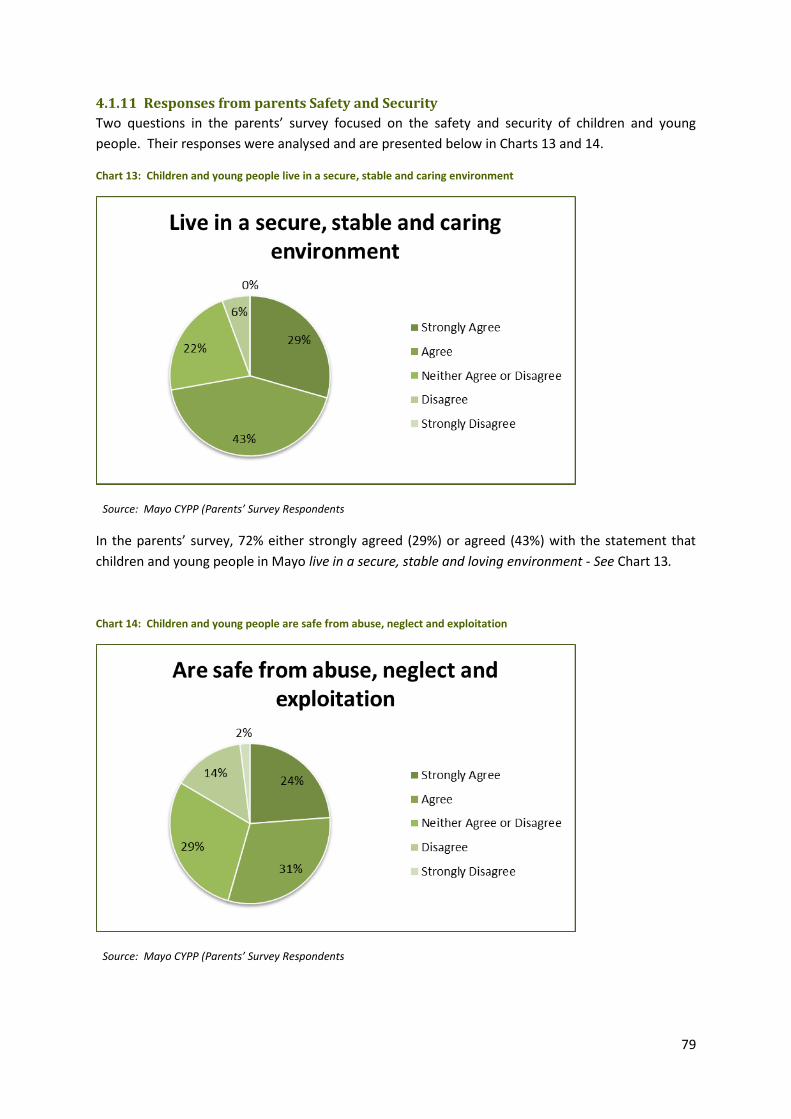
79
4.1.11 Responses from parents Safety and Security
Two questions in the parents’ survey focused on the safety and security of children and young
people. Their responses were analysed and are presented below in Charts 13 and 14.
Chart 13: Children and young people live in a secure, stable and caring environment
Source: Mayo CYPP (Parents’ Survey Respondents
In the parents’ survey, 72% either strongly agreed (29%) or agreed (43%) with the statement that
children and young people in Mayo live in a secure, stable and loving environment - See Chart 13.
Chart 14: Children and young people are safe from abuse, neglect and exploitation
Source: Mayo CYPP (Parents’ Survey Respondents
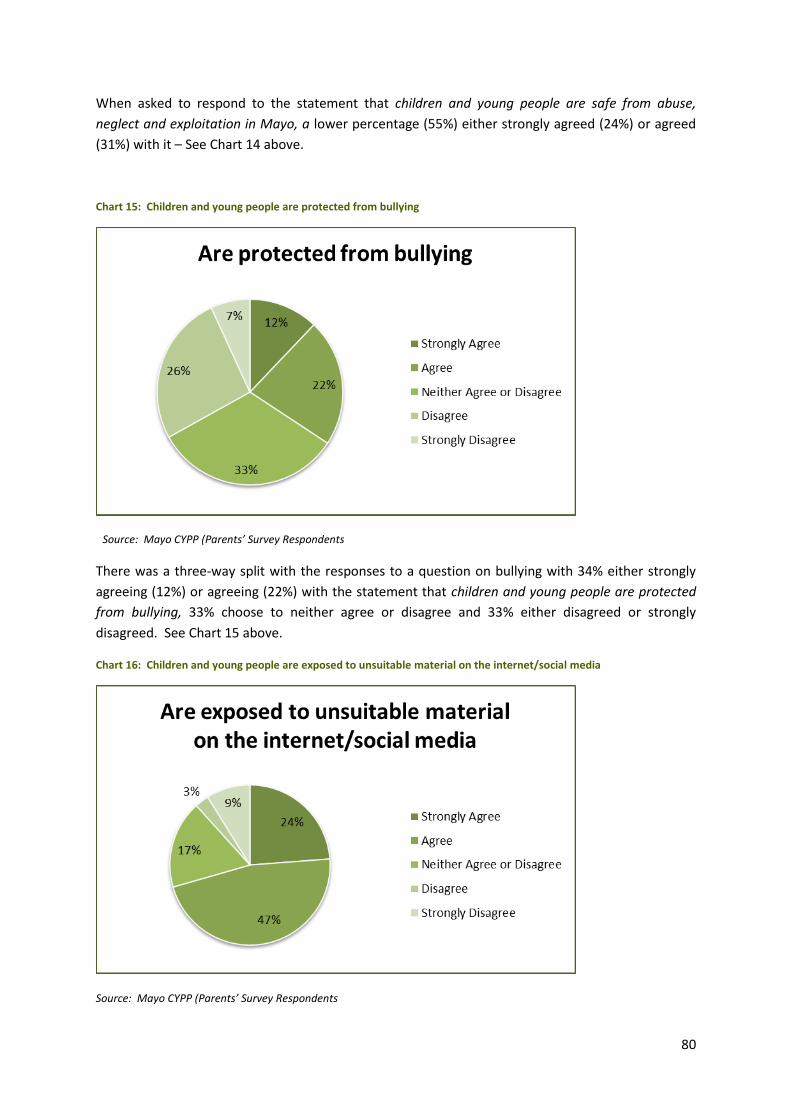
80
When asked to respond to the statement that children and young people are safe from abuse,
neglect and exploitation in Mayo, a lower percentage (55%) either strongly agreed (24%) or agreed
(31%) with it – See Chart 14 above.
Chart 15: Children and young people are protected from bullying
Source: Mayo CYPP (Parents’ Survey Respondents
There was a three-way split with the responses to a question on bullying with 34% either strongly
agreeing (12%) or agreeing (22%) with the statement that children and young people are protected
from bullying, 33% choose to neither agree or disagree and 33% either disagreed or strongly
disagreed. See Chart 15 above.
Chart 16: Children and young people are exposed to unsuitable material on the internet/social media
Source: Mayo CYPP (Parents’ Survey Respondents
81
When asked about the exposure of children and young people to unsuitable material on the
internet/Social Media, 71% of the respondents either strongly agreed (24%) or agreed (47%) with
the statement. See Chart 16.
Cost, distance and time were the main challenges identified by parents in accessing services for
children and young people. Achill Island and the Barony of Erris are both located on the west coast
and without access to transport, services that are located in larger towns such as Westport, Ballina
and Castlebar can be difficult for parents (and children and young people) to access.
Parents also identified the need for supports around themes such as:
Drugs and Alcohol Misuse
Skills to deal with new technologies/Social Media
Anti-bullying workshops
4.1.12 Responses from Service Providers
The main gaps/barriers in relation to service users identified by the Service Providers according to
the survey responses were fear, stigma, distance, lack of knowledge of services, red tape and
qualifying criteria. One survey respondent summed up the issues succinctly as follows:
“Stigma, geography, knowledge, empowerment, isolation, discrimination.”
(Service provider survey respondent)
In addition, three geographic areas, namely Swinford, Erris and Achill were identified as being in
need of Family Support Services and Achill, Erris and East Mayo were identified as in need of youth
services.
Some of the service providers also noted that there can be confusion around what services are
available and how to access them and this issue was also noted by some parents and young people
in the survey responses. One parent’s response in relation to this was that:
“It is difficult to know what services are actually available, and often you may
have heard of a service but not know anything about it or how to access it or even
know if it’s relevant to you or your needs. When my daughter needed
bereavement counselling, it was really difficult to knowhow to go about getting
information on counselling services” (Parents’ survey respondent)
The recently established Child and Family Support Networks in different areas of the County should
in time result in more clarity around what is available and how to access the different services
leading to better outcomes for children, young people and their families. A number of activities
have already commenced that will improve access to information about services (eg Social Media
Workshops). The challenge of internal and external communications is something that is also
addressed in the section under Change Management.
Three priority areas have been identified under outcome 3 and they are:
3.1 Prevention, Partnership and Family Support
3.2 Parenting support and engagement
82
3.3 Safeguarding children and young people
4.1.13 Prevention, Partnership and Family Support
The objective of this priority area is to continue improve the referral mechanisms and pathways to
ensure that children, young people and their parents/guardians are offered the support most
appropriate to their needs. The Child and Family Support Networksiv (CFSN) bring together all the
services that play a role in the lives of children and families and are organised on a geographic
basis50. By networking, communicating, identifying gaps/issues and working in partnership to come
up with solutions, outcomes for children, young people and their families should be improved.
CYPSC will support the role of the CFSNs. The CFSNs will also provide a useful platform for sharing
information so that all providers of services to children, young people and their families are aware of
the different and most appropriate pathways and the Meithealv (See Endnote page 160) national
practice model. One of the objectives of the Meitheal is to ensure that the needs and strengths of
children and their families are effectively identified and understood and responded to in a timely
way so that children and families get the help and support needed to improve children’s outcomes
and realise their rights. The model is also intended to avoid duplication and particularly the need for
families to repeatedly retell their story51. This will meet some of the needs identified during the
CYPP consultation process.
4.1.14 Parenting support and engagement
Common Sense Parenting is an evidence informed parenting programme delivered at present in
Mayo. The need to recruit and train members of minority communities (such as Travellers and
migrants) as facilitators for this programme was identified during the research process. The socio-
demographic data (CSO 2016) showed that Mayo had a much higher rate of Travellers than the State
per 1,000 (10.1 to 6.6). Mayo reported a slightly higher percentage of Irish nationals aged 0-24
years (91.5%), Lithuanian (0.8%), Polish (2.1%) and UK (2.0%) compared to the State (90.0%, 0.7%,
2.0% and 1.0% respectively) and was lower in percentage terms for all other nationalities. Accessing
and understanding services that are not in a person’s first language can be a challenge and it is
recommended that the Common Sense Parenting material be translated into other languages to
make it more accessible for parents as well as training members from migrant communities to
become facilitators. Additional modules could be developed for the Common Sense Parenting
Programme that would take into account the needs identified by parents for support around topics
such as bullying, skills to deal with new technologies and workshops to be better informed around
Drugs and Alcohol misuse. Difficulties in accessing information about services was another challenge
raised by parents and by service providers and one of the recommendations was to establish an
online ‘hub’ of parenting resources for the county would improve this access for parents and service
providers alike.
4.1.15 Safeguarding Children and Young People
This section outlines the needs in relation to the implementation of the Children’s First Act 2015 and
unmet needs for children, young people and families in relation to Domestic and Sexual Violence.
50 At present, there are four networks in Mayo 51
http://www.tusla.ie/uploads/content/Tusla_Meitheal_A_National_Practice_Model.pdf
83
4.1.15.1 Mandatory reporting
The Children’s First Act 2015 places additional responsibilities on all organisations working with
children such as ensuring that a Child Safeguarding Statement (CSS) and supporting policies are in
place. The CSS has to be reviewed every two years. Mayo CYPSC will work with local agencies and
organisations to provide support and coordinate the local implementation of the Children First Act
2015.
4.1.15.2 Domestic and Sexual Violence
Service providers across the county have stressed the need to raise awareness of the impact of
Domestic/Sexual Violence on Children, Young people and families. Ensuring the ‘voice of the child’ is
heard; especially in relation to court mandated access with the abuser was named by a number of
services. Issues such as teen sexual violence, consent and the importance of developing healthy,
loving relationships were identified. Young People in rural areas also highlighted the need for easy
and confidential access to information around sexual health.
Outcome 4: Economic security and opportunity Opportunities for ongoing education and training are part of a national commitment to lifelong
learning (Better Outcomes, Brighter Futures 2014-2020) and the Government recognises the strong
correlation between educational attainment, employment and future earnings. It also recognises
the importance of providing flexible opportunities to continue formal education, particularly for
early school leavers as well as others and in providing an alternative approach and learning
environment for many early school leavers (p92).
The CSO Live Register data at the end of August 2017 showed that there were 864 young people less
than 25 years of age on the Live Register, representing 10.3% of the total persons on the Live
Register in Mayo at that time.
4.1.16 Responses from young people
The research and consultation process undertaken for the Mayo CYPP engaged directly through
Focus Groups with young people who are often not included as follows:
• Young Single Mothers
• Young People (who were NEETs and were on a short-term, part-time
training course)
• Young Travellers
The learning from this process is that the category of NEETs can often include young people from
different backgrounds, education levels, life experiences and outlooks. This means that the needs
are different and a ‘one size fits all’ approach will not result is the best outcomes for the young
people who fall into this category.
Mayo CYPSC captured additional data through the administration of the online survey to young
people and the following charts present the levels of importance that the young people rated
different statements in relation to Outcome 4.
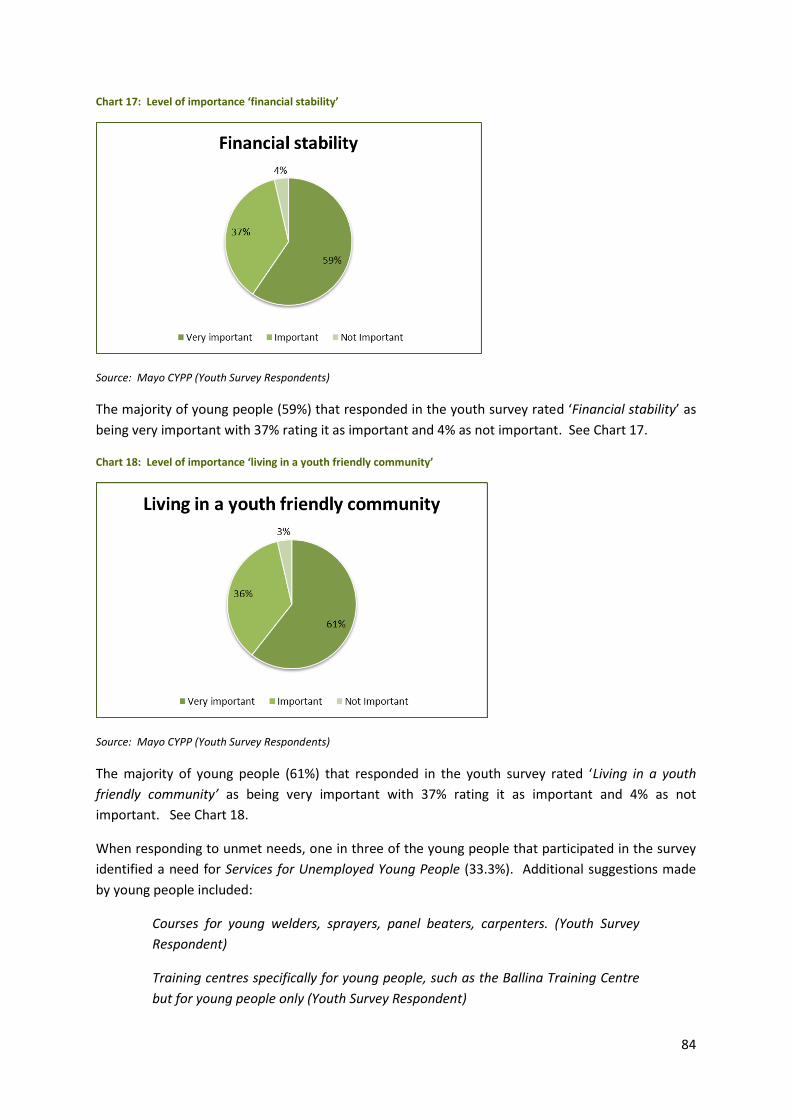
84
Chart 17: Level of importance ‘financial stability’
Source: Mayo CYPP (Youth Survey Respondents)
The majority of young people (59%) that responded in the youth survey rated ‘Financial stability’ as
being very important with 37% rating it as important and 4% as not important. See Chart 17.
Chart 18: Level of importance ‘living in a youth friendly community’
Source: Mayo CYPP (Youth Survey Respondents)
The majority of young people (61%) that responded in the youth survey rated ‘Living in a youth
friendly community’ as being very important with 37% rating it as important and 4% as not
important. See Chart 18.
When responding to unmet needs, one in three of the young people that participated in the survey
identified a need for Services for Unemployed Young People (33.3%). Additional suggestions made
by young people included:
Courses for young welders, sprayers, panel beaters, carpenters. (Youth Survey
Respondent)
Training centres specifically for young people, such as the Ballina Training Centre
but for young people only (Youth Survey Respondent)
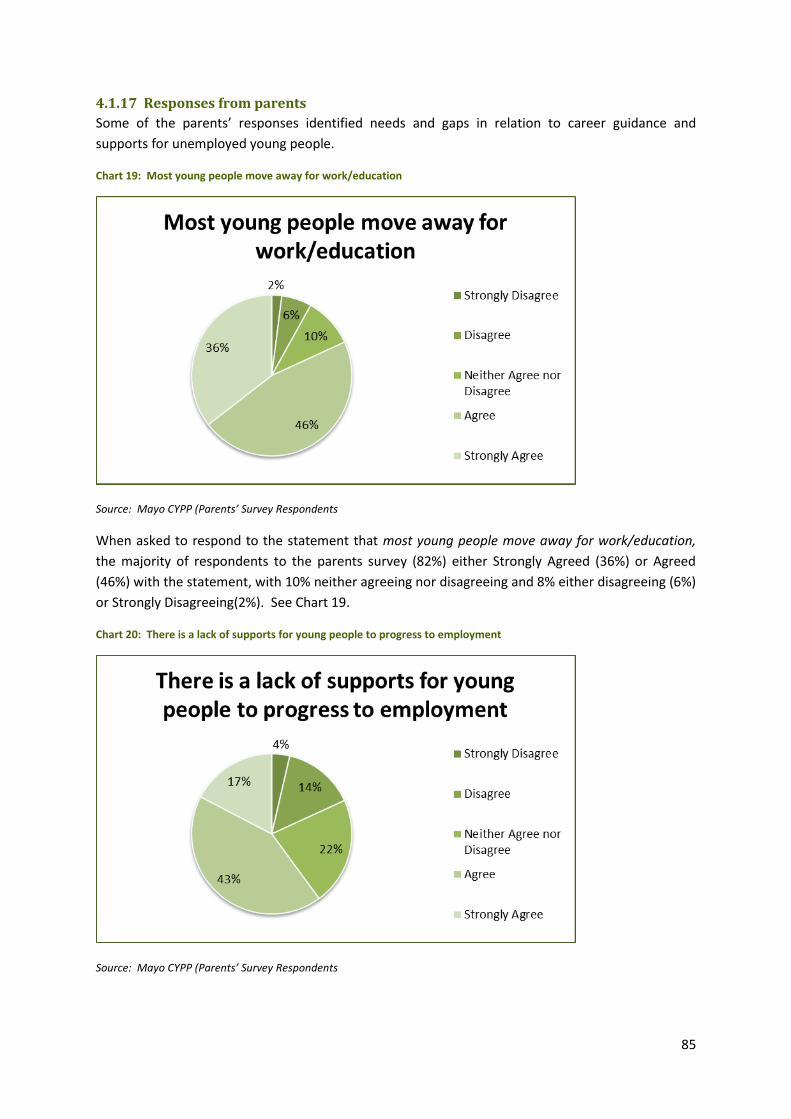
85
4.1.17 Responses from parents
Some of the parents’ responses identified needs and gaps in relation to career guidance and
supports for unemployed young people.
Chart 19: Most young people move away for work/education
Source: Mayo CYPP (Parents’ Survey Respondents
When asked to respond to the statement that most young people move away for work/education,
the majority of respondents to the parents survey (82%) either Strongly Agreed (36%) or Agreed
(46%) with the statement, with 10% neither agreeing nor disagreeing and 8% either disagreeing (6%)
or Strongly Disagreeing(2%). See Chart 19.
Chart 20: There is a lack of supports for young people to progress to employment
Source: Mayo CYPP (Parents’ Survey Respondents
86
When asked to respond to the statement that there is a lack of supports for young people to
progress to employment, the majority of respondents to the parents survey (60%) either Strongly
Agreed (17%) or Agreed (43%) with the statement, with 22% neither agreeing nor disagreeing and
18% either disagreeing (14%) or Strongly Disagreeing (4%). See Chart 20.
Parents were also given an opportunity to provide additional comments in relation to services for
this outcome. Many of the comments were similar across the five outcomes in relation to lack of
knowledge about the services that are available, most services located in larger towns so transport is
an issue, opportunities for young people with disabilities are limited. Some comments submitted by
parents in the survey are presented below:
There is a gap in services once young people leave school, regardless of age. There
is no equivalent to a school guidance councillor [sic] once they leave which could
be helpful for a lot of people trying to search for available services etc (Parents’
survey respondent)
There are not enough services for those with physical and intellectual disability.
(Parents’ survey respondent)
4.1.18 Responses from Service Providers
A common challenge emerging from the consultation with service providers is that it can be difficult
to identify; access and engage with young people in the NEETs category by virtue of the fact that
they are not engaged with any mainstream services. South West Mayo Development Company
piloted a part-time training initiative for NEETs in the Castlebar area (Foundation for Life) in 2017.
This evidence informed model will be further developed during the lifespan of the CYPP and will be
formally evaluated in 2018.
One priority areas has been identified to be addressed under this Outcome in the Mayo CYPP 2018-
2020 which is:
4.1 Young People (16-24 years) not in Employment, Education or Training (NEETs)
4.1.19 Young People not in Employment, Education or Training (NEETs)
The priority issue to be addressed focuses on young people that are Not in Employment, Education
or Training (NEETs). This priority area will also be informed from the learning in Action 2.1: Young
People not attending school and will be informed by the most recent Pobal publication “Best
practice for working with NEETs under the Social Inclusion and Community Activation Programme
(SICAP) which was launched in October 2017. It will also be informed by the results from the
proposed evaluation of Foundation for Life.
Mayo CYPSC will support the establishment of a Local Training Initiative targeting Early School
Leavers in Ballina (Ballina has the highest level of youth unemployment in the county, with 32% of all
young people under 25 years on the Live Register at the end of August 2017, number = 276 ). This
87
will be an alternative learning programme; the young people involved will be facilitated to design
the modules ensuring that the providers/implementers listen to and involve the young people
(aligned with transformational goal 3: Listen to and involve children and young people).
Outcome 5: Connected, respected and contributing to their world The policy framework (Better Outcomes, Better Futures 2014-2020) recognises that children and
young people should be supported and encouraged to play a full role in society. It advocates that
children and young people, through their choices and determination, can heavily influence their own
lives now and in the future. It recognises the value to society of promoting equality and diversity,
supporting children and young people to develop their own identity and to be free from
discrimination. One of the aims (5.3) is that children and young people are civically engaged, socially
and environmentally conscious (pp99-102). Mayo CYPSC approached consultation with children and
young people as part of the planning process based on the Lundy’s Model of Participation as
outlined in the National Strategy on Children and Young People’s Participation in Decision-making
2015-2020.
The Mayo CYPSC has identified the following priority areas:
5.1 Voice of children and young people 0-24 years
5.2 Connecting and respecting seldom heard children and young people
5.3 Rural Transport
4.1.20 Voice of children and young people
The policy framework (Better Outcomes, Better Futures 2014-2020) notes that children and young
people should be supported and encouraged to play a full role in society, recognising that they
themselves through their choices and determination, can heavily influence their own lives now and
in the future. This will involve the inclusion of the voice of children and young people of all ages
using the appropriate structures and mechanisms. The Children and Young Persons Advocacy
Group52 undertook research in 2017 “An investigation into what young people in County Mayo want
services and the adults who engage with children and young people to know” which was youth led.
The research findings were formally presented at a Conference on 18th January 2018 and included 8
key messages of what young people want adults to know (See Appendix VI). The tagline emerging
was “Listen ….. just listen”.
Mayo CYPSC will ensure that the most vulnerable and marginalised children and young people will
be enabled to participate and have their voice heard. This will include participation of children and
52 A joint Tusla and Foróige project
88
young people in the planning and development of services, public spaces, the environment and
decisions that affect them. ‘Youth friendly zones’ as a concept was identified in the research
process whereby young people would be given an opportunity to work with local community groups
and statutory agencies to ensure that community and public spaces are meeting the needs of
children and young people. The research also identified the need to have artistic and creative
activities available as an alternative to sports.
4.1.21 Connecting and respecting young people
Many children and young people contribute significantly to their communities and are often keenly
interested in social, political and environmental issues, envisioning the kind of world they want to be
part of and taking action to create such a world (Better Outcomes, Brighter Futures 2014-2020
p102). The Government recognises the value of facilitating the active participation of children and
young people in decisions that affect their individual and collective lives. Young people need
opportunities to engage in meaningful civic discourse that contributes to policy-making. It
recognises the importance of encouraging greater participation, particularly of young women, in
public life and in decision-making roles. Outdoor learning spaces should be a feature of the lives of
children and young people to raise their environmental consciousness (ibid).
A need emerging throughout the consultation process that cuts across different outcomes is for
more local and free activities for children and young people. Costs, distance and lack of time are the
three main factors that parents identified as specific challenges for them that can prevent their
children/young people from being active. The main factors that prevent participation according to
the youth survey participants were ‘Friends not taking part’, ‘Distance from services’ and a ‘lack of
services in my area’. The main factors that encourage involvement in youth services are that they
are ‘enjoyable’, ‘friends taking part’ and that they are ‘free or cheap’. The service mapping process
identified some geographic areas where there were deficits in youth service provision and these
included Ballyhaunis, Swinford and East Mayo, Achill and Erris.
The following data was also collected in the parents’ and youth survey responses:
54.5% of the youth survey respondents would like to see adventure/activity clubs for young people
53.4% of the youth survey respondents would like to have a youth café (further exploration of this concept through the focus groups found that the young people wanted a dedicated space where they could hang out without being judged and that it would be a space to relax even if the young person was not a member of a structured youth group/service).
46% of the parents agreed with the statement that children and young people in their local community are involved in the planning of activities
80% of the parents agreed with the statement that we live in a family friendly community
61% of young people deemed it very important to them to live in a youth friendly community
The inclusion of marginalised children and young people in the work of CYPSC was cited as a priority
during the planning and consultation process. It was recognised that some organisations already
89
have systems and protocols in place that promote inclusion resulting in equality of opportunity and
outcomes. Mayo CYPSC also recognises the importance of public sector duty as set out in the Irish
Human Rights and Equality Commission Act 2014. It was suggested that the use of an Ethnic
Identifier by service providers would enable a baseline to be established that could be used to
measure progress in relation to inclusion of ethnic minority children and young people. This concept
is at the preliminary discussion stage and warrants further exploration and agreement by CYPSC
prior to becoming actionable.
4.1.22 Rural Transport
Mayo is a predominately rural county and the lack of a rural and integrated public transport system
leads to isolation especially for young people living in rural areas. This is an issue that was identified
by young people, parents and service providers. Mayo CYPSC will ensure that the needs of young
people in the county is communicated and that their voices are heard in the development of a Local
Transport Strategy to be developed by Mayo Local Community Development Committee (LCDC).
Change Management This is the first Children and Young People’s Plan prepared by Mayo CYPSC. The learning from the
process has identified aspects of the work of the CYPSC that needs to be addressed during the
implementation of the plan. These are covered in greater detail in the sub-sections below and are:
Interagency Working and Collaboration
Information, Research and Communications
Advocacy and Influencing Policy
4.1.23 Interagency Working and collaboration
The objective is to enhance coordination and collaboration in the planning and delivery of services
by gaining a deeper understanding of the challenges and benefits of collaborative working. The
service provider survey results show that 29.2% of the service providers rated their experience of
interagency collaboration as Poor (6.7%) and Fair (22.5%) with 10.1% having no previous experience.
The remaining responses indicated that their experiences were good (32.6%), very good (20.2%) and
excellent (7.9%) which is positive in relation to working together in the future to ensure better
outcomes for children and young people. In addition, just over one-fifth (21%) of the service
providers that participated in the survey responded that they were not familiar with the Hardiker
Scale and would like to find out more. This identifies the need to provide additional information and
training on the Hardiker Scale. This should lead to the development of a common language and
interpretation of the Hardiker Levels. This should result in data being more accurately captured in
relation to services targeted at different levels of the scale. See Chart 21 and Chart 22.
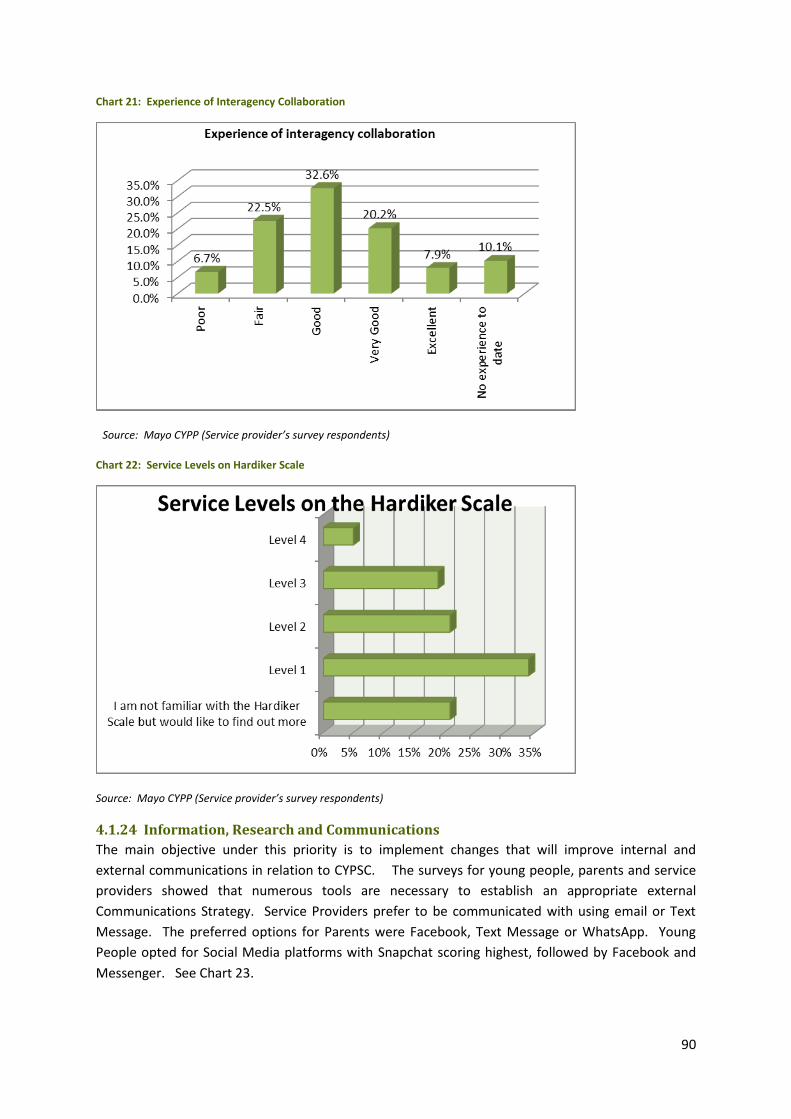
90
Chart 21: Experience of Interagency Collaboration
Source: Mayo CYPP (Service provider’s survey respondents)
Chart 22: Service Levels on Hardiker Scale
Source: Mayo CYPP (Service provider’s survey respondents)
4.1.24 Information, Research and Communications
The main objective under this priority is to implement changes that will improve internal and
external communications in relation to CYPSC. The surveys for young people, parents and service
providers showed that numerous tools are necessary to establish an appropriate external
Communications Strategy. Service Providers prefer to be communicated with using email or Text
Message. The preferred options for Parents were Facebook, Text Message or WhatsApp. Young
People opted for Social Media platforms with Snapchat scoring highest, followed by Facebook and
Messenger. See Chart 23.
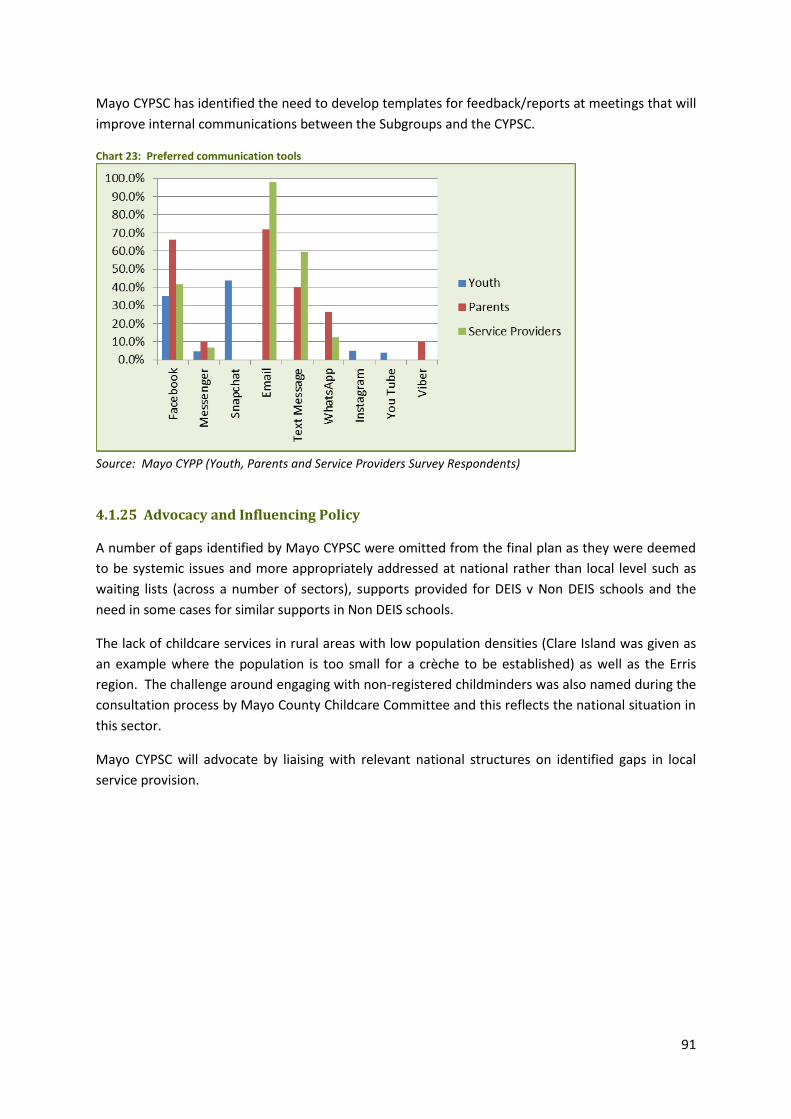
91
Mayo CYPSC has identified the need to develop templates for feedback/reports at meetings that will
improve internal communications between the Subgroups and the CYPSC.
Chart 23: Preferred communication tools
Source: Mayo CYPP (Youth, Parents and Service Providers Survey Respondents)
4.1.25 Advocacy and Influencing Policy
A number of gaps identified by Mayo CYPSC were omitted from the final plan as they were deemed
to be systemic issues and more appropriately addressed at national rather than local level such as
waiting lists (across a number of sectors), supports provided for DEIS v Non DEIS schools and the
need in some cases for similar supports in Non DEIS schools.
The lack of childcare services in rural areas with low population densities (Clare Island was given as
an example where the population is too small for a crèche to be established) as well as the Erris
region. The challenge around engaging with non-registered childminders was also named during the
consultation process by Mayo County Childcare Committee and this reflects the national situation in
this sector.
Mayo CYPSC will advocate by liaising with relevant national structures on identified gaps in local
service provision.
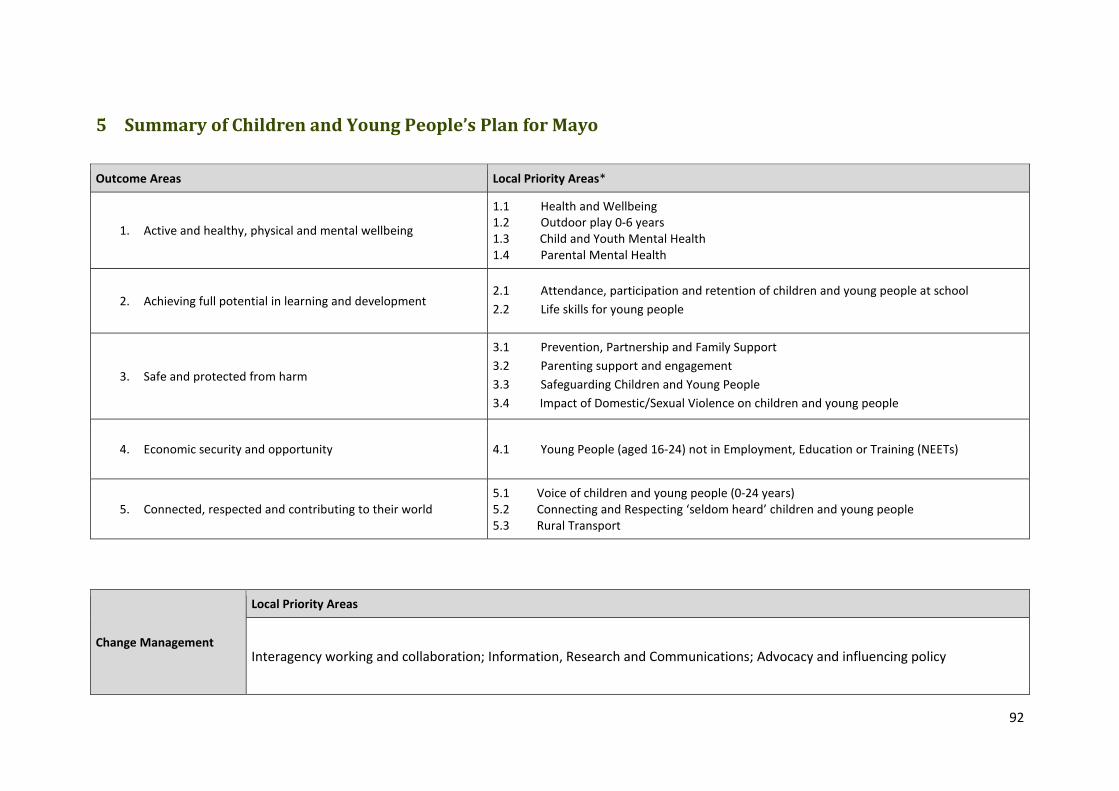
92
5 Summary of Children and Young People’s Plan for Mayo
Outcome Areas Local Priority Areas*
1. Active and healthy, physical and mental wellbeing
1.1 Health and Wellbeing 1.2 Outdoor play 0-6 years 1.3 Child and Youth Mental Health 1.4 Parental Mental Health
2. Achieving full potential in learning and development 2.1 Attendance, participation and retention of children and young people at school
2.2 Life skills for young people
3. Safe and protected from harm
3.1 Prevention, Partnership and Family Support
3.2 Parenting support and engagement
3.3 Safeguarding Children and Young People
3.4 Impact of Domestic/Sexual Violence on children and young people
4. Economic security and opportunity 4.1 Young People (aged 16-24) not in Employment, Education or Training (NEETs)
5. Connected, respected and contributing to their world 5.1 Voice of children and young people (0-24 years) 5.2 Connecting and Respecting ‘seldom heard’ children and young people 5.3 Rural Transport
Change Management
Local Priority Areas
Interagency working and collaboration; Information, Research and Communications; Advocacy and influencing policy
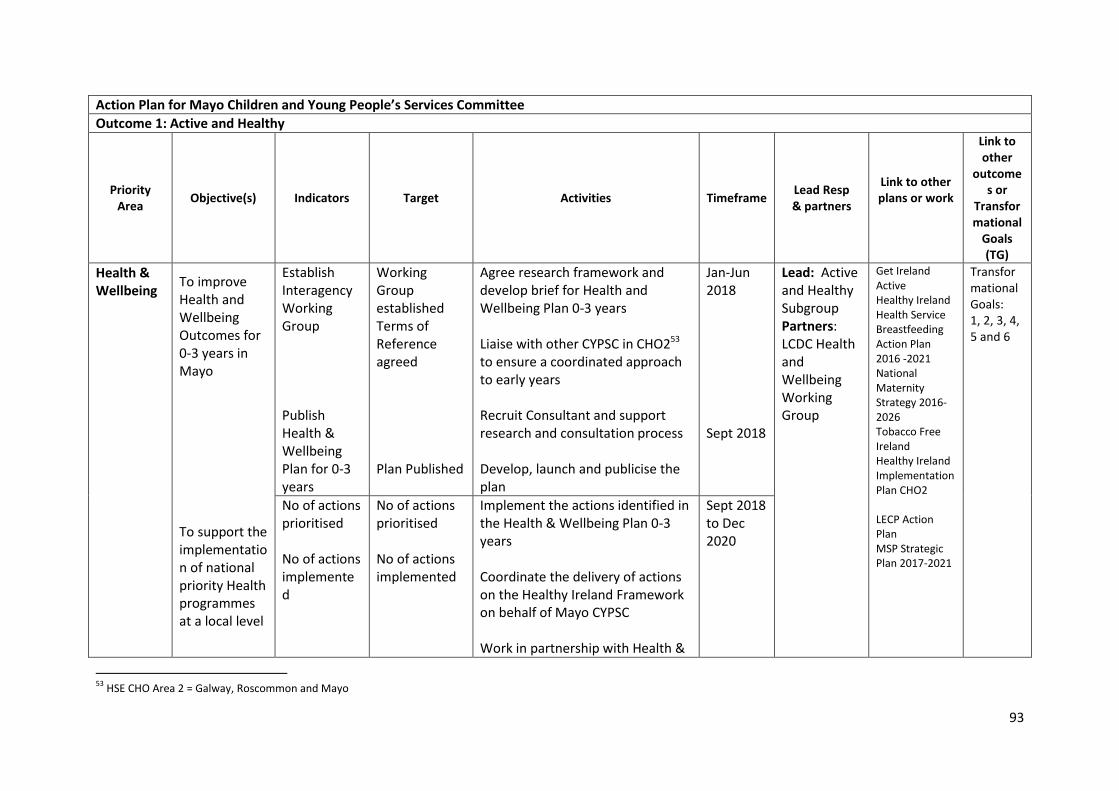
93
Action Plan for Mayo Children and Young People’s Services Committee
Outcome 1: Active and Healthy
Priority Area
Objective(s)
Indicators
Target Activities Timeframe
Lead Resp & partners
Link to other plans or work
Link to other
outcomes or
Transformational
Goals (TG)
Health & Wellbeing
To improve Health and Wellbeing Outcomes for 0-3 years in Mayo To support the implementation of national priority Health programmes at a local level
Establish Interagency Working Group Publish Health & Wellbeing Plan for 0-3 years
Working Group established Terms of Reference agreed Plan Published
Agree research framework and develop brief for Health and Wellbeing Plan 0-3 years Liaise with other CYPSC in CHO253 to ensure a coordinated approach to early years Recruit Consultant and support research and consultation process Develop, launch and publicise the plan
Jan-Jun 2018 Sept 2018
Lead: Active and Healthy Subgroup Partners: LCDC Health and Wellbeing Working Group
Get Ireland Active Healthy Ireland Health Service Breastfeeding Action Plan 2016 -2021 National Maternity Strategy 2016-2026 Tobacco Free Ireland Healthy Ireland Implementation Plan CHO2 LECP Action Plan MSP Strategic Plan 2017-2021
Transformational Goals: 1, 2, 3, 4, 5 and 6
No of actions prioritised No of actions implemented
No of actions prioritised No of actions implemented
Implement the actions identified in the Health & Wellbeing Plan 0-3 years Coordinate the delivery of actions on the Healthy Ireland Framework on behalf of Mayo CYPSC Work in partnership with Health &
Sept 2018 to Dec 2020
53
HSE CHO Area 2 = Galway, Roscommon and Mayo
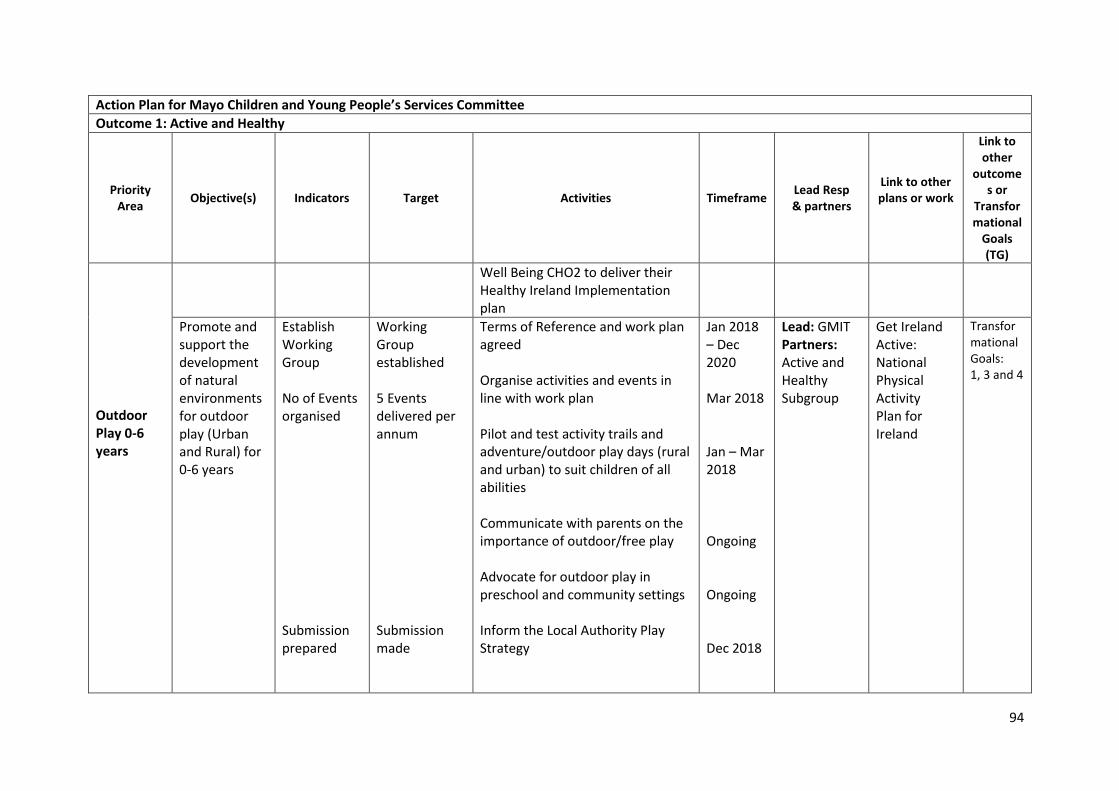
94
Action Plan for Mayo Children and Young People’s Services Committee
Outcome 1: Active and Healthy
Priority Area
Objective(s)
Indicators
Target Activities Timeframe
Lead Resp & partners
Link to other plans or work
Link to other
outcomes or
Transformational
Goals (TG)
Outdoor Play 0-6 years
Well Being CHO2 to deliver their Healthy Ireland Implementation plan
Promote and support the development of natural environments for outdoor play (Urban and Rural) for 0-6 years
Establish Working Group No of Events organised Submission prepared
Working Group established 5 Events delivered per annum Submission made
Terms of Reference and work plan agreed Organise activities and events in line with work plan Pilot and test activity trails and adventure/outdoor play days (rural and urban) to suit children of all abilities Communicate with parents on the importance of outdoor/free play Advocate for outdoor play in preschool and community settings Inform the Local Authority Play Strategy
Jan 2018 – Dec 2020 Mar 2018 Jan – Mar 2018 Ongoing Ongoing Dec 2018
Lead: GMIT Partners: Active and Healthy Subgroup
Get Ireland Active: National Physical Activity Plan for Ireland
Transformational Goals: 1, 3 and 4
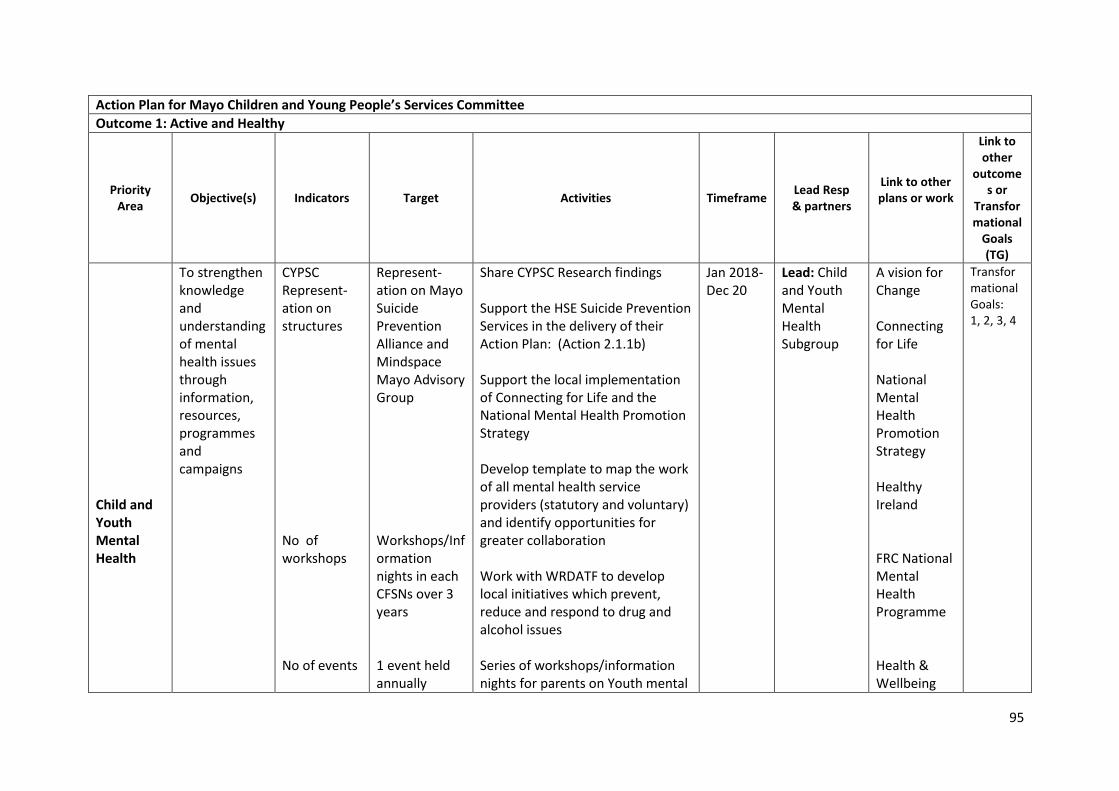
95
Action Plan for Mayo Children and Young People’s Services Committee
Outcome 1: Active and Healthy
Priority Area
Objective(s)
Indicators
Target Activities Timeframe
Lead Resp & partners
Link to other plans or work
Link to other
outcomes or
Transformational
Goals (TG)
Child and Youth Mental Health
To strengthen knowledge and understanding of mental health issues through information, resources, programmes and campaigns
CYPSC Represent-ation on structures No of workshops No of events
Represent-ation on Mayo Suicide Prevention Alliance and Mindspace Mayo Advisory Group Workshops/Information nights in each CFSNs over 3 years 1 event held annually
Share CYPSC Research findings Support the HSE Suicide Prevention Services in the delivery of their Action Plan: (Action 2.1.1b) Support the local implementation of Connecting for Life and the National Mental Health Promotion Strategy Develop template to map the work of all mental health service providers (statutory and voluntary) and identify opportunities for greater collaboration Work with WRDATF to develop local initiatives which prevent, reduce and respond to drug and alcohol issues Series of workshops/information nights for parents on Youth mental
Jan 2018-Dec 20
Lead: Child and Youth Mental Health Subgroup
A vision for Change Connecting for Life National Mental Health Promotion Strategy Healthy Ireland FRC National Mental Health Programme Health & Wellbeing
Transformational Goals: 1, 2, 3, 4
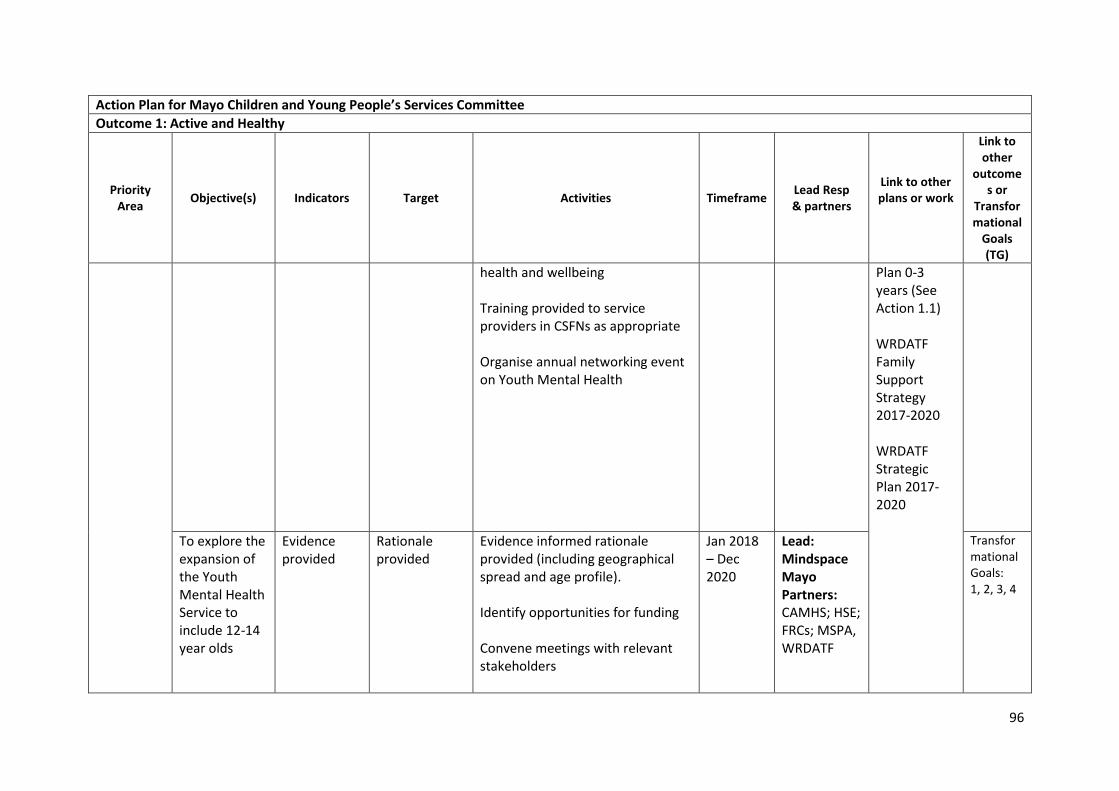
96
Action Plan for Mayo Children and Young People’s Services Committee
Outcome 1: Active and Healthy
Priority Area
Objective(s)
Indicators
Target Activities Timeframe
Lead Resp & partners
Link to other plans or work
Link to other
outcomes or
Transformational
Goals (TG)
health and wellbeing Training provided to service providers in CSFNs as appropriate Organise annual networking event on Youth Mental Health
Plan 0-3 years (See Action 1.1) WRDATF Family Support Strategy 2017-2020 WRDATF Strategic Plan 2017-2020
To explore the expansion of the Youth Mental Health Service to include 12-14 year olds
Evidence provided
Rationale provided
Evidence informed rationale provided (including geographical spread and age profile). Identify opportunities for funding Convene meetings with relevant stakeholders
Jan 2018 – Dec 2020
Lead: Mindspace Mayo Partners: CAMHS; HSE; FRCs; MSPA, WRDATF
Transformational Goals: 1, 2, 3, 4
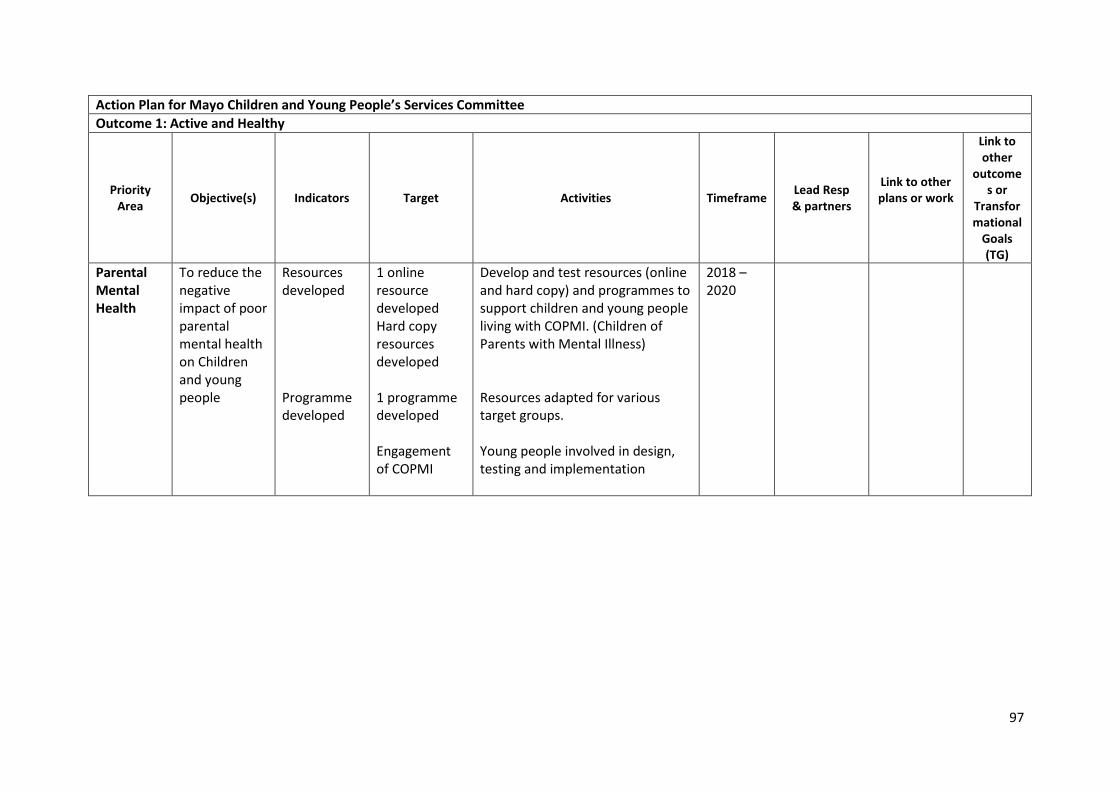
97
Action Plan for Mayo Children and Young People’s Services Committee
Outcome 1: Active and Healthy
Priority Area
Objective(s)
Indicators
Target Activities Timeframe
Lead Resp & partners
Link to other plans or work
Link to other
outcomes or
Transformational
Goals (TG)
Parental Mental Health
To reduce the negative impact of poor parental mental health on Children and young people
Resources developed Programme developed
1 online resource developed Hard copy resources developed 1 programme developed Engagement of COPMI
Develop and test resources (online and hard copy) and programmes to support children and young people living with COPMI. (Children of Parents with Mental Illness) Resources adapted for various target groups. Young people involved in design, testing and implementation
2018 – 2020

98
Action Plan for Mayo Children and Young People’s Services Committee
Outcome 2: Achieving full potential in learning and development
Priority Area Objective(s)
Indicators
Target Activities Timeframe
Lead Resp & partners
Link to other plans or work
Link to other outcomes or Transformational Goals
Attendance, Participation and Retention of Children and Young people in school
To address absenteeism and Early School Leaving using interagency approaches and solutions To ensure supports are available for children and young people experiencing difficulties in school
Working Group established Actions/priorities identified Baseline established % Reduction in school absenteeism at post primary level Research study completed
Working Group established by Mar 2018 Priorities agreed Action plan implemented Baseline established Target for % reduction in absenteeism agreed Research completed and disseminated
Agree priorities to improve attendance, participation and retention of young people at post-primary level Develop common baseline to measure improvements for school attendance based on current 2015/16 data from Tusla re School absenteeism Develop peer led research on young Travellers experiences of education in the county
Jan 2018-Dec 2020
Lead: Education and Learning Subgroup Partners: NEPS, HSCLs, LDC, Mindspace, Mayo Youth Network Lead: Mayo Traveller Support Group
National Plan for Education 2016-2019 National Youth Strategy2015-2020 National Behavioural Support Service Education and Welfare Service Strategic Plan DEIS Plan 2017 School Completion Programme Retention Plans
National Traveller and Roma Inclusion Strategy 2017-2021
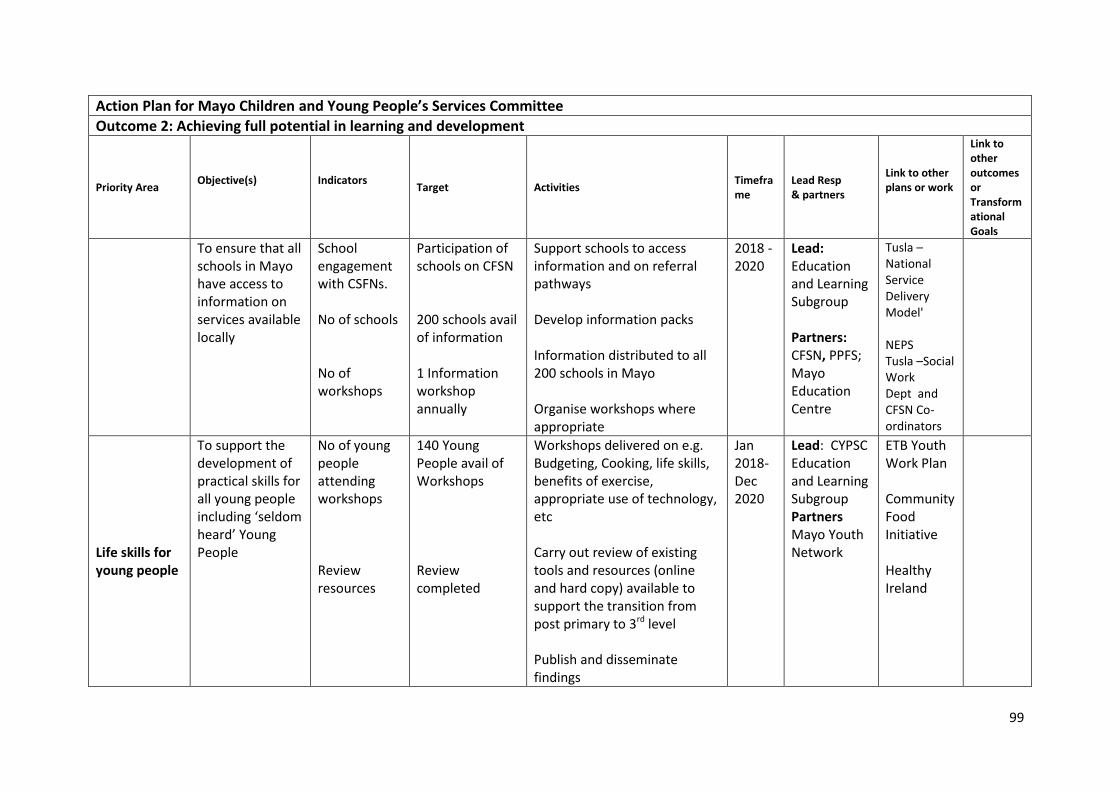
99
Action Plan for Mayo Children and Young People’s Services Committee
Outcome 2: Achieving full potential in learning and development
Priority Area Objective(s)
Indicators
Target Activities Timeframe
Lead Resp & partners
Link to other plans or work
Link to other outcomes or Transformational Goals
To ensure that all schools in Mayo have access to information on services available locally
School engagement with CSFNs. No of schools No of workshops
Participation of schools on CFSN 200 schools avail of information 1 Information workshop annually
Support schools to access information and on referral pathways Develop information packs Information distributed to all 200 schools in Mayo Organise workshops where appropriate
2018 - 2020
Lead: Education and Learning Subgroup Partners: CFSN, PPFS; Mayo Education Centre
Tusla – National Service Delivery Model' NEPS Tusla –Social Work Dept and CFSN Co-ordinators
Life skills for young people
To support the development of practical skills for all young people including ‘seldom heard’ Young People
No of young people attending workshops Review resources
140 Young People avail of Workshops Review completed
Workshops delivered on e.g. Budgeting, Cooking, life skills, benefits of exercise, appropriate use of technology, etc Carry out review of existing tools and resources (online and hard copy) available to support the transition from post primary to 3rd level Publish and disseminate findings
Jan 2018-Dec 2020
Lead: CYPSC Education and Learning Subgroup Partners Mayo Youth Network
ETB Youth Work Plan Community Food Initiative Healthy Ireland
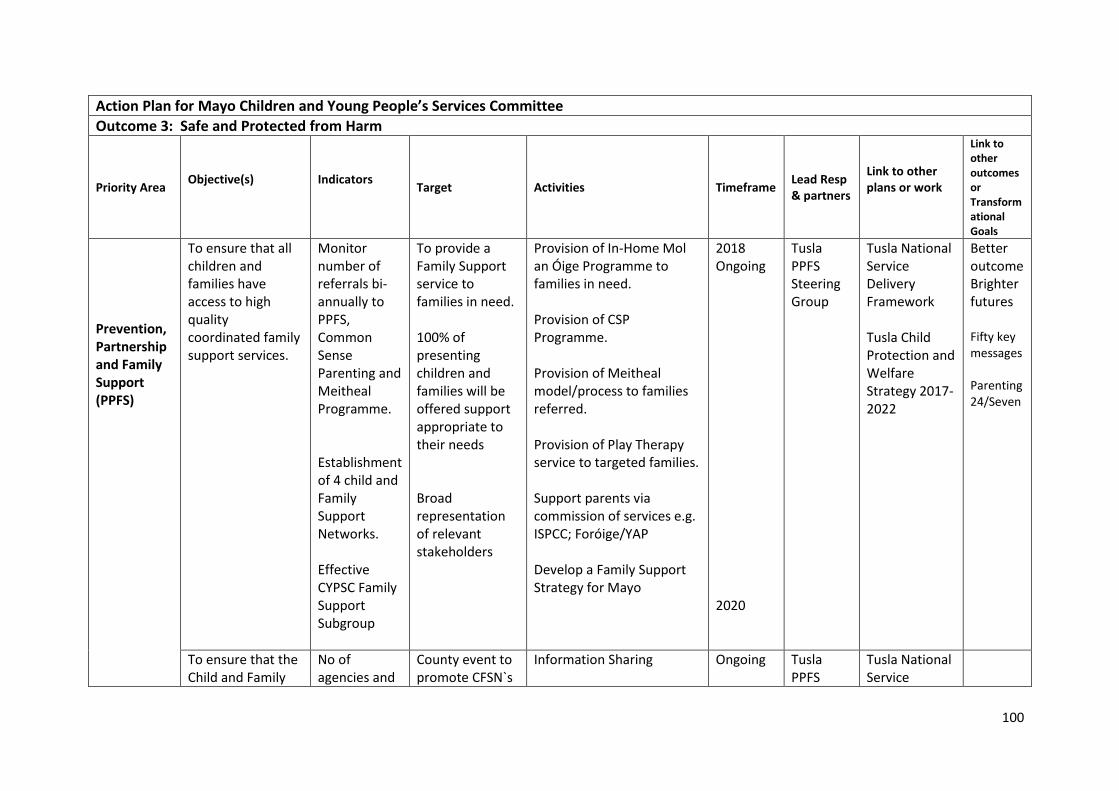
100
Action Plan for Mayo Children and Young People’s Services Committee
Outcome 3: Safe and Protected from Harm
Priority Area Objective(s)
Indicators
Target Activities Timeframe Lead Resp & partners
Link to other plans or work
Link to other outcomes or Transformational Goals
Prevention, Partnership and Family Support (PPFS)
To ensure that all children and families have access to high quality coordinated family support services.
Monitor number of referrals bi-annually to PPFS, Common Sense Parenting and Meitheal Programme. Establishment of 4 child and Family Support Networks. Effective CYPSC Family Support Subgroup
To provide a Family Support service to families in need. 100% of presenting children and families will be offered support appropriate to their needs Broad representation of relevant stakeholders
Provision of In-Home Mol an Óige Programme to families in need. Provision of CSP Programme. Provision of Meitheal model/process to families referred. Provision of Play Therapy service to targeted families. Support parents via commission of services e.g. ISPCC; Foróige/YAP Develop a Family Support Strategy for Mayo
2018 Ongoing 2020
Tusla PPFS Steering Group
Tusla National Service Delivery Framework Tusla Child Protection and Welfare Strategy 2017-2022
Better outcome Brighter futures Fifty key messages Parenting24/Seven
To ensure that the Child and Family
No of agencies and
County event to promote CFSN`s
Information Sharing
Ongoing
Tusla PPFS
Tusla National Service
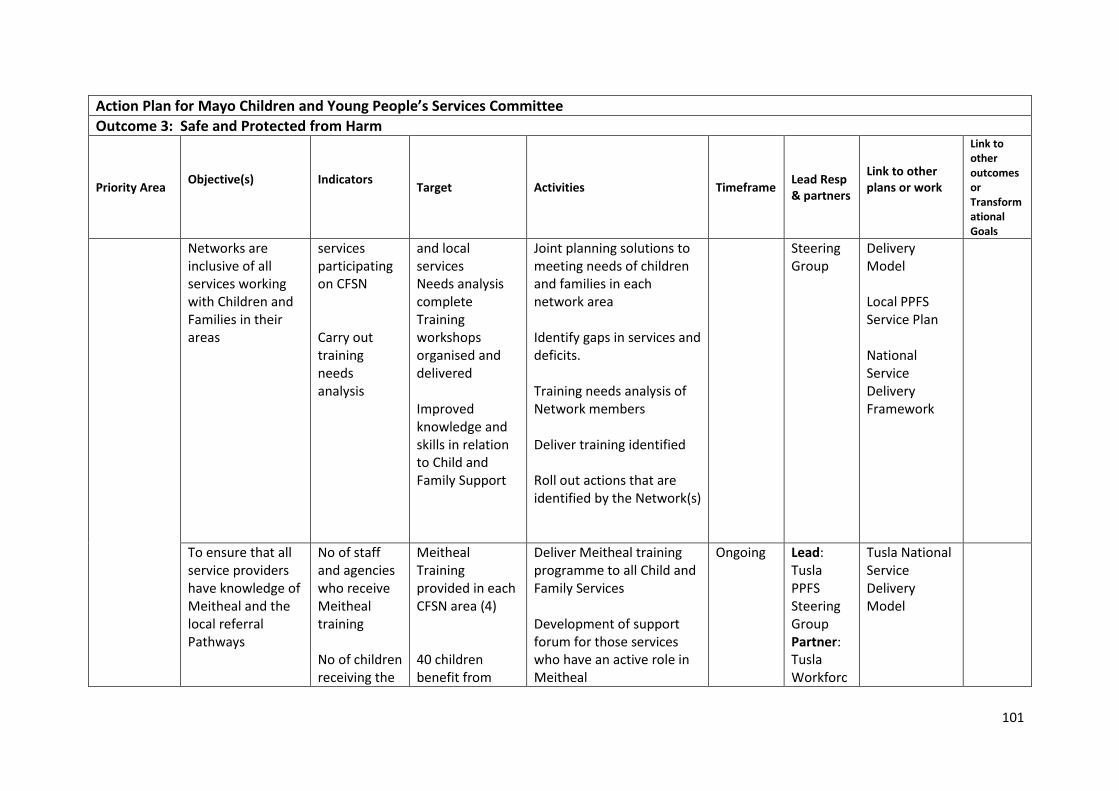
101
Action Plan for Mayo Children and Young People’s Services Committee
Outcome 3: Safe and Protected from Harm
Priority Area Objective(s)
Indicators
Target Activities Timeframe Lead Resp & partners
Link to other plans or work
Link to other outcomes or Transformational Goals
Networks are inclusive of all services working with Children and Families in their areas
services participating on CFSN Carry out training needs analysis
and local services Needs analysis complete Training workshops organised and delivered Improved knowledge and skills in relation to Child and Family Support
Joint planning solutions to meeting needs of children and families in each network area Identify gaps in services and deficits. Training needs analysis of Network members Deliver training identified Roll out actions that are identified by the Network(s)
Steering Group
Delivery Model Local PPFS Service Plan National Service Delivery Framework
To ensure that all service providers have knowledge of Meitheal and the local referral Pathways
No of staff and agencies who receive Meitheal training No of children receiving the
Meitheal Training provided in each CFSN area (4) 40 children benefit from
Deliver Meitheal training programme to all Child and Family Services Development of support forum for those services who have an active role in Meitheal
Ongoing Lead: Tusla PPFS Steering Group Partner: Tusla Workforc
Tusla National Service Delivery Model
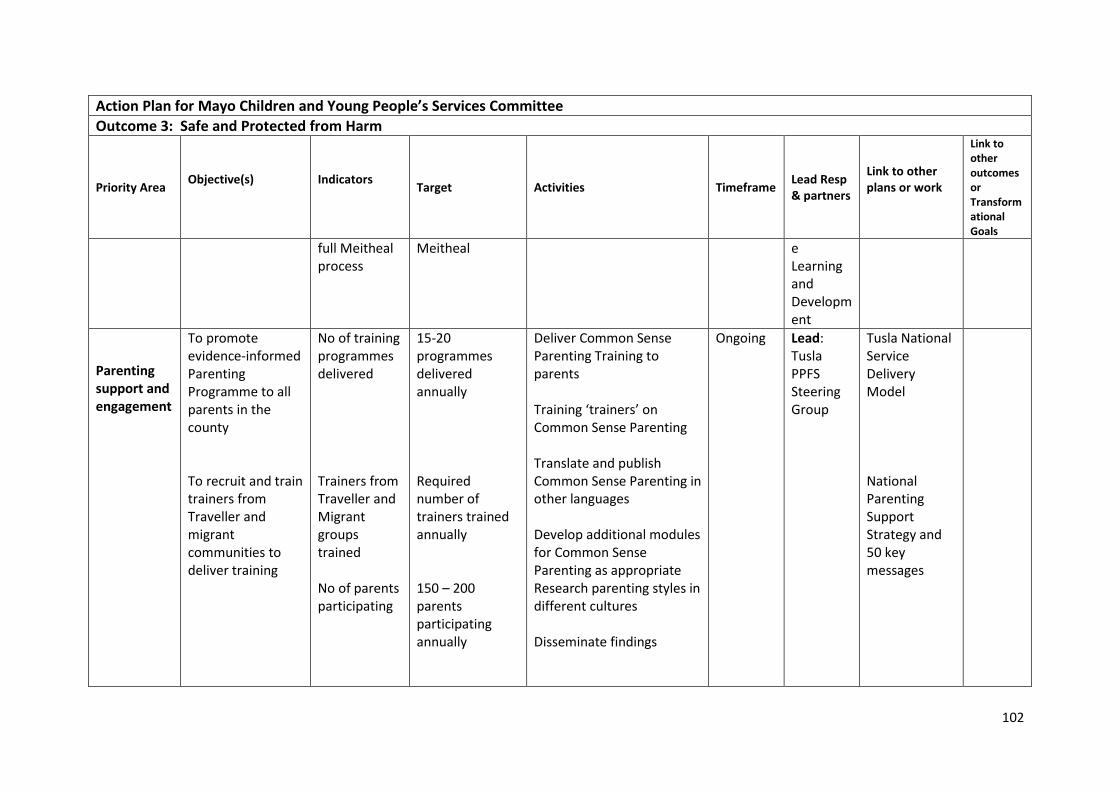
102
Action Plan for Mayo Children and Young People’s Services Committee
Outcome 3: Safe and Protected from Harm
Priority Area Objective(s)
Indicators
Target Activities Timeframe Lead Resp & partners
Link to other plans or work
Link to other outcomes or Transformational Goals
full Meitheal process
Meitheal e Learning and Development
Parenting support and engagement
To promote evidence-informed Parenting Programme to all parents in the county To recruit and train trainers from Traveller and migrant communities to deliver training
No of training programmes delivered Trainers from Traveller and Migrant groups trained No of parents participating
15-20 programmes delivered annually Required number of trainers trained annually 150 – 200 parents participating annually
Deliver Common Sense Parenting Training to parents Training ‘trainers’ on Common Sense Parenting Translate and publish Common Sense Parenting in other languages Develop additional modules for Common Sense Parenting as appropriate Research parenting styles in different cultures Disseminate findings
Ongoing Lead: Tusla PPFS Steering Group
Tusla National Service Delivery Model National Parenting Support Strategy and 50 key messages
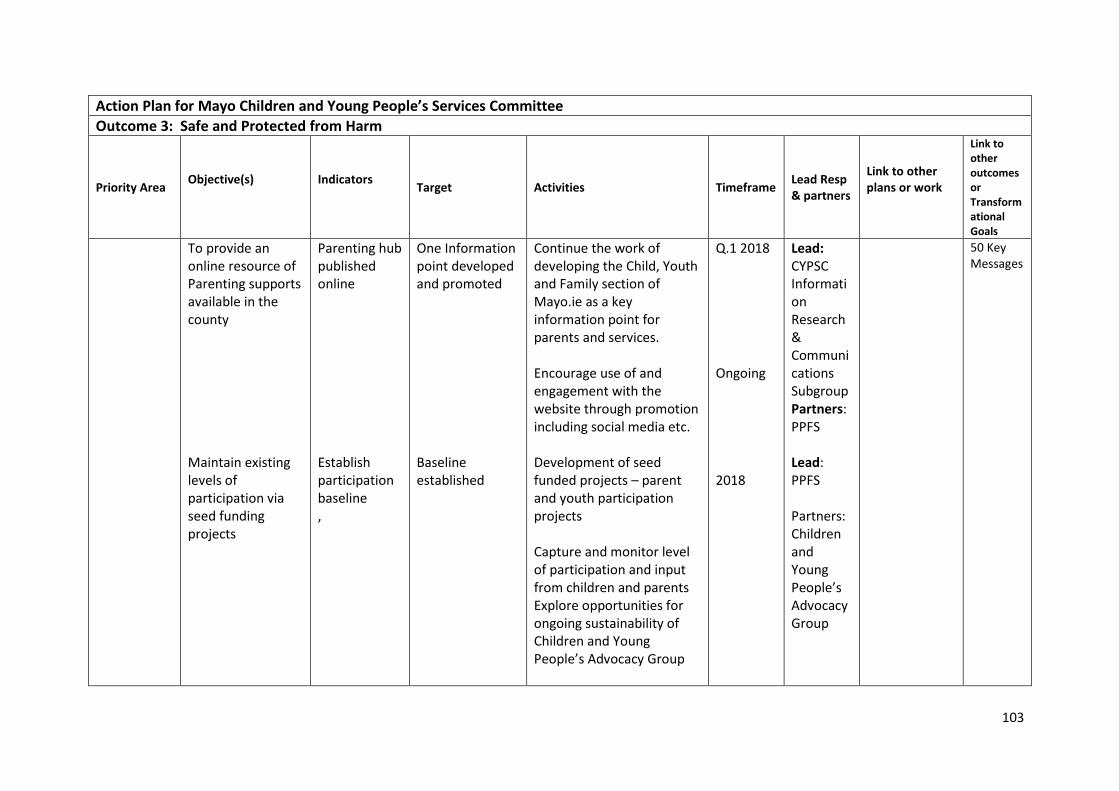
103
Action Plan for Mayo Children and Young People’s Services Committee
Outcome 3: Safe and Protected from Harm
Priority Area Objective(s)
Indicators
Target Activities Timeframe Lead Resp & partners
Link to other plans or work
Link to other outcomes or Transformational Goals
To provide an online resource of Parenting supports available in the county Maintain existing levels of participation via seed funding projects
Parenting hub published online Establish participation baseline ,
One Information point developed and promoted Baseline established
Continue the work of developing the Child, Youth and Family section of Mayo.ie as a key information point for parents and services. Encourage use of and engagement with the website through promotion including social media etc. Development of seed funded projects – parent and youth participation projects Capture and monitor level of participation and input from children and parents Explore opportunities for ongoing sustainability of Children and Young People’s Advocacy Group
Q.1 2018 Ongoing 2018
Lead: CYPSC Information Research & Communications Subgroup Partners: PPFS Lead: PPFS Partners: Children and Young People’s Advocacy Group
50 Key Messages
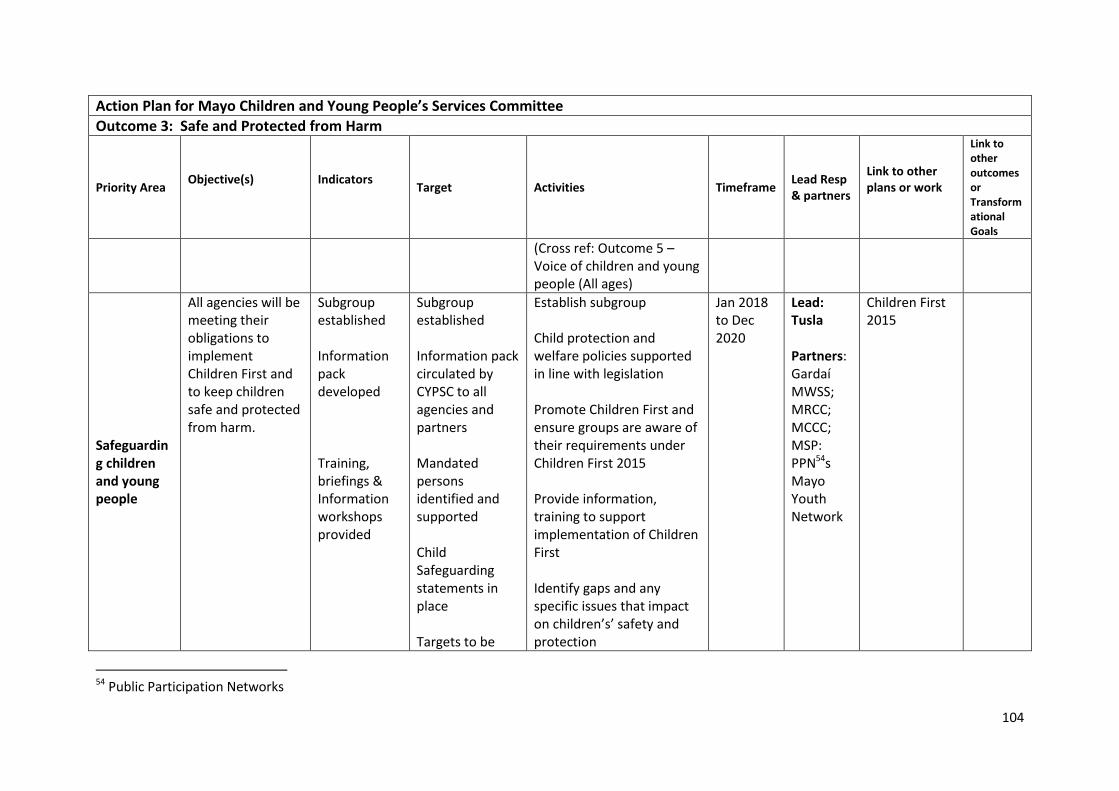
104
Action Plan for Mayo Children and Young People’s Services Committee
Outcome 3: Safe and Protected from Harm
Priority Area Objective(s)
Indicators
Target Activities Timeframe Lead Resp & partners
Link to other plans or work
Link to other outcomes or Transformational Goals
(Cross ref: Outcome 5 – Voice of children and young people (All ages)
Safeguarding children and young people
All agencies will be meeting their obligations to implement Children First and to keep children safe and protected from harm.
Subgroup established Information pack developed Training, briefings & Information workshops provided
Subgroup established Information pack circulated by CYPSC to all agencies and partners Mandated persons identified and supported Child Safeguarding statements in place Targets to be
Establish subgroup Child protection and welfare policies supported in line with legislation Promote Children First and ensure groups are aware of their requirements under Children First 2015 Provide information, training to support implementation of Children First Identify gaps and any specific issues that impact on children’s’ safety and protection
Jan 2018 to Dec 2020
Lead: Tusla Partners: Gardaí MWSS; MRCC; MCCC; MSP: PPN54s Mayo Youth Network
Children First 2015
54 Public Participation Networks
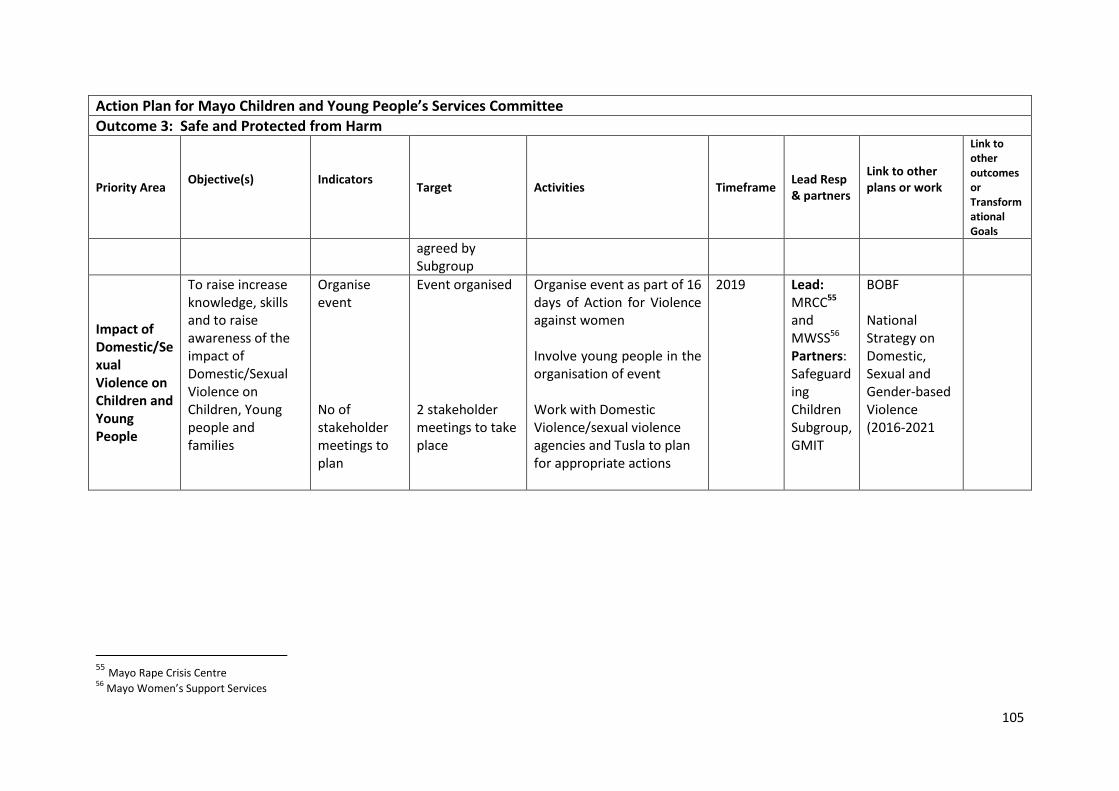
105
Action Plan for Mayo Children and Young People’s Services Committee
Outcome 3: Safe and Protected from Harm
Priority Area Objective(s)
Indicators
Target Activities Timeframe Lead Resp & partners
Link to other plans or work
Link to other outcomes or Transformational Goals
agreed by Subgroup
Impact of Domestic/Sexual Violence on Children and Young People
To raise increase knowledge, skills and to raise awareness of the impact of Domestic/Sexual Violence on Children, Young people and families
Organise event No of stakeholder meetings to plan
Event organised 2 stakeholder meetings to take place
Organise event as part of 16 days of Action for Violence against women Involve young people in the organisation of event Work with Domestic Violence/sexual violence agencies and Tusla to plan for appropriate actions
2019
Lead: MRCC55 and MWSS56 Partners: Safeguarding Children Subgroup, GMIT
BOBF National Strategy on Domestic, Sexual and Gender-based Violence (2016-2021
55 Mayo Rape Crisis Centre 56
Mayo Women’s Support Services
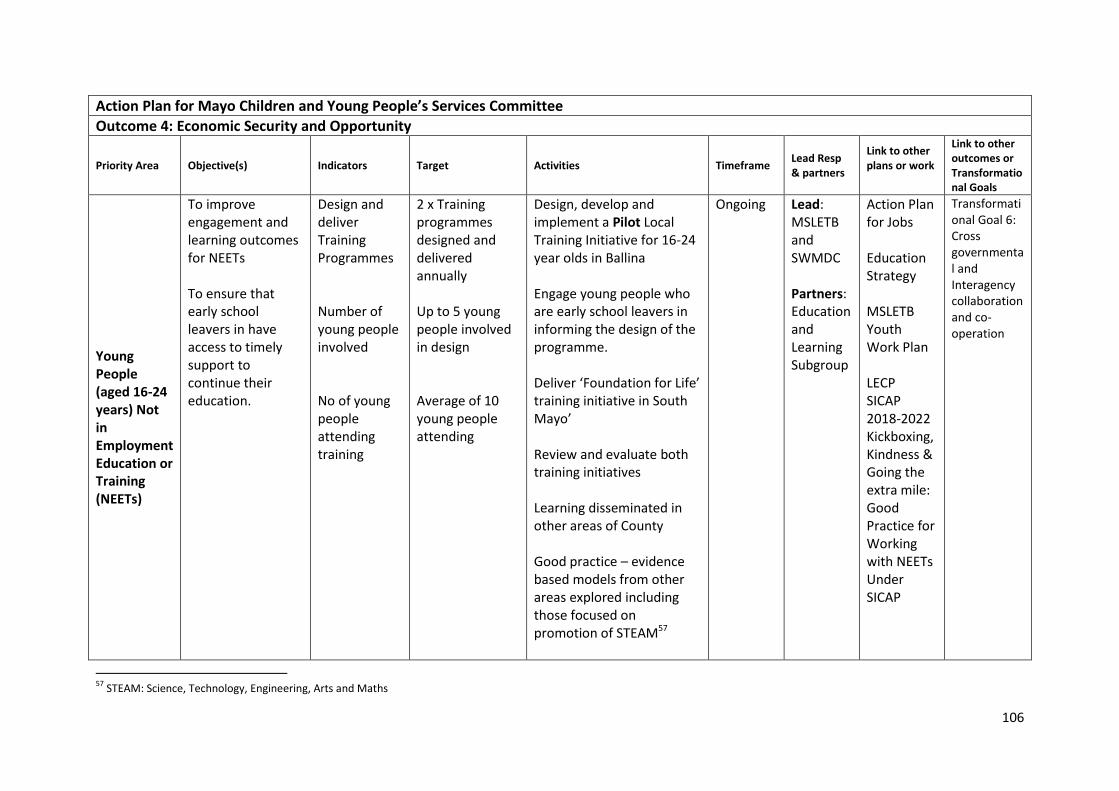
106
Action Plan for Mayo Children and Young People’s Services Committee
Outcome 4: Economic Security and Opportunity
Priority Area Objective(s)
Indicators
Target Activities Timeframe Lead Resp & partners
Link to other plans or work
Link to other outcomes or Transformational Goals
Young People (aged 16-24 years) Not in Employment Education or Training (NEETs)
To improve engagement and learning outcomes for NEETs To ensure that early school leavers in have access to timely support to continue their education.
Design and deliver Training Programmes Number of young people involved No of young people attending training
2 x Training programmes designed and delivered annually Up to 5 young people involved in design Average of 10 young people attending
Design, develop and implement a Pilot Local Training Initiative for 16-24 year olds in Ballina Engage young people who are early school leavers in informing the design of the programme. Deliver ‘Foundation for Life’ training initiative in South Mayo’ Review and evaluate both training initiatives Learning disseminated in other areas of County Good practice – evidence based models from other areas explored including those focused on promotion of STEAM57
Ongoing Lead: MSLETB and SWMDC Partners: Education and Learning Subgroup
Action Plan for Jobs Education Strategy MSLETB Youth Work Plan LECP SICAP 2018-2022 Kickboxing, Kindness & Going the extra mile: Good Practice for Working with NEETs Under SICAP
Transformational Goal 6: Cross governmental and Interagency collaboration and co-operation
57
STEAM: Science, Technology, Engineering, Arts and Maths
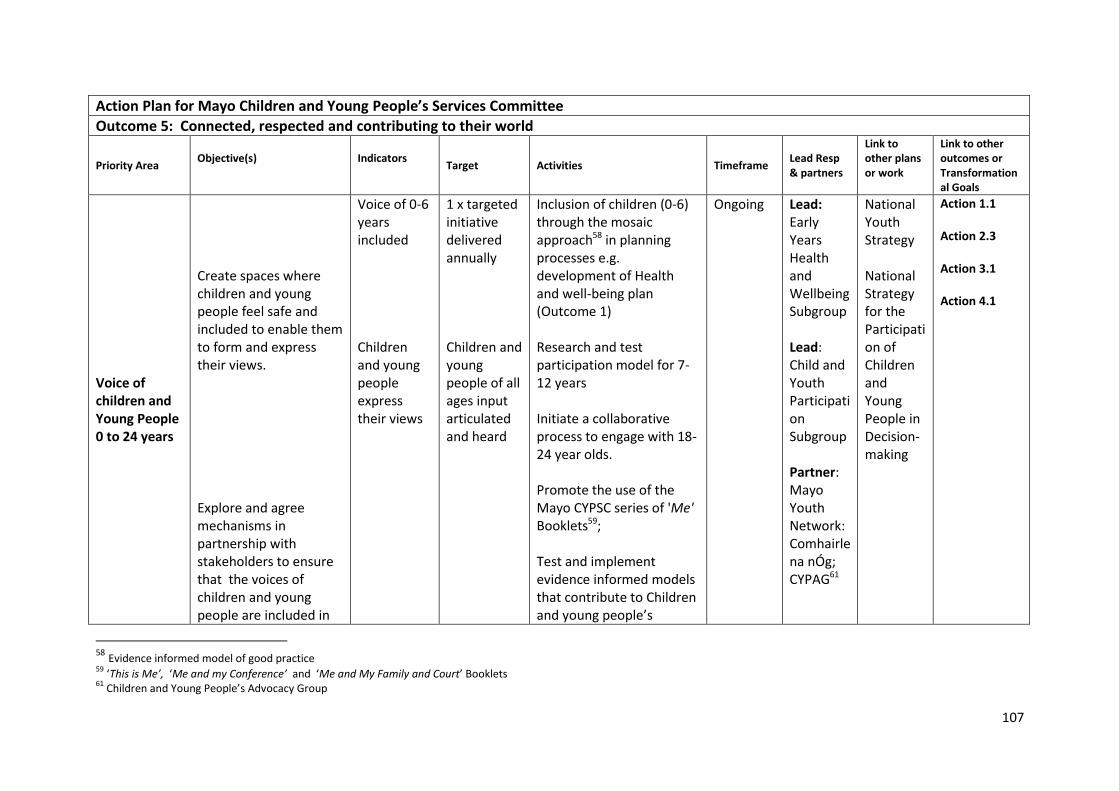
107
Action Plan for Mayo Children and Young People’s Services Committee
Outcome 5: Connected, respected and contributing to their world
Priority Area Objective(s)
Indicators
Target Activities Timeframe Lead Resp & partners
Link to other plans or work
Link to other outcomes or Transformational Goals
Voice of children and Young People 0 to 24 years
Create spaces where children and young people feel safe and included to enable them to form and express their views. Explore and agree mechanisms in partnership with stakeholders to ensure that the voices of children and young people are included in
Voice of 0-6 years included Children and young people express their views
1 x targeted initiative delivered annually Children and young people of all ages input articulated and heard
Inclusion of children (0-6) through the mosaic approach58 in planning processes e.g. development of Health and well-being plan (Outcome 1) Research and test participation model for 7-12 years Initiate a collaborative process to engage with 18-24 year olds. Promote the use of the Mayo CYPSC series of 'Me' Booklets59; Test and implement evidence informed models that contribute to Children and young people’s
Ongoing
Lead: Early Years Health and Wellbeing Subgroup Lead: Child and Youth Participation Subgroup Partner: Mayo Youth Network: Comhairle na nÓg; CYPAG61
National Youth Strategy National Strategy for the Participation of Children and Young People in Decision-making
Action 1.1 Action 2.3 Action 3.1 Action 4.1
58 Evidence informed model of good practice 59
‘This is Me’, ‘Me and my Conference’ and ‘Me and My Family and Court’ Booklets 61
Children and Young People’s Advocacy Group
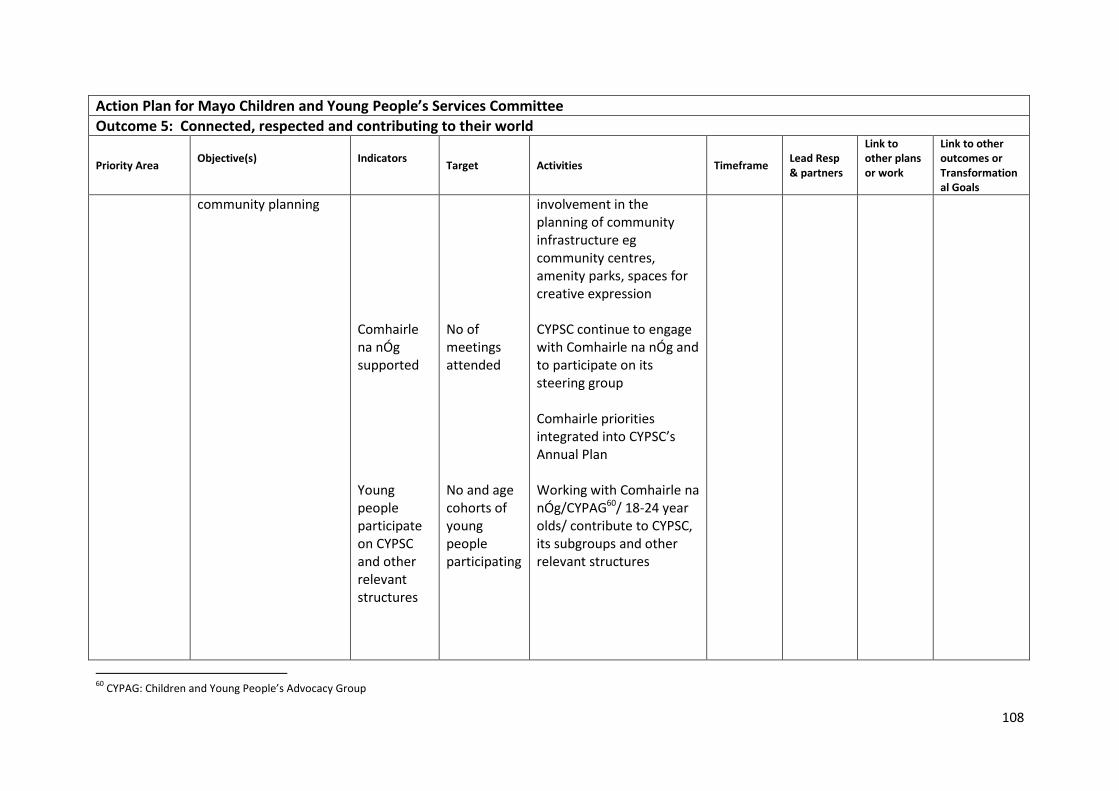
108
Action Plan for Mayo Children and Young People’s Services Committee
Outcome 5: Connected, respected and contributing to their world
Priority Area Objective(s)
Indicators
Target Activities Timeframe Lead Resp & partners
Link to other plans or work
Link to other outcomes or Transformational Goals
community planning
Comhairle na nÓg supported Young people participate on CYPSC and other relevant structures
No of meetings attended No and age cohorts of young people participating
involvement in the planning of community infrastructure eg community centres, amenity parks, spaces for creative expression CYPSC continue to engage with Comhairle na nÓg and to participate on its steering group Comhairle priorities integrated into CYPSC’s Annual Plan Working with Comhairle na nÓg/CYPAG60/ 18-24 year olds/ contribute to CYPSC, its subgroups and other relevant structures
60
CYPAG: Children and Young People’s Advocacy Group
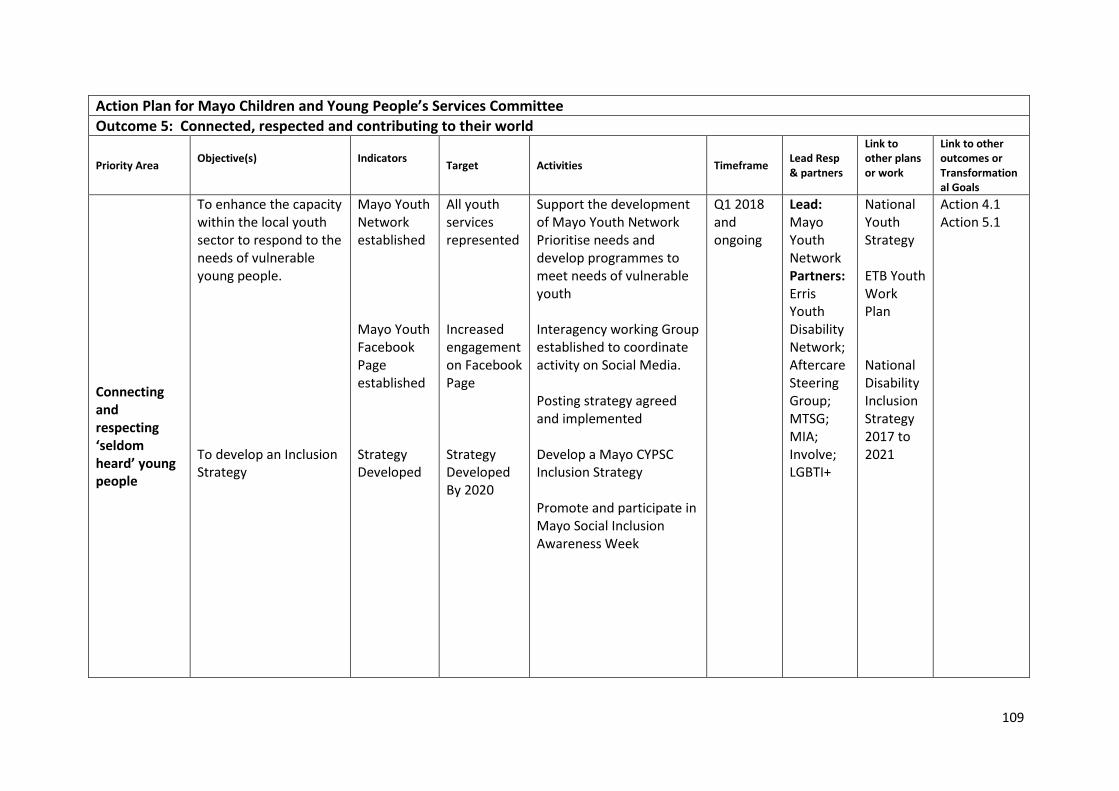
109
Action Plan for Mayo Children and Young People’s Services Committee
Outcome 5: Connected, respected and contributing to their world
Priority Area Objective(s)
Indicators
Target Activities Timeframe Lead Resp & partners
Link to other plans or work
Link to other outcomes or Transformational Goals
Connecting and respecting ‘seldom heard’ young people
To enhance the capacity within the local youth sector to respond to the needs of vulnerable young people. To develop an Inclusion Strategy
Mayo Youth Network established Mayo Youth Facebook Page established Strategy Developed
All youth services represented Increased engagement on Facebook Page Strategy Developed By 2020
Support the development of Mayo Youth Network Prioritise needs and develop programmes to meet needs of vulnerable youth Interagency working Group established to coordinate activity on Social Media. Posting strategy agreed and implemented Develop a Mayo CYPSC Inclusion Strategy Promote and participate in Mayo Social Inclusion Awareness Week
Q1 2018 and ongoing
Lead: Mayo Youth Network Partners: Erris Youth Disability Network; Aftercare Steering Group; MTSG; MIA; Involve; LGBTI+
National Youth Strategy ETB Youth Work Plan National Disability Inclusion Strategy 2017 to 2021
Action 4.1 Action 5.1
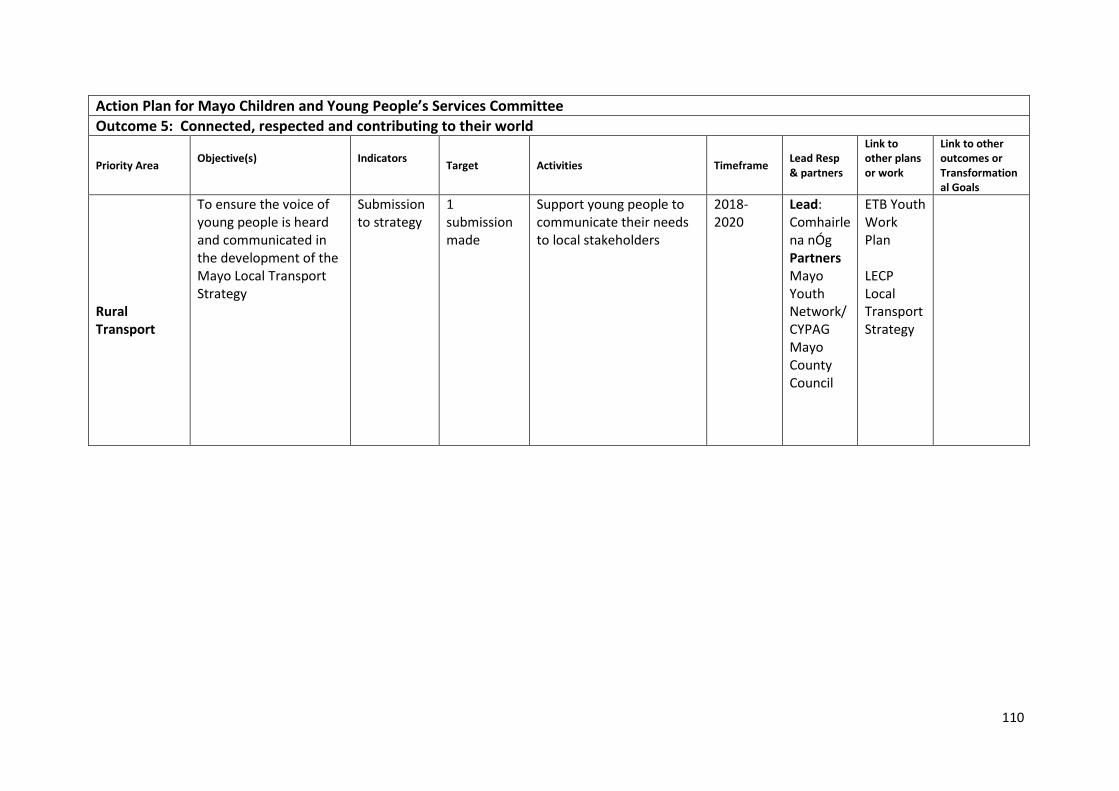
110
Action Plan for Mayo Children and Young People’s Services Committee
Outcome 5: Connected, respected and contributing to their world
Priority Area Objective(s)
Indicators
Target Activities Timeframe Lead Resp & partners
Link to other plans or work
Link to other outcomes or Transformational Goals
Rural Transport
To ensure the voice of young people is heard and communicated in the development of the Mayo Local Transport Strategy
Submission to strategy
1 submission made
Support young people to communicate their needs to local stakeholders
2018-2020
Lead: Comhairle na nÓg Partners Mayo Youth Network/CYPAG Mayo County Council
ETB Youth Work Plan LECP Local Transport Strategy
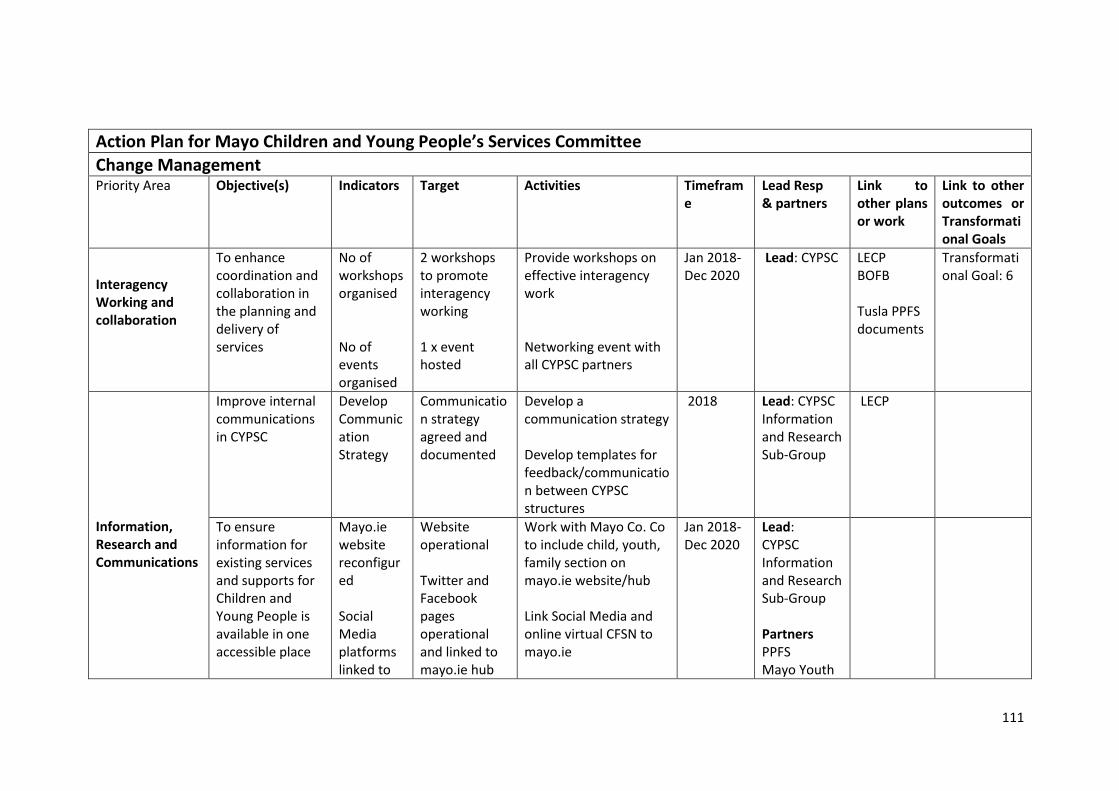
111
Action Plan for Mayo Children and Young People’s Services Committee
Change Management Priority Area Objective(s)
Indicators
Target Activities Timeframe
Lead Resp & partners
Link to other plans or work
Link to other outcomes or Transformational Goals
Interagency Working and collaboration
To enhance coordination and collaboration in the planning and delivery of services
No of workshops organised No of events organised
2 workshops to promote interagency working 1 x event hosted
Provide workshops on effective interagency work Networking event with all CYPSC partners
Jan 2018-Dec 2020
Lead: CYPSC LECP BOFB Tusla PPFS documents
Transformational Goal: 6
Information, Research and Communications
Improve internal communications in CYPSC
Develop Communication Strategy
Communication strategy agreed and documented
Develop a communication strategy Develop templates for feedback/communication between CYPSC structures
2018
Lead: CYPSC Information and Research Sub-Group
LECP
To ensure information for existing services and supports for Children and Young People is available in one accessible place
Mayo.ie website reconfigured Social Media platforms linked to
Website operational Twitter and Facebook pages operational and linked to mayo.ie hub
Work with Mayo Co. Co to include child, youth, family section on mayo.ie website/hub Link Social Media and online virtual CFSN to mayo.ie
Jan 2018-Dec 2020
Lead: CYPSC Information and Research Sub-Group Partners PPFS Mayo Youth
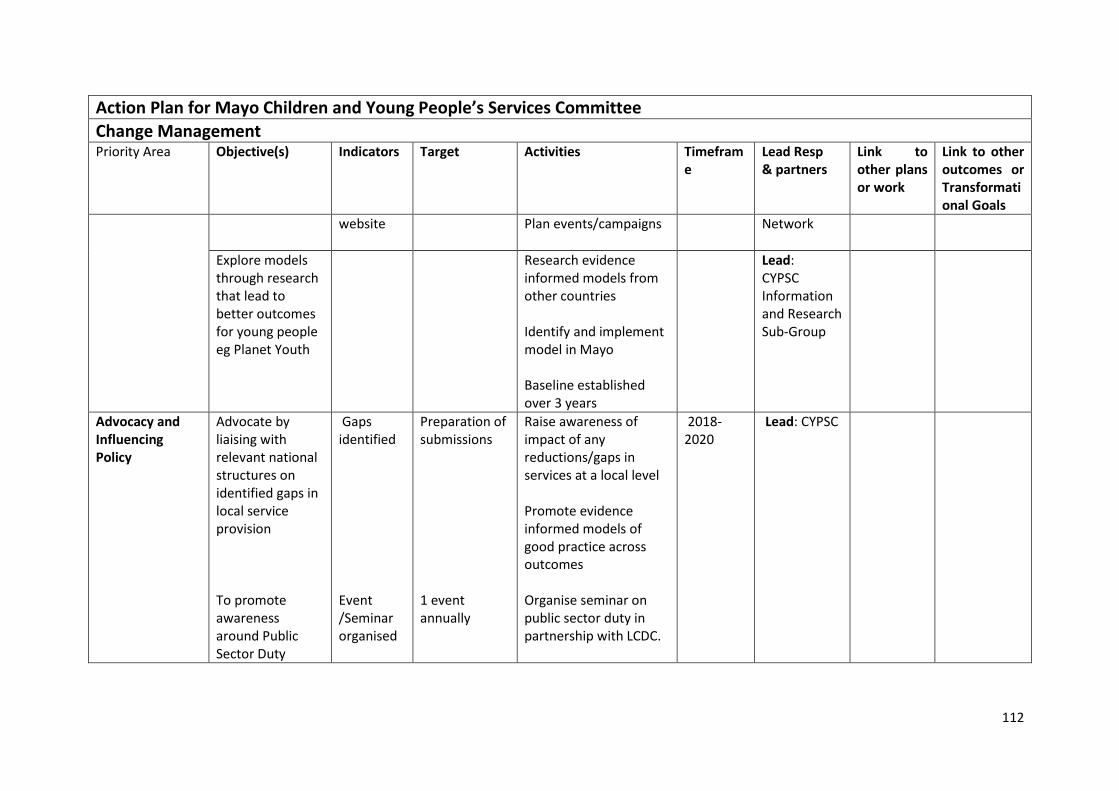
112
Action Plan for Mayo Children and Young People’s Services Committee
Change Management Priority Area Objective(s)
Indicators
Target Activities Timeframe
Lead Resp & partners
Link to other plans or work
Link to other outcomes or Transformational Goals
website
Plan events/campaigns
Network
Explore models through research that lead to better outcomes for young people eg Planet Youth
Research evidence informed models from other countries Identify and implement model in Mayo Baseline established over 3 years
Lead: CYPSC Information and Research Sub-Group
Advocacy and Influencing Policy
Advocate by liaising with relevant national structures on identified gaps in local service provision To promote awareness around Public Sector Duty
Gaps identified Event /Seminar organised
Preparation of submissions 1 event annually
Raise awareness of impact of any reductions/gaps in services at a local level Promote evidence informed models of good practice across outcomes Organise seminar on public sector duty in partnership with LCDC.
2018-2020
Lead: CYPSC
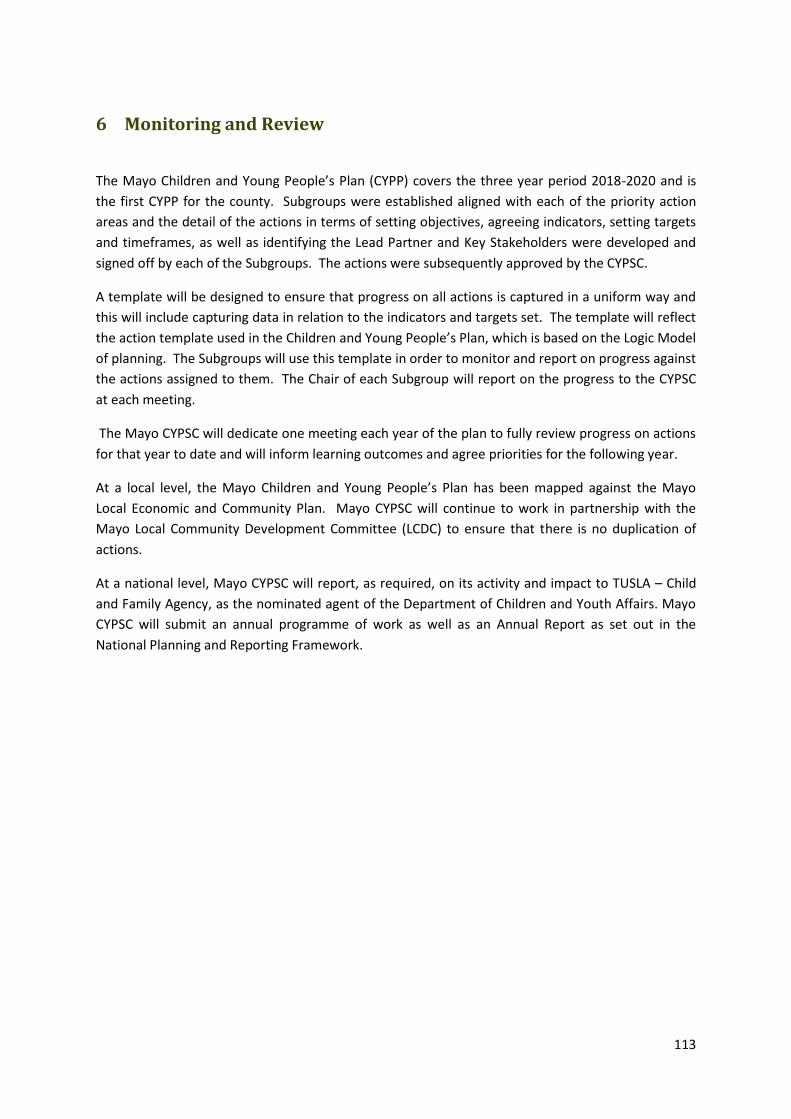
113
6 Monitoring and Review
The Mayo Children and Young People’s Plan (CYPP) covers the three year period 2018-2020 and is
the first CYPP for the county. Subgroups were established aligned with each of the priority action
areas and the detail of the actions in terms of setting objectives, agreeing indicators, setting targets
and timeframes, as well as identifying the Lead Partner and Key Stakeholders were developed and
signed off by each of the Subgroups. The actions were subsequently approved by the CYPSC.
A template will be designed to ensure that progress on all actions is captured in a uniform way and
this will include capturing data in relation to the indicators and targets set. The template will reflect
the action template used in the Children and Young People’s Plan, which is based on the Logic Model
of planning. The Subgroups will use this template in order to monitor and report on progress against
the actions assigned to them. The Chair of each Subgroup will report on the progress to the CYPSC
at each meeting.
The Mayo CYPSC will dedicate one meeting each year of the plan to fully review progress on actions
for that year to date and will inform learning outcomes and agree priorities for the following year.
At a local level, the Mayo Children and Young People’s Plan has been mapped against the Mayo
Local Economic and Community Plan. Mayo CYPSC will continue to work in partnership with the
Mayo Local Community Development Committee (LCDC) to ensure that there is no duplication of
actions.
At a national level, Mayo CYPSC will report, as required, on its activity and impact to TUSLA – Child
and Family Agency, as the nominated agent of the Department of Children and Youth Affairs. Mayo
CYPSC will submit an annual programme of work as well as an Annual Report as set out in the
National Planning and Reporting Framework.
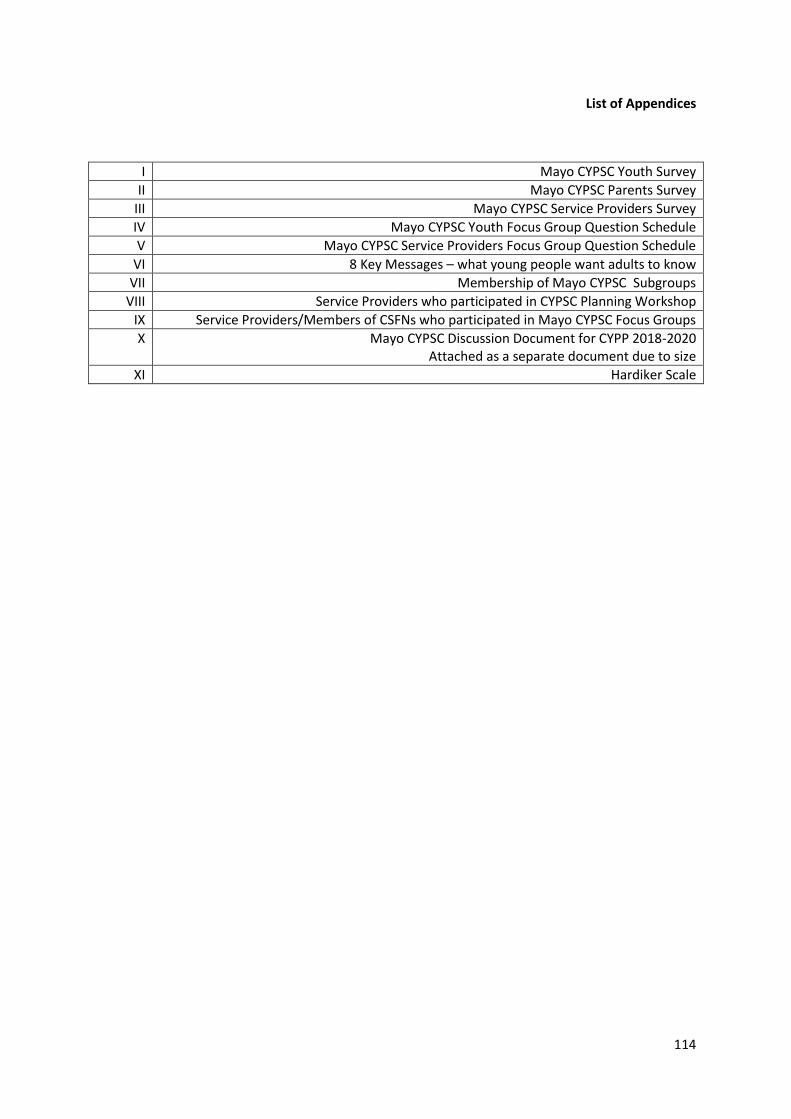
114
List of Appendices
I Mayo CYPSC Youth Survey
II Mayo CYPSC Parents Survey
III Mayo CYPSC Service Providers Survey
IV Mayo CYPSC Youth Focus Group Question Schedule
V Mayo CYPSC Service Providers Focus Group Question Schedule
VI 8 Key Messages – what young people want adults to know
VII Membership of Mayo CYPSC Subgroups
VIII Service Providers who participated in CYPSC Planning Workshop
IX Service Providers/Members of CSFNs who participated in Mayo CYPSC Focus Groups
X Mayo CYPSC Discussion Document for CYPP 2018-2020 Attached as a separate document due to size
XI Hardiker Scale
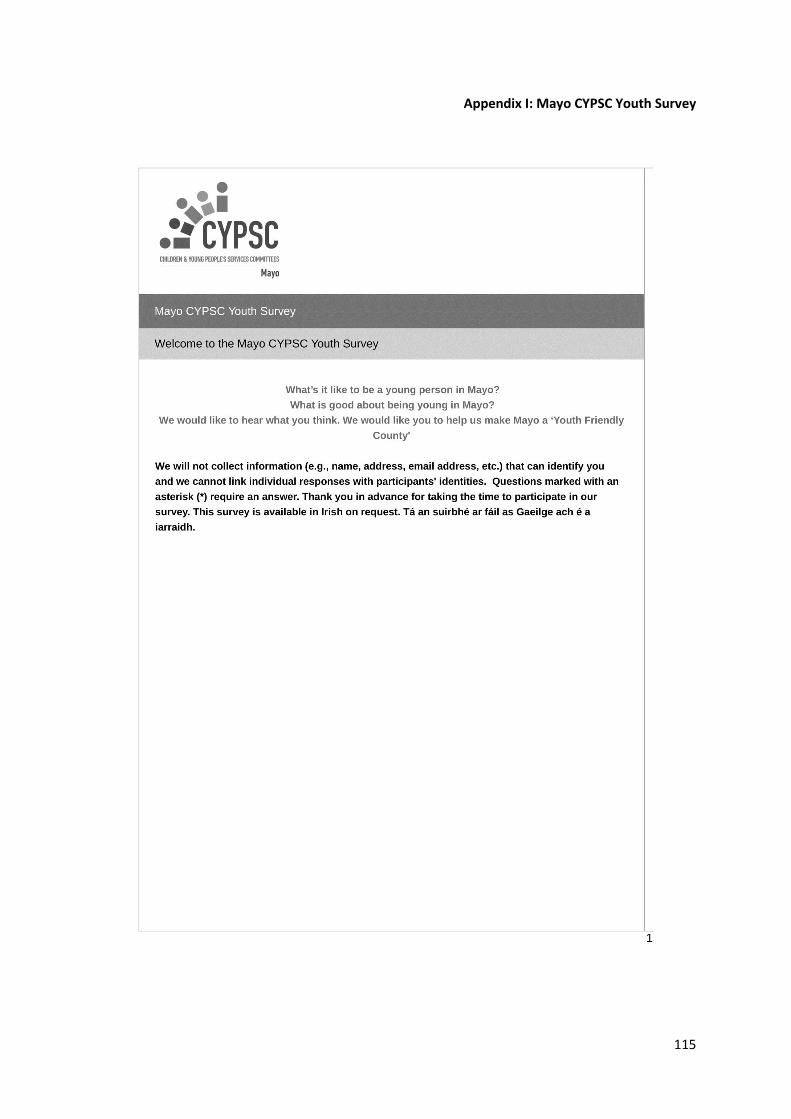
115
Appendix I: Mayo CYPSC Youth Survey
116
117
118
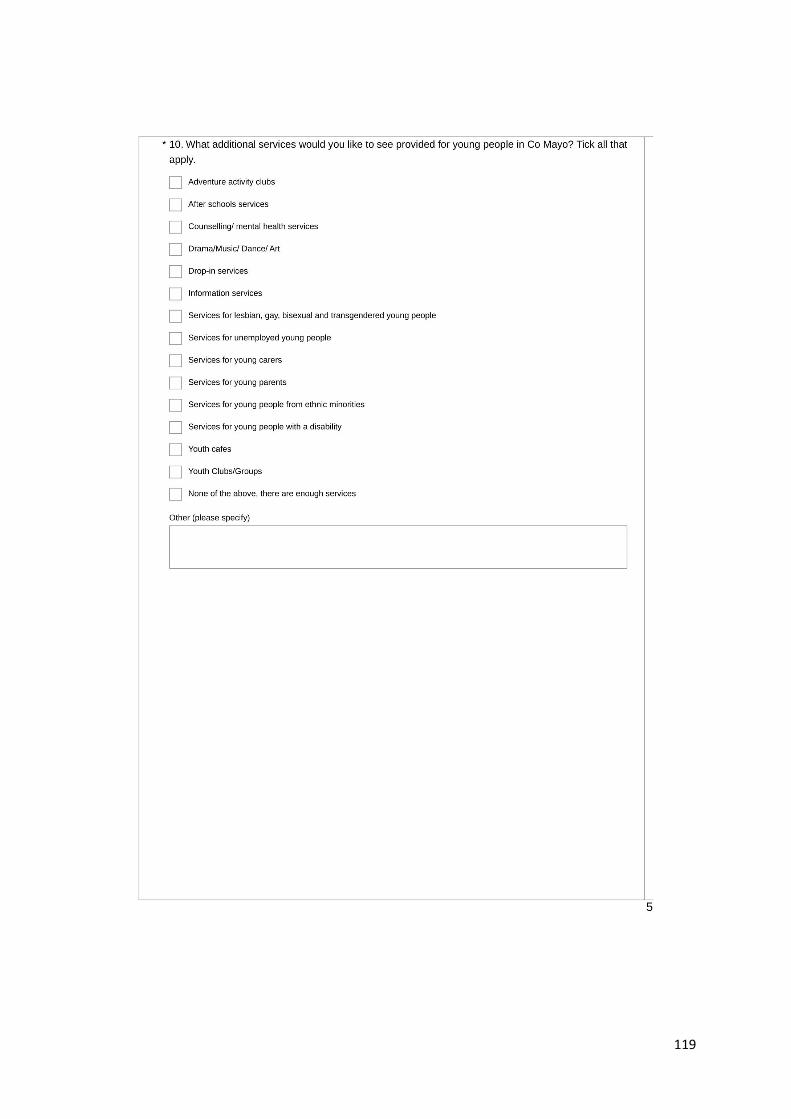
119
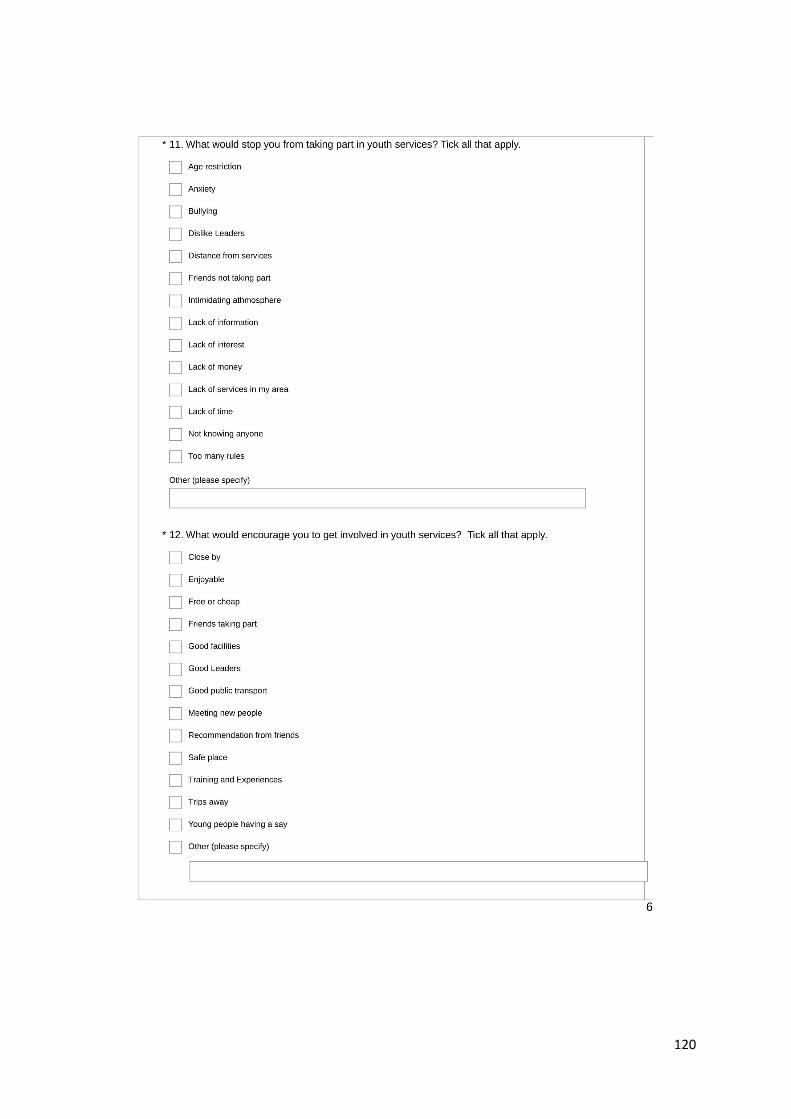
120
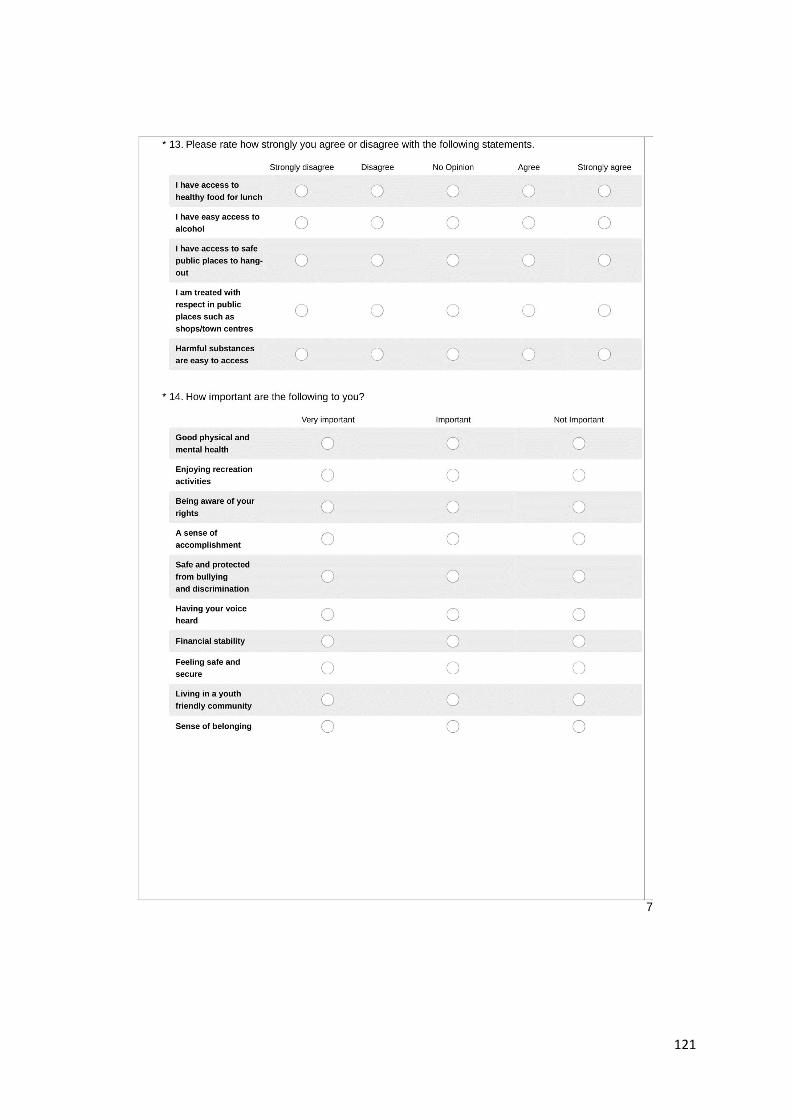
121
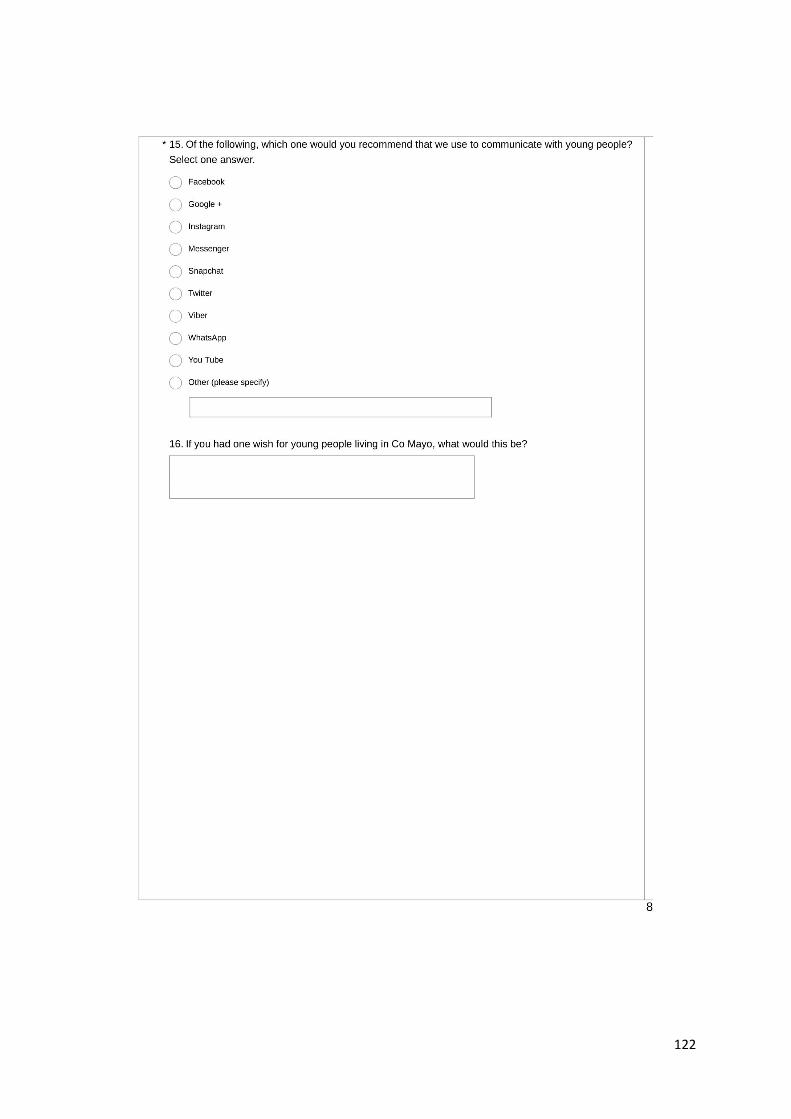
122
123
124
Appendix II: Mayo CYPSC Parents’ Survey
125
126
127
128
129
130

131
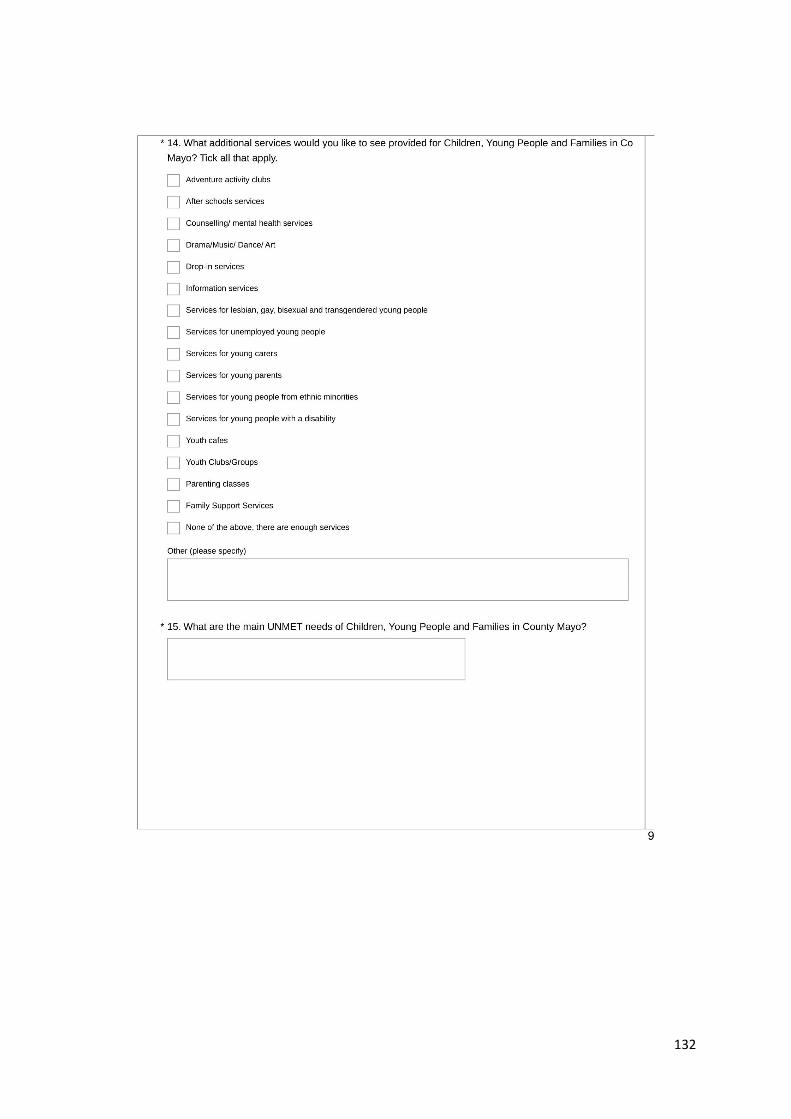
132

133
134
135
Appendix III: Mayo CYPSC Service Providers Survey
136
137
138
139
140

141
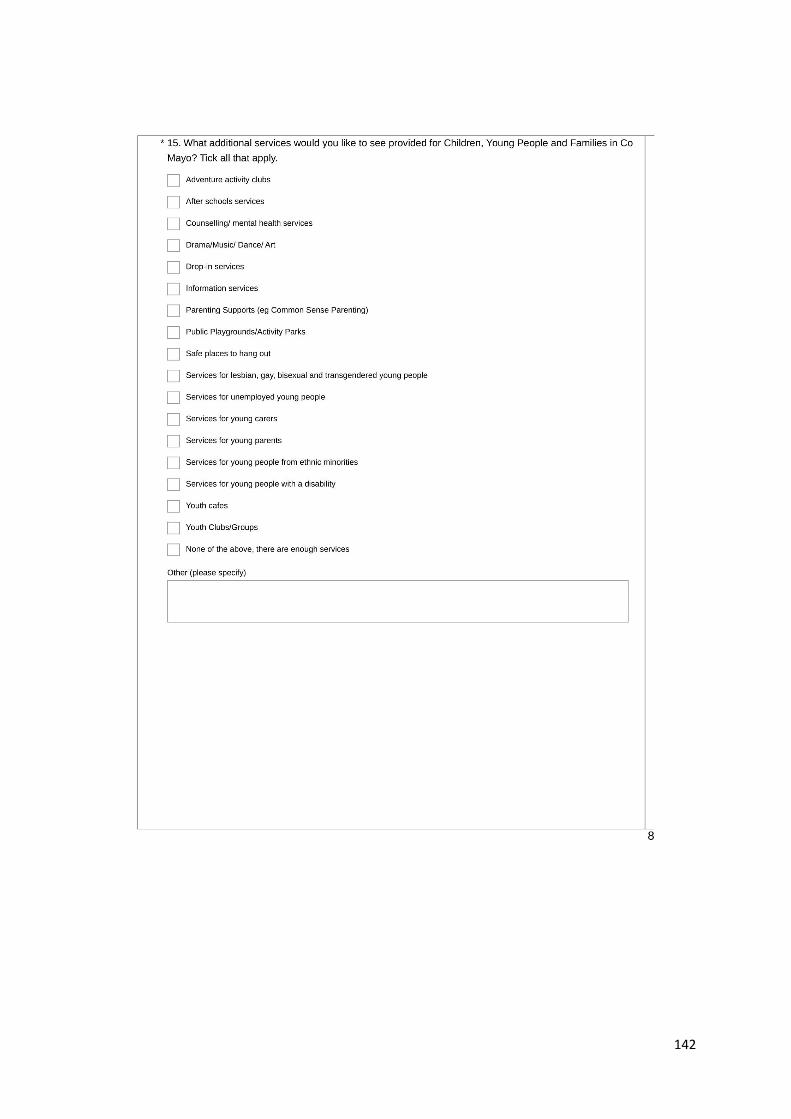
142
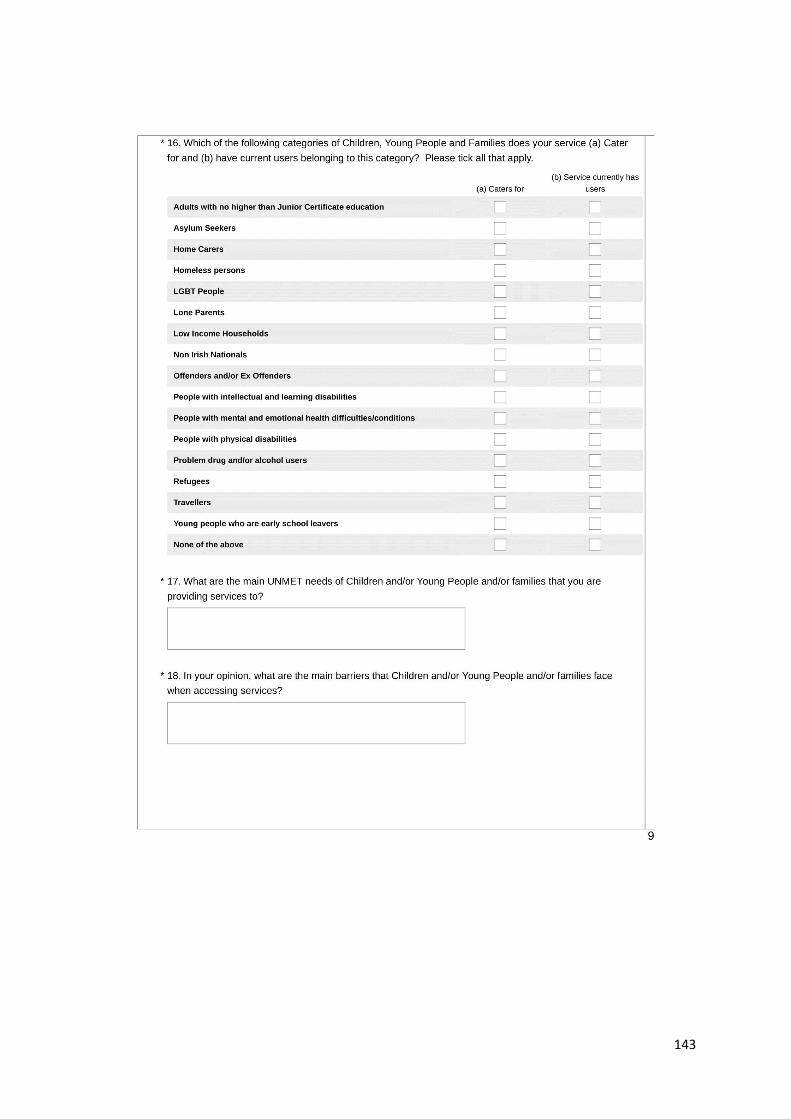
143
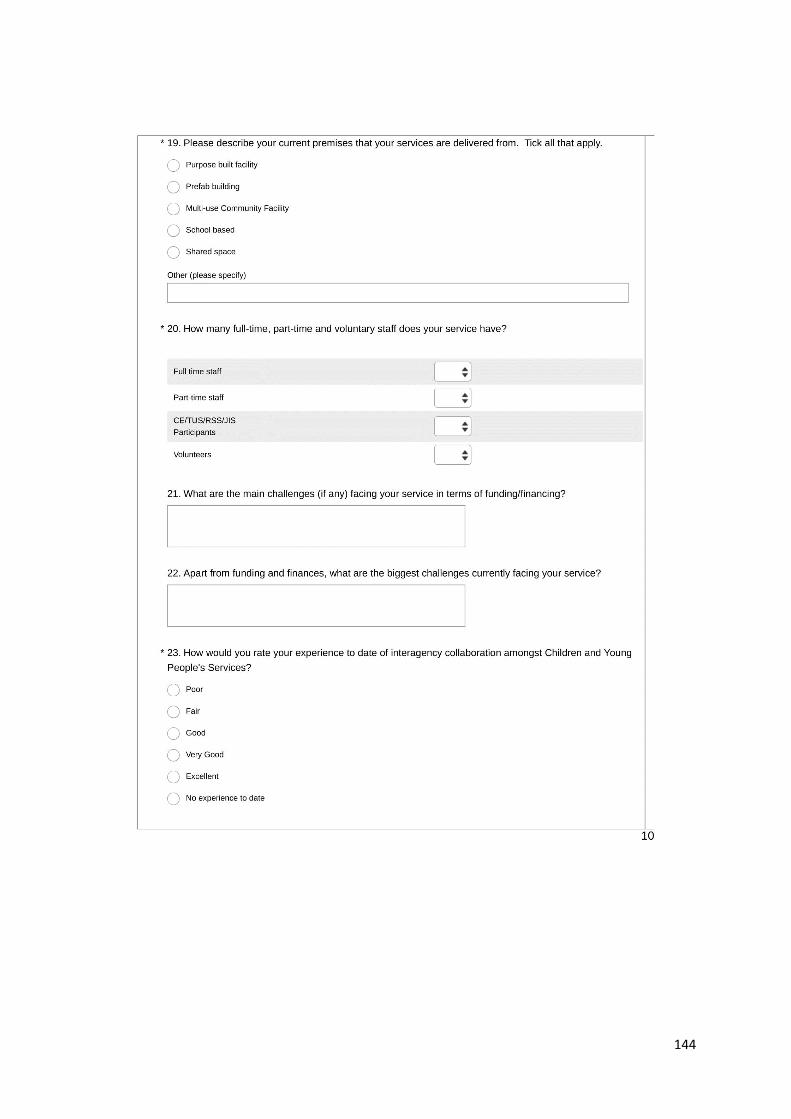
144
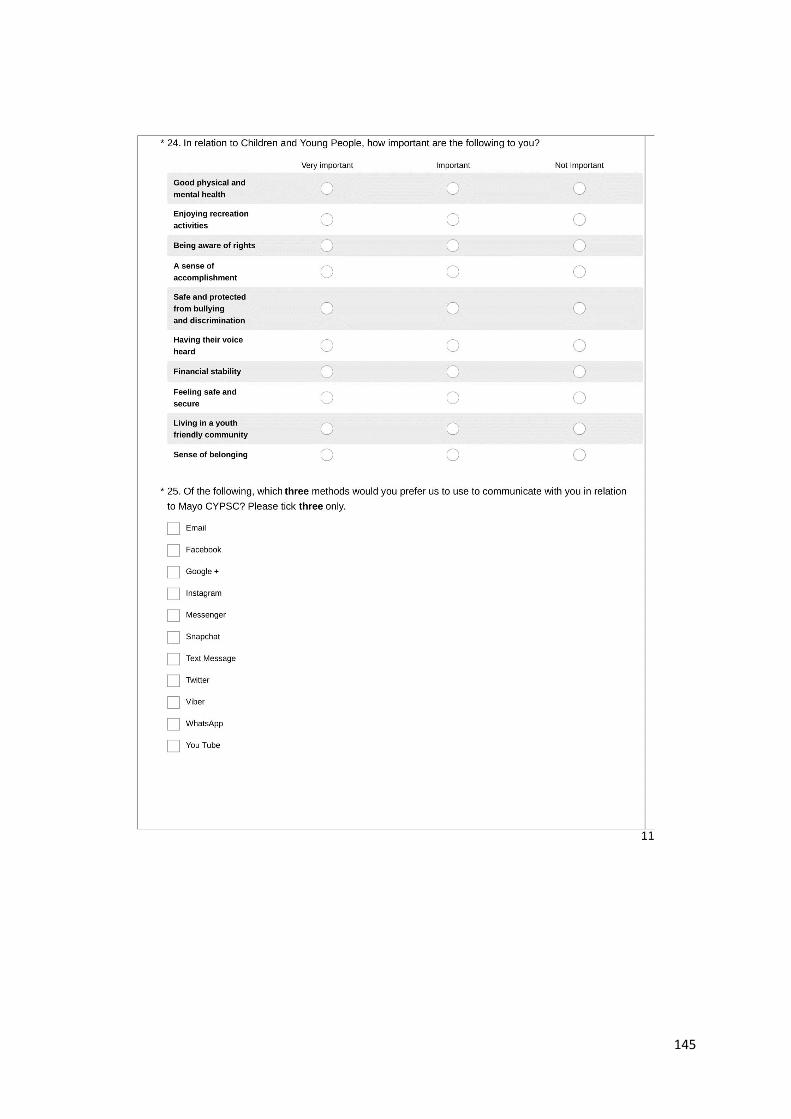
145
146
147
Appendix IV: Mayo CYPSC Youth Focus Group Question Schedule
Youth Focus Groups
Summary Timeframe:
Introduction to Mayo CYPSC 5 mins
Introduction to Research 5 mins
Purpose and structure of Focus Group 5 mins
Group Discussion & Feedback 30 mins
I major Challenge & 1 potential Solution (individual) 10 mins
Wrap up and next steps 5 mins
Total Time required 60 minutes
Introduction to Mayo CYPSC (5 mins)
Mayo CYPSC (What is it and who is involved? Why has it been established? What difference will it make to
young people? How can they get involved?) (5 mins)
Introduction and overview of research (5 mins)
1. Literature Review
2. Socio Demographic Profile
3. Primary Research: Surveys and Focus Groups
4. Identification of needs/priority actions
5. Finalise 3-year Plan
Purpose and structure of Focus Group (5 mins)
The purpose of the Focus Group is to add ‘richness’ to the data that is currently being captured through the
use of surveys. It is about giving young people a chance to ‘have a say’ and be listened to – to have their voice
heard and incorporated into the research.
Five Outcomes Handout – allow time to read
There are five national outcomes – these are the areas that Mayo CYPSC needs to work to in relation to
prioritising actions and planning activities to be delivered over the 3 year period of the plan. These outcomes
are:
1. Active and Healthy (physical and mental wellbeing)
2. Achieving full potential in learning and development
3. Safe and protected from harm
4. Economic Security and Opportunity
5. Connected, Respected and contributing to their world
148
Instructions:
Break into smaller groups of 10 (ideally group will be between 8-10 people). One person assigned to each
group as a note-taker/rapporteur.
Facilitator: In the survey we asked young people to get involved so that they could help us make Co Mayo a
“Youth Friendly County”. We now want to explore this term and get a better understanding of what this
means to you as a young person. There are no right or wrong answers; we want you to tell us what you think.
Your opinion counts.
Warm up: 5 minutes
Facilitator: Before we start the group discussions, I would like to find out your thoughts on the following two
questions (ask each question separately and get quick fire responses to the following from each person – no
discussions, no clarification, just note the responses):
What is the best thing about living in Co Mayo?
What is the worst thing about living in Co Mayo?
The facilitator will make a note of the responses. This will also help the young people to focus prior to the
group discussion.
Group Discussion including feedback: 25 minutes
Facilitator: In each of your groups, and thinking about the five national outcomes, discuss the following:
What is a Child/Youth Friendly Mayo?
What does it mean? What does it look like? What does it feel like? What is different?
How do we get there? What needs to change?
How will we know when we get there?
Note for Rapporteur/Note-taker: The discussion can be kept broad and it is not necessary to align comments
with the five outcomes. The facilitator will do this as part of the data analysis. Use the above questions to keep
the discussion flowing and encourage responses.
You will have 15 minutes for this discussion.
Feedback and comments from each group (10 minutes – 5 minutes for each group)
The note-takers will feedback from each of the groups and time will be given for additional comments.
Facilitator will summarise and get consensus.
Brick Wall and Opportunities Tree: 10 minutes
Facilitator: We would like to know what you personally see as being the biggest barrier to young people in Co
Mayo (it can be anything but please be specific) and to come up with a solution to address this. Take a few
minutes to think about this and then I would like you to write the barrier on a post-it and stick it on the Brick
Wall and write the solution on another post-it and stick it on the Opportunities Tree. You have 10 minutes to
do this.
Wrap Up and next steps: 5 minutes
Facilitator feeds back main points arising from the discussions and outlines the next steps in the research
process. Remind the group members to like the Facebook page and to follow on Twitter.
149
Appendix V: Service Providers Focus Group Question Schedule
Service Providers Focus Groups
Aim of the Focus Group: To gather information on the range of services provided to Children, Young People
and Parents in relation to the following:
What is working well?
What can be improved?
What can the network members do together to improve outcomes for Children, Young People and
Parents?
Guiding questions:
Individual Services (Focus: what’s working well, what needs to change (gaps))
Think about the service you provide. What are your thoughts about what’s currently in place in relation to
access and quality of services?
"Would you say you are satisfied with the current situation, with the way things are going?" (If so) "What are
you satisfied about? Why is that?" (Or, "What's going well...?")
"Are there things you are dissatisfied with, that you would like to see changed?" (Or, "What's not going
well...?"). "What are they? Why is that? How should they change? What kinds of things would you like to see
happen?"
Network (focus: What can the network members do together that will help improve collaboration
and ultimately outcomes for the service users?)
The network is a new structure. What are some of your thoughts about what's going on now? What would
make the network more relevant in your day to day work?
What can the members of the network do together that will encourage collaborative working? How can the
network members support each other and in doing so improve outcomes for Children, Young People and
Parents? What practices can you engage in?
What supports do you need in order to facilitate this to happen? eg from within your own organisation, from
the Network Co-ordinator?
What can the network members challenge themselves to do to improve outcomes for their service users and
for themselves?
Some probes/follow up questions to use:
Some people have said that one way to improve X is to do Y. Do you agree with this?' (Or, "How do you feel
about that?")
Are there other recommendations that you have, or suggestions you would like to make?
Can you say more about that? Can you give an example?
Jane says X. How about the rest of the group? What do you think? Or … How about you, John? Do you have
some thoughts on this?
Are there other things you would like to say before we wind up?
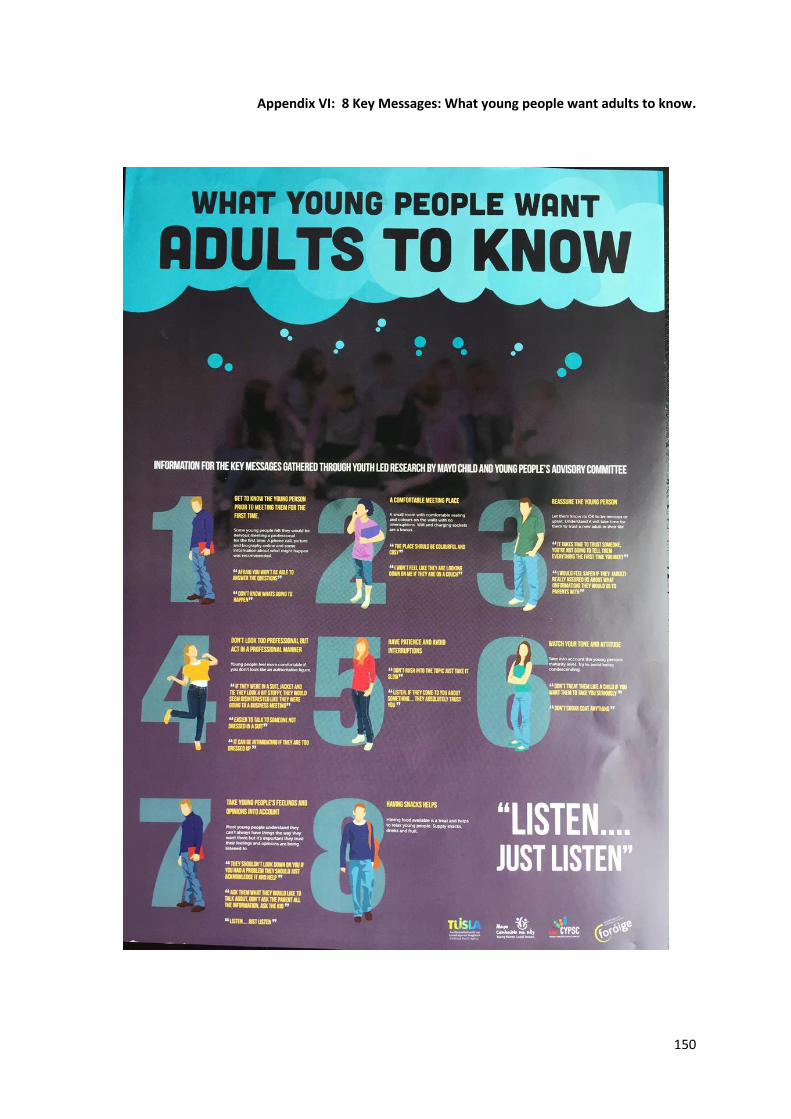
150
Appendix VI: 8 Key Messages: What young people want adults to know.

151
Appendix VII: Membership of Mayo CYPSC Subgroups
(Draft Lists as some are in the process of being finalised)
Outcome 1: Active and Healthy Subgroup
Chair: Thelma Birrane – HSE Health Promotion Officer
Organisation Representative
HSE Public Health Nursing Mary O Malley
Early Intervention Service Eilish Noone
Curious Minds Preschool Ann Halligan
Tusla - Child and Family Support Network Coordinator Elaine English
Mayo County Childcare Committee Jim Power
Parent Representative/Love Castlebar Helen O Hara
GMIT - Early Childhood Education and Care Coordinator Mary Skillington
Mayo University Hospital Nursing & Midwifery Andrea Mc Grail
Tusla Zero2Six Family Support Projec t Anne Marie Tiernan
HSE Pyschology Cynthia Silva
HSE Social Work Ann Doherty
Mayo Traveller Support Group Vivienne Fitzmaurice
Mayo Intercultural Action
Mayo Sports Partnership
Family Resource Centre Ann Conway
Outcome 1 Child and Youth Mental Health Subgroup
Chair: Peadar Gardiner – Mindspace Mayo
Organisation Representative
HSE Pyschology Jeananne Garavan
WRDATF Debbie Mc Donagh
Mayo Youth Network
Tusla Child and Family Support Network Coordinator Siobhan Duane
ISPCC
CAMHS Sharon Byrne
Public Health Nursing
Family Resource Centre Leanne Barrett
Mayo Traveller Support Group Pippa Daniels
GMIT Daniel Caldwell
Mindspace Youth Advisory Panel
NEPS
Psychiatry
Parent Representative
CIPC
Mayo Mental Health Association
LGBTI
Mayo Intercultural Action

152
Outcome 2 Education and Learning Subgroup
Chair:
Organisation Representative
Mayo Sligo Leitrim Education and Training Board Breda Ruane
Mindspace Mayo Peadar Gardiner
Western Region Drugs and Alcohol Task Force Debbie Mc Donagh
Education and Welfare Service Norma Grego
Irish Primary Principals Network Nessa Mc Gowan
National Association of Principals and Vice Principals Liam O Ruain
School Completion Programme Sheila Feeney
Family Resource Centre
Mayo Traveller Support Group Pippa Daniels
GMIT Joanne Doherty
Mayo Intercultural Action Patricia Quinn
Outcome 3 Safeguarding Children and Young People Subgroup
Chair: Heather Wilson - Tusla
Organisation Representative
Tusla – Children First Information and Advice Officer Sandra Claxton
Mayo Women’s Support Services Assumpta
Mayo Rape Crisis Centre Loretta Mc Donagh
Mayo Sports Partnership Charlie Lambert
ISPCC Gillian Baker
Mayo Youth Network
Family Resource Centre Nuala Gilligan
Public Partnership Network (PPNs)
An Garda Síochána Mandy Gaynor
Outcome 3 Prevention Partnership and Family Support Subgroup
Chair: Liam Whyte PPFS Manager
Organisation Representative
Tusla – Family Focus / Parent Support Champion Mary Everard
Community Based Family Support Kate Donnelly
School Completion Programme Sarah Sheridan
Tusla – Network Coordinator Siobhan Duane
ISPCC Laura Cawley
Tusla Teresa Quinn
Family Resource Centre Siobhan Smith
Mayo Traveller Support Group
Mayo Intercultural Action Elzbieta Gizicka
Foróige Linda Lohan
153
Outcome 4 Economic Security and Opportunity Subgroup
Chair: Breda Ruane – Mayo Sligo Leitrim Education and Training Board
Organisation Representative
School Completion Project Sheila Feeney
Involve Youth Service Alice Dixon
Involve Youth Service James Maughan
Mayo Sligo Leitrim Education and Training Board Simon
South West Mayo Development Company Catherine Mc Closkey
North Connaught Youth Service – Youth Justice Project Micheal Kenny
Foróige Roisin Moyles
Family Resource Centre Shirley Moyles
Outcome 5 Child and Youth Participation Subgroup
Chair: Sheila Mc Ardle - GMIT
Organisation Representative
Mindspace Youth Panel
Mayo County Council Declan Turnbull
Mayo Sligo Leitrim ETB Youth Office Breda Ruane
Mayo Youth Network
Children & Young People’s Advocacy Group Stephaine Cook
Comhairle na nÓg
Young Person 18 – 24 years
Young Person 12-17 years
LGBTI+
Family Resource Centre Grace Mc Gee
Involve Youth Project
EPIC After Care Group Lorraine Gaughan
Mayo Intercultural Action Patricia Quinn
Change Management Information, Research and Communications Subgroup
Chair: Síofra Kilcullen – Mayo County Council
Organisation Representative
HSE Thelma Birrane
MSLETB
Mayo County Council Cora Gilligan
Tusla Siobhan Duane
Mayo County Childcare Committee Jim Power
GMIT Sheila McArdle
Family Resource Centre John Doherty
154
Appendix VIII: Service Providers who participated in CYPSC Planning Workshop
Organisation Representative
Tusla Paddy Martin Liam Whyte Heather Wilson Sandra Claxton Norma Grego
Mayo County Council Síofra Kilcullen Declan Turnbull Cora Gilligan
Western Care Bernard O Regan Ruth Kneafsey
Probation Service Miriam Tallon
Foróige Michele Reynolds
Galway Mayo Institute of Technology Sheila Mc Ardle Joanne Doherty
Irish Primary Principal’s Network Nessa Mc Gowan
Mayo County Childcare Committee Jim Power
Mayo Sligo Leitrim Education and Training Board
Breda Ruane Barbara Ronayne
An Garda Síochána Mandy Gaynor
School Completion Programme Sheila Feeney
HSE Thelma Birrane Martin Greaney Anne O Neill Helen Browne Jeananne Garavan Cynthia Silva
Family Resource Centres Mary Jackson Ann Conway
National Association Principals and Deputy Principals
Liam Ó Ruáin
South West Mayo Development Company Catherine Mc Closkey
Mayo Sports Partnership Charlie Lambert
Mindspace Mayo Peadar Gardiner
WRDATF Debbie Mc Donagh
ISPCC Gillian Baker
Mayo Traveller Support Group Pippa Daniels
Mayo Intercultural Action Patricia Quinn Natalia Pestova

155
Mayo Women’s Support Services Assumpta Lally
Mayo Rape Crisis Centre Loretta Mc Donagh
156
Appendix IX: Service Providers (members of Child and Family Support Networks) who participated in Mayo CYPSC Focus Groups
Organisation Name
Tusla Early Years’ Service Mariea Mortimer
Education Welfare Service Norma Grego
Child and Family Support Network Coordinators Elaine English
Siobhan Duane
ISPCC Alona Levinge
Foróige Stephen Bourke
Tusla - Child Protection and Welfare Breda Quinn
Mayo Community Based Family Support Service Siobhan O Brien
Mayo County Council – Social Work Orla Hughes
Mayo Early Intervention Service Niamh Lyons
HSE Public Health Nurse Patricia Dever
Tusla - Social Care Manager Marian Turner
CAMHS – Clinical Nurse Manager Edel Cahill
Home School Liaison Thérèse Connolly
CAMHS - Clinical Psychologist Sharyn Byrne
Foróige Louise O Malley
Mindspace Mayo Stephen Coyne
Tusla Edge Project Maureen Reilly
Tusla Family Focus Teresa Walsh
Mayo Community Based Family Support Project Claire Mc Nally
Mayo Community Based Family Support Project Geraldine Glackin
Claremorris Family Resource Centre Nuala Gilligan
Tusla Social Work Sharon Campbell
Mount St. Michael Secondary School Principal Fionnghuala King
Tusla PPFS Manager Liam White
Disabled Drivers Association of Ireland John Sheehan
Big Brother Big Sister Peter Duffy
157
Appendix X: Mayo CYPSC Discussion Document
Mayo CYPSC Discussion Document for Mayo Children and Young People’s Plan 2018-2020
Attached as separate document.
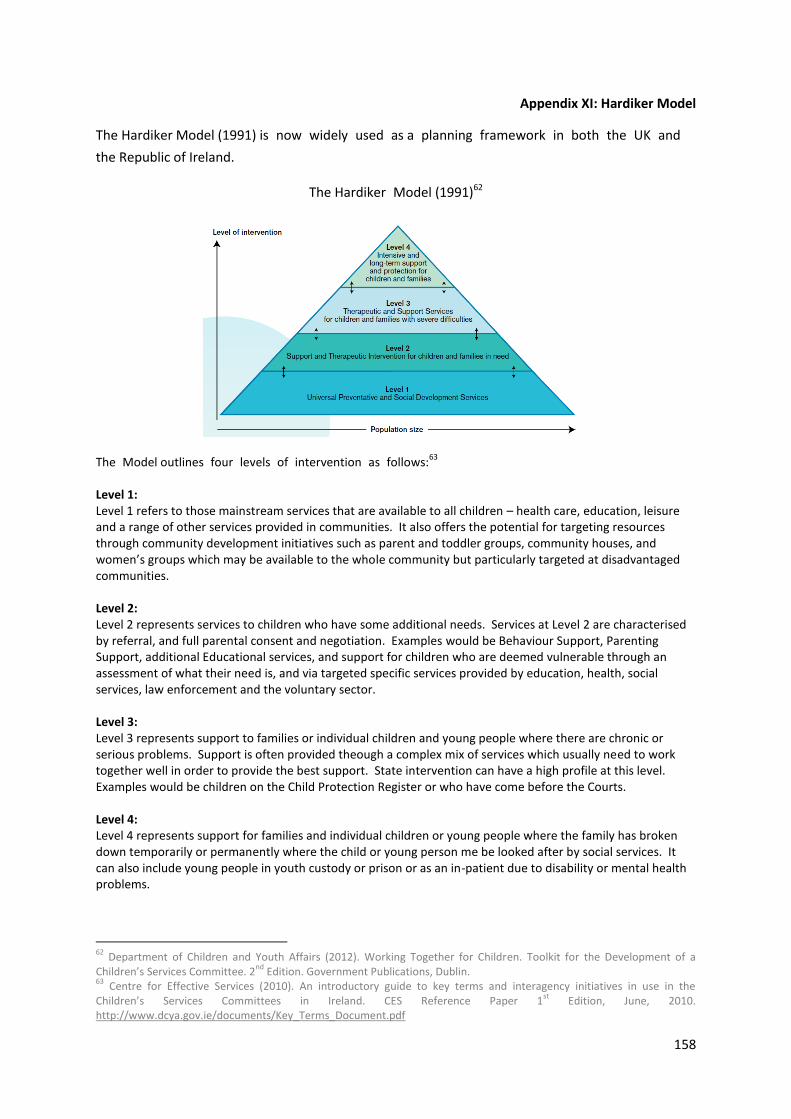
158
Appendix XI: Hardiker Model
The Hardiker Model (1991) isnowwidelyusedas aplanningframeworkinboththeUKand
the Republic of Ireland.
The HardikerModel (1991)62
TheModel outlinesfourlevelsofinterventionasfollows:63
Level 1: Level 1 refers to those mainstream services that are available to all children – health care, education, leisure and a range of other services provided in communities. It also offers the potential for targeting resources through community development initiatives such as parent and toddler groups, community houses, and women’s groups which may be available to the whole community but particularly targeted at disadvantaged communities. Level 2: Level 2 represents services to children who have some additional needs. Services at Level 2 are characterised by referral, and full parental consent and negotiation. Examples would be Behaviour Support, Parenting Support, additional Educational services, and support for children who are deemed vulnerable through an assessment of what their need is, and via targeted specific services provided by education, health, social services, law enforcement and the voluntary sector. Level 3: Level 3 represents support to families or individual children and young people where there are chronic or serious problems. Support is often provided theough a complex mix of services which usually need to work together well in order to provide the best support. State intervention can have a high profile at this level. Examples would be children on the Child Protection Register or who have come before the Courts. Level 4: Level 4 represents support for families and individual children or young people where the family has broken down temporarily or permanently where the child or young person me be looked after by social services. It can also include young people in youth custody or prison or as an in-patient due to disability or mental health problems.
62
Department of Children and Youth Affairs (2012). Working Together for Children. Toolkit for the Development of a Children’s Services Committee. 2
nd Edition. Government Publications, Dublin.
63 Centre for Effective Services (2010). An introductory guide to key terms and interagency initiatives in use in the
Children’s Services Committees in Ireland. CES Reference Paper 1st
Edition, June, 2010. http://www.dcya.gov.ie/documents/Key_Terms_Document.pdf
159
Endnotes
i Childcare Programmes ECCE is available to all children in the State, who on 1st September each year are in the qualifying age range of
between 3 years 2 months and 4 years 7 months. The Community Childcare Subvention (CCS) Programme is
targeted to help children from low-income household’s access quality early education and childcare services.
The objective of the TEC Programmes is to support parents on eligible training courses and eligible categories
of parents returning to work, by providing subsidised childcare places. There are three separate strands to this
funding stream:
(1) Childcare Education and Training Support Programme (CETS) provides childcare for children of
eligible parents taking part in ETB/Solas training courses.
(2) After School Childcare Programme (ASCC) provides afterschool care for primary school children for
eligible working parents and parents on DSP employment programmes (excluding Community
Employment)
(3) Community Employment Childcare Programme (CEC) provides childcare for children of eligible
parents taking part in Community Employment schemes. CEC is split into two streams: CEC Pre-school
(PS) and CEC After-School (AS).
ii Live Register
The Live Register is a monthly count of the number of persons under 65 years registering for Jobseekers
Benefit or Allowance or various other statutory entitlements with the Department of Social Protection. Live
Register statistics are compiled from administrative returns made to the CSO by each local office of the
Department of Social Protection. Although the Live Register is not an official measure of unemployment, it is
used as a short term indicator of unemployment. The Live Register is not specifically designed to measure
unemployment - it includes persons who are working part-time and signing on part-time. In addition, a
number of the unemployed are not on the Live Register because they were previously self-employed, have a
spouse earning, or for other reasons. Live Register statistics are available at local social welfare office of
registration – providing indicative movements in the number of unemployed persons at local level.
www.cso.ie
iii Deprivation
The 2016 Pobal HP Deprivation Index (Haase and Pratschke, 2016)
The index provides a method of measuring the relative affluence or disadvantage of a particular geographical
area using data compiled from various censuses. A score is given to the area based on a national average of
zero and ranging from approximately -40 (being the most disadvantaged) to +40 (being the most affluent). In
addition to this, percentage data for the area is given under the following categories:
- Population Change - Age Dependency Ratio - Single Parent Ratio - Primary Education Only - Third Level Education - Unemployment Rate (male and female) - Proportion living in Local Authority Rented Housing
160
The relative index scoring and the above percentage data focuses particularly on the previous three censuses,
enabling easy comparison of data between 2006, 2011 and 2016. This index is of particular significance given
the economic changes that have occurred nationally during this period. The change in the index scoring and in
each measured category is also calculated, meaning that the increase or decrease on a national, regional and
local level can be easily viewed.
Figure Error! Main Document Only.: Labelling of Relative Index Scores, 2006 to 2016
Source: Pobal 2017
Small Area Population Statistics:
The Small Area Population Statistics (SAPS) of the 2016 Census of Population has been released at the level of
18,488 Small Areas (SAs). SAs are standardised in size, with a minimum of 50 households and a mean of just
under 100, thus effectively providing street‐level information on the Irish population.
iv Child and Family Support Networks (CFSN)
The local CFSNs should consist of all services that play a role in the lives of children and families in a given area.
This includes local statutory children and families service providers (e.g. psychology, public health nurses,
social work, justice, education and welfare) and local voluntary and community children and families services
(Family Support Centres, agencies currently funded through the HSE/Child and Family Support Agency,
children and families services & organisations funded through other sources e.g. Pobal, Department of
Education).
http://www.tusla.ie/services/family-community-support/prevention-partnership-and-family-support-
programme/meitheal-national-practice-model/what-are-child-and-family-support-networks-cfsns
v Meitheal
Meitheal is a National Practice Model to ensure that the needs and strengths of children and their families are
effectively identified and understood and responded to in a timely way so that children and families get the
help and support needed to improve children’s outcomes and realise their rights. It is an early intervention,
multi-agency (when necessary) response tailored to the needs of an individual child or young person.
http://www.tusla.ie/services/family-community-support/prevention-partnership-and-family-support-
programme/meitheal-national-practice-model