May 2020 Dear Fellow Stockholders: We hope this letter finds ...
124
May 2020 Dear Fellow Stockholders: We hope this letter finds you and your families safe and well. The COVID-19 outbreak presents an unprecedented global medical, financial, and human challenge affecting every aspect of our lives. Ensuring the safety and well-being of our employees, partners and communities are our top priorities as we continue to serve our customers and build value for our stockholders during these extraordinary times. While some effects of the pandemic will be temporary, this crisis will certainly have long- term implications for how we live, work and interact. In this vein, it is important to recognize the role DSP Group’s technologies play is more essential now than it has ever been. We have developed world class technologies and innovative solutions for three market verticals that have been our recent growth engines, and will be increasingly important in the new environments in which we will be living and working: Unified Communications (Office/VoIP) Voice as a user interface (SmartVoice) IoT connectivity solutions (SmartHome) The pandemic and its long-term impact on society will have significant implications for each of our target markets. First, work habits are changing, with more employees working from home and offices reconfiguring workspaces to allow more separation. Second, people have become much more conscious of the risk of spreading germs and will want to avoid touching commonly used surfaces. This will drive increased adoption of Voice User Interfaces (VUIs) across a broad array of devices. We believe that DSP Group is in a unique spot to leverage our leadership position in the following areas: 1) Unified Communications (UC): The widespread mandatory stay-at-home orders across the globe have created a surge in the number of individuals working from home or remote locations. This has created an increased demand for UC products such as headsets, phones, conferencing systems to enhance the level of efficiency and productivity. 2) VUI; Our SmartVoice solutions are already powering more than 80 products—from tablets to light switches, remote controls, cameras, and many more—to address the rising need to add VUI to more devices due to the increased preferences for contactless and voice- enabled interfaces. 3) IoT connectivity solutions: Our DECT/ULE products are addressing the rising need for a reliable means of IoT and two-way voice communications for the SmartHome market. Amid the COVID-19 outbreak, voice calls made from home increased significantly, which
-
Upload
khangminh22 -
Category
Documents
-
view
2 -
download
0
Transcript of May 2020 Dear Fellow Stockholders: We hope this letter finds ...

May 2020 Dear Fellow Stockholders: We hope this letter finds you and your families safe and well. The COVID-19 outbreak presents an unprecedented global medical, financial, and human challenge affecting every aspect of our lives. Ensuring the safety and well-being of our employees, partners and communities are our top priorities as we continue to serve our customers and build value for our stockholders during these extraordinary times. While some effects of the pandemic will be temporary, this crisis will certainly have long-term implications for how we live, work and interact. In this vein, it is important to recognize the role DSP Group’s technologies play is more essential now than it has ever been. We have developed world class technologies and innovative solutions for three market verticals that have been our recent growth engines, and will be increasingly important in the new environments in which we will be living and working:
Unified Communications (Office/VoIP) Voice as a user interface (SmartVoice) IoT connectivity solutions (SmartHome)
The pandemic and its long-term impact on society will have significant implications for each of our target markets. First, work habits are changing, with more employees working from home and offices reconfiguring workspaces to allow more separation. Second, people have become much more conscious of the risk of spreading germs and will want to avoid touching commonly used surfaces. This will drive increased adoption of Voice User Interfaces (VUIs) across a broad array of devices. We believe that DSP Group is in a unique spot to leverage our leadership position in the following areas: 1) Unified Communications (UC): The widespread mandatory stay-at-home orders across the globe have created a surge in the number of individuals working from home or remote locations. This has created an increased demand for UC products such as headsets, phones, conferencing systems to enhance the level of efficiency and productivity. 2) VUI; Our SmartVoice solutions are already powering more than 80 products—from tablets to light switches, remote controls, cameras, and many more—to address the rising need to add VUI to more devices due to the increased preferences for contactless and voice-enabled interfaces. 3) IoT connectivity solutions: Our DECT/ULE products are addressing the rising need for a reliable means of IoT and two-way voice communications for the SmartHome market. Amid the COVID-19 outbreak, voice calls made from home increased significantly, which
should drive demand for integration of DECT/ ULE in home gateways (HGWs), to ensure quality of service (QoS) and full home coverage. In this letter, we will describe the status of each of these initiatives—Unified Communications, SmartVoice and SmartHome—and what we have been doing to build successful, high-margin businesses in each segment. We will then share why we believe DSP Group is now uniquely positioned in each of our growth initiatives, and why we have high confidence in our growth potential going forward.* Unified Communications (Office/VoIP): Even before the COVID-19 outbreak, the work space was evolving towards ubiquitous screens and an increasing need for high-quality voice and video communications as flexible models of working emerged and collaboration tools became even more essential for day-to-day business activities. Now, with companies around the globe having rolled out mandatory remote-work requirements, these tools need to be as reliable, high quality, and productive for home use as they are for office use. DSP Group is at the forefront of addressing these needs and is well positioned to capitalize on such market trends through our best-in-class product offering for Unified Communications endpoints as well as for portable terminals, headsets, IoT, VUIs, and AI at the edge.* Our products are powering all the top seven leading enterprise OEMs, including: Cisco, Avaya, Poly, Yealink, Mitel, ALE and NEC. In addition, during 2019 we secured a high-volume design win that has already commenced mass shipments and is expected to contribute in a meaningful way to our 2020 revenues. We remain highly confident in the growth prospects of this market as evidenced by these achievements, as well as our solid engagement pipeline of opportunties.*
SmartVoice: Amid the COVID-19 outbreak, The Centers for Disease Control and Prevention (CDC) in the U.S. and similar bodies in other countries recommend that, among other things, we avoid touching surfaces in public places that have traditionally been high-touch (i.e., elevator buttons, light switches, and trash cans). Even at home, it is best to avoid touching surfaces of devices that could be shared (i.e., remote controls, smartphones and tablets). VUI adoption should accelerate more rapidly as a result of this crisis as we embrace new habits faster than we would have otherwise. VUIs are already popular, adopted mainly due to ease of use and simplicity, but now they have become a must-have feature that can help meet CDC guidelines and eliminate the need to touch contaminated touchpoints and reduce disease transmission. DSP Group is playing an instrumental role in addressing these developments with a portfolio of innovative low-power and high-performance voice and audio SoCs, and a suite
of algorithms and hardware that address the rising need to add a high-quality VUI to any device. In addition, as VUIs becomes ubiquitous, more AI processing is performed at the edge to address privacy concerns, reduce latency, and make better use of available bandwidth. The application of AI at the edge requires more efficient hardware and associated algorithms that are tightly coupled and optimized. Our portfolio of AI solutions for edge devices includes smart and robust solutions for applications such as sound detection, proximity detection and acoustic beaconing, all while maintaining the lowest power consumption. Our SmartVoice solutions are driving VUI and AI in a broad array of applications; with over 80 products by 40+ vendors, including tier-1 brands, such as Alibaba, Amazon, Arlo, Facebook, Google, GoPro, Lenovo, Logitech, Oppo, Samsung and TCL that leverage our solutions to bring to market highly differentiated and innovative products. During the year, we continued to solidify our leadership position in three promising new market verticals—entertainment, cameras and tablets—which together accounted for a majority of SmartVoice revenues. We are confident that our existing design and engagement pipeline will drive the SmartVoice business to future growth.* SmartHome: Phone calls have made a comeback amid the COVID-19 outbreak. In the U.S., Internet traffic in general is up around 20% to 25% from typical daily patterns, while at the same time, the number of calls made from home has nearly doubled. Service providers are leveraging their infrastructure to deal with the growth in voice calls and are offering better QoS and a more reliable means of communication, supported by the integration of DECT/ULE into their HGWs to provide portability, reliability, and full home coverage. * Moreover, the convergence of VUIs and IoT connectivity is becoming a reality and the level of interest in high-quality, real-time, two-way communications for home IoT has never been stronger. Voice in the smart home is fast becoming the interface of choice, and the ability to add both high-QoS voice and IoT capabilities—without additional cost—is an attractive proposition. In addition, we are excited about the role that ULE can play in the U.S. security market. ULE’s unmatched benefits, which include superior range, interference-free spectrum and inherently reliable voice and audio support, are crucial for security products, especially during emergencies when call-center or 911 support is required. DSP Group, and our DECT and ULE technologies are in a unique position to benefit from these trends.* In fact, DECT/ULE is gaining ground as the go-to wireless standard for applications requiring transfer of high-quality voice.*

During 2019, we enhanced our wireless leadership position and marked a milestone event by securing our first significant ULE win in the U.S. market. ADT, the leading security service provider, announced that it selected our ULE technology as the primary connectivity technology for its new DIY wireless security offering. Moreover, we securely positioned ULE as the leading smart home technology in the European market when Orange, the leading French-based service provider, launched its new connected home service, called ‘Maison Connectée,’ and selected ULE as its primary IoT technology. To date, three leading tier-1 service providers—ADT, Deutsche Telekom and Orange— have chosen our ULE technology as their primary wireless IoT technology, thereby driving more OEMs and ODMs to take an active role within the expanding ULE ecosystem.* We are confident in the design momentum and growth potential of this product category. The recent success in the U.S. security market will pave the path for ULE’s broad market adoption in the Americas, supported by further expansion in Europe, following the increased traction for ULE products from existing and new customers.* In summary, we are proud that DSP Group has an important role to play in helping our customers transition to a safer and more productive work and home environment with innovative tools for communication and collaboration.* Finally, we would like to thank our stockholders, customers, business partners, and our employees for their continued and outstanding support, cooperation, and loyalty. We believe that with your support, our focus, the loyalty of our customers, and the dedication of our staff, we are well positioned to reap the benefits of our investments and achieve long-term, sustainable, profitable revenue growth and stockholder value.*
Kenneth Traub Ofer Elyakim Chairman of the Board Chief Executive Officer
*Forward-Looking Information This letter contains forward-looking statements (which are denoted by an asterisk) that involve risks and uncertainties, as well as assumptions that if they materialize or prove incorrect, could cause DSP Group’s results to differ materially from those expressed or implied by such forward-looking statements. Please review the “Risk Factors” section of DSP Group’s 2019 Form 10-K that accompanies this letter for a description of the risks, uncertainties and assumptions associated with DSP Group’s business and financial results. DSP Group assumes no obligation to update any forward-looking statements or information.
SECURITIES AND EXCHANGE COMMISSION Washington, D.C. 20549
FORM 10-K ANNUAL REPORT PURSUANT TOSECTION 13 OR 15(d)
OF THE SECURITIES EXCHANGE ACT OF 1934
For the Fiscal Year Ended December 31, 2019
Commission File Number 001-35256
DSP GROUP, INC. (Exact name of registrant as specified in its charter)
Delaware (State or other jurisdiction of
incorporation and organization)
94-2683643 (I.R.S. Employer Identification No.)
2055 Gateway Place, Suite 480, San Jose, California 95110
(Address of principal executive offices, including zip code)
408-986-4300 (Registrant’s telephone number)
Securities registered pursuant to Section 12(b) of the Act: None
Securities registered pursuant to Section 12(g) of the Act: Common Stock, $.001 per share
(Title of class)
Securities registered pursuant to Section 12(b) of the Act
Title of each class Trading Symbol(s) Name of each exchange on which registered
Common Stock, $.001 per share DSPG The NASDAQ Stock Market LLC
Indicate by check mark if the registrant is a well-known seasoned issuer, as defined in Rule 405 of the Securities Act. Yes No
Indicate by check mark if the registrant is not required to file reports pursuant to Section 13 or Section 15(d) of the Exchange Act. Yes No
Indicate by check mark whether the Registrant (1) has filed all reports required to be filed by Section 13 or 15(d) of the Securities Exchange Act of 1934 during the preceding 12 months (or for such shorter period that the Registrant was required to file such reports), and (2) has been subject to such filing requirements for the past 90 days. Yes No
Indicate by check mark whether the registrant has submitted electronically every Interactive Data File required to be submitted pursuant to Rule 405 of Regulation S-T (§232.405 of this chapter) during the preceding 12 months (or for such shorter period that the registrant was required to submit such files). Yes No
Indicate by check mark whether the registrant is a large accelerated filer, an accelerated filer, a non-accelerated filer, or a smaller reporting company. See definitions of “large accelerated filer,” “accelerated filer,” and “smaller reporting company” in Rule 12b-2 of the Exchange Act.
Large accelerated filer Accelerated filer Non-accelerated filer Smaller reporting company Emerging growth Company
If an emerging growth company, indicate by check mark if the registrant has elected not to use the extended
transition period for complying with any new or revised financial accounting standards provided pursuant to Section 13(a) of the Exchange Act.
Indicate by check mark whether the registrant is a shell company (as defined in Rule 12b-2 of the Exchange Act). Yes No
As of June 30, 2019, the aggregate market value of voting stock held by non-affiliates of the Registrant, based on the closing price of the Common Stock on June 28, 2019 as reported on the NASDAQ Global Select Market, was approximately $265,430,000. Shares of Common Stock held by each officer and director and by each person who owns 10% or more of the outstanding Common Stock have been excluded from this computation in that such persons may be deemed to be affiliates. This determination of affiliate status is not necessarily a conclusive determination for other purposes.
As of March 4, 2020, the Registrant had outstanding 23,428,494 shares of Common Stock.
Documents incorporated by reference: Portions of the Registrant’s proxy statement to be filed pursuant to Regulation 14A within 120 days after Registrant’s fiscal year end of December 31, 2019 are incorporated herein by reference into Item 5 of Part II and Items 10, 11, 12, 13 and 14 of Part III of this annual report.
INDEX
DSP GROUP, INC.
Page No . PART I Item 1. BUSINESS. .................................................................................................... 3 Item 1A. RISK FACTORS. ........................................................................................ 11 Item 1B. UNRESOLVED STAFF COMMENTS. ..................................................... 25 Item 2. PROPERTIES. ............................................................................................. 26 Item 3. LEGAL PROCEEDINGS. ........................................................................... 26 Item 4. MINE SAFETY DISCLOSURES. .............................................................. 26
PART II Item 5. MARKET FOR REGISTRANT’S COMMON EQUITY, RELATED
STOCKHOLDER MATTERS AND ISSUER PURCHASES OF EQUITY SECURITIES. .............................................................................. 27
Item 6. SELECTED FINANCIAL DATA ............................................................... 30 Item 7. MANAGEMENT’S DISCUSSION AND ANALYSIS OF
FINANCIAL CONDITION AND RESULTS OF OPERATIONS. ............ 31 Item 7A. QUANTITATIVE AND QUALITATIVE DISCLOSURES ABOUT
MARKET RISK........................................................................................... 46 Item 8. FINANCIAL STATEMENTS AND SUPPLEMENTARY DATA. ........... 48 Item 9. CHANGES IN AND DISAGREEMENTS WITH ACCOUNTANTS
ON ACCOUNTING AND FINANCIAL DISCLOSURE. ....................... 106 Item 9A. CONTROLS AND PROCEDURES. ......................................................... 106 Item 9B. OTHER INFORMATION. ........................................................................ 106 PART III Item 10. DIRECTORS, EXECUTIVE OFFICERS AND CORPORATE
GOVERNANCE. ....................................................................................... 107 Item 11. EXECUTIVE COMPENSATION. ............................................................ 107 Item 12. SECURITY OWNERSHIP OF CERTAIN BENEFICIAL OWNERS
AND MANAGEMENT AND RELATED STOCKHOLDER MATTERS. ................................................................................................ 107
Item 13. CERTAIN RELATIONSHIPS AND RELATED TRANSACTIONS, AND DIRECTOR INDEPENDENCE. ..................................................... 107
Item 14. PRINCIPAL ACCOUNTANT FEES AND SERVICES. ......................... 107 PART IV Item 15. EXHIBITS AND FINANCIAL STATEMENT SCHEDULES. ............... 108
SIGNATURES ........................................................................................... 113

-2-
This report and certain information incorporated herein by reference contain forward-looking statements, which are provided under the "safe harbor" protection of the Private Securities Litigation Reform Act of 1995. All statements included or incorporated by reference in this report, other than statements that are purely historical in nature, are forward-looking statements. Forward-looking statements are generally written in the future tense and/or are preceded by words such as "will," "may," "should," "could," "expect," "suggest," "believe," "anticipate," "intend," "plan," or other similar words. Forward-looking statements include statements regarding:
• Our expectation that revenues from our growth initiatives will increase in 2020 as compared to 2019;
• Our expectation that revenues from growth initiatives will represent more than two-thirds of the total revenues in 2020;
• Our expectation that our next generation AI/ML with voice enhancement SoC will be introduced in 2020;
• Our expectation that the Unified Communications market will recover in 2020;
• Our anticipation that our gross margin on an annual basis will continue to increase in the foreseeable future as our product mix shifts in favor of new products, which generally have higher gross margins;
• Our belief that our past research and development investments in new technologies are paying off;
• Our belief that because of the growth of new communication access methods, including mobile, wireless broadband, cable and other connectivity, the traditional cordless telephony market using fixed-line telephony will continue to decline, which will continue to reduce our revenues derived from, and unit sales of, cordless telephony products;and
• Our belief that our available cash and cash equivalents at December 31, 2019 should be sufficient to finance our operations for the foreseeable future.
All forward looking statements included in this Annual Report on Form 10-K are made as of the date hereof, based on information available to us as of the date hereof, and we assume no obligation to update any forward-looking statement. Many factors may cause actual results to differ materially from those express or implied by the forward –looking statements contained in this report. These factors include those risks described in Part II Item 1A "Risk Factors" of this Form 10-K.
This Annual Report on Form 10-K includes trademarks and registered trademarks of DSP Group. Products or service names of other companies mentioned in this Annual Report on Form 10-K may be trademarks or registered trademarks of their respective owners.
DSP Group, Inc. is referred to in this Annual Report as "DSP Group," "we," "us" "our" or "company."

-3-
PART I
Item 1. BUSINESS.
Introduction
DSP Group®, Inc. (NASDAQ: DSPG) is a global leader in wireless, audio, voice and AI chipsets for a wide range of smart-enabled devices. Delivering semiconductor system solutions with software and hardware reference designs, DSP Group enables original equipment manufacturers (OEMs), original design manufacturers (ODMs), consumer electronics (CE) manufacturers and service providers to cost-effectively develop new products with fast time to market. At the forefront of semiconductor, communication-related innovation and operational excellence for over three decades, DSP Group provides a broad portfolio of wireless chipsets integrating industry leading standards, including DECT/CAT-iq, ULE, PSTN, HDClear™ voice, video and VoIP technologies. DSP Group is a leader in high performance low-power integrated circuits (ICs) for audio and voice signal processing applications. We enable converged voice, audio, video and data connectivity across diverse mobile, consumer and enterprise products. Applications range from mobile phones, IoT, wearable devices, hearable devices, connected multimedia screens, home automation and security to cordless phones, Unified Communications systems and home gateways. Leveraging industry-leading experience, expertise and patent portfolio, DSP Group partners with leading CE manufacturers and service providers to reshape the future of converged communications at home, office and mobile on the go devices.
In 2019, revenues from our growth initiatives, mainly Unified Communications, SmartVoice and SmartHome products (consisting of ULE ICs and home gateway ICs), accounted for 63% of our total revenues. We expect that revenues from these growth initiatives will represent more than two-thirds of our 2020 total revenues.
We were incorporated in California in 1987 and reincorporated in Delaware in 1994. We completed our initial public offering in February 1994.
Industry Environment and Our Business
Our focus on the design of highly-integrated, mixed-signal devices that combine signal processing, complex RF (radio frequency), analog and digital functions enables us to address the complex challenges of integrating various technologies, platforms and processes posed by emerging trends in the industry. Our IC products are customizable, achieve high functionality and performance at reduced power consumption, especially for Internet of Things (IoT), home automation devices, mobile, hearables, wearables, cordless and IP telephony products that require very low power consumption, and can be manufactured in high volumes using cost-effective process technologies. Our system level architectures provide an open design environment for ODMs to design and market their own differentiated end products.
Our expertise and investment in software development, including Board Support Packages (BSPs) and drivers, telephony, communication stacks and application layers in Real-Time Operating System (RTOS) and Full Featured Operating System (FFOS) frameworks, enable our customers-’ fast time to market with cost- and performance-optimized flexible solutions. With our internally developed innovations and acquired intellectual property, we deliver value to our existing market verticals and address new market verticals, including markets for IoT, office phones, mobile, hearables and wearables, consumer and computing devices, and voice user interface, thus expanding our market opportunities.
We offer leading wireless voice and data transmission system solutions for various connectivity applications in the home and enterprise. Since 1999, we have developed and acquired a broad set of communication technologies, including Direct Sequence Spread Spectrum (DSSS), Frequency Hopping Spread Spectrum (FHSS), Orthogonal Frequency Digital Modulation (OFDM), Digital Narrow Band, Complementary Metal Oxide Semiconductor (CMOS), Gallium Arsenide (GaAs) technology, and Silicon Germanium (SiGe) RF chips for 900MHz, 2.4GHz and 5.8GHz Industry Scientific and Medical (ISM) bands, European DECT
-4-
(1.9GHz), DECT 6.0 (1.8GHz), Korean DECT (1.7GHz), Bluetooth (2.4GHz), Wi-Fi (802.11, 2.4GHz/5GHz), BiCMOS (Bipolar CMOS) and deep sub-micron CMOS technologies.
Moreover, we expanded our DECT solutions beyond cordless telephony to address the IoT market via an ultra-low energy version of DECT called DECT ULE or ULE. ULE offers numerous technological benefits due to its licensed and interference-free bands, longer range, RF robustness, propagation through multiple walls, voice and visual support, while operating at very low power. ULE is built from the ground up to support voice and audio transport, making it ideal for today’s voice-enabled SmartHome.
In the past decade, we have expanded from primarily delivering cordless telephony solutions serving consumers to chipsets and telephony solutions for office and business applications to becoming a market leader in the Office segment. Today, DSP Group offers comprehensive systems-on-a-chip (SoC) and solutions for VoIP, home, SoHo and office IP phones. VoIP is a technology that enables users to make HD voice and video calls via a broadband Internet connection rather than an analog phone line. Furthermore, with speech-enabled mobile, smart assistants and IoT devices playing an increasingly significant role in peoples’ lives, in February 2013, we unveiled our HDClear technology. We have incorporated this HDClear technology into our SmartVoice product family consisting of a comprehensive suite of noise suppression and voice quality enhancement products for mobile, wearables, hearables and always-on IoT and SmartHome devices. HDClear capitalizes on the voice user interface trend by incorporating voice command, voice activation, proprietary noise cancellation, acoustic echo cancellation, and beam forming algorithms, thereby dramatically improving user experience and delivering unparalleled voice quality and speech recognition. Our HDClear technology is both high performance and ultra-low power. This technology was conceived through internal development combined with the acquisition of BoneTone Communications Ltd. (“BoneTone”) and the addition of their innovative intelligent noise cancellation algorithms to our low power SoC. In 2015, we secured our first design win for HDClear with a tier one mobile customer and started mass production shipments during the fourth quarter of 2015. In 2016, we shipped our HDClear hardware and software solution in mass production to a tier one mobile customer for one of its flagship mobile phones. In 2017, we shipped our HDClear solution to two flag ship mobile phones and eight different OEMs for non-mobile phone applications. In 2018, we shipped our solution to over a dozen smartphone, IoT, wearable and computing OEMs, and achieved over 124% year-over-year growth in the SmartVoice segment. In 2019, we achieved 74% year-over-year growth in the SmartVoice segment via a broad-based expansion with both existing and new customers across our target markets.
Committed to advancing technology across the CE and telecommunications markets, DSP Group is actively involved in prominent industry associations, including the Wi-Fi Alliance, ULE Alliance, the European Telecommunications Standards Institute and DECT Forum. We also participate in the 3GPP and MIPI alliance. DSP Group is further deeply involved in all stages of defining DECT CAT-iq and ULE standards and is building full eco-systems to support these solutions. We are also an active member of the Home Gateway Initiative (HGI). Such industry involvements enable us to participate in the definition of standards and keep abreast of the latest innovations, and market and technology requirements. We also maintain close relationships with many world-leading telecommunication service providers, thereby providing us with insight into future plans across the industry.
Target Markets and DSP Group Products
In response to market trends, we are concentrating our development efforts on new products and opportunities to leverage our strong voice technology base and customer relationships to address evolving market opportunities and take advantage of the current market trends in our domain. We focus our efforts on four product areas: (i) SmartVoice products which consist of AI/ML engines with DSP for voice-enabled products targeting mobile computing, SmartHome/IoT, and wearable and hearable device markets that incorporate our HDClear and Neural Network (AI) technologies, as well as other third party advanced voice processing, always on and sensor fusion functionalities; (ii) Unified Communications products consisting of VoIP SoC products for Enterprise, SMB and SoHo; (iii) SmartHome products consisting of ULE ICs and home gateway ICs targeting the growing markets of IoT, SmartHome and security devices; and (iv) cordless phones
-5-
which consist of largely DECT SoCs for cordless telephony. The SmartHome and cordless product lines are both part of our Home segment.
Below is a discussion of our business segments and the products within each segment.
SmartVoice - Products Targeted at Mobile Computing, Consumer Electronics, IoT ,Wearable and Hearables Device Markets
Our SmartVoice product portfolio encompasses HDClear technology for intelligent voice enhancement, always-on voice trigger and control, and noise cancellation. This technology is primarily targeted at devices supporting voice as a user interface. The current market trend is to use voice as a user interface in almost all devices. Our HDClear high performance and lower power solutions continue to garner important design wins with our numerous enabling technologies such as voice command, voice activation, proprietary noise cancellation, acoustic echo cancellation and beam forming algorithms, all of which dramatically improve user experience and deliver world class voice quality and speech recognition.
HDClear-based solutions offer mobile IoT voice quality and intelligibility, while minimizing background noise. Delivering clearer voice calls made from noisy environments, HDClear also maximizes accuracy of Automatic Speech Recognition (ASR) applications in noisy environments by leveraging robust and powerful noise cancellation algorithms. HDClear more effectively isolates voice from ambient noise, thereby drastically lowering Word Error Rate (WER) and dramatically improving the user experience for speech-enabled applications like virtual assistants, voice search, speakerphone conference calls and speech-to-text on mobile and wearable devices, tablets and other consumer devices. In 2012, we taped-out the DBMD2 chip, which we believe is one of the most efficient voice enhancement processors in the market. DBMD2’s low power enables an always-on voice feature for mobile devices. Always-on is a low power decisive natural voice interface for mobile and wearable devices. An average user accesses his/her device tens or hundreds of times per day by physically pressing a screen or a button. A truly always-on technology enables the user to skip this step by using natural voice to access the device even while the device is in standby mode. DBMD2 enables mobile OEMs to offload voice and audio tasks from mobile device CPUs, in addition to running HDClear to enhance automatic speech recognition (ASR) accuracy. In 2015, we taped-out DBMD4, a chip targeted for ultra-low-power, always-on voice and audio applications. DBMD4 incorporates a suite of voice enhancement algorithms, including noise suppression, which significantly improves user experience and accuracy of speech-driven applications, particularly in high noise environments. Offered in a small form factor, DBMD4 embeds a TeakLite-III DSP core, incorporates advanced connectivity options, including I2S, UART, SPI, I2C ports and SLIMbus, and is equipped with a comprehensive software framework that enables rapid development and fast time-to-market, thereby overcoming the challenges of portable design, real estate and power consumption.
In January 2017, we unveiled our latest audio and voice enhancement SoC, the DBMD5. This audio SoC is built to drive clearer human machine voice interactions in multi microphone equipped devices.
2018 was a milestone year for SmartVoice in which we shipped our SoCs to customers in six different categories – smartphones, IoT, wearables, hearables, tablets and smart speakers. In addition, during the year, market-leading Amazon Alexa Voice Services certified our far field 3-Mic development kit based on our DBMD5 processor.
In 2019, we introduced our DBMD7 line of audio & voice processors that carefully balance low power consumption needed for smart sensing with high-performance computing capability and large embedded memory needed for high-quality, low-latency voice and ML processing at the edge. DBMD7 meets the need for high-performance processing to run the advanced algorithms required for far-field voice activation, accuracy, range and reliability. At the same time, it allows our customers to meet EnergyStar requirements for stand-by power consumption.
We are currently working on our next generation AI/ML with voice enhancement SoC which we expect to introduce in 2020.
-6-
Unified Communications (formerly Office) Segment - Products Targeted at the Office Market
As a leading silicon vendor for enterprise voice, we offer a comprehensive portfolio of solutions for VoIP telephony solutions. Our DVF SoCs family is a comprehensive solution for developing affordable, scalable and green VoIP home and office products. DVF facilitates rapid introduction of embedded features into residential devices such as cordless IP and instant messaging (IM) phones. DVF enables development of low-power enterprise IP, analog terminal adapters (ATAs) and home VoIP phones that offer superb acoustic echo cancellation, high-quality HD voice, multi-line capabilities, and an enhanced user interface (UI). Built on an open platform with multi-ARM processors running on Linux OS, DVF includes IPfonePro™, an extensive SDK for IP phones and ATAs.
In 2012, we taped-out VoIP SoC DVF99xx, which commercially launched in January 2013. Built with two ARM926EJ-S™ cores, this VoIP SoC provides combined processing speed of 1.1 GHz, and is designed to support IP phone processing needs - from basic single-line IP phones to high-end multi-line gigabit Ethernet IP phones with large color display and advanced GUI. The DVF99 also integrates multiple hardware accelerators, including a hardware security engine which enables a new class of secure IP phones, an LCD controller, a 2D graphics engine, a high-speed USB 2.0 port, DDR3/DDR2 memory and minimal power consumption. This product was designed to meet the needs of the enterprise IP telephony market.
DVF101 was taped out during 2016 and provides outstanding cost/performance value for high-end IP phones. Designed specifically to meet Tier 1 requirements, DVF101 fully complements existing solutions, including DVF99 VoIP processors for mid to high-end IP phones. DVF101 is an ideal solution for high-end voice terminals, with high-resolution color display, rich 3D graphical user interface, full HD-voice and super wideband acoustical echo cancellation, as well as fully secured communication.
For the video phone product family, we offer the DVF1100, a high-end media processor, which powers advanced Android video phones and conferencing phones.
Our software and hardware offered for the enterprise telephony product family keeps expanding beyond conventional VoIP phones and ATAs to cover conferencing systems, IP intercoms, public announcement systems, as well as accessories such as key expansion modules, DECT microphones and headsets with advanced capabilities for voice and audio.
A number of customers successfully launched phones based on our DVF99 and DVF101 families. In addition, we secured additional design wins with our existing tier one customers for higher end products which are expected to go into production in the 2020 timeframe, thereby contributing to further progress in this growing segment.
Home Segment – Our SmartHome Products, Including Home Gateways, Home Automation Products and Cordless Telephony Products
Our DECT and 2.4 GHz technologies are targeted at three broad categories of products: (a) home gateways and fixed mobile convergence, (b) home automation/security and IoT applications, and (c) digital cordless telephony. Gateway products and IoT applications that are supported by our ULE technology are categorized as SmartHome.
As a market leader in DECT, we offer a wide range of cost-effective, highly integrated SoC solutions. Delivering high-quality audio with low power consumption, our field-proven chipset solutions are ideal for highly integrated digital cordless telephony, DECT-enabled gateways and home automation and security. Our chipsets provide an integrated digital solution and include all relevant digital baseband, analog interface and RF functionality.
Our Home chipset solutions enable worldwide coverage, supporting all RF bands and cordless protocols, such as:
-7-
• 1.7GHz -1.9GHz DECT – used in Europe, U.S. (DECT6.0), Korea, Japan and Latin America; and
• 2.4GHz – used in Japan, China, India and the U.S.; the dominant protocols for this RF band is our proprietary EDCT (Enhanced Digital Cordless Technology) and WDCT (Wireless Digital Cordless Technology) protocols.
This chipset portfolio combines wireless communications technology with a range of telephony features, audio and voice-processing algorithms to provide the industry a low cost, high performance and small footprint solution. Enhanced with our hardware and software technologies, these chipsets are highly versatile and enable the development of an array of cordless telephony solutions, DECT home gateways and SmartHome applications and devices that allow for faster time to market than alternative custom silicon and software offerings. This portfolio supports cordless phones, cordless headsets, remote controls, home DECT-enabled gateways, fixed-mobile convergence solutions and home security and automation devices.
From 2016, our DHX91, a ULE SoC, was incorporated into end customer products for home automation and security applications. . In 2016, Panasonic Communications Ltd. (“Panasonic”), Sercomm Corporation, Eurotronic Technology GmbH and several other leading CE brands launched ULE based products that utilizes DECT/ULE for sensors, actuators, voice and video cameras. In 2017, Deutsche Telecom launched home automation and control services and products based on our DECT and ULE solutions. In 2018, Zipato, AwoX, Deutsche Telecom, SGW, Technicolor, Elite Computer, Bezeq and Orange all announced plans to roll out products and/or services based on ULE solutions. In 2019, we successfully penetrated the U.S. market with ULE, as ADT, a security provider serving residential and business customers in the U.S., selected our ULE technology and SmartVoice solutions to wirelessly connect its smart IoT devices to its Blue by ADT security systems.
In 2019, we enhanced our DHX91 offering by introducing the DHX101 SoC with low-power, flashed-based chipset solution for home automation and security targeted for the node/device side. We also offer pre-certified, product quality ULE modules for both the device and the hub/gateway side. The DHAN-S and DHAN-T modules are appropriate for a ULE Dual-Mode (data and/or audio) application on the device side. These modules all include microphone and speaker interfaces for applications using audio links. They also feature super low current hibernation mode to facilitate a multi-year battery lifetime.
Customers
We are an innovative, flexible, customer-centric company that proactively partners with our broad base of global customers and service providers. As a reliable long-term industry supplier, we maintain a proven track record of operational excellence and successful on-time delivery. With offices across Asia, Europe and North America, we deliver outstanding local service and support worldwide. We sell our products through distributors and directly to OEMs and ODMs who incorporate our products into consumer and commercial products for the worldwide residential wireless communications market and enterprise products for the worldwide office communications market.
In 2019, we continued expanding our customer base, and in some cases, increased our share of business with existing customers. Our blue-chip customer base features leading international CE manufacturers, including the world’s top consumer brands, which have deployed our chipset and software solutions at prominent tier-one customers across the globe, and include: Aprotech, ADB, ADT, AEG, Alcatel-Lucent Enterprise, Alibaba, Atcom, AT&T, Arlo, Arris, Atlink, Arcadyan, Askey, Audiocodes, Avaya, Ayecom, Baycom, Belgacom, Binatone, British Telecom, Brother, CCT Tech, Cetis, CIG, Cisco, Climax, Comcast, Crow, Cybertan, Grandstream, Deutsche Telekom, Doro, DNI, DTS, DX Antenna, Eclogic, Escene, Eurotronic, Facebook, Fanvil, Flextronics, Fujitsu, France Telecom, Freebox, Gibson (formerly Philips), Gaoxinqi, Gemtek, Gigaset, Goertek, GoPro, Foxconn, Huawei, Iflytek, Infinite, Innomedia, Intelbras, Invoxia, JXE, Kaonmedia, Kocom, Korea Telecom, KPN, Lenovo, LG Electronics, Libre, Logitech, Meitu, Mitac, Mitel, Mitrastar, Motorola, Moimstone, Netgear, NTT, Ooma, Oppo, Panasonic, Pegatron, Pioneer, Poly, Proximus, Sagemcom, Samsung, Sanyo, SAXA, Sercomm, SGW, Sharp, , SK Telecom, Sony, Spracht, Sumitomo, Sunrise, Swissvoice,
-8-
Swisscom, TCL, Tecom, Telecom Italia, Telefonica, Telstra, Technicolor, Telefield (RCA), Tinno, T&W, Uniden, Unihan, Urmet, Uwin, Turkcell, Turkish Telecom, Verisure, Verizon, VTech, Vodafone, Wistron, WNC, WONDALINK, Xingtel, Yamaha, Yealink, Yeastar and ZTE.
International Sales and Operations
International sales accounted for 96% of our total revenues for 2019, 95% of our total revenues for 2018 and 96% in 2017. As most of our sales to foreign entities are denominated in U.S. dollars, we are subject to risks of conducting business internationally. See Note 17 of the attached Notes to Consolidated Financial Statements for the year ended December 31, 2019, for a summary of the geographic breakdown of our revenues and location of our long-lived assets.
As a result of our international operations, a significant portion of our expenses in Israel is paid in the Israeli currency (New Israeli Shekel (NIS)). Our primary expenses paid in NIS are employee salaries and lease payments on our Israeli facilities. In addition, a portion of our expenses in Europe is paid in Euro. Our primary expenses paid in Euro are employee salaries and lease and operational payments on our European facility.
Sales, Marketing and Distribution
We market and distribute our products through our direct sales and marketing offices, as well as through a network of global distributors. Our sales and marketing team has global reach through our sales offices in San Jose, California; Hong Kong, China; Nierenberg, Germany; Tokyo, Japan; Herzliya Pituach, Israel, Edinburgh, Scotland; Shanghai and Shenzhen, China and South Korea. In territories where we do not have sales offices, we operate either directly from our corporate headquarters or through a network of distributors and representatives.
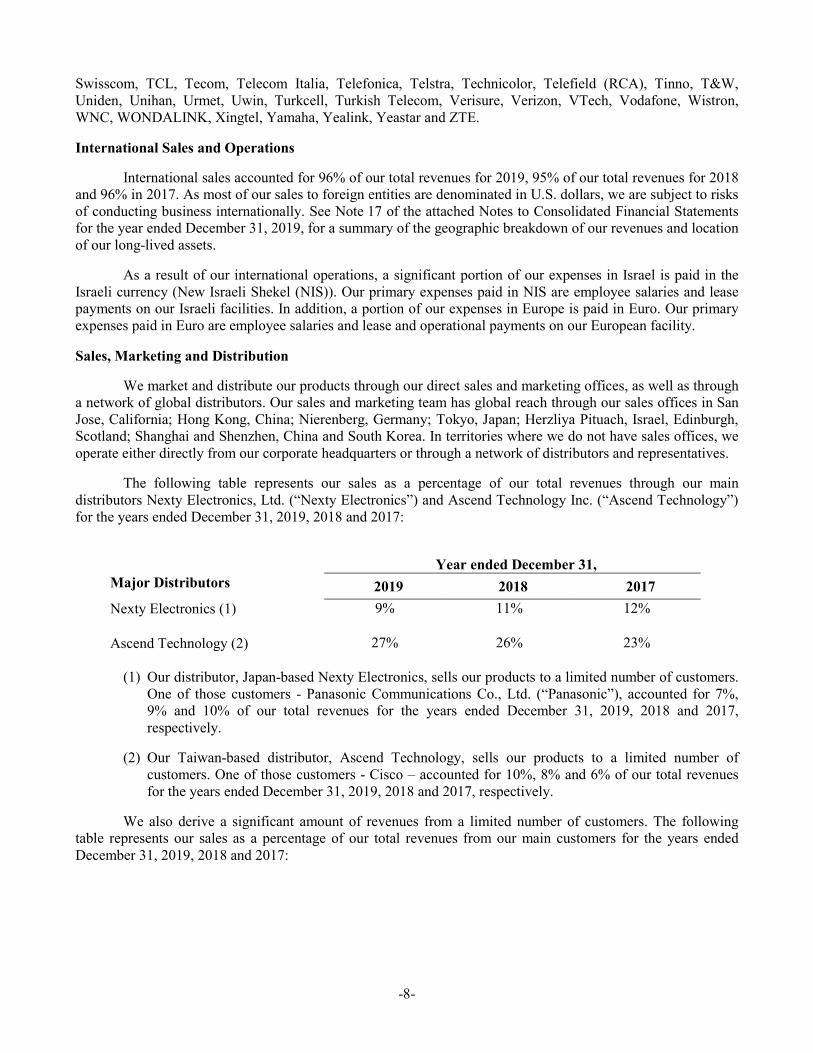
The following table represents our sales as a percentage of our total revenues through our main distributors Nexty Electronics, Ltd. (“Nexty Electronics”) and Ascend Technology Inc. (“Ascend Technology”) for the years ended December 31, 2019, 2018 and 2017:
Year ended December 31,
Major Distributors 2019 2018 2017 Nexty Electronics (1) 9% 11% 12%
Ascend Technology (2) 27% 26% 23%
(1) Our distributor, Japan-based Nexty Electronics, sells our products to a limited number of customers. One of those customers - Panasonic Communications Co., Ltd. (“Panasonic”), accounted for 7%, 9% and 10% of our total revenues for the years ended December 31, 2019, 2018 and 2017, respectively.
(2) Our Taiwan-based distributor, Ascend Technology, sells our products to a limited number of customers. One of those customers - Cisco – accounted for 10%, 8% and 6% of our total revenues for the years ended December 31, 2019, 2018 and 2017, respectively.
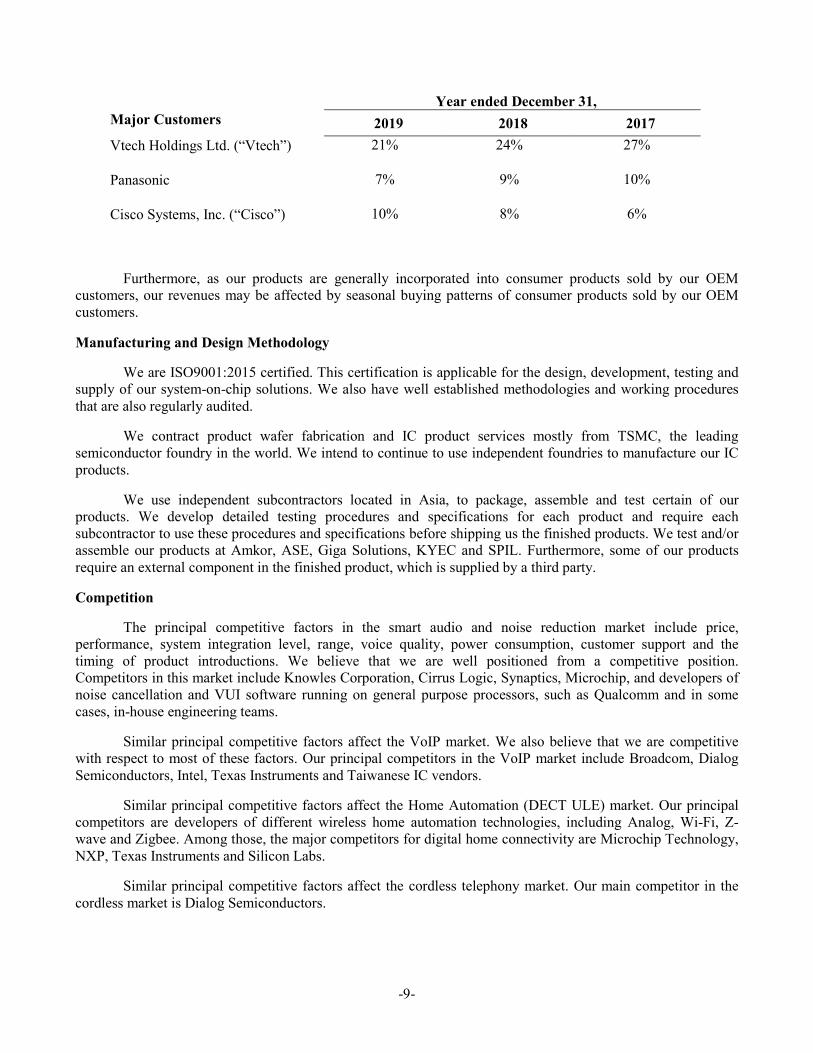
We also derive a significant amount of revenues from a limited number of customers. The following table represents our sales as a percentage of our total revenues from our main customers for the years ended December 31, 2019, 2018 and 2017:
-9-
Year ended December 31,
Major Customers 2019 2018 2017 Vtech Holdings Ltd. (“Vtech”) 21% 24% 27%
Panasonic 7% 9% 10%
Cisco Systems, Inc. (“Cisco”) 10% 8% 6%
Furthermore, as our products are generally incorporated into consumer products sold by our OEM customers, our revenues may be affected by seasonal buying patterns of consumer products sold by our OEM customers.
Manufacturing and Design Methodology
We are ISO9001:2015 certified. This certification is applicable for the design, development, testing and supply of our system-on-chip solutions. We also have well established methodologies and working procedures that are also regularly audited.
We contract product wafer fabrication and IC product services mostly from TSMC, the leading semiconductor foundry in the world. We intend to continue to use independent foundries to manufacture our IC products.
We use independent subcontractors located in Asia, to package, assemble and test certain of our products. We develop detailed testing procedures and specifications for each product and require each subcontractor to use these procedures and specifications before shipping us the finished products. We test and/or assemble our products at Amkor, ASE, Giga Solutions, KYEC and SPIL. Furthermore, some of our products require an external component in the finished product, which is supplied by a third party.
Competition
The principal competitive factors in the smart audio and noise reduction market include price, performance, system integration level, range, voice quality, power consumption, customer support and the timing of product introductions. We believe that we are well positioned from a competitive position. Competitors in this market include Knowles Corporation, Cirrus Logic, Synaptics, Microchip, and developers of noise cancellation and VUI software running on general purpose processors, such as Qualcomm and in some cases, in-house engineering teams.
Similar principal competitive factors affect the VoIP market. We also believe that we are competitive with respect to most of these factors. Our principal competitors in the VoIP market include Broadcom, Dialog Semiconductors, Intel, Texas Instruments and Taiwanese IC vendors.
Similar principal competitive factors affect the Home Automation (DECT ULE) market. Our principal competitors are developers of different wireless home automation technologies, including Analog, Wi-Fi, Z-wave and Zigbee. Among those, the major competitors for digital home connectivity are Microchip Technology, NXP, Texas Instruments and Silicon Labs.
Similar principal competitive factors affect the cordless telephony market. Our main competitor in the cordless market is Dialog Semiconductors.

-10-
Research and Development
Timely development and introduction of new products are essential to maintain our competitive position. We currently conduct most of our product development at our facilities. As of December 31, 2019, we had a staff of 204 research and development personnel, of which 134 were located in Israel. We also employ independent contractors to assist with certain product development and testing activities. Due to various new developments in the home residential market and consistent with our strategy, we have expanded our product lines and developed products and services targeted at wider markets, including office enterprise market, the intensively competitive mobile device market and the expansive voice user interface market. We will need to continue to invest in research and development, and our research and development expenses may increase in the future, including the addition of new research and development personnel, to secure our leading position in discrete markets we operate in and keep pace with new and rapidly changing trends in our industry.
Licenses, Patents and Trademarks
We actively pursue foreign patent protection in countries of interest to us. Our policy is to apply for patents or for other appropriate statutory protection when we develop valuable technology. As of December 31, 2019, we have been granted a total of 167 patents and 47 patents are pending.
We attempt to protect our trade secrets and other proprietary information through agreements with our customers, suppliers, employees and consultants, and through other security measures. Although we intend to protect our rights vigorously, there are no assurances that these measures will be successful.
While our ability to compete may be affected by our ability to protect our intellectual property, we believe that because of the rapid pace of technological change in our industry, our technical expertise and ability to innovate on a timely basis and in a cost-effective manner will be at least as important in maintaining our competitive position than the protection of our intellectual property. In addition, we believe that due to rapid technological changes in residential telephony, computer telephony and personal computer markets, patents and trade secret protection are important but must be supported by other factors, including expanding the knowledge, ability and experience of our personnel, new product introductions and frequent product enhancements. Although we continue to implement protective measures and intend to defend our intellectual property rights vigorously, we cannot assure that these measures will be successful.
Backlog
At December 31, 2019, our backlog was approximately $21.4 million, compared to approximately $23.5 million and $20.6 million at December 31, 2018 and 2017, respectively. We include in our backlog all accepted product purchase orders with respect to which a delivery schedule has been specified for product shipment within one year and for which collectability is not considered a risk. Our business is characterized by short-term order and shipment schedules. Product orders in our current backlog are subject to change, sometimes on short notice, due to changes in delivery schedules or cancellation by a purchaser. Accordingly, although useful for scheduling production, backlog as of any particular date may not be a reliable measure of our sales for any future period.
Employees
At December 31, 2019, we had 340 employees, including 204 in research and development, 73 in sales and marketing, and 63 in corporate, administration and manufacturing coordination. Competition for personnel in the semiconductor industry in general is intense. We believe that our future prospects will depend, in part, on our ability to continue to attract and retain sought after, highly-skilled technical, marketing and management personnel and are taking active measures to ensure we are perceived as a sought after employer. In particular, there is a limited supply of RF chip designers and highly-qualified engineers with digital signal processing, machine learning and artificial intelligence experience. We believe that we provide an excellent culture, challenging work and competitive compensation to retain our valuable employees.
-11-
Web Site Access to Company’s Reports
Our web site address is www.dspg.com. Our annual reports on Form 10-K, quarterly reports on Form 10-Q, current reports on Form 8-K, and amendments to those reports filed or furnished pursuant to Section 13(a) or 15(d) of the Exchange Act are available free of charge through our web site as soon as reasonably practicable after they are electronically filed with, or furnished to, the Securities and Exchange Commission. We will also provide the reports in electronic or paper form free of charge upon request.
Our website and the information contained therein or connected thereto are not intended to be incorporated into this Annual Report on Form 10-K.
Item 1A. RISK FACTORS.
The following risk factors, among others, could in the future affect our actual results of operations and could cause our actual results to differ materially from those expressed in our forward-looking statements. These forward-looking statements are based on current expectations and we assume no obligation to update this information. Before you decide to buy, hold, or sell our common stock, you should carefully consider the risks described below, in addition to the other information contained elsewhere in this report in addition to our other public filings and presentations. The following risk factors are not the only risk factors facing our company. Additional risks and uncertainties not presently known to us or that we currently deem immaterial may also affect our business. Our business, financial condition, and results of operation could be seriously harmed if any of the events underlying any of these risks or uncertainties actually occurs. In that event, the market price for our common stock could decline, and you may lose all or part of your investment.
In order to sustain the future growth of our business, we must penetrate new markets and our new products must achieve widespread market acceptance but such additional revenue opportunities may not be implemented and may not be achieved.
In order to expand our business and increase our revenues, we must penetrate new markets and introduce new products, especially our Unified Communications, SmartVoice and SmartHome product families. To sustain the future growth of our business, we need to introduce new products as sales of our cordless products continue to decline as expected. We have invested significant resources in pursuing potential opportunities for revenue growth in new product initiatives. We also are exploring opportunities to expand sales of our products in new geographies, including China, South Korea and South America. However, there are no assurances that we will be successful in the development, sales and marketing of our products in these competitive markets. Moreover, there are no assurances that we will recoup our investments made pursuing additional revenue opportunities. Our inability to penetrate such markets and increase our market share in those markets or lack of customer acceptance of those products may harm our business and potential growth.
Because the markets in which we compete are subject to rapid changes, our products may become obsolete or unmarketable.
The markets for our products and services are characterized by rapidly changing technology, short product life cycles, evolving industry standards, changes in customer needs, geo-political influences, demand for higher levels of integration, growing competition and new product introductions. Our future growth is dependent not only on the continued success of our existing products but also successful introduction of new products. Our ability to adapt to changing technology and anticipate future standards, and the rate of adoption and acceptance of those standards, will be a significant factor in maintaining or improving our competitive position and prospects for growth. If new industry standards emerge, our products or our customers’ products could become unmarketable or obsolete, and we could lose market share. We may also have to incur substantial unanticipated costs to comply with these new standards. If our product development and improvements take longer than planned, the availability of our products would be delayed. Any such delay may render our products obsolete or unmarketable, which would have a negative impact on our ability to sell our products and our results of operations. Moreover, if any of our competitors implement new technologies before us, those competitors may be able to provide products that are more effective or with more user-friendly features than ours, possibly at
-12-
lower prices, which could adversely impact our sales and impact our market share. Our failure to develop and introduce competitive new products that are compatible with industry standards and that satisfy customer requirements, and the failure of our products to achieve broad market acceptance, could have a negative impact on our ability to sell our products and our results of operations.
Because our quarterly operating results may fluctuate significantly, the price of our common stock may decline.
Our quarterly results of operations may vary significantly in the future for a variety of reasons, many of which are outside our control, including the following:
• fluctuations in volume and timing of product orders;
• timing, rescheduling or cancellation of significant customer orders and our ability, as well as the ability of our customers, to manage inventory;
• changes in demand for our products due to seasonal consumer buying patterns and other factors;
• timing of new product introductions by us and by our customers or competitors;
• changes in the mix of products sold by us or our competitors;
• fluctuations in the level of sales by our OEM customers and other vendors of end products incorporating our products;
• timing and size of expenses, including expenses to develop new products and product improvements, and expenses resulting from restructuring activities;
• the timing and amount of funding from Israeli Innovation Authority (“IIA”);
• entry into new geographies, including China, South Korea and South America;
• our ability to scale our operations in response to changes in demand for our existing products and services or demand for new products requested by our customers;
• Geo-political policies outside of our control;
• mergers and acquisitions by us, our competitors and our existing and potential customers; and
• general economic conditions, including current economic conditions in the United States and worldwide, and the adverse effects on the semiconductor and consumer electronics industries.
Each of the above factors is difficult to forecast and could harm our business, financial condition and results of operations. Also, we sell our products to OEM customers that operate in consumer markets. As a result, our revenues are affected by seasonal buying patterns of consumer products sold by our OEM customers that incorporate our products and the market acceptance of such products supplied by our OEM customers.
Our future success is dependent on market acceptance of our SmartVoice, SmartHome and Unified Communications product families, which are intensively competitive markets with dominant and established players.
Our ability to increase our revenues and offset declining revenues from our cordless product family are substantially dependent on our ability to gain market share for our SmartVoice, SmartHome and Unified Communications product families. Moreover, we are targeting a new market with our SmartVoice product family, a market with dominant and established players selling to OEM customers with whom they have established relationships. In order to gain market share, we will need to earn the business of such customers,

-13-
with whom we do not have established relationships. If we are unable to generate significant revenues from our SmartVoice product family and gain significant and sustainable market share in the mobile device market, our operating results would be adversely affected. Furthermore, our future growth is also dependent on the market acceptance of our Unified Communications products, a market where we also compete with existing and potential competitors, many of whom have significantly greater financial, technical, manufacturing, marketing, sales and distribution resources and management expertise than we do. In addition, our continued success and growth in the new markets in which we have recently gained market share, which markets are highly competitive, is highly dependent on our ability to be designed into future flagship products of top tier OEMs.
The market for mobile device components is highly competitive and we expect competition to intensify in the future.
The market for mobile device components is highly competitive and characterized by the presence of large companies with significantly greater resources than we have. Our SmartVoice product family relates only to the voice and audio subsystem of a mobile device and there are only a limited number of OEMs that address this market. Our main competitors include Knowles Corporation, Synaptics and Cirrus Logic. We also face competition from other companies and could face competition from new market entrants. We also compete against solutions internally developed by OEMs, as well as combined third-party software and hardware systems. Notwithstanding prior design wins with any OEM customer, our SmartVoice products may be designed out as a result of internal solutions or replacement with software systems in future products of such OEM customer. If we are unable to compete effectively, we may not succeed in achieving additional design wins and may have to lower our pricing in an attempt to gain design wins, both of which would adversely impact our operating results.
Our future business growth depends on the growth in demand for mobile devices with improved sound quality and always-on capability.
Our SmartVoice product family is designed to enhance the sound quality and minimize background noise for mobile device users and to enable always-on capabilities in mobile and other wearable devices. OEMs and ODMs may decide that the costs of improving sound quality outweigh the benefits or that always-on voice technology is not a required feature, both of which could limit demand for our SmartVoice product family. Moreover, users may also be satisfied with existing sound quality or blame poor quality on phone carriers. The market that we are targeting is evolving rapidly and is technologically challenging. New mobile devices with different components or software may be introduced that provide the same functionality as SmartVoice product family. Our future business growth will depend on the growth of this market and our ability to adapt to technological changes, user preferences and OEM demands. Our business could be materially adversely affected if we fail to do so.
We generate a significant amount of our total revenues from the sale of digital cordless telephony products and our business and operating results may be materially adversely affected if we do not continue to succeed in this competitive market or if sales within the overall cordless digital market continue to decrease.
Sales of our digital cordless telephony products comprised 37% of our total revenues for 2019, 45% for 2018 and 54% for 2017. Although we historically generated a majority of our revenue from cordless telephony products, the traditional cordless telephony market using fixed-line telephony is declining and will continue to decline, potentially steeper than prior years, which reduces our revenues derived from, and unit sales of, cordless telephony products.
We rely significantly on revenue derived from a limited number of customers.
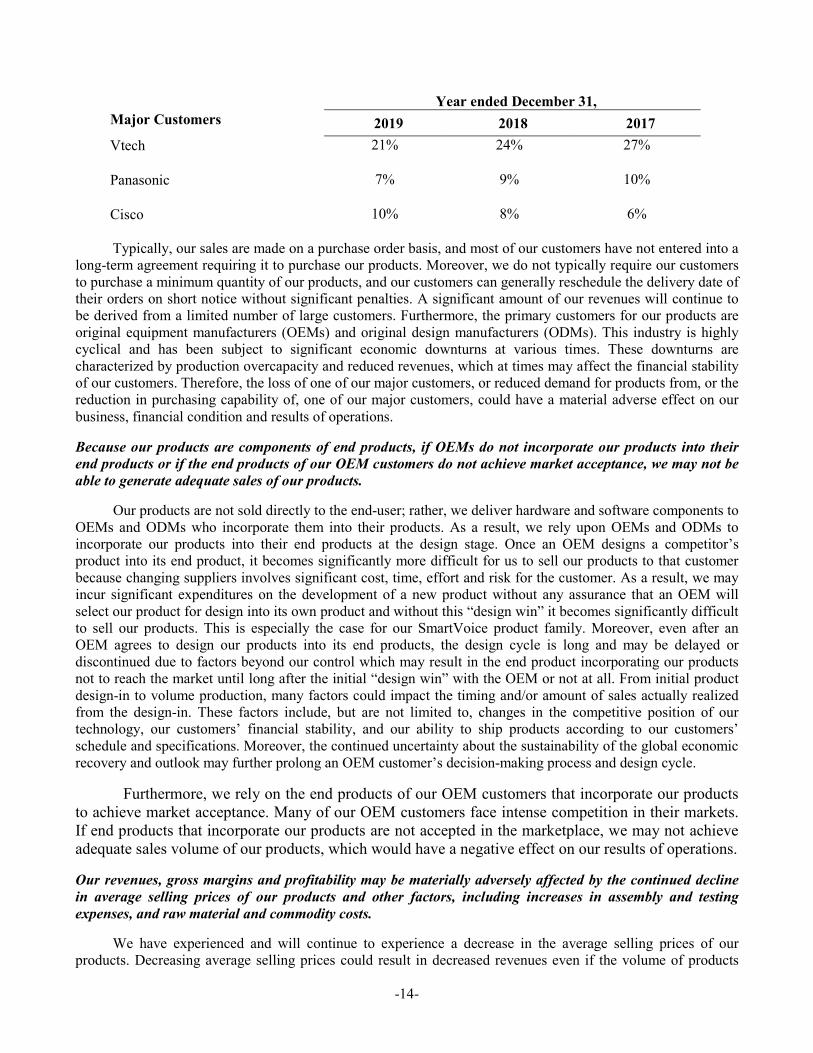
We expect that a limited number of customers, varying in identity from period-to-period, will account for a substantial portion of our revenues in any period. VTech, Panasonic through Nexty Electronics and Cisco through Ascend Technology, accounted for approximately 38%, 41% and 43% of our total revenues for each of 2019, 2018 and 2017, respectively. The following table represents our sales from our 10% and above customers as a percentage of our total revenues for the years ended December 31, 2019, 2018 and 2017:
-14-
Year ended December 31,
Major Customers 2019 2018 2017 Vtech 21% 24% 27%
Panasonic 7% 9% 10%
Cisco 10% 8% 6%
Typically, our sales are made on a purchase order basis, and most of our customers have not entered into a long-term agreement requiring it to purchase our products. Moreover, we do not typically require our customers to purchase a minimum quantity of our products, and our customers can generally reschedule the delivery date of their orders on short notice without significant penalties. A significant amount of our revenues will continue to be derived from a limited number of large customers. Furthermore, the primary customers for our products are original equipment manufacturers (OEMs) and original design manufacturers (ODMs). This industry is highly cyclical and has been subject to significant economic downturns at various times. These downturns are characterized by production overcapacity and reduced revenues, which at times may affect the financial stability of our customers. Therefore, the loss of one of our major customers, or reduced demand for products from, or the reduction in purchasing capability of, one of our major customers, could have a material adverse effect on our business, financial condition and results of operations.
Because our products are components of end products, if OEMs do not incorporate our products into their end products or if the end products of our OEM customers do not achieve market acceptance, we may not be able to generate adequate sales of our products.
Our products are not sold directly to the end-user; rather, we deliver hardware and software components to OEMs and ODMs who incorporate them into their products. As a result, we rely upon OEMs and ODMs to incorporate our products into their end products at the design stage. Once an OEM designs a competitor’s product into its end product, it becomes significantly more difficult for us to sell our products to that customer because changing suppliers involves significant cost, time, effort and risk for the customer. As a result, we may incur significant expenditures on the development of a new product without any assurance that an OEM will select our product for design into its own product and without this “design win” it becomes significantly difficult to sell our products. This is especially the case for our SmartVoice product family. Moreover, even after an OEM agrees to design our products into its end products, the design cycle is long and may be delayed or discontinued due to factors beyond our control which may result in the end product incorporating our products not to reach the market until long after the initial “design win” with the OEM or not at all. From initial product design-in to volume production, many factors could impact the timing and/or amount of sales actually realized from the design-in. These factors include, but are not limited to, changes in the competitive position of our technology, our customers’ financial stability, and our ability to ship products according to our customers’ schedule and specifications. Moreover, the continued uncertainty about the sustainability of the global economic recovery and outlook may further prolong an OEM customer’s decision-making process and design cycle.
Furthermore, we rely on the end products of our OEM customers that incorporate our products to achieve market acceptance. Many of our OEM customers face intense competition in their markets. If end products that incorporate our products are not accepted in the marketplace, we may not achieve adequate sales volume of our products, which would have a negative effect on our results of operations.
Our revenues, gross margins and profitability may be materially adversely affected by the continued decline in average selling prices of our products and other factors, including increases in assembly and testing expenses, and raw material and commodity costs.
We have experienced and will continue to experience a decrease in the average selling prices of our products. Decreasing average selling prices could result in decreased revenues even if the volume of products
-15-
sold increases. Decreasing average selling prices may also require us to sell our products at much lower gross margin than in the past and reduce profitability. Although we have to date been able to partially offset on an annual basis the declining average selling prices of our products through general operational efficiencies and manufacturing cost reductions by achieving a higher level of product integration and improving our yield percentages, there is no guarantee that our ongoing efforts will be successful or that they will keep pace with the anticipated, continued decline in average selling prices of our products.
In addition to the continued decline in the average selling prices of our products, our gross profit may decrease in the future due to other factors, including the roll-out of new products in any given period and the penetration of new markets which may require us to sell products at a lower margin, our failure to introduce new engineering processes and mix of products sold.
Our gross margins also are affected by the product mix. The pressures in the supply chain make it very difficult for us to increase or even maintain our product pricing, which further adversely affects our gross margins.
Furthermore, increases in the price of silicon wafers, testing costs and commodities such as gold and oil, which may result in increased production costs, mainly assembly and packaging costs, may result in a decrease in our gross margins. Moreover, our suppliers may pass the increase in raw materials and commodity costs onto us which would further reduce the gross margin of our products. In addition, as we are a fabless company, global market trends such as “under-capacity” problems so that there is a shortage of capacity to fulfill our fabrication needs also may increase our raw material costs and thus decrease our gross margin.
We are dependent on a small number of OEM customers, and our business could be harmed by the loss of any of these customers or reductions in their purchasing volumes.
We sell our products to a limited number of OEM customers directly or through a network of distributors. Moreover, many North American, European and Japanese OEMs are moving their manufacturing sites to Southeast Asia and China, as a result of the cyclical nature of manufacturing capacity issues and cost of silicon integrated circuits, the continued decline of average selling prices of chipsets and other industry-wide factors. In addition, OEMs located in Southeast Asia and China are growing and gaining competitive strength. As a result, the mix of our OEM customers may change in the future. However, we may not succeed in attracting new customers as these potential customers may have pre-existing relationships with our current or potential competitors. This trend also may promote the consolidation of OEMs located in North America, Europe and Japan with OEMs located in Southeast Asia, which may reduce the number of our potential customers and reduce the volume of chipsets the combined OEM customer may purchase from us. However, as is common in our industry, we typically do not enter into long-term contracts with our customers in which they commit to purchase products from us. The loss of any of our OEM customers may have a material adverse effect on our results of operations. To attract new customers, we may be faced with intense price competition, which may affect our revenues and gross margins.
Because we have significant international operations, we may be subject to political, economic and other conditions relating to our international operations that could increase our operating expenses and disrupt our business.
Although the majority of end users of the consumer products that incorporate our products are located in the U.S., we are dependent on sales to OEM customers, located outside of the U.S., that manufacture these consumer and office products. Also, we depend on a network of distributors to sell our products that also are primarily located outside of the U.S. Export sales shipped to manufacturers in Europe and Asia, including Japan and Asia Pacific, represented 96%, 95% and 96% of our total revenues for 2019, 2018 and 2017, respectively. Furthermore, we have material operations in Germany, Hong Kong and India and employ a number of individuals within those foreign operations. As a result, the occurrence of any negative international political, economic or geographic events, as well as our failure to mitigate the challenges in managing an organization operating in various countries, could result in significant revenue shortfalls and disrupt our workforce within our
-16-
foreign operations. These shortfalls and disruptions could cause our business, financial condition and results of operations to be harmed. Some of the risks of doing business internationally include:
• unexpected changes in foreign government regulatory requirements;
• fluctuations in the exchange rate for the U.S. dollar;
• import and export license requirements;
• imposition of tariffs and other barriers and restrictions;
• burdens of complying with a variety of foreign laws, treaties and technical standards;
• uncertainty of laws and enforcement in certain countries relating to the protection of intellectual property;
• difficulty in collecting accounts receivable and longer payment cycles for international customers than existing customers;
• difficulty in staffing and managing foreign operations and maintaining the morale and productivity of employees within foreign operations;
• multiple and possibly overlapping tax structures and potentially adverse tax consequences;
• political and economic instability, including protectionist policies; and
• changes in diplomatic and trade relationships.
One or more of these factors may have a material adverse effect on our future operations and consequently, on our business, financial conditions and operating results.
Because the markets in which we compete are highly competitive, and many of our competitors may have greater resources than we do, we cannot be certain that our products will be accepted in the marketplace or capture market share.
The markets in which we operate are extremely competitive and characterized by rapid technological change, evolving standards, short product life cycles and price erosion. We expect competition to intensify as current competitors expand their product offerings and new competitors enter the market. Given the highly competitive environment in which we operate, we cannot be sure that any competitive advantages enjoyed by our current products would be sufficient to establish and sustain our new products in the market. Any increase in materials price or competition could result in the erosion of our market share, to the extent we have obtained market share, and would have a negative impact on our financial condition and results of operations.
In each of our business activities, we face current and potential competition from competitors that may have significantly greater financial, technical, manufacturing, marketing, sales and distribution resources and management expertise than we do. These competitors may also have pre-existing relationships with our customers or potential customers. Further, in the event of a manufacturing capacity shortage, these competitors may be able to manufacture products when we are unable to do so. Our principal competitor in the cordless market is Dialog Semiconductors. Our principal competitors in the VoIP market include Broadcom, Dialog Semiconductors, Intel, Texas Instruments and Taiwanese IC vendors. Our principal competitors in the smart audio and noise reduction market include Knowles Corporation, Cirrus Logic, Synaptics, Microchip and developers of noise cancellation software running on mobile phones such as Qualcomm.
As discussed above, various new technological developments require us to enter into new markets with competitors that have more established presence, and significantly greater financial, technical, manufacturing, marketing, sales and distribution resources and management expertise than we do. The expenditure of greater

-17-
resources to expand our current product lines may increase our operating expenses and reduce our gross profit. There are no assurances that we will succeed in developing and introducing new products that are responsive to market demands.
Our research and development expenses may increase if the grants we currently receive from the Israeli government are reduced or withheld.
We currently receive research grants from programs of the Israeli Innovation Authority (“IIA”). To be eligible for these grants, we must meet certain development conditions and comply with periodic reporting obligations. Although we have met such conditions in the past, should we fail to meet such conditions in the future our research grants may be repayable, reduced or withheld. Such reduction can also take place due to different allocation and methodology that IIA is implementing. The reduction of such research grants may increase our research and development expenses, which in turn may reduce our operating income. As an example, in 2019 and 2018, the amount of grants approved by the IIA was lower than prior years due to different allocation and methodology that IIA has implemented. Our research and development expenses may increase if the grants from the IIA are reduced which may negatively affect our financial results.
Because we depend on independent foundries and other third party suppliers to manufacture and test all of our integrated circuit products, we are subject to additional risks that may materially disrupt our business.
All of our integrated circuit products are manufactured and tested by independent foundries and other third party suppliers. While these foundries and other third party suppliers have been able to adequately meet the demands of our increasing business, we are and will continue to be dependent upon these foundries and third party suppliers to achieve acceptable manufacturing yields, quality levels and costs, and to allocate to us a sufficient portion of their foundry, assembly and test capacity to meet our needs in a timely manner.
While we currently believe we have access to adequate capacity to support our current sales levels pursuant to our arrangement with our foundries and other third party suppliers, we may encounter capacity shortage issues in the future. In the event of a worldwide shortage in foundry, assembly and/or test capacity, we may not be able to obtain a sufficient allocation of such capacity to meet our product needs or we may incur additional costs to ensure specified quantities of products and services. Under-capacity at the current foundries and other third party suppliers we use, or future foundries or other third party suppliers we may use, to manufacture and test our integrated circuit products may lead to increased operating costs and lower gross margins. In addition, such a shortage could lengthen our products’ manufacturing and testing cycle and cause a delay in the shipment of our products to our customers. This could ultimately lead to a loss of sales of our products, harm our reputation and competitive position, and our revenues could be materially reduced. Our business could also be harmed if our current foundries or other third party suppliers terminate their relationship with us and we are unable to obtain satisfactory replacements to fulfill customer orders on a timely basis and in a cost-effective manner. Moreover, we do not have long-term capacity guarantee agreements with our foundries and with other third party suppliers.
In addition, as TSMC produces a significant portion of our integrated circuit products and ASE tests and assembles a significant portion of our products, earthquakes, aftershocks or other natural disasters in Asia, or adverse changes in the political situation in Taiwan, could preclude us from obtaining an adequate supply of wafers to fill customer orders. Such events could harm our reputation, business, financial condition, and results of operations.
Our operating results are affected by general economic conditions and the highly cyclical nature of the semiconductor industry.
The general worldwide economic conditions remain uncertain which continues to make it difficult for our customers, the end-product customers, our vendors and us to accurately forecast and plan future business activities. Moreover, we operate within the semiconductor industry which experiences significant fluctuations in sales, availability and profitability. Downturns in the semiconductor industry are characterized by diminished product demand, excess customer inventories, accelerated erosion of prices and excess production capacity.
-18-
These factors could cause substantial fluctuations in our revenues and in our results of operations. If global economic and market conditions remain uncertain or deteriorate, we could experience a material adverse impact on our business and results of operations.
Because the manufacture of our products is complex, the foundries on which we depend may not achieve the necessary yields or product reliability that our business requires.
The manufacture of our products is a highly complex and precise process, requiring production in a highly controlled environment. Changes in manufacturing processes or the inadvertent use of defective or contaminated materials by a foundry could adversely affect the foundry’s ability to achieve acceptable manufacturing yields and product reliability. If the foundries we currently use do not achieve the necessary yields or product reliability, our ability to fulfill our customers’ needs could suffer. This could ultimately lead to a loss of sales of our products and have a negative effect on our gross margins and results of operations.
Furthermore, there are other significant risks associated with relying on these third-party foundries, including:
• risks due to the fact that we have reduced control over production cost, delivery schedules and product quality;
• less recourse if problems occur as the warranties on wafers or products supplied to us are limited; and
• increased exposure to potential misappropriation of our intellectual property.
As we depend on independent subcontractors, located in Asia, to assemble and test our semiconductor products, we are subject to additional risks that may materially disrupt our business.
Independent subcontractors, located in Asia, assemble and test our semiconductor products. Because we rely on independent subcontractors to perform these services, we cannot directly control our product delivery schedules or quality levels. We are dependent on these subcontractors to allocate to us a sufficient portion of their capacity to meet our needs in a timely manner. Our future success also depends on the financial viability of our independent subcontractors. If the capital structures of our independent subcontractors weaken, we may experience product shortages, production delays, quality assurance problems, increased manufacturing costs, and/or supply chain disruption. All of this could ultimately lead to a loss of sales of our products, harm our reputation and competitive position, and our revenues could be materially harmed.
Moreover, the economic, market, social, and political situations in countries where some of our independent subcontractors are located are unpredictable, can be volatile, and can have a significant impact on our business because we may not be able to obtain product in a timely manner. Market and political conditions, including currency fluctuation, terrorism, political strife, war, labor disruption, and other factors, including natural or man-made disasters, adverse changes in tax laws, tariff, import or export quotas, power and water shortages, or interruption in air transportation, in areas where our independent subcontractors are located also could have a severe negative impact on our operating capabilities.
We are subject to order and shipment uncertainties and if we are unable to accurately predict customer demand, our business may be harmed.
We typically sell products pursuant to shorter term purchase orders rather than long-term purchase commitments. Customers can generally change or defer purchase orders on short notice without incurring a significant penalty. Given current market conditions, we have less ability to accurately predict what or how many products our customers will need in the future. In addition, we have little visibility into and no control of the demand by our customer’s customers – generally consumer electronics retailers and businesses. Furthermore, based on discussions with our customers, we understand that our customers also have less visibility into their product demands. A decrease in the consumer electronics retailers’ or businesses’ demand or a build-
-19-
up of their inventory, both of which are out of the control of our customers and us, may cause a cancellation, change or deferral of purchase orders on short notice by our customers. Anticipating demand is difficult because our customers and their customers face volatile pricing and unpredictable demand for their own products, and are increasingly focused on cash preservation and tighter inventory management. Based on these trends, our customers are reluctant to place orders with normal lead times, and we are seeing a shift to shorter lead-times and rush orders. However, we place orders with our suppliers based on forecasts of our customers’ demand and, in some instances, may establish buffer inventories to accommodate anticipated demand. Our forecasts are based on multiple assumptions, each of which may introduce error into our estimates. If we overestimate our customers’ demand or our customers overestimate their demand, we may allocate resources to manufacturing products that we may not be able to sell when we expect to, if at all. As a result, we could hold excess or obsolete inventory, which would reduce our profit margins and adversely affect our financial results. Conversely, if we underestimate our customers’ demand or our customers underestimate their demand and insufficient manufacturing capacity is available, we could forego revenue opportunities and potentially lose market share and damage our customer relationships.
Furthermore, we maintain inventory, or hubbing, arrangements with certain of our customers. Pursuant to these arrangements, we deliver products to a customer or a designated third party warehouse based upon the customer’s projected needs, but do not recognize product revenue unless and until the customer reports that it has removed our product from the warehouse to incorporate into its end products. Since we own inventory that is physically located in a third party’s warehouse, our ability to effectively manage inventory levels may be impaired, causing our total inventory turns to decrease, which could increase expenses associated with excess and obsolete product and negatively impact our cash flow.
The possible emerging trend of our OEM customers outsourcing their production may cause our revenue to decline.
We believe there may be an emerging trend of our OEM customers outsourcing their production to third parties. We have invested substantial resources to build relationships with our OEM customers. However, the outsourcing companies whom our OEM customers may choose to outsource production may not have prior business relationship with us or may instead have prior or ongoing relationships with our competitors. The emergence of this trend may require us to expend substantial additional resources to build relationships with these outsourcing companies, which would increase our operating expenses. Even if we do expend such resources, there are no assurances that these outsourcing companies will choose to incorporate our chipsets rather than chipsets of our competitors. Our inability to retain an OEM customer once such customer chooses to outsource production would have a material adverse effect on our future revenue.
Third party claims of infringement or other claims against us could adversely affect our ability to market our products, require us to redesign our products or seek licenses from third parties, and seriously harm our operating results and disrupt our business.
As is typical in the semiconductor industry, we and our customers have been and may from time to time be notified of claims that we may be infringing patents or intellectual property rights owned by third parties. In addition, patent infringement claims are increasingly being asserted by patent holding companies (so-called patent “trolls”), which do not use technology and whose sole business is to enforce patents against companies, such as us, for monetary gain. Because such patent holding companies do not provide services or use technology, the assertion of our own patents by way of counter-claim may be ineffective. We have received claims that our products infringe upon the proprietary rights of such patent holding companies. In addition, third parties have asserted and may in the future assert intellectual property infringement claims against our customers, which we have agreed in certain circumstances to indemnify and defend against such claims. If litigation becomes necessary to determine the validity of any third party claims, it could result in significant expense to us and could divert the efforts of our technical and management personnel, whether or not the claim has merit and notwithstanding that the litigation is determined in our favor.
-20-
If it appears necessary or desirable, we may try to obtain licenses for those patents or intellectual property rights that we are allegedly infringing. Although holders of these types of intellectual property rights commonly offer these licenses, we cannot assure you that licenses will be offered or that the terms of any offered licenses will be acceptable to us. Our failure to obtain a license for key intellectual property rights from a third party for technology used by us could cause us to incur substantial liabilities, suspend the manufacturing of products utilizing the technology or damage the relationship with our customers. Alternatively, we could be required to expend significant resources to develop non-infringing technology. We cannot assure you that we would be successful in developing non-infringing technology. The occurrence of any of these events could harm our business, financial condition or results of operations.
Because we have significant operations in Israel, we may be subject to political, economic and other conditions affecting Israel that could increase our operating expenses and disrupt our business.
Our principal research and development facilities are located in the State of Israel and, as a result, at December 31, 2019, 202 of our 340 employees were located in Israel, including 134 out of 204 of our research and development personnel. In addition, although we are incorporated in Delaware, a majority of our executive officers are residents of Israel. Although substantially all of our sales currently are being made to customers outside of Israel, we are nonetheless directly influenced by the political, economic and military conditions affecting Israel. Any major hostilities involving Israel, or the interruption or curtailment of trade between Israel and its present trading partners, could significantly harm our business, operating results and financial condition.
Israel’s economy has been subject to numerous destabilizing factors, including a period of rampant inflation in the early to mid-1980s, low foreign exchange reserves, fluctuations in world commodity prices, military conflicts and civil unrest. In addition, Israel and companies doing business with Israel have been the subject of an economic boycott by the Arab countries since Israel’s establishment. Although they have not done so to date, these restrictive laws and policies may have an adverse impact on our operating results, financial condition or expansion of our business.
Since the establishment of the State of Israel in 1948, a state of hostility has existed, varying in degree and intensity, between Israel and the Arab countries. Although Israel has entered into various agreements with certain Arab countries and the Palestinian Authority, and various declarations have been signed in connection with efforts to resolve some of the economic and political problems in the Middle East, hostilities between Israel and some of its Arab neighbors have recently escalated and intensified. We cannot predict whether or in what manner these conflicts will be resolved. Our results of operations may be negatively affected by the obligation of key personnel to perform military service. In addition, certain of our officers and employees are currently obligated to perform annual reserve duty in the Israel Defense Forces and are subject to being called for active military duty at any time. Although we have operated effectively under these requirements since our inception, we cannot predict the effect of these obligations on the company in the future. Our operations could be disrupted by the absence, for a significant period, of one or more of our officers or key employees due to military service.
The tax benefits available to us under Israeli law require us to meet several conditions, and may be terminated or reduced in the future, which would increase our taxes.
Our facilities in Israel have been granted Approved Enterprise and Beneficiary Enterprise status under the Law for the Encouragement of Capital Investments, 1959, commonly referred to as the “Investment Law,” as amended. The Investment Law provides that capital investments in a production facility (or other eligible assets) designated as an Approved Enterprise or Beneficiary Enterprise receive certain tax benefits in Israel. Our investment programs that generate taxable income are currently subject to an average tax rate of up to approximately 10% based on a variety of factors, including percentage of foreign ownership and approvals for the erosion of the tax basis of our investment programs. To be eligible for tax benefits, we must meet certain conditions, relating principally to adherence to the investment program filed with the Investment Center of the Israeli Ministry of Economy and periodic reporting obligations. Although we believe we have met such conditions in the past, should we fail to meet such conditions in the future, we would be subject to corporate tax in Israel at the standard corporate tax rate (23% for 2020) and could be required to refund tax benefits (including
-21-
with interest and adjustments for inflation based on the Israeli consumer price index) already received. Our average tax rate for our investment programs also may change in the future due to circumstances outside of our control, including changes to legislation. For example, in July 2013, the Investment Law was amended whereby the reduction of corporate tax rate for preferred enterprises was eliminated such that such enterprises, which are subject to the new law, would be subject to a 16% tax rate. Therefore, we cannot provide any assurances that our average tax rate for our investment programs will continue in the future at their current levels, if at all. The termination or reduction of certain programs and tax benefits or a requirement to refund tax benefits (including with interest and adjustments for inflation based on the Israeli consumer price index) already received may have a material adverse effect on our business, operating results and financial condition.
We may engage in future acquisitions that could dilute our stockholders’ equity and harm our business, results of operations and financial condition.
We have pursued, and will continue to pursue, growth opportunities through internal development and acquisition of complementary businesses, products and technologies. We are unable to predict whether or when any other prospective acquisition will be completed. The process of integrating an acquired business may be prolonged due to unforeseen difficulties and may require a disproportionate amount of our resources and management’s attention. There are no assurances that we will be able to successfully identify suitable acquisition candidates, complete acquisitions, integrate acquired businesses into our operations, or expand into new markets. Further, once integrated, acquisitions may not achieve comparable levels of revenues, profitability or productivity as our existing business or otherwise perform as expected. The occurrence of any of these events could harm our business, financial condition or results of operations. Future acquisitions may require substantial capital resources, which may require us to seek additional debt or equity financing. Future acquisitions by us could result in the following, any of which could seriously harm our results of operations or the price of our stock:
• issuance of equity securities that would dilute our current stockholders’ percentages of ownership;
• large one-time write-offs;
• the incurrence of debt and contingent liabilities;
• difficulties in the assimilation and integration of operations, personnel, technologies, products and information systems of the acquired companies;
• diversion of management’s attention from other business concerns;
• contractual disputes;
• risks of entering geographic and business markets in which we have no or only limited prior experience; and
• potential loss of key employees of acquired organizations.
We may not be able to adequately protect or enforce our intellectual property rights, which could harm our competitive position.
Our success and ability to compete is in part dependent upon our internally-developed technology and other proprietary rights, which we protect through a combination of copyright, trademark and trade secret laws, as well as through confidentiality agreements and licensing arrangements with our customers, suppliers, employees and consultants. In addition, we have filed a number of patents in the United States and in other foreign countries with respect to new or improved technology that we have developed. However, the status of any patent involves complex legal and factual questions, and the breadth of claims allowed is uncertain. Accordingly, we cannot assure you that any patent application filed by us will result in a patent being issued, or
-22-
that the patents issued to us will not be infringed by others. Also, our competitors and potential competitors may develop products with similar technology or functionality as our products, or they may attempt to copy or reverse engineer aspects of our product line or to obtain and use information that we regard as proprietary. Moreover, the laws of certain countries in which our products are or may be developed, manufactured or sold, including Hong Kong, Japan, Korea, China and Taiwan, may not protect our products and intellectual property rights to the same extent as the laws of the United States. Policing the unauthorized use of our products is difficult and may result in significant expense to us and could divert the efforts of our technical and management personnel. Even if we spend significant resources and efforts to protect our intellectual property, we cannot assure you that we will be able to prevent misappropriation of our technology. Use by others of our proprietary rights could materially harm our business and expensive litigation may be necessary in the future to enforce our intellectual property rights.
Because our products are complex, the detection of errors in our products may be delayed, and if we deliver products with material defects, our credibility will be harmed, the sales and market acceptance of our products may decrease and product liability claims may be made against us.
Our products are complex and may contain errors, defects and bugs when introduced. If we deliver products with material errors, defects or bugs, our credibility and the market acceptance and sales of our products could be significantly harmed. Furthermore, the nature of our products may also delay the detection of any such error or defect. If our products contain material errors, defects and bugs, then we may be required to expend significant capital and resources to alleviate these problems. This could result in the diversion of technical and other resources from our other development efforts. Any actual or perceived problems or delays may also adversely affect our ability to attract or retain customers. Furthermore, the existence of any defects, errors or failures in our products could lead to product liability claims or lawsuits against us or against our customers. We generally provide our customers with a standard warranty for our products, generally lasting one year from the date of purchase. Although we attempt to limit our liability for product defects to product replacements, we may not be successful, and customers may sue us or claim liability for the defective products. A successful product liability claim could result in substantial cost and divert management’s attention and resources, which would have a negative impact on our financial condition and results of operations.
We are exposed to the credit risk of our customers and to credit exposures in weakened markets, which could result in material losses.
Most of our sales are on an open credit basis. Because of current conditions in the global economy, our exposure to credit risks relating to sales on an open credit basis has increased. We expect demand for enhanced open credit terms, for example, longer payment terms, to continue and believe that such arrangements are a competitive factor in obtaining business. Although we monitor and attempt to mitigate credit risks, including through insurance coverage from time to time, there can be no assurance that our efforts will be effective. Moreover, even if we attempt to mitigate credit risks through insurance coverage, such coverage may not be sufficient to cover all of our losses and we would be subject to a deductible under any insurance coverage. As a result, our future credit risk exposure may increase. Although any losses to date relating to credit exposure of our customers have not been material, future losses, if incurred, could harm our business and have a material adverse effect on our operating results and financial condition. Moreover, the loss of a customer due to its financial default also could harm our future business and potential growth.
Our executive officers and key personnel are critical to our business, and because there is significant competition for personnel in our industry, we may not be able to attract and retain such qualified personnel.
Our success depends to a significant degree upon the continued contributions of our executive management team, and our technical, marketing, sales customer support and product development personnel. The loss of significant numbers of such personnel could significantly harm our business, financial condition and results of operations. We do not have any life insurance or other insurance covering the loss of any of our key employees. Because our products are specialized and complex, our success depends upon our ability to attract,
-23-
train and retain qualified personnel, including qualified technical, marketing and sales personnel. However, the competition for personnel is intense and we may have difficulty attracting and retaining such personnel.
We may have exposure to additional tax liabilities as a result of our foreign operations.
We are subject to income taxes in the United States and various foreign jurisdictions. In addition to our significant operations in Israel, we have operations in Germany, the United Kingdom, Hong Kong, China, Japan, South Korea and India. Significant judgment is required in determining our worldwide provision for income taxes and other tax liabilities. In the ordinary course of a global business, there are many intercompany transactions and calculations where the ultimate tax determination is uncertain. We are regularly under audit by tax authorities and as an example, we are now under audit for one of our subsidiaries, the outcome of which could have material adverse impact on our financial condition. Our intercompany transfer pricing may be reviewed by the U.S. Internal Revenue Service and by foreign tax jurisdictions. Although we believe that our tax estimates are reasonable, due to the complexity of our corporate structure, the multiple intercompany transactions and the various tax regimes, we cannot assure you that a tax audit or tax dispute to which we may be subject will result in a favorable outcome for us. If taxing authorities do not accept our tax positions and impose higher tax rates on our foreign operations, our overall tax expenses could increase.
We are exposed to fluctuations in currency exchange rates.
A significant portion of our business is conducted outside the United States. Export sales to manufacturers in Europe and Asia, including Japan and Asia Pacific, represented 96% of our total revenues for 2019 and 95% of our total revenues for 2018 and 96% of our total revenues in 2017. Although most of our revenue and expenses are transacted in U.S. dollars, we may be exposed to currency exchange fluctuations in the future as business practices evolve and we are forced to transact business in local currencies. Moreover, part of our expenses in Israel are paid in Israeli currency, which subjects us to the risks of foreign currency fluctuations between the U.S. dollar and the New Israeli Shekel (NIS) and to economic pressures resulting from Israel’s general rate of inflation. Our primary expenses paid in NIS are employee salaries and lease payments on our Israeli facilities. Furthermore, a portion of our expenses for our European operations are paid in the Euro, which subjects us to the risks of foreign currency fluctuations between the U.S. dollar and the Euro. Our primary expenses paid in the Euro are employee salaries, lease and operational payments on our European facilities. As a result, an increase in the value of the NIS and Euro in comparison to the U.S. dollar could increase the cost of our technology development, research and development expenses and general and administrative expenses, all of which could harm our operating profit. From time to time, we use derivative instruments in order to minimize the effects of currency fluctuations, but our hedging positions may be partial, may not exist at all in the future or may not succeed in minimizing our foreign currency fluctuation risks. Our financial results may be harmed if the trend relating to the devaluation of the U.S. dollars continues for an extended period.
An unfavorable government review of our federal income tax returns or changes in our effective tax rates could adversely affect our operating results.
Our future effective tax rates could be adversely affected by earnings being lower than anticipated in countries where we have lower statutory rates and higher than anticipated in countries where we have higher statutory rates, by changes in the valuation of our deferred tax assets and liabilities, or by changes in tax laws, regulations, accounting principles or interpretations thereof. In addition, we are subject to the periodic examination of our income tax returns by the IRS and other tax authorities. We regularly assess the likelihood of adverse outcomes resulting from these examinations to determine the adequacy of our provision for income taxes, as an example, we are now under audit for one of our subsidiaries. The outcome from this examination may have an adverse effect on our operating results and financial condition.
Our business operations would be disrupted if the information technology systems we rely on fail to function properly.
We rely on complex information technology systems to manage our business which operates in many geographical locations. For example, to achieve short delivery lead times and superior levels of customer service

-24-
while maintaining low levels of inventory, we frequently adjust our production schedules with manufacturers and subcontractors. We develop and adjust these schedules based on end customer demand as communicated by our customers and distributors and based on our inventory levels, manufacturing cycle times, component lead times, and projected production yields. We combine and distribute all of this information electronically over a complex global communications network. Our ability to estimate demand and to adjust our production schedules is highly dependent on this network. Any delay in the implementation of, or disruption in the transition to, new or enhanced processes, systems or controls, could adversely affect our ability to manage customer orders and manufacturing schedules, as well as generate accurate financial and management information in a timely manner. These systems are also susceptible to power and telecommunication disruptions and other system failures. Failure of our IT systems or difficulties in managing them could result in business disruption. Our business could be significantly disrupted and we could be subject to third party claims associated with such disruptions.
A breach of our information technology systems could subject us to liability, reputational damage or interrupt the operation of our business.
We rely upon our information technology systems and infrastructure for our business. We could experience theft of confidential information or reputational damage from industrial espionage attacks, malware or other cyber attacks, which may compromise our system infrastructure or lead to data leakage, either internally or at our third-party providers. Similarly, data privacy breaches by those who access our systems may pose a risk that sensitive data, including intellectual property, trade secrets or personal information belonging to us, our patients, employees, customers or other business partners, may be exposed to unauthorized persons or to the public. Cyber-attacks are increasing in their frequency, sophistication and intensity, and have become increasingly difficult to detect. There can be no assurance that our efforts to protect our data and information technology systems will prevent breaches in our systems (or that of our third-party providers) that could adversely affect our business and result in financial and reputational harm to us, theft of trade secrets and other proprietary information, legal claims or proceedings, liability under laws that protect the privacy of personal information, and regulatory penalties.
New tariffs and other trade measures could adversely affect our consolidated results of operations, financial position and cash flows.
General trade tensions between the U.S. and China have been escalating since 2018 and are not fully resolved yet. While tariffs and other retaliatory trade measures imposed by other countries on U.S. goods have not yet had a significant impact on our business or results of operations, we cannot predict further developments, and such existing or future tariffs could have a material adverse effect on our consolidated results of operations, financial position and cash flows. Furthermore, changes in U.S. trade policy could trigger retaliatory actions by affected countries, which could impose restrictions on our ability to do business in or with affected countries or prohibit, reduce or discourage purchases of our products by foreign customers, leading to increased costs of components contained in our products, increased costs of manufacturing our products, and higher prices for our products in foreign markets. For example, there are risks that the Chinese government may, among other things, require the use of local suppliers, compel companies that do business in China to partner with local companies to conduct business and provide incentives to government-backed local customers to buy from local suppliers. Changes in, and responses to, U.S. trade and tariff policy could reduce the competitiveness of our products and cause our sales and revenues to drop, which could materially and adversely impact our business and results of operations.
If we determine that our goodwill and intangible assets have become impaired, we may incur impairment charges, which would negatively impact our operating results.
Goodwill represents the excess of cost over the fair value of net assets acquired in business combinations. Under accounting principles generally accepted in the United States of America, we assess potential impairment of our goodwill and intangible assets at least annually, as well as on an interim basis to the extent that factors or indicators become apparent that could reduce the fair value of any of our businesses below

-25-
book value. Impairment may result from significant changes in the manner of use of the acquired asset, negative industry or economic trends and significant underperformance relative to historic or projected operating results.
The impact of the coronavirus on our operations, and the operations of our customers, suppliers and logistics providers, may harm our business.
We are actively assessing and responding where possible to the potential impact of the coronavirus outbreak in China and elsewhere in the world. This includes evaluating the impact on our customers, suppliers, and logistics providers as well as evaluating governmental actions being taken to curtail the spread of the virus. The significance of the impact on us is yet uncertain; however, a material adverse effect on our customers, suppliers, or logistics providers could have a material adverse effect on our operating results.
We may experience difficulties in transitioning to smaller geometry process technologies or in achieving higher levels of design integration, which may result in reduced manufacturing yields, delays in product deliveries and increased expenses.
A growing trend in our industry is the integration of greater semiconductor content into a single chip to achieve higher levels of functionality. In order to remain competitive, we must achieve higher levels of design integration and deliver new integrated products on a timely basis. This will require us to expend greater research and development resources, and may require us to modify the manufacturing processes for some of our products, to achieve greater integration. We periodically evaluate the benefits, on a product-by-product basis, of migrating to smaller geometry process technologies to reduce our costs. Although this migration to smaller geometry process technologies has helped us to offset the declining average selling prices of our products, this effort may not continue to be successful. Also, because we are a fabless semiconductor company, we depend on our foundries to transition to smaller geometry processes successfully. We cannot assure you that our foundries will be able to effectively manage the transition. In case our foundries or we experience significant delays in this transition or fail to efficiently implement this transition, our business, financial condition and results of operations could be materially and adversely affected.
The anti-takeover provisions in our certificate of incorporation and bylaws could prevent or discourage a third party from acquiring us.
Our certificate of incorporation and bylaws contain provisions that may prevent or discourage a third party from acquiring us, even if the acquisition would be beneficial to our stockholders. Our board of directors also has the authority to fix the rights and preferences of shares of our preferred stock and to issue such shares without a stockholder vote. Our bylaws also place limitations on the authority to call a special meeting of stockholders. Our stockholders may take action only at a meeting of stockholders and not by written consent. We have advance notice procedures for stockholders desiring to nominate candidates for election as directors or to bring matters before an annual meeting of stockholders. In addition, these factors may also adversely affect the market price of our common stock, and the voting and other rights of the holders of our common stock.
Our stock price may be volatile so stockholders may not be able to resell shares of our common stock at or above the price they paid for them.
Announcements of developments related to our business, announcements by competitors, quarterly fluctuations in our financial results, changes in the general conditions of the highly dynamic industry in which we compete or the national economies in which we do business, and other factors could cause the price of our common stock to fluctuate, perhaps substantially. In addition, in recent years, the stock market has experienced extreme price fluctuations, which have often been unrelated to the operating performance of affected companies. These factors and fluctuations could have a material adverse effect on the market price of our common stock.
Item 1B. UNRESOLVED STAFF COMMENTS.
None.
-26-
Item 2. PROPERTIES.
We are headquartered in San Jose, California, in a leased facilities of approximately 1,723 square feet pursuant to a lease agreement that terminates in December 2021. Our operations in Israel are located in leased facilities of approximately 43,282 square feet located in Herzliya, Israel. These facilities are leased for 10 years ending in April 2029. Our subsidiary in Tokyo, Japan has a lease that terminates in October 2020. Our subsidiary in Nuremberg, Germany has a lease that terminates in December 2020. Our subsidiary in India has a lease that terminates in August 2020. Our subsidiary in China has two lease agreements for its facilities, one in Shenzhen that terminates in September 2020, and the other in Shanghai that terminates in July 2020. Our subsidiary in Hong Kong entered into a lease agreement that is effective until November 2022. Our subsidiary in South Korea has a lease that terminates in July 2020. We believe that our existing facilities are adequate to meet our needs for the immediate future.
Item 3. LEGAL PROCEEDINGS.
From time to time, we may become involved in litigation relating to claims arising from our ordinary course of business activities. Also, as is typical in the semiconductor industry, we have been and may from time to time be notified of claims that we may be infringing patents or intellectual property rights owned by third parties. We currently believe that there are no claims or actions pending or threatened against us, the ultimate disposition of which would have a material adverse effect on us.
Item 4. MINE SAFETY DISCLOSURES.
Not applicable.

-27-
PART II
Item 5. MARKET FOR REGISTRANT’S COMMON EQUITY, RELATED STOCKHOLDER MATTERS AND ISSUER PURCHASES OF EQUITY SECURITIES.
Our common stock, par value $0.001, trades on the NASDAQ Global Select Market (NASDAQ symbol “DSPG”). As of March 4, 2020, there were 23,428,494 shares of common stock outstanding. As of March 4, 2020, the company had approximately 16 holders of record and we believe greater than 3,070 beneficial holders. We have never paid cash dividends on our common stock and presently intend to continue a policy of retaining any earnings for reinvestment in our business.
Equity Compensation Plan Information
Information relating to our equity compensation plans will be presented under the caption “Equity Compensation Plan Information” of our definitive proxy statement pursuant to Regulation 14A in connection with the annual meeting of stockholders to be held on May 18, 2020. The definitive proxy statement will be filed with the Securities and Exchange Commission no later than 120 days after the end of the fiscal year covered by this report. Such information is incorporated herein by reference.

-28-
Issuer Purchases of Equity Securities
Our board of directors has previously approved a number of share repurchase programs, including those in accordance with Rule 10b5-1 of the Securities Exchange Act of 1934, for the repurchase of our common stock. At December 31, 2019, 794,913 shares of our common stock are available for repurchase under our board-authorized share repurchase program. The repurchase program is being affected from time to time, depending on market conditions and other factors, through Rule 10b5-1 plans, open market purchases and privately negotiated transactions. The repurchase program has no set expiration or termination date.
During 2019, we did not repurchase any shares of common stock.
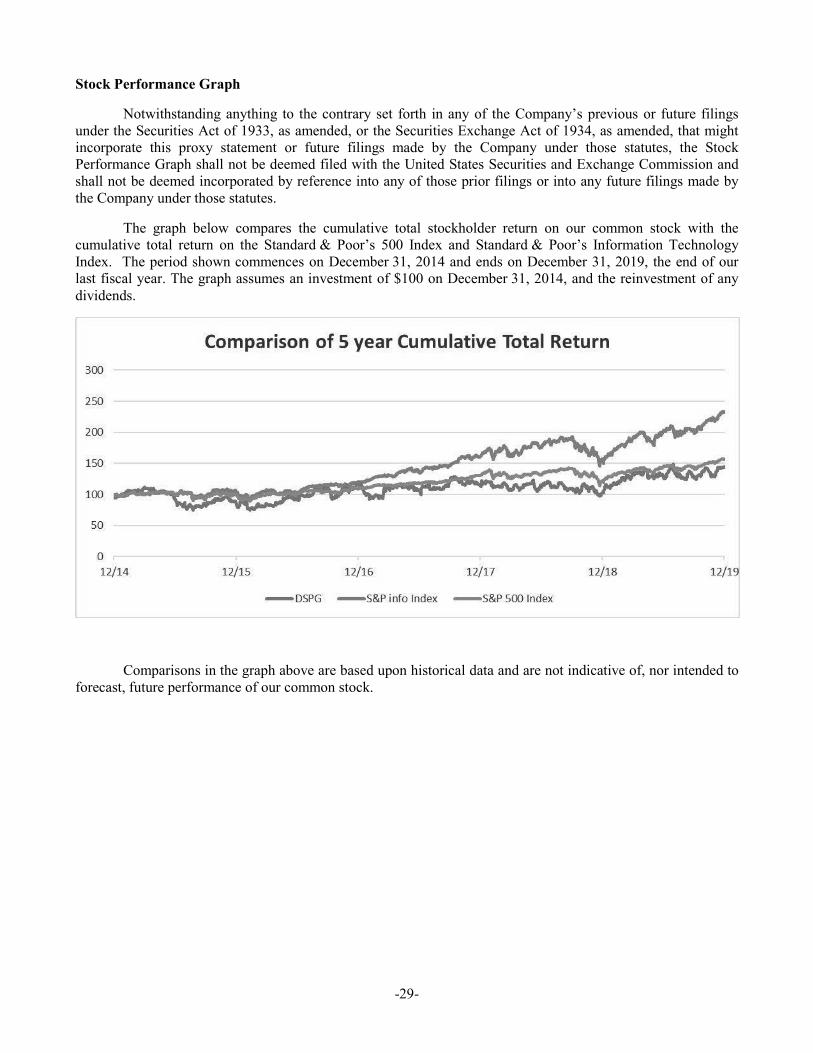
-29-
Stock Performance Graph
Notwithstanding anything to the contrary set forth in any of the Company’s previous or future filings under the Securities Act of 1933, as amended, or the Securities Exchange Act of 1934, as amended, that might incorporate this proxy statement or future filings made by the Company under those statutes, the Stock Performance Graph shall not be deemed filed with the United States Securities and Exchange Commission and shall not be deemed incorporated by reference into any of those prior filings or into any future filings made by the Company under those statutes.
The graph below compares the cumulative total stockholder return on our common stock with the cumulative total return on the Standard & Poor’s 500 Index and Standard & Poor’s Information Technology Index. The period shown commences on December 31, 2014 and ends on December 31, 2019, the end of our last fiscal year. The graph assumes an investment of $100 on December 31, 2014, and the reinvestment of any dividends.
Comparisons in the graph above are based upon historical data and are not indicative of, nor intended to forecast, future performance of our common stock.
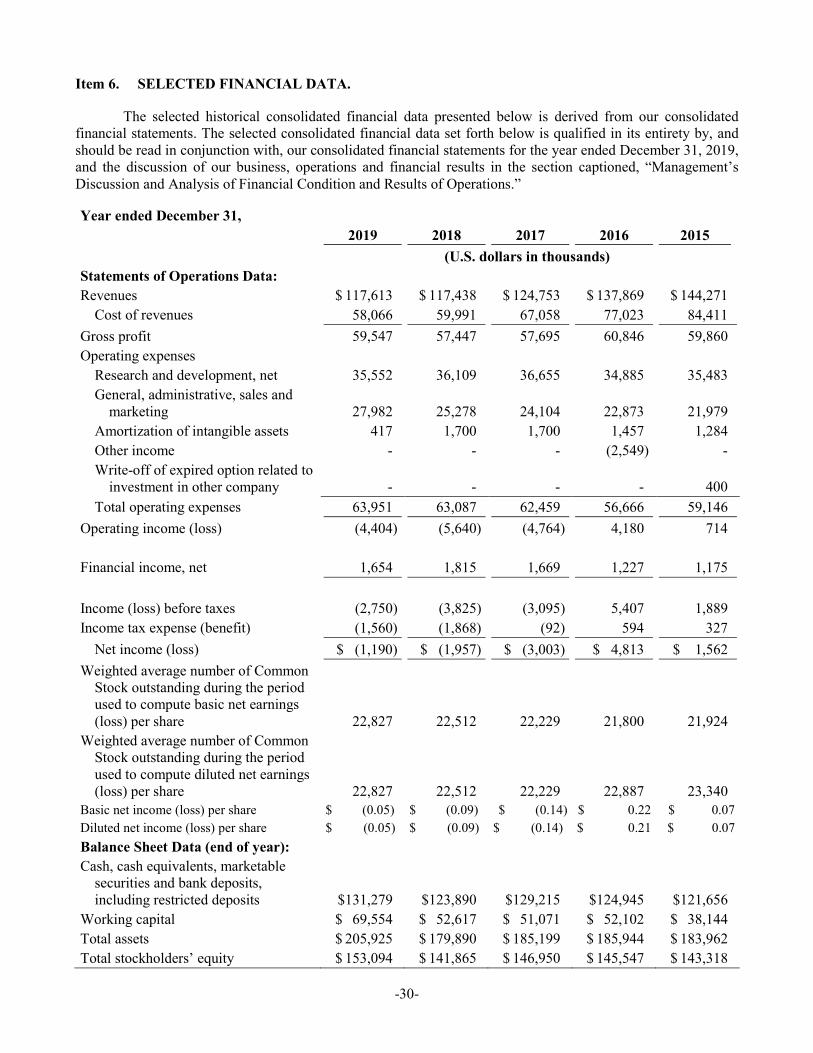
-30-
Item 6. SELECTED FINANCIAL DATA.
The selected historical consolidated financial data presented below is derived from our consolidated financial statements. The selected consolidated financial data set forth below is qualified in its entirety by, and should be read in conjunction with, our consolidated financial statements for the year ended December 31, 2019, and the discussion of our business, operations and financial results in the section captioned, “Management’s Discussion and Analysis of Financial Condition and Results of Operations.”
Year ended December 31, 2019 2018 2017 2016 2015 (U.S. dollars in thousands) Statements of Operations Data: Revenues $ 117,613 $ 117,438 $ 124,753 $ 137,869 $ 144,271
Cost of revenues 58,066 59,991 67,058 77,023 84,411 Gross profit 59,547 57,447 57,695 60,846 59,860 Operating expenses
Research and development, net 35,552 36,109 36,655 34,885 35,483 General, administrative, sales and
marketing 27,982 25,278 24,104 22,873 21,979 Amortization of intangible assets 417 1,700 1,700 1,457 1,284 Other income - - - (2,549) - Write-off of expired option related to
investment in other company - - - - 400 Total operating expenses 63,951 63,087 62,459 56,666 59,146
Operating income (loss) (4,404) (5,640) (4,764) 4,180 714 Financial income, net 1,654 1,815 1,669 1,227 1,175 Income (loss) before taxes (2,750) (3,825) (3,095) 5,407 1,889 Income tax expense (benefit) (1,560) (1,868) (92) 594 327
Net income (loss) $ (1,190) $ (1,957) $ (3,003) $ 4,813 $ 1,562 Weighted average number of Common
Stock outstanding during the period used to compute basic net earnings (loss) per share 22,827 22,512 22,229 21,800 21,924
Weighted average number of Common Stock outstanding during the period used to compute diluted net earnings (loss) per share 22,827 22,512 22,229 22,887 23,340
Basic net income (loss) per share $ (0.05) $ (0.09) $ (0.14) $ 0.22 $ 0.07 Diluted net income (loss) per share $ (0.05) $ (0.09) $ (0.14) $ 0.21 $ 0.07 Balance Sheet Data (end of year): Cash, cash equivalents, marketable
securities and bank deposits, including restricted deposits $131,279 $123,890 $129,215 $124,945 $121,656
Working capital $ 69,554 $ 52,617 $ 51,071 $ 52,102 $ 38,144 Total assets $ 205,925 $ 179,890 $ 185,199 $ 185,944 $ 183,962 Total stockholders’ equity $ 153,094 $ 141,865 $ 146,950 $ 145,547 $ 143,318

-31-
Year ended December 31,
Fiscal Years by Quarter
2019 2018
Quarterly Data: 4th’ 3rd’ 2nd’ 1st’ 4th’ 3rd’ 2nd’ 1st’ (Unaudited, U.S. dollars in thousands, except per share amount) Revenues $29,261 $31,042 $29,034 $28,276 $26,057 $32,619 $30,651 $28,111 Gross profit $14,892 $15,780 $14,419 $14,456 $12,376 $16,304 $15,053 $13,714 Net income (loss) $ (87) $ 484 $ (521) $(1,066) $ (321) $ 405 $ (288) $(1,753) Net income (loss)
per share — Basic
$ (0.00) $ 0.02 $ (0.02) $ (0.05) $ (0.01) $ 0.02 $ (0.01) $ (0.08)
Net income (loss) per share — Diluted
$ (0.00) $ 0.02 $ (0.02) $ (0.05) $ (0.01) $ 0.02 $ (0.01) $ (0.08)
Item 7. MANAGEMENT’S DISCUSSION AND ANALYSIS OF FINANCIAL CONDITION AND RESULTS OF OPERATIONS.
The following discussion and analysis is intended to provide an investor with a narrative of our financial results and an evaluation of our financial condition and results of operations. The discussion should be read in conjunction with our consolidated financial statements and notes thereto.
Business Overview
DSP Group is a leading global provider of wireless chipset solutions for converged communications, delivering system solutions that combine semiconductors and software with reference designs. We provide a broad portfolio of wireless chipsets integrating DECT, Wi-Fi, PSTN and VoIP technologies with state-of-the-art application processors. We also enable converged voice, audio and data connectivity across diverse consumer and enterprise products – from cordless and VoIP phones to home gateways and connected multimedia screens. Our Home segment consists of cordless telephony products and SmartHome products, which are comprised of our home gateway and home automation products. Our Unified Communications segment consists of a comprehensive set of solutions for Unified Communications (VoIP office products). Our SmartVoice segment consists of products targeted at mobile, IoT and wearable device markets that incorporate our noise suppression and voice quality enhancement HDClear technology, as well as other third party advanced voice processing, always on and sensor hub functionalities.
We are seeing evidence that our past research and development investments in new technologies are paying off. We achieved a number of design wins for our growth initiative products and a number of such new products have begun mass shipments. During 2019, revenues from our growth initiatives, namely sales from our Unified Communications, SmartHome and SmartVoice products, were $73.8 million and accounted for 63% of our total revenues, as compared to 55% of our total revenues in 2018, and represented an increase of 15% year-over-year. Revenues from our Unified Communications products represented 32% and 33% of our total revenues in 2019 and 2018, respectively. Revenues from our SmartVoice products represented 16% and 9% of our total revenues in 2019 and 2018, respectively. Revenues from SmartHome products accounted for 14% and 12% of our revenues in 2019 and 2018, respectively. In 2019 as compared to 2018, revenues from the SmartVoice segment grew by 78%. Revenues from the Unified Communications segment decreased by 2%, and revenues from SmartHome products increased by 12%. Based on a strong pipeline of design wins, our current mix of growth initiatives products and anticipated commercialization schedules of customers incorporating such products, we anticipate annual revenues generated from our growth initiatives to increase in 2020 as compared to 2019, and we expect such revenues to represent more than two-thirds of our total revenues for 2020. The expected increase in revenues from growth initiatives will be driven mainly by our Unified Communications
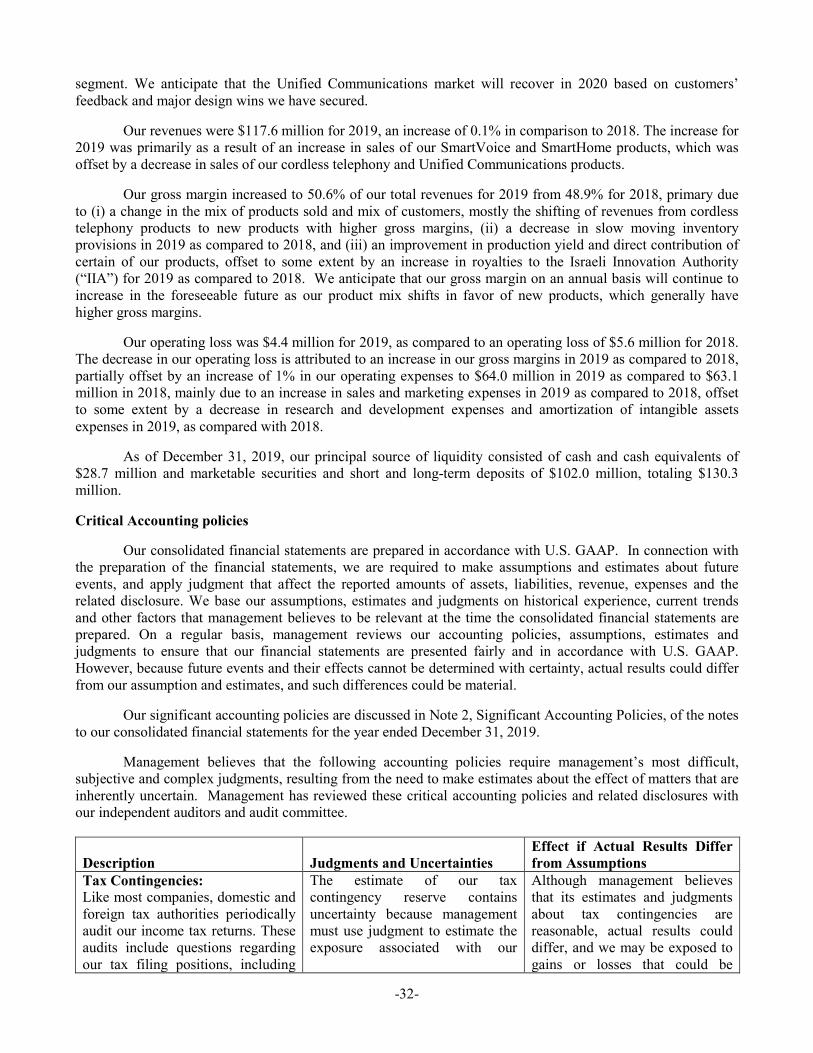
-32-
segment. We anticipate that the Unified Communications market will recover in 2020 based on customers’ feedback and major design wins we have secured.
Our revenues were $117.6 million for 2019, an increase of 0.1% in comparison to 2018. The increase for 2019 was primarily as a result of an increase in sales of our SmartVoice and SmartHome products, which was offset by a decrease in sales of our cordless telephony and Unified Communications products.
Our gross margin increased to 50.6% of our total revenues for 2019 from 48.9% for 2018, primary due to (i) a change in the mix of products sold and mix of customers, mostly the shifting of revenues from cordless telephony products to new products with higher gross margins, (ii) a decrease in slow moving inventory provisions in 2019 as compared to 2018, and (iii) an improvement in production yield and direct contribution of certain of our products, offset to some extent by an increase in royalties to the Israeli Innovation Authority (“IIA”) for 2019 as compared to 2018. We anticipate that our gross margin on an annual basis will continue to increase in the foreseeable future as our product mix shifts in favor of new products, which generally have higher gross margins.
Our operating loss was $4.4 million for 2019, as compared to an operating loss of $5.6 million for 2018. The decrease in our operating loss is attributed to an increase in our gross margins in 2019 as compared to 2018, partially offset by an increase of 1% in our operating expenses to $64.0 million in 2019 as compared to $63.1 million in 2018, mainly due to an increase in sales and marketing expenses in 2019 as compared to 2018, offset to some extent by a decrease in research and development expenses and amortization of intangible assets expenses in 2019, as compared with 2018.
As of December 31, 2019, our principal source of liquidity consisted of cash and cash equivalents of $28.7 million and marketable securities and short and long-term deposits of $102.0 million, totaling $130.3 million.
Critical Accounting policies
Our consolidated financial statements are prepared in accordance with U.S. GAAP. In connection with the preparation of the financial statements, we are required to make assumptions and estimates about future events, and apply judgment that affect the reported amounts of assets, liabilities, revenue, expenses and the related disclosure. We base our assumptions, estimates and judgments on historical experience, current trends and other factors that management believes to be relevant at the time the consolidated financial statements are prepared. On a regular basis, management reviews our accounting policies, assumptions, estimates and judgments to ensure that our financial statements are presented fairly and in accordance with U.S. GAAP. However, because future events and their effects cannot be determined with certainty, actual results could differ from our assumption and estimates, and such differences could be material.
Our significant accounting policies are discussed in Note 2, Significant Accounting Policies, of the notes to our consolidated financial statements for the year ended December 31, 2019.
Management believes that the following accounting policies require management’s most difficult, subjective and complex judgments, resulting from the need to make estimates about the effect of matters that are inherently uncertain. Management has reviewed these critical accounting policies and related disclosures with our independent auditors and audit committee.
Description Judgments and Uncertainties Effect if Actual Results Differ from Assumptions
Tax Contingencies: Like most companies, domestic and foreign tax authorities periodically audit our income tax returns. These audits include questions regarding our tax filing positions, including
The estimate of our tax contingency reserve contains uncertainty because management must use judgment to estimate the exposure associated with our
Although management believes that its estimates and judgments about tax contingencies are reasonable, actual results could differ, and we may be exposed to gains or losses that could be

-33-
Description Judgments and Uncertainties Effect if Actual Results Differ from Assumptions
the timing and amount of deductions and the allocation of income among various tax jurisdictions. In evaluating the exposure associated with our various tax filing positions, including state, foreign and local taxes, we record reserves for probable exposures. A number of years may elapse before a particular matter, for which we have established a reserve, is audited and fully resolved.
We report a liability for unrecognized tax benefits resulting from uncertain tax positions taken or expected to be taken in a tax return. We recognize interest and penalties, if any, related to unrecognized tax benefits in income tax expense.
various tax filing positions.
According to Financial Accounting Standards Board (“FASB”) Accounting Standards Codification (“ASC”) No. 740, “Income Taxes,” the first step is to evaluate the tax position for recognition by determining if the weight of available evidence indicates it is more likely than not that the position will be sustained on audit, including resolution of related appeals or litigation processes, if any. The second step is to measure the tax benefit as the largest amount which is more than 50% likely of being realized upon ultimate settlement.
material. To the extent we prevail in matters for which reserve has been established, or are required to pay amounts in excess of the reserve, our effective tax rate for a given financial statement period could be materially affected. An unfavorable tax settlement would require use of our cash and result in an increase in our effective tax rate for the year of resolution. A favorable tax settlement would be recognized as a reduction in our effective tax rate for the year of resolution.
Tax Valuation Allowance: We have a valuation allowance for some of our deferred tax assets based on the determination that it is more likely than not that some of these assets will not be realized.
Our management inherently must make estimates to determine the ultimate realization of these assets. The estimate of our tax valuation allowance contains uncertainty because management must use judgment to estimate the expected results for tax purposes.
Although management believes that its estimates and judgments about expected results for tax purposes are reasonable, actual results could differ, and we may be required to record an additional valuation allowance for our deferred tax assets.
Valuation of Long-Lived Assets, Intangible Assets and Goodwill: Goodwill represents the excess of purchase price over the fair value of identifiable net assets acquired in business combination. The goodwill on our consolidated balance sheet is a result of our acquisition of BoneTone and a private company in Asia. The identifiable intangible asset included on our consolidated balance sheet is technology acquired in the BoneTone acquisition and customer relationship in the form of a distribution agreement acquired in the acquisition of a private company in Asia.
We determine fair value using widely accepted valuation techniques, including discounted cash flow and market multiple analyses. These types of analyses require us to make assumptions and estimates regarding industry economic factors and the profitability of future business strategies. It is our policy to conduct impairment testing based on our current business strategy in light of present industry and economic conditions, as well as future expectations.
If management’s estimates or related assumptions change in the future, we may be required to record impairment charges for our intangible assets.
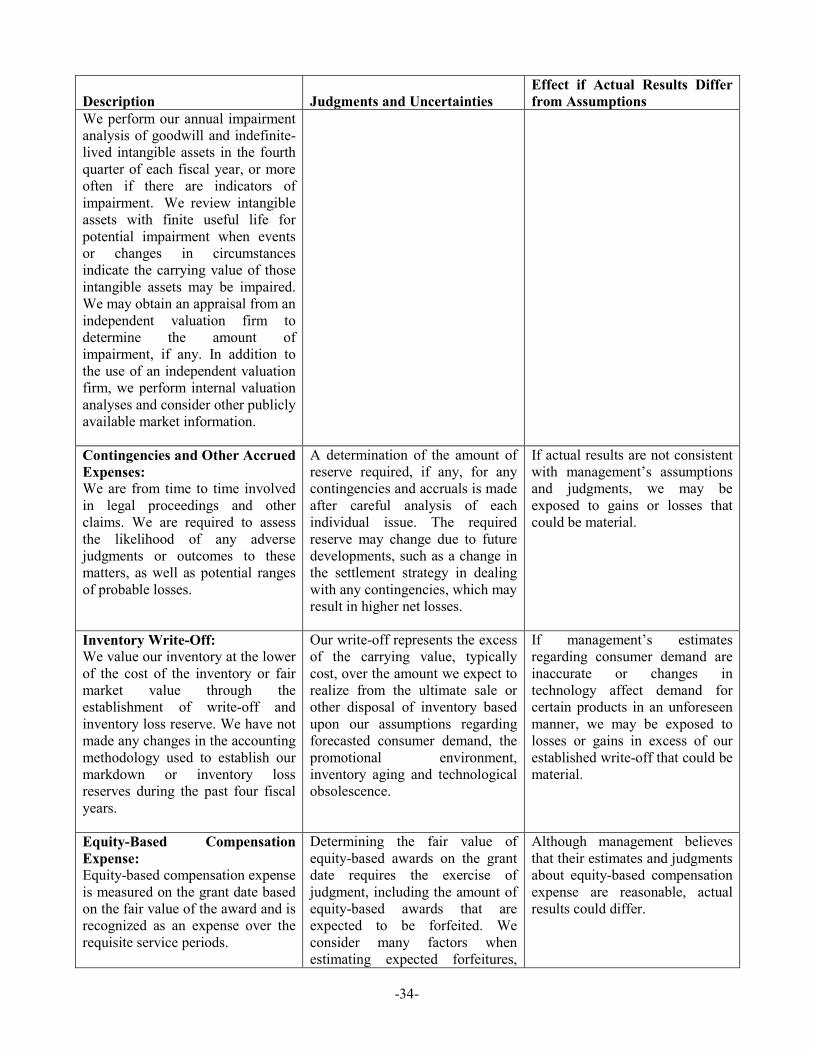
-34-
Description Judgments and Uncertainties Effect if Actual Results Differ from Assumptions
We perform our annual impairment analysis of goodwill and indefinite-lived intangible assets in the fourth quarter of each fiscal year, or more often if there are indicators of impairment. We review intangible assets with finite useful life for potential impairment when events or changes in circumstances indicate the carrying value of those intangible assets may be impaired. We may obtain an appraisal from an independent valuation firm to determine the amount of impairment, if any. In addition to the use of an independent valuation firm, we perform internal valuation analyses and consider other publicly available market information.
Contingencies and Other Accrued Expenses: We are from time to time involved in legal proceedings and other claims. We are required to assess the likelihood of any adverse judgments or outcomes to these matters, as well as potential ranges of probable losses.
A determination of the amount of reserve required, if any, for any contingencies and accruals is made after careful analysis of each individual issue. The required reserve may change due to future developments, such as a change in the settlement strategy in dealing with any contingencies, which may result in higher net losses.
If actual results are not consistent with management’s assumptions and judgments, we may be exposed to gains or losses that could be material.
Inventory Write-Off: We value our inventory at the lower of the cost of the inventory or fair market value through the establishment of write-off and inventory loss reserve. We have not made any changes in the accounting methodology used to establish our markdown or inventory loss reserves during the past four fiscal years.
Our write-off represents the excess of the carrying value, typically cost, over the amount we expect to realize from the ultimate sale or other disposal of inventory based upon our assumptions regarding forecasted consumer demand, the promotional environment, inventory aging and technological obsolescence.
If management’s estimates regarding consumer demand are inaccurate or changes in technology affect demand for certain products in an unforeseen manner, we may be exposed to losses or gains in excess of our established write-off that could be material.
Equity-Based Compensation Expense: Equity-based compensation expense is measured on the grant date based on the fair value of the award and is recognized as an expense over the requisite service periods.
Determining the fair value of equity-based awards on the grant date requires the exercise of judgment, including the amount of equity-based awards that are expected to be forfeited. We consider many factors when estimating expected forfeitures,
Although management believes that their estimates and judgments about equity-based compensation expense are reasonable, actual results could differ.

-35-
Description Judgments and Uncertainties Effect if Actual Results Differ from Assumptions
including types of awards, employee class, and historical experience. Actual results, and future changes in estimates, may differ substantially from our current estimates.
We estimate the fair value of equity-based awards using a binomial option pricing model. The fair value of an award is affected by our stock price on the date of grant as well as other assumptions, including expected stock price volatility and the expected term of the equity-based award. The risk-free interest rate is based on the yield from U.S. treasury bonds with an equivalent term. Expected volatility is calculated based upon actual historical stock price movements. The expected term of the equity-based award granted is based upon historical experience and represents the period of time that the award granted is expected to be outstanding. Our expected dividend rate is zero since we do not currently pay cash dividends and do not anticipate doing so in the foreseeable future.
Marketable Securities: Management determines the appropriate classification for our investments in debt and equity securities at the time of purchase and re-evaluates such determination at each balance sheet date.
The marketable securities are periodically reviewed for impairment. If it is concluded that any of these investments are impaired, management determines whether such impairment is “other-than-temporary.” Factors that are considered in making such a determination include the duration and severity of the impairment, the reason for the decline in value and the potential recovery period, and our intent to sell, or whether it is more likely than not that we will be required to sell, the investment before recovery of its cost basis. If any impairment is considered “other-
Although management believes that their considerations and judgments about fair value and whether a loss associated with a marketable security is other-than-temporary, actual results could differ from management’s estimation. Given current market conditions and uncertainty, management’s judgments could prove to be wrong, and companies with relatively high credit ratings and solid financial conditions may not be able to fulfill their obligations and thereby cause other-than-temporary losses.

-36-
Description Judgments and Uncertainties Effect if Actual Results Differ from Assumptions
than-temporary,” the investment is written down to its fair value and a corresponding charge is recorded in financial income, net.

-37-
Results of Operations:
Total Revenues.
The following tables represent our total revenues and our revenues by product family for the years ended December 31, 2019, 2018 and 2017 (dollars in millions):
2019 YoY Change 2018 YoY Change 2017
Total Revenues (1,2) $117.6 0% $117.4 (6)% $124.8
Cordless (3) $43.9 (18)% $53.2 (21)% $67.4
Percentage of total revenues 37% 45% 54%
SmartHome (4,5) $16.3 12% $14.5 (17)% $17.6
Percentage of total revenues 14% 12% 14%
Unified Communications (6,7) $38.1 (2)% $38.8 11% $34.9
Percentage of total revenues 32% 33% 28%
SmartVoice (8) $19.3 78% $10.9 124% $4.9
Percentage of total revenues 16% 9% 4%
1. The increase in revenues in 2019 as compared to 2018 was primarily as a result of increased sales of our SmartVoice and SmartHome products, offset to some extent by decreased sales of our cordless and Unified Communications products.
2. The decrease in revenues in 2018 as compared to 2017 was primarily as a result of decreased sales of our cordless telephony and SmartHome products, offset to some extent by increased sales of our Unified Communications and SmartVoice products.
3. The decrease in cordless revenues for both comparable periods was mainly attributable to decreased demand from our customers in all markets due to an overall reduction in demand for cordless phones.
4. The increase of our SmartHome product sales in 2019 as compared to 2018 was mainly attributable to higher demand for our home gateway and home automation products.
5. The decrease of our SmartHome product sales in 2018 as compared to 2017 is mainly attributable to lower demands for our home gateway and home automation products.
6. The decrease in our Unified Communications sales in 2019 as compared to 2018 is mainly attributable to a delay in the timing of orders originating from uncertainties relating to trade war concerns, as well as weakness in enterprise IT spending by businesses.
7. The increase in our Unified Communications sales for 2018 is mainly attributable to a growth in market demand for our Unified Communications products that resulted from the growth of our market share within this domain.
8. The increase in our SmartVoice revenues for the comparable periods was attributable to an increase in the number of customers and design wins in this segment.

-38-
The following table shows the breakdown of revenues for all product lines for the periods indicated by geographic location based on the geographic location of our customers (in thousands):
Year ended December 31, 2019 2018 2017 United States ..................................... $ 4,947 $ 5,876 $ 4,927 Hong Kong ........................................ 31,692 36,666 46,119 Japan .................................................. 11,249 14,284 16,567 Europe ............................................... 9,546 9,022 9,882 China ................................................. 22,813 16,107 16,096 Taiwan ............................................... 26,634 23,940 22,442 Korea ................................................. 7,285 7,341 4,190 Other .................................................. 3,447 4,202 4,530 Total revenues ................................... $ 117,613 $ 117,438 $ 124,753
Sales to our customers in United States decreased for 2019 as compared 2018, representing a decrease of 16% in absolute dollars. The decrease in our sales to the United States for the comparable periods resulted mainly from a decrease in sales to one of our U.S. customers. Sales to our customers in United States increased for 2018 as compared 2017, representing an increase of 19%, in absolute dollars. The increase in our sales to the United States for the comparable periods resulted mainly from an increase in sales to one of our U.S. customers.
Sales to our customers in Hong Kong decreased for 2019 as compared to 2018, representing a decrease of 14% in absolute dollars. The decrease in our sales to Hong Kong for the comparable periods resulted mainly from a decrease in sales to VTech of 13% when comparing 2019 to 2018, and a decrease in sales to CCT Technology of 57% when comparing 2019 to 2018, mostly resulting from the expected decline in cordless sales.
Sales to our customers in Hong Kong decreased for 2018 as compared to 2017, representing a decrease of 20% in absolute U.S. dollars. The decrease in our sales to Hong Kong for the comparable periods resulted mainly from a decrease in sales to VTech of 17% when comparing 2018 to 2017, a decrease in sales to CCT Technology of 66% when comparing 2018 to 2017, and a decrease of 23% in sales to Guo Wei when comparing 2018 to 2017, mostly resulting from the decline in cordless sales.
The decrease in our sales to Japan in 2019 as compared to 2018 resulted mainly from a decrease in sales through our distributor, Nexty Electronics, to Panasonic of 20% for the comparable periods.
The decrease in our sales to Japan in 2018 as compared to 2017 resulted mainly from a decrease in sales through our distributor, Nexty Electronics, to Panasonic of 13% in the comparable periods.
Sales to our customers in China increased in 2019 as compared to 2018, representing a 42% increase in absolute dollars. The increase in our sales to China in 2019 resulted mainly from an increase in demand from our customers, especially sales of our SmartVoice products to OPPO Mobile Telecommunications Corp. Ltd (“OPPO”), one of China’s top mobile OEMs, as well as an increase in the number of our Chinese customers.
Sales to our customers in Taiwan increased for 2019 as compared to 2018, representing an increase of 11% in absolute dollars. The increase in our sales to Taiwan for the comparable periods resulted mainly from an increase in sales to Cisco, as well as other customers in Taiwan through our distributor, Ascend Technology,
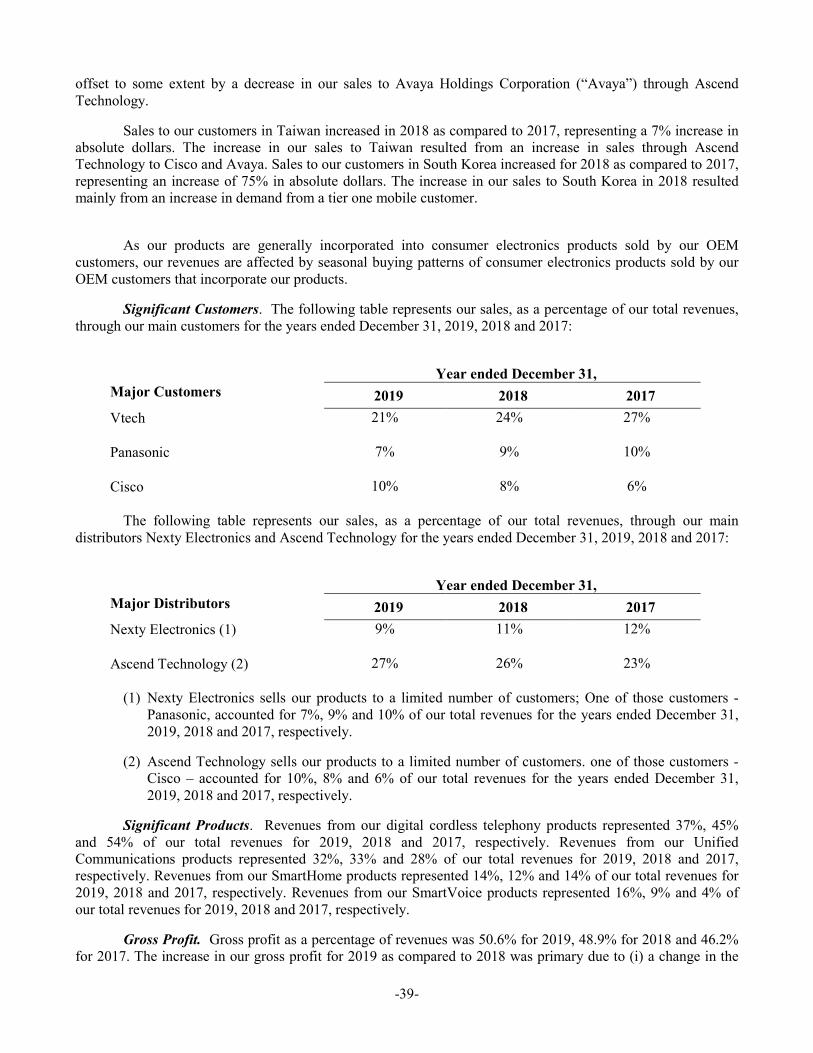
-39-
offset to some extent by a decrease in our sales to Avaya Holdings Corporation (“Avaya”) through Ascend Technology.
Sales to our customers in Taiwan increased in 2018 as compared to 2017, representing a 7% increase in absolute dollars. The increase in our sales to Taiwan resulted from an increase in sales through Ascend Technology to Cisco and Avaya. Sales to our customers in South Korea increased for 2018 as compared to 2017, representing an increase of 75% in absolute dollars. The increase in our sales to South Korea in 2018 resulted mainly from an increase in demand from a tier one mobile customer.
As our products are generally incorporated into consumer electronics products sold by our OEM customers, our revenues are affected by seasonal buying patterns of consumer electronics products sold by our OEM customers that incorporate our products.
Significant Customers. The following table represents our sales, as a percentage of our total revenues, through our main customers for the years ended December 31, 2019, 2018 and 2017:
Year ended December 31,
Major Customers 2019 2018 2017 Vtech 21% 24% 27%
Panasonic 7% 9% 10%
Cisco 10% 8% 6%
The following table represents our sales, as a percentage of our total revenues, through our main distributors Nexty Electronics and Ascend Technology for the years ended December 31, 2019, 2018 and 2017:
Year ended December 31,
Major Distributors 2019 2018 2017 Nexty Electronics (1) 9% 11% 12%
Ascend Technology (2) 27% 26% 23%
(1) Nexty Electronics sells our products to a limited number of customers; One of those customers - Panasonic, accounted for 7%, 9% and 10% of our total revenues for the years ended December 31, 2019, 2018 and 2017, respectively.
(2) Ascend Technology sells our products to a limited number of customers. one of those customers - Cisco – accounted for 10%, 8% and 6% of our total revenues for the years ended December 31, 2019, 2018 and 2017, respectively.
Significant Products. Revenues from our digital cordless telephony products represented 37%, 45% and 54% of our total revenues for 2019, 2018 and 2017, respectively. Revenues from our Unified Communications products represented 32%, 33% and 28% of our total revenues for 2019, 2018 and 2017, respectively. Revenues from our SmartHome products represented 14%, 12% and 14% of our total revenues for 2019, 2018 and 2017, respectively. Revenues from our SmartVoice products represented 16%, 9% and 4% of our total revenues for 2019, 2018 and 2017, respectively.
Gross Profit. Gross profit as a percentage of revenues was 50.6% for 2019, 48.9% for 2018 and 46.2% for 2017. The increase in our gross profit for 2019 as compared to 2018 was primary due to (i) a change in the
-40-
mix of products sold and mix of customers, (ii) an improvement in production yield and direct contribution of certain of our products, and (iii) lower provisions for slow moving inventories in 2019 as compared to 2018. Those factors were partially offset by an increase in royalties, mostly paid to the IIA in 2019, as compared to 2018.
The increase in our gross profit for 2018 as compared to 2017 was primary due to (i) a change in the mix of products sold and mix of customers, and (ii) an improvement in production yield and direct contribution of certain of our products. Those factors were partially offset by a decrease in total revenues in 2018 as compared to 2017.
Cost of goods sold consists primarily of costs of wafer manufacturing and fabrication, assembly and testing of integrated circuit devices and related overhead costs, and compensation and associated expenses related to manufacturing and testing support, inventory obsolesce and logistics personnel.
Operating Expenses. Our operating expenses were $64.0 million for 2018, $63.1 million for 2018 and $62.5 million for 2017. The increase in operating expenses for 2019 as compared to 2018 was primarily attributable to (i) an increase of $2.3 million in selling and marketing expenses, mostly attributable to an increase in employee-related expenses, and (ii) an increase in general and administrative expenses in the amount of $0.4 million, mostly attributable to an increase in equity-based compensation and professional expenses. These increases were partially offset by a decrease in the amount of $0.6 million in research and development expenses, mostly attributable to a decrease in IP and tape-out expenses in 2019 as compared to 2018, partially offset by an increase in development tools expenses in 2019 as compared to 2018, and a decrease of $1.3 million in amortization expenses of intangible assets in 2019 as compared to 2018, mainly due to the cessation of amortization of intangible assets related to previous acquisitions.
The increase in operating expenses for 2018 as compared to 2017 was primarily attributable to (i) an increase of $1 million in selling and marketing expenses, mostly attributable to an increase in employee-related expenses and commissions and (ii) an increase in general and administrative expenses in the amount of $0.2 million, mostly attributable to equity-based compensation expenses. These increases were partially offset by a decrease in the amount of $0.5 million in research and development expenses, mostly attributable to a decrease in subcontractors, IP and development tools expenses in 2018 as compared to 2017.
Our operating loss was $4.4 for 2019, as compared to an operating loss of $5.6 million in 2018 and an operating loss of $4.8 million for 2017. The decrease in operating loss in 2019 as compared to 2018 was mainly due to an increase in gross margin in 2019 as compared to 2018, partially offset by an increase in operating expenses in 2019, as compared to 2018.
The increase in operating loss in 2018 as compared to 2017 is mainly due to decrease in revenues and increase in operating expenses, partially offset by increase in gross margin in 2018 as compared to 2017.
Research and Development Expenses. Our research and development expenses, net, were $35.6 million for 2019, $36.1 million for 2018 and $36.7 million for 2017. The decrease for 2019 in research and development expenses, net, as compared to 2018, was mainly due to a decrease in tape-outs and IP expenses in 2019 as compared to 2018 in the amount of $1.0 million, partially offset by an increase in development tools expenses in amount of $0.4 million in 2019 as compared to 2018.
The decrease for 2018 in research and development expenses, net, as compared to 2017, was mainly due to (i) a decrease in subcontractors and development tools expenses in amount of $0.7 million in 2018 as compared to 2017, (ii) a decrease in IP expenses in 2018 as compared to 2017 in the amount of $0.3 million, and (iii) an increase in funding from the IIA in an amount of $0.2 million in 2018 as compared to 2017. These decreases were partially offset by an increase in equity-based compensation expenses in amount of $0.5 million in 2018 as compared to 2017.
IIA funding is recognized as a deduction of our research and development expenses, net. As a result of receipt of IIA funding, royalties may be payable to the IIA in the future based on a percentage of revenues

-41-
derived from sales of products whose development was facilitated by the IIA funding. The obligation to pay these royalties is contingent on actual sales of these products.
Our research and development expenses, net, as a percentage of our total revenues were 30%, 31% and 29% for the years ended on December 31, 2019, 2018 and 2017, respectively. The decrease in research and development expenses, net, as a percentage of total revenues for 2019 as compared to 2018 was mainly due to a decrease in research and development expenses for 2019, as compared to 2018. The increase in research and development expenses, net, as a percentage of total revenues for 2018 as compared to 2017 was mainly due to a decrease in revenues for the comparable periods, partially offset by a decrease in research and development expenses in 2018 as compared to 2017.
Research and development expenses consist mainly of payroll expenses to employees involved in research and development activities, expenses related to tape-out and mask work, subcontracting, labor contractors and engineering expenses, depreciation and maintenance fees related to equipment and software tools used in research and development, and facilities expenses associated with and allocated to research and development activities.
Sales and Marketing Expenses. Our sales and marketing expenses were $17.7 million for 2019, $15.3 million for 2018 and $14.3 million for 2017. The increase in sales and marketing expenses between 2019 and 2018 was mainly attributable to (i) an increase in employee-related expenses in the amount of $2.0 million as compared to 2018, (ii) an increase in equity-based compensation expenses of $0.5 million in 2019 compared to 2018, and (iii) an increase in subcontracting and consultant expenses in the amount of $0.1 million as compared to 2018. These increases were partially offset by a decrease in sales commissions in the amount of $0.4 million as compared to 2018.
The increase in sales and marketing expenses between 2018 and 2017 was mainly attributable to (i) an increase in sales commissions in the amount of $0.4 million as compared to 2017, (ii) an increase in employee-related expenses in amount of $0.4 million as compared to 2017, and (iii) an increase in equity-based compensation expenses of $0.1 million in 2018 compared to 2017.
Our sales and marketing expenses as a percentage of our total revenues were 15%, 13% and 11% for 2019, 2018 and 2017, respectively. The increase in sales and marketing expenses as a percentage of total revenues for 2019 as compared to 2018 was mainly due to an increase in sales and marketing expenses for 2019 as compared to 2018.
The increase in sales and marketing expenses as a percentage of total revenues for 2018 as compared to 2017 was mainly due to a decrease in absolute dollars of the total revenues and an increase in sales and marketing expenses in 2018 as compared to 2017.
Sales and marketing expenses consist mainly of sales commissions, payroll expenses to direct sales and marketing employees, travel, trade show expenses, and facilities expenses associated with and allocated to sales and marketing activities.
General and Administrative Expenses. Our general and administrative expenses were $10.3 million, $10.0 million and $9.8 million for 2019, 2018 and 2017, respectively. The increase in general and administrative expenses for 2019 as compared to 2018 was mainly due to an increase in equity-based compensation expenses of $0.3 million in 2019 as compared to 2018.
The increase in general and administrative expenses for 2018 as compared to 2017 was mainly due to an increase in equity-based compensation expenses of $0.2 million in 2018 as compared to 2017.
General and administrative expenses as a percentage of our total revenues were 9%, 8% and 8% for the three years ended December 31, 2019, 2018 and 2017, respectively. The increase in general and administrative expenses as a percentage of total revenues for 2019 as compared to 2018 was mainly due to an increase in general and administrative expenses for 2019 as compared to 2018.

-42-
Our general and administrative expenses consist mainly of payroll expenses for management and administrative employees, accounting and legal fees, expenses related to investor relations as well as facilities expenses associated with general and administrative activities.
Amortization of Intangible Assets. During 2019, 2018 and 2017, we recorded an expense of $0.4 million, $1.7 million and $1.7 million, respectively, relating to the amortization of intangible assets associated with prior acquisitions. The decrease in 2019 was attributable to the cessation of amortization of intangible assets related to our acquisition of BoneTone Communications in 2011.
Financial Income, net. Financial income, net, was $1.7 million, $1.8 million and $1.7 million for the three years ended December 31, 2019, 2018 and 2017, respectively. The decrease in financial income in 2019 as compared to 2018 was mainly due to $0.8 million of foreign currency exchange rate expenses related to the lease liability created under the new lease accounting standard, resulting from the devaluation of the U.S. dollar against the new Israeli Shekel, This decrease was partially offset by an increase of $0.4 million in marketable securities and deposits interest in 2019 as compared to 2018, resulting from an increase in interest rates, and an increase in foreign currency exchange rate income of $0.3 million in 2019 (related to New Israeli shekel assets), as compared to 2018. The increase in financial income in 2018 as compared to 2017 was mainly due to an increase of $0.4 million in marketable securities and deposits interest in 2018 as compared to 2017, resulting from an increase in interest rates. This increase was partially offset by an increase in foreign currency exchange rate expenses of $0.3 million in 2018.
Our total cash, cash equivalents, marketable securities and short and long-term deposits, including restricted deposits, were $131.3 million as of December 31, 2019, as compared to $123.9 million as of December 31, 2018.
Provision for Income Taxes. In 2019, we had tax benefit of $1.6 million as compared to tax benefit of $1.9 million in 2018 and tax benefit of $0.1 million for 2017.
The tax benefit for 2019 was mainly attributed to (i) income in the amount of $1.0 million from changes in other deferred taxes, mainly related to Israeli research and development expenses that were capitalized for tax purposes and will be utilized in the future at higher tax rates less current tax expenses, (ii) income from changes in deferred taxes related to equity-based compensation expenses in the amount of $0.5 million, and (iii) income from amortization of deferred tax liability related to intangible assets acquired in connection with prior acquisitions in the amount of $0.1 million,
The tax benefit for 2018 was mainly attributed to (i) income from changes in deferred taxes related to equity-based compensation expenses in the amount of $0.8 million, (ii) income in the amount of $0.7 million from changes in other deferred taxes mainly related to Israeli research and development expenses that were capitalized for tax purposes and will be utilized in the future at higher tax rates less current tax expenses, and (iii) income from amortization of deferred tax liability related to intangible assets acquired in connection with prior acquisitions in the amount of $0.4 million.
Tax benefit for 2017 was mainly attributed to income from amortization of deferred tax liability related to intangible assets acquired in connection with prior acquisitions in the amount of $0.4 million, offset to some extent by current tax expenses that were recorded in the amount of $0.3 million.
Description of Segments.
We operate under three reportable segments.
Our segment information has been prepared in accordance with ASC 280, “Segment Reporting.” Operating segments are defined as components of an enterprise engaging in business activities about which separate financial information is available that is evaluated regularly by the company’s chief operating decision-maker (“CODM”) in deciding how to allocate resources and assess performance. Our CODM is our Chief
-43-
Executive Officer, who evaluates the Company’s performance and allocates resources based on segment revenues and operating income.
Our operating segments are as follows: Home, Unified Communications and SmartVoice. The classification of our business segments is based on a number of factors that our management uses to evaluate, view and run the company’s business operations, which include, but are not limited to, customer base, homogeneity of products and technology.
A description of the types of products provided by each business segment is as follows:
Home - Wireless chipset solutions for converged communication at home. Such solutions include integrated circuits targeted for cordless phones sold in retail or supplied by telecommunication service providers, home gateway devices supplied by telecommunication service providers which integrate the DECT/CAT-iq functionality, integrated circuits addressing home automation applications, as well as fixed-mobile convergence solutions. During 2017, we consolidated our home gateway and home automation products into a new product line called SmartHome. In this segment, (i) revenues from cordless telephony products amounted to 37%, 45% and 54% of our total revenues for 2019, 2018 and 2017, respectively, and (ii) revenues from our SmartHome products amounted to 14%, 12% and 14% of our total revenues for 2019, 2018 and 2017, respectively.
Unified Communications - Comprehensive solution for Unified Communications products, including office solutions that offer businesses of all sizes VoIP terminals with converged voice and data applications. Revenues from our Unified Communications products represented 32%, 33% and 28% of our total revenues for 2019, 2018 and 2017, respectively. No revenues derived from other products in the Unified Communications segment exceeded 10% of our total consolidated revenues for the years 2019, 2018 and 2017.
SmartVoice - Products for the SmartVoice market that provide voice activation and recognition, voice enhancement, always-on and far-end noise elimination that target mobile phones, mobile headsets and other devices that incorporate our noise suppression and voice quality enhancement HDClear technology. Revenues derived from products in the SmartVoice segment represented 16% of our total revenues for 2019 but did not exceed 10% of our total revenues for 2018 or 2017. No revenue derived from other products in the SmartVoice segment exceeded 10% of our total consolidated revenues for the years 2019, 2018 and 2017.
Segment data:
We derive the results of our business segments directly from our internal management reporting system and by using certain allocation methods. The accounting policies we use to derive business segment results are substantially the same as those we use for consolidation of our financial statements. The Chief Operating Decision Maker (“CODM”) measures the performance of each business segment based on several metrics, including earnings from operations. The CODM uses these results, in part, to evaluate the performance of, and to assign resources to, each of the business segments. We do not allocate to our business segments certain operating expenses, which we manage separately at the corporate level. These unallocated costs include primarily amortization of purchased intangible assets, equity-based compensation expenses, and certain corporate governance costs.
We do not allocate any assets to segments and, therefore, no amount of assets is reported to management and disclosed in the financial information for segments. Selected operating results information for each business segment was as follows for the years ended December 31, 2019, 2018 and 2017:
Year ended December 31 Revenues Income (loss) from operations 2019 2018 2017 2019 2018 2017
Home $60,153 $67,741 $85,021 $16,821 $14,206 $16,256

-44-
Year ended December 31 Revenues Income (loss) from operations 2019 2018 2017 2019 2018 2017
Unified Communications $38,123 $38,817 $34,879 $12,555 $12,147 $9,105
SmartVoice $19,337 $10,880 $4,853 $(23,657) $(21,476) $(20,798)
Total $117,613 $117,438 $124,753 $5,719 $4,877 $4,563
Sales to our customers in the Home segment decreased for 2019 as compared to 2018, representing a decrease of 11% in absolute dollars and decreased in 2018 as compared to 2017, representing a decrease of 20% in absolute dollars. The decrease in our Home segment sales for 2019 as compared to 2018 was mainly attributable to a decline in market demands for our cordless telephony products, offset to some extent by an increase in market demands for our SmartHome products. The decrease in our Home segment sales for 2018 as compared to 2017 was mainly attributable to a decline in market demands for our cordless telephony and SmartHome products over the comparative periods.
Sales to our customers in the Unified Communications segment decreased for 2019 as compared to 2018, representing a decrease of 2% in absolute dollars. The decrease in sales in the Unified Communications segment for the comparable periods was attributable to delay in the timing of orders originating from uncertainties relating to trade war concerns as well as weakness in enterprise IT spending by businesses.
Sales to our customers in the Unified Communications segment increased for 2018 as compared to 2017, representing an increase of 11% in absolute U.S. dollars. The increase in our Unified Communications segment sales for 2018 as compared to 2017 was mainly due to an increase in our market share of Unified Communications products.
Sales to our customers in the SmartVoice segment increased for 2019 as compared to 2018, representing an increase of 78% in absolute U.S. dollars. The increase in our SmartVoice sales in 2019 as compared to 2018 was mainly attributed to an increase in the number of customers in the segment, as well as increased demand from our customers.
Sales to our customers in the SmartVoice segment increased for 2018 as compared to 2017, representing an increase of 124% in absolute U.S. dollars. The increase in our SmartVoice sales in 2018 as compared to 2017 was mainly attributed to an increase in the number of customers in the segment, as well as increased demands from our customers.
The reconciliation of segment operating results information to our consolidated financial information is included in Note 17 to our consolidated financial statements.
LIQUIDITY AND CAPITAL RESOURCES
Operating Activities. We generated $10.5, $8.7 and $8.5 million of cash and cash equivalents from our operating activities during 2019, 2018 and 2017, respectively. The increase in net cash generated by operating activities for 2019, as compared to 2018, was mainly as a result of a decrease in net loss in 2019 as compared to 2018 and of changes in working capital such as: (i) a decrease in inventories in the amount of $2.3 million during 2019 as compared to an increase of $0.4 million in 2018, and (ii) an increase in income taxes payable of $1.7 million in 2019 as compared to an increase of $0.2 million in 2018. These increases were partially offset by (a) a decrease in accounts payable in the amount of $1.2 million in 2019, as compared to an increase of $0.9 million in 2018, and (b) a decrease in accrued expenses in amount of $0.6 million as compared to an increase of $0.8 million in 2018.
-45-
The increase in net cash generated by operating activities for 2018, as compared to 2017, was mainly as a result of changes in working capital such as: (i) an increase in accounts payable in the amount of $0.9 million during 2018 as compared to a decrease of $3.9 million during 2017, (ii) an increase in accrued expenses in the amount of $0.8 million during 2018 as compared to a decrease of $0.7 million during 2017, and (iii) an increase in other accounts receivable and prepaid expenses in the amount of $0.1 million during 2018 as compared to an increase of $1.1 million during 2017. The above mentioned increases were partially offset by (x) an increase in accounts receivable in an amount of $0.1 million during 2018 as compared to a decrease of $5.7 million during 2017, (y) an increase in inventories in the amount of $0.4 million during 2018 as compared to decrease of $0.4 million during 2017, and (z) an increase in net loss before taxes on income in 2018, as compared to 2017.
Investing Activities. We invest excess cash in marketable securities of varying maturities, depending on our projected cash needs for operations, capital expenditures and other business purposes. During 2019, we purchased $73.5 million of investments in marketable securities and deposits, as compared to $36.2 million during 2018 and $49.8 million during 2017. During the same periods, $44.4 million, $20.5 million and $21.5 million, respectively, of investments in marketable securities matured and were called by the issuer. During the same periods, $25.1 million, $5.1 million and $19.2 million, respectively, of investments in marketable securities were sold. Additionally, during 2019, 2018 and 2017, $14.4 million, $5.7 million and $8.3 million, respectively, of short and long-term deposits matured.
As of December 31, 2019, the amortized cost of our marketable securities and deposits was approximately $102.1 million and their stated market value was approximately $102.0 million, representing an unrealized loss of approximately $0.1 million.
Our capital equipment purchases for 2019, consisting primarily of research and development software tools, computers and other peripheral equipment, engineering test and lab equipment, leasehold improvements, furniture and fixtures, totaled $5.6 million, as compared to $1.2 million for 2018, and $0.8 million for 2017. The increase in capital equipment spending in 2019 as compared to previous years is mainly due to the renovation of our Israeli subsidiary’s new facilities in Israel due to the new 10 year lease agreement initiated during 2019.
Financing Activities. No shares of common stock were repurchased during 2019. In addition, during 2019, we received $1.4 million upon the exercise of employee stock options.
During 2018, we repurchased approximately 1.0 million shares of our common stock at an average purchase price of $12.14 per share for an aggregate amount of $12.3 million. In addition, during 2018, we received $0.7 million upon the exercise of employee stock options.
Our board of directors has previously approved a number of share repurchase programs, including those in accordance with Rule 10b5-1 of the Securities Exchange Act of 1934, for the repurchase of our common stock. At December 31, 2019, 794,913 shares of our common stock are available for repurchase under our board-authorized share repurchase program. As of December 31, 2019, we had cash and cash equivalents totaling approximately $28.7 million and marketable securities and time deposits of approximately $102.0 million. Out of total cash, cash equivalents and marketable securities of $130.8 million, $120.2 million was held by foreign entities. Our intent is to permanently reinvest earnings of our foreign operations and our current operating plans do not demonstrate a need to repatriate foreign earnings to fund our U.S. operations. However, if these funds were repatriated to the United States, we would be required to accrue and pay taxes in several countries to repatriate these funds. The determination of the amount of taxes related to the repatriation of these earnings is not practicable, as it may vary based on various factors such as the location of the cash and the effect of regulation in the various jurisdictions from which the cash would be repatriated.
Our working capital at December 31, 2019 was approximately $69.6 million, as compared to $52.6 million as of December 31, 2018. The increase in working capital was mainly due to (i) net cash of $10.5 million generated by operating activities during 2019, and (ii) the replacement of long-term marketable securities and deposits with short-term marketable securities and deposits. The above mentioned increases were offset to some extent by the purchase of capital equipment in the amount of $5.6 during 2019. We believe that our current

-46-
cash, cash equivalents, cash deposits and market securities will be sufficient to meet our cash requirements for both the short and long term.
In addition, as part of our business strategy, we may evaluate potential acquisitions of businesses, products and technologies. Accordingly, a portion of our available cash may be used at any time for the acquisition of complementary products or businesses. Such potential transactions may require substantial capital resources, which may require us to seek additional debt or equity financing. We cannot assure you that we will be able to successfully identify suitable acquisition candidates, complete acquisitions, integrate acquired businesses into our current operations, or expand into new markets. Furthermore, we cannot assure you that additional financing will be available to us in any required time frame and on commercially reasonable terms, if at all. See the section of the risk factors entitled “We may engage in future acquisitions that could dilute our stockholders’ equity and harm our business, results of operations and financial condition.” for more detailed information.
Contractual Obligations
The following table aggregates our material expected obligations and commitments as of December 31, 2019 (in thousands):
Payment Due By Period
Contractual Obligations Total Less Than
1 Year 2-3 Years 4-5 Years More Than
5 Years
Operating Lease Commitments (1) $ 16,195 $ 2,807 $ 4,088 $ 2,976 $ 6,324 Net Pension Liability (2) 1,283 9 40 36 1,198 Development tools lease and other (3) 1,695 1,579 116 - - Total Contractual Obligations $ 19,173 $ 4,395 $ 4,244 $ 3,012 $ 7,522
(1) Represents mainly operating lease payments for facilities and vehicles under non-cancelable lease
agreements.
(2) Includes estimates of gross contributions and future payments required to meet the requirements of several defined benefit plans. The amounts presented in the table are not discounted and do not take into consideration staff turnover assumptions.
(3) Represents lease payments for development tools and other non-cancelable lease agreements.
At December 31, 2019, we had a liability for unrecognized tax benefits and an accrual for the payment of related interests totaling $3.2 million. Due to uncertainties related to those tax matters, we currently are unable to make a reasonably reliable estimate of when cash settlement with a taxing authority will occur. We believe a change in the amount of unrecognized tax benefit is reasonably possible in the next 12 months due to the examination of the tax returns of one of our subsidiaries. We currently cannot provide an estimate of the range of change in the amount of the unrecognized tax benefits due to the ongoing status of the examination.
Off-Balance Sheet Arrangements.
We do not have any off-balance sheet arrangements, as such term is defined in recently enacted rules by the Securities and Exchange Commission, that have or are reasonably likely to have a current or future effect on our financial condition, changes in financial condition, revenues or expenses, results of operations, liquidity, capital expenditures or capital resources that are material to investors.

-47-
Item 7A. QUANTITATIVE AND QUALITATIVE DISCLOSURES ABOUT MARKET RISK.
Interest Rate Risk. It is our policy not to enter into interest rate derivative financial instruments, except for hedging of foreign currency exposures discussed below. We do not currently have any significant interest rate risk since we do not have any financial obligations.
The majority of our cash and cash equivalents are invested in high grade certificates of deposits with major U.S., European and Israeli banks. Generally, cash and cash equivalents and short term deposits may be redeemed and therefore minimal credit risk exists with respect to them. Nonetheless, cash deposits with these banks exceed the Federal Deposit Insurance Corporation (“FDIC”) insurance limits in the U.S. or similar limits in foreign jurisdictions to the extent such deposits are even insured in such foreign jurisdictions. While we monitor on a systematic basis the cash balances and adjust the balances as appropriate, these balances could be impacted if one or more of the financial institutions with which we deposit our funds fails or is subject to other adverse conditions in the financial or credit markets. To date we have experienced no loss of principal or lack of access to our cash; however, we can provide no assurances that access to our cash will not be affected if the financial institutions that we hold our cash fail or if there is significant instability in the financial and credit markets.
We hold an investment portfolio of marketable securities consisting principally of debentures of U.S. and European corporations, and state and political subdivisions of the U.S. government. We intend, and have the ability, to hold investments in marketable securities with a decline in fair value until an anticipated recovery of any temporary declines in their market value. We typically do not attempt to reduce or eliminate our market exposures on our investment securities because the majority of our investments are short-term. However, we can provide no assurances that we will recover present declines in the market value of our investments.
Interest rate fluctuations relating to our cash and cash equivalents and within our investment portfolio have not had, and we do not currently anticipate such fluctuations will have, a material effect on our financial position on an annual or quarterly basis.
Foreign Currency Exchange Rate Risk. A significant part of our sales and expenses are denominated in U.S. dollars. Part of our expenses in Israel are paid in NIS, which subjects us to the risks of foreign currency fluctuations between the U.S. dollar and the NIS. Our primary expenses paid in NIS are employee salaries and lease payments on our Israeli facilities. Furthermore, a portion of our expenses for our European operations are paid in the Euro, which subjects us to the risks of foreign currency fluctuations between the U.S. dollar and the Euro. Our primary expenses paid in Euro are employee salaries, lease and operational payments on our European facilities. To partially protect the company against an increase in value of forecasted foreign currency cash flows resulting from salary and lease payments denominated in NIS during 2019, we instituted a foreign currency cash flow hedging program. The option and forward contracts used are designated as cash flow hedges, as defined by FASB ASC No. 815,” Derivatives and Hedging,” and are all effective as hedges of these expenses. For more information about our hedging activity, see Note 2 to our notes to our consolidated financial statements for the year ended December 31, 2019. An increase in the value of the NIS and the Euro in comparison to the U.S. dollar could increase the cost of our research and development expenses and general and administrative expenses, all of which could harm our operating profit. Although we currently are using a hedging program to minimize the effects of currency fluctuations relating to the NIS, our hedging position is partial, may not exist at all in the future and may not succeed in minimizing our foreign currency fluctuation risks.

-48-
Item 8. FINANCIAL STATEMENTS AND SUPPLEMENTARY DATA
CONSOLIDATED FINANCIAL STATEMENTS
AS OF DECEMBER 31, 2019
IN U.S. DOLLARS
INDEX
Page Reports of Independent Registered Public Accounting Firm 48 Consolidated Balance Sheets 50 Consolidated Statements of Operations 52 Consolidated Statements of Comprehensive Income (Loss) 53 Statements of Changes in Stockholders’ Equity 54 Consolidated Statements of Cash Flows 56 Notes to Consolidated Financial Statements 58
- - - - - - - - - -
-49-
REPORT OF INDEPENDENT REGISTERED PUBLIC ACCOUNTING FIRM To the Stockholders and the Board of Directors of DSP GROUP, Inc.
Opinion on the Financial Statements
We have audited the accompanying consolidated balance sheets of DSP GROUP, Inc. and its subsidiaries (the “Company”)
as of December 31, 2019 and 2018, the related consolidated statements of operations, comprehensive income (loss), change
in stockholders' equity and cash flows for each of the three years in the period ended December 31, 2019, and the related
notes (collectively referred to as the “financial statements”). In our opinion, the consolidated financial statements present
fairly, in all material respects, the consolidated financial position of the Company at December 31, 2019 and 2018, and the
consolidated results of its operations and its cash flows for each of the three years in the period ended December 31, 2019,
in conformity with U.S. generally accepted accounting principles.
We also have audited, in accordance with the standards of the Public Company Accounting Oversight Board (United States)
(PCAOB), the Company's internal control over financial reporting as of December 31, 2019, based on criteria established in
Internal Control-Integrated Framework issued by the Committee of Sponsoring Organizations of the Treadway Commission
and our report dated March 11, 2020 expressed an unqualified opinion thereon.
Basis for Opinion
These financial statements are the responsibility of the Company's management. Our responsibility is to express an opinion
on the Company’s financial statements based on our audits. We are a public accounting firm registered with the Public
Company Accounting Oversight Board (United States) PCAOB and are required to be independent with respect to the
Company in accordance with the U.S. federal securities laws and the applicable rules and regulations of the Securities and
Exchange Commission and the PCAOB. We conducted our audits in accordance with the standards of the PCAOB. Those
standards require that we plan and perform the audit to obtain reasonable assurance about whether the financial statements
are free of material misstatement, whether due to error or fraud. Our audits included performing procedures to assess the
risks of material misstatement of the financial statements, whether due to error or fraud, and performing procedures that
respond to those risks. Such procedures included examining, on a test basis, evidence regarding the amounts and disclosures
in the financial statements. Our audits also included evaluating the accounting principles used and significant estimates
made by management, as well as evaluating the overall presentation of the financial statements. We believe that our audits
provide a reasonable basis for our opinion.
/s/ Kost Forer Gabbay & Kasierer, a Member of Ernst & Young Global
Kost Forer Gabbay & Kasierer 144 Menachem Begin Road, Building A Tel-Aviv 6492102, Israel
Tel: +972-3-6232525 Fax: +972-3-5622555 ey.com
Tel-Aviv, Israel March 11, 2020 We have served as the Company's auditor since 1998.

-50-
REPORT OF INDEPENDENT REGISTERED PUBLIC ACCOUNTING FIRM The Board of Directors and Stockholders of DSP GROUP, Inc. Opinion on Internal Control over Financial Reporting
We have audited DSP GROUP, Inc.`s (the “Company”) internal control over financial reporting as of December 31,
2019, based on criteria established in Internal Control - Integrated Framework issued by the Committee of Sponsoring Organizations of the Treadway Commission (2013 framework) (the COSO criteria). In our opinion, the Company maintained, in all material respects, effective internal control over financial reporting as of December 31, 2019, based on the COSO criteria.
We also have audited, in accordance with the standards of the Public Company Accounting Oversight Board (United
States) (PCAOB), the consolidated balance sheets of the Company as of December 31, 2019 and 2018, and the related consolidated statements of income (loss), changes in stockholders' equity and cash flows for each of the three years in the period ended December 31, 2019 and the related notes, and our report dated March 11, 2020 expressed an unqualified opinion thereon.
Basis for Opinion
The Company's management is responsible for maintaining effective internal control over financial reporting and for its assessment of the effectiveness of internal control over financial reporting included in the accompanying Management’s Report on Internal Control Over Financial Reporting. Our responsibility is to express an opinion on the Company’s internal control over financial reporting based on our audit. We are a public accounting firm registered with the PCAOB and are required to be independent with respect to the Company in accordance with the U.S. federal securities laws and the applicable rules and regulations of the Securities and Exchange Commission and the PCAOB.
We conducted our audit in accordance with the standards of the PCAOB. Those standards require that we plan and perform the audit to obtain reasonable assurance about whether effective internal control over financial reporting was maintained in all material respects.
Our audit included obtaining an understanding of internal control over financial reporting, assessing the risk that a
material weakness exists, testing and evaluating the design and operating effectiveness of internal control based on the assessed risk, and performing such other procedures, as we considered necessary in the circumstances. We believe that our audit provides a reasonable basis for our opinion. Definition and Limitations of Internal Control Over Financial Reporting
A company’s internal control over financial reporting is a process designed to provide reasonable assurance
regarding the reliability of financial reporting and the preparation of financial statements for external purposes in accordance with generally accepted accounting principles. A company’s internal control over financial reporting includes those policies and procedures that (1) pertain to the maintenance of records that, in reasonable detail, accurately and fairly reflect the transactions and dispositions of the assets of the company; (2) provide reasonable assurance that transactions are recorded as necessary to permit preparation of financial statements in accordance with generally accepted accounting principles, and that receipts and expenditures of the company are being made only in accordance with authorizations of management and directors of the company; and (3) provide reasonable assurance regarding prevention or timely detection of unauthorized acquisition, use, or disposition of the company’s assets that could have a material effect on the financial statements.
Because of its inherent limitations, internal control over financial reporting may not prevent or detect
misstatements. Also, projections of any evaluation of effectiveness to future periods are subject to the risk that controls may become inadequate because of changes in conditions, or that the degree of compliance with the policies or procedures may deteriorate.
Kost Forer Gabbay & Kasierer 144 Menachem Begin Road, Building A Tel-Aviv 6492102, Israel
Tel: +972-3-6232525 Fax: +972-3-5622555 ey.com

-51-
/s/ Kost Forer Gabbay & Kasierer, a Member of Ernst & Young Global
Tel-Aviv, Israel March 11, 2020
Kost Forer Gabbay & Kasierer 144 Menachem Begin Road, Building A Tel-Aviv 6492102, Israel
Tel: +972-3-6232525 Fax: +972-3-5622555 ey.com
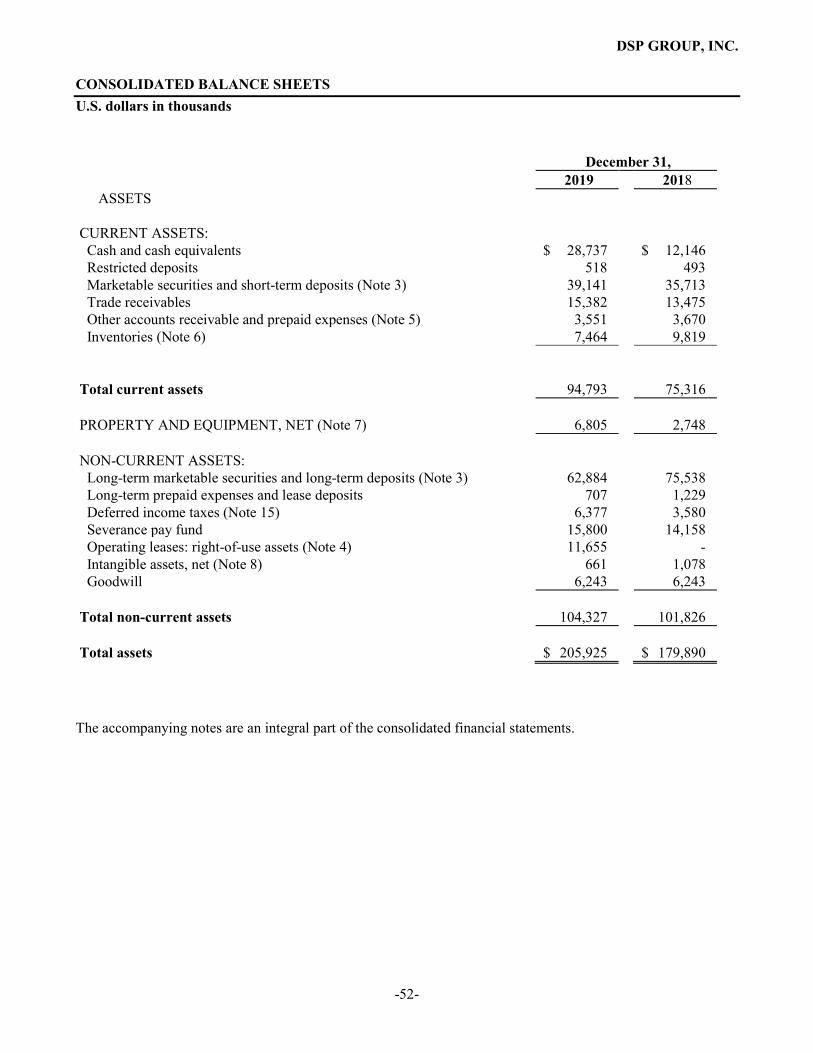
DSP GROUP, INC.
-52-
CONSOLIDATED BALANCE SHEETS U.S. dollars in thousands
December 31, 2019 2018 ASSETS
CURRENT ASSETS:
Cash and cash equivalents $ 28,737 $ 12,146 Restricted deposits 518 493 Marketable securities and short-term deposits (Note 3) 39,141 35,713 Trade receivables 15,382 13,475 Other accounts receivable and prepaid expenses (Note 5) 3,551 3,670 Inventories (Note 6) 7,464 9,819
Total current assets 94,793 75,316 PROPERTY AND EQUIPMENT, NET (Note 7) 6,805 2,748 NON-CURRENT ASSETS:
Long-term marketable securities and long-term deposits (Note 3) 62,884 75,538 Long-term prepaid expenses and lease deposits 707 1,229 Deferred income taxes (Note 15) 6,377 3,580 Severance pay fund 15,800 14,158 Operating leases: right-of-use assets (Note 4) 11,655 - Intangible assets, net (Note 8) 661 1,078 Goodwill 6,243 6,243
Total non-current assets 104,327 101,826 Total assets $ 205,925 $ 179,890
The accompanying notes are an integral part of the consolidated financial statements.
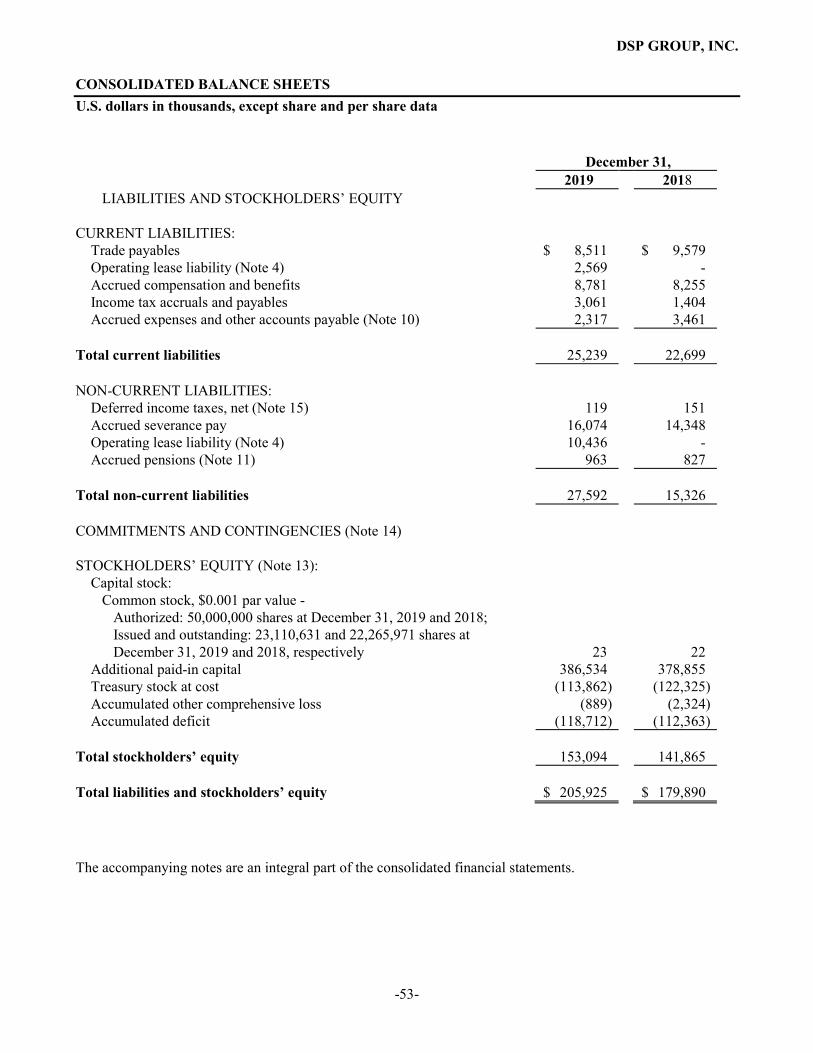
DSP GROUP, INC.
-53-
CONSOLIDATED BALANCE SHEETS U.S. dollars in thousands, except share and per share data
December 31, 2019 2018 LIABILITIES AND STOCKHOLDERS’ EQUITY
CURRENT LIABILITIES:
Trade payables $ 8,511 $ 9,579 Operating lease liability (Note 4) 2,569 - Accrued compensation and benefits 8,781 8,255 Income tax accruals and payables 3,061 1,404 Accrued expenses and other accounts payable (Note 10) 2,317 3,461
Total current liabilities 25,239 22,699 NON-CURRENT LIABILITIES:
Deferred income taxes, net (Note 15) 119 151 Accrued severance pay 16,074 14,348 Operating lease liability (Note 4) 10,436 - Accrued pensions (Note 11) 963 827
Total non-current liabilities 27,592 15,326 COMMITMENTS AND CONTINGENCIES (Note 14) STOCKHOLDERS’ EQUITY (Note 13):
Capital stock: Common stock, $0.001 par value -
Authorized: 50,000,000 shares at December 31, 2019 and 2018; Issued and outstanding: 23,110,631 and 22,265,971 shares at December 31, 2019 and 2018, respectively 23 22
Additional paid-in capital 386,534 378,855 Treasury stock at cost (113,862) (122,325) Accumulated other comprehensive loss (889) (2,324) Accumulated deficit (118,712) (112,363)
Total stockholders’ equity 153,094 141,865 Total liabilities and stockholders’ equity $ 205,925 $ 179,890 The accompanying notes are an integral part of the consolidated financial statements.
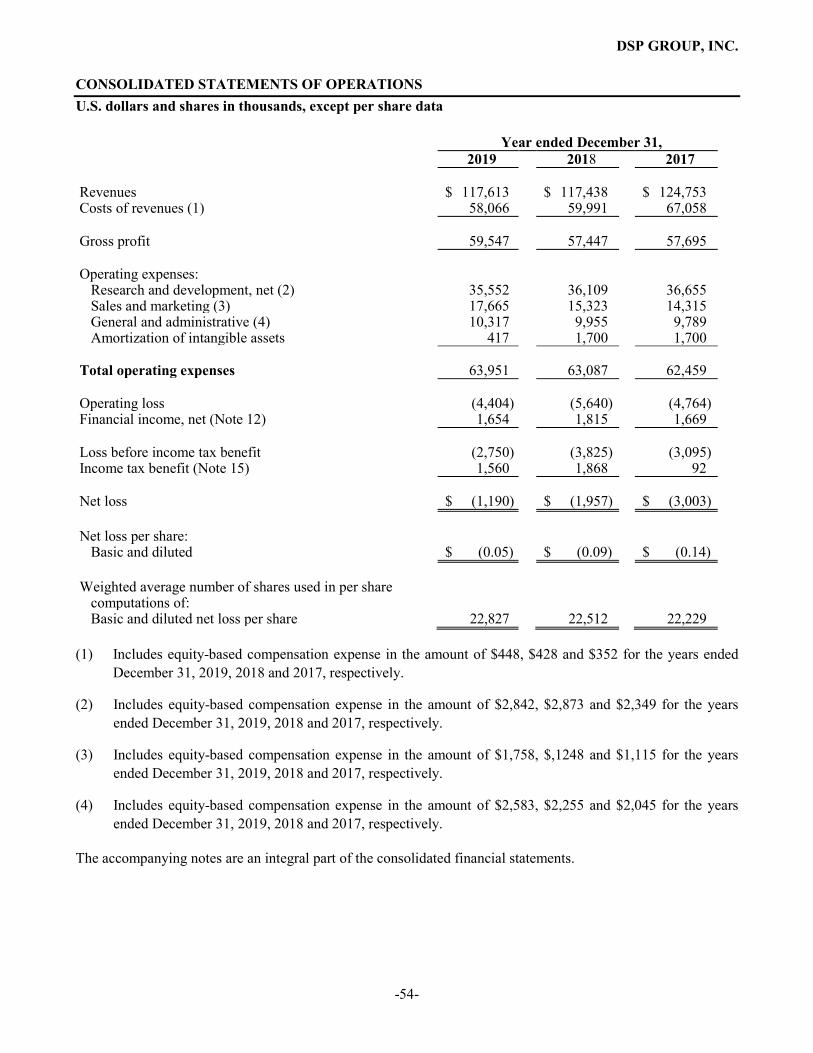
DSP GROUP, INC.
-54-
CONSOLIDATED STATEMENTS OF OPERATIONS U.S. dollars and shares in thousands, except per share data Year ended December 31, 2019 2018 2017 Revenues $ 117,613 $ 117,438 $ 124,753 Costs of revenues (1) 58,066 59,991 67,058 Gross profit 59,547 57,447 57,695 Operating expenses:
Research and development, net (2) 35,552 36,109 36,655 Sales and marketing (3) 17,665 15,323 14,315 General and administrative (4) 10,317 9,955 9,789 Amortization of intangible assets 417 1,700 1,700
Total operating expenses 63,951 63,087 62,459 Operating loss (4,404) (5,640) (4,764) Financial income, net (Note 12) 1,654 1,815 1,669 Loss before income tax benefit (2,750) (3,825) (3,095) Income tax benefit (Note 15) 1,560 1,868 92 Net loss $ (1,190) $ (1,957) $ (3,003) Net loss per share:
Basic and diluted $ (0.05) $ (0.09) $ (0.14) Weighted average number of shares used in per share
computations of: Basic and diluted net loss per share 22,827 22,512 22,229
(1) Includes equity-based compensation expense in the amount of $448, $428 and $352 for the years ended December 31, 2019, 2018 and 2017, respectively.
(2) Includes equity-based compensation expense in the amount of $2,842, $2,873 and $2,349 for the years ended December 31, 2019, 2018 and 2017, respectively.
(3) Includes equity-based compensation expense in the amount of $1,758, $ 1, 248 and $1,115 for the years ended December 31, 2019, 2018 and 2017, respectively.
(4) Includes equity-based compensation expense in the amount of $2,583, $2,255 and $2,045 for the years ended December 31, 2019, 2018 and 2017, respectively.
The accompanying notes are an integral part of the consolidated financial statements.

DSP GROUP, INC.
-55-
CONSOLIDATED STATEMENTS OF COMPREHENSIVE INCOME (LOSS) U.S. dollars in thousands
Year ended December 31,
2019 2018 2017
Net loss: $ (1,190) $ (1,957) $ (3,003) Other comprehensive income (loss):
Available-for-sale securities:
Changes in unrealized income (loss) 1,494 (465) (158)Reclassification adjustments for losses included in net income (loss) 73 41 50
Net change 1,567 (424) (108)Cash flow hedges:
Changes in unrealized gains (losses) 108 (19) 163Reclassification adjustments for (gains) losses included in net income (loss) (105) 16 (172) Net change 3 (3) (9)
Change in unrealized components of defined benefit plans:
Gains (losses) arising during the period (141) 29 24 Amortization of actuarial loss and prior
service benefit 16 19 22 Net change (125) 48 46
Foreign currency translation adjustments, net (10) (71) 49
Other comprehensive income (loss) 1,435 (450) (22)Comprehensive income (loss) $ 245 $ (2,407) $ (3,025)
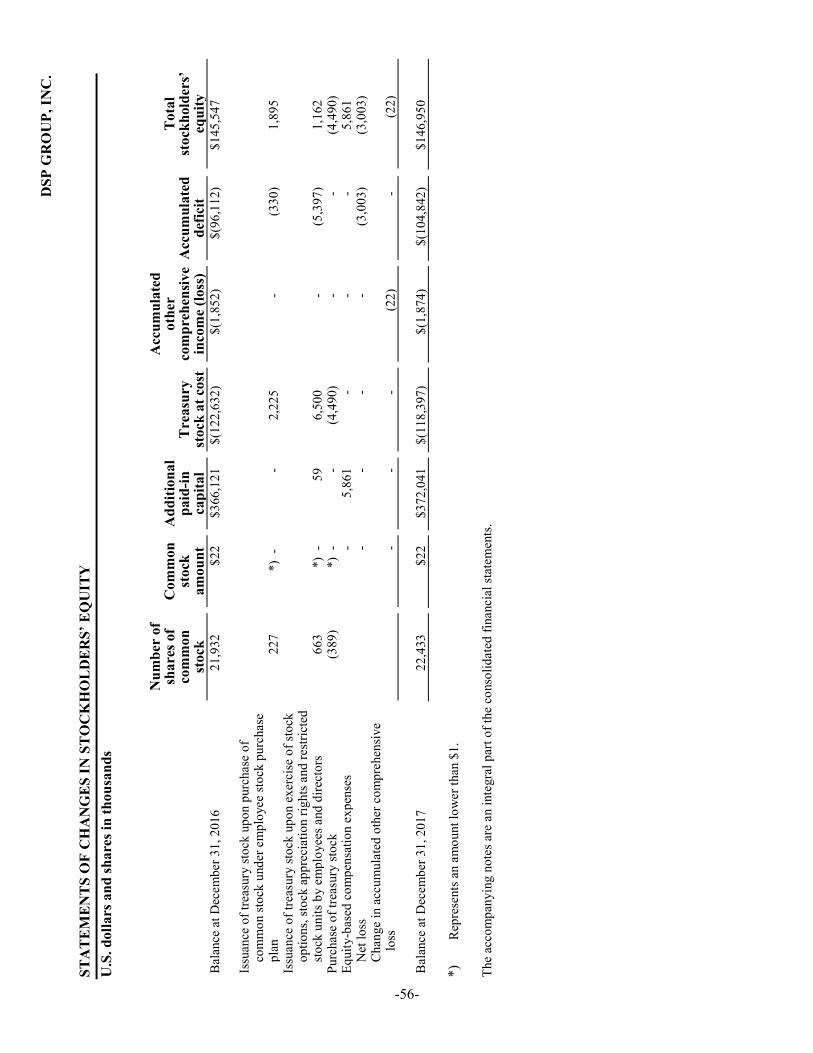
DSP
GR
OU
P, IN
C.
STA
TE
ME
NT
S O
F C
HA
NG
ES
IN S
TO
CK
HO
LD
ER
S’ E
QU
ITY
U
.S. d
olla
rs a
nd sh
ares
in th
ousa
nds
Num
ber
of
shar
es o
f co
mm
on
stoc
k
Com
mon
st
ock
amou
nt
Add
ition
al
paid
-in
capi
tal
Tre
asur
y st
ock
at c
ost
Acc
umul
ated
ot
her
com
preh
ensi
ve
inco
me
(loss
) A
ccum
ulat
ed
defic
it
Tot
al
stoc
khol
ders
’ eq
uity
B
alan
ce a
t Dec
embe
r 31,
201
6 21
,932
$2
2 $3
66,1
21
$(12
2,63
2)
$(1,
852)
$(
96,1
12)
$145
,547
Issu
ance
of t
reas
ury
stoc
k up
on p
urch
ase
of
com
mon
stoc
k un
der e
mpl
oyee
stoc
k pu
rcha
se
plan
22
7 *)
-
- 2,
225
-(3
30)
1,89
5 Is
suan
ce o
f tre
asur
y st
ock
upon
exe
rcis
e of
stoc
k op
tions
, sto
ck a
ppre
ciat
ion
right
s and
rest
ricte
d st
ock
units
by
empl
oyee
s and
dire
ctor
s 66
3 *
) -
59
6,50
0 -
(5,3
97)
1,16
2 Pu
rcha
se o
f tre
asur
y st
ock
(389
)*)
--
(4,4
90)
--
(4,4
90)
Equi
ty-b
ased
com
pens
atio
n ex
pens
es
-5,
861
- -
- 5,
861
Net
loss
-
--
- (3
,003
) (3
,003
) C
hang
e in
acc
umul
ated
oth
er c
ompr
ehen
sive
lo
ss
- -
- (2
2)-
(22)
Bal
ance
at D
ecem
ber 3
1, 2
017
22
,433
$22
$3
72,0
41
$(1
18,3
97)
$(1,
874)
$(
104,
842)
$1
46,9
50
*)
Rep
rese
nts a
n am
ount
low
er th
an $
1.
The
acco
mpa
nyin
g no
tes a
re a
n in
tegr
al p
art o
f the
con
solid
ated
fina
ncia
l sta
tem
ents
.
-56-
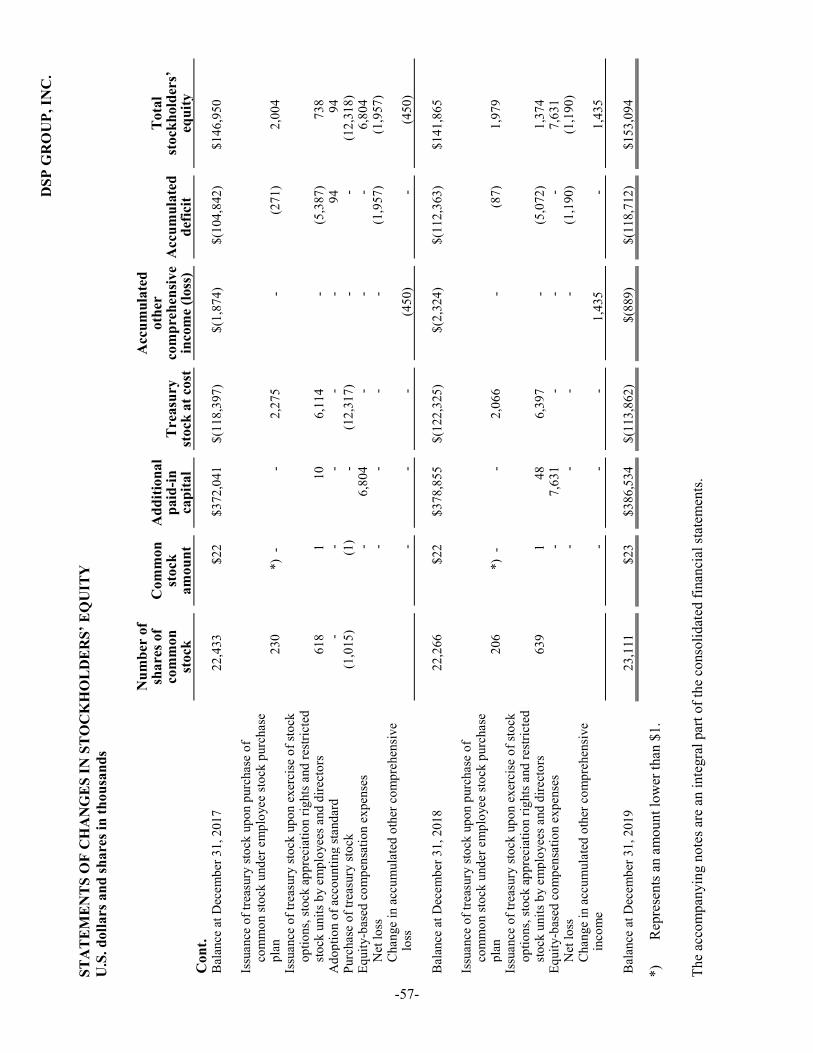
DSP
GR
OU
P, IN
C.
STA
TE
ME
NT
S O
F C
HA
NG
ES
IN S
TO
CK
HO
LD
ER
S’ E
QU
ITY
U
.S. d
olla
rs a
nd sh
ares
in th
ousa
nds
Num
ber
of
shar
es o
f co
mm
on
stoc
k
Com
mon
st
ock
amou
nt
Add
ition
al
paid
-in
capi
tal
Tre
asur
y st
ock
at c
ost
Acc
umul
ated
ot
her
com
preh
ensi
ve
inco
me
(loss
) A
ccum
ulat
ed
defic
it
Tot
al
stoc
khol
ders
’ eq
uity
C
ont.
Bal
ance
at D
ecem
ber 3
1, 2
017
22,4
33
$22
$372
,041
$(
118,
397)
$(
1,87
4)
$(10
4,84
2)
$146
,950
Issu
ance
of t
reas
ury
stoc
k up
on p
urch
ase
of
com
mon
stoc
k un
der e
mpl
oyee
stoc
k pu
rcha
se
plan
23
0 *)
-
- 2,
275
-(2
71)
2,00
4 Is
suan
ce o
f tre
asur
y st
ock
upon
exe
rcis
e of
stoc
k op
tions
, sto
ck a
ppre
ciat
ion
right
s and
rest
ricte
d st
ock
units
by
empl
oyee
s and
dire
ctor
s 61
8 1
10
6,
114
-(5
,387
)73
8 A
dopt
ion
of a
ccou
ntin
g st
anda
rd
- -
- -
-94
94
Purc
hase
of t
reas
ury
stoc
k (1
,015
) (1
)-
(12,
317)
-
-(1
2,31
8)
Equi
ty-b
ased
com
pens
atio
n ex
pens
es
-6,
804
- -
- 6,
804
Net
loss
-
--
- (1
,957
) (1
,957
) C
hang
e in
acc
umul
ated
oth
er c
ompr
ehen
sive
lo
ss
- -
- (4
50)
-(4
50)
Bal
ance
at D
ecem
ber 3
1, 2
018
22,2
66
$22
$378
,855
$(
122,
325)
$(
2,32
4)
$(11
2,36
3)
$141
,865
Issu
ance
of t
reas
ury
stoc
k up
on p
urch
ase
of
com
mon
stoc
k un
der e
mpl
oyee
stoc
k pu
rcha
se
plan
20
6 *)
-
- 2,
066
-(8
7)1,
979
Issu
ance
of t
reas
ury
stoc
k up
on e
xerc
ise
of st
ock
optio
ns, s
tock
app
reci
atio
n rig
hts a
nd re
stric
ted
stoc
k un
its b
y em
ploy
ees a
nd d
irect
ors
639
1
48
6,39
7 -
(5,0
72)
1,37
4 Eq
uity
-bas
ed c
ompe
nsat
ion
expe
nses
-
7,63
1-
- -
7,63
1 N
et lo
ss
- -
- -
(1,1
90)
(1,1
90)
Cha
nge
in a
ccum
ulat
ed o
ther
com
preh
ensi
ve
inco
me
- -
- 1,
435
-1,
435
Bal
ance
at D
ecem
ber 3
1, 2
019
23,1
11
$23
$386
,534
$
(113
,862
) $(
889)
$(
118,
712)
$1
53,0
94
*)
Rep
rese
nts a
n am
ount
low
er th
an $
1.
The
acco
mpa
nyin
g no
tes a
re a
n in
tegr
al p
art o
f the
con
solid
ated
fina
ncia
l sta
tem
ents
.
-57-

U.S
. dol
lars
in th
ousa
nds,
exce
pt sh
are
and
per
shar
e da
ta.
CO
NSO
LID
AT
ED
ST
AT
EM
EN
TS
OF
CA
SH F
LOW
S U
.S. d
olla
rs in
thou
sand
s
Yea
r en
ded
Dec
embe
r 31
, 20
19
2018
20
17
Cas
h flo
ws f
rom
ope
ratin
g ac
tiviti
es:
Net
loss
$
(1,1
90)
$ (1
,957
) $
(3,0
03)
Adj
ustm
ents
requ
ired
to re
conc
ile n
et lo
ss to
net
cas
h pr
ovid
ed b
y op
erat
ing
activ
ities
: D
epre
ciat
ion
1,
517
1,59
3 1,
781
Equi
ty-b
ased
com
pens
atio
n ex
pens
es re
late
d to
em
ploy
ees’
stoc
k op
tions
, SA
Rs a
nd R
SUs
7,63
1 6,
804
5,86
1 C
apita
l los
s fro
m sa
le a
nd d
ispo
sal o
f pro
perty
and
eq
uipm
ent
9 -
19R
ealiz
ed lo
sses
from
sale
of m
arke
tabl
e se
curit
ies,
net
73
41
50A
mor
tizat
ion
of in
tang
ible
ass
ets
417
1,70
0 1,
700
Ope
ratin
g le
ase
right
-of-u
se a
sset
am
ortiz
atio
n ex
pens
es
1,34
7 -
- C
hang
e in
ope
ratin
g le
ase
liabi
lity
(562
)-
- A
ccru
ed in
tere
st a
nd a
mor
tizat
ion
of p
rem
ium
on
mar
keta
ble
secu
ritie
s and
shor
t-ter
m d
epos
its
337
601
372
Cha
nge
in o
pera
ting
asse
ts a
nd li
abili
ties:
D
efer
red
inco
me
tax
asse
ts a
nd li
abili
ties,
net
(2,8
33)
(2,8
14)
(459
) Tr
ade
rece
ivab
les,
net
(1,9
16)
(107
)5,
728
Oth
er a
ccou
nts r
ecei
vabl
e an
d pr
epai
d ex
pens
es
817
(76)
(1,1
42)
Inve
ntor
ies
2,34
5 (4
31)
363
Long
-term
pre
paid
exp
ense
s and
leas
e de
posi
ts (2
8)(1
59)
(212
)Tr
ade
paya
bles
(1
,197
) 92
7(3
,893
) A
ccru
ed c
ompe
nsat
ion
and
bene
fits
2,51
5 1,
598
1,87
8 In
com
e ta
x ac
crua
ls
1,65
3 18
0 39
A
ccru
ed e
xpen
ses a
nd o
ther
acc
ount
s pay
able
(5
73)
767
(704
) A
ccru
ed se
vera
nce
pay,
net
84
(8
)11
7A
ccru
ed p
ensi
ons
26
32
18
Net
cas
h pr
ovid
ed b
y op
erat
ing
activ
ities
10
,472
8,
691
8,51
3
Cas
h flo
ws f
rom
inve
stin
g ac
tiviti
es:
-58-

U.S
. dol
lars
in th
ousa
nds,
exce
pt sh
are
and
per
shar
e da
ta.
Purc
hase
of m
arke
tabl
e se
curit
ies
(57,
558)
(2
7,56
4)
(38,
924)
Pu
rcha
se o
f sho
rt-te
rm d
epos
its
(15,
942)
(8
,668
) (1
0,88
4)
Proc
eeds
from
mat
urity
of m
arke
tabl
e se
curit
ies
44,3
96
20,5
01
21,4
99
Proc
eeds
from
sale
s of m
arke
tabl
e se
curit
ies
25,0
64
5,11
3 19
,226
Pr
ocee
ds fr
om re
dem
ptio
n of
shor
t-ter
m d
epos
its
14,4
20
5,66
8 8,
309
Purc
hase
s of p
rope
rty a
nd e
quip
men
t (5
,638
) (1
,181
) (8
38)
Pr
ocee
ds fr
om sa
le o
f fix
ed a
sset
s 51
-
-
Oth
er in
vest
ing
activ
ities
(5
18)
(104
)-
Net
cas
h pr
ovid
ed b
y (u
sed
in) i
nves
ting
activ
ities
$
4
,275
$
(6
,235
) $
(1
,612
)
The
acco
mpa
nyin
g no
tes a
re a
n in
tegr
al p
art o
f the
con
solid
ated
fina
ncia
l sta
tem
ents
.
-59-
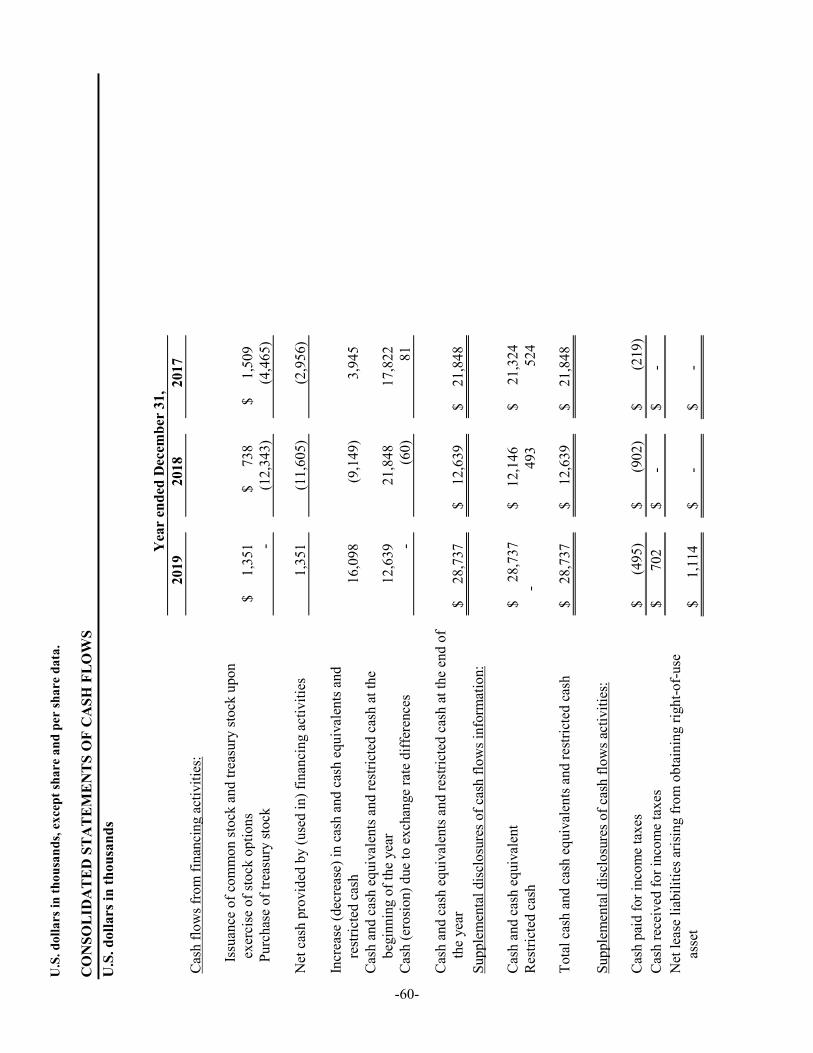
U.S
. dol
lars
in th
ousa
nds,
exce
pt sh
are
and
per
shar
e da
ta.
CO
NSO
LID
AT
ED
ST
AT
EM
EN
TS
OF
CA
SH F
LOW
S U
.S. d
olla
rs in
thou
sand
s
Yea
r en
ded
Dec
embe
r 31
, 20
19
2018
20
17
Cas
h flo
ws f
rom
fina
ncin
g ac
tiviti
es:
Issu
ance
of c
omm
on st
ock
and
treas
ury
stoc
k up
on
exer
cise
of s
tock
opt
ions
$
1
,351
$
7
38
$
1,5
09
Purc
hase
of t
reas
ury
stoc
k -
(12,
343)
(4,4
65)
Net
cas
h pr
ovid
ed b
y (u
sed
in) f
inan
cing
act
iviti
es
1,35
1 (1
1,60
5)
(2,9
56)
Incr
ease
(dec
reas
e) in
cas
h an
d ca
sh e
quiv
alen
ts a
nd
rest
ricte
d ca
sh
16,0
98
(9,1
49)
3,94
5 C
ash
and
cash
equ
ival
ents
and
rest
ricte
d ca
sh a
t the
be
ginn
ing
of th
e ye
ar
12,6
39
21,8
48
17,8
22
Cas
h (e
rosi
on) d
ue to
exc
hang
e ra
te d
iffer
ence
s -
(60)
81
Cas
h an
d ca
sh e
quiv
alen
ts a
nd re
stric
ted
cash
at t
he e
nd o
f th
e ye
ar
$ 28
,737
$
12,6
39
$ 21
,848
Su
pple
men
tal d
iscl
osur
es o
f cas
h flo
ws i
nfor
mat
ion:
Cas
h an
d ca
sh e
quiv
alen
t $
2
8,73
7 $
12
,146
$
2
1,32
4 R
estri
cted
cas
h -
493
524
Tota
l cas
h an
d ca
sh e
quiv
alen
ts a
nd re
stric
ted
cash
$
28,7
37
$ 12
,639
$
21,8
48
Supp
lem
enta
l dis
clos
ures
of c
ash
flow
s act
iviti
es:
Cas
h pa
id fo
r inc
ome
taxe
s $
(495
)$
(902
)$
(21
9)
Cas
h re
ceiv
ed fo
r inc
ome
taxe
s $
702
$
-$
-
Net
leas
e lia
bilit
ies a
risin
g fr
om o
btai
ning
righ
t-of-
use
asse
t $
1
,114
$
-$
-
-60-

U.S
. dol
lars
in th
ousa
nds,
exce
pt sh
are
and
per
shar
e da
ta.
The
acco
mpa
nyin
g no
tes a
re a
n in
tegr
al p
art o
f the
con
solid
ated
fina
ncia
l sta
tem
ents
.
-61-

U.S
. dol
lars
in th
ousa
nds,
exce
pt sh
are
and
per
shar
e da
ta.
NO
TE
1:-
G
EN
ER
AL
DSP
Gro
up, I
nc.,
a D
elaw
are
corp
orat
ion,
and
its
subs
idia
ries
(col
lect
ivel
y, th
e “C
ompa
ny”)
, are
a fa
bles
s se
mic
ondu
ctor
com
pany
off
erin
g ad
vanc
ed c
hips
et s
olut
ions
for a
var
iety
of v
oice
, aud
io, v
ideo
and
dat
a ap
plic
atio
ns. T
he C
ompa
ny is
a w
orld
wid
e le
ader
in th
e sh
ort-r
ange
w
irele
ss c
omm
unic
atio
n m
arke
t, en
ablin
g ho
me
and
busi
ness
net
wor
king
con
verg
ence
for v
oice
, aud
io, v
ideo
and
dat
a.
The
Com
pany
sel
ls it
s pr
oduc
ts th
roug
h di
strib
utor
s an
d di
rect
ly to
OEM
s an
d or
igin
al d
esig
n m
anuf
actu
rers
(O
DM
s) th
at in
corp
orat
e th
e C
ompa
ny’s
pro
duct
s in
to c
onsu
mer
and
ent
erpr
ise
prod
ucts
. The
Com
pany
exp
ects
that
a li
mite
d nu
mbe
r of c
usto
mer
s, va
ryin
g in
iden
tity
from
per
iod-
to-p
erio
d, w
ill a
ccou
nt fo
r a su
bsta
ntia
l por
tion
of it
s rev
enue
s in
any
perio
d. T
he lo
ss o
f, or
redu
ced
dem
and
for p
rodu
cts f
rom
, an
y of
the
Com
pany
’s m
ajor
cus
tom
ers
coul
d ha
ve a
mat
eria
l adv
erse
eff
ect o
n th
e C
ompa
ny’s
bus
ines
s, fin
anci
al c
ondi
tion
and
resu
lts o
f op
erat
ions
.
The
follo
win
g ta
ble
repr
esen
ts th
e C
ompa
ny’s
sal
es, a
s a
perc
enta
ge o
f th
e C
ompa
ny’s
tota
l rev
enue
s, fo
r th
e ye
ars
ende
d D
ecem
ber
31,
2019
, 201
8 an
d 20
17:
Yea
r en
ded
Dec
embe
r 31
, M
ajor
Cus
tom
ers/
Dis
trib
utor
s 20
19
2018
20
17
VTe
ch H
oldi
ngs L
td.
21%
24
%
27%
Nex
ty E
lect
roni
cs L
td. (
“Nex
ty
Elec
troni
cs”)
¹ ²
*11
%12
%
Asc
end
Tech
nolo
gy In
c. (“
Asc
end
Tech
nolo
gy”)
¹ ³
27%
26
%23
%
*Les
s tha
n 10
%.
¹ Dis
tribu
tor
² Nex
ty E
lect
roni
cs s
ells
the
Com
pany
’s p
rodu
cts
to a
lim
ited
num
ber
of c
usto
mer
s. O
ne c
usto
mer
, Pan
ason
ic C
omm
unic
atio
ns C
o., L
td.
(“Pa
naso
nic”
) ha
s co
ntin
ually
acc
ount
ed f
or a
maj
ority
of
the
sale
s of
Nex
ty E
lect
roni
cs. S
ales
to
Pana
soni
c th
roug
h N
exty
Ele
ctro
nics
ge
nera
ted
appr
oxim
atel
y 7%
, 9%
and
10%
of t
he C
ompa
ny’s
tota
l rev
enue
s for
201
9, 2
018
and
2017
, res
pect
ivel
y.
³ A
scen
d Te
chno
logy
sel
ls o
ur p
rodu
cts
to a
lim
ited
num
ber
of c
usto
mer
s. on
e of
tho
se c
usto
mer
s –
Cis
co S
yste
ms,
Inc.
(“C
isco
”) –
ac
coun
ted
for 1
0%, 8
% a
nd 6
% o
f our
tota
l rev
enue
s for
the
year
s end
ed D
ecem
ber 3
1, 2
019,
201
8 an
d 20
17, r
espe
ctiv
ely.
-62-

U.S
. dol
lars
in th
ousa
nds,
exce
pt sh
are
and
per
shar
e da
ta.
All
of t
he C
ompa
ny’s
int
egra
ted
circ
uit
prod
ucts
are
man
ufac
ture
d an
d te
sted
by
inde
pend
ent
foun
drie
s an
d te
st h
ouse
s. W
hile
the
se
foun
drie
s an
d te
st h
ouse
s ha
ve b
een
able
to a
dequ
atel
y m
eet t
he d
eman
ds o
f the
Com
pany
’s b
usin
ess,
the
Com
pany
is a
nd w
ill c
ontin
ue to
be
dep
ende
nt u
pon
thes
e fo
undr
ies a
nd te
st h
ouse
s to
achi
eve
acce
ptab
le m
anuf
actu
ring
yiel
ds, q
ualit
y le
vels
and
cos
ts, a
nd to
allo
cate
to th
e C
ompa
ny a
suf
ficie
nt p
ortio
n of
foun
dry
and
test
cap
acity
to m
eet t
he C
ompa
ny’s
nee
ds in
a ti
mel
y m
anne
r. R
even
ues
coul
d be
mat
eria
lly
and
adve
rsel
y af
fect
ed s
houl
d an
y of
thes
e fo
undr
ies
and
test
hou
ses
fail
to m
eet t
he C
ompa
ny’s
requ
est f
or p
rodu
ct m
anuf
actu
ring
due
to a
sh
orta
ge o
f pr
oduc
tion
capa
city
, pr
oces
s di
ffic
ultie
s, lo
w y
ield
rat
es o
r fin
anci
al i
nsta
bilit
y. A
dditi
onal
ly,
certa
in o
f th
e ra
w m
ater
ials
, co
mpo
nent
s, an
d su
bass
embl
ies
incl
uded
in
the
prod
ucts
man
ufac
ture
d by
the
Com
pany
’s o
rigin
al e
quip
men
t m
anuf
actu
rer
(OEM
) cu
stom
ers,
whi
ch in
corp
orat
e th
e C
ompa
ny’s
pro
duct
s, ar
e ob
tain
ed fr
om a
lim
ited
grou
p of
supp
liers
. Dis
rupt
ions
, sho
rtage
s, or
term
inat
ion
of c
erta
in o
f the
se so
urce
s of s
uppl
y co
uld
occu
r and
cou
ld n
egat
ivel
y af
fect
the
Com
pany
’s fi
nanc
ial c
ondi
tion
and
resu
lts o
f ope
ratio
ns.
NO
TE
2:-
SI
GN
IFIC
AN
T A
CC
OU
NT
ING
PO
LIC
IES
The
cons
olid
ated
fin
anci
al s
tate
men
ts a
re p
repa
red
acco
rdin
g to
Uni
ted
Stat
es g
ener
ally
acc
epte
d ac
coun
ting
prin
cipl
es (
“U.S
. G
AA
P”).
a.U
se o
f est
imat
es:
The
prep
arat
ion
of f
inan
cial
sta
tem
ents
in
conf
orm
ity w
ith U
.S.
GA
AP
requ
ires
man
agem
ent
to m
ake
estim
ates
, ju
dgm
ents
and
assu
mpt
ions
. The
Com
pany
’s m
anag
emen
t bel
ieve
s th
at th
e es
timat
es, j
udgm
ents
and
ass
umpt
ions
use
d ar
e re
ason
able
bas
ed u
pon
info
rmat
ion
avai
labl
e at
the
tim
e th
at t
hese
est
imat
es,
judg
men
ts a
nd a
ssum
ptio
ns a
re m
ade.
The
se e
stim
ates
, ju
dgm
ents
and
assu
mpt
ions
can
aff
ect t
he re
porte
d am
ount
s of
ass
ets
and
liabi
litie
s an
d di
sclo
sure
of c
ontin
gent
ass
ets
and
liabi
litie
s at
the
date
s of
the
finan
cial
sta
tem
ents
, and
the
repo
rted
amou
nts
of r
even
ue a
nd e
xpen
ses
durin
g th
e re
porti
ng p
erio
d. A
ctua
l res
ults
cou
ld d
iffer
from
thos
e es
timat
es.
b.Fi
nanc
ial s
tate
men
ts in
U.S
. dol
lars
:
Mos
t of t
he C
ompa
ny’s
reve
nues
are
gen
erat
ed in
U.S
. dol
lars
. In
addi
tion,
a s
ubst
antia
l por
tion
of th
e C
ompa
ny’s
cos
ts a
re in
curr
edin
U.S
. dol
lars
. The
Com
pany
’s m
anag
emen
t bel
ieve
s th
at th
e U
.S. d
olla
r is
the
curr
ency
of
the
prim
ary
econ
omic
env
ironm
ent i
nw
hich
the
Com
pany
ope
rate
s. Th
us, t
he fu
nctio
nal a
nd re
porti
ng c
urre
ncy
of th
e Co
mpa
ny is
the
U.S
. dol
lar.
Mon
etar
y ac
coun
ts m
aint
aine
d in
cur
renc
ies
othe
r tha
n th
e U
.S. d
olla
r are
rem
easu
red
into
dol
lars
in a
ccor
danc
e w
ith A
SC N
o. 8
30-
30, “
Tran
slat
ion
of F
inan
cial
Sta
tem
ents
.” A
ll tra
nsac
tion
gain
s an
d lo
sses
res
ultin
g fr
om th
e re
mea
sure
men
t of
mon
etar
y ba
lanc
esh
eet i
tem
s are
refle
cted
in th
e co
nsol
idat
ed st
atem
ents
of o
pera
tions
as f
inan
cial
inco
me
or e
xpen
ses a
s app
ropr
iate
.
The
finan
cial
sta
tem
ents
of t
he C
ompa
ny’s
sub
sidi
ary
– D
SP G
roup
Tec
hnol
ogie
s G
mbH
who
se fu
nctio
nal c
urre
ncy
is in
Eur
o, h
asbe
en tr
ansl
ated
into
dol
lars
. All
amou
nts
on th
e ba
lanc
e sh
eets
hav
e be
en tr
ansl
ated
into
the
dolla
r usi
ng th
e ex
chan
ge ra
tes
in e
ffec
ton
the
rele
vant
bal
ance
shee
t dat
es. A
ll am
ount
s in
the
cons
olid
ated
stat
emen
ts o
f ope
ratio
ns h
ave
been
tran
slate
d in
to th
e do
llar u
sing
-63-
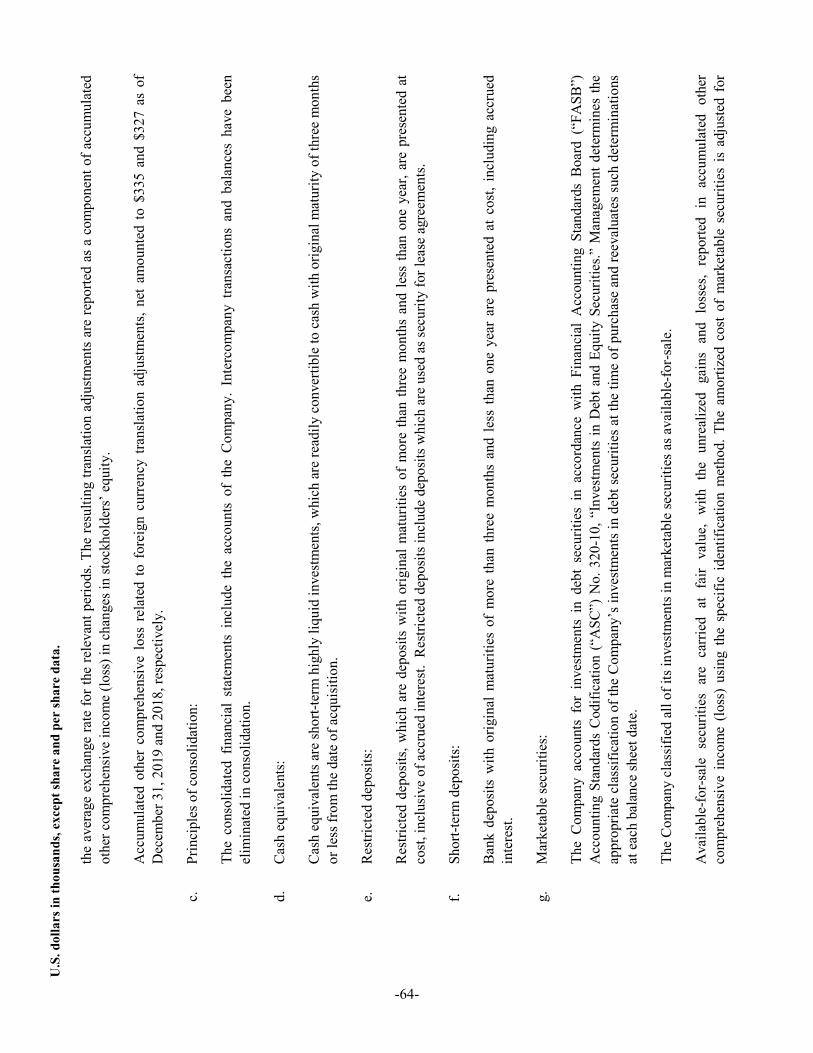
U.S
. dol
lars
in th
ousa
nds,
exce
pt sh
are
and
per
shar
e da
ta.
the
aver
age
exch
ange
rate
for t
he re
leva
nt p
erio
ds. T
he re
sulti
ng tr
ansl
atio
n ad
just
men
ts a
re re
porte
d as
a c
ompo
nent
of a
ccum
ulat
ed
othe
r com
preh
ensi
ve in
com
e (lo
ss) i
n ch
ange
s in
stoc
khol
ders
’ equ
ity.
Acc
umul
ated
oth
er c
ompr
ehen
sive
los
s re
late
d to
for
eign
cur
renc
y tra
nsla
tion
adju
stm
ents
, net
am
ount
ed t
o $3
35 a
nd $
327
as o
f D
ecem
ber 3
1, 2
019
and
2018
, res
pect
ivel
y.
c.Pr
inci
ples
of c
onso
lidat
ion:
The
cons
olid
ated
fin
anci
al s
tate
men
ts i
nclu
de t
he a
ccou
nts
of t
he C
ompa
ny.
Inte
rcom
pany
tra
nsac
tions
and
bal
ance
s ha
ve b
een
elim
inat
ed in
con
solid
atio
n.
d.C
ash
equi
vale
nts:
Cas
h eq
uiva
lent
s are
shor
t-ter
m h
ighl
y liq
uid
inve
stm
ents
, whi
ch a
re re
adily
con
verti
ble
to c
ash
with
orig
inal
mat
urity
of t
hree
mon
ths
or le
ss fr
om th
e da
te o
f acq
uisi
tion.
e.R
estri
cted
dep
osits
:
Res
trict
ed d
epos
its, w
hich
are
dep
osits
with
orig
inal
mat
uriti
es o
f m
ore
than
thre
e m
onth
s an
d le
ss th
an o
ne y
ear,
are
pres
ente
d at
cost
, inc
lusi
ve o
f acc
rued
inte
rest.
Res
trict
ed d
epos
its in
clud
e de
posit
s whi
ch a
re u
sed
as se
curit
y fo
r lea
se a
gree
men
ts.
f.Sh
ort-t
erm
dep
osits
:
Ban
k de
posi
ts w
ith o
rigin
al m
atur
ities
of
mor
e th
an t
hree
mon
ths
and
less
tha
n on
e ye
ar a
re p
rese
nted
at
cost
, inc
ludi
ng a
ccru
edin
tere
st.
g.M
arke
tabl
e se
curit
ies:
The
Com
pany
acc
ount
s fo
r in
vest
men
ts i
n de
bt s
ecur
ities
in
acco
rdan
ce w
ith F
inan
cial
Acc
ount
ing
Stan
dard
s B
oard
(“F
ASB
”)A
ccou
ntin
g St
anda
rds
Cod
ifica
tion
(“A
SC”)
No.
320
-10,
“In
vest
men
ts in
Deb
t and
Equ
ity S
ecur
ities
.” M
anag
emen
t det
erm
ines
the
appr
opria
te c
lass
ifica
tion
of th
e C
ompa
ny’s
inve
stm
ents
in d
ebt s
ecur
ities
at t
he ti
me
of p
urch
ase
and
reev
alua
tes s
uch
dete
rmin
atio
nsat
eac
h ba
lanc
e sh
eet d
ate.
The
Com
pany
cla
ssifi
ed a
ll of
its i
nves
tmen
ts in
mar
keta
ble
secu
ritie
s as a
vaila
ble-
for-
sale
.
Ava
ilabl
e-fo
r-sal
e se
curit
ies
are
carr
ied
at f
air
valu
e, w
ith t
he u
nrea
lized
gai
ns a
nd l
osse
s, re
porte
d in
acc
umul
ated
oth
erco
mpr
ehen
sive
inc
ome
(loss
) us
ing
the
spec
ific
iden
tific
atio
n m
etho
d. T
he a
mor
tized
cos
t of
mar
keta
ble
secu
ritie
s is
adj
uste
d fo
r
-64-
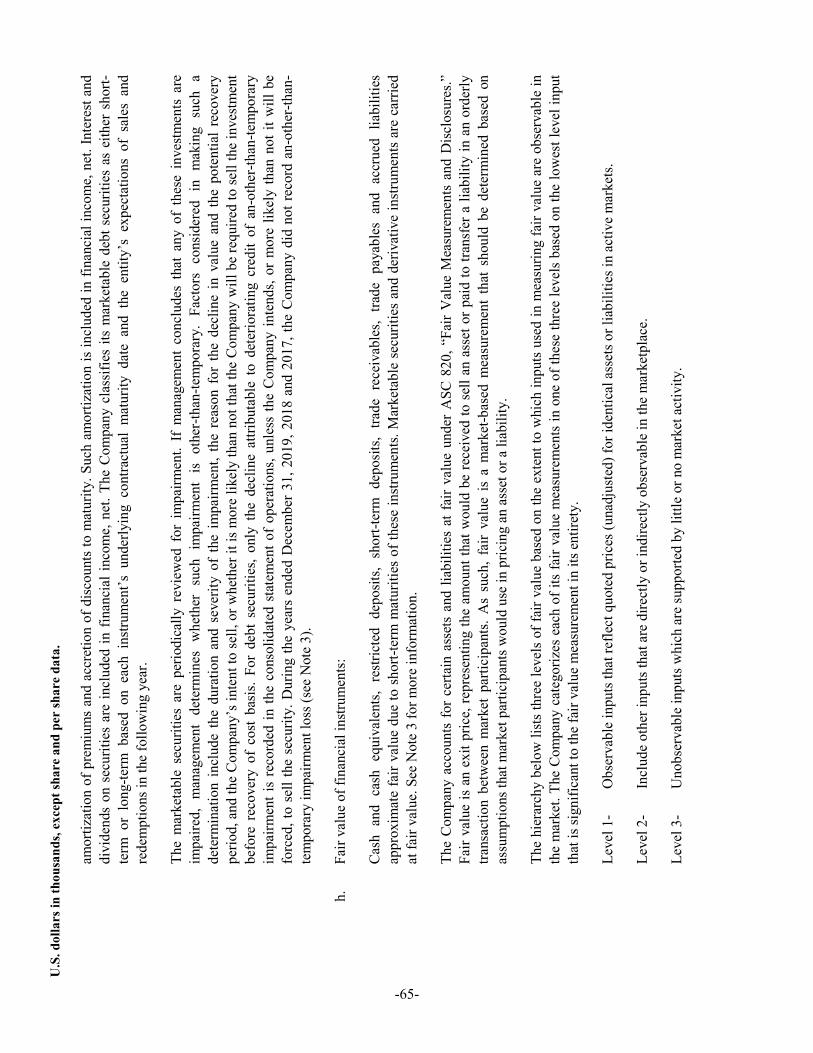
U.S
. dol
lars
in th
ousa
nds,
exce
pt sh
are
and
per
shar
e da
ta.
amor
tizat
ion
of p
rem
ium
s an
d ac
cret
ion
of d
isco
unts
to m
atur
ity. S
uch
amor
tizat
ion
is in
clud
ed in
fina
ncia
l inc
ome,
net
. Int
eres
t and
di
vide
nds
on s
ecur
ities
are
incl
uded
in f
inan
cial
inco
me,
net
. The
Com
pany
cla
ssifi
es it
s m
arke
tabl
e de
bt s
ecur
ities
as
eith
er s
hort-
term
or
long
-term
bas
ed o
n ea
ch i
nstru
men
t’s u
nder
lyin
g co
ntra
ctua
l m
atur
ity d
ate
and
the
entit
y’s
expe
ctat
ions
of
sale
s an
d re
dem
ptio
ns in
the
follo
win
g ye
ar.
The
mar
keta
ble
secu
ritie
s ar
e pe
riodi
cally
rev
iew
ed f
or i
mpa
irmen
t. If
man
agem
ent
conc
lude
s th
at a
ny o
f th
ese
inve
stm
ents
are
im
paire
d, m
anag
emen
t de
term
ines
whe
ther
suc
h im
pairm
ent
is o
ther
-than
-tem
pora
ry.
Fact
ors
cons
ider
ed i
n m
akin
g su
ch a
de
term
inat
ion
incl
ude
the
dura
tion
and
seve
rity
of t
he i
mpa
irmen
t, th
e re
ason
for
the
dec
line
in v
alue
and
the
pot
entia
l re
cove
ry
perio
d, a
nd th
e C
ompa
ny’s
inte
nt to
sell,
or w
heth
er it
is m
ore
likel
y th
an n
ot th
at th
e C
ompa
ny w
ill b
e re
quire
d to
sell
the
inve
stm
ent
befo
re r
ecov
ery
of c
ost
basi
s. Fo
r de
bt s
ecur
ities
, on
ly t
he d
eclin
e at
tribu
tabl
e to
det
erio
ratin
g cr
edit
of a
n-ot
her-t
han-
tem
pora
ry
impa
irmen
t is
reco
rded
in th
e co
nsol
idat
ed s
tate
men
t of
oper
atio
ns, u
nles
s th
e C
ompa
ny in
tend
s, or
mor
e lik
ely
than
not
it w
ill b
e fo
rced
, to
sell
the
secu
rity.
Dur
ing
the
year
s en
ded
Dec
embe
r 31
, 201
9, 2
018
and
2017
, the
Com
pany
did
not
reco
rd a
n-ot
her-t
han-
tem
pora
ry im
pairm
ent l
oss (
see
Not
e 3)
.
h.Fa
ir va
lue
of fi
nanc
ial i
nstru
men
ts:
Cas
h an
d ca
sh e
quiv
alen
ts,
rest
ricte
d de
posit
s, sh
ort-t
erm
dep
osits
, tra
de r
ecei
vabl
es,
trade
pay
able
s an
d ac
crue
d lia
bilit
ies
appr
oxim
ate
fair
valu
e du
e to
sho
rt-te
rm m
atur
ities
of t
hese
inst
rum
ents
. Mar
keta
ble
secu
ritie
s an
d de
rivat
ive
inst
rum
ents
are
car
ried
at fa
ir va
lue.
See
Not
e 3
for m
ore
info
rmat
ion.
The
Com
pany
acc
ount
s fo
r ce
rtain
ass
ets
and
liabi
litie
s at
fai
r va
lue
unde
r A
SC 8
20, “
Fair
Val
ue M
easu
rem
ents
and
Dis
clos
ures
.”Fa
ir va
lue
is a
n ex
it pr
ice,
repr
esen
ting
the
amou
nt th
at w
ould
be
rece
ived
to s
ell a
n as
set o
r pai
d to
tran
sfer
a li
abili
ty in
an
orde
rlytra
nsac
tion
betw
een
mar
ket
parti
cipa
nts.
As
such
, fa
ir va
lue
is a
mar
ket-b
ased
mea
sure
men
t th
at s
houl
d be
det
erm
ined
bas
ed o
nas
sum
ptio
ns th
at m
arke
t par
ticip
ants
wou
ld u
se in
pric
ing
an a
sset
or a
liab
ility
.
The
hier
arch
y be
low
list
s th
ree
leve
ls o
f fai
r val
ue b
ased
on
the
exte
nt to
whi
ch in
puts
use
d in
mea
surin
g fa
ir va
lue
are
obse
rvab
le in
the
mar
ket.
The
Com
pany
cat
egor
izes
eac
h of
its
fair
valu
e m
easu
rem
ents
in o
ne o
f the
se th
ree
leve
ls b
ased
on
the
low
est l
evel
inpu
tth
at is
sign
ifica
nt to
the
fair
valu
e m
easu
rem
ent i
n its
ent
irety
.
Leve
l 1-
Obs
erva
ble
inpu
ts th
at re
flect
quo
ted
pric
es (u
nadj
uste
d) fo
r ide
ntic
al a
sset
s or l
iabi
litie
s in
activ
e m
arke
ts.
Leve
l 2-
Incl
ude
othe
r inp
uts t
hat a
re d
irect
ly o
r ind
irect
ly o
bser
vabl
e in
the
mar
ketp
lace
.
Leve
l 3-
Uno
bser
vabl
e in
puts
whi
ch a
re su
ppor
ted
by li
ttle
or n
o m
arke
t act
ivity
.
-65-
U.S
. dol
lars
in th
ousa
nds,
exce
pt sh
are
and
per
shar
e da
ta.
The
fai r
valu
e hi
erar
chy
also
requ
ires
an e
ntity
to m
axim
ize
the
use
of o
bser
vabl
e in
puts
and
min
imiz
e th
e us
e of
uno
bser
vabl
e in
puts
whe
n m
easu
ring
fair
valu
e.
i.In
vent
orie
s:
Inve
ntor
ies
are
stat
ed a
t the
low
er o
f cos
t and
net
real
izab
le v
alue
. Inv
ento
ry re
serv
es a
re p
rovi
ded
to c
over
risk
s ar
isin
g fr
om s
low
-m
ovin
g ite
ms o
r tec
hnol
ogic
al o
bsol
esce
nce.
The
Com
pany
and
its
sub
sidi
arie
s pe
riodi
cally
eva
luat
e th
e qu
antit
ies
on h
and
rela
tive
to h
isto
rical
, cu
rrent
and
pro
ject
ed s
ales
volu
me.
Bas
ed o
n th
is e
valu
atio
n, a
n im
pairm
ent c
harg
e is
reco
rded
whe
n re
quire
d to
writ
e-do
wn
inve
ntor
y to
its m
arke
t val
ue.
Cos
t is d
eter
min
ed a
s fol
low
s:
Wor
k in
pro
gres
s and
fini
shed
pro
duct
s- o
n th
e ba
sis o
f raw
mat
eria
ls a
nd m
anuf
actu
ring
cost
s on
an a
vera
ge b
asis
.
The
Com
pany
reg
ular
ly e
valu
ates
the
abi
lity
to r
ealiz
e th
e va
lue
of i
nven
tory
bas
ed o
n a
com
bina
tion
of f
acto
rs,
incl
udin
g th
efo
llow
ing:
his
toric
al u
sage
rat
es a
nd f
orec
aste
d sa
les
acco
rdin
g to
out
stan
ding
bac
klog
s. Pu
rcha
sing
req
uire
men
ts a
nd a
ltern
ativ
eus
age
are
expl
ored
with
in th
ese
proc
esse
s to
miti
gate
inv
ento
ry e
xpos
ure.
Whe
n re
cord
ed, t
he r
eser
ves
are
inte
nded
to
redu
ce th
eca
rryi
ng v
alue
of
inve
ntor
y to
its
net r
ealiz
able
val
ue. I
nven
tory
of
$7,4
64, $
9,81
9 an
d $9
,422
as
of D
ecem
ber 3
1, 2
019,
201
8 an
d20
17, r
espe
ctiv
ely,
is s
tate
d ne
t of
inve
ntor
y re
serv
es o
f $3
82, $
508
and
$468
in e
ach
year
, res
pect
ivel
y. I
f ac
tual
dem
and
for
the
Com
pany
’s p
rodu
cts
dete
riora
tes,
or m
arke
t con
ditio
ns a
re le
ss fa
vora
ble
than
thos
e pr
ojec
ted,
add
ition
al in
vent
ory
rese
rves
may
be
requ
ired.
j.Pr
oper
ty a
nd e
quip
men
t, ne
t:
Prop
erty
and
equ
ipm
ent a
re s
tate
d at
cos
t, ne
t of a
ccum
ulat
ed d
epre
ciat
ion.
Dep
reci
atio
n is
cal
cula
ted
usin
g th
e str
aigh
t-lin
e m
etho
dov
er th
e es
timat
ed u
sefu
l liv
es o
f the
ass
ets,
at th
e fo
llow
ing
annu
al ra
tes:
%
Mai
nly
%
Com
pute
rs a
nd e
quip
men
t 20
– 3
3 33
O
ffic
e fu
rnitu
re a
nd e
quip
men
t 7
– 15
15
Le
aseh
old
impr
ovem
ents
se
e be
low
Leas
ehol
d im
prov
emen
ts a
re d
epre
ciat
ed o
n a
stra
ight
-line
bas
is o
ver t
he sh
orte
r of t
he le
ase
term
(inc
ludi
ng th
e ex
tens
ion
optio
n he
ld
by th
e C
ompa
ny a
nd in
tend
ed to
be
exer
cise
d) a
nd th
e ex
pect
ed li
fe o
f the
impr
ovem
ent.
-66-
U.S
. dol
lars
in th
ousa
nds,
exce
pt sh
are
and
per
shar
e da
ta.
Long
-live
d as
sets
of
the
Com
pany
are
rev
iew
ed f
or i
mpa
irmen
t w
hene
ver
even
ts o
r ch
ange
s in
circ
umst
ance
s in
dica
te t
hat
the
carr
ying
am
ount
of a
n as
set m
ay n
ot b
e re
cove
rabl
e. T
he re
cove
rabi
lity
of a
sset
s to
be
held
and
use
d is
mea
sure
d by
a c
ompa
rison
of
the
carr
ying
am
ount
of
such
ass
ets
to th
e fu
ture
und
isco
unte
d ca
sh f
low
s ex
pect
ed to
be
gene
rate
d by
the
asse
ts. I
f su
ch a
sset
s ar
e co
nsid
ered
to b
e im
paire
d, th
e im
pairm
ent t
o be
rec
ogni
zed
is m
easu
red
by th
e am
ount
by
whi
ch th
e ca
rryi
ng a
mou
nt o
f th
e as
sets
exce
eds t
he fa
ir va
lue
of th
e as
sets
.
Dur
ing
the
year
s end
ed D
ecem
ber 3
1, 2
019,
201
8 an
d 20
17, n
o im
pairm
ent l
osse
s wer
e id
entif
ied.
The
Com
pany
acc
ount
s for
cos
ts o
f com
pute
r sof
twar
e de
velo
ped
or o
btai
ned
for i
nter
nal u
se in
acc
orda
nce
with
FA
SB A
SC N
o. 3
50-
40,
“The
Int
erna
l U
se S
oftw
are.
” FA
SB A
SC 3
50-4
0 re
quire
s th
e ca
pita
lizat
ion
of c
erta
in c
osts
inc
urre
d in
con
nect
ion
with
de
velo
ping
or o
btai
ning
inte
rnal
use
softw
are.
Dur
ing
2019
, 201
8 an
d 20
17, t
he C
ompa
ny d
id n
ot c
apita
lize
inte
rnal
use
softw
are.
k.G
oodw
ill a
nd o
ther
inta
ngib
le a
sset
s:
The
good
will
and
cer
tain
oth
er p
urch
ased
int
angi
ble
asse
ts h
ave
been
rec
orde
d as
a r
esul
t of
the
Bon
eTon
e ac
quis
ition
and
the
acqu
isiti
on o
f a p
rivat
e co
mpa
ny in
Asi
a. G
oodw
ill re
pres
ents
the
exce
ss o
f the
pur
chas
e pr
ice
in a
bus
ines
s co
mbi
natio
n ov
er th
e fa
irva
lue
of n
et ta
ngib
le a
nd in
tang
ible
ass
ets a
cqui
red.
Goo
dwill
is n
ot a
mor
tized
, but
rath
er is
subj
ect t
o an
ann
ual i
mpa
irmen
t tes
t.
ASC
350
pre
scrib
es a
two-
phas
e pr
oces
s for
impa
irmen
t tes
ting
of g
oodw
ill. T
he fi
rst p
hase
scr
eens
for i
mpa
irmen
t, w
hile
the
seco
ndph
ase
(if n
eces
sary
) mea
sure
s im
pairm
ent.
Goo
dwill
impa
irmen
t is
deem
ed to
exi
st if
the
net b
ook
valu
e of
a re
porti
ng u
nit e
xcee
dsits
est
imat
ed fa
ir va
lue.
In s
uch
a ca
se, t
he s
econ
d ph
ase
is th
en p
erfo
rmed
, and
the
Com
pany
mea
sure
s im
pairm
ent b
y co
mpa
ring
the
carr
ying
am
ount
of
the
repo
rting
uni
t’s g
oodw
ill to
the
impl
ied
fair
valu
e of
that
goo
dwill
. An
impa
irmen
t los
s is
rec
ogni
zed
in a
nam
ount
equ
al to
the
exce
ss. A
SC 3
50 a
llow
s an
entit
y to
firs
t ass
ess q
ualit
ativ
e fa
ctor
s to
dete
rmin
e w
heth
er it
is n
eces
sary
to p
erfo
rmth
e tw
o-st
ep q
uant
itativ
e go
odw
ill im
pairm
ent t
est.
An
entit
y is
not
requ
ired
to c
alcu
late
the
fair
valu
e of
a re
porti
ng u
nit u
nles
s th
een
tity
dete
rmin
es, b
ased
on
a qu
alita
tive
asse
ssm
ent,
that
it is
mor
e lik
ely
than
not
that
its f
air v
alue
is le
ss th
an it
s car
ryin
g am
ount
.
Alte
rnat
ivel
y, A
SC 3
50 p
erm
its a
n en
tity
to b
ypas
s th
e qu
alita
tive
asse
ssm
ent
for
any
repo
rting
uni
t an
d pr
ocee
d di
rect
ly t
ope
rfor
min
g th
e fir
st st
ep o
f the
goo
dwill
impa
irmen
t tes
t.
The
Com
pany
per
form
s an
ann
ual i
mpa
irmen
t tes
t on
Dec
embe
r 31
of
each
fisc
al y
ear,
or m
ore
freq
uent
ly if
impa
irmen
t ind
icat
ors
are
pres
ent.
The
Com
pany
’s re
porti
ng u
nits
are
con
sist
ent w
ith th
e re
porta
ble
segm
ents
iden
tifie
d in
Not
e 17
.
-67-
U.S
. dol
lars
in th
ousa
nds,
exce
pt sh
are
and
per
shar
e da
ta.
Fair
valu
e is
det
erm
ined
usi
ng d
isco
unte
d ca
sh f
low
s, m
arke
t mul
tiple
s an
d m
arke
t cap
italiz
atio
n. S
igni
fican
t est
imat
es u
sed
in th
e m
etho
dolo
gies
incl
ude
estim
ates
of f
utur
e ca
sh-fl
ows,
futu
re s
hort-
term
and
long
-term
gro
wth
rate
s, w
eigh
ted
aver
age
cost
of c
apita
l an
d m
arke
t mul
tiple
s for
the
repo
rting
uni
t.
For t
he fi
scal
yea
r end
ed D
ecem
ber 3
1, 2
019,
201
8 an
d 20
17, t
he C
ompa
ny p
erfo
rmed
a q
uant
itativ
e as
sess
men
t on
its g
oodw
ill a
nd
no im
pairm
ent l
osse
s wer
e id
entif
ied.
Inta
ngib
le a
sset
s tha
t are
not
con
side
red
to h
ave
an in
defin
ite u
sefu
l life
are
am
ortiz
ed u
sing
the
stra
ight
-line
bas
is o
ver t
heir
estim
ated
us
eful
liv
es,
whi
ch r
ange
fro
m 5
to
6 ye
ars.
The
carr
ying
am
ount
of
thes
e as
sets
is
revi
ewed
whe
neve
r ev
ents
or
chan
ges
in
circ
umst
ance
s in
dica
te t
hat
the
carr
ying
val
ue o
f an
ass
et m
ay n
ot b
e re
cove
rabl
e. R
ecov
erab
ility
of
thes
e as
sets
is
mea
sure
d by
co
mpa
rison
of t
he c
arry
ing
amou
nt o
f the
ass
et to
the
futu
re u
ndis
coun
ted
cash
flow
s the
ass
et is
exp
ecte
d to
gen
erat
e.
If su
ch a
sset
is c
onsi
dere
d to
be
impa
ired,
the
impa
irmen
t to
be re
cogn
ized
is m
easu
red
as th
e di
ffer
ence
bet
wee
n th
e ca
rryi
ng a
mou
nt
of th
e as
sets
and
the
fair
valu
e of
the
impa
ired
asse
t.
Dur
ing
the
fisca
l yea
r end
ed D
ecem
ber 3
1, 2
019,
201
8 an
d 20
17, n
o im
pairm
ent l
osse
s wer
e id
entif
ied.
l.Se
vera
nce
pay:
DSP
Gro
up L
td.,
the
Com
pany
’s Is
rael
i sub
sidi
ary
(“D
SP Is
rael
”), h
as a
liab
ility
for s
ever
ance
pay
pur
suan
t to
Isra
eli l
aw, b
ased
on
the
mos
t rec
ent m
onth
ly s
alar
y of
its
empl
oyee
s m
ultip
lied
by th
e nu
mbe
r of
yea
rs o
f em
ploy
men
t as
of th
e ba
lanc
e sh
eet d
ate
for
such
em
ploy
ees.
DSP
Isra
el’s
liab
ility
is fu
lly p
rovi
ded
for b
y m
onth
ly a
ccru
al a
nd d
epos
its w
ith s
ever
ance
pay
fund
s an
d in
sura
nce
polic
ies.
The
depo
sited
fund
s in
clud
e pr
ofits
acc
umul
ated
up
to th
e ba
lanc
e sh
eet d
ate.
The
dep
osite
d fu
nds
may
be
with
draw
n on
ly u
pon
the
fulfi
llmen
t of t
he o
blig
atio
n pu
rsua
nt to
Isra
el’s
Sev
eran
ce P
ay L
aw o
r lab
or a
gree
men
ts.
The
Com
pany
’s K
orea
n su
bsid
iary
has
a s
tatu
tory
lia
bilit
y fo
r se
vera
nce
pay
purs
uant
to
Kor
ean
law
bas
ed o
n th
e m
ost
rece
ntm
onth
ly s
alar
y of
its
empl
oyee
s m
ultip
lied
by th
e nu
mbe
r of y
ears
of e
mpl
oym
ent o
f suc
h em
ploy
ees
as o
f the
bal
ance
she
et d
ate
for
such
em
ploy
ees.
The
Kor
ean
subs
idia
ry’s
liab
ility
is fu
lly a
ccru
ed.
Seve
ranc
e ex
pens
es fo
r the
yea
rs e
nded
Dec
embe
r 31,
201
9, 2
018
and
2017
, wer
e $1
,685
, $1,
679
and
$1,6
66, r
espe
ctiv
ely.
m.
Rev
enue
reco
gniti
on:
The
Com
pany
gen
erat
es it
s rev
enue
s fro
m sa
les o
f pro
duct
s. Th
e C
ompa
ny se
lls it
s pro
duct
s thr
ough
a d
irect
sale
s for
ce a
nd th
roug
h a
netw
ork
of d
istri
buto
rs.
-68-
U.S
. dol
lars
in th
ousa
nds,
exce
pt sh
are
and
per
shar
e da
ta.
The
Com
pany
ado
pted
ASC
606
, R
even
ue f
rom
Con
tract
s w
ith C
usto
mer
s (A
SC 6
06),
effe
ctiv
e on
Jan
uary
1,
2018
, us
ing
the
mod
ified
ret
rosp
ectiv
e m
etho
d. A
s a
resu
lt of
this
ado
ptio
n, th
e C
ompa
ny r
evis
ed it
s ac
coun
ting
polic
y fo
r re
venu
e re
cogn
ition
as
deta
iled
belo
w. U
nder
the
mod
ified
retro
spec
tive
met
hod,
the
Com
pany
reco
gniz
ed th
e cu
mul
ativ
e ef
fect
of i
nitia
lly a
pply
ing
the
new
re
venu
e st
anda
rd a
s an
adju
stm
ent t
o th
e op
enin
g ba
lanc
e of
reta
ined
ear
ning
s. R
esul
ts fo
r rep
ortin
g pe
riods
beg
inni
ng a
fter J
anua
ry 1
, 20
18 a
re p
rese
nted
und
er T
opic
606
, whi
le p
rior p
erio
d am
ount
s ar
e no
t adj
uste
d an
d co
ntin
ue to
be
repo
rted
in a
ccor
danc
e w
ith th
e C
ompa
ny’s
his
toric
acc
ount
ing
unde
r Rev
enue
Rec
ogni
tion
(“To
pic
605”
).
The
Com
pany
reco
gniz
es re
venu
e un
der t
he c
ore
prin
cipl
e th
at tr
ansf
er o
f con
trol t
o th
e C
ompa
ny’s
cus
tom
ers
shou
ld b
e de
pict
ed in
an
am
ount
ref
lect
ing
the
cons
ider
atio
n th
e C
ompa
ny e
xpec
ts t
o re
ceiv
e in
rev
enue
. In
ord
er t
o ac
hiev
e th
at c
ore
prin
cipl
e, t
he
Com
pany
app
lies
the
follo
win
g fiv
e-st
ep a
ppro
ach:
(1) i
dent
ify th
e co
ntra
ct w
ith a
cus
tom
er, (
2) id
entif
y th
e pe
rfor
man
ce o
blig
atio
ns
in th
e co
ntra
ct, (
3) d
eter
min
e th
e tra
nsac
tion
pric
e, (4
) allo
cate
the
trans
actio
n pr
ice
to th
e pe
rfor
man
ce o
blig
atio
ns in
the
cont
ract
, and
(5
)rec
ogni
ze re
venu
e w
hen
a pe
rfor
man
ce o
blig
atio
n is
satis
fied.
(1)
Iden
tify
the
cont
ract
with
a c
usto
mer
A c
ontra
ct is
an
agre
emen
t bet
wee
n tw
o or
mor
e pa
rties
that
cre
ates
enf
orce
able
righ
ts a
nd o
blig
atio
ns. I
n ev
alua
ting
the
cont
ract
, the
C
ompa
ny a
naly
zes
the
cust
omer
’s i
nten
t an
d ab
ility
to
pay
the
amou
nt o
f pr
omis
ed c
onsi
dera
tion
(cre
dit
risk)
and
con
side
rs t
he
prob
abili
ty o
f col
lect
ing
subs
tant
ially
all
of th
e co
nsid
erat
ion.
(1)
Iden
tify
the
perf
orm
ance
obl
igat
ions
in th
e co
ntra
ct
At
a co
ntra
ct’s
inc
eptio
n, t
he C
ompa
ny a
sses
ses
the
good
s or
ser
vice
s pr
omis
ed i
n a
cont
ract
with
a c
usto
mer
and
ide
ntifi
es t
he
perf
orm
ance
obl
igat
ions
.
The
Com
pany
’s c
ontra
cts w
ith c
usto
mer
s for
the
sale
of p
rodu
cts g
ener
ally
incl
ude
one
perf
orm
ance
obl
igat
ion.
(2)
Det
erm
ine
the
trans
actio
n pr
ice
The
trans
actio
n pr
ice
is t
he a
mou
nt o
f co
nsid
erat
ion
to w
hich
the
Com
pany
is
entit
led
in e
xcha
nge
for
trans
ferr
ing
good
s to
a
cust
omer
. Gen
eral
ly, t
he C
ompa
ny d
oes n
ot p
rovi
de a
ny v
aria
ble
cons
ider
atio
n, in
clud
ing
pric
e pr
otec
tion,
stoc
k ro
tatio
n, a
nd/o
r rig
ht
of re
turn
.
(3)
Allo
cate
the
trans
actio
n pr
ice
to th
e pe
rfor
man
ce o
blig
atio
ns in
the
cont
ract
The
Com
pany
allo
cate
s the
tran
sact
ion
pric
e to
one
per
form
ance
obl
igat
ion.
(4)
Rec
ogni
ze re
venu
e w
hen
a pe
rfor
man
ce o
blig
atio
n is
satis
fied
-69-
U.S
. dol
lars
in th
ousa
nds,
exce
pt sh
are
and
per
shar
e da
ta.
Rev
enue
is re
cogn
ized
at a
poi
nt in
tim
e w
hen
or a
s per
form
ance
obl
igat
ion
is sa
tisfie
d by
tran
sfer
ring
cont
rol o
f a p
rom
ised
goo
d to
a
cust
omer
. Gen
eral
ly, c
ontro
l of a
n as
set i
s tra
nsfe
rred
to th
e cu
stom
er o
n de
liver
y of
the
prod
ucts
.
Und
er A
SC 6
06,
certa
in p
rodu
ct s
ales
thr
ough
the
Com
pany
’s d
istri
buto
rs w
here
rev
enue
was
pre
viou
sly
defe
rred
unt
il th
e di
strib
utor
s re
sold
the
Com
pany
’s p
rodu
cts
to th
e en
d cu
stom
ers
are
now
rec
ogni
zed
whe
n pr
oduc
ts a
re d
eliv
ered
to th
e di
strib
utor
an
d co
ntro
l of t
he p
rom
ised
goo
ds a
re tr
ansf
erre
d, in
an
amou
nt th
at re
flect
s th
e co
nsid
erat
ion
that
the
com
pany
exp
ects
to re
ceiv
e in
ex
chan
ge fo
r tho
se g
oods
or s
ervi
ces.
For i
nfor
mat
ion
of d
isag
greg
ated
reve
nue
per s
egm
ent,
plea
se re
fer t
o N
ote
17.
n.W
arra
nty:
The
Com
pany
war
rant
s its
pro
duct
s aga
inst
err
ors,
defe
cts a
nd b
ugs f
or g
ener
ally
one
yea
r. Th
e Co
mpa
ny e
stim
ates
the
cost
s tha
t may
be in
curr
ed u
nder
its
war
rant
y an
d re
cord
s a li
abili
ty in
the
amou
nt o
f suc
h co
sts.
The
Com
pany
per
iodi
cally
ass
esse
s th
e ad
equa
cy o
fits
reco
rded
war
rant
y lia
bilit
ies a
nd a
djus
ts th
e am
ount
s as n
eces
sary
. War
rant
y co
sts a
nd li
abili
ty w
ere
imm
ater
ial f
or th
e ye
ars e
nded
Dec
embe
r 31,
201
9, 2
018
and
2017
.
o.R
esea
rch
and
deve
lopm
ent c
osts
, net
:
Res
earc
h an
d de
velo
pmen
t cos
ts, n
et o
f gra
nts r
ecei
ved,
are
cha
rged
to th
e co
nsol
idat
ed st
atem
ent o
f ope
ratio
ns a
s inc
urre
d.
p.G
over
nmen
t gra
nts:
Gov
ernm
ent g
rant
s re
ceiv
ed b
y th
e C
ompa
ny’s
Isr
aeli
subs
idia
ry a
re c
redi
ted
to th
e co
nsol
idat
ed s
tate
men
ts o
f in
com
e du
ring
the
perio
d in
whi
ch th
e ex
pend
iture
to w
hich
they
rel
ate
is c
harg
ed. R
oyal
ty a
nd n
on r
oyal
ty b
earin
g gr
ants
from
the
Isra
eli I
nnov
atio
nA
utho
rity
("IIA
") (f
orm
erly
kno
wn
as O
ffic
e of
the
Chi
ef S
cien
tist)
for f
undi
ng c
erta
in a
ppro
ved
rese
arch
and
dev
elop
men
t pro
ject
sar
e re
cogn
ized
at t
he ti
me
whe
n th
e C
ompa
ny’s
Isra
eli s
ubsi
diar
y is
ent
itled
to s
uch
gran
ts, o
n th
e ba
sis
of th
e re
late
d co
sts
incu
rred
,an
d ar
e in
clud
ed a
s a d
educ
tion
from
rese
arch
and
dev
elop
men
t exp
ense
s, ne
t.
The
Com
pany
reco
rded
gra
nts i
n th
e am
ount
of $
1,63
5, $
1,67
8 an
d $1
,528
for t
he y
ear e
nded
Dec
embe
r 31,
201
9 an
d 20
18 a
nd 2
017,
resp
ectiv
ely.
The
vas
t maj
ority
of t
hose
gra
nts a
re b
earin
g ro
yalti
es.
The
Com
pany
’s Is
rael
i sub
sidi
ary
is o
blig
ated
to p
ay ro
yalti
es a
mou
ntin
g to
5%
of
the
sale
s of
cer
tain
pro
duct
s th
e de
velo
pmen
t of
whi
ch r
ecei
ved
gran
ts f
rom
the
IIA
in
prev
ious
yea
rs. T
he o
blig
atio
n to
pay
the
se r
oyal
ties
is c
ontin
gent
on
actu
al s
ales
of
such
prod
ucts
. Gra
nts
rece
ived
from
the
IIA m
ay b
ecom
e re
paya
ble
if ce
rtain
crit
eria
und
er th
e gr
ants
are
not
met
. Th
e Is
rael
i Res
earc
han
d D
evel
opm
ent
Law
pro
vide
s th
at k
now
-how
dev
elop
ed u
nder
an
appr
oved
res
earc
h an
d de
velo
pmen
t pr
ogra
m m
ay n
ot b
etra
nsfe
rred
to
third
par
ties
with
out
the
appr
oval
of
the
IIA.
Such
app
rova
l is
not
req
uire
d fo
r th
e sa
le o
r ex
port
of a
ny p
rodu
cts
-70-
U.S
. dol
lars
in th
ousa
nds,
exce
pt sh
are
and
per
shar
e da
ta.
resu
lt ing
fro
m s
uch
rese
arch
or
deve
lopm
ent.
The
IIA
, und
er s
peci
al c
ircum
stan
ces,
may
app
rove
the
trans
fer
of II
A-fu
nded
kno
w-
how
out
side
Isra
el, i
n th
e fo
llow
ing
case
s: (a
) the
gra
nt re
cipi
ent p
ays
to th
e IIA
a p
ortio
n of
the
sale
pric
e pa
id in
con
side
ratio
n fo
r su
ch I
IA-fu
nded
kno
w-h
ow o
r in
con
side
ratio
n fo
r th
e sa
le o
f th
e gr
ant r
ecip
ient
itse
lf, a
s th
e ca
se m
ay b
e, w
hich
por
tion
will
not
ex
ceed
six
tim
es th
e am
ount
of t
he g
rant
s re
ceiv
ed p
lus
inte
rest
(or t
hree
tim
es th
e am
ount
of t
he g
rant
rece
ived
plu
s in
tere
st, i
n th
e ev
ent t
hat t
he r
ecip
ient
of
the
know
-how
has
com
mitt
ed to
ret
ain
the
rese
arch
and
dev
elop
men
t act
iviti
es o
f th
e gr
ant r
ecip
ient
in
Isra
el a
fter t
he tr
ansf
er);
(b) t
he g
rant
reci
pien
t rec
eive
s kn
ow-h
ow fr
om a
third
par
ty in
exc
hang
e fo
r its
IIA
-fund
ed k
now
-how
; (c)
su
ch tr
ansf
er o
f IIA
-fund
ed k
now
-how
aris
es in
con
nect
ion
with
cer
tain
type
s of
coo
pera
tion
in re
sear
ch a
nd d
evel
opm
ent a
ctiv
ities
; or
(d)
if
such
tra
nsfe
r of
kno
w-h
ow a
rises
in
conn
ectio
n w
ith a
liq
uida
tion
by r
easo
n of
ins
olve
ncy
or r
ecei
vers
hip
of t
he g
rant
re
cipi
ent.
q.Eq
uity
-bas
ed c
ompe
nsat
ion:
At D
ecem
ber
31, 2
019,
the
Com
pany
had
two
equi
ty in
cent
ive
plan
s fr
om w
hich
the
Com
pany
may
gra
nt fu
ture
equ
ity a
war
ds a
ndon
e ex
pire
d eq
uity
ince
ntiv
e pl
ans
from
whi
ch n
o fu
ture
equ
ity a
war
ds m
ay b
e gr
ante
d bu
t had
out
stan
ding
equ
ity a
war
ds g
rant
edpr
ior t
o ex
pira
tion.
The
Com
pany
als
o ha
d on
e em
ploy
ee st
ock
purc
hase
pla
n. S
ee fu
ll de
scrip
tion
in N
ote
13.
The
Com
pany
acc
ount
s fo
r eq
uity
-bas
ed c
ompe
nsat
ion
in a
ccor
danc
e w
ith A
SC N
o. 7
18, “
Stoc
k C
ompe
nsat
ion”
(“A
SC N
o. 7
18”)
.A
SC N
o. 7
18 re
quire
s com
pani
es to
est
imat
e th
e fa
ir va
lue
of e
quity
-bas
ed a
war
ds o
n th
e da
te o
f gra
nt u
sing
an
optio
n-pr
icin
g m
odel
.Th
e va
lue
of th
e po
rtion
of t
he a
war
d th
at is
ulti
mat
ely
expe
cted
to v
est i
s re
cogn
ized
as
an e
xpen
se o
ver t
he re
quis
ite se
rvic
e pe
riods
in th
e C
ompa
ny’s
con
solid
ated
stat
emen
ts o
f ope
ratio
ns.
The
Com
pany
rec
ogni
zes
com
pens
atio
n ex
pens
es f
or t
he v
alue
of
its a
war
ds g
rant
ed b
ased
on
the
acce
lera
ted
attri
butio
n m
etho
d,ra
ther
than
a s
traig
ht-li
ne m
etho
d ov
er th
e re
quis
ite s
ervi
ce p
erio
d of
eac
h of
the
awar
ds, n
et o
f es
timat
ed f
orfe
iture
s. FA
SB A
SCN
o. 7
18 re
quire
s fo
rfei
ture
s to
be
estim
ated
at t
he ti
me
of g
rant
and
revi
sed,
if n
eces
sary
, in
subs
eque
nt p
erio
ds if
act
ual f
orfe
iture
sdi
ffer
from
thos
e es
timat
es. E
stim
ated
forf
eitu
res a
re b
ased
on
actu
al h
isto
rical
pre
-ves
ting
forf
eitu
res.
The
Com
pany
sel
ecte
d th
e la
ttice
opt
ion
pric
ing
mod
el a
s th
e m
ost a
ppro
pria
te f
air
valu
e m
etho
d fo
r its
equ
ity-b
ased
aw
ards
and
valu
es o
ptio
ns a
nd s
tock
app
reci
atio
n rig
hts
(“SA
Rs”
) ba
sed
on th
e m
arke
t val
ue o
f the
und
erly
ing
shar
es o
n th
e da
te o
f gr
ant.
The
optio
n-pr
icin
g m
odel
requ
ires
a nu
mbe
r of a
ssum
ptio
ns, o
f whi
ch th
e m
ost s
igni
fican
t are
the
expe
cted
sto
ck p
rice
vola
tility
and
the
expe
cted
term
of
the
equi
ty-b
ased
aw
ard.
Exp
ecte
d vo
latil
ity is
cal
cula
ted
base
d up
on a
ctua
l his
toric
al s
tock
pric
e m
ovem
ents
. The
expe
cted
term
of t
he e
quity
-bas
ed a
war
d gr
ante
d is
bas
ed u
pon
hist
oric
al e
xper
ienc
e an
d re
pres
ents
the
perio
d of
tim
e th
at th
e aw
ard
gran
ted
is e
xpec
ted
to b
e ou
tsta
ndin
g. T
he r
isk-
free
inte
rest
rat
e is
bas
ed o
n th
e yi
eld
from
U.S
. tre
asur
y bo
nds
with
an
equi
vale
ntte
rm. T
he C
ompa
ny h
as h
isto
rical
ly n
ot p
aid
divi
dend
s and
has
no
fore
seea
ble
plan
s to
pay
divi
dend
s.
With
res
pect
to th
e C
ompa
ny’s
em
ploy
ee s
tock
pur
chas
e pl
an, t
he C
ompa
ny s
elec
ted
the
Mon
te C
arlo
pric
ing
mod
el a
s th
e m
ost
appr
opria
te fa
ir va
lue
met
hod.
-71-

U.S
. dol
lars
in th
ousa
nds,
exce
pt sh
are
and
per
shar
e da
ta.
A m
ajo r
ity o
f th
e C
ompa
ny’s
equ
ity a
war
ds u
ntil
2012
wer
e in
the
form
of
SAR
s. St
artin
g in
201
3, a
maj
ority
of
the
Com
pany
’s
equi
ty a
war
ds w
ere
in th
e fo
rm o
f res
trict
ed st
ock
unit
(“R
SU”)
gra
nts.
The
fair
valu
e of
eac
h re
stric
ted
stoc
k un
it (“
RSU
”) is
bas
ed o
n th
e m
arke
t val
ue o
f the
und
erly
ing
shar
e on
the
date
of g
rant
.
r.B
asic
and
dilu
ted
inco
me
(loss
) per
shar
e:
Bas
ic n
et in
com
e (lo
ss) p
er s
hare
is c
ompu
ted
base
d on
the
wei
ghte
d av
erag
e nu
mbe
r of s
hare
s of
com
mon
sto
ck o
utst
andi
ng d
urin
gth
e ye
ar. D
ilute
d ne
t inc
ome
(loss
) per
sha
re fu
rther
incl
udes
the
dilu
tive
effe
ct o
f sto
ck o
ptio
ns, S
AR
s an
d R
SUs
outs
tand
ing
durin
gth
e ye
ar, a
ll in
acc
orda
nce
with
ASC
No.
260
, “Ea
rnin
gs P
er S
hare
.”
The
tota
l wei
ghte
d av
erag
e nu
mbe
r of s
hare
s re
late
d to
the
outs
tand
ing
stoc
k op
tions
, SA
Rs
and
RSU
s ex
clud
ed fr
om th
e ca
lcul
atio
nof
dilu
ted
net i
ncom
e pe
r sha
re d
ue to
thei
r ant
i-dilu
tive
effe
ct w
as 1
,419
,612
, 1,3
17,1
97 a
nd 1
,378
,282
for t
he y
ears
end
ed D
ecem
ber
31, 2
019,
201
8 an
d 20
17, r
espe
ctiv
ely.
s.In
com
e ta
xes:
The
Com
pany
acc
ount
s fo
r in
com
e ta
xes
in a
ccor
danc
e w
ith A
SC N
o. 7
40, “
Inco
me
Taxe
s.” T
his
topi
c pr
escr
ibes
the
use
of th
elia
bilit
y m
etho
d, w
here
by d
efer
red
tax
asse
t an
d lia
bilit
y ac
coun
t ba
lanc
es a
re d
eter
min
ed b
ased
on
diff
eren
ces
betw
een
finan
cial
repo
rting
and
tax
base
s of a
sset
s and
liab
ilitie
s and
are
mea
sure
d us
ing
the
enac
ted
tax
rate
s tha
t will
be
in e
ffec
t whe
n th
e di
ffer
ence
sar
e ex
pect
ed to
rev
erse
. The
Com
pany
pro
vide
s a
valu
atio
n al
low
ance
, if
nece
ssar
y, to
red
uce
defe
rred
tax
asse
ts to
thei
r es
timat
edre
aliz
able
val
ue.
Def
erre
d ta
x lia
bilit
ies
and
asse
ts a
re c
lass
ified
as
non-
curr
ent b
ased
on
the
adop
ting
of A
ccou
ntin
g St
anda
rds
Upd
ate
(“A
SU”)
201
5-17
, “B
alan
ce S
heet
Cla
ssifi
catio
n of
Def
erre
d Ta
xes.”
The
Com
pany
acc
ount
s fo
r unc
erta
in ta
x po
sitio
ns in
acc
orda
nce
with
ASC
740
, whi
ch c
onta
ins
a tw
o-st
ep a
ppro
ach
to re
cogn
izin
gan
d m
easu
ring
unce
rtain
tax
posi
tions
. The
firs
t ste
p is
to e
valu
ate
the
tax
posi
tion
take
n or
exp
ecte
d to
be
take
n in
a ta
x re
turn
by
dete
rmin
ing
whe
ther
the
wei
ght o
f av
aila
ble
evid
ence
indi
cate
s th
at it
is m
ore
likel
y th
an n
ot th
at, o
n an
eva
luat
ion
of th
e te
chni
cal
mer
its, t
he ta
x po
sitio
n w
ill b
e su
stai
ned
on a
udit,
incl
udin
g re
solu
tion
of a
ny re
late
d ap
peal
s or
litig
atio
n pr
oces
ses.
The
seco
nd s
tep
is to
mea
sure
the
tax
bene
fit a
s th
e la
rges
t am
ount
that
is m
ore
than
50%
like
ly to
be
real
ized
upo
n ul
timat
e se
ttlem
ent.
The
Com
pany
reev
alua
tes
its i
ncom
e ta
x po
sitio
ns p
erio
dica
lly t
o co
nsid
er f
acto
rs s
uch
as c
hang
es i
n fa
cts
or c
ircum
stan
ces,
chan
ges
in o
rin
terp
reta
tions
of t
ax la
w, e
ffec
tivel
y se
ttled
issu
es u
nder
aud
it, a
nd n
ew a
udit
activ
ity. S
uch
a ch
ange
in re
cogn
ition
or m
easu
rem
ent
wou
ld re
sult
in re
cogn
ition
of a
tax
bene
fit o
r an
addi
tiona
l cha
rge
to th
e ta
x pr
ovis
ion.
-72-
U.S
. dol
lars
in th
ousa
nds,
exce
pt sh
are
and
per
shar
e da
ta.
The
Com
pany
inc
lude
s in
tere
st r
elat
ed t
o ta
x is
sues
as
part
of i
ncom
e ta
x ex
pens
e in
its
con
solid
ated
fin
anci
al s
tate
men
ts.
The
Com
pany
reco
rds a
ny a
pplic
able
pen
altie
s rel
ated
to ta
x is
sues
with
in th
e in
com
e ta
x pr
ovis
ion.
t.C
once
ntra
tions
of c
redi
t risk
:
Fina
ncia
l in
stru
men
ts t
hat
pote
ntia
lly s
ubje
ct t
he C
ompa
ny t
o co
ncen
tratio
ns o
f cr
edit
risk
cons
ist
prin
cipa
lly o
f ca
sh a
nd c
ash
equi
vale
nts,
rest
ricte
d de
posi
ts, s
hort-
term
dep
osits
, tra
de re
ceiv
able
s and
mar
keta
ble
secu
ritie
s.
The
maj
ority
of
cash
and
cas
h eq
uiva
lent
s an
d sh
ort-t
erm
dep
osits
of
the
Com
pany
are
inve
sted
in d
olla
r de
posi
ts w
ith m
ajor
U.S
.,Eu
rope
an a
nd I
srae
li ba
nks.
Dep
osits
in
U.S
. ban
ks m
ay b
e in
exc
ess
of i
nsur
ed l
imits
and
are
not
ins
ured
in
othe
r ju
risdi
ctio
ns.
Gen
eral
ly, c
ash
and
cash
equ
ival
ents
and
thes
e dep
osits
may
be
with
draw
n up
on d
eman
d an
d th
eref
ore
bear
low
risk
.
The
Com
pany
’s m
arke
tabl
e se
curit
ies
cons
ist
of i
nves
tmen
t-gra
de c
orpo
rate
bon
ds a
nd U
.S.
gove
rnm
ent-s
pons
ored
ent
erpr
ise
(“G
SE”)
sec
uriti
es. A
s of
Dec
embe
r 31,
201
9, t
he a
mor
tized
cos
t of
the
Com
pany
’s m
arke
tabl
e se
curit
ies
was
$87
,024
, and
the
irst
ated
mar
ket v
alue
was
$86
,958
, rep
rese
ntin
g an
unr
ealiz
ed n
et lo
ss o
f $66
.
A s
igni
fican
t por
tion
of th
e pr
oduc
ts o
f the
Com
pany
is s
old
to o
rigin
al e
quip
men
t man
ufac
ture
rs o
f con
sum
er e
lect
roni
cs p
rodu
cts.
The
cust
omer
s of
the
Com
pany
are
loca
ted
prim
arily
in J
apan
, Hon
g K
ong,
Tai
wan
, Chi
na, K
orea
, Eur
ope
and
the
Uni
ted
Stat
es. T
heC
ompa
ny p
erfo
rms
ongo
ing
cred
it ev
alua
tions
of t
heir
cust
omer
s. A
spe
cific
allo
wan
ce fo
r dou
btfu
l acc
ount
s is
det
erm
ined
, bas
ed o
nm
anag
emen
t’s e
stim
ates
and
his
toric
al e
xper
ienc
e. U
nder
cer
tain
circ
umst
ance
s, th
e C
ompa
ny m
ay r
equi
re a
let
ter
of c
redi
t. Th
eC
ompa
ny c
over
s mos
t of i
ts tr
ade
rece
ivab
les t
hrou
gh c
redi
t ins
uran
ce. A
s of D
ecem
ber 3
1, 2
019
and
2018
, no
allo
wan
ce fo
r dou
btfu
lac
coun
ts w
as p
rovi
ded.
The
Com
pany
has
no
off-b
alan
ce-s
heet
con
cent
ratio
n of
cre
dit r
isk,
exc
ept f
or c
erta
in d
eriv
ativ
e in
stru
men
ts a
s men
tione
d be
low
.
u.D
eriv
ativ
e in
stru
men
ts:
The
Com
pany
acc
ount
s fo
r de
rivat
ives
and
hed
ging
bas
ed o
n A
SC N
o.81
5, “
Der
ivat
ives
and
Hed
ging
”. A
SC N
o. 8
15 r
equi
res
com
pani
es to
reco
gniz
e al
l of t
heir
deriv
ativ
e in
stru
men
ts a
s eith
er a
sset
s or l
iabi
litie
s on
the
bala
nce
shee
t at f
air v
alue
.
For d
eriv
ativ
e in
stru
men
ts th
at a
re d
esig
nate
d an
d qu
alify
as
a ca
sh fl
ows
hedg
e (i.
e., h
edgi
ng th
e ex
posu
re to
var
iabi
lity
in e
xpec
ted
futu
re c
ash
flow
s th
at i
s at
tribu
tabl
e to
a p
artic
ular
ris
k), t
he e
ffec
tive
porti
on o
f th
e ga
in o
r lo
ss o
n th
e de
rivat
ive
instr
umen
t is
repo
rted
as a
com
pone
nt o
f oth
er c
ompr
ehen
sive
inco
me
and
recl
assi
fied
into
ear
ning
s in
the
sam
e pe
riod
or p
erio
ds d
urin
g w
hich
the
hedg
ed tr
ansa
ctio
n af
fect
s ea
rnin
gs. A
ny g
ain
or lo
ss o
n a
deriv
ativ
e in
stru
men
t in
exce
ss o
f th
e cu
mul
ativ
e ch
ange
in th
e pr
esen
tva
lue
of fu
ture
cas
h flo
ws o
f the
hed
ged
item
is re
cogn
ized
in c
urre
nt e
arni
ngs d
urin
g th
e pe
riod
of c
hang
e.
-73-
U.S
. dol
lars
in th
ousa
nds,
exce
pt sh
are
and
per
shar
e da
ta.
To p
rot e
ct a
gain
st th
e in
crea
se in
val
ue o
f fo
reca
sted
for
eign
cur
renc
y ca
sh f
low
s re
sulti
ng f
rom
sal
ary
and
rent
pay
men
ts in
New
Is
rael
i She
kel (
“NIS
”) d
urin
g th
e ye
ar, t
he C
ompa
ny in
stitu
ted
a fo
reig
n cu
rren
cy c
ash
flow
hed
ging
pro
gram
. The
Com
pany
hed
ges
porti
ons
of th
e an
ticip
ated
pay
roll
and
rent
of i
ts Is
rael
i fac
ilitie
s de
nom
inat
ed in
NIS
for a
per
iod
of o
ne to
12
mon
ths
with
put
and
ca
ll op
tions
and
for
war
d co
ntra
cts.
Thes
e fo
rwar
d co
ntra
cts
and
put a
nd c
all o
ptio
ns a
re d
esig
nate
d as
cas
h flo
w h
edge
s an
d ar
e al
l ef
fect
ive
as h
edge
s of t
hese
exp
ense
s.
The
effe
ct o
f de
rivat
ive
inst
rum
ents
in c
ash
flow
hed
ging
tran
sact
ions
on
inco
me
and
othe
r co
mpr
ehen
sive
inco
me
(“O
CI”
) fo
r th
e ye
ars e
nded
Dec
embe
r 31,
201
9, 2
018
and
2017
is su
mm
ariz
ed b
elow
:
Gai
ns (l
osse
s) o
n de
riva
tives
re
cogn
ized
in O
CI
Yea
r en
ded
Dec
embe
r 31
, 20
19
2018
20
17
Fore
ign
exch
ange
forw
ard
cont
ract
s and
pu
t and
cal
l opt
ions
$
108
$ (1
9)
$ 16
3
Gai
ns (l
osse
s) o
n de
riva
tives
rec
lass
ified
fr
om O
CI t
o in
com
e
Yea
r en
ded
Dec
embe
r 31
, L
ocat
ion
2019
20
18
2017
Fore
ign
exch
ange
forw
ard
cont
ract
s and
put
and
ca
ll op
tions
Ope
ratin
g ex
pens
es
$ 10
5 $
(16)
$17
2
As o
f Dec
embe
r 31,
201
9, th
e C
ompa
ny h
ad n
o ou
tsta
ndin
g op
tion
or fo
rwar
d co
ntra
cts.
As o
f Dec
embe
r 31,
201
8, th
e C
ompa
ny h
ad o
utst
andi
ng o
ptio
n co
ntra
cts i
n th
e am
ount
of $
3,60
0.
As o
f Dec
embe
r 31,
201
7, th
e C
ompa
ny h
ad n
o ou
tsta
ndin
g op
tion
or fo
rwar
d co
ntra
cts.
-74-

U.S
. dol
lars
in th
ousa
nds,
exce
pt sh
are
and
per
shar
e da
ta.
v.C
ompr
ehen
sive
inco
me:
The
Com
pany
acc
ount
s fo
r co
mpr
ehen
sive
inc
ome
in a
ccor
danc
e w
ith A
SC N
o. 2
20,
“Com
preh
ensi
ve I
ncom
e.”
Com
preh
ensi
vein
com
e ge
nera
lly r
epre
sent
s al
l ch
ange
s in
sto
ckho
lder
s’ e
quity
dur
ing
the
perio
d ex
cept
tho
se r
esul
ting
from
inv
estm
ents
by,
or
dist
ribut
ions
to, s
tock
hold
ers.
The
Com
pany
det
erm
ined
that
its
item
s of
oth
er c
ompr
ehen
sive
inco
me
rela
te to
gai
ns a
nd lo
sses
on
hedg
ing
deriv
ativ
e in
stru
men
ts, u
nrea
lized
gai
ns a
nd lo
sses
on
avai
labl
e-fo
r-sal
e se
curit
ies,
unre
aliz
ed g
ains
and
loss
es fr
om p
ensi
onan
d un
real
ized
gai
n an
d lo
sses
from
fore
ign
curr
ency
tran
slat
ion
adju
stm
ents
.
The
follo
win
g ta
ble
sum
mar
izes
the
chan
ges i
n ac
cum
ulat
ed b
alan
ces o
f oth
er c
ompr
ehen
sive
inco
me
(loss
) for
201
9:
Unr
ealiz
ed
gain
s (lo
sses
) on
ava
ilabl
e-fo
r-sa
le
mar
keta
ble
secu
ritie
s
Unr
ealiz
ed
gain
s (lo
sses
) on
Cas
h Fl
ow
Hed
ges
Unr
ealiz
ed
gain
s (lo
sses
) on
com
pone
nts o
f de
fined
ben
efit
plan
s
Unr
ealiz
ed
gain
s (lo
sses
) on
fore
ign
curr
ency
tr
ansl
atio
n T
otal
Ja
nuar
y 1,
201
9 $
(1,6
33)
$ (3
)$
(361
)$
(327
) $
(2,3
24)
Oth
er c
ompr
ehen
sive
inco
me
(loss
) bef
ore
recl
assi
ficat
ions
1,
494
108
(141
)(1
0)1,
451
Loss
es (g
ains
) rec
lass
ified
fr
om a
ccum
ulat
ed o
ther
co
mpr
ehen
sive
inco
me
(loss
) 73
(1
05)
16-
(16)
Net
cur
rent
per
iod
othe
r co
mpr
ehen
sive
inco
me
(loss
) 1,
567
3 (1
25)
(10)
1,43
5
Dec
embe
r 31,
201
9 $
(66)
$-
$(4
86)
$ (3
37)
$(88
9)
-75-

U.S. dollars in thousands, except share and per share data.
-76-
The following table provides details about reclassifications out of accumulated other comprehensive income (loss) for 2019:
Details about Accumulated Other Comprehensive Income
Components
Losses (gains) reclassified from
accumulated other
comprehensive income
Affected Line Item in the Statement of Income (Loss)
Losses on available-for-sale marketable securities $ 73 Financial income, net
- Provision for income taxes73 Total, net of income taxes
Gains on cash flow hedges (83) Research and development
(8) Sales and marketing(14) General and administrative
(105) Total, before income taxes- Provision for income taxes
(105) Total, net of income taxes
Losses on components of defined benefit plans 11 Research and development
5 Sales and marketing 16 Total, before income taxes
- Provision for income taxes16 Total, net of income taxes
Total reclassifications for the period (16) Total, net of income taxes
w. Treasury stock at cost
The Company repurchases its common stock from time to time on the open market or inother transactions and holds such shares as treasury stock. The Company presents the cost torepurchase treasury stock as a reduction of stockholders’ equity.
From time to time, the Company reissues treasury stock under its employee stock purchaseplan and equity incentive plans, upon purchases or exercises of equity awards under theplans. When treasury stock is reissued, the Company accounts for the re-issuance inaccordance with ASC No. 505-30, “Treasury Stock” and charges the excess of the purchasecost over the re-issuance price (loss) to retained earnings. The purchase cost is calculated

U.S. dollars in thousands, except share and per share data.
-77-
based on the specific identification method. In case the purchase cost is lower than the re-issuance price, the Company credits the difference to additional paid-in capital.
x. Operating leases:
Effective as of January 1, 2019, the Company adopted Topic 842 (“Topic 842”), which requires the recognition of lease assets and lease liabilities by lessees for leases classified as operating leases. The Company determines if an arrangement is a lease at inception. The Company’s assessment is based on: (1) whether the contract includes an identified asset, (2) whether the Company obtains substantially all of the economic benefits from the use of the asset throughout the period of use, and (3) whether the Company has the right to direct how and for what purpose the identified asset is used throughout the period of use.
Leases are classified as either finance leases or operating leases. A lease is classified as a finance lease if any one of the following criteria are met: the lease transfers ownership of the asset by the end of the lease term, the lease contains an option to purchase the asset that is reasonably certain to be exercised, the lease term is for a major part of the remaining useful life of the asset, the present value of the lease payments equals or exceeds substantially all of the fair value of the asset, or the underlying asset is of such a specialized nature that it is expected to have no alternative use to the lessor at the end of lease term. A lease is classified as an operating lease if it does not meet any of those criteria. Since all of the Company’s lease contracts do not meet any of the criteria above, the Company concluded that all of its lease contracts should be classified as operation leases. ROU assets and liabilities are recognized on the commencement date based on the present value of remaining lease payments over the lease term. For this purpose, the Company considers only payments that are fixed and determinable at the time of commencement.
Some leases include one or more options for renewal. The exercise of the lease renewal options is typically at the Company's sole discretion; therefore, a majority of renewals to extend the lease terms are included in the Company’s right-of-use assets and liabilities as they are reasonably certain of exercise. New lease modifications result in remeasurement of the right of use assets and lease liability.
Some of the leases contain variable lease payments, including payments based on the Consumer Price Index (CPI). Variable lease payments based on a CPI are initially measured using the index in effect at lease adoption. Additional payments based on changes in CPI are recorded as a period expense when incurred.
As most of the Company's leases do not provide an implicit rate, the Company used a third party valuation firm to determine the incremental borrowing rate in determining the present value of lease payments. The ROU asset also includes any lease payments made prior to commencement and is recorded net of any lease incentives received. All ROU assets are reviewed for impairment. The lease terms may include options to extend or terminate the lease when it is reasonably certain that the Company will exercise such options.
y. Recently issued and adopted accounting pronouncements:
On January 1, 2019, the Company adopted Topic 842 using the modified retrospective transition approach by applying the new standard to all leases existing on the date of initial
U.S. dollars in thousands, except share and per share data.
-78-
application. Results and disclosure requirements for reporting periods beginning after January 1, 2019 are presented under Topic 842, while prior period amounts have not been adjusted and continue to be reported in accordance with the Company’s historical accounting under Topic 840. The Company elected the package of practical expedients permitted under the transition guidance, which allowed the Company to carryforward (i) the historical lease classification, (ii) the Company’s assessment regarding whether a contract was or contains a lease, and (iii) not to reassess initial direct costs for any leases that existed prior to January 1, 2019. The Company also elected to keep leases with an initial term of 12 months or less off the balance sheet and recognized the associated lease payments in the consolidated statements of income on a straight-line basis over the lease term. As a result of the adoption of Topic 842, on January 1, 2019, the Company recorded both operating lease right-of-use assets of $12,500 and operating lease liabilities of $12,500. The adoption did not impact the Company’s beginning retained earnings, or its prior year condensed consolidated statements of income and statements of cash flows.
z. Recently issued accounting pronouncements not yet effective:
In August 2018, the FASB issued ASU 2018-15, Intangibles—Goodwill and Other—Internal-Use Software (Subtopic 350-40): Customer’s Accounting for Implementation Costs Incurred in a Cloud Computing Arrangement That Is a Service Contract. The amendments in this ASU align the requirements for capitalizing implementation costs incurred in a hosting arrangement with the requirements for capitalizing implementation costs incurred to develop or obtain internal-use software. The implementation costs incurred in a hosting arrangement that is a service contract should be presented as a prepaid asset on the balance sheet and expensed over the term of the hosting arrangement to the same line item in the statement of income as the costs related to the hosting fees. The guidance in this ASU is effective for fiscal years beginning after December 15, 2019, including interim periods within those fiscal years, and early adoption is permitted, including adoption in any interim period. The amendments should be applied either retrospectively or prospectively to all implementation costs incurred after adoption. The Company is currently evaluating the impact that the standard will have on our consolidated financial statements and do not expect the adoption of this ASU to have a material effect on our consolidated financial statements. In August 2018, the FASB issued ASU 2018-14—Compensation—Retirement Benefits—Defined Benefit Plans—General (Topic 715-20): Disclosure Framework—Changes to the Disclosure Requirements for Defined Benefit Plans which improves disclosure requirements for employers that sponsor defined benefit pension or other postretirement plans. This standard is effective for fiscal years ending after December 15, 2020, for public business entities. Early adoption is permitted for all entities. Entities are to apply the amendments in this Update on a retrospective basis for all periods presented. The Company is currently evaluating the impact that the standard will have on the Company’s consolidated financial statements and related disclosures. In June 2016, the FASB issued ASU 2016-13, “Financial Instruments – Credit Losses on Financial Instruments” (“ASU 2016-13”), which requires that expected credit losses relating to financial assets measured on an amortized cost basis and available-for-sale debt securities be recorded through an allowance for credit losses. ASU 2016-13 limits the amount of credit losses to be recognized for available-for-sale debt securities to the amount by which carrying value exceeds fair value and also requires the reversal of previously recognized credit losses if fair value increases. The new standard will be effective for interim and annual periods beginning after January 1, 2020, and early adoption is permitted. The Company does not expect this standard to have a material effect on its consolidated financial statements.

U.S. dollars in thousands, except share and per share data.
-79-
NOTE 3: MARKETABLE SECURITIES AND TIME DEPOSITS
The following is a summary of marketable securities and time deposits at December 31, 2019 and 2018 (see also Note 9):
Amortized cost Unrealized gains
(losses), net Fair value 2019 2018 2019 2018 2019 2018 Short-term deposit $ 15,067 $ 8,349 $ - $ - $ 15,067 $ 8,349 Long-term deposit - 5,130 - - - 5,130 U.S. GSE securities 4,468 21,550 (6) (253) 4,462 21,297 Corporate obligations 82,556 77,857 (60) (1,382) 82,496 76,475 $102,091 $112,885 $ (66) $ (1,635) $102,025 $111,251
The amortized costs of marketable debt securities at December 31, 2019, by contractual maturities or anticipated dates of sale, are shown below:
Amortized Unrealized gains (losses) Fair cost Gains Losses value Due in one year or less $ 24,033 $ 55 $ (14) $ 24,074 Due after one year to five years 62,991 124 (231) 62,884 $ 87,024 $ 179 $ (245) $ 86,958
The amortized cost of marketable debt securities at December 31, 2018, by contractual maturities or anticipated dates of sale, are shown below:
Amortized Unrealized gains (losses) Fair cost Gains Losses value Due in one year or less $ 27,442 $ - $ (78) $ 27,364 Due after one year to six years 71,965 1 (1,558) 70,408 $ 99,406 $ 1 $ (1,636) $ 97,772
The actual maturity dates may differ from the contractual maturities because debtors may have the right to call or prepay obligations without penalties.
The total fair value of marketable securities with outstanding unrealized losses as of December 31, 2019 amounted to $56,855, while the unrealized losses for these marketable securities amounted to $245. Of the $245 unrealized losses outstanding as of December 31, 2019, a portion of which in the amount of $115 was related to marketable securities that were in a loss position for more than 12 months and the remaining portion of $130 was related to marketable securities that were in a loss position for less than 12 months.
The total fair value of marketable securities with outstanding unrealized losses as of December 31, 2018 amounted to $94,550, while the unrealized losses for these marketable securities amounted to $1,636. Of the $1,636 unrealized losses outstanding as of December 31, 2018, a portion of which in

U.S. dollars in thousands, except share and per share data.
-80-
the amount of $1,498 was related to marketable securities that were in a loss position for more than 12 months and the remaining portion of $138 was related to marketable securities that were in a loss position for less than 12 months.
Management believes that as of December 31, 2019, the unrealized losses in the Company’s investments in all types of marketable securities were temporary and no impairment loss was realized in the Company’s consolidated statements of operations.
The unrealized losses related to the Company’s marketable securities were primarily due to changes in interest rates. Because the Company does not intend to sell the investments and it is not more likely than not that the Company will be required to sell the investments before recovery of their amortized cost bases, which may be maturity, the Company does not consider those investments to be other-than-temporarily impaired at December 31, 2019.
Proceeds from maturity of available-for-sale marketable securities during 2019, 2018 and 2017 were $44,396, $20,501 and $21,499, respectively. Proceeds from sales of available-for-sale marketable securities during 2019, 2018 and 2017 were $25,064, $5,113 and $19,226, respectively. Realized gains from the sale of available-for sale marketable securities for 2019, 2018 and 2017 were $4, $26 and $7, respectively. Realized losses from the sale of available-for sale marketable securities for 2019, 2018 and 2017 were $77, $67 and $57, respectively. The Company determines realized gains or losses on the sale of available-for-sale marketable securities based on a specific identification method.
NOTE 4:- OPERATING LEASES
The Company has entered into various non-cancelable operating lease agreements of its offices and car leases. The Company’s headquarters is located in San Jose, California pursuant to a lease that terminates in December 2021. The Company and its subsidiaries lease certain equipment and facilities under non-cancelable operating leases. The Company has significant leased facilities in Herzliya, Israel. The lease agreement for the facilities of its Israeli subsidiary is effective until April 2029. The Company’s subsidiaries in Germany, China (Shanghai and Shenzhen), Japan, South Korea and India have lease agreements for their facilities that terminate in 2020, with the agreement in India having an option to be extended until 2030. The Company’s subsidiary in Hong-Kong has a lease agreement for its facilities that terminate in 2022. The Company has operating lease agreements for its motor vehicles which terminate in 2020 through 2022.
Many leases include one or more options to renew. The Company assumes renewals in the determination of the lease term if the renewals are deemed to be reasonably assured at lease commencement date. The Company's lease agreements do not contain any material residual value guarantees or material restrictive covenants. Total operating lease costs during 2019 were $2,997, out of which an amount of $2,432 represented the total cash paid for amounts included in the measurement of operating lease liabilities during the year ended December 31, 2019. During 2019, total new lease liability amounted to $1,114. Other information about lease amounts recognized in the Company’s consolidated financial statements is summarized as follows:
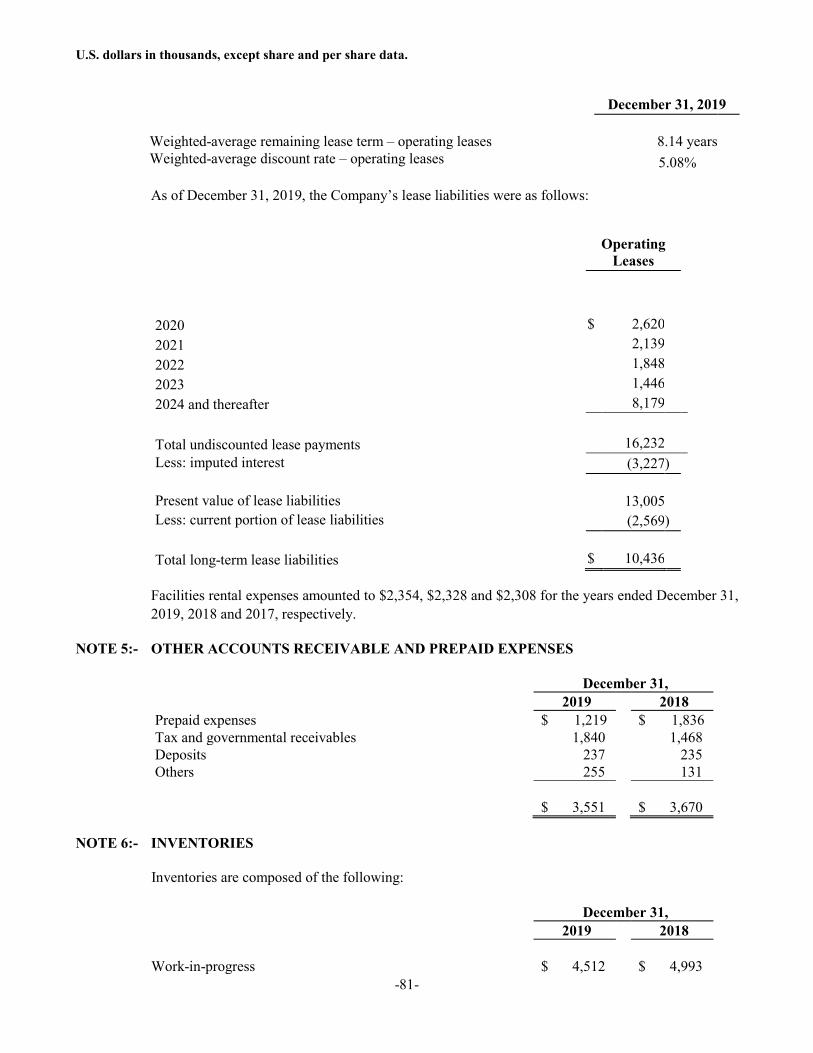
U.S. dollars in thousands, except share and per share data.
-81-
December 31, 2019
Weighted-average remaining lease term – operating leases 8.14 years
Weighted-average discount rate – operating leases 5.08%
As of December 31, 2019, the Company’s lease liabilities were as follows:
Operating
Leases
2020 $ 2,620
2021 2,139 2022 1,848 2023 1,446 2024 and thereafter 8,179 Total undiscounted lease payments 16,232 Less: imputed interest (3,227 ) Present value of lease liabilities 13,005
Less: current portion of lease liabilities (2,569 )
Total long-term lease liabilities $ 10,436
Facilities rental expenses amounted to $2,354, $2,328 and $2,308 for the years ended December 31, 2019, 2018 and 2017, respectively.
NOTE 5:- OTHER ACCOUNTS RECEIVABLE AND PREPAID EXPENSES
December 31, 2019 2018 Prepaid expenses $ 1,219 $ 1,836 Tax and governmental receivables 1,840 1,468 Deposits 237 235 Others 255 131 $ 3,551 $ 3,670
NOTE 6:- INVENTORIES
Inventories are composed of the following:
December 31, 2019 2018
Work-in-progress $ 4,512 $ 4,993

U.S. dollars in thousands, except share and per share data.
-82-
Finished products 2,952 4,826 $ 7,464 $ 9,819
During 2019, the Company recorded $27 of income due to the utilization of inventory that was previously written off.
Inventory write-downs amounted to $89 and $51 for the years ended December 31, 2018 and 2017, respectively.
NOTE 7:- PROPERTY AND EQUIPMENT
Composition of assets, grouped by major classifications, is as follows:
December 31, 2019 2018
Cost: Computers and equipment $ 20,435 $ 22,139 Office furniture and equipment 1,380 1,471 Leasehold improvements 4,953 5,221
26,768 28,831 Less - accumulated depreciation 19,963 26,083 Depreciated cost $ 6,805 $ 2,748
During 2019, the Company disposed or sold equipment and leasehold improvements, which ceased to be used, in the amount of $7,676. Capital loss in an amount of $9 was recorded due to this disposal of equipment in the consolidated statement of operations.
During 2018, the Company disposed leasehold improvements, which ceased to be used, in the amount of $109. No capital loss was recorded due to this disposal of equipment in the consolidated statement of operations.
Depreciation expenses amounted to $1,517, $1,593 and $1,781 for the years ended December 31, 2019, 2018 and 2017, respectively.
NOTE 8:- INTANGIBLE ASSETS
The following table shows the Company’s intangible assets for the periods presented:
Useful life December 31, (years) 2019 2018
Cost: Distribution agreement 5 2,086 2,086

U.S. dollars in thousands, except share and per share data.
-83-
Non-competition agreement 3 519 519 2,605 2,605 Accumulated amortization:
Distribution agreement 1,425 1,008 Non-competition agreement 519 519
1,944 1,527 Amortized cost $ 661 $ 1,078
a. Amortization expenses amounted to $417, $1,700 and $1,700 for the years ended December 31, 2019, 2018 and 2017, respectively. Those expenses were included in amortization of intangible assets in the Company’s consolidated financial statements.
b. Estimated amortization expenses for the years ending:
Year ending December 31, 2020 $ 417 2021 244 $ 661
NOTE 9:- FAIR VALUE MEASUREMENTS
In accordance with ASC 820, the Company measures its cash equivalents, marketable securities and foreign currency derivative contracts at fair value. Cash equivalents, marketable securities and foreign currency derivative contracts are classified within Level 1 or Level 2 value hierarchies. This is because cash equivalents, and marketable securities are valued using quoted market prices or alternative pricing sources and models utilizing market observable inputs. Foreign currency derivative contracts are classified within Level 2 value hierarchy as the valuation inputs are based on quoted prices and market observable data of similar instruments.
The following table provides information by value level for financial assets and liabilities that are measured at fair value on a recurring basis as of December 31, 2019 (see also Note 3):
Balance as of Fair value measurements
Description December 31,
2019 Level 1 Level 2 Level 3 Assets Cash equivalents Money market mutual funds $ 11,635 $ 11,635 $ - $ -

U.S. dollars in thousands, except share and per share data.
-84-
Short-term marketable securities and time deposits
U.S. GSE securities $ 752 $ - $ 752 $ - Corporate debt securities $ 23,322 $ - $ 23,322 $ - Long-term marketable securities U.S. GSE securities $ 3,710 $ - $ 3,710 $ - Corporate debt securities $ 59,174 $ - $ 59,174 $ -
The following table provides information by value level for financial assets and liabilities that are measured at fair value on a recurring basis as of December 31, 2018 (see also Note 3):
Balance as of Fair value measurements
Description December 31,
2018 Level 1 Level 2 Level 3 Assets Cash equivalents Money market mutual funds $ 773 $ 773 $ - $ - Short-term marketable
securities and time deposits
U.S. GSE securities $ 1,785 $ - $ 1,785 $ - Corporate debt securities $ 25,579 $ - $ 25,579 $ - Long-term marketable
securities
U.S. GSE securities $ 19,512 $ - $ 19,512 $ - Corporate debt securities $ 50,896 $ - $ 50,896 $ - Derivative liabilities $ 3 $ - $ 3
$ -
In addition to the assets and liabilities described above, the Company’s financial instruments also include cash and cash equivalents, restricted deposits, short term deposits, trade receivables, other accounts receivable, trade payables, accrued expenses and other payables. The fair value of these financial instruments was not materially different from their carrying value at December 31, 2019 and 2018 due to the short-term maturity of these instruments.
NOTE 10:- ACCRUED EXPENSES AND OTHER ACCOUNTS PAYABLE
December 31, 2019 2018 Accrued expenses $ 769 $ 1,658 Royalties and commission 1,057 1,089 Accrued legal, and accounting expenses 424 370 Governmental payables 67 341 Others - 3
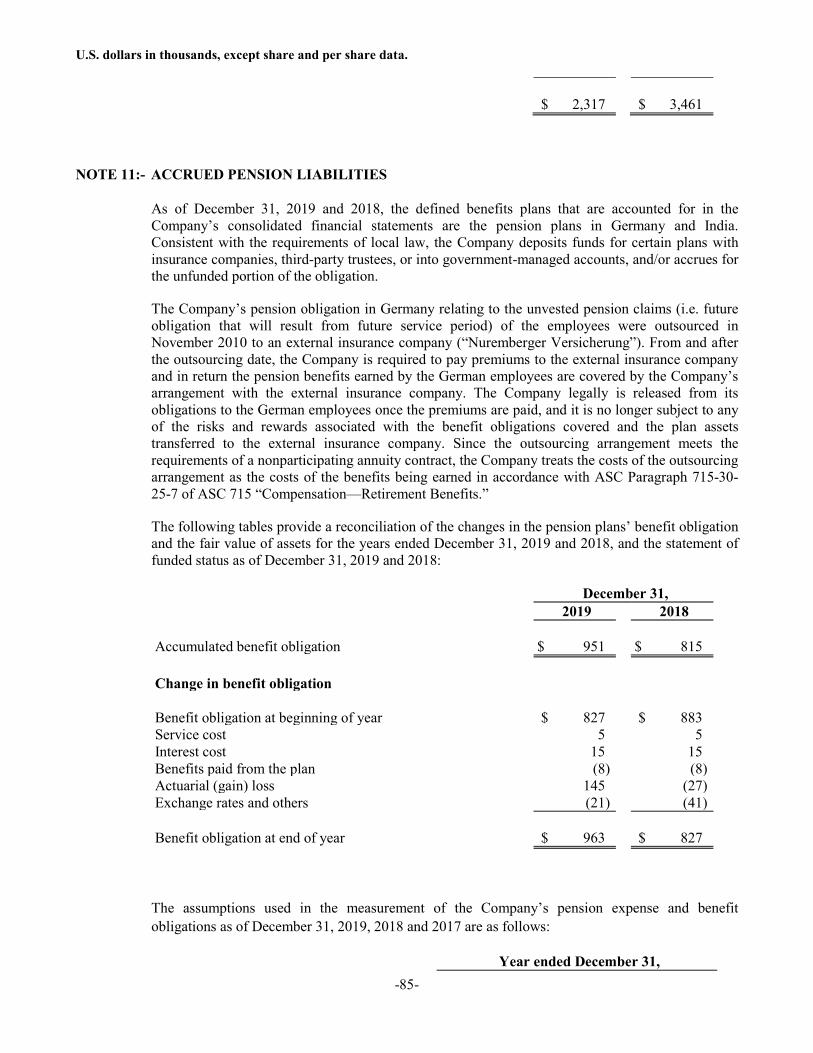
U.S. dollars in thousands, except share and per share data.
-85-
$ 2,317 $ 3,461
NOTE 11:- ACCRUED PENSION LIABILITIES
As of December 31, 2019 and 2018, the defined benefits plans that are accounted for in the Company’s consolidated financial statements are the pension plans in Germany and India. Consistent with the requirements of local law, the Company deposits funds for certain plans with insurance companies, third-party trustees, or into government-managed accounts, and/or accrues for the unfunded portion of the obligation.
The Company’s pension obligation in Germany relating to the unvested pension claims (i.e. future obligation that will result from future service period) of the employees were outsourced in November 2010 to an external insurance company (“Nuremberger Versicherung”). From and after the outsourcing date, the Company is required to pay premiums to the external insurance company and in return the pension benefits earned by the German employees are covered by the Company’s arrangement with the external insurance company. The Company legally is released from its obligations to the German employees once the premiums are paid, and it is no longer subject to any of the risks and rewards associated with the benefit obligations covered and the plan assets transferred to the external insurance company. Since the outsourcing arrangement meets the requirements of a nonparticipating annuity contract, the Company treats the costs of the outsourcing arrangement as the costs of the benefits being earned in accordance with ASC Paragraph 715-30-25-7 of ASC 715 “Compensation—Retirement Benefits.”
The following tables provide a reconciliation of the changes in the pension plans’ benefit obligation and the fair value of assets for the years ended December 31, 2019 and 2018, and the statement of funded status as of December 31, 2019 and 2018:
December 31, 2019 2018 Accumulated benefit obligation $ 951 $ 815 Change in benefit obligation Benefit obligation at beginning of year $ 827 $ 883 Service cost 5 5 Interest cost 15 15 Benefits paid from the plan (8) (8) Actuarial (gain) loss 145 (27) Exchange rates and others (21) (41)
Benefit obligation at end of year $ 963 $ 827
The assumptions used in the measurement of the Company’s pension expense and benefit obligations as of December 31, 2019, 2018 and 2017 are as follows:
Year ended December 31,
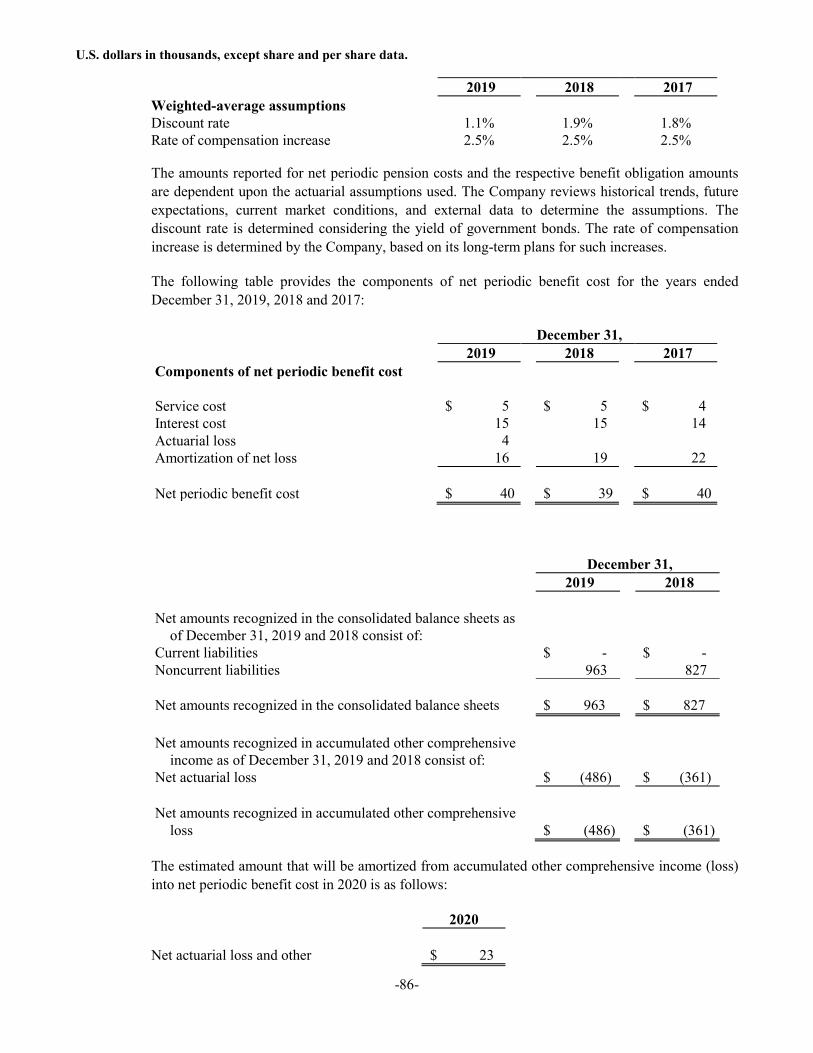
U.S. dollars in thousands, except share and per share data.
-86-
2019 2018 2017 Weighted-average assumptions Discount rate 1.1% 1.9% 1.8% Rate of compensation increase 2.5% 2.5% 2.5%
The amounts reported for net periodic pension costs and the respective benefit obligation amounts are dependent upon the actuarial assumptions used. The Company reviews historical trends, future expectations, current market conditions, and external data to determine the assumptions. The discount rate is determined considering the yield of government bonds. The rate of compensation increase is determined by the Company, based on its long-term plans for such increases.
The following table provides the components of net periodic benefit cost for the years ended December 31, 2019, 2018 and 2017:
December 31, 2019 2018 2017 Components of net periodic benefit cost Service cost $ 5 $ 5 $ 4 Interest cost 15 15 14 Actuarial loss 4 Amortization of net loss 16 19 22 Net periodic benefit cost $ 40 $ 39 $ 40
December 31, 2019 2018 Net amounts recognized in the consolidated balance sheets as
of December 31, 2019 and 2018 consist of:
Current liabilities $ - $ - Noncurrent liabilities 963 827 Net amounts recognized in the consolidated balance sheets $ 963 $ 827 Net amounts recognized in accumulated other comprehensive
income as of December 31, 2019 and 2018 consist of:
Net actuarial loss $ (486) $ (361) Net amounts recognized in accumulated other comprehensive
loss
$ (486) $ (361)
The estimated amount that will be amortized from accumulated other comprehensive income (loss) into net periodic benefit cost in 2020 is as follows:
2020 Net actuarial loss and other $ 23
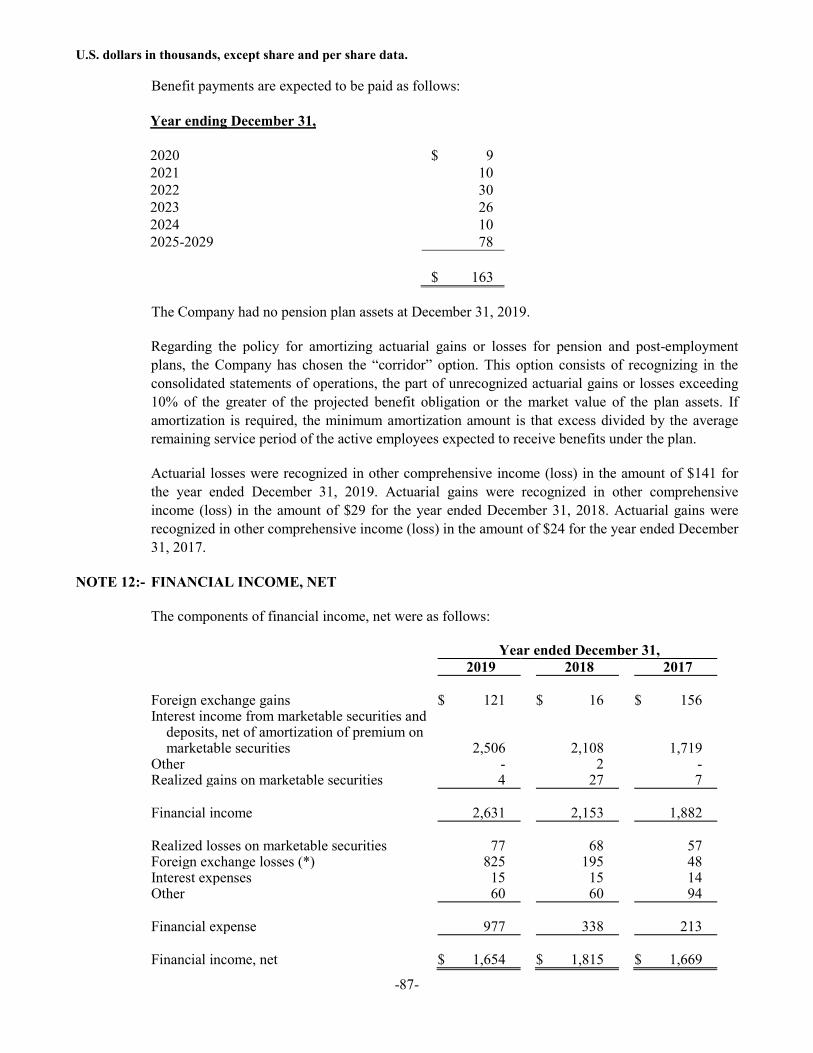
U.S. dollars in thousands, except share and per share data.
-87-
Benefit payments are expected to be paid as follows:
Year ending December 31, 2020 $ 9 2021 10 2022 30 2023 26 2024 10 2025-2029 78 $ 163
The Company had no pension plan assets at December 31, 2019.
Regarding the policy for amortizing actuarial gains or losses for pension and post-employment plans, the Company has chosen the “corridor” option. This option consists of recognizing in the consolidated statements of operations, the part of unrecognized actuarial gains or losses exceeding 10% of the greater of the projected benefit obligation or the market value of the plan assets. If amortization is required, the minimum amortization amount is that excess divided by the average remaining service period of the active employees expected to receive benefits under the plan.
Actuarial losses were recognized in other comprehensive income (loss) in the amount of $141 for the year ended December 31, 2019. Actuarial gains were recognized in other comprehensive income (loss) in the amount of $29 for the year ended December 31, 2018. Actuarial gains were recognized in other comprehensive income (loss) in the amount of $24 for the year ended December 31, 2017.
NOTE 12:- FINANCIAL INCOME, NET
The components of financial income, net were as follows:
Year ended December 31, 2019 2018 2017 Foreign exchange gains $ 121 $ 16 $ 156 Interest income from marketable securities and
deposits, net of amortization of premium on marketable securities 2,506 2,108 1,719
Other - 2 - Realized gains on marketable securities 4 27 7 Financial income 2,631 2,153 1,882 Realized losses on marketable securities 77 68 57 Foreign exchange losses (*) 825 195 48 Interest expenses 15 15 14 Other 60 60 94 Financial expense 977 338 213 Financial income, net $ 1,654 $ 1,815 $ 1,669

U.S. dollars in thousands, except share and per share data.
-88-
(*) Includes $785 of exchange rate differences resulting from the new lease accounting standard (ASC 842) for the year ended December 31, 2019.
NOTE 13:- STOCKHOLDERS’ EQUITY
a. Preferred stock:
The Company’s Board of Directors has the authority, without any further vote or action by the stockholders, to provide for the issuance of up to 5,000,000 shares of preferred stock in one or more series with such designations, rights, preferences, and limitations as the Board of Directors may determine, including the consideration received, the number of shares comprising each series, dividend rates, redemption provisions, liquidation preferences, sinking fund provisions, conversion rights and voting rights. No shares of preferred stock are currently outstanding.
b. Common stock:
Currently, 50,000,000 shares of common stock are authorized. Holders of common stock are entitled to one vote per share on all matters to be voted upon by the Company’s stockholders. Subject to the rights of holders of preferred stock, if any, in the event of liquidation, dissolution or winding up, holders of common stock are entitled to share ratably in all of the Company’s assets. The Company’s Board of Directors may declare a dividend out of funds legally available therefore and, subject to the rights of holders of preferred stock, if any, the holders of common stock are entitled to receive ratably any such dividends.
Holders of common stock have no preemptive rights or other subscription rights to convert their shares into any other securities. There are no redemption or sinking fund provisions applicable to common stock.
c. Dividend policy:
At December 31, 2019, the Company had an accumulated deficit of $118,712. The Company has never paid cash dividends on the common stock and presently intends to follow a policy of retaining earnings for reinvestment in its business.
d. Share repurchase program:
The Company’s board of directors has previously approved a number of share repurchase plans, including those in accordance with Rule 10b5-1 of the Securities Exchange Act of 1934, for the repurchase of our common stock. In February 2019, our board authorized an increase of the existing share repurchase program to an aggregate of $10,000, inclusive of previously authorized amounts under the repurchase program.
In 2019, the Company did not repurchase any of its common stocks. In 2018 and 2017, the Company repurchased approximately 1,015,000, 389,000 shares, respectively, of common stock at an average purchase price of $12.14 and $11.55 per share, respectively, for an aggregate purchase price of $12,318 and $4,490, respectively. As of December 31, 2019, 794,913 shares of the Company’s common stock were available for repurchase under the Company’s board authorized share repurchase program.
U.S. dollars in thousands, except share and per share data.
-89-
In 2019, 2018 and 2017, the Company issued 845,000, 848,000 and 890,000 shares, respectively, of common stock, out of treasury stock, to employees who exercised their equity awards and had vested RSUs under the Company’s equity incentive plans or purchased shares from the Company’s 1993 Employee Stock Purchase Plan (“ESPP”).
e. Stock purchase plan and equity incentive plans:
The Company has various equity incentive plans under which employees, officers, non-employee directors of the Company and its subsidiaries and others, including consultants, may be granted rights to purchase the Company’s common stock. The plans authorize the administrator, except for the grant of RSUs, to grant equity incentive awards at an exercise price of not less than 100% of the fair market value of the common stock on the date the award is granted. It is the Company’s policy to grant stock options and SARs at an exercise price that equals the fair market value.
Equity awards granted under all stock incentive plans that are cancelled or forfeited before expiration become available for future grant.
Until the end of 2012, the Company granted to employees and executive officers of the Company primarily SARs, capped with a ceiling, under the various equity incentive plans. The SAR unit confers the holder the right to stock appreciation over a preset price of the Company’s common stock during a specified period of time. When the unit is exercised, the appreciation amount is paid through the issuance of shares of the Company’s common stock. The ceiling limits the maximum income for each SAR unit and the maximum number of shares to be issued. SARs are considered an equity instrument as it is a net share settled award capped with a ceiling.
Starting in 2013, the Company granted to employees and executive officers of the Company primarily RSUs under the various equity incentive plans. An RSU award is an agreement to issue shares of our common stock at the time the award is vested. RSUs granted to employees and executive officers generally vest over a four year period from the grant date with 25% of the RSUs granted vesting on the first anniversary of the grant date and 6.25% vesting each quarter thereafter.
A summary of the various plans is as follows:
1993 Director Stock Option Plan (Directors Plan)
Upon the closing of the Company’s initial public offering, the Company adopted the Directors Plan. Under the Directors Plan, which expired in January 2014, the Company was authorized to issue nonqualified stock options to the Company’s outside non-employee directors to purchase up to 1,980,875 shares of common stock at an exercise price equal to the fair market value of the common stock on the date of grant. Options granted under the Directors Plan generally had a term of 10 years. One-third of the shares were exercisable after the first year and thereafter one-third at the end of each twelve-month period.
The Directors Plan expired in January 2014 and therefore no further awards may be granted thereunder. As of December 31, 2019, 2,464,933 shares of common stock had been granted

U.S. dollars in thousands, except share and per share data.
-90-
under the plan and stock options to acquire 150,000 shares remained outstanding out of grants made prior to its expiration.
1998 Non-Officer Employee Stock Option Plan (1998 Plan)
In 1998, the Company adopted the 1998 Plan. Under the 1998 Plan, employees may be granted non-qualified stock options for the purchase of common stock. The 1998 Plan currently provides for the purchase of up to 5,062,881 shares of common stock. As of December 31, 2019, 20,841 shares of common stock remained available for grant under the 1998 Plan.
The exercise price of options under the 1998 Plan shall not be less than the fair market value of common stock for nonqualified stock options, as determined by the Company’s Board of Directors or a committee appointed by the Company’s Board of Directors.
Options under the 1998 Plan are generally exercisable over a 48-month period beginning 12 months after issuance, or as determined by the Company’s Board of Directors or a committee appointed by the Company’s Board of Directors. Options under the 1998 Plan expire up to seven years after the date of grant.
2012 Equity Incentive Plan (2012 Plan)
In 2012, the Company adopted the 2012 Plan, which also complies with the Israeli tax reforms. Under the 2012 Plan, employees, directors and consultants may be granted incentive or non-qualified stock options, SARs, RSUs and other awards under the plan. The exercise price for stock options under the 2012 Plan shall not be less than the fair market value of common stock at the time of grant, unless otherwise determined by the Company’s Board of Directors or a committee appointed by the Company’s Board of Directors. The 2012 Plan currently provides for the purchase of up to 5,250,000 shares of common stock. As of December 31, 2019, 1,715,124 shares of common stock remained available for grant under the 2012 Plan.
Stock options, SARs and RSUs awarded under the 2012 Plan to employees and executive officers are generally exercisable over a 48-month period beginning 12 months after issuance, or as determined by the Company’s Board of Directors or a committee appointed by the Company’s Board of Directors Equity awards under the 2012 Plan expire up to seven years after the date of grant.
A director subplan was established under the 2012 Plan to provide for the grant of equity awards to the Company’s non-employee directors. The director subplan is designed to work automatically; however, to the extent administration is necessary, it would be provided by the Company’s board of directors. From 2014 to 2018, non-employee directors were granted automatically under the director subplan, on January 1 of each year, 8,000 stock options and 4,000 RSUs, all of which would fully vest at the end of one year from the grant date. Starting in 2019, the mix of options and restricted stock units awarded to directors under the director subplan was eliminated. In lieu of the mix, directors are automatically granted on January 1 of each year RSUs with a value of $100,000 with the exact number of restricted stock units to be based on a 30-day average closing price of the Company’s common stock prior to the RSU grant date. The RSU awards would fully vest at the end of one year from the grant date.

U.S. dollars in thousands, except share and per share data.
-91-
If a director is appointed for a term commencing during a calendar year, the director would be granted RSUs on the date of appointment and the number of RSUs granted would be based upon the number of days remaining in the in the calendar year following the date such person was nominated as a director.
1993 Employee Stock Purchase Plan (ESPP)
Upon the closing of the Company’s initial public offering, the Company adopted the ESPP. The Company has reserved an aggregate of 4,800,000 shares of common stock for issuance under the ESPP. The ESPP provides that substantially all employees of the Company may purchase Company common stock at 85% of its fair market value on specified dates via payroll deductions. There were approximately 206,000, 230,000 and 227,000 shares of common stock issued at a weighted average purchase price of $9.61, $8.71 and $8.34 per share under the ESPP in 2019, 2018 and 2017, respectively. As of December 31, 2019, 273,000 shares of common stock were reserved under the ESPP.
Stock Reserved for Future Issuance
The following table summarizes the number of shares available for future issuance at December 31, 2019 (after giving effect to the above increases in the equity incentive plans):
ESPP 273,000 Equity awards 1,736,000 Undesignated preferred stock 5,000,000
7,009,000
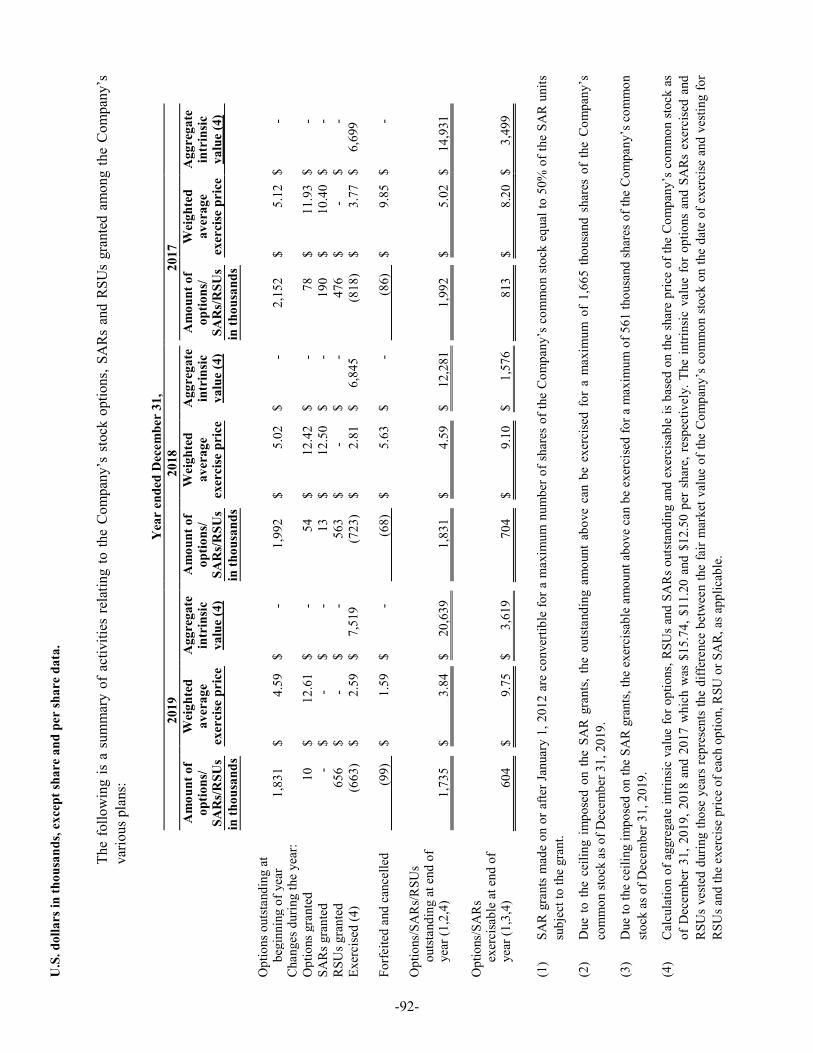
U.S
. dol
lars
in th
ousa
nds,
exce
pt sh
are
and
per
shar
e da
ta.
The
follo
win
g is
a s
umm
ary
of a
ctiv
ities
rel
atin
g to
the
Com
pany
’s s
tock
opt
ions
, SA
Rs
and
RSU
s gr
ante
d am
ong
the
Com
pany
’s
vario
us p
lans
:
Yea
r en
ded
Dec
embe
r 31
, 20
19
2018
20
17
Am
ount
of
optio
ns/
SAR
s/R
SUs
Wei
ghte
d av
erag
e ex
erci
se p
rice
Agg
rega
te
intr
insi
c va
lue
(4)
Am
ount
of
optio
ns/
SAR
s/R
SUs
Wei
ghte
d av
erag
e ex
erci
se p
rice
Agg
rega
te
intr
insi
c va
lue
(4)
Am
ount
of
optio
ns/
SAR
s/R
SUs
Wei
ghte
d av
erag
e ex
erci
se p
rice
Agg
rega
te
intr
insi
c va
lue
(4)
in th
ousa
nds
in th
ousa
nds
in
thou
sand
s
Opt
ions
out
stan
ding
at
begi
nnin
g of
yea
r 1,
831
$ 4.
59
$ -
1,99
2
$5.
02
$ -
2,15
2 $
5.12
$
- C
hang
es d
urin
g th
e ye
ar:
Opt
ions
gra
nted
10
$
12.6
1 $
-54
$12
.42
$ -
78
$11
.93
$ -
SAR
s gra
nted
-
$-
$-
13
$
12.5
0 $
-19
0 $
10.4
0 $
- R
SUs g
rant
ed
656
$ -
$-
563
$
-$
-47
6 $
-$
- Ex
erci
sed
(4)
(663
)$
2.59
$
7
,519
(7
23)
$2.
81
$
6,8
45
(818
)$
3.77
$
6
,699
Forf
eite
d an
d ca
ncel
led
(99)
$1.
59
$ -
(68)
$
5.63
$
-(8
6)
$9.
85
$ -
Opt
ions
/SA
Rs/
RSU
s ou
tsta
ndin
g at
end
of
year
(1,2
,4)
1,73
5 $
3.84
$
2
0,63
9 1,
831
$ 4.
59
$
12,
281
1,99
2 $
5.02
$
1
4,93
1
Opt
ions
/SA
Rs
exer
cisa
ble
at e
nd o
f ye
ar (1
,3,4
) 60
4 $
9.75
$
3,61
9 70
4 $
9.10
$
1,57
6 81
3 $
8.20
$
3,49
9
(1)
SAR
gra
nts
mad
e on
or a
fter J
anua
ry 1
, 201
2 ar
e co
nver
tible
for a
max
imum
num
ber o
f sha
res
of th
e C
ompa
ny’s
com
mon
sto
ck e
qual
to 5
0% o
f the
SA
R u
nits
subj
ect t
o th
e gr
ant.
(2)
Due
to
the
ceili
ng i
mpo
sed
on t
he S
AR
gra
nts,
the
outs
tand
ing
amou
nt a
bove
can
be
exer
cise
d fo
r a
max
imum
of
1,66
5 th
ousa
nd s
hare
s of
the
Com
pany
’sco
mm
on st
ock
as o
f Dec
embe
r 31,
201
9.
(3)
Due
to th
e ce
iling
impo
sed
on th
e SA
R g
rant
s, th
e ex
erci
sabl
e am
ount
abo
ve c
an b
e ex
erci
sed
for a
max
imum
of 5
61 th
ous a
nd s
hare
s of t
he C
ompa
ny’s
com
mon
stoc
k as
of D
ecem
ber 3
1, 2
019.
(4)
Cal
cula
tion
of a
ggre
gate
intri
nsic
val
ue fo
r opt
ions
, RSU
s an
d SA
Rs
outs
tand
ing
and
exer
cisa
ble
is b
ased
on
the
shar
e pr
ice
of th
e C
ompa
ny’s
com
mon
sto
ck a
sof
Dec
embe
r 31
, 201
9, 2
018
and
2017
whi
ch w
as $
15.7
4, $
11.2
0 an
d $1
2.50
per
sha
re, r
espe
ctiv
ely.
The
intri
nsic
val
ue f
or o
ptio
ns a
nd S
AR
s ex
erci
sed
and
RSU
s ve
sted
dur
ing
thos
e ye
ars
repr
esen
ts th
e di
ffere
nce
betw
een
the
fair
mar
ket v
alue
of t
he C
ompa
ny’s
com
mon
sto
ck o
n th
e da
te o
f exe
rcis
e an
d ve
stin
g fo
rR
SUs a
nd th
e ex
erci
se p
rice
of e
ach
optio
n, R
SU o
r SA
R, a
s app
licab
le.
-92-
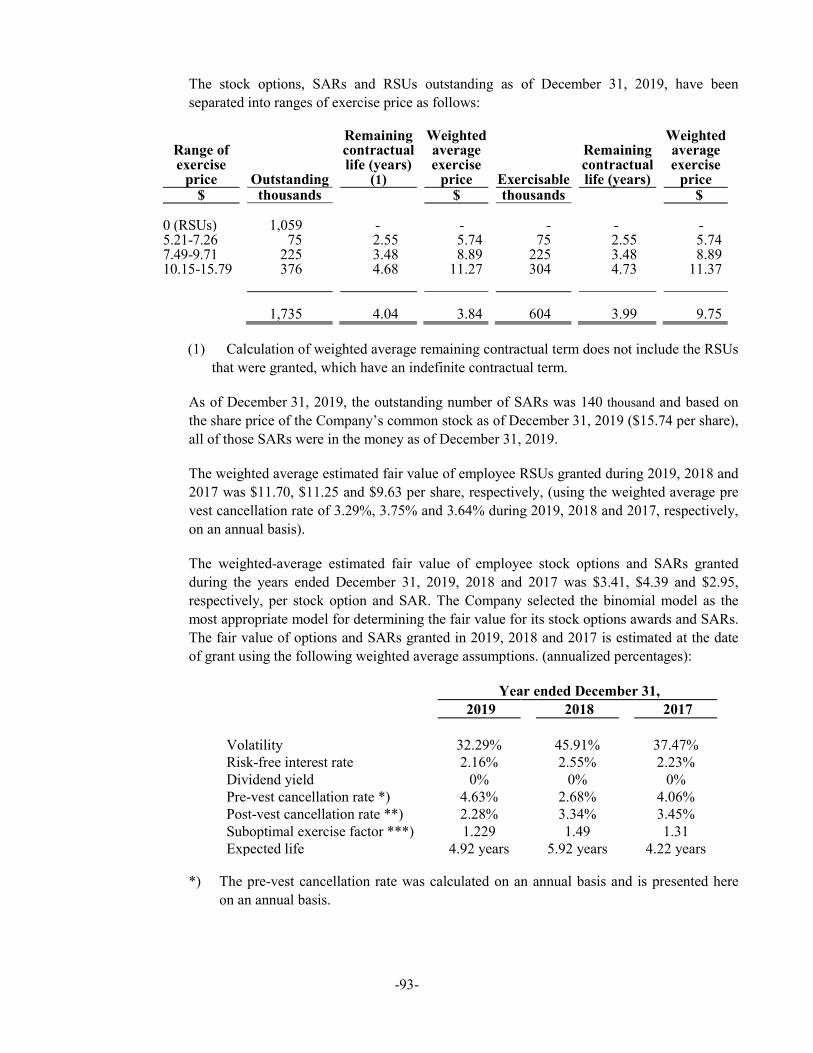
-93-
The stock options, SARs and RSUs outstanding as of December 31, 2019, have been separated into ranges of exercise price as follows:
Range of exercise
price Outstanding
Remaining contractual life (years)
(1)
Weighted average exercise
price Exercisable
Remaining contractual life (years)
Weighted average exercise
price $ thousands $ thousands $
0 (RSUs) 1,059 - - - - - 5.21-7.26 75 2.55 5.74 75 2.55 5.74 7.49-9.71 225 3.48 8.89 225 3.48 8.89 10.15-15.79 376 4.68 11.27 304 4.73 11.37 1,735 4.04 3.84 604 3.99 9.75
(1) Calculation of weighted average remaining contractual term does not include the RSUs that were granted, which have an indefinite contractual term.
As of December 31, 2019, the outstanding number of SARs was 140 thousand and based on the share price of the Company’s common stock as of December 31, 2019 ($15.74 per share), all of those SARs were in the money as of December 31, 2019.
The weighted average estimated fair value of employee RSUs granted during 2019, 2018 and 2017 was $11.70, $11.25 and $9.63 per share, respectively, (using the weighted average pre vest cancellation rate of 3.29%, 3.75% and 3.64% during 2019, 2018 and 2017, respectively, on an annual basis).
The weighted-average estimated fair value of employee stock options and SARs granted during the years ended December 31, 2019, 2018 and 2017 was $3.41, $4.39 and $2.95, respectively, per stock option and SAR. The Company selected the binomial model as the most appropriate model for determining the fair value for its stock options awards and SARs. The fair value of options and SARs granted in 2019, 2018 and 2017 is estimated at the date of grant using the following weighted average assumptions. (annualized percentages):
Year ended December 31, 2019 2018 2017
Volatility 32.29% 45.91% 37.47% Risk-free interest rate 2.16% 2.55% 2.23% Dividend yield 0% 0% 0% Pre-vest cancellation rate *) 4.63% 2.68% 4.06% Post-vest cancellation rate **) 2.28% 3.34% 3.45% Suboptimal exercise factor ***) 1.229 1.49 1.31 Expected life 4.92 years 5.92 years 4.22 years
*) The pre-vest cancellation rate was calculated on an annual basis and is presented here on an annual basis.
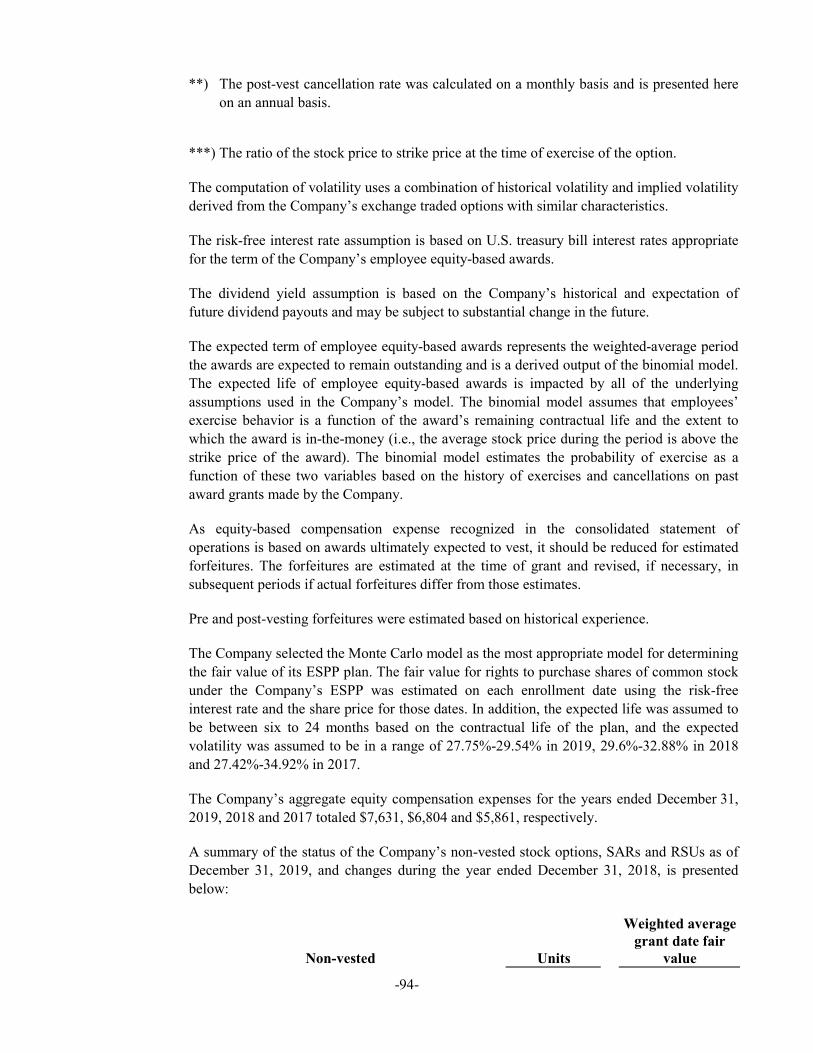
-94-
**) The post-vest cancellation rate was calculated on a monthly basis and is presented here on an annual basis.
***) The ratio of the stock price to strike price at the time of exercise of the option.
The computation of volatility uses a combination of historical volatility and implied volatility derived from the Company’s exchange traded options with similar characteristics.
The risk-free interest rate assumption is based on U.S. treasury bill interest rates appropriate for the term of the Company’s employee equity-based awards.
The dividend yield assumption is based on the Company’s historical and expectation of future dividend payouts and may be subject to substantial change in the future.
The expected term of employee equity-based awards represents the weighted-average period the awards are expected to remain outstanding and is a derived output of the binomial model. The expected life of employee equity-based awards is impacted by all of the underlying assumptions used in the Company’s model. The binomial model assumes that employees’ exercise behavior is a function of the award’s remaining contractual life and the extent to which the award is in-the-money (i.e., the average stock price during the period is above the strike price of the award). The binomial model estimates the probability of exercise as a function of these two variables based on the history of exercises and cancellations on past award grants made by the Company.
As equity-based compensation expense recognized in the consolidated statement of operations is based on awards ultimately expected to vest, it should be reduced for estimated forfeitures. The forfeitures are estimated at the time of grant and revised, if necessary, in subsequent periods if actual forfeitures differ from those estimates.
Pre and post-vesting forfeitures were estimated based on historical experience.
The Company selected the Monte Carlo model as the most appropriate model for determining the fair value of its ESPP plan. The fair value for rights to purchase shares of common stock under the Company’s ESPP was estimated on each enrollment date using the risk-free interest rate and the share price for those dates. In addition, the expected life was assumed to be between six to 24 months based on the contractual life of the plan, and the expected volatility was assumed to be in a range of 27.75%-29.54% in 2019, 29.6%-32.88% in 2018 and 27.42%-34.92% in 2017.
The Company’s aggregate equity compensation expenses for the years ended December 31, 2019, 2018 and 2017 totaled $7,631, $6,804 and $5,861, respectively.
A summary of the status of the Company’s non-vested stock options, SARs and RSUs as of December 31, 2019, and changes during the year ended December 31, 2018, is presented below:
Non-vested Units
Weighted average grant date fair
value
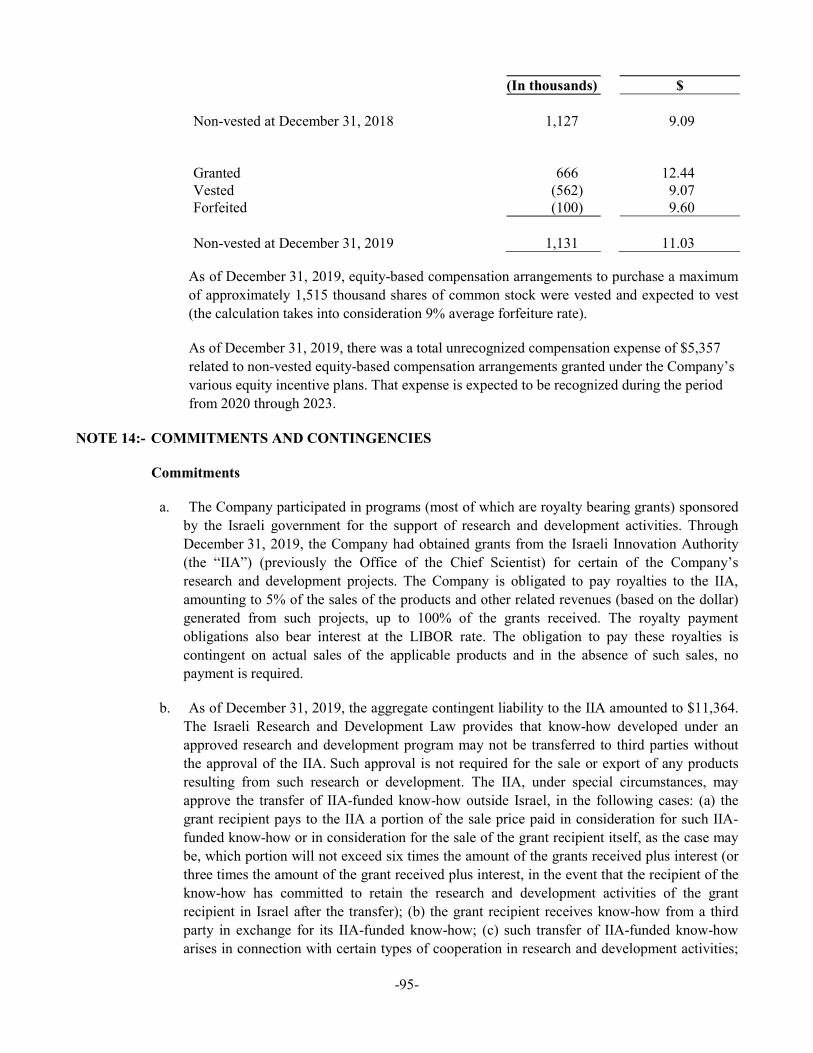
-95-
(In thousands) $ Non-vested at December 31, 2018 1,127 9.09 Granted 666 12.44 Vested (562) 9.07 Forfeited (100) 9.60 Non-vested at December 31, 2019 1,131 11.03
As of December 31, 2019, equity-based compensation arrangements to purchase a maximum of approximately 1,515 thousand shares of common stock were vested and expected to vest (the calculation takes into consideration 9% average forfeiture rate).
As of December 31, 2019, there was a total unrecognized compensation expense of $5,357 related to non-vested equity-based compensation arrangements granted under the Company’s various equity incentive plans. That expense is expected to be recognized during the period from 2020 through 2023.
NOTE 14:- COMMITMENTS AND CONTINGENCIES
Commitments
a. The Company participated in programs (most of which are royalty bearing grants) sponsored by the Israeli government for the support of research and development activities. Through December 31, 2019, the Company had obtained grants from the Israeli Innovation Authority (the “IIA”) (previously the Office of the Chief Scientist) for certain of the Company’s research and development projects. The Company is obligated to pay royalties to the IIA, amounting to 5% of the sales of the products and other related revenues (based on the dollar) generated from such projects, up to 100% of the grants received. The royalty payment obligations also bear interest at the LIBOR rate. The obligation to pay these royalties is contingent on actual sales of the applicable products and in the absence of such sales, no payment is required.
b. As of December 31, 2019, the aggregate contingent liability to the IIA amounted to $11,364. The Israeli Research and Development Law provides that know-how developed under an approved research and development program may not be transferred to third parties without the approval of the IIA. Such approval is not required for the sale or export of any products resulting from such research or development. The IIA, under special circumstances, may approve the transfer of IIA-funded know-how outside Israel, in the following cases: (a) the grant recipient pays to the IIA a portion of the sale price paid in consideration for such IIA-funded know-how or in consideration for the sale of the grant recipient itself, as the case may be, which portion will not exceed six times the amount of the grants received plus interest (or three times the amount of the grant received plus interest, in the event that the recipient of the know-how has committed to retain the research and development activities of the grant recipient in Israel after the transfer); (b) the grant recipient receives know-how from a third party in exchange for its IIA-funded know-how; (c) such transfer of IIA-funded know-how arises in connection with certain types of cooperation in research and development activities;
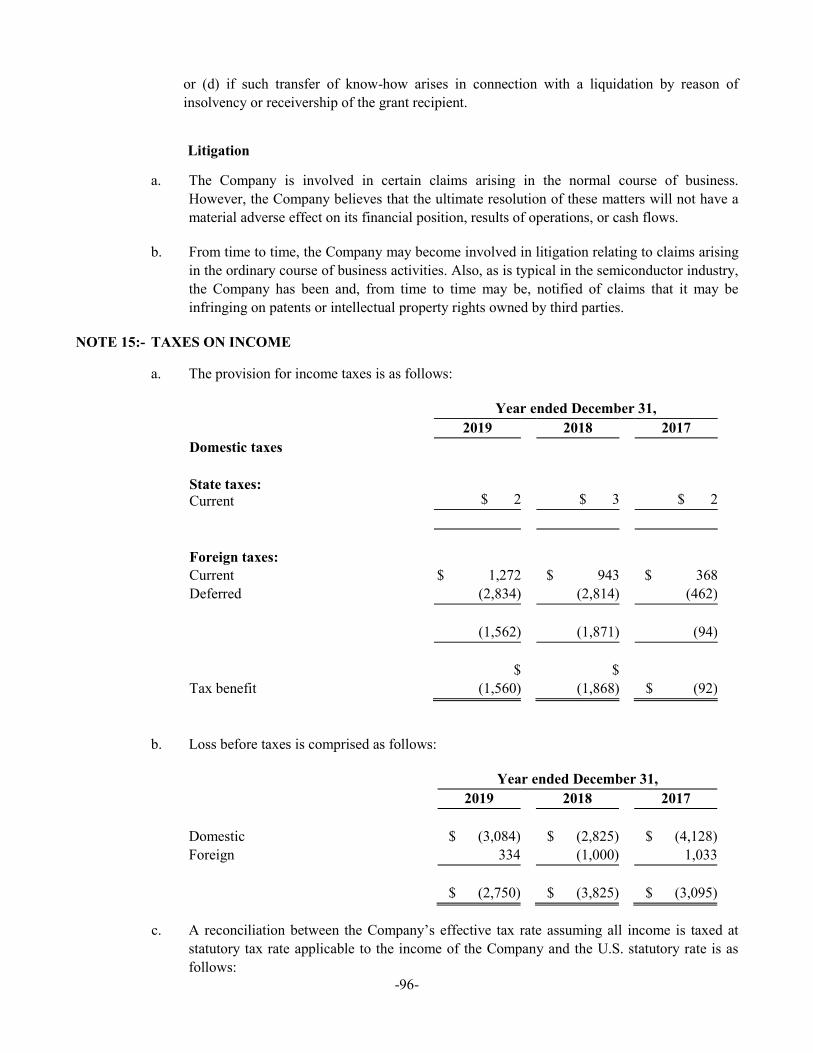
-96-
or (d) if such transfer of know-how arises in connection with a liquidation by reason of insolvency or receivership of the grant recipient.
Litigation
a. The Company is involved in certain claims arising in the normal course of business. However, the Company believes that the ultimate resolution of these matters will not have a material adverse effect on its financial position, results of operations, or cash flows.
b. From time to time, the Company may become involved in litigation relating to claims arising in the ordinary course of business activities. Also, as is typical in the semiconductor industry, the Company has been and, from time to time may be, notified of claims that it may be infringing on patents or intellectual property rights owned by third parties.
NOTE 15:- TAXES ON INCOME
a. The provision for income taxes is as follows:
Year ended December 31, 2019 2018 2017 Domestic taxes State taxes: Current $ 2 $ 3 $ 2 Foreign taxes: Current $ 1,272 $ 943 $ 368 Deferred (2,834) (2,814) (462) (1,562) (1,871) (94)
Tax benefit $
(1,560) $
(1,868) $ (92)
b. Loss before taxes is comprised as follows:
Year ended December 31, 2019 2018 2017
Domestic $ (3,084) $ (2,825) $ (4,128) Foreign 334 (1,000) 1,033 $ (2,750) $ (3,825) $ (3,095)
c. A reconciliation between the Company’s effective tax rate assuming all income is taxed at statutory tax rate applicable to the income of the Company and the U.S. statutory rate is as follows:

-97-
Year ended December 31, 2019 2018 2017
Loss before taxes on income $ (2,750) $ (3,825) $ (3,095) Theoretical tax benefit at U.S. statutory tax rate (21% for 2019 and 2018 and 35% for 2017) $ (578) $ (803) $ (1,083) State taxes, net of federal benefit 2 3 2 Foreign income taxed at rates other than the U.S. rate (including deferred taxes that were not provided, valuation allowance and current adjustment and interest on uncertain tax position liability) (1,761) (1,767) (808) Nondeductible equity-based compensation expenses 604 542 816 Valuation allowance in U.S. 173 157 984 Other - - (2)
$
(1,560) $
(1,868) $ (91)
d. Deferred income taxes reflect the net tax effects of temporary differences between the carrying amounts of assets and liabilities for financial reporting purposes and the amounts used for income tax purposes.
December 31, 2019 2018 Reserves and accruals $ 499 $ 284 Equity-based compensation 2,348 1,621 Intangible assets 86 184 Carryforward tax losses 9,370 6,715 Other 941 858 Total deferred tax assets 13,244 9,662 Valuation allowance (6,867) (6,082) Total deferred tax assets 6,377 3,580
Deferred tax liabilities, net Acquired intangible assets 119 195 Acquired carryforward tax losses - (44)

-98-
December 31, 2019 2018 Total deferred tax liabilities, net $ 119 $ 151
Management believes that part of the deferred tax assets will not be realized based on current levels of future taxable income and potentially refundable taxes. Accordingly, a valuation allowance in the amount of $6,867 and $6,082 was recognized as of December 31, 2019 and 2018, respectively.
In 2017, the Tax Cuts and Jobs Act of 2017 (the “TCJA”) was signed into law in the U.S. Changes include, but are not limited to, a corporate tax rate decrease from 35% to 21% effective for tax years beginning after December 31, 2017. In accordance with ASC 740, the Company recorded $2,500 of deferred tax expense in connection with the remeasurement of certain deferred tax assets and liabilities. This was fully offset by a valuation allowance. Accordingly, there was no net impact on the Company’s income tax expense for the year ended December 31, 2017. The remaining provisions of the TCJA have no material impact on the Company's results of operations. December 22, 2018 marked the end of the measurement period for purposes of SAB 118, and the Company concluded that no change was required based on its initial assessment.
As of December 31, 2019, the Company had cash and cash equivalents, marketable securities and time deposits of approximately $131,300. Out of total cash, cash equivalents, marketable securities and time deposits of $131,300, $120,700 was held by foreign subsidiaries of the Company. The Company intends to permanently reinvest earnings of its foreign operations and its current operating plans do not demonstrate a need to repatriate foreign earnings to fund the Company’s U.S. operations. However, if these funds were needed for the Company’s operations in the United States, the Company would be required to accrue and pay taxes in several countries to repatriate these funds. The determination of the amount of additional taxes related to the repatriation of these earnings is not practicable, as it may vary based on various factors such as the location of the cash and the effect of regulation in the various jurisdictions from which the cash would be repatriated.
e. Uncertain tax positions:
A reconciliation of the beginning and ending balances of the total amounts of gross unrecognized tax benefits is as follows:
2019 2018 2017 Gross unrecognized tax benefits at January 1, $ 2,040 $ 1,273 $ 1,023 Decreases in tax positions for previous years (175) - (268) Increases in tax positions for current year 1,153 776 306 Increase in tax positions for previous years 95 - 131 Change in interest and linkage related to tax positions 57 (9) 81 Gross unrecognized tax benefits at
December 31,
$ 3,170 $ 2,040 $ 1,273
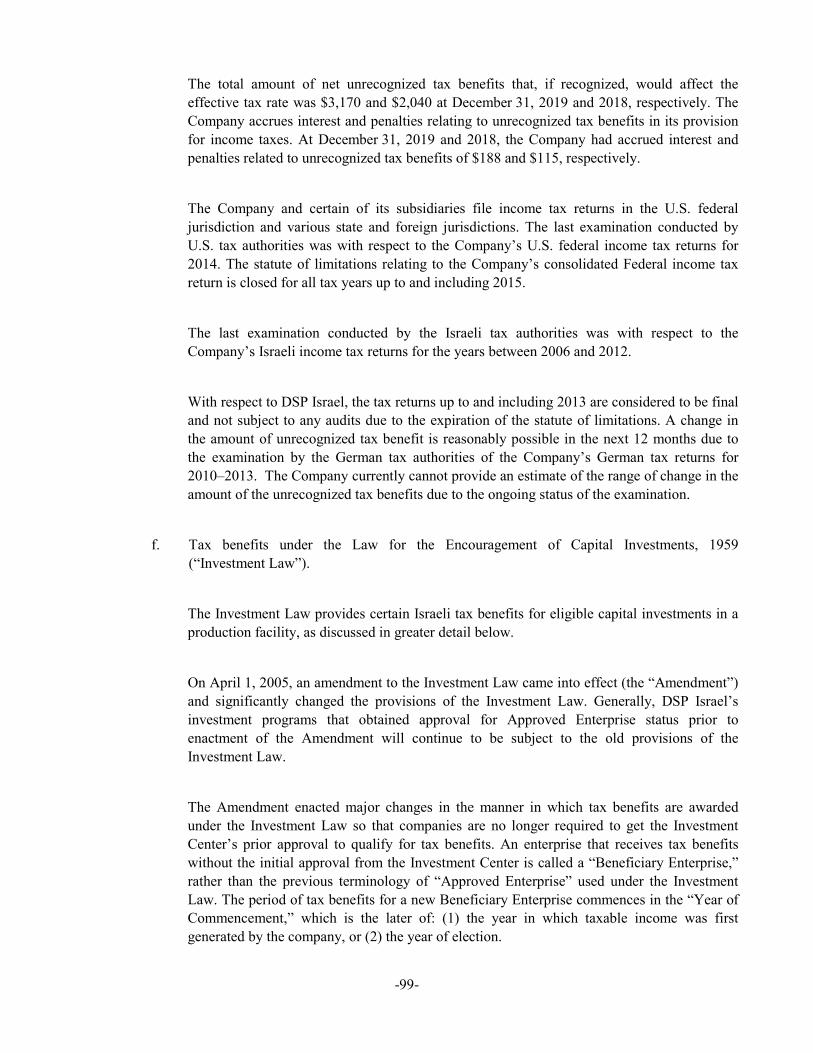
-99-
The total amount of net unrecognized tax benefits that, if recognized, would affect the effective tax rate was $3,170 and $2,040 at December 31, 2019 and 2018, respectively. The Company accrues interest and penalties relating to unrecognized tax benefits in its provision for income taxes. At December 31, 2019 and 2018, the Company had accrued interest and penalties related to unrecognized tax benefits of $188 and $115, respectively.
The Company and certain of its subsidiaries file income tax returns in the U.S. federal jurisdiction and various state and foreign jurisdictions. The last examination conducted by U.S. tax authorities was with respect to the Company’s U.S. federal income tax returns for 2014. The statute of limitations relating to the Company’s consolidated Federal income tax return is closed for all tax years up to and including 2015.
The last examination conducted by the Israeli tax authorities was with respect to the Company’s Israeli income tax returns for the years between 2006 and 2012.
With respect to DSP Israel, the tax returns up to and including 2013 are considered to be final and not subject to any audits due to the expiration of the statute of limitations. A change in the amount of unrecognized tax benefit is reasonably possible in the next 12 months due to the examination by the German tax authorities of the Company’s German tax returns for 2010–2013. The Company currently cannot provide an estimate of the range of change in the amount of the unrecognized tax benefits due to the ongoing status of the examination.
f. Tax benefits under the Law for the Encouragement of Capital Investments, 1959 (“Investment Law”).
The Investment Law provides certain Israeli tax benefits for eligible capital investments in a production facility, as discussed in greater detail below.
On April 1, 2005, an amendment to the Investment Law came into effect (the “Amendment”) and significantly changed the provisions of the Investment Law. Generally, DSP Israel’s investment programs that obtained approval for Approved Enterprise status prior to enactment of the Amendment will continue to be subject to the old provisions of the Investment Law.
The Amendment enacted major changes in the manner in which tax benefits are awarded under the Investment Law so that companies are no longer required to get the Investment Center’s prior approval to qualify for tax benefits. An enterprise that receives tax benefits without the initial approval from the Investment Center is called a “Beneficiary Enterprise,” rather than the previous terminology of “Approved Enterprise” used under the Investment Law. The period of tax benefits for a new Beneficiary Enterprise commences in the “Year of Commencement,” which is the later of: (1) the year in which taxable income was first generated by the company, or (2) the year of election.

-100-
In addition, under the Amendment, tax benefits are available for production facilities, which generally are required to derive more than 25% of their business income from export. Furthermore, in order to receive the tax benefits under the Amendment, a company is required to make an investment in the Benefited Enterprise exceeding a certain percentage or a minimum amount specified in the Investment Law.
DSP Israel chose the “alternative benefits” track for all of its investment programs. Accordingly, DSP Israel’s income from an “Approved Enterprise” and “Beneficiary Enterprise” is tax-exempt for a period of two or four years and is subject to a reduced corporate tax rate of 10%-25% (based on the percentage of foreign ownership) for an additional period of six or eight years.
DSP Israel’s first, second, third, fourth, fifth and sixth investment programs, which were completed and commenced operations in 1994, 1996, 1998, 1999, 2002 and 2004, respectively, were tax exempt for a period of between two and four years, from the first year they had taxable income and were entitled to a reduced corporate tax rate of 10%-25% (based on the percentage of foreign ownership) for an additional period of between five to eight years. As of 2019, all those investment programs were no longer entitled to a reduced corporate tax rate.
DSP Israel’s seventh and eighth investment programs have been in operation since 2006 and 2009, respectively, and entitles DSP Israel to a corporate tax exemption for a period of two years and a reduced corporate tax rate of 10%-25% (based on the percentage of foreign ownership) for an additional period of eight years from the first year it had taxable income. As of 2019, the seventh investment program was no longer entitled to a reduced corporate tax rate. The period of tax benefits for the eight investment program commenced in fiscal year 2018 and will continue until the program expiration by the end of 2020.
Since DSP Israel is operating under more than one approval, its effective tax rate is the result of a weighted combination of the various applicable tax rates and tax exemptions and the computation is made for income derived from each investment program on the basis and formulas specified in the Investment Law and the approvals.
The Company’s investment programs that generate taxable income are currently subject to an average tax rate of up to approximately 10% based on a variety of factors, including percentage of foreign ownership and approvals for the erosion of the tax basis of our investment programs. The Company’s average tax rate for its investment programs may change in the future due to circumstances outside of its control and therefore, the Company cannot provide any assurances that its average tax rate for its investment programs will continue at an approximate rate of 10% in the future.
Amendment to the Law for the Encouragement of Capital Investments, 1959 (Amendment 73):
-101-
In December 2016, the Economic Efficiency Law (Legislative Amendments for Applying the Economic Policy for the 2017 and 2018 Budget Years), 2016 which includes Amendment 73 to the Law for the Encouragement of Capital Investments (the “2016 Amendment") was published. According to the 2016 Amendment, a preferred enterprise located in development area A will be subject to a tax rate of 7.5% instead of 9% effective from January 1, 2017 and thereafter. DSP Israel is not located in development area A and the tax rate applicable to preferred enterprises like DSP Israel located in other areas remains at 16%, subject to the below. The 2016 Amendment also prescribes special tax tracks for technological enterprises. The new tax tracks under the 2016 Amendment are as follows: Technological preferred enterprise - an enterprise for which total consolidated revenues of its parent company and all subsidiaries are less than NIS 10 billion ($2.9 billion). A technological preferred enterprise, as defined in the Law, which is located in the center of Israel will be subject to tax at a rate of 12% on profits deriving from intellectual property. DSP Israel is located in the center of Israel. Any dividends distributed to "foreign companies" as defined in the Law, deriving from income from the technological enterprises, will be subject to a tax rate of 4%.
The Company evaluated the effect of the adoption of the 2016 Amendment on its financial statements and determined to not apply for the 2016 Amendment. Rather, the Company has continued to comply with the Law as it was in effect prior to enactment of the 2016 Amendment until the earlier of such time that compliance with the Law prior to enactment of the 2016 Amendment is no longer in the Company’s best interests or until the expiration of its current investment programs. The Company may change its position in the future.
The Company is required to comply with the 2016 Amendment subsequent to the expiration of the Company’s current investment programs and for any new qualified investment program after a transitional period. Once the Company is required to comply with the 2016 Amendment, its average tax rate may increase.
As of December 31, 2019, DSP Israel believed that it met all the conditions required under the plans.
Should DSP Israel fail to meet such conditions in the future, it could be subject to corporate tax in Israel at the standard tax rate (23% for 2019) plus a consumer price index linkage adjustment and interest and could be required to refund tax benefits already received.
As of December 31, 2019, approximately $67,297 was derived from tax exempt profits earned by DSP Israel’s “Approved Enterprises” and “Beneficiary Enterprises.” The Company has determined that such tax-exempt income will not be distributed as dividends and intends to reinvest the amount of its tax exempt income earned by DSP Israel. Accordingly, no provision for deferred income taxes has been provided on income attributable to DSP Israel’s “Approved Enterprises” and “Beneficiary Enterprises” as such income is essentially permanently reinvested.

-102-
If DSP Israel’s retained tax-exempt income is distributed, the income would be taxed at the applicable corporate tax rate (currently 10%) as if it had not elected the alternative tax benefits under the Investment Law and an income tax liability of approximately $7,477 would have been incurred as of December 31, 2019.
DSP Israel’s income from sources other than the “Approved Enterprises” and “Beneficiary Enterprises” during the benefit period will be subject to tax at the effective standard corporate tax rate in Israel (23% for 2018 and 2019).
g. The Law for Encouragement of Industry (Taxation), 1969:
DSP Israel has the status of an “industrial company”, as defined by this law. According to this status and by virtue of regulations published thereunder, DSP Israel is entitled to claim a deduction of accelerated depreciation on equipment used in industrial activities, as determined in the regulations issued under the Inflationary Law. The Company is also entitled to amortize a patent or rights to use a patent or intellectual property that are used in the enterprise's development or advancement, to deduct issuance expenses for shares listed for trading, and to file consolidated financial statements under certain conditions.
h. Israeli tax rates:
The rate of the Israeli corporate tax is as follows: 2017 – 24%, and 2018 and 2019 – 23%. Tax rate of 25% applies to capital gains arising after January 1, 2003.
j. The Company has accumulated losses for federal and state tax purposes as of December 31, 2019 of approximately $22,243 and $2,750, respectively, which may be carried forward and offset against future taxable income for an indefinite period. Accumulated losses generated in taxable year 2017 and earlier can be carried forward for a period of twelve to nineteen years. DSP Israel has no accumulated losses for tax purposes as of December 31, 2019, but has approximately $33,060 of research and development expense, which may be carried forward and offset against future taxable income for an indefinite period.
NOTE 16:- BASIC AND DILUTED LOSS PER SHARE
The following table sets forth the computation of basic and diluted net loss per share:
Year ended December 31, 2019 2018 2017 Numerator: Net loss $ (1,190) $ (1,957) $ (3,003) Denominator:
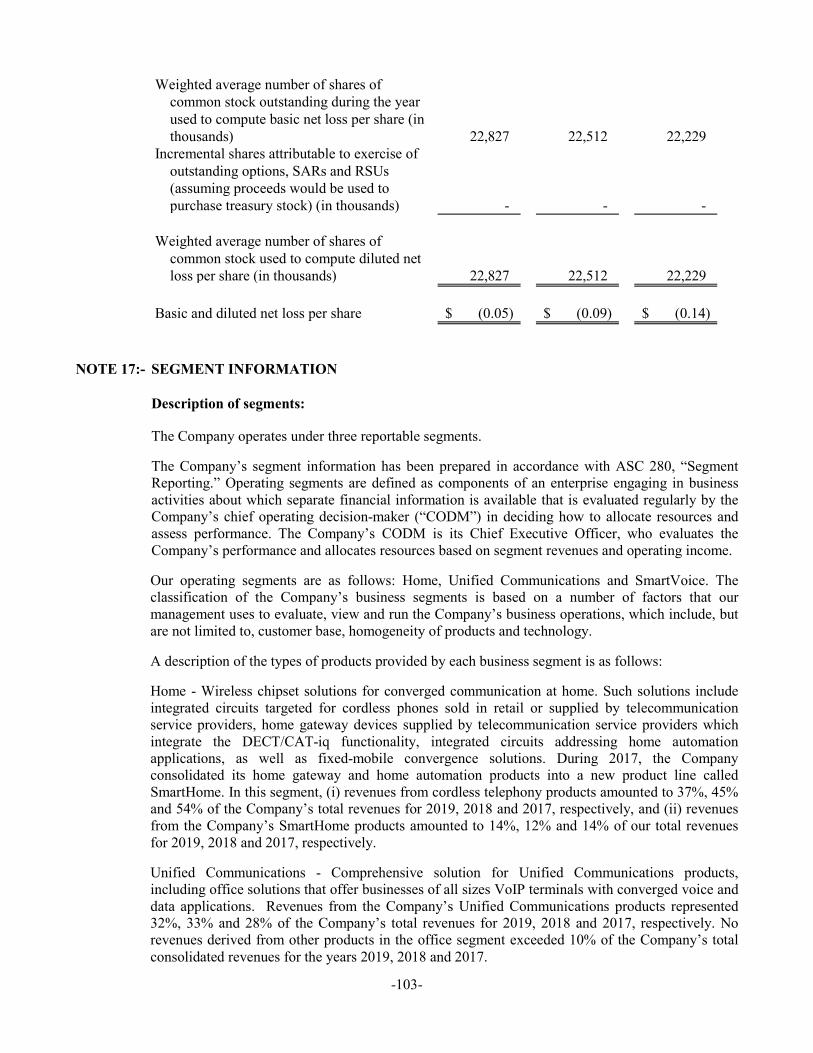
-103-
Weighted average number of shares of common stock outstanding during the year used to compute basic net loss per share (in thousands) 22,827 22,512 22,229
Incremental shares attributable to exercise of outstanding options, SARs and RSUs (assuming proceeds would be used to purchase treasury stock) (in thousands) - - -
Weighted average number of shares of
common stock used to compute diluted net loss per share (in thousands) 22,827 22,512 22,229
Basic and diluted net loss per share $ (0.05) $ (0.09) $ (0.14)
NOTE 17:- SEGMENT INFORMATION
Description of segments:
The Company operates under three reportable segments.
The Company’s segment information has been prepared in accordance with ASC 280, “Segment Reporting.” Operating segments are defined as components of an enterprise engaging in business activities about which separate financial information is available that is evaluated regularly by the Company’s chief operating decision-maker (“CODM”) in deciding how to allocate resources and assess performance. The Company’s CODM is its Chief Executive Officer, who evaluates the Company’s performance and allocates resources based on segment revenues and operating income.
Our operating segments are as follows: Home, Unified Communications and SmartVoice. The classification of the Company’s business segments is based on a number of factors that our management uses to evaluate, view and run the Company’s business operations, which include, but are not limited to, customer base, homogeneity of products and technology.
A description of the types of products provided by each business segment is as follows:
Home - Wireless chipset solutions for converged communication at home. Such solutions include integrated circuits targeted for cordless phones sold in retail or supplied by telecommunication service providers, home gateway devices supplied by telecommunication service providers which integrate the DECT/CAT-iq functionality, integrated circuits addressing home automation applications, as well as fixed-mobile convergence solutions. During 2017, the Company consolidated its home gateway and home automation products into a new product line called SmartHome. In this segment, (i) revenues from cordless telephony products amounted to 37%, 45% and 54% of the Company’s total revenues for 2019, 2018 and 2017, respectively, and (ii) revenues from the Company’s SmartHome products amounted to 14%, 12% and 14% of our total revenues for 2019, 2018 and 2017, respectively.
Unified Communications - Comprehensive solution for Unified Communications products, including office solutions that offer businesses of all sizes VoIP terminals with converged voice and data applications. Revenues from the Company’s Unified Communications products represented 32%, 33% and 28% of the Company’s total revenues for 2019, 2018 and 2017, respectively. No revenues derived from other products in the office segment exceeded 10% of the Company’s total consolidated revenues for the years 2019, 2018 and 2017.

-104-
SmartVoice - Products for the SmartVoice market that provide voice activation and recognition, voice enhancement, always-on and far-end noise elimination that target mobile phones, mobile hearables and headsets and other devices that incorporate the Company’s noise suppression and voice quality enhancement HDClear technology. Revenues derived from products in the SmartVoice segment represented 16% of the Company’s total revenues for 2019 but did not exceed 10% of the Company’s total revenues for 2018 or 2017. No individual product in the SmartVoice segment exceeded 10% of the Company’s total revenues for the years 2019, 2018 and 2017.
Segment data:
The Company derives the results of its business segments directly from its internal management reporting system and by using certain allocation methods. The accounting policies the Company uses to derive business segment results are substantially the same as those we use for consolidation of our financial statements. The CODM measures the performance of each business segment based on several metrics, including earnings from operations. The CODM uses these results, in part, to evaluate the performance of, and to assign resources to, each of the business segments. The Company does not allocate to its business segments certain operating expenses, which it manages separately at the corporate level. These unallocated costs include primarily amortization of purchased intangible assets, equity-based compensation expenses, and certain corporate governance costs.
The Company does not allocate any assets to segments and, therefore, no amount of assets is reported to management and disclosed in the financial information for segments. Selected operating results information for each business segment was as follows for the years ended December 31, 2019, 2018 and 2017:
Year ended December 31 Revenues Income (loss) from operations 2019 2018 2017 2019 2018 2017
Home $60,153 $67,741 $85,021 $16,821 $14,206 $16,256
Unified Communications $38,123 $38,817 $34,879 $12,555 $12,147 $9,105
SmartVoice $19,337 $10,880 $4,853 $(23,657) $(21,476) $(20,798)
Total $117,613 $117,438 $124,753 $5,719 $4,877 $4,563

-105-
The reconciliation of segment operating results information to the Company’s consolidated financial information was as follows:
Year ended December 31, 2019 2018 2017 Income from operations $ 5,719 $ 4,877 $ 4,563 Unallocated corporate, general and administrative expenses* (2,075) (2,013) (1,766) Equity-based compensation expenses (7,631) (6,804) (5,861) Intangible assets amortization expenses (417) (1,700) (1,700) Financial income, net 1,654 1,815 1,669 Total consolidated income (loss) before taxes $ (2,750) $ (3,825) $ (3,095)
*Includes mainly legal, accounting, board of directors and investors relation expenses.
Major customers and geographic information
The following table shows the breakdown of revenues for all product lines for the periods indicated by geographic location based on the geographic location of the Company’s customers (in thousands):
Year ended December 31, 2019 2018 2017 United States ..................................... $ 4,947 $ 5,876 $ 4,927 Hong Kong ........................................ 31,692 36,666 46,119 Japan .................................................. 11,249 14,284 16,567 Europe ............................................... 9,546 9,022 9,882 China ................................................. 22,813 16,107 16,096 Taiwan ............................................... 26,634 23,940 22,442 Korea ................................................. 7,285 7,341 4,190 Other .................................................. 3,447 4,202 4,530 Total revenues ................................... $ 117,613 $ 117,438 $ 124,753
For a summary of revenues from major customers, please see Note 1.
The following is a summary of long-lived assets (property and equipment and operating leases) within geographic areas based on the assets’ locations:
December 31, 2019 2018 Long-lived assets Europe $ 192 $ 146 Israel 15,423 1,786 Other 2,845 816 $ 18,460 $ 2,748

-106-
Item 9. CHANGES IN AND DISAGREEMENTS WITH ACCOUNTANTS ON ACCOUNTING AND FINANCIAL DISCLOSURE.
None.
Item 9A. CONTROLS AND PROCEDURES.
Evaluation of Disclosure Controls and Procedures
As of the end of the period covered by this report, we carried out an evaluation, under the supervision and with the participation of our Chief Executive Officer and Chief Financial Officer, of the effectiveness of the design and operation of our disclosure controls and procedures. Based on this evaluation, our Chief Executive Officer and Chief Financial Officer concluded that our disclosure controls and procedures were effective as of December 31, 2019.
There has been no change in our internal control over financial reporting that occurred during our most recent fiscal quarter that has materially affected or is reasonably likely to materially affect our internal control over financial reporting.
Management’s Annual Report on Internal Control over Financial Reporting
Our management is responsible for establishing and maintaining adequate internal control over financial reporting, as such term is defined in Rule 13a-15(f) and Rule 15d-15(f) promulgated under the Securities Exchange Act of 1934, as amended. Our internal control over financial reporting is a process designed to provide reasonable assurance regarding the reliability of financial reporting and the preparation of financial statements for external purposes in accordance with generally accepted accounting principles. Because of its inherent limitations, internal control over financial reporting may not prevent or detect misstatements. Also, projections of any evaluation of effectiveness to future periods are subject to the risk that controls may become inadequate because of changes in conditions, or that the degree of compliance with the policies or procedures may deteriorate.
Under the supervision and with the participation of our management, including our principal executive officer and principal financial officer, we conducted an evaluation of the effectiveness of our internal control over financial reporting based on the updated 2013 framework in Internal Control—Integrated Framework issued by the Committee of Sponsoring Organizations of the Treadway Commission. Based on this assessment, our management concluded that our internal control over financial reporting was effective as of December 31, 2019.
The effectiveness of our internal control over financial reporting as of December 31, 2019 has been audited by Kost, Forer, Gabbay & Kasierer, a member of Ernst & Young Global, an independent registered public accounting firm, who audited and reported on the consolidated financial statements of the company for the year ended December 31, 2019, as stated in their report which is presented in this Annual Report on Form 10-K under Item 8.
Item 9B. OTHER INFORMATION.
None.

-107-
PART III
Certain information required by Part III of this Annual Report is omitted and will be incorporated by reference herein from our definitive proxy statement pursuant to Regulation 14A in connection with the 2020 Annual Meeting of Stockholders to be held on May 18, 2020.
Item 10. DIRECTORS, EXECUTIVE OFFICERS AND CORPORATE GOVERNANCE.
Information relating to our directors and executive officers will be presented under the captions “Proposal No. 1 – Election of Directors” and “Executive Officers and Directors” in our definitive proxy statement. Such information is incorporated herein by reference.
Item 11. EXECUTIVE COMPENSATION.
Information relating to executive compensation will be presented under the caption “Executive Compensation” in our definitive proxy statement. Such information is incorporated herein by reference.
Item 12. SECURITY OWNERSHIP OF CERTAIN BENEFICIAL OWNERS AND MANAGEMENT AND RELATED STOCKHOLDER MATTERS.
Information relating to the security ownership of our common stock by our management and other beneficial owners will be presented under the caption “Security Ownership of Certain Beneficial Owners and Management” in our definitive proxy statement. Such information is incorporated herein by reference.
Information relating to our equity compensation plans will be presented under the caption “Equity Compensation Plan Information” in our definitive proxy statement. Such information is incorporated herein by reference.
Item 13. CERTAIN RELATIONSHIPS AND RELATED TRANSACTIONS, AND DIRECTOR INDEPENDENCE.
Information relating to certain relationships of our directors and executive officers and related transactions, as well as director independence information, will be presented under the caption “Certain Relationships and Related Transactions” in our definitive proxy statement. Such information is incorporated herein by reference.
Item 14. PRINCIPAL ACCOUNTANT FEES AND SERVICES.
Information relating to principal accountant fees and services will be presented under the caption “Principal Accountant Fees and Services” in our definitive proxy statement. Such information is incorporated herein by reference.

-108-
PART IV
Item 15. EXHIBITS AND FINANCIAL STATEMENT SCHEDULES.
(a) The following documents have been filed as a part of this Annual Report on Form 10-K.
1. Index to Financial Statements.
Description:
Report of Kost, Forer, Gabbay & Kasierer, a member of Ernst & Young Global
Consolidated Balance Sheets as of December 31, 2019, 2018 and 2017
Consolidated Statements of Operations for the years ended December 31, 2019, 2018 and 2017
Consolidated Statements of Changes in Stockholders’ Equity for the years ended December 31, 2019, 2018 and 2017
Consolidated Statements of Cash Flows for the years ended December 31, 2019, 2018 and 2017
Notes to Consolidated Financial Statements
2. Index to Financial Statement Schedules.
The following financial statement schedule and related auditor’s report are filed as part of this Annual Report on Form 10-K:
Description:
Valuation and Qualifying Accounts Schedule II
All other schedules are omitted because they are not applicable or the required information is included in the attached consolidated financial statements or the related notes for the year ended December 31, 2019.
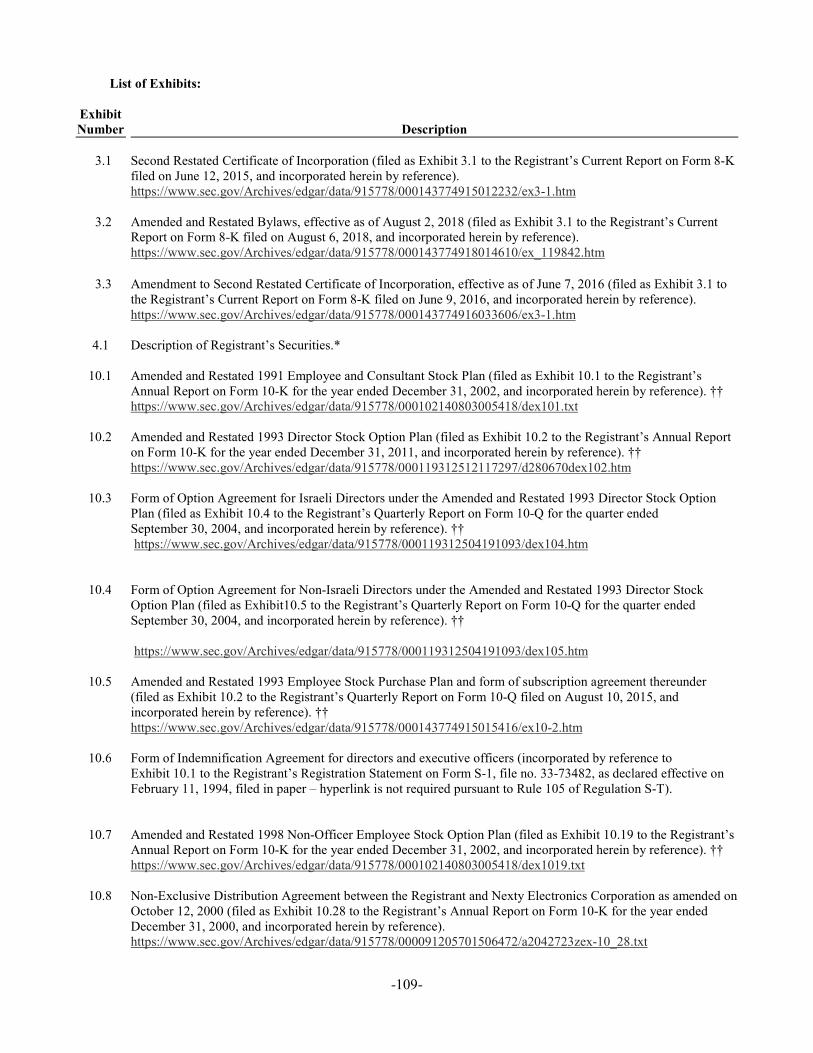
-109-
List of Exhibits: Exhibit Number Description
3.1 Second Restated Certificate of Incorporation (filed as Exhibit 3.1 to the Registrant’s Current Report on Form 8-K filed on June 12, 2015, and incorporated herein by reference).
https://www.sec.gov/Archives/edgar/data/915778/000143774915012232/ex3-1.htm
3.2 Amended and Restated Bylaws, effective as of August 2, 2018 (filed as Exhibit 3.1 to the Registrant’s Current Report on Form 8-K filed on August 6, 2018, and incorporated herein by reference). https://www.sec.gov/Archives/edgar/data/915778/000143774918014610/ex_119842.htm
3.3
Amendment to Second Restated Certificate of Incorporation, effective as of June 7, 2016 (filed as Exhibit 3.1 to the Registrant’s Current Report on Form 8-K filed on June 9, 2016, and incorporated herein by reference).
4.1
https://www.sec.gov/Archives/edgar/data/915778/000143774916033606/ex3-1.htm Description of Registrant’s Securities.*
10.1
Amended and Restated 1991 Employee and Consultant Stock Plan (filed as Exhibit 10.1 to the Registrant’s Annual Report on Form 10-K for the year ended December 31, 2002, and incorporated herein by reference). ††
https://www.sec.gov/Archives/edgar/data/915778/000102140803005418/dex101.txt
10.2 Amended and Restated 1993 Director Stock Option Plan (filed as Exhibit 10.2 to the Registrant’s Annual Report on Form 10-K for the year ended December 31, 2011, and incorporated herein by reference). ††
https://www.sec.gov/Archives/edgar/data/915778/000119312512117297/d280670dex102.htm
10.3 Form of Option Agreement for Israeli Directors under the Amended and Restated 1993 Director Stock Option Plan (filed as Exhibit 10.4 to the Registrant’s Quarterly Report on Form 10-Q for the quarter ended September 30, 2004, and incorporated herein by reference). ††
https://www.sec.gov/Archives/edgar/data/915778/000119312504191093/dex104.htm
10.4 Form of Option Agreement for Non-Israeli Directors under the Amended and Restated 1993 Director Stock Option Plan (filed as Exhibit10.5 to the Registrant’s Quarterly Report on Form 10-Q for the quarter ended September 30, 2004, and incorporated herein by reference). ††
https://www.sec.gov/Archives/edgar/data/915778/000119312504191093/dex105.htm
10.5 Amended and Restated 1993 Employee Stock Purchase Plan and form of subscription agreement thereunder (filed as Exhibit 10.2 to the Registrant’s Quarterly Report on Form 10-Q filed on August 10, 2015, and incorporated herein by reference). ††
https://www.sec.gov/Archives/edgar/data/915778/000143774915015416/ex10-2.htm
10.6 Form of Indemnification Agreement for directors and executive officers (incorporated by reference to Exhibit 10.1 to the Registrant’s Registration Statement on Form S-1, file no. 33-73482, as declared effective on February 11, 1994, filed in paper – hyperlink is not required pursuant to Rule 105 of Regulation S-T).
10.7 Amended and Restated 1998 Non-Officer Employee Stock Option Plan (filed as Exhibit 10.19 to the Registrant’s Annual Report on Form 10-K for the year ended December 31, 2002, and incorporated herein by reference). ††
https://www.sec.gov/Archives/edgar/data/915778/000102140803005418/dex1019.txt
10.8 Non-Exclusive Distribution Agreement between the Registrant and Nexty Electronics Corporation as amended on October 12, 2000 (filed as Exhibit 10.28 to the Registrant’s Annual Report on Form 10-K for the year ended December 31, 2000, and incorporated herein by reference).
https://www.sec.gov/Archives/edgar/data/915778/000091205701506472/a2042723zex-10_28.txt

-110-
10.9 Amended and Restated 2001 Stock Incentive Plan and form of option agreement thereunder (filed as
Exhibit 10.31 to the Registrant’s Annual Report on Form 10-K for the year ended December 31, 2002, and incorporated herein by reference). ††
https://www.sec.gov/Archives/edgar/data/915778/000102140803005418/dex1031.txt
10.10 Amended and Restated 2003 Israeli Share Incentive Plan (filed as Exhibit 10.1 to the Registrant’s Current Report on Form 8-K filed on May 4, 2011, and incorporated herein by reference) and form of option agreement thereunder (filed as Exhibit 10.32 to the Registrant’s Annual Report on Form 10-K for the year ended December 31, 2002, and incorporated herein by reference). ††
https://www.sec.gov/Archives/edgar/data/915778/000119312511127143/dex101.htm https://www.sec.gov/Archives/edgar/data/915778/000102140803005418/dex1032.txt
10.11 Manufacturing Capacity Agreement, effective as of July 1, 2004, by and among DSP Group, Inc., DSP Group,
Ltd, and Taiwan Semiconductor Manufacturing Company Ltd (filed as Exhibit 10.4 to the Registrant’s Quarterly Report on Form 10-Q for the quarter ended September 30, 2004, and incorporated herein by reference) (confidential treatment has been granted for portions of this exhibit).
https://www.sec.gov/Archives/edgar/data/915778/000119312504193190/dex1044.htm
10.12 Form of Non-Qualified Stock Option Agreement Providing for the Grant of Options as a Material Inducement of Employment (filed as Exhibit 4.1 to Registrant’s Registration Statement on Form S-8 filed on July 21, 2005, and incorporated herein by reference). ††
https://www.sec.gov/Archives/edgar/data/915778/000119312505146231/dex41.htm
10.13 Form of Stock Appreciation Right Agreement for Executive Officers pursuant to the Amended and Restated 2003 Israeli Share Incentive Plan (filed as Exhibit 99.2 to Registrant’s Current Report on 8-K filed on April 11, 2006, and incorporated herein by reference). ††
https://www.sec.gov/Archives/edgar/data/915778/000119312506077627/dex992.htm
10.14 Employment Agreement by and between DSP Group, Ltd. and Ofer Elyakim, effective June 25, 2009 (filed as Exhibit 10.32 to Registrant’s Annual Report on 10-K for the year ended December 31, 2010, and incorporated herein by reference). ††
https://www.sec.gov/Archives/edgar/data/915778/000119312511068724/dex1032.htm
10.15 Amendment to Employment Agreement by and between DSP Group, Ltd. and Ofer Elyakim, effective January 31, 2011 (filed as Exhibit 10.33 to Registrant’s Annual Report on 10-K for the year ended December 31, 2010, and incorporated herein by reference). ††
https://www.sec.gov/Archives/edgar/data/915778/000119312511068724/dex1033.htm
10.16 Amendment to Employment Agreement by and between DSP Group, Ltd. and Ofer Elyakim, as amended, effective as of May 16, 2011(filed as Exhibit 10.2 to Registrant’s Current Report on 8-K filed on May 20, 2011, and incorporated herein by reference). ††
https://www.sec.gov/Archives/edgar/data/915778/000119312511146581/dex102.htm
10.17 Employment Agreement by and between DSP Group, Ltd. and Dror Levy, effective June 9, 2002 (filed as Exhibit 10.34 to Registrant’s Annual Report on 10-K for the year ended December 31, 2010, and incorporated herein by reference). ††
https://www.sec.gov/Archives/edgar/data/915778/000119312511068724/dex1034.htm
10.18 Amendment to Employment Agreement by and between DSP Group, Ltd. and Dror Levy, effective January 31, 2011 (filed as Exhibit 10.35 to Registrant’s Annual Report on 10-K for the year ended December 31, 2010, and incorporated herein by reference). ††
https://www.sec.gov/Archives/edgar/data/915778/000119312511068724/dex1035.htm
10.19 Amendment to Employment Agreement by and between DSP Group, Ltd. and Dror Levy, as amended, effective as of May 16, 2011 (filed as Exhibit 10.3 to Registrant’s Current Report on 8-K filed on May 20, 2011, and incorporated herein by reference). †† https://www.sec.gov/Archives/edgar/data/915778/000119312511146581/dex103.htm

-111-
10.20 Amendment to Employment Agreement by and among DSP Group, Inc., DSP Group, Ltd. and Ofer Elyakim, as
amended, effective as of November 5, 2012(filed as Exhibit 10.1 to Registrant’s Current Report on 8-K filed on November 9, 2012, and incorporated herein by reference). †† https://www.sec.gov/Archives/edgar/data/915778/000119312512463578/d437363dex101.htm
10.21 Amendment to Employment Agreement by and among DSP Group, Inc., DSP Group, Ltd. and Dror Levy, as
amended, effective as of November 5, 2012 (filed as Exhibit 10.2 to Registrant’s Current Report on 8-K filed on November 9, 2012, and incorporated herein by reference). ††
https://www.sec.gov/Archives/edgar/data/915778/000119312512463578/d437363dex102.htm
10.22 DSP Group, Inc. Amended and Restated 2012 Stock Incentive Plan (filed as Exhibit 10.1 to Registrant’s Current Report on Form 8-K filed on May 26, 2015, and incorporated herein by reference). †† https://www.sec.gov/Archives/edgar/data/915778/000143774915010990/ex10-1.htm
10.23 Amendment to Employment Agreement of Ofer Elyakim, effective March 5, 2013 (filed as Exhibit 10.1 to
Registrant’s Current Report on 8-K filed on March 8, 2013, and incorporated herein by reference). †† https://www.sec.gov/Archives/edgar/data/915778/000119312513098948/d499323dex101.htm
10.24 Amendment to Employment Agreement of Dror Levy, effective March 5, 2013 (filed as Exhibit 10.2 to
Registrant’s Current Report on 8-K filed on March 8, 2013, and incorporated herein by reference). †† https://www.sec.gov/Archives/edgar/data/915778/000119312513098948/d499323dex102.htm
10.25 Form of Restricted Stock Unit Agreement for Israeli Resident Grantees under the 2012 Stock Incentive Plan
(filed as Exhibit 10.1 to Registrant’s Current Report on 8-K filed on August 21, 2013, and incorporated herein by reference). ††
https://www.sec.gov/Archives/edgar/data/915778/000119312513342182/d588382dex101.htm
10.26 Amendment to Employment Agreement of Ofer Elyakim, effective October 31, 2013 (filed as Exhibit 10.1 to Registrant’s Current Report on 8-K filed on November 1, 2013, and incorporated herein by reference). †† https://www.sec.gov/Archives/edgar/data/915778/000143774913013774/ex10-1.htm
10.27 Amendment to Employment Agreement of Dror Levy, effective October 31, 2013 (filed as Exhibit 10.2 to
Registrant’s Current Report on 8-K filed on November 1, 2013, and incorporated herein by reference). †† https://www.sec.gov/Archives/edgar/data/915778/000143774913013774/ex10-2.htm
10.28 Form of Restricted Stock Unit Agreement for Members of the Board of Directors under the 2012 Stock Incentive
Plan (filed as Exhibit 10.41 to Registrant’s Annual Report on Form 10-K filed on March 18, 2014, and incorporated herein by reference). ††
https://www.sec.gov/Archives/edgar/data/915778/000143774914004402/ex10-41.htm
10.29 Form of Restricted Stock Unit Agreement for Members of the Board of Directors Who Are Israeli Residents under the 2012 Stock Incentive Plan (filed as Exhibit 10.42 to Registrant’s Annual Report on Form 10-K filed on March 18, 2014, and incorporated herein by reference). ††
https://www.sec.gov/Archives/edgar/data/915778/000143774914004402/ex10-42.htm
10.30 Amended and Restated Director Equity Sub-Plan under the 2012 Equity Incentive Plan (filed as Exhibit 10.43 to Registrant’s Annual Report on Form 10-K filed on March 18, 2014, and incorporated herein by reference). ††
https://www.sec.gov/Archives/edgar/data/915778/000143774914004402/ex10-43.htm 10.31 10.32
2019 Performance-Based Bonus Plan applicable for the Chief Executive Officer and Chief Financial Officer of DSP Group, Inc. the Company (terms set forth in the Registrant’s Current Report on Form 8-K filed on February 14, 2019, and incorporated herein by reference). †† https://www.sec.gov/Archives/edgar/data/915778/000143774919002625/dspg20190213_8k.htm 2020 Performance-Based Bonus Plan applicable for the Chief Executive Officer and Chief Financial Officer of DSP Group, Inc. the Company (terms set forth in the Registrant’s Current Report on Form 8-K filed on February 14, 2020, and incorporated herein by reference). ††
-112-
https://www.sec.gov/Archives/edgar/data/915778/000143774920002641/dspg20200212_8k.htm
21.1 Subsidiaries of DSP Group, Inc.*
23.1 Consent of Kost Forer Gabbay & Kasierer, a member of Ernst & Young Global, Independent Registered Public Accounting Firm.*
24.1 Power of Attorney (See signature page of this Annual Report on Form 10-K).*
31.1 Rule 13a-14(a)/15d-14(a) Certification of Chief Executive Officer.*
31.2 Rule 13a-14(a)/15d-14(a) Certification of Chief Financial Officer.*
32.1 Section 1350 Certification of Chief Executive Officer.*
32.2 Section 1350 Certification of Chief Financial Officer.*
101.INS
XBRL Instance Document
101.SCH XBRL Taxonomy Extension Schema Document 101.CAL XBRL Taxonomy Extension Calculation Linkbase Document 101.DEF XBRL Taxonomy Extension Definition Linkbase Document 101.LAB XBRL Taxonomy Extension Labels Linkbase Document 101.PRE XBRL Taxonomy Extension Presentation Linkbase Document
†† Management contract or compensatory plan or arrangement required to be filed as an exhibit pursuant to Item 15(c) of Form 10-K.
* Filed herewith.
-113-
SIGNATURES
Pursuant to the requirements of Section 13 or 15(d) of the Securities Exchange Act of 1934, the Registrant has duly caused this report to be signed on its behalf by the undersigned, thereunto duly authorized.
DSP GROUP, INC. By: /s/ Ofer Elyakim
Ofer Elyakim Chief Executive Officer (Principal Executive Officer)
Date: March 11, 2020
Power of Attorney
KNOW ALL MEN BY THESE PRESENTS, that each person whose signature appears below constitutes and appoints Ofer Elyakim and Dror Levy or either of them, his true and lawful attorneys-in-fact and agents, with full power of substitution and re-substitution, for him and in his name, place and stead, in any and all capacities to sign any and all amendments to this Annual Report on Form 10-K, and to file the same, with all exhibits thereto and other documents in connection therewith, with the Securities and Exchange Commission, granting unto said attorneys-in-fact and agents, and each of them, full power and authority to do and perform each and every act and thing requisite and necessary to be done in connection therewith, as fully to all intents and purposes as he might or could do in person, hereby ratifying and confirming all that said attorneys-in-fact and agents, or either of them, or their or his substitutes or substitute, may lawfully do or cause to be done by virtue hereof.
Pursuant to the requirements of the Securities Exchange Act of 1934, this report has been signed below by the following persons on behalf of the Registrant and in the capacities and on the dates indicated.
Signature Title Date
/s/ Kenneth H. Traub Kenneth H. Traub
Chairman of the Board March 11, 2020
/s/ Ofer Elyakim Ofer Elyakim
Chief Executive Officer (Principal Executive Officer) and Director
March 11, 2020
/s/ Dror Levy Dror Levy
Chief Financial Officer and Secretary (Principal Financial Officer and Principal Accounting Officer)
March 11, 2020
/s/ Thomas A. Lacey Thomas A. Lacey
Director March 11, 2020
-114-
Signature Title Date
/s/ Cynthia Paul Cynthia Paul
Director March 11, 2020
/s/ Gabi Seligsohn Gabi Seligsohn
Director March 11, 2020
/s/ Yair Seroussi Yair Seroussi
Director March 11, 2020
/s/ Norman Taffe Norman Taffe
Director March 11, 2020

[This page intentionally left blank]

[This page intentionally left blank]
Corporate Directory Management Ofer Elyakim Chief Executive Officer Dror Levy Corporate Vice President of Finance and Chief Financial Officer Tali Chen Corporate Vice President and Chief Marketing Officer Lior Blanka Corporate Vice President and Chief Technology Officer Eric Stauffer Corporate Vice President and Chief Revenue Officer Dima Friedman Corporate Vice President of Operations Dotan Sokolov Corporate Vice President of Research and Development Hila Manoach Corporate Vice President of Human Resources Ran Klier Corporate Vice President, Unified Communications & Hearables Product Lines Yosi Brosh Corporate Vice President, SmartVoice Product Line Fredy Rabih Corporate Vice President of Product Management Directors Kenneth H. Traub Chairman of the Board Ofer Elyakim Chief Executive Officer Tom Lacey Director Gabi Seligsohn Director
Yair Seroussi Chairman of the board, Enlight Renewable Energy
Norm P. Taffe Executive Vice President, North America Residential, SunPower Corporation
Cynthia Paul, Chief Investment Officer, Lynrock Lake LP
Independent Auditors Kost, Forer Gabbay & Kassierer A member of Ernst & Young Global, Tel Aviv, Israel
General Legal Counsel Morrison & Foerster LLP, San-Francisco, California
Registrar and Transfer Agent American Stock Transfer and Trust Company New York, NY
Annual Meeting The annual meeting of stockholders will be held on: June 10, 2020, at 9:00 a.m., Eastern Time, virtually via the Internet. Stockholders will be able to listen, vote and submit questions from any remote location by logging in at: www.virtualshareholdermeeting.com/DSPG2020.
DSP Group, Inc. 2055 Gateway Place, Suite 480, San Jose, California 95110 Tel: +1(408) 986-4300 Fax: +1(408) 986-4323 www.dspg.com
Copyright © 2020, DSP Group, Inc. All rights reserved. DSP Group, Inc. and DSP Group Logo are trademarks of DSP Group, Inc. Other third party trademarks are property of their respective owners. All product information, dates and figures are not warranted as accurate or complete, and may be revised based on further information without notice.
For more information on our products and services, visit our website at: www.dspg.com or contact us at: [email protected]
BR23332B-0420-10K