May 19, 2022 PHILIPPINE DEALING AND EXCHANGE ...
431
May 19, 2022 PHILIPPINE DEALING AND EXCHANGE CORPORATION 29/F, BDO Equitable Tower, 8751 Paseo de Roxas, Makati City Attention: Atty. Marie Rose M. Magallen-Lirio Head – Issuer Compliance and Disclosure Department Re: Disclosure on the Definitive Information Statement Dear Atty. Magallen-Lirio: In compliance with the disclosure requirements of the Philippine Dealing and Exchange Corporation (“PDEX”), please find attached our disclosure on the Definitive Information Statement. Thank you. Sincerely yours, MARIA CECILIA V. CHANECO-LONZON Assistant Corporate Secretary Encl: a/s
-
Upload
khangminh22 -
Category
Documents
-
view
0 -
download
0
Transcript of May 19, 2022 PHILIPPINE DEALING AND EXCHANGE ...

May 19, 2022
PHILIPPINE DEALING AND EXCHANGE CORPORATION
29/F, BDO Equitable Tower,
8751 Paseo de Roxas, Makati City
Attention: Atty. Marie Rose M. Magallen-Lirio
Head – Issuer Compliance and Disclosure Department
Re: Disclosure on the Definitive Information Statement
Dear Atty. Magallen-Lirio:
In compliance with the disclosure requirements of the Philippine Dealing and Exchange
Corporation (“PDEX”), please find attached our disclosure on the Definitive Information
Statement.
Thank you.
Sincerely yours,
MARIA CECILIA V. CHANECO-LONZON
Assistant Corporate Secretary
Encl: a/s

Yes No
CR03293-2022
SECURITIES AND EXCHANGE COMMISSIONSEC FORM 20-IS
INFORMATION STATEMENT PURSUANT TO SECTION 17.1(b)OF THE SECURITIES REGULATION CODE
1. Check the appropriate box: Preliminary Information Statement Definitive Information Statement
2. Name of Registrant as specified in its charterRIZAL COMMERCIAL BANKING CORPORATION
3. Province, country or other jurisdiction of incorporation or organizationPhilippines
4. SEC Identification Number17514
5. BIR Tax Identification Code000-599-760-000
6. Address of principal office6819 Ayala cor. Gil J. Puyat Ave., Makati CityPostal Code 0727
7. Registrant's telephone number, including area code8894-9000
8. Date, time and place of the meeting of security holdersJune 27, 2022, 4:00 pm, Virtual Meeting via https://www.rcbc.com/ASM2022
9. Approximate date on which the Information Statement is first to be sent or given to security holdersMay 30, 2022
10. In case of Proxy Solicitations:
Name of Person Filing the Statement/SolicitorAtty. George Gilbert G. dela Cuesta
Address and Telephone No.46/F Yuchengco Tower, RCBC Plaza 6819 Ayala Ave. cor. Sen. Gil Puyat Ave.,Makati City - 88949000
11. Securities registered pursuant to Sections 8 and 12 of the Code or Sections 4 and 8 of the RSA(information on number of shares and amount of debt is applicable only to corporate registrants):
Title of Each Class Number of Shares of Common Stock Outstanding and Amount of Debt OutstandingCommon 2,037,478,896
13. Are any or all of registrant's securities listed on a Stock Exchange?
If yes, state the name of such stock exchange and the classes of securities listed therein:Philippine Stock Exchange - common

The Exchange does not warrant and holds no responsibility for the veracity of the facts and representations contained in all corporatedisclosures, including financial reports. All data contained herein are prepared and submitted by the disclosing party to the Exchange,and are disseminated solely for purposes of information. Any questions on the data contained herein should be addressed directly tothe Corporate Information Officer of the disclosing party.
Rizal Commercial Banking CorporationRCB
PSE Disclosure Form 17-5 - Information Statement for Annual or Special Stockholders' Meeting References: SRC Rule 20 and
Section 17.10 of the Revised Disclosure Rules
Date of Stockholders'Meeting Jun 27, 2022
Type (Annual orSpecial) Annual
Time 4:00 pmVenue Virtual Meeting via https://www.rcbc.com/ASM2022Record Date May 30, 2022
Inclusive Dates of Closing of Stock Transfer Books
Start Date N/AEnd date N/A
Other Relevant Information
Please see attached Definitive Information Statement as filed to the SEC.
Filed on behalf by:Name Maria Cecilia Chaneco-LonzonDesignation Assistant Corporate Secretary

COVER SHEET 1 7 5 1 4
S.E.C. Registration Number
R I Z A L C O M M E R C I A L B A N K I N G
C O R P O R A T I O N
(Company’s Full Name)
6 8 1 9 A Y A L A A V E N U E C O R N E R G I L
P U Y A T A V E N U E M A K A T I C I T Y
(Business Address: No. Street City/ Town/ Province)
GEORGE GILBERT G. DELA CUESTA 8894-94-55
Contact Person Company Telephone Number
DEFINITIVE INFORMATION STATEMENT
1 2 3 1 0 6
Month Day FORM TYPE Month Day Fiscal Year Annual Meeting
GSED Secondary License Type, If Applicable
Dept. Requiring this Doc. Amended Articles Number/Section
Total Amount of Borrowings 820
Total No. Of Stockholders Domestic Foreign ----------------------------------------------------------------------------------------------------------------------------------------------------
To be accomplished by SEC Personnel concerned
_____________________
File Number LCU
_____________________ Document I.D. Cashier
STAMPS
Remarks= pls. Use black ink for scanning purposes


2
A. GENERAL INFORMATION 1. Date, Time and Place of Meeting of Security Holders
Date : June 27, 2022 Time : 4:00 P.M. Place : There is no physical place for the meeting The meeting will be held virtually in view of the
COVID-19 pandemic. The link for the virtual meeting will be provided to stockholders of record who register to confirm their attendance.
Complete mailing address of Principal office : 21
st Floor, RCBC Plaza, Tower II
6819 Ayala Avenue corner 333 Sen. Gil J. Puyat Avenue Makati City
Approximate date on which the Information Statement is first to be sent or given to security holders : May 30, 2022
WE ARE NOT ASKING YOU FOR A PROXY AND YOU ARE REQUESTED NOT TO SEND US A PROXY.
2. Dissenter’s Right of Appraisal Apart from the extension of the corporate term to perpetual existence (as part of the Amendment of the Articles of Incorporation as proposed, please see page 27 of this Information Statement), there are no other matters or proposed actions as specified in the attached Notice of Annual Stockholders’ Meeting that may give rise to a possible exercise by shareholders of their appraisal rights or similar right as provided in Title X of the Corporation Code of the Philippines. However, if at any time after this Information Statement has been sent out, an action (which may give rise to exercise of appraisal right) is proposed at the Annual Stockholders’ Meeting, any stockholder who wishes to exercise such right and who voted against the proposed action must make a written demand within thirty (30) days after the Annual Stockholders’ Meeting. Under Title X of the Corporation Code, shareholders dissenting from and voting against the following corporate actions may demand payment of the fair value of their shares as of the day prior to the date on which the vote was taken for such corporation action: (i) amendment to the Bank’s articles and by-laws which has the effect of changing or restricting the rights of any shareholder or class of shares, or authorizing preferences in any respect superior to those of outstanding shares of any class; (ii) sale, lease, exchange, transfer, mortgage, pledge, or other disposition of all or substantially all of the Bank’s assets; (iii) merger or consolidation; (iv) investment of corporate funds in another corporation or business or for any purpose other than its primary purpose; and (v) extension or shortening of term of corporate existence. The appraisal right may be exercised by any shareholder who shall have voted against the proposed corporate action, by making a written demand on the Bank within thirty (30) days after the date on which the vote was taken for payment of the fair market value of such shareholder’s shares. The failure to make demand within such period shall be deemed a waiver of the appraisal right. If the proposed corporate action is implemented or effected, the Bank shall pay the dissenting shareholder, upon surrender of the certificate(s) representing his shares, the fair value thereof as of the day prior to the date on which the vote was taken, excluding any appreciation or depreciation in anticipation of such corporate action.

3
3. Interest of Certain Persons in or Opposition to Matters to be Acted Upon No director or officer of the Bank and, to the best knowledge of the Bank, no associate of a director or officer of the Bank has any substantial interest, direct or indirect, by security holdings or otherwise, in any of the corporate actions to be acted upon at the Annual Stockholders’ Meeting, other than election to office of the directors. None of the directors of the Bank has informed the Bank of his/her intention to oppose any of the corporate actions to be acted upon at the Annual Stockholders’ Meeting. Moreover, all directors and management of the Bank act in the best interest of the Shareholders and there have been no adverse findings of conflict of interest or insider trading involving any director or management in the past 2 years. B. CONTROL AND COMPENSATION INFORMATION 4. Voting Securities and Principal Holders Thereof
Class of Voting Securities: As of April 30, 2022, 2,037,478,896 Common shares and 267,410 Preferred shares are outstanding, and are entitled to be represented and vote at the Annual Stockholders’ Meeting. Each share is entitled to one vote. Record Date: Only stockholders of record as of May 30, 2022 shall be entitled to notice and vote at the meeting. Manner of Voting: The By-Laws of the Bank provides that the election shall be by ballot, and that every stockholder entitled to vote shall have the right to vote in person or by proxy the number of shares of stock standing in his own name in the stock and transfer books of the Bank at the time the books were closed and said stockholder may vote such number of shares for as many persons as there are directors, or he may cumulate said shares and give one candidate as many votes as the number of directors to be elected, multiplied by the number of shares shall equal, or he may distribute them on the same principle among as many candidates as he shall see fit, Provided, that the whole number of votes cast by him shall not exceed the number of shares owned by him, as shown in the books of the Bank, multiplied by the whole number of directors to be elected; and Provided, that no stock declared delinquent by the Board of Directors for unpaid subscriptions shall be voted. The votes shall be verified and tabulated by Punongbayan and Araullo, which is an independent third party. As allowed by the Revised Corporation Code and the Commission’s rules, the Board of Directors, on April 25, 2022, issued a resolution allowing voting through remote communication or in absentia. Security Ownership of Certain Record Owners of more than 5% (as of March 31, 2022) (1)
Title of Class
(2) Name, address of record owner and relationship
with issuer
(3) Name of Beneficial Owner
and Relationship with Record Owner
(4) Citizenship
(5) Number of
Shares Held
(6) Percent
Common Pan Malayan Management & Investment Corporation
(PMMIC) Address: 48/F Yuchengco Tower, RCBC Plaza, 6819 Ayala Ave., Makati City Relationship with Issuer: RCBC is a subsidiary of
Pan Malayan Management & Investment Corporation The records in the possession of the Bank show that the beneficial ownership of this company belongs to the shareholders of record of said company. The Bank has not been advised otherwise.
Filipino 807,582,173*
39.64%
This includes certificated shares (29.17%) and shares under PCD Nominee (10.47%)

4
PMMIC Atty. Guia Margarita Y. Santos and Michele Marie Y. Dee are authorized to vote the certificated shares (594,248,085) of PMMIC. RCBC Securities, Inc.’s Marilen B. Zuñiga and Simeon A. Lorica, Jr. are authorized to vote the 213,334,088 shares of PMMIC under PCD Nominee.
Cathay Life Insurance Co. LTD
(Cathay) Address: No. 296 Ren Ai Road Sec. 4 Taipei R.O.C. (Taiwan) 10633 Relationship with Issuer: Stockholder HSBC’s Karina del Rosario and Paul Arthur O. Austria are authorized to vote the shares of Cathay which are all under PCD Nominee.
Cathay Life Insurance Co.Ltd. The records in the possession of the Bank show that the beneficial ownership of this company belongs to the shareholders of record of said company. The Bank has not been advised otherwise.
Non-Filipino
452,018,582 22.19% (Shares are under PCD Nominee)
Common International Finance Corporation (IFC) & IFC Capitalization (Equity) Fund, L.P.
(IFC) Address:2121 Pennsylvania Avenue, NW Washington, DC 20433 USA Relationship with Issuer: Stockholder HSBC’s Karina del Rosario and Paul Arthur O. Austria are authorized to vote 71,151,505 shares of IFC under PCD Nominee. Citibank’s Rachel Oliveros, and Ginger Aguirre-Reyes are authorized to vote 36,724,137 shares of IFC under PCD Nominee.
International Finance Corporation (IFC) The records in the possession of the Bank show that the beneficial ownership of this company belongs to the shareholders of record of said company. The Bank has not been advised otherwise.
Non-Filipino
107,875,642 5.29%
(Shares are under PCD Nominee)
*Combined Direct and Indirect Shares of PMMIC
No other individual or corporation under PCD Nominee Corp. holds shares in excess of 5%.

5
The participants under PCD owning more than 5% of the voting securities (common) are (as of March 31, 2022):
Name Shares % of Total
RCBC Securities, Inc. 628,309,882 30.84% The Hongkong and Shanghai Banking Corp. Ltd.
523,842,000 25.71%
BDO Securities Corporation 111,839,911 5.49%
Security Ownership of Certain Record Owners of more than 5% (as of April 30, 2022)
Title of Class
Name & Address of Record Owner and
Relationship with Issuer
Name of Beneficial Owner and Relationship
with Record Owner
Citizen-ship
No. of Shares
Percent
Preferred None
Security Ownership of Foreigners (as of April 30, 2022)
Title of Class Shares % of Total
Common 686,670,489 33.70%
Preferred 0 0.00
Security Ownership of Management (as of April 30, 2022)
Title of Class
Name of Beneficial Owner/ Position
Amount and Nature of Beneficial Ownership
”r”/”b”*
Citizen- ship
Percent of
Class
a. Board of Directors:
Common Helen Y. Dee Chairperson P4,380.00 “r” P14,918,680.00 “b”
Filipino 0.07%
Common Cesar E. A. Virata Director/ Corporate Vice-Chairman
P1,670 “r” P1,382,670.00 “b”
Filipino 0.01%
Common Eugene S. Acevedo President and CEO P3,441,000.00 “b” Filipino 0.02%
Common Gil A Buenaventura Director P50.00 “r” Filipino 0.000%
Common John Law Director P10.00 “r” French/ Taiwanese
0.000%
Common Shih-Chiao (Joe) Lin Director P10.00 “r” R.O.C./ Taiwanese
0.000%
Common Arnold Kai Yuen Kan Director P10.00 “r” Canadian 0.000%
Common Lilia B. De Lima Director P10.00 “r” Filipino 0.000%
Common Gayatri P. Bery Director P10.00 “r” American 0.000%
Common Armando M. Medina Director P1,950.00 “r” Filipino 0.000%
Common Adelita A Vergel De Dios
Independent Director P10.00 “r” Filipino 0.000%
Common Gabriel S Claudio Independent Director P10.00 “r” Filipino 0.000%
Common Vaughn F Montes Independent Director P50.00 “r” Filipino 0.00%
Common Laurito E. Serrano Independent Director P10.00 “r” Filipino 0.000%
Common Juan B Santos Independent Director P50.00 “r” Filipino 0.00%
b. Senior Management:
c. Directors & Principal Officers (as a Group) P19,750,580.00 0.10%
*”r” refers to registered ownership and “b” refers to beneficial ownership
Changes in Control: At present, there is no arrangement known to the Bank which may result in a change in control.
Voting Trust Holders of 5% or More: There are no shareholdings holding any Voting Trust Agreement or any such similar agreement.

6
5. Directors and Executive Officers (a) Nominees for Independent Directors:
i. Mr. Juan B. Santos ii. Atty. Adelita A. Vergel De Dios iii. Mr. Gabriel S. Claudio iv. Mr. Vaughn F. Montes, PhD v. Mr. Laurito E. Serrano
(b) Nominees for Directors:
i. Ms. Helen Y. Dee ii. Mr. Cesar E.A. Virata iii. Mr. Eugene S. Acevedo iv. Mr. Gil A. Buenaventura v. Mr. Armando M. Medina vi. Mr. John Law vii. Mr. Shih-Chiao (Joe) Lin viii. Mr. Arnold Kai Yuen Kan ix. Atty. Lilia B. De Lima x. Ms. Gayatri P. Bery
Mr. Eduardo S. Lopez, Jr., a stockholder who is not in any way related to the nominees, nominated to the Board the re-election of Mr. Juan B. Santos, Atty. Adelita A. Vergel De Dios, Mr. Gabriel S. Claudio, Mr. Vaughn F. Montes, and Mr. Laurito E. Serrano as Independent Directors. The Corporate Governance Committee composed of five (5) members, three (3) of whom are independent directors, reviews and evaluates the qualifications of all persons to be nominated to the Board as well as those to be nominated to other positions requiring appointment by the Board of Directors, i.e, with the ranks of Vice President and higher. The Directors will be nominated and elected in accordance with SRC Rule 38. All the nominated directors comply with all the qualifications required of a director mentioned under Section 132 (for director) of the Manual of Regulations for Banks (MORB) and do not possess any of the disqualifications mentioned under Section 138 (for director) of the MORB. Likewise, pursuant to the Code of Corporate Governance for Publicly-Listed Companies (2016), all the directors for re-election have satisfied the required number of attendance in board meetings, as well as in their respective Committees. The Directors shall hold office for one (1) year and until their successors are elected and qualified. The Independent Directors, Mr. Juan B. Santos, Atty. Adelita A. Vergel De Dios, Mr. Gabriel S. Claudio, Mr. Vaughn F. Montes, and Mr. Laurito E. Serrano have each always possessed the qualifications and none of the disqualifications of an independent director. The Certification of Independent Director of each of the foregoing Independent Directors is attached. The Certification of Independent Director Atty. Adelita A. Vergel De Dios, who is currently abroad, has been signed and is attached to the Information Statement. The Bank undertakes to submit the notarized (with apostille) or consularized Certification to the Commission once the same becomes available.

7
(c) Directors: (Age)/ Directors Citizenship Position/Period which they have served Helen Y. Dee
(78)/ Filipino
Board Chairperson (June 25, 2007 to present) Director (March 28, 2005 to present)
Ms. Dee is the Bank’s Chairperson. Ms. Dee is also the Chairperson of House of Investments, Inc, EEI Corporation, Petroenergy Resources Corp, all of which are PSE-listed companies. She is also the Chairperson of Pan Malayan Management and Investment Corporation, Malayan Insurance Co. Inc., Landev Corporation, Hi-Eisai Pharmaceutical Inc., Malayan Educational Systems, Inc. and Manila Memorial Park Cemetery. Among the top companies where she holds a directorship position are Philippine Long Distance Telephone Company and Sun Life Grepa Financial, Inc. She graduated from Assumption College with a Bachelor of Science degree in Commerce and completed her Master’s in Business Administration at De La Salle University. Recent training/continuing education (2018 to present): Corporate Governance and Financial Technology (RCBC); Sustainability Reporting, and Customer Due Diligence and Trade-Based Money Laundering (RCBC); Best Practices to Manage ML/TF Risks from Online Sexual Exploitation of Children Coursed through Banks and MSBs, and ML/TF Typologies (ABCOMP and Baiphil); BSP Supervisory Assessment Framework to replace CAMELS and ROCA Rating Systems for BSFIs (ABCOMP and Baiphil), How to Lead Courageously During a Crisis (PLDT); Lessons from a Pandemic: the MPIC Hospital Group COVID-19 Experience and Best Practices (PLDT); Building Better Bankers: Fostering a Stronger KYE Program (ABCOMP); Becoming Obsessed with the Customer - 2021 Annual Corporate Governance Session (PLDT), Sunlife Advanced Corporate Governance and AML Refresher Course (Sunlife Philippines) Annual Corporate Governance Enhancement Session - Agile Leadership : A Conversation with Ms. Anna Wintour (PLDT).
Company Position
Philippine Long Distance Telephone Company Director
Landev Corp. Chairperson
House of Investments, Inc. Chairperson
HI-Eisai Pharmaceuticals, Inc. Chairperson
Manila Memorial Park Cemetery, Inc. Chairperson
Petro Energy Resources Inc. Chairperson
Luis Miguel Foods Director
Pan Malayan Management & Investment Corp. Chairperson
Shayamala Corporation Chairperson
Honda Cars Philippines, Inc. Director
Isuzu Philippines, Inc. Director
EEI Corporation Chairperson
Luisita Industrial Park Corporation Director
Malayan Education System, Inc. Chairperson
Pan Malayan Realty Corp. Chairperson
Honda Cars Kalookan, Inc. Director
GPL Holdings, Inc. President
La Funeraria Paz Sucat, Inc. Chairperson
Malayan Insurance Co. Inc. Chairperson
Xamdu Motors, Inc. Chairperson
Philippine Integrated Advertising Agency, Inc. Director

8
RCBC Leasing and Finance Corporation Chairperson
Philippine Business for Education, Inc. Board Member / Trustee
Petrowind Energy Inc. Chairperson
Y Realty, Inc. Director
Malayan High School of Science, Inc. Chairperson
Malayan Colleges Laguna, Inc. Trustee
Pan Malayan Express Chairperson
Sunlife Grepa Financial, Inc. Chairperson
Malayan Colleges of Mindanao, Inc. Chairperson
MICO Equities, Inc. Chairperson
Yuchengco Center, Inc. Chairperson
A.T. Yuchengo, Inc. Chairperson
ET Yuchengco, Inc. Chairperson
YGC Corporate Services, Inc. Chairperson / President
Mayahin Holdings Corporation Chairperson
RCBC Realty Corporation Chairperson
RCBC Land, Inc. Director
AY Holdings, Inc. Chairperson
AY Foundation, Inc. Chairperson / Trustee
Cesar E.A. Virata (91)/
Filipino Director (1995 to present) Corporate Vice Chairperson (June 22, 2000 to present)
Mr. Virata has been a Director since 1995, Corporate Vice Chairman since June 2000 and Senior Adviser from 2007. Mr. Virata’s roster of companies where he is also a Director and/or Chairman includes RCBC Realty Corp., RCBC Land, Inc., Malayan Insurance Co., Inc., Business World Publishing Corporation, Luisita Industrial Park Corporation, RCBC Bankard Services Corporation, and AY Foundation, Inc., among others. Mr. Virata has held important/key positions in the Philippine government, including Prime Minister, Secretary/Minister of Finance, Chairman of the Committee on Finance of the Batasang Pambansa (National Assembly) and member of the Monetary Board. He was also Chairman of the Land Bank of the Philippines. He has served as Governor for the Philippines to the World Bank, the Asian Development Bank and the International Fund for Agriculture Development. He was Chairman of the Development Committee of the World Bank and International Monetary Fund from 1976 to 1980 and Chairman of the Board of Governors of the Asian Development Bank. Prior to his Government positions, he was a Professor and Dean of the College of Business Administration of the University of the Philippines and Principal, SyCip Gorres Velayo and Company, Management Services Division. Mr. Virata has also held membership in various international committees/fora in the past, including: Bretton Woods Committee, Group of 30, Institute of International Finance, Rockefeller Tripartite Commission for Asia, Davos Forum, and ADB Forum. Mr. Virata graduated from the University of the Philippines with degrees in Mechanical Engineering and Business Administration (Cum Laude). He completed his Master’s in Business Administration from the Wharton Graduate School, University of Pennsylvania. Recent training/continuing education (2018 to present): Advanced Corporate Governance Training Program (ICD); Corporate Governance and Financial Technology (RCBC); Sustainability Reporting, and Customer Due Diligence and Trade-Based Money Laundering (RCBC); Best Practices to Manage ML/TF Risks from Online Sexual Exploitation of Children Coursed through Banks and MSBs, and ML/TF Typologies (ABCOMP and Baiphil); BSP Supervisory Assessment Framework to replace CAMELS and ROCA Rating Systems for BSFIs (ABCOMP and Baiphil); Building Better Bankers: Fostering a Stronger KYE Program (ABCOMP); Leveraging on FinTech: Financial Services Under the New Economy Arrangement (ABCOMP).

9
Company Position
ATAR VI Property Holding Company, Inc. Chairman / Director
RCBC Realty Corporation. Director
RCBC Bankard Services Corporation Chairman / Director
RCBC Land, Inc. Chairman / Director
ALTO Pacific Company, Inc. Chairman / Director
Malayan Insurance Co., Inc. Director
Luisita Industrial Park Corporation Vice Chairman / Director
Lopez Holdings Corp. Adviser
Cavitex Holdings, Inc. Director
YGC Corporate Services, Inc. Director
Niyog Properties Holdings, Inc. Director
Business World Publishing Corp. Vice Chairman / Director
City and Land Developers, Inc. Independent Director
Cajel Realty Corporation Director
AY Foundation, Inc. Trustee
Malayan Education System, Inc. (Mapua Institute of Technology)
Trustee
World Trade Center Management, Inc. Director
Yuchengco Center Trustee
Tan Yan Kee Foundation, Inc. Trustee
IFI Support Foundation, Inc. Trustee
UP Business Research Foundation, Inc. Chairman Emeritus
Yuchengco Museum, Inc. Trustee
UCMP Foundation, Inc. Chairman / Trustee
UP Engineering Foundation, Inc. Member
MAP Agribusiness Foundation, Inc. Member
Federation for Economic Freedom Adviser
Makati Business Club Member
Cavite Historical Society, Inc. Chairman/ Trustee
Investment & Capital Corporation of the Phils. Adviser
Phil. Dealing System Holding Corporation Chairman Emeritus
Eugene S. Acevedo (58)/
Filipino Director, President and CEO (July 1, 2019 to present)
Mr. Acevedo is the Bank’s President and Chief Executive Officer. He has over thirty years (30) years of banking experience gained from local and multinational banks including Union Bank of the Philippines, CitySavings Bank, Philippine National Bank, and Citibank Philippines, N.A. He is a Magna Cum Laude graduate from the University of San Carlos where he earned a degree in Bachelor of Science in Physics in 1984. He has a Master’s degree in Business Administration from the Asian Institute of Management and completed an Advanced Management Program at the Harvard Business School. He also holds a Professional Certificate in Clean Power from the Imperial College London. Recent training/continuing education (2018 to present): Corporate Governance Orientation Program (ICD); Sustainability Reporting, and Customer Due Diligence and Trade-Based Money Laundering (RCBC); Best Practices to Manage ML/TF Risks from Online Sexual Exploitation of Children Coursed through Banks and MSBs, and ML/TF Typologies (ABCOMP and Baiphil); BSP Supervisory Assessment Framework to replace CAMELS and ROCA Rating Systems for BSFIs (ABCOMP and Baiphil); Building Better Bankers: Fostering a Stronger KYE Program (ABCOMP); Leveraging on FinTech: Financial Services Under the New Economy Arrangement (ABCOMP).

10
Company Position
De La Salle John Bosco College Trustee
Holly Tree Holdings Chairman
Amadeus Arabica Corp Director
Rizal Microbank, Inc. – A Thrift Bank of RCBC Chairman
RCBC Leasing and Finance Corporation Vice Chairman / Director
RCBC Capital Corporation Director
RCBC International Finance Limited Director
RCBC Investment Limited Director
Niyog Property Holdings, Inc. Director
Bancnet Director
PPMI Director
Asian Institute of Management Trustee
Asian Bankers Association Chairman
YGC CSI Director
Gil A. Buenaventura
(69)/ Filipino
Director (July 1, 2016 to present)
Mr. Buenaventura has been a Director of the Bank since July 2016 and has since been sitting as a member of the Bank’s Executive Committee. He was also President and Chief and Executive Officer of the Bank until June 30, 2019. He holds directorship and officership positions in De La Salle Philippines School System, Malayan Insurance Company, Inc., House of Investments, Inc., and Manila Memorial Park Cemetery, Inc. He graduated with a Bachelor of Arts degree, major in Economics, from the University of San Francisco, California, and with a Master’s of Business Administration in Finance from the University of Wisconsin. Recent training/continuing education (2018 to present): Corporate Governance and Financial Technology (RCBC); Sustainability Reporting, and Customer Due Diligence and Trade-Based Money Laundering (RCBC); Best Practices to Manage ML/TF Risks from Online Sexual Exploitation of Children Coursed through Banks and MSBs, and ML/TF Typologies (ABCOMP and Baiphil); BSP Supervisory Assessment Framework to replace CAMELS and ROCA Rating Systems for BSFIs (ABCOMP and Baiphil); Building Better Bankers: Fostering a Stronger KYE Program (ABCOMP).
Company Position
De La Salle Philippines School System Member of the Investment Committee
Malayan Insurance Company, Inc. Director
House of Investments, Inc. Director
Manila Memorial Park Cemetery, Inc. Director
Armando M. Medina (72)/
Filipino Director (January 1, 2021 to present)
Mr. Medina was an Independent Director of the Bank from 2003 to 2020. He became a regular director of the Bank starting January 1, 2021. He is a member of the Bank’s Executive Committee. He is also an Independent Director of Malayan Insurance. He served as an Independent Director of RCBC Capital Corporation until December 31, 2020. He graduated from De La Salle University with a Bachelor of Arts degree in Economics and a Bachelor of Science degree in commerce with a major in Accounting.

11
Recent training/continuing education (2018 to present): Corporate Governance and Financial Technology (RCBC); Sustainability Reporting, and Customer Due Diligence and Trade-Based Money Laundering (RCBC); Best Practices to Manage ML/TF Risks from Online Sexual Exploitation of Children Coursed through Banks and MSBs, and ML/TF Typologies (ABCOMP and Baiphil); BSP Supervisory Assessment Framework to replace CAMELS and ROCA Rating Systems for BSFIs (ABCOMP and Baiphil); Building Better Bankers: Fostering a Stronger KYE Program (ABCOMP); Leveraging on FinTech: Financial Services Under the New Economy Arrangement (ABCOMP); Executive Briefing Center: Plenary- Culture, Innovation, & Transformation (AWS-YGC); Executive Briefing Center: Industry Block 1: Banking, Financial Services, and Insurance (AWS-YGC); Understanding Climate Risks: Launch of The ASEAN Climate Governance Network (CGM)
Company Position
Malayan Insurance Co. Independent Director
John Law (71)/
French & Taiwanese (dual citizen)
Director (April 27, 2015 to present)
Mr. Law has been a Director of the Bank since April 2015. He is also currently a Director of Far East Horizon Ltd. in Hong Kong and Khan Bank in Mongolia. He served as Senior Advisor for Greater China for Oliver Wyman until his retirement as of December 31, 2020. He holds a Bachelor of Science degree, major in Psychology, from Chung Yuan University in Taiwan; a Master’s of Business Administration degree from Indiana University; and a Master’s of Arts degree, major in Poetry, from the University of Paris, France.
Recent training/continuing education (2018 to present): Corporate Governance and Financial Technology (RCBC); Customer Due Diligence and Trade-Based Money Laundering (RCBC); Sustainability Reporting, and Customer Due Diligence and Trade-Based Money Laundering (RCBC); Best Practices to Manage ML/TF Risks from Online Sexual Exploitation of Children Coursed through Banks and MSBs, and ML/TF Typologies (ABCOMP and Baiphil); BSP Supervisory Assessment Framework to replace CAMELS and ROCA Rating Systems for BSFIs (ABCOMP and Baiphil); Building Better Bankers: Fostering a Stronger KYE Program (ABCOMP).
Company Position
Far East Horizon Ltd. Non-Executive Director
Khan Bank (Mongolia) Non-Executive Director
Shih-Chiao (Joe) Lin (50)/
R.O.C/Taiwanese Director (March 25, 2019 to present)
Mr. Lin has been a Director of the Bank since March 25, 2019. He has been with Cathay Life Insurance for over 20 years and is currently an Executive Vice President there. He graduated with a Bachelor’s degree in Business Administration from the National Chengchi University and holds an MBA from the National Taiwan University. Recent training/continuing education (2018 to present): Corporate Governance Orientation Program (ICD); Best Practices to Manage ML/TF Risks from Online Sexual Exploitation of Children Coursed through Banks and MSBs, and ML/TF Typologies (ARCCO-Phil.); BSP Supervisory Assessment Framework to replace CAMELS and ROCA Rating Systems for BSFIs (ABCOMP and Baiphil); Building Better Bankers: Fostering a Stronger KYE Program (ABCOMP); Leveraging on FinTech: Financial Services Under the New Economy Arrangement (ABCOMP); 2021 Cathay Sustainable Finance and Climate Change Summit.

12
Company Position
Cathay Life Insurance Executive Vice President
Arnold Kai Yuen Kan
(61)/ Canadian
Director (June 24, 2019 to present)
Mr. Kai Yuen Kan gained experience from Citibank, the First National Bank of Chicago, the National Westminster Bank, JP Morgan Chase Bank, Credit Agricole Corporate & Investment Bank, and Krea Capital Limited. He is currently the Chief Executive of Cathay United Bank’s Hong Kong Branch and Co-Head of the International Banking Group. He graduated with a Bachelor of Social Sciences degree from the University of Hong Kong and obtained a Master’s degree in Business Administration from the York University in Canada. Recent training/continuing education (2019 to present): Corporate Governance Orientation Program (ICD). Best Practices to Manage ML/TF Risks from Online Sexual Exploitation of Children Coursed through Banks and MSBs, and ML/TF Typologies (ABCOMP and Baiphil); BSP Supervisory Assessment Framework to replace CAMELS and ROCA Rating Systems for BSFIs (ABCOMP and Baiphil); Building Better Bankers: Fostering a Stronger KYE Program (ABCOMP); Leveraging on FinTech: Financial Services Under the New Economy Arrangement (ABCOMP); From Green Finance to Social and Sustainable Bonds: Principles, Standards, Developments and Social-Economic Implications (HKQAA); Climate Risk from the Regulatory Perspective (HKMA); Reporting and Monitoring (KPMG); Due Diligence (KPMG) Legal Documentation for Transition away from LIBOR (HKAB); FATCA/CRS Refresher Training (KPMG). Company Position
Cathay United Bank Chief Executive, Hong Kong Branch Co-Head of International Banking Group
New Foresight Limited Director
Alpha Vantage Investments Limited Director
Alpha Guard Investments Limited Director
Krea Capital Limited Director
Atty. Lilia B. De Lima (81)/ Filipino
Director (June 24, 2019 to present)
Atty. De Lima has been has been a Director of the Bank since June 24, 2019. She was an Independent Member of the Bank’s Advisory Board from July 3, 2017 to June 24, 2019. Prior thereto, she served as the Director General of PEZA from 1995 to 2016. Other positions she has held include being Board Member of the Cagayan and Zamboanga Economic Zones, Commissioner of the National Amnesty Commission, Executive Director of the Department of Trade and Industry Price Stabilization Council and Director of the Bureau of Trade, and Chief Operating Officer of the World Trade Center Manila. She was an Elected Delegate to the 1971 Constitutional Convention representing the 2
nd District of Camarines Sur. She is the recipient of
numerous local and international awards including the 2017 Ramon Magsaysay Award, The Order of the Rising Sun-Gold and Silver Star (Japan), The Outstanding Women in the Nation’s Service (TOWNS) in the field of law, and the 2010 Management Man of the Year. Recent training/continuing education (2018 to present): Briefing on Best Practices in Board Risk Oversight (PHINMA); Corporate Governance Orientation Program (ICD); Sustainability Reporting, and Customer Due Diligence and Trade-Based Money Laundering (RCBC); . Business Continuity Planning: Executive Briefing for Board Directors and Management (PHINMA); Best Practices to Manage ML/TF Risks from Online Sexual Exploitation of Children Coursed through Banks and

13
MSBs, and ML/TF Typologies (ABCOMP and Baiphil); BSP Supervisory Assessment Framework to replace CAMELS and ROCA Rating Systems for BSFIs (ABCOMP and Baiphil); Investment, Trust and Estate Management (Wealth Management Center for Communication and Research, Inc.); Building Better Bankers: Fostering a Stronger KYE Program (ABCOMP); Leveraging on FinTech: Financial Services Under the New Economy Arrangement (ABCOMP); Industry Block 1: Banking, Financial Services, and Insurance (AWS-YGC).
Company Position
Fatima Center for Human Development Trustee
IONICS, Inc. Independent Director
IONICS EMS, Inc. Independent Director Science Park of the Philippines Independent Director
RFM Science Park of the Philippines Independent Director
Asian Institute of Management Executive in Residence
PHINMA Corporation Independent Director
FWD Life Insurance Corporation Independent Director
Dusit Thani Philippines Independent Director Regatta Properties, Inc. Independent Director
Pueblo de Oro Development Corporation Independent Trustee
AC Industrials Advisory Council Member
Gayatri P. Bery (56)/ American
Director (July 27, 2020 to present)
Ms. Bery gained experience from Drexel Burnham & Lambert (New York), Ranieri & Company (New York), Morgan Stanley & Co. Incorporated (New York), being an investment advisor in Hong Kong, and being a member of the Steering Committee of Morgan Stanley’s HK Women’s Business Alliance Team. She also served as Chief Operating Officer, Global Capital Markets - Asia Pacific, Morgan Stanley (Hong Kong). She graduated with a Bachelor of Science degree in Applied Mathematics/Computer Science from the Carnegie Mellon University, and obtained a Master of Business Administration (with concentrations in Finance and International Business) from the Columbia Business School (New York).
Recent training/continuing education (2019 to present): Financial Times Non-Executive Director Diploma (Hong Kong); Corporate Governance Orientation Program (ICD); Best Practices to Manage ML/TF Risks from Online Sexual Exploitation of Children Coursed through Banks and MSBs, and ML/TF Typologies (ABCOMP and Baiphil); BSP Supervisory Assessment Framework to replace CAMELS and ROCA Rating Systems for BSFIs (Baiphil); Leveraging on FinTech: Financial Services Under the New Economy Arrangement (ABCOMP); 2021 GRI Cross Country Learning Session for Business (GRI-SEC)
Company Position
None none
The Bank is compliant with SEC Memorandum Circular No. 4, Series of 2017 on the term limit of independent directors. It provides that an independent director shall serve for a maximum cumulative term of nine years, and that the reckoning period for the cumulative nine-year term is 2012. All Independent Directors set forth below have served for less than nine (9) years.

14
Juan B. Santos (83)/ Filipino
Independent Director (November 2, 2016 to present)
Mr. Santos has been an Independent Director of the Bank since November 2016. He serves as Lead Independent Director of the Bank. He holds director, trustee, and advisory positions in various companies as detailed below. Prior to joining the Bank, he was the Chairman of the Social Security Commission. He served briefly as Secretary of Trade and Industry and was CEO and Chairman of Nestle Philippines, Singapore, and Thailand. He also served as Director of various publicly listed companies, including the Philippine Long Distance Telephone Company, Philex Mining Corporation, San Miguel Corporation, Equitable Savings Bank, Inc., and PCI Leasing and Finance, Inc. He holds a Bachelor of Science in Business Administration degree from the Ateneo de Manila University and a degree in Foreign Trade from the Thunderbird School of Management in Arizona, USA. He completed his Advanced Management Course at the International Institute for Management Development in Lausanne, Switzerland. Recent training/continuing education (2018 to present): Advanced Corporate Governance Training (ICD); Best Practices to Manage ML/TF Risks from Online Sexual Exploitation of Children Coursed through Banks and MSBs, and ML/TF Typologies (ABCOMP and Baiphil); BSP Supervisory Assessment Framework to replace CAMELS and ROCA Rating Systems for BSFIs (ABCOMP and Baiphil); Building Better Bankers: Fostering a Stronger KYE Program (ABCOMP); Executive Briefing Center: Industry Block 1: Banking, Financial Services, and Insurance (AWS-YGC).
Company Position
Philippine Investment Management Corp. Director
Mitsubishi Motor Phil. Corp. Advisory Board
House of Investments, Inc. Director
Dualtech Training Center Foundation Trustee
East-West Seed Co. Inc. (Phils.) Advisory Board
Marsman-Drysdale Group Consultant
SunLife Grepa Financial, Inc. Independent Director
St. Luke's Medical Center Trustee
Allamanda Management Corp. Director Gabriel S. Claudio
(67)/ Filipino
Independent Director (July 25, 2016 to present)
Mr. Claudio Filipino, has been an Independent Director of the Bank since July 2016. He has directorships in Ginebra San Miguel, Incorporated, Risk & Opportunities Assessment Management, Conflict Resolution Group Foundation (CORE), Toby’s Youth Sports Foundation, and the Philippine Amusement and Gaming Corporation (PAGCOR). He served as political adviser to former presidents Fidel V. Ramos and Gloria Macapagal-Arroyo and held various positions in the Cabinet and government including: Presidential Political and Legislative Adviser, Chief of the Presidential Legislative Liaison Office, Cabinet Officer for Regional Development for Eastern Visayas, and Acting Executive Secretary. He also previously served as Chairman of the Board of Trustees of the Metropolitan Water and Sewerage System, Director of the Development Bank of the Philippines, and Director of the Philippine Charity Sweepstakes Office. He holds an AB Communication Arts degree from the Ateneo de Manila University. Recent training/continuing education (2018 to present): Corporate Governance and Financial Technology (RCBC); Corporate Governance and Crisis Management (Ginebra San Miguel, Inc.- GSMI); Best Practices to Manage ML/TF Risks from Online Sexual Exploitation of Children Coursed through Banks and MSBs, and ML/TF Typologies (ABCOMP and Baiphil); BSP Supervisory Assessment Framework to replace CAMELS and ROCA Rating Systems for BSFIs

15
(ABCOMP and Baiphil); Building Better Bankers: Fostering a Stronger KYE Program (ABCOMP); Leveraging on FinTech: Financial Services Under the New Economy Arrangement (ABCOMP).
Company Position
Philippine Amusement & Gaming Corporation Member, Board of Directors
Ginebra San Miguel, Incorporated Member, Board of Directors
Risk & Opportunities Assessment Management Vice Chairman/Member, Board of Directors
Conflict Resolution Group Foundation (CORE) Member, Board of Directors
Toby's Youth Sports Foundation Member, Board of Directors Vaughn F. Montes, Ph.D.
(71)/ Filipino
Independent Director (September 26, 2016 to present)
Mr. Montes has been an Independent Director of the Bank since September 2016. He is a Teaching Fellow on Corporate Governance courses at the Institute of Corporate Directors. He is a Director of the Center for Excellence in Governance, and President of the Center for Family Advancement. He is a national consultant for Risk Management to the NEDA PPP Center under an ADB technical assistance grant. He is a Trustee and Founding Fellow of the Foundation for Economic Freedom. He is also currently a Trustee at Parents for Education Foundation (“PAREF”), and Chairman and President at PAREF Southridge School for Boys. He worked in Citibank over a period of 25 years in various capacities including: Senior Economist in Philippine Debt Restructuring Committee; Head of the International Corporate Finance Unit; and Director and Head of Public Sector. He worked as an Associate Economist at the Wharton Econometric Forecasting Associates in Philadelphia USA. He holds an AB (Bachelor of Arts) Economics degree from the Ateneo de Manila University, an MS (Master of Science) Industrial Economics degree from the Center for Research and Communications (now University of Asia and the Pacific), and a PhD in Business Economics from the Wharton Doctoral Programs, University of Pennsylvania, USA. Recent training/continuing education (2018 to present): Corporate Governance and Financial Technology (RCBC); Sustainability Reporting, and Customer Due Diligence and Trade-Based Money Laundering (RCBC); Best Practices to Manage ML/TF Risks from Online Sexual Exploitation of Children Coursed through Banks and MSBs, and ML/TF Typologies (ABCOMP and Baiphil); BSP Supervisory Assessment Framework to replace CAMELS and ROCA Rating Systems for BSFIs (ABCOMP and Baiphil); Building Better Bankers: Fostering a Stronger KYE Program (ABCOMP); Leveraging on FinTech: Financial Services Under the New Economy Arrangement (ABCOMP).
Company Position
Parents for Education Foundation (PAREF) Trustee PAREF Southridge School for Boys Chairman and President
PAREF Westbridge School for Boys Trustee
PAREF Northfield School for Boys Trustee
Foundation for Economic Freedom Founding Fellow/Trustee
Center for Family Advancement President
Center for Excellence in Governance Director
Institute for Corporate Directors Teaching Fellow-Corporate Governance
Asian Development Bank Technical Assistance Grant on Public Private Partnerships Program
National Consultant on Public Private Partnerships Risk Management to the National Economic Development Authority / Public Private Partnership Center

16
Laurito E. Serrano (61)/ Filipino
Independent Director (March 20, 2019 to present)
Mr. Serrano was elected as an independent director of the Bank effective March 20, 2019. Mr. Serrano was part of the Audit & Business Advisory Group and a partner of SGV & Co - Corporate Finance Consulting Group before joining companies in general finance and special project functions. He is currently in the financial advisory practice with clients mostly in the private sector and has over 30 years of experience in the management and execution of engagements involving fund raising, business/asset acquisitions, public offerings, securitization, and project development works. His past experience also includes, among others, directorships in Metro Global Holdings Group, Metro Rail Transit Group, Travellers Hotels Philippines, Inc. (Resorts World), MJCI Investments, Inc., United Paragon Mining Corp., Sagittarius Mining Corporation, APC Group, Inc., and Philippine Veterans Bank. Mr. Serrano holds a Bachelor of Science degree in Commerce (Major in Accounting) from the Polytechnic University of the Philippines and has a Masters in Business Administration degree from the Harvard Graduate School of Business. Recent training/continuing education (2018 to present): Corporate Governance Orientation Program (Institute of Corporate Directors); Best Practices to Manage ML/TF Risks from Online Sexual Exploitation of Children Coursed through Banks and MSBs, and ML/TF Typologies (ARCCO-Phil.); BSP Supervisory Assessment Framework to replace CAMELS and ROCA Rating Systems for BSFIs (ABCOMP and Baiphil); Crypto Assets for Corporates (Center for Global Best Practices); Revised Corporation Code of the Philippines (Center for Global Best Practices); Building Better Bankers: Fostering a Stronger KYE Program (ABCOMP); Leveraging on FinTech: Financial Services Under the New Economy Arrangement (ABCOMP) Company Position
Anglo Philippine Holdings Inc Independent Director
2GO Group Inc. Independent Director Pacific Online Systems Corporation Independent Director
Axelum Resources Corp. Independent Director
MRT Development Corporation Director
Atty. Adelita A. Vergel De Dios
(75)/ Filipino
Independent Director (June 27, 2016 to present)
Atty. Vergel De Dios has been an Independent Director of the Bank since June 2016. She was also an Independent Director of RCBC Savings Bank before the merger of the same into RCBC. She served as Commissioner of the Insurance Commission and held directorship and officership positions in various companies. She obtained her Bachelor of Business Administration and Accounting and Bachelor of Laws (Magna Cum Laude) from the University of the East. She is a Certified Public Accountant and a Member of the Integrated Bar of the Philippines. Recent training/continuing education (2018 to present): Sustainability, and Customer Due Diligence and Trade-Based Money Laundering (RCBC); Best Practices to Manage ML/TF Risks from Online Sexual Exploitation of Children Coursed through Banks and MSBs, and ML/TF Typologies (ABCOMP and Baiphil); BSP Supervisory Assessment Framework to replace CAMELS and ROCA Rating Systems for BSFIs (ABCOMP and Baiphil); Investment, Trust and Estate Management (Wealth Management Center for Communication and Research, Inc.); Building Better Bankers: Fostering a Stronger KYE Program (ABCOMP); Leveraging on FinTech: Financial Services Under the New Economy Arrangement (ABCOMP).
Company Position
none none

17
Please see the Annual Report Accompanying the Information Statement (Annex A) for reports on attendance, performance appraisal, and compensation of directors.
(d) Executive Officers:
Senior Executive Vice Presidents BANCOD, Redentor C. Group Head
Chief of Staff
Office of the Group Head – ITSSG & Operations Office of the President & Chief Executive Officer
CEBRERO, Horacio III E. Treasurer/Group Head (*retired effective March 4, 2022)
Office of the Group Head - Treasury
DEVERAS, John Thomas G. Head, Strategic Initiatives Group Head
Office of the President & Chief Executive Officer Office of the Group Head - Asset Management & Remedial
Executive Vice-Presidents
LIM, Richard C. Group Head Office of the Group Head- Retail Banking
NARCISO, Emmanuel T. Group Head Office of the Group Head – Global Transaction Banking
VILLANUEVA, Angelito M. Chief Innovation and Inclusion Officer/ Group Head
Office of the Group Head – Digital Enterprise & Innovation
First Senior Vice-Presidents ALVAREZ, Ma. Christina P. Group Head Office of the Group Head –
Corporate Planning
BUENO, Marita E. Group Head Office of the Group Head – Data Science & Analytics
CORONEL, Elizabeth E. Group Head Office of the Group Head –Corporate Banking
DELA CUESTA, George Gilbert G. Group Head / Corporate Secretary
Office of the Group Head – Legal Affairs and Corporate Secretariat
ESTRELLA, Brent C. Chief Compliance Officer / Group Head
Compliance Office and Office of the Group Head – Regulatory Affairs
MADONZA, Florentino M. Group Head Office of the Group Head – Controllership
MAŇAGO, Jane N. Group Head Office of the Group Head - Wealth Management
MATSUMOTO, Yasuhiro Segment Head (“retired effective April 1, 2022)
Global and Ecozone Segment
PEDROSA, Alberto N. Treasurer / Group Head (*effective March 4, 2022)
Office of the Group Head - Treasury
RAMOS, Robert Rol Richard Raymond B.
Trust Officer / Group Head
Office of the Group Head – Trust & Investments
RODRIGUEZ, Joseph Colin B. Segment Head Subsidiaries Treasury Risk Positions
SANTIAGO, Bennett Clarence D. Group Head Office of the Group Head – Credit Management
SUBIDO, Rowena F. Group Head Office of the Group Head – Human Resources
TINIO, Ma. Angela V. Group Head Small & Medium Enterprise Banking

18
Senior Vice-Presidents BILAOS, Lalaine I. Division Head (*retired
effective October 1, 2021) Local Corporate Banking Segment Division II
BOLISAY, Ma. Carmela S. Division Head (*retired effective February 1, 2022)
Office of the Division Head – Management Services
BORROMEO, Jose Maria P. Segment Head Central Funding Division
BUENAFLOR, Enrique C. Segment Head Global Transaction Banking
CANLAS, Karen K. Division Head Wealth Management Division 2
CRUZ, Antonio Manuel E. Jr. Segment Head Chinese Banking Segment 1
DE VILLA, Ramil M. Group Head
Office of the Group Head – Consumer Lending
ERMITA, Edwin, R. Bank Security Officer (*retired effective April 2, 2022)
Office of the President & Chief Executive Officer
ESTACIO, Benjamin E. Regional Service Head Mindanao Service Region
GASPAR, Bernice U. Division Head Chinese Banking Segment – Division III
MACATANGAY, Mary Grace P. Segment Head Consumer Services & Collection Segment
MENDOZA, Jose Jayson L.
Division Head Metro Manila Division
MIRAL, Gerardo G. Division Head Global & Ecozone Segment – Division II
NATIVIDAD, Maria Cecilia F. Group Head Office of the Group Head – Marketing
NOVILLA, Aline A. Chief Audit Executive / Group Head
Office of the Group Head – Internal Audit
ONG, Arniel Vincent B. President and Chief Executive Officer
RCBC Bankard Services Corporation (Seconded)
QUIOGUE, Nancy J. Regional Service Head North Metro Manila Region
RAMOS, Elsie S. Division Head Litigation / Labor Division
REYES, Ismael S. Segment Head Retail Banking – Support Segment
REYES, Steven Michael T. Segment Head (*resigned effective September 25, 2021)
Treasury Sales & Digital Service Delivery
SANTOS, Raoul V. Segment Head Investment Services Division
SARMIENTO, Jose Rene Y. Segment Head Conglomerates and Strategic Corporate Segment
SELIRIO, Libertine R. Division Head Global & Ecozone Segment – Division 1
SO, Johan C. Division Head Local Corp. Banking Segment Division 1
SORIANO, Elvira D. Segment Head BCLC Audit Segment 1
SOTO, Zenaida S. Regional Sales Director (*retired effective February 28, 2022)
Laguna 2-Bicol-MIMAROPA Regional Office
TABUENA, Cecilia E. Segment Head Local Corporate Banking Segment
TIRADO, Gianni Franco D. Regional Sales Director West Mindanao Regional Office
TOMAS, Juan Gabriel R. IV Chief Risk Officer / Group Head
Office of the Group Head – Risk Management
TORRES, Lea B. Division Head Remedial Management Division
USON, Raul Martin D. Segment Head (“retired effective April 20, 2022)
Branch Services Support Segment
VALDES, Emmanuel Mari K. Regional Sales Director Metro East Regional Office
ZAMORA, Paula Fritzie C. Segment Head Financial Institutions & Support Segment
ZANTUA, Nilo C. Chief Technology Officer Office of the Group Head - ITSSG

19
Nine of the Directors and most of the Executive Officers mentioned herein have held their positions for at least five (5) years. There are no compensation arrangements for members of the Board of Directors, other than the per diem and dividends/profit sharing provided under Article V, Section 8, and Article XI, Section 2, respectively, of the Bank’s Revised By-Laws. Key executives also receive long term bonuses earned over a 5-year period, the amount of which is tied directly to shareholder value, profitability and enterprise value.
(e) Significant Employees: There is no person other than the entire human resources as a whole, and the executive officers, who is expected to make a significant contribution to the Bank.
(f) Family Relationships: None of the Bank’s Directors are related to one another or to any
of the Bank’s executive officers.
(g) Legal Proceedings:
In the normal course of operations of the Bank, there are various outstanding commitments and contingent liabilities such as guarantees, commitments to extend credit, tax assessments, etc., which are not reflected in the accompanying financial statements. Management does not anticipate losses from these transactions that will adversely affect results of operations. In the opinion of Management, the suits and claims arising from the normal course of operations of the Bank that remain unsettled, if decided adversely, will not involve sums that would have a material effect on Bank’s financial position or operating results. HHIC-Philippines, Inc. Rehabilitation Proceedings
On January 9, 2019, HHIC-Phil, Inc. (“HHIC-Phil”) filed a Petition for corporate rehabilitation under R.A. No. 10142, the Financial Rehabilitation and Insolvency Act of 2010, which was given due course by the Regional Trial Court, Branch 72, Olongapo City (the “Rehabilitation Court”). After negotiating with HHIC-Phil/HHIC-Korea, which resulted in the creditors/Rehabilitation Court-approved Modified Rehabilitation Plan with Clarifications (“MRP-C”), the Bank and four (4) other creditor banks successfully negotiated the sale of the Subic Shipyard/certain other assets to third-party buyers, as called for by the MRP-C. And in the Order dated December 6, 2021, the Rehabilitation Court approved the Asset Purchase Agreement (“APA”) dated October 5, 2021. As of March 31, 2022, the outstanding loan obligation of HHIC-Phil to the Bank was in the amount of USD81,228,290, exclusive of accrued and compounded interest, as well as penalty on interest and principal. On April 19, 2022, this has been fully settled in accordance with the APA.
Applicability of RR 4-2011
In March 2011, the Bureau of Internal Revenue (“BIR”) issued RR 4-2011, prescribing a new way of
reporting income solely for banks/other financial institutions, and issued assessment notices to
banks/other financial institutions for deficiency income tax.
In its Order dated May 25, 2018, the Regional Trial Court of Makati (a) granted the Petition of the
Bank/other Bankers Association of the Philippines (“BAP”) member banks praying for the
nullification of RR 4-2011; and (b) permanently enjoined the enforcement of the same.
The Department of Finance/BIR filed a Petition for Review with the Supreme Court (a) claiming that
jurisdiction over the matter lies with the Court of Tax Appeals; (b) challenging the propriety of the
declaratory relief action filed by the Bank/other BAP member banks in view of the prior issuance of

20
Preliminary Assessment Notices; and (c) arguing that public hearings are not required in all
instances involving regulatory issuances. The matter remains pending to date.
Alleged Unauthorized Transfer of funds – Bank of Bangladesh In February 2016, four (4) allegedly unauthorized fund transfers were made into four (4) accounts with the Bank from Bangladesh Bank’s account with the Federal Reserve Bank of New York, before being further dispersed to other banks and casinos. In August 2016, the Monetary Board impose a P1 Billion fine upon the Bank, which it paid in full, without any effect on its ability to perform its existing obligations or its operations. U.S. Litigation relating to the Bangladesh Bank Incident Failing to prosecute the Bank under the Federal Racketeer Influence and Corrupt Organizations Act, Bangladesh Bank initiated a second complaint before the New York State Court, on May 27, 2020. The Bank has since sought the dismissal of this second case, citing (a) New York’s lack of personal jurisdiction over it; (b) the impropriety of New York as a forum, given the ongoing related proceedings in the Philippines and the location of material witnesses/evidence; and (c) the untenable nature of the fraud charge against the Bank due to the lack of any fiduciary duty to Bangladesh Bank. The Bank’s Motion to Dismiss was heard on October 14, 2021. The matter remains pending to date. Philippine Litigation relating to the Bangladesh Bank Incident On March 6, 2019, the Bank/its former National Sales Director (“NSD”) filed a complaint for Injunction and Damages against Bangladesh Bank with the Regional Trial Court of Makati City (“Makati Trial Court”). Despite being properly served with the summons/Complaint, and even after the denial of its claim of immunity from suit, Bangladesh Bank refused to submit to the jurisdiction of the Makati Trial Court. In an Order dated October 18, 2021, the Makati Trial Court denied Bangladesh Bank's Motion to Admit Attached Motion to Dismiss dated January 27, 2021, holding that its failure to file a motion for reconsideration on the July 19, 2019 Order had long resulted in the finality of the ruling that (a) court processes were properly served upon the said defendant, and (b) the Makati Trial Court had already acquired jurisdiction over Bangladesh Bank. The Makati Trial Court further directed the Bank/the former NSD to provide proof of service of their Motion to declare Bangladesh Bank in default upon its counsel, which was complied with via their Compliance with Manifestation dated November 8, 2021. The Bank/former NSD’s Motion remains pending to date. Except for the above-mentioned proceedings, the Bank is not aware of any suits and claims by or against it or its subsidiaries, which if decided adversely, would have a material effect on its financial position or operating results.
(h) Non-Involvement in Certain Legal Proceedings: To the knowledge and/or information of the Bank, the nominees for election as Directors of the Bank, its present members of the Board of Directors or its Executive Officers, are not, presently or during the last five (5) years, involved or have been involved in any legal proceeding decided adversely affecting/involving themselves, and/or their property before any court of law or administrative body in the Philippines or elsewhere. No director has resigned or declined to stand for re-election to the board of directors since the date of the annual meeting of security holders because of disagreement with the Bank on any matter relating to the Bank’s operations, policies or practices.

21
To the knowledge and/or information of the Bank, none of the following events has occurred with respect to the nominees for election as Directors of the Bank, its present members of the Board of Directors, its Executive Officers, underwriters, or control persons during the last five (5) years:
a. Any bankruptcy petition filed by or against any business of which such person was a general partner or executive officer either at the time of the bankruptcy or within two years prior to that time;
b. Any conviction by final judgment in a criminal proceeding, domestic or foreign, or being subject to a pending criminal proceeding, domestic or foreign, excluding traffic violations and other minor offenses;
c. Being subject to any order, judgment, or decree, not subsequently reversed, suspended or vacated, of any court of competent jurisdiction, domestic or foreign, permanently or temporarily enjoining, barring, suspending or otherwise limiting his involvement in any type of business, securities, commodities or banking activities; and
d. Being found by a domestic or foreign court of competent jurisdiction (in a civil action), the Commission or comparable foreign body, or a domestic or foreign Exchange or other organized trading market or self-regulatory organization, to have violated a securities or commodities law or regulation and the judgment has not been reversed, suspended, or vacated.
(i) Certain Relationships and Related Transactions:
RCBC is a 39.64% owned subsidiary of Pan Malayan Management and Investment Corporation (PMMIC), the holding company of the flagship institutions of the Yuchengco Group of Companies (YGC). As of December 31, 2021, Cathay Life Insurance Co. Ltd. (Cathay) also owns 22.18% interest in RCBC. The Bank and its subsidiaries, in the ordinary course of business, engage in transactions with entities within the YGC. The Bank adheres to the policy that transactions with related parties are conducted at arm’s length basis or above board, with any transaction, whether or not a price is charged, in connection with any such transaction being on terms no less favorable to the Bank than terms available to any unconnected third party under the same or similar circumstances. The same has been institutionalized in the Bank’s Policy on Related Party Transactions (the “Policy”). The Policy adopts an expanded definition of “related parties.” Related parties include directors, officers, stockholders and related interests (“DOSRI”) as defined under the General Banking Law, BSP Circular 895, and other related issuances, as well as members of the Advisory Board of the Bank, entities within the conglomerate of which the Bank is a member, and subsidiaries of related parties. The Bank maintains a database of related parties which is regularly updated to capture organizational and structural changes within the YGC. Transactions with related parties involving an amount of at least Ten Million (P10,000,000.0) Pesos, or significant transactions with related parties requiring Board approval regardless of amount, are reportable to the RPT Board Committee. On the other hand, related party transactions involving amounts below the materiality threshold of Ten Million Pesos (P10,000,000.0) are reportable to the RPT Management Committee. Related parties, through their respective account officers, are enjoined to notify the appropriate RPT Committee of any potential related party transaction as soon as they become aware of it. The RPT Board Committee is composed of at least three members of the Board of Directors, entirely consisting of two independent directors and non-executive directors. The Chairman is an independent director. The RPT Management Committee is composed of heads of the Controllership Group, Operations Group, Risk Management Group, Retail Banking Group, and Corporate Planning Group, or their selected designates.

22
If a transaction is determined to be a related party transaction, the said transaction and all its relevant details are required to be submitted to the appropriate RPT Committee for evaluation. Once determined to be on arm’s length terms, related party transactions evaluated by the RPT Board Committee are thereafter endorsed to the Board of Directors for approval. Transactions reviewed and approved by the RPT Management Committee are presented to the Board of Directors for confirmation. In the event that a member of the Board has an interest in the transaction under evaluation, the said member shall not participate in the discussion and shall abstain from voting on the approval of the related party transaction. Pursuant to BSP Circular No. 895, as amended, and the Bank’s Corporate Governance Manual, the Bank’s significant transactions with its DOSRI and related parties were confirmed by majority vote of the Bank’s stockholders during the last annual stockholders’ meeting on June 28, 2021. The review of related party transactions is part of the compliance testing of the Compliance Office as well as audit work program of the Internal Audit Group. The Group’s significant transactions with its related parties as of end December 2021 include loans and receivables and deposit liabilities. The total amount of loans outstanding was at P19.4 Billion (Note 28.1, Notes to Financial Statements) while total deposit liabilities was at P9.2 Billion (Note 28.2, Note to Financial Statements) as of December 31, 2021. The Bank complies with existing BSP regulations on loans, credit accommodations and guarantees to its DOSRI. In the ordinary course of business, the Group has loan transactions with each other, their other affiliates, and with certain DOSRIs. Under existing policies of the Group, these loans are made substantially on the same terms as loans to other non-related individuals and business of comparable risks. Under current BSP regulations, the amount of loans to each DOSRI, 70% of which must be secured, should not exceed the amount of his unencumbered deposit and book value of his investment in the Bank. In the aggregate, loans to DOSRIs, generally, should not exceed the total capital funds or 15% of the total loan portfolio of the Bank and/or any of its lending and non-banking financial subsidiaries, whichever is lower. However, non-risk loans are excluded in both individual and aggregate ceiling computations. As of December 31, 2021 and 2020, the Group and the Parent Company are in compliance with these requirements The total amount of Parent Company DOSRI loans was at P304 Million by end of December 2021 and at P920 Million as of end December 2020. Some of the Bank’s major related party transactions are described below.
Sale and Purchase of Securities - The Parent Company and certain subsidiaries engage in the trading of investment securities as counterparties to the transaction. These transactions are priced similar to transactions with other counterparties outside the Group and there are no unsettled transactions as of the end of each reporting period. (Note 28.3, Notes to Financial Statements)
Retirement Fund - The Parent Company and certain subsidiaries’ retirement funds covered under their defined benefit post-employment plan maintained for qualified employees are administered and managed by the Parent Company’s Trust Department in accordance with the respective trust agreements covering the plan. (Note 28.4, Notes to Financial Statements)
Transactions with subsidiaries which are eliminated in the consolidated financial statements are as follows:

23
Lease contracts with RCBC Rentals Corp. (RRC) and Sub-lease Agreements with Subsidiaries. The Parent Company and certain subsidiaries occupy several floors of RCBC Plaza as leaseholders of RRC. The occupancy of some of subsidiaries in RCBC Plaza is covered by sublease agreements with RCBC. RCBC’s lease contract with RRC is effective until December 31, 2025 [Note 28.5(a), Notes to Financial Statements]
Service Agreement with RCBC Bankard Services Corporation (RBSC). The Parent Company has Service Agreement with RBSC, wherein RBSC shall provide the Parent Company with marketing, distribution, technical, collection and selling assistance and processing services in connection with the operation of the Parent Company’s credit card business. [Note 28.5(b), Notes to Financial Statements]
The Bank has service agreements with RBSC for the in-sourced internal audit services. The Bank provides limited audit services to RBSC, specifically IT audit, operations audit and financial statements review. Also, the Bank has formalized the service agreements for the internal audit services being provided to subsidiaries namely: RCBC Capital Corp., RCBC Securities, Inc., RCBC Forex Brokers Corp., Merchant Savings and Loan Association, Inc. (Rizal Microbank), RCBC Leasing and Finance Corporation and Niyog Property Holdings, Inc.
The Bank has a service agreement with RCBC Forex Brokers Corporation (RCBC Forex) for in-sourced services, rendered by the following business units: 1) business and operational risk, 2) compliance, 3) internal audit, 4) information technology, and 5) human resources. The services shall be limited to: compliance with relevant laws, rules and regulations, market, liquidity, and operational risk management, internal audit, information technology, review of salary and processing of payroll on a bi-monthly basis, and implementation of exclusive succession planning, human resources information system and database administration and organization of training programs.
The Bank has a service agreement with RCBC Forex for the referral of money service business customers to RCBC Forex, to facilitate the purchase and/or sale of foreign currencies. The services to be rendered are relative to account opening and compliance with customer identification regulatory requirements.
The Bank has a service agreement with RCBC International Finance Limited (RIFL) to facilitate the remittance tie-up and account solicitation arrangement agreement with RIFL which is based in Hongkong.
The Bank has an agreement with RCBC Rentals Corp. (RRC) for the financing of the lease of 1,600 new ATMs with a term of 60 months.
The Bank’s other transactions with affiliates include service agreements, leasing office premises to subsidiaries which is eliminated during consolidation, accreditation of RCBC Trust agent and of insurance companies, and regular banking transactions (including purchases and sales of trading account securities, securing insurance coverage on loans and property risks and intercompany advances), all of which are at arms’ length and conducted in the ordinary course of business. The Bank does not have any transactions with promoters within the past five (5) years. The Bank does not have transactions with parties that fall outside the definition of related parties under regulations, but with whom the registrants or its related parties have a relationship that enables the parties to negotiate terms of material transactions that may not be available from other, more clearly independent parties on an arm’s length basis. The foregoing information is correlated with the information in Note 28 of the Audited Financial Statements annexed to this Information Statement (please see Notes to Financial Statements, Annex “B-1").

24
6. Compensation of Directors and Executive Officers
Executive Compensation:
Information as to the aggregate compensation paid or accrued during the last three fiscal years of the Bank’s Directors, Chief Executive Officer and four other most highly compensated executive officers and all other officers as a group is presented below (in thousand pesos):
RIZAL COMMERCIAL BANKING CORPORATION AND SUBSIDIARIES
Names Principal Position Aggregate
Compensation (net of Bonuses)
Bonuses
2022 Estimate
Eugene S. Acevedo President & Chief Executive Officer 97,178 44,933
Redentor C. Bancod Senior Executive Vice President
Horacio E. Cebrero III Senior Executive Vice President
John Thomas G. Deveras Senior Executive Vice President
Angelito M. Villanueva Executive Vice President
2021 Actual
Eugene S. Acevedo President & Chief Executive Officer 92,550 39,072
Redentor C. Bancod Senior Executive Vice President
Horacio E. Cebrero III Senior Executive Vice President
John Thomas G. Deveras Senior Executive Vice President
Angelito M. Villanueva Executive Vice President
2020 Actual
Eugene S. Acevedo President & Chief Executive Officer 89,276 39,699
Redentor C. Bancod Senior Executive Vice President
Horacio E. Cebrero III Senior Executive Vice President
John Thomas G. Deveras Senior Executive Vice President
Emmanuel T. Narciso Executive Vice President
Officers as a Group Unnamed
2022 Estimate 3,939,697 1,051,467
2021 Actual 3,517,587 938,810
2020 Actual 4,253,136 1.027,609
All Directors (Fees and Other Compensation)*
2022 Estimate 92,062
2021 Actual 69,688
2020 Actual 59,941
* Inclusive of per diem of Directors amounting to P12.9 Million in 2020, P13.1 Million in 2021 and P13.1 Million in 2022 (estimate).
Profit Sharing Bonus and Per Diem of Directors
Pursuant to Article V of the By-Laws of the Bank, the members of the Board of Directors, the Advisory Board and the Executive Committee are entitled to per diem for every meeting they attended. Directors who hold executive or management position do not receive directors’ fees or per diems. Likewise, Article XI of the By-Laws the Bank entitles the members of the Board of Directors, the Advisory Board and the Executive Committee of the Bank to profit sharing bonus at a maximum of 2% but not less than 1% of the net earnings resulting from the operation of the Bank during the preceding year, after provisions for taxes and after deductions as may be required by law or

25
regulations. For the year 2021, total fees and other compensation of all Directors amounted to P69.7 Million, inclusive of P13.1 Million representing per diem paid for the meetings they attended during the year. For the protection of its directors from threats against the security of their persons, property, and private data, the Bank presents above the aggregate compensation of the members of the Board of Directors and Advisory Board for 2021, inclusive of bonuses received in accordance with the By-Laws. A report on the total compensation per director shall be presented to the stockholders during the Annual Stockholders’ Meeting of the Bank on June 27, 2022, and a similar report will be directly submitted to the SEC. The above-named executive officers and directors, and all officers and directors as a group, do not hold equity warrants or options as the Bank does not have any outstanding equity warrants or options. 7. Independent Public Accounts Punongbayan and Araullo (P&A) acts as the independent auditor of RCBC, RCBC Forex Brokers Corporation, and RCBC Leasing and Finance Corporation since 2006, of RCBC Capital Corporation since 2003, of Rizal Microbank, Inc.-A Thrift Bank of RCBC since 2008 and of RCBC-JPL Holding Company, Inc. since 2009. In connection with the audits of the Bank’s financial statements for the two (2) most recent years ended December 31, 2021 and 2020, there were no disagreements with P&A on any matter of accounting principles or practices, financial statement disclosures, audit scope or procedure. P&A has been the independent external auditor of the Bank beginning with the audited financial statements (AFS) for the year ended December 31, 2005 and they will be recommended for re-appointment at the scheduled annual stockholders’ meeting. For the period 2005-2009 Mr. Leonardo Cuaresma, Jr. was the handling/signing partner of the Bank. Mr. Cuaresma, Jr. was replaced by Mr. Romualdo V. Murcia III as the handling/signing partner in 2010 and 2011. Mr. Murcia was replaced by Mr. Benjamin P. Valdez in 2012 and 2013. For the years 2014 to 2017, Ms. Maria Isabel E. Comedia was the handling/signing partner of the Bank which was further replaced by Mr. Anthony L. Ng for the year 2018. Representatives of P&A are expected to be present at the stockholders’ meeting and will have the opportunity to make a statement if they desire to do so and will be available to answer appropriate questions. The Bank is in compliance with the SRC Rule 68 (3)(b)(iv). 8. Compensation Plans – Not Applicable C. ISSUANCE AND EXCHANGE OF SECURITIES 9. Authorization or Issuance of Securities Other than for Exchange – Not applicable 10. Modification or Exchange of Securities – Not applicable

26
11. Financial and Other Information
a. Financial statements meeting the requirements of SRC Rule 68, as amended Please see Annex “B” (includes Supplementary Schedules required by SRC Rule 68- Please see Annex “B-1”), Also attached, as Annex “B-2” are the Interim Financial Statements for the First Quarter 2022 (17-Q),
b. Management’s Discussion and Analysis (MD & A) or Plan of Operation Please see Annex “A”
c. Changes in and Disagreements with Accountants on Accounting and Financial Disclosures - None.
d. A statement as to whether or not representatives of the principal accountants for the current year and for the most recently completed fiscal year: Representatives of Punongbayan & Araullo are expected to be present at the stockholders’ meeting and will have the opportunity to make a statement if they desire to do so and will be available to answer appropriate questions.
12. Acquisition or Disposition of Property – Please see Notes 13 and 14 of the attached
Audited Financial Statements in Annex B 13. Restatement of Accounts – Please see Note 2 of the attached Audited Financial
Statements in Annex B
D. OTHER MATTERS 15. Action with Respect to Reports
The Management Report, as set forth in the Annual Report, and the Minutes of the previous stockholders’ regular meeting held on June 28, 2021 will be submitted for stockholders’ approval. Approval of the Annual Report constitutes a ratification of the Bank’s performance during the previous fiscal years as contained in the Annual Report. Approval of the June 28, 2021 Minutes constitutes a ratification of the accuracy and faithfulness of the Minutes to the events that transpired during said meeting, such as: (a) 2020 annual report and audited financial statements, (b) ratification of actions and proceedings of the Board of Directors, different Committees and Management during the year 2020, (d) confirmation of significant transactions with DOSRI and related parties, (e) election of directors, and (f) appointment of external auditor. A copy of the Minutes for the foregoing meeting is attached as Annex E. The corporate acts of the Board of Directors, different Committees and Management that are subject to ratification are those made from the date of the last annual stockholders’ meeting (June 28, 2021) up to the date of the meeting (June 27, 2022). These include, among others, those that involve day-to-day operations, administration and management of the corporate affairs such as approval of loans, write-offs, restructuring of past due accounts, sale of ROPOAs, appointment/resignation of directors/officers, authorization of officers, sanctions/disciplinary measures imposed to erring officers/employees, and authority to file or handle criminal/civil complaints.
16. Matters Not Required to be Submitted – Not applicable

27
17. Amendment of Charter, By-Laws or Other Documents – Among the matters in the Agenda for the June 27, 2022 Annual Stockholders’ Meeting is the amendment of the Articles of Incorporation of the Bank. The following are the proposed amendments to the Articles of Incorporation: a. Amendment to Article Fourth
The proposed amendment to Article Fourth of the Bank’s Articles of Incorporation, as approved by the Board of Directors at its meeting on April 25, 2022, will be presented to the stockholders for approval, to reflect that the Bank shall have perpetual corporate existence in accordance with the Revised Corporation Code. Upon approval by the stockholders, Article Fourth of the Amended Articles of Incorporation of the Bank shall read as follows:
“FOURTH - The Corporation shall have perpetual corporate existence.”
b. Amendment to Article Seventh
The proposed amendment to Article Seventh of the Bank’s Articles of Incorporation, as approved by the Board of Directors at its meeting on April 25, 2022, will be presented to the stockholders for approval, to delete the nationality restriction in the ownership of the Bank’s common shares in accordance with the Republic Act No. 7721, also known as An Act Liberalizing the Entry and Scope of Operations of Foreign Banks in the Philippines, as amended by Republic Act No. 10641, which allows qualified foreign nationals to own more than 40% of the voting shares of a Philippine bank. Management continuously explores various capital raising opportunities. Some of these opportunities include foreign investors. The foregoing amendment is proposed in order to accommodate any capital to be provided in the future by new/existing foreign investors into the Bank. Upon approval by the stockholders, Article Seventh of the Amended Articles of Incorporation of the Bank shall read as follows:
“SEVENTH - That the authorized capital of said Corporation is TWENTY EIGHT
BILLION PESOS (₱28,000,000,000.00) Philippine Currency, divided into the following classes of shares: 1. Two Billion Six Hundred Million (2,600,000,000) Common Shares of stock with a par
value of Ten Pesos (₱10.00) per share. (As amended on 29 January 2018)
2. Two Hundred Million (200,000,000) Preferred Shares of stock with a par value of Ten Pesos (P10.00).
Common Shares of stock are entitled to participate and vote at stockholders'
meetings or in connection with any corporate action in which the consent and approval of stockholders is required by law.
The particular features of the Preferred Shares are as follows:
x x x” With the approval of the stockholders, the Bank will seek the approval of the BSP for the foregoing amendments. Thereafter, SEC approval will likewise be obtained.


2
PROCEDURE FOR THE ANNUAL STOCKHOLDERS’ MEETING 1. Only stockholders of record at close of business on May 30, 2022 (Stockholders) will be entitled
to participate and vote at the meeting or any adjournment thereof.
2. For the safety and well-being of all the Bank's stakeholders, there will be no physical meeting on
June 27, 2022.
3. Stockholders may participate in the virtual meeting either by remote communication by
themselves or by proxy, or by casting their votes in absentia. For this purpose, Stockholders
must duly register by sending a registration email to [email protected] by 5:00 pm
of June 19, 2022. Only duly registered stockholders shall be counted for purposes of quorum.
4. REGISTRATION - The registration email should contain the following:
a. Form of participation (choose one)
(i) stockholder by remote communication (ii) proxy by remote communication (iii) vote in absentia
b. Information of the stockholder (i) name (ii) address (iii) telephone number (iv) mobile number (v) valid and active email address For corporate stockholders, please include the following information: (i) name of authorized representative (ii) mobile number of authorized representative (iii) valid and active email address of authorized representative
c. Supporting documents – Each must be in either JPEG or PDF format and must not exceed
400 KB. For individual stockholders: (i) Scanned copy of a valid government-issued ID with photo, signature and personal
details, preferably with residential address.
For corporate stockholders: (i) Scanned copy of Secretary’s Certificate attesting to the authority of the representative to
participate by remote communication for and on behalf of the Corporation (ii) Scanned copy of the authorized representative’s valid government-issued ID with photo,
signature and personal details, preferably with residential address
d. Duly accomplished Proxy Form (for those attending through proxy by remote communication). If a stockholder opts to attend through proxy by remote communication but does not indicate the name of the proxy, the stockholder shall be deemed to have appointed the Chairperson as his proxy.
e. Duly Accomplished Vote Ballot Each stockholder personally attending by remote communication or voting in absentia shall submit a duly accomplished Vote Ballot.
5. Duly registered Stockholders who signified attendance by remote communication or their identified proxies shall receive an email with a link and password for the meeting.

3
6. OPEN FORUM - Due to logistical limitations at the virtual meeting, only relevant comments and
questions on agenda items which are submitted by email to [email protected] by 5:00
pm of June 24, 2022 with subject: QUESTIONS/COMMENTS will be considered during the
open forum. The Corporate Secretary will reply, by email, to relevant comments and questions
received after the June 24, 2022 cut-off and until the end of the meeting.
7. VOTING - Votes of duly registered Stockholders can only be cast through ballots or proxies.
The ballot or proxy should be substantially in the form provided in the Definitive Information
Statement and filled in accordance with the instructions set forth therein. All ballots and proxies
should be received by the Bank together with the registration email not later than 5:00 pm of
June 19, 2022. Failure of the stockholder to send his/her votes as stated herein shall be
deemed a vote of approval for all the agenda items.
If a stockholder avails of the option to vote through ballots and also issues proxy votes with differing instructions, the ballots shall replace the proxy votes issued by the stockholder.
8. Validation of ballots and proxies will be on June 20, 2022 at 9:00 am.
9. Stockholders shall be responsible for their own internet connectivity during the virtual meeting.
10. The proceedings of the meeting will be recorded.
Should you have questions or requests for clarification on the procedure for attending the annual stockholders’ meeting through remote communication, please email them to [email protected] with subject: CLARIFICATION NEEDED.
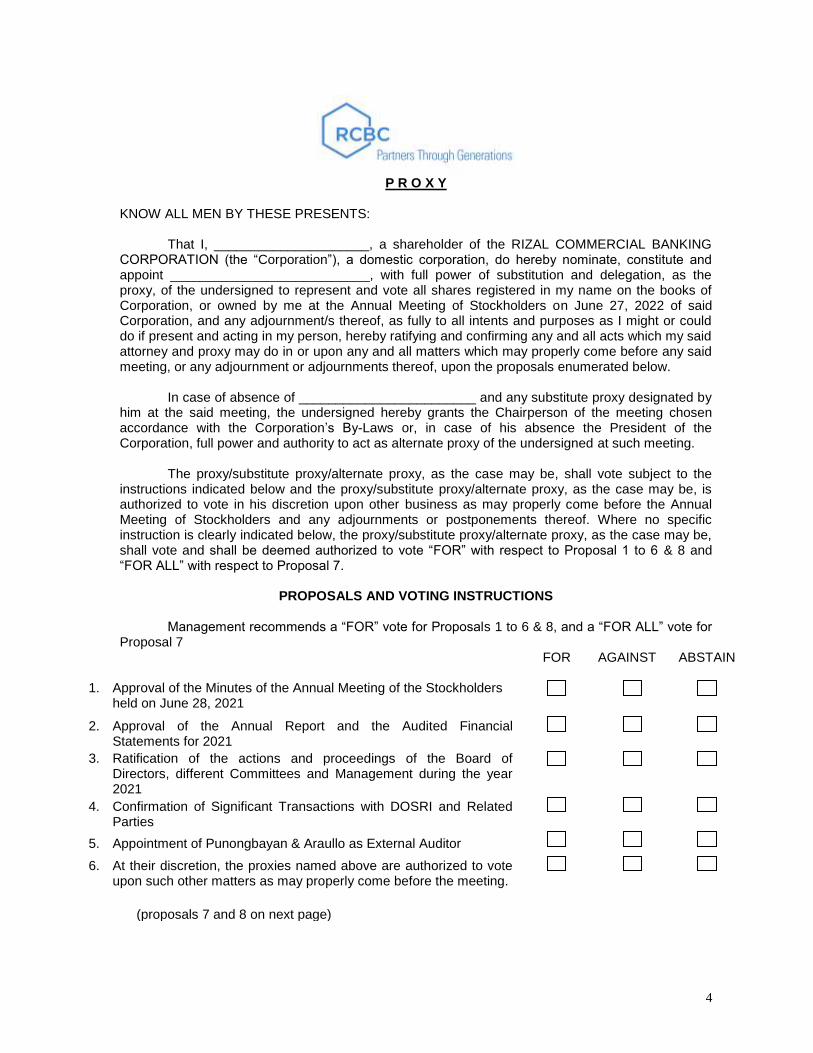
4
P R O X Y
KNOW ALL MEN BY THESE PRESENTS: That I, _____________________, a shareholder of the RIZAL COMMERCIAL BANKING CORPORATION (the “Corporation”), a domestic corporation, do hereby nominate, constitute and appoint ___________________________, with full power of substitution and delegation, as the proxy, of the undersigned to represent and vote all shares registered in my name on the books of Corporation, or owned by me at the Annual Meeting of Stockholders on June 27, 2022 of said Corporation, and any adjournment/s thereof, as fully to all intents and purposes as I might or could do if present and acting in my person, hereby ratifying and confirming any and all acts which my said attorney and proxy may do in or upon any and all matters which may properly come before any said meeting, or any adjournment or adjournments thereof, upon the proposals enumerated below. In case of absence of ________________________ and any substitute proxy designated by him at the said meeting, the undersigned hereby grants the Chairperson of the meeting chosen accordance with the Corporation’s By-Laws or, in case of his absence the President of the Corporation, full power and authority to act as alternate proxy of the undersigned at such meeting.
The proxy/substitute proxy/alternate proxy, as the case may be, shall vote subject to the instructions indicated below and the proxy/substitute proxy/alternate proxy, as the case may be, is authorized to vote in his discretion upon other business as may properly come before the Annual Meeting of Stockholders and any adjournments or postponements thereof. Where no specific instruction is clearly indicated below, the proxy/substitute proxy/alternate proxy, as the case may be, shall vote and shall be deemed authorized to vote “FOR” with respect to Proposal 1 to 6 & 8 and “FOR ALL” with respect to Proposal 7.
PROPOSALS AND VOTING INSTRUCTIONS
Management recommends a “FOR” vote for Proposals 1 to 6 & 8, and a “FOR ALL” vote for
Proposal 7
FOR AGAINST ABSTAIN
1. Approval of the Minutes of the Annual Meeting of the Stockholders held on June 28, 2021
2. Approval of the Annual Report and the Audited Financial Statements for 2021
3. Ratification of the actions and proceedings of the Board of Directors, different Committees and Management during the year 2021
4. Confirmation of Significant Transactions with DOSRI and Related Parties
5. Appointment of Punongbayan & Araullo as External Auditor
6. At their discretion, the proxies named above are authorized to vote upon such other matters as may properly come before the meeting.
(proposals 7 and 8 on next page)

5
7. Election of Directors 15 Directors (10 Regular Directors and 5 Independent Directors)
REGULAR DIRECTORS a. Ms. Helen Y. Dee b. Mr. Cesar E.A. Virata c. Mr. Eugene S. Acevedo d. Mr. Gil A. Buenaventura e. Mr. Armando M. Medina f. Mr. John Law g. Mr. Shih-Chiao (Joe) Lin h. Mr. Arnold Kai Yuen Kan i. Atty. Lilia B. De Lima j. Ms. Gayatri Bery
INDEPENDENT DIRECTORS k. Mr. Juan B. Santos l. Atty. Adelita A. Vergel De Dios m. Mr. Gabriel S. Claudio
n. Mr. Vaughn F. Montes
o. Mr. Laurito E. Serrano
For All Withhold For All Exceptions (please state) __________________________
__________________________ __________________________
The stockholder may withhold authority to vote for any or some nominee(s), by marking the
exception box and writing the name(s) of such nominee(s) on the space provided above. If the stockholder designates exception(s), the number of shares to be distributed to each of the remaining nominees must be indicated on the spaces provided above.
The stockholder can either (a) vote for all of the nominees, in which case the stockholder’s
total votes will be split and cast equally among the nominee(s); (b) withhold his vote for all of the nominees; or (c) vote only for some and not all of the nominees, in which case the stockholder’s total votes will be distributed and cast as indicated by the stockholder in the spaces provided above. If the stockholder does not indicate the number of shares to be distributed among the remaining nominees who are not named on the spaces for exceptions above, then the stockholder’s total votes will be split and cast equally among the remaining nominees. The total number of votes which a stockholder may cast is equal to fifteen (15) times the number of shares of common stock and voting preferred stock held as of the Record Date.
FOR AGAINST ABSTAIN
8. Amendment of the Articles of Incorporation
This proxy shall be valid for the Annual Meeting of Stockholders of the Corporation on June
27, 2022 unless sooner withdrawn by me through notice in writing delivered to the Corporate Secretary. In case I shall be present at the meeting, this proxy stands revoked. IN WITNESS WHEREOF, I, the undersigned shareholder, have executed this proxy at ____________________ this _______day of __________________ 2022.
________________________________ (Signature Over Printed Name) □ Stockholder
□ Authorized Representative of Stockholder
**PLEASE SEE NEXT PAGE** Date: _______________, 2022

6
OTHER INFORMATION AND INSTRUCTIONS FOR THE PROXY FORM
1. Submission of Proxy
(a) The proxy form must be duly completed, signed and dated by the stockholder or his duly authorized representative, and received by email via [email protected] together with the stockholder’s registration mail by 5:00 pm of June 19, 2022. If the name of the proxy is not specified, the stockholder shall be deemed as having appointed the Chairperson as proxy.
(b) If the proxy is given by one or more joint owners of shares of stock of the Company, the proxy form must be signed by all of the joint owners.
(c) If the shares of stock of the Company are owned in an “and/or” capacity, the proxy form must be signed by either one of the registered owners.
(d) If the proxy is given by a holder of shares of stock of the Company that is a corporation, association, partnership or unincorporated entity, the proxy form must be accompanied by a certification signed by a duly authorized officer, partner or representative of such corporation, association, partnership or unincorporated entity, to the effect that the person signing the proxy form has been authorized by the governing body or has the power pursuant to the By-Laws, constitutive documents or duly approved policies of such corporation, association, partnership or unincorporated entity, for such purpose.
(e) A proxy given by a broker or dealer in respect of shares of stock of the Company carried by such broker or dealer for the account of a customer must be supported by a sworn certification that the same is given with the express prior authorization of such customer.
(f) If any customer of a broker or dealer who is the beneficial owner of shares of stock of the Company executes a sub-proxy, the broker or dealer shall certify that the signature on the sub-proxy is the true and genuine signature of its customer.
2. Revocation of Proxy
A holder of shares of stock of the Company who has given a proxy has the power to revoke
it by written instrument duly signed and dated, which must be received by email via [email protected] not later than 5:00 pm of June 24, 2022. A proxy is also considered suspended if an individual stockholder signifies by email to [email protected] on or before 5:00 pm of June 19, 2022 that he is attending the meeting by remote communication.
3. Validation of Proxy
The validation of proxies will be held on June 20, 2022 at 9:00 am at the Office of the
Corporate Secretary. Validation of proxies will be done by the Corporate Secretary and persons designated by the Corporate Secretary who shall be under his supervision and control, in accordance with the procedure and guidelines set out in the Company’s By-Laws and Section 11(b) of the SRC Rule 20.

7
VOTE BALLOT
___ Attending by remote communication ___ Voting in absentia
PROPOSALS AND VOTING INSTRUCTIONS
Management recommends a “FOR” vote for Proposals 1 to 6 & 8, and a “FOR ALL” vote for Proposal 7. (Item 8 is on the next page)
FOR AGAINST ABSTAIN
1. Approval of the Minutes of the Annual Meeting of the Stockholders held on June 28, 2021
2. Approval of the Annual Report and the Audited Financial Statements for 2021
3. Ratification of the actions and proceedings of the Board of Directors, different Committees and Management during the year 2021
4. Confirmation of Significant Transactions with DOSRI and Related Parties
5. Appointment of Punongbayan & Araullo as External Auditor
6. At their discretion, the proxies named above are authorized to vote upon such other matters as may properly come before the meeting.
7. Election of Directors 15 Directors (10 Regular Directors and 5 Independent Directors)
REGULAR DIRECTORS a. Ms. Helen Y. Dee b. Mr. Cesar E.A. Virata c. Mr. Eugene S. Acevedo d. Mr. Gil A. Buenaventura e. Mr. Armando M. Medina f. Mr. John Law g. Mr. Shih-Chiao (Joe) Lin h. Mr. Arnold Kai Yuen Kan i. Atty. Lilia B. De Lima j. Ms. Gayatri Bery
INDEPENDENT DIRECTORS k. Mr. Juan B. Santos l. Atty. Adelita A. Vergel De Dios m. Mr. Gabriel S. Claudio
n. Mr. Vaughn F. Montes
o. Mr. Laurito E. Serrano
For All Withhold For All Exceptions (please state)
__________________________ __________________________ __________________________ The stockholder may withhold authority to vote for any or some nominee(s), by marking the
exception box and writing the name(s) of such nominee(s) on the space provided above. If the stockholder designates exception(s), the number of shares to be distributed to each of the remaining nominees must be indicated on the spaces provided above.

8
The stockholder can either (a) vote for all of the nominees, in which case the stockholder’s total votes will be split and cast equally among the nominee(s); (b) withhold his vote for all of the nominees; or (c) vote only for some and not all of the nominees, in which case the stockholder’s total votes will be distributed and cast as indicated by the stockholder in the spaces provided above. If the stockholder does not indicate the number of shares to be distributed among the remaining nominees who are not named on the spaces for exceptions above, then the stockholder’s total votes will be split and cast equally among the remaining nominees. The total number of votes which a stockholder may cast is equal to fifteen (15) times the number of shares of common stock and voting preferred stock held as of the Record Date.
FOR AGAINST ABSTAIN
8. Amendment of the Articles of Incorporation
Where no specific instruction is clearly indicated above in any, some, or all of the items, the
vote shall be deemed as a vote “FOR” with respect to Proposal 1 to 6 & 8, and “FOR ALL” with respect to Proposal 7.
IN WITNESS WHEREOF, I, the undersigned stockholder have cast the foregoing Vote Ballot at ____________________ this _______day of __________________ 2022.
__________________________ _____ (Signature Over Printed Name) □ Stockholder
□ Authorized Representative of Stockholder
Date: _______________ , 2022

9
RIZAL COMMERCIAL BANKING CORPORATION
AGENDA
ANNUAL MEETING OF THE STOCKHOLDERS
DATE : June 27, 2022 TIME : 4:00 P. M. PLACE : Virtual Meeting https://www.rcbc.com/ASM2022
1. Proof of the Due Notice of the Meeting
2. Determination of the presence of a Quorum
3. Approval of the Minutes of the Annual Meeting of the Stockholders held on June 28, 2021
4. Approval of the Annual Report and the Audited Financial Statements for 2021
5. Ratification of the actions and proceedings of the Board of Directors, different Committees and Management during the year 2021
6. Confirmation of significant transactions with DOSRI and related parties
7. Election of Directors
8. Appointment of External Auditor
9. Amendment of the Articles of Incorporation
10. Other Matters
11. Open Forum
12. Adjournment

10
RATIONALE / EXPLANATION FOR AGENDA ITEMS REQUIRING SHAREHOLDERS’ APPROVAL
1. Proof of Due Notice of the Meeting
Rationale/ Explanation:
Only stockholders of record as of May 30, 2022 shall be entitled to notice and vote at the meeting. The notice of the meeting, which shall contain, in addition to the date, hour and link to the virtual meeting, a statement of the matters to be taken up at such meeting, shall be published for 2 consecutive days in 2 newspapers of general circulation in both print and online formats in accordance with the rules of the Securities and Exchange Commission. The Corporate Secretary shall confirm that due notice of the meeting was made.
2. Determination of the presence of a Quorum
Rationale/ Explanation:
Quorum shall consist of stockholders owning the majority of the subscribed capital stock represented in person or by proxy, or with votes cast in absentia who duly registered through [email protected] as of June 19, 2022. On the basis of such registration, the Corporate Secretary shall declare whether or not a quorum exists for the Annual Stockholders Meeting. Stockholders who cast their votes in absentia shall be deemed present for purposes of quorum.
3. Approval of the Minutes of the Annual Meeting of the Stockholders held on June 28,
2021
Rationale/ Explanation:
Approval of the June 28, 2021 Minutes of the Annual Meeting of the Stockholders constitutes a ratification of the accuracy and faithfulness of the Minutes to the events that transpired during said meeting, including, (a) approval of the Minutes of the 2020 meeting, (b) 2020 annual report and audited financial statements, (c) ratification of actions and proceedings of the Board of Directors, different Committees and Management during the year 2020, (d) confirmation of significant transactions with DOSRI and related parties, (e) election of directors, and (f) appointment of external auditor. The said Minutes is available on the Bank’s website and attached to the Information Statement.
A vote representing majority of stockholders represented and eligible to vote during the meeting is required to pass a resolution on this matter.
4. Approval of the Annual Report and the Audited Financial Statements for 2021
Rationale/ Explanation:
Approval of the Annual Report constitutes a ratification of the Bank’s performance during the previous fiscal years as contained in the Annual Report. The Annual Report will contain the results of the operation of the Company during the year 2021. The financial statements as of December 31, 2021 will also be presented and endorsed for approval by the Board of Directors and the Audit Committee. The Audited Financial Statements for 2021 will be attached to the Definitive Information Statement and is incorporated in the Bank’s SEC 17-A (Annual Report) submitted to the Securities and Exchange Commission (SEC) and available on the Bank’s website.
A vote representing majority of stockholders represented and eligible to vote during the meeting is required to pass a resolution on this matter.

11
5. Ratification of the actions and proceedings of the Board of Directors, different Committees and Management during the year 2021
Rationale/ Explanation:
The corporate acts of the Board of Directors, different Committees and Management that are subject to ratification are those made from the date of the last annual stockholders’ meeting (June 28, 2021) up to the date of the meeting (June 27, 2022). These include, among others, those that involve the day-to-day operation, administration and management of the corporate affairs such as approval of loans, restructuring of past due accounts, sale of ROPOAs, appointment/ resignation of directors/ officers, sanctions/disciplinary measures imposed to erring officers/ employees, authority to file criminal/civil complaints, and related matters.
A vote representing majority of stockholders represented and eligible to vote during the meeting is required to pass a resolution on this matter.
6. Confirmation of Significant Transactions with DOSRI and Related Parties
Rationale/ Explanation:
Significant transactions with DOSRI and related parties for the year 2021 include: loans/receivables and deposit liabilities; trading of investment securities; lease contracts with RCBC Rentals Corporation and sub-lease agreements with subsidiaries for occupancy in the RCBC Plaza; various service agreements with RCBC Bankard Serivces Corporation, RCBC Forex Brokers Corporation, RCBC Capital Corporation, RCBC Securities, Inc., Rizal Microbank – A Thrift Bank of RCBC, RCBC Leasing and Finance Corporation, Niyog Property Holdings, Inc., and RCBC International Finance Limited; agreement with RCBC Rentals Corporation for the financing of 1,600 new ATMs; and the administration and management of some of the subsidiaries’ retirement funds. The Bank’s other transactions with affiliates include service agreements, leasing office premises to subsidiaries, accreditation of RCBC Trust agent and of insurance companies, and regular banking transactions (including purchases and sales of trading account securities, securing insurance coverage on loans and property risks and intercompany advances). Details of said related party transactions are disclosed in the Bank’s SEC 17-A Report which is also available on the Bank’s website. These are also provided in the Annual Report accompanying the Definitive Information Statement, Annex A.
In accordance with BSP Circular No. 895 dated December 14, 2015, which requires the Bank’s stockholders to confirm by majority vote, the Bank’s significant transactions with DOSRI and related parties, the above-mentioned significant transactions are presented to the stockholders for confirmation.
7. Election of Directors
Rationale/ Explanation:
The By-Laws of the Bank allows all shareholders, including minority stockholders, the right to nominate candidates for the Board of Directors. Nominees for election as members of the Board of Directors of RCBC, including nominees for election as independent Directors, as well as their profiles are provided in the Definitive Information Statement.
A vote representing majority of stocks represented and eligible to vote during the meeting is required to pass a resolution on this matter.

12
8. Appointment of External Auditor
Rationale/ Explanation:
The Audit and Compliance Committee will screen and endorse to the stockholders the appointment of a selected qualified SEC-accredited auditing firm as external auditor of RCBC for the year 2022, including their proposed remuneration. The profile of the external auditor is provided in the Definitive Information Statement.
A vote representing majority of stocks represented and eligible to vote during the meeting is required to pass a resolution on this matter.
9. Approval of the Amendment of the Articles of Incorporation
Rationale/ Explanation:
The Board of Directors will endorse to the stockholders the amendment of the Articles of Incorporation, particularly Articles Fourth and Seventh. Article Fourth, as amended, will provide for the perpetual corporate existence of the Bank in accordance with Section 11 of the Revised Corporation Code. Article Seventh will be amended to delete the nationality restriction in the ownership of the Bank’s common shares in accordance with the Republic Act No. 7721, also known as An Act Liberalizing the Entry and Scope of Operations of Foreign Banks in the Philippines, as amended by Republic Act No. 10641, which allows qualified foreign nationals to own more than 40% of the voting shares of a Philippine bank. Management continuously explores various capital raising opportunities. Some of these opportunities include foreign investors. The amendment is proposed in order to accommodate any capital to be provided in the future by new/existing foreign investors into the Bank.
Pursuant to Section 15 of the Revised Corporation Code, a vote representing 2/3 of the outstanding capital stock is required to pass a resolution on this matter.
10. Other Matters
Rationale/ Explanation:
Other matters that may have arisen after the Notice of Meeting and Agenda have been sent out, or those raised throughout the meeting may be presented to the stockholders for consideration. Stockholders may also propose to consider such other relevant matters or issues.
11. Open Forum
Rationale/ Explanation:
Due to logistical limitations at the virtual meeting, only relevant comments and questions on agenda items which are submitted by email to [email protected] with subject: QUESTIONS/COMMENTS by 5:00 pm of June 24, 2022 will be considered during the open forum. The Corporate Secretary will reply, by email, to relevant comments and questions received after the June 24, 2022 cut-off and until the end of the meeting.
12. Adjournment

ANNUAL REPORT ACCOMPANYING INFORMATION STATEMENT REQUIRED UNDER SRC RULE 17.1 (b) (A) Audited Consolidated Financial Statements The Audited Financial Statements of the Bank as of December 31, 2021 are contained in the latest annual report sent to security holders at the Annual Stockholders‘ meeting on June 27, 2022. They are also attached to the Information Statement. (B) Management Discussion and Analysis of Financial Conditions and Results of
Operations (2019-2021) and Plan of Operation 2019
Rising trade barriers especially between US and China, and associated uncertainties weighed on business sentiment and economic activity globally. Global growth in 2019 recorded its weakest pace since the global financial crisis a decade ago. However, despite external challenges, Philippine economy in 2019 continued to be resilient and remained as one of Asia‘s strong performers, managing to grow 5.9%, albeit moderated vs. 6.2% in the previous year, and the slowest rate of expansion in eight years. Philippines‘ economic performance in 2019 still showed that the country‘s strong macroeconomic fundamentals with robust domestic demand, strong-performing services sector, generally-stable inflation environment, and sound reform measures successfully lent solid support towards sustaining a momentum of growth amid dimmer global market conditions. Budget delay a major factor that slowed down 2019 economic growth While the growth of exports of goods and services decelerated due to weaker external demand brought by US-China trade war, much of the slowdown was driven by government underspending. After growing at a faster pace in the previous years with the government‘s commitment to ramp up spending, especially to improve infrastructure (through the Build, Build, Build program), both government spending and public construction slowed dramatically in early-2019 as a result of the delay in the passage of 2019 national budget. Economic managers estimated that the budget delay cut 1 percentage point from 2019 real GDP growth, missing government‘s target of 6%-7%. Alongside the budget delay, the 45-day election ban on public works also contributed to the slowdown in state spending. However, full-year government expenditures managed to grow +11% year-on-year to Php3.8 trillion, Php28.0 million (or 1%) above full-year target, as the government came up with its catch-up plan to break away from the underspending seen in early-2019. The catch-up performance in late-2019 led to the widest yearly fiscal deficit of -Php660 billion (3.6% of GDP), exceeding the –Php620 billion (3.2% of GDP) full-year deficit target. Meanwhile, government revenue growth managed to improve with the ongoing impact of the Tax Reform for Acceleration and Inclusion (TRAIN) law, or the government‘s tax reform package that included predetermined rate increases for certain excise taxes (on fuel, tobacco, sweetened beverages, etc.) while reducing individual income tax rates. Easing inflationary pressures supported monetary easing in 2019 Inflation averaged 2.5% in 2019, well-placed within government‘s 2%-4% inflation target, and slower vs. decade-high 5.2% in 2018. Price pressures have eased since inflation peaked at 6.7% in October 2018, bottoming out at 0.8% in October 2019 primarily driven by high base effects, lower global oil prices, lower food prices, and stronger peso exchange rate. Prices of rice, which

2
make up nearly about 10% of the inflation basket, fell about 10% lower vs. in 2018 due to liberalization of rice imports implemented in 2019. Benign inflation allowed the BSP to ease monetary policy, after raising policy rates by 175 basis points (bps) in 2018. BSP cut policy rates by a total of 75 bps and reduced banks‘ reserve requirement ratio (RRR) by a total of 400 basis points in 2019. Local long-term interest rates (PHP BVAL yields) bottomed-out by mid-August 2019, ending the year at about 350-400 bps below decade-highs recorded in 2018. Philippine economy remained adequately cushioned against external headwinds Philippines‘ dollar reserves hit new record-highs as of end-2019 to US$87 billion, enough to cover 7.5 months‘ worth of imports, providing sufficient buffer against external shocks. Structural dollar inflows from overseas workers (OFWs), business process outsourcing (BPO), offshore gaming operations (POGOs), and tourism continued to support liquidity. Sustained inflows of foreign direct investments (FDI), which are still among record-highs despite being dampened by investor sentiment, along with the structural sources of dollar inflows, also support the country‘s strong macroeconomic fundamentals. The Philippines‘ strong macroeconomic fundamentals resulted to S&P upgrading the country‘s credit rating by 1 notch to BBB+ (two notches above the minimum investment grade) on April 30, 2019. The country‘s external trade of goods was adversely affected by the slowing global economy. Imports fell 4.8% year-on-year that could also be due to the government underspending that reduced the importation of construction materials needed for various infrastructure projects. High base from 2018, where imports recorded 17.4% growth amid increased importation of capital goods required by the growing economy, also contributed to the year-on-year decline. Exports of Philippine-made goods proved its resilience in 2019 amid trade war as it managed to grow by 1.5%, becoming the second-best performer among East Asian economies, next to Vietnam. While Philippine exports that are part of US and China‘s supply chain were adversely affected by the trade tensions between the world‘s two largest economies, this factor could have been offset by the supply chain shift from China to ASEAN/Philippines and continuous diversification of the country‘s export markets. Lower imports, with growing exports in 2019, led to narrower trade balance–one of the factors that led to stronger peso (closing at 50.635 pesos per dollar, -3.7% vs. 2018) for the year. Financial and Operating Highlights Balance Sheet
BALANCE SHEET
In Million Pesos 2019 2018 2017
Total Assets 767,079 644,595 553,988
Investment Securities 160,719 118,449 72,932
Loans and Receivables (Net) 449,219 398,300 354,243
Total Deposits 456,581 423,399 388,412
Capital Funds 82,850 81,170 67,027
RCBC‘s Total Assets grew by 19.0% or P122.5 billion from P644.6 billion to P767.1 billion attributable to increase in BSP placements, investments securities, and loans and receivables. Due from BSP increased by 54.4% or P30.8 billion from P56.5 billion to P87.3 billion, primarily due to higher term deposit placement, this represented 11.4% of Total Resources. On the other

3
hand, Loans under reverse repurchase agreement decreased by 42.5% or P4.3 billion from P10.0 billion to P5.8 billion. Total Investment Securities, representing 21.0% of Total Resources, increased by 35.7% or P42.3 billion from P118.4 billion to P160.7 billion, attributable to 146.7% or P32.3 billion increase in Financial Assets at Fair Value through other Comprehensive Income (FVOCI) from P22.0 billion to P54.2 billion and 13.5% or P12.0 billion increase in Investment Securities at Amortized Cost from P88.9 billion to P100.9 billion. Loans and Receivables-net went up by 12.8% or P50.9 billion from P398.3 billion to P449.2 billion and represented 58.6% of Total Resources. This was primarily as a result of increase in the volume of loan releases. Bank Premises, Furniture, Fixtures & Equipment, net increased by 31.4% or P2.6 billion from P8.4 billion to P11.1 billion attributable to the recognition of right of use of asset in accordance with the Bank‘s adoption of PFRS 16, Leases. Investment Properties, net increased by 14.8% or P511.0 million from P3.6 billion to P4.1 billion mainly due to additional foreclosed properties. Also, Other Resources, net increased by 17.6% or P1.6 billion from P9.0 billion to P10.6 billion. Deposit liabilities grew by 7.8% or P33.2 billion from P423.4 billion to P456.6 billion and represented 59.5% of Total Resources. Demand deposits increased by 25.0% or P14.1 billion from P56.4 billion to P70.5 billion and accounted for 9.2% of Total Resources; Savings Deposits was recorded at P179.2 billion and accounted for 23.4% of Total Resources. Time deposits grew by 7.2% or P13.9 billion from P192.9 billion to P206.8 billion and accounted for 27.0% of Total Resources. Bills payable increased by 81.4% or P45.6 billion from P56.0 to P101.6 billion primarily attributable to increase in foreign borrowing, it represented 13.3% of Total Resources. Bonds payable also increased by 82.4% or P43.7 billion from P53.1 billion to P96.8 billion primarily as a result of the P15.0 billion ASEAN green bonds issuance, P8.0 billion ASEAN Sustainability Bond, and P15.5 billion senior notes and P7.5 billion Peso Bonds; it represented 12.6% of Total Resources. On October 2019, the Bank retired the P10.0 billion issued subordinated debt. Accrued taxes, interest and other expenses payable increased by 17.5% or P925.0 million from P5.3 billion to P6.2 billion mainly due to increase in accruals for interest. Other Liabilities also grew by 46.9% or P7.4 billion from P15.7 billion to P23.0 billion primarily due to the recognition of lease liability in accordance with the Bank‘s adoption of PFRS 16. Total liabilities grew by 21.4% or P120.8 billion to settle at P684.2 billion, it represented 89.2% of the Total Resources. Net Unrealized Gains on Financial Assets at Fair Value through Other Comprehensive Income declined by 42.5% or P661.0 million from P1.6 billion to P894.0 million mainly as a result of revaluation of investment securities. Actual Gains on Remeasurement of Net Defined Benefits also declined by 134.0% or P1.8 billion from a negative balance of P1.3 billion to a negative balance of P3.1 billion. Retained Earnings increased by 13.7% or P3.6 billion from P26.5 billion to P30.1 billion as a result of increase in net profit for the period, net of cash dividends paid and transfer to general loan loss reserve. Total Capital Funds was recorded at P82.9 billion and accounted for 10.8% of Total Resources. Finally, there are no known trends, demands, and commitments, events, or uncertainties that will have a material impact on the Bank‘s operational performance and ability to service obligations.

4
Income Statement
INCOME STATEMENT
In Million Pesos 2019 2018 2017
Interest Income 37,578 30,933 24,764
Interest Expense 15,210 10,444 6,743
Net Interest Income 22,368 20,489 18,021
Other Operating Income 13,490 6,006 7,100
Impairment Losses 7,397 1,899 2,155
Operating Expenses 21,798 19,403 17,815
Tax Expense 1,275 872 841
Net income 5,388 4,321 4,310
Attributable to:
Parent Company‘s Shareholders 5,387 4,320 4,308
Non-controlling Interests 1 1 2
Total interest income increased by 21.5% or P6.6 billion from P30.9 billion to P37.6 billion and accounted for 104.8% of total operating income. Interest income from loans and receivables went up by 20.8% or P5.6 billion from P27.0 billion to P32.6 billion and accounted for 91.0% of total operating income. The increase is mainly due to increase in average volume of Loans and Receivables and increase in average yield of loans and receivables. Interest income from investment securities also went up by 32.2% or P1.1 billion from P3.4 billion to P4.5 billion mainly due to increase in average volume and yield of investment securities, it accounted for 12.5% of total operating income. Other interest income declined by 12.0% or P59.0 million from P493.0 million to P434.0 million primarily as a result of lower BSP placements. Total interest expense grew by 45.6% or P4.8 billion from P10.4 billion to P15.2 billion and accounted 42.4% of total operating income. Interest expense on deposit liabilities increased by 37.0% from P6.3 billion to P8.6 billion, representing 24.1% of total operating income. The increase was a result of higher volume and cost of time deposits. Interest expense on bills payable and other borrowings increased by 58.7% or P2.4 billion from P4.1 billion to P6.6 billion mainly due to increase in volume and yield of Bonds Payable. As a result, Net Interest Income increased by 9.2% or P1.9 billion from P20.5 billion to P22.4 billion. The Group booked higher impairment losses at P7.4 billion, up by 289.5% or P5.5 billion from P1.9 billion and represented 20.6% of total operating income. Increase in impairment losses net, was mainly due to higher specific provisioning and additional provisions following the bank‘s ECL methodology. Other operating income of P13.5 billion, ballooned by 124.6% or P7.5 billion from P6.0 billion, it was accounted for 37.6% of total operating income and is broken down as follows:
Trading and securities gain-net recorded an increase from nil in end-2018 to a gain of P7.5 billion attributable to realized trading gain from investment securities, it accounted 20.9% of total operating income.
Service fees and commissions grew by 16.0% or P531.0 million from P3.3 billion to P3.9 billion and accounted for 10.8% of total operating income. Increase is primarily due to increase in credit card related fees, loan and deposit related fees, and bancnet fees.
Foreign exchange gains declined by 58.8% or P496.0 million from P843.0 million to P347.0 million primarily due to lower FX positions gains.
Trust fees expanded by 16.2% or P45.0 million from P278.0 million to P323.0 million.
Share in net earnings of subsidiaries and associates increased by 50% or P7.0 million to settle at P21.0 million from P14.0 million in 2018.

5
Miscellaneous income declined by 6.1% or P95.0 million from P1.5 billion to P1.5 billion brought about by lower dividend income and income from assets acquired.
Operating expenses went up by 12.3% or P2.4 billion from P19.4 billion to P21.8 billion and accounted 60.8% of Total Operating Income.
Manpower costs settled at P6.8 billion and accounted for 19.1% of total operating income;
Occupancy and equipment-related declined by 19.0% or P657.0 million from P3.5 billion to P2.8 billion, mainly due to the prospective adoption of PFRS 16 Leases;
Taxes and licenses expanded by 38.7% or P865.0 million from P2.2 billion to P3.1 billion mainly due to the gross receipt tax impact on higher gross revenues and higher DST due to the increase in Peso Bonds and growth in TD;
Depreciation and amortization went up by 37.5% or P682.0 million from P1.8 billion to P2.5 due to the prospective recognition of amortization of right to use asset under PFRS 16; and
Miscellaneous expenses went up by 23.2% or P1.2 billion to settle at P6.6 billion from P5.3 billion, primarily as a result of higher service fees, communication and information expenses, and ROPA-related costs, and it consumed 18.3% of total operating income.
Tax expense increased by 46.2% or P403.0 million from P872.0 million to P1.3 billion mainly due to higher final tax paid for the period and lower set-up of deferred tax assets. Net profit attributable to non-controlling interest settled at P1.0 million. Overall, net income was recorded at P5.4 billion, 24.7% or P1.1 billion higher than last year‘s P4.3 billion. Performance Indicators
RIZAL COMMERCIAL BANKING CORPORATION AND SUBSIDIARIES
Audited
Consolidated Parent
2019 2018 2019* 2018*
Return on Average Assets (ROA) 0.8% 0.7% 0.8% 0.7%
Return on Average Equity (ROE) 6.5% 5.8% 6.5% 5.1% Risk-based Capital Adequacy Ratio (CAR) 13.8% 16.1% 13.2% 16.5%
Common Equity Tier 1 Ratio 12.9% 13.4% 12.3% 13.2%
Non-Performing Loans (NPL) Ratio 2.2% 1.3% 2.0% 1.2%
Non-Performing Assets (NPA) Ratio 2.0% 1.3% 1.9% 1.2%
Net Interest Margin (NIM) 4.0% 4.0% 4.0% 4.0%
Cost-to-Income Ratio 60.8% 73.2% 60.4% 73.1%
Loans-to-Deposit Ratio** 95.3% 91.9% 93.3% 90.3%
Current Ratio 0.5 0.5 0.5 0.5
Liquid Assets-to-Total Assets Ratio 0.2 0.2 0.2 0.2
Debt-to-Equity Ratio 8.3 6.9 8.2 6.9
Asset-to- Equity Ratio 9.3 7.9 9.2 7.9
Asset -to- Liability Ratio 1.1 1.1 1.1 1.1
Interest Rate Coverage Ratio 1.4 1.5 1.4 1.5
Earnings per Share (EPS)
Basic Php 2.78 Php 2.62 Php 2.78 Php 2.62
Diluted Php 2.78 Php 2.62 Php 2.78 Php 2.62 * Restated due to merger; **Excluding Interbank loans and Loans under Reverse Repurchase Agreement

6
Wholly-Owned/Virtually Wholly Owned Subsidiaries
RCBC SAVINGS BANK Audited
In Php 000s (Except EPS) 2019 2018
Net Income
Merged with RCBC Parent on July 2019
Php 1,041,275
Return on Average Assets (ROA) 0.8%
Return on Average Equity (ROE) 7.9%
Risk-based Capital Adequacy Ratio (CAR) 12.8%
Non-Performing Loans (NPL) Ratio 3.3%
Non-Performing Assets (NPA) Ratio 3.4%
Earnings per Share (EPS) Php 33.46
RIZAL MICROBANK Audited
In Php 000s (Except EPS) 2019 2018
Net Income (Loss) Php 13,269 Php 24,181
Return on Average Assets (ROA) 0.8% 1.7%
Return on Average Equity (ROE) 2.2% 4.1%
Risk-based Capital Adequacy Ratio (CAR) 29.5% 65.3%
Non-Performing Loans (NPL) Ratio 6.8% 0. 1%
Non-Performing Assets (NPA) Ratio 5.6% 0.7%
Earnings (Loss) per Share (EPS) Php 1.18 Php 2.76
RCBC CAPITAL CORPORATION and Subsidiaries
Audited
In Php 000s (Except EPS) 2019 2018
Net Income Php 277,001 Php 109,679
Return on Average Assets (ROA) 5.5% 2.6%
Return on Average Equity (ROE) 7.2% 2.9%
Risk-based Capital Adequacy Ratio (CAR) 56.4% 28.0%
Non-Performing Loans (NPL) Ratio - -
Non-Performing Assets (NPA) Ratio 0.0% 0.0%
Earnings per Share (EPS) Php 2.34 Php 0.94
RCBC FOREX BROKERS CORPORATION
Audited
In Php 000s (Except EPS) 2019 2018
Net Income Php 15,588 Php 14,096
Return on Average Assets (ROA) 7.8% 7.8%
Return on Average Equity (ROE) 8.2% 8.3%
Capital to Total Assets 96.6% 95.2%
Non-Performing Loans (NPL) Ratio 0 0
Non-Performing Assets (NPA) Ratio 0 0
Earnings per Share (EPS)* Php (16.82) Php (19.81) *Net of 12% dividend on preferred shares equivalent to P12 per share
RCBC INTERNATIONAL FINANCE, LTD. and Subsidiary
Audited
In Php 000s (Except EPS) 2019 2018
Net Loss Php 2,301 Php (13,402)
Return on Average Assets (ROA) 1.9% -10.0%
Return on Average Equity (ROE) 1.9% -10.3%
Capital to Total Assets 97.6% 96.7%
Non-Performing Loans (NPL) Ratio 0.0% 0.0%
Non-Performing Assets (NPA) Ratio 0.0% 0.0%
Loss per Share Php 0.92 Php (5.36)

7
RCBC TELEMONEY EUROPE S.P.A ** Audited
In Php 000s (Except EPS) 2019 2018
Net Loss Php (13,630) Php (16,222)
Return on Average Assets (ROA) -49.2% -111.2%
Return on Average Equity (ROE) 33.6% 34.6%
Capital to Total Assets -158.5% -310.7%
Non-Performing Loans (NPL) Ratio 0 0
Non-Performing Assets (NPA) Ratio 0 0
Loss per Share (EPS) Php (136.30) Php (162.22) **Closed operations in March 2016.
RCBC-JPL HOLDING COMPANY, INC. (Formerly JP Laurel Bank, Inc.)
Audited
In Php 000s (Except EPS) 2019 2018
Net Income Php 2,007 Php 1,203
Return on Average Assets (ROA) 1.1% 0.8%
Return on Average Equity (ROE) -1.8% -1.3%
Capital to Total Assets -63.3% -62.2%
Non-Performing Loans (NPL) Ratio 0 0
Non-Performing Assets (NPA) Ratio 0 0
Earnings per Share (EPS) Php 0.01 Php 0.01
NIYOG PROPERTY HOLDINGS, INC. Audited
In Php 000s (Except EPS) 2019 2018
Net Income Php 51,382 Php 33,920
Return on Average Assets (ROA) 8.4% 5.0%
Return on Average Equity (ROE) 8.9% 5.3%
Capital to Total Assets 95.3% 95.0%
Non-Performing Loans (NPL) Ratio 0 0
Non-Performing Assets (NPA) Ratio 0 0
Earnings per Share (EPS) Php 36.94 Php 24.39
RCBC LEASING AND FINANCE CORP. and Subsidiary
Audited
In Php 000s (Except EPS) 2019 2018
Net Income Php 105,628 Php 120,513
Return on Average Assets (ROA) 1.0% 1.3%
Return on Average Equity (ROE) 5.5% 11.7%
Capital to Total Assets 20.5% 12.6%
Non-Performing Loans (NPL) Ratio 13.4% 6.4%
Non-Performing Assets (NPA) Ratio 9.7% 5.2%
Earnings per Share (EPS) Php 0.07 Php 0.261
Notes to the Computations:
1. Consolidated and Parent Company ROA and ROE ratios were taken from the corresponding audited financial statements. ROA ratio of the subsidiaries was determined based on the average of the quarterly ending balances of total assets, audited and/or unaudited. ROE ratio of the subsidiaries was likewise computed based on the average of the quarterly ending balances of total equity, audited and/or unaudited.
2. CAR covers combined credit, market and operational risks. Where the Risk-Based CAR
was not computed, the simple Capital to Total Assets ratio formula was used.

8
3. NPL ratio is determined by using the following formula: (Total NPLs net of total specific provision for losses of NPLs) / (Total gross loan portfolio)
4. NPA ratio is determined by using the following formula: (Net NPLs + Gross ROPA + Non-
performing SCR) / Gross Total Assets. For some subsidiaries, the NPL/NPA ratios were not computed since these ratios were not applicable.
2020
Philippines has been enjoying strong economic growth over the years, making it one of the fastest-growing economies in Asia. Real GDP grew on an average of 6.3% over ten years to 2019. However, the raging COVID-19 pandemic in 2020 brought global economic activity to a near-standstill as countries imposed tight restrictions on movement to prevent the spread of the virus. Global output has contracted to levels much worse relative to other global recessions since 1990. This same pandemic brought Philippines to a recession—its worst annual contraction on record, breaking almost three decades of uninterrupted growth. COVID-19 delivered multiple shocks to the Philippine economy—a health crisis, strict quarantine measures, and a global recession of unprecedented scale. The economy plunged -9.5% in 2020 following a lockdown described as one of the longest and strictest, where about 75% of the economy was shut down. The sharp contraction was mainly driven by the steep dive in domestic demand and the collapse of trade due to the impact of strict quarantine measures domestically and globally. Moreover, the country was hit by a series of strong typhoons that severely affected economic activities in some areas. Household consumption dropped -7.9%, its worst performance on record, after being a major growth driver in the demand side of the economy in the past years. The decline was mainly due to a combination of factors that crippled domestic demand including record-high unemployment, declining household incomes, movement restrictions that reduced consumption, and a historic decline in consumer confidence. Unemployment rate reached 10.3% in 2020 as factories and public transportation were shut down, businesses were closed, and supply chains were cut. Meanwhile, OFW remittances, which were heavily relied on by Filipino families for household consumption, contracted by -0.8% as of November 2020 as the global economic slump under the pandemic forced thousands of OFWs out of their jobs. The deepest contraction, with respect to domestic demand, was registered in the consumption of non-essential goods and services and those that were affected by the implementation of strict quarantine measures, while essential goods such as food registered small positive growth. In particular, the combination of travel restrictions and weak consumer confidence resulted in a collapse in domestic tourism expenditures, which make up about a fifth of private consumption. Headline inflation averaged 2.6%, at the lower end of the government‘s 2%-4% target band, as weak household consumption led to lower price pressures. The benign inflation environment has rendered the BSP ample space to aggressively implement an accommodative monetary policy to mitigate the impact of the crisis. Since the beginning of 2020, BSP has reduced the key policy rate by a cumulative 200 basis points (bps) to a record low of 2.0% and the reserve requirement (RRR) by 200 bps to 12.0%. Local long-term interest rates (PHP BVAL yields) hovered near record lows as a result, with the 10-year BVAL yield ending the year at about 100 bps below its levels in end-2019. The collapse in private consumption was compounded by the sharp decline in external demand and exports, due to significant disruptions in domestic and global supply chains and international travel restrictions. Exports fell by -16.7% due to contractions in both services and merchandise exports. Transport and travel services were hit the hardest among services exports, which both

9
declined by -51.0% and -81.0% respectively, as the global tourism industry suffered from strict travel and mobility restrictions. Foreign tourist arrivals contracted by -87.0%, resulting in an -83.0% contraction in inbound tourism revenues. Merchandise exports contracted by -10.1% across all major product categories, a reversal from the 2.3% growth recorded in 2019. The decline in trade activity was caused by disruptions in source countries and weak consumption in key export markets due to the economic fallout caused by the pandemic. The country‘s economic condition has impacted positively the overall balance of payments position of the country. Contraction in private consumption, deterioration in private investment activities, and a shift of public resources from public investment spending toward immediate COVID-19 response, all resulted in a -23.3% goods import contraction in 2020, vs. -1.1% in 2019. As a result, current account turned into a surplus of US$8.7 billion (3.4% of GDP) as of 3Q 2020, outpacing net capital outflow, leading to a balance of payment surplus of US$11.8 billion as of November 2020. The significant contraction in imports lessened the demand for US dollars contributing to the appreciation of the Philippine peso to its strongest in more than four years, and record high foreign reserve accumulation. To mitigate the negative impact of COVID-19 on the economy, the government responded swiftly by increasing public spending through economic stimulus packages despite falling revenues. As a result, fiscal deficit (as of 3Q 2020) widened to -6.9% of GDP from -2.1% over the same period in 2019. This is the result of a shrinking tax base amid a slumping global and domestic economy while public spending increased rapidly to mitigate the effects of the crisis. Total public revenues fell by -9.6% in nominal terms as a result of a -12.2% decline in tax revenues. Public spending increased by 11.6%, mainly due to the implementation of the Bayanihan to Heal as One Act. The sharp increase in the fiscal deficit resulted in the public debt ratio reaching its highest level in nearly a decade. Yet, the country‘s long-term fiscal sustainability remains manageable, benefitting from years of prudent fiscal management by the government. Financial and Operating Highlights Balance Sheet
BALANCE SHEET
In Million Pesos 2020 2019 2018
Total Assets 772,106 767,079 644,595
Investment Securities 88,064 160,719 118,449
Loans and Receivables (Net) 491,284 449,219 398,300
Total Deposits 535,788 456,581 423,399
Capital Funds 101,378 82,850 81,170
RCBC‘s Total Assets stood at P772.1 billion. Cash and other Cash Items decreased by 2.3% or P387.0 million from P16.9 billion to P16.5 billion. Due from Bangko Sentral ng Pilipinas (BSP) increased by 32.3% or P28.2 billion from P87.3 billion to P115.5 billion attributable to the increase in level of Overnight Deposits as temporary placement of excess funds and Special Savings Account with BSP used as clearing account. Due from Other Banks decreased by 16.5% or P3.1 billion from P18.8 billion to P15.7 billion, mainly due to decrease in foreign bank placements as a net result of servicing the matured obligations of the Bank. Loans under Reverse Repurchase Agreement increased by 131.6% or P7.6 billion from P5.8 billion to P13.4 billion due to higher placements with BSP shifted from Term Deposits.

10
Total Investment Securities, representing 11.4% of Total Resources, decreased by 45.2% or P72.7 billion from P160.7 billion to P88.1 billion mainly due to the sale of Investment Securities at Amortized Cost and Financial Assets at Fair Value Through Other Comprehensive Income (FVOCI). Investment Securities at Amortized Cost decreased by 57.4% or P57.9 billion from P100.9 billion to P43.0 billion; Financial Assets at FVOCI decreased by 26.0% or P14.1 billion from P54.2 billion to P40.2 billion. Financial Assets at Fair Value Through Profit or Loss (FVTPL) also decreased by 11.9% or P660.0 million from P5.5 billion to P4.9 billion as part of the Bank‘s regular trading activities. Loans and Receivables – net, grew by 9.4% or P42.1 billion from P449.2 billion to P491.3 billion largely attributable to the increase in level of Interbank Loans by 127.0% or P23.9 billion and increase in total loan to customers amounting to P22.3 billion. It represented 63.6% of Total Resources. Investment in Associates – net, decreased by 23.7% or P105.0 million from P444.0 million to P339.0 million mainly attributable to the decrease in equity investment in Honda Cars Philippines, Inc. as a result of closure of its local manufacturing plant. Bank Premises, Furniture, Fixtures & Equipment – net, increased by 18.1% or P2.0 billion from P11.1 billion to P13.1 billion largely due to the recognition of right-of-use (ROU) asset relative to the five-year incremental lease of the Bank‘s head office following PFRS 16, Leases. Investment Properties – net, declined by 10.1% or P417.0 million from P4.1 billion to P3.7 billion as a result of the disposals and higher provision on real estate properties and auto during the year. Deferred Tax Assets increased by 42.2% or P904.0 million from P2.1 billion to P3.0 billion due to recognition of additional deferred tax asset on higher provision for impairment losses during the year.
Other Resources – net, increased by 8.8% or P930.0 million from P10.6 billion to P11.5 billion mainly attributable to the increase in non-current assets held for sale, software and prepaid expenses during the year. Deposit Liabilities were recorded at P535.8 billion and represented 69.4% of Total Resources. Demand deposits grew by 52.0% or P36.6 billion from P70.5 billion to P107.2 billion and accounted for 13.9% of Total Resources. Savings deposits grew by 8.9% or P15.9 billion from P179.2 billion to P195.2 billion and accounted for 25.3% of Total Resources. Total Current and Savings Account deposits grew by 21.1% or P52.6 billion from P249.8 billion to P302.3 billion from previous year. Time deposits reached P233.5 billion, which grew by 12.9% or P26.6 billion from P206.8 billion and accounted for 30.2% of Total Resources. Bills Payable decreased by 87.0% or P88.4 billion from P101.6 billion to P13.2 billion primarily due to maturities of foreign and local borrowings during the year. Bonds Payable decreased by 6.6% or P6.4 billion from P96.8 billion to P90.4 billion attributable to the maturity of the USD 243.0 million or P12.3 billion Senior Notes in January 2020 and P15.0 billion Green Bonds in August 2020, net of the P23.7 billion Peso Bond issuances during the year. Accrued Taxes, Interest and Other Expenses decreased by 4.9% or P302.0 million from P6.2 billion to P5.9 billion due to lower interest expense on Time Deposits as a result of the decline in interest rates.

11
Other Liabilities increased by 10.5% or P2.4 billion from P23.0 billion to P25.4 billion primarily due to the recognition of finance lease liability on the incremental lease of Bank‘s head office following PFRS 16, as discussed above. Total Liabilities stood at P670.7 billion and represented 86.9% of Total Resources. On August 27, 2020, the Bank issued foreign currency denominated Securities eligible as Additional Tier 1 Capital amounting to USD 300.0 million or P14.5 billion with an interest rate of 6.5% per annum payable semi-annually in arrears due on February 27 and August 27 of each year. Other Comprehensive Income increased by 5.6% or P123.0 million from loss of P2.2 billion to P2.1 billion mainly due to the improvement in the market value of retirement plan. Retained Earnings increased by 11.8% or P3.9 billion from P33.3 billion to P37.2 billion mainly on account of the net income during the year, net of P1.1 billion cash dividends paid on Common and Preferred Shares. Total Capital Funds were recorded at P101.4 billion and accounted for 13.1% of Total Resources . Income Statement
INCOME STATEMENT
In Million Pesos 2020 2019 2018
Interest Income 36,952 37,578 30,933
Interest Expense 10,671 15,210 10,444
Net Interest Income 26,281 22,368 20,489
Other Operating Income 11,632 13,490 6,006
Impairment Losses 9,375 7,397 1,899
Operating Expenses 22,045 21,798 19,403
Tax Expense (Income) 1,475 1,275 872
Net income 5,018 5,388 4,321
Attributable to:
Parent Company‘s Shareholders 5,020 5,387 4,320
Non-controlling Interests (2) 1 1
Total interest income slightly decreased by 1.7% or P626.0 million from P37.6 billion to P37.0 billion and accounted for 97.5% of total operating income. Interest income on loans and receivables went up by 3.9% or P1.3 billion from P32.6 billion to P33.9 billion and accounted 89.4% of total operating income. Interest income on Investment Securities decreased by 53.8% or P2.4 billion from P4.5 billion to P2.1 billion as a result of decline in average volume; it accounted 5.5% of total operating income. Other interest income, on the other hand, increased by 122.1% or P530.0 million from P434.0 million to P964.0 million due to the increase in volume of Overnight and Term Deposits with the BSP. Total interest expense went down by 29.8% or P4.5 billion from P15.2 billion to P10.7 billion and accounted for 28.2% of total operating income. Interest expense on deposit liabilities decreased by 38.7% or P3.3 billion from P8.6 billion to P5.3 billion primarily as a result of lower average costs, partly off-set by the impact of the increase in average volume; it represented 14.0% of total operating income. Interest expense on bills payable and other borrowings decreased by 18.2% or P1.2 billion from P6.6 billion to P5.4 billion due to lower average costs and the decline in average volume year-on-year. As a result, net interest income increased by 17.5% or P3.9 billion from P22.4 billion to P26.3 billion.

12
As part of the Bank‘s conservative stance on loan loss provisioning, the Bank booked total impairment losses of P9.4 billion, up by 26.7% or P2.0 billion from P7.4 billion last year to cover the expected increase in non-performing loans due to the impact of COVID-19 pandemic. It represented 24.7% of total operating income. Other operating income decreased by 13.8% or P1.9 billion from last year‘s P13.5 billion now at P11.6 billion. This accounted for 30.7% of total operating income, and is broken down as follows:
Trading and securities gain – net, decreased by 18.8% or P1.4 billion from P7.5 billion to P6.1 billion, due to lower realized trading gains from sale of investment securities and lower unrealized marked-to-market gains. It accounted 16.1% of total operating income;
Service fees and commissions decreased by 9.0% or P348.0 million from P3.9 billion to P3.5 billion mainly due to lower fees on loans and deposit and branch related fees. It represented 9.3% of total operating income;
Trust fees remained flat at P323.0 million year-on-year;
Foreign exchange gains – net, increased by 65.4% or P227.0 million from P347.0 million to P574.0 million. This was primarily due to higher foreign currency position profit;
Share in net earnings of subsidiaries and associates decreased by 547.6% or P115.0 million due to lower equity earnings from Investments in Associates;
Miscellaneous income decreased by 14.7% or P214.0 million from P1.5 billion to P1.2 billion largely due to lower dividend income.
Operating expenses, which accounted for 58.2% of total operating income, slightly increased by 1.1% or P247.0 million from P21.8 billion to P22.0 billion due to the following:
Total Employee benefits decreased by 3.0% or P207.0 million from P6.8 billion to P6.6. It represented 17.5% of total operating income;
Occupancy and equipment-related expenses slightly increased by 0.7% or P19.0 million from P2.8 billion to P2.8 billion. It represented 7.4% of total operating income;
Taxes and licenses, which accounted for 8.4% of total operating income, slightly increased by 2.6% or P81.0 million from P3.1 billion to P3.2 billion;
Depreciation and amortization was recorded at P2.9 billion, up by 16.8% or P421.0 million from P2.5 billion largely due to higher depreciation on consumer loan-related ROPAs and leased equipment of its leasing subsidiary. It represented 7.7% of total operating income;
Miscellaneous expenses declined by 1.0% or P67.0 million to P6.5 billion from P6.6 billion. It accounted for 17.1% of total operating income..
Tax expense increased by 15.7% or P200.0 million from P1.3 billion to P1.5 billion due to higher final tax on investment securities and higher regular corporate income tax. Net loss attributable to non-controlling interest settled at P2.0 million. Overall, net income declined by 6.9% or P370.0 million from P5.4 billion to P5.0 billion. There were no significant elements of income or loss that did not arise from the Bank‘s continuing operations.

13
Performance Indicators
RIZAL COMMERCIAL BANKING CORPORATION AND SUBSIDIARIES
Audited
Consolidated Parent
2020 2019 2020 2019
Return on Average Assets (ROA) 0.7% 0.8% 0.7% 0.8%
Return on Average Equity (ROE)** 5.5% 6.5% 5.6% 6.5% Risk-based Capital Adequacy Ratio (CAR) 16.1% 13.8% 15.9% 13.2%
Common Equity Tier 1 Ratio 12.6% 12.9% 12.3% 12.3%
Non-Performing Loans (NPL) Ratio 2.9% 2.2% 2.8% 2.0%
Non-Performing Assets (NPA) Ratio 2.8% 2.0% 2.7% 1.9%
Net Interest Margin (NIM) 4.3% 4.0% 4.3% 4.0%
Cost-to-Income Ratio 58.1% 60.8% 57.8% 60.4%
Loans-to-Deposit Ratio* 85.2% 95.3% 83.6% 93.3%
Current Ratio 0.8 0.5 0.8 0.5
Liquid Assets-to-Total Assets Ratio 0.3 0.2 0.3 0.2
Debt-to-Equity Ratio 6.6 8.3 6.5 8.2
Asset-to- Equity Ratio 7.6 9.3 7.5 9.2
Asset -to- Liability Ratio 1.2 1.1 1.2 1.1
Interest Rate Coverage Ratio 1.6 1.4 1.6 1.4
Earnings per Share (EPS)**
Basic Php 2.43 Php 2.78 Php 2.43 Php 2.78
Diluted Php 2.43 Php 2.78 Php 2.43 Php 2.78 * Excluding Interbank loans and Loans under Reverse Repurchase Agreement **Net of dividends on Hybrid Tier 1 Securities in 2020
Wholly-Owned/Virtually Wholly Owned Subsidiaries
RIZAL MICROBANK Audited
In Php 000s (Except EPS) 2020 2019
Net Income (Loss) Php (88,981) Php 13,269
Return on Average Assets (ROA) -4.9% 0.8%
Return on Average Equity (ROE) -15.7% 2.2%
Risk-based Capital Adequacy Ratio (CAR) 30.7% 29.5%
Non-Performing Loans (NPL) Ratio 1.9% 6.8%
Non-Performing Assets (NPA) Ratio 2.9% 5.6%
Earnings (Loss) per Share (EPS) Php (7.90) Php 1.18
RCBC CAPITAL CORPORATION and Subsidiaries
Audited
In Php 000s (Except EPS) 2020 2019
Net Income Php 160,673 Php 277,001
Return on Average Assets (ROA) 3.5% 5.5%
Return on Average Equity (ROE) 4.6% 7.2%
Risk-based Capital Adequacy Ratio (CAR) 39.9% 56.4%
Non-Performing Loans (NPL) Ratio - -
Non-Performing Assets (NPA) Ratio 0.0% 0.0%
Earnings per Share (EPS) Php 1.36 Php 2.34

14
RCBC FOREX BROKERS CORPORATION
Audited
In Php 000s (Except EPS) 2020 2019
Net Income Php 5,503 Php 15,588
Return on Average Assets (ROA) 3.2% 7.8%
Return on Average Equity (ROE) 3.3% 8.2%
Capital to Total Assets 92.1% 96.6%
Non-Performing Loans (NPL) Ratio 0 0
Non-Performing Assets (NPA) Ratio 0 0
Loss per Share (EPS)* Php (37.12) Php (31.18) *Net of 12% dividend on preferred shares equivalent to P12 per share
RCBC INTERNATIONAL FINANCE, LTD. and Subsidiary
Audited
In Php 000s (Except EPS) 2020 2019
Net Income (Loss) Php (9,101) Php 2,301
Return on Average Assets (ROA) -7.6% 1.9%
Return on Average Equity (ROE) -7.8% 1.9%
Capital to Total Assets 103.2% 97.6%
Non-Performing Loans (NPL) Ratio 0.0% 0.0%
Non-Performing Assets (NPA) Ratio 0.0% 0.0%
Earnings (Loss) per Share Php (3.64) Php 0.92
RCBC TELEMONEY EUROPE S.P.A * Audited
In Php 000s (Except EPS) 2020 2019
Net Loss Php 0.00 Php (13,630)
Return on Average Assets (ROA) 0.0% -49.2%
Return on Average Equity (ROE) 0.0% 33.6%
Capital to Total Assets -158.5% -158.5%
Non-Performing Loans (NPL) Ratio 0 0
Non-Performing Assets (NPA) Ratio 0 0
Loss per Share (EPS) Php 0.00 Php (136.30) *In the process of liquidation.
RCBC-JPL HOLDING COMPANY, INC. (Formerly JP Laurel Bank, Inc.)
Audited
In Php 000s (Except EPS) 2020 2019
Net Income Php 2,276 Php 2,007
Return on Average Assets (ROA) 1.4% 1.1%
Return on Average Equity (ROE) -2.0% -1.8%
Capital to Total Assets -72.6% -63.3%
Non-Performing Loans (NPL) Ratio 0 0
Non-Performing Assets (NPA) Ratio 0 0
Earnings per Share (EPS) Php 0.01 Php 0.01
NIYOG PROPERTY HOLDINGS, INC. Audited
In Php 000s (Except EPS) 2020 2019
Net Income Php 13,695 Php 51,382
Return on Average Assets (ROA) 2.3% 8.4%
Return on Average Equity (ROE) 2.4% 8.9%
Capital to Total Assets 93.1% 95.3%
Non-Performing Loans (NPL) Ratio 0 0
Non-Performing Assets (NPA) Ratio 0 0
Earnings per Share (EPS) Php 9.85 Php 36.94

15
RCBC LEASING AND FINANCE CORP. and Subsidiary
Audited
In Php 000s (Except EPS) 2020 2019
Net Income (Loss) Php (61,919) Php 105,628
Return on Average Assets (ROA) -0.5% 1.0%
Return on Average Equity (ROE) -2.9% 5.5%
Capital to Total Assets 17.9% 20.5%
Non-Performing Loans (NPL) Ratio 11.2% 13.4%
Non-Performing Assets (NPA) Ratio 7.2% 9.7%
Earnings (Loss) per Share (EPS) Php (0.04) Php 0.07
CAJEL REALTY CORPORATION Audited
In Php 000s (Except EPS) 2020 2019
Net Loss Php (119) Php (726)
Return on Average Assets (ROA) -0.2% -1.3%
Return on Average Equity (ROE) -0.2% -1.3%
Capital to Total Assets 100.0% 99.9%
Non-Performing Loans (NPL) Ratio 0 0
Non-Performing Assets (NPA) Ratio 0 0
Loss per Share (EPS) Php (0.20) Php (1.21)
Notes to the Computations:
1. Consolidated and Parent Company ROA and ROE ratios were taken from the corresponding audited financial statements. ROA ratio of the subsidiaries was determined based on the average of the quarterly ending balances of total assets, audited and/or unaudited. ROE ratio of the subsidiaries was likewise computed based on the average of the quarterly ending balances of total equity, audited and/or unaudited.
2. CAR covers combined credit, market and operational risks. Where the Risk-based CAR was not computed, the simple Capital to Total Assets ratio formula was used.
3. NPL ratio is determined by using the following formula: (Total NPLs net of total specific provision for losses of NPLs) / (Total gross loan portfolio)
4. NPA ratio is determined by using the following formula: (Net NPLs + Gross ROPA + Non-performing SCR) / Gross Total Assets. For some subsidiaries, the NPL/NPA ratios were not computed since these ratios were not applicable.
2021
The Philippine economy rebounded in 2021 despite the continuing resurgence of COVID-19, posting a full-year GDP growth of 5.6% after the record of 9.6% drop in 2020. Domestic output grew faster than expected as low base effects magnified the improvement in economic activity that is now less sensitive to infections and containment measures compared to previous lockdowns. Quarantine measures imposed by the government throughout 2021 restricted overall mobility less than the previous year, while households and firms have learned to cope with infections and diminished mobility. Domestic demand managed to pick up despite the implementation of several lockdowns, which is primarily driven by the recovery in household spending, from a 7.9% contraction last year to a 4.2% growth in 2021, due to more relaxed quarantine measures as well as the increasing vaccination rate that protected the population against the severe outcomes of COVID-19. Household spending was also supported by steady growth in OFW remittances throughout the

16
year, or by 5.2% in the first eleven months of 2021, despite weaker labor market conditions abroad, mainly due to the reopening of many host economies worldwide and low base effects. However, it is still tempered by elevated inflation and unemployment, lockdowns, and low consumer confidence. Meanwhile, government spending eased, in part due to the base effects from the swift disbursement of economic stimulus packages a year ago. External demand, on the other hand, has shown some recovery as the country benefitted from robust global activity in merchandise trade. Export of goods in 2021 reached record highs, surpassing its pre-pandemic levels, as it registered a 14.5% growth mainly driven by the increased demand for electronics, the country‘s largest export commodity. However, services trade remained weak, as lingering restrictions in travel and tourism weighed heavily on travel and transport export services, which contracted by 52.6% and 5.4%, respectively. Meanwhile, imports grew strongly as importation of consumption goods, raw materials, and capital goods picked up due to increased economic activity and a strong rebound in the manufacturing industry. This, along with elevated global commodity prices due to supply chain disruptions, ultimately led to a wider trade deficit year-on-year. On the supply side, economic activity was supported by growth in the industry and services sectors. The industry sector rebounded to 8.2% in 2021 vs. -13.2% in 2020. Its strong performance was driven by a strong rebound in manufacturing amid a more supportive external environment, along with increased infrastructure spending. The services sector, which accounts for a huge chunk (or 61%) of GDP among the three major economic sectors, posted a more moderate expansion of 5.3% in 2021 as key services such as wholesale and retail trade, transportation, and accommodation and food services continue to struggle amid the pandemic. However, sectors such as health and information and communication fueled growth, benefitting from increased demand on their services. Lastly, the agriculture sector contracted by 0.3% as farm output continued to suffer from the ongoing outbreak of African swine fever and the damages brought by several strong typhoons that hit the country during the year. The monetary authority maintained a low interest rate to support the economic recovery. Headline inflation averaged by 4.5% in 2021, breaching the upper bound of the government‘s 2%-4% target band. Supply-side constraints drove inflation higher with food adversely affected by weather disturbances alongside rising global commodity prices. Core inflation, on the other hand, which excluded volatile food and energy items, remained stable, averaging 3.3% in 2021, which indicates weak underlying price pressure especially as aggregate demand remained generally tempered by the pandemic. To support the country‘s economic recovery prospects in terms of relatively lower borrowing costs, BSP kept its key policy rate to the record low of 2.0% and the reserve requirement ratio (RRR) to 12.0% despite elevated headline inflation. Local short-term interest rates (PHP BVAL yields) continued to hover near record lows as a result, but long-term interest rates have already started to go up by late-2021. The fiscal stance remains supportive of economic recovery, but the policy space is narrowing. Public spending accelerated to 24.6% of GDP in the first three quarters of 2021, vs. 23.6% in the same period in 2020, due to increased government spending especially on infrastructure to boost economic recovery and ongoing fiscal support to mitigate the economic fallout due to the pandemic. Infrastructure outlays increased to 4.7% of GDP in the first three quarters of 2021, vs. 3.5% in the previous year. Increased public spending coupled with a shrinking tax base amid multiple lockdowns that slowed down tax revenue collections ultimately widened the fiscal deficit to 8.3% of GDP in the first three quarters of 2021, vs. 6.9% in the same period last year. The sharp increase in the fiscal deficit resulted in the public debt ratio reaching its highest level in 15 years to 63.1% as of 3Q 2021. Yet, the country‘s long-term fiscal sustainability remains manageable, benefitting from years of prudent fiscal management by the government..

17
Financial and Operating Highlights Balance Sheet
BALANCE SHEET
In Million Pesos 2021 2020 2019
Total Assets 959,133 772,106 767,079
Investment Securities 219,235 88,064 160,719
Loans and Receivables (Net) 538,302 491,284 449,219
Total Deposits 672,459 535,788 456,581
Capital Funds 111,080 101,378 82,850
RCBC‘s Total Assets stood at P959.1 billion. Cash and other Cash Items decreased by 11.1% or P1.8 billion from P16.5 billion to P14.7 billion due to the decline in cash on hand and cash in ATMs. Due from Bangko Sentral ng Pilipinas (BSP) increased by 12.7% or P14.7 billion from P115.5 billion to P130.2 billion mainly attributable to the increase in Demand Deposit Account with the BSP and higher Term Deposit. Due from Other Banks decreased by 22.6% or P3.5 billion from P15.7 billion to P12.2 billion, mainly due to decrease in foreign bank placements as a result of redeployment of funds. Loans Arising from Reverse Repurchase Agreement decreased by 12.5% or P1.7 billion from P13.4 billion to P11.7 billion due to lower placements with the BSP. Total Investment Securities, representing 22.9% of Total Resources, increased by 149.0% or P131.2 billion from P88.1 billion to P219.2 billion attributable to the 280.3% or P120.6 billion increase in Investment Securities at Amortized Cost from P43.0 billion to P163.6 billion; 23.9% or P9.6 billion increase in Financial Assets at Fair Value Other Comprehensive Income (FVOCI) from P40.2 billion to P49.8 billion; and 20.0% or P975.0 million increase in Financial Assets at Fair Value Through Profit or Loss (FVTPL) from P4.9 billion to P5.9 billion. Loans and Receivables – net, grew by 9.6% or P47.0 billion from P491.3 billion to P538.3 billion attributable to the increase in total loan to customers amounting to P56.2 billion, which grew by 12.3% versus last year, net of the decrease in level of Interbank Loans by 28.4% or P12.2 billion. It represented 56.1% of Total Resources. Deferred Tax Assets (DTA) increased by 5.3% or P162.0 million from P3.0 billion to P3.2 billion mainly due to net DTA set-up during the year. Other Resources – net, increased by 13.5% or P1.6 billion from P11.5 billion to P13.1 billion largely attributable to the increase in Non-current Assets Held for Sale. Deposit Liabilities were recorded at P672.5 billion and represented 70.1% of Total Resources. Demand deposits grew by 35.1% or P37.6 billion from P107.2 billion to P144.8 billion and accounted for 15.1% of Total Resources. Savings deposits grew by 17.1% or P33.3 billion from P195.2 billion to P228.5 billion and accounted for 23.8% of Total Resources. Time deposits reached P299.2 billion, which grew by 28.2% or P65.7 billion from P233.5 billion to P299.2 billion and accounted for 31.2% of Total Resources. Bills Payable increased by 324.6% or P42.7 billion from P13.2 billion to P55.9 billion primarily due to increase in foreign borrowings as an alternative source of funding. Total Liabilities stood at P848.1 billion and represented 88.4% of Total Resources.

18
Treasury Shares decreased by 32.3% or P4.4 billion from P13.7 billion to P9.3 billion due to the re-issuance of the 101,850,000 common shares to Sumitomo Mitsui Banking Corporation (SMBC) in July 2021. Other Comprehensive Income increased by 7.1% or P147.0 million from loss of P2.1 billion to P1.9 billion mainly due to the improvement in the valuation of retirement plan , net of the decline in Net Unrealized Gains on Financial Assets at FVOCI securities as compared with previous year. Retained Earnings increased by 13.9% or P5.2 billion from P37.2 billion to P42.4 billion mainly on account of the net income during the year, net of cash dividends paid during the year. Total Capital Funds were recorded at P111.1 billion and accounted for 11.6% of Total Resources. . Income Statement
INCOME STATEMENT
In Million Pesos 2021 2020 2019
Interest Income 37,111 36,952 37,578
Interest Expense 8,280 10,671 15,210
Net Interest Income 28,831 26,281 22,368
Other Operating Income 7,563 11,632 13,490
Impairment Losses 6,048 9,375 7,397
Operating Expenses 22,535 22,045 21,798
Tax Expense (Income) 728 1,475 1,275
Net income 7083 5018 5388
Attributable to:
Parent Company‘s Shareholders 7,082 5,020 5,387
Non-controlling Interests 1 (2) 1
Total interest income slightly increased by 0.4% or P159.0 million from P37.0 billion to P37.1 billion and accounted for 102.0% of total operating income. Interest income on loans and receivables went down by 5.9% or P2.0 billion from P33.9 billion to P31.9 billion due to lower average yield, net of growth in average volume. It accounted 87.7% of total operating income. Interest income on Investment Securities increased by 114.0% or P2.4 billion from P2.1 billion to P4.4 billion as a result of the increase in volume and improvement in average yield; it accounted 12.2% of total operating income. Other interest income, on the other hand, decreased by 20.9% or P201.0 million from P964.0 million to P763.0 million due to lower yield on net placements with the BSP. Total interest expense went down by 22.4% or P2.4 billion from P10.7 billion to P8.3 billion and accounted for 22.8% of total operating income. Interest expense on Deposit Liabilities decreased by 23.2% or P1.2 billion from P5.3 billion to P4.1 billion primarily due to decrease in average costs, net of the increase in average volume; it represented 11.2% of total operating income. Interest expense on Bills Payable and Other Borrowings decreased by 21.6% or P1.2 billion from P5.4 billion to P4.2 billion due to combined effects of lower average volume and lower average costs, year-on-year. As a result, net interest income increased by 9.7% or P2.6 billion from P26.3 billion to P28.8 billion. As business environment started to improve, the Bank booked total Impairment losses of P6.0 billion, down by 35.5% or P3.3 billion from P9.4 billion last year. It represented 16.6% of total operating income.

19
Other operating income decreased by 35.0% or P4.1 billion from last year‘s P11.6 billion to P7.6 billion. This accounted for 20.8% of total operating income, and is broken down as follows:
Trading and securities gain – net, decreased by 85.8% or P5.2 billion from P6.1 billion to P863.0 million mainly due to lower realized trading gains from sale of investment securities. It accounted 2.4% of total operating income;
Service fees and commissions increased by 30.0% or P1.0 billion from P3.5 billion to P4.5 billion mainly due to improvement in fee income from across all products. It represented 12.5% of total operating income;
Foreign exchange gains – net, decreased by 68.5% or P393.0 million from P574.0 million to P181.0 million due to lower revaluation profits as a result of the weakening of the peso.
Trust fees increased by 21.4% or P69.0 million from P323.0 million to P392.0 million due to significant increase in volume of managed funds;
Share in net earnings of subsidiaries and associates increased by 112.8% or P106.0 million due to higher equity earnings from Investments in Associates;
Miscellaneous income increased by 26.4% or P327.0 million from P1.2 billion to P1.6 billion mainly due to higher gain on sale of assets and other income.
Operating expenses, which accounted for 61.9% of total operating income, slightly increased by 2.2% or P490.0 million from P22.0 billion to P22.5 billion due to the following:
Total Employee benefits decreased by 3.9% or P255.0 million from P6.6 billion to P6.4 billion. It represented 17.5% of total operating income;
Taxes and licenses, which accounted for 9.6% of total operating income, increased by 9.1% or P291.0 million from P3.2 billion to P3.5 billion mainly due to higher documentary stamp tax, which is volume-related;
Depreciation and amortization was recorded at P3.0 billion, up by 3.3% or P96.0 million from P2.9 billion from previous year. It represented 8.3% of total operating income;
Occupancy and equipment-related expenses slightly increased by 0.0% or P1.0 million from P2.8 billion to P2.8 billion year-on-year. It represented 7.8% of total operating income;
Miscellaneous expenses increased by 5.5% or P357.0 million to P6.8 billion from P6.5 billion to P6.8 billion largely due to the increase in regulatory related fees as a result of the growth in deposit liabilities and total resources. It accounted for 18.8% of total operating income.
Tax expense decreased by 50.6% or P747.0 million from P1.5 billion to P728.0 million mainly due to lower final tax on investment securities and the impact of the implementation of Corporate Recovery and Tax Incentives for Enterprise Act Law reducing the corporate income tax rate by 5% effective July 1, 2020. Net profit attributable to non-controlling interest settled at P1.0 million. Overall, net income increased by 41.2% or P2.1 billion from P5.0 billion to P7.1 billion. There were no significant elements of income or loss that did not arise from the Bank‘s continuing operations.

20
Performance Indicators
RIZAL COMMERCIAL BANKING CORPORATION AND SUBSIDIARIES
Audited
Consolidated Parent
2021 2020 2021 2020
Return on Average Assets (ROA) 0.8% 0.7% 0.9% 0.7%
Return on Average Equity (ROE)** 6.7% 5.5% 6.7% 5.6% Risk-based Capital Adequacy Ratio (CAR) 15.2% 16.1% 14.9% 15.9%
Common Equity Tier 1 Ratio 12.2% 12.6% 11.8% 12.3%
Non-Performing Loans (NPL) Ratio 3.3% 2.9% 3.2% 2.8%
Non-Performing Assets (NPA) Ratio 2.7% 2.8% 2.6% 2.7%
Net Interest Margin (NIM) 4.1% 4.3% 4.1% 4.3%
Cost-to-Income Ratio 61.9% 58.2% 61.4% 57.8%
Loans-to-Deposit Ratio* 76.3% 85.2% 74.9% 83.6%
Current Ratio 0.6 0.8 0.6 0. 8
Liquid Assets-to-Total Assets Ratio 0.2 0.3 0.2 0.3
Debt-to-Equity Ratio 7.6 6.6 7.6 6.5
Asset-to- Equity Ratio 8.6 7.6 8.6 7.5
Asset -to- Liability Ratio 1.1 1.2 1.1 1.2
Interest Rate Coverage Ratio 1.9 1.6 2.0 1.6
Earnings per Share (EPS)**
Basic Php 3.09 Php 2.43 Php 3.09 Php 2.43
Diluted Php 3.09 Php 2.43 Php 3.09 Php 2.43 * Excluding Interbank loans and Loans under Reverse Repurchase Agreement **Net of dividends on Hybrid Tier 1 Securities in 2020
Wholly-Owned/Virtually Wholly Owned Subsidiaries
RIZAL MICROBANK Audited
In Php 000s (Except EPS) 2021 2020
Net Income (Loss) Php (9,938) Php (88,981)
Return on Average Assets (ROA) -0.7% -4.9%
Return on Average Equity (ROE) -2.0% -15.7%
Risk-based Capital Adequacy Ratio (CAR) 31.0% 30.7%
Non-Performing Loans (NPL) Ratio 3.0% 1.9%
Non-Performing Assets (NPA) Ratio 4.6% 2.9%
Earnings (Loss) per Share (EPS) Php (0.88) Php (7.90)
RCBC CAPITAL CORPORATION and Subsidiaries
Audited
In Php 000s (Except EPS) 2021 2020
Net Income Php 315,427 Php 160,673
Return on Average Assets (ROA) 7.3% 3.5%
Return on Average Equity (ROE) 9.6% 4.6%
Risk-based Capital Adequacy Ratio (CAR) 38.5% 39.9%
Non-Performing Loans (NPL) Ratio - -
Non-Performing Assets (NPA) Ratio 0.0% 0.0%
Earnings per Share (EPS) Php 2.67 Php 1.36

21
RCBC FOREX BROKERS CORPORATION
Audited
In Php 000s (Except EPS) 2021 2020
Net Income Php 1,725 Php 5,503
Return on Average Assets (ROA) 1.0% 3.2%
Return on Average Equity (ROE) 1.1% 3.3%
Capital to Total Assets 95.7% 92.1%
Non-Performing Loans (NPL) Ratio 0 0
Non-Performing Assets (NPA) Ratio 0 0
Loss per Share (EPS)* Php (44.55) Php (37.12) *Net of 12% dividend on preferred shares equivalent to P12 per share
RCBC INTERNATIONAL FINANCE, LTD. and Subsidiary
Audited
In Php 000s (Except EPS) 2021 2020
Net Income (Loss) Php (8,176) Php (9,101)
Return on Average Assets (ROA) -7.5% -7.6%
Return on Average Equity (ROE) -7.7% -7.8%
Capital to Total Assets 95.4% 103.2%
Non-Performing Loans (NPL) Ratio 0.0% 0.0%
Non-Performing Assets (NPA) Ratio 0.0% 0.0%
Earnings (Loss) per Share Php (3.27) Php (3.64)
RCBC TELEMONEY EUROPE S.P.A * Audited
In Php 000s (Except EPS) 2021 2020
Net Loss Php 0.00 Php 0.00
Return on Average Assets (ROA) 0.0% 0.0%
Return on Average Equity (ROE) 0.0% 0.0%
Capital to Total Assets -158.5% -158.5%
Non-Performing Loans (NPL) Ratio 0 0
Non-Performing Assets (NPA) Ratio 0 0
Loss per Share (EPS) Php 0.00 Php 0.00 *In the process of liquidation.
RCBC-JPL HOLDING COMPANY, INC. (Formerly JP Laurel Bank, Inc.)
Audited
In Php 000s (Except EPS) 2021 2020
Net Income Php (3,458) Php 2,276
Return on Average Assets (ROA) -2.2% 1.4%
Return on Average Equity (ROE) 3.1% -2.0%
Capital to Total Assets -80.1% -72.6%
Non-Performing Loans (NPL) Ratio 0 0
Non-Performing Assets (NPA) Ratio 0 0
Earnings per Share (EPS) Php (0.02) Php 0.01
NIYOG PROPERTY HOLDINGS, INC. Audited
In Php 000s (Except EPS) 2021 2020
Net Income Php 22,490 Php 13,695
Return on Average Assets (ROA) 4.0% 2.3%
Return on Average Equity (ROE) 4.3% 2.4%
Capital to Total Assets 93.6% 93.1%
Non-Performing Loans (NPL) Ratio 0 0
Non-Performing Assets (NPA) Ratio 0 0
Earnings per Share (EPS) Php 16.17 Php 9.85

22
RCBC LEASING AND FINANCE CORP. and Subsidiary
Audited
In Php 000s (Except EPS) 2021 2020
Net Income (Loss) Php 147,883 Php (61,919)
Return on Average Assets (ROA) 1.3% -0.5%
Return on Average Equity (ROE) 6.8% -2.9%
Capital to Total Assets 17.4% 17.9%
Non-Performing Loans (NPL) Ratio 8.3% 11.2%
Non-Performing Assets (NPA) Ratio 5.4% 7.2%
Earnings (Loss) per Share (EPS) Php 0.05 Php (0.04)
CAJEL REALTY CORPORATION Audited
In Php 000s (Except EPS) 2021 2020
Net Loss Php (476) Php (119)
Return on Average Assets (ROA) -0.9% -0.2%
Return on Average Equity (ROE) -0.9% -0.2%
Capital to Total Assets 100.0% 100.0%
Non-Performing Loans (NPL) Ratio 0 0
Non-Performing Assets (NPA) Ratio 0 0
Loss per Share (EPS) Php (0.80) Php (0.20)
Notes to the Computations:
1. Consolidated and Parent Company ROA and ROE ratios were taken from the corresponding audited financial statements. ROA ratio of the subsidiaries was determined based on the average of the quarterly ending balances of total assets, audited and/or unaudited. ROE ratio of the subsidiaries was likewise computed based on the average of the quarterly ending balances of total equity, audited and/or unaudited.
2. CAR covers combined credit, market and operational risks. Where the Risk-based CAR was not computed, the simple Capital to Total Assets ratio formula was used.
3. NPL ratio is determined by using the following formula: (Total NPLs net of total specific provision for losses of NPLs) / (Total gross loan portfolio)
4. NPA ratio is determined by using the following formula: (Net NPLs + Gross ROPA + Non-performing SCR) / Gross Total Assets.
5. For some subsidiaries, the NPL/NPA ratios were not computed since these ratios were not applicable.
Key Variable and Other Qualitative and Quantitative Factors Plans for 2022
The 2022 plans are based on the recovery of the country from the impact of the 2021 lockdowns as a result of the COVID-19 variants (Alpha, Delta, and Omicron) and working to be a digital-centric bank in this new normal. The Bank will grow its deposits, mostly CASA, through cash management services and increasing the customer base via digital marketing capabilities. Asset quality will be managed through a tight and strict monitoring of accounts and improvement in credit and remedial systems and loan growth will be moderate and in selective segments. The 2022 strategy is anchored on customer acquisition; improve processes to deliver fast and efficient service and give the best customer experience; and to migrate more customers to the mobile app and digitize all our core products.

23
Note to Financial Statements as of March 31, 2022 Statement of Compliance with Generally Accepted Accounting Principles. The interim financial statements of the Bank have been prepared in accordance with the Philippine Financial Reporting Standards (PFRS)
See accompanying Notes to Interim Financial Statements for the detailed discussion of compliance with Generally Accepted Accounting Principles
Accounting Policies and Methods of Computation. See accompanying Notes to Interim Financial Statements for the detailed discussion of the accounting policies and methods of computation (Note 2)
Seasonality or Cyclicality of Interim Operations. Seasonal or cyclical events and/or conditions do not materially affect the year-round operations of the Bank.
Changes in Estimates of Amounts Reported. There were no changes in estimates of amounts reported in prior interim periods of the current financial year or in estimates of amounts reported in prior financial years
Issuances, Repurchases and Repayments of Debt and Equity Securities. On February 21, 2022, the Bank successfully listed its Php14.76 billion Series E ASEAN Sustainability Bonds (the ―Bonds‖) due 2024 with the Philippine Dealing and Exchange Corporation. The Bonds carry a coupon of 3.0% per annum with a tenor of two years and three months (2.25 years).
On January 31, 2022, the Board of Directors approved the issuance of US Dollar Senior Notes out of the balance of the Bank‘s USD3 billion Medium Term Note Programme.
On June 28, 2021, the Board of Directors approved the sale of 101,850,000 common shares held by the Bank in treasury (Sale Shares) to Sumitomo Mitsui Banking Corporation (SMBC) at a price per Sale Share of Php44.00 which will generate Php4.48 billion of new Core Equity Tier 1 capital for the Bank. On July 28, 2021, the Bank received Php4.48 billion capital infusion from SMBC due to its acquisition of 101.85 million common shares representing a 4.99% stake of the Bank.
On June 4, 2021, the Bank redeemed the Php8.0 billion ASEAN Bonds with a coupon rate of 6.15% per annum.
On March 31, 2021, the Bank raised Php17.873 billion through the issuance of the 2.5-year and 5.25-year fixed rate ASEAN Sustainability Peso Bond Offering. The bonds carry a fixed coupon rate of 3.2% and 4.18% per annum for the 2.5-year and 5.25-year tenor, respectively.
On February 2, 2021, the Bank redeemed the USD320.0 million or Php15.367 billion Senior Notes with coupon rate of 3.45%
Dividends Paid for Ordinary or Other Shares. In its meeting held on March 28, 2022, the Board of Directors approved the declaration and payment of cash dividends amounting to P0.6180 per share or a total of approximately P1,259,162.0 thousand and P165.3 thousand payable to holders of Common Class and Preferred Class shares, respectively, both paid on April 27, 2022. In its meeting held on February 28, 2022, the Board of Directors approved the declaration and payment of cash dividends amounting to P0.0553 per share or a total of approximately P14.8 thousand payable to holders of Preferred Class shares and paid on March 23, 2022. In its meeting held on January 31, 2022, the Board of Directors approved the declaration and payment of the cash dividends on the Bank‘s USD300 million Non-cumulative Hybrid Perpetual Securities at a dividend rate of 6.50% per annum or a total of USD9.8 million or approximately P497,445.0 thousand payable to holders of said Securities, which was paid on February 28, 2022. In its meeting held on November 29, 2021, the Board of Directors approved the declaration and payment of cash dividends amounting to P0.0537 per share or a total of approximately P14.6 thousand payable to holders of Preferred Class shares and paid on December 24, 2021.

24
In its meeting held on August 31, 2021, the Board of Directors approved the declaration and payment of cash dividends amounting to P0.0546 per share or a total of approximately P14.6 thousand payable to holders of Preferred Class shares and paid on September 24, 2021. In its meeting held on July 26, 2021, the Board of Directors approved the declaration and payment of the cash dividends on the Bank‘s USD300 million Non-cumulative Hybrid Perpetual Securities at a dividend rate of 6.50% per annum or a total of USD9.8 million or approximately P491,107.5 thousand payable to holders of said Securities, which was paid on August 26, 2021. In its meeting held on May 31, 2021, the Board of Directors approved the declaration and payment of cash dividends amounting to P0.0559 per share or a total of approximately P14.9 thousand payable to holders of Preferred Class shares and paid on June 25, 2021. In its meeting held on April 26, 2021, the Board of Directors approved the declaration and payment of cash dividends amounting to P0.4850 per share or a total of approximately P938,780.0 thousand and P129.7 thousand payable to holders of Common Class and Preferred Class shares, respectively, both paid on May 25, 2021. In its meeting held on February 22, 2021 the Board of Directors approved the declaration and payment of cash dividends amounting to P0.0560 per share or a total of approximately P15.0 thousand payable to holders of Preferred Class shares and paid on March 31, 2021. In its meeting held on February 22, 2021 the Board of Directors approved the declaration and payment of the first semi-annual cash dividends/distributions on the Bank‘s USD300 million Non-cumulative Hybrid Perpetual Securities at a dividend rate of 6.50% per annum or a total of USD9.8 million or approximately P472,397.3 thousand payable to holders of said Securities, which was paid on February 26, 2021. The details of the cash dividend approvals and distributions from 2021 up to March 31, 2022 are as follows (amounts in Thousand Php except per share figures):
Date Declared
Dividend Date Paid / Payable
Nature of Securities
Per Share Total Amount (in Thousand)
22-Feb-21 - P 472,397.3 26-Feb-21 Hybrid Perpetual Securities
22-Feb-21 P 0.0560 P 15.0 31-Mar-21 Convertible Preferred
26-Apr-21 P 0.4850 P 938,780.0 25-May-21 Common
26-Apr-21 P 0.4850 P 129.7 25-May-21 Convertible Preferred
31-May-21 P 0.0559 P 14.9 25-Jun-21 Convertible Preferred
26-Jul-21 - P 491,107.5 26-Aug -21 Hybrid Perpetual Securities
31-Aug-21 P 0.0546 P 14.6 24-Sep-21 Convertible Preferred
29-Nov-21 P 0.0537 P 14.4 24-Dec-21 Convertible Preferred
31-Jan-22 - P 497,445.0 28-Feb-22 Hybrid Perpetual Securities
28-Feb-22 P 0.0553 P 14.8 23-Mar-22 Convertible Preferred
28-Mar-22 P 0.6180 P 1,259,162.0 27-Apr-22 Common Stock
28-Mar-22 P 0.6180 P 165.3 27-Apr-22 Convertible Preferred
Note: In 2015, the BSP, through the monetary board, approved the liberalized rules for banks and quasi-banks on dividend declaration. The policy requires that dividend declaration be immediately recognized as a liability upon the approval of the BOD and that it be disclosed in the statement of changes in equity. Further, prior BSP approval is no longer required except for certain cases.

25
Material Events Subsequent to the End of the Interim Period Not Reflected in the Financial Statements. See accompanying Notes to Interim Financial Statements for the detailed discussion on the material events subsequent to the end of the interim period not reflected in the financial statements (Note 13). Changes in Composition of the Issuer During the Interim Period and Material Contingencies and Any Other Events or Transactions. There were no material changes in composition of the issuer during the interim period and material contingencies and any other events or transactions. Changes in Contingent Liabilities or Contingent Assets. There were no material changes in contingent liabilities or contingent assets since the last annual balance sheet date. Item 2. Management’s Discussion and Analysis of Financial Condition and Results of Operations. Financial Performance

26
Notes to the Computations:
1. Average assets for the consolidated and parent ratios were computed based on the 3-month average of end of month balances of total assets. Unaudited net income for the 3-month period ended March 31, 2022 in the amount of P2.1 billion represented the consolidated and parent.
2. Average equity for the consolidated and parent ratios were, likewise, computed based on the 3-month average of end of month balances. Unaudited net income for the 3-month period ended March 31, 2022 in the amount of P1.9 billion represented the consolidated and parent, net of dividends on Hybrid Perpetual Securities of P248.7 million.
3. NPL ratio is determined by using the following formula: (Total NPLs net of total specific provision for losses of NPLs) / (Total gross loan portfolio).
4. NPA ratio is determined by using the following formula: [Net NPLs + Gross Real and Other Properties Acquired (ROPA) + Non-performing SCR] / Gross Total Assets.
5. Excluding Interbank Loans
6. Total weighted average number of issued and outstanding common shares (diluted) were 2,037,537,205 shares as of March 31, 2022 and 1,979,217,811 shares as of December 31, 2021. The determined net income was net of dividends on Hybrid Capital Securities.
Statement of Condition 31 March 2022 vs 31 December 2021 RCBC‟s Total Assets stood at P961.7 billion. Cash and Other Cash Items decreased by 18.1% or P2.7 billion from P14.7 billion to P12.0 billion due to high level of cash requirements during long holiday at year-end. Due from BSP decreased by 39.2% or P51.0 billion from P130.2 billion to P79.2 billion due to lower level of Term Deposit and Demand Deposit Account, net of the increase in Overnight Deposit with the BSP as a result of redeployment of funds. Due from Other Banks decreased by 60.4% or P7.4 billion from P12.2 billion to P4.8 billion, mainly due to decrease in foreign bank placements as a result of redeployment of funds. Loans under Reverse Repurchase Agreement increased by 62.1% or P7.3 billion from P11.7 billion to P18.9 billion due to higher placements with the BSP. Total Investment Securities, representing 28.7% of Total Resources, increased by 25.7% or P56.4 billion from P219.2 billion to P275.6 billion attributable to the 30.2% or P49.4 billion increase in Investment Securities at Amortized Cost from P163.6 billion to P213.0 billion; 16.2% or P8.0 billion increase in Financial Assets at Fair Value Through Other Comprehensive Income (FVOCI) from P49.8 billion to P57.8 billion; net of the 18.3% or P1.1 billion decrease in Financial Assets at Fair Value Through Profit or Loss (FVTPL) from P5.9 billion to P4.8 billion. Loans and Receivables – net, remained at P538.3 billion. It represented 56.0% of Total Resources. Investment in Associates – net, increased by 4.6% or P15.9 million from P344.0 million to P359.9 million. Bank Premises, Furniture, Fixtures & Equipment – net, slightly decreased by 0.5% or P69.1 million from P12.7 billion to P12.6 billion.

27
Investment Properties – net, slightly declined by 2.8% or P98.5 million from P3.6 billion to P3.5 billion. Deferred Tax Assets (DTA) increased by 8.1% or P260.3 million from P3.2 billion to P3.5 billion mainly due to net DTA set-up during the period. Other Resources – net, decreased by 1.1% or P147.4 million from P13.1 billion to P13.0 billion. Deposit Liabilities were recorded at P675.3 billion and represented 70.2% of Total Resources. Demand deposits settled at 142.5 billion and accounted for 14.8% of Total Resources; Savings deposits at P227.2 billion and accounted for 23.6% of Total Resources; and Time deposits at P305.6 billion and accounted for 31.8% of Total Resources. Bills Payable decreased by 37.5% or P21.0 billion from P55.9 billion to P34.9 billion primarily due to maturities of foreign borrowings during the period. Bonds Payable increased by 17.6% or P15.3 billion from P87.2 billion to P102.5 billion attributable to the P14.8 billion Series E ASEAN Sustainability Bonds issuance in February 2022. Accrued Taxes, Interest and Other Expenses decreased by 5.2% or P315.7 million from P6.1 billion to P5.8 billion mainly due to the reversal of PDIC accruals paid in the first quarter of the year. Other Liabilities increased by 29.9% or P7.9 billion from P26.4 billion to P34.3 billion largely due to the increase in Bills Purchased Contra and set-up of Dividends Payable on common shares. Rizal Commercial Banking Corporation: March 2022 SEC Form 17-Q 34 Total Liabilities stood at P852.8 billion and represented 88.7% of Total Resources. Other Comprehensive Income was lower by 131.6% or P2.5 billion from loss of P1.9 billion to P4.5 billion due to the Net Unrealized Market Losses on Financial Assets at FVOCI securities brought about by rising interest rates. Total Capital Funds were recorded at P108.9 billion and accounted for 11.3% of Total Resources. Income Statement 31 March 2021 vs. 31 March 2022 Total interest income increased by 21.8% or P1.8 billion from P8.4 billion to P10.3 billion and accounted for 103.8% of total operating income. Interest income on loans and receivables increased by 7.3% or P549.9 million from P7.6 billion to P8.1 billion due to increase in average volume of loans and receivables year-on-year. It accounted for 82.0% of total operating income. Interest income on investment securities increased by 235.2% or P1.4 billion from P600.3 million to P2.0 billion as a result of the growth in volume and improvement in average yield; it accounted 20.3% of total operating income. Other interest income, on the other hand, decreased by 46.4% or P120.6 million from P259.8 million to P139.2 million due to the lower placements with the BSP. Total interest expense increased by 12.9% or P254.1 million from P2.0 billion to P2.2 billion and accounted for 22.4% of total operating income. Interest expense on deposit liabilities increased by 20.1% or P183.4 million from P913.4 million to P1.1 billion primarily due to the growth in average volume; it represented 11.1% of total operating income. Interest expense on bills payable and other borrowings settled at P1.1 billion, which increased by 6.7% or P70.7 million mainly due to the increase in average volume.

28
As a result, net interest income increased by 24.6% or P1.6 billion from P6.5 billion to P8.1 billion. The Group booked total Impairment Losses of P1.6 billion, higher by P616.8 million or 65.9% from P935.5 million as a result of the annual updating of expected credit losses (ECL) components and the implementation of the revised ECL framework. It represented 15.7% of total operating income. Other operating income stood at P1.8 billion. This accounted for 18.7% of total operating income and is broken down as follows:
Trading and securities gains and losses – net, increased by 441.9% or P155.9 million from a loss of P35.3 million to P120.6 million gain, mainly attributable to higher realized trading gains from FVTPL and derivative transactions. It accounted for 1.2% of total operating income;
Service fees and commissions decreased by 15.8% or P211.0 million from P1.3 billion to P1.1 billion mainly due to lower consumer loan-related fees. It represented 11.4% of total operating income;
Trust fees increased by 12.4% or P11.3 million from P90.5 million to P101.8 million due to significant increase in volume of managed funds;
Foreign exchange gains – net, were lower by 48.7% or P22.7 million from P46.5 million to P23.9 million mainly driven by the impact of foreign currency revaluation as peso weakens year-on-year;
Miscellaneous income increased by 16.5% or P68.1 million from P411.4 million to P479.5 million largely due to higher gain on sale of acquired assets and recoveries from written-off accounts.
Operating expenses were recorded at P5.9 billion from P5.7 billion. This accounted for 59.4% of total operating income, and broken down as follows:
Manpower costs settled at P1.6 billion and accounted for 16.0% of total operating income;
Occupancy and equipment-related expenses were recorded at P736.1 million and represented 7.4% of total operating income;
Taxes and licenses, which accounted for 9.8% of total operating income, increased by 23.7% or P186.6 million from P787.2 billion to P973.8 billion mainly due to higher gross receipt tax attributed to increase in gross revenues year-on-year and documentary stamp tax on account of growth in peso Time Deposits and bond issuances.
Depreciation and amortization went down by 8.5% or P68.0 million from P796.3 million to P728.3 million largely due to lower depreciation on ROPAs. It represented 7.4% of total operating income;
Tax expense increased by 207.5% or P219.5 million from P105.8 million to P325.2 million due to higher final tax on investment securities and higher regular corporate income tax. Net profit attributable to non-controlling interest settled at P190.8 thousand. Overall, net income increased by 35.5% or P561.3 million from P1.6 billion to P2.1 billion. There were no significant elements of income or loss that did not arise from the Bank‟s continuing operations. Commitments and Contingent Liabilities See accompanying Notes to FS for the detailed discussion of Commitments and Contingent Liabilities and the summary of contingencies and commitments arising from off-balance sheet items and their equivalent peso contractual amounts (Note 12).

29
There are also no known trends, events or uncertainties that have had or that are reasonably expected to have a material favorable or unfavorable impact on net sales/revenues/income from continuing operations. There were no material off-balance sheet transactions, arrangements, obligations (including contingent obligations), and other relationships of the company with unconsolidated entities or other persons created during the reporting period. Similarly, there were no significant elements of income or loss that did not arise from the Bank‟s continuing operations (C) Financial Statements
The consolidated financial statements have been prepared in conformity with Philippine Financial Reporting Standards and reflect amounts that are based on the best estimates and informed judgment of management with appropriate consideration to materiality. (Please see Annex B for the audited financial statements for 2021) If material;
(i) Commitments and Contingent Liabilities
In the normal course of operations of the Bank, there are various outstanding commitments and contingent liabilities such as guarantees, commitments to extend credit, tax assessments, claims from customers and third parties, etc., which are not reflected in the accompanying financial statements. Management does not anticipate losses from these transactions that will adversely affect results of operations. In the opinion of Management, the suits and claims arising from the normal course of operations of the Bank that remain unsettled, if decided adversely, will not involve sums that would have a material effect on Bank‘s financial position or operating results. These suits are specified in the Legal Proceedings portion of the Information Statement.
There are no known trends, demands, and commitments, events, or uncertainties that will have a
material impact on the Bank‘s operational performance and ability to service obligations.
Except for the above-mentioned proceedings, the Bank is not aware of any suits and claims by or
against it or its subsidiaries, which if decided adversely would have a material effect on its
financial position or operating results.
(ii) events that will trigger direct or contingent financial obligation that is material to the company; including any default or acceleration of an obligation To the knowledge and/or information of the Bank, there are no events that will trigger a direct or contingent financial obligation that is material to the company, including any default or acceleration of an obligation. (iii) all material off-balance sheet transactions, arrangements, obligations (including contingent obligations), and other relationships of the company with unconsolidated entities or other persons created during the reporting period The following is a summary of contingencies and commitments arising from off-statement of financial position items at their equivalent peso contractual amounts as of March 31, 2022 and December 31, 2021:

30
(iv) description of any material commitments for capital expenditures, general purpose of such commitments, expected sources of funds for such expenditures There were no material commitments for capital expenditures. (v) any known trends, events or uncertainties (material impact on sales) There are also no known trends, events or uncertainties that have had or that are reasonably expected to have a material favorable or unfavorable impact on net sales/revenues/income from continuing operations. (D) External Audit Fees External Audit Fees and Services. The Audit Committee is empowered to appoint the external auditor of the Group and pre-approve all auditing and non-audit services. It recommends to the Board the selection of external auditor considering independence and effectiveness and recommends the fees to be paid.. For the audit of the Bank‘s annual financial statements and services provided in connection with statutory and regulatory filings or engagements, the aggregate amount to be billed/billed, excluding out-of-pocket expenses, by its independent accountant amounts/amounted to P12.35 million and P12.02 million for 2021 and 2020, respectively. Additionally, approximately P3.54 million was paid for other services rendered by the independent accountant in 2021. The audit fees already incorporate fees for tax accounting, compliance, advice, planning and any other form of tax services rendered by the external auditor. There is no separate breakdown of tax fees since the tax compliance procedures are normal/recurring procedures conducted by the external auditor during their year-end audit and is not engaged separately by the Bank from the annual financial statements audit. As for non-audit services and other fees, these pertain only to the quarterly financial statements review.

31
Changes in and Disagreements With Accountants on Accounting and Financial Disclosure. In connection with the audits of the Bank‘s financial statements for the two (2) most recent years ended December 31, 2021 and 2020, there were no disagreements with Punongbayan and Araullo on any matter of accounting principles or practices, financial statement disclosures, audit scope or procedures. The Audit and Compliance Committee approved the policies and procedures for the above services. (F) Brief Description of the General Nature and Scope of Business of RCBC and its Subsidiaries Rizal Commercial Banking Corporation (RCBC or the Bank) is a universal bank in the Philippines that provides a wide range of banking and financial products and services. It has total resources of P959.1 billion and total networth of P111.1 billion, including minority interest, as of end-December 2021. The Bank ranked sixth (6
th) in terms of assets among private local banks. In
terms of business centers, the Bank, excluding government-owned and foreign banks, ranked seventh (7
th) with a consolidated network of 434 business centers inclusive of 6 extension offices
and supplemented by 1,245 automated teller machines (ATMs) as of December 31, 2021. The Bank offers commercial, corporate and consumer lending products, cash management products, treasury products, remittance services as well as digital and mobile banking services. RCBC also enters into forward currency contracts as an accommodation to its clients and as a means of managing its foreign exchange exposures. The Bank and its subsidiaries (hereinafter referred to as the Group) are engaged in all aspects of traditional banking, investment banking, retail financing (auto, mortgage/housing loans, credit cards and microfinance loans), remittance, leasing, foreign exchange and stock brokering. The Bank, incorporated under the name Rizal Development Bank, began operations as a private development bank in the province of Rizal in 1960. In 1963, the Bank received approval from the Central Bank of the Philippines to operate as a commercial bank and began operations under its present name, Rizal Commercial Banking Corporation. RCBC obtained its universal banking license in 1989 and has been listed on the Philippine Stock Exchange Inc. (PSE) since 1986. RCBC‘s common shares are 39.64% directly and indirectly owned by Pan Malayan Management and Investment Corporation (PMMIC), a company incorporated and domiciled in the Philippines. PMMIC is the holding company of the flagship institutions comprising the Yuchengco Group of Companies (YGC) and other investments. Another significant investor is Cathay Life Insurance Co. Ltd., a wholly-owned subsidiary of Cathay Financial which is the largest publicly listed financial holding company in Taiwan. The registered address of RCBC is Yuchengco Tower, RCBC Plaza, 6819 Ayala Avenue, Makati City. Through its universal banking license, the Bank is allowed to perform a number of expanded commercial and investment bank functions and to invest in the equity of a variety of allied and non-allied financial and non-financial undertakings. The Bank‘s subsidiaries are as follows: RCBC Capital Corporation (RCBC Capital), a 99.96% owned subsidiary, was established in 1974 as the Bank‘s investment banking subsidiary. It offers a complete range of investment banking and financial consultancy services which include (i) the underwriting of equity, quasi-equity and debt securities on a firm or best effort basis for private placement or public distribution; (ii) the syndication of foreign currency or peso loans; and (iii) financial advisory services.

32
RCBC Securities, Inc. (RCBC Securities), a wholly-owned subsidiary of RCBC Capital, is engaged in the electronic and traditional trading of listed securities and in providing corporate and market research. RCBC Bankard Services Corporation (RCBC Bankard), a wholly-owned subsidiary of RCBC Capital is engaged in providing services to the credit card business of the Bank.
RCBC Forex Brokers Corporation (RCBC Forex), a wholly-owned subsidiary of the Bank, was incorporated in 1998. RCBC Forex is primarily engaged in dealing and brokering currencies in foreign exchange contracts with local and international clients. The Company is registered to operate as a money changer/ foreign exchange dealer with a Type ―E‖ registration (as an authorized agent bank‘s subsidiary foreign exchange corporation) under the regulatory supervision of the Bangko Sentral ng Pilipinas. The Company deals with money changers, foreign exchange dealers and remittance agents.
RCBC International Finance Limited (RCBC IFL), a wholly-owned subsidiary of the Bank, was established on July 31, 1962 and is the Bank's overseas branch in Hong Kong. RCBC Investment Ltd. (RCBC IL) is a 100% owned subsidiary of RCBC IFL established on August 1, 1980 to engage in the business of remittance, money exchange, retail lending and investment. RCBC IL was placed under dormant status in May 2009 and RCBC IFL took over its businesses using the Money Service Operator's (MSO) and Money Lender's (ML) Licenses Rizal Microbank, Inc. – A Thrift Bank of RCBC (formerly Merchants Savings and Loan Association, Inc.), a 98.03% owned subsidiary, was acquired on May 15, 2008 to engage in microfinancing and development of small businesses. Rizal Microbank has 16 branches and 2 branch lite offices with operations in Southern Luzon and Mindanao. Rizal Microbank moved its Head Office (HO) and branch from Makati City to Davao City in April 2011. RCBC Leasing and Finance Corporation (formerly First Malayan Leasing and Finance Corporation) (RCBC LFC), a 99.67% owned subsidiary of the Bank acquired in March 2012, is a pioneer in the leasing and financing industry in the Philippines as the company started its operations in 1957. RCBC LFC is a non-bank financial institution with a quasi-banking license granted by the Bangko Sentral ng Pilipinas (BSP). It serves the requirements of corporate, commercial and consumer markets through its innovative loans, leases and investment products. RCBC Rental Corporation is a wholly-owned subsidiary of RCBC LFC engaged in renting and leasing business machines, transport vehicles and heavy equipment under an operating lease arrangement. Niyog Property Holdings, Inc. (NPHI), and Cajel Realty Corporation (CRC) are wholly-owned subsidiaries of the Bank, incorporated on September 13, 2005 and February 29, 2008, respectively to purchase, subscribe for or otherwise dispose of real and personal property of every kind and description but not as an investment company. RCBC-JPL Holding Company, Inc. (formerly Pres. Jose P. Laurel Rural Bank, Inc.) (RCBC-JPL), 99.41% owned, was renamed with a corresponding change in primary business to handle the disposition of the remaining assets of the former JPL Rural Bank. On April 1, 2012, RMB acquired selected assets and liabilities of JPL Rural Bank.

33
(G) Directors and Executive Officers The directors of the Company are elected at the annual stockholders‘ meeting to hold office until the next succeeding annual meeting and until their respective successors have been elected and qualified. Incumbent directors are: Name Age Position Inclusive Dates Citizenshi
p
Helen Y. Dee 78 Director March 28, 2005 to present Filipino
Chairperson of the Board June 27, 2007 to present
Interim President and Chief Executive Officer
March 23, 2016 to June 30, 2016
Cesar E. A. Virata 91 Director 1995 to present Filipino
Corporate Vice-Chairman June 22, 2000 to present
Acting Chief Executive Officer
January 28, 2002 to June 29, 2003
Chief Executive Officer June 30, 2003 to June 28, 2004
Eugene S. Acevedo 58 Director July 1, 2019 to present Filipino
President and Chief Executive Officer
July 1, 2019 to present
Deputy Chief Executive Officer
January 2, 2019 to June 30, 2019
Gil A. Buenaventura 69 Director July 1, 2016 to present Filipino
President and Chief Executive Officer
July 1, 2016 to June 30, 2019
Armando M. Medina 72 Director January 1, 2021 to present Filipino
Independent Director Feb. 26, 2003 to December 31, 2020
John Law 71 Director April 27, 2015 to present French & Taiwanese (dual citizen)
Shih-Chiao (Joe) Lin 50 Director March 25, 2019 to present R.O.C.
Arnold Kai Yuen Kan 61 Director June 24, 2019 to present Canadian
Lilia B. De Lima 81 Director June 24, 2019 to present Filipino
Independent Member of the Advisory Board
July 3, 2017 to June 23, 2019
Gayatri P. Bery 56 Independent Director July 27, 2020 to present American
Juan B. Santos 83 Independent Director Effective July 1, 2016 (assumption of office is on November 2, 2016) to present
Filipino
Adelita A. Vergel De Dios
75 Independent Director June 27, 2016 to present Filipino
Gabriel S. Claudio 67 Independent Director July 25, 2016 to present Filipino
Vaughn F. Montes, PhD
71 Independent Director September 26, 2016 to present (appointed on July 25, 2016)
Filipino
Laurito E. Serrano 61 Independent Director March 20, 2019 to present Filipino
Regular Directors
Ms. Helen Y. Dee is the Bank‘s Chairperson. Ms. Dee is also the Chairperson of House of Investments, Inc, EEI Corporation, Petroenergy Resources Corp, all of which are PSE-listed companies. She is also the Chairperson of Pan Malayan Management and Investment Corporation, Malayan Insurance Co.Inc., Landev Corporation, Hi-Eisai Pharmaceutical Inc., Malayan Educational Systems, Inc. and Manila Memorial Park Cemetery. Among the top companies where she holds a directorship position are Philippine Long Distance Telephone

34
Company and Sun Life Grepa Financial, Inc. She graduated from Assumption College with a Bachelor of Science degree in Commerce and completed her Master‘s in Business Administration at De La Salle University.
Mr. Cesar E. A. Virata has been a Director since 1995, Corporate Vice Chairman since June 2000 and Senior Adviser from 2007. Mr. Virata‘s roster of companies where he is also a Director and/or Chairman includes RCBC Realty Corp., RCBC Land, Inc., Malayan Insurance Co., Inc., Business World Publishing Corporation, Luisita Industrial Park Corporation, RCBC Bankard Services Corporation, and AY Foundation, Inc., among others. Mr. Virata has held important/key positions in the Philippine government, including Prime Minister, Secretary/Minister of Finance, Chairman of the Committee on Finance of the Batasang Pambansa (National Assembly) and member of the Monetary Board. He was also Chairman of the Land Bank of the Philippines. He has served as Governor for the Philippines to the World Bank, the Asian Development Bank and the International Fund for Agriculture Development. He was Chairman of the Development Committee of the World Bank and International Monetary Fund from 1976 to 1980 and Chairman of the Board of Governors of the Asian Development Bank. Prior to his Government positions, he was a Professor and Dean of the College of Business Administration of the University of the Philippines and Principal, SyCip Gorres Velayo and Company, Management Services Division. Mr. Virata has also held membership in various international committees/fora in the past, including: Bretton Woods Committee, Group of 30, Institute of International Finance, Rockefeller Tripartite Commission for Asia, Davos Forum, and ADB Forum. Mr. Virata graduated from the University of the Philippines with degrees in Mechanical Engineering and Business Administration (Cum Laude). He completed his Master‘s in Business Administration from the Wharton Graduate School, University of Pennsylvania. Mr. Eugene S. Acevedo is the Bank‘s President and Chief Executive Officer. He has over thirty years (30) years of banking experience gained from local and multinational banks including Union Bank of the Philippines, CitySavings Bank, Philippine National Bank, and Citibank Philippines, N.A. He is a Magna Cum Laude graduate from the University of San Carlos where he earned a degree in Bachelor of Science in Physics in 1984. He has a Master‘s degree in Business Administration from the Asian Institute of Management and completed an Advanced Management Program at the Harvard Business School. He also holds a Professional Certificate in Clean Power from the Imperial College London. Mr. Gil A. Buenaventura has been a Director of the Bank since July 2016 and has since been sitting as a member of the Bank‘s Executive Committee. He was also President and Chief and Executive Officer of the Bank until June 30, 2019. He holds directorship and officership positions in De La Salle Philippines School System, Malayan Insurance Company, Inc., House of Investments, Inc., and Manila Memorial Park Cemetery, Inc. He graduated with a Bachelor of Arts degree, major in Economics, from the University of San Francisco, California, and with a Master‘s of Business Administration in Finance from the University of Wisconsin. Mr. Armando M. Medina was an Independent Director of the Bank from 2003 to 2020. He became a regular director of the Bank starting January 1, 2021. He is a member of the Bank‘s Executive Committee. He is also an Independent Director of Malayan Insurance. He served as an Independent Director of RCBC Capital Corporation until December 31, 2020. He graduated from De La Salle University with a Bachelor of Arts degree in Economics and a Bachelor of Science degree in commerce with a major in Accounting. Mr. John Law has been a Director of the Bank since April 2015. He is also currently a Director of Far East Horizon Ltd. in Hong Kong and Khan Bank in Mongolia. He served as Senior Advisor for Greater China for Oliver Wyman until his retirement as of December 31, 2020. He holds a Bachelor of Science degree, major in Psychology, from Chung Yuan University in Taiwan; a Master‘s of Business Administration degree from Indiana University; and a Master‘s of Arts degree, major in Poetry, from the University of Paris, France.

35
Mr. Shih-Chiao (Joe) Lin has been a Director of the Bank since March 25, 2019. He has been with Cathay Life Insurance for over 20 years and is currently an Executive Vice President there. He graduated with a Bachelor‘s degree in Business Administration from the National Chengchi University and holds an MBA from the National Taiwan University. Mr. Arnold Kai Yuen Kan has been a Director of the Bank since June 24, 2019. He gained experience from Citibank, the First National Bank of Chicago, the National Westminster Bank, JP Morgan Chase Bank, Credit Agricole Corporate & Investment Bank, and Krea Capital Limited. He is currently the Chief Executive of Cathay United Bank‘s Hong Kong Branch and Co-Head of the International Banking Group. He graduated with a Bachelor of Social Sciences degree from the University of Hong Kong and obtained a Master‘s degree in Business Administration from the York University in Canada.
Atty. Lilia B. De Lima has been has been a Director of the Bank since June 24, 2019. She was an Independent Member of the Bank‘s Advisory Board from July 3, 2017 to June 24, 2019. Prior thereto, she served as the Director General of PEZA from 1995 to 2016. Other positions she has held include being Board Member of the Cagayan and Zamboanga Economic Zones, Commissioner of the National Amnesty Commission, Executive Director of the Department of Trade and Industry Price Stabilization Council and Director of the Bureau of Trade, and Chief Operating Officer of the World Trade Center Manila. She was an Elected Delegate to the 1971 Constitutional Convention representing the 2
nd District of Camarines Sur. She is the recipient of
numerous local and international awards including the 2017 Ramon Magsaysay Award, The Order of the Rising Sun-Gold and Silver Star (Japan), The Outstanding Women in the Nation‘s Service (TOWNS) in the field of law, and the 2010 Management Man of the Year.
Ms. Gayatri P. Bery has been a Director of the Bank since July 27, 2021. She gained experience from Drexel Burnham & Lambert (New York), Ranieri & Company (New York), Morgan Stanley & Co. Incorporated (New York), being an investment advisor in Hong Kong, and being a member of the Steering Committee of Morgan Stanley‘s HK Women‘s Business Alliance Team. She also served as Chief Operating Officer, Global Capital Markets - Asia Pacific, Morgan Stanley (Hong Kong). She graduated with a Bachelor of Science degree in Applied Mathematics/Computer Science from the Carnegie Mellon University, and obtained a Master of Business Administration (with concentrations in Finance and International Business) from the Columbia Business School (New York).
Independent Directors Mr. Juan B. Santos has been an Independent Director of the Bank since November 2016. He serves as Lead Independent Director of the Bank. He holds director, trustee, and advisory positions in various companies as detailed below. Prior to joining the Bank, he was the Chairman of the Social Security Commission. He served briefly as Secretary of Trade and Industry and was CEO and Chairman of Nestle Philippines, Singapore, and Thailand. He also served as Director of various publicly listed companies, including the Philippine Long Distance Telephone Company, Philex Mining Corporation, San Miguel Corporation, Equitable Savings Bank, Inc., and PCI Leasing and Finance, Inc. He holds a Bachelor of Science in Business Administration degree from the Ateneo de Manila University and a degree in Foreign Trade from the Thunderbird School of Management in Arizona, USA. He completed his Advanced Management Course at the International Institute for Management Development in Lausanne, Switzerland. Atty. Adelita A. Vergel De Dios has been an Independent Director of the Bank since June 2016. She was also an Independent Director of RCBC Savings Bank before the merger of the same into RCBC. She served as Commissioner of the Insurance Commission and held directorship and officership positions in various companies. She obtained her Bachelor of Business Administration and Accounting and Bachelor of Laws (Magna Cum Laude) from the University of the East. She is a Certified Public Accountant and a Member of the Integrated Bar of the Philippines.

36
Mr. Gabriel S. Claudio has been an Independent Director of the Bank since July 2016. He has
directorships in Ginebra San Miguel, Incorporated, Risk & Opportunities Assessment
Management, Conflict Resolution Group Foundation (CORE), Toby‘s Youth Sports Foundation,
and the Philippine Amusement and Gaming Corporation (PAGCOR). He served as political
adviser to former presidents Fidel V. Ramos and Gloria Macapagal-Arroyo and held various
positions in the Cabinet and government including: Presidential Political and Legislative Adviser,
Chief of the Presidential Legislative Liaison Office, Cabinet Officer for Regional Development for
Eastern Visayas, and Acting Executive Secretary. He also previously served as Chairman of the
Board of Trustees of the Metropolitan Water and Sewerage System, Director of the Development
Bank of the Philippines, and Director of the Philippine Charity Sweepstakes Office. He holds an
AB Communication Arts degree from the Ateneo de Manila University.
Mr. Vaughn F. Montes, Ph.D has been an Independent Director of the Bank since September
2016. He is a Teaching Fellow on Corporate Governance courses at the Institute of Corporate
Directors. He is a Director of the Center for Excellence in Governance, and President of the
Center for Family Advancement. He is a national consultant for Risk Management to the NEDA
PPP Center under an ADB technical assistance grant. He is a Trustee and Founding Fellow of
the Foundation for Economic Freedom. He is also currently a Trustee at Parents for Education
Foundation (―PAREF‖), and Chairman and President at PAREF Southridge School for Boys. He
worked in Citibank over a period of 25 years in various capacities including: Senior Economist in
Philippine Debt Restructuring Committee; Head of the International Corporate Finance Unit; and
Director and Head of Public Sector. He worked as an Associate Economist at the Wharton
Econometric Forecasting Associates in Philadelphia USA. He holds an AB (Bachelor of Arts)
Economics degree from the Ateneo de Manila University, an MS (Master of Science) Industrial
Economics degree from the Center for Research and Communications (now University of Asia
and the Pacific), and a PhD in Business Economics from the Wharton Doctoral Programs,
University of Pennsylvania, USA.
Mr. Laurito E. Serrano has been an independent director of the Bank since March 20, 2019. Mr. Serrano was part of the Audit & Business Advisory Group and a partner of SGV & Co - Corporate Finance Consulting Group before joining companies in general finance and special project functions. He is currently in the financial advisory practice with clients mostly in the private sector and has over 30 years of experience in the management and execution of engagements involving fund raising, business/asset acquisitions, public offerings, securitization, and project development works. His past experience also includes, among others, directorships in Metro Global Holdings Group, Metro Rail Transit Group, Travellers Hotels Philippines, Inc. (Resorts World), MJCI Investments, Inc., United Paragon Mining Corp., Sagittarius Mining Corporation, APC Group, Inc., and Philippine Veterans Bank. Mr. Serrano holds a Bachelor of Science degree in Commerce (Major in Accounting) from the Polytechnic University of the Philippines and has a Masters in Business Administration degree from the Harvard Graduate School of Business. The names, ages and positions of all incumbent executive officers (including those who retired/resigned after the 2021 Annual Stockholders‘ Meeting) are as follows: Redentor C. Bancod, 58, Filipino, Senior Executive Vice President, is the Bank‘s Chief of Staff, Head Operations Group, and Head of the IT Shared Services Group. He was appointed on 1 July 2018 as concurrent Head of the Operations Group of the Bank. He was also designated as Chief of Staff on 2 November 2017. Prior to assuming these roles, he was the Head of IT Shared Services & Operations Group and the concurrent Head of Digital Banking Group before assuming his current role. Previously, he was Vice-President & General Manager, Central Systems Asia of Sun Life Financial, Asia and Senior Vice-President and Chief Technology Officer of Sun Life Of Canada (Philippines) Inc. from October 2003 to 2007; Senior Vice-President & Chief Information Officer of Equitable Bank from July 1996 to September 2003; Assistant Vice-President and Head of Applications Development in Far East Bank from October 1993 to June 1996; Assistant Vice-President of Regional Operations (Asia Pacific) of Sequel Concepts, Inc. U.S.A/Ayala Systems

37
Technology Inc. from November 1992 to September 1993; Project Manager in Union Bank of Switzerland, NA from April 1988 to November 1992; and Chief Designer and Technical Adviser in Computer Information System Inc. from March 1984 to April 1998. He obtained his Bachelor of Arts degree in Philosophy from the University of the Philippines and is a candidate for a Master of
Science degree in Information Management from the Ateneo de Manila University. Horacio E. Cebrero III, 60, Filipino, Senior Executive Vice-President, is the Treasurer/Head of Treasury Group. Prior to joining RCBC in November 5, 2018, he was connected with the Philippine National Bank where he was the Treasury Head, a role which he handled since July 2010. He was previously employed by East West Banking Corporation where he worked as Treasurer from August 2006 to July 2010. He also worked in RCBC in 2004 until 2006 as Deputy Treasurer. He had stints with other firms as follows: Citibank N.A. (Manila) as Chief Dealer; Asian Bank Corporation as Vice President for Treasury Group, AB Capital and Investment House as Manager for Financial Markets; Anscor Capital and Investment House as Manager for Financial Markets, Asian Savings Bank as Manager for Trust and Investments Division; Asia Trust Development Bank as Account Officer; and at Far East Bank & Trust Company as Account Supervisor for Branch Treasury Marketing and Loans & Credit Analyst for Loans and Credit Department. He also held directorships in various firms as follows: PNB Europe as Chairman from January 2016 to November 2018; PNB Capital and Investment Corporation as Director from July 2016 to November 2018; PNB Forex Corporation as Director from August 2014 to 2017; and AIG Philam Savings Bank as Director from March 2009 to September 2009. He graduated with a degree in Bachelor of Science in Commerce major in Marketing Management in 1983 at De La Salle University in Manila. He earned some units in Master of Business Administration at the Graduate School of Business Economics of the same university. He attended and finished Stanford Senior Executive Leadership Program (SSELP), an advance 5-part Executive Education Course Series in Stanford University at Arthur and Toni Rembe Rock Center Hong Kong in December 2017. (Retirement effective March 4, 2022). John Thomas G. Deveras, 59, Filipino, Senior Executive Vice-President, is the Head of Asset Management & Remedial Group and Strategic Initiatives. Initially, he was the Strategic Initiatives Head when he joined RCBC in 2007 but was appointed as Head of Asset Management & Remedial Group in October 2015. Prior to joining the Bank, he was an Investment Officer at International Finance Corporation. He also worked for PNB Capital and Investment Corporation as President and PNB Corporate Finance as Senior Vice-President. He obtained his Bachelor of Science degree in Management Engineering from the Ateneo de Manila University and earned his Masters in Business Administration from the University of Chicago. Richard C. Lim, 53, Filipino, Executive Vice President, is the Head of Retail Banking Group effective September 14, 2018. Prior to this, he was seconded to RCBC Savings as Chief Operating Officer. Mr. Lim previously worked with Maybank Inc. Last position he held in the said bank was as Head of Retail Banking. He also handled the following roles in the said bank: Head of Retail Marketing Management, Assistant Vice President for Cash Management Services, Head of Consumer Sales Department, and Cluster Head for Binondo Manila area. He also had stints with other banks namely , Philam Bank -AIG where he worked as Manager for Binondo Branch, International Exchange where he functioned as Assistant Manager/ Sales Officer, Banco De Oro where he was a Marketing Officer, Urban Bank where he performed the role of a Marketing Associate, and Chinabank where he was designated as Officer‘s Assistant at Cash Department. He graduated from the University of Santo Tomas in 1991 with a degree in Bachelor of Science major in Biology. Angelito M. Villanueva, 50, Filipino, Executive Vice President, is the Bank‘s Chief Innovation and Inclusion Officer/ Head of Digital Enterprise and Innovations Group. Prior to joining RCBC, he pioneered the financial technology business in firms such as PLDT Group and was among the founding executives of PayMaya wallet. He was the Managing Director of FINTQnologies Corp, the financial technology (FinTech) arm of Voyager Innovations from June 2013 to March 31, 2019. He was also a Member of the Board of Directors in FINTQnologies (June 2017 to March

38
2019) and FINTQSurelite Insurance Agency (June 2017 to March 2019). His previous stints include the following roles in various institutions and organizations : Founder and Lead Convenor of KasamaKa Financial Inclusion Movement (September 2017 to March 31, 2019); Head, Customer Strategy and Market Activation, Visa, Nov 2011 – Jan 2013; Short-term Consultant on Mobile Money Transfer in Mongolia at IFC World Bank Group, Aug 2011 – Dec 2011; Monitoring and Evaluation (M&E) Consultant at Department of Social Welfare and Development-World Bank, March 2011 – February 2012; VP and Head, Mobile Financial Services - Smart Communications, Inc., Feb 2007 – Jan 2009; Regional Manager for Marketing and Special Projects for APAC and EMEA at BCD Travel 2003 – 2006; Executive Director and VP at Luntiang Pilipinas (Green PH) Foundation, Inc. 2000 – 2003; Chief of Division, Overseas Correspondent Banking Department, Global Banking Group at Land Bank of the Philippines, 1995 – 2000; Senior Research Associate and Associate Editor at Economist Intelligence Unit (EIU) Phils. 1993 – 1995. Mr. Villanueva graduated from the University of Santo Tomas in 1992 with a degree in Bachelor of Arts in Political Science. He completed a Master in National Security Administration at the National Defense College of the Philippines in 2000. He also finished his Master in Public Administration as Magna Cum Laude at the University of Santo Tomas in 2000. Emmanuel T. Narciso, 60, Filipino, Executive Vice President, is the Group Head of Global Transaction Banking. Prior to joining RCBC, he was the Group Head of Transaction Banking in Banco de Oro Unibank, Inc. from June 2011 to August 2015. He was also previously connected with the Hongkong and Shanghai Banking Corporation, where he handled the following roles: Head of Business Banking Division (Philippines), Head of Payments and Cash Management for Vietnam and Philippines. He also worked for Security Bank Corporation as Head of Corporate Transaction Banking Division and Citibank N.A. where his last appointment was as Business Development Head for Global Transaction Services. Mr. Narciso started his career in the banking industry when he was hired by the Bank of the Philippine Islands as an Analyst/Programmer in 1984. He obtained his Bachelor of Arts in Economics from the Ateneo de Manila University in 1984 and finished his Master in Business Management from the Asian Institute of Management in 1989. Ma. Christina P. Alvarez, 51, Filipino, First Senior Vice-President, is the Head of Corporate Planning Group. Prior to assuming this position, she was the OIC of Corporate Planning Group from October to December 2014 and the Financial Planning and Development Division Head from August 2006 to September 2014. She worked with various institutions in the following capacities: Financial Planning Officer at Banco de Oro from July 2005 to July 2006, Corporate Planning Officer at RCBC from 1999 to 2005, Risk Management and Planning Officer of Malayan Bank from 1998 to 1999, Research Officer of Unicapital, Inc. from 1995 to 1996 and Credit/Financial Analyst of Multinational Investment Corporation from 1991 to 1995. Ms. Alvarez graduated from Ateneo de Manila University in 1991 with a Bachelor of Arts degree in Management Economics. She earned her Masters in Business Management degree from the Asian Institute of Management in 1998. Marita E. Bueno, 53, Filipino, First Senior Vice President, is the Head of Data Science and Analytics Group. She has over twenty-four (24) years of professional experience and her expertise are in the fields of data analytics and predictive modeling, risk management, program management, credit management, credit policy development and implementation, and portfolio risk management. Prior to joining RCBC, she was previously connected with Union Bank of the Philippines where she was the Head of Data Science and Analytics Group, a role which she handled since August 2015. By April 2018, she was appointed to concurrently handle the same role in Aboitiz Equity Venture. Ms. Bueno also had previous stints with other banking/financial firms such as Citibank and JP Morgan Chase. She started her banking career with Citibank in 1994 as an Analyst for Credit Acquisitions Direct Mail Processing. She handled other roles such as Project Manager for Credit Card Acquisitions Preapproved Direct Mail Processing; Unit Manager for Credit Acquisitions; Senior Credit Analyst and Vice President for Portfolio Risk Management; Vice President for Existing Cardmember Marketing; Vice President for Travel & Leisure Acquisitions Risk Management (New York); Vice President for Regional Decision

39
Management (Singapore); Chief of Staff, Regional Risk Management (Hong Kong). Her last position in the said bank was as Regional Director/Credit Products Analytics Head, Regional Decision Management (Singapore). During her employment with JP Morgan Chase, she handled the following roles: Scored Underwriting Policy Manager/Vice President for Small Business Financial Services Risk Management and Vice President for Credit Policy and Account Management for Overdraft Line of Credit and Loans. She is a Magna Cum Laude graduate of St. John‘s University in New York where she earned a Bachelor of Science degree in Computer Science in 1991. She finished Master of Business Administration on Quantitative Analysis in the same university in 1994. Elizabeth E. Coronel, 53, Filipino, First Senior Vice-President, is the Head of Corporate Banking Group. She joined RCBC in June 2013 as Senior Banker and Head of Conglomerate Banking Division and was assigned as Segment Head of Conglomerates and Global Corporate Banking, a role which she performed on August 2014 until she was appointed as Group Head in June 2018. Previously, she was the Senior Vice-President and Chief Operations Officer of Equicom Savings Bank, a position she held for more than five years. She also held various positions in local and foreign banks namely Mizuho Corporate Bank as Vice President and Co-Head of Corporate Finance Department (January 2007 to February 2008), Equitable PCIBank as Vice-President and Head of Corporate Banking Division 4 (1996 to 2007) and Citibank as Relationship Manager of Global Consumer Bank (1993 to 1996). She started her career in the banking industry when she joined RCBC in 1989 as Marketing Assistant for Corporate Banking. Ms. Coronel obtained her Bachelor of Arts degree in Behavioral Science from the University of Santo Tomas and earned MBA units from the Ateneo Graduate School of Business. She also completed the Mizuho-ICS (MICS) Mini-MBA program at Hitotsubashi University Graduate School of International Corporate Strategy. George Gilbert G. dela Cuesta, 54, Filipino, First Senior Vice President, is the Group Head of the Legal Affairs Group and the Bank's Corporate Secretary. He joined RCBC in November 2016. Previously, he was General Counsel Asian Terminals Inc. He previously worked also as General Counsel for Hanjin Heavy Industries & Construction Co. Ltd. and for Mirant (Phils) Corporation. He had previous consultancy engagements and employment with Follosco Morallos & Herce Law Office, PNOC-EDC and at the Department of Environmental and Natural Resources. He started his career at Quisumbing and Torres. Atty. dela Cuesta graduated from the University of the Philippines in 1988 with a degree in Bachelor of Arts major in Political Science (cum laude). He earned his Law degree from the same university in 1992. Brent C. Estrella, 38, Filipino, is the Chief Compliance Officer and Head of Regulatory Affairs Group effective December 2, 2020. He has 16 years of compliance and risk management experience which he gained from the Hong Kong and Shanghai Banking Corporation (HSBC) across various jurisdictions in Southeast Asia (the Philippines), the Middle East (UAE) and Sub Saharan Africa (Mauritius). He is a Certified Anti-Money Laundering Specialist, with broad experience in supporting multiple lines of business specifically Wealth and Personal Banking, Commercial Banking, and Global Banking and Markets. Prior to joining RCBC, he was the Senior Vice President and Country Head for Financial Crime Compliance and an Executive Committee member at Hong Kong and Shanghai Banking Corporation (HSBC) – Philippines.. He has handled this role since October 2018. He handled other positions prior his current post as follows: HSBC Mauritius (April 2016 to October 2018) as Chief Compliance Officer/Executive Committee Member; HSBC United Arab Emirates (December 2012 to April 2016) as Country Head of AML and UAE Money Laundering Reporting Officer, Regional Manager, Global Banking and Markets Compliance Advisory; HSBC Philippines (September 2004 to December 2012) as Vice President, Compliance & Money Laundering Control Officer, Assistant Vice President, Fraud Risk Management, Security and Fraud Risk, Supervisor, Legal and Compliance, and Compliance Staff for Legal and Compliance. He graduated with a degree in Bachelor of Science in Legal Management (Academic Scholar) at the Ateneo De Manila University in 2004.

40
Florentino M. Madonza, 51, Filipino, First Senior Vice-President, is the Head of Controllership Group effective October 14, 2014. He was the Deputy Group Head of Controllership from August 2014 to October 2014, General Accounting and Services Division Head from July 2004 to July 2014, General Accounting Department Head from September 2001 to July 2004, Assistant to the Department Head of General Accounting from January 1998 to September 2001, Asset Management and Sundry Section Head from September 1997 to December 1997 and Corporate Disbursement and Payroll Section Head from June 1996 to September 1997. Prior to joining the Bank, he worked for Sycip, Gorres, Velayo and Co. from July 1993 to May 1996 as Auditor. Mr. Madonza completed his Bachelor of Science in Commerce major in Accounting (Cum Laude) from the Araullo University, and is a Certified Public Accountant. Yasuhiro Matsumoto, 63, Japanese, First Senior Vice-President, is the Head of Global and Ecozone Segment and concurrently, Head of the Japanese Business Relationship Office. Prior to this, he worked for The Bank of Tokyo-Mitsubishi UFJ, Ltd. since 1984, when the bank was named The Sanwa Bank, Ltd. He has also previously served as a director of the Bank. He obtained his Bachelor of Economics degree from Waseda University, Japan. (Retirement effective April 1, 2022). Alberto N. Pedrosa, 52, Filipino, First Senior Vice President, is currently the Treasurer and Head of Treasury Group. Prior to his appointment to this role on 04 March 2022, He was Head of Asset and Liability Management in Treasury Group. He handled other roles in the bank as follows: Head of Balance Sheet Management and Investment & Markets Trading Group from July 2017 to April 2019; Head of Investment and Markets Trading Segment from July 2013 to June 2017 and Investment Portfolio Management Division Head from August 2009 to June 2013. He has previous employment with other financial institutions where he handled significant roles as follows: Vice-President and Head of Global Liquid Products Trading for JG Summit Capital Markets (2000 to 2008), Assistant Vice-President of Asset and Liquidity Management & Investment and Trading for PCIBank (1995 to 2000) and Senior Assistant Manager and Junior FX Trader for the Bank of the Philippine Islands (1993 to 1995). Mr. Pedrosa started his career when he joined BPI's Officer Training Program in 1993. He completed his Bachelor of Science degree in Commerce majoring in Philosophy at the London School of Economics. Robert Rol Richard Raymond B. Ramos, 48, Filipino, First Senior Vice President, is the Trust Officer and Head of Trust and Investments Group. Prior to joining RCBC, he was connected with East West Banking Corporation as Chief Trust Officer and Chief Investment Officer /Senior Vice President for Trust and Asset Management Group. Prior to joining East West Banking Corporation in October 2017, he worked at Union Bank of the Philippines from February 2007 to October 2017. The last role that he held in this bank was as Trust Officer and Chief Investment Officer/First Vice President. Other roles he handled in the said bank are as follows: Business Development Head and Portfolio Manager. He also had other stints with other banks such as in BDO Private Bank, Inc. (formerly Banco Santander Philippines, Inc.) where he worked as Senior Manager/Relationship Manager from October 2001 to January 2007; at Bank of the Philippine Islands where he handled roles such as Branch Manager/Branch Service Officer/Treasury Staff/Trust Staff from May 1999 to September 2001. He rendered services with the United States Agency for International Development Project as Project Development Officer from January 1996 to May 1997 and with the World Health Organization Strategy Development Project as Technical Writer from March 1995 to December 1995. Mr. Ramos completed his undergraduate degree of Bachelor of Science in Management Engineering from the Ateneo de Manila (as Honorable Mention) in 1995. He finished his masteral degrees at the Asian Institute of Management (Business Management) in 1999 and the University of Asia and the Pacific (Business Economics) in 2012. He completed his doctoral degree in Business and Economics from De La Salle University in 2016. He is a Chartered Financial Analyst (CFA), a Chartered Alternative Investment Analyst (CAIA), a Certificant for the Certificate in Investment Performance Measurement (CIPM), Certified Securities Representative, a Registered Financial Consultant, and a Certified Treasury Professional. He also completed a 1-year course on Trust Operations with distinction. He has also served as President of the Trust Officers Association of the Philippines and the De La Salle

41
University Doctoral Society and currently, he is the President of the CFA Society of the Philippines. Joseph Colin B. Rodriguez, 55, Filipino, First Senior Vice President, is the President and CEO of RCBC Forex Brokers Corporation. Upon merger, he was also assigned at Treasury Group as Head of Subsidiaries Treasury Risk Positions Segment Prior to this appointment, he served as Treasurer of RCBC Savings Bank effective September 2016 and before assuming this post, he was the President and Chief Executive Officer of RCBC Forex Brokers Corporation from April 2015 to August 2016 and Senior Vice President and Treasurer of RCBC Savings Bank from August 2011 to March 2015. He also assumed various positions in Rizal Commercial Banking Corporation as Head of the FX Risk Division and Head of Institutional Relationship Management Division. Before joining RCBC, he spent over two decades at the Treasury division of several foreign /local banks. He was Vice President and Head of the Foreign Exchange and Swap Desk at ING Bank Manila. He was also a Dealer at the Manila office of Banque Indosuez and Assistant Dealer at the Riyadh office of Banque Al Hollandi (ABN AMRO Bank). He also headed the FX and Swaps division of Bank of the Philippine Islands. He graduated from De La Salle University with a double degree in Liberal Arts & Commerce, Major in Marketing and in Political Science. Bennett Clarence D. Santiago, 52, Filipino, First Senior Vice President, is the Head of the Credit Management Group. He has over 21 years of professional experience in risk management with significant years focused to commercial credit risk management and evaluation as well as enterprise risk management. Prior to joining RCBC, he was the Business Head for Small Business Loans in the Consumer Lending Group of Banco De Oro Unibank. His experiences also include serving as Head, Commercial Banking Credit Evaluation Unit, Risk Management Group of BDO; Risk Head of Citibank N.A.; Chief Compliance Officer, Union Bank of the Philippines; and various officer positions in International Exchange Bank, Globe Telecom Inc., and Hongkong and Shanghai Banking Corporation. He graduated from the University of the Philippines in 1991 with a Bachelor of Science degree in Business Administration. He finished his Master‘s in Business Administration in 2001 from Ateneo Business School. Rowena F. Subido, 55, Filipino, First Senior Vice-President, is the Group Head of Human Resources. She was also the Deputy Group Head of Human Resources before assuming her current position. Prior to joining the Bank, she worked with Citibank, N.A. as Country Lead Human Resources Generalist/Senior Vice-President, prior to which she was Head of Human Resources for the Institutional Clients Group for almost two years. She has also worked with Citifinancial Corporation, the Consumer Finance Division of Citigroup, as Human Resources Head for four years. She also has HR experience in retail, distribution and manufacturing industries, having worked for California Clothing Inc. where she was Human Resources Head, International Marketing Corporation as Division Manager for Human Resources & Operations, Tricom Systems (Philippines), Inc. as Personnel and Administration Officer and Seamark Enterprises, Inc. as a Personnel Officer. Ms. Subido obtained her Bachelor of Science degree majoring in Psychology from the University of Santo Tomas and earned units in Masters in Psychology majoring in Organisational /Industrial Psychology at De La Salle University. Ma. Angela V. Tinio, 59, Filipino, First Senior Vice-President, is the Head of Small Medium Enterprises Banking Group (previously a Segment under the National Corporate Banking Group). She has been with the Bank since 2000, holding various positions in National Corporate Banking as Segment Head for Commercial Small and Medium Enterprise Banking (October 2013 to June 2019) and in Corporate Banking, as VisMin Lending Region Head (December 2010 to September 2013), Metro Manila-Luzon Region Head (April 2006 to November 2010) and Account Management Department Head (July 2000 to April 2006). She worked with Bank of the Philippine Islands as Special Business Unit/Corporate Banking II Manager and Market Head in April 2000. She also held various positions in Far East Bank and Trust Company from June 1997 to April 2000, PDB Leasing and Finance Corporation from February 1996 to April 1997 and Traders Royal Bank from January 1985 to January 1996. Ms. Tinio obtained her Bachelor of Arts degree

42
in Economics from the University of the Philippines and her Master's degree in Business Administration from the De La Salle University. Lalaine I. Bilaos, 52, Filipino, Senior Vice President, is the Head of the Local Corporate Banking Segment – Division II. Prior to occupying the position of Division Head on April 2011, she was holding the position of a Relationship Manager. She joined the bank in June 1992 as a Secretary for Corporate Planning. Six months thereafter, she moved to Credit Operations Department to handle a Credit Analyst role. By January 1994, she joined Corporate Banking Group and was assigned under Project Finance as a Project Analyst. She also had other roles in the said team as Marketing Assistant and Jr. Project Account Officer. She became an Account Officer in 2000 at the Corporate Division 1 of Corporate Banking Group in Ortigas. Before joining RCBC, she had stints with Dynamic Union of Consultants and Managers, Inc. and American Home Assurance Co. as Credit and Collection Assistant and Billing Assistant respectively. She graduated from De La Salle University in Manila in 1989 with a degree in Bachelor of Arts major in Economics. (Resignation effective October 1, 2021) Ma. Carmela S. Bolisay, 53, Filipino, Senior Vice President, is the Head of Management Services Division in Operations Group. Prior to being employed at RCBC, she was last employed from June 2016 to February 2017 as the Chief of Staff for the Chairman (Vice President on consultant status) of W Hydrocolloids Inc. of W Group. She also previously worked with the following firms and banks: Standard Chartered Bank where she handled roles such as Business Planning Manager/VP for the CEO, Country Manager for Service Excellence/VP, Business Project Director/VP, and Vice President for Product and Process Management in Cards & Personal Loans Service Quality; Security International Card Corporation as First Vice President for Consumer Services Group, Credit Risk Management Division, Member Services Division, Member Services and Collections Division, Mastercard Task Force Head, and Vice President/Assistant Vice President for Clubmember Services Division, Equitable Cardnetwork, Inc. as Senior Manager for Customer Service; Assistant Manager for Collections and Junior Collections Assistant. She graduated with a degree in Bachelor of Arts major in Psychology, minor in Education at the University of the Philippines in 1990. She took up Basic Management Program at Asian Institute of Management (AIM) in 1992. (Resignation effective February 1, 2022) Jose Maria P. Borromeo, 55, Filipino, Senior Vice President, is the Head of Reserves and Liquidity Management Segment in Treasury Group. Prior to assuming this role, he was Head of Balance Sheet Management Segment from July 2018 to April 2019. He joined the bank in February 2016 and was initially assigned as Head of Central Funding. He was previously employed at Standard Chartered Bank as Head of Asset and Liability Management, Financial Markets Group. He had a stint with the Bank of the Philippine Islands where had the following roles: Head of FX Swaps and Domestic Liquidity Department; Head of Product Development and Financial Markets Research Department; Head of Risk Management Department in Treasury Group, and Dealer for Financial Derivatives Division. He also had previous experience with Citytrust Banking Corporation where he worked as Head of Balance Sheet Management Unit. He started as a Management Associate Trainee in the said bank. Early in his professional career, he was connected with the Private Development Corporation of the Philippines as an Account Officer for Project Loans and as an Associate Economist for Economic and Corporate Research. He earned his undergraduate degree, Bachelor of Science in Economics from the University of the Philippines in 1988. He took up Masters in Business Administration in 1993 in the same university. Enrique C. Buenaflor, 51, Filipino, Senior Vice President, is the Head of Corporate Cash Management Segment. He joined RCBC in 2010 as Business Development Manager of Global Transaction Banking Group and was later appointed as Head of Business Development Division in 2011. Prior to joining RCBC, he was the Group Head/Vice-President of Structure Products for Philippine Bank of Communications (August 2005 to March 2010), Operations Head of Central Verification Unit for Citifinancial Corporation (July 2004 to July 2005), Sales Head/Assistant Vice-

43
President of Corporate Cash Management Services (2001 to 2004) and Product Manager (1999 to 2001) for ABN AMRO Bank. He also worked for Philippine Global Communications Corporation as Senior Manager for Corporate Planning (July 1999 to November 1999) and Capitol Wireless, Inc as Business Development Director/Marketing and Sales Manager (March 1997 to May 1999). He started his career in Citibank N.A. as Operations Staff in 1992 and then as Management Associate in 1996. Mr. Buenaflor earned his undergraduate degree, Bachelor of Science in Business Management from Ateneo de Manila University and finished his Masters in Business Management at Asian Institute of Management. Karen K. Canlas, 47, Filipino, Senior Vice-President, is the Division 2 Head of Wealth Management Segment 2. She was the OIC of Division 1 from February to August 2011 and the Senior Relationship Manager of the same division from February 2010 to February 2011. Prior to joining RCBC, she was the Corporate Sales Unit Head/Vice President of Export Bank from August 2005 to January 2010, Relationship Manager/Senior Manager of Equitable PCI Bank from February 2003 to August 2005, Branch Head (Main Office) of Bank of Commerce from May 2002 to January 2003, Manager (Relationship Banking Group) of Export and Industry Bank from September 2001 to May 2002 and Branch Head of Global Business Bank from September 2000 to September 2001. She also held various positions at Urban Bank for almost 6 years in which her last appointment was as Manager of Alabang Regional Office, Business Development Group. Ms. Canlas started her career as Technical Staff at the National Economic Development Authority in March 1994. She obtained her Bachelor of Arts major in Economics minor in Political Science degree from De La Salle University in 1994. Antonio Manuel E. Cruz, Jr., 54, Filipino, Senior Vice President, is the Head of Chinese Banking Segment. Prior to being designated to this role, he was the Division 1 Head for Emerging Corporates Segment. He joined the Bank in 2008 and assumed the following positions for Commercial & Small Medium Enterprises under National Corporate Banking: Metro Manila-Luzon Head from December 2012 to September 2013, Makati Lending Center Head from September 2009 to December 2012 and Metro Manila Lending Center Head from January 2008 to September 2009. Before joining RCBC, he was the Ortigas Lending Center Head for Philippine National Bank from December 2005 to December 2007 and the Relationship Manager for Asia United Bank from September 2000 to November 2005. He started his banking career at Solidbank Corporation where he assumed the following positions: Relationship Manager from January 1994 to August 2000, Management Trainee from July 1993 to December 1993, Senior Analyst from January 1993 to June 1993 and Junior Analyst from July 1990 to December 1992. Mr. Cruz obtained his degree in AB Economics from the Ateneo de Manila University in 1990. Ramil M. De Villa, 48, Filipino, Senior Vice President, is the Head of Consumer Lending Group . Prior to this appointment , he was Head of the Consumer Collection Segment in Credit Management Group. Before he joined RCBC, he was connected with Maybank Phils, Inc as Head/Senior Vice President of Asset Quality Management in Consumer Finance. Prior to assuming this in July 2019, he was Head of Asset Quality Management in Group Finance with the rank of Vice President from 2017 to June 2019. He started his employment with the said bank in 2014 as Head of Asset Quality Management with the rank of Senior Assistant Vice President. He previously worked with Premier Development Bank where he was initially hired in February 1999 as Legal Assistant/Officer. He left the said bank in December 1999 to work in a law office and joined the same bank again in 2001. During this second employment, he was assigned to handle the following roles: as Head of the Documentation Unit of Legal Services Department from 2007 to 2012 and as Litigation Lawyer of Legal Department from 2001 to 2007. He also gained legal experience from Demetria Escondo Maloloyon Law Offices where he was a Senior Associate from 1999 to 2001. He graduated with a degree in Bachelor of Laws (LLB) at University of Santo Tomas, 1997. He finished his undergraduate studies, Bachelor of Arts major in Philosophy in 1993 from the same university. He passed the Philippine Bar Exams on September 1998.

44
Edwin R. Ermita, 60, Filipino, Senior Vice-President, is the Bank Security Officer. He was also the Corporate Services Division Head prior to assuming his current position. Previously, Mr. Ermita worked for CTK Incorporated as Consultant, Solidbank as Security and Safety Department Head and UCPB as Security and Safety Department Head. He started his career in UCPB as Teller in 1983 before moving to Branch Marketing in 1985. Mr. Ermita earned his Bachelor of Science in Management from Ateneo de Manila University. He finished his Masters in Business Administration with specialization in Industrial Security Management from the Philippine Women's University. (Retirement effective April 2, 2022) Benjamin E. Estacio, 51, Filipino, Senior Vice-President, is the Regional Service Head of Mindanao. Prior to assuming this position, he was the District Service Head of Southern Mindanao from May 2004 to March 2011. Mr. Estacio started his career with the Bank as SA Bookkeeper in February 1992 after which he assumed various positions in the branch. He graduated from the University of San Carlos, Cebu City with a Bachelor of Science in Commerce major in Accounting in 1991. Bernice Uy-Gaspar, 55, Filipino, Senior Vice-President, is the Head of Division III in Chinese Banking Segment. Prior to this role, she was Head of Caloocan Division for the same segment. She had previous stints with other local banks as follows: Philippine National Bank where she worked as Business Center Head for the Manila Commercial Banking Center; BDO Universal Bank, Inc. where she was assigned as Relationship Officer for Corporate Banking Group; Equitable PCI Bank where she functioned as Account Officer for Chinese Banking Group, and BDO Commercial Bank where she handled an Account Officer role for Corporate Banking Group. She graduated from the University of Santo Tomas in 1987 with a degree in Bachelor of Science in Food Technology. She completed all courses leading to an MBA except the required thesis at De La Salle University in 1992. Mary Grace P. Macatangay, 52, Filipino, Senior Vice-President, is the Head of Consumer Services and Collections Segment ( formerly named as Consumer Loans Services and Support Segment in Consumer Lending Group. Prior to this role which she assumed on January 16, 2021, she was assigned in Credit Management Group as Consumer Loan Segment Head. She was previously, the Group Head of Credit Management in RCBC Savings Bank from March 01, 2016 to July 21, 2019. Prior to this, she held the following positions in RCBC Savings Bank : Group Head for Asset Management and Remedial: Head for Loan Operations Division; Head for Planning and Budgeting Department and Head of Collection and Admin Department in Mortgage Banking Division. She also had previous experience in other banks such as Capitol Development Bank where she was Head of Admin and Collections Department; Asiatrust Development Bank where she was assigned with roles such as Assistant Manager for Trust Department and Account Officer for Business Development Group. She had exposure in a non-banking institution such as Nikon Industrial Corporation where she was Head of Corporate Planning Department. She earned her degree in Bachelor of Science in Business Administration in 1990 at the University of the Philippines. She completed her Masters in Business Administration from the same university in 1997. Jane N. Mañago, 57, Filipino, Senior Vice-President, is the Group Head of Wealth Management. Prior to this appointment, she was the OIC of Wealth Management Group from December 2015 to January 2016, Segment Head of Wealth Management 1 from September 2014 to November 2015, Division 2 Head of Wealth Management from December 2006 to August 2014 and Relationship Manager for Division 2 from April 2006 to December 2006. She also worked for YGC Corporate Services Inc. as Officer-In-Charge and Marketing Head. Prior to joining the Bank, she worked with Citibank as Cash Product Manager for Global Transaction Services (September 1998 to January 1999), Account Manager (April to August 1998) and Head of Corporate Banking for Chinatown Branch (November 1996 to March 1998) and at Equitable Banking Corporation from May 1986 to October 1996, where her last appointment was the Head of the Research and Special Projects Unit. She obtained her Bachelor of Science degree in Commerce degree

45
majoring in Business Administration and her Bachelor of Arts degree majoring in Behavioural Science from the University of Santo Tomas. Jose Jayson L. Mendoza, 51, Filipino, Senior Vice President, is the Head of North Metro Manila Division in SME Banking. Prior to this, he held positions as Head of Metro Manila Division and VisMIn Lending Region. He joined the Bank in 2008 as Lending Center Head for Small & Medium Enterprises Division-Luzon. Previously, he worked with MayBank Philippines as Head of Retail Loans Management (January 2005 to August 2008), Philippine National Bank as Account Officer (January 2003 to December 2004), Philippine Savings Bank as Account Officer (August 1996 to December 2002) and Islacom as Senior Credit Investigator (May 1994 to July 1996). He started his banking career when he joined Allied Banking Corp. as Credit Investigator in 1993. Mr. Mendoza graduated in 1993 from De La Salle University with a degree of AB Management. Gerardo G. Miral, 56, Filipino, Senior Vice-President, is the Head of Global & Ecozone Segment – Division 2. He was previously the Head of Consumer Lending Group of RCBC Savings Bank. Prior to his secondment to RCBC Savings Bank, he was the Division II Head of Global and Ecozone Segment from April 2011 to January 2016 and Relationship Manager for JES Division II from February 2002 to April 2011. He also assumed various positions in the branch from September 1987 to February 2002. Mr. Miral obtained his Bachelor of Arts major in Economics degree from the University of Sto. Tomas in 1986. Ma. Cecilia F. Natividad, 48, Senior Vice President, is the Head of the Marketing Group. Before joining RCBC, she served as Head of Marketing at Western Union Financial Services, Inc. She previously worked with other firms like Nestle Philippines Incorporated as Consumer Marketing Manager and at Ayala Life Assurance Incorporated as Sales Trainor, and at Amon Trading as Management Trainee. She graduated from the Ateneo de Manila University in 1995 with a Bachelor of Science degree in Management major in Legal Management. Aline A. Novilla, 39, Filipino, Senior Vice President, is the Chief Audit Executive/Head of Internal Audit Group effective August 10, 2020. She joined RCBC in November 2019 as Head of AML Segment in Regulatory Affairs Group, a position she held prior to her transfer to Internal Audit Group as Deputy Group Head in January 2, 2020. Prior to joining the bank, she was a Partner at the Financial Services Audit Group of R.G. Manabat & Co. Before rejoining KPMG in 2011 as Audit Director, she served as Senior Manager for Assurance Services, Financial Services Industry Practice for Isla Lipana & Co (a member firm of Pricewaterhouse Coopers). In her earlier stint with KPMG, she was assigned in Hong Kong as an Assistant Manager for Audit Services. She gained her first auditing exposure at Manabat San Agustin & Co., CPAs (formerly Laya Mananghaya & Co., a member firm of KPMG network of Independent member firms affiliated with KPMG International). She started as an Associate Auditor in November 2003 and was promoted to more senior audit roles during her employment with the said firm. Last position held was as Supervising Senior Auditor. Ms. Novilla graduated Cum Laude at the University of the Philippines in 2003 with a degree in Bachelor of Science in Business Administration and Accountancy. She passed the CPA Licensure Exam in October 2003. Arniel Vincent B. Ong, 36, Senior Vice President, is the President and CEO of RCBC Bankard Corporation. Upon joining RCBC in December 2, 2019, he was seconded to RCBC Bankard Services Corporation as Head of Cards Strategic Initiatives and functioned as such until July 15, 2020. Prior to joining RCBC, he was connected with HSBC Philippines where last position held was as Head of Contact Management Centre and Digital of Retail Banking and Wealth Management since January 2016. He started as Management Trainee of the said bank in 2006. He also served the said bank in various roles which included the following: as Vice President of Policy, Acquisition and Portfolio Management in Retail Banking and Wealth Management; as Head of Consumer Credit Risk for Short Term Attachment assigned at HSBC Vietnam (stint from February 2013 to May 2013); various roles within Retail Credit Risk Management; and as Manager for Payment Services. He also worked as an Assistant Instructor at Ateneo De Manila University after graduation from college. He graduated with a double degree in Bachelor of

46
Science major in Management Engineering and AB Economics. He finished his undergraduate course with honors at Ateneo de Manila University, 2006. Nancy J. Quiogue, 53, Filipino, Senior Vice-President, is the Regional Service Head of North Metro Manila. Prior to assuming her current position, she was the Regional Service Head for North Metro Manila and Central Metro Manila. She was the Regional Service Head for Metro Manila from April 2010 to December 2014 and District Service Head for Metro Manila from May 2004 to April 2010. She also held various positions at the Bank since 1991. Ms. Quiogue graduated from the Philippine School of Business Administration with a Bachelor of Science degree in Business Administration majoring in Accounting. Elsie S. Ramos, 56, Filipino, Senior Vice-President, is the Head of Litigation/Labor Division. Prior to this appointment, she was Head of Legal Affairs Division. She joined the Bank in 2006 and assumed the position of Litigation Department Head. Prior to joining RCBC, she was the Corporate Lawyer and Head of Legal and Corporate Affairs Division for Empire East/Land Holdings (2004 to 2006), Senior Associate and Lawyer-In-Charge of the Docket/Records Section for Ponce Enrile Reyes and Manalastas (2003 to 2004), Senior Associate for Martinez and Mendoza (2001 to 2002), Senior/Junior Associate for Ponce Enrile Reyes and Manalastas (1996 to 2000) and Legal Consultant for Companero Y Companera (1997 to 1998). She held various positions in the University of the Philippines, Department of History such as Assistant Professor (1994 to 1998), Assistant to the Chairman (1992 to 1993) and Instructor (1988 to 1994). She was also a Part-Time Instructor at the St. Scholastica's College, Manila from 1987 to 1989. She obtained her Bachelor of Arts and Master of Arts degree in History from the University of the Philippines, Diliman. She also finished her Bachelor of Law in the same university. Ismael S. Reyes, 56, Filipino, Senior Vice-President, is currently the Segment Head of RBG Marketing & Strategy . Prior to assuming this role in March 21, 2022 , he was designated as Regional Sales Director for Metro Central Region. He was also previously assigned as the Regional Sales Director for Quezon City. Prior to this, he served as Head of Retail Banking Marketing Segment. He was formerly the National Sales Director when he joined the Bank in 2013. Prior to joining RCBC, he assumed various positions in Philippine Savings Bank as First Vice-President/ Head of the Loans Operations Group (October 2012 to October 2013), First Vice President/Branch Banking Group Head (January 2011 to October 2012), Vice-President/Deputy Branch Banking Group Head (June 2010 to December 2010) and Vice- President/ Business Development Unit Head (October 2008 to May 2010). He worked for iRemit Inc where he handled roles such as Division Head for Market Management (January 2004 to September 2008) and Deputy Head for the Global Sales and Marketing Division (August 2001 to December 2003). He also worked with Bank of the Philippine Islands where he was assigned as Operations Manager/Section Head for Funds Transfer Department from 1999 to 2001. His banking career started in Far East Bank in 1987 when he was hired as Staff for International Operations Division. By 1990 he was promoted to a supervisory rank in the same division and as an officer in 1993. He held the position of Department Head in International Operations in 1995 and became a Project Officer for the Remittance Center in 1996. Mr. Reyes earned his Bachelor of Science degree in Commerce major in Economics at the University of Santo Tomas. Steven Michael T. Reyes, 50, Filipino, Senior Vice-President, is the Head of Treasury Sales and Digital Service Delivery Segment. Prior to being designated into this role, he was Head of Commercial Trading and Sales Segment until the reorganization in Treasury in May 2019. Previously, he was First Vice President of Global Markets for Australian & New Zealand Banking Group (March 2009 to January 2014), Vice President / Head of Capital Markets for Banco De Oro (October 2006 to March 2009), Assistant Vice President /Debt and Interest Rate Trader for Citibank, Singapore (January 2006 to October 2006) and Assistant Vice President/Bonds Trader for Citibank, Manila (January 2002 to December 2005). He also worked for Equitable PCIBank from July 1999 to December 2001 and PCIBank from May 1996 to July 1999 and held the following positions: Senior Manager/Head of Capital Markets Desk (July 2000 to December 2001), Manager /Global Fixed Income Proprietary Trader (July 1999 to July 2000), Assistant

47
Manager / Fixed Income Proprietary Bond Trader (July 1997 to July 1999) and Proprietary Bond Trader (May 1996 to July 1997). Mr. Reyes started his banking career when he joined Bank of the Philippine Islands in 1993 as Position Analyst. He completed his Bachelor of Science in Tourism Management at the University of the Philippines in 1993. (Resignation effective September 25, 2021). Ma. Rosanna M. Rodrigo, 60, Filipino, Senior Vice President, is the Regional Sales Director of Central Luzon Region. She was previously assigned in the same role to focus on North Luzon Sales for Retail Banking. Ms. Rodrigo joined the Bank in 1992 and assumed the following positions: Marketing and Sales Director of North West Luzon (February 2013 to September 2013), District Sales Manager of North Central Luzon (November 2009 to February 2013), Branch Manager of Tarlac (February 2005 to November 2009), Branch Manager of Hacienda Luisita (July 1997 to January 2005) and Senior Personal Banker of Tarlac (November 1992 to June 1997). She also worked for Producers Bank of the Philippines as Cashier of Tarlac Branch (April 1983 to October 1992), Far East Bank and Trust Co. as New Accounts Clerk of Tarlac Branch (March 1982 to March 1983) and as contractual employee for New Accounts of Tarlac Branch (December 1981 to February 1982). Ms. Rodrigo obtained her Bachelor of Arts degree in Mass Communication major in Broadcasting from the University of the Philippines in 1981. (Retirement effective June 27, 2021) Raoul V. Santos, 55, Filipino, Senior Vice-President, is the Head of Trust Investment Segment in Trust and Investments Group. Concurrently, he also handles the role of the Head for Institutional Relationship Management Division. He joined RCBC in 2001 as Portfolio Management Section Head before assuming the Investment Services Department Head position in 2008. He also worked for Metropolitan Bank and Trust Company (2000 to 2001), Solidbank Corporation (1999 to 2000). Phinma, Inc. (1991 to 1999) and SGV & Co. (1990 to 1991). Mr. Santos obtained his Bachelor of Science degree in Management of Financial Institutions and Bachelor of Arts degree in Asian Studies from the De La Salle University. Jose Rene Y. Sarmiento, 37, Filipino, Senior Vice President, is the Head of Conglomerates & Strategic Corporate Segment of the Corporate Banking Group. Prior to assuming this role, he was Division Head at the Global Ecozone Segment from 2016 to 2019. He joined RCBC as Head of Credit Business Management in March 2014 and functioned as such until 2016. He previously worked with Security Bank Corporation as Enterprise Risk Manager from 2010 to 2012 and at Citibank NA where his banking career started as a Credit Risk Associate from 2009 to 2010. He also previously worked as a Manager at Greenfield Tech Innovations Company from 2007 to 2009. He graduated from the Ateneo De Manila University in 2007 where he obtained a degree in Bachelor of Science in Business Management. He obtained his Masters in Business Administration degree from the Asian Institute of Management in 2013 and completed an Executive Program in Management at the Columbia Business School ( New York USA) in 2019. Libertine R. Selirio, 56, Filipino, Senior Vice-President, is the Head of Business Development Division in Corporate Banking Group. Before assuming this current role, she was Division I Head of Global and Ecozone Segment in Corporate Banking. Prior to this, she was the Deputy Division Head of JES II from June 2011 to October 2012, Relationship Manager of JES Division II from February 2002 to May 2011, Branch Manager of Dasmarinas from September 2000 to February 2002, Branch Manager of Carmona from July 1998 to September 2000 and Branch Manager of Imus from September 1997 to July 1998. Before joining RCBC, she worked for Pilipinas Bank and assumed the following positions: Account Officer (1993 – 1997), Financial Analysis and Evaluation Section Head (1991 – 1993), Credit Analyst (1989 – 1991) and EDP Teller (1987 – 1989). Ms. Selirio earned her Bachelor of Science in Commerce major in Accounting from St. Scholastica‘s College in 1986. Johan C. So, 51, Filipino, Senior Vice-President, is a Senior Relationship Manager in the Local Corporate Segment. He was previously assigned as Head of Division I in the same segment up until the consolidation of divisions during the reorganization in Corporate Banking Group. Prior to assuming current position, he was the Head of Kaloocan Division from July 2013 to January 2014

48
and Head of Chinese Banking Division III from June 2008 to June 2013. From August 2005 to May 2008, he worked for Philippine Bank of Communications in which the last position he assumed was as Vice-President/Unit Head of Corporate Banking Group 5. He also worked for Standard Chartered Bank from May 1999 to May 2002, T.A. Bank of the Philippines, Inc. from February 1997 to May 1999 and China Banking Corporation from 1993 to 1997. Mr. So graduated from De La Salle University in 1992 with a degree in Bachelor of Science in Applied Economics and Bachelor of Science in Commerce major in Marketing Management. He obtained his Masters degree in Business Administration from the Ateneo Graduate School of Business in 1999. Elvira D. Soriano, 56, Filipino, Senior Vice President, is the Segment Head of BLC Audit of Internal Audit Group. She had prior assignment to handle the Head Office Audit Segment. Before assuming this role in September 2017, she was an Audit Cluster Head since January 2008. She previously worked with other banks namely: United Coconut Planters Bank where she performed roles in Audit and Credit Review; PDCP Bank where she was assigned with roles such as Account Officer, Project Analyst, Accountant and Audit Assistant. She earned a Bachelor of Science degree in Commerce at the University of Bohol in 1986. Zenaida S. Soto, 60, Filipino, Senior Vice President, is the Regional Sales Head of Laguna 2-Bicol-MIMAROPA Region. She was with Retail Banking Group since July 1995 where she was initially assigned at the Science Park Business Center and then at Sta Rosa Business Center as Branch Operations Head. She was given a sales role as Senior Personal Banker in 2002 and became a Business Manager by 2008. Her movement to a District Sales Director role was effected in 2016 and she was designated as a Regional Sales Director by 2019. Prior to joining RCBC, she was employed by Pilipinas Bank as an Accountant for 2 years. Her first work experience was gained at the Republic Flour Mill where she had a four-month employment as a Jr. Bookeeper in 1983. She had more than nine years of employment with the government from 1984 to 1993 under the Department of Budget and Management (DBM) as Senior Budget Specialist for Regional Office IV and as an Accounting Clerk III for Procurement Service. She is a graduate of Bachelor of Science in Business Administration major in Accounting from the Aquinas University in 1982. She obtained her Master in Business Administration in Government Accounting from Rizal Technological College in 1991. (Retirement effective February 28, 2022) Cecilia E. Tabuena, 55, Filipino, Senior Vice President, is the Head of Local Corporate Banking Segment. She was previously connected with CTBC Bank (Philippines) Corporation as Officer-in-Charge /Senior Vice President of the Institutional Banking Group. Prior to assuming this role, she was Deputy Head of Origination & Structuring of the same group. She previously worked in other banks in various roles as follows: Security Bank Corporation as Head of Fixed Income; Citigroup Philippines as Head of Debt Capital Markets and Senior Transactor; Citicorp Securities International R.P. Inc as Equities Research Analyst; The Long Term Credit Bank of Japan, Los Angeles California Agency as Associate for Corporate Finance; and All Asia Capital and Trust Company as Money Market Trader. She obtained her Master‘s in Business Administration degree in Finance at Peter F. Drucker Graduate School of Management at Claremont Graduate University (California, USA) in 1994. Her undergraduate degrees were Bachelor of Science in Commerce major in Marketing Management and Bachelor of Arts major in Psychology which she both finished at De La Salle University in 1990. Gianni Franco D. Tirado, 49, Filipino, Senior Vice President, is the Regional Sales Director of West Mindanao and concurrent Regional Sales Director for Davao City. Prior to assuming his current role, he was the Marketing and Sales Director of Central Mindanao (February 2013 to September 2013), District Sales Manager of Central Mindanao (March 2009 to February 2013) and Branch Manager for several branches in Mindanao (November 2000 to February 2009). He also assumed the Branch Operations Head position of Marbel (February 1998 to October 2000), CI/Appraiser/Loans Clerk (June 1996 to January 1998) and CASA Bookkeeper of Dadiangas (October 1993 to May 1996). Mr. Tirado earned his Bachelor of Science in Commerce major in

49
Accounting degree from the Notre Dame of Dadiangas University in 1993. He also completed his Master‘s in Education major in Special Education at the Holy Cross of Davao College in 2009. Juan Gabriel R. Tomas IV, 51, Filipino, Senior Vice President, is the Chief Risk Officer/ Head of Risk Management Group. Prior to assuming this role, he was under Operations Group as Head of the Customer Service Support Segment. His experiences include serving as Head of Capital Markets and Custody, Operations Group, Citibank N. A., Head of Treasury Services Unit, Citibank N. A., Production Officer for Treasury Services Unit, Citibank, Consultant for Controllers‘ Department, Deutsche Bank AG Manila, and Consultant, for Process Competency Group at Accenture (formerly Andersen Consulting). Mr. Tomas graduated from Ateneo de Manila University in 1993 with a Bachelor of Science degree in Management. He completed his Masters in Business Management major in Finance in 2001 at the Asian Institute of Management.. Lea B. Torres, 57, Filipino, Senior Vice President, is the Head of Remedial Management Division in Asset Management and Remedial Group. Prior to assuming this role, she was a Department Head for Account Management for nearly fifteen years. She rose from the ranks from an initial assignment as a Loan Review Assistant in the Credit and Supervision Division upon hiring by the Bank in May 1988. Four and a half years later, she was promoted as Credit Review Section Head /Authorized Signer in 1992. By August 1994, she transferred to a Junior Account Officer role in Corporate Banking Group which she handled for more than 3 years and was transferred thereafter to the Special Accounts Department as an Account Officer until 2004. She got her promotion to a Senior Remedial Account Officer role in March 2004 and then to a Department Head role by 2006. Her first banking experience was gained from a short employment stint as an Export Clerk in Security Bank and Trust Corporation in 1985 Aside from banking, she had a 9-month teaching engagement as an instructor for the College of Commerce at the Divine Word College in Legazpi. Raul Martin J. Uson, 59, Filipino, Senior Vice President, is the Segment Head for Branch Services Support Segment. Prior to joining RCBC, he was previously connected with PBCom as Business Centre Operations and Oversight Head. He also assumed the following roles at Citibank N.A. prior to joining PBCom in 2012 : Operations and Services Head (2007 to 2012), Deputy Senior Country Operations Officer for Citi Indonesia (2006), Credit Operations and Transaction Services Head for Citigroup Business Process Solutions (2004 to 2006), Transaction Services Head (2001 to 2004), Internal Control Head (1999 to 2001), Infrastructure Head (1998 to 2001), Quality Assurance Head (1996 to 1998), Expense Processing Department Head (1993 to 1995), Quality Assurance Officer (1991 to 1993), Trade and Reconcilement Unit Head (1988 to 1991), Cash Officer for Greenhillls Branch (1985 to 1988) and Teller for Makati Branch (1984 to 1985). Mr. Uson graduated from the University of the Philippines Baguio with a degree in AB Economics and Psychology in 1983. (Retirement effective April 20, 2022). Emmanuel Mari K. Valdes, 49, Filipino, Senior Vice President, is currently the Regional Sales Director for Metro East . Before this recent movement to the region last March 21, 2022 , he was assigned as the Head of Customer Acquisition and Retention Division ( formerly named as Products and Promotions Division) in Retail Banking Group. Prior to assuming this role, he was the Head of Retail Financial Products Division with the rank of First Vice President from October 2013 to June 2017. He joined the RCBC in 2010 as Head of Cash Management Services Department and was assigned in 2013 as Financial Center Head under Retail Banking Group. He started his banking career in January 1996 when he joined CityTrust Banking Corporation as a Sales Officer in Retail Banking Branch. He then transferred to Bank of Southeast Asia in 1997 where he handled the same role. He had previous stints thereafter with other banks such as UnionBank of the Philippines where he was Head of Sales Department for Cash Management Services and Standard Chartered where he was a Sales Head also. He graduated from De La Salle University in 1995 with a degree in Bachelor of Science in Commerce major in Business Management. Anna Christina M. Vicente, 55, Filipino, Senior Vice President, is the President and Chief Executive Officer of RCBC Leasing and Finance Corporation. Prior to her secondment to this subsidiary in June 2021, she was a Segment Head in Small and Medium Enterprises Banking

50
Group and as Division Head for North Metro Manila, a position which she has held since hired in June 2016 for SME (under the former National Corporate Banking Group). Prior to joining RCBC, she was connected with Maybank Philippines as Vice President / Head for Business Banking in Retail Banking Group from 2013 to 2016. She was also previously employed at 3 other local banks and was assigned to handle various functions as follows : At United Coconut Planters Bank - Team Head of Metro Manila , Corporate & Commercial Banking Division (January 2008 to June 2013); Head, Credit Control Division (January 2005 to December 2007); Department Head, Supervised Credit Division (March 2002- January 2005); Account Officer, Institutional Recovery Management Division (July 1999-February 2002); Account Officer, Corporate Banking Division (August 1994 - June 1999) ; at Bank of Commerce as Manager of Branch Banking Group I (March 1992 - July 1994); UCPB Savings Bank as Manager for Commercial Loans ( November 1991 to February 1992) and at Far East Bank & Trust Company - Staff Assistant, Retail Banking Group-Marketing Division (February 1990 - October 1991); Loans Assistant, Greenhills Branch (June 1989 - January 1990); Credit Analyst Trainee, Credit Division (November 1988 - May 1989); and Money Market Trader, Greenhills Branch (May 1986 - October 1988). Ms. Vicente graduated from Ateneo de Manila University in 1986 with a degree in Bachelor of Arts major in Interdisciplinary Studies Paula Fritzie C. Zamora, 51, Filipino, Senior Vice President, is the Head of Financial Institutions and Support Segment (formerly named as Financial Institutions Management Segment) in Treasury Group, a role which she has been handling since June 2012. Prior to assuming this role, she was the Head of Derivatives Department and Head of Financial Engineering Department. She had previous work experience which she gained from other firms like Tokio Marine Malayan Insurance Co. where she was a Finance Officer for Cash Department and Far East Bank & Trust Company where she was employed as Treasury Trader. She graduated from the Ateneo De Manila University in 1992 with a degree in Bachelor of Science in Management. Nilo C. Zantua, 56, Filipino, Senior Vice President, is the Chief Technology Officer. He was initially hired by the Bank as Deputy Chief Technology Officer. Prior to joining RCBC, he was connected with Nexus Technologies, Inc as Vice President) and was a Director-Group Advisory for Jupiter Systems, Inc. (under the Nexus Group of Companies). He also had a stint with Trends & Technologies, Inc. as Group Head – Managed ICT Services. He previously worked also with Philam Life where he handled significant roles as Chief Technology Officer and Deputy Head of IT and Head of IT Infrastructure. He was also previously employed at Sunlife Financial Asia where he performed roles as follows: Head of Shared IT Infrastructure and Operations-Asia, Asia Shared IT Services; IT Director of Manila Shared Services Center; and Head of Regional IT Infrastructure and Operations in Sun Life of Canada Philippines, Inc.; Manager for Operations and Network Computing; Network Services Supervisor for Sun Life Assurance Company of Canada. He also worked in KSA with Binzagr Co. as Technical Services Supervisor and in other institutions and firms as Senior Computer Operator/Programmer at the Department of Health, Central Office Manila; and at Capitol Wireless Inc. as Telecoms Engineer. He graduated with a degree in Bachelor of Science major in Electronics and Communications Engineering in University of Santo Tomas, 1987. He passed the licensure examination in 1987. He completed a Management Diploma-BMP, a four-month short course in Asian Institute of Management, 1999. Nine of the Directors and most of the executive officers mentioned above have held their positions for at least five (5) years.
(H) Market Price and Dividends
(1) Market Price of Bank’s Common Equity and Related Stockholder Matters
The common shares of the Bank are listed in the Philippine Stock Exchange. As of May 16, 2022, the market price of RCBC‘s common shares closed at P20.20 per share. The trading prices of said shares for the different quarters of the years 2022, 2021, 2020 and 2019 are as follows

51
Q1 Q2 Q3 Q4
Last Practicable Last Practicable Last Practicable Last Practicable
Trading Date Trading Date Trading Date Trading Date
2022 High 20.70 1.13.22
Low 19.94 1.07.22
2021 High 19.00 1.15.21 28.50 6.29.21 23.55 7.01.21 21.90 11.08.21
Low 16.80 3.31.21 16.50 5.18.21 18.50 9.29.21 18.00 10.06.21
2020 High 23.50 1.20.20 21.85 6.03.20 17.20 7.06.20 19.80 11.24.20
Low 15.60 3.19.20 14.50 5.26.20 15.30 9.02.20 16.40 10.01.20
2019 High 29.50 1.09.19 28.50 6.20.19 30.70 7.31.19 27.00 10.17.19
Low 26.00 2.01.19 25.55 4.23.19 26.35 7.10.19 22.10 12.17.19
Source: Philippine Stock Exchange
(2) Number of Stockholders as of April 30, 2022 — 748 stockholders (common)
— 72 stockholders (preferred) There were 72 preferred shareholders and 748 common shareholders of record as of April 30, 2022. Likewise, preferred shares and common shares outstanding as of April 30, 2022 were 267,410 and 2,037,478,896, respectively. As of April 30, 2022, total equity ownership of foreigners on the Bank‘s common shares was at 33.70% or 686,670,489 shares. .
(3) Recent sales of unregistered or exempt securities including recent issuance of securities constituting an exempt transaction
No recent sales of unregistered or exempt securities, including recent issuance of securities constituting an exempt transaction to be reported.
(4) Top 20 Stockholders of RCBC as of April 30, 2022
Common stockholders
Name No. of Shares % to Total
PCD NOMINEE CORP - FILIPINO Includes Pan Malayan Management and Investment Corporation 728,407,754.00 35.750444
PCD NOMINEE CORP - NON-FILIPINO Includes Cathay Life Insurance Co. Ltd Includes International Finance Corporation and IFC Capitalization (Equity Fund, LP *No other PCD Nominee shareholder holds more than 5% 686,456,043.00 33.691443
PAN MALAYAN MANAGEMENT AND INVESTMENT CORPORATION 594,248,085.00 29.165852
SYBASE EQUITY INVESTMENTS CORPORATION 23,528,800.00 1.154800
HYDEE MANAGEMENT & RESOURCE CORPORATION 2,173,349.00 0.106669
REGINA CAPITAL DEVELOPMENT CORP 324,454.00 0.015924
A. T. YUCHENGCO, INC. 255,190.00 0.012525
ALAS, CARLOS DE LAS 114,298.00 0.005610
ALAS, CORNELIO DE LAS 114,195.00 0.005605
CHAN, FREDERICK 111,677.00 0.005481
YANG JIN LIANG 100,000.00 0.004908

52
RUFINO, JOSIE PADILLA 92,865.00 0.004558
LOMBOS, MANUEL C. &/OR MEYRICK J. 68,574.00 0.003366
MANUEL A. SANTIAGO OR ELLA C. SANTIAGO 65,900.00 0.003234
YAO, SHUOBIN 57,000.00 0.002798
YAO, SHUOYU 57,000.00 0.002798
RUFINO, JOSEFINA PADILLA 54,292.00 0.002665
QUE, LIONG HEE G. 52,297.00 0.002567
CIPRIANO, BIENVENIDO C. 45,354.00 0.002226
REYES JR., MAURO C. 45,183.00 0.002218
Preferred stockholders
Name No. of Shares % to Total
ROSARIO, RODOLFO P. DEL 81,521.00 30.485397
GO, HOMER 46,355.00 17.334804
CONCEPCION, CARMENCITA 31,842.00 11.907558
OPTIMUM SECURITIES CORP. 16,666.00 6.232377
BDO SECURITIES CORP. 9,304.00 3.479301
NGO, LORETA 8,600.00 3.216035
MANDARIN SECURITIES CORPORATION 7,583.00 2.835720
TAN, LUCIANO H. 7,309.00 2.733256
ABACUS SECURITIES CORP. 6,021.00 2.251599
HWANG, HANS YAP 5,558.00 2.078456
ANG, TONY ANG &/OR ROSEMARIE 5,372.00 2.008900
SIA, JOHNSON CHUA 5,000.00 1.869788
CAMPOS LANUZA & CO. INC. 3,535.00 1.321940
ACERO, NICASIO MARIN JR., &/OR ARNOLFO O. 3,371.00 1.260611
CO, JUSTINA DY 3,258.00 1.218354
CHENG, SUSAN 2,665.00 0.996597
GLOBALINKS SEC. & STOCKS 2,454.00 0.917692
BEDAN CORPORATION 2,100.00 0.785311
LUYS SECURITIES CO. INC. 1,852.00 0.692569
GO, ROBERTO CHAN 1,367.00 0.511200
* The list of material information on the Bank’s stockholders as of record date will be posted on the PSE edge and the Bank’s website after May 30, 2022 (the record date).
Security Ownership of Foreigners (as of April 30, 2022)
Title of Class Shares % of Total
Common 686,670,489 33.70%
Preferred 0 0.00

53
(4) Cash Dividends (from 2019 and as of December 31, 2021)
Nature of Securities
Dividend
Record Date Date
Approved by BOD
Date Paid /Payable Per Share
Total Amount (in Million Php)
Preferred P0.1205 P0.03 21-Mar-19 26-Feb-19 25-Mar-19
Common P0.4460 P863.29 15-May-19 29-Apr-19 29-May-19
Preferred P0.4460 P0.12 15-May-19 29-Apr-19 29-May-19
Preferred P0.1166 P0.03 21-Jun-19 27-May-19 26-Jun-19
Preferred P0.1121 P0.03 21-Sep-19 27-Aug-19 24-Sep-19
Preferred P0.1051 P0.03 21-Dec-19 25-Nov-19 26-Dec-19
Preferred P0.0993 P0.03 26-Feb-20 24-Feb-20 1-Apr-20
Preferred P0.0808 P0.02 27-May-20 26-May-20 24-Jun-20
Common P0.5560 P1,076.21 28-May-20 26-May-20 24-Jun-20
Preferred P0.5560 P0.15 28-May-20 26-May-20 24-Jun-20
Preferred P0.0589 P0.02 17-Sep-20 1-Sep-20 24-Sep-20
Preferred P0.0563 P0.02 21-Dec-20 1-Dec-20 7-Jan-21
Hybrid Tier 1 Securities - P472.40 22-Feb-21 22-Feb-21 26-Feb-21
Preferred P0.0560 P0.01 22-Feb-21 22-Feb-21 31-Mar-21
Common P0.4850 P938.78 26-Apr-21 26-Apr-21 25-May-21
Preferred P0.4850 P0.13 26-Apr-21 26-Apr-21 25-May-21
Preferred P0.0559 P0.01 31-May-21 31-May-21 25-Jun-21
Hybrid Tier 1 Securities - P491.11 28-Jul-21 26-Jul-21 26-Aug-21
Preferred P0.0546 P0.01 24-Sep-21 31-Aug-21 24-Sep-21
Preferred P0.0537 P0.01 29-Nov-21 29-Nov-21 24-Dec-21
In 2015, the Bangko Sentral ng Pilipinas (BSP), through the Monetary Board, approved the liberalized rules for banks and quasi-banks on dividend declaration. The policy no longer requires prior regulatory approval, except for certain cases, and requires that dividend declaration be immediately recognized as a liability upon the approval of the BOD and that it be disclosed in the statement of changes in equity. Dividends are declared and paid out of the surplus profits of the Bank as often and at such times as the Board of Directors may determine after making provisions for the necessary reserves in accordance with law and the regulations of the BSP. (I) Compliance with leading practices on Corporate Governance Core Principles RCBC affirms its commitment to good corporate governance. With an empowered Board leading the way, RCBC continues to work towards a solid control environment, high levels of transparency and disclosure, and well-defined shareholders‘ rights.

54
The corporate governance framework of RCBC combines global best practices such as the G20/OECD Principles of Good Governance and the general principles of the ASEAN Corporate Governance Scorecard, and the regulatory requirements of SEC Memorandum Circular No. 19, series of 2016 or the Code of Corporate Governance for Publicly-listed Companies and BSP Circular No. 969, series of 2017 or the Enhanced Corporate Governance Guidelines for BSP Supervised Financial Institutions. RCBC‘s corporate governance framework is embodied in its Corporate Governance Manual, the latest version of which was approved by the Board in March 2021.
Board Governance The Board of Directors Key Roles and Responsibilities RCBC is headed by a competent and working board that oversees the implementation of the Bank‘s strategic objectives, governance framework and corporate values. The Board of Directors is primarily responsible for establishing a sound corporate governance framework not only for the Bank but for the whole RCBC Group. It has the fiduciary responsibility to the Bank and all its shareholders, including minority shareholders. Among its many functions include the approval and oversight on the implementation of RCBC‘s strategies to achieve corporate objectives, risk governance framework, and systems of checks and balances. The Board also approves the selection of the CEO and key members of senior management and heads of control functions. Board Composition In accordance with RCBC‘s By-Laws and Corporate Governance Manual, its Board of Directors is comprised of fifteen (15) members, all of whom are known for their integrity, experience, education, training and competence. The Corporate Governance Committee ensures that majority of the Board are non-executive directors who possess the necessary qualifications to effectively participate and help secure objective and independent judgment on corporate affairs and to substantiate proper check and balances. Out of the 15 board members, 14 are non-executive directors including the 5 independent directors, and 1 executive director. The Board of Directors promotes diversity in its membership. It is the policy of RCBC that no person shall be disqualified to sit as member of its Board on the basis of gender, age, religion or political affiliation. The representation of women in the Board remains at 26.67% with 4 female directors out of the 15-member board. Among the women in the Board are Atty. Adelita A. Vergel De Dios, an independent director and Mrs. Helen Y. Dee, the Chairperson. Nomination and Election Directors of RCBC are elected at the Annual Stockholders‘ Meeting, each of whom shall hold office for a term of one year or until his successor shall have been duly chosen and qualified. The first fifteen candidates receiving the highest number of votes shall be declared as elected. All nomination for election of directors by the stockholders shall be submitted in writing to the President and the Corporate Secretary at RCBC‘s principal place of business at least thirty (30) working days before the regular or special meeting of the stockholders for the purpose of electing directors. The Corporate Governance Committee reviews the qualifications of persons nominated to the Board, and applies the fit and proper standards in its evaluation. The Committee considers the nominee‘s educational background, professional experience, nature and business of the corporations of which he/she is a director, age, number of directorships/active

55
memberships and officerships in other corporations/organizations, and possible conflict of interest in determining his/her suitability to be nominated to the Board. The Committee ensures that each nominee possesses all of the minimum qualifications and none of the disqualifications as prescribed under existing laws and regulations. It is provided in the By-Laws that no person shall be qualified or be eligible for nomination or election to the Board of Directors if he is engaged in any business that competes with or is antagonistic to that of RCBC, its subsidiaries and affiliates, as may be determined by the Board of Directors, in the exercise of its judgment in good faith, by at least a majority vote. Maximum Board Seats Being a director of the Bank necessitates commitment. Thus, under the Bank‘s Corporate Governance Manual, a non-executive director may concurrently serve as a director in a maximum of five (5) publicly-listed companies to ensure that they have sufficient time to fully prepare for meetings, challenge Management‘s proposals/views, and oversee the long-term strategy of the company. In applying this policy to concurrent directorships in entities within a conglomerate, each entity where the non-executive director is concurrently serving as director shall be separately considered in assessing compliance with this requirement. Who Are In Our Board
Non-Executive Non-Independent
Non-Executive Independent
Executive
Ms. Helen Y. Dee Mr. Cesar E.A. Virata Mr. Gil A. Buenaventura Mr. Armando M. Medina Mr. John Law Mr. Shih-Chiao Lin Mr. Arnold Kai Yuen Kan Atty. Lilia B. De Lima Ms. Gayatri P. Bery
Mr. Juan B. Santos Atty. Adelita A. Vergel De Dios Mr. Gabriel S. Claudio Mr. Vaughn F. Montes, Ph.D. Mr. Laurito E. Serrano
Mr. Eugene S. Acevedo
Independent Directors The Bank adopts the definition of independent directors under SEC‘s Code of Corporate Governance for Publicly Listed Companies and BSP‘s Enhanced Guidelines on Corporate Governance for BSP Supervised Financial Institutions. The attributes of an independent director include independence from management or from any business or relationship which could, or could reasonably be perceived to materially interfere with the exercise of independent judgment, and the lack of relationship to the Bank, its related companies or substantial shareholders as a regular director or officer or relative of said director or officer, as an executive or professional adviser within the past three (3) years, or business relations other than arm‘s length, immaterial or insignificant transactions. The Bank‘s independent directors are active in board-level committees. It is the policy of the Bank, however, that an independent director who is a member of any committee that exercises executive or management functions that can potentially impair such director‘s independence cannot accept membership in committees that perform independent oversight or control functions such as the Audit and Compliance Committee, Risk Oversight Committee, Corporate Governance Committee, Related Party Transactions Committee, and the Anti-Money Laundering Committee.

56
In 2021, RCBC had 5 independent directors, including one female independent director, Atty. Adelita A. Vergel de Dios. The 4 other independent directors are Mr. Gabriel S. Claudio, Mr. Vaughn F. Montes, Ph.D., Mr. Juan B. Santos and Mr. Laurito E. Serrano. Mr. Santos is the Lead Independent Director. An independent director of RCBC is only allowed to serve for a maximum cumulative term of nine (9) years. After which the independent director shall be perpetually barred from serving as independent director in the Bank, but may continue to serve as a regular director. The maximum cumulative term of nine (9) years shall be reckoned from 2012. In adherence to the foregoing policy, Mr. Armando A. Medina, who has already served the Bank as an independent director for a maximum cumulative term of 9 years, reckoned from 2012, has ceased to be an independent director by December 31, 2020 and has been appointed as a regular director effective January 1, 2021. The Chairperson The Chairperson of the Board of Directors, Mrs. Helen Y. Dee, provides leadership in the Board of Directors. She ensures the effective functioning of the Board of Directors, including maintaining a relationship of trust with members of the Board of Directors. To promote checks and balances, it is provided under the Bank‘s Corporate Governance Manual that the Chairperson of the Board of Directors shall be a non-executive director or an independent director, and must not have served as CEO of the Bank within the past three (3) years. Moreover, the Chairperson should not concurrently serve as CEO.
The Corporate Vice Chairperson The By-laws of the Bank provides that the Corporate Vice Chairman shall have such powers and perform such duties as the Board of Directors may from time to time prescribe. In the absence or inability of the Chairperson to act, the Corporate Vice Chairman will act in her stead, and will exercise any and all such powers and perform any and all duties pertaining to the office of the Chairperson conferred upon it by the By-laws. Mr. Cesar E.A. Virata is the Bank‘s Corporate Vice Chairman. Lead Independent Director The Bank‘s Corporate Governance Manual provides that the Board should designate a lead independent director among the independent directors if the Chairman of the Board is not an independent director, including if the positions of the Chairman of the Board and Chief Executive Officer are held by one person. Mr. Juan B. Santos has been appointed by the Board as the Bank‘s Lead Independent Director effective March 24, 2021. The Lead Independent Director shall perform a more enhanced function over the other Independent Directors and shall: a) Lead the independent directors at BOD meetings in raising queries and pursuing matters; b) Convene and chair meetings of the non-executive directors without the presence of the executive directors; c) Serve as an intermediary between the Chairperson and the other directors when necessary; and d) Contribute to the performance evaluation of the Chairperson, as required. Meetings and Quorum Requirement The regular meeting of the Board of Directors is every last Monday of the month at the principal office of RCBC. Should the meeting date fall on a holiday, the meeting shall be held at the same hour on the next succeeding business day. A majority of the incumbent Directors shall constitute a quorum at any meeting, and a majority of the members in attendance at any Board meeting shall decide its action.

57
The meetings of the Board of Directors may be conducted through modern technologies such as, but not limited to, teleconferencing and video conferencing as long as the director who is taking part in said meetings can actively participate in the deliberations on matters taken up therein. It is further required that every member shall physically attend at least twenty-five percent (25%) of all meetings of the Board of Directors every year. The absence of a director in more than fifty percent (50%) of all regular and special meetings of the board of directors during his/her incumbency is a ground for disqualification in the succeeding election. Due to the Covid-19 pandemic, the Board Meetings in 2021 were held via remote communications and/or video conferencing as allowed by the BSP and SEC. Meetings of board committees are prescribed in their respective charters. Participation of committee members may likewise be in person or through modern technologies. A director‘s attendance in committee meetings is considered by the Corporate Governance Committee in the assessment of the director‘s continuing fitness and propriety as a member of the said board-level committee and of the Board of Directors. Due to the Covid-19 pandemic, the meetings of the Board in 2021 were also held via remote communications and/or video conferencing as allowed by the BSP and SEC. From the period January to December 2021, the members‘ attendance at Board and Committee meetings are as follows:
Directors BOARD EXCOM TRUST TECH ACC ROC CG RPT AML Total %
Attendance M A M A M A M A M A M A M A M A M A M A
Helen Y. Dee 13 13 49 49
12 12
74 74 100.00%
Cesar E.A. Virata 13 13 49 49 11 11 12 12
85 85 100.00%
Gil A. Buenaventura 13 13 49 49
11 11 73 73 100.00%
Eugene S. Acevedo 13 13 49 49 11 11 12 12
85 85 100.00%
John Law 13 13
13 13 100.00%
Lilia B. De lima 13 13
11 11
10 10
34 34 100.00%
Laurito E. Serrano 13 13
12 12 14 14
39 39 100.00%
Arnold Kai Yuen Kan 13 13
13 13 100.00%
Armando M. Medina 13 13 49 49
62 62 100.00%
Shih-Chiao (Joe) Lin 13 13
10 8 11 8
34 29 85.29%
Vaughn F. Montes 13 13
12 12 14 14 10 10
11 11 60 60 100.00%
Juan B. Santos 13 13
11 10
24 23 95.83%
Adelita A. Vergel de Dios 13 13
12 12
10 10 11 11
46 46 100.00%
Gabriel S. Claudio 13 13
10 10 11 11 11 11 45 45 100.00%
Gayatri P. Bery 13 12 14 12 27 24 88.88% M = Numbers of Meetings
A = Meetings Attended
Separate meeting of the Non-Executive Directors Non-executive directors (NEDs) are required to have separate periodic meetings with the heads of the internal audit, compliance and risk functions and external auditor without any executive directors present to ensure that proper checks and balances are in place within the Bank. For Y2020, the NEDS held a separate meeting with the heads of internal audit, compliance and risk functions and external auditor on December 13, 2021 to discuss the control units‘ assessment of the business units and the Bank as a whole. The meeting was chaired by the Lead Independent Director, Mr. Santos. Board Performance The Corporate Governance Committee oversees the periodic evaluation of contribution and performance of the Board of Directors, board-level committees, and senior management. This exercise covers the assessment of the ongoing suitability of each member, taking into account his or her performance in the board of directors and board-level committees.

58
The Corporate Governance Committee decides the manner by which the Board‘s performance may be evaluated, and proposes an objective performance criteria approved by the Board. The performance indicators determine how the Board has enhanced long-term shareholder value. . Board of Directors Training Program The Corporate Governance Committee oversees the continuing education program for the Board of Directors. The Training Program for the members of the Board has been adopted in the Bank‘s Corporate Governance Manual. Under the Bank‘s Corporate Governance Manual, all new directors must undergo proper orientation upon joining the Board. This ensures that new members are appropriately apprised of their duties and responsibilities before beginning their directorships. The orientation program covers SEC-mandated topics on corporate governance and an introduction to the Bank‘s business, Articles of Incorporation, and Code of Conduct. The Orientation Program is designed to meet the specific needs of the individual directors and aid any new director in effectively performing his or her functions. In addition to the Orientation Program, first-time directors are required to attend a seminar on corporate governance following the BSP-prescribed syllabus. The directors are required to submit a certification of compliance of this requirement to BSP. The members of the Board also undergo the Annual Continuing Training Program. The program covers courses on corporate governance, matters relevant to the company, including audit, internal controls, risk management, sustainability and strategy. The Board of Directors, through the Corporate Governance Committee, assesses its members‘ training and development needs in determining the coverage of the Annual Continuing Training Program. The directors are required to complete at least four hours of the Annual Continuing Training Program.. Remuneration of the Board Remuneration of directors is commensurate with their contributions and scope of their responsibilities. Executive directors do not receive any per diem for attendance in board and board committee meetings. They are entitled to remuneration and benefits by virtue of their being officers of the Bank. Non-executive directors are entitled to reasonable per diem for attendance in board and board committee meetings. Non-executive directors receive a per diem of P35,000.00 for attendance in board meetings. The Chairpersons of Audit and Risk Oversight Committees receive P20,000.00 while members of the said committees receive P15,000.00 per diem for attendance in meetings. The per diem in other board committees is at no greater than P15,000.00 for the chairperson and P10,000.00 for members. The members of the Board of Directors, the Advisory Board, the Executive Committee and the Officers of the Bank are entitled to profit sharing bonus in accordance with the By-Laws of the Bank. For the protection of its directors from threats against the security of their persons, property, and private data, the Bank presents below the aggregate compensation of the members of the Board of Directors and Advisory Board for 2021, inclusive of bonuses received in accordance with the By-Laws. A report on the total compensation per director shall be presented to the stockholders during the Annual Stockholders‘ Meeting of the Bank on June 27, 2022, and a similar report will be submitted to the SEC.

59
Remuneration Item 2021 (in Php ‗000)
(a) Per diem Allowance
13,100 (aggregate amount for the 2021 meetings of
the Board and Committees)
(b) Directors’ Bonuses Directors‘ bonuses are given to non-executive and independent directors based on the formula provided for in the Bank‘s By-Laws.
56,588 (aggregate amount for NEDs, IDs, for the
Board and Executive Committee for the year 2021)
TOTAL 69,688
Board Committees The Board of Directors has delegated some of its functions to the following board-level committees: 1. Executive Committee Composition: Chairperson and at least four (4) members of the Board of Directors Members: Helen Y. Dee - Chairperson Eugene S. Acevedo - Vice Chairperson Gil A. Buenaventura Cesar E.A. Virata Armando M. Medina The Executive Committee has the power to act and pass upon such matters as the Board of Directors may entrust to it for action. However, matters affecting general policy are always referred to the Board of Directors for decision. The Executive Committee has the power to review an asset or loan to ensure timely recognition and resolution of impaired assets. In 2021, the Executive Committee:
Discussed various issuances by regulatory agencies;
Approved non-DOSRI loans that reach the Single Borrower‘s Limit (SBL);
Evaluated and approved various operations/product manuals;
Reviewed and endorsed for Board approval various management matters;
Deliberated upon and approved various management matters within its approving authority.
2. Audit and Compliance Committee Composition: The Audit and Compliance Committee shall be composed of at least three (3) members of the board of directors, majority of whom shall be independent including the Chairperson. The Chairperson should not be the Chairperson of the Board or of any other board-level committees. Members of the committee should have the knowledge of the industry in which the bank operates, the ability to read and understand fundamental financial statements, and the ability to understand key business and financial risks and related controls and control processes. Members: Laurito E. Serrano (ID) - Chairperson Vaughn F. Montes (ID) Adelita A. Vergel De Dios (ID)

60
Observer: Shih-Chiao (Joe) Lin The Audit and Compliance Committee, a board-level committee, shall be responsible for overseeing senior management in establishing and maintaining an adequate, effective and efficient internal control framework. It is constituted to perform the following core functions:
Oversight of the institution‘s financial reporting policies, practices and controls, as well as of the internal and external audit functions. This includes responsibility for the setting up of an internal audit unit and for the appointment of the internal auditor as well as the independent external auditor who shall both report directly to the Audit and Compliance Committee. Based on its mandated assurance activities, in accordance with its authority coming from the Board of Directors through the Audit and Compliance Committee, Internal Audit provides reasonable assurance to Senior Management, the Audit and Compliance Committee and the Board of Directors that the Bank‘s internal control, corporate governance, and risk management systems and processes are adequate and generally effective. It collaborates with and complements the activities of the Risk Management Group, Regulatory Affairs Group, and other assurance and oversight units, as well as the Bank‘s external auditors.
Investigation of any matter within its terms of reference, with full access to and cooperation by management and full discretion to invite any director or executive officer to attend its meetings and adequate resources to enable it to effectively discharge its functions.
Ensuring that a review of the effectiveness of the institution‘s internal controls, including financial, operational and compliance controls, information technology security and controls, and risk management, is conducted at least annually. Through this comprehensive system of monitoring and review of risks, controls and compliance in the institution, the Board ensures that the Bank and all business units proactively manage the risk and compliance exposures impacting their respective businesses.
The Audit and Compliance Committee reports its evaluation of the effectiveness of the internal controls, financial reporting processes, information technology security and controls, risk management systems and governance process of the Bank based on the report and unqualified opinion obtained from the External Auditor, the overall assurance provided by the Chief Audit Executive and additional reports and information requested from Senior Management, and found that these are generally adequate across RCBC. In 2021, the highlights of the Audit and Compliance Committee‘s actions pertaining to Internal Audit, External Audit and Compliance functions are as follows: a. For External Audit Function
• Review of Results and Endorsement for Board Approval of Punongbayan & Araullo's Quarterly Review of the Financial Information of RCBC and selected Subsidiaries
• Review of Results and Endorsement for Board Approval of P&A‘s Audit of the Financial Statements of RCBC and Subsidiaries for the year ended December 31, 2020.
• Reappointment and approval of fees of P&A as External Financial Auditor and corresponding Review and Approval of P&A‘s Plan for the Audit of the Financial Statements of RCBC and Subsidiaries for the year ending December 31, 2021.
• Approval of the External Auditors‘ Fees for the (1) Quarterly Review of the Financial Statements of RCBC and selected Subsidiaries and (2) for the Review of RCBC‘s 2021 Sustainability Bonds Allocation Report
b. For Internal Audit Function
• Engaging in discussions on the results of internal audits managed and executed by the Internal Audit Group and those outsourced to External Service Providers during the monthly Audit and Compliance Committee meetings to evaluate the adequacy and effectiveness of the Bank‘s internal control and risk management systems including financial reporting and information technology security.

61
• Assessing and resolving to refer to the immediate attention of the responsible business units, Board-level Committees and Bank personnel matters arising from the internal audits.
• Monthly review and notation of the status of audit plans, IAG manpower complement and vacancies, and outstanding/unresolved audit issues.
• Approval of contract extension until April 15, 2021 of the external service provider, R.G. Manabat & Co. in order to complete the outsourced engagements under the 2020 Audit Plan.
• Approval of Revisions in the Internal Audit Charter to add specific provisions on retention requirements for Audit Working Papers.
• Approval of IAG‘s New Policy on the Use of Computer Assisted Audit Techniques and New Policy on Confirmation of Balances.
• Approval of Revised Annual Audit Planning Policy effective January 19, 2021 and effective December 14, 2021.
• Approval to Conduct Special Audits in accordance with IAG‘s Special Audit and Consulting Policy.
• Approval of factors for performance evaluation of the Chief Audit Executive and corresponding 2020 performance evaluation in a separate meeting session with the CAE.
• Approval of revisions in the 2021 Annual Audit Plan
• Approval of 2021 HOAS and BCLCAS Audit Plan and the Internal Audit Group‘s 2022 Audit Plan (HOAS, BCLCAS and IT)
• Approval to include the outsourcing of the audit of certain units and/or processes as part of the strategies of IAG to manage the completion of the 2022 audit plan vis-à-vis IAG‘s capacity and existing competencies.
• Notation of 2020 External Quality Assessment Report on the RCBC Internal Audit Activity conducted by Reyes, Tacandong & Co.
• Notation of 2021 Internal Audit Group‘s Annual Report for the 2020 Internal Audit Activities and approval to release such to Stockholder Cathay Life Insurance Co. Ltd.
• Notation of the Agreement to Provide Direct Assistance to External Auditors, Punongbayan & Araullo for the 2021 Financial Statements Audit
c. For Compliance Function
• Review of the extent and scope, activities, staffing, resources and organizational structure of the Compliance Function.
• Review of the compliance reports of the Compliance Officer to assess compliance with laws, rules and regulations. This also included the review of findings of any examinations by regulatory agencies (e.g., BSP, National Privacy Commission, etc.).
• Approval on the revisions of Data Privacy Policy
• Notation of updates on the Regulatory Affairs Group‘s New Operating Model
• Notation of updates on the Compliance Testing of Subsidiaries
• Notation of updates on the Compliance Assurance Testing
• Notation of BSP Evaluation on RCBC‘s Reply to the Advance Report of Examination Findings
3. Risk Oversight Committee
Composition: The Risk Oversight Committee (ROC) shall be composed of at least three (3) non-executive members of the Board of Directors, none of whom is also a member of a management committee. Majority of the members shall be independent directors, including the Chairperson. The ROC's Chairperson shall not be the Chairperson of the Board of Directors, or any other board-level committee. The Risk Oversight Committee shall possess a range of expertise and adequate knowledge on risk management issues and practices.

62
Members: Vaughn F. Montes (ID) – Chairperson Laurito E. Serrano (ID) – Vice Chairperson Gayatri P. Bery Observers: Eugene S. Acevedo John Law
The ROC supports the Board with respect to oversight and management of risk exposures of the RCBC parent bank and subsidiaries (the Group). In this regard, the ROC exercises authority over all other risk committees of the Group, with the principal purpose of assisting the Board in fulfilling its risk oversight responsibilities. The ROC oversees the following: 1) The Risk Governance Framework; 2) The Risk Management Function; 3) Adherence to Risk Appetite; 4). Capital Planning and Management; and 5) Recovery Plans. The highlights of the Risk Oversight Committee‘s actions in 2021 are as follows: ROC Charter
Approved the updated ROC Charter
Risk Governance Framework
Approved the revisions to the Risk Governance Framework ROC Self-Assessment
Noted the 2021 ROC Self-Assessment Results Enterprise Risk and ICAAP
Approved: ⁻ 2021 ICAAP and Recovery Plan including updates on BSP Audit Findings on the
2021 ICAAP-RP Document
⁻ 2022 ICAAP and RP Workplan/Updates ⁻ Advanced Internal Rating-Based Approach and Validation Results ⁻ 4Q2020-3Q2021 Risk Materiality Assessment
Noted:
⁻ Enterprise Risk Reports including RCBC Group Risk Profile, Risk Dashboards, Risk Heat Maps, Reports on Asset Quality and Capital Adequacy
⁻ Results of Uniform Stress Testing on Credit Risk ⁻ S&P Scorecard Performance Review and Transition Matrix Analysis ⁻ Capital Equity Tier 1 (CET1) Projections ⁻ 2022 ICAAP and RP Workplan/Updates
Credit Management
Noted the Credit Management reports including Updates on Asset Quality, Key Accounts, Flagged Accounts, Problem Loan Committee, COVID-19 Assessment and Stress Testing, NPL and ECL Forecast, Updates on CARE Program, Ratings Migration, Industry Exposure Limits, Consumer Loan Portfolio, Treasury Bond Portfolio, Portfolio Quality of Subsidiaries and Moody‘s Rating Downgrade.
Market and Liquidity Risk
Approved: ⁻ Market and Liquidity Risk Models and Assumptions ⁻ 2021 Treasury Limits including 2021 FVOCI YTD Loss Limit ⁻ Policy on Investments of Subsidiaries ⁻ Market and Liquidity Risk Backtesting

63
⁻ Intraday Liquidity Trigger ⁻ Amended Minimum Amount for Large Fund Providers ⁻ Post BSP Audit Changes ⁻ Trading Limits for Filinvest, RLC and Megaworld REITs ⁻ PSR factors (that will be used from August 2021 to July 2022) ⁻ Review of the Bank‘s Economic Value of Equity ⁻ Off-Market Tolerance Factors
Noted: ⁻ 2021 and 2022 Treasury Funding Plan ⁻ Market and Liquidity Risk Reports including Regulatory Ratios, Liquidity and Repricing
Gaps, Interest Rate Risk in the Banking Book (IRRBB) Metrics, and other measures
⁻ Deposit Level Update ⁻ Results of Uniform Stress Testing on Market Risk ⁻ IRRBB Model Development Update and Model Validation Report ⁻ Peso IRG Forecast and Review of Peso IRG Limit Increase ⁻ Updates on MLRMD‘s Post BSP Audit Changes ⁻ RCBC Investment Book
Portfolio Quality
Approved: ⁻ 2020 Sustainability Report ⁻ RCBC Commitment to Partnership for Carbon Accounting Financials
Noted: - Credit Portfolio Quality Report
⁻ Independent Credit Review Updates ⁻ Sustainability Bonds Allocation Report (monthly and annual) ⁻ Environmental and Social Risk Report ⁻ 2020 Impact Report ⁻ Bank‘s Sustainability Initiatives, including update on compliance with BSP Circular
1085 (Sustainable Finance Framework) Operational Risk
Noted:
⁻ Operational Risk Reports including RCSA, KRI, and CST Library ⁻ KRI and CST Results ⁻ Business Resiliency Reports ⁻ Trust Risk Reports ⁻ Consumer Protection Reports ⁻ RCBC‘s Cyber Risk Insurance including Cyber Insurance Policy Limit ⁻ Update on Bankwide Document Deficiency Monitoring
Enterprise Fraud Risk
Noted:
⁻ Enterprise Fraud Risk Reports ⁻ Update on Fraud Incidents involving New Merchants
Information Security Governance
Approved:
⁻ Ransomware Business Continuity Plan ⁻ Update on Vendor Security Assessment Questionnaire
Noted: ⁻ Information Security and Systems Reports ⁻ Updated Email Policies and Minimum Standards ⁻ Report on the Bank‘s Readiness and Security Plan against Cyber Threats ⁻ Update on the use of McAfee as a tool for monitoring unauthorized applications

64
⁻ Update on migration of the RCBC email addresses of the ROC members to G-Suite ⁻ 2020 Information Security Annual Certification ⁻ Updates on Measures against Social Engineering ⁻ Information Security Strategy on Use of Personal Email for Corporate Purposes ⁻ 2020 RCBC Information Security Risk Assessment
Reputational Risk
Noted: ⁻ Reputational Risk Reports
Others
Noted: ⁻ Subsidiary Reports ⁻ Consumer Loans report including Consumer Portfolio Analytics and Consumer Loans
Clean-up Update
⁻ Update on the ECL Methodology of RCBC Leasing and Finance Corporation ⁻ RCBC International Finance Limited: Establishment of a Facility ⁻ Update on DiskarTech Fraudulent IDs ⁻ Assessment of MORB Regulations on Single Borrower‘s Limit ⁻ Report on Bank‘s Response to BSP Circular 1111 (Amendments to the Rules and
Regulations on the Mandatory Credit Allocation for Agriculture and Agrarian Reform Credit)
⁻ BSP Circular 1113 - Amendments to the Guidelines on Recovery Plan of a Domestic Systematically Important Bank
⁻ Update on the Creation of e-Library for ROC-Related Information ⁻ DiskarTech‘s New Onboarding Process ⁻ Update on RCBC Capital Corporation‘s strategy on its non-moving equities ⁻ Launch of RCBC Peso Green Time Deposit
4. The Corporate Governance Committee Composition: The Corporate Governance Committee shall be composed of at least five (5) members of the board of directors who shall all be non-executive directors, majority of whom shall be independent directors, including the chairperson, with (1) one member representing the minority shareholders. Members: Adelita A. Vergel de Dios (ID) – Chairperson Vaughn F. Montes (ID) Gabriel S. Claudio (ID) Shih-Chiao (Joe) Lin Lilia B. de Lima The Corporate Governance Committee assists the Board of Directors in fulfilling its corporate governance responsibilities. The highlights of the actions of the Corporate Governance Committee in 2021 are as follows:
Exercised oversight on the nomination process for members of the Board of Directors and for positions requiring board approval;
Reviewed and recommended to the Board the assignment to Board Committees;
Reviewed and endorsed for Board approval the interlocking positions of directors and officers;
Reviewed and endorsed for Board approval the appointments of senior officers;
Reviewed and endorsed for Board approval the secondment of senior officers to Subsidiary Companies;
Exercised oversight on the continuing education program for the Board of Directors;
Reviewed and endorsed for Board approval the revisions to the Corporate Governance Manual;
Reviewed and approved the 2020 Integrated Annual Corporate Governance Report

65
Reviewed and endorsed for Board approval the Amendment to the Performance Management System to integrate sustainability agenda
Reviewed and endorsed for Board approval the 2022 Annual Board Plan
Discussed and Noted the following: (a) Quarterly Report on New Hires and Separated Employees, and Attrition Report (b) Quarterly Whistleblowing Report (c) MORB Sec. 137, particularly on Interlocking Officerships (d) Recommendations In The 3rd Party Board Evaluation Report (e) Result of the 3rd Party Board Evaluation (f) ASEAN Corporate Governance Scorecard – 2019 Results and 2020 preliminary Results (g) RMG updates on the Bank‘s compliance with BSP Cir. 1085 – Sustainable Finance
Framework vis-à-vis Duties and Responsibilities of the BOD (h) Roadmap to ACGS 5 Golden Arrows
5. The Related Party Transactions Committee Composition: The Related Party Transactions (RPT) Committee shall be composed of at least three (3) members of the board of directors, two (2) of whom shall be independent directors, including the chairperson. The Committee shall at all times be entirely composed of independent directors and non-executive directors, with independent directors comprising majority of the members. Members: Adelita A. Vergel De Dios (ID) – Chairperson Gabriel S. Claudio (ID) Shih-Chiao (Joe) Lin The RPT Committee assists the Board in ensuring that transactions with related parties are handled in a sound and prudent manner, with integrity, and in compliance with applicable laws and regulations to protect the interest of depositors, creditors and other stakeholders. In 2021, the RPT Committee fulfilled its mandate under its charter particularly on the review and disclosure of material related party transactions. Work done by the Committee in 2021 includes the following:
Reviewed and evaluated all material related party transactions, those within the threshold amount of Php10,000.00 and above and those that require Board approval regardless of amount (i.e., DOSRI loans, outsourcing, cross-selling, etc.) to ensure that such transactions are conducted on an arm‘s length basis and that no stakeholder is unduly disadvantaged
All vetted material RPTs were endorsed to the Board for approval
Reviewed and reported to the Board on a quarterly basis the status and aggregate exposures to each related party as well as the total amount of exposures to all related parties
⁻ Exercised oversight on the filing of the required reports to BSP under BSP Circular No. 895, as amended: (a) Report on Conglomerate Structure, and (b) Report on Material Related Party Transactions.
6. The Anti-Money Laundering Committee Composition: The Anti-Money Laundering Committee shall be composed of at least three (3) directors, majority of whom are independent directors, including the chairperson. Members: Gabriel S. Claudio (ID)
– Chairperson
Vaughn F. Montes (ID) Gil A. Buenaventura

66
Observers: Eugene S. Acevedo Hiroki Nakatsuka The AML Committee assists the Board of Directors in its mandate to fully comply with the Anti-Money Laundering Act, as amended, its Revised Implementing Rules and Regulations and the Anti-Money Laundering Regulations under the Manual of Regulations for Banks (MORB); and to ensure that oversight on the Bank‘s compliance management is adequate. In 2021, some of the crucial actions of the Committee include:
Approval of:
- Information Sharing Protocol Agreement with AMLC - Changes to Transaction Monitoring Department‘s‘ On-going Customer Monitoring
Operating Manual
- Changes to the policy on Politically Exposed Persons.
- Changes to the Bank‘s Financial Crime Country Risk Rating Model
- 2020 Annual Review of GFBS Tie Ups
- Changes to the MTPP on on-going monitoring of customers, accounts, and transactions
- Changes to the MSB Due Diligence Recommendation Criteria
- Changes in the Rationalized MSB Offline Alert Parameter - Changes to Transaction Monitoring Department‘s MSB Operations Manual
The AML Committee closely monitored the remediation plan of the Bank on its covered transaction reporting to ensure that all regulatory issues are addressed in a manner acceptable to the Anti-Money Laundering Council.
The AML Committee continues to monitor the review of Money Service Business (MSB) clients, which includes the review of online and offline alerts and periodic reviews.
7. The Trust Committee
Composition: At least five (5) members including (i) the president or any senior officer of the bank and (ii) the trust officer. The remaining committee members, including the chairman, may be any of the following: (i) non-executive directors or independent directors who are not part of the Audit Committee or (ii) those considered as qualified independent professionals, provided that in case there are more than five (5) Trust Committee members, the majority shall be composed of qualified non-executive members. Members: Juan B. Santos (ID) – Chairperson Cesar E.A. Virata Eugene S. Acevedo Lilia B. De Lima Trust Officer: Robert B. Ramos The Trust Committee is a special committee which reports directly to the Board of Directors and is primarily responsible for overseeing the fiduciary activities of the Bank. Its activities in 2020 include the following:
Formulation of new policies and guidelines
Oversight of trust business
⁻ Review of Trust performance and approval business plans ⁻ Discussions on the monthly market updates and investment strategies of Trust ⁻ Approval of creation and amendments of new UITF products, and ⁻ Review of organization structure, succession plan for Trust and other HR matters,
among others

67
Approval of the launching of the new RCBC US Equity Index Fund, a dollar-denominated fund that feeds into the BlackRock iShares IVV ETF that is invested in the S&P500
Approval and monitoring the launching of the first online Investment Management Account in the Philippines with the IMA ROR Project
Evaluation and approval of management recommendations on the investment and disposition of funds or properties held in trust
Management of risks in the conduct of the trust business ⁻ Monthly discussions and review of various risk management reports (market risk,
credit risk, operational risk, reputation risk, strategic risk, legal risk)
⁻ Discussions on incident reports and issues affecting Trust ⁻ Monitoring of the proper implementation of approved policies and guidelines
Monitored resolution of various audit and compliance issues in BSP examination, internal audit and compliance reviews
8. The Technology Committee Composition: At least three (3) members of the Board of Directors. Members: Helen Y. Dee – Chairperson Cesar E.A. Virata Eugene S. Acevedo (Executive Director) The Technology Committee exercises authority over all IT Project Steering Committees of the various RCBC Business Groups and subsidiaries (Group), with the principal purpose of assisting the Board in fulfilling the following oversight responsibilities:
Approves major IT investments.
Manages and aligns IT initiatives across the Group.
Reviews status of major projects.
Prioritizes IT initiatives, when warranted.
Evaluates emerging IT solutions for use of the Group.
Reviews, evaluates and resolves Cyber Security Issues, Disruptions and Disaster Recovery activities raised in the TechCom.
Ensures compliance to BSP rules and regulations relating to Information Technology.
In 2021, highlights of the actions of the Technology Committee are as follows:
Launch Digital Payroll for Payroll Account Onboarding
Offer an RCBC eCommerce Payment Platform to clients by partnering with a payment gateway service provider
Acquire new Wealth Management System
Implement SOFR in Guava as well as to pursue the Equity Trading module.
Auto ROPA Automation
Acquire Cash Deposit Machine and QR Withdrawal and outsource the services
SME Salesforce Upgrade
Various DiskarTech Enhancements
Various RCBC Online Retail and RCBC Online Corporate Enhancement
Acquire Okta platform as MFA solution for RCBC Group
Acquire Google GSuite Collaboration Solution
Replace current Security Information and Event Management
Infrastructure Refresh
Launch RCBC Bankard P2M as an RFI (merchant acquirer)
Enhance RCBC Bankard Mobile App Features
Enhance RCBC Bankard‘s Call Center IVR capabilities and features.

68
RCBC Bankard‘s Collections Management System Refresh
RCBC Bankard‘s Operational Data Source Infrastructure Upgrade
Launch RCBC Bankard Payroll Advance & Loan
Advisory Board The Bank has an Advisory Board that provides informed guidance to the Board of Directors. Members of the Advisory Board are appointed by the Board of Directors. They do not have any voting rights but contribute by way of providing non-binding but relevant advice during board meetings. While the By-Laws allow for up to 10 members in the Advisory Board, the Bank has 3 appointed Advisory Board members. Each of these members is considered as business leaders and is of known probity and integrity. The members of the Advisory Board are Mr. Francis C. Laurel, Ms. Yvonne S. Yuchengco and Mr. Hiroki Nakatsuka.
Shareholdings in the Company As of December 31, 2021, only the following stockholders own more than 5% of RCBC‘s common stock:
Title of Class
Name, Address of record owner and relationship with
Issuer
Name of Beneficial Owner and
Relationship with Record Owner
Citizenship Number of Shares Held
Percent (%)
Common Pan Malayan Management & Investment Corporation
Address: 48/F Yuchengco Tower, RCBC Plaza 6819 Ayala Avenue Makati City
Relationship with issuer: RCBC is a subsidiary of PMMIC
Pan Malayan Management & Investment Corporation The records in the possession of the Bank show that the beneficial ownership of this company belong to the shareholders of record of said company. The Bank has not been advised otherwise.
Filipino 807,582,173*
39.64%
Common Cathay Life Insurance Corporation
Address: 296 Ren Al Road Sec4 Taipei 10633 Taiwan R.O.C. Relationship with Issuer: Stockholder
Non-Filipino 452,018,582 22.19%
Common International Finance Corporation (IFC) & IFC Capitalization (Equity) Fund, L.P.
Address: 2121 Pennsylvania
International Finance Corporation The records in the possession of the Bank show that the beneficial ownership of this company belong to the shareholders of record
Non-Filipino 107,875,642 5.29%

69
Title of Class
Name, Address of record owner and relationship with
Issuer
Name of Beneficial Owner and
Relationship with Record Owner
Citizenship Number of Shares Held
Percent (%)
Avenue, NW Washington, DC 20433 USA Relationship with Issuer: Stockholder
of said company. The Bank has not been advised otherwise.
*Combined Direct and Indirect Shares of PMMIC;
As of December 31, 2021, the following directors and officers directly and indirectly own shares in RCBC:
Title of Class
Name of Beneficial Owner Amount and nature of record / beneficial
ownership
Citizenship Percent of Class
(%)
Par Amount Nature
Directors
Common Helen Y. Dee 14,923,060 R / B Filipino 0.07
Common Gil A. Buenaventura 50 R / B Filipino 0.00
Common Cesar E.A. Virata 1,384,340 R / B Filipino 0.01
Common Lilia B. De Lima 10 R Filipino 0.00
Common Vaughn F. Montes 50 R Filipino 0.00
Common Eugene S. Acevedo 3,441,000 R / B Filipino 0.00
Common Gayatri P. Bery 10 R American 0.00
Common Shih-Chiao Lin 10 R R.O.C. Taiwan 0.00
Common Arnold Kai Yuen Kan 10 R Canadian 0.00
Common Armando M. Medina 1,950 R Filipino 0.00
Common John Law 10 R French 0.00
Common Gabriel S. Claudio 10 R Filipino 0.00
Common Laurito E. Serrano 10 R Filipino 0.00
Common Adelita A. Vergel de Dios 10 R Filipino 0.00
Common Juan B. Santos 50 R Filipino 0.00
Subtotal 19,750,580
Executive Officers
na
TOTAL 19,750,580
Shareholders’ Rights and Protection of Minority Stockholders’ Interest The Bank respects the rights of the stockholders as provided for in the Revised Corporation Code; namely:
1. Right to vote on all matters that require their consent or approval;
2. Right to inspect the books and records of the Bank;
3. Right to information;
4. Right to dividends; and
5. Appraisal right.
It is the duty of the Board to promote the rights of the stockholders, remove impediments to the exercise of those rights and provide an adequate avenue for them to seek timely redress for breach of their rights, i.e., any shareholder or group of shareholders with at least five percent (5%) share of the total outstanding shares of the company shall be allowed to propose any relevant item for inclusion in the agenda for the meeting.

70
Right to Nominate Candidates for Board of Directors
The By-Laws of the Bank allows all shareholders, including minority stockholders, the right to nominate candidates for the Board of Directors. Voting Right The Board shall be transparent and fair in the conduct of the annual and special stockholders' meetings of the Bank. The stockholders shall be encouraged to personally attend such meetings. As allowed by the Revised Corporation Code and the Commission‘s rules, the Board of Directors, on April 25, 2022, issued a resolution allowing voting through remote communication or in absentia In case the stockholders cannot attend the annual and special stockholders' meetings, they shall be apprised ahead of time of their right to appoint a proxy. Subject to the requirements of the by-laws, the exercise of that right shall not be unduly restricted and any doubt about the validity of a proxy shall be resolved in the stockholders' favor. The Board shall take the appropriate steps to remove excessive costs and other administrative impediments to the stockholders' participation in meetings, whether in person or by proxy. Accurate and timely information shall be made available to the stockholders to enable them to make a sound judgment on all matters brought to their attention for consideration or approval. Stockholders shall have the right to elect, remove and replace directors and vote on certain corporate acts in accordance with the Revised Corporation Code. A director shall not be removed without cause if it shall deny minority stockholders representation in the Board.
The voting rights and procedures are also detailed in the Procedure for the Annual Stockholders‘ Meeting, the Proxy Form, and the Vote Ballot with Instructions and Procedures, all of which are attached to this Information Statement on the pages that follow the Notice of Meeting (before this Annex). Conduct of Shareholders’ Meeting Stockholders are encouraged to personally attend shareholders‘ meetings. In case the stockholders cannot attend the annual and special stockholders‘ meetings, they are apprised ahead of time of their right to appoint a proxy. As allowed by the Revised Corporation Code and the Commission‘s rules, the Board of Directors, on April 25, 2022, issued a resolution allowing voting through remote communication or in absentia. Accurate and timely information is made available to the stockholders to enable them to make a sound judgment on all matters brought to their attention for consideration or approval. Stockholders are allowed to pose questions and/or raise matters in person during the meeting and are addressed by the Chairperson, members of the Board and/or management. In view of the Covid-19 pandemic, the Annual Stockholders‘ Meeting which was held on June 28, 2021 was conducted virtually via videoconferencing as allowed by the SEC. The Bank hired an independent party, Punongbayan & Araullo, to count and validate votes cast at the said meeting. Proper and timely disclosures were made immediately after the ASM. Results of the meeting as well as minutes thereof are available on the Bank‘s website.

71
Right to Inspection
All stockholders shall be allowed to inspect corporate books and records including minutes of Board meetings and stock registries in accordance with the Revised Corporation Code and shall be furnished with annual reports, including financial statements, without cost or restrictions. Right to Information The stockholders shall be provided, upon request, with periodic reports which disclose relevant personal and professional information about the directors and officers and certain other matters such as their holdings of the Bank's shares, dealing with the Bank, relationships among directors and key officers, and the aggregate compensation of directors and officers. The minority stockholders shall be granted the right to propose the holding of a meeting, and the right to propose items in the agenda of the meeting, provided the items are for legitimate business purposes. The minority stockholders shall have access to any and all information relating to matters for which the management is accountable for and to those relating to matters for which the management shall include such information and, if not included, then the minority stockholders shall be allowed to propose to include such matters in the agenda of stockholders' meeting, being within the definition of "legitimate purposes". Dividend Policy Article XI, Section 1 of the By-Laws of the Bank, provides that dividends shall be declared and paid out of the surplus profits of the Bank as often and at such times as the Board of Directors may determine after making provisions for the necessary reserves in accordance with law and the regulations of the Central Bank of the Philippines. As a policy, management shall determine the amount of dividends to be declared and present the recommendation for the declaration of the same to the Board of Directors for approval. If it has stipulated dividend payment obligations, the Bank shall declare dividends in accordance with its commitment. The Bank ensures compliance with pre-requisites set by the BSP for the declaration of dividends. The net amount available for dividends is also in accordance with the formula provided under §124 of the BSP‘s Manual of Regulations for Banks (MORB), as follows: Amount of unrestricted or free earned surplus and undivided profits less:
a. Bad debts against which valuation reserves are not required by the BSP to be set up; b. Unbooked valuation reserves, and other unbooked capital adjustments required by the
BSP, whether or not allowed to be set up on a staggered basis; c. Deferred income tax; d. Accumulated profits not yet received but already recorded by a bank representing its
share in profits of its subsidiaries under the equity method of accounting; e. Accrued interest as required to be excluded pursuant to §305 of the MORB, net of
booked valuation reserves on accrued interest receivable or allowance for uncollectible interest on loans; and
f. Foreign exchange profit arising from revaluation of foreign exchange denominated accounts.
For purposes of the subsection, any balance of Paid-in Surplus account may be included in the amount available for stock dividends.

72
Details of the 2021 cash dividend distribution are as follows:
Nature of Securities
Date Declared
Dividend Record
Date
Date Approved Date Paid/
Per Share
Total Amount
By BOD
Convertible Preferred Feb. 22, 2021 0.0560 0.01 Mar. 21, 2021 Feb. 22, 2021 Mar. 31, 2021
Hybrid Perpetual Securities
Feb. 22, 2021 - 472.40 Feb. 26, 2021 Feb. 22, 2021 Feb. 26, 2021
Common Stock Apr. 26, 2021 0.4850 938.78 May 10, 2021 Apr. 26, 2021 May 25, 2021
Preferred Stock Apr. 26, 2021 0.4850 0.13 May 10, 2021 Apr. 26, 2021 May 25, 2021
Convertible Preferred May 31, 2021 0.0559 0.01 Jun. 21, 2021 May 31, 2021 Jun. 25, 2021
Hybrid Perpetual Securities
Jul. 26, 2021 - 486.04 Aug. 26, 2021 Jul. 26, 2021 Aug. 26, 2021
Convertible Preferred Aug. 31, 2021 0.0545 0.01 Sep. 21, 2021 Aug. 31, 2021 Sep. 24, 2021
Convertible Preferred Nov. 29, 2021 0.0537 0.01 Dec. 21, 2021 Nov. 29, 2021 Dec. 24, 2021
Appraisal Right The stockholders shall have appraisal right or the right to dissent and demand payment of the fair value of their shares in the manner provided for under Section 81 of the Revised Corporation Code of the Philippines. Investor Relations Program The Bank is committed to high standards of transparency, accountability, and fairness through its Investor Relations (IR) program. The IR program adopts a comprehensive communication and engagement framework to ensure the timely and accurate disclosure of material and relevant information, including its operating and financial results, and significant business developments, to provide the basis for the sound investment decisions of shareholders and investors. Company disclosures, investor and briefing presentations, and press releases are prepared and submitted in accordance to the requirements of the applicable regulatory institution. These are posted on the Bank‘s website at www.rcbc.com Material Information/Transactions The Board shall commit at all times to fully disclose material information dealings. It shall cause the timely filling of all required information for the interest of its shareholders and other stakeholders. The reports or disclosures required shall be prepared and submitted to the SEC and Philippine Stock Exchange (PSE) by the responsible committee or officer through the Bank's Compliance Officer. Material Information emanating from the Board of Directors shall be disclosed under the responsibility of the Corporate Information Officer (CIO). The CIO shall be responsible for efficiency in providing information and addressing concerns of its shareholders and other stakeholders through the Bank webpage which provides complete information about the Bank in a form that is user-friendly. Transactions between related parties shall be disclosed to include the nature of the related party relationship as well as information about the transactions and outstanding balances necessary for an understanding of the potential effect of the relationship of the financial statements. All material information about the Bank, i.e., anything that could adversely affect share price, shall be publicly disclosed. Such information and/or transactions shall include, among others, earnings results, acquisition or disposal of significant assets, related party transactions, board membership changes, shareholdings of directors and officers and any changes thereto, and such material

73
events or information which are required to be disclosed pursuant to the SRC and its Implementing Rules and Regulations. Other information that shall always be disclosed includes remuneration (including stock options) of all directors and senior management, corporate strategy, and off balance sheet transactions. All disclosed information shall be released via the approved and established stock exchange procedure for corporate announcements as well as through the annual report. The governance of the Bank shall be adequately transparent to its shareholders and other stakeholders. The Bank shall designate authorized signatories and alternates for disclosures. All disclosures or information stated or relayed by the authorized signatory shall be presumed to have been made with the approval of the Chairman of the Board, and principal officers of the Bank.. Other Stakeholders Creditors’ Rights It is the policy of the Bank to conduct its business in an efficient and fair manner in order for it to meet its contractual obligations to its depositors, subordinated debt noteholders, and service providers. In the event of any liquidation or bankruptcy proceeding, such creditors have preference over the assets of the Bank in accordance with Philippine laws on preference of credits. As a listed company, the Bank discloses, either through its website or the required stock exchanges, the relevant terms and conditions of their investment and fund-raising activities. Supplier/Contractor Selection and Criteria The Bank has a board-approved Policy on Outsourcing in accordance with BSP Circular No. 765 re: ―Revised Outsourcing Framework for Banks.‖ The Bank‘s policy provides for guidelines, processes, and controls in managing outsourcing risks. The Bank is required under the policy and in accordance with the BSP Circular to conduct due diligence on service providers to ensure their integrity, technical expertise, operational capability, financial capacity, and suitability to perform the outsourced activity. In certain cases as permitted by law and regulations, the supplier/contractor selection process is being handled by House of Investments, Inc. (HOI), an affiliate of the Bank. HOI‘s Procurement Shared Services has the following policies:
a. Code of Ethics for Procurement b. Code of Ethics for Suppliers c. Supplier Management d. Policies in Choosing a Supplier e. Procurement Process f. Contract Management g. Manual Structure, Use, Revisions/Amendments h. Early Involvement in Procurement
Suppliers are evaluated based on compliance with user requirements, quality, performance record in the industry, technical competence, customer service, design, delivery, dependability. Accreditation of new suppliers is based on recommendations of procurement heads or officers

74
and is evaluated and approved by the HOI‘s PSS Manager and General Manager. Accredited suppliers are likewise subject to performance evaluation. Towards Sustainable Value Chains The Bank sustainable strategy started more than ten years ago through the implementation of the Environmental and Social Management System (ESMS) in 2011. This was followed by the adoption of a Sustainable Finance Framework in April 2019, making the Bank the earliest adopter of the BSP Circular 1085 on Sustainable Finance Framework that was issued in April 2020. The Bank is committed in building partnerships within the organization and the people it serves by creating long-term sustainable value chains through its lending strategies and operations and supporting the needs of the society. The Bank‘s ESMS requires that all lending relationships/credits, both pipeline and portfolio, are vetted from an environmental and social (E&S) risk perspective. The ESMS is implemented to safeguard lending operations from exposure to activities with identified E&S risks. The Bank‘s ESMS Policy is a declaration of its commitment to sustainable development and management of E&S issues. The Bank‘s Sustainable Finance Framework subscribes to global bond standards, primarily the International Capital Market Association (ICMA) bond principles. Under the Bank‘s Sustainable Finance Framework, the Bank has supported a sustainable portfolio consisting of roughly 9,000 projects as of the end of 2021, with about 70% attributable to eligible green projects and 30% to eligible social projects. By the end of 2021, the sustainable asset portfolio comprised 12% of the Bank‘s total loan portfolio, up from 10% in 2020. The Bank‘s ESMS Policy and Sustainable Finance Framework are both aligned with the salient provisions of BSP Circular 1085 and BSP Circular 1128 (Environmental and Social Risk Management, issued in October 2021). Both Circulars promote the need for periodic assessment of the Policy / Framework to ensure its relevance with developments in the business environment. ESMS Policy updates were implemented in April 2021 to facilitate the E&S assessment process and consolidate reference materials into one of the Policy‘s supporting schedules. Updates on global bond guidelines, on the other hand, are regularly followed / monitored by the Bank for the application of the eligibility criteria under its Sustainable Finance Framework. The most recent examples of these are the Green/ Social/ Sustainability Bond Guidelines released by ICMA in June 2021. Internal Control Effective internal control is the foundation of safe and sound banking. It reduces the possibility of significant errors and irregularities, and in the event of occurrence, said internal control assists in timely detection. A properly designed and consistently enforced system of operational and financial internal controls helps the Bank‘s Board of Directors and Management to safeguard the Bank‘s resources, produce reliable financial reports and comply with applicable laws and regulations. The Bank has established an effective internal control system to ensure that the Bank is managed and controlled in a sound and prudent manner. It includes the following critical components:
Control Environment Control environment is the framework under which internal controls are developed, implemented and monitored. It consists of the mechanisms and arrangements that ensure internal and external risks to which the company is exposed are identified, and appropriate and effective internal controls are developed and implemented to manage said risks soundly.

75
The control environment emanates from the Board of Directors and reflects Management‘s commitment to internal controls. In line with this, the Management has ensured the strategic implementation of internal controls that provide for an organizational structure that establishes clear lines of authority and responsibility for monitoring adherence to prescribed policies, effective risk assessment, timely and accurate financial and regulatory reports, and adequate procedures to safeguard and manage the Bank‘s assets.
Risk Assessment The Bank‘s risk assessment is a systematic process of identifying and analyzing relevant inherent and residual risks and the corresponding control mechanisms that can adversely affect the achievement of the Bank‘s objectives. The assessment helps determine the adequacy and effectiveness of control mechanisms in mitigating risks and the corresponding strengths and weaknesses of the Bank vis-à-vis the risk environment. The Bank‘s Risk Oversight Committee (ROC, a Board-level Committee) has responsibility over the Risk Governance Framework (RGF) which provides a detailed discussion on each type of risk including the identification, measurement and management of these risks. The ROC shall oversee compliance to the established risk appetite, risk management policies, and limits. The assessment of control mechanisms in managing inherent and residual risks by the business units is an effective risk engine in the risk management process. By determining and assessing the risks involved in banking operations, the Bank can decide what types of controls are needed and how they should be managed. Supporting the ROC in carrying out its mandate are the Risk Management Group (RMG) and Credit Management Group (CMG). These groups are responsible for overseeing the risk-taking activities across the Group, as well as in evaluating whether these remain consistent with the Bank‘s risk appetite and strategic direction. RMG is headed by the Bank‘s Chief Risk Officer (CRO). The CRO serves on a full-time basis and functionally reports to the ROC. The CRO is responsible for overseeing the risk management function and supporting the Board of Directors in the development of the risk appetite of the Bank. The CRO leads a team of six different risk areas: i) Enterprise Risk, ii) Portfolio Quality, iii) Market and Liquidity Risk Management, iv) Operational Risk Management v) Enterprise Fraud Risk and vi) Information Security Governance. CMG, headed by the Chief Credit Officer, manages the Bank‘s credit risk portfolio covering both business and consumer lending exposures, by way of formulating relevant credit risk policies as well as providing independent credit risk assessment on all exposure types. The Chief Credit Officer provides regular reports and insights on the Bank‘s portfolio credit quality to stakeholders including the Risk Oversight Committee, and the Senior Management Committee and regulators like the BSP.
Control Activities Control activities refer to the policies and procedures designed to help ensure that all bank personnel are properly guided by the control measures established by the Bank. Control activities form an integral part of the daily activities of the Bank. An effective internal control system requires that appropriate control mechanisms are set up, with control activities defined at every business level. In this regard, the Bank has ensured that control activities, which are directed through policies and procedures, are designed and implemented to address the risks involved in banking operations.

76
The control activities implemented by the Bank include, but are not limited to, the following: a. Establishing approvals and authorization for transactions and activities; b. Reconciliation; c. Review of operating performance and exception reports; d. Establishing safeguards or physical controls for use of assets and records; e. Segregation of duties to reduce a person‘s opportunity to commit and conceal fraud or errors; f. Requirement on mandatory leaves; g. Rotation of duties; and h. Number control
Management Reporting System Another element in an effective internal control program involves accurate accounting and comprehensive information and communication systems that are relevant to decision-making. These systems not only capture information and generate necessary reports, but also enable all personnel to understand their roles in the overall control system, how their activities relate to others, and their accountability for the activities they conduct.
Monitoring Activities and Correcting Deficiencies Monitoring activities entails assessing the quality of performance over time and making any necessary modifications to correct any deficiencies. The overall effectiveness of the Bank‘s internal controls is monitored on an ongoing basis. In view of changing internal and external conditions, Management continually monitors and evaluates the Bank‘s internal control system to ensure that these are adequate and continue to function properly. Periodic assessment and evaluation of control mechanisms used in managing risks are conducted by the business units in coordination with internal audit, risk management and other support units. Internal control deficiencies, whether identified by business units, internal audit or other control personnel, are reported in a timely manner to the appropriate management level so that the same can be addressed immediately. Internal control is the responsibility of all employees of the Bank. Everyone in the organization is responsible for ensuring that the internal control measures being adopted by the organization are properly and strictly enforced and are effectively operational. The channels of communication ensure that all employees fully understand and adhere to policies and procedures affecting their work, and that other relevant information is properly communicated to the appropriate personnel. Likewise, the Bank‘s internal audit, risk management unit and external audit provide an objective, independent review of bank activities, internal controls and management information systems to help the Board of Directors and the Management monitor and evaluate internal control adequacy and effectiveness. Compliance Function The compliance function of the Bank facilitates the effective management of compliance risks or risks of legal or regulatory sanctions, material financial loss, or loss to reputation that a bank may suffer as a result of its failure to comply with laws, rules, related self-regulatory organization standards, and codes of conduct applicable to its activities. The Compliance Function is discharged by the Regulatory Affairs Group (RAG) headed by the Chief Compliance Officer (CCO). RAG is a separate and independent unit with no business function. It reports to the Board of Directors through the Audit and Compliance Committee and the AML Committee.

77
RAG facilitates the effective management of compliance risks by:
a. Advising the Board of Directors and senior management on relevant laws, rules and standards, including keeping them informed on developments in the area;
b. Apprising Bank personnel on compliance issues, and acting as a contact point within the Bank for compliance queries from its personnel;
c. Establishing written guidance to staff on the appropriate implementation of laws, rules and standards through policies and procedures and other documents such as compliance manuals, internal codes of conduct and practice guidelines;
d. Identifying, documenting and assessing the compliance risks associated with the Bank's business activities, including new products and business units;
e. Assessing the appropriateness of the Bank's compliance procedures and guidelines, promptly following up any identified deficiencies, and where necessary, formulating proposals for amendments;
f. Monitoring and testing compliance by performing sufficient and representative compliance testing; and
g. Maintaining a constructive working relationship with the BSP and other regulators. The functions of RAG are discharged by the following divisions which are under the direct supervision of the CCO:
a. The Regulatory Affairs Divisions performs horizon scanning and impact assessment of new regulations and market trends, and the embedding of rules and regulations to the Bank‘s policies, procedures, and controls.
b. The Anti-Money Laundering Monitoring and Reporting Division is responsible for the
monitoring, analysis, disposition and investigation of AML alerts; reporting of possible suspicious transactions; filing of reports on crimes and losses; monitoring and filing of covered transactions reports and suspicious transactions reports; recommending new or updating AML alert rules; and updating AML watchlists for name screening.
c. The Testing and Monitoring Division is responsible for the identification, assessment and
monitoring of compliance risks and level of compliance of the different business lines, products and services with the relevant regulations governing banks. It also supports the overall operations of RAG which includes project management for key compliance projects; dissemination and reporting of regulatory issuances; planning, and administrative matters.
Internal Audit The Bank has in place an independent internal audit function headed by the Chief Audit Executive who functionally and administratively reports to the Audit and Compliance Committee. The scope of work of Internal Audit encompasses, but is not limited to, the examination and evaluation of all business systems, processes, operations, functions and activities within the Bank including functions that are outsourced, its subsidiaries and branches. Such scope of work determines the adequacy and effectiveness of the Bank‘s risk management, control and governance process to provide reasonable assurance that:
Risks are appropriately identified and managed in the context of current and potential risks;
Interaction with various governance groups and control units occurs as needed;
Programs, plans and objectives are achieved;
Resources are acquired economically, used efficiently and protected adequately;

78
Quality and continuous improvement are fostered in the Bank‘s control process;
Significant financial, managerial and operating information is accurate, reliable and timely;
Employees‘ actions including performance of trading activities are in compliance with policies, standards, procedures and applicable laws and regulations;
Significant legislative or regulatory issues impacting the Bank are appropriately recognized and addressed including areas of interest to regulators such as, among others, monitoring of compliance with relevant laws, rules and regulations, including but not limited to the assessment of the adequacy of capital and provisions; liquidity level; regulatory and internal reporting;
Management and financial information system including the electronic information system and electronic banking services are reliable and effective and resulting data has integrity
Internal Audit adheres to the applicable professional standards and code of ethics, including the Institute of Internal Auditors‘ International Standards for the Professional Practice of Internal Auditing, Information Systems Audit and Control Association standards and guidelines and the relevant requirements of the Bangko Sentral ng Pilipinas and other bank regulators. An independent assessment of the internal audit function is conducted every five (5) years by an external auditor through a quality assurance review. In 2020, the internal audit function underwent a full external quality assessment review by an independent assessor and the latest Quality Assessment Report was released on May 11, 2021. The External Auditor External Audit Fees and Services. The Audit and Compliance Committee is empowered to appoint the external auditor of the Bank and approve all auditing and non-audit services. It recommends to the Board the selection of the external auditor considering independence and effectiveness and recommends the fees to be paid. The following are audit and non-audit fees paid to the bank‘s external auditor, Punongbayan and Araullo, in 2021 (in Million Pesos):
2021 Audit Fee Non-Audit Fee Total
Parent 7.61 2.52 10.13
Group 12.35 3.54 15.89
Non-audit fees include engagements for the quarterly review and agreed upon procedures in connection with the Bank's Offering Circulars. Changes in and Disagreements with Accountants on Accounting and Financial Disclosure. In connection with the audits of the Bank‘s financial statements for the two (2) most recent years ended December 31, 2021 and 2020, there were no disagreements with Punongbayan and Araullo on any matter of accounting principles or practices, financial statement disclosures, audit scope or procedures. Policies Code of Conduct All directors and employees are governed by the Bank‘s Code of Conduct, which revolves around the Core Values of the company. It is designed to serve as a guide to all directors and employees on how they should conduct themselves within and outside the Bank premises and in dealing with clients/customers and co-associates.

79
Adherence to this Code is the responsibility of each and every associate. It is administered uniformly throughout the Bank and is independent of the practices of other banks. It is a condition for continuous employment. Any breach of this Code may result in disciplinary action ranging from reprimand to termination of employment, depending on the gravity of the offense, after the observance of due process. The Code of Conduct is divided into five parts as follows:
A. Treatment of Clients B. Treatment of Bank Assets C. Treatment of Others D. Conflict of Interests E. Knowledge, Understanding & Compliance
Anti-Corruption Policies Under Part D of the Code of Conduct on Conflict of Interests, to avoid conflict of interest, employees are to conduct business transactions for the Bank in accordance with Bank policy and avoid direct or indirect use of the Bank‘s goodwill, reputation, funds and property or other resources for personal gain. This involves, among other things, accepting gifts, entertainment or favors from customers or suppliers; outside employment; outside directorship; and receiving commissions or benefits from customers or suppliers. Gifts and Entertainment. The Bank does not allow solicitation of gifts, directly or indirectly, from customers or suppliers. Under no circumstance do employees accept, directly or indirectly, payments, loans, kickbacks, special privileges or services in exchange for favors. Favors. The Bank does not buy business. This is obtained on the merits of the Bank‘s products, services and people. It does not bend rules nor offer money, illegal or inappropriate favors of unusual value to obtain or retain business. In this regard, any and all significant donations or contributions to or through a customer for whatever purpose using Bank property or funds should be with the prior authorization of the concerned Group Head. Should said donation or contribution be through the purchase of a raffle or lottery ticket, any prize or winnings therefrom, regardless of whether the ticket is in the employee‘s possession or in the employee‘s name, must be turned over to the Bank. Receiving Commissions or Benefits. Employees must avoid situations which may unduly influence the relationships with customers or suppliers in a position to transact business with the Bank. Employees must make sure that the procedures laid down in providing customer services or in purchasing goods and services are strictly followed. Employees who have a direct hand in choosing companies from which purchases of the Bank‘s business requirements are to be made, are discouraged to use said authority to obtain commissions or leverage to purchase the same item/s for personal interests at terms not otherwise available to his/her colleagues or the public. Suppliers and customers are chosen based on merit and not on what can be gained from them. The Code of Conduct is a main topic included in the Bank‘s Employee Orientation Program which is held on a regular basis. The Code of Discipline provides for penalties for violations of the Code of Conduct. Administrative cases are handled in accordance with the Bank‘s Administrative Cases Procedure and existing laws. The Personnel Evaluation and Review Committee, as mentioned, acts as an independent body in the evaluation and review of cases involving dishonesty, fraud, negligence or violation of any internal Bank policy, rule or procedure committed by an RCBC employee and ensures that the appropriate preventive, corrective and disciplinary measures are imposed on cases involving dishonesty, fraud, negligence or violation of any internal Bank policy, rule or procedure committed by an RCBC employee.

80
Insider Information
There are laws that prohibit the use of inside information when buying, selling or trading publicly traded securities, including RCBC securities. Inside information can take many forms, but always includes information which is not available to the public and which might influence an investor‘s decision to buy, sell or hold securities in a company. Under the Code of Conduct, employees are prohibited from buying, selling or trading RCBC securities or the securities of other companies about which employees have inside information, until that information becomes public. In addition, this information should not be shared with anyone else, including family members or friends or anyone about trading in any securities based on this information. Whistleblowing Policy The Bank‘s Whistleblowing Policy is a key element in safeguarding the Bank‘s integrity. It aims to enhance the Bank‘s transparency and system for combating practices that might damage its activities and reputation. Protecting the integrity and reputation of the Bank requires the active support of its stakeholders, particularly its employees. The following are the basic principles of the Bank‘s Whistleblowing Policy:
1. Employees and other stakeholders must be provided with alternative and sufficient channels for whistleblowing and communication. In certain instances, they must be able to bypass the main channels for whistleblowing if these prove inappropriate;
2. Employees and other stakeholders making the report in good faith should at all times be protected against reprisals;
3. Identity of the whistleblower making the report in good faith should remain confidential; 4. Reported incidents shall be verified in an appropriate manner, and if confirmed, the Bank
must take the necessary actions; 5. The rights of any person implicated in any report must be respected.
Reports of any actual or suspected criminal activities, unlawful acts or omissions, fraud, violations of the Code of Conduct and other bank policies, danger to health and safety, improprieties or malpractice in the workplace, including those relative to matters of financial reporting, internal control and/or auditing may be sent through YGC‘s Open Communication system at www.rcbc.com/TalktoUs. AMLA RCBC is committed in embedding a culture of compliance in the overall structure of Bank as this is critical in the development and ongoing administration of an effective AML/CFT Program. The Board of Directors commitment to this objective is set forth in this Money Laundering and Terrorist Financing Prevention Program (MTPP). In combating money laundering, terrorist financing, and proliferation financing, the Bank shall apply the following principles: 1. Conduct business in conformity with high ethical standards in order to protect its safety and
soundness as well as the integrity of the national banking and financial system; 2. Know sufficiently your customer at all times and ensure that the financially or socially
disadvantaged are not denied access to financial services while at the same time prevent suspicious individuals or entities from opening or maintaining an account or transacting with the covered person by himself or otherwise;
3. Adopt and effectively implement a sound money laundering, terrorist financing, and proliferation financing prevention risk management system that identifies, assesses, monitors and controls risks associated with money laundering and terrorist financing;

81
4. Comply fully with Part Nine of the MORB, existing laws, and implementing rules and regulations aimed at combating money laundering and terrorist financing by making sure that officers and employees are aware of their respective responsibilities and carry them out in accordance with superior and principled culture of compliance; and
5. Fully cooperate with the Anti-Money Laundering Council for the effective implementation and enforcement of the Anti-Money Laundering Act (AMLA), as amended, the Terrorist Financing Suppression and Prevention Act and the Anti-Terrorism Act and their respective IRRs.
The MTPP is strategically aligned with the results of the National Risk Assessment on Money Laundering (ML) and Terrorist Financing (TF) of the Philippines, a government-wide assessment of the overall exposure of the country to money laundering and its related predicate offenses, terrorism and terrorist financing. It is a comprehensive process of identifying and analyzing the money laundering and terrorist financing (ML/TF) risks within the realm of the supervised sectors, financial institutions, and covered persons and entities under the AMLA, as amended. The MTPP shall be updated at least once every two (2) years or as needed to properly adhere to the new rules and regulations of regulatory agencies, laws of the Republic of the Philippines and other countries, and policies and procedures of the Bank. Related Party Transactions In May 31 2021, the Board approved the revised Policy on Related Party Transactions (RPT) following SEC Memorandum Circular No. 10, series of 2019 or the ―Rules on Material Related Party Transactions for Publicly-listed Companies‖ issued on April 27, 2019. The said policy defines ―related party transactions‖ as transactions or dealings with related parties of the Bank, including its trust department, regardless of whether or not a price is charged. These shall include, but not limited, to the following:
On- and off-balance sheet credit exposures and claims and write-offs;
Investments and/or subscriptions for debt/equity issuances;
Consulting, professional, agency and other service arrangements/contracts;
Purchases and sales of assets, including transfer of technology and intangible items (e.g. research and development, trademarks and license agreements)
Construction arrangements/contracts;
Lease arrangements/contracts;
Trading and derivative transactions;
Borrowings, commitments, fund transfers and guarantees;
Sale, purchase or supply of any goods or materials; and
Establishment of joint venture entities RPTs shall be interpreted broadly to include not only transactions that are entered into with related parties but also outstanding transactions that were entered into with an unrelated party that subsequently becomes a related party. The term ―related parties‖ under the Bank‘s updated RPT Policy has been expanded in scope as it broadens the definition of ―close family members‖ to include relatives of the Bank‘s Directors, Officers and Stockholders within the 4th degree of consanguinity or affinity, legitimate or common-law. Related parties also include corresponding persons in affiliated companies, those with direct or indirect linkages with the Bank, members of the Bank‘s Advisory Board and subsidiaries of related parties. The Bank constituted the Related Party Transactions Committee and RPT Management Committee to review and approve, as the case may be, related party transactions.

82
The RPT Committee reviews material RPTs to ensure that they are conducted in the regular course of business and not undertaken on more favorable economic terms (e.g., price, commissions, interest rates, fees, tenor, and collateral requirement) to such related parties than similar transactions with non-related parties under similar circumstances. On favorable review, the RPT Committee endorses material RPTs to the Board for approval. All material RPTs shall be approved by at least two-thirds (2/3) vote of the Board of Directors, with at least a majority of the independent directors voting to approve the material RPT. In case that a majority of the independent directors‘ vote is not secured, the material RPT may be ratified by the vote of the stockholders representing at least two-thirds (2/3) of the outstanding capital stock. Material RPTs approved by the Board shall be submitted to the Stockholders for confirmation during the Annual Stockholders Meeting. On the other hand, the RPT Management Committee reviews and approves proposed RPTs below the materiality threshold or those that do not require Board approval to ensure that said RPTs are conducted in the regular course of business and not undertaken on more favorable economic terms to such related parties than similar transactions with non-related parties under similar circumstances. On favorable review, the RPT Management Committee approves the non-material RPT and submits the same to the BOD for confirmation. Transactions with related parties involving amounts of at least Pesos: Ten Million (Php10,000,000.00) are considered as material RPTs. The said threshold shall not apply to DOSRI loans and other credit accommodations and guarantees, and other transactions requiring Board approval under the regulations, i.e., cross-selling, outsourcing, etc., which are always considered ―material‖ regardless of amount. Where the amount involved in the transaction is at least 10% of the combined assets of the RCBC Group, the transaction shall be accompanied by a fairness opinion issued by an external independent party to be appointed by the Board of Directors. The Bank observes the following limits on exposures to related parties:
INDIVIDUAL AGGREGATE LOANS / CREDIT SBL 50% of Capital
OTHER CONTRACT NONE* 10% of Capital
* Not to exceed the aggregate limit for Other Contracts
The Bank submits a quarterly report to the BSP on material exposures to related parties, which include the material RPTs of non-bank financial subsidiaries and affiliates. A summary of material RPTs entered into during the reporting year is also disclosed in the Bank‘s Integrated Annual Corporate Governance Report. . Details of the Bank‘s major related party transactions in 2021 are described below:
Sale and Purchase of Securities - The Parent Company and certain subsidiaries engage in the trading of investment securities as counterparties to the transaction. These transactions are priced similar to transactions with other counterparties outside the Group and there are no unsettled transactions as of the end of each reporting period. [Note 28.3, Notes to Financial Statements]
Retirement Fund - The Parent Company and certain subsidiaries‘ retirement funds covered under their defined benefit post-employment plan maintained for qualified employees are administered and managed by the Parent Company‘s Trust Department in accordance with the respective trust agreements covering the plan. [Note 28.4, Notes to Financial Statements]

83
The Group‘s significant transactions with its related parties as of end December 2021 include loans and receivables and deposit liabilities. The total amount of loans outstanding was at P19.4 Billion while total deposit liabilities was at P9.2 Billion as of December 31, 2021. The total amount of Parent Company DOSRI loans was P304 Million by end of December 2021. The RPT Policy as well as any update thereto shall be submitted to the Securities and Exchange Commission pursuant to SEC Memorandum Circular No. 10, series of 2019 or the ‗Rules on Material Related Party Transactions for Publicly-Listed Companies.‘ The policy shall be signed by the Chairperson and the Chief Compliance Officer. The policy shall also be posted in RCBC‘s website within 5 days from submission to the SEC. Transactions with subsidiaries which are eliminated in the consolidated financial statements are as follows:
Lease contract with RCBC Rental Corporation (RRC) and Sublease Agreements with Subsidiaries - The Parent Company and certain subsidiaries occupy several floors of RCBC Plaza as leaseholders of RRC. The occupancy of some of subsidiaries in RCBC Plaza is covered by sublease agreements with RCBC. RCBC‘s lease contract with RRC is effective until December 31, 2025. [Note 28.5(a), Notes to Financial Statements]
Service Agreement with RCBC Bankard Services Corp. (RBSC) - The Parent Company has a Service Agreement with RBSC, wherein RBSC shall provide the Parent Company with marketing, distribution, technical, collection and selling assistance and processing services in connection with the operation of the Parent Company‘s credit card business. [Note 28.5(b), Notes to Financial Statements]
The Bank has service agreements with RBSC for the in-sourced internal audit services. The Bank provides limited audit services to RBSC, specifically IT audit, operations audit and financial statements review. Also, the Bank has formalized the service agreements for the internal audit services being provided to subsidiaries namely: RCBC Capital Corp., RCBC Securities, Inc., RCBC Forex Brokers Corp., Merchant Savings and Loan Association, Inc. (Rizal Microbank), RCBC Leasing and Finance Corporation and Niyog Property Holdings, Inc.
The Bank has a service agreement with RCBC Forex Brokers Corporation (RCBC Forex) for in-sourced services, rendered by the following business units: 1) business and operational risk, 2) compliance, 3) internal audit, 4) information technology, and 5) human resources. The services shall be limited to: compliance with relevant laws, rules and regulations, market, liquidity, and operational risk management, internal audit, information technology, review of salary and processing of payroll on a bi-monthly basis, and implementation of exclusive succession planning, human resources information system and database administration and organization of training programs.
The Bank has a service agreement with RCBC Forex for the referral of money service business customers to RCBC Forex, to facilitate the purchase and/or sale of foreign currencies. The services to be rendered are relative to account opening and compliance with customer identification regulatory requirements.
The Bank has a service agreement with RCBC International Finance Limited (RIFL) to facilitate the remittance tie-up and account solicitation arrangement agreement with RIFL which is based in Hongkong.
The Bank has an agreement with RRC for the lease of 1,600 new ATMs with a lease term of 60 months. The agreement is expected to be implemented over a period of 3 years.
The Bank‘s other transactions with affiliates include service agreements, leasing office premises to subsidiaries which is eliminated during consolidation, accreditation of RCBC Trust agent and of insurance companies, and regular banking transactions (including purchases and sales of trading

84
account securities, securing insurance coverage on loans and property risks and intercompany advances), all of which are at arms‘ length and conducted in the ordinary course of business. The Bank does not have any transactions with promoters within the past five (5) years. The Bank does not have transactions with parties that fall outside the definition of related parties under regulations, but with whom the registrants or its related parties have a relationship that enables the parties to negotiate terms of material transactions that may not be available from other, more clearly independent parties on an arm‘s length basis.
(J) Undertaking to Provide Annual Report
The Bank undertakes to provide each stockholder without charge a copy of the annual report on SEC Form 17-A upon written request to the Bank addressed to:
Atty. George Gilbert G. dela Cuesta Corporate Secretary Rizal Commercial Banking Corporation 46/F, Yuchengco Tower, RCBC Plaza 6819 Ayala Ave. cor. Sen. Gil J. Puyat Ave. Makati City

?
r^A*m{:
STATENIENT OF N,LdNAGEN{ENT'S RESPONSIBILIT\-F'OR FINANCIAL STATEN{ENTS
The management of Rizal Cornmercial Banking and Subsidiaries (the Group), is responsible for thepreparation and fair presentation of the financial statements, including the schedules attached therern,as of and for the yeat ended December 31,2021 (includiag the comparative hnancial statements as ofDecember 31,,2020 and for the years ended December 31, 2O2O ar,d 2019), h accordance with theprescribed financial reportirrg framework indicated therein, and for such internal control as
management determines is necessary to enable the preparation of financial statements that are freefrom material misstatement, whether due to fraud or error.
In prepadng the hnancial statements, management is responsible for assessirg the Group's ability tocontinue as a going concero, disclosing, as applicable, matters related to going concern and using thegoing coflcern basis of accounting unless management either intends to liquidate the Group or tocease operations, or has no realistic alternatir.,e to do so.
The Board of Directors is responsible for overseeing the Group's financial repofiing process.
The Board of Directors reviews and approves the financiai statemeflts, including the schedules
attached therein, and submits the same to the stockholders.
Punongbayan & Araullo, the independent auditors appointed by the stockholders, have audited thefinancial statements of the Group in accordance with Philippine Standards on Auditing, and in theirrePort to the stockholders, have expressed their opinion on the fair-ness of presentation uponcompletion of such audit.
Yuchengco Tower, RCBC Plaza, 6819 Ayala Avenrle, Makati Cily 0727(632) BB94-9OOO I wwwrcbc.com

*
F*rtn*rs Tl:r rs*g{t fi ***rati*nt
SUBSCRIBED AND SwoRN To BEFORE N{E, this
- afi}Er t fl l!"??
2022 at Nlakati City,Philippines, afhants exhibited to me their valid identifications, to wit:
Chairperson. Board of Directors
4a ,'?-
ALBERTO N. PEDROSAFS\IP, Head - Treasury Group
rrcraNrkffiNz;,FSYP. Head - Contr6llership Group
EUGE S. ACE.\TEDOPresident & ef Executive Officer
Date/Plan o;f Ixue
5 / 11 / 2018, N{akatr
6 I 11 / 2018, Nlanila
2/8/21, Nlanila
7 /1/2020,I{anila
Narne
Helen Y. Dee
Eugene S. Acevedo
Alberto N. Pedrosa
Florentino N[. N'Iadonza
,rD Na.
Driver's License N1 1 -75,01 6658
Passport No. P751i081A
Passport No. P73213058
PRC License 0088956
Doc. |,1o.
I*age i'Jo"lltx:ir jr;'ci.
$irries *f
ATTY. CATALINO VICENTE L.ARABITNOTARY PUBLIC
Appointment No. M-66 (2021-2022)PTR No- 88541 M; a1 tA3D2; Makati CityIBP No. 178707; Ail04122; Makati City
ROLL NO.4014521st Floor Yuchengco Towei2, RCBC Plaza
6819 Ayala Avmue, Maj<eti City
Yuchengco lbwer, RCBC Plaza, 6819 Ayata Avonue, Makati City a727(632) BB94-90O0 | wwv,;.rcbc.corn

Punongbayan & Araullo (P&A) is the Philippine member firm of Grant Thornton International Ltd
Financial Statements and Independent Auditors’ Report Rizal Commercial Banking Corporation December 31, 2021 and 2020
FOR SEC FILING

Punongbayan & Araullo 20th Floor, Tower 1 The Enterprise Center 6766 Ayala Avenue 1200 Makati City Philippines T +63 2 8988 2288
a
Certified Public Accountants Punongbayan & Araullo (P&A) is the Philippine member firm of Grant Thornton International Ltd. Offices in Cavite, Cebu, Davao BOA/ PRC Cert of Reg. No. 0002 SEC Accreditation No. 0002
grantthornton.com.ph
Report of Independent Auditors The Board of Directors and the Stockholders Rizal Commercial Banking Corporation Yuchengco Tower, RCBC Plaza 6819 Ayala Avenue cor. Sen. Gil Puyat Avenue Makati City Report on the Audit of the Financial Statements Opinion We have audited the financial statements of Rizal Commercial Banking Corporation and subsidiaries (together hereinafter referred to as the Group) and of Rizal Commercial Banking Corporation (the Parent Company), which comprise the statements of financial position as at December 31, 2021 and 2020, and the statements of profit or loss, statements of comprehensive income, statements of changes in equity and statements of cash flows for each of the three years in the period ended December 31, 2021, and notes to the financial statements, including a summary of significant accounting policies. In our opinion, the accompanying financial statements present fairly, in all material respects, the financial position of the Group and of the Parent Company as at December 31, 2021 and 2020, and their financial performance and their cash flows for each of the three years in the period ended December 31, 2021 in accordance with Philippine Financial Reporting Standards (PFRS). Basis for Opinion We conducted our audits in accordance with Philippine Standards on Auditing (PSA). Our responsibilities under those standards are further described in the Auditors’ Responsibilities for the Audit of the Financial Statements section of our report. We are independent of the Group in accordance with the Code of Ethics for Professional Accountants in the Philippines (Code of Ethics) together with the ethical requirements that are relevant to our audits of the financial statements in the Philippines, and we have fulfilled our other ethical responsibilities in accordance with these requirements and the Code of Ethics. We believe that the audit evidence we have obtained is sufficient and appropriate to provide a basis for our opinion.

Certified Public Accountants Punongbayan & Araullo (P&A) is the Philippine member firm of Grant Thornton International Ltd.
- 2 -
Key Audit Matters Key audit matters are those matters that, in our professional judgment, were of most significance in our audit of the financial statements of the current period. These matters were addressed in the context of our audit of the financial statements as a whole, and in forming our opinion thereon, and we do not provide a separate opinion on these matters. The following are the key audit matters identified in our audit of the financial statements of the Group and of the Parent Company:
(a) Expected Credit Loss (ECL) Model for Loans and Receivables
Description of the Matter As at December 31, 2021, the Group’s and the Parent Company’s expected credit loss (ECL) allowance for loans and receivables amounted to P18,264 million and P17,339 million, respectively, while the carrying amount of loans and receivables amounted to P538,302 million and P530,464 million, respectively. We have identified the Group’s and the Parent Company’s ECL model significant to our audit as this: • requires significant management judgment on the interpretation and implementation of
the requirements of PFRS 9, Financial Instruments, in assessing impairment losses based on an ECL model that involves segmenting credit risk exposures, defining when does default occur and what constitutes a significant increase in credit risk (SICR) of different exposures;
• involves high degree of estimation uncertainty related to management’s use of various inputs and assumptions applied in the ECL model such as credit risk rating of the counterparty, expected amount and timing of cash flows, including recovery of collaterals for defaulted accounts, and forward-looking macroeconomic information which may be affected by management estimation bias; and,
• requires complex estimation process that entails implementation of internal controls
and use of information system in ensuring the completeness and accuracy of data used in the ECL calculation and in the preparation of required disclosures in the financial statements.
These judgments and estimates remained to be significant due to the unprecedented impact of COVID-19 pandemic to the Group’s and Parent Company’s loans and receivables. Given that changing the existing ECL model will take a significant amount of time to develop and validate, and the data limitation in respect of lagging credit information and granular behavior analysis of customers, the management has still applied post-model adjustments in the existing ECL model in 2021 to reflect the impact of the COVID-19 pandemic and the Group’s and Parent Company’s financial support program to its customers on a reasonable and supportable basis. The incorporation of post-model adjustments has considered re-segmentation of loan portfolios based on perceived and expected COVID-19 impact to the customers’ businesses and industries and additional qualitative factors that would elevate COVID-19 changes to SICR.

Certified Public Accountants Punongbayan & Araullo (P&A) is the Philippine member firm of Grant Thornton International Ltd.
- 3 -
The summary of significant accounting policies, the significant judgment, including estimation applied by the management, and those related to the credit risk assessment process of the Group and the Parent Company are disclosed in Notes 2, 3 and 4 to the financial statements, respectively. How the Matter was Addressed in the Audit We obtained an understanding of the Group’s and the Parent Company’s accounting policies and methodologies applied and we evaluated whether those: (a) are established and implemented consistent with the underlying principles of PFRS 9; (b) are appropriate in the context of the Group’s lending activities and asset portfolio that takes into consideration the different segments of credit exposures and the relevant regulatory framework; and, (c) are supported by pertinent processes and controls, including documentations of the accounting policies that capture in sufficient detail the judgment, including estimation applied in the development of the ECL model and post-model adjustments. With respect to the use of significant judgments, including those involving estimation of inputs and assumptions used in the ECL model and post-model adjustments, we performed the following:
• assessed the Group’s and the Parent Company’s segmentation and re-segmentation
of its credit risk exposures based on homogeneity of credit risk characteristics and impact of COVID-19 pandemic and evaluated the appropriateness of the specific model and post-model adjustments applied for each loan portfolio;
• evaluated both the quantitative and qualitative criteria applied in the definition of
default against historical analysis for each segment of loan portfolio and in accordance with credit risk management practices, and tested the criteria in the determination of the SICR, including assignment of a loan or group of loans into different stages of impairment;
• further evaluated additional qualitative factors considered that would elevate
COVID-19 related changes to SICR; • tested the Group’s and the Parent Company’s application of internal credit risk
rating system for selected items of loans, and verified the mapping of the ratings to the ECL calculation;
• tested loss given default information across various types of loan by inspecting
records of historical recoveries and relevant costs, including valuation and cash flows from collateral, and write-offs;
• reconciled and tested exposure at default for all outstanding loans against the
relevant loan databases, including review of the potential exposures from undrawn commitments against historical drawdown and impact of loan modifications;
• assessed the appropriateness of the identification of forward-looking information
(overlays) used in the ECL model and validated their reasonableness against publicly available information and our understanding of Group’s and Parent Company’s loan portfolios and industry where they operate; and,
• tested the effective interest rate used in discounting the ECL.

Certified Public Accountants Punongbayan & Araullo (P&A) is the Philippine member firm of Grant Thornton International Ltd.
- 4 -
As part of our audit of the ECL methodology, we tested the completeness and accuracy of the data used in the ECL model through reconciliation of loan data subjected to the ECL calculations, which were prepared by management outside its general ledger system, against the relevant financial reporting applications and other accounting records. Moreover, we tested the stratification of loan data that were disaggregated into various portfolio segments for purposes of ECL calculations. Furthermore, we tested the mathematical formula and the computation logics applied in the calculation of the different inputs in the ECL model and the estimation of the credit losses for all loans and receivables subjected to impairment assessment. We evaluated the completeness of the disclosures in the financial statements against the requirements of the relevant standards.
(b) Loan Modification
Description of the Matter The Group and the Parent Company offered a comprehensive financial support program for customers significantly affected by COVID-19 pandemic to allow them to get back in the habit of paying loans and receivables. As at December 31, 2021, the total outstanding balance of loans and receivables modified under the Group’s and Parent Company’s financial support program amounted to P31,144 million and P27,032 million, respectively. Management has assessed that these modifications were only to provide temporary relief to customers and the net economic value of the loans and receivables is not significantly affected; therefore, accounted for as non-substantial modification. The assessment to determine whether the modifications are substantial, that would result in the derecognition of the financial asset, or not, is consistent with the Group’s and Parent Company’s own accounting policies as there is no explicit guidance in PFRS 9 for when a modification should result in derecognition. The disclosures in relation to this matter are included in Notes 2 and 4 to the financial statements. Accordingly, we have assessed the accounting for loan modification as a key audit matter.
How the Matter was Addressed in the Audit We obtained an understanding of the Group’s and Parent Company’s accounting policies and procedures for loan modification and we evaluated whether those: (a) are established and implemented consistently; (b) are appropriate in the context of the Group’s and Parent Company’s comprehensive financial support measures; and, (c) are supported by pertinent processes and controls, including modification documentations that capture correct information of the modification mandated, are introduced and agreed with customers. We also performed the following audit procedures to address this key audit matter:
• verified the completeness of the loan modification database used by validating and comparing the listing of all modified loans and receivables, which were prepared by management outside its loan management system, against relevant financial reporting applications and other accounting records;
• verified the accuracy of the underlying loan modification database by agreeing a
representative sample of modified loans to the related documentation made and agreed with customers or other supporting information, and checked the integrity and mathematical accuracy of the calculations through recalculation of the expected loan modification adjustments;

Certified Public Accountants Punongbayan & Araullo (P&A) is the Philippine member firm of Grant Thornton International Ltd.
- 5 -
• assessed whether determination of loan modification as non-substantial is appropriate and verified the amount of any gain or loss from loan modification; and,
• evaluated whether the disclosures within the financial statements are appropriate
and complete based on of the requirements of the relevant standards.
(c) Fair Value Measurement of Unquoted Securities Classified at Fair Value Through Other Comprehensive Income Description of the Matter The Group and the Parent Company have significant investments in unquoted equity securities measured at fair value through other comprehensive income amounting to P1,815 million and P1,788 million, respectively, as December 31, 2021. The valuation of these financial instruments involves complex valuation techniques (i.e., price-to-book value method and discounted cash flow method) and significant estimation which are highly dependent on underlying assumptions and inputs such as price-to-book ratios of selected comparable listed entities, application of a certain haircut rate, and appropriate discount rate in computing the present value of future cash flows expected from dividend or redemption payments. These inputs are considered Level 3 unobservable inputs in the fair value hierarchy under PFRS 13, Fair Value Measurement, as discussed in Notes 3 and 7 to the financial statements. Accordingly, we have assessed the valuation of the unquoted equity securities as a key audit matter.
How the Matter was Addressed in the Audit We evaluated the appropriateness of management’s valuation methodology in accordance with PFRS 13. For equity security valued using the price-to-book value method, we used our own internal valuation expert to assess and challenge the valuation assumptions used, including the identification and selection of comparable listed entities and the related financial information such as net book value per share and quoted prices of those listed entities. In testing the reasonableness of the haircut rate used, we reviewed available non-financial information relevant to the assessment of the potential marketability of the subject security, and the consistency of the application of the haircut rate used in prior period in light of the current industry and economic circumstances. With respect to the equity security measured using the discounted cash flow method, we evaluated the reasonableness of the amount of future cash flows from the dividend or redemption expected to be received from the counterparty, and the appropriate discount rate used. We also tested the mathematical accuracy of the calculation for both valuation techniques used by management.
Other Information Management is responsible for the other information. The other information comprises the information included in the Group’s and the Parent Company’s Securities and Exchange Commission (SEC) Form 20-IS (Definitive Information Statement), SEC Form 17-A and Annual Report for the year ended December 31, 2021, but does not include the financial statements and our auditors’ report thereon. The SEC Form 20-IS, SEC Form 17-A and Annual Report for the year ended December 31, 2021 are expected to be made available to us after the date of this auditors’ report. Our opinion on the financial statements does not cover the other information and we will not express any form of assurance conclusion thereon. In connection with our audits of the financial statements, our responsibility is to read the other information identified above when it becomes available and, in doing so, consider whether the other information is materially inconsistent with the financial statements or our knowledge obtained in the audits, or otherwise appears to be materially misstated.

Certified Public Accountants Punongbayan & Araullo (P&A) is the Philippine member firm of Grant Thornton International Ltd.
- 6 -
Responsibilities of Management and Those Charged with Governance for the Financial Statements
Management is responsible for the preparation and fair presentation of the financial statements in accordance with PFRS, and for such internal control as management determines is necessary to enable the preparation of financial statements that are free from material misstatement, whether due to fraud or error. In preparing the financial statements, management is responsible for assessing the Group’s and the Parent Company’s ability to continue as a going concern, disclosing, as applicable, matters related to going concern and using the going concern basis of accounting unless management either intends to liquidate the Group and the Parent Company or to cease operations, or has no realistic alternative but to do so. Those charged with governance are responsible for overseeing the Group’s and the Parent Company’s financial reporting process. Auditors’ Responsibilities for the Audit of the Financial Statements
Our objectives are to obtain reasonable assurance about whether the financial statements as a whole are free from material misstatement, whether due to fraud or error, and to issue an auditors’ report that includes our opinion. Reasonable assurance is a high level of assurance, but is not a guarantee that an audit conducted in accordance with PSA will always detect a material misstatement when it exists. Misstatements can arise from fraud or error and are considered material if, individually or in the aggregate, they could reasonably be expected to influence the economic decisions of users taken on the basis of these financial statements. As part of an audit in accordance with PSA, we exercise professional judgment and maintain professional skepticism throughout the audit. We also:
• Identify and assess the risks of material misstatement of the financial statements, whether due to fraud or error, design and perform audit procedures responsive to those risks, and obtain audit evidence that is sufficient and appropriate to provide a basis for our opinion. The risk of not detecting a material misstatement resulting from fraud is higher than for one resulting from error, as fraud may involve collusion, forgery, intentional omissions, misrepresentations, or the override of internal control.
• Obtain an understanding of internal control relevant to the audit in order to design audit procedures that are appropriate in the circumstances, but not for the purpose of expressing an opinion on the effectiveness of the Group’s and the Parent Company’s internal control.
• Evaluate the appropriateness of accounting policies used and the reasonableness of accounting estimates and related disclosures made by management.
• Conclude on the appropriateness of management’s use of the going concern basis of accounting and, based on the audit evidence obtained, whether a material uncertainty exists related to events or conditions that may cast significant doubt on the Group’s and the Parent Company’s ability to continue as a going concern. If we conclude that a material uncertainty exists, we are required to draw attention in our auditors’ report to the related disclosures in the financial statements or, if such disclosures are inadequate, to modify our opinion. Our conclusions are based on the audit evidence obtained up to the date of our auditors’ report. However, future events or conditions may cause the Group and the Parent Company to cease to continue as a going concern.
• Evaluate the overall presentation, structure and content of the financial statements, including the disclosures, and whether the financial statements represent the underlying transactions and events in a manner that achieves fair presentation.

Certified Public Accountants Punongbayan & Araullo (P&A) is the Philippine member firm of Grant Thornton International Ltd.
- 7 -
• Obtain sufficient and appropriate audit evidence regarding the financial information of the entities or business activities within the Group to express an opinion on the financial statements. We are responsible for the direction, supervision and performance of the group audit. We remain solely responsible for our audit opinion.
We communicate with those charged with governance regarding, among other matters, the planned scope and timing of the audit and significant audit findings, including any significant deficiencies in internal control that we identify during our audit. We also provide those charged with governance with a statement that we have complied with relevant ethical requirements regarding independence, and to communicate with them all relationships and other matters that may reasonably be thought to bear on our independence, and where applicable, related safeguards. From the matters communicated with those charged with governance, we determine those matters that were of most significance in the audit of the financial statements of the current period and are therefore the key audit matters. We describe these matters in our auditors’ report unless law or regulation precludes public disclosure about the matter or when, extremely rare circumstances, we determine that a matter should not be communicated in our report because the adverse consequences of doing so would reasonably be expected to outweigh the public interest benefits of such communication. Report on Other Legal and Regulatory Requirements Our audits were conducted for the purpose of forming an opinion on the basic financial statements taken as a whole. As discussed in Note 26 to the financial statements, the Parent Company presented the supplementary information required by the Bureau of Internal Revenue (BIR) under Revenue Regulations (RR) 15-2010 in a supplementary schedule filed separately from the basic financial statements. RR 15-2010 requires the supplementary information to be presented in the notes to financial statements. The supplementary information for the year ended December 31, 2021 and 2020 required by the Bangko Sentral ng Pilipinas (BSP) as disclosed in Note 34 to the financial statements is presented for purposes of additional analysis. Such supplementary information required by the BIR and BSP are the responsibility of management and are not a required part of the basic financial statements prepared in accordance with PFRS; it is neither a required disclosure under the Revised Securities Regulation Code Rule 68 of the SEC. The supplementary information have been subjected to the auditing procedures applied in the audit of the basic financial statements and, in our opinion, is fairly stated in all material respects in relation to the basic financial statements taken as a whole.

Certified Public Accountants Punongbayan & Araullo (P&A) is the Philippine member firm of Grant Thornton International Ltd.
- 8 -
The engagement partner on the audits resulting in this independent auditors’ report is Anthony L. Ng. PUNONGBAYAN & ARAULLO
By: Anthony L. Ng Partner CPA Reg. No. 0109764 TIN 230-169-270 PTR No. 8852341, January 3, 2022, Makati City SEC Group A Accreditation Partner - No. 109764-SEC (until Dec. 31, 2023) Firm - No. 0002 (until Dec. 31, 2024) BIR AN 08-002511-038-2019 (until Sept. 4, 2022) Firm’s BOA/PRC Cert. of Reg. No. 0002 (until Aug. 27, 2024) February 28, 2022

Notes 2021 2020 2021 2020
CASH AND OTHER CASH ITEMS 9 14,691 P 16,520 P 14,663 P 16,464 P
DUE FROM BANGKO SENTRAL NG PILIPINAS 9 130,170 115,467 128,931 113,949
DUE FROM OTHER BANKS 9 12,162 15,707 11,860 15,214
LOANS ARISING FROM REVERSEREPURCHASE AGREEMENTS 9 11,691 13,356 11,656 13,226
TRADING AND INVESTMENT SECURITIES - Net 10 219,235 88,064 216,177 85,141
LOANS AND RECEIVABLES - Net 11 538,302 491,284 530,464 483,814
INVESTMENTS IN SUBSIDIARIESAND ASSOCIATES - Net 12 344 339 7,027 6,980
BANK PREMISES, FURNITURE, FIXTURESAND EQUIPMENT - Net 13 12,660 13,062 10,571 10,500
INVESTMENT PROPERTIES - Net 14 3,572 3,725 3,435 3,580
DEFERRED TAX ASSETS - Net 26 3,206 3,044 3,013 2,765
OTHER RESOURCES - Net 15 13,100 11,538 12,497 10,889
TOTAL RESOURCES 959,133 P 772,106 P 950,294 P 762,522 P
GROUP PARENT COMPANY
RIZAL COMMERCIAL BANKING CORPORATION AND SUBSIDIARIESSTATEMENTS OF FINANCIAL POSITION
DECEMBER 31, 2021 AND 2020(Amounts in Millions of Philippine Pesos)
R E S O U R C E S
See Notes to Financial Statements.

Notes 2021 2020 2021 2020
DEPOSIT LIABILITIES 17 672,459 P 535,788 P 674,414 P 536,748 P
BILLS PAYABLE 18 55,904 13,167 46,399 4,200
BONDS PAYABLE 19 87,215 90,439 87,215 90,439
ACCRUED INTEREST, TAXES AND OTHER EXPENSES 21 6,097 5,900 5,880 5,685
OTHER LIABILITIES 22 26,378 25,434 25,393 24,158
Total Liabilities 848,053 670,728 839,301 661,230
EQUITY 23Attributable to:
Parent Company's Shareholders 111,062 101,361 110,993 101,292 Non-controlling Interests 18 17 - -
111,080 101,378 110,993 101,292
TOTAL LIABILITIES AND EQUITY 959,133 P 772,106 P 950,294 P 762,522 P
See Notes to Financial Statements.
- 2 -
GROUP
LIABILITIES AND EQUITY
PARENT COMPANY

Notes 2021 2020 2019 2021 2020 2019
INTEREST INCOMELoans and receivables 11 31,900 P 33,909 P 32,646 P 31,095 P 33,031 P 31,748 P Trading and investment securities 10 4,448 2,079 4,498 4,379 1,991 4,439 Others 9 763 964 434 755 945 415
37,111 36,952 37,578 36,229 35,967 36,602
INTEREST EXPENSEBills payable and other borrowings 18, 19, 20, 22, 24 4,221 5,383 6,584 3,837 4,877 6,121 Deposit liabilities 17 4,059 5,288 8,626 4,056 5,265 8,598
8,280 10,671 15,210 7,893 10,142 14,719
NET INTEREST INCOME 28,831 26,281 22,368 28,336 25,825 21,883
IMPAIRMENT LOSSES - Net 16
Financial assets 11, 10.3 5,013 9,108 6,781 4,912 8,686 6,576 Non-financial assets 14, 15 1,035 267 616 1,021 265 616
6,048 9,375 7,397 5,933 8,951 7,192
NET INTEREST INCOME AFTER IMPAIRMENT LOSSES 22,783 16,906 14,971 22,403 16,874 14,691
OTHER OPERATING INCOMEService fees and commissions 2 4,549 3,506 3,854 4,047 3,320 3,543 Trading and securities gains (losses) - net 10 863 6,084 7,492 856 6,040 7,432 Trust fees 27 392 323 323 392 323 323 Foreign exchange gains - net 19 181 574 347 171 558 378 Share in net earnings (losses) of subsidiaries
and associates 12 12 94 )( 21 477 70 )( 473 Miscellaneous - net 25 1,566 1,239 1,453 771 513 618
7,563 11,632 13,490 6,714 10,684 12,767
TOTAL OPERATING INCOME (Forward) 30,346 P 28,538 P 28,461 P 29,117 P 27,558 P 27,458 P
RIZAL COMMERCIAL BANKING CORPORATION AND SUBSIDIARIESSTATEMENTS OF PROFIT OR LOSS
FOR THE YEARS ENDED DECEMBER 31, 2021, 2020 AND 2019(Amounts in Millions of Philippine Pesos, Except Per Share Data)
GROUP PARENT COMPANY
See Notes to Financial Statements.

Notes 2021 2020 2019 2021 2020 2019
TOTAL OPERATING INCOME 30,346 P 28,538 P 28,461 P 29,117 P 27,558 P 27,458 P
OTHER OPERATING EXPENSESEmployee benefits 24 6,371 6,626 6,833 5,686 5,896 6,109 Taxes and licenses 14 3,475 3,184 3,103 3,341 3,062 2,966 Depreciation and amortization 13, 14, 15 3,020 2,924 2,503 2,524 2,491 2,183 Occupancy and equipment-related 28, 29 2,820 2,819 2,800 2,763 2,777 2,756 Miscellaneous 25 6,849 6,492 6,559 7,196 6,875 6,912
22,535 22,045 21,798 21,510 21,101 20,926
PROFIT BEFORE TAX 7,811 6,493 6,663 7,607 6,457 6,532
TAX EXPENSE 26 728 1,475 1,275 525 1,437 1,145
NET PROFIT 7,083 P 5,018 P 5,388 P 7,082 P 5,020 P 5,387 P
ATTRIBUTABLE TO:
PARENT COMPANY'S SHAREHOLDERS 7,082 P 5,020 P 5,387 P
NON-CONTROLLING INTERESTS 1 2 )( 1
7,083 P 5,018 P 5,388 P
Earnings Per Share
Basic and diluted 30 3.09 P 2.43 P 2.78 P
- 2 -
GROUP PARENT COMPANY
See Notes to Financial Statements.

Notes 2021 2020 2019 2021 2020 2019
NET PROFIT 7,083 P 5,018 P 5,388 P 7,082 P 5,020 P 5,387 P
OTHER COMPREHENSIVE INCOME (LOSS)
Items that will not be reclassified subsequently to profit or loss
Actuarial gains (losses) on defined benefit plan 24 425 361 1,798 )( 375 361 1,777 )( Fair value gains (losses) on equity securities at fair value through
other comprehensive income (FVOCI) 10, 23 548 570 )( 586 )( 490 591 )( 837 )( Share in other comprehensive income (losses) of the subsidiaries
and associates:Actuarial gains (losses) on defined benefit plan 12 3 )( 8 )( - 47 8 )( 21 )( Fair value gains (losses) on equity securities at FVOCI 12, 23 - - - 58 21 251
970 217 )( 2,384 )( 970 217 )( 2,384 )(
Items that will be reclassified subsequently to profit or loss
Fair value gains (losses) on debt securities at FVOCI 10, 23 823 )( 339 116 )( 823 )( 339 116 )( Translation adjustments on foreign operations 23 - 1 - - 1 -
823 )( 340 116 )( 823 )( 340 116 )(
Total Other Comprehensive Income (Loss) 23 147 123 2,500 )( 147 123 2,500 )(
TOTAL COMPREHENSIVE INCOME FOR THE YEAR 7,230 P 5,141 P 2,888 P 7,229 P 5,143 P 2,887 P
ATTRIBUTABLE TO:
PARENT COMPANY'S SHAREHOLDERS 7,229 P 5,143 P 2,887 P
NON-CONTROLLING INTERESTS 1 2 )( 1
7,230 P 5,141 P 2,888 P
See Notes to Financial Statements.
RIZAL COMMERCIAL BANKING CORPORATION AND SUBSIDIARIESSTATEMENTS OF COMPREHENSIVE INCOME
FOR THE YEARS ENDED DECEMBER 31, 2021, 2020 AND 2019(Amounts in Millions of Philippine Pesos)
GROUP PARENT COMPANY

CAPITAL PAID HYBRID RESERVE GENERAL NON-COMMON PREFERRED IN EXCESS PERPETUAL REVALUATION TREASURY FOR TRUST OTHER LOAN LOSS CONTROLLING TOTAL
Notes STOCK STOCK OF PAR SECURITIES RESERVES SHARES BUSINESS RESERVES RESERVE SURPLUS TOTAL INTERESTS EQUITY
Balance at January 1, 2021 22,509 P 3 P 42,568 P 14,463 2,070 )( P 13,719 )( P 499 P 97 )( P 3,451 P 33,754 P 101,361 P 17 P 101,378 P
Transactions with owners:Reissuance of treasury shares 23 - - 63 )( - - 4,432 - - - - 4,369 - 4,369 Cash dividends 23 - - - - - - - - - 1,897 )( 1,897 )( - 1,897 )( Total transactions with owners - - 63 )( - - 4,432 - - - 1,897 )( 2,472 - 2,472
Net profit for the year - - - - - - - - - 7,082 7,082 1 7,083 Other comprehensive income - - - - 147 - - - - - 147 - 147 General loan loss appropriation 23 - - - - - - - - 166 166 )( - - - Transfer from surplus to reserve for trust business 27 - - - - - - 9 - - 9 )( - - -
- - - - 147 - 9 - 166 6,907 7,229 1 7,230
Balance at December 31, 2021 22,509 P 3 P 42,505 P 14,463 P 1,923 )( P 9,287 )( P 508 P 97 )( P 3,617 P 38,764 P 111,062 P 18 P 111,080 P
Balance at January 1, 2020 22,509 P 3 P 42,568 P - 2,193 )( P 13,719 )( P 485 P 97 )( P 3,132 P 30,143 P 82,831 P 19 P 82,850 P
Transactions with owners -Issuance of hybrid perpetual securities 23 - - - 14,463 - - - - - - 14,463 - 14,463 Cash dividends 23 - - - - - - - - - 1,076 )( 1,076 )( - 1,076 )( Total transactions with owners - - - 14,463 - - - - - 1,076 )( 13,387 - 13,387
Net profit for the year - - - - - - - - - 5,020 5,020 2 )( 5,018 Other comprehensive income - - - - 123 - - - - - 123 - 123 General loan loss appropriation 23 - - - - - - - - 319 319 )( - - - Transfer from surplus to reserve for trust business 27 - - - - - - 14 - - 14 )( - - -
- - - - 123 - 14 - 319 4,687 5,143 2 )( 5,141
Balance at December 31, 2020 22,509 P 3 P 42,568 P 14,463 P 2,070 )( P 13,719 )( P 499 P 97 )( P 3,451 P 33,754 P 101,361 P 17 P 101,378 P
Balance at January 1, 2019 22,509 P 3 P 42,568 P - 266 P 13,719 )( P 454 P 97 )( P 2,594 P 26,230 P 80,808 P 18 P 80,826 P
Transactions with owners -Cash dividends 23 - - - - - - - - - 864 )( 864 )( - 864 )(
Net profit for the year - - - - - - - - - 5,387 5,387 1 5,388 Other comprehensive income - - - - 2,500 )( - - - - - 2,500 )( - 2,500 )( General loan loss appropriation 23 - - - - - - - - 538 538 )( - - - Transfer of fair value loss on financial asset at fair value - -
through other comprehensive income to surplus 10, 23 - - - - 41 - - - - 41 )( - - Transfer from surplus to reserve for trust business 27 - - - - - - 31 - - 31 )( - - -
- - - - 2,459 )( - 31 - 538 4,777 2,887 1 2,888
Balance at December 31, 2019 22,509 P 3 P 42,568 P - 2,193 )( P 13,719 )( P 485 P 97 )( P 3,132 P 30,143 P 82,831 P 19 P 82,850 P
See Notes to Financial Statements.
ATTRIBUTABLE TO PARENT COMPANY'S SHAREHOLDERS
RIZAL COMMERCIAL BANKING CORPORATION AND SUBSIDIARIESSTATEMENTS OF CHANGES IN EQUITY
FOR THE YEARS ENDED DECEMBER 31, 2021, 2020 AND 2019(Amounts in Millions of Philippine Pesos)
GROUP
P
P
P
P

CAPITAL PAID HYBRID RESERVE GENERAL COMMON PREFERRED IN EXCESS PERPETUAL REVALUATION TREASURY FOR TRUST LOAN LOSS TOTAL
Notes STOCK STOCK OF PAR SECURITIES RESERVES SHARES BUSINESS RESERVE SURPLUS EQUITY
Balance at January 1, 2021 22,509 P 3 P 42,568 P 14,463 P 2,070 )( P 13,719 )( P 499 P 3,440 P 33,599 P 101,292 P
Transactions with owners -Reissuance of treasury shares 23 - - 63 )( - - 4,432 - - - 4,369 Cash dividends 23 - - - - - - - - 1,897 )( 1,897 )( Total transactions with owners - - 63 )( - - 4,432 - - 1,897 )( 2,472
Net profit for the year - - - - - - - - 7,082 7,082 Other comprehensive income - - - - 147 - - - - 147 General loan loss appropriation 23 - - - - - - - 176 176 )( - Transfer from surplus to reserve for trust business 27 - - - - - - 9 - 9 )( -
- - - - 147 - 9 176 6,897 7,229
Balance at December 31, 2021 22,509 P 3 P 42,505 P 14,463 P 1,923 )( P 9,287 )( P 508 P 3,616 P 38,599 P 110,993 P
Balance at January 1, 2020 22,509 P 3 P 42,568 P - 2,193 )( P 13,719 )( P 485 P 3,130 P 29,979 P 82,762 P
Transactions with owners - Issuance of hybrid perpetual securities 23 - - - 14,463 - - - - - 14,463 Cash dividends 23 - - - - - - - - 1,076 )( 1,076 )( Total transactions with owners - - - 14,463 - - - - 1,076 )( 13,387
Net profit for the year - - - - - - - - 5,020 5,020 Other comprehensive income - - - - 123 - - - - 123 General loan loss appropriation 23 - - - - - - - 310 310 )( - Transfer from surplus to reserve for trust business 27 - - - - - - 14 - 14 )( -
- - - - 123 - 14 310 4,696 5,143
Balance at December 31, 2020 22,509 P 3 P 42,568 P 14,463 P 2,070 )( P 13,719 )( P 499 P 3,440 P 33,599 P 101,292 P
Balance at January 1, 2019 22,509 P 3 P 42,568 P - 266 P 13,719 )( P 454 P 2,587 P 26,071 P 80,739 P
Transactions with owners - Cash dividends 23 - - - - - - - - 864 )( 864 )(
Net profit for the year - - - - - - - - 5,387 5,387 Other comprehensive loss 23 - - - - 2,500 )( - - - - 2,500 )( General loan loss appropriation - - - - - - - 543 543 )( - Transfer of fair value loss on financial asset at fair value
through other comprehensive income to surplus 10, 23 - - - - 41 - - - 41 )( - Transfer from surplus to reserve for trust business - - - - - - 31 - 31 )( -
- - - - 2,459 )( - 31 543 4,772 2,887
Balance at December 31, 2019 22,509 P 3 P 42,568 P - 2,193 )( P 13,719 )( P 485 P 3,130 P 29,979 P 82,762 P
- 2 -
PARENT COMPANY
See Notes to Financial Statements.
P
P
P

Notes 2021 2020 2019 2021 2020 2019
CASH FLOWS FROM OPERATING ACTIVITIESProfit before tax 7,811 P 6,493 P 6,663 P 7,607 P 6,457 P 6,532 P Adjustments for:
Interest income 9, 10, 11 37,111 )( 36,952 )( 37,578 )( 36,229 )( 35,967 )( 36,602 )( Interest received 35,416 35,607 41,050 34,676 34,780 41,050 Interest expense 17, 18, 19, 20, 22, 24 8,280 10,671 15,210 7,893 10,142 14,719 Interest paid 8,244 )( 11,669 )( 9,501 )( 7,892 )( 11,142 )( 9,501 )( Impairment losses - net 16 6,048 9,375 7,397 5,933 8,951 7,192 Depreciation and amortization 13, 14, 15 3,020 2,924 2,503 2,524 2,491 2,183 Recoveries from written-off assets 25 223 )( 102 )( 179 )( 223 )( 99 )( 179 )( Dividend income 25 105 )( 78 )( 304 )( 39 )( 16 )( 95 )( Gains on assets sold - net 25 101 )( 37 )( 109 )( 65 )( 11 )( 20 )( Share in net earnings of subsidiaries and associates 12 12 )( 94 21 )( 477 )( 70 473 )( Gain on sale of financial assets at amortized cost -net 10 - 2,695 )( 3,685 )( - 2,678 )( 3,685 )(
Operating profit before working capital changes 14,779 13,631 21,446 13,708 12,978 21,121 Decrease (increase) in financial assets at fair value through profit and loss 975 )( 660 2,022 1,064 )( 985 1,893 Increase in loans and receivables 62,435 )( 25,935 )( 61,164 )( 62,076 )( 25,969 )( 51,147 )( Decrease (increase) in investment properties 359 )( 4 630 )( 363 )( 38 631 )( Increase in other resources 2,636 )( 3,320 )( 3,723 )( 1,937 )( 3,703 )( 3,147 )( Increase in deposit liabilities 136,671 79,207 33,182 137,666 80,155 33,064 Increase (decrease) in accrued interest, taxes and other expenses 130 326 4,499 )( 194 394 4,096 )( Increase (decrease) in other liabilities 1,628 )( 31 )( 10,846 2,729 )( 454 )( 3,105
Cash generated from (used in) operations 83,547 64,542 2,520 )( 83,399 64,424 162 Income taxes paid 859 )( 2,009 )( 1,548 )( 773 )( 1,921 )( 1,386 )(
Net Cash From (Used in) Operating Activities 82,688 62,533 4,068 )( 82,626 62,503 1,224 )(
CASH FLOWS FROM INVESTING ACTIVITIESAdditional investments in securities at amortized cost 230,816 )( 174,920 )( 128,062 )( 230,816 )( 174,920 )( 126,480 )( Proceeds from disposal and maturity of securities at amoritzed cost 110,217 235,515 123,395 110,418 235,304 118,587 Acquistion of securities at at fair value through other
comprehensive income (FVOCI) 127,044 )( 201,531 )( 146,985 )( 126,809 )( 201,351 )( 146,196 )( Disposal of securities at FVOCI 117,158 215,395 111,744 116,890 214,711 111,633 Acquisitions of bank premises, furniture, fixtures, and equipment 13 1,333 )( 1,764 )( 2,245 )( 995 )( 773 )( 1,717 )( Acquisitions of intangible assets 15 494 )( 591 )( 233 )( 493 )( 575 )( 231 )( Cash dividends received 12, 25 105 78 304 663 659 95 Proceeds from disposals of bank premises, furniture, fixtures and equipment 13 88 92 908 95 39 831
Net Cash From (Used in) Investing Activities (Forward) 132,119 )( P 72,274 P 41,174 )( P 131,047 )( P 73,094 P 43,478 )( P
RIZAL COMMERCIAL BANKING CORPORATION AND SUBSIDIARIESSTATEMENTS OF CASH FLOWS
FOR THE YEARS ENDED DECEMBER 31, 2021, 2020 AND 2019(Amounts in Millions of Philippine Pesos)
GROUP PARENT COMPANY
See Notes to Financial Statements.

Notes 2021 2020 2019 2021 2020 2019
CASH FLOWS FROM FINANCING ACTIVITIESProceeds from availments of bills payable 18, 31 148,820 P 284,718 P 89,737 P 142,675 P 276,859 P 89,100 P Payments of bills payable 18, 31 104,018 )( 371,858 )( 44,388 )( 98,411 )( 365,298 )( 44,177 )( Maturity of bonds payable 19, 31 18,810 )( 27,371 )( - 18,810 )( 27,371 )( - Issuance of bonds payable 19, 31 17,873 23,670 45,697 17,873 23,670 45,697 Reissuance of treasury shares 23 4,369 - - 4,369 - - Dividends paid 23 1,897 )( 1,076 )( 864 )( 1,897 )( 1,076 )( 864 )( Payment of lease liabilities 22 1,360 )( 1,173 )( 1,186 )( 1,205 )( 1,113 )( 1,086 )( Net proceeds from issuance of hybrid perpetual securities 23 - 14,463 - - 14,463 - Redemption of subordinated debt 20 - - 9,986 )( - - 9,986 )(
Net Cash From (Used in) Financing Activities 44,977 78,627 )( 79,010 44,594 79,866 )( 78,684
NET INCREASE (DECREASE) IN CASH AND CASH EQUIVALENTS 4,454 )( 56,180 33,768 3,827 )( 55,731 33,982
CASH AND CASH EQUIVALENTS AT BEGINNING OF YEARCash and other cash items 9 16,520 16,907 17,392 16,464 16,808 17,321 Due from Bangko Sentral ng Pilipinas 9 115,467 87,255 56,495 113,949 85,453 55,059 Due from other banks 9 15,707 18,818 20,342 15,214 18,468 19,815 Loans arising from reverse repurchase agreements 9 13,356 5,768 10,032 13,226 5,629 10,000 Interbank loans receivable 9, 11 42,681 18,803 9,522 42,647 19,411 9,592
203,731 147,551 113,783 201,500 145,769 111,787
CASH AND CASH EQUIVALENTS AT END OF YEARCash and other cash items 9 14,691 16,520 16,907 14,663 16,464 16,808 Due from Bangko Sentral ng Pilipinas 9 130,170 115,467 87,255 128,931 113,949 85,453 Due from other banks 9 12,162 15,707 18,818 11,860 15,214 18,468 Loans arising from reverse repurchase agreements 9 11,691 13,356 5,768 11,656 13,226 5,629 Interbank loans receivable 9, 11 30,563 42,681 18,803 30,563 42,647 19,411
199,277 P 203,731 P 147,551 P 197,673 P 201,500 P 145,769 P
See Notes to Financial Statements.
- 2 -
GROUP PARENT COMPANY

RIZAL COMMERCIAL BANKING CORPORATION AND SUBSIDIARIES NOTES TO FINANCIAL STATEMENTS
DECEMBER 31, 2021 AND 2020 (Amounts in Millions of Philippine Pesos, Except Share and Per Share Data or As Indicated)
1. CORPORATE MATTERS
1.1 Incorporation and Operations
Rizal Commercial Banking Corporation (the Parent Company, the Bank or RCBC), a universal bank engaged in all aspects of banking, was originally incorporated on September 23, 1960. The Bank renewed its corporate existence on December 10, 2009. It provides products and services related to traditional loans and deposits, trade finance, domestic and foreign fund transfers or remittance, cash management, treasury, and trust and custodianship services. Under relevant authority granted by the Bangko Sentral ng Pilipinas (BSP), the Bank is also licensed to deal in different types of derivative products such as, but not limited, to foreign currency forwards, interest rate swaps and cross currency swaps. The Parent Company and its subsidiaries (together hereinafter referred to as the Group) are engaged in all aspects of traditional banking, investment banking, retail financing (credit cards, auto loans, mortgage/housing and microfinance loans), remittance, leasing and stock brokering. As a banking institution, the Group’s operations are regulated and supervised by the BSP. As such, the Group is required to comply with banking rules and regulations such as those relating to maintenance of reserve requirements on deposit liabilities and deposit substitutes and those relating to the adoption and use of safe and sound banking practices, among others, as promulgated by the BSP. The Group’s activities are subject to the provisions of Republic Act (RA) No. 8791, the General Banking Law of 2000, and other related banking laws. The Parent Company’s common shares are listed in the Philippine Stock Exchange (PSE). The Group and the Parent Company’s banking network within and outside the Philippines as of December 31 follows:
Group Parent Company 2021 2020 2021 2020 Automated teller machines (ATMs) 1,245 1,426 1,245 1,426 Branches 428 440 412 424 Extension offices 6 7 4 5
RCBC is a 39.64%-owned subsidiary of Pan Malayan Management and Investment Corporation (PMMIC or Ultimate Parent), a company incorporated and domiciled in the Philippines. PMMIC is the holding company of the flagship institutions of the Yuchengco Group of Companies (YGC), with registered business address at 48th Floor, Yuchengco Tower, RCBC Plaza, 6819 Ayala Avenue cor. Sen. Gil Puyat Avenue, Makati City. As of December 31, 2021, Cathay Life Insurance Corporation (Cathay) also owns 22.18% interest in RCBC. The Parent Company’s registered address, which is also its principal office, is at Yuchengco Tower, RCBC Plaza, 6819 Ayala Avenue cor. Sen. Gil Puyat Avenue, Makati City.

- 2 -
1.2 Subsidiaries and Associates
The Parent Company holds ownership interests in the following subsidiaries and associates at the end of 2021 and 2020:
Line of Explanatory Effective Percentage Subsidiaries and Associates Business Notes of Ownership Subsidiaries: RCBC Forex Brokers Corporation Foreign exchange (RCBC Forex) dealing 100.00 RCBC Telemoney Europe (RCBC Telemoney) Remittance 100.00 RCBC International Finance Limited (RCBC IFL) Remittance 100.00 RCBC Investment Ltd. Remittance (a) 100.00 RCBC Capital Corporation (RCBC Capital) Investment house 99.96 RCBC Securities, Inc. Securities brokerage (RSI or RCBC Securities) and dealing (b) 99.96 RCBC Bankard Services Corporation (RBSC) Credit card management (b) 99.96 RCBC-JPL Holding Company, Inc. (RCBC JPL) Property holding 99.41 Rizal Microbank, Inc. (Rizal Microbank) Thrift banking and microfinance 98.03 RCBC Leasing and Finance Corporation (RCBC LFC) Financial leasing 99.67 RCBC Rental Corporation (RRC) Property leasing (c) 99.67 Special Purpose Companies (SPCs): Real estate buying and selling (d) Cajel Realty Corporation (Cajel) 100.00 Niyog Property Holdings, Inc. (NPHI) 100.00 Associates: YGC Corporate Services, Inc. (YCS) Support services for YGC 40.00 Luisita Industrial Park Co. (LIPC) Real estate buying, developing, selling and rental 35.00 Honda Cars Phils., Inc. (HCPI) Sale of motor vehicles 12.88
Except for RCBC Telemoney (Italy), RCBC IFL (Hongkong) and RCBC Investment Ltd. (Hongkong), all other subsidiaries and associates are incorporated and conducting their businesses in the Philippines. RCBC Telemoney was operational only until March 1, 2016 and is currently in the process of liquidation.
Explanatory Notes:
(a) A wholly-owned subsidiary of RCBC IFL. (b) Wholly-owned subsidiaries of RCBC Capital. (c) A wholly-owned subsidiary of RCBC LFC. (d) In 2019, SPCs other than NPHI and Cajel were liquidated pursuant to BSP
recommendation and upon receipt of necessary regulatory clearance (see Note 15.3).

- 3 -
1.3 Approval of Financial Statements
The consolidated financial statements of RCBC and subsidiaries and the separate financial statements of RCBC as of and for the year ended December 31, 2021 (including the comparative financial statements as of December 31, 2020 and for the years ended December 31, 2020 and 2019) were approved and authorized for issue by the Board of Directors (BOD) of the Parent Company on February 28, 2022.
2. SUMMARY OF SIGNIFICANT ACCOUNTING POLICIES
The significant accounting policies that have been used in the preparation of these financial statements are summarized below. The accounting policies have been consistently applied to all the years presented, except when otherwise indicated.
2.1 Basis of Preparation of Financial Statements
(a) Statement of Compliance with Philippine Financial Reporting Standards
The consolidated financial statements of the Group and the separate financial statements of the Parent Company have been prepared in accordance with Philippine Financial Reporting Standards (PFRS). PFRS are adopted by the Financial Reporting Standards Council (FRSC) from the pronouncements issued by the International Accounting Standards Board (IASB), and approved by Philippine Board of Accountancy.
These financial statements have been prepared using the measurement bases specified by PFRS for each type of resource, liability, income and expense. The measurement bases are more fully described in the accounting policies that follow.
(b) Presentation of Financial Statements
The financial statements are presented in accordance with Philippine Accounting Standards (PAS) 1, Presentation of Financial Statements. The Group presents all items of income and expenses in two statements: a “statement of profit or loss” and a “statement of comprehensive income”.
The Group presents a third statement of financial position as of the beginning of the preceding period when it applies an accounting policy retrospectively, or makes a retrospective restatement or reclassification of items that have a material effect on the information in the statement of financial position at the beginning of the preceding period. The related notes to the third statement of financial position are not required to be disclosed.
(c) Functional and Presentation Currency
These financial statements are presented in Philippine pesos, the Group’s functional
and presentation currency (see Note 2.15). All amounts are in millions, except share and per share data or when otherwise indicated.
Items included in the financial statements of the Group are measured using its
functional currency. Functional currency is the currency of the primary economic environment in which the Group operates.

- 4 -
2.2 Adoption of New and Amended PFRS
(a) Effective in 2021 that are Relevant to the Group
The Group adopted for the first time the following amendments and improvements to PFRS, which are mandatorily effective for annual periods beginning on or after January 1, 2021:
(i) PFRS 9 (Amendments), Financial Instruments, PFRS 7 (Amendments), Financial
Instruments Disclosures, and PFRS 16 (Amendments), Leases – Interest Rate Benchmark Reform Phase 2. The amendments address issues that may affect the financial reporting during the interest rate benchmark reform, including the effect of changes to contractual cash flows or hedging relationships resulting from the replacement of the London Interbank Offered Rate (LIBOR) with alternative benchmark rates. The Phase 2 amendments are relevant to the Group because it is exposed to the effects of the LIBOR reform on its financial instruments that will mature post-June 30, 2023 (the date by which the reform is expected to be implemented). Discussed below are the relevant information arising from the Group’s adoption of these amendments. When the contractual terms of the Group’s borrowings are amended as a direct
consequence of the interest rate benchmark reform and the new basis for determining the contractual cash flows is economically equivalent to the basis immediately preceding the change, the Group changes the basis for determining the contractual cash flows prospectively by revising the effective interest rate. If additional changes are made, which are not directly related to the reform, the applicable requirements of PFRS 9 are applied to the other changes.
When a lease is modified as a direct consequence of the interest rate benchmark reform and the new basis for determining the lease payments is economically equivalent to the previous basis, the Group remeasures the lease liability to reflect the revised lease payments discounted using a revised discount rate that reflects the change in the basis for determining the contractual cash flows.
For the year ended December 31, 2021, the interest rate benchmark reform has no significant impact on the Group’s financial assets and liabilities. The changes in the Group’s risk management strategy arising from the LIBOR reform and other required disclosures are disclosed in Note 4.7.
(b) Effective Subsequent to 2021 but Not Adopted Early
There are amendments to existing standards effective for annual periods subsequent to 2021, which are adopted by the FRSC. Management will adopt the following relevant pronouncements below and in the succeeding page in accordance with their transitional provisions; and, unless otherwise stated, none of these are expected to have significant impact on the Group’s financial statements: (i) PFRS 16 (Amendments), Leases – COVID-19-Related Rent Concessions beyond June 30,
2021 (effective from April 1, 2021)

- 5 -
(ii) PAS 16 (Amendments), Property, Plant and Equipment – Proceeds Before Intended Use (effective from January 1, 2022)
(iii) PAS 37 (Amendments), Provisions, Contingent Liabilities and Contingent Assets – Onerous
Contracts – Cost of Fulfilling a Contract (effective January 1, 2022)
(iv) PFRS 3 (Amendments), Business Combination – Reference to the Conceptual Framework (effective from January 1, 2022).
(v) Annual Improvements to PFRS 2018-2020 Cycle. Among the improvements, the
following amendments, which are effective from January 1, 2022, are relevant to the Group:
PFRS 9 (Amendments), Financial Instruments – Fees in the ’10 per cent’ Test for
Derecognition of Liabilities Illustrative Examples Accompanying PFRS 16 – Lease Incentives
(vi) PAS 1 (Amendments), Presentation of Financial Statements – Classification of Liabilities as
Current or Non-current (effective January 1, 2023)
(vii) PAS 1 (Amendments), Presentation of Financial Statements – Disclosure of Accounting Policies (effective January 1, 2023)
(viii) PAS 8 (Amendments), Income Taxes – Deferred Tax Related to Assets and Liabilities
Arising from a Single Transaction (effective January 1, 2023)
(ix) PFRS 10 (Amendments), Consolidated Financial Statements, and PAS 28 (Amendments), Investments in Associates and Joint Ventures – Sale or Contribution of Assets Between an Investor and its Associates or Joint Venture (effective date deferred indefinitely)
2.3 Basis of Consolidation and Accounting for Investments in Subsidiaries and
Associates in the Separate Financial Statements The Group’s consolidated financial statements comprise the accounts of the Parent Company and its subsidiaries as enumerated in Note 1.2, after the elimination of material intercompany transactions. All intercompany resources and liabilities, equity, income, expenses and cash flows relating to transactions with subsidiaries are eliminated in full. Unrealized profits and losses from intercompany transactions that are recognized in assets are also eliminated in full. Intercompany losses that indicate impairment are recognized in the consolidated financial statements. The financial statements of the subsidiaries are prepared in the same reporting period as the Parent Company, using consistent accounting policies.

- 6 -
The Parent Company accounts for its investments in subsidiaries, associates, interests in jointly controlled operations and non-controlling interests as follows:
(a) Investments in Subsidiaries
Subsidiaries are entities (including structured entities) over which the Group has control. The Group controls an entity when it has the power over the entity; it is exposed, or has rights to, variable returns from its involvement with the entity; and, it has the ability to affect those returns through its power over the entity. Subsidiaries are consolidated from the date the Group obtains control.
The Parent Company’s investments in subsidiaries are initially recognized at cost and subsequently accounted for in its separate financial statements using the equity method. Under the equity method, all subsequent changes to the ownership interest in the equity of the subsidiaries are recognized in the Parent Company’s carrying amount of the investments. Changes resulting from the profit or loss generated by the subsidiaries are credited or charged against the Share in Net Earnings (Losses) of Subsidiaries and Associates account in the statement of profit or loss. These changes include subsequent depreciation, amortization, impairment and fair value adjustments of assets and liabilities. Dividends received are accounted for as reduction in the carrying value of the investment.
Changes resulting from items of other comprehensive income of the subsidiaries or items that have been directly recognized in the subsidiaries’ equity are recognized in other comprehensive income or equity, respectively, of the Parent Company.
However, when the Parent Company’s share in losses of subsidiaries equals or exceeds its interest in the subsidiary, including any other unsecured receivables, the Parent Company does not recognize further losses, unless it has incurred obligations or made payments on behalf of the subsidiary. If the subsidiary subsequently reports profits, the Group resumes recognizing its share of those profits only after its share of the profits exceeds the accumulated share of losses that has not been recognized previously.
Unrealized gains on transactions between the Parent Company and its subsidiaries are eliminated to the extent of the Parent Company’s interest in the subsidiaries. Unrealized losses are also eliminated unless the transaction provides evidence of an impairment of the assets that were transferred. Where necessary, accounting policies of subsidiaries are changed to ensure consistency with the policies adopted by the Parent Company. The Parent Company reassesses whether or not it controls an entity if facts and circumstances indicate that there are changes to one or more of the three elements of controls. Accordingly, entities are deconsolidated from the date that control ceases.
Acquired subsidiaries are subject to either of the following relevant policies:
(i) Purchase method – involves the revaluation at fair value of all identifiable assets and
liabilities, including contingent liabilities of a subsidiary, at the acquisition date, regardless of whether or not they were recorded in the financial statements of a subsidiary prior to acquisition. On initial recognition, the assets and liabilities of a subsidiary are included in the consolidated statement of financial position at their revalued amounts, which are also used as the bases for subsequent measurement in accordance with the Group’s accounting policies.

- 7 -
Goodwill represents the excess of acquisition cost over the fair value of the Group’s share of the identifiable net assets of the acquired subsidiary at the date of acquisition. On the other hand, negative goodwill represents the excess of the Group’s share in the fair value of identifiable net assets of the subsidiary at the date of acquisition over acquisition cost and is recognized directly in profit or loss.
(ii) Pooling of interest method – is applicable for business combinations involving entities
under common control. On initial recognition, the assets and liabilities of a subsidiary are included in the consolidated statement of financial position at their book values. Adjustments, if any, are recorded to achieve uniform accounting policies. The combining entities’ results and financial positions are presented in the consolidated financial statements as if they had always been combined. No goodwill or negative goodwill is recognized. Any difference between the cost of the investment and the subsidiary’s identifiable net assets is recognized on consolidation in Capital Paid in Excess of Par account in equity.
(b) Investments in Associates
Associates are those entities over which the Group is able to exert significant influence but which are neither subsidiaries nor interests in joint venture. In the consolidated and separate financial statements, investments in associates are initially recognized at cost and subsequently accounted for using the equity method. Under the equity method, the Group recognizes in profit or loss its share in the net earnings or losses of the associates. The cost of the investment is increased or decreased by the Group’s equity in net earnings or losses of the associates since the date of acquisition. Dividends received are accounted for as reduction in the carrying value of the investment. Acquired investments in associates are subject to purchase method of accounting as described in Note 2.3(a)(i). However, any goodwill that represents the excess of identifiable net assets of the acquiree at the date of acquisition or fair value adjustment attributable to the Group’s share in the associate is included in the amount recognized as investments in associates. All subsequent changes to the ownership of interest in the equity of the associate are recognized in the Group’s carrying amount of the investment. Changes resulting from the profit or loss generated by the associate are credited against Share in Net Earnings (Losses) of Subsidiaries and Associates account in the statement of profit or loss. These changes include subsequent depreciation, amortization, impairment, and fair value adjustments of assets and liabilities. Changes resulting from items of other comprehensive income of the associate or items that have been directly recognized in the associate’s equity are recognized in other comprehensive income or equity, respectively, of the Group. However, when the Group’s share in losses of an associate equals or exceeds its interest in the associate, including any other unsecured receivables, the Group does not recognize further losses, unless it has incurred obligations or made payments on behalf of the associate. If the associate subsequently reports profits, the Group resumes recognizing its share of those profits only after its share of the profits exceeds the accumulated share of losses that has not been recognized previously. Unrealized gains on transactions between the Group and its associates are eliminated to the extent of the Group’s interest in the associates. Unrealized losses are also eliminated unless the transaction provides evidence of an impairment of the assets that were transferred. Where necessary, accounting policies of associates are changed to ensure consistency with the policies adopted by the Group.

- 8 -
The Group reassesses whether or not an entity qualifies as an associate in the occurrence of changes to facts and circumstances surrounding its ability to exert significant influence.
(c) Interest in Jointly Controlled Operations
For interests in jointly controlled operations, the Group recognizes in its financial statements the assets that it controls, the liabilities and the expenses that it incurs and its share in the income from the sale of goods or services by the joint venture. The amounts of these related accounts are presented as part of the regular asset and liability accounts and income and expense accounts of the Group. No adjustment or other consolidation procedures are required for the assets, liabilities, income and expenses of the joint venture that are recognized in the separate financial statements of the venturers.
(d) Transactions with Non-controlling Interests
Non-controlling interests (NCI) represent the portion of the net assets and profit or loss not attributable to the Group. The Group applies a policy of treating transactions with NCI as transactions with parties external to the Group. Disposals to NCI result in gains and losses for the Group that are recorded in profit or loss. Purchases of equity shares from NCI may result in goodwill, being the difference between any consideration paid and the relevant share acquired in the carrying value of the net assets of a subsidiary. In the consolidated financial statements, the NCI component is shown as part of the Equity account in the consolidated statement of changes in equity.
In the Parent Company’s financial statements, impairment loss is provided when there is objective evidence that the investments in subsidiaries and associates will not be recovered (see Note 2.16).
2.4 Segment Reporting
A business segment is a group of assets and operations engaged in providing products or services that are subject to risks and returns that are different from those of other business segments. A geographical segment is a segment engaged in providing products or services within a particular economic environment that is subject to risks and returns that are different from those of segments operating in other economic environments. The Group’s operations are structured according to the nature of the services provided (primary segment) and different geographical markets served (secondary segment). Financial information on business segments is presented in Note 8.

- 9 -
2.5 Financial Instruments
Financial assets and financial liabilities are recognized when the Group becomes a party to the contractual provisions of the financial instrument. For purposes of classifying financial instruments, an instrument is considered as an equity instrument if it is non-derivative and meets the definition of equity for the issuer in accordance with the criteria under PAS 32, Financial Instruments: Presentation. All other non-derivative financial instruments are treated as debt instruments. At initial recognition, the Group measures a financial asset or financial liability at its fair value plus or minus, in the case of a financial asset or financial liability not at fair value through profit or loss (FVTPL), transaction costs that are incremental or directly attributable to the acquisition or issue of the financial asset or liability, such as fees and commissions. Transactions costs of financial assets or financial liabilities carried at FVTPL are expensed in profit or loss.
(a) Financial Assets
Regular purchases and sales of financial assets are recognized on their trade date (i.e., the date that the Group commits to purchase or sell the asset). Deposits, amounts due to banks and customers, and loans are recognized when cash is received by the Group or advanced to the borrowers.
(i) Classification and Measurement of Financial Assets
The classification and measurement of financial assets is driven by the Group’s business models for managing the financial assets and the contractual cash flow characteristics of the financial assets. The Group’s classification and measurement of financial assets are described below and in the succeeding pages.
Financial Assets at Amortized Cost
Financial asset is measured at amortized cost if both of the following conditions are met: the financial asset is held within the Group’s business model whose objective is to
hold financial assets in order to collect contractual cash flows (“hold to collect or HTC”); and,
the contractual terms of the financial asset give rise on specified dates to cash flows that are solely payments of principal and interest (SPPI) on the principal amount outstanding.
Financial assets meeting these criteria are measured initially at fair value and are subsequently measured at amortized cost using the effective interest method, less any allowance for expected credit loss (ECL). Where the business model is to hold assets to collect contractual cash flows, the Group assesses whether the financial instruments’ cash flows represent SPPI. In making this assessment, the Group considers whether the contractual cash flows are consistent with basic lending arrangements, i.e., interest includes only consideration for the time value of money, credit risk, other basic lending risks and a profit margin. Where the contractual terms introduce exposure to risk or volatility that are inconsistent with basic lending arrangements, the related financial asset is classified and measured at FVTPL.

- 10 -
The Group’s financial assets measured at amortized cost include those presented in the statements of financial position as Cash and Other Cash Items, Due from BSP, Due from Other Banks, Loans Arising from Reverse Repurchase Agreements, Investment securities at amortized cost under Trading and Investment Securities, Loans and Receivables and certain Other Resources accounts. For purposes of cash flows reporting and presentation, cash equivalents comprise of accounts with original maturities of three months or less, including non-restricted balances of Due from BSP, Due from Other Banks, Loans Arising from Reverse Repurchase Agreements, and Interbank loans receivables (part of Loans and Receivables). Cash equivalents are short-term, highly liquid investments that are readily convertible to known amounts of cash and which are subject to insignificant risk of changes in value. Cash comprises cash and other cash items and demand deposits. The Group may irrevocably elect at initial recognition to classify a financial asset that meets the amortized cost criteria as at FVTPL if that designation eliminates or significantly reduces an accounting mismatch had the financial asset been measured at amortized cost. In 2021 and 2020, the Group has not made such designation.
Financial Assets at Fair Value Through Other Comprehensive Income (FVOCI) Financial asset is classified and measured at FVOCI if both of the following conditions are met: the financial asset is held under a business model whose objective is achieved by
both collecting contractual cash flows and selling (“hold to collect and sell”); and,
the contractual terms of the financial asset give rise to cash flows that are SPPI on the principal amount outstanding.
At initial recognition, the Group can make an irrevocable election (on an instrument-by-instrument basis) to designate equity investments as at FVOCI; however, such designation is not permitted if the equity investment is held by the Group for trading or a contingent consideration recognized arising from a business combination. The Group has made irrevocable designation of equity instruments not held for trading into this category.
Financial assets at FVOCI are initially measured at fair value plus transaction costs. After initial recognition, financial assets at FVOCI are subsequently measured at fair value, with no deduction for any disposal costs. Gains and losses arising from changes in fair value, including the foreign exchange component, are recognized in other comprehensive income, net of any effects arising from income taxes, and are reported as part of Revaluation Reserves account in equity. Upon disposal, the cumulative fair value gains or losses on equity investments previously recognized in the Revaluation Reserves account is not reclassified to profit or loss, but is reclassified directly to Surplus account, while the cumulative fair value gains or losses for debt securities are reclassified to profit or loss.
- 11 -
Any dividends earned on holding equity instruments are recognized in profit or loss as part of Miscellaneous under Other Operating Income account, when the Group’s right to receive dividends is established, it is probable that the economic benefits associated with the dividend will flow to the Group, and the amount of the dividend can be reliably measured, unless the dividends clearly represent recovery of a part of the cost of the investment.
Financial Assets at Fair Value Through Profit or Loss Debt instruments that do not meet the amortized cost criteria, or that meet the criteria but the Group has chosen to designate as at FVTPL at initial recognition, or those that do not qualify under the FVOCI or “hold to collect and sell” business model, are measured at FVTPL. Equity investments are classified as financial assets at FVTPL, unless the Group designates an equity investment that is not held for trading as at FVOCI at initial recognition. The Group’s financial assets at FVTPL include government securities, corporate debt securities, equity securities and derivative instruments, which are held for trading purposes or designated as at FVTPL. A financial asset is considered as held for trading if:
it has been acquired principally for the purpose of selling it in the near term;
on initial recognition, it is part of a portfolio of identified financial instruments
that the Group manages together and has evidence of a recent actual pattern of short-term profit-taking; or,
it is a derivative that is not designated and effective as a hedging instrument or
financial guarantee. Financial assets at FVTPL are initially measured at fair value and transaction costs are expensed in profit or loss. Unrealized gains and losses arising from changes (mark-to-market) in the fair value of the financial assets at FVTPL category and realized gains or losses arising from disposals of these instruments are included in Trading and Securities Gains (Losses) under Other Operating Income account in the statement of profit or loss. Interest earned on these investments is reported in profit or loss under Interest Income account while dividend income is reported in profit or loss under Miscellaneous included in Other Operating Income account when the right of payment has been established.
(ii) Effective Interest Rate Method and Interest Income
Interest income on financial assets measured at amortized cost and all interest-bearing debt financial assets classified as at FVTPL, or at FVOCI, is recognized using the effective interest rate method. The effective interest rate is the rate that exactly discounts estimated future cash receipts through the expected life of the financial instrument or, when appropriate, a shorter period, to the net carrying amount of the financial asset.

- 12 -
The effective interest rate is calculated by taking into account any discount or premium on acquisition, fees and costs that are an integral part of effective interest rate. The Group recognizes interest income using a rate of return that represents the best estimate of a constant rate of return over the expected life of the instrument; hence, it recognizes the effect of potentially different interest rates charged at various stages, and other characteristics of the product life cycle (including prepayments, penalty interest and charges). If expectations regarding the cash flows on the financial asset are revised for reasons other than credit risk, the adjustment is booked as a positive or negative adjustment to the carrying amount of the asset with an increase or reduction in interest income. The Group calculates interest income by applying the effective interest rate to the gross carrying amount of the financial assets, except for those that are subsequently identified as credit-impaired and or are purchased or originated credit-impaired assets. For financial assets that have become credit-impaired subsequent to initial recognition, interest income is calculated by applying the effective interest rate to the net carrying amount of the financial assets (after deduction of the loss allowance). If the asset is no longer credit-impaired, the calculation of interest income reverts to gross basis. For financial assets that were credit-impaired on initial recognition, interest income is calculated by applying a credit-adjusted effective interest rate to the amortized cost of the asset. The calculation of interest income does not revert to a gross basis even if the credit risk of the asset subsequently improves.
(iii) Reclassification of Financial Assets
The Group can only reclassify financial assets if the objective of its business model for managing those financial assets changes. Accordingly, the Group is required to reclassify financial assets: (i) from amortized cost to FVTPL, if the objective of the business model changes so that the amortized cost criteria are no longer met; and, (ii) from FVTPL to amortized cost, if the objective of the business model changes so that the amortized cost criteria start to be met and the characteristic of the instrument’s contractual cash flows meet the amortized cost criteria. A change in the objective of the Group’s business model will be effected only at the beginning of the next reporting period following the change in the business model.
(iv) Impairment of Financial Assets
The Group recognizes a loss allowance for ECL on all financial assets that are measured at amortized cost and debt instruments classified as at FVOCI, as well as financial guarantee and loan commitments. Equity securities, either measured as at FVTPL or designated as at FVOCI, are not subject to impairment. The Group measures the ECL of a financial asset in such manner that reflects: (i) the time value of money; and, (ii) reasonable and supportable information about past events, current conditions and forecasts of future economic conditions that affect the collectability of the future cash flows of the financial assets.

- 13 -
The amount of allowance for ECL is updated at the end of each reporting period to reflect the changes in credit risk of the financial asset since initial recognition. The Group recognizes lifetime ECL when there has been a significant increase in credit risk (SICR) since initial recognition. However, if the credit risk on the financial instrument has not increased significantly since initial recognition, the Group measures the loss allowance for that financial instrument at an amount equal to 12-month ECL. Lifetime ECL represents the expected credit losses that will result from all possible default events over the expected life of a financial instrument. In contrast, 12-month ECL represents the portion of lifetime ECL that is expected to result from default events on a financial instrument that are possible within 12 months after the end of the reporting period. The Group’s ECL model follows a three-stage impairment approach, which guide in the determination of the loss allowance to be recognized in the financial statements. The staging of financial assets and definition of default for purposes of determining ECL are further discussed in Note 4.4. ECL is a function of the probability of default (PD), loss-given default (LGD), and exposure-at-default (EAD), with the timing of the loss also considered, and is estimated by incorporating forward-looking economic information and through the use of experienced credit judgement. These elements are discussed more fully in Note 4.4. The Group calculates ECL either on an individual or a collective basis. For modelling ECL parameters which were carried out on a collective basis, the financial instruments are grouped on the basis of shared credit risk characteristics, such as but not limited to instrument type, credit risk rating, collateral type, product type, historical net charge-offs, industry type, and geographical locations of the borrowers or counterparties. The Group applies a simplified ECL approach for its accounts receivables and other risk assets wherein the Group uses a provision matrix that considers historical changes in the behavior of the portfolio of credit exposures based on internally collected data to predict conditions over the span of a given observation period. These receivables include claims from various counterparties, which are not originated through the Group’s lending activities. For these instruments, the Group measures the loss allowance at an amount equal to lifetime ECL. The Group recognizes an impairment loss in profit or loss for all financial instruments subjected to ECL impairment assessment with a corresponding adjustment to their carrying amount through a loss allowance account. With respect to investments in debt securities that are measured at FVOCI, the related loss allowance account is recognized in other comprehensive income and accumulated in the Revaluation Reserves account, and does not reduce the carrying amount of the financial asset in the statement of financial position.
For loan commitments, the loss allowance is recognized as provisions (presented and included as part of Other Liabilities account in the statement of financial position). Where a financial instrument includes a drawn and undrawn component, and the Group cannot identify the ECL on the loan commitment component separately from those on the drawn commitment; the Group presents a combined allowance for ECL for both components. The combined amount is presented as a deduction from the gross carrying amount of the drawn component. Any excess of the loss allowance over the gross amount of the drawn component is presented as provisions.

- 14 -
(v) Derecognition of Financial Assets
The financial assets are derecognized when the contractual rights to receive cash flows from the financial instruments expire, or when the financial assets and all substantial risks and rewards of ownership have been transferred to another party. If the Group neither transfers nor retains substantially all the risks and rewards of ownership and continues to control the transferred asset, the Group recognizes its retained interest in the asset and an associated liability for amounts it may have to pay.
If the Group retains substantially all the risks and rewards of ownership of a transferred financial asset, the Group continues to recognize the financial asset and also recognizes a collateralized borrowing for the proceeds received.
(i) Modification of Loans
When the Group renegotiates or otherwise modifies the contractual cash flows of loans to customers, the Group assesses whether or not the new terms are substantially different to the original terms of the instrument. In making such assessment, the Group considers, among others: If the borrower is in financial difficulty, whether the modification merely
reduces the contractual cash flows to amounts the borrower is expected to be able to pay;
Whether any substantial new terms are introduced that will affect the risk profile of the loan;
Significant extension of the loan term when the borrower is not in financial difficulty;
Significant change in the interest rate; Change in the currency the loan is denominated in; and/or, Insertion of collateral, other security or credit enhancements that will
significantly affect the credit risk associated with the loan.
If the terms are substantially different, the Group derecognizes the original financial asset and recognizes a “new” asset at fair value and recalculates a new effective interest rate for the asset. The date of renegotiation is consequently considered to be the date of initial recognition for impairment calculation, including for the purpose of determining whether SICR has occurred.
However, the Group also assesses whether the new financial asset recognized is deemed to be credit-impaired at initial recognition, especially in circumstances where the renegotiation was driven by the debtor being unable to make the originally agreed payments. Differences in the carrying amount between the old financial asset derecognized and the fair value of the new financial asset are recognized in profit or loss as either gain or loss on derecognition of financial assets. As to the impact on ECL measurement, the expected fair value of the “new” financial asset is treated as the final cash flow from the existing financial asset at the date of derecognition. Such amount is included in the calculation of cash shortfalls from the existing financial asset that are discounted from the expected date of derecognition to the reporting date using the original effective interest rate of the existing financial asset.

- 15 -
If the terms are not substantially different, the renegotiation or modification does not result in derecognition, and the Group recalculates the gross carrying amount based on the revised cash flows of the financial asset and recognizes the gain or loss arising from the modification in profit or loss. The new gross carrying amount is recalculated by discounting the modified cash flows of the original effective interest rate (or credit-adjusted effective interest rate for purchased or originated credit-impaired financial assets). As to the impact on ECL measurement, the derecognition of the existing financial asset will result in the expected cash flows arising from the modified financial asset to be included in the calculation of cash shortfalls from the existing financial asset.
(ii) Derecognition of Financial Assets Other than Modification
A financial asset (or where applicable, a part of a financial asset or part of a group of financial assets) is derecognized when the contractual rights to receive cash flows from the financial instruments expire, or when the financial assets and all substantial risks and rewards of ownership have been transferred to another party. If the Group neither transfers nor retains substantially all the risks and rewards of ownership and continues to control the transferred financial asset, the Group recognizes its retained interest in the financial asset and an associated liability for amounts it may have to pay. If the Group retains substantially all the risks and rewards of ownership of a transferred financial asset, the Group continues to recognize the financial asset and also recognizes a collateralized borrowing for the proceeds received.
(b) Financial Liabilities at Amortized Cost
Financial liabilities including deposit liabilities, bills payable, bonds payable, accrued interest and other expenses, and other liabilities (except derivatives with negative fair value, tax-related payables, post-employment defined benefit obligation and deferred income) are recognized initially at their fair value and subsequently measured at amortized cost using the effective interest method, for those with maturities beyond one year, less settlement payments. All interest-related charges incurred on financial liabilities are recognized as an expense in the statement of profit or loss under the caption Interest Expense.
Deposit liabilities are stated at amounts in which they are to be paid. Interest is accrued periodically and recognized in a separate liability account before recognizing as part of deposit liabilities. Bills payable and bonds payable are recognized initially at fair value, which is the issue proceeds (fair value of consideration received), net of direct issue costs. These are subsequently measured at amortized cost; any difference between the proceeds net of transaction costs and the redemption value is recognized in profit or loss over the period of the borrowings using the effective interest method. Dividend distributions to shareholders are recognized as financial liabilities when the dividends are declared by the Group.

- 16 -
Financial liabilities are derecognized from the statement of financial position only when the obligations are extinguished either through discharge, cancellation or expiration. Where an existing financial liability is replaced by another from the same lender on substantially different terms, or if the terms of an existing liability are substantially modified, such an exchange or modification is treated as a derecognition of the original liability and a recognition of the new liability, and the difference in the respective carrying amounts is recognized as gain or loss in profit or loss.
(c) Financial Guarantees and Undrawn Loan Commitments
The Group issues financial guarantees and loan commitments. Financial guarantees are those issued by the Group to creditors as allowed under existing rules and regulations whereby it guarantees third party obligations by signing as guarantor in the contract or agreement. Undrawn loan commitments and letters of credit are commitments under which, over the duration of the commitment, the Group is required to provide a loan with pre-specified terms to the customer. The nominal contractual value of financial guarantees and undrawn loan commitments, where the loan agreed to be provided is on market terms, are not reflected in the statement of financial position. These contracts are in the scope of the ECL requirements where the Group estimates the expected portion of the irrevocable undrawn loan commitments that will be drawn over their expected life based on the Group’s historical observations of actual drawdowns and forward-looking forecasts. The ECL related to financial guarantees and loan commitments without outstanding drawn amounts is recognized under Other Liabilities account in the statement of financial position.
(d) Derivative Financial Instruments and Hedge Accounting
The Group is a party to various foreign currency forward contracts, cross currency swaps, futures, interest rate swaps, debt warrants, options and credit default swap. These contracts are entered into as a service to customers and as a means of reducing or managing the Group’s foreign exchange and interest rate exposures as well as for trading purposes. Amounts contracted are recorded as contingent accounts and are not included in the statement of financial position.
Derivatives are carried as assets when fair value is positive (recognized as part of Investment securities at FVPL under the Trading and Investment Securities account) and as liabilities (recognized under the Accrued Expenses and Other Liabilities account) when fair value is negative. Derivatives are initially recognized at fair value on the date on which a derivative contract is entered into and are subsequently measured at their fair value. Fair values are obtained from active markets for listed or traded securities or determined using valuation techniques if quoted prices are not available, including discounted cash flow models and option pricing models, as appropriate. The change in fair value of derivative financial instruments is recognized in profit or loss, except when their effects qualify as a hedging instrument. The best evidence of the fair value of a derivative at initial recognition is the transaction price (i.e., the fair value of the consideration given or received) unless the fair value of that instrument is evidenced by comparison with other observable current market transactions in the same instrument (i.e., without modification or repackaging) or based on a valuation technique whose variables include only data from observable markets. When such evidence exists, the Group recognizes a gain or loss at initial recognition.

- 17 -
(e) Offsetting Financial Instruments Financial assets and liabilities are offset and the resulting net amount, considered as a single financial asset or financial liability, is reported in the statement of financial position when there is a legally enforceable right to offset the recognized amounts and there is an intention to settle on a net basis, or realize the asset and settle the liability simultaneously. The right of set-off must be available at the end of the reporting period, that is, it is not contingent on future event. It must also be enforceable in the normal course of business, in the event of default, and in the event of insolvency or bankruptcy; and, must be legally enforceable for both entity and all counterparties to the financial instruments.
2.6 Bank Premises, Furniture, Fixtures and Equipment
Land is stated at cost less impairment losses, if any. As no finite useful life for land can be determined, the related carrying amounts are not depreciated. All other bank premises, furniture, fixtures and equipment are carried at cost less accumulated depreciation, amortization and any impairment in value. The cost of an asset comprises its purchase price and directly attributable costs of bringing the asset to working condition for its intended use. Expenditures for additions, major improvements and renewals are capitalized, while expenditures for repairs and maintenance are charged to expense as incurred.
Depreciation is computed using the straight-line method over the estimated useful lives of the depreciable assets as follows:
Buildings 20-50 years Furniture, fixtures and equipment 3-15 years
Leasehold rights and improvements are amortized over the term of the lease or the estimated useful lives of the improvements, whichever is shorter. An asset’s carrying amount is written down immediately to its recoverable amount if the asset’s carrying amount is greater than its estimated recoverable amount (see Note 2.16). The residual values, estimated useful lives, and method of depreciation and amortization of bank premises, furniture, fixtures and equipment (except land) are reviewed and adjusted if appropriate, at the end of each reporting period. An item of bank premises, furniture, fixtures and equipment, including the related accumulated depreciation, amortization and any impairment losses, is derecognized upon disposal or when no future economic benefits are expected to arise from the continued use of the asset. Any gain or loss arising on derecognition of the asset (calculated as the difference between the net disposal proceeds and the carrying amount of the item) is included in profit or loss in the year the item is derecognized.
2.7 Investment Properties Investment properties pertain to land, buildings or condominium units acquired by the Group, in settlement of loans from defaulting borrowers through foreclosure or dacion in payment, which are either held by the Group for sale in the next 12 months or being used in the rendering of services or for administrative purposes. This also includes properties held for rental.

- 18 -
Investment properties are stated at cost, less accumulated depreciation and any impairment losses (see Note 2.16). The cost of an investment property comprises its purchases price and directly attributable costs incurred such as legal fees, transfer taxes and other transaction costs.
Transfers from other accounts (such as bank premises, furniture, fixtures and equipment) are made to investment properties when and only when, there is a change in use, evidenced by ending of owner-occupation or commencement of an operating lease to another party or holding the property for capital appreciation, while transfers from investment properties are made when, and only when, there is a change in use, evidenced by commencement of owner-occupation or commencement of development with a view to sell. In isolation, a change in management’s intentions for the use of a property does not provide evidence of a change in use. Depreciation and impairment loss are recognized in the same manner as in bank premises, furniture, fixtures and equipment. Direct operating expenses related to investment properties, such as repairs and maintenance, and real estate taxes are normally charged against current operations in the period in which these costs are incurred.
Investment properties, including the related accumulated depreciation and any impairment losses, are derecognized upon disposal or when permanently withdrawn from use and no future economic benefit is expected from its disposal. Any gain or loss on the retirement or disposal of investment properties is recognized in Miscellaneous income (expenses) under the Other Operating Income (Expenses) account in the statement of profit or loss, in the year of retirement or disposal.
2.8 Assets Held-for-Sale and Disposal Group
Assets held-for-sale and disposal group, which are presented as part of Other Resources account, include shares of stock and real and other properties acquired through repossession, foreclosure, exchange or purchase that the Group intends to sell within one year from the date of classification as held-for-sale and for which the Group is committed to immediately dispose through an active marketing plan. The Group classifies an asset (or disposal group) as held-for-sale if its carrying amount will be recovered principally through a sale transaction rather than through continuing use.
In the event that the sale of the asset is extended beyond one year, the extension of the period required to complete the sale does not preclude an asset from being classified as held-for-sale if the delay is caused by events or circumstances beyond the Group’s control and there is sufficient evidence that the Group remains committed to its plan to sell the asset. Assets classified as held-for-sale are measured at the lower of their carrying amounts, immediately prior to their classification as held-for-sale and their fair value less costs to sell. Assets classified as held-for-sale are not subject to depreciation or amortization. Asset that ceases to be classified as held-for-sale is measured at the lower of: (a) its carrying amount before the asset was classified as held-for-sale, adjusted for any depreciation, amortization or revaluations that would have been recognized had the asset not been classified as held-for-sale; and, (b) its recoverable amount at the date of the subsequent decision not to sell. Any adjustment to the carrying amount of an asset that ceases to be classified as held-for-sale resulting in either a gain or loss, is recognized in profit or loss. The Group recognizes an impairment loss for any initial or subsequent write-down of the assets held-for-sale to fair value less cost to sell, to the extent that it has not been previously recognized in profit or loss.

- 19 -
On the other hand, any gain from any subsequent increase in fair value less costs to sell of an asset up to the extent of the cumulative impairment loss that has been previously recognized is recognized in profit or loss. The gains or losses arising from the sale or remeasurement of assets held-for-sale is recognized in Miscellaneous income (expenses) under the Other Operating Income (Expenses) account in the statement of profit or loss. 2.9 Intangible Assets
Intangible assets include goodwill, branch licenses, trading right, and computer software licenses which are accounted for under cost model and are reported under Other Resources account in the statement of financial position. The cost of the asset is the amount of cash and cash equivalents paid or the fair value of the other considerations given to acquire an asset at the time of acquisition. Goodwill represents the excess of the cost of acquisition over the fair value of the identifiable net assets acquired at the date of acquisition (see Note 2.3). Branch licenses represent the rights given by the BSP to the Group to establish a certain number of branches in various areas in the country.
Goodwill and branch licenses are classified as intangible assets with indefinite useful life and, thus, not subject to amortization but are tested annually for impairment (see Note 2.16). After initial recognition, goodwill and branch licenses are subsequently carried at cost less accumulated impairment losses. Goodwill is allocated to cash-generating units for the purpose of impairment testing. Each of those generating units is represented by each primary reporting segment.
Trading right, included as part of Miscellaneous under Other Resources account, represents the right given to RSI, a subsidiary engaged in stock brokerage, to preserve its access to the trading facilities and to transact business at the PSE. Trading right is assessed as having an indefinite useful life. It is carried at the amount allocated from the original cost of the exchange membership seat (after a corresponding allocation was made to the value of the PSE shares) less allowance for impairment, if any. The trading right is tested annually for any impairment in value (see Note 2.16). Acquired computer software licenses are capitalized on the basis of the costs incurred to acquire and bring to use the specific software. These costs are amortized on a straight line basis over the expected useful lives of the software of three to ten years. Costs associated with developing or maintaining computer software programs are recognized as expense as incurred. Costs that are directly associated with the production of identifiable and unique software products controlled by the Group, and that will probably generate economic benefits exceeding costs beyond one year, are recognized as intangible assets. Direct costs include employee costs incurred on software development and an appropriate portion of relevant overhead costs. Computer software development costs recognized as assets are amortized using the straight-line method over their useful lives (not exceeding ten years). When an intangible asset is disposed of, the gain or loss on disposal is determined as the difference between the proceeds and the carrying amount of the asset and is recognized in profit or loss.

- 20 -
2.10 Other Resources
Other resources (excluding items classified as intangible assets and assets held-for-sale and disposal group) pertain to other assets controlled by the Group as a result of past events. These are recognized in the financial statements when it is probable that the future economic benefits will flow to the Group and the asset has a cost or value that can be measured reliably.
2.11 Provisions and Contingencies
Provisions are recognized when present obligations will probably lead to an outflow of economic resources and they can be estimated reliably even if the timing or amount of the outflow may still be uncertain. A present obligation arises from the presence of a legal or constructive obligation that has resulted from past events (e.g., legal dispute or onerous contracts).
Provisions are measured at the estimated expenditure required to settle the present obligation, based on the most reliable evidence available at the end of the reporting period, including the risks and uncertainties associated with the present obligation. Where there are a number of similar obligations, the likelihood that an outflow will be required in settlement is determined by considering the class of obligations as a whole.
When time value of money is material, long-term provisions are discounted to their present values using a pretax rate that reflects market assessments and the risks specific to the obligation. The increase in provision due to passage of time is recognized as interest expense. Provisions are reviewed at the end of each reporting period and adjusted to reflect the current best estimate.
In those cases, where the possible outflow of economic resource as a result of present obligations is considered improbable or remote, or the amount to be provided for cannot be measured reliably, no liability is recognized in the financial statements. Similarly, possible inflows of economic benefits to the Group that do not yet meet the recognition criteria of an asset are considered contingent assets; hence, are not recognized in the financial statements. On the other hand, any reimbursement that the Group can be virtually certain to collect from a third party with respect to the obligation is recognized as a separate asset not exceeding the amount of the related provision. 2.12 Equity
Preferred and common stock represent the nominal value of shares of stock that have been issued. Capital paid in excess of par includes any premiums received on the issuance of capital stock. Any transaction costs associated with the issuance of shares of stock are deducted from capital paid in excess of par, net of any related income tax benefits. Hybrid perpetual securities are non-cumulative, unsecured, subordinated capital securities which qualify as Additional Tier 1 (AT1) capital under Basel III standards. The capital securities are perpetual in respect of which there is no fixed redemption date. The Parent Company may redeem the capital securities only in certain circumstances as described in the conditions of the securities and with prior written consent of BSP. The capital securities confer a right to receive distributions on the principal amount from, and including, the issue date at the applicable distribution rate. Any distribution may only be paid out of distributable reserves. Distributions are non-cumulative and payable semi-annually in arrear at a rate of 6.5%. Certain conditions provide for circumstances under which the Parent Company will not be obliged to pay any distribution on the applicable payment date.

- 21 -
Treasury shares are stated at the cost of reacquiring such shares and are deducted from equity attributable to the Parent Company’s equity holders until the shares are cancelled, reissued or disposed of. Revaluation reserves consist of:
(a) Net unrealized fair value gains or losses arising from remeasurements of financial assets at
FVOCI;
(b) Reserves on remeasurements of post-employment defined benefit plan comprising of net accumulated actuarial gains or losses arising from experience adjustments and other changes in actuarial assumptions, and actual return on plan assets (excluding account included in net interest);
(c) Accumulated translation adjustments related to the cumulative gains from the translation
of the financial statements of foreign subsidiaries whose functional currency is different from that of the Parent Company; and,
(d) Share in other comprehensive income or loss of subsidiaries and associates.
Reserve for trust business representing the accumulated amount set aside by the Group under existing regulations requiring the Parent Company to appropriate and transfer to surplus 10% of its net profits accruing from their trust business until the surplus shall amount to 20% of the regulatory capital. The reserve shall not be paid out in dividends, but losses accruing in the course of the trust business may be charged against this account.
General loan loss reserve pertains to the accumulated amount of appropriation from Surplus made by the Group arising from the excess of the one-percent general loan loss provisions for outstanding loans as required by the BSP under Circular No. 1011, Guidelines on the Adoption of PFRS 9 (Circular No. 1011) over the computed allowance for ECL. Other reserves refer to the amount attributable to the Parent Company arising from the changes in the ownership of the NCI in the Group. Surplus represents all current and prior period results of operations as disclosed in the statement of profit or loss, reduced by the amount of dividends declared. NCI represents the portion of the net assets and profit or loss not attributable to the Group and are presented separately in the consolidated statement of profit or loss and consolidated statement of comprehensive income and within equity in the consolidated statement of financial position and consolidated statement of changes in equity. 2.13 Other Income and Expense Recognition
Revenue is recognized when (or as) the Group satisfies a performance obligation by transferring control of the promised services to the customer. A contract with a customer that results in a recognized financial instrument in the Group’s financial statements may partially be within the scope of PFRS 9 and partially within the scope of PFRS 15, Revenue from Contracts from Customers. In such case, the Group first applies PFRS 9 to separate and measure the part of the contract that is in-scope of PFRS 9, and then applies PFRS 15 to the residual part of the contract. Costs and expenses, if any, are recognized in profit or loss upon utilization of the assets and/or services or at the date those are incurred. All finance costs are reported in profit or loss on accrual basis, except capitalized borrowing costs which are included as part of the cost of the related qualifying asset, if any (see Note 2.18).

- 22 -
The Group assesses its revenue arrangements against specific criteria to determine if it is acting as a principal or agent. The Group concluded that it is acting as a principal in all its revenue arrangements except for certain brokerage transactions. For revenues arising from various services which are to be accounted for under PFRS 15, the following provides information about the nature and timing of satisfaction of performance obligations in contracts with customers, including significant payment terms, and the related revenue recognition policies:
(a) Charges, Fees and Commissions
The following charges, fees and commissions are recognized as follows:
(i) Commissions and fees – these income arising from loans, deposits, and other banking
and brokerage transactions are recognized as income based on agreed terms and conditions with customers, which are generally when the services have been performed.
(ii) Annual membership fees – pertains to annual fees charged to credit cardholders.
Revenues from membership fees are recognized over time from the date of renewal of the credit card until the validity date covered by the said renewal, usually termed as the expiry date of the issued cards. The credit card’s validity period is deemed to be the servicing period.
(iii) Interchange fees, net of interchange costs – are recognized as income upon presentation by
member establishments of charges arising from RBSC and non-RBSC (associated with MasterCard, JCB, VISA and China UnionPay labels) credit card availments passing through the Point of Sale (POS) terminals of the Parent Company. These discounts are computed based on agreed rates and are deducted from the amounts remitted to member establishments. Interchange costs pertain to the other credit card companies’ share in RBSC’s merchant discounts whenever their issued credit cards transact in the Parent Company’s POS terminals.
The Parent Company has a rewards program related to its deposit, loans and credit card operations, which allows its cardholders to accumulate award credits or loyalty points that can be redeemed for free products. The loyalty points give rise to a separate performance obligation as they provide a material right to the cardholder. Accordingly, the Parent Company allocates a portion of the interchange fee billed to participating merchants to the loyalty points granted to cardholders based on relative stand-alone selling price and recognizes liability equivalent to the estimated loyalty points until these are redeemed. Revenue is recognized upon actual redemption by the cardholder.
(iv) Loan syndication fees – are recognized as revenue when the syndication has been completed and the Group retained no part of the loan package for itself or retained a part at the same effective interest rate for the other participants.
(v) Underwriting and arrangers fees – are fees arising from negotiating, or participating in the negotiation of a transaction for a third party such as arrangement of the acquisition of shares or other securities or the purchase or sale of businesses, are recognized at the completion of the underlying transaction and where there are no further obligations to perform under the agreement.

- 23 -
(b) Trust Fees These are service fees calculated in reference to the net asset value of the funds managed and deducted from the customer’s account balance on a monthly basis which are recognized over time as the asset management services are provided. These are also applicable for wealth management and asset custody services that are continuously provided over an extended period of time.
For other income outside the scope of PFRS 15, the following provides information about the nature and the related revenue recognition policies: (a) Trading and Securities Gains (Losses) These are recognized when the ownership of the securities is transferred to the buyer
and is computed as the difference between the selling price and the carrying amount of the securities disposed of. These also include trading gains and losses as a result of the mark-to-market valuation of investment securities classified as FVTPL.
(b) Gains on Assets Sold
Gains on assets sold arise from the disposals of bank premises, furniture, fixtures and equipment, investment properties, real estate properties for sale, and assets held-for-sale. The Group recognizes the gain on sale at the time the control of the assets is transferred to the buyer, when the Group does not retain either continuing managerial involvement to the degree usually associated with ownership, or effective control over the assets sold, and when the collectability of the entire sales price is reasonably assured. Gains on assets sold are included as part of Miscellaneous income under Other Operating Income account in the statement of profit or loss.
(c) Dividend Income
Dividend income is recognized when the Group’s right to receive payment is established.
(d) Recoveries from Assets Written Off
These are income recognized from the increase in carrying amount of assets previously written off. The amount of reversal does not exceed the amount of impairment loss previously recognized for the related asset.
Collections from accounts, which did not qualify for revenue recognition are treated as customers’ deposit included as part of Accounts payable under Other Liabilities account in the statement of financial position.
2.14 Leases
The Group accounts for its leases as follows: (a) Group as Lessee
The Group considers whether a contract is, or contains, a lease. A lease is defined as a contract, or part of a contract, that conveys the right to use an asset (the underlying asset) for a period of time in exchange for consideration. To apply this definition, the Group assesses whether the contract meets three key evaluations which are whether:

- 24 -
the contract contains an identified asset, which is either explicitly identified in the contract or implicitly specified by being identified at the time the asset is made available to the Group;
the Group has the right to obtain substantially all of the economic benefits from use of the identified asset throughout the period of use, considering its rights within the defined scope of the contract; and,
the Group has the right to direct the use of the identified asset throughout the
period of use. The Group assesses whether it has the right to direct ‘how and for what purpose’ the asset is used throughout the period of use.
At lease commencement date, the Group recognizes a right-of-use asset and a lease liability on the statement of financial position. The right-of-use asset is measured at cost, which is made up of the initial measurement of the lease liability, estimates of any costs to dismantle and remove the asset at the end of the lease, and any lease payments made in advance of the lease commencement date (net of any incentives received). Subsequently, the Group depreciates the right-of-use asset on a straight-line basis from the lease commencement date to the earlier of the end of the useful life of the right-of-use asset or the end of the lease term. The Group also assesses the right-of-use asset for impairment when such indicators exist (see Note 2.16).
At the commencement date, the Group measures the lease liability at the present value of the lease payments unpaid at that date, discounted using the interest rate implicit in the lease if that rate is readily available or the Group’s incremental borrowing rate. Lease payments include fixed payments (including in-substance fixed) less lease incentives receivable, if any, variable lease payments based on an index or rate, amounts expected to be payable under a residual value guarantee, and payments arising from options (either renewal or termination) reasonably certain to be exercised. Subsequent to initial measurement, the liability will be reduced for payments made and increased for interest. It is remeasured to reflect any reassessment or modification, or if there are changes in in-substance fixed payments. When the lease liability is remeasured, the corresponding adjustment is reflected in the right-of-use asset, or to profit and loss if the right-of-use asset is already reduced to zero. The Group has elected to account for short-term leases and leases of low-value assets using the practical expedients. Instead of recognizing a right-of-use asset and lease liability, the payments in relation to these are recognized as an expense in profit or loss on a straight-line basis over the lease term. On the statement of financial position, Right-of-use assets and Lease liabilities have been included as part of Bank Premises, Furniture, Fixtures and Equipment, and Other Liabilities, respectively in the SOFP.

- 25 -
(b) Group as Lessor
Leases which transfer to the lessee all risks and benefits incidental to ownership of the leased item are classified as finance leases and are presented at an amount equal to the Group’s net investment in the lease. Finance income is recognized based on the pattern reflecting a constant periodic rate of return on the Group’s net investment outstanding in respect of the finance lease, and is included as part of Interest Income on loans and receivables.
Leases which do not transfer to the lessee substantially all the risks and benefits of ownership of the asset are classified as operating leases. Lease income from operating leases is recognized in profit or loss on a straight-line basis over the lease term. These are recognized as part of Miscellaneous income under Other Operating Income account in the statement of profit or loss.
2.15 Foreign Currency Transactions and Translations
The Group’s transactions in foreign currencies are accounted for as follows:
(a) Transactions and Balances
Except for the foreign subsidiaries and accounts of the Group’s foreign currency deposit unit (FCDU), the accounting records of the Group are maintained in Philippine pesos. Foreign currency transactions during the period are translated into the functional currency at exchange rates which approximate those prevailing at transaction dates. Resources and liabilities denominated in U.S. dollars are translated to Philippine pesos at the prevailing Philippine Dealing System closing rates (PDSCR) at the end of the reporting period. Foreign exchange gains and losses resulting from the settlement of foreign currency transactions and from the translation at year-end exchange rates of monetary assets and liabilities denominated in foreign currencies are recognized in profit or loss, except when recognized in other comprehensive income and deferred in equity as qualifying cash flow hedges and qualifying net investment hedges. Translation differences on non-monetary items, such as equity securities classified as at FVTPL, are reported as part of fair value gain or loss in profit or loss.
For financial reporting purposes, the accounts of the FCDU are translated into their equivalents in Philippine pesos based on the prevailing PDSCR at the end of each reporting period (for resources and liabilities) and at the weighted average PDSCR for the period (for income and expenses). Any foreign exchange difference is recognized in profit or loss.
Changes in the fair value of monetary financial assets (debt securities) denominated in foreign currency classified as financial assets at FVTPL and financial assets at FVOCI are analyzed between translation differences resulting from changes in the amortized cost of the security and other changes in the carrying amount of the security. Accordingly, translation differences related to changes in amortized cost of investment in debt securities are recognized in profit or loss, and other changes in the carrying amount are recognized as gains and losses in other comprehensive income.

- 26 -
(b) Translation of Financial Statements of Foreign Subsidiaries The results of operations and financial position of all the Group’s foreign subsidiaries
(none of which has the currency dependency of a hyperinflationary economy) that have a functional currency different from the presentation currency are translated into the presentation currency as follows:
(i) Assets and liabilities at the end of each reporting period as presented in the
statement of financial position are translated at the closing rate at the date of that statement of financial position;
(ii) Income and expenses are translated at average exchange rates during the period (unless this average is not a reasonable approximation of the cumulative effect of the rates prevailing on the transactions’ dates, in which case income and expenses are translated at the dates of the transactions); and,
(iii) All resulting exchange differences are recognized as a component of equity.
In consolidation, exchange differences arising from the translation of the net investment in foreign entities are recognized in other comprehensive income which form part of Revaluation Reserves account in equity. When a foreign operation is sold, the accumulated translation and exchange differences are recognized in profit or loss as part of the gain or loss on assets sold.
The translation of the financial statements into Philippine peso should not be construed
as a representation that the amounts stated in currencies other than the Philippine peso could be converted in Philippine peso amounts at the translation rates or at any other rates of exchange.
2.16 Impairment of Non-financial Assets Investments in subsidiaries and associates, bank premises, furniture, fixtures and equipment (including right-of-use asset), investment properties, and other resources (including intangible assets, and assets held for sale and disposal group) and other non-financial assets are subject to impairment testing. Intangible assets (including goodwill, branch licenses and trading right) with an indefinite useful life or those not yet available for use are tested for impairment at least annually. For purposes of assessing impairment, assets are grouped at the lowest levels for which there are separately identifiable cash flows [cash-generating units (CGU)]. As a result, some assets are tested for impairment either individually or at the CGU level. Except for intangible assets with an indefinite useful life (i.e., goodwill, branch licenses and trading right) or those not yet available for use, individual assets or CGU are tested for impairment whenever events or changes in circumstances indicate that their carrying amount may not be recoverable. Goodwill is reviewed for impairment annually or more frequently if events or changes in circumstances indicate that the carrying value may be impaired. Impairment is determined for goodwill by assessing the recoverable amount of the CGU (or group of CGUs) to which the goodwill relates. Where the recoverable amount of the CGU (or group of CGUs) is less than the carrying amount of the CGU (or group of CGUs) to which goodwill has been allocated, an impairment loss is recognized immediately in profit or loss. Impairment losses relating to goodwill cannot be reversed for subsequent increases in its recoverable amount in future periods.

- 27 -
Other intangible assets with indefinite useful lives, branch licenses and exchange trading right, are tested for impairment either individually or at the cash generating unit level, as appropriate when circumstances indicate that the intangible asset may be impaired.
Impairment loss is recognized in profit or loss for the amount by which the asset’s or CGU’s carrying amount exceeds its recoverable amount which is the higher of its fair value less costs to sell and its value in use. The fair value less costs to sell is the amount obtainable from the sale of an asset in an arm’s length transaction, while in determining value in use, management estimates the expected future cash flows to be generated from the continued use of the asset or CGU, and determines the suitable interest rate in order to calculate the present value of those cash flows. The data used for impairment testing procedures are directly linked to the Group’s latest approved budget, adjusted as necessary to exclude the effects of asset enhancements. Discount factors are determined individually for each CGU and reflect management’s assessment of respective risk profiles, such as market and asset-specific risk factors.
All assets, except for intangible assets with indefinite useful life, are subsequently reassessed for indications that an impairment loss previously recognized may no longer exist. An impairment loss is reversed if the asset’s or CGU’s recoverable amount exceeds its carrying amount. 2.17 Employee Benefits
Entities under the Group provide respective post-employment benefits to employees through a defined benefit plan and defined contribution plan, as well as other benefits, which are recognized and measured as follows: (a) Post-employment Defined Benefit Plan A defined benefit plan is a post-employment plan that defines an amount of post-employment benefit that an employee will receive on retirement, usually
dependent on one or more factors such as age, years of service and salary. The legal obligation for any benefits from this kind of post-employment plan remains with the Group, even if plan assets for funding the defined benefit plan have been acquired. Plan assets may include assets specifically designated to a long-term benefit fund, as well as qualifying insurance policies. The Group’s post-employment defined benefit plan covers all regular full-time employees. The pension plan is tax-qualified, non-contributory and administered by trustees.
The liability recognized as part of Other Liabilities account in the statement of financial position for defined benefit post-employment plan is the present value of the defined benefit obligation at the end of the reporting period less the fair value of plan assets. The defined benefit obligation is calculated annually by independent actuaries using the projected unit credit method. The present value of the defined benefit obligation is determined by discounting the estimated future cash outflows for expected benefit payments using a discount rate derived from the interpolated yields of government bonds as calculated by Bloomberg which used Bloomberg Valuation (BVAL) Evaluated Pricing Service to calculate the PHP BVAL Reference Rates. These yields are denominated in the currency in which the benefits will be paid and that have terms to maturity approximating to the terms of the related post-employment liability.

- 28 -
Remeasurements, comprising of actuarial gains and losses arising from experience adjustments and other changes in actuarial assumptions, effect of the changes to the asset ceiling, if any, and actual return on plan assets (excluding amount included in net interest), are reflected immediately in the statement of financial position with a charge or credit recognized in other comprehensive income (loss) in the period in which they arise. Remeasurements are not reclassified to profit or loss in the subsequent periods. Net interest is calculated by applying the discount rate at the beginning of the period, taking account of any changes in the net defined benefit liability or asset during the period as a result of contributions and benefit payments. Net interest is reported as part of Other Interest Income or Interest Expense from Bills Payable and Other Borrowings accounts in the statement of profit or loss.
Past-service costs are recognized immediately in profit or loss in the period of a plan
amendment or curtailment.
(b) Post-employment Defined Contribution Plan A defined contribution plan is a post-employment plan under which the Group pays
fixed contributions into an independent entity such as the Social Security System. The Group has no legal or constructive obligations to pay further contributions after payment of the fixed contribution. The contributions recognized in respect of defined contribution plans are expensed as they fall due. Liabilities or assets may be recognized if underpayment or prepayment has occurred.
(c) Short-term Benefits
Short-term employee benefits include wages, salaries, bonuses, and non-monetary benefits provided to current employees, which are expected to be settled before twelve months after the end of the reporting period during which an employee services are rendered, but does not include termination benefits. The undiscounted amount of the benefits expected to be paid in respect of services rendered by employees in an accounting period is recognized in profit or loss during that period and any unsettled amount at the end of the reporting period is included as part of Accrued Interest, Taxes and Other Expenses in the statement of financial position.
(d) Termination Benefits Termination benefits are payable when employment is terminated by the Group before
the normal retirement date, or whenever an employee accepts voluntary redundancy in exchange for these benefits.
The Group recognizes termination benefits at the earlier of: (i) when it can no longer withdraw the offer of such benefits, and, (ii) when it recognizes costs for a restructuring that is within the scope of Philippine Accounting Standard (PAS 37) and involves the payment of termination benefits. In the case of an offer made to encourage voluntary redundancy, the termination benefits are measured based on the number of employees expected to accept the offer. Benefits falling due more than 12 months after the end of the reporting period are discounted to their present value.
(e) Bonus Plans The Group recognizes a liability and an expense for bonuses, based on a fixed formula.
The Group recognizes a provision where it is contractually obliged to pay the benefits, or where there is a past practice that has created a constructive obligation.

- 29 -
(f) Compensated Absences Compensated absences are recognized for the number of paid leave days
(including holiday entitlement) remaining at the end of the reporting period. They are included in the Accrued Interest, Taxes and Other Expenses account in the statement of financial position at the undiscounted amount that the Group expects to pay as a result of the unused entitlement.
2.18 Borrowing Costs
Borrowing costs are recognized as expense in the period in which they are incurred, except to the extent that they are capitalized. Borrowing costs that are directly attributable to the acquisition, construction or production of a qualifying asset (i.e., an asset that takes a substantial period of time to get ready for its intended use or sale) are capitalized as part of the cost of such asset. The capitalization of borrowing costs commences when expenditures for the asset and borrowing costs are being incurred and activities that are necessary to prepare the asset for its intended use or sale are in progress. Capitalization ceases when substantially all such activities are completed. Investment income earned on the temporary investment of specific borrowings pending their expenditure on qualifying assets is deducted from the borrowing costs eligible for capitalization.
2.19 Income Taxes
Tax expense recognized in profit or loss comprises the sum of current tax and deferred tax
not recognized in other comprehensive income or directly in equity, if any.
Current tax assets or liabilities comprise those claims from, or obligations to, tax authorities relating to the current or prior reporting period, that are unpaid at the end of the reporting period. They are calculated according to the tax rates and tax laws applicable to the periods to which they relate, based on the taxable profit for the year. All changes to current tax assets or liabilities are recognized as a component of tax expense in the statement of profit or loss.
Deferred tax is provided using the liability method, on temporary differences at the end of the reporting period between the tax bases of assets and liabilities and their carrying amounts for financial reporting purposes. Under the liability method, with certain exceptions, deferred tax liabilities are recognized for all taxable temporary differences and deferred tax assets are recognized for all deductible temporary differences and the carry-forward of unused tax losses and unused tax credits to the extent that it is probable that taxable profit will be available against which the deferred tax assets can be utilized. Deferred tax assets are reassessed at the end of each reporting period. Previously unrecognized deferred tax assets are recognized to the extent that it has become probable that future taxable profit will be available to allow such deferred tax assets to be recovered. Deferred tax assets and liabilities are measured at the tax rates that are expected to apply in the period when the asset is realized or the liability is settled provided such tax rates have been enacted or substantively enacted at the end of the reporting period.
The carrying amount of deferred tax assets is reviewed at the end of each reporting period and
reduced to the extent that it is probable that sufficient taxable profit will be available to allow all or part of the deferred tax assets to be utilized.
The measurement of deferred tax liabilities and assets reflects the tax consequences that would
follow from the manner in which the Group expects, at the end of the reporting period, to recover or settle the carrying amount of the assets and liabilities.

- 30 -
Most changes in deferred tax assets or liabilities are recognized as a component of tax expense in profit or loss, except to the extent that it relates to items recognized in other comprehensive income or directly in equity. In this case, the tax is also recognized in other comprehensive income or directly in equity, respectively.
Deferred tax assets and deferred tax liabilities recognized by the entities under the Group are offset if they have a legally enforceable right to set off current tax assets against current tax liabilities and the deferred taxes relate to the same entity and the same taxation authority.
2.20 Related Party Relationships and Transactions
Related party transactions are transfers of resources, services or obligations between the Group and its related parties, regardless of whether a price is charged.
Parties are considered to be related if one party has the ability to control the other party or exercise significant influence over the other party in making financial and operating decisions. These parties include: (a) individuals owning, directly or indirectly through one or more intermediaries, control or are controlled by, or under common control with the Group; (b) associates; (c) individuals owning, directly or indirectly, an interest in the voting power of the Group that gives them significant influence over the Group and close members of the family of any such individual; and, (d) the funded retirement plan of each of the entities under the Group. In considering each possible related party relationship, attention is directed to the substance of the relationship and not merely on the legal form.
All material related party transactions shall be approved by at least two-thirds vote of the BOD, with at least a majority of the independent directors voting to approve the material related party transactions. In case that a majority of the independent directors’ is not secured, the material related party transaction may be ratified by the vote of the stockholders representing at least two-thirds of the outstanding capital stock. Transactions amounting to 10% or more of the consolidated total assets based on the latest audited consolidated financial statements entered into with related parties are considered material.
2.21 Earnings and Dilutive Earning Per Share Basic earnings per share (EPS) is determined by dividing the adjusted net profit for the year attributable to common shareholders by the weighted average number of common stocks outstanding during the period, after giving retroactive effect to any stock dividends declared in the current period. Diluted EPS is also computed by dividing net profit by the weighted average number of common stocks subscribed and issued during the period. However, net profit attributable to common stocks and the weighted average number of common stocks outstanding are adjusted to reflect the effects of potentially dilutive convertible preferred stocks. Convertible preferred stocks are deemed to have been converted into common stocks at the issuance of preferred stocks. In cases of redemption of preference shares, the net income used in the computation of basic and diluted EPS is decreased by the excess of the fair value of consideration paid to holders of the instruments over the carrying amount of such repurchased instruments.

- 31 -
2.22 Trust and Fiduciary Activities The Group commonly acts as trustee and in other fiduciary capacities that result in the holding or placing of assets on behalf of individuals, trusts, retirement benefit plans and other institutions. The resources, liabilities and income or loss arising thereon are excluded from these financial statements, as these are neither resources nor income of the Group. 2.23 Events After the End of the Reporting Period
Any post year-end event that provides additional information about the Group’s financial position at the end of the reporting period (adjusting event) is reflected in the financial statements. Post year-end events that are not adjusting events, if any, are disclosed when material to the financial statements.
3. SIGNIFICANT ACCOUNTING JUDGMENTS AND ESTIMATES
The preparation of the Group’s financial statements in accordance with PFRS requires management to make judgments and estimates that affect the amounts reported in the financial statements and related notes. Judgments and estimates are continually evaluated and are based on historical experience and other factors, including expectations of future events that are believed to be reasonable under the circumstances. Actual results may ultimately vary from these estimates.
3.1 Critical Management Judgments in Applying Accounting Policies
In the process of applying the Group’s accounting policies, management has made the following judgments, apart from those involving estimation, which have the most significant effect on the amounts recognized in the financial statements:
(a) Application of ECL to Financial Assets at Amortized Cost and Financial Assets at FVOCI
The Group uses the general approach to calculate ECL for all debt instruments carried at amortized cost and FVOCI, together with loan commitments and financial guarantee contracts. The allowance for impairment is based on the ECLs associated with the probability of default of a financial instrument in the next 12 months, unless there has been a significant increase in credit risk since origination of the financial instrument, in such case, a lifetime ECL for the instrument is recognized. The Group has established a policy to perform an assessment, at the end of each reporting period, whether a financial instrument’s credit risk has increased significantly since initial recognition, by considering the change in the risk of default occurring over the remaining life of the financial instrument.
(b) Evaluation of Business Models Applied in Managing Financial Instruments
The Group manages its financial assets based on business models that maintain adequate level of financial assets to match its expected cash outflows, largely, its core deposit funding arising from customers’ withdrawals and continuing loan disbursements to borrowers, while maintaining a strategic portfolio of financial assets for trading activities consistent with its risk appetite.

- 32 -
The Group’s business models reflect how it manages its portfolio of financial instruments. The Group’s business models need not be assessed at entity level or as a whole but applied at the level of a portfolio of financial instruments (i.e., group of financial instruments that are managed together by the Group) and not on an instrument-by-instrument basis (i.e., not based on intention or specific characteristics of individual financial instrument).
In determining the classification of a financial instrument, the Group evaluates in which business model a financial instrument or a portfolio of financial instruments belongs to taking into consideration the objectives of each business model established by the Group (e.g., held-for-trading, generating accrual income, direct matching to a specific liability) as those relate to the Group’s investment, trading and lending strategies.
If more than an infrequent sale is made out of a portfolio of financial assets carried at amortized cost, an entity should assess whether and how such sales are consistent with the objective of collecting contractual cash flows. In making this judgment, the Group considers certain circumstances documented in its business model manual to assess that an increase in the frequency or value of sales of financial instruments in a particular period is not necessarily inconsistent with the HTC business model if the Group can explain the reasons for those sales and why those sales do not reflect a change in the Group’s objective for the business model.
In 2020, the Parent Company disposed of certain debt securities from its HTC portfolio in accordance with its investment policy and has applied these evaluation process to ensure that the disposal is consistent with the Group’s HTC business model (see Note 10.3). There is no similar transaction in 2021.
(c) Testing the Cash Flow Characteristics of Financial Assets and Continuing Evaluation of the Business
Model
In determining the classification of financial assets, the Group assesses whether the contractual terms of the financial assets give rise on specified dates to cash flows that are SPPI on the principal outstanding, with interest representing time value of money and credit risk associated with the principal amount outstanding. The assessment as to whether the cash flows meet the test is made in the currency in which the financial asset is denominated. Any other contractual term that changes the timing or amount of cash flows (unless it is a variable interest rate that represents time value of money and credit risk) does not meet the amortized cost criteria. In cases where the relationship between the passage of time and the interest rate of the financial instrument may be imperfect, known as modified time value of money, the Group assesses the modified time value of money feature to determine whether the financial instrument still meets the SPPI criterion. The objective of the assessment is to determine how different the undiscounted contractual cash flows could be from the undiscounted cash flows that would arise if the time value of money element was not modified (the benchmark cash flows). If the resulting difference is significant, the SPPI criterion is not met. In view of this, the Group considers the effect of the modified time value of money element in each reporting period and cumulatively over the life of the financial instrument.

- 33 -
(d) Determination of Timing of Satisfaction of Performance Obligation
The Group determines that its revenue shall be recognized at a point in time for loan syndication and underwriting fees and commission. In making its judgment, the Group considers the timing of receipt and consumption of benefits provided by the Group to the customers. The services provided by the Group would need substantial reperformance from other entities. This demonstrates that the customers do not simultaneously receive and consume the benefits provided by the Group. For the revenues from services related to credit card membership and account management, the Group determines that its revenues shall be recognized over time. In making its judgment, the Group considers the timing of receipt and consumption of benefits provided to the customers. As the work is performed, the Group becomes entitled to payments. This demonstrates that the customers simultaneously receive and consume the benefits of the Group’s rendering of these services as it performs.
(e) Determination of Lease Term of Contracts with Renewal and Termination Options
In determining the lease term, management considers all relevant factors and circumstances that create an economic incentive to exercise a renewal option or not exercise a termination option. Renewal options and/or periods after termination options are only included in the lease term if the lease is reasonably certain to be extended or not terminated. For leases of offices and branches, the factors that are normally the most relevant are (a) if there are significant penalties should the Group pre-terminate the contract, and (b) if any leasehold improvements are expected to have a significant remaining value, the Group is reasonably certain to extend and not to terminate the lease contract. The Group did not include renewal options as part of the lease term as the terms are renewable upon mutual agreement. The lease term is reassessed if an option is actually exercised or not exercised or the Group becomes obliged to exercise or not exercise it. The assessment of reasonable certainty is only revised if a significant event or a significant change in circumstances occurs, which affects this assessment, and that is within the control of the Group.
(f) Distinction Between Investment Properties and Owner-occupied Properties
The Group determines whether a property qualifies as an investment property. In making its judgment, the Group considers whether the property generates cash flows largely independent of the other assets held by the Group. Owner-occupied properties generate cash flows that are attributable not only to property but also to other assets used in the production, supply process, and in the Group’s banking operation.
Some properties comprise a portion that is held to earn rental or for capital appreciation and another portion that is held for use for administrative purposes. If these portions can be sold separately (or leased out separately under finance lease) then these portions can be accounted for separately. If the portions cannot be sold separately, the property is accounted for as investment property only if an insignificant portion is held for use in operations or for administrative purposes. Judgment is applied in determining whether ancillary services are so significant that a property does not qualify as investment property.

- 34 -
As of the end of the reporting period, the Group has a certain building which comprise a portion that is held for rental and other portion is used for operations which were classified by the Group as Investment Properties or as part of Bank Premises, Furniture, Fixtures and Equipment according to its current use.
(g) Distinction Between Operating and Finance Leases where the Group is the Lessor
The Group has entered into various lease agreements as a lessor. Judgment was exercised by management to distinguish each lease agreement as either an operating or finance lease by looking at the transfer or retention of significant risk and rewards of ownership of the properties covered by the agreements. Failure to make the right judgment will result in either overstatement or understatement of assets or liabilities.
In determining whether the lease arrangements of the Parent Company and RCBC LFC qualify as a finance lease, the following factors have been considered:
(i) the lease provides the lessee an option to purchase the asset; or,
(ii) the lease transfers ownership of the property at the end of the lease and the related
lease terms approximate the estimate useful life of the asset being leased.
(h) Classification and Determination of Fair Value of Acquired Properties
The Group classifies its acquired properties as Bank Premises, Furniture, Fixtures and Equipment if used in operations, as Assets held-for-sale and disposal group presented under Other Resources account if the Group expects that the assets will be sold within one year from the date of recognition, as Investment Properties if held for rental or for currently undetermined future use and is regarded as held for capital appreciation, or as financial assets. At initial recognition, the Group determines the fair value of acquired properties through internal and external appraisal depending on the Group’s threshold policy. The appraised value is determined based on the current economic and market conditions, as well as the physical condition of the property. The Group’s methodology in determining the fair value of Investment Properties are further discussed in Note 7.4.
(i) Assessment of Significant Influence on HCPI in which the Group and the Parent Company Holds
Less than 20% Ownership
The management considers that the Group and the Parent Company have significant influence on HCPI even though it holds less than 20% of the ordinary shares in the latter. In making this judgment, management considered the Group’s and the Parent Company’s rights to commit and undertake to vote, and to regulate the conduct of voting and the relationship between them with respect to their exercise of their voting rights (see Note 12.1).
(j) Recognition of Provisions and Contingencies
Judgment is exercised by management to distinguish between provisions and contingencies. Policies on recognition of provisions and contingencies are discussed in Note 2.11 and relevant disclosures are presented in Note 29. In dealing with the Group’s various legal proceedings, the Group’s estimate of the probable costs that may arise from claims and contingencies has been developed in consultation and coordination with the Group’s internal and outside counsels acting in defense for the Group and the Parent Company’s legal cases and are based upon the analysis of probable results.

- 35 -
Although the Group does not believe that its on-going proceedings, as disclosed in Note 29, will have material adverse effect on the Group’s financial position, it is possible that future results of operations could be materially affected by changes in the estimates or in the effectiveness of the strategies conducted relating to those proceedings.
3.2 Key Sources of Estimation Uncertainty
The following are the key assumptions concerning the future, and other key sources of estimation uncertainty at the end of each reporting period, that have a significant risk of causing a material adjustment to the carrying amounts of assets and liabilities within the next reporting period:
(a) Estimation of Expected Credit Loss on Financial Assets
When measuring allowance for ECL for relevant categories of financial assets, management applies judgment in defining the criteria in assessing whether a financial asset has experienced SICR since initial recognition, and in the estimation of the contractual cash flows due from counterparty and those that the Group would expect to receive, taking into account the cash flows from the realization of collateral and integral credit enhancements. The Group’s ECL calculations are outputs of complex models with a number of underlying assumptions about future economic conditions and credit behaviour of counterparties (e.g., the likelihood of counterparties defaulting and the resulting losses). The computation of the ECL also considers the use of reasonable and supportable forward-looking information, which is based on assumptions for the future movement of different economic drivers and how these drivers will affect each other that may result in different levels of loss allowance. Significant factors affecting the estimates on the ECL model include: internal rating matrix which determines the PD to be assigned to a financial asset; criteria for assessing if there has been an SICR and when a financial asset will be
transferred between the three stages; the Group’s definition of default for different segments of credit exposures that
considers the regulatory requirements; establishing groups of similar financial assets (i.e., segmentation) for the purposes of
measuring ECL on a collective basis; establishment of LGD parameters based on historical recovery rates of claims against
defaulted counterparties across different group of financial instruments; and, establishing the number and relative weightings of forward-looking scenarios for each
type of product/market and the associated ECL.
The explanation of inputs, assumptions and estimation techniques used in measuring ECL (including under COVID-19 situation) and the analysis of the allowance for ECL on various groups of financial instruments is further discussed in Note 4.4.
(b) Fair Value Measurement for Financial Assets at FVTPL and at FVOCI
The Group carries certain financial assets at fair value which requires judgment and extensive use of accounting estimates. In cases when active market quotes are not available, fair value is determined by reference to the current market value of another financial instrument which is substantially the same or is calculated based on the expected cash flows of the underlying net base of the instrument or other more appropriated valuation techniques (see Note 7.2). The amount of changes in fair value would differ if the Group had utilized different valuation methods and assumptions. Any change in fair value of the financial assets and financial liabilities would affect profit or loss or other comprehensive income.

- 36 -
The fair value of derivative financial instruments that are not quoted in an active market is determined through valuation techniques using the net present value computation (see Note 7.2). The carrying values of the Group’s and the Parent Company’s trading and investment securities and the amounts of fair value changes recognized on those financial assets are disclosed in Note 10.
(c) Estimation of Useful Lives of Bank Premises, Furniture, Fixtures and Equipment, Right-of-use
Assets, Investment Properties, Computer Software, Goodwill, Branch Licenses and Trading Right
The Group estimates the useful lives of bank premises, furniture, fixtures and equipment, including right-of-use assets, investment properties and computer software based on the period over which the assets are expected to be available for use. The estimated useful lives of these assets are reviewed periodically and are updated if expectations differ from previous estimates due to physical wear and tear, technical or commercial obsolescence and legal or other limits on the use of the assets.
The Group’s goodwill, branch licenses and trading right were regarded as having indefinite useful lives considering there is no foreseeable limit to the period over which such assets are expected to generate net cash inflows for the Group. The assessment of having indefinite useful lives is reviewed periodically and is updated whether events and circumstances such as the period of control over these assets and legal or similar limits on the use of these assets continue to support such assessment.
The carrying amounts of bank premises, furniture, fixtures and equipment, including right-of-use assets, investment properties and computer software are analyzed in Notes 13, 14 and 15, respectively, while the carrying amounts of goodwill, branch licenses and trading right are analyzed in Note 15. Based on management’s assessment as of December 31, 2021 and 2020, there are no changes in the useful lives of these assets. Actual results, however, may vary due to changes in estimates brought about by changes in factors mentioned above.
(d) Determination of Realizable Amount of Deferred Tax Assets
The Group reviews its deferred tax assets at the end of each reporting period and reduces the carrying amount to the extent that it is no longer probable that sufficient taxable profit will be available to allow all or part of the deferred tax asset to be utilized. Significant judgment is applied by management to determine the amount of deferred tax assets that can be recognized based on the likely timing and level of the Group’s future taxable income together with its future tax planning strategies. The Group assessed its projected performance in determining the sufficiency of the future taxable income to support the recognition of deferred tax assets. The carrying values of recognized and unrecognized deferred tax assets as of December 31, 2021 and 2020 are disclosed in Note 26.1.
(e) Estimation of Impairment Losses of Non-financial Assets
Except for intangible assets with indefinite useful lives, PFRS requires that an impairment review be performed when certain impairment indications are present. The Group’s policy on estimating the impairment of non-financial assets is discussed in detail in Note 2.16.
- 37 -
The Group assesses impairment on these non-financial assets and considers the following important indicators:
significant changes in asset usage; significant decline in assets’ market value; obsolescence or physical damage of an asset; significant underperformance relative to expected historical or projected future
operating results; significant changes in the manner of usage of the acquired assets or the strategy
for the Group’s overall business; and, significant negative industry or economic trends.
If such indications are present and where the carrying amount of the asset exceeds its recoverable amount, the asset is considered impaired and is written down to its recoverable amount. Though management believes that the assumptions used in the estimation of fair values of non-financial assets are appropriate and reasonable, significant changes in these assumptions may materially affect the assessment of recoverable values and any resulting impairment loss could have a material adverse effect on the results of operations.
(f) Determination of Fair Value of Investment Properties
The Group’s investment properties are composed of parcels of land, buildings and condominium units which are held for capital appreciation or held-for-lease, and are measured using cost model. The estimated fair value of investment properties disclosed in Note 7.4 is determined by either an independent or internal appraiser on the basis of current appraised values of the properties or similar properties in the same location and condition. For investment properties with appraisal conducted prior to the end of the current reporting period, management determines whether there are significant circumstances during the intervening period that may require adjustments or changes in the disclosure of fair value of those properties.
A significant change in key inputs and sources of information used in the determination of the fair value disclosed for those assets may result in adjustment in the carrying amount of the assets reported in the financial statements if their fair value will indicate evidence of impairment.
(g) Determination of Appropriate Discount Rate in Measuring Lease Liabilities The Group measures its lease liabilities at present value of the lease payments that are not paid at the commencement date of the lease contract. The lease payments were discounted using a reasonable rate deemed by management equal to the Group’s incremental borrowing rate. In determining a reasonable discount rate, management considers the term of the leases, the underlying asset and the economic environment. Actual results, however, may vary due to changes in estimates brought about by changes in such factors.
(h) Recognition of Reward Points The Group has a reward program related to its deposits, loans and credit card operations, which allows its cardholders to accumulate award credits or loyalty points that can be redeemed for free products.

- 38 -
The Group allocated a portion of the interchange fee billed to participating merchants to the loyalty points granted to cardholders based on relative stand-alone selling price and recognizes liability equivalent to the estimated loyalty points until these are redeemed.
(i) Valuation of Post-employment Defined Benefits
The determination of the Group’s obligation and cost of post-employment defined benefits is dependent on the selection of certain assumptions used by actuaries in calculating such amounts. Those assumptions include, among others, discount rates, and salary increase rate. A significant change in any of these actuarial assumptions may generally affect the recognized expense, other comprehensive income or loss, and the carrying amount of the post-employment benefit obligation in the next reporting period. The amounts of post-employment benefit obligation and related income or expense, and an analysis of the movements in the estimated present value of post-employment benefit obligation, as well as the significant assumptions used in estimating such obligation, are presented in Note 24.2.
4. RISK MANAGEMENT POLICIES AND OBJECTIVES
The Group is exposed to risks in relation to its operating, investing, and financing activities, and the business environment in which it operates. The Group’s objectives in risk management are to ensure that it identifies, measures, monitors, and controls the various risks that arise from its business activities, and that it adheres strictly to the policies, procedures, and control systems which are established to address these risks.
A committee system is a fundamental part of the Group’s process of managing risk. The following five committees of the Parent Company’s BOD are relevant in this context: The Executive Committee, which meets weekly, has the power to act and pass upon such
matters as the BOD may entrust to it for action in between BOD meetings. It may also consider and approve loans and other credit related matters, investments, purchase of shares of stock, bonds, securities and other commercial papers for the Bank’s portfolio. The Executive Committee also has the power to review an asset or loan to ensure timely resolution and recognition of losses of impaired assets.
The Risk Oversight Committee (ROC), which meets monthly, carries out the BOD’s oversight responsibility for Group’s capital adequacy and risk management strategy and actions covering credit, market and operational risks under Pillar I of the Basel framework; as well as the management of other material risks determined under Pillar II and the Internal Capital Adequacy Assessment Process (ICAAP) (see Note 5.2). Risk limits are reviewed and approved by the ROC.
The Audit and Compliance Committee (ACC), which meets monthly, reviews the results of the Internal Audit examinations and recommends remedial actions to the BOD as appropriate. The ACC also performs oversight functions over the Regulatory Affairs Group on matters such as compliance risk assessment, annual testing work plan, compliance breaches, and other regulatory issues.
The Related Party Transactions (RPT) Committee, which meets monthly and as necessary, reviews proposed RPT within the materiality threshold to determine whether or not the transaction is on terms no less favorable to the Group than terms available to any unconnected third party under the same or similar circumstances. On favorable review, the RPT Committee endorses transactions to the BOD for approval.

- 39 -
The Anti-Money Laundering (AML) Board Committee, which meets monthly, oversees the implementation of the Bank’s Money Laundering and Terrorist Financing Prevention Program (MTPP) and ensures that Money Laundering/Terrorist Financing risks are effectively managed. The AML Board Committee also ensures that infractions are immediately corrected, issues are addressed and AML training of directors, officers, and staff are regularly conducted.
Four senior management committees also provide a regular forum to take up risk issues. The Credit and Collection Committee (CRECOL), chaired by the Chief Executive Officer
(CEO) and composed of the heads of credit risk-taking business units and the head of credit management group, meets weekly to review and approve credit exposures within its authority. It also reviews plans and progress on the resolution of problem loan accounts.
The Asset/Liability Committee (ALCO), chaired by the Treasurer of the Parent Company
and with the participation of the CEO and key business and support unit heads meets weekly to appraise market trends, and economic and political developments. It provides direction in the management of interest rate risk, liquidity risk, foreign currency risk, and trading and investment portfolio decisions. It sets prices or rates for various asset and liability, and trading products, in light of funding costs and competitive and other market conditions. It receives confirmation that market risk limits (as described in the succeeding pages) are not breached; or if breached, it provides guidance on the handling of the relevant risk exposure in between ROC meetings.
The Related Party Transactions Management Committee (RPT ManCom), composed
of the Group Heads of the business units as specified in the charter or their respective designates. It meets monthly to review and approve proposed RPT within the materiality threshold for the purpose of determining whether or not the transaction is on terms no less favorable to the Bank than terms available to any unconnected third party under the same or similar circumstances unless the transaction requires BOD approval. On favorable review, the RPT ManCom endorses the transaction for BOD confirmation.
The Anti-Money Laundering Management Committee (AML ManCom), which meets weekly, evaluates the unusual/suspicious transaction reported by the different bank units to determine the filing of Suspicious Transaction Reports (STRs) to the Anti-Money Laundering Council (AMLC). The AML ManCom is composed of the Chief Compliance Officer as the Chairperson and Presiding Officer and the Heads of Operations Group, Retail Banking Group, Controllership Group, Legal Affairs Group, Risk Management Group or their duly appointed designates, as members, and AML Monitoring and Reporting Division (AMRD) as the Rapporteur. The AMRD, through the Chief Compliance Officer, reports to the AML Board Committee its monthly activities including the results of the AML ManCom meetings.
The Parent Company established a Risk Management Group (RMG), headed by the Chief Risk Officer, to ensure that consistent implementation of the objectives of risk identification, measurement and/or assessment, mitigation, and monitoring are pursued via practices commensurate with the group-wide risk profile. In addition to established risk management systems and controls, the Group holds capital commensurate with the levels of risk it undertakes (see Note 5), in accordance with regulatory capital standards and internal benchmarks set by the Parent Company’s BOD.

- 40 -
4.1 Group’s Strategy in Using Financial Instruments
It is the Group’s intent to generate returns mainly from the traditional financial intermediation and service-provision activities, augmented by returns from positions based on views on the financial markets. The main source of risk, therefore, remains to be that arising from credit risk exposures. Nevertheless, within BSP regulatory constraints, and subject to limits and parameters established by the BOD and/or the ROC, the Group is exposed to liquidity risk and interest rate risk inherent in the Group’s operations, and other market risks, which include foreign exchange risk. In the course of performing financial intermediation function, the Group accepts deposits from customers at fixed and floating rates, and for various periods, and seeks to earn interest margins by investing these funds in high-quality assets. The conventional strategy to enhance net interest margin is the investment of short-term funds in longer-term assets, such as fixed-income securities. While, in doing so, the Group maintains liquidity at prudent levels to meet all claims that fall due, the Group fully recognizes the consequent interest rate risk exposure. The Group’s investment portfolio is composed mainly of marketable, sovereign and corporate debt instruments.
The Parent Company was granted by the BSP additional derivatives authorities effective January 2011. Products approved under the Limited Dealer Authority (Type 2) are foreign currency forwards, non-deliverable forwards, interest rate and cross currency swaps while credit-linked notes and bond options were approved under the Limited User Authority (Type 3). In February 2012, bond forwards, non-deliverable swaps and foreign exchange options have been included under the same Type 3 license. In June 2013, the Parent Company was granted a Type 2 license non-deliverable swaps, foreign currency options, bond and interest rate options, and asset swaps. During the same period, additional Type 3 licenses for foreign exchange-option and bond-option linked notes were likewise approved. The Parent Company’s derivatives portfolio consists mostly of short-term currency forward contracts and swaps, and interest rate swaps and futures.
4.2 Liquidity Risk
Liquidity risk refers to current and prospective risk to earnings or capital arising from a bank’s inability to meet its obligations when they come due without incurring unacceptable losses or costs. Liquidity risk includes the inability to manage unplanned decreases or changes in funding sources. The Group manages liquidity risk by limiting the maturity mismatch between assets and liabilities, and by holding sufficient liquid assets of appropriate quality and marketability. The Group recognizes the liquidity risk inherent in its activities, and identifies, measures, monitors and controls the liquidity risk inherent to the members of the Group which are financial intermediaries.
The Group’s liquidity policy is to manage its operations to ensure that funds available are more than adequate to meet demands of its customers and to enable deposits to be repaid on maturity. The Group’s liquidity policies and procedures are set out in its funding and liquidity plan which contains certain funding requirements based on assumptions and uses resources and liability maturity gap analysis.

- 41 -
The Group uses Maximum Cumulative Outflow (MCO) model to measure liquidity risk arising from mismatches of assets and liabilities. MCO is a liquidity gap tool to project cash flow expectations on a status quo condition. The MCO is generated by distributing the cash flows of the Group’s assets, liabilities and off-balance sheet items to time buckets based cash flow expectations such as contractual maturity, nature of the account, behavioral patterns, projections on business strategies, and/or optionality of certain products. The incorporation of behavioral cash flow assumptions and business projections or targets results in a dynamic gap report which realistically captures the behavior of the products and creates a forward-looking cash flow projection. The Group monitors MCO regularly to ensure that it remains within the set limits. The Parent Company generates and monitors daily its MCO. The subsidiaries generate at least monthly their respective MCO reports. The liquidity profile of the Group is reported monthly to the Parent Company’s ROC. To supplement the status quo scenario parameters reflected in the MCO report, the Group also conducts liquidity stress testing to determine the impact of extreme factors, scenarios and events to the Group’s liquidity profile.
The gap analyses as of December 31, 2021 and 2020 are presented below. Group
2021 One to Three One to More Three Months to Five than Five Months One Year Years Years Non-maturity Total Resources: Cash and cash equivalents P 130,264 P 5,523 P 3,048 P 1 P 60,441 P 199,277 Investments - net 7,593 2,901 26,666 176,914 5,161 219,235 Loans and receivables - net 31,319 21,174 40,637 48,351 366,258 507,739 Other resources - net 2,578 3,780 652 169 25,703 32,882 Total resources 171,754 33,378 71,003 225,435 457,563 959,133 Liabilities: Deposit liabilities 108,927 34,938 12,391 9 516,194 672,459 Bills payable 23,560 - 32,344 - - 55,904 Bonds payable - 31,171 56,044 - - 87,215 Other liabilities 8,053 5,907 330 - 18,185 32,475 Total liabilities 140,540 72,016 101,109 9 534,379 848,053 Equity - - - - 111,080 111,080 Total liabilities and equity 140,540 72,016 101,109 9 645,459 959,133 On-book gap 31,214 ( 38,638 ) ( 30,106 ) 225,426 ( 187,896 ) - Cumulative on-book gap 31,214 ( 7,424 ) ( 37,530 ) 187,896 - - Contingent resources 25,670 - - - - 25,670 Contingent liabilities 35,842 - - - - 35,842 Off-book gap ( 10,172 ) - - - - ( 10,172 ) Cumulative off-book gap ( 10,172 ) ( 10,172 ) ( 10,172 ) ( 10,172 ) ( 10,172 ) - Periodic gap 21,042 ( 38,638 ) ( 30,106) 225,426 ( 187,896 ) ( 10,172 ) Cumulative total gap P 21,042 (P 17,596) (P 47,702) P 177,724 (P 10,172 ) P -

- 42 -
Group 2020
One to Three One to More Three Months to Five than Five Months One Year Years Years Non-maturity Total Resources: Cash and cash equivalents P 146,268 P 3,285 P 3,779 P - P 50,399 P 203,731 Investments - net 25,530 18,975 12,559 26,558 4,442 88,064 Loans and receivables - net 29,916 64,658 123,306 90,347 140,376 448,603 Other resources - net 2,235 3,232 2,114 1,853 22,274 31,708 Total resources 203,949 90,150 141,758 118,758 217,491 772,106 Liabilities: Deposit liabilities 87,139 24,516 16,159 1 407,973 535,788 Bills payable 3,349 1,933 7,536 - 349 13,167 Bonds payable 15,482 8,000 66,957 - - 90,439 Other liabilities 9,968 12,201 100 - 9,065 31,334 Total liabilities 115,938 46,650 90,752 1 417,387 670,728 Equity - - - - 101,378 101,378 Total liabilities and equity 115,938 46,650 90,752 1 518,765 772,106 On-book gap 88,011 43,500 51,006 118,757 ( 301,274 ) - Cumulative on-book gap 88,011 131,511 182,517 301,274 - - Contingent resources 8,726 - - - - 8,726 Contingent liabilities 5,625 - - - - 5,625 Off-book gap 3,101 - - - - 3,101 Cumulative off-book gap 3,101 3,101 3,101 3,101 3,101 - Periodic gap 91,112 43,500 51,006 118,757 ( 301,274 ) 3,101 Cumulative total gap P 91,112 P 134,612 P 185,618 P 304,375 P 3,101 P -

- 43 -
Parent Company 2021
One to Three One to More Three Months to Five than Five Months One Year Years Years Non-maturity Total Resources: Cash and cash equivalents P 140,623 P 4,478 P 1,337 P 1 P 51,234 P 197,673 Investments - net 5,663 2,901 26,666 176,914 4,033 216,177 Loans and receivables - net 30,424 20,624 34,555 48,349 365,949 499,901 Other resources - net 2,468 3,780 652 169 29,474 36,543 Total resources 179,178 31,783 63,210 225,433 450,690 950,294 Liabilities: Deposit liabilities 108,526 34,802 12,383 9 518,694 674,414 Bills payable 23,560 - 22,839 - - 46,399 Bonds payable - 31,171 56,044 - - 87,215 Other liabilities 7,289 5,889 330 - 17,765 31,273 Total liabilities 139,375 71,862 91,596 9 536,459 839,301 Equity - - - - 110,993 110,993 Total liabilities and equity 139,375 71,862 91,596 9 647,452 950,294 On-book gap 39,803 ( 40,079 ) ( 28,386 ) 225,424 ( 196,762 ) - Cumulative on-book gap 39,803 ( 276 ) ( 28,662 ) 196,762 - - Contingent resources 25,667 - - - - 25,667 Contingent liabilities 22,561 - - - - 22,561 Off-book gap 3,106 - - - - 3,106 Cumulative off-book gap 3,106 3,106 3,106 3,106 3,106 - Periodic gap 42,909 ( 40,079 ) ( 28,386) 225,424 ( 196,762 ) 3,106 Cumulative total gap P 42,909 P 2,830 (P 25,556) P 199,868 P 3,106 P -

- 44 -
Parent Company 2020 One to Three One to More Three Months to Five than Five Months One Year Years Years Non-maturity Total Resources: Cash and cash equivalents P 144,754 P 2,735 P 2,161 P - P 51,850 P 201,500 Investments - net 23,552 18,975 12,559 26,558 3,497 85,141 Loans and receivables - net 28,960 63,634 117,803 90,346 140,424 441,167 Other resources - net 2,122 3,226 2,103 1,852 25,411 34,714 Total resources 199,388 88,570 134,626 118,756 221,182 762,522 Liabilities: Deposit liabilities 86,714 24,307 16,136 1 409,590 536,748 Bills payable 2,743 16 1,441 - - 4,200 Bonds payable 15,482 8,000 66,957 - - 90,439 Other liabilities 9,332 12,166 100 - 8,245 29,843
Total liabilities 114,271 44,489 84,634 1 417,835 661,230 Equity - - - - 101,292 101,292 Total liabilities and equity 114,271 44,489 84,634 1 519,127 762,522 On-book gap 85,117 44,081 49,992 118,755 ( 297,945 ) - Cumulative on-book gap 85,117 129,198 179,190 297,945 - - Contingent resources 8,722 - - - - 8,722 Contingent liabilities 5,625 - - - - 5,625 Off-book gap - - - - 3,097 Cumulative off-book gap 3,097 3,097 3,097 3,097 3,097 - Periodic gap 88,214 44,081 49,992 118,755 ( 297,945 ) 3,097 Cumulative total gap P 88,214 P 132,295 P 182,287 P 301,042 P 3,097 P -
Pursuant to applicable BSP regulations, the Group is required to maintain reserves against deposit liabilities which are based on certain percentages of deposits. The required reserves against deposit liabilities shall be kept in the form of deposits placed in the Group’s demand deposit accounts with the BSP. The BSP also requires the Parent Company to maintain asset cover of 100% for foreign currency-denominated liabilities of its FCDU.
4.2.1 Foreign Currency Liquidity Management The liquidity risk management policies and objectives described also apply to the management of any foreign currency to which the Group maintains significant exposure. Specifically, the Group ensures that its measurement, monitoring, and control systems account for these exposures as well. The Group sets and regularly reviews limits on the size of the cash flow mismatches for each significant individual currency and in aggregate over appropriate time horizons. The Group also assesses its access to foreign exchange markets when setting up its risk limits. Following BSP Circular No. 639 on ICAAP, the Group likewise calculates and maintains a level of capital needed to support unexpected losses attributable to liquidity risk (see Note 5.2).

- 45 -
4.2.2 Liquidity Risk Stress
To augment the effectiveness of the Group’s gap analysis, the Group regularly assesses liquidity risk based on behavioral and hypothetical assumptions under stress conditions. Survivability and resilience of the Bank are assessed for a minimum stress period of 30 days for all crisis scenarios enumerated in BSP Circular No. 981: Guidelines on Liquidity Risk Management. The results of these liquidity stress simulations are reported monthly to ALCO and ROC.
4.3 Market Risk The Group’s exposure to market risk is the potential diminution of earnings arising from the adverse movement of market interest rates and foreign exchange rates, as well as the potential loss of market value, primarily of its holdings of foreign exchange currencies, debt securities and derivatives. The market risks of the Group are: (a) foreign exchange risk, (b) interest rate risk and (c) equity price risk. The Group manages these risks via a process of identifying, analyzing, measuring and controlling relevant market risk factors, and establishing appropriate limits for the various exposures. The market risk metrics in use, each of which has a corresponding limit, include the following: Nominal Position – an open risk position that is held as of any point in time expressed
in terms of the nominal amount of the exposure.
Dollar Value of 01 (DV01) – an estimate of the price impact due to a one-basis point change in the yield of fixed income securities. It effectively captures both the nominal size of the portfolio as well as its duration. A given DV01 limit accommodates various combinations of portfolio nominal size and duration, thus providing a degree of flexibility to the trading/risk taking function, but at the same time represents a ceiling to the rate sensitivity of the exposure according to the Group’s risk appetite.
Value-at-Risk (VaR) – an estimate of the amount of loss that a given risk exposure is unlikely to exceed during a given time period, at a given level of statistical confidence. Analytically, VaR is the product of: (a) the sensitivity of the market value of the position to movements of the relevant market risk factors, and (b) the volatility of the market risk factor for the given time horizon at a specified level of statistical confidence. Typically, the Group uses a 99% confidence level for this measurement. VaR is used as a risk measure for trading positions, which are marked-to-market (as opposed to exposures resulting from banking, or accrual, book resources and liabilities). Foreign Exchange Position VaR uses a one-day holding period, while Fixed Income VaR uses a defeasance period assessed periodically as appropriate to allow an orderly unwinding of the position. VaR models are back-tested to ensure that results remain consistent with the expectations based on the chosen statistical confidence level. The Bank employs appropriate back-testing methodology to perform a “reality check” on the models used. More specifically, the current back-test procedure employs the “hypothetical P&L” method where the daily position from which the VaR was computed is marked-to-market using the closing price of that day and the closing price of the next trading day. Any change in value in excess of the day’s VaR is treated as an exception.

- 46 -
The Parent Company uses VaR as an important tool for measuring market risk, they are cognizant of its limitations, notably the following:
The use of historical data as a basis for determining the possible range of future
outcomes may not always cover all possible scenarios, especially those of an exceptional nature.
VaR is based on historical volatility. Future volatility may be different due to either random, one-time events or structural changes (including changes in correlation). VaR may be unable to capture volatility due to either of these.
The holding period assumption may not be valid in all cases, such as during periods of extremely stressed market liquidity.
VaR is, by definition, an estimate at a specified level of confidence. Losses may occur
beyond VaR. A 99% VaR implies that losses can exceed VaR 1% of the time. In cases where a parametric distribution is assumed to calculate VaR, the assumed
distribution may not fit the actual distribution well.
VaR assumes a static position over the holding period. In reality, trading positions change, even during the trading day.
In addition to the limits corresponding to the above measurements, the following are also in place:
Loss Limit – represents a ceiling on accumulated month-to-date and year-to-date losses.
For trading positions, a Management Action Trigger (MAT) is also usually defined to be at 50% of the Loss Limit. When MAT is breached, the risk-taking unit must consult with ALCO for approval of a course of action moving forward.
Product Limit – the nominal position exposure for certain specific financial instruments is
established. Stress Testing, which uses more severe rate/price volatility and/or holding period assumptions, (relative to those used for VaR) is applied to marked-to-market positions to arrive at “worst case” loss estimates. This supplements the VaR measure, in recognition of its limitations mentioned above.
A summary of the VaR position of the trading portfolios at December 31 is as follows: Group and Parent Company At December 31 Average Maximum Minimum 2021: Foreign currency risk P 51 P 56 P 112 P 37 Interest rate risk 501 425 769 183 Overall P 552 P 481 P 881 P 220 2020: Foreign currency risk P 82 P 56 P 89 P 32 Interest rate risk 260 367 984 97 Overall P 342 P 423 P 1,073 P 129

- 47 -
Group and Parent Company At December 31 Average Maximum Minimum 2019: Foreign currency risk P 72 P 34 P 88 P 10 Interest rate risk 218 653 1,354 131 Overall P 290 P 687 P 1,442 P 141 4.3.1 Foreign Exchange Risk Foreign exchange risk is the risk to earnings or capital arising from changes in foreign exchange rates. The net foreign exchange exposure, or the difference between foreign currency denominated assets and foreign currency denominated liabilities, is capped by current BSP regulations. Compliance with this ceiling by the Group and the respective foreign currency positions of its subsidiaries are reported to the BSP on a daily basis as required. Beyond this constraint, the Group manages its foreign exchange exposure by limiting it within the conservative levels justifiable from a return/risk perspective. In addition, the Group regularly calculates VaR for each currency position, which is incorporated in the foregoing market risk management discussion. The following table sets forth the impact of reasonably possible changes in the USD exchange rate and other currencies per Philippine peso on pre-tax income and equity of the Group and Parent Company:
Group and Parent Company 2021 2020 Change in Effect on Change in Effect on currency profit before Effect on currency profit before Effect on rate in % tax equity rate in % tax equity Currency: USD +1.00% P 1 1 +1.00% ( P 4 ) ( P 4 ) -1.00% ( 1 ) ( 1 ) -1.00% 4 4 EUR +1.00% ( 2 ) ( 2 ) +1.00% 2 2 -1.00% 2 2 -1.00% ( 2 ) ( 2 ) GBP +1.00% 1 1 +1.00% - - -1.00% ( 1 ) ( 1 ) -1.00% - - Others +1.00% ( 3 ) ( 3 ) +1.00% 3 3 -1.00% 3 3 -1.00% ( 3 ) ( 3 )
Closing exchange rates and weighted average rates (WAR) of USD to Philippine peso as of and for each of the year ended December 31 are as follows:
2021 2020 2019
Closing P 50.99 P 48.04 P 50.74 WAR 49.26 49.61 51.79

- 48 -
The breakdown of the financial resources and financial liabilities as to foreign and Philippine peso-denominated balances, after elimination of intercompany accounts or transactions, as of December 31 follows: Group Foreign Philippine Currencies Pesos Total
2021:
Resources: Cash and other cash items P 718 P 13,973 P 14,691 Due from BSP - 130,170 130,170 Due from other banks 10,721 1,441 12,162 Loans arising from reverse repurchase agreements - 11,691 11,691 Financial assets at FVTPL 641 5,222 5,863 Financial assets at FVOCI 18,866 30,895 49,761 Investment securities at amortized cost - net 75,676 87,935 163,611 Loans and receivables - net 84,144 454,158 538,302 Other resources - 825 825 P 190,766 P 736,310 P 927,076 Liabilities: Deposit liabilities P 120,601 P 551,858 P 672,459 Bills payable 46,398 9,506 55,904 Bonds payable 38,249 48,966 87,215 Accrued interest and other expenses 596 4,963 5,559 Other liabilities 1,224 20,426 21,650 P 207,068 P 635,719 P 842,787
2020:
Resources: Cash and other cash items P 1,406 P 15,114 P 16,520 Due from BSP - 115,467 115,467 Due from other banks 14,433 1,274 15,707 Loans arising from reverse repurchase agreements - 13,356 13,356 Financial assets at FVTPL 2,653 2,235 4,888 Financial assets at FVOCI 4,090 36,060 40,150 Investment securities at amortized cost - net 22,738 20,288 43,026 Loans and receivables - net 94,505 396,779 491,284 Other resources 56 875 931 P 139,881 P 601,448 P 741,329

- 49 -
Group Foreign Philippine Currencies Pesos Total
2020:
Liabilities: Deposit liabilities P 96,280 P 439,508 P 535,788 Bills payable 4,183 8,984 13,167 Bonds payable 51,269 39,170 90,439 Accrued interest and other expenses 541 4,852 5,393 Other liabilities 918 19,574 20,492 P 153,191 P 512,088 P 665,279
Parent Company Foreign Philippine Currencies Pesos Total
2021: Resources: Cash and other cash items P 716 P 13,947 P 14,663 Due from BSP - 128,931 128,931 Due from other banks 10,721 1,139 11,860 Loans arising from reverse repurchase agreements - 11,656 11,656 Financial assets at FVTPL 641 4,238 4,879 Financial assets at FVOCI 18,766 29,633 48,399 Investment securities at amortized cost - net 75,676 87,223 162,899 Loans and receivables - net 84,144 446,320 530,464 Other resources - 823 823 P 190,664 P 723,910 P 914,574 Liabilities: Deposit liabilities P 120,601 P 553,813 P 674,414 Bills payable 46,398 1 46,399 Bonds payable 38,249 48,966 87,215 Accrued interest and other expenses 596 4,795 5,391 Other liabilities 1,224 19,343 20,567 P 207,068 P 626,918 P 833,986

- 50 -
Parent Company Foreign Philippine Currencies Pesos Total
2020:
Resources: Cash and other cash items P 1,404 P 15,060 P 16,464 Due from BSP - 113,949 113,949 Due from other banks 14,406 808 15,214 Loans arising from reverse repurchase agreements - 13,226 13,226 Financial assets at FVTPL 2,653 1,162 3,815 Financial assets at FVOCI 4,085 34,728 38,813 Investment securities at amortized cost - net 22,130 20,383 42,513 Loans and receivables - net 94,505 389,309 483,814 Other resources 56 868 924 P 139,239 P 589,493 P 728,732 Liabilities: Deposit liabilities P 96,280 P 440,468 P 536,748 Bills payable 4,183 17 4,200 Bonds payable 51,269 39,170 90,439 Accrued interest and other expenses 541 4,655 5,196 Other liabilities 918 18,398 19,316 P 153,191 P 502,708 P 655,899
4.3.2 Interest Rate Risk in the Banking Book (IRRBB) The interest rate risk inherent in the Group’s financial statements arises from re-pricing mismatches between financial assets and financial liabilities. The IRRBB Management Framework details the Group’s policy on managing its assets and liabilities to ensure that exposure to fluctuations in interest rates are kept within acceptable limits. To aid the Group in managing IRRBB, the following measurement techniques are used. These are prepared and reported to ALCO and ROC, on a monthly basis.
Technique Description Interest Rate Gap or Re-pricing Gap Contractual Gap
Measures the sensitivity of assets, liabilities and off-balance sheet items towards changes in the market interest rates based on
the re-pricing frequency of each item. Behavioral Gap Behavioral assumption (BeA) is applied to the contractual cash
flows to reflect sensitivity to market conditions or behavioral characteristics (i.e., early redemption of deposits, prepayment of loans, etc.).
Earnings Approach Net Interest Income at Risk Measures the sensitivity of earnings to market interest rates
movements over a short- and medium-term horizon. Interest rate volatility is based on the maximum volatility of the 1-mo, 3-mo, 6-mo and 1-yr tenors over a 260-day look back.

- 51 -
Technique Description Economic Value Approach Earnings-at-Risk Measures the sensitivity of capital to market interest rates given
the resulting Net Interest Income (NII)-at-Risk and fair value through profit and loss portfolio value-at-risk (FVTPL VaR).
Capital-at-Risk Measures the sensitivity of capital to market interest rates given
the resulting EaR and fair value through other comprehensive income value-at-risk (FVOCI VaR).
Economic Value of Equity (EVE) Measures the sensitivity of economic value of all non-trading book
assets, liabilities and interest rate sensitive off-balance sheet products to interest rate movements over a longer time horizon.
Stress Test Assesses the ability to withstand such changes, usually in
relation to the capacity of its capital and earnings to absorb potentially significant loses. Stress testing, which includes both scenario and sensitivity analysis, is an integral part of IRR management. Scenario analysis estimates possible outcomes given an event or series of events, while sensitivity analysis estimates the impact of change in one or only a few of model’s significant parameters.
Earnings approach: NII-at-Risk Stress Test assumes gradual
increase in Peso and USD interest rates to 400bps and 300bps, respectively. These are based on past local and global market events.
Economic Value approach: The EVE Stress Test uses Basel’s six
interest rate scenarios to capture parallel and non-parallel gap risks. The standardized scenarios are as follows: 1) parallel shock up; 2) parallel shock down; 3) steepener shock (short rates down and long rates up); 4) flattener shock (short rates up and long rates down; 5) short rates shock up; and, 6) short rates shock down.
The interest rate gap analyses of financial assets and financial liabilities as of end of the reporting period based on re-pricing maturities are shown in the succeeding pages. It should be noted that such interest rate gap analyses are based on the following key assumptions: Loans and time deposits are subject to re-pricing on their contractual maturity dates.
Non-performing loans, however, are not re-priced;
Debt securities at amortized cost are bucketed based on their re-pricing profile; Held-for-trading securities and derivatives are considered as non-rate sensitive; and,
For financial assets and financial liabilities with no definite re-pricing schedule or
maturity, slotting is based on the Group’s empirical assumptions.
These assumptions are reviewed on a regular basis. Similarly, other assumptions and behavioral models used in the preparation of other IRRBB metrics are also being reviewed, annually, at the minimum.

- 52 -
Group 2021
One to Three One to More Three Months to Five than Five Non-rate Months One Year Years Years Sensitive Total Resources: Cash and cash equivalents P 149,292 P 6,613 P 14,779 P 13,773 P 14,820 P 199,277 Investments - net 3,694 1,758 26,914 176,739 10,130 219,235 Loans and receivables - net 212,486 88,138 144,070 36,581 26,464 507,739 Other resources - net 2,642 850 533 395 28,462 32,882 Total resources 368,114 97,359 186,296 227,488 79,876 959,133 Liabilities: Deposit liabilities 307,238 57,063 160,125 147,743 290 672,459 Bills payable 23,560 - 32,344 - - 55,904 Bonds - payable - 31,171 56,044 - - 87,215 Other liabilities 764 238 570 - 30,903 32,475 Total liabilities 331,562 88,472 249,083 147,743 31,193 848,053 Equity - - - - 111,080 111,080 Total liabilities and equity 331,562 88,472 249,083 147,743 142,273 959,133 On-book gap 36,552 8,887 ( 62,787 ) 79,745 ( 62,397 ) - Cumulative on-book gap 36,552 45,439 ( 17,348 ) 62,397 - - Contingent resources 25,670 - - - - 25,670 Contingent liabilities 35,983 - - - - 35,983 Off-book gap ( 10,313 ) - - - - ( 10,313 ) Cumulative off-book gap ( 10,313 ) ( 10,313 ) ( 10,313 ) ( 10,313 ) ( 10,313 ) - Periodic gap 26,239 8,887 ( 62,787) 79,745 ( 62,397 ) ( 10,313 ) Cumulative total gap P 26,239 P 35,126 ( P 27,661) P 52,084 ( P 10,313 ) P -

- 53 -
Group 2020
One to Three One to More Three Months to Five than Five Non-rate Months One Year Years Years Sensitive Total Resources: Cash and cash equivalents P 161,839 P 3,795 P 21,482 P - P 16,615 P 203,731 Investments - net 23,130 18,353 12,018 25,930 8,633 88,064 Loans and receivables - net 189,831 58,361 106,720 37,455 56,236 448,603 Other resources - net 358 59 123 330 30,838 31,708 Total resources 375,158 80,568 140,343 63,715 112,322 772,106 Liabilities: Deposit liabilities 243,782 31,793 258,573 1 1,639 535,788 Bills payable 3,626 1,887 7,654 - - 13,167 Bonds payable 15,482 8,000 66,957 - - 90,439 Other liabilities 636 36 - - 30,662 31,334 Total liabilities 263,526 41,716 333,184 1 32,301 670,728 Equity - - - - 101,378 101,378 Total liabilities and equity 263,526 41,716 333,184 1 133,679 772,106 On-book gap 111,632 38,852 ( 192,841 ) 63,714 ( 21,357 ) - Cumulative on-book gap 111,632 150,484 ( 42,357 ) 21,357 - - Contingent resources 8,726 - - - - 8,726 Contingent liabilities 5,625 - - - - 5,625 Off-book gap 3,101 - - - - 3,101 Cumulative off-book gap 3,101 3,101 3,101 3,101 3,101 - Periodic gap 114,733 38,852 ( 192,841 ) 63,714 ( 21,357 ) 3,101 Cumulative total gap P 114,733 P 153,585 ( P 39,256 ) P 24,458 P 3,101 P -

- 54 -
Parent Company 2021
One to Three One to More Three Months to Five than Five Non-rate Months One Year Years Years Sensitive Total Resources: Cash and cash equivalents P 147,996 P 5,567 P 15,674 P 13,773 P 14,663 P 197,673 Investments - net 1,999 1,758 26,914 176,739 8,767 216,177 Loans and receivables - net 211,706 87,588 137,988 36,579 26,040 499,901 Other resources - net 2,532 849 533 395 32,234 36,543 Total resources 364,233 95,762 181,109 227,486 81,704 950,294 Liabilities: Deposit liabilities 306,836 56,926 161,487 149,114 51 674,414 Bills payable 23,560 - 22,839 - - 46,399 Bonds payable - 31,171 56,044 - - 87,215 Other liabilities - 219 571 - 30,483 31,273 Total liabilities 330,396 88,316 240,941 149,114 30,534 839,301 Equity - - - - 110,993 110,993 Total liabilities and equity 330,396 88,316 240,941 149,114 141,527 950,294 On-book gap 33,837 7,446 ( 59,832 ) 78,372 ( 59,823 ) - Cumulative on-book gap 33,837 41,283 ( 18,549 ) 59,823 - - Contingent resources 25,667 - - - - 25,667 Contingent liabilities 35,983 - - - - 35,983 Off-book gap ( 10,316 ) - - - - ( 10,316 ) Cumulative off-book gap ( 10,316 ) ( 10,316) ( 10,316 ) ( 10,316 ) ( 10,316 ) - Periodic gap 23,521 7,446 ( 59,832) 78,372 ( 59,823 ) ( 10,316 ) Cumulative total gap P 23,521 P 30,967 ( P 28,865) P 49,507 ( P 10,316 ) P -

- 55 -
Parent Company 2020 One to Three One to More Three Months to Five than Five Non-rate Months One Year Years Years Sensitive Total Resources: Cash and cash equivalents P 160,244 P 3,243 P 21,589 P - P 16,424 P 201,500 Investments - net 21,613 18,353 12,018 25,930 7,227 85,141 Loans and receivables - net 188,876 57,331 101,207 37,453 56,300 441,167 Other resources - net 245 59 122 329 33,959 34,714 Total resources 370,978 78,986 134,936 63,712 113,910 762,522 Liabilities: Deposit liabilities 243,357 31,584 260,311 1 1,495 536,748 Bills payable 2,743 16 1,441 - - 4,200 Bonds payable 15,482 8,000 66,957 - - 90,439 Other liabilities - - - - 29,843 29,843 Total liabilities 261,582 39,600 328,709 1 31,338 661,230 Equity - - - - 101,292 101,292 Total liabilities and equity 261,582 39,600 328,709 1 132,630 762,522 On-book gap 109,396 39,386 ( 193,773 ) 63,711 ( 18,720 ) - Cumulative on-book gap 109,396 148,782 ( 44,991) 18,720 - - Contingent resources 8,722 - - - - 8,722 Contingent liabilities 5,621 - - - - 5,621 Off-book gap 3,101 - - - - 3,101 Cumulative off-book gap 3,101 3,101 3,101 3,101 3,101 - Periodic gap 112,497 39,386 ( 193,773 ) 63,711 ( 18,720 ) 3,101 Cumulative total gap P 112,497 P 151,883 ( P 41,890 ) P 21,821 P 3,101 P - The table below summarizes the potential impact on the Group and the Parent Company’s annual interest income of parallel rate shifts using the re-pricing.
Changes in Interest Rates (in basis points) - 100 - 200 + 100 + 200 December 31, 2021 Group ( P 405) ( P 809) P 405 P 809 Parent Company ( 372) ( 744 ) 372 744 December 31, 2020 Group ( P 1,241) ( P 2,481) P 1,241 P 2,481 Parent Company ( 1,220) ( 2,441 ) 1,220 2,441

- 56 -
4.3.3 Equity Price Risk The Group’s exposure to price risk on equity securities held and classified in the statement of financial position as financial assets at FVTPL or financial assets at FVOCI (under Trading and Investment Securities account) as of December 31, 2021 and 2020 is managed through diversification of portfolio and monitoring of changes in market prices. Diversification of the portfolio is done in accordance with the limits set by the Group. Moreover, RCBC Capital and RSI estimate the potential loss and determine the market and position risk requirement on equity securities at FVTPL in the computation of the market and position risk requirement for all equity positions. RCBC Capital uses the delta-normal approach as its VaR model to estimate the daily potential loss that can be incurred from equity securities held for trading. VaR is a key measure in the management of market price risk. VaR is defined as a statistical estimate of the maximum possible loss on a given position during a time horizon within a given confidence interval. RCBC Capital uses a 99% confidence level and a minimum 260-day observation period in VaR calculation. In addition, RSI computes its market and position risk for all equity positions, if any, in conjunction with the Risk Based Capital Adequacy ratio required to be maintained. Market and position risk requirement is calculated using position risk factor multiplied by mark-to-market value security.
4.4 Credit Risk
Credit risk is the risk that the counterparty in a transaction may default, and arises from lending, trade finance, treasury, derivatives and other activities undertaken by the Group. The Group manages credit risk through a system of policies and authorities that govern the processes and practices of all credit-originating and borrowing relationship management units. The Enterprise Risk Division of RMG assists senior management: (a) in establishing risk concentration limits at the portfolio level; and (b) in the continuous monitoring of the actual credit risk portfolio from the perspective of those limits and other risk management objectives. The Credit Management Group (CMG), on the other hand, is responsible for: (a) the development of credit policies relating to account management; (b) the financial evaluation and credit risk rating of borrowers; and, (c) asset quality review. At the individual borrower level, exposure to credit risk is managed via adherence to a set of policies, the most notable features of which, in this context, are: (a) credit approving authority, except as noted below, is not exercised by a single individual but rather, through a hierarchy of limits that is effectively exercised collectively; (b) business center (BC) managers have limited approval authority only for credit exposure related to deposit-taking operations in the form of bills purchase, acceptance of second endorsed checks and 1:1 loan accommodations; (c) an independent credit risk assessment by the CMG of large corporate and middle-market borrowers, summarized into a borrower risk rating, is provided as input to the credit decision-making process; and, (d) borrower credit analysis is performed at origination and at least annually thereafter or co-terminus with the renewal of the credit line. In addition, adverse economic and market conditions that may impact a certain borrower or a group of borrowers may trigger the Group to conduct a special credit review prior to expiry of credit line.

- 57 -
CMG also identifies homogenous target market and design Credit Programs that will accelerate credit processing of accounts without sacrificing underwriting quality, and, set up enhanced data framework that would deepen the Bank’s ability to identify potential problem accounts earlier. 4.4.1 Concentrations of Credit Risk Credit risk concentration in the context of banking generally denotes the risk arising from an uneven distribution of counterparties in credit or in any other business relationships, or from a concentration in business sectors or geographic regions which is capable of generating losses large enough to jeopardize an institution’s solvency. The Group monitors concentrations of credit risk by sector. An analysis of concentrations of credit risk of the loan portfolio at the end of the reporting period is shown in Note 34. In the course of the Group’s implementation of ICAAP (see Note 5.2), it adopts a quantification of credit risk concentration following frameworks prescribed by some of the more advanced European central banks as well as established concentration metrics. Using sector distribution as a tool, the Group performs a straightforward application of the Herfindahl-Hirshman Index (HHI) to determine the existence of credit risk concentration. The Group supplements this methodology with the use of the Comprehensive Concentration Index (CCI) to monitor and analyze name concentration. The Group, however, recognizes the inherent limitations of the use of HHI and CCI to assess credit concentration risk. To augment this measure and to appropriately manage said risk, the Group performs an in-depth analysis of its large borrowing groups. To ensure the independence of this process, the review and analysis are done during the ROC meetings.
4.4.2 Credit Risk Assessment The Group’s credit risk assessment is performed based on the different segments of financial asset portfolio such as (a) corporate, which generally include corporate banking group loans, commercial and small-medium size segment loans, lease contract and finance receivables, and unquoted debt securities classified as loan (UDSCL), (b) retail, which include housing, auto, credit cards, and microfinance lending; and, (c) treasury, which covers credit exposures on debt securities under the Group’s HTC portfolio and financial assets at FVOCI. The Group also established credit risk assessment procedures for sales contract receivables and other risk assets including accounts receivables. i. Corporate Loans
Loans, regardless if the accounts have been fully paid, extended or renewed in subsequent period, are subjected to evaluation for possible losses. The Group’s estimation of credit exposure for risk management purposes is complex and requires the use of models, as the exposure varies with changes in market conditions (or industry performance), expected cash flows, and the passage of time. The assessment of credit risk of a portfolio of assets requires further estimations as to the PDs occurring, of the associated loss ratios, and of default correlations between counterparties; accordingly, such credit risk is measured using PD, LGD, and EAD, for purposes of measuring ECL.

- 58 -
The Group uses its internal credit risk rating system (ICRRS) to determine any evidence of potential deterioration in the quality of an instrument that take into consideration both quantitative and qualitative criteria. The rating system classifies performing accounts from a scale of AAA indicating an extremely strong capacity of the counterparty to meet financial commitments down to ratings lower than CCC demonstrating weakness in the counterparty’s economic and financial condition that could lead to payment default on financial commitments. Past due accounts, accounts identified for phase-out and those that exhibit the characteristics of classified loans shall be risk-rated following the guidelines on credit classification per BSP Manual of Regulations for Banks and under the BSP Circular No. 1011, i.e., Especially Mentioned, Substandard, Doubtful or Loss. These guidelines are used by the Group to assign the individually assessed loan or a group of loans within a particular portfolio segment to a specific stage category under the PFRS 9 loan impairment standards (i.e., Stage 1, 2, 3). In assessing accounts subject to individual assessment, the Group has established a materiality threshold of P15 for all exposures classified under Stage 3. Such threshold shall be regularly reviewed at the end of reporting period to ensure that it appropriately captures what the Parent Company considers as material items of loan for individual assessment. The provision for ECL for individually assessed exposures shall reflect consideration of the facts and circumstances that affect the repayment of each individual loan as of evaluation date.
The ICRRS is established by the Group in congruence with and with reference to the credit risk rating methodology used by Standard & Poor’s (S&P) in measuring the creditworthiness of an individual borrower, whether the related borrowing is still performing or current in status. The risk ratings determined by the Group for its portfolio of loans and receivables at a given review date is updated to consider the possible shift in the economy or business environment or circumstances affecting the industry and the entity or borrower, in particular. Accordingly, a periodic assessment of credit quality may improve the borrower’s rating or it could lead to one or more rating downgrades over time; hence, could lead to the transfer of credit exposure in different stages of impairment. The credit risk ratings in ICRRS are calibrated such that the risk of default increases exponentially at each higher risk rating (e.g., a difference in the PD between a risk rating of A and A- is lower than the difference in the PD between a B and B- risk rating). In the process of applying the Group’s ICRRS in determining the credit quality of loans and receivables, the Group analyzes the credit quality of the borrowers and counterparties through a set of criteria and rating scale classified into the following:
Rating Scale Rating Description/Criteria AAA Extremely strong capacity to meet financial commitments AA* Very strong capacity to meet financial commitments A* Strong capacity to meet financial commitments, but somewhat susceptible to adverse economic conditions and changes in circumstances BBB* Adequate capacity to meet financial commitments, but more subject to adverse economic conditions

- 59 -
Rating Scale Rating Description/Criteria BB* Less vulnerable in the near-term but faces major ongoing uncertainties to adverse business, financial and economic conditions B* More vulnerable to adverse business, financial and economic conditions but currently has the capacity to meet financial commitments CCC and below* Not at risk of loss at the moment and the borrower has the
financial capacity to meet its obligations but its exposure to adverse business, financial or economic conditions has weakened it and, unless present trends are reversed, could eventually lead to losses.
Especially Mentioned Has potential weaknesses that deserve management’s close
attention and if left uncorrected, these weaknesses may affect the repayment of the loan.
Substandard Have well-defined weakness(es), that may jeopardize
repayment/liquidation in full, either in respect of the business, cash flow or financial position, which may include adverse trends or developments that affect willingness or repayment ability of the borrower.
Doubtful Loans and credit accommodations that exhibit more severe
weaknesses than those classified as “Substandard”, whose characteristics on the basis of currently known facts, conditions and values make collection or liquidation highly improbable.
Loss Loans considered absolutely uncollectible or worthless
* Ratings from AA to CCC are modified by a plus (+) or minus (-) sign to show relative standing within the rating categories.
As part of credit risk assessment documentation and reporting, the Group includes financial instruments rated as AAA to B- under the “Pass” classification, while instruments rated CCC+ and below are grouped under the Watchlisted classification. Generally, “Pass” classification include loans and other credit accommodations that do not have a greater-than-normal credit risk and do not possess the characteristics of classified loans. These are credits that have the apparent ability and willingness to satisfy their obligations in full and therefore, no loss in ultimate collection is anticipated. On the other hand, watchlisted counterparties are characterized by the following:
those that belong to an unfavorable industry or has company-specific risk factors
which represent a concern; the operating performance and financial strength may be marginal and it is
uncertain if borrower can attract alternative course of finance; borrower finds it hard to cope with any significant economic downturn and a
default in such a case is more than a possibility; and, borrower incurs net losses and has salient financial weaknesses, reflected on their
financial statements, specifically in profitability.

- 60 -
Split classification/rating may apply for non-performing secured loans and other credit accommodations, depending on the recoverability and liquidity of the collateral. The secured portion may be classified as “substandard” or “doubtful”, as appropriate, while the unsecured portion shall be classified “loss” if there is no other source of payment other than the collateral.
In the case of syndicated loans, the Group shall maintain credit information on the borrower, and grade and make provision for its portion of the syndicated loan in accordance with its policy. The lead financial institution or bank shall provide participating financial institutions with the credit information on the borrower upon request by the participating financial institutions and inform the latter if the loan will be classified so as to achieve uniform classification of the syndicated loan.
(ii) Retail and Other Products
CMG is tasked to measure, control and manage credit risk on the consumer loans business of the Group through the performance of regular monitoring, reporting and recommendation of risk mitigation measures of the actual credit risk portfolio to the CRECOL and ROC, as well as accomplishment of the corresponding review and development of credit policies and guidelines to sustain asset quality. For consumer loans, risk assessment is performed on an individual borrower through the use of a credit application scorecard for Housing, Auto and Personal Loans while for Corporate Salary Loans, rule-based credit criteria on company accreditation and borrower evaluation has been established. The credit application scorecard makes use of customer, loan and collateral characteristics which have been assigned weights based on their predictive power in determining the propensity of an account to default or maintain a satisfactory credit performance. Credit decisions are based on recommended score cut-offs. Asset quality of the Group is monitored through a regular portfolio performance review including customer segmentation and loan concentration risk assessment to identify sources of risk and to determine risk mitigation on segments that drive delinquency or manifests triggers for default. Likewise, close monitoring and review of industry performance, economic changes and market conditions that may affect the consumer loans business is also taken into consideration to establish a holistic risk assessment process. For the credit card portfolio of the Group, credit risk assessment is performed through segmentation process to diversify the portfolio risk into different homogeneous populations or segments. Over-all account distribution is analyzed for three different snapshots with respect to month-on-month days past due (DPD) to see consistency in the portfolio. For microfinance and small business loans, regardless if the accounts have been fully paid, extended or renewed in subsequent period, are subjected to evaluation for possible losses. Credit risk assessment is performed based on groups of loan portfolio segmented by product type such as (a) credit accommodations to small-medium size borrowers; and, (b) agricultural and microfinance loans.

- 61 -
The Group classifies the consumer, microfinance and small business loans based on days past due following the categories that are consistent with the manner applied under the Group’s internal credit risk assessment and regulatory reporting as follows:
Bucket Classification Secured Unsecured Current Unclassified Unclassified Unclassified One to 30 days Especially Mentioned Unclassified Especially Mentioned 31 to 60 days Especially Mentioned Especially Mentioned Especially Mentioned 61 to 90 days Substandard Especially Mentioned Substandard 91 to 180 days Substandard Substandard Substandard 181 to 365 days Doubtful Doubtful Doubtful More than 365 days Loss Loss Loss
The Group assigns consumer, microfinance and small business loans based on classification into stages of impairment as follows:
Classification Stage Unclassified 1 Especially Mentioned 2 Defaulted 3
For purposes of the information disclosed for credit risk exposures, ‘defaulted’ accounts include those which are classified as Substandard, Doubtful, and Loss. The groupings of financial instruments into a pool of shared credit quality are subject to the regular review by the Group’s CMG in order to ensure that credit exposures within a particular group remain appropriately homogenous.
(iii) Debt Securities at Amortized Cost and at FVOCI
For debt securities, the Group adopts similar credit risk ratings published by reputable external rating agency (e.g., S&P). These ratings are continuously monitored and updated. The PD associated with each rating is determined based on realized default rates over the previous 12 months, as published by the rating agency.
4.4.3 Assessment of SICR
In assessing whether the credit risk on a financial instrument has increased significantly since initial recognition, the Group assesses the change in the risk of a default occurring over the remaining life of the financial instrument. In making this assessment, the Group assesses on a periodic basis both quantitative and qualitative information that is reasonable and supportable, including historical experience and forward-looking information as appropriate. These may include macroeconomic conditions, economic sector and geographical region relevant to the counterparty or borrower and other factors that are counterparty-specific. As the Group holds various arrays of financial instruments, the extent of assessment may depend on the materiality of the financial instrument or the complexity of the portfolio being assessed.

- 62 -
The Group ECL model follows a three-stage impairment approach in determining the loss allowance to be recognized in the financial statements: (i) Stage 1 – comprises of all credit exposures that are considered ‘performing’ and with no
observed SICR since initial recognition. These include those financial instruments with low credit risk. For these financial instruments, the loss allowance is determined based on a 12-month ECL.
(ii) Stage 2 – comprises of all financial instruments assessed to have SICR since initial
recognition based on the Group’s quantitative and qualitative criteria, though not yet deemed to be credit-impaired. Using the Group’s ICRRS, Stage 2 includes credit exposures that are considered ‘under-performing’ in which risk ratings were downgraded by at least three notches and/or downgraded to CCC+ to Especially Mentioned. Stage 2 financial instruments may also include those facilities where the credit risk has improved and have been reclassified from Stage 3 subject to the Group’s observation period on the creditworthiness of the counterparty. A lifetime ECL is recognized for these financial instruments.
(iii) Stage 3 – comprises credit exposures which are assessed as ‘credit-impaired’, thus
considered by the Group as ‘non-performing’, which is assessed consistently with the Group’s definition of default. Generally, this includes accounts classified as Substandard, Doubtful and Loss. The Group recognizes a lifetime ECL for all credit-impaired financial assets.
The Group considers low credit risk for listed debt security when its credit risk rating is equivalent to a globally understood definition of ‘investment grade’ (which should be from at least one major rating agency); other debt securities are considered to be low credit risk when they have a low risk of default and the issuer has a strong capacity to meet its contractual cash flow obligations in the near term.
Financial assets that are credit-impaired on initial recognition are classified as purchased or originated credit-impaired assets. ECL is only recognized or released to the extent that there is a subsequent change in the ECLs. The criteria for determining whether credit risk has increased significantly vary by portfolio and include quantitative changes in probabilities of default and qualitative factors, including a backstop based on delinquency. The credit risk of a particular exposure is deemed to have increased significantly since initial recognition if, based on the Group’s internal credit assessment, the borrower or counterparty is determined to have well-defined credit weaknesses. Under the Group’s ICRRS, these are exposures rated at least Especially Mentioned. For exposures with no internal credit risk rating performed, if contractual payments are more than a specified days past due threshold, the credit risk is deemed to have increased significantly since initial recognition. Depending on the number of days past due which differ across the various retail products of the Group, a credit exposure may be transferred to Stage 2 or Stage 3. Days past due are determined by counting the number of days since the earliest elapsed due date in respect of which full payment has not been received. In subsequent reporting periods, if the credit risk of the financial instrument improves such that there is no longer a SICR since initial recognition, the Group shall revert to recognizing a 12-month ECL. As a general rule, an upgrade or transfer of credit exposure from Stage 3 to Stage 1 is allowed when there is sufficient evidence to support that full collection of principal and interest is probable, consistent with the Group’s definition of curing period.

- 63 -
For portfolios in respect of which the Group has limited historical data, external benchmark information (e.g., Basel LGD) is used to supplement the internally available data. The portfolios for which external benchmark information represents a significant input into measurement of ECL include exposures to foreign borrowers and low default borrower segments.
4.4.4 Definition of Default and Credit-impaired Assets
i. Loans and Receivables
The Group defines a loan instrument as in default, which is aligned with the definition of credit-impaired, when the borrower is more than 90 days past due on its contractual payments, except for the 30 days past due threshold for retail loans of the Group and one day past due for microfinance loan portfolio of Rizal Microbank. As part of a qualitative assessment of whether a customer is in default, the Group also considers a variety of instances and factors that may indicate unlikeliness to pay which may include (a) significant financial difficulty of the issuer or borrower; (b) the restructuring of a loan by the Group, for economic or legal reasons relating to the borrower’s financial difficulty, on terms that the Group would not consider otherwise; or (c) it becoming probable that the borrower will enter bankruptcy or other financial reorganization. When such events occur, the Group carefully considers whether the event should result in treating the customer as defaulted. A loan that has been renegotiated due to a deterioration in the borrower’s condition is usually considered to be credit-impaired unless there is evidence that the risk of not receiving contractual cash flows has reduced significantly and there are no other indicators of impairment. An instrument is considered to be no longer in default or have cured when the borrower is able to repay the installments in arrears and the account no longer meets any of the default criteria for a consecutive period of 180 days, observation period, within which the borrower shall make consecutive payments. The definitions of default and observation period have been aligned with the definition used for regulatory capital purposes. Definitions of default and cure period can be rebutted and the rebuttal will be monitored and reviewed by the CMG on annual basis to ensure definitions remains appropriate. These criteria are consistent with the definition of default used for internal credit risk management purposes that is aligned with the default criteria used for regulatory capital purposes. Such definition is consistently applied in determining PD, LGD, and EAD for each loan portfolio segment and throughout the ECL calculations of the Group.
ii. Investments in Debt Securities
Investments in debt securities is assessed as credit-impaired and impairment losses are incurred if, and only if, there is objective evidence of impairment as a result of an event that occurred after the initial recognition of the security (a “loss event”) and that loss event has impact on the estimated future cash flows of the securities. Losses expected as a result of future events, shall also be considered in estimating the ECL.

- 64 -
Objective evidence that the security is impaired includes observable data that comes to the attention of the holder of the security about the following loss events:
significant financial difficulty of the issuer or obligor; breach of contract, such as a default or delinquency in interest or principal
payments; the financial institution, for economic or legal reasons relating to the issuer’s
financial difficulty, granting to the issuer a concession that the financial institution would not otherwise consider;
it becoming probable that the issuer will enter bankruptcy or other financial reorganization;
the disappearance of an active market for that security because of financial difficulties; or,
observable data indicating that there is a measurable decrease in the estimated future cash flows from a portfolio of securities since the initial recognition of those assets, although the decrease cannot yet be identified with the individual securities in the portfolio, including adverse change in the payment status of issuers in the portfolio; or national or local economic conditions that correlate with defaults on the securities in the portfolio.
The disappearance of an active market because a financial institution’s held securities are no longer publicly traded is not evidence of impairment. A downgrade of an issuer’s credit rating is not, by itself, evidence of impairment, although it may be evidence of impairment when considered with other available information. A decline in the fair value of a security below its cost or amortized cost is not necessarily evidence of impairment (for example, a decline in fair value of an investment in debt security that results from an increase in the risk-free interest rate). In making an assessment of whether an investment in sovereign debt is credit-impaired, the Group considers the following factors:
the market’s assessment of creditworthiness as reflected in the bond yields; the rating agencies’ assessment of creditworthiness; the country’s ability to access the capital markets for new debt issuance; the probability of debt being restructured, resulting in holders suffering losses
through voluntary or mandatory debt forgiveness; or, the internal support mechanism in place to provide the necessary support as
‘lender of last resort’ to that country, as well as the intention, reflected in public statements, of governments and agencies to use those mechanisms. This includes an assessment of the depth of those mechanisms and, irrespective of the political intent, whether there is the capacity to fulfill the required criteria.
4.4.5 ECL Measurement Inputs
Integral in the Group’s established policies in measuring and calculating ECL on financial instrument is the use of appropriate model for each segment of financial asset that applies relevant inputs and assumptions, including forward-looking information as appropriate.

- 65 -
(a) Key Inputs and Assumptions in the ECL Model
The ECL is determined by projecting the PD, LGD and EAD for each future month and for each individual exposure or collective segment.
(i) PD represents an estimate of likelihood of a borrower defaulting on its financial
obligation over a given time horizon, either over the next 12 months (12-month PD) or over the remaining lifetime (lifetime PD) of the obligation. PD is calculated based on statistical rating models, and assessed using rating tools tailored to the various categories of counterparties and exposures which considers both quantitative and qualitative factors. In determining PD, the Group performed segmentation of its credit exposures based on homogenous characteristics [including corporate loan and retail loan (including credit-card and microfinance)] and developed a systematic PD methodology for each portfolio. Generally, if a counterparty or exposure migrates between rating classes, this will lead to a change in the estimate of the associated PD.
(ii) LGD pertains to estimate of loss related to the amount that may not be recovered after the borrower defaults. The Group estimates LGD parameters based on historical recovery rates of claims against defaulted counterparties, which takes into consideration the realization of any collateral that is integral to the financial asset. For secured credit exposure, the determination of LGD is dependent on the Group’s collateral data which are available at the origination of the instrument which takes into account the amount and timing of the cash inflows (actual recovery) and outflows (actual expenses) and on the time value of money. Recoveries are calculated on a discounted cash flows basis using the effective interest rate as the discounting factor.
(iii) EAD represents the gross carrying amount of the exposure in the event of default which include the amortized cost amount of an instrument and any accrued interest receivable. For lending commitments, the EAD includes the amount of drawn and undrawn irrevocable loan commitments under the contract, which are estimated based on historical observations and forward-looking forecast. For some financial assets (e.g., credit card lending), EAD is determined by modelling the range of possible exposure outcomes at various points in time using scenario and statistical technique which considers the ability of borrowers to increase its exposure from the time of ECL calculation to the time of default (i.e., credit conversion factor).
These three components are multiplied together and adjusted for the likelihood of survival (i.e., the exposure has not been prepaid or defaulted in an earlier month). This effectively calculates an ECL for each future month, which is then discounted back to and summed at the end of the reporting period. The discount rate used in the ECL calculation is the original effective interest rate or an approximation thereof. The lifetime PD is developed by applying a maturity profile to the current 12-month PD. The maturity profile looks at how defaults develop on a portfolio from the point of initial recognition throughout the life of the instrument. The maturity profile is based on historical observed data and is assumed to be the same across all assets within a portfolio and credit grade band. Such profile is supported by a historical analysis (i.e., an observation period of five years) which uses, among others the number of rated accounts and ratings of bad accounts at the time of default. Bad accounts are defaulted accounts classified into three classes such as the non-performing loans, accounts classified as Substandard, Doubtful or Loss, and real past due accounts.

- 66 -
In a risk rating model applied by the Group, a better rating or score denotes less probability of default than those of a worse rating. Identifying the counterparty default is done through a computation of the portfolio’s observed default frequency (ODF). In cases when ODF method and the data to be used is limited, the Group may also employ the implied probability of default frequency (IPD) and the application of overlay factors in the PD. Using the historical defaults under the Group’s ICRRS based on S&P scale, ODF is calculated per rating class using the cumulative five-year data as the basis for grouping. This represents the actual numbers of bad borrower cases that have occurred during the five-year timeframe. On the other hand, unrated account are distributed to existing S&P rating classes using normal distribution assumption. In cases when there is zero-percent ODF in any of the rating class, these are grouped together with the next rating class with at least one bad borrower using cumulative five-year data. If there is no rating class after certain rating, grouping shall be decided by management. The 12-month and lifetime EADs are determined based on the expected payment profile, which varies by product type. For loans with periodic amortization and one-time full payment at end of the term, EAD is based on the contractual repayments owed by the borrower over a 12-month or lifetime basis. This will also be adjusted for any expected overpayments made by a borrower. Early repayment or refinancing assumptions are also incorporated into the calculation. For revolving products (such as credit cards and credit line facilities), EAD is determined by taking current drawn balance and adding a “credit conversion factor” which allows for the expected drawdown of the remaining limit by the time of default. These assumptions vary by product type and current limit utilization band, based on analysis of the Group’s recent default data.
The 12-month and lifetime LGDs are determined based on the factors which impact the recoveries made post default, and may vary by product type. For secured products, this is primarily based on collateral type and projected collateral values, historical discounts to market or book values due to forced sales, time to repossession and recovery costs observed. For unsecured products, LGD is typically set at product level due to the limited differentiation in recoveries achieved across different borrowers. The LGD is influenced by collection strategies. For cash and cash equivalents and debt securities, the Group applies the low credit risk simplification. The probability of default and loss given defaults are publicly available and are considered to be low credit risk investments. It is the Group’s policy to measure ECL on such instruments on a 12-month basis. However, when there has been a SICR since origination, the allowance will be based on the lifetime ECL. The Group uses the ratings from S&P to determine whether the debt instrument has significantly increased in credit risk and to estimate ECL. The assumptions underlying the ECL calculation are monitored and reviewed on an annual basis. There have been no significant changes in estimation techniques or significant assumptions made during the reporting period.

- 67 -
The determination of the 12-month and lifetime PD, LGD, and EAD includes the overlay of forward-looking economic information discussed below. (b) Overlay of Forward-looking Information
The Group incorporates forward-looking information (FLI) in its calculation of ECL. The Group has performed historical analysis and has identified the key macroeconomic variables (MEVs) impacting credit risk associated with its borrowers and/or counterparties and the ECL for relevant portfolio of debt instruments. The MEVs and their associated impact on the PD, LGD and EAD vary by financial instrument. To project the MEVs for the full remaining life of each financial instrument, a mean reversion approach has been used, which means that MEVs tend to either a long run average rate (e.g., for unemployment) or a long run average growth rate [e.g., Gross Domestic Product (GDP)] over a period of two to five years. The impact of these economic variables on the PD, LGD and EAD has been determined by performing statistical regression analysis to understand the impact changes in these variables have had historically on default rates and on the components of LGD and EAD. The MEVs considered by the Group include economic data and forecasts published by government bodies (e.g., BSP and Philippine Statistics Authority), international organizations (e.g., International Monetary Fund), and certain reputable private and academic organizations involved in forecasting. Accordingly, the Group has identified key drivers for credit risk for its corporate loans portfolio, which include among others, GDP growth rate, inflation rate, unemployment rate, interest rate (i.e., based on 91-day T-bill Yield), and foreign currency exchange rates. On the other hand, the key drivers for the Group’s retail and consumer loans portfolio include unemployment rate, GDP growth rate, consumer spending growth rate, and inflation rate. Using an analysis of historical data, the Group has estimated relationships between MEVs and credit risk and credit losses.
As with any economic forecasts, the projections and likelihoods of occurrence are subject to a high degree of inherent uncertainty, and therefore, the actual outcomes may be significantly different to those projections. The Group considers these forecasts to represent its best estimate of the possible outcomes. Management has also considered other FLI not incorporated within the above economic scenarios, such as any regulatory, legislative, or political changes, but are not deemed to have a significant impact on the calculation of ECL. Management reviews and monitors the appropriateness of FLIs on a regular basis and additional factors may be incorporated from time to time as deemed appropriate.
4.4.6 Impact of COVID-19 on Measurement of ECL In response to the COVID-19 situation and the Group’s expectations of economic impacts, the key conditions and assumptions utilized in the Group’s calculation of ECL have been revisited and recalibrated. The economic scenarios and forward-looking macroeconomic assumptions underpinning the ECL calculation are outlined in Note 4.4.2. As of December 31, 2021 and 2020, the expected impacts of COVID-19 have been reasonably captured using the Group’s business-as-usual (BAU) ECL methodology (i.e., the ECL methodology consistently used in the prior years) and post-model adjustments (or the “COVID-19 overlay”).

- 68 -
The BAU ECL methodology have been constructed and calibrated using historical trends and correlations as well as forward-looking economic scenarios. The severity of the current macroeconomic projections and the added complexity caused by the various support schemes and regulatory guidance could not be reliably modelled for the time being. Therefore, the BAU ECL model may generate results that are either overly conservative or overly optimistic depending on the specific portfolio or segment. As a result, post-model adjustments are needed to reflect the considerable uncertainty in BAU ECL methodology given the unprecedented impacts of COVID-19.
Given BAU ECL model changes take a significant amount of time to develop and validate, and the data limitation in respect of lagging credit information and granular behavior analysis of customers, the Group expects that post-model adjustments will be applied for the foreseeable future. Notwithstanding that the measurement inputs and assumptions, including forward-looking macroeconomic assumptions, were recalibrated in response to the COVID-19 situation, the fundamental ECL mechanics and methodology underpinning the Group’s measurement of ECL have remained consistent with the prior periods. In identifying the impact of COVID-19 pandemic to the Group’s customers, the Group re-segmented its loan portfolio based on the perceived and expected COVID-19 impact to the customers’ businesses and industries which also considers additional qualitative characteristics that would elevate COVID-19 changes to SICR such as differentiation of temporary liquidity need from permanently impacted or SICR. Supporting the re-segmentation is the COVID-19 Assistance and Recovery Enhancement (CARE) Program, primarily designed to: (1) extend financial assistance to customers by way of extended repayment plans given cash flow tightness and (2) immediately get the customer back into the habit of paying based on amounts they can afford. In accordance with regulatory guidance, the Group also implemented mandatory payment holidays to all eligible loans (see also Note 4.4.12). The following are the considerations in measuring ECL under the COVID-19 situation: (a) SICR The offer or uptake of COVID-19 related repayment deferrals, whether coming from government reliefs or from the Group’s CARE Program, does not itself constitute an SICR event unless the exposure is considered to have experienced an SICR based on other available information. SICR has been reassessed with reference to the Group’s CARE Program credit risk rating which considers industry or segment assessment under the COVID-19 situation, financial performance indicators, historical credit information of the borrower and other modifiers. The Group’s reassessment is to determine if changes in the customers’ circumstances were sufficient to constitute SICR. (b) COVID-19 Overlay COVID-19 overlay represents adjustments in relation to data and model limitations as a result of the COVID-19 economic disruption. The adjustments are based on a combination of portfolio level credit risk analysis and an evaluation of ECL coverage at an exposure level. This also includes the effect of government and other support program. Considerations included the potential severity and duration of the economic disruption and the heightened credit risk of specific sectors and loan classes or segments including recoveries arising from loan modifications and collateral foreclosures in case of default.

- 69 -
Under the Bank’s CARE Program, identified corporate accounts were categorized into segments which consider the borrower’s feedback and the account officer/relationship manager’s assessment. Under this overlay, EAD shall be based on the loan exposure that is not covered by the loan-to-value of collaterals. An adjusted PD shall be computed per segment to account for expected worsening per risk classification. LGD, on the other hand, shall be calculated only for the unsecured portion of loans as the Bank’s claim on the collaterals may be enforced if necessary. Updated valuations of collateral shall likewise be incorporated. For consumer loans, the COVID-19 overlay shall be implemented for auto loans given the observed worsening in non-performing loans over the duration of the pandemic. For home, personal and salary loans, the BAU ECL methodology shall be used as delinquency deterioration is not as pronounced for these portfolios and the collateral for home loans appreciates in value thereby improving loan coverage. Under this overlay, LGD for auto loans is adjusted considering available data on disposed assets and using the net present value of recoveries net of related expenses based on aging buckets prior to foreclosure.
The adjustments apply to both clean and secured collaterals but since the exposure at default for secured loans is fully covered by the fair value of the collaterals net of haircuts applied, which implies full recovery in case of default, the COVID-19 overlay was set to zero. The impact of post-model adjustments made in estimating the reported ECL as at December 31, 2021 and 2020 are disclosed in Note 4.4.9.
4.4.7 Credit Risk Exposures An analysis of the maximum credit risk exposure relating to receivables from customers is shown below:
2021 Gross Fair Financial Maximum Value of Net Effect of Exposure Collaterals Exposure Collaterals Group Loans and discounts: Corporate P 363,508 P 284,574 P 78,794 P 284,714 Consumer 109,994 163,700 - 109,994 Credit card receivables 35,563 - 35,563 - Leasing and finance 2,593 5,992 - 2,593 Microfinance and small business 1,073 3,341 - 1,073 P 512,731 P 457,747 P 114,357 P 398,374 Parent Company Loans and discounts: Corporate P 359,376 P 284,574 P 74,802 P 284,574 Consumer 109,994 163,700 - 109,994 Credit card receivables 35,563 - 35,563 - P 504,933 P 448,274 P 110,365 P 394,568

- 70 -
2020 Gross Fair Financial Maximum Value of Net Effect of Exposure Collaterals Exposure Collaterals Group Loans and discounts: Corporate P 318,859 P 302,815 P 16,044 P 302,815 Consumer 101,146 174,219 - 101,146 Credit card receivables 31,973 - 31,973 - Leasing and finance 3,458 5,020 - 3,458 Microfinance and small business 1,129 4,405 - 1,129 P 456,565 P 486,459 P 48,017 P 408,548 Parent Company Loans and discounts: Corporate P 315,544 P 302,815 P 12,729 P 302,815 Consumer 101,146 174,219 - 101,146 Credit card receivables 31,973 - 31,973 - P 448,663 P 477,034 P 44,702 P 403,961
The table below sets out the gross carrying amounts of the exposures to credit risk on financial assets with low credit risk measured at amortized cost and debt securities at FVOCI as of December 31.
Group Parent Company 2021 2020 2021 2020 Cash equivalents P 184,586 P 187,211 P 183,010 P 185,036 Debt securities: At amortized cost 163,758 43,168 162,951 42,561 At FVOCI 46,094 36,720 45,611 36,295 P 394,438 P 267,099 P 391,572 P 263,892
Cash equivalents includes loans and advances to banks [i.e., Due from BSP, Due from Other Banks, Loans Arising from Repurchase Agreements, and Interbank Loans Receivables (see Note 9)]. Debt securities includes government and corporate bonds and bills. These are held with central bank, financial institutions and other counterparties that are reputable and with low credit risk; corresponding allowance for ECL is shown in the succeeding pages. The information about the credit exposures on the above financial assets as well as on loan commitments by stages of impairment as of December 31, 2021 and 2020, shown at their gross carrying amounts with the corresponding allowance for ECL are shown in the succeeding pages. All instruments, which were not assessed by the Group for ECL based on individual credit risk rating were evaluated on a collective basis, applying applicable PD and LGD based on the segment of instrument.

- 71 -
The maximum exposure to credit risks for other financial assets is limited to their carrying values as of December 31, 2021 and 2020.
a) Loans and receivables – Group and Parent Company
Corporate Loans Purchased credit- Stage 1 Stage 2 Stage 3 impaired* Total
2021
Pass AAA to BBB P 12,771 P - P - P - P 12,771 BBB- to B- 331,812 145 2,458 - 334,415 Watchlisted 4,066 460 54 - 4,580 Especially mentioned - 45 444 - 489 Defaulted - - 7,671 45 7,716 Unrated 3,440 4 93 - 3,537 352,089 654 10,720 45 363,508 Allowance for ECL ( 2,064) ( 29) ( 5,218 )( 40 )( 7,351 ) Carrying amount P 350,025 P 625 P 5,502 P 5 P 356,157
2020
Pass
AAA to BBB P 5,352 P - P 42 P - P 5,394 BBB- to B- 284,059 26 1,174 - 285,259 Watchlisted 400 2,584 19 - 3,003 Especially mentioned 1 2,327 465 - 2,793 Defaulted - - 8,212 48 8,260 Unrated 14,060 - 90 - 14,150 303,872 4,937 10,002 48 318,859 Allowance for ECL ( 1,813 ) ( 761 )( 4,853 )( 36 )( 7,463 ) Carrying amount P 302,059 P 4,176 P 5,149 P 12 P 311,396
*Purchased credit-impaired financial assets pertain to the non-performing loans of RCBC JPL
Retail and Other Products Stage 1 Stage 2 Stage 3 Total
2021
Consumer loans Standard monitoring P 81,363 P 12,513 P - P 93,876 Defaulted - - 16,118 16,118 81,363 12,513 16,118 109,994 Allowance for ECL ( 363 ) ( 357 ) ( 3,772 ) ( 4,492 ) Carrying amount 81,000 12,156 12,346 105,502 Credit cards Current P 31,598 P 46 P - P 31,644 1-29 dpd 637 18 - 655 30-59 dpd - 351 - 351 60-89 dpd - 377 - 377 Defaulted - - 2,536 2,536 32,235 792 2,536 35,563 Allowance for ECL ( 572 ) ( 325 ) ( 2,150 ) ( 3,047 ) Carrying amount 31,663 467 386 32,516

- 72 -
Retail and Other Products Stage 1 Stage 2 Stage 3 Total Leasing and finance receivables* AAA+ to B+ P 1,101 P - P - P 1,101 B to B- - 755 - 755 CCC and below - - 737 737 1,101 755 737 2,593 Allowance for ECL ( 31 ) ( 35 ) ( 654 ) ( 720 ) Carrying amount 1,070 720 83 1,873
Micro and small business loans** Unclassified P 684 P - P - P 684 Especially mentioned - 322 - 322 Defaulted - - 67 67 684 322 67 1,073 Allowance for ECL ( 49 ) ( 16 ) ( 66 ) ( 131 ) Carrying amount 635 306 1 942 Total gross amount 115,383 14,382 19,458 149,223 Total allowance for ECL ( 1,015 ) ( 733 ) ( 6,642 ) ( 8,390 ) Total carrying amount P 114,368 P 13,649 P 12,816 P 140,833
*Leasing and finance receivables are from RCBC LFC **Micro and small business loans are from Rizal Microbank
2020
Consumer loans Standard monitoring P 78,060 P 11,986 P - P 90,046 Defaulted - - 11,100 11,100 78,060 11,986 11,100 101,146 Allowance for ECL ( 725 ) ( 393 ) ( 3,077 ) ( 4,195 ) Carrying amount 77,335 11,593 8,023 96,951 Credit cards Current P 25,500 P 21 P - P 25,521 1-29 dpd 1,406 8 - 1,414 30-59 dpd - 1,715 - 1,715 60-89 dpd - 698 - 698 Defaulted - - 2,625 2,625 26,906 2,442 2,625 31,973 Allowance for ECL ( 656 ) ( 1,499 ) ( 2,625 ) ( 4,780 ) Carrying amount 26,250 943 - 27,193 Leasing and finance receivables* AAA+ to B+ P 2,153 P - P - P 2,153 B to B- - 680 - 680 CCC and below - - 625 625 2,153 680 625 3,458 Allowance for ECL ( 18 ) ( 76 ) ( 204 ) ( 298 ) Carrying amount 2,135 604 421 3,160
*Leasing and finance receivables are from RCBC LFC

- 73 -
Retail and Other Products Stage 1 Stage 2 Stage 3 Total Micro and small business loans** Unclassified P 1,021 P - P - P 1,021 Especially mentioned - 10 - 10 Defaulted - - 98 98 1,021 10 98 1,129 Allowance for ECL ( 40 ) ( 2 ) ( 92 ) ( 134 ) Carrying amount 981 8 6 995 Total gross amount P 108,140 P 15,118 P 14,448 P 137,706 Total allowance for ECL ( 1,439 ) ( 1,970 ) ( 5,998 ) ( 9,407 ) Total carrying amount P 106,701 P 13,148 P 8,450 P 128,299
**Micro and small business loans are from Rizal Microbank
b) Investments in debt securities at amortized cost and at FVOCI Group Parent Company HTC FVOCI HTC FVOCI 2021 Government securities AAA to A+ P 12,021 P - P 12,021 P - BBB+ to BBB- 120,948 28,682 120,141 28,682 132,969 28,682 132,162 28,682 Corporate debt securities AAA - 272 - 272 AA+ to A+ 764 260 764 260 A to A- 638 - 638 - BBB+ to BBB- 19,520 13,381 19,520 13,381 BB+ to BB- 9,704 3,499 9,704 3,016 B+ and below 163 - 163 - 30,789 17,412 30,789 16,929 Allowance for ECL ( 147 ) ( 12 ) ( 52 ) ( 12 ) 30,642 17,400 30,737 16,917 P 163,611 P 46,082 P 162,899 P 45,599 2020 Government securities AAA to A+ P - P 13,542 P - P 13,542 BBB+ to BBB- 37,022 7,021 36,932 7,021 37,022 20,563 36,932 20,563 Corporate debt securities AAA - 268 - 268 AA+ to A+ - 257 - 257 A to A- - - - - BBB+ to BBB- 2,771 12,803 2,771 12,799 BB+ to BB- 3,375 2,829 2,858 2,408 B+ and below - - - - 6,146 16,157 5,629 15,732 Allowance for ECL ( 142 ) ( 1 ) ( 48 ) ( 1 ) 6,004 16,156 5,581 15,731 P 43,026 P 36,719 P 42,513 P 36,294
Credit exposures for debt securities not held for trading are all classified as Stage 1.

- 74 -
c) Loan Commitments
The credit quality of the Group and Parent Company’s irrevocable loan commitments with amounts determined after considering credit conversion factor, as of December 31 follows:
Group and Parent Company Stage 1 Stage 2 Stage 3 Total 2021 Corporate loans Pass AAA to BBB P 77 P - P - P 77 BBB- to B- 3,914 - - 3,914 Watchlisted - 4 13 17 Unrated 115 - - 115 4,106 4 13 4,123 ECL provisions ( 18 ) - ( 5 ) ( 23 ) 4,088 4 8 4,100 Credit cards Current 9,607 - 9,607 ECL provisions ( 122 ) - - ( 122 ) 9,485 - - 9,485 P 13,573 P 4 P 8 P 13,585 2020 Corporate loans Pass AAA to BBB P 2,153 P - P - P 2,153 BBB- to B- 3,284 - - 3,284 Watchlisted - 12 13 25 Unrated 99 - - 99 5,536 12 13 5,561 ECL provisions ( 18 ) ( 1 ) ( 5 ) ( 24 ) 5,518 11 8 5,537 Credit cards Current 8,501 - - 8,501 ECL provisions ( 115 ) - - ( 115 ) 8,386 - - 8,386 P 13,904 P 11 P 8 P 13,923
4.4.8 Maximum Exposure to Credit Risk of Financial Instruments not Subject to Impairment
The following table contains analysis of the maximum credit risk exposure from financial assets not subject to impairment (i.e., FVTPL).
Group Parent Company 2021 2020 2021 2020 Government securities P 4,330 P 1,876 P 3,346 P 1,808 Corporate debt securities 35 710 35 606 Derivative financial assets 1,266 1,129 1,266 1,129 P 5,631 P 3,715 P 4,647 P 3,543

- 75 -
4.4.9 Allowance for ECL The following tables show the reconciliation of the loss allowance for ECL by class of significant financial instruments. a) Loans and receivables – Group and Parent Company
Corporate Loans
Purchased credit- Stage 1 Stage 2 Stage 3 impaired Total
2021
Balance at beginning of year P 1,813 P 761 P 4,853 P 36 P 7,463 Transfers: Stage 1 to Stage 2 ( 2 ) 2 - - - Stage 1 to Stage 3 ( 9 ) - 9 - - Stage 2 to Stage 1 635 ( 635 ) - - - Stage 2 to Stage 3 - ( 20 ) 20 - - Stage 3 to Stage 1 75 - ( 75 ) - - Stage 3 to Stage 2 - 3 ( 3 ) - - Assets derecognized or repaid ( 1,877 ) ( 91 ) ( 63 ) - ( 2,031 ) New assets originated: Remained in Stage 1 1,429 - - - 1,429 Moved to Stages 2 and 3 - 9 477 4 490 251 ( 732 ) 365 4 ( 112 )
Balance at end of year P 2,064 P 29 P 5,218 P 40 P 7,351
2020 Balance at beginning of year P 706 P 529 P 4,659 P 36 P 5,930 Transfers: Stage 1 to Stage 2 ( 2 ) 2 - - - Stage 1 to Stage 3 ( 13 ) - 13 - - Stage 2 to Stage 1 65 ( 65 ) - - - Stage 2 to Stage 3 - ( 42 ) 42 - - Stage 3 to Stage 1 4 - ( 4 ) - - Assets derecognized or repaid ( 1,768 ) ( 232 ) ( 144 ) - ( 2,143 ) New assets originated: Remained in Stage 1 2,821 - - - 2,821 Moved to Stages 2 and 3 - 568 287 - 855 1,107 232 194 - 1,533
Balance at end of year P 1,813 P 761 P 4,853 P 36 P 7,463

- 76 -
Retail and Other Products Stage 1 Stage 2 Stage 3 Total 2021 Consumer loans Balance at beginning of year P 725 P 393 P 3,077 P 4,195 Transfers: Stage 1 to Stage 2 ( 37 ) 37 - - Stage 1 to Stage 3 ( 8 ) - 8 - Stage 2 to Stage 1 318 ( 318 ) - - Stage 2 to Stage 3 - ( 21 ) 21 - Stage 3 to Stage 1 709 ( 709 ) - Stage 3 to Stage 2 - 569 ( 569 ) - Assets derecognized or repaid ( 1,697 ) ( 412 ) ( 624 ) ( 2,733 ) New assets originated: Remained in Stage 1 353 - - 353 Moved to Stages 2 and 3 - 109 2,568 2,677 ( 362 ) ( 36 ) 695 297 Balance at end of year 363 357 3,772 4,492 Credit cards Balance at beginning of year P 656 P 1,499 P 2,625 P 4,780 Transfers: Stage 1 to Stage 2 ( 28 ) 28 - - Stage 1 to Stage 3 ( 90 ) - 90 - Stage 2 to Stage 1 89 ( 89 ) - - Stage 2 to Stage 3 - ( 140 ) 140 - Stage 3 to Stage 1 65 - ( 65 ) - Stage 3 to Stage 2 - 37 ( 37 ) - Assets derecognized or repaid ( 608 ) ( 615 ) ( 867 ) ( 2,090 ) New assets originated: Remained in Stage 1 591 - - 591 Moved to Stages 2 and 3 - 346 4,577 5,514 Write-offs ( 103 ) ( 741 ) ( 4,313 ) ( 5,157 ) ( 84 ) ( 1,174 ) ( 475 ) ( 1,733 ) Balance at end of year 572 325 2,150 3,047 Leasing and finance receivables* Balance at beginning of year P 18 P 76 P 204 P 298 Transfers: Stage 1 to Stage 2 ( 13 ) 13 - - Stage 1 to Stage 3 ( 78 ) - 78 - Stage 2 to Stage 3 - ( 149 ) 149 - New assets originated: Remained in Stage 1 7 - - 7
Moved to Stages 2 and 3 - 7 15 22
Assets derecognized or repaid ( 5 ) ( 20 ) ( 24 ) ( 49 ) Others 102 108 232 442 13 ( 41 ) 450 422 Balance at end of year 31 35 654 720

- 77 -
Retail and Other Products Stage 1 Stage 2 Stage 3 Total Micro and small business loans** Balance at beginning of year P 40 P 2 P 92 P 134 Transfers: Stage 1 to Stage 2 ( 2 ) 2 - - Stage 2 to Stage 3 - ( 2 ) 2 - Stage 3 to Stage 1 2 - ( 2 ) - Assets derecognized or repaid ( 11 ) - ( 34 ) ( 45 ) New assets originated: Remained in Stage 1 20 - - 20 Moved to Stages 2 and 3 - 14 8 22 9 14 ( 26 ) ( 3 ) Balance at end of year 49 16 66 131 P 1,541 P 900 P 6,716 P 9,157
*Leasing and finance receivables are from RCBC LFC **Micro and small business loans are from Rizal Microbank
2020 Consumer loans Balance at beginning of year P 845 P 507 P 1,018 P 2,370 Transfers: Stage 1 to Stage 2 ( 104 ) 104 - - Stage 1 to Stage 3 ( 50 ) - 50 - Stage 2 to Stage 1 165 ( 165 ) - - Stage 2 to Stage 3 - ( 74 ) 74 - Stage 3 to Stage 2 - 20 ( 20 ) - Assets derecognized or repaid ( 9 ) ( 167 ) ( 19 ) ( 195 ) New assets originated: Remained in Stage 1 223 - - 223 Moved to Stages 2 and 3 - 534 1,950 2,484 Write-offs - - ( 907 ) ( 907 ) Others ( 345 ) ( 366 ) 931 ( 220 ) ( 120 ) ( 114 ) 2,059 1,825 Balance at end of year 725 393 3,077 4,195 Credit cards Balance at beginning of year P 510 P 278 P 1,051 P 1,839 Transfers: Stage 1 to Stage 2 ( 49 ) 49 - - Stage 1 to Stage 3 ( 74 ) - 74 - Stage 2 to Stage 1 25 ( 25 ) - - Stage 2 to Stage 3 - ( 69 ) 69 - Stage 3 to Stage 1 21 - ( 21 ) - Stage 3 to Stage 2 - 17 ( 17 ) - Assets derecognized or repaid ( 663 ) ( 245 ) ( 272 ) ( 1,180 ) New assets originated: Remained in Stage 1 911 - - 911 Moved to Stages 2 and 3 - 1,665 2,547 4,212 Write-offs ( 25 ) ( 171 ) ( 806 ) ( 1,002 ) 146 1,221 1,574 2,941 Balance at end of year 656 1,499 2,625 4,780

- 78 -
Retail and Other Products Stage 1 Stage 2 Stage 3 Total Leasing and finance receivables* Balance at beginning of year P 62 P 275 P 246 P 583 Transfers: Stage 1 to Stage 2 ( 57 ) 57 - - Stage 2 to Stage 3 - ( 253 ) 253 - Stage 3 to Stage 2 - 226 ( 226 ) - New assets originated: Remained in Stage 1 5 - - 5
Moved to Stages 2 and 3 - 44 43 87
Write-offs ( 27 ) ( 120 ) ( 107 ) ( 254 ) Others 35 ( 153 ) ( 5 ) ( 123 ) ( 44 ) ( 199 ) ( 42 ) ( 285 ) Balance at end of year 18 76 204 298 Micro and small business loans** Balance at beginning of year P 15 P 11 P 55 P 81 Transfers: Stage 1 to Stage 2 ( 1 ) 1 - - Stage 2 to Stage 3 - ( 1 ) 1 - Stage 3 to Stage 1 1 - ( 1 ) - Assets derecognized or repaid - ( 21 ) ( 25 ) ( 46 ) New assets originated: Remained in Stage 1 25 - - 25 Moved to Stages 2 and 3 - 12 62 74 25 ( 9 ) 37 53 Balance at end of year 40 2 92 134 P 1,439 P 1,970 P 5,998 P 9,407
*Leasing and finance receivables are from RCBC LFC **Micro and small business loans are from Rizal Microbank
Presented below are the composition of allowance for ECL as by loan portfolio (see Note 11):
Group Parent Company 2021 2020 2021 2020 Corporate P 7,351 P 7,463 P 7,311 P 7,427 Credit card receivables 3,047 4,780 3,047 4,780 Consumer 4,492 4,195 4,492 4,195 Leasing and finance 720 298 - - Microfinance and small business 131 134 - - Other receivables 2,523 2,323 2,489 1,961
P 18,264 P 19,193 P 17,339 P 18,363

- 79 -
Post-model adjustments made in estimating the reported ECL as at December 31, 2021 and 2020 are set out in the following table:
Group BAU COVID-19 ECL Overlay Total ECL 2021 Corporate P 6,724 P 627 P 7,351 Consumer 4,418 74 4,492 Credit card receivables 3,047 - 3,047 Leasing and finance 690 30 720 Microfinance and small business 131 - 131 Other receivables 2,523 - 2,523 P 17,533 P 731 P 18,264 2020 Corporate P 6,692 P 771 P 7,463 Consumer 3,255 940 4,195 Credit card receivables 3,739 1,041 4,780 Leasing and finance 253 45 298 Microfinance and small business 134 - 134 Other receivables 2,323 - 2,323 P 16,396 P 2,797 P 19,193 Parent Company BAU COVID-19 ECL Overlay Total ECL 2021 Corporate P 6,684 P 627 P 7,311 Consumer 4,418 74 4,492 Credit card receivables 3,047 - 3,047 Other receivables 2,489 - 2,489 P 16,638 P 701 P 17,339 2020 Corporate P 6,656 P 771 P 7,427 Consumer 3,255 940 4,195 Credit card receivables 3,739 1,041 4,780 Other receivables 1,961 - 1,961 P 15,611 P 2,752 P 18,363
b) Investments in debt securities at amortized cost and at FVOCI ECL for investments in debt securities at amortized cost amounted to P14 and P1 in 2021 and 2020, respectively, for the Group while P12 and nil in 2021 and 2020, respectively, for the Parent. The allowance for ECL for investments in debt securities at amortized cost amounted to P147 and P142 for the Group and P52 and P48 for the Parent Company in December 31, 2021 and 2020, respectively. The allowance for ECL recognized for debt securities at FVOCI acquired were P12 and P1 in 2021 and 2020 for both Group and Parent.

- 80 -
c) Loan commitments Allowance for ECL recognized both by the Group and Parent Company related to undrawn loan commitments as of December 31, 2021 and 2020 amounted to P145 and P139, respectively, presented as ECL provisions on loan commitments under Other Liabilities account (see Note 22). ECL recognized in profit or loss in 2021, 2020 and 2019 amounted to P5, P14 and P23, respectively.
The information on how the significant changes in the gross carrying amount of the financial instruments contributed to the changes in the amount of allowance for ECL are presented in Note 4.4.10.
4.4.10 Significant Changes in Gross Carrying Amount Affecting Allowance for ECL
The tables below and in the succeeding pages provides information how the significant changes in the gross carrying amount of financial instruments in 2021 and 2020 contributed to the changes in the allowance for ECL. a) Loans and receivables – Group and Parent Company
Corporate Loans
Purchased credit- Stage 1 Stage 2 Stage 3 impaired Total
2021 Balance at beginning of year P 303,872 P 4,937 P 10,002 P 48 P 318,859
Transfers: Stage 1 to Stage 2 ( 121 ) 121 - - - Stage 1 to Stage 3 ( 768 ) - 768 - - Stage 2 to Stage 1 3,412 ( 3,412 ) - - - Stage 2 to Stage 3 ( 83 ) 83 - - Stage 3 to Stage 1 198 - ( 198 ) - - Stage 3 to Stage 2 - 8 ( 8 ) - - Assets derecognized or repaid ( 150,404 ) ( 1,164 ) ( 1,004 ) ( 3 ) ( 152,575) New assets originated: Remained in Stage 1 195,900 - - - 195,900
Moved to Stages 2 and 3 - 247 1,077 - 1,324 48,217 ( 4,283 ) 718 ( 3 ) 44,649 Balance at end of year P 352,089 P 654 P 10,720 P 45 P 363,508
2020
Balance at beginning of year P 284,284 P 10,726 P 7,278 P 52 P 302,340
Transfers: Stage 1 to Stage 2 ( 213 ) 213 - - - Stage 1 to Stage 3 ( 1,174 ) - 1,174 - - Stage 2 to Stage 1 678 ( 678 ) - - Stage 2 to Stage 3 - 399 ) 399 - - Stage 3 to Stage 1 10 - ( 10 ) - - Assets derecognized or repaid ( 151,639 )( 8,028 ) ( 1,559 )( 4 ) ( 161,230) New assets originated: Remained in Stage 1 171,926 - - - 171,926
Moved to Stages 2 and 3 - 3,103 2,720 - 5,823 19,588 ( 5,789 ) 2,724 ( 4 ) 16,519 Balance at end of year P 303,872 P 4,937 P 10,002 P 48 P 318,859

- 81 -
Retail and Other Products Stage 1 Stage 2 Stage 3 Total 2021 Consumer loans Balance at beginning of year P 78,060 P 11,986 P 11,100 P 101,146 Transfers: Stage 1 to Stage 2 ( 3,462 ) 3,462 - - Stage 1 to Stage 3 ( 794 ) - 794 - Stage 2 to Stage 1 7,918 ( 7,918 ) - - Stage 2 to Stage 3 - ( 534 ) 534 - Stage 3 to Stage 1 4,576 - ( 4,576 ) - Stage 3 to Stage 2 - 3,740 ( 3,740 ) - Assets derecognized or repaid ( 4,986 ) ( 1,175 ) ( 3,035 ) ( 9,196 ) New assets originated: Remained in Stage 1 51 - - 51 Moved to Stages 2 and 3 - 2,952 15,041 17,993 3,303 527 5,018 8,848 Balance at end of year 81,363 12,513 16,118 109,994 Credit cards Balance at beginning of year P 26,906 P 2,442 P 2,625 P 31,973 Transfers: Stage 1 to Stage 2 ( 669 ) 669 - - Stage 1 to Stage 3 ( 1,519 ) - 1,519 - Stage 2 to Stage 1 230 ( 230 ) - - Stage 2 to Stage 3 - ( 322 ) 322 - Stage 3 to Stage 1 90 - ( 90 ) - Stage 3 to Stage 2 - 51 ( 51 ) - Assets derecognized or repaid ( 55,774 ) ( 368 ) ( 413 ) ( 56,555 ) New assets originated: Remained in Stage 1 64,072 - - 64,072 Moved to Stages 2 and 3 - 369 860 1,229 Write-offs ( 1,101 ) ( 1,819 ) ( 2,236 ) ( 5,156 ) 5,329 ( 1,650 ) ( 89 ) 3,590 Balance at end of year 32,235 792 2,536 35,563 Leasing and finance receivables* Balance at beginning of year P 2,153 P 680 P 625 P 3,458 Transfers: Stage 1 to Stage 2 ( 715 ) 715 - - Stage 1 to Stage 3 ( 463 ) - 463 - Stage 2 to Stage 3 - ( 322 ) 322 - Stage 3 to Stage 1 38 - ( 38 ) - New assets originated: Remained in Stage 1 515 - - 515
Moved to Stages 2 and 3 - 200 5 205
Assets derecognized or repaid ( 348 ) ( 25 ) ( 130 ) ( 503 ) Others ( 79 ) ( 493 ) ( 510 ) ( 1,082 ) ( 1,052 ) 75 112 ( 865 ) Balance at end of year 1,101 755 737 2,593

- 82 -
Retail and Other Products Stage 1 Stage 2 Stage 3 Total Micro and small business loans** Balance at beginning of year P 1,021 P 10 P 98 P 1,129 Transfers: Stage 1 to Stage 2 ( 42 ) 42 - - Stage 2 to Stage 3 - ( 3 ) 3 - Stage 3 to Stage 1 1 - ( 1 ) - Stage 3 to Stage 2 - 8 ( 8 ) - Assets derecognized or repaid ( 667 ) ( 1 ) ( 35 ) ( 703 ) New assets originated: Remained in Stage 1 371 - - 371 Moved to Stages 2 and 3 - 266 10 276 ( 337 ) 312 ( 31 ) ( 56 ) Balance at end of year 684 322 67 1,073 P 115,383 P 14,382 P 19,458 P 149,223
*Leasing and finance receivables are from RCBC LFC **Micro and small business loans are from Rizal Microbank
2020 Consumer loans Balance at beginning of year P 80,056 P 11,129 P 4,792 P 95,977 Transfers: Stage 1 to Stage 2 ( 8,534 ) 8,534 - - Stage 1 to Stage 3 ( 4,579 ) - 4,579 - Stage 2 to Stage 1 4,155 ( 4,155 ) - Stage 2 to Stage 3 - ( 3,264 ) 3,264 - Stage 3 to Stage 2 - 380 ( 380 ) - Assets derecognized or repaid ( 2,264 ) ( 767 ) ( 773 ) ( 3,804 ) New assets originated: Remained in Stage 1 20,471 - - 20,471 Moved to Stages 2 and 3 - 1,429 1,274 2,703 Write-offs - - ( 907 ) ( 907 ) Others ( 11,245 ) ( 1,300 ) ( 749 ) ( 13,294 ) ( 1,996 ) 857 6,308 5,169 Balance at end of year 78,060 11,986 11,100 101,146 Credit cards Balance at beginning of year P 29,110 P 666 P 1,267 P 31,043 Transfers: Stage 1 to Stage 2 ( 1,679 ) 1,679 - - Stage 1 to Stage 3 ( 1,578 ) - 1,578 - Stage 2 to Stage 1 65 ( 65 ) - - Stage 2 to Stage 3 - ( 170 ) 170 - Stage 3 to Stage 1 28 - ( 28 ) - Stage 3 to Stage 2 - 21 ( 21 ) - Assets derecognized or repaid ( 49,736 ) ( 682 ) ( 349 ) ( 50,767 ) New assets originated: Remained in Stage 1 50,900 - - 50,900 Moved to Stages 2 and 3 - 1,391 994 2,385 Write-offs ( 204 ) ( 398 ) ( 986 ) ( 1,588 ) ( 2,204 ) 1,776 1,358 930 Balance at end of year 26,906 2,442 2,625 31,973

- 83 -
Retail and Other Products Stage 1 Stage 2 Stage 3 Total Leasing and finance receivables* Balance at beginning of year P 1,891 P 1,985 P 569 P 4,445 Transfers: Stage 1 to Stage 3 ( 215 ) - 215 - Stage 2 to Stage 3 - ( 227 ) 227 - Stage 3 to Stage 2 - 65 ( 65 ) - Assets derecognized or repaid ( 815 ) ( 722 ) ( 1,082 ) ( 2,619 ) New assets originated: Remained in Stage 1 1,676 - - 1,676 Moved to Stages 2 and 3 - 1,758 504 2,262 Others ( 384 ) ( 2,179 ) 257 ( 2,306 ) 262 ( 1,305 56 ( 987 ) Balance at end of year 2,153 680 625 3,458 Microfinance and small business loans** Balance at beginning of year P 1,142 P 29 P 143 P 1,314 Transfers: Stage 1 to Stage 2 ( 6 ) 6 - - Stage 2 to Stage 3 - ( 1 ) 1 - Stage 3 to Stage 1 1 - ( 1 ) - Assets derecognized or repaid ( 320 ) ( 27 ) ( 55 ) ( 402 ) New assets originated: Remained in Stage 1 204 - - 204 Moved to Stages 2 and 3 ( - 3 10 13 121 ) ( 19 ) ( 45 ) ( 185 ) Balance at end of year 1,021 10 98 1,129
P 108,140 P 15,118 P 14,448 P 137,706
*Leasing and finance receivables are from RCBC LFC **Micro and small business loans are from Rizal Microbank
The amounts of “Transfers to” include the changes in the ECL on the exposures transferred
from one stage to another during the year. The Group’s receivables arising from salary loans are generally fully recoverable as those are collected through salary deductions, except for those receivables from resigned employees which were provided with full ECL allowance. The breakdown of the total ECL allowances as to BAU ECL and COVID-19 overlay is presented in Note 4.4.9.

- 84 -
b) Investment in debt securities at amortized cost and at FVOCI
Group Parent Company HTC FVOCI HTC FVOCI 2021 Balance at beginning of year P 43,168 P 36,720 P 42,561 P 36,295 Assets purchased 230,816 84,009 230,816 84,009 Assets derecognized ( 110,226 ) ( 73,812 ) ( 110,426 ) ( 73,870 ) Fair value loss - ( 823 ) - ( 823 ) Balance at end of year P 163,758 P 46,094 P 162,951 P 45,611 2020 Balance at beginning of year P 101,068 P 50,612 P 100,268 P 49,584 Assets purchased 174,920 200,545 174,920 200,545 Assets derecognized ( 232,820 ) ( 214,777 ) ( 232,627 ) ( 214,174 ) Fair value gains - 340 - 340 Balance at end of year P 43,168 P 36,720 P 42,561 P 36,295
4.4.11 Collateral Held as Security and Other Credit Enhancements
The Group holds collateral against loans and advances to customers in the form of hold-out deposits, real estate mortgage, standby letters of credit or bank guaranty, government guaranty, chattel mortgage, assignment of receivables, pledge of equity securities, personal and corporate guaranty and other forms of security. Estimates of fair value are based on the value of collateral assessed at the time of borrowing and are generally updated annually.
Generally, collateral is not held over loans and advances to other banks, except when securities are held as part of reverse repurchase and securities borrowing arrangements. Collateral is not usually held against trading and investment securities, and no such collateral was held as of December 31, 2021 and 2020.
The estimated fair value of collateral and other security enhancements held against the loan portfolio as of December 31 are presented below.
Group Stage 1 Stage 2 Stage 3 Total 2021 Real properties P 141,510 P 12,997 P 16,335 P 170,842 Chattel 71,445 8,963 14,090 94,498 Hold-out deposits 7,338 100 19 7,457 Equity securities 21,554 30 3,390 24,974 Others 147,719 558 11,699 159,976 P 389,566 P 22,648 P 45,533 P 457,747

- 85 -
Group Stage 1 Stage 2 Stage 3 Total 2020 Real properties P 122,910 P 14,064 P 114,694 P 251,668 Chattel 75,449 6,363 10,744 92,556 Hold-out deposits 8,419 81 81 8,581 Equity securities 7,505 - 2,243 9,748 Others 121,665 1,075 1,166 123,906 P 335,948 P 21,583 P 128,928 P 486,459
Parent Company Stage 1 Stage 2 Stage 3 Total 2021 Real properties P 137,586 P 12,187 P 15,745 P 165,518 Chattel 69,144 8,571 13,662 91,377 Hold-out deposits 7,338 100 19 7,457 Equity securities 21,554 30 3,390 24,974 Others 147,069 370 11,509 158,948 P 382,691 P 21,258 P 44,325 P 448,274 2020 Real properties P 118,776 P 14,035 P 114,481 P 247,292 Chattel 73,394 6,285 10,608 90,287 Equity securities 7,505 - 2,243 9,748 Hold-out deposits 8,266 81 81 8,428 Others 119,278 948 1,053 121,279 P 327,219 P 21,349 P 128,466 P 477,034
The Group and the Parent Company have recognized certain properties arising from foreclosures in settlement of loan account amounting to P908 and P907, respectively, in 2021 and P637 and P612, respectively, in 2020. The Group and the Parent Company’s manner of disposing the collateral for impaired loans and receivables is normally through sale of these assets after foreclosure proceedings have taken place. The Group and the Parent Company do not generally use the non-cash collateral for its own operations.
There were no changes in the Group and the Parent Company’s collateral policies in 2021 and 2020.

- 86 -
4.4.12 Modifications of Financial Assets (a) Financial Reliefs Provided by the Group In certain cases, the Group modifies the terms of the loans provided to the borrowers due to commercial renegotiations, or for distressed loans, with a view of maximizing recovery of the contractual amount of obligation that the Group is owed to. Restructuring policies and practices are based on indicators or criteria which, in the management’s judgment, indicate that payment will most likely continue. Such policies are continuously reviewed and updated as necessary. Restructuring is most commonly applied to term or corporate loans. On top of the government reliefs, the Group has offered financial relief through its CARE Program, which was approved by the Executive Committee on May 4, 2020, in response to the COVID-19 situation. These relief measures were granted to eligible customers to allow them to get back into the habit of paying loans and included the following: payment relief including extension of contractual terms; principal and interest relief including lower amortization on extended term with interest
payment only on the first year; and, extension of balloon repayment terms. The outstanding balance of loans modified under the CARE Program in 2021 and 2020 amounted to P30,918 and P26,652, respectively, for the Group, and P27,032 and P25,817, respectively for the Parent Company. (b) Financial Reliefs Mandated by the Government In compliance with Republic Act No. 11469, Bayanihan to Heal as One Act, (BAHO Act), the Group implemented a minimum 30-day grace period on all loans with principal and interests falling due within the period of the Enhanced Community Quarantine (ECQ), which started on March 17, 2020 up to April 30, 2020, which was extended until May 31, 2020. There is no similar government relief in 2021. In compliance with Republic Act No. 11494, Bayanihan to Recover as One Act, (BARO Act), the Group granted one-time 60-day grace period for payments and/or maturity periods of all existing, current and outstanding loans as of September 15, 2020, falling due, or any part thereof, on or before December 31, 2020, subject to compliance with regulatory requirements. There is no similar government relief in 2021. During the grace period or payment holiday, there were no interests on interests, penalties, or other charges but accrued interests at contractual rate for grace periods were charged based on the outstanding principal balance of loan at the time of application of the grace periods except for microfinance loans. The total outstanding balance of loans modified under BAHO and BARO Acts amounts to P138,275 and P137,638, respectively, as of December 31, 2020 for the Group and Parent Company. Financial reliefs provided by the Group and mandated by the government were assessed to be non-substantial modification and has not resulted to material modification loss as the present value of the original cash flows and the present value of the revised cash flows using the original effective interest rate were substantially the same.

- 87 -
The fo llowing tables provide a summary of the outstanding balance of modified loans resulting from the financial reliefs provided by the Group and mandated by the government as of December 31:
Group 2021 2020 CARE BAHO Act/ CARE Program BARO Act Program Total Stage 1 (Performing) Corporate P 23,104 P 29,614 P 15,111 P 44,725 Consumer 540 72,958 66 73,024 Credit card - 5,804 5,176 10,980 Leasing and finance 1,519 20 3,335 3,355 Microfinance and small business 178 423 4 427 P 25,341 P 108,819 P 23,692 P 132,511 Stage 2 (Underperforming) Corporate P 351 P 1,769 P 1,769 P 3,538 Consumer 518 12,278 138 12,416 Credit card - 1,002 162 1,164 Leasing and finance 518 177 246 423 Microfinance and small business 41 - 5 5 P 1,428 P 15,226 P 2,320 P 17,546 Stage 3 (Nonperforming) Corporate P 1,112 P 505 P 324 P 829 Consumer 1,900 11,335 55 11,390 Credit card - 2,373 16 2,389 Leasing and finance 1,136 14 237 251 Microfinance and small business 1 3 8 11 P 4,149 P 14,230 P 640 P 14,870 Parent 2021 2020 CARE BAHO Act/ CARE Program BARO Act Program Total Stage 1 (Performing) Corporate P 23,000 P 29,614 P 15,111 P 44,725 Consumer 540 72,958 66 73,024 Credit card - 5,804 5,176 10,980 P 23,540 P 108,376 P 20,353 P 129,729 Stage 2 (Underperforming) Corporate P 351 P 1,769 P 1,769 P 3,538 Consumer 744 12,278 138 12,416 Credit card - 1,002 162 1,164 P 1,095 P 15,049 P 2,069 P 17,118

- 88 -
Parent 2021 2020 CARE BAHO Act/ CARE Program BARO Act Program Total Stage 3 (Nonperforming) Corporate P 497 P 505 P 324 P 829 Consumer 1,900 11,335 55 11,390 Credit card - 2,373 16 2,389 P 2,397 P 14,213 P 395 P 14,608
(c) Assessment of SICR The risk of default of such assets after modification is assessed at the reporting date and compared with the risk under the original terms at initial recognition, when the modification is not substantial and so does not result in derecognition of the original asset. The Group monitors the performance of the financial asset subsequent to its modification. The Group may determine that the credit risk has significantly improved after restructuring (in accordance with the new terms for six consecutive months or more), so that the assets are moved from Stage 3 or Stage 2. The Group continues to monitor if there is a subsequent SICR in relation to such modified assets through the use of specific models for modified assets [see also Note 4.4.6(a)]. 4.4.13 Write-offs
The Group and the Parent Company write off financial assets, in whole or in part, when it has exhausted all practical recovery efforts and has concluded that there is no reasonable expectation of recovery of the financial asset. Indicators that there is no reasonable expectation of recovery include: cessation of enforcement activity; and, where the Group and Parent Company’s recovery method is through foreclosure of collateral and the value of the collateral is less than the outstanding contractual amounts of the financial assets to be written-off. The Group and Parent Company may write off financial assets that are still subject to enforcement activity. The outstanding amounts of such assets written off in 2021 and 2020 amounted to P5,161 and P3,330, respectively, for the Group, and P5,157 and P3,078, respectively, for the Parent Company. The Group and the Parent Company still seek to recover amounts legally owed in full, but which have been partially written off due to no reasonable expectation of full recovery.
4.4.14 Credit Risk Stress Test To enhance the assessment of credit risk, the Group adopted a credit risk stress testing framework using break-even sales and cash flow debt service to determine a borrower’s vulnerability and ultimately impact to the Group’s capital adequacy. The Parent Company adopted a portfolio credit risk testing framework that takes into consideration the causal relationships among industry sectors.

- 89 -
4.4.15 Sensitivity Analysis on ECL Measurement Set out below are the changes to the Group’s ECL as of December 31, 2021 and 2020 that would result from reasonably possible changes in these parameters from the actual assumptions used in the Group’s economic variable assumptions:
Change in MEVs Impact on ECL Upside Downside Upside Downside Scenario Scenario Scenario Scenario 2021 Credit card receivables (P 97) P 4,972 Unemployment rate - 0.70% + 11.20% Inflation rate - 0.10% + 6.60% Corporate loans ( 87 ) 40 USD-Php exchange rate - P3.00 + P10.50 Inflation rate - 0.50% + 5.00% 91D TD bill - 0.50% + 5.00% Consumer loans: Salary loans ( 12 ) 16 Unemployment rate - 2.00% + 9.00% USD-Php exchange rate - P4.00 + P9.50 Inflation rate - 1.00% + 5.00% Bank lending rate - 0.50% + 5.00% Housing loans ( 7 ) 57 Unemployment rate - 2.00% + 9.00% Inflation rate - 1.00% + 5.00% Bank lending rate - 0.50% + 5.00% Auto loans ( 3 ) 18 GDP + P24,118 - P313,538 USD-Php exchange rate - P4.00 + P9.50 Bank lending rate - 0.50% + 5.00% Personal loans ( 10 ) 44 GDP + P24,118 - P313,538 USD-Php exchange rate - P4.00 + P9.50 Bank lending rate - 0.50% + 5.00%

- 90 -
Change in MEVs Impact on ECL Upside Downside Upside Downside Scenario Scenario Scenario Scenario 2020 Credit card receivables (P 1,178 ) P 4,823 Unemployment rate - 1.00% + 12.00% Inflation rate - 0.50% + 5.00% Corporate loans ( 279 ) 2,100 GDP growth rate + 0.70% - 1.40% Inflation rate - 0.50% + 5.00% 91D TD bill - 0.50% + 5.00% Consumer loans: Salary loans ( 19 ) 44 Unemployment rate - 2.00% + 9.00% USD-Php exchange rate - P3.00 + P10.50 Inflation rate - 1.70% + 3.80% Bank lending rate - 0.50% + 5.00% Housing loans ( 7 ) 44 Unemployment rate - 2.00% + 9.00% Inflation rate - 1.70% + 3.80% Bank lending rate - 0.50% + 5.00% Auto loans ( 1 ) 8 GDP + P26,301 - P341,915 USD-Php exchange rate - P3.00 + P10.50 Bank lending rate - 0.50% + 5.00% Personal loans ( 8 ) 44 GDP + P26,301 - P341,915 USD-Php exchange rate - P3.00 + P10.50 Bank lending rate - 0.50% + 5.00%
4.5 Operational Risk Operational risks are risks arising from the potential inadequate information systems and systems, operations or transactional problems (relating to service or product delivery), breaches in internal controls, fraud, or unforeseen catastrophes that may result in unexpected loss. Operational risks include the risk of loss arising from various types of human or technical error, settlement or payments failures, business interruption, administrative and legal risks, and the risk arising from systems not performing adequately. The Operational Risk Management Division (ORMD) assists management in meeting its responsibility to understand and manage operational risk exposures and to ensure consistent application of operational risk management tools across the Group.

- 91 -
The ORMD applies a number of techniques to efficiently manage operational risks. Among these are as follows: Each major business line has an embedded designated operational risk officer who
acts as a point person for the implementation of various operational risk tools. The operational risk officers attend annual risk briefings conducted by the ORMD to keep them up-to-date with different operational risk issues, challenges and initiatives;
With ORMD’s bottom up self-assessment process, which is conducted at least annually,
areas with high risk potential are highlighted and reported, and control measures are identified. The result of said self-assessment exercise also serves as one of the inputs in identifying specific key risk indicators (KRIs);
KRIs are used to monitor the operational risk profile of the Group and of each business unit, and alert management of impending problems in a timely fashion;
Internal loss information is collected, reported, and utilized to model operational risk;
and,
The ORMD reviews product and operating manuals, policies, procedures and circulars, thus allowing the embedding of desired operational risk management practices in all business units.
Operational Risk Management, as it relates to capital adequacy, is currently under Basic Indicator Approach (see Note 5.2). The Group has also developed a Business Continuity Plan (BCP) based on several crisis severity levels which is tested at least annually and updated for any major changes in systems and procedures. Central to the Group’s BCP is a disaster recovery plan to address the continued functioning of systems, recovery of critical data, and contingency processing requirements in the event of a disaster.
4.5.1 Reputation Risk
Reputation risk is the risk to earnings or capital arising from negative public opinion. This affects the Group’s ability to establish new relationships or services, or to continue servicing existing relationships. This risk can expose the Group to litigation, financial loss, or damage to its reputation. Reputation risk arises whenever technology-based banking products, services, delivery channels, or processes may generate adverse public opinion such that it seriously affects the Group’s earnings or impairs its capital. This risk is present in activities such as asset management and regulatory compliance. The Group adopted a reputation risk monitoring and reporting framework to manage public perception. Central to the said framework is the creation of the RCBC Marketing Committee chaired by the Parent Company’s Chief Marketing Officer.

- 92 -
4.5.2 Legal Risk and Regulatory Risk Management Changes in laws and regulations and fiscal policies could adversely affect the Group’s operations and financial reporting. In addition, the Group faces legal risks in enforcing its rights under its loan agreements, such as foreclosing of collateral. Legal risk is higher in new areas of business where the law remains untested by the courts. The Group uses a legal review process as the primary control mechanism for legal risk. Such a legal review aims to verify and validate the existence, genuineness and due execution of legal documents, and verify the capacity and authority of counterparties and customers to enter into transactions. In addition, the Group seeks to minimize its legal risk by using stringent legal documentation, imposing certain requirements designed to ensure that transactions are properly authorized, and consulting internal and external legal advisors.
Regulatory risk refers to the potential for the Group to suffer financial loss due to mid-stream changes in regulatory regime affecting current position and/or strategy. Compliance Risk is the risk of loss resulting from failure to comply with laws, regulations, rules, related self-regulatory organization standards, and codes of conduct applicable to its banking activities. The Group’s Compliance Program, the design and implementation of which is overseen and coordinated by the Chief Compliance Officer, is the primary control process for regulatory and compliance risk issues. The Compliance Office is committed to safeguard the integrity of the Group by maintaining a high level of regulatory compliance. It is responsible for communicating and disseminating new rules and regulations to all units, assessing and addressing identified compliance issues, performing periodic compliance testing an, and reporting compliance findings to the ACC and the BOD.
4.6 Anti-Money Laundering Controls
The AMLA or RA No. 9160 was passed in September 2001. It was subsequently amended by RA No. 9194, RA No. 10167, and RA No. 10365 in March 2003, June 2012 and February 2013, respectively. Together with the Terrorism Financing Prevention and Suppression Act (TFPSA) which was passed in June 2012 by virtue of RA No. 10168, and Anti-Terrorism Act of 2020 or R.A. 11479 these laws provide the regulatory framework for the Philippine Anti-Money Laundering and Terrorist Financing Prevention regulations. The Anti-Money Laundering Council is the financial intelligence unit tasked to implement AMLA, as amended. It is also the government agency that issues implementing guidelines to the AMLA and the TFPSA.
RCBC, as a BSP-supervised covered person, is subject to the Anti-Money Laundering and Combatting the Financing of Terrorism Regulations under Part Nine of the Manual of Regulations for Banks (MORB). Recent amendments to the said regulations were covered by BSP Circular Nos. 950 and 1022.

- 93 -
RCBC’s Money Laundering and Terrorist Financing Prevention Program (MTPP) is aligned with the foregoing laws, rules, and regulations, and follows a risk-based approach in identifying, assessing, and mitigating money laundering, terrorist financing, and proliferation financing risks. It includes the policies, procedures, and controls that are designed to prevent, detect, and deter money laundering and terrorist financing. Some of these controls include the following: Delineation of the sales and the service functions of the first line of defense. The Sales
function is focused on marketing and sales, relationship management, cross-selling, credit-related matters and documentation, and loan-related referrals and documentation; while the Service function is focused on BC operations such as: (a) customer servicing, which includes know your customer (KYC) and account opening, account maintenance and tellering, cash and vault management and ATM servicing, (b) BC administration, (c) customer experience management such as inquiries, feedback, and problem resolution, and (d) compliance and audit.
The Bank also created middle offices under the Branch Operations and Control Segment, comprised of Middle Office Support Division (MOSD) and Branch Control Division (BCD), tasked to review and validate KYC documents. The MOSD ensures the uniqueness of Customer Information Files and accuracy of information captured in the Credit Risk Mitigation (CRM). It also reviews the completeness of account opening documents. The BCD, on the other hand, ensures the proper implementation of KYC, the performance of independent enhanced due diligence (EDD) based on customer risk profile, and monitoring adherence of BCs to standard operating procedures. It also acts as the additional control layer to track exceptions and decides on dispositions, recommends sanctions or additional trainings for BCs, and recommends process improvements. The key processes of the BOCD are KYC, exceptions reporting, and quality assurance.
Use of technology in automating compliance activities such as client risk profiling, watch list and sanctions screening, transaction monitoring, and regulatory reporting. In addition to this, the Bank recently initiated use of proactive compliance analytics and investigation to gain more actionable insights and typologies.
For the controls to remain effective, the RCBC Group assesses its key exposures to ML (money laundering)/TF (terrorist financing)/PF (proliferation financing) risks by performing an Institutional ML/TF/PF Risk Assessment (IRA) focusing on evaluating the inherent ML/TF/PF risks presented by the Bank’s business activities and the controls in place to mitigate the inherent ML/TF/PF risks so as to determine the overall residual risks. The institutional risk assessment is conducted at least once every two (2) years, or as often as the Board or senior management may direct, depending on the level of risks identified in the previous risk assessment, or other relevant AML/Countering Financing of Terrorism developments that may have an impact on the covered person’s operations. 4.7 Impact of LIBOR Reform
As disclosed in Note 2.2(a), the Group currently has exposure to contracts which reference LIBOR and extend beyond 2021, including swaps which will transition under the International Swaps and Derivatives Association (ISDA) protocols.

- 94 -
In 2021, the Group established working team consisting of key personnel from treasury, finance, risk, IT, legal, compliance and lending groups to oversee the Group’s transition plan. This working group put in place a transition project for those contracts which reference USD LIBOR to transition them to Secured Overnight Financing Rate (SOFR), with the aim of minimizing the potential disruption to business and mitigating operational risks and possible financial losses. This transition project is considering changes to systems, processes, risk management and valuation models, as well as managing related tax and accounting implications. Significant risk areas affected by the replacement of LIBOR include: (i) updating systems and processes which capture USD LIBOR referenced contracts; (ii) amending affected contracts, or existing fallback/transition clauses not operating as anticipated; and (iii) reviewing mismatches in timing of derivatives and loans transitioning from USD LIBOR and the resulting impact on economic risk management. As confirmed by the United Kingdom’s Financial Conduct Authority that LIBOR setting will either cease to be provided or no longer representative for: All Sterling, Euro, Swiss Franc and Japanese Yen settings and the 1-week and 2-month
USD settings by December 31, 2021
Remaining overnight, 1-month, 3-month and 12-month USD settings by June 30, 2023
The Group has decided to continue the use of USD LIBOR for its outstanding contracts until June 30, 2023. On the other hand, beginning January 1, 2022, the Group will use the Chicago Mercantile Exchange (CME) Term SOFR as reference for new loans while new derivative contracts will use SOFR.
As of December 31, 2021, the Group has identified the required changes to systems and processes and will be implemented in 2022. Internal briefings were held across all lending units to disseminate the use of the new benchmark. The Group also sent notice to identified clients advising them of benchmark developments and the Group’s adoption of CME Term SOFR for new loans beginning 2022. Loan documentations have also been reviewed for consistency with the new benchmark.
The Group continues to engage with industry participants and the BSP, to ensure an orderly transition to SOFR and to minimize the risks associating from transition, and it will continue to identify and assess risks associated with the USD LIBOR replacement. The following table contains details of the carrying values of all financial instruments the Group holds as of December 31, 2021 which reference USD LIBOR and have not yet transitioned to SOFR: Assets Liabilities
Non-derivative exposed to USD LIBOR
measured at amortized cost : Loans and receivables P 16,717 P - Bills payable - 1,531 16,717 1,531
Derivatives 168 176
Total assets/liabilities exposed to USD LIBOR P 16,885 P 1,707

- 95 -
(a) Risks Arising from the Interest Rate Benchmark Reform
The following are the key risks for the Group arising from the transition:
Liquidity Risk: There are fundamental differences between LIBOR and the alternative benchmark rate which the Group will be adopting. LIBOR are forward-looking term rates published for a period (e.g., 3 months) at the beginning of that period and include an inter-bank credit spread, whereas alternative benchmark rates are typically risk-free overnight rates published at the end of the overnight period with no embedded credit spread. These differences will result in additional uncertainty regarding floating rate interest payments which will require additional liquidity management. The Group’s liquidity risk management policy has been updated to ensure sufficient liquid resources to accommodate unexpected increases in overnight rates.
Accounting: If transition to alternative benchmark rates for certain contracts is finalized in a manner that does not permit the application of reliefs, this could lead to volatility in profit or loss if non-derivative financial instruments are modified or derecognized. In particular, the Group is not seeking to novate derivatives or close out derivatives and enter into new on-market derivatives where derivatives have been designated in hedging relationships.
Operational Risk: The Group’s current treasury management system will undergo upgrades to fully manage the transition to alternative benchmark rates and there is a risk that such upgrades are not fully functional in time, resulting in additional manual procedures which give rise to operational risks. The Group is working closely with its system provider to ensure the relevant updates are made in good time and the Group has plans in place for alternative manual procedures with relevant controls to address any potential delay.
Litigation Risk: If no agreement is reached to implement the interest rate benchmark reform on prospective contracts, there is a risk of prolonged disputes with counterparties which could give rise to additional legal and other costs. The Group is working closely with all counterparties to avoid this from occurring.
5. CAPITAL MANAGEMENT
5.1 Regulatory Capital The Group’s lead regulator, the BSP, sets and monitors the capital requirements of the Group. In implementing the current capital requirements, the BSP requires the Group to maintain a prescribed ratio of qualifying regulatory capital to total risk-weighted assets including market risk and operational risk computed based on BSP-prescribed formula provided under its circulars.
On January 15, 2013, the BSP issued Circular No. 781, Basel III Implementing Guidelines on Minimum Capital Requirements, which provides the implementing guidelines on the revised risk-based capital adequacy framework particularly on the minimum capital and disclosure requirements for universal banks and commercial banks, as well as their subsidiary banks and quasi-banks, in accordance with the Basel III standards. Circular No. 781 is effective on January 1, 2014.

- 96 -
The BSP has adopted the Basel III risk-based capital adequacy framework effective January 1, 2014, which requires the Group to maintain at all times the following: (a) Common Equity Tier 1 (CET1) of at least 6.0% of risk-weighted assets; (b) Tier 1 Capital of at least 7.5% of risk-weighted assets; (c) Qualifying Capital (Tier 1 plus Tier 2 Capital) of at least 10.0% of risk-weighted assets;
and, (d) Capital Conservation Buffer of 2.5% of risk-weighted assets, comprised of CET1 Capital.
Under the relevant provisions of the current BSP regulations, the required minimum capitalization for the Parent Company, Rizal Microbank, RCBC Capital and RCBC LFC is P20,000, P400, P300 and P300, respectively.
In computing for the capital adequacy ratio (CAR), the regulatory qualifying capital is analyzed into two tiers which are: (i) Tier 1 Capital comprised of CET1 and AT1 capital, and, (ii) Tier 2 Capital, defined as follows and are subject to deductions as defined in relevant regulations:
(a) CET1 Capital includes the following:
(i) paid-up common stock; (ii) common stock dividends distributable; (iii) additional paid-in capital; (iv) deposit for common stock subscription; (v) retained earnings; (vi) undivided profits; (vii) other comprehensive income from net unrealized gains or losses on financial assets
at FVOCI and cumulative foreign currency translation; and, (viii) minority interest in subsidiary banks which are less than wholly-owned, subject to
regulatory conditions.
(b) AT1 Capital includes: (i) instruments that do not qualify as CET1, but meet the criteria set out in Annex B of
BSP Circular No. 781; (ii) financial liabilities meeting loss absorbency requirements set out in Annex E of
BSP Circular No. 781; (iii) financial liabilities bearing loss absorbency features at point of non-viability as set out
in Annex F of BSP Circular No. 781; (iv) additional paid-in capital resulting from issuance of AT1 capital; (v) deposit for subscription to AT1 instruments; and, (vi) minority interest in subsidiary banks which are less than wholly-owned, subject to
regulatory conditions.
(c) Tier 2 Capital includes: (i) instruments issued that are not qualified as Tier 1 capital but meet the criteria set
forth in Annex C of BSP Circular No. 781; (ii) financial liabilities bearing loss absorbency features at point of non-viability as set out
in Annex F of BSP Circular No. 781; (iii) deposit for subscription of Tier 2 capital; (iv) appraisal increment reserve on bank premises, as authorized by the Monetary
Board (MB) of the BSP; (v) general loan loss provisions; and,

- 97 -
(vi) minority interest in subsidiary banks that are less than wholly-owned, subject to regulatory conditions.
In the calculation of Risk-based CAR, the total Qualifying Capital is expressed as a percentage of Total Risk-Weighted Assets based on book exposures, where Risk Weighted Assets is composed of Credit Risk, Market Risk and Operational Risk, net of specific provisions and exposures covered by CRM. Banking book exposures shall be risk-weighted based on third party credit assessment of the individual exposure given by eligible external credit institutions and the corresponding external credit assessment are mapped with the corresponding risk weights following the Standardized Credit Risk Weights table as provided under BSP Circular No. 538, Revised Risk-Based Capital Adequacy Framework. BSP Circular No. 856, Implementing Guidelines on the Framework for Dealing with Domestic Systemically Important Banks under Basel III, covers the implementing guidelines on the framework for dealing with domestic systemically important banks (D-SIBs) in accordance with the Basel III standards. Banks identified as D-SIBs shall be required to have higher loss absorbency, on top of the minimum CET1 capital and capital conservation buffer. Compliance with this requirement was phased-in starting January 1, 2017, with full compliance on January 1, 2019.
The Group and Parent Company’s regulatory capital position based on the Basel III
risk-based capital adequacy framework as reported to the BSP follows:
Parent Group Company
2021:
Tier 1 Capital CET 1 P 79,409 P 75,449 AT1 14,465 14,465 93,874 89,914 Tier 2 Capital 5,591 5,522 Total Qualifying Capital P 99,465 P 95,436 Total Risk – Weighted Assets P 653,108 P 638,940 Capital ratios:
Total qualifying capital expressed as a percentage of total risk-weighted assets 15.23% 14.94% Tier 1 Capital Ratio 14.37% 14.07% Total CET 1 Ratio 12.16% 11.81%

- 98 -
Parent Group Company 2020:
Tier 1 Capital CET 1 P 70,326 P 66,421 AT1 14,465 14,465 84,791 80,886 Tier 2 Capital 5,017 4,895 Total Qualifying Capital P 89,808 P 85,781 Total Risk – Weighted Assets P 556,585 P 540,897 Capital ratios:
Total qualifying capital expressed as a percentage of total risk-weighted assets 16.14% 15.86% Tier 1 Capital Ratio 15.23% 14.95 % Total CET 1 Ratio 12.64% 12.28%
The foregoing capital ratios comply with the related BSP prescribed ratios. 5.2 Internal Capital Adequacy Assessment and Pillar 2 Risk-Weighted Assets In January 2009, the BSP issued Circular No. 639 on the ICAAP and Supervisory Review Process covering universal and commercial banks on a group-wide basis. As a supplement to BSP Circular No. 538 on the Risk-Based Capital Adequacy Framework, ICAAP sets out the following principles: (a) Banks must have a process for assessing capital adequacy relative to their risk profile,
operating environment, and strategic/business plans;
(b) The Bank’s ICAAP is the responsibility of the BOD, must be properly documented and approved and with policies and methodologies integrated into banking operations;
(c) The Bank’s ICAAP should address other material risks – Pillar 2 risks – in addition to
those covered by Pillar 1, with risk measurement methodologies linked to the assessment of corresponding capital requirement both on a BAU and stressed scenario;
(d) The minimum CAR prescribed by the BSP after accounting for Pillar 1 and other risks is retained at 10%; and,
(e) The Bank’s ICAAP document must be submitted to the BSP every March 31 of each year.
The Group identified the following Pillar 2 risks as material to its operations, and consequently set out methodologies to quantify the level of capital that it must hold. (a) Credit Risk Concentration – The Group has so far limited its analysis to credit risk
concentration arising from the uneven sector distribution of the Group’s credit exposures. Aside from using a simplified application of the HHI, concentration is estimated using the CCI. The capital charge is estimated by calculating the change in the Economic Capital (EC) requirement of the credit portfolio as an effect of credit deterioration in the largest industry exposure.

- 99 -
(b) IRRBB – It is the current and prospective negative impact on earnings and capital arising from interest rate shifts. The Group IRRBB estimates as its NII-at-risk, and accordingly deducts the same from regulatory qualifying capital. Stressed IRRBB is calculated by applying the highest observed market volatilities over a determined timeframe.
(c) Liquidity Risk – The Group estimates its liquidity risk under BAU scenario using standard
gap analysis. Stressed liquidity risk on the other hand assumes a repeat of a historical liquidity stress, and estimates the impact if the Group were to partially defend its deposits and partially pay-off by drawing from its reserve of liquid assets.
(d) IT Risk – It is the current and prospective negative impact to earnings arising from failure
of IT systems and realization of cyber security threats. The Group treats this risk as forming part of Operational Risk.
(e) Compliance Risk – It is the current and prospective negative impact on earnings and capital
arising from violation of laws, regulations, ethical standards, and the like. For BAU scenario, the Group estimates compliance risk charge from historical fines and penalties as the worst-case loss determined via a frequency-severity analysis of each penalty type. The resulting compliance risk charge calculation is likewise directly deducted from earnings.
(f) Strategic Business Risk – It is the current and prospective negative impact on earnings and
capital arising from adverse business decisions, improper implementation, and failure to respond to industry changes. The Group treats strategic business risk as a catch-all risk, and expresses its estimate as a cap on additional risk-weighted assets given other risks and the desired level of capital adequacy. The Group maintains that the assessment of strategic risk is embedded in the budget of the Group. Its capital impact therefore on a BAU case is already expressed in the amount of risk projected to be taken on in the forecast years. However, the Group does recognize the need to set up processes that would enable to put a number to the risk incurred by going into specific strategies.
(g) Reputation Risk – From the adoption of a theoretical measure, the Group amended its approach to reputation risk in 2011 by adopting instead a reputation risk monitoring and reporting process, run primarily by its Marketing Committee. The measurement of reputation risk under stress is folded into the Group’s assessment of stressed liquidity risk.
5.3 Basel III Leverage Ratio
BSP issued Circular No. 881, Implementing Guidelines on the Basel III Leverage Ratio Framework, which provides the implementing guidelines on the leverage ratio framework designed to act as a supplementary measure to the risk-based capital requirements. It sets out a minimum leverage ratio of 5.00% on a solo and consolidated basis and shall be complied with at all times. The monitoring period has been set every quarter starting December 31, 2014 and extended until June 30, 2018 per BSP Circular No. 990, Amendments to the Basel III Leverage Ratio Framework, issued on January 22, 2018. Effective July 1, 2018, the monitoring of the leverage ratio was implemented as a Pillar I minimum requirement. The Basel III leverage ratio intends to restrict the build-up of leverage to avoid destabilizing deleveraging processes which can damage the broader financial system and the economy. Likewise, it reinforces the risk-based requirements with a simple, non-risk based “backstop” measure. The Basel III leverage ratio is defined as the ratio of capital measure (Tier 1 Capital) and the exposure measure. Exposure measure includes: on-balance sheet exposures, securities financing transactions exposures and off-balance sheet.

- 100 -
The Group and Parent Company’s Basel III leverage ratio as reported to the BSP are as follows:
Parent Group Company
2021 :
Tier 1 Capital P 93,874 P 89,914 Exposure measure 963,320 950,191 9.74% 9.46%
2020 :
Tier 1 Capital P 84,791 P 80,886 Exposure measure 769,933 755,631 11.01% 10.70%
5.4 Liquidity Coverage Ratio and Net Stable Funding Ratio
On March 10, 2016, the BSP issued Circular No. 905, Implementation of Basel III Framework on Liquidity Standards - Liquidity Coverage Ratio and Disclosure Standards, which provides the implementing guidelines on liquidity coverage ratio (LCR) and disclosure standards that are consistent with the Basel III framework. The LCR is the ratio of high-quality liquid assets to total net cash outflows, which should not be lower than 100.00%. Compliance with the LCR minimum requirement commenced on January 1, 2018 with the prescribed minimum ratio of 90.00% for 2018 and 100.00% effective January 1, 2019. To promote the short-term resilience of the liquidity risk profile, the Bank maintains adequate stock of unencumbered high-quality liquid assets (HQLAs) that consists of cash or assets that can be converted into cash at little or no loss of value in private markets, to meet its liquidity needs under stressed conditions. The stock of liquid assets should enable the Bank to withstand significant liquidity shocks for at least 30 calendar days, which would give time for corrective actions to be taken by the Bank management and/or the BSP. Details of the Group’s and Parent Company’s LCR are summarized below.
Group Parent Company Total Total Total Total Unweighted Value Weighted Value Unweighted Value Weighted Value December 31, 2021 Total stock of HQLA P 283,070 P 269,687 P 280,895 P 267,777 Expected Net Cash Outflows* 992,911 175,035 994,823 175,800 Liquidity Coverage Ratio 154.08% 152.32% December 31, 2020 Total stock of HQLA P 201,781 P 196,234 P 199,145 P 193,866 Expected Net Cash Outflows* 945,349 107,677 847,479 108,563 Liquidity Coverage Ratio 182.24% 178.57%
*Includes Restricted Term Deposits and Deposits pledged as collateral or under hold-out arrangements

- 101 -
Net Stable Funding Ratio (NSFR), as detailed in BSP Circular No. 1007, Implementing Guidelines on the adoption of the Basel III Framework on Liquidity Standards - Net Stable Funding Ratio, measures the availability of medium and long-term stable funding to support illiquid assets and business activities on an on-going basis. It is an assessment of the level of sustainable funding required to reduce funding risk over a one-year time horizon. The NSFR complements the LCR, which promotes short-term resilience of the Bank’s liquidity profile.
To promote long-term resilience against liquidity risk, the Group maintains a stable funding profile in relation to the composition of its assets and off-balance sheet activities and seeks to meet this objective by limiting overreliance on short-term wholesale funding and promoting enhanced assessment of funding risk across all on- and off-balance sheet accounts. Details of the Group’s and Parent Company’s Basel III NSFR are summarized below. Parent Group Company
December 31, 2021 Available stable funding P 599,445 P 593,274 Required stable funding 503,747 504,473
Basel III NSFR 119.00% 117.60% December 31, 2020 Available stable funding P 508,987 P 503,188 Required stable funding 434,859 430,458
Basel III NSFR 117.05% 116.90%
The Bank has complied with the daily minimum regulatory requirement of 100% for both ratios beginning in 2019. For the Bank’s subsidiaries, per BSP Memo dated March 8, 2019, the observation period for LCR and NSFR was extended up to the end of December 2019 to give sufficient time to build up liquidity position given the combined impact of these liquidity measures.

- 102 -
6. CATEGORIES AND OFFSETTING OF FINANCIAL ASSETS AND FINANCIAL LIABILITIES
6.1 Carrying Amounts and Fair Values by Category The following table summarizes the carrying amounts and corresponding fair values of financial assets and financial liabilities presented in the statements of financial position.
Group
2021 2020 Carrying Carrying Amount Fair Value Amount Fair Value
Financial Assets At amortized cost:
Cash and cash equivalents P 199,277 P 199,277 P 203,731 P 203,731 Investment securities - net 163,611 164,277 43,026 43,416
Loans and receivables - net 507,739 538,971 448,603 475,331 Other resources 825 825 931 931
871,452 903,350 696,291 723,409 At fair value: Investment securities at FVTPL 5,863 5,863 4,888 4,888
Investment securities at FVOCI 49,761 49,761 40,150 40,150 55,624 55,624 45,038 45,038
P 927,076 P 958,974 P 741,329 P 768,447 Financial Liabilities At amortized cost:
Deposit liabilities P 672,459 P 672,708 P 535,788 P 536,233 Bills payable 55,904 55,904 13,167 13,167 Bonds payable 87,215 87,687 90,439 93,611 Accrued interest and other expenses 5,559 5,559 5,393 5,393 Other liabilities 20,724 20,724 19,008 19,008 841,861 842,582 663,795 667,412 At fair value − Derivative financial liabilities 926 926 1,484 1,484
P 842,787 P 843,508 P 665,279 P 668,896
Parent Company 2021 2020
Carrying Carrying Amount Fair Value Amount Fair Value
Financial Assets At amortized cost:
Cash and cash equivalents P 197,673 P 197,673 P 201,500 P 201,500 Investment securities - net 162,899 163,560 42,513 42,902
Loans and receivables - net 499,901 531,276 441,167 468,224 Other resources 823 823 924 924
861,296 893,332 686,104 713,550 At fair value: Investment securities at FVTPL 4,879 4,879 3,815 3,815
Investment securities at FVOCI 48,399 48,399 38,813 38,813 53,278 53,278 42,628 42,628
P 914,574 P 946,610 P 728,732 P 756,178

- 103 -
Parent Company 2021 2020
Carrying Carrying Amount Fair Value Amount Fair Value
Financial Liabilities At amortized cost:
Deposit liabilities P 674,414 P 674,663 P 536,748 P 537,193 Bills payable 46,399 46,399 4,200 4,200 Bonds payable 87,215 87,687 90,439 93,611 Accrued interest and other expenses 5,391 5,391 5,196 5,196 Other liabilities 19,641 19,641 17,832 17,832 833,060 833,781 654,415 658,032 At fair value − Derivative financial liabilities 926 926 1,484 1,484
P 833,986 P 834,707 P 655,899 P 659,516
Except for investment securities at amortized cost, deposit liabilities, loans and receivables, and bonds payable with fair value disclosed different from their carrying amounts, management considers that the carrying amounts of other financial assets and financial liabilities presented above which are measured at amortized cost, approximate the fair values either because those instruments are short-term in nature or the effect of discounting for those with maturities of more than one year is not material. The fair value information disclosed for the Group and Parent Company’s investment securities at amortized cost and other financial assets and liabilities measured at fair value on a recurring basis are determined based on the procedures and methodologies discussed in Note 7.2. 6.2 Offsetting Financial Assets and Financial Liabilities
The following financial assets presented in the statements of financial position at gross amounts are covered by enforceable master netting arrangements and similar arrangements:
Group Gross amounts recognized in Related amounts not set off in the the statements statements of financial position of financial Financial Collateral Notes position instruments received Net amount
December 31, 2021
Loans and receivables – Receivable from customers 11 P 512,731 ( P 7,464 ) P - P 505,267 Trading and investment securities – Investment securities at amortized cost 10 163,611 ( 45,378 ) - 118,233 Other resources – Margin deposits 15 73 - ( 73 ) -
December 31, 2020
Loans and receivables – Receivable from customers 11 P 456,565 ( P 8,581 ) P - P 447,984 Trading and investment securities – Investment securities at amortized cost 10 43,026 ( 4,199 ) - 38,827 Other resources – Margin deposits 15 17 - ( 17 ) -

- 104 -
Parent Company Gross amounts recognized in Related amounts not set off in the the statements statements of financial position of financial Financial Collateral Notes position instruments received Net amount
December 31, 2021
Loans and receivables – Receivable from customers 11 P 504,933 ( P 7,457 ) P - P 497,476 Trading and investment securities – Investment securities at amortized cost 10 162,899 ( 45,378 ) - 117,521 Other resources – Margin deposits 15 73 - ( 73) -
December 31, 2020
Loans and receivables – Receivable from customers 11 P 448,663 ( P 8,428 ) P - P 440,235 Trading and investment securities – Investment securities at amortized cost 10 42,513 ( 4,199 ) - 38,314 Other resources – Margin deposits 15 17 - ( 17 ) -
The following financial liabilities presented in the statements of financial position at gross amounts are covered by enforceable master netting arrangements and similar agreements:
Group Gross amounts recognized in Related amounts not set off in the the statements statements of financial position of financial Financial Collateral Notes position instruments received Net amount
December 31, 2021
Deposit liabilities 17 P 672,459 ( P 7,464 ) P - P 664,995 Bills payable 18 55,904 ( 45,378 ) - 10,526 Other liabilities – Derivative financial liabilities 22 926 - ( 73 ) 853
December 31, 2020
Deposit liabilities 17 P 535,788 ( P 8,581 ) P - P 527,207 Bills payable 18 13,167 ( 4,199 ) - 8,968 Other liabilities – Derivative financial liabilities 22 1,484 - ( 17 ) 1,467 Parent Company Gross amounts recognized in Related amounts not set off in the the statements statements of financial position of financial Financial Collateral Notes position instruments received Net amount
December 31, 2021
Deposit liabilities 17 P 674,414 ( P 7,457 ) P - P 666,957 Bills payable 18 46,399 ( 45,378 ) 1,021 Other liabilities – Derivative financial liabilities 22 926 - ( 73 ) 853
December 31, 2020
Deposit liabilities 17 P 536,748 ( P 8,428 ) P - P 528,320 Bills payable 18 4,200 ( 4,199 ) - 1 Other liabilities – Derivative financial liabilities 22 1,484 - ( 17 ) 1,467

- 105 -
For financial assets and financial liabilities subject to enforceable master netting agreements or similar arrangements above, each agreement between the Group and its counterparties allows for net settlement of the relevant financial assets and liabilities when both elect to settle on a net basis. In the absence of such an election, financial assets and liabilities will be settled on a gross basis. However, each party to the master netting agreement or similar agreement will have the option to settle all such amounts on a net basis in the event of default of the other party. For purposes of presenting the above information, the related amounts not set off in the statements of financial position pertains to: (a) hold-out deposits and equity securities which serve as the Group’s collateral enhancement for certain loans and receivables; (b) collaterized bills payable under sale and repurchase agreements; and, (c) margin deposits which serve as security for outstanding financial market transactions and other liabilities. The financial instruments that can be set off are only disclosed to the extent of the amounts of the Group’s obligations to counterparties.
7. FAIR VALUE MEASUREMENT AND DISCLOSURES
7.1 Fair Value Hierarchy In accordance with PFRS 13, Fair Value Measurement, the fair value of financial assets and financial liabilities and non-financial assets which are measured at fair value on a recurring or non-recurring basis and those assets and liabilities not measured at fair value but for which fair value is disclosed in accordance with other relevant PFRS, are categorized into three levels based on the significance of inputs used to measure the fair value. The fair value hierarchy has the following levels:
Level 1: quoted prices (unadjusted) in active markets for identical assets or liabilities
that an entity can access at the measurement date; Level 2: inputs other than quoted prices included within Level 1 that are observable for
the asset or liability, either directly (i.e., as prices) or indirectly (i.e., derived from prices); and,
Level 3: inputs for the asset or liability that are not based on observable market data
(unobservable inputs).
The level within which the asset or liability is classified is determined based on the lowest level of significant input to the fair value measurement. For purposes of determining the market value at Level 1, a market is regarded as active if quoted prices are readily and regularly available from an exchange, dealer, broker, industry group, pricing service, or regulatory agency, and those prices represent actual and regularly occurring market transactions on an arm’s length basis. For investments which do not have quoted market price, the fair value is determined by using generally acceptable pricing models and valuation techniques or by reference to the current market value of another instrument which is substantially the same after taking into account the related credit risk of counterparties, or is calculated based on the expected cash flows of the underlying net asset base of the instrument.

- 106 -
When the Group uses valuation technique, it maximizes the use of observable market data where it is available and rely as little as possible on entity specific estimates. However, areas such as credit risk (both own and counterparty), volatilities and correlations require management to make estimates. If all significant inputs required to determine the fair value of an instrument are observable, the instrument is included in Level 2. Otherwise, it is included in Level 3. Changes in assumptions could also affect the reported fair value of the financial instruments. The Group uses judgment to select a variety of valuation techniques and to make assumptions that are mainly based on market conditions existing at the end of each reporting period.
7.2 Financial Instruments Measured at Fair Value The table below shows the fair value hierarchy of the Group’s classes of financial assets and financial liabilities measured at fair value in the statements of financial position on a recurring basis as of December 31, 2021 and 2020.
Group Level 1 Level 2 Level 3 Total
2021: Financial assets at FVTPL:
Government securities P 4,330 P - P - P 4,330 Corporate debt securities 35 - - 35 Equity securities 232 - - 232 Derivative assets 11 1,255 - 1,266 4,608 1,255 - 5,863
Financial assets at FVOCI: Equity securities 1,497 355 1,815 3,667 Government securities 28,682 - - 28,682 Corporate debt securities 17,412 - - 17,412 47,591 355 1,815 49,761
Total Resources at Fair Value P 52,199 P 1,610 P 1,815 P 55,624
Derivative liabilities P 1 P 925 P - P 926 2020:
Financial assets at FVTPL:
Government securities P 1,876 P - P - P 1,876 Corporate debt securities 710 - - 710 Equity securities 1,173 - - 1,173 Derivative assets 15 1,114 - 1,129 3,774 1,114 - 4,888
Financial assets at FVOCI: Equity securities 1,573 287 1,570 3,430 Government securities 20,563 - - 20,563 Corporate debt securities 16,157 - - 16,157 38,293 287 1,570 40,150
Total Resources at Fair Value P 42,067 P 1,401 P 1,570 P 45,038
Derivative liabilities P 2 P 1,482 P - P 1,484

- 107 -
Parent Company Level 1 Level 2 Level 3 Total
2021:
Financial assets at FVTPL:
Government securities P 3,346 P - P - P 3,346 Corporate debt securities 35 - - 35 Equity securities 232 - - 232 Derivative assets 11 1,255 - 1,266 3,624 1,255 - 4,879
Financial assets at FVOCI: Equity securities 645 355 1,788 2,788 Government securities 28,682 - - 28,682 Corporate debt securities 16,929 - - 16,929 46,256 355 1,788 48,399
Total Resources at Fair Value P 49,880 P 1,610 P 1,788 P 53,278
Derivative liabilities P 1 P 925 P - P 926 2020:
Financial assets at FVTPL:
Government securities P 1,808 P - P - P 1,808 Corporate debt securities 606 - - 606 Equity securities 272 - - 272 Derivative assets 15 1,114 - 1,129 2,701 1,114 - 3,815
Financial assets at FVOCI: Equity securities 689 287 1,542 2,518 Government securities 20,563 - - 20,563 Corporate debt securities 15,732 - - 15,732
36,984 287 1,542 38,813
Total Resources at Fair Value P 39,685 P 1,401 P 1,542 P 42,628
Derivative liabilities P 2 P 1,482 P - P 1,484 Described below and in the succeeding page are the information about how the fair values of the Group’s classes of financial assets and financial liabilities were determined. (a) Government and Corporate Debt Securities
The fair value of the Group’s government and corporate debt securities are categorized within Level 1 of the fair value hierarchy. Fair values of peso-denominated government debt securities issued by the Philippine government, are determined based on the reference price per Bloomberg which used BVAL. These BVAL reference rates are computed based on the weighted price derived using an approach based on a combined sequence of proprietary BVAL algorithms of direct observations or observed comparables. Fair values of actively traded corporate debt securities are determined based on their market prices quoted in the Philippine Dealing Holdings System or based on the direct reference price per Bloomberg at the end of each reporting period; hence, categorized within Level 1.

- 108 -
(b) Equity Securities The fair values of certain equity securities classified as financial assets at FVTPL and at
FVOCI as of December 31, 2021 and 2020 were valued based on their market prices quoted in the PSE at the end of each reporting period; hence, categorized within Level 1. Level 2 category includes the Group’s investments in proprietary club shares as their prices are not derived from a market considered as active due to lack of trading activities among market participants at the end of each reporting period. For equity securities which are not traded in an active market and with fair value categorized within Level 3, their fair value is determined through valuation techniques such as market-based approach (price-to-book value method) using current market values of comparable listed entities, net asset value method, or dividend discounted model. The price-to-book value method used to value a certain equity security of the Parent Company uses the price-to-book ratio of comparable listed entities as multiple in determining the fair value adjusted by a certain valuation discount. The price-to-book ratio used in the fair value measurement as of December 31, 2021 and 2020 ranges from 0.84:1 to 1.56:1 and from 0.26:1 to 1.53:1, respectively. Increase or decrease in the price-to-book ratio and net asset value would result in higher or lower fair values, all else equal. For a certain preferred equity security, the Group has used the discounted cash flow method applying a discount rate of 4.8% and 5.5%, which is based on the latest available weighted cost of capital of the investee company, in 2021 and 2020, respectively, to determine the present value of future cash flows from dividends or redemption expected to be received from the instrument.
A reconciliation of the carrying amounts of Level 3 FVOCI equity securities at the beginning and end of 2021 and 2020 is shown below.
Group Parent Company 2021 2020 2021 2020 Balance at beginning of year P 1,570 P 1,612 P 1,542 P 1,581 Fair value gains (losses) - net 245 ( 42 ) 246 ( 39 ) Balance at end of year P 1,815 P 1,570 P 1,788 P 1,542
There were neither transfers between the levels of the fair value hierarchy nor gains or losses recognized in the statements of profit or loss for Level 3 financial assets in 2021 and 2020.
(c) Derivative Assets and Liabilities
The fair value of the Group’s derivative assets categorized within Level 1 is determined
be the current mid-price based on the last trading transaction as defined by third-party market makers.
On the other hand, the fair values of certain derivative financial assets and liabilities categorized within Level 2 were determined through valuation techniques using net present value computation which makes use of the streams of cash flows related to the derivative financial instruments such as interest rate swaps and currency swaps.

- 109 -
7.3 Financial Instruments Measured at Amortized Cost for Which Fair Value is Disclosed
The table below summarizes the fair value hierarchy of the Group and Parent Company’s financial assets and financial liabilities which are not measured at fair value in the statements of financial position but for which fair value is disclosed.
Group Level 1 Level 2 Level 3 Total
2021: Financial Assets:
Cash and other cash items P 14,691 P - P - P 14,691 Due from BSP 130,170 - - 130,170 Due from other banks 12,162 - - 12,162 Loans arising from reverse repurchase 11,691 - - 11,691 agreements Interbank loans 30,563 - - 30,563 Investment securities at amortized cost 163,566 - 711 164,277 Loans and receivables - net - - 538,971 538,971 Other resources - - 825 825 P 362,843 P - P 540,507 P 903,350
Financial Liabilities:
Deposit liabilities P - P - P 672,708 P 672,708 Bills payable - - 55,904 55,904 Bonds payable - 87,687 - 87,687 Accrued interest and other expenses - - 5,559 5,559 Other liabilities - - 20,724 20,724 P - P 87,687 P 754,895 P 842,582
2020:
Financial Assets: Cash and other cash items P 16,520 P - P - P 16,520 Due from BSP 115,467 - - 115,467 Due from other banks 15,707 - - 15,707 Loans arising from reverse repurchase agreements 13,356 - - 13,356 Interbank loans 42,681 - - 42,681 Investment securities at amortized cost 42,908 - 508 43,416 Loans and receivables - net - - 475,331 475,331 Other resources - - 931 931 P 246,639 P - P 476,770 P 723,409
Financial Liabilities:
Deposit liabilities P - P - P 536,233 P 536,233 Bills payable - - 13,167 13,167 Bonds payable - 93,611 - 93,611 Accrued interest and other expenses - - 5,393 5,393 Other liabilities - - 19,008 19,008 P - P 93,611 P 573,801 P 667,412

- 110 -
Parent Company Level 1 Level 2 Level 3 Total
2021:
Financial Assets: Cash and other cash items P 14,663 P - P - P 14,663 Due from BSP 128,931 - - 128,931 Due from other banks 11,860 - - 11,860 Loans arising from reverse repurchase 11,656 - - 11,656 agreements Interbank loans 30,563 - - 30,563 Investment securities at amortized cost 163,560 - - 163,560 Loans and receivables - net - - 531,276 531,276 Other resources - - 823 823 P 361,233 P - P 532,099 P 893,332
Financial Liabilities:
Deposit liabilities P - P - P 674,663 P 674,663 Bills payable - - 46,399 46,399 Bonds payable - 87,687 - 87,687 Accrued interest and other expenses - - 5,391 5,391 Other liabilities - - 19,641 19,641 P - P 87,687 P 746,094 P 833,781 2020:
Financial Assets: Cash and other cash items P 16,464 P - P - P 16,464 Due from BSP 113,949 - - 113,949 Due from other banks 15,214 - - 15,214 Loans arising from reverse repurchase agreements 13,226 - - 13,226 Interbank loans 42,647 - - 42,647 Investment securities at amortized cost 42,902 - - 42,902 Loans and receivables - net - - 468,224 468,224 Other resources - - 924 924 P 244,402 P - P 469,148 P 713,550
Financial Liabilities:
Deposit liabilities P - P - P 537,193 P 537,193 Bills payable - - 4,200 4,200 Bonds payable - 93,611 - 93,611 Accrued interest and other expenses - - 5,196 5,196 Other liabilities - - 17,832 17,832
P - P 93,611 P 564,421 P 658,032

- 111 -
The following are the methods used to determine the fair value of financial assets and financial liabilities not presented in the statements of financial position at their fair values:
(a) Due from BSP and Other Banks, and Loans and Receivables Arising from Reverse Repurchase
Agreements
Due from BSP pertains to deposits made to the BSP for clearing and reserve requirements, overnight and term deposit facilities, while loans and receivables arising from reverse repurchase agreements pertain to loans and receivables from BSP arising from overnight lending from excess liquidity. Due from other banks includes items in the course of collection. The fair value of floating rate placements and overnight deposits is their carrying amount. The estimated fair value of fixed interest-bearing deposits is based on the discounted cash flows using prevailing money market interest rates for debt with similar credit risk and remaining maturity, which for short-term deposits approximate the nominal value.
(b) Investment Securities at Amortized Cost
The fair value of investment securities at amortized cost consisting of government securities and corporate debt securities is determined based on reference prices appearing in Bloomberg.
(c) Deposits Liabilities and Borrowings
The estimated fair value of demand deposits with no stated maturity, which includes non-interest-bearing deposits, is the amount repayable on demand. The estimated fair value of long-term fixed interest-bearing deposits and other borrowings without quoted market price is based on discounted cash flows using interest rates for new debts with similar remaining maturity. The Level 2 fair value of bonds payable and subordinated debt is determined based on the average of ask and bid prices as appearing on Bloomberg. For bills payable categorized within Level 3, fair value is determined based on their discounted amount of estimated future cash flows expected to be received or paid, or based on their cost which management estimates to approximate their fair values.
(d) Other Resources and Other Liabilities Due to their short duration, the carrying amounts of other resources and liabilities in the statements of financial position are considered to be reasonable approximation of their fair values.
7.4 Fair Value Disclosures for Investment Properties Carried at Cost
The total estimated fair values of the investment properties amounted to P11,610, P10,772 and P10,045 in the Group’s financial statements and P11,181, P10,307 and P9,595 in the Parent Company’s financial statements as of December 31, 2021, 2020 and 2019, respectively (see Note 14). The fair value hierarchy of these properties as of December 31, 2021 and 2020 is categorized as Level 3.

- 112 -
The fair values of the Group and Parent Company’s investment properties were determined based on the following approaches:
(a) Fair Value Measurement for Land
The Level 2 fair value of land was derived using the market comparable approach that reflects the recent transaction prices for similar properties in nearby locations as determined by an independent appraiser. Under this approach, when sales prices and/or actual sales transaction of comparable land in close proximity are used in the valuation of the subject property with no adjustment on the price, fair value is included in Level 2.
On the other hand, if the observable and recent prices of the reference properties were adjusted for differences in key attributes such as property size, location and zoning, and accessibility, or any physical or legal restrictions on the use of the property, the fair value will be categorized as Level 3. The most significant input into this valuation approach is the price per square feet, hence, the higher the price per square feet, the higher the fair value.
(b) Fair Value Measurement for Buildings and Improvements
The Level 3 fair value of the buildings was determined using the cost approach that reflects the cost to a market participant to construct an asset of comparable usage, construction standards, design and layout, adjusted for obsolescence. The more significant inputs used in the valuation include direct and indirect costs of construction such as but not limited to, labor and contractor’s profit, materials and equipment, surveying and permit costs, electricity and utility costs, architectural and engineering fees, insurance and legal fees. These inputs were derived from various suppliers and contractor’s quotes, price catalogues, and construction price indices. Under this approach, higher estimated costs used in the valuation will result in higher fair value of the properties.
There has been no change in the valuation techniques for investment properties in both years. 8. SEGMENT INFORMATION
8.1 Business Segments The Group’s operating businesses are managed separately according to the nature of services provided (primary segments) and the different geographical markets served (secondary segments) with a segment representing a strategic business unit. The Group’s business segments follow: (a) Retail – principally handles the BCs offering a wide range of consumer banking products
and services. Products offered include individual customer’s deposits, credit cards, home and mortgage loans, auto, personal and microfinance loans, overdraft facilities, payment remittances and foreign exchange transactions. It also upsells bank products [unit investment trust funds (UITFs), etc.] and cross-sells bancassurance products. The segment includes the net assets of the servicing entity, RBSC, and portfolios of Rizal Microbank.
(b) Corporate – principally handles distinct customer segments: (i) conglomerates; (ii) large corporations; (iii) emerging corporates, which focus on large middle accounts often referred to as the “Next 500 Corporations”; (iv) Japanese multinationals with a strong presence in the country; (v) Filipino-Chinese businesses; and, (vi) Korean businesses. This segment includes portfolio of RCBC LFC.

- 113 -
(c) Small and Medium Enterprises (SME) – principally handles the financial needs of the country’s small businesses or the SMEs and the Commercial Middle Market segments. The SME Banking Group provides a holistic approach serving both the financial (e.g., loans, deposits, investments, insurance, etc.) and non-financial needs (e.g., networking, financial literacy trainings, etc.) of client to help them grow their business. Clients are the entrepreneurs located in different parts of the country and spread in various industry sectors such as manufacturing, wholesale and retail trade, construction, hotels, agriculture, and healthcare, among others.
(d) Treasury – principally provides money market, trading and treasury services, as well as the management of the Group’s funding operations by use of treasury bills, government securities and placements and acceptances with other banks, through treasury and wholesale banking.
(e) Others – consists of other subsidiaries except for RBSC and Rizal Microbank, which is
presented as part of Retail, and RCBC LFC which is presented under Corporate.
These segments are the basis on which the Group reports its primary segment information. Other operations of the Group comprise the operations and financial control groups. Transactions between segments are conducted at estimated market rates on an arm’s length basis.
Segment revenues and expenses that are directly attributable to primary business segment and the relevant portions of the Group’s revenues and expenses that can be allocated to that business segment are accordingly reflected as revenues and expenses of that business segment. For secondary segments, revenues and expenses are attributed to geographic areas based on the location of the resources producing the revenues, and in which location the expenses are incurred. There were no changes in the Group’s operating segments in 2021 and 2020.
8.2 Analysis of Primary Segment Information Primary segment information (by business segment) on a consolidated basis as of and for the years ended December 31, 2021, 2020 and 2019 follow:
Retail Corporate SME Treasury Others Total 2021: Revenues From external customers Interest income P 22,901 P 21,285 P 5,164 P 5,613 P 91 P 55,054 Interest expense ( 7,648) ( 10,564) ( 2,273) ( 2,193) ( 10) ( 22,688) Net interest income 15,253 10,721 2,891 3,420 81 32,366 Non-interest income 6,188 2,257 162 1,524 1,163 11,294 21,441 12,978 3,053 4,944 1,244 43,660 Intersegment revenues Interest income - 8 1,271 - 11 1,290 Non-interest income 564 - - - - 564 564 8 1,271 - 11 1,854 Total net revenues 22,005 12,986 4,324 4,944 1,255 45,514 Expenses Operating expenses excluding depreciation and amortization 19,122 3,240 608 791 710 24,471 Depreciation and amortization 1,200 694 27 51 24 1,996 20,322 3,934 635 842 734 26,467 Segment operating income P 1,683 P 9,052 P 3,689 P 4,102 P 521 P 19,047
Total resources P 155,373 P 295,922 P 76,409 P 236,958 P 4,944 P 769,606
Total liabilities P 450,053 P 352,807 P 88,464 P 23,076 P 1,395 P 915,795

- 114 - Retail Corporate SME Treasury Others Total
2020: Revenues From external customers Interest income P 28,426 P 18,995 P 4,976 P 3,891 P 125 P 56,413 Interest expense ( 10,719) ( 11,742) ( 2,920) ( 2,814) 19 ( 28,176) Net interest income 17,707 7,253 2,056 1,077 144 28,237 Non-interest income 4,742 1,905 142 7,022 ( 9) 13,802 22,449 9,158 2,198 8,099 135 42,039 Intersegment revenues Interest income - 3,539 1,913 - 11 5,463 Non-interest income 617 - - - - 617 617 3,539 1,913 - 11 6,080 Total net revenues 23,066 12,697 4,111 8,099 146 48,119 Expenses Operating expenses excluding depreciation and amortization 19,791 1,824 1,970 1,006 220 24,811 Depreciation and amortization 945 521 16 42 14 1,538 20,736 2,345 1,986 1,048 234 26,349 Segment operating income P 2,330 P 10,352 P 2,125 P 7,052 (P 88) P 21,771
Total resources P 153,127 P 267,468 P 66,421 P 184,695 P 4,994 P 676,705
Total liabilities P 393,074 P 267,700 P 67,247 P 27,640 P 1,296 P 756,957
2019: Revenues From external customers Interest income P 37,465 P 20,012 P 4,608 P 6,978 P 103 P 69,166 Interest expense ( 17,303) ( 13,879) ( 3,648) ( 6,164) ( 42) ( 41,036) Net interest income 20,162 6,133 960 814 61 28,130 Non-interest income 4,928 2,266 171 8,207 1,163 16,735 25,090 8,399 1,131 9,021 1,224 44,865 Intersegment revenues Interest income - 3,463 1,940 - 8 5,411 Non-interest income 591 - - - - 591 591 3,463 1,940 - 8 6,002 Total net revenues 25,681 11,862 3,071 9,021 1,232 50,867 Expenses Operating expenses excluding depreciation and amortization 15,910 5,412 1,129 1,109 285 23,845 Depreciation and amortization 418 381 7 14 14 834 16,328 5,793 1,136 1,123 299 24,679 Segment operating income P 9,353 P 6,069 P 1,935 P 7,898 P 933 P 26,188
Total resources P 150,515 P 228,346 P 52,419 P 109,199 P 5,467 P 545,946
Total liabilities P 423,075 P 80,654 P 43,722 P 14,703 P 1,287 P 563,441
8.3 Reconciliation Presented below is a reconciliation of the Group’s segment information to the key financial information presented in its consolidated financial statements.
2021 2020 2019 Revenue Total segment revenues P 45,514 P 48,119 P 50,866 Elimination of intersegment revenues ( 9,120 ) ( 10,206 ) ( 15,008 ) Net revenues as reported in profit or loss P 36,394 P 37,913 P 35,858 Profit or loss Total segment operating income P 19,047 P 21,771 P 26,188 Elimination of intersegment profit ( 11,964 ) ( 16,753 ) ( 20,800 ) Group net profit as reported in profit or loss P 7,083 P 5,018 P 5,388

- 115 - 2021 2020 2019 Resources Total segment resources P 769,606 P 676,705 P 545,946 Unallocated assets 189,527 95,401 221,133 Total resources P 959,133 P 772,106 P 767,079 Liabilities Total segment liabilities P 915,795 P 756,957 P 563,441 Unallocated liabilities (elimination of intersegment liabilities) ( 67,742 ) ( 86,229 ) 120,788 Total liabilities P 848,053 P 670,728 P 684,229
8.4 Analysis of Secondary Segment Information Secondary information (by geographical locations) as of and for the years ended December 31, 2021, 2020 and 2019 follow:
Asia and Philippines Europe Total 2021: Statement of profit or loss Total income P 44,660 P 14 P 44,674 Total expenses 35,569 22 37,591 Net profit (loss) P 7,091 ( P 8 ) P 7,083 Statement of financial position Total resources P 959,022 P 111 P 959,133 Total liabilities P 848,048 P 5 P 848,053 Other segment information Depreciation and amortization P 3,020 P - P 3,020 2020: Statement of profit or loss Total income P 48,572 P 12 P 48,584 Total expenses 43,545 21 43,566 Net profit (loss) P 5,027 ( P 9 ) P 5,018 Statement of financial position Total resources P 771,994 P 112 P 772,106 Total liabilities P 670,722 P 6 P 670,728 Other segment information Depreciation and amortization P 2,924 P - P 2,924

- 116 -
Asia and Philippines Europe Total 2019: Statement of profit or loss Total income P 51,067 P - P 51,067 Total expenses 45,666 14 45,680 Net profit (loss) P 5,401 ( P 14 ) P 5,387 Statement of financial position Total resources P 767,050 P 29 P 767,079 Total liabilities P 684,155 P 74 P 684,229 Other segment information Depreciation and amortization P 2,503 P - P 2,503
9. CASH AND CASH EQUIVALENTS The components of Cash and Cash Equivalents follow: Group Parent Company 2021 2020 2021 2020 Cash and other cash items P 14,691 P 16,520 P 14,663 P 16,464 Due from BSP 130,170 115,467 128,931 113,949 Due from other banks 12,162 15,707 11,860 15,214 Loans arising from reverse repurchase agreements 11,691 13,356 11,656 13,226 Interbank loans receivables (see Note 11) 30,563 42,681 30,563 42,647 P 199,277 P 203,731 P 197,673 P 201,500
Cash consists primarily of funds in the form of Philippine currency notes and coins, and includes foreign currencies acceptable to form part of the international reserves in the Group’s vault and those in the possession of tellers, including ATMs. Other cash items include cash items other than currency and coins on hand, such as checks drawn on other banks or other branches after the clearing cut-off time until the close of the regular banking hours. Due from BSP represents the aggregate balance of deposit accounts maintained with the BSP primarily to meet reserve requirements (see Note 17), to serve as clearing account for interbank claims and to comply with existing trust regulations. Loans arising from repurchase agreements, which normally mature within 30 days, represents overnight placements with private entities where the underlying securities cannot be sold or repledged to parties other than the contracting party.

- 117 -
Due from BSP includes: Group Parent Company 2021 2020 2021 2020 Demand deposit and secured settlement accounts P 65,074 P 49,539 P 63,931 P 48,119 Term deposit 45,086 28,000 45,000 28,000 Overnight deposit 20,010 37,928 20,000 37,830 P 130,170 P 115,467 P 128,931 P 113,949
The balance of Due from other banks account represents regular deposits with the following:
Group Parent Company 2021 2020 2021 2020 Foreign banks P 10,386 P 14,422 P 10,371 P 14,406 Local banks 1,776 1,285 1,489 808 P 12,162 P 15,707 P 11,860 P 15,214
Interest on placements with BSP and other banks, which is presented as part of Interest Income on Others in the statements of profit or loss, consist of:
Group 2021 2020 2019 BSP P 755 P 929 P 269 Other banks 8 35 165 P 763 P 964 P 434 Parent Company 2021 2020 2019 BSP P 752 P 917 P 262 Other banks 3 28 153 P 755 P 945 P 415 Interests on loans arising from reverse repurchase agreements and interbank loan receivables
are presented as part of Interest on loans and receivables (see Note 11). The Group’s deposits in other banks and in BSP arising from overnight lending from excess
liquidity earn annual interest as follows: 2021 2020 2019 BSP 1.50% - 2.50% 1.50% - 2.50 % 3.50% - 4.50% Other banks 0.00% - 2.00% 0.00% - 2.00 % 0.00% - 2.50%

- 118 -
10. TRADING AND INVESTMENT SECURITIES
This account is comprised of: Group Parent Company 2021 2020 2021 2020 Financial assets at FVTPL P 5,863 P 4,888 P 4,879 P 3,815 Financial assets at FVOCI 49,761 40,150 48,399 38,813 Investment securities at amortized cost 163,611 43,026 162,899 42,513 P 219,235 P 88,064 P 216,177 P 85,141
10.1 Financial Assets at Fair Value Through Profit or Loss Financial assets at FVTPL is composed of the following: Group Parent Company 2021 2020 2021 2020 Government securities P 4,330 P 1,876 P 3,346 P 1,808 Corporate debt securities 35 710 35 606 Equity securities 232 1,173 232 272 Derivative financial assets 1,266 1,129 1,266 1,129 P 5,863 P 4,888 P 4,879 P 3,815
The carrying amounts of financial assets at FVTPL are classified as follows:
Group Parent Company 2021 2020 2021 2020 Held-for-trading P 4,365 P 2,586 P 3,381 P 2,414 Designated as at FVTPL 232 1,173 232 272 Derivative financial assets 1,266 1,129 1,266 1,129 P 5,863 P 4,888 P 4,879 P 3,815
Equity securities are composed of listed shares of stock traded at the PSE and shares of stock designated as at FVTPL. Dividend income earned by the Group on these equity securities amounted to P22, P20 and P10 in 2021, 2020 and 2019, respectively, and P22, P9 and nil for the Parent Company in 2021, 2020 and 2019, respectively, which are included as part of Miscellaneous income under the Other Operating Income account in the statements of profit or loss (see Note 25.1) Treasury bills and other debt securities issued by the government and other private corporations earn annual interest as follows:
2021 2020 2019 Peso denominated 1.37% - 8.12% 2.38% - 15.00% 3.25% - 15.00% Foreign currency denominated 1.37% - 10.62% 2.46% - 10.63% 2.05% - 10.63%

- 119 -
Derivative instruments used by the Group include foreign currency short-term forwards, cross-currency swaps, debt warrants and options. Foreign currency forwards represent commitments to purchase/sell on a future date at a specific exchange rate. Foreign currency short-term swaps are simultaneous foreign currency spot and forward deals with tenor of one year. Debt warrants attached to the bonds and other debt securities allows the Group to purchase additional debt securities from the same contracting issuer at the same price and yield as the initial purchased security. Option is a derivative financial instrument that specifies a contract between two parties for a future transaction on an asset at a reference price.
The aggregate contractual or notional amount of derivative financial instruments and the aggregative fair values of derivative financial assets and financial liabilities as of December 31 both in the Group and Parent Company’s financial statements are shown below.
Notional Fair Values Amount Assets Liabilities
2021: Currency swaps and forwards P 85,909 P 985 P 745 Interest rate swaps and futures 18,854 272 177 Debt warrants 5,364 8 - Credit default swap 11,216 1 4 P 121,343 P 1,266 P 926
2020: Currency swaps and forwards P 38,432 P 681 P 1,111 Interest rate swaps and futures 21,440 435 370 Debt warrants 5,051 10 - Credit default swap 192 3 3 P 65,115 P 1,129 P 1,484
Derivative liabilities are shown as Derivative financial liabilities as part of Other Liabilities account in the statements of financial position (see Note 22). The significant portion of such derivative liabilities have maturity periods of less than a year.
Other information about the fair value measurement of the Group and Parent Company’s financial assets at FVTPL are presented in Note 7.2. 10.2 Financial Assets at Fair Value Through Other Comprehensive Income Financial assets at FVOCI as of December 31 consist of:
Group Parent Company 2021 2020 2021 2020 Quoted equity securities P 1,852 P 1,860 P 1,000 P 976 Unquoted equity securities 1,815 1,570 1,788 1,542 Government debt securities 28,682 20,563 28,682 20,563 Corporate debt securities 17,412 16,157 16,929 15,732 P 49,761 P 40,150 P 48,399 P 38,813
The Group made an irrevocable designation for the above local equity securities as at FVOCI because they are held for long-term investments and are neither held-for-trading nor designated as at FVTPL. Unquoted equity securities include investments in non-marketable equity securities of private companies.

- 120 -
Included in the carrying amount of the Group’s financial assets at FVOCI as of December 31, 2021 and 2020 are unquoted equity securities with fair value of P1,815 and P1,570, respectively, determined using the net asset value method, dividend discounted model, or a market-based approach (price-to-book value method), hence, categorized under Level 3 of the fair value hierarchy (see Note 7.2). As a result of the Group’s disposal of certain equity securities classified as at FVOCI in 2019, the related fair value loss recognized in other comprehensive income under Revaluation Reserves account amounting to P41, were transferred to Surplus account (see Note 23.6). There were no disposal of equity securities classified as at FVOCI in 2021 and 2020. In 2021, 2020 and 2019, dividends on these equity securities were recognized amounting to P83, P58 and P294 by the Group and, P17, P7 and P95 by the Parent Company, respectively, which are included as part of Miscellaneous income under the Other Operating Income account in the statements of profit or loss (see Note 25.1).
10.3 Investment Securities at Amortized Cost Investment securities at amortized cost as of December 31 consist of:
Group Parent Company 2021 2020 2021 2020 Government securities P 132,969 P 37,022 P 132,162 P 36,932 Corporate debt securities 30,789 6,146 30,789 5,629 163,758 43,168 162,951 42,561 Allowance for impairment ( 147) ( 142 ) ( 52 ) ( 48 ) P 163,611 P 43,026 P 162,899 P 42,513
Interest rates per annum on government securities and corporate debt securities range from the following:
2021 2020 2019 Peso denominated securities 2.63% - 8.13% 3.38% - 8.60% 3.63% - 8.60% Foreign currency-denominated securities 0.18% - 10.63% 0.18% - 10.63% 1.63% - 10.63%
In 2020, the Group and Parent Company disposed of certain local and foreign sovereign bonds, and corporate bonds denominated in Philippine peso, US dollar, and euro under its HTC portfolio with aggregate carrying amount of P62,960, resulting in net gains amounting to P2,678. The disposal was made in order to address the capital adequacy ratio requirements after complying with the real estate stress test. There is no similar transaction in 2021.
Management had assessed that the disposals of the investment securities under the HTC
portfolio in 2020 are consistent with the Group’s HTC business model with the objective of collecting contractual cash flows and have qualified under the permitted sale events set forth in the Group’s business model in managing financial assets manual and the requirements of PFRS 9. The above disposals of investment securities were approved by the Executive Committee of the Parent Company in compliance with the documentation requirements of the BSP.

- 121 -
The Group recognized ECL on investment securities at amortized cost amounting to P14 in 2021, P1 in 2020, and P12 in 2019 (see Note 16). The Parent Company recognized ECL in investment at amortized cost amounting to P12 in 2021 and nil for 2020 and 2019 (see Note 16).
Certain government securities are deposited with the BSP as security for the Group’s faithful compliance with its fiduciary obligations in connection with its trust operations (see Note 27).
As of December 31, 2021 and 2020, certain investment securities of both the Group and Parent Company were pledged as collateral for bills payable under repurchase agreements (see Note 18).
10.4 Interest Income from Trading and Investment Securities Interest income from trading and investment securities recognized by the Group and Parent Company in 2021, 2020 and 2019 are shown below.
Group 2021 2020 2019 Financial assets at FVTPL P 96 P 223 P 368 Debt securities at FVOCI 1,343 848 1,418 Investment securities at amortized cost 3,009 1,008 2,712 P 4,448 P 2,079 P 4,498 Parent 2021 2020 2019 Financial assets at FVTPL P 92 P 213 P 358 Debt securities at FVOCI 1,320 804 1,397 Investment securities at amortized cost 2,967 974 2,684 P 4,379 P 1,991 P 4,439
10.5 Trading and Securities Gains (Losses)
The Group and the Parent Company recognized trading and securities gains (losses) in its trading or disposals of investment securities, including their fair value changes, in 2021, 2020, and 2019 are as follows:
Group 2021 2020 2019 Profit or loss: Financial assets at FVTPL P 309 P 286 P 611
Debt securities at FVOCI 554 3,103 3,196 Investment securities at
amortized cost - 2,695 3,685 P 863 P 6,084 P 7,492 Other comprehensive income (loss): Equity securities at FVOCI P 548 ( P 570 ) ( P 586 ) Debt securities at FVOCI ( 823 ) 339 ( 116 ) ( P 275 ) ( P 231 ) ( P 702 )

- 122 -
Parent 2021 2020 2019 Profit or loss: Financial assets at FVTPL P 314 P 264 P 581 Debt securities at FVOCI 542 3,098 3,166 Investment securities at amortized cost - 2,678 3,685 P 856 P 6,040 P 7,432 Other comprehensive income (loss): Equity securities at FVOCI P 490 ( P 591 ) ( P 837 ) Debt securities at FVOCI ( 823 ) 339 ( 116 ) ( P 333 ) ( P 252 ) ( P 953 ) 11. LOANS AND RECEIVABLES This account consists of the following (see also Note 28.1) Group Parent Company 2021 2020 2021 2020 Receivables from customers: Loans and discounts P 452,495 P 400,846 P 446,954 P 395,850 Credit card receivables 35,563 31,973 35,563 31,973 Customers’ liabilities on acceptances, import bills and trust receipts 20,662 18,868 20,662 18,868 Lease contract receivables 2,296 3,115 - - Bills purchased 2,033 2,109 2,033 2,109 Receivables financed 297 343 - - 513,346 457,254 505,212 448,800 Unearned discount ( 615 ) ( 689 ) ( 279 ) ( 137 ) 512,731 456,565 504,933 448,663 Other receivables: Interbank loans receivables (see Note 9) 30,563 42,681 30,563 42,647 Accrued interest receivables 7,372 5,677 7,058 5,505 Accounts receivables [see Note 28.5(a)] 4,114 3,661 3,603 3,631 UDSCL 989 965 989 965 Sales contract receivables 797 928 657 766 43,835 53,912 42,870 53,514 556,566 510,477 547,803 502,177 Allowance for impairment (see Notes 4.4.9 and 16) ( 18,264 ) ( 19,193 ) ( 17,339 ) ( 18,363 )
P 538,302 P 491,284 P 530,464 P 483,814

- 123 -
Receivables from customers’ portfolio earn average annual interest or range of interest as follows: 2021 2020 2019 Loans and discounts: Philippine peso 7.37% 8.58% 8.69% Foreign currencies 4.37% 4.62% 4.96% Credit card receivables 14.23% - 18.87% 16.52% - 29.87% 23.58% - 24.86% Lease contract receivables 8% - 26.00% 9.50% - 26.00% 8.00% - 18.00% Receivables financed 11% - 22.00% 10.00% - 24.00% 8.00% - 14.00%
Effective November 3, 2020, interest rates and cash advance fees charged by the Parent Company to its credit card holders were updated to comply with BSP Circular No. 1098, Ceiling on Interest of Finance Charges of Credit Card Receivables. Under the new circular, interest or finance charges on all credit card transactions are not to exceed an annual interest rate of 24%, except credit card installment loans which shall be subject to monthly add-on rate not exceeding 1%. In addition, the maximum amount that can be charged for Cash Advances is capped at P200 (absolute amount) per transaction.
Included in UDSCL is a 10-year note with carrying amount of P742 and P264 as of December 31, 2021 and 2020, respectively, and bears 6.44% interest per annum. This pertains to the agreement entered into in June 2017 with a third party for the sale of various foreclosed real properties with book value of P1,127, for a total consideration of P1,385; of which P396 and P989 (with present value of P742 on date of sale) were in the form of cash and note receivable, respectively.
Also included in the Parent Company’s accounts receivables is the amount due from RCBC JPL which was acquired from Rizal Microbank in 2015 amounting to P222. As of December 31, 2021 and 2020, the outstanding balance amounted to P127 and P147, respectively. The receivable amount is unsecured, noninterest-bearing and payable in cash on demand (see Note 28). The receivable has been appropriately provided with allowance for ECL. Interest income earned by the Bank from its loans and other receivables is broken down as follows:
Group 2021 2020 2019 Loans and discounts P 26,090 P 25,965 P 25,529 Credit card receivables 4,890 6,759 5,939 Others 920 1,185 1,178 P 31,900 P 33,909 P 32,646 Parent Company 2021 2020 2019 Loans and discounts P 25,924 P 25,770 P 24,644 Credit card receivables 4,890 6,759 5,939 Others 281 502 1,165 P 31,095 P 33,031 P 31,748

- 124 -
The breakdown of the receivables from customers’ portfolio as to secured and unsecured follows:
Group Parent Company 2021 2020 2021 2020 Secured: Real estate mortgage P 132,782 P 135,421 P 132,094 P 134,077 Chattel mortgage 66,351 53,456 66,254 50,990 Hold-out deposits 7,464 8,581 7,457 8,428 Other securities 14,280 17,181 14,248 13,585 220,877 214,639 220,053 207,080 Unsecured 291,854 241,926 284,880 241,583 P 512,731 P 456,565 P 504,933 P 448,663
A reconciliation of the allowance for impairment on loans and receivables at the beginning and end of 2021 and 2020 is shown below (see Note 16).
Group Parent Company 2021 2020 2021 2020 Balance at beginning of year P 19,193 P 13,430 P 18,363 P 12,726 Impairment losses during the year 4,994 9,093 4,895 8,672 Accounts written off and others ( 5,923 ) ( 3,330 ) ( 5,919 ) ( 3,035 ) Balance at end of year P 18,264 P 19,193 P 17,339 P 18,363 12. INVESTMENTS IN SUBSIDIARIES AND ASSOCIATES
The components of the carrying values of investments in and advances to subsidiaries and associates are as follows (refer to Note 1.2 for the effective percentage of ownership, line of business, and country of incorporation of subsidiaries and associates):
Group and Parent Company 2021 2020 Acquisition costs of associates: HCPI P 91 P 91 LIPC 57 57 YCS 4 4 152 152
Accumulated equity in net earnings: Balance at beginning of year 187 292 Share in net earnings (losses) for the year 12 ( 94 ) Share in actuarial losses on defined benefit plan ( 3) ( 8 ) Others ( 4) ( 3 ) Balance at end of year 192 187
P 344 P 339

- 125 -
Note Parent Company 2021 2020 Acquisition costs of subsidiaries: RCBC Capital P 2,231 P 2,231 Rizal Microbank 1,242 1,242 RCBC LFC 1,987 1,987 NPHI 609 609 RCBC JPL 403 403 RCBC Forex 150 150 RCBC Telemoney 72 72 RCBC IFL 58 58 Cajel 51 51 Total acquisition costs 6,803 6,803
Accumulated equity in net earnings: Balance at beginning of year ( 162) 477 Share in net earnings for the year 465 24 Share in actuarial gains on defined benefit plan 50 - Share in fair value gains on financial assets at FVOCI 58 21 Cash dividends 28 ( 524) ( 1,243 ) Others ( 7) 559 Balance at end of year ( 120) ( 162 ) Investments in subsidiaries 6,683 6,641 Investments in associates 344 339 P 7,027 P 6,980
At the end of each reporting period, the Group has no material interest in unconsolidated structured entities. Also, the Parent Company and its subsidiaries did not enter in any contractual arrangements to provide financial support to any entities under the Group.
The Parent Company earned dividends from its subsidiaries and associates amounted to P524 and nil, respectively, in 2021, P1,243 and nil, respectively, in 2020, and P536 and nil, respectively, in 2019 (see Note 28). Dividends receivable as of December 31, 2021 and 2020 amounted to P500 and P600, respectively.

- 126 -
12.1 Information About Investments in Associates The Parent Company, under a shareholder’s agreement, agreed with another stockholder of HCPI to commit and undertake to vote, as a unit, the shares of stock thereof, which they proportionately own and hold, and to regulate the conduct of the voting and the relationship between them with respect to their exercise of their voting rights. As a result of this agreement, the Parent Company is able to exercise significant influence over the operating and financial policies of HCPI. Thus, HCPI has been considered by the Parent Company as an associate despite holding only 12.88% ownership interest. The investments in LIPC and YCS have an aggregate carrying value of P11 and nil as of December 31, 2021 and 2020, respectively, which are insignificant to the Group. The table below presents the summary of the unaudited financial information of HCPI as of and for the years ended December 31, 2021 and 2020. HCPI uses a fiscal year ending March 31 as its reporting period.
2021 2020 Financial position: Current assets P 3,835 P 5,384 Noncurrent assets 1,063 1,297 Current liabilities 1,758 3,496 Noncurrent liabilities 420 549 Financial performance: Revenues 11,113 2,851 Gross income 1,070 937 Operating income (loss) 255 ( 916 ) Net income (loss) 221 ( 620 ) Other comprehensive loss ( 25 ) ( 62 ) Total comprehensive income (loss) 196 ( 682 ) Cash flows: Net cash from (used in): Operating activities ( 930 ) 1,148 Investing activities ( 31 ) 90 Cash at the beginning 1,640 402 Cash at the end 679 1,640
On February 22, 2020, HCPI announced its plan to cease its production facility in Laguna in consideration of efficient allocation and distribution of its resources in Asia and Oceania. Automobile sales and after-sales services will continue through its regional network.

- 127 -
13. BANK PREMISES, FURNITURE, FIXTURES AND EQUIPMENT
The gross carrying amounts and accumulated depreciation and amortization of bank premises, furniture, fixtures and equipment at the beginning and end of 2021 and 2020 are shown below.
Group Furniture, Leasehold Fixtures and Rights and Right-of- Land Buildings Equipment Improvements use Asset Total
December 31, 2021 Cost P 1,267 P 3,822 P 11,470 P 914 P 3,626 P 21,099 Accumulated depreciation and amortization - ( 1,742 ) ( 6,697 ) - - ( 8,439 ) Net carrying amount P 1,267 P 2,080 P 4,773 P 914 P 3,626 P 12,660 December 31, 2020 Cost P 1,286 P 3,780 P 12,914 P 1,306 P 6,113 P 25,399 Accumulated depreciation and amortization - ( 1,661 ) ( 8,281 ) ( 339 ) ( 2,056 ) ( 12,337 ) Net carrying amount P 1,286 P 2,119 P 4,633 P 967 P 4,057 P 13,062 January 1, 2020 Cost P 1,270 P 3,673 P 10,161 P 1,094 P 3,283 P 19,481 Accumulated depreciation and amortization - ( 1,563 ) ( 6,041 ) - ( 818 ) ( 8,422 ) Net carrying amount P 1,270 P 2,110 P 4,120 P 1,094 P 2,465 P 11,059 Parent Company Furniture, Leasehold Fixtures and Rights and Right-of- Land Buildings Equipment Improvements use Asset Total
December 31, 2021 Cost P 1,222 P 3,788 P 8,828 P 880 P 4,150 P 18,868 Accumulated depreciation and amortization - ( 1,720 ) ( 6,577 ) - - ( 8,297 ) Net carrying amount P 1,222 P 2,068 P 2,251 P 880 P 4,150 P 10,571 December 31, 2020 Cost P 1,249 P 3,733 P 8,603 P 1,214 P 5,954 P 20,753 Accumulated depreciation and amortization - ( 1,630 ) ( 6,387 ) ( 284 ) ( 1,952 ) ( 10,253) Net carrying amount P 1,249 P 2,103 P 2,216 P 930 P 4,002 P 10,500 January 1, 2020 Cost P 1,249 P 3,625 P 8,193 P 1,056 P 3,208 P 17,331 Accumulated depreciation and amortization - ( 1,534 ) ( 5,919 ) - ( 807 ) ( 8,260 ) Net carrying amount P 1,249 P 2,091 P 2,274 P 1,056 P 2,401 P 9,071

- 128 -
A reconciliation of the carrying amounts of bank premises, furniture, fixtures and equipment at the beginning and end of 2021 and 2020 is shown below.
Group Furniture, Leasehold Fixtures and Rights and Right-of- Land Buildings Equipment Improvements Use Asset Total
Balance at January 1, 2021, net of accumulated depreciation and amortization P 1,286 P 2,119 P 4,633 P 967 P 4,057 P 13,062 Additions - 93 1,020 220 855 2,188 Reclassifications 4 3 ( 1 ) - - 6 Disposals ( 23 ) ( 11) ( 36 ) ( 17) ( 1) ( 88 ) Depreciation and amortization charges for the period - ( 124 ) ( 843) ( 256 ) ( 1,285 ) ( 2,508 ) Balance at December 31, 2021, net of accumulated depreciation and amortization P 1,267 P 2,080 P 4,773 P 914 P 3,626 P 12,660 Balance at January 1, 2020, net of accumulated depreciation and amortization P 1,270 P 2,110 P 4,120 P 1,094 P 2,465 P 11,059 Additions 17 118 1,462 167 2,789 4,553 Reclassifications - 19 2 9 1 31 Disposals ( 1 ) ( 2 ) ( 80 ) ( 7 ) ( 2 ) ( 92 ) Depreciation and amortization charges for the period - ( 126 ) ( 871 ) ( 296 ) ( 1,196 ) ( 2,489 ) Balance at December 31, 2020, net of accumulated depreciation and amortization P 1,286 P 2,119 P 4,633 P 967 P 4,057 P 13,062

- 129 - Parent Company Furniture, Leasehold Fixtures and Rights and Right-of- Land Buildings Equipment Improvements use Asset Total
Balance at January 1, 2021, net of accumulated depreciation and amortization P 1,249 P 2,103 P 2,216 P 930 P 4,002 P 10,500 Additions - 93 688 214 1,180 2,175 Reclassifications 4 3 - - - 7 Disposals ( 31) ( 9 ) ( 38) ( 17 ) - ( 95 ) Depreciation and amortization charges for the period - ( 122 ) ( 615 ) ( 247 ) ( 1,032 ) ( 2,016 ) Balance at December 31, 2021, net of accumulated depreciation and amortization P 1,222 P 2,068 P 2,251 P 880 P 4,150 P 10,571 Balance at January 1, 2020
net of accumulated depreciation and amortization P 1,249 P 2,091 P 2,274 P 1,056 P 2,401 P 9,071 Additions - 117 497 159 2,746 3,519 Disposals - ( 2 ) ( 36 ) ( 1) - ( 39 ) Depreciation and amortization charges for the period - ( 122 ) ( 519 ) ( 284) ( 1,145 ) ( 2,070 ) Reclassification - 19 - - - 19 Balance at December 31, 2020, net of accumulated depreciation and amortization P 1,249 P 2,103 P 2,216 P 930 P 4,002 P 10,500
Under BSP rules, investments in bank premises, furniture, fixtures and equipment should not exceed 50% of the respective unimpaired capital of the Parent Company and its bank subsidiaries. As of December 31, 2021 and 2020, the Parent Company and its bank subsidiary have satisfactorily complied with this BSP requirement. The cost of the Group and the Parent Company’s fully depreciated bank premises, furniture, fixtures and equipment that are still in use in operations is P6,974 and P6,334, respectively, as of December 31, 2021, and P6,812 and P6,178, respectively, as of December 31, 2020.
The Group has leases for certain offices and branches. With the exception of short-term leases and leases of low-value underlying assets, each lease is reflected as a right-of-use asset and a Lease liability as part of Bank Premises, Furniture, Fixtures and Equipment and Other Liabilities (see Note 22), respectively. Variable lease payments which do not depend on an index or a rate are excluded from the initial measurement of the Lease liability and Right-of-use asset.

- 130 -
Each lease generally imposes a restriction that, unless there is a contractual right for the Group to sublet the asset to another party, the right-of-use asset can only be used by the Group. Leases are either non-cancellable or may only be cancelled by incurring a substantive termination fee. Some leases contain an option to extend the lease for a further term. The Group is prohibited from selling or pledging the underlying leased assets as security. For leases over branches and offices, the Group must keep those properties in a good state of repair and return the properties in their original condition at the end of the lease. Further, the Group must insure the leased assets and incur maintenance fees on such items in accordance with the lease contracts.
The use of extension and termination options gives the Group added flexibility in the event it has identified more suitable premises in terms of cost and/or location or determined that it is advantageous to remain in a location beyond the original lease term. An option is only exercised when consistent with the Group’s regional markets strategy and the economic benefits of exercising the option exceeds the expected overall cost.
14. INVESTMENT PROPERTIES Investment properties pertain to land, buildings or condominium units acquired by the Group, in settlement of loans from defaulting borrowers through foreclosure or dacion in payment and properties which are held for rental.
The gross carrying amounts and accumulated depreciation and impairment losses of investment properties at the beginning and end of 2021 and 2020 are shown below.
Group Parent Company Land Buildings Total Land Buildings Total
December 31, 2021 Cost P 1,658 P 3,096 P 4,754 P 1,518 P 3,070 P 4,588 Accumulated depreciation - ( 905 ) ( 905 ) - ( 892 ) ( 892 ) Accumulated impairment (see Note 16) ( 17) ( 260 ) ( 277 ) ( 1 ) ( 260 ) ( 261 ) Net carrying amount P 1,641 P 1,931 P 3,572 P 1,517 P 1,918 P 3,435 December 31, 2020 Cost P 1,783 P 3,044 P 4,827 P 1,634 P 3,021 P 4,655 Accumulated depreciation - ( 791 ) ( 791 ) - ( 777 ) ( 777 ) Accumulated impairment (see Note 16) ( 40 ) ( 271 ) ( 311 ) ( 27 ) ( 271 ) ( 298 ) Net carrying amount P 1,743 P 1,982 P 3,725 P 1,607 P 1,973 P 3,580 January 1, 2020 Cost P 1,797 P 3,035 P 4,832 P 1,649 P 3,016 P 4,665 Accumulated depreciation - ( 638 ) ( 638 ) - ( 625 ) ( 625 ) Accumulated impairment (see Note 16) ( 18 ) ( 34 ) ( 52 ) ( 18 ) ( 5 ) ( 23 ) Net carrying amount P 1,779 P 2,363 P 4,142 P 1,631 P 2,386 P 4,017

- 131 -
The reconciliations of the carrying amounts of investment properties at the beginning and end of 2021 and 2020 follow:
Group Parent Company 2021 2020 2021 2020 Balance at January 1, net of accumulated depreciation and impairment P 3,725 P 4,142 P 3,580 P 4,017 Additions 437 64 436 39 Disposals ( 71 ) ( 147) ( 66)( 144 ) Reclassification ( 7 ) ( 20) ( 7)( 20 ) Depreciation charges for the year ( 172 ) ( 126) ( 172)( 126 ) Impairment losses ( 340 ) ( 188) ( 336)( 186 ) Balance at December 31, net of accumulated depreciation and impairment P 3,572 P 3,725 P 3,435 P 3,580
As of December 31, 2021 and 2020, there is no restriction on the realizability of investment properties or the remittance of income and proceeds of disposal therefrom.
14.1 Additions and Disposals of Investment Properties The Group and the Parent Company foreclosed real and other properties totaling P437 and P436, respectively, in 2021, and P64 and P39, respectively, in 2020, in settlement of certain loan accounts. As of December 31, 2021, and 2020, foreclosed investment properties still subject to redemption period by the borrowers amounted to P638 and P409, respectively, for the Group and P633 and P407, respectively, for the Parent Company.
The total gain recognized by the Group and the Parent Company from disposals of investment properties amounted to P30 and P18, respectively, in 2021, and P23 and P20, respectively, in 2020, which is presented as part of Gains on assets sold under Miscellaneous Income account in the statements of profit or loss (see Note 25.1).
14.2 Income and Expenses from Investment Properties Held for Rental The Group and Parent Company earned rental income from investment properties amounting to P229 in 2021, P215 in 2020 and P275 in 2019, and are presented as part of Rentals under Miscellaneous Income account in the statements of profit or loss [see Notes 25.1 and 28.5(a)]. Expenses incurred by the Group and Parent Company in relation to the investment properties include taxes and licenses amounting to P16 and P13, respectively, in 2021, P6 and P5, respectively, in 2020 and P20 and P17, respectively, in 2019.

- 132 -
15. OTHER RESOURCES Other resources consist of the following:
Group Parent Company Notes 2021 2020 2021 2020 Assets held-for-sale and disposal group 15.3 P 5,295 P 4,182 P 4,745 P 3,648 Creditable withholding taxes 2,412 2,154 2,398 2,148 Prepaid expenses 15.4 1,651 1,003 1,449 856 Software – net 15.2 1,338 1,184 1,332 1,175 Branch licenses 15.1 1,000 1,000 1,000 1,000 Refundable and other deposits 528 720 526 713 Goodwill 15.5 426 426 269 269 Unused stationery and supplies 419 311 412 300 Deferred charges 390 176 369 153 Returned checks and other cash items 196 155 196 155 Margin deposits 15.6 73 17 73 17 Miscellaneous 15.7 640 1,012 863 1,125 14,368 12,340 13,632 11,559 Allowance for impairment 15.3, 15.5 ( 1,268 ) ( 802 ) ( 1,135)( 670 ) P 13,100 P 11,538 P 12,497 P 10,889
15.1 Branch Licenses Branch licenses represent the rights granted by the BSP to the Parent Company in 2015 to establish a certain number of branches in the restricted areas in the country. Branch licenses are annually tested for impairment either individually or at the cash generating unit level, as appropriate when circumstances indicate that the intangible asset may be impaired. As of December 31, 2021 and 2020, the Group has assessed that the recoverable amount of these branch licenses, which is based on the last transacted price, is higher than the carrying value; hence, no impairment loss is required to be recognized in the statements of profit or loss.
15.2 Software A reconciliation of the carrying amounts of software at the beginning and end of 2021 and 2020 is shown below.
Group Parent Company 2021 2020 2021 2020
Balance at beginning of year P 1,184 P 902 P 1,175 P 895 Additions 494 591 493 575 Amortization ( 340) ( 309 ) ( 336 ) ( 295 ) P 1,338 P 1,184 P 1,332 P 1,175

- 133 -
Amortization charges for software are included as part of Depreciation and Amortization account in the statements of profit or loss. 15.3 Assets Held-for-Sale and Disposal Group
Group Parent Company 2021 2020 2021 2020
Equity securities P 1,842 P 1,931 P 1,842 P 1,931 Foreclosed automobiles 2,812 1,599 2,673 1,488 Foreclosed real properties 641 652 230 229 5,295 4,182 4,745 3,648 Allowance for impairment ( 1,118) ( 652 ) ( 1,118 ) ( 652 ) Balance at end of year P 4,177 P 3,530 P 3,627 P 2,996
Assets held-for-sale represents assets that are approved by management to be immediately sold in its present condition and management believes that the sale is highly probable at the time of reclassification. These mainly include real properties, automobiles, equipment and other assets foreclosed by the Parent Company and RCBC LFC in settlement of loans and real properties held for sale by NHPI and Cajel. 15.3.1 HHIC Equity Securities In May 2019, RCBC, together with other local banks, entered into a Detailed Implementing Agreement with Hanjin Heavy Industries and Construction Philippines, Inc. (HHIC-Phil), a subsidiary of Hanjin Heavy Industry Co., Ltd. (HHIC), a Korean shipbuilding company, to convert a part of the former’s debt into a 20% stake in HHIC (see Note 29.7). Accordingly, in June 2019, the Bank received 7,100,129 common shares representing 8.53% ownership in HHIC in settlement of HHIC-Phil’s gross outstanding loan amounting to USD63.5 million or P3,286. As of December 31, 2021, the Bank estimates that it will need two more years to complete the sale of the shares under its current disposal plan. This is covered by the exception in PFRS 5, Non-current Assets Held for Sale and Discontinued Operations, which states that an extension of the period required to complete a sale does not preclude an asset (or disposal group) from being classified as held for sale if the delay is caused by events or circumstances beyond the entity’s control and there is sufficient evidence that the entity remains committed to its plan to sell the asset. As a result, the carrying amount of the investment is measured at the lower of their carrying amount, immediately prior to its classification as held-for-sale and its fair value less costs to sell.
15.3.2 Other Foreclosed Assets
In 2009, in accordance with the letter received by RCBC Savings Bank, Inc. (RSB), which was merged with RCBC on July 22, 2019, from BSP dated March 26, 2009, RSB reclassified certain investment properties to equity investments as its investment in subsidiaries in its separate financial statements which resulted in the inclusion of the assets, liabilities, income and expenses of the SPCs of RSB in the Group’s consolidated financial statements. The approval of the BSP through the MB is subject to the following conditions: (i) RSB should immediately dissolve the SPCs once the underlying dacioned real property assets were sold or disposed of; and, (ii) the equity investments in the SPCs shall be disposed of within a reasonable period of time.

- 134 -
In partial compliance with the requirements of the BSP, the management of RSB resolved that certain SPCs be disposed of through the conversion of the SPCs’ existing common shares into redeemable preferred shares which shall be subsequently redeemed. Accordingly, at their special meeting held on September 30, 2013, the respective BOD and the stockholders of the SPCs approved that a portion of the common shares of the SPCs owned by RSB shall be converted to redeemable preferred shares and that for such purpose, the Articles of Incorporation of the SPCs below have been amended. The amendment was approved by the SEC on November 28, 2013. The involved SPCs are as follows: (a) Goldpath Properties Development Corporation (b) Eight Hills Property and Development Corporation (c) Crescent Park Property and Development Corporation (d) Niceview Property and Development Corporation (e) Lifeway Property and Development Corporation (f) Gold Place Properties Development Corporation (g) Princeway Properties Development Corporation (h) Greatwings Properties Development Corporation (i) Top Place Properties Development Corporation (j) Crestview Properties Development Corporation (k) Best Value Property and Development Corporation
On December 23, 2013, the BOD of RSB approved the foregoing SPCs’ redemption of the SPCs’ respective preferred shares for a total consideration of P1,555. This transaction resulted in the recognition of a redemption loss by RSB amounting to P185 which is reported in the 2013 consolidated financial statements of the Group as part of Other Reserves account pending the eventual retirement of these redeemable preferred shares. On May 30, 2014 and on October 16, 2014, the retirement of the preferred shares was approved by the BOD and SEC, respectively; hence, the retirement of shares was executed by RSB. Consequently, the amount of the redemption loss was transferred directly to Surplus account from Other Reserves account as the redemption of shares of these SPCs is considered transaction between owners within the Group (see Note 23.8). In relation to the SPCs disposal plan and to fully comply with the requirements of the BSP, the BOD of RSB has approved in its meeting held on May 30, 2014 the shortening of the corporate life of these SPCs until December 31, 2015 which was approved by the SEC in various dates during the last quarter of 2014. In 2019, the Group has completed the liquidation of the operations of SPCs. NPHI and Cajel are retained by the Parent Company and are presented under Investment in Subsidiaries and Associates account (see Note 12).
15.4 Prepaid Expenses
Prepaid expenses include prepayments for insurance, taxes and licenses, and software maintenance. 15.5 Goodwill The Parent Company recognized goodwill amounting to P269 which arose from its acquisition of the net assets of another bank in 1998 from which it had expected future economic benefits and synergies that will result from combining the operations of the acquired bank.

- 135 -
Goodwill is subject to annual impairment testing and whenever there is an indication of impairment. In 2021 and 2020, the Parent Company engaged a third party consultant to perform an independent impairment testing of goodwill. The recoverable amount of the CGU has been based on Value-in-Use (VIU) calculation using the cash flow projections from financial budgets approved by the Parent Company’s senior management covering a five-year period. The Group also considered key assumptions in determining cash flow projections which includes discount rates and growth rates. Future cash flows and growth rates were based on experience, strategies developed, and prospects. The discount rate used for the computation of the net present value is the cost of equity and was determined by reference to comparable entities within the industry. In 2021 and 2020, the discount rate applied to cash flow projections is 10.55% and 8.28% respectively, while the growth rate used to extrapolate cash flows beyond five-year period is 6.46% and 6.47% for 2021 and 2020, respectively. On the basis of the report of the third-party consultant dated Januar 26, 2022 and January 21, 2021 with valuation date as of the end of 2021 and 2020 respectively, the Group has assessed that the recoverable amount of the goodwill is higher than its carrying value. Accordingly, no impairment loss is required to be recognized in the statements of profit or loss in both years. In addition, the goodwill pertaining to the acquisition of Rizal Microbank amounting to P157 million was fully provided with impairment in 2011. 15.6 Margin Deposits Margin deposits serve as security for outstanding financial market transactions and other liabilities. These are designed to provide additional credit risk protection for counterparty exposures.
15.7 Miscellaneous Miscellaneous account includes various deposits, advance rentals, service provider fund, trading right and other assets.

- 136 -
16. ALLOWANCE FOR EXPECTED CREDIT LOSS AND IMPAIRMENT Changes in the amounts of allowance for impairment are summarized below. Group Parent Company Notes 2021 2020 2021 2020 Balance at beginning of year Loans and receivables 11 P 19,193 P 13,430 P 18,363 P 12,726 Investment securities at amortized cost 10.3 142 142 48 49 Investment properties 14 311 52 298 23 Other resources 15 802 723 670 591 20,448 14,347 19,379 13,389
Impairment losses – net: Loans and receivables 11 4,994 9,093 4,895 8,672 Investment securities at amortized cost 10.3 14 1 12 - Loan commitments 5 14 5 14 Investment properties 14 340 188 336 186 Other resources 15 695 79 685 79 6,048 9,375 5,933 8,951 Charge-offs and other adjustments during the year ( 6,540) ( 3,274 ) ( 6,525) ( 2,961 ) Balance at end of year
Loans and receivables 11 18,264 19,193 17,339 18,363 Investment securities at
at amortized cost 10.3 147 142 52 48 Investment properties 14 277 311 261 298 Other resources 15 1,268 802 1,135 670
P 19,956 P 20,448 P 18,787 P 19,379

- 137 -
17. DEPOSIT LIABILITIES
The following is the breakdown of deposit liabilities (see also Note 28.2): Group Parent Company 2021 2020 2021 2020 Demand P 144,810 P 107,172 P 146,793 P 108,445 Savings 228,470 195,164 228,944 195,394 Time 293,097 227,370 292,595 226,827 Long-term Negotiable Certificate of Deposits (LTNCD) 6,082 6,082 6,082 6,082 P 672,459 P 535,788 P 674,414 P 536,748
The Parent Company’s LTNCD as of December 31, 2021 and 2020 are as follows:
Coupon Outstanding Issuance Date Maturity Date Interest Balance September 28, 2018 March 28, 2024 5.50% P 3,580 August 11, 2017 February 11, 2023 3.75% 2,502 P 6,082
The Parent Company’s LTNCD were used in the expansion of its term deposit base to support long-term asset growth and for other general funding purposes.
The Group’s deposit liabilities bear annual interest as follows: 2021 2020 2019 Demand, Savings and Time deposits 0.10% - 6.00% 0.10% - 5.00% 0.10% - 4.50%
The total interest expense incurred by the Group and the Parent Company on deposit liabilities are as follows:
Group 2021 2020 2019 Demand P 524 P 327 P 217 Savings 597 503 449 Time 2,639 4,118 7,149 LTNCD 299 340 811 P 4,059 P 5,288 P 8,626 Parent Company 2021 2020 2019 Demand P 528 P 335 P 220 Savings 597 504 451 Time 2,632 4,086 7,116 LTNCD 299 340 811 P 4,056 P 5,265 P 8,598

- 138 -
Under existing BSP regulations, non-FCDU deposit liabilities, including tax exempt LTNCDs, of the Parent Company and Rizal Microbank is subject to reserve requirement of 14% and 4%, respectively, at the end of 2019 until April 2, 2020. In 2020, BSP reduced the reserve requirements for both the Parent Company and Rizal Microbank effective April 3 and July 31 by 200 basis points and 100 basis points, respectively. As of December 31, 2021 and 2020, reserve requirement ratio for the Parent Company and Rizal Microbank is at 12% and 3%, respectively. Peso-denominated LTNCDs of the Parent Company are subject to reserve requirement equivalent of 4% in 2021 and 2020. As of December 31, 2021 and 2020, the Group is in compliance with such regulatory reserve requirements. Under BSP Circular No. 1063, Reduction in Reserve Requirements, cash in vault and regular reserve deposit accounts with BSP are excluded as eligible forms of compliance for the reserve requirements. The required reserve shall only be kept in the form of demand deposit accounts with the BSP. Available reserves consist of Due from BSP amounting to P65,074, P49,539 and P53,094 for the Group and P63,931, P48,119 and P52,353 for the Parent Company as of December 31, 2021, 2020 and 2019, respectively (see Note 9).
18. BILLS PAYABLE
This account consists of borrowings from: Group Parent Company 2021 2020 2021 2020 Foreign banks P 46,398 P 4,183 P 46,398 P 4,183 Local banks 9,505 8,983 - 16 Others 1 1 1 1 P 55,904 P 13,167 P 46,399 P 4,200
Borrowings from foreign and local banks are subject to annual fixed interest rates as follows:
2021 2020 2019 Group Peso denominated 4.15 - 7.50% 4.66% - 4.96% 2.00% - 7.35% Foreign currency denominated 0.0001% - 0.725% 0.22% - 0.54% 0.04% - 2.68% Parent Company Peso denominated - 4.66% - 4.96% - Foreign currency denominated 0.0001% - 0.725% 0.22% - 0.54% 0.04% - 2.68%
The total interest expense incurred by the Group on the bills payable amounted to P420 in 2021, P933 in 2020, and P2,069 in 2019. The total interest expense incurred by the Parent Company on the bills payable amounted to P22 in 2021, P434 in 2020, and P1,606 in 2019. As of December 31, 2021 and 2020, bills payable availed under repurchase agreements amounting to P45,378 and P4,199 are secured by the Group and Parent Company’s investment securities.

- 139 -
19. BONDS PAYABLE The composition of this account for the Group and the Parent Company follows: Coupon Face Value Outstanding Balance Issuance Date Maturity Date Interest (in millions) 2021 2020 March 31, 2021 June 30, 2026 4.18% P 4,130 P 4,130 P - March 31, 2021 June 30, 2026 3.20% P 13,743 13,743 - July 27, 2020 July 27, 2022 3.25% P 16,616 16,616 16,616 April 7, 2020 April 7, 2022 4.85% P 7,054 7,054 7,054 November 13, 2019 November 13, 2022 4.43% P 7,500 7,500 7,500 September 11, 2019 September 11, 2024 3.00% $ 300 15,264 14,362 June 4, 2019 June 4, 2021 6.15% P 8,000 - 8,000 March 15, 2018 March 16, 2023 4.13% $ 450 22,908 21,540 November 2, 2015 February 2, 2021 3.45% $ 320 - 15,367 P 87,215 P 90,439
On March 31, 2021, the Parent Company issued unsecured Peso-denominated Senior Notes with principal amount and outstanding balance as of December 31, 2021 of P4,130 and P13,743 bearing an interest of 4.18% and 3.20% per annum, respectively, payable quarterly in arrears on March 31, June 30, September 30 and December 31 of each year. The senior notes will mature on June 30, 2026. On July 27, 2020, the Parent Company issued unsecured Peso-denominated Senior Notes with principal amount and outstanding balance as of December 31, 2021 of P16,616 bearing an interest of 3.25% per annum, payable in arrears on January 27, April 27, July 27 and October 27. The senior notes will mature on July 27, 2022. On April 7, 2020, the Parent Company issued unsecured Peso-denominated Senior Notes with principal amount and outstanding balance as of December 31, 2021 of P7,054 bearing an interest of 4.85% per annum, payable quarterly in arrears on January 7, April 7, July 7 and October 7. The senior notes will mature on April 7, 2022. In November 2019, the Parent Company issued unsecured Peso-denominated Senior Notes with principal amount and outstanding balance as of December 31, 2021 and 2020, of P7,500 bearing an interest of 4.43% per annum, payable quarterly in arrears on February 13, May 13, August 13 and November 13. The senior notes will mature on November 13, 2022. In September 2019, the Parent Company issued unsecured US$-denominated Senior Notes with principal amount of US$300 bearing an interest of 3.00% per annum, payable semi-annually in arrears every March 11 and September 1 of each year. The senior notes, unless redeemed, will mature on September 11, 2024. As of December 31, 2021 and 2020, the peso equivalent of this outstanding bond issue amounted to P15,624 and P14,362, respectively.
In June 2019, the Parent Company issued unsecured Peso-denominated Senior Notes with principal amount and outstanding balance as of December 31, 2020 and 2019 of P8,000 bearing an interest of 6.15% per annum, payable quarterly in arrears every March 4, June 4, September 4 and December 4 of each year. The senior notes matured on June 4, 2021.

- 140 -
In March 2018, the Parent Company issued unsecured US$-denominated Senior Notes with principal amount of US$450 bearing an interest of 4.13% per annum, payable semi-annually in arrears every March 16 and September 16 of each year. The senior notes, unless redeemed, will mature on March 16, 2023. As of December 31, 2021, and 2020, the peso equivalent of this outstanding bond issue amounted to P22,906 and P21,540, respectively. In November 2015, the Parent Company issued unsecured US$-denominated Senior Notes with principal amount of US$320 bearing an interest of 3.45% per annum, payable semi-annually in arrears every May 2 and November 2 of each year. The senior notes matured on February 2, 2021
Unamortized bond premium/discount amounted to P77, P116, and P170 as of December 31, 2021, 2020 and 2019, respectively. The related amortization of unamortized bond premium/discounts is recorded as part of Interest Expense in the statements of profit or loss. The interest expense incurred on these bonds payable amounted to P3,503 in 2021, P4,023 in 2020, and P3,550 in 2019. The Group and Parent Company recognized foreign currency exchange gains related to these bonds payable amounting to P2,287, P2,712 and P2,031 in 2021, 2020 and 2019, respectively. Foreign currency exchange losses are netted against Foreign exchange gains presented under Other Operating Income account in the statements of profit or loss.
20. SUBORDINATED DEBT
On June 27, 2014, the Parent Company issued P7 billion Basel III-compliant Tier 2 Capital Notes (the “Tier 2 Notes”) which shall be part of the Group’s regulatory capital compliance in accordance with Basel III capital guidelines of the BSP. The Parent Company re-opened the Tier 2 Notes and issued an additional P3 billion of the Notes on September 5, 2014, which constituted a further issuance of, and formed a single series with the existing P7,000 Tier 2 Notes. The significant terms and conditions of the Tier 2 Notes with an aggregate issue amount of P10,000, are as follows:
The Tier 2 Notes shall mature on September 27, 2024, provided that they are not
redeemed at an earlier date.
Subject to satisfaction of certain regulatory approval requirements, the Parent Company may, on September 26, 2019, and on any Interest Payment Date thereafter, redeem all of the outstanding Tier 2 Notes at redemption price equal to 100% of its face value together with accrued and unpaid interest thereon. The terms and conditions of the Tier 2 Notes also allow for early redemption upon the occurrence of a Tax Redemption Event or a Regulatory Redemption Event.
The Tier 2 Notes shall initially bear interest at the rate of 5.375% per annum from and including June 27, 2014 to but excluding September 27, 2019 and shall be payable quarterly in arrears at the end of each interest period on March 27, June 27,
September 27 and December 27 of each year.

- 141 -
Unless the Tier 2 Notes are previously redeemed, the initial interest rate will be reset on September 26, 2019 at the equivalent of the five-year PDST-R2 or the relevant five-year benchmark plus the initial spread of 1.93% per annum. Such reset interest shall be payable quarterly in arrears commencing on September 27, 2019 up to and including September 27, 2024, if not otherwise redeemed earlier.
The Tier 2 Notes have a loss absorption feature which means the notes are subject to a
Non-Viability Write-Down in case of the occurrence of a Non-Viability Event, subject to certain conditions as set out in the terms and conditions of the notes, when the Issuer is considered non-viable as determined by the BSP. Non-Viability is defined as a deviation from a certain level of CET1 ratio or the inability of the Issuer to continue business (closure) or any other event as determined by the BSP, whichever comes earlier. Upon the occurrence of a Non-Viability Event, the Issuer shall write-down the principal amount of the notes to the extent required by the BSP, which could go as low as zero. A Non-Viability Write-Down shall have the following effects:
(i) it shall reduce the claim on the notes in liquidation; (ii) reduce the amount re-paid when a call or redemption is properly exercised; and, (iii) partially or fully reduce the interest payments on the notes.
On May 27, 2019, the RCBC BOD approved to exercise its call option and redeem its P10,000 5.375% Tier 2 Notes. The request was subsequently approved by the MB on July 25, 2019, subject to compliance with BSP conditions. On September 26, 2019, the Bank exercised the call option and fully redeemed the notes. The total interest expense incurred by the Group and Parent Company on the notes amounted to P471 in 2019.
21. ACCRUED INTEREST, TAXES AND OTHER EXPENSES
The composition of this account follows: Group Parent Company 2021 2020 2021 2020 Accrued expenses P 4,236 P 4,106 P 4,113 P 3,919 Accrued interest 1,323 1,287 1,278 1,277 Taxes payable 538 507 489 489 P 6,097 P 5,900 P 5,880 P 5,685
Accrued expenses represent mainly the accruals for utilities, employee benefits and other operating expenses. Accrued interest primarily includes unpaid interest on deposit liabilities, bills payable and bonds payable at the end of each reporting period.

- 142 -
22. OTHER LIABILITIES
Other liabilities consist of the following:
Group Parent Company Notes 2021 2020 2021 2020 Accounts payable 28.5(b) P 7,963 P 8,811 P 7,155 P 8,231 Outstanding acceptances payable 4,634 2,417 4,634 2,417 Lease liabilities 4,050 4,385 4,479 4,319 Post-employment defined benefit obligation 24.2 2,501 2,993 2,487 2,953 Manager’s checks 1,150 1,150 1,150 1,150 Bills purchased – contra 1,018 915 1,018 915 Derivative financial liabilities 10.1 926 1,484 926 1,484 Deposit on lease contracts 799 621 92 91 Unearned income 585 152 558 135 Withholding taxes payable 449 220 448 212 Other credits 440 446 440 446 Guaranty deposits 363 20 363 20 Sundry credits 341 478 341 478 Payment orders payable 263 194 263 194 ECL provisions on loan commitments 4.4.9(c) 145 139 145 139 Advance rentals 72 74 72 74 Due to BSP 44 49 44 49 Miscellaneous 635 886 778 851 P 26,378 P 25,434 P 25,393 P 24,158
Accounts payable is mainly composed of prepaid card balances of customers, settlement billing from credit card operations and the Group’s expenditure purchases which are to be settled within the next reporting period.
The Group and the Parent Company have elected not to recognize lease liabilities for short-term leases or leases of low value assets. Payments made under such leases are expensed on a straight-line basis. In addition, certain variable lease payments are not permitted to be recognized as lease liabilities and are expensed as incurred.
The lease liabilities are secured by the related underlying assets. The undiscounted maturity analysis of lease liabilities at December 31, 2021 and 2020 are as follows:
Within Two to More than 1 Year Five Years Five Years Total 2021: Group Lease payments P 1,053 P 3,340 P 393 P 4,786 Finance charges ( 165 ) ( 514 ) ( 58) ( 737 ) Net present value P 888 P 2,826 P 335 P 4,049

- 143 -
Within Two to More than 1 Year Five Years Five Years Total Parent Company Lease payments P 1,163 P 3,461 P 415 P 5,039 Finance charges ( 181) ( 336) ( 43) ( 560 ) Net present value P 982 P 3,125 P 372 P 4,479 2020: Group Lease payments P 1,058 P 2,674 P 898 P 4,630 Finance charges ( 101 ) ( 103 ) ( 41) ( 245 ) Net present value P 957 P 2,571 P 857 P 4,385
Parent Company Lease payments P 1,012 P 2,554 P 976 P 4,542 Finance charges ( 91) ( 89 ) ( 43) ( 223 ) Net present value P 921 P 2,465 P 933 P 4,319
On January 1, 2021, the Parent Company and RCBC Realty Corporation renewed the terms for the lease of RCBC Plaza’s several floors. The amendments in the terms include a new rental rate and extended term of five years. Total cash outflow in respect of leases in 2021, 2020 and 2019 amounted to P1,360, P1,173 and P1,186, respectively, for the Group, and P1,205, P1,113 and P1,086, respectively, for the Parent Company. Interest expense in relation to lease liabilities in 2021, 2020 and 2019 amounted to P170, P165 and P221, respectively, for the Group, and P185, P162 and P222, respectively, for the Parent Company and is presented as part of Interest expense in the statements of profit or loss. Miscellaneous liabilities include unclaimed balances for deposits and other miscellaneous liabilities. Interest expense incurred on other liabilities for 2021, 2020 and 2019 amounted to P15, P83 and P203 for the Group, and P15, P81 and P187 for the Parent Company, respectively.

- 144 -
23. EQUITY
23.1 Capital Stock
The movements in the outstanding capital stock of the Parent Company are as follows: Number of Shares 2021 2020 2019 Preferred stock – voting, non-cumulative non-redeemable, participating, convertible into common stock – P10 par value Authorized – 200,000,000 shares Issued and outstanding Balance at beginning of year 267,410 267,410 267,887 Conversion of shares during the year - - ( 477 ) Balance at end of year 267,410 267,410 267,410 Common stock – P10 par value Authorized: Balance at beginning and end of year 2,600,000,000 2,600,000,000 2,600,000,000 Issued and outstanding: Balance at beginning of year 1,935,628,896 1,935,628,896 1,935,628,775 Reissuance of shares during the year 101,850,000 - - Conversion of shares during the year - - 121 Balance at end of year 2,037,478,896 1,935,628,896 1,935,628,896
As of December 31, 2021, and 2020, there are 748 holders of the Parent Company’s listed shares holding an equivalent of 100.00% of the Parent Company’s total issued and outstanding shares. Such listed shares closed at P20.00 per share and P18.88 per share as of December 31, 2021 and 2020, respectively.
In 1986, the Parent Company listed its common shares with the PSE. The historical information on the Parent Company’s issuance of common shares arising from the initial and subsequent public offerings, including private placements is presented below. Number of Issuance Subscriber Issuance Date Shares Issued
Initial public offering Various November 1986 1,410,579 Stock rights offering Various April 1997 44,492,908 Stock rights offering Various July 1997 5,308,721 Stock rights offering Various August 1997 830,345 Stock rights offering Various January 2002 167,035,982 Stock rights offering Various June 2002 32,964,018 Follow-on offering Various March 2007 210,000,000 Private placement International Finance Corporation (IFC) March 2011 73,448,275 Private placement Hexagon Investments B.V. September 2011 126,551,725 Private placement PMMIC March 2013 63,650,000 Private placement IFC Capitalization Fund April 2013 71,151,505 Private placement Cathay April 2015 124,242,272 Stock rights offering Various July 2018 535,710,378 Private placement Sumitomo Mitsui Banking Corporation (SMBC) July 2021 101,850,000

- 145 -
On May 29, 2006, the Parent Company’s stockholders approved the issuance of up to 200,000,000 convertible preferred shares with a par value of P10 per share, subject to the approval, among others, by the PSE. The purpose of the issuance of the convertible preferred shares is to raise the Tier 1 capital pursuant to BSP regulations, thereby strengthening the capital base of the Parent Company and allowing it to expand its operations. On February 13, 2007, the PSE approved the listing application of the underlying common shares for the 105,000 convertible preferred shares, subject to the compliance of certain conditions of the PSE.
Preferred shares have the following features: (a) Entitled to dividends at floating rate equivalent to the three-month London Interbank
Offered Rate plus a spread of 2.0% per annum, calculated quarterly;
(b) Convertible to common shares at any time after the issue date at the option of the Parent Company at a conversion price using the adjusted net book value per share of the Parent Company based on the latest available financial statements prepared in accordance with PFRS, adjusted by local regulations;
(c) Non-redeemable; and,
(d) Participating as to dividends on a pro rata basis with the common stockholders in the
surplus of the Parent Company after dividend payments had been made to the preferred shareholders.
On June 28, 2010, the Parent Company’s stockholders owning or representing more than two-thirds of the outstanding capital stock confirmed and ratified the approval by the majority of the BOD on their Executive Session held on May 21, 2010, the proposed increase in Parent Company’s authorized capital stock and removal of pre-emptive rights from holders of capital stock, whether common or preferred, to subscribe for or to purchase any shares of stock of any class, by amending the Parent Company’s Articles of Incorporation. The proposed P16,000 authorized capital stock is divided into the following classes of stocks: (a) 1,400,000,000 common shares with a par value of ten pesos (P10.00) per share.
(b) 200,000,000 preferred shares with a par value of ten pesos (P10.00) per share. The removal of pre-emptive rights was approved by the BSP and SEC on October 20, 2010 and November 4, 2010, respectively. On the other hand, the increase in authorized capital stock of the Parent Company was approved by the BSP and SEC on August 24, 2011 and September 16, 2011, respectively. Common shares may be transferred to local and foreign nationals and shall, at all times, not be less than 60% and not more than 40% of the voting stock, be beneficially owned by local nationals and by foreign nationals, respectively.

- 146 -
23.2 Issuance of Common Shares
On July 22, 2019, the effective date of merger, the Parent Company issued 315,287,248 common shares in exchange of the transfer of net assets of RSB at carrying value. The Parent Company recognized P10,507 as additional paid-in capital, which pertains to the difference between the par value of the shares issued and the carrying value of the net assets of RSB.
On November 27, 2017, the BOD of the Parent Company approved the increase in the Parent Company’s authorized capital through the increase in the authorized common stock from 1,400,000,000 shares to 2,600,000,000 shares at P10 par value per share or for a total capital stock of P14,000 to P26,000. The BOD also approved the amendment of the Parent Company’s Articles of Incorporation for the principal purpose of reflecting the said increase in authorized capital. These resolutions were approved by the Parent Company’s stockholders representing at least two-thirds of its outstanding capital stock in a special meeting held on January 29, 2018. In the same meeting, the Parent Company’s BOD approved the stock rights offering (Rights Offer) to be subscribed out of the increase in the authorized capital. The increase in authorized capital stock and the Rights Offer were approved by the BSP and SEC on June 29, 2018 and July 4, 2018, respectively. The offering of the stock rights representing 535,710,378 common shares (with equivalent amount of P5,357) occurred from June 25 to June 29, 2018 and the shares were listed at the PSE on July 16, 2018. The Rights Offer and issuance generated P15,000 proceeds, reduced by P217 issue costs; hence, resulting in P9,426 excess of consideration received over par value recognized in Capital Paid in Excess of Par account. In 2015, the Parent Company issued common shares to Cathay at P64 per share for a total issue price of P7,951. This issuance resulted in the recognition of Capital Paid in Excess of Par amounting to P6,709 reduced by the total issuance cost of P222. The acquisition involves Cathay: (i) acquiring from Hexagon Investments B.V., an entity controlled by funds managed by CVC Asia Pacific Limited, 118,935,590 secondary shares at P64 per share, pursuant to a Sale and Purchase Agreement; (ii) acquiring 36,724,138 secondary common shares from IFC Capitalization Fund also at P64 per share, pursuant to a Sale and Purchase Agreement; and, (iii) entering into a shareholders agreement with PMMIC and the Parent Company. In 2013, the Parent Company issued common shares to PMMIC and IFC Capitalization Fund at P64 and P58 per share for a total issue price of P4,074 and P4,127, respectively. These issuances resulted in the recognition of Capital Paid in Excess of Par amounting to P3,437 and P3,415, respectively, reduced by total issuance costs of P101.
23.3 Treasury Shares
In 2019, subsequent to the effective date of the merger, the Parent Company acquired the 315,287,248 common shares issued in exchange of the net assets of RSB equal to the Parent Company’s investment in RSB as at December 31, 2018.
On September 23, 2011, the Parent Company issued 5,821,548 common shares (equivalent of 18,082,311 preferred shares and with total par value of P58) from the treasury account reissuance (with total cost of P182) and an additional 120,730,177 common stock (with total par value of P1,207) from unissued portion of the increase in authorized capital stock on September 23, 2011 to Hexagon Investments B.V. that is equivalent to approximately 15.00% of the outstanding common shares. The issuance resulted in the recognition of additional Capital Paid in Excess of Par amounting to P2,264.

- 147 -
On March 17, 2011, the Parent Company issued 73,448,275 common shares, comprising of 50,427,931 treasury shares reissuance (with total cost of P771) and 23,020,344 unissued stock (with total par value of P230), to IFC Capitalization Fund for a total consideration of P2,130 representing 7.20% ownership interest. The issuance resulted in the recognition of additional Capital Paid in Excess of Par amounting to P1,078. On July 23, 2021, the Parent Company sold 101,850,000 shares to SMBC at P44.00 per share. This came from the treasury shares resulting from the merger of Parent Company and RSB. The sale of shares held by the Parent Company in treasury is equivalent to 4.999% of the total outstanding Common Stock. The issuance resulted in a recognition of additional Capital Paid in Excess of Par amounting to P50. The Parent Company incurred expenses related to the issuance amounting to P113 which was charged to equity resulting in a P63 net decrease in the Capital Paid in Excess of Par.
23.4 Hybrid Perpetual Securities
In August 27, 2020, the Parent Company issued US$300 non-cumulative, unsecured, subordinated capital securities which qualify as AT1 capital under Basel III standards. As of December 31, 2021 and 2020, the hybrid perpetual securities amounted to P14,463, net of issuance costs.
The capital securities are perpetual in respect of which there is no fixed redemption date. The Parent Company may redeem the capital securities only in certain circumstances as described in the conditions of the securities and with prior written consent of BSP. Distributions are non-cumulative and payable semi-annually in arrear at a rate of 6.5%. Certain conditions provide for circumstances under which the Parent Company will not be obliged to pay any distribution on the applicable payment date. The proceeds of the hybrid perpetual securities are used to support and finance medium-term to long-term asset growth, loans to customers, other general corporate purposes and to maintain sufficient buffers above the minimum capital thresholds required by BSP.
23.5 Surplus and Dividend Declarations The details of the cash dividend distributions follow: Date Dividend Date Approved Date Declared Per Share Total Amount Record Date by BOD* Paid/Payable February 26, 2019 0.1205 0.03 March 21, 2019 February 26, 2019 March 25, 2019 April 29, 2019 0.4460 863.29 May 15, 2019 April 29, 2019 May 29, 2019 April 29, 2019 0.4460 0.12 May 15, 2019 April 29, 2019 May 29, 2019
May 27, 2019 0.1166 0.03 June 21, 2019 May 27, 2019 June 26, 2019 August 27, 2019 0.1121 0.03 September 21, 2019 August 27, 2019 September 24, 2019 November 25, 2019 0.1051 0.03 December 21, 2019 November 25, 2019 December 26, 2019 February 24, 2020 0.0993 0.03 March 21, 2020 February 24, 2020 April 1, 2020 May 26, 2020 0.0808 0.02 June 21, 2020 May 26, 2020 June 24, 2020 May 26, 2020 0.5560 1,076.21 June 9, 2020 May 26, 2020 June 24, 2020 May 26, 2020 0.5560 0.15 June 9, 2020 May 26, 2020 June 24, 2020 September 1, 2020 0.0589 0.02 September 21, 2020 September 1, 2020 September 24, 2020 December 1, 2020 0.0563 0.02 December 21, 2020 December 1, 2020 January 7, 2021
February 22, 2021 0.0560 0.01 March 21, 2021 February 22, 2021 March 31, 2021 February 22, 2021 - 472.40 February 26, 2021 February 22, 2021 February 26, 2021 April 26, 2021 0.4850 938.78 May 10, 2021 April 26, 2021 May 25, 2021 April 26, 2021 0.4850 0.13 May 10, 2021 April 26, 2021 May 25, 2021 May 31, 2021 0.0559 0.01 June 21, 2021 May 31, 2021 June 25, 2021 July 26, 2021 - 486.04 August 26, 2021 July 26, 2021 August 26, 2021 August 31, 2021 0.0545 0.01 September 21, 2021 August 31, 2021 September 24, 2021 November 29, 2021 0.0537 0.01 December 21, 2021 November 29, 2021 December 24, 2021 * BSP approval is no longer required

- 148 -
In 2015, the BSP, through the MB, approved the liberalized rules for banks and quasi-banks on dividend declaration. The policy requires that dividend declaration be immediately recognized as a liability upon the approval of the BOD and that it be disclosed in the statement of changes in equity.
A portion of the Parent Company’s surplus corresponding to the equity in net earnings of certain subsidiaries and associates totaling P11,749 and P11,286 as of December 31, 2021 and 2020, respectively, and treasury shares of the Parent Company amounting to P9,287 and P13,719 as of December 31, 2021 and 2020, respectively, are not currently available for distribution as dividends. 23.6 Revaluation Reserves
The components and reconciliation of items of other comprehensive income presented in the statements of changes in equity of the Group and Parent Company at their aggregate amount under Revaluation Reserves account are shown below.
Accumulated Actuarial Revaluation of Translation Gains Financial Adjustments (Losses) Assets at on Foreign on Defined FVOCI Operations Benefit Plan Total Balance as of January 1, 2021 P 664 P 54 ( P 2,788) ( P 2,070 ) Actuarial gains on defined benefit plan - - 422 422 Fair value loss on financial assets at FVOCI ( 275 ) - - ( 275 ) Other comprehensive income (loss) ( 275) - 422 147 Balance as of December 31, 2021 P 389 P 54 ( P 2,366) ( P 1,923 ) Balance as of January 1, 2020 P 895 P 53 ( P 3,141) ( P 2,193 ) Actuarial gains on defined benefit plan - - 353 353 Fair value loss on financial assets at FVOCI ( 231 ) - - ( 231 ) Translation adjustments on foreign operations - 1 - 1 Other comprehensive income (loss) ( 231) 1 353 123 Balance as of December 31, 2020 P 664 P 54 ( P 2,788) ( P 2,070 ) Balance as of January 1, 2019 P 1,556 P 53 ( P 1,343) P 266 Actuarial losses on defined benefit plan - - ( 1,798) ( 1,798 ) Fair value loss on financial assets at FVOCI ( 702 ) - - ( 702 ) Other comprehensive loss ( 702 ) - ( 1,798) ( 2,500 ) Transfer from fair value loss on financial asset at FVOCI to Surplus 41 - - 41 Balance as of December 31, 2019 P 895 P 53 ( P 3,141) ( P 2,193 )

- 149 -
23.7 Appropriation for General Loan Loss Reserves
Pursuant to the requirements of the BSP under Circular No. 1011, the Group shall recognize general loan loss provisions equivalent to one percent of all outstanding loans as of the end of the reporting period, except for accounts considered as credit risk-free under the existing BSP regulations. In cases when the computed allowance for ECL on those exposures is less than one percent of the general loan loss provisions required, the deficiency is recognized through appropriation from the Group’s available Surplus. Such appropriation is considered as Tier 2 capital subject to the limit provided under the CAR framework. The outstanding balance of appropriation for General Loan Loss Reserves as of December 31, 2021 and 2020 amounted to P3,617 and P3,451 for the Group, and P3,616 and P3,440 for the Parent Company, respectively. The additional appropriation made in 2021 amounted to P166 and P176, for the Group and Parent Company, respectively.
23.8 Other Reserves
As of December 31, 2021 and 2020, this account consists of reserves arising from the acquisitions of RCBC LFC and Rizal Microbank for a total of P97.
24. EMPLOYEE BENEFITS
24.1 Salaries and Employee Benefits Expense
Expenses recognized for salaries and other employee benefits are shown below.
Group 2021 2020 2019 Short-term employee benefits P 5,888 P 6,167 P 6,470 Post-employment defined benefits 483 459 363 P 6,371 P 6,626 P 6,833 Parent Company 2021 2020 2019 Short-term employee benefits P 5,247 P 5,468 P 5,782 Post-employment defined benefits 439 428 327 P 5,686 P 5,896 P 6,109
24.2 Post-employment Defined Benefit Plan
(a) Characteristics of the Defined Benefit Plan
The Parent Company and certain subsidiaries maintain a funded, tax-qualified, non-contributory post-employment benefit plan that is being administered by the Parent Company’s Trust and Investment Group (TIG), covering all regular full-time employees. The Parent Company’s TIG manages the fund in coordination with the Parent Company’s Retirement Plan Committee (RPC), Trust Committee and the respective committees of the subsidiaries which act in the best interest of the plan assets and are responsible for setting the investment policies.
The normal retirement age of the Group’s employees ranges between 55 to 60 but the plan also provides for an early retirement at age 50 to 55 with a minimum of 10 to 20 years of credited service. The maximum retirement benefit is the lump sum equivalent to two months pay per year of continuous employment based on the employees’ salary at retirement. Any fraction of a year shall be computed proportionately.

- 150 -
(b) Explanation of Amounts Presented in the Financial Statements
Actuarial valuations are made annually to update the post-employment benefit costs and the amount of contributions. All amounts presented below are based on the actuarial valuation reports obtained from independent actuaries in 2021 and 2020.
The amounts of post-employment benefit obligation recognized in the financial statements are determined as follows:
Group Parent Company
2021 2020 2021 2020 Present value of the obligation P 5,604 P 5,650 P 5,309 P 5,342 Fair value of plan assets ( 3,104) ( 2,657 ) ( 2,822 ) ( 2,389) Effect of asset ceiling test 1 - - - Deficiency of plan assets P 2,501 P 2,993 P 2,487 P 2,953
The Group and Parent Company’s post-employment defined benefit obligation as of December 31, 2021 and 2020 are included as part of Other Liabilities account in the statements of financial position (see Note 22).
The movements in the present value of the defined benefit obligation follow:
Group Parent Company
2021 2020 2021 2020 Balance at beginning of year P 5,650 P 6,282 P 5,342 P 6,029 Current and past service cost 483 459 439 428 Interest expense 223 327 212 314 Remeasurements – actuarial losses (gains) arising from changes in: – experience adjustments ( 254) ( 179 ) ( 248 ) ( 172 ) – financial assumptions ( 80) ( 422 ) ( 28 ) ( 443 ) – demographic assumptions ( 1) ( 1 ) ( 1 ) - Benefits paid by the plan ( 417) ( 816) ( 407 ) ( 814 ) Balance at end of year P 5,604 P 5,650 P 5,309 P 5,342
The movements in the fair value of plan assets are presented below.
Group Parent Company
2021 2020 2021 2020 Balance at beginning of year P 2,657 P 3,022 P 2,389 P 2,786 Interest income 110 148 99 137 Gains (losses) on plan assets (excluding amounts included in net interest) 91 ( 241 ) 98 ( 254 ) Contributions paid into the plan 663 544 643 534 Benefits paid by the plan ( 417) ( 816 ) ( 407 ) ( 814 ) Balance at end of year P 3,104 P 2,657 P 2,822 P 2,389

- 151 -
The composition of the fair value of plan assets at the end of each reporting period by category and risk characteristics is shown below.
Group Parent Company
2021 2020 2021 2020 Cash and cash equivalents P 551 P 152 P 450 P 23 Debt securities: Corporate debt securities 385 509 378 498 Government bonds 90 57 1 - Equity securities: Financial intermediaries 1,077 1,010 1,066 1,008 Transportation and communication 254 205 254 205 Electricity, gas and water 113 118 112 118 Diversified holding companies 31 119 24 94 Others 180 69 114 26 Unquoted long-term equity investments 140 129 140 129 UITF 273 272 273 272 Investment properties 5 4 5 4 Loans and receivables 5 6 5 5 Others - 7 - 7 P 3,104 P 2,657 P 2,822 P 2,389
The fair values of the above debt securities and quoted equity securities are determined based on market prices in active markets. Long-term equity investments represent investment in corporations not listed in active and organized markets. Fair values are determined based on the book value per share based on latest audited financial statements of the investee company. The fair value of the UITF is determined based on the net asset value per unit of investment held in the fund.
The fair value of the plan assets is at Level 1 in the fair value hierarchy except for unquoted long-term equity investments, loans and receivables, investment properties and other investments which are at Level 3.
The net gains (losses) on plan assets are as follows:
Group Parent Company 2021 2020 2021 2020
Fair value gains (losses) P 91 (P 241 ) P 98 (P 254 ) Interest income 110 148 99 137
Actual gains (losses) P 201 (P 93 ) P 197 (P 117 )
The amounts of post-employment benefit expense recognized in the profit or loss and in other comprehensive income in respect of the defined benefit post-employment plan are determined below and in the succeeding page as follows:
Group 2021 2020 2019 Reported in profit or loss: Current and past service cost P 483 P 459 P 363 Net interest expense 113 179 70 P 596 P 638 P 433

- 152 -
Group 2021 2020 2019
Reported in other comprehensive income: Actuarial gains (losses) arising from changes in: – Experience adjustments 254 179 85 – Financial assumptions P 80 P 422 (P 1,418) – Demographic assumptions 1 1 6 Effect of asset ceiling test ( 1) - - Gains (Losses) on plan assets (excluding amounts included in net interest) 91 ( 241) ( 471) P 425 P 361 (P 1,798) Parent Company 2021 2020 2019 Reported in profit or loss: Current service costs P 439 P 428 P 327 Net interest expense 112 177 85 P 551 P 605 P 412 Reported in other comprehensive income: Actuarial gains (losses) arising from changes in: – Experience adjustments P 248 P 172 P 71 – Financial assumptions 28 443 ( 1,483) – Demographic assumptions 1 - - Transfer from RSB - - 10 Gains (Losses) on plan assets (excluding amounts included in net interest) 98 ( 254) ( 375) P 375 P 361 (P 1,777)
Current service costs, including the effect of curtailment and past service cost, form part of Employee Benefits under the Other Operating Expenses account, while net interest expense or income is presented as part of Interest Expense – Bills Payable and Other Borrowings in the statements of profit or loss. Amounts recognized in other comprehensive income were included within items that will not be reclassified subsequently to profit or loss.
In determining the amounts of post-employment obligation, the following ranges of actuarial assumptions were used:
2021 2020 2019 Group Discount rates 4.98%-5.09% 3.67% - 4.08% 4.95% - 5.23% Expected rate of salary increases 3.50%-8.00% 2.70% - 8.00% 3.40% - 8.00% Parent Company Discount rates 5.01% 3.95% 5.23% Expected rate of salary increases 4.00% 3.00% 5.00%

- 153 -
Assumptions regarding future mortality are based on published statistics and mortality tables. The average life expectancy of an individual retiring at the Group’s normal retiring age of 60 is based on the 2017 Philippine Intercompany Mortality table. These assumptions were developed by management with the assistance of an independent actuary. Discount factors are determined close to the end of each reporting period by reference to the interest rates of zero coupon government bonds with terms to maturity approximating to the terms of the post-employment obligation. Other assumptions are based on current actuarial benchmarks and management’s historical experience.
(c) Risks Associated with the Retirement Plan
The plan exposes the Group to actuarial risks such as investment risk, interest rate risk, longevity risk and salary risk.
(i) Investment and Interest Rate Risks
The present value of the defined benefit obligation is calculated using a discount
rate determined by reference to market yields of government bonds. Generally, a decrease in the interest rate of a reference government bonds will increase the plan obligation. However, this will be partially offset by an increase in the return on the plan’s investments in debt securities and if the return on plan asset falls below this rate, it will create a deficit in the plan.
Currently, the plan assets of the Group are significantly invested in equity and debt
securities, while the Group also invests in cash and cash equivalents and other investments. Due to the long-term nature of the plan obligation, a level of continuing equity investments is an appropriate element of the Group’s long-term strategy to manage the plan efficiently.
(ii) Longevity and Salary Risks
The present value of the defined benefit obligation is calculated by reference to the best estimate of the mortality of the plan participants during their employment, and to their future salaries. Consequently, increases in the life expectancy and salary of the plan participants will result in an increase in the plan obligation.
(d) Other Information
The information on the sensitivity analysis for certain significant actuarial assumptions, the Group’s asset-liability matching strategy, and the timing and uncertainty of future cash flows related to the post-employment plan are described in the succeeding pages.

- 154 -
(i) Sensitivity Analysis The following table summarizes the effects of changes in the significant actuarial
assumptions used in the determination of the defined benefit obligation as of December 31, 2021 and 2020:
Group Impact on Post-employment Defined Benefit Obligation Change in Increase in Decrease in Assumption Assumption Assumption 2021: Discount rate +/-1 % (P 551 ) P 638 Salary growth rate +/-1 % 641 ( 558 ) 2020: Discount rate +/-1 % (P 569 ) P 663 Salary growth rate +/-1 % 666 ( 574 ) Parent Company Impact on Post-employment Defined Benefit Obligation Change in Increase in Decrease in Assumption Assumption Assumption 2021: Discount rate +/- 1% (P 512 ) P 600 Salary growth rate +/- 1% 600 ( 520 ) 2020: Discount rate +/- 1% (P 533 ) P 627 Salary growth rate +/- 1% 626 ( 542 )
The sensitivity analysis is based on a change in an assumption while holding all other assumptions constant. This analysis may not be representative of the actual change in the defined benefit obligation as it is unlikely that the change in assumptions would occur in isolation of one another as some of the assumptions may be correlated. Furthermore, in presenting the sensitivity analysis, the present value of the defined benefit obligation at the end of each reporting period has been calculated using the projected unit credit method, which is the same as that applied in calculating the defined benefit obligation recognized in the statements of financial position.
(ii) Asset-liability Matching Strategies
To efficiently manage the retirement plan, the Parent Company through its RPC in coordination with the Parent Company’s Trust Investment Group, ensures that the investment positions are managed considering the computed retirement obligations under the retirement plan. This strategy aims to match the plan assets to the retirement obligations due by investing in assets that are easy to liquidate (i.e., government securities, corporate bonds, equities with high value turnover).

- 155 -
As the Group’s retirement obligations are in Philippine peso, all assets are invested in the same currency. The Group actively monitors how the duration and the expected yield of the investments are matching the expected cash outflows arising from the retirement obligations. In view of this, various investments are made in a portfolio that may be liquidated within a reasonable period of time. A large portion of the plan assets as of December 31, 2021 and 2020 consists of equity securities with the balance invested in fixed income securities and cash and cash equivalents. The Group believes that equity securities offer the best returns over the long term with an acceptable level of risk.
(iii) Funding Arrangements and Expected Contributions
The plan is currently underfunded by P2,501 and P2,487 for the Group and Parent Company, respectively, based on the latest funding actuarial valuations in 2021.
The maturity profile of undiscounted expected benefit payments from the plan within 15 years from the end of each reporting period follows:
Group Parent Company 2021 2020 2021 2020 Less than one year P 194 P 267 P 186 P 264 More than one year to five years 1,592 1,256 1,472 1,157 More than five years to ten years 3,646 3,275 3,477 3,111 More than ten to fifteen years 19 - - - More than fifteen years 26 - - - P 5,477 P 4,798 P 5,135 P 4,532
The Group and Parent Company expect to contribute P587 and P572, respectively, to the plan in 2022.
25. MISCELLANEOUS INCOME AND EXPENSES
These accounts consist of the following:
25.1 Miscellaneous Income
Group Notes 2021 2020 2019 Rentals 14.2 P 926 P 883 P 811 Recoveries from written off assets 223 102 179 Dividend income 10.1,10.2 105 78 304 Gains on assets sold − net 14.1 101 37 109 Others 211 139 50 P 1,566 P 1,239 P 1,453

- 156 -
Parent Company Notes 2021 2020 2019 Rentals 14.2, 28.5(a) P 287 P 266 P 321 Recoveries from written off assets 223 99 179 Gains on assets sold − net 14.1 65 11 20 Dividend income 10.1,10.2 39 16 95 Others 157 121 3 P 771 P 513 P 618
Miscellaneous income classified as Others includes rebates, penalty charges and other income items that cannot be appropriately classified under any of the foregoing income accounts.
25.2 Miscellaneous Expenses
Group 2021 2020 2019 Insurance P 1,215 P 1,017 P 1,014 Credit card-related expenses 1,114 1,023 1,248 Litigation/assets acquired expenses 739 434 353 Communication and information services 604 639 596 Service and processing fees 540 420 348 Management and other professional fees 514 413 490 Advertising and publicity 324 288 278 Banking fees 319 271 257 Other outside services 135 137 152 Transportation and travel 133 166 264 Stationery and office supplies 118 233 223 Donation and charitable contribution 79 93 68 Membership fees 17 22 26 Representation and entertainment 15 29 64 Others 983 1,307 1,178 P 6,849 P 6,492 P 6,559 Parent Company 2021 2020 2019 Credit card-related expenses P 1,655 P 1,631 P 1,826 Insurance 1,213 1,015 996 Litigation/assets acquired expense 729 427 343 Communication and information services 572 606 569 Service and processing fees 540 419 348 Management and other professional fees 438 334 463 Advertising and publicity 321 286 274 Banking fees 316 267 251 Other outside services 135 135 149 Transportation and travel 126 155 250 Stationery and office supplies 115 228 218 Donations and charitable contributions 79 93 68 Membership fees 16 16 25 Representation and entertainment 11 24 54 Others 930 1,239 1,078 P 7,196 P 6,875 P 6,912

- 157 -
The Group’s other expenses are composed of freight, various processing fees, fines and penalties, and seasonal giveaways. The Group and Parent Company’s other expenses also include fees for records, facilities and management services to a related party under common control amounting to P270 and P268, P267 and P263, and P152 and P225, in 2021, 2020 and 2019, respectively (see Note 28).
26. INCOME AND OTHER TAXES
Under Philippine tax laws, the regular banking unit (RBU) of the Parent Company and its domestic subsidiaries are subject to percentage and other taxes (presented as Taxes and Licenses in the statements of profit or loss), as well as income taxes. Percentage and other taxes paid consist principally of the gross receipts tax (GRT) and documentary stamp tax (DST). RA No. 9238, which was enacted on February 10, 2004, provides for the reimposition of GRT on banks and non-bank financial intermediaries performing quasi-banking functions and other non-bank financial intermediaries beginning January 1, 2004.
The recognition of liability of the Parent Company and certain subsidiaries for GRT is based on the related regulations issued by the tax authorities. Income taxes include the regular corporate income tax (RCIT) of 25% or 30%, and final tax paid at the rate of 20%, which represents the final withholding tax on gross interest income from government securities and other deposit substitutes. Interest allowed as a deductible expense is reduced by an amount equivalent to certain percentage of interest income subjected to final tax. Minimum corporate income tax (MCIT) of 1% or 2% on modified gross income is computed and compared with the RCIT. Any excess of the MCIT over the RCIT is deferred and can be used as a tax credit against regular income tax liability in the next three consecutive years. In addition, ordinarily, the Group’s net operating loss carry over (NOLCO) is allowed as a deduction from taxable income in the next three consecutive years.
However, pursuant to Section 4 (bbb) of BARO Act and as implemented under Revenue Regulation 25-2020, the net operating losses of a business or enterprise incurred for taxable years 2020 and 2021 can be carried over as a deduction from gross income for the next five consecutive taxable years following the year of such loss.
Effective May 2004, RA No. 9294 restored the tax exemption of FCDUs and offshore banking units (OBUs). Under such law, the income derived by the FCDU from foreign currency transactions with non-residents, OBUs, local commercial banks including branches of foreign banks is tax-exempt while interest income on foreign currency loans from residents other than OBUs or other depository banks under the expanded system is subject to 10% gross income tax. Interest income on deposits with other FCDUs and offshore banking units is subject to 15.0% final tax effective January 1, 2018. In 2021, 2020 and 2019, the Group opted to continue claiming itemized deductions for income tax purposes. The Parent Company’s foreign subsidiaries are subject to income and other taxes based on the enacted tax laws of the countries and/or jurisdictions where they operate.

- 158 -
26.1 Current and Deferred Taxes
On March 26, 2021, R.A. No. 11534, Corporate Recovery and Tax Incentives for Enterprises (CREATE) Act, as amended, was signed into law and shall be effective beginning July 1, 2020. The following are the major changes brought about by the CREATE Act that are relevant to and considered by the Company.
RCIT was reduced from 30% to 25% starting July 1, 2020; MCIT was reduced from 2% to 1% starting July 1, 2020 until June 30, 2023; and, The allowable deduction for interest expense is reduced from 33% to 20% of the interest
income subjected to final tax. As a result of the application of the lower RCIT rate of 25% starting July 1, 2020, the current income tax expense and income tax payable, as presented in the 2020 annual income tax return of the Parent Company, would be lower by P165 and P151, respectively, than the amount presented in the 2020 financial statements and such amount was charged to 2021 profit or loss. In 2021, the recognized net deferred tax assets as of December 31, 2020 was remeasured using the 25% tax rate. This resulted in a decline in the recognized deferred tax asset as of December 31, 2020 by P508 and P460 for the Group and Parent, respectively, and such was recognized in the 2021 profit or loss. The tax expense as reported in the statements of profit or loss consists of:
Group 2021 2020 2019 Current tax expense: Final tax P 635 P 1,278 P 717 RCIT at 25% in 2021 and 30% in 2020 and 2019 192 1,091 611 Adjustment in 2020 income taxes due to change in income tax rate ( 165) - - Excess MCIT over RCIT 228 10 4 890 2,379 1,332 Deferred tax income arising from: Origination and reversal of temporary differences ( 670) ( 904) ( 57) Effect of change in income tax rate 508 - - ( 162) ( 904) ( 57) P 728 P 1,475 P 1,275

- 159 -
Parent Company 2021 2020 2019 Current tax expense: Final tax P 618 P 1,033 P 698 RCIT at 25% in 2021 and 30% in 2020 and 2019 80 1,281 498 Adjustment in 2020 income taxes due to change in income tax rate ( 151) - - Excess MCIT over RCIT 226 - - 773 2,314 1,196
Deferred tax income arising from: Origination and reversal of temporary differences ( 708) ( 877) ( 51) Effect of change in income tax rate 460 - - ( 248) ( 877) ( 51) P 525 P 1,437 P 1,145
A reconciliation of tax on pretax profit computed at the applicable statutory rates to tax expense reported in profit or loss is as follows:
Group 2021 2020 2019 Tax on pretax profit at at 25% in 2021 and 30% in 2020 and 2019 P 1,952 P 1,948 P 1,999 Adjustments for income subjected to lower income tax rates ( 108) ( 348) ( 403 ) Adjustment in 2020 income taxes due to change in income tax rate 343 - - Tax effects of: Non-taxable income ( 680) ( 1,672 ) ( 1,391 ) Recognition of previously unrecognized deferred tax asset ( 614) - 38 Non-deductible expenses 406 2,146 1,110 FCDU income ( 402) ( 755 ) ( 635 ) Unrecognized temporary differences ( 396) 157 551 Excess MCIT over RCIT 228 - - Utilization of NOLCO ( 8) ( 1 ) ( 1 ) Others 7 - 7 P 728 P 1,475 P 1,275 Parent Company 2021 2020 2019 Tax on pretax profit at at 25% in 2021 and 30% in 2020 and 2019 P 1,902 P 1,937 P 1,956 Adjustments for income subjected to lower income tax rates ( 104 ) ( 337 ) ( 395 ) Adjustment in 2020 income taxes due to change in income tax rate 309 - - Tax effects of: Non-taxable income ( 627 ) ( 1,656 ) ( 1,465 ) Recognition of previously unrecognized deferred tax asset ( 614) - 38 Unrecognized temporary differences ( 404 ) 124 550 FCDU income ( 402 ) ( 755 ) ( 635 ) Non-deductible expenses 239 2,124 1,096 Excess MCIT over RCIT 226 - - P 525 P 1,437 P 1,145

- 160 -
The deferred tax assets of the Group recognized in the consolidated statements of financial position as of December 31, 2021 and 2020 relate to the operations of the Parent Company and certain subsidiaries as shown below.
Statements of Statements of Financial Position Profit or Loss 2021 2020 2021 2020 2019 Allowance for impairment P 2,785 P 2,834 (P 49) P 1,109 P 79 Post-employment benefit obligation 102 138 ( 36) 52 ( 50 ) NOLCO 33 67 ( 34) 67 ( 3) Excess MCIT over RCIT 286 5 281 ( 199) 99 Provision for credit card reward payments - - - ( 117 ) ( 39 ) Others - - - ( 8 ) ( 29 ) Deferred tax assets – net P 3,206 P 3,044 Deferred tax income – net P 162 P 904 P 57
The deferred tax assets of the Parent Company recognized in its statements of financial position as of December 31, 2021 and 2020 is shown below.
Statement of Financial Position Statements of Profit of Loss 2021 2020 2021 2020 2019 Allowance for impairment P 2,648 P 2,681 (P 33 ) P 1,131 P 54 Excess MCIT over RCIT 226 - 226 ( 124 ) 19 Post-employment benefit obligation 106 84 22 7 12 NOLCO 33 - 33 - - Provision for credit card reward payments - - - ( 117 ) ( 39 ) Others - - - ( 20 ) 5 Deferred tax assets P 3,013 P 2,765 Deferred tax income – net P 248 P 877 P 51
The Parent Company and certain subsidiaries have not recognized deferred tax assets on certain temporary differences since management believes that the Parent Company and certain subsidiaries may not be able to generate sufficient taxable profit in the future against which the tax benefits arising from those deductible temporary differences, NOLCO and other tax credits can be utilized.
The unrecognized deferred tax assets relate to the following:
Group Parent Company 2021 2020 2021 2020 Allowance for impairment P 2,204 P 3,300 P 2,049 P 3,133 Post-employment benefit obligation 523 760 516 802 NOLCO 226 202 - - Excess MCIT over RCIT 33 86 - - Others - 8 - - P 2,986 P 4,356 P 2,565 P 3,935
Consequently, deferred tax liabilities were also not recognized on certain taxable temporary differences as the settlement of those can be offset by the available deductible temporary differences in the future.

- 161 -
In addition, deferred tax liabilities on accumulated translation adjustments, relating to its foreign subsidiaries were not recognized since their reversal can be controlled, and it is probable that the temporary difference will not reverse in the foreseeable future.
NOLCO can be claimed as deduction from future taxable income within three and five years from the year the taxable loss was incurred. In accordance with BARO Act, NOLCO incurred in 2020 and 2021 can be claimed as a deduction from the gross income until 2025. The details of the Group’s NOLCO are shown below. Inception Expiry Year Amount Utilized Expired Balance Year
2021 P 140 P - P - P 140 2026 2020 873 - - 873 2025 2019 23 - - 23 2022 2018 37 27 10 - 2021
P 1,073 P 27 P 10 P 1,036 In 2021, the Parent Company reported NOLCO amounting to P132 which can be claimed as deduction from the gross income until 2025. The breakdown of the Group’s excess MCIT over RCIT with the corresponding validity periods follows: Inception Expiry Year Amount Utilized Expired Balance Year
2021 P 228 P - P - P 228 2024 2020 10 - - 10 2023 2019 80 - - 80 2022 2018 54 53 1 - 2021
P 372 P 53 P 1 P 318
The breakdown of the Parent Company’s excess MCIT over RCIT with the corresponding validity periods follows: Inception Expiry Year Amount Utilized Expired Balance Year
2021 P 226 P - P - P 226 2024 2019 19 19 - - 2022 2018 53 53 - - 2021
P 298 P 72 P - P 226 26.2 Supplementary Information Required Under Revenue Regulation No. 15-2010
The Bureau of Internal Revenue (BIR) issued RR 15-2010 on November 25, 2010 which require certain tax information to be disclosed as part of the notes to financial statements. Such supplementary information is, however, not a required part of the basic financial statements prepared in accordance with PFRS; it is neither a required disclosure under the SEC rules and regulations covering form and content of financial statements under the Revised Securities Regulation Code Rule 68. The Parent Company presented this tax information required by the BIR as a supplemental schedule filed separately from the basic financial statements.

- 162 -
27. TRUST OPERATIONS
Securities and properties (other than deposits) held by the Parent Company in fiduciary or agency capacity for its customers are not included in the financial statements, since these are not resources of the Parent Company. The Group and Parent Company’s total trust resources amounted to P146,769 and P116,652 as of December 31, 2021 and 2020, respectively, (see Note 34).
Investment in government securities which are shown as part of Investment securities at amortized cost (see Note 10.3) with a total face value of P1,638 and P1,187 as of December 31, 2021 and 2020, respectively, for both the Group and the Parent Company are deposited with the BSP as security for faithful compliance with fiduciary obligations. Income from trust operations, shown as Trust fees under Other Operating Income account, amounted to P392, P323 and P323 in 2021, 2020 and 2019, respectively, in the Group and Parent Company’s statements of income.
28. RELATED PARTY TRANSACTIONS
The Group and Parent Company’s related parties include its ultimate parent company, subsidiaries, associates, entities under common ownership, key management personnel and others. The RPT Committee, which meet monthly and as necessary, review proposed RPT within the materiality threshold to determine whether or not the transaction is on terms no less favorable to the Group than terms available to any unconnected third party under the same or similar circumstances. On favorable review, the RPT Committee endorse transactions to the BOD for approval.

- 163 -
A summary of the Group and Parent Company’s transactions and outstanding balances of such transactions with related parties as of and for the years ended December 31, 2021, 2020 and 2019 is presented below.
Group 2021 2020 2019 Amount of Outstanding Amount of Outstanding Amount of Outstanding Notes Transaction Balance Transaction Balance Transaction Balance Stockholders Loans and receivables 28.1 ( P 55 ) P 96 ( P 55 ) P 151 ( P 55 ) P 206 Deposit liabilities 28.2 ( 864 ) 391 454 1,255 744 801 Interest expense on deposits 28.2 24 - 17 - 15 - Cash received from issuance of shares of stock 23.3 4,369 - - - - - Interest income from loans and receivables 28.1 9 - 14 - 19 - Associates Loans and receivables 28.1 ( 203 ) - 203 203 - - Deposit liabilities 28.2 ( 1,002 ) 83 769 1,085 181 316 Interest expense on deposits 28.2 1 - 3 - 2 - Related Parties Under Common Ownership Loans and receivables 28.1 ( 2,818 ) 815 3,436 3,633 ( 161 ) 197 Deposit liabilities 28.2 ( 1,500 ) 3,016 628 4,516 181 3,888 Interest expense on deposits 28.2 61 - 67 - 61 - Occupancy and equipment related expenses 28.5(a) 967 5 777 - 955 - Miscellaneous expenses – others 25.2 270 - 267 - 152 - Interest income from loans and receivables 28.1 37 - 183 - 192 -

- 164 -
Group 2021 2020 2019 Amount of Outstanding Amount of Outstanding Amount of Outstanding Note Transaction Balance Transaction Balance Transaction Balance Key Management Personnel Loans and receivables 28.1 ( P 8 ) P 6 P 1 P 14 P - P 13 Deposit liabilities 28.2 75 319 42 244 108 202 Interest income from loans and receivables 28.1 - - - - 1 - Interest expense on deposits 28.2 2 - 4 - 6 - Salaries and employee benefits 28.5(c) 585 - 629 - 556 - Other Related Interests Loans and receivables 28.1 9,979 18,530 5,863 8,551 ( 426 ) 2,688 Deposit liabilities 28.2 914 5,434 1,202 4,520 1,906 2,968 Interest income from loans and receivables 28.1 716 - 370 - 158 - Interest expense on deposits 28.2 776 - 48 - 96 - Parent Company 2021 2020 2019 Amount of Outstanding Amount of Outstanding Amount of Outstanding Note Transaction Balance Transaction Balance Transaction Balance Stockholders Loans and receivables 28.1 (P 55 ) P 96 ( P 55 ) P 151 ( P 55 ) P 206 Deposit liabilities 28.2 ( 864 ) 391 296 1,255 744 959 Interest expense on deposits 28.2 24 - 17 - 15 - Cash received from reissuance of treasury shares 23.3 4,369 - - - - - Interest income from loans and receivables 28.1 9 - 14 - 19 -

- 165 -
Parent Company 2021 2020 2019 Amount of Outstanding Amount of Outstanding Amount of Outstanding Notes Transaction Balance Transaction Balance Transaction Balance
Subsidiaries Loans and receivable 28.1 P - P - (P 13 ) P - (P 987 ) P 13 Deposit liabilities 28.2 341 782 ( 1 ) 441 40 442 Interest expense on deposits 28.2 5 - 1 - 1 - Dividend 12 524 500 1,243 600 576 - Rental income 28.5(a) 60 - 50 - 40 - Occupancy and equipment-related expenses 28.5(a) 420 - 368 - 365 - Service and processing fees 28.5(b) 564 - 617 - 591 - Sale of investment securities 28.3 76 - 30 - 126 - Purchase of investment securities 28.3 2,550 - 1,202 - 3 - Assignment of receivables 11 ( 20 ) 127 ( 25 ) 147 ( 10 ) 172
Associates Loans and receivables 28.1 ( 203 ) - 203 203 - - Deposit liabilities 28.2 ( 1,002 ) 83 1,009 1,085 53 76 Interest expense on deposits 28.2 1 - 3 - 2 -
Related Parties Under
Common Ownership Loans and receivables 28.1 ( 2,818 ) 815 212 3,633 293 3,421 Deposit liabilities 28.2 ( 3,380 ) 3,016 1,632 6,396 2,166 4,764 Interest income from loans and receivables 28.1 37 - 176 - 192 - Interest expense on deposits 28.2 61 - 55 - 56 - Occupancy and equipment-related expenses 28.5(a) 961 - 775 - 946 - Miscellaneous expenses – others 25.2 268 - 263 - 225 -

- 166 -
Parent Company 2021 2020 2019 Amount of Outstanding Amount of Outstanding Amount of Outstanding Note Transaction Balance Transaction Balance Transaction Balance
Key Management Personnel Loans and receivables 28.1 P - P 1 P 1 P 1 P - P - Deposit liabilities 28.2 62 306 42 244 108 202 Interest expense on deposits 28.2 2 - 4 - 6 - Salaries and employee benefits 28.5(c) 335 - 391 - 329 - Other Related Interests Loans and receivables 28.1 9,984 18,530 6,171 8,546 ( 739 ) 2,375 Deposit liabilities 28.2 914 5,434 1,202 4,520 2,622 3,318 Interest income from loans and receivables 28.1 716 - 370 - 158 - Interest expense on deposits 28.2 776 - 48 - 96 -

- 167 -
28.1 Loans and Receivables
The summary of the Group and Parent Company’s significant transactions and the related outstanding balances for loans and receivables with its related parties as of and for the years ended December 31, 2021, 2020 and 2019 are as follows:
Group Interest Loans Related Party Category Issuances Repayments Income Outstanding 2021: Stockholders P - P 55 P 9 P 96 Associate - 203 - - Related parties under common ownership 360 3,178 37 815 Key management personnel 2 10 - 6 Other related interests 12,345 2,366 716 18,530 P 12,707 P 5,812 P 762 P 19,447 2020: Stockholders P - P 55 P 14 P 151 Associate 203 - - 203 Related parties under common ownership 4,133 697 183 3,633 Key management personnel 1 - - 14 Other related interests 7,257 1,394 370 8,551 P 11,594 P 2,146 P 567 P 12,552 2019: Stockholders P - P 55 P 19 P 206 Related parties under common ownership 102 263 192 197 Key management personnel - - 1 13 Other related interests 687 1,113 158 2,688 P 789 P 1,431 P 370 P 3,104 Parent Company Interest Loans Related Party Category Issuances Repayments Income Outstanding 2021: Stockholders P - P 55 P 9 P 96 Associate - 203 - - Related parties under common ownership 360 3,178 37 815 Key management personnel 1 1 - 1 Other related interests 12,345 2,361 716 18,530 P 12,706 P 5,798 P 762 P 19,442

- 168 -
Parent Company Interest Loans Related Party Category Issuances Repayments Income Outstanding
2020: Stockholders P - P 55 P 14 P 151 Subsidiaries - 13 - - Associate 203 - - 203 Related parties under common ownership 2,229 2,017 176 3,633 Key management personnel 1 - - 1 Other related interests 7,242 1,071 370 8,546 P 9,675 P 3,156 P 560 P 12,534 2019: Stockholders P - P 55 P 19 P 206 Subsidiaries - 987 - 13 Related parties under common ownership 390 97 192 3,421 Other related interests 328 1,067 158 2,375 P 718 P 2,206 P 369 P 6,015
In the ordinary course of business, the Group has loan transactions with each other, their other affiliates, and with certain Directors, Officers, Stockholders and Related Interests (DOSRIs). Under existing policies of the Group, these loans are made substantially on the same terms as loans to other individuals and businesses of comparable risks. As of December 31, 2021, 2020 and 2019, the Group and Parent Company is in compliance with these regulatory requirements. As of December 31, 2021, 2020 and 2019, the Group has not recognized impairment loss on loans and receivables from DOSRI.
28.2 Deposit Liabilities The summary of the Group and Parent Company’s significant transactions and the related outstanding balances for deposit liabilities with its related parties as of and for the years ended December 31, 2021, 2020 and 2019 are as follows (see Note 17):
Group Interest Outstanding Related Party Category Deposits Withdrawals Expense Balance 2021: Stockholders P 11,048 P 11,912 P 24 P 391 Associate 50,457 51,459 1 83 Related parties under common ownership 199,399 200,899 61 3,016 Key management personnel 840 765 2 319 Other related interests 186,805 185,891 776 5,434 P 448,549 P 450,926 P 864 P 9,243

- 169 -
Group Interest Outstanding Related Party Category Deposits Withdrawals Expense Balance 2020: Stockholders P 10,149 P 9,853 P 17 P 1,255 Associates 49,173 48,404 3 1,085 Related parties under common ownership 196,041 195,413 67 4,516 Key management personnel 815 773 4 244 Other related interests 186,607 185,405 48 4,520 P 442,785 P 439,848 P 139 P 11,620 2019: Stockholders P 4,465 P 3,721 P 15 P 801 Associates 20,445 20,264 2 316 Related parties under common ownership 140,566 140,385 61 3,888 Key management personnel 943 835 6 202 Other related interests 120,371 118,465 96 2,968 P 286,790 P 283,670 P 180 P 8,175 Parent Company Interest Outstanding Related Party Category Deposits Withdrawals Expense Balance 2021: Stockholders P 11,048 P 11,912 P 24 P 391 Subsidiaries 142,414 142,073 5 782 Associate 50,457 51,459 1 83 Related parties under common ownership 199,399 202,779 61 3,016 Key management personnel 825 763 2 306 Other related interests 186,805 185,891 776 5,434 P 590,948 P 594,877 P 869 P 10,012 2020: Stockholders P 10,149 P 9,853 P 17 P 1,255 Subsidiaries 142,175 142,176 1 441 Associates 49,173 48,164 3 1,085 Related parties under common ownership 197,006 195,374 55 6,396 Key management personnel 815 773 4 244 Other related interests 186,607 185,405 48 4,520 P 585,925 P 581,745 P 128 P 13,941 2019: Stockholders P 4,465 P 3,721 P 15 P 959 Subsidiaries 124,353 124,313 1 442 Associates 20,277 20,224 2 76 Related parties under common ownership 142,381 140,215 56 4,764 Key management personnel 943 835 6 202 Other related interests 121,087 118,465 96 3,318 P 413,506 P 407,773 P 176 P 9,761

- 170 -
Deposit liabilities transactions with related parties have similar terms with other counterparties. 28.3 Sale and Purchase of Securities
The Parent Company and certain subsidiaries engage in the trading of investment securities as
counterparties to the transaction. These transactions are priced similar to transactions with other counterparties outside the Group and there are no unsettled transactions as of the end of each reporting period.
28.4 Retirement Fund
The Parent Company and certain subsidiaries’ retirement funds covered under their defined
benefit post-employment plan maintained for qualified employees are administered and managed by the Parent Company’s TIG in accordance with the respective trust agreements covering the plan.
The retirement funds have transactions with the Group and Parent Company as of December 31, 2021, 2020 and 2019 as follows:
Group Parent Company Net Amount Outstanding Net Amount Outstanding Nature of Transactions of Transaction Balance of Transaction Balance 2021: Investment in common shares of Parent Company P 23 P 1,040 P 58 P 1,035 Investments in corporate debt securities of Parent Company ( 558 ) 4 ( 498 ) - Deposits with the Parent Company 46 83 30 53 Fair value losses 58 - 58 - 2020: Investment in common shares of Parent Company ( P 176 ) P 1,017 ( P 213 ) P 977 Investments in corporate debt securities of Parent Company 238 562 187 498 Deposits with the Parent Company ( 27 ) 37 ( 17 ) 23 Fair value losses ( 190 ) - ( 195 ) - Interest income 19 - 18 - 2019: Investment in common shares of Parent Company ( P 674 ) P 1,193 ( P 673 ) P 1,190 Investments in corporate debt securities 273 324 209 311 Deposits with the Parent Company ( 41 ) 64 ( 65 ) 40 Fair value losses ( 369 ) - ( 375 ) - Interest income 23 - 18 -

- 171 -
The carrying amount and the composition of the plan assets as of December 31, 2021, 2020 and 2019 are disclosed in Note 24.2. Investments in corporate debt securities include long-term negotiable certificates of deposit issued by the Parent Company.
The information on the Group and Parent Company’s contributions to the retirement fund
and benefit payments through the fund are disclosed in Note 24.2. The retirement fund neither provides any guarantee or surety for any obligation of the Group
nor its investments in its own shares of stock covered by any restriction and liens.
28.5 Other Related Party Transactions
(a) Lease Contracts with RRC and Sublease Agreement with Subsidiaries The Parent Company and certain subsidiaries occupy several floors of RCBC Plaza as leaseholders of RRC [see Note 29.4(b)]. Amortization of right-of-use of asset amounted to P241 million for the years ended December 31, 2021 and 2020, and are presented as part of Depreciation and Amortization expenses account in the statement of profit or loss. The Parent Company’s lease contract with RRC is effective until December 31, 2025. The Parent Company entered into sublease agreements with certain subsidiaries which occupy several floors of RCBC Plaza. Rental income by Parent Company related to these sublease arrangements is included as part of Rentals under the Miscellaneous income account in the statements of profit or loss (see Notes 14.2). The outstanding receivable on the lease contracts, if any, is presented as part of Accounts receivable under Loans and Receivables account in the statements of financial position (see Note 11). The related outstanding receivable is unsecured, noninterest-bearing and payable in cash on demand. Management believes that the receivables on the sublease agreements are fully recoverable.
(b) Service Agreement with RBSC
The Parent Company has Service Agreement (the Agreement) with RBSC, wherein RBSC shall provide the Parent Company with marketing, distribution, technical, collection and selling assistance and processing services in connection with the operation of the Parent Company’s credit card business. The total service processing fees incurred by the Parent Company is recognized as part of the Service and processing fees under the Miscellaneous Expenses account in the statements of profit or loss (see Note 25.2). The outstanding payable related to the service agreement is presented as part of Accounts payable under Other Liabilities account in the statements of financial position (see Note 22). The related outstanding payable is unsecured, noninterest-bearing and payable in cash on demand. (c) Key Management Personnel Compensation The breakdown of key management personnel compensation follows:
Group 2021 2020 2019 Short-term employee benefits P 546 P 601 P 525 Post-employment defined benefits 39 28 31 P 585 P 629 P 556

- 172 -
Parent Company 2021 2020 2019 Short-term employee benefits P 335 P 391 P 329 29. COMMITMENTS AND CONTINGENCIES
In the normal course of operations of the Group, there are various outstanding commitments and contingent liabilities such as guarantees, commitments to extend credit, tax assessments, claims from customers and third parties, etc., with amounts not reflected in the financial statements. Management does not anticipate losses from these transactions that will adversely affect the Group’s operations. In the opinion of management, the suits and claims arising from the normal course of operations of the Group that remain unsettled, if decided adversely, will not involve sums that would have material effect on the Group’s financial position or operating results.
29.1 Applicability of RR 4-2011
In March 2011, the BIR issued RR 4-2011, prescribing a new way of reporting income solely for banks/other financial institutions, and issued assessment notices to banks/other financial institutions for deficiency income tax. In its Order dated May 25, 2018, the Regional Trial Court of Makati (a) granted the Petition of the Bank/other Bankers Association of the Philippines (“BAP”) member banks praying for the nullification of RR 4-2011; and (b) permanently enjoined the enforcement of the same. The Department of Finance/BIR filed a Petition for Review with the Supreme Court (a) claiming that jurisdiction over the matter lies with the Court of Tax Appeals; (b) challenging the propriety of the declaratory relief action filed by the Bank/other BAP member banks in view of the prior issuance of Preliminary Assessment Notices; and (c) arguing that public hearings are not required in all instances involving regulatory issuances. The matter remains pending to date.
29.2 Alleged Unauthorized Transfer of Funds – Bank of Bangladesh In February 2016, four allegedly unauthorized fund transfers were made into four (4) accounts with the Bank from Bangladesh Bank’s account with the Federal Reserve Bank of New York, before being further dispersed to other banks and casinos. In August 2016, the Monetary Board imposed a P1 Billion fine upon the Bank, which it paid in full, without any effect on its ability to perform its existing obligations or its operations.
29.2.1 U.S. Litigation relating to the Bangladesh Bank Incident Failing to prosecute the Bank under the Federal Racketeer Influence and Corrupt Organizations Act, Bangladesh Bank initiated a second complaint before the New York State Court, on May 27, 2020. The Bank has since sought the dismissal of this second case, citing (a) New York’s lack of personal jurisdiction over it; (b) the impropriety of New York as a forum, given the ongoing related proceedings in the Philippines and the location of material witnesses/evidence; and (c) the untenable nature of the fraud charge against the Bank due to the lack of any fiduciary duty to Bangladesh Bank. The Bank’s Motion to Dismiss was heard on October 14, 2021. The matter remains pending to date.

- 173 -
29.2.2 Philippine Litigation relating to the Bangladesh Bank Incident On March 6, 2019, the Bank/its former National Sales Director filed a complaint for Injunction and Damages against Bangladesh Bank with the Regional Trial Court of Makati City (“Makati Trial Court”). Despite being properly served with the summons/Complaint, and even after the denial of its claim of immunity from suit, Bangladesh Bank refuses to submit to the jurisdiction of the Makati Trial Court. Bangladesh Bank’s Motion to Dismiss and the Bank’s Motion to declare Bangladesh Bank in default have been submitted for resolution.
29.3 HHIC-Phil Rehabilitation Proceedings
On January 9, 2019, HHIC-Phil, Inc. (“HHIC-Phil”) filed a Petition for corporate rehabilitation under R.A. No. 10142, the Financial Rehabilitation and Insolvency Act of 2010, which was given due course by the Regional Trial Court, Branch 72, Olongapo City (the “Rehabilitation Court”). After negotiating with HHIC-Phil/HHIC-Korea, which resulted in the creditors/Rehabilitation Court-approved Modified Rehabilitation Plan with Clarifications (“MRP-C”), the Bank and four (4) other creditor banks successfully negotiated the sale of the Subic Shipyard/certain other assets to third-party buyers, as called for by the MRP-C. In the Order dated December 6, 2021, the Rehabilitation Court approved the Asset Purchase Agreement (“APA”) dated October 5, 2021. As of December 31, 2021, the outstanding loan obligation of HHIC-Phil to the Bank remains at USD82, exclusive of accrued and compounded interest, as well as penalty on interest and principal. This is expected to be settled with the approval of the APA.
Except for the above-mentioned proceedings, the Bank is not aware of any suits and claims by or against it or its subsidiaries, which if decided adversely, would have a material effect on its financial position or operating results. 29.4 Lease Commitments (a) Parent Company as a Lessor
The Parent Company has entered into various lease contracts related to ATY Center, an investment property held for rental, with lease terms ranging from one to five years and with monthly rent depending on market price with 6% escalation rate every year. Total rent income earned from these leases amounted to P180, P174, and P235 in 2021, 2020, and 2019, respectively, which are presented as part of Rental under the Miscellaneous Income account in the statements of profit or loss (see Note 25.1).
The Parent Company’s future minimum rental receivables under this non-cancellable operating lease arrangement are as follows:
Parent Company
2021 2020 2019
Within one year P 498 P 470 P 444 After one year but not more than five years 957 903 852
P 1,455 P 1,373 P 1,296

- 174 -
(b) Group as Lessee
The Parent Company and certain subsidiaries lease some of the premises occupied by their respective head offices [see Note 28.5(a)] and branches/BCs for lease periods from one to 25 years. The Group’s rental expense related to these leases (included as part of Occupancy and Equipment-related expenses account in the 2019 statement of profit or loss) amounted to P1,187. Most of the lease contracts contain renewal options, which give the Group the right to extend the lease on terms mutually agreed upon by the parties.
30. EARNINGS PER SHARE
The following shows the Group’s profit and per share data used in the basic and diluted EPS computations for the three years presented:
2021 2020 2019
Net profit attributable to Parent Company’s shareholders P 7,082 P 5,020 P 5,387 Dividends paid to preferred shareholders and distributions allocated to holders of hybrid perpetual securities ( 964 ) ( 320) - 6,118 4,700 5,387 Weighted average number of outstanding common shares of stock 1,979 1,936 1,936 Basic and diluted EPS P 3.09 P 2.43 P 2.78
The convertible preferred shares did not have a significant impact on the EPS for each of the periods presented. The Group and the Parent Company has no potential dilutive shares as of the end of each reporting period.
31. SUPPLEMENTARY INFORMATION TO STATEMENTS OF CASH FLOWS
Significant non-cash transaction of the Group and the Parent Company includes additional leases under PFRS 16 as discussed in Notes 13 and 22; additions of real properties, chattel properties and other assets through foreclosures, dacion in payment and repossessions as discussed in Notes 14.1 and 15.3.2; and, partial settlement of certain loan in exchange of equity securities as discussed in Note 15.3.1

- 175 -
Presented below is the reconciliation of the Group and Parent Company’s liabilities arising from financing activities, which includes both cash and non-cash changes.
Group Hybrid Lease Perpetual Bills Payable Bonds Payable Liabilities Securities Total Financing (see Note 18) (see Note 19) (see Note 22) (see Note 23) Activities
Balance at January 1, 2021 P 13,167 P 90,439 P 4,385 P 14,463 P 122,454 Cash flow from financing activities: Availments/proceeds from issuance 148,820 17,873 - - 166,693 Payments/redemption ( 104,018) ( 18,810) ( 1,360 ) - ( 124,188) Non-cash financing activities: Additional lease liabilities - - 855 - 855 Foreign exchange gains ( 2,065 ) ( 2,312) - - ( 4,377) Amortization of Discount and interest - 25 170 - 195 Balance at December 31, 2021 P 55,904 P 87,215 P 4,050 P 14,463 P 161,632 Balance at January 1, 2020 P 101,606 P 96,814 P 2,877 P - P 201,297 Cash flow from financing activities: Availments/proceeds from issuance 284,718 23,670 - 14,463 322,851 Payments/redemption ( 371,858) ( 27,371) ( 1,173 ) - ( 400,402) Non-cash financing activities: Additional lease liabilities - - 2,516 - 2,516 Foreign exchange gains ( 1,299 ) ( 2,712) - - ( 4,011) Amortization of discount and interest - 38 165 - 203 Balance at December 31, 2020 P 13,167 P 90,439 P 4,385 P 14,463 P 122,454 Balance at January 1, 2019 P 56,001 P 53,090 P 3,571 P - P 112,662 Cash flow from financing activities: Availments/proceeds from issuance 89,737 45,697 - - 135,434 Payments/redemption ( 44,388) - ( 1,186) - ( 45,574) Non-cash financing activities: Additional lease liabilities - - 271 - 271 Foreign exchange losses (gains) 256 ( 2,031) - - ( 1,775) Amortization of discount and interest - 58 221 - 279 Balance at December 31, 2019 P 101,606 P 96,814 P 2,877 P - P 201,297
Parent Company Hybrid Lease Perpetual Bills Payable Bonds Payable Liabilities Securities Total Financing (see Note 18) (see Note 19) (see Note 22) (see Note 23) Activities
Balance at January 1, 2021 P 4,200 P 90,439 P 4,319 P 14,463 P 113,421 Cash flow from financing
activities: Availments/proceeds from issuance 142,675 17,873 - - 160,548 Payments/redemption ( 98,411) ( 18,810) ( 1,205 ) - ( 118,426) Non-cash financing activities: Additional lease liabilities - - 1,180 - 1,180 Foreign exchange gains ( 2,065 ) ( 2,312) - - ( 4,377) Amortization of discount and interest - 25 185 - 210 Balance at December 31, 2021 P 46,399 P 87,215 P 4,479 P 14,463 P 152,556

- 176 -
Parent Company Hybrid Lease Perpetual Bills Payable Bonds Payable Liabilities Securities Total Financing (see Note 18) (see Note 19) (see Note 22) (see Note 23) Activities
Balance at January 1, 2020 P 93,938 P 96,814 P 2,797 P - P 193,549 Cash flow from financing activities: Availments/proceeds from issuance 276,859 23,670 - 14,463 314,992 Payments/redemption ( 365,298) ( 27,371) ( 1,113) - ( 393,782) Non-cash financing activities: Additional lease liabilities - - 2,473 - 2,473 Foreign exchange gains ( 1,299 ) ( 2,712) - - ( 4,011) Amortization of discount and interest - 38 162 - 200 Balance at December 31, 2020 P 4,200 P 90,439 P 4,319 P 14,463 P 113,421
Balance at January 1, 2019 P 48,759 P 53,090 P 3,382 P - P 105,231 Cash flow from financing activities: Availments/proceeds from issuance 89,100 45,697 - - 134,797 Payments/redemption ( 44,177) - ( 1,086 ) - ( 45,263) Non-cash financing activities: Additional lease liabilities - - 279 - 279 Foreign exchange losses (gains) 256 ( 2,031) - - ( 1,775) Amortization of discount and interest - 58 222 - 280 Balance at December 31, 2019 P 93,938 P 96,814 P 2,797 P - P 193,549
In 2019, the Group exercised its call option and fully redeemed its Tier 2 Notes amounting to P9,986 (see Note 20).
32. MATURITY ANALYSIS OF ASSETS AND LIABILITIES
The table below shows an analysis of assets and liabilities analyzed according to when they are expected to be recovered or settled:
2021 Group Parent Company Within Beyond Within Beyond One Year One Year Total One Year One Year Total
Financial Assets Cash and other cash items P 14,691 P - P 14,691 P 14,663 P - P 14,663 Due from BSP 130,170 - 130,170 128,931 - 128,931 Due from other banks 12,162 - 12,162 11,860 - 11,860 Loans and receivables arising from reverse repurchase agreements 11,691 - 11,691 11,656 - 11,656 Interbank loans receivables 30,563 - 30,563 30,563 - 30,563 Financial assets at FVTPL 5,863 - 5,863 4,879 - 4,879 Financial assets at FVOCI - net 7,107 42,654 49,761 5,745 42,654 48,399 Investments at amortized cost - net 81,599 82,012 163,611 81,599 81,300 162,899 Loans and other receivables - net 54,493 453,246 507,739 51,048 448,853 499,901 Other resources - net 825 - 825 823 - 823 349,164 577,912 927,076 341,767 572,807 914,574
Non Financial Assets Investment in subsidiaries and associates - net - 344 344 - 7,027 7,027 Bank premises, furnitures, fixtures and equipment - net - 12,660 12,660 - 10,571 10,571 Investment properties - net - 3,572 3,572 - 3,435 3,435 Deferred tax asset-net - 3,206 3,206 - 3,013 3,013 Intangible and other resources - net 6,358 5,917 12,275 6,248 5,426 11,674
6,358 25,699 32,057 6,248 29,472 35,720
P 355,522 P 603,611 P 959,133 P 348,015 P 602,279 P 950,294

- 177 -
2021
Group Parent Company Within Beyond Within Beyond One Year One Year Total One Year One Year Total
Financial Liabilities Deposit liabilities P 143,865 P 528,594 P 672,459 P 143,328 P 531,086 P 674,414 Bills payable 23,560 32,344 55,904 23,560 22,839 46,399 Bonds payable 31,171 56,044 87,215 31,171 56,044 87,215 Accrued interest and other expenses 1,323 4,236 5,559 1,278 4,113 5,391 Other liabilities 12,188 9,815 22,003 10,963 8,678 19,641 212,107 631,033 843,140 210,300 622,760 833,060
Non Financial Liabilities Accrued interest and other expenses 538 - 538 489 - 489 Other liabilities 449 3,926 4,375 448 5,304 5,752 987 3,926 4,913 937 5,304 6,241 P 213,094 P 634,959 P 848,053 P 211,237 P 628,064 P 839,301
2020 Group Parent Company Within Beyond Within Beyond One Year One Year Total One Year One Year Total
Financial Assets Cash and other cash items P 16,520 P - P 16,520 P 16,464 P - P 16,464 Due from BSP 115,467 - 115,467 113,949 - 113,949 Due from other banks 15,707 - 15,707 15,214 - 15,214 Loans and receivables arising from reverse repurchase agreements 13,356 - 13,356 13,226 - 13,226 Interbank loans receivables 42,681 - 42,681 42,647 - 42,647 Financial assets at FVTPL 4,888 - 4,888 3,815 - 3,815 Financial assets at FVOCI - net 39,617 533 40,150 38,712 101 38,813 Investments at amortized cost - net - 43,026 43,026 - 42,513 42,513 Loans and other receivables - net 94,574 354,029 448,603 92,594 348,573 441,167 Other resources - net 931 - 931 924 - 924 343,741 397,588 741,329 337,545 391,187 728,732
Non Financial Assets Investment in subsidiaries and associates - net - 339 339 - 6,980 6,980 Bank premises, furnitures, fixtures and equipment - net - 13,062 13,062 - 10,500 10,500 Investment properties - net - 3,725 3,725 - 3,580 3,580 Deferred tax asset-net - 3,044 3,044 - 2,765 2,765 Intangible and other resources - net 5,467 5,140 10,607 5,348 4,617 9,965
5,467 25,310 30,777 5,348 28,442 33,790
P 349,208 P 422,898 P 772,106 P 342,893 P 419,629 P 762,522
Financial Liabilities Deposit liabilities P 111,655 P 424,133 P 535,788 P 111,021 P 425,727 P 536,748 Bills payable 5,282 7,885 13,167 2,759 1,441 4,200 Bonds payable 23,482 66,957 90,439 23,482 66,957 90,439 Accrued interest and other expenses 1,287 4,106 5,393 1,277 3,919 5,196 Other liabilities 18,430 2,062 20,492 17,842 1,474 19,316 160,136 505,143 665,279 156,381 499,518 655,899
Non Financial Liabilities Accrued interest and other expenses 507 - 507 489 - 489 Other liabilities 1,946 2,996 4,942 1,890 2,952 4,842 2,453 2,996 5,449 2,379 2,952 5,331
P 162,589 P 508,139 P 670,728 P 158,760 P 502,470 P 661,230

- 178 -
33. OTHER MATTERS 33.1 Continuing Impact of COVID-19
In December 2019, COVID-19 was reported to have surfaced in China. The World Health Organization has declared the outbreak as a ‘public health emergency of international concern’. COVID-19 started to become widespread in the Philippines in early March 2020 causing the government to declare the country in a state of public health emergency followed by implementation of ECQ and social distancing measures and restrictions within the Luzon area with other cities and provinces in the country enacting similar measures thereafter. This resulted in a wide-ranging business suspension – disrupting the supply chains, affecting production and sales across a range of industries, and weakening the stock market. On March 23, 2020, BAHO Act was signed into law declaring a national health emergency throughout the Philippines as a result of the COVID-19 crisis. The implementation of Section 4(aa) of said law has directed banks and other private and government financial institutions to implement a minimum thirty (30)-day grace period on all loans with principal and interests falling due within the period of the Enhanced Community Quarantine (ECQ), which started on March 17, 2020 up to April 30, 2020, which was extended until May 31, 2020, without incurring interest, penalties, fees or other charges. On September 11, 2020, BARO Act was signed into law which directed banks and other private and government financial institutions particularly under Section 4 (uu) the grant of one-time sixty (60)-day grace period for payments and/or maturity periods of all existing, current and outstanding loans as of September 15, 2020, falling due, or any part thereof, on or before December 31, 2020, without incurring interest on interests, penalties, fees or other charges, thereby extending the maturity of the said loans, subject to compliance with regulatory requirements. The Group has been able to keep approximately 50-60% of its branches open during the early part of the community quarantine in mid-March 2020, and around 40-50% in April and May, with a skeletal workforce and corresponding adjustments in banking hours and cut-off times similar to adjustments instituted by the BSP and Bankers Association of the Philippines. By end-September 2020, the Group has kept about 98% of its branches open. Among the steps taken to address its customers’ needs during the COVID-19 outbreak, the Group has (i) ensured cash availability at its ATMs and branches and (ii) extended loan payments for corporate and consumer loans for 60 days and waived fees on electronic and similar forms of payments for its clients. The Group has also encouraged its customers to use its online and mobile banking services to pay bills, send money, as well as use ATMs and cash acceptance machines as an alternative to branch banking. The Group also did not experience massive withdrawals from its depositors as the deposit liabilities still increased during the ECQ period. Further, the Group focused on supporting customers who are experiencing and about to experience financial difficulties as a result of the COVID-19 global pandemic and has offered a range of financial assistance measures including temporary loan repayment deferrals (principal and/or interest) through its COVID-19 Assistance and Recovery Enhancement (CARE) Program. The Group’s CARE Program is primarily designed to provide financial assistance to customers by way of extended repayment plans. The assistance would help get the customer back into the habit of paying based on amounts they can afford. Albeit using tighter credit underwriting parameters, the Group continued its lending activities including on-boarding of new customer for both wholesale and consumer lending. Despite these challenges, cash flow remained stable given the growth in deposits and with some clients still opting to continue their amortization payments despite the loan payment moratorium provided for under the BAHO Act and BARO Act.

- 179 -
As of December 31, 2021, an increase in volume of transactions is evident to the Group which was mainly due to customer acquisition driven by data science and digital marketing. The Group expects the general business environment to improve as quarantine restrictions ease and vaccination uptake increases in the last quarter of 2021. While economic recovery is expected, the Group will stay focused on keeping efficient operations as it embarks on transformation projects such as: (i) fully automated KYC process and (ii) enhanced credit and control systems. These activities include various business process reengineering exercises such as process reviews and digital enhancements that support efficiency, lower cost of transaction and reduced costs in product delivery.
34. SUPPLEMENTARY INFORMATION REQUIRED BY THE BSP
Presented below are the supplementary information required by the BSP under Section 174 (Appendix 55) of the BSP Manual of Regulations for Banks (MORB) to be disclosed as part of the notes to financial statements based on BSP Circular No. 1074, Amendments to Regulations on Financial Audit of Banks.
(a) Selected Financial Performance Indicators
The following basic ratios measure the financial performance of the Group and the Parent Company:
Group 2021 2020 2019 Return on average equity Net profit 6.71% 5.54% 6.47% Average total equity Return on average resources Net profit 0.84% 0.68% 0.80% Average total resources Net interest margin Net interest income 4.07% 4.31% 4.03% Average interest earning resources Parent Company 2021 2020 2019 Return on average equity Net profit 6.72% 5.55% 6.48% Average total equity Return on average resources Net profit 0.85% 0.69% 0.81% Average total resources Net interest margin Net interest income 4.06% 4.31% 4.02% Average interest earning resources

- 180 -
(b) Capital Instruments Issued
(j) Common stock
As of December 31, 2021 and 2020, the Parent Company’s common stock amounted to P22,509 representing 2,250,916,144 issued common shares.
In July 22, 2019, the effective date of merger, the Parent Company issued 315,287,248 common shares in exchange of the transfer of net assets of RSB at carrying value. Additional paid-in capital of P10,507 was recognized pertaining to the difference between the par value of the shares issued and carrying value of net assets of RSB. Subsequently the issuance, the Parent Company acquired the same number of issued common shares as a result of the merger and recognized treasury shares amounting to P13,719. The transactions did not affect the total number of issued and outstanding common shares in 2019. On July 23, 2021, the Parent Company sold 101,850,000 shares to Sumitomo Mitsui Banking Corporation (SMBC) at P44.00 per share. This came from the treasury shares resulting from the merger of Parent Company and RSB.
(ii) Preferred stock As of December 31, 2021 and 2020, the Parent Company’s issued and outstanding preferred stock amounted to P3 representing 267,410 preferred shares. These preferred shares are voting, non-cumulative, non-redeemable, participating and convertible into common stock. In 2019, 477 preferred shares were converted to 121 common shares. No similar transaction occurred in 2021 and 2020.
(iii) Hybrid Perpetual Securities
In August 27, 2020, the Parent Company issued US$300 non-cumulative, unsecured, subordinated AT1 capital securities. The capital securities are perpetual in respect of which there is no fixed redemption date. The Parent Company may redeem the capital securities only in certain circumstances as described in the conditions of the securities and with prior written consent of BSP. Distributions are non-cumulative and payable semi-annually in arrear at a rate of 6.5%. Certain conditions provide for circumstances under which the Parent Company will not be obliged to pay any distribution on the applicable payment date.

- 181 -
(c) Significant Credit Exposures for Loans
The Group and Bank’s concentration of credit as to industry for its receivables from customers gross of allowance for ECL follows:
Group 2021 2020 Amount Share Amount Share Consumer P 145,560 28% P 139,232 31% Real estate, renting and other related activities 89,891 18% 67,578 15% Electricity, gas and water 69,258 14% 67,530 15% Wholesale and retail trade 57,829 11% 51,537 11% Manufacturing (various industries) 55,618 11% 50,020 11% Transportation and communication 41,080 8% 25,494 6% Financial intermediaries 33,794 7% 34,034 7% Agriculture, fishing, and forestry 4,414 1% 4,967 1% Hotels and restaurants 4,207 1% 4,132 1% Other community, social and personal activities 2,439 - 5,289 1% Mining and quarrying 1,022 - 1,010 - Others 7,619 1% 5,742 1% P 512,731 100% P 456,565 100% Parent Company 2021 2020 Amount Share Amount Share Consumer P 145,557 29% P 139,128 31% Real estate, renting and other related activities 83,231 16% 60,878 14% Electricity, gas and water 69,258 14% 67,530 15% Wholesale and retail trade 56,866 11% 51,086 11% Manufacturing (various industries) 55,618 11% 50,020 11% Transportation and communication 41,080 8% 25,494 6% Financial intermediaries 33,772 7% 34,008 8% Agriculture, fishing, and forestry 4,309 1% 4,427 1% Hotels and restaurants 4,207 1% 4,132 1% Other community, social and personal activities 2,439 - 5,289 1% Mining and quarrying 1,022 - 1,010 - Others 7,574 2% 5,661 1% P 504,933 100% P 448,663 100%

- 182 -
The BSP considers that loan concentration exists when the total loan exposure to a particular industry exceeds 30% of the total loan portfolio plus the outstanding interbank loans receivable.
(d) Credit Status of Loans
The breakdown of receivable from customers as to status is shown below. Group
2021 Non- Total Loan Performing performing Portfolio Gross carrying amount: Corporate P 354,599 P 11,502 P 366,101 Consumer 127,909 18,721 146,630 482,508 30,223 512,731 Allowance for ECL ( 3,841) ( 11,900) ( 15,741 )
Net carrying amount P 478,667 P 18,323 P 496,990
2020 Non- Total Loan Performing performing Portfolio Gross carrying amount: Corporate P 311,642 P 10,675 P 322,317 Consumer 120,425 13,823 134,248 432,067 24,498 456,565 Allowance for ECL ( 5,983) ( 10,887) ( 16,870 )
Net carrying amount P 426,084 P 13,611 P 439,695
Parent Company
2021 Non- Total Loan Performing performing Portfolio Gross carrying amount: Corporate P 348,656 P 10,720 P 359,376 Consumer 126,903 18,654 145,557 475,559 29,374 504,933 Allowance for ECL ( 3,710) ( 11,140) ( 14,850 )
Net carrying amount P 471,849 P 18,234 P 490,083 2020 Non- Total Loan Performing performing Portfolio Gross carrying amount: Corporate P 305,542 P 10,002 P 315,544 Consumer 119,394 13,725 133,119 424,936 23,727 448,663 Allowance for ECL ( 5,847) ( 10,555) ( 16,402 )
Net carrying amount P 419,089 P 13,172 P 432,261

- 183 -
NPLs included in the total loan portfolio of the Group and the Parent Company as of December 31 as reported to the BSP are presented below.
Group Parent Company 2021 2020 2021 2020 Gross NPLs P 30,223 P 24,498 P 29,374 P 23,727 Allowance for impairment ( 11,900 ) ( 10,887 ) ( 11,140 ) ( 10,555 ) P 18,323 P 13,611 P 18,234 P 13,172
Under banking regulations, loan accounts shall be considered non-performing, even without any missed contractual payments, when they are considered impaired under existing accounting standards, classified as doubtful or loss, in litigation, and/or there is evidence that full repayment of principal or interest is unlikely without foreclosure of collateral, if any. All other loans, even if not considered impaired, shall be considered non-performing if any principal and/or interest are unpaid for more than 90 days from contractual due date, or accrued interests for more than 90 days have been capitalized, refinanced, or delayed by agreement.
Restructured loans shall be considered non-performing. However, if prior to restructuring, the loans were categorized as performing, such classification shall be retained. Moreover, NPLs shall remain classified as such until (a) there is sufficient evidence to support that full collection of principal and interests is probable and payments of interest and/or principal are received for at least 6 months; or (b) written-off. Microfinance and other small loans with similar credit characteristics shall be considered non-performing after contractual due date or after they have become past due.
As of December 31, 2021, gross and net NPL ratios of the Group and the Parent Company as reported to BSP were 5.45% and 3.30%, and 5.28% and 3.24%, respectively. As of December 31, 2020, gross and net NPL ratios of the Group and the Parent Company as reported to BSP were 5.00% and 2.94%, and 4.81% and 2.83%, respectively. Most of the NPLs are secured by real estate or chattel mortgages.
The breakdown of restructured receivables from customers follows:
Group Parent Company 2021 2020 2021 2020 Loans and discounts P 433 P 257 P 433 P 257 Credit card receivables - 3 - 3 P 433 P 260 P 433 P 260
Interest income from restructured receivables from customers amounted P10, P1, and P5 in 2021, 2020, 2019, respectively, for both the Group and the Parent Company.

- 184 -
(e) Analysis of Loan Portfolio as to Type of Security The breakdown of the receivables from customers’ portfolio as to secured and unsecured follows:
Group Parent Company 2021 2020 2021 2020 Secured: Real estate mortgage P 132,782 P 135,421 P 132,094 P 134,077 Chattel mortgage 66,351 53,456 66,254 50,990 Hold-out deposits 7,464 8,581 7,457 8,428 Other securities 14,280 17,181 14,248 13,585 220,877 214,639 220,053 207,080 Unsecured 291,854 241,926 284,880 241,583 P 512,731 P 456,565 P 504,933 P 448,663
(f) Information on Related Party Loans
In the ordinary course of business, the Bank has loan transactions with each other, their other affiliates, and with certain DOSRI. Under existing policies of the Bank, these loans are made substantially on the same terms as loans to other individuals and businesses of comparable risks.
Under the current BSP regulations, the amount of individual loans to a DOSRI, 70% of which must be secured, should not exceed the amount of the encumbered deposit and book value of the investment in the Bank and/or any of its lending and nonbank financial subsidiaries. In the aggregate, loans to DOSRIs, generally, should not exceed the total equity or 15% of the total loan portfolio of the Bank. However, non-risk loans are excluded in both individual and aggregate ceiling computation.
The following table shows the information relating to the loans, other credit accommodations and guarantees granted to DOSRI as of December 31 in accordance with BSP reporting guidelines:
Group Parent Company 2021 2020 2021 2020
Total outstanding DOSRI loans P 325 P 946 P 304 P 920 Unsecured DOSRI 98 657 90 649 Past due DOSRI 1 5 - 5 Non-accruing DOSRI 1 5 1 5
Percent of DOSRI loans to total loan portfolio 0.06% 0.19% 0.06% 0.19%
Percent of unsecured DOSRI loans to total
DOSRI loans 30.15% 69.45% 29.61% 70.54% Percent of past due DOSRI
Loans to total DOSRI 0.31% 0.53% 0.00% 0.54% Percent of non-accruing DOSRI loans to total
DOSRI loans 0.31% 0.53% 0.33% 0.54%

- 185 -
The following table shows the other information relating to the loans, other credit accommodations and guarantees granted to related parties (inclusive of DOSRI) as of December 31 as reported to the BSP:
Group Parent Company 2021 2020 2021 2020 Total outstanding Related Party loans P 19,447 P 12,552 P 19,442 P 12,534 Unsecured Related Party 16,165 10,564 16,162 8,010 Past due Related Party 1 5 1 1 Non-accruing Related Party - 5 - - Percent of Related Party loans to total loan portfolio 3.61% 4.31% 3.66% 2.59% Percent of unsecured Related Party loans to total Related Party loans 83.12% 84.16% 83.13% 63.91% Percent of past due Related Party loans to total Related Party loans 0.00% 0.00% 0.00% 0.01% Percent of non-accruing Related Party loans to total Related Party loans 0.00% 0.00% 0.00% 0.00%
In accordance with existing BSP regulations, the reported DOSRI performing loans exclude loans extended to certain borrowers before these borrowers became DOSRI. Under BSP regulations, total outstanding exposures to each of the Parent Company’s subsidiaries and affiliates shall not exceed 10.0% of the Group’s net worth, the unsecured portion of which shall not exceed 5.0% of such net worth. Further, the total outstanding exposures to subsidiaries and affiliates shall not exceed 20.0% of the net worth of the Parent Company. As of December 31, 2021, 2020 and 2019, the Group and Parent Company is in compliance with these regulatory requirements.
As of December 31, 2021, 2020 and 2019, the Group has not recognized impairment loss on loans and receivables from DOSRI.
(g) Secured Liabilities and Assets Pledged as Security
Assets pledged as security for liabilities of the Group and Parent Company are shown below.
2021 2020 Aggregate amount of secured liabilities P 45,378 P 4,199 Aggregate amount of resources pledged as security P 54,145 P 8,245

- 186 -
(h) Contingencies and Commitments Arising from Off-balance Sheet Items
The following is a summary of contingencies and commitments arising from transactions not given recognition in the statement of financial position, expressed at their equivalent peso contractual amounts as of December 31, 2021 and 2020:
2021 2020 Trust Investment Group accounts P 146,769 P 116,652 Outstanding guarantees issued 79,927 67,297 Derivative assets 71,092 36,980 Derivative liabilities 50,251 28,135 Unused commercial letters of credit 12,412 20,495 Spot exchange bought 6,170 8,681 Spot exchange sold 6,165 8,674 Inward bills for collection 4,003 1,694 Late deposits/payments received 377 644 Outward bills for collection 78 94 Others 58 17

Punongbayan & Araullo 20th Floor, Tower 1 The Enterprise Center 6766 Ayala Avenue 1200 Makati City Philippines T +63 2 8988 2288
a
Certified Public Accountants Punongbayan & Araullo (P&A) is the Philippine member firm of Grant Thornton International Ltd. Offices in Cavite, Cebu, Davao BOA/ PRC Cert of Reg. No. 0002 SEC Accreditation No. 0002
grantthornton.com.ph
Report of Independent Auditors to Accompany Supplementary Information Required by the Securities and Exchange Commission Filed Separately from the Basic Financial Statements The Board of Directors and the Stockholders Rizal Commercial Banking Corporation Yuchengco Tower, RCBC Plaza 6819 Ayala Avenue cor. Sen. Gil Puyat Avenue Makati City We have audited, in accordance with Philippine Standards on Auditing, the financial statements of Rizal Commercial Banking Corporation for the year ended December 31, 2021, on which we have rendered our report dated February 28, 2022. Our audits were made for the purpose of forming an opinion on the basic financial statements taken as a whole. The Reconciliation of Retained Earnings Available for Dividend Declaration for the year ended December 31, 2021 is presented for purposes of additional analysis in compliance with the requirements under the Revised Securities Regulation Code Rule 68, and is not a required part of the basic financial statements prepared in accordance with Philippine Financial Reporting Standards. Such supplementary information is the responsibility of management. The supplementary information has been subjected to the auditing procedures applied in the audit of the basic financial statements and, in our opinion, is fairly stated in all material respects in relation to the basic financial statements taken as a whole. PUNONGBAYAN & ARAULLO
By: Anthony L. Ng Partner CPA Reg. No. 0109764 TIN 230-169-270 PTR No. 8852341, January 3, 2022, Makati City SEC Group A Accreditation Partner - No. 109764-SEC (until Dec. 31, 2023) Firm - No. 0002 (until Dec. 31, 2024) BIR AN 08-002511-038-2019 (until Sept. 4, 2022) Firm’s BOA/PRC Cert. of Reg. No. 0002 (until Aug. 27, 2024) February 28, 2022

Punongbayan & Araullo 20th Floor, Tower 1 The Enterprise Center 6766 Ayala Avenue 1200 Makati City Philippines T +63 2 8988 2288
a
Certified Public Accountants Punongbayan & Araullo (P&A) is the Philippine member firm of Grant Thornton International Ltd. Offices in Cavite, Cebu, Davao BOA/ PRC Cert of Reg. No. 0002 SEC Accreditation No. 0002
grantthornton.com.ph
Report of Independent Auditors on Components of Financial Soundness Indicators The Board of Directors and the Stockholders Rizal Commercial Banking Corporation Yuchengco Tower, RCBC Plaza 6819 Ayala Avenue cor. Sen. Gil Puyat Avenue Makati City We have audited, in accordance with Philippine Standards on Auditing, the consolidated financial statements of Rizal Commercial Banking Corporation and subsidiaries (the Group) as at December 31, 2021 and 2020 and for each of the three years in the period ended December 31, 2021, on which we have rendered our report dated February 28, 2022. Our audit was made for the purpose of forming an opinion on the basic consolidated financial statements taken as a whole. The Supplementary Schedule on Financial Soundness Indicators, including their definitions, formulas, calculation and their appropriateness or usefulness to the intended users, are the responsibility of the Group’s management. These financial soundness indicators are not measures of operating performance defined by Philippine Financial Reporting Standards (PFRS) and may not be comparable to similarly titled measures presented by other companies. This schedule is presented for the purposes of complying with the Revised Securities Regulation Code Rule 68 issued by the Securities and Exchange Commission, and is not a required part of the basic consolidated financial statements prepared in accordance with PFRS. The components of these financial soundness indicators have been traced to the Group’s consolidated financial statements as at December 31, 2021 and 2020 and for each of the three years in the period ended December 31, 2021 and no material exceptions were noted. PUNONGBAYAN & ARAULLO
By: Anthony L. Ng Partner CPA Reg. No. 0109764 TIN 230-169-270 PTR No. 8852341, January 3, 2022, Makati City SEC Group A Accreditation Partner - No. 109764-SEC (until Dec. 31, 2023) Firm - No. 0002 (until Dec. 31, 2024) BIR AN 08-002511-038-2019 (until Sept. 4, 2022) Firm’s BOA/PRC Cert. of Reg. No. 0002 (until Aug. 27, 2024) February 28, 2022

Punongbayan & Araullo 20th Floor, Tower 1 The Enterprise Center 6766 Ayala Avenue 1200 Makati City Philippines T +63 2 8988 2288
a
Certified Public Accountants Punongbayan & Araullo (P&A) is the Philippine member firm of Grant Thornton International Ltd. Offices in Cavite, Cebu, Davao BOA/ PRC Cert of Reg. No. 0002 SEC Accreditation No. 0002
grantthornton.com.ph
Report of Independent Auditors to Accompany Supplementary Information Required by the Securities and Exchange Commission Filed Separately from the Basic Consolidated Financial Statements The Board of Directors and the Stockholders Rizal Commercial Banking Corporation Yuchengco Tower, RCBC Plaza 6819 Ayala Avenue cor. Sen. Gil Puyat Avenue Makati City We have audited, in accordance with Philippine Standards on Auditing, the consolidated financial statements of Rizal Commercial Banking Corporation and subsidiaries (the Group) for the year ended December 31, 2021, on which we have rendered our report dated February 28, 2022. Our audits were made for the purpose of forming an opinion on the basic financial statements taken as a whole. The applicable supplementary information (see List of Supplementary Information) is presented for purposes of additional analysis in compliance with the requirements of Revised Securities Regulation Code Rule 68, and is not a required part of the basic consolidated financial statements prepared in accordance with Philippine Financial Reporting Standards. Such supplementary information is the responsibility of the Group’s management. The supplementary information has been subjected to the auditing procedures applied in the audit of the basic consolidated financial statements and, in our opinion, is fairly stated in all material respects in relation to the basic consolidated financial statements taken as a whole. PUNONGBAYAN & ARAULLO
By: Anthony L. Ng Partner CPA Reg. No. 0109764 TIN 230-169-270 PTR No. 8852341, January 3, 2022, Makati City SEC Group A Accreditation Partner - No. 109764-SEC (until Dec. 31, 2023) Firm - No. 0002 (until Dec. 31, 2024) BIR AN 08-002511-038-2019 (until Sept. 4, 2022) Firm’s BOA/PRC Cert. of Reg. No. 0002 (until Aug. 27, 2024) February 28, 2022

Page
Schedules Required under Annex 68-J of the Revised Securities Regulation Code Rule 68
A Financial Assets 2
B Amounts Receivable from Directors, Officers, Employees, Related Parties and Principal Stockholders (Other than Related Parties) 3
C Amounts Receivable from Related Parties which are Eliminated during the Consolidation of Financial Statements 4
D Long Term Debt 5
E Indebtedness to Related Parties (Long-term Loans from Related Companies) 6
F Guarantees of Securities of Other Issuers 7
G Capital Stock 8
Other Required Information
Reconciliation of Retained Earnings Available for Dividend Declaration* 9
Schedule of Recent Public Offerings 10
Map Showing the Relationship Between the Company and its Related Entities 11
Schedule of Financial Soundness Indicators 12
*Information therein are based on the separate financial statements of the Parent Company.
Rizal Commercial Banking Corporation and SubsidiariesList of Supplementary Information
December 31, 2021
Schedule Description

Name of issuing entity and association of cash issue Number of shares or principal amount of bonds or notes
Amount shown on the balance sheet
Value based on the market quotation at balance sheet date Income received and accrued
Financial Asset at Fair Value Through Profit or LossGovernment securities 1,835 P 4,330 P 4,330 P 58 P Corporate debt securities 691 P 35 35 9 Equity securities 142,672,612 shares 232 232 24 Derivative financial assets 65,115 P 1,266 1,266 29
5,863 5,863 120
Financial Asset at Fair Value Through Other Comprehensive IncomeQuoted equity securities 63,181,305 shares 1,852 1,852 17 Unquoted equity securities 67,224,308 shares 1,815 1,815 64 Government securities 16,733 P 28,682 28,682 759 Corporate debt securities 15,688 P 17,412 17,412 584
49,761 49,761 1,424
Investment Securities at Amortized CostGovernment securities 35,156 P 132,969 132,818 2,460 Corporate debt securities 6,365 P 30,789 31,606 549
163,758 164,424 3,009
Allowance for impairment 147 )( 147 )( -
163,611 164,277 3,009
219,235 P 219,901 P 4,553 P
Rizal Commercial Banking Corporation and SubsidiariesSchedule A - Financial Assets
December 31, 2021(Amount in Millions of Philippine Pesos, Except Share Data)
2 of 12

Name and Designation of debtor Balance at beginning of period Additions Amounts collected Amounts written off Current Not Current Balance at end of period
Rizal Commercial Banking CorporationLoans ReceivablePan Malayan Management and Investment Corp. 151 P - 55 P - 96 P - 96 P House of Investments Inc. 564 120 372 - 312 - 312
Credit Card ReceivablesBankard (Officers) 1 - - - 1 - 1
RCBC Capital CorporationLoans ReceivableEmployee Loans 1 1 1 - 1 - 1
RCBC Leasing and Finance Corp.Loans ReceivableEmployee Loans 1 1 1 - 1 - 1
RCBC Bankard Services CorporationLoans ReceivableEmployee Loans 12 12 4 - 4 - 4
Rizal Commercial Banking Corporation and SubsidiariesSchedule B - Amounts Receivable from Directors, Officers, Employees, Related Parties and Principal Stockholders (Other than Related Parties)
December 31, 2021(Amount in Millions of Philippine Pesos)
P P P
3 of 12

Amounts collected Amounts written off Current Not Current
Rizal Microbank, Inc.Due from other banks - RCBC 95 - 27 )( - 68 - 68
RCBC Capital CorporationDue from other banks - RCBC 1 - - - 1 - 1 Dividends receivable 600 500 600 )( - 500 - 500
Cajel Realty CorporationDue from other banks - RCBC - - - - - - -
RCBC Leasing and Finance Corp.Due from other banks - RCBC 96 100 - - 196 - 196
RCBC International Finance, Ltd.Due from other banks - RCBC - 17 - - 17 - 17
RCBC Forex Brokers Corp.Due from other banks - RCBC 87 - 5 )( - 82 - 82
RCBC - JPL Holding CompanyAssignment of receivables 147 - 20 )( - 127 - 127
Niyog Property Holdings, Inc.Due from other banks - RCBC 68 50 - - 118 - 118
Balance at end of period
Rizal Commercial Banking Corporation and SubsidiariesSchedule C - Amounts Receivable from Related Parties which are Eliminated during the Consolidation of Financial Statements
December 31, 2021(Amount in Millions of Philippine Pesos)
Name and Designation of debtor Balance at beginning of period Additions Deductions Classification
4 of 12

Title of Issue and type of obligation Amount authorized by indenture Amount shown under caption "Current portion of long-term debt" in related balance sheet
Amount shown under caption "Long-Term Debt" in related balance sheet
Rizal Commercial Banking Corporation
P 13,742,840,000 Senior Notes P 13,743 - P 13,743Interest Rate: 3.2% Fixed RateMaturity Date: 9/30/2023Number of periodic installments: Not applicable
P 4,130,000,000 Senior Notes P4,130 - P 4,130Interest Rate: 4.18% Fixed RateMaturity Date: 6/30/2026Number of periodic installments: Not applicable
US$ 300,000,000 Senior Notes Interest Rate: 3.00% Fixed RateMaturity Date: 9/11/2024Number of periodic installments: Not applicable US$ 300 - P 15,264
P 3,580,000,000 Long Term Negotiable Certificate of DepositInterest Rate: 5.5%Maturity Date: 3/28/2024Number of periodic installments: Not applicable P 3,580 - P 3,580
US$ 450,000,000 Senior Notes Interest Rate: 4.13% Fixed RateMaturity Date: 3/16/2023Number of periodic installments: Not applicable US$ 450 - P 22,908
P 2,502,000,000 Long Term Negotiable Certificate of DepositInterest Rate: 3.75% Fixed RateMaturity Date: 2/11/2023Number of periodic installments: Not applicable P 2,502 - P 2,502
P 7,500,000,000 Senior Note Interest Rate: 4.43% Fixed RateMaturity Date: 11/13/2022Number of periodic installments: Not applicable P 7,500 - P 7,500
P 16,616,410,000 Senior Note Interest Rate: 3.25% Fixed RateMaturity Date: 7/27/2022Number of periodic installments: Not applicable P 16,616 - P 16,616
P 7,054,300,000 Senior Note Interest Rate: 4.85% Fixed RateMaturity Date: 4/7/2022Number of periodic installments: Not applicable P 7,054 - P 7,054
Rizal Commercial Banking Corporation and SubsidiariesSchedule D - Long Term Debt
December 31, 2021(Amount in Millions)
5 of 12

Not applicable
Balance at end of period
Rizal Commercial Banking Corporation and SubsidiariesSchedule E - Indebtedness to Related Parties (Long-Term Loans from Related Companies)
December 31, 2021(Amount in Millions of Philippine Pesos)
Name of related party Balance at beginning of period
6 of 12

Not applicable
Rizal Commercial Banking Corporation and SubsidiariesSchedule F - Guarantees of Securities of Other Issuers
December 31, 2021(Amount in Millions of Philippine Pesos)
Name of issuing entity of securities guaranteed by the company for which this statement is filed Title of issue of each class of securities guaranteed Nature of guaranteeTotal amount guaranteed and outstanding Amount owned by person for which statement
is filed
7 of 12

Preferred Sharesvoting, non-cumulative,non-redeemable, participating convertible into common shares 200,000,000.00 267,410.00 267,410.00 - - -
Common Shares 2,600,000,000.00 2,037,478,896.00 - 1,648,101,196.00 1,977,758.00 591,099,942.00
Directors, officers and employees
Rizal Commercial Banking Corporation and SubsidiariesSchedule G - Capital Stock
December 31, 2021(Amount in Millions of Philippine Pesos, Except Share Data)
Title of Issue Number of shares authorized Number of shares issued and outstanding as shown under related statement of financial position caption
Number of shares reserved for options, warrants, conversion and other rights OthersNumber of shares held by related
parties
8 of 12

Unappropriated Retained Earnings at Beginning of Year 33,599 P Adjustments:
Accumulated share in equity of subsidiaries and associates 1,613 )( Deferred tax assets 2,765 )( 4,378 )(
Unappropriated Retained Earnings at Beginning of Year Available forDividend Declaration at Beginning of Year, As Adjusted 29,221
Net Profit Realized During the YearNet profit per audited financial statements 7,082 Non-actual/unrealized income
Share in net income of subsidiaries and associates 477 )( Deferred tax income 248 )(
6,357
Other Transactions During the YearDividends declared 1,897 )( Appropriation for general loan loss provision 176 )( Appropriation of retained earnings to trust reserves 9 )( 2,082 )(
Unappropriated Retained Earnings Available forDividend Declaration at End of Year 33,496 P
RIZAL COMMERCIAL BANKING CORPORATIONYuchengco Tower, RCBC Plaza, 6819 Ayala Avenue cor. Sen Gil Puyat Avenue, Makati CityParent Company Reconciliation of Retained Earnings Available for Dividend Declaration
(Amounts in Millions of Philippine Pesos)December 31, 2021
9 of 12

2017 - P2,502,000,000 Long Term Negotiable Certificate of Deposit Gross Proceeds: P2,502,000,000 (Issue Price: P2,502,000,000 @ 100.00% )Related Expenses: P15,703,828Use of Proceeds: To be used for general funding purposes.
2018- P3,580,000,000 Long Term Negotiable Certificate of DepositGross Proceeds: P3,580,000,000 (Issue Price: P3,580,000,000 @ 100.00% )Related Expenses: P30,915,597.18Use of Proceeds: To be used for general funding purposes.
2018 - US$ 450,000,000 Senior Note Gross Proceeds: US$450,000,000 (Issue Price: US$ 420,000,000 @ 100.00%)Related Expenses: US$885,914.99Use of Proceeds: To be used for general banking and re-lending purposes.
2018 - P15,000,000,000 Stock Rights Offering (535,710,378 shares)Gross Proceeds: P15,000,000,000 (Issue Price: P28 per share)Related Expenses: P217,262,589Use of Proceeds: To strengthen the Bank's capital ratio and fund its business expansion (i.e. loan growth).
2019 - US$ 300,000,000 Senior Note Gross Proceeds: US$300,000,000 (Issue Price: US$ 300,000,000 @ 99.751%) Related Expenses: US$862,031.65 Use of Proceeds: To be used for general banking and re-lending purposes.
2020 - P7,054,300,000 Senior Note Gross Proceeds: P7,054,300,000 (Issue Price: P7,054,300,000 @ 100.00% ) Related Expenses: P1,154,630.38Use of Proceeds: To be used for general banking and re-lending purposes.
2020 - P16,616,410,000 Senior Note Gross Proceeds: P16,616,410,000 (Issue Price: P16,616,410,000 @ 100.00% ) Related Expenses: P14,986,758.48Use of Proceeds: To be used for general banking and re-lending purposes.
2020 - US$ 300,000,000 Hybrid Perpetual SecuritiesGross Proceeds: US$ 300,000,000 (Issue Price: US$ 300,000,000 @ 100.00% ) Related Expenses: US$796,991.93Use of Proceeds: To to support and finance medium-term to long-term asset growth, loans to customers,
other general corporate purposes and to maintain sufficient buffers above the minimum capital thresholds required by BSP.
2019 - P7,500,000,000 Senior Note Gross Proceeds: P7,500,000,000 (Issue Price: P7,500,000,000 @ 100.00% ) Related Expenses: 56,250,000Use of Proceeds: To be used for general banking and re-lending purposes.
2021 - P13,742,840,000 Senior Note Gross Proceeds: P13,742,840,000 (Issue Price: P13,742,840,000 @ 100.00% ) Related Expenses: P103,071,300Use of Proceeds: To be used for general banking and re-lending purposes.
2021 - P4,129,730,000 Senior Note Gross Proceeds: P4,129,730,000 (Issue Price: P4,129,730,000 @ 100.00% ) Related Expenses: P30,972,975Use of Proceeds: To be used for general banking and re-lending purposes.
Rizal Commercial Banking Corporation and SubsidiariesSchedule of Recent Public Offerings
December 31, 2021
10 of 12

RCBC SECURITIES, INC.100%
RCBC BANKARD SERVICES
CORPORATION100%
RCBC RENTAL CORP.100%
RCBC INVESTMENT, LTD.100%
RCBC TELEMONEY EUROPE
100%
RCBC FOREX BROKERS CORP.
100%
RCBC-JPL HOLDING COMPANY
99.41%
NIYOG PROPERTY HOLDINGS, INC.
100%
CAJEL REALTYCORPORATION
100%
RCBC CAPITAL CORPORATION
99.96%
MERCHANTS LOANS AND ASSOCIATION, INC.
98.03%
RCBC LEASING AND FINANCE CORP.
99.67%
RCBC INT'L FINANCE, LTD.100%
Rizal Commercial Banking Corporation and SubsidiariesMap Showing the Relationships Between and Among the RCBC and Its Related Parties
December 31, 2021
PAN MALAYAN MANAGEMENT AND INVESTMENT CORPORATION(PMMIC)
MICO EQUITIES, INC.PMMIC - 77.19%
GPL HOLDINGS, INC.PMMIC - 60.91%
HOUSE OF INVESTMENTS
PMMIC - 51.15%
RIZAL COMMERCIAL BANKING
CORPORATIONPMMIC - 39.64%
OTHERS
A
A
11 of 12

Ratio Formula
Current ratio Total current assets 423,628 0.58 419,412 0.78
Total current liabilities 724,701 540,244
Acid test ratio Quick assets 205,140 0.28 208,619 0.39
Total current liabilities 724,701 540,244
Solvency ratio Total liabilities 848,053 88.42% 670,728 86.87%
Total assets 959,133 772,106
Debt-to-equity ratio Total liabilities 848,053 7.63 670,728 6.62
Total equity 111,080 101,378
Resources-to-equity ratio Total resources 959,133 8.63 772,106 7.62
Total equity 111,080 101,378
Interest rate coverage ratio Earnings before interest and taxes 16,091 1.94 17,164 1.61
Interest expense 8,280 10,671
Return on equity Net profit * 6,120 6.71% 4,698 5.54%
Average total equity ** 91,180 84,820
Return on resources Net profit 7,083 0.84% 5,018 0.68%
Average total resources 844,048 736,564
Net profit margin Net profit 7,083 19.46% 5,018 13.24%
Revenues 36,394 37,913
Other ratios:
Net interest margin Net interest income 29,054 4.07% 26,281 4.25%
Average interest earning resources 713,875 617,896
Cost-to-income ratio Total other operating expenses 22,535 61.92% 22,045 58.15%
Gross income 36,394 37,913
Capital adequacy ratio Total qualifying capital 99,465 15.23% 89,808 16.14%
Total risk-weighted assets 653,108 556,585
* net of dividends to Hybrid Perpertual Securities
** excluding Hybrid Perpertual Securities
2021 2020
Rizal Commercial Banking Corporation and Subsidiaries
Supplemental Schedule of Financial Soundness Indicators
(Amount in Millions of Philippine Pesos, Except Share Data)December 31, 2021 and 2020
Ratio
12 of 12

May 12, 2022
Director Vicente Graciano F. Felizmenio, Jr. Head, Markets and Securities Regulation Department (MSRD) G/F Secretariat Building Securities and Exchange Commission PICC Complex, Roxas Boulevard Pasay City, 1307 Dear Director Felizmenio, We submit herewith the March 31, 2022 SEC 17-Q report of Rizal Commercial Banking Corporation. Thank you. Very truly yours, Florentino M. Madonza FSVP, Head-Controllership Group cc: The Philippine Stock Exchange, Inc. 6/F PSE Tower 5th Avenue corner 28th Street Bonifacio Global City, Taguig City

Rizal Commercial Banking Corporation: March 2022 SEC Form 17-Q 1
COVER SHEET
1 7 5 1 4
S.E.C. Registration Number
R I Z A L C O M M E R C I A L B A N K I N G
C O R P O R A T I O N A N D S U B S I D I A R I E S
(Company's Full Name)
Y U C H E N G C O T O W E R , R C B C P L A Z A,
6 8 1 9 A Y A L A A V E N U E , M A K A T I C I T Y
MARIETA O. MIRANDA
8 8 9 4 9 9 3 2
Contact Person
Company Telephone Number
0 3
3 1
1 7 Q
Month
Day
FORM TYPE
Month
Day
Fiscal Year
Annual Meeting
Secondary License Type, If
Applicable
S E C
Dept. Requiring this
Doc. Amended Articles Number/Section
Total Amount of Borrowings
74 8
Total No. of Stockholders
Domestic
Foreign
To be accomplished by SEC Personnel concerned
File Number
LCU
Document I.D.
Cashier
S T A M P S

Rizal Commercial Banking Corporation: March 2022 SEC Form 17-Q 2
SEC Number 17514 PSE Code _______ File Number _______
______________________________________________________
RIZAL COMMERCIAL BANKING CORPORATION AND SUBSIDIARIES
______________________________________________________ (Company‟s Full Name)
Yuchengco Tower, RCBC Plaza 6819 Ayala Ave. corner Sen. Gil J. Puyat Ave., Makati City
______________________________________________________ (Company‟s Address)
8894-9000 ______________________________________________________
(Telephone Number)
December 31 ______________________________________________________
(Fiscal Year Ending)
SEC FORM 17-Q ______________________________________________________
Form Type
______________________________________________________ Amendment Designation (if applicable)
March 31, 2022 ______________________________________________________
For the Quarterly Period Ended
______________________________________________________ (Secondary License Type and File Number)

Rizal Commercial Banking Corporation: March 2022 SEC Form 17-Q 3
SECURITIES AND EXCHANGE COMMISSION SEC FORM 17-Q
QUARTERLY REPORT PURSUANT TO SECTION 17 OF THE SECURITIES
REGULATION CODE AND SRC RULE 17(2)(b) THEREUNDER
1. For the quarterly period ended March 31, 2022
2. SEC Identification Number 17514 3. BIR Tax Identification No. 000-599-760-000
4. Exact name of registrant as specified in its charter:
RIZAL COMMERCIAL BANKING CORPORATION
5. Philippines 6. Province, Country or other jurisdiction of
incorporation or organization
7. RCBC Plaza, Yuchengco Tower #6819 Ayala Ave. cor. Sen. Puyat Avenue, Makati City 1200
Address of principal office Postal Code
8. (632) 8894-9000
Registrant‟s telephone number, including area code
9. Not applicable
Former name, former address & former fiscal year, if changed since last report
10. Securities registered pursuant to Sections 8 and 12 of the SRC or Sections 4 and 8 of the RSA
Title of Each Class Number of Shares of Common Stock Outstanding Common Stock, P10 par value 2,037,478,896 (March 31, 2022)
11. Are any or all of these securities listed on the Philippine Stock Exchange
Yes (x) No ( )
12. Check whether the registrant:
(a) has filed all reports required to be filed by Section 17 of the SRC thereunder or Section 11 of the RSA and RSA Rule 11(a)-1 thereunder and Sections 26 and 141 of the Corporation Code of the Philippines during the preceding 12 months (or for such shorter period that the registrant was required to file such reports);
Yes (x) No ( )
(b) has been subject to such filing requirements for the past 90 days Yes (x) No ( )
(SEC Use Only)
Industry Classification Code:

Rizal Commercial Banking Corporation: March 2022 SEC Form 17-Q 4
TABLE OF CONTENTS
Page Number PART I – FINANCIAL INFORMATION Item 1. Financial Statements 5 Item 2. Management‟s Discussion and Analysis of 32 Financial Condition and Results of Operations PART II – OTHER INFORMATION SIGNATURES 37 AGING OF ACCOUNTS RECEIVABLES 38

Rizal Commercial Banking Corporation: March 2022 SEC Form 17-Q 5
Item 1. Financial Statements
3/31/2022 12/31/2021
Notes (Unaudited) (Audited)
Cash and Other Cash Items 12,031 P 14,691 P
Due From Bangko Sentral ng Pilipinas 79,183 130,170
Due From Other Banks 4,811 12,162
Loans Under Reverse Repurchase Agreement 18,945 11,691
Trading and Investment Securities - Net 3 275,622 219,235
Loans and Receivables - Net 4 538,278 538,302
Investments in Associates - Net 360 344
Bank Premises, Furniture, Fixtures & Equipment- Net 12,591 12,660
Investment Properties - Net 3,473 3,572
Deferred Tax Assets 3,466 3,206
Other Resources - Net 5 12,952 13,100
Total Resources 961,712 P 959,133 P
Deposit Liabilities 6 675,268 672,459
Bills Payable 7 34,937 55,904
Bonds Payable 8 102,539 87,215
Accrued Taxes, Interest And Other Expenses 5,781 6,097
Other Liabilities 9 34,261 26,378
Total Liabilities 852,786 848,053
CAPITAL FUNDS
Attributable to Parent Company Shareholders:
Preferred Stock 10 3 3
Common Stock 10 22,509 22,509
Hybrid Perpetual Securities 14,463 14,463
Capital Paid in Excess of Par 10 42,505 42,505
Treasury Shares 10 9,287 )( 9,287 )(
Other Comprehensive Income:
2,142 )( 390
Cumulative Translation Adjustment 54 54
Retirement plan 2,366 )( 2,367 )(
Reserve for Trust Business 518 508
Other Reserves 97 )( 97 )(
Retained Earnings Appropriated for General Provision 3,742 3,617
Retained Earnings 39,006 38,764
108,908 111,062
Non-controlling Interest 18 18
Total Capital Funds 108,926 111,080
TOTAL LIABILITIES AND CAPITAL FUNDS 961,712 P 959,133 P
Net Unrealized Gains/(Losses) on Financial Assets At Fair
Value Through Other Comprehensive Income
PART I - FINANCIAL INFORMATION
See Notes to Interim Financial Statements.
RESOURCES
LIABILITIES AND CAPITAL FUNDS
RIZAL COMMERCIAL BANKING CORPORATION AND SUBSIDIARIES
STATEMENTS OF FINANCIAL POSITION
(Amounts in Millions of Philippine Pesos)

Rizal Commercial Banking Corporation: March 2022 SEC Form 17-Q 6
1/1/2022 to 1/1/2021 to
3/31/2022 3/31/2021
Note (Unaudited) (Unaudited)
INTEREST INCOME ON
Loans and receivables 8,122 7,572
Investment securities 2,012 600
Others 139 260
10,273 8,432
INTEREST EXPENSE ON
Deposit liabilities 1,097 913
Bills payable and other borrowings 1,125 1,054
2,222 1,967
NET INTEREST INCOME 8,051 6,465
IMPAIRMENT LOSSES - Net 1,552 936
AFTER IMPAIRMENT LOSSES 6,499 5,530
OTHER OPERATING INCOME (CHARGES)
Service fees and commissions 1,124 1,335
Trading and securities gain - net 121 35 )(
Trust fees 102 91
Foreign exchange gains (losses) - net 24 47
Miscellaneous 11 480 412
1,851 1,848
OTHER OPERATING EXPENSES
Employee benefits 1,589 1,593
Taxes and licenses 974 787
Occupancy and equipment-related 736 723
Depreciation and amortization 728 796
Miscellaneous 11 1,857 1,794
5,884 5,692
PROFIT BEFORE TAX 2,466 1,686
TAX EXPENSE 325 106
NET PROFIT 2,141 1,580
Net Profit Attributable to Non-Controlling Interest - -
Net Profit Attributable to Parent Company Shareholders 2,141 1,580
Earnings Per Share (Annualized)
Basic 3.77 2.81
Diluted 3.77 2.81
See Notes to Interim Financial Statements.
RIZAL COMMERCIAL BANKING CORPORATION AND SUBSIDIARIES
STATEMENTS OF INCOME
(Amounts in Millions of Philippine Pesos, Except Per Share Data)
NET INTEREST INCOME

Rizal Commercial Banking Corporation: March 2022 SEC Form 17-Q 7
1/1/2022 to 1/1/2021 to
3/31/2022 3/31/2021
(Unaudited) (Unaudited)
NET PROFIT FOR THE PERIOD 2,141 1,580
OTHER COMPREHENSIVE LOSSES DURING THE PERIOD:
Fair value losses on Financial assets at Other Comprehensive Income 2,533 )( 16 )(
Retirement plan 1 7
Translation adjustments on foreign operations - -
Other Comprehensive Loss for the period 2,532 )( 9 )(
TOTAL COMPREHENSIVE INCOME (LOSS) FOR THE PERIOD 391 )( 1,571
- -
COMPREHENSIVE INCOME (LOSS) ATTRIBUTABLE TO PARENT
COMPANY'S SHAREHOLDERS 391 )( 1,571
See Notes to Interim Financial Statements.
RIZAL COMMERCIAL BANKING CORPORATION AND SUBSIDIARIES STATEMENTS OF COMPREHENSIVE INCOME
(Amounts in Millions of Philippine Pesos)
COMPREHENSIVE INCOME ATTRIBUTABLE TO NON-CONTROLLING
INTEREST

Rizal Commercial Banking Corporation: March 2022 SEC Form 17-Q 8
1/1/2022 to 1/1/2021 to
3/31/2022 3/31/2021
(Unaudited) (Unaudited)
ATTRIBUTABLE TO PARENT COMPANY SHAREHOLDERS
PREFERRED STOCK
Balance at beginning and end of period 3 3
COMMON STOCK
Balance at beginning and end of period 22,509 22,509
HYBRID PERPETUAL SECURITIES
Balance at beginning and end of period 14,463 14,463
CAPITAL PAID IN EXCESS OF PAR
Balance at beginning and end of period 42,505 42,568
TEASURY SHARES, At Cost
Balance at beginning and end of period 9,287 )( 13,719 )(
Beginning balance 391 664
Fair value losses during the period 2,533 )( 16 )(
Balance, end 2,142 )( 648
CUMULATIVE TRANSLATION ADJUSTMENTS
Balance at beginning and end of period 54 54
OTHER COMPREHENSIVE INCOME - RETIREMENT PLAN
Balance, beginning 2,367 )( 2,788 )(
Remeasurement of the defined benefits during the priod 1 7
Balance, end 2,366 )( 2,781 )(
RESERVE FOR TRUST BUSINESS
Balance, beginning 507 499
Transfer from retained earnings - free 11 -
Balance, end 518 499
OTHER RESERVES 97 )( 97 )(
RETAINED EARNINGS APPROPRIATED FOR
GENERAL PROVISION
Beginning balance 3,617 3,442
Transfer from retained earnings - free 125 8
Balance, end 3,742 3,450
RETAINED EARNINGS
Beginning balance 38,764 33,763
Net profit 2,141 1,580
Cash dividends on common shares 1,259 )( -
Dividends on Hybrid Capital Securities 497 )( 472 )(
Transfer of fair value reserves on FVOCI 7 )( 3 )(
Transfer to retained earnings appropriated for general provision 125 )( 7 )(
Transfer to reserves for trust business 11 )( -
Balance, end 39,006 34,861
ATTRIBUTABLE TO
PARENT COMPANY SHAREHOLDERS 108,908 102,457
MINORITY INTEREST
Balance at beginning and end of period 18 17
TOTAL CAPITAL FUNDS 108,926 102,474
RIZAL COMMERCIAL BANKING CORPORATION AND SUBSIDIARIESSTATEMENTS OF CHANGES IN CAPITAL FUNDS
(Amounts in Millions of Philippine Pesos)
NET UNREALIZED GAINS/(LOSSES) ON FINANCIAL ASSETS AT
OTHER COMPREHENSIVE INCOME
See Notes to Interim Financial Statements.

Rizal Commercial Banking Corporation: March 2022 SEC Form 17-Q 9
YTD Ended YTD Ended
3/31/2022 3/31/2021
(Unaudited) (Unaudited)
CASH FLOWS FROM OPERATING ACTIVITIES
Profits before tax 2,466 1,686
Adjustments for:
Interest income 10,273 )( 8,432 )(
Interest expense 2,222 1,967
Impairment losses 1,552 936
Depreciation and amortization 728 796
Dividend income 24 )( 7 )(
Share in net earnings of associates 16 )( 5
Operating income before working capital changes 3,345 )( 3,049 )(
Decrease (Increase) in financial assets at fair value through profit and loss 1,075 507 )(
Decrease (Increase) in loans and receivables 3,803 31,318 )(
Decrease in investment property 99 126
Decrease (Increase) in other resources 11,770 )( 4,468
Increase in deposit liabilities 2,809 27,071
Increase (Decrease) in accrued taxes, interest and other expenses 146 90 )(
Increase in other liabilities 8,040 1,717
Cash generated from (used in) operations 857 1,582 )(
Interest received 10,068 8,188
Interest paid 2,805 )( 2,423 )(
Cash paid for taxes 291 )( 80 )(
Net Cash From Operating Activities 7,829 4,103
CASH FLOWS FROM INVESTING ACTIVITIES
Decrease (increase) in Financial Assets at FVOCI 10,565 )( 16,452
Increase in Investment securities at amortized cost 49,422 )( 44,292 )(
Acquisitions of bank premises, furniture, fixtures and equipment (net) 492 )( 803 )(
Cash dividends received 24 7
Acquisitions of intangibles 62 )( 172 )(
Net Cash Used in Investing Activities 60,517 )( 28,808 )(
CASH FLOWS FROM FINANCING ACTIVITIES
Payments of bills payable 20,967 )( 3,302 )(
Dividends paid 497 )( 472 )(
Redemption of bonds payable 15,324 2,897
Net Cash Used in Financing Activities 6,140 )( 877 )(
NET DECREASE IN CASH AND CASH EQUIVALENTS 58,827 )( 25,582 )(
CASH AND CASH EQUIVALENTS, BEGINNING
Cash and other cash items 14,691 16,520
Due from Bangko Sentral ng Pilipinas 130,170 115,467
Due from other banks 12,162 15,707
Interbank Loans and Loans and Receivables under reverse repurchase agreement 42,254 56,037
199,277 203,731
CASH AND CASH EQUIVALENTS, END
Cash and other cash items 12,031 13,333
Due from Bangko Sentral ng Pilipinas 79,183 123,650
Due from other banks 4,811 12,631
Interbank Loans and Loans and Receivables under reverse repurchase agreement 44,425 28,535
140,450 178,149
See Notes to Interim Financial Statements.
RIZAL COMMERCIAL BANKING CORPORATION AND SUBSIDIARIES
STATEMENTS OF CASH FLOWS
(Amounts in Millions of Philippine Pesos)

Rizal Commercial Banking Corporation: March 2022 SEC Form 17-Q 10
RIZAL COMMERCIAL BANKING CORPORATION AND SUBSIDIARIES NOTES TO INTERIM CONDENSED FINANCIAL STATEMENTS
MARCH 31, 2022 AND DECEMBER 31, 2021 (Amounts in Millions of Philippine Pesos)
1. CORPORATE MATTERS
1.1 Incorporation and Operations Rizal Commercial Banking Corporation (the Parent Company, the Bank or RCBC), a universal bank engaged in all aspects of banking, was originally incorporated on September 23, 1960. The Bank renewed its corporate existence on December 10, 2009. It provides products and services related to traditional loans and deposits, trade finance, domestic and foreign fund transfers or remittance, cash management, treasury, and trust and custodianship services. It also enters into forward currency contracts as an accommodation to its clients and as a means of managing its foreign exchange exposures. The Parent Company and its subsidiaries (together hereinafter referred to as the Group) are engaged in all aspects of traditional banking, investment banking, retail financing (credit cards, auto loans, mortgage/housing and microfinance loans), remittance, leasing and stock brokering. As a banking institution, the Group‟s operations are regulated and supervised by the Bangko Sentral ng Pilipinas (BSP). As such, the Group is required to comply with banking rules and regulations such as those relating to maintenance of reserve requirements on deposit liabilities and deposit substitutes and those relating to the adoption and use of safe and sound banking practices, among others, as promulgated by the BSP. The Group‟s activities are subject to the provisions of Republic Act (RA) No. 8791, the General Banking Law of 2000, and other related banking laws. The Parent Company‟s common shares are listed in the Philippine Stock Exchange (PSE). The Parent Company is a 39.64% owned subsidiary of Pan Malayan Management and Investment Corporation (PMMIC), a company incorporated and domiciled in the Philippines. PMMIC is the holding company of the flagship institutions of the Yuchengco Group of Companies. The registered address of the Parent Company is Yuchengco Tower, RCBC Plaza, 6819 Ayala Avenue cor. Sen. Gil Puyat Avenue, Makati City. PMMIC‟s registered business address is 48th Floor, Yuchengco Tower, RCBC Plaza, 6819 Ayala Avenue, Makati City.
The condensed consolidated interim financial statements of the Group as of and for the three months ended March 31, 2022 (including the comparatives for the three months ended March 31, 2021) and the year ended December 31, 2021 were presented to and reviewed by the Bank's Audit and Compliance Committee.
2. SUMMARY OF SIGNIFICANT ACCOUNTING POLICIES The significant accounting policies that have been used in the preparation of these financial statements are summarized in the succeeding pages. The policies have been consistently applied to all the periods presented, unless otherwise stated.

Rizal Commercial Banking Corporation: March 2022 SEC Form 17-Q 11
2.1 Basis of Preparation of Financial Statements
(a) Statement of Compliance with Philippine Financial Reporting Standards
The interim financial statements of the Bank have been prepared in accordance with Philippine Financial Reporting Standards (PFRS).
There were no changes in the accounting policies and methods of computation followed in the interim financial statements as compared with the most recent annual financial statements.
(b) Presentation of Financial Statements
The financial statements are presented in accordance with Philippine Accounting Standards (PAS) 1, Presentation of Financial Statements. The Group presents its statement of financial position broadly in order of liquidity and presents all items of income and expenses in two statements: a “statement of profit or loss” and a “statement of comprehensive income.”
(c) Functional and Presentation Currency
These financial statements are presented in Philippine pesos, the Group‟s functional and presentation currency. All amounts are in millions, except per share data or when otherwise indicated.
2.2 Basis of Consolidation and Accounting for Investments in Subsidiaries and Associates in the Separate Financial Statements
The Group‟s consolidated financial statements comprise the accounts of the Parent Company and its subsidiaries, after the elimination of material intercompany transactions. All intercompany resources and liabilities, equity, income, expenses and cash flows relating to transactions with subsidiaries are eliminated in full. Unrealized profits and losses from intercompany transactions that are recognized in assets are also eliminated in full. Intercompany losses that indicate impairment are recognized in the consolidated financial statements.
2.3 Financial Assets Financial assets are recognized when the Group becomes a party to the contractual terms of the financial instrument. For purposes of classifying financial assets, an instrument is considered as an equity instrument if it is non-derivative and meets the definition of equity for the issuer in accordance with the criteria under PAS 32, Financial Instruments: Presentation. All other non-derivative financial instruments are treated as debt instruments.
(a) Classification, Measurement and Reclassification of Financial Assets Under PFRS 9, Financial Instruments, the classification and measurement of financial assets is driven by the entity‟s business model for managing the financial assets and the contractual cash flow characteristics of the financial assets. The classification and measurement of financial assets are described in the succeeding paragraphs.

Rizal Commercial Banking Corporation: March 2022 SEC Form 17-Q 12
(i) Financial Assets at Amortized Cost
Financial assets are measured at amortized cost if both of the following conditions are met:
the asset is held within the Group‟s business model whose objective is to hold financial assets in order to collect contractual cash flows; and,
the contractual terms of the instrument give rise, on specified dates, to cash flows that are solely payments of principal and interest (SPPI) on the principal amount outstanding.
Financial assets meeting these criteria are measured initially at fair value plus transaction costs. They are subsequently measured at amortized cost using the effective interest method, less any impairment in value.
(ii) Financial Assets at Fair Value Through Profit or Loss (FVPL)
The Group classifies financial assets as FVPL when they have been purchased or issued primarily for short-term profit making through trading activities or form part of a portfolio of financial instruments that are managed together, for which there is evidence of a recent pattern of short-term profit taking. Debt instruments that do not meet the amortized cost criteria, or that meet the criteria but the Group has chosen to designate as at FVPL at initial recognition, are measured at FVPL. Equity investments are classified as financial assets at FVPL, unless the Group designates an equity investment that is not held for trading as at Financial Assets at Fair Value Through Other Comprehensive Income (FVOCI) at initial recognition. The Group‟s financial assets at FVPL include government securities, corporate bonds, equity securities, which are held for trading purposes or designated as at FVPL.
Financial assets at FVPL are initially measured at fair value and transaction costs are expensed in profit or loss. Unrealized gains and losses arising from changes (mark-to-market) in the fair value of the financial assets at FVPL category and realized gains or losses arising from disposals of these instruments are included in Trading and Securities Gains under Other Operating Income account in the statement of profit or loss.
(iii) Financial Assets at Fair Value Through Other Comprehensive Income (FVOCI)
Debt Instruments at FVOCI The Group classifies debt instruments under FVOCI when both of the following conditions are met:
the asset is held within the Group‟s business model whose objective is achieved by both collecting contractual cash flows and selling financial assets; and,
the contractual terms of the instrument give rise, on specified dates, to cash flows that are solely payments of principal and interest (SPPI) on the principal amount outstanding.

Rizal Commercial Banking Corporation: March 2022 SEC Form 17-Q 13
FVOCI debt securities are initially measured at fair value plus transaction costs. They are subsequently measured at fair value with gains and losses arising from changes in fair value recognized in Other Comprehensive Income (OCI). Interest Income and foreign exchange gains and losses are recognized in profit or loss in the same manner as for financial assets measured at amortized cost. On derecognition, cumulative gains or losses previously recognized in OCI are reclassified to profit or loss. Equity Instruments at FVOCI At initial recognition, the Group can make an irrevocable election (on an instrument-by-instrument basis) to designate equity investments as at FVOCI; however, such designation is not permitted if the equity investment is held by the Group for trading. The Group has designated certain equity instruments as at FVOCI on initial application of PFRS 9.
Financial assets at FVOCI are initially measured at fair value plus transaction costs. Subsequently, they are measured at fair value, with no deduction for any disposal costs. Gains and losses arising from changes in fair value, including the foreign exchange component, are recognized in other comprehensive income, net of any effects arising from income taxes, and are reported as part of Revaluation Reserves account in equity. When the asset is disposed of, the cumulative gain or loss previously recognized in the Revaluation Reserves account is not reclassified to profit or loss, but is reclassified directly to Surplus account.
(b) Impairment of Financial Assets
PFRS 9 requires the Bank to record an allowance for Expected Credit Losses (ECL) for all loans and other debt financial assets not held at FVPL, together with loan commitments and financial guarantee contracts. The allowance is based on the ECLs associated with the probability of default in the next twelve months unless there has been a significant increase in credit risk since origination. If the financial asset meets the definition of purchased or originated credit impaired, the allowance is based on the change in the ECLs over the life of the asset. The Group has established a policy to perform an assessment, at the end of each reporting period, of whether a financial instrument‟s credit risk has increased significantly since initial recognition, by considering the change in the risk of default occurring over the remaining life of the financial instrument.

Rizal Commercial Banking Corporation: March 2022 SEC Form 17-Q 14
The Group ECL model follows a three-stage impairment approach in determining the loss allowance to be recognized in the financial statements: (i) Stage 1 – comprises of all credit exposures that are considered „performing‟ and
with no observed significant increase in credit risk (SICR) since initial recognition. These include those financial instruments with low credit risk. For these financial instruments, the loss allowance is determined based on a 12-month ECL.
(ii) Stage 2 – comprises of all financial instruments assessed to have SICR since initial recognition based on the Group‟s quantitative and qualitative criteria, though not yet deemed to be credit-impaired. Using the Group‟s ICRRS, Stage 2 includes credit exposures that are considered „under-performing‟ in which risk ratings were downgraded by at least three notches and/or downgraded to CCC+ to Especially Mentioned. Stage 2 financial instruments may also include those facilities where the credit risk has improved and have been reclassified from Stage 3 subject to the Group‟s observation period on the creditworthiness of the counterparty. A lifetime ECL is recognized for these financial instruments.
(iii) Stage 3 – comprises credit exposures which are assessed as „credit-impaired‟, thus considered by the Group as „non-performing‟, which is assessed consistently with the Group‟s definition of default. Generally, this includes accounts classified as Substandard, Doubtful and Loss. The Group recognizes a lifetime ECL for all credit-impaired financial assets.
The key elements used in the calculation of ECL are as follows: Probability of Default – is an estimate of the likelihood of default over a given time horizon. A default may only happen at a certain time over the assessed period, if the facility has not been previously derecognized and is still in the portfolio. Loss Given Default – is an estimate of the loss arising in the case where a default occurs at a given time. It is based on the difference between the contractual cash flows due and those that the Bank would expect to receive, including the realization of any collateral. Exposure At Default – represents the gross carrying amount of the financial instruments subject to the impairment calculation.
b.1 Impact of COVID-19 on Measurement of ECL In response to the COVID-19 situation and the Group‟s expectations of economic impacts, the key conditions and assumptions utilized in the Group‟s calculation of ECL have been revisited and recalibrated. The Bank considers economic scenarios and forward-looking macroeconomic assumptions underpinning the ECL calculation. The expected impacts of COVID-19 have been reasonably captured using the Group‟s business-as-usual (BAU) ECL methodology (i.e., the ECL methodology consistently used in the prior years) and post-model adjustments (or the “COVID-19 overlay”), as applicable.
Prior to 2022, the Bank‟s BAU ECL methodology have been constructed and calibrated using historical trends and correlations as well as forward-looking economic scenarios. The severity of the current macroeconomic projections and the added complexity caused by the various support schemes and regulatory guidance could not be reliably modelled for the time being. Therefore, the BAU ECL model may generate results that are either overly conservative or overly optimistic depending on the specific portfolio or segment. As a result, post-model adjustments were needed to reflect the considerable uncertainty in BAU ECL methodology given the unprecedented impacts of COVID-19.

Rizal Commercial Banking Corporation: March 2022 SEC Form 17-Q 15
In 2022, the Bank revised its BAU ECL methodology to incorporate impacts of COVID-19 under its new normal assessments eliminating the need for separate post model adjustments. Notwithstanding that the measurement inputs and assumptions, including forward-looking macroeconomic assumptions were recalibrated in response to the COVID-19 situation, the fundamental ECL mechanics and methodology underpinning the Group‟s measurement of ECL have remained consistent with the prior periods.
In identifying the impact of COVID-19 pandemic to the Group‟s customers, the Group re-segmented its loan portfolio based on the perceived and expected COVID-19 impact to the customers‟ businesses and industries which also considers additional qualitative characteristics that would elevate COVID-19 changes to SICR such as differentiation of temporary liquidity need from permanently impacted or SICR.
Supporting the re-segmentation is the COVID-19 Assistance and Recovery Enhancement (CARE) Program, primarily designed to: (1) extend financial assistance to customers by way of extended repayment plans given cash flow tightness and (2) immediately get the customer back into the habit of paying based on amounts they can afford. In accordance with regulatory guidance, the Group also implemented mandatory payment holidays to all eligible loans. The following are the considerations in measuring ECL under the COVID-19 situation: (a) SICR
The offer or uptake of COVID-19 related repayment deferrals, whether coming from government reliefs or from the Group‟s CARE Program, does not itself constitute an SICR event unless the exposure is considered to have experienced an SICR based on other available information. SICR has been reassessed with reference to the Group‟s CARE Program credit risk rating which considers industry or segment assessment under the COVID-19 situation, financial performance indicators, historical credit information of the borrower and other modifiers. The Group‟s reassessment is to determine if changes in the customers‟ circumstances were sufficient to constitute SICR.
(b) COVID-19 Overlay (applicable to 2021 only)
COVID-19 overlay represents adjustments in relation to data and model limitations as a result of the COVID-19 economic disruption. The adjustments are based on a combination of portfolio level credit risk analysis and an evaluation of ECL coverage at an exposure level. This also includes the effect of government and other support program. Considerations included the potential severity and duration of the economic disruption and the heightened credit risk of specific sectors and loan classes or segments.
(c) Derecognition of Financial Assets
A financial asset (or where applicable, a part of a financial asset or part of a group of financial assets) is derecognized when the contractual rights to receive cash flows from the financial instruments expire, or when the financial assets and all substantial risks and rewards of ownership have been transferred to another party. If the Group neither transfers nor retains substantially all the risks and rewards of ownership and continues to control the transferred asset, the Group recognizes its retained interest in the asset and an associated liability for amounts it may have to pay. If the Group retains substantially all the risks and rewards of ownership of a transferred financial asset, the Group continues to recognize the financial asset and also recognizes a collateralized borrowing for the proceeds received.

Rizal Commercial Banking Corporation: March 2022 SEC Form 17-Q 16
(d) Modification of Loans When the Group derecognizes a financial asset through renegotiation or modification of the contractual payment terms of the loans due to significant credit distress of the borrower, the Group assesses whether or not the new terms are substantially different to the original terms of the instrument. In making such assessment, the Group considers, among others:
• If the borrower is in financial difficulty, whether the modification merely reduces the contractual cash flows to amounts the borrower is expected to be able to pay;
• Whether any substantial new terms are introduced that will affect the risk profile of the loan;
• Significant extension of the loan term when the borrower is not in financial difficulty; • Significant change in the interest rate; • Change in the currency the loan is denominated in; and/or, • Insertion of collateral, other security or credit enhancements that will significantly
affect the credit risk associated with the loan.
2.4 Financial Liabilities
Financial liabilities which include deposit liabilities, bills payable, bonds payable, accrued interest and other expenses, and other liabilities (except tax-related payables, post-employment defined benefit obligation and deferred income) are recognized when the Group becomes a party to the contractual terms of the instrument. Financial liabilities are recognized initially at their fair value and subsequently measured at amortized cost using the effective interest method, for those with maturities beyond one year, less settlement payments. All interest-related charges incurred on financial liabilities are recognized as an expense in the statement of profit or loss under the caption Interest Expense.
2.5 Provisions and Contingencies
Provisions are recognized when present obligations will probably lead to an outflow of economic resources and they can be estimated reliably even if the timing or amount of the outflow may still be uncertain. A present obligation arises from the presence of a legal or constructive obligation that has resulted from past events (e.g., legal dispute or onerous contracts).
2.6 Revenue and Expense Recognition
Revenue is recognized to the extent that the revenue can be reliably measured; it is probable that the economic benefits will flow to the Group; and the costs incurred or to be incurred can be measured reliably.
2.7 Impairment of Non-financial Assets
For purposes of assessing impairment, assets are grouped at the lowest levels for which there are separately identifiable cash flows [cash-generating units (CGU)]. As a result, some assets are tested for impairment either individually or at the CGU level.

Rizal Commercial Banking Corporation: March 2022 SEC Form 17-Q 17
Impairment loss is recognized in profit or loss for the amount by which the asset‟s or CGU‟s carrying amount exceeds its recoverable amount which is the higher of its fair value less costs to sell and its value in use. In determining value in use, management estimates the expected future cash flows from each CGU and determines the suitable interest rate in order to calculate the present value of those cash flows. The data used for impairment testing procedures are directly linked to the Group‟s latest approved budget, adjusted as necessary to exclude the effects of asset enhancements. Discount factors are determined individually for each CGU and reflect management‟s assessment of respective risk profiles, such as market and asset-specific risk factors. All assets, except for intangible assets with indefinite useful life and goodwill, are subsequently reassessed for indications that an impairment loss previously recognized may no longer exist. An impairment loss is reversed if the asset‟s or CGU‟s recoverable amount exceeds its carrying amount.
2.8 Income Taxes
Tax expense recognized in profit or loss comprises the sum of current tax and deferred tax not recognized in other comprehensive income or directly in equity, if any. Current tax assets or liabilities comprise those claims from, or obligations to, tax authorities relating to the current or prior reporting period, that are unpaid at the end of the reporting period. They are calculated according to the tax rates and tax laws applicable to the periods to which they relate, based on the taxable profit for the year. All changes to current tax assets or liabilities are recognized as a component of tax expense in the statement of profit or loss.
Deferred tax is provided using the liability method, on temporary differences at the end of the reporting period between the tax bases of assets and liabilities and their carrying amounts for financial reporting purposes. Under the liability method, with certain exceptions, deferred tax liabilities are recognized for all taxable temporary differences and deferred tax assets are recognized for all deductible temporary differences and the carry-forward of unused tax losses and unused tax credits to the extent that it is probable that taxable profit will be available against which the deferred tax assets can be utilized. Deferred tax assets are reassessed at the end of each reporting period. Previously unrecognized deferred tax assets are recognized to the extent that it has become probable that future taxable profit will be available to allow such deferred tax assets to be recovered.
2.9 Related Party Relationships and Transactions
Related party transactions are transfers of resources, services or obligations between the Group and its related parties, regardless of whether a price is charged. Parties are considered to be related if one party has the ability to control the other party or exercise significant influence over the other party in making financial and operating decisions. These parties include: (a) individuals owning, directly or indirectly through one or more intermediaries, control or are controlled by, or under common control with the Group; (b) associates; (c) individuals owning, directly or indirectly, an interest in the voting power of the Group that gives them significant influence over the Group and close members of the family of any such individual; and, (d) the funded retirement plan of each of the entities under the Group.

Rizal Commercial Banking Corporation: March 2022 SEC Form 17-Q 18
2.10 Events After the End of the Reporting Period
Any event that provides additional information about the Group‟s financial position at the end of the reporting period (adjusting event) is reflected in the financial statements. Post-reporting events that are not adjusting events, if any, are disclosed when material to the financial statements.
3. TRADING AND INVESTMENT SECURITIES
This account is composed of the following: March 31, 2022 December 31, 2021 (Unaudited) (Audited)
Financial assets at FVPL P 4,788 P 5,863 Financial assets at FVOCI 57,801 49,761 Investment securities at amortized cost - net 213,033 163,611 P 275,622 P 219,235
3.1 Financial Assets at FVPL
This account is composed of the following:
March 31, 2022 December 31, 2021 (Unaudited) (Audited)
Government securities P 2,797 P 4,330 Derivative financial assets 1,010 1,266 Equity securities 941 232 Corporate debt securities 40 35 P 4,788 P 5,863
3.2 Financial Assets at FVOCI
This account is composed of the following:
March 31, 2022 December 31, 2021 (Unaudited) (Audited)
Government bonds P 42,233 P 28,682 Corporate debt securities 11,940 17,412 Unquoted equity securities 2,176 1,815 Quoted equity securities 1,452 1,852 P 57,801 P 49,761

Rizal Commercial Banking Corporation: March 2022 SEC Form 17-Q 19
3.3 Investments at Amortized Cost
This account is composed of the following: March 31, 2022 December 31, 2021 (Unaudited) (Audited)
Government securities P 189,453 P 132,969 Corporate debt securities 23,727 30,789 213,180 163,758 Allowance for impairment ( 147 ) ( 147 ) P 213,033 P 163,611
4. LOANS AND RECEIVABLES This account consists of the following:
March 31, 2022 December 31, 2021 (Unaudited) (Audited)
Receivable from customers: Loans and discounts P 452,743 P 452,495 Credit card receivables 35,806 35,563 Customers‟ liabilities on acceptances, import bills and trust receipts 20,441 20,662 Lease contract receivable 1,793 2,296 Bills purchased 7,050 2,033 Receivables financed 67 297 517,900 513,346
Unearned discount ( 558 ) ( 615 ) 517,342 512,731 Other receivables: Interbank loans receivables 25,480 30,563 Accrued interest receivable 7,403 7,372 Accounts receivable 3,312 4,114 Unquoted debt securities classified as loans 989 989 Sales contract receivable 778 797 37,962 43,835
555,304 556,566 Allowance for impairment ( 17,026 ) ( 18,264 )
P 538,278 P 538,302

Rizal Commercial Banking Corporation: March 2022 SEC Form 17-Q 20
5. OTHER RESOURCES
This account consists of the following: March 31, December 31, 2022 2021 (Unaudited) (Audited)
Assets held-for-sale and disposal group P 4,773 P 5,295 Creditable withholding taxes 2,589 2,412 Prepaid expenses 1,855 1,651 Software – net 1,312 1,338 Branch licenses 1,000 1,000 Deferred charges 518 390 Unused stationery and supplies 468 419 Goodwill 426 426 Refundable and other deposits 382 528 Margin deposits 182 73 Returned checks and other cash items 87 196 Miscellaneous 469 640 14,083 14,368 Allowance for impairment ( 1,131 ) ( 1,268 ) P 12,952 P 13,100
6. DEPOSIT LIABILITIES The following is the breakdown of deposit liabilities: March 31, December 31, 2022 2021 (Unaudited) (Audited) Demand P 142,478 P 144,810 Savings 227,224 228,470 Time 299,484 293,097 Long-term Negotiable Certificate of Deposits (LTNCD) 6,082 6,082 P 675,268 P 672,459
The details of the Parent Company‟s Long-term Negotiable Certificates of Deposits (LTNCDs)
as of March 31, 2022 and December 31, 2021 are as follows:
Coupon Outstanding Issuance Date Maturity Date Interest Balance September 28, 2018 March 28, 2024 5.50% P 3,580 August 11, 2017 February 11, 2023 3.75% 2,502 P 6,082
The Parent Company‟s LTNCDs were used in the expansion of its term deposit base to support long-term asset growth and for other general funding purposes.

Rizal Commercial Banking Corporation: March 2022 SEC Form 17-Q 21
7. BILLS PAYABLE This account consists of borrowings from: March 31, December 31, 2022 2021 (Unaudited) (Audited) Foreign banks P 25,673 P 46,398 Local banks 9,263 9,505 Others 1 1 P 34,937 P 55,904
8. BONDS PAYABLE
The composition of this account for the Group and the Parent Company follows: Outstanding Balance March 31, December 31, Coupon 2022 2021 Issuance Date Maturity Date Interest Face Value (Unaudited) (Audited) February 21, 2022 May 21, 2024 3.00% P 14,756 P 14,756 P - March 31, 2021 September 30, 2023 3.20% P 13,743 13,743 13,743 March 31, 2021 June 30, 2026 4.18% P 4,130 4,130 4,130 July 27, 2020 July 27, 2022 3.25% P 16,616 16,616 16,616 April 7, 2020 April 7, 2022 4.85% P 7,054 7,054 7,054 November 13, 2019 November 13, 2022 4.43% P 7,500 7,500 7,500 September 11, 2019 September 11, 2024 3.05% $ 300 15,494 15,264 March 15, 2018 March 16, 2023 4.13% $ 450 23,246 22,908 P 102,539 P 87,215

Rizal Commercial Banking Corporation: March 2022 SEC Form 17-Q 22
9. OTHER LIABILITIES
Other liabilities consist of the following: March 31, 2022 December 31, 2021
(Unaudited) (Audited) Accounts payable P 7,787 P 7,963 Outstanding acceptances payable 5,753 4,634 Bills purchased – contra 5,995 1,018 Lease liabilities 3,879 4,050 Post-employment defined benefit obligation 2,490 2,501 Guaranty deposits 1,244 363 Dividends payable 1,260 - Manager‟s checks 1,207 1,150 Deposits on lease contracts 817 799 Derivative financial liabilities 758 926 Unearned income 555 585 Withholding taxes payable 502 449 Other credits 361 440 Sundry credits 326 341 Payment orders payable 205 263 Expected credit loss provisions on loan commitments 168 145 Due to BSP 131 44 Miscellaneous 823 707 P 34,261 P 26,378
10. EQUITY The movements in the outstanding capital stock are as follows:
Number of Shares* March 31, 2022 December 31, 2021
(Unaudited) (Audited) Preferred stock – voting, non-cumulative non-redeemable, participating convertible into common stock
– P10 par value Authorized – 200,000,000 shares
Balance at beginning and end of period 267,410 267,410 Common stock – P10 par value
Authorized – 2,600,000,000 shares
Balance at beginning of period 2,037,478,896 1,935,628,896 Re-issuance of treasury shares - 101,850,000 Balance at end of period 2,037,478,896 2,037,478,896
*Amounts in absolute number of shares

Rizal Commercial Banking Corporation: March 2022 SEC Form 17-Q 23
10.1 Treasury Shares In 2019, subsequent to the effective date of the merger, the Parent Company acquired the 315,287,248 common shares issued in exchange of the net assets of RSB equal to the Parent Company‟s investment in RSB as at December 31, 2018. On September 23, 2011, the Parent Company issued 5,821,548 common shares (equivalent of 18,082,311 preferred shares and with total par value of P58) from the treasury account reissuance (with total cost of P182) and an additional 120,730,177 common stock (with total par value of P1,207) from unissued portion of the increase in authorized capital stock on September 23, 2011 to Hexagon Investments B.V. that is equivalent to approximately 15.00% of the outstanding common shares. The issuance resulted in the recognition of additional Capital Paid in Excess of Par amounting to P2,264. On March 17, 2011, the Parent Company issued 73,448,275 common shares, comprising of 50,427,931 treasury shares reissuance (with total cost of P771) and 23,020,344 unissued stock (with total par value of P230), to IFC Capitalization Fund for a total consideration of P2,130 representing 7.20% ownership interest. The issuance resulted in the recognition of additional Capital Paid in Excess of Par amounting to P1,078. On July 23, 2021, the Parent Company sold 101,850,000 shares to Sumitomo Mitsui Banking Corporation (SMBC) at P44.00 per share. This came from the treasury shares resulting from the merger of Parent Company and RSB. The sale of shares held by the Parent Company in treasury is equivalent to 4.999% of the total outstanding Common Stock. The issuance resulted in a recognition of additional Capital Paid in Excess of Par amounting to P50. The Parent Company incurred expenses related to the issuance amounting to P113 which was charged to equity resulting in a P63 net decrease in the Capital Paid in Excess of Par. 10.2 Hybrid Perpetual Securities
On August 27, 2020, the Parent Company issued US$300 non-cumulative, unsecured, subordinated capital securities which qualify as AT1 capital under Basel III standards. As of March 31, 2022, the hybrid perpetual securities amounted to P14,463, net of issuance costs. The capital securities are perpetual in respect of which there is no fixed redemption date. The Parent Company may redeem the capital securities only in certain circumstances as described in the conditions of the securities and with prior written consent of BSP. Distributions are non-cumulative and payable semi-annually in arrear at a rate of 6.5%. Certain conditions provide for circumstances under which the Parent Company will not be obliged to pay any distribution on the applicable payment date. The proceeds of the hybrid perpetual securities are used to support and finance medium-term to long-term asset growth, loans to customers, other general corporate purposes and to maintain sufficient buffers above the minimum capital thresholds required by BSP.

Rizal Commercial Banking Corporation: March 2022 SEC Form 17-Q 24
11. MISCELLANEOUS INCOME AND EXPENSES
11.1 Miscellaneous Income For the Three Months Ended
March 31, 2022 March 31, 2021 (Unaudited) (Unaudited)
Rentals P 241 P 262 Recoveries 75 42 Gains on assets sold 46 28 Dividend income 24 30 Others 94 50
P 480 P 412 11.2 Miscellaneous Expenses For the Three Months Ended
March 31, 2022 March 31, 2021 (Unaudited) (Unaudited)
Insurance P 379 P 314 Credit card related expenses 277 284 Communication and information 170 171 Litigation/asset acquired expenses 152 139 Service processing fees 165 162 Management and other professional fees 126 106 Banking fees 88 75 Advertising and publicity 84 71 Transportation and travel 51 40 Other outside services 33 41 Stationery and office supplies 30 33 Donations and charitable contributions 24 17 Shipment and freight 7 12 Representation and entertainment 12 9 Others 259 319
P 1,857 P 1,793
12. COMMITMENTS AND CONTINGENCIES
In the normal course of operations of the Group, there are various outstanding commitments and contingent liabilities such as guarantees, commitments to extend credit, tax assessments, etc., with amounts not reflected in the financial statements. Management does not anticipate losses from these transactions that will adversely affect the Group‟s operations. In the opinion of management, the suits and claims arising from the normal course of operations of the Group that remain unsettled, if decided adversely, will not involve sums that would have material effect on the Group‟s financial position or operating results.

Rizal Commercial Banking Corporation: March 2022 SEC Form 17-Q 25
12.1 Contingent Accounts, Guarantees and Other Commitments The following is a summary of contingencies and commitments arising from off-statement of financial position items at their equivalent peso contractual amounts as of March 31, 2022 and December 31, 2021:
March 31, December 31, 2022 2021 (Unaudited) (Audited) Trust department accounts P 141,015 P 116,652 Outstanding guarantees issued 99,410 67,297 Derivative assets 52,959 36,980 Derivative liabilities 50,899 28,135 Unused commercial letters of credit 16,017 20,495 Spot exchange bought 14,455 8,681 Spot exchange sold 14,446 8,674 Inward bills for collection 3,900 1,694 Late deposits/payments received 493 644 Outward bills for collection 61 94 Others 59 17
12.2 HHIC-Philippines, Inc. Rehabilitation Proceedings On January 9, 2019, HHIC-Phil, Inc. (“HHIC-Phil”) filed a Petition for corporate rehabilitation under R.A. No. 10142, the Financial Rehabilitation and Insolvency Act of 2010, which was given due course by the Regional Trial Court, Branch 72, Olongapo City (the “Rehabilitation Court”).
After negotiating with HHIC-Phil/HHIC-Korea, which resulted in the creditors/Rehabilitation Court-approved Modified Rehabilitation Plan with Clarifications (“MRP-C”), the Bank and four (4) other creditor banks successfully negotiated the sale of the Subic Shipyard/certain other assets to third-party buyers, as called for by the MRP-C. And in the Order dated December 6, 2021, the Rehabilitation Court approved the Asset Purchase Agreement (“APA”) dated October 5, 2021.
As of March 31, 2022, the outstanding loan obligation of HHIC-Phil to the Bank remains at
USD82, exclusive of accrued and compounded interest, as well as penalty on interest and principal. On April 19, 2022, this has been fully settled in accordance with the APA.
12.3 Applicability of RR 4-2011 In March 2011, the Bureau of Internal Revenue (“BIR”) issued RR 4-2011, prescribing a new way of reporting income solely for banks/other financial institutions, and issued assessment notices to banks/other financial institutions for deficiency income tax. In its Order dated May 25, 2018, the Regional Trial Court of Makati (a) granted the Petition of the Bank/other Bankers Association of the Philippines (“BAP”) member banks praying for the nullification of RR 4-2011; and (b) permanently enjoined the enforcement of the same. The Department of Finance/BIR filed a Petition for Review with the Supreme Court (a) claiming that jurisdiction over the matter lies with the Court of Tax Appeals; (b) challenging the propriety of the declaratory relief action filed by the Bank/other BAP member banks in view of the prior issuance of Preliminary Assessment Notices; and (c) arguing that public hearings are not required in all instances involving regulatory issuances. The matter remains pending to date.

Rizal Commercial Banking Corporation: March 2022 SEC Form 17-Q 26
12.4 Alleged Unauthorized Transfer of Funds – Bank of Bangladesh In February 2016, four (4) allegedly unauthorized fund transfers were made into four (4) accounts with the Bank from Bangladesh Bank‟s account with the Federal Reserve Bank of New York, before being further dispersed to other banks and casinos. In August 2016, the Monetary Board impose a P1 Billion fine upon the Bank, which it paid in full, without any effect on its ability to perform its existing obligations or its operations. U.S. Litigation relating to the Bangladesh Bank Incident Failing to prosecute the Bank under the Federal Racketeer Influence and Corrupt Organizations Act, Bangladesh Bank initiated a second complaint before the New York State Court, on May 27, 2020. The Bank has since sought the dismissal of this second case, citing (a) New York‟s lack of personal jurisdiction over it; (b) the impropriety of New York as a forum, given the ongoing related proceedings in the Philippines and the location of material witnesses/evidence; and (c) the untenable nature of the fraud charge against the Bank due to the lack of any fiduciary duty to Bangladesh Bank. The Bank‟s Motion to Dismiss was heard on October 14, 2021. The matter remains pending to date. Philippine Litigation relating to the Bangladesh Bank Incident On March 6, 2019, the Bank/its former National Sales Director (“NSD”) filed a complaint for Injunction and Damages against Bangladesh Bank with the Regional Trial Court of Makati City (“Makati Trial Court”). Despite being properly served with the summons/Complaint, and even after the denial of its claim of immunity from suit, Bangladesh Bank refused to submit to the jurisdiction of the Makati Trial Court. In an Order dated October 18, 2021, the Makati Trial Court denied Bangladesh Bank's Motion to Admit Attached Motion to Dismiss dated January 27, 2021, holding that its failure to file a motion for reconsideration on the July 19, 2019 Order had long resulted in the finality of the ruling that (a) court processes were properly served upon the said defendant, and (b) the Makati Trial Court had already acquired jurisdiction over Bangladesh Bank. The Makati Trial Court further directed the Bank/the former NSD to provide proof of service of their Motion to declare Bangladesh Bank in default upon its counsel, which was complied with via their Compliance with Manifestation dated November 8, 2021. The Bank/former NSD‟s aforecited Motion remains pending to date. Except for the above-mentioned proceedings, the Bank is not aware of any suits and claims by or against it, which if decided adversely, would have a material effect on its financial position or operating results. Except for the above-mentioned proceedings, the Bank is not aware of any suits and claims by or against it or its subsidiaries, which if decided adversely, would have a material effect on its financial position or operating results.

Rizal Commercial Banking Corporation: March 2022 SEC Form 17-Q 27
13. OTHER MATTERS
13.1 Continuing Impact of COVID-19
In December 2019, COVID-19 was reported to have surfaced in China. The World Health Organization has declared the outbreak as a „public health emergency of international concern. COVID-19 started to become widespread in the Philippines in early March 2020 causing the government to declare the country in a state of public health emergency followed by implementation of ECQ and social distancing measures and restrictions within the Luzon area with other cities and provinces in the country enacting similar measures thereafter. This resulted in a wide-ranging business suspension – disrupting the supply chains, affecting production and sales across a range of industries, and weakening the stock market. On March 23, 2020, BAHO Act was signed into law declaring a national health emergency throughout the Philippines as a result of the COVID-19 crisis. The implementation of Section 4(aa) of said law has directed banks and other private and government financial institutions to implement a minimum thirty (30)-day grace period on all loans with principal and interests falling due within the period of the Enhanced Community Quarantine (ECQ), which started on March 17, 2020 up to April 30, 2020, which was extended until May 31, 2020, without incurring interest, penalties, fees or other charges. On September 11, 2020, BARO Act was signed into law which directed banks and other private and government financial institutions particularly under Section 4 (uu) the grant of one-time sixty (60)-day grace period for payments and/or maturity periods of all existing, current and outstanding loans as of September 15, 2020, falling due, or any part thereof, on or before December 31, 2020, without incurring interest on interests, penalties, fees or other charges, thereby extending the maturity of the said loans, subject to compliance with regulatory requirements. The Group has been able to keep approximately 50-60% of its branches open during the early part of the community quarantine in mid-March 2020, and around 40-50% in April and May, with a skeletal workforce and corresponding adjustments in banking hours and cut-off times similar to adjustments instituted by the BSP and Bankers Association of the Philippines. By end-September 2020, the Group has kept about 98% of its branches open. Among the steps taken to address its customers‟ needs during the COVID-19 outbreak, the Group has (i) ensured cash availability at its ATMs and branches and (ii) extended loan payments for corporate and consumer loans for 60 days and waived fees on electronic and similar forms of payments for its clients. The Group has also encouraged its customers to use its online and mobile banking services to pay bills, send money, as well as use ATMs and cash acceptance machines as an alternative to branch banking. The Group also did not experience massive withdrawals from its depositors as the deposit liabilities still increased during the ECQ period. Further, the Group focused on supporting customers who are experiencing and about to experience financial difficulties as a result of the COVID-19 global pandemic and has offered a range of financial assistance measures including temporary loan repayment deferrals (principal and/or interest) through its COVID-19 Assistance and Recovery Enhancement (CARE) Program. The Group‟s CARE Program is primarily designed to provide financial assistance to customers by way of extended repayment plans. The assistance would help get the customer back into the habit of paying based on amounts they can afford. Albeit using tighter credit underwriting parameters, the Group continued its lending activities including on-boarding of new customer for both wholesale and consumer lending. Despite these challenges, cash flow remained stable given the growth in deposits and with some clients still opting to continue their amortization payments despite the loan payment moratorium provided for under the BAHO Act and BARO Act.

Rizal Commercial Banking Corporation: March 2022 SEC Form 17-Q 28
Since last year, an increase in volume of transactions is evident to the Group which was mainly due to customer acquisition driven by data science and digital marketing. The Group expects the general business environment to improve as quarantine restrictions ease and vaccination uptake continued to increase. While economic recovery is expected, the Group will stay focused on keeping efficient operations as it embarks on transformation projects such as: (i) fully automated KYC process and (ii) enhanced credit and control systems. These activities include various business process reengineering exercises such as process reviews and digital enhancements that support efficiency, lower cost of transaction and reduced costs in product delivery.

Rizal Commercial Banking Corporation: March 2022 SEC Form 17-Q 29
ADDITIONAL DISCLOSURES TO ITEM I – FINANCIAL STATEMENTS
Statement of Compliance with Generally Accepted Accounting Principles. The interim financial statements of the Bank have been prepared in accordance with the Philippine Financial Reporting Standards (PFRS). See accompanying Notes to Interim Financial Statements for the detailed discussion of compliance with Generally Accepted Accounting Principles. Accounting Policies and Methods of Computation. See accompanying Notes to Interim Financial Statements for the detailed discussion of the accounting policies and methods of computation (Note 2). Seasonality or Cyclicality of Interim Operations. Seasonal or cyclical events and/or conditions do not materially affect the year-round operations of the Bank. Changes in Estimates of Amounts Reported. There were no changes in estimates of amounts reported in prior interim periods of the current financial year or in estimates of amounts reported in prior financial years. Issuances, Repurchases and Repayments of Debt and Equity Securities. On February 21, 2022, the Bank successfully listed its Php14.76 billion Series E ASEAN Sustainability Bonds (the “Bonds”) due 2024 with the Philippine Dealing and Exchange Corporation. The Bonds carry a coupon of 3.0% per annum with a tenor of two years and three months (2.25 years).
On January 31, 2022, the Board of Directors approved the issuance of US Dollar Senior Notes out of the balance of the Bank‟s USD3 billion Medium Term Note Programme.
Dividends Paid for Ordinary or Other Shares. In its meeting held on March 28, 2022, the Board of Directors approved the declaration and payment of cash dividends amounting to P0.6180 per share or a total of approximately P1,259,162.0 thousand and P165.3 thousand payable to holders of Common Class and Preferred Class shares, respectively, both paid on April 27, 2022. In its meeting held on February 28, 2022, the Board of Directors approved the declaration and payment of cash dividends amounting to P0.0553 per share or a total of approximately P14.8 thousand payable to holders of Preferred Class shares and paid on March 23, 2022. In its meeting held on January 31, 2022, the Board of Directors approved the declaration and payment of the cash dividends on the Bank‟s USD300 million Non-cumulative Hybrid Perpetual Securities at a dividend rate of 6.50% per annum or a total of USD9.8 million or approximately P497,445.0 thousand payable to holders of said Securities, which was paid on February 28, 2022. In its meeting held on November 29, 2021, the Board of Directors approved the declaration and payment of cash dividends amounting to P0.0537 per share or a total of approximately P14.6 thousand payable to holders of Preferred Class shares and paid on December 24, 2021. In its meeting held on August 31, 2021, the Board of Directors approved the declaration and payment of cash dividends amounting to P0.0546 per share or a total of approximately P14.6 thousand payable to holders of Preferred Class shares and paid on September 24, 2021. In its meeting held on July 26, 2021, the Board of Directors approved the declaration and payment of the cash dividends on the Bank‟s USD300 million Non-cumulative Hybrid Perpetual Securities at a dividend rate of 6.50% per annum or a total of USD9.8 million or approximately P491,107.5 thousand payable to holders of said Securities, which was paid on August 26, 2021.

Rizal Commercial Banking Corporation: March 2022 SEC Form 17-Q 30
In its meeting held on May 31, 2021, the Board of Directors approved the declaration and payment of cash dividends amounting to P0.0559 per share or a total of approximately P14.9 thousand payable to holders of Preferred Class shares and paid on June 25, 2021. In its meeting held on April 26, 2021, the Board of Directors approved the declaration and payment of cash dividends amounting to P0.4850 per share or a total of approximately P938,780.0 thousand and P129.7 thousand payable to holders of Common Class and Preferred Class shares, respectively, both paid on May 25, 2021. In its meeting held on February 22, 2021 the Board of Directors approved the declaration and payment of cash dividends amounting to P0.0560 per share or a total of approximately P15.0 thousand payable to holders of Preferred Class shares and paid on March 31, 2021. In its meeting held on February 22, 2021 the Board of Directors approved the declaration and payment of the first semi-annual cash dividends/distributions on the Bank‟s USD300 million Non-cumulative Hybrid Perpetual Securities at a dividend rate of 6.50% per annum or a total of USD9.8 million or approximately P472,397.3 thousand payable to holders of said Securities, which was paid on February 26, 2021. The details of the cash dividend approvals and distributions from 2021 up to March 31, 2022 are as follows (amounts in Thousand Php except per share figures):
Date Declared
Dividend Date Paid /
Payable Nature of Securities
Per Share Total Amount (in Thousand)
22-Feb-21 - P 472,397.3 26-Feb-21 Hybrid Perpetual Securities
22-Feb-21 P 0.0560 P 15.0 31-Mar-21 Convertible Preferred
26-Apr-21 P 0.4850 P 938,780.0 25-May-21 Common
26-Apr-21 P 0.4850 P 129.7 25-May-21 Convertible Preferred
31-May-21 P 0.0559 P 14.9 25-Jun-21 Convertible Preferred
26-Jul-21 - P 491,107.5 26-Aug -21 Hybrid Perpetual Securities
31-Aug-21 P 0.0546 P 14.6 24-Sep-21 Convertible Preferred
29-Nov-21 P 0.0537 P 14.4 24-Dec-21 Convertible Preferred
31-Jan-22 - P 497,445.0 28-Feb-22 Hybrid Perpetual Securities
28-Feb-22 P 0.0553 P 14.8 23-Mar-22 Convertible Preferred
28-Mar-22 P 0.6180 P 1,259,162.0 27-Apr-22 Common Stock
28-Mar-22 P 0.6180 P 165.3 27-Apr-22 Convertible Preferred
Note: In 2015, the BSP, through the monetary board, approved the liberalized rules for banks and quasi-banks on dividend declaration. The policy requires that dividend declaration be immediately recognized as a liability upon the approval of the BOD and that it be disclosed in the statement of changes in equity. Further, prior BSP approval is no longer required except for certain cases.

Rizal Commercial Banking Corporation: March 2022 SEC Form 17-Q 31
Material Events Subsequent to the End of the Interim Period Not Reflected in the Financial Statements. See accompanying Notes to Interim Financial Statements for the detailed discussion on the material events subsequent to the end of the interim period not reflected in the financial statements (Note 13).
Changes in Composition of the Issuer During the Interim Period and Material Contingencies and Any Other Events or Transactions. There were no material changes in composition of the issuer during the interim period and material contingencies and any other events or transactions. Changes in Contingent Liabilities or Contingent Assets. There were no material changes in contingent liabilities or contingent assets since the last annual balance sheet date.

Rizal Commercial Banking Corporation: March 2022 SEC Form 17-Q 32
ITEM 2. MANAGEMENT’S DISCUSSION AND ANALYSIS OF FINANCIAL CONDITION AND RESULTS OF OPERATIONS
Financial Performance
RIZAL COMMERCIAL BANKING CORPORATION AND SUBSIDIARIES
Consolidated Parent
Unaudited Audited Unaudited Audited
31-Mar-22 31-Dec-21 31-Mar-22 31-Dec-21
Return on Average Assets (ROA)* 1/ 0.9% 0.8% 0.9% 0.9%
Return on Average Equity (ROE) *2/ 8.0% 6.7% 8.0% 6.7%
Risk-based Capital Adequacy Ratio (CAR) 14.8% 15.2% 14.5% 14.9%
Common Equity Tier 1 Ratio 11.7% 12.2% 11.3% 11.8%
Non-Performing Loans (NPL) Ratio 3/ 3.2% 3.3% 3.1% 3.2%
Non-Performing Assets (NPA) Ratio 4/ 2.6% 2.7% 2.5% 2.6%
Net Interest Margin (NIM)* 4.1% 4.1% 4.0% 4.1%
Cost-to-Income Ratio 59.4% 61.9% 58.6% 61.4%
Loans-to-Deposit Ratio 5/ 76.6% 76.3% 75.3% 74.9%
Current Ratio 0.5 0.6 0.5 0.6
Liquid Assets-to-Total Assets Ratio 0.2 0.2 0.1 0.2
Debt-to-Equity Ratio 7.8 7.6 7.8 7.6
Asset-to-Equity Ratio 8.8 8.6 8.8 8.6
Asset-to-Liability Ratio 1.1 1.1 1.1 1.1
Interest Rate Coverage Ratio 2.1 1.9 2.1 2.0
Earnings per share (EPS) 6/
Quarter-to-date Basic and Diluted PHP 0.93 PHP 0.74 PHP 0.93 PHP 0.74
Year-to-date Basic and Diluted PHP 0.93 PHP 3.09 PHP 0.93 PHP 3.09
Basic and Diluted* PHP 3.77 PHP 3.09 PHP 3.77 PHP 3.09
* March 31, 2022 ratios/amounts were annualized
1/ Average assets for the consolidated and parent ratios were computed based on the 3-month average of end of month balances of total assets. Unaudited net income for the 3-month period ended March 31, 2022 in the amount of P2.1 billion represented the consolidated and parent.
2/ Average equity for the consolidated and parent ratios were, likewise, computed based on the 3-month average of end of month balances. Unaudited net income for the 3-month period ended March 31, 2022 in the amount of P1.9 billion represented the consolidated and parent, net of dividends on Hybrid Perpetual Securities of P248.7 million.
3/ NPL ratio is determined by using the following formula: (Total NPLs net of total specific provision for losses of NPLs) / (Total gross loan portfolio).
4/ NPA ratio is determined by using the following formula: [Net NPLs + Gross Real and Other Properties Acquired (ROPA) + Non-performing SCR] / Gross Total Assets.
5/ Excluding Interbank Loans
6/ Total weighted average number of issued and outstanding common shares (diluted) were 2,037,537,205 shares as of March 31, 2022 and 1,979,217,811 shares as of December 31, 2021. The determined net income was net of dividends on Hybrid Capital Securities.

Rizal Commercial Banking Corporation: March 2022 SEC Form 17-Q 33
STATEMENT OF CONDITION: 31 March 2022 vs. 31 December 2021
RCBC‟s Total Assets stood at P961.7 billion.
Cash and Other Cash Items decreased by 18.1% or P2.7 billion from P14.7 billion to P12.0 billion due to high level of cash requirements during long holiday at year-end. Due from BSP decreased by 39.2% or P51.0 billion from P130.2 billion to P79.2 billion due to lower level of Term Deposit and Demand Deposit Account, net of the increase in Overnight Deposit with the BSP as a result of redeployment of funds. Due from Other Banks decreased by 60.4% or P7.4 billion from P12.2 billion to P4.8 billion, mainly due to decrease in foreign bank placements as a result of redeployment of funds. Loans under Reverse Repurchase Agreement increased by 62.1% or P7.3 billion from P11.7 billion to P18.9 billion due to higher placements with the BSP. Total Investment Securities, representing 28.7% of Total Resources, increased by 25.7% or P56.4 billion from P219.2 billion to P275.6 billion attributable to the 30.2% or P49.4 billion increase in Investment Securities at Amortized Cost from P163.6 billion to P213.0 billion; 16.2% or P8.0 billion increase in Financial Assets at Fair Value Through Other Comprehensive Income (FVOCI) from P49.8 billion to P57.8 billion; net of the 18.3% or P1.1 billion decrease in Financial Assets at Fair Value Through Profit or Loss (FVTPL) from P5.9 billion to P4.8 billion. Loans and Receivables – net, remained at P538.3 billion. It represented 56.0% of Total Resources. Investment in Associates – net, increased by 4.6% or P15.9 million from P344.0 million to P359.9 million. Bank Premises, Furniture, Fixtures & Equipment – net, slightly decreased by 0.5% or P69.1 million from P12.7 billion to P12.6 billion. Investment Properties – net, slightly declined by 2.8% or P98.5 million from P3.6 billion to P3.5 billion. Deferred Tax Assets (DTA) increased by 8.1% or P260.3 million from P3.2 billion to P3.5 billion mainly due to net DTA set-up during the period. Other Resources – net, decreased by 1.1% or P147.4 million from P13.1 billion to P13.0 billion. Deposit Liabilities were recorded at P675.3 billion and represented 70.2% of Total Resources. Demand deposits settled at 142.5 billion and accounted for 14.8% of Total Resources; Savings deposits at P227.2 billion and accounted for 23.6% of Total Resources; and Time deposits at P305.6 billion and accounted for 31.8% of Total Resources.
Bills Payable decreased by 37.5% or P21.0 billion from P55.9 billion to P34.9 billion primarily due to maturities of foreign borrowings during the period. Bonds Payable increased by 17.6% or P15.3 billion from P87.2 billion to P102.5 billion attributable to the P14.8 billion Series E ASEAN Sustainability Bonds issuance in February 2022. Accrued Taxes, Interest and Other Expenses decreased by 5.2% or P315.7 million from P6.1 billion to P5.8 billion mainly due to the reversal of PDIC accruals paid in the first quarter of the year. Other Liabilities increased by 29.9% or P7.9 billion from P26.4 billion to P34.3 billion largely due to the increase in Bills Purchased Contra and set-up of Dividends Payable on common shares.

Rizal Commercial Banking Corporation: March 2022 SEC Form 17-Q 34
Total Liabilities stood at P852.8 billion and represented 88.7% of Total Resources. Other Comprehensive Income was lower by 131.6% or P2.5 billion from loss of P1.9 billion to P4.5 billion due to the Net Unrealized Market Losses on Financial Assets at FVOCI securities brought about by rising interest rates. Total Capital Funds were recorded at P108.9 billion and accounted for 11.3% of Total Resources.

Rizal Commercial Banking Corporation: March 2022 SEC Form 17-Q 35
INCOME STATEMENT: 31 March 2022 vs. 31 March 2021
Total interest income increased by 21.8% or P1.8 billion from P8.4 billion to P10.3 billion and accounted for 103.8% of total operating income. Interest income on loans and receivables increased by 7.3% or P549.9 million from P7.6 billion to P8.1 billion due to increase in average volume of loans and receivables year-on-year. It accounted for 82.0% of total operating income. Interest income on investment securities increased by 235.2% or P1.4 billion from P600.3 million to P2.0 billion as a result of the growth in volume and improvement in average yield; it accounted 20.3% of total operating income. Other interest income, on the other hand, decreased by 46.4% or P120.6 million from P259.8 million to P139.2 million due to the lower placements with the BSP. Total interest expense increased by 12.9% or P254.1 million from P2.0 billion to P2.2 billion and accounted for 22.4% of total operating income. Interest expense on deposit liabilities increased by 20.1% or P183.4 million from P913.4 million to P1.1 billion primarily due to the growth in average volume; it represented 11.1% of total operating income. Interest expense on bills payable and other borrowings settled at P1.1 billion, which increased by 6.7% or P70.7 million mainly due to the increase in average volume. As a result, net interest income increased by 24.6% or P1.6 billion from P6.5 billion to P8.1 billion. The Group booked total Impairment Losses of P1.6 billion, higher by P616.8 million or 65.9% from P935.5 million as a result of the annual updating of expected credit losses (ECL) components and the implementation of the revised ECL framework. It represented 15.7% of total operating income. Other operating income stood at P1.8 billion. This accounted for 18.7% of total operating income and is broken down as follows:
Trading and securities gains and losses – net, increased by 441.9% or P155.9 million from a loss of P35.3 million to P120.6 million gain, mainly attributable to higher realized trading gains from FVTPL and derivative transactions. It accounted for 1.2% of total operating income;
Service fees and commissions decreased by 15.8% or P211.0 million from P1.3 billion to P1.1 billion mainly due to lower consumer loan-related fees. It represented 11.4% of total operating income;
Trust fees increased by 12.4% or P11.3 million from P90.5 million to P101.8 million due to significant increase in volume of managed funds;
Foreign exchange gains – net, were lower by 48.7% or P22.7 million from P46.5 million to P23.9 million mainly driven by the impact of foreign currency revaluation as peso weakens year-on-year;
Miscellaneous income increased by 16.5% or P68.1 million from P411.4 million to P479.5 million largely due to higher gain on sale of acquired assets and recoveries from written-off accounts.
Operating expenses were recorded at P5.9 billion from P5.7 billion. This accounted for 59.4% of total operating income, and broken down as follows:
Manpower costs settled at P1.6 billion and accounted for 16.0% of total operating income;
Occupancy and equipment-related expenses were recorded at P736.1 million and represented 7.4% of total operating income;
Taxes and licenses, which accounted for 9.8% of total operating income, increased by 23.7% or P186.6 million from P787.2 billion to P973.8 billion mainly due to higher gross receipt tax attributed to increase in gross revenues year-on-year and documentary stamp tax on account of growth in peso Time Deposits and bond issuances.
Depreciation and amortization went down by 8.5% or P68.0 million from P796.3 million to P728.3 million largely due to lower depreciation on ROPAs. It represented 7.4% of total operating income;

Rizal Commercial Banking Corporation: March 2022 SEC Form 17-Q 36
Miscellaneous expenses stood at P1.9 billion from P1.8 billion and accounted for 18.7% of total operating income.
Tax expense increased by 207.5% or P219.5 million from P105.8 million to P325.2 million due to higher final tax on investment securities and higher regular corporate income tax. Net profit attributable to non-controlling interest settled at P190.8 thousand. Overall, net income increased by 35.5% or P561.3 million from P1.6 billion to P2.1 billion. There were no significant elements of income or loss that did not arise from the Bank‟s continuing operations.
Commitments and Contingent Liabilities See accompanying Notes to FS for the detailed discussion of Commitments and Contingent Liabilities and the summary of contingencies and commitments arising from off-balance sheet items and their equivalent peso contractual amounts (Note 12). There are also no known trends, events or uncertainties that have had or that are reasonably expected to have a material favorable or unfavorable impact on net sales/revenues/income from continuing operations. There were no material off-balance sheet transactions, arrangements, obligations (including contingent obligations), and other relationships of the company with unconsolidated entities or other persons created during the reporting period. Similarly, there were no significant elements of income or loss that did not arise from the Bank‟s continuing operations.

Rizal Commercial Banking Corporation: March 2022 SEC Form 17-Q 37
SIGNATURES
Pursuant to the requirements of the Securities Regulation Code, the registrant has duly caused this report to be signed on its behalf by the undersigned thereunto duly authorized. Issuer RIZAL COMMERCIAL BANKING CORPORATION Date May 11, 2022 EUGENE S. ACEVEDO President & CEO FLORENTINO M. MADONZA FSVP, Head-Controllership Group MA. CHRISTINA P. ALVAREZ FSVP, Head-Corporate Planning Group

Rizal Commercial Banking Corporation: March 2022 SEC Form 17-Q 38
RIZAL COMMERCIAL BANKING CORPORATION Aging of Other Receivables As of March 31, 2022 (Amounts in Millions of Philippine Pesos)
1 - 90 days
91 - 180 days
181 -1 year
Over 1 year
Total Allowance
Net
Accounts Receivable 1,801.2 131.7 295.9 641.7
2,870.5
1,136.2 1,734.3


RIZAL COMMERCIAL BANKING CORPORATION
Minutes of the Annual Stockholders’ Meeting
(For approval of the Stockholders at the 2022 Annual Stockholders’ Meeting)
Date : 28 June 2021
Time : 4:00 PM
Place : Virtual Meeting https://www.rcbc.com/ASM2021
Pursuant to notices served to all stockholders, the Annual Stockholders’ Meeting of
Rizal Commercial Banking Corporation (the ―Bank‖) was held on June 28, 2021 at 4:00 PM
and conducted virtually via https://www.rcbc.com/ASM2021 in view of the COVID-19
pandemic.
Chairperson Helen Y. Dee presided over the meeting, while the Corporate Secretary,
Atty. George dela Cuesta, recorded the proceedings. Calling the meeting to order,
Chairperson H. Y. Dee explained that for the second time, the meeting is being held in a
virtual format due to the current pandemic. She welcomed the shareholders who joined the
live webcast, those participating in the meeting through voting in absentia and those who
appointed her as proxy. She then introduced those who are joining her in the meeting, Mr.
Eugene Acevedo, President and CEO, and Atty. dela Cuesta.
Thereafter, the Chairperson asked the Corporate Secretary whether proper notice of
the meeting was sent to each stockholder of record and whether there was quorum for the
transaction of business.
I. Proof of Notice — The Corporate Secretary explained that notices for the
meeting were duly served to all stockholders of record as of May 31, 2021 in three ways as
allowed by prevailing SEC Rules and Circulars: (a) by posting on the Bank’s website, (b) by
disclosure in the Philippine Stock Exchange (PSE), and (c) by publication for 2 consecutive
days on May 31, 2021 and June 1, 2021, in the print and online business section of two
newspapers of general circulation, namely The Philippines Star and Manila Bulletin. (The
list of stockholders as of Record Date May 31, 2021 is hereto attached as Annex “A” and
made an integral part of the minutes.)
II. Quorum — The Corporate Secretary reported that stockholders owning a
total of 1,751,751,370 common and preferred shares representing 90.49% of the total
outstanding common and preferred shares entitled to vote were present. (The list of
stockholders who were present is hereto attached as Annex “B” and made an integral part of
the minutes.)
In view of the foregoing, the Corporate Secretary certified the presence of a quorum.
All the members of the Board of Directors and other officers of the Bank and
representatives of Punongbayan & Araullo were in attendance through the live webcast. (The
list of directors and officers of the Bank present is hereto attached as Annex “C” and made an
integral part of the minutes.)
The presence of a quorum being ascertained, the Chairperson declared the agenda
open for deliberation.

Minutes of the Annual Stockholders’ Meeting Rizal Commercial Banking Corporation June 28, 2021
Page 2
III. Instructions on Rules of Conduct and Procedures — The Chairperson said
that while the meeting is being held in a virtual format due to the government regulations that
prevented people from conducting in-person meetings, the Bank strived to provide the
shareholders the opportunity to participate in the meeting.
The Corporate Secretary reported that the rules of conduct and voting procedures are
set forth in the Notice of the Annual Stockholders’ Meeting. He highlighted the following
points:
1. Only Stockholders who notified the Bank by email at RCBC-ASM-
[email protected] until 5:00 p.m. of June 20, 2021 and who duly registered by email are
allowed to access the virtual meeting at https://www.rcbc.com/ASM2021.
2. Only those who registered were allowed to send their questions or comments
on the agenda items to [email protected]. And only those questions the Bank
received by 5:00 pm of June 25, 2021 were considered for the open forum at the
stockholders’ meeting.
3. The Bank will reply by email to questions and comments it received, if any,
after June 25 up to 4 p.m. of June 28, 2021.
The process for stockholders to ask questions was provided in the Procedure for the
Annual Stockholders’ Meeting attached to the Definitive Information Statement.
4. As indicated in the ballot for the voting of shareholders, there are six
resolutions proposed for approval by the stockholders in the meeting. Each proposed
resolution will be shown on the screen as the same is being taken up.
5. Stockholders or their representative cast their votes on the proposed
resolutions by completing, dating, signing and emailing/sending the proxy form/ballot form
to the Bank via [email protected] together with the stockholder’s registration
mail by 5:00 P.M. of June 20, 2021. If the name of the proxy is not specified, the stockholder
shall be deemed as having appointed the Chairperson as proxy.
6. The Bank has tabulated the votes cast after the end of the proxy validation
process. Those votes are from stockholders representing 90.49% of the total outstanding
shares.
To count and/or validate the votes of the meeting, the Bank has engaged an
independent party, Punongbayan & Araullo.
The Definitive Information Statement and the Explanation of Agenda Items also
provides that (1) only stockholders of record at close of business on May 31, 2021 will be
entitled to participate and vote at the meeting or any adjournment thereof; (2) only duly
registered stockholders shall be counted for purposes of quorum; and (3) where no specific
instruction is clearly indicated in any, some or all of the items specified in the proxy
form/ballot form, the vote shall be deemed as a vote ―FOR‖ with respect to proposal 1 to 6
(i.e., Items IV to VII and IX hereof) in the forms and ―FOR ALL‖ with respect to proposal 7
(i.e., Item VIII hereof) in the forms.
IV. Approval of the Minutes — The Chairperson explained that an electronic
copy of the minutes is available on the website of the Bank and was attached to the Definitive
Information Statement.
The Corporate Secretary reported that Management is proposing the adoption of
Resolution No. 21-01 (as shown below) and that stockholders representing 1,751,004,935
shares or 99.96% of the votes cast, voted in favor of approval of the minutes of the Annual

Minutes of the Annual Stockholders’ Meeting Rizal Commercial Banking Corporation June 28, 2021
Page 3
Stockholders’ Meeting held on July 27, 2020. Accordingly, the following resolution was
approved:
Resolution No. 21-01
―BE IT RESOLVED, AS IT IS HEREBY IS
RESOLVED, That the stockholders hereby approve, confirm
and ratify the Minutes of the Annual Stockholders’ Meeting
held on July 27, 2020, copies of which are posted on the
Bank’s website, and attached to the Definitive Information
Statement.‖
V. Approval of the Annual Report and Audited Financial Statements for
2020 — The Annual Report and the 2020 Audited Financial Statements of the Bank, copies
of which are available at the Bank’s website, the PSE Edge and which were also attached to
the Definitive Information Statement, were explained and submitted to the stockholders for
approval.
The Annual Report together with the Definitive Information Statement includes,
among others, the following matters: (a) an explanation of the dividend policy and dividend
payments; (b) material information on the current stockholders and their voting rights; and
(c) a detailed, descriptive and balanced assessment of the Bank’s performance. The duly
signed and certified Audited Financial Statements also includes a statement on the adequacy
of the corporation’s internal controls or risk management systems, and a statement of all
external audit and non-audit fees.
Mr. Acevedo presented his report to the Stockholders. He started his report by
highlighting the launch by RCBC of its new campaign ―Partners through Generations‖. This
campaign articulates what sustains the Bank’s business and such draws upon the strong
relationships and partnerships RCBC has built over the last 60 years. Now, more than ever,
RCBC needs to be the best partner in every role it plays: the best bank for its customers, the
best employer for its people, the best partner for government organizations, and the best
corporate citizen for its country.
He said that the pandemic puts banks on the frontline and RCBC is an active part of
the solution. He cited the following actions taken by RCBC:
a. RCBC activated its Pandemic and Infectious Disease Plan to manage the impact of
the pandemic to its people and its business. The Bank enforced health and safety
protocols to protect its RCBC bankers, especially those in its branches.
b. RCBC moved with haste to minimize business disruptions as well as transform the
way RCBC works. The Bank shifted to Work from Home mode and virtual meetings
while ensuring that its IT infrastructure can support these.
c. RCBC rationalized its branch network by closing 56 branches as foot traffic declined
and as customers shifted to digital platforms.
d. For customers severely affected by the pandemic and may take time to recover,
RCBC launched the COVID Assistance and Recovery (CARE) Program as a pre-
emptive refinancing of their loans.
e. To manage the higher risks and to preserve the Bank’s asset quality in the event of a
continuous economic downturn, RCBC set aside Php9.4 billion in loan loss
provision, 2.5 times higher than last year.
Mr. Acevedo reported that the Bank’s efforts have been recognized as the Philippines
Domestic COVID Management Initiative of the Year was awarded to RCBC by the Asian
Banking and Finance (ABF) Wholesale Banking Awards 2021.
Mr. Acevedo said that after putting all RCBC’s defenses in place, the Bank unleashed
its arsenal of digital solutions. He shared that this is a battleground the Bank has been
preparing for. He cited the following actions of the Bank:

Minutes of the Annual Stockholders’ Meeting Rizal Commercial Banking Corporation June 28, 2021
Page 4
a. Before the ECQ, the Bank already established a Board-approved Digital Committee,
which enabled the Bank to quickly provide essential digital services during the
lockdown.
b. RCBC fortified its IT infrastructure to accommodate the heavy influx of online
banking transactions.
c. RCBC Mobile App became even more powerful in 2020. RCBC went above and
beyond by providing more capabilities so its customers can bank from home. In July
2020, RCBC launched DiskarTech.
He proudly reported about RCBC’s success in the digital space, shown by the surge
in digital transactions by 183% in customer enrolment since March 2020. The Bank’s Send
Cash, Cardless Withdrawal, and Online Check Deposit features had a surge in utilization rate
by as much as 1,300% compared with pre-quarantine levels in 2020. DiskarTech has set a
national record for being the fastest to reach one million downloads after only 30 days and an
enrolment speed of as much as 1.3 downloads per second.
For these programs, RCBC was awarded as Best Digital Bank, Most Innovative
Internet Banking Services Provider and Best Digital Inclusion Initiative for Service and
Solution by industry experts and peers, such as Alpha Southeast Asia, Asiamoney, The
Global Economics and the International Innovation Awards.
While RCBC strives to be ahead in the digital race, at the end of the day, the only
thing that matters is if RCBC is able to put these innovations to good use by solving society’s
problems. He shared the following actions of the Bank:
a. RCBC led a private sector coalition called Damayang Sambayanihan: Hatid-Ayuda
sa Kababayan. This was a quick-response initiative to ensure the timely disbursement
of Php200 billion (USD4 billion) in emergency government aid.
b. RCBC became the first private universal bank authorized by the Department of Social
Welfare and Development (DSWD) and the Bangko Sentral ng Pilipinas (BSP) to
accept and disburse government funds.
c. To ensure the timely distribution of aid to 18 million families nationwide, RCBC
deployed its 2,000-strong handheld RCBC ATM Go network. By end-2020, RCBC
had managed to digitally disburse Php12.43 billion (USD258.71 million) in cash
subsidy to more than 3.3 million households or approximately 16.6 million
individuals in 72 out of 81 provinces.
d. While 2020 was a trying time for many, RCBC continued to sharpen its focus on
sustainability efforts. It has funded a total of 9,950 green and social projects
amounting to more than Php51.0 billion as of end-2020 or 10.5% of its total loans.
e. The Bank has also taken the lead roles in financing some of the country’s biggest
green infrastructure and renewable energy projects. RCBC stopped funding new
coal-fired power plants in the country, aligned with the policy decision of the
Department of Energy to shift to a renewable energy mix.
For these projects, the Bank garnered awards such as Best Sustainability Bond in the
Philippines from the Asset Asian Awards, Philippine Domestic Initiative of the Year for
Sustainable Financing from ABF Wholesale Banking Awards and Best Green Bank
Philippines from Global Banking and Finance Awards.
Despite the many unexpected challenges, the Bank performed relatively well. In
2020, its gross revenues rose 6.0% to Php37.9 billion from Php35.9 billion in 2019. Net
interest income also jumped by 17.5% to Php26.3 billion amid a decline in funding costs and
higher margins. Its loan book expanded 5.0% to Php456.6 billion while total deposits
reached Php535.8 billion, fuelled by a 21.0% surge in low-cost CASA deposits. RCBC is the
only major bank in the country that saw a rise in loans during the pandemic.
With the Bank’s loan loss provision of Php9.4 billion, RCBC ended 2020 with a net
income of Php5.0 billion, just 7% lower than Php5.4 billion the previous year. Amid the

Minutes of the Annual Stockholders’ Meeting Rizal Commercial Banking Corporation June 28, 2021
Page 5
crisis, RCBC managed to keep its net non-performing loan ratio at 2.9%. The Bank remains
more than adequately capitalized, as its CAR ratio stood at 16.1% while its common equity
Tier 1 ratio was at 12.6%.
RCBC continued to reap rewards during the first half of 2021. The Bank just received
three Best Digital Bank awards. RCBC was also recognized as Best Cash Management and
Retail Bank by Global Banking and Finance.
These recognitions serve as a testament to the Bank’s collective strength. He stated
that in the moment when the Bank’s customers, employees, and its country needed it most,
the Bank came together as one RCBC Family.
While COVID continues to paint a cloud of uncertainty, RCBC must not lose sight of
its purpose, its shared values, and its commitment to a shared future. He urged RCBC to turn
this pandemic into its ―golden hour‖. He stressed that the building of partnerships is not just
with RCBC’s customers, but also with each other.
He asked his colleagues in RCBC: as RCBC Bankers, they must live what they
promise, that through collaboration, agility and care – we must continue to go beyond
expectations for those we serve.
Mr. Acevedo ended by giving gratitude to the Chairperson and to the members of the
Board of Directors for steering the Bank to the right direction.
The Chairperson thanked Mr. Acevedo for his report.
The Corporate Secretary then reported that Management is proposing the adoption of
Resolution No. 21-02 (as shown below) and that the stockholders representing 1,751,004,935
shares or 99.96 % of the votes cast, voted in favor of the approval of the Bank’s Annual
Report and its Audited Financial Statements for the year 2020. Accordingly, the following
resolution was approved:
Resolution No. 21-02
―BE IT RESOLVED, AS IT IS HEREBY IS
RESOLVED, That the stockholders hereby approve the
Annual Report and Audited Financial Statements of the Bank
for the year 2020.‖
VI. Ratification of actions of the Board of Directors, different Committees
and Management — The next item considered was the ratification of the actions of the
Board of Directors, the different Committees and Management of the Bank from July 27,
2020 to the date of the meeting, June 28, 2021. The Corporate Secretary described the
transactions subject of the ratification.
Thereafter, he presented Resolution No. 21-03 (as shown below) and reported that
stockholders representing 1,751,751,370 shares or 100 % of the votes cast voted in favor of
the approval, confirmation and ratification of the actions of the Board of Directors, the
different Committees and the Management from July 27, 2020 to June 28, 2021.
Accordingly, the following resolution was approved:
Resolution No. 21-03
―BE IT RESOLVED, AS IT IS HEREBY IS
RESOLVED, That the stockholders hereby approve, confirm
and ratify, the actions of the Board of Directors, different
Committees and Management from July 27, 2020 to June 28,
2021.‖

Minutes of the Annual Stockholders’ Meeting Rizal Commercial Banking Corporation June 28, 2021
Page 6
VII. Confirmation of Significant Transactions with DOSRI and Related
Parties — The confirmation of significant transactions with DOSRI and related parties
approved by the Board of Directors, the different Committees and Management of the Bank
from July 27, 2020 to June 28, 2021 was then considered.
The Corporate Secretary reported that significant transactions with DOSRI and
related parties from July 27, 2020 to June 28, 2021 include: loans/receivables and deposit
liabilities; trading of investment securities; lease and sub-lease with RCBC Realty
Corporation; various service agreements with RCBC Bankard Services Corporation, RCBC
Forex Brokers Corporation, RCBC Capital Corporation, RCBC Securities, Inc., Rizal
Microbank Inc., RCBC Leasing and Finance Corporation, Niyog Property Holdings, Inc.,
RCBC International Finance Limited; and lease agreement with RCBC Rentals Corporation
for the lease of ATMs. He added that the subject transactions include the administration and
management of the retirement funds of some of the subsidiaries, service agreements, leasing
office premises to subsidiaries, accreditation of RCBC Trust agent and of insurance
companies, and regular banking transactions.
Details of said related party transactions are disclosed in the Bank’s SEC 17-A
Report which is also available on the Bank’s website. These were also provided in the
Annual Report together with the Definitive Information Statement.
The Corporate Secretary then presented Resolution No. 21-04 (as shown below) and
reported that stockholders representing 1,751,702,330 shares or 99.997% of the votes cast,
voted in favor of the approval, confirmation and ratification of the significant transactions
with DOSRI and related parties approved by the Board of Directors, the different Committees
and Management from July 27, 2020 to June 28, 2021. Accordingly, the following resolution
was approved:
Resolution No. 21-04
―BE IT RESOLVED, AS IT IS HEREBY IS
RESOLVED, That the stockholders hereby approve, confirm
and ratify, the significant transactions with DOSRI and related
parties approved by the Board of Directors, the different
Committees and Management July 27, 2020 to June 28,
2021.‖
VIII. Election of Directors — The next item in the Agenda was the election of
Directors of the Bank for the year 2021-2022. Before the election, the Corporate Secretary
reported to the stockholders the annual compensation of each of the directors. He explained
that the Bank is sharing the information in compliance with Corporate Governance
Regulations of the SEC and the Revised Corporation Code.
The Corporate Secretary then shared the findings of the Institute of Corporate
Directors (or ICD) when it audited the processes of the Board. ICD highlighted that with the
Golden Arrow Recognition received by the Bank from the SEC, ―the Bank is considered as
one of the model enterprises for corporate governance in the Philippines.‖ ICD also stated
that the RCBC Board is composed of ―working‖ directors who are able to contribute their
expertise and competencies in their respective Board Committees and to the Board. Finally,
the assessment corroborates that the RCBC Board is ably led by Chairperson, Helen Y. Dee,
while President and Chief Executive Officer, Eugene S. Acevedo, effectively leads the
management of the Bank.
Thereafter, the Corporate Secretary presented the names of the following
stockholders duly nominated as members of the Board of Directors for the ensuing term:

Minutes of the Annual Stockholders’ Meeting Rizal Commercial Banking Corporation June 28, 2021
Page 7
As Regular Directors
1. Ms. Helen Y. Dee
2. Mr. Cesar E.A. Virata
3. Mr. Eugene S. Acevedo
4. Mr. Gil A. Buenaventura
5. Mr. Armando M. Medina
6. Mr. John Law
7. Mr. Shih-Chiao (Joe) Lin
8. Mr. Arnold Kai Yuen Kan
9. Atty. Lilia B. De Lima, and
10. Ms. Gayatri P. Bery
As Independent Directors
1. Mr. Juan B. Santos
2. Atty. Adelita A. Vergel De Dios
3. Mr. Gabriel S. Claudio
4. Mr. Vaughn F. Montes, and
5. Mr. Laurito E. Serrano
The Corporate Secretary reported that the Bank’s Corporate Governance Committee
has ascertained that all the nominees for directors are qualified to serve as directors of the
Bank, and that all the nominees have given their consent to their respective nominations.
The Corporate Secretary reported that each of the fifteen nominees for director has
garnered at least 99.995% of the votes cast and consequently certified that each of the
nominees has received sufficient votes for election to the Board of Directors of the Bank.
As verified and tabulated by independent third party Punongbayan and Araullo, the
votes for the directors were as follows:
FOR PERCENTAGE
1. Ms. Helen Y. Dee 1,751,672,330 99.995%
2. Mr. Cesar E.A. Virata 1,751,721,370 99.998%
3. Mr. Eugene S. Acevedo 1,751,751,370 100.00%
4. Mr. Gil A. Buenaventura 1,751,702,330 99.997%
5. Mr. Armando M. Medina 1,751,721,370 99.998%
6. Mr. John Law 1,751,751,370 100.00%
7. Mr. Shih-Chiao (Joe) Lin 1,751,671,970 99.995%
8. Mr. Arnold Kai Yuen Kan 1,751,751,370 100.00%
9. Atty. Lilia B. De Lima 1,751,671,970 99.995%
10. Ms. Gayatri P. Bery 1,751,751,370 100.00%
11. Mr. Juan B. Santos 1,751,751,370 100.00%
12. Atty. Adelita A. Vergel De Dios 1,751,751,370 100.00%
13. Mr. Gabriel S. Claudio 1,751,751,370 100.00%
14. Mr. Vaughn F. Montes 1,751,751,370 100.00%
15. Mr. Laurito E. Serrano 1,751,751,370 100.00%
Accordingly, the following resolution was approved:

Minutes of the Annual Stockholders’ Meeting Rizal Commercial Banking Corporation June 28, 2021
Page 8
Resolution No. 21-05
―BE IT RESOLVED, AS IT IS HEREBY IS
RESOLVED, That the stockholders duly elected the members
of the Board of Directors of the Bank as named hereunder, to
hold office for a term of one year until their successors shall
have been duly elected and qualified:
As Regular Directors:
1. Ms. Helen Y. Dee
2. Mr. Cesar E.A. Virata
3. Mr. Eugene S. Acevedo
4. Mr. Gil A. Buenaventura
5. Mr. Armando M. Medina
6. Mr. John Law
7. Mr. Shih-Chiao (Joe) Lin
8. Mr. Arnold Kai Yuen Kan
9. Atty. Lilia B. De Lima, and
10. Ms. Gayatri P. Bery
As Independent Directors:
11. Mr. Juan B. Santos
12. Atty. Adelita A. Vergel De Dios
13. Mr. Gabriel S. Claudio
14. Mr. Vaughn F. Montes, and
15. Mr. Laurito E. Serrano‖
IX. Appointment of External Auditor — The appointment of the External
Auditor of the Bank was next taken up. Punongbayan & Araullo is proposed to be re-
appointed as auditor of the Bank for the year ending December 31, 2021.
Management is proposing the adoption of Resolution No. 21-06 (as shown below).
The Corporate Secretary reported that stockholders representing 1,750,955,895 shares or
99.95% of the votes cast, voted in favor of the approval of the re-appointment of
Punongbayan & Araullo as auditor of the Bank for the fiscal year 2021. Accordingly, the
following resolution was approved:
Resolution No. 21-06
―BE IT RESOLVED, AS IT IS HEREBY IS RESOLVED, That the
stockholders approve that the services of Punongbayan & Araullo be retained
as External Auditor of the Bank for the fiscal year 2021.‖
X. Other Matters – The Chairperson asked if there were questions or comments
received from the stockholders. The Corporate Secretary informed the Chairperson that there
were no questions received from the stockholders.
XI. Adjournment — There being no other business to transact, the meeting was
adjourned at 04:36 P.M.

Minutes of the Annual Stockholders’ Meeting Rizal Commercial Banking Corporation June 28, 2021
Page 9
Attachments:
1. The list of stockholders as of Record Date May 31, 2021 is hereto attached as
Annex “A” and made an integral part of the minutes.
2. The list of stockholders who were present is hereto attached as Annex “B” and
made an integral part of the minutes.
3. The list of directors and officers of the Bank present is hereto attached as Annex
“C” and made an integral part of the minutes.

COMMON SH Name TOTAL NO. OF SHARES PERCENTAGEMARASIGAN, APOLINARIO/PURITA/MA. C.P. ASSUMPTA 30.00 0.000002CHUA, VICKY BARRETTO 100.00 0.000005FAJARDO, MARIETTA A. 638.00 0.000033CHUA, MARIA TERESA N. 169.00 0.000009TAN, REMEDIOS TIU 13,129.00 0.000678TAN, ALFREDO 516.00 0.000027DIAZ, RICARDO L. 6.00 0.000000ALVAREZ, RODERICK ALAIN 115.00 0.000006ESTRADA, FRANCIS G. 3.00 0.000000LAUREL, FRANCIS 2.00 0.000000FERNANDEZ-ESTAVILLO, MA. CELIA H. 18.00 0.000001HANS YAP HWANG 833.00 0.000043RAMOS, CAROLYN 129.00 0.000007PO, VICTORIA L. 1,495.00 0.000077MARTINEZ, CARMEN R. 750.00 0.000039OSMENA, ISABEL 15.00 0.000001SANCHEZ, WILFRIDO E. 1.00 0.000000SALOM, R. JOHN CHRISTOPHER J. 874.00 0.000045SALOM, H.J. ADELEEN FRANCES J. 874.00 0.000045IMEE T. ESTABILLO &/OR NIKKA DENESSE E. QUINSAAT 115.00 0.000006YUCHENGCO, YVONNE S. 1.00 0.000000EIZMENDI, FRANCISCO 1.00 0.000000OCAMPO, ROBERTO DE 1.00 0.000000VEA, REYNALDO 1.00 0.000000AU, OWEN NATHANIEL AU ITF: LI MARCUS 11.00 0.000001BDO SECURITIES CORP. 1,395.00 0.000072EIB SECURITIES INC. 12.00 0.000001ACERO, NICASIO MARIN JR. &/OR ARNOLFO O. 505.00 0.000026CHAN, SHERWIN CO 25.00 0.000001CHOA MEI LING 19.00 0.000001CUBILLAN, JACINTO CU 22.00 0.000001ESTABILLO, IMEE T. 2.00 0.000000GUSAYKO ONG, MARIA CHUA 2.00 0.000000JASMIN, JUANITA S. 12.00 0.000001RAMIREZ, IDA 9.00 0.000000TAN, CRESENCIO B. 52.00 0.000003UY, CO FAY 1,222.00 0.000063YAP, BENNETH YAP &/OR LIBERATA BASA 2.00 0.000000CORTEZ, PAULINO A. 10,000.00 0.000517TEAGUE, CHRISTOPHER IAN 100.00 0.000005MCCARTHY, ROBERT 100.00 0.000005YANG JIN LIANG 100,000.00 0.005166SEC ACCOUNT FAO: VARIOUS CUSTOMERS OF GUOGO SEC (PHILS) INC. 538.00 0.000028ALINDOGAN JR., ANTONINO 1.00 0.000000CHARLTON NG ITF KAITLIN CHUA NG 2,000.00 0.000103

CHARLTON NG ITF BENEDICT CHUA NG 2,000.00 0.000103AMERICAN WIRE & CABLE CO., INC. 20,000.00 0.001033CHAM TENG HUI 40,000.00 0.002067TANJUAKIO, NOE AMAGNA 2,777.00 0.000143TEO, STEPHEN T. TEO &/OR TERESITA R. 3,000.00 0.000155ALCANTARA, ZENAIDA P. ALCANTARA &/OR LUIS M. 25,000.00 0.001292DAVID, MARY LYN Y. 1,100.00 0.000057JULIETA Q. TAGORDA ITF JONAS ALEXIS Q. TAGORDA 82.00 0.000004SEC ACCOUNT NO. 2 FAO: VARIOUS CUSTOMERS OF GUOCO SECURITIES (PHILIPPINES), INC. 81.00 0.000004YU, JAMES ONG 100.00 0.000005EDWIN B. ARCILLA &/OR MINDA GARCIA 200.00 0.000010CASAMBROS, NEMESIO D. CASAMBROS &/OR PRISCILA D. 500.00 0.000026RUBIALES, PAUL OBANIANA 300.00 0.000015PASCUAL, ALVIN J. 345.00 0.000018YAN, LUCIO W. YAN &/OR CLARA 30,000.00 0.001550VALENCIA, JESUS SAN LUIS 20.00 0.000001MAXIMO S. UY &/OR LIM HUE HUA 20,000.00 0.001033DIPASUPIL, MARGARITA F. 1,382.00 0.000071HAPI ILOILO CORPORATION 100.00 0.000005TAN, ROGER KO TAN &/OR MAE ROLEN HING 4,707.00 0.000243VILLANUEVA, FRANK CHUA 553.00 0.000029LIM, CHARLIE S. 10,000.00 0.000517M.J. SORIANO TRADING, INC. 100.00 0.000005YAO, SHUOBIN 57,000.00 0.002945YAO, SHUOYU 57,000.00 0.002945PUEY, MANUEL H. 1,000.00 0.000052GASPAY, MERLY B. 100.00 0.000005TALISAYAN, BENITA Z. 1,300.00 0.000067NAVAS, WINFRED T. 500.00 0.000026TACUB, PACIFICO B. 2,000.00 0.000103LIM, NIEVES Q. LIM &/OR CHARIS HONEYLET Q. 1,000.00 0.000052ANGANGCO, RAOUL R. 10,000.00 0.000517HYDEE MANAGEMENT & RESOURCE CORPORATION 2,173,349.00 0.112281NERA, MEDEL T. 1.00 0.000000LOMBOS, MANUEL C. &/OR MEYRICK J. 68,574.00 0.003543SYBASE EQUITY INVESTMENTS CORPORATION 23,528,800.00 1.215564ONG, JILLIANNE DE JESUS 5,000.00 0.000258REITERER, ALFRED 1.00 0.000000BUENAVENTURA, LEOPOLDO E. SAN 250.00 0.000013NAVARRO, RODEL SY 10.00 0.000001CBNA MLA OBO AC 6011800001 4.00 0.000000CHENG, CHARLEY W. 198.00 0.000010LAW, JOHN 1.00 0.000000BALADAD, ALFREDO R. 1,300.00 0.000067ESMANE, CONCHITA E. 790.00 0.000041LEOPOLDO E. SAN BUENAVENTURA ITF CHARMELYN M. SAN BUENAVENTURA 100.00 0.000005

LEOPOLDO E. SAN BUENAVENTURA ITF LEOPOLDO M. SAN BUENAVENTURA JR. 100.00 0.000005LEOPOLDO E. SAN BUENAVENTURA ITF MARGHELYC M. SAN BUENAVENTURA 100.00 0.000005LEOPOLDO E. SAN BUENAVENTURA ITF QUELHMARD M. SAN BUENAVENTURA 100.00 0.000005LEOPOLDO E. SAN BUENAVENTURA ITF PHOLYMN M. SAN BUENAVENTURA 100.00 0.000005LEOPOLDO E. SAN BUENAVENTURA ITF MAYRHILYN M. SAN BUENAVENTURA 100.00 0.000005RAMOS, ELISEA S. 3,234.00 0.000167VIDAL, CHERRY R. 647.00 0.000033RAMOS, JOSEPH DAVID S. 647.00 0.000033RAMOS, ELSIE GRACE S. 647.00 0.000033BUENAVENTURA, GIL A. 5.00 0.000000SANTOS, JUAN B. 5.00 0.000000CLAUDIO, GABRIEL S. 1.00 0.000000DIOS, ADELITA A. VERGEL DE 1.00 0.000000ALEXIS CONSORCIO P. PASQUIN 563.00 0.000029MONTES, VAUGHN F. 5.00 0.000000HERRERA III, FLORENTINO M. 1.00 0.000000SHAREHOLDERS' ASSOCIATION OF THE PHILIPPINES, INC. 100.00 0.000005DIPASUPIL, CHRISTIAN FANDIALAN 1,000.00 0.000052HERRERA, NADEZHDA ISKRA F. 200.00 0.000010ESTERO, FELICITAS DIPASUPIL 1,382.00 0.000071RICARDO L. DIAZ 42.00 0.000002LARRGO SECURITIES CO., INC. 12.00 0.000001JOAQUIN FALGUERA JUNQUERA 380.00 0.000020SANDRA MARIE R. AGUILAR 3,272.00 0.000169GISELLE KAREN Y. GO 10,000.00 0.000517REUEL ALLACAR ALMARIO 2,333.00 0.000121STEPHEN G. SOLIVEN 38.00 0.000002LAURITO E. SERRANO 1.00 0.000000BOTSCHAFT N. CHENG OR SEVILA NGO 1.00 0.000000SHIH-CHIAO LIN 1.00 0.000000ARNOLD KAI YUEN KAN 1.00 0.000000LILIA B. DE LIMA 1.00 0.000000MANUEL A. SANTIAGO OR ELLA C. SANTIAGO 65,900.00 0.003405GAYATRI P. BERY 1.00 0.000000ARMANDO ENERO 2,065.00 0.000107GERARDO L. SALGADO 8.00 0.000000REGINA CAPITAL DEVELOPMENT CORP 324,454.00 0.016762REGINA CAPITAL DEV. CORP. 000351 25,098.00 0.001297ABAYA, CARLOS MIGUEL Y. 1,905.00 0.000098ABAYA, JOSE PAOLO Y. 1,905.00 0.000098ABAYA, MONA LISA Y. 4,496.00 0.000232ALMARIO, ROBERTO 218.00 0.000011ALVENDIA, JOSE P. 69.00 0.000004ALVENDIA, SYLVIA P. 116.00 0.000006ALVERO, MYRNA A. 1,207.00 0.000062ANGARA, EDGARDO 13.00 0.000001

ARANETA, ENRIQUE 40.00 0.000002ARANETA II, GREGORIO 540.00 0.000028ARCENAL, CELSO R. 1,541.00 0.000080BARROGA, ANTONIO B. 218.00 0.000011BORROMEO, MILAGROS N. 13,662.00 0.000706BUHAY, RICARDO 3,122.00 0.000161CALADIAO JR., EUSEBIO 3,737.00 0.000193CHAN, FREDERICK 111,677.00 0.005770CHANGCO JR., PEDRO 425.00 0.000022CIPRIANO, BIENVENIDO C. 45,354.00 0.002343COCHONGCO, CYNTHIA 218.00 0.000011CUEVA, TELESFORO DELA 540.00 0.000028DEE, HELEN Y. 438.00 0.000023DY, TEDDY T. 247.00 0.000013FRANCO, RENATO V. 540.00 0.000028GALVAN, FREDESVINDO 540.00 0.000028GO ENG BOK 23.00 0.000001GO, JOY MARGARET C. 9,000.00 0.000465GOLOY, ANTONIO 540.00 0.000028GOMEZ, ERIBERTO H. 7,252.00 0.000375GUANZON, HENRY 218.00 0.000011FLORENTINO HERRERA III & VICTORIA SYCIP IN TRUST FOR AMOR ROSELLE HERRERA 157.00 0.000008FLORENTINO HERRERA III & VICTORIA SYCIP IN TRUST FOR ANNA CARMINA HERRERA 157.00 0.000008ILUSTRE, ANGELINA LEILA A. 1,367.00 0.000071ILUSTRE, GIL A. 1,367.00 0.000071ILUSTRE, ROMAN V. 1,367.00 0.000071LEON, HONESTO DE 52.00 0.000003LIMJUCO, SONIA 14,547.00 0.000752LOPEZ JR., EDUARDO S. 6,091.00 0.000315MACEDA, ARTURO F. 80.00 0.000004MAGBANUA, RENE T. 2,370.00 0.000122MALLARI, ESPERANZA 364.00 0.000019MARTINEZ, JOSEFINA H. 4,573.00 0.000236MARTINEZ, SALVADOR 218.00 0.000011MEDINA, ARMANDO M. 195.00 0.000010ALBERT &/OR BERNADETTE &/OR EMMANUEL MENDOZA 2,415.00 0.000125ANTONIO MOJICA &/OR ZENAIDA MOJICA 1,367.00 0.000071MONZON, ARTURO T. 32.00 0.000002PADILLA, ALEXANDER A. 1,550.00 0.000080PADILLA, MARIE GRACE A. 23.00 0.000001PADILLA, MARIA ROSARIO A. 23.00 0.000001PENAOJAS, AZUCENA 10.00 0.000001PERFECTO, RAFAEL Z. 155.00 0.000008RAMOS JR., CARLOS 4,689.00 0.000242REYES, AMANDO 57.00 0.000003REYES JR., MAURO C. 45,183.00 0.002334

RODRIGUEZ, JOSE MARIA A. 790.00 0.000041RODRIGUEZ, MARIA ELENA A. 790.00 0.000041RODRIGUEZ, SANDRA MARIE A. 10.00 0.000001ROJAS JR., FILADELFO S. 1,139.00 0.000059ROMAN III, ANGEL 598.00 0.000031RUBIO, CESAR A. 7,252.00 0.000375RUFINO, JOSEFINA PADILLA 54,292.00 0.002805SALES, MERLYN K. 604.00 0.000031SANCHEZ, AMPARO V. 6,993.00 0.000361AUGUSTO V. SANCHEZ &/OR FRANCIANINA G. SANCHEZ 34.00 0.000002MARY LINA SANTIAGO IN TRUST TO DANILO H. &/OR MARIA LINA A. DE SANTIAGO 5,842.00 0.000302STELLA MARIS SANTIAGO IN TRUST TO DANILO H. &/OR MARIA LINA A. DE SANTIAGO 5,842.00 0.000302GERALDINE MARIE SANTIAGO IN TRUST TO DANILO H. &/OR MARIA LINA A. DE SANTIAGO 5,842.00 0.000302SANTOS, JOSE F. 1,307.00 0.000068SANTOS, SUSANNE Y. 137.00 0.000007SEGARRA, CONRADO 218.00 0.000011TAN, ALLEN M. 218.00 0.000011TANTOCO JR., BIENVENIDO R. 247.00 0.000013TANTOCO SR., BIENVENIDO R. 247.00 0.000013TIMBOL, ALEXANDER S. 7,659.00 0.000396VALDEZ, MANUEL C. 50.00 0.000003VALENCIA JR., ABELARDO 218.00 0.000011VILLAMOR, REYNALDO 247.00 0.000013YIN, ANTHONY WOO PEY 2,748.00 0.000142GREGORIO YAP JR. &/OR AIDA SANCHEZ 3,239.00 0.000167YIU, AGUSTINO ONG 218.00 0.000011YNZON, BENJAMIN DE 40.00 0.000002YU, EDWARD R. 2,093.00 0.000108YU, PETER C. 140.00 0.000007YUCHENGCO, ALFONSO T. 3,997.00 0.000206YUCHENGCO JR., ALFONSO 261.00 0.000013ZALDIVAR, MELCHOR P. 20.00 0.000001A. T. YUCHENGCO, INC. 255,190.00 0.013184BRIDGESTONE SECURITIES CORPORATION 12,454.00 0.000643PAN MALAYAN MANAGEMENT AND INVESTMENT CORPORATION 594,248,085.00 30.700517RCBC TA #75-172 2,900.00 0.000150RTG & COMPANY, INC. 34.00 0.000002RUSTAN INVESTMENT AND MANAGEMENT CORPORATION 12,605.00 0.000651CONCEPCION, CARMENCITA DE LAS ALAS 224,490.00 0.011598ALAS, CORNELIO DE LAS 114,195.00 0.005900ALAS, CARLOS DE LAS 114,298.00 0.005905DONES, VALENTINO M. 70.00 0.000004JESUS, ZENAIDA D. DE 7,982.00 0.000412SUAREZ, MARIA LUISA J. 6,716.00 0.000347RAMIREZ, MARIA SOCORRO J. 7,604.00 0.000393JESUS, LUIS CONRADO D. DE 7,604.00 0.000393

JESUS, MARCOS RUSTICO D. DE 7,604.00 0.000393TANADA, CAMILLE F. 110.00 0.000006TANADA, SUSAN F. 110.00 0.000006TANADA, ROSALIA F. 110.00 0.000006TANADA, MELISSA F. 5,623.00 0.000290CO FAY UY 2,937.00 0.000152E. CHUA CHIACO SECURITIES, INC. 80.00 0.000004LAUREL III, JOSE S. 92.00 0.000005LEGASPI, GRELI S. 80.00 0.000004GALVEZ, ROSARIO PADILLA 69.00 0.000004RUFINO, JOSIE PADILLA 92,865.00 0.004798RODRIGUEZ, SYLVIA A. 13,258.00 0.000685VIRATA, CESAR E.A. 167.00 0.000009CHUA, MERCEDES 92.00 0.000005CO, JUSTINA DY 22,973.00 0.001187PENA, TEODORO Q. 101.00 0.000005RCBC TA# 33-472-3 3,260.00 0.000168ORTIGAS, RAFAEL B. 1,092.00 0.000056UAL, NESTOR P. 80.00 0.000004CHIACO, BERNARD S. CHUA 23.00 0.000001NGO, KENDRICK 7.00 0.000000EQUITIWORLD SECURITIES, INC. 249.00 0.000013DINGCO, ANGELITO DELA 11.00 0.000001RCBC T/A 76-284-9 2,169.00 0.000112CRUZ, NORLABEL DELA 11.00 0.000001ZIALCITA, XAVIER 3.00 0.000000DY, MARCELO T. 1.00 0.000000PUEY, ANNA CRISTINA 1.00 0.000000PUEY, ANNA MARIE 3.00 0.000000PUEY, JOSE ALFONSO 3.00 0.000000ZARAGOZA, ROSAURO D. 97.00 0.000005ROSAL, RAYMOND U. 168.00 0.000009AQUINO, GODOFREDO 57.00 0.000003ANGPING & ASSOC. SEC., INC. A/C CWEI0000 259.00 0.000013GISON JR., AMBROSIO M. 57.00 0.000003ALVENDIA, ESPERANZA 2,265.00 0.000117SYCIP, JOSE G. 437.00 0.000023SYCIP, JOHN G. 142.00 0.000007DIZON, SALVADOR T. 347.00 0.000018ABELLERA, FELIX 100.00 0.000005SYCIP, PAUL 57.00 0.000003BARJA, EDWARD 20.00 0.000001INVESTORS SECURITIES, INC. 34.00 0.000002OLAGUER, ROGERIO R. 1,365.00 0.000071ORIENTAL ASSURANCE CORPORATION 1,966.00 0.000102EAST ASIA CAPITAL CORPORATION 103.00 0.000005

ASIA PACIFIC CAPITAL EQUITIES & SECURITIES CORP. 23.00 0.000001YAP, ROSALINA O. 179.00 0.000009PNB SECURITIES, INC. 211.00 0.000011YOUNG, JAMES D. 5,451.00 0.000282MUKESH S. ADVANI &/OR SITA S. ADVANI 319.00 0.000016INTRA INVEST SECURITIES, INC. 4,201.00 0.000217POA LIM &/OR VIVIAN L. TAN 75.00 0.000004DUHIG, ELSIE T. 150.00 0.000008DEES SECURITIES CORPORATION 345.00 0.000018SARABIA, CONDRADO L. 60.00 0.000003CUBILLAN, ROSALINA C. 127.00 0.000007FORTUNATO &/OR ARSENIA SY 2,875.00 0.000149R. COYIUTO SECURITIES, INC. 172.00 0.000009R.S. LIM & COMPANY, INC. 750.00 0.000039TORRES, FLORDELIZA G. 115.00 0.000006VALENZUELA, ELSA 460.00 0.000024OPTIMUM SECURITIES CORPORATION 2,499.00 0.000129CANEDA, LUCITA 129.00 0.000007TORRE, LARA M. 230.00 0.000012CRUZ, MILAGROS O. DELA 885.00 0.000046HAO, ANGELINA 60.00 0.000003LU, RINA U. 115.00 0.000006WONG WEE SIOK 29.00 0.000001OCUBILLO, JOSEPHINE F. 105.00 0.000005CO, BYRON JOHN 437.00 0.000023CAYABYAB, ROVIL L. 519.00 0.000027FERNANDEZ, GLORIA S. 650.00 0.000034HERNARDO, NEL 115.00 0.000006LEE, WILLY P. 632.00 0.000033QUIMBO, TERESITA 45.00 0.000002QUIMBO, VINCENT CHRISTIAN 30.00 0.000002SINGSON, ANTONIO 22.00 0.000001TIZO, ALEX 115.00 0.000006TANLU, JOEMARIE 389.00 0.000020ALDRIC CHUA &/OR KATHERINE CHUA 405.00 0.000021CHEN, JOHNSON 402.00 0.000021REYES, ROBERTO A. 57.00 0.000003YUBOCO, FIDEL &/OR EVANGELINE 750.00 0.000039CARDENAS , DAVID 1,301.00 0.000067CARMONA, ROSEMARIE S. 172.00 0.000009TAN CHONG SENG 90.00 0.000005TAN, LUCIANO H. 7,674.00 0.000396GSIS FAO GRACE ALVAREZ ABONITALLA 161.00 0.000008DABLE JR., DAVID 138.00 0.000007LIM, ERNIE Y. 1,265.00 0.000065LEGASPI, MA. SALOME 57.00 0.000003

MADRID, RUBEN 23.00 0.000001ALIPIO, ANTONIO 58.00 0.000003GUZMAN, ELEANOR DE 22.00 0.000001ESTERON JR., ISMAEL J. 11.00 0.000001ESPINUEVA, JEMELLI G. 259.00 0.000013NAZAIRE, SARAHLEE C. 129.00 0.000007KHOE JR., ANANIAS 400.00 0.000021SARSOSA, MALOU K. 57.00 0.000003TEH, BASILIO 103.00 0.000005BITONG, ELIZABETH 1,150.00 0.000059YUKEE, MINERVA F. 1,610.00 0.000083GONZALES, ESTHER ESMENA 115.00 0.000006MANAPAT, CARLOS B. 477.00 0.000025LIM, CELY S. 1,150.00 0.000059OMENGAN JR., VICENTE U. 699.00 0.000036LI, SANDRA 150.00 0.000008TAN, CARIDAD K. 7,066.00 0.000365ALPAPARA, WILSON 481.00 0.000025ERIC VERBO &/OR ANGELITA VERBO 29.00 0.000001MARTIN, LYONELL 135.00 0.000007MUNOZ, MILADY 910.00 0.000047ANG YEE TIM 120.00 0.000006DIAZ, AIDA GARCIA 345.00 0.000018PASCUA, ERLINDA A. 202.00 0.000010REGINA CAPT DEVT CORP/001081 333.00 0.000017ROBLES, MARIO J. 489.00 0.000025ALPAPARA, WILSON 212.00 0.000011CHIN, JIMMY NG ENG 1,169.00 0.000060CHUAN, MANUEL CO SING 450.00 0.000023LIM, ERNNIE P, 30.00 0.000002TIU, GRACE L. 834.00 0.000043QUERUBIN, CRISOSTOMO 880.00 0.000045YEO, MICHAEL 495.00 0.000026VENUS, ALEXANDER 14.00 0.000001ELMAR PANOPIO &/OR RUBY PANOPIO 44.00 0.000002TANG, SAMUEL U. DY 169.00 0.000009JALOCON, BLESILDA G. 16.00 0.000001DAGANDAN, VIRGINIA A. 239.00 0.000012VALIANT CARE SYSTEM CORP. 67.00 0.000003GO, MIGUELA SY 2,848.00 0.000147WEE, BENITA 849.00 0.000044TONY CO &/OR HERBERT CO 33.00 0.000002PO, JOSE 91.00 0.000005CARMENCITA PAJARILLO &/OR CEZAR P. PAJARILLO 995.00 0.000051SARABIA, MARIETTA 30.00 0.000002CUBILLAN, JACINTO 125.00 0.000006

POA LIM &/OR BRYAN LIM 75.00 0.000004DIAZ, CATHERINE P. 30.00 0.000002ESMANE, GENARO E. 118.00 0.000006ALEXANDER D. LO &/OR CARMELITA L. LO 150.00 0.000008SARABIA, MARIETTA 45.00 0.000002CHI DANG CO &/OR GREG S. CO 230.00 0.000012CO, DANIEL S. 230.00 0.000012JOSE J. LEONARDO &/OR TERESITA LEONARDO 38.00 0.000002SIA LIM BOON 1,435.00 0.000074ONGCHINKE, WINSTON 574.00 0.000030SIA PHOA A HON 5,593.00 0.000289PEREZ, NICASIO P. 244.00 0.000013MANZANO, DOMINIC 1,150.00 0.000059YAP, VICTORIA 519.00 0.000027VITO, AUGUST CAESAR 425.00 0.000022ROSA, GABRIEL P. LA 874.00 0.000045DOBLES, RODOLFO D. 230.00 0.000012BARENG, JOCELYN D. 30.00 0.000002FRANCISCO, RUBEN C. 230.00 0.000012GARCIA, MARIA C. 43.00 0.000002LIM, MANUEL G. 84.00 0.000004GAW, TERESITA 575.00 0.000030ANA, EMMANUEL SAN JUAN STA. 105.00 0.000005CATHAY SECURITIES CO., INC. A/C#1713 9.00 0.000000LIM SIN ENG 150.00 0.000008CELESTINO FRANCISCO B. ALMAZAN II &/OR MARIA JOVIE ANN O. ALMAZAN 931.00 0.000048ASICO, WINIFREDA B. 169.00 0.000009UY BEE NGO 230.00 0.000012YU CHENG KANG 150.00 0.000008ALFREDO MARTINEZ &/OR ELIZABETH GABRIEL 30.00 0.000002DALANGIN, RADILLA RAZON 575.00 0.000030JERUSALEM, DULCESIMA L. 30.00 0.000002LO, JOHNNY 12,261.00 0.000633ONG, DOLORES 920.00 0.000048BALBINO, RUBY B. 420.00 0.000022AQUINO, ROSALIE A. 858.00 0.000044SADO, JULIET P. 1,035.00 0.000053ESTER A. CUEVA &/OR MARY JOYCE A. CUEVA 920.00 0.000048FERNANDEZ, JOHHNY 1,150.00 0.000059TRINIDAD, ANGEL 45.00 0.000002PASCUAL, BENJAMIN S. 175.00 0.000009LAO, GINA A. 62.00 0.000003YUOANKEE, PAUL D. 2,355.00 0.000122MAURICIO A. PIRAMIDE &/OR ALBERTINO B. ALO 43.00 0.000002DY, BERNABE 1,150.00 0.000059ONG, JERRY C. 5,795.00 0.000299

KA, JUANA ONG 30.00 0.000002UY, JULIETA T. 150.00 0.000008SUGAY, MA. THERESA L. 1,150.00 0.000059CANIZARES, MANUEL &/OR ANTONIA 1,713.00 0.000088LACSON, ELIA L. 120.00 0.000006GURNAMAL, AIL &/OR HARESH 195.00 0.000010BARRAMEDA, MA. JESUSA O. 15.00 0.000001DEPAKAKIBO, ARNOLD RAFAEL Y. 460.00 0.000024LAU KAY CHUNG 60.00 0.000003TAN, NATIVIDAD L. 575.00 0.000030UY, ANTONIO 2,300.00 0.000119GAWTEE, NIDA UY 230.00 0.000012CHUA, JEANIE A. 52.00 0.000003LECHIDO, JOAN S. 230.00 0.000012BORRES, JUN M. 1,495.00 0.000077PALISOC, MARCELINO N. 1,301.00 0.000067PEPITO, RUNALDO 75.00 0.000004CASUPANAN, JANE 230.00 0.000012LLESOL, MANUEL I. 1,150.00 0.000059PARAGGUA, RUTHEBBA L. 230.00 0.000012SANTIAGO, CECILIA ROSEMELI C. 230.00 0.000012CHUA, VICENTE EUTY 16.00 0.000001TAN, HUDSON ANG 3,000.00 0.000155TAN, GEORGE D. &/OR LUZ A. 575.00 0.000030CONQUEST LINKAGES CORPORATION CCONQ 728.00 0.000038YEO, MELVISON 1,265.00 0.000065TANUNLIONG, ERWIN T. 839.00 0.000043CHUA BON PEN 1,950.00 0.000101TONY CO &/OR KENNETH CO 575.00 0.000030YANG, YLAINE DEE 230.00 0.000012DULALIA, ELIAS D. 115.00 0.000006LIBI, MADEILINE TAN 150.00 0.000008SO, HELEN C. 1,952.00 0.000101ERFELO, ANABELLE M. 63.00 0.000003AMANDA M. PADILLA A/C CPADIAMA 718.00 0.000037BIANCA M. PADILLA A/C CPADIBIA 718.00 0.000037ERICA M. PADILLA A/C CPADIERI 718.00 0.000037PATRICK M. PADILLA A/C CPADIPAT 93.00 0.000005MAURO BRAVO JR. &/OR ANDRELIE BRAVO 90.00 0.000005ACOSTA, EVELYN M. 84.00 0.000004ANG, JONATHAN ONG 230.00 0.000012SORIANO, GINA C. 690.00 0.000036SAY, ELIZABETH C. 115.00 0.000006GATCHALIAN, EMERITA &/OR CECILIA RIVERA 230.00 0.000012OQUIAS, JOCELYN LIM 5,750.00 0.000297FRANCIS I. SALVADOR ITF JOSE LEANDRO F. SALVADOR 1,150.00 0.000059
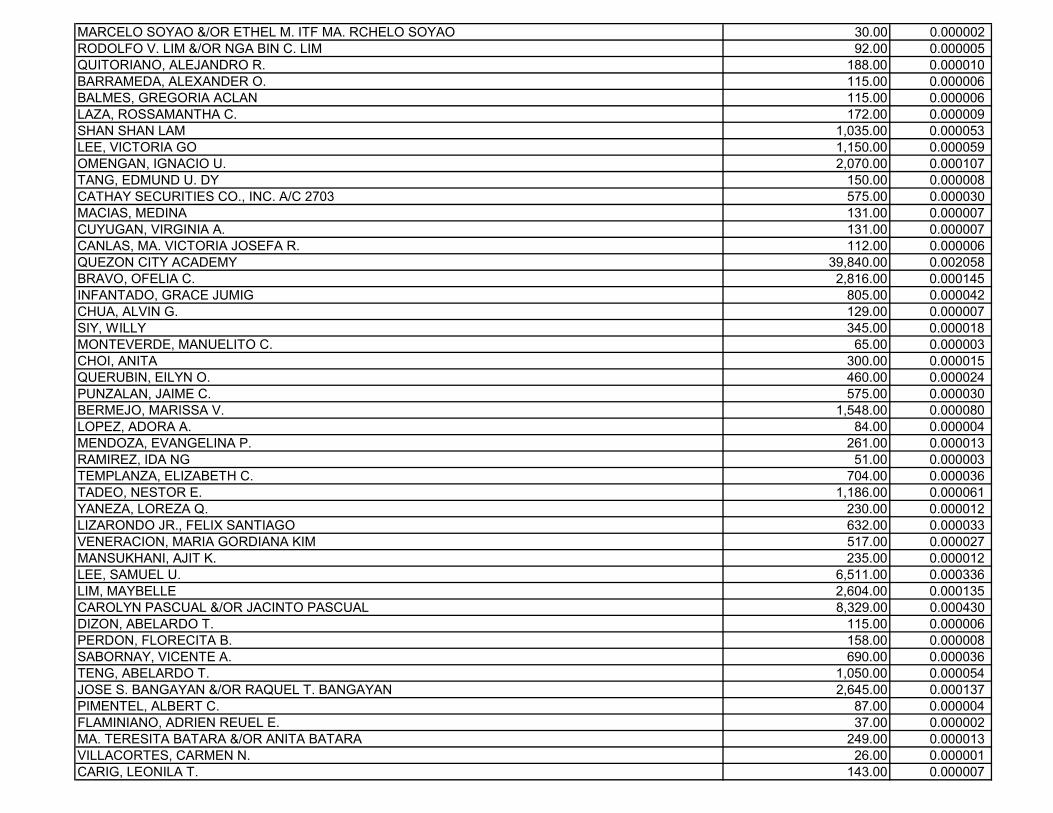
MARCELO SOYAO &/OR ETHEL M. ITF MA. RCHELO SOYAO 30.00 0.000002RODOLFO V. LIM &/OR NGA BIN C. LIM 92.00 0.000005QUITORIANO, ALEJANDRO R. 188.00 0.000010BARRAMEDA, ALEXANDER O. 115.00 0.000006BALMES, GREGORIA ACLAN 115.00 0.000006LAZA, ROSSAMANTHA C. 172.00 0.000009SHAN SHAN LAM 1,035.00 0.000053LEE, VICTORIA GO 1,150.00 0.000059OMENGAN, IGNACIO U. 2,070.00 0.000107TANG, EDMUND U. DY 150.00 0.000008CATHAY SECURITIES CO., INC. A/C 2703 575.00 0.000030MACIAS, MEDINA 131.00 0.000007CUYUGAN, VIRGINIA A. 131.00 0.000007CANLAS, MA. VICTORIA JOSEFA R. 112.00 0.000006QUEZON CITY ACADEMY 39,840.00 0.002058BRAVO, OFELIA C. 2,816.00 0.000145INFANTADO, GRACE JUMIG 805.00 0.000042CHUA, ALVIN G. 129.00 0.000007SIY, WILLY 345.00 0.000018MONTEVERDE, MANUELITO C. 65.00 0.000003CHOI, ANITA 300.00 0.000015QUERUBIN, EILYN O. 460.00 0.000024PUNZALAN, JAIME C. 575.00 0.000030BERMEJO, MARISSA V. 1,548.00 0.000080LOPEZ, ADORA A. 84.00 0.000004MENDOZA, EVANGELINA P. 261.00 0.000013RAMIREZ, IDA NG 51.00 0.000003TEMPLANZA, ELIZABETH C. 704.00 0.000036TADEO, NESTOR E. 1,186.00 0.000061YANEZA, LOREZA Q. 230.00 0.000012LIZARONDO JR., FELIX SANTIAGO 632.00 0.000033VENERACION, MARIA GORDIANA KIM 517.00 0.000027MANSUKHANI, AJIT K. 235.00 0.000012LEE, SAMUEL U. 6,511.00 0.000336LIM, MAYBELLE 2,604.00 0.000135CAROLYN PASCUAL &/OR JACINTO PASCUAL 8,329.00 0.000430DIZON, ABELARDO T. 115.00 0.000006PERDON, FLORECITA B. 158.00 0.000008SABORNAY, VICENTE A. 690.00 0.000036TENG, ABELARDO T. 1,050.00 0.000054JOSE S. BANGAYAN &/OR RAQUEL T. BANGAYAN 2,645.00 0.000137PIMENTEL, ALBERT C. 87.00 0.000004FLAMINIANO, ADRIEN REUEL E. 37.00 0.000002MA. TERESITA BATARA &/OR ANITA BATARA 249.00 0.000013VILLACORTES, CARMEN N. 26.00 0.000001CARIG, LEONILA T. 143.00 0.000007

ROCES, IRENE VIOLA DE 301.00 0.000016CASELA, PETRONILA A. 117.00 0.000006DELARIARTE, MICHAEL L. 1,207.00 0.000062SALCEDO, EDGARDO M. 575.00 0.000030SANTOS, RAUL L. 435.00 0.000022LAO, JOHN T. 2,201.00 0.000114CARINO, NESTOR C. 450.00 0.000023LANUZA, ROGELIO A. 129.00 0.000007GUSAYKO, MARIA CHUA 16.00 0.000001MELENDEZ, ALFREDO V. 455.00 0.000024MERCADO, BRANDO 115.00 0.000006PADILLA, JOCELYN T. 244.00 0.000013ESPARAGOZA, ROWENA TEVES 75.00 0.000004LOQUELLANO, ROSALIE TEVES 749.00 0.000039ABABAT, ROSEMARIE TEVES 182.00 0.000009MERCADO, GRACE 150.00 0.000008VICENTE TE &/OR BETTY TE 864.00 0.000045HUI TIN WAI 197.00 0.000010MACABASCO JR., CORNELIO M. 575.00 0.000030LIM, JACOB G. 1,725.00 0.000089LIM, TIMOTHY G. 1,725.00 0.000089GUZMAN, AGNES 7.00 0.000000DELFIN LETRAN &/OR DAVID JOE KEE SI 3,000.00 0.000155MARTINEZ, ANTONIO C. 431.00 0.000022ASIA METAL TRADING CORPORATION 1,050.00 0.000054DALIVA, MA. LILIAN D. L. 15.00 0.000001QUA, RAFAEL MARIA 23.00 0.000001GUZMAN, MA. TERESITA DE 345.00 0.000018TAN, WILLIAM LUY 300.00 0.000015DIAZ, EMMANUEL 1,150.00 0.000059YU, SILVESTRE &/OR KAREN GEMMEL 575.00 0.000030LIM, JOSEFITO 300.00 0.000015LUMANTAS, NEIL /MARIO PELISCO 460.00 0.000024MONTANTE, CONCHITA I. 73.00 0.000004SANTOS, RONALDY S. 15.00 0.000001JESUS, MILDRED H. DE 90.00 0.000005LIM, DIOMEDES G. 39.00 0.000002PANTALEON, VIRGINIA 73.00 0.000004GSIS FAO EDNA M. VILLAMIN 115.00 0.000006MAGBALON, LORITESSE S. 287.00 0.000015HINLO, GISELLE M. 115.00 0.000006CHU, DARWIN M. 115.00 0.000006YUMOL, RAFAEL I. 4.00 0.000000PICACHE, MA. ELIZABETH V. 750.00 0.000039MALIG, JAIME 3,906.00 0.000202BALDAGO, GLORIA PATRIA A. 17.00 0.000001

WONG, CORAZON KIAT 1,762.00 0.000091ESPARAGOZA, EMMANUEL L. 305.00 0.000016MATIAS, LETICIA V. 35.00 0.000002EBOL, WILLIAM 2,449.00 0.000127TORRES, ESTRELLA M. 716.00 0.000037SI JOE KEE, DAVID 2,300.00 0.000119CELY C. REAPORT &/OR SENEN C. REAPORT 150.00 0.000008ROBERT ANG &/OR FELIZA YAP 1,150.00 0.000059MACALAGAY, MARY JOY 230.00 0.000012BIGORNIA, WILLIAM DE LEON 129.00 0.000007DOMANTAY, MARY JOY S. 345.00 0.000018DIPASUPIL, EUSEBIO A. 414.00 0.000021TAN BUN BENG 2,875.00 0.000149SY, MICHAEL 16.00 0.000001TORRES, RODOLFO O. 87.00 0.000004BALDERAMA, LYMA 115.00 0.000006HO, RACHEL Y. 337.00 0.000017DUHIG, ELMA G. 517.00 0.000027CATAPIA, ARMI LYLAH 1,150.00 0.000059OCCIDENTAL, VERNACITA 36.00 0.000002MORENO, ERNESTO 1,150.00 0.000059DIZON, FRANCISCO A. 7,122.00 0.000368ENDAYA, TITUS L. 2,000.00 0.000103MONDIDO, ALEGRIA P. 230.00 0.000012ANG, DANNY K. 10,640.00 0.000550ANGLINBEE, ROBERTO K. 6,655.00 0.000344CASTRO, MA. ELEONOR T. 115.00 0.000006LIM, BENJAMIN T. 892.00 0.000046ONG, ANTONIO 80.00 0.000004GOTAMCO, IDA GOTAMCO TAN &/OR AMELIA 780.00 0.000040GINETE, MYLA 129.00 0.000007BUYCO, MARY ALLYN C. 230.00 0.000012MARIA TERESA V. SORIANO &/OR LOURDES C. VELASCO 1,096.00 0.000057TE, FLORENCE 460.00 0.000024TANJUAKIO, NOE A. 416.00 0.000021CHU, IVY T. CHU &/OR CESAR S. 68.00 0.000004YEE, JENNIFER T. 33.00 0.000002MELGAR, BALTAZAR L. 2,389.00 0.000123SIA, ANITA 3,450.00 0.000178ICARO, CARLITO L. &/OR MILAGROS L. 259.00 0.000013PO, EPIFANIO T. 734.00 0.000038MOYA, JOSEPH ROSTUM B. 230.00 0.000012CASTRO, EDUARDO F. 227.00 0.000012REGALA, TEODORO D. 1.00 0.000000JASMIN, RUFINO T. 822.00 0.000042UY CHUN BING 3,170.00 0.000164

GO, ALBERT H. 11,500.00 0.000594MANTUANO, RONER R. 1,301.00 0.000067GARRIDO, PIVI H. 120.00 0.000006ANTINEO, RODRIGO L. 115.00 0.000006TAN, SAMSON 3,105.00 0.000160SALUD, ROY O. 349.00 0.000018TAN KOK PUAN 33.00 0.000002RAMIREZ, LEOVINO C. 126.00 0.000007PHILIPPINE JOURNALISTS, INC. 10,898.00 0.000563UY, BENITO C. 886.00 0.000046ONG, SIAO-LIONG L. 450.00 0.000023LIBARIOS, RUBY 690.00 0.000036MAYBELLINE IGNACIO &/OR JOSEPH PATRICK ROBERT IGNACIO 51.00 0.000003DOMOGO, JOSEPH G. 1,150.00 0.000059SALMIN, CECILE 158.00 0.000008LIM, ANDRES 2,300.00 0.000119HERNANDEZ, RENATO M. 3,450.00 0.000178CHUA, LOLITA 150.00 0.000008NGO, LORETA T. 1,290.00 0.000067GERARDINE VILLAPANDO &/OR PILAR ROSALES ITF ARMALOU R. VILLAPANDO 5.00 0.000000SUY LING DY, ROSA 4,600.00 0.000238ANG KIAN LAM 2,070.00 0.000107YU, FORTUNATA 230.00 0.000012LIMKIMSO, MARIANO 287.00 0.000015VIRTUSIO, MA. CECILIA G. 115.00 0.000006CHUA, CEFERINO 3,737.00 0.000193ARIZNABARRETA, EDGAR G. 752.00 0.000039CORTES, RENATO M. 1,150.00 0.000059YAN, MIA CARLA S. 2,300.00 0.000119ATILES, MA. ELAINE P. 75.00 0.000004QUA, PATRICK L. 3.00 0.000000QUA, GERARD L. 42.00 0.000002ADUAN, SOFRONIO R. 3.00 0.000000LACSON, SALVACION L. 150.00 0.000008DIAMANTE, PERLA 36.00 0.000002TAN SIOK YAN 13.00 0.000001UY, HYDEE 118.00 0.000006PLANDES, JOVITA A. 30.00 0.000002ERNESTO B. LLANEZA &/OR ERNESTO LLANEZA III 30.00 0.000002GAMBOA JR., DOMINADOR L. 477.00 0.000025CHUA, REGINA DE VILLA 88.00 0.000005PANTALEON, VIRGINIA G. 438.00 0.000023PADILLA, AMANDA MEDINA 277.00 0.000014PADILLA, PATRICK MEDINA 36.00 0.000002PADILLA, BIANCA MEDINA 277.00 0.000014PADILLA, ERICA MEDINA 277.00 0.000014

LIM, MELCHOR TAN 442.00 0.000023OBANA, VALERIANO RESARDE 719.00 0.000037QUINTO, SOFIA CERA 1,035.00 0.000053GEMILIANO S. MANALILI &/OR ALMA B. MANALILI 97.00 0.000005YUCHENGCO III, ALFONSO S. 11,904.00 0.000615DIZON, SALVADOR TIOTUYCO 56.00 0.000003ATIENZA, MA. LUISA ONGSIAPCO 1,150.00 0.000059TAN, FELISA Y. 602.00 0.000031YUCHENGCO-LIM DEV. CORP. 8,445.00 0.000436LIM JR., VICTOR YUCHENGCO 920.00 0.000048CANIZARES, MANUEL RAMOS 19,154.00 0.000990ONGADON, JORDAN CHAN 5,795.00 0.000299ONG, JOSEPH CHAN 7,419.00 0.000383CHUA, BON PEN SEE 750.00 0.000039BUENAVENTURA, PEDRO PANOPIO 335.00 0.000017LAM, SHAN SHAN 399.00 0.000021TONG, FRANCISCO K. 34.00 0.000002FERMIN, ERNESTO A. 113.00 0.000006ANGEL S. TRINIDAD &/OR ERLINDA R. DUQUE 92.00 0.000005GO, PACITA TAN 360.00 0.000019DY TANG, EDMUND UY 57.00 0.000003PANOPIO, ELMAR A. 1,199.00 0.000062CHU, JOHN FREDERICK DY 2,165.00 0.000112GERALDINE MARIE SANTIAGO IN TRUST TO DANILO H. SANTIAGO 2,252.00 0.000116BENJAMIN CO CA & CO., INC. 335.00 0.000017CO, FAY UY 7,332.00 0.000379YAO, LUIS ANTONIO UY 1,274.00 0.000066ADVANI, SITA SEHWANI 945.00 0.000049OBIDOS, WINSTON M. 18.00 0.000001ETHEL M. SOYAO OR MARCELO U. SOYAO 11.00 0.000001ONG, GIOK ENG O. 235.00 0.000012ALDRIC SY CHUA &/OR KATHERINE COO CHUA 486.00 0.000025ALICIA T. LIM &/OR JOY T. LIM & RICHARD T. LIM 9,200.00 0.000475JOSE BERNARDINO SO &/OR AMELIA CASTILLO SO 7,648.00 0.000395DY, AURORA Y. 17.00 0.000001VILLADELGADO, FREDDIE G. 80.00 0.000004ALVENDIA, ESPERANZA PAHATI 874.00 0.000045ALVENDIA, SYLVIA PAHATI 43.00 0.000002TE, CYNTHIA DIONISIO 79.00 0.000004PROJECT QUEST CORPORATION 357.00 0.000018TANDOC, NEIL CLIFFORD C. 324.00 0.000017ANTHONY TAN ANG &/OR SUSAN SI ANG 3,520.00 0.000182CHUA, TERESITA WY 7,526.00 0.000389CHUA, CONSTANTINO WY 381.00 0.000020CHUA, WILLINGTON WY 1,792.00 0.000093CHENG, SUSAN CHAM 18,792.00 0.000971

BILLY GO KHU &/OR WARREN CHONG-THAY KHU 3,450.00 0.000178CRUZ, MARY JOY DOMANTAY 132.00 0.000007PINEDA, RODOLFO R. 94.00 0.000005SY, WILSON L. 9,683.00 0.000500TANQUIENG, JULIET OMENGAN 955.00 0.000049OMENGAN, JOYCE D. 1,060.00 0.000055ENDAYA, TITUS LEVISTE 41.00 0.000002LUY TAN, WILLIAM HAW 115.00 0.000006MACIAS, NELLY L. 187.00 0.000010LIBRES, RICHARD P.N. 718.00 0.000037TAN, HELEN C. 259.00 0.000013SANVICTORES, JULIUS J. 230.00 0.000012CHUA, JOSE 1,690.00 0.000087TAN YAN DOO, JOSE 5,750.00 0.000297ENRIQUEZ, EUGENIO ACIERTO 194.00 0.000010CO KIAN CHAY 45.00 0.000002BALBON, EVELINA A. 678.00 0.000035SIO FONG WONG 49.00 0.000003TURNER, PHILIP 1.00 0.000000AUGUSTO VILLANUEVA SANCHEZ &/OR FRANCIANINA GONZALEZ SANCHEZ 4,744.00 0.000245YU, VERONICA VIRGINIA R. 359.00 0.000019SANTOS-QUA, GUIA MARGARITA 11.00 0.000001PENA, NELIA A. 353.00 0.000018TAN, JOSE YAN DOO 345.00 0.000018TURNER, ELNORA N. 1.00 0.000000TAN, MA. LIWAYWAY M. 259.00 0.000013WONG, JUSTINE U. 105.00 0.000005GERALDINE A. SANTIAGO IN TRUST TO DANILO H. SANTIAGO 443.00 0.000023MARY LINA A. SANTIAGO IN TRUST TO DANILO H. SANTIAGO 2,696.00 0.000139STELLA MARIE A. SANTIAGO IN TRUST TO DANILO H. SANTIAGO 2,696.00 0.000139BAUAN MACHINE SHOP, INC. 52.00 0.000003DIAZ, AIDA G. 8.00 0.000000GISON, AMBROSIO M. 28.00 0.000001CO, KIAN CHAY G. 361.00 0.000019PACIFIC NORTHSTAR, INC. 24.00 0.000001ONG, CHRISTINE S. 5,996.00 0.000310QUE, LIONG HEE G. 52,297.00 0.002702LAGANDAON, ROMULUS T. &/OR MA. LOURDES 4,343.00 0.000224PASCUAL, JACINTO OR CAROLYN 3,546.00 0.000183TANTUCO, ELOISA G. 10.00 0.000001NICASIO M. MARIN JR. &/OR ARNOLFO O. ACERO 2,269.00 0.000117NG, MARIA ROSARIO Y. 1,212.00 0.000063TE, BETTY G. 506.00 0.000026CHUA, VICENTE EUTY L. 690.00 0.000036BENDOM HOLDINGS CORPORATION 1,780.00 0.000092VILLALBA JR., ISIDRO C. 484.00 0.000025

MADILYN O. CALDOZA 181.00 0.000009YAP, ROBERT LOUIS L. 125.00 0.000006DIAZ, EMMANUEL G. 64.00 0.000003GEMPERLE, MICHELLE PEREZ 2,213.00 0.000114GILI JR., GUILLERMO F. 1,212.00 0.000063PANG, VICENTE LIM 230.00 0.000012MEDINA, ARNIE A. 16.00 0.000001YU, JOSEPHINE 30.00 0.000002AGUIRRE, EMELITA G. 58.00 0.000003PUEBLO, MARY GRACE G. 345.00 0.000018ALOVA, AARON T. ALOVA &/OR NORA G. 1,380.00 0.000071BELL-KNIGHT, EDNA S. 5,750.00 0.000297ONG, VICTOR SY 1,682.00 0.000087PCD NOMINEE CORP - FILIPINO 674,668,629.00 34.855267PCD NOMINEE CORP - NON-FILIPINO 638,116,728.00 32.966894
1,935,628,896.00

PREFERRED SH Name TOTAL NO. OF SHARES PERCENTAGEABACUS SECURITIES CORP. 6,021.00 2.251599MANDARIN SECURITIES CORPORATION 7,583.00 2.835720MONTANTE, CONCHITA I. 70.00 0.026177AQUINO, ROSALIE 133.00 0.049736ARAMBULO, GUADALUPE A. 575.00 0.215026NGO, LORETA 8,600.00 3.216035BDO SECURITIES CORP. 9,304.00 3.479301OCCIDENTAL, VERNACITA 35.00 0.013089BERMEJO, MARISSA 243.00 0.090872BUENVIAJE, ALLAN 255.00 0.095359OPTIMUM SECURITIES CORP. 16,666.00 6.232377CAMPOS LANUZA & CO. INC. 3,535.00 1.321940CASELA, PETRONILA 16.00 0.005983CHENG SIO BIN 128.00 0.047867CHENG, SUSAN 2,665.00 0.996597CHUA, JEANIE A. 50.00 0.018698PANTALEON, VIRGINIA 487.00 0.182117CHUA, VICENTE 110.00 0.041135PASCUAL, CAROLYN &/OR JACINTO 1,295.00 0.484275CO, JUSTINA DY 3,258.00 1.218354PASCUAL, CAROLYN OR JACINTO 570.00 0.213156CO, KIAN CHAY 110.00 0.041135YUOANKEE, PAUL D. 369.00 0.137990CONCEPCION CHUA CHENG 333.00 0.124528CONCEPCION, CARMENCITA 31,842.00 11.907558CUBILLAN, JACINTO CU 153.00 0.057216CUBILLAN, ROSALINA C. 133.00 0.049736PENA, NELIA A. 55.00 0.020568PIMENTEL, ALBERT CHUA 83.00 0.031038ROSARIO, RODOLFO P. DEL 81,521.00 30.485397DIAZ, AIDA GARCIA 55.00 0.020568PO, EPIFANIO T. 104.00 0.038892PO, JOSE 87.00 0.032534EIB SECURITIES INC. 83.00 0.031038RAMIREZ, IDA 63.00 0.023559ESTABILLO, IMEE T. 17.00 0.006357ROSAL, RAYMOND U. 174.00 0.065069RUBIO, CESAR A. 1,028.00 0.384428LAO, GINA A. 416.00 0.155566SALES, MERLYN K. 85.00 0.031786GLOBALINKS SEC. & STOCKS 2,454.00 0.917692GO, PACITA TAN 51.00 0.019072SALOM, R. JOHN CHRISTOPHER J. 833.00 0.311507GO, ROBERTO CHAN 1,367.00 0.511200SALOM, H.J. ADELEEN FRANCES J. 833.00 0.311507GOMEZ, ERIBERTO H. 1,028.00 0.384428SALUD, ROY ONG 333.00 0.124528GURNAMAL, AIL &/OR HARESH 202.00 0.075539GUSAYKO ONG, MARIA CHUA 18.00 0.006731HUI, TIN WAI 188.00 0.070304HWANG, HANS YAP 5,558.00 2.078456TAN, CARIDAD K. 1,111.00 0.415467JASMIN, RUFINO T. 116.00 0.043379TAN, LUCIANO H. 7,309.00 2.733256TAN, REMEDIOS TIU 866.00 0.323847LAO, BUN THIAM 925.00 0.345911TANDOC, NEIL CLIFFORD C. 46.00 0.017202

LIBRES, RICHARD PONCIANO 425.00 0.158932LUYS SECURITIES CO. INC. 1,852.00 0.692569ANG, TONY ANG &/OR ROSEMARIE 5,372.00 2.008900VIDAL, JULIETA M. 215.00 0.080401VILLACORTES, CARMEN NICOLASORA 174.00 0.065069WONG, CORAZON KIAT 250.00 0.093489ACERO, NICASIO MARIN JR., &/OR ARNOLFO O. 3,371.00 1.260611GO, HOMER 46,355.00 17.334804YAP, BENNETH YAP &/OR LIBERATA BASA 18.00 0.006731CHOA MEI LENG 128.00 0.047867CHAN, SHERWIN CO 167.00 0.062451JASMIN, JUANITA S. 83.00 0.031038TAN, CRESENCIO B. 352.00 0.131633BEDAN CORPORATION 2,100.00 0.785311SIA, JOHNSON CHUA 5,000.00 1.869788
267,410.00

RIZAL COMMERCIAL BANKING CORPORATIONASM: JUNE 28, 2021
LAW, JOHNBUENAVENTURA, GIL A.SANTOS, JUAN B.CLAUDIO, GABRIEL S.DIOS, ADELITA A. VERGEL DEMONTES, VAUGHN F.SERRANO, LAURITO E. LIN, SHIH-CHIAOKAN, ARNOLD KAI YUENDE LIMA, LILIA B.BERY, GAYATRI P.DEE, HELEN Y.MEDINA, ARMANDO M.VIRATA, CESAR E.A.SANVICTORES, JULIUS J.PAN MALAYAN MANAGEMENT AND INVESTMENT CORPORATIONRCBC TRUST & INVESTMENTS GROUPRCBC SECURITIES FAO PAN MALAYAN MANAGEMENT & INVESTMENT CORPCITIOMNIFOR 6002070101CITIOMNIFOR 6002070102CITIOMNIFOR 6002070132CITIOMNIFOR 6002079583CITIOMNIFOR 6002079785CITIOMNIFOR 6002079787DEUTSCHE BANK AG MANILARCBC SECURITIES INC.HSBC10SSBTC FUND 59HMSSBTC FUND NYLYSSBTC FUND N2XPSSBTC FUND NYLS

ANNEX "C"
RIZAL COMMERCIAL BANKING CORPORATION
ANNUAL STOCKHOLDERS MEETING: JUNE 28, 2021
Helen Y. Dee
Cesar E.A. Virata
Eugene S. Acevedo
Gil A. Buenaventura
Armando M. Medina
John Law
Shih-Chiao (Joe) Lin
Arnold Kai Yuen Kan
Lilia B. De Lima, and
Gayatri P. Bery
Juan B. Santos
Adelita A. Vergel De Dios
Gabriel S. Claudio
Vaughn F. Montes, and
Laurito E. Serrano
Yvonne S. Yuchengco
Francis C. Laurel
Ma. Christina P. Alvarez
Redentor C. Bancod
Marita E. Bueno
Horacio E. Cebrero III
Elizabeth E. Coronel
Ramil M. De Villa
George Gilbert G. Dela Cuesta
John Thomas G. Deveras
Brent C. Estrella
Richard C. Lim
Florentino M. Madonza
Jane N. Mañago
Emmanuel T. Narciso
Maria Cecilia F. Natividad
Aline A. Novilla
Robert Rol Richard Raymond B. Ramos
Bennett Clarence D. Santiago
Rowena F. Subido
Maria Angela V. Tinio
Juan Gabriel R. Tomas IV
Angelito M. Villanueva
Nilo C. Zantua
Arniel Vincent B. Ong (Head of subsidiary)
Raymundo C. Roxas (Head of subsidiary)
Liza Marie G. Vengco
Michael Christopher C. Cruz
Dino V. Yason
Joyce Corine O. Lacson
Maria Cecilia V. Chaneco-Lonzon
LIST OF DIRECTORS and OFFICERS PRESENT