May 14, 2019 INDIANA UTILITY REGULATORY COMMISSION
162
INDIANA MICHIGAN POWER COMPANY PRE-FILED VERIFIED DIRECT TESTIMONY OF ROBERT B. HEVERT
-
Upload
khangminh22 -
Category
Documents
-
view
1 -
download
0
Transcript of May 14, 2019 INDIANA UTILITY REGULATORY COMMISSION

INDIANA MICHIGAN POWER COMPANY
PRE-FILED VERIFIED DIRECT TESTIMONY
OF
ROBERT B. HEVERT
jxn
Typewritten text
Cause No. 45235
loldham
New Stamp

PETITIONER’S EXHIBIT __
DIRECT TESTIMONY OF ROBERT B. HEVERT
ROBERT B. HEVERT - i -
TABLE OF CONTENTS
I. INTRODUCTION AND OVERVIEW ...............................................................................1
II. SUMMARY OF KEY CONCLUSIONS.............................................................................2
III. CAPITAL MARKET ENVIRONMENT ..........................................................................11
IV. COST OF EQUITY ANALYSIS.......................................................................................20
A. Regulatory Guidelines and Financial Considerations ..........................................20
B. Proxy Group Selection ...........................................................................................26
C. Cost of Equity .........................................................................................................30
D. Flotation Costs .......................................................................................................37
V. BUSINESS RISKS AND OTHER CONSIDERATIONS .................................................41
A. Generation Portfolio & Environmental Regulations .............................................41
B. Customer Concentration ........................................................................................47
C. Regulatory Mechanisms and Capital Spending .....................................................49
VI. CAPITAL STRUCTURE AND COST OF DEBT ............................................................56
A. Capital Structure ....................................................................................................56
B. Cost of Debt ...........................................................................................................58
VII. CONCLUSIONS AND RECOMMENDATION ..............................................................59
VIII. APPENDIX A ....................................................................................................................61
A. Constant Growth Discounted Cash Flow Model ...................................................61
B. Capital Asset Pricing Model and Empirical Capital Asset Pricing Model ...........67
C. Bond Yield Plus Risk Premium Approach .............................................................76
D. Expected Earnings Analysis ...................................................................................79

PETITIONER’S EXHIBIT __
DIRECT TESTIMONY OF ROBERT B. HEVERT
ROBERT B. HEVERT - ii -
Glossary of Frequently Used Terms
TERM DESCRIPTION
Beta Coefficient A component of the CAPM that measures the risk of a given stock relative to the risk of the overall market.
Bond Yield Plus Risk Premium Approach
A risk premium model used to estimate the Cost of Equity. The Bond Yield Plus Risk Premium approach assumes that investors required a risk premium over the cost of debt as compensation for assuming the greater risk of common equity investment.
Capital Asset Pricing Model (“CAPM”)
A risk premium-based model used to estimate the Cost of Equity, assuming the stock is added to a well-diversified portfolio. The CAPM assumes that investors are compensated for the time value of money (represented by the Risk-Free Rate), and risk (represented by the combination of the Beta Coefficient and the Market Risk Premium).
Capital Structure The capital structure is how a utility finances its overall investments and expenses by using various sources of funds. Capital Structure generally comprises of debt (short-term and long-term) and equity (common and preferred).
Constant Growth DCF Model A form of the DCF model that assumes cash flows will grow at a constant rate, in perpetuity. The model simplifies to a form that expresses the ROE as the sum of the expected dividend yield and the expected growth rate.
Cost of Equity The return required by investors to invest in equity securities. The terms “Return on Equity” and “Cost of Equity” are sometimes used interchangeably.
Discounted Cash Flow (“DCF”) Model A model used to estimate the Cost of Equity based on expected cash flows. The Cost of Equity equals the discount rate that sets the current market price equal to the present value of expected cash flows.
Dividend Yield For a given stock, the current dividend divided by the current market price.
Empirical Capital Asset Pricing Model (“ECAPM”)
Empirical CAPM is a variant of the CAPM model. ECAPM adjusts for the CAPM’s tendency to under-estimate returns for companies that have Beta coefficients less than one, and over-estimate returns for relatively high-Beta coefficient stocks

PETITIONER’S EXHIBIT __
DIRECT TESTIMONY OF ROBERT B. HEVERT
ROBERT B. HEVERT - iii -
TERM DESCRIPTION
Flotation Costs Flotation costs are the costs associated with the sale of new issues of common stock. These costs include out-of-pocket expenditures for preparation, filing, underwriting and other issuance costs of common stock.
Gross Domestic Product (“GDP”) The value of all finished goods and services produced within a country during a given period of time (usually measured annually). GDP includes public and private consumption, government expenditures, investments, and exports less imports.
Market Return The expected return on the equity market, taken as a portfolio.
Market Risk Premium The additional compensation required by investing in the equity market as a portfolio over the Risk-Free rate. The Market Risk Premium is a component of the CAPM.
Proxy Group A group of publicly traded companies used as the “proxy” for the subject company (in this case, I&M). Proxy companies are sometimes referred to as “Comparable Companies”.
Quantitative Easing Quantitative Easing is a monetary policy in which the central bank purchases government securities or other securities from the market to increase the money supply and encourage lending and investment.
Return on Equity (“ROE”) The return required by investors to invest in equity securities. The terms "Return on Equity" and "Cost of Equity" are sometimes used interchangeably.
Risk-Free Rate The rate of return on an asset with no default risk.
Risk Premium The additional compensation required by investors for taking on additional increments of risk. Risk Premium-based approaches are used in addition to the DCF and CAPM to estimate the Cost of Equity.
Treasury Inflation Protected Securities (“TIPS”)
Treasury securities that are indexed to inflation. The principal value of TIPS increases with inflation and decrease with deflation, as measured by the Consumer Price Index.
Treasury Yield The return on Treasury securities; the yield on long-term Treasury bonds is considered to be a measure of the Risk-Free Rate.
Vertically Integrated Utilities Electric utilities that own and operate distribution, transmission and generation assets.

ROBERT B. HEVERT - 1 -
DIRECT TESTIMONY OF ROBERT B. HEVERT ON BEHALF OF INDIANA MICHIGAN POWER COMPANY
CAUSE NO. ________ BEFORE THE INDIANA UTILITY REGULATORY COMMISSION
I. INTRODUCTION AND OVERVIEW 1
Q. PLEASE STATE YOUR NAME AND AFFILIATION. 2
A. My name is Robert B. Hevert. I am a Partner at ScottMadden, Inc. (“ScottMadden”). 3
My business address is 1900 West Park Drive, Suite 250, Westborough, Massachusetts 4
01581. 5
Q. ON WHOSE BEHALF ARE YOU SUBMITTING THIS TESTIMONY? 6
A. I am submitting this direct testimony (“Direct Testimony”) before the Indiana Utility 7
Regulatory Commission (“Commission”) on behalf of Indiana Michigan Power Company 8
(“I&M” or the “Company”). 9
Q. PLEASE DESCRIBE YOUR EDUCATIONAL BACKGROUND. 10
A. I hold a Bachelor’s degree in Business and Economics from the University of Delaware, 11
and an MBA with a concentration in Finance from the University of Massachusetts. I 12
also hold the Chartered Financial Analyst designation. 13
Q. PLEASE DESCRIBE YOUR EXPERIENCE IN THE ENERGY AND UTILITY 14
INDUSTRIES. 15
A. I have worked in regulated industries for over thirty years, having served as an executive 16
and manager with consulting firms, a financial officer of a publicly traded natural gas 17
utility, and an analyst at a telecommunications utility. In my role as a consultant, I have 18
advised numerous energy and utility clients on a wide range of financial and economic 19
issues including corporate and asset-based transactions, asset and enterprise valuation, 20

PETITIONER’S EXHIBIT ____
DIRECT TESTIMONY OF ROBERT B. HEVERT
ROBERT B. HEVERT - 2 -
transaction due diligence, and strategic matters. As an expert witness, I have provided 1
testimony in more than 250 proceedings regarding various financial and regulatory 2
matters before numerous state utility regulatory agencies, the Federal Energy Regulatory 3
Commission (“FERC”), the Alberta Utilities Commission, and United States Federal 4
Court. A summary of my professional and educational background, including a list of 5
my testimony in prior proceedings, is included as Attachment RBH-1. 6
Q. WHAT IS THE PURPOSE OF YOUR DIRECT TESTIMONY IN THIS 7
PROCEEDING? 8
A. The purpose of my Direct Testimony is to present evidence and provide the Commission 9
with a recommendation regarding the Company’s return on equity (“ROE”).1 10
Additionally, I assess the reasonableness of the Company’s proposed capital structure and 11
Cost of Debt. The analyses and conclusions contained in my Direct Testimony are 12
supported by the data presented in Attachment RBH-2 through RBH-11, which have been 13
prepared by me or under my direction. 14
II. SUMMARY OF KEY CONCLUSIONS 15
Q. WHAT IS YOUR CONCLUSION REGARDING THE APPROPRIATE COST OF 16
EQUITY FOR INDIANA MICHIGAN POWER COMPANY? 17
A. My analyses indicate that I&M’s Cost of Equity currently is in the range of 10.00 percent 18
to 10.75 percent. Based on the quantitative and qualitative analyses discussed throughout 19
my Direct Testimony, it is my view that 10.50 percent is a reasonable estimate of I&M’s 20
Cost of Equity. 21
1 Throughout my Direct Testimony, I sometimes use the “ROE” interchangeable with the term “Cost of
Equity”.

PETITIONER’S EXHIBIT ____
DIRECT TESTIMONY OF ROBERT B. HEVERT
ROBERT B. HEVERT - 3 -
As to its proposed capital structure for the test year ending December 31, 2020, 1
which (on the basis of investor-supplied capital) includes 46.80 percent common equity 2
and 53.20 percent long-term debt, I conclude that the Company’s proposal is consistent 3
with the capital structures that have been in place over several fiscal quarters at 4
comparable operating utility companies. Given the consistency of its proposal with 5
similarly situated utility companies, I conclude that the Company’s proposed capital 6
structure is reasonable and appropriate. Regarding the cost of debt, I also understand that 7
the Company’s projected weighted average cost of long-term debt at the end of the test 8
year is 4.54 percent, which I believe is reasonable and appropriate. 9
Q. PLEASE BRIEFLY SUMMARIZE YOUR ANALYTICAL APPROACH AND 10
RECOMMENDATION REGARDING THE COMPANY’S COST OF EQUITY. 11
A. Because all financial models are subject to various assumptions and constraints, equity 12
analysts and investors tend to use multiple methods to develop their return requirements. 13
I therefore relied on several widely accepted methods to develop my ROE 14
recommendation: (1) the Constant Growth Discounted Cash Flow (“DCF”) model; (2) 15
the traditional and empirical forms of the Capital Asset Pricing Model (“CAPM”); and 16
(3) the Bond Yield Plus Risk Premium approach. Those analyses indicate the Company’s 17
Cost of Equity currently to be in the range of 10.00 percent to 10.75 percent. That range 18
is corroborated by the Expected Earnings approach which, as I discuss later in my Direct 19
Testimony, is supported by recent FERC Orders. 20
My recommendation takes into consideration the risk factors associated with: (1) 21
the Company’s generation portfolio and related environmental regulations; (2) customer 22
concentration; and (3) the Company’s planned capital expenditures and the effect, if any, 23

PETITIONER’S EXHIBIT ____
DIRECT TESTIMONY OF ROBERT B. HEVERT
ROBERT B. HEVERT - 4 -
of certain regulatory mechanisms. In addition to the methods noted above, I calculated 1
the costs of issuing common stock (that is, “flotation” costs), and considered evolving 2
capital market and business conditions, including changes in Federal Reserve monetary 3
policy and increases in current and projected government bond yields. Although those 4
factors are very relevant to investors, their effect on the Company’s Cost of Equity 5
cannot be directly quantified. Therefore, although I did not make explicit adjustments to 6
my ROE estimates, I considered those factors in determining where the Company’s Cost 7
of Equity falls within the range of analytical results. In light of those analyses, I believe 8
that my recommended range is reasonable and appropriate. 9
My analyses recognize that estimating the Cost of Equity is an empirical, but not 10
entirely mathematical exercise; it relies on both quantitative and qualitative data and 11
analyses, all of which are used to inform the judgment that inevitably must be applied. 12
No single model is more reliable than all others under all market conditions, and all 13
require the use of reasoned judgment in their application, and in interpreting their results. 14
Therefore, the results of each ROE model must be assessed in the context of current and 15
expected capital market conditions, and relative to other appropriate benchmarks. 16
In developing my recommendation, I recognized that the low and high ends of the 17
range of results (set by the low end of the range of Constant Growth DCF model results, 18
and the high end of the range of CAPM results, respectively) are not likely to be 19
reasonable estimates of the Company’s Cost of Equity. In large measure, that is the case 20
because those results are far removed from the returns recently authorized in other 21
jurisdictions and, in the case of DCF-based methods, fail to adequately reflect evolving 22
capital market conditions. Because Risk Premium-based methods directly reflect 23

PETITIONER’S EXHIBIT ____
DIRECT TESTIMONY OF ROBERT B. HEVERT
ROBERT B. HEVERT - 5 -
measures of capital market risk, they are more likely than other approaches (such as the 1
Constant Growth DCF method) to provide reliable estimates of the Cost of Equity during 2
periods of market instability. 3
Q. WHAT IS THE BASIS OF YOUR VIEW THAT THE CONSTANT GROWTH 4
DCF METHOD RECENTLY HAS FAILED TO PROVIDE RELIABLE ROE 5
ESTIMATES? 6
A. Since 2014, the model has produced results (i.e., mean results) consistently and 7
meaningfully below authorized returns (see Chart 1, below). That data suggests state 8
regulatory commissions have recognized the model’s results are not necessarily reliable 9
estimates of the Cost of Equity, and that other methods should be given meaningful 10
weight in determining the ROE. 11
Chart 1: Mean DCF Results vs. Authorized ROE Over Time2 12
13
2 DCF results based on quarterly average stock prices, Earnings Per Share growth rates from Value Line,
Zacks, and First Call; assumes my proxy group. Authorized ROEs are quarterly averages for vertically integrated and transmission and distribution electric utilities; source: S&P Global Market Intelligence. Please note that 2016 Q2 and 2017 Q3 included only one ROE decision.
7.50%
8.00%
8.50%
9.00%
9.50%
10.00%
10.50%
2014Q1 2014Q4 2015Q3 2016Q2 2017Q1 2017Q4 2018Q3
Mean DCF Estimate Authorized ROE

PETITIONER’S EXHIBIT ____
DIRECT TESTIMONY OF ROBERT B. HEVERT
ROBERT B. HEVERT - 6 -
For example, in Baltimore Gas and Electric Company’s 2016 rate case, the 1
Maryland Public Service Commission discussed the importance of considering multiple 2
analytical methods, given the complexity of determining the investor-required ROE: 3
The ROE witnesses used various analyses to estimate the appropriate 4 return on equity […] including the DCF model, the IRR/DCF, the 5 traditional CAPM, the ECAPM, and risk premium methodologies. 6 Although the witnesses argued strongly over the correctness of their 7 competing analyses, we are not willing to rule that there can be only 8 one correct method for calculating an ROE. Neither will we eliminate 9 any particular methodology as unworthy of basing a decision. The 10 subject is far too complex to reduce to a single mathematical formula. 11 That conclusion is made apparent, in practice, by the fact that the 12 expert witnesses used discretion to eliminate outlier returns that they 13 testified were too high or too low to be considered reasonable, even 14 when using their own preferred methodologies.3 15
Similarly, FERC recently addressed its longstanding focus on the DCF method. 16
In its November 15, 2018 Order Directing Briefs, FERC found that “in light of current 17
investor behavior and capital market conditions, relying on the DCF methodology alone 18
will not produce a just and reasonable ROE.”4 In its October 16, 2018 Order Directing 19
Briefs, FERC found that although it “previously relied solely on the DCF model to 20
produce the evidentiary zone of reasonableness…”, it is “…concerned that relying on that 21
methodology alone will not produce just and reasonable results.”5 As FERC explained, it 22
is important to understand “how investors analyze and compare their investment 23
opportunities.”6 FERC also explained that, although certain investors may give some 24
weight to the DCF approach, other investors “place greater weight on one or more of the 25
3 In the matter of the application of Baltimore Gas and Electric Company for adjustments to its electric and
gas base rates, Public Service Commission of Maryland, Case No. 9406, Order No. 87591, at 153. Citations omitted.
4 Docket Nos. EL14-12-003 and EL15-45-000, Order Directing Briefs, 165 FERC ¶ 61,118 (November 15, 2018) at para. 34.
5 Docket No. EL11-66-001, et al., Order Directing Briefs 165 FERC ¶ 61,030 (October 16, 2018) at para. 30. 6 Id., at para. 33.

PETITIONER’S EXHIBIT ____
DIRECT TESTIMONY OF ROBERT B. HEVERT
ROBERT B. HEVERT - 7 -
other methods…”7 Those methods include the CAPM and the Risk Premium method, 1
which I have applied in this proceeding. 2
Since FERC issued its Order Directing Briefs, the South Carolina Public Service 3
Commission came to a similar finding, explaining that “it is appropriate and reasonable to 4
consider a range of estimates under various methodologies in order to more accurately 5
estimate [South Carolina Electric & Gas’s] cost of equity”, and relying on a single 6
analytical method is “inconsistent with decisions reached by regulatory commissions over 7
the past several years and departs from the normal practice of estimating the Cost of 8
Equity for utilities.”8 9
Q. HAVE OTHER STATE REGULATORY COMMISSIONS DECLINED TO RELY 10
ON THE DCF MODEL RESULTS? 11
A. Yes. For example, in its July 2017 Order Accepting Stipulation in which it authorized a 12
9.90 percent ROE for Duke Energy Carolinas, the North Carolina Utilities Commission 13
noted it “carefully evaluated the DCF analysis recommendations” of the ROE witnesses 14
(which ranged from 8.45 percent to 8.80 percent) and determined that “all of these DCF 15
analyses in the current market produce unrealistically low results.”9 16
7 Id., at para. 35. See also, Docket No. PL19-4-000, Inquiry Regarding the Commission’s Policy for
Determining Return on Equity, March 21, 2019. 8 Public Service Commission of South Carolina, Docket Nos. 2017-207-E, 2017-305-E, and 2017-370-E,
Order No. 2018-804, Order Addressing South Carolina Electric & Gas Nuclear Dockets, at 88-89. [clarification added]
9 State of North Carolina Utilities Commission, Docket No. E-7, Sub 1146, In the Matter of Application of
Duke Energy Carolinas, LLC, for Adjustment of Rates and Charges Applicable to Electric Utility Service in
North Carolina, Order Accepting Stipulation, Deciding Contested Issues, and Requiring Revenue Reduction, July 25, 2017.

PETITIONER’S EXHIBIT ____
DIRECT TESTIMONY OF ROBERT B. HEVERT
ROBERT B. HEVERT - 8 -
Q. ARE THERE ASPECTS OF THE CONSTANT GROWTH DCF MODEL THAT 1
MAY EXPLAIN WHY REGULATORY COMMISSIONS CURRENTLY DO NOT 2
RELY PRINCIPALLY ON IT WHEN DETERMINING THE COST OF EQUITY? 3
A. Yes. Quite simply, the model’s underlying structure and assumptions are not compatible 4
with the recent capital market and economic environment. That can most easily be seen 5
by recognizing that the model’s fundamental structure requires the assumption of 6
constancy in perpetuity. It assumes there will be no change in growth rates, dividend 7
payout ratios, Price/Earnings (“P/E”) ratios, Market/Book ratios, or in the economic and 8
market conditions that support those variables. Equally important, the model assumes the 9
Cost of Equity estimated today will remain unchanged, also in perpetuity. That is, the 10
model requires that the Cost of Equity estimate produced today will be the same forward-11
looking return equity investors will require every day in the future, in perpetuity. 12
A concern, of course, is that federal monetary policy has had a significant, 13
intentional effect on capital markets, dampening both interest rates and volatility. At 14
issue is whether we reasonably can assume the market conditions created by those 15
policies will stay in place over the long run. For example, we know that the Federal 16
Reserve is continuing to “normalize” its monetary policy such that the conditions 17
supporting current ROE estimates will not persist in the long-run.10 Regardless of its 18
eventual disposition, neither the Federal Reserve’s unconventional monetary policy 19
initiatives, nor the capital market conditions they supported, will remain in place in 20
10 I understand that the Federal Reserve recently announced it intends to slow the reduction of its holdings of
Treasury securities beginning in May 2019 and conclude the reduction of its aggregate securities holdings in September 2019. See Federal Reserve Press Release, Balance Sheet Normalization Principles and Plans, March 20, 2019.

PETITIONER’S EXHIBIT ____
DIRECT TESTIMONY OF ROBERT B. HEVERT
ROBERT B. HEVERT - 9 -
perpetuity, as the Constant Growth DCF model requires. On that basis alone, we should 1
be cautious about the weight given to the DCF method. 2
The model also assumes investors use its fundamental structure to find the 3
“intrinsic” value of stock, that is, the price they are willing to pay.11 In practice, investors 4
also consider relative valuation multiples – Price/Earnings, Market/Book, Enterprise 5
Value/EBITDA12 – in their buying and selling decisions. They do so because no single 6
financial model produces the most accurate measure of fundamental value, or the most 7
reliable estimate of the Cost of Equity, at all times. 8
Q. IS IT YOUR VIEW THAT THE DCF MODEL SHOULD BE GIVEN NO 9
WEIGHT IN DETERMINING THE COMPANY’S COST OF EQUITY? 10
A. No, it is not. It is my view, however, that we should carefully consider the range of 11
results the model produces in arriving at ROE recommendations. As discussed later in 12
my Direct Testimony, doing so fully supports my ROE range and recommendation. 13
Q. PLEASE SUMMARIZE THE RESULTS OF THE ANALYSES, AND HOW THEY 14
CONTRIBUTED TO YOUR ROE RECOMMENDATION. 15
A. The range of results produced by the three primary approaches noted above are 16
summarized in Tables 1a and 1b, below. 17
11 See Equations [4] and [5], in Appendix A below. 12 Earnings Before Interest, Taxes, Depreciation, and Amortization.

PETITIONER’S EXHIBIT ____
DIRECT TESTIMONY OF ROBERT B. HEVERT
ROBERT B. HEVERT - 10 -
Table 1a: Summary of Discounted Cash Flow Model Results13 1
Mean Mean High
30-Day Average 8.92% 9.97%
90-Day Average 9.03% 10.08%
180-Day Average 9.12% 10.17%
Table 1b: Summary of Risk Premium Results14 2
CAPM
Bloomberg Derived
Market Risk Premium
Value Line Derived
Market Risk Premium
Average Bloomberg Beta Coefficient
Current 30-Year Treasury (3.03%) 8.14% 9.64%
Near Term Projected 30-Year Treasury (3.25%) 8.36% 9.86%
Average Value Line Beta Coefficient
Current 30-Year Treasury (3.03%) 9.33% 11.18%
Near Term Projected 30-Year Treasury (3.25%) 9.55% 11.40%
ECAPM
Bloomberg Derived
Market Risk Premium
Value Line Derived
Market Risk Premium
Average Bloomberg Beta Coefficient
Current 30-Year Treasury (3.03%) 9.51% 11.42%
Near Term Projected 30-Year Treasury (3.25%) 9.74% 11.64%
Average Value Line Beta Coefficient
Current 30-Year Treasury (3.03%) 10.41% 12.57%
Near Term Projected 30-Year Treasury (3.25%) 10.63% 12.79%
Bond Yield Plus Risk Premium Approach
Current 30-Year Treasury (3.03%) 9.93%
Near Term Projected 30-Year Treasury (3.25%) 9.96%
Long-Term Projected 30-Year Treasury (4.05%) 10.17%
13 See also Attachment RBH-2, which includes the Mean Low estimates. 14 See Attachments RBH-5 and RBH-6.

PETITIONER’S EXHIBIT ____
DIRECT TESTIMONY OF ROBERT B. HEVERT
ROBERT B. HEVERT - 11 -
Based on those estimates, it is my view that a reasonable range of estimates is from 10.00 1
percent to 10.75 percent, and within that range, an ROE of 10.50 percent is reasonable 2
and appropriate. That range is supported by the Expected Earnings approach, which 3
results in an average ROE estimate of 10.26 percent and a median ROE estimate of 10.04 4
percent. 5
Q. HOW IS THE REMAINDER OF YOUR DIRECT TESTIMONY ORGANIZED? 6
A. The remainder of my Direct Testimony is organized as follows: 7
• Section III – Discusses the effect of the current capital market environment on 8
the Cost of Equity; 9
• Section IV – Discusses the Cost of Equity analyses; 10
• Section V – Discusses the Company’s business risks; 11
• Section VI – Addresses the reasonableness of the Company’s Test Year capital 12
structure and Cost of Debt; 13
• Section VII – Summarizes my conclusions and recommendations; and 14
• Appendix A – Provides the details regarding my analytical methodologies. 15
III. CAPITAL MARKET ENVIRONMENT 16
Q. DO ECONOMIC CONDITIONS INFLUENCE THE REQUIRED COST OF 17
CAPITAL AND REQUIRED RETURN ON COMMON EQUITY? 18
A. Yes. As discussed in Section IV and Appendix A, the models used to estimate the Cost 19
of Equity are meant to reflect, and therefore are influenced by, current and expected 20
capital market conditions. Therefore, it is important to assess the reasonableness of any 21
financial model’s results in the context of observable market data. To the extent a given 22
model’s assumptions are misaligned with such data, or its results inconsistent with basic 23

PETITIONER’S EXHIBIT ____
DIRECT TESTIMONY OF ROBERT B. HEVERT
ROBERT B. HEVERT - 12 -
financial principles, it is appropriate to consider whether other methods likely provide 1
more meaningful and reliable results. 2
Q. DO YOU HAVE ANY GENERAL OBSERVATIONS REGARDING THE 3
RELATIONSHIP BETWEEN FEDERAL RESERVE MONETARY POLICY, 4
CAPITAL MARKET CONDITIONS, AND THE COMPANY’S COST OF 5
EQUITY? 6
A. Yes, I do. Although the Federal Reserve completed its Quantitative Easing initiative in 7
October 2014, it was not until December 2015 that it raised the Federal Funds rate and 8
began the process of monetary policy normalization.15 A significant analytical issue is 9
how investors likely will react as that process continues, and eventually is completed. 10
For example, increasing interest rates may be seen as an indication of expanding 11
macroeconomic growth, in which case we reasonably could expect the growth rate 12
component of the Discounted Cash Flow model to increase. At the same time, sectors 13
that historically have included dividend-paying companies have lost value, as increasing 14
interest rates provide investors with alternative sources of current income. A more 15
reasoned approach is to understand the relationships among capital market and 16
macroeconomic variables, and to consider how those factors may affect different models 17
and their results. 18
Q. DOES YOUR RECOMMENDATION CONSIDER THE INTEREST RATE 19
ENVIRONMENT? 20
A. Yes, it does. From an analytical perspective, it is important that the inputs and 21
assumptions used to arrive at an ROE recommendation, including assessments of capital 22
15 See Federal Reserve Press Release, December 16, 2015.

PETITIONER’S EXHIBIT ____
DIRECT TESTIMONY OF ROBERT B. HEVERT
ROBERT B. HEVERT - 13 -
market conditions, are consistent with the recommendation itself. Although all analyses 1
require an element of judgment, the application of that judgment must be made in the 2
context of the quantitative and qualitative information available to the analyst, and the 3
capital market environment in which the analyses were undertaken. Because the Cost of 4
Equity is forward-looking, the salient issue is whether investors see the likelihood of 5
increased interest rates during the period in which the rates set in this proceeding will be 6
in effect. 7
Although the Federal Reserve’s market intervention policies kept interest rates 8
historically low, since July 8, 2016 (when the 30-year Treasury yield fell to its secular 9
low of 2.11 percent) rates have risen. As the Federal Reserve increased the Federal 10
Funds target rate eight times between December 2015 and December 2018 to 2.25 11
percent - 2.50 percent, short-term and long-term interest rates also increased (see Chart 2 12
below).16 13
16 Federal Reserve Board Schedule H.15. 1-year, 10-year, and 30-year Treasury yields increased by 204 basis
points, 122 basis point, and 91 basis points, respectively, July 8, 2016 to March 15, 2019.

PETITIONER’S EXHIBIT ____
DIRECT TESTIMONY OF ROBERT B. HEVERT
ROBERT B. HEVERT - 14 -
Chart 2: Treasury Yield Curve: 7/8/2016, 3/15/2019 1
and Projected Q2 202017 2
3
In a press conference following the December 2018 Federal Open Market 4
Committee meeting, Chairman Powell discussed the recent increases in the Federal Funds 5
rate and the expectation for some further gradual rate increases, noting a strengthening 6
economy, a strong labor market and rising wages.18 7
Aside from increases in the Federal Funds rate, in October 2017, the Federal 8
Reserve initiated its balance sheet normalization program that includes gradual reductions 9
to its security holdings by decreasing its reinvestment activities.19 In the January 2019 10
17 Sources: Federal Reserve Board Schedule H.15.; Blue Chip Financial Forecasts, Vol. 38, No. 3, at 2 (March
1, 2019). 3-year, 7-year and 20-year projected Treasury yields interpolated. 18 Transcript of Chairman Powell’s Press Conference, December 19, 2018. 19 See: https://www.federalreserve.gov/monetarypolicy/policy-normalization.htm and Federal Open Market
Committee (“FOMC”) Press Release, June 14, 2017. In its January 30, 2019 press release the FOMC noted that although it continues to view changes in the federal funds target rate as the “primary means of adjusting monetary policy”, it also would adjust the details of its balance sheet normalization based on economic and financial developments.

PETITIONER’S EXHIBIT ____
DIRECT TESTIMONY OF ROBERT B. HEVERT
ROBERT B. HEVERT - 15 -
meeting, the Federal Reserve decided to continue with the balance sheet wind-down.20 1
At the same time, the supply of marketable U.S. Treasury securities has increased by 2
approximately $1.14 trillion.21 The growing supply of Treasury securities from both the 3
Federal Reserve and the U.S. Treasury puts upward pressure on Treasury rates. 4
Q. DOES MARKET-BASED DATA INDICATE INVESTORS SEE A PROBABILITY 5
OF INCREASING INTEREST RATES? 6
A. Yes. Consensus near-term forecasts of the 30-year Treasury yield reported by Blue Chip 7
Financial Forecast indicate the market expects long-term rates to reach 3.40 percent by 8
the second quarter of 2020.22 Importantly, the potential for rising rates represents risk for 9
utility investors. 10
Q. HAS MARKET VOLATILITY CHANGED WITH THE FEDERAL RESERVE’S 11
MOVE TOWARD MONETARY POLICY NORMALIZATION? 12
A. Yes, it has. A visible and widely reported measure of expected volatility is the Cboe 13
Options Exchange (“Cboe”) Volatility Index, often referred to as the VIX. As Cboe 14
explains, the VIX “is a calculation designed to produce a measure of constant, 30-day 15
expected volatility of the U.S. stock market, derived from real-time, mid-quote prices of 16
S&P 500® Index call and put options.”23 Simply, the VIX is a market-based measure of 17
expected volatility. Because volatility is a measure of risk, increases in the VIX, or in its 18
volatility, are a broad indicator of expected increases in market risk. 19
20 Federal Reserve Press Release dated January 30, 2019. The FOMC noted that although it continues to
view changes in the federal funds target rate as the “primary means of adjusting monetary policy”, it also would adjust the details of its balance sheet normalization based on economic and financial developments.
21 Source: U.S. Treasury, Monthly Statement of the Public Debt. See https://www.treasurydirect.gov/govt/reports/pd/mspd/mspd.htm. U.S. marketable securities increased from $14.48 trillion to $15.62 trillion between December 31, 2017 and December 31, 2018.
22 Blue Chip Financial Forecast, Vol. 38, No. 3, March 1, 2019, at 2. 23 Source: http://www.cboe.com/vix

PETITIONER’S EXHIBIT ____
DIRECT TESTIMONY OF ROBERT B. HEVERT
ROBERT B. HEVERT - 16 -
Although the VIX is not expressed as a percentage, it should be understood as 1
such. That is, if the VIX stood at 15.00, it would be interpreted as an expected standard 2
deviation in annual market returns of 15.00 percent over the coming 30 days. Since 3
2000, the VIX has averaged about 19.67, which is highly consistent with the long-term 4
standard deviation on annual market returns (19.80 percent, as reported by Duff & 5
Phelps24). 6
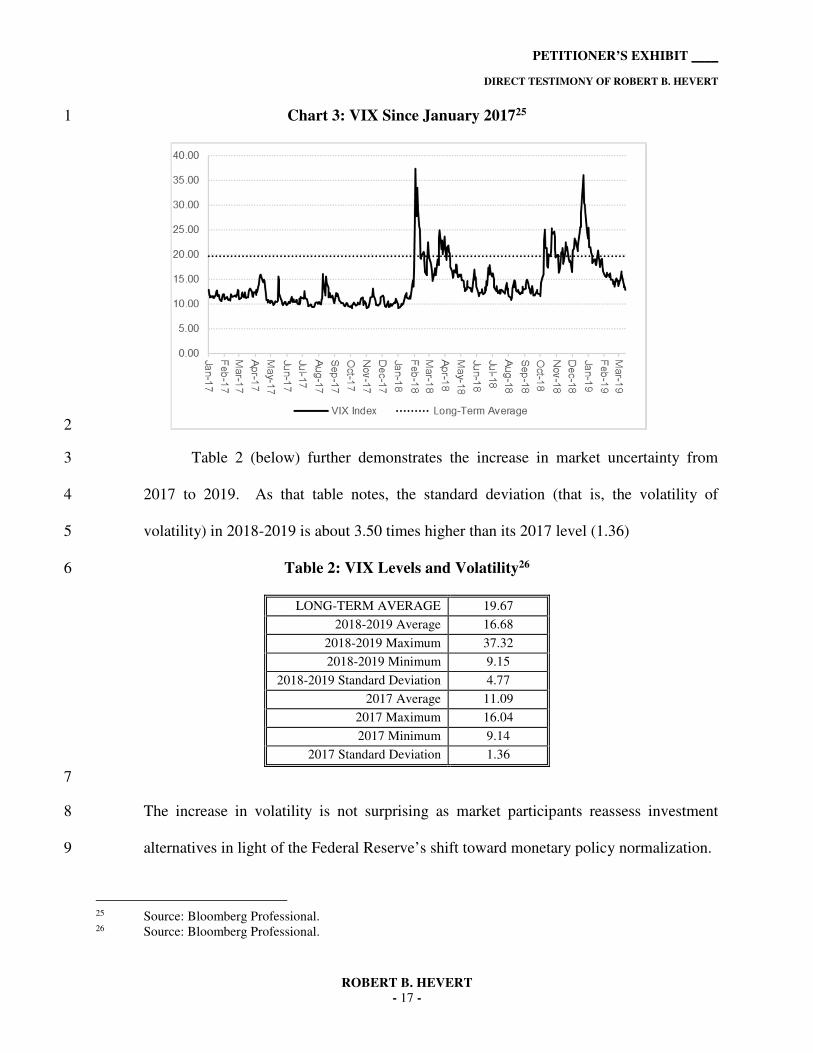
As Chart 3 (below) demonstrates, in 2017 market volatility was well below its 7
long-term average, and moved within a somewhat narrow range; the VIX averaged about 8
11.09, with a standard deviation of 1.36. Throughout 2018 and into 2019, the VIX 9
average increased to 16.68 with a standard deviation of 4.77. That is, from 2017 to 2019 10
both the level and the volatility of market volatility increased. 11
24 Duff & Phelps, 2019 SBBI Yearbook, at 6-17.
PETITIONER’S EXHIBIT ____
DIRECT TESTIMONY OF ROBERT B. HEVERT
ROBERT B. HEVERT - 17 -
Chart 3: VIX Since January 201725 1
2
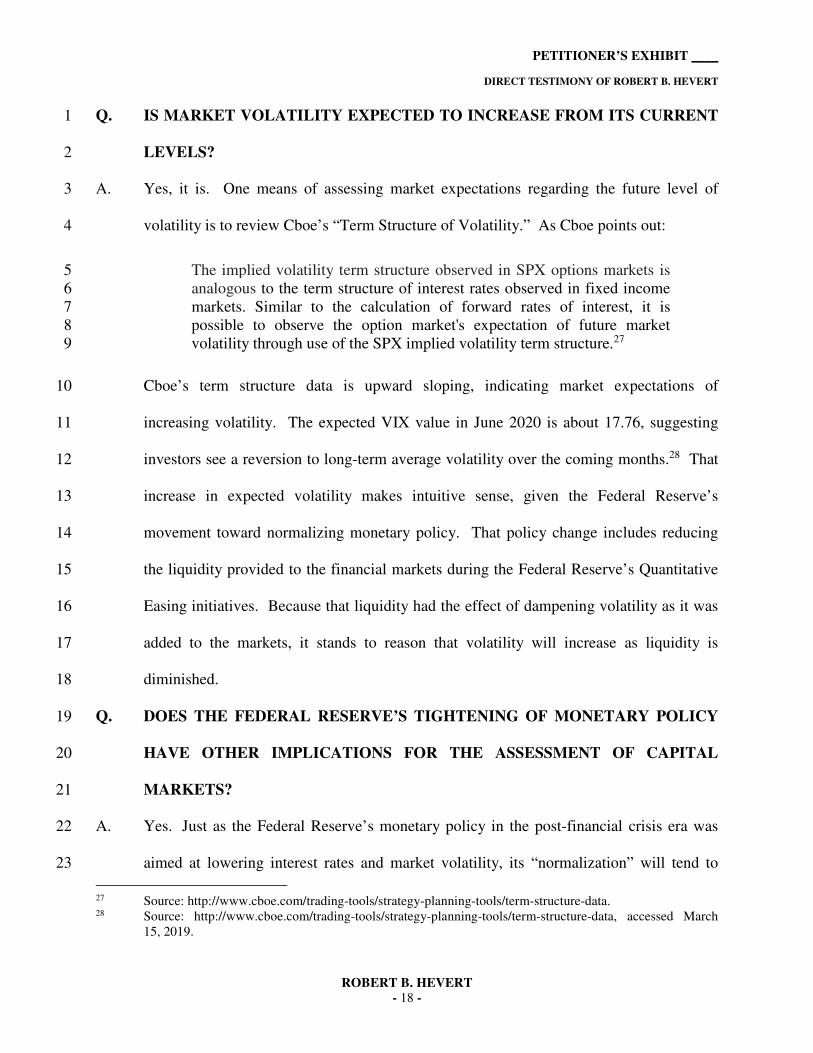
Table 2 (below) further demonstrates the increase in market uncertainty from 3
2017 to 2019. As that table notes, the standard deviation (that is, the volatility of 4
volatility) in 2018-2019 is about 3.50 times higher than its 2017 level (1.36) 5
Table 2: VIX Levels and Volatility26 6
LONG-TERM AVERAGE 19.67
2018-2019 Average 16.68
2018-2019 Maximum 37.32
2018-2019 Minimum 9.15
2018-2019 Standard Deviation 4.77
2017 Average 11.09
2017 Maximum 16.04
2017 Minimum 9.14
2017 Standard Deviation 1.36
7
The increase in volatility is not surprising as market participants reassess investment 8
alternatives in light of the Federal Reserve’s shift toward monetary policy normalization. 9
25 Source: Bloomberg Professional. 26 Source: Bloomberg Professional.
PETITIONER’S EXHIBIT ____
DIRECT TESTIMONY OF ROBERT B. HEVERT
ROBERT B. HEVERT - 18 -
Q. IS MARKET VOLATILITY EXPECTED TO INCREASE FROM ITS CURRENT 1
LEVELS? 2
A. Yes, it is. One means of assessing market expectations regarding the future level of 3
volatility is to review Cboe’s “Term Structure of Volatility.” As Cboe points out: 4
The implied volatility term structure observed in SPX options markets is 5 analogous to the term structure of interest rates observed in fixed income 6 markets. Similar to the calculation of forward rates of interest, it is 7 possible to observe the option market's expectation of future market 8 volatility through use of the SPX implied volatility term structure.27 9
Cboe’s term structure data is upward sloping, indicating market expectations of 10
increasing volatility. The expected VIX value in June 2020 is about 17.76, suggesting 11
investors see a reversion to long-term average volatility over the coming months.28 That 12
increase in expected volatility makes intuitive sense, given the Federal Reserve’s 13
movement toward normalizing monetary policy. That policy change includes reducing 14
the liquidity provided to the financial markets during the Federal Reserve’s Quantitative 15
Easing initiatives. Because that liquidity had the effect of dampening volatility as it was 16
added to the markets, it stands to reason that volatility will increase as liquidity is 17
diminished. 18
Q. DOES THE FEDERAL RESERVE’S TIGHTENING OF MONETARY POLICY 19
HAVE OTHER IMPLICATIONS FOR THE ASSESSMENT OF CAPITAL 20
MARKETS? 21
A. Yes. Just as the Federal Reserve’s monetary policy in the post-financial crisis era was 22
aimed at lowering interest rates and market volatility, its “normalization” will tend to 23
27 Source: http://www.cboe.com/trading-tools/strategy-planning-tools/term-structure-data. 28 Source: http://www.cboe.com/trading-tools/strategy-planning-tools/term-structure-data, accessed March
15, 2019.

PETITIONER’S EXHIBIT ____
DIRECT TESTIMONY OF ROBERT B. HEVERT
ROBERT B. HEVERT - 19 -
increase both. Because it is at least a directional indicator of investors’ return 1
requirements, the elevated uncertainty supports my recommended range. 2
It also is important to recognize that the Federal Reserve’s reduction in monetary 3
stimulus is related to expectations of improved economic and financial conditions, and 4
sustained growth in the overall economy. When increasing the Federal Funds rate on 5
December 19, 2018, the Federal Open Market Committee noted the labor market 6
continued to strengthen and that household spending was rising at a strong rate while 7
business fixed investment had moderated from its rapid pace earlier in the 8
year.29 Although the Federal Reserve did not increase the Federal Funds rate in its 9
January 2019 meeting, the Federal Open Market Committee observed the labor market 10
continued to strengthen, and economic activity continued to rise at a solid rate.30 At its 11
March 2019 meeting, the FOMC determined it would hold the Federal Funds target rate 12
constant, looking to current and expected economic conditions to determine future rate 13
adjustments.31 14
Q. WHAT CONCLUSIONS DO YOU DRAW FROM YOUR ANALYSES OF THE 15
CURRENT CAPITAL MARKET ENVIRONMENT, AND HOW DO THOSE 16
CONCLUSIONS AFFECT YOUR ROE RECOMMENDATION? 17
A. From an analytical perspective, it is important that the inputs and assumptions used to 18
arrive at an ROE determination, including assessments of capital market conditions, are 19
consistent with the conclusion itself. Although all analyses require an element of 20
judgment, the application of that judgment must be made in the context of the 21
29 Federal Reserve Press Release dated December 19, 2018. 30 Federal Reserve Press Release dated January 30, 2019. 31 Federal Reserve Press Release dated March 20, 2019.

PETITIONER’S EXHIBIT ____
DIRECT TESTIMONY OF ROBERT B. HEVERT
ROBERT B. HEVERT - 20 -
quantitative and qualitative information available to the analyst and the capital market 1
environment in which the analyses were undertaken. Because the application of financial 2
models and interpretation of their results often is the subject of differences among 3
analysts in regulatory proceedings, it is important to review and consider a variety of data 4
points. That approach enables us to put in context both quantitative analyses and the 5
associated recommendations. Further, because all models produce ranges of results, it is 6
important to consider the type of information discussed above to determine where the 7
Company’s ROE falls within those ranges. As discussed throughout my testimony, doing 8
so supports my recommended range of 10.00 percent to 10.75 percent. 9
IV. COST OF EQUITY ANALYSIS 10
A. Regulatory Guidelines and Financial Considerations 11
Q. BEFORE ADDRESSING THE SPECIFIC ASPECTS OF THIS PROCEEDING, 12
PLEASE PROVIDE AN OVERVIEW OF THE ISSUES SURROUNDING THE 13
COST OF EQUITY IN REGULATORY PROCEEDINGS, GENERALLY. 14
A. In very general terms, the Cost of Equity is the return investors require to make an equity 15
investment in a firm. That is, investors will provide funds to a firm only if the return they 16
expect is equal to, or greater than, the return they require to accept the risk of providing 17
funds to the firm. From the firm’s perspective, that required return, whether it is 18
provided to debt or equity investors, has a cost. Individually, we speak of the “Cost of 19
Debt” and the “Cost of Equity” as measures of those costs; together, they are referred to 20
as the “Cost of Capital.” 21
The Cost of Capital (including the costs of both debt and equity) is based on the 22
economic principle of “opportunity costs.” Investing in any asset, whether debt or equity 23

PETITIONER’S EXHIBIT ____
DIRECT TESTIMONY OF ROBERT B. HEVERT
ROBERT B. HEVERT - 21 -
securities, implies a forgone opportunity to invest in alternative assets. For any 1
investment to be sensible, its expected return must be at least equal to the return expected 2
on alternative, comparable risk investment opportunities. Because investments with like 3
risks should offer similar returns, the opportunity cost of an investment should equal the 4
return available on an investment of comparable risk. In that important respect, the 5
returns required by debt and equity investors represent a cost to the Company. 6
Although both debt and equity have required costs, they differ in certain 7
fundamental ways. Most noticeably, the Cost of Debt is contractually defined and can be 8
directly observed as the interest rate or yield on debt securities.32 The Cost of Equity, on 9
the other hand, is neither directly observable nor a contractual obligation. Rather, equity 10
investors have a claim on cash flows only after debt holders are paid; the uncertainty (or 11
risk) associated with those residual cash flows determines the Cost of Equity. Because 12
equity investors bear that additional, “residual risk”, they require higher returns than debt 13
holders. In that basic sense, equity and debt investors differ: they invest in different 14
securities, face different risks, and require different returns. 15
Whereas the Cost of Debt can be directly observed, the Cost of Equity must be 16
estimated based on market data and various financial models. As discussed throughout 17
my Direct Testimony, each of those models is subject to specific assumptions, which may 18
be more, or less, applicable under differing market conditions. In addition, because the 19
Cost of Equity is premised on opportunity costs, the models typically are applied to a 20
group of “comparable” or “proxy” companies. The choice of models (including their 21
inputs), the selection of proxy companies, and the interpretation of the model results all 22
32 The observed interest rate may be adjusted to reflect issuance costs.

PETITIONER’S EXHIBIT ____
DIRECT TESTIMONY OF ROBERT B. HEVERT
ROBERT B. HEVERT - 22 -
require the application of reasoned judgment. That judgment should consider data and 1
information that is not necessarily included in the models themselves. In the end, the 2
estimated Cost of Equity should reflect the return that investors require in light of the 3
subject company’s risks, and the returns available on comparable investments. 4
Q. PLEASE NOW PROVIDE A BRIEF SUMMARY OF THE REGULATORY 5
GUIDELINES ESTABLISHED FOR THE PURPOSE OF DETERMINING THE 6
ROE. 7
A. The Court established the guiding principles for establishing a fair return for capital in 8
two cases: (1) Bluefield Water Works and Improvement Co. v. Public Service Comm’n. 9
(“Bluefield”);33 and (2) Federal Power Comm’n v. Hope Natural Gas Co. (“Hope”).34 In 10
Bluefield, the Court stated: 11
A public utility is entitled to such rates as will permit it to earn a return 12 on the value of the property which it employs for the convenience of 13 the public equal to that generally being made at the same time and in 14 the same general part of the country on investments in other business 15 undertakings which are attended by corresponding, risks and 16 uncertainties; but it has no constitutional right to profits such as are 17 realized or anticipated in highly profitable enterprises or speculative 18 ventures. The return should be reasonably sufficient to assure 19 confidence in the financial soundness of the utility and should be 20 adequate, under efficient and economical management, to maintain 21 and support its credit and enable it to raise the money necessary for the 22 proper discharge of its public duties.35 23
The Court therefore recognized that: (1) a regulated company cannot remain financially 24
sound unless the return it is allowed to earn on its invested capital is at least equal to the 25
cost of capital (the principle relating to the demand for capital); and (2) a regulated 26
33 Bluefield Waterworks & Improvement Co., v. Public Service Commission of West Virginia, 262 U.S. 679,
692-93 (1923). 34 Federal Power Commission v. Hope Natural Gas Co., 320 U.S. 591, 603 (1944). 35 Bluefield Waterworks & Improvement Co., v. Public Service Commission of West Virginia, 262 U.S. 679,
692-93 (1923).

PETITIONER’S EXHIBIT ____
DIRECT TESTIMONY OF ROBERT B. HEVERT
ROBERT B. HEVERT - 23 -
company will not be able to attract capital if it does not offer investors an opportunity to 1
earn a return on their investment equal to the return they expect to earn on other 2
investments of the same risk (the principle relating to the supply of capital). 3
Q. DOES INDIANA PRECEDENT PROVIDE SIMILAR GUIDANCE? 4
A. Yes. In a recent order, the Commission stated (as it has in previous rate orders), that it 5
has used the following standards and criteria to determine a fair rate of return on a 6
petitioner’s investment in its utility plant: 7
(1) Return comparable to return on investments in other enterprises 8 having corresponding risks; 9
(2) Return sufficient to ensure confidence in the financial integrity of 10 the petitioner; 11
(3) Return sufficient to maintain and support the petitioner’s credit 12 [rating]; and 13
(4) Return sufficient to attract capital as reasonably required by the 14 petitioner in its utility business.36 15
Citing the State Supreme Court, the Commission noted that: 16
The ratemaking process involves a balancing of all these factors and 17 probably others; a balancing of the owner’s or investor’s interest with 18 the consumer’s interest. On the one side, the rates may not be so low 19 as to confiscate the investor’s interest or property; on the other side the 20 rates may not be so high as to injure the consumer by charging an 21 exorbitant price for service and at the same time giving the utility 22 owner an unreasonable or excessive profit.37 23
The Commission concluded that: 24
…the results of any return computation may be tempered by the 25 Commission’s duty to balance the respective interests involved in 26 ratemaking. The end result of the Commission’s Orders must be 27 measured as much by the success with which they protect the broad 28
36 Indiana Utility Regulatory Commission, Cause No. 44075, Petition of Indiana Michigan Power Company,
an Indiana Corporation, for Authority to Increase its Rates and Charges for Electric Utility Service, For
Approval of: Revised Depreciation Rates; Accounting Relief; Inclusion in Basic Rates and Charges of the
Costs of Qualified Pollution Control Property; Modifications to Rate Adjustment Mechanisms; and Major
Storm Reserves; and for Approval of New Schedules of Rates, Rules and Regulations, Approved February 13, 2013, at 47.
37 Id., at 47-48.
PETITIONER’S EXHIBIT ____
DIRECT TESTIMONY OF ROBERT B. HEVERT
ROBERT B. HEVERT - 24 -
public interest entrusted to our protection as by the effectiveness with 1 which they allow utilities to maintain credit and attract capital.38 2
Based on those standards, the ROE authorized in this proceeding should provide 3
the Company with the opportunity to earn a fair and reasonable return, and enable 4
efficient access to external capital under a variety of market conditions. 5
Q. WHY IS IT IMPORTANT FOR A UTILITY TO BE ALLOWED THE 6
OPPORTUNITY TO EARN A RETURN ADEQUATE TO ATTRACT EQUITY 7
CAPITAL AT REASONABLE TERMS? 8
A. A return that is adequate to attract capital at reasonable terms enables the utility to 9
provide safe, reliable service while maintaining its financial integrity. As discussed 10
above, and in keeping with the Hope and Bluefield standards, that return should be 11
commensurate with the returns expected elsewhere in the market for investments of 12
equivalent risk. The consequence of the Commission’s order in this case, therefore, 13
should be to provide I&M with the opportunity to earn a return on equity that is: (1) 14
adequate to attract capital at reasonable terms; (2) sufficient to ensure its financial 15
integrity; and (3) commensurate with returns on investments in enterprises having 16
corresponding risks. 17
To the extent the Company is provided a reasonable opportunity to earn its 18
market-based Cost of Equity, neither customers nor shareholders should be 19
disadvantaged. In fact, a return that is adequate to attract capital at reasonable terms 20
enables I&M to provide safe, reliable electric utility service while maintaining its 21
financial integrity. 22
38 Id., at 48.
PETITIONER’S EXHIBIT ____
DIRECT TESTIMONY OF ROBERT B. HEVERT
ROBERT B. HEVERT - 25 -
Q. HOW IS THE COST OF EQUITY ESTIMATED IN REGULATORY 1
PROCEEDINGS? 2
A. As noted earlier (and as described in more detail in Appendix A), the Cost of Equity is 3
estimated using various financial models. By their very nature, those models produce a 4
range of results from which the ROE must be determined. That determination, which 5
should be based on a comprehensive review of relevant data and information, does not 6
necessarily lend itself to a strict mathematical solution. The key consideration in 7
determining the ROE is to ensure that the overall analysis reasonably reflects investors’ 8
view of the financial markets in general and the subject company (in the context of the 9
proxy companies), in particular. 10
The use of multiple models makes intuitive sense when we consider that market 11
prices are set by the buying and selling behavior of multiple investors, whose 12
circumstances, objectives, and constraints vary over time and across market conditions. 13
We cannot assume a single method is the best measure of the factors motivating those 14
decisions for all investors, at all times. Intuition suggests it is more appropriate to use as 15
many methods as we reasonably can, and to reflect the many factors motivating 16
investment decisions as best we can. In this instance, intuition, financial theory,39 and 17
39 As Professor Eugene Brigham explains: “Whereas debt and preferred stocks are contractual obligations
which have easily determined costs, it is not at all easy to estimate [the Cost of Equity]. However, three methods can be used: (1) the Capital Asset Pricing Model (CAPM), (2) the discounted cash flow (DCF) model, and (3) the bond-yield-plus-risk-premium approach. These methods should not be regarded as mutually exclusive – no one dominates the others, and all are subject to error when used in practice. Therefore, when faced with the task of estimating a company’s cost of equity, we generally use all three methods and then choose among them on the basis of our confidence in the data used for each in the specific case at hand.” Eugene F. Brigham, Louis C. Gapenski, Financial Management, Theory and Practice, 7th ed., The Dryden Press, 1994, at 341.

PETITIONER’S EXHIBIT ____
DIRECT TESTIMONY OF ROBERT B. HEVERT
ROBERT B. HEVERT - 26 -
financial practice reach a common conclusion: we should apply and reasonably consider 1
multiple methods when estimating the Cost of Equity. 2
Lastly, practitioners and academics recognize that financial models simply are 3
approximations of investor behavior, not precise quantifications of it. They appreciate 4
that models are tools to be used in the ROE determination process, and that strict 5
adherence to any single approach, or to the specific results of any single approach, can 6
lead to flawed or misleading conclusions. That recognition is consistent with the Hope 7
and Bluefield principle that it is the analytical result, as opposed to the methodology 8
employed, that is controlling in arriving at just and reasonable rates.40 A reasonable ROE 9
estimate therefore appropriately considers alternative methodologies, and the 10
reasonableness of their individual and collective results in the context of observable, 11
relevant market information. 12
B. Proxy Group Selection 13
Q. AS A PRELIMINARY MATTER, WHY IS IT NECESSARY TO SELECT A 14
GROUP OF PROXY COMPANIES TO DETERMINE THE COST OF EQUITY 15
FOR I&M? 16
A. First, it is important to bear in mind that the Cost of Equity for a given enterprise depends 17
on the risks attendant to the business in which it is engaged. According to financial 18
theory, the value of a given company is equal to the aggregate market value of its 19
constituent business units. The value of the individual business units reflects the risks 20
and opportunities inherent in the business sectors in which those units operate. In this 21
40 That finding also is consistent with the Commission’s finding in Cause No. 44075, which noted the
importance of the end result in balancing the interests of customers and investors.

PETITIONER’S EXHIBIT ____
DIRECT TESTIMONY OF ROBERT B. HEVERT
ROBERT B. HEVERT - 27 -
proceeding, we are focused on estimating the Cost of Equity for the Indiana operations of 1
I&M, whose parent is American Electric Power Company, Inc. (“AEP”). Because the 2
ROE is a market-based concept and I&M is not a separate entity with its own stock price, 3
it is necessary to establish a group of companies that are both publicly traded and 4
comparable to I&M in certain fundamental respects to serve as its “proxy” in the ROE 5
estimation process. 6
Even if I&M were a publicly traded entity, short-term events could bias its market 7
value during a given period. A significant benefit of using a proxy group is that it serves 8
to moderate the effects of anomalous, temporary events associated with any one 9
company. 10
Q. DOES THE SELECTION OF A PROXY GROUP SUGGEST THAT 11
ANALYTICAL RESULTS WILL BE TIGHTLY CLUSTERED AROUND 12
AVERAGE (I.E., MEAN) RESULTS? 13
A. No. For example, the Constant Growth DCF approach defines the Cost of Equity as the 14
sum of the expected dividend yield and projected long-term growth. Despite the care 15
taken to ensure risk comparability, market expectations with respect to future risks and 16
growth opportunities will vary from company to company. Even within a group of 17
similarly situated companies, it is common for analytical results to reflect a seemingly 18
wide range. Consequently, at issue is how to estimate the Cost of Equity from within that 19
range. Such a determination necessarily must consider a wide range of both quantitative 20
and qualitative information. 21
Q. PLEASE PROVIDE A SUMMARY PROFILE OF I&M. 22

PETITIONER’S EXHIBIT ____
DIRECT TESTIMONY OF ROBERT B. HEVERT
ROBERT B. HEVERT - 28 -
A. I&M, which is a wholly owned subsidiary of AEP, provides electric service to 1
approximately 596,000 retail customers in northern and eastern Indiana and southwestern 2
Michigan.41 The Company’s current long-term issuer credit rating from Standard & 3
Poor’s (“S&P”) is A- (outlook: Stable), A3 (outlook: Stable) from Moody’s Investor 4
Service (“Moody’s”), and BBB (outlook: Stable) from FitchRatings (“Fitch”).42 5
Q. HOW DID YOU SELECT THE COMPANIES INCLUDED IN YOUR PROXY 6
GROUP? 7
A. A proxy group should include companies with risk profiles comparable to the subject 8
company. In selecting the proxy group, my objective was to balance the dual objectives 9
of selecting companies that are highly representative of the risks and prospects faced by 10
the Company, while ensuring a sufficient number of companies in the group. Based on 11
those two considerations, I began with the universe of companies that Value Line 12
classifies as Electric Utilities, and applied the following screening criteria: 13
• I excluded companies that do not consistently pay quarterly cash dividends; 14
• I excluded companies that were not covered by at least two utility industry 15
equity analysts; 16
• I excluded companies that do not have investment grade senior unsecured 17
bond and/or corporate credit ratings from S&P; 18
• I excluded companies that were not vertically-integrated, i.e. utilities that own 19
and operate regulated generation, transmission, and distribution assets; 20
41 American Electric Power Company, Inc., SEC Form 10-K, for the fiscal year ended December 31, 2018, at
2. 42 Source: Bloomberg Professional.

PETITIONER’S EXHIBIT ____
DIRECT TESTIMONY OF ROBERT B. HEVERT
ROBERT B. HEVERT - 29 -
• I excluded companies with less than 60.00 percent of total net operating 1
income derived from regulated utility operations over the three most recently 2
reported fiscal years; 3
• I excluded companies whose regulated electric operating income over the 4
three most recently reported fiscal years represented less than 60.00 percent of 5
total regulated operating income, and; 6
• I eliminated companies that are currently known to be party to a merger or 7
other significant transaction. 8
Q. DID YOU INCLUDE AEP IN YOUR ANALYSIS? 9
A. No. To avoid the circular logic that otherwise would occur, it is my practice to exclude 10
the subject company, or its parent holding company, from the proxy group. 11
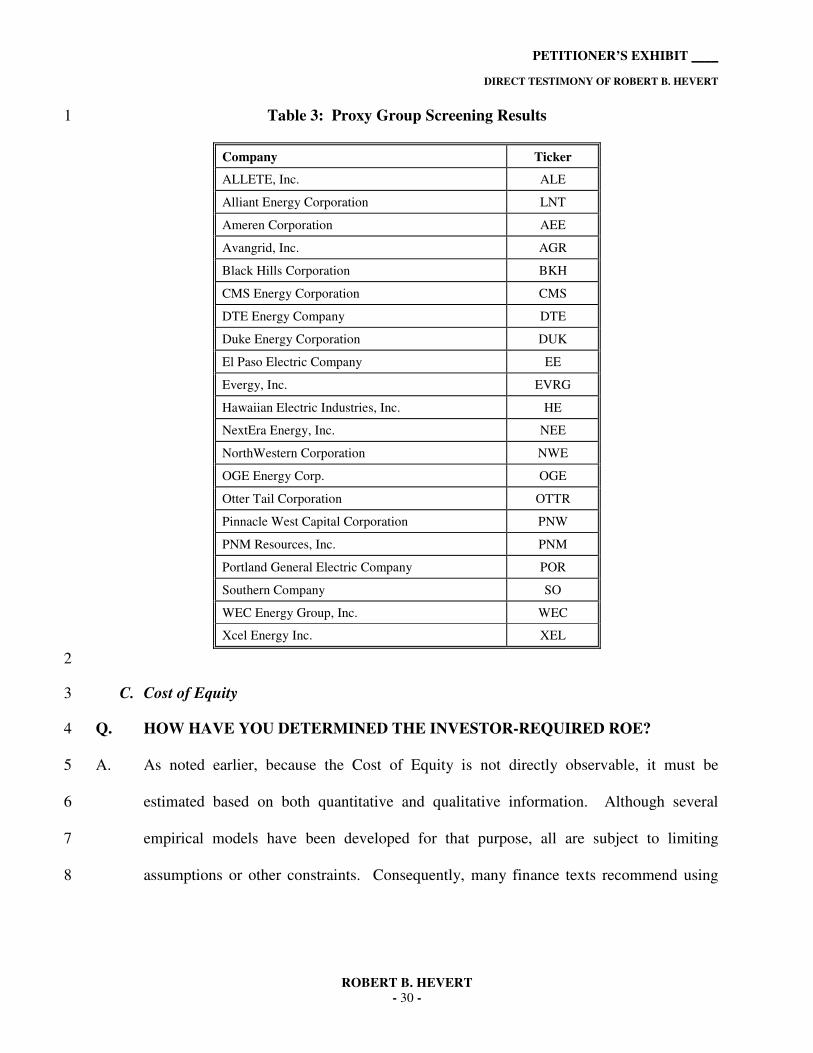
Q. WHAT COMPANIES MET THOSE SCREENING CRITERIA? 12
A. The criteria discussed above resulted in a proxy group of the following 21 companies: 13
PETITIONER’S EXHIBIT ____
DIRECT TESTIMONY OF ROBERT B. HEVERT
ROBERT B. HEVERT - 30 -
Table 3: Proxy Group Screening Results 1
Company Ticker
ALLETE, Inc. ALE
Alliant Energy Corporation LNT
Ameren Corporation AEE
Avangrid, Inc. AGR
Black Hills Corporation BKH
CMS Energy Corporation CMS
DTE Energy Company DTE
Duke Energy Corporation DUK
El Paso Electric Company EE
Evergy, Inc. EVRG
Hawaiian Electric Industries, Inc. HE
NextEra Energy, Inc. NEE
NorthWestern Corporation NWE
OGE Energy Corp. OGE
Otter Tail Corporation OTTR
Pinnacle West Capital Corporation PNW
PNM Resources, Inc. PNM
Portland General Electric Company POR
Southern Company SO
WEC Energy Group, Inc. WEC
Xcel Energy Inc. XEL
2
C. Cost of Equity 3
Q. HOW HAVE YOU DETERMINED THE INVESTOR-REQUIRED ROE? 4
A. As noted earlier, because the Cost of Equity is not directly observable, it must be 5
estimated based on both quantitative and qualitative information. Although several 6
empirical models have been developed for that purpose, all are subject to limiting 7
assumptions or other constraints. Consequently, many finance texts recommend using 8

PETITIONER’S EXHIBIT ____
DIRECT TESTIMONY OF ROBERT B. HEVERT
ROBERT B. HEVERT - 31 -
multiple approaches to estimate the Cost of Equity as detailed in Appendix A.43 When 1
faced with the task of estimating the Cost of Equity, analysts and investors are inclined to 2
gather and evaluate as much relevant data as reasonably can be analyzed and, therefore, 3
rely on multiple analytical approaches. 4
As a practical matter, no individual model is more reliable than all others under 5
all market conditions. Therefore, it is important to use multiple methods to mitigate the 6
effects of assumptions and inputs associated with any single approach. As noted earlier, 7
the use of multiple methods, and the consideration given to them, recently was addressed 8
by FERC. 9
Consistent with that approach, I have considered the results of the Constant 10
Growth DCF model, the traditional and empirical forms of the CAPM, and the Bond 11
Yield Plus Risk Premium approach. I also have provided an Expected Earnings analysis, 12
which I have applied as a corroborating method. FERC issued similar guidance, using 13
the Expected Earnings analysis in its determination of the “zone of reasonableness”, 14
observing that “investors use those models”.44 15
Q. PLEASE BRIEFLY DESCRIBE THE CONSTANT GROWTH DCF MODEL. 16
A. The Constant Growth DCF approach defines the Cost of Equity as the sum of (1) the 17
expected dividend yield, and (2) expected long-term growth. As explained in Appendix 18
A, the model often is expressed in the familiar form 19
� = �(���)
�+ , where the expected dividend yield generally equals the expected annual 20
43 See, e.g., Eugene Brigham, Louis Gapenski, Financial Management: Theory and Practice, 7th Ed., 1994, at
341, and Tom Copeland, Tim Koller and Jack Murrin, Valuation: Measuring and Managing the Value of Companies, 3rd ed., 2000, at 214.
44 Id., at 29 (italics in original).
PETITIONER’S EXHIBIT ____
DIRECT TESTIMONY OF ROBERT B. HEVERT
ROBERT B. HEVERT - 32 -
dividend divided by the current stock price, and the growth rate is based on analysts’ 1
expectations of earnings growth. The Constant Growth DCF formula, which falls from 2
the longer “present value” structure,45 requires several simplifying assumptions, 3
including the constancy of inputs in perpetuity. 4
Under the model’s strict assumptions, the growth rate equals the rate of capital 5
appreciation (that is, the growth in the stock price).46 Given that assumption, it does not 6
matter whether the investor holds the stock in perpetuity, or whether they hold the stock 7
for some period of time, collect the dividends, then sell at the prevailing market price. 8
That result also requires that the ROE result reached today will remain unchanged in 9
perpetuity. So, if market conditions are such that the model produces an unreasonably 10
low (or high) ROE estimate today, it assumes that estimate will be the same ROE 11
investors require every day in the future, regardless of whether or how market conditions 12
change. 13
Q. PLEASE BRIEFLY DESCRIBE THE CAPITAL ASSET PRICING MODEL. 14
A. Whereas DCF models focus on expected cash flows, Risk Premium-based models such as 15
the CAPM focus on the additional return that investors require for taking on additional 16
risk. In finance, “risk” generally refers to the variation in expected returns, rather than 17
the expected return, itself. Consider two firms, X and Y, with expected returns, and the 18
expected variation in returns noted in Chart 4, below. Although the two have the same 19
expected return (12.50 percent), Firm Y’s are far more variable. From that perspective, 20
Firm Y would be considered the riskier investment. 21
45 See Appendix A, part A. 46 As discussed in Appendix A, part A, the model assumes that earnings, dividends, book value, and the stock
price all grow at the same constant rate in perpetuity. Additionally, academic research has indicated that analysts forecasts of growth are superior to other measures of growth (see Appendix A, part A).

PETITIONER’S EXHIBIT ____
DIRECT TESTIMONY OF ROBERT B. HEVERT
ROBERT B. HEVERT - 33 -
Chart 4: Expected Return and Risk 1
2
Now consider two other firms, Firm A and Firm B. Both have expected returns of 3
12.50 percent, and both are equally risky as measured by their volatility. But as Firm A’s 4
returns go up, Firm B’s returns go down. That is, the returns are negatively correlated. 5
Chart 5: Relative Risk 6
7
8 9 10 11 12 13 14 15 16 17
Expected Rate of Return (%)
Firm X
Firm Y

PETITIONER’S EXHIBIT ____
DIRECT TESTIMONY OF ROBERT B. HEVERT
ROBERT B. HEVERT - 34 -
If we were to combine Firms A and B into a portfolio, we would expect a 12.50 1
percent return with no uncertainty because of the opposing symmetry of their risk 2
profiles. That is, we can diversify the risk away. As long as two stocks are not perfectly 3
correlated, we can achieve diversification benefits by combining them in a portfolio. 4
That is the essence of the Capital Asset Pricing Model – because we can combine firms 5
into a portfolio, the only risk that matters is the risk that remains after diversification, i.e., 6
the “non-diversifiable” risk. 7
The CAPM defines the Cost of Equity as the sum of the “risk-free” rate, and a 8
premium to reflect the additional risk associated with equity investments. The “risk-free” 9
rate is the yield on a security viewed as having no default risk, such as long-term 10
Treasury bonds. The risk-free rate essentially sets the baseline of the CAPM. That is, an 11
investor would expect a higher return than the risk-free rate to purchase an asset that 12
carries risk. The difference between that higher return (i.e., the required return) and the 13
risk-free rate is the risk premium. 14
Risk-Free Rate + Risk Premium = Cost of Equity [1] 15
The risk premium is defined as a security’s Beta coefficient multiplied by the risk 16
premium of the overall market (the “Market Risk Premium” or “MRP”). The Beta 17
coefficient is a measure of the subject company’s risk relative to the overall market, i.e., 18
the “non-diversifiable” risk. A Beta coefficient of 1.00 means the security is as risky as 19
the overall market; a value below 1.00 represents a security with less risk than the overall 20
market, and a value over 1.00 represents a security with more risk than the overall 21
market. 22
Risk-Free Rate + (Beta Coefficient x Market Risk Premium) = Cost of Equity [2] 23
PETITIONER’S EXHIBIT ____
DIRECT TESTIMONY OF ROBERT B. HEVERT
ROBERT B. HEVERT - 35 -
Given that the correlation between the proxy group companies and the S&P 500 1
has declined since 2010, while the relative risk has increased, the CAPM in the form 2
presented here may not adequately reflect the expected systematic risk, and therefore, the 3
returns required by investors in low-Beta companies. As such, I have considered the 4
Empirical CAPM (“ECAPM”) approach, which is a variant of the CAPM approach. The 5
ECAPM adjusts for the CAPM’s tendency to under-estimate returns for companies that 6
(like utilities) have Beta coefficients less than one, and over-estimate returns for 7
relatively high-Beta coefficient stocks. 8
Q. PLEASE BRIEFLY DESCRIBE THE BOND YIELD PLUS RISK PREMIUM 9
APPROACH. 10
A. This approach is based on the basic financial principle that equity investors bear the risk 11
associated with ownership and therefore require a premium over the return they would 12
have earned as a bondholder. That is, because returns to equity holders are more risky 13
than returns to bondholders, equity investors must be compensated for bearing that 14
additional risk (that difference often is referred to as the “Equity Risk Premium”). Bond 15
Yield Plus Risk Premium approaches estimate the Cost of Equity as the sum of the 16
Equity Risk Premium and the yield on a particular class of bonds. 17
Bond Yield + Equity Risk Premium = Cost of Equity [3] 18
Q. PLEASE SUMMARIZE YOUR ANALYTICAL RESULTS. 19
A. The results of the models described above are provided in Tables 4a and 4b, below.47 20
47 See Appendix A for a more detailed description of the models, assumptions, and inputs described in
Section IV.

PETITIONER’S EXHIBIT ____
DIRECT TESTIMONY OF ROBERT B. HEVERT
ROBERT B. HEVERT - 36 -
Table 4a: Summary of DCF Results48 1
Mean Low Mean
Mean High
30-Day Average 8.03% 8.92% 9.97%
90-Day Average 8.13% 9.03% 10.08%
180-Day Average 8.22% 9.12% 10.17%
2
Table 4b: Summary of Risk Premium Results49 3
CAPM
Bloomberg Derived
Market Risk Premium
Value Line Derived
Market Risk Premium
Average Bloomberg Beta Coefficient
Current 30-Year Treasury (3.03%) 8.14% 9.64%
Near Term Projected 30-Year Treasury (3.25%) 8.36% 9.86%
Average Value Line Beta Coefficient
Current 30-Year Treasury (3.03%) 9.33% 11.18%
Near Term Projected 30-Year Treasury (3.25%) 9.55% 11.40%
ECAPM
Bloomberg Derived
Market Risk Premium
Value Line Derived
Market Risk Premium
Average Bloomberg Beta Coefficient
Current 30-Year Treasury (3.03%) 9.51% 11.42%
Near Term Projected 30-Year Treasury (3.25%) 9.74% 11.64%
Average Value Line Beta Coefficient
Current 30-Year Treasury (3.03%) 10.41% 12.57%
Near Term Projected 30-Year Treasury (3.25%) 10.63% 12.79%
Bond Yield Plus Risk Premium Approach
Current 30-Year Treasury (3.03%) 9.93%
Near Term Projected 30-Year Treasury (3.25%) 9.96%
Long-Term Projected 30-Year Treasury (4.05%) 10.17%
4
48 See Attachment RBH-2. 49 See Attachments RBH-5 and RBH-6.
PETITIONER’S EXHIBIT ____
DIRECT TESTIMONY OF ROBERT B. HEVERT
ROBERT B. HEVERT - 37 -
Q. PLEASE BRIEFLY DESCRIBE THE EXPECTED EARNINGS ANALYSIS. 1
A. The Expected Earnings analysis is based on the principle of opportunity costs. By taking 2
historical returns on book equity and comparing those to authorized ROEs, investors are 3
able to directly compare returns from investments of similar risk. In addition to historical 4
returns, Value Line also provides projected returns on book equity. I have relied solely on 5
forward-looking projections in the Expected Earnings analysis.50 Those results range 6
from 6.50 percent to 14.06 percent, with an average of 10.26 percent.51 As noted earlier, 7
I used those results to assess the reasonableness of the DCF, CAPM, and Bond-Yield 8
Plus Risk Premium results.52 9
D. Flotation Costs 10
Q. WHAT ARE FLOTATION COSTS? 11
A. Flotation costs are the costs associated with the sale of new issues of common stock. 12
These costs include out-of-pocket expenditures for preparation, filing, underwriting, and 13
other issuance costs of common stock. 14
Q. WHY IS IT IMPORTANT TO RECOGNIZE FLOTATION COSTS IN THE 15
ALLOWED ROE? 16
A. To attract and retain new investors, a regulated utility must have the opportunity to earn a 17
return that is both competitive and compensatory. To the extent a company is denied the 18
opportunity to recover prudently incurred flotation costs, actual returns will fall short of 19
expected (or required) returns, thereby diminishing its ability to attract adequate capital 20
on reasonable terms. 21
50 As described more fully in Appendix A, an adjustment is necessary to accurately reflect the average
invested capital over the period in question. 51 Attachment RBH-7. 52 See Docket Nos. EL14-12-003 and EL15-45-000, Order Directing Briefs. (November 15, 2018)

PETITIONER’S EXHIBIT ____
DIRECT TESTIMONY OF ROBERT B. HEVERT
ROBERT B. HEVERT - 38 -
Q. ARE FLOTATION COSTS PART OF THE UTILITY’S INVESTED COSTS OR 1
PART OF THE UTILITY’S EXPENSES? 2
A. Flotation costs are part of the invested costs of the utility, which are properly reflected on 3
the balance sheet under “paid in capital.” They are not current expenses, and therefore 4
are not reflected on the income statement. Rather, like investments in rate base or the 5
issuance costs of long-term debt, flotation costs are incurred over time. As a result, the 6
great majority of a utility’s flotation cost is incurred prior to the test year, but remains 7
part of the cost structure that exists during the test year and beyond. As such, it should be 8
recognized for ratemaking purposes. Therefore, recovery of flotation costs is appropriate 9
even if no new issuances are planned in the near future because failure to allow such cost 10
recovery may deny I&M the opportunity to earn its required rate of return in the future. 11
Q. IS THE NEED TO CONSIDER FLOTATION COSTS ELIMINATED BECAUSE 12
I&M IS A WHOLLY OWNED SUBSIDIARY OF AEP? 13
A. No, it is not. Wholly owned subsidiaries such as I&M receive equity capital from their 14
parents, and provide returns on the capital that roll up to the parent, which is designated 15
to attract and raise capital based on the returns of those subsidiaries. To deny recovery of 16
issuance costs associated with capital that is invested in the subsidiaries ultimately would 17
penalize the investors that fund the utility operations, and would inhibit the utility’s 18
ability to obtain new equity capital at a reasonable cost. This is important for companies 19
such as I&M that are planning continued capital expenditures in the near term, and for 20
which access to capital (at reasonable cost rates) to fund such required expenditures will 21
be critical. 22

PETITIONER’S EXHIBIT ____
DIRECT TESTIMONY OF ROBERT B. HEVERT
ROBERT B. HEVERT - 39 -
Q. DO THE DCF AND CAPM MODELS ALREADY INCORPORATE INVESTOR 1
EXPECTATIONS OF A RETURN TO COMPENSATE FOR FLOTATION 2
COSTS? 3
A. No. The models used to estimate the appropriate ROE assume no “friction” or 4
transaction costs, as these costs are not reflected in the market price (in the case of the 5
DCF model) or risk premium (in the case of the CAPM and the Bond Yield Plus Risk 6
Premium model). Therefore, it is appropriate to consider flotation costs when 7
determining where within the range of reasonable results I&M’s return should fall. 8
Q. IS THE NEED TO CONSIDER FLOTATION COSTS RECOGNIZED BY THE 9
ACADEMIC AND FINANCIAL COMMUNITIES? 10
A. Yes. The need to reimburse investors for equity issuance costs is recognized by the 11
academic and financial communities in the same spirit that investors are reimbursed for 12
the costs of issuing debt. For example, Dr. Morin notes that “[t]he costs of issuing 13
[common stock] are just as real as operating and maintenance expenses or costs incurred 14
to build utility plants, and fair regulatory treatment must permit the recovery of these 15
costs.”53 Dr. Morin further notes that “equity capital raised in a given stock issue remains 16
on the utility’s common equity account and continues to provide benefits to ratepayers 17
indefinitely.”54 This treatment is consistent with the philosophy of a fair rate of return. 18
As explained by Dr. Shannon Pratt: 19
Flotation costs occur when a company issues new stock. The business 20 usually incurs several kinds of flotation or transaction costs, which 21 reduce the actual proceeds received by the business. Some of these are 22 direct out-of-pocket outlays, such as fees paid to underwriters, legal 23
53 Roger A. Morin, New Regulatory Finance, Public Utility Reports, Inc., 2006, at 321. 54 Id., at 327.

PETITIONER’S EXHIBIT ____
DIRECT TESTIMONY OF ROBERT B. HEVERT
ROBERT B. HEVERT - 40 -
expenses, and prospectus preparation costs. Because of this reduction 1 in proceeds, the business’s required returns must be greater to 2 compensate for the additional costs. Flotation costs can be accounted 3 for either by amortizing the cost, thus reducing the net cash flow to 4 discount, or by incorporating the cost into the cost of equity capital. 5 Since flotation costs typically are not applied to operating cash flow, 6 they must be incorporated into the cost of equity capital.55 7
Similarly, Morningstar has commented on the need to reflect flotation costs in the cost of 8
capital: 9
Although the cost of capital estimation techniques set forth later in this 10 book are applicable to rate setting, certain adjustments may be 11 necessary. One such adjustment is for flotation costs (amounts that 12 must be paid to underwriters by the issuer to attract and retain 13 capital).56 14
Q. HAVE YOU CALCULATED THE EFFECT OF FLOTATION COSTS ON THE 15
RETURN ON EQUITY? 16
A. Yes, I have. I modified the DCF calculation to derive the dividend yield that would 17
reimburse investors for direct issuance costs. Based on the weighted average issuance 18
costs shown in Attachment RBH-8, a reasonable estimate of flotation costs is 19
approximately 0.09 percent (nine basis points). Although I have calculated the effect of 20
flotation costs, I did not make any explicit adjustments to my ROE estimates to account 21
for flotation costs. Rather, I took it into consideration in determining where the 22
Company’s Cost of Equity falls within the range of analytical results. 23
55 Shannon P. Pratt, Roger J. Grabowski, Cost of Capital: Applications and Examples, 4th Ed. (John Wiley &
Sons, Inc., 2010), at 586. 56 Morningstar, Inc. Ibbotson SBBI 2013 Valuation Yearbook, at 25.

PETITIONER’S EXHIBIT ____
DIRECT TESTIMONY OF ROBERT B. HEVERT
ROBERT B. HEVERT - 41 -
V. BUSINESS RISKS AND OTHER CONSIDERATIONS 1
Q. DO THE MEAN DCF, CAPM, AND RISK PREMIUM RESULTS FOR THE 2
PROXY GROUP PROVIDE AN APPROPRIATE ESTIMATE FOR THE COST 3
OF EQUITY FOR I&M? 4
A. No, the mean results do not necessarily provide an appropriate estimate of I&M’s Cost of 5
Equity. In my view, there are additional factors that must be taken into consideration 6
when determining where I&M’s Cost of Equity falls within the range of results, 7
including: (1) the risks associated with the Company’s generation portfolio and related 8
environmental regulations; (2) the risk associated with customer concentration; and (3) 9
the Company’s planned capital expenditures and the effect, if any, of certain regulatory 10
mechanisms. Those factors, which are discussed below, should be considered in terms of 11
their overall effect on I&M’s business risk and investor earnings and, therefore, its Cost 12
of Equity. 13
A. Generation Portfolio & Environmental Regulations 14
Q. PLEASE PROVIDE AN OVERVIEW OF THE RISKS ASSOCIATED WITH 15
I&M’S GENERATION PORTFOLIO AND CURRENT ENVIRONMENTAL 16
REGULATIONS. 17
A. I&M’s operations are substantially dependent on coal-fired, and nuclear generation. As 18
shown in Figure TLT-1 included in Company witness Mr. Thomas’s testimony, coal-19
fired generation represented approximately 46.50 percent of the Company’s total 20
generation resources and nuclear generation represented approximately 44.10 percent. In 21
total, coal-fired and nuclear generation represent approximately 90.60 percent of I&M’s 22
generation resource mix. In general, capital-intensive generation assets, such as nuclear 23

PETITIONER’S EXHIBIT ____
DIRECT TESTIMONY OF ROBERT B. HEVERT
ROBERT B. HEVERT - 42 -
and coal-fired generation facilities, are subject to certain risks including the recovery of 1
the investors’ capital in the event of a change in market structure or a plant failure, and 2
the recovery of replacement power and repair costs in the event of extended or unplanned 3
outage. In addition, Federal environmental regulations present the substantial risk of 4
acquiring and investing additional capital to comply with new regulations, operating 5
restrictions, or possibly closure. 6
Most recently, the U.S. Environmental Protection Agency (“EPA”) unveiled a 7
proposal to replace the Clean Power Plan with the Affordable Clean Energy (“ACE”) 8
rule. The ACE rule would allow utilities to make heat efficiency upgrades to coal-fired 9
power plants without triggering further environmental controls and would exclude natural 10
gas-fired power plants from emissions limits.57 Because investors consider those risks 11
when establishing their return requirements, the Commission likewise should consider 12
the effect of the additional risk associated with the Company’s generating portfolio in 13
determining its authorized ROE. 14
As noted by Company witness Mr. Thomas, I&M faces additional environmental 15
requirements related to its coal-fired generation, in particular, the Consent Decree that 16
was entered between the EPA, I&M, and other parties under the New Source Review 17
regulations of the Clean Air Act. These environmental requirements bring to focus the 18
risks and costs associated with I&M’s coal-fired generation. 19
In a recent report, S&P noted that power generators have addressed carbon-20
reduction policies that target coal-fired generating plants by implementing three 21
57 See S&P Global Market Intelligence, “EPA's Affordable Clean Energy rule: How it would work,” August
21, 2018. The EPA has pushed back its timeline for issuing regulations for ACE to the second quarter of 2019. See S&P Global Market Intelligence, “US EPA pushes back timeline for Clean Power Plan replacement following shutdown” February 7, 2019.

PETITIONER’S EXHIBIT ____
DIRECT TESTIMONY OF ROBERT B. HEVERT
ROBERT B. HEVERT - 43 -
strategies: adding “scrubbers” to coal-fired plants; switching to burning natural gas; or 1
retiring coal-fired plants outright.58 To the extent those strategies increase costs for 2
utilities, the companies’ credit profiles may come under pressure. As noted by S&P: 3
Higher costs could become a key credit issue for regulated utilities 4 given the importance of managing customer rate increases, which has 5 implications for relations with regulators, as well as economic and 6 political ramifications that could heighten business risk. Any rating 7 actions would likely not occur until there is further clarity from a 8 utility about early plant retirements and related cost recovery. For 9 utilities that have significant coal-fired generation, recovery 10 mechanisms will be extremely important to continue to support 11 operating cash flow and maintain robust financial measures.59 12
Consequently, the risks associated with the Company’s generation mix and the 13
potential cost of compliance with related environmental regulations could affect the 14
Company’s financial profile. 15
Q. PLEASE DESCRIBE THE COMPANY’S NUCLEAR GENERATING ASSETS. 16
A. I&M’s generation portfolio includes approximately 2,278 megawatts (“MW”) of owned 17
operating nuclear generating capacity from its Cook Plant, as discussed in greater detail 18
by Company witness Mr. Lies. AEP states in its 2018 SEC Form 10-K that it is exposed 19
to nuclear generation risk: 20
I&M owns the Cook Plant, which consists of two nuclear generating 21 units for a rated capacity of 2,278 MWs, or about 7% of the generating 22 capacity in the AEP System. AEP and I&M are, therefore, subject to 23 the risks of nuclear generation, which include the following: 24
• The potential harmful effects on the environment and human 25 health due to an adverse incident/event resulting from the 26 operation of nuclear facilities and the storage, handling and 27 disposal of radioactive materials such as spent nuclear fuel. 28
58 S&P Research, The Clean Power Plan Will Spur Further Coal Plant Closings, but How Will U.S. Utilities
Recover the Costs? (Sept. 2, 2014).
59 Id.

PETITIONER’S EXHIBIT ____
DIRECT TESTIMONY OF ROBERT B. HEVERT
ROBERT B. HEVERT - 44 -
• Limitations on the amounts and types of insurance 1 commercially available to cover losses that might arise in 2 connection with nuclear operations. 3
• Uncertainties with respect to contingencies and assessment 4 amounts triggered by a loss event (federal law requires owners 5 of nuclear units to purchase the maximum available amount of 6 nuclear liability insurance and potentially contribute to the 7 coverage for losses of others). 8
• Uncertainties with respect to the technological and financial 9 aspects of decommissioning nuclear plants at the end of their 10 licensed lives. 11
There can be no assurance that I&M’s preparations or risk mitigation 12 measures will be adequate if and when these risks are triggered. 13
* * * * 14
Costs associated with the operation (including fuel), maintenance and 15 retirement of nuclear plants continue to be more significant and less 16 predictable than costs associated with other sources of generation, in 17 large part due to changing regulatory requirements and safety 18 standards, availability of nuclear waste disposal facilities and 19 experience gained in the operation of nuclear facilities. Costs also may 20 include replacement power, any unamortized investment at the end of 21 the useful life of the Cook Plant (whether scheduled or premature), the 22 carrying costs of that investment and retirement costs. The ability to 23 obtain adequate and timely recovery of costs associated with the Cook 24 Plant is not assured.60 25
Q. PLEASE EXPLAIN THE RISK ASSOCIATED WITH THE COMPANY’S 26
NUCLEAR GENERATING ASSETS. 27
A. Nuclear generating resources are regulated by the U.S. Nuclear Regulatory Commission 28
(“NRC”). I&M is subject to NRC mandates to meet licensing and safety related 29
standards that may require increased capital spending and incremental operating costs to 30
ensure the continued operation of this very low-cost and emission-free generating source. 31
60 American Electric Power Co., Inc. SEC 10-K, for the fiscal year ended December 31, 2018, at 33-34.

PETITIONER’S EXHIBIT ____
DIRECT TESTIMONY OF ROBERT B. HEVERT
ROBERT B. HEVERT - 45 -
With respect to the potential for new regulatory requirements, AEP’s SEC Form 10-K 1
specifically noted: 2
The NRC has broad authority under federal law to impose licensing 3 and safety-related requirements for the operation of nuclear generation 4 facilities. In the event of non compliance, the NRC has the authority to 5 impose fines or shut down a unit, or both, depending upon its 6 assessment of the severity of the situation, until compliance is 7 achieved. Revised safety requirements promulgated by the NRC could 8 necessitate substantial capital expenditures at nuclear plants. In 9 addition, although management has no reason to anticipate a serious 10 nuclear incident at the Cook Plant, if an incident did occur, it could 11 harm results of operations or financial condition. A major incident at a 12 nuclear facility anywhere in the world could cause the NRC to limit or 13 prohibit the operation or licensing of any domestic nuclear unit. 14 Moreover, a major incident at any nuclear facility in the U.S. could 15 require AEP or I&M to make material contributory payments.61 16
Q. ARE THERE EXAMPLES OF THE INCREASED RISK OF NEW 17
REGULATORY REQUIREMENTS THAT NUCLEAR GENERATION PLANT 18
OPERATORS FACE? 19
A. Yes. One example of nuclear risk is the increased oversight and regulatory requirements 20
put in place following the March 11, 2011 earthquake and tsunami, which caused 21
significant damage to the Fukushima Daiichi nuclear complex and threatened the public 22
health. After the Fukushima accident, the NRC assembled a task force to assess current 23
regulation and determine if new measures were required to ensure safety. The task force 24
issued a report in July 2011 that included a set of recommendations for NRC 25
consideration. 26
Those recommendations continue to be modified and expanded by NRC staff, and 27
the first related regulatory requirements were issued in March 2012 with implementation 28
61 American Electric Power, Inc. SEC 10-K, for the fiscal year ended December 31, 2018, at 34.

PETITIONER’S EXHIBIT ____
DIRECT TESTIMONY OF ROBERT B. HEVERT
ROBERT B. HEVERT - 46 -
guidance issued on August 30, 2012.62 The evolving nature of these NRC requirements 1
put nuclear operators at risk of incurring costly future capital expenditures. For example, 2
a 2013 survey of approximately one-half of the nuclear operators in the U.S. indicated 3
that upgrade costs for the country’s nuclear fleet could total $3.6 billion over the coming 4
three to five years.63 5
Another example of nuclear risk is the ongoing and long-term uncertainty in 6
regard to nuclear waste disposal, as discussed by Company Witness Mr. Lies. On June 8, 7
2012, the U.S. Court of Appeals vacated the NRC’s rulemaking regarding storage and 8
permanent disposal of nuclear waste. The Court of Appeals found the NRC rulemaking 9
was deficient in that: (1) it “did not calculate the environmental effects of failing to 10
secure permanent storage,” and (2) “in determining that spent fuel can safely be stored on 11
site at nuclear plants for sixty years after the expiration of a plant’s license, the [NRC] 12
failed to properly examine future dangers and key consequences.”64 The adjudicatory 13
hearing that is required before a licensing decision can be made remains suspended.65 14
Nuclear operators therefore face future capital expenditures related to expansion of 15
nuclear waste storage, and may face additional costs to meet safety standards that may be 16
required when the NRC addresses the Court of Appeal’s ruling. 17
To the extent further mandates are promulgated by the NRC, additional spending 18
may be required. Absent full and timely recovery, increases in the Company’s capital 19
62 www.nrc.gov/reactors/operating/ops-experience/japan-info.html 63 U.S. Nuclear Plant Operators Estimate $3.6 billion in Post-Fukushima Costs, Platts Nucleonics Week (June
6, 2013).
64 U.S. Court of Appeals For the District of Columbia Circuit, On Petitions for Review of Orders of the
Nuclear Regulatory Commission, Case No. 11-1045, Decided June 8, 2012, at 3. 65 https://www.nrc.gov/waste/hlw-disposal.html
PETITIONER’S EXHIBIT ____
DIRECT TESTIMONY OF ROBERT B. HEVERT
ROBERT B. HEVERT - 47 -
investment requirements will place additional pressure on its free cash flow and credit 1
metrics. 2
Q. WHAT ARE YOUR CONCLUSIONS REGARDING THE RISK OF I&M’S 3
GENERATING PORTFOLIO? 4
A. First, approximately 90.60 percent of I&M’s generating portfolio consists of coal-fired 5
and nuclear power plants that face certain inherent risks associated with capital intensive 6
assets such as the risk of new regulations, cost uncertainty, and the ability to obtain 7
adequate and timely cost recovery. In particular, I&M and its investors face the risk that 8
federal environmental regulations will require the Company to invest additional capital or 9
face closure or curtailment of generating capacity. Because investors consider these risks 10
in establishing their return requirements, the Commission likewise should consider the 11
effect of the additional risk associated with I&M’s generating portfolio in determining its 12
authorized ROE. 13
B. Customer Concentration 14
Q. PLEASE DISCUSS I&M’S DEGREE OF CUSTOMER CONCENTRATION. 15
A. As described by Company witnesses Mr. Thomas and Mr. Williamson, several wholesale 16
contracts are scheduled to end in June 2020, which the Company has not been able to 17
replace. Additionally, the Company has one large industrial customer that represents a 18
significant load. 19
Q. HOW DOES CUSTOMER CONCENTRATION AFFECT I&M’S BUSINESS 20
RISK? 21
A. I&M’s concentration of load under wholesale contract poses an incremental element of 22
business risk in two ways. First, these wholesale contracts reflect a substantial amount of 23

PETITIONER’S EXHIBIT ____
DIRECT TESTIMONY OF ROBERT B. HEVERT
ROBERT B. HEVERT - 48 -
the Company’s fixed costs which are otherwise subject to recovery from retail customers. 1
Second, this potential increase in the cost burden of retail customers poses customer risk, 2
further exacerbating the issue. Consequently, the Company’s substantial capital 3
investment plans and flat or declining retail load create a circumstance under which each 4
dollar of invested assets produces fewer dollars of revenue. Under this scenario, the 5
Company’s ability to fund capital investments through growth-related revenue increases 6
would be severely limited. 7
Q. PLEASE DESCRIBE THE TREND IN THE COMPANY’S SALES AND 8
CUSTOMERS. 9
A. As discussed by Company witness Mr. Burnett, the Company has experienced a 10
significant decrease in residential usage per customer over the last decade.66 As a result, 11
the Company’s weather normalized residential retail sales load in Indiana has declined by 12
0.70 percent per year from 2005 to 2015 even though the customer count slightly 13
increased. The decrease in residential usage per customer is largely driven by an 14
aggressive promotion of energy efficiency technologies and Company-sponsored 15
Demand Side Management programs.67 16
As discussed by Company witness Thomas, the Company also expects a decline 17
in wholesale demand during the test year as several contracts with Indiana Michigan 18
Municipal Distributors Association (“IMMDA”) members expire on or before June 1, 19
2020.68 20
66 Direct Testimony of Chad Burnett, at 16-17. 67 Id., at 17. 68 Direct Testimony of Toby Thomas, at 6.

PETITIONER’S EXHIBIT ____
DIRECT TESTIMONY OF ROBERT B. HEVERT
ROBERT B. HEVERT - 49 -
Q. WHAT EFFECT DOES DECLINING LOAD HAVE ON THE COMPANY AND 1
ITS CUSTOMERS? 2
A. All else equal, flat or declining load produces lower revenues, which diminishes the 3
Company’s ability to recover its cost of service, putting upward pressure on rates and 4
increasing the burden on customers that remain on the system. Absent the ability to 5
offset lower revenues with cost savings, the result is an inability to earn the Company’s 6
authorized return. 7
C. Regulatory Mechanisms and Capital Spending 8
Q. HOW COMMON ARE REVENUE STABILIZATION AND COST RECOVERY 9
MECHANISMS WITHIN THE INDUSTRY? 10
A. There is little question that revenue stabilization and cost recovery structures are 11
becoming increasingly common. The increased interest in such mechanisms has 12
generally resulted from the growing cost of maintaining system reliability, coupled with 13
the flat or declining sales volume brought on by energy efficiency and relatively slow 14
economic growth. Adjustment mechanisms to recover fuel costs, purchased power 15
expenses, energy efficiency and demand-side program costs, new plant investment, and 16
other expenses are common.69 In addition, full or partial decoupling mechanisms have 17
been implemented by electric utilities in 32 jurisdictions.70 Consequently, the 18
implementation of alternative regulation mechanisms has become an increasingly visible 19
issue to investors. 20
69 Attachment RBH-9. 70 See for example, Adjustment Clauses: A State-by-State Overview, Regulatory Research Associates,
September 28, 2018; ACEEE Utility Business Model database, https://database.aceee.org/state/utility-business-model.
PETITIONER’S EXHIBIT ____
DIRECT TESTIMONY OF ROBERT B. HEVERT
ROBERT B. HEVERT - 50 -
Q. ARE ALTERNATIVE REGULATION MECHANISMS COMMON AMONG THE 1
PROXY GROUP COMPANIES? 2
A. Yes, they are. Attachment RBH-9 provides a summary of alternative regulation 3
mechanisms and cost trackers currently in effect at each electric utility subsidiary of the 4
proxy group companies. As Attachment RBH-9 demonstrates, recovery mechanisms are 5
common among the proxy companies. Under the comparable earnings standard, the 6
allowed Return on Equity should represent a return commensurate with the returns on 7
investments of similar risk. To the extent the proxy companies have mechanisms in place 8
to address revenue shortfalls or cost recovery, the Company’s use of cost recovery 9
mechanisms make it more comparable to its peers. 10
Q. DO THE COMPANY’S COST RECOVERY MECHANISMS REDUCE ITS COST 11
OF EQUITY? 12
A. No, they do not. The principal analytical issue is whether the Company is so less risky 13
than its peers as a direct result of its recovery mechanisms that investors would 14
specifically and measurably reduce their return requirements. The fact that the 15
Company’s existing recovery mechanisms may, to a degree, stabilize the Company's 16
revenues will not affect its Cost of Equity unless it can be demonstrated that (1) the 17
Company is materially less risky than the proxy group by virtue of those mechanisms; 18
and (2) investors are likely to react to the incremental effect of those mechanisms. 19
Because revenue stabilization and cost recovery mechanisms are common among the 20
proxy companies, there is no reason to assume that I&M would be materially less risky, 21
and that its Cost of Equity would be lower than its peers’ as a result of its recovery 22
mechanisms. 23

PETITIONER’S EXHIBIT ____
DIRECT TESTIMONY OF ROBERT B. HEVERT
ROBERT B. HEVERT - 51 -
Q. DOES THE COMPANY’S PROPOSED CUSTOMER CHARGE HAVE THE 1
EFFECT OF REDUCING ITS COST OF EQUITY? 2
A. No, it does not. I understand that the Company’s proposed customer charge, which 3
would provide an incremental degree of revenue stability, is intended to reduce the extent 4
to which volumetric rates recover fixed costs. However, Company’s proposed rates 5
result in only a modest improvement in fixed cost recovery with 88.0 percent of fixed 6
costs still being recovered through volumetric rates. 7
Q. HAVE YOU ALSO CONSIDERED THE EFFECT OF THE COMPANY’S 8
FUTURE TEST YEAR ON ITS COST OF EQUITY? 9
A. Yes, I have. Attachment RBH-9 demonstrates that a number of the proxy companies 10
operate in jurisdictions that provide for future or partially forecast test years, or that 11
permit Construction Work In Progress (“CWIP”) to be included in rate base.71 As to their 12
prevalence, Value Line believes that the use of such regulatory mechanisms “is likely to 13
increase as utilities request similar mechanisms in additional states.”72 Similarly, S&P 14
has noted that it has “seen many state commissions approve alternative ratemaking 15
techniques to traditional base rate case applications, which help utilities sustain cash flow 16
measures, earning power, and ultimately, credit quality.”73 Consequently, the use of a 17
forecast test year does not reduce the Company’s risk relative to the proxy group. 18
71 Source: Regulatory Research Associates. See Attachment RBH-9. 72 See Paul E. Debbas, CFA, What Electric Utilities Are Doing About Regulatory Lag, Value Line, May 23,
2012. 73 S&P RatingsDirect, Industry Economic and Ratings Outlook: U.S. Regulated Utilities Expected To
Continue On Stable Trajectory In 2013, January 25, 2013.

PETITIONER’S EXHIBIT ____
DIRECT TESTIMONY OF ROBERT B. HEVERT
ROBERT B. HEVERT - 52 -
Q. IS THE TIMELINESS OF RECOVERY AFFORDED BY THE COMPANY’S 1
TRACKERS OF CONCERN TO INVESTORS? 2
A. Yes. Although the capital recovery mechanisms discussed above are viewed positively 3
by the investment community,74 of concern is the effect of the regulatory lag given the 4
Company’s proposed capital spending program. I&M currently plans to invest over 5
$1.23 billion during the period including 2019-2020.75 That amount includes 6
expenditures in both transmission and distribution facilities and to maintain safe, 7
sufficient, and reliable service. As the Company moves forward with its capital spending 8
plan, retained earnings will be an important source of funding in mitigating the delay of 9
capital recovery and executing its capital spending program.76 10
Q. PLEASE SUMMARIZE I&M’S CAPITAL EXPENDITURE PLANS. 11
A. As discussed by Company witness Mr. Lucas, the Company’s capital expenditure 12
program is substantial. I&M currently plans to invest approximately $1.23 billion of 13
additional capital from 2019-2020, which includes the test year period (see Table 5, 14
below).77 15
Table 5: I&M Capital Spending ($ millions)78 16
2019 2020 Total $635 $597 $1,232
17
74 See Moody’s Investor Service, Credit Opinion: Indiana Michigan Power Company, April 27, 2018, at 3. 75 See Attachment DAL-2, Page 1. 76 Moody’s Investor Service, Indiana Michigan Power Company, April 27, 2018, at 5. 77 See Attachment DAL-2, Page 1. 78 Id.

PETITIONER’S EXHIBIT ____
DIRECT TESTIMONY OF ROBERT B. HEVERT
ROBERT B. HEVERT - 53 -
Because the Company will continue to make substantial investments in its utility 1
operations, it will require efficient access to capital markets during the period that rates 2
established in this proceeding will be in effect. 3
Q. PLEASE ELABORATE ON THE COMPANY’S NEED TO RELY ON RETAINED 4
EARNINGS. 5
A. It is particularly important for utilities to fund capital investments with internally 6
generated cash flow. Since 2013, however, I&M’s ratio of cash flow from operating 7
activities to capital expenditures has remained below its peers (see Chart 6, below). 8
Because its cash flows have been less able to support its capital investment, the Company 9
must access external capital, increasing the potential for negative credit consequences. 10
Chart 6: Historical Ratio of 11
Cash Flow from Operating Activities to Capital Expenditures79 12
13
Retained earnings is an important funding mechanism in that net income is a primary 14
source of operating cash flow, which reduces the Company’s need to rely on external 15
79 Source: S&P Global Market Intelligence.
0.00
0.20
0.40
0.60
0.80
1.00
1.20
2013 2014 2015 2016 2017
Indiana Michigan Power Proxy Group OpCo Median

PETITIONER’S EXHIBIT ____
DIRECT TESTIMONY OF ROBERT B. HEVERT
ROBERT B. HEVERT - 54 -
capital.80 As shown above, however, the Company’s capital expenditures have 1
considerably exceeded its operating cash flow. 2
Q. PLEASE ELABORATE ON WHY IS IT IMPORTANT FOR A UTILITY TO BE 3
ALLOWED THE OPPORTUNITY TO EARN A RETURN THAT IS ADEQUATE 4
TO ATTRACT CAPITAL AT REASONABLE TERMS. 5
A. As discussed earlier in my Direct Testimony, the allowed ROE should enable the subject 6
utility to finance capital expenditures and working capital requirements at reasonable 7
rates, and to maintain its financial integrity in a variety of economic and capital market 8
conditions. The ratemaking process is based on the principle that, in order for investors 9
and companies to commit the capital needed to provide safe and reliable utility services, 10
the utility must have the opportunity to recover the return of, and the market-required 11
return on, invested capital. Regulatory commissions recognize that because utility 12
operations are capital intensive, their decisions should enable the utility to attract capital 13
at reasonable terms; doing so balances the long-term interests of the utility and its 14
ratepayers. 15
Further, the financial community carefully monitors the current and expected 16
financial condition of utility companies, as well as the regulatory environment in which 17
those companies operate. In that respect, the regulatory environment is one of the most 18
important factors considered in both debt and equity investors’ assessments of risk. That 19
is especially important during periods in which the utility expects to make significant 20
capital investments and, therefore, may require access to capital markets. 21
80 Moody’s Investor Service, Indiana Michigan Power Company, April 27, 2018, at 5.

PETITIONER’S EXHIBIT ____
DIRECT TESTIMONY OF ROBERT B. HEVERT
ROBERT B. HEVERT - 55 -
Q. HOW DO THOSE CONSIDERATIONS APPLY TO I&M AND ITS CAPITAL 1
SPENDING PLANS? 2
A. It is clear I&M’s capital expenditure program is significant. It also is clear that the 3
financial community recognizes the need for timely cost recovery for those capital 4
expenditures. From a credit perspective, the additional pressure on cash flows associated 5
with high levels of capital expenditures exerts corresponding pressure on credit metrics 6
and, therefore, credit ratings. S&P has noted several long-term challenges for utilities’ 7
financial health including: heavy construction programs to address demand growth; 8
declining capacity margins; and aging infrastructure and regulatory responsiveness to 9
mounting requests for rate increases.81 More recently, S&P noted that: 10
We assume that capital spending will remain a focus of most utility 11 managements and strain credit metrics. It provides growth when sales 12 are diminished by ongoing demanded efficiency from regulators and 13 other trends, and it is welcomed by policymakers that appreciate the 14 economic stimulus and the benefits of safer, more reliable service. The 15 speed with which the regulatory process turns the new spending into 16 higher rates to begin to pay for it is an important factor in our 17 assumptions and the forecast. Any extended lag between spending and 18 recovery can exacerbate the negative effect on credit metrics and 19 therefore ratings.82 20
Q. WHAT ARE YOUR CONCLUSIONS REGARDING THE EFFECT OF THE 21
COMPANY’S CAPITAL INVESTMENT PLAN AND THE ASSOCIATED 22
RECOVERY MECHANISMS? 23
A. I&M’s capital expenditure plan is significantly larger than its internally generated cash, 24
likely placing downward pressure on its free cash flow and credit profile. The 25
81 See Standard & Poor’s, Industry Report Card: Utility Sectors in the Americas Remain Stable, While
Challenges Beset European, Australian, and New Zealand Counterparts, RatingsDirect, June 27, 2008, at 4.
82 See Standard & Poor’s Rating Services, Industry Top Trends 2017: Utilities, RatingsDirect, February 16, 2017, at 4.

PETITIONER’S EXHIBIT ____
DIRECT TESTIMONY OF ROBERT B. HEVERT
ROBERT B. HEVERT - 56 -
Company’s capital recovery mechanisms are important to continue to provide retained 1
earnings as a funding source for the Company to mitigate equity capital market risk. 2
Although the Company’s recovery mechanisms may be credit supportive, they are not 3
necessarily credit enhancing. Consequently, the Commission’s decision in this 4
proceeding will directly affect the Company’s ability to fund capital investments with 5
operating cash flows, and the financial community’s view of its financial profile. 6
VI. CAPITAL STRUCTURE AND COST OF DEBT 7
A. Capital Structure 8
Q. PLEASE SUMMARIZE THE COMPANY’S TEST YEAR CAPITAL 9
STRUCTURE AND OVERALL RATE OF RETURN. 10
A. The Company is proposing an end of test year capital structure components and resulting 11
overall rate of return on an investor-supplied capital basis as presented in Table 6 below: 12
Table 6: Summary of Overall Rate of Return (Investor-Supplied Capital)83 13
Capital Components Ratio Cost Weighted Cost
Long-Term Debt 53.20% 4.54% 2.42%
Common Equity 46.80% 10.50% 4.91%
Total 100.00% 7.33%
14
Q. HOW DOES THE CAPITAL STRUCTURE AFFECT THE COST OF EQUITY? 15
A. In practice, the capital structure should enable the Company to maintain or enhance its 16
financial integrity, thereby enabling access to capital at competitive rates under a variety 17
of economic and financial market conditions. The capital structure relates to financial 18
risk, which is a function of the percentage of debt relative to equity (that relationship is 19
83 See Exhibit A-7, page 3.

PETITIONER’S EXHIBIT ____
DIRECT TESTIMONY OF ROBERT B. HEVERT
ROBERT B. HEVERT - 57 -
often referred to as “financial leverage”). As the percentage of debt in the capital 1
structure increases, so do the fixed obligations for the repayment of that debt and, 2
therefore, the risk that cash flows may not be sufficient to meet those obligations on a 3
timely basis. Consequently, as the degree of financial leverage increases, the risk of 4
financial distress (i.e., financial risk) also increases. Because the capital structure can 5
affect the subject company’s overall level of risk, it is an important consideration in 6
establishing a just and reasonable rate of return. Therefore, it is important to consider the 7
capital structure in the context of industry practice and investor requirements. 8
Q. PLEASE DESCRIBE YOUR ANALYSIS OF THE COMPANY’S CAPITAL 9
STRUCTURE RELATIVE TO INDUSTRY PRACTICE. 10
A. As a measure of industry practice, I calculated the average capital structure for each of 11
the utility operating companies held by the proxy companies over the last eight fiscal 12
quarters. As shown in Attachment RBH-10, the average capital structure over that period 13
included 53.63 percent common equity and 46.37 percent long-term debt; the average 14
common equity ratios (on a company-specific basis) range from 46.73 percent to 62.16 15
percent. Based on that review, it is apparent that I&M’s projected investor-supplied 16
capital structure is within the range of those in place at the operating companies held 17
within the proxy group. 18
Q. WHAT IS THE BASIS FOR USING AVERAGE CAPITAL COMPONENTS 19
RATHER THAN A POINT-IN-TIME MEASUREMENT? 20
A. Measuring the capital components at a particular point in time can skew the capital 21
structure by the specific circumstances of a particular period. Therefore, it is more 22

PETITIONER’S EXHIBIT ____
DIRECT TESTIMONY OF ROBERT B. HEVERT
ROBERT B. HEVERT - 58 -
appropriate to normalize the relative relationship between the capital components over a 1
period of time. 2
Q. WHAT IS YOUR CONCLUSION REGARDING AN APPROPRIATE CAPITAL 3
STRUCTURE FOR I&M? 4
A. Considering the range of proxy company average equity ratios from 46.73 percent to 5
62.16 percent, I believe that I&M’s 46.80 percent common equity ratio is reasonable, 6
although it is somewhat below those of its peers. 7
B. Cost of Debt 8
Q. WHAT IS THE TEST YEAR COST OF DEBT PRESENTED BY THE COMPANY 9
IN THIS PROCEEDING? 10
A. The Company has proposed a Cost of Debt of 4.54 percent, which is the Company’s 11
weighted average cost of debt at the end of the test year. 12
Q. PLEASE DISCUSS YOUR ANALYSIS OF THE COMPANY’S COST OF DEBT. 13
A. To test the reasonableness of the Company’s proposed cost of debt I reviewed the yield 14
on equivalent debt at the time of issuance. As shown in Attachment RBH-11, I compared 15
the cost of each individual issuance to the Moody’s BBB Utility Index at the time of the 16
issuance.84 The expected cost of debt, based on the Moody’s A and BBB Utility Bond 17
Index (the “Moody’s Index”) ranges from 4.19 percent to 4.62 percent, indicating that the 18
Company’s 4.54 percent proposed weighted average Cost of Debt is reasonable. 19
84 See also Attachment A-7, Page 4.
PETITIONER’S EXHIBIT ____
DIRECT TESTIMONY OF ROBERT B. HEVERT
ROBERT B. HEVERT - 59 -
VII. CONCLUSIONS AND RECOMMENDATION 1
Q. WHAT IS YOUR CONCLUSION REGARDING THE COMPANY’S COST OF 2
EQUITY? 3
A. As discussed throughout my Direct Testimony, it is prudent and appropriate to consider 4
multiple methodologies to arrive at an ROE recommendation for I&M. To that point, in 5
the current capital market environment Constant Growth DCF-based models should be 6
viewed with caution, because they do not adequately reflect changing capital market 7
conditions and high levels of instability, whereas Risk Premium-based methods directly 8
reflect such changes and measures of risk. As such, I have given somewhat more weight 9
to the Risk Premium-based methods in arriving at my ROE recommendation. 10
As discussed in Appendix A and as shown in Attachments RBH-2 through RBH-11
7, I have performed several analyses to estimate I&M’s Cost of Equity. In light of those 12
results, and taking into consideration other relevant and observable market data, I believe 13
that an ROE in the range of 10.00 percent to 10.75 percent represents the range of returns 14
required by equity investors under current and expected market conditions. My 15
recommendation reflects analytical results based on a proxy group of electric utilities, 16
and takes into consideration the risk factors associated with: (1) the Company’s 17
generation portfolio and environmental regulations; (2) customer concentration; (3) the 18
Company’s planned capital expenditures and the effect, if any, of certain regulatory 19
mechanisms; and (4) the costs of issuing common stock (that is, “flotation” costs). 20

PETITIONER’S EXHIBIT ____
DIRECT TESTIMONY OF ROBERT B. HEVERT
ROBERT B. HEVERT - 60 -
Q. WHAT IS YOUR CONCLUSION REGARDING THE COMPANY’S CAPITAL 1
STRUCTURE AND COST OF DEBT? 2
A. I conclude that the Company’s 4.54 percent projected Cost of Debt at the end of the test 3
year reflects prevailing market conditions at the times of issuance, and therefore is 4
reasonable and appropriate. I also conclude that the Company’s investor-supplied capital 5
structure, which includes 46.80 percent common equity and 53.20 percent long-term debt 6
is reasonable relative to its peers, although it does contain somewhat more financial 7
leverage. The Company’s Test Year capital structure is consistent with industry practice 8
and supports I&M’s financial integrity. 9
Q. DOES THIS CONCLUDE YOUR PREFILED DIRECT TESTIMONY? 10
A. Yes, it does. 11

ROBERT B. HEVERT - 61 -
VIII. APPENDIX A 1
A. Constant Growth Discounted Cash Flow Model 2
Q. PLEASE MORE FULLY DESCRIBE THE CONSTANT GROWTH DCF 3
APPROACH. 4
A. The Constant Growth DCF approach is based on the theory that a stock’s current price 5
represents the present value of all expected future cash flows. In its simplest form, the 6
Constant Growth DCF model expresses the Cost of Equity as the discount rate that sets 7
the current price equal to expected cash flows: 8
P = $%
(��&)+ $'
(��&)' + ⋯ + $)
(��&)) * = �%
(��+)+ �'
(��+)' + ⋯ + �)
(��+)) [4] 9
where P represents the current stock price, D1 … D∞ represent expected future dividends, 10
and k is the discount rate, or required ROE. Equation [4] is a standard present value 11
calculation that can be simplified and rearranged into the familiar form: 12
� = �� (���)
+ [5] 13
Equation [5] often is referred to as the “Constant Growth DCF” model, in which the first 14
term is the expected dividend yield and the second term is the expected long-term annual 15
growth rate. 16
Q. WHAT ASSUMPTIONS ARE INHERENT IN THE CONSTANT GROWTH DCF 17
MODEL? 18
A. The Constant Growth DCF model assumes: (1) earnings, book value, and dividends all 19
grow at the same, constant rate in perpetuity; (2) a constant dividend payout ratio in 20
perpetuity; (3) the observed P/E ratio will remain constant in perpetuity; and (4) 21
estimated Cost of Equity will remain constant, also in perpetuity. 22

PETITIONER’S EXHIBIT ____
DIRECT TESTIMONY OF ROBERT B. HEVERT
ROBERT B. HEVERT - 62 -
Q. WHAT MARKET DATA DID YOU USE TO CALCULATE THE DIVIDEND 1
YIELD IN YOUR CONSTANT GROWTH DCF MODEL? 2
A. The dividend yield is based on each proxy company’s current annualized dividend and 3
average closing stock price over the 30-, 90-, and 180-trading day periods as of March 4
15, 2019, as explained more fully below. 5
Q. WHY DID YOU USE THREE AVERAGING PERIODS TO CALCULATE AN 6
AVERAGE STOCK PRICE? 7
A. I did so to ensure the model’s results are not skewed by anomalous events that may affect 8
stock prices on any given trading day. At the same time, the averaging period should be 9
reasonably representative of expected capital market conditions over the long term. In 10
my view, using 30-, 90-, and 180-day averaging periods reasonably balances those 11
concerns. 12
Q. DID YOU MAKE ANY ADJUSTMENTS TO THE DIVIDEND YIELD TO 13
ACCOUNT FOR PERIODIC GROWTH IN DIVIDENDS? 14
A. Yes, I did. Because utility companies tend to increase their quarterly dividends at 15
different times throughout the year, it is reasonable to assume that dividend increases will 16
be evenly distributed over calendar quarters. Given that assumption, it is appropriate to 17
calculate the expected dividend yield by applying one-half of the long-term growth rate 18
to the current dividend yield. That adjustment ensures that the expected dividend yield is, 19
on average, representative of the coming twelve-month period, and does not overstate the 20
dividends to be paid during that time. 21

PETITIONER’S EXHIBIT ____
DIRECT TESTIMONY OF ROBERT B. HEVERT
ROBERT B. HEVERT - 63 -
Q. IS IT IMPORTANT TO SELECT APPROPRIATE MEASURES OF LONG-1
TERM GROWTH IN APPLYING THE DCF MODEL? 2
A. Yes. In its Constant Growth form, the DCF model (i.e., as presented in Equation [5] 3
above) assumes a single growth estimate in perpetuity. Accordingly, to reduce the long-4
term growth rate to a single measure, one must assume a fixed payout ratio, and the same 5
constant growth rate for earnings per share (“EPS”), dividends per share, and book value 6
per share. Since dividend growth can only be sustained by earnings growth, the model 7
should incorporate a variety of measures of long-term earnings growth. This can be 8
accomplished by averaging those measures of long-term growth that tend to be least 9
influenced by capital allocation decisions that companies may make in response to near-10
term changes in the business environment. Because such decisions may directly affect 11
near-term dividend payout ratios, estimates of earnings growth are more indicative of 12
long-term investor expectations than are dividend growth estimates. Therefore, for the 13
purposes of the Constant Growth DCF model, growth in EPS represents the appropriate 14
measure of long-term growth. 15
Q. PLEASE SUMMARIZE THE FINDINGS OF ACADEMIC RESEARCH ON THE 16
APPROPRIATE MEASURE FOR ESTIMATING EQUITY RETURNS USING 17
THE DCF MODEL. 18
A. The relationship between various growth rates and stock valuation metrics has been the 19
subject of much academic research.85 As noted over 40 years ago by Charles Phillips in 20
The Economics of Regulation: 21
85 See for example, Robert S. Harris, Using Analysts’ Growth Forecasts to Estimate Shareholder Required
Rate of Return, Financial Management, Spring 1986.

PETITIONER’S EXHIBIT ____
DIRECT TESTIMONY OF ROBERT B. HEVERT
ROBERT B. HEVERT - 64 -
For many years, it was thought that investors bought utility stocks 1 largely on the basis of dividends. More recently, however, studies 2 indicate that the market is valuing utility stocks with reference to total 3 per share earnings, so that the earnings-price ratio has assumed 4 increased emphasis in rate cases.86 5
Phillips’ conclusion continues to hold true. Subsequent academic research has 6
clearly and consistently indicated that measures of earnings and cash flow are strongly 7
related to returns, and that analysts’ forecasts of growth are superior to other measures of 8
growth in predicting stock prices.87 For example, Vander Weide and Carleton state that, 9
“[our] results…are consistent with the hypothesis that investors use analysts’ forecasts, 10
rather than historically oriented growth calculations, in making stock buy-and-sell 11
decisions.”88 Other research specifically has noted the importance of analysts’ growth 12
estimates in determining the Cost of Equity, and in the valuation of equity securities. Dr. 13
Robert Harris noted that “a growing body of knowledge shows that analysts’ earnings 14
forecasts are indeed reflected in stock prices.”89 Citing Cragg and Malkiel, Dr. Harris 15
notes that those authors “found that the evaluations of companies that analysts make are 16
the sorts of ones on which market valuation is based.”90 As Brigham, Shome and Vinson 17
noted, “evidence in the current literature indicates that (i) analysts’ forecasts are superior 18
86 Charles F. Phillips, Jr., The Economics of Regulation, Revised Edition, 1969, Richard D. Irwin, Inc., at
285. 87 See for example, Christofi, Christofi, Lori and Moliver, Evaluating Common Stocks Using Value Line’s
Projected Cash Flows and Implied Growth Rate, Journal of Investing (Spring 1999); Harris and Marston, Estimating Shareholder Risk Premia Using Analysts’ Growth Forecasts, Financial Management, 21 (Summer 1992); and Vander Weide and Carleton, Investor Growth Expectations: Analysts vs. History, The Journal of Portfolio Management, Spring 1988.
88 Vander Weide and Carleton, Investor Growth Expectations: Analysts vs. History, The Journal of Portfolio Management, Spring 1988.
89 Robert S. Harris, Using Analysts’ Growth Forecasts to Estimate Shareholder Required Rate of Return, Financial Management, Spring 1986.
90 Id.

PETITIONER’S EXHIBIT ____
DIRECT TESTIMONY OF ROBERT B. HEVERT
ROBERT B. HEVERT - 65 -
to forecasts based solely on time series data; and (ii) investors do rely on analysts’ 1
forecasts.”91 2
To that point, the research of Carleton and Vander Weide found earnings growth 3
projections had a statistically significant relationship to stock valuation levels, whereas 4
dividend growth rates did not.92 Those findings suggest that investors form their 5
investment decisions based on expectations of growth in earnings, not dividends. 6
Consequently, earnings growth not dividend growth, is the appropriate estimate in the 7
Constant Growth DCF model. 8
Q. PLEASE SUMMARIZE YOUR INPUTS TO THE CONSTANT GROWTH DCF 9
MODEL. 10
A. I applied the DCF model to the proxy group of integrated electric utility companies using 11
the following inputs for the price and dividend terms: 12
• The average daily closing prices for the 30-trading days, 90-trading days, and 13
180-trading days ended March 15, 2019, for the term P0; and 14
• The annualized dividend per share as of March 15, 2019, for the term D0. 15
I then calculated my DCF results using each of the following growth terms: 16
• The Zacks consensus long-term earnings growth estimates; 17
• The First Call consensus long-term earnings growth estimates; and 18
• The Value Line long-term earnings growth estimates. 19
91 Eugene F. Brigham, Dilip K. Shome, and Steve R. Vinson, The Risk Premium Approach to Measuring a
Utility’s Cost of Equity, Financial Management, Spring 1985. 92 See Vander Weide and Carleton, Investor Growth Expectations: Analysts vs. History, The Journal of
Portfolio Management, Spring 1988.

PETITIONER’S EXHIBIT ____
DIRECT TESTIMONY OF ROBERT B. HEVERT
ROBERT B. HEVERT - 66 -
As explained below, I calculated a low, mean, and high DCF result for each proxy 1
company (see Attachment RBH-2). 2
Q. HOW DID YOU CALCULATE THE MEAN HIGH AND MEAN LOW DCF 3
RESULTS? 4
A. For each proxy company, I calculated the high DCF result by combining the maximum 5
EPS growth rate estimate as reported by Value Line, Zacks, and First Call with the 6
subject company’s dividend yield. The mean high result simply is the average of those 7
estimates. I used the same approach to calculate the low DCF result, using instead the 8
minimum of the Value Line, Zacks, and First Call estimate for each proxy company, and 9
calculating the average result for those estimates. 10
Q. WHAT ARE THE RESULTS OF YOUR CONSTANT GROWTH DCF 11
ANALYSIS? 12
A. My Constant Growth DCF results are summarized in Table 7 below (see also Attachment 13
RBH-2). 14
Table 7: Mean Constant Growth DCF Results93 15
Mean Low Mean Mean High
30-Day Average 8.03% 8.92% 9.97%
90-Day Average 8.13% 9.03% 10.08%
180-Day Average 8.22% 9.12% 10.17%
16
As noted earlier, the Constant Growth DCF model is predicated on several assumptions, 17
one of which is that the P/E ratio will remain constant, in perpetuity. Because utility 18
sector P/E ratios have expanded to the point that they recently have exceeded both their 19
93 See Attachment RBH-2.
PETITIONER’S EXHIBIT ____
DIRECT TESTIMONY OF ROBERT B. HEVERT
ROBERT B. HEVERT - 67 -
long-term average and the market P/E ratio, the Constant Growth DCF model’s results 1
should be viewed with considerable caution. As a practical matter, the mean Constant 2
Growth DCF results are well below a highly observable and relevant benchmark: the 3
returns authorized for vertically integrated electric utilities.94 As such, considering 4
multiple methods, including the CAPM approach, and the Bond Yield Plus Risk Premium 5
model, is more appropriate in current market conditions. 6
B. Capital Asset Pricing Model and Empirical Capital Asset Pricing Model 7
Q. PLEASE BRIEFLY DESCRIBE THE GENERAL FORM OF THE CAPM 8
ANALYSIS. 9
A. The CAPM analysis is a risk premium method that estimates the Cost of Equity for a 10
given security as a function of a risk-free return plus a risk premium (to compensate 11
investors for the non-diversifiable or “systematic” risk of that security). As shown in 12
Equation [6], the CAPM is defined by four components, each of which theoretically must 13
be a forward-looking estimate: 14
Ke = rf + β(rm – rf) [6] 15
where: 16
Ke = the required market ROE for a security; 17
β = the Beta coefficient of that security; 18
rf = the risk-free rate of return; and 19
rm = the required return on the market as a whole. 20
94 For example, since January 2015, the average authorized ROE for vertically-integrated utilities has been
9.76 percent. Source: Regulatory Research Associates.
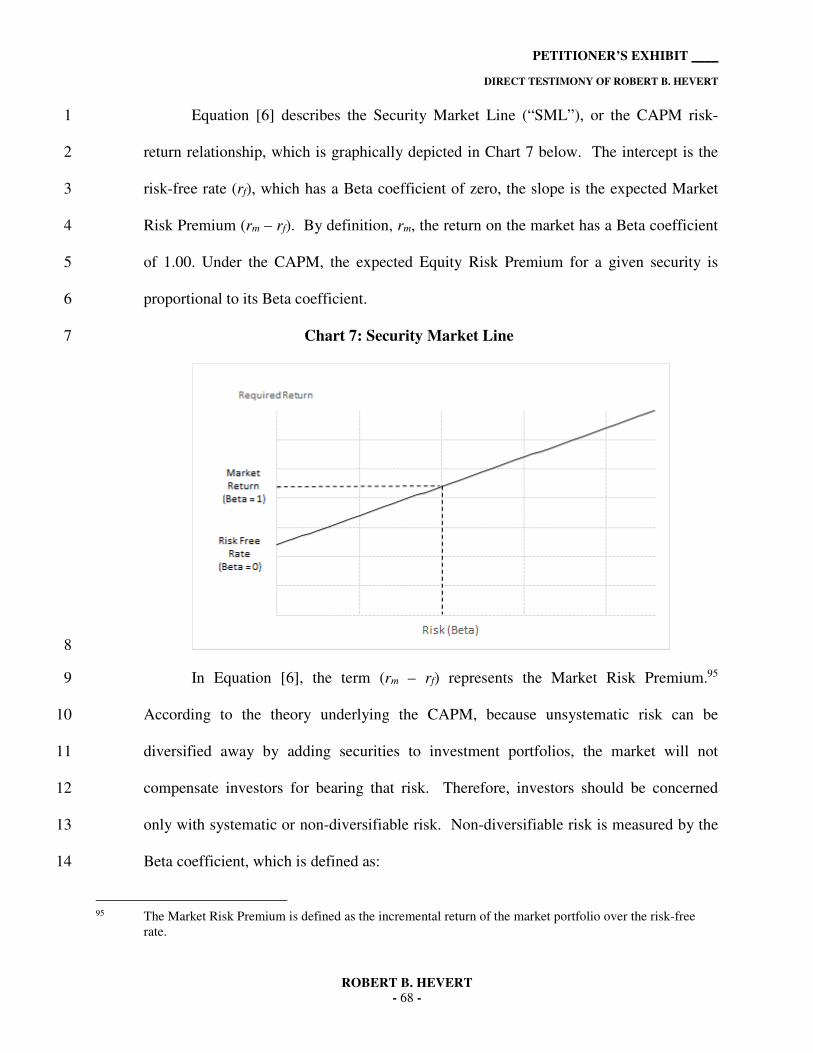
PETITIONER’S EXHIBIT ____
DIRECT TESTIMONY OF ROBERT B. HEVERT
ROBERT B. HEVERT - 68 -
Equation [6] describes the Security Market Line (“SML”), or the CAPM risk-1
return relationship, which is graphically depicted in Chart 7 below. The intercept is the 2
risk-free rate (rf), which has a Beta coefficient of zero, the slope is the expected Market 3
Risk Premium (rm – rf). By definition, rm, the return on the market has a Beta coefficient 4
of 1.00. Under the CAPM, the expected Equity Risk Premium for a given security is 5
proportional to its Beta coefficient. 6
Chart 7: Security Market Line 7
8
In Equation [6], the term (rm – rf) represents the Market Risk Premium.95 9
According to the theory underlying the CAPM, because unsystematic risk can be 10
diversified away by adding securities to investment portfolios, the market will not 11
compensate investors for bearing that risk. Therefore, investors should be concerned 12
only with systematic or non-diversifiable risk. Non-diversifiable risk is measured by the 13
Beta coefficient, which is defined as: 14
95 The Market Risk Premium is defined as the incremental return of the market portfolio over the risk-free
rate.

PETITIONER’S EXHIBIT ____
DIRECT TESTIMONY OF ROBERT B. HEVERT
ROBERT B. HEVERT - 69 -
β- = ./
.0 x ρ3,5 [7] 1
where σj 63is the standard deviation of returns for company “j,” σm 65is the standard 2
deviation of returns for the broad market (as measured, for example, by the S&P 500 3
Index), and ρj,m 73,5is the correlation of returns in between company j and the broad 4
market. The Beta coefficient therefore represents both relative volatility (i.e., the 5
standard deviation) of returns, and the correlation in returns between the subject company 6
and the overall market. 7
Intuitively, companies with higher Beta coefficients have had more volatile 8
returns, and have moved more closely with the overall companies with lower Beta 9
coefficients. The implication is that a company with a Beta coefficient of 1.00 is as risky 10
as the overall market; companies with Beta coefficients less than 1.00 are less risky, and 11
those whose Beta coefficients are greater than 1.00 have greater risk than the overall 12
market. 13
Q. WHAT ASSUMPTIONS DID YOU INCLUDE IN YOUR CAPM ANALYSIS? 14
A. Because utility assets represent long duration investments, I used two different measures 15
of the risk-free rate: (1) the current 30-day average yield on 30-year Treasury bonds (3.03 16
percent); and (2) the projected 30-year Treasury yield (3.25 percent).96 17
Q. WHY HAVE YOU RELIED ON THE 30-YEAR TREASURY YIELD FOR YOUR 18
CAPM ANALYSIS? 19
A. In determining the risk-free rate, it is important to select the term (or maturity) that best 20
matches the life of the underlying investment. Electric utilities typically are long-21
96 Blue Chip Financial Forecast, Vol. 38, No. 3, March 1, 2019, at 2.
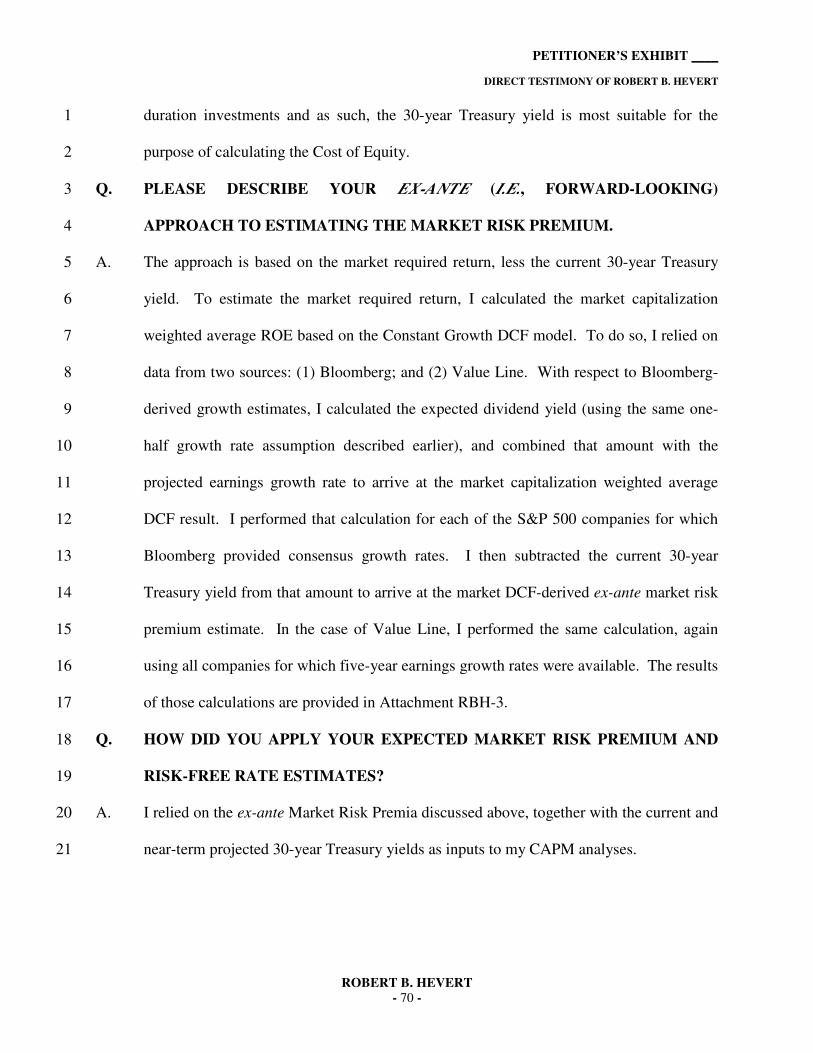
PETITIONER’S EXHIBIT ____
DIRECT TESTIMONY OF ROBERT B. HEVERT
ROBERT B. HEVERT - 70 -
duration investments and as such, the 30-year Treasury yield is most suitable for the 1
purpose of calculating the Cost of Equity. 2
Q. PLEASE DESCRIBE YOUR EX-ANTE (I.E., FORWARD-LOOKING) 3
APPROACH TO ESTIMATING THE MARKET RISK PREMIUM. 4
A. The approach is based on the market required return, less the current 30-year Treasury 5
yield. To estimate the market required return, I calculated the market capitalization 6
weighted average ROE based on the Constant Growth DCF model. To do so, I relied on 7
data from two sources: (1) Bloomberg; and (2) Value Line. With respect to Bloomberg-8
derived growth estimates, I calculated the expected dividend yield (using the same one-9
half growth rate assumption described earlier), and combined that amount with the 10
projected earnings growth rate to arrive at the market capitalization weighted average 11
DCF result. I performed that calculation for each of the S&P 500 companies for which 12
Bloomberg provided consensus growth rates. I then subtracted the current 30-year 13
Treasury yield from that amount to arrive at the market DCF-derived ex-ante market risk 14
premium estimate. In the case of Value Line, I performed the same calculation, again 15
using all companies for which five-year earnings growth rates were available. The results 16
of those calculations are provided in Attachment RBH-3. 17
Q. HOW DID YOU APPLY YOUR EXPECTED MARKET RISK PREMIUM AND 18
RISK-FREE RATE ESTIMATES? 19
A. I relied on the ex-ante Market Risk Premia discussed above, together with the current and 20
near-term projected 30-year Treasury yields as inputs to my CAPM analyses. 21

PETITIONER’S EXHIBIT ____
DIRECT TESTIMONY OF ROBERT B. HEVERT
ROBERT B. HEVERT - 71 -
Q. WHAT BETA COEFFICIENT DID YOU USE IN YOUR CAPM MODEL? 1
A. As shown in Attachment RBH-4, I considered Beta coefficients reported by two sources, 2
Bloomberg and Value Line. Although both services adjust their calculated (or “raw”) 3
Beta coefficients to reflect the tendency to regress to the market mean of 1.00, Value 4
Line calculates the Beta coefficient over a five-year period, whereas Bloomberg’s 5
calculation is based on two years of data. 6
Q. WHAT ARE THE RESULTS OF YOUR CAPM ANALYSIS? 7
A. As shown in Table 8 (below) the CAPM analyses suggest an ROE range of 8.14 percent 8
to 11.40 percent (see also Attachment RBH-5). 9
Table 8: Summary of CAPM Results97 10
Bloomberg Derived
Market Risk Premium
Value Line Derived
Market Risk Premium
Average Bloomberg Beta Coefficient
Current 30-Year Treasury (3.03%) 8.14% 9.64%
Near Term Projected 30-Year Treasury (3.25%) 8.36% 9.86%
Average Value Line Beta Coefficient
Current 30-Year Treasury (3.03%) 9.33% 11.18%
Near Term Projected 30-Year Treasury (3.25%) 9.55% 11.40%
11
Q. DOES THE RECENT DECLINE IN THE PROXY GROUP AVERAGE BETA 12
COEFFICIENT IMPLY A DECREASE IN RISK RELATIVE TO THE 13
MARKET? 14
A. Not necessarily. Although the proxy group average Beta coefficient reported by 15
Bloomberg has fallen from approximately 0.77 in 2014 to 0.48 in March 2019, as Chart 8 16
97 See Attachment RBH-5.

PETITIONER’S EXHIBIT ____
DIRECT TESTIMONY OF ROBERT B. HEVERT
ROBERT B. HEVERT - 72 -
below demonstrates, when the Beta coefficient is deconstructed into its components 1
shown in Equation [7] above, we see that the correlation between the proxy group 2
companies and the S&P 500 has declined, while the relative risk has increased. Given 3
that the correlation between the proxy group companies and the S&P 500 has declined 4
since 2014, while the relative risk has increased, the CAPM in the form presented here 5
may not adequately reflect the expected systematic risk, and therefore, the returns 6
required by investors in low-Beta companies such as utilities. 7
Chart 8: Components of Beta Coefficients Over Time98 8
9
10
Q. DID YOU CONSIDER ANOTHER FORM OF THE CAPM IN YOUR 11
ANALYSIS? 12
A. Yes. I also included the ECAPM approach, which calculates the product of the adjusted 13
Beta coefficient and the Market Risk Premium, and applies a weight of 75.00 percent to 14
that result. The model then applies a 25.00 percent weight to the Market Risk Premium, 15
98 Source: S&P Global Market Intelligence. Calculated as an index.
0%
20%
40%
60%
80%
100%
120%
140%
Jan-10 Jan-11 Jan-12 Jan-13 Jan-14 Jan-15 Jan-16 Jan-17 Jan-18 Jan-19
RELATIVE VOLATILITY CORRELATION

PETITIONER’S EXHIBIT ____
DIRECT TESTIMONY OF ROBERT B. HEVERT
ROBERT B. HEVERT - 73 -
without any effect from the Beta coefficient.99 The results of the two calculations are 1
summed, along with the risk-free rate, to produce the ECAPM result, as noted in 2
Equation [8] below: 3
ke = rf + 0.75β(rm – rf) + 0.25(rm – rf) [8] 4
where: 5
ke = the required market ROE. 6
β = Adjusted Beta coefficient of an individual security. 7
rf = the risk-free rate of return. 8
rm = the required return on the market as a whole. 9
Q. WHAT IS THE BENEFIT OF THE ECAPM APPROACH? 10
A. The ECAPM addresses the tendency of the CAPM to under-estimate the Cost of Equity 11
for companies, such as regulated utilities, with low Beta coefficients. As discussed 12
below, the ECAPM recognizes the results of academic research indicating that the risk-13
return relationship is different (in essence, flatter) than estimated by the CAPM, and that 14
the CAPM under-estimates the alpha, or the constant return term.100 15
Numerous tests of the CAPM have measured the extent to which security returns 16
and Beta coefficients are related as predicted by the CAPM. The ECAPM method 17
reflects the finding that the actual Security Market Line (SML) described by the CAPM 18
formula is not as steeply sloped as the predicted SML.101 Fama and French state that 19
99 See e.g., Roger A. Morin, New Regulatory Finance 189-90 (2006).
100 Id. at 191 (“The ECAPM and the use of adjusted betas comprised two separate features of asset pricing. Even if a company’s beta is estimated accurately, the CAPM still understates the return for low-beta stocks.”).
101 Id. at 175. The Security Market Line plots the CAPM estimate on the Y-axis, and Beta coefficients on the X-axis.

PETITIONER’S EXHIBIT ____
DIRECT TESTIMONY OF ROBERT B. HEVERT
ROBERT B. HEVERT - 74 -
“[t]he returns on the low beta portfolios are too high, and the returns on the high beta 1
portfolios are too low.”102 Similarly, Morin states: 2
With few exceptions, the empirical studies agree that . . . low-beta 3 securities earn returns somewhat higher than the CAPM would predict, 4 and high-beta securities earn less than predicted. . . . 5
Therefore, the empirical evidence suggests that the expected return on 6 a security is related to its risk by the following approximation: 7
K = RF + x β(RM - RF) + (1-x) β(RM - RF) 8
where x is a fraction to be determined empirically. The value of x that 9 best explains the observed relationship Return = 0.0829 + 0.0520 β is 10 between 0.25 and 0.30. If x = 0.25, the equation becomes: 11
K = RF + 0.25(RM - RF) + 0.75 β(RM - RF) 103 12
Some analysts claim that using adjusted Beta coefficients addresses the empirical 13
issues with the CAPM by increasing the expected returns for low Beta stocks and 14
decreasing the returns for high Beta stocks, concluding that there is no need for the 15
ECAPM approach. I disagree with that conclusion. Beta coefficients are adjusted 16
because of their general regression tendency to converge toward 1.00 over time, i.e., over 17
successive calculations. As also noted earlier, numerous studies have determined that at 18
any given point in time, the SML described by the CAPM formula is not as steeply 19
sloped as the predicted SML. To that point, Morin states: 20
Some have argued that the use of the ECAPM is inconsistent with the 21 use of adjusted betas, such as those supplied by Value Line and 22 Bloomberg. This is because the reason for using the ECAPM is to 23 allow for the tendency of betas to regress toward the mean value of 24 1.00 over time, and, since Value Line betas are already adjusted for 25 such trend, an ECAPM analysis results in double-counting. This 26
102 Eugene F. Fama & Kenneth R. French, The Capital Asset Pricing Model: Theory and Evidence, Journal of
Economic Perspectives, Vol. 18, No. 3, Summer 2004, at 33.
103 Roger A. Morin, New Regulatory Finance 175, 190 (2006).

PETITIONER’S EXHIBIT ____
DIRECT TESTIMONY OF ROBERT B. HEVERT
ROBERT B. HEVERT - 75 -
argument is erroneous. Fundamentally, the ECAPM is not an 1 adjustment, increase or decrease, in beta. This is obvious from the fact 2 that the expected return on high beta securities is actually lower than 3 that produced by the CAPM estimate. The ECAPM is a formal 4 recognition that the observed risk-return tradeoff is flatter than 5 predicted by the CAPM based on myriad empirical evidence. The 6 ECAPM and the use of adjusted betas comprised two separate features 7 of asset pricing. Even if a company’s beta is estimated accurately, the 8 CAPM still understates the return for low-beta stocks. Even if the 9 ECAPM is used, the return for low-beta securities is understated if the 10 betas are understated. Referring back to Figure 6-1, the ECAPM is a 11 return (vertical axis) adjustment and not a beta (horizontal axis) 12 adjustment. Both adjustments are necessary. 104 13
Therefore, it is appropriate to rely on adjusted Beta coefficients in both the CAPM 14
and ECAPM. As with the CAPM, my application of the ECAPM uses the Market DCF-15
derived ex-ante Market Risk Premium estimate, the current yield on 30-year Treasury 16
securities as the risk-free rate, and two estimates of the Beta coefficient. The results of 17
my ECAPM analyses shown on Attachment RBH-5 and summarized in Table 9 below. 18
Table 9: Summary of ECAPM Results105 19
Bloomberg Derived
Market Risk Premium
Value Line Derived
Market Risk Premium
Average Bloomberg Beta Coefficient
Current 30-Year Treasury (3.03%) 9.51% 11.42%
Near Term Projected 30-Year Treasury (3.25%) 9.74% 11.64%
Average Value Line Beta Coefficient
Current 30-Year Treasury (3.03%) 10.41% 12.57%
Near Term Projected 30-Year Treasury (3.25%) 10.63% 12.79%
20
104 Id. at 191.
105 See Attachment RBH-5.

PETITIONER’S EXHIBIT ____
DIRECT TESTIMONY OF ROBERT B. HEVERT
ROBERT B. HEVERT - 76 -
C. Bond Yield Plus Risk Premium Approach 1
Q. PLEASE GENERALLY DESCRIBE THE BOND YIELD PLUS RISK PREMIUM 2
APPROACH. 3
A. This approach is based on the basic financial principle that because equity investors bear 4
the residual risk associated with ownership, they require a premium over the return they 5
would have earned as a bondholder. That is, because returns to equity holders are more 6
risky than returns to bondholders, equity investors must be compensated for bearing that 7
additional risk. Risk premium approaches, therefore, estimate the Cost of Equity as the 8
sum of the equity risk premium and the yield on a particular class of bonds. As noted in 9
my discussion of the CAPM, because the equity risk premium is not directly observable, 10
it typically is estimated using a variety of approaches, some of which incorporate ex-ante, 11
or forward-looking estimates of the Cost of Equity, and others that consider historical, or 12
ex-post, estimates. An alternative approach is to use actual authorized returns for electric 13
utilities to estimate the Equity Risk Premium. 14
Q. PLEASE EXPLAIN HOW YOU PERFORMED YOUR BOND YIELD PLUS RISK 15
PREMIUM ANALYSIS. 16
A. As suggested above, I first defined the Risk Premium as the difference between the 17
authorized ROE and the then-prevailing level of the long-term (i.e., 30-year) Treasury 18
yield. I then gathered data for 1,584 electric utility rate proceedings between January 19
1980 and March 15, 2019. In addition to the authorized ROE, I also calculated the 20
average period between the filing of the case and the date of the final order (the “lag 21
period”). To reflect the prevailing level of interest rates during the pendency of the 22

PETITIONER’S EXHIBIT ____
DIRECT TESTIMONY OF ROBERT B. HEVERT
ROBERT B. HEVERT - 77 -
proceedings, I calculated the average 30-year Treasury yield over the average lag period 1
(approximately 200 days). 2
Because the data cover multiple economic cycles, the analysis also may be used to 3
assess the stability of the Equity Risk Premium. Prior research, for example, has shown 4
that the Equity Risk Premium is inversely related to the level of interest rates. That 5
analysis is particularly relevant given the relatively low, but increasing level of current 6
Treasury yields. 7
Q. HOW DID YOU MODEL THE RELATIONSHIP BETWEEN INTEREST RATES 8
AND THE EQUITY RISK PREMIUM? 9
A. The basic method used was regression analysis, in which the observed Equity Risk 10
Premium is the dependent variable, and the average 30-year Treasury yield is the 11
independent variable. Relative to the long-term historical average, the analytical period 12
includes interest rates and authorized ROEs that are quite high during one period (i.e., the 13
1980s) and that are quite low during another (i.e., the post-Lehman bankruptcy period). 14
To account for that variability, I used the semi-log regression, in which the Equity Risk 15
Premium is expressed as a function of the natural log of the 30-year Treasury yield: 16
RP = 8 + 9:;<(=>?)@ [9] 17
As shown on Chart 9 (below), the semi-log form is useful when measuring an 18
absolute change in the dependent variable (in this case, the Risk Premium) relative to a 19
proportional change in the independent variable (the 30-year Treasury yield). 20

PETITIONER’S EXHIBIT ____
DIRECT TESTIMONY OF ROBERT B. HEVERT
ROBERT B. HEVERT - 78 -
Chart 9: Equity Risk Premium106 1
2
As Chart 9 illustrates, the Equity Risk Premium increases as interest rates fall. 3
That finding, that there an inverse relationship between interest rates and the Equity Risk 4
Premium is supported by published research. For example, Dr. Roger Morin notes that: 5
“… [p]ublished studies by Brigham, Shome, and Vinson (1985), Harris (1986), Harris 6
and Marston (1992, 1993), Carleton, Chambers, and Lakonishok (1983), Morin (2005), 7
and McShane (2005), and others demonstrate that, beginning in 1980, risk premiums 8
varied inversely with the level of interest rates - rising when rates fell and declining when 9
interest rates rose.”107 Consequently, simply applying the long-term average Equity Risk 10
Premium of 4.67 percent would significantly understate the Cost of Equity and produce 11
results well below any reasonable estimate. Based on the regression coefficients in Chart 12
106 See Attachment RBH-6. 107 Roger A: Morin, New Regulatory Finance, Public Utilities Reports, Inc. 2006, at 128 [clarification added]
y = -0.0268ln(x) - 0.0248
R² = 0.7408
-6.00%
-4.00%
-2.00%
0.00%
2.00%
4.00%
6.00%
8.00%
10.00%
0.00% 2.00% 4.00% 6.00% 8.00% 10.00% 12.00% 14.00% 16.00%
Eq
uit
y R
isk P
rem
ium
Treasury Yield

PETITIONER’S EXHIBIT ____
DIRECT TESTIMONY OF ROBERT B. HEVERT
ROBERT B. HEVERT - 79 -
9, however, the implied ROE is between 9.93 percent and 10.17 percent (see Table 10 1
below and Attachment RBH-6). 2
Table 10: Summary of Bond Yield Plus Risk Premium Results108 3
Return on Equity
Current 30-Year Treasury (3.03%) 9.93%
Near-Term Projected 30-Year Treasury (3.25%) 9.96%
Long-Term Projected 30-Year Treasury (4.05%) 10.17%
4
D. Expected Earnings Analysis 5
Q. PLEASE DESCRIBE THE EXPECTED EARNINGS ANALYSIS 6
A. The Expected Earnings analysis is based on the principle of opportunity costs. Because 7
investors may invest in, and earn returns on alternative investments of similar risk, those 8
rates of return can provide a useful benchmark in determining the appropriate rate of 9
return for a firm. Further, because those results are based solely on the returns expected 10
by investors, exclusive of market-data or models, the Expected Earnings approach 11
provides a direct comparison. 12
Q. PLEASE EXPLAIN HOW THE EXPECTED EARNINGS ANALYSIS IS 13
CONDUCTED. 14
A. The Expected Earnings analysis typically takes the actual earnings on book value of 15
investment for each of the members of the proxy group and compares those values to the 16
rate of return in question. Although the traditional approach uses data based on historical 17
accounting records, it is common to use forecasted data in conducting the analysis. 18
108 See Attachment RBH-6.

PETITIONER’S EXHIBIT ____
DIRECT TESTIMONY OF ROBERT B. HEVERT
ROBERT B. HEVERT - 80 -
Projected returns on book investment are provided by various industry publications (e.g., 1
Value Line), which I have used in my analysis. 2
I relied on Value Line’s projected Return on Common for the period 2021-3
2023/2022-2024, and adjusted those projected returns to account for the fact that they 4
reflect common shares outstanding at the end of the period, rather than the average shares 5
outstanding over the course of the year.109 The results range from 6.50 percent to 14.06 6
percent, with an average value of 10.26 percent (see Attachment RBH-7). 7
109 The rationale for that adjustment is straightforward: Earnings are achieved over the course of a year, and
should be related to the equity that was, on average, in place during that year. See Leopold A. Bernstein, Financial Statement Analysis: Theory, Application, and Interpretation, Irwin, 4th Ed., 1988, at 630.

PETITIONER’S EXHIBIT ____
DIRECT TESTIMONY OF ROBERT B. HEVERT
ROBERT B. HEVERT
- 81 -
VERIFICATION
I, Robert B. Hevert, Partner of ScottMadden, Inc., affirm under penalties of perjury that
the foregoing representations are true and correct to the best of my knowledge, information, and
belief.
Date: ____May 10, 2019____
________________________________
Robert B. Hevert
Attachment RBH-1
Resume of:
Robert B. Hevert, Partner Rates, Regulation & Planning Practice Leader
Summary
Bob Hevert is a financial and economic consultant with more than 30 years of broad experience in the energy and utility industries. He has an extensive background in the areas of corporate finance, mergers and acquisitions, project finance, asset and business unit valuation, rate and regulatory matters, energy market assessment, and corporate strategic planning. He has provided expert testimony on a wide range of financial, strategic, and economic matters on more than 250 occasions at the state, provincial, and federal levels. Prior to joining ScottMadden, Bob served as managing partner at Sussex Economic Advisors, LLC. Throughout the course of his career, he has worked with numerous leading energy companies and financial institutions throughout North America. He has provided expert testimony and support of litigation in various regulatory proceedings on a variety of energy and economic issues. Bob earned a B.S. in business and economics from the University of Delaware and an M.B.A. with a concentration in finance from the University of Massachusetts at Amherst. Bob also holds the Chartered Financial Analyst designation.
Areas of Specialization
Regulation and rates Utilities Fossil/hydro generation Markets and RTOs Nuclear generation Mergers and acquisitions Regulatory strategy and rate case support Capital project planning Strategic and business planning
Recent Expert Testimony Submission/Appearance
Federal Energy Regulatory Commission – Return on Equity New Jersey Board of Public Utilities – Merger Approval New Mexico Public Regulation Commission – Cost of Capital and Financial Integrity United States District Court – PURPA and FERC Regulations Alberta Utilities Commission – Return on Equity and Capital Structure
Recent Assignments
Provided expert testimony on the cost of capital for ratemaking purposes before numerous state utility regulatory agencies, the Alberta Utilities Commission, and the Federal Energy Regulatory Commission
For an independent electric transmission provider in Texas, prepared an expert report on the economic damages with respect to failure to meet guaranteed completion dates. The report was filed as part of an arbitration proceeding and included a review of the ratemaking implications of economic damages
Advised the board of directors of a publicly traded electric and natural gas combination utility on dividend policy issues, earnings payout trends and related capital market considerations
Assisted a publicly traded utility with a strategic buy-side evaluation of a gas utility with more than $1 billion in assets. The assignment included operational performance benchmarking, calculation of merger synergies, risk analysis, and review of the regulatory implications of the transaction
Provided testimony before the Arkansas Public Service Commission in support of the acquisition of SourceGas LLC by Black Hills Corporation. The testimony addressed certain balance sheet capitalization and credit rating issues
For the State of Maine Public Utility Commission, prepared a report that summarized the Northeast and Atlantic Canada natural gas power markets and analyzed the potential benefits and costs associated with natural gas pipeline expansions. The independent report was filed at the Maine Public Utility Commission

Attachment RBH-1
Testimony Listing of:
Robert B. Hevert, Partner Rates, Regulation and Planning Practice Leader
2
SPONSOR DATE CASE/APPLICANT DOCKET NO. SUBJECT
Regulatory Commission of Alaska
Cook Inlet Natural Gas Storage Alaska, LLC 06/18 Cook Inlet Natural Gas Storage Alaska, LLC Docket No. U-18-043 Return on Equity
ENSTAR Natural Gas Company 06/16 ENSTAR Natural Gas Company Matter No. TA 285-4 Return on Equity
ENSTAR Natural Gas Company 08/14 ENSTAR Natural Gas Company Matter No. TA 262-4 Return on Equity
Alberta Utilities Commission
AltaLink, L.P., and EPCOR Distribution & Transmission, Inc., and FortisAlberta Inc.
10/17 AltaLink, L.P., and EPCOR Distribution & Transmission, Inc., and FortisAlberta Inc.
2018 General Cost of Capital, Proceeding ID. 22570
Rate of Return
EPCOR Energy Alberta G.P. Inc. 01/17 EPCOR Energy Alberta G.P. Inc. Proceeding 22357 Energy Price Setting Plan
AltaLink, L.P., and EPCOR Distribution & Transmission, Inc.
02/16 AltaLink, L.P., and EPCOR Distribution & Transmission, Inc.
2016 General Cost of Capital, Proceeding ID. 20622
Rate of Return
Arizona Corporation Commission
Southwest Gas Corporation 05/19 Southwest Gas Corporation Docket No. G-01551A-19-0055 Return on Equity
Southwest Gas Corporation 05/16 Southwest Gas Corporation Docket No. G-01551A-16-0107 Return on Equity
Southwest Gas Corporation 11/10 Southwest Gas Corporation Docket No. G-01551A-10-0458 Return on Equity
Arkansas Public Service Commission
Southwestern Electric Power Company 02/19 Southwestern Electric Power Company Docket No. 19-008-U Return on Equity
Oklahoma Gas and Electric Company 09/16 Oklahoma Gas and Electric Company Docket No. 16-052-U Return on Equity
SourceGas Arkansas, Inc. 12/15 SourceGas Arkansas, Inc. Docket No. 15-078-U Response to Direct Testimony by Arkansas Attorney General related to Compliance Issues
CenterPoint Energy Resources Corp. d/b/a CenterPoint Energy Arkansas Gas
11/15 CenterPoint Energy Resources Corp. d/b/a CenterPoint Energy Arkansas Gas
Docket No. 15-098-U Return on Equity
SourceGas Arkansas, Inc. 04/15 SourceGas Arkansas, Inc. Docket No. 15-011-U Return on Equity
CenterPoint Energy Resources Corp. d/b/a CenterPoint Energy Arkansas Gas
01/07 CenterPoint Energy Resources Corp. d/b/a CenterPoint Energy Arkansas Gas
Docket No. 06-161-U Return on Equity
California Public Utilities Commission
Southwest Gas Corporation 12/12 Southwest Gas Corporation Docket No. A-12-12-024 Return on Equity
Colorado Public Utilities Commission
Atmos Energy Corporation 06/17 Atmos Energy Corporation Docket No. 17AL-0429G Return on Equity

Attachment RBH-1
Testimony Listing of:
Robert B. Hevert, Partner Rates, Regulation and Planning Practice Leader
3
SPONSOR DATE CASE/APPLICANT DOCKET NO. SUBJECT
Xcel Energy, Inc. 03/15 Public Service Company of Colorado Docket No. 15AL-0135G Return on Equity (gas)
Xcel Energy, Inc. 06/14 Public Service Company of Colorado Docket No. 14AL-0660E Return on Equity (electric)
Xcel Energy, Inc. 12/12 Public Service Company of Colorado Docket No. 12AL-1268G Return on Equity (gas)
Xcel Energy, Inc. 11/11 Public Service Company of Colorado Docket No. 11AL-947E Return on Equity (electric)
Xcel Energy, Inc. 12/10 Public Service Company of Colorado Docket No. 10AL-963G Return on Equity (electric)
Atmos Energy Corporation 07/09 Atmos Energy Colorado-Kansas Division Docket No. 09AL-507G Return on Equity (gas)
Xcel Energy, Inc. 12/06 Public Service Company of Colorado Docket No. 06S-656G Return on Equity (gas)
Xcel Energy, Inc. 04/06 Public Service Company of Colorado Docket No. 06S-234EG Return on Equity (electric)
Xcel Energy, Inc. 08/05 Public Service Company of Colorado Docket No. 05S-369ST Return on Equity (steam)
Xcel Energy, Inc. 05/05 Public Service Company of Colorado Docket No. 05S-246G Return on Equity (gas)
Connecticut Public Utilities Regulatory Authority
Connecticut Light and Power Company 11/17 Connecticut Light and Power Company Docket No. 17-10-46 Return on Equity
Connecticut Light and Power Company 06/14 Connecticut Light and Power Company Docket No. 14-05-06 Return on Equity
Southern Connecticut Gas Company 09/08 Southern Connecticut Gas Company Docket No. 08-08-17 Return on Equity
Southern Connecticut Gas Company 12/07 Southern Connecticut Gas Company Docket No. 05-03-17PH02 Return on Equity
Connecticut Natural Gas Corporation 12/07 Connecticut Natural Gas Corporation Docket No. 06-03-04PH02 Return on Equity
Council of the City of New Orleans
Entergy New Orleans, LLC 09/18 Entergy New Orleans, LLC Docket No. UD-18-07 Return on Equity
Delaware Public Service Commission
Delmarva Power & Light Company 08/17 Delmarva Power & Light Company Docket No. 17-0977 (Electric) Return on Equity
Delmarva Power & Light Company 08/17 Delmarva Power & Light Company Docket No. 17-0978 (Gas) Return on Equity
Delmarva Power & Light Company 05/16 Delmarva Power & Light Company Case No. 16-649 (Electric) Return on Equity
Delmarva Power & Light Company 05/16 Delmarva Power & Light Company Case No. 16-650 (Gas) Return on Equity
Delmarva Power & Light Company 03/13 Delmarva Power & Light Company Case No. 13-115 Return on Equity
Delmarva Power & Light Company 12/12 Delmarva Power & Light Company Case No. 12-546 Return on Equity
Delmarva Power & Light Company 03/12 Delmarva Power & Light Company Case No. 11-528 Return on Equity
District of Columbia Public Service Commission
Potomac Electric Power Company 12/17 Potomac Electric Power Company Formal Case No. 1150 Return on Equity

Attachment RBH-1
Testimony Listing of:
Robert B. Hevert, Partner Rates, Regulation and Planning Practice Leader
4
SPONSOR DATE CASE/APPLICANT DOCKET NO. SUBJECT
Potomac Electric Power Company 06/16 Potomac Electric Power Company Formal Case No. 1139 Return on Equity
Washington Gas Light Company 02/16 Washington Gas Light Company Formal Case No. 1137 Return on Equity
Potomac Electric Power Company 03/13 Potomac Electric Power Company Formal Case No. 1103-2013-E Return on Equity
Potomac Electric Power Company 07/11 Potomac Electric Power Company Formal Case No. 1087 Return on Equity
Federal Energy Regulatory Commission
Sabine Pipeline, LLC 09/15 Sabine Pipeline, LLC Docket No. RP15-1322-000 Return on Equity
NextEra Energy Transmission West, LLC 07/15 NextEra Energy Transmission West, LLC Docket No. ER15-2239-000 Return on Equity
Maritimes & Northeast Pipeline, LLC 05/15 Maritimes & Northeast Pipeline, LLC Docket No. RP15-1026-000 Return on Equity
Public Service Company of New Mexico 12/12 Public Service Company of New Mexico Docket No. ER13-685-000 Return on Equity
Public Service Company of New Mexico 10/10 Public Service Company of New Mexico Docket No. ER11-1915-000 Return on Equity
Portland Natural Gas Transmission System 05/10 Portland Natural Gas Transmission System Docket No. RP10-729-000 Return on Equity
Florida Gas Transmission Company, LLC 10/09 Florida Gas Transmission Company, LLC Docket No. RP10-21-000 Return on Equity
Maritimes and Northeast Pipeline, LLC 07/09 Maritimes and Northeast Pipeline, LLC Docket No. RP09-809-000 Return on Equity
Spectra Energy 02/08 Saltville Gas Storage Docket No. RP08-257-000 Return on Equity
Panhandle Energy Pipelines 08/07 Panhandle Energy Pipelines Docket No. PL07-2-000 Response to draft policy statement regarding inclusion of MLPs in proxy groups for determination of gas pipeline ROEs
Southwest Gas Storage Company 08/07 Southwest Gas Storage Company Docket No. RP07-541-000 Return on Equity
Southwest Gas Storage Company 06/07 Southwest Gas Storage Company Docket No. RP07-34-000 Return on Equity
Sea Robin Pipeline LLC 06/07 Sea Robin Pipeline LLC Docket No. RP07-513-000 Return on Equity
Transwestern Pipeline Company 09/06 Transwestern Pipeline Company Docket No. RP06-614-000 Return on Equity
GPU International and Aquila 11/00 GPU International Docket No. EC01-24-000 Market Power Study
Florida Public Service Commission
Florida Power & Light Company 03/16 Florida Power & Light Company Docket No. 160021-EI Return on Equity
Tampa Electric Company 04/13 Tampa Electric Company Docket No. 130040-EI Return on Equity
Georgia Public Service Commission
Atlanta Gas Light Company 05/10 Atlanta Gas Light Company Docket No. 31647-U Return on Equity
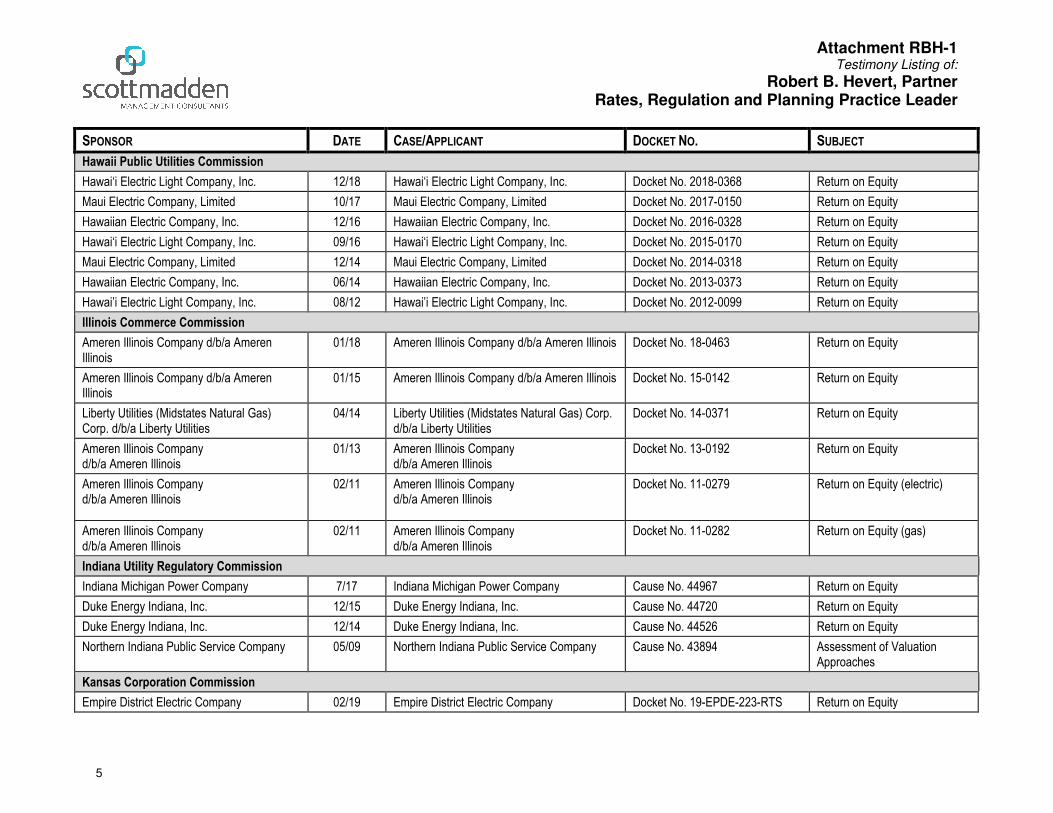
Attachment RBH-1
Testimony Listing of:
Robert B. Hevert, Partner Rates, Regulation and Planning Practice Leader
5
SPONSOR DATE CASE/APPLICANT DOCKET NO. SUBJECT
Hawaii Public Utilities Commission
Hawai‘i Electric Light Company, Inc. 12/18 Hawai‘i Electric Light Company, Inc. Docket No. 2018-0368 Return on Equity
Maui Electric Company, Limited 10/17 Maui Electric Company, Limited Docket No. 2017-0150 Return on Equity
Hawaiian Electric Company, Inc. 12/16 Hawaiian Electric Company, Inc. Docket No. 2016-0328 Return on Equity
Hawai‘i Electric Light Company, Inc. 09/16 Hawai‘i Electric Light Company, Inc. Docket No. 2015-0170 Return on Equity
Maui Electric Company, Limited 12/14 Maui Electric Company, Limited Docket No. 2014-0318 Return on Equity
Hawaiian Electric Company, Inc. 06/14 Hawaiian Electric Company, Inc. Docket No. 2013-0373 Return on Equity
Hawai’i Electric Light Company, Inc. 08/12 Hawai’i Electric Light Company, Inc. Docket No. 2012-0099 Return on Equity
Illinois Commerce Commission
Ameren Illinois Company d/b/a Ameren Illinois
01/18 Ameren Illinois Company d/b/a Ameren Illinois Docket No. 18-0463 Return on Equity
Ameren Illinois Company d/b/a Ameren Illinois
01/15 Ameren Illinois Company d/b/a Ameren Illinois Docket No. 15-0142 Return on Equity
Liberty Utilities (Midstates Natural Gas) Corp. d/b/a Liberty Utilities
04/14 Liberty Utilities (Midstates Natural Gas) Corp. d/b/a Liberty Utilities
Docket No. 14-0371 Return on Equity
Ameren Illinois Company d/b/a Ameren Illinois
01/13 Ameren Illinois Company d/b/a Ameren Illinois
Docket No. 13-0192 Return on Equity
Ameren Illinois Company d/b/a Ameren Illinois
02/11 Ameren Illinois Company d/b/a Ameren Illinois
Docket No. 11-0279 Return on Equity (electric)
Ameren Illinois Company d/b/a Ameren Illinois
02/11 Ameren Illinois Company d/b/a Ameren Illinois
Docket No. 11-0282 Return on Equity (gas)
Indiana Utility Regulatory Commission
Indiana Michigan Power Company 7/17 Indiana Michigan Power Company Cause No. 44967 Return on Equity
Duke Energy Indiana, Inc. 12/15 Duke Energy Indiana, Inc. Cause No. 44720 Return on Equity
Duke Energy Indiana, Inc. 12/14 Duke Energy Indiana, Inc. Cause No. 44526 Return on Equity
Northern Indiana Public Service Company 05/09 Northern Indiana Public Service Company Cause No. 43894 Assessment of Valuation Approaches
Kansas Corporation Commission
Empire District Electric Company 02/19 Empire District Electric Company Docket No. 19-EPDE-223-RTS Return on Equity

Attachment RBH-1
Testimony Listing of:
Robert B. Hevert, Partner Rates, Regulation and Planning Practice Leader
6
SPONSOR DATE CASE/APPLICANT DOCKET NO. SUBJECT
Empire District Electric Company 12/18 Empire District Electric Company Docket No. 19-EPDE-223-RTS Alternative Ratemaking Mechanisms
Kansas City Power & Light Company 05/18 Kansas City Power & Light Company Docket No. 18-KCPE-480-RTS Return on Equity
Westar Energy 02/18 Westar Energy Docket No. 18-WSEE-328-RTS Return on Equity
Great Plains Energy, Inc. and Kansas City Power & Light Company
01/17 Great Plains Energy, Inc. and Kansas City Power & Light Company
Docket No. 16-KCPE-593-ACQ Response to Direct Testimony by Commission Staff related to the ratemaking capital structure processes
Kansas City Power & Light Company 01/15 Kansas City Power & Light Company Docket No. 15-KCPE-116-RTS Return on Equity
Maine Public Utilities Commission
Northern Utilities, Inc. 05/17 Northern Utilities, Inc. Docket No. 2017-00065 Return on Equity
Central Maine Power Company 06/11 Central Maine Power Company Docket No. 2010-327 Response to Bench Analysis provided by Commission Staff relating to the Company’s credit and collections processes
Maryland Public Service Commission
Washington Gas Light Company 04/19 Washington Gas Light Company Case No. 9605 Return on Equity
Potomac Electric Power Company 01/19 Potomac Electric Power Company Case No. 9602 Return on Equity
Washington Gas Light Company 05/18 Washington Gas Light Company Case No. 9481 Return on Equity
Potomac Electric Power Company 01/18 Potomac Electric Power Company Case No. 9472 Return on Equity
Delmarva Power & Light Company 07/17 Delmarva Power & Light Company Case No. 9455 Return on Equity
Potomac Electric Power Company 03/17 Potomac Electric Power Company Case No. 9443 Return on Equity
Delmarva Power & Light Company 06/16 Delmarva Power & Light Company Case No. 9424 Return on Equity
Potomac Electric Power Company 06/16 Potomac Electric Power Company Case No. 9418 Return on Equity
Potomac Electric Power Company 12/13 Potomac Electric Power Company Case No. 9336 Return on Equity
Delmarva Power & Light Company 03/13 Delmarva Power & Light Company Case No. 9317 Return on Equity
Potomac Electric Power Company 11/12 Potomac Electric Power Company Case No. 9311 Return on Equity
Potomac Electric Power Company 12/11 Potomac Electric Power Company Case No. 9286 Return on Equity
Delmarva Power & Light Company 12/11 Delmarva Power & Light Company Case No. 9285 Return on Equity

Attachment RBH-1
Testimony Listing of:
Robert B. Hevert, Partner Rates, Regulation and Planning Practice Leader
7
SPONSOR DATE CASE/APPLICANT DOCKET NO. SUBJECT
Delmarva Power & Light Company 12/10 Delmarva Power & Light Company Case No. 9249 Return on Equity
Massachusetts Department of Public Utilities
NSTAR Electric Company d/b/a Eversource Energy; Massachusetts Electric Company & Nantucket Electric Company, d/b/a National Grid; and Fitchburg Gas and Electric Light Company, d/b/a Unitil
02/19 NSTAR Electric Company d/b/a Eversource Energy; Massachusetts Electric Company & Nantucket Electric Company, d/b/a National Grid; and Fitchburg Gas and Electric Light Company, d/b/a Unitil
DPU 18-64/DPU 18-65/DPU 18-66 Response to Direct Testimony by Attorney General Witness regarding Remuneration Rate Section 83D
National Grid 11/18 Massachusetts Electric Company and Nantucket Electric Company d/b/a National Grid
DPU 18-150 Return on Equity
NSTAR Electric Company d/b/a Eversource Energy
11/18 NSTAR Electric Company d/b/a Eversource Energy
DPU 18-76/DPU 18-77/DPU 18-78 Response to Direct Testimony by Attorney General Witness regarding Remuneration Rate Section 83C
Boston Gas Company, Colonial Gas Company each d/b/a National Grid
11/17 Boston Gas Company, Colonial Gas Company each d/b/a National Grid
DPU 17-170 Return on Equity
NSTAR Electric Company Western and Massachusetts Electric Company each d/b/a Eversource Energy
01/17 NSTAR Electric Company Western Massachusetts Electric Company each d/b/a Eversource Energy
DPU 17-05 Return on Equity
National Grid 11/15 Massachusetts Electric Company and Nantucket Electric Company d/b/a National Grid
DPU 15-155 Return on Equity
Fitchburg Gas and Electric Light Company d/b/a Unitil
06/15 Fitchburg Gas and Electric Light Company d/b/a Unitil
DPU 15-80 Return on Equity
NSTAR Gas Company 12/14 NSTAR Gas Company DPU 14-150 Return on Equity
Fitchburg Gas and Electric Light Company d/b/a Unitil
07/13 Fitchburg Gas and Electric Light Company d/b/a Unitil
DPU 13-90 Return on Equity
Bay State Gas Company d/b/a Columbia Gas of Massachusetts
04/12 Bay State Gas Company d/b/a Columbia Gas of Massachusetts
DPU 12-25 Capital Cost Recovery
National Grid 08/09 Massachusetts Electric Company d/b/a National Grid
DPU 09-39 Revenue Decoupling and Return on Equity

Attachment RBH-1
Testimony Listing of:
Robert B. Hevert, Partner Rates, Regulation and Planning Practice Leader
8
SPONSOR DATE CASE/APPLICANT DOCKET NO. SUBJECT
National Grid 08/09 Massachusetts Electric Company and Nantucket Electric Company d/b/a National Grid
DPU 09-38 Return on Equity – Solar Generation
Bay State Gas Company 04/09 Bay State Gas Company DPU 09-30 Return on Equity
NSTAR Electric 09/04 NSTAR Electric DTE 04-85 Divestiture of Power Purchase Agreement
NSTAR Electric 08/04 NSTAR Electric DTE 04-78 Divestiture of Power Purchase Agreement
NSTAR Electric 07/04 NSTAR Electric DTE 04-68 Divestiture of Power Purchase Agreement
NSTAR Electric 07/04 NSTAR Electric DTE 04-61 Divestiture of Power Purchase Agreement
NSTAR Electric 06/04 NSTAR Electric DTE 04-60 Divestiture of Power Purchase Agreement
Unitil Corporation 01/04 Fitchburg Gas and Electric DTE 03-52 Integrated Resource Plan; Gas Demand Forecast
Bay State Gas Company 01/93 Bay State Gas Company DPU 93-14 Divestiture of Shelf Registration
Bay State Gas Company 01/91 Bay State Gas Company DPU 91-25 Divestiture of Shelf Registration
Michigan Public Service Commission
Indiana Michigan Power Company 05/17 Indiana Michigan Power Company Case No. U-18370 Return on Equity
Minnesota Public Utilities Commission
CenterPoint Energy Resources Corp. d/b/a CenterPoint Energy Minnesota Gas
08/17 CenterPoint Energy Resources Corp. d/b/a CenterPoint Energy Minnesota Gas
Docket No. G-008/GR-17-285 Return on Equity
ALLETE, Inc., d/b/a Minnesota Power Inc. 11/16 ALLETE, Inc., d/b/a Minnesota Power Inc. Docket No. E015/GR-16-664 Return on Equity
Otter Tail Power Corporation 02/16 Otter Tail Power Company Docket No. E017/GR-15-1033 Return on Equity
Minnesota Energy Resources Corporation 09/15 Minnesota Energy Resources Corporation Docket No. G-011/GR-15-736 Return on Equity
CenterPoint Energy Resources Corp. d/b/a CenterPoint Energy Minnesota Gas
08/15 CenterPoint Energy Resources Corp. d/b/a CenterPoint Energy Minnesota Gas
Docket No. G-008/GR-15-424 Return on Equity
Xcel Energy, Inc. 11/13 Northern States Power Company Docket No. E002/GR-13-868 Return on Equity

Attachment RBH-1
Testimony Listing of:
Robert B. Hevert, Partner Rates, Regulation and Planning Practice Leader
9
SPONSOR DATE CASE/APPLICANT DOCKET NO. SUBJECT
CenterPoint Energy Resources Corp. d/b/a CenterPoint Energy Minnesota Gas
08/13 CenterPoint Energy Resources Corp. d/b/a CenterPoint Energy Minnesota Gas
Docket No. G-008/GR-13-316 Return on Equity
Xcel Energy, Inc. 11/12 Northern States Power Company Docket No. E002/GR-12-961 Return on Equity
Otter Tail Power Corporation 04/10 Otter Tail Power Company Docket No. E-017/GR-10-239 Return on Equity
Minnesota Power a division of ALLETE, Inc. 11/09 Minnesota Power Docket No. E-015/GR-09-1151 Return on Equity
CenterPoint Energy Resources Corp. d/b/a CenterPoint Energy Minnesota Gas
11/08 CenterPoint Energy Minnesota Gas Docket No. G-008/GR-08-1075 Return on Equity
Otter Tail Power Corporation 10/07 Otter Tail Power Company Docket No. E-017/GR-07-1178 Return on Equity
Xcel Energy, Inc. 11/05 Northern States Power Company -Minnesota Docket No. E-002/GR-05-1428 Return on Equity (electric)
Xcel Energy, Inc. 09/04 Northern States Power Company - Minnesota Docket No. G-002/GR-04-1511 Return on Equity (gas)
Mississippi Public Service Commission
CenterPoint Energy Resources, Corp. d/b/a CenterPoint Energy Entex and CenterPoint Energy Mississippi Gas
07/09 CenterPoint Energy Mississippi Gas Docket No. 09-UN-334
Return on Equity
Missouri Public Service Commission
Union Electric Company d/b/a Ameren Missouri
12/18 Union Electric Company d/b/a Ameren Missouri
Case No. GR-2019-0077 Return on Equity
KCP&L Greater Missouri Operations Company
01/18 KCP&L Greater Missouri Operations Company
Case No. ER-2018-0146 Return on Equity
Kansas City Power & Light Company 01/18 Kansas City Power & Light Company Case No. ER-2018-0145 Return on Equity
Laclede Gas Company and Missouri Gas Energy
11/17 Laclede Gas Company and Missouri Gas Energy
Case No. GR-2017-0215 Case No. GR-2017-0216
Goodwill Adjustment on Capital Structure
Liberty Utilities (Midstates Natural Gas) Corp. d/b/a/ Liberty Utilities
09/17 Liberty Utilities (Midstates Natural Gas) Corp. d/b/a/ Liberty Utilities
Case No. GR-2018-0013 New Ratemaking Mechanisms
Union Electric Company d/b/a Ameren Missouri
07/16 Union Electric Company d/b/a Ameren Missouri
Case No. ER-2016-0179 Return on Equity (electric)
Kansas City Power & Light Company 07/16 Kansas City Power & Light Company Case No. ER-2016-0285 Return on Equity (electric)
Kansas City Power & Light Company 02/16 Kansas City Power & Light Company Case No. ER-2016-0156 Return on Equity (electric)
Kansas City Power & Light Company 10/14 Kansas City Power & Light Company Case No. ER-2014-0370 Return on Equity (electric)

Attachment RBH-1
Testimony Listing of:
Robert B. Hevert, Partner Rates, Regulation and Planning Practice Leader
10
SPONSOR DATE CASE/APPLICANT DOCKET NO. SUBJECT
Union Electric Company d/b/a Ameren Missouri
07/14 Union Electric Company d/b/a Ameren Missouri
Case No. ER-2014-0258 Return on Equity (electric)
Union Electric Company d/b/a Ameren Missouri
06/14 Union Electric Company d/b/a Ameren Missouri
Case No. EC-2014-0223 Return on Equity (electric)
Liberty Utilities (Midstates Natural Gas) Corp. d/b/a Liberty Utilities
02/14 Liberty Utilities (Midstates Natural Gas) Corp. d/b/a Liberty Utilities
Case No. GR-2014-0152 Return on Equity
Laclede Gas Company 12/12 Laclede Gas Company Case No. GR-2013-0171 Return on Equity
Union Electric Company d/b/a Ameren Missouri
02/12 Union Electric Company d/b/a Ameren Missouri
Case No. ER-2012-0166 Return on Equity (electric)
Union Electric Company d/b/a AmerenUE 09/10 Union Electric Company d/b/a AmerenUE Case No. ER-2011-0028 Return on Equity (electric)
Union Electric Company d/b/a AmerenUE 06/10 Union Electric Company d/b/a AmerenUE Case No. GR-2010-0363 Return on Equity (gas)
Montana Public Service Commission
Northwestern Corporation 09/12 Northwestern Corporation d/b/a Northwestern Energy
Docket No. D2012.9.94 Return on Equity (gas)
Nevada Public Utilities Commission
Southwest Gas Corporation 05/18 Southwest Gas Corporation Docket No. 18-05031 Return on Equity (gas)
Southwest Gas Corporation 04/12 Southwest Gas Corporation Docket No. 12-04005 Return on Equity (gas)
Nevada Power Company 06/11 Nevada Power Company Docket No. 11-06006 Return on Equity (electric)
New Hampshire Public Utilities Commission
Northern Utilities, Inc. 06/17 Northern Utilities, Inc. Docket No. DG 17-070 Return on Equity
Liberty Utilities d/b/a EnergyNorth Natural Gas
04/17 Liberty Utilities d/b/a EnergyNorth Natural Gas Docket No. DG 17-048 Return on Equity
Unitil Energy Systems, Inc. 04/16 Unitil Energy Systems, Inc. Docket No. DE 16-384 Return on Equity
Liberty Utilities d/b/a Granite State Electric Company
04/16 Liberty Utilities d/b/a Granite State Electric Company
Docket No. DE 16-383 Return on Equity
Liberty Utilities d/b/a EnergyNorth Natural Gas
08/14 Liberty Utilities d/b/a EnergyNorth Natural Gas Docket No. DG 14-180 Return on Equity
Liberty Utilities d/b/a Granite State Electric Company
03/13 Liberty Utilities d/b/a Granite State Electric Company
Docket No. DE 13-063 Return on Equity

Attachment RBH-1
Testimony Listing of:
Robert B. Hevert, Partner Rates, Regulation and Planning Practice Leader
11
SPONSOR DATE CASE/APPLICANT DOCKET NO. SUBJECT
EnergyNorth Natural Gas d/b/a National Grid NH
02/10 EnergyNorth Natural Gas d/b/a National Grid NH
Docket No. DG 10-017 Return on Equity
Unitil Energy Systems, Inc., EnergyNorth Natural Gas, Inc. d/b/a National Grid NH, Granite State Electric Company d/b/a National Grid, and Northern Utilities, Inc. – New Hampshire Division
08/08 Unitil Energy Systems, Inc., EnergyNorth Natural Gas, Inc. d/b/a National Grid NH, Granite State Electric Company d/b/a National Grid, and Northern Utilities, Inc. – New Hampshire Division
Docket No. DG 07-072 Carrying Charge Rate on Cash Working Capital
New Jersey Board of Public Utilities
Elizabethtown Gas Company 04/19 Elizabethtown Gas Company Docket No. GR19040486 Return on Equity
Atlantic City Electric Company 10/18 Atlantic City Electric Company Docket No. EO18020196 Return on Equity
Atlantic City Electric Company 08/18 Atlantic City Electric Company Docket No. ER18080925 Return on Equity
Atlantic City Electric Company 06/18 Atlantic City Electric Company Docket No. ER18060638 Return on Equity
Atlantic City Electric Company 03/17 Atlantic City Electric Company Docket No. ER17030308 Return on Equity
Pivotal Utility Holdings, Inc. 08/16 Elizabethtown Gas Docket No. GR16090826 Return on Equity
The Southern Company; AGL Resources Inc.; AMS Corp. and Pivotal Holdings, Inc. d/b/a Elizabethtown Gas
04/16 The Southern Company; AGL Resources Inc.; AMS Corp. and Pivotal Holdings, Inc. d/b/a Elizabethtown Gas
BPU Docket No. GM15101196 Merger Approval
Atlantic City Electric Company 03/16 Atlantic City Electric Company Docket No. ER16030252 Return on Equity
Pepco Holdings, Inc. 03/14 Atlantic City Electric Company Docket No. ER14030245 Return on Equity
Orange and Rockland Utilities 11/13 Rockland Electric Company Docket No. ER13111135 Return on Equity
Atlantic City Electric Company 12/12 Atlantic City Electric Company Docket No. ER12121071 Return on Equity
Atlantic City Electric Company 08/11 Atlantic City Electric Company Docket No. ER11080469 Return on Equity
Pepco Holdings, Inc. 09/06 Atlantic City Electric Company Docket No. EM06090638 Divestiture and Valuation of Electric Generating Assets
Pepco Holdings, Inc. 12/05 Atlantic City Electric Company Docket No. EM05121058 Market Value of Electric Generation Assets; Auction
Conectiv 06/03 Atlantic City Electric Company Docket No. EO03020091 Market Value of Electric Generation Assets; Auction Process

Attachment RBH-1
Testimony Listing of:
Robert B. Hevert, Partner Rates, Regulation and Planning Practice Leader
12
SPONSOR DATE CASE/APPLICANT DOCKET NO. SUBJECT
New Mexico Public Regulation Commission
Public Service Company of New Mexico 12/16 Public Service Company of New Mexico Case No. 16-00276-UT Return on Equity (electric)
Public Service Company of New Mexico 08/15 Public Service Company of New Mexico Case No. 15-00261-UT Return on Equity (electric)
Public Service Company of New Mexico 12/14 Public Service Company of New Mexico Case No. 14-00332-UT Return on Equity (electric)
Public Service Company of New Mexico 12/14 Public Service Company of New Mexico Case No. 13-00390-UT Cost of Capital and Financial Integrity
Southwestern Public Service Company 02/11 Southwestern Public Service Company Case No. 10-00395-UT Return on Equity (electric)
Public Service Company of New Mexico 06/10 Public Service Company of New Mexico Case No. 10-00086-UT Return on Equity (electric)
Public Service Company of New Mexico 09/08 Public Service Company of New Mexico Case No. 08-00273-UT Return on Equity (electric)
Xcel Energy, Inc. 07/07 Southwestern Public Service Company Case No. 07-00319-UT Return on Equity (electric)
New York State Public Service Commission
Consolidated Edison Company of New York, Inc.
01/15 Consolidated Edison Company of New York, Inc.
Case No. 15-E-0050 Return on Equity (electric)
Orange and Rockland Utilities, Inc. 11/14 Orange and Rockland Utilities, Inc. Case Nos. 14-E-0493 and 14-G-0494
Return on Equity (electric and gas)
Consolidated Edison Company of New York, Inc.
01/13 Consolidated Edison Company of New York, Inc.
Case No. 13-E-0030 Return on Equity (electric)
Niagara Mohawk Corporation d/b/a National Grid for Electric Service
04/12 Niagara Mohawk Corporation d/b/a National Grid for Electric Service
Case No. 12-E-0201 Return on Equity (electric)
Niagara Mohawk Corporation d/b/a National Grid for Gas Service
04/12 Niagara Mohawk Corporation d/b/a National Grid for Gas Service
Case No. 12-G-0202 Return on Equity (gas)
Orange and Rockland Utilities, Inc. 07/11 Orange and Rockland Utilities, Inc. Case No. 11-E-0408 Return on Equity (electric)
Orange and Rockland Utilities, Inc. 07/10 Orange and Rockland Utilities, Inc. Case No. 10-E-0362 Return on Equity (electric)
Consolidated Edison Company of New York, Inc.
11/09 Consolidated Edison Company of New York, Inc.
Case No. 09-G-0795 Return on Equity (gas)
Consolidated Edison Company of New York, Inc.
11/09 Consolidated Edison Company of New York, Inc.
Case No. 09-S-0794 Return on Equity (steam)
Niagara Mohawk Power Corporation 07/01 Niagara Mohawk Power Corporation Case No. 01-E-1046 Power Purchase and Sale Agreement; Standard Offer Service Agreement
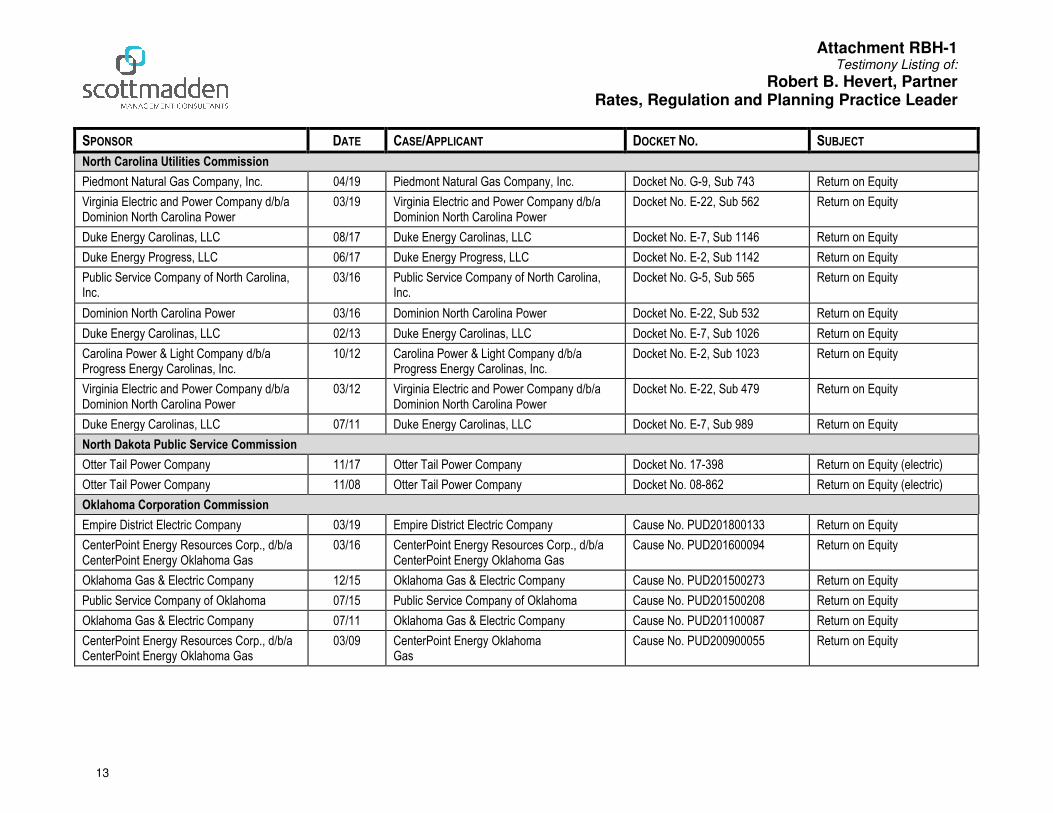
Attachment RBH-1
Testimony Listing of:
Robert B. Hevert, Partner Rates, Regulation and Planning Practice Leader
13
SPONSOR DATE CASE/APPLICANT DOCKET NO. SUBJECT
North Carolina Utilities Commission
Piedmont Natural Gas Company, Inc. 04/19 Piedmont Natural Gas Company, Inc. Docket No. G-9, Sub 743 Return on Equity
Virginia Electric and Power Company d/b/a Dominion North Carolina Power
03/19 Virginia Electric and Power Company d/b/a Dominion North Carolina Power
Docket No. E-22, Sub 562 Return on Equity
Duke Energy Carolinas, LLC 08/17 Duke Energy Carolinas, LLC Docket No. E-7, Sub 1146 Return on Equity
Duke Energy Progress, LLC 06/17 Duke Energy Progress, LLC Docket No. E-2, Sub 1142 Return on Equity
Public Service Company of North Carolina, Inc.
03/16 Public Service Company of North Carolina, Inc.
Docket No. G-5, Sub 565 Return on Equity
Dominion North Carolina Power 03/16 Dominion North Carolina Power Docket No. E-22, Sub 532 Return on Equity
Duke Energy Carolinas, LLC 02/13 Duke Energy Carolinas, LLC Docket No. E-7, Sub 1026 Return on Equity
Carolina Power & Light Company d/b/a Progress Energy Carolinas, Inc.
10/12 Carolina Power & Light Company d/b/a Progress Energy Carolinas, Inc.
Docket No. E-2, Sub 1023 Return on Equity
Virginia Electric and Power Company d/b/a Dominion North Carolina Power
03/12 Virginia Electric and Power Company d/b/a Dominion North Carolina Power
Docket No. E-22, Sub 479 Return on Equity
Duke Energy Carolinas, LLC 07/11 Duke Energy Carolinas, LLC Docket No. E-7, Sub 989 Return on Equity
North Dakota Public Service Commission
Otter Tail Power Company 11/17 Otter Tail Power Company Docket No. 17-398 Return on Equity (electric)
Otter Tail Power Company 11/08 Otter Tail Power Company Docket No. 08-862 Return on Equity (electric)
Oklahoma Corporation Commission
Empire District Electric Company 03/19 Empire District Electric Company Cause No. PUD201800133 Return on Equity
CenterPoint Energy Resources Corp., d/b/a CenterPoint Energy Oklahoma Gas
03/16 CenterPoint Energy Resources Corp., d/b/a CenterPoint Energy Oklahoma Gas
Cause No. PUD201600094 Return on Equity
Oklahoma Gas & Electric Company 12/15 Oklahoma Gas & Electric Company Cause No. PUD201500273 Return on Equity
Public Service Company of Oklahoma 07/15 Public Service Company of Oklahoma Cause No. PUD201500208 Return on Equity
Oklahoma Gas & Electric Company 07/11 Oklahoma Gas & Electric Company Cause No. PUD201100087 Return on Equity
CenterPoint Energy Resources Corp., d/b/a CenterPoint Energy Oklahoma Gas
03/09 CenterPoint Energy Oklahoma Gas
Cause No. PUD200900055 Return on Equity
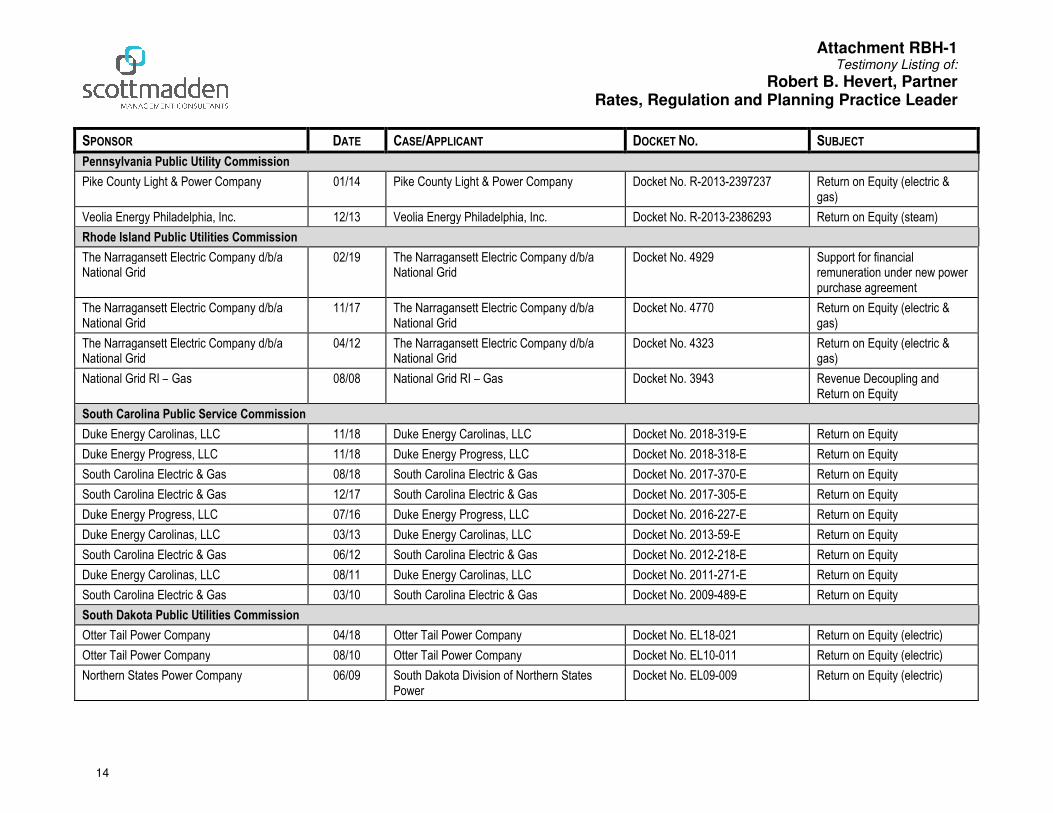
Attachment RBH-1
Testimony Listing of:
Robert B. Hevert, Partner Rates, Regulation and Planning Practice Leader
14
SPONSOR DATE CASE/APPLICANT DOCKET NO. SUBJECT
Pennsylvania Public Utility Commission
Pike County Light & Power Company 01/14 Pike County Light & Power Company Docket No. R-2013-2397237 Return on Equity (electric & gas)
Veolia Energy Philadelphia, Inc. 12/13 Veolia Energy Philadelphia, Inc. Docket No. R-2013-2386293 Return on Equity (steam)
Rhode Island Public Utilities Commission
The Narragansett Electric Company d/b/a National Grid
02/19 The Narragansett Electric Company d/b/a National Grid
Docket No. 4929 Support for financial remuneration under new power purchase agreement
The Narragansett Electric Company d/b/a National Grid
11/17 The Narragansett Electric Company d/b/a National Grid
Docket No. 4770 Return on Equity (electric & gas)
The Narragansett Electric Company d/b/a National Grid
04/12 The Narragansett Electric Company d/b/a National Grid
Docket No. 4323 Return on Equity (electric & gas)
National Grid RI – Gas 08/08 National Grid RI – Gas Docket No. 3943 Revenue Decoupling and Return on Equity
South Carolina Public Service Commission
Duke Energy Carolinas, LLC 11/18 Duke Energy Carolinas, LLC Docket No. 2018-319-E Return on Equity
Duke Energy Progress, LLC 11/18 Duke Energy Progress, LLC Docket No. 2018-318-E Return on Equity
South Carolina Electric & Gas 08/18 South Carolina Electric & Gas Docket No. 2017-370-E Return on Equity
South Carolina Electric & Gas 12/17 South Carolina Electric & Gas Docket No. 2017-305-E Return on Equity
Duke Energy Progress, LLC 07/16 Duke Energy Progress, LLC Docket No. 2016-227-E Return on Equity
Duke Energy Carolinas, LLC 03/13 Duke Energy Carolinas, LLC Docket No. 2013-59-E Return on Equity
South Carolina Electric & Gas 06/12 South Carolina Electric & Gas Docket No. 2012-218-E Return on Equity
Duke Energy Carolinas, LLC 08/11 Duke Energy Carolinas, LLC Docket No. 2011-271-E Return on Equity
South Carolina Electric & Gas 03/10 South Carolina Electric & Gas Docket No. 2009-489-E Return on Equity
South Dakota Public Utilities Commission
Otter Tail Power Company 04/18 Otter Tail Power Company Docket No. EL18-021 Return on Equity (electric)
Otter Tail Power Company 08/10 Otter Tail Power Company Docket No. EL10-011 Return on Equity (electric)
Northern States Power Company 06/09 South Dakota Division of Northern States Power
Docket No. EL09-009 Return on Equity (electric)

Attachment RBH-1
Testimony Listing of:
Robert B. Hevert, Partner Rates, Regulation and Planning Practice Leader
15
SPONSOR DATE CASE/APPLICANT DOCKET NO. SUBJECT
Otter Tail Power Company 10/08 Otter Tail Power Company Docket No. EL08-030 Return on Equity (electric)
Texas Public Utility Commission
CenterPoint Energy Houston Electric LLC 04/19 CenterPoint Energy Houston Electric LLC Docket No. 49421 Return on Equity
Texas-New Mexico Power Company 05/18 Texas-New Mexico Power Company Docket No. 48401 Return on Equity
Entergy Texas, Inc. 05/18 Entergy Texas, Inc. Docket No. 48371 Return on Equity
Southwestern Public Service Company 08/17 Southwestern Public Service Company Docket No. 47527 Return on Equity
Oncor Electric Delivery Company, LLC 03/17 Oncor Electric Delivery Company, LLC Docket No. 46957 Return on Equity
El Paso Electric Company 02/17 El Paso Electric Company Docket No. 46831 Return on Equity
Southwestern Electric Power Company 12/16 Southwestern Electric Power Company Docket No. 46449 Return on Equity (electric)
Sharyland Utilities, L.P. 04/16 Sharyland Utilities, L.P. Docket No. 45414 Return on Equity
Southwestern Public Service Company 02/16 Southwestern Public Service Company Docket No. 44524 Return on Equity (electric)
Wind Energy Transmission Texas, LLC 05/15 Wind Energy Transmission Texas, LLC Docket No. 44746 Return on Equity
Cross Texas Transmission 12/14 Cross Texas Transmission Docket No. 43950 Return on Equity
Southwestern Public Service Company 12/14 Southwestern Public Service Company Docket No. 43695 Return on Equity (electric)
Sharyland Utilities, L.P. 05/13 Sharyland Utilities, L.P. Docket No. 41474 Return on Equity
Wind Energy Texas Transmission, LLC 08/12 Wind Energy Texas Transmission, LLC Docket No. 40606 Return on Equity
Southwestern Electric Power Company 07/12 Southwestern Electric Power Company Docket No. 40443 Return on Equity
Oncor Electric Delivery Company, LLC 01/11 Oncor Electric Delivery Company, LLC Docket No. 38929 Return on Equity
Texas-New Mexico Power Company 08/10 Texas-New Mexico Power Company Docket No. 38480 Return on Equity (electric)
CenterPoint Energy Houston Electric LLC 06/10 CenterPoint Energy Houston Electric LLC Docket No. 38339 Return on Equity
Xcel Energy, Inc. 05/10 Southwestern Public Service Company Docket No. 38147 Return on Equity (electric)
Texas-New Mexico Power Company 08/08 Texas-New Mexico Power Company Docket No. 36025 Return on Equity (electric)
Xcel Energy, Inc. 05/06 Southwestern Public Service Company Docket No. 32766 Return on Equity (electric)
Texas Railroad Commission
Atmos Energy Corporation – Mid-Tex Division
10/18 Atmos Energy Corporation – Mid-Tex Division GUD 10779 Return on Equity
Atmos Energy Corporation – West Texas Division
06/18 Atmos Energy Corporation – West Texas Division
GUD 10743 Return on Equity

Attachment RBH-1
Testimony Listing of:
Robert B. Hevert, Partner Rates, Regulation and Planning Practice Leader
16
SPONSOR DATE CASE/APPLICANT DOCKET NO. SUBJECT
Atmos Energy Corporation – Mid-Texas Division
06/18 Atmos Energy Corporation – Mid-Texas Division
GUD 10742 Return on Equity
CenterPoint Energy Resources Corp. D/B/A CenterPoint Energy Entex And CenterPoint Energy Texas Gas
11/17 CenterPoint Energy Resources Corp. D/B/A CenterPoint Energy Entex And CenterPoint Energy Texas Gas
GUD 10669 Return on Equity
Atmos Pipeline - Texas 01/17 Atmos Pipeline - Texas GUD 10580 Return on Equity
CenterPoint Energy Resources Corp. D/B/A CenterPoint Energy Entex And CenterPoint Energy Texas Gas
12/16 CenterPoint Energy Resources Corp. D/B/A CenterPoint Energy Entex And CenterPoint Energy Texas Gas
GUD 10567 Return on Equity
CenterPoint Energy Resources Corp. d/b/a CenterPoint Energy Entex and CenterPoint Energy Texas Gas
03/15 CenterPoint Energy Resources Corp. d/b/a CenterPoint Energy Entex and CenterPoint Energy Texas Gas
GUD 10432 Return on Equity
CenterPoint Energy Resources Corp. d/b/a CenterPoint Energy Entex and CenterPoint Energy Texas Gas
07/12 CenterPoint Energy Resources Corp. d/b/a CenterPoint Energy Entex and CenterPoint Energy Texas Gas
GUD 10182 Return on Equity
Atmos Energy Corporation – West Texas Division
06/12 Atmos Energy Corporation – West Texas Division
GUD 10174 Return on Equity
Atmos Energy Corporation – Mid-Texas Division
06/12 Atmos Energy Corporation – Mid-Texas Division
GUD 10170 Return on Equity
CenterPoint Energy Resources Corp. d/b/a CenterPoint Energy Entex and CenterPoint Energy Texas Gas
12/10 CenterPoint Energy Resources Corp. d/b/a CenterPoint Energy Entex and CenterPoint Energy Texas Gas
GUD 10038 Return on Equity
Atmos Pipeline – Texas 09/10 Atmos Pipeline - Texas GUD 10000 Return on Equity
CenterPoint Energy Resources Corp. d/b/a CenterPoint Energy Entex and CenterPoint Energy Texas Gas
07/09 CenterPoint Energy Resources Corp. d/b/a CenterPoint Energy Entex and CenterPoint Energy Texas Gas
GUD 9902 Return on Equity
CenterPoint Energy Resources Corp. d/b/a CenterPoint Energy Texas Gas
03/08 CenterPoint Energy Resources Corp. d/b/a CenterPoint Energy Texas Gas
GUD 9791 Return on Equity
Utah Public Service Commission
Questar Gas Company 12/07 Questar Gas Company Docket No. 07-057-13 Return on Equity

Attachment RBH-1
Testimony Listing of:
Robert B. Hevert, Partner Rates, Regulation and Planning Practice Leader
17
SPONSOR DATE CASE/APPLICANT DOCKET NO. SUBJECT
Vermont Public Service Board
Central Vermont Public Service Corporation; Green Mountain Power
02/12 Central Vermont Public Service Corporation; Green Mountain Power
Docket No. 7770 Merger Policy
Central Vermont Public Service Corporation 12/10 Central Vermont Public Service Corporation Docket No. 7627 Return on Equity (electric)
Green Mountain Power 04/06 Green Mountain Power Docket Nos. 7175 and 7176 Return on Equity (electric)
Vermont Gas Systems, Inc. 12/05 Vermont Gas Systems Docket Nos. 7109 and 7160 Return on Equity (gas)
Virginia State Corporation Commission
Virginia Electric and Power Company 03/19 Virginia Electric and Power Company Case No. PUR-2019-00050 Return on Equity
Virginia Electric and Power Company 03/17 Virginia Electric and Power Company Case No. PUR-2017-00038 Return on Equity
Virginia Natural Gas, Inc. 03/17 Virginia Natural Gas, Inc. Case No. PUE-2016-00143 Return on Equity
Virginia Electric and Power Company 10/16 Virginia Electric and Power Company Case No. PUE-2016-00112; PUE-2016-00113; PUE-2016-00136
Return on Equity
Washington Gas Light Company 06/16 Washington Gas Light Company Case No. PUE-2016-00001 Return on Equity
Virginia Electric and Power Company 06/16 Virginia Electric and Power Company
Case Nos. PUE-2016-00063; PUE-2016-00062; PUE-2016-00061; PUE-2016-00060; PUE-2016-00059
Return on Equity
Virginia Electric and Power Company 12/15 Virginia Electric and Power Company Case Nos. PUE-2015-00058; PUE-2015-00059; PUE-2015-00060; PUE-2015-00061; PUE-2015-00075; PUE-2015-00089; PUE-2015-00102; PUE-2015-00104
Return on Equity
Virginia Electric and Power Company 03/15 Virginia Electric and Power Company Case No. PUE-2015-00027 Return on Equity
Virginia Electric and Power Company 03/13 Virginia Electric and Power Company Case No. PUE-2013-00020 Return on Equity
Virginia Natural Gas, Inc. 02/11 Virginia Natural Gas, Inc. Case No. PUE-2010-00142 Capital Structure
Columbia Gas of Virginia, Inc. 06/06 Columbia Gas of Virginia, Inc. Case No. PUE-2005-00098 Merger Synergies
Dominion Resources 10/01 Virginia Electric and Power Company Case No. PUE000584 Corporate Structure and Electric Generation Strategy

Attachment RBH-1
Testimony Listing of:
Robert B. Hevert, Partner Rates, Regulation and Planning Practice Leader
18
Expert Reports
United States District Court, District of South Carolina, Columbia Division
South Carolina Electric & Gas Company 07/18 South Carolina Electric & Gas Company Case No. 3:18-CV-01795-JMC Return on Equity
United States District Court, Western District of Texas, Austin Division
Southwestern Public Service Company 02/12 Southwestern Public Service Company C.A. No. A-09-CA-917-SS PURPA and FERC regulations
American Arbitration Association
Confidential Client 11/14 Confidential Client Confidential Economic harm related to failure to perform

Indiana Michigan Power CompanyAttachment RBH-2
Page 1 of 3
Constant Growth Discounted Cash Flow Model with Half Year Growth Adjustment 30 Day Average Stock Price
[1] [2] [3] [4] [5] [6] [7] [8] [9] [10] [11]
Company TickerAnnualized Dividend
Average StockPrice
Dividend Yield
Expected Dividend
Yield
Zacks Earnings Growth
First Call Earnings Growth
Value Line Earnings Growth
Average Earnings Growth
LowROE
MeanROE
HighROE
ALLETE, Inc. ALE $2.35 $80.27 2.93% 3.01% NA 6.00% 5.00% 5.50% 8.00% 8.51% 9.02%Alliant Energy Corporation LNT $1.42 $45.56 3.12% 3.22% 6.00% 7.25% 6.50% 6.58% 9.21% 9.80% 10.48%Ameren Corporation AEE $1.90 $70.76 2.68% 2.78% 6.80% 7.70% 6.50% 7.00% 9.27% 9.78% 10.49%Avangrid, Inc. AGR $1.76 $49.39 3.56% 3.74% 7.70% 9.20% 12.00% 9.63% 11.40% 13.37% 15.78%Black Hills Corporation BKH $2.02 $70.59 2.86% 2.93% 4.70% 3.63% 6.50% 4.94% 6.54% 7.88% 9.45%CMS Energy Corporation CMS $1.53 $53.59 2.86% 2.95% 6.00% 6.89% 7.00% 6.63% 8.94% 9.58% 9.96%DTE Energy Company DTE $3.78 $121.33 3.12% 3.19% 6.00% 4.16% 5.00% 5.05% 7.34% 8.25% 9.21%Duke Energy Corporation DUK $3.71 $89.40 4.15% 4.25% 5.00% 4.50% 5.50% 5.00% 8.74% 9.25% 9.76%El Paso Electric Company EE $1.44 $55.16 2.61% 2.66% 2.70% 5.10% 3.00% 3.60% 5.35% 6.26% 7.78%Evergy, Inc. EVRG $1.90 $57.00 3.33% 3.44% 6.70% 6.25% NMF 6.48% 9.69% 9.92% 10.14%Hawaiian Electric Industries, Inc. HE $1.28 $38.43 3.33% 3.43% 6.20% 7.80% 3.50% 5.83% 6.89% 9.26% 11.26%NextEra Energy, Inc. NEE $5.00 $185.69 2.69% 2.80% 7.70% 7.46% 9.00% 8.05% 10.25% 10.85% 11.81%NorthWestern Corporation NWE $2.30 $67.21 3.42% 3.47% 3.10% 2.74% 2.50% 2.78% 5.97% 6.25% 6.58%OGE Energy Corp. OGE $1.46 $41.97 3.48% 3.58% 4.80% NA 6.50% 5.65% 8.36% 9.23% 10.09%Otter Tail Corporation OTTR $1.40 $49.90 2.81% 2.90% NA 9.00% 5.00% 7.00% 7.88% 9.90% 11.93%Pinnacle West Capital Corporation PNW $2.95 $91.67 3.22% 3.30% 4.80% 4.56% 6.00% 5.12% 7.85% 8.42% 9.31%PNM Resources, Inc. PNM $1.16 $44.14 2.63% 2.70% 4.60% 4.10% 7.50% 5.40% 6.78% 8.10% 10.23%Portland General Electric Company POR $1.45 $49.89 2.91% 2.97% 4.00% 4.90% 4.00% 4.30% 6.96% 7.27% 7.88%Southern Company SO $2.40 $49.84 4.82% 4.90% 4.50% 2.16% 3.50% 3.39% 7.03% 8.28% 9.42%WEC Energy Group, Inc. WEC $2.36 $75.56 3.12% 3.20% 4.40% 4.59% 6.00% 5.00% 7.59% 8.20% 9.22%Xcel Energy Inc. XEL $1.62 $54.41 2.98% 3.07% 5.90% 6.60% 5.50% 6.00% 8.56% 9.07% 9.68%
Proxy Group Mean 3.17% 3.26% 5.35% 5.73% 5.80% 5.66% 8.03% 8.92% 9.97%Proxy Group Median 3.12% 3.19% 5.00% 5.55% 5.75% 5.50% 7.88% 9.07% 9.76%
Notes:[1] Source: Bloomberg Professional[2] Source: Bloomberg Professional, equals indicated number of trading day average as of March 15, 2019[3] Equals [1] / [2][4] Equals [3] x (1 + 0.5 x [8])[5] Source: Zacks[6] Source: Yahoo! Finance [7] Source: Value Line[8] Equals Average([5], [6], [7])[9] Equals [3] x (1 + 0.5 x Minimum([5], [6], [7])) + Minimum([5], [6], [7])[10] Equals [4] + [8][11] Equals [3] x (1 + 0.5 x Maximum([5], [6], [7])) + Maximum([5], [6], [7])

Indiana Michigan Power CompanyAttachment RBH-2
Page 2 of 3
Constant Growth Discounted Cash Flow Model with Half Year Growth Adjustment 90 Day Average Stock Price
[1] [2] [3] [4] [5] [6] [7] [8] [9] [10] [11]
Company TickerAnnualized Dividend
Average StockPrice
Dividend Yield
Expected Dividend
Yield
Zacks Earnings Growth
First Call Earnings Growth
Value Line Earnings Growth
Average Earnings Growth
LowROE
MeanROE
HighROE
ALLETE, Inc. ALE $2.35 $78.18 3.01% 3.09% NA 6.00% 5.00% 5.50% 8.08% 8.59% 9.10%Alliant Energy Corporation LNT $1.42 $44.33 3.20% 3.31% 6.00% 7.25% 6.50% 6.58% 9.30% 9.89% 10.57%Ameren Corporation AEE $1.90 $68.43 2.78% 2.87% 6.80% 7.70% 6.50% 7.00% 9.37% 9.87% 10.58%Avangrid, Inc. AGR $1.76 $49.63 3.55% 3.72% 7.70% 9.20% 12.00% 9.63% 11.38% 13.35% 15.76%Black Hills Corporation BKH $2.02 $66.38 3.04% 3.12% 4.70% 3.63% 6.50% 4.94% 6.73% 8.06% 9.64%CMS Energy Corporation CMS $1.53 $51.67 2.96% 3.06% 6.00% 6.89% 7.00% 6.63% 9.05% 9.69% 10.06%DTE Energy Company DTE $3.78 $117.08 3.23% 3.31% 6.00% 4.16% 5.00% 5.05% 7.46% 8.36% 9.33%Duke Energy Corporation DUK $3.71 $87.56 4.24% 4.34% 5.00% 4.50% 5.50% 5.00% 8.83% 9.34% 9.85%El Paso Electric Company EE $1.44 $53.94 2.67% 2.72% 2.70% 5.10% 3.00% 3.60% 5.41% 6.32% 7.84%Evergy, Inc. EVRG $1.90 $57.64 3.30% 3.40% 6.70% 6.25% NMF 6.48% 9.65% 9.88% 10.11%Hawaiian Electric Industries, Inc. HE $1.28 $37.58 3.41% 3.51% 6.20% 7.80% 3.50% 5.83% 6.97% 9.34% 11.34%NextEra Energy, Inc. NEE $5.00 $179.34 2.79% 2.90% 7.70% 7.46% 9.00% 8.05% 10.35% 10.95% 11.91%NorthWestern Corporation NWE $2.30 $63.69 3.61% 3.66% 3.10% 2.74% 2.50% 2.78% 6.16% 6.44% 6.77%OGE Energy Corp. OGE $1.46 $40.33 3.62% 3.72% 4.80% NA 6.50% 5.65% 8.51% 9.37% 10.24%Otter Tail Corporation OTTR $1.40 $48.82 2.87% 2.97% NA 9.00% 5.00% 7.00% 7.94% 9.97% 12.00%Pinnacle West Capital Corporation PNW $2.95 $88.79 3.32% 3.41% 4.80% 4.56% 6.00% 5.12% 7.96% 8.53% 9.42%PNM Resources, Inc. PNM $1.16 $42.64 2.72% 2.79% 4.60% 4.10% 7.50% 5.40% 6.88% 8.19% 10.32%Portland General Electric Company POR $1.45 $47.89 3.03% 3.09% 4.00% 4.90% 4.00% 4.30% 7.09% 7.39% 8.00%Southern Company SO $2.40 $47.46 5.06% 5.14% 4.50% 2.16% 3.50% 3.39% 7.27% 8.53% 9.67%WEC Energy Group, Inc. WEC $2.36 $72.33 3.26% 3.34% 4.40% 4.59% 6.00% 5.00% 7.73% 8.34% 9.36%Xcel Energy Inc. XEL $1.62 $51.95 3.12% 3.21% 5.90% 6.60% 5.50% 6.00% 8.70% 9.21% 9.82%
Proxy Group Mean 3.27% 3.37% 5.35% 5.73% 5.80% 5.66% 8.13% 9.03% 10.08%Proxy Group Median 3.20% 3.31% 5.00% 5.55% 5.75% 5.50% 7.96% 9.21% 9.85%
Notes:[1] Source: Bloomberg Professional[2] Source: Bloomberg Professional, equals indicated number of trading day average as of March 15, 2019[3] Equals [1] / [2][4] Equals [3] x (1 + 0.5 x [8])[5] Source: Zacks[6] Source: Yahoo! Finance[7] Source: Value Line[8] Equals Average([5], [6], [7])[9] Equals [3] x (1 + 0.5 x Minimum([5], [6], [7])) + Minimum([5], [6], [7])[10] Equals [4] + [8][11] Equals [3] x (1 + 0.5 x Maximum([5], [6], [7])) + Maximum([5], [6], [7])

Indiana Michigan Power CompanyAttachment RBH-2
Page 3 of 3
Constant Growth Discounted Cash Flow Model with Half Year Growth Adjustment 180 Day Average Stock Price
[1] [2] [3] [4] [5] [6] [7] [8] [9] [10] [11]
Company TickerAnnualized Dividend
Average StockPrice
Dividend Yield
Expected Dividend
Yield
Zacks Earnings Growth
First Call Earnings Growth
Value Line Earnings Growth
Average Earnings Growth
LowROE
MeanROE
HighROE
ALLETE, Inc. ALE $2.35 $77.34 3.04% 3.12% NA 6.00% 5.00% 5.50% 8.11% 8.62% 9.13%Alliant Energy Corporation LNT $1.42 $43.68 3.25% 3.36% 6.00% 7.25% 6.50% 6.58% 9.35% 9.94% 10.62%Ameren Corporation AEE $1.90 $65.93 2.88% 2.98% 6.80% 7.70% 6.50% 7.00% 9.48% 9.98% 10.69%Avangrid, Inc. AGR $1.76 $49.67 3.54% 3.71% 7.70% 9.20% 12.00% 9.63% 11.38% 13.35% 15.76%Black Hills Corporation BKH $2.02 $63.29 3.19% 3.27% 4.70% 3.63% 6.50% 4.94% 6.88% 8.21% 9.80%CMS Energy Corporation CMS $1.53 $50.31 3.04% 3.14% 6.00% 6.89% 7.00% 6.63% 9.13% 9.77% 10.15%DTE Energy Company DTE $3.78 $113.55 3.33% 3.41% 6.00% 4.16% 5.00% 5.05% 7.56% 8.47% 9.43%Duke Energy Corporation DUK $3.71 $84.29 4.40% 4.51% 5.00% 4.50% 5.50% 5.00% 9.00% 9.51% 10.02%El Paso Electric Company EE $1.44 $57.17 2.52% 2.56% 2.70% 5.10% 3.00% 3.60% 5.25% 6.16% 7.68%Evergy, Inc. EVRG $1.90 $57.02 3.33% 3.44% 6.70% 6.25% NMF 6.48% 9.69% 9.91% 10.14%Hawaiian Electric Industries, Inc. HE $1.28 $36.49 3.51% 3.61% 6.20% 7.80% 3.50% 5.83% 7.07% 9.44% 11.44%NextEra Energy, Inc. NEE $5.00 $174.90 2.86% 2.97% 7.70% 7.46% 9.00% 8.05% 10.43% 11.03% 11.99%NorthWestern Corporation NWE $2.30 $61.51 3.74% 3.79% 3.10% 2.74% 2.50% 2.78% 6.29% 6.57% 6.90%OGE Energy Corp. OGE $1.46 $38.40 3.80% 3.91% 4.80% NA 6.50% 5.65% 8.69% 9.56% 10.43%Otter Tail Corporation OTTR $1.40 $48.32 2.90% 3.00% NA 9.00% 5.00% 7.00% 7.97% 10.00% 12.03%Pinnacle West Capital Corporation PNW $2.95 $84.87 3.48% 3.57% 4.80% 4.56% 6.00% 5.12% 8.12% 8.69% 9.58%PNM Resources, Inc. PNM $1.16 $40.91 2.84% 2.91% 4.60% 4.10% 7.50% 5.40% 6.99% 8.31% 10.44%Portland General Electric Company POR $1.45 $46.70 3.11% 3.17% 4.00% 4.90% 4.00% 4.30% 7.17% 7.47% 8.08%Southern Company SO $2.40 $46.55 5.16% 5.24% 4.50% 2.16% 3.50% 3.39% 7.37% 8.63% 9.77%WEC Energy Group, Inc. WEC $2.36 $69.74 3.38% 3.47% 4.40% 4.59% 6.00% 5.00% 7.86% 8.47% 9.49%Xcel Energy Inc. XEL $1.62 $49.73 3.26% 3.36% 5.90% 6.60% 5.50% 6.00% 8.85% 9.36% 9.97%
Proxy Group Mean 3.36% 3.45% 5.35% 5.73% 5.80% 5.66% 8.22% 9.12% 10.17%Proxy Group Median 3.26% 3.36% 5.00% 5.55% 5.75% 5.50% 8.11% 9.36% 10.02%
Notes:[1] Source: Bloomberg Professional[2] Source: Bloomberg Professional, equals indicated number of trading day average as of March 15, 2019[3] Equals [1] / [2][4] Equals [3] x (1 + 0.5 x [8])[5] Source: Zacks[6] Source: Yahoo! Finance[7] Source: Value Line[8] Equals Average([5], [6], [7])[9] Equals [3] x (1 + 0.5 x Minimum([5], [6], [7])) + Minimum([5], [6], [7])[10] Equals [4] + [8][11] Equals [3] x (1 + 0.5 x Maximum([5], [6], [7])) + Maximum([5], [6], [7])

Indiana Michigan Power CompanyAttachment RBH-3
Page 1 of 14
Ex-Ante Market Risk PremiumMarket DCF Method Based - Bloomberg
[1] [2] [3]S&P 500
Est. RequiredMarket Return
Year Treasury
(30-day average)
Implied Market Risk Premium
13.64% 3.03% 10.61%
[4] [5] [6] [7] [8] [9]
Company TickerMarket
CapitalizationWeight in
IndexEstimated
Dividend YieldLong-Term Growth Est. DCF Result
WeightedDCF Result
Agilent Technologies Inc A 25,751 N/A 0.83% N/A N/A N/AAmerican Airlines Group Inc AAL 14,114 0.06% 1.29% 9.54% 10.89% 0.0062%Advance Auto Parts Inc AAP 11,097 0.04% 0.15% 15.47% 15.64% 0.0070%Apple Inc AAPL 877,608 3.54% 1.58% 9.40% 11.05% 0.3908%AbbVie Inc ABBV 119,983 0.48% 5.31% 8.81% 14.36% 0.0694%AmerisourceBergen Corp ABC 16,925 0.07% 2.00% 8.70% 10.79% 0.0074%ABIOMED Inc ABMD 15,024 0.06% 0.00% 29.00% 29.00% 0.0176%Abbott Laboratories ABT 140,272 0.57% 1.53% 11.69% 13.30% 0.0752%Accenture PLC ACN 106,225 0.43% 1.76% 10.27% 12.12% 0.0519%Adobe Inc ADBE 125,747 0.51% 0.00% 17.16% 17.16% 0.0869%Analog Devices Inc ADI 40,290 0.16% 1.90% 11.98% 13.98% 0.0227%Archer-Daniels-Midland Co ADM 24,185 0.10% 3.29% 1.40% 4.71% 0.0046%Automatic Data Processing Inc ADP 67,658 0.27% 1.87% 14.00% 16.00% 0.0436%Alliance Data Systems Corp ADS 9,137 0.04% 1.44% -1.33% 0.10% 0.0000%Autodesk Inc ADSK 33,570 0.14% 0.00% 51.81% 51.81% 0.0701%Ameren Corp AEE 17,868 0.07% 2.67% 6.35% 9.11% 0.0066%American Electric Power Co Inc AEP 41,342 0.17% 3.21% 6.12% 9.43% 0.0157%AES Corp/VA AES 12,129 0.05% 3.04% 7.67% 10.82% 0.0053%Aflac Inc AFL 37,479 0.15% 2.19% 3.43% 5.66% 0.0085%Allergan PLC AGN 50,308 0.20% 1.98% 5.45% 7.48% 0.0152%American International Group Inc AIG 38,292 0.15% 3.09% 11.00% 14.26% 0.0220%Apartment Investment & Management Co AIV 7,326 0.03% 4.09% 8.77% 13.03% 0.0038%Assurant Inc AIZ 6,091 N/A 2.53% N/A N/A N/AArthur J Gallagher & Co AJG 14,776 0.06% 2.14% 10.17% 12.41% 0.0074%Akamai Technologies Inc AKAM 11,828 0.05% 0.00% 15.40% 15.40% 0.0073%Albemarle Corp ALB 9,033 0.04% 1.61% 12.19% 13.89% 0.0051%Align Technology Inc ALGN 20,184 0.08% 0.00% 23.19% 23.19% 0.0189%Alaska Air Group Inc ALK 6,889 0.03% 2.45% 25.37% 28.13% 0.0078%Allstate Corp/The ALL 31,483 0.13% 2.04% 9.00% 11.13% 0.0141%Allegion PLC ALLE 8,351 0.03% 1.20% 10.22% 11.48% 0.0039%Alexion Pharmaceuticals Inc ALXN 30,412 0.12% 0.00% 15.78% 15.78% 0.0193%Applied Materials Inc AMAT 38,346 0.15% 2.10% 9.23% 11.42% 0.0177%Advanced Micro Devices Inc AMD 23,413 0.09% 0.00% 15.67% 15.67% 0.0148%AMETEK Inc AME 18,386 0.07% 0.71% 8.98% 9.72% 0.0072%Affiliated Managers Group Inc AMG 5,692 0.02% 1.27% 4.98% 6.28% 0.0014%Amgen Inc AMGN 119,004 0.48% 2.98% 5.83% 8.89% 0.0426%Ameriprise Financial Inc AMP 17,474 0.07% 2.94% 11.80% 14.92% 0.0105%American Tower Corp AMT 83,361 0.34% 1.95% 18.21% 20.34% 0.0683%Amazon.com Inc AMZN 841,116 3.39% 0.00% 37.60% 37.60% 1.2744%Arista Networks Inc ANET 22,474 0.09% 0.00% 21.64% 21.64% 0.0196%ANSYS Inc ANSS 15,111 0.06% 0.00% 10.37% 10.37% 0.0063%Anthem Inc ANTM 77,948 0.31% 1.02% 12.54% 13.62% 0.0428%Aon PLC AON 40,800 0.16% 1.01% 10.57% 11.63% 0.0191%AO Smith Corp AOS 8,615 0.03% 1.68% 9.33% 11.09% 0.0039%Apache Corp APA 12,933 0.05% 5.13% -5.19% -0.19% -0.0001%Anadarko Petroleum Corp APC 22,256 0.09% 2.64% 19.98% 22.88% 0.0205%Air Products & Chemicals Inc APD 40,599 0.16% 2.48% 12.30% 14.93% 0.0244%Amphenol Corp APH 28,443 0.11% 0.93% 10.85% 11.83% 0.0136%Aptiv PLC APTV 21,137 0.09% 1.12% 10.66% 11.84% 0.0101%Alexandria Real Estate Equities Inc ARE 15,841 0.06% 2.83% 4.80% 7.69% 0.0049%Arconic Inc ARNC 9,209 0.04% 0.53% 14.35% 14.91% 0.0055%Atmos Energy Corp ATO 11,866 0.05% 2.07% 6.50% 8.64% 0.0041%Activision Blizzard Inc ATVI 34,090 0.14% 0.82% 6.65% 7.50% 0.0103%AvalonBay Communities Inc AVB 27,559 0.11% 3.06% 5.61% 8.76% 0.0097%Broadcom Inc AVGO 114,985 0.46% 3.47% 14.11% 17.82% 0.0826%Avery Dennison Corp AVY 9,255 0.04% 1.91% 5.75% 7.72% 0.0029%American Water Works Co Inc AWK 19,125 0.08% 1.86% 8.45% 10.39% 0.0080%American Express Co AXP 95,215 0.38% 1.42% 12.22% 13.72% 0.0526%AutoZone Inc AZO 23,948 0.10% 0.00% 13.08% 13.08% 0.0126%Boeing Co/The BA 214,124 0.86% 2.13% 15.15% 17.44% 0.1505%Bank of America Corp BAC 282,421 1.14% 2.34% 9.45% 11.90% 0.1354%Baxter International Inc BAX 39,435 0.16% 1.09% 12.20% 13.36% 0.0212%BB&T Corp BBT 38,168 0.15% 3.41% 9.85% 13.42% 0.0206%Best Buy Co Inc BBY 18,738 0.08% 2.84% 10.65% 13.64% 0.0103%Becton Dickinson and Co BDX 68,321 0.28% 1.25% 12.41% 13.73% 0.0378%Franklin Resources Inc BEN 16,977 0.07% 3.10% 10.00% 13.25% 0.0091%

Indiana Michigan Power CompanyAttachment RBH-3
Page 2 of 14
Company TickerMarket
CapitalizationWeight in
IndexEstimated
Dividend YieldLong-Term Growth Est. DCF Result
WeightedDCF Result
Brown-Forman Corp BF/B 24,125 0.10% 1.29% 9.91% 11.27% 0.0110%Brighthouse Financial Inc BHF 4,617 0.02% 0.00% 11.14% 11.14% 0.0021%Baker Hughes a GE Co BHGE 28,864 0.12% 2.28% 40.82% 43.56% 0.0507%Biogen Inc BIIB 64,888 0.26% 0.00% 5.08% 5.08% 0.0133%Bank of New York Mellon Corp/The BK 50,721 0.20% 2.27% 7.33% 9.69% 0.0198%Booking Holdings Inc BKNG 78,870 0.32% 0.00% 12.50% 12.50% 0.0397%BlackRock Inc BLK 68,934 0.28% 3.06% 8.53% 11.72% 0.0325%Ball Corp BLL 19,215 0.08% 0.70% 6.50% 7.22% 0.0056%Bristol-Myers Squibb Co BMY 81,568 0.33% 3.30% 11.02% 14.50% 0.0477%Broadridge Financial Solutions Inc BR 11,979 0.05% 1.84% 10.00% 11.93% 0.0058%Berkshire Hathaway Inc BRK/B 503,471 2.03% 0.00% -1.60% -1.60% -0.0325%Boston Scientific Corp BSX 55,730 0.22% 0.00% 33.46% 33.46% 0.0751%BorgWarner Inc BWA 7,850 0.03% 1.80% 5.78% 7.63% 0.0024%Boston Properties Inc BXP 20,510 0.08% 2.93% 6.24% 9.26% 0.0077%Citigroup Inc C 152,577 0.61% 3.00% 11.23% 14.40% 0.0886%Conagra Brands Inc CAG 11,213 0.05% 3.64% 8.00% 11.79% 0.0053%Cardinal Health Inc CAH 14,981 0.06% 3.92% 4.77% 8.78% 0.0053%Caterpillar Inc CAT 76,357 0.31% 2.64% 13.35% 16.17% 0.0497%Chubb Ltd CB 62,500 0.25% 2.23% 10.60% 12.95% 0.0326%Cboe Global Markets Inc CBOE 10,832 0.04% 1.35% 13.46% 14.90% 0.0065%CBRE Group Inc CBRE 17,007 0.07% 0.00% 8.55% 8.55% 0.0059%CBS Corp CBS 17,796 0.07% 1.63% 15.05% 16.81% 0.0121%Crown Castle International Corp CCI 51,959 0.21% 3.66% 16.20% 20.16% 0.0422%Carnival Corp CCL 38,927 0.16% 3.64% 10.93% 14.77% 0.0232%Cadence Design Systems Inc CDNS 17,150 0.07% 0.00% 10.35% 10.35% 0.0072%Celanese Corp CE 12,942 0.05% 2.33% 7.05% 9.46% 0.0049%Celgene Corp CELG 62,113 0.25% 0.00% 20.70% 20.70% 0.0518%Cerner Corp CERN 18,784 0.08% 0.00% 13.20% 13.20% 0.0100%CF Industries Holdings Inc CF 9,595 0.04% 2.80% 19.75% 22.83% 0.0088%Citizens Financial Group Inc CFG 16,514 0.07% 3.75% 16.69% 20.76% 0.0138%Church & Dwight Co Inc CHD 16,574 0.07% 1.37% 7.68% 9.11% 0.0061%CH Robinson Worldwide Inc CHRW 12,180 0.05% 2.28% 9.07% 11.45% 0.0056%Charter Communications Inc CHTR 89,394 0.36% 0.00% 41.16% 41.16% 0.1483%Cigna Corp CI 63,261 0.25% 0.02% 11.80% 11.82% 0.0301%Cincinnati Financial Corp CINF 13,967 N/A 2.72% N/A N/A N/AColgate-Palmolive Co CL 57,905 0.23% 2.57% 6.07% 8.72% 0.0203%Clorox Co/The CLX 20,592 0.08% 2.42% 4.91% 7.39% 0.0061%Comerica Inc CMA 12,992 0.05% 3.20% 13.20% 16.61% 0.0087%Comcast Corp CMCSA 183,166 0.74% 2.07% 11.03% 13.21% 0.0975%CME Group Inc CME 60,875 0.25% 3.31% 12.23% 15.74% 0.0386%Chipotle Mexican Grill Inc CMG 17,674 0.07% 0.00% 20.31% 20.31% 0.0145%Cummins Inc CMI 24,767 0.10% 2.94% 6.66% 9.70% 0.0097%CMS Energy Corp CMS 15,737 0.06% 2.76% 6.61% 9.45% 0.0060%Centene Corp CNC 24,439 0.10% 0.00% 13.68% 13.68% 0.0135%CenterPoint Energy Inc CNP 15,449 0.06% 3.80% 6.44% 10.36% 0.0065%Capital One Financial Corp COF 39,456 0.16% 1.96% 4.77% 6.78% 0.0108%Cabot Oil & Gas Corp COG 10,978 0.04% 1.09% 27.91% 29.16% 0.0129%Cooper Cos Inc/The COO 14,577 0.06% 0.02% 5.23% 5.25% 0.0031%ConocoPhillips COP 76,674 0.31% 1.83% 6.00% 7.89% 0.0244%Costco Wholesale Corp COST 102,756 0.41% 1.01% 10.09% 11.15% 0.0462%Coty Inc COTY 8,181 0.03% 4.59% 8.76% 13.56% 0.0045%Campbell Soup Co CPB 10,843 0.04% 3.92% 1.85% 5.80% 0.0025%Capri Holdings Ltd CPRI 6,922 0.03% 0.00% 6.73% 6.73% 0.0019%Copart Inc CPRT 13,471 0.05% 0.00% 20.00% 20.00% 0.0109%salesforce.com Inc CRM 124,524 0.50% 0.00% 24.13% 24.13% 0.1211%Cisco Systems Inc CSCO 234,188 0.94% 2.56% 6.84% 9.49% 0.0895%CSX Corp CSX 59,386 0.24% 1.25% 10.47% 11.79% 0.0282%Cintas Corp CTAS 21,489 0.09% 0.98% 12.02% 13.05% 0.0113%CenturyLink Inc CTL 13,055 0.05% 10.02% 2.50% 12.64% 0.0066%Cognizant Technology Solutions Corp CTSH 41,482 0.17% 1.09% 11.40% 12.55% 0.0210%Citrix Systems Inc CTXS 13,289 0.05% 0.00% 11.85% 11.85% 0.0063%CVS Health Corp CVS 72,118 0.29% 3.55% 8.22% 11.92% 0.0346%Chevron Corp CVX 238,097 0.96% 3.77% 6.93% 10.83% 0.1039%Concho Resources Inc CXO 20,772 0.08% 0.28% 18.60% 18.90% 0.0158%Dominion Energy Inc D 61,586 0.25% 4.76% 5.60% 10.49% 0.0260%Delta Air Lines Inc DAL 34,755 0.14% 2.82% 11.99% 14.98% 0.0210%Deere & Co DE 50,370 0.20% 1.88% 10.39% 12.37% 0.0251%Discover Financial Services DFS 24,025 0.10% 2.26% 9.83% 12.20% 0.0118%Dollar General Corp DG 29,940 0.12% 1.13% 12.85% 14.05% 0.0169%Quest Diagnostics Inc DGX 11,875 0.05% 2.37% 8.05% 10.51% 0.0050%DR Horton Inc DHI 15,221 0.06% 1.48% 13.10% 14.68% 0.0090%Danaher Corp DHR 91,832 0.37% 0.53% 9.01% 9.56% 0.0354%Walt Disney Co/The DIS 171,380 0.69% 1.55% 3.76% 5.33% 0.0368%Discovery Inc DISCA 19,134 0.08% 0.00% 12.30% 12.30% 0.0095%DISH Network Corp DISH 15,239 0.06% 0.00% -11.00% -11.00% -0.0068%Digital Realty Trust Inc DLR 25,167 0.10% 3.72% 17.36% 21.41% 0.0217%Dollar Tree Inc DLTR 23,764 0.10% 0.00% 9.41% 9.41% 0.0090%Dover Corp DOV 13,167 0.05% 2.19% 10.97% 13.28% 0.0070%

Indiana Michigan Power CompanyAttachment RBH-3
Page 3 of 14
Company TickerMarket
CapitalizationWeight in
IndexEstimated
Dividend YieldLong-Term Growth Est. DCF Result
WeightedDCF Result
Duke Realty Corp DRE 10,982 0.04% 2.82% 4.50% 7.38% 0.0033%Darden Restaurants Inc DRI 13,668 0.06% 2.71% 10.31% 13.17% 0.0073%DTE Energy Co DTE 22,715 0.09% 3.06% 5.53% 8.68% 0.0079%Duke Energy Corp DUK 65,903 0.27% 4.19% 5.04% 9.34% 0.0248%DaVita Inc DVA 8,907 0.04% 0.00% 19.15% 19.15% 0.0069%Devon Energy Corp DVN 12,991 0.05% 1.14% 5.82% 6.99% 0.0037%DowDuPont Inc DWDP 124,643 0.50% 2.84% 6.17% 9.10% 0.0457%DXC Technology Co DXC 17,639 0.07% 1.16% 6.70% 7.90% 0.0056%Electronic Arts Inc EA 29,654 0.12% 0.00% 11.87% 11.87% 0.0142%eBay Inc EBAY 33,210 0.13% 0.70% 10.67% 11.41% 0.0153%Ecolab Inc ECL 50,222 0.20% 1.07% 13.43% 14.57% 0.0295%Consolidated Edison Inc ED 27,240 0.11% 3.49% 3.07% 6.61% 0.0073%Equifax Inc EFX 13,400 0.05% 1.44% 7.16% 8.65% 0.0047%Edison International EIX 20,826 0.08% 3.88% 5.51% 9.50% 0.0080%Estee Lauder Cos Inc/The EL 58,776 0.24% 1.02% 12.04% 13.12% 0.0311%Eastman Chemical Co EMN 10,992 0.04% 3.02% 6.73% 9.85% 0.0044%Emerson Electric Co EMR 41,382 0.17% 2.92% 8.95% 12.00% 0.0200%EOG Resources Inc EOG 51,538 0.21% 0.97% 9.90% 10.92% 0.0227%Equinix Inc EQIX 36,966 0.15% 2.24% 18.39% 20.83% 0.0310%Equity Residential EQR 27,656 0.11% 2.99% 6.71% 9.79% 0.0109%Eversource Energy ES 22,737 0.09% 2.99% 5.76% 8.83% 0.0081%Essex Property Trust Inc ESS 19,011 0.08% 2.69% 6.59% 9.36% 0.0072%E*TRADE Financial Corp ETFC 12,074 0.05% 1.02% 12.08% 13.16% 0.0064%Eaton Corp PLC ETN 34,184 0.14% 3.56% 9.23% 12.95% 0.0178%Entergy Corp ETR 17,946 0.07% 3.89% -0.89% 2.99% 0.0022%Evergy Inc EVRG 14,685 0.06% 3.34% 6.67% 10.12% 0.0060%Edwards Lifesciences Corp EW 37,346 0.15% 0.00% 14.00% 14.00% 0.0211%Exelon Corp EXC 48,487 0.20% 2.89% 4.12% 7.07% 0.0138%Expeditors International of Washington I EXPD 13,049 0.05% 1.25% 7.70% 9.00% 0.0047%Expedia Group Inc EXPE 17,892 0.07% 1.07% 17.20% 18.37% 0.0132%Extra Space Storage Inc EXR 12,702 0.05% 3.58% 4.39% 8.05% 0.0041%Ford Motor Co F 33,632 0.14% 6.81% -0.70% 6.08% 0.0082%Diamondback Energy Inc FANG 16,831 0.07% 0.63% 22.91% 23.62% 0.0160%Fastenal Co FAST 17,822 0.07% 2.73% 14.85% 17.79% 0.0128%Facebook Inc FB 473,705 1.91% 0.00% 21.88% 21.88% 0.4177%Fortune Brands Home & Security Inc FBHS 6,457 0.03% 1.83% 9.97% 11.88% 0.0031%Freeport-McMoRan Inc FCX 17,896 0.07% 1.84% -12.55% -10.83% -0.0078%FedEx Corp FDX 46,461 0.19% 1.44% 14.25% 15.80% 0.0296%FirstEnergy Corp FE 21,858 0.09% 3.69% -0.02% 3.67% 0.0032%F5 Networks Inc FFIV 9,136 0.04% 0.00% 8.41% 8.41% 0.0031%Fidelity National Information Services I FIS 35,160 0.14% 1.29% 8.10% 9.44% 0.0134%Fiserv Inc FISV 33,803 0.14% 0.00% 7.40% 7.40% 0.0101%Fifth Third Bancorp FITB 18,369 0.07% 3.42% 3.95% 7.44% 0.0055%Foot Locker Inc FL 6,658 0.03% 2.61% 7.31% 10.01% 0.0027%FLIR Systems Inc FLIR 6,800 N/A 1.36% N/A N/A N/AFluor Corp FLR 5,269 0.02% 2.23% 20.49% 22.94% 0.0049%Flowserve Corp FLS 5,800 0.02% 1.82% 13.05% 14.99% 0.0035%FleetCor Technologies Inc FLT 20,543 0.08% 0.00% 16.50% 16.50% 0.0137%FMC Corp FMC 10,165 0.04% 1.85% 9.87% 11.81% 0.0048%Twenty-First Century Fox Inc FOXA 96,347 0.39% 0.77% 2.66% 3.44% 0.0133%First Republic Bank/CA FRC 17,258 0.07% 0.73% 12.39% 13.17% 0.0092%Federal Realty Investment Trust FRT 9,867 0.04% 3.13% 5.91% 9.13% 0.0036%TechnipFMC PLC FTI 10,312 0.04% 2.27% 15.43% 17.88% 0.0074%Fortinet Inc FTNT 14,207 0.06% 0.00% 22.10% 22.10% 0.0127%Fortive Corp FTV 27,620 0.11% 0.37% 13.89% 14.28% 0.0159%General Dynamics Corp GD 48,940 0.20% 2.32% 10.09% 12.53% 0.0247%General Electric Co GE 86,703 0.35% 0.40% 1.60% 2.00% 0.0070%Gilead Sciences Inc GILD 83,712 0.34% 3.82% -1.48% 2.31% 0.0078%General Mills Inc GIS 28,352 0.11% 4.15% 6.33% 10.62% 0.0121%Corning Inc GLW 27,159 0.11% 2.31% 10.39% 12.82% 0.0140%General Motors Co GM 53,659 0.22% 4.02% 6.03% 10.17% 0.0220%Alphabet Inc GOOGL 825,305 3.33% 0.00% 15.22% 15.22% 0.5063%Genuine Parts Co GPC 15,623 0.06% 2.89% 6.34% 9.32% 0.0059%Global Payments Inc GPN 21,171 0.09% 0.03% 17.00% 17.03% 0.0145%Gap Inc/The GPS 9,646 0.04% 3.87% 8.70% 12.74% 0.0050%Garmin Ltd GRMN 15,718 0.06% 2.70% 7.28% 10.07% 0.0064%Goldman Sachs Group Inc/The GS 75,909 0.31% 1.71% 6.74% 8.51% 0.0260%WW Grainger Inc GWW 16,524 0.07% 1.92% 12.47% 14.51% 0.0097%Halliburton Co HAL 24,405 0.10% 2.52% 30.08% 32.98% 0.0324%Hasbro Inc HAS 10,913 0.04% 3.14% 10.85% 14.16% 0.0062%Huntington Bancshares Inc/OH HBAN 14,451 0.06% 4.31% 8.20% 12.69% 0.0074%Hanesbrands Inc HBI 6,373 0.03% 3.55% 3.72% 7.33% 0.0019%HCA Healthcare Inc HCA 45,349 0.18% 1.03% 11.56% 12.64% 0.0231%HCP Inc HCP 14,878 0.06% 4.76% 2.57% 7.40% 0.0044%Home Depot Inc/The HD 205,834 0.83% 2.94% 10.72% 13.82% 0.1146%Hess Corp HES 17,652 0.07% 1.74% -9.23% -7.57% -0.0054%HollyFrontier Corp HFC 8,914 0.04% 2.60% 7.07% 9.76% 0.0035%Hartford Financial Services Group Inc/Th HIG 17,549 0.07% 2.54% 9.50% 12.16% 0.0086%

Indiana Michigan Power CompanyAttachment RBH-3
Page 4 of 14
Company TickerMarket
CapitalizationWeight in
IndexEstimated
Dividend YieldLong-Term Growth Est. DCF Result
WeightedDCF Result
Huntington Ingalls Industries Inc HII 8,489 0.03% 1.65% 40.00% 41.98% 0.0144%Hilton Worldwide Holdings Inc HLT 25,115 0.10% 0.76% 13.26% 14.07% 0.0142%Harley-Davidson Inc HOG 5,839 0.02% 4.25% 8.60% 13.03% 0.0031%Hologic Inc HOLX 12,742 0.05% 0.00% 3.10% 3.10% 0.0016%Honeywell International Inc HON 113,152 0.46% 2.14% 7.88% 10.10% 0.0461%Helmerich & Payne Inc HP 5,968 0.02% 5.22% 96.36% 104.09% 0.0250%Hewlett Packard Enterprise Co HPE 22,022 0.09% 2.86% 6.09% 9.03% 0.0080%HP Inc HPQ 30,578 0.12% 3.18% 3.08% 6.31% 0.0078%H&R Block Inc HRB 4,950 0.02% 4.12% 10.00% 14.33% 0.0029%Hormel Foods Corp HRL 22,798 0.09% 1.96% 5.80% 7.82% 0.0072%Harris Corp HRS 18,954 0.08% 1.68% 7.00% 8.74% 0.0067%Henry Schein Inc HSIC 8,977 0.04% 0.00% 7.11% 7.11% 0.0026%Host Hotels & Resorts Inc HST 14,187 0.06% 4.41% 2.70% 7.17% 0.0041%Hershey Co/The HSY 23,102 0.09% 2.66% 7.20% 9.96% 0.0093%Humana Inc HUM 37,998 0.15% 0.70% 14.11% 14.86% 0.0228%International Business Machines Corp IBM 124,074 0.50% 4.67% 0.72% 5.41% 0.0270%Intercontinental Exchange Inc ICE 42,427 0.17% 1.44% 10.09% 11.60% 0.0198%IDEXX Laboratories Inc IDXX 18,595 0.07% 0.00% 16.24% 16.24% 0.0122%International Flavors & Fragrances Inc IFF 13,285 0.05% 2.28% 4.00% 6.32% 0.0034%Illumina Inc ILMN 45,546 0.18% 0.00% 27.09% 27.09% 0.0497%Incyte Corp INCY 18,151 0.07% 0.00% 47.53% 47.53% 0.0348%IHS Markit Ltd INFO 21,776 0.09% 0.00% 11.21% 11.21% 0.0098%Intel Corp INTC 244,322 0.98% 2.32% 8.54% 10.96% 0.1079%Intuit Inc INTU 66,875 0.27% 0.70% 16.03% 16.79% 0.0452%International Paper Co IP 18,215 0.07% 4.43% 6.08% 10.64% 0.0078%Interpublic Group of Cos Inc/The IPG 8,599 0.03% 4.22% 11.49% 15.95% 0.0055%IPG Photonics Corp IPGP 8,135 0.03% 0.00% 7.89% 7.89% 0.0026%IQVIA Holdings Inc IQV 27,825 0.11% 0.00% 16.28% 16.28% 0.0182%Ingersoll-Rand PLC IR 25,694 0.10% 2.05% 9.92% 12.07% 0.0125%Iron Mountain Inc IRM 10,003 0.04% 7.07% 5.62% 12.89% 0.0052%Intuitive Surgical Inc ISRG 64,396 0.26% 0.00% 12.82% 12.82% 0.0333%Gartner Inc IT 13,012 0.05% 0.00% 14.02% 14.02% 0.0074%Illinois Tool Works Inc ITW 46,979 0.19% 2.80% 7.27% 10.17% 0.0193%Invesco Ltd IVZ 7,852 0.03% 6.29% 6.34% 12.83% 0.0041%JB Hunt Transport Services Inc JBHT 11,233 0.05% 0.98% 18.78% 19.85% 0.0090%Johnson Controls International plc JCI 32,703 0.13% 3.03% 7.63% 10.77% 0.0142%Jacobs Engineering Group Inc JEC 10,298 0.04% 0.77% 13.96% 14.78% 0.0061%Jefferies Financial Group Inc JEF 5,874 N/A 2.57% N/A N/A N/AJack Henry & Associates Inc JKHY 10,592 0.04% 1.14% 11.00% 12.20% 0.0052%Johnson & Johnson JNJ 366,397 1.48% 2.76% 7.34% 10.20% 0.1506%Juniper Networks Inc JNPR 9,338 0.04% 2.81% 8.76% 11.69% 0.0044%JPMorgan Chase & Co JPM 348,870 1.41% 3.18% 6.77% 10.05% 0.1413%Nordstrom Inc JWN 7,305 0.03% 3.55% 10.55% 14.29% 0.0042%Kellogg Co K 18,654 0.08% 4.34% 3.05% 7.46% 0.0056%KeyCorp KEY 17,533 0.07% 4.26% 13.17% 17.72% 0.0125%Keysight Technologies Inc KEYS 16,163 0.07% 0.00% 17.00% 17.00% 0.0111%Kraft Heinz Co/The KHC 39,132 0.16% 4.99% 2.44% 7.48% 0.0118%Kimco Realty Corp KIM 7,442 0.03% 6.39% 3.26% 9.75% 0.0029%KLA-Tencor Corp KLAC 19,577 0.08% 2.51% 8.58% 11.20% 0.0088%Kimberly-Clark Corp KMB 41,359 0.17% 3.42% 6.09% 9.60% 0.0160%Kinder Morgan Inc/DE KMI 44,979 0.18% 5.01% 10.00% 15.26% 0.0277%CarMax Inc KMX 10,386 0.04% 0.00% 12.92% 12.92% 0.0054%Coca-Cola Co/The KO 193,665 0.78% 3.62% 6.72% 10.46% 0.0816%Kroger Co/The KR 19,433 0.08% 2.40% 6.75% 9.22% 0.0072%Kohl's Corp KSS 11,225 0.05% 3.94% 10.40% 14.55% 0.0066%Kansas City Southern KSU 11,517 0.05% 1.33% 8.97% 10.36% 0.0048%Loews Corp L 14,874 N/A 0.59% N/A N/A N/AL Brands Inc LB 7,313 0.03% 4.52% 10.72% 15.48% 0.0046%Leggett & Platt Inc LEG 5,636 0.02% 3.58% 10.00% 13.76% 0.0031%Lennar Corp LEN 15,088 0.06% 0.34% 12.74% 13.10% 0.0080%Laboratory Corp of America Holdings LH 15,220 0.06% 0.00% 7.08% 7.08% 0.0043%Linde PLC LIN 97,284 N/A 1.77% N/A N/A N/ALKQ Corp LKQ 8,763 0.04% 0.00% 13.05% 13.05% 0.0046%L3 Technologies Inc LLL 16,424 0.07% 1.65% 5.00% 6.69% 0.0044%Eli Lilly & Co LLY 128,330 0.52% 2.03% 13.81% 15.98% 0.0826%Lockheed Martin Corp LMT 83,681 0.34% 3.02% 7.61% 10.74% 0.0362%Lincoln National Corp LNC 12,813 0.05% 2.38% 9.00% 11.49% 0.0059%Alliant Energy Corp LNT 11,190 0.05% 3.00% 6.29% 9.38% 0.0042%Lowe's Cos Inc LOW 80,408 0.32% 2.08% 15.80% 18.04% 0.0584%Lam Research Corp LRCX 27,832 0.11% 2.23% -0.42% 1.81% 0.0020%Southwest Airlines Co LUV 28,392 0.11% 1.35% 9.97% 11.39% 0.0130%Lamb Weston Holdings Inc LW 10,183 0.04% 1.13% 11.02% 12.21% 0.0050%LyondellBasell Industries NV LYB 32,291 0.13% 4.67% 6.80% 11.63% 0.0151%Macy's Inc M 7,291 0.03% 6.36% 1.67% 8.08% 0.0024%Mastercard Inc MA 237,159 0.96% 0.50% 19.66% 20.21% 0.1931%Mid-America Apartment Communities Inc MAA 12,262 0.05% 3.58% 7.00% 10.70% 0.0053%Macerich Co/The MAC 6,018 0.02% 7.10% -0.09% 7.01% 0.0017%Marriott International Inc/MD MAR 41,548 0.17% 1.38% 10.81% 12.27% 0.0205%

Indiana Michigan Power CompanyAttachment RBH-3
Page 5 of 14
Company TickerMarket
CapitalizationWeight in
IndexEstimated
Dividend YieldLong-Term Growth Est. DCF Result
WeightedDCF Result
Masco Corp MAS 11,479 0.05% 1.22% 12.50% 13.79% 0.0064%Mattel Inc MAT 4,998 0.02% 0.00% 10.00% 10.00% 0.0020%McDonald's Corp MCD 141,836 0.57% 2.53% 8.52% 11.16% 0.0638%Microchip Technology Inc MCHP 20,403 0.08% 1.69% 12.39% 14.19% 0.0117%McKesson Corp MCK 22,877 0.09% 1.24% 8.08% 9.37% 0.0086%Moody's Corp MCO 33,361 0.13% 1.11% 8.00% 9.16% 0.0123%Mondelez International Inc MDLZ 69,031 0.28% 2.19% 7.33% 9.59% 0.0267%Medtronic PLC MDT 125,787 0.51% 2.12% 7.70% 9.90% 0.0502%MetLife Inc MET 43,374 0.17% 3.86% 9.27% 13.31% 0.0233%MGM Resorts International MGM 13,971 0.06% 1.96% 12.99% 15.08% 0.0085%Mohawk Industries Inc MHK 9,297 0.04% 0.00% 7.59% 7.59% 0.0028%McCormick & Co Inc/MD MKC 18,474 0.07% 1.63% 6.10% 7.78% 0.0058%Martin Marietta Materials Inc MLM 12,080 0.05% 1.01% 13.29% 14.37% 0.0070%Marsh & McLennan Cos Inc MMC 47,122 0.19% 1.87% 12.27% 14.26% 0.0271%3M Co MMM 119,812 0.48% 2.76% 7.70% 10.56% 0.0510%Monster Beverage Corp MNST 32,736 0.13% 0.00% 15.40% 15.40% 0.0203%Altria Group Inc MO 106,374 0.43% 5.79% 5.57% 11.51% 0.0493%Mosaic Co/The MOS 11,067 0.04% 0.67% 8.40% 9.10% 0.0041%Marathon Petroleum Corp MPC 40,662 0.16% 3.55% 16.14% 19.98% 0.0327%Merck & Co Inc MRK 210,550 0.85% 2.70% 8.76% 11.58% 0.0982%Marathon Oil Corp MRO 14,136 0.06% 1.16% 0.45% 1.61% 0.0009%Morgan Stanley MS 74,042 0.30% 3.02% 8.99% 12.15% 0.0362%MSCI Inc MSCI 16,051 0.06% 1.22% 9.25% 10.53% 0.0068%Microsoft Corp MSFT 889,286 3.58% 1.54% 11.68% 13.31% 0.4770%Motorola Solutions Inc MSI 23,047 0.09% 1.65% 4.10% 5.78% 0.0054%M&T Bank Corp MTB 23,887 0.10% 2.49% 7.98% 10.57% 0.0102%Mettler-Toledo International Inc MTD 17,600 0.07% 0.00% 12.67% 12.67% 0.0090%Micron Technology Inc MU 44,326 0.18% 0.36% -3.30% -2.94% -0.0053%Maxim Integrated Products Inc MXIM 14,802 0.06% 3.40% 8.93% 12.48% 0.0074%Mylan NV MYL 14,493 0.06% 0.00% 4.86% 4.86% 0.0028%Noble Energy Inc NBL 11,171 0.05% 1.91% 16.07% 18.13% 0.0082%Norwegian Cruise Line Holdings Ltd NCLH 12,095 0.05% 0.37% 12.25% 12.64% 0.0062%Nasdaq Inc NDAQ 13,821 0.06% 2.23% 9.11% 11.45% 0.0064%NextEra Energy Inc NEE 91,445 0.37% 2.61% 4.90% 7.57% 0.0279%Newmont Mining Corp NEM 17,653 0.07% 1.69% 5.55% 7.29% 0.0052%Netflix Inc NFLX 157,813 0.64% 0.00% 32.07% 32.07% 0.2039%NiSource Inc NI 10,389 0.04% 2.92% 5.75% 8.75% 0.0037%NIKE Inc NKE 136,606 0.55% 0.98% 18.34% 19.41% 0.1068%Nektar Therapeutics NKTR 6,186 N/A 0.00% N/A N/A N/ANielsen Holdings PLC NLSN 9,579 N/A 4.78% N/A N/A N/ANorthrop Grumman Corp NOC 46,035 0.19% 1.92% 8.89% 10.90% 0.0202%National Oilwell Varco Inc NOV 10,153 0.04% 0.78% 77.76% 78.84% 0.0323%NRG Energy Inc NRG 11,709 0.05% 0.29% 38.22% 38.56% 0.0182%Norfolk Southern Corp NSC 48,014 0.19% 1.90% 13.78% 15.81% 0.0306%NetApp Inc NTAP 16,809 0.07% 2.34% 13.23% 15.73% 0.0107%Northern Trust Corp NTRS 20,740 0.08% 2.59% 10.65% 13.38% 0.0112%Nucor Corp NUE 17,874 0.07% 2.71% 0.85% 3.57% 0.0026%NVIDIA Corp NVDA 102,905 0.41% 0.39% 7.86% 8.27% 0.0343%Newell Brands Inc NWL 6,579 0.03% 5.90% -5.93% -0.20% -0.0001%News Corp NWSA 7,414 0.03% 1.68% -9.13% -7.52% -0.0022%Realty Income Corp O 21,642 0.09% 3.83% 4.39% 8.30% 0.0072%ONEOK Inc OKE 27,516 0.11% 5.37% 12.82% 18.54% 0.0206%Omnicom Group Inc OMC 16,882 0.07% 3.43% 3.78% 7.27% 0.0049%Oracle Corp ORCL 189,997 0.77% 1.57% 7.54% 9.17% 0.0702%O'Reilly Automotive Inc ORLY 29,001 0.12% 0.00% 14.83% 14.83% 0.0173%Occidental Petroleum Corp OXY 49,073 0.20% 4.79% -0.50% 4.27% 0.0084%Paychex Inc PAYX 28,451 0.11% 2.88% 9.25% 12.26% 0.0141%People's United Financial Inc PBCT 6,555 0.03% 4.11% 2.00% 6.15% 0.0016%PACCAR Inc PCAR 23,455 0.09% 4.08% 5.90% 10.10% 0.0095%Public Service Enterprise Group Inc PEG 30,164 0.12% 3.14% 6.73% 9.97% 0.0121%PepsiCo Inc PEP 162,419 0.65% 3.30% 5.48% 8.87% 0.0580%Pfizer Inc PFE 231,954 0.93% 3.45% 5.45% 8.99% 0.0841%Principal Financial Group Inc PFG 14,520 0.06% 4.27% 4.16% 8.52% 0.0050%Procter & Gamble Co/The PG 256,262 1.03% 2.84% 6.51% 9.44% 0.0974%Progressive Corp/The PGR 42,981 0.17% 1.92% 9.80% 11.82% 0.0205%Parker-Hannifin Corp PH 22,092 0.09% 1.77% 9.52% 11.36% 0.0101%PulteGroup Inc PHM 7,447 0.03% 1.63% 7.17% 8.85% 0.0027%Packaging Corp of America PKG 9,089 0.04% 3.21% 8.25% 11.59% 0.0042%PerkinElmer Inc PKI 10,420 0.04% 0.31% 15.95% 16.28% 0.0068%Prologis Inc PLD 45,158 0.18% 2.83% 6.87% 9.79% 0.0178%Philip Morris International Inc PM 141,234 0.57% 5.17% 8.62% 14.01% 0.0798%PNC Financial Services Group Inc/The PNC 58,906 0.24% 3.15% 7.37% 10.63% 0.0252%Pentair PLC PNR 7,304 0.03% 1.70% 10.29% 12.08% 0.0036%Pinnacle West Capital Corp PNW 10,783 0.04% 3.13% 5.18% 8.38% 0.0036%PPG Industries Inc PPG 25,978 0.10% 1.76% 7.49% 9.32% 0.0098%PPL Corp PPL 23,583 0.10% 5.08% 2.53% 7.67% 0.0073%Perrigo Co PLC PRGO 6,542 0.03% 1.55% 1.00% 2.56% 0.0007%Prudential Financial Inc PRU 39,256 0.16% 4.23% 9.00% 13.42% 0.0212%

Indiana Michigan Power CompanyAttachment RBH-3
Page 6 of 14
Company TickerMarket
CapitalizationWeight in
IndexEstimated
Dividend YieldLong-Term Growth Est. DCF Result
WeightedDCF Result
Public Storage PSA 37,974 0.15% 3.75% 5.15% 9.00% 0.0138%Phillips 66 PSX 44,818 0.18% 3.49% 5.70% 9.29% 0.0168%PVH Corp PVH 8,369 0.03% 0.14% 11.03% 11.17% 0.0038%Quanta Services Inc PWR 5,298 0.02% 0.11% 22.00% 22.12% 0.0047%Pioneer Natural Resources Co PXD 22,843 0.09% 0.31% 26.85% 27.20% 0.0250%PayPal Holdings Inc PYPL 118,177 0.48% 0.00% 23.55% 23.55% 0.1121%QUALCOMM Inc QCOM 68,503 0.28% 4.47% 11.71% 16.43% 0.0454%Qorvo Inc QRVO 8,553 0.03% 0.00% 11.83% 11.83% 0.0041%Royal Caribbean Cruises Ltd RCL 24,512 0.10% 2.38% 11.72% 14.24% 0.0141%Everest Re Group Ltd RE 8,910 0.04% 2.52% 10.00% 12.65% 0.0045%Regency Centers Corp REG 10,858 0.04% 3.57% 4.67% 8.33% 0.0036%Regeneron Pharmaceuticals Inc REGN 45,292 0.18% 0.00% 13.88% 13.88% 0.0253%Regions Financial Corp RF 16,019 0.06% 3.85% 10.88% 14.94% 0.0096%Robert Half International Inc RHI 7,851 0.03% 1.83% 9.25% 11.16% 0.0035%Red Hat Inc RHT 32,132 0.13% 0.00% 18.40% 18.40% 0.0238%Raymond James Financial Inc RJF 11,550 0.05% 1.58% 17.00% 18.71% 0.0087%Ralph Lauren Corp RL 9,496 0.04% 2.02% 6.84% 8.93% 0.0034%ResMed Inc RMD 14,383 0.06% 1.49% 12.50% 14.09% 0.0082%Rockwell Automation Inc ROK 21,438 0.09% 2.17% 8.94% 11.21% 0.0097%Rollins Inc ROL 13,252 0.05% 1.94% 10.00% 12.04% 0.0064%Roper Technologies Inc ROP 33,798 0.14% 0.56% 11.33% 11.92% 0.0162%Ross Stores Inc ROST 33,316 0.13% 1.18% 10.38% 11.61% 0.0156%Republic Services Inc RSG 25,289 0.10% 1.92% 13.01% 15.06% 0.0153%Raytheon Co RTN 50,224 0.20% 2.09% 9.37% 11.55% 0.0234%SBA Communications Corp SBAC 21,499 0.09% 0.00% 25.05% 25.05% 0.0217%Starbucks Corp SBUX 87,885 0.35% 2.12% 13.22% 15.47% 0.0548%Charles Schwab Corp/The SCHW 60,580 0.24% 1.36% 19.78% 21.28% 0.0519%Sealed Air Corp SEE 7,050 0.03% 1.46% 6.04% 7.55% 0.0021%Sherwin-Williams Co/The SHW 39,948 0.16% 1.01% 10.99% 12.05% 0.0194%SVB Financial Group SIVB 12,961 0.05% 0.01% 11.00% 11.01% 0.0058%JM Smucker Co/The SJM 12,009 0.05% 3.14% 3.20% 6.39% 0.0031%Schlumberger Ltd SLB 58,751 0.24% 4.72% 33.69% 39.20% 0.0928%SL Green Realty Corp SLG 7,714 0.03% 3.77% -0.59% 3.17% 0.0010%Snap-on Inc SNA 8,654 0.03% 2.42% 7.93% 10.45% 0.0036%Synopsys Inc SNPS 16,340 0.07% 0.00% 14.50% 14.50% 0.0095%Southern Co/The SO 53,653 0.22% 4.76% 3.38% 8.21% 0.0178%Simon Property Group Inc SPG 54,406 0.22% 4.71% 5.21% 10.04% 0.0220%S&P Global Inc SPGI 50,511 0.20% 1.10% 11.05% 12.21% 0.0249%Sempra Energy SRE 34,151 0.14% 3.12% 10.10% 13.38% 0.0184%SunTrust Banks Inc STI 28,280 0.11% 3.32% 8.04% 11.49% 0.0131%State Street Corp STT 26,544 0.11% 2.88% 8.69% 11.70% 0.0125%Seagate Technology PLC STX 13,315 0.05% 5.28% 3.37% 8.74% 0.0047%Constellation Brands Inc STZ 32,419 0.13% 1.74% 11.12% 12.95% 0.0169%Stanley Black & Decker Inc SWK 19,905 0.08% 2.04% 10.50% 12.64% 0.0101%Skyworks Solutions Inc SWKS 14,580 0.06% 1.85% 8.87% 10.80% 0.0063%Synchrony Financial SYF 23,646 0.10% 2.70% 1.55% 4.28% 0.0041%Stryker Corp SYK 72,312 0.29% 1.16% 8.54% 9.76% 0.0284%Symantec Corp SYMC 14,715 0.06% 1.32% 7.50% 8.87% 0.0053%Sysco Corp SYY 34,027 0.14% 2.28% 12.83% 15.26% 0.0209%AT&T Inc T 223,418 0.90% 6.67% 4.92% 11.75% 0.1058%Molson Coors Brewing Co TAP 13,172 0.05% 3.36% 0.26% 3.63% 0.0019%TransDigm Group Inc TDG 23,268 0.09% 0.00% 11.07% 11.07% 0.0104%TE Connectivity Ltd TEL 28,362 0.11% 2.12% 11.18% 13.42% 0.0153%Teleflex Inc TFX 13,940 0.06% 0.45% 12.45% 12.93% 0.0073%Target Corp TGT 39,582 0.16% 3.44% 6.44% 9.99% 0.0159%Tiffany & Co TIF 11,770 0.05% 2.22% 10.53% 12.86% 0.0061%TJX Cos Inc/The TJX 63,840 0.26% 1.68% 11.57% 13.34% 0.0343%Torchmark Corp TMK 9,162 0.04% 0.82% 7.53% 8.38% 0.0031%Thermo Fisher Scientific Inc TMO 104,974 0.42% 0.28% 12.00% 12.30% 0.0520%Tapestry Inc TPR 9,337 0.04% 4.22% 10.58% 15.02% 0.0057%TripAdvisor Inc TRIP 7,126 0.03% 0.00% 11.39% 11.39% 0.0033%T Rowe Price Group Inc TROW 24,248 0.10% 2.93% 5.40% 8.41% 0.0082%Travelers Cos Inc/The TRV 35,342 0.14% 2.39% 17.72% 20.32% 0.0289%Tractor Supply Co TSCO 10,850 0.04% 1.49% 11.06% 12.64% 0.0055%Tyson Foods Inc TSN 23,823 N/A 2.41% N/A N/A N/ATotal System Services Inc TSS 16,692 0.07% 0.56% 12.14% 12.74% 0.0086%Take-Two Interactive Software Inc TTWO 10,586 0.04% 3.31% 10.30% 13.78% 0.0059%Twitter Inc TWTR 23,940 0.10% 0.00% 37.35% 37.35% 0.0360%Texas Instruments Inc TXN 103,943 0.42% 2.83% 10.48% 13.46% 0.0564%Textron Inc TXT 12,109 0.05% 0.16% 11.26% 11.42% 0.0056%Under Armour Inc UAA 9,379 0.04% 0.00% 33.97% 33.97% 0.0128%United Continental Holdings Inc UAL 21,789 0.09% 0.00% 14.17% 14.17% 0.0124%UDR Inc UDR 12,438 0.05% 3.02% 5.54% 8.64% 0.0043%Universal Health Services Inc UHS 12,187 0.05% 0.30% 10.88% 11.19% 0.0055%Ulta Beauty Inc ULTA 20,072 0.08% 0.00% 21.20% 21.20% 0.0171%UnitedHealth Group Inc UNH 241,228 0.97% 1.49% 13.99% 15.58% 0.1515%Unum Group UNM 7,808 0.03% 2.94% 9.00% 12.07% 0.0038%Union Pacific Corp UNP 119,275 0.48% 2.14% 13.86% 16.14% 0.0776%
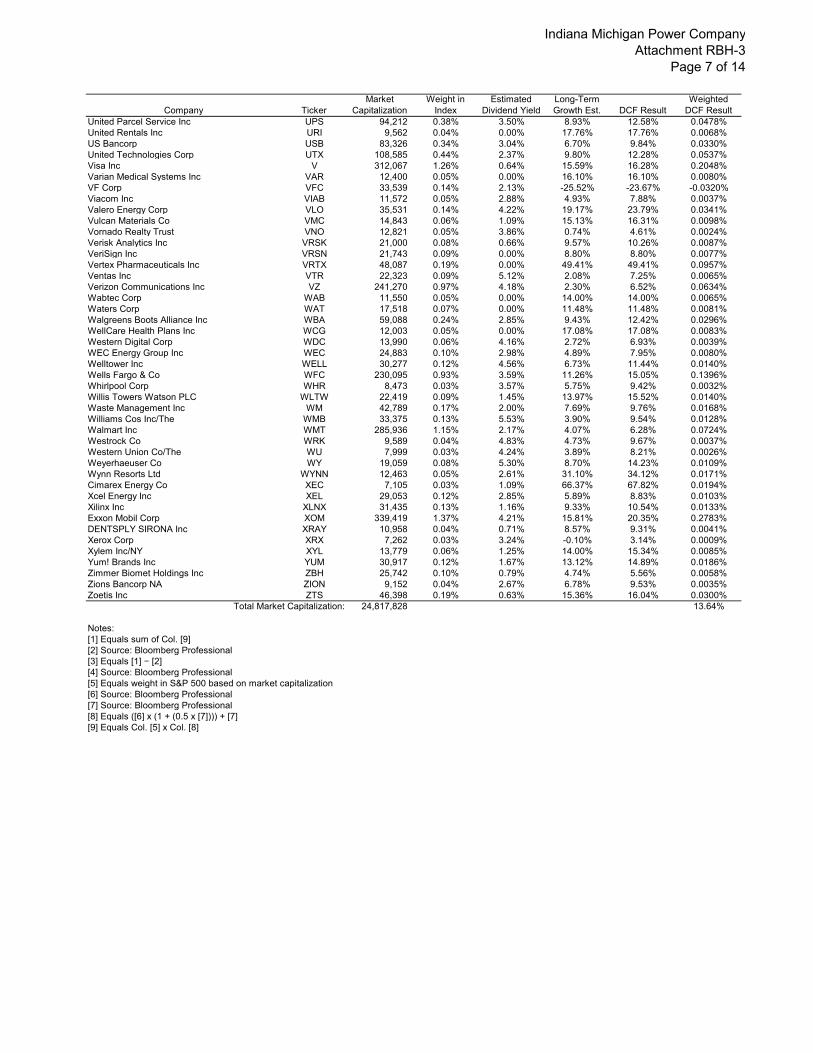
Indiana Michigan Power CompanyAttachment RBH-3
Page 7 of 14
Company TickerMarket
CapitalizationWeight in
IndexEstimated
Dividend YieldLong-Term Growth Est. DCF Result
WeightedDCF Result
United Parcel Service Inc UPS 94,212 0.38% 3.50% 8.93% 12.58% 0.0478%United Rentals Inc URI 9,562 0.04% 0.00% 17.76% 17.76% 0.0068%US Bancorp USB 83,326 0.34% 3.04% 6.70% 9.84% 0.0330%United Technologies Corp UTX 108,585 0.44% 2.37% 9.80% 12.28% 0.0537%Visa Inc V 312,067 1.26% 0.64% 15.59% 16.28% 0.2048%Varian Medical Systems Inc VAR 12,400 0.05% 0.00% 16.10% 16.10% 0.0080%VF Corp VFC 33,539 0.14% 2.13% -25.52% -23.67% -0.0320%Viacom Inc VIAB 11,572 0.05% 2.88% 4.93% 7.88% 0.0037%Valero Energy Corp VLO 35,531 0.14% 4.22% 19.17% 23.79% 0.0341%Vulcan Materials Co VMC 14,843 0.06% 1.09% 15.13% 16.31% 0.0098%Vornado Realty Trust VNO 12,821 0.05% 3.86% 0.74% 4.61% 0.0024%Verisk Analytics Inc VRSK 21,000 0.08% 0.66% 9.57% 10.26% 0.0087%VeriSign Inc VRSN 21,743 0.09% 0.00% 8.80% 8.80% 0.0077%Vertex Pharmaceuticals Inc VRTX 48,087 0.19% 0.00% 49.41% 49.41% 0.0957%Ventas Inc VTR 22,323 0.09% 5.12% 2.08% 7.25% 0.0065%Verizon Communications Inc VZ 241,270 0.97% 4.18% 2.30% 6.52% 0.0634%Wabtec Corp WAB 11,550 0.05% 0.00% 14.00% 14.00% 0.0065%Waters Corp WAT 17,518 0.07% 0.00% 11.48% 11.48% 0.0081%Walgreens Boots Alliance Inc WBA 59,088 0.24% 2.85% 9.43% 12.42% 0.0296%WellCare Health Plans Inc WCG 12,003 0.05% 0.00% 17.08% 17.08% 0.0083%Western Digital Corp WDC 13,990 0.06% 4.16% 2.72% 6.93% 0.0039%WEC Energy Group Inc WEC 24,883 0.10% 2.98% 4.89% 7.95% 0.0080%Welltower Inc WELL 30,277 0.12% 4.56% 6.73% 11.44% 0.0140%Wells Fargo & Co WFC 230,095 0.93% 3.59% 11.26% 15.05% 0.1396%Whirlpool Corp WHR 8,473 0.03% 3.57% 5.75% 9.42% 0.0032%Willis Towers Watson PLC WLTW 22,419 0.09% 1.45% 13.97% 15.52% 0.0140%Waste Management Inc WM 42,789 0.17% 2.00% 7.69% 9.76% 0.0168%Williams Cos Inc/The WMB 33,375 0.13% 5.53% 3.90% 9.54% 0.0128%Walmart Inc WMT 285,936 1.15% 2.17% 4.07% 6.28% 0.0724%Westrock Co WRK 9,589 0.04% 4.83% 4.73% 9.67% 0.0037%Western Union Co/The WU 7,999 0.03% 4.24% 3.89% 8.21% 0.0026%Weyerhaeuser Co WY 19,059 0.08% 5.30% 8.70% 14.23% 0.0109%Wynn Resorts Ltd WYNN 12,463 0.05% 2.61% 31.10% 34.12% 0.0171%Cimarex Energy Co XEC 7,105 0.03% 1.09% 66.37% 67.82% 0.0194%Xcel Energy Inc XEL 29,053 0.12% 2.85% 5.89% 8.83% 0.0103%Xilinx Inc XLNX 31,435 0.13% 1.16% 9.33% 10.54% 0.0133%Exxon Mobil Corp XOM 339,419 1.37% 4.21% 15.81% 20.35% 0.2783%DENTSPLY SIRONA Inc XRAY 10,958 0.04% 0.71% 8.57% 9.31% 0.0041%Xerox Corp XRX 7,262 0.03% 3.24% -0.10% 3.14% 0.0009%Xylem Inc/NY XYL 13,779 0.06% 1.25% 14.00% 15.34% 0.0085%Yum! Brands Inc YUM 30,917 0.12% 1.67% 13.12% 14.89% 0.0186%Zimmer Biomet Holdings Inc ZBH 25,742 0.10% 0.79% 4.74% 5.56% 0.0058%Zions Bancorp NA ZION 9,152 0.04% 2.67% 6.78% 9.53% 0.0035%Zoetis Inc ZTS 46,398 0.19% 0.63% 15.36% 16.04% 0.0300%
Total Market Capitalization: 24,817,828 13.64%
Notes:[1] Equals sum of Col. [9][2] Source: Bloomberg Professional[3] Equals [1] − [2][4] Source: Bloomberg Professional[5] Equals weight in S&P 500 based on market capitalization [6] Source: Bloomberg Professional[7] Source: Bloomberg Professional[8] Equals ([6] x (1 + (0.5 x [7]))) + [7][9] Equals Col. [5] x Col. [8]

Indiana Michigan Power CompanyAttachment RBH-3
Page 8 of 14
Ex-Ante Market Risk PremiumMarket DCF Method Based - Value Line
[1] [2] [3]S&P 500
Est. RequiredMarket Return
Year Treasury
(30-day average)
Implied Market Risk Premium
16.75% 3.03% 13.72%
[4] [5] [6] [7] [8] [9]
Company TickerMarket
CapitalizationWeight in
IndexEstimated
Dividend YieldLong-Term Growth Est. DCF Result
WeightedDCF Result
Agilent Technologies Inc A 25,036 0.11% 0.84% 9.50% 10.38% 0.0118%American Airlines Group Inc AAL 14,839 0.07% 1.24% 1.00% 2.25% 0.0015%Advance Auto Parts Inc AAP 11,235 0.05% 0.16% 13.00% 13.17% 0.0067%Apple Inc AAPL 815,891 3.70% 1.87% 17.50% 19.53% 0.7234%AbbVie Inc ABBV 117,686 0.53% 5.47% 14.50% 20.37% 0.1088%AmerisourceBergen Corp ABC 16,108 0.07% 2.10% 8.00% 10.18% 0.0074%ABIOMED Inc ABMD 14,302 0.06% 0.00% 24.50% 24.50% 0.0159%Abbott Laboratories ABT 134,886 0.61% 1.67% 10.00% 11.75% 0.0720%Accenture PLC ACN 103,265 0.47% 1.89% 9.50% 11.48% 0.0538%Adobe Inc ADBE 124,578 0.57% 0.00% 22.00% 22.00% 0.1244%Analog Devices Inc ADI 38,923 0.18% 2.04% 10.50% 12.65% 0.0223%Archer-Daniels-Midland Co ADM 23,615 0.11% 3.32% 9.50% 12.98% 0.0139%Automatic Data Processing Inc ADP 65,613 0.30% 2.23% 15.00% 17.40% 0.0518%Alliance Data Systems Corp ADS 9,044 0.04% 1.52% 13.50% 15.12% 0.0062%Autodesk Inc ADSK 33,458 N/A 0.00% N/A N/A N/AAmeren Corp AEE 17,413 0.08% 2.75% 6.50% 9.34% 0.0074%American Electric Power Co Inc AEP 40,175 0.18% 3.39% 4.00% 7.46% 0.0136%AES Corp/VA AES 11,703 N/A 3.11% N/A N/A N/AAflac Inc AFL 36,730 0.17% 2.30% 8.50% 10.90% 0.0182%Allergan PLC AGN 48,220 0.22% 2.07% 4.50% 6.62% 0.0145%American International Group Inc AIG 36,987 0.17% 3.06% 52.00% 55.86% 0.0938%Apartment Investment & Management Co AIV 7,526 0.03% 3.26% 5.50% 8.85% 0.0030%Assurant Inc AIZ 6,259 0.03% 2.39% 7.50% 9.98% 0.0028%Arthur J Gallagher & Co AJG 14,373 0.07% 2.20% 17.00% 19.39% 0.0126%Akamai Technologies Inc AKAM 11,972 0.05% 0.00% 17.50% 17.50% 0.0095%Albemarle Corp ALB 8,983 0.04% 1.74% 8.50% 10.31% 0.0042%Align Technology Inc ALGN 18,774 0.09% 0.00% 28.50% 28.50% 0.0243%Alaska Air Group Inc ALK 6,902 0.03% 2.50% 3.50% 6.04% 0.0019%Allstate Corp/The ALL 32,168 0.15% 2.15% 11.50% 13.77% 0.0201%Allegion PLC ALLE 8,325 0.04% 1.23% 10.50% 11.79% 0.0045%Alexion Pharmaceuticals Inc ALXN 28,595 0.13% 0.00% 24.50% 24.50% 0.0318%Applied Materials Inc AMAT 35,669 0.16% 2.13% 19.00% 21.33% 0.0345%Advanced Micro Devices Inc AMD 22,190 N/A 0.00% N/A N/A N/AAMETEK Inc AME 18,321 0.08% 0.71% 10.50% 11.25% 0.0094%Affiliated Managers Group Inc AMG 6,062 0.03% 1.54% 6.50% 8.09% 0.0022%Amgen Inc AMGN 114,247 0.52% 3.22% 7.00% 10.33% 0.0536%Ameriprise Financial Inc AMP 17,465 0.08% 2.88% 16.00% 19.11% 0.0151%American Tower Corp AMT 80,111 0.36% 1.96% 9.50% 11.55% 0.0420%Amazon.com Inc AMZN 795,090 3.61% 0.00% 57.00% 57.00% 2.0570%Arista Networks Inc ANET 20,826 0.09% 0.00% 19.00% 19.00% 0.0180%ANSYS Inc ANSS 15,022 0.07% 0.00% 13.00% 13.00% 0.0089%Anthem Inc ANTM 75,010 0.34% 1.10% 18.00% 19.20% 0.0654%Aon PLC AON 39,207 0.18% 0.98% 9.50% 10.53% 0.0187%AO Smith Corp AOS 8,529 0.04% 1.74% 12.50% 14.35% 0.0056%Apache Corp APA 12,695 N/A 3.01% N/A N/A N/AAnadarko Petroleum Corp APC 21,356 N/A 2.78% N/A N/A N/AAir Products & Chemicals Inc APD 39,457 0.18% 2.58% 9.50% 12.20% 0.0219%Amphenol Corp APH 28,135 0.13% 0.99% 10.00% 11.04% 0.0141%Aptiv PLC APTV 21,356 0.10% 1.07% 11.00% 12.13% 0.0118%Alexandria Real Estate Equities Inc ARE 13,640 N/A 2.84% N/A N/A N/AArconic Inc ARNC 8,853 N/A 1.31% N/A N/A N/AAtmos Energy Corp ATO 11,626 0.05% 2.18% 7.50% 9.76% 0.0052%Activision Blizzard Inc ATVI 31,603 0.14% 0.92% 14.50% 15.49% 0.0222%AvalonBay Communities Inc AVB 26,997 0.12% 3.12% 5.50% 8.71% 0.0107%Broadcom Inc AVGO 109,656 0.50% 3.99% 47.50% 52.44% 0.2610%Avery Dennison Corp AVY 9,379 0.04% 2.04% 11.50% 13.66% 0.0058%American Water Works Co Inc AWK 18,358 0.08% 1.91% 10.00% 12.01% 0.0100%American Express Co AXP 92,112 0.42% 1.53% 9.00% 10.60% 0.0443%AutoZone Inc AZO 23,717 0.11% 0.00% 12.50% 12.50% 0.0135%Boeing Co/The BA 239,862 1.09% 1.95% 17.50% 19.62% 0.2136%Bank of America Corp BAC 281,453 1.28% 2.10% 13.00% 15.24% 0.1946%Baxter International Inc BAX 39,847 0.18% 1.02% 12.50% 13.58% 0.0246%BB&T Corp BBT 37,808 0.17% 3.27% 10.00% 13.43% 0.0231%Best Buy Co Inc BBY 18,398 0.08% 3.25% 12.00% 15.45% 0.0129%Becton Dickinson and Co BDX 66,370 0.30% 1.27% 10.00% 11.33% 0.0341%Franklin Resources Inc BEN 15,979 0.07% 3.43% 9.00% 12.58% 0.0091%

Indiana Michigan Power CompanyAttachment RBH-3
Page 9 of 14
Company TickerMarket
CapitalizationWeight in
IndexEstimated
Dividend YieldLong-Term Growth Est. DCF Result
WeightedDCF Result
Brown-Forman Corp BF/B 23,939 0.11% 1.33% 15.50% 16.93% 0.0184%Brighthouse Financial Inc BHF N/A N/A 0.00% N/A N/A N/ABaker Hughes a GE Co BHGE 10,733 N/A 2.76% N/A N/A N/ABiogen Inc BIIB 63,526 0.29% 0.00% 6.50% 6.50% 0.0187%Bank of New York Mellon Corp/The BK 50,655 0.23% 2.19% 9.00% 11.29% 0.0260%Booking Holdings Inc BKNG 80,430 0.37% 0.00% 14.00% 14.00% 0.0511%BlackRock Inc BLK 67,219 0.31% 3.12% 9.00% 12.26% 0.0374%Ball Corp BLL 18,332 0.08% 0.73% 22.00% 22.81% 0.0190%Bristol-Myers Squibb Co BMY 84,075 0.38% 3.18% 13.50% 16.89% 0.0645%Broadridge Financial Solutions Inc BR 11,410 0.05% 2.04% 11.00% 13.15% 0.0068%Berkshire Hathaway Inc BRK/B - N/A 0.00% N/A N/A N/ABoston Scientific Corp BSX 54,781 0.25% 0.00% 17.00% 17.00% 0.0423%BorgWarner Inc BWA 8,044 0.04% 1.76% 8.00% 9.83% 0.0036%Boston Properties Inc BXP 20,442 0.09% 2.94% 3.50% 6.49% 0.0060%Citigroup Inc C 151,168 0.69% 3.20% 8.50% 11.84% 0.0812%Conagra Brands Inc CAG 10,864 0.05% 3.80% 4.50% 8.39% 0.0041%Cardinal Health Inc CAH 14,155 0.06% 4.11% 10.00% 14.32% 0.0092%Caterpillar Inc CAT 78,366 0.36% 2.59% 17.00% 19.81% 0.0705%Chubb Ltd CB 61,179 0.28% 2.20% 8.50% 10.79% 0.0300%Cboe Global Markets Inc CBOE 10,351 0.05% 1.34% 17.00% 18.45% 0.0087%CBRE Group Inc CBRE 16,996 0.08% 0.00% 10.50% 10.50% 0.0081%CBS Corp CBS 18,428 0.08% 1.47% 10.50% 12.05% 0.0101%Crown Castle International Corp CCI 50,107 0.23% 3.81% 10.50% 14.51% 0.0330%Carnival Corp CCL 38,766 0.18% 3.61% 13.50% 17.35% 0.0305%Cadence Design Systems Inc CDNS 16,581 0.08% 0.00% 12.50% 12.50% 0.0094%Celanese Corp CE 13,764 0.06% 2.36% 10.00% 12.48% 0.0078%Celgene Corp CELG 59,910 0.27% 0.00% 14.50% 14.50% 0.0394%Cerner Corp CERN 18,250 0.08% 0.00% 7.50% 7.50% 0.0062%CF Industries Holdings Inc CF 9,336 0.04% 3.23% 48.50% 52.51% 0.0223%Citizens Financial Group Inc CFG 16,556 0.08% 3.67% 12.50% 16.40% 0.0123%Church & Dwight Co Inc CHD 16,203 0.07% 1.39% 10.00% 11.46% 0.0084%CH Robinson Worldwide Inc CHRW 12,071 0.05% 2.29% 9.50% 11.90% 0.0065%Charter Communications Inc CHTR 76,627 0.35% 0.00% 16.00% 16.00% 0.0556%Cigna Corp CI 39,893 0.18% 0.02% 15.50% 15.52% 0.0281%Cincinnati Financial Corp CINF 13,763 0.06% 2.65% 7.00% 9.74% 0.0061%Colgate-Palmolive Co CL 56,383 0.26% 2.57% 10.50% 13.20% 0.0338%Clorox Co/The CLX 20,124 0.09% 2.44% 7.50% 10.03% 0.0092%Comerica Inc CMA 13,740 0.06% 3.24% 15.50% 18.99% 0.0118%Comcast Corp CMCSA 173,707 0.79% 2.19% 12.00% 14.32% 0.1129%CME Group Inc CME 58,626 0.27% 1.74% 4.50% 6.28% 0.0167%Chipotle Mexican Grill Inc CMG 16,940 0.08% 0.00% 16.50% 16.50% 0.0127%Cummins Inc CMI 24,764 0.11% 2.96% 8.00% 11.08% 0.0125%CMS Energy Corp CMS 15,382 0.07% 2.87% 7.00% 9.97% 0.0070%Centene Corp CNC 23,276 0.11% 0.00% 15.50% 15.50% 0.0164%CenterPoint Energy Inc CNP 15,051 0.07% 3.86% 12.50% 16.60% 0.0113%Capital One Financial Corp COF 38,499 0.17% 1.97% 10.00% 12.07% 0.0211%Cabot Oil & Gas Corp COG 10,902 N/A 1.12% N/A N/A N/ACooper Cos Inc/The COO 14,218 0.06% 0.02% 14.50% 14.52% 0.0094%ConocoPhillips COP 78,227 N/A 1.80% N/A N/A N/ACostco Wholesale Corp COST 95,506 0.43% 1.12% 8.50% 9.67% 0.0419%Coty Inc COTY 8,158 0.04% 4.60% 9.00% 13.81% 0.0051%Campbell Soup Co CPB 10,812 N/A 3.90% N/A N/A N/ACapri Holdings Ltd CPRI 6,630 0.03% 0.00% 7.50% 7.50% 0.0023%Copart Inc CPRT 13,210 0.06% 0.00% 13.00% 13.00% 0.0078%salesforce.com Inc CRM 119,034 0.54% 0.00% 65.00% 65.00% 0.3512%Cisco Systems Inc CSCO 226,907 1.03% 2.73% 8.00% 10.84% 0.1116%CSX Corp CSX 60,815 0.28% 1.33% 16.50% 17.94% 0.0495%Cintas Corp CTAS 21,291 0.10% 1.11% 15.50% 16.70% 0.0161%CenturyLink Inc CTL 13,086 0.06% 8.26% 0.50% 8.78% 0.0052%Cognizant Technology Solutions Corp CTSH 41,951 0.19% 1.11% 10.00% 11.17% 0.0213%Citrix Systems Inc CTXS 13,852 0.06% 1.36% 7.50% 8.91% 0.0056%CVS Health Corp CVS 53,355 0.24% 3.82% 8.00% 11.97% 0.0290%Chevron Corp CVX 233,000 1.06% 3.90% 25.00% 29.39% 0.3108%Concho Resources Inc CXO 20,519 0.09% 0.49% 30.00% 30.56% 0.0285%Dominion Energy Inc D 49,859 0.23% 4.82% 6.50% 11.48% 0.0260%Delta Air Lines Inc DAL 34,000 0.15% 3.01% 9.50% 12.65% 0.0195%Deere & Co DE 50,328 0.23% 1.92% 14.00% 16.05% 0.0367%Discover Financial Services DFS 23,624 0.11% 2.29% 8.00% 10.38% 0.0111%Dollar General Corp DG 31,252 0.14% 0.98% 13.00% 14.04% 0.0199%Quest Diagnostics Inc DGX 11,236 0.05% 2.55% 8.50% 11.16% 0.0057%DR Horton Inc DHI 15,139 0.07% 1.48% 8.00% 9.54% 0.0066%Danaher Corp DHR 87,222 0.40% 0.51% 10.50% 11.04% 0.0437%Walt Disney Co/The DIS 171,015 0.78% 1.54% 7.00% 8.59% 0.0667%Discovery Inc DISCA 14,878 0.07% 0.00% 17.00% 17.00% 0.0115%DISH Network Corp DISH 15,052 0.07% 0.00% -2.00% -2.00% -0.0014%Digital Realty Trust Inc DLR 23,146 0.11% 3.84% 6.50% 10.46% 0.0110%Dollar Tree Inc DLTR 24,549 0.11% 0.00% 17.50% 17.50% 0.0195%Dover Corp DOV 13,195 0.06% 2.13% 13.00% 15.27% 0.0091%

Indiana Michigan Power CompanyAttachment RBH-3
Page 10 of 14
Company TickerMarket
CapitalizationWeight in
IndexEstimated
Dividend YieldLong-Term Growth Est. DCF Result
WeightedDCF Result
Duke Realty Corp DRE 10,563 0.05% 2.97% 7.00% 10.07% 0.0048%Darden Restaurants Inc DRI 13,392 0.06% 2.97% 12.00% 15.15% 0.0092%DTE Energy Co DTE 22,286 0.10% 3.18% 5.00% 8.26% 0.0084%Duke Energy Corp DUK 63,871 0.29% 4.26% 5.50% 9.88% 0.0286%DaVita Inc DVA 8,389 0.04% 0.00% 9.50% 9.50% 0.0036%Devon Energy Corp DVN 13,275 0.06% 1.28% 19.00% 20.40% 0.0123%DowDuPont Inc DWDP 125,071 N/A 3.08% N/A N/A N/ADXC Technology Co DXC 17,375 0.08% 1.18% 14.00% 15.26% 0.0120%Electronic Arts Inc EA 29,907 0.14% 0.00% 11.50% 11.50% 0.0156%eBay Inc EBAY 34,870 0.16% 1.55% 14.50% 16.16% 0.0256%Ecolab Inc ECL 48,993 0.22% 1.09% 9.00% 10.14% 0.0225%Consolidated Edison Inc ED 26,752 0.12% 3.59% 3.00% 6.64% 0.0081%Equifax Inc EFX 13,110 0.06% 1.44% 7.50% 8.99% 0.0054%Edison International EIX 20,265 0.09% 3.96% 4.50% 8.55% 0.0079%Estee Lauder Cos Inc/The EL 56,233 0.26% 1.12% 12.50% 13.69% 0.0349%Eastman Chemical Co EMN 11,188 0.05% 3.10% 9.50% 12.75% 0.0065%Emerson Electric Co EMR 41,443 0.19% 2.93% 14.00% 17.14% 0.0322%EOG Resources Inc EOG 52,968 N/A 1.01% N/A N/A N/AEquinix Inc EQIX 34,137 0.15% 2.44% 25.50% 28.25% 0.0438%Equity Residential EQR 27,024 0.12% 2.94% -15.00% -12.28% -0.0151%Eversource Energy ES 21,989 0.10% 3.08% 5.50% 8.66% 0.0086%Essex Property Trust Inc ESS 18,646 0.08% 2.76% 0.50% 3.27% 0.0028%E*TRADE Financial Corp ETFC 12,127 0.06% 1.19% 26.00% 27.34% 0.0151%Eaton Corp PLC ETN 34,642 0.16% 3.55% 9.00% 12.71% 0.0200%Entergy Corp ETR 17,418 0.08% 3.99% 0.50% 4.50% 0.0036%Evergy Inc EVRG 14,143 N/A 3.50% N/A N/A N/AEdwards Lifesciences Corp EW 35,748 0.16% 0.00% 15.00% 15.00% 0.0243%Exelon Corp EXC 46,948 0.21% 2.99% 7.50% 10.60% 0.0226%Expeditors International of Washington I EXPD 12,830 0.06% 1.21% 8.50% 9.76% 0.0057%Expedia Group Inc EXPE 18,378 0.08% 1.04% 20.00% 21.14% 0.0176%Extra Space Storage Inc EXR 12,214 0.06% 3.67% 5.00% 8.76% 0.0049%Ford Motor Co F 33,733 0.15% 7.08% 0.50% 7.60% 0.0116%Diamondback Energy Inc FANG 9,646 N/A 0.77% N/A N/A N/AFastenal Co FAST 17,660 0.08% 2.80% 11.50% 14.46% 0.0116%Facebook Inc FB 482,697 2.19% 0.00% 26.00% 26.00% 0.5696%Fortune Brands Home & Security Inc FBHS 6,510 0.03% 1.91% 13.50% 15.54% 0.0046%Freeport-McMoRan Inc FCX 17,837 N/A 1.95% N/A N/A N/AFedEx Corp FDX 45,124 0.20% 1.71% 7.50% 9.27% 0.0190%FirstEnergy Corp FE 20,857 0.09% 3.78% 6.50% 10.40% 0.0098%F5 Networks Inc FFIV 9,549 0.04% 0.00% 12.00% 12.00% 0.0052%Fidelity National Information Services I FIS 34,653 0.16% 1.33% 15.50% 16.93% 0.0266%Fiserv Inc FISV 34,089 0.15% 0.00% 13.50% 13.50% 0.0209%Fifth Third Bancorp FITB 17,439 0.08% 3.53% 7.00% 10.65% 0.0084%Foot Locker Inc FL 7,044 0.03% 2.45% 8.00% 10.55% 0.0034%FLIR Systems Inc FLIR 6,781 0.03% 1.36% 13.50% 14.95% 0.0046%Fluor Corp FLR 5,079 0.02% 2.31% 8.50% 10.91% 0.0025%Flowserve Corp FLS 5,624 0.03% 1.76% 7.50% 9.33% 0.0024%FleetCor Technologies Inc FLT 20,167 0.09% 0.00% 14.50% 14.50% 0.0133%FMC Corp FMC 10,479 0.05% 2.06% 22.50% 24.79% 0.0118%Twenty-First Century Fox Inc FOXA 93,942 0.43% 0.71% 12.50% 13.25% 0.0565%First Republic Bank/CA FRC 16,728 0.08% 0.71% 11.50% 12.25% 0.0093%Federal Realty Investment Trust FRT 9,674 0.04% 3.10% 3.50% 6.65% 0.0029%TechnipFMC PLC FTI N/A N/A 0.00% N/A N/A N/AFortinet Inc FTNT 14,046 0.06% 0.00% 39.50% 39.50% 0.0252%Fortive Corp FTV 28,355 N/A 0.35% N/A N/A N/AGeneral Dynamics Corp GD 48,022 0.22% 2.45% 6.00% 8.52% 0.0186%General Electric Co GE 82,197 N/A 0.42% N/A N/A N/AGilead Sciences Inc GILD 80,914 0.37% 4.03% -6.50% -2.60% -0.0096%General Mills Inc GIS 27,687 0.13% 4.27% 3.00% 7.33% 0.0092%Corning Inc GLW 26,768 0.12% 2.36% 15.50% 18.04% 0.0219%General Motors Co GM 53,256 0.24% 4.10% 3.00% 7.16% 0.0173%Alphabet Inc GOOGL N/A N/A 0.00% N/A N/A N/AGenuine Parts Co GPC 15,681 0.07% 2.85% 8.50% 11.47% 0.0082%Global Payments Inc GPN 20,544 0.09% 0.03% 20.00% 20.03% 0.0187%Gap Inc/The GPS 10,207 0.05% 3.63% 7.00% 10.76% 0.0050%Garmin Ltd GRMN 15,727 0.07% 2.55% 10.50% 13.18% 0.0094%Goldman Sachs Group Inc/The GS 71,853 0.33% 1.66% 9.50% 11.24% 0.0367%WW Grainger Inc GWW 16,766 0.08% 1.83% 9.50% 11.42% 0.0087%Halliburton Co HAL 24,467 N/A 2.58% N/A N/A N/AHasbro Inc HAS 10,986 0.05% 3.14% 8.00% 11.27% 0.0056%Huntington Bancshares Inc/OH HBAN 14,532 0.07% 4.24% 12.50% 17.01% 0.0112%Hanesbrands Inc HBI 6,611 0.03% 3.27% 4.00% 7.34% 0.0022%HCA Healthcare Inc HCA 43,444 0.20% 1.26% 12.00% 13.34% 0.0263%HCP Inc HCP 14,271 0.06% 5.00% 35.50% 41.39% 0.0268%Home Depot Inc/The HD 206,419 0.94% 2.98% 12.50% 15.67% 0.1468%Hess Corp HES 16,771 N/A 1.77% N/A N/A N/AHollyFrontier Corp HFC 8,693 0.04% 2.73% 22.50% 25.54% 0.0101%Hartford Financial Services Group Inc/Th HIG 17,231 0.08% 2.50% 13.00% 15.66% 0.0122%

Indiana Michigan Power CompanyAttachment RBH-3
Page 11 of 14
Company TickerMarket
CapitalizationWeight in
IndexEstimated
Dividend YieldLong-Term Growth Est. DCF Result
WeightedDCF Result
Huntington Ingalls Industries Inc HII 8,441 0.04% 1.71% 7.00% 8.77% 0.0034%Hilton Worldwide Holdings Inc HLT 24,624 0.11% 0.72% 9.00% 9.75% 0.0109%Harley-Davidson Inc HOG 6,100 0.03% 4.00% 9.00% 13.18% 0.0036%Hologic Inc HOLX 12,513 0.06% 0.00% 18.50% 18.50% 0.0105%Honeywell International Inc HON 112,879 0.51% 2.15% 9.00% 11.25% 0.0576%Helmerich & Payne Inc HP 5,969 0.03% 5.21% 56.50% 63.18% 0.0171%Hewlett Packard Enterprise Co HPE 21,593 0.10% 2.87% 7.50% 10.48% 0.0103%HP Inc HPQ 28,971 0.13% 3.40% 9.50% 13.06% 0.0172%H&R Block Inc HRB 4,966 0.02% 4.26% 8.50% 12.94% 0.0029%Hormel Foods Corp HRL 23,204 0.11% 1.93% 9.00% 11.02% 0.0116%Harris Corp HRS 18,989 0.09% 1.70% 13.50% 15.31% 0.0132%Henry Schein Inc HSIC 8,750 0.04% 0.00% 8.50% 8.50% 0.0034%Host Hotels & Resorts Inc HST 14,324 N/A 4.28% N/A N/A N/AHershey Co/The HSY 23,474 0.11% 2.58% 6.50% 9.16% 0.0098%Humana Inc HUM 36,826 0.17% 0.82% 13.50% 14.38% 0.0240%International Business Machines Corp IBM 123,014 N/A 4.82% N/A N/A N/AIntercontinental Exchange Inc ICE 42,054 0.19% 1.49% 12.50% 14.08% 0.0269%IDEXX Laboratories Inc IDXX 17,646 0.08% 0.00% 15.00% 15.00% 0.0120%International Flavors & Fragrances Inc IFF 11,420 0.05% 2.43% 8.00% 10.53% 0.0055%Illumina Inc ILMN 42,933 0.19% 0.00% 15.50% 15.50% 0.0302%Incyte Corp INCY 17,648 N/A 0.00% N/A N/A N/AIHS Markit Ltd INFO 21,020 0.10% 0.00% 15.50% 15.50% 0.0148%Intel Corp INTC 240,066 1.09% 2.40% 12.50% 15.05% 0.1640%Intuit Inc INTU 63,593 0.29% 0.77% 14.50% 15.33% 0.0442%International Paper Co IP 18,371 0.08% 4.36% 15.50% 20.20% 0.0168%Interpublic Group of Cos Inc/The IPG 8,741 0.04% 4.21% 11.50% 15.95% 0.0063%IPG Photonics Corp IPGP 7,835 0.04% 0.00% 10.50% 10.50% 0.0037%IQVIA Holdings Inc IQV 27,239 0.12% 0.00% 12.50% 12.50% 0.0155%Ingersoll-Rand PLC IR 25,639 0.12% 2.03% 13.50% 15.67% 0.0182%Iron Mountain Inc IRM 9,981 0.05% 7.00% 6.50% 13.73% 0.0062%Intuitive Surgical Inc ISRG 60,887 0.28% 0.00% 15.00% 15.00% 0.0415%Gartner Inc IT 12,879 0.06% 0.00% 13.50% 13.50% 0.0079%Illinois Tool Works Inc ITW 46,701 0.21% 2.84% 10.00% 12.98% 0.0275%Invesco Ltd IVZ 7,675 0.03% 6.43% 4.00% 10.56% 0.0037%JB Hunt Transport Services Inc JBHT 11,125 0.05% 1.02% 11.50% 12.58% 0.0064%Johnson Controls International plc JCI 32,556 0.15% 2.92% 6.00% 9.01% 0.0133%Jacobs Engineering Group Inc JEC 10,124 0.05% 0.94% 13.00% 14.00% 0.0064%Jefferies Financial Group Inc JEF 6,257 0.03% 2.65% 20.50% 23.42% 0.0067%Jack Henry & Associates Inc JKHY 10,109 0.05% 1.22% 11.50% 12.79% 0.0059%Johnson & Johnson JNJ 370,919 1.68% 2.71% 10.50% 13.35% 0.2248%Juniper Networks Inc JNPR 8,989 0.04% 2.93% 5.00% 8.00% 0.0033%JPMorgan Chase & Co JPM 342,418 1.55% 3.15% 9.50% 12.80% 0.1989%Nordstrom Inc JWN 7,558 0.03% 3.31% 7.00% 10.43% 0.0036%Kellogg Co K 18,842 0.09% 4.16% 5.50% 9.77% 0.0084%KeyCorp KEY 17,273 0.08% 4.07% 13.00% 17.33% 0.0136%Keysight Technologies Inc KEYS 15,893 0.07% 0.00% 16.00% 16.00% 0.0115%Kraft Heinz Co/The KHC 38,874 0.18% 5.02% 9.50% 14.76% 0.0260%Kimco Realty Corp KIM 7,402 0.03% 6.56% -0.50% 6.04% 0.0020%KLA-Tencor Corp KLAC 17,351 0.08% 2.62% 10.50% 13.26% 0.0104%Kimberly-Clark Corp KMB 39,737 0.18% 3.58% 10.50% 14.27% 0.0257%Kinder Morgan Inc/DE KMI 44,881 0.20% 4.03% 34.50% 39.23% 0.0799%CarMax Inc KMX 10,259 0.05% 0.00% 11.50% 11.50% 0.0054%Coca-Cola Co/The KO 192,712 0.87% 3.67% 6.50% 10.29% 0.0900%Kroger Co/The KR 20,437 0.09% 2.42% 5.00% 7.48% 0.0069%Kohl's Corp KSS 11,380 0.05% 3.89% 11.00% 15.10% 0.0078%Kansas City Southern KSU 11,306 0.05% 1.29% 12.00% 13.37% 0.0069%Loews Corp L 14,746 0.07% 0.53% 16.50% 17.07% 0.0114%L Brands Inc LB 7,230 0.03% 4.56% -4.50% -0.04% 0.0000%Leggett & Platt Inc LEG 5,780 0.03% 3.43% 9.00% 12.58% 0.0033%Lennar Corp LEN 15,418 0.07% 0.34% 12.00% 12.36% 0.0086%Laboratory Corp of America Holdings LH 14,785 0.07% 0.00% 8.50% 8.50% 0.0057%Linde PLC LIN - N/A 2.09% N/A N/A N/ALKQ Corp LKQ 8,846 0.04% 0.00% 10.50% 10.50% 0.0042%L3 Technologies Inc LLL 16,349 0.07% 1.64% 7.00% 8.70% 0.0065%Eli Lilly & Co LLY 133,835 0.61% 2.04% 12.00% 14.16% 0.0860%Lockheed Martin Corp LMT 85,146 0.39% 2.97% 14.00% 17.18% 0.0664%Lincoln National Corp LNC 12,432 0.06% 2.52% 10.50% 13.15% 0.0074%Alliant Energy Corp LNT 10,904 0.05% 3.07% 6.50% 9.67% 0.0048%Lowe's Cos Inc LOW 81,172 0.37% 2.09% 13.00% 15.23% 0.0561%Lam Research Corp LRCX 25,736 0.12% 2.63% 13.00% 15.80% 0.0185%Southwest Airlines Co LUV 28,973 0.13% 1.22% 11.50% 12.79% 0.0168%Lamb Weston Holdings Inc LW 10,329 N/A 1.14% N/A N/A N/ALyondellBasell Industries NV LYB 33,727 0.15% 4.59% 5.50% 10.22% 0.0156%Macy's Inc M 7,164 0.03% 6.48% 5.00% 11.64% 0.0038%Mastercard Inc MA 230,194 1.04% 0.59% 16.00% 16.64% 0.1738%Mid-America Apartment Communities Inc MAA 11,930 0.05% 3.66% -4.50% -0.92% -0.0005%Macerich Co/The MAC 5,999 0.03% 7.10% 8.00% 15.38% 0.0042%Marriott International Inc/MD MAR 41,693 0.19% 1.34% 12.50% 13.92% 0.0263%

Indiana Michigan Power CompanyAttachment RBH-3
Page 12 of 14
Company TickerMarket
CapitalizationWeight in
IndexEstimated
Dividend YieldLong-Term Growth Est. DCF Result
WeightedDCF Result
Masco Corp MAS 11,453 0.05% 1.23% 14.50% 15.82% 0.0082%Mattel Inc MAT 5,001 0.02% 0.00% 22.00% 22.00% 0.0050%McDonald's Corp MCD 139,163 0.63% 2.62% 9.50% 12.24% 0.0773%Microchip Technology Inc MCHP 20,012 0.09% 1.78% 15.00% 16.91% 0.0154%McKesson Corp MCK 21,558 0.10% 1.39% 9.00% 10.45% 0.0102%Moody's Corp MCO 32,451 0.15% 1.18% 11.50% 12.75% 0.0188%Mondelez International Inc MDLZ 68,206 0.31% 2.31% 9.50% 11.92% 0.0369%Medtronic PLC MDT 122,101 0.55% 2.33% 7.50% 9.92% 0.0550%MetLife Inc MET 43,728 0.20% 3.93% 7.00% 11.07% 0.0220%MGM Resorts International MGM 14,070 0.06% 1.97% 31.00% 33.28% 0.0212%Mohawk Industries Inc MHK 9,669 0.04% 0.00% 4.50% 4.50% 0.0020%McCormick & Co Inc/MD MKC 17,858 0.08% 1.68% 10.00% 11.76% 0.0095%Martin Marietta Materials Inc MLM 12,313 0.06% 0.99% 13.00% 14.05% 0.0079%Marsh & McLennan Cos Inc MMC 45,238 0.21% 1.85% 9.00% 10.93% 0.0224%3M Co MMM 116,376 0.53% 2.88% 9.00% 12.01% 0.0634%Monster Beverage Corp MNST 34,056 0.15% 0.00% 15.00% 15.00% 0.0232%Altria Group Inc MO 102,586 0.47% 5.85% 10.50% 16.66% 0.0776%Mosaic Co/The MOS 10,762 0.05% 0.72% 12.00% 12.76% 0.0062%Marathon Petroleum Corp MPC 26,537 0.12% 3.60% 13.50% 17.34% 0.0209%Merck & Co Inc MRK 213,896 0.97% 2.74% 5.50% 8.32% 0.0807%Marathon Oil Corp MRO 14,129 N/A 1.31% N/A N/A N/AMorgan Stanley MS 71,051 0.32% 2.92% 11.00% 14.08% 0.0454%MSCI Inc MSCI 16,129 0.07% 1.44% 19.50% 21.08% 0.0154%Microsoft Corp MSFT 848,126 3.85% 1.67% 15.00% 16.80% 0.6465%Motorola Solutions Inc MSI 22,807 0.10% 1.64% 12.50% 14.24% 0.0147%M&T Bank Corp MTB 23,713 0.11% 2.39% 13.00% 15.55% 0.0167%Mettler-Toledo International Inc MTD 17,043 0.08% 0.00% 10.00% 10.00% 0.0077%Micron Technology Inc MU 42,370 0.19% 0.00% 7.50% 7.50% 0.0144%Maxim Integrated Products Inc MXIM 14,318 0.06% 3.51% 11.50% 15.21% 0.0099%Mylan NV MYL 13,829 0.06% 0.00% 14.00% 14.00% 0.0088%Noble Energy Inc NBL 10,863 N/A 1.94% N/A N/A N/ANorwegian Cruise Line Holdings Ltd NCLH 12,114 0.05% 0.00% 16.50% 16.50% 0.0091%Nasdaq Inc NDAQ 14,095 0.06% 2.05% 9.50% 11.65% 0.0075%NextEra Energy Inc NEE 89,820 0.41% 2.66% 9.00% 11.78% 0.0480%Newmont Mining Corp NEM 17,695 0.08% 1.69% 5.00% 6.73% 0.0054%Netflix Inc NFLX 153,764 0.70% 0.00% 47.00% 47.00% 0.3280%NiSource Inc NI 9,900 0.04% 2.94% 15.00% 18.16% 0.0082%NIKE Inc NKE 134,455 0.61% 1.03% 16.00% 17.11% 0.1044%Nektar Therapeutics NKTR 6,199 N/A 0.00% N/A N/A N/ANielsen Holdings PLC NLSN 9,276 0.04% 5.36% 5.00% 10.49% 0.0044%Northrop Grumman Corp NOC 47,163 0.21% 1.74% 9.50% 11.32% 0.0242%National Oilwell Varco Inc NOV 10,189 0.05% 0.75% 41.50% 42.41% 0.0196%NRG Energy Inc NRG 11,957 N/A 0.29% N/A N/A N/ANorfolk Southern Corp NSC 48,671 0.22% 1.93% 13.50% 15.56% 0.0344%NetApp Inc NTAP 15,675 0.07% 2.52% 20.50% 23.28% 0.0166%Northern Trust Corp NTRS 19,921 0.09% 2.67% 10.00% 12.80% 0.0116%Nucor Corp NUE 18,525 0.08% 2.71% 21.50% 24.50% 0.0206%NVIDIA Corp NVDA 91,049 0.41% 0.43% 23.00% 23.48% 0.0970%Newell Brands Inc NWL 7,597 0.03% 5.94% 9.50% 15.72% 0.0054%News Corp NWSA 7,545 N/A 1.55% N/A N/A N/ARealty Income Corp O 19,742 0.09% 3.90% 4.50% 8.49% 0.0076%ONEOK Inc OKE 27,104 0.12% 5.46% 18.50% 24.47% 0.0301%Omnicom Group Inc OMC 16,687 0.08% 3.49% 7.00% 10.61% 0.0080%Oracle Corp ORCL 190,971 0.87% 1.45% 9.50% 11.02% 0.0955%O'Reilly Automotive Inc ORLY 29,200 0.13% 0.00% 13.00% 13.00% 0.0172%Occidental Petroleum Corp OXY 49,567 N/A 4.78% N/A N/A N/APaychex Inc PAYX 27,363 0.12% 3.26% 11.00% 14.44% 0.0179%People's United Financial Inc PBCT 5,854 0.03% 4.15% 11.00% 15.38% 0.0041%PACCAR Inc PCAR 23,479 0.11% 4.92% 7.00% 12.09% 0.0129%Public Service Enterprise Group Inc PEG 29,736 0.13% 3.22% 4.50% 7.79% 0.0105%PepsiCo Inc PEP 163,933 0.74% 3.20% 7.50% 10.82% 0.0805%Pfizer Inc PFE 239,254 1.09% 3.48% 14.00% 17.72% 0.1925%Principal Financial Group Inc PFG 14,180 0.06% 4.32% 6.50% 10.96% 0.0071%Procter & Gamble Co/The PG 246,531 1.12% 2.92% 10.50% 13.57% 0.1519%Progressive Corp/The PGR 42,111 0.19% 0.55% 20.00% 20.61% 0.0394%Parker-Hannifin Corp PH 22,040 0.10% 1.78% 14.00% 15.90% 0.0159%PulteGroup Inc PHM 7,629 0.03% 1.60% 15.50% 17.22% 0.0060%Packaging Corp of America PKG 9,227 0.04% 3.24% 9.50% 12.89% 0.0054%PerkinElmer Inc PKI 10,358 0.05% 0.30% 11.50% 11.82% 0.0056%Prologis Inc PLD 36,998 0.17% 3.05% 9.00% 12.19% 0.0205%Philip Morris International Inc PM 135,197 0.61% 5.24% 7.50% 12.94% 0.0794%PNC Financial Services Group Inc/The PNC 58,207 0.26% 3.02% 9.50% 12.66% 0.0335%Pentair PLC PNR 7,248 0.03% 1.73% 5.50% 7.28% 0.0024%Pinnacle West Capital Corp PNW 10,388 0.05% 3.28% 6.00% 9.38% 0.0044%PPG Industries Inc PPG 26,349 0.12% 1.75% 4.50% 6.29% 0.0075%PPL Corp PPL 23,081 0.10% 5.24% 3.00% 8.32% 0.0087%Perrigo Co PLC PRGO 6,324 0.03% 1.81% 0.50% 2.31% 0.0007%Prudential Financial Inc PRU 38,652 0.18% 4.25% 6.50% 10.89% 0.0191%

Indiana Michigan Power CompanyAttachment RBH-3
Page 13 of 14
Company TickerMarket
CapitalizationWeight in
IndexEstimated
Dividend YieldLong-Term Growth Est. DCF Result
WeightedDCF Result
Public Storage PSA 37,234 0.17% 4.06% 7.00% 11.20% 0.0189%Phillips 66 PSX 44,476 0.20% 3.61% 12.50% 16.34% 0.0330%PVH Corp PVH 8,370 0.04% 0.14% 11.00% 11.15% 0.0042%Quanta Services Inc PWR 5,204 0.02% 0.46% 19.50% 20.00% 0.0047%Pioneer Natural Resources Co PXD 23,237 0.11% 0.37% 75.00% 75.51% 0.0796%PayPal Holdings Inc PYPL 113,335 0.51% 0.00% 18.50% 18.50% 0.0952%QUALCOMM Inc QCOM 65,376 0.30% 5.00% 10.50% 15.76% 0.0468%Qorvo Inc QRVO 8,407 N/A 0.00% N/A N/A N/ARoyal Caribbean Cruises Ltd RCL 24,181 0.11% 2.42% 11.00% 13.55% 0.0149%Everest Re Group Ltd RE 8,867 0.04% 2.61% 10.00% 12.74% 0.0051%Regency Centers Corp REG 10,933 0.05% 3.66% 14.00% 17.92% 0.0089%Regeneron Pharmaceuticals Inc REGN 44,647 0.20% 0.00% 12.00% 12.00% 0.0243%Regions Financial Corp RF 16,907 0.08% 3.76% 13.50% 17.51% 0.0134%Robert Half International Inc RHI 7,943 0.04% 1.90% 9.00% 10.99% 0.0040%Red Hat Inc RHT 31,873 0.14% 0.00% 17.50% 17.50% 0.0253%Raymond James Financial Inc RJF 11,314 0.05% 1.74% 12.00% 13.84% 0.0071%Ralph Lauren Corp RL 9,695 0.04% 2.03% 7.00% 9.10% 0.0040%ResMed Inc RMD 14,398 0.07% 1.47% 14.50% 16.08% 0.0105%Rockwell Automation Inc ROK 20,991 0.10% 2.25% 10.50% 12.87% 0.0123%Rollins Inc ROL 13,083 0.06% 1.05% 13.50% 14.62% 0.0087%Roper Technologies Inc ROP 33,020 0.15% 0.58% 14.50% 15.12% 0.0227%Ross Stores Inc ROST 34,289 0.16% 1.10% 11.50% 12.66% 0.0197%Republic Services Inc RSG 25,475 0.12% 1.98% 12.00% 14.10% 0.0163%Raytheon Co RTN 50,822 0.23% 1.93% 10.00% 12.03% 0.0277%SBA Communications Corp SBAC 21,354 0.10% 0.00% 35.50% 35.50% 0.0344%Starbucks Corp SBUX 87,789 0.40% 2.21% 13.50% 15.86% 0.0632%Charles Schwab Corp/The SCHW 59,503 0.27% 1.55% 16.00% 17.67% 0.0477%Sealed Air Corp SEE 6,984 0.03% 1.44% 19.00% 20.58% 0.0065%Sherwin-Williams Co/The SHW 38,766 0.18% 1.09% 13.00% 14.16% 0.0249%SVB Financial Group SIVB 12,737 0.06% 0.00% 21.50% 21.50% 0.0124%JM Smucker Co/The SJM 11,679 0.05% 3.37% 4.50% 7.95% 0.0042%Schlumberger Ltd SLB 58,840 0.27% 4.71% 26.00% 31.32% 0.0837%SL Green Realty Corp SLG 8,495 0.04% 3.81% 6.50% 10.43% 0.0040%Snap-on Inc SNA 9,017 0.04% 2.37% 8.00% 10.46% 0.0043%Synopsys Inc SNPS 15,414 0.07% 0.00% 10.50% 10.50% 0.0073%Southern Co/The SO 50,440 0.23% 4.91% 3.50% 8.50% 0.0195%Simon Property Group Inc SPG 54,574 0.25% 4.85% 3.00% 7.92% 0.0196%S&P Global Inc SPGI 49,297 0.22% 1.16% 13.00% 14.24% 0.0319%Sempra Energy SRE 33,346 0.15% 3.25% 9.50% 12.90% 0.0195%SunTrust Banks Inc STI 28,471 0.13% 3.39% 13.50% 17.12% 0.0221%State Street Corp STT 25,950 0.12% 2.75% 9.00% 11.87% 0.0140%Seagate Technology PLC STX 12,795 0.06% 5.58% 9.00% 14.83% 0.0086%Constellation Brands Inc STZ 31,828 0.14% 1.91% 11.00% 13.02% 0.0188%Stanley Black & Decker Inc SWK 19,825 0.09% 2.06% 10.00% 12.16% 0.0109%Skyworks Solutions Inc SWKS 13,841 0.06% 1.91% 11.00% 13.02% 0.0082%Synchrony Financial SYF 22,639 0.10% 2.67% 11.00% 13.82% 0.0142%Stryker Corp SYK 69,995 0.32% 1.11% 15.00% 16.19% 0.0514%Symantec Corp SYMC 13,988 0.06% 1.37% 9.50% 10.94% 0.0069%Sysco Corp SYY 33,825 0.15% 2.37% 13.00% 15.52% 0.0238%AT&T Inc T 217,866 0.99% 6.85% 5.50% 12.54% 0.1240%Molson Coors Brewing Co TAP 12,957 0.06% 2.73% 11.00% 13.88% 0.0082%TransDigm Group Inc TDG 22,604 0.10% 0.00% 6.50% 6.50% 0.0067%TE Connectivity Ltd TEL 28,825 0.13% 2.17% 9.50% 11.77% 0.0154%Teleflex Inc TFX 13,222 0.06% 0.47% 12.00% 12.50% 0.0075%Target Corp TGT 39,746 0.18% 3.36% 7.00% 10.48% 0.0189%Tiffany & Co TIF 11,518 0.05% 2.49% 12.00% 14.64% 0.0077%TJX Cos Inc/The TJX 63,815 0.29% 1.55% 13.00% 14.65% 0.0424%Torchmark Corp TMK 9,114 0.04% 0.79% 10.00% 10.83% 0.0045%Thermo Fisher Scientific Inc TMO 100,970 0.46% 0.30% 10.50% 10.82% 0.0496%Tapestry Inc TPR 9,912 0.04% 3.95% 13.00% 17.21% 0.0077%TripAdvisor Inc TRIP 7,025 0.03% 0.00% 10.50% 10.50% 0.0033%T Rowe Price Group Inc TROW 23,355 0.11% 3.16% 11.50% 14.84% 0.0157%Travelers Cos Inc/The TRV 34,819 0.16% 2.34% 6.50% 8.92% 0.0141%Tractor Supply Co TSCO 11,263 0.05% 1.48% 10.50% 12.06% 0.0062%Tyson Foods Inc TSN 23,464 0.11% 2.34% 7.00% 9.42% 0.0100%Total System Services Inc TSS 16,969 0.08% 0.56% 11.50% 12.09% 0.0093%Take-Two Interactive Software Inc TTWO 9,999 0.05% 0.00% 29.50% 29.50% 0.0134%Twitter Inc TWTR 22,903 N/A 0.00% N/A N/A N/ATexas Instruments Inc TXN 99,193 0.45% 2.94% 12.50% 15.62% 0.0703%Textron Inc TXT 12,609 0.06% 0.15% 15.00% 15.16% 0.0087%Under Armour Inc UAA 9,706 0.04% 0.00% 11.50% 11.50% 0.0051%United Continental Holdings Inc UAL 22,508 0.10% 0.00% 8.50% 8.50% 0.0087%UDR Inc UDR 11,961 0.05% 2.89% -2.50% 0.35% 0.0002%Universal Health Services Inc UHS 11,982 0.05% 0.31% 10.50% 10.83% 0.0059%Ulta Beauty Inc ULTA 18,162 0.08% 0.00% 20.00% 20.00% 0.0165%UnitedHealth Group Inc UNH 227,232 1.03% 1.52% 13.50% 15.12% 0.1560%Unum Group UNM 7,892 0.04% 2.88% 9.50% 12.52% 0.0045%Union Pacific Corp UNP 121,646 0.55% 2.13% 14.50% 16.78% 0.0927%

Indiana Michigan Power CompanyAttachment RBH-3
Page 14 of 14
Company TickerMarket
CapitalizationWeight in
IndexEstimated
Dividend YieldLong-Term Growth Est. DCF Result
WeightedDCF Result
United Parcel Service Inc UPS 91,793 0.42% 3.63% 8.50% 12.28% 0.0512%United Rentals Inc URI 10,110 0.05% 0.00% 17.00% 17.00% 0.0078%US Bancorp USB 82,256 0.37% 3.04% 7.00% 10.15% 0.0379%United Technologies Corp UTX 99,690 0.45% 2.36% 9.50% 11.97% 0.0542%Visa Inc V 295,275 1.34% 0.74% 14.50% 15.29% 0.2050%Varian Medical Systems Inc VAR 12,124 0.06% 0.00% 9.50% 9.50% 0.0052%VF Corp VFC 33,615 0.15% 2.40% 12.00% 14.54% 0.0222%Viacom Inc VIAB 11,742 0.05% 2.75% 4.00% 6.81% 0.0036%Valero Energy Corp VLO 34,222 0.16% 4.47% 9.00% 13.67% 0.0212%Vulcan Materials Co VMC 15,033 0.07% 1.09% 18.00% 19.19% 0.0131%Vornado Realty Trust VNO 12,861 0.06% 3.91% -5.50% -1.70% -0.0010%Verisk Analytics Inc VRSK 20,862 0.09% 0.79% 9.50% 10.33% 0.0098%VeriSign Inc VRSN 21,305 0.10% 0.00% 12.00% 12.00% 0.0116%Vertex Pharmaceuticals Inc VRTX 45,655 N/A 0.00% N/A N/A N/AVentas Inc VTR 21,965 0.10% 5.24% 3.50% 8.83% 0.0088%Verizon Communications Inc VZ 232,633 1.06% 4.30% 4.50% 8.90% 0.0939%Wabtec Corp WAB 6,736 0.03% 0.69% 10.00% 10.72% 0.0033%Waters Corp WAT 18,052 0.08% 0.00% 11.00% 11.00% 0.0090%Walgreens Boots Alliance Inc WBA 56,409 0.26% 2.94% 10.00% 13.09% 0.0335%WellCare Health Plans Inc WCG 11,784 0.05% 0.00% 23.00% 23.00% 0.0123%Western Digital Corp WDC 13,674 0.06% 4.26% 1.50% 5.79% 0.0036%WEC Energy Group Inc WEC 24,242 0.11% 3.12% 6.00% 9.21% 0.0101%Welltower Inc WELL 27,917 0.13% 4.74% 8.50% 13.44% 0.0170%Wells Fargo & Co WFC 234,070 1.06% 3.68% 6.00% 9.79% 0.1040%Whirlpool Corp WHR 8,797 0.04% 3.35% 8.00% 11.48% 0.0046%Willis Towers Watson PLC WLTW 22,101 N/A 1.53% N/A N/A N/AWaste Management Inc WM 42,584 0.19% 2.06% 9.00% 11.15% 0.0216%Williams Cos Inc/The WMB 32,612 0.15% 5.64% 19.00% 25.18% 0.0373%Walmart Inc WMT 283,118 1.29% 2.18% 7.00% 9.26% 0.1189%Westrock Co WRK 9,547 0.04% 4.87% 14.50% 19.72% 0.0085%Western Union Co/The WU 7,858 0.04% 4.52% 7.00% 11.68% 0.0042%Weyerhaeuser Co WY 18,175 0.08% 5.59% 17.50% 23.58% 0.0195%Wynn Resorts Ltd WYNN 12,903 0.06% 2.53% 20.00% 22.78% 0.0133%Cimarex Energy Co XEC 6,825 0.03% 1.12% 32.50% 33.80% 0.0105%Xcel Energy Inc XEL 28,498 0.13% 2.92% 5.50% 8.50% 0.0110%Xilinx Inc XLNX 30,357 0.14% 1.20% 11.00% 12.27% 0.0169%Exxon Mobil Corp XOM 339,398 1.54% 4.19% 14.00% 18.48% 0.2847%DENTSPLY SIRONA Inc XRAY 10,729 0.05% 0.73% 3.00% 3.74% 0.0018%Xerox Corp XRX 7,414 0.03% 3.31% 2.50% 5.85% 0.0020%Xylem Inc/NY XYL 13,535 0.06% 1.28% 15.50% 16.88% 0.0104%Yum! Brands Inc YUM 30,217 0.14% 1.74% 10.00% 11.83% 0.0162%Zimmer Biomet Holdings Inc ZBH 24,764 0.11% 0.79% 4.50% 5.31% 0.0060%Zions Bancorp NA ZION 9,361 0.04% 2.46% 15.00% 17.64% 0.0075%Zoetis Inc ZTS 44,515 0.20% 0.71% 13.50% 14.26% 0.0288%
Total Market Capitalization: 22,031,880 16.75%
Notes:[1] Equals sum of Col. [9][2] Source: Value Line[3] Equals [1] − [2][4] Source: Value Line[5] Equals weight in S&P 500 based on market capitalization [6] Source: Value Line[7] Source: Value Line[8] Equals ([6] x (1 + (0.5 x [7]))) + [7][9] Equals Col. [5] x Col. [8]

Indiana Michigan Power CompanyAttachment RBH-4
Page 1 of 1
[1] [2]Company Ticker Bloomberg Value Line
ALLETE, Inc. ALE 0.448 0.650Alliant Energy Corporation LNT 0.528 0.650Ameren Corporation AEE 0.436 0.600Avangrid, Inc. AGR 0.468 0.400Black Hills Corporation BKH 0.534 0.750CMS Energy Corporation CMS 0.466 0.550DTE Energy Company DTE 0.503 0.550Duke Energy Corporation DUK 0.431 0.500El Paso Electric Company EE 0.503 0.650Evergy, Inc. EVRG 0.414 0.523Hawaiian Electric Industries, Inc. HE 0.468 0.600NextEra Energy, Inc. NEE 0.553 0.600NorthWestern Corporation NWE 0.481 0.550OGE Energy Corp. OGE 0.557 0.850Otter Tail Corporation OTTR 0.521 0.700Pinnacle West Capital Corporation PNW 0.418 0.550PNM Resources, Inc. PNM 0.501 0.650Portland General Electric Company POR 0.463 0.600Southern Company SO 0.472 0.500WEC Energy Group, Inc. WEC 0.474 0.550Xcel Energy Inc. XEL 0.479 0.500
Mean 0.482 0.594
Notes:[1] Source: Bloomberg Professional[2] Source: Value Line
Bloomberg and Value Line Beta Coefficients

Indiana Michigan Power CompanyAttachment RBH-5
Page 1 of 1
Capital Asset Pricing Model and Empirical Capital Asset Pricing Model ResultsBloomberg, and Value Line Derived Market Risk Premium
[1] [2] [3] [4] [5] [6] [7] [8]CAPM ECAPM
Risk-Free Rate
Average Beta
Coefficient
Bloomberg Market DCF
Derived
Value Line Market DCF
DerivedBloomberg
MRPValue Line
MRPBloomberg
MRPValue Line
MRP
PROXY GROUP AVERAGE BLOOMBERG BETA COEFFICIENTCurrent 30-Year Treasury (30-day average) [9] 3.03% 0.482 10.61% 13.72% 8.14% 9.64% 9.51% 11.42%Near-Term Projected 30-Year Treasury [10] 3.25% 0.482 10.61% 13.72% 8.36% 9.86% 9.74% 11.64%Mean 8.25% 9.75% 9.63% 11.53%
CAPM ECAPM
Risk-Free Rate
Average Beta
Coefficient
Bloomberg Market DCF
Derived
Value Line Market DCF
DerivedBloomberg
MRPValue Line
MRPBloomberg
MRPValue Line
MRP
PROXY GROUP AVERAGE VALUE LINE AVERAGE BETA COEFFICIENTCurrent 30-Year Treasury (30-day average) [9] 3.03% 0.594 10.61% 13.72% 9.33% 11.18% 10.41% 12.57%Near-Term Projected 30-Year Treasury [10] 3.25% 0.594 10.61% 13.72% 9.55% 11.40% 10.63% 12.79%Mean 9.44% 11.29% 10.52% 12.68%
Notes:[1] See Notes [9] and [10][2] Source: Attachment RBH-4[3] Source: Attachment RBH-3[4] Source: Attachment RBH-3[5] Equals Col. [1] + (Col. [2] x Col. [3])[6] Equals Col. [1] + (Col. [2] x Col. [4])[7] Equals Col. [1] + (Col. [2] x Col. [3] x 0.75) + (Col. [3] x 0.25)[8] Equals Col. [1] + (Col. [2] x Col. [4] x 0.75) + (Col. [4] x 0.25)[9] Source: Bloomberg Professional[10] Source: Blue Chip Financial Forecasts, Vol. 38, No. 3, March 1, 2019, at 2.

Indiana Michigan Power CompanyAttachment RBH-6
Page 1 of 32
Bond Yield Plus Risk Premium
[1] [2] [3] [4] [5]
Constant Slope
30-Year Treasury
YieldRisk
PremiumReturn on
Equity-2.48% -2.68%Current 30-Year Treasury 3.03% 6.90% 9.93%
Near-Term Projected 30-Year Treasury 3.25% 6.71% 9.96%Long-Term Projected 30-Year Treasury 4.05% 6.12% 10.17%
Notes:[1] Constant of regression equation[2] Slope of regression equation[3] Source: Current = Bloomberg Professional, [3] Near Term Projected = Blue Chip Financial Forecasts, Vol. 38, No. 3, March 1, 2019, at 2.[3] Long Term Projected = Blue Chip Financial Forecasts, Vol. 37, No. 12, December 1, 2018, at 14.[4] Equals [1] + ln([3]) x [2][5] Equals [3] + [4][6] Source: S&P Global Market Intelligence[7] Source: S&P Global Market Intelligence[8] Source: Bloomberg Professional, equals 200-trading day average (i.e. lag period)[9] Equals [7] - [8]
y = -0.0268ln(x) - 0.0248R² = 0.7408
-6.00%
-4.00%
-2.00%
0.00%
2.00%
4.00%
6.00%
8.00%
10.00%
0.00% 2.00% 4.00% 6.00% 8.00% 10.00% 12.00% 14.00% 16.00%
Equi
ty R
isk
Prem
ium
Treasury Yield

Indiana Michigan Power CompanyAttachment RBH-6
Page 2 of 32
Bond Yield Plus Risk Premium[6] [7] [8] [9]
Date of Electric Rate
CaseReturn on
Equity
30-Year Treasury
YieldRisk
Premium1/1/1980 14.50% 9.36% 5.14%1/7/1980 14.39% 9.38% 5.01%1/9/1980 15.00% 9.40% 5.60%
1/14/1980 15.17% 9.42% 5.75%1/17/1980 13.93% 9.44% 4.49%1/23/1980 15.50% 9.47% 6.03%1/30/1980 13.86% 9.52% 4.34%1/31/1980 12.61% 9.53% 3.08%2/6/1980 13.71% 9.58% 4.13%
2/13/1980 12.80% 9.63% 3.17%2/14/1980 13.00% 9.65% 3.35%2/19/1980 13.50% 9.68% 3.82%2/27/1980 13.75% 9.78% 3.97%2/29/1980 13.75% 9.81% 3.94%2/29/1980 14.00% 9.81% 4.19%2/29/1980 14.77% 9.81% 4.96%3/7/1980 12.70% 9.89% 2.81%
3/14/1980 13.50% 9.97% 3.53%3/26/1980 14.16% 10.10% 4.06%3/27/1980 14.24% 10.12% 4.12%3/28/1980 14.50% 10.13% 4.37%4/11/1980 12.75% 10.27% 2.48%4/14/1980 13.85% 10.29% 3.56%4/16/1980 15.50% 10.31% 5.19%4/22/1980 13.25% 10.35% 2.90%4/22/1980 13.90% 10.35% 3.55%4/24/1980 16.80% 10.38% 6.43%4/29/1980 15.50% 10.41% 5.09%5/6/1980 13.70% 10.45% 3.25%5/7/1980 15.00% 10.45% 4.55%5/8/1980 13.75% 10.46% 3.29%5/9/1980 14.35% 10.47% 3.88%
5/13/1980 13.60% 10.48% 3.12%5/15/1980 13.25% 10.49% 2.76%5/19/1980 13.75% 10.51% 3.24%5/27/1980 13.62% 10.54% 3.08%5/27/1980 14.60% 10.54% 4.06%5/29/1980 16.00% 10.56% 5.44%5/30/1980 13.80% 10.56% 3.24%6/2/1980 15.63% 10.57% 5.06%6/9/1980 15.90% 10.60% 5.30%
6/10/1980 13.78% 10.60% 3.18%6/12/1980 14.25% 10.61% 3.64%6/19/1980 13.40% 10.62% 2.78%6/30/1980 13.00% 10.65% 2.35%6/30/1980 13.40% 10.65% 2.75%7/9/1980 14.75% 10.67% 4.08%
7/10/1980 15.00% 10.68% 4.32%7/15/1980 15.80% 10.70% 5.10%7/18/1980 13.80% 10.71% 3.09%

Indiana Michigan Power CompanyAttachment RBH-6
Page 3 of 32
Date of Electric Rate
CaseReturn on
Equity
30-Year Treasury
YieldRisk
Premium7/22/1980 14.10% 10.72% 3.38%7/24/1980 15.00% 10.73% 4.27%7/25/1980 13.48% 10.73% 2.75%7/31/1980 14.58% 10.75% 3.83%8/8/1980 13.50% 10.78% 2.72%8/8/1980 14.00% 10.78% 3.22%8/8/1980 15.45% 10.78% 4.67%
8/11/1980 14.85% 10.78% 4.07%8/14/1980 14.00% 10.79% 3.21%8/14/1980 16.25% 10.79% 5.46%8/25/1980 13.75% 10.82% 2.93%8/27/1980 13.80% 10.83% 2.97%8/29/1980 12.50% 10.84% 1.66%9/15/1980 13.50% 10.88% 2.62%9/15/1980 13.93% 10.88% 3.05%9/15/1980 15.80% 10.88% 4.92%9/24/1980 12.50% 10.93% 1.57%9/24/1980 15.00% 10.93% 4.07%9/26/1980 13.75% 10.94% 2.81%9/30/1980 14.10% 10.96% 3.14%9/30/1980 14.20% 10.96% 3.24%10/1/1980 13.90% 10.97% 2.93%10/3/1980 15.50% 10.98% 4.52%10/7/1980 12.50% 10.99% 1.51%10/9/1980 13.25% 11.00% 2.25%10/9/1980 14.50% 11.00% 3.50%10/9/1980 14.50% 11.00% 3.50%10/16/1980 16.10% 11.02% 5.08%10/17/1980 14.50% 11.03% 3.47%10/31/1980 13.75% 11.11% 2.64%10/31/1980 14.25% 11.11% 3.14%11/4/1980 15.00% 11.12% 3.88%11/5/1980 13.75% 11.12% 2.63%11/5/1980 14.00% 11.12% 2.88%11/8/1980 13.75% 11.14% 2.61%11/10/1980 14.85% 11.15% 3.70%11/17/1980 14.00% 11.18% 2.82%11/18/1980 14.00% 11.19% 2.81%11/19/1980 13.00% 11.19% 1.81%11/24/1980 14.00% 11.21% 2.79%11/26/1980 14.00% 11.21% 2.79%12/8/1980 14.15% 11.22% 2.93%12/8/1980 15.10% 11.22% 3.88%12/9/1980 15.35% 11.22% 4.13%12/12/1980 15.45% 11.23% 4.22%12/17/1980 13.25% 11.23% 2.02%12/18/1980 15.80% 11.23% 4.57%12/19/1980 14.50% 11.23% 3.27%12/19/1980 14.64% 11.23% 3.41%12/22/1980 13.45% 11.23% 2.22%12/22/1980 15.00% 11.23% 3.77%12/30/1980 14.50% 11.22% 3.28%

Indiana Michigan Power CompanyAttachment RBH-6
Page 4 of 32
Date of Electric Rate
CaseReturn on
Equity
30-Year Treasury
YieldRisk
Premium12/30/1980 14.95% 11.22% 3.73%12/31/1980 13.39% 11.22% 2.17%1/2/1981 15.25% 11.22% 4.03%1/7/1981 14.30% 11.21% 3.09%
1/19/1981 15.25% 11.20% 4.05%1/23/1981 13.10% 11.20% 1.90%1/23/1981 14.40% 11.20% 3.20%1/26/1981 15.25% 11.20% 4.05%1/27/1981 15.00% 11.21% 3.79%1/31/1981 13.47% 11.22% 2.25%2/3/1981 15.25% 11.23% 4.02%2/5/1981 15.75% 11.25% 4.50%
2/11/1981 15.60% 11.28% 4.32%2/20/1981 15.25% 11.33% 3.92%3/11/1981 15.40% 11.49% 3.91%3/12/1981 14.51% 11.50% 3.01%3/12/1981 16.00% 11.50% 4.50%3/13/1981 13.02% 11.52% 1.50%3/18/1981 16.19% 11.55% 4.64%3/19/1981 13.75% 11.56% 2.19%3/23/1981 14.30% 11.58% 2.72%3/25/1981 15.30% 11.60% 3.70%4/1/1981 14.53% 11.68% 2.85%4/3/1981 19.10% 11.71% 7.39%4/9/1981 15.00% 11.78% 3.22%4/9/1981 15.30% 11.78% 3.52%4/9/1981 16.50% 11.78% 4.72%4/9/1981 17.00% 11.78% 5.22%
4/10/1981 13.75% 11.80% 1.95%4/13/1981 13.57% 11.82% 1.75%4/15/1981 15.30% 11.85% 3.45%4/16/1981 13.50% 11.87% 1.63%4/17/1981 14.10% 11.87% 2.23%4/21/1981 14.00% 11.90% 2.10%4/21/1981 16.80% 11.90% 4.90%4/24/1981 16.00% 11.95% 4.05%4/27/1981 12.50% 11.97% 0.53%4/27/1981 13.61% 11.97% 1.64%4/29/1981 13.65% 12.00% 1.65%4/30/1981 13.50% 12.02% 1.48%5/4/1981 16.22% 12.05% 4.17%5/5/1981 14.40% 12.07% 2.33%5/7/1981 16.25% 12.11% 4.14%5/7/1981 16.27% 12.11% 4.16%5/8/1981 13.00% 12.13% 0.87%5/8/1981 16.00% 12.13% 3.87%
5/12/1981 13.50% 12.16% 1.34%5/15/1981 15.75% 12.22% 3.53%5/18/1981 14.88% 12.23% 2.65%5/20/1981 16.00% 12.26% 3.74%5/21/1981 14.00% 12.27% 1.73%5/26/1981 14.90% 12.30% 2.60%

Indiana Michigan Power CompanyAttachment RBH-6
Page 5 of 32
Date of Electric Rate
CaseReturn on
Equity
30-Year Treasury
YieldRisk
Premium5/27/1981 15.00% 12.31% 2.69%5/29/1981 15.50% 12.34% 3.16%6/1/1981 16.50% 12.35% 4.15%6/3/1981 14.67% 12.37% 2.30%6/5/1981 13.00% 12.39% 0.61%
6/10/1981 16.75% 12.42% 4.33%6/17/1981 14.40% 12.46% 1.94%6/18/1981 16.33% 12.47% 3.86%6/25/1981 14.75% 12.51% 2.24%6/26/1981 16.00% 12.52% 3.48%6/30/1981 15.25% 12.54% 2.71%7/1/1981 15.50% 12.56% 2.94%7/1/1981 17.50% 12.56% 4.94%
7/10/1981 16.00% 12.62% 3.38%7/14/1981 16.90% 12.64% 4.26%7/15/1981 16.00% 12.65% 3.35%7/17/1981 15.00% 12.67% 2.33%7/20/1981 15.00% 12.68% 2.32%7/21/1981 14.00% 12.69% 1.31%7/28/1981 13.48% 12.74% 0.74%7/31/1981 13.50% 12.78% 0.72%7/31/1981 15.00% 12.78% 2.22%7/31/1981 16.00% 12.78% 3.22%8/5/1981 15.71% 12.83% 2.88%
8/10/1981 14.50% 12.87% 1.63%8/11/1981 15.00% 12.88% 2.12%8/20/1981 13.50% 12.95% 0.55%8/20/1981 16.50% 12.95% 3.55%8/24/1981 15.00% 12.97% 2.03%8/28/1981 15.00% 13.01% 1.99%9/3/1981 14.50% 13.05% 1.45%
9/10/1981 14.50% 13.11% 1.39%9/11/1981 16.00% 13.12% 2.88%9/16/1981 16.00% 13.15% 2.85%9/17/1981 16.50% 13.16% 3.34%9/23/1981 15.85% 13.20% 2.65%9/28/1981 15.50% 13.23% 2.27%10/9/1981 15.75% 13.33% 2.42%10/15/1981 16.25% 13.37% 2.88%10/16/1981 15.50% 13.38% 2.12%10/16/1981 16.50% 13.38% 3.12%10/19/1981 14.25% 13.39% 0.86%10/20/1981 15.25% 13.41% 1.84%10/20/1981 17.00% 13.41% 3.59%10/23/1981 16.00% 13.45% 2.55%10/27/1981 10.00% 13.48% -3.48%10/29/1981 14.75% 13.51% 1.24%10/29/1981 16.50% 13.51% 2.99%11/3/1981 15.17% 13.53% 1.64%11/5/1981 16.60% 13.55% 3.05%11/6/1981 15.17% 13.56% 1.61%11/24/1981 15.50% 13.61% 1.89%

Indiana Michigan Power CompanyAttachment RBH-6
Page 6 of 32
Date of Electric Rate
CaseReturn on
Equity
30-Year Treasury
YieldRisk
Premium11/25/1981 15.25% 13.61% 1.64%11/25/1981 15.35% 13.61% 1.74%11/25/1981 16.10% 13.61% 2.49%11/25/1981 16.10% 13.61% 2.49%12/1/1981 15.70% 13.61% 2.09%12/1/1981 16.00% 13.61% 2.39%12/1/1981 16.49% 13.61% 2.88%12/1/1981 16.50% 13.61% 2.89%12/4/1981 16.00% 13.61% 2.39%12/11/1981 16.25% 13.63% 2.62%12/14/1981 14.00% 13.63% 0.37%12/15/1981 15.81% 13.63% 2.18%12/15/1981 16.00% 13.63% 2.37%12/16/1981 15.25% 13.63% 1.62%12/17/1981 16.50% 13.63% 2.87%12/18/1981 15.45% 13.63% 1.82%12/30/1981 14.25% 13.67% 0.58%12/30/1981 16.00% 13.67% 2.33%12/30/1981 16.25% 13.67% 2.58%12/31/1981 16.15% 13.67% 2.48%1/4/1982 15.50% 13.67% 1.83%
1/11/1982 14.50% 13.72% 0.78%1/11/1982 17.00% 13.72% 3.28%1/13/1982 14.75% 13.74% 1.01%1/14/1982 15.75% 13.75% 2.00%1/15/1982 15.00% 13.76% 1.24%1/15/1982 16.50% 13.76% 2.74%1/22/1982 16.25% 13.79% 2.46%1/27/1982 16.84% 13.81% 3.03%1/28/1982 13.00% 13.81% -0.81%1/29/1982 15.50% 13.82% 1.68%2/1/1982 15.85% 13.82% 2.03%2/3/1982 16.44% 13.84% 2.60%2/8/1982 15.50% 13.86% 1.64%
2/11/1982 16.00% 13.88% 2.12%2/11/1982 16.20% 13.88% 2.32%2/17/1982 15.00% 13.89% 1.11%2/19/1982 15.17% 13.89% 1.28%2/26/1982 15.25% 13.89% 1.36%3/1/1982 15.03% 13.89% 1.14%3/1/1982 16.00% 13.89% 2.11%3/3/1982 15.00% 13.88% 1.12%3/8/1982 17.10% 13.88% 3.22%
3/12/1982 16.25% 13.88% 2.37%3/17/1982 17.30% 13.88% 3.42%3/22/1982 15.10% 13.89% 1.21%3/27/1982 15.40% 13.89% 1.51%3/30/1982 15.50% 13.90% 1.60%3/31/1982 17.00% 13.91% 3.09%4/1/1982 14.70% 13.91% 0.79%4/1/1982 16.50% 13.91% 2.59%4/2/1982 15.50% 13.91% 1.59%

Indiana Michigan Power CompanyAttachment RBH-6
Page 7 of 32
Date of Electric Rate
CaseReturn on
Equity
30-Year Treasury
YieldRisk
Premium4/5/1982 15.50% 13.92% 1.58%4/8/1982 16.40% 13.93% 2.47%
4/13/1982 14.50% 13.94% 0.56%4/23/1982 15.75% 13.94% 1.81%4/27/1982 15.00% 13.94% 1.06%4/28/1982 15.75% 13.94% 1.81%4/30/1982 14.70% 13.94% 0.76%4/30/1982 15.50% 13.94% 1.56%5/3/1982 16.60% 13.94% 2.66%5/4/1982 16.00% 13.94% 2.06%
5/14/1982 15.50% 13.92% 1.58%5/18/1982 15.42% 13.92% 1.50%5/19/1982 14.69% 13.92% 0.77%5/20/1982 15.00% 13.91% 1.09%5/20/1982 15.10% 13.91% 1.19%5/20/1982 15.50% 13.91% 1.59%5/20/1982 16.30% 13.91% 2.39%5/21/1982 17.75% 13.91% 3.84%5/27/1982 15.00% 13.89% 1.11%5/28/1982 15.50% 13.89% 1.61%5/28/1982 17.00% 13.89% 3.11%6/1/1982 13.75% 13.89% -0.14%6/1/1982 16.60% 13.89% 2.71%6/9/1982 17.86% 13.88% 3.98%
6/14/1982 15.75% 13.88% 1.87%6/15/1982 14.85% 13.88% 0.97%6/18/1982 15.50% 13.87% 1.63%6/21/1982 14.90% 13.87% 1.03%6/23/1982 16.00% 13.86% 2.14%6/23/1982 16.17% 13.86% 2.31%6/24/1982 14.85% 13.86% 0.99%6/25/1982 14.70% 13.86% 0.84%7/1/1982 16.00% 13.84% 2.16%7/2/1982 15.62% 13.84% 1.78%7/2/1982 17.00% 13.84% 3.16%
7/13/1982 14.00% 13.82% 0.18%7/13/1982 16.80% 13.82% 2.98%7/14/1982 15.76% 13.82% 1.94%7/14/1982 16.02% 13.82% 2.20%7/19/1982 16.50% 13.80% 2.70%7/22/1982 14.50% 13.77% 0.73%7/22/1982 17.00% 13.77% 3.23%7/27/1982 16.75% 13.75% 3.00%7/29/1982 16.50% 13.74% 2.76%8/11/1982 17.50% 13.68% 3.82%8/18/1982 17.07% 13.63% 3.44%8/20/1982 15.73% 13.60% 2.13%8/25/1982 16.00% 13.57% 2.43%8/26/1982 15.50% 13.56% 1.94%8/30/1982 15.00% 13.55% 1.45%9/3/1982 16.20% 13.53% 2.67%9/8/1982 15.00% 13.52% 1.48%

Indiana Michigan Power CompanyAttachment RBH-6
Page 8 of 32
Date of Electric Rate
CaseReturn on
Equity
30-Year Treasury
YieldRisk
Premium9/15/1982 13.08% 13.50% -0.42%9/15/1982 16.25% 13.50% 2.75%9/16/1982 16.00% 13.50% 2.50%9/17/1982 15.25% 13.50% 1.75%9/23/1982 17.17% 13.47% 3.70%9/24/1982 14.50% 13.46% 1.04%9/27/1982 15.25% 13.46% 1.79%10/1/1982 15.50% 13.42% 2.08%10/15/1982 15.90% 13.32% 2.58%10/22/1982 15.75% 13.24% 2.51%10/22/1982 17.15% 13.24% 3.91%10/29/1982 15.54% 13.16% 2.38%11/1/1982 15.50% 13.15% 2.35%11/3/1982 17.20% 13.13% 4.07%11/4/1982 16.25% 13.11% 3.14%11/5/1982 16.20% 13.09% 3.11%11/9/1982 16.00% 13.05% 2.95%11/23/1982 15.50% 12.89% 2.61%11/23/1982 15.85% 12.89% 2.96%11/30/1982 16.50% 12.81% 3.69%12/1/1982 17.04% 12.79% 4.25%12/6/1982 15.00% 12.73% 2.27%12/6/1982 16.35% 12.73% 3.62%12/10/1982 15.50% 12.66% 2.84%12/13/1982 16.00% 12.65% 3.35%12/14/1982 15.30% 12.63% 2.67%12/14/1982 16.40% 12.63% 3.77%12/20/1982 16.00% 12.57% 3.43%12/21/1982 14.75% 12.56% 2.19%12/21/1982 15.85% 12.56% 3.29%12/22/1982 16.25% 12.54% 3.71%12/22/1982 16.58% 12.54% 4.04%12/22/1982 16.75% 12.54% 4.21%12/29/1982 14.90% 12.48% 2.42%12/29/1982 16.25% 12.48% 3.77%12/30/1982 16.00% 12.47% 3.53%12/30/1982 16.35% 12.47% 3.88%12/30/1982 16.77% 12.47% 4.30%1/5/1983 17.33% 12.40% 4.93%
1/11/1983 15.90% 12.34% 3.56%1/12/1983 14.63% 12.33% 2.30%1/12/1983 15.50% 12.33% 3.17%1/20/1983 17.75% 12.24% 5.51%1/21/1983 15.00% 12.22% 2.78%1/24/1983 14.50% 12.21% 2.29%1/24/1983 15.50% 12.21% 3.29%1/25/1983 15.85% 12.19% 3.66%1/27/1983 16.14% 12.17% 3.97%2/1/1983 18.50% 12.13% 6.37%2/4/1983 14.00% 12.10% 1.90%
2/10/1983 15.00% 12.06% 2.94%2/21/1983 15.50% 11.98% 3.52%

Indiana Michigan Power CompanyAttachment RBH-6
Page 9 of 32
Date of Electric Rate
CaseReturn on
Equity
30-Year Treasury
YieldRisk
Premium2/22/1983 15.50% 11.97% 3.53%2/23/1983 15.10% 11.96% 3.14%2/23/1983 16.00% 11.96% 4.04%3/2/1983 15.25% 11.89% 3.36%3/9/1983 15.20% 11.82% 3.38%
3/15/1983 13.00% 11.77% 1.23%3/18/1983 15.25% 11.73% 3.52%3/23/1983 15.40% 11.69% 3.71%3/24/1983 15.00% 11.67% 3.33%3/29/1983 15.50% 11.63% 3.87%3/30/1983 16.71% 11.61% 5.10%3/31/1983 15.00% 11.59% 3.41%4/4/1983 15.20% 11.58% 3.62%4/8/1983 15.50% 11.51% 3.99%
4/11/1983 14.81% 11.49% 3.32%4/19/1983 14.50% 11.38% 3.12%4/20/1983 16.00% 11.36% 4.64%4/29/1983 16.00% 11.24% 4.76%5/1/1983 14.50% 11.24% 3.26%5/9/1983 15.50% 11.15% 4.35%
5/11/1983 16.46% 11.12% 5.34%5/12/1983 14.14% 11.11% 3.03%5/18/1983 15.00% 11.05% 3.95%5/23/1983 14.90% 11.01% 3.89%5/23/1983 15.50% 11.01% 4.49%5/25/1983 15.50% 10.98% 4.52%5/27/1983 15.00% 10.96% 4.04%5/31/1983 14.00% 10.95% 3.05%5/31/1983 15.50% 10.95% 4.55%6/2/1983 14.50% 10.93% 3.57%
6/17/1983 15.03% 10.84% 4.19%7/1/1983 14.80% 10.78% 4.02%7/1/1983 14.90% 10.78% 4.12%7/8/1983 16.25% 10.76% 5.49%
7/13/1983 13.20% 10.75% 2.45%7/19/1983 15.00% 10.74% 4.26%7/19/1983 15.10% 10.74% 4.36%7/25/1983 16.25% 10.73% 5.52%7/28/1983 15.90% 10.74% 5.16%8/3/1983 16.34% 10.75% 5.59%8/3/1983 16.50% 10.75% 5.75%
8/19/1983 15.00% 10.80% 4.20%8/22/1983 15.50% 10.80% 4.70%8/22/1983 16.40% 10.80% 5.60%8/31/1983 14.75% 10.84% 3.91%9/7/1983 15.00% 10.86% 4.14%
9/14/1983 15.78% 10.89% 4.89%9/16/1983 15.00% 10.90% 4.10%9/19/1983 14.50% 10.91% 3.59%9/20/1983 16.50% 10.91% 5.59%9/28/1983 14.50% 10.94% 3.56%9/29/1983 15.50% 10.95% 4.55%
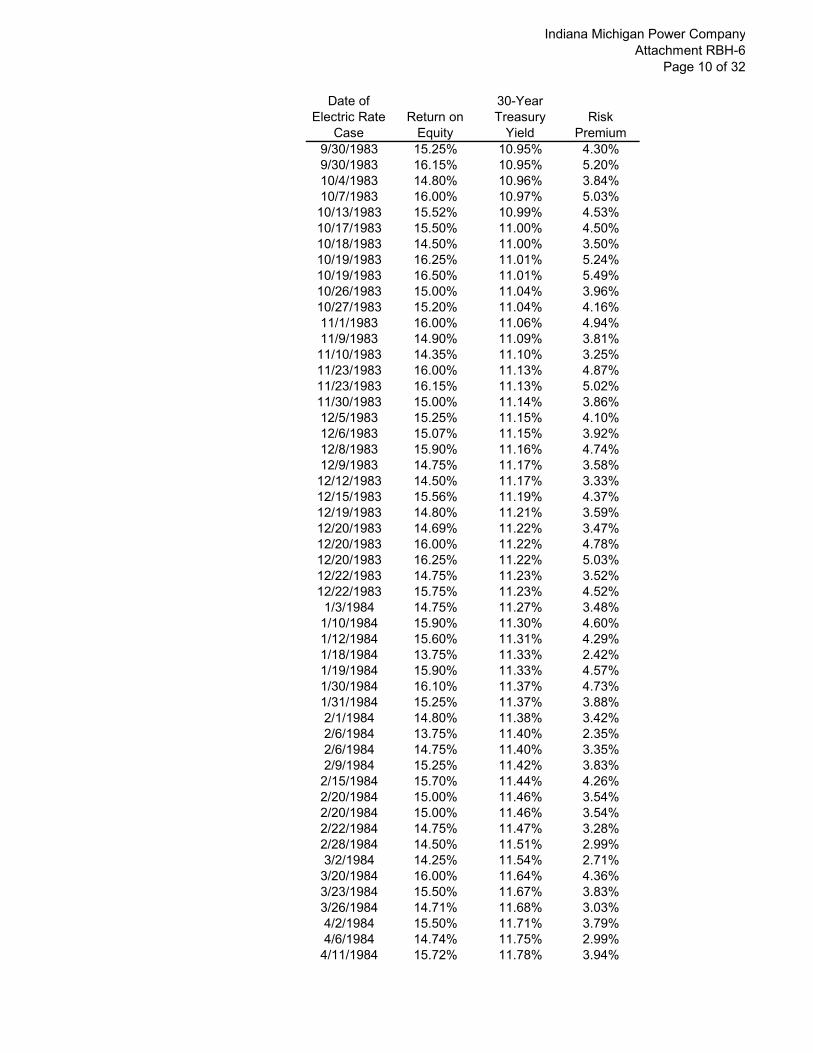
Indiana Michigan Power CompanyAttachment RBH-6
Page 10 of 32
Date of Electric Rate
CaseReturn on
Equity
30-Year Treasury
YieldRisk
Premium9/30/1983 15.25% 10.95% 4.30%9/30/1983 16.15% 10.95% 5.20%10/4/1983 14.80% 10.96% 3.84%10/7/1983 16.00% 10.97% 5.03%10/13/1983 15.52% 10.99% 4.53%10/17/1983 15.50% 11.00% 4.50%10/18/1983 14.50% 11.00% 3.50%10/19/1983 16.25% 11.01% 5.24%10/19/1983 16.50% 11.01% 5.49%10/26/1983 15.00% 11.04% 3.96%10/27/1983 15.20% 11.04% 4.16%11/1/1983 16.00% 11.06% 4.94%11/9/1983 14.90% 11.09% 3.81%11/10/1983 14.35% 11.10% 3.25%11/23/1983 16.00% 11.13% 4.87%11/23/1983 16.15% 11.13% 5.02%11/30/1983 15.00% 11.14% 3.86%12/5/1983 15.25% 11.15% 4.10%12/6/1983 15.07% 11.15% 3.92%12/8/1983 15.90% 11.16% 4.74%12/9/1983 14.75% 11.17% 3.58%12/12/1983 14.50% 11.17% 3.33%12/15/1983 15.56% 11.19% 4.37%12/19/1983 14.80% 11.21% 3.59%12/20/1983 14.69% 11.22% 3.47%12/20/1983 16.00% 11.22% 4.78%12/20/1983 16.25% 11.22% 5.03%12/22/1983 14.75% 11.23% 3.52%12/22/1983 15.75% 11.23% 4.52%1/3/1984 14.75% 11.27% 3.48%
1/10/1984 15.90% 11.30% 4.60%1/12/1984 15.60% 11.31% 4.29%1/18/1984 13.75% 11.33% 2.42%1/19/1984 15.90% 11.33% 4.57%1/30/1984 16.10% 11.37% 4.73%1/31/1984 15.25% 11.37% 3.88%2/1/1984 14.80% 11.38% 3.42%2/6/1984 13.75% 11.40% 2.35%2/6/1984 14.75% 11.40% 3.35%2/9/1984 15.25% 11.42% 3.83%
2/15/1984 15.70% 11.44% 4.26%2/20/1984 15.00% 11.46% 3.54%2/20/1984 15.00% 11.46% 3.54%2/22/1984 14.75% 11.47% 3.28%2/28/1984 14.50% 11.51% 2.99%3/2/1984 14.25% 11.54% 2.71%
3/20/1984 16.00% 11.64% 4.36%3/23/1984 15.50% 11.67% 3.83%3/26/1984 14.71% 11.68% 3.03%4/2/1984 15.50% 11.71% 3.79%4/6/1984 14.74% 11.75% 2.99%
4/11/1984 15.72% 11.78% 3.94%

Indiana Michigan Power CompanyAttachment RBH-6
Page 11 of 32
Date of Electric Rate
CaseReturn on
Equity
30-Year Treasury
YieldRisk
Premium4/17/1984 15.00% 11.81% 3.19%4/18/1984 16.20% 11.82% 4.38%4/25/1984 14.64% 11.85% 2.79%4/30/1984 14.40% 11.87% 2.53%5/16/1984 14.69% 11.98% 2.71%5/16/1984 15.00% 11.98% 3.02%5/22/1984 14.40% 12.02% 2.38%5/29/1984 15.10% 12.06% 3.04%6/13/1984 15.25% 12.15% 3.10%6/15/1984 15.60% 12.17% 3.43%6/22/1984 16.25% 12.21% 4.04%6/29/1984 15.25% 12.26% 2.99%7/2/1984 13.35% 12.27% 1.08%
7/10/1984 16.00% 12.31% 3.69%7/12/1984 16.50% 12.32% 4.18%7/13/1984 16.25% 12.33% 3.92%7/17/1984 14.14% 12.35% 1.79%7/18/1984 15.30% 12.36% 2.94%7/18/1984 15.50% 12.36% 3.14%7/19/1984 14.30% 12.37% 1.93%7/24/1984 16.79% 12.39% 4.40%7/31/1984 16.00% 12.43% 3.57%8/3/1984 14.25% 12.44% 1.81%
8/17/1984 14.30% 12.49% 1.81%8/20/1984 15.00% 12.49% 2.51%8/27/1984 16.30% 12.51% 3.79%8/31/1984 15.55% 12.52% 3.03%9/6/1984 16.00% 12.53% 3.47%
9/10/1984 14.75% 12.54% 2.21%9/13/1984 15.00% 12.55% 2.45%9/17/1984 17.38% 12.56% 4.82%9/26/1984 14.50% 12.57% 1.93%9/28/1984 15.00% 12.57% 2.43%9/28/1984 16.25% 12.57% 3.68%10/9/1984 14.75% 12.58% 2.17%10/12/1984 15.60% 12.59% 3.01%10/22/1984 15.00% 12.59% 2.41%10/26/1984 16.40% 12.58% 3.82%10/31/1984 16.25% 12.58% 3.67%11/7/1984 15.60% 12.58% 3.02%11/9/1984 16.00% 12.58% 3.42%11/14/1984 15.75% 12.58% 3.17%11/20/1984 15.25% 12.58% 2.67%11/20/1984 15.92% 12.58% 3.34%11/23/1984 15.00% 12.58% 2.42%11/28/1984 16.15% 12.57% 3.58%12/3/1984 15.80% 12.56% 3.24%12/4/1984 16.50% 12.56% 3.94%12/18/1984 16.40% 12.53% 3.87%12/19/1984 14.75% 12.53% 2.22%12/19/1984 15.00% 12.53% 2.47%12/20/1984 16.00% 12.53% 3.47%

Indiana Michigan Power CompanyAttachment RBH-6
Page 12 of 32
Date of Electric Rate
CaseReturn on
Equity
30-Year Treasury
YieldRisk
Premium12/28/1984 16.00% 12.50% 3.50%1/3/1985 14.75% 12.49% 2.26%
1/10/1985 15.75% 12.47% 3.28%1/11/1985 16.30% 12.46% 3.84%1/23/1985 15.80% 12.43% 3.37%1/24/1985 15.82% 12.43% 3.39%1/25/1985 16.75% 12.42% 4.33%1/30/1985 14.90% 12.40% 2.50%1/31/1985 14.75% 12.39% 2.36%2/8/1985 14.47% 12.35% 2.12%3/1/1985 13.84% 12.31% 1.53%3/8/1985 16.85% 12.28% 4.57%
3/14/1985 15.50% 12.25% 3.25%3/15/1985 15.62% 12.25% 3.37%3/29/1985 15.62% 12.17% 3.45%4/3/1985 14.60% 12.14% 2.46%4/9/1985 15.50% 12.11% 3.39%
4/16/1985 15.70% 12.06% 3.64%4/22/1985 14.00% 12.02% 1.98%4/26/1985 15.50% 11.98% 3.52%4/29/1985 15.00% 11.97% 3.03%5/2/1985 14.68% 11.94% 2.74%5/8/1985 15.62% 11.89% 3.73%
5/10/1985 16.50% 11.87% 4.63%5/29/1985 14.61% 11.73% 2.88%5/31/1985 16.00% 11.71% 4.29%6/14/1985 15.50% 11.61% 3.89%7/9/1985 15.00% 11.45% 3.55%
7/16/1985 14.50% 11.39% 3.11%7/26/1985 14.50% 11.33% 3.17%8/2/1985 14.80% 11.29% 3.51%8/7/1985 15.00% 11.27% 3.73%
8/28/1985 14.25% 11.15% 3.10%8/28/1985 15.50% 11.15% 4.35%8/29/1985 14.50% 11.15% 3.35%9/9/1985 14.60% 11.11% 3.49%9/9/1985 14.90% 11.11% 3.79%
9/17/1985 14.90% 11.08% 3.82%9/23/1985 15.00% 11.06% 3.94%9/27/1985 15.50% 11.05% 4.45%9/27/1985 15.80% 11.05% 4.75%10/2/1985 14.00% 11.03% 2.97%10/2/1985 14.75% 11.03% 3.72%10/3/1985 15.25% 11.03% 4.22%10/24/1985 15.40% 10.96% 4.44%10/24/1985 15.82% 10.96% 4.86%10/24/1985 15.85% 10.96% 4.89%10/28/1985 16.00% 10.95% 5.05%10/29/1985 16.65% 10.94% 5.71%10/31/1985 15.06% 10.93% 4.13%11/4/1985 14.50% 10.92% 3.58%11/7/1985 15.50% 10.90% 4.60%

Indiana Michigan Power CompanyAttachment RBH-6
Page 13 of 32
Date of Electric Rate
CaseReturn on
Equity
30-Year Treasury
YieldRisk
Premium11/8/1985 14.30% 10.89% 3.41%12/12/1985 14.75% 10.73% 4.02%12/18/1985 15.00% 10.69% 4.31%12/20/1985 14.50% 10.67% 3.83%12/20/1985 14.50% 10.67% 3.83%12/20/1985 15.00% 10.67% 4.33%1/24/1986 15.40% 10.41% 4.99%1/31/1986 15.00% 10.35% 4.65%2/5/1986 15.00% 10.32% 4.68%2/5/1986 15.75% 10.32% 5.43%
2/10/1986 13.30% 10.29% 3.01%2/11/1986 12.50% 10.28% 2.22%2/14/1986 14.40% 10.24% 4.16%2/18/1986 16.00% 10.23% 5.77%2/24/1986 14.50% 10.18% 4.32%2/26/1986 14.00% 10.15% 3.85%3/5/1986 14.90% 10.08% 4.82%
3/11/1986 14.50% 10.02% 4.48%3/12/1986 13.50% 10.00% 3.50%3/27/1986 14.10% 9.86% 4.24%3/31/1986 13.50% 9.84% 3.66%4/1/1986 14.00% 9.83% 4.17%4/2/1986 15.50% 9.81% 5.69%4/4/1986 15.00% 9.78% 5.22%
4/14/1986 13.40% 9.69% 3.71%4/23/1986 15.00% 9.57% 5.43%5/16/1986 14.50% 9.32% 5.18%5/16/1986 14.50% 9.32% 5.18%5/29/1986 13.90% 9.19% 4.71%5/30/1986 15.10% 9.18% 5.92%6/2/1986 12.81% 9.17% 3.64%
6/11/1986 14.00% 9.07% 4.93%6/24/1986 16.63% 8.94% 7.69%6/26/1986 12.00% 8.91% 3.09%6/26/1986 14.75% 8.91% 5.84%6/30/1986 13.00% 8.87% 4.13%7/10/1986 14.34% 8.75% 5.59%7/11/1986 12.75% 8.73% 4.02%7/14/1986 12.60% 8.71% 3.89%7/17/1986 12.40% 8.66% 3.74%7/25/1986 14.25% 8.57% 5.68%8/6/1986 13.50% 8.44% 5.06%
8/14/1986 13.50% 8.35% 5.15%9/16/1986 12.75% 8.06% 4.69%9/19/1986 13.25% 8.03% 5.22%10/1/1986 14.00% 7.95% 6.05%10/3/1986 13.40% 7.93% 5.47%10/31/1986 13.50% 7.77% 5.73%11/5/1986 13.00% 7.75% 5.25%12/3/1986 12.90% 7.58% 5.32%12/4/1986 14.44% 7.58% 6.86%12/16/1986 13.60% 7.52% 6.08%

Indiana Michigan Power CompanyAttachment RBH-6
Page 14 of 32
Date of Electric Rate
CaseReturn on
Equity
30-Year Treasury
YieldRisk
Premium12/22/1986 13.80% 7.51% 6.29%12/30/1986 13.00% 7.49% 5.51%1/2/1987 13.00% 7.49% 5.51%
1/12/1987 12.40% 7.47% 4.93%1/27/1987 12.71% 7.46% 5.25%3/2/1987 12.47% 7.47% 5.00%3/3/1987 13.60% 7.47% 6.13%3/4/1987 12.38% 7.47% 4.91%
3/10/1987 13.50% 7.47% 6.03%3/13/1987 13.00% 7.47% 5.53%3/31/1987 13.00% 7.46% 5.54%4/6/1987 13.00% 7.47% 5.53%
4/14/1987 12.50% 7.49% 5.01%4/16/1987 14.50% 7.50% 7.00%4/27/1987 12.00% 7.54% 4.46%5/5/1987 12.85% 7.58% 5.27%
5/12/1987 12.65% 7.62% 5.03%5/28/1987 13.50% 7.70% 5.80%6/15/1987 13.20% 7.78% 5.42%6/29/1987 15.00% 7.83% 7.17%6/30/1987 12.50% 7.84% 4.66%7/8/1987 12.00% 7.86% 4.14%
7/10/1987 12.90% 7.86% 5.04%7/15/1987 13.50% 7.88% 5.62%7/16/1987 13.50% 7.88% 5.62%7/16/1987 15.00% 7.88% 7.12%7/27/1987 13.00% 7.92% 5.08%7/27/1987 13.40% 7.92% 5.48%7/27/1987 13.50% 7.92% 5.58%7/31/1987 12.98% 7.95% 5.03%8/26/1987 12.63% 8.06% 4.57%8/26/1987 12.75% 8.06% 4.69%8/27/1987 13.25% 8.06% 5.19%9/9/1987 13.00% 8.14% 4.86%
9/30/1987 12.75% 8.31% 4.44%9/30/1987 13.00% 8.31% 4.69%10/2/1987 11.50% 8.33% 3.17%10/15/1987 13.00% 8.43% 4.57%11/2/1987 13.00% 8.55% 4.45%11/19/1987 13.00% 8.64% 4.36%11/30/1987 12.00% 8.68% 3.32%12/3/1987 14.20% 8.70% 5.50%12/15/1987 13.25% 8.77% 4.48%12/16/1987 13.50% 8.78% 4.72%12/16/1987 13.72% 8.78% 4.94%12/17/1987 11.75% 8.79% 2.96%12/18/1987 13.50% 8.80% 4.70%12/21/1987 12.01% 8.81% 3.20%12/22/1987 12.00% 8.81% 3.19%12/22/1987 12.00% 8.81% 3.19%12/22/1987 12.75% 8.81% 3.94%12/22/1987 13.00% 8.81% 4.19%

Indiana Michigan Power CompanyAttachment RBH-6
Page 15 of 32
Date of Electric Rate
CaseReturn on
Equity
30-Year Treasury
YieldRisk
Premium1/20/1988 13.80% 8.94% 4.86%1/26/1988 13.90% 8.95% 4.95%1/29/1988 13.20% 8.96% 4.24%2/4/1988 12.60% 8.96% 3.64%3/1/1988 11.56% 8.94% 2.62%
3/23/1988 12.87% 8.92% 3.95%3/24/1988 11.24% 8.92% 2.32%3/30/1988 12.72% 8.92% 3.80%4/1/1988 12.50% 8.92% 3.58%4/7/1988 13.25% 8.93% 4.32%
4/25/1988 10.96% 8.96% 2.00%5/3/1988 12.91% 8.97% 3.94%
5/11/1988 13.50% 8.99% 4.51%5/16/1988 13.00% 8.99% 4.01%6/30/1988 12.75% 9.00% 3.75%7/1/1988 12.75% 8.99% 3.76%
7/20/1988 13.40% 8.96% 4.44%8/5/1988 12.75% 8.92% 3.83%
8/23/1988 11.70% 8.93% 2.77%8/29/1988 12.75% 8.94% 3.81%8/30/1988 13.50% 8.94% 4.56%9/8/1988 12.60% 8.95% 3.65%
10/13/1988 13.10% 8.93% 4.17%12/19/1988 13.00% 9.02% 3.98%12/20/1988 12.25% 9.02% 3.23%12/20/1988 13.00% 9.02% 3.98%12/21/1988 12.90% 9.02% 3.88%12/27/1988 13.00% 9.03% 3.97%12/28/1988 13.10% 9.03% 4.07%12/30/1988 13.40% 9.04% 4.36%1/27/1989 13.00% 9.05% 3.95%1/31/1989 13.00% 9.05% 3.95%2/17/1989 13.00% 9.05% 3.95%2/20/1989 12.40% 9.05% 3.35%3/1/1989 12.76% 9.05% 3.71%3/8/1989 13.00% 9.05% 3.95%
3/30/1989 14.00% 9.05% 4.95%4/5/1989 14.20% 9.05% 5.15%
4/18/1989 13.00% 9.05% 3.95%5/5/1989 12.40% 9.05% 3.35%6/2/1989 13.20% 9.00% 4.20%6/8/1989 13.50% 8.98% 4.52%
6/27/1989 13.25% 8.91% 4.34%6/30/1989 13.00% 8.90% 4.10%8/14/1989 12.50% 8.77% 3.73%9/28/1989 12.25% 8.63% 3.62%10/24/1989 12.50% 8.54% 3.96%11/9/1989 13.00% 8.49% 4.51%12/15/1989 13.00% 8.34% 4.66%12/20/1989 12.90% 8.32% 4.58%12/21/1989 12.90% 8.31% 4.59%12/27/1989 12.50% 8.29% 4.21%

Indiana Michigan Power CompanyAttachment RBH-6
Page 16 of 32
Date of Electric Rate
CaseReturn on
Equity
30-Year Treasury
YieldRisk
Premium12/27/1989 13.00% 8.29% 4.71%1/10/1990 12.80% 8.24% 4.56%1/11/1990 12.90% 8.24% 4.66%1/17/1990 12.80% 8.22% 4.58%1/26/1990 12.00% 8.20% 3.80%2/9/1990 12.10% 8.17% 3.93%
2/24/1990 12.86% 8.15% 4.71%3/30/1990 12.90% 8.16% 4.74%4/4/1990 15.76% 8.17% 7.59%
4/12/1990 12.52% 8.18% 4.34%4/19/1990 12.75% 8.20% 4.55%5/21/1990 12.10% 8.28% 3.82%5/29/1990 12.40% 8.30% 4.10%5/31/1990 12.00% 8.30% 3.70%6/4/1990 12.90% 8.30% 4.60%6/6/1990 12.25% 8.31% 3.94%
6/15/1990 13.20% 8.32% 4.88%6/20/1990 12.92% 8.32% 4.60%6/27/1990 12.90% 8.33% 4.57%6/29/1990 12.50% 8.33% 4.17%7/6/1990 12.10% 8.34% 3.76%7/6/1990 12.35% 8.34% 4.01%
8/10/1990 12.55% 8.41% 4.14%8/16/1990 13.21% 8.43% 4.78%8/22/1990 13.10% 8.45% 4.65%8/24/1990 13.00% 8.46% 4.54%9/26/1990 11.45% 8.59% 2.86%10/2/1990 13.00% 8.61% 4.39%10/5/1990 12.84% 8.62% 4.22%10/19/1990 13.00% 8.67% 4.33%10/25/1990 12.30% 8.68% 3.62%11/21/1990 12.70% 8.69% 4.01%12/13/1990 12.30% 8.67% 3.63%12/17/1990 12.87% 8.67% 4.20%12/18/1990 13.10% 8.67% 4.43%12/19/1990 12.00% 8.66% 3.34%12/20/1990 12.75% 8.66% 4.09%12/21/1990 12.50% 8.66% 3.84%12/27/1990 12.79% 8.66% 4.13%1/2/1991 13.10% 8.65% 4.45%1/4/1991 12.50% 8.65% 3.85%
1/15/1991 12.75% 8.64% 4.11%1/25/1991 11.70% 8.63% 3.07%2/4/1991 12.50% 8.60% 3.90%2/7/1991 12.50% 8.59% 3.91%
2/12/1991 13.00% 8.58% 4.43%2/14/1991 12.72% 8.57% 4.15%2/22/1991 12.80% 8.55% 4.25%3/6/1991 13.10% 8.53% 4.57%3/8/1991 12.30% 8.52% 3.78%3/8/1991 13.00% 8.52% 4.48%
4/22/1991 13.00% 8.49% 4.51%

Indiana Michigan Power CompanyAttachment RBH-6
Page 17 of 32
Date of Electric Rate
CaseReturn on
Equity
30-Year Treasury
YieldRisk
Premium5/7/1991 13.50% 8.47% 5.03%
5/13/1991 13.25% 8.47% 4.78%5/30/1991 12.75% 8.44% 4.31%6/12/1991 12.00% 8.41% 3.59%6/25/1991 11.70% 8.39% 3.31%6/28/1991 12.50% 8.38% 4.12%7/1/1991 12.00% 8.38% 3.62%7/3/1991 12.50% 8.37% 4.13%
7/19/1991 12.10% 8.34% 3.76%8/1/1991 12.90% 8.32% 4.58%
8/16/1991 13.20% 8.29% 4.91%9/27/1991 12.50% 8.23% 4.27%9/30/1991 12.25% 8.23% 4.02%10/17/1991 13.00% 8.20% 4.80%10/23/1991 12.50% 8.20% 4.30%10/23/1991 12.55% 8.20% 4.35%10/31/1991 11.80% 8.19% 3.61%11/1/1991 12.00% 8.19% 3.81%11/5/1991 12.25% 8.19% 4.06%11/12/1991 12.50% 8.18% 4.32%11/12/1991 13.25% 8.18% 5.07%11/25/1991 12.40% 8.18% 4.22%11/26/1991 11.60% 8.18% 3.42%11/26/1991 12.50% 8.18% 4.32%11/27/1991 12.10% 8.18% 3.92%12/18/1991 12.25% 8.15% 4.10%12/19/1991 12.60% 8.15% 4.45%12/19/1991 12.80% 8.15% 4.65%12/20/1991 12.65% 8.14% 4.51%1/9/1992 12.80% 8.09% 4.71%
1/16/1992 12.75% 8.07% 4.68%1/21/1992 12.00% 8.06% 3.94%1/22/1992 13.00% 8.06% 4.94%1/27/1992 12.65% 8.05% 4.60%1/31/1992 12.00% 8.04% 3.96%2/11/1992 12.40% 8.03% 4.37%2/25/1992 12.50% 8.01% 4.49%3/16/1992 11.43% 7.98% 3.45%3/18/1992 12.28% 7.98% 4.30%4/2/1992 12.10% 7.95% 4.15%4/9/1992 11.45% 7.94% 3.51%
4/10/1992 11.50% 7.93% 3.57%4/14/1992 11.50% 7.93% 3.57%5/5/1992 11.50% 7.89% 3.61%
5/12/1992 11.87% 7.88% 3.99%5/12/1992 12.46% 7.88% 4.58%6/1/1992 12.30% 7.87% 4.43%
6/12/1992 10.90% 7.86% 3.04%6/26/1992 12.35% 7.85% 4.50%6/29/1992 11.00% 7.85% 3.15%6/30/1992 13.00% 7.85% 5.15%7/13/1992 11.90% 7.84% 4.06%

Indiana Michigan Power CompanyAttachment RBH-6
Page 18 of 32
Date of Electric Rate
CaseReturn on
Equity
30-Year Treasury
YieldRisk
Premium7/13/1992 13.50% 7.84% 5.66%7/22/1992 11.20% 7.83% 3.37%8/3/1992 12.00% 7.81% 4.19%8/6/1992 12.50% 7.80% 4.70%
9/22/1992 12.00% 7.71% 4.29%9/28/1992 11.40% 7.71% 3.69%9/30/1992 11.75% 7.70% 4.05%10/2/1992 13.00% 7.70% 5.30%10/12/1992 12.20% 7.70% 4.50%10/16/1992 13.16% 7.70% 5.46%10/30/1992 11.75% 7.71% 4.04%11/3/1992 12.00% 7.71% 4.29%12/3/1992 11.85% 7.68% 4.17%12/15/1992 11.00% 7.66% 3.34%12/16/1992 11.90% 7.66% 4.24%12/16/1992 12.40% 7.66% 4.74%12/17/1992 12.00% 7.66% 4.34%12/22/1992 12.30% 7.65% 4.65%12/22/1992 12.40% 7.65% 4.75%12/29/1992 12.25% 7.63% 4.62%12/30/1992 12.00% 7.63% 4.37%12/31/1992 11.90% 7.63% 4.27%1/12/1993 12.00% 7.61% 4.39%1/21/1993 11.25% 7.59% 3.66%2/2/1993 11.40% 7.56% 3.84%
2/15/1993 12.30% 7.52% 4.78%2/24/1993 11.90% 7.49% 4.41%2/26/1993 11.80% 7.48% 4.32%2/26/1993 12.20% 7.48% 4.72%4/23/1993 11.75% 7.29% 4.46%5/11/1993 11.75% 7.25% 4.50%5/14/1993 11.50% 7.24% 4.26%5/25/1993 11.50% 7.23% 4.27%5/28/1993 11.00% 7.22% 3.78%6/3/1993 12.00% 7.21% 4.79%
6/16/1993 11.50% 7.19% 4.31%6/18/1993 12.10% 7.18% 4.92%6/25/1993 11.67% 7.17% 4.50%7/21/1993 11.38% 7.10% 4.28%7/23/1993 10.46% 7.09% 3.37%8/24/1993 11.50% 6.96% 4.54%9/21/1993 10.50% 6.81% 3.69%9/29/1993 11.47% 6.77% 4.70%9/30/1993 11.60% 6.76% 4.84%11/2/1993 10.80% 6.60% 4.20%11/12/1993 12.00% 6.57% 5.43%11/26/1993 11.00% 6.52% 4.48%12/14/1993 10.55% 6.48% 4.07%12/16/1993 10.60% 6.48% 4.12%12/21/1993 11.30% 6.47% 4.83%1/4/1994 10.07% 6.44% 3.63%
1/13/1994 11.00% 6.42% 4.58%

Indiana Michigan Power CompanyAttachment RBH-6
Page 19 of 32
Date of Electric Rate
CaseReturn on
Equity
30-Year Treasury
YieldRisk
Premium1/21/1994 11.00% 6.40% 4.60%1/28/1994 11.35% 6.39% 4.96%2/3/1994 11.40% 6.38% 5.02%
2/17/1994 10.60% 6.36% 4.24%2/25/1994 11.25% 6.35% 4.90%2/25/1994 12.00% 6.35% 5.65%3/1/1994 11.00% 6.35% 4.65%3/4/1994 11.00% 6.35% 4.65%
4/25/1994 11.00% 6.41% 4.59%5/10/1994 11.75% 6.45% 5.30%5/13/1994 10.50% 6.46% 4.04%6/3/1994 11.00% 6.54% 4.46%
6/27/1994 11.40% 6.65% 4.75%8/5/1994 12.75% 6.88% 5.87%
10/31/1994 10.00% 7.33% 2.67%11/9/1994 10.85% 7.39% 3.46%11/9/1994 10.85% 7.39% 3.46%11/18/1994 11.20% 7.45% 3.75%11/22/1994 11.60% 7.47% 4.13%11/28/1994 11.06% 7.49% 3.57%12/8/1994 11.50% 7.54% 3.96%12/8/1994 11.70% 7.54% 4.16%12/14/1994 10.95% 7.56% 3.39%12/15/1994 11.50% 7.57% 3.93%12/19/1994 11.50% 7.58% 3.92%12/28/1994 12.15% 7.61% 4.54%1/9/1995 12.28% 7.64% 4.64%
1/31/1995 11.00% 7.69% 3.31%2/10/1995 12.60% 7.70% 4.90%2/17/1995 11.90% 7.70% 4.20%3/9/1995 11.50% 7.71% 3.79%
3/20/1995 12.00% 7.72% 4.28%3/23/1995 12.81% 7.72% 5.09%3/29/1995 11.60% 7.72% 3.88%4/6/1995 11.10% 7.71% 3.39%4/7/1995 11.00% 7.71% 3.29%
4/19/1995 11.00% 7.70% 3.30%5/12/1995 11.63% 7.68% 3.95%5/25/1995 11.20% 7.65% 3.55%6/9/1995 11.25% 7.60% 3.65%
6/21/1995 12.25% 7.56% 4.69%6/30/1995 11.10% 7.52% 3.58%9/11/1995 11.30% 7.20% 4.10%9/27/1995 11.30% 7.12% 4.18%9/27/1995 11.50% 7.12% 4.38%9/27/1995 11.75% 7.12% 4.63%9/29/1995 11.00% 7.11% 3.89%11/9/1995 11.38% 6.90% 4.48%11/9/1995 12.36% 6.90% 5.46%11/17/1995 11.00% 6.86% 4.14%12/4/1995 11.35% 6.78% 4.57%12/11/1995 11.40% 6.74% 4.66%

Indiana Michigan Power CompanyAttachment RBH-6
Page 20 of 32
Date of Electric Rate
CaseReturn on
Equity
30-Year Treasury
YieldRisk
Premium12/20/1995 11.60% 6.70% 4.90%12/27/1995 12.00% 6.66% 5.34%2/5/1996 12.25% 6.48% 5.77%
3/29/1996 10.67% 6.42% 4.25%4/8/1996 11.00% 6.42% 4.58%
4/11/1996 12.59% 6.43% 6.16%4/11/1996 12.59% 6.43% 6.16%4/24/1996 11.25% 6.43% 4.82%4/30/1996 11.00% 6.43% 4.57%5/13/1996 11.00% 6.44% 4.56%5/23/1996 11.25% 6.43% 4.82%6/25/1996 11.25% 6.48% 4.77%6/27/1996 11.20% 6.48% 4.72%8/12/1996 10.40% 6.57% 3.83%9/27/1996 11.00% 6.71% 4.29%10/16/1996 12.25% 6.76% 5.49%11/5/1996 11.00% 6.81% 4.19%11/26/1996 11.30% 6.83% 4.47%12/18/1996 11.75% 6.83% 4.92%12/31/1996 11.50% 6.83% 4.67%1/3/1997 10.70% 6.83% 3.87%
2/13/1997 11.80% 6.82% 4.98%2/20/1997 11.80% 6.82% 4.98%3/31/1997 10.02% 6.80% 3.22%4/2/1997 11.65% 6.80% 4.85%
4/28/1997 11.50% 6.81% 4.69%4/29/1997 11.70% 6.81% 4.89%7/17/1997 12.00% 6.77% 5.23%12/12/1997 11.00% 6.60% 4.40%12/23/1997 11.12% 6.57% 4.55%2/2/1998 12.75% 6.39% 6.36%3/2/1998 11.25% 6.29% 4.96%3/6/1998 10.75% 6.27% 4.48%
3/20/1998 10.50% 6.22% 4.28%4/30/1998 12.20% 6.12% 6.08%7/10/1998 11.40% 5.94% 5.46%9/15/1998 11.90% 5.78% 6.12%11/30/1998 12.60% 5.58% 7.02%12/10/1998 12.20% 5.54% 6.66%12/17/1998 12.10% 5.52% 6.58%2/5/1999 10.30% 5.38% 4.92%3/4/1999 10.50% 5.34% 5.16%4/6/1999 10.94% 5.32% 5.62%
7/29/1999 10.75% 5.52% 5.23%9/23/1999 10.75% 5.70% 5.05%11/17/1999 11.10% 5.90% 5.20%1/7/2000 11.50% 6.05% 5.45%1/7/2000 11.50% 6.05% 5.45%
2/17/2000 10.60% 6.17% 4.43%3/28/2000 11.25% 6.20% 5.05%5/24/2000 11.00% 6.18% 4.82%7/18/2000 12.20% 6.16% 6.04%

Indiana Michigan Power CompanyAttachment RBH-6
Page 21 of 32
Date of Electric Rate
CaseReturn on
Equity
30-Year Treasury
YieldRisk
Premium9/29/2000 11.16% 6.03% 5.13%11/28/2000 12.90% 5.89% 7.01%11/30/2000 12.10% 5.88% 6.22%1/23/2001 11.25% 5.79% 5.46%2/8/2001 11.50% 5.77% 5.73%5/8/2001 10.75% 5.62% 5.13%
6/26/2001 11.00% 5.62% 5.38%7/25/2001 11.02% 5.60% 5.42%7/25/2001 11.02% 5.60% 5.42%7/31/2001 11.00% 5.59% 5.41%8/31/2001 10.50% 5.56% 4.94%9/7/2001 10.75% 5.55% 5.20%
9/10/2001 11.00% 5.55% 5.45%9/20/2001 10.00% 5.55% 4.45%10/24/2001 10.30% 5.54% 4.76%11/28/2001 10.60% 5.49% 5.11%12/3/2001 12.88% 5.49% 7.39%12/20/2001 12.50% 5.50% 7.00%1/22/2002 10.00% 5.50% 4.50%3/27/2002 10.10% 5.45% 4.65%4/22/2002 11.80% 5.45% 6.35%5/28/2002 10.17% 5.46% 4.71%6/10/2002 12.00% 5.47% 6.53%6/18/2002 11.16% 5.48% 5.68%6/20/2002 11.00% 5.48% 5.52%6/20/2002 12.30% 5.48% 6.82%7/15/2002 11.00% 5.48% 5.52%9/12/2002 12.30% 5.45% 6.85%9/26/2002 10.45% 5.41% 5.04%12/4/2002 11.55% 5.29% 6.26%12/13/2002 11.75% 5.27% 6.48%12/20/2002 11.40% 5.25% 6.15%1/8/2003 11.10% 5.19% 5.91%
1/31/2003 12.45% 5.13% 7.32%2/28/2003 12.30% 5.05% 7.25%3/6/2003 10.75% 5.03% 5.72%3/7/2003 9.96% 5.02% 4.94%
3/20/2003 12.00% 4.98% 7.02%4/3/2003 12.00% 4.96% 7.04%
4/15/2003 11.15% 4.94% 6.21%6/25/2003 10.75% 4.79% 5.96%6/26/2003 10.75% 4.79% 5.96%7/9/2003 9.75% 4.79% 4.96%
7/16/2003 9.75% 4.79% 4.96%7/25/2003 9.50% 4.80% 4.70%8/26/2003 10.50% 4.83% 5.67%12/17/2003 9.85% 4.94% 4.91%12/17/2003 10.70% 4.94% 5.76%12/18/2003 11.50% 4.94% 6.56%12/19/2003 12.00% 4.94% 7.06%12/19/2003 12.00% 4.94% 7.06%12/23/2003 10.50% 4.94% 5.56%

Indiana Michigan Power CompanyAttachment RBH-6
Page 22 of 32
Date of Electric Rate
CaseReturn on
Equity
30-Year Treasury
YieldRisk
Premium1/13/2004 12.00% 4.95% 7.05%3/2/2004 10.75% 4.99% 5.76%
3/26/2004 10.25% 5.02% 5.23%4/5/2004 11.25% 5.03% 6.22%
5/18/2004 10.50% 5.07% 5.43%5/25/2004 10.25% 5.08% 5.17%5/27/2004 10.25% 5.08% 5.17%6/2/2004 11.22% 5.08% 6.14%
6/30/2004 10.50% 5.10% 5.40%6/30/2004 10.50% 5.10% 5.40%7/16/2004 11.60% 5.11% 6.49%8/25/2004 10.25% 5.10% 5.15%9/9/2004 10.40% 5.10% 5.30%
11/9/2004 10.50% 5.07% 5.43%11/23/2004 11.00% 5.06% 5.94%12/14/2004 10.97% 5.07% 5.90%12/21/2004 11.25% 5.07% 6.18%12/21/2004 11.50% 5.07% 6.43%12/22/2004 10.70% 5.07% 5.63%12/22/2004 11.50% 5.07% 6.43%12/29/2004 9.85% 5.07% 4.78%1/6/2005 10.70% 5.08% 5.62%
2/18/2005 10.30% 4.98% 5.32%2/25/2005 10.50% 4.96% 5.54%3/10/2005 11.00% 4.93% 6.07%3/24/2005 10.30% 4.90% 5.40%4/4/2005 10.00% 4.88% 5.12%4/7/2005 10.25% 4.87% 5.38%
5/18/2005 10.25% 4.78% 5.47%5/25/2005 10.75% 4.76% 5.99%5/26/2005 9.75% 4.76% 4.99%6/1/2005 9.75% 4.75% 5.00%
7/19/2005 11.50% 4.64% 6.86%8/5/2005 11.75% 4.62% 7.13%
8/15/2005 10.13% 4.61% 5.52%9/28/2005 10.00% 4.54% 5.46%10/4/2005 10.75% 4.54% 6.21%12/12/2005 11.00% 4.55% 6.45%12/13/2005 10.75% 4.55% 6.20%12/21/2005 10.29% 4.54% 5.75%12/21/2005 10.40% 4.54% 5.86%12/22/2005 11.00% 4.54% 6.46%12/22/2005 11.15% 4.54% 6.61%12/28/2005 10.00% 4.54% 5.46%12/28/2005 10.00% 4.54% 5.46%1/5/2006 11.00% 4.53% 6.47%
1/27/2006 9.75% 4.52% 5.23%3/3/2006 10.39% 4.53% 5.86%
4/17/2006 10.20% 4.61% 5.59%4/26/2006 10.60% 4.64% 5.96%5/17/2006 11.60% 4.69% 6.91%6/6/2006 10.00% 4.74% 5.26%

Indiana Michigan Power CompanyAttachment RBH-6
Page 23 of 32
Date of Electric Rate
CaseReturn on
Equity
30-Year Treasury
YieldRisk
Premium6/27/2006 10.75% 4.80% 5.95%7/6/2006 10.20% 4.83% 5.37%
7/24/2006 9.60% 4.86% 4.74%7/26/2006 10.50% 4.86% 5.64%7/28/2006 10.05% 4.86% 5.19%8/23/2006 9.55% 4.89% 4.66%9/1/2006 10.54% 4.90% 5.64%
9/14/2006 10.00% 4.91% 5.09%10/6/2006 9.67% 4.92% 4.75%11/21/2006 10.08% 4.95% 5.13%11/21/2006 10.08% 4.95% 5.13%11/21/2006 10.12% 4.95% 5.17%12/1/2006 10.25% 4.95% 5.30%12/1/2006 10.50% 4.95% 5.55%12/7/2006 10.75% 4.95% 5.80%12/21/2006 10.90% 4.95% 5.95%12/21/2006 11.25% 4.95% 6.30%12/22/2006 10.25% 4.95% 5.30%1/5/2007 10.00% 4.95% 5.05%
1/11/2007 10.10% 4.95% 5.15%1/11/2007 10.10% 4.95% 5.15%1/11/2007 10.90% 4.95% 5.95%1/12/2007 10.10% 4.95% 5.15%1/13/2007 10.40% 4.95% 5.45%1/19/2007 10.80% 4.94% 5.86%3/21/2007 11.35% 4.87% 6.48%3/22/2007 9.75% 4.86% 4.89%5/15/2007 10.00% 4.81% 5.19%5/17/2007 10.25% 4.81% 5.44%5/17/2007 10.25% 4.81% 5.44%5/22/2007 10.20% 4.80% 5.40%5/22/2007 10.50% 4.80% 5.70%5/23/2007 10.70% 4.80% 5.90%5/25/2007 9.67% 4.80% 4.87%6/15/2007 9.90% 4.82% 5.08%6/21/2007 10.20% 4.83% 5.37%6/22/2007 10.50% 4.83% 5.67%6/28/2007 10.75% 4.84% 5.91%7/12/2007 9.67% 4.86% 4.81%7/19/2007 10.00% 4.87% 5.13%7/19/2007 10.00% 4.87% 5.13%8/15/2007 10.40% 4.88% 5.52%10/9/2007 10.00% 4.91% 5.09%10/17/2007 9.10% 4.91% 4.19%10/31/2007 9.96% 4.90% 5.06%11/29/2007 10.90% 4.87% 6.03%12/6/2007 10.75% 4.86% 5.89%12/13/2007 9.96% 4.86% 5.10%12/14/2007 10.70% 4.86% 5.84%12/14/2007 10.80% 4.86% 5.94%12/19/2007 10.20% 4.86% 5.34%12/20/2007 10.20% 4.85% 5.35%

Indiana Michigan Power CompanyAttachment RBH-6
Page 24 of 32
Date of Electric Rate
CaseReturn on
Equity
30-Year Treasury
YieldRisk
Premium12/20/2007 11.00% 4.85% 6.15%12/28/2007 10.25% 4.85% 5.40%12/31/2007 11.25% 4.85% 6.40%1/8/2008 10.75% 4.83% 5.92%
1/17/2008 10.75% 4.81% 5.94%1/28/2008 9.40% 4.80% 4.60%1/30/2008 10.00% 4.79% 5.21%1/31/2008 10.71% 4.79% 5.92%2/29/2008 10.25% 4.75% 5.50%3/12/2008 10.25% 4.73% 5.52%3/25/2008 9.10% 4.68% 4.42%4/22/2008 10.25% 4.60% 5.65%4/24/2008 10.10% 4.60% 5.50%5/1/2008 10.70% 4.59% 6.11%
5/19/2008 11.00% 4.56% 6.44%5/27/2008 10.00% 4.55% 5.45%6/10/2008 10.70% 4.54% 6.16%6/27/2008 10.50% 4.54% 5.96%6/27/2008 11.04% 4.54% 6.50%7/10/2008 10.43% 4.52% 5.91%7/16/2008 9.40% 4.52% 4.88%7/30/2008 10.80% 4.51% 6.29%7/31/2008 10.70% 4.51% 6.19%8/11/2008 10.25% 4.51% 5.74%8/26/2008 10.18% 4.50% 5.68%9/10/2008 10.30% 4.50% 5.80%9/24/2008 10.65% 4.48% 6.17%9/24/2008 10.65% 4.48% 6.17%9/24/2008 10.65% 4.48% 6.17%9/30/2008 10.20% 4.48% 5.72%10/8/2008 10.15% 4.46% 5.69%11/13/2008 10.55% 4.45% 6.10%11/17/2008 10.20% 4.44% 5.76%12/1/2008 10.25% 4.40% 5.85%12/23/2008 11.00% 4.27% 6.73%12/29/2008 10.00% 4.24% 5.76%12/29/2008 10.20% 4.24% 5.96%12/31/2008 10.75% 4.22% 6.53%1/14/2009 10.50% 4.15% 6.35%1/21/2009 10.50% 4.12% 6.38%1/21/2009 10.50% 4.12% 6.38%1/21/2009 10.50% 4.12% 6.38%1/27/2009 10.76% 4.09% 6.67%1/30/2009 10.50% 4.08% 6.42%2/4/2009 8.75% 4.06% 4.69%3/4/2009 10.50% 3.96% 6.54%
3/12/2009 11.50% 3.93% 7.57%4/2/2009 11.10% 3.85% 7.25%
4/21/2009 10.61% 3.80% 6.81%4/24/2009 10.00% 3.79% 6.21%4/30/2009 11.25% 3.78% 7.47%5/4/2009 10.74% 3.77% 6.97%

Indiana Michigan Power CompanyAttachment RBH-6
Page 25 of 32
Date of Electric Rate
CaseReturn on
Equity
30-Year Treasury
YieldRisk
Premium5/20/2009 10.25% 3.74% 6.51%5/28/2009 10.50% 3.74% 6.76%6/22/2009 10.00% 3.76% 6.24%6/24/2009 10.80% 3.77% 7.03%7/8/2009 10.63% 3.77% 6.86%
7/17/2009 10.50% 3.78% 6.72%8/31/2009 10.25% 3.82% 6.43%10/14/2009 10.70% 4.01% 6.69%10/23/2009 10.88% 4.06% 6.82%11/2/2009 10.70% 4.09% 6.61%11/3/2009 10.70% 4.10% 6.60%11/24/2009 10.25% 4.15% 6.10%11/25/2009 10.75% 4.16% 6.59%11/30/2009 10.35% 4.17% 6.18%12/3/2009 10.50% 4.18% 6.32%12/7/2009 10.70% 4.18% 6.52%12/16/2009 10.90% 4.21% 6.69%12/16/2009 11.00% 4.21% 6.79%12/18/2009 10.40% 4.22% 6.18%12/18/2009 10.40% 4.22% 6.18%12/22/2009 10.20% 4.23% 5.97%12/22/2009 10.40% 4.23% 6.17%12/22/2009 10.40% 4.23% 6.17%12/30/2009 10.00% 4.26% 5.74%1/4/2010 10.80% 4.28% 6.52%
1/11/2010 11.00% 4.30% 6.70%1/26/2010 10.13% 4.35% 5.78%1/27/2010 10.40% 4.35% 6.05%1/27/2010 10.40% 4.35% 6.05%1/27/2010 10.70% 4.35% 6.35%2/9/2010 9.80% 4.38% 5.42%
2/18/2010 10.60% 4.40% 6.20%2/24/2010 10.18% 4.41% 5.77%3/2/2010 9.63% 4.41% 5.22%3/4/2010 10.50% 4.41% 6.09%3/5/2010 10.50% 4.41% 6.09%
3/11/2010 11.90% 4.42% 7.48%3/17/2010 10.00% 4.41% 5.59%3/25/2010 10.15% 4.42% 5.73%4/2/2010 10.10% 4.43% 5.67%
4/27/2010 10.00% 4.46% 5.54%4/29/2010 9.90% 4.46% 5.44%4/29/2010 10.06% 4.46% 5.60%4/29/2010 10.26% 4.46% 5.80%5/12/2010 10.30% 4.45% 5.85%5/12/2010 10.30% 4.45% 5.85%5/28/2010 10.10% 4.44% 5.66%5/28/2010 10.20% 4.44% 5.76%6/7/2010 10.30% 4.44% 5.86%
6/16/2010 10.00% 4.44% 5.56%6/28/2010 9.67% 4.43% 5.24%6/28/2010 10.50% 4.43% 6.07%

Indiana Michigan Power CompanyAttachment RBH-6
Page 26 of 32
Date of Electric Rate
CaseReturn on
Equity
30-Year Treasury
YieldRisk
Premium6/30/2010 9.40% 4.43% 4.97%7/1/2010 10.25% 4.43% 5.82%
7/15/2010 10.53% 4.43% 6.10%7/15/2010 10.70% 4.43% 6.27%7/30/2010 10.70% 4.41% 6.29%8/4/2010 10.50% 4.41% 6.09%8/6/2010 9.83% 4.41% 5.42%
8/25/2010 9.90% 4.37% 5.53%9/3/2010 10.60% 4.35% 6.25%
9/14/2010 10.70% 4.33% 6.37%9/16/2010 10.00% 4.33% 5.67%9/16/2010 10.00% 4.33% 5.67%9/30/2010 9.75% 4.29% 5.46%10/14/2010 10.35% 4.24% 6.11%10/28/2010 10.70% 4.21% 6.49%11/2/2010 10.38% 4.20% 6.18%11/4/2010 10.70% 4.20% 6.50%11/19/2010 10.20% 4.18% 6.02%11/22/2010 10.00% 4.18% 5.82%12/1/2010 10.13% 4.16% 5.97%12/6/2010 9.86% 4.15% 5.71%12/9/2010 10.25% 4.15% 6.10%12/13/2010 10.70% 4.15% 6.55%12/14/2010 10.13% 4.15% 5.98%12/15/2010 10.44% 4.15% 6.29%12/17/2010 10.00% 4.15% 5.85%12/20/2010 10.60% 4.15% 6.45%12/21/2010 10.30% 4.14% 6.16%12/27/2010 9.90% 4.14% 5.76%12/29/2010 11.15% 4.14% 7.01%1/5/2011 10.15% 4.13% 6.02%
1/12/2011 10.30% 4.12% 6.18%1/13/2011 10.30% 4.12% 6.18%1/18/2011 10.00% 4.12% 5.88%1/20/2011 9.30% 4.12% 5.18%1/20/2011 10.13% 4.12% 6.01%1/31/2011 9.60% 4.12% 5.48%2/3/2011 10.00% 4.12% 5.88%
2/25/2011 10.00% 4.14% 5.86%3/25/2011 9.80% 4.18% 5.62%3/30/2011 10.00% 4.18% 5.82%4/12/2011 10.00% 4.21% 5.79%4/25/2011 10.74% 4.23% 6.51%4/26/2011 9.67% 4.23% 5.44%4/27/2011 10.40% 4.24% 6.16%5/4/2011 10.00% 4.24% 5.76%5/4/2011 10.00% 4.24% 5.76%
5/24/2011 10.50% 4.27% 6.23%6/8/2011 10.75% 4.30% 6.45%
6/16/2011 9.20% 4.32% 4.88%6/17/2011 9.95% 4.32% 5.63%7/13/2011 10.20% 4.36% 5.84%

Indiana Michigan Power CompanyAttachment RBH-6
Page 27 of 32
Date of Electric Rate
CaseReturn on
Equity
30-Year Treasury
YieldRisk
Premium8/1/2011 9.20% 4.39% 4.81%8/8/2011 10.00% 4.38% 5.62%
8/11/2011 10.00% 4.38% 5.62%8/12/2011 10.35% 4.37% 5.98%8/19/2011 10.25% 4.36% 5.89%9/2/2011 12.88% 4.32% 8.56%
9/22/2011 10.00% 4.24% 5.76%10/12/2011 10.30% 4.14% 6.16%10/20/2011 10.50% 4.10% 6.40%11/30/2011 10.90% 3.87% 7.03%11/30/2011 10.90% 3.87% 7.03%12/14/2011 10.00% 3.80% 6.20%12/14/2011 10.30% 3.80% 6.50%12/20/2011 10.20% 3.76% 6.44%12/21/2011 10.20% 3.76% 6.44%12/22/2011 9.90% 3.75% 6.15%12/22/2011 10.40% 3.75% 6.65%12/23/2011 10.19% 3.74% 6.45%1/25/2012 10.50% 3.57% 6.93%1/27/2012 10.50% 3.56% 6.94%2/15/2012 10.20% 3.47% 6.73%2/23/2012 9.90% 3.44% 6.46%2/27/2012 10.25% 3.43% 6.82%2/29/2012 10.40% 3.41% 6.99%3/29/2012 10.37% 3.32% 7.05%4/4/2012 10.00% 3.30% 6.70%
4/26/2012 10.00% 3.21% 6.79%5/2/2012 10.00% 3.18% 6.82%5/7/2012 9.80% 3.17% 6.63%
5/15/2012 10.00% 3.14% 6.86%5/29/2012 10.05% 3.11% 6.94%6/7/2012 10.30% 3.08% 7.22%
6/14/2012 9.40% 3.06% 6.34%6/15/2012 10.40% 3.06% 7.34%6/18/2012 9.60% 3.06% 6.54%6/19/2012 9.25% 3.05% 6.20%6/26/2012 10.10% 3.04% 7.06%6/29/2012 10.00% 3.04% 6.96%7/9/2012 10.20% 3.03% 7.17%
7/16/2012 9.80% 3.02% 6.78%7/20/2012 9.31% 3.01% 6.30%7/20/2012 9.81% 3.01% 6.80%9/13/2012 9.80% 2.94% 6.86%9/19/2012 9.80% 2.94% 6.86%9/19/2012 10.05% 2.94% 7.11%9/26/2012 9.50% 2.94% 6.56%10/12/2012 9.60% 2.93% 6.67%10/23/2012 9.75% 2.93% 6.82%10/24/2012 10.30% 2.93% 7.37%11/9/2012 10.30% 2.92% 7.38%11/28/2012 10.40% 2.90% 7.50%11/29/2012 9.75% 2.89% 6.86%
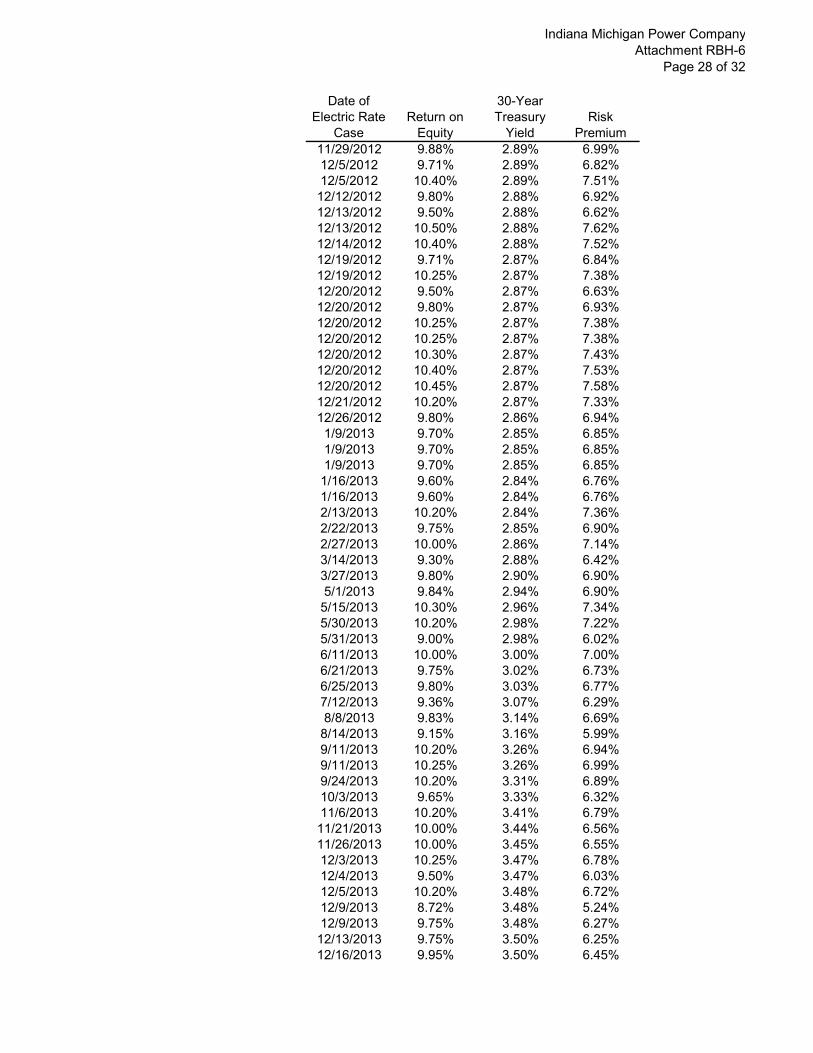
Indiana Michigan Power CompanyAttachment RBH-6
Page 28 of 32
Date of Electric Rate
CaseReturn on
Equity
30-Year Treasury
YieldRisk
Premium11/29/2012 9.88% 2.89% 6.99%12/5/2012 9.71% 2.89% 6.82%12/5/2012 10.40% 2.89% 7.51%12/12/2012 9.80% 2.88% 6.92%12/13/2012 9.50% 2.88% 6.62%12/13/2012 10.50% 2.88% 7.62%12/14/2012 10.40% 2.88% 7.52%12/19/2012 9.71% 2.87% 6.84%12/19/2012 10.25% 2.87% 7.38%12/20/2012 9.50% 2.87% 6.63%12/20/2012 9.80% 2.87% 6.93%12/20/2012 10.25% 2.87% 7.38%12/20/2012 10.25% 2.87% 7.38%12/20/2012 10.30% 2.87% 7.43%12/20/2012 10.40% 2.87% 7.53%12/20/2012 10.45% 2.87% 7.58%12/21/2012 10.20% 2.87% 7.33%12/26/2012 9.80% 2.86% 6.94%1/9/2013 9.70% 2.85% 6.85%1/9/2013 9.70% 2.85% 6.85%1/9/2013 9.70% 2.85% 6.85%
1/16/2013 9.60% 2.84% 6.76%1/16/2013 9.60% 2.84% 6.76%2/13/2013 10.20% 2.84% 7.36%2/22/2013 9.75% 2.85% 6.90%2/27/2013 10.00% 2.86% 7.14%3/14/2013 9.30% 2.88% 6.42%3/27/2013 9.80% 2.90% 6.90%5/1/2013 9.84% 2.94% 6.90%
5/15/2013 10.30% 2.96% 7.34%5/30/2013 10.20% 2.98% 7.22%5/31/2013 9.00% 2.98% 6.02%6/11/2013 10.00% 3.00% 7.00%6/21/2013 9.75% 3.02% 6.73%6/25/2013 9.80% 3.03% 6.77%7/12/2013 9.36% 3.07% 6.29%8/8/2013 9.83% 3.14% 6.69%
8/14/2013 9.15% 3.16% 5.99%9/11/2013 10.20% 3.26% 6.94%9/11/2013 10.25% 3.26% 6.99%9/24/2013 10.20% 3.31% 6.89%10/3/2013 9.65% 3.33% 6.32%11/6/2013 10.20% 3.41% 6.79%11/21/2013 10.00% 3.44% 6.56%11/26/2013 10.00% 3.45% 6.55%12/3/2013 10.25% 3.47% 6.78%12/4/2013 9.50% 3.47% 6.03%12/5/2013 10.20% 3.48% 6.72%12/9/2013 8.72% 3.48% 5.24%12/9/2013 9.75% 3.48% 6.27%12/13/2013 9.75% 3.50% 6.25%12/16/2013 9.95% 3.50% 6.45%

Indiana Michigan Power CompanyAttachment RBH-6
Page 29 of 32
Date of Electric Rate
CaseReturn on
Equity
30-Year Treasury
YieldRisk
Premium12/16/2013 9.95% 3.50% 6.45%12/16/2013 10.12% 3.50% 6.62%12/17/2013 9.50% 3.51% 5.99%12/17/2013 10.95% 3.51% 7.44%12/18/2013 8.72% 3.51% 5.21%12/18/2013 9.80% 3.51% 6.29%12/19/2013 10.15% 3.51% 6.64%12/30/2013 9.50% 3.54% 5.96%2/20/2014 9.20% 3.68% 5.52%2/26/2014 9.75% 3.69% 6.06%3/17/2014 9.55% 3.72% 5.83%3/26/2014 9.40% 3.73% 5.67%3/26/2014 9.96% 3.73% 6.23%4/2/2014 9.70% 3.73% 5.97%
5/16/2014 9.80% 3.70% 6.10%5/30/2014 9.70% 3.68% 6.02%6/6/2014 10.40% 3.67% 6.73%
6/30/2014 9.55% 3.64% 5.91%7/2/2014 9.62% 3.64% 5.98%
7/10/2014 9.95% 3.63% 6.32%7/23/2014 9.75% 3.61% 6.14%7/29/2014 9.45% 3.60% 5.85%7/31/2014 9.90% 3.60% 6.30%8/20/2014 9.75% 3.57% 6.18%8/25/2014 9.60% 3.56% 6.04%8/29/2014 9.80% 3.54% 6.26%9/11/2014 9.60% 3.51% 6.09%9/15/2014 10.25% 3.51% 6.74%10/9/2014 9.80% 3.45% 6.35%11/6/2014 9.56% 3.37% 6.19%11/6/2014 10.20% 3.37% 6.83%11/14/2014 10.20% 3.35% 6.85%11/26/2014 9.70% 3.33% 6.37%11/26/2014 10.20% 3.33% 6.87%12/4/2014 9.68% 3.31% 6.37%12/10/2014 9.25% 3.29% 5.96%12/10/2014 9.25% 3.29% 5.96%12/11/2014 10.07% 3.29% 6.78%12/12/2014 10.20% 3.28% 6.92%12/17/2014 9.17% 3.27% 5.90%12/18/2014 9.83% 3.26% 6.57%1/23/2015 9.50% 3.14% 6.36%2/24/2015 9.83% 3.04% 6.79%3/18/2015 9.75% 2.98% 6.77%3/25/2015 9.50% 2.96% 6.54%3/26/2015 9.72% 2.95% 6.77%4/23/2015 10.20% 2.87% 7.33%4/29/2015 9.53% 2.86% 6.67%5/1/2015 9.60% 2.85% 6.75%
5/26/2015 9.75% 2.83% 6.92%6/17/2015 9.00% 2.82% 6.18%6/17/2015 9.00% 2.82% 6.18%

Indiana Michigan Power CompanyAttachment RBH-6
Page 30 of 32
Date of Electric Rate
CaseReturn on
Equity
30-Year Treasury
YieldRisk
Premium9/2/2015 9.50% 2.79% 6.71%
9/10/2015 9.30% 2.79% 6.51%10/15/2015 9.00% 2.81% 6.19%11/19/2015 10.00% 2.88% 7.12%11/19/2015 10.30% 2.88% 7.42%12/3/2015 10.00% 2.90% 7.10%12/9/2015 9.14% 2.90% 6.24%12/9/2015 9.14% 2.90% 6.24%12/11/2015 10.30% 2.90% 7.40%12/15/2015 9.60% 2.91% 6.69%12/17/2015 9.70% 2.91% 6.79%12/18/2015 9.50% 2.91% 6.59%12/30/2015 9.50% 2.93% 6.57%1/6/2016 9.50% 2.94% 6.56%
2/23/2016 9.75% 2.94% 6.81%3/16/2016 9.85% 2.91% 6.94%4/29/2016 9.80% 2.83% 6.97%6/3/2016 9.75% 2.80% 6.95%6/8/2016 9.48% 2.80% 6.68%
6/15/2016 9.00% 2.78% 6.22%6/15/2016 9.00% 2.78% 6.22%7/18/2016 9.98% 2.71% 7.27%8/9/2016 9.85% 2.66% 7.19%
8/18/2016 9.50% 2.63% 6.87%8/24/2016 9.75% 2.62% 7.13%9/1/2016 9.50% 2.59% 6.91%9/8/2016 10.00% 2.58% 7.42%
9/28/2016 9.58% 2.54% 7.04%9/30/2016 9.90% 2.53% 7.37%11/9/2016 9.80% 2.48% 7.32%11/10/2016 9.50% 2.48% 7.02%11/15/2016 9.55% 2.49% 7.06%11/18/2016 10.00% 2.50% 7.50%11/29/2016 10.55% 2.51% 8.04%12/1/2016 10.00% 2.51% 7.49%12/6/2016 8.64% 2.52% 6.12%12/6/2016 8.64% 2.52% 6.12%12/7/2016 10.10% 2.52% 7.58%12/12/2016 9.60% 2.53% 7.07%12/14/2016 9.10% 2.53% 6.57%12/19/2016 9.00% 2.54% 6.46%12/19/2016 9.37% 2.54% 6.83%12/22/2016 9.60% 2.55% 7.05%12/22/2016 9.90% 2.55% 7.35%12/28/2016 9.50% 2.55% 6.95%1/18/2017 9.45% 2.58% 6.87%1/24/2017 9.00% 2.59% 6.41%1/31/2017 10.10% 2.60% 7.50%2/15/2017 9.60% 2.62% 6.98%2/22/2017 9.60% 2.64% 6.96%2/24/2017 9.75% 2.64% 7.11%2/28/2017 10.10% 2.64% 7.46%

Indiana Michigan Power CompanyAttachment RBH-6
Page 31 of 32
Date of Electric Rate
CaseReturn on
Equity
30-Year Treasury
YieldRisk
Premium3/2/2017 9.41% 2.65% 6.76%
3/20/2017 9.50% 2.68% 6.82%4/4/2017 10.25% 2.71% 7.54%
4/12/2017 9.40% 2.74% 6.66%4/20/2017 9.50% 2.76% 6.74%5/3/2017 9.50% 2.79% 6.71%
5/11/2017 9.20% 2.81% 6.39%5/18/2017 9.50% 2.83% 6.67%5/23/2017 9.70% 2.84% 6.86%6/16/2017 9.65% 2.89% 6.76%6/22/2017 9.70% 2.90% 6.80%6/22/2017 9.70% 2.90% 6.80%7/24/2017 9.50% 2.95% 6.55%8/15/2017 10.00% 2.97% 7.03%9/22/2017 9.60% 2.93% 6.67%9/28/2017 9.80% 2.92% 6.88%10/20/2017 9.50% 2.91% 6.59%10/26/2017 10.20% 2.91% 7.29%10/26/2017 10.25% 2.91% 7.34%10/26/2017 10.30% 2.91% 7.39%11/6/2017 10.25% 2.90% 7.35%11/15/2017 11.95% 2.89% 9.06%11/30/2017 10.00% 2.88% 7.12%11/30/2017 10.00% 2.88% 7.12%12/5/2017 9.50% 2.88% 6.62%12/6/2017 8.40% 2.87% 5.53%12/6/2017 8.40% 2.87% 5.53%12/7/2017 9.80% 2.87% 6.93%12/14/2017 9.60% 2.86% 6.74%12/14/2017 9.65% 2.86% 6.79%12/18/2017 9.50% 2.86% 6.64%12/20/2017 9.58% 2.86% 6.72%12/21/2017 9.10% 2.85% 6.25%12/28/2017 9.50% 2.85% 6.65%12/29/2017 9.51% 2.85% 6.66%1/18/2018 9.70% 2.84% 6.86%1/31/2018 9.30% 2.84% 6.46%2/2/2018 9.98% 2.84% 7.14%
2/23/2018 9.90% 2.85% 7.05%3/12/2018 9.25% 2.86% 6.39%3/15/2018 9.00% 2.87% 6.13%3/29/2018 10.00% 2.88% 7.12%4/12/2018 9.90% 2.89% 7.01%4/13/2018 9.73% 2.89% 6.84%4/18/2018 9.25% 2.89% 6.36%4/18/2018 10.00% 2.89% 7.11%4/26/2018 9.50% 2.90% 6.60%5/30/2018 9.95% 2.94% 7.01%5/31/2018 9.50% 2.94% 6.56%6/14/2018 8.80% 2.96% 5.84%6/22/2018 9.50% 2.97% 6.53%6/22/2018 9.90% 2.97% 6.93%

Indiana Michigan Power CompanyAttachment RBH-6
Page 32 of 32
Date of Electric Rate
CaseReturn on
Equity
30-Year Treasury
YieldRisk
Premium6/28/2018 9.35% 2.97% 6.38%6/29/2018 9.50% 2.97% 6.53%8/8/2018 9.53% 2.99% 6.54%
8/21/2018 9.70% 3.00% 6.70%8/24/2018 9.28% 3.01% 6.27%9/5/2018 9.56% 3.02% 6.54%
9/14/2018 10.00% 3.03% 6.97%9/20/2018 9.80% 3.04% 6.76%9/26/2018 9.77% 3.05% 6.72%9/26/2018 10.00% 3.05% 6.95%9/27/2018 9.30% 3.05% 6.25%10/4/2018 9.85% 3.06% 6.79%10/29/2018 9.60% 3.10% 6.50%10/31/2018 9.99% 3.11% 6.88%11/1/2018 8.69% 3.11% 5.58%12/4/2018 8.69% 3.14% 5.55%12/13/2018 9.30% 3.14% 6.16%12/14/2018 9.50% 3.14% 6.36%12/19/2018 9.84% 3.14% 6.70%12/20/2018 9.65% 3.14% 6.51%12/21/2018 9.30% 3.14% 6.16%1/9/2019 10.00% 3.14% 6.86%
2/27/2019 9.75% 3.12% 6.63%3/13/2019 9.60% 3.12% 6.48%3/14/2019 9.00% 3.12% 5.88%3/14/2019 9.40% 3.12% 6.28%
# of Cases: 1584Average: 4.67%

Indiana Michigan Power CompanyAttachment RBH-7
Page 1 of 1
[1] [2] [3] [4] [5] [6]Expected
ROE Adjustment Adjusted
Company Ticker2021-23/ 2022-24 2019
2021-23/ 2022-24 % Increase Factor ROE
ALLETE, Inc. ALE 9.00% 51.50 51.50 0.00% 1.000 9.00%Alliant Energy Corporation LNT 10.00% 240.00 250.00 0.82% 1.004 10.04%Ameren Corporation AEE 10.50% 246.50 253.00 0.52% 1.003 10.53%Avangrid, Inc. AGR 6.50% 309.00 309.00 0.00% 1.000 6.50%Black Hills Corporation BKH 10.00% 60.50 61.00 0.21% 1.001 10.01%CMS Energy Corporation CMS 14.00% 285.00 297.00 0.83% 1.004 14.06%DTE Energy Company DTE 10.50% 192.00 200.00 0.82% 1.004 10.54%Duke Energy Corporation DUK 8.50% 731.50 750.00 0.50% 1.002 8.52%El Paso Electric Company EE 8.50% 40.70 41.00 0.18% 1.001 8.51%Evergy, Inc. EVRG 8.50% 225.00 212.00 -1.18% 0.994 8.45%Hawaiian Electric Industries, Inc. HE 9.50% 110.00 113.00 0.67% 1.003 9.53%NextEra Energy, Inc. NEE 13.50% 535.00 535.00 0.00% 1.000 13.50%NorthWestern Corporation NWE 9.00% 50.50 51.00 0.25% 1.001 9.01%OGE Energy Corp. OGE 11.50% 199.70 199.70 0.00% 1.000 11.50%Otter Tail Corporation OTTR 10.50% 39.75 41.75 0.99% 1.005 10.55%Pinnacle West Capital Corporation PNW 10.50% 112.75 114.25 0.33% 1.002 10.52%PNM Resources, Inc. PNM 9.50% 79.65 83.00 1.04% 1.005 9.55%Portland General Electric Company POR 9.00% 89.40 90.00 0.17% 1.001 9.01%Southern Company SO 13.00% 1050.00 1090.00 0.75% 1.004 13.05%Wisconsin Energy Corporation WEC 12.50% 315.50 315.50 0.00% 1.000 12.50%Xcel Energy Inc. XEL 10.50% 518.00 533.00 0.72% 1.004 10.54%
Median 10.04%Average 10.26%
Notes:[1] Source: Value Line [3] Source: Value Line [5] Equals (2 x (1 + [4])) / (2 + [4])[2] Source: Value Line [4] Equals =([3] / [2])^(1/4)-1; ([3] / [2])^(1/5)-1 [6] Equals [1] x [5]
Expected Earnings Analysis
Shares Outstanding

Indiana Michigan Power CompanyAttachment RBH-8
Page 1 of 2
Flotation Cost Adjustment
Two most recent open market common stock issuances per company, if available[1] [2] [3] [4] [5] [6] [7] [8] [9]
Company DateSharesIssued
OfferingPrice
Underwriting Discount
OfferingExpense
NetProceeds Per
Share
Total Flotation
CostsGross Equity Issue
Before Costs Net ProceedsFlotation Cost Percentage
American Electric Power Company, Inc. 4/1/2009 69,000,000 $24.50 $0.7350 $400,000 $23.76 $51,115,000 $1,690,500,000 $1,639,385,000 3.024%American Electric Power Company, Inc. 2/27/2003 57,500,000 $20.95 $0.6285 $550,000 $20.31 $36,688,750 $1,204,625,000 $1,167,936,250 3.046%
Average 3.035%
ALLETE, Inc. 2/27/2014 3,220,000 $49.75 $1.7413 $450,000 $47.87 $6,056,825 $160,195,000 $154,138,175 3.781%ALLETE, Inc. 5/25/2001 7,475,000 $23.68 $0.9472 $350,000 $22.69 $7,430,320 $177,008,000 $169,577,680 4.198%Alliant Energy Corporation 7/1/2003 17,250,000 $19.25 $0.7700 $370,000 $18.46 $13,652,500 $332,062,500 $318,410,000 4.111%Alliant Energy Corporation 11/8/2001 9,775,000 $28.00 $1.0500 $425,000 $26.91 $10,688,750 $273,700,000 $263,011,250 3.905%Ameren Corp. 9/9/2009 21,850,000 $25.25 $0.7575 $450,000 $24.47 $17,001,375 $551,712,500 $534,711,125 3.082%Ameren Corp. 6/30/2004 10,925,000 $42.00 $1.2600 $400,000 $40.70 $14,165,500 $458,850,000 $444,684,500 3.087%Avangrid, Inc. 9/26/2013 5,750,000 $37.25 $1.3038 $250,000 $35.90 $7,746,563 $214,187,500 $206,440,938 3.617%Avangrid, Inc. 9/16/2010 20,355,000 $25.75 $1.0944 $325,000 $24.64 $22,601,003 $524,141,250 $501,540,247 4.312%Black Hills Corporation 11/19/2015 5,980,000 $40.25 $1.4088 $1,200,000 $38.64 $9,624,325 $240,695,000 $231,070,675 3.999%Black Hills Corporation 11/12/2010 4,600,000 $29.75 $1.0413 $276,650 $28.65 $5,066,400 $136,850,000 $131,783,600 3.702%CMS Energy Corporation 3/30/2005 23,000,000 $12.25 $0.4288 $325,000 $11.81 $10,187,400 $281,750,000 $271,562,600 3.616%CMS Energy Corporation 10/7/2004 32,775,000 $9.10 $0.3185 $325,000 $8.77 $10,763,838 $298,252,500 $287,488,663 3.609%DTE Energy Company 6/19/2002 6,325,000 $43.25 $1.4056 $250,000 $41.80 $9,140,420 $273,556,250 $264,415,830 3.341%Duke Energy Corporation 3/6/2018 21,275,000 $74.07 $0.0000 $450,000 $74.05 $450,000 $1,575,881,800 $1,575,431,800 0.029%Duke Energy Corporation 3/2/2016 10,637,500 $72.00 $2.1600 $400,000 $69.80 $23,377,000 $765,900,000 $742,523,000 3.052%Evergy, Inc. 9/27/2016 60,490,000 $26.45 $0.7935 $500,000 $25.65 $48,498,815 $1,599,960,500 $1,551,461,685 3.031%Evergy, Inc. 9/23/2013 8,916,000 $31.15 $1.0900 $250,000 $30.03 $9,968,440 $277,733,400 $267,764,960 3.589%Hawaiian Electric Industries, Inc 3/19/2013 7,000,000 $26.75 $1.0031 $450,000 $25.68 $7,471,840 $187,250,000 $179,778,160 3.990%Hawaiian Electric Industries, Inc 12/2/2008 5,750,000 $23.00 $0.8625 $300,000 $22.09 $5,259,375 $132,250,000 $126,990,625 3.977%NextEra Energy, Inc. 11/1/2016 13,800,000 $124.00 $0.0000 $750,000 $123.95 $750,000 $1,711,200,000 $1,710,450,000 0.044%NextEra Energy, Inc. 11/18/2013 11,100,000 $88.03 $0.0000 $750,000 $87.96 $750,000 $977,133,000 $976,383,000 0.077%NorthWestern Corporation 9/29/2015 1,100,000 $51.81 $1.3300 $1,000,000 $49.57 $2,463,000 $56,991,000 $54,528,000 4.322%NorthWestern Corporation 11/5/2014 7,766,990 $51.50 $1.8025 $1,000,000 $49.57 $14,999,999 $399,999,985 $384,999,986 3.750%OGE Energy Corp. 8/21/2003 5,324,074 $21.60 $0.7900 $325,000 $20.75 $4,531,018 $114,999,998 $110,468,980 3.940%Otter Tail Corporation 9/18/2008 5,175,000 $30.00 $1.0875 $400,000 $28.84 $6,027,813 $155,250,000 $149,222,188 3.883%Otter Tail Corporation 12/7/2004 3,335,000 $25.45 $0.9500 $300,000 $24.41 $3,468,250 $84,875,750 $81,407,500 4.086%Pinnacle West Capital Corporation 4/8/2010 6,900,000 $38.00 $1.3300 $190,000 $36.64 $9,367,000 $262,200,000 $252,833,000 3.572%Pinnacle West Capital Corporation 4/27/2005 6,095,000 $42.00 $1.3650 $250,000 $40.59 $8,569,675 $255,990,000 $247,420,325 3.348%PNM Resources, Inc. 12/6/2006 5,750,000 $30.79 $1.0780 $250,000 $29.67 $6,448,500 $177,042,500 $170,594,000 3.642%PNM Resources, Inc. 3/23/2005 3,910,000 $26.76 $0.8697 $200,000 $25.84 $3,600,527 $104,631,600 $101,031,073 3.441%Portland General Electric Company 6/11/2013 12,765,000 $29.50 $0.9588 $600,000 $28.49 $12,838,444 $376,567,500 $363,729,056 3.409%Portland General Electric Company 3/5/2009 12,477,500 $14.10 $0.4935 $375,000 $13.58 $6,532,646 $175,932,750 $169,400,104 3.713%Southern Company 8/16/2016 32,500,000 $49.30 $1.6600 $557,000 $47.62 $54,507,000 $1,602,250,000 $1,547,743,000 3.402%Southern Company 5/5/2016 18,300,000 $48.60 $2.0200 $395,000 $46.56 $37,361,000 $889,380,000 $852,019,000 4.201%WEC Energy Group, Inc. 11/16/2005 5,290,000 $53.70 $1.7450 $0 $51.96 $9,231,050 $284,073,000 $274,841,950 3.250%WEC Energy Group, Inc. 11/20/2003 4,025,000 $43.00 $1.5050 $0 $41.50 $6,057,625 $173,075,000 $167,017,375 3.500%Xcel Energy Inc. 8/3/2010 21,850,000 $21.50 $0.6450 $600,000 $20.83 $14,693,250 $469,775,000 $455,081,750 3.128%Xcel Energy Inc. 9/9/2008 17,250,000 $20.25 $0.1500 $600,000 $20.07 $3,187,500 $349,312,500 $346,125,000 0.913%
Mean $13,308,468 $499,443,520WEIGHTED AVERAGE FLOTATION COSTS: 2.665% [10]
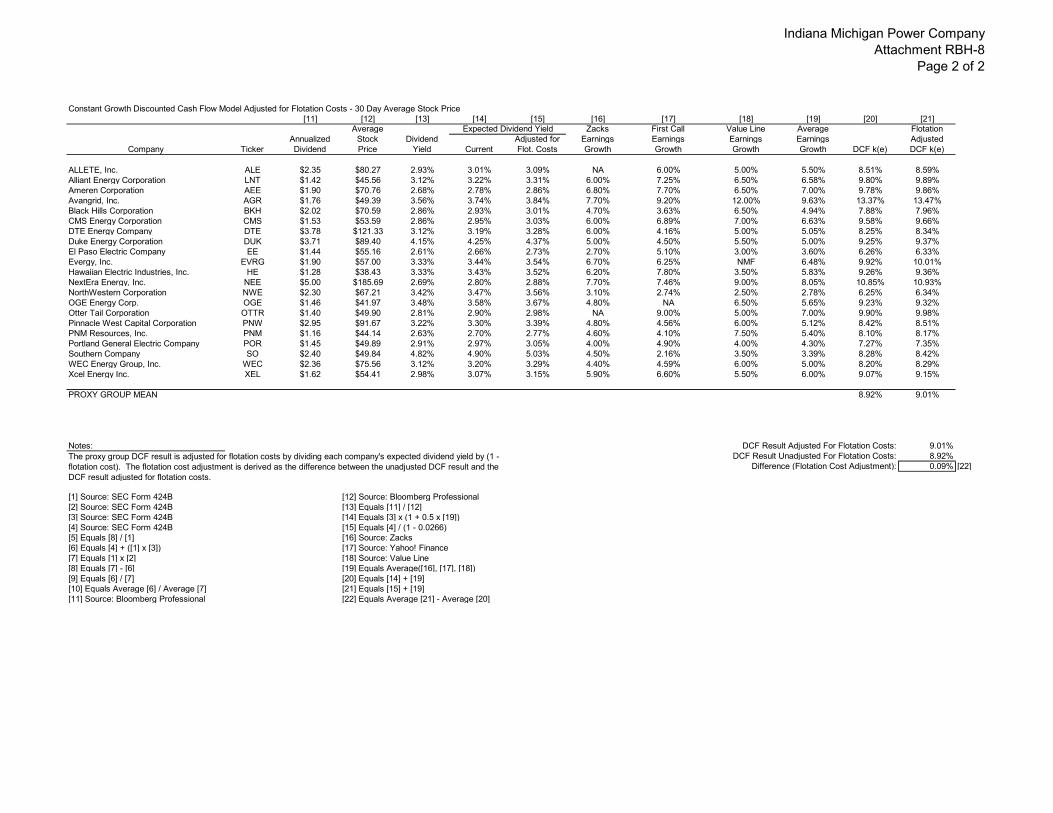
Indiana Michigan Power CompanyAttachment RBH-8
Page 2 of 2
Constant Growth Discounted Cash Flow Model Adjusted for Flotation Costs - 30 Day Average Stock Price[11] [12] [13] [14] [15] [16] [17] [18] [19] [20] [21]
Average Expected Dividend Yield Zacks First Call Value Line Average FlotationAnnualized Stock Dividend Adjusted for Earnings Earnings Earnings Earnings Adjusted
Company Ticker Dividend Price Yield Current Flot. Costs Growth Growth Growth Growth DCF k(e) DCF k(e)
ALLETE, Inc. ALE $2.35 $80.27 2.93% 3.01% 3.09% NA 6.00% 5.00% 5.50% 8.51% 8.59%Alliant Energy Corporation LNT $1.42 $45.56 3.12% 3.22% 3.31% 6.00% 7.25% 6.50% 6.58% 9.80% 9.89%Ameren Corporation AEE $1.90 $70.76 2.68% 2.78% 2.86% 6.80% 7.70% 6.50% 7.00% 9.78% 9.86%Avangrid, Inc. AGR $1.76 $49.39 3.56% 3.74% 3.84% 7.70% 9.20% 12.00% 9.63% 13.37% 13.47%Black Hills Corporation BKH $2.02 $70.59 2.86% 2.93% 3.01% 4.70% 3.63% 6.50% 4.94% 7.88% 7.96%CMS Energy Corporation CMS $1.53 $53.59 2.86% 2.95% 3.03% 6.00% 6.89% 7.00% 6.63% 9.58% 9.66%DTE Energy Company DTE $3.78 $121.33 3.12% 3.19% 3.28% 6.00% 4.16% 5.00% 5.05% 8.25% 8.34%Duke Energy Corporation DUK $3.71 $89.40 4.15% 4.25% 4.37% 5.00% 4.50% 5.50% 5.00% 9.25% 9.37%El Paso Electric Company EE $1.44 $55.16 2.61% 2.66% 2.73% 2.70% 5.10% 3.00% 3.60% 6.26% 6.33%Evergy, Inc. EVRG $1.90 $57.00 3.33% 3.44% 3.54% 6.70% 6.25% NMF 6.48% 9.92% 10.01%Hawaiian Electric Industries, Inc. HE $1.28 $38.43 3.33% 3.43% 3.52% 6.20% 7.80% 3.50% 5.83% 9.26% 9.36%NextEra Energy, Inc. NEE $5.00 $185.69 2.69% 2.80% 2.88% 7.70% 7.46% 9.00% 8.05% 10.85% 10.93%NorthWestern Corporation NWE $2.30 $67.21 3.42% 3.47% 3.56% 3.10% 2.74% 2.50% 2.78% 6.25% 6.34%OGE Energy Corp. OGE $1.46 $41.97 3.48% 3.58% 3.67% 4.80% NA 6.50% 5.65% 9.23% 9.32%Otter Tail Corporation OTTR $1.40 $49.90 2.81% 2.90% 2.98% NA 9.00% 5.00% 7.00% 9.90% 9.98%Pinnacle West Capital Corporation PNW $2.95 $91.67 3.22% 3.30% 3.39% 4.80% 4.56% 6.00% 5.12% 8.42% 8.51%PNM Resources, Inc. PNM $1.16 $44.14 2.63% 2.70% 2.77% 4.60% 4.10% 7.50% 5.40% 8.10% 8.17%Portland General Electric Company POR $1.45 $49.89 2.91% 2.97% 3.05% 4.00% 4.90% 4.00% 4.30% 7.27% 7.35%Southern Company SO $2.40 $49.84 4.82% 4.90% 5.03% 4.50% 2.16% 3.50% 3.39% 8.28% 8.42%WEC Energy Group, Inc. WEC $2.36 $75.56 3.12% 3.20% 3.29% 4.40% 4.59% 6.00% 5.00% 8.20% 8.29%Xcel Energy Inc. XEL $1.62 $54.41 2.98% 3.07% 3.15% 5.90% 6.60% 5.50% 6.00% 9.07% 9.15%
PROXY GROUP MEAN 8.92% 9.01%
Notes: DCF Result Adjusted For Flotation Costs: 9.01%DCF Result Unadjusted For Flotation Costs: 8.92%
Difference (Flotation Cost Adjustment): 0.09% [22]
[1] Source: SEC Form 424B [12] Source: Bloomberg Professional[2] Source: SEC Form 424B [13] Equals [11] / [12][3] Source: SEC Form 424B [14] Equals [3] x (1 + 0.5 x [19])[4] Source: SEC Form 424B [15] Equals [4] / (1 - 0.0266)[5] Equals [8] / [1] [16] Source: Zacks[6] Equals [4] + ([1] x [3]) [17] Source: Yahoo! Finance[7] Equals [1] x [2] [18] Source: Value Line[8] Equals [7] - [6] [19] Equals Average([16], [17], [18])[9] Equals [6] / [7] [20] Equals [14] + [19][10] Equals Average [6] / Average [7] [21] Equals [15] + [19][11] Source: Bloomberg Professional [22] Equals Average [21] - Average [20]
The proxy group DCF result is adjusted for flotation costs by dividing each company's expected dividend yield by (1 - flotation cost). The flotation cost adjustment is derived as the difference between the unadjusted DCF result and the DCF result adjusted for flotation costs.

Indiana Michigan Power CompanyAttachment RBH-9
Page 1 of 2
Adjustment Clauses
Company Parent State
Fuel/ Purchased
PowerDecoupling
(F/P) [1]New Capital
Investment [2]Energy
Efficiency [3]Renewables &
RPS [4]Environmental
[5] Other [6]ALLETE (Minnesota Power) ALE Minnesota Superior Water, Light and Power Company ALE Wisconsin Interstate Power and Light Company LNT Iowa Wisconsin Power and Light Company LNT Wisconsin Ameren Illinois Company AEE Illinois Union Electric Company AEE Missouri P Central Maine Power Company AGR Maine F New York State Electric & Gas Corporation AGR New York F Rochester Gas and Electric Corporation AGR New York F United Illuminating Company AGR Connecticut F Black Hills Colorado Electric Utility Company, LP BKH Colorado Black Hills Power, Inc. BKH South Dakota P Black Hills Power, Inc. BKH Wyoming Cheyenne Light, Fuel and Power Company BKH Wyoming P Consumers Energy Company CMS Michigan DTE Electric Company DTE Michigan Duke Energy Carolinas, LLC DUK North Carolina P Duke Energy Carolinas, LLC DUK South Carolina P Duke Energy Florida, LLC DUK Florida Duke Energy Indiana, LLC DUK Indiana P Duke Energy Kentucky, Inc. DUK Kentucky P Duke Energy Ohio, Inc. DUK Ohio P Duke Energy Progress, LLC DUK North Carolina P Duke Energy Progress, LLC DUK South Carolina P El Paso Electric Company EE New Mexico El Paso Electric Company EE Texas Kansas City Power & Light Company EVRG Kansas Kansas City Power & Light Company EVRG Missouri P KCP&L Greater Missouri Operations Company EVRG Missouri Westar Energy (KPL) EVRG Kansas P Hawaii Electric Light Company, Inc. HE Hawaii F Hawaiian Electric Company, Inc. HE Hawaii F Maui Electric Company, Limited HE Hawaii F Florida Power & Light Company NEE Florida Gulf Power Company NEE Florida NorthWestern Energy NWE Montana NorthWestern Energy NWE South Dakota Oklahoma Gas and Electric Company OGE Arkansas P Oklahoma Gas and Electric Company OGE Oklahoma P Otter Tail Power Company OTTR Minnesota Otter Tail Power Company OTTR North Dakota Otter Tail Power Company OTTR South Dakota Arizona Public Service Company PNW Arizona P Public Service Company of New Mexico PNM New Mexico Texas-New Mexico Power Company PNM Texas NA Portland General Electric Company POR Oregon P Alabama Power Company SO Alabama Georgia Power Company SO Georgia Mississippi Power Company SO Mississippi P Upper Michigan Energy Resources Corp WEC Michigan Wisconsin Electric Power WEC Wisconsin Wisconsin Public Service Company WEC Wisconsin Northern States Power Company - MN XEL Minnesota F Northern States Power Company - MN XEL North Dakota Northern States Power Company - MN XEL South Dakota P Northern States Power Company - WI XEL Michigan Northern States Power Company - WI XEL Wisconsin Public Service Company of Colorado XEL Colorado Southwestern Public Service Company XEL New Mexico Southwestern Public Service Company XEL Texas
Indiana Michigan Power Company AEP Indiana P
59 26 23 51 30 33 60Notes: 100% 43% 38% 85% 50% 55% 100%
Summary of Adjustment Clauses & Alternative Regulation/Incentive Plans
[3] Utility-sponsored conservation, energy efficiency, load control, or other demand side management programs.
A mechanism may cover one or more cost categories; therefore, designations may not indicate separate mechanisms for each category. Texas T&D utilities do not have retail obligation, thus do not need a purchased power clause[1] Full or partial decoupling (such as Straight-Fixed Variable rate design, weather normalization clauses, and recovery of lost revenues as a result of Energy Efficiency programs).[2] Includes recovery of costs related to targeted new generation projects, infrastructure replacement, system integrity/hardening, Smart Grid, AMI metering, and other capital expenditures.

Indiana Michigan Power CompanyAttachment RBH-9
Page 2 of 2
Company Parent StateALLETE (Minnesota Power) ALE MinnesotaSuperior Water, Light and Power Company ALE WisconsinInterstate Power and Light Company LNT IowaWisconsin Power and Light Company LNT WisconsinAmeren Illinois Company AEE IllinoisUnion Electric Company AEE MissouriCentral Maine Power Company AGR MaineNew York State Electric & Gas Corporation AGR New YorkRochester Gas and Electric Corporation AGR New YorkUnited Illuminating Company AGR ConnecticutBlack Hills Colorado Electric Utility Company, LP BKH ColoradoBlack Hills Power, Inc. BKH South Dakota Black Hills Power, Inc. BKH WyomingCheyenne Light, Fuel and Power Company BKH WyomingConsumers Energy Company CMS MichiganDTE Electric Company DTE MichiganDuke Energy Carolinas, LLC DUK North CarolinaDuke Energy Carolinas, LLC DUK South CarolinaDuke Energy Florida, LLC DUK FloridaDuke Energy Indiana, LLC DUK IndianaDuke Energy Kentucky, Inc. DUK KentuckyDuke Energy Ohio, Inc. DUK OhioDuke Energy Progress, LLC DUK North CarolinaDuke Energy Progress, LLC DUK South CarolinaEl Paso Electric Company EE New MexicoEl Paso Electric Company EE TexasKansas City Power & Light Company EVRG KansasKansas City Power & Light Company EVRG MissouriKCP&L Greater Missouri Operations Company EVRG MissouriWestar Energy (KPL) EVRG KansasHawaii Electric Light Company, Inc. HE HawaiiHawaiian Electric Company, Inc. HE HawaiiMaui Electric Company, Limited HE HawaiiFlorida Power & Light Company NEE FloridaGulf Power Company NEE FloridaNorthWestern Energy NWE MontanaNorthWestern Energy NWE South Dakota Oklahoma Gas and Electric Company OGE ArkansasOklahoma Gas and Electric Company OGE OklahomaOtter Tail Power Company OTTR MinnesotaOtter Tail Power Company OTTR North DakotaOtter Tail Power Company OTTR South Dakota Arizona Public Service Company PNW ArizonaPublic Service Company of New Mexico PNM New MexicoTexas-New Mexico Power Company PNM TexasPortland General Electric Company POR OregonAlabama Power Company SO AlabamaGeorgia Power Company SO GeorgiaMississippi Power Company SO MississippiUpper Michigan Energy Resources Corp WEC MichiganWisconsin Electric Power WEC WisconsinWisconsin Public Service Company WEC WisconsinNorthern States Power Company - MN XEL MinnesotaNorthern States Power Company - MN XEL North DakotaNorthern States Power Company - MN XEL South Dakota Northern States Power Company - WI XEL MichiganNorthern States Power Company - WI XEL WisconsinPublic Service Company of Colorado XEL ColoradoSouthwestern Public Service Company XEL New MexicoSouthwestern Public Service Company XEL Texas
Indiana Michigan Power Company AEP Indiana
Notes:
Summary of Adjustment
Alternative Regulation / Incentive Plans
Formula-Based Rates
Multiyear Rate Plans
Performance Based
Ratemaking
CWIP Allowed in Rate Base
(L/F)Forward Test
YearPrice Freeze/
CapEarnings Sharing
Formula-Based ROE
Service Quality /
PerformanceMerger Savings
L L
L
L
F
L L
F F
F
F F
F
L
FLF L
F
L
L
F L
L L L F L
L L
L F L
F
4 21 13 33 24 20 17 2 3 17% 35% 22% 55% 40% 33% 28% 3% 5% 2%
Summary of Adjustment Clauses & Alternative Regulation/Incentive Plans
Sources: Alternative Regulation/Incentive Plans: A State-by-State Overview , November 19, 2013; Regulatory Research Associates, Adjustment Clauses: A State-by-State Overview , September 28, 2018; Regulatory Research Associates, Rate Freezes: Their historical context and prevalence today , October 15, 2018; Regulatory Research Associates Commission Profiles ; SEC Form 10-Ks; Company Tariffs.
[4] Recovers costs associated with renewable energy projects, Distributed Energy Resources, REC purchases, net metering, RPS expense, and renewable PPAs.
[5] EPA upgrade costs, emissions control & allowance purchase costs, nuclear/coal plant decommissioning, and other costs to comply with state and federal environmental mandates. [6] Pension expenses, bad debt costs, storm costs, vegetation management, RTO/Transmission Expense, capacity costs, transmission costs, government & franchise fees and taxes, economic development, and low income programs.

Indiana Michigan Power CompanyAttachment RBH-10
Page 1 of 2
Company Ticker 2018Q3 2018Q2 2018Q1 2017Q4 2017Q3 2017Q2 2017Q1 2016Q4 AverageALLETE, Inc. ALE 58.50% 58.84% 63.09% 62.51% 61.03% 60.62% 60.28% 59.02% 60.49%Alliant Energy Corporation LNT 51.13% 51.00% 49.74% 49.77% 52.09% 51.23% 50.84% 50.73% 50.82%Ameren Corporation AEE 53.22% 52.01% 53.04% 52.65% 53.56% 53.11% 52.77% 52.62% 52.87%Avangrid, Inc. AGR 56.13% 54.93% 56.55% 55.69% 53.88% 53.54% 55.66% 54.95% 55.17%Black Hills Corporation BKH 53.20% 53.82% 53.79% 54.40% 54.75% 53.84% 53.20% 52.81% 53.73%CMS Energy Corporation CMS 53.01% 52.86% 53.13% 52.25% 53.25% 52.97% 52.10% 51.24% 52.60%DTE Energy Company DTE 49.97% 49.23% 51.12% 51.02% 50.50% 50.63% 50.50% 50.50% 50.43%Duke Energy Corporation DUK 55.03% 54.94% 54.46% 54.30% 53.78% 54.62% 54.37% 54.66% 54.52%El Paso Electric Company EE 48.57% 47.32% 49.46% 49.95% 49.81% 48.01% 47.48% 47.73% 48.54%Evergy, Inc EVRG 59.86% 58.51% 58.73% 58.62% 59.41% 58.74% 58.75% 59.28% 58.99%Hawaiian Electric Industries, Inc. HE 56.09% 55.78% 57.44% 57.42% 58.11% 57.76% 57.71% 57.70% 57.25%NextEra Energy, Inc. NEE 64.78% 60.84% 61.23% 59.93% 63.00% 62.78% 62.05% 62.65% 62.16%NorthWestern Corporation NWE 48.36% 48.41% 47.48% 49.89% 48.86% 48.61% 48.61% 48.13% 48.54%OGE Energy Corp. OGE 53.05% 54.25% 53.59% 53.36% 53.05% 52.75% 53.46% 56.09% 53.70%Otter Tail Corporation OTTR 53.49% 53.11% 52.67% 57.34% 57.24% 55.31% 55.31% 55.06% 54.94%Pinnacle West Capital Corporation PNW 53.68% 53.71% 53.18% 53.14% 53.05% 53.32% 53.20% 54.59% 53.48%PNM Resources, Inc. PNM 48.01% 46.68% 46.20% 46.06% 47.58% 46.89% 46.38% 46.01% 46.73%Portland General Electric Company POR 50.51% 50.29% 50.14% 49.80% 50.17% 50.32% 50.28% 49.82% 50.17%Southern Company SO 51.50% 50.31% 49.98% 47.67% 50.14% 49.99% 51.41% 51.10% 50.26%WEC Energy Group, Inc. WEC 58.30% 57.72% 61.62% 54.62% 55.82% 55.48% 54.80% 56.26% 56.83%Xcel Energy Inc. XEL 53.37% 53.63% 54.15% 53.95% 53.93% 54.37% 54.94% 54.37% 54.09%Mean 53.80% 53.25% 53.85% 53.54% 53.95% 53.57% 53.53% 53.59% 53.63%
Operating Company Parent 2018Q3 2018Q2 2018Q1 2017Q4 2017Q3 2017Q2 2017Q1 2016Q4 AverageALLETE (Minnesota Power) ALE 60.43% 60.33% 60.38% 60.04% 59.73% 59.16% 58.71% 56.92% 59.46%Superior Water, Light and Power Company ALE 56.58% 57.34% 65.80% 64.99% 62.33% 62.08% 61.85% 61.12% 61.51%Interstate Power and Light Company LNT 49.64% 50.47% 49.92% 50.31% 51.79% 50.89% 50.23% 50.24% 50.44%Wisconsin Power and Light Company LNT 52.62% 51.52% 49.57% 49.23% 52.39% 51.56% 51.45% 51.22% 51.19%Ameren Illinois Company AEE 53.18% 52.74% 54.24% 53.38% 54.98% 54.55% 54.09% 53.44% 53.82%Union Electric Company AEE 53.26% 51.28% 51.84% 51.92% 52.14% 51.68% 51.45% 51.80% 51.92%Central Maine Power Company AGR 64.17% 63.53% 64.18% 63.82% 63.97% 63.27% 62.84% 62.39% 63.52%New York State Electric & Gas Corporation AGR 53.95% 50.99% 54.51% 53.30% 48.27% 50.24% 49.68% 48.84% 51.22%Rochester Gas and Electric Corporation AGR 48.16% 47.77% 50.80% 49.63% 48.94% 48.46% 55.25% 54.30% 50.42%United Illuminating Company AGR 58.23% 57.43% 56.70% 56.00% 54.35% 52.17% 54.88% 54.26% 55.50%Black Hills Colorado Electric Utility Company, LP BKH 53.04% 54.85% 54.68% 55.69% 54.96% 55.01% 53.08% 52.20% 54.19%Black Hills Power, Inc. BKH 53.51% 53.30% 53.22% 53.49% 56.14% 53.26% 53.24% 52.88% 53.63%Cheyenne Light, Fuel and Power Company BKH 53.04% 53.32% 53.46% 54.01% 53.16% 53.27% 53.29% 53.35% 53.36%Consumers Energy Company CMS 53.01% 52.86% 53.13% 52.25% 53.25% 52.97% 52.10% 51.24% 52.60%DTE Electric Company DTE 49.97% 49.23% 51.12% 51.02% 50.50% 50.63% 50.50% 50.50% 50.43%Duke Energy Carolinas, LLC DUK 52.64% 52.10% 51.70% 52.98% 53.98% 53.49% 53.32% 52.81% 52.88%Duke Energy Florida, LLC DUK 49.65% 48.79% 49.92% 49.25% 49.46% 47.74% 46.95% 50.83% 49.07%Duke Energy Indiana, LLC DUK 52.79% 52.64% 52.54% 51.94% 51.71% 51.89% 52.15% 51.59% 52.16%Duke Energy Kentucky, Inc. DUK 56.58% 55.79% 53.72% 53.11% 50.69% 55.74% 55.43% 54.74% 54.48%Duke Energy Ohio, Inc. DUK 67.73% 67.10% 66.06% 66.24% 65.79% 65.38% 65.36% 66.39% 66.25%Duke Energy Progress, LLC DUK 50.76% 53.22% 52.82% 52.27% 51.06% 53.51% 52.99% 51.58% 52.28%El Paso Electric Company EE 48.57% 47.32% 49.46% 49.95% 49.81% 48.01% 47.48% 47.73% 48.54%Kansas City Power & Light Company EVRG 49.50% 48.88% 49.25% 49.15% 49.42% 48.47% 49.19% 49.61% 49.19%Kansas Gas and Electric Company EVRG 74.91% 74.45% 74.29% 74.18% 74.21% 73.69% 73.49% 73.37% 74.07%KCP&L Greater Missouri Operations Company EVRG 55.70% 52.03% 52.63% 52.40% 55.14% 54.57% 54.22% 54.47% 53.89%Westar Energy (KPL) EVRG 59.34% 58.68% 58.75% 58.74% 58.87% 58.22% 58.10% 59.68% 58.80%Hawaii Electric Light Company, Inc. HE NA NA NA NA NA NA NA NA NAHawaiian Electric Company, Inc. HE 56.09% 55.78% 57.44% 57.42% 58.11% 57.76% 57.71% 57.70% 57.25%Maui Electric Company, Limited HE NA NA NA NA NA NA NA NA NAFlorida Power & Light Company NEE 64.78% 60.84% 61.23% 59.93% 63.00% 62.78% 62.05% 62.65% 62.16%NorthWestern Corporation NWE 48.36% 48.41% 47.48% 49.89% 48.86% 48.61% 48.61% 48.13% 48.54%Oklahoma Gas and Electric Company OGE 53.05% 54.25% 53.59% 53.36% 53.05% 52.75% 53.46% 56.09% 53.70%Otter Tail Power Company OTTR 53.49% 53.11% 52.67% 57.34% 57.24% 55.31% 55.31% 55.06% 54.94%Arizona Public Service Company PNW 53.68% 53.71% 53.18% 53.14% 53.05% 53.32% 53.20% 54.59% 53.48%Public Service Company of New Mexico PNM 48.01% 46.68% 46.20% 46.06% 47.58% 46.89% 46.38% 46.01% 46.73%Portland General Electric Company POR 50.51% 50.29% 50.14% 49.80% 50.17% 50.32% 50.28% 49.82% 50.17%Alabama Power Company SO 48.13% 47.51% 48.86% 47.07% 47.93% 47.25% 47.00% 46.97% 47.59%Georgia Power Company SO 57.27% 54.97% 53.81% 50.06% 50.35% 51.55% 50.36% 51.63% 52.50%Gulf Power Company SO 55.34% 54.90% 54.27% 54.19% 54.97% 54.41% 58.80% 56.16% 55.38%Mississippi Power Company SO 45.28% 43.87% 43.00% 39.34% 47.32% 46.76% 49.50% 49.62% 45.58%Upper Michigan Energy Resources Corporation WEC 55.08% 54.53% 70.04% 49.85% NA NA NA NA 57.37%Wisconsin Electric Power Company WEC 59.25% 59.09% 56.47% 55.94% 55.97% 55.76% 55.58% 56.74% 56.85%Wisconsin Public Service Corporation WEC 60.59% 59.53% 58.35% 58.06% 55.68% 55.21% 54.02% 55.78% 57.15%Northern States Power Company - MN XEL 52.64% 52.61% 52.59% 52.38% 52.22% 52.78% 52.62% 52.31% 52.52%Northern States Power Company - WI XEL 48.45% 53.85% 53.79% 53.36% 55.57% 55.22% 55.66% 54.93% 53.85%Public Service Company of Colorado XEL 56.08% 54.17% 56.67% 56.50% 55.64% 54.88% 57.00% 56.32% 55.91%Southwestern Public Service Company XEL 56.29% 53.88% 53.54% 53.55% 52.29% 54.61% 54.48% 53.93% 54.07%
54.52% 54.00% 54.62% 53.92% 54.23% 54.00% 54.17% 54.13% 54.24%
Source: S&P Global Market Intelligence
% Common Equity
Proxy Group Capital Structure
% Common Equity
Operating Company Capital Structure

Indiana Michigan Power CompanyAttachment RBH-10
Page 2 of 2
Company Ticker 2018Q3 2018Q2 2018Q1 2017Q4 2017Q3 2017Q2 2017Q1 2016Q4 AverageALLETE, Inc. ALE 41.50% 41.16% 36.91% 37.49% 38.97% 39.38% 39.72% 40.98% 39.51%Alliant Energy Corporation LNT 48.87% 49.00% 50.26% 50.23% 47.91% 48.77% 49.16% 49.27% 49.18%Ameren Corporation AEE 46.78% 47.99% 46.96% 47.35% 46.44% 46.89% 47.23% 47.38% 47.13%Avangrid, Inc. AGR 43.87% 45.07% 43.45% 44.31% 46.12% 46.46% 44.34% 45.05% 44.83%Black Hills Corporation BKH 46.80% 46.18% 46.21% 45.60% 45.25% 46.16% 46.80% 47.19% 46.27%CMS Energy Corporation CMS 46.99% 47.14% 46.87% 47.75% 46.75% 47.03% 47.90% 48.76% 47.40%DTE Energy Company DTE 50.03% 50.77% 48.88% 48.98% 49.50% 49.37% 49.50% 49.50% 49.57%Duke Energy Corporation DUK 44.97% 45.06% 45.54% 45.70% 46.22% 45.38% 45.63% 45.34% 45.48%El Paso Electric Company EE 51.43% 52.68% 50.54% 50.05% 50.19% 51.99% 52.52% 52.27% 51.46%Evergy, Inc EVRG 40.14% 41.49% 41.27% 41.38% 40.59% 41.26% 41.25% 40.72% 41.01%Hawaiian Electric Industries, Inc. HE 43.91% 44.22% 42.56% 42.58% 41.89% 42.24% 42.29% 42.30% 42.75%NextEra Energy, Inc. NEE 35.22% 39.16% 38.77% 40.07% 37.00% 37.22% 37.95% 37.35% 37.84%NorthWestern Corporation NWE 51.64% 51.59% 52.52% 50.11% 51.14% 51.39% 51.39% 51.87% 51.46%OGE Energy Corp. OGE 46.95% 45.75% 46.41% 46.64% 46.95% 47.25% 46.54% 43.91% 46.30%Otter Tail Corporation OTTR 46.51% 46.89% 47.33% 42.66% 42.76% 44.69% 44.69% 44.94% 45.06%Pinnacle West Capital Corporation PNW 46.32% 46.29% 46.82% 46.86% 46.95% 46.68% 46.80% 45.41% 46.52%PNM Resources, Inc. PNM 51.99% 53.32% 53.80% 53.94% 52.42% 53.11% 53.62% 53.99% 53.27%Portland General Electric Company POR 49.49% 49.71% 49.86% 50.20% 49.83% 49.68% 49.72% 50.18% 49.83%Southern Company SO 48.50% 49.69% 50.02% 52.33% 49.86% 50.01% 48.59% 48.90% 49.74%WEC Energy Group, Inc. WEC 41.70% 42.28% 38.38% 45.38% 44.18% 44.52% 45.20% 43.74% 43.17%Xcel Energy Inc. XEL 46.63% 46.37% 45.85% 46.05% 46.07% 45.63% 45.06% 45.63% 45.91%Mean 46.20% 46.75% 46.15% 46.46% 46.05% 46.43% 46.47% 46.41% 46.37%
Operating Company Parent 2018Q3 2018Q2 2018Q1 2017Q4 2017Q3 2017Q2 2017Q1 2016Q4 AverageALLETE (Minnesota Power) ALE 39.57% 39.67% 39.62% 39.96% 40.27% 40.84% 41.29% 43.08% 40.54%Superior Water, Light and Power Company ALE 43.42% 42.66% 34.20% 35.01% 37.67% 37.92% 38.15% 38.88% 38.49%Interstate Power and Light Company LNT 50.36% 49.53% 50.08% 49.69% 48.21% 49.11% 49.77% 49.76% 49.56%Wisconsin Power and Light Company LNT 47.38% 48.48% 50.43% 50.77% 47.61% 48.44% 48.55% 48.78% 48.81%Ameren Illinois Company AEE 46.82% 47.26% 45.76% 46.62% 45.02% 45.45% 45.91% 46.56% 46.18%Union Electric Company AEE 46.74% 48.72% 48.16% 48.08% 47.86% 48.32% 48.55% 48.20% 48.08%Central Maine Power Company AGR 35.83% 36.47% 35.82% 36.18% 36.03% 36.73% 37.16% 37.61% 36.48%New York State Electric & Gas Corporation AGR 46.05% 49.01% 45.49% 46.70% 51.73% 49.76% 50.32% 51.16% 48.78%Rochester Gas and Electric Corporation AGR 51.84% 52.23% 49.20% 50.37% 51.06% 51.54% 44.75% 45.70% 49.58%United Illuminating Company AGR 41.77% 42.57% 43.30% 44.00% 45.65% 47.83% 45.12% 45.74% 44.50%Black Hills Colorado Electric Utility Company, LP BKH 46.96% 45.15% 45.32% 44.31% 45.04% 44.99% 46.92% 47.80% 45.81%Black Hills Power, Inc. BKH 46.49% 46.70% 46.78% 46.51% 43.86% 46.74% 46.76% 47.12% 46.37%Cheyenne Light, Fuel and Power Company BKH 46.96% 46.68% 46.54% 45.99% 46.84% 46.73% 46.71% 46.65% 46.64%Consumers Energy Company CMS 46.99% 47.14% 46.87% 47.75% 46.75% 47.03% 47.90% 48.76% 47.40%DTE Electric Company DTE 50.03% 50.77% 48.88% 48.98% 49.50% 49.37% 49.50% 49.50% 49.57%Duke Energy Carolinas, LLC DUK 47.36% 47.90% 48.30% 47.02% 46.02% 46.51% 46.68% 47.19% 47.12%Duke Energy Florida, LLC DUK 50.35% 51.21% 50.08% 50.75% 50.54% 52.26% 53.05% 49.17% 50.93%Duke Energy Indiana, LLC DUK 47.21% 47.36% 47.46% 48.06% 48.29% 48.11% 47.85% 48.41% 47.84%Duke Energy Kentucky, Inc. DUK 43.42% 44.21% 46.28% 46.89% 49.31% 44.26% 44.57% 45.26% 45.52%Duke Energy Ohio, Inc. DUK 32.27% 32.90% 33.94% 33.76% 34.21% 34.62% 34.64% 33.61% 33.75%Duke Energy Progress, LLC DUK 49.24% 46.78% 47.18% 47.73% 48.94% 46.49% 47.01% 48.42% 47.72%El Paso Electric Company EE 51.43% 52.68% 50.54% 50.05% 50.19% 51.99% 52.52% 52.27% 51.46%Kansas City Power & Light Company EVRG 50.50% 51.12% 50.75% 50.85% 50.58% 51.53% 50.81% 50.39% 50.81%Kansas Gas and Electric Company EVRG 25.09% 25.55% 25.71% 25.82% 25.79% 26.31% 26.51% 26.63% 25.93%KCP&L Greater Missouri Operations Company EVRG 44.30% 47.97% 47.37% 47.60% 44.86% 45.43% 45.78% 45.53% 46.11%Westar Energy (KPL) EVRG 40.66% 41.32% 41.25% 41.26% 41.13% 41.78% 41.90% 40.32% 41.20%Hawaii Electric Light Company, Inc. HE NA NA NA NA NA NA NA NA NAHawaiian Electric Company, Inc. HE 43.91% 44.22% 42.56% 42.58% 41.89% 42.24% 42.29% 42.30% 42.75%Maui Electric Company, Limited HE NA NA NA NA NA NA NA NA NAFlorida Power & Light Company NEE 35.22% 39.16% 38.77% 40.07% 37.00% 37.22% 37.95% 37.35% 37.84%NorthWestern Corporation NWE 51.64% 51.59% 52.52% 50.11% 51.14% 51.39% 51.39% 51.87% 51.46%Oklahoma Gas and Electric Company OGE 46.95% 45.75% 46.41% 46.64% 46.95% 47.25% 46.54% 43.91% 46.30%Otter Tail Power Company OTTR 46.51% 46.89% 47.33% 42.66% 42.76% 44.69% 44.69% 44.94% 45.06%Arizona Public Service Company PNW 46.32% 46.29% 46.82% 46.86% 46.95% 46.68% 46.80% 45.41% 46.52%Public Service Company of New Mexico PNM 51.99% 53.32% 53.80% 53.94% 52.42% 53.11% 53.62% 53.99% 53.27%Portland General Electric Company POR 49.49% 49.71% 49.86% 50.20% 49.83% 49.68% 49.72% 50.18% 49.83%Alabama Power Company SO 51.87% 52.49% 51.14% 52.93% 52.07% 52.75% 53.00% 53.03% 52.41%Georgia Power Company SO 42.73% 45.03% 46.19% 49.94% 49.65% 48.45% 49.64% 48.37% 47.50%Gulf Power Company SO 44.66% 45.10% 45.73% 45.81% 45.03% 45.59% 41.20% 43.84% 44.62%Mississippi Power Company SO 54.72% 56.13% 57.00% 60.66% 52.68% 53.24% 50.50% 50.38% 54.42%Upper Michigan Energy Resources Corporation WEC 44.92% 45.47% 29.96% 50.15% NA NA NA NA 42.63%Wisconsin Electric Power Company WEC 40.75% 40.91% 43.53% 44.06% 44.03% 44.24% 44.42% 43.26% 43.15%Wisconsin Public Service Corporation WEC 39.41% 40.47% 41.65% 41.94% 44.32% 44.79% 45.98% 44.22% 42.85%Northern States Power Company - MN XEL 47.36% 47.39% 47.41% 47.62% 47.78% 47.22% 47.38% 47.69% 47.48%Northern States Power Company - WI XEL 51.55% 46.15% 46.21% 46.64% 44.43% 44.78% 44.34% 45.07% 46.15%Public Service Company of Colorado XEL 43.92% 45.83% 43.33% 43.50% 44.36% 45.12% 43.00% 43.68% 44.09%Southwestern Public Service Company XEL 43.71% 46.12% 46.46% 46.45% 47.71% 45.39% 45.52% 46.07% 45.93%Mean 45.48% 46.00% 45.38% 46.08% 45.77% 46.00% 45.83% 45.87% 45.76%
% Long-Term Debt
Proxy Group Capital Structure
% Long-Term Debt
Operating Company Capital Structure

Indiana Michigan Power CompanyAttachment RBH-11
Page 1 of 1
Initial Date of Date of Years to Premiums Net BFV Utility UtilityIssue Offering Offering Maturity Maturity Coupon or Discounts Proceeds Yield Term A-Rated BBB-Rated
Pollution Control Rev. BondsRockport 2002A $50,000,000 6/3/2002 6/1/2025 23 2.75% ($1,091,674) $48,908,326 2.88% 25 7.02% 7.63%Rockport 2009A $50,000,000 3/26/2009 6/1/2025 16 3.05% ($3,499,294) $46,500,706 3.62% 16 6.20% 7.41%Rockport 2009B $50,000,000 3/26/2009 6/1/2025 16 3.05% ($1,580,739) $48,419,261 3.30% 16 6.20% 7.41%Lawrenceburg, 2008 Series H $52,000,000 5/20/2008 11/1/2021 13 2.33% ($3,002,838) $48,997,162 2.85% 13 5.86% 6.49%Rockport Series D $40,000,000 10/13/2003 4/1/2025 21 2.05% ($3,431,712) $36,568,288 2.57% 4 2.37% 2.60%
Senior Unsecured NotesI&M Series H $400,000,000 11/14/2006 3/15/2037 30 6.05% ($22,115,857) $377,884,143 6.47% 30 5.67% 5.97%I&M Series J $250,000,000 3/18/2013 3/15/2023 10 3.20% ($18,437,101) $231,562,899 4.10% 10 2.84% 3.44%I&M Series K $400,000,000 3/3/2016 3/15/2046 30 4.55% ($5,408,755) $394,591,245 4.63% 30 4.08% 4.69%I&M Series L $300,000,000 6/29/2017 7/1/2047 30 3.75% ($5,227,683) $294,772,317 3.85% 30 3.97% 4.30%I&M Series M $350,000,000 5/2/2018 5/15/2028 10 3.85% ($3,967,894) $346,032,106 3.99% 10 3.94% 4.28%I&M Series N $475,000,000 8/8/2018 8/15/2048 30 4.25% ($18,043,146) $456,956,854 4.48% 30 4.24% 4.59%I&M Series O $300,000,000 11/6/2019 11/15/2049 30 4.71% ($3,223,069) $296,776,931 4.78% 31 4.24% 4.59%
Term Loan Facility3-year Term Loan $200,000,000 5/9/2018 5/9/2021 3 4.18% ($508,528) $199,491,472 4.27% 3 1.68% 1.98%
Other DebtFort Wayne Lease $26,802,388 3/1/2010 3/1/2025 15 6.00% 0 $26,802,388 6.00% 15 5.69% 5.75%
A-Rated BBB-Rated
TOTAL $2,943,802,388 Weighted Averages: 4.28% 4.53% 4.19% 4.62%
Notes:Sources: Exhibit A-7 Page 4 and Bloomberg Professional. Weighted average cost of debt does not include underwriting fees or other amortized costs. Bloomberg Fair Value Curve yields are 30-day averages.
Cost of Long-Term Debt Comparison
Bloomberg Fair Value Curve
Bloomberg Fair Value Curve