MAXIM INTEGRATED PRODUCTS, INC. - AnnualReports.com
112
UNITED STATES SECURITIES AND EXCHANGE COMMISSION Washington, D.C. 20549 Form 10-K (Mark One) ☑ ANNUAL REPORT PURSUANT TO SECTION 13 OR 15(d) OF THE SECURITIES EXCHANGE ACT OF 1934 For the fiscal year ended October 30, 2021 OR ☐ TRANSITION REPORT PURSUANT TO SECTION 13 OR 15(d) OF THE SECURITIES EXCHANGE ACT OF 1934 For the transition period from to Commission file number 1-7819 Analog Devices, Inc. (Exact name of registrant as specified in its charter) Massachusetts 04-2348234 (State or other jurisdiction of incorporation or organization) (I.R.S. Employer Identification No.) One Analog Way, Wilmington, MA 01887 (Address of principal executive offices) (Zip Code) (781) 935-5565 (Registrant’s telephone number, including area code) ______________________________ Securities registered pursuant to Section 12(b) of the Act: Title of each class Trading Symbol(s) Name of each exchange on which registered Common Stock $0.16 2/3 par value per share ADI Nasdaq Global Select Market Securities registered pursuant to Section 12(g) of the Act: None Title of Class Indicate by check mark if the registrant is a well-known seasoned issuer, as defined in Rule 405 of the Securities Act. Yes ☑ No ☐ Indicate by check mark if the registrant is not required to file reports pursuant to Section 13 or Section 15(d) of the Act. Yes ☐ No ☑ Indicate by check mark whether the registrant (1) has filed all reports required to be filed by Section 13 or 15(d) of the Securities Exchange Act of 1934 during the preceding 12 months (or for such shorter period that the registrant was required to file such reports), and (2) has been subject to such filing requirements for the past 90 days. Yes ☑ No ☐ Indicate by check mark whether the registrant has submitted electronically every Interactive Data File required to be submitted pursuant to Rule 405 of Regulation S-T (§ 232.405 of this chapter) during the preceding 12 months (or for such shorter period that the registrant was required to submit such files). Yes ☑ No ☐ Indicate by check mark whether the registrant is a large accelerated filer, an accelerated filer, a non-accelerated filer, a smaller reporting company, or an emerging growth company. See the definitions of “large accelerated filer,” “accelerated filer,” “smaller reporting company,” and "emerging growth company" in Rule 12b-2 of the Exchange Act. Large accelerated filer ☑ Accelerated filer ☐ Non-accelerated filer ☐ Smaller reporting company ☐ Emerging growth company ☐ If an emerging growth company, indicate by check mark if the registrant has elected not to use the extended transition period for complying with any new or revised financial accounting standards provided pursuant to Section 13(a) of the Exchange Act. ☐ Indicate by check mark whether the registrant has filed a report on and attestation to its management’s assessment of the effectiveness of its internal control over financial reporting under Section 404(b) of the Sarbanes-Oxley Act (15 U.S.C. 7262(b)) by the registered public accounting firm that prepared or issued its audit report. ☑ Indicate by check mark whether the registrant is a shell company (as defined in Rule 12b-2 of the Act). Yes ☐ No ☑
-
Upload
khangminh22 -
Category
Documents
-
view
3 -
download
0
Transcript of MAXIM INTEGRATED PRODUCTS, INC. - AnnualReports.com

UNITED STATESSECURITIES AND EXCHANGE COMMISSION
Washington, D.C. 20549
Form 10-K(Mark One)
☑ ANNUAL REPORT PURSUANT TO SECTION 13 OR 15(d) OF THE SECURITIES EXCHANGE ACT OF 1934
For the fiscal year ended October 30, 2021OR
☐ TRANSITION REPORT PURSUANT TO SECTION 13 OR 15(d) OF THE SECURITIES EXCHANGE ACT OF 1934
For the transition period from toCommission file number 1-7819
Analog Devices, Inc.(Exact name of registrant as specified in its charter)
Massachusetts 04-2348234(State or other jurisdiction of incorporation or organization) (I.R.S. Employer Identification No.)
One Analog Way, Wilmington, MA 01887(Address of principal executive offices) (Zip Code)
(781) 935-5565(Registrant’s telephone number, including area code)______________________________
Securities registered pursuant to Section 12(b) of the Act:
Title of each class Trading Symbol(s) Name of each exchange on which registeredCommon Stock $0.16 2/3 par value per share ADI Nasdaq Global Select Market
Securities registered pursuant to Section 12(g) of the Act:None
Title of Class
Indicate by check mark if the registrant is a well-known seasoned issuer, as defined in Rule 405 of the Securities Act. Yes☑ No ☐
Indicate by check mark if the registrant is not required to file reports pursuant to Section 13 or Section 15(d) of the Act. Yes☐ No☑Indicate by check mark whether the registrant (1) has filed all reports required to be filed by Section 13 or 15(d) of the Securities
Exchange Act of 1934 during the preceding 12 months (or for such shorter period that the registrant was required to file such reports), and(2) has been subject to such filing requirements for the past 90 days. Yes☑ No ☐
Indicate by check mark whether the registrant has submitted electronically every Interactive Data File required to be submitted pursuantto Rule 405 of Regulation S-T (§ 232.405 of this chapter) during the preceding 12 months (or for such shorter period that the registrant wasrequired to submit such files). Yes☑ No ☐
Indicate by check mark whether the registrant is a large accelerated filer, an accelerated filer, a non-accelerated filer, a smaller reportingcompany, or an emerging growth company. See the definitions of “large accelerated filer,” “accelerated filer,” “smaller reporting company,”and "emerging growth company" in Rule 12b-2 of the Exchange Act.
Large accelerated filer ☑ Accelerated filer ☐
Non-accelerated filer ☐ Smaller reporting company ☐
Emerging growth company ☐
If an emerging growth company, indicate by check mark if the registrant has elected not to use the extended transition period forcomplying with any new or revised financial accounting standards provided pursuant to Section 13(a) of the Exchange Act.☐
Indicate by check mark whether the registrant has filed a report on and attestation to its management’s assessment of the effectiveness ofits internal control over financial reporting under Section 404(b) of the Sarbanes-Oxley Act (15 U.S.C. 7262(b)) by the registered publicaccounting firm that prepared or issued its audit report. ☑
Indicate by check mark whether the registrant is a shell company (as defined in Rule 12b-2 of the Act). Yes☐ No☑

The aggregate market value of the voting and non-voting common equity held by non-affiliates of the registrant was approximately$42,211,000,000 based on the last reported sale of the Common Stock on The Nasdaq Global Select Market on April 30, 2021. Shares ofvoting and non-voting stock beneficially owned by executive officers, directors and holders of more than 5% of the outstanding stock havebeen excluded from this calculation because such persons or institutions may be deemed affiliates. This determination of affiliate status is nota conclusive determination for other purposes.
As of October 30, 2021, there were 525,330,672 shares of Common Stock, $0.16 2/3 par value per share, outstanding.Documents Incorporated by Reference
Document Description Form 10-K Part
Portions of the Registrant’s Proxy Statement for the Annual Meeting of Shareholders to be held March 9, 2022 III
TABLE OF CONTENTSNote about Forward-Looking Statements . . . . . . . . . . . . . . . . . . . . . . . . . . . . . . . . . . . . . . . . . . . . . . . . . . . . . . . . . . . . . . . 1PART I . . . . . . . . . . . . . . . . . . . . . . . . . . . . . . . . . . . . . . . . . . . . . . . . . . . . . . . . . . . . . . . . . . . . . . . . . . . . . . . . . . . . . . . . . . 2
Item 1. Business . . . . . . . . . . . . . . . . . . . . . . . . . . . . . . . . . . . . . . . . . . . . . . . . . . . . . . . . . . . . . . . . . . . . . . . . . . . . . . . 2Item 1A. Risk Factors . . . . . . . . . . . . . . . . . . . . . . . . . . . . . . . . . . . . . . . . . . . . . . . . . . . . . . . . . . . . . . . . . . . . . . . . . . . 11Item 1B. Unresolved Staff Comments . . . . . . . . . . . . . . . . . . . . . . . . . . . . . . . . . . . . . . . . . . . . . . . . . . . . . . . . . . . . . . 22Item 2. Properties . . . . . . . . . . . . . . . . . . . . . . . . . . . . . . . . . . . . . . . . . . . . . . . . . . . . . . . . . . . . . . . . . . . . . . . . . . . . . . 23Item 3. Legal Proceedings . . . . . . . . . . . . . . . . . . . . . . . . . . . . . . . . . . . . . . . . . . . . . . . . . . . . . . . . . . . . . . . . . . . . . . . . 24Item 4. Mine Safety Disclosures . . . . . . . . . . . . . . . . . . . . . . . . . . . . . . . . . . . . . . . . . . . . . . . . . . . . . . . . . . . . . . . . . . . 24
Information About our Executive Officers . . . . . . . . . . . . . . . . . . . . . . . . . . . . . . . . . . . . . . . . . . . . . . . . . . . . . . . . . . . . . . . 25PART II . . . . . . . . . . . . . . . . . . . . . . . . . . . . . . . . . . . . . . . . . . . . . . . . . . . . . . . . . . . . . . . . . . . . . . . . . . . . . . . . . . . . . . . . . 26
Item 5. Market for Registrant's Common Equity, Related Stockholder Matters and Issuer Purchases of EquitySecurities . . . . . . . . . . . . . . . . . . . . . . . . . . . . . . . . . . . . . . . . . . . . . . . . . . . . . . . . . . . . . . . . . . . . . . . . . . . . . . . . . . . . . 26Item 6. Reserved . . . . . . . . . . . . . . . . . . . . . . . . . . . . . . . . . . . . . . . . . . . . . . . . . . . . . . . . . . . . . . . . . . . . . . . . . . . . . . . 27Item 7. Management's Discussion and Analysis of Financial Condition and Results of Operations . . . . . . . . . . . . . . . 28Item 7A. Quantitative and Qualitative Disclosures about Market Risk . . . . . . . . . . . . . . . . . . . . . . . . . . . . . . . . . . . . . 41Report of Independent Registered Public Accounting Firm . . . . . . . . . . . . . . . . . . . . . . . . . . . . . . . . . . . . . . . . . . . . . . 43Item 8. Financial Statements and Supplementary Data . . . . . . . . . . . . . . . . . . . . . . . . . . . . . . . . . . . . . . . . . . . . . . . . . . 45
Consolidated Statements of Income . . . . . . . . . . . . . . . . . . . . . . . . . . . . . . . . . . . . . . . . . . . . . . . . . . . . . . . . . . . . . 45Consolidated Statements of Comprehensive Income . . . . . . . . . . . . . . . . . . . . . . . . . . . . . . . . . . . . . . . . . . . . . . . . 46Consolidated Balance Sheets . . . . . . . . . . . . . . . . . . . . . . . . . . . . . . . . . . . . . . . . . . . . . . . . . . . . . . . . . . . . . . . . . . 47Consolidated Statements of Shareholders' Equity . . . . . . . . . . . . . . . . . . . . . . . . . . . . . . . . . . . . . . . . . . . . . . . . . . 48Consolidated Statements of Cash Flows . . . . . . . . . . . . . . . . . . . . . . . . . . . . . . . . . . . . . . . . . . . . . . . . . . . . . . . . . 49Notes to Consolidated Financial Statements . . . . . . . . . . . . . . . . . . . . . . . . . . . . . . . . . . . . . . . . . . . . . . . . . . . . . . 50
Item 9. Changes in and Disagreements with Accountants on Accounting and Financial Disclosure . . . . . . . . . . . . . . . 88Item 9A. Controls and Procedures . . . . . . . . . . . . . . . . . . . . . . . . . . . . . . . . . . . . . . . . . . . . . . . . . . . . . . . . . . . . . . . . . 88Item 9B. Other Information . . . . . . . . . . . . . . . . . . . . . . . . . . . . . . . . . . . . . . . . . . . . . . . . . . . . . . . . . . . . . . . . . . . . . . . 90Item 9C. Disclosure Regarding Foreign Jurisdictions That Prevent Inspections . . . . . . . . . . . . . . . . . . . . . . . . . . . . . . 90
PART III . . . . . . . . . . . . . . . . . . . . . . . . . . . . . . . . . . . . . . . . . . . . . . . . . . . . . . . . . . . . . . . . . . . . . . . . . . . . . . . . . . . . . . . . . 91Item 10. Directors, Executive Officers and Corporate Governance . . . . . . . . . . . . . . . . . . . . . . . . . . . . . . . . . . . . . . . . 91Item 11. Executive Compensation . . . . . . . . . . . . . . . . . . . . . . . . . . . . . . . . . . . . . . . . . . . . . . . . . . . . . . . . . . . . . . . . . 91Item 12. Security Ownership of Certain Beneficial Owners and Management and Related Stockholder Matters . . . . . 91Item 13. Certain Relationships and Related Transactions, and Director Independence . . . . . . . . . . . . . . . . . . . . . . . . . 91Item 14. Principal Accounting Fees and Services . . . . . . . . . . . . . . . . . . . . . . . . . . . . . . . . . . . . . . . . . . . . . . . . . . . . . . 91
PART IV . . . . . . . . . . . . . . . . . . . . . . . . . . . . . . . . . . . . . . . . . . . . . . . . . . . . . . . . . . . . . . . . . . . . . . . . . . . . . . . . . . . . . . . . . 92Item 15. Exhibits and Financial Statement Schedules . . . . . . . . . . . . . . . . . . . . . . . . . . . . . . . . . . . . . . . . . . . . . . . . . . 92Schedule II - Valuation and Qualifying Accounts . . . . . . . . . . . . . . . . . . . . . . . . . . . . . . . . . . . . . . . . . . . . . . . . . . . . . 98Item 16. Form 10-K Summary . . . . . . . . . . . . . . . . . . . . . . . . . . . . . . . . . . . . . . . . . . . . . . . . . . . . . . . . . . . . . . . . . . . . 99
Signatures . . . . . . . . . . . . . . . . . . . . . . . . . . . . . . . . . . . . . . . . . . . . . . . . . . . . . . . . . . . . . . . . . . . . . . . . . . . . . . . . . . . . . . . . 100


Note About Forward-Looking Statements
This Annual Report on Form 10-K, including “Management’s Discussion and Analysis of Financial Condition andResults of Operations,” contains forward-looking statements regarding future events and our future results that are subject to thesafe harbor created under the Private Securities Litigation Reform Act of 1995 and other safe harbors under the Securities Actof 1933 and the Securities Exchange Act of 1934. All statements other than statements of historical fact are statements thatcould be deemed forward-looking statements. These statements are based on current expectations, estimates, forecasts, andprojections about the industries in which we operate and the beliefs and assumptions of our management. Words such as“expects,” “anticipates,” “targets,” “goals,” “projects,” “intends,” “plans,” “believes,” “seeks,” “estimates,” “continues,” “may,”“could” and “will,” and variations of such words and similar expressions are intended to identify such forward-lookingstatements. In addition, any statements that refer to projections regarding our future financial performance; our anticipatedgrowth and trends in our businesses; our future liquidity, capital needs and capital expenditures; the impact of the COVID-19pandemic on our business, financial condition and results of operations; our future market position and expected competitivechanges in the marketplace for our products; our ability to pay dividends or repurchase stock; our ability to service ouroutstanding debt; our expected tax rate; the effect of changes in or the application of new or revised tax laws; expected costsavings; the effect of new accounting pronouncements; our ability to successfully integrate acquired businesses andtechnologies, including the acquired business, operations and employees of Maxim Integrated Products, Inc.; and othercharacterizations of future events or circumstances are forward-looking statements. Readers are cautioned that these forward-looking statements are only predictions and are subject to risks, uncertainties, and assumptions that are difficult to predict,including those identified in Part I, Item 1A. "Risk Factors" and elsewhere in this Annual Report on Form 10-K. Therefore,actual results may differ materially and adversely from those expressed in any forward-looking statements. We undertake noobligation to revise or update any forward-looking statements, including to reflect events or circumstances occurring after thedate of the filing of this report, except to the extent required by law.
1

PART I
ITEM 1. BUSINESS
Company Overview, Strategy and Mission
Analog Devices, Inc. (we, Analog Devices or the Company) is a leading global high-performance semiconductorcompany dedicated to solving our customers' most complex engineering challenges. We play a critical role at the intersection ofthe physical and digital world by providing the building blocks to sense, measure, interpret, connect and power. We design,manufacture, test and market a broad portfolio of solutions, including integrated circuits (ICs), software and subsystems thatleverage high-performance analog, mixed-signal and digital signal processing technologies. Our comprehensive productportfolio, deep domain expertise and advanced manufacturing capabilities extend across high-performance precision and high-speed mixed-signal, power management and processing technologies – including data converters, amplifiers, powermanagement, radio frequency (RF) ICs, edge processors and other sensors.
The Third Wave of Information and Communications Technology, as we refer to it at Analog Devices, is characterizedby ubiquitous sensing, hyper-scale and edge computing and pervasive connectivity. These technological trends are driving acontinuous evolution of new generations of applications that are increasing the demand for Analog Devices’ high-performanceanalog, mixed-signal, power and RF ICs. We have positioned our business to capitalize on the secular growth opportunitiesacross our markets and to deliver innovative solutions. Central to our strategy is our focus on challenges that our customershave across the most impactful application areas. That is built around the following three key priorities, which will continue todrive our long-term success:
• Efficient use of capital. Research and development (R&D) is critical to continue our cycle of innovation-drivensuccess. We target the most attractive opportunities, particularly across our business-to-business (B2B) marketsincluding Industrial, Automotive and Communications. We are also deeply committed to extracting value from ourrecent acquisitions to complement our R&D and drive long-term value creation. Through the development of cutting-edge innovations and our ability to solve difficult problems across a broad array of applications, we generatesignificant cash flow and are deeply committed to delivering strong shareholder returns.
• Deepening customer-centricity.We possess a broad range of product portfolios, applications expertise, andmanufacturing capabilities in high-performance power management and precision and high-speed signal processingtechnologies. At the same time, our engineering talent continues to be an important competitive differentiator in thesemiconductor space. We strive to be the destination for the world's best engineering talent with a team of more than11,000 engineers. Together, our products and our engineering talent enable us to partner with our customers,leveraging our analog domain expertise and receiving the full benefit of our technology capabilities to developcomplete and innovative solutions.
• Capitalizing on secular trends.We are positioned to capitalize on important secular growth trends, includingIndustry 4.0, 5G communications networks, data center connectivity, electric vehicles, in-cabin experience, digitalhealthcare and space, as we are well-aligned with the key B2B markets driving this increase in data and we willcontinue to be a critical partner in the collection, creation and communication of our customers’ edge data.
In addition to driving organic growth, our strategy involves expansion through the acquisition of businesses, assets ortechnologies that allow us to complement our existing product offerings, expand our market coverage, increase our engineeringtalent or enhance our technological capabilities. For example, we have executed on this strategy through:
• the acquisition of Hittite Microwave Corporation in the fiscal year ended November 1, 2014, which strengthened ourmarket leadership in high-performance RF and broadened our portfolio across the entire frequency spectrum from DCto 100 gigahertz;
• the acquisition of Linear Technology Corporation (Linear) in the fiscal year ended October 28, 2017, which addedhigh-performance power management and additional precision signal processing to our portfolio, expanding anddiversifying our offerings to deliver more complete solutions; and
• the acquisition of Maxim Integrated Products, Inc. (Maxim) completed on August 26, 2021 and further describedbelow, which strengthens our position as a high-performance analog semiconductor company.
We were incorporated in Massachusetts in 1965 with our corporate headquarters near Boston in Wilmington,Massachusetts. We have manufacturing facilities primarily in the United States, Ireland and Southeast Asia. Our commonstock is listed on the Nasdaq Global Select Market under the symbol ADI and is included in the Standard & Poor’s 500 Index.
2

Acquisition of Maxim Integrated Products, Inc.
On August 26, 2021 (Acquisition Date), we completed the acquisition of Maxim, an independent manufacturer ofinnovative analog and mixed-signal products and technologies. Pursuant to the Agreement and Plan of Merger, dated as of July12, 2020 (the Merger Agreement), Maxim stockholders received, for each outstanding share of Maxim common stock, 0.6300of a share of the Company’s common stock as of the Acquisition Date, for total consideration of approximately $28.0 billion ofour common stock. The acquisition of Maxim is referred to as the Acquisition.
Available Information
We maintain a website with the address www.analog.com. We are not including the information contained on our websiteas a part of, or incorporating it by reference into, this Annual Report on Form 10-K. We make available free of charge throughour website our Annual Reports on Form 10-K, Quarterly Reports on Form 10-Q and Current Reports on Form 8-K (includingexhibits), and amendments to these reports, as soon as reasonably practicable after we electronically file such material with, orfurnish such material to, the Securities and Exchange Commission (SEC). We also make available on our website our by-laws,corporate governance guidelines, the charters for our audit committee, compensation committee, and nominating and corporategovernance committee, our equity award granting policies, our code of business conduct and ethics which applies to ourdirectors, officers and employees, and our related person transaction policy, and such information is available in print and freeof charge to any shareholder of Analog Devices who requests it. In addition, we intend to disclose on our website anyamendments to, or waivers from, our code of business conduct and ethics that are required to be publicly disclosed pursuant torules of the SEC or Nasdaq.
Products
Semiconductor components are the building blocks used in electronic systems and equipment. These components areclassified as either discrete devices, such as individual transistors, or as ICs, in which a number of transistors and otherelements are combined to form a more complicated electronic circuit.
Our ICs are designed to address a wide range of real-world signal processing applications. We sell our ICs to customersworldwide, many of whom use products spanning our core technologies in a wide range of applications. Our IC productportfolio includes both general-purpose products used by a broad range of customers and applications, as well as application-specific products designed for specific target markets. By using readily available, high-performance, general-purpose productsin their systems, our customers can reduce the time they need to bring new products to market. Given the high cost ofdeveloping more customized ICs, our standard products often provide a cost-effective solution for many low to medium volumeapplications. More specifically, our analog ICs monitor, condition, amplify or transform continuous analog signals associatedwith physical properties, such as temperature, pressure, weight, light, sound or motion, and play an important role in bridgingreal world phenomena to a variety of electronic systems. Analog ICs also provide voltage regulation and power control toelectronic systems.
We also focus on working with leading customers to design application-specific solutions. We begin with our existingcore technologies, which leverage our analog and mixed signal, power management, RF and microwave, edge processors andother sensors, and devise solutions that more closely meet the needs of a specific customer or group of customers. Because wehave already developed the core technology platform for our general-purpose products, we can create application-specificsolutions quickly and efficiently.
Our analog and mixed-signal IC technology has been the foundation of our business for over five decades, and we are oneof the world’s largest suppliers of high-performance analog ICs. Our analog signal processing ICs are primarily high-performance devices, offering higher dynamic range, greater bandwidth, and other enhanced features. We believe that theprincipal advantages these products have as compared to competitors’ products include higher accuracy, higher speed, lowercost per function, smaller size, lower power consumption and fewer components, resulting in improved performance andreliability. Our product portfolio includes several thousand analog ICs, many of which can have several hundred end customers.Our analog ICs typically have long product life cycles. Our customers include original equipment manufacturers (OEMs) andcustomers who build electronic subsystems for integration into larger systems.
Our product offerings include more than 75,000 stock keeping units (SKUs) that can be aggregated into the followinggeneral categories:
• Analog and Mixed Signal—We are a leading supplier of data converter products. Data converters translate real-worldanalog signals into digital data and also translate digital data into analog signals. Data converters remain our largestand most diverse product family and an area where we are continuously innovating to enable our customers to redefineand differentiate their products. Our converter products combine sampling rates and accuracy with the low noise,power, price and small package size required by industrial, automotive, consumer, and communications electronics.
3

• Power Management & Reference—Power management and reference products, which include functions such as powerconversion, driver monitoring, sequencing and energy management, provide efficient solutions for power managementand conversion applications in the automotive, communications, industrial and high-end consumer markets. Our high-performance power ICs include powerful performance, integration and software design simulation tools to provide fastand accurate power supply designs.
• Amplifiers/Radio Frequency (RF) and Microwave—We are also a leading supplier of high-performance amplifierswhich are used to condition analog signals. High performance amplifiers emphasize the performance dimensions ofspeed and precision. Within this product portfolio we provide precision, instrumentation, high speed, intermediatefrequency/RF/microwave, broadband, and other amplifiers. Our analog product line also includes a broad portfolio ofhigh-performance RF and microwave ICs covering the entire RF signal chain. Our high-performance RF andmicrowave ICs support the high-performance requirements of cellular infrastructure and a broad range of applicationsin our target markets, including instrumentation, aerospace and automotive.
• Sensors & Actuators—Our analog technology portfolio is comprised of sensor and actuator products, includingproducts based on MEMS technology. MEMS technology enables us to build extremely small sensors that incorporatean electromechanical structure and the supporting analog circuitry for conditioning signals obtained from the sensingelement. Our MEMS product portfolio includes accelerometers used to sense acceleration, gyroscopes used to senserotation, inertial measurement units used to sense multiple degrees of freedom combining multiple sensing types alongmultiple axes, and broadband switches suitable for radio and instrument systems. We offer other high-performancesensors, from temperature to magnetic fields, that are deployed in a variety of systems. In addition to sensor products,our other analog product category includes isolators that enable designers to implement isolation in designs without thecost, size, power, performance, and reliability constraints found with optocouplers.
• Digital Signal Processing and System Products (DSPs)—DSPs are optimized for high-speed numeric calculations,which are essential for instantaneous, or real-time, processing of digital data generated, in most cases, from analog todigital signal conversion. Our DSPs are designed to be fully programmable and to efficiently execute specializedsoftware programs, or algorithms, associated with processing digitized real-time, real-world data. Programmable DSPsare designed to provide the flexibility to modify the device’s function quickly and inexpensively using software. Ourgeneral-purpose DSP IC customers typically write their own algorithms using software development tools provided byus and third-party suppliers. Our DSPs are designed in families of products that share common architectures andtherefore can execute the same software across a range of products.
Sales Channel
We sell our products globally through a direct sales force, third-party distributors, independent sales representatives andvia our website. We have direct sales offices, sales representatives and/or distributors in over 50 countries. We support ourworldwide sales efforts through our website and with extensive promotional programs that include editorial coverage and paidadvertising in online and printed trade publications, webinars, social media and communities, promotional and training videos,direct mail programs, technical seminars and participation in trade shows. We publish, share and distribute technical contentsuch as data sheets, application guides and catalogs. We maintain a staff of field application engineers who aid customers inincorporating our products into their products. In addition, we offer a variety of web-based tools that ease product selection andaid in the design process for our customers.
We believe distributors provide a cost-effective means of reaching a broad range of customers while providing efficientlogistics services. From time to time, we may add or terminate distributors in specific geographies, or move customers to adirect support or fulfillment model as we deem appropriate given our strategies, the level of distributor business activity anddistributor performance and financial condition.
These distributors typically maintain an inventory of our products. Some of them also sell products that compete with ourproducts, including those for which we are an alternate source. We make sales to distributors under agreements that allowcertain distributors to receive price adjustment credits and to return qualifying products for credit, as determined by us, in orderto reduce the amounts of slow-moving, discontinued or obsolete product from their inventory. These agreements limit suchreturns to a certain percentage of our shipments to that distributor during the prior quarter. In addition, certain distributors areallowed to return unsold products if we terminate the relationship with the distributor. Additional information relating to ourrevenue and customer concentration is set forth in Note 2l, Concentrations of Risk; Note 2n, Revenue Recognition; and Note 4,Industry, Segment and Geographic Information, of the Notes to Consolidated Financial Statements contained in Part II, Item 8of this Annual Report on Form 10-K.
We typically do not have long-term sales contracts with our customers. In some of our markets where end-user demandmay be particularly volatile and difficult to predict, some customers place orders that require us to manufacture product andhave it available for shipment, even though the customer is unwilling to make a binding commitment to purchase all, or even
4

any, of the product. In other instances, we manufacture product based on forecasts of customer demand. As a result, we mayincur inventory and manufacturing costs in advance of anticipated sales and are subject to the risk of cancellation of ordersleading to a sharp reduction of sales and backlog. Further, those orders or forecasts may be for products that meet thecustomer’s unique requirements so that those canceled orders would, in addition, result in an inventory of unsaleable products,resulting in potential inventory write-offs. As a result of lengthy manufacturing cycles for some of our products that are subjectto these uncertainties, the amount of unsaleable product could be substantial.
Markets
The breakdown of our annual revenue by end market is set out in the table below:
End Market*Percent of Fiscal2021 Revenue
Percent of Fiscal2020 Revenue
Percent of Fiscal2019 Revenue
Industrial 55% 54 % 50 %Automotive 17% 14 % 16 %Communications 16% 21 % 22 %Consumer 12% 11 % 13 %
*The sum of the individual percentages may not equal 100% due to rounding.
The following describes some of the characteristics of, and customer products within, our major end markets ofIndustrial, Automotive, Communications and Consumer:
Industrial—Our industrial market includes the following sectors:
Industrial Automation—We are a leader in industrial automation because we deliver robust, high performance solutionsthat impact our planet and people—from our deep motion and process control expertise and precision sensing measurement andinterpretation, to expansive connectivity and power capabilities. We take real-world phenomena in the most complexenvironments on the factory floor, and translate it into valuable insights and outcomes. We co-create with customers to architectrobotics systems and solutions that improve dynamic behavior and precision while enhancing worker safety, machine health,and manufacturing flexibility—delivering energy efficiency and sustainability. Our industrial automation market includesapplications such as:• Condition-based monitoring (CbM) • Industrial power supplies• Industrial robotics • Industrial motion control• Factory and process control
Instrumentation & Measurement—Advances in wireless communication technology, autonomous vehicles, energystorage, human machine interfaces and cloud-connected sensors that help form the Internet of Things are driving the demandfor faster and more precise measurement capabilities in smaller form-factors. Our semiconductors and advanced packagingtechnologies form the foundation of next-generation electronic test and measurement solutions for measuring the electricalparameters in applications such as these, enabling the research, development and production of future electronic systems. Inaddition, our ICs have set the standard for precision in battery formation and test, which is critical for ensuring battery qualityand safety in electric vehicles. Our instrumentation and measurement market includes applications such as:• Automated test equipment • Battery formation and test• Weigh scales • Chemical analysis and analytical instruments
Aerospace/Defense— The defense, commercial avionics and space markets all require high-performance ICs that meetrigorous environmental and reliability specifications. Many of our ICs can be supplied in versions that meet these standards. Inaddition, many products can be supplied to meet the standards required for broadcast satellites and other commercial spaceapplications. Most of our products sold in this market are specially tested versions of products derived from our standardproduct offering. As end systems are becoming more complex, many of our customers in this market also look for us to providehigher levels of integration in order to minimize size, weight and power and to improve ease-of-use. As such, we also sellproducts in the form of SiPs (system in package), printed circuit board assemblies, modules, and subsystems. Customerproducts include applications such as:• Navigation systems • Radar systems• Space and satellite communications • Security devices• Communication systems • Electronic surveillance and countermeasures
5

Healthcare— The healthcare market is evolving in response to the need for increased access to better and moreaffordable care, as well as a growing focus on preventative healthcare and the need to better manage chronic conditions. Tohelp achieve this, we are collaborating with customers and partners on innovative solutions that are designed to achieve betteroutcomes for patients and physicians at reduced costs for all. Our offerings include both standard and application-specificproducts and are used in applications such as:• Ultrasound systems • Anesthesia equipment• X-Ray equipment (CT and DR) • Lab diagnostic equipment• Image guided therapy • Surgical tools and instruments• Multi-parameter vital signs monitors • Blood analyzers• Remote patient monitoring • Point-of-care diagnostics
Energy Management— The global drive towards improved energy efficiency, conservation, reliability and cleanliness isdriving investments in electrification across many different application areas, including electric vehicle charging infrastructure,renewable energy, power transmission and distribution systems, electric meters and other innovative areas. The commoncharacteristic behind these efforts is the addition of sensing, measurement and communication technologies to electricalinfrastructure. Our offerings include both standard and application-specific products and are used in applications such as:• Utility meters • Wind turbines• Electric vehicle charging infrastructure • Solar inverters• Substation relays and automation equipment • Building energy automation/control
Automotive - We develop differentiated high-performance signal processing solutions, which enable sophisticatedtransportation systems that span Infotainment, Electrification and Autonomous applications. Through collaboration withmanufacturers worldwide, we have developed a broad portfolio of analog, digital, power and sensor ICs that address theemerging needs of this evolving industry. Our focus is on audio/video applications that lead to an enriched in-cabin experience,electrification applications that improve vehicle range and reduce emissions, and mission-critical perception and navigationapplications that enable vehicles to more clearly sense the external environment. Specifically, we have developed products usedin applications such as:• Car audio, voice processing and connectivity • Battery monitoring and management systems• Video processing and connectivity
Communications— The development of broadband, wireless and internet infrastructures around the world has createdan important market for our communications products. Communications technology involves the processing of signals that areconverted from analog to digital and digital to analog form during the process of transmitting and receiving data. The need forhigher speed and reduced power consumption, coupled with more reliable, bandwidth-efficient communications, createsdemand for our products, which are used in the full spectrum of signal processing for data, video, voice and machine-to-machine communications. In wireless and wireline communication applications, our products are incorporated into:• Cellular base station equipment • Satellite and terrestrial broadband access equipment• Microwave backhaul systems • Optical and cable networking equipment for data center
and carrier providers• Data centers & data storage
Consumer— To address the market demand for state of the art personal and professional entertainment systems and theconsumer demand for high quality user interfaces, music, movies and photographs, we have developed analog, digital andmixed-signal solutions that meet the rigorous cost and time-to-market requirements of the consumer electronics market. Theemergence of high-performance, feature-rich consumer products has created a market for our high-performance ICs with a highlevel of specific functionality that enables best in class user experience. These products include:• Portable devices (smart phones, tablets and wearabledevices) for media and vital signs monitoring applications
• Prosumer audio/video equipment
See Note 4, Industry, Segment and Geographic Information, of the Notes to Consolidated Financial Statements containedin Part II, Item 8 of this Annual Report on Form 10-K for further information about our products by end market.
Competition
We believe that competitive performance in the marketplace for signal processing products depends upon multiplefactors, including technological innovation, strength of brand, diversity of product portfolio, product performance, technicalsupport, delivery capabilities, customer service quality, reliability and price, with the relative importance of these factors
6

varying among products, markets, and customers. We compete with a number of semiconductor companies in markets that arehighly competitive. Many companies have sufficient financial, manufacturing, technical, sales and marketing resources todevelop and market products that compete with our products. Some of our competitors may have more advantageous supply ordevelopment relationships with our current and potential customers or suppliers. Our competitors also include both emergingcompanies selling specialized products in markets we serve and companies outside of the U.S., including entities associatedwith well-funded efforts by foreign governments to create indigenous semiconductor industries.
Our competitors include but are not limited to:• Broadcom Inc. • Monolithic Power Systems, Inc.• Infineon Technologies AG • NXP Semiconductors N.V.• Microchip Technology Incorporated • Qorvo, Inc.• STMicroelectronics N.V. • Texas Instruments Incorporated• Xilinx, Inc.
We believe that our technical innovation emphasizing product performance and reliability, supported by our commitmentto strong customer service and technical support, enables us to make a fundamental difference to our customers’competitiveness in our chosen markets.
Seasonality
Our sales are subject to a varying degree of seasonality. Historically, sales to customers during our first fiscal quartermay be lower than other quarters due to plant shutdowns at some of our customers during the holiday season. In general, theseasonality for any specific period of time has not had a material impact on our results of operations. In addition, as explainedin our risk factors contained in Item 1A of this Annual Report on Form 10-K, our revenue is more likely to be influenced on aquarter to quarter basis by cyclicality in the semiconductor industry.
We believe that a number of factors should be used to assess future customer demand, including backlog, macroeconomictrends, customer insights and current customer bookings as compared to billings (book-to-bill) ratio. We define backlog tomean firm orders from a customer or distributor with a requested delivery date within thirteen weeks. However, backlog may beimpacted by the tendency of customers to rely on shorter lead times available from suppliers, including us, in periods ofdepressed demand. In periods of increased demand, there is a tendency towards longer lead times that has the effect ofincreasing backlog and, in some instances, we may not have manufacturing capacity sufficient to fulfill all orders. Recently, wehave experienced increased demand within the semiconductor industry leading to a constrained supply environment which webelieve will continue in the near term. We have added manufacturing capacity to address some of the increased demand and wehave also required customers to commit to orders for up to a twenty week period prior to shipment to give us better visibilityinto the backlog. Outside of the commitments window noted above, as is customary in the semiconductor industry, we allowmost orders to be canceled or deliveries to be delayed by customers without significant penalty, while also allowing certaindistributors to receive price adjustment credits and to return qualifying products for credit, as determined by us, in order toreduce the amounts of slow-moving, discontinued or obsolete product from their inventory.
Production Resources
Monolithic IC components are manufactured in a sequence of semiconductor production steps that include waferfabrication, wafer testing, dicing the wafer into individual “chips,” or dice, assembly of the dice into packages and electricaltesting of the devices in final packaged form. The raw materials used to manufacture these devices include silicon wafers,processing chemicals (including liquefied gases), precious metals laminates, ceramic and plastic used for packaging. Weutilize, develop and employ a wide variety of manufacturing processes, primarily based on bipolar and complementary metal-oxide semiconductor (CMOS) transistors, which are specifically tailored for use in fabricating high-performance analog, DSPand mixed-signal ICs. Devices such as MEMS, iCoupler® isolators and various sensors are fabricated using specializedprocesses, which typically use substantially similar equipment as bipolar and CMOS processes.
Our IC products are fabricated on proprietary processes at our internal production facilities in Wilmington,Massachusetts; Camas, Washington; Beaverton, Oregon; and Limerick, Ireland and also on a mix of proprietary and non-proprietary processes at third-party wafer fabricators. We currently source approximately half of our wafer requirementsannually internally and the remaining from third-party wafer fabrication foundries, such as Taiwan SemiconductorManufacturing Company (TSMC) and others, typically where deep-submicron lithography capabilities and/or largemanufacturing capacity is required. In addition, we operate an assembly and wafer sort facility in Penang, Malaysia, and testfacilities in the Philippines and Thailand. We also make extensive use of third-party subcontractors for the assembly and testingof our products.
7

Our products require a wide variety of components, raw materials and external foundry services, most of which wepurchase from third-party suppliers. We have multiple sources for many of the components and materials that we purchase andincorporate into our products. If any of our key suppliers are unable or unwilling to manufacture and deliver sufficientquantities of components to us on the time schedule and of the quality that we require, we may be forced to seek to engageadditional or replacement suppliers, which could result in significant expenses and disruptions or delays in manufacturing,product development and shipment of product to our customers. Given the current demand environment in the semiconductorindustry, we expect to face a constrained supply environment in the near term. We are working to balance these constraints aswe shift our global resources and add capacity where appropriate.
Patents and Intellectual Property Rights
We seek to establish and maintain our proprietary rights in our technology and products through the use of patents,copyrights, mask works, trademarks and trade secrets. We have a program to file applications for and obtain patents,copyrights, mask works and trademarks in the United States and in selected foreign countries where we believe filing for suchprotection is appropriate. We also seek to maintain our trade secrets and confidential information by nondisclosure policies andthrough the use of appropriate confidentiality agreements. We have obtained a substantial number of patents and trademarks inthe United States and in other countries. As of October 30, 2021, we held approximately 4,700 U.S. patents and approximately400 published pending U.S. patent applications with expiration dates ranging from 2021 through 2041. There can be noassurance, however, that the rights obtained can be successfully enforced against infringing products in every jurisdiction.While our patents, copyrights, mask works, trademarks and trade secrets provide some advantage and protection, we believeour competitive position and future success is largely determined by such factors as the system and application knowledge,innovative skills, technological expertise and management ability and experience of our personnel; the range and success ofnew products being developed by us; our market brand recognition and ongoing marketing efforts; and customer service andtechnical support. It is generally our policy to seek patent protection for significant inventions that may be patented, though wemay elect, in certain cases, not to seek patent protection even for significant inventions, if we determine other protection, suchas maintaining the invention as a trade secret, to be more advantageous. We also have trademarks that are used in the conduct ofour business to distinguish genuine Analog Devices products, and we maintain cooperative advertising programs to promoteour brands and identify products containing genuine Analog Devices components.
Environmental, Health and Safety Compliance
We are committed to protecting the environment and the health and safety of our employees, customers and the public.We endeavor to adhere to applicable environmental, health and safety (EHS) regulatory and industry standards across all of ourfacilities, and to encourage pollution prevention, reduce our water and energy consumption, reduce waste generation, and strivetowards continual improvement. We strive to achieve excellence in EHS management practices as an integral part of our totalquality management system.
Our EHS management systems in all of our facilities are certified to ISO 14001:2015 for environmental management, andall of our facilities conform to ISO 45001 for occupational health and safety. Our industrial hygiene surveillance programminimizes and prevents exposures in the workplace and reduces the risk of specific diseases. We use two industry standardmetrics to assess injury performance and trends worldwide. Legacy Analog Devices' sites have ISO 45001 health and safetycertification, with the exception of one site from the acquisition of Linear Technology Corporation which is planned forcertification to the same standard by the second quarter of fiscal 2022. As part of our integration efforts, management isassessing the path to certification for Maxim sites.
Our manufacturing facilities are subject to numerous and increasingly strict federal, state, local and foreign EHS laws andregulations, particularly with respect to the transportation, storage, handling, use, emission, discharge and disposal of certainchemicals used or produced in the semiconductor manufacturing process. Our products are subject to increasingly stringentregulations regarding substance content in jurisdictions where we sell products, including the Restriction of HazardousSubstances (RoHS) directive in the European Union and China and the Registration, Evaluation, Authorization and Restrictionof Chemicals (REACH) directive in the European Union. Contracts with many of our customers reflect these and additionalEHS compliance standards. Compliance with these laws and regulations has not had a material impact on our capitalexpenditures, earnings, financial condition or competitive position. There can be no assurance, however, that current or futureenvironmental laws and regulations will not impose costly requirements upon us. Any failure by us to comply with applicableenvironmental laws, regulations and contractual obligations could result in fines, suspension of production, the need to altermanufacturing processes and legal liability.
We are a member of the Responsible Business Alliance, which was formerly known as the Electronic IndustryCitizenship Coalition, as well as a participant of the United Nations Global Compact and the Business Ambition for 1.5°Ccampaign. Our Corporate Responsibility Report (CRR) states our commitment to be carbon neutral by calendar year 2030 andachieve net zero emissions by calendar year 2050, to conserve resources by consuming less energy and water, to comply withour code of business conduct and ethics, and to apply fair labor standards, among other things. We are neither including the
8

information contained in our CRR in, nor incorporating it by reference into, this Annual Report on Form 10-K. The CRR isavailable on our website at www.analog.com/sustainability.
To further strengthen these commitments to environmental, social and governance (ESG) initiatives, we recentlydeployed three sustainable finance instruments. In April 2020, we completed our inaugural green bond issuance of $400million, marking our leadership as the first semiconductor company and one of the first U.S. technology companies to issue agreen bond in the U.S. debt capital markets. In June 2021, we refinanced our revolving credit facility with a new $2.5 billionsustainability-linked revolving credit facility, becoming one of the first semiconductor companies to use this instrument. InOctober 2021, we issued our inaugural sustainability-linked $750 million bond offering. These transactions support ourcommitment to environmental sustainability by linking financing to the achievement of our ambitious ESG targets.
Cybersecurity and Information Security Risk Oversight
We regularly perform risk assessments relating to cybersecurity and technology risks. Our enterprise security programhas been developed based on industry standards, including those published by the International Organization forStandardization (ISO) and the National Institute of Standards and Technology. Highlights of the program include:
• A comprehensive set of enterprise security policies and procedures that guide our protection strategy.• Protecting against threats through use of the following measures: identifying critical assets and high-risk threats;implementing cybersecurity detection, controls and remediation practices; implementing a third-party riskmanagement program to evaluate our critical partners’ cyber posture; and evaluating our program effectiveness byperforming internal and external audits.
Risks identified by our cybersecurity program are analyzed to determine the potential impact on us and the likelihood ofoccurrence. Such risks are continuously monitored to ensure that the circumstances and severity of such risks have not changed.
We conduct regular workforce training to instruct employees to identify cybersecurity concerns and take the appropriateaction. We install and regularly update antivirus software on all company managed systems and workstations to detect andprevent malicious code from impacting our systems. In addition, we have a product security team focused on integrating riskand security best practices into our product development life cycle. Periodically, we are audited by an independent informationsystems expert to determine both the adequacy of, and compliance with, controls and standards.
Senior leadership and Internal Audit present to our full Board of Directors on information security and cybersecuritymatters and risks at least annually. We have conducted an analysis and determined that an information security risk insurancepolicy would not be effective, and that we should continue to self-insure for cybersecurity risks. We have not experienced amaterial security breach in the last three years, and as a result, we have not incurred any net expenses from such a breach.Furthermore, we have not been penalized or paid any amount under an information security breach settlement over the last threeyears.
Human Capital and Empowerment
Our company was founded on the principle that people are our greatest asset. Our future success depends in large part onthe continued service of our key technical and senior management personnel, and on our ability to continue to attract, retain andmotivate qualified employees, particularly highly-skilled engineers involved in the design, development, support andmanufacture of new and existing products and processes. In order for us to attract the best talent, we aim to offer challengingwork in an environment that enables our employees to learn, grow and reach their full potential.
Core to our empowerment strategy is embracing diversity and building a culture of inclusion across the organization. Weare working to achieve this by expanding the diversity of our workforce, creating growth and development opportunities for ouremployees, embracing different perspectives and fostering an inclusive work environment for all. We launched the People ofColor and Allies Network (POCAN), a new employee resource group focused on elevating and prioritizing the needs of peopleof color and creating opportunities to support colleagues from underrepresented groups. POCAN broadens our network ofexisting employee groups, including the Women's Leadership Network, Young Professionals Network, and LGBTQ+ Network,which all contribute to our broader diversity and inclusion initiatives. As noted in "Environmental, Health and SafetyCompliance" above, we published our annual CRR which details our sustainability efforts, operations efficiency, employeeengagement, and governance, and also provides a look at the state of our organization and overview of some of the initiativeswe have launched to drive continuous improvements across diversity and inclusion.
As of October 30, 2021, we had approximately 24,700 employees, of whom approximately 11,000 are in engineeringroles. Approximately 60% of our workforce is male and 40% female. Our senior leadership team is 70% male and 30% female,while manager roles are approximately 74% male and 26% female. 30% of the members of our Board of Directors are female.For the year ended October 30, 2021 (fiscal 2021) our voluntary employee turnover rate was approximately 6.7%.
9

Our human capital resource objectives include identifying, recruiting, retaining, incentivizing and integrating our existingand future employees. We strive to attract and retain the most talented employees in the industry and across the globe byoffering competitive compensation and benefits that support their health, financial and emotional well-being. Our compensationphilosophy is based on rewarding each employee’s individual contributions and striving to achieve equal pay for equal workregardless of gender, race or ethnicity. We use a combination of fixed and variable pay including base salary, bonuses,performance awards and equity compensation. The principal purposes of our equity incentive plans are to attract, retain andmotivate selected employees and directors through the granting of stock-based compensation awards. We offer employeesbenefits that vary by country and are designed to meet or exceed local laws and to be competitive in the marketplace. Examplesof benefits offered in the U.S. include a 401(k) plan with employer contributions; health benefits; life, business travel anddisability insurance; additional voluntary insurance; paid time off and parental leave; education assistance; paid counselingassistance; backup child and adult care; adoption support; and family college planning. For further information concerning ourequity incentive plans, see Note 3, Stock-based Compensation and Shareholders' Equity, of the Notes to Consolidated FinancialStatements contained in Part II, Item 8 of this Annual Report on Form 10-K.
We conduct annual assessments that review department goals to identify talent needs, assess how each division ispositioned from a talent perspective, review the current state of talent vitality for each division, review key talent segments andprioritize actions to identify and develop talent. We encourage all employees to never stop learning through the 70-20-10philosophy. We believe that by employees growing through career experiences (70%), learning from others (20%) andeducation (10%), they can continue to further their own growth and development. We offer employees access to variousinternal and external formal training and development courses to support individual development. We regularly reviewsuccession plans and focus on promoting internal talent to help grow our employees' careers.
In order to ensure that we are meeting our human capital objectives we frequently utilize employee surveys to understandthe effectiveness of our employee and compensation programs and where we can improve across the company. Our latestsurvey, which was completed in fiscal 2021 prior to the Acquisition, had a participation rate of over 87% of legacy employeesof Analog Devices. The survey results indicated that we excel in areas including purpose, goals sharing, employeecollaboration and overall culture. Our dual focus of being a great place to work and providing industry-leading benefits andwork culture has led to strong employee satisfaction and pride that has been recognized across the globe, as evidenced with thefollowing awards: Forbes America’s Best Employers List (2020, 2019, 2018), Forbes Global 2000: World’s Best EmployerList (2019, 2018) and The Boston Globe’s Top Places to Work (2020, 2019, 2018, 2017).
10
ITEM 1A. RISK FACTORS
Set forth below and elsewhere in this report and in other documents we file with the Securities and ExchangeCommission (SEC) are descriptions of certain risks and uncertainties that could cause our actual results to differ materiallyfrom the results contemplated by the forward-looking statements in this report.
Risks Related to our Acquisition of Maxim Integrated Products, Inc. (Maxim)
We will incur substantial expenses related to the integration of Maxim.
We completed our acquisition of Maxim, which we refer to as the acquisition or the merger, on August 26, 2021. Wehave incurred and expect to incur a number of non-recurring costs associated with combining the operations of the twocompanies. These costs and expenses include fees paid to financial, legal and accounting advisors, facilities and systemsconsolidation costs, severance and other potential employment-related costs, including severance payments that may be made tocertain Maxim employees, filing fees, printing expenses and other related charges.
The combined company has and will continue to incur restructuring and integration costs in connection with the merger.The costs related to restructuring are being expensed as a cost of the ongoing results of operations. There are a large number ofprocesses, policies, procedures, operations, technologies and systems that must be integrated in connection with the merger andthe integration of Maxim’s business. Although we expect that the elimination of duplicative costs, strategic benefits, andadditional income, as well as the realization of other efficiencies related to the integration of the businesses, may offsetincremental transaction, merger-related and restructuring costs over time, any net benefit may not be achieved in the near termor at all.
Combining our business with Maxim’s may be more difficult, costly or time-consuming than expected and the combinedcompany may fail to realize the anticipated benefits of the merger, which may adversely affect the combined company’sbusiness results and negatively affect the value of the combined company’s common stock.
The success of the merger will depend on, among other things, the ability of the two companies to combine theirbusinesses in a manner that facilitates growth opportunities and realizes expected cost savings. The combined company mayencounter difficulties in integrating our and Maxim’s businesses and realizing the anticipated benefits of the merger. Thecombined company must achieve the anticipated growth and cost savings without adversely affecting current revenues andinvestments in future growth. If the combined company is not able to successfully achieve these objectives, the anticipatedbenefits of the merger may not be realized fully, or at all, or may take longer to realize than expected.
The merger involves the combination of two companies which operated, until the completion of the merger, asindependent public companies. There can be no assurances that the two businesses can be integrated successfully. It is possiblethat the integration process could result in the loss of key employees from both companies, the loss of customers, the disruptionof ongoing businesses, inconsistencies in standards, controls, procedures and policies, unexpected integration issues, higherthan expected integration costs and an overall integration process that takes longer than originally anticipated. Managementmust devote attention and resources to integrating the combined company's business practices and operations. Potentialdifficulties the combined company may encounter as the integration process continues include the following:
• lost sales and customers as a result of certain of our and/or Maxim's customers deciding not to do business with thecombined company, or deciding to decrease their amount of business in order to reduce their reliance on a singlecompany;
• integrating personnel and operations from the two companies while maintaining focus on providing consistent, high-quality products and services, especially in the COVID-19 environment which has required employees to workremotely in some locations;
• potential unknown liabilities and unforeseen or increased costs and expenses; and• performance shortfalls as a result of the diversion of management’s attention caused by integrating the companies’
operations.
Any of these factors could result in the combined company failing to realize the anticipated benefits of the acquisition, onthe expected timeline or at all. An inability to realize the full extent of the anticipated benefits of the merger, as well as anydelays encountered in the integration process, could have an adverse effect upon the revenues, level of expenses and operatingresults of the combined company, which may adversely affect the value of the common stock of the combined company.
In addition, the actual integration may result in additional and unforeseen expenses, and the anticipated benefits of theintegration plan may not be realized. Actual growth and cost savings, if achieved, may be lower than what we expect and maytake longer to achieve than anticipated. If we are not able to adequately address integration challenges, we may be unable tosuccessfully integrate their operations or realize the anticipated benefits of the integration of the two companies.
11
Risks Related to our Global Operations
The extent to which the novel strain of the coronavirus (COVID-19) pandemic will adversely affect our business, financialcondition and results of operations is uncertain.
The COVID-19 pandemic, and the numerous measures implemented by government authorities in response, haveadversely impacted and are expected to continue to adversely impact our workforce and operations, the operations of ourcustomers, and those of our respective vendors and suppliers. We have significant operations worldwide, including in theUnited States, the Philippines, Ireland, Thailand, Malaysia, China, and India. Each of these countries has been affected by thepandemic and taken measures to try to contain it, resulting in disruptions at some of our manufacturing operations and facilities,including restrictions on our access to facilities. It is uncertain what the full extent of the impact, and duration, of suchmeasures and potential future measures may be and how such measures will affect our vendors and suppliers. Increasedrestrictions on or disruptions of transportation, such as reduced availability of air transport, port closures, and increased bordercontrols or closures, could limit our capacity to meet customer demand and have a material adverse effect on our business,financial condition and results of operations.
The spread of COVID-19 has caused us to modify our business practices by, among other things, restricting employeetravel, modifying employee work locations, and canceling physical participation in meetings, events and conferences. As aresult of our changed workplace practices, many of our employees are temporarily working remotely. Any of these changesmay adversely impact our business operations or customer relationships and result in further disruptions to our supply chain,manufacturing operations and facilities, and workplace. We may take further actions as may be required by governmentauthorities or that we determine are in the best interests of our employees, customers, partners, and suppliers, which may causeeven further disruption. Although these alterations to our business practices are intended to minimize the spread of COVID-19,we cannot provide assurance that such measures will be sufficient to mitigate the risks posed by COVID-19, and if a significantnumber of our employees or members of our board of directors become ill, our ability to perform critical functions could beharmed.
The COVID-19 pandemic has significantly increased economic and demand uncertainty and could result in a globalrecession. The COVID-19 pandemic has led to disruption and volatility in the global capital markets, which may adverselyaffect our and our customers’ and suppliers’ liquidity, cost of capital and ability to access the capital markets. As a result, thecontinued spread of COVID-19 could cause further disruption in our supply chain and customer demand, and could adverselyaffect the ability of our customers to perform, including in making timely payments to us, which could further adversely impactour business, financial condition and results of operations.
We cannot at this time fully quantify or forecast the impact of the COVID-19 pandemic on our business. The full extentof the impact of the pandemic on our business, financial condition and results of operations will depend on futuredevelopments, which are highly uncertain, including the continued duration and severity of the pandemic, the spread of morecontagious variants of the virus, the adoption rate of vaccines, the actions to contain the virus or treat its impact, or how quicklyand to what extent normal economic and operating conditions can resume.
Political and economic uncertainty as well as disruptions in global credit and financial markets could materially and adverselyaffect our business and results of operations.
Continuing political and global macroeconomic uncertainty, including related to the COVID-19 pandemic, trade andpolitical disputes between the United States and China, China-Taiwan relations, and the United Kingdom's withdrawal from theEuropean Union, and uncertainty regarding the stability of global credit and financial markets may lead consumers andbusinesses to postpone or reduce spending, which may cause our customers to cancel, decrease or delay their existing andfuture orders for our products and make it difficult for us to accurately forecast and plan our future business activities.Financial difficulties experienced by our customers could result in nonpayment or payment delays for previously purchasedproducts, thereby increasing our credit risk exposure. Uncertainty regarding the macroeconomic conditions as well as thefuture stability of the global credit and financial markets could cause the value of the currency in the affected markets todeteriorate, thus reducing the purchasing power of those customers. Significant disruption to global credit and financial marketsmay also adversely affect our ability to access external financing sources on acceptable terms. In addition, financial difficultiesexperienced by our suppliers, distributors or customers could result in product delays, increased accounts receivable defaultsand inventory challenges. If economic conditions deteriorate, we may record additional charges relating to restructuring costs orthe impairment of assets and our business and results of operations could be materially and adversely affected.
12

We are exposed to business, economic, political, legal, regulatory and other risks through our significant worldwideoperations, which could adversely affect our business, financial condition and results of operations.
We have significant operations and manufacturing facilities outside the United States, including in Ireland, thePhilippines, Thailand, and Malaysia. A significant portion of our revenue is derived from customers in international markets,and we expect that international sales will continue to account for a significant portion of our revenue in the future. Risksassociated with our international business operations include the following:
• political, legal and economic changes, crises or instability and civil unrest in markets in which we do business, such aspotential macroeconomic weakness related to trade and political disputes between the United States and China,changes in China-Taiwan relations that may adversely affect our operations in Taiwan, our customers, and thetechnology industry supply chain, the United Kingdom's withdrawal from the European Union and the implementationof the United States-Mexico-Canada Agreement;
• compliance requirements of U.S. customs and export regulations, including the Export Administration Regulations andthe International Traffic and Arms Regulations;
• currency conversion risks and exchange rate and interest rate fluctuations, including the potential impact of thetransition from LIBOR;
• trade policy, commercial, travel, export or taxation disputes or restrictions, government sanctions, import or exporttariffs, changes to export classifications or other restrictions imposed by the U.S. government or by the governments ofthe countries in which we do business, particularly in China;
• complex, varying and changing government regulations and legal standards and requirements, particularly with respectto tax regulations, price protection, competition practices, export control regulations and restrictions, customs and taxrequirements, immigration, anti-boycott regulations, data privacy, intellectual property, anti-corruption andenvironmental compliance, including the Foreign Corrupt Practices Act;
• economic disruption from terrorism and threats of terrorism and the response to them by the U.S. and its allies;• increased managerial complexities, including different employment practices and labor issues;• changes in immigration laws, regulations and procedures and enforcement practices of various government agencies;• greater difficulty enforcing intellectual property rights and weaker laws protecting such rights;• natural disasters or public health emergencies, such as the current COVID-19 pandemic;• transportation disruptions and delays and increases in labor and transportation costs;• changes to foreign taxes, tariffs and freight rates;• fluctuations in raw material costs and energy costs;• greater difficulty in accounts receivable collections and longer collection periods; and• costs associated with our foreign defined benefit pension plans.
Any of these risks, or any other risks related to international business operations, could materially adversely affect ourbusiness, financial condition and results of operations.
Many of these risks are present within our business operations in China. For example, changes in U.S.-China relations,the political environment or international trade policies and relations could result in further revisions to laws or regulations ortheir interpretation and enforcement, increased taxation, trade sanctions, the imposition of import or export duties and tariffs,restrictions on imports or exports, currency revaluations, or retaliatory actions, which have had and may continue to have anadverse effect on our business plans and operating results. In addition, expanded export restrictions may limit our ability to sellto certain Chinese companies and to third parties that do business with those companies. These restrictions have created andmay continue to create uncertainty and caution with our current or prospective customers and may cause them to amass largeinventories of our products, replace our products with products from another supplier that is not subject to the exportrestrictions, or focus on building indigenous semiconductor capacity to reduce reliance on U.S. suppliers. Furthermore, if theseexport restrictions cause our current or potential customers to view U.S. companies as unreliable, we could suffer reputationaldamage or lose business to foreign competitors who are not subject to such export restrictions, and our business could bematerially harmed. We are continuing to evaluate the impact of these restrictions on our business, but these actions may havedirect and indirect adverse impacts on our revenues and results of operations in China and elsewhere.
In addition, our success in the Chinese markets may be adversely affected by China's continuously evolving policies, lawsand regulations, including those relating to antitrust, cybersecurity, data protection and data privacy, the environment,indigenous innovation and the promotion of a domestic semiconductor industry, and intellectual property rights andenforcement and protection of those rights.
13
If we are unable to address our U.S. cash requirements, it may be necessary for us to consider repatriation of foreign earnings,which could have a material adverse effect on our results of operations and financial condition.
We carry outside basis differences in certain of our subsidiaries, primarily arising from acquisition accountingadjustments and certain undistributed earnings that are considered indefinitely reinvested. We intend to reinvest these funds inour international operations, and our current plans do not demonstrate a need to repatriate these earnings to fund our U.S. cashrequirements. We require a substantial amount of cash in the United States for operating requirements, stock repurchases, cashdividends and acquisitions. If we are unable to address our U.S. cash requirements through operations, borrowings under ourcurrent revolving credit facility, future debt or equity offerings or other sources of cash obtained at an acceptable cost, it may benecessary for us to consider repatriation of earnings that are indefinitely reinvested, and we may be required to pay additionaltaxes under current tax laws, which could have a material adverse effect on our results of operations and financial condition.
Risks Related to our Business, Industry and Partners
Our future revenue, gross margins, operating results, net income and earnings per share are difficult to predict and maymaterially fluctuate.
Our future revenue, gross margins, operating results, net income and earnings per share are difficult to predict and maybe materially affected by a number of factors, including:
• the extent of the impact and the duration of the COVID-19 pandemic;• the effects of adverse economic conditions in the markets in which we sell our products, including inflationary
pressures;• changes in customer demand or order patterns for our products and/or for end products that incorporate our products;• the timing, delay, reduction or cancellation of significant customer orders and our ability to manage inventory;• our ability to accurately forecast distributor demand for our products;• our ability to accurately estimate future distributor pricing credits and/or stock rotation rights;• our ability to effectively manage our cost structure in both the short term and over a longer duration;• changes in geographic, product or customer mix;• changes in our effective tax rates or new or revised tax legislation in the United States, Ireland or worldwide;• the effects of issued, threatened or retaliatory government sanctions, trade barriers or economic restrictions; changes in
law, regulations or other restrictions, including executive orders; and changes in import and export regulations,including restrictions on exports to certain companies or to third parties that do business with such companies, exportclassifications, or duties and tariffs, particularly with respect to China;
• the timing of new product announcements or introductions by us, our customers or our competitors and the marketacceptance of such products;
• pricing decisions and competitive pricing pressures;• fluctuations in manufacturing yields, adequate availability of wafers and other raw materials, and manufacturing,
assembly and test capacity;• the ability of our third-party suppliers, subcontractors and manufacturers to supply us with sufficient quantities of raw
materials, products and/or components;• a decline in infrastructure spending by foreign governments, including China;• a decline in the U.S. government defense budget, changes in spending or budgetary priorities, a prolonged U.S.
government shutdown or delays in contract awards;• any significant decline in our backlog;• our ability to recruit, hire, retain and motivate adequate numbers of engineers and other qualified employees to meet
the demands of our customers;• our ability to generate new design opportunities and win competitive bid selection processes;• the increasing costs of providing employee benefits worldwide, including health insurance, retirement plan and
pension plan contributions and retirement benefits;• our ability to utilize our manufacturing facilities at efficient levels;• potential significant litigation-related costs or product liability, warranty and/or indemnity claims, including those not
covered by our suppliers or insurers;
14

• the difficulties inherent in forecasting future operating expense levels, including with respect to costs associated withlabor, utilities, transportation and raw materials;
• the costs related to compliance with increasing worldwide government, environmental and social responsibilitystandards;
• new accounting pronouncements or changes in existing accounting standards and practices; and• the effects of public health emergencies, civil unrest, natural disasters, widespread travel disruptions, security risks,
terrorist activities, international conflicts and other events beyond our control.
In addition, the semiconductor market has historically been cyclical and subject to significant economic upturns anddownturns. Our business and certain of the end markets we serve are also subject to rapid technological changes and materialfluctuations in demand based on end-user preferences. There can be no assurance (i) that products stocked in our inventory willnot be rendered obsolete before we ship them, or (ii) that we will be able to design, develop and produce products in a timelyfashion to accommodate changing customer demand. As a result of these and other factors, we may experience materialfluctuations in future revenue, gross margins, operating results, net income and earnings per share on a quarterly or annualbasis. Our historical financial performance and results of operations should not be relied upon as indicators of futureperformance or results. In addition, if our revenue, gross margins, operating results, net income and earnings per share resultsor expectations do not meet the expectations of securities analysts or investors, the market price of our common stock maydecline.
Increases in our effective tax rate and exposure to additional tax liabilities may adversely impact our results of operations.
Our effective tax rate reflects the applicable tax rate in effect in the various tax jurisdictions around the world where ourincome is earned. Our effective tax rate for the fiscal year ended October 30, 2021 was below our U.S. federal statutory rate of21%. This is primarily due to lower statutory tax rates applicable to our operations in the foreign jurisdictions in which we earnincome. A number of factors may increase our future effective tax rate, including: new or revised tax laws or legislation or theinterpretation of such laws or legislation by governmental authorities; increases in tax rates in various jurisdictions; variation inthe mix of jurisdictions in which our profits are earned and taxed; deferred taxes arising from basis differences in investments inforeign subsidiaries; any adverse resolution of ongoing tax audits or adverse rulings from taxing authorities worldwide; changesin the valuation of our deferred tax assets and liabilities; adjustments to income taxes upon finalization of various tax returns;increases in expenses not deductible for tax purposes, including executive compensation subject to the limitations of Section162(m) of the Internal Revenue Code and amortization of assets acquired in connection with strategic transactions; decreasedavailability of tax deductions for stock-based compensation awards worldwide; and changes in available tax credits. In addition,we have a partial tax holiday through July 2025 in Malaysia. The ability to extend such tax holiday beyond its expiration datecannot be assured. In addition, if we fail to meet certain conditions of the tax holiday, we may lose the benefit of the tax holidayand/or be subject to additional taxes and/or penalties. Any significant increase in our future effective tax rate could adverselyimpact our net income during future periods.
Compliance with tax legislation may require the collection of information not regularly produced within the Company,and therefore necessitate the use of estimates in our Consolidated Financial Statements and the exercise of significant judgmentin accounting for its provisions. As regulations and guidance evolve with respect to tax legislation, and as more information isgathered and analyzed, our results may differ from previous estimates and may materially affect our Consolidated FinancialStatements.
We are also subject to laws and regulations in various jurisdictions that determine how much profit has been earned andwhen it is subject to taxation in that jurisdiction. Changes in these laws and regulations, including those that align to or areassociated with the Organization for Economic Cooperation and Development's Base Erosion and Profit Shifting (BEPS)Actions Plans, could impact the jurisdictions where we are deemed to earn income, which could in turn adversely affect our taxliability and results of operations.
Our customers typically do not make long-term product purchase commitments and incorrect forecasts or reductions,cancellations or delays in orders for our products could adversely affect our operating results.
We typically do not have sales contracts with our customers that include long-term product purchase commitments. Incertain markets where end-user demand may be particularly volatile and difficult to predict, some customers place orders thatrequire us to manufacture product and have it available for shipment, even though the customer is unwilling to make a bindingcommitment to purchase all, or even any, of the product. In other instances, we manufacture product based on non-bindingforecasts of customer demands, which may fluctuate significantly on a quarterly or annual basis and at times may prove to beinaccurate. Additionally, our U.S. government contracts and subcontracts may be funded in increments over a number ofgovernment budget periods and typically can be terminated by the government for its convenience. As a result, we may incurinventory and manufacturing costs in advance of anticipated sales, and we are subject to the risk of lower than expected ordersor cancellations of orders, leading to a sharp reduction of sales and backlog. Further, if orders or forecasts for products that
15
meet a customer’s unique requirements are canceled or unrealized we may be left with an inventory of unsaleable products,causing potential inventory write-offs, and hindering our ability to recover our costs. As a result of lengthy manufacturingcycles for certain of the products that are subject to these uncertainties, the amount of unsaleable product could be substantial.Incorrect forecasts, or reductions, cancellations or delays in orders for our products could adversely affect our operating results.
Our future success depends upon our ability to execute our business strategy, continue to innovate, improve our existingproducts, design, develop, produce and market new products, and identify and enter new markets.
Our future success significantly depends on our ability to execute our business strategy, continue to innovate, improveour existing products, and design, develop, produce and market innovative new products and system-level solutions. Productdesign, development, innovation and enhancement is often a complex, time-consuming and costly process involving significantinvestment in research and development, with no assurance of return on investment. There can be no assurance that we will beable to develop and introduce new and improved products in a timely or efficient manner or that new and improved products, ifdeveloped, will achieve market acceptance. Our products generally must conform to various evolving and sometimes competingindustry standards, which may adversely affect our ability to compete in certain markets or require us to incur significant costs.In addition, our customers generally impose very high quality and reliability standards on our products, which often change andmay be difficult or costly to satisfy. Any inability to satisfy customer quality and reliability standards or comply with industrystandards and technical requirements may adversely affect demand for our products and our results of operations.
Our growth is also dependent on our ability to identify and penetrate new markets where we have limited experience yetrequire significant investments, resources and technological advancements in order to compete effectively, and there can be noassurance that we will achieve success in these markets. There can be no assurance that the markets we serve and/or targetbased on our business strategy will grow in the future, that our existing and new products will meet the requirements of thesemarkets, that our products, or the end-products in which our products are used, will achieve customer acceptance in thesemarkets, that competitors will not force price reductions or take market share from us, or that we can achieve or maintainadequate gross margins or profits in these markets.
We may not be able to compete successfully in markets within the semiconductor industry in the future.
We face intense competition in the semiconductor industry, and we expect this competition to increase in the future,including from companies located outside of the United States. Competition is generally based on innovation, design, qualityand reliability of products, product performance, features and functionality, product pricing, availability and capacity,technological service and support, and the availability of integrated system solutions, with the relative importance of thesefactors varying among products, markets and customers. Many companies have sufficient financial, manufacturing, technical,sales and marketing resources to develop and market products that compete with our products. Some of our competitors mayhave more advantageous supply or development relationships with our current and potential customers or suppliers. Ourcompetitors also include both emerging companies selling specialized products in markets we serve and companies outside ofthe U.S., including entities associated with well-funded efforts by foreign governments to create indigenous semiconductorindustries. Existing or new competitors may develop products or technologies that more effectively address the demands of ourcustomers and markets with enhanced performance, features and functionality, lower power requirements, greater levels ofintegration or lower cost. In addition, as we seek to expand our business, including the design and production of products andservices for developing and emerging markets, we may encounter increased competition from our current competitors and/ornew competitors. Increased competition in certain markets has resulted in and may continue to result in declining averageselling prices, reduced gross margins and loss of market share in those markets. There can be no assurance that we will be ableto compete successfully in the future against existing or new competitors, or that our operating results will not be adverselyaffected by increased competition. In addition, the semiconductor industry has experienced significant consolidation over thepast several years. Consolidation among our competitors could lead to a changing competitive landscape, which couldnegatively impact our competitive position and market share and harm our results of operations.
We rely on third parties for supply of raw materials and parts, semiconductor wafer foundry services, assembly and testservices, and transportation, among other things, and we generally cannot control their availability or conditions of supply orservices.
We rely, and plan to continue to rely, on third-party suppliers and service providers, including raw material andcomponents suppliers, semiconductor wafer foundries, assembly and test contractors, and freight carriers (collectively, vendors)in manufacturing our products. This reliance involves several risks, including reduced control over availability, capacityutilization, delivery schedules, manufacturing yields, and costs. We currently source approximately half of our waferrequirements annually from third-party wafer foundries, including Taiwan Semiconductor Manufacturing Company (TSMC)and others. These foundries often provide wafer foundry services to our competitors and therefore periods of increased industrydemand may result in capacity constraints. With respect to TSMC in particular, geopolitical changes in China-Taiwan relationscould disrupt TSMC’s operations, which would adversely affect our ability to manufacture certain products. Recently, we haveexperienced increased demand leading to a constrained supply environment which we believe will continue in the near term. In
16
addition, our manufacturing processes require availability of certain raw materials and supplies. Limited or delayed access tothese items could adversely affect our results of operations. In certain instances, one of our vendors may be the sole source ofhighly specialized processing services or materials. If such vendor is unable or unwilling to manufacture and delivercomponents to us on the time schedule and of the quality or quantity that we require, we may be forced to seek to engage anadditional or replacement vendor, which could result in additional expenses and delays in product development or shipment ofproduct to our customers. If additional or replacement vendors are not available, we may also experience delays in productdevelopment or shipment which could, in turn, result in the temporary or permanent loss of customers.
A prolonged disruption of our internal manufacturing operations could have a material adverse effect on our business,financial condition and results of operations.
In addition to leveraging an outsourcing model for manufacturing operations, we also rely on our internal manufacturingoperations located in the United States, Ireland, the Philippines, Thailand and Malaysia. A prolonged disruption at, or inabilityto utilize, one or more of our manufacturing facilities, loss of raw materials or damage to our manufacturing equipment for anyreason, including due to the COVID-19 pandemic, natural or man-made disasters, civil unrest or other events outside of ourcontrol, such as widespread outbreaks of illness, or the failure to maintain our labor force at one or more of these facilities, maydisrupt our operations, delay production, shipments and revenue and result in us being unable to timely satisfy customerdemand. As a result, we could forgo revenue opportunities, potentially lose market share and damage our customerrelationships, all of which could materially and adversely affect our business, financial condition and results of operations.
The markets for semiconductor products are cyclical, and increased production may lead to overcapacity and lower prices, andconversely, we may not be able to satisfy unexpected demand for our products.
The cyclical nature of the semiconductor industry has resulted in periods when demand for our products has increased ordecreased rapidly. The demand for our products is subject to the strength of our four major end markets of Industrial,Automotive, Communications, and Consumer. If we expand our operations and workforce too rapidly or procure excessiveresources in anticipation of increased demand for our products, and that demand does not materialize at the pace at which weexpect, or declines, or if we overbuild inventory in a period of decreased demand, our operating results may be adverselyaffected as a result of increased operating expenses, reduced margins, underutilization of capacity or asset impairment charges.These capacity expansions by us and other semiconductor manufacturers could also lead to overcapacity in our target marketswhich could lead to price erosion that would adversely impact our operating results. Conversely, during periods of rapidincreases in demand, our available capacity may not be sufficient to satisfy the demand. In addition, we may not be able toexpand our workforce and operations in a sufficiently timely manner, procure adequate resources and raw materials, locatesuitable third-party suppliers, or respond effectively to changes in demand for our existing products or to demand for newproducts requested by our customers, and our current or future business could be materially and adversely affected.
Our semiconductor products are complex and we may be subject to warranty, indemnity and/or product liability claims, whichcould result in significant costs and damage to our reputation and adversely affect customer relationships, the marketacceptance of our products and our operating results.
Semiconductor products are highly complex and may contain defects that affect their quality or performance. Failures inour products and services or in the products of our customers could result in damage to our reputation for reliability andincrease our legal or financial exposure to third parties. Certain of our products and services could also contain securityvulnerabilities, defects, bugs and errors, which could also result in significant data losses, security breaches and theft ofintellectual property. We generally warrant that our products will meet their published specifications, and that we will repair orreplace defective products, for one year from the date title passes from us to the customer. We invest significant resources in thetesting of our products; however, if any of our products contain defects, we may be required to incur additional developmentand remediation costs pursuant to warranty and indemnification provisions in our customer contracts and purchase orders.These problems may divert our technical and other resources from other product development efforts and could result in claimsagainst us by our customers or others, including liability for costs and expenses associated with product defects, includingrecalls, which may adversely impact our operating results. We may also be subject to customer intellectual property indemnityclaims. Our customers have on occasion been sued, and may be sued in the future, by third parties alleging infringement ofintellectual property rights, or damages resulting from use of our products. Those customers may seek indemnification from usunder the terms and conditions of our sales contracts with them. In certain cases, our potential indemnification liability may besignificant.
Further, we sell to customers in industries such as automotive (including autonomous vehicles), aerospace, defense, andhealthcare, where failure of the systems in which our products are integrated could cause damage to property or persons. Wemay be subject to product liability claims if our products, or the integration of our products, cause system failures. Any productliability claim, whether or not determined in our favor, could result in significant expense, divert the efforts of our technical andmanagement personnel, and harm our business. In addition, if any of our products contain defects, or have reliability, quality or
17
compatibility problems not capable of being resolved, our reputation may be damaged, which could make it more difficult forus to sell our products to customers and which could also adversely affect our operating results. Furthermore, we market andsell our products through authorized third-party distributors, and from time to time our products may be diverted from ourauthorized distribution channels and sold on the “gray market.” There is a risk that customers purchasing our products on thegray market may use our products for purposes for which they were not intended, or may purchase counterfeit or substandardproducts, including products that have been altered, mishandled or damaged, or used products presented as new, which couldresult in damage to property or persons and cause serious reputational harm.
The fabrication of integrated circuits is highly complex and precise, and our manufacturing processes utilize a substantialamount of technology. Minute impurities, contaminants in the manufacturing environment, difficulties in the fabricationprocess, defects in the masks used in the wafer manufacturing process, manufacturing equipment failures, wafer breakage orother factors can cause a substantial percentage of wafers to be rejected or numerous dice on each wafer to be nonfunctional.While we have significant expertise in semiconductor manufacturing, it is possible that some processes could become unstable.This instability could result in manufacturing delays and product shortages, which could have a material adverse effect on ouroperating results.
If we are unable to recruit or retain our key personnel, our ability to execute our business strategy will be adversely affected.
Our continued success depends to a significant extent upon the recruitment, retention and effective succession of our keypersonnel, including our leadership team, management and technical personnel, particularly our experienced engineers. Thecompetition for these employees is intense. The loss of key personnel or the inability to attract, hire and retain key employeeswith critical technical skills to achieve our strategy, including as a result of changes to immigration policies, could also have amaterial adverse effect on our business. We do not maintain any key person life insurance policy on any of our officers or otheremployees.
To remain competitive, we may need to invest in or acquire other companies, purchase or license technology from third parties,or enter into other strategic transactions in order to introduce new products or enhance our existing products.
An element of our business strategy involves expansion through the acquisitions of businesses, assets, products ortechnologies that allow us to complement our existing product offerings, diversify our product portfolio, expand our marketcoverage, increase our engineering workforce, expand our technical skill sets or enhance our technological capabilities. We maynot be able to find businesses that have the technology or resources we need and, if we find such businesses, we may not beable to invest in, purchase or license the technology or resources on commercially favorable terms or at all. Acquisitions,investments and technology licenses are challenging to complete for a number of reasons, including difficulties in identifyingpotential targets, the cost of potential transactions, competition among prospective buyers and licensees, the need for regulatoryapprovals, and difficulties related to integration efforts. In addition, investments in companies are subject to a risk of a partialor total loss of our investment. Both in the U.S. and abroad, governmental regulation of acquisitions, including antitrust andother regulatory reviews and approvals, has become more complex, increasing the costs and risks of undertaking andconsummating significant acquisitions. In order to finance a potential transaction, we may need to raise additional funds byissuing securities or borrowing money. We may not be able to obtain financing on favorable terms, and the sale of our stockmay result in the dilution of our existing shareholders or the issuance of securities with rights that are superior to the rights ofour common shareholders.
Acquisitions also involve a number of challenges and risks, including:• diversion of management’s attention in connection with both negotiating the transaction and integrating the acquired
assets and businesses;• difficulty or delay integrating acquired technologies, operations, systems and infrastructure, and personnel with our
existing businesses;• strain on managerial and operational resources as management tries to oversee larger or more complex operations;• the future funding requirements for acquired companies, including research and development costs, employee
compensation and benefits, and operating expenses, which may be significant;• servicing significant debt that may be incurred in connection with acquisitions;• potential loss of key employees;• exposure to unforeseen liabilities or regulatory compliance issues of acquired companies;• higher than expected or unexpected costs relating to or associated with an acquisition and integration of assets and
businesses;• difficulty realizing expected cost savings, operating synergies and growth prospects of an acquisition in a timely
manner or at all; and
18
• increased risk of costly and time-consuming legal proceedings.
If we are unable to successfully address these risks, we may not realize some or all of the expected benefits of ouracquisitions, which may have an adverse effect on our business strategy, plans and operating results.
Our results of operations could be affected by natural disasters in the locations in which we operate.
We, like many companies in the semiconductor industry, rely on supplies, services, internal manufacturing capacity,wafer fabrication foundries and other subcontractors in locations around the world that are susceptible to natural disasters andother significant disruptions. Earthquakes, fires, tsunamis, flooding or other natural disasters may disrupt local semiconductor-related businesses and adversely affect manufacturing capacity, availability and cost of key raw materials, utilities andequipment, and availability of key services, including transport of our products worldwide. Our insurance may not adequatelycover losses resulting from such disruptions. Any prolonged inability to utilize one of our manufacturing facilities, or those ofour subcontractors or third-party wafer fabrication foundries, as a result of fire, flood, natural disaster, unavailability of utilitiesor otherwise, could result in a temporary or permanent loss of customers for affected products, which could have a materialadverse effect on our results of operations and financial condition. In addition, global climate change can result in certainnatural disasters occurring more frequently or with greater intensity, such as drought, wildfires, storms, sea-level rise, andflooding, and could disrupt the availability of water necessary for the operation of our fabrication facilities located in semi-aridregions. During 2021, the west coast of the U.S. experienced historic wildfires where we have operations and manufacturingfacilities. The long-term effects of climate change on the global economy and the semiconductor industry in particular areunclear, but could be severe.
Our operating results are dependent on the performance of independent distributors.
A significant portion of our sales are through independent global and regional distributors that are not under our control.These independent distributors generally represent product lines offered by several companies and thus could reduce their salesefforts for our products or they could terminate their representation of us. We generally do not require letters of credit from ourdistributors, including our largest distributor, and are not protected against accounts receivable default or declarations ofbankruptcy by these distributors. Our inability to collect open accounts receivable could adversely affect our operating results.Termination of a significant distributor or a group of distributors, whether at our initiative or the distributor’s initiative orthrough consolidation in the distribution industry, could disrupt our current business, and if we are unable to find suitablereplacements with the appropriate scale and resources, our operating results could be adversely affected.
We are required to estimate the effects of returns and allowances provided to distributors and record revenue at the timeof sale to the distributor. If our estimates of such credits and rights are materially understated, it could cause subsequentadjustments that negatively impact our revenues and gross profits in a future period.
Our stock price may be volatile.
The market price of our common stock has been volatile in the past and may be volatile in the future, as it may besignificantly affected by factors including:
• the extent of the impact and the duration of the COVID-19 pandemic;• global economic conditions generally;• crises in global credit, debt and financial markets;• actual or anticipated fluctuations in our revenue and operating results;• changes in financial estimates or other statements made by securities analysts or others in analyst reports or other
publications, or our failure to perform in line with those estimates or statements or our published guidance;• financial results and prospects of our customers;• U.S. and foreign government actions, including with respect to trade, travel, export and taxation;• changes in market valuations of other semiconductor companies;• rumors and speculation in the press, investment community or on social media about us, our customers or other
companies in our industry;• announcements by us, our customers or our competitors of significant new products, technical innovations, material
transactions, acquisitions or dispositions, litigation, capital commitments, including share repurchases and dividendpolicies, or revised earnings estimates;
• departures of key personnel;
19

• alleged noncompliance with laws, regulations or ethics standards by us or any of our employees, officers or directors;and
• negative media publicity targeting us or our suppliers, customers or competitors.
The stock market has historically experienced volatility, especially within the semiconductor industry, that often hasbeen unrelated to the performance of particular companies. These market fluctuations may cause our stock price to fallregardless of our operating results.
Our directors and executive officers periodically buy or sell shares of our common stock in the market, includingpursuant to Rule 10b5-1 trading plans. Regardless of the individual's reasons for such purchases or sales, securities analystsand investors could view such transactions as positive or negative indicators and our stock price could be adversely affected asa result.
Risks Related to our Indebtedness
If we are unable to generate sufficient cash flow, we may not be able to service our debt obligations, including makingpayments on our outstanding indebtedness.
Our ability to make payments of principal and interest on our indebtedness when due depends upon our futureperformance, which will be subject to general economic conditions, industry cycles and financial, business and other factorsaffecting our consolidated operations, many of which are beyond our control. For example, the disruption to economic activityresulting from the COVID-19 pandemic has had, and is likely to continue to have, adverse effects on our supply chain,manufacturing operations and facilities, and workforce. If we are unable to generate sufficient cash flow from operations in thefuture to service our outstanding debt, we may be required to, among other things:
• seek additional financing in the debt or equity markets;• refinance or restructure all or a portion of our indebtedness;• borrow under our revolving credit facility;• divert funds that would otherwise be invested in growing our business operations;• repatriate earnings as dividends from foreign locations with potential for negative tax consequences; or• sell selected assets.
Such measures might not be sufficient to enable us to service our debt, which could negatively impact our financialresults. In addition, we may not be able to obtain any such financing, refinancing or complete a sale of assets on economicallyfavorable terms. In the case of financing or refinancing, favorable interest rates will depend on the health of the debt capitalmarkets.
Restrictions in our revolving credit facility and outstanding debt instruments may limit our activities.
Our current revolving credit facility and outstanding debt instruments impose, and future debt instruments to which wemay become subject may impose, restrictions that limit our ability to engage in activities that could otherwise benefit ourCompany, including to undertake certain transactions, to create certain liens on our assets and to incur certain subsidiaryindebtedness. Our ability to comply with these financial restrictions and covenants is dependent on our future performance,which is subject to prevailing economic conditions and other factors, including factors that are beyond our control such aschanges in technology, government regulations and the level of competition in our markets. In addition, our revolving creditfacility require us to maintain compliance with specified financial ratios. If we breach any of the covenants under our revolvingcredit facility, the indentures governing our outstanding senior unsecured notes, or any future debt instruments to which we maybecome subject and do not obtain appropriate waivers, then, subject to applicable cure periods, our outstanding indebtednessthereunder could be declared immediately due and payable and/or we may be restricted from further borrowing under ourrevolving credit facility.
Risks Related to Legal, Regulatory and Compliance Matters
We may be unable to adequately protect our proprietary intellectual property rights, which may limit our ability to competeeffectively.
Our future success depends, in part, on our ability to protect our intellectual property. We primarily rely on patent, maskwork, copyright, trademark and trade secret laws, as well as nondisclosure agreements, information security practices, and othermethods, to protect our proprietary information, technologies and processes. Despite our efforts to protect our intellectualproperty, it is possible that competitors or other unauthorized third parties may obtain or disclose our confidential information,reverse engineer or copy our technologies, products or processes, or otherwise misappropriate our intellectual property.
20

Moreover, the laws of foreign countries in which we design, manufacture, market and sell our products may afford little or noeffective protection of our intellectual property.
There can be no assurance that the claims allowed in our issued patents will be sufficiently broad to protect ourtechnology. In addition, any of our existing or future patents may be challenged, invalidated or circumvented. As such, anyrights granted under these patents may not prevent others from exploiting our proprietary technology. We may not be able toobtain foreign patents or pending applications corresponding to our U.S. patents and applications. Even if patents are granted,we may not be able to effectively enforce our rights. If our patents and mask works do not adequately protect our technology, orif our registrations expire prior to end of life of our products, our competitors may be able to offer products similar to ours. Ourcompetitors may also be able to develop similar technology independently or design around our patents.
We generally enter into confidentiality agreements with our employees, consultants and strategic partners. We also try tocontrol access to and distribution of our technologies, documentation and other proprietary information. Despite these efforts,internal or external parties may attempt to copy, disclose, obtain or use our products or technology without our authorization.Also, former employees may seek employment with our business partners, customers or competitors, and there can be noassurance that the confidential nature of our proprietary information will be maintained in the course of such futureemployment.
A significant disruption in, or breach in security of, our information technology systems or certain of our products couldmaterially and adversely affect our business or reputation.
We rely on information technology systems throughout our company to keep financial records and customer data,process orders, manage inventory, coordinate shipments to customers, maintain confidential and proprietary information, assistin semiconductor engineering and other technical activities and operate other critical functions such as Internet connectivity,network communications and email. Our information technology systems may be susceptible to damage, disruptions orshutdowns due to power outages, hardware failures, telecommunication failures, employee malfeasance, user errors,catastrophes or other unforeseen events. Due to the COVID-19 pandemic, many of our employees and directors are temporarilyworking remotely, which may pose additional data security risks. We also rely upon external cloud providers for certaininfrastructure activities. If we were to experience a prolonged disruption in the information technology systems that involve ourinternal communications or our interactions with customers or suppliers, it could result in the loss of sales and customers andsignificant incremental costs, which could adversely affect our business. We may also be subject to security breaches of ourinformation technology systems and certain of our products caused by viruses, illegal break-ins or hacking, sabotage, or acts ofvandalism by third parties or our employees or contractors. Our security measures or those of our third-party service providersmay not detect or prevent security breaches, defects, bugs or errors. In addition, we provide our confidential and proprietaryinformation to our strategic partners in certain cases where doing so is necessary to conduct our business. Those third partiesmay be subject to security breaches or otherwise compromise the protection of such information. Security breaches of ourinformation technology systems or those of our partners could result in the misappropriation or unauthorized disclosure ofconfidential and proprietary information belonging to us or to our employees, partners, customers, suppliers, or other thirdparties which could result in our suffering significant financial or reputational damage.
We are occasionally involved in litigation, including claims regarding intellectual property rights, which could be costly tolitigate and could require us to redesign products or pay significant royalties.
The semiconductor industry is characterized by frequent claims and litigation involving patent and other intellectualproperty rights. Other companies or individuals have obtained patents covering a variety of semiconductor designs andprocesses, and we might be required to obtain licenses under some of these patents or be precluded from making and sellinginfringing products, if those patents are found to be valid and infringed by us. In the event a third party makes a validintellectual property claim against us and a license is not available to us on commercially reasonable terms, or at all, we couldbe forced either to redesign or to stop production of products incorporating that intellectual property, and our operating resultscould be materially and adversely affected. Litigation may be necessary to enforce our patents or other of our intellectualproperty rights or to defend us against claims of infringement, and this litigation could be costly and divert the attention of ourkey personnel. We could also be subject to litigation or arbitration disputes arising under our contractual obligations, as well ascustomer indemnity, warranty or product liability claims that could lead to significant costs and expenses as we defend thoseclaims or pay damage awards. There can be no assurance that we are adequately insured to protect against all claims andpotential liabilities, and we may elect to self-insure with respect to certain matters. An adverse outcome in litigation orarbitration could have a material adverse effect on our financial position or on our operating results or cash flows in the periodin which the dispute is resolved.
21

We are subject to environmental, health and safety (EHS) regulations, which could increase our expenses and affect ouroperating results.
Our industry is subject to EHS requirements, particularly those that control and restrict the sourcing, use, transportation,emission, discharge, storage and disposal of certain substances, and materials used or produced in the semiconductormanufacturing process. Public attention to environmental sustainability and social responsibility concerns continues to increase,and our customers routinely include stringent environmental and other standards in their contracts with us. Changes in EHSlaws or regulations may require us to invest in costly equipment or make manufacturing process changes and may adverselyaffect the sourcing, supply and pricing of materials used in our products. In particular, climate change concerns and thepotential resulting environmental impact may result in new environmental, health, and safety laws and regulations that mayaffect us, our suppliers, and our customers. Such laws or regulations could cause us to incur additional direct costs forcompliance, as well as increased indirect costs resulting from our customers, suppliers, or both incurring additional compliancecosts that are passed on to us. These costs may adversely impact our results of operations and financial condition. In addition,we use hazardous and other regulated materials that subject us to risks of strict liability for damages caused by potential oractual releases of such materials. Any failure to control such materials adequately or to comply with existing or future EHSstatutory or regulatory standards, requirements or contractual obligations could result in any of the following, each of whichcould have a material adverse effect on our business and operating results:
• liability for damages and remediation;• the imposition of regulatory penalties and civil and criminal fines;• the suspension or termination of the development, manufacture, sale or use of certain of our products;• changes to our manufacturing processes or a need to substitute materials that may cost more or be less available;• damage to our reputation; and/or• increased expenses associated with compliance.
If we fail to comply with government contracting regulations, we could suffer a loss of revenue or incur price adjustments orother penalties.
Some of our revenue is derived from contracts with agencies of the United States government and subcontracts with itsprime contractors. As a United States government contractor or subcontractor, we are subject to federal contracting regulations,including the Federal Acquisition Regulations, which govern the allowability of costs incurred by us in the performance ofUnited States government contracts. Certain contract pricing is based on estimated direct and indirect costs, which are subject tochange. Additionally, the United States government is entitled after final payment on certain negotiated contracts to examine allof our cost records with respect to such contracts and to seek a downward adjustment to the price of the contract if it determinesthat we failed to furnish complete, accurate and current cost or pricing data in connection with the negotiation of the price of thecontract.
In connection with our United States government business, we are also subject to government audits and to review andapproval of our policies, procedures, and internal controls for compliance with procurement regulations and applicable laws,such as the Cybersecurity Maturity Model Certification. In certain circumstances, if we do not comply with the terms of agovernment contract or with regulations or statutes, we could be subject to downward contract price adjustments or refundobligations or could in extreme circumstances be assessed civil and criminal penalties or be debarred or suspended fromobtaining future contracts for a specified period of time. Any such suspension or debarment or other sanction could have anadverse effect on our business.
Under some of our government subcontracts, we are required to maintain secure facilities and to obtain securityclearances for personnel involved in performance of the contract, in compliance with applicable federal standards. If we wereunable to comply with these requirements, or if personnel critical to our performance of these contracts were unable to obtain ormaintain their security clearances, we might be unable to perform these contracts or compete for other projects of this nature,which could adversely affect our revenue.
ITEM 1B. UNRESOLVED STAFF COMMENTS
None.
22
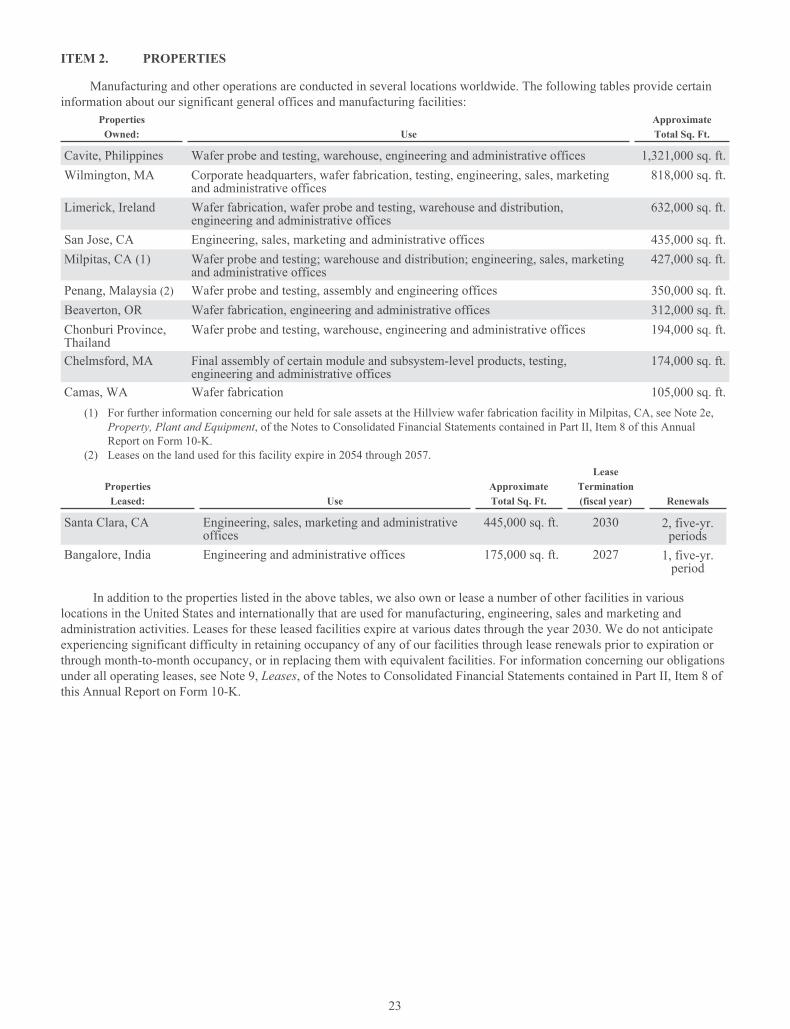
ITEM 2. PROPERTIES
Manufacturing and other operations are conducted in several locations worldwide. The following tables provide certaininformation about our significant general offices and manufacturing facilities:
Properties ApproximateOwned: Use Total Sq. Ft.
Cavite, Philippines Wafer probe and testing, warehouse, engineering and administrative offices 1,321,000 sq. ft.Wilmington, MA Corporate headquarters, wafer fabrication, testing, engineering, sales, marketing
and administrative offices818,000 sq. ft.
Limerick, Ireland Wafer fabrication, wafer probe and testing, warehouse and distribution,engineering and administrative offices
632,000 sq. ft.
San Jose, CA Engineering, sales, marketing and administrative offices 435,000 sq. ft.Milpitas, CA (1) Wafer probe and testing; warehouse and distribution; engineering, sales, marketing
and administrative offices427,000 sq. ft.
Penang, Malaysia (2) Wafer probe and testing, assembly and engineering offices 350,000 sq. ft.Beaverton, OR Wafer fabrication, engineering and administrative offices 312,000 sq. ft.Chonburi Province,Thailand
Wafer probe and testing, warehouse, engineering and administrative offices 194,000 sq. ft.
Chelmsford, MA Final assembly of certain module and subsystem-level products, testing,engineering and administrative offices
174,000 sq. ft.
Camas, WA Wafer fabrication 105,000 sq. ft.(1) For further information concerning our held for sale assets at the Hillview wafer fabrication facility in Milpitas, CA, see Note 2e,
Property, Plant and Equipment, of the Notes to Consolidated Financial Statements contained in Part II, Item 8 of this AnnualReport on Form 10-K.
(2) Leases on the land used for this facility expire in 2054 through 2057.Lease
Properties Approximate TerminationLeased: Use Total Sq. Ft. (fiscal year) Renewals
Santa Clara, CA Engineering, sales, marketing and administrativeoffices
445,000 sq. ft. 2030 2, five-yr.periods
Bangalore, India Engineering and administrative offices 175,000 sq. ft. 2027 1, five-yr.period
In addition to the properties listed in the above tables, we also own or lease a number of other facilities in variouslocations in the United States and internationally that are used for manufacturing, engineering, sales and marketing andadministration activities. Leases for these leased facilities expire at various dates through the year 2030. We do not anticipateexperiencing significant difficulty in retaining occupancy of any of our facilities through lease renewals prior to expiration orthrough month-to-month occupancy, or in replacing them with equivalent facilities. For information concerning our obligationsunder all operating leases, see Note 9, Leases, of the Notes to Consolidated Financial Statements contained in Part II, Item 8 ofthis Annual Report on Form 10-K.
23

ITEM 3. LEGAL PROCEEDINGS
From time to time in the ordinary course of our business, various claims, charges and litigation are asserted orcommenced against us arising from, or related to, among other things, contractual matters, patents, trademarks, personal injury,environmental matters, product liability, insurance coverage, employment or employee benefits. As to such claims andlitigation, we can give no assurance that we will prevail. We do not believe that any current legal matters will have a materialadverse effect on our financial position, results of operations or cash flows.
ITEM 4. MINE SAFETY DISCLOSURES
Not Applicable.
24

INFORMATION ABOUT OUR EXECUTIVE OFFICERS
The following table sets forth (i) the name, age and position of each of our executive officers as of December 3, 2021 and(ii) the business experience of each person named in the table during at least the past five years. There is no family relationshipamong any of our executive officers.
Vincent Roche 61 President and ChiefExecutive Officer
President and Chief Executive Officer since May 2013;President since November 2012; Vice President, StrategicSegments Group and Global Sales from October 2009 toNovember 2012; Vice President, Worldwide Sales fromMarch 2001 to October 2009; Vice President and GeneralManager, Silicon Valley Business Units and Computer &Networking from 1999 to March 2001; Product LineDirector from 1995 to 1999; and Product MarketingManager from 1988 to 1995.
Prashanth Mahendra-Rajah 51 Senior Vice President,Finance and ChiefFinancial Officer
Senior Vice President, Finance and Chief Financial Officersince September 2017; Chief Financial Officer of WABCOHoldings Inc., a supplier of commercial vehicletechnologies, from June 2014 to September 2017; CorporateVice President and Segment CFO of the Silicon SystemsGroup of Applied Materials Inc., a provider ofmanufacturing equipment, services and software to theglobal semiconductor industry, from April 2012 to June2014.
Martin Cotter 56 Senior Vice President,Industrial & Multi-Markets
Senior Vice President, Industrial & Multi-Markets sinceSeptember 2021; Senior Vice President, Industrial,Consumer & Multi-Markets from January 2021 toSeptember 2021; Senior Vice President, Worldwide Salesand Digital Marketing from September 2016 to January2021; Vice President Internet of Things (IoT), Healthcare,and Consumer Business Units, from November 2015 toSeptember 2016; Vice President, Healthcare and ConsumerBusiness Groups from November 2014 to November 2015;and VP, Communications Infrastructure Business Unit fromOctober 2012 to November 2014.
Gregory Henderson 53 Senior Vice President,Automotive,Communications andAerospace
Senior Vice President, Automotive, Communications andAerospace since June 2017; Vice President, RF andMicrowave Business Unit from July 2014 to June 2017;Vice President of the RF and Microwave Business Unit ofHittite Microwave Corporation, a maker of chips and relatedcomponents, from October 2013 to July 2014; and DirectorProduct Management of Harris Corporation, a defensecontractor and technology provider of communications,electronic, and space and intelligence systems, from 2011 toOctober 2013.
Anelise Sacks 43 Senior Vice Presidentand Chief CustomerOfficer
Senior Vice President and Chief Customer Officer sinceMarch 2021; Vice President and General Manager, DLPProducts from December 2017 to December 2020 andGeneral Manager, Power Interface from December 2016 toDecember 2017 at Texas Instruments, Inc., a globalsemiconductor company.
Executive Officer Age Position(s) Business Experience
25

PART II
ITEM 5. MARKET FOR REGISTRANT’S COMMON EQUITY, RELATED STOCKHOLDER MATTERS ANDISSUER PURCHASES OF EQUITY SECURITIES
Our common stock is listed on The Nasdaq Global Select Market under the symbol ADI. The number of holders of recordof our common stock at November 26, 2021 was 2,492. This number does not include shareholders for whom shares are held ina “nominee” or “street” name. On October 29, 2021, the last reported sales price of our common stock on The Nasdaq GlobalSelect Market was $173.49 per share.
On November 22, 2021, our Board of Directors declared a cash dividend of $0.69 per outstanding share of commonstock. The dividend will be paid on December 14, 2021 to all shareholders of record at the close of business on December 3,2021 and is expected to total approximately $362.5 million. We currently expect quarterly dividends to continue in futureperiods, although they remain subject to determination and declaration by our Board of Directors. The payment of futuredividends, if any, will be based on several factors, including our financial performance, outlook and liquidity.
Information regarding our equity compensation plans and the securities authorized for issuance thereunder is set forth inItem 12 of this Annual Report on Form 10-K.
Issuer Purchases of Equity Securities
The table below summarizes the activity related to stock repurchases for the three months ended October 30, 2021. Wehave an ongoing authorization, originally approved by our Board of Directors in 2004, and subsequently amended, torepurchase shares of our common stock in open market or negotiated transactions. In March 2020, we temporarily suspendedour share repurchase program as a result of the global macroeconomic environment. That suspension continued through thefourth quarter of fiscal 2020 given the planned acquisition of Maxim Integrated Products, Inc. We reinstated the common stockrepurchase program effective November 2020. In September 2021, we entered into Accelerated Share Repurchase agreementsto repurchase $2.5 billion of our common stock. These agreements were partially settled in September 2021 and we expect theremaining 20% of shares, or $500.0 million, to settle in the first half of the fiscal year ending October 29, 2022 (fiscal 2022).As of October 30, 2021, the Company had repurchased a total of approximately 171.6 million shares of its common stock forapproximately $8.8 billion under our share repurchase program, excluding the $500.0 million noted above. An additional $7.4billion remains available for repurchase of shares under the current authorized program. Future repurchases of common stockwill be dependent upon our financial position, results of operations, outlook, liquidity, and other factors we deem relevant.
Period
Total Numberof
SharesPurchased (1)
AveragePrice PaidPer Share (2)
Total Number of SharesPurchased as Part ofPublicly AnnouncedPlans or Programs (3)
Approximate DollarValue of Shares thatMay Yet Be PurchasedUnder the Plans orPrograms (4)
August 1, 2021 through August 28, 2021 285,504 $ 168.68 282,172 $ 1,395,596,501August 29, 2021 through September 25, 2021 12,484,097 $ 163.35 12,307,715 $ 7,386,077,264September 26, 2021 through October 30, 2021 48,223 $ 176.12 — $ 7,386,077,264
Total 12,817,824 $ 163.52 12,589,887 $ 7,386,077,264_______________________________________(1) Includes 227,937 shares withheld by us from employees to satisfy employee tax obligations upon vesting of restricted stock units/
awards granted to our employees under our equity compensation plans.(2) The average price paid for shares in connection with vesting of restricted stock units/awards are averages of the closing stock price at
the vesting date which is used to calculate the number of shares to be withheld.(3) Shares repurchased pursuant to the stock repurchase program publicly announced on August 12, 2004. On August 25, 2021, the Board
of Directors approved an increase to the current authorization for the stock repurchase program by an additional $8.5 billion to $16.7billion in the aggregate. Under the repurchase program, we may repurchase outstanding shares of our common stock from time to timein the open market and through privately negotiated transactions. Unless terminated earlier by resolution of our Board of Directors, therepurchase program will expire when we have repurchased all shares authorized for repurchase under the repurchase program.
(4) Includes a $500.0 million advance payment for the remaining 20% of shares to be delivered in the first half of 2022 under ourAccelerated Share Repurchase agreement discussed above.
26

Comparative Stock Performance Graph
The following graph compares cumulative total shareholder return on our common stock since October 29, 2016 with thecumulative total return of the Standard & Poor’s (S&P) 500 Index and the S&P Semiconductors Index. This graph assumes theinvestment of $100 on October 29, 2016 in our common stock, the S&P 500 Index and the S&P Semiconductors Index andassumes all dividends are reinvested. Measurement points are the last trading day for each respective fiscal year.
ITEM 6. RESERVED
27

ITEM 7. MANAGEMENT’S DISCUSSION AND ANALYSIS OF FINANCIAL CONDITION AND RESULTSOF OPERATIONS (all tabular amounts in thousands except per share amounts)
The following discussion includes a comparison of our Results of Operations and Liquidity and Capital Resources for thefiscal years ended October 30, 2021 (fiscal 2021), the fiscal year ended October 31, 2020 (fiscal 2020) and the fiscal year endedNovember 2, 2019 (fiscal 2019). Our fiscal year is the 52-week or 53-week period ending on the Saturday closest to the lastday in October. Fiscal 2021, fiscal 2020 and fiscal 2019 were 52-week fiscal periods.
Impact of COVID-19 on our Business
The pandemic caused by the novel strain of the coronavirus (COVID-19) and the numerous measures implemented bygovernment authorities in response, have impacted and likely will continue to impact our workforce and operations, theoperations of our customers and those of our respective vendors and suppliers. We have significant operations worldwide,including in the United States, the Philippines, Ireland, Malaysia, Thailand, China and India. Each of these countries has beenaffected by the pandemic and taken measures to try to contain it, resulting in disruptions at some of our manufacturingoperations and facilities.
The spread of COVID-19 has caused us to modify our business practices (including restricting employee travel,modifying employee work locations and cancelling physical participation in meetings, events and conferences) and we maytake further actions as may be required by government authorities or that we determine are in the best interests of ouremployees, customers, partners, suppliers and shareholders.
While we are confident that our strategy and long-term contingency planning have positioned us well to weather thecurrent uncertainty, we cannot at this time fully quantify or forecast the impact of COVID-19 on our business. The full extentof the impact of the COVID-19 pandemic on our business, financial condition and results of operations will depend on futuredevelopments, which are highly uncertain such as the continued duration and severity of the pandemic, the spread of morecontagious variants of the virus, the adoption rate of vaccines, the actions to contain the virus or treat its impact, or how quicklyand to what extent normal economic and operating conditions can resume.
Acquisition of Maxim Integrated Products, Inc.
On August 26, 2021 (Acquisition Date), we completed the acquisition of Maxim Integrated Products, Inc. (Maxim), anindependent manufacturer of innovative analog and mixed-signal products and technologies. Pursuant to the Agreement andPlan of Merger, dated as of July 12, 2020 (the Merger Agreement), Maxim stockholders received, for each outstanding share ofMaxim common stock, 0.6300 of a share of the Company’s common stock as of the Acquisition Date, for total consideration ofapproximately $28.0 billion of our common stock. The acquisition of Maxim is referred to as the Acquisition. Theconsolidated financial statements included in this Annual Report on Form 10-K include the financial results of Maximprospectively from the Acquisition Date. See Note 6, Acquisitions, of the Notes to the Consolidated Financial Statementscontained in Item 8 of this Annual Report on Form 10-K for further information.
Results of Operations
A discussion of changes in our results of operations from fiscal 2019 to fiscal 2020 has been omitted from this Form 10-K, but may be found in “Item 7. Management’s Discussion and Analysis of Financial Condition and Results of Operations” ofour Form 10-K for fiscal 2020 filed with the Securities and Exchange Commission on November 24, 2020.
28

OverviewFiscal Year 2021 over 2020 2020 over 2019
2021 2020 2019 $ Change%
Change $ Change%
Change
Revenue $7,318,286 $5,603,056 $5,991,065 $ 1,715,230 31 % $ (388,009) (6)%Gross margin % 61.8 % 65.9 % 67.0 %Net income $1,390,422 $1,220,761 $1,363,011 $ 169,661 14 % $ (142,250) (10)%Net income as a % of revenue 19.0 % 21.8 % 22.8 %Diluted EPS $ 3.46 $ 3.28 $ 3.65 $ 0.18 5 % $ (0.37) (10)%
Revenue Trends by End Market
The following table summarizes revenue by end market. The categorization of revenue by end market is determined usinga variety of data points including the technical characteristics of the product, the “sold to” customer information, the "ship to"customer information and the end customer product or application into which our product will be incorporated. As data systemsfor capturing and tracking this data and our methodology evolves and improves, the categorization of products by end marketcan vary over time. When this occurs, we reclassify revenue by end market for prior periods. Such reclassifications typically donot materially change the sizing of, or the underlying trends of results within each end market.
Fiscal 2021 Fiscal 2020 Fiscal 2019
Revenue
% ofTotalProductRevenue(1) Y/Y% Revenue
% ofTotalProductRevenue(1) Y/Y% Revenue
% ofTotalProductRevenue(1)
Industrial $ 4,011,485 55 % 34 % $ 2,998,259 54 % (1)% $ 3,014,890 50 %Automotive 1,248,635 17 % 60 % 778,297 14 % (16)% 929,671 16 %Communications 1,198,461 16 % 1 % 1,191,169 21 % (8)% 1,294,233 22 %Consumer 859,705 12 % 35 % 635,331 11 % (16)% 752,271 13 %Total Revenue $ 7,318,286 100 % 31 % $ 5,603,056 100 % (6)% $ 5,991,065 100 %_______________________________________(1) The sum of the individual percentages may not equal the total due to rounding.
Revenue increased across all end markets in fiscal 2021 as compared to fiscal 2020 primarily as a result of higher broad-based demand for our products sold into the Automotive, Consumer and Industrial end markets. Revenue in theCommunications end market was also slightly higher in fiscal 2021 compared to fiscal 2020 as the timing of infrastructuredeployment cycles in certain regions offset higher demand. Incremental revenue as a result of the Acquisition also contributedto higher revenue in each end market in fiscal 2021, as compared to fiscal 2020.
Revenue by Sales Channel
The following table summarizes revenue by sales channel. We sell our products globally through a direct sales force,third party distributors, independent sales representatives and via our website. Distributors are customers that buy products withthe intention of reselling them. Direct customers are non-distributor customers and consist primarily of original equipmentmanufacturers (OEMs). Other customers include the U.S. government, government prime contractors and certain commercialcustomers for which revenue is recorded over time.
29

Fiscal 2021 Fiscal 2020 Fiscal 2019
Revenue
% ofTotalProductRevenue(1) Revenue
% ofTotalProductRevenue(1) Revenue
% ofTotalProductRevenue(1)
Distributors $ 4,589,944 63 % $ 3,216,302 57 % $ 3,409,161 57 %Direct customers 2,600,353 36 % 2,300,493 41 % 2,506,065 42 %Other 127,989 2 % 86,261 2 % 75,839 1 %Total Revenue $ 7,318,286 100 % $ 5,603,056 100 % $ 5,991,065 100 %_______________________________________(1) The sum of the individual percentages may not equal the total due to rounding.
The percentage of total revenue sold via each channel can fluctuate from time to time based on end customer demand. Infiscal 2021, higher demand within our Automotive and Industrial end markets resulted in increased revenue through ourdistributor channel.
Revenue Trends by Geographic Region
Revenue by geographic region, based upon the geographic location of the distributors or OEMs who purchased theCompany's products, for fiscal 2021, fiscal 2020 and fiscal 2019 was as follows:
ChangeFiscal Year 2021 over 2020 2020 over 2019
2021 2020 2019 $ Change
%Change(1) $ Change
%Change(1)
United States $2,389,439 $1,887,443 $2,020,886 $ 501,996 27 % $ (133,443) (7)%Rest of North and South America 42,830 41,250 55,059 1,580 4 % (13,809) (25)%Europe 1,592,989 1,245,695 1,374,673 347,294 28 % (128,978) (9)%Japan 787,966 521,720 657,632 266,246 51 % (135,912) (21)%China 1,614,396 1,348,011 1,316,275 266,385 20 % 31,736 2 %Rest of Asia 890,666 558,937 566,540 331,729 59 % (7,603) (1)%Total Revenue $7,318,286 $5,603,056 $5,991,065 $1,715,230 31 % $ (388,009) (6)%
_______________________________________(1) The sum of the individual percentages may not equal the total due to rounding.
In all periods presented, the predominant countries comprising “Rest of North and South America” are Canada andMexico; the predominant countries comprising “Europe” are Germany, Sweden, and the Netherlands; and the predominantcountries comprising “Rest of Asia” are Taiwan, Malaysia, South Korea and Singapore.
Total revenue increased in fiscal 2021 as compared to fiscal 2020 due to broad-based, global demand in thesemiconductor industry as well as the incremental impact of revenue from the Acquisition. We saw increases across all endmarkets in territories, with the exception of sales into the Communication end market in China, which was impacted byinfrastructure deployment cycles as noted above.
30

Gross Margin
ChangeFiscal Year 2021 over 2020 2020 over 2019
2021 2020 2019 $ Change%
Change $ Change % Change
Gross margin $4,525,012 $3,690,478 $4,013,750 $ 834,534 23 % $ (323,272) (8)%Gross margin % 61.8 % 65.9 % 67.0 %
Gross margin percentage in fiscal 2021 decreased by 410 basis points compared to fiscal 2020, primarily as a result ofrecording additional costs related to the Acquisition, including $331.1 million and $155.4 million of cost of goods sold relatedto the fair value adjustments recorded to inventory and amortization expense of intangible assets, respectively. These increasesin cost of sales as a result of the Acquisition were partially offset by the favorable impact of higher utilization of our factoriesdue to increased customer demand.
Research and Development (R&D)
ChangeFiscal Year 2021 over 2020 2020 over 2019
2021 2020 2019 $ Change % Change $ Change % Change
R&D expenses $1,296,126 $1,050,519 $1,130,348 $ 245,607 23 % $ (79,829) (7)%R&D expenses as a % ofrevenue 18 % 19 % 19 %
R&D expenses increased in fiscal 2021 as compared to fiscal 2020 primarily as a result of higher R&D employee-relatedvariable compensation expense, incremental R&D expenses incurred as a result of the Acquisition and higher salary and benefitexpenses.
R&D expenses as a percentage of revenue will fluctuate from year-to-year depending on the amount of revenue and thesuccess of new product development efforts, which we view as critical to our future growth. We expect to continue thedevelopment of innovative technologies and processes for new products. We believe that a continued commitment to R&D isessential to maintain product leadership with our existing products as well as to provide innovative new product offerings.Therefore, we expect to continue to make significant R&D investments in the future.
Selling, Marketing, General and Administrative (SMG&A)
ChangeFiscal Year 2021 over 2020 2020 over 2019
2021 2020 2019 $ Change%
Change $ Change % Change
SMG&A expenses $ 915,418 $ 659,923 $ 648,094 $ 255,495 39 % $ 11,829 2 %SMG&A expenses as a % ofrevenue 13 % 12 % 11 %
SMG&A expenses increased in fiscal 2021 as compared to fiscal 2020, primarily as a result of higher costs due toacquisition-related transaction costs, incremental SMG&A expenses incurred as a result of the Acquisition and higher variablecompensation expense and salary and benefit expenses.
Amortization of Intangibles
ChangeFiscal Year 2021 over 2020 2020 over 2019
2021 2020 2019 $ Change%
Change $ Change % Change
Amortization expenses $ 536,811 $ 429,455 $ 429,041 $ 107,356 25 % $ 414 — %Amortization expenses as a %of revenue 7 % 8 % 7 %
Amortization expenses increased in fiscal 2021 as compared to fiscal 2020, primarily as a result of $105.8 million ofamortization expense of intangible assets recorded as part of the Acquisition.
31

Special Charges, Net
We monitor global macroeconomic conditions on an ongoing basis and continue to assess opportunities for improvedoperational effectiveness and efficiency, as well as a better alignment of expenses with revenues. As a result of theseassessments, we have undertaken various restructuring actions over the past several years.
Closure of Manufacturing Facilities:We recorded special charges as a result of our decision to consolidate certain waferand test facility operations acquired as part of the acquisition of Linear. The special charges include severance and fringebenefit costs, in accordance with the Company's ongoing benefit plan or statutory requirements at foreign locations and one-time termination benefits for the impacted employees and other exit costs. These one-time termination benefits are beingrecognized over the future service period required for employees to earn these benefits. In addition, as a result of management'splan to close certain wafer and test facility operations acquired as part of the acquisition of Linear Technology Corporation(Linear), the Company sold its facility in Singapore and ceased production at its Hillview manufacturing facility in Milpitas,California during fiscal 2021.
Repositioning Actions: In fiscal 2020, we recorded special charges of $49.4 million as a result of organizational initiatives tobetter align its global workforce with its long-term strategic plan. The special charges include severance and fringe benefitcosts, in accordance with the Company's ongoing benefit plan or statutory requirements at foreign locations and the write-off ofacquired intellectual property due to the Company's decision to discontinue certain product development strategies.
Other: The other special charges of $83.4 million recognized during fiscal 2021 include severance and benefit costs as wellas charges recorded from acceleration of equity awards in connection with the termination of a limited number of employees aspart of the integration of the Acquisition.
Operating Income
ChangeFiscal Year 2021 over 2020 2020 over 2019
2021 2020 2019 $ Change%
Change $ Change % Change
Operating income $1,692,201 $1,498,244 $1,710,608 $ 193,957 13 % $ (212,364) (12)%Operating income as a % ofrevenue 23.1 % 26.7 % 28.6 %
The increase in operating income in fiscal 2021 as compared to fiscal 2020 was primarily the result of a $834.5 millionincrease in gross margin, partially offset by a $255.5 million increase in SMG&A expenses, a $245.6 million increase in R&Dexpenses, a $107.4 million increase in amortization expenses and a $32.1 million increase in special charges, net as more fullydescribed above under the headings Gross Margin, Selling, Marketing, General and Administrative (SMG&A), Research andDevelopment (R&D), Amortization of Intangibles and Special Charges, Net.
Nonoperating (Income) Expense
ChangeFiscal Year 2021 over 2020 2020 over 2019
2021 2020 2019 $ Change $ Change
Total Nonoperating expense $ 363,487 $ 186,627 $ 224,880 $ 176,860 $ (38,253)
The year-over-year increase in nonoperating expense in fiscal 2021 as compared to fiscal 2020 was primarily the result ofa loss on the extinguishment of debt related to debt transactions in the fourth quarter of fiscal 2021, partially offset by gainsrecorded on other investments and a decrease in interest expense related to our debt obligations in the period.
(Benefit From) Provision for Income Taxes
ChangeFiscal Year 2021 over 2020 2020 over 2019
2021 2020 2019 $ Change%
Change $ Change % Change
(Benefit from) provision forincome taxes $ (61,708) $ 90,856 $ 122,717 $ (152,564) (168)% $ (31,861) (26)%Effective income tax rate (4.6)% 6.9 % 8.3 %
Our effective tax rates for fiscal 2021 and fiscal 2020 were below the U.S. statutory rate of 21% due to lower statutory taxrates applicable to our operations in the foreign jurisdictions in which we earn income. Our provision for income taxes was
32
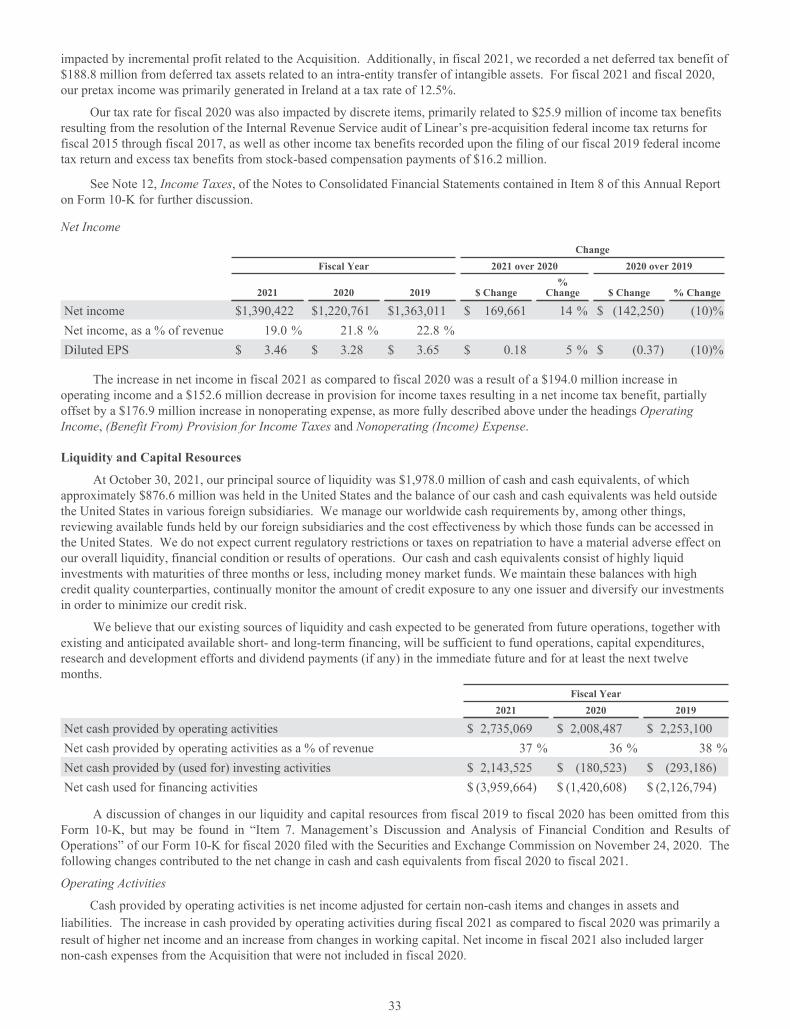
impacted by incremental profit related to the Acquisition. Additionally, in fiscal 2021, we recorded a net deferred tax benefit of$188.8 million from deferred tax assets related to an intra-entity transfer of intangible assets. For fiscal 2021 and fiscal 2020,our pretax income was primarily generated in Ireland at a tax rate of 12.5%.
Our tax rate for fiscal 2020 was also impacted by discrete items, primarily related to $25.9 million of income tax benefitsresulting from the resolution of the Internal Revenue Service audit of Linear’s pre-acquisition federal income tax returns forfiscal 2015 through fiscal 2017, as well as other income tax benefits recorded upon the filing of our fiscal 2019 federal incometax return and excess tax benefits from stock-based compensation payments of $16.2 million.
See Note 12, Income Taxes, of the Notes to Consolidated Financial Statements contained in Item 8 of this Annual Reporton Form 10-K for further discussion.
Net Income
ChangeFiscal Year 2021 over 2020 2020 over 2019
2021 2020 2019 $ Change%
Change $ Change % Change
Net income $1,390,422 $1,220,761 $1,363,011 $ 169,661 14 % $ (142,250) (10)%Net income, as a % of revenue 19.0 % 21.8 % 22.8 %Diluted EPS $ 3.46 $ 3.28 $ 3.65 $ 0.18 5 % $ (0.37) (10)%
The increase in net income in fiscal 2021 as compared to fiscal 2020 was a result of a $194.0 million increase inoperating income and a $152.6 million decrease in provision for income taxes resulting in a net income tax benefit, partiallyoffset by a $176.9 million increase in nonoperating expense, as more fully described above under the headings OperatingIncome, (Benefit From) Provision for Income Taxes and Nonoperating (Income) Expense.
Liquidity and Capital Resources
At October 30, 2021, our principal source of liquidity was $1,978.0 million of cash and cash equivalents, of whichapproximately $876.6 million was held in the United States and the balance of our cash and cash equivalents was held outsidethe United States in various foreign subsidiaries. We manage our worldwide cash requirements by, among other things,reviewing available funds held by our foreign subsidiaries and the cost effectiveness by which those funds can be accessed inthe United States. We do not expect current regulatory restrictions or taxes on repatriation to have a material adverse effect onour overall liquidity, financial condition or results of operations. Our cash and cash equivalents consist of highly liquidinvestments with maturities of three months or less, including money market funds. We maintain these balances with highcredit quality counterparties, continually monitor the amount of credit exposure to any one issuer and diversify our investmentsin order to minimize our credit risk.
We believe that our existing sources of liquidity and cash expected to be generated from future operations, together withexisting and anticipated available short- and long-term financing, will be sufficient to fund operations, capital expenditures,research and development efforts and dividend payments (if any) in the immediate future and for at least the next twelvemonths.
Fiscal Year2021 2020 2019
Net cash provided by operating activities $ 2,735,069 $ 2,008,487 $ 2,253,100Net cash provided by operating activities as a % of revenue 37 % 36 % 38 %Net cash provided by (used for) investing activities $ 2,143,525 $ (180,523) $ (293,186)Net cash used for financing activities $ (3,959,664) $ (1,420,608) $ (2,126,794)
A discussion of changes in our liquidity and capital resources from fiscal 2019 to fiscal 2020 has been omitted from thisForm 10-K, but may be found in “Item 7. Management’s Discussion and Analysis of Financial Condition and Results ofOperations” of our Form 10-K for fiscal 2020 filed with the Securities and Exchange Commission on November 24, 2020. Thefollowing changes contributed to the net change in cash and cash equivalents from fiscal 2020 to fiscal 2021.
Operating Activities
Cash provided by operating activities is net income adjusted for certain non-cash items and changes in assets andliabilities. The increase in cash provided by operating activities during fiscal 2021 as compared to fiscal 2020 was primarily aresult of higher net income and an increase from changes in working capital. Net income in fiscal 2021 also included largernon-cash expenses from the Acquisition that were not included in fiscal 2020.
33

Investing Activities
Investing cash flows generally consist of capital expenditures, cash used for acquisitions and proceeds from or purchasesof investments. The increase in cash provided by (used for) investing activities during fiscal 2021 as compared to fiscal 2020was primarily the result of cash received from the Acquisition, partially offset by an increase in cash used for capitalexpenditures.
Financing Activities
Financing cash flows consist primarily of payments of dividends to stockholders, repurchases of common stock, issuanceand repayment of debt, and proceeds from the sale of shares of common stock pursuant to employee equity incentive plans.The increase in cash used for financing activities during fiscal 2021 as compared to fiscal 2020 was primarily the result of anincrease in common stock repurchases in connection with our accelerated share repurchase program and higher dividendpayments, partially offset by a net increase in debt in fiscal 2021 as we terminated some debt and raised additional proceedsfrom debt compared to the net decrease in debt in 2020.
Working CapitalFiscal Year
2021 2020 $ Change % Change
Accounts receivable, net $1,459,056 $ 737,536 $ 721,520 98 %Days sales outstanding (1) 55 45Inventory $1,200,610 $ 608,260 $ 592,350 97 %Days cost of sales in inventory (1) 118 116_______________________________________(1) We use the average of the current year and prior year ending net accounts receivable and ending inventory balance in our calculation of
days sales outstanding and days cost of sales in inventory, respectively. Cost of sales amounts used in the calculation of days cost ofsales in inventory for fiscal 2021 include Acquisition accounting adjustments related to the sale of acquired inventory written up to fairvalue, amortization of developed technology intangible assets acquired and depreciation related to the write-up of fixed assets to fairvalue. The calculations above include the financial results of Maxim prospectively from the Acquisition Date.
The increase in accounts receivable for fiscal 2021 compared to fiscal 2020 was primarily the result of the Acquisition aswell as normal variations in the timing of collections and billings.
Inventory in dollars increased in fiscal 2021 as compared to fiscal 2020, primarily as a result of the Acquisition as well asour efforts to balance manufacturing production, demand and inventory levels. Our inventory levels are impacted by our need tosupport forecasted sales demand and variations between those forecasts and actual demand. During the fourth quarter of fiscal2021, the inventory values on the Consolidated Balance Sheet were also impacted by additional costs related to the Acquisitionand the requirement to account for acquired inventory at fair-value.
Current liabilities increased to $2,770.3 million at October 30, 2021 from $1,365.0 million recorded at the end of fiscal2020. The increase was primarily due to the Acquisition, including $516.7 million of Maxim debt obligations classified ascurrent and $584.9 million of accrued liabilities.
Revolving Credit Facility
Our Third Amended and Restated Revolving Credit Agreement, dated as of June 23, 2021, with Bank of America N.A. asadministrative agent and the other banks identified therein as lenders (Revolving Credit Agreement) amended and restated ourSecond Amended and Restated Credit Agreement dated as of June 28, 2019 and provides for a five year unsecured revolvingcredit facility in an aggregate principal amount not to exceed $2.5 billion (subject to certain terms and conditions). In March2020, we borrowed $350.0 million under this revolving credit facility and utilized the proceeds for the repayment of existingindebtedness and working capital requirements. We repaid the $350.0 million plus interest in April 2020. In September 2021,we borrowed $400.0 million under this revolving credit facility and utilized the proceeds for the repayment of existingindebtedness and working capital requirements. We repaid the $400.0 million plus interest in October 2021.
We may borrow under this revolving credit facility in the future and use the proceeds for repayment of existingindebtedness, stock repurchases, acquisitions, capital expenditures, working capital and other lawful corporate purposes. Theterms of the Revolving Credit Agreement impose restrictions on our ability to undertake certain transactions, to create certainliens on assets and to incur certain subsidiary indebtedness. In addition, the Revolving Credit Agreement contains aconsolidated leverage ratio covenant of total consolidated funded debt to consolidated earnings before interest, taxes,depreciation, and amortization (EBITDA) of not greater than 3.5 to 1.0. As of October 30, 2021, we were in compliance withthese covenants. See Note 13, Revolving Credit Facility, of the Notes to Consolidated Financial Statements contained in Item 8of this Annual Report on Form 10-K for further information on our revolving credit facility.
34

Debt
As of October 30, 2021, we had $6.8 billion of carrying value outstanding on our debt. On November 4, 2021, weredeemed Maxim's 3.375% Senior Notes due 2023 in the aggregate principal amount of $500.0 million. The difference in thecarrying value of the debt and the principal is due to the unamortized discount and issuance fees and other adjustments on theseinstruments. The indentures governing certain of our debt instruments contain covenants that may limit our ability to: incur,create, assume or guarantee any debt or borrowed money secured by a lien upon a principal property; enter into sale and lease-back transactions with respect to a principal property; and consolidate with or merge into, or transfer or lease all or substantiallyall of our assets to, any other party. As of October 30, 2021, we were compliant with these covenants. See Note 14, Debt, andNote 15, Subsequent Events, of the Notes to Consolidated Financial Statements contained in Item 8 of this Annual Report onForm 10-K for further information on our outstanding debt.
Stock Repurchase Program
In September 2021, we entered into accelerated share repurchase agreements (ASR) with third party financial institutionsto repurchase $2.5 billion of our common stock. We paid $2.5 billion and received an initial delivery of 12.3 million shares ofcommon stock, which represented approximately 80% of the notional amount of the ASR. The final settlement of thetransaction under the ASR is expected to occur in the first half of fiscal 2022.
Our common stock repurchase program has been in place since August 2004. Since inception, our Board of Directors hasauthorized us to repurchase $16.7 billion of our common stock under the program, which includes the $8.5 billion authorizationapproved by the Board of Directors on August 25, 2021. Under the program, we may repurchase outstanding shares of ourcommon stock from time to time in the open market and through privately negotiated transactions. Unless terminated earlier byresolution of our Board of Directors, the repurchase program will expire when we have repurchased all shares authorized underthe program.
As of October 30, 2021, $7.4 billion remained available for repurchase under the current authorized program. Therepurchased shares are held as authorized but unissued shares of common stock. We also repurchase shares in settlement ofemployee tax withholding obligations due upon the vesting of restricted stock units/awards or the exercise of stock options.Future repurchases of common stock will be dependent upon our financial position, results of operations, outlook, liquidity, andother factors we deem relevant.
Capital Expenditures
Net additions to property, plant and equipment were $343.7 million in fiscal 2021 and were funded with a combination ofcash on hand and cash generated from operations. We expect capital expenditures for fiscal 2022 to be between 6% and 8% ofrevenue, which is above our historical levels primarily due to our plans to expand internal manufacturing capacity. Thesecapital expenditures will be funded with a combination of cash on hand and cash expected to be generated from futureoperations, together with existing and anticipated available short- and long-term financing.
Analog Devices Foundation
During the first quarter of fiscal 2020, we contributed 335,654 shares of our common stock to the Analog DevicesFoundation. As of the date of the contribution, the shares had a fair value of approximately $40.0 million. This expense wasrecorded in SMG&A in the Consolidated Statement of Income.
Dividends
On November 22, 2021, our Board of Directors declared a cash dividend of $0.69 per outstanding share of commonstock. The dividend will be paid on December 14, 2021 to all shareholders of record at the close of business on December 3,2021 and is expected to total approximately $362.5 million. We currently expect quarterly dividends to continue in futureperiods, although they remain subject to determination and declaration by our Board of Directors. The payment of futuredividends, if any, will be based on several factors, including our financial performance, outlook and liquidity.
35

Contractual Obligations
The table below summarizes our material contractual obligations in specified periods as of October 30, 2021:Payment due by period
Less than More than(thousands) Total 1 Year 1-3 Years 3-5 Years 5 Years
Contractual obligations:Debt obligations (1) $ 6,776,865 $ 500,000 $ 500,000 $ 400,000 $ 5,376,865Interest payments associated with debt obligations 2,460,541 171,718 340,784 320,139 1,627,900Transition tax (2) 793,176 137,106 320,315 335,755 —Operating leases (3) 393,002 61,855 103,418 84,059 143,670Inventory-related purchase commitments (4) 291,200 52,800 91,733 63,333 83,334
Total $10,714,784 $ 923,479 $ 1,356,250 $ 1,203,286 $ 7,231,769_______________________________________(1) Debt obligations are assumed to be held to maturity.(2) Tax obligation relates to the one-time tax on deemed repatriated earnings under the Tax Cuts and Jobs Act of 2017 enacted in fiscal
2018. See Note 12, Income Taxes, of the Notes to Consolidated Financial Statements contained in Item 8 of this Annual Report on Form10-K for further discussion. This amount includes transition tax payable attributable to the Acquisition of $266.1 million.
(3) Certain of our operating lease obligations include escalation clauses. These escalating payment requirements are reflected in the table.(4) In connection with the Acquisition, we acquired a supplier commitment for the purchase of materials and supplies in advance or with
minimum purchase quantities.
As of October 30, 2021, our total liabilities associated with uncertain tax positions was $170.5 million, which areincluded in non-current income taxes payable in our Consolidated Balance Sheets contained in Item 8 of this Annual Report onForm 10-K. Due to the complexity associated with our tax uncertainties, we cannot make a reasonably reliable estimate of theperiod in which we expect to settle the non-current liabilities associated with these uncertain tax positions. Therefore, we havenot included these uncertain tax positions in the above contractual obligations table.
The expected timing of payments and the amounts of the obligations discussed above are estimated based on currentinformation available as of October 30, 2021.
New Accounting Pronouncements
From time to time, new accounting pronouncements are issued by the Financial Accounting Standards Board (FASB) andare adopted by us as of the specified effective date. Unless otherwise discussed, management believes that the impact ofrecently issued standards will not have a material impact on our future financial condition and results of operations. See Note2s, New Accounting Pronouncements, of the Notes to Consolidated Financial Statements contained in Item 8 of this AnnualReport on Form 10-K for a description of recently issued and adopted accounting pronouncements, including the dates ofadoption and impact on our historical financial condition and results of operations.
Critical Accounting Policies and Estimates
Management’s discussion and analysis of the financial condition and results of operations is based upon the ConsolidatedFinancial Statements, which have been prepared in accordance with U.S. GAAP. The preparation of these financial statementsrequires us to make estimates and judgments that affect the reported amounts of assets, liabilities, revenue and expenses, andrelated disclosure of contingent assets and liabilities. We base our estimates and judgments on historical experience, knowledgeof current conditions and beliefs of what could occur in the future based on available information. We consider the followingaccounting policies to be both those most important to the portrayal of our financial condition and those that require the mostsubjective judgment. If actual results differ significantly from management’s estimates and projections, there could be amaterial effect on our financial statements. We also have other policies that we consider key accounting policies; however, theapplication of these policies does not require us to make significant estimates or judgments that are difficult or subjective.
Revenue Recognition
Recognition of revenue occurs when a customer obtains control of promised goods or services in an amount that reflectsthe consideration to which the providing entity expects to be entitled in exchange for those goods or services. We recognizerevenue upon transfer of control of promised products or services to customers in an amount that reflects the consideration thatwe expect to receive in exchange for those products or services. We recognize revenue when all of the following criteria aremet: (1) we have entered into a binding agreement, (2) the performance obligations have been identified, (3) the transactionprice to the customer has been determined, (4) the transaction price has been allocated to the performance obligations in the
36
contract, and (5) the performance obligations have been satisfied. The majority of our shipping terms permit us to recognizerevenue at point of shipment or delivery. Certain shipping terms require the goods to be through customs or be received by thecustomer before title passes. In those instances, we defer the revenue recognized until title has passed. Shipping costs arecharged to selling, marketing, general and administrative expense as incurred. Sales taxes are excluded from revenue.
Revenue from contracts with the United States government, government prime contractors and certain commercialcustomers is recorded over time using either units delivered or costs incurred as the measurement basis for progress towardcompletion. These measures are used to measure results directly and is generally the best measure of progress towardcompletion in circumstances in which a reliable measure of output can be established. Estimated revenue in excess of amountsbilled is reported as unbilled receivables. Contract accounting requires judgment in estimating costs and assumptions related totechnical issues and delivery schedule. Contract costs include material, subcontract costs, labor and an allocation of indirectcosts. The estimation of costs at completion of a contract is subject to numerous variables involving contract costs and estimatesas to the length of time to complete the contract. Changes in contract performance, estimated gross margin, including the impactof final contract settlements, and estimated losses are recognized in the period in which the changes or losses are determined.
Performance Obligations: Substantially all of our contracts with customers contain a single performance obligation, thesale of mixed-signal integrated circuit (IC) products. Such sales represent a single performance obligation because the sale isone type of good or includes multiple goods that are neither capable of being distinct nor separable from the other promises inthe contract. This performance obligation is satisfied when control of the product is transferred to the customer, which occursupon shipment or delivery. Unsatisfied performance obligations primarily represent contracts for products with future deliverydates and with an original expected duration of one year or less. We generally warrant that our products will meet theirpublished specifications, and that we will repair or replace defective products, for one year from the date title passes from us tothe customer. Specific accruals are recorded for known product warranty issues.
Transaction Price: The transaction price reflects our expectations about the consideration we will be entitled to receivefrom the customer and may include fixed or variable amounts. Fixed consideration primarily includes sales to direct customersand sales to distributors in which both the sale to the distributor and the sale to the end customer occur within the samereporting period. Variable consideration includes sales in which the amount of consideration that we will receive is unknown asof the end of a reporting period. Such consideration primarily includes credits issued to the distributor due to price protectionand sales made to distributors under agreements that allow certain rights of return, referred to as stock rotation. Price protectionrepresents price discounts granted to certain distributors to allow the distributor to earn an appropriate margin on salesnegotiated with certain customers and in the event of a price decrease subsequent to the date the product was shipped and billedto the distributor. Stock rotation allows distributors limited levels of returns in order to reduce the amounts of slow-moving,discontinued or obsolete product from their inventory. A liability for distributor credits covering variable consideration is madebased on management's estimate of historical experience rates as well as considering economic conditions and contractualterms. To date, actual distributor claims activity has been materially consistent with the provisions we have made based on ourhistorical estimates.
Contract Balances: Accounts receivable represents our unconditional right to receive consideration from our customers.Payments are typically due within 30 to 45 days of invoicing and do not include a significant financing component. To date,there have been no material impairment losses on accounts receivable. There were no material contract assets or contractliabilities recorded on the Consolidated Balance Sheets in any of the periods presented.
Inventory Valuation
We value inventories at the lower of cost (first-in, first-out method) or market. Because of the cyclical nature of thesemiconductor industry, changes in inventory levels, obsolescence of technology, and product life cycles, we write downinventories to net realizable value. We employ a variety of methodologies to determine the net realizable value of inventory.While a portion of the calculation is determined via reference to the age of inventory and lower of cost or market calculations,an element of the calculation is subject to significant judgments made by us about future demand for our inventory. If actualdemand for our products is less than our estimates, additional adjustments to existing inventories may need to be recorded infuture periods. To date, our actual results have not been materially different than our estimates, and we do not expect them to bematerially different in the future.
Long-Lived Assets
We review property, plant, and equipment and intangible assets for impairment whenever events or changes incircumstances indicate that the carrying value of assets may not be recoverable. Recoverability of these assets is determined bycomparison of their carrying value to the estimated future undiscounted cash flows that the assets are expected to generate overtheir remaining estimated lives. If such assets are considered to be impaired, the impairment to be recognized in earnings equalsthe amount by which the carrying value of the assets exceeds their fair value determined by either a quoted market price, if any,or a value determined by utilizing a discounted cash flow technique. Although we have recognized no material impairment
37

adjustments related to our property, plant, and equipment and identified intangible assets during the past three fiscal years,except those made in conjunction with restructuring actions, deterioration in our business in the future could lead to suchimpairment adjustments in future periods. Evaluation of impairment of long-lived assets requires estimates of future operatingresults that are used in the preparation of the expected future undiscounted cash flows. Actual future operating results and theremaining economic lives of our long-lived assets could differ from the estimates used in assessing the recoverability of theseassets. These differences could result in impairment charges, which could have a material adverse impact on our results ofoperations. In addition, in certain instances, assets may not be impaired but their estimated useful lives may have decreased. Inthese situations, we amortize the remaining net book values over the revised useful lives.
Goodwill
Goodwill is subject to impairment tests annually or more frequently if events or changes in circumstances suggest that thecarrying value of goodwill may not be recoverable, utilizing either the qualitative or quantitative method. We test goodwill forimpairment at the reporting unit level, which we determined is consistent with our identified operating segments, on an annualbasis on the first day of the fourth quarter (on or about August 1) or more frequently if we believe indicators of impairmentexist or we reorganize our operating segments or reporting units.
We have the option to first assess qualitative factors to determine whether it is more likely than not that the fair value of areporting unit is less than its net book value. When using the qualitative method, we consider several factors, including thefollowing:
– the amount by which the fair values of each reporting unit exceeded their carrying values as of the date of the mostrecent quantitative impairment analysis, which indicated there would need to be substantial negative developments inthe markets in which these reporting units operate in order for there to be potential impairment;
– the carrying values of these reporting units as of the assessment date compared to their previously calculated fairvalues as of the date of the most recent quantitative impairment analysis;
– the current forecasts as compared to the forecasts included in the most recent quantitative impairment analysis;– public information from competitors and other industry information to determine if there were any significant adverse
trends in our competitors' businesses;– changes in the value of major U.S. stock indices that could suggest declines in overall market stability that could
impact the valuation of our reporting units;– changes in our market capitalization and overall enterprise valuation to determine if there were any significant
decreases that could be an indication that the valuation of our reporting units had significantly decreased; and– whether there had been any significant increases to the weighted-average cost of capital rates for each reporting unit,
which could materially lower our prior valuation conclusions under a discounted cash flow approach.
If we elect not to use this option, or we determine that it is more likely than not that the fair value of a reporting unit isless than its net book value, then we perform the quantitative goodwill impairment test. The quantitative goodwill impairmenttest requires an entity to compare the fair value of a reporting unit with its carrying amount. If fair value is determined to be lessthan carrying value, an impairment loss is recognized for the amount of the carrying value that exceeds the amount of thereporting unit's fair value, not to exceed the total amount of goodwill allocated to the reporting unit. Additionally, we considerincome tax effects from any tax deductible goodwill on the carrying amount of the reporting unit when measuring the goodwillimpairment loss, if applicable. We determine the fair value of our reporting units using a weighting of the income and marketapproaches. Under the income approach, we use a discounted cash flow methodology which requires management to makesignificant estimates and assumptions related to forecasted revenues, gross profit margins, operating income margins, workingcapital cash flow, perpetual growth rates, and long-term discount rates, among others. For the market approach, we usethe guideline public company method. Under this method we utilize information from comparable publicly traded companieswith similar operating and investment characteristics as the reporting units, to create valuation multiples that are applied to theoperating performance of the reporting unit being tested, in order to obtain their respective fair values. In order to assess thereasonableness of the calculated reporting unit fair values, we reconcile the aggregate fair values of our reporting unitsdetermined, as described above, to our total company market capitalization, allowing for a reasonable control premium.
During fiscal 2021 and fiscal 2020, we elected to use the quantitative method of assessing goodwill for all of ourreporting units. In all periods presented, we concluded the reporting units' fair values exceeded their carrying amounts as of theassessment dates and no risk of impairment existed.
38

Business Combinations
Under the acquisition method of accounting, we recognize tangible and identifiable intangible assets acquired andliabilities assumed based on their estimated fair values. We record the excess of the fair value of the purchase considerationover the value of the net assets acquired as goodwill. The accounting for business combinations requires us to make significantestimates and assumptions, especially with respect to intangible assets and the fair value of contingent payment obligations.Critical estimates in valuing purchased technology, customer lists and other identifiable intangible assets include future cashflows that we expect to generate from the acquired assets. If the subsequent actual results and updated projections of theunderlying business activity change compared with the assumptions and projections used to develop these values, we couldexperience impairment charges which could be material. In addition, we have estimated the economic lives of certain acquiredassets and these lives are used to calculate depreciation and amortization expense. If our estimates of the economic liveschange, depreciation or amortization expenses could be accelerated or slowed.
We record contingent consideration resulting from a business combination at its fair value on the acquisition date. Wegenerally determine the fair value of the contingent consideration using the income approach methodology of valuation. Eachreporting period thereafter, we revalue these obligations and record increases or decreases in their fair value as an adjustment tooperating expenses within the Consolidated Statements of Income. Changes in the fair value of the contingent consideration canresult from changes in assumed discount periods and rates, and from changes pertaining to the achievement of the definedmilestones. Significant judgment is employed in determining the appropriateness of these assumptions as of the acquisition dateand for each subsequent period. Accordingly, future business and economic conditions, as well as changes in any of theassumptions described above, can materially impact the amount of contingent consideration expense we record in any givenperiod.
Accounting for Income Taxes
We make certain estimates and judgments in determining income tax expense for financial statement purposes. Theseestimates and judgments occur in the calculation of income tax credits, benefits, and deductions, and in the calculation ofcertain tax assets and liabilities, which arise from differences in the timing of the recognition of certain expenses for tax andfinancial statement purposes. We assess the likelihood of the realization of deferred tax assets and record a correspondingvaluation allowance as necessary if we determine those deferred tax assets may not be realized due to the uncertainty of thetiming and amount to be realized of certain state and international tax credit carryovers. In reaching our conclusion, weevaluate certain relevant criteria including the existence of deferred tax liabilities that can be used to realize deferred tax assets,the taxable income in prior carryback years in the impacted state and international jurisdictions that can be used to absorb netoperating losses and taxable income in future years. Our judgments regarding future profitability may change due to futuremarket conditions, changes in U.S. or international tax laws and other factors. These changes, if any, may require materialadjustments to these deferred tax assets, which may result in an increase or decrease to our income tax provision in futureperiods.
We account for uncertain tax positions by first determining if it is “more likely than not” that a tax position will besustained by the appropriate taxing authorities prior to recording any benefit in the financial statements. An uncertain incometax position is not recognized if it has less than a 50% likelihood of being sustained. For those tax positions where it is morelikely than not that a tax position will be sustained, we have recorded the largest amount of tax benefit with a greater than 50%likelihood of being realized upon ultimate settlement with a taxing authority that has full knowledge of all relevant information.For those income tax positions where it is not more likely than not that a tax benefit will be sustained, no tax benefit has beenrecognized in the financial statements. We classify interest and penalties related to uncertain tax positions within the (benefitfrom) provision for income taxes line of the Consolidated Statements of Income. We reevaluate these uncertain tax positionson a quarterly basis. This evaluation is based on factors including, but not limited to, changes in known facts or circumstances,changes in tax law, effectively settled issues under audit, and new guidance on legislative interpretations. A change in thesefactors could result in the recognition of an increase or decrease to our income tax provision, which could materially impact ourconsolidated financial position and results of operations.
In the ordinary course of global business, there are many transactions and calculations where the ultimate tax outcome isuncertain. Some of these uncertainties arise as a consequence of cost reimbursement and royalty arrangements among relatedentities. Although we believe our estimates are reasonable, no assurance can be given that the final tax outcome of these matterswill not be different than that which is reflected in our historical income tax provisions and income tax liabilities. In the eventour assumptions are incorrect, the differences could have a material impact on our income tax provision and operating results inthe period in which such determination is made. In addition to the factors described above, our current and expected effectivetax rate is based on then-current tax law. Significant changes during the year in enacted tax law could affect these estimates.
See Note 12, Income Taxes, of the Notes to Consolidated Financial Statements contained in Item 8 of this Annual Reporton Form 10-K for further discussion.
39

Stock-Based Compensation
Stock-based compensation expense associated with stock options and related awards is recognized in the ConsolidatedStatements of Income. Determining the amount of stock-based compensation to be recorded requires us to develop estimates tobe used in calculating the grant-date fair value of stock options and market-based restricted stock units. We calculate the grant-date fair values of stock options using the Black-Scholes valuation model. The grant-date fair value of restricted stock unitswith a service condition and restricted stock units with both service and performance conditions are calculated using the valueof our common stock on the date of grant, reduced by the present value of dividends expected to be paid on our common stockprior to vesting. For restricted stock units with both service and performance conditions, this grant-date fair value is alsoimpacted by the number of units that are expected to vest during the performance period and is adjusted through the relatedstock-based compensation expense at each reporting period based on the probability of achievement of that performancecondition. If we determine that an award is unlikely to vest, any previously recorded stock-based compensation expense isreversed in the period of that determination. The grant date fair value of restricted stock units or performance-based stockoptions with both service and market conditions are calculated using the Monte Carlo simulation model to estimate theprobability of satisfying the performance condition stipulated in the award grant, including the possibility that the marketcondition may not be satisfied.
The use of valuation models requires us to make estimates of key assumptions such as expected option term and stockprice volatility to determine the fair value of a stock option. The estimate of these key assumptions is based on historicalinformation and judgment regarding market factors and trends. We recognize the expense related to equity awards on a straight-line basis over the vesting period. See Note 2r, Stock-based Compensation, and Note 3, Stock-Based Compensation andShareholders' Equity, of the Notes to Consolidated Financial Statements contained in Item 8 of this Annual Report on Form 10-K for more information related to stock-based compensation.
Contingencies
From time to time, in the ordinary course of business, various claims, charges and litigation are asserted or commencedagainst us arising from, or related to, among other things, contractual matters, patents, trademarks, personal injury,environmental matters, product liability, insurance coverage, employment or employment benefits. We periodically assess eachmatter to determine if a contingent liability should be recorded. In making this determination, we may, depending on the natureof the matter, consult with internal and external legal counsel and technical experts. Based on the information we obtain,combined with our judgment regarding all the facts and circumstances of each matter, we determine whether it is probable thata contingent loss may be incurred and whether the amount of such loss can be reasonably estimated. If a loss is probable andreasonably estimable, we record a contingent loss. In determining the amount of a contingent loss, we consider advice receivedfrom experts in the specific matter, current status of legal proceedings, settlement negotiations that may be ongoing, prior casehistory and other factors. If the judgments and estimates made by us are incorrect, we may need to record additional contingentlosses that could materially adversely impact our results of operations.
40

ITEM 7A. QUANTITATIVE AND QUALITATIVE DISCLOSURES ABOUT MARKET RISK
Interest Rate Exposure
Our interest income and expense are sensitive to changes in the general level of interest rates. In this regard, changes ininterest rates affect the interest earned or paid on our marketable securities and debt, as well as the fair value of our investmentsand debt.
Based on the $500.0 million of our floating rate debt outstanding as of October 30, 2021, our annual interest expensewould change by approximately $5.0 million for each 100 basis point increase in interest rates.
In certain instances, we utilize interest rate derivatives to manage interest rate exposure on both outstanding debt as wellas future issuances. As of October 30, 2021, we had no outstanding interest rate derivative instruments. As of October 31,2020, for each 100 basis point decrease in the ten-year U.S. Treasury rate, the fair value of our outstanding derivativeinstruments would have changed by approximately $102.0 million.
Based on our marketable securities outstanding as of October 30, 2021 and October 31, 2020, our annual interest incomewould change by approximately $19.7 million and $10.6 million, respectively, for each 100 basis point increase in interestrates.
To provide a meaningful assessment of the interest rate risk associated with our investment portfolio, we performed asensitivity analysis to determine the impact a change in interest rates would have on the value of our investment portfolioassuming a 100 basis point parallel shift in the yield curve. Based on investment positions as of October 30, 2021 andOctober 31, 2020, a hypothetical 100 basis point increase in interest rates across all maturities would not materially impact thefair market value of the portfolio in either period. If significant, such losses would only be realized if we sold the investmentsprior to maturity.
As of October 30, 2021, we had $6.8 billion in principal amount of senior unsecured notes outstanding, with a fair valueof $7.1 billion. The fair value of our notes is subject to interest rate risk, market risk, and other factors. Generally, the fair valueof our notes will increase as interest rates fall and decrease as interest rates rise. The fair values of our notes as of October 30,2021 and October 31, 2020, assuming a hypothetical 100 basis point increase in market interest rates, are as follows:
October 30, 2021 October 31, 2020
(thousands)
PrincipalAmount
Outstanding Fair Value
Fair Valuegiven anincrease ininterest ratesof 100 basispoints
PrincipalAmount
Outstanding Fair Value
Fair Valuegiven anincrease ininterest ratesof 100 basispoints
2021 Notes, due December 2021 $ — $ — $ — $ 400,000 $408,565 $ 404,1702023 Notes, due March 2023 500,000 520,236 513,273 — — —Maxim 2023 Notes, due June 2023 — — — 500,000 526,855 513,8742023 Notes, due December 2023 — — — 550,000 590,177 572,9652024 Notes, due October 2024 500,000 500,482 486,201 — — —2025 Notes, due April 2025 400,000 423,265 409,725 400,000 434,919 417,2252025 Notes, due December 2025 — — — 850,000 969,033 924,6952026 Notes, due December 2026 900,000 986,243 941,160 900,000 1,017,505 962,821Maxim 2027 Notes, due June 2027 500,000 542,942 515,866 — — —2028 Notes, due October 2028 750,000 743,109 696,554 — — —2031 Notes, due October 2031 1,000,000 996,702 912,196 — — —2036 Notes, due December 2036 144,278 176,960 158,110 250,000 298,153 265,2102041 Notes, due October 2041 750,000 758,246 652,754 — — —2045 Notes, due December 2045 332,587 469,592 404,287 400,000 538,788 463,4252051 Notes, due October 2051 1,000,000 1,029,830 848,513 — — —
41
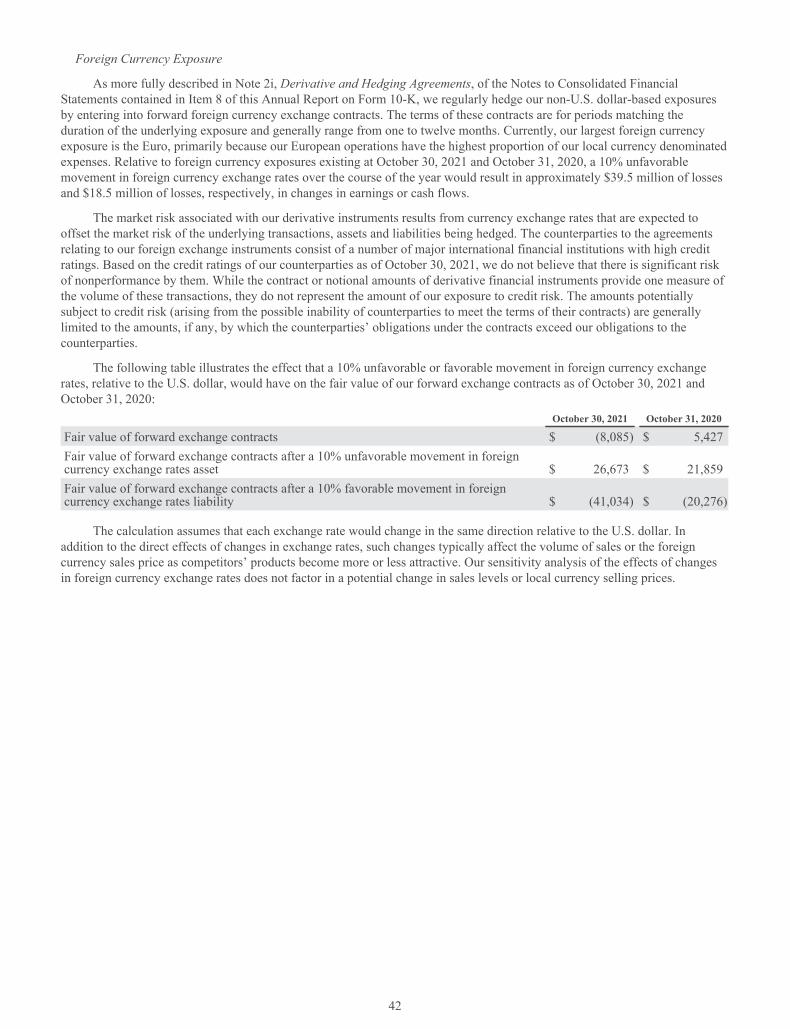
Foreign Currency Exposure
As more fully described in Note 2i, Derivative and Hedging Agreements, of the Notes to Consolidated FinancialStatements contained in Item 8 of this Annual Report on Form 10-K, we regularly hedge our non-U.S. dollar-based exposuresby entering into forward foreign currency exchange contracts. The terms of these contracts are for periods matching theduration of the underlying exposure and generally range from one to twelve months. Currently, our largest foreign currencyexposure is the Euro, primarily because our European operations have the highest proportion of our local currency denominatedexpenses. Relative to foreign currency exposures existing at October 30, 2021 and October 31, 2020, a 10% unfavorablemovement in foreign currency exchange rates over the course of the year would result in approximately $39.5 million of lossesand $18.5 million of losses, respectively, in changes in earnings or cash flows.
The market risk associated with our derivative instruments results from currency exchange rates that are expected tooffset the market risk of the underlying transactions, assets and liabilities being hedged. The counterparties to the agreementsrelating to our foreign exchange instruments consist of a number of major international financial institutions with high creditratings. Based on the credit ratings of our counterparties as of October 30, 2021, we do not believe that there is significant riskof nonperformance by them. While the contract or notional amounts of derivative financial instruments provide one measure ofthe volume of these transactions, they do not represent the amount of our exposure to credit risk. The amounts potentiallysubject to credit risk (arising from the possible inability of counterparties to meet the terms of their contracts) are generallylimited to the amounts, if any, by which the counterparties’ obligations under the contracts exceed our obligations to thecounterparties.
The following table illustrates the effect that a 10% unfavorable or favorable movement in foreign currency exchangerates, relative to the U.S. dollar, would have on the fair value of our forward exchange contracts as of October 30, 2021 andOctober 31, 2020:
October 30, 2021 October 31, 2020
Fair value of forward exchange contracts $ (8,085) $ 5,427Fair value of forward exchange contracts after a 10% unfavorable movement in foreigncurrency exchange rates asset $ 26,673 $ 21,859Fair value of forward exchange contracts after a 10% favorable movement in foreigncurrency exchange rates liability $ (41,034) $ (20,276)
The calculation assumes that each exchange rate would change in the same direction relative to the U.S. dollar. Inaddition to the direct effects of changes in exchange rates, such changes typically affect the volume of sales or the foreigncurrency sales price as competitors’ products become more or less attractive. Our sensitivity analysis of the effects of changesin foreign currency exchange rates does not factor in a potential change in sales levels or local currency selling prices.
42

REPORT OF INDEPENDENT REGISTERED PUBLIC ACCOUNTING FIRM
The Board of Directors and ShareholdersAnalog Devices, Inc.
Opinion on the Financial StatementsWe have audited the accompanying consolidated balance sheets of Analog Devices, Inc. (the Company) as of October 30, 2021and October 31, 2020, the related consolidated statements of income, comprehensive income, shareholders' equity and cashflows for each of the three years in the period ended October 30, 2021, and the related notes and financial statement schedulelisted in the Index at Item 15(a)(2) (collectively referred to as the “consolidated financial statements”). In our opinion, theconsolidated financial statements present fairly, in all material respects, the financial position of the Company at October 30,2021 and October 31, 2020, and the results of its operations and its cash flows for each of the three years in the period endedOctober 30, 2021, in conformity with U.S. generally accepted accounting principles.
We also have audited, in accordance with the standards of the Public Company Accounting Oversight Board (United States)(PCAOB), the Company's internal control over financial reporting as of October 30, 2021, based on criteria established inInternal Control-Integrated Framework issued by the Committee of Sponsoring Organizations of the Treadway Commission(2013 framework), and our report dated December 3, 2021 expressed an unqualified opinion thereon.
Basis for OpinionThese financial statements are the responsibility of the Company's management. Our responsibility is to express an opinion onthe Company’s financial statements based on our audits. We are a public accounting firm registered with the PCAOB and arerequired to be independent with respect to the Company in accordance with the U.S. federal securities laws and the applicablerules and regulations of the Securities and Exchange Commission and the PCAOB.
We conducted our audits in accordance with the standards of the PCAOB. Those standards require that we plan and perform theaudit to obtain reasonable assurance about whether the financial statements are free of material misstatement, whether due toerror or fraud. Our audits included performing procedures to assess the risks of material misstatement of the financialstatements, whether due to error or fraud, and performing procedures that respond to those risks. Such procedures includedexamining, on a test basis, evidence regarding the amounts and disclosures in the financial statements. Our audits also includedevaluating the accounting principles used and significant estimates made by management, as well as evaluating the overallpresentation of the financial statements. We believe that our audits provide a reasonable basis for our opinion.
Critical Audit MattersThe critical audit matters communicated below are matters arising from the current period audit of the financial statements thatwere communicated or required to be communicated to the audit committee and that: (1) relate to accounts or disclosures thatare material to the financial statements and (2) involved our especially challenging, subjective or complex judgments. Thecommunication of critical audit matters does not alter in any way our opinion on the consolidated financial statements, taken asa whole, and we are not, by communicating the critical audit matters below, providing separate opinions on the critical auditmatters or on the accounts or disclosures to which they relate.
Revenue Recognition – Measuring Variable ConsiderationDescription ofthe Matter
As described in Note 2 to the consolidated financial statements, the Company's sales contracts providecertain distributors with credits for price protection and rights of return, which results in variableconsideration. During 2021, sales to distributors were $4.6 billion net of expected price protection discountsand rights of return for which the liability balance as of October 30, 2021 was $664.2 million.
Auditing the Company's measurement of variable consideration under distributor contracts involvedespecially challenging judgment because the calculation involves subjective management assumptions aboutestimates of expected price protection discounts and returns. For example, estimated variable considerationincluded in the transaction price reflects management's evaluation of contractual terms, historical experienceand assumptions about future economic conditions. Changes in those assumptions can have a material effecton the amount of variable consideration recognized.
43

How WeAddressed theMatter in OurAudit
We obtained an understanding over the Company's process to calculate the variable consideration. With theexception of the portion of the balance that related to Maxim Integrated Products, Inc., we also evaluated thedesign and tested the operating effectiveness of the relevant controls. For example, we tested controls overthe appropriateness of assumptions management used as well as controls over the completeness andaccuracy of the data underlying estimates of expected price protection discounts and returns.
Our audit procedures included, among others, inspecting contractual terms in distributor agreements andtesting the underlying data used in management’s calculation for completeness and accuracy as well asevaluating the significant assumptions used in the estimation of variable consideration. We evaluated theCompany’s methods and assumptions used in the estimates, which included comparing the assumptions tohistorical trends. We inspected and tested the results of the Company's retrospective review analysis ofactual returns and price protection discounts claimed by distributors, evaluated the estimates made based onhistorical experience and performed sensitivity analyses of the Company’s significant assumptions to assessthe impact on the variable consideration. We also evaluated whether the Company appropriately considerednew information that could significantly change the estimated future price protection discounts or returns.
Accounting for Acquisitions – Valuation of Identified IntangiblesDescription ofthe Matter
During 2021, the Company completed its acquisition of Maxim Integrated Products, Inc. (Maxim) for totalconsideration of $27.9 billion, as disclosed in Note 6 to the consolidated financial statements. Thetransaction was accounted for as a business combination.
Auditing the Company's accounting for its acquisition of Maxim was complex due to the significantestimation uncertainty in the Company’s determination of the fair value of identifiable intangible assets of$12.4 billion, which principally consisted of developed technology and customer relationships. Thesignificant estimation uncertainty was primarily due to the sensitivity of the respective fair values tounderlying assumptions about the future performance of the acquired business. The Company useddiscounted cash flow models to measure the developed technology and customer relationship intangibleassets. The significant assumptions used to estimate the fair value of the intangible assets included discountrates and certain assumptions that form the basis of the forecasted results (e.g., annual revenue growth rates,developed technology obsolescence rates and customer attrition rates). These significant assumptions areforward looking and could be affected by future economic and market conditions.
How WeAddressed theMatter in OurAudit
We obtained an understanding, evaluated the design and tested the operating effectiveness of controls overthe Company's accounting for acquisitions process. For example, we tested controls over the appropriatenessof the valuation model, assumptions management used as well as controls over the completeness andaccuracy of the data underlying the valuation of the developed technology and customer relationshipintangible assets.
To test the estimated fair value of the developed technology and customer relationship intangible assets, ouraudit procedures included, among others, assessing methodologies and testing the significant assumptionsdiscussed above and the underlying data supporting the significant assumptions and estimates used by theCompany in the valuation. We tested significant assumptions through a combination of procedures, asapplicable for each assumption, including comparing them to current and forecasted industry and economictrends, as well as to the historical results of the acquired business and other guideline companies within thesame industry. With the assistance of our valuation specialists, we evaluated the methodology used by theCompany and significant assumptions included in the fair value estimates.
/s/ Ernst & Young LLP
We have served as the Company’s auditor since 1967.
Boston, MassachusettsDecember 3, 2021
44

ITEM 8. FINANCIAL STATEMENTS AND SUPPLEMENTARY DATA
ANALOG DEVICES, INC.
CONSOLIDATED STATEMENTS OF INCOMEYears ended October 30, 2021, October 31, 2020 and November 2, 2019
(thousands, except per share amounts) 2021 2020 2019
RevenueRevenue $ 7,318,286 $ 5,603,056 $ 5,991,065Costs and ExpensesCost of sales 2,793,274 1,912,578 1,977,315Gross margin 4,525,012 3,690,478 4,013,750Operating expenses:Research and development 1,296,126 1,050,519 1,130,348Selling, marketing, general and administrative 915,418 659,923 648,094Amortization of intangibles 536,811 429,455 429,041Special charges, net 84,456 52,337 95,659
2,832,811 2,192,234 2,303,142Operating income: 1,692,201 1,498,244 1,710,608Nonoperating expense (income):Interest expense 184,825 193,305 229,075Loss on extinguishment of debt 215,150 — —Interest income (1,220) (4,305) (10,229)Other, net (35,268) (2,373) 6,034
363,487 186,627 224,880EarningsIncome before income taxes 1,328,714 1,311,617 1,485,728(Benefit from) provision for income taxes (61,708) 90,856 122,717Net income $ 1,390,422 $ 1,220,761 $ 1,363,011
Shares used to compute earnings per common share — basic 397,462 368,633 369,133Shares used to compute earnings per common share — diluted 401,288 371,973 372,871
Basic earnings per common share $ 3.50 $ 3.31 $ 3.68Diluted earnings per common share $ 3.46 $ 3.28 $ 3.65
See accompanying Notes.
45

ANALOG DEVICES, INC.
CONSOLIDATED STATEMENTS OF COMPREHENSIVE INCOMEYears ended October 30, 2021, October 31, 2020 and November 2, 2019
(thousands) 2021 2020 2019
Net income $ 1,390,422 $ 1,220,761 $ 1,363,011Foreign currency translation adjustment 1,057 3,224 (1,365)Change in fair value of available-for-sale securities — — 10
Change in unrecognized gains/losses on derivative instruments designated as cashflow hedges:Changes in fair value of derivatives (net of tax of $14,217 in 2021, $17,468 in2020 and $29,401 in 2019) 41,817 (51,437) (111,327)Adjustment for realized gain/loss reclassified into earnings (net of tax of $189 in2021, $158 in 2020 and $1,518 in 2019) 7,099 (839) 7,667Total change in derivative instruments designated as cash flow hedges, net of tax 48,916 (52,276) (103,660)
Changes in accumulated other comprehensive loss — pension plans:Change in actuarial loss/gain (net of tax of $637 in 2021, $5,167 in 2020 and$5,734 in 2019) 12,923 (10,231) (24,344)Other comprehensive income (loss) 62,896 (59,283) (129,359)
Comprehensive income $ 1,453,318 $ 1,161,478 $ 1,233,652
See accompanying Notes.
46
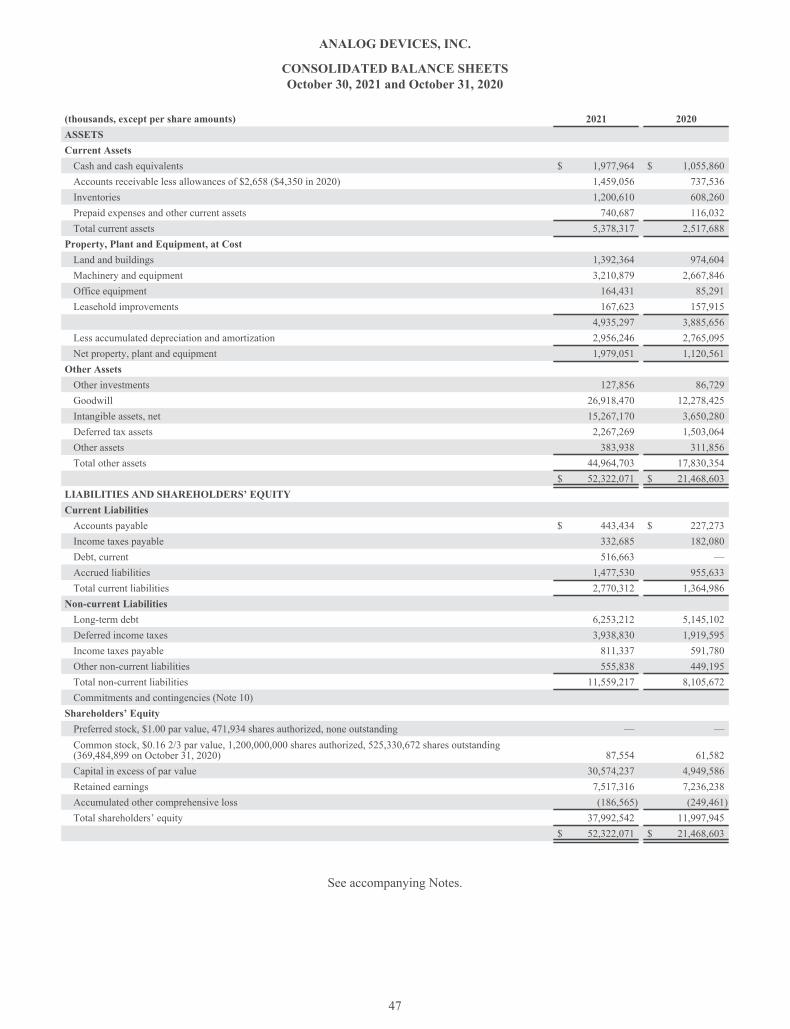
ANALOG DEVICES, INC.
CONSOLIDATED BALANCE SHEETSOctober 30, 2021 and October 31, 2020
(thousands, except per share amounts) 2021 2020ASSETSCurrent AssetsCash and cash equivalents $ 1,977,964 $ 1,055,860Accounts receivable less allowances of $2,658 ($4,350 in 2020) 1,459,056 737,536Inventories 1,200,610 608,260Prepaid expenses and other current assets 740,687 116,032Total current assets 5,378,317 2,517,688
Property, Plant and Equipment, at CostLand and buildings 1,392,364 974,604Machinery and equipment 3,210,879 2,667,846Office equipment 164,431 85,291Leasehold improvements 167,623 157,915
4,935,297 3,885,656Less accumulated depreciation and amortization 2,956,246 2,765,095Net property, plant and equipment 1,979,051 1,120,561
Other AssetsOther investments 127,856 86,729Goodwill 26,918,470 12,278,425Intangible assets, net 15,267,170 3,650,280Deferred tax assets 2,267,269 1,503,064Other assets 383,938 311,856Total other assets 44,964,703 17,830,354
$ 52,322,071 $ 21,468,603LIABILITIES AND SHAREHOLDERS’ EQUITYCurrent LiabilitiesAccounts payable $ 443,434 $ 227,273Income taxes payable 332,685 182,080Debt, current 516,663 —Accrued liabilities 1,477,530 955,633Total current liabilities 2,770,312 1,364,986
Non-current LiabilitiesLong-term debt 6,253,212 5,145,102Deferred income taxes 3,938,830 1,919,595Income taxes payable 811,337 591,780Other non-current liabilities 555,838 449,195Total non-current liabilities 11,559,217 8,105,672Commitments and contingencies (Note 10)
Shareholders’ EquityPreferred stock, $1.00 par value, 471,934 shares authorized, none outstanding — —Common stock, $0.16 2/3 par value, 1,200,000,000 shares authorized, 525,330,672 shares outstanding(369,484,899 on October 31, 2020) 87,554 61,582Capital in excess of par value 30,574,237 4,949,586Retained earnings 7,517,316 7,236,238Accumulated other comprehensive loss (186,565) (249,461)Total shareholders’ equity 37,992,542 11,997,945
$ 52,322,071 $ 21,468,603
See accompanying Notes.
47

ANALOG DEVICES, INC.
CONSOLIDATED STATEMENTS OF SHAREHOLDERS’ EQUITYYears ended October 30, 2021, October 31, 2020 and November 2, 2019
Capital inAccumulatedOther
Common Stock Excess of Retained Comprehensive(thousands) Shares Amount Par Value Earnings (Loss) Income
BALANCE, NOVEMBER 3, 2018 (1) 370,160 $ 61,694 $ 5,282,222 $ 5,982,697 $ (58,440)
Effect of Accounting Standards Update 2016-16 331,026Net Income — 2019 1,363,011Dividends declared and paid - $2.10 per share (777,481)Issuance of stock under stock plans and other 4,271 712 115,811Stock-based compensation expense 150,300Other comprehensive loss (129,359)Common stock repurchased (6,129) (1,021) (611,984)
BALANCE, NOVEMBER 2, 2019 368,302 61,385 4,936,349 6,899,253 (187,799)Effect of Accounting Standards Update 2018-02 2,379 (2,379)Net Income — 2020 1,220,761Dividends declared and paid - $2.40 per share (886,155)Issuance of stock under stock plans and other 3,110 518 67,885Issuance of stock as charitable contribution 336 56 39,944Stock-based compensation expense 149,518Other comprehensive loss (59,283)Common stock repurchased (2,263) (377) (244,110)
BALANCE, OCTOBER 31, 2020 369,485 61,582 4,949,586 7,236,238 (249,461)Net Income — 2021 1,390,422Dividends declared and paid - $2.69 per share (1,109,344)Issuance of stock under stock plans and other 2,738 355 62,750Issuance of stock in connection with the Acquisition 169,233 28,204 27,725,957Stock-based compensation expense 243,611Replacement share-based awards issued in connection withthe Acquisition 194,890Other comprehensive income 62,896Common stock repurchased (16,125) (2,587) (2,602,557)BALANCE, OCTOBER 30, 2021 525,331 $ 87,554 $ 30,574,237 $ 7,517,316 $ (186,565)_______________________________________
(1) Balances have been restated to reflect the adoption of Accounting Standards Update (ASU) 2014-09, Revenue from Contracts withCustomers (ASU 2014-09). See Note 2a, Principles of Consolidation, of the Notes to Consolidated Financial Statements.
See accompanying Notes.
48
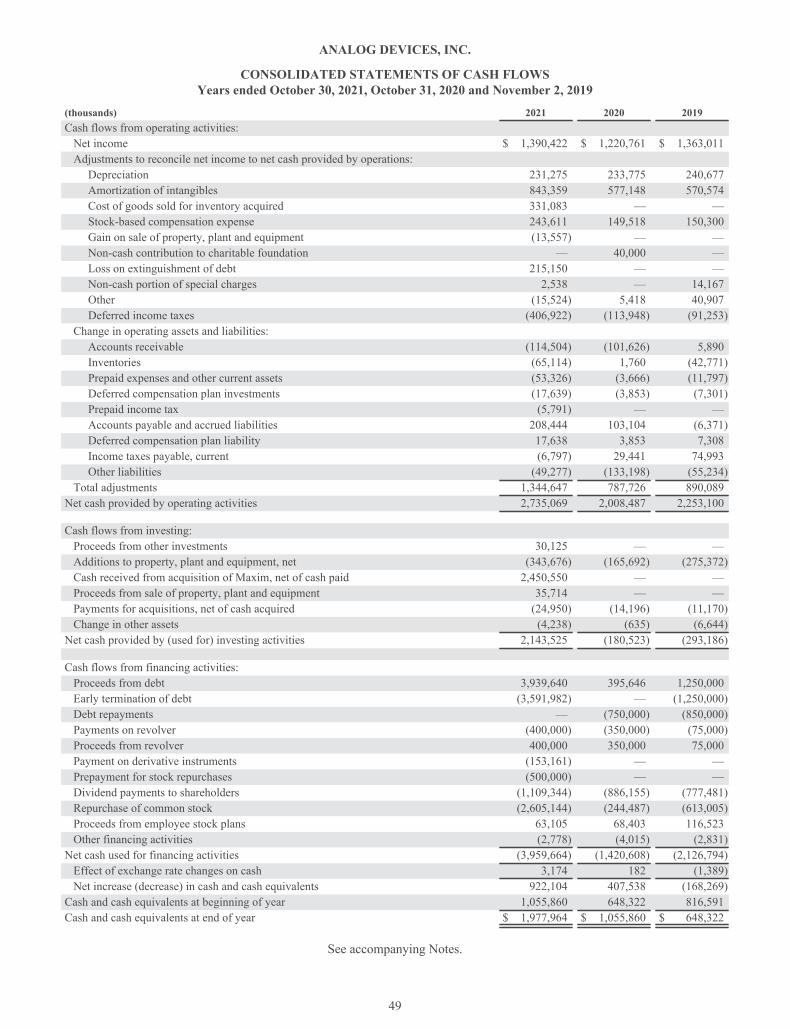
ANALOG DEVICES, INC.
CONSOLIDATED STATEMENTS OF CASH FLOWSYears ended October 30, 2021, October 31, 2020 and November 2, 2019
(thousands) 2021 2020 2019Cash flows from operating activities:Net income $ 1,390,422 $ 1,220,761 $ 1,363,011Adjustments to reconcile net income to net cash provided by operations:Depreciation 231,275 233,775 240,677Amortization of intangibles 843,359 577,148 570,574Cost of goods sold for inventory acquired 331,083 — —Stock-based compensation expense 243,611 149,518 150,300Gain on sale of property, plant and equipment (13,557) — —Non-cash contribution to charitable foundation — 40,000 —Loss on extinguishment of debt 215,150 — —Non-cash portion of special charges 2,538 — 14,167Other (15,524) 5,418 40,907Deferred income taxes (406,922) (113,948) (91,253)
Change in operating assets and liabilities:Accounts receivable (114,504) (101,626) 5,890Inventories (65,114) 1,760 (42,771)Prepaid expenses and other current assets (53,326) (3,666) (11,797)Deferred compensation plan investments (17,639) (3,853) (7,301)Prepaid income tax (5,791) — —Accounts payable and accrued liabilities 208,444 103,104 (6,371)Deferred compensation plan liability 17,638 3,853 7,308Income taxes payable, current (6,797) 29,441 74,993Other liabilities (49,277) (133,198) (55,234)
Total adjustments 1,344,647 787,726 890,089Net cash provided by operating activities 2,735,069 2,008,487 2,253,100
Cash flows from investing:Proceeds from other investments 30,125 — —Additions to property, plant and equipment, net (343,676) (165,692) (275,372)Cash received from acquisition of Maxim, net of cash paid 2,450,550 — —Proceeds from sale of property, plant and equipment 35,714 — —Payments for acquisitions, net of cash acquired (24,950) (14,196) (11,170)Change in other assets (4,238) (635) (6,644)Net cash provided by (used for) investing activities 2,143,525 (180,523) (293,186)
Cash flows from financing activities:Proceeds from debt 3,939,640 395,646 1,250,000Early termination of debt (3,591,982) — (1,250,000)Debt repayments — (750,000) (850,000)Payments on revolver (400,000) (350,000) (75,000)Proceeds from revolver 400,000 350,000 75,000Payment on derivative instruments (153,161) — —Prepayment for stock repurchases (500,000) — —Dividend payments to shareholders (1,109,344) (886,155) (777,481)Repurchase of common stock (2,605,144) (244,487) (613,005)Proceeds from employee stock plans 63,105 68,403 116,523Other financing activities (2,778) (4,015) (2,831)Net cash used for financing activities (3,959,664) (1,420,608) (2,126,794)Effect of exchange rate changes on cash 3,174 182 (1,389)Net increase (decrease) in cash and cash equivalents 922,104 407,538 (168,269)Cash and cash equivalents at beginning of year 1,055,860 648,322 816,591Cash and cash equivalents at end of year $ 1,977,964 $ 1,055,860 $ 648,322
See accompanying Notes.
49

ANALOG DEVICES, INC.
NOTES TO CONSOLIDATED FINANCIAL STATEMENTSYears ended October 30, 2021, October 31, 2020 and November 2, 2019
(all tabular amounts in thousands except per share amounts)
1. Description of Business
Analog Devices, Inc. (Analog Devices or the Company) is a leading global high-performance semiconductor companydedicated to solving its customers' most complex engineering challenges. Since its inception in 1965, the Company has playeda critical role at the intersection of the physical and digital world by providing the building blocks to sense, measure, interpret,connect and power. The Company designs, manufactures, tests and markets a broad portfolio of solutions, including integratedcircuits (ICs), software and subsystems that leverage high-performance analog, mixed-signal and digital signal processingtechnologies. The Company's comprehensive product portfolio, deep domain expertise and advanced manufacturing capabilitiesextend across high-performance precision and high-speed mixed-signal, power management and processing technologies –including data converters, amplifiers, power management, radio frequency ICs, edge processors and other sensors. TheCompany's focus is largely on the business-to-business end markets of Industrial, Automotive and Communications and relatedapplications, as well as Consumer applications, with the goal of driving sustainable and profitable growth over the long term.
2. Summary of Significant Accounting Policies
a. Principles of Consolidation
The Consolidated Financial Statements include the accounts of the Company and all of its subsidiaries. Uponconsolidation, all intercompany accounts and transactions are eliminated. Certain amounts reported in previous years have beenreclassified to conform to the presentation for the fiscal year ended October 30, 2021 (fiscal 2021). Such reclassified amountsare immaterial.
The Company’s fiscal year is the 52-week or 53-week period ending on the Saturday closest to the last day in October.Fiscal 2021, fiscal 2020 and fiscal 2019 were 52-week fiscal periods.
On August 26, 2021 (Acquisition Date), the Company completed the acquisition of Maxim Integrated Products, Inc.(Maxim), an independent manufacturer of innovative analog and mixed-signal products and technologies. Pursuant to theAgreement and Plan of Merger, dated as of July 12, 2020 (the Merger Agreement), Maxim stockholders received, for eachoutstanding share of Maxim common stock, 0.6300 of a share of the Company’s common stock as of the Acquisition Date fortotal consideration of approximately $28.0 billion of the Company's common stock. The acquisition of Maxim is referred to asthe Acquisition. The consolidated financial statements included in this Annual Report on Form 10-K include the financialresults of Maxim prospectively from the Acquisition Date. See Note 6, Acquisitions, of the Notes to Consolidated FinancialStatements for additional information.
The Company adopted the Financial Accounting Standards Board (FASB) Accounting Standards Update (ASU)2014-09, Revenue from Contracts with Customers (ASU 2014-09), in the first quarter of fiscal 2019. See Note 2n, RevenueRecognition, of the Notes to Consolidated Financial Statements for the details of the Company’s revenue recognition policies.As shown in the table below, pursuant to the guidance in ASU 2014-09, the Company restated its historical financial results tobe consistent with the standard.
The impact on the Company's previously reported Consolidated Statement of Shareholders' Equity line item is as follows:
November 3, 2018
As Reported
Impact ofAdoption of ASU
2014-09 As AdjustedRetained earnings $ 5,703,064 $ 279,633 $ 5,982,697
b. Cash and Cash Equivalents
Cash and cash equivalents are highly liquid investments with insignificant interest rate risk and maturities of ninety daysor less at the time of acquisition. Cash and cash equivalents consist primarily of government and institutional money marketfunds, corporate obligations such as commercial paper and floating rate notes, bonds, demand deposit accounts and bank timedeposits.
50

The Company classifies its investments in readily marketable debt and equity securities as “held-to-maturity,” “available-for-sale” or “trading” at the time of purchase. There were no transfers between investment classifications in any of the fiscalyears presented. Held-to-maturity securities, which are carried at amortized cost, include only those securities the Company hasthe positive intent and ability to hold to maturity. Securities such as bank time deposits, which by their nature are typically heldto maturity, are classified as such. The Company’s other readily marketable cash equivalents are classified as available-for-sale.Available-for-sale securities are carried at fair value with unrealized gains and losses, net of related tax, reported inaccumulated other comprehensive (loss) income (AOCI). Adjustments to the fair value of investments classified as available-for-sale are recorded as an increase or decrease in AOCI, unless the adjustment is considered an other-than-temporaryimpairment, in which case the adjustment is recorded as a charge in the Consolidated Statements of Income.
The Company’s deferred compensation plan investments are classified as trading. See Note 2j, Fair Value and Note 11,Retirement Plans, of the Notes to Consolidated Financial Statements for additional information on these investments.
The Company periodically evaluates its investments for impairment. There were no other-than-temporary impairments ofinvestments in any of the fiscal years presented.
Realized gains or losses on investments are determined based on the specific identification basis and are recognized innonoperating (income) expense. There were no material net realized gains or losses from the sales of available-for-saleinvestments during any of the fiscal periods presented.
The components of the Company’s cash and cash equivalents as of October 30, 2021 and October 31, 2020 were asfollows:
2021 2020
Cash $ 1,314,967 $ 239,607Available-for-sale securities 662,997 816,253Total cash and cash equivalents $ 1,977,964 $ 1,055,860
See Note 2j, Fair Value, of the Notes to Consolidated Financial Statements for additional information on the Company’scash equivalents.
c. Supplemental Cash Flow Statement Information
2021 2020 2019
Cash paid during the fiscal year for:Income taxes $ 388,115 $ 237,691 $ 205,762Interest $ 197,841 $ 185,854 $ 216,143Noncash issuance of common stock for the Acquisition $ 27,754,161 $ — $ —Fair value of partially vested equity replacement awards issued for theAcquisition $ 194,890 $ — $ —
d. Inventories
Inventories are valued at the lower of cost (first-in, first-out method) or market. The valuation of inventory requires theCompany to estimate obsolete or excess inventory as well as inventory that is not of saleable quality. The Company employs avariety of methodologies to determine the net realizable value of its inventory. While a portion of the calculation to recordinventory at its net realizable value is based on the age of the inventory and lower of cost or market calculations, a key factor inestimating obsolete or excess inventory requires the Company to estimate the future demand for its products. If actual demandis less than the Company’s estimates, impairment charges, which are recorded to cost of sales, may need to be recorded infuture periods. Inventory in excess of saleable amounts is not valued, and the remaining inventory is valued at the lower of costor market.
Inventories at October 30, 2021 and October 31, 2020 were as follows:2021 2020
Raw materials $ 71,639 $ 33,806Work in process 858,627 443,690Finished goods 270,344 130,764Total inventories $ 1,200,610 $ 608,260
ANALOG DEVICES, INC.
NOTES TO CONSOLIDATED FINANCIAL STATEMENTS — (Continued)
51

e. Property, Plant and Equipment
Property, plant and equipment (PP&E) is recorded at cost, less allowances for depreciation. The straight-line method ofdepreciation is used for all classes of assets for financial statement purposes while both straight-line and accelerated methodsare used for income tax purposes. Leasehold improvements are depreciated over the lesser of the term of the lease or the usefullife of the asset. Repairs and maintenance charges are expensed as incurred. Depreciation is based on the following ranges ofestimated useful lives:Buildings Up to 30 yearsMachinery & equipment 3-10 yearsOffice equipment 3-10 yearsLeasehold improvements 7-20 years
The Company reviews PP&E for impairment whenever events or changes in circumstances indicate that the carryingamount of assets may not be recoverable. Recoverability of these assets is determined by comparison of their carrying amountto the future undiscounted cash flows the assets are expected to generate over their remaining economic lives. If such assets areconsidered to be impaired, the impairment to be recognized in earnings equals the amount by which the carrying value of theassets exceeds their fair value determined by either a quoted market price, if any, or a value determined by utilizing adiscounted cash flow technique. If such assets are not impaired, but their useful lives have decreased, the remaining net bookvalue is depreciated over the revised useful life.
PP&E is identified as held for sale when it meets the held for sale criteria of Accounting Standards Codification Topic360, Property, Plant, and Equipment (ASC 360). Depreciation is not recorded for assets that are classified as held for sale.When an asset meets the held for sale criteria, the lower of its carrying value or fair value less costs to sell is reclassified fromthe relevant PP&E line items and into current assets on the balance sheet, where it remains until it is either sold or it no longermeets the held for sale criteria. If the assets held for sale were carried at fair value, it would be considered a Level 3 fair valuemeasurement, and determined based on the use of appraisals and input from market participants.
During fiscal 2021, the Company ceased production at its Hillview wafer fabrication facility located in Milpitas,California and determined that this facility met the held for sale criteria specified in ASC 360. As of October 30, 2021, Prepaidexpenses and other current assets includes the following assets held for sale recorded at the fair value of the asset group, lesscosts to sell:
Land and buildings $ 40,070Less accumulated depreciation and amortization (13,634)Net property, plant and equipment reclassified to Prepaid expenses and other current assets $ 26,436
f. Goodwill and Intangible Assets
Goodwill
The Company evaluates goodwill for impairment annually, as well as whenever events or changes in circumstancessuggest that the carrying value of goodwill may not be recoverable, utilizing either the qualitative or quantitative method. TheCompany tests goodwill for impairment at the reporting unit level, which the Company has determined is consistent with itsidentified operating segments, on an annual basis on the first day of the fourth quarter (on or about August 1) or morefrequently if indicators of impairment exist or the Company reorganizes its operating segments or reporting units.
The Company has the option to first assess qualitative factors to determine whether it is more likely than not that the fairvalue of a reporting unit is less than its net book value. When using the qualitative method, the Company considers severalfactors, including the following:
– the amount by which the fair values of each reporting unit exceeded their carrying values as of the date of the mostrecent quantitative impairment analysis, which indicated there would need to be substantial negative developments inthe markets in which these reporting units operate in order for there to be potential impairment;
– the carrying values of these reporting units as of the assessment date compared to the previously calculated fair valuesas of the date of the most recent quantitative impairment analysis;
– the Company's current forecasts as compared to the forecasts included in the most recent quantitative impairmentanalysis;
– public information from competitors and other industry information to determine if there were any significant adversetrends in the Company's competitors' businesses;
ANALOG DEVICES, INC.
NOTES TO CONSOLIDATED FINANCIAL STATEMENTS — (Continued)
52

– changes in the value of major U.S. stock indices that could suggest declines in overall market stability that couldimpact the valuation of the Company's reporting units;
– changes in the Company's market capitalization and overall enterprise valuation to determine if there were anysignificant decreases that could be an indication that the valuation of its reporting units had significantly decreased;and
– whether there had been any significant increases to the weighted-average cost of capital rates for each reporting unit,which could materially lower the Company's prior valuation conclusions under a discounted cash flow approach.
If the Company elects not to use this option, or it determines that it is more likely than not that the fair value of areporting unit is less than its net book value, then the Company performs the quantitative goodwill impairment test. Thequantitative goodwill impairment test requires an entity to compare the fair value of a reporting unit with its carrying amount. Iffair value is determined to be less than carrying value, an impairment loss is recognized for the amount of the carrying valuethat exceeds the amount of the reporting unit's fair value, not to exceed the total amount of goodwill allocated to the reportingunit. Additionally, the Company considers income tax effects from any tax deductible goodwill on the carrying amount of thereporting unit when measuring the goodwill impairment loss, if applicable. Management determines the fair values of thereporting units using a weighting of the income and market approaches. Under the income approach, it uses a discounted cashflow methodology, which requires management to make significant estimates and assumptions related to forecasted revenues,gross profit margins, operating income margins, working capital cash flow, perpetual growth rates and long-term discount rates,among others. For the market approach, it uses the guideline public company method. Under this method management utilizesinformation from comparable publicly traded companies with similar operating and investment characteristics as the reportingunits, to create valuation multiples that are applied to the operating performance of the reporting unit being tested, in order toobtain its respective fair value. In order to assess the reasonableness of the calculated values, the aggregate fair values of thereporting units are reconciled to the Company's total market capitalization, allowing for a reasonable control premium.
During fiscal 2021 and fiscal 2020, the Company elected to use the quantitative method of assessing goodwill for all ofits reporting units. In all periods presented, management concluded the reporting units' fair values exceeded their carryingamounts as of the assessment dates and no risk of impairment existed.
The Company’s next annual impairment assessment will be performed as of the first day of the fourth quarter of the fiscalyear ending October 29, 2022 (fiscal 2022) unless indicators arise that would require the Company to reevaluate at an earlierdate.
The following table presents the changes in goodwill during fiscal 2021 and fiscal 2020:
2021 2020Balance at beginning of year $ 12,278,425 $ 12,256,880Acquisition of Maxim (Note 6) 14,645,076 —Goodwill related to other acquisitions (1) — 17,839Foreign currency translation adjustment and other adjustments (5,031) 3,706Balance at end of year $ 26,918,470 $ 12,278,425_______________________________________(1) Represents goodwill related to other acquisitions that were not material to the Company on either an individual or aggregate basis.
Intangible Assets
The Company reviews finite-lived intangible assets for impairment whenever events or changes in circumstances indicatethat the carrying value of assets may not be recoverable. If required, recoverability of these assets is determined by comparisonof their carrying value to the estimated future undiscounted cash flows the assets are expected to generate over their remainingestimated useful lives. If such assets are considered to be impaired, the impairment to be recognized in earnings equals theamount by which the carrying value of the assets exceeds their estimated fair value determined by either a quoted market price,if any, or a value determined by utilizing a discounted cash flow technique.
In-process research and development (IPR&D) assets are considered indefinite-lived intangible assets until completion orabandonment of the associated research and development (R&D) efforts. Upon completion of the projects, the IPR&D assetsare reclassified to technology-based intangible assets and amortized over their estimated useful lives.
ANALOG DEVICES, INC.
NOTES TO CONSOLIDATED FINANCIAL STATEMENTS — (Continued)
53

As of October 30, 2021 and October 31, 2020, the Company’s intangible assets consisted of the following:
October 30, 2021 October 31, 2020Gross Carrying
AmountAccumulatedAmortization
Gross CarryingAmount
AccumulatedAmortization
Customer relationships $ 10,336,477 $ 2,191,729 $ 4,700,454 $ 1,703,299Technology-based 7,559,503 819,204 1,136,742 518,328Trade-name 72,200 47,803 72,200 37,489Backlog 361,200 32,746 — —Assembled workforce 1,800 750 — —IPR&D 28,222 — — —Total (1) (2) $ 18,359,402 $ 3,092,232 $ 5,909,396 $ 2,259,116_______________________________________(1) Foreign intangible asset carrying amounts are affected by foreign currency translation.(2) Increases in intangible assets primarily related to the Acquisition. See Note 6, Acquisitions, of the Notes to the Consolidated FinancialStatements for further information.
Amortization expense related to intangible assets was $843.4 million, $577.1 million and $570.6 million in fiscal 2021,2020 and 2019, respectively, and is recorded in Cost of sales and Amortization of intangibles on the Consolidated Statements ofIncome. The remaining amortization expense will be recognized over the remaining weighted average life of approximately 4.9years.
The Company expects annual amortization expense for intangible assets as follows:Fiscal Year Amortization Expense
2022 $ 2,013,9772023 $ 1,956,1132024 $ 1,730,7332025 $ 1,569,4702026 $ 1,519,949
g. Grant Accounting
Certain of the Company’s foreign subsidiaries have received grants from governmental agencies. These grants includecapital, employment and research and development grants. Capital grants for the acquisition of property, plant and equipmentare netted against the related capital expenditures and amortized as a credit to depreciation expense over the estimated usefullife of the related asset. Employment grants, which relate to employee hiring and training, and research and development grantsare recognized in earnings in the period in which the related expenditures are incurred by the Company.
h. Translation of Foreign Currencies
The functional currency for certain of the Company’s foreign operations is the applicable local currency. Gains and lossesresulting from translation of these foreign currencies into U.S. dollars are recorded in AOCI. Transaction gains and losses andre-measurement of foreign currency denominated assets and liabilities are included in income currently, including those at theCompany’s principal foreign manufacturing operations where the functional currency is the U.S. dollar. Foreign currencytransaction gains or losses are included in Other, net in the Consolidated Statements of Income.
i. Derivative Instruments and Hedging Agreements
Foreign Exchange Exposure Management— The Company enters into forward foreign currency exchange contracts tooffset certain operational and balance sheet exposures from the impact of changes in foreign currency exchange rates. Suchexposures result from the portion of the Company’s operations, assets and liabilities that are denominated in currencies otherthan the U.S. dollar, primarily the Euro; other significant exposures include the British Pound, Philippine Peso, Thai Baht,South Korean Won and the Japanese Yen. Derivative instruments are employed to eliminate or minimize certain foreigncurrency exposures that can be confidently identified and quantified. These foreign currency exchange contracts are entered intoto support transactions made in the normal course of business, and accordingly, are not speculative in nature. The contracts arefor periods consistent with the terms of the underlying transactions, generally one year or less. Hedges related to anticipatedtransactions are matched with the underlying exposures at inception and designated and documented as cash flow hedges. Theyare qualitatively evaluated for effectiveness on a quarterly basis. The gain or loss on the derivatives are reported as a component
ANALOG DEVICES, INC.
NOTES TO CONSOLIDATED FINANCIAL STATEMENTS — (Continued)
54

of AOCI in shareholders’ equity and reclassified into earnings in the same line item on the Consolidated Statements of Incomeas the impact of the hedged transaction in the same period during which the hedged transaction affects earnings.
The total notional amounts of forward foreign currency derivative instruments designated as hedging instruments of cashflow hedges as of October 30, 2021 and October 31, 2020 was $343.6 million and $202.7 million, respectively. The fair valuesof forward foreign currency derivative instruments designated as hedging instruments in the Company’s Consolidated BalanceSheets as of October 30, 2021 and October 31, 2020 were as follows:
Fair Value At
Balance Sheet Location October 30, 2021 October 31, 2020
Forward foreign currency exchange contracts Prepaid expenses and other current assets $ — $ 5,550Forward foreign currency exchange contracts Accrued liabilities $ 7,113 $ —
Additionally, the Company enters into forward foreign currency contracts that economically hedge the gains and lossesgenerated by the re-measurement of certain recorded assets and liabilities in a non-functional currency. Changes in the fairvalue of these undesignated hedges are recognized in other (income) expense immediately as an offset to the changes in the fairvalue of the asset or liability being hedged. As of October 30, 2021 and October 31, 2020, the total notional amount of theseundesignated hedges was $120.0 million and $62.7 million, respectively.
The Company estimates that $10.0 million, net of tax, of settlements of forward foreign currency derivative instrumentsincluded in OCI will be reclassified into earnings within the next 12 months.
All of the Company’s derivative financial instruments are eligible for netting arrangements that allow the Company andits counterparties to net settle amounts owed to each other. Derivative assets and liabilities that can be net settled under thesearrangements have been presented in the Company's Consolidated Balance Sheets on a net basis. As of October 30, 2021 andOctober 31, 2020, none of the netting arrangements involved collateral.
The following table presents the gross amounts of the Company's forward foreign currency exchange contracts and the netamounts recorded in the Company's Consolidated Balance Sheets as of October 30, 2021 and October 31, 2020:
October 30, 2021 October 31, 2020
Gross amount of recognized assets $ 319 $ 6,114Gross amounts of recognized liabilities offset in the Consolidated Balance Sheets (8,404) (687)Net (liabilities) assets presented in the Consolidated Balance Sheets $ (8,085) $ 5,427
Interest Rate Exposure Management— The Company's current and future debt may be subject to interest rate risk. TheCompany utilizes interest rate derivatives to alter interest rate exposure in an attempt to reduce the effects of the changes ininterest rates. During fiscal 2019, the Company entered into an interest rate swap agreement which locked in the interest ratefor up to $1 billion in future debt issuances. The interest rate swap was designated and qualified as a cash flow hedge. Duringfiscal 2021, the Company issued $1 billion of 2.100% Senior Notes due October 2031, and the swap was cash terminated in theamount of $153.2 million. The accumulated loss recorded in AOCI will be reclassified to interest expense on a straight-linebasis over the 10-year term of such Senior Notes.
The market risk associated with the Company’s derivative instruments results from currency exchange rate or interest ratemovements that are expected to offset the market risk of the underlying transactions, assets and liabilities being hedged. Thecounterparties to the agreements relating to the Company’s derivative instruments consist of a number of major internationalfinancial institutions with high credit ratings. Based on the credit ratings of the Company’s counterparties as of October 30,2021 and October 31, 2020, nonperformance is not perceived to be a material risk. Furthermore, none of the Company’sderivatives are subject to collateral or other security arrangements and none contain provisions that are dependent on theCompany’s credit ratings from any credit rating agency. While the contract or notional amounts of derivative financialinstruments provide one measure of the volume of these transactions, they do not represent the amount of the Company’sexposure to credit risk. The amounts potentially subject to credit risk (arising from the possible inability of counterparties tomeet the terms of their contracts) are generally limited to the amounts, if any, by which the counterparties’ obligations under thecontracts exceed the obligations of the Company to the counterparties. As a result of the above considerations, the Companydoes not consider the risk of counterparty default to be significant.
The Company records the fair value of its derivative financial instruments in its Consolidated Financial Statements inother current assets, other assets, accrued liabilities and other non-current liabilities, depending on their net position, regardlessof the purpose or intent for holding the derivative contract. Changes in the fair value of the derivative financial instruments are
ANALOG DEVICES, INC.
NOTES TO CONSOLIDATED FINANCIAL STATEMENTS — (Continued)
55

either recognized periodically in earnings or in shareholders’ equity as a component of OCI. Changes in the fair value of cashflow hedges are recorded in OCI and reclassified into earnings in the same line item on the Consolidated Statements of Incomeas the impact of the hedged transaction when the underlying contract matures. Changes in the fair values of derivatives notqualifying for hedge accounting are reported in earnings as they occur.
For information on the unrealized holding gains (losses) on derivatives included in and reclassified out of AOCI into theConsolidated Statements of Income related to forward foreign currency exchange contracts, see Note 2o, Accumulated OtherComprehensive (Loss) Income, of the Notes to Consolidated Financial Statements.
j. Fair Value
The Company defines fair value as the price that would be received to sell an asset or be paid to transfer a liability in anorderly transaction between market participants at the measurement date. The Company applies the following fair valuehierarchy, which prioritizes the inputs used to measure fair value into three levels and bases the categorization within thehierarchy upon the lowest level of input that is available and significant to the fair value measurement. The hierarchy gives thehighest priority to unadjusted quoted prices in active markets for identical assets or liabilities (Level 1 measurements) and thelowest priority to unobservable inputs (Level 3 measurements).
Level 1— Level 1 inputs are quoted prices (unadjusted) in active markets for identical assets or liabilities that thereporting entity has the ability to access at the measurement date.
Level 2— Level 2 inputs are inputs other than quoted prices included within Level 1 that are observable for the asset orliability, either directly or indirectly. If the asset or liability has a specified (contractual) term, a Level 2 input must beobservable for substantially the full term of the asset or liability.
Level 3— Level 3 inputs are unobservable inputs for the asset or liability in which there is little, if any, market activityfor the asset or liability at the measurement date.
The tables below, set forth by level, presents the Company’s financial assets and liabilities, excluding accrued interestcomponents, that were accounted for at fair value on a recurring basis as of October 30, 2021 and October 31, 2020. The tablesexclude cash on hand and assets and liabilities that are measured at historical cost or any basis other than fair value. As ofOctober 30, 2021 and October 31, 2020, the Company held $1,315.0 million and $239.6 million, respectively, of cash and held-to-maturity investments that were excluded from the tables below.
October 30, 2021Fair Value measurement atReporting Date using:
QuotedPrices inActiveMarketsfor
IdenticalAssets(Level 1)
SignificantOther
ObservableInputs(Level 2) Total
AssetsCash equivalents:
Available-for-sale:Government and institutional money market funds $ 662,997 $ — $ 662,997
Other assets:Deferred compensation investments 71,301 — 71,301
Total assets measured at fair value $ 734,298 $ — $ 734,298Liabilities
Forward foreign currency exchange contracts (1) $ — $ 8,085 $ 8,085Total liabilities measured at fair value $ — $ 8,085 $ 8,085(1) The Company has master netting arrangements by counterparty with respect to derivative contracts. See Note 2i, DerivativeInstruments and Hedging Agreements, of the Notes to Consolidated Financial Statements for more information related to the
ANALOG DEVICES, INC.
NOTES TO CONSOLIDATED FINANCIAL STATEMENTS — (Continued)
56
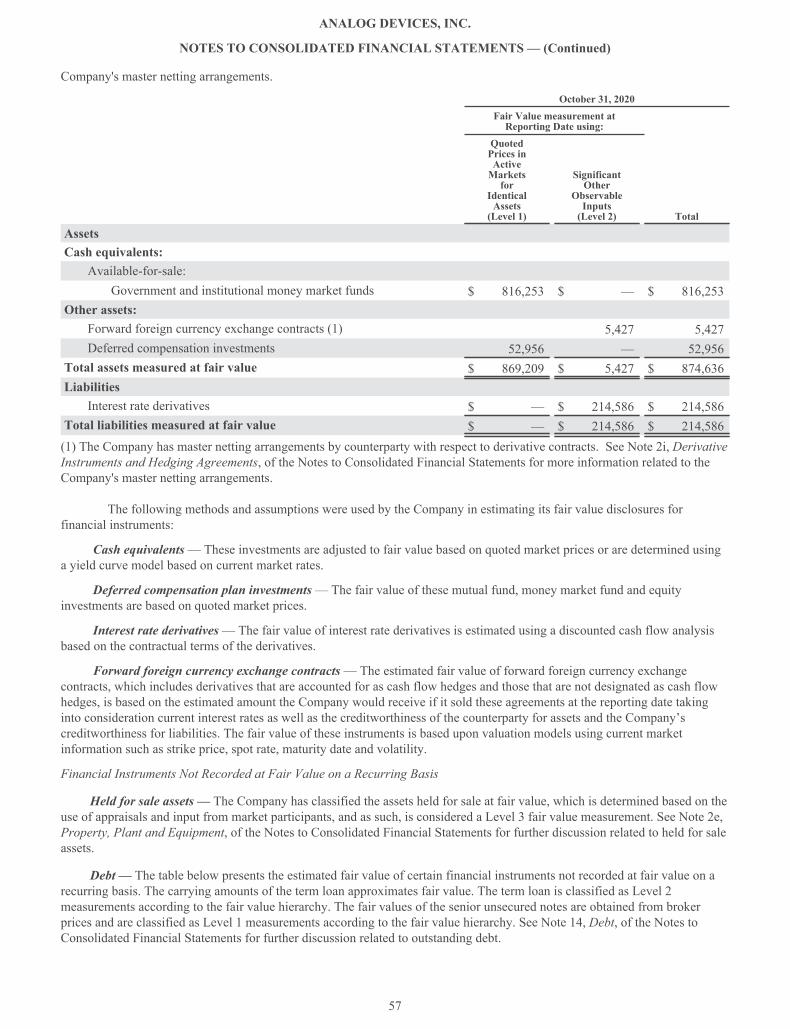
Company's master netting arrangements.
October 31, 2020Fair Value measurement atReporting Date using:
QuotedPrices inActiveMarketsfor
IdenticalAssets(Level 1)
SignificantOther
ObservableInputs(Level 2) Total
AssetsCash equivalents:
Available-for-sale:Government and institutional money market funds $ 816,253 $ — $ 816,253
Other assets:Forward foreign currency exchange contracts (1) 5,427 5,427Deferred compensation investments 52,956 — 52,956
Total assets measured at fair value $ 869,209 $ 5,427 $ 874,636Liabilities
Interest rate derivatives $ — $ 214,586 $ 214,586Total liabilities measured at fair value $ — $ 214,586 $ 214,586(1) The Company has master netting arrangements by counterparty with respect to derivative contracts. See Note 2i, DerivativeInstruments and Hedging Agreements, of the Notes to Consolidated Financial Statements for more information related to theCompany's master netting arrangements.
The following methods and assumptions were used by the Company in estimating its fair value disclosures forfinancial instruments:
Cash equivalents— These investments are adjusted to fair value based on quoted market prices or are determined usinga yield curve model based on current market rates.
Deferred compensation plan investments— The fair value of these mutual fund, money market fund and equityinvestments are based on quoted market prices.
Interest rate derivatives— The fair value of interest rate derivatives is estimated using a discounted cash flow analysisbased on the contractual terms of the derivatives.
Forward foreign currency exchange contracts— The estimated fair value of forward foreign currency exchangecontracts, which includes derivatives that are accounted for as cash flow hedges and those that are not designated as cash flowhedges, is based on the estimated amount the Company would receive if it sold these agreements at the reporting date takinginto consideration current interest rates as well as the creditworthiness of the counterparty for assets and the Company’screditworthiness for liabilities. The fair value of these instruments is based upon valuation models using current marketinformation such as strike price, spot rate, maturity date and volatility.
Financial Instruments Not Recorded at Fair Value on a Recurring Basis
Held for sale assets — The Company has classified the assets held for sale at fair value, which is determined based on theuse of appraisals and input from market participants, and as such, is considered a Level 3 fair value measurement. See Note 2e,Property, Plant and Equipment, of the Notes to Consolidated Financial Statements for further discussion related to held for saleassets.
Debt — The table below presents the estimated fair value of certain financial instruments not recorded at fair value on arecurring basis. The carrying amounts of the term loan approximates fair value. The term loan is classified as Level 2measurements according to the fair value hierarchy. The fair values of the senior unsecured notes are obtained from brokerprices and are classified as Level 1 measurements according to the fair value hierarchy. See Note 14, Debt, of the Notes toConsolidated Financial Statements for further discussion related to outstanding debt.
ANALOG DEVICES, INC.
NOTES TO CONSOLIDATED FINANCIAL STATEMENTS — (Continued)
57

October 30, 2021 October 31, 2020
Principal AmountOutstanding Fair Value
Principal AmountOutstanding Fair Value
3-Year term loan, due March 2022 — $ — 925,000 $ 925,0002021 Notes, due December 2021 — — 400,000 408,565Maxim 2023 Notes, due March 2023 500,000 520,236 — —2023 Notes, due June 2023 — — 500,000 526,8552023 Notes, due December 2023 — — 550,000 590,1772024 Notes, due October 2024 500,000 500,482 — —2025 Notes, due April 2025 400,000 423,265 400,000 434,9192025 Notes, due December 2025 — — 850,000 969,0332026 Notes, due December 2026 900,000 986,243 900,000 1,017,505Maxim 2027 Notes, due June 2027 500,000 542,942 — —2028 Notes, due October 2028 750,000 743,109 — —2031 Notes, due October 2031 1,000,000 996,702 — —2036 Notes, due December 2036 144,278 176,960 250,000 298,1532041 Notes, due October 2041 750,000 758,246 — —2045 Notes, due December 2045 332,587 469,592 400,000 538,7882051 Notes, due October 2051 1,000,000 1,029,830 — —Total Debt $ 6,776,865 $ 7,147,607 $ 5,175,000 $ 5,708,995
k. Use of Estimates
The preparation of financial statements in conformity with accounting principles generally accepted in the United Statesrequires management to make estimates and assumptions that affect the reported amounts of assets and liabilities and disclosureof contingencies at the date of the financial statements and the reported amounts of revenue and expenses during the reportingperiod. Such estimates relate to the useful lives of fixed assets and identified intangible assets; allowances for doubtful accountsand customer returns; the net realizable value of inventory; potential reserves relating to litigation matters; accrued liabilities,including estimates of variable consideration related to distributor sales; accrued taxes; uncertain tax positions; deferred taxvaluation allowances; assumptions pertaining to stock-based compensation payments and defined benefit plans; and fair valueof acquired assets and liabilities, including inventory, property, plant and equipment, goodwill, and acquired intangibles; andother reserves. Actual results could differ from those estimates and such differences may be material to the financial statements.
l. Concentrations of Risk
Financial instruments that potentially subject the Company to concentrations of credit risk consist principally ofinvestments and trade accounts receivable.
The Company maintains cash and cash equivalents with high credit quality counterparties, continuously monitors theamount of credit exposure to any one issuer and diversifies its investments in order to minimize its credit risk.
The Company sells its products to distributors and original equipment manufacturers (OEMs) involved in a variety ofindustries including industrial, communications, automotive and consumer end markets. The Company has adopted creditpolicies and standards to accommodate growth in these markets. The Company performs continuing credit evaluations of itscustomers’ financial condition and although the Company generally does not require collateral, the Company may requireletters of credit from customers in certain circumstances. The Company provides reserves for estimated amounts of accountsreceivable that may not be collected.
The Company's largest customer, which is a distributor rather than an end customer, accounted for approximately 26%,29%, and 30% of net revenues in fiscal 2021, fiscal 2020 and fiscal 2019, respectively. The Company's next largest customer,which is also a distributor, accounted for approximately 11% and 10% of net revenues in fiscal 2021 and fiscal 2019,respectively. This next largest customer accounted for less than 10% of net revenues in fiscal 2020. No other customeraccounted for greater than 10% of revenue in any period presented.
ANALOG DEVICES, INC.
NOTES TO CONSOLIDATED FINANCIAL STATEMENTS — (Continued)
58

m. Concentration of Other Risks
The semiconductor industry is characterized by rapid technological change, competitive pricing pressures and cyclicalmarket patterns. The Company’s financial results are affected by a wide variety of factors, including general economicconditions worldwide, economic conditions specific to the semiconductor industry, the timely implementation of newmanufacturing technologies, the ability to safeguard patents and intellectual property in a rapidly evolving market and relianceon assembly and test subcontractors, third-party wafer fabricators and independent distributors. In addition, the semiconductormarket has historically been cyclical and subject to significant economic downturns at various times. The Company is exposedto the risk of obsolescence of its inventory depending on the mix of future business. Additionally, a large portion of theCompany’s purchases of external wafer and foundry services are from a limited number of suppliers, such as TaiwanSemiconductor Manufacturing Company (TSMC) and others. If these suppliers or any of the Company’s other key suppliers areunable or unwilling to manufacture and deliver sufficient quantities of components, on the time schedule and of the quality thatthe Company requires, the Company may be forced to engage additional or replacement suppliers, which could result insignificant expenses and disruptions or delays in manufacturing, product development and shipment of product to theCompany’s customers. Given the current demand environment in the semiconductor industry, the Company expects to face aconstrained supply environment in the near term. Management is working to balance these constraints as it shifts theCompany's global resources and adds capacity where appropriate.
n. Revenue Recognition
Recognition of revenue occurs when a customer obtains control of promised goods or services in an amount that reflectsthe consideration to which the providing entity expects to be entitled in exchange for those goods or services. The Companyrecognizes revenue upon transfer of control of promised products or services to customers in an amount that reflects theconsideration the Company expects to receive in exchange for those products or services. The Company recognizes revenuewhen all of the following criteria are met: (1) the Company has entered into a binding agreement, (2) the performanceobligations have been identified, (3) the transaction price to the customer has been determined, (4) the transaction price hasbeen allocated to the performance obligations in the contract, and (5) the performance obligations have been satisfied. Themajority of the Company's shipping terms permit the Company to recognize revenue at point of shipment or delivery. Certainshipping terms require the goods to be through customs or be received by the customer before title passes. In those instances,the Company defers the revenue recognized until title has passed. Shipping costs are charged to selling, marketing, general andadministrative expense as incurred. Sales taxes are excluded from revenue.
Revenue from contracts with the United States government, government prime contractors and certain commercialcustomers is recorded over time using either units delivered or costs incurred as the measurement basis for progress towardcompletion. These measures are used to measure results directly and is generally the best measure of progress towardcompletion in circumstances in which a reliable measure of output can be established. Estimated revenue in excess of amountsbilled is reported as unbilled receivables. Contract accounting requires judgment in estimating costs and assumptions related totechnical issues and delivery schedule. Contract costs include material, subcontract costs, labor and an allocation of indirectcosts. The estimation of costs at completion of a contract is subject to numerous variables involving contract costs and estimatesas to the length of time to complete the contract. Changes in contract performance, estimated gross margin, including the impactof final contract settlements, and estimated losses are recognized in the period in which the changes or losses are determined.
Performance Obligations: Substantially all of the Company’s contracts with customers contain a single performanceobligation, the sale of mixed-signal integrated circuit products. Such sales represent a single performance obligation because thesale is one type of good or includes multiple goods that are neither capable of being distinct nor separable from the otherpromises in the contract. This performance obligation is satisfied when control of the product is transferred to the customer,which occurs upon shipment or delivery. Unsatisfied performance obligations primarily represent contracts for products withfuture delivery dates and with an original expected duration of one year or less. The Company generally offers a twelve-monthwarranty for its products. The Company’s warranty policy provides for replacement of defective products. Specific accruals arerecorded for known product warranty issues. Product warranty expenses during fiscal 2021, fiscal 2020 and fiscal 2019 werenot material.
Transaction Price: The transaction price reflects the Company’s expectations about the consideration it will be entitled toreceive from the customer and may include fixed or variable amounts. Fixed consideration primarily includes sales to directcustomers and sales to distributors in which both the sale to the distributor and the sale to the end customer occur within thesame reporting period. Variable consideration includes sales in which the amount of consideration that the Company willreceive is unknown as of the end of a reporting period. Such consideration primarily includes credits issued to the distributordue to price protection and sales made to distributors under agreements that allow certain rights of return, referred to as stockrotation. Price protection represents price discounts granted to certain distributors to allow the distributor to earn an appropriate
ANALOG DEVICES, INC.
NOTES TO CONSOLIDATED FINANCIAL STATEMENTS — (Continued)
59

margin on sales negotiated with certain customers and in the event of a price decrease subsequent to the date the product wasshipped and billed to the distributor. Stock rotation allows distributors limited levels of returns in order to reduce the amountsof slow-moving, discontinued or obsolete product from their inventory. A liability for distributor credits covering variableconsideration is made based on the Company's estimate of historical experience rates as well as considering economicconditions and contractual terms. To date, actual distributor claims activity has been materially consistent with the provisionsthe Company has made based on its historical estimates. For fiscal 2021 and fiscal 2020, sales to distributors wereapproximately $4.6 billion and $3.2 billion, respectively, net of variable consideration for which the liability balances as ofOctober 30, 2021 and October 31, 2020 were $664.2 million and $229.8 million, respectively, and were recorded in Accruedliabilities on the Consolidated Balance Sheets.
Contract Balances: Accounts receivable represents the Company’s unconditional right to receive consideration from itscustomers. Payments are typically due within 30 to 45 days of invoicing and do not include a significant financing component.To date, there have been no material credit losses on accounts receivable. There were no material contract assets or contractliabilities recorded on the Consolidated Balance Sheets in any of the periods presented.
o. Accumulated Other Comprehensive (Loss) Income
Accumulated other comprehensive (loss) income (AOCI) includes certain transactions that have generally been reportedin the Consolidated Statement of Shareholders’ Equity. The changes in components of AOCI at October 30, 2021 andOctober 31, 2020 consisted of the following:
Foreigncurrencytranslationadjustment
Unrealizedholding
gains/losseson
derivativesPensionplans Total
October 31, 2020 $ (26,852) $ (172,670) $ (49,939) $ (249,461)Other comprehensive income before reclassifications 1,057 56,034 9,307 66,398Amounts reclassified out of other comprehensive loss — 7,288 2,979 10,267Tax — (14,406) 637 (13,769)Other comprehensive income 1,057 48,916 12,923 62,896October 30, 2021 $ (25,795) $ (123,754) $ (37,016) $ (186,565)
ANALOG DEVICES, INC.
NOTES TO CONSOLIDATED FINANCIAL STATEMENTS — (Continued)
60

The amounts reclassified out of AOCI into the Consolidated Statements of Income, with presentation location during eachperiod were as follows:Comprehensive Income Component 2021 2020 LocationChanges in unrealized holding gains/losses on derivativesCurrency forwards $ (2,682) $ (2,522) Cost of sales
(1,622) (127) Research and development
(958) 112Selling, marketing, general andadministrative
Interest rate derivatives 12,550 1,856 Interest expense7,288 (681) Total before tax(189) (158) Tax
Effect of Accounting Standards Update2018-02 — (2,379) Retained earnings
$ 7,099 $ (3,218) Net of tax
Amortization of pension components included in the computation of net periodic benefit costActuarial losses 2,979 2,617 (1)
339 651 Tax$ 3,318 $ 3,268 Net of tax
Total amounts reclassified out of AOCI, net of tax $ 10,417 $ 50_______________________________________(1) The amortization of pension components is included in the computation of net periodic benefit cost. See Note 11, Retirement Plans, of
the Notes to Consolidated Financial Statements for further information.
p. Income Taxes
The Company makes certain estimates and judgments in determining income tax expense for financial statementpurposes. These estimates and judgments occur in the calculation of income tax credits, benefits, and deductions, and in thecalculation of certain tax assets and liabilities, which arise from differences in the timing of the recognition of certain expensesfor tax and financial statement purposes. The likelihood of the realization of deferred tax assets is assessed and a correspondingvaluation allowance is recorded as necessary if management determines those deferred tax assets may not be realized due to theuncertainty of the timing and amount to be realized of certain state and international tax credit carryovers. In reaching thisconclusion, the Company evaluates certain relevant criteria including the existence of deferred tax liabilities that can be used torealize deferred tax assets, the taxable income in prior carryback years in the impacted state and international jurisdictions thatcan be used to absorb net operating losses and taxable income in future years. Judgments regarding future profitability maychange due to future market conditions, changes in U.S. or international tax laws and other factors. These changes, if any, mayrequire material adjustments to these deferred tax assets, which may result in an increase or decrease to the income taxprovision in future periods.
The Company accounts for uncertain tax positions by first determining if it is “more likely than not” that a tax positionwill be sustained by the appropriate taxing authorities prior to recording any benefit in the Consolidated Financial Statements.An uncertain income tax position is not recognized if it has less than a 50% likelihood of being sustained. For those taxpositions where it is more likely than not that a tax position will be sustained, the Company has recorded the largest amount oftax benefit with a greater than 50% likelihood of being realized upon ultimate settlement with a taxing authority that has fullknowledge of all relevant information. For those income tax positions where it is not more likely than not that a tax benefit willbe sustained, no tax benefit has been recognized in the financial statements. Management classifies interest and penalties relatedto uncertain tax positions within the (benefit from) provision for income taxes line of the Consolidated Statements of Income.Management reevaluates these uncertain tax positions on a quarterly basis. This evaluation is based on factors including, but notlimited to, changes in known facts or circumstances, changes in tax law, effectively settled issues under audit, and newguidance on legislative interpretations. A change in these factors could result in the recognition of an increase or decrease to theCompany's income tax provision which could materially impact its consolidated financial position and results of operations.
In the ordinary course of global business, there are many transactions and calculations where the ultimate tax outcome isuncertain. Some of these uncertainties arise as a consequence of cost reimbursement and royalty arrangements among relatedentities. Although the Company believes its estimates are reasonable, no assurance can be given that the final tax outcome ofthese matters will not be different than that which is reflected in the historical income tax provisions and income tax liabilities.
ANALOG DEVICES, INC.
NOTES TO CONSOLIDATED FINANCIAL STATEMENTS — (Continued)
61

In the event management's assumptions are incorrect, the differences could have a material impact on its income tax provisionand operating results in the period in which such determination is made. In addition to the factors described above, the currentand expected effective tax rate is based on then-current tax law. Significant changes in enacted tax law could affect theseestimates. See Note 12, Income Taxes, of the Notes to Consolidated Financial Statements for further information related toincome taxes.
q. Earnings Per Share of Common Stock
Basic earnings per share is computed based only on the weighted average number of common shares outstanding duringthe period. Diluted earnings per share is computed using the weighted average number of common shares outstanding duringthe period, plus the dilutive effect of potential future issuances of common stock relating to stock option programs and otherpotentially dilutive securities using the treasury stock method. In calculating diluted earnings per share, the dilutive effect ofstock options and restricted stock units is computed using the average market price for the respective period. In addition, theassumed proceeds under the treasury stock method include the average unrecognized compensation expense of stock optionsthat are in-the-money and restricted stock units. This results in the “assumed” buyback of additional shares, thereby reducingthe dilutive impact of in-the-money stock options. Potential shares related to certain of the Company’s outstanding stockoptions and restricted stock units were excluded because they were anti-dilutive. Those potential shares, determined based onthe weighted average exercise prices during the respective periods, could be dilutive in the future.
In connection with the acquisition of Linear Technology Corporate (Linear), the Company granted restricted stockawards to replace outstanding restricted stock awards of Linear employees. These restricted stock awards entitle recipients tovoting and nonforfeitable dividend rights from the date of grant. These unvested stock-based compensation awards areconsidered participating securities and the two-class method is used for purposes of calculating earnings per share. Underthe two-class method, a portion of net income is allocated to these participating securities and therefore is excluded from thecalculation of earnings per share allocated to common stock, as shown in the table below. The difference between the incomeallocated to participating securities under the basic and diluted two-class methods is not material.
The following table sets forth the computation of basic and diluted earnings per share:2021 2020 2019
Net income $ 1,390,422 $ 1,220,761 $ 1,363,011Less: income allocated to participating securities (1) — — 3,229Net income allocated to common shareholders $ 1,390,422 $ 1,220,761 $ 1,359,782
Basic shares:Weighted-average shares outstanding 397,462 368,633 369,133Earnings per common share basic $ 3.50 $ 3.31 $ 3.68
Diluted shares:Weighted-average shares outstanding 397,462 368,633 369,133Assumed exercise of common stock equivalents 3,826 3,340 3,738Weighted-average common and common equivalent shares 401,288 371,973 372,871Earnings per common share diluted $ 3.46 $ 3.28 $ 3.65Anti-dilutive shares related to:Outstanding stock options 424 460 826
_______________________________________(1) For fiscal 2021 and fiscal 2020, the amount is not material.
r. Stock-Based Compensation
Stock-based compensation is measured at the grant date based on the grant-date fair value of the awards ultimatelyexpected to vest and is recognized as an expense on a straight-line basis over the vesting period, which is generally four yearsfor stock options and restricted stock units, or in annual installments of 25% on each of the first, second, third and fourthanniversaries of the date of grant. Restricted stock units with service and performance or market conditions generally vest inone installment on the third anniversary of the date of grant. For grants issued prior to fiscal 2018, the vesting period wasgenerally five years for stock options, or in annual installments of 20% on each of the first, second, third, fourth and fifth
ANALOG DEVICES, INC.
NOTES TO CONSOLIDATED FINANCIAL STATEMENTS — (Continued)
62

anniversaries of the date of grant and in one installment on the third anniversary of the date of grant for restricted stock units/awards. The maximum contractual term of all stock options is ten years.
Determining the amount of stock-based compensation expense to be recorded requires the Company to develop estimatesused in calculating the grant-date fair value of awards. These estimates may be based on different valuation models dependingupon the type of award and may include assumptions, such as expected volatility, expected term, risk-free interest rate,expected dividend yield, forfeiture rate and others. The Company uses the Black-Scholes valuation model to calculate the grant-date fair value of stock option awards. The grant-date fair value of restricted stock units with a service condition and restrictedstock units with both service and performance conditions are calculated using the value of the Company's common stock on thedate of grant, reduced by the present value of dividends expected to be paid on the Company's common stock prior to vesting.For restricted stock units with both service and performance conditions, this grant-date fair value is also impacted by thenumber of units that are expected to vest during the performance period and is adjusted through the related stock-basedcompensation expense at each reporting period based on the probability of achievement of that performance condition. If theCompany determines that an award is unlikely to vest, any previously recorded stock-based compensation expense is reversedin the period of that determination. The grant date fair value of restricted stock units or performance-based stock options withboth service and market conditions is calculated using the Monte Carlo simulation model to estimate the probability ofsatisfying the performance condition stipulated in the award grant, including the possibility that the market condition may notbe satisfied.
See Note 3, Stock-Based Compensation and Shareholders' Equity, of the Notes to Consolidated Financial Statements foradditional information relating to stock-based compensation.
s. New Accounting Pronouncements
Standards Implemented During Current Fiscal Year
Financial Instruments
In June 2016, the Financial Accounting Standards Board (FASB) issued Accounting Standards Update 2016-13, FinancialInstruments - Credit Losses (Topic 326), Measurement of Credit Losses on Financial Instruments (ASU 2016-13). ASU2016-13 requires a financial asset (or group of financial assets) measured at amortized cost basis to be presented at the netamount expected to be collected. The allowance for credit losses is a valuation account that is deducted from the amortized costbasis of the financial asset(s) to present the net carrying value at the amount expected to be collected on the financial asset. In2019, the FASB issued ASU 2019-05, Financial Instruments - Credit Losses (Topic 326): Targeted Transition Relief (ASU2019-05) and ASU 2019-11, Codification Improvements to Topic 326 (ASU 2019-11). ASU 2019-05 allows an entity toirrevocably elect the fair value option for certain financial instruments. Once elected, an entity would recognize the differencebetween the carrying amount and the fair value of the financial instrument as part of the cumulative effect adjustmentsassociated with the adoption of ASU 2016-13. ASU 2019-11 allows entities to exclude the accrued interest component ofamortized cost from various disclosures required by ASC 326.
The Company is exposed to credit losses through sales of its products and certain financial instruments. The Companydetermines if there is an expected loss on its accounts receivables using historical collection experience, current and futureeconomic and market conditions and a review of the current status of customers' trade accounts receivables. The Companyadopted these standards effective November 1, 2020 using the modified retrospective approach, which did not have a materialimpact on the Company's financial position and results of operations. See Note 8, Fair Value, of the Notes to ConsolidatedFinancial Statements for more information related to how the Company assesses credit losses on its available-for-sale debtsecurities.
Income taxes
In December 2019, the FASB issued ASU 2019-12, Simplifying the Accounting for Income Taxes (ASU-2019-12). ASU2019-12 eliminates certain exceptions related to the approach for intraperiod tax allocation, the methodology for calculatingincome taxes in an interim period and the recognition of deferred tax liabilities for outside basis differences. It also clarifies andsimplifies other aspects of the accounting for income taxes. The Company adopted ASU 2019-12 in the first quarter of fiscal2021. Upon adoption, ASU 2019-12 did not have a material impact on the Company's financial position and results ofoperations.
Retirement Benefits
In August 2018, the FASB issued ASU 2018-14, Compensation-Retirement Benefits-Defined Benefit Plans-General(Topic 715-20): Disclosure Framework-Changes to the Disclosure Requirements for Defined Benefit Plans (ASU2018-14), which modifies the disclosure requirements for defined benefit pension plans and other post-retirement plans. ASU
ANALOG DEVICES, INC.
NOTES TO CONSOLIDATED FINANCIAL STATEMENTS — (Continued)
63

2018-14 is effective for fiscal years ending after December 15, 2020, with early adoption permitted. The Company adoptedASU 2018-14 in the first quarter of fiscal 2021. Upon adoption, ASU 2018-14 did not have a material impact on theCompany's financial position and results of operations.
Standards to Be Implemented
Reference Rate Reform
In March 2020, the FASB issued ASU No. 2020-04, Reference Rate Reform (Topic 848) - Facilitation of the Effects ofReference Rate Reform on Financial Reporting, which provides optional guidance for accounting for contracts, hedgingrelationships, and other transactions affected by reference rate reform, if certain criteria are met. The provisions of this standardare available for election through December 31, 2022. The Company does not expect ASU 2020-04 to have a material impacton the Company's financial position and results of operations.
Acquired Contract Assets and Contract Liabilities
In October 2021, the FASB issued ASU No. 2021-08, Business Combinations (Topic 805): Accounting for AcquiredContract Assets and Contract Liabilities. Under the new guidance (ASC 805-20-30-28), the acquirer should determine whatcontract assets and/or contract liabilities it would have recorded under ASC 606 (the revenue guidance) as of the acquisitiondate, as if the acquirer had entered into the original contract at the same date and on the same terms as the acquiree. Therecognition and measurement of those contract assets and contract liabilities will likely be comparable to what the acquiree hasrecorded on its books under ASC 606 as of the acquisition date. ASU 2021-08 is effective for fiscal years beginning afterDecember 15, 2022, including interim periods within those fiscal years. ASU 2021-08 is effective for the Company in the firstquarter of fiscal 2024. Early adoption is permitted, including in an interim period, for any period for which financial statementshave not yet been issued. However, adoption in an interim period other than the first fiscal quarter requires an entity to applythe new guidance to all prior business combinations that have occurred since the beginning of the annual period in which thenew guidance is adopted. The Company is currently evaluating the adoption date of ASU 2021-08 and the impact, if any,adoption will have on its financial position and results of operations.
3. Stock-Based Compensation and Shareholders’ Equity
Equity Compensation Plans
The Company grants, or has granted, stock options and other stock and stock-based awards under the Company's 2020Equity Incentive Plan (2020 Plan), which was approved by shareholders in March 2020. The 2020 Plan provides for the grantof up to 21.2 million shares of the Company’s common stock, which includes shares under the Company’s previous equitycompensation plans, including the Amended and Restated 2006 Stock Incentive Plan, the Linear Technology CorporationAmended and Restated 2005 Equity Incentive Plan and the Amended and Restated 2010 Equity Incentive Plan. The 2020 Planprovides for the grant of incentive stock options intended to qualify under Section 422 of the Internal Revenue Code of 1986, asamended, non-statutory stock options, stock appreciation rights, restricted stock, restricted stock units and other stock-basedawards. Employees, officers, directors, consultants and advisors of the Company and its subsidiaries are eligible to be grantedawards under the 2020 Plan. No award may be made under the 2020 Plan after March 11, 2030, but awards previously grantedmay extend beyond that date. The Company does not intend to grant further equity awards under any previous legacy AnalogDevices' and Linear Technology Corporation's equity compensation plans. In connection with the Acquisition, the Companyassumed the Maxim 1996 Stock Incentive Plan (1996 Plan) and may grant stock options and other stock and stock-basedawards under the 1996 Plan. As of October 30, 2021, a total of 18.2 million common shares were available for future grantunder the 2020 Plan and 9.0 million common shares were available for future grant under the 1996 Plan.
Maxim Replacement Awards
In connection with the Acquisition, the Company issued equity awards, consisting of restricted stock awards and restrictedstock units (replacement awards), to certain Maxim employees in replacement of Maxim equity awards. The replacementawards consist of restricted stock and restricted stock unit awards for approximately 3.7 million shares of the Company'scommon stock with a weighted average grant date fair value of $161.63. The terms and intrinsic value of these replacementawards are substantially the same as the converted Maxim awards. The fair value of the replacement awards associated withservices rendered through the Acquisition Date was recognized as a component of the total acquisition consideration, and theremaining fair value of the replacement awards associated with post-Acquisition services will be recognized as an expense on astraight-line basis over the remaining vesting period.
ANALOG DEVICES, INC.
NOTES TO CONSOLIDATED FINANCIAL STATEMENTS — (Continued)
64

Modification of Awards
The Company has, from time to time, modified the terms of its equity awards to employees and directors. Themodifications made to the Company’s equity awards in fiscal 2021, fiscal 2020 and fiscal 2019 did not result in significantincremental compensation costs, either individually or in the aggregate.
Grant-Date Fair Value of Stock Options
Information pertaining to the Company’s stock option awards and the related estimated weighted-average assumptions tocalculate the fair value of stock options using the Black-Scholes valuation model granted in fiscal 2021, fiscal 2020 and fiscal2019 is as follows:
2021 2020 2019
Options granted (in thousands) 644 359 454Weighted-average exercise price $145.04 $94.41 $107.11Weighted-average grant-date fair value $33.35 $18.81 $23.29Assumptions:Weighted-average expected volatility 35.3 % 29.5 % 26.4 %Weighted-average expected term (in years) 5.0 5.0 5.0Weighted-average risk-free interest rate 0.8 % 0.7 % 2.4 %Weighted-average expected dividend yield 1.9 % 2.6 % 2.0 %
Expected volatility— The Company is responsible for estimating volatility and has considered a number of factors,including third-party estimates. The Company currently believes that the exclusive use of implied volatility results in the bestestimate of the grant-date fair value of employee stock options because it reflects the market’s current expectations of futurevolatility. In evaluating the appropriateness of exclusively relying on implied volatility, the Company concluded that:(1) options in the Company’s common stock are actively traded with sufficient volume on several exchanges; (2) the marketprices of both the traded options and the underlying shares are measured at a similar point in time to each other and on a dateclose to the grant date of the employee share options; (3) the traded options have exercise prices that are both near-the-moneyand close to the exercise price of the employee share options; and (4) the remaining maturities of the traded options used toestimate volatility are at least one year.
Expected term— The Company uses historical employee exercise and option expiration data to estimate the expectedterm assumption for the Black-Scholes grant-date valuation. The Company believes that this historical data is currently the bestestimate of the expected term of a new option, and that generally its employees exhibit similar exercise behavior.
Risk-free interest rate— The yield on zero-coupon U.S. Treasury securities for a period that is commensurate with theexpected term assumption is used as the risk-free interest rate.
Expected dividend yield— Expected dividend yield is calculated by annualizing the cash dividend declared by theCompany’s Board of Directors for the current quarter and dividing that result by the closing stock price on the date of grant.Until such time as the Company’s Board of Directors declares a cash dividend for an amount that is different from the currentquarter’s cash dividend, the current dividend will be used in deriving this assumption. Cash dividends are not paid on options,restricted stock, replacement awards or restricted stock units. In connection with the acquisition of Linear, the Company grantedrestricted stock awards to replace outstanding restricted stock awards of Linear employees. These restricted stock awardsspecific to legacy Linear awards entitle recipients to voting and nonforfeitable dividend rights from the date of grant.
Stock-Based Compensation Expense
The amount of stock-based compensation expense recognized during a period is based on the value of the awards that areultimately expected to vest. Forfeitures are estimated at the time of grant and revised, if necessary, in subsequent periods ifactual forfeitures differ from those estimates. The term “forfeitures” is distinct from “cancellations” or “expirations” andrepresents only the unvested portion of the surrendered stock-based award. Based on an analysis of its historical forfeitures, theCompany has applied an annual forfeiture rate of 5.0% to all unvested stock-based awards as of October 30, 2021. This analysiswill be re-evaluated annually and the forfeiture rate will be adjusted as necessary. Ultimately, the actual expense recognizedover the vesting period will only be for those awards that vest.
ANALOG DEVICES, INC.
NOTES TO CONSOLIDATED FINANCIAL STATEMENTS — (Continued)
65
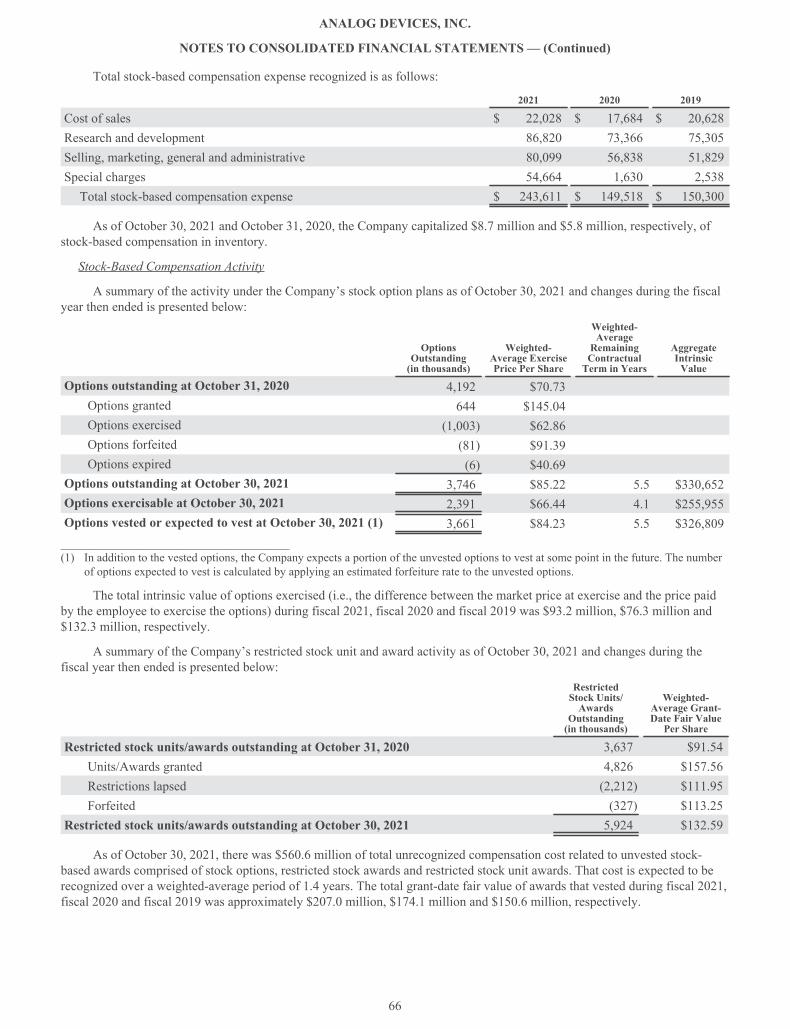
Total stock-based compensation expense recognized is as follows:
2021 2020 2019
Cost of sales $ 22,028 $ 17,684 $ 20,628Research and development 86,820 73,366 75,305Selling, marketing, general and administrative 80,099 56,838 51,829Special charges 54,664 1,630 2,538Total stock-based compensation expense $ 243,611 $ 149,518 $ 150,300
As of October 30, 2021 and October 31, 2020, the Company capitalized $8.7 million and $5.8 million, respectively, ofstock-based compensation in inventory.
Stock-Based Compensation Activity
A summary of the activity under the Company’s stock option plans as of October 30, 2021 and changes during the fiscalyear then ended is presented below:
OptionsOutstanding(in thousands)
Weighted-Average ExercisePrice Per Share
Weighted-AverageRemainingContractualTerm in Years
AggregateIntrinsicValue
Options outstanding at October 31, 2020 4,192 $70.73Options granted 644 $145.04Options exercised (1,003) $62.86Options forfeited (81) $91.39Options expired (6) $40.69
Options outstanding at October 30, 2021 3,746 $85.22 5.5 $330,652Options exercisable at October 30, 2021 2,391 $66.44 4.1 $255,955Options vested or expected to vest at October 30, 2021 (1) 3,661 $84.23 5.5 $326,809_______________________________________(1) In addition to the vested options, the Company expects a portion of the unvested options to vest at some point in the future. The number
of options expected to vest is calculated by applying an estimated forfeiture rate to the unvested options.
The total intrinsic value of options exercised (i.e., the difference between the market price at exercise and the price paidby the employee to exercise the options) during fiscal 2021, fiscal 2020 and fiscal 2019 was $93.2 million, $76.3 million and$132.3 million, respectively.
A summary of the Company’s restricted stock unit and award activity as of October 30, 2021 and changes during thefiscal year then ended is presented below:
RestrictedStock Units/Awards
Outstanding(in thousands)
Weighted-Average Grant-Date Fair ValuePer Share
Restricted stock units/awards outstanding at October 31, 2020 3,637 $91.54Units/Awards granted 4,826 $157.56Restrictions lapsed (2,212) $111.95Forfeited (327) $113.25
Restricted stock units/awards outstanding at October 30, 2021 5,924 $132.59
As of October 30, 2021, there was $560.6 million of total unrecognized compensation cost related to unvested stock-based awards comprised of stock options, restricted stock awards and restricted stock unit awards. That cost is expected to berecognized over a weighted-average period of 1.4 years. The total grant-date fair value of awards that vested during fiscal 2021,fiscal 2020 and fiscal 2019 was approximately $207.0 million, $174.1 million and $150.6 million, respectively.
ANALOG DEVICES, INC.
NOTES TO CONSOLIDATED FINANCIAL STATEMENTS — (Continued)
66

Common Stock Repurchases
In September 2021, the Company entered into accelerated share repurchase agreements (ASR) with third party financialinstitutions to repurchase $2.5 billion of the Company's common stock. The Company paid $2.5 billion and received an initialdelivery of 12.3 million shares of common stock, which represented approximately 80% of the notional amount of the ASR.The Company recorded the remaining 20%, or $500.0 million, within Prepaid expenses and other current assets on theConsolidated Balance Sheet. The average price paid for all of the shares delivered under the ASR through October 30, 2021was $163.27 per share. The final settlement of the transaction under the ASR is expected to occur in the first half of fiscal 2022.
The Company’s share repurchase program has been in place since August 2004. In the aggregate, the Board of Directorshas authorized the Company to repurchase $16.7 billion of the Company’s common stock under the program, which includesthe $8.5 billion authorization approved by the Board of Directors on August 25, 2021. The Company may repurchaseoutstanding shares of its common stock from time to time in the open market and through privately negotiated transactions.Unless terminated earlier by resolution of the Company’s Board of Directors, the repurchase program will expire when theCompany has repurchased all shares authorized under the program. As of October 30, 2021, the Company had repurchased atotal of approximately 171.6 million shares of its common stock for approximately $8.8 billion under this program, excludingthe $500.0 million within Prepaid expenses and other current assets noted above. $7.4 billion remains available for repurchaseof shares under the current authorized program in addition to the $500.0 million advance payment under the ASR. Therepurchased shares are held as authorized but unissued shares of common stock. Future repurchases of common stock will bedependent upon the Company's financial position, results of operations, outlook, liquidity, and other factors deemed relevant bythe Company.
The Company also, from time to time, repurchases shares in settlement of employee tax withholding obligations due uponthe vesting of restricted stock units/awards or the exercise of stock options. The withholding amount is based on the employee'sminimum statutory withholding requirement. Any future common stock repurchases will be dependent upon several factors,including the Company's financial performance, outlook, liquidity and the amount of cash the Company has available in theUnited States.
Analog Devices Foundation
During the first quarter of fiscal 2020, the Company contributed 335,654 shares of its common stock to the AnalogDevices Foundation. As of the date of the charitable contribution, the shares had a fair value of approximately $40.0 million.This expense was recorded in Selling, marketing, general and administrative expense in the Consolidated Statement of Income.
Preferred Stock
The Company has 471,934 authorized shares of $1.00 par value preferred stock, none of which is issued or outstanding.The Board of Directors is authorized to fix designations, relative rights, preferences and limitations on the preferred stock at thetime of issuance.
4. Industry, Segment and Geographic Information
The Company operates and tracks its results in one reportable segment based on the aggregation of its operatingsegments. The Company designs, develops, manufactures and markets a broad range of integrated circuits (ICs). The ChiefExecutive Officer has been identified as the Company's Chief Operating Decision Maker. The Company has determined that allof the Company's operating segments share the following similar economic characteristics, and therefore meet the criteriaestablished for operating segments to be aggregated into one reportable segment, namely:
• The primary source of revenue for each operating segment is the sale of ICs.
• The ICs sold by each of the Company's operating segments are manufactured using similar semiconductormanufacturing processes and raw materials in either the Company’s own production facilities or by third-party wafer fabricatorsusing proprietary processes.
• The Company sells its products to tens of thousands of customers worldwide. Many of these customers use productsspanning all operating segments in a wide range of applications.
• The ICs marketed by each of the Company's operating segments are sold globally through a direct sales force, third-party distributors, independent sales representatives and via the Company's website to the same types of customers.
All of the Company's operating segments share a similar long-term financial model as they have similar economiccharacteristics. The causes for variation in operating and financial performance are the same among the Company's operatingsegments and include factors such as (i) life cycle and price and cost fluctuations, (ii) number of competitors, (iii) product
ANALOG DEVICES, INC.
NOTES TO CONSOLIDATED FINANCIAL STATEMENTS — (Continued)
67
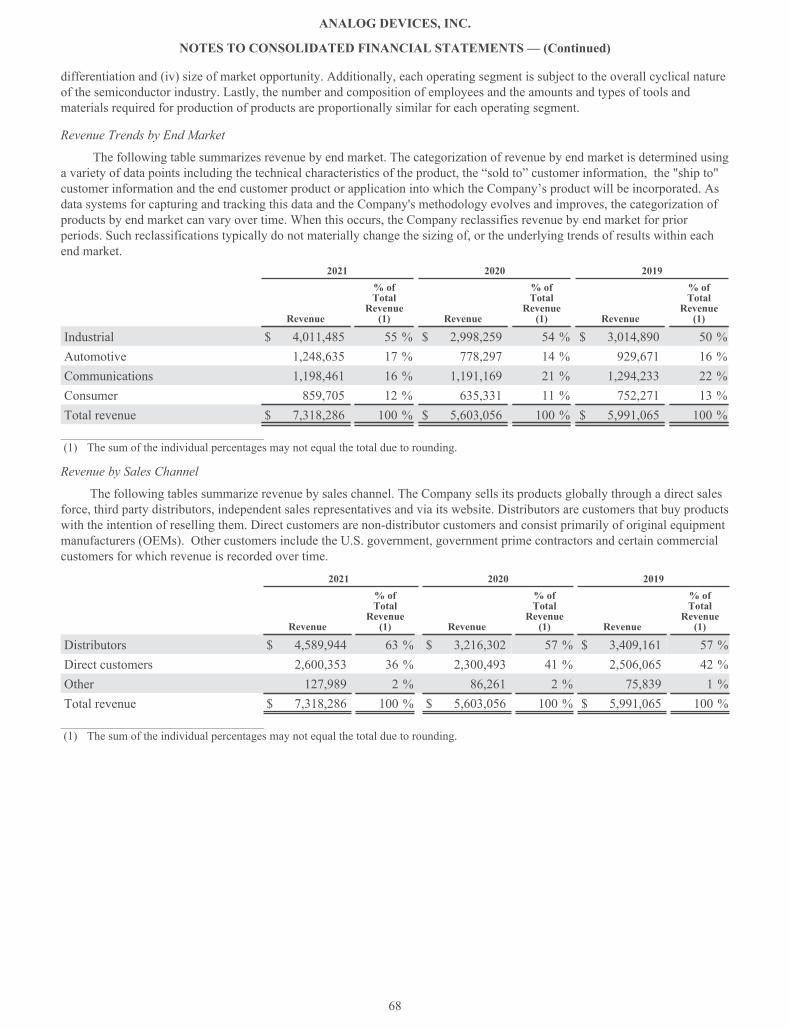
differentiation and (iv) size of market opportunity. Additionally, each operating segment is subject to the overall cyclical natureof the semiconductor industry. Lastly, the number and composition of employees and the amounts and types of tools andmaterials required for production of products are proportionally similar for each operating segment.
Revenue Trends by End Market
The following table summarizes revenue by end market. The categorization of revenue by end market is determined usinga variety of data points including the technical characteristics of the product, the “sold to” customer information, the "ship to"customer information and the end customer product or application into which the Company’s product will be incorporated. Asdata systems for capturing and tracking this data and the Company's methodology evolves and improves, the categorization ofproducts by end market can vary over time. When this occurs, the Company reclassifies revenue by end market for priorperiods. Such reclassifications typically do not materially change the sizing of, or the underlying trends of results within eachend market.
2021 2020 2019
Revenue
% ofTotalRevenue(1) Revenue
% ofTotalRevenue(1) Revenue
% ofTotalRevenue(1)
Industrial $ 4,011,485 55 % $ 2,998,259 54 % $ 3,014,890 50 %Automotive 1,248,635 17 % 778,297 14 % 929,671 16 %Communications 1,198,461 16 % 1,191,169 21 % 1,294,233 22 %Consumer 859,705 12 % 635,331 11 % 752,271 13 %Total revenue $ 7,318,286 100 % $ 5,603,056 100 % $ 5,991,065 100 %_______________________________________(1) The sum of the individual percentages may not equal the total due to rounding.
Revenue by Sales Channel
The following tables summarize revenue by sales channel. The Company sells its products globally through a direct salesforce, third party distributors, independent sales representatives and via its website. Distributors are customers that buy productswith the intention of reselling them. Direct customers are non-distributor customers and consist primarily of original equipmentmanufacturers (OEMs). Other customers include the U.S. government, government prime contractors and certain commercialcustomers for which revenue is recorded over time.
2021 2020 2019
Revenue
% ofTotalRevenue(1) Revenue
% ofTotalRevenue(1) Revenue
% ofTotalRevenue(1)
Distributors $ 4,589,944 63 % $ 3,216,302 57 % $ 3,409,161 57 %Direct customers 2,600,353 36 % 2,300,493 41 % 2,506,065 42 %Other 127,989 2 % 86,261 2 % 75,839 1 %Total revenue $ 7,318,286 100 % $ 5,603,056 100 % $ 5,991,065 100 %_______________________________________(1) The sum of the individual percentages may not equal the total due to rounding.
ANALOG DEVICES, INC.
NOTES TO CONSOLIDATED FINANCIAL STATEMENTS — (Continued)
68

Geographic Information
Geographic revenue information for fiscal 2021, fiscal 2020 and fiscal 2019 reflects the geographic location of thedistributors or OEMs who purchased the Company's products. This may differ from the geographic location of the endcustomers. In all periods presented, the predominant countries comprising “Rest of North and South America” are Canada andMexico; the predominant countries comprising “Europe” are Germany, Sweden, and the Netherlands; and the predominantcountries comprising “Rest of Asia” are Taiwan, Malaysia, South Korea and Singapore.
2021 2020 2019
RevenueUnited States $ 2,389,439 $ 1,887,443 $ 2,020,886Rest of North and South America 42,830 41,250 55,059Europe 1,592,989 1,245,695 1,374,673Japan 787,966 521,720 657,632China 1,614,396 1,348,011 1,316,275Rest of Asia 890,666 558,937 566,540
Subtotal all foreign countries 4,928,847 3,715,613 3,970,179Total revenue $ 7,318,286 $ 5,603,056 $ 5,991,065
Property, plant and equipmentUnited States $ 956,624 $ 579,755 $ 592,591Ireland 206,353 169,968 184,791Philippines 524,128 256,470 247,823Thailand 126,040 — —Singapore (1) — 18,518 88,385Malaysia 84,971 53,616 56,292All other countries 80,935 42,234 50,107
Subtotal all foreign countries 1,022,427 540,806 627,398Total property, plant and equipment $ 1,979,051 $ 1,120,561 $ 1,219,989
_______________________________________(1) As further discussed in Note 5, Special Charges, of the Notes to Consolidated Financial Statements, the Company sold this facility in
fiscal 2021.
5. Special Charges, net
The Company monitors global macroeconomic conditions on an ongoing basis and continues to assess opportunities forimproved operational effectiveness and efficiency, as well as a better alignment of expenses with revenues. As a result of theseassessments, the Company has undertaken various actions resulting in special charges over the past several years.
The following table summarizes activity included in special charges, net in the Company's Consolidated Statements ofIncome:
ANALOG DEVICES, INC.
NOTES TO CONSOLIDATED FINANCIAL STATEMENTS — (Continued)
69

Closure ofManufacturingFacilities
RepositioningAction Other
Special Charges,Net
Fiscal 2019Employee severance and benefit costs $ 7,556 $ 71,397 $ — $ 78,953Employee equity acceleration charge — 2,538 — 2,538Impairment charges — 14,168 — 14,168Total special charges, net $ 7,556 $ 88,103 $ — $ 95,659
Fiscal 2020Employee severance and benefit costs $ — $ 47,326 $ — $ 47,326Employee equity acceleration charge — 2,093 — 2,093Facility closure costs 2,918 — — 2,918Total special charges, net $ 2,918 $ 49,419 $ — $ 52,337
Fiscal 2021Employee severance and benefit costs $ 200 $ — $ 28,731 $ 28,931Employee equity acceleration charge — — 54,664 54,664Facility closure costs 11,880 — — 11,880Fair value write-down of assets held for sale 2,538 — — 2,538(Gain) on sale of facility (13,557) — — (13,557)Total special charges, net $ 1,061 $ — $ 83,395 $ 84,456
Liabilities related to special charges, net are presented in Accrued Liabilities in the Consolidated Balance Sheets. Theactivity is detailed below:
Accrued Special Charges
Closure ofManufacturingFacilities
RepositioningAction Other
Balance at November 3, 2018 $ 42,974 $ — $ —Employee severance and benefit costs 7,556 71,397 —Severance and benefit payments — (12,487) —Effect of foreign currency on accrual (129) (15) —Balance at November 2, 2019 $ 50,401 $ 58,895 $ —Employee severance and benefit costs — 47,326 —Facility closure costs 2,918 — —Severance and benefit payments (5,098) (85,301) —Facility closure cost payments (2,969) —Effect of foreign currency on accrual (76) (146) —Balance at October 31, 2020 $ 45,176 $ 20,774 $ —Employee severance and benefit costs 200 — 28,731Facility closure costs 11,880 — —Severance and benefit payments (19,602) (13,551) (15,053)Facility closure cost payments (11,880) — —Effect of foreign currency on accrual — 164 —Balance at October 30, 2021 $ 25,774 $ 7,387 $ 13,678
Closure of Manufacturing Facilities
The Company recorded special charges of $55.9 million on a cumulative basis through October 30, 2021 as a result of itsdecision to consolidate certain wafer and test facility operations acquired as part of the acquisition of Linear.
ANALOG DEVICES, INC.
NOTES TO CONSOLIDATED FINANCIAL STATEMENTS — (Continued)
70

The special charges include severance and fringe benefit costs, in accordance with the Company's ongoing benefit plan orstatutory requirements at foreign locations and one-time termination benefits for the impacted employees and other exit costs.These one-time termination benefits are being recognized over the future service period required for employees to earn thesebenefits.
During fiscal 2021, the Company ceased production at its Hillview wafer fabrication facility located in Milpitas,California and determined that this facility met the held for sale criteria specified in ASC 360. See Note 2e, Property, Plant andEquipment for amounts reclassified.
During fiscal 2021, the Company completed the sale of its facility and certain equipment in Singapore, which werepreviously classified as held for sale, for approximately $35.7 million, which resulted in a gain of $13.6 million. Concurrentwith the sale, the Company entered into a short-term lease agreement to leaseback a portion of the facility while it completes itstransition of related operations to its facilities in Penang, Malaysia and the Philippines, as well as to its outsourced assemblyand test partners, which is expected to be competed in the fiscal 2022.
Repositioning Actions
The Company recorded special charges of $137.5 million on a cumulative basis through October 30, 2021 as a result oforganizational initiatives to better align its global workforce with its long-term strategic plan. The special charges includeseverance and fringe benefit costs, in accordance with the Company's ongoing benefit plan or statutory requirements at foreignlocations, and the write-off of acquired intellectual property due to the Company's decision to discontinue certain productdevelopment strategies.
Other
The other special charges of $83.4 million recognized during fiscal 2021 included severance and benefit costs as well ascharges recorded from acceleration of equity awards in connection with the termination of a limited number of employees aspart of the integration of the Acquisition.
6. Acquisitions
Maxim Integrated Products, Inc.
On the Acquisition Date, the Company completed its acquisition of all of the voting interests of Maxim, an independentmanufacturer of innovative analog and mixed-signal products and technologies. Under the terms of the agreement pursuant towhich the Company acquired Maxim (Merger Agreement), Maxim stockholders received, for each outstanding share of Maximcommon stock, 0.6300 of a share of the Company's common stock at the closing. The Company believes the combinationcreates an expanded suite of top-performing mixed-signal and power management technology offerings and complements theCompany's legacy offerings. The results of operations of Maxim from the Acquisition Date are included in the Company’sConsolidated Statement of Income, Consolidated Balance Sheet, Consolidated Statement of Cash Flows and ConsolidatedStatement of Shareholders’ Equity for fiscal 2021. The amount of revenue attributable to Maxim included in the Company'sConsolidated Statement of Income for fiscal 2021 was $558.8 million. The amount of Maxim's earnings included in theConsolidated Statement of Income for fiscal 2021 is impracticable to calculate.
The Acquisition Date fair value of the consideration transferred in the Acquisition consisted of the following:
Cash consideration (a) $ 47Issuance of common stock (b) 27,754,161Fair value of partially vested restricted stock and restricted stock unit replacement awards (c) 194,890Total purchase consideration $ 27,949,098
____________________(a) This reflects the cash paid for fractional shares of the Company’s common stock in respect of shares of Maximcommon stock outstanding.
(b) The fair value is based on the issuance of approximately 169.2 million shares of the Company's common stock with aper share value of $164.00 on the Acquisition Date.
(c) In connection with the Acquisition, the Company issued equity awards, consisting of restricted stock and restrictedstock units, to certain Maxim employees in replacement of Maxim equity awards that were cancelled at closing. Thereplacement awards consist of restricted stock and restricted stock unit awards for approximately 3.7 million shares ofthe Company's common stock with a weighted average grant date fair value of $161.63. This amount represents theportion of the fair value of the replacement equity awards associated with services rendered through the AcquisitionDate and has been included as a component of the total purchase consideration.
ANALOG DEVICES, INC.
NOTES TO CONSOLIDATED FINANCIAL STATEMENTS — (Continued)
71

The preliminary fair values of assets acquired and liabilities assumed as of the Acquisition Date are set forth in the tablebelow. The excess of the purchase consideration over the aggregate Acquisition Date value of identifiable net assets acquiredwas recorded as goodwill. Substantially all of the goodwill is not expected to be deductible for tax purposes. These preliminaryAcquisition Date values were generally determined through established and generally accepted valuation techniques and aresubject to change during the measurement period as valuations are finalized. As a result, the Acquisition accounting is notcomplete and additional information that existed at the Acquisition Date may become known to the Company during theremainder of the measurement period. As of the filing date of this Annual Report on Form 10-K, the Company is still in theprocess of valuing Maxim's assets, including inventory, fixed assets, intangible assets, and liabilities, including related incometax accounting.
Cash and cash equivalents $ 2,450,597Accounts receivable 609,245Inventories 858,300Prepaid expenses and other current assets 59,310Property, plant and equipment 759,544Intangible assets (Note 2f) 12,429,100Goodwill (Note 2f) 14,645,076Other long-term assets 80,373Total assets $ 31,891,545Accounts payable 112,828Income taxes payable 137,590Accrued liabilities 590,855Long-term debt 1,072,150Deferred income taxes 1,665,356Other non-current liabilities 363,668Total liabilities $ 3,942,447Total purchase consideration $ 27,949,098
The acquired intangible assets consisted of the following, which are being amortized on a straight-line basis over theirestimated useful lives or on an accelerated method of amortization that is expected to reflect the estimated pattern of economicuse.
Fair Value(in thousands)
Weighted AverageUseful Life(in Years)
Customer relationships $ 5,642,100 14Developed technology 6,425,800 8Backlog 361,200 2Total amortizable intangible assets $ 12,429,100 10
The fair value of the intangible assets was determined through discounted cash flow models. The significant assumptionsused to estimate the value of the intangible assets included annual revenue growth rates, developed technology obsolescencerates, customer attrition rates and discount rates.
The goodwill recognized is attributable to synergies which are expected to enhance and expand the Company’s overallproduct portfolio and opportunities in new and existing markets, future technologies that have yet to be determined andMaxim’s assembled workforce. Future technologies do not meet the criteria for recognition separately from goodwill becausethey are part of future development and growth of the business.
There were no significant contingencies assumed as part of the Acquisition.
The Company recognized $132.9 million of transaction-related costs, including legal, accounting and other related feesthat were expensed in fiscal 2021 and fiscal 2020. These costs are included in the Consolidated Statements of Income in
ANALOG DEVICES, INC.
NOTES TO CONSOLIDATED FINANCIAL STATEMENTS — (Continued)
72

operating expenses within Selling, marketing, general and administrative expenses (SMG&A). The Company may incuradditional transaction-related costs in the future related to the Acquisition that will be expensed as incurred.
The following unaudited pro forma consolidated financial information for the twelve months ended October 30, 2021combines the results of the Company for the year ended October 30, 2021 and the unaudited results of Maxim for thecorresponding period through the Acquisition Date. The following unaudited pro forma consolidated financial information forthe twelve months ended October 31, 2020 combines the results of the Company for fiscal 2020 and the unaudited results ofMaxim for the corresponding period. The unaudited pro forma consolidated financial information assumes that the Acquisition,which closed on August 26, 2021, was completed on November 3, 2019 (the first day of fiscal 2020). The pro formaconsolidated financial information has been calculated after applying the Company’s accounting policies and includesadjustments for amortization expense of acquired intangible assets, fair value adjustments for acquired inventory, property,plant and equipment and long-term debt and compensation expense for ongoing share-based compensation arrangements thatwere replaced in conjunction with the Acquisition, together with the consequential tax effects. For fiscal 2020, non-recurringpro forma adjustments directly attributable to the Acquisition included pre-tax amounts of $602.5 million related to theacquisition accounting effect of inventories acquired and $54.2 million of accelerated stock-based compensation expense,together with the consequential tax effects. Additionally, $309.0 million of pre-tax transaction costs, together with theconsequential tax effects, that were incurred related to the Acquisition are reflected in the pro forma results for fiscal 2020.These pro forma results have been prepared for comparative purposes only and do not purport to be indicative of the operatingresults of the Company that would have been achieved had the Acquisition actually taken place on November 3, 2019. Inaddition, these results are not intended to be a projection of future results and do not reflect events that may occur after theAcquisition, including but not limited to revenue enhancements, cost savings or operating synergies that the combinedCompany may achieve as a result of the Acquisition.
Pro Forma Twelve Months Ended(unaudited)
October 30, 2021 October 31, 2020Revenue $ 9,580,488 $ 7,896,855Net income (loss) $ 1,578,274 $ (144,198)Basic net income (loss) per common share $ 2.94 $ (0.27)Diluted net income (loss) per common share $ 2.91 $ (0.27)
Other Acquisitions
The Company has not provided pro forma results of operations for any other acquisitions completed in fiscal 2021, fiscal2020 or fiscal 2019 herein as they were not material to the Company on either an individual or an aggregate basis. TheCompany included the results of operations of each acquisition in its Consolidated Statements of Income from the closing dateof each acquisition.
7. Other Investments
Other investments consist of interests in venture capital funds and other long-term investments. Investments are accountedfor using the equity method of accounting or cost, less any impairment, plus or minus changes resulting from observable pricechanges in orderly transactions for an identical or similar investment of the same issuer. For equity method investments,realized gains and losses are reflected in nonoperating (income) expense based upon the Company's ownership share of theinvestee's financial results.
ANALOG DEVICES, INC.
NOTES TO CONSOLIDATED FINANCIAL STATEMENTS — (Continued)
73

8. Accrued Liabilities
Accrued liabilities at October 30, 2021 and October 31, 2020 consisted of the following:2021 2020
Distributor price adjustments and other revenue reserves $ 664,198 $ 257,343Accrued compensation and benefits 381,678 203,675Interest rate swap — 214,586Accrued professional fees 152,689 2,077Accrued interest 29,361 56,083Accrued special charges 46,839 65,950Lease liabilities 52,576 39,923Other 150,189 115,996Total accrued liabilities $ 1,477,530 $ 955,633
9. Leases
The Company enters into operating leases which primarily relate to certain facilities. The Company determines whetheran arrangement is or contains a lease based on the unique facts and circumstances present at the inception of an arrangement.Lease assets represent the Company's right to use underlying assets for the lease term, and lease liabilities represent theobligation to make lease payments over the lease term. At lease commencement, leases are evaluated for classification, andassets and liabilities are recognized based on the present value of lease payments over the lease term. The interest rate implicitin lease contracts is typically not readily determinable. As such, the Company utilizes the appropriate incremental borrowingrate, which is the rate incurred to borrow on a collateralized basis over a similar term at an amount equal to the lease paymentsin a similar economic environment. Certain adjustments to the right-of-use asset may be required for items such as initial directcosts paid or incentives received, such as construction allowances from landlords and/or rent abatements subsequent to takingpossession of the leased property. The Company has agreements with lease and non-lease components, which are accounted foras a single lease component. Non-lease components may include real estate taxes, insurance, maintenance, parking and otheroperating costs. If these costs are variable costs they are not included in the measurement of the right-of-use assets and leaseliabilities, but are expensed when the event determining the amount of variable consideration to be paid occurs. The Company’sleases have remaining lease terms of less than one year to approximately twenty-four years, some of which may include optionsto extend the initial term of the lease. These options are included in determining the initial lease term at lease commencementonly if the Company is reasonably certain to exercise the option. Lease costs are recognized on a straight-line basis as leaseexpense over the lease term. For leases with terms of twelve months or less the Company recognizes the related lease paymentsas expense either on a straight-line basis over the lease term or as incurred depending on whether the lease payments are fixedor variable.
The following table presents supplemental balance sheet information related to the Company's operating leases:
October 30, 2021 October 31, 2020
AssetsOperating lease right-of-use assets in Other assets $ 279,542 $ 256,625
LiabilitiesOperating lease liabilities in Accrued liabilities $ 52,576 $ 39,923Operating lease liabilities in Other non-current liabilities $ 295,782 $ 288,492
ANALOG DEVICES, INC.
NOTES TO CONSOLIDATED FINANCIAL STATEMENTS — (Continued)
74

Details of the Company's operating leases are as follows:October 30, 2021 October 31, 2020
Lease expense $ 50,799 $ 45,892Cash paid for amounts included in the measurement of operating lease liabilities
Operating cash flows from operating leases $ 53,724 $ 47,243Lease assets obtained in exchange for new lease liabilities $ 25,946 $ 54,392Weighted average remaining lease term 7.9 years 9.2 yearsWeighted average discount rate 2.9% 3.1%
The following table presents the maturities of the Company's operating lease liabilities as of October 30, 2021:Fiscal year Operating Leases2022 $ 61,8552023 53,9642024 49,4542025 44,0552026 40,004Thereafter 143,670Total future minimum operating lease payments 393,002Less: imputed interest (44,644)Present value of operating lease liabilities $ 348,358
10. Commitments and Contingencies
From time to time, in the ordinary course of the Company’s business, various claims, charges and litigation are assertedor commenced against the Company arising from, or related to, among other things, contractual matters, acquisitions, patents,trademarks, personal injury, environmental matters, product liability, insurance coverage, employment or employment benefits.As to such claims and litigation, the Company can give no assurance that it will prevail. The Company does not believe that anycurrent legal matters will have a material adverse effect on the Company’s financial position, results of operations or cashflows.
In connection with the Acquisition, the Company acquired a supplier commitment of approximately $291.2 million forthe purchase of materials and supplies in advance or with minimum purchase quantities through 2031.
11. Retirement Plans
The Company and its subsidiaries have various savings and retirement plans covering substantially all employees.
Defined Contribution Plans
The Company maintains a defined contribution plan for the benefit of its eligible U.S. employees. This plan provides forCompany contributions of up to 5% of each participant’s total eligible compensation. In addition, the Company contributes anamount equal to each participant’s pre-tax contribution, if any, up to a maximum of 3% of each participant’s total eligiblecompensation. For former Maxim employees, the Company contributes an amount equal to each participant's pre-taxcontribution, if any, up to a maximum of 3% of each participant's eligible compensation and an additional 50% match for thenext 2% of each participant's eligible compensation. The total expense related to the defined contribution plans for all eligibleU.S. employees was $52.1 million in fiscal 2021, $48.7 million in fiscal 2020 and $47.7 million in fiscal 2019.
ANALOG DEVICES, INC.
NOTES TO CONSOLIDATED FINANCIAL STATEMENTS — (Continued)
75

Non-Qualified Deferred Compensation Plan
The Deferred Compensation Plan (DCP) allows certain members of management and other highly-compensatedemployees and non-employee directors to defer receipt of all or any portion of their compensation. The DCP was established toprovide participants with the opportunity to defer receiving all or a portion of their compensation, which includes salary, bonus,commissions and director fees. Under the DCP, the Company provides all participants (other than non-employee directors) withCompany contributions equal to 8% of eligible deferred contributions. The DCP is a non-qualified plan that is maintained in arabbi trust. The fair value of the investments held in the rabbi trust are included within other investments, with the currentportion of the investment included in prepaid expenses and other current assets in the Consolidated Balance Sheets. SeeNote 2j, Fair Value, of the Notes to Consolidated Financial Statements for further information on these investments. Thedeferred compensation obligation represents DCP participant accumulated deferrals and earnings thereon since the inception ofthe DCP net of withdrawals. The deferred compensation obligation is included within other non-current liabilities, with thecurrent portion of the obligation in accrued liabilities in the Consolidated Balance Sheets. The Company’s liability under theDCP is an unsecured general obligation of the Company.
Defined Benefit Pension and Post Retirement Benefit Plans
The Company also has various defined benefit pension and other retirement plans for certain non-U.S. employees that areconsistent with local statutory requirements and practices. The total expense related to the various defined benefit pension,contribution and other retirement plans for certain non-U.S. employees was $45.9 million in fiscal 2021, $37.6 million in fiscal2020 and $35.8 million in fiscal 2019.
The Company’s funding policy for its foreign defined benefit pension plans is consistent with the local requirements ofeach country. The plans’ assets consist primarily of U.S. and non-U.S. equity securities, bonds, property and cash. TheCompany has elected to measure defined benefit plan assets and obligations as of October 31, which is the month-end that isclosest to its fiscal year-ends, which were October 30, 2021 for fiscal 2021 and October 31, 2020 for fiscal 2020.
As a result of the Acquisition, the Company acquired a postretirement plan that provides postretirement medical expensesto certain former employees of a Maxim acquired company and certain former Maxim executives in the U.S.
Components of Net Periodic Benefit Cost
Net annual periodic benefit cost of the Company’s pension and postretirement benefit plans for fiscal 2021, fiscal 2020and fiscal 2019 is presented in the following table:
2021 2020 2019
Service cost $ 9,207 $ 8,587 $ 5,578Interest cost 4,071 3,917 4,079Expected return on plan assets (3,759) (5,296) (5,279)Amortization of prior service cost — — 3Recognized actuarial loss 2,973 2,583 1,000Subtotal $ 12,492 $ 9,791 $ 5,381Curtailment impact — (203) —Settlement impact $ (6) $ — $ —Net periodic benefit cost $ 12,486 $ 9,588 $ 5,381
The service cost component of net periodic benefit cost above is recorded in Cost of sales, Research and development,Selling, marketing, general and administrative expenses within the Consolidated Statements of Income, while the remainingcomponents are recorded to Other, net.
ANALOG DEVICES, INC.
NOTES TO CONSOLIDATED FINANCIAL STATEMENTS — (Continued)
76

Benefit Obligations and Plan Assets
Obligation and asset data of the Company’s pension and postretirement benefit plans at October 30, 2021 andOctober 31, 2020 is presented in the following table:
2021 2020
Change in Benefit ObligationBenefit obligation at beginning of year $ 186,735 $ 169,648Service cost 9,207 8,587Interest cost 4,071 3,917Curtailment — (705)Settlement (885) —Acquisition of Maxim benefit obligation 49,807 —Actuarial (gain) loss (4,005) 2,916Benefits paid (3,983) (2,661)Exchange rate adjustment 1,646 5,033Benefit obligation at end of year $ 242,593 $ 186,735Change in Plan AssetsFair value of plan assets at beginning of year $ 107,505 $ 99,939Actual return on plan assets 10,637 1,366Employer contributions 11,035 6,943Settlements (885) —Benefits paid (3,983) (2,661)Acquisitions 1,728 —Exchange rate adjustment 2,246 1,918Fair value of plan assets at end of year $ 128,283 $ 107,505Reconciliation of Funded StatusFunded status $ (114,310) $ (79,230)Amounts Recognized in the Balance SheetNon-current assets $ 1,709 $ —Current liabilities $ (2,730) $ (973)Non-current liabilities (113,289) (78,257)
Net amount recognized $ (114,310) $ (79,230)
ANALOG DEVICES, INC.
NOTES TO CONSOLIDATED FINANCIAL STATEMENTS — (Continued)
77

2021 2020
Reconciliation of Amounts Recognized in the Statement of Financial PositionPrior service credit (38) (44)Net loss (43,662) (55,942)Accumulated other comprehensive loss (43,700) (55,986)Accumulated contributions less than net periodic benefit cost (70,610) (23,244)
Net amount recognized $ (114,310) $ (79,230)Changes Recognized in Other Comprehensive Income (Loss)Changes in plan assets and benefit obligations recognized in other comprehensive income(loss)Net gain/loss arising during the year $ (10,884) $ 6,342Effect of exchange rates on amounts included in AOCI 1,565 1,305Amounts recognized as a component of net periodic benefit costAmortization or settlement recognition of net loss (2,967) (2,583)
Total recognized in other comprehensive gain/loss $ (12,286) $ 5,064Total recognized in net periodic cost and other comprehensive loss $ 200 $ 14,652
Estimated amounts that will be amortized from AOCI over the next fiscal yearNet loss $ (2,413) $ (2,845)
The accumulated benefit obligation for the Company’s pension and postretirement benefit plans was $178.2 million and$155.5 million at October 30, 2021 and October 31, 2020, respectively.
Information relating to the Company’s pension and postretirement benefit plans with projected benefit obligations inexcess of plan assets and accumulated benefit obligations in excess of plan assets at October 30, 2021 and October 31, 2020 ispresented in the following table:
2021 2020
Plans with projected benefit obligations in excess of plan assets:Projected benefit obligation $ 161,803 $ 186,735Fair value of plan assets $ 45,784 $ 107,505Plans with accumulated benefit obligations in excess of plan assets:Projected benefit obligation $ 94,038 $ 141,982Accumulated benefit obligation $ 77,337 $ 132,517Fair value of plan assets $ 3,544 $ 69,250
Assumptions
The range of assumptions used for the Company’s pension and postretirement benefit plans reflects the differenteconomic environments within the various countries as well as the differences in the attributes of the participants.
The projected benefit obligation was determined using the following weighted-average assumptions:2021 2020
Discount rate 2.77 % 2.15 %Rate of increase in compensation levels 3.70 % 3.19 %
Net annual periodic benefit cost was determined using the following weighted average assumptions:2021 2020
Discount rate 2.15 % 2.45 %Expected long-term return on plan assets 3.32 % 5.22 %Rate of increase in compensation levels 3.19 % 3.38 %
ANALOG DEVICES, INC.
NOTES TO CONSOLIDATED FINANCIAL STATEMENTS — (Continued)
78
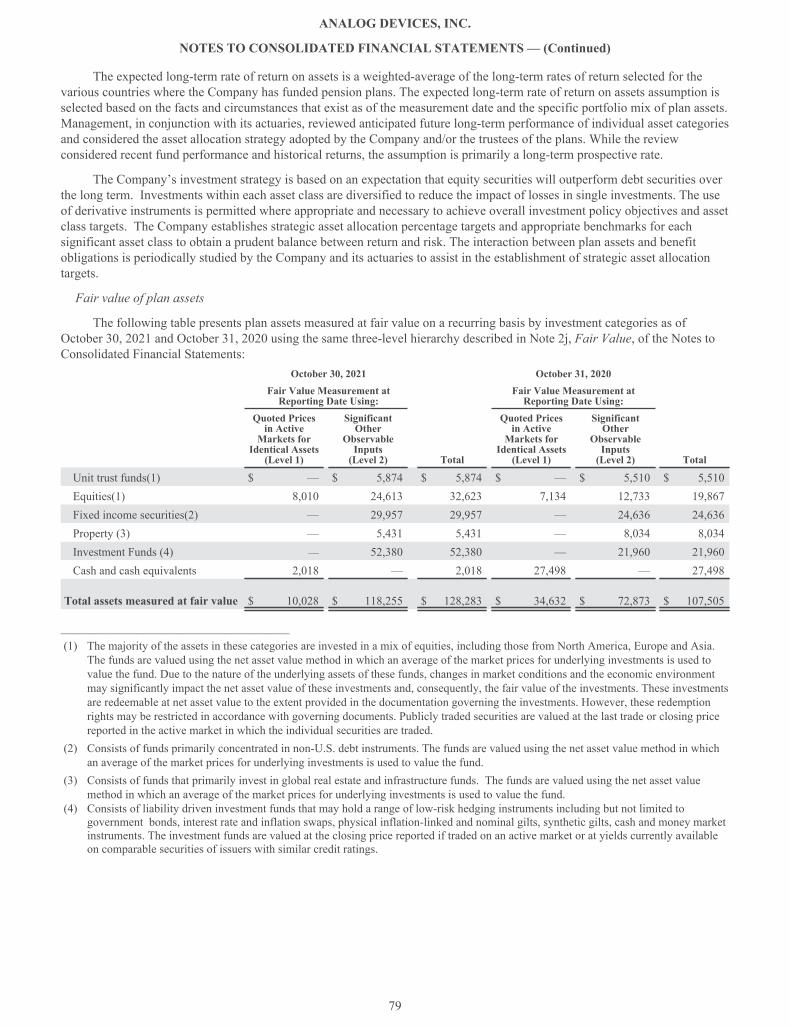
The expected long-term rate of return on assets is a weighted-average of the long-term rates of return selected for thevarious countries where the Company has funded pension plans. The expected long-term rate of return on assets assumption isselected based on the facts and circumstances that exist as of the measurement date and the specific portfolio mix of plan assets.Management, in conjunction with its actuaries, reviewed anticipated future long-term performance of individual asset categoriesand considered the asset allocation strategy adopted by the Company and/or the trustees of the plans. While the reviewconsidered recent fund performance and historical returns, the assumption is primarily a long-term prospective rate.
The Company’s investment strategy is based on an expectation that equity securities will outperform debt securities overthe long term. Investments within each asset class are diversified to reduce the impact of losses in single investments. The useof derivative instruments is permitted where appropriate and necessary to achieve overall investment policy objectives and assetclass targets. The Company establishes strategic asset allocation percentage targets and appropriate benchmarks for eachsignificant asset class to obtain a prudent balance between return and risk. The interaction between plan assets and benefitobligations is periodically studied by the Company and its actuaries to assist in the establishment of strategic asset allocationtargets.
Fair value of plan assets
The following table presents plan assets measured at fair value on a recurring basis by investment categories as ofOctober 30, 2021 and October 31, 2020 using the same three-level hierarchy described in Note 2j, Fair Value, of the Notes toConsolidated Financial Statements:
October 30, 2021 October 31, 2020Fair Value Measurement atReporting Date Using:
Fair Value Measurement atReporting Date Using:
Quoted Pricesin ActiveMarkets forIdentical Assets(Level 1)
SignificantOther
ObservableInputs(Level 2) Total
Quoted Pricesin ActiveMarkets forIdentical Assets(Level 1)
SignificantOther
ObservableInputs(Level 2) Total
Unit trust funds(1) $ — $ 5,874 $ 5,874 $ — $ 5,510 $ 5,510Equities(1) 8,010 24,613 32,623 7,134 12,733 19,867Fixed income securities(2) — 29,957 29,957 — 24,636 24,636Property (3) — 5,431 5,431 — 8,034 8,034Investment Funds (4) — 52,380 52,380 — 21,960 21,960Cash and cash equivalents 2,018 — 2,018 27,498 — 27,498
Total assets measured at fair value $ 10,028 $ 118,255 $ 128,283 $ 34,632 $ 72,873 $ 107,505
_______________________________________(1) The majority of the assets in these categories are invested in a mix of equities, including those from North America, Europe and Asia.
The funds are valued using the net asset value method in which an average of the market prices for underlying investments is used tovalue the fund. Due to the nature of the underlying assets of these funds, changes in market conditions and the economic environmentmay significantly impact the net asset value of these investments and, consequently, the fair value of the investments. These investmentsare redeemable at net asset value to the extent provided in the documentation governing the investments. However, these redemptionrights may be restricted in accordance with governing documents. Publicly traded securities are valued at the last trade or closing pricereported in the active market in which the individual securities are traded.
(2) Consists of funds primarily concentrated in non-U.S. debt instruments. The funds are valued using the net asset value method in whichan average of the market prices for underlying investments is used to value the fund.
(3) Consists of funds that primarily invest in global real estate and infrastructure funds. The funds are valued using the net asset valuemethod in which an average of the market prices for underlying investments is used to value the fund.
(4) Consists of liability driven investment funds that may hold a range of low-risk hedging instruments including but not limited togovernment bonds, interest rate and inflation swaps, physical inflation-linked and nominal gilts, synthetic gilts, cash and money marketinstruments. The investment funds are valued at the closing price reported if traded on an active market or at yields currently availableon comparable securities of issuers with similar credit ratings.
ANALOG DEVICES, INC.
NOTES TO CONSOLIDATED FINANCIAL STATEMENTS — (Continued)
79
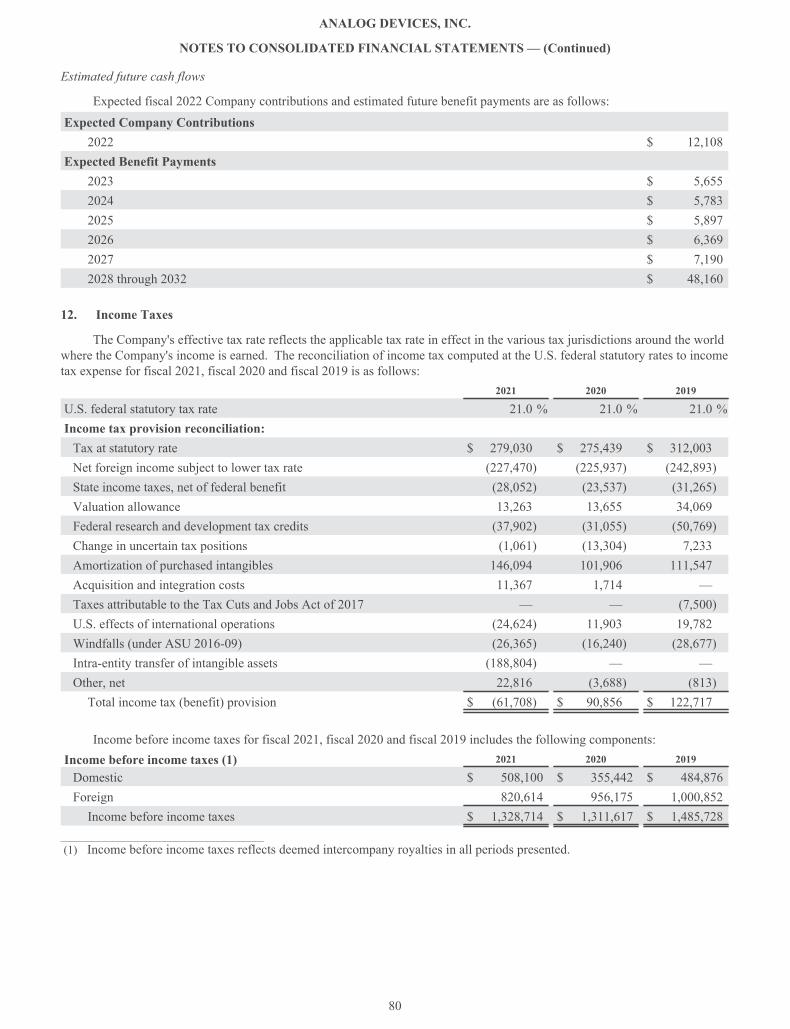
Estimated future cash flows
Expected fiscal 2022 Company contributions and estimated future benefit payments are as follows:Expected Company Contributions
2022 $ 12,108Expected Benefit Payments
2023 $ 5,6552024 $ 5,7832025 $ 5,8972026 $ 6,3692027 $ 7,1902028 through 2032 $ 48,160
12. Income Taxes
The Company's effective tax rate reflects the applicable tax rate in effect in the various tax jurisdictions around the worldwhere the Company's income is earned. The reconciliation of income tax computed at the U.S. federal statutory rates to incometax expense for fiscal 2021, fiscal 2020 and fiscal 2019 is as follows:
2021 2020 2019
U.S. federal statutory tax rate 21.0 % 21.0 % 21.0 %Income tax provision reconciliation:Tax at statutory rate $ 279,030 $ 275,439 $ 312,003Net foreign income subject to lower tax rate (227,470) (225,937) (242,893)State income taxes, net of federal benefit (28,052) (23,537) (31,265)Valuation allowance 13,263 13,655 34,069Federal research and development tax credits (37,902) (31,055) (50,769)Change in uncertain tax positions (1,061) (13,304) 7,233Amortization of purchased intangibles 146,094 101,906 111,547Acquisition and integration costs 11,367 1,714 —Taxes attributable to the Tax Cuts and Jobs Act of 2017 — — (7,500)U.S. effects of international operations (24,624) 11,903 19,782Windfalls (under ASU 2016-09) (26,365) (16,240) (28,677)Intra-entity transfer of intangible assets (188,804) — —Other, net 22,816 (3,688) (813)Total income tax (benefit) provision $ (61,708) $ 90,856 $ 122,717
Income before income taxes for fiscal 2021, fiscal 2020 and fiscal 2019 includes the following components:Income before income taxes (1) 2021 2020 2019
Domestic $ 508,100 $ 355,442 $ 484,876Foreign 820,614 956,175 1,000,852Income before income taxes $ 1,328,714 $ 1,311,617 $ 1,485,728
_______________________________________(1) Income before income taxes reflects deemed intercompany royalties in all periods presented.
ANALOG DEVICES, INC.
NOTES TO CONSOLIDATED FINANCIAL STATEMENTS — (Continued)
80

The components of the (benefit from) provision for income taxes for fiscal 2021, fiscal 2020 and fiscal 2019 are asfollows:
2021 2020 2019
Current:Federal tax $ 134,652 $ 64,876 $ 74,049State 7,772 4,882 2Foreign 202,790 135,046 139,919Total current $ 345,214 $ 204,804 $ 213,970
Deferred:Federal $ 515,541 $ (159,229) $ (158,472)State (12,444) (12,684) (3,627)Foreign (910,019) 57,965 70,846Total deferred $ (406,922) $ (113,948) $ (91,253)(Benefit from) provision for income tax $ (61,708) $ 90,856 $ 122,717
U.S. Tax Legislation subjects a U.S. shareholder to tax on global intangible low-taxed income (GILTI). Under U.S.GAAP, an accounting policy election can be made to either treat taxes due on the GILTI inclusion as a current period expenseor to recognize deferred taxes for temporary basis differences expected to reverse as GILTI in future years. The Companyelected the deferral method and recorded the corresponding GILTI deferred tax assets and liabilities on its ConsolidatedBalance Sheets.
The Company carries other outside basis differences in its subsidiaries, primarily arising from acquisition accountingadjustments and certain undistributed earnings that are considered indefinitely reinvested. As of October 30, 2021, theCompany has not recognized deferred income tax on $33.6 billion of outside basis differences because of its intent and abilityto indefinitely reinvest these basis differences. These basis differences could be reversed through a sale of the subsidiaries orthe receipt of dividends from the subsidiaries, as well as various other events, none of which are considered probable at thistime. Determination of the amount of unrecognized deferred income tax liability related to these outside basis differences is notpracticable.
The Company adopted ASU 2016-16, Intra-Entity Transfers of Assets Other Than Inventory (ASU 2016-16) in the firstquarter of fiscal 2019 using the modified retrospective method with a cumulative-effect adjustment directly to retained earnings.The adoption of ASU 2016-16 resulted in a net cumulative-effect adjustment that resulted in an increase in retained earnings of$331.0 million, by recording new deferred tax assets from intra-entity transfers involving assets other than inventory, partiallyoffset by a U.S. deferred tax liability related to GILTI. Adoption of the standard resulted in an increase in long-term deferredtax assets of $1.7 billion and an increase in long-term deferred tax liabilities of $1.3 billion.
ANALOG DEVICES, INC.
NOTES TO CONSOLIDATED FINANCIAL STATEMENTS — (Continued)
81
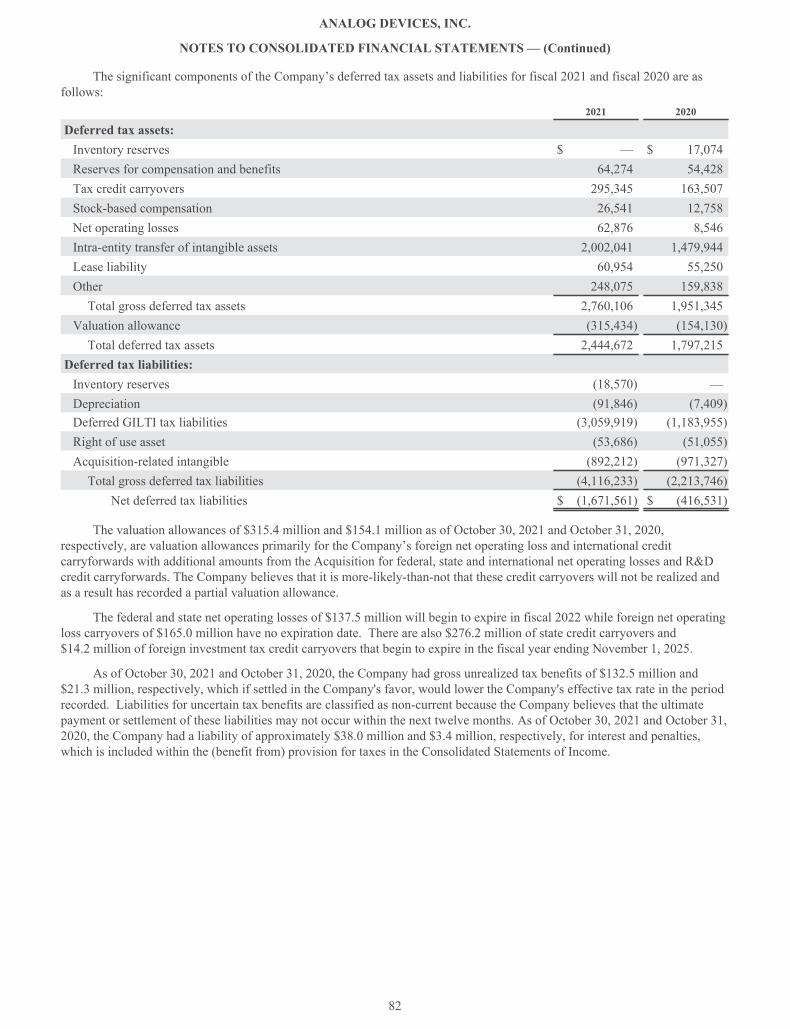
The significant components of the Company’s deferred tax assets and liabilities for fiscal 2021 and fiscal 2020 are asfollows:
2021 2020
Deferred tax assets:Inventory reserves $ — $ 17,074Reserves for compensation and benefits 64,274 54,428Tax credit carryovers 295,345 163,507Stock-based compensation 26,541 12,758Net operating losses 62,876 8,546Intra-entity transfer of intangible assets 2,002,041 1,479,944Lease liability 60,954 55,250Other 248,075 159,838Total gross deferred tax assets 2,760,106 1,951,345
Valuation allowance (315,434) (154,130)Total deferred tax assets 2,444,672 1,797,215
Deferred tax liabilities:Inventory reserves (18,570) —Depreciation (91,846) (7,409)Deferred GILTI tax liabilities (3,059,919) (1,183,955)Right of use asset (53,686) (51,055)Acquisition-related intangible (892,212) (971,327)Total gross deferred tax liabilities (4,116,233) (2,213,746)
Net deferred tax liabilities $ (1,671,561) $ (416,531)
The valuation allowances of $315.4 million and $154.1 million as of October 30, 2021 and October 31, 2020,respectively, are valuation allowances primarily for the Company’s foreign net operating loss and international creditcarryforwards with additional amounts from the Acquisition for federal, state and international net operating losses and R&Dcredit carryforwards. The Company believes that it is more-likely-than-not that these credit carryovers will not be realized andas a result has recorded a partial valuation allowance.
The federal and state net operating losses of $137.5 million will begin to expire in fiscal 2022 while foreign net operatingloss carryovers of $165.0 million have no expiration date. There are also $276.2 million of state credit carryovers and$14.2 million of foreign investment tax credit carryovers that begin to expire in the fiscal year ending November 1, 2025.
As of October 30, 2021 and October 31, 2020, the Company had gross unrealized tax benefits of $132.5 million and$21.3 million, respectively, which if settled in the Company's favor, would lower the Company's effective tax rate in the periodrecorded. Liabilities for uncertain tax benefits are classified as non-current because the Company believes that the ultimatepayment or settlement of these liabilities may not occur within the next twelve months. As of October 30, 2021 and October 31,2020, the Company had a liability of approximately $38.0 million and $3.4 million, respectively, for interest and penalties,which is included within the (benefit from) provision for taxes in the Consolidated Statements of Income.
ANALOG DEVICES, INC.
NOTES TO CONSOLIDATED FINANCIAL STATEMENTS — (Continued)
82
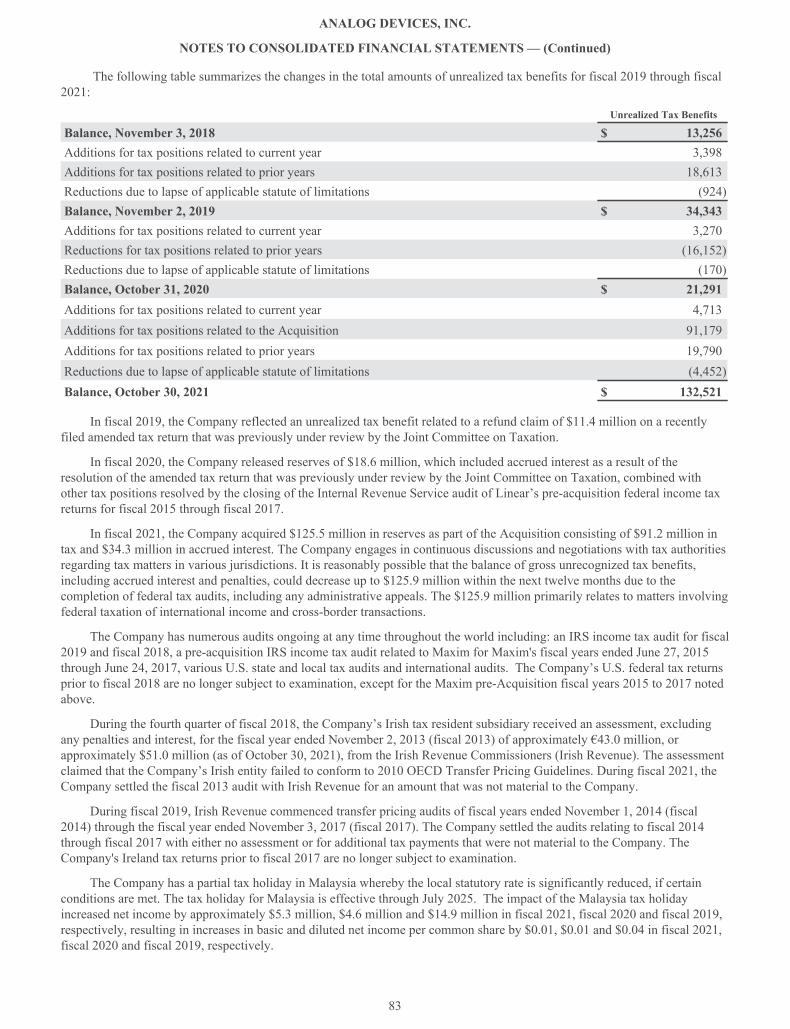
The following table summarizes the changes in the total amounts of unrealized tax benefits for fiscal 2019 through fiscal2021:
Unrealized Tax Benefits
Balance, November 3, 2018 $ 13,256Additions for tax positions related to current year 3,398Additions for tax positions related to prior years 18,613Reductions due to lapse of applicable statute of limitations (924)Balance, November 2, 2019 $ 34,343Additions for tax positions related to current year 3,270Reductions for tax positions related to prior years (16,152)Reductions due to lapse of applicable statute of limitations (170)Balance, October 31, 2020 $ 21,291Additions for tax positions related to current year 4,713Additions for tax positions related to the Acquisition 91,179Additions for tax positions related to prior years 19,790Reductions due to lapse of applicable statute of limitations (4,452)Balance, October 30, 2021 $ 132,521
In fiscal 2019, the Company reflected an unrealized tax benefit related to a refund claim of $11.4 million on a recentlyfiled amended tax return that was previously under review by the Joint Committee on Taxation.
In fiscal 2020, the Company released reserves of $18.6 million, which included accrued interest as a result of theresolution of the amended tax return that was previously under review by the Joint Committee on Taxation, combined withother tax positions resolved by the closing of the Internal Revenue Service audit of Linear’s pre-acquisition federal income taxreturns for fiscal 2015 through fiscal 2017.
In fiscal 2021, the Company acquired $125.5 million in reserves as part of the Acquisition consisting of $91.2 million intax and $34.3 million in accrued interest. The Company engages in continuous discussions and negotiations with tax authoritiesregarding tax matters in various jurisdictions. It is reasonably possible that the balance of gross unrecognized tax benefits,including accrued interest and penalties, could decrease up to $125.9 million within the next twelve months due to thecompletion of federal tax audits, including any administrative appeals. The $125.9 million primarily relates to matters involvingfederal taxation of international income and cross-border transactions.
The Company has numerous audits ongoing at any time throughout the world including: an IRS income tax audit for fiscal2019 and fiscal 2018, a pre-acquisition IRS income tax audit related to Maxim for Maxim's fiscal years ended June 27, 2015through June 24, 2017, various U.S. state and local tax audits and international audits. The Company’s U.S. federal tax returnsprior to fiscal 2018 are no longer subject to examination, except for the Maxim pre-Acquisition fiscal years 2015 to 2017 notedabove.
During the fourth quarter of fiscal 2018, the Company’s Irish tax resident subsidiary received an assessment, excludingany penalties and interest, for the fiscal year ended November 2, 2013 (fiscal 2013) of approximately €43.0 million, orapproximately $51.0 million (as of October 30, 2021), from the Irish Revenue Commissioners (Irish Revenue). The assessmentclaimed that the Company’s Irish entity failed to conform to 2010 OECD Transfer Pricing Guidelines. During fiscal 2021, theCompany settled the fiscal 2013 audit with Irish Revenue for an amount that was not material to the Company.
During fiscal 2019, Irish Revenue commenced transfer pricing audits of fiscal years ended November 1, 2014 (fiscal2014) through the fiscal year ended November 3, 2017 (fiscal 2017). The Company settled the audits relating to fiscal 2014through fiscal 2017 with either no assessment or for additional tax payments that were not material to the Company. TheCompany's Ireland tax returns prior to fiscal 2017 are no longer subject to examination.
The Company has a partial tax holiday in Malaysia whereby the local statutory rate is significantly reduced, if certainconditions are met. The tax holiday for Malaysia is effective through July 2025. The impact of the Malaysia tax holidayincreased net income by approximately $5.3 million, $4.6 million and $14.9 million in fiscal 2021, fiscal 2020 and fiscal 2019,respectively, resulting in increases in basic and diluted net income per common share by $0.01, $0.01 and $0.04 in fiscal 2021,fiscal 2020 and fiscal 2019, respectively.
ANALOG DEVICES, INC.
NOTES TO CONSOLIDATED FINANCIAL STATEMENTS — (Continued)
83

13. Revolving Credit Facility
On June 23, 2021, the Company entered into a Third Amended and Restated Credit Agreement (Revolving CreditAgreement) with Bank of America, N.A. as administrative agent and the other banks identified therein as lenders, whichamended and restated its Second Amended and Restated Credit Agreement dated as of June 28, 2019. The Revolving CreditAgreement provides for a five year unsecured revolving credit facility in an aggregate principal amount not to exceed$2.5 billion (subject to certain terms and conditions). Prior to the Acquisition, the aggregate principal amount which wasavailable under the Revolving Credit Agreement was $1.25 billion. In September 2021, the Company borrowed $400.0 millionunder this revolving credit facility and utilized the proceeds for the repayment of existing indebtedness and working capitalrequirements. The Company repaid the $400.0 million plus interest in October 2021. As of October 30, 2021, the Companyhad no outstanding borrowings under this revolving credit facility but may borrow in the future and use the proceeds forrepayment of existing indebtedness, stock repurchases, acquisitions, capital expenditures, working capital and other lawfulcorporate purposes.
Revolving loans under the Revolving Credit Agreement can be Eurocurrency Rate Loans or Base Rate Loans (each asdefined in the Revolving Credit Agreement) at the Company's option. Each Eurocurrency Rate Loan will bear interest at a rateper annum equal to the applicable Eurocurrency Rate plus a margin based on the Company's Debt Ratings (as defined in theRevolving Credit Agreement) from time to time of between 0.690% and 1.175%. Each Base Rate Loan will bear interest at arate per annum equal to the Base Rate plus a margin based on the Company's debt ratings from time to time of between 0.00%and 0.175%. In addition, the Company has agreed to pay a facility fee based on the Company's Debt Ratings from time to timeof between 0.060% and 0.200% multiplied by the actual daily amount of the Commitments (as defined in the Revolving CreditAgreement) in effect. The Revolving Credit Agreement also contains a sustainability-linked pricing component which providesfor interest rate and facility fee reductions or increases based on the Company meeting or missing targets related toenvironmental sustainability, specifically greenhouse gas emissions and renewable energy usage. The Revolving CreditAgreement includes a multicurrency borrowing feature for certain specified foreign currencies. The Company will guaranteethe obligations of each subsidiary that is named a Designated Borrower under the Revolving Credit Agreement.
The Revolving Credit Agreement contains customary representations and warranties, and affirmative and negativecovenants and events of default applicable to the Company and its subsidiaries. As of October 30, 2021, the Company was incompliance with these covenants.
14. Debt
On June 3, 2013, the Company issued $500.0 million aggregate principal amount of 2.875% senior unsecured notes dueJune 1, 2023 (the June 2023 Notes) with semi-annual fixed interest payments due on June 1 and December 1 of each year,commencing December 1, 2013. Prior to issuing the June 2023 Notes, on April 24, 2013, the Company entered into a treasuryrate lock agreement with Bank of America. This agreement allowed the Company to lock a 10-year US Treasury rate of1.7845% through June 14, 2013 for its anticipated issuance of the June 2023 Notes. The net proceeds of the offering were$493.9 million, after discounts and issuance costs. Debt discounts and issuance costs were amortized through interest expenseover the term of the June 2023 Notes. On October 5, 2021 and October 7, 2021, $133.7 million, or 26.73%, of the$500.0 million aggregate principal amount of the June 2023 Notes at a price of $1,041.39 for each $1,000 principal amount ofJune 2023 Notes were tendered for redemption. On October 20, 2021, the remaining June 2023 Notes were redeemed for cashat a redemption price equal to $1,038.82 for each $1,000 principal amount of June 2023 Notes. In connection with the tenderand subsequent redemption of the June 2023 Notes, the Company recognized a loss on extinguishment of $19.8 million.
On December 14, 2015, the Company issued $850.0 million aggregate principal amount of 3.9% senior unsecured notesdue December 15, 2025 (the 2025 Notes) and $400.0 million aggregate principal amount of 5.3% senior unsecured notes dueDecember 15, 2045 (the 2045 Notes) with semi-annual fixed interest payments due on June 15 and December 15 of each year,commencing June 15, 2016. The net proceeds of the offering were $1.2 billion, after discounts and issuance costs. Debtdiscounts and issuance costs will be amortized through interest expense over the term of the 2025 Notes and 2045 Notes. Theindenture governing the 2025 Notes and 2045 Notes contains covenants that may limit the Company's ability to: incur, create,assume or guarantee any debt for borrowed money secured by a lien upon a principal property; enter into sale and lease-backtransactions with respect to a principal property; and consolidate with or merge into, or transfer or lease all or substantially allof its assets to, any other party. As of October 30, 2021, the Company was compliant with these covenants. The 2025 Notes and2045 Notes are subordinated to any future secured debt and to the other liabilities of the Company's subsidiaries. On October 5,2021 and October 7, 2021, $325.5 million, or 38.3%, of the $850.0 million aggregate principal amount of the 2025 Notes at aprice of $1,112.13 for each $1,000 principal amount of 2025 Notes, and $67.4 million, or 16.85%, of the $400.0 millionaggregate principal amount of the 2045 Notes at a price of $1,400.67 for each $1,000 principal amount of 2045 Notes, weretendered for redemption. On October 20, 2021, the remaining 2025 Notes were redeemed for cash at a redemption price equal
ANALOG DEVICES, INC.
NOTES TO CONSOLIDATED FINANCIAL STATEMENTS — (Continued)
84
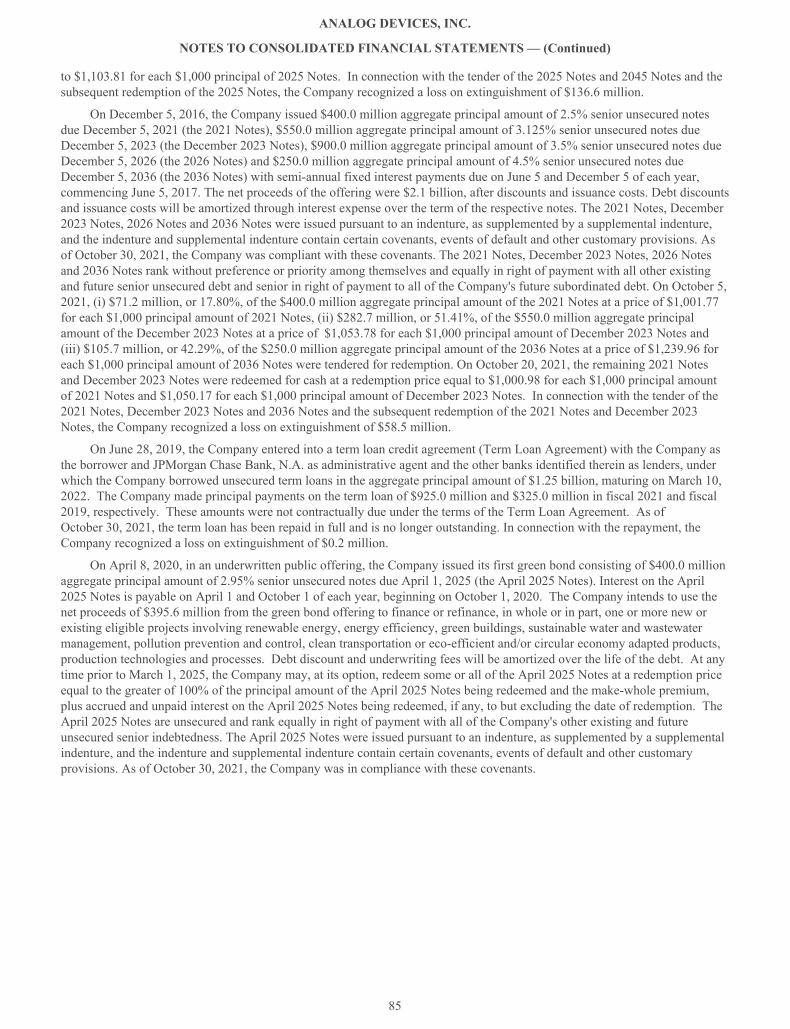
to $1,103.81 for each $1,000 principal of 2025 Notes. In connection with the tender of the 2025 Notes and 2045 Notes and thesubsequent redemption of the 2025 Notes, the Company recognized a loss on extinguishment of $136.6 million.
On December 5, 2016, the Company issued $400.0 million aggregate principal amount of 2.5% senior unsecured notesdue December 5, 2021 (the 2021 Notes), $550.0 million aggregate principal amount of 3.125% senior unsecured notes dueDecember 5, 2023 (the December 2023 Notes), $900.0 million aggregate principal amount of 3.5% senior unsecured notes dueDecember 5, 2026 (the 2026 Notes) and $250.0 million aggregate principal amount of 4.5% senior unsecured notes dueDecember 5, 2036 (the 2036 Notes) with semi-annual fixed interest payments due on June 5 and December 5 of each year,commencing June 5, 2017. The net proceeds of the offering were $2.1 billion, after discounts and issuance costs. Debt discountsand issuance costs will be amortized through interest expense over the term of the respective notes. The 2021 Notes, December2023 Notes, 2026 Notes and 2036 Notes were issued pursuant to an indenture, as supplemented by a supplemental indenture,and the indenture and supplemental indenture contain certain covenants, events of default and other customary provisions. Asof October 30, 2021, the Company was compliant with these covenants. The 2021 Notes, December 2023 Notes, 2026 Notesand 2036 Notes rank without preference or priority among themselves and equally in right of payment with all other existingand future senior unsecured debt and senior in right of payment to all of the Company's future subordinated debt. On October 5,2021, (i) $71.2 million, or 17.80%, of the $400.0 million aggregate principal amount of the 2021 Notes at a price of $1,001.77for each $1,000 principal amount of 2021 Notes, (ii) $282.7 million, or 51.41%, of the $550.0 million aggregate principalamount of the December 2023 Notes at a price of $1,053.78 for each $1,000 principal amount of December 2023 Notes and(iii) $105.7 million, or 42.29%, of the $250.0 million aggregate principal amount of the 2036 Notes at a price of $1,239.96 foreach $1,000 principal amount of 2036 Notes were tendered for redemption. On October 20, 2021, the remaining 2021 Notesand December 2023 Notes were redeemed for cash at a redemption price equal to $1,000.98 for each $1,000 principal amountof 2021 Notes and $1,050.17 for each $1,000 principal amount of December 2023 Notes. In connection with the tender of the2021 Notes, December 2023 Notes and 2036 Notes and the subsequent redemption of the 2021 Notes and December 2023Notes, the Company recognized a loss on extinguishment of $58.5 million.
On June 28, 2019, the Company entered into a term loan credit agreement (Term Loan Agreement) with the Company asthe borrower and JPMorgan Chase Bank, N.A. as administrative agent and the other banks identified therein as lenders, underwhich the Company borrowed unsecured term loans in the aggregate principal amount of $1.25 billion, maturing on March 10,2022. The Company made principal payments on the term loan of $925.0 million and $325.0 million in fiscal 2021 and fiscal2019, respectively. These amounts were not contractually due under the terms of the Term Loan Agreement. As ofOctober 30, 2021, the term loan has been repaid in full and is no longer outstanding. In connection with the repayment, theCompany recognized a loss on extinguishment of $0.2 million.
On April 8, 2020, in an underwritten public offering, the Company issued its first green bond consisting of $400.0 millionaggregate principal amount of 2.95% senior unsecured notes due April 1, 2025 (the April 2025 Notes). Interest on the April2025 Notes is payable on April 1 and October 1 of each year, beginning on October 1, 2020. The Company intends to use thenet proceeds of $395.6 million from the green bond offering to finance or refinance, in whole or in part, one or more new orexisting eligible projects involving renewable energy, energy efficiency, green buildings, sustainable water and wastewatermanagement, pollution prevention and control, clean transportation or eco-efficient and/or circular economy adapted products,production technologies and processes. Debt discount and underwriting fees will be amortized over the life of the debt. At anytime prior to March 1, 2025, the Company may, at its option, redeem some or all of the April 2025 Notes at a redemption priceequal to the greater of 100% of the principal amount of the April 2025 Notes being redeemed and the make-whole premium,plus accrued and unpaid interest on the April 2025 Notes being redeemed, if any, to but excluding the date of redemption. TheApril 2025 Notes are unsecured and rank equally in right of payment with all of the Company's other existing and futureunsecured senior indebtedness. The April 2025 Notes were issued pursuant to an indenture, as supplemented by a supplementalindenture, and the indenture and supplemental indenture contain certain covenants, events of default and other customaryprovisions. As of October 30, 2021, the Company was in compliance with these covenants.
ANALOG DEVICES, INC.
NOTES TO CONSOLIDATED FINANCIAL STATEMENTS — (Continued)
85

In conjunction with the Acquisition, the Company recognized $500.0 million aggregate principal amount of Maxim’s3.375% senior unsecured and unsubordinated notes due March 15, 2023 (the Maxim March 2023 Notes) and $500.0 millionaggregate principal amount of Maxim’s 3.45% senior unsecured and unsubordinated notes due June 15, 2027 (the Maxim June2027 Notes), which were recognized at fair value as of the Acquisition Date. The difference between the fair value at theAcquisition Date and the principal outstanding for the Maxim March 2023 Notes and Maxim June 2027 Notes will beamortized through interest expense over the term of the underlying debt. The amortization of the fair value adjustment reducedinterest expense by $3.8 million for the year ended October 30, 2021. Semi-annual fixed interest payments on the MaximMarch 2023 Notes are due on March 15 and September 15 of each year. Semi-annual fixed interest payments on the MaximJune 2027 Notes are due on June 15 and December 15 of each year, beginning on December 15, 2017. The Maxim March 2023Notes and Maxim June 2027 Notes were issued pursuant to an indenture, and the indenture contains certain covenants, eventsof default and other customary provisions. As of October 30, 2021, Maxim was in compliance with these covenants. OnOctober 5, 2021, Maxim gave notice that it would redeem the Maxim March 2023 Notes, and, subsequent to October 30, 2021,the Maxim March 2023 Notes were redeemed for cash. Accordingly, the Company classified the Maxim March 2023 Notes as acurrent liability as of October 30, 2021. See Note 15, Subsequent events, of these Notes to Consolidated Financial Statementsfor additional information on the redemption of the Maxim March 2023 Notes.
On September 28, 2021, in an underwritten public offering, the Company issued $500.0 million aggregate principalamount of floating rate senior notes due October 1, 2024 (the Floating Rate Notes), $750.0 million aggregate principal amountof 1.7% sustainability-linked senior notes due October 1, 2028 (the Sustainability-Linked Senior Notes), $1.0 billion aggregateprincipal amount of 2.1% senior notes due October 1, 2031 (the 2031 Notes), $750.0 million aggregate principal amount of2.8% senior notes due October 1, 2041 (the 2041 Notes), and $1.0 billion aggregate principal amount of 2.95% senior notes dueOctober 1, 2051 (the 2051 Notes, and, together with the Floating Rate Notes, the Sustainability-Linked Senior Notes, the 2031Notes and the 2041 Notes, the Notes). The Floating Rate Notes bear interest at a floating annual rate equal to a benchmark rate,which initially is Compounded SOFR (as defined in the Supplemental Indenture) plus 25 basis points. As of October 30, 2021,the interest rate on the Floating Rate Notes was 0.3% per annum. Interest payments on the Floating Rate Notes are due onJanuary 1, April 1, July 1 and October 1 of each year, beginning on January 1, 2022. The Sustainability-Linked Senior Notesinitially bear interest at a rate of 1.7% per annum and are subject to an increase of an additional 30 basis points from April 1,2026 to the maturity date unless the Sustainability Performance Target (as defined in the Note) has been satisfied. Semi-annualfixed interest payments on the Sustainability-Linked Senior Notes, the 2031 Notes, the 2041 Notes and the 2051 Notes are dueon April 1 and October 1 of each year, beginning on April 1, 2022.
At any time prior to August 1, 2028 in the case of the Sustainability-Linked Senior Notes, July 1, 2031 in the case of the2031 Notes, April 1, 2041 in the case of the 2041 Notes and April 1, 2051 in the case of the 2051 Notes (each, a Par Call Date),the Company may, at its option, redeem some or all of the applicable series of Notes at a redemption price equal to the greaterof (i) 100% of the principal amount of such series of Notes being redeemed and (ii) the make-whole redemption price (asdescribed in the Supplemental Indenture). On and after the applicable Par Call Date, the Company may, at its option, redeemsome or all of the applicable series of Notes at a redemption price equal to 100% of the principal amount of the Notes beingredeemed. In each case, the Company will also pay the accrued and unpaid interest on the Notes being redeemed to, butexcluding, the date of redemption. The Company may not redeem the Floating Rate Notes prior to their maturity. The Notes areunsecured and rank equally in right of payment with all of the Company’s other existing and future unsecured seniorindebtedness. The net proceeds of the offering were $3.9 billion, after discounts and issuance costs, and a portion of theproceeds were used to pay the tender and redemption prices for, and accrued and unpaid interest on, the tender offers andredemptions described above. Debt discounts and issuance costs will be amortized through interest expense over the term of therespective Notes. The Notes were issued pursuant to an indenture, as supplemented by a supplemental indenture, and theindenture and supplemental indenture contain certain covenants, events of default and other customary provisions. As ofOctober 30, 2021, the Company was in compliance with these covenants.
ANALOG DEVICES, INC.
NOTES TO CONSOLIDATED FINANCIAL STATEMENTS — (Continued)
86

The Company’s debt consisted of the following as of October 30, 2021 and October 31, 2020:October 30, 2021 October 31, 2020
Principal
Unamortizeddiscounts, debtissuance costs and
fair valueadjustments Principal
Unamortizeddiscount and debtissuance costs
3-Year term loan, due March 2022 $ — $ — $ 925,000 $ —2021 Notes, due December 2021 — — 400,000 1,0092023 Notes, due June 2023 — — 500,000 1,5892023 Notes, due December 2023 — — 550,000 2,7412024 Notes, due October 2024 500,000 3,091 — —2025 Notes, due April 2025 400,000 3,029 400,000 3,9162025 Notes, due December 2025 — — 850,000 4,5042026 Notes, due December 2026 900,000 6,534 900,000 7,813Maxim 2027 Notes, due June 2027 500,000 (51,646) — —2028 Notes, due October 2028 750,000 10,419 — —2031 Notes, due October 2031 1,000,000 13,956 — —2036 Notes, due December 2036 144,278 1,814 250,000 3,3752041 Notes, due October 2041 750,000 13,690 — —2045 Notes, due December 2045 332,587 3,952 400,000 4,9512051 Notes, due October 2051 1,000,000 18,814 — —Total Long-Term Debt $ 6,276,865 $ 23,653 $ 5,175,000 $ 29,898Maxim 2023 Notes, due March 2023 500,000 (16,663) — —Total Current Debt $ 500,000 $ (16,663) $ — $ —
Total Debt $ 6,776,865 $ 6,990 $ 5,175,000 $ 29,898
15. Subsequent Events
As discussed in Note 14, Debt, of the Notes to Consolidated Financial Statements, on October 5, 2021, Maxim gavenotice that it would redeem the Maxim March 2023 Notes in the aggregate principal amount of $500.0 million. Subsequently,on November 4, 2021, the Maxim March 2023 Notes were redeemed for cash and are no longer outstanding.
On November 22, 2021, the Board of Directors of the Company declared a cash dividend of $0.69 per outstanding shareof common stock. The dividend will be paid on December 14, 2021 to all shareholders of record at the close of business onDecember 3, 2021 and is expected to total $362.5 million.
ANALOG DEVICES, INC.
NOTES TO CONSOLIDATED FINANCIAL STATEMENTS — (Continued)
87

ITEM 9. CHANGES IN AND DISAGREEMENTS WITH ACCOUNTANTS ON ACCOUNTING ANDFINANCIAL DISCLOSURE
Not applicable.
ITEM 9A. CONTROLS AND PROCEDURES
(a) Evaluation of Disclosure Controls and Procedures. Our management, with the participation of our Chief ExecutiveOfficer and Chief Financial Officer, evaluated the effectiveness of Analog’s disclosure controls and procedures as ofOctober 30, 2021. The term “disclosure controls and procedures,” as defined in Rules 13a-15(e) and 15d-15(e) under theSecurities Exchange Act of 1934, as amended (the “Exchange Act”), means controls and other procedures of a company that aredesigned to ensure that information required to be disclosed by a company in the reports that it files or submits under theExchange Act is recorded, processed, summarized and reported, within the time periods specified in the SEC’s rules and forms.Disclosure controls and procedures include, without limitation, controls and procedures designed to ensure that informationrequired to be disclosed by a company in the reports that it files or submits under the Exchange Act is accumulated andcommunicated to the company’s management, including its principal executive and principal financial officers, as appropriateto allow timely decisions regarding required disclosure. Management recognizes that any controls and procedures, no matterhow well designed and operated, can provide only reasonable assurance of achieving their objectives and managementnecessarily applies its judgment in evaluating the cost-benefit relationship of possible controls and procedures. Based on theevaluation of our disclosure controls and procedures as of October 30, 2021, our Chief Executive Officer and Chief FinancialOfficer concluded that, as of such date, our disclosure controls and procedures were effective at the reasonable assurance level.
(b) Management’s Report on Internal Control Over Financial Reporting.
Management’s Report on Internal Control Over Financial Reporting
Our management is responsible for establishing and maintaining adequate internal control over financial reporting.Internal control over financial reporting is defined in Rule 13a-15(f) or 15d-15(f) promulgated under the Securities ExchangeAct of 1934 as a process designed by, or under the supervision of, the company’s principal executive and principal financialofficers and effected by the company’s board of directors, management and other personnel, to provide reasonable assuranceregarding the reliability of financial reporting and the preparation of financial statements for external purposes in accordancewith generally accepted accounting principles and includes those policies and procedures that:
• Pertain to the maintenance of records that in reasonable detail accurately and fairly reflect the transactions anddispositions of the assets of the company;
• Provide reasonable assurance that transactions are recorded as necessary to permit preparation of financialstatements in accordance with generally accepted accounting principles, and that receipts and expenditures of thecompany are being made only in accordance with authorizations of management and directors of the company; and
• Provide reasonable assurance regarding prevention or timely detection of unauthorized acquisition, use ordisposition of the company’s assets that could have a material effect on the financial statements.
Because of its inherent limitations, internal control over financial reporting may not prevent or detect misstatements.Projections of any evaluation of effectiveness to future periods are subject to the risk that controls may become inadequatebecause of changes in conditions, or that the degree of compliance with the policies or procedures may deteriorate.
Our management assessed the effectiveness of our internal control over financial reporting as of October 30, 2021. Inmaking this assessment, the company’s management used the criteria set forth by the Committee of Sponsoring Organizationsof the Treadway Commission (COSO) in Internal Control-Integrated 2013 Framework.
Based on this assessment, our management concluded that, as of October 30, 2021, our internal control over financialreporting is effective based on those criteria.
Management excluded from its assessment of the Company's internal control over financial reporting as of October 30,2021, the internal control over financial reporting of Maxim Integrated Products, Inc. (Maxim), which was acquired by theCompany on August 26, 2021. This exclusion is consistent with guidance issued by the SEC that an assessment of a recentlyacquired business may be omitted from the scope of management's report on internal control over financial reporting in the yearof acquisition. Total assets and net liabilities of Maxim as of October 30, 2021 (excluding goodwill and other intangible assets,which were included in management's assessment of internal control over financial reporting as of October 30, 2021) wereapproximately $4,155.2 million and $423.9 million, respectively. Maxim represented $558.8 million of our consolidated netrevenues for the year ended October 30, 2021. See a discussion of this acquisition in Note 6, Acquisitions, of the Notes to theConsolidated Financial Statements contained in Item 8 of this Annual Report on Form 10-K.
Our independent registered public accounting firm that audited the financial statements included in this annual report hasissued an attestation report on our internal control over financial reporting. This report appears below.
88

(c) Attestation Report of the Registered Public Accounting Firm
REPORT OF INDEPENDENT REGISTERED PUBLIC ACCOUNTING FIRM
The Board of Directors and ShareholdersAnalog Devices, Inc.
Opinion on Internal Control over Financial ReportingWe have audited Analog Devices, Inc.’s internal control over financial reporting as of October 30, 2021, based on criteriaestablished in Internal Control—Integrated Framework issued by the Committee of Sponsoring Organizations of the TreadwayCommission (2013 framework) (the COSO criteria). In our opinion, Analog Devices, Inc. (the Company) maintained, in allmaterial respects, effective internal control over financial reporting as of October 30, 2021, based on the COSO criteria.
As indicated in the accompanying Management’s Report on Internal Control Over Financial Reporting, management’sassessment of and conclusion on the effectiveness of internal control over financial reporting did not include the internalcontrols of Maxim Integrated Products, Inc., which is included in the 2021 consolidated financial statements of the Companyand constituted $4,155.2 million of total assets and $423.9 million of net liabilities, respectively, as of October 30, 2021 and$558.8 million of revenues for the year then ended. Our audit of internal control over financial reporting of the Company alsodid not include an evaluation of the internal control over financial reporting of Maxim Integrated Products, Inc.
We also have audited, in accordance with the standards of the Public Company Accounting Oversight Board (United States)(PCAOB), the consolidated balance sheets of Analog Devices, Inc. as of October 30, 2021 and October 31, 2020, the relatedconsolidated statements of income, comprehensive income, shareholders’ equity and cash flows for each of the three years inthe period ended October 30, 2021, and the related notes and financial statement schedule listed in the Index at Item 15(a)(2)and our report dated December 3, 2021 expressed an unqualified opinion thereon.
Basis for OpinionThe Company’s management is responsible for maintaining effective internal control over financial reporting and for itsassessment of the effectiveness of internal control over financial reporting included in the accompanying Management’s Reporton Internal Control Over Financial Reporting. Our responsibility is to express an opinion on the Company’s internal controlover financial reporting based on our audit. We are a public accounting firm registered with the PCAOB and are required to beindependent with respect to the Company in accordance with the U.S. federal securities laws and the applicable rules andregulations of the Securities and Exchange Commission and the PCAOB.
We conducted our audit in accordance with the standards of the PCAOB. Those standards require that we plan and perform theaudit to obtain reasonable assurance about whether effective internal control over financial reporting was maintained in allmaterial respects.
Our audit included obtaining an understanding of internal control over financial reporting, assessing the risk that a materialweakness exists, testing and evaluating the design and operating effectiveness of internal control based on the assessed risk, andperforming such other procedures as we considered necessary in the circumstances. We believe that our audit provides areasonable basis for our opinion.
Definition and Limitations of Internal Control Over Financial ReportingA company’s internal control over financial reporting is a process designed to provide reasonable assurance regarding thereliability of financial reporting and the preparation of financial statements for external purposes in accordance with generallyaccepted accounting principles. A company’s internal control over financial reporting includes those policies and proceduresthat (1) pertain to the maintenance of records that, in reasonable detail, accurately and fairly reflect the transactions anddispositions of the assets of the company; (2) provide reasonable assurance that transactions are recorded as necessary to permitpreparation of financial statements in accordance with generally accepted accounting principles, and that receipts andexpenditures of the company are being made only in accordance with authorizations of management and directors of thecompany; and (3) provide reasonable assurance regarding prevention or timely detection of unauthorized acquisition, use, ordisposition of the company’s assets that could have a material effect on the financial statements.
Because of its inherent limitations, internal control over financial reporting may not prevent or detect misstatements. Also,projections of any evaluation of effectiveness to future periods are subject to the risk that controls may become inadequatebecause of changes in conditions, or that the degree of compliance with the policies or procedures may deteriorate.
/s/ Ernst & Young LLP
Boston, MassachusettsDecember 3, 2021
89

(d) Changes in Internal Controls over Financial Reporting. No change in our internal control over financial reporting (asdefined in Rules 13a-15(f) and 15d-15(f) under the Securities Exchange Act) occurred during the fiscal quarter endedOctober 30, 2021 that has materially affected, or is reasonably likely to materially affect, our internal control over financialreporting.
ITEM 9B. OTHER INFORMATION
Not applicable.
ITEM 9C. DISCLOSURE REGARDING FOREIGN JURISDICTIONS THAT PREVENT INSPECTIONS
Not applicable.
90

PART III
ITEM 10. DIRECTORS, EXECUTIVE OFFICERS AND CORPORATE GOVERNANCE
Information required by this item relating to our directors and nominees is contained under the caption “Proposal 1 —Election of Directors” contained in our 2022 proxy statement to be filed with the U.S. Securities and Exchange Commission(the SEC) within 120 days after October 30, 2021 and is incorporated herein by reference. Information required by this itemrelating to our executive officers is contained under the caption “INFORMATION ABOUT OUR EXECUTIVE OFFICERS” inPart I of this Annual Report on Form 10-K and is incorporated herein by reference. If applicable, information required by thisitem relating to compliance with Section 16(a) of the Securities Exchange Act of 1934 will be contained under the caption“Delinquent Section 16(a) Reports” in our 2022 proxy statement to be filed with the SEC within 120 days after October 30,2021 and is incorporated herein by reference.
We have adopted a written code of business conduct and ethics that applies to our principal executive officer, principalfinancial officer, principal accounting officer or controller, or persons performing similar functions and have posted it in theCorporate Governance section of our website which is located at www.analog.com. To the extent permitted by Nasdaq andSEC regulations, we intend to satisfy any disclosure requirement under Item 5.05 of Form 8-K regarding any amendments to, orwaivers from, our code of business conduct and ethics by posting such information on our website which is located atwww.analog.com.
During fiscal 2021, we made no material change to the procedures by which shareholders may recommend nominees toour Board of Directors, as described in our 2021 proxy statement.
Information required by this item relating to the audit committee of our Board of Directors is contained under the caption“Corporate Governance — Board of Directors Meetings and Committees — Audit Committee” in our 2022 proxy statement tobe filed with the SEC within 120 days after October 30, 2021 and is incorporated herein by reference.
ITEM 11. EXECUTIVE COMPENSATION
Information required by this item is contained under the captions “Corporate Governance — Director Compensation” and“Information About Executive Compensation” in our 2022 proxy statement to be filed with the SEC within 120 days afterOctober 30, 2021 and is incorporated herein by reference.
ITEM 12. SECURITY OWNERSHIP OF CERTAIN BENEFICIAL OWNERS AND MANAGEMENT ANDRELATED STOCKHOLDER MATTERS
Information required by this item relating to security ownership of certain beneficial owners and management iscontained under the captions “Security Ownership of Certain Beneficial Owners” and “Security Ownership of Directors andExecutive Officers”in our 2022 proxy statement to be filed with the SEC within 120 days after October 30, 2021 and isincorporated herein by reference. Information required by this item relating to securities authorized for issuance under equitycompensation plans is contained under the caption “Information About Executive Compensation — Securities Authorized forIssuance Under Equity Compensation Plans” in our 2022 proxy statement to be filed with the SEC within 120 days afterOctober 30, 2021 and is incorporated herein by reference.
ITEM 13. CERTAIN RELATIONSHIPS AND RELATED TRANSACTIONS, AND DIRECTORINDEPENDENCE
Information required by this item relating to transactions with related persons is contained under the caption “CorporateGovernance — Certain Relationships and Related Transactions” in our 2022 proxy statement to be filed with the SEC within120 days after October 30, 2021 and is incorporated herein by reference. Information required by this item relating to directorindependence is contained under the caption “Corporate Governance — Determination of Independence” in our 2022 proxystatement to be filed with the SEC within 120 days after October 30, 2021 and is incorporated herein by reference.
ITEM 14. PRINCIPAL ACCOUNTING FEES AND SERVICES
Information required by this item is contained under the caption “Proposal 4 — Ratification of Selection of IndependentRegistered Public Accounting Firm” in our 2022 proxy statement to be filed with the SEC within 120 days after October 30,2021 and is incorporated herein by reference.
91

PART IV
ITEM 15. EXHIBITS AND FINANCIAL STATEMENT SCHEDULES
(a) The following are filed as part of this Annual Report on Form 10-K:1. Financial Statements
The following consolidated financial statements are included in Item 8 of this Annual Report on Form 10-K:— Consolidated Statements of Income for the years ended October 30, 2021, October 31, 2020 and November 2, 2019
— Consolidated Statements of Comprehensive Income for the years ended October 30, 2021, October 31, 2020 andNovember 2, 2019
— Consolidated Balance Sheets as of October 30, 2021 and October 31, 2020
— Consolidated Statements of Shareholders’ Equity for the years ended October 30, 2021, October 31, 2020 andNovember 2, 2019
— Consolidated Statements of Cash Flows for the years ended October 30, 2021, October 31, 2020 and November 2, 2019
2. Financial Statement Schedules
Schedule II — Valuation and Qualifying Accounts
All other schedules have been omitted since the required information is not present, or not present in amounts sufficientto require submission of the schedule or because the information required is included in the Consolidated Financial Statementsor the Notes thereto.
3. Exhibits
2.1 Agreement and Plan of Merger, dated as of July 26, 2016, by and among Analog Devices, Inc., LinearTechnology Corporation and Agreement and Plan of Merger, dated as of July 26, 2016, by and among AnalogDevices, Inc., Linear Technology Corporation and Tahoe Acquisition Corp., filed as exhibit 2.1 to theCompany’s Current Report on Form 8-K (File No. 1-7819) as filed with the Commission on July 29, 2016 andincorporated herein by reference.
2.2 Agreement and Plan of Merger, dated as of July 12, 2020, by and among Analog Devices, Inc., MaximIntegrated Products, Inc. and Magneto Corp., filed as exhibit 2.1 to the Company’s Current Report on Form 8-K(File No. 1-7819) as filed with the Commission on July 15, 2020 and incorporated herein by reference.
3.1 Restated Articles of Organization of Analog Devices, Inc., as amended, filed as exhibit 3.1 to the Company'sQuarterly Report on Form 10-Q for the fiscal quarter ended May 3, 2008 (File No. 1-7819) as filed with theCommission on May 20, 2008 and incorporated herein by reference.
3.2 Amendment to Restated Articles of Organization of Analog Devices, Inc., filed as exhibit 3.1 to the Company'sCurrent Report on Form 8-K (File No. 1-7819) as filed with the Commission on December 8, 2008 andincorporated herein by reference.
3.3 Amended and Restated By-Laws of Analog Devices, Inc., filed as exhibit 3.1 to the Company's Current Reporton Form 8-K (File No. 1-7819) as filed with the Commission on December 17, 2018 and incorporated herein byreference.
4.1 Indenture, dated as of June 10, 2010, between Maxim Integrated Products, Inc. and Wells Fargo Bank, NationalAssociation, as trustee, filed as exhibit 4.4 to Maxim Integrated Products, Inc.'s Registration Statement on FormS-3 (File No. 1-34192) as filed with the Commission on June 10, 2010 and incorporated herein by reference.
4.2 Second Supplemental Indenture, dated as of March 18, 2013, between Maxim Integrated Products, Inc. andWells Fargo Bank, National Association, as trustee, filed as exhibit 4.1 to Maxim Integrated Products, Inc.'sCurrent Report on Form 8-K (File No. 1-34192) as filed with the Commission on March 21, 2013 andincorporated herein by reference.
4.3 Indenture, dated as of June 3, 2013, by and between Analog Devices, Inc. and The Bank of New York MellonTrust Company, N.A., as trustee, filed as exhibit 4.1 to the Company's Current Report on Form 8-K (File No.1-7819) as filed with the Commission on June 3, 2013 and incorporated herein by reference.
4.4 Supplemental Indenture, dated as of June 3, 2013, by and between Analog Devices, Inc. and The Bank of NewYork Mellon Trust Company, N.A., as trustee, filed as exhibit 4.2 to the Company's Current Report on Form 8-K(File No. 1-7819) as filed with the Commission on June 3, 2013 and incorporated herein by reference.
Exhibit No. Description
92

4.5 Supplemental Indenture, dated December 14, 2015, between Analog Devices, Inc. and The Bank of New YorkMellon Trust Company, N.A., as trustee, filed as exhibit 4.2 to the Company's Current Report on Form 8-K (FileNo. 1-7819) as filed with the Commission on December 14, 2015 and incorporated herein by reference.
4.6 Supplemental Indenture, dated December 5, 2016, between Analog Devices, Inc. and The Bank of New YorkMellon Trust Company, N.A., as trustee, filed as exhibit 4.2 to the Company's Current Report on Form 8-K (FileNo. 1-7819) as filed with the Commission on December 5, 2016 and incorporated herein by reference.
4.7 Fourth Supplemental Indenture, dated as of June 15, 2017, between Maxim Integrated Products, Inc. and WellsFargo Bank, National Association, as trustee, filed as exhibit 4.1 to Maxim Integrated Products, Inc.'s CurrentReport on Form 8-K (File No. 1-34192) as filed with the Commission on June 20, 2017 and incorporated hereinby reference.
4.8 Supplemental Indenture, dated March 12, 2018, between Analog Devices, Inc. and The Bank of New YorkMellon Trust Company, N.A., as trustee, filed as exhibit 4.2 to the Company's Current Report on Form 8-K (FileNo. 1-7819) as filed with the Commission on March 12, 2018 and incorporated herein by reference.
4.9 Supplemental Indenture, dated April 8, 2020, between Analog Devices and The Bank of New York Mellon TrustCompany, N.A., as trustee (including the form of note contained therein), filed as exhibit 4.2 to the Company’sCurrent Report on Form 8-K (File No. 1-7819) as filed with the Commission on April 8, 2020 and incorporatedherein by reference.
4.10 Supplemental Indenture, dated October 5, 2021, between Analog Devices and The Bank of New York MellonTrust Company, N.A., as trustee (including the forms of note contained therein), filed as exhibit 4.2 to theCompany's Current Report on Form 8-K (File No. 1-7819) as filed with the Commission on October 5, 2021 andincorporated herein by reference.
4.11 Description of Registrant's Securities, filed as exhibit 4.6 to the Company's Annual Report on Form 10-K for thefiscal year ended November 2, 2019 (File No. 1-7819) as filed with the Commission on November 26, 2019 andincorporated herein by reference.
*10.1 Analog Devices, Inc. Amended and Restated Deferred Compensation Plan, filed as exhibit 10.1 to theCompany's Current Report on Form 8-K as filed with the Commission on December 8, 2008 (File No. 1-7819)and incorporated herein by reference.
*10.2 First Amendment to the Analog Devices, Inc. Amended and Restated Deferred Compensation Plan, filed asexhibit 10.1 to the Company's Quarterly Report on Form 10-Q for the fiscal quarter ended July 30, 2011 (FileNo. 1-7819) as filed with the Commission on August 16, 2011 and incorporated herein by reference.
*10.3 Second Amendment to the Analog Devices, Inc. Amended and Restated Deferred Compensation Plan, filed asexhibit 10.1 to the Company's Quarterly Report on Form 10-Q for the fiscal quarter ended August 1, 2015 (FileNo. 1-7819) as filed with the Commission on August 18, 2015 and incorporated herein by reference.
*10.4 Third Amendment to the Analog Devices, Inc. Amended and Restated Deferred Compensation Plan, filed asexhibit 10.6 to the Company's Quarterly Report on Form 10-Q for the fiscal quarter ended July 29, 2017(File No. 1-7819) as filed with the Commission on August 30, 2017 and incorporated herein by reference.
*10.5 Fourth Amendment to the Analog Devices, Inc. Amended and Restated Deferred Compensation Plan, filed asexhibit 10.5 to the Company's Annual Report on Form 10-K for the fiscal year ended November 2, 2019 (FileNo. 1-7819) as filed with the Commission on November 26, 2019 and incorporated herein by reference.
*10.6 Fifth Amendment to the Analog Devices, Inc. Amended and Restate Deferred Compensation Plan, filed asexhibit 10.1 to the Company's Quarterly Report on Form 10-Q for the fiscal quarter ended July 31, 2021 (FileNo. 1-7819) as filed with the Commission on August 18, 2021 and incorporated herein by reference.
*10.7 Trust Agreement for Deferred Compensation Plan dated as of October 1, 2003 between Analog Devices, Inc.and Fidelity Management Trust Company, filed as exhibit 10.28 to the Company's Annual Report on Form 10-Kfor the fiscal year ended November 1, 2003 (File No. 1-7819) as filed with the Commission on December 23,2003 and incorporated herein by reference.
*10.8 First Amendment to Trust Agreement for Deferred Compensation Plan between Analog Devices, Inc. andFidelity Management Trust Company dated as of January 1, 2005, filed as exhibit 10.3 to the Company's AnnualReport on Form 10-K for the fiscal year ended October 28, 2006 (File No. 1-7819) as filed with the Commissionon November 20, 2006 and incorporated herein by reference.
*10.9 Second Amendment to Trust Agreement for Deferred Compensation Plan between Analog Devices, Inc. andFidelity Management Trust Company dated as of December 10, 2007, filed as exhibit 10.41 to the Company'sAnnual Report on Form 10-K for the fiscal year ended November 1, 2008 (File No. 1-7819) as filed with theCommission on November 25, 2008 and incorporated herein by reference.
*10.10 Amended and Restated 2006 Stock Incentive Plan of Analog Devices, Inc., filed as exhibit 10.1 to theCompany's Quarterly Report on Form 10-Q for the fiscal quarter ended February 1, 2014 (File No. 1-7819) asfiled with the Commission on February 18, 2014 and incorporated herein by reference.
*10.11 Linear Technology Corporation Amended and Restated 2005 Equity Incentive Plan, filed as Exhibit 4.1 to thePost-Effective Amendment No. 1 on Form S-8 to the Company's Registration Statement on Form S-4 (File No.333-213454) as filed with the Commission on March 15, 2017 and incorporated herein by reference.
Exhibit No. Description

*10.12 Analog Devices, Inc. Amended and Restated 2010 Equity Incentive Plan, filed as Exhibit 4.2 to the Post-Effective Amendment No. 1 on Form S-8 to the Company's Registration Statement on Form S-4 (File No.333-213454) as filed with the Commission on March 15, 2017 and incorporated herein by reference.
*10.13 Form of Global Non-Qualified Stock Option Agreement for Employees for usage under the Company'sAmended and Restated 2006 Stock Incentive Plan, filed as exhibit 10.1 to the Company's Quarterly Report onForm 10-Q for the fiscal quarter ended February 2, 2019 (File No. 1-7819) as filed with the Commission onFebruary 20, 2019 and incorporated herein by reference.
*10.14 Form of Non-Qualified Stock Option Agreement for Directors for usage under the Company's Amended andRestated 2006 Stock Incentive Plan, filed as exhibit 10.4 to the Company's Quarterly Report on Form 10-Q forthe fiscal quarter ended January 28, 2017 (File No. 1-7819) as filed with the Commission on February 15, 2017and incorporated herein by reference.
*10.15 Form of Global Restricted Stock Unit Agreement for Employees for usage under the Company's Amended andRestated 2006 Stock Incentive Plan, filed as exhibit 10.2 to the Company's Quarterly Report on Form 10-Q forthe fiscal quarter ended February 2, 2019 (File No. 1-7819) as filed with the Commission on February 20, 2019and incorporated herein by reference.
*10.16 Form of Performance Restricted Stock Unit Agreement for Employees for usage under the Company's Amendedand Restated 2006 Stock Incentive Plan, filed as exhibit 10.7 to the Company's Quarterly Report on Form 10-Qfor the fiscal quarter ended February 3, 2018 (File No. 1-7819) as filed with the Commission on February 28,2018 and incorporated herein by reference.
*10.17 Form of Relative TSR Performance Restricted Stock Unit Agreement for Employees for usage under theCompany's Amended and Restated 2006 Stock Incentive Plan, filed as exhibit 10.1 to the Company's QuarterlyReport on Form 10-Q for the fiscal quarter ended May 4, 2019 (File No. 1-7819) as filed with the Commissionon May 22, 2019 and incorporated herein by reference.
*10.18 Form of Financial Key Metric Performance Restricted Stock Unit Agreement for Employees for usage under theCompany's Amended and Restated 2006 Stock Incentive Plan, filed as Exhibit 10.2 to the Company's QuarterlyReport on Form 10-Q for the fiscal quarter ended May 4, 2019 (File No. 1-7819) as filed with the Commissionon May 22, 2019 and incorporated herein by reference.
*10.19 Form of Restricted Stock Unit Agreement for Directors for usage under the Company's Amended and Restated2006 Stock Incentive Plan, filed as exhibit 10.3 to the Company's Quarterly Report on Form 10-Q for the fiscalquarter ended February 2, 2019 (File No. 1-7819) as filed with the Commission on February 20, 2019 andincorporated herein by reference.
*10.20 Form of Analog Devices, Inc. Equity Award Conversion Notice to Linear employees, filed as exhibit 10.1 to theCompany's Quarterly Report on Form 10-Q for the fiscal quarter ended April 29, 2017 (File No. 1-7819) as filedwith the Commission on May 31, 2017 and incorporated herein by reference.
*10.21 Form of Linear Integration Performance Restricted Stock Unit Agreement for Employees for usage under theAnalog Devices, Inc. Amended and Restated 2006 Stock Incentive Plan, filed as Exhibit 10.1 to the Company'sCurrent Report on Form 8-K (File No. 1-7819) as filed with the Commission on July 11, 2017 and incorporatedby herein reference.
*10.22 Analog Devices, Inc. 2020 Equity Incentive Plan, filed as Appendix B to the Company’s Definitive ProxyStatement on Schedule 14A (File No. 1-7819), as filed with the Commission on January 24, 2020 andincorporated herein by reference.
*10.23 Form of Financial Metric Performance Restricted Stock Unit Agreement for Employees for usage under theCompany's 2020 Equity Incentive Plan, filed as exhibit 10.1 to the Company’s Quarterly Report on Form 10-Qfor the fiscal quarter ended February 1, 2020 (File No. 1-7819) as filed with the Commission on February 19,2020 and incorporated herein by reference.
*10.24 Form of Global Non-Qualified Stock Option Agreement for Employees for usage under the Company's 2020Equity Incentive Plan, filed as exhibit 10.2 to the Company’s Quarterly Report on Form 10-Q for the fiscalquarter ended February 1, 2020 (File No. 1-7819) as filed with the Commission on February 19, 2020 andincorporated herein by reference.
*10.25 Form of Global Restricted Stock Unit Agreement for Employees for usage under the Company's 2020 EquityIncentive Plan, filed as exhibit 10.3 to the Company’s Quarterly Report on Form 10-Q for the fiscal quarterended February 1, 2020 (File No. 1-7819) as filed with the Commission on February 19, 2020 and incorporatedherein by reference.
*10.26 Form of Restricted Stock Unit Agreement for Directors for usage under the Company's 2020 Equity IncentivePlan, filed as exhibit 10.4 to the Company’s Quarterly Report on Form 10-Q for the fiscal quarter endedFebruary 1, 2020 (File No. 1-7819) as filed with the Commission on February 19, 2020 and incorporated hereinby reference.
*10.27 Form of Relative Total Shareholder Return Performance Restricted Stock Unit Agreement for Employees forusage under the Company's 2020 Equity Incentive Plan, filed as exhibit 10.5 to the Company’s Quarterly Reporton Form 10-Q for the fiscal quarter ended February 1, 2020 (File No. 1-7819) as filed with the Commission onFebruary 19, 2020 and incorporated herein by reference.
Exhibit No. Description

*10.28 Non-Qualified Performance Stock Option Agreement – CEO Performance Stock Option Award, filed as Exhibit10.1 to the Company’s Current Report on Form 8-K (File No. 001-07819) as filed with the Commission onDecember 17, 2020 and incorporated herein by reference.
*10.29 Form of Performance Restricted Stock Unit Agreement – Integration Award, filed as Exhibit 10.2 to theCompany’s Current Report on Form 8-K (File No. 001-07819) as filed with the Commission on December 17,2020 and incorporated herein by reference.
*10.30 Form of Restricted Stock Unit Agreement for Non-Employee Directors for usage under the Company’s 2020Equity Incentive Plan adopted December 8, 2020, filed as exhibit 10.3 to the Company's Quarterly Report onForm 10-Q for the fiscal quarter ended January 30, 2021 (File No. 1-7819) as filed with the Commission onFebruary 17, 2021 and incorporated herein by reference.
*10.31 Form of Global Non-Qualified Stock Option Agreement for Employees for usage under the Company’s 2020Equity Incentive Plan adopted December 8, 2020, filed as exhibit 10.4 to the Company's Quarterly Report onForm 10-Q for the fiscal quarter ended January 30, 2021 (File No. 1-7819) as filed with the Commission onFebruary 17, 2021 and incorporated herein by reference.
*10.32 Form of Global Restricted Stock Unit Agreement for Employees for usage under the Company’s 2020 EquityIncentive Plan adopted December 8, 2020, filed as exhibit 10.5 to the Company's Quarterly Report on Form 10-Q for the fiscal quarter ended January 30, 2021 (File No. 1-7819) as filed with the Commission on February 17,2021 and incorporated herein by reference.
*10.33 Form of Relative Total Shareholder Return Performance Restricted Stock Unit Agreement for Employees forusage under the Company's 2020 Equity Incentive Plan adopted December 8, 2020, filed as exhibit 10.6 to theCompany's Quarterly Report on Form 10-Q for the fiscal quarter ended January 30, 2021 (File No. 1-7819) asfiled with the Commission on February 17, 2021 and incorporated herein by reference.
*10.34 Form of Financial Metric Performance Restricted Stock Unit Agreement for Employees for usage under the2020 Equity Incentive Plan adopted December 8, 2020, filed as exhibit 10.7 to the Company's Quarterly Reporton Form 10-Q for the fiscal quarter ended January 30, 2021 (File No. 1-7819) as filed with the Commission onFebruary 17, 2021 and incorporated herein by reference.
*10.35 Form of Financial Metric Performance Restricted Stock Unit Agreement for China Employees for usage underthe 2020 Equity Stock Incentive Plan adopted December 8, 2020, filed as exhibit 10.8 to the Company'sQuarterly Report on Form 10-Q for the fiscal quarter ended January 30, 2021 (File No. 1-7819) as filed with theCommission on February 17, 2021 and incorporated herein by reference.
†10.36 Amended and Restated 1996 Stock Incentive Plan.†10.37 Form of Global Restricted Stock Unit Agreement for usage under the Amended and Restated 1996 Stock
Incentive Plan.†10.38 Form of Global Non-Qualified Stock Option Agreement for usage under the Amended and Restated 1996 Stock
Incentive Plan.*10.39 2021 Executive Performance Incentive Plan, filed as exhibit 10.28 to the Company's Annual Report on Form 10-
K for the fiscal year ended October 31, 2020 (File No. 1-7819) as filed with the Commission on November 24,2020 and incorporated herein by reference.
†10.40 2022 First and Second Fiscal Quarters Executive Performance Incentive Plan.*10.41 Form of Employee Retention Agreement, filed as exhibit 10.1 to the Company's Quarterly Report on Form 10-Q
for the fiscal quarter ended May 5, 2012 (File No. 1-7819) as filed with the Commission on May 22, 2012 andincorporated herein by reference.
*10.42 Employee Change in Control Severance Policy of Analog Devices, Inc., as amended, filed as exhibit 10.20 to theCompany's Annual Report on Form 10-K for the fiscal year ended October 30, 1999 (File No. 1-7819) as filedwith the Commission on January 28, 2000 and incorporated herein by reference.
*10.43 Senior Management Change in Control Severance Policy of Analog Devices, Inc., as amended, filed as exhibit10.21 to the Company's Annual Report on Form 10-K for the fiscal year ended October 30, 1999 (File No.1-7819) as filed with the Commission on January 28, 2000 and incorporated herein by reference.
*10.44 Offer Letter for Prashanth Mahendra-Rajah, dated August 4, 2017, filed as exhibit 10.28 to the Company'sAnnual Report on Form 10-K for the fiscal year ended October 28, 2017 (File No. 1-7819) as filed with theCommission on November 22, 2017 and incorporated herein by reference.
*10.45 Severance Agreement and Release between Analog Devices, Inc. and Steven Pietkiewicz, dated February 15,2021, filed as exhibit 10.9 to the Company's Quarterly Report on Form 10-Q for the fiscal quarter ended January30, 2021 (File No. 1-7819) as filed with the Commission on February 17, 2021 and incorporated herein byreference.
*10.46 Maxim Integrated Products, Inc. Amended and Restated Change in Control Employee Severance Plan for U.S.Based Employees, filed as exhibit 10.1 to Maxim Integrated Products, Inc.'s Quarterly Report on Form 10-Q forthe fiscal quarter ended December 26, 2020 (File No. 1-34192) as filed with the Commission on January 27,2021 and incorporated herein by reference.
Exhibit No. Description

*10.47 Form of Indemnification Agreement for Directors and Officers, filed as exhibit 10.30 to the Company's AnnualReport on Form 10-K for the fiscal year ended November 1, 2008 (File No. 1-7819) as filed with theCommission on November 25, 2008 and incorporated herein by reference.
*10.48 Credit Agreement, dated as of June 28, 2019, among Analog Devices, Inc., as Borrower, JPMorgan Chase Bank,N.A. as Administrative Agent and each lender from time to time party thereto, filed as exhibit 10.1 to theCompany's Current Report on Form 8-K (File No. 1-7819) as filed with the Commission on July 1, 2019 andincorporated herein by reference.
*10.49 Third Amended and Restated Credit Agreement, dated as of June 23, 2021, among Analog Devices, Inc., asBorrower, Bank of America, N.A. as Administrative Agent, Swing Line Lender and L/C Issuer, and each lenderfrom time to time party thereto, filed as exhibit 10.1 to the Company's Current Report on Form 8-K (File No.1-7819) as filed with the Commission on June 23, 2021 and incorporated herein by reference.
†21 Subsidiaries of the Company.†23 Consent of Ernst & Young LLP, Independent Registered Public Accounting Firm.†31.1 Certification Pursuant to Rule 13a-14(a) and 15d-14(a) of the Exchange Act, as Adopted Pursuant to Section 302
of the Sarbanes-Oxley Act of 2002 (Chief Executive Officer).†31.2 Certification Pursuant to Rule 13a-14(a) and 15d-14(a) of the Exchange Act, as Adopted Pursuant to Section 302
of the Sarbanes-Oxley Act of 2002 (Chief Financial Officer).†32.1 Certification Pursuant to 18 U.S.C. Section 1350 (Chief Executive Officer).†32.2 Certification Pursuant to 18 U.S.C. Section 1350 (Chief Financial Officer).101. INS The instance document does not appear in the Interactive Data File because its XBRL tags are embedded within
the inline XBRL document.**101. SCH Inline XBRL Schema Document.**101. CAL Inline XBRL Calculation Linkbase Document.**101. LAB Inline XBRL Labels Linkbase Document.**101. PRE Inline XBRL Presentation Linkbase Document.**101. DEF Inline XBRL Definition Linkbase Document**104 Cover page Interactive Data File (formatted as inline XBRL with applicable taxonomy extension information
contained in Exhibits 101).
Exhibit No. Description
_______________________________________
† Filed herewith.* Management contracts and compensatory plan or arrangements required to be filed as an Exhibit pursuant to
Item 15(b) of Form 10-K.** Submitted electronically herewith.
Attached as Exhibit 101 to this report are the following formatted in iXBRL (Inline Extensible Business Reporting Language):(i) Consolidated Statements of Income for the years ended October 30, 2021, October 31, 2020 and November 2, 2019,(ii) Consolidated Balance Sheets as of October 30, 2021 and October 31, 2020, (iii) Consolidated Statements of Shareholders’Equity for the years ended October 30, 2021, October 31, 2020 and November 2, 2019, (iv) Consolidated Statements ofComprehensive Income for the years ended October 30, 2021, October 31, 2020 and November 2, 2019, (v) ConsolidatedStatements of Cash Flows for the years ended October 30, 2021, October 31, 2020 and November 2, 2019, (vi) Notes toConsolidated Financial Statements for the years ended October 30, 2021, October 31, 2020 and November 2, 2019.

ANALOG DEVICES, INC.ANNUAL REPORT ON FORM 10-KYEAR ENDED OCTOBER 30, 2021
FINANCIAL STATEMENT SCHEDULE
97

ANALOG DEVICES, INC.
SCHEDULE II — VALUATION AND QUALIFYING ACCOUNTS
Years ended October 30, 2021, October 31, 2020 and November 2, 2019
(dollar amounts in thousands)
Description
Balance atBeginning ofPeriod
Additions(Reductions)Charged toIncomeStatement Other Deductions
Balance atEnd of Period
Accounts Receivable Reserves andAllowances:Year ended November 2, 2019 $ 2,284 $ 13,979 $ — $ 7,876 $ 8,387Year ended October 31, 2020 $ 8,387 $ 1,318 $ — $ 5,355 $ 4,350Year ended October 30, 2021 $ 4,350 $ 6,065 $ — $ 7,757 $ 2,658Valuation Allowance for Deferred TaxAsset:Year ended November 2, 2019 $ 82,280 $ 34,069 $ — $ — $ 116,349Year ended October 31, 2020 $ 116,349 $ 37,622 $ 159 $ — $ 154,130Year ended October 30, 2021 $ 154,130 $ 13,714 $ 147,590 (1) $ — $ 315,434_______________________________________(1) Represents balances assumed as part of the Acquisition.
98

ITEM 16. FORM 10-K SUMMARY
None.
99

SIGNATURESPursuant to the requirements of Section 13 or 15(d) of the Securities Exchange Act of 1934, the registrant has duly caused
this report to be signed on its behalf by the undersigned, thereunto duly authorized.
ANALOG DEVICES, INC.
Date: December 3, 2021 By: /s/ Vincent RocheVincent Roche
President and Chief Executive Officer(Principal Executive Officer)
Pursuant to the requirements of the Securities and Exchange Act of 1934, this report has been signed below by the followingpersons on behalf of the registrant and in the capacities and on the dates indicated.
/s/ Ray Stata Chairman of the Board December 3, 2021Ray Stata
/s/ Vincent Roche President and Chief ExecutiveOfficer and Director
(Principal Executive Officer)
December 3, 2021
Vincent Roche
/s/ Prashanth Mahendra-Rajah Senior Vice President, Finance andChief Financial Officer
(Principal Financial Officer)
December 3, 2021
Prashanth Mahendra-Rajah
/s/ Michael Sondel Corporate Vice President and ChiefAccounting Officer
(Principal Accounting Officer)
December 3, 2021
Michael Sondel
/s/ James A. Champy Director December 3, 2021James A. Champy
/s/ Anantha P. Chandrakasan Director December 3, 2021Anantha P. Chandrakasan
/s/ Tunç Doluca Director December 3, 2021Tunc Doluca
/s/ Bruce R. Evans Director December 3, 2021Bruce R. Evans
/s/ Edward H. Frank Director December 3, 2021Edward H. Frank
/s/ Laurie H. Glimcher Director December 3, 2021Laurie H. Glimcher
/s/ Karen M. Golz Director December 3, 2021Karen M. Golz
Name Title Date
100

/s/ Mercedes Johnson Director December 3, 2021Mercedes Johnson
/s/ Mark M. Little Director December 3, 2021Mark M. Little
/s/ Kenton J. Sicchitano Director December 3, 2021Kenton J. Sicchitano
/s/ Susie Wee Director December 3, 2021Susie Wee
Name Title Date
101

ANALOG DEVICES, INC.RECONCILIATION OF GAAP TO NON-GAAP RESULTS
(Unaudited)(In thousands, except per share amounts)
FY21Oct 30, 2021
Gross margin . . . . . . . . . . . . . . . . . . . . . . . . . . . . . . . . . . . . . . . . . . . . . . . . . . . . . . . . . . . . . . . . . . . . . . . . . . . . . . . . . . . . . . . . . . . . . . . . . . . . . . . $ 4,525,012Gross margin percentage . . . . . . . . . . . . . . . . . . . . . . . . . . . . . . . . . . . . . . . . . . . . . . . . . . . . . . . . . . . . . . . . . . . . . . . . . . . . . . . . . . . . . . . . . . . . . 61.8 %Acquisition related expenses . . . . . . . . . . . . . . . . . . . . . . . . . . . . . . . . . . . . . . . . . . . . . . . . . . . . . . . . . . . . . . . . . . . . . . . . . . . . . . . . . . . . . . . . 661,438
Adjusted gross margin . . . . . . . . . . . . . . . . . . . . . . . . . . . . . . . . . . . . . . . . . . . . . . . . . . . . . . . . . . . . . . . . . . . . . . . . . . . . . . . . . . . . . . . . . . . . . . . $ 5,186,450Adjusted gross margin percentage . . . . . . . . . . . . . . . . . . . . . . . . . . . . . . . . . . . . . . . . . . . . . . . . . . . . . . . . . . . . . . . . . . . . . . . . . . . . . . . . . . . . . 70.9 %
Operating expenses . . . . . . . . . . . . . . . . . . . . . . . . . . . . . . . . . . . . . . . . . . . . . . . . . . . . . . . . . . . . . . . . . . . . . . . . . . . . . . . . . . . . . . . . . . . . . . . . . . $ 2,832,811Percent of revenue . . . . . . . . . . . . . . . . . . . . . . . . . . . . . . . . . . . . . . . . . . . . . . . . . . . . . . . . . . . . . . . . . . . . . . . . . . . . . . . . . . . . . . . . . . . . . . . . . . 38.7 %Acquisition related expenses . . . . . . . . . . . . . . . . . . . . . . . . . . . . . . . . . . . . . . . . . . . . . . . . . . . . . . . . . . . . . . . . . . . . . . . . . . . . . . . . . . . . . . . . (552,789)Acquisition related transaction costs . . . . . . . . . . . . . . . . . . . . . . . . . . . . . . . . . . . . . . . . . . . . . . . . . . . . . . . . . . . . . . . . . . . . . . . . . . . . . . . . . (112,859)Special charges, net . . . . . . . . . . . . . . . . . . . . . . . . . . . . . . . . . . . . . . . . . . . . . . . . . . . . . . . . . . . . . . . . . . . . . . . . . . . . . . . . . . . . . . . . . . . . . . . (84,458)
Adjusted operating expenses . . . . . . . . . . . . . . . . . . . . . . . . . . . . . . . . . . . . . . . . . . . . . . . . . . . . . . . . . . . . . . . . . . . . . . . . . . . . . . . . . . . . . . . . . . . $ 2,082,705Adjusted operating expenses percentage . . . . . . . . . . . . . . . . . . . . . . . . . . . . . . . . . . . . . . . . . . . . . . . . . . . . . . . . . . . . . . . . . . . . . . . . . . . . . . . . 28.5 %
Operating income . . . . . . . . . . . . . . . . . . . . . . . . . . . . . . . . . . . . . . . . . . . . . . . . . . . . . . . . . . . . . . . . . . . . . . . . . . . . . . . . . . . . . . . . . . . . . . . . . . . $ 1,692,201Operating margin . . . . . . . . . . . . . . . . . . . . . . . . . . . . . . . . . . . . . . . . . . . . . . . . . . . . . . . . . . . . . . . . . . . . . . . . . . . . . . . . . . . . . . . . . . . . . . . . . . 23.1 %Acquisition related expenses . . . . . . . . . . . . . . . . . . . . . . . . . . . . . . . . . . . . . . . . . . . . . . . . . . . . . . . . . . . . . . . . . . . . . . . . . . . . . . . . . . . . . . . . 1,214,227Acquisition related transaction costs . . . . . . . . . . . . . . . . . . . . . . . . . . . . . . . . . . . . . . . . . . . . . . . . . . . . . . . . . . . . . . . . . . . . . . . . . . . . . . . . . 112,859Special charges, net . . . . . . . . . . . . . . . . . . . . . . . . . . . . . . . . . . . . . . . . . . . . . . . . . . . . . . . . . . . . . . . . . . . . . . . . . . . . . . . . . . . . . . . . . . . . . . . 84,458
Adjusted operating income . . . . . . . . . . . . . . . . . . . . . . . . . . . . . . . . . . . . . . . . . . . . . . . . . . . . . . . . . . . . . . . . . . . . . . . . . . . . . . . . . . . . . . . . . . . . $ 3,103,745Adjusted operating margin . . . . . . . . . . . . . . . . . . . . . . . . . . . . . . . . . . . . . . . . . . . . . . . . . . . . . . . . . . . . . . . . . . . . . . . . . . . . . . . . . . . . . . . . . . . 42.4 %
Nonoperating expense (income) . . . . . . . . . . . . . . . . . . . . . . . . . . . . . . . . . . . . . . . . . . . . . . . . . . . . . . . . . . . . . . . . . . . . . . . . . . . . . . . . . . . . . . . . 363,487Acquisition related expenses . . . . . . . . . . . . . . . . . . . . . . . . . . . . . . . . . . . . . . . . . . . . . . . . . . . . . . . . . . . . . . . . . . . . . . . . . . . . . . . . . . . . . . . . 3,842Loss on extinguishment of debt . . . . . . . . . . . . . . . . . . . . . . . . . . . . . . . . . . . . . . . . . . . . . . . . . . . . . . . . . . . . . . . . . . . . . . . . . . . . . . . . . . . . . (215,150)
Adjusted nonoperating expense (income) . . . . . . . . . . . . . . . . . . . . . . . . . . . . . . . . . . . . . . . . . . . . . . . . . . . . . . . . . . . . . . . . . . . . . . . . . . . . . . . . . 152,179
(Loss) income before income taxes . . . . . . . . . . . . . . . . . . . . . . . . . . . . . . . . . . . . . . . . . . . . . . . . . . . . . . . . . . . . . . . . . . . . . . . . . . . . . . . . . . . . . $ 1,328,714Acquisition related expenses . . . . . . . . . . . . . . . . . . . . . . . . . . . . . . . . . . . . . . . . . . . . . . . . . . . . . . . . . . . . . . . . . . . . . . . . . . . . . . . . . . . . . . . . 1,210,385Acquisition related transaction costs . . . . . . . . . . . . . . . . . . . . . . . . . . . . . . . . . . . . . . . . . . . . . . . . . . . . . . . . . . . . . . . . . . . . . . . . . . . . . . . . . 112,859Special charges, net . . . . . . . . . . . . . . . . . . . . . . . . . . . . . . . . . . . . . . . . . . . . . . . . . . . . . . . . . . . . . . . . . . . . . . . . . . . . . . . . . . . . . . . . . . . . . . . 84,458Loss on extinguishment of debt . . . . . . . . . . . . . . . . . . . . . . . . . . . . . . . . . . . . . . . . . . . . . . . . . . . . . . . . . . . . . . . . . . . . . . . . . . . . . . . . . . . . . 215,150
Adjusted income before income taxes . . . . . . . . . . . . . . . . . . . . . . . . . . . . . . . . . . . . . . . . . . . . . . . . . . . . . . . . . . . . . . . . . . . . . . . . . . . . . . . . . . . $ 2,951,566
(Benefit from) provision for income taxes . . . . . . . . . . . . . . . . . . . . . . . . . . . . . . . . . . . . . . . . . . . . . . . . . . . . . . . . . . . . . . . . . . . . . . . . . . . . . . . . $ (61,708)Effective tax rate . . . . . . . . . . . . . . . . . . . . . . . . . . . . . . . . . . . . . . . . . . . . . . . . . . . . . . . . . . . . . . . . . . . . . . . . . . . . . . . . . . . . . . . . . . . . . . . . . . . (4.6)%Income tax effect of adjustments above . . . . . . . . . . . . . . . . . . . . . . . . . . . . . . . . . . . . . . . . . . . . . . . . . . . . . . . . . . . . . . . . . . . . . . . . . . . . . . . 231,972Income tax from certain discrete tax items . . . . . . . . . . . . . . . . . . . . . . . . . . . . . . . . . . . . . . . . . . . . . . . . . . . . . . . . . . . . . . . . . . . . . . . . . . . . . 188,872
Adjusted provision for income taxes . . . . . . . . . . . . . . . . . . . . . . . . . . . . . . . . . . . . . . . . . . . . . . . . . . . . . . . . . . . . . . . . . . . . . . . . . . . . . . . . . . . . $ 359,136Adjusted tax rate . . . . . . . . . . . . . . . . . . . . . . . . . . . . . . . . . . . . . . . . . . . . . . . . . . . . . . . . . . . . . . . . . . . . . . . . . . . . . . . . . . . . . . . . . . . . . . . . . . . 12.2 %
Diluted EPS . . . . . . . . . . . . . . . . . . . . . . . . . . . . . . . . . . . . . . . . . . . . . . . . . . . . . . . . . . . . . . . . . . . . . . . . . . . . . . . . . . . . . . . . . . . . . . . . . . . . . . . . $ 3.46Acquisition related expenses . . . . . . . . . . . . . . . . . . . . . . . . . . . . . . . . . . . . . . . . . . . . . . . . . . . . . . . . . . . . . . . . . . . . . . . . . . . . . . . . . . . . . . . . 3.02Acquisition related transaction costs . . . . . . . . . . . . . . . . . . . . . . . . . . . . . . . . . . . . . . . . . . . . . . . . . . . . . . . . . . . . . . . . . . . . . . . . . . . . . . . . . 0.28Special charges, net . . . . . . . . . . . . . . . . . . . . . . . . . . . . . . . . . . . . . . . . . . . . . . . . . . . . . . . . . . . . . . . . . . . . . . . . . . . . . . . . . . . . . . . . . . . . . . . 0.21Loss on extinguishment of debt . . . . . . . . . . . . . . . . . . . . . . . . . . . . . . . . . . . . . . . . . . . . . . . . . . . . . . . . . . . . . . . . . . . . . . . . . . . . . . . . . . . . . 0.54Income tax effect of adjustments above . . . . . . . . . . . . . . . . . . . . . . . . . . . . . . . . . . . . . . . . . . . . . . . . . . . . . . . . . . . . . . . . . . . . . . . . . . . . . . . (0.58)Income tax from certain discrete tax items . . . . . . . . . . . . . . . . . . . . . . . . . . . . . . . . . . . . . . . . . . . . . . . . . . . . . . . . . . . . . . . . . . . . . . . . . . . . . (0.47)
Adjusted diluted EPS* . . . . . . . . . . . . . . . . . . . . . . . . . . . . . . . . . . . . . . . . . . . . . . . . . . . . . . . . . . . . . . . . . . . . . . . . . . . . . . . . . . . . . . . . . . . . . . . $ 6.46
* The sum of the individual per share amounts may not equal the total due to rounding.
$
$

ANALOG DEVICES, INC.RECONCILIATION OF NET CASH PROVIDED BY OPERATING ACTIVITIES TO FREE CASH FLOW
(Unaudited)(In thousands)
FY21Oct 30, 2021
Revenue . . . . . . . . . . . . . . . . . . . . . . . . . . . . . . . . . . . . . . . . . . . . . . . . . . . . . . . . . . . . . . . . . . . . . . . . . . . . $ 7,318,286Net cash provided by operating activities . . . . . . . . . . . . . . . . . . . . . . . . . . . . . . . . . . . . . . . . . . . . . . . . . . $ 2,735,069% of Revenue . . . . . . . . . . . . . . . . . . . . . . . . . . . . . . . . . . . . . . . . . . . . . . . . . . . . . . . . . . . . . . . . . . . . . . . . 37 %Capital expenditures . . . . . . . . . . . . . . . . . . . . . . . . . . . . . . . . . . . . . . . . . . . . . . . . . . . . . . . . . . . . . . . . . . . $ (343,676)Free cash flow . . . . . . . . . . . . . . . . . . . . . . . . . . . . . . . . . . . . . . . . . . . . . . . . . . . . . . . . . . . . . . . . . . . . . . . $ 2,391,393% of Revenue . . . . . . . . . . . . . . . . . . . . . . . . . . . . . . . . . . . . . . . . . . . . . . . . . . . . . . . . . . . . . . . . . . . . . . . . 33 %

Notes

Notes

Notes

Notes

BOARD OF DIRECTORS
Ray StataOutgoing Chair of the Board of Directors of Analog Devices, Inc.
Vincent RocheIncoming Chair of the Board ofDirectors and Chief Executive Officerof Analog Devices, Inc.
JamesA. ChampyFormer Vice President of the Dell/PerotSystems business unit of Dell, Inc.
Anantha P. Chandrakasan, Ph.D.Dean of the MIT School of Engineeringand Vannevar Bush Professor of ElectricalEngineering and Computer Science
Tunç DolucaFormer President and Chief ExecutiveOffiff cer of Maxim Integrated, Inc.
Bruce R. Evans
Senior Advisor and Former ChairmanPresident of Evans Capital and
of the Board of Summit Partners
Edward H. Frank, Ph.D.Co-founder and Former Chief ExecutiveOffiff cer of Cloud Parity
Dr.rr Laurie H. GlimcherProfessor of Medicine at Harvard MedicalSchool and President and Chief ExecutiveOffiff cer of the Dana-Farber Cancer Institute
KarenM. GolzFormer Global Vice Chair of Ernst & Young
Mercedes JohnsonFormer Chief Financial Officer of AvagoTechnologies (Now Broadcom Inc.)
Kenton J. SicchitanoFormer Global Managing Partner ofPricewaterhouseCoopers LLP
SusieWee, Ph.D.Former Senior Vice President and GeneralManager of DevNet and CX EcosystemSuccess Group at Cisco Systems, Inc.
LEADERSHIP TEAM
Vincent RochePresident and Chief Executive Offiff cer
JaneneAsgeirssonSenior Vice President, Chief LegalOffiff cer, Chief Risk Offiff cer andCorporate Secretary
Martin CotterSenior Vice President, Industrialand Multi-Markets
Joseph (John) HassettSenior Vice President and ChiefOperating Offiff cer, Maxim Business
Greg HendersonSenior Vice President, Automotive andEnergy, Communications, and AerospaceGroup
Viveii k JainSenior Vice President, Global Operationsand Technology
Bruno KranzenSenior Vice President, Consumer andCloud Infrastructure Group
PrashanthMahendra-RajahSenior Vice President, Financeand Chief Financial Offiff cer
Patrick O’DohertyttSenior Vice President,Digital Healthcare
Anelise SacksSenior Vice President andChief Customer Offiff cer
Margaret SeifChief People Offiff cer
Independent RegisteredPublicAccounting FirmErnst & Young LLP200 Clarendon StreetBoston, MA 02116
TransferAgentComputershareP.O. Box 505000Louisville, KY 40233(877) 373-6374 (U.S.)(781) 575-2715 (Outside U.S.)
computershare.com/investorrr
Shareholder InquiriesShareholders of record shouldcontact Computershare withinquiries about their holdings,dividends, transfers ofownership, address changes,or account consolidations.
Stock TradingAnalog Devices’ commonstock trades on The NasdaqGlobal Select Market underthe symbol ADI.
Other InformationTo obtain a free copy ofthe 2021 Annual Reporton Form 10-K, CorporateGovernance Guidelines,Code of Business Conductand Ethics, or additionalinformation, visitinvestor.analog.comrror write to:
Analog Devices, Inc.Investor RelationsOne Analog WayWilmington, MA 01887
Email:investor.rrr [email protected]
AnnualMeetingAnalog Devices will hold itsAnnual Shareholders’ Meetingat 9:00 a.m. (local time) onWednesday,yy March 9, 2022 at125 Summer Street, Boston, MA.
Analog Devices and the Analog Devices logo are registered marksrr of Analog Devices, Inc. All other marks are trademaraa ksrr of their respective owners.
Daniel LeibholzllSenior Vice President andChief Technology Offiff cer