
QAD Inc. FY05 Annual Report - AnnualReports.com
110
-
Upload
khangminh22 -
Category
Documents
-
view
1 -
download
0
Transcript of QAD Inc. FY05 Annual Report - AnnualReports.com

© 2005 QAD Inc. All Rights ReservedItem # 73-1695H
QA
D Inc. FY
05 Annual R
epo
rt

F i n a n c i a l H i g h l i g h t s Fiscal years ended January 31. Amounts in thousands, except per share data.
6%Latin
America
15%Asia
Pacific
42%North
America
37%Europe,
Middle East& Africa
17%ConsumerProducts/
Food &Beverage
18%Medical
30%Automotive
35%Electronics/
Industrial
35%Electronics/
Industrial 49%Maintenance
and Other
49%Maintenance
and Other
26%License26%License
25%Services25%
Services
FY05 Revenue by Region FY05 Revenue by Vertical FY05 Revenue by Type
Fiscal 2005 marked the most profitable year in QAD’s history
1 | QAD Inc Annual Report FY05
FY2005 FY2004 FY2003
Total revenue $231,206 $230,652 $195,248
Net income (loss) 24,483 16,317 (7,649)
Diluted earnings (loss) per share 0.70 0.47 (0.22)
Cash, restricted cash & marketable securities 68,289 59,784 51,204
Total debt 25,636 19,707 11,125
Cash flow from operations 22,980 19,840 13,441

Dear Shareholders:
Fiscal 2005 was a milestone year for QAD. It marked our 25th anniversary of providing innovative software solutions to manufacturing companies – quite an achievement considering the short life span of the average software company. Moreover, fiscal 2005 marked the most profitable year in our history. In a sector where thousands of companies have gone by the wayside, we continue to succeed.
Growing and operating as an enterprise software company for a quarter century and reaching revenue in excess of $230 million places QAD in an elite group. We have reached this threshold by listening intently to our customers and meeting or exceeding their specific industry needs, all the while maintaining our own core values and perspective.
We started our business with a focus on providing innovative software solutions to manufacturing companies and we have never wavered from that vision. What sets us apart is our ability to deliver new capabilities that add tangible value to the enterprise. Over the years, our products have become increasingly more refined and therefore easy to use, and free of excess and often cumbersome functionality that can hinder deployment.
Our customers also have evolved over the last 25 years and one of the most exciting aspects of this transformation has been the move toward globalization. We understand our global customers intimately because we are closely aligned with their industries – their business is our business. We have grown with them and now share the same global stage. We are working in tandem to help our customers establish common global standards to streamline communication, enhance efficiencies and create increased competitive advantages.
At the core of QAD’s success is our ongoing focus on building a team with both the right aptitude and the right attitude. We have always sought to add professionals who are expert in their respective fields, with requisite certification and many years of professional experience. By combining seasoned talent with the personal enthusiasm and commitment that drive goal achievement, we have established a world-class team.
QAD has grown in size and scope, financially and geographically. As the industry has consolidated, we have succeeded in a maturing market where only the best survive. And we are now a mature company with a world-class, established enterprise that remains focused on being a thought leader and innovator in our industry.
Steady Financial Performance
We have worked very hard to deliver stable and reliable financial results to our shareholders and are pleased to note that, not only was fiscal 2005 our most profitable year, we also achieved the highest operating margins in our history.
Revenue for fiscal 2005 was $231.2 million, which includes $60.5 million in licenses, $56.9 million in services and $113.8 million in maintenance and other revenue. License sales were lower than we expected, due in part to slower technology spending by companies focused on Sarbanes-Oxley compliance issues rather than software implementations. The services area produced solid results, not only in revenue growth but in margin performance as well. Maintenance and other revenue in fiscal 2005 was slightly lower due, in part, to lower hardware sales, which are typically generated through license sales.
Net income was $24.5 million, or $0.70 per diluted share. Operating income was $23.4 million, highlighting the success we had in reaching our goal of attaining operating margins of at least 10 percent, the highest in our history. We also generated $23 million in operating cash flow in fiscal 2005, our sixth consecutive year with positive annual cash flow from operations.
QAD’s flexibility and agility helped us maintain profitability despite a challenging manufacturing business environment. With an ever watchful eye on costs, we decreased operating expenses by reallocating resources and implementing cost controls.
L e t t e r t o o u r S h a r e h o l d e r s
QAD Inc Annual Report FY05 | 2

3 | QAD Inc Annual Report FY05 QAD Inc Annual Report FY05 | 4
We also were very pleased that 2005 saw continued customer loyalty, and we were able to build from this foundation to strengthen our global services business, which further enhanced our ability to provide integrated business solutions to our customers.
Our strong financial position and demonstrated financial prudence provided the confidence for our board of directors to pay our shareholders a special dividend and initiate quarterly dividends – actions very much in keeping with our desire to consistently deliver value to our shareholders. We also implemented a stock repurchase program, further under-scoring our commitment to maximizing shareholder value and reflecting the belief that QAD stock represents a sound long-term investment.
The Year’s Achievements
In addition to building a stable and profitable enterprise, we continued our history of software innovation.
A highlight during the year was the rollout of the new Domain platform that we believe will serve as the foundation for the next decade of our R&D efforts. Domain offers manufacturers an entirely new level of technology and we believe it will alter the way QAD is perceived, further building understanding of our corporation-wide solutions.
We are excited about Domain as the next platform because it has the functionalities powerful enough to tie together a global company with common processes, including shared services, financials, distributed order management and global business intelligence. It also is entirely flexible, enabling our customers to build a model that best represents their company and their respective business. This is more important than ever in the world of manufacturing today – as globalization continues, customers need the ability to control global processes and they need the capability to address the controls required in an increasingly complex regulatory environment. We launched Domain last year and received very positive feedback from customers, many of whom are now operating successfully on this platform.
We have made additional significant investments in the future to support our anticipated growth. QAD now has new corporate headquarters with operations consolidated under one roof. Adding to our development capabilities in Australia, Ireland, India and Spain, as well as here in the U.S., we opened a development center in China, enhancing the position we have been building for more than ten years in that region to support manufacturing expansion in Asia Pacific. In total, with our product direction and infrastructure, QAD is well positioned for the future.
Opportunities for Growth
We see the combination of our manufacturing industry expertise in key vertical markets, our global presence and our customer partnerships, as unique in our industry. Together, they give us the opportunity to be one of the dominant players in delivering enterprise software solutions for global manu-facturing. By some estimates, the market we serve is considered to be as large as $4 billion. We strive to capture more and more of that market and provide more and more of the overall technology capability.
Our objective reflects confidence in our sales execution strategies and ability to penetrate the manufacturing base throughout the world. License growth will be generated in part by Lean Manufacturing and Just-In-Time (JIT) Sequencing modules, which are not typically offered by ERP providers. Lean and JIT Sequencing are catalysts for a real shift in the market – they have gained traction in the automotive vertical and are spreading into consumer, electronic and medical areas. They extend beyond the enterprise and go a layer deeper, integrating at the control level with machinery on the shop floor and interfacing with transportation and retail.
We are continuing our R&D efforts, expanding our sales force with experienced, knowledgeable professionals and strengthening our geographic presence in rapidly developing regions to further establish QAD as a leader in manufacturing software.

3 | QAD Inc Annual Report FY05 QAD Inc Annual Report FY05 | 4
A Thought Leader
Unlike other software companies, we are deeply intertwined with our customers: we belong to the same organizations and associations that they do; we face the same challenges that they do; their problems are our problems, their successes are our successes. This provides us with a unique perspective to continue to add value and create innovative solutions for the manufacturing industries that we serve. We strive to deliver the best value and solutions – not necessarily to be the biggest software company in the world. In fact, we are more than a software company, we are a manufacturing industry technology company, intent on building lasting, profitable relationships and innovative products.
A Salute to Our Stakeholders
We are very proud of our accomplishments over the past 25 years and are proud of our longevity and stability in a sometimes turbulent and always changing business environ-ment. We have embraced globalization, valuing the cultural differences among countries while building common ground between them. We remain focused on delivering value to our customers and appreciate their continuing loyalty. We also are committed to providing returns to our shareholders and thank you for your support. And, we are extremely proud of what our success says about the many employees who have worked so tirelessly over the years to make our collective goals a reality. We look forward to the next 25 years.
Sincerely,
Karl Lopker Pamela Meyer LopkerChief Executive Officer Chairman of the Board and
QAD has built a stable and profitable enterprise and continues its history of software innovation

5 | QAD Inc Annual Report FY05
25 yearsInnovative Solutions Driving the Evolution of Manufacturing
QAD was founded with a goal of providing the best enterprise software solutions for manufacturers. At that time, the manufacturing industry looked quite different than it does today. Manufacturers used software to auto- mate certain operational functions such as planning production and managing inventory – the processes that impacted the factory floor.
Today, manufacturing and QAD circle the globe as companies are seeking ways to improve operations beyond the factory floor, including internal and external processes that impact the dynamics of their supply chains. QAD enables manufacturers to stay competitive in the marketplace, with software solutions that help them manage their global operations, as well as collaboration with suppliers and customers.
Delivering the Solutions that Manufacturers Want
For a quarter of a century, QAD has continued to deliver innovative software solutions – from our flagship software, MFG/PRO to the latest Lean Manufacturing and Just-In-Time (JIT) Sequencing modules – that help global manufacturers address real business needs and achieve real business value. We have watched manufacturing evolve, and today, QAD solutions are crucial to many of the largest global manufacturers’ operations and supply chains, and are licensed at approximately 5,300 sites in more than 90 countries worldwide.
We recognize the significant differences among manufacturing sectors, and are committed to serving them by building solutions that address the specific needs of global manufacturers in six vertical markets: automotive, consumer products, food and beverage, electronics, industrial and medical industries. Our customer-centric approach also helps ensure that our solutions deliver optimum value and support the long-term objectives of our customers, whether those are to expand into new markets or to operate a truly lean enterprise.
Innovation that Drives Business Value
QAD broke new ground 25 years ago by developing solutions that were elegant in design and easy to use on both the factory floor and in the back office. As production processes have evolved, we have developed solutions and invested in new, open
technology standards that support our customers’ advanced manufacturing initiatives.
Our long history of applying innovative technology and manufacturing techniques to deliver maximum business value continues today. In fiscal 2005, customers selected QAD’s Lean Manufacturing and JIT Sequencing solutions to eliminate waste from the supply chain and align inventory with demand. We launched products, such as QAD Business Intelligence, in response to customer input and helped our automotive customers in North America and Europe comply with newly mandated industry guidelines for managing materials.
Our long-term strategic alliance with Progress Software allowed QAD to build on our partner’s technology advances. In fiscal 2005, we enhanced our core software with support for service-oriented architectures. Most significantly, we introduced the Domain platform to provide global manufacturers with the power to centralize common processes including shared services, financials, distributed order management and global business intelligence. We expect Domain to serve as the foundation for the next decade of QAD product innovation.
The Next 25 Years
Today, a typical supply chain is six levels deep – beginning with the raw materials used to create the final product. Currently, it takes six weeks for customer demand information to move through a typical supply chain – one week per level. QAD’s vision is to reduce global supply chain response from six weeks to six hours. Our focus on manufacturing and commitment to giving our customers the market’s best enterprise software will continue to drive the development of our innovative solutions. Working closely with our customers and vertical industries to pursue strategic development where it’s needed most, QAD will continue to provide manufacturers with immediate business benefits and support their long-term success – as a thought leader and software innovator serving the manufacturing sector.
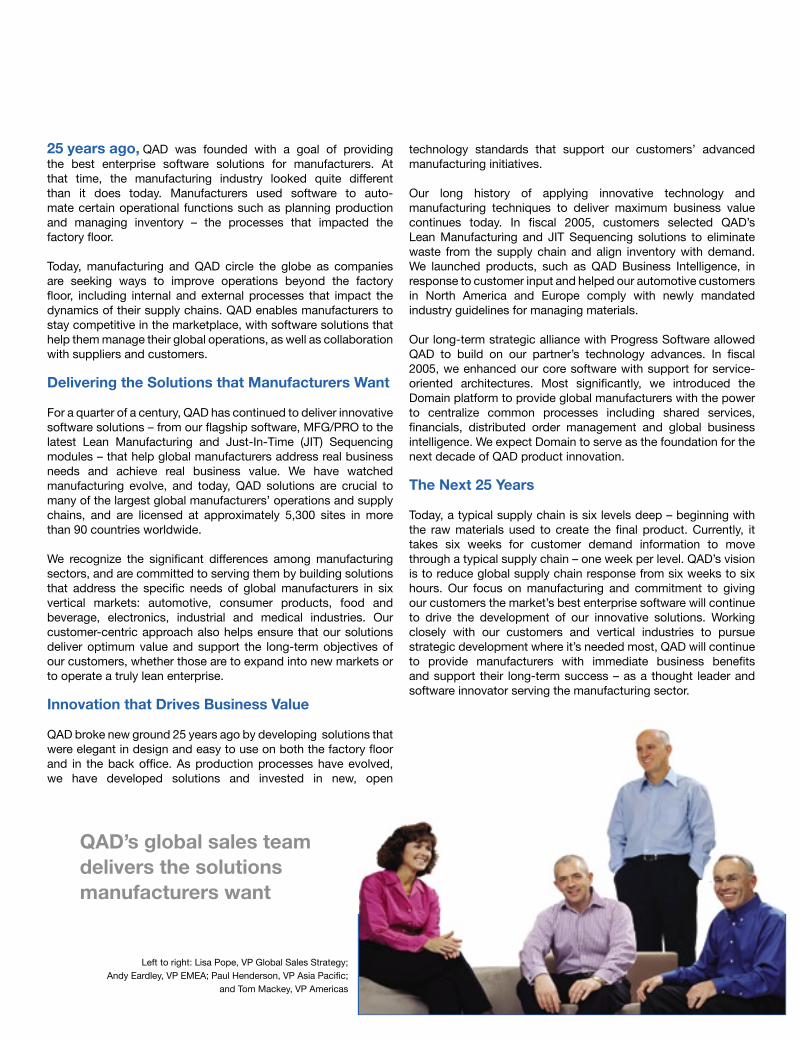
QAD’s global sales team delivers the solutions manufacturers want
Left to right: Lisa Pope, VP Global Sales Strategy; Andy Eardley, VP EMEA; Paul Henderson, VP Asia Pacific;
and Tom Mackey, VP Americas
25 years ago,
5 | QAD Inc Annual Report FY05
25 years

7 | QAD Inc Annual Report FY05 QAD Inc Annual Report FY05 | 8
25 yearsGlobal Partner to Global Manufacturers

7 | QAD Inc Annual Report FY05 QAD Inc Annual Report FY05 | 8
QAD had one office and one customer in Santa Barbara, California. In 1979, our first year in busi-ness, we had two employees who developed, sold and supported our software. Within five years, we had 50 customers, and in early 1990 we opened our first international office in The Netherlands. In 1997, we completed our IPO and continued our expansion with global manufacturers.
Today, we have offices in 26 countries, products in 27 languages, six development centers and seven support centers, and more than 1,200 employees around the world. Our team of sales, development, marketing, service and support profession-als are available around the clock and around the world to ensure customer success with our solutions.
Serving Customers around the World
As manufacturing has expanded around the world, so too has QAD. Today, our global presence is more pervasive than most companies our size, and QAD has the capabilities and agility to serve manufacturers throughout the world.
With development capabilities around the globe, including our newly opened development center in Shanghai, China, QAD solutions are designed with the needs of global manufactur-ers in mind and include functionality to support the differing regional and local requirements in manufacturing. Our sales, service and marketing teams are strategically placed around the world to personally interact with customers and launch and support our products.
As a global partner to manufacturers, QAD Global Services brings a deep understanding of local business and regula-tory practices in both established and emerging manufacturing regions. In fiscal 2005, we grew our Global Services organization, and increased revenue and margin performance.
QAD Support obtained global certification from the prestigious Help Desk Institute (HDI) for all seven QAD support centers worldwide in fiscal 2005. The achievement was a first in the history of HDI’s certification program. QAD Learning marked a year of expansion as well, adding new training and eLearning offerings designed to empower customers’ employees to work smarter using QAD solutions.
Committed to Operational Excellence
QAD is one of the few companies able to develop, deploy and support customer implementations of its software on a global scale. Our strong business model and ability to execute make us an attractive partner for customers in growing manufacturing centers, and for multinationals who out- source to these locations. We believe that distinction gives us a competitive advantage. We are committed to ensuring our teams around the world are also able to support customers consistently and efficiently. Our global footprint and our ability to assemble teams with the right aptitude and attitude give us a strong foundation for excel-lence. QAD professionals’ drive and commitment, certification, expertise in the markets we serve, and experience with cultural diversity and local needs add up to a personal excellence that complements the company’s capabilities, agility and vision.
Growing with Global Manufacturing
Over 25 years, QAD has become expert in global manufactur-ing and a leading provider of technology solutions. Our global presence ensures that wherever customers do business with us, our team can support them, now and in the future. As national borders continue to fade and production processes become global standards, manufacturers will be looking for new ways to differentiate themselves and gain competitive advantage. QAD will be there to provide innovative software solutions that contribute to these goals.
Today, we have offices in 26 countries, products in 27 languages, six development centers and seven support centers, and more than 1,200 employees around the world
QAD Corporate Headquarters, Summerland, California
25 years ago,

Executive Officers
Pamela LopkerChairman of the Boardand President
Karl LopkerChief Executive Officer
Daniel LenderExecutive Vice President,Chief Financial Officer
Vince NiedzielskiExecutive Vice President,Research and Development
Roland DesiletsExecutive Vice President,General Counsel and Secretary
Michael LodatoExecutive Vice President,Chief Marketing Officer
Murray RayExecutive Vice President,Global Services and Human Resources
Valerie Miller (not shown)
Vice President, Corporate Controllerand Chief Accounting Officer
QAD is a world-class enterprise focused on being a thought leader and software innovator
Left to right: Karl Lopker, Daniel Lender, Vince Niedzielski, Pamela Lopker, Michael Lodato, Roland Desilets, Murray Ray

Board of Directors
Pamela LopkerChairman of the Boardand President, QAD
Karl LopkerChief Executive Officer, QAD
Peter van CuylenburgIndependent adviser to high technology companies
Jeffrey LipkinGeneral Partner, RecoveryEquity Investors I and II, L.P.
A.J. MoyerConsultant and formerQAD Chief Financial Officer
A. Barry PatmoreConsultant and formerPartner, Accenture
Larry WolfeConsultant and formerSenior Vice President, Intuit Inc.
Independent RegisteredPublic Accounting FirmKPMG LLPLos Angeles, California
Legal CounselManatt, Phelps & Phillips LLPLos Angeles, California
Investor RelationsPondelWilkinson IncLos Angeles, CaliforniaTel: 310.279.5980
Transfer Agent/RegistrarAmerican Stock Transfer & TrustNew York, New YorkTel: 212.936.5100
Corporate Headquarters2111 Ortega Hill RoadSummerland, California 93067Tel: 805.566.6000www.qad.com
Mailing Address:6450 Via RealCarpinteria, California 93013
Other North America OfficesColorado Illinois Michigan New JerseyCanada
Europe, Middle East and Africa OfficesBelgium France Germany Ireland Italy Netherlands Poland Portugal South Africa Spain Switzerland Turkey United Kingdom
Asia Pacific OfficesAustralia China Hong Kong India Japan Korea Malaysia Singapore Thailand
Latin America Offices Brazil Mexico
Stock InformationThe Company’s common stock trades on the Nasdaq Stock Market under the symbol QADI.
Annual Report on Form 10-KA copy of the company’s annual report to the Securities and Exchange Commission on Form 10-K is available without charge upon request to the company’s Investor Relations depart-ment or from the company’s Web site at www.qad.com.
Annual Meeting The annual meeting of shareholders will be held on Tuesday, June 21, 2005, at 2 pm, Pacific Daylight Time, at QAD Inc, 2111 Ortega Hill Road, Summerland, CA 93067, Tel: +1.805.566.6000. A formal Notice of Meeting, Proxy Statement and Proxy have been sent to shareholders.
Dividend Reinvestment PlanQAD’s Dividend Reinvestment Plan offers shareholders a convenient way to purchase additional QAD Common Shares through the reinvestment of dividends. For further information concerning the Plan, contact American Stock Transfer & Trust Company by telephone at 888.888.0418 or at www.amstock.com.
QAD Inc Annual Report FY05 | 10
“QAD” and "MFG/PRO" are registered trademarks of QAD Inc. “MFG/PRO eB2,” “QAD Supply Visualization,”
“QAD CSS” and “MFGx.net” are trademarks of QAD Inc. This annual report may contain trademarks and registered
trademarks of companies other than QAD.
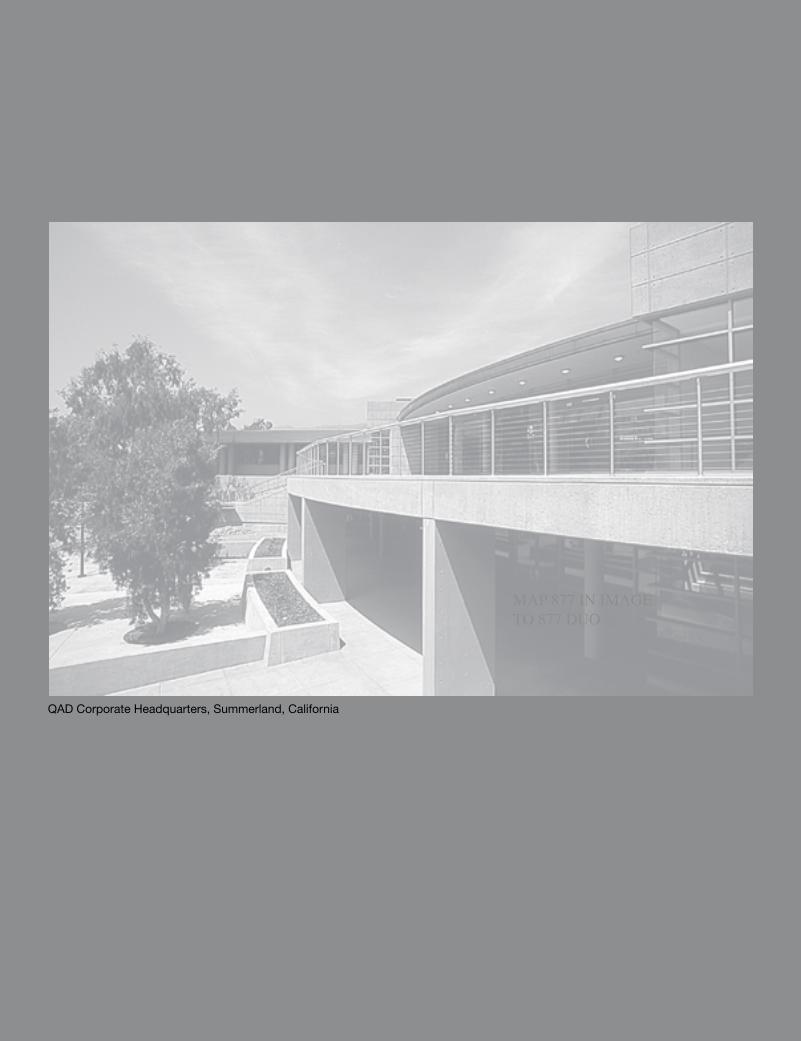
QAD Corporate Headquarters, Summerland, California
MAP 877 IN IMAGE TO 877 DUO

UNITED STATESSECURITIES AND EXCHANGE COMMISSION
Washington D.C. 20549
FORM 10-K� ANNUAL REPORT PURSUANT TO SECTION 13 OR 15(d) OF THE
SECURITIES EXCHANGE ACT OF 1934For the fiscal year ended January 31, 2005
OR
� TRANSITION REPORT PURSUANT TO SECTION 13 OR 15(d) OF THESECURITIES EXCHANGE ACT OF 1934
For the Transition from to
Commission File Number: 0-22823
QAD Inc.(Exact name of Registrant as specified in its charter)
Delaware(State or Other Jurisdiction of 77-0105228Incorporation or Organization) (I.R.S. Employer Identification No.)
6450 Via RealCarpinteria, California 93013
(Address of principal executive offices and zip code)
Registrant’s telephone number, including area code (805) 684-6614
Securities registered pursuant to Section 12(b) of the Act: None
Securities registered pursuant to Section 12(g) of the Act: Common Stock, $.001 par value
Indicate by check mark whether the Registrant (1) has filed all reports required to be filed bySection 13 or 15(d) of the Securities Exchange Act of 1934 during the preceding 12 months (or for suchshorter period that the Registrant was required to file such reports), and (2) has been subject to such filingrequirements for the past 90 days. � YES � NO
Indicate by check mark if disclosure of delinquent filers pursuant to Item 405 of Regulation S-K is notcontained herein, and will not be contained, to the best of Registrant’s knowledge, in definitive proxy orinformation statements incorporated by reference in Part III of this Form 10-K or an amendment to thisForm 10-K. �
Indicate by check mark whether the Registrant is an accelerated filer (as defined in Rule 12b-2 of theAct). � YES � NO
As of July 30, 2004, the last business day of the Registrant’s most recently completed second fiscalquarter, there were 34,172,714 shares of the Registrant’s common stock outstanding, and the aggregatemarket value of such shares held by non-affiliates of the Registrant (based on the closing sale price of suchshares on the NASDAQ National Market on July 31, 2004) was approximately $132,819,908. Shares of theRegistrant’s common stock held by each executive officer and director and by each entity that owns 5% ormore of the Registrant’s outstanding common stock have been excluded in that such persons may be deemedto be affiliates. This determination of affiliate status is not necessarily a conclusive determination for otherpurposes.
As of March 31, 2005, there were 33,883,437 shares of the Registrant’s common stock outstanding.
DOCUMENTS INCORPORATED BY REFERENCE
Items 10 through 14 of Part III incorporate information by reference from the Definitive ProxyStatement for the Registrant’s Annual Meeting of Stockholders to be held on June 21, 2005.

QAD INC.FISCAL YEAR 2005 FORM 10-K ANNUAL REPORT
TABLE OF CONTENTS
Page
PART IITEM 1. BUSINESS . . . . . . . . . . . . . . . . . . . . . . . . . . . . . . . . . . . . . . . . . . 1ITEM 2. PROPERTIES . . . . . . . . . . . . . . . . . . . . . . . . . . . . . . . . . . . . . . . . 15ITEM 3. LEGAL PROCEEDINGS . . . . . . . . . . . . . . . . . . . . . . . . . . . . . . . . 15ITEM 4. SUBMISSION OF MATTERS TO A VOTE OF SECURITY
HOLDERS . . . . . . . . . . . . . . . . . . . . . . . . . . . . . . . . . . . . . . . . . . 15
PART IIITEM 5. MARKET FOR REGISTRANT’S COMMON EQUITY, RELATED
STOCKHOLDER MATTERS AND ISSUER PURCHASES OFEQUITY SECURITIES . . . . . . . . . . . . . . . . . . . . . . . . . . . . . . . . . 16
ITEM 6. SELECTED FINANCIAL DATA . . . . . . . . . . . . . . . . . . . . . . . . . . 18ITEM 7. MANAGEMENT’S DISCUSSION AND ANALYSIS OF
FINANCIAL CONDITION AND RESULTS OF OPERATIONS . . . 19ITEM 7A. QUANTITATIVE AND QUALITATIVE DISCLOSURES ABOUT
MARKET RISK . . . . . . . . . . . . . . . . . . . . . . . . . . . . . . . . . . . . . . . 46ITEM 8. FINANCIAL STATEMENTS AND SUPPLEMENTARY DATA . . . . 46ITEM 9. CHANGES IN AND DISAGREEMENTS WITH ACCOUNTANTS
ON ACCOUNTING AND FINANCIAL DISCLOSURE . . . . . . . . . 46ITEM 9A. CONTROLS AND PROCEDURES . . . . . . . . . . . . . . . . . . . . . . . . 46ITEM 9B. OTHER INFORMATION . . . . . . . . . . . . . . . . . . . . . . . . . . . . . . . 48
PART IIIITEM 10. DIRECTORS AND EXECUTIVE OFFICERS OF THE
REGISTRANT . . . . . . . . . . . . . . . . . . . . . . . . . . . . . . . . . . . . . . . 49ITEM 11. EXECUTIVE COMPENSATION . . . . . . . . . . . . . . . . . . . . . . . . . . 49ITEM 12. SECURITY OWNERSHIP OF CERTAIN BENEFICIAL OWNERS
AND MANAGEMENT . . . . . . . . . . . . . . . . . . . . . . . . . . . . . . . . . 49ITEM 13. CERTAIN RELATIONSHIPS AND RELATED TRANSACTIONS . 49ITEM 14. PRINCIPAL ACCOUNTANT FEES AND SERVICES . . . . . . . . . . 49
PART IVITEM 15. EXHIBITS, FINANCIAL STATEMENT SCHEDULES . . . . . . . . . . 50SIGNATURES . . . . . . . . . . . . . . . . . . . . . . . . . . . . . . . . . . . . . . . . . . . . . . . . . 85

FORWARD-LOOKING STATEMENTS
In addition to historical information, this Annual Report on Form 10-K contains forward-looking statements. These statements typically are preceded or accompanied by words like‘‘believe’’, ‘‘anticipate’’, ‘‘expect’’ and words of similar meaning. These forward-looking statementsare subject to certain risks and uncertainties that could cause actual results to differ materiallyfrom those reflected in these forward-looking statements. Factors that might cause such adifference include, but are not limited to, those discussed in Item 7 entitled ‘‘Management’sDiscussion and Analysis of Financial Condition and Results of Operations’’ and in particular thesubsection of Item 7 entitled ‘‘Factors That May Affect Future Results and Market Price ofStock.’’ Readers are cautioned not to place undue reliance on these forward-looking statements,which reflect management’s opinions only as of the date hereof. We undertake no obligation torevise or update or publicly release the results of any revision or update to these forward-lookingstatements. Readers should carefully review the risk factors and other information described inother documents we file from time to time with the Securities and Exchange Commission,including the Quarterly Reports on Form 10-Q to be filed by QAD in fiscal 2006.
PART I
ITEM 1. BUSINESS
ABOUT QAD
QAD, a Delaware corporation, was founded in 1979 and is a provider of enterprise resourceplanning (ERP) software applications for global manufacturing companies. QAD enterpriseapplications provide robust functionality for managing operations and resources for manufacturingwithin and beyond the enterprise, enabling global manufacturers to collaborate with customers,suppliers and partners to make and deliver the right product, at the right cost, at the right time.
QAD enterprise applications are focused and optimized for select manufacturing industrysegments: automotive, consumer products, electronics, food and beverage, industrial and medical.QAD’s core enterprise application suite MFG/PRO and related QAD applications address theneeds of today’s multinational manufacturers, enabling them to think and operate globally whilepreserving their ability to meet local requirements by providing business-critical functions andprocesses at two levels: 1) the Enterprise, providing traditional ERP functionality for intra-enterprise functions; and 2) the Extended Enterprise, providing communication capabilities forsupplier-management and customer-management functions.
QAD has built a solid customer base of global Fortune 1000 and mid-market manufacturerswho are prospects for future sales of QAD’s enterprise applications. With 25 years of focus on themanufacturing industry, and approximately 5,300 licensed sites of our software around the world,QAD is well-qualified to meet the business and technology requirements of global manufacturingcompanies worldwide. We develop our products with input from leading multinationalmanufacturers within the vertical industries we serve. This vertical industry focus is a keydifferentiator for QAD, enabling our customers to implement QAD applications rapidly, realize ahigh return on investment and achieve a lower total cost of ownership when compared with theproduct offerings of competitors targeting the industries we serve.
Global service and support are important components of our solutions. We are one of a fewselect organizations with the capabilities and industry expertise required to implement oursolutions almost anywhere in the world, in multiple languages and currencies, and supportbusiness processes tailored to local financial and operational practices. Our geographicmanagement structure enables our global practices to meet local requirements and our services tobe delivered effectively within each region. We support our customers’ global operations through
1

our network of regional support centers as well as certain alliances and online support, accessible24 hours a day, seven days a week, virtually anywhere in the world.
CUSTOMERS
As of January 31, 2005, our software was licensed at approximately 5,300 sites in more than90 countries. No single customer accounted for more than 10 percent of total revenue during anyof our last three fiscal years. The following are among the companies and/or subsidiaries of thosecompanies that have each generated more than $1.0 million in software license, maintenance andservices billings over the last three fiscal years:
Automotive
ArvinMeritor, Caterpillar, Delco Remy International, Delphi Automotive Systems,DURA Automotive Systems, Eaton, Federal-Mogul, Ford Motor Company,Freudenberg & Company, GKN, Johnson Controls, Lear, Safety Components, Textron,Webasto
Consumer Products
Applica, Avent, Avery Dennison, Avon Products, Black & Decker, Cussons, DavidYurman, Imperial Tobacco Group, Neschen, Sherwin-Williams, Top Flite, U.S. Cotton,Villeroy & Boch
Electronics
Allied Telsyn, Anritsu, Epson, FEI, General Electric, HP Indigo, Invensys, Lem Holding,Lucent Technologies, Moog, Philips Electronics, Thompson Multimedia
Food and Beverage
Bakkersland, Coca-Cola, Friesland, Kraft Foods, Lion Nathan, Mars, National Brands,National Foods, PepsiCo, Rich Products, Sara Lee, Wander
Industrial
Actaris, AKZO Nobel, Albany International, Alcoa, Amcor, Culligan, DistinctiveAppliances, Enodis, Ingersoll-Rand, Metso, Rockwell Automation, Saint-Gobain,Schlumberger, Thales
Medical
American Type Culture, Arrow International, C.R. Bard, Cephalon, Flexsys, Genzyme,GlaxoSmithKline, Johnson & Johnson, Mayne Group, Medex, Medtronic, MetrologicInstruments, Teleflex, UCB Pharma
INDUSTRY BACKGROUND AND COMPETITION
Manufacturing businesses continue to be subject to increasing global competition, resulting inpressure to lower production costs, improve product performance and quality, increaseresponsiveness to customers and shorten product development, manufacturing and delivery cycles.Globalization and the outsourcing of manufacturing to countries throughout the world has greatlyincreased the scope and complexity of multinational manufacturing organizations, while theInternet has had a profound effect on the way these companies conduct business. We believe that
2

manufacturers who focus on collaborating across their supply chain, including their distributionchannels, suppliers and customers in their business, will reap significant benefits.
To accomplish this, we believe manufacturers within our target markets typically choose fromfive types of enterprise solutions:
Global Manufacturing industry-focused ERP solutions: These solutions are designed andbuilt on a single platform with a singular focus on the unique needs of manufacturingenterprises and provide a robust suite of capabilities that enable the integration andmanagement of critical data within a manufacturing enterprise. These solutions supportinternal and external business processes such as sales order management, procurement,inventory management, product lifecycle management, supply chain management,manufacturing planning and control, service and support, project management, distributionand finance. We believe QAD is the only significant provider of global manufacturingindustry-focused ERP solutions that are designed to handle these internal and select externalbusiness processes that are highly beneficial for manufacturing operations in the industries weserve. We believe our focus on meeting the needs of manufacturers within these industrieshas resulted in software applications that are more fully integrated than point solutions(defined below) and result in faster implementations, a lower total cost of ownership and ahigher return on investment than mega-suite solutions (also defined below).
Mega-suite ERP solutions: (a term originally coined by Gartner Research in itsOctober 2002 report entitled ‘‘ERP II Will Support Performance/Relationship Management’’).These solutions are designed with the goal of trying to satisfy the needs of multipleindustries, including manufacturing, but also unrelated industries such as banking, insurance,retail, state and local government, telecommunications, entertainment and education, amongothers. These solutions attempt to satisfy the diverse needs of many different industrieswithin a single database and software application and provide a wide set of functionality.QAD believes that a lack of focus on the manufacturing sector has caused manufacturerswho purchase these mega-suite applications to experience longer implementation times, ahigher total cost of ownership and a lower return on investment than for QAD solutions. Webelieve this is because the mega-suites’ extremely broad industry scope and higher solutioncomplexity limits their effectiveness in addressing the specific needs of manufacturingenterprises, individual plants or divisions for our targeted vertical markets. Examples ofmega-suite ERP vendors currently competing in the market include SAP, Oracle andMicrosoft.
Roll-up solutions: These solutions are neither designed nor built as single solutions, butrather are the result of continued consolidation in the ERP market. QAD uses the term‘‘roll-up’’ to describe legacy ERP vendors who employ an acquisition strategy. GartnerResearch began referring to these vendors as ‘‘Collectors’’ in their December 2003 report,‘‘Management Update: The ERP Market and Vendors in 2004.’’ In recent years, we haveseen many companies focus on growing their revenue by acquiring legacy or point solutions.Often the acquired solutions have similar features and overlapping functionality with theroll-up vendors’ existing solutions already available on different platforms. QAD believes thatthe resulting solution set created when diverse applications from multiple companies arebrought together is usually not easily or well unified and generally consists of multipleapplications that rely on dissimilar technologies. We also believe that these roll-up solutionspresent considerable risk to customers because long term support for similar solutions onmultiple platforms is unlikely and could result in a costly transition to a new system in thefuture, and because these solutions lack the cohesion and integrated functionality expected byglobal manufacturers. Examples of roll-up vendors currently competing in the market include
3
Infor (which purchased former roll-up vendor Mapics in January 2005, and was formerlyknown as Agilysis), SSA, Epicor and GEAC.
Regional solutions: These solutions are designed to provide functionality that is highlytargeted to meet the needs of a specific region or country. Vendors of these solutionstypically lack the global reach and financial viability that global manufacturers expect of theirERP vendors. Examples of regional solution vendors currently competing in the marketinclude IFS and Intentia, where we see competition most often in Europe and Australia,respectively; User Friendly Software in China and Datasul in South America.
Point solutions: These solutions are designed to provide a fairly narrow set offunctionality. Examples include solutions that provide functionality such as only procurementcapabilities, only customer relationship management capabilities or only supply chainmanagement capabilities. We believe these solutions tend to be highly specialized within alimited functionality scope compared to the four types of ERP suite solutions defined aboveand they often lack integration with processes to which they are directly related.
QAD’s manufacturing industry-focused ERP solutions are designed for the specific needs ofmanufacturing enterprises in the industries we serve to handle their internal and select externalbusiness processes. We believe this focus has helped us deliver software applications and servicesthat are more fully integrated than point solutions or roll-ups and yield faster implementations, alower total cost of ownership and a higher return on investment than mega-suite solutions. Wealso believe that regional vendors lack the global capabilities or financial viability that globalmanufacturers expect of their ERP vendors.
The enterprise software applications market is highly competitive and rapidly changing. It isaffected by new product introductions and other market activities, including consolidations amongindustry participants and the entry of new participants.
As the market for enterprise software continues to develop, companies with significantlygreater resources could attempt to increase their presence in these markets by acquiringtechnology and related resources or forming strategic alliances with our competitors or with ourcurrent or potential partners. The dynamic nature of the emerging market space leads us tobelieve that numerous smaller, but well-capitalized, vendors, may emerge as strong competitors.
Increased competition and consolidation in these markets is likely to result in pricereductions, reduced operating margins and changes in market share, any one of which couldadversely affect us. Many of our competitors are significantly larger and have broader footprintsacross our industry. These present or future competitors may have significantly greater financial,technical, marketing and other resources, greater name recognition and a larger installed base ofcustomers than we do. As a result, they may be able to devote greater resources to thedevelopment, promotion and sale of their products. Although we believe we offer, and willcontinue to offer, products that are competitive, we can make no assurance that we will be able tocompete successfully with existing or new competitors or that competition will not adverselyaffect us.
THE QAD STRATEGY
Our primary Company objective is to be the leading global provider of manufacturingindustry-focused ERP and supply chain solutions. We will continue to target multinational, largeand midrange manufacturing and distribution companies within the following industry
4

segments: automotive, consumer products, electronics, food and beverage, industrial and medical.Our strategies for achieving our primary objective include the following:
• Leverage Our Customer Base. As of January 31, 2005, QAD software was licensed atapproximately 5,300 sites in more than 90 countries. With a substantial customer base anda maintenance renewal rate in excess of 90%, we expect to continue to benefit from sellingadditional products and services to existing customers. We plan to leverage our favorablereputation and track record to capitalize on this opportunity to build additional businessfor our product offerings.
• Expand Our Customer Base. We leverage our existing relationships to expand our customerbase by targeting the many related divisions that reside within the same corporate structureas our existing customers. We believe these divisions may have either outgrown their legacyERP solutions or need to extend the capabilities of those legacy ERP solutions with oursupply chain capabilities. We have found that we can be successful generating revenue innew, related divisions by using existing divisions of our customers as ‘‘internal’’ references.
• Leverage our market position and expertise in key vertical industries. We believe we havestrong market positions in the vertical industries we serve. We have developed even furtherexpertise and strength in specific market niches within these vertical industries that we cancontinue to leverage into leadership positions. For example, in our target automotivevertical market, QAD has customer relationships with some of the largest automotiveTier 1 suppliers who supply components to the automotive Original EquipmentManufacturers (OEM). In our target medical market, we have many customer relationshipsand gained significant expertise in the medical-device market. Our focus on meeting theneeds of these and the other vertical industries we target has driven us to design specificfunctionality for these markets.
• Leverage our market position and reputation in markets emerging as global manufacturingcenters. We believe that our vertical industry focus enables our customers to implementQAD solutions more rapidly, realize a high and rapid return on investment and achieve alower total cost of ownership compared to the product offerings of competitors targetingthe industries we serve. These characteristics make QAD an attractive solution formanufacturers in markets that are emerging as global manufacturing centers, such as Chinaand Eastern Europe, and multinational manufacturers who need to manage outsourcedmanufacturing relationships in these markets. As an example of an emerging marketadvantage, an April 2004 survey entitled ‘‘China Auto Industry Suppliers Survey,’’conducted by the Economist Corporate Network, reports that QAD was ‘‘easily the leadingprovider of ERP systems’’ to automotive suppliers in China, with 56 percent of Chineseautomotive suppliers using ERP relying on QAD. We believe our understanding ofemerging markets, such as that in China, provides us a competitive advantage in otheremerging manufacturing markets, such as Eastern Europe, Southeast Asia and SouthAmerica.
• Leverage Global Network of Alliances. Strategic alliances with partners expand our salesreach, improve our marketing impact, provide technological advantages and strengthen ourstrategic position in the industries that we serve. We leverage the expertise of distribution,software, services and technology alliances to meet the diverse needs of our customers. Weaugment our direct sales organization with a global network of more than 40 distributorsand sales agents, as well as numerous service organizations that offer consulting andimplementation services to expand our reach.
5

2MAY200516511213
QAD SOLUTIONS
QAD provides both enterprise applications and professional services to address therequirements of global manufacturers within the automotive, consumer products, electronics, foodand beverage, industrial and medical industries.
QAD’s core enterprise application suite MFG/PRO and related QAD applications providefunctionality at two levels required by global manufacturers—the Enterprise level and theExtended Enterprise level. We define the functions that streamline processes within the four wallsof a manufacturing plant as the ‘‘Enterprise’’ solutions. We define the functions that streamlineprocesses with their outside customers, suppliers and partners as the ‘‘Extended Enterprise’’solutions.
Additionally, we have an integration framework, known as QXtend. It enables seamlessinteraction among QAD applications and other enterprise applications such as financials, humanresources, customer relationship management (CRM) and legacy applications.
Within the ERP Enterprise and Extended Enterprise contexts, we believe our solutionsinclude functionality that help manufacturers respond to market pressures causing them to investin technology and business improvement projects.
QAD SOLUTIONS
The diagram above provides a visual framework of current market pressures and the types ofEnterprise and Extended Enterprise functionality QAD’s core enterprise application suiteMFG/PRO and related applications offer to address them.
On the outside of the diagram are the current external market pressures that globalmanufacturers face; in the center is the pressure manufacturers face to improve businessperformance through deeper business intelligence. Key functionality within QAD’s Enterprise andExtended Enterprise solutions that address these pressures are depicted in the adjacent wedge-shaped pieces inside the diagram. QAD’s integration layer, QXtend, surrounds the QAD solutionsto create a unified system.
6

Current market pressures include:
Manufacturing: These include the introduction of new manufacturing techniques to increasequality, reduce cost and increase throughput. To help customers respond, QAD solutions include:
Enterprise Solutions
• Planning. QAD MFG/PRO includes manufacturing planning functions to helpcustomers make decisions faster and deploy resources more effectively by convertingexternal and internal demands for products into detailed manufacturing, procurementand resource utilization plans. Capabilities range from enterprise-level strategicplanning functions through plant level master production scheduling and materialrequirements planning.
• Production. QAD MFG/PRO includes manufacturing control functions to support anycombination of manufacturing methods, including discrete, repetitive, lean andjust-in-time (JIT). It helps manufacturers control activities on the production floor,from identifying missing parts to labor reporting, and provides a closed-loopenvironment with transaction, variance and lot/serial traceability reporting, leanmanufacturing and quality management.
Extended Enterprise Solutions
• Lean Manufacturing. QAD’s Lean Manufacturing solution helps manufacturers managefluctuating customer demand and minimize inventory carrying costs by synchronizingmanufacturing processes with the extended supply chain and responding to changes indemand and supply. QAD Lean Manufacturing sends electronic signals within amanufacturing plant or to suppliers via electronic data interchange or through theInternet, making accurate inventory replenishment information immediately visible andthereby reducing information lead-time and eliminating waste in the flow of materialfrom suppliers to customers.
• Just-In-Time Sequencing (JIT/S). QAD’s JIT/S solution, which is currently in the earlyadopter phases, allows manufacturers to produce and deliver components andsubsystems in the exact sequence and timeframe that products are being manufacturedon the assembly line. QAD JIT/S enables manufacturers to deliver unique productconfigurations on an item-by-item basis, while keeping inventory on hand to aminimum.
• Warehousing. QAD’s Advanced Inventory Management (AIM) solution offers a rangeof inventory management capabilities that enable manufacturers to control the receipt,put away, storage, picking and shipping of inventory using warehouses. QAD AIMsolution provides increased inventory visibility and precision with better warehousespace utilization and includes advanced inventory replenishment capabilities, put-awayand picking logic and radio-frequency scheduling of warehouse staff.
Supply: These include the need to increase collaboration with suppliers and improve themanagement of inventory. To help customers respond, QAD solutions include:
Enterprise Solutions
• Purchasing. QAD MFG/PRO includes purchasing functions for integrated purchasing,supplier schedules and quality management. It provides a link between plans,operations and trading partners, and supports requisitions, purchase orders, receiving,vouchering (supplier invoice processing) and supplier performance tracking. Formanufacturers who need more extensive functionality, QAD offers PRO/PLUS, a
7
module that builds on MFG/PRO’s basic purchasing capabilities with additional toolsto streamline the purchase requisition process, monitor supplier performance andother productivity enhancements.
• Supply Chain Planning. QAD MFG/PRO includes supply chain planning functionsconsisting of distribution requirements planning (DRP), enterprise operationsmanagement (EOM) and linked site costing. Distribution requirements planning(DRP) is a planning function designed to balance supply and demand in a time-phasedmanner for items transferred between sites. Enterprise operations planning (EOP) is astrategic as well as tactical production planning tool designed to help manufacturersbalance supply and demand across sites. Linked-site costing functions letmanufacturers specify default cost source sites for items held at multiple sites in onedatabase.
Extended Enterprise Solutions
• Supplier Schedules. QAD MFG/PRO includes supplier schedule functions thatsupplement QAD purchasing functions to support high-volume, repetitive deliveries.Functionality enables manufacturers to produce schedules for specific dates, and evenhours of delivery, in the near term, and provides insight into long-term plans that canbe used to plan orders for raw materials, production and deliveries.
• Supplier Self Service. QAD’s Supply Visualization hosted solution on MFGx.netpromotes collaboration within the supply chain by providing authorized suppliersreal-time visibility into critical inventory and order data over the Internet. It allowssuppliers to closely monitor how items are being consumed, and to determine thetiming and volume needed to replenish stock.
• Distributed Order Management (DOM). QAD MFG/PRO includes sales and distributionfunctions that monitor inventory balances, and manage purchasing and sales orderentry activities. They enable seamless management, analysis, planning and control ofactivities related to the procurement of raw materials, or parts, and distribution offinished goods.
• Electronic Data Interchange (EDI). QAD’s EDI ECommerce solution allows customersto have real-time collaboration with suppliers electronically. It provides a streamlinedmethod of managing electronic communications between trading partners, QADsolutions and other enterprise solutions, and enables users to manipulate, analyze,edit, and reprocess EDI documents quickly and efficiently.
• Supplier Consignment Inventory. QAD’s Supplier Consignment Inventory solutionextends the purchase order process by providing new types of transactions to receivematerial and identify it as consigned. With Supplier Consignment Inventory, thefinancial transaction on consignment inventory can be delayed until it is consumed, butthe material is still visible for planning. When consumption is reported back to thesupplier, the supplier can transfer liability for the material in its system and issue aninvoice if self-billing is not being used.
Demand: These include the need to increase collaboration with customers and improveresponsiveness and customer service. QAD solutions include:
Enterprise Solutions
• Forecasting. QAD MFG/PRO includes forecasting functions that apply statisticalmethods and extrapolation techniques to evaluate underlying patterns in sales history
8
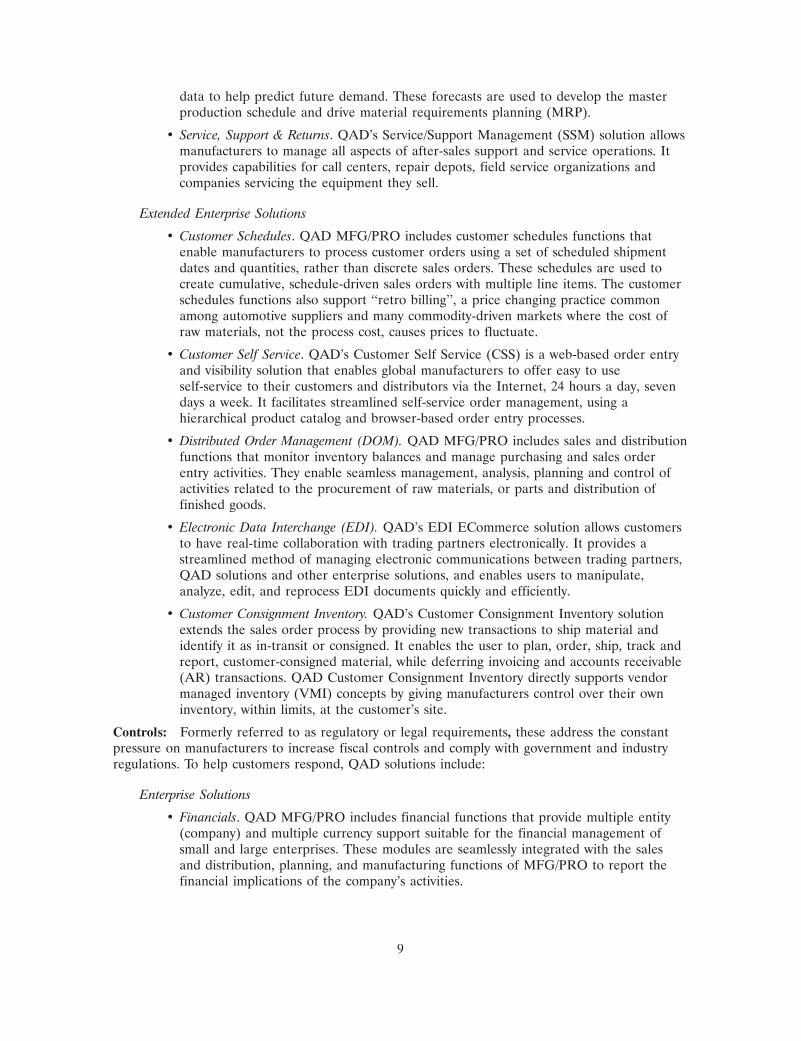
data to help predict future demand. These forecasts are used to develop the masterproduction schedule and drive material requirements planning (MRP).
• Service, Support & Returns. QAD’s Service/Support Management (SSM) solution allowsmanufacturers to manage all aspects of after-sales support and service operations. Itprovides capabilities for call centers, repair depots, field service organizations andcompanies servicing the equipment they sell.
Extended Enterprise Solutions
• Customer Schedules. QAD MFG/PRO includes customer schedules functions thatenable manufacturers to process customer orders using a set of scheduled shipmentdates and quantities, rather than discrete sales orders. These schedules are used tocreate cumulative, schedule-driven sales orders with multiple line items. The customerschedules functions also support ‘‘retro billing’’, a price changing practice commonamong automotive suppliers and many commodity-driven markets where the cost ofraw materials, not the process cost, causes prices to fluctuate.
• Customer Self Service. QAD’s Customer Self Service (CSS) is a web-based order entryand visibility solution that enables global manufacturers to offer easy to useself-service to their customers and distributors via the Internet, 24 hours a day, sevendays a week. It facilitates streamlined self-service order management, using ahierarchical product catalog and browser-based order entry processes.
• Distributed Order Management (DOM). QAD MFG/PRO includes sales and distributionfunctions that monitor inventory balances and manage purchasing and sales orderentry activities. They enable seamless management, analysis, planning and control ofactivities related to the procurement of raw materials, or parts and distribution offinished goods.
• Electronic Data Interchange (EDI). QAD’s EDI ECommerce solution allows customersto have real-time collaboration with trading partners electronically. It provides astreamlined method of managing electronic communications between trading partners,QAD solutions and other enterprise solutions, and enables users to manipulate,analyze, edit, and reprocess EDI documents quickly and efficiently.
• Customer Consignment Inventory. QAD’s Customer Consignment Inventory solutionextends the sales order process by providing new transactions to ship material andidentify it as in-transit or consigned. It enables the user to plan, order, ship, track andreport, customer-consigned material, while deferring invoicing and accounts receivable(AR) transactions. QAD Customer Consignment Inventory directly supports vendormanaged inventory (VMI) concepts by giving manufacturers control over their owninventory, within limits, at the customer’s site.
Controls: Formerly referred to as regulatory or legal requirements, these address the constantpressure on manufacturers to increase fiscal controls and comply with government and industryregulations. To help customers respond, QAD solutions include:
Enterprise Solutions
• Financials. QAD MFG/PRO includes financial functions that provide multiple entity(company) and multiple currency support suitable for the financial management ofsmall and large enterprises. These modules are seamlessly integrated with the salesand distribution, planning, and manufacturing functions of MFG/PRO to report thefinancial implications of the company’s activities.
9

• Multinational. QAD solutions are designed for global business and maximum flexibilityand are available in 27 languages. Our technology’s architecture preserves operationalflexibility so that the customer can select the production models, plant locations, andfinancial reporting that best suit its business. Additionally, QAD solutions have multi-currency support throughout the entire application, and accounting transactions can berecorded in multiple currencies and reported on either in its transaction currency ortranslated at the then prevailing exchange rate to the operation’s currency.
Extended Enterprise Solutions:
• Shared Services. QAD’s Shared Services Domain solution allows multi-entityconsolidations and eliminations to be performed across multiple general ledgers.Sophisticated chart of account mapping capabilities allow for different chart ofaccounts to be consolidated and full traceability to originating transactions can bemaintained, critical for audit ability.
• Compliance. QAD MFG/PRO and related solutions provide best-practicemanufacturing and business processes for automated activities, with a multitude ofembedded basic internal process security and controls throughout the applicationmodules that work to provide transaction integrity throughout supply chain processes.These security and control features, if set-up, implemented, and utilized to their fullestdegree, provide an excellent foundation for systematic internal control demonstration.
Business Intelligence: These include the need to access and analyze operational data within themanufacturing enterprise in order to help improve business performance.
To help customers respond, QAD provides the QAD Business Intelligence (BI) module tohelp companies leverage and analyze data from their QAD system to help make better informedbusiness decisions. QAD BI comprises two primary components: a data transformer and a set ofpre-defined business models. The data transformer performs extraction, transformation andloading functions on the raw data collected by MFG/PRO, ensures its consistency, and thenaggregates this content in a separate, dedicated business intelligence data warehouse. Pre-definedbusiness models for inventory monitoring, sales analysis and manufacturing performance, amongothers, incorporate 150 key performance indicators (KPIs) and provide a framework for mappingthe collated data to a meaningful format.
Global services and support. In addition to providing core functionality required by globalmanufacturers in our enterprise software, QAD Global Services offers consulting, support andeducation for QAD solutions. They offer strategic consulting, business solution design andimplementation, application management services and technical services to our customers.
Our customer support organization operates attended and automated support systems aroundthe world, including a global call tracking and escalation system. Our solution-centered supportprovides customers with online access to customer service solutions 24 hours a day, seven days aweek, giving customers the ability to download the latest updates to our software.
We also offer comprehensive education and training services to our customers and serviceproviders that we continue to enhance with both online and classroom training.
VALUE OF QAD SOLUTIONS
We believe that QAD is well-positioned to continue to meet the requirements of globalmanufacturing customers in the industries we serve by providing solutions that deliver:
Focused Expertise and Functionality for Specific Industries. Our industry expertise and strategyof developing industry-specific solutions has enabled us to achieve strong positions in the
10

automotive, consumer products, electronics, food and beverage, industrial and medical industries.In order to stay at the forefront of the industries we serve, QAD partners with our customersthrough active industry development groups to define enhancements and additional industry-specific functionality for the next generation of QAD solutions.
Rapid Implementations and Time-to-Benefit. The industry-specific features and functionalityof QAD solutions mean customers in the industries we serve can have feature-rich solutions forsignificantly less customization cost, and can implement those solutions in significantly less timethan other manufacturing ERP solutions, so customers are able to achieve rapid time-to-benefit.QAD’s low total cost of ownership, rapid implementations and favorable time-to-benefitcompared to its competitors were verified in an April 2003 study titled ‘‘Deriving Value From 21stCentury ERP Applications’’ published by industry analyst firm META Group. To date, anotherindustry study of this kind has not been completed.
Global Capabilities. Our reputation for best-in-class manufacturing applications is supportedby a proven track record of successful multinational deployments. Our solutions are available in asmany as 27 languages and incorporate functionality that address both global and localrequirements and practices in many of our major markets. Additionally, our Global Servicesorganization makes us one of a few select organizations with the capability to implement oursolutions across the globe and support those solutions in multiple languages and countries.
Supply Chain Efficiencies. QAD’s Extended Enterprise solutions help global manufacturersmanage resources beyond the enterprise, enabling them to speed communications, streamlinebusiness processes and achieve more efficient interactions between partners, suppliers andcustomers.
Open Integration Architecture. Our open systems architecture incorporates OpenApplications Group Integration Specification standards and advanced Internet technologies inorder to deliver open, flexible and scalable end-to-end enterprise and supply chain solutions.
QAD PRODUCT ALLIANCES
We have a number of ongoing business alliances that extend the functionality of our softwarethrough the addition of integrated best-in-class applications. We have also entered into selectagreements with third-party software developers who provide functionality that has beenembedded into or integrated with QAD software and alliance arrangements to deliver morecomplete solutions for the vertical markets we target. Additionally, we support a number ofdifferent hardware platforms. Our alliances include Progress Software Corporation, Cognos,Adexa, ILOG, Sterling Commerce, Vertex and Oracle. These and other business affiliations areclosely aligned to our organization and participate in the selling process.
TECHNOLOGY
QAD MFG/PRO has been developed with a commercially available toolset marketed byProgress Software Corporation (Progress) that works with relational databases provided byProgress and Oracle Corporation. Our software operates under UNIX, Linux and Windows NToperating systems.
In fiscal 2005, QAD introduced its Shared Services Domain solution. This architecturalenhancement was developed in response to customer demand to address situations where multipledivisions within a single enterprise need to maintain different currencies, charts of accounts,manufacturing configurations and other business options on a single system. With Shared ServicesDomain, QAD has given customers the ability to create multiple, virtual QAD MFG/PRO datastructures, we call instances, all within a single database. Each instance has its own unique identityand behaves like an independent MFG/PRO database. Customers gain flexibility to run QAD
11

MFG/PRO according to their business processes—using one centralized database to run multipleday-to-day business operations where productivity and central control make sense, or in adecentralized mode where functions need to perform as autonomous operations.
In fiscal 2005, we also saw increased customer interest in a new computing model called WebServices. This emerging model enables customers to leverage multiple, best-of-breed applicationsin their enterprise reducing the need for costly or time consuming integration to be written inorder for applications to interact and share information with one another. This enables customersto easily integrate applications, such as financial or shop floor applications, to QAD software.
To enable customers to take advantage of Web Services, in fiscal year 2005 QAD adopted aService Oriented Architecture (SOA) within its QXtend integration framework. QAD Enterpriseand Extended Enterprise solutions enable resources and information within applications to bemore easily made available to participants in the network via SOA. This capability is enabled byProgress Software’s latest products, Sonic and OpenEdge.
RESEARCH AND DEVELOPMENT
Our principal research and development staff is focused on developing new functionality forthe industries we serve and on providing continuing updates and improvements to QADapplications to better serve the needs of our customers.
We have embarked on an opportunistic strategy of acquiring certain niche products to extendand enhance our solutions. These acquisitions involve third-party products, or software developedby customers, that are already used in conjunction with our software, but only in a limitedgeography. We believe that our ability to enhance and globalize these products and distribute,service and support them internationally offers us a unique opportunity.
We are committed to the continuing development of our products through in-house andthird-party development. As of January 31, 2005, approximately 250 research and developmentpersonnel, comprised of 200 internal personnel and 50 outside consultants, were involved in thedevelopment of QAD solutions.
We continue to utilize high quality, cost-effective development resources wherever possible.In December 2004, QAD augmented its existing Shanghai, China operations with theestablishment of a new research and development (R&D) center that will focus on developingcore product functionality for QAD solutions and functionality designed specifically for theChinese market. The establishment of the Shanghai R&D center adds to QAD’s existing R&Dcenters in the United States, Australia, Spain, Ireland and India.
Our research and development expenses totaled $33.2 million, $36.2 million and $33.4 millionin fiscal 2005, 2004 and 2003, respectively.
SALES AND MARKETING
QAD sells and supports its products and services through direct and indirect sales channelsand service organizations located throughout the world.
Our direct sales organization is composed of approximately 85 commissioned sales people.We continually align our sales organization and our business strategies with market conditions inorder to ensure that we sustain our effectiveness in the sales process. Within each territory, afocus on the industries we serve is maintained through marketing, local product development andsales training.
Our indirect sales channel consists of over 40 distributors and sales agents worldwide. We donot grant exclusive rights to any of our distributors or sales agents. Our distributors and salesagents primarily sell independently to companies within their geographic territory, but may also
12

work in conjunction with our direct sales organization. In addition, we leverage our relationshipswith implementation service providers, hardware vendors and other third parties to identify salesopportunities on a global basis.
Our marketing strategy includes developing demand for our products by consistentlycommunicating with QAD vertical prospects and key audiences to increase awareness. QADundertakes a variety of marketing activities such as analyst relations, press relations, investorrelations, sales and marketing events, advertising, the development of sales tools, and thecontinued improvement of our Web site. The global marketing organization plans and coordinatesfocused campaigns as set forth in our strategic plan. The team utilizes marketing automation toolsto support our field sales organization and our direct and indirect marketing efforts.
EMPLOYEES
As of January 31, 2005, we had approximately 1,200 full-time employees of whichapproximately 500 were in support and services, 200 were in research and development, 280 werein sales and marketing and 220 were in administration. Generally, our employees are notrepresented by collective bargaining agreements. However, certain employees of our Netherlandsand French subsidiaries are represented by statutory works councils as required under the locallaws. Employees of our Brazilian subsidiary are represented by a collective bargaining agreementwith the Data Processing Union. We believe that, in general, our employee relations are good.
EXECUTIVE OFFICERS OF THE REGISTRANT
Set forth below is certain information concerning our executive officers. All ages are as ofMarch 31, 2005.NAME AGE POSITION(S)
Pamela M. Lopker . . . . . . . . . . . . . . . 50 Chairman of the Board and PresidentKarl F. Lopker . . . . . . . . . . . . . . . . . . 53 Chief Executive OfficerDaniel Lender . . . . . . . . . . . . . . . . . . 38 Executive Vice President and Chief Financial
OfficerVincent P. Niedzielski . . . . . . . . . . . . . 51 Executive Vice President, Research and
DevelopmentMurray W. Ray . . . . . . . . . . . . . . . . . 57 Executive Vice President, Global Services and
Human ResourcesRoland B. Desilets . . . . . . . . . . . . . . . 43 Executive Vice President, General Counsel and
SecretaryMichael Lodato . . . . . . . . . . . . . . . . . 40 Executive Vice President, Chief Marketing OfficerValerie J. Miller . . . . . . . . . . . . . . . . . 41 Vice President, Corporate Controller and Chief
Accounting Officer
13

Pamela M. Lopker founded QAD in 1979 and has been Chairman of the Board and Presidentsince the Company’s incorporation in 1981. Prior to founding QAD, Ms. Lopker served as SeniorSystems Analyst for Comtek Research from 1977 to 1979. She is certified in Production andInventory Management by the American Production and Inventory Control Society. Ms. Lopkerearned a Bachelor of Arts degree in Mathematics from the University of California, SantaBarbara. She is married to Karl F. Lopker, Chief Executive Officer of QAD.
Karl F. Lopker has served as Chief Executive Officer and a Director of the Company sincejoining QAD in 1981. Previously, he founded Deckers Outdoor Corporation in 1973 and wasPresident until 1981. Mr. Lopker is certified in Production and Inventory Management by theAmerican Production and Inventory Control Society. Mr. Lopker earned a Bachelor of Sciencedegree in Electrical Engineering from the University of California, Santa Barbara. Mr. Lopker ismarried to Pamela M. Lopker, Chairman of the Board and President of QAD.
Daniel Lender has served as Executive Vice President and Chief Financial Officer sinceJuly 2003. Previously, he had served as the Company’s Vice President of Global Sales Operationsand Vice President of Latin America. Mr. Lender joined QAD in 1998 as Treasurer following anine-year tenure with the former Republic National Bank of New York, last serving as VicePresident and Treasurer of the Bank’s Delaware subsidiary. He earned a Master of BusinessAdministration degree from the Wharton School of the University of Pennsylvania and a Bachelorof Science degree in Applied Economics and Business Management from Cornell University.
Vincent P. Niedzielski has served as Executive Vice President, Research and Development,since joining QAD in April 1996. Prior to joining QAD, Mr. Niedzielski served as Vice President,Production and Development at Candle Corporation for 12 years. Mr. Niedzielski received aBachelor of Science degree in Mathematics and Computer Science from the University ofScranton.
Murray W. Ray has served as Executive Vice President, Global Services and Human Resourcessince February 2001. He joined QAD in August 1996 and was appointed Vice President of GlobalServices in October 1998. Prior to joining QAD, Mr. Ray was a Director of Professional Servicesat AT&T. Previously, he served 11 years at the former Digital Equipment Corp. as an IndustrialMarketing Manager and then as a Director of Professional Services. Mr. Ray received a Bachelorof Science degree in Mathematics and Statistics from the University of Western Australia.
Roland B. Desilets has served as Executive Vice President, General Counsel and Secretarysince April 2001, when he rejoined QAD after spending one year as Vice President and GeneralCounsel of Atlas Commerce, Inc. Mr. Desilets initially joined QAD in 1993 serving as RegionalGeneral Counsel until 1998 when he was named Corporate General Counsel. Previously he wasIntellectual Property Counsel for Unisys Corporation. Mr. Desilets holds a Juris Doctor degreefrom Widener University School of Law, a Master of Science degree in Computer Science fromVillanova University and a Bachelor of Science degree in Physics from Ursinus College.
Michael Lodato has served as Executive Vice President, Chief Marketing Officer at QADsince September 2003. He joined the Company in March 2002 as Chief Marketing Officer.Previously, Mr. Lodato was Vice President of Marketing and Market Development atDigitalThink, Inc. Prior to that, he served Siebel Systems, Inc. as Senior Director of StrategicAccounts and held leadership positions at Sybase, Inc. and KPMG Consulting, Inc. (now knownas BearingPoint). Mr. Lodato earned a Bachelor of Arts degree in Management Science from theUniversity of California, San Diego.
Valerie J. Miller has served as Vice President, Corporate Controller and Chief AccountingOfficer since June 2001. She joined QAD as Assistant Corporate Controller in May 1999 afterserving eight years in various financial positions at Allergan, Inc. Ms. Miller began her career at
14

the public accounting firm of Ernst & Young. She is a Certified Public Accountant and received aBachelor of Arts degree in Business Economics with an Accounting emphasis from the Universityof California, Santa Barbara.
SEGMENT REPORTING
Segment financial information for fiscal 2005, 2004 and 2003 is presented in note 11 withinthe Notes to Consolidated Financial Statements included in Item 15 of this Annual Report onForm 10-K.
AVAILABLE INFORMATION
Our Annual Report on Form 10-K, Quarterly Reports on Form 10-Q, Current Reports onForm 8-K and amendments filed or furnished pursuant to Section 13(a) or 15(d) of the Securitiesand Exchange Commission Act of 1934, as amended, are available free of charge on our websiteat www.qad.com, as soon as reasonably practicable after such reports have been electronicallyfiled or otherwise furnished to the Securities and Exchange Commission.
ITEM 2. PROPERTIES
During fiscal 2005, QAD completed the construction of its new company headquarters inSummerland, California where we own 28 acres of property. The construction project added anadditional 83,000 square feet of office space to the previously existing 45,000 square feet, whichallowed the consolidation of QAD’s corporate operations. The Company’s headquarters werepreviously located in Carpinteria, California. We moved out of our leased space in Carpinteria,California in two phases. In December 2004, we vacated certain space and immediately enteredinto a sublease arrangement. As a result, we took a $0.7 million charge in the fourth quarter offiscal 2005. Then, on March 18, 2005, we moved our data center from the Carpinteria location toour new corporate headquarters. The move resulted in an impairment charge of approximately$0.9 million in the first quarter of fiscal 2006. We continue to use our Carpinteria address as ourmailing address until we register our corporate headquarters’ address as our mailing address.
QAD has over 30 additional offices located across four geographic regions with leasecommitments ranging from 2005 until 2019. These include major offices located in the UnitedStates, the Netherlands, Australia, the United Kingdom, Mexico, Poland, Thailand, China, Spain,France and Japan.
Although we may seek new or expanded facilities in the future, we expect that our currentdomestic and international facilities will be sufficient to meet our needs for at least the next12 months.
ITEM 3. LEGAL PROCEEDINGS
We are not party to any material legal proceedings. We are from time to time party, either asplaintiff or defendant, to various legal proceedings and claims which arise in the ordinary courseof business. While the outcome of these claims cannot be predicted with certainty, managementdoes not believe that the outcome of any of these legal matters will have a material adverse effecton our consolidated financial position or results of operations.
ITEM 4. SUBMISSION OF MATTERS TO A VOTE OF SECURITY HOLDERS
None.
15

PART II
ITEM 5. MARKET FOR REGISTRANT’S COMMON EQUITY, RELATED STOCKHOLDERMATTERS AND ISSUER PURCHASES OF EQUITY SECURITIES
QAD common stock has been traded on the NASDAQ National Market (NASDAQ) sinceour initial public offering in August 1997 (under the symbol QADI). The following table sets forththe low and high prices for QAD’s common stock as reported by NASDAQ in each quarter of thelast two fiscal years.
Low Price High Price
Fiscal 2005:Fourth quarter . . . . . . . . . . . . . . . . . . . . . . . . . . . . . . $ 7.12 $ 9.33Third quarter . . . . . . . . . . . . . . . . . . . . . . . . . . . . . . . 5.82 10.29Second quarter . . . . . . . . . . . . . . . . . . . . . . . . . . . . . . 8.95 11.20First quarter . . . . . . . . . . . . . . . . . . . . . . . . . . . . . . . 10.54 17.14
Fiscal 2004:Fourth quarter . . . . . . . . . . . . . . . . . . . . . . . . . . . . . . $10.69 $15.74Third quarter . . . . . . . . . . . . . . . . . . . . . . . . . . . . . . . 7.17 13.00Second quarter . . . . . . . . . . . . . . . . . . . . . . . . . . . . . . 4.95 9.75First quarter . . . . . . . . . . . . . . . . . . . . . . . . . . . . . . . 3.14 5.36
Holders
As of March 31, 2005, there were approximately 350 shareholders of record of our commonstock, although there is a much larger number of beneficial owners.
Dividends
During the fiscal 2005 second quarter, we declared a one-time special dividend of $0.10 pershare of common stock. In addition, we announced the initiation of quarterly cash dividends. Wedeclared three quarterly dividends in fiscal 2005 of $0.025 per share of common stock. Continuingquarterly cash dividends are subject to the continued profitability and liquidity requirements ofQAD.
During the fiscal 2005 second quarter, we established a dividend reinvestment plan. The plancommenced with the payment of the first quarterly cash dividend.
Recent Sales of Unregistered Securities
None.
Issuer Purchases of Equity Securities
During the fiscal 2005 second quarter, the Board of Directors approved an open marketstock repurchase program authorized for one year to buy up to one million shares of QADcommon stock. Purchases under QAD’s repurchase program may be made from time to time,without prior notice. During fiscal 2005, we repurchased approximately 742,000 shares at anaverage repurchase price of $7.52 per share, including fees.
16

The following table summarizes common stock repurchases made during fiscal 2005, byquarter:
Total NumberTotal of Shares Remaining Authorized
Number Average Purchased as Part Number of Shares to beof Shares Price Paid of Publicly Announced Purchased Under the
Period Purchased(1) per Share(2) Program(3) Program
2/1/04 - 4/30/04 . . . . . . . . . . — $ — — —5/1/04 - 7/31/04 . . . . . . . . . . 144,865 $10.20 144,865 855,1358/1/04 - 10/31/04 . . . . . . . . . . 597,443 $ 6.87 597,443 257,692
11/1/04 - 1/31/05 . . . . . . . . . . — $ — — 257,692
(1) All share repurchases were made in open-market transactions.
(2) Average price per share is calculated on a settlement basis plus commission.
(3) In June 2004 the Board of Directors authorized an open market repurchase program for one year tobuy up to one million shares of QAD common stock.
17
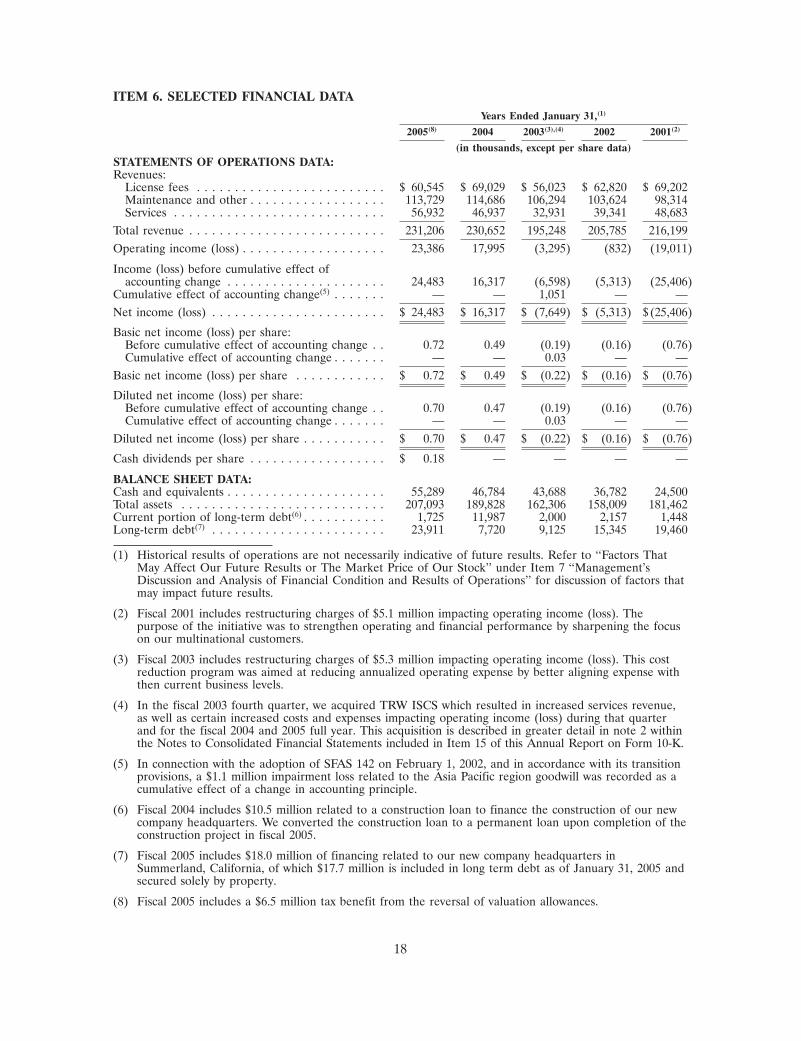
ITEM 6. SELECTED FINANCIAL DATAYears Ended January 31,(1)
2005(8) 2004 2003(3),(4) 2002 2001(2)
(in thousands, except per share data)STATEMENTS OF OPERATIONS DATA:Revenues:
License fees . . . . . . . . . . . . . . . . . . . . . . . . . $ 60,545 $ 69,029 $ 56,023 $ 62,820 $ 69,202Maintenance and other . . . . . . . . . . . . . . . . . . 113,729 114,686 106,294 103,624 98,314Services . . . . . . . . . . . . . . . . . . . . . . . . . . . . 56,932 46,937 32,931 39,341 48,683
Total revenue . . . . . . . . . . . . . . . . . . . . . . . . . . 231,206 230,652 195,248 205,785 216,199Operating income (loss) . . . . . . . . . . . . . . . . . . . 23,386 17,995 (3,295) (832) (19,011)
Income (loss) before cumulative effect ofaccounting change . . . . . . . . . . . . . . . . . . . . . 24,483 16,317 (6,598) (5,313) (25,406)
Cumulative effect of accounting change(5) . . . . . . . — — 1,051 — —Net income (loss) . . . . . . . . . . . . . . . . . . . . . . . $ 24,483 $ 16,317 $ (7,649) $ (5,313) $(25,406)
Basic net income (loss) per share:Before cumulative effect of accounting change . . 0.72 0.49 (0.19) (0.16) (0.76)Cumulative effect of accounting change . . . . . . . — — 0.03 — —
Basic net income (loss) per share . . . . . . . . . . . . $ 0.72 $ 0.49 $ (0.22) $ (0.16) $ (0.76)
Diluted net income (loss) per share:Before cumulative effect of accounting change . . 0.70 0.47 (0.19) (0.16) (0.76)Cumulative effect of accounting change . . . . . . . — — 0.03 — —
Diluted net income (loss) per share . . . . . . . . . . . $ 0.70 $ 0.47 $ (0.22) $ (0.16) $ (0.76)
Cash dividends per share . . . . . . . . . . . . . . . . . . $ 0.18 — — — —
BALANCE SHEET DATA:Cash and equivalents . . . . . . . . . . . . . . . . . . . . . 55,289 46,784 43,688 36,782 24,500Total assets . . . . . . . . . . . . . . . . . . . . . . . . . . . 207,093 189,828 162,306 158,009 181,462Current portion of long-term debt(6) . . . . . . . . . . . 1,725 11,987 2,000 2,157 1,448Long-term debt(7) . . . . . . . . . . . . . . . . . . . . . . . 23,911 7,720 9,125 15,345 19,460
(1) Historical results of operations are not necessarily indicative of future results. Refer to ‘‘Factors ThatMay Affect Our Future Results or The Market Price of Our Stock’’ under Item 7 ‘‘Management’sDiscussion and Analysis of Financial Condition and Results of Operations’’ for discussion of factors thatmay impact future results.
(2) Fiscal 2001 includes restructuring charges of $5.1 million impacting operating income (loss). Thepurpose of the initiative was to strengthen operating and financial performance by sharpening the focuson our multinational customers.
(3) Fiscal 2003 includes restructuring charges of $5.3 million impacting operating income (loss). This costreduction program was aimed at reducing annualized operating expense by better aligning expense withthen current business levels.
(4) In the fiscal 2003 fourth quarter, we acquired TRW ISCS which resulted in increased services revenue,as well as certain increased costs and expenses impacting operating income (loss) during that quarterand for the fiscal 2004 and 2005 full year. This acquisition is described in greater detail in note 2 withinthe Notes to Consolidated Financial Statements included in Item 15 of this Annual Report on Form 10-K.
(5) In connection with the adoption of SFAS 142 on February 1, 2002, and in accordance with its transitionprovisions, a $1.1 million impairment loss related to the Asia Pacific region goodwill was recorded as acumulative effect of a change in accounting principle.
(6) Fiscal 2004 includes $10.5 million related to a construction loan to finance the construction of our newcompany headquarters. We converted the construction loan to a permanent loan upon completion of theconstruction project in fiscal 2005.
(7) Fiscal 2005 includes $18.0 million of financing related to our new company headquarters inSummerland, California, of which $17.7 million is included in long term debt as of January 31, 2005 andsecured solely by property.
(8) Fiscal 2005 includes a $6.5 million tax benefit from the reversal of valuation allowances.
18

ITEM 7. MANAGEMENT’S DISCUSSION AND ANALYSIS OF FINANCIAL CONDITION ANDRESULTS OF OPERATIONS
FORWARD-LOOKING STATEMENTS
In addition to historical information, this Annual Report on Form 10-K contains forward-looking statements. These statements typically are preceded or accompanied by words like‘‘believe,’’ ‘‘anticipate,’’ ‘‘expect’’ and words of similar meaning. These forward-looking statementsare subject to certain risks and uncertainties that could cause actual results to differ materiallyfrom those reflected in these forward-looking statements. Factors that might cause such adifference include, but are not limited to, those discussed in this Item 7 entitled ‘‘Management’sDiscussion and Analysis of Financial Condition and Results of Operations’’ and in particular thesubsection of this Item 7 entitled ‘‘Factors That May Affect Future Results and Market Price ofStock.’’ Readers are cautioned not to place undue reliance on these forward-looking statements,which reflect management’s opinions only as of the date hereof. We undertake no obligation torevise or update or publicly release the results of any revision or update to these forward-lookingstatements. Readers should carefully review the risk factors and other information described inother documents we file from time to time with the Securities and Exchange Commission,including the Quarterly Reports on Form 10-Q to be filed by QAD in fiscal 2006.
INTRODUCTION
The following discussion should be read in conjunction with our financial statements andnotes thereto included in Item 15 of this Annual Report on Form 10-K.
OVERVIEW
The Business
QAD, a Delaware corporation, was founded in 1979 and is a provider of enterprise resourceplanning (ERP) software applications for global manufacturing companies. QAD enterpriseapplications provide robust functionality for managing operations and resources for manufacturingwithin and beyond the enterprise, enabling global manufacturers to collaborate with customers,suppliers and partners to make and deliver the right product, at the right cost, at the right time.
QAD enterprise applications are focused and optimized for select manufacturing industrysegments: automotive, consumer products, electronics, food and beverage, industrial and medical.QAD’s core enterprise application suite MFG/PRO and related QAD applications address theneeds of today’s multinational manufacturers, enabling them to think and operate globally whilepreserving their ability to meet local requirements by providing business-critical functions andprocesses at two levels: 1) the Enterprise, providing traditional ERP functionality for intra-enterprise functions; and 2) the Extended Enterprise, providing communication capabilities forsupplier-management and customer-management functions.
QAD has built a solid customer base of global Fortune 1000 and mid-market manufacturerswho are prospects for future sales of QAD’s enterprise applications. With 25 years of focus on themanufacturing industry, and approximately 5,300 licensed sites of our software around the world,QAD is well-qualified to meet the business and technology requirements of global manufacturingcompanies worldwide. We develop our products with input from leading multinationalmanufacturers within the vertical industries we serve. This vertical industry focus is a keydifferentiator for QAD, enabling our customers to implement QAD applications rapidly, realize ahigh return on investment and achieve a lower total cost of ownership when compared with theproduct offerings of competitors targeting the industries we serve.
19

Global service and support are important components of our solutions. We are one of a fewselect organizations with the capabilities and industry expertise required to implement oursolutions almost anywhere in the world, in multiple languages and currencies, and supportbusiness processes tailored to local financial and operational practices. Our geographicmanagement structure enables our global practices to meet local requirements and our services tobe delivered effectively within each region. We support our customers’ global operations throughour network of regional support centers as well as certain alliances and online support, accessible24 hours a day, seven days a week, virtually anywhere in the world.
Industry Factors
The enterprise software applications industry is highly competitive, rapidly changing andaffected by new product introductions and other market activities, including consolidations amongindustry participants and the entry of new participants.
In viewing the competition, QAD separates its competition into four groups: mega-suitesolutions, roll-up solutions, regional solutions and point solution solutions.
Mega-suite ERP solutions: (a term originally coined by Gartner Research in itsOctober 2002 report entitled ‘‘ERP II Will Support Performance/Relationship Management’’).These solutions are designed with the goal of trying to satisfy the needs of multipleindustries, including manufacturing, but also unrelated industries such as banking, insurance,retail, state and local government, telecommunications, entertainment and education, amongothers. These solutions attempt to satisfy the diverse needs of many different industrieswithin a single database and software application and provide a wide set of functionality.QAD believes that a lack of focus on the manufacturing sector has caused manufacturerswho purchase these mega-suite applications to experience longer implementation times, ahigher total cost of ownership and a lower return on investment than with QAD solutions.We believe this is because the mega-suites’ extremely broad industry scope and highersolution complexity limits their effectiveness in addressing the specific needs of manufacturingenterprises, individual plants or divisions for our targeted vertical markets. Examples ofmega-suite ERP vendors currently competing in the market include SAP, Oracle andMicrosoft.
Roll-up solutions: These solutions are neither designed nor built as single solutions, butrather are the result of continued consolidation in the ERP market. QAD uses the term‘‘roll-up’’ to describe legacy ERP vendors who employ an acquisition strategy. GartnerResearch began referring to these vendors as ‘‘Collectors’’ in their December 2003 report,‘‘Management Update: The ERP Market and Vendors in 2004.’’ In recent years, we haveseen many companies focus on growing their revenue by acquiring legacy or point solutions.Often the acquired solutions have similar features and overlapping functionality with theroll-up vendors’ existing solutions already available on different platforms. QAD believes theresulting solution set created when diverse applications from multiple companies are broughttogether is usually not easily or well unified and generally consists of multiple applicationsthat rely on dissimilar technologies. We also believe that these roll-up solutions presentconsiderable risk to customers because long term support for similar solutions on multipleplatforms is unlikely and could result in a costly-transition to a new system in the future, andbecause these solutions lack the cohesion and integrated functionality expected by globalmanufacturers. Examples of roll-up vendors currently competing in the market include Infor(which purchased former roll-up vendor Mapics in January 2005, and was formerly known asAgilysis), SSA, Epicor and GEAC.
20

Regional solutions: These solutions are designed to provide functionality that is highlytargeted to meet the needs of a specific region or country. Vendors of these solutionstypically lack the global reach and financial viability that global manufacturers expect of theirERP vendors. Examples of regional solution vendors currently competing in the marketinclude IFS and Intentia, where we see competition most often in Europe and Australia,respectively, User Friendly Software in China and Datasul in South America.
Point solutions: These solutions are designed to provide a fairly narrow set offunctionality. Examples include solutions that provide functionality such as only procurementcapabilities, only customer relationship management capabilities or only supply chainmanagement capabilities. We believe these solutions tend to be highly specialized within alimited functionality scope compared to manufacturing industry-focused ERP solutions suchas QAD, or the other three types of ERP suite solutions defined above and they often lackintegration with processes to which they are directly related.
QAD’s manufacturing industry-focused ERP solutions are designed for the specific needs ofmanufacturing enterprises in the industries we serve to handle their internal and select externalbusiness processes. We believe this focus has helped us deliver software applications and servicesthat are more fully integrated than point solutions or roll-ups, and yield faster implementations, alower total cost of ownership and a higher return on investment than mega-suite solutions. Wealso believe that regional vendors lack the global capabilities or financial viability that globalmanufacturers expect of their ERP vendors.
As the market for enterprise software continues to develop, companies with significantlygreater resources could attempt to increase their presence in these markets by acquiring orforming strategic alliances with our competitors or with our current or potential partners. Thedynamic nature of the emerging market space leads us to believe that numerous smaller, butwell-capitalized vendors may emerge as strong competitors. Increased competition in thesemarkets is likely to result in price reductions, reduced operating margins and changes in marketshare, any one of which could adversely affect us. Many of our present or future competitors mayhave significantly greater financial, technical, marketing and other resources, greater namerecognition and a larger installed base of customers than we do. As a result, they may be able todevote greater resources to the development, promotion and sale of their products. Although webelieve we offer, and will continue to offer, products that are competitive, we can make noassurance that we will be able to compete successfully with existing or new competitors or thatcompetition will not adversely affect us.
Economic Factors
Global economic factors can impact the growth rates of manufacturing companies within ourtarget markets. As our customers experience fluctuations in the demand for the products theymanufacture, they may react by adjusting their operations and level of investing. At times, thesereactions may include increasing, decreasing or delaying capital software purchases, which candirectly impact the level and timing of our revenue. We routinely monitor indices that measurereported and forecasted global and regional manufacturing production levels. We consider theseindices, among other factors, in forecasting the demand for our own products and services.Recently reported global manufacturing production indices reflect expansion in production andorders in the majority of geographies where we do business, believed to be driven in part by anupturn in economic confidence. This optimism continues to be tempered by the potential foreconomic volatility due to uncertainties related to the global political environment. With thesefactors in mind, we remain cautiously optimistic regarding the economic factors that could impactour growth opportunities.
21

Compliance Factors
Compliance factors, such as the requirements associated with the Sarbanes-Oxley Act of2002, have had an impact on us and on our customers. The cost and effort of our own compliancewith Sarbanes-Oxley has been significant, at approximately $1.6 million of additional outsideconsulting and audit fees for fiscal 2005. Many of our customers have also been impacted by suchcompliance efforts, which we believe has contributed to delays in capital software buying decisionsduring fiscal 2005. We continue to monitor market reaction as first year compliance efforts cometo completion, anticipating a potential release of pent up demand. We are cautiously optimisticthat previously delayed capital software buying decisions may fuel growth in fiscal 2006 andbeyond. We are aware that our current and potential customers could choose another softwarevendor’s solution, if they perceive there is greater benefit from a compliance perspective.
Executive Focus On Operations
In addition to the industry and economic factors described above, management continuallymonitors QAD’s performance within our business segments. Our business segments consist of acorporate operating segment and four geographic regions: North America; Europe, the MiddleEast and Africa (EMEA); Asia Pacific and Latin America. For more information regarding ourbusiness segments, see note 11 within the Notes to Consolidated Financial Statements included inItem 15 of this Annual Report on Form 10-K.
Regional performance measures such as revenues, operating margins and days’ salesoutstanding are reviewed routinely. In addition, we closely monitor our level of personnel andrelated expenses, which represents the largest portion of our expense structure. We also monitorrevenue dollars per employee and the productivity levels of our support and services personnel.We consider this data in our decision-making process related to additions or reductions inspending.
CRITICAL ACCOUNTING POLICIES
We consider certain accounting policies related to revenue recognition, accounts receivableallowances, impairment of long-lived assets, capitalized software development costs, valuation ofdeferred tax assets and accounting for stock-based compensation to be critical policies due to thesignificance of these items to our operating results and the estimation processes and managementjudgment involved in each.
• Revenue Recognition. We generally license our software under non-cancelable licenseagreements including third-party software sold in conjunction with our software, customersupport and services including technical, implementation and training. Revenue isrecognized in accordance with the American Institute of Certified Public Accountant’sStatement of Position (SOP) No. 97-2, ‘‘Software Revenue Recognition,’’ as modified bySOP No. 98-9, ‘‘Modification of SOP No. 97-2, Software Revenue Recognition withRespect to Certain Transactions’’ and Staff Accounting Bulletin (SAB) No. 104, ‘‘RevenueRecognition.’’ Our revenue recognition policy is as follows:
License Revenue. We recognize revenue from license contracts when a non-cancelable,non-contingent license agreement has been signed, the software product has beendelivered, no uncertainties exist surrounding product acceptance, fees from theagreement are fixed or determinable and collection is probable. Our typical paymentterms vary by region. While most of our arrangements are within our normal paymentterms, we have provided extended terms on occasion. Terms granted are typically lessthan one year and we have established a positive history of collection withoutconcessions, on those receivables. Provided all other revenue recognition criteria have
22
been met, we recognize license revenue for these arrangements on delivery. We use theresidual method to recognize revenue. When a license agreement includes one or moreelements to be delivered at a future date, if vendor-specific, objective evidence of thefair value of all undelivered elements exists then the revenue for the undeliveredelement is deferred. The fair value of the undelivered elements is determined based onthe historical evidence of stand-alone sales of these elements to customers and theremaining portion of the arrangement fee is recognized as revenue. If evidence of thefair value of the undelivered elements does not exist, revenue is deferred and recognizedwhen we have vendor-specific, objective evidence for undelivered elements or whendelivery of all elements occurs.
Subscription license revenue from our hosted product offerings is recognized ratably overthe contract period. Our standard products do not require significant production,modification or customization of software or services that are essential to thefunctionality of the software. Certain judgments affect the application of our licenserevenue recognition policy, such as the assessment of collectibility for which we review acustomer’s credit worthiness and our historical experience with that customer, ifapplicable.
Maintenance Revenue. Revenue from ongoing customer support and product updates isrecognized ratably over the term of the maintenance period, which in most instances isone year.
Services Revenue. Revenue from technical and implementation services is recognized asservices are performed for time-and-materials contracts. Although infrequent, we do attimes enter into fixed-price services contracts for which we recognize the servicesrevenue on the percentage-of-completion methods as prescribed by Accounting ResearchBulletin No. 45, ‘‘Long-term Construction-Type Contracts’’, and in SOP No. 81-1,‘‘Accounting for Performance of Construction-Type and Certain Production-TypeContracts.’’ Revenue from training services is recognized as the services are performed.
We believe that we are currently in compliance with the applicable accounting standardsgoverning revenue recognition. However, the accounting standard setting bodies continueto discuss various provisions of these guidelines with the objective of providing additionalguidance on their future application. These discussions and the issuance of newinterpretations, once finalized, could lead to unanticipated changes in recognized revenue.They could also drive significant adjustments to our business practices that could result inincreased administrative costs, lengthened sales cycles and other changes that could affectour results of operations.
• Accounts Receivable Allowances. We review the collectibility of our accounts receivable eachperiod by analyzing balances based on age and record specific allowances for any balancesthat we determine may not be fully collectible. We also provide an additional reserve basedon historical data including analysis of credit memo data and other known factors. Thesedeterminations require management judgment. Actual collection of these balances maydiffer due to global or regional economic factors, challenges faced by customers within ourtargeted vertical markets or specific financial difficulties of individual customers.
• Goodwill and Intangible Assets. Goodwill and other intangible assets at January 31, 2005,was $11.6 million and $0.3 million, respectively, accounting for 6% of our total assets. Inassessing the recoverability of our intangibles, excluding goodwill, we must makeassumptions regarding estimated future cash flows to determine the fair value of therespective assets. If these estimates or their related assumptions change in the future, wemay be required to record impairment losses for these assets. Effective February 1, 2002,
23

we adopted Statement of Financial Accounting Standards (SFAS) No. 142, ‘‘Goodwill andOther Intangible Assets’’ (SFAS 142) which requires us to analyze goodwill for impairmenton at least an annual basis. These periodic analyses are performed by an independentvaluation consulting firm. In estimating the fair value of our individual reporting units, theenterprise fair value was considered based upon the income approach, which utilizes adiscounted cash flow method to determine the fair value of the business based on thepresent value of future benefits the business is expected to generate. If the assumptionsunderlying these estimated future benefits change, we may be required to recordimpairment losses for these assets. For a further discussion of goodwill, see note 4 withinthe Notes to Consolidated Financial Statements included in Item 15 of this Annual Reporton Form 10-K.
• Capitalized Software Costs. We capitalize software development costs incurred in connectionwith the localization and translation of our products once technological feasibility has beenachieved based on a working model. We also capitalize software purchased from thirdparties or through business combinations as acquired software technology if such softwarehas reached technological feasibility. A working model is defined as an operative version ofthe computer software product that is completed in the same software language as theproduct to be ultimately marketed, performs all the major functions planned for theproduct and is ready for initial customer testing. Capitalized software costs are amortizedon a straight-line basis over three years and charged to ‘‘Cost of license fees’’. Weperiodically compare the unamortized capitalized software development costs to theestimated net realizable value of the associated product. The amount by which theunamortized capitalized software costs of a particular software product exceed theestimated net realizable value of that asset is reported as a charge to the statement ofoperations. This review requires management judgment regarding future cash flows. Ifthese estimates or their related assumptions require updating in the future, we may berequired to recognize losses for these assets.
• Valuation of Deferred Tax Assets. Statement of Financial Accounting Standards No. 109,‘‘Accounting for Income Taxes’’ (SFAS 109), requires that the carrying value of ourdeferred tax assets reflects an amount that is more likely than not to be realized. AtJanuary 31, 2005, we had $7.8 million of deferred tax assets, net of valuation allowances,consisting of $41.4 million of gross deferred tax assets offset by valuation allowances of$33.6 million. In assessing the likelihood of realizing tax benefits associated with deferredtax assets and the need for a valuation allowance, we consider the weight of all availableevidence, both positive and negative, including expected future taxable income and taxplanning strategies that are both prudent and feasible. At April 30, 2004 and January 31,2005, we performed an assessment of the recoverability of our net deferred tax assets. Wedetermined that some tax benefits associated with previously reserved net deferred taxassets were more likely than not realizable through future taxable income and futurereversals of existing taxable temporary differences. As a result, we recorded a tax benefit of$1.2 million at April 30, 2004 and $5.3 million at January 31, 2005, resulting from thereduction of previously recorded valuation allowances against net deferred tax assets.Should we determine that we would not be able to realize all or part of the net deferredtax asset in the future, an adjustment to deferred tax assets would increase tax expense inthe period such determination was made.
• Stock-based Compensation Expense. We account for our stock option grants in accordancewith the provisions of Accounting Principles Board Opinion No. 25, ‘‘Accounting for StockIssued to Employees’’ (APB 25), and related interpretations including Financial AccountingStandards Board Interpretation No. 44, ‘‘Accounting for Certain Transactions Involving
24

Stock Compensation.’’ As such, compensation expense is generally recorded on the date ofgrant only if the current market price of the underlying stock exceeded the exercise priceor in connection with the modification to outstanding awards and/or changes in granteestatus.
Compensation expense related to stock options granted to non-employees is accounted forunder Statement of Financial Accounting Standards No. 123, ‘‘Accounting for Stock-BasedCompensation’’ (SFAS 123) and EITF 96-18, ‘‘Accounting for Equity Instruments that areIssued to Other than Employees for Acquiring, or in Conjunction with Selling, Goods, orServices’’, which requires entities to recognize an expense based on the fair value of therelated awards. Statement of Financial Accounting Standards No. 148, ‘‘Accounting forStock-Based Compensation-Transition and Disclosure—an Amendment of FASB StatementNo. 123’’ amended SFAS 123 to provide alternative methods of transition for a voluntarychange to the fair-value-based method of accounting for stock-based employeecompensation. We are not currently required to transition to a fair value method ofaccounting for stock-based employee compensation. Instead, we have elected to provide therequired disclosures as if we had transitioned. For pro forma net income (loss) and relatedincome (loss) per share had we applied the fair value recognition provisions of SFAS 123,as amended, to stock-based employee compensation, see note 1 to Notes to ConsolidatedFinancial Statements within this Annual Report on Form 10-K.
In December 2004, the Financial Accounting Standards Board issued Statement ofFinancial Accounting Standard No. 123R, ‘‘Share-Based Payment’’ (SFAS 123R).SFAS 123R will require us to account for our stock options using a fair-value-basedmethod as described in such statement and recognize the resulting compensation expensein our financial statements. We are currently evaluating the requirements of SFAS 123R.We have not determined the method of adoption and have not determined whether theadoption will result in amounts recognized in the income statement that are similar to thecurrent pro forma disclosures under SFAS 123. The actual annual expense is dependent ona number of factors, including the number of stock options granted, our common stockprice and related expected volatility and other inputs utilized in estimating the fair value ofthe stock options at the time of grant. Accordingly, the adoption in fiscal 2007 ofSFAS 123R will likely have a substantial material effect on our results of operations andresults of operations may not be comparative on a historical basis.
Historically, estimates described in our critical accounting policies that have requiredsignificant judgment and estimation on the part of management have been reasonablyaccurate.
25
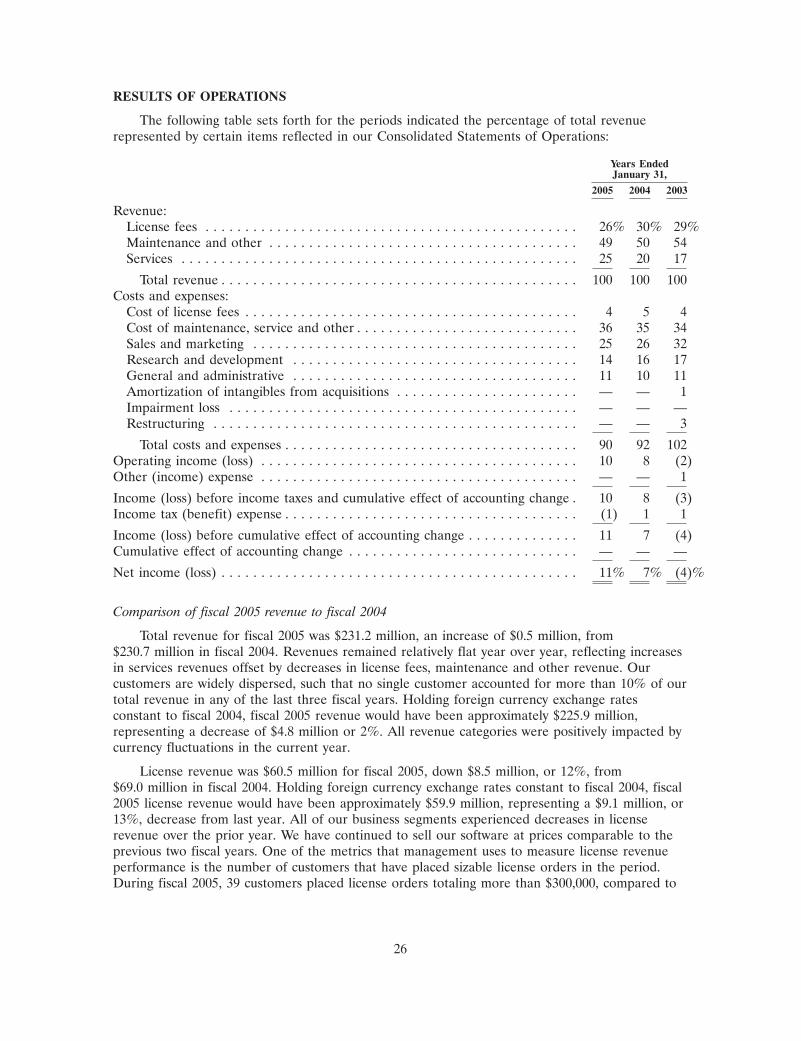
RESULTS OF OPERATIONS
The following table sets forth for the periods indicated the percentage of total revenuerepresented by certain items reflected in our Consolidated Statements of Operations:
Years EndedJanuary 31,
2005 2004 2003
Revenue:License fees . . . . . . . . . . . . . . . . . . . . . . . . . . . . . . . . . . . . . . . . . . . . . . . 26% 30% 29%Maintenance and other . . . . . . . . . . . . . . . . . . . . . . . . . . . . . . . . . . . . . . . 49 50 54Services . . . . . . . . . . . . . . . . . . . . . . . . . . . . . . . . . . . . . . . . . . . . . . . . . . 25 20 17
Total revenue . . . . . . . . . . . . . . . . . . . . . . . . . . . . . . . . . . . . . . . . . . . . . 100 100 100Costs and expenses:
Cost of license fees . . . . . . . . . . . . . . . . . . . . . . . . . . . . . . . . . . . . . . . . . . 4 5 4Cost of maintenance, service and other . . . . . . . . . . . . . . . . . . . . . . . . . . . . 36 35 34Sales and marketing . . . . . . . . . . . . . . . . . . . . . . . . . . . . . . . . . . . . . . . . . 25 26 32Research and development . . . . . . . . . . . . . . . . . . . . . . . . . . . . . . . . . . . . 14 16 17General and administrative . . . . . . . . . . . . . . . . . . . . . . . . . . . . . . . . . . . . 11 10 11Amortization of intangibles from acquisitions . . . . . . . . . . . . . . . . . . . . . . . — — 1Impairment loss . . . . . . . . . . . . . . . . . . . . . . . . . . . . . . . . . . . . . . . . . . . . — — —Restructuring . . . . . . . . . . . . . . . . . . . . . . . . . . . . . . . . . . . . . . . . . . . . . . — — 3
Total costs and expenses . . . . . . . . . . . . . . . . . . . . . . . . . . . . . . . . . . . . . 90 92 102Operating income (loss) . . . . . . . . . . . . . . . . . . . . . . . . . . . . . . . . . . . . . . . . 10 8 (2)Other (income) expense . . . . . . . . . . . . . . . . . . . . . . . . . . . . . . . . . . . . . . . . — — 1
Income (loss) before income taxes and cumulative effect of accounting change . 10 8 (3)Income tax (benefit) expense . . . . . . . . . . . . . . . . . . . . . . . . . . . . . . . . . . . . . (1) 1 1
Income (loss) before cumulative effect of accounting change . . . . . . . . . . . . . . 11 7 (4)Cumulative effect of accounting change . . . . . . . . . . . . . . . . . . . . . . . . . . . . . — — —
Net income (loss) . . . . . . . . . . . . . . . . . . . . . . . . . . . . . . . . . . . . . . . . . . . . . 11% 7% (4)%
Comparison of fiscal 2005 revenue to fiscal 2004
Total revenue for fiscal 2005 was $231.2 million, an increase of $0.5 million, from$230.7 million in fiscal 2004. Revenues remained relatively flat year over year, reflecting increasesin services revenues offset by decreases in license fees, maintenance and other revenue. Ourcustomers are widely dispersed, such that no single customer accounted for more than 10% of ourtotal revenue in any of the last three fiscal years. Holding foreign currency exchange ratesconstant to fiscal 2004, fiscal 2005 revenue would have been approximately $225.9 million,representing a decrease of $4.8 million or 2%. All revenue categories were positively impacted bycurrency fluctuations in the current year.
License revenue was $60.5 million for fiscal 2005, down $8.5 million, or 12%, from$69.0 million in fiscal 2004. Holding foreign currency exchange rates constant to fiscal 2004, fiscal2005 license revenue would have been approximately $59.9 million, representing a $9.1 million, or13%, decrease from last year. All of our business segments experienced decreases in licenserevenue over the prior year. We have continued to sell our software at prices comparable to theprevious two fiscal years. One of the metrics that management uses to measure license revenueperformance is the number of customers that have placed sizable license orders in the period.During fiscal 2005, 39 customers placed license orders totaling more than $300,000, compared to
26

49 customers in fiscal 2004. We believe that the lower number of sizable orders this year can beattributed, in part, to our customers focusing on Sarbanes-Oxley compliance rather than systemsimplementations.
Maintenance and other revenue was $113.7 million for fiscal 2005, representing a decrease of$1.0 million, or 1%, from the $114.7 million for fiscal 2004. Holding exchange rates constant tothose prevailing in fiscal 2004, fiscal 2005 maintenance and other revenue would have beenapproximately $111.5 million, representing a $3.2 million, or 3%, decrease from last year.Maintenance revenue decreased $1.8 million year over year due in part to improvements in ourmaintenance renewal backlog in fiscal 2005 which has resulted in fewer significant cases ofdelayed renewal commitments than in the prior year, which has an unfavorable impact whencomparing to last year. In addition, other revenue decreased $1.3 million, primarily due to lowerhardware sales in the Asia Pacific region year over year. One of the ways management measuresour success in securing contract renewals is by measuring the number of customer sites with activecontracts as of the end of the previous reporting period and comparing this to the number ofthose same customers that have renewed, or are in the process of renewing, as of the currentperiod end. Our maintenance contract renewal rate has remained consistent, in excess of 90% forboth fiscal 2005 and 2004.
Services revenue was $56.9 million for fiscal 2005, representing an increase of $10.0 million,or 21%, when compared to last year at $46.9 million. Holding exchange rates constant to thoseprevailing during fiscal 2004, fiscal 2005 services revenue would have been approximately$54.4 million, reflecting a $7.5 million, or 16%, increase over last year. The effect of the changein exchange rates mainly related to fluctuations in the euro. Increases in North America werepartly offset by decreases in EMEA region. Our services backlog as of the current year-end isslightly lower than fiscal 2004, primarily due to the timing of major contract awards.
Comparison of fiscal 2004 revenue to fiscal 2003
Total revenue for fiscal 2004 was $230.7 million, an increase of $35.4 million, or 18%, fromfiscal 2003, reflecting increases in all revenue categories and regions. Holding foreign currencyexchange rates constant to fiscal 2003, fiscal 2004 revenue would have been approximately$221.6 million, representing an increase of $26.4 million, or 13%, over fiscal 2003.
License revenue was $69.0 million for fiscal 2004, up $13.0 million, or 23%, from$56.0 million for fiscal 2003. Holding foreign currency exchange rates constant to fiscal 2003,fiscal 2004 license revenue would have been approximately $67.6 million, representing an$11.6 million, or 21%, increase over fiscal 2003. All of our business segments experiencedincreases over the prior year. The increase over fiscal 2003 reflected a higher volume of userlicenses sold, due in part to the favorable impact of a return to somewhat higher IT spendinglevels within our customer base during fiscal 2004. We believe that this shift was partlyattributable to a more positive outlook regarding the economy and the global politicalenvironment. In addition, we experienced increases in revenue within the Asia Pacific regionduring fiscal 2004, partly due to greater success in our sales execution process in Asia. In relationto the number of customers that had placed sizable license orders in the period, during fiscal2004, 49 customers placed license orders totaling more than $300,000, compared to 39 customersin fiscal 2003.
Maintenance and other revenue was $114.7 million for fiscal 2004, representing an increaseof $8.4 million, or 8%, over the $106.3 million for fiscal 2003. Holding exchange rates constant tothose prevailing in fiscal 2003, fiscal 2004 maintenance and other revenue would have beenapproximately $111.3 million, representing a $5.0 million, or 5%, increase over last year. Theincrease in maintenance revenue was made up of increases in each of our regions. The
27
year-over-year increase was primarily due to additional maintenance on new license sales, partiallyoffset by cancellations within our existing customer base.
Services revenue was $46.9 million for fiscal 2004, representing an increase of $14.0 million,or 43%, when compared to fiscal 2003 at $32.9 million. Holding foreign currency exchange ratesconstant to fiscal 2003, fiscal 2004 services revenue would have been approximately $42.7 million,reflecting a $9.7 million, or 30%, increase over the prior year. The effect of the change inexchange rates mainly related to fluctuations in the euro. In addition, services revenue increasedover fiscal 2003 due to the inclusion of a full year of services revenue in fiscal 2004 in the EMEAregion from the TRW ISCS acquisition that was completed in November 2002. Also contributingto the increase was an increase in the number of larger license sales, primarily in North America,which typically lead to significant services engagements. Our services backlog as of the fiscal2004 year-end had increased over the prior year-end mainly due to the assimilation of the TRWISCS operations. In North America, we experienced an increase in the number and size ofservices contracts awarded to our services organization, rather than our partners or other serviceproviders in fiscal 2004.
Comparison of costs and expenses—fiscal 2005, 2004 and 2003
Total Cost of Revenue. Total cost of revenue (combined cost of license fees and cost ofmaintenance, service and other revenue) was $91.5 million for both fiscal 2005 and 2004 and was$75.0 million for fiscal 2003 and as a percentage of total revenue was 40%, for both fiscal 2005and 2004 and was 38% for fiscal 2003. Holding exchange rates constant to the most recentpreceding fiscal year, total cost of revenue would have been approximately $88.5 million and$85.9 million for fiscal 2005 and 2004, respectively, reflecting the impact of the weakening U.S.dollar in comparison to other currencies. At constant exchange rates, the total cost of revenuepercentage for both fiscal 2005 and fiscal 2004 would have decreased 1% to 39%.
Fiscal 2005 and 2004 included employee separation costs of $1.6 million and $2.0 million,respectively (mainly in EMEA). Fiscal 2003 included non-recurring expense reductions related totwo separate royalty contract accruals totaling $1.2 million, resulting in a one-point decrease inthe total cost of revenue percentage to 38%. Excluding the impact of the royalty expensereduction, the total cost of revenue percentage would have been 39% in fiscal 2003.
Sales and Marketing. Sales and marketing expense was $56.6 million, $60.2 million and$61.7 million for fiscal 2005, 2004 and 2003, respectively. The decrease of $3.6 million from fiscal2004 to fiscal 2005 was primarily related to lower personnel expenses of $3.8 million, lower travelexpenses of $1.2 million and lower marketing expenses of $0.8 million, all related to our costcontainment efforts in fiscal 2005, partially offset by increased sales agent fees of $0.8 million andthe unfavorable currency impact of $1.8 million, mainly due to the strengthening of the euro.
The decrease of $1.5 million from fiscal 2003 to 2004 was mainly related to lower salariesand related allocations, partly due to the favorable impact of the fiscal 2003 cost containmentefforts on the fiscal 2004 results, significantly offset by the unfavorable impact of the weakening ofthe U.S. dollar, mainly in relation to the euro and the Australian dollar, higher bonus expense onimproved performance metrics and the inclusion of $0.9 million of additional employee separationcosts in fiscal 2004.
Research and Development. Research and development expense, which is managed on aglobal basis, was $33.2 million, $36.2 million and $33.4 million in fiscal 2005, 2004 and 2003,respectively. The decrease of $3.0 million from fiscal 2004 to 2005 was primarily attributable tolower personnel expenses of $2.6 million, primarily due to our cost containment efforts in NorthAmerica and a lower level of contractor expense in the current year.
28

The increase from fiscal 2003 to 2004 was primarily due to increased personnel, consultingand related expenses aligned with our investment in the development of our products in fiscal2004. In addition, we were unfavorably impacted by the weakening of the U.S. dollar relative tocertain other currencies, mainly the euro and Australian dollar, in fiscal 2004.
General and Administrative. General and administrative expense was $26.1 million,$24.2 million and $21.8 million for fiscal 2005, 2004 and 2003, respectively. The $1.8 millionincrease from fiscal 2004 to 2005 was mainly related to a $1.3 million increase in professionalfees, primarily related to compliance with Section 404 of the Sarbanes-Oxley Act of 2002, and$0.7 million unfavorable currency fluctuation related to the weakening of the U.S. dollar.
The $2.4 million increase from fiscal 2003 to 2004 was primarily due to incrementally higherexpense in EMEA, including personnel and associated costs related to the TRW ISCS acquisitioncompleted in November 2002, higher bonuses on improved performance metrics and the impactof the weakening of the U.S. dollar.
Amortization of Intangibles from Acquisitions. Amortization of intangibles from acquisitionstotaled $0.5 million, $0.9 million and $1.2 million in fiscal 2005, 2004 and 2003, respectively. Theyear over year declines were primarily related to certain intangible assets that had become fullyamortized.
Impairment Loss. SFAS 142 requires us to analyze goodwill for impairment at least on anannual basis or when a triggering event requires an additional analysis. We have chosenNovember 30th of our fiscal year as our annual test period. During the fourth quarter of fiscal2005, 2004 and 2003, in connection with our annual test, all reporting units containing goodwillwere valued and tested for impairment. The results of this test yielded no indication ofimpairment for the reporting units that had goodwill on their balance sheets as of the test date,which included EMEA, Latin America and Asia Pacific.
During fiscal 2004 and 2003, we made earnout payments to the selling entity of an acquiredbusiness in our Asia Pacific reporting unit of $0.3 million and $0.2 million, respectively, based onfinancial performance under the purchase agreement. The payments effectively served to increasethe purchase price of the acquisition, thus adding to our goodwill balance. Based on the earnoutpayments, under SFAS 142, the Asia Pacific reporting unit was valued and tested for impairment.In fiscal 2004, no impairment was indicated. In accordance with the provisions of SFAS 142, thefiscal 2003 additional $0.2 million of goodwill in Asia Pacific was fully impaired and the relatedimpairment loss is included in our Consolidated Statement of Operations for fiscal 2003.
Restructuring. In prior years, we implemented restructuring programs designed to strengthenoperations and financial performance. Charges and adjustments related to restructurings areincluded in ‘‘Restructuring’’ in our Consolidated Statements of Operations. During fiscal 2004 and2003, we recorded $(0.3) million and $5.3 million, respectively, related to restructuring. Below is adiscussion of those restructuring programs and related activity through January 31, 2005.
During fiscal 2003, we implemented cost reduction programs aimed at reducing annualizedoperating expenses to better align them with then current business levels. The related actionsresulted in a combined $4.4 million charge that included a reduction of approximately 130employees across all regions and functions ($4.1 million), facility consolidations ($0.1 million) andassociated asset write-downs ($0.2 million). In addition, during fiscal 2003, we recorded anadjustment of $0.9 million as an increase to total costs and expenses, related to a fiscal 2002restructuring accrual due to our inability to sublease certain office space as originally planned.During fiscal 2004, we recorded an adjustment of $0.3 million as a decrease to total costs andexpenses related to the fiscal 2002 restructuring accrual to reflect a change in utilization related to
29

a previously vacated leased office space. As of January 31, 2005 the restructuring accruals, asadjusted, were fully utilized.
Total Other (Income) Expense. Total other (income) expense was $1.0 million, $(1.4) millionand $2.0 million in fiscal 2005, 2004 and 2003, respectively. The $2.4 million unfavorable changefrom fiscal 2004 to 2005 mainly relates to a $1.5 million gain on sale of property in fiscal 2004. Inaddition, interest expense increased $0.9 million due to additional interest incurred in relation tothe $18.0 million long-term financing, as described in the Contractual Obligations section below.
The favorable change from fiscal 2003 to 2004 was primarily related to the inclusion of the$1.5 million gain on the sale of property in fiscal 2004, and a favorable change in foreign currencytransaction and remeasurement (gains) and losses when compared to fiscal 2003.
Income Tax Expense. We recorded an income tax benefit of $2.1 million in fiscal 2005 andincome tax expense of $3.1 million and $1.3 million in fiscal years 2004 and 2003, respectively.These amounts include taxes in profitable jurisdictions. We have not provided tax benefits forcertain jurisdictions in loss positions due to management’s determination regarding theuncertainty of the realization of these tax benefits. These amounts also include benefits related tothe reversal of tax valuation allowances of $6.5 million in fiscal 2005. For further informationregarding income taxes, please see note 8 within the Notes to Consolidated Financial Statementsincluded in Item 15 of this Annual Report on Form 10-K.
Cumulative Effect of Accounting Change. During fiscal 2003, we adopted SFAS 142 related toimpairment tests for goodwill, resulting in the reporting of a cumulative effect of a change inaccounting principle of $1.1 million. For a further discussion related to this change, see note 4within the Notes to Consolidated Financial Statements included in Item 15 of this Annual Reporton Form 10-K.
LIQUIDITY AND CAPITAL RESOURCES
We have historically financed our operations and met our capital expenditure requirementsthrough cash flows from operations, sale of equity securities and borrowings.
Our principal sources of liquidity are cash flows generated from operations and our cash andequivalents and marketable securities balances. Cash and equivalents and marketable securitiescombined were $68.3 million and $59.8 million at January 31, 2005 and 2004, respectively. Ourworking capital increased to $27.6 million as of January 31, 2005 from $6.0 million as ofJanuary 31, 2004. The increase in working capital of $21.6 million from last year-end includes a$15.0 million decrease in current liabilities and a $6.6 million increase in current assets. The$15.0 million decrease in current liabilities primarily related to a $10.3 million decrease in ourcurrent portion of long-term debt. During fiscal 2005, we repaid all of our borrowings under ourconstruction loan as described below and entered into a new long-term loan agreement secured byour property located in Summerland, California.
The $6.6 million increase in current assets related primarily to an $8.5 million increase incash and equivalents as detailed in our Consolidated Statement of Cash Flows for the year endedJanuary 31, 2005, partially offset by lower accounts receivable, mainly related to higher collectionsin the current year. Accounts receivable days’ sales outstanding, using the count back method,increased slightly to 60 days at January 31, 2005, from 58 days at January 31, 2004.
Net Cash
Net cash, defined as cash and equivalents and marketable securities less short and long termdebt, increased slightly to $42.7 million as of January 31, 2005 from $40.1 million at January 31,
30

2004. Cash increases from operating cash flow were offset by additional debt, incurred to financethe construction of our corporate headquarters.
Cash Flows
The following is a summary of cash flows for fiscal 2005, 2004 and 2003:
Operating Activities
Cash provided by operating activities was $23.0 million, $19.8 million and $13.4 millionin fiscal 2005, 2004 and 2003, respectively. The increase from fiscal 2004 to 2005 relatedprimarily to an increase in net income year over year offset by a decrease in depreciation andamortization and a non-cash tax benefit from the reversal of deferred tax valuationallowances of $6.5 million. In addition, accounts receivable reflected a net decrease in fiscal2005 due to collections in excess of billings, versus a net increase in accounts receivable infiscal 2004. Increases to cash flow in fiscal 2005 were offset by decreases in other liabilitieswhich primarily relates to higher income tax payments and payroll-related payments in fiscal2005.
Operating activities in fiscal 2005 include $0.7 million of exit costs related to an officelease we vacated in December 2004. At the time we vacated the lease we secured a sub-leasefor an amount less than our current lease payments. Therefore, we incurred a non-cashimpairment charge in fiscal 2005.
The increase from fiscal 2003 to 2004 related primarily to the shift in our financialresults of operations from a net loss to net income. This was partially offset by the impact ofan increase in accounts receivable in fiscal 2004 due to billings in excess of collections, versusa decrease in accounts receivable in fiscal 2003 related to collections in excess of billings.
Investing Activities
Cash used in investing activities for fiscal 2005, 2004 and 2003 was $13.0 million,$21.2 million and $3.3 million, respectively, mainly related to the purchase of property andequipment.
Purchases of property and equipment for fiscal 2005, 2004 and 2003 were $10.6 million,$17.8 million and $9.3 million, respectively. Property and equipment purchases primarilyrelate to capital investments of $6.6 million, $13.8 million and $4.3 million, respectively, forthe construction of our new company headquarters on property owned by QAD inSummerland, California. Upon securing our construction loan in fiscal 2003, approximately$6.8 million was transferred into a restricted cash account at Santa Barbara Bank and Trust(SBB&T). Of the restricted cash amount, approximately $2.5 million was used to pay costsrelated to the project before loan proceeds were borrowed from SBB&T. At January 31,2003, the remaining restricted cash balance was $1.0 million and was fully utilized to fund theconstruction project during fiscal 2004. In fiscal 2004, these purchases were partially offset bythe proceeds from the sale of a parcel of property located in Carpinteria, California. Wemoved into our new company headquarters in May 2004, and shortly thereafter we paid ourconstruction loan in full and entered into a long-term financing arrangement with Mid-Statebank, which is secured by the property.
We invest funds in short term marketable securities on which we earn interest income.This balance can fluctuate based on our short-term investing decisions. In fiscal 2003 and2004, we sold $7.5 million and $0.5 million, respectively, in marketable securities. In fiscal2004, we made purchases at a cost of $7.0 million.
31

In April 2004, we acquired certain assets and liabilities of Oxford Consulting Group, Inc.located in the United States. We paid $0.8 million in cash upon consummation which isincluded in ‘‘Acquisitions of businesses, net of cash acquired’’ in our January 31, 2005Consolidated Statement of Cash Flows.
In November 2002, we acquired the TRW Integrated Supply Chain Solutions (TRWISCS) business covering 10 European countries and North America from BDMInternational, Inc. (a wholly-owned subsidiary of TRW Inc.) and TRW Inc. Prior to theacquisition, TRW ISCS, a QAD alliance partner pursuant to an agreement with QAD,operated businesses that primarily focused on systems installation, integration and services inconnection with the MFG/PRO software owned and licensed by QAD and otherQAD-related goods and services. Under the terms of the Stock and Asset PurchaseAgreement, QAD paid $1.0 million in cash and incurred transaction costs, including directacquisition costs, involuntary termination costs and facility related costs, of approximately$5.7 million. QAD funded the purchase price paid to BDM International, Inc. and TRW Inc.with cash generated from operating activities. Among the assets acquired by QAD from TRWISCS was approximately $1.8 million in cash and equivalents. Because the cash acquiredexceeded the cash expended for the acquisition, the net cash impact of $0.8 million for theacquisition is reflected as cash provided from investing activities in our fiscal 2003Consolidated Statement of Cash Flows.
In March 2003, we sold a 34-acre undeveloped parcel of property in Carpinteria,California for $3.3 million, net of associated fees. The book value of this property was$1.8 million resulting in a $1.5 million gain on disposal of the property.
Financing Activities
Cash (used in) provided by financing activities was $(2.1) million, $2.9 million and $(5.5)million for fiscal 2005, 2004 and 2003, respectively.
The fiscal 2005 activity includes loan proceeds of $17.8 million from a loan agreementwe entered into with Mid-State Bank in July of 2004. We used $14.3 million of the proceedsto pay the then existing construction loan with SBB&T. We implemented a dividend programduring the year and as a result, paid $5.1 million in dividends to our common stockholders.Proceeds from the issuance of common stock was $2.8 million, primarily related to theexercise of stock options. In addition, our board of directors approved a stock repurchaseprogram to repurchase up to 1.0 million shares of common stock. Approximately 742,000shares of common stock were repurchased for $5.6 million during fiscal 2005.
The fiscal 2004 activity includes approximately $15.2 million in expenditures related to a‘‘Modified Dutch Auction’’ tender offer, in which we purchased approximately 2.9 millionshares of our common stock at a price of $5.00 per share. Proceeds from the issuance ofcommon stock were $9.6 million and $0.9 million for fiscal 2004 and 2003, respectively,primarily related to the exercise of stock options. Also included in the fiscal 2004 proceedsfrom the issuance of stock was the December 2003 exercise of a warrant by Recovery EquityInvestors II, L.P. to purchase 225,000 shares of QAD common stock at an exercise price of$7.50 per share for which QAD received $1.7 million in cash. In addition, fiscal 2004 includes$10.5 million in proceeds from the construction loan related to the building of our newheadquarters in Summerland, California.
Upon securing our construction loan in fiscal 2003, $6.8 million was transferred to arestricted cash account at SBB&T, of which approximately $4.3 million was used within thatfiscal year, to pay off the existing first deed mortgage secured by the property.
32

We believe that the cash on hand, net cash provided by operating activities and the availableborrowings under our existing and future credit facility will provide us with sufficient resources tomeet our current and long-term working capital requirements, debt service, dividend paymentsand other cash needs for at least the next twelve months.
CONTRACTUAL OBLIGATIONS
The following summarizes our significant contractual obligations at January 31, 2005 and theeffect these contractual obligations are expected to have on our liquidity and cash flows in futureperiods.
Year Ended January 31,
2006 2007 2008 2009 2010 Thereafter Total(in millions)Credit facility . . . . . . . . . . . . . . . . . . . . . . . . $ 1.5 $ 6.1 $ — $ — $ — $ — $ 7.6Notes payable . . . . . . . . . . . . . . . . . . . . . . . 0.2 0.2 0.2 0.3 0.3 16.7 17.9Notes payable interest payments . . . . . . . . . . . 1.2 1.2 1.2 1.1 1.1 4.8 10.6Lease obligations . . . . . . . . . . . . . . . . . . . . . 5.8 4.3 2.0 1.6 1.4 4.2 19.3Technology purchases . . . . . . . . . . . . . . . . . . 4.0 0.2 — — — — 4.2
Total . . . . . . . . . . . . . . . . . . . . . . . . . . . . $12.7 $12.0 $3.4 $3.0 $2.8 $25.7 $59.6
Credit Facility
Effective April 7, 2005, we entered into a new unsecured loan agreement with ComericaBank. The agreement provides a three-year commitment for a $20 million line of credit (CBFacility). On April 7, 2005, we terminated our existing $30 million secured credit facility withWells Fargo Foothill, Inc. Amounts then outstanding under the Wells Fargo Foothill Facility wererepaid with funds borrowed from the CB Facility.
The maximum amount that can be borrowed under the CB Facility is subject to a borrowingbase calculation of 1.5 times the four-quarter trailing EBITDA. We will pay an annualcommitment fee of between 0.25% and 0.50% calculated on the average unused portion of the$20 million CB Facility. The rate is determined by our ratio of funded debt to our 12-monthtrailing EBITDA.
The CB Facility provides that we will maintain certain financial and operating covenantswhich include, among other provisions, maintaining a minimum liquidity ratio of 1.3 to 1.0, aminimum 12-month trailing EBITDA of $10 million and a minimum cash balance in the UnitedStates of $10 million. Borrowings under the CB Facility bear interest at a floating rate based onLIBOR or prime plus the corresponding applicable margins, ranging from 0.75% to 1.75% for theLIBOR option or -0.25% to 0.25% for the prime option, depending on QAD’s funded debt to12-month trailing EBITDA ratio.
The balance sheet classification as of January 31, 2005 consists of $1.5 million in ‘‘Currentportion of long-term debt’’ and $6.1 million in ‘‘Long-term debt’’ as we have the ability and intentto repay $1.5 million of the amount borrowed from the CB Facility within the next twelve months.For a detailed discussion regarding our Wells Fargo Foothill Facility outstanding as of January 31,2005, see note 7 within the Notes to Consolidated Financial Statements included in Item 15 ofthis Annual Report of Form 10-K. As of January 31, 2005, we were in compliance with the WellsFargo Foothill Facility covenants, as amended.
33
Notes Payable
On July 28, 2004, QAD Ortega Hill, LLC, a wholly-owned subsidiary of QAD Inc. enteredinto a loan agreement with Mid-State Bank & Trust. The loan has a principal amount of$18.0 million and bears interest at a fixed rate of 6.5%. This is a non-recourse loan, which issecured by real property located in Summerland, California. The loan matures on July 28, 2014.Over the term of the loan, we will make 119 monthly payments of $115,000 and one finalpayment of $15.4 million. Total proceeds were $17.8 million, which was net of transaction fees of$0.2 million. A portion of these proceeds were used to repay our then existing construction loanwith Santa Barbara Bank and Trust. The balance of the note payable at January 31, 2005 was$17.9 million.
Lease Obligations
We lease certain office facilities, office equipment and automobiles under operating leaseagreements. Future minimum rental payments under non-cancelable operating lease commitmentswith terms of more than one year are included in the above table of contractual obligations. Forfurther discussion of our leased office facilities, see Item 2 entitled ‘‘Properties’’ includedelsewhere in this Annual Report on form 10-K.
Technology Purchases
Subsequent to our fiscal 2005 year-end, QAD acquired intellectual property comprised ofcertain software that is complementary to MFG/PRO and that will enhance the financial andarchitectural capabilities of MFG/PRO. The acquisition price was approximately $3.7 million,payable in four installments. The first payment of approximately $1.3 million was made inFebruary 2005. The final payment is due in May 2006.
During the fiscal 2004 third quarter, QAD acquired intellectual property comprised of certainsoftware that is complementary to MFG/PRO and is part of our Customer Self-Service solution.The acquisition price included a total of $0.8 million in guaranteed payments, payable annuallyover three years, beginning with $0.3 million paid upon acquisition. The agreement sets forthadditional potential future contingent payments by QAD of up to $0.3 million per year for threeyears commencing upon acquisition, based on future sales of the acquired software when usedwith certain versions of MFG/PRO.
During the fiscal 2004 fourth quarter, QAD acquired intellectual property comprised ofcertain software that is complementary to MFG/PRO and is part of our Business Intelligencesolution. The acquisition price included a total of $0.9 million in guaranteed payments, payableannually over three years beginning with $0.3 million that was due in February 2004. Theagreement also sets forth potential future contingent payments by QAD for three yearscommencing upon acquisition, based on future sales of the acquired software.
34
FACTORS THAT MAY AFFECT FUTURE RESULTS AND MARKET PRICE OF STOCK
HISTORICAL FLUCTUATIONS IN QUARTERLY RESULTS AND POTENTIAL FUTURESIGNIFICANT FLUCTUATIONS
Our quarterly revenue, expenses and operating results have varied significantly in the past.We anticipate that such fluctuations will continue in the future as a result of a number of factors,many of which are outside our control. The factors affecting these fluctuations include demandfor our products and services, the size, timing and structure of significant licenses purchased bycustomers, market acceptance of new or enhanced versions of our software products and productsthat operate with our products, the publication of opinions about us, our products and technologyby industry analysts, the entry of new competitors and technological advances by competitors,delays in localizing our products for new markets, delays in sales as a result of lengthy salescycles, changes in operating expenses, foreign currency exchange rate fluctuations, changes inaccounting principles, changes in pricing policies by us or our competitors, customer orderdeferrals in anticipation of product enhancements or new product offerings by us or ourcompetitors, the timing of the release of new or enhanced versions of our software products andproducts that operate with our products, changes in the method of product distribution andlicensing (including the mix of direct and indirect channels), product life cycles, changes in themix of products and services licensed or sold by us, customer cancellation of major plannedsoftware development programs or maintenance contracts and general, regional or marketeconomic factors and the global political environment.
We have historically recognized a substantial portion of our revenue from sales booked andshipped in the last month of a quarter. As a result, the magnitude of quarterly fluctuations inlicense fees may not become evident until late in, or at the end of, a particular quarter. If salesforecasted from a specific customer for a particular quarter are not realized in that quarter, weare unlikely to be able to generate revenue from alternate sources in time to compensate for theshortfall. As a result, a lost or delayed sale could have an adverse effect on our quarterlyoperating results. To the extent that significant sales occur earlier than expected, operating resultsfor subsequent quarters may be adversely affected. We have also historically operated with littlebacklog for licenses because our products are generally shipped as orders are received. As aresult, revenue from license fees in any quarter is substantially dependent on orders booked andshipped in that quarter. Sales derived through indirect channels are more difficult to predict andmay have lower profit margins than direct sales.
A significant portion of our revenue in any quarter may be derived from a limited number oflarge, non-recurring license sales. We expect to continue to experience from time to time large,individual license sales, which may cause significant variations in quarterly license fees. We alsobelieve that the purchase of our products is relatively discretionary and generally involves asignificant commitment of a customer’s capital resources. Therefore, a downturn in any potentialcustomer’s business could result in order cancellations that could have a significant adverse impacton our revenue and quarterly results. Moreover, actual or perceived declines in general economicconditions, worsening of the global political environment or a delay in the improvement of thecurrent economic situation may result in significant reductions in corporate spending forinformation technology, which could result in delays, cancellations or reductions of orders for ourproducts.
The services business may fluctuate. Services staffing increases our overhead and the servicesbusiness reduces our gross margins. Services revenue remains a substantial part of our business.Services revenue increased in fiscal 2004 and 2005, due primarily to the TRW ISCS acquisition,the Oxford acquisition and an increase in license sales in fiscal 2004. While the expensesassociated with services operations are relatively predictable, the revenues are dependent upon the
35

timing and size of customer orders to provide the services. To the extent that we are notsuccessful in securing orders from customers to provide services on a regular basis, our resultsmay be negatively affected.
Fixed expense level is based on expected revenues. Our expense level is relatively fixed and isbased, in significant part, on expectations of future revenue. Because our expense level isrelatively fixed, if revenue levels are below expectations, expense could be disproportionately highas a percentage of total revenue. If this were to occur, operating results would be immediatelyand adversely affected and losses could occur.
Because of the significant fluctuations in our revenue, period-to-period comparisons may not bemeaningful. Based upon the factors described above, we believe that our quarterly revenue,expenses and operating results are likely to vary significantly in the future, that period-to-periodcomparisons of our results of operations are not necessarily meaningful and that, as a result, thesecomparisons should not be relied upon as indications of future performance. Moreover, there canbe no assurance that our revenue will grow in future periods or that we will be profitable on aquarterly or annual basis. We have in the past, and may in the future, experience quarterly losses.
RISKS ASSOCIATED WITH SALES CYCLE
Our products involve a long sales cycle and the timing of sales is difficult to predict. Because thelicensing of our primary products generally involves a significant commitment of capital by ourcustomers (which typically range from approximately $50,000 to several million dollars), the salescycle associated with a customer’s purchase of our products is generally lengthy (with a typicalduration of 4 to 15 months), varies from customer to customer and is subject to a number ofsignificant risks over which we have little or no control. These risks include customers’ budgetaryconstraints, timing of budget cycles, concerns about the introduction of new products by us or ourcompetitors and actual or perceived declines in general economic conditions that can result indelays or cancellations of information systems investments. Due in part to the strategic nature ofour products, potential customers are typically cautious in making product acquisition decisions.The decision to license our products generally requires us to provide a significant level ofeducation to prospective customers regarding the uses and benefits of our products, and we mustfrequently commit substantial presales resources in the sales cycle.
While we believe we have established a robust global support and services organization overthe past several years, we continue to rely on third-parties for a portion of our implementationand systems support services, which in the past caused sales cycles to be lengthened and may haveresulted in the loss of sales. Further, the uncertainty of the outcome of our sales efforts and thelength of our sales cycles could still result in substantial fluctuations in operating results. If salesforecasted from a specific customer for a particular quarter are not realized in that quarter, thenwe are unlikely to be able to generate revenue from alternative sources in time to compensate forthe shortfall. As a result, and due to the relatively large size of some orders, a lost or delayed salecould have an adverse effect on our quarterly and/or annual operating results.
DEPENDENCE ON THIRD-PARTY PRODUCTS
We are dependent on third-party products, particularly Progress software. MFG/PRO software iswritten in a programming language that is proprietary to Progress Software Corporation(Progress). We have entered into a license agreement with Progress that provides us and each ofour subsidiaries, among other things, with the perpetual, worldwide, royalty-free right to use theProgress programming language to develop and market our software products. Effective July 2002,we entered a three-year extension of the agreement with Progress under which Progress providessupport to us at no charge.
36

Our success is dependent upon Progress continuing to develop, support and enhance itsprogramming language, its toolset and database, as well as the continued market acceptance ofProgress as a standard database program and continuing our relationship with them. We have inthe past, and may in the future, experience product release delays because of delays in the releaseof Progress products or product enhancements. Any of these delays could have an adverse effecton our business, operating results and financial condition. MFG/PRO software employs Progressprogramming interfaces that allow MFG/PRO software to operate with Oracle Corporationdatabase software. However, MFG/PRO software does not run within programming environmentsother than Progress and our customers must acquire rights to Progress software in order to useMFG/PRO software. We are in the process of extending our current Value Added Resellerrelationship with Progress.
We also are reliant on the Java programming language (Java) in developing and supportingour products. For instance, the user interface for MFG/PRO software products employs Java. Thefailure to successfully incorporate Java in new products, to convert MFG/PRO software toJava-interfaced Progress software components, to extend the MFG/PRO Java user interfaces, orof Java or Enterprise Java Beans technology to maintain market acceptance, could have anadverse effect on us.
We also maintain development and product alliances with other third-parties. These alliancesinclude software developed to be sold in conjunction with QAD software products, technologydeveloped to be included in or encapsulated within QAD software products and numerous third-party software programs that generally are not sold with QAD software but interoperate directlywith QAD software through application program interfaces. We occasionally enter into jointdevelopment agreements with our third-party software development alliances that governownership of the technology collectively developed. In addition, we have embarked on anopportunistic strategy of acquiring certain niche products to extend and enhance our productoffering. These acquisitions involve third party products, or software developed by a customer,that were already in use with our software but only on a limited basis geographically. Theseinclude products such as our customer self-service solution, our inventory management product,known as AIM, our QAD Sequencing (or Just in Time) software, our Business Intelligencesolution and an enhancement to our finance solution. While we believe these products will yieldsignificant value to QAD in the future, at this point they are at various stages of being integratedinto our product offering.
Each of our partner agreements and third-party development, product acquisition or reselleragreements contain strict confidentiality and non-disclosure provisions for the service provider,end-user and third-party developer. Our third-party development agreements contain restrictionson the use of QAD technology outside of the development process. Any failure to establish ormaintain successful relationships with these third-party software providers or third-partyinstallation, implementation and development partners or failure of these third-party softwareproviders to develop and support their software could have an adverse effect on us. Any failure bythem to provide appropriate indemnification in the event of an alleged infringement by a third-party related to their products could have an adverse effect on us.
RAPID TECHNOLOGICAL CHANGE
The market for our software products is characterized by rapid technological advances, evolvingindustry standards in computer hardware and software technology, changes in customer requirementsand frequent new product introductions and enhancements as well as industry consolidation.Customer requirements for products can change rapidly as a result of innovations or changeswithin the computer hardware and software industries, the introduction of new products andtechnologies (including new hardware platforms and programming languages) and the emergence,
37

evolution or widespread adoption of, or changes to, industry standards including those related toconsolidation in the industry. For example, increasing commercial use of the Internet is giving riseto new customer requirements and new industry standards. Our future success will depend uponour ability to continue to enhance our current product line and to develop and introduce newproducts that keep pace with technological developments, satisfy increasingly sophisticatedcustomer requirements, keep pace with industry and compliance standards and achieve marketacceptance. In particular, we believe our future success will depend on our ability to convert ourproducts to component objects, as well as our ability to develop products that will operate andinteroperate across the Internet and assist customers to operate within the Extended Enterprise.We cannot ensure that we will be successful in developing and marketing, on a timely andcost-effective basis, product enhancements or new products that respond to technological advancesby others. Our products may also not achieve market acceptance. Our failure to successfullydevelop and market product enhancements or new products could have an adverse effect on us.
New software releases and enhancements may adversely affect our software sales. While wegenerally take steps to avoid interruptions of sales due to the pending availability of new products,customers may delay their purchasing decisions in anticipation of the general availability of newor enhanced QAD software or other software, which could have an adverse effect on us. Theactual or anticipated introduction of new products, technologies and industry standards can alsorender existing products obsolete or unmarketable or result in delays in the purchase of thoseproducts. As a result, the life cycles of our products are difficult to estimate. We must respond todevelopments rapidly and incur substantial product development expenses. Any failure by us toanticipate or respond adequately to developments in technology or customer requirements, or anysignificant delays in the introduction of new products, could result in a loss of revenue. Moreover,significant delays in the general availability of new releases, significant problems in the installationor implementation of new releases, or customer dissatisfaction with new releases could adverselyaffect us.
PROPRIETARY RIGHTS AND LICENSING
Our success is dependent upon our proprietary technology and other intellectual property. Werely primarily on a combination of the protections provided by applicable copyright, trademarkand trade secret laws, as well as on confidentiality procedures and licensing arrangements, toestablish and protect our rights in our software and related materials and information. We enterinto license agreements with each of our customers. Each of these license agreements provides forthe non-exclusive license of QAD software. These licenses generally are perpetual and containstrict confidentiality and non-disclosure provisions, a limited warranty covering our software andindemnification for the customer from infringement actions related to our software.
The pricing policy for each license is based on a standard price list and may vary based on anumber of parameters including the number of end-users, number of sites, number of modules,number of languages, the country in which the license is granted and level of ongoing support,training and services to be provided by QAD.
In fiscal 2005, we started implementing a new Business Process Cycle (BPC) pricing andlicensing model for some of our solutions. Currently, our applications are priced and licensedprimarily on a per user basis. With BPC pricing, QAD products will be licensed based upon acombination of the number of users and the extent to which a QAD customer leverages QAD’ssoftware to automate and optimize key business processes. There are no assurances that such alicensing model will be accepted in the market place or will yield revenue comparable to thecurrent licensing method.
38

To facilitate our customers’ ability to customize our software, we generally license oursoftware to end-users in both object code (machine-readable) and source code (human-readable)formats. While this practice facilitates customization, making software available in source codealso makes it easier for third-parties to copy or modify our software for impermissible purposes.Distributors or other persons may independently develop a modified version of our software. Ourlicense agreements generally allow the use of our software solely by the customer for internalpurposes without the right to sublicense or transfer the software to third-parties. Although wecurrently have no patents, we have two pending patent applications.
We believe that the measures we take to protect our proprietary technology and otherintellectual property afford only limited protection. Despite our efforts, it may be possible forthird-parties to copy portions of our products, to reverse engineer them or to obtain and useinformation that we regard as proprietary. In addition, the laws of certain countries do not protectour proprietary rights to the same extent as the laws of the United States. Accordingly, there canbe no assurance that we will be able to protect our proprietary software against unauthorizedcopying or use, which could adversely affect our competitive position. Furthermore, there can beno assurance that our competitors will not independently develop technology similar to ours.
We may be faced with or need to bring infringement claims to protect our rights. We have beenin the past, and may be in the future, subject to claims of intellectual property infringement andmay increasingly be subject to these types of claims as the number of products and competitors inour targeted vertical markets grows and the functionality of products in other industry segmentsoverlaps. Although we do not believe that any of our products infringe upon the proprietary rightsof third-parties, there can be no assurance that third-parties will not claim infringement by us withrespect to current or future products.
We may also initiate or be subject to claims or litigation with or against third-parties forinfringement of our proprietary rights or to establish the validity of our proprietary rights, whichcould result in significant expense to us, cause product shipment delays, require us to enterroyalty or licensing agreements and divert the efforts of our technical and management personnelfrom productive tasks, whether or not such litigation were determined in our favor.
We also periodically acquire intellectual property from third-parties. In some instances, thisintellectual property is prepared on a work-for-hire or similar basis, and in other instances, welicense the intellectual property. We have been in the past, and expect to be in the future, partyto disputes about ownership, license scope and royalty or fee terms with respect to intellectualproperty.
Our intellectual property rights may be significantly affected by third-party relationships andactions. We have in the past, and may in the future, resell certain software which we licensefrom third-parties. In addition, we have in the past, and may in the future, jointly developsoftware in which we will have co-ownership or cross-licensing rights. There can be no assurancethat these third-party software arrangements and licenses will continue to be available to us onterms that provide us with the third-party software we require, provide adequate functionality inour products on terms that adequately protect our proprietary rights, or are commerciallyfavorable to us. The loss of or inability to maintain or obtain any of these software licenses,including a loss as a result of a third-party infringement claim, could result in delays or reductionsin product shipments until equivalent software, if any, could be identified, licensed or developedand integrated.
We may be exposed to product liability claims. While our license agreements with ourcustomers typically contain provisions designed to limit our exposure to potential material productliability claims including appropriate warranty, indemnification waiver and limitation of liability
39

provisions, it is possible that such provisions may not be effective under the laws of somejurisdictions. Although we have not experienced any product liability claims to date, we may besubject to claims in the future. We have an errors and omissions insurance policy. However, thisinsurance may not continue to be available to us on commercially reasonable terms, or at all. Asuccessful product liability or errors or omissions claim brought against us could have an adverseeffect on us. Moreover, defending a suit, regardless of its merits, could entail substantial expenseand require the time and attention of key management personnel, either of which could have anadverse effect on us.
EXTENDED ENTERPRISE SOLUTIONS
The market for Extended Enterprise solutions is uncertain. A significant element of ourstrategy is the acceptance of our Extended Enterprise solution, a series of new solutions targetedat enabling manufacturers to communicate with customers and suppliers. We have devotedsubstantial resources to developing our Extended Enterprise solutions, such as CSS, EDI, andsupply visualization hosted on MFGx.net, and are working with third-parties to develop softwarecomponents that may be included as part of or incorporated within such Extended Enterprisesolutions. However, we cannot ensure our other planned releases for such Extended Enterprisesolutions, whether developed by us or third-parties, will achieve the performance standardsrequired for commercialization. In addition, our Extended Enterprise solutions may not achievemarket acceptance or be profitable. If our Extended Enterprise solutions do not achieve suchperformance standards or do not achieve market acceptance, we would be adversely affected.
The underlying technology being used to develop some of our applications has been updated andis dependent on specific technologies. Our Extended Enterprise solutions are being designed andbuilt using updated Progress Software technology, as well as the object-oriented technology of SunMicrosystems—Java 2 Enterprise Edition (J2EE). Our Extended Enterprise solutions depend onthe commercial success of platforms that support Progress Software and Enterprise Java Beans inApplication Server environments. In addition, we have embarked on an opportunistic strategy ofacquiring certain niche products to extend and enhance our product offering, including those forthe Extended Enterprise solutions. The success of the Extended Enterprise solutions will dependon our ability to successfully enhance and globalize these acquired products and distribute, serviceand support them internationally.
Object-oriented applications, such as our Extended Enterprise solutions, are characterized bytechnology development styles and programming languages that differ from those used intraditional software applications. We believe that the flexibility inherent in object-basedfunctionality will play a key role in the competitive manufacturing, distribution, financial, planningand service/support management information technology strategies of customers in our targetedindustry segments. We cannot ensure that we will be successful in developing our other plannedExtended Enterprise solutions on a timely basis or that our Extended Enterprise solutions willachieve market acceptance.
MARKET CONCENTRATION
Our target markets are concentrated and, as a result, we are dependent upon achieving success inthose markets. We have made a strategic decision to concentrate our product development andsales and marketing in certain primary vertical industry segments—automotive, consumerproducts, electronics, food and beverage, industrial and medical. An important element of ourstrategy is to achieve technological and market leadership recognition for our software products inthese segments. The failure of our products to achieve or maintain substantial market acceptancein one or more of these segments could have an adverse effect on us. If any of these targetedindustry segments experience a material slowdown in expansion or in prospects for future growth,
40

that downturn would adversely affect the demand for our products. A discussion of concentrationof our credit risk is contained in note 1 within the Notes to Consolidated Financial Statementsincluded in Item 15 of this Annual Report on Form 10-K.
DEPENDENCE UPON KEY PERSONNEL
We are dependent upon key personnel. Our future operating results depend in significant partupon the continued service of a relatively small number of key technical and senior managementpersonnel, including Founder, Chairman of the Board and President, Pamela M. Lopker, andChief Executive Officer, Karl F. Lopker, neither of whom is bound by an employment agreement.Pamela and Karl Lopker are married to each other and, as of March 31, 2005, jointly andbeneficially owned approximately 53% of QAD’s outstanding common stock.
Our future success also depends on our continuing ability to attract and retain other highlyqualified technical and managerial personnel. Competition for these personnel can be intense, andwe have at times experienced difficulty in recruiting and retaining qualified personnel. We may beunable to retain our key technical and managerial employees and we may not be successful inattracting, assimilating and retaining other highly qualified technical and managerial personnel inthe future. The loss of any member of our key technical and senior management personnel or theinability to attract and retain additional qualified personnel could have an adverse effect on us.We do not currently have key-person insurance covering any of our employees.
DEPENDENCE UPON DEVELOPMENT AND MAINTENANCE OF SALES AND MARKETINGCHANNELS
We are dependent upon the development and maintenance of sales and marketing channels. Wesell and support our products through direct and indirect sales organizations throughout theworld. In the past, we have made significant expenditures in the expansion of our sales andmarketing force, primarily outside the United States. More recently, we have tailored our salesand marketing expenditures to align more closely with our targeted vertical and geographicmarkets. Our future success will depend in part upon the productivity of our sales and marketingforce and our ability to continue to attract, integrate, train, motivate and retain new sales andmarketing personnel.
Competition for sales and marketing personnel in the software industry can be intense. Wecannot ensure that we will be successful in hiring these personnel in accordance with our plans.Neither can there be assurance that our recent and planned expenses in sales and marketing willultimately prove to be successful or that the incremental revenue generated will exceed thesignificant incremental costs associated with these efforts. In addition, our sales and marketingorganization may not be able to compete successfully against the significantly more extensive andbetter funded sales and marketing operations of many of our current and potential competitors. Ifwe are unable to develop and manage our sales and marketing force effectively, we could beadversely affected.
Our indirect sales channel consists of over 40 distributors and sales agents worldwide (saleschannels). We do not grant exclusive distribution rights to our sales channels. Our sales channelsprimarily sell independently to companies within their geographic territory but may also work inconjunction with our direct sales organization. We will need to maintain and expand ourrelationships with our existing sales channels to expand the distribution of our products. Ourcurrent or future sales channels may not provide the level and quality of expertise and servicerequired to successfully license our software products. We also may not be able to maintaineffective, long-term relationships with them. In addition, our selected sales channels may notcontinue to meet our sales needs. Further, they may market software products in competition with
41

us in the future or otherwise reduce or discontinue their relationships with or support of us andour products. Any failure to successfully maintain our existing indirect sales channel relationshipsor to establish new relationships in the future could have an adverse effect on us. Also, if any ofour distributors or sales agents exclusively adopts a product other than QAD software products,or if any distributor or sales agent reduces its sales efforts relating to our software products orincreases support for competitive products, we could be adversely affected.
RELIANCE ON RELATIONSHIPS WITH THIRD-PARTIES
We are reliant on relationships with third-parties. We have certain relationships with a numberof consulting and systems integration organizations that we believe are important to ourworldwide sales, marketing, service and support activities and the implementation of our products.We are aware that these third-party providers do not provide system integration servicesexclusively for our products and in many instances these firms have similar, and often moreestablished, relationships with our principal competitors. We expect to continue to utilize third-party system integrators.
QAD global services is a significant part of our business that offers technical, implementationand learning services to our customers. We have designed our service organization so that we cansubcontract our services to third-party providers for specific technical needs and also subcontractservices from our providers to meet our capacity requirements. We believe this method allows foradditional flexibility in ensuring our customers’ needs for services are met. These relationshipsalso assist us in keeping pace with the technological and marketing developments of majorsoftware vendors, and, in certain instances, provide us with technical assistance for our productdevelopment efforts.
We typically enter into separate agreements with each of our distribution and service providers.These agreements make available to our providers the non-exclusive right to promote and marketQAD software products and to provide training, installation, implementation and other servicesfor QAD software products within a defined territory for a specified period of time (generally twoyears). Our installation and implementation providers generally do not receive fees for the sale ofour software products unless they participate actively in a sale as a sales agent. However, theygenerally are permitted to set their own rates for their installation and implementation services,and we typically do not receive a royalty or percentage fee from these providers on servicesperformed. We also enter into similar agreements with our distribution providers that grant theseproviders the non-exclusive right, within a specified territory, to market, license, deliver andsupport our software products. In exchange for these distribution services, we grant a discount tothe provider for the license of our software products.
These third-parties may not provide the level and quality of service required to meet theneeds of our customers and we may not be able to maintain an effective, long-term relationshipwith these third-parties. Any failure to maintain our existing relationships or to establish newrelationships in the future, or the failure of these third-parties to meet the needs of ourcustomers, could have an adverse effect on us. In addition, if these third-parties exclusively adopta product or technology other than QAD software product or technology, or if these third-partiesreduce their support of QAD software products and technology or increase such support forcompetitive products or technology, we could be adversely affected.
We also rely on third-parties for the development or interoperation of key components of oursoftware. These research and product alliances develop software to be sold in conjunction withour software products, technology to be included in or incorporated within QAD softwareproducts and numerous third-party software programs that generally are not sold with QADsoftware products, but interoperate directly with QAD software through application program
42

interfaces. We generally enter into reseller or joint development agreements with our third-partysoftware development partners that govern ownership of the technology collectively developed.Each of our partner agreements and third-party development agreements contains strictconfidentiality and non-disclosure provisions for the service provider, end-user and third-partydeveloper. Our third-party development agreements contain restrictions on the use of ourtechnology outside of the development process. Any failure to establish or maintain successfulrelationships with these third-party software providers or these third-party implementation anddevelopment alliances or the failure of these third-party software providers to develop andsupport their software could have an adverse effect on us.
INTEGRATION OF ACQUIRED BUSINESS AND INTELLECTUAL PROPERTY
We have continued an opportunistic strategy of acquiring certain niche products to extendand enhance our product offering. These acquisitions involve third-party products, or softwaredeveloped by a customer, that were already in use with our software but only on a limited basisgeographically. These include products such as a module within our Customer Self Service module(known as CSS), our inventory management product (known as AIM), our EDI solutions, ourfinancial solution enhancement, our QAD Sequencing (or Just in Time) software and ourBusiness Intelligence solution. While we believe these products will yield significant value to QADin the future, at this point they are at various stages of being integrated into our product offering.There is no assurance that we will be successful in integrating these acquisitions, or any futureacquisitions, into our business and any failure to do so may adversely affect our results.
RISKS ASSOCIATED WITH INTERNATIONAL OPERATIONS
Our operations are international in scope, which exposes us to additional risk, including currency-related risk. For the last three fiscal years, we derived approximately 60% of our total revenuefrom sales outside the United States. Of our more than 5,300 licensed sites in more than 90countries, as of January 31, 2005, approximately 80% are outside the United States. Our foreignexchange risk is discussed in Item 7A of this Annual Report on Form 10-K.
Continued terrorism threats and war in the Middle East have had a negative impact on the globaleconomy. The adverse consequences of war and the effects of terrorism have had a negativeaffect on the global economy. Prolonged conflict could negatively impact our ability to raiseadditional funds if needed and our revenues will be adversely affected if consumers andbusinesses choose to cut back spending due to conflicts or such threats.
Labor laws vary by country exposing us to potential costs not typically borne in the United States.The nature of our international business, and that of our customers, is such that we have toregularly review the composition of our workforce on a country by country basis and determine ifwe have the appropriate workforce in place. We have in the past, and may in the future, besubject to costs associated with restructuring our workforce in a given country. The costs of suchrestructurings, should they be necessary, may be significant and could adversely affect our results.
RISKS DUE TO BUSINESS INTERRUPTIONS
Our operations are vulnerable to interruption by fire, earthquake, power loss, telecommunicationsfailure and other events beyond our control. A substantial portion of our facilities, including ourcorporate headquarters and other critical business operations, are located near major earthquakefaults. Although the facilities in which we host our computer systems are designed to be faulttolerant and disaster recovery procedures are in place, the systems are susceptible to damage fromfire, floods, earthquakes, power loss, telecommunications failures, and similar events. In addition,terrorist acts or acts of war may cause damage or disruption to us and our employees, facilities,
43

suppliers, distributors and customers, which could have a material adverse effect on ouroperations and financial results. If a business interruption occurs, our business could be seriouslyharmed.
EFFECT OF SUBSTANTIAL SALES OF STOCK
Substantial sales of our stock could negatively affect its price. As of January 31, 2005, QADhad 33.8 million shares of common stock outstanding and 4.5 million outstanding stock optionsunder stock option plans. As a result, a substantial number of shares of common stock will beeligible for sale in the public market at various times in the future. Sales of substantial amountsof such shares could adversely affect the market price of our stock.
MARKET CONSOLIDATION
The ERP software market has experienced significant consolidation. This consolidation hasincluded numerous mergers and acquisitions including hostile takeovers such as the Oracle/Peoplesoft transaction. As a result, many prospective buyers are experiencing some reluctance inpurchasing applications that could have a short lifespan due to an acquisition resulting in theapplication’s life being abruptly cut short. In addition, increased competition and consolidation inthese markets is likely to result in price reductions, reduced operating margins and changes inmarket share, any one of which could adversely affect us. QAD’s controlled company statusmakes it highly unlikely that a hostile takeover of the company would occur.
THE MARKET FOR OUR STOCK IS VOLATILE
The market prices for securities of technology companies, such as QAD, have been quite volatile.Quarter to quarter variations in our operating results, changes in our guidance on revenues andearnings estimates, announcements of technological innovations or new products by us, or by ourcompetitors, the loss or gain of significant customers or changes in stock market analystsestimates, announcements of major contract awards, changes in accounting standards orregulatory requirements as promulgated by the FASB, PCAOB, SEC, NASDAQ or otherregulatory entities, and other events or factors may have a significant impact on the market priceof our stock. In addition, the securities of many technology companies have experienced extremeprice and volume fluctuations, which have often been unrelated to the companies’ operatingperformance. These conditions may adversely affect the market price of our stock. Because ofthese and other factors affecting our operating results, past financial performance should not beconsidered as an indicator of future stock performance, and investors should not use historicaltrends to anticipate results or trends in future periods.
The market price of our common stock and the number of shares traded each day havevaried greatly. Such fluctuations may continue due to numerous factors, including:
• quarterly fluctuations in operating results;
• announcements of new products by us or our competitors;
• gains or losses of significant customers;
• the presence of short-selling of our common stock;
• sales of a high volume of shares of our common stock by our large stockholders;
• events affecting other companies that the market deems comparable to us;
• general economic conditions in the United States and abroad.
44

INTERNAL CONTROL OVER FINANCIAL REPORTING
Failure to maintain adequate internal control over financial reporting could have a materialadverse effect upon our results of operations. If we fail to maintain an effective system of internalcontrols we may not be able to accurately report our financial results. If we cannot providereliable financial reports, our business and operating results could be harmed. As a result, currentand potential stockholders could lose confidence in our financial reporting, which would harm ourbusiness and the trading price of our stock.
PRINCIPAL STOCKHOLDERS
Our principal stockholders are also directors. As of March 31, 2005, Pamela and Karl Lopkerjointly and beneficially owned approximately 53% of our outstanding common stock. RecoveryEquity Investors II, L.P. (REI) owned approximately 9% of our outstanding common stock.Pamela and Karl Lopker currently constitute two of the seven members of the board of directorsand are also officers of QAD in their capacity as President and CEO, respectively. A generalpartner of the general partner of REI is also on the QAD board of directors. On a combinedbasis, current directors and executive officers beneficially owned approximately 62% of thecommon stock.
Pamela and Karl Lopker are generally not prohibited from selling a controlling interest in usto a third party. Their concentrated control could discourage others from initiating any potentialmerger, takeover or other change of control transaction that might be beneficial to our business.As a result, the market price of our common stock could be adversely affected.
Because Pamela and Karl Lopker, as husband and wife, own a majority of our commonstock, we are a ‘‘controlled company’’ within the meaning of the rules of the NASDAQ. As such,we are not required to comply with certain corporate governance rules of the NASDAQ thatwould otherwise apply to us as a listed company on the NASDAQ. These rules are generallyintended to increase the likelihood that boards will make decisions in the best interests ofshareholders.
Specifically, we are not required to have a majority of independent directors on our board ofdirectors and we are not required to have nominating and corporate governance andcompensation committees composed of independent directors. Should the interests of Pamela andKarl Lopker differ from those of other shareholders, the other shareholders will not be affordedthe protections of having a majority of directors on the board who are independent from ourprincipal shareholders or our management.
IMPACT OF LEGISLATION
Concern about corporate governance in the U.S. has caused government agencies to enact morestringent controls, primarily including requirements associated with the Sarbanes-Oxley Act of 2002.These changes impact the public accounting profession, public companies, including corporateduties and responsibilities, and securities analysts. Some highlights include establishment of thePublic Company Accounting Oversight Board, enhanced disclosure requirements for publiccompanies and their insiders, required certification by CEO’s and CFO’s of SEC financial filings,prohibitions on certain loans to officers and directors, efforts to curb potential securities analysts’conflicts of interest, possible forfeiture of profits by certain insiders in the event financialstatements are restated, enhanced board audit committee requirements, protections providedunder a formal system to handle complaints to the audit committee, reporting on internal controlsby management and independent auditors, and enhanced civil and criminal penalties for violationsof securities laws. It is difficult to predict the full impact of these changes. However it hasincreased and will continue to increase the costs of securities law compliance for publicly tradedcompanies such as ours.
45

These compliance requirements also impose a demand that our software provide the abilityto enable our customers to meet these requirements. Any failure by us to keep pace with suchrequirements could impact our ability to continue to market our products. We are aware that ourcurrent and potential customers could choose another software vendor’s solution, if they perceivegreater benefit from a compliance perspective.
Like many companies, the cost and effort necessary to comply with the Sarbanes-Oxley Act,particularly Section 404 of the Act, has imposed a significant burden on us and still remains apotential risk.
ITEM 7A. QUANTITATIVE AND QUALITATIVE DISCLOSURES ABOUT MARKET RISK
Foreign Exchange. In fiscal 2005, approximately 35% of our revenue was denominated inforeign currencies compared to 35% and 30% in fiscal years 2004 and 2003, respectively. We alsoincurred approximately 45% of our expenses in currencies other than the U.S. dollar in both fiscal2005 and 2004, compared with approximately 40% in fiscal 2003. As a result, fluctuations in thevalues of the respective currencies relative to the currencies in which we generate revenue couldadversely affect us.
Fluctuations in currencies relative to the U.S. dollar have affected, and will continue toaffect, period-to-period comparisons of our reported results of operations. In fiscal 2005, 2004 and2003, foreign currency transaction and remeasurement (gains) and losses totaled $(189,000),$(36,000) and $818,000, respectively, and are included in ‘‘Other (income) expense, net’’ in ourConsolidated Statements of Operations. Due to constantly changing currency exposures and thevolatility of currency exchange rates, we may experience currency losses in the future, and wecannot predict the effect of exchange rate fluctuations upon future operating results. Although wedo not currently undertake hedging transactions, we may choose to hedge a portion of ourcurrency exposure in the future, as we deem appropriate.
Interest Rates. We invest our surplus cash in a variety of financial instruments, consistingprincipally of bank time deposits and short-term marketable securities with maturities of less thanone year. Our investment securities are held for purposes other than trading. Cash balances heldby subsidiaries are invested in short-term time deposits with the local operating banks.Additionally, our short-term and long-term debt bears interest at variable rates.
We prepared sensitivity analyses of our interest rate exposure and our exposure fromanticipated investment and borrowing levels for fiscal 2006 to assess the impact of hypotheticalchanges in interest rates. Based upon the results of these analyses, a 10% adverse change ininterest rates from the 2005 fiscal year-end rates would not have a material adverse effect on thefair value of investments and would not materially impact our results of operations or financialcondition for the next fiscal year.
ITEM 8. FINANCIAL STATEMENTS AND SUPPLEMENTARY DATA
The response to this item is included in Item 15 of this Annual Report on Form 10-K.
ITEM 9. CHANGES IN AND DISAGREEMENTS WITH ACCOUNTANTS ON ACCOUNTINGAND FINANCIAL DISCLOSURE
None.
ITEM 9A. CONTROLS AND PROCEDURES
Evaluation of disclosure controls and procedures. The Company’s management evaluated,with the participation of the Chief Executive Officer and the Chief Financial Officer, theeffectiveness of the Company’s disclosure controls and procedures as of the end of the period
46

covered by this Annual Report on Form 10-K. Based on this evaluation, the Company’s principalexecutive officer and principal financial officer have concluded that the Company’s disclosurecontrols and procedures (as defined in Rules 13a-15(e) and 15d-15(e) under the SecuritiesExchange Act of 1934 (the Exchange Act) are effective to ensure that information required to bedisclosed by the Company in reports that it files or submits under the Exchange Act is recorded,processed, summarized and reported within the time periods specified in Securities and ExchangeCommission rules and forms.
Management’s Report on Internal Control Over Financial Reporting. QAD’s management isresponsible for establishing and maintaining adequate internal control over financial reporting.The Company’s system of internal control over financial reporting is designed to providereasonable assurance regarding the reliability of financial reporting and the preparation ofconsolidated financial statements for external purposes in accordance with generally acceptedaccounting principles. The Company’s internal control over financial reporting includes thosepolicies and procedures that: (i) pertain to the maintenance of records that, in reasonable detail,accurately and fairly reflect the transactions and dispositions of the Company’s assets; (ii) providereasonable assurance that transactions are recorded as necessary to permit preparation offinancial statements in accordance with generally accepted accounting principles, and that theCompany’s receipts and expenditures are being made only in accordance with authorizations ofthe Company’s management and directors; and (iii) provide reasonable assurance regardingprevention or timely detection of unauthorized acquisition, use or disposition of the Company’sassets that could have a material effect on the financial statements.
Management has assessed the effectiveness of the Company’s internal control system as ofJanuary 31, 2005 based on the criteria for effective internal control over financial reportingdescribed in ‘‘Internal Control—Integrated Framework’’ issued by the Committee of SponsoringOrganizations of the Treadway Commission (COSO). Based on this assessment, managementbelieves that, as of January 31, 2005, the company’s system of internal control over financialreporting is effective.
The Company’s independent registered public accounting firm, KPMG LLP, has issued anattestation report on management’s assessment of QAD’s internal control over financial reporting.
Limitations on the Effectiveness of Controls. Because of its inherent limitations, internalcontrol over financial reporting may not prevent or detect misstatements. Also, projections of anyevaluation of effectiveness to future periods are subject to the risk that controls may becomeinadequate because of changes in conditions, or that the degree of compliance with the policies orprocedures may deteriorate.
Report of Independent Registered Public Accounting Firm
The Board of Directors and StockholdersQAD Inc.:
We have audited management’s assessment, included in the accompanying report entitled‘‘Management’s Report on Internal Control Over Financial Reporting’’, that QAD Inc. maintainedeffective internal control over financial reporting as of January 31, 2005, based on criteriaestablished in Internal Control—Integrated Framework issued by the Committee of SponsoringOrganizations of the Treadway Commission (COSO). QAD Inc.’s management is responsible formaintaining effective internal control over financial reporting and for its assessment of theeffectiveness of internal control over financial reporting. Our responsibility is to express anopinion on management’s assessment and an opinion on the effectiveness of the Company’sinternal control over financial reporting based on our audit.
47
We conducted our audit in accordance with the standards of the Public Company AccountingOversight Board (United States). Those standards require that we plan and perform the audit toobtain reasonable assurance about whether effective internal control over financial reporting wasmaintained in all material respects. Our audit included obtaining an understanding of internalcontrol over financial reporting, evaluating management’s assessment, testing and evaluating thedesign and operating effectiveness of internal control, and performing such other procedures aswe considered necessary in the circumstances. We believe that our audit provides a reasonablebasis for our opinion.
A company’s internal control over financial reporting is a process designed to providereasonable assurance regarding the reliability of financial reporting and the preparation offinancial statements for external purposes in accordance with generally accepted accountingprinciples. A company’s internal control over financial reporting includes those policies andprocedures that (1) pertain to the maintenance of records that, in reasonable detail, accuratelyand fairly reflect the transactions and dispositions of the assets of the company; (2) providereasonable assurance that transactions are recorded as necessary to permit preparation offinancial statements in accordance with generally accepted accounting principles, and that receiptsand expenditures of the company are being made only in accordance with authorizations ofmanagement and directors of the company; and (3) provide reasonable assurance regardingprevention or timely detection of unauthorized acquisition, use, or disposition of the company’sassets that could have a material effect on the financial statements.
Because of its inherent limitations, internal control over financial reporting may not preventor detect misstatements. Also, projections of any evaluation of effectiveness to future periods aresubject to the risk that controls may become inadequate because of changes in conditions, or thatthe degree of compliance with the policies or procedures may deteriorate.
In our opinion, management’s assessment that QAD Inc. maintained effective internal controlover financial reporting as of January 31, 2005, is fairly stated, in all material respects, based oncriteria established in Internal Control—Integrated Framework issued by the Committee ofSponsoring Organizations of the Treadway Commission (COSO). Also, in our opinion, QAD Inc.maintained, in all material respects, effective internal control over financial reporting as ofJanuary 31, 2005, based on criteria established in Internal Control—Integrated Framework issuedby the Committee of Sponsoring Organizations of the Treadway Commission (COSO).
We also have audited, in accordance with the standards of the Public Company AccountingOversight Board (United States), the consolidated balance sheets of QAD Inc. and subsidiaries asof January 31, 2005 and 2004, and the related consolidated statements of operations, stockholders’equity and comprehensive income (loss), and cash flows for each of the years in the three-yearperiod ended January 31, 2005, and the related financial statement schedule II, and our reportdated April 15, 2005 expressed an unqualified opinion on those consolidated financial statements.
KPMG LLP
Los Angeles, CaliforniaApril 15, 2005
ITEM 9B. OTHER INFORMATION
None.
48
PART III
ITEM 10. DIRECTORS AND EXECUTIVE OFFICERS OF THE REGISTRANT
Information regarding QAD directors is set forth in the section entitled ‘‘Election ofDirectors’’ appearing in our Definitive Proxy Statement for the Annual Meeting of Stockholders(Proxy Statement) to be filed with the Securities and Exchange Commission within 120 days afterthe end of our fiscal 2005, which information is incorporated herein by reference.
In addition, information required by Item 10 with respect to our audit committee and ourcode of ethics applying to our principal executive officer(s) and principal financial and accountingofficers, is incorporated by reference from the Proxy Statement.
Certain information with respect to persons who are or may be deemed to be executiveofficers of the Registrant is set forth under the caption ‘‘Executive Officers of the Registrant’’ inPart I of this Annual Report on Form 10-K.
ITEM 11. EXECUTIVE COMPENSATION
Information regarding executive compensation is set forth under the caption ‘‘ExecutiveCompensation’’ in the Proxy Statement, which information is incorporated herein by reference.
ITEM 12. SECURITY OWNERSHIP OF CERTAIN BENEFICIAL OWNERS ANDMANAGEMENT
Information regarding security ownership of certain beneficial owners and management is setforth under the caption ‘‘Stock Ownership of Directors, Executive Officers and Certain BeneficialOwners’’ in the Proxy Statement, which information is incorporated herein by reference.
ITEM 13. CERTAIN RELATIONSHIPS AND RELATED TRANSACTIONS
Information regarding certain relationships and related transactions is set forth under thecaption ‘‘Certain Transactions’’ in the Proxy Statement, which information is incorporated hereinby reference.
ITEM 14. PRINCIPAL ACCOUNTANT FEES AND SERVICES
Information regarding services performed by, and fees paid to, our independent auditors isset forth under the caption ‘‘Principal Accountant Fees and Services’’ in the Proxy Statement,which information is incorporated herein by reference.
49

PART IV
ITEM 15. EXHIBITS, FINANCIAL STATEMENT SCHEDULES
1. FINANCIAL STATEMENTS
The following financial statements are filed as a part of this Annual Report on Form 10-K:
QAD INC.INDEX TO CONSOLIDATED FINANCIAL STATEMENTS
PAGE
Report of Independent Registered Public Accounting Firm . . . . . . . . . . . . . . . . . 51Consolidated Balance Sheets as of January 31, 2005 and 2004 . . . . . . . . . . . . . . . 52Consolidated Statements of Operations for the years ended January 31, 2005,
2004 and 2003 . . . . . . . . . . . . . . . . . . . . . . . . . . . . . . . . . . . . . . . . . . . . . . . 53Consolidated Statement of Stockholders’ Equity and Comprehensive Income
(Loss) for the years ended January 31, 2005, 2004 and 2003 . . . . . . . . . . . . . . 54Consolidated Statements of Cash Flows for the years ended January 31, 2005,
2004 and 2003 . . . . . . . . . . . . . . . . . . . . . . . . . . . . . . . . . . . . . . . . . . . . . . . 55Notes to Consolidated Financial Statements . . . . . . . . . . . . . . . . . . . . . . . . . . . . 56
2. INDEX TO FINANCIAL STATEMENT SCHEDULES
The following financial statement schedule is filed as a part of this Annual Report onForm 10-K:
PAGE
SCHEDULE II—VALUATION AND QUALIFYING ACCOUNTS . . . . . . . . . . . . . 84
All other schedules are omitted because they are not required or the required information ispresented in the financial statements or notes thereto.
3. INDEX TO EXHIBITS
See the Index of Exhibits at page 86.
50
REPORT OF INDEPENDENT REGISTERED PUBLIC ACCOUNTING FIRM
The Board of Directors and StockholdersQAD Inc.:
We have audited the accompanying consolidated balance sheets of QAD Inc. and subsidiariesas of January 31, 2005 and 2004, and the related consolidated statements of operations,stockholders’ equity and comprehensive income (loss), and cash flows for each of the years in thethree-year period ended January 31, 2005. In connection with our audits of the consolidatedfinancial statements, we also have audited the related financial statement schedule II. Theseconsolidated financial statements and financial statement schedule are the responsibility of theCompany’s management. Our responsibility is to express an opinion on these consolidatedfinancial statements and financial statement schedule based on our audits.
We conducted our audits in accordance with the standards of the Public CompanyAccounting Oversight Board (United States). Those standards require that we plan and performthe audit to obtain reasonable assurance about whether the financial statements are free ofmaterial misstatement. An audit includes examining, on a test basis, evidence supporting theamounts and disclosures in the financial statements. An audit also includes assessing theaccounting principles used and significant estimates made by management, as well as evaluatingthe overall financial statement presentation. We believe that our audits provide a reasonable basisfor our opinion.
In our opinion, the consolidated financial statements referred to above present fairly, in allmaterial respects, the financial position of QAD Inc. and subsidiaries as of January 31, 2005 and2004, and the results of their operations and their cash flows for each of the years in thethree-year period ended January 31, 2005, in conformity with U.S. generally accepted accountingprinciples. Also in our opinion, the related financial statement schedule II, when considered inrelation to the basic consolidated financial statements taken as a whole, presents fairly, in allmaterial respects, the information set forth therein.
We also have audited, in accordance with the standards of the Public Company AccountingOversight Board (United States), the effectiveness of QAD Inc.’s internal control over financialreporting as of January 31, 2005, based on criteria established in Internal Control—IntegratedFramework issued by the Committee of Sponsoring Organizations of the Treadway Commission(COSO), and our report dated April 15, 2005 expressed an unqualified opinion on management’sassessment of, and the effective operation of, internal control over financial reporting.
KPMG LLP
Los Angeles, CaliforniaApril 15, 2005
51

QAD INC.
CONSOLIDATED BALANCE SHEETS
(in thousands, except share data)
January 31,
2005 2004
AssetsCurrent assets:
Cash and equivalents . . . . . . . . . . . . . . . . . . . . . . . . . . . . . . . . . . . . . . $ 55,289 $ 46,784Marketable securities . . . . . . . . . . . . . . . . . . . . . . . . . . . . . . . . . . . . . . 13,000 13,000Accounts receivable, net of allowances of $3.7 million and $4.9 million at
January 31, 2005 and 2004, respectively . . . . . . . . . . . . . . . . . . . . . . . 63,145 65,455Other current assets . . . . . . . . . . . . . . . . . . . . . . . . . . . . . . . . . . . . . . . 13,785 13,352
Total current assets . . . . . . . . . . . . . . . . . . . . . . . . . . . . . . . . . . . . . . 145,219 138,591
Property and equipment, net . . . . . . . . . . . . . . . . . . . . . . . . . . . . . . . . . . 39,701 34,485Capitalized software costs, net . . . . . . . . . . . . . . . . . . . . . . . . . . . . . . . . . 2,791 2,966Goodwill . . . . . . . . . . . . . . . . . . . . . . . . . . . . . . . . . . . . . . . . . . . . . . . . . 11,552 11,306Other assets, net . . . . . . . . . . . . . . . . . . . . . . . . . . . . . . . . . . . . . . . . . . . 7,830 2,480
Total assets . . . . . . . . . . . . . . . . . . . . . . . . . . . . . . . . . . . . . . . . . . . . $207,093 $189,828
Liabilities and Stockholders’ EquityCurrent liabilities:
Current portion of long-term debt . . . . . . . . . . . . . . . . . . . . . . . . . . . . . $ 1,725 $ 11,987Accounts payable . . . . . . . . . . . . . . . . . . . . . . . . . . . . . . . . . . . . . . . . . 11,896 12,553Deferred revenue . . . . . . . . . . . . . . . . . . . . . . . . . . . . . . . . . . . . . . . . . 70,805 69,252Other current liabilities . . . . . . . . . . . . . . . . . . . . . . . . . . . . . . . . . . . . . 33,234 38,821
Total current liabilities . . . . . . . . . . . . . . . . . . . . . . . . . . . . . . . . . . . . 117,660 132,613
Long-term debt . . . . . . . . . . . . . . . . . . . . . . . . . . . . . . . . . . . . . . . . . . . . 23,911 7,720Other liabilities . . . . . . . . . . . . . . . . . . . . . . . . . . . . . . . . . . . . . . . . . . . . 892 1,882Minority interest . . . . . . . . . . . . . . . . . . . . . . . . . . . . . . . . . . . . . . . . . . . 593 500Commitments and contingenciesStockholders’ equity:
Preferred stock, $0.001 par value. Authorized 5,000,000 shares; noneissued and outstanding . . . . . . . . . . . . . . . . . . . . . . . . . . . . . . . . . . . — —
Common stock, $0.001 par value. Authorized 150,000,000 shares; issued35,338,952 shares and 35,334,291 shares at January 31, 2005 and 2004,respectively . . . . . . . . . . . . . . . . . . . . . . . . . . . . . . . . . . . . . . . . . . . . 35 35
Additional paid-in capital . . . . . . . . . . . . . . . . . . . . . . . . . . . . . . . . . . . 119,533 119,411Treasury stock, at cost (1,529,792 shares and 1,561,056 shares at
January 31, 2005 and January 31, 2004, respectively) . . . . . . . . . . . . . . (9,668) (8,100)Accumulated deficit . . . . . . . . . . . . . . . . . . . . . . . . . . . . . . . . . . . . . . . (40,154) (58,038)Unearned compensation—restricted stock . . . . . . . . . . . . . . . . . . . . . . . (440) —Accumulated other comprehensive loss . . . . . . . . . . . . . . . . . . . . . . . . . (5,269) (6,195)
Total stockholders’ equity . . . . . . . . . . . . . . . . . . . . . . . . . . . . . . . . . 64,037 47,113
Total liabilities and stockholders’ equity . . . . . . . . . . . . . . . . . . . . . . . $207,093 $189,828
See accompanying notes to consolidated financial statements.
52

QAD INC.
CONSOLIDATED STATEMENTS OF OPERATIONS
(in thousands, except per share data)
Years Ended January 31,
2005 2004 2003
Revenue:License fees . . . . . . . . . . . . . . . . . . . . . . . . . . . . . . . . . . . . . $ 60,545 $ 69,029 $ 56,023Maintenance and other . . . . . . . . . . . . . . . . . . . . . . . . . . . . 113,729 114,686 106,294Services . . . . . . . . . . . . . . . . . . . . . . . . . . . . . . . . . . . . . . . . 56,932 46,937 32,931
Total revenue . . . . . . . . . . . . . . . . . . . . . . . . . . . . . . . . . . 231,206 230,652 195,248
Costs and expenses:Cost of license fees . . . . . . . . . . . . . . . . . . . . . . . . . . . . . . . 8,628 10,299 8,620Cost of maintenance, service and other revenue . . . . . . . . . . . 82,825 81,215 66,378Sales and marketing . . . . . . . . . . . . . . . . . . . . . . . . . . . . . . . 56,552 60,183 61,723Research and development . . . . . . . . . . . . . . . . . . . . . . . . . . 33,229 36,191 33,395General and administrative . . . . . . . . . . . . . . . . . . . . . . . . . . 26,070 24,228 21,824Amortization of intangibles from acquisitions . . . . . . . . . . . . 516 887 1,165Impairment loss . . . . . . . . . . . . . . . . . . . . . . . . . . . . . . . . . . — — 151Restructuring . . . . . . . . . . . . . . . . . . . . . . . . . . . . . . . . . . . . — (346) 5,287
Total costs and expenses . . . . . . . . . . . . . . . . . . . . . . . . . . 207,820 212,657 198,543
Operating income (loss) . . . . . . . . . . . . . . . . . . . . . . . . . . . . . 23,386 17,995 (3,295)Other (income) expense:
Interest income . . . . . . . . . . . . . . . . . . . . . . . . . . . . . . . . . . (809) (540) (752)Interest expense . . . . . . . . . . . . . . . . . . . . . . . . . . . . . . . . . . 1,889 943 1,614Other (income) expense, net . . . . . . . . . . . . . . . . . . . . . . . . . (120) (1,803) 1,141
Total other (income) expense . . . . . . . . . . . . . . . . . . . . . . 960 (1,400) 2,003
Income (loss) before income taxes and cumulative effect ofaccounting change . . . . . . . . . . . . . . . . . . . . . . . . . . . . . . . . 22,426 19,395 (5,298)
Income tax (benefit) expense . . . . . . . . . . . . . . . . . . . . . . . . . . (2,057) 3,078 1,300
Income (loss) before cumulative effect of accounting change . . . 24,483 16,317 (6,598)Cumulative effect of accounting change . . . . . . . . . . . . . . . . . . — — 1,051
Net income (loss) . . . . . . . . . . . . . . . . . . . . . . . . . . . . . . . . . . $ 24,483 $ 16,317 $ (7,649)
Basic net income (loss) per share:Before cumulative effect of accounting change . . . . . . . . . . . . $ 0.72 $ 0.49 $ (0.19)Cumulative effect of accounting change . . . . . . . . . . . . . . . . . — — 0.03
Basic net income (loss) per share . . . . . . . . . . . . . . . . . . . . . . . $ 0.72 $ 0.49 $ (0.22)
Diluted net income (loss) per share:Before cumulative effect of accounting change . . . . . . . . . . . . $ 0.70 $ 0.47 $ (0.19)Cumulative effect of accounting change . . . . . . . . . . . . . . . . . — — 0.03
Diluted net income (loss) per share . . . . . . . . . . . . . . . . . . . . . $ 0.70 $ 0.47 $ (0.22)
See accompanying notes to consolidated financial statements.
53
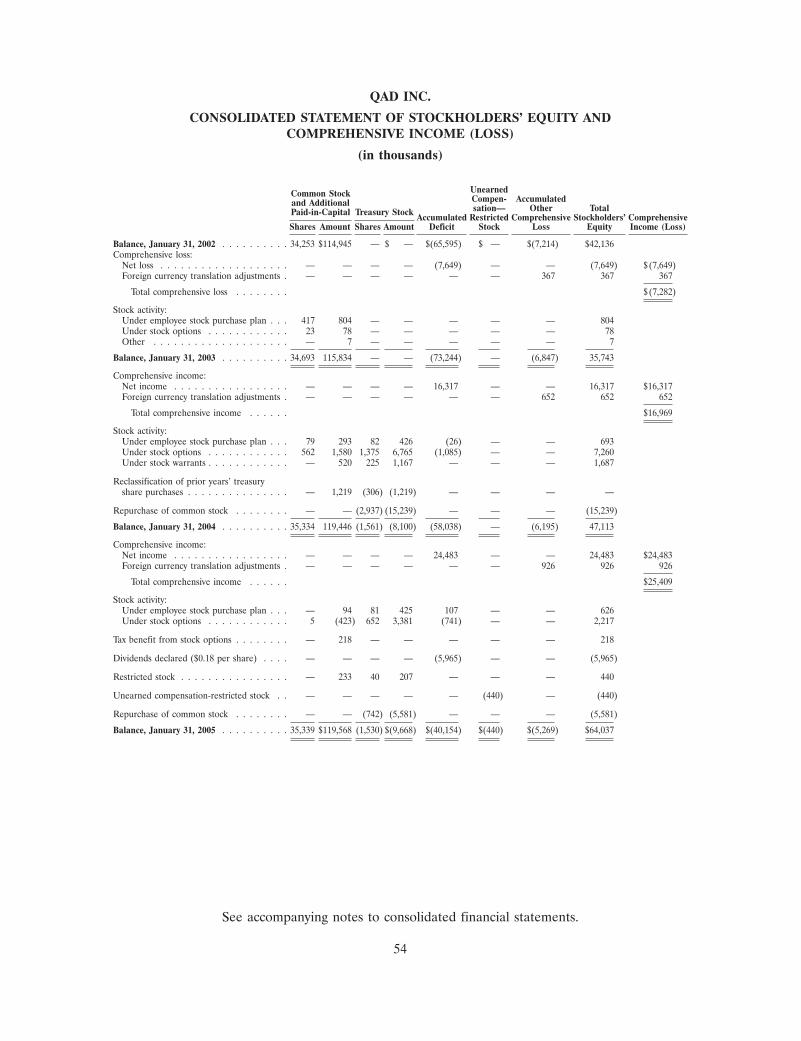
QAD INC.
CONSOLIDATED STATEMENT OF STOCKHOLDERS’ EQUITY ANDCOMPREHENSIVE INCOME (LOSS)
(in thousands)
UnearnedCommon Stock Compen- Accumulatedand Additional sation— Other TotalPaid-in-Capital Treasury Stock Accumulated Restricted Comprehensive Stockholders’ ComprehensiveShares Amount Shares Amount Deficit Stock Loss Equity Income (Loss)
Balance, January 31, 2002 . . . . . . . . . . 34,253 $114,945 — $ — $(65,595) $ — $(7,214) $42,136Comprehensive loss:
Net loss . . . . . . . . . . . . . . . . . . . — — — — (7,649) — — (7,649) $(7,649)Foreign currency translation adjustments . — — — — — — 367 367 367
Total comprehensive loss . . . . . . . . $ (7,282)
Stock activity:Under employee stock purchase plan . . . 417 804 — — — — — 804Under stock options . . . . . . . . . . . . 23 78 — — — — — 78Other . . . . . . . . . . . . . . . . . . . . — 7 — — — — — 7
Balance, January 31, 2003 . . . . . . . . . . 34,693 115,834 — — (73,244) — (6,847) 35,743
Comprehensive income:Net income . . . . . . . . . . . . . . . . . — — — — 16,317 — — 16,317 $16,317Foreign currency translation adjustments . — — — — — — 652 652 652
Total comprehensive income . . . . . . $16,969
Stock activity:Under employee stock purchase plan . . . 79 293 82 426 (26) — — 693Under stock options . . . . . . . . . . . . 562 1,580 1,375 6,765 (1,085) — — 7,260Under stock warrants . . . . . . . . . . . . — 520 225 1,167 — — — 1,687
Reclassification of prior years’ treasuryshare purchases . . . . . . . . . . . . . . . — 1,219 (306) (1,219) — — — —
Repurchase of common stock . . . . . . . . — — (2,937) (15,239) — — — (15,239)
Balance, January 31, 2004 . . . . . . . . . . 35,334 119,446 (1,561) (8,100) (58,038) — (6,195) 47,113
Comprehensive income:Net income . . . . . . . . . . . . . . . . . — — — — 24,483 — — 24,483 $24,483Foreign currency translation adjustments . — — — — — — 926 926 926
Total comprehensive income . . . . . . $25,409
Stock activity:Under employee stock purchase plan . . . — 94 81 425 107 — — 626Under stock options . . . . . . . . . . . . 5 (423) 652 3,381 (741) — — 2,217
Tax benefit from stock options . . . . . . . . — 218 — — — — — 218
Dividends declared ($0.18 per share) . . . . — — — — (5,965) — — (5,965)
Restricted stock . . . . . . . . . . . . . . . . — 233 40 207 — — — 440
Unearned compensation-restricted stock . . — — — — — (440) — (440)
Repurchase of common stock . . . . . . . . — — (742) (5,581) — — — (5,581)
Balance, January 31, 2005 . . . . . . . . . . 35,339 $119,568 (1,530) $(9,668) $(40,154) $(440) $(5,269) $64,037
See accompanying notes to consolidated financial statements.
54

QAD INC.
CONSOLIDATED STATEMENTS OF CASH FLOWS
(in thousands)
Years Ended January 31,
2005 2004 2003
Cash flows from operating activities:Net income (loss) . . . . . . . . . . . . . . . . . . . . . . . . . . . . . . . . . . . . . . . . . . . . . $24,483 $16,317 $(7,649)
Adjustments to reconcile net income (loss) to net cash provided by operatingactivities:
Depreciation and amortization . . . . . . . . . . . . . . . . . . . . . . . . . . . . . . . . . . . 7,541 8,082 10,637Provision for doubtful accounts and sales adjustments . . . . . . . . . . . . . . . . . . . . . 257 137 836(Gain) loss on disposal of property and equipment . . . . . . . . . . . . . . . . . . . . . . 129 (1,542) 209Impairment loss . . . . . . . . . . . . . . . . . . . . . . . . . . . . . . . . . . . . . . . . . . . . . — — 151Tax benefit from reversal of deferred tax valuation allowance . . . . . . . . . . . . . . . . (6,548) — —Exit costs . . . . . . . . . . . . . . . . . . . . . . . . . . . . . . . . . . . . . . . . . . . . . . . . . 687 — —Restructuring . . . . . . . . . . . . . . . . . . . . . . . . . . . . . . . . . . . . . . . . . . . . . . — (346) 5,287Cumulative effect of accounting change . . . . . . . . . . . . . . . . . . . . . . . . . . . . . . — — 1,051Tax benefit from stock options . . . . . . . . . . . . . . . . . . . . . . . . . . . . . . . . . . . 218 — —Other, net . . . . . . . . . . . . . . . . . . . . . . . . . . . . . . . . . . . . . . . . . . . . . . . . (18) 171 (180)
Changes in assets and liabilities, net of effects from acquisitions:Accounts receivable . . . . . . . . . . . . . . . . . . . . . . . . . . . . . . . . . . . . . . . . . . 2,995 (5,803) 10,447Other assets . . . . . . . . . . . . . . . . . . . . . . . . . . . . . . . . . . . . . . . . . . . . . . . (311) 2,450 (2,119)Accounts payable . . . . . . . . . . . . . . . . . . . . . . . . . . . . . . . . . . . . . . . . . . . . (847) (681) (1,667)Deferred revenue . . . . . . . . . . . . . . . . . . . . . . . . . . . . . . . . . . . . . . . . . . . . 866 683 4,041Other liabilities . . . . . . . . . . . . . . . . . . . . . . . . . . . . . . . . . . . . . . . . . . . . . (6,472) 372 (7,603)
Net cash provided by operating activities . . . . . . . . . . . . . . . . . . . . . . . . . . . 22,980 19,840 13,441
Cash flows from investing activities:Purchase of property and equipment . . . . . . . . . . . . . . . . . . . . . . . . . . . . . . . (10,577) (17,785) (9,261)Purchase of marketable securities . . . . . . . . . . . . . . . . . . . . . . . . . . . . . . . . . — (7,000) —Proceeds from sale of marketable securities . . . . . . . . . . . . . . . . . . . . . . . . . . . — 500 7,500Restricted cash under construction loan . . . . . . . . . . . . . . . . . . . . . . . . . . . . . . — 1,016 (1,016)Capitalized software costs . . . . . . . . . . . . . . . . . . . . . . . . . . . . . . . . . . . . . . (1,665) (929) (1,446)Acquisitions of businesses, net of cash acquired . . . . . . . . . . . . . . . . . . . . . . . . . (766) (445) 785Proceeds from sale of property and equipment . . . . . . . . . . . . . . . . . . . . . . . . . 29 3,395 145
Net cash used in investing activities . . . . . . . . . . . . . . . . . . . . . . . . . . . . . . . (12,979) (21,248) (3,293)
Cash flows from financing activities:Proceeds from construction loan . . . . . . . . . . . . . . . . . . . . . . . . . . . . . . . . . . 3,870 10,468 —Repayments of long-term debt . . . . . . . . . . . . . . . . . . . . . . . . . . . . . . . . . . . (1,604) (2,005) (6,377)Repayments of construction loan . . . . . . . . . . . . . . . . . . . . . . . . . . . . . . . . . . (14,338) — —Proceeds from notes payable, net of fees . . . . . . . . . . . . . . . . . . . . . . . . . . . . . 17,843 — —Dividends paid . . . . . . . . . . . . . . . . . . . . . . . . . . . . . . . . . . . . . . . . . . . . . (5,121) — —Proceeds from issuance of common stock . . . . . . . . . . . . . . . . . . . . . . . . . . . . 2,843 9,640 882Repurchase of common stock . . . . . . . . . . . . . . . . . . . . . . . . . . . . . . . . . . . . (5,581) (15,239) —
Net cash provided by (used in) financing activities . . . . . . . . . . . . . . . . . . . . . (2,088) 2,864 (5,495)Effect of exchange rates on cash and equivalents . . . . . . . . . . . . . . . . . . . . . . . . . 592 1,640 2,253
Net increase in cash and equivalents . . . . . . . . . . . . . . . . . . . . . . . . . . . . . . . . . 8,505 3,096 6,906Cash and equivalents at beginning of period . . . . . . . . . . . . . . . . . . . . . . . . . . . . 46,784 43,688 36,782
Cash and equivalents at end of period . . . . . . . . . . . . . . . . . . . . . . . . . . . . . . . . $55,289 $46,784 $43,688
Supplemental disclosure of cash flow information:Cash paid (received) during the period for:
Interest . . . . . . . . . . . . . . . . . . . . . . . . . . . . . . . . . . . . . . . . . . . . . . . . . . $ 1,783 $ 1,061 $ 1,531Income taxes, net of refunds . . . . . . . . . . . . . . . . . . . . . . . . . . . . . . . . . . . . . 1,904 (70) (100)
Supplemental disclosure of non-cash activities:Forgiveness of accounts receivable (payable) in connection with acquisitions of
businesses . . . . . . . . . . . . . . . . . . . . . . . . . . . . . . . . . . . . . . . . . . . . . . . . — — (2,836)Realization of acquired deferred tax asset . . . . . . . . . . . . . . . . . . . . . . . . . . . . . . 342 375 117Adjustments to goodwill acquired . . . . . . . . . . . . . . . . . . . . . . . . . . . . . . . . . . . 47 284 —Future obligations associated with technology purchases . . . . . . . . . . . . . . . . . . . . . 550 1,400 —Future obligations associated with dividend declaration . . . . . . . . . . . . . . . . . . . . . 844 — —
See accompanying notes to consolidated financial statements.
55

QAD INC.
NOTES TO CONSOLIDATED FINANCIAL STATEMENTS
1. SUMMARY OF BUSINESS AND SIGNIFICANT ACCOUNTING POLICIES
BUSINESS
QAD Inc., a Delaware Corporation (the Company), was founded in 1979 and is a globalprovider of enterprise resource planning (ERP) software applications for multinational, large andmid-range manufacturing and distribution companies. QAD serves the specific needs of theautomotive, consumer products, electronics, food and beverage, industrial and medical industries.The Company markets, distributes, implements and supports its products worldwide. QADenterprise applications provide functionality for managing manufacturing resources and operationswithin and beyond the enterprise, enabling global manufacturers to collaborate with theircustomers, suppliers and partners to improve delivery performance and reduce production andinventory costs.
PRINCIPLES OF CONSOLIDATION
The consolidated financial statements include the accounts of QAD Inc. and all of itssubsidiaries. All significant transactions among the consolidated entities have been eliminatedfrom the financial statements.
USE OF ESTIMATES
The financial statements have been prepared in conformity with accounting principlesgenerally accepted in the United States of America and, as such, include amounts based oninformed estimates and judgments of management, with consideration given to materiality, thataffect the reported amounts of assets and liabilities, disclosure of contingent assets and liabilitiesat the date of the Company’s financial statements, and the reported amounts of revenue andexpenses during the reporting period. Actual results could differ from those estimates.
The Company considers certain accounting policies related to revenue recognition, accountsreceivable allowances, impairment of long-lived assets, capitalized software costs, valuation ofdeferred tax assets and accounting for stock-based compensation to be critical policies due to thesignificance of these items to its operating results and the estimation processes and management’sjudgment involved in each.
CASH AND EQUIVALENTS
Cash and equivalents consist of cash and short-term investments with maturities less than90 days. The Company considers all highly liquid investments purchased with an original maturityof three months or less to be cash equivalents.
MARKETABLE SECURITIES
The Company determines the appropriate classification of its marketable securities at thetime of purchase and reevaluates such classification as of each balance sheet date. QAD classifiesits marketable securities as available-for-sale and carries such securities at fair value, and, ifapplicable, unrealized gains and losses, net of tax, are reported in stockholders’ equity untildisposition or maturity.
Marketable securities consist of auction rate securities which are stated at fair value, are notrestricted and are classified as current assets. The cost of the auction rate securities approximates
56

QAD INC.
NOTES TO CONSOLIDATED FINANCIAL STATEMENTS (Continued)
1. SUMMARY OF BUSINESS AND SIGNIFICANT ACCOUNTING POLICIES (Continued)
their fair value, with no unrealized or realized gains/losses recorded. Interest is paid when theauction rate notes renew, which is typically every seven days.
Reclassification
The Company reclassified its auction rate securities from cash and equivalents to marketablesecurities for both the current year ended January 31, 2005 and historical years included in thisAnnual Report on Form 10-K. Due to the liquidity and credit risks the auction rate securities areexposed to the Company believes the classification as marketable securities is more appropriatethan its previous classification of cash and equivalents.
REVENUE RECOGNITION
QAD licenses its software under non-cancelable license agreements including third-partysoftware sold in conjunction with QAD software, provides customer support and provides servicesincluding technical, implementation and training. Revenue is recognized in accordance with theAmerican Institute of Certified Public Accountant’s Statement of Position (SOP) No. 97-2,‘‘Software Revenue Recognition,’’ as modified by SOP No. 98-9 ‘‘Modification of SOP No. 97-2,Software Revenue Recognition with Respect to Certain Transactions’’ and Staff AccountingBulletin (SAB) No. 104 ‘‘Revenue Recognition.’’ The Company’s revenue recognition policy is asfollows:
License Revenue. QAD recognizes revenue from license contracts when anon-cancelable, non-contingent license agreement has been signed, the software product hasbeen delivered, no uncertainties exist surrounding product acceptance, fees from theagreement are fixed or determinable, and collection is probable. The Company’s typicalpayment terms vary by region. While most of its arrangements are within its normal paymentterms, the Company has provided extended terms on occasion. Terms granted are typicallyless than one year and the Company has established a history of collection, withoutconcessions, on those receivables. Provided all other revenue recognition criteria have beenmet, the Company recognizes license revenue for these arrangements on delivery. TheCompany uses the residual method to recognize revenue when a license agreement includesone or more elements to be delivered at a future date if vendor-specific, objective evidenceof the fair value of all undelivered elements exists and such items are not essential to thefunctionality of the software. The fair value of the undelivered elements is determined basedon the historical evidence of stand-alone sales of these elements to customers. Under theresidual method, the fair value of the undelivered elements is deferred and the remainingportion of the arrangement fee is recognized as revenue. If evidence of the fair value of theundelivered elements does not exist, revenue is deferred and recognized when the Companyhas vendor-specific, objective evidence for undelivered elements or when delivery of allelements occurs.
Subscription license revenue from the Company’s hosted product offerings is recognizedratably over the contract period. The Company’s standard products do not require significantproduction, modification or customization of software or services that are essential to thefunctionality of the software. Certain judgments affect the application of the Company’slicense revenue recognition policy, such as the assessment of collectibility for which the
57
QAD INC.
NOTES TO CONSOLIDATED FINANCIAL STATEMENTS (Continued)
1. SUMMARY OF BUSINESS AND SIGNIFICANT ACCOUNTING POLICIES (Continued)
Company reviews a customer’s credit worthiness and its historical experience with thatcustomer, if applicable.
Maintenance Revenue. Revenue from ongoing customer support and product updates isrecognized ratably over the term of the maintenance period, which in most instances is oneyear.
Services Revenue. Revenue from technical and implementation services is recognized asservices are performed for time-and-materials contracts. Although infrequent, the Companydoes at times enter into fixed price services contracts for which the Company recognizes theservices revenue on the percentage-of-completion method as prescribed by AccountingResearch Bulletin No. 45, ‘‘Long-term Construction-Type Contracts’’, and in SOP No. 81-1,‘‘Accounting for Performance of Construction-Type and Certain Production-Type Contracts.’’Revenue from training services is recognized as the services are performed.
The Company believes that it is currently in compliance with the applicable accountingstandards governing revenue recognition. However, the accounting standard setting bodiescontinue to discuss various provisions of these guidelines with the objective of providingadditional guidance on their future application. These discussions and the issuance of newinterpretations, once finalized, could lead to unanticipated changes in recognized revenue. Theycould also drive significant adjustments to the Company’s business practices that could result inincreased administrative costs, lengthened sales cycles and other changes that could affect theCompany’s results of operations.
ACCOUNTS RECEIVABLE ALLOWANCES
The Company reviews the collectibility of its accounts receivable each period by analyzingbalances based on age and records specific allowances for any balances that it determines may notbe fully collectible. The Company also provides an additional reserve based on historical dataincluding analysis of credit memo data and other known factors.
INCOME TAXES
QAD recognizes deferred tax assets and liabilities for temporary differences between thefinancial reporting basis and the tax basis of its assets and liabilities and expected benefits ofutilizing net operating loss and credit carryforwards. In assessing whether there is a need for avaluation allowance on deferred tax assets, the Company determines whether it is more likelythan not that it will realize tax benefits associated with deferred tax assets. In making thisdetermination, the Company considers future taxable income and tax planning strategies that areboth prudent and feasible. The impact on deferred taxes of changes in tax rates and laws, if any,are reflected in the financial statements in the period of enactment. No provision is made fortaxes on unremitted earnings of foreign subsidiaries, which are or will be reinvested indefinitely insuch operations.
58

QAD INC.
NOTES TO CONSOLIDATED FINANCIAL STATEMENTS (Continued)
1. SUMMARY OF BUSINESS AND SIGNIFICANT ACCOUNTING POLICIES (Continued)
COMPUTATION OF NET INCOME OR LOSS PER SHARE
The following table sets forth the computation of basic and diluted net income (loss) pershare:
Years Ended January 31,
2005 2004 2003
(in thousands, except per share data)
Net income (loss) . . . . . . . . . . . . . . . . . . . . . . . . . $24,483 $16,317 $(7,649)
Weighted average shares of common stockoutstanding—basic . . . . . . . . . . . . . . . . . . . . . . . 33,952 33,123 34,460
Weighted average shares of common stockequivalents issued using the treasury stockmethod . . . . . . . . . . . . . . . . . . . . . . . . . . . . . . . 1,246 1,759 —
Weighted average shares of common stock andcommon stock equivalents outstanding—diluted . . 35,198 34,882 34,460
Basic net income (loss) per share . . . . . . . . . . . . . . $ 0.72 $ 0.49 $ (0.22)
Diluted net income (loss) per share . . . . . . . . . . . . $ 0.70 $ 0.47 $ (0.22)
Common stock equivalent shares consist of the shares issuable upon the exercise of stockoptions and warrants using the treasury stock method. Shares of common stock equivalents ofapproximately 0.7 million, 0.4 million and 3.9 million for fiscal 2005, 2004 and 2003, respectively,were not included in the diluted calculation because they were anti-dilutive. Due to the net lossfor fiscal 2003, basic and diluted per share amounts are the same.
FOREIGN CURRENCY TRANSLATION
The financial position and results of operations of the Company’s foreign subsidiaries aregenerally determined using the country’s local currency as the functional currency. Assets andliabilities recorded in foreign currencies are translated at the exchange rates on the balance sheetdate. Revenue and expenses are translated at average rates of exchange prevailing during theyear. Translation adjustments resulting from this process are charged or credited to othercomprehensive income (loss), which is included in ‘‘Accumulated other comprehensive loss’’ withinthe Consolidated Balance Sheets.
Gains and losses resulting from foreign currency transactions and remeasurement adjustmentsof monetary assets and liabilities not held in an entity’s functional currency are included inearnings. Foreign currency transaction and remeasurement (gains) and losses for fiscal 2005, 2004and 2003 totaled $(189,000), $(36,000) and $818,000, respectively, and are included in ‘‘Other(income) expense, net’’ in the accompanying Consolidated Statements of Operations.
59

QAD INC.
NOTES TO CONSOLIDATED FINANCIAL STATEMENTS (Continued)
1. SUMMARY OF BUSINESS AND SIGNIFICANT ACCOUNTING POLICIES (Continued)
FINANCIAL INSTRUMENTS AND CONCENTRATION OF CREDIT RISK
At January 31, 2003, the Company had $1.0 million in restricted cash in connection withsecuring its construction loan as described in note 7 within these Notes to Consolidated FinancialStatements. During fiscal 2004, the Company fully utilized this cash to help fund the constructionproject, its intended use.
The carrying amounts of cash and equivalents, restricted cash, marketable securities, accountsreceivable and accounts payable approximate fair value due to the short-term maturities of theseinstruments. The Company’s debt instruments bear variable market interest rates, subject tocertain minimum interest rates. The carrying values of these instruments reasonably approximatefair value. Concentration of credit risk with respect to trade receivables is limited due to the largenumber of customers comprising our customer base, and their dispersion across many differentindustries and locations throughout the world. No single customer accounted for 10% or more ofthe Company’s total revenue in any of the last three fiscal years. Also, no single customeraccounted for 10% or more of accounts receivable at January 31, 2005 or January 31, 2004.
LONG-LIVED ASSETS
Property and equipment are stated at cost. Additions and significant renewals andimprovements are capitalized, while maintenance and repairs are expensed. For financial reportingpurposes, depreciation is generally provided on the straight-line method over the useful life of3 years for computer equipment and software, 5 years for furniture and office equipment, and39 years for buildings. Leasehold improvements are generally depreciated over the shorter of thelease term or the useful life of the asset.
In accordance with Statement of Financial Accounting Standards No. 144, ‘‘Accounting forthe Impairment or Disposal of Long-Lived Assets’’ (SFAS 144), the Company periodically reviewsapplicable assets for triggering events and, if necessary, for impairment in value based uponundiscounted future operating cash flows from those assets. If it is determined that the carryingamount of an asset may not be recovered, appropriate losses are recognized.
Goodwill represents the excess of acquisition costs over the fair value of net assets ofpurchased businesses. Other intangible assets include customer contracts, non-competeagreements and acquired intellectual property. Through January 31, 2002, goodwill and otherintangible assets were amortized using the straight-line method over lives of 10 to 15 years and 2to 5 years, respectively. Effective February 1, 2002, as required under Statement of FinancialAccounting Standards No. 142, ‘‘Goodwill and Other Intangible Assets’’ (SFAS 142), goodwill isno longer amortized. Instead, goodwill is assessed on at least an annual basis for impairment atthe reporting unit level by applying a fair value-based test. For further discussion related toSFAS 142 and its adoption, see note 4 within these Notes to Consolidated Financial Statements.
CAPITALIZED SOFTWARE COSTS
The Company capitalizes software development costs incurred in connection with thelocalization and translation of its products once technological feasibility has been achieved basedon a working model. The Company also capitalizes software purchased from third parties orthrough business combinations as acquired software technology if the related software under
60

QAD INC.
NOTES TO CONSOLIDATED FINANCIAL STATEMENTS (Continued)
1. SUMMARY OF BUSINESS AND SIGNIFICANT ACCOUNTING POLICIES (Continued)
development has reached technological feasibility. A working model is defined as an operativeversion of the computer software product that is completed in the same software language as theproduct to be ultimately marketed, performs all the major functions planned for the product, andis ready for initial customer testing (usually identified as beta testing).
Capitalized software costs are amortized on a straight-line basis over three years. TheCompany periodically compares the unamortized capitalized software costs to the estimated netrealizable value of the associated product. The amount by which the unamortized capitalizedsoftware costs of a particular software product exceeds the estimated net realizable value of thatasset is reported as a charge to the Consolidated Statement of Operations.
RESEARCH AND DEVELOPMENT
All costs incurred to establish the technological feasibility of the Company’s computersoftware products are expensed to research and development as incurred within its ConsolidatedStatements of Operations.
COMPREHENSIVE INCOME (LOSS)
Comprehensive income (loss) includes changes in the balances of items that are reporteddirectly in a separate component of stockholders’ equity on the Consolidated Balance Sheets. Thecomponents of comprehensive income (loss) are net income (loss) and foreign currencytranslation adjustments. The Company does not provide for income taxes on foreign currencytranslation adjustments since it does not provide for taxes on the unremitted earnings of itsforeign subsidiaries. The changes in ‘‘Accumulated other comprehensive loss’’ are included in theCompany’s Consolidated Statement of Stockholders’ Equity and Comprehensive Income (Loss).
ACCOUNTING FOR STOCK-BASED COMPENSATION
The Company accounts for its stock option grants in accordance with the provisions ofAccounting Principles Board Opinion No. 25, ‘‘Accounting for Stock Issued to Employees’’(APB 25), and related interpretations including Financial Accounting Standards BoardInterpretation No. 44, ‘‘Accounting for Certain Transactions Involving Stock Compensation.’’ Assuch, compensation expense is generally recorded on the date of grant only if the current marketprice of the underlying stock exceeded the exercise price or in connection with the modification tooutstanding awards or changes in grantee status. No employee stock option compensation expenseis reflected in results of operations, as all options granted under those plans had an exercise priceequal to the market value of the underlying common stock on the date of grant. Stockcompensation expense related to stock granted in conjunction with the acquisition of OxfordConsulting is included in the results of operations. For further description of the acquisition, seenote 2 within these Notes to Consolidated Financial Statements.
61
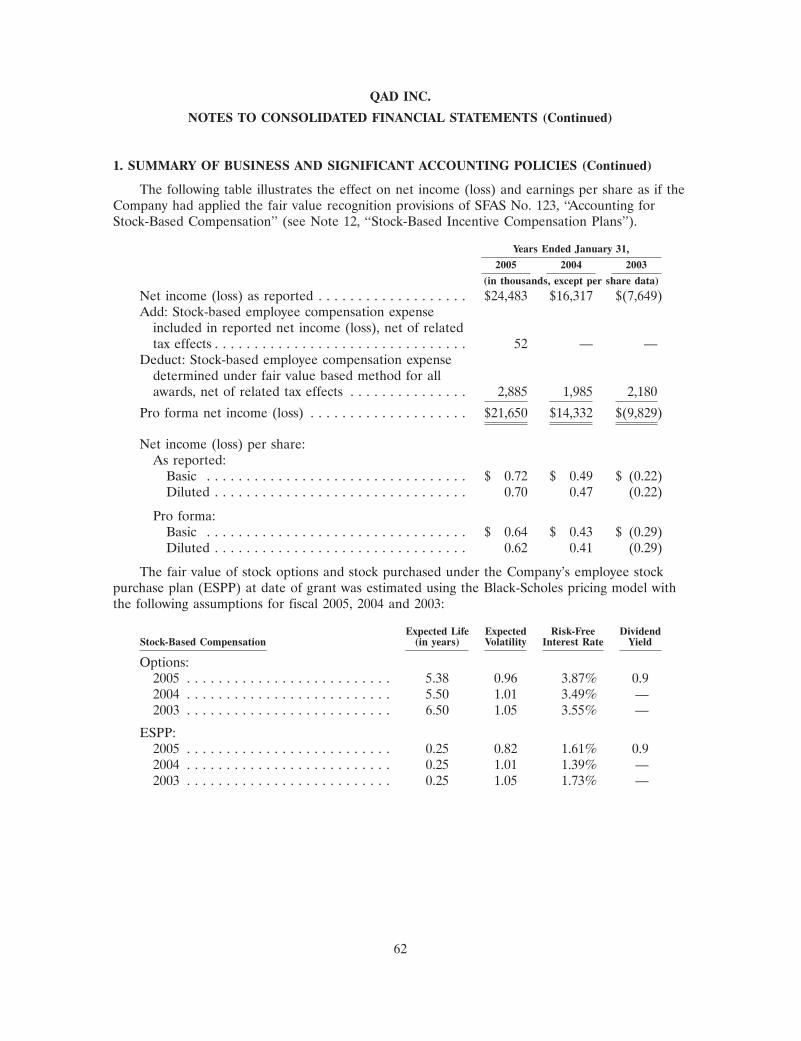
QAD INC.
NOTES TO CONSOLIDATED FINANCIAL STATEMENTS (Continued)
1. SUMMARY OF BUSINESS AND SIGNIFICANT ACCOUNTING POLICIES (Continued)
The following table illustrates the effect on net income (loss) and earnings per share as if theCompany had applied the fair value recognition provisions of SFAS No. 123, ‘‘Accounting forStock-Based Compensation’’ (see Note 12, ‘‘Stock-Based Incentive Compensation Plans’’).
Years Ended January 31,
2005 2004 2003
(in thousands, except per share data)
Net income (loss) as reported . . . . . . . . . . . . . . . . . . . $24,483 $16,317 $(7,649)Add: Stock-based employee compensation expense
included in reported net income (loss), net of relatedtax effects . . . . . . . . . . . . . . . . . . . . . . . . . . . . . . . . 52 — —
Deduct: Stock-based employee compensation expensedetermined under fair value based method for allawards, net of related tax effects . . . . . . . . . . . . . . . 2,885 1,985 2,180
Pro forma net income (loss) . . . . . . . . . . . . . . . . . . . . $21,650 $14,332 $(9,829)
Net income (loss) per share:As reported:
Basic . . . . . . . . . . . . . . . . . . . . . . . . . . . . . . . . . $ 0.72 $ 0.49 $ (0.22)Diluted . . . . . . . . . . . . . . . . . . . . . . . . . . . . . . . . 0.70 0.47 (0.22)
Pro forma:Basic . . . . . . . . . . . . . . . . . . . . . . . . . . . . . . . . . $ 0.64 $ 0.43 $ (0.29)Diluted . . . . . . . . . . . . . . . . . . . . . . . . . . . . . . . . 0.62 0.41 (0.29)
The fair value of stock options and stock purchased under the Company’s employee stockpurchase plan (ESPP) at date of grant was estimated using the Black-Scholes pricing model withthe following assumptions for fiscal 2005, 2004 and 2003:
Expected Life Expected Risk-Free DividendStock-Based Compensation (in years) Volatility Interest Rate Yield
Options:2005 . . . . . . . . . . . . . . . . . . . . . . . . . . 5.38 0.96 3.87% 0.92004 . . . . . . . . . . . . . . . . . . . . . . . . . . 5.50 1.01 3.49% —2003 . . . . . . . . . . . . . . . . . . . . . . . . . . 6.50 1.05 3.55% —
ESPP:2005 . . . . . . . . . . . . . . . . . . . . . . . . . . 0.25 0.82 1.61% 0.92004 . . . . . . . . . . . . . . . . . . . . . . . . . . 0.25 1.01 1.39% —2003 . . . . . . . . . . . . . . . . . . . . . . . . . . 0.25 1.05 1.73% —
62

QAD INC.
NOTES TO CONSOLIDATED FINANCIAL STATEMENTS (Continued)
1. SUMMARY OF BUSINESS AND SIGNIFICANT ACCOUNTING POLICIES (Continued)
RECENT ACCOUNTING STANDARDS
In December 2004, the Financial Accounting Standards Board issued Statement of FinancialAccounting Standards No. 123 (revised 2004), ‘‘Share-Based Payment,’’ or SFAS 123R.SFAS 123R revises Statement of Financial Accounting Standards No. 123, ‘‘Accounting for Stock-Based Compensation,’’ or SFAS 123, and supersedes Accounting Principles Board Opinion 25,‘‘Accounting for Stock Issued to Employees’’ and related interpretations and Statement ofFinancial Accounting Standards No. 148, ‘‘Accounting for Stock-Based Compensation-Transitionand Disclosure.’’ SFAS 123R requires compensation cost relating to all share-based payments toemployees to be recognized in the financial statements based on their fair values in the firstannual reporting period beginning after June 15, 2005. The pro forma disclosures previouslypermitted under SFAS 123 will no longer be an alternative to financial statement recognition. TheCompany is evaluating the requirements of SFAS 123R and expects that the adoption ofSFAS 123R will have a material impact on its consolidated financial position and results ofoperations. The Company has not determined the method of adoption and it has not determinedwhether the adoption will result in amounts recognized in the income statement that are similarto the current pro forma disclosures under SFAS 123.
RECLASSIFICATIONS
Certain prior year balances have been reclassified to conform to current year presentation.
2. BUSINESS COMBINATIONS
Oxford Consulting Group, Inc.
On April 30, 2004, the Company acquired certain assets and liabilities of Oxford ConsultingGroup, Inc. (Oxford) located in the United States. Oxford’s business primarily focused onelectronic data interchange (EDI) systems design, installation and services in connection with theMFG/PRO software owned and licensed by the Company.
Under the terms of the asset purchase agreement, the Company paid $0.8 million in cashupon consummation and issued 40,000 shares of restricted common stock. The approximate valueof the shares ($0.4 million) at the date of acquisition was included as outstanding stock with anequal offset as ‘‘Unearned compensation—restricted stock,’’ within stockholders’ equity in theCompany’s Consolidated Balance Sheet at April 30, 2004. The shares vest ratably in equalportions over four years on each anniversary date of the acquisition. As such, the Company isexpensing the unearned compensation straight-line over four years. An additional $0.4 million incash is payable to Oxford through February 2006. Both the potential future cash payments andvesting of common stock are contingent on the future employment of certain employees ofOxford. Therefore, and in accordance with accounting principles generally accepted in the UnitedStates of America, the cash payments and fair value of common stock are considered futurecompensation expense, not an increase to the purchase price.
The acquisition was accounted for as a business combination and, accordingly, the totalpurchase price was allocated to the acquired assets, including identifiable intangible assets andliabilities at their fair values as of April 30, 2004. The $0.8 million purchase price was mainlyallocated to intellectual property ($0.6 million), a customer list ($0.1 million) and customer
63

QAD INC.
NOTES TO CONSOLIDATED FINANCIAL STATEMENTS (Continued)
2. BUSINESS COMBINATIONS (Continued)
contracts ($0.1 million). The Company is amortizing the intellectual property over three years andthe customer list over one year and amortized the customer contracts over six months. Theintellectual property was primarily comprised of certain EDI libraries developed by Oxford thatare complimentary to MFG/PRO. Based on the purchase price allocation, no goodwill wasrecorded in connection with this transaction.
TRW ISCS
During the fourth quarter of fiscal 2003, the Company acquired TRW Integrated SupplyChain Solutions (TRW ISCS). In connection with the acquisition, the Company implemented aplan to eliminate redundant positions and facilities within TRW ISCS. Accordingly, the Companyrecognized certain liabilities in accordance with EITF 95-3 ‘‘Recognition of Liabilities inConnection with a Purchase Business Combination.’’ The related actions resulted in a $4.4 millionincrease to the acquisition cost, which included a reduction of approximately 40 employees acrossmost functions (approximately $2.8 million) and facility consolidations related to certain formerTRW ISCS locations (approximately $1.6 million). As of January 31, 2005, $3.9 million of the$4.4 million acquisition-related restructuring charge was utilized and $0.2 million was adjusteddownwards due to a change in estimate. The remaining balance of $0.3 million, consisting of leaseobligations, includes payments scheduled through fiscal 2017.
The following table presents the plan activities for the years ended January 31, 2004 and2005:
EmployeeLease Termination Total
Obligations Costs Restructuring
(in thousands)
Balances, January 31, 2003 . . . . . . . . . . . . . . . . . . $1,518 $ 665 $2,183
Fiscal 2004 activity:Utilization . . . . . . . . . . . . . . . . . . . . . . . . . . . . (321) (635) (956)Adjustments . . . . . . . . . . . . . . . . . . . . . . . . . . . (121) 20 (101)
Balances, January 31, 2004 . . . . . . . . . . . . . . . . . . 1,076 50 1,126
Fiscal 2005 activity:Utilization . . . . . . . . . . . . . . . . . . . . . . . . . . . . (786) — (786)Adjustments . . . . . . . . . . . . . . . . . . . . . . . . . . . — (50) (50)
Balances, January 31, 2005 . . . . . . . . . . . . . . . . . . $ 290 $ — $ 290
64

QAD INC.
NOTES TO CONSOLIDATED FINANCIAL STATEMENTS (Continued)
3. CAPITALIZED SOFTWARE COSTS
Capitalized software costs and accumulated amortization at January 31, 2005 and 2004 wereas follows:
January 31,
2005 2004
(in thousands)
Capitalized software costs:Capitalized software development costs . . . . . . . . . . . . . . . . . . . . $ 2,708 $ 2,309Acquired software technology . . . . . . . . . . . . . . . . . . . . . . . . . . . 2,600 1,850
5,308 4,159Accumulated amortization . . . . . . . . . . . . . . . . . . . . . . . . . . . . . . (2,517) (1,193)
Capitalized software costs, net . . . . . . . . . . . . . . . . . . . . . . . . . . . $ 2,791 $ 2,966
Amortization of capitalized software costs of $1.6 million in fiscal 2005, $1.5 million in fiscal2004 and $2.1 million in fiscal 2003 is included in ‘‘Cost of license fees’’ in the accompanyingConsolidated Statements of Operations. The increase in acquired software technology is primarilyattributable to intellectual property acquired in connection with the Oxford business combinationduring the fiscal 2005 first quarter. For further discussion of the business combination see note 2within these Notes to Consolidated Financial Statements.
4. GOODWILL AND INTANGIBLE ASSETS
Goodwill
For the applicable reporting units, the changes in the carrying amount of goodwill were asfollows (reporting unit regions are defined in note 11 within these Notes to ConsolidatedFinancial Statements):
Asia LatinEMEA Pacific America Total
(in thousands)
Balances, January 31, 2003 . . . . . . . . . . . . . . . . . . $ 9,692 $ — $810 $10,502
Fiscal 2004 activity:Goodwill acquired . . . . . . . . . . . . . . . . . . . . . . . — 262 — 262Adjustments to goodwill acquired . . . . . . . . . . . . (729) — — (729)Realization of acquired deferred tax asset . . . . . . (375) — — (375)Impact of foreign currency translation . . . . . . . . 1,639 18 (11) 1,646
Balances, January 31, 2004 . . . . . . . . . . . . . . . . . . 10,227 280 799 11,306
Fiscal 2005 activity:Adjustments to goodwill acquired . . . . . . . . . . . . (47) — — (47)Realization of acquired deferred tax asset . . . . . . (342) — — (342)Impact of foreign currency translation . . . . . . . . 639 5 (9) 635
Balances, January 31, 2005 . . . . . . . . . . . . . . . . . . $10,477 $285 $790 $11,552
65

QAD INC.
NOTES TO CONSOLIDATED FINANCIAL STATEMENTS (Continued)
4. GOODWILL AND INTANGIBLE ASSETS (Continued)
In connection with the adoption of SFAS 142 on February 1, 2002, all reporting units werevalued and tested for impairment where goodwill existed. The fair value of the reporting units wasdetermined using the income approach, which utilizes a discounted cash flow method todetermine the present value of future benefits the reporting unit is expected to generate. Inaccordance with the transition provisions of SFAS 142, a $1.1 million impairment loss related toAsia Pacific goodwill was recorded as a cumulative effect of accounting change and is included inthe Company’s Consolidated Statement of Operations for the fiscal year ended January 31, 2003.The impairment loss recorded for Asia Pacific related to anticipated trends in the manufacturingsector for that region.
During fiscal 2004 and 2003, the Company made earnout payments to the selling entity of anacquired business in Asia Pacific of $0.3 million and $0.2 million, respectively, based on financialperformance under the purchase agreement. These payments effectively served to increase thepurchase price of the acquisition, thus adding to the Company’s goodwill balance. Based on theseearnout payments, the Asia Pacific reporting unit was again valued and tested for impairmentunder SFAS 142. The fair value of the Asia Pacific reporting unit was determined using adiscounted cash flow approach. The results of the fiscal 2004 test yielded no indication ofimpairment. However, in accordance with the provisions of SFAS 142, the fiscal 2003 additional$0.2 million of goodwill in Asia Pacific was deemed to be fully impaired and the relatedimpairment loss is included in the Company’s Consolidated Statement of Operations for the fiscalyear ended January 31, 2003.
In November 2002, the Company acquired $2.2 million of goodwill in connection with theacquisition of TRW ISCS. This goodwill was allocated completely to the EMEA reporting unit.During fiscal 2005 and 2004, the Company recorded purchase accounting adjustments of $47,000and $0.7 million, respectively, to the purchase price allocation for identifiable assets, liabilities andgoodwill acquired in connection with the acquisition of TRW ISCS. These adjustments weremainly due to certain liabilities deemed no longer necessary after analysis of additionalinformation not available at the date of acquisition. For further discussion of the TRW ISCSacquisition, see note 2 within these Notes to Consolidated Financial Statements.
SFAS 109 requires that management consider whether it is more likely than not that someportion or all of deferred tax assets will be realized. At the date of the TRW ISCS acquisition,management considered that it was more likely than not that the acquired TRW ISCS deferredtax assets would not be realized. However, during fiscal 2005, 2004 and 2003, $0.3 million,$0.4 million and $0.1 million, respectively, of TRW ISCS deferred tax assets were realized,resulting in a corresponding decrease in goodwill.
SFAS 142 requires the Company to analyze goodwill for impairment at least on an annualbasis. The Company has chosen the fourth quarter of its fiscal year as its annual test period.During the fourth quarter of fiscal year 2005, 2004 and 2003, in connection with the annual test,all reporting units containing goodwill were valued and tested for impairment. The fair value ofeach reporting unit was determined using an equally weighted income and market approach. Theresults of this test yielded no indication of impairment for each applicable reporting unit.
66

QAD INC.
NOTES TO CONSOLIDATED FINANCIAL STATEMENTS (Continued)
4. GOODWILL AND INTANGIBLE ASSETS (Continued)
Intangible Assets
January 31,
2005 2004
(in thousands)
Amortizable intangible assets(various, principally customer contracts) . . . . . . . . . . . . . . . . . . . $ 2,888 $ 11,175
Less: accumulated amortization . . . . . . . . . . . . . . . . . . . . . . . . . . . (2,568) (10,522)
Net amortizable intangible assets . . . . . . . . . . . . . . . . . . . . . . . . $ 320 $ 653
Intangible assets are included in ‘‘Other assets, net’’ in the Company’s Consolidated BalanceSheets. The change in amortizable intangible assets from January 31, 2004 to January 31, 2005includes $8.5 million of ‘‘amortizable intangible assets’’ being removed from the balance sheet. Itis the Company’s policy to write-off intangible assets once fully amortized. Accordingly, thecorresponding $8.5 million of ‘‘accumulated amortization’’ was also removed from the balancesheet. These write-offs do not impact ‘‘Net amortizable intangible assets’’, nor are they reflectedas a charge to expense on the Consolidated Statements of Operations. This decrease in the grossintangible asset balance was partially offset by the acquisition of certain intangible assets relatedto the Oxford business combination. For further discussion of the business combination, seenote 2 within these Notes to Consolidated Financial Statements.
As of January 31, 2005 and January 31, 2004, excluding goodwill, all of the Company’sintangible assets were determined to have definite useful lives, and therefore were subject toamortization. The aggregate amortization expense related to amortizable intangible assets was$0.5 million, $0.9 million and $1.2 million for fiscal 2005, 2004 and 2003, respectively.
The estimated remaining amortization expense related to amortizable intangible assets for theyears ended January 31, 2006, 2007 and 2008 is $273,000, $42,000 and $5,000, respectively. Noadditional amortization is estimated in fiscal 2009 and thereafter.
5. RESTRUCTURING CHARGES
In prior years, the Company implemented restructuring programs designed to strengthenoperations and financial performance. Charges and adjustments related to restructurings areincluded in ‘‘Restructuring’’ in the Company’s Consolidated Statements of Operations. Below is adiscussion of recent restructuring programs and related activity through January 31, 2005.
During fiscal 2003, the Company implemented cost reduction programs aimed at reducingannualized operating expenses to better align them with then current business levels. The relatedactions resulted in a combined $4.4 million charge that included a reduction of approximately 130employees across all regions and functions ($4.1 million), facility consolidations ($0.1 million), andassociated asset write-downs ($0.2 million). In addition, during fiscal 2003, the Company recordedan adjustment of $0.9 million as an increase to total costs and expenses, related to the fiscal 2002restructuring accrual as noted below. As of January 31, 2004, of the combined $4.4 million fiscal2003 restructuring charges, $4.3 million was utilized and $0.1 million was adjusted downwardbecause employee termination costs were lower than originally estimated.
67
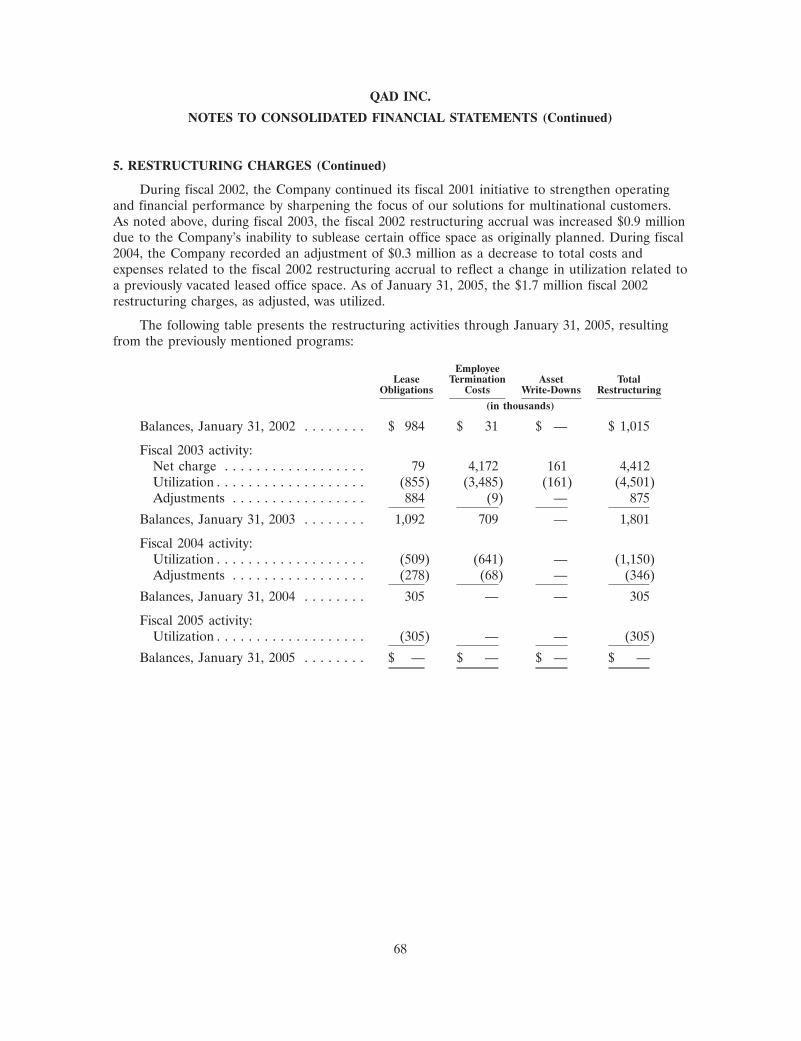
QAD INC.
NOTES TO CONSOLIDATED FINANCIAL STATEMENTS (Continued)
5. RESTRUCTURING CHARGES (Continued)
During fiscal 2002, the Company continued its fiscal 2001 initiative to strengthen operatingand financial performance by sharpening the focus of our solutions for multinational customers.As noted above, during fiscal 2003, the fiscal 2002 restructuring accrual was increased $0.9 milliondue to the Company’s inability to sublease certain office space as originally planned. During fiscal2004, the Company recorded an adjustment of $0.3 million as a decrease to total costs andexpenses related to the fiscal 2002 restructuring accrual to reflect a change in utilization related toa previously vacated leased office space. As of January 31, 2005, the $1.7 million fiscal 2002restructuring charges, as adjusted, was utilized.
The following table presents the restructuring activities through January 31, 2005, resultingfrom the previously mentioned programs:
EmployeeLease Termination Asset Total
Obligations Costs Write-Downs Restructuring
(in thousands)
Balances, January 31, 2002 . . . . . . . . $ 984 $ 31 $ — $ 1,015
Fiscal 2003 activity:Net charge . . . . . . . . . . . . . . . . . . 79 4,172 161 4,412Utilization . . . . . . . . . . . . . . . . . . . (855) (3,485) (161) (4,501)Adjustments . . . . . . . . . . . . . . . . . 884 (9) — 875
Balances, January 31, 2003 . . . . . . . . 1,092 709 — 1,801
Fiscal 2004 activity:Utilization . . . . . . . . . . . . . . . . . . . (509) (641) — (1,150)Adjustments . . . . . . . . . . . . . . . . . (278) (68) — (346)
Balances, January 31, 2004 . . . . . . . . 305 — — 305
Fiscal 2005 activity:Utilization . . . . . . . . . . . . . . . . . . . (305) — — (305)
Balances, January 31, 2005 . . . . . . . . $ — $ — $ — $ —
68
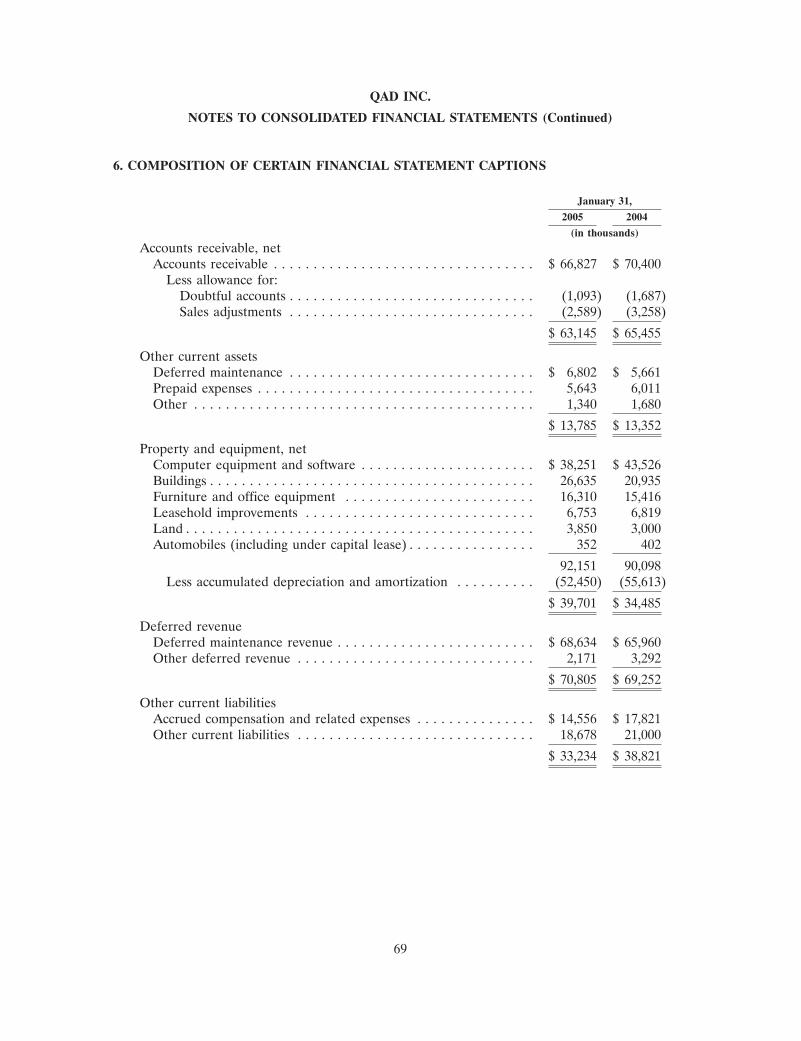
QAD INC.
NOTES TO CONSOLIDATED FINANCIAL STATEMENTS (Continued)
6. COMPOSITION OF CERTAIN FINANCIAL STATEMENT CAPTIONS
January 31,
2005 2004
(in thousands)
Accounts receivable, netAccounts receivable . . . . . . . . . . . . . . . . . . . . . . . . . . . . . . . . . $ 66,827 $ 70,400
Less allowance for:Doubtful accounts . . . . . . . . . . . . . . . . . . . . . . . . . . . . . . . (1,093) (1,687)Sales adjustments . . . . . . . . . . . . . . . . . . . . . . . . . . . . . . . (2,589) (3,258)
$ 63,145 $ 65,455
Other current assetsDeferred maintenance . . . . . . . . . . . . . . . . . . . . . . . . . . . . . . . $ 6,802 $ 5,661Prepaid expenses . . . . . . . . . . . . . . . . . . . . . . . . . . . . . . . . . . . 5,643 6,011Other . . . . . . . . . . . . . . . . . . . . . . . . . . . . . . . . . . . . . . . . . . . 1,340 1,680
$ 13,785 $ 13,352
Property and equipment, netComputer equipment and software . . . . . . . . . . . . . . . . . . . . . . $ 38,251 $ 43,526Buildings . . . . . . . . . . . . . . . . . . . . . . . . . . . . . . . . . . . . . . . . . 26,635 20,935Furniture and office equipment . . . . . . . . . . . . . . . . . . . . . . . . 16,310 15,416Leasehold improvements . . . . . . . . . . . . . . . . . . . . . . . . . . . . . 6,753 6,819Land . . . . . . . . . . . . . . . . . . . . . . . . . . . . . . . . . . . . . . . . . . . . 3,850 3,000Automobiles (including under capital lease) . . . . . . . . . . . . . . . . 352 402
92,151 90,098Less accumulated depreciation and amortization . . . . . . . . . . (52,450) (55,613)
$ 39,701 $ 34,485
Deferred revenueDeferred maintenance revenue . . . . . . . . . . . . . . . . . . . . . . . . . $ 68,634 $ 65,960Other deferred revenue . . . . . . . . . . . . . . . . . . . . . . . . . . . . . . 2,171 3,292
$ 70,805 $ 69,252
Other current liabilitiesAccrued compensation and related expenses . . . . . . . . . . . . . . . $ 14,556 $ 17,821Other current liabilities . . . . . . . . . . . . . . . . . . . . . . . . . . . . . . 18,678 21,000
$ 33,234 $ 38,821
69

QAD INC.
NOTES TO CONSOLIDATED FINANCIAL STATEMENTS (Continued)
7. LONG-TERM DEBT
January 31,
2005 2004
(in thousands)
Total debtNotes payable . . . . . . . . . . . . . . . . . . . . . . . . . . . . . . . . . . . . . . $17,914 $ —Credit facility . . . . . . . . . . . . . . . . . . . . . . . . . . . . . . . . . . . . . . . 7,625 9,125Construction loan . . . . . . . . . . . . . . . . . . . . . . . . . . . . . . . . . . . . — 10,468Capital lease obligations . . . . . . . . . . . . . . . . . . . . . . . . . . . . . . . 97 114
25,636 19,707Less current maturities . . . . . . . . . . . . . . . . . . . . . . . . . . . . . . 1,725 11,987
Long-term debt . . . . . . . . . . . . . . . . . . . . . . . . . . . . . . . . . . $23,911 $ 7,720
The aggregate maturities of long-term debt, for each of the next five fiscal years andthereafter are as follows: $1.7 million in fiscal 2006; $6.4 million in fiscal 2007; $0.2 million infiscal 2008; $0.3 million in fiscal 2009; $0.3 million in fiscal 2010; and $16.7 million thereafter.
Notes Payable
On July 28, 2004, QAD Ortega Hill, LLC, a wholly-owned subsidiary of QAD Inc. enteredinto a loan agreement with Mid-State Bank & Trust. The loan had an initial principal amount of$18.0 million and bears interest at a fixed rate of 6.5%. This is a non-recourse loan, which issecured by real property located in Summerland, California. The loan matures on July 28, 2014.Over the term of the loan, the Company shall make 119 monthly payments of $115,000 and onefinal payment of $15.4 million. Total proceeds were $17.8 million, which was net of transactionfees of $0.2 million. A portion of these proceeds was used to repay the then existing constructionloan with Santa Barbara Bank and Trust. The balance of the note payable at January 31, 2005 was$17.9 million.
Credit Facility
In September 2000, the Company entered into a five-year senior credit facility (WFF Facility)with Foothill Capital Corporation, now known as Wells Fargo Foothill Inc. The maximumavailable amount of borrowings under the WFF Facility is $30.0 million. The WFF Facility issecured by certain assets of QAD Inc., including certain cash, receivables, property, intellectualproperty rights, copyrights, and stock of subsidiary corporations. The Company pays an annualcommitment fee of 0.375% calculated on the average unused portion of the $30.0 million WFFFacility. The WFF Facility, as amended, provides that the Company will maintain certain financialand operating covenants which include, among other provisions, maintaining minimum 12-monthtrailing earnings before interest, taxes, depreciation and amortization (EBITDA) and tangible networth balances, as well as a minimum cash coverage ratio. At January 31, 2005, the Company wasin compliance with the applicable covenants under the WFF Facility, as amended.
The WFF Facility includes a $15.0 million term loan with a five-year amortization schedule.Borrowings under the term loan portion of the WFF Facility bear interest at the greater of thebank’s prime rate plus 3.75% or a minimum of 8%. As of January 31, 2005, the rate for the term
70
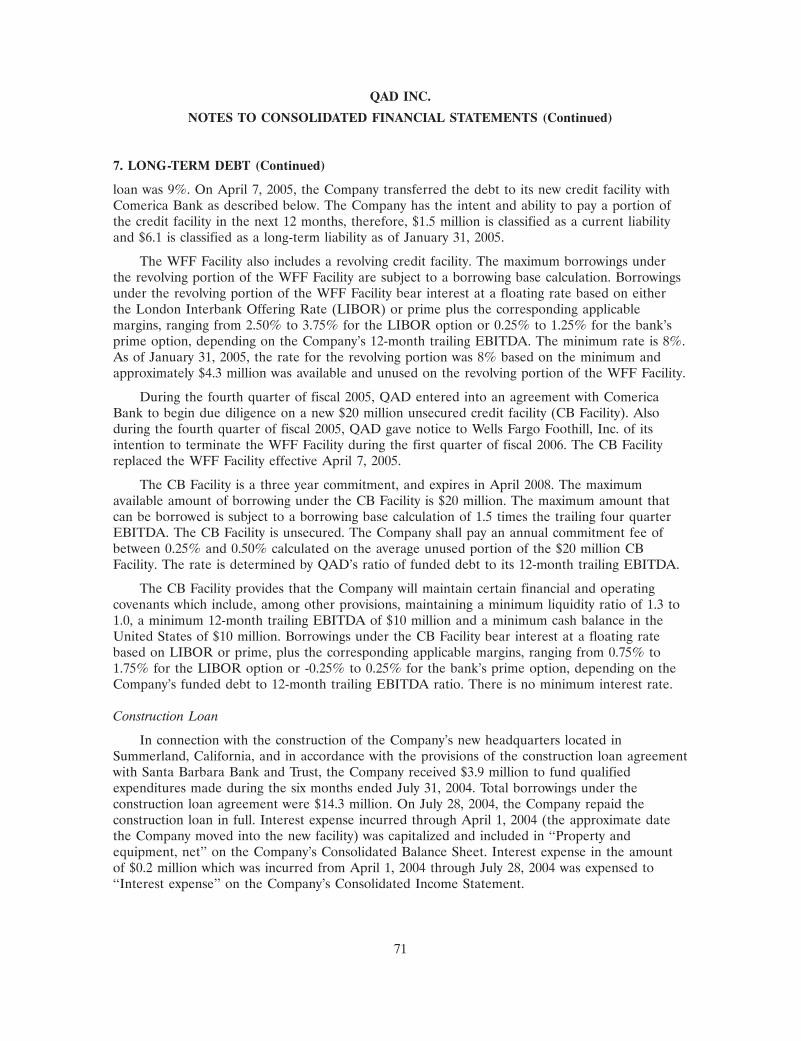
QAD INC.
NOTES TO CONSOLIDATED FINANCIAL STATEMENTS (Continued)
7. LONG-TERM DEBT (Continued)
loan was 9%. On April 7, 2005, the Company transferred the debt to its new credit facility withComerica Bank as described below. The Company has the intent and ability to pay a portion ofthe credit facility in the next 12 months, therefore, $1.5 million is classified as a current liabilityand $6.1 is classified as a long-term liability as of January 31, 2005.
The WFF Facility also includes a revolving credit facility. The maximum borrowings underthe revolving portion of the WFF Facility are subject to a borrowing base calculation. Borrowingsunder the revolving portion of the WFF Facility bear interest at a floating rate based on eitherthe London Interbank Offering Rate (LIBOR) or prime plus the corresponding applicablemargins, ranging from 2.50% to 3.75% for the LIBOR option or 0.25% to 1.25% for the bank’sprime option, depending on the Company’s 12-month trailing EBITDA. The minimum rate is 8%.As of January 31, 2005, the rate for the revolving portion was 8% based on the minimum andapproximately $4.3 million was available and unused on the revolving portion of the WFF Facility.
During the fourth quarter of fiscal 2005, QAD entered into an agreement with ComericaBank to begin due diligence on a new $20 million unsecured credit facility (CB Facility). Alsoduring the fourth quarter of fiscal 2005, QAD gave notice to Wells Fargo Foothill, Inc. of itsintention to terminate the WFF Facility during the first quarter of fiscal 2006. The CB Facilityreplaced the WFF Facility effective April 7, 2005.
The CB Facility is a three year commitment, and expires in April 2008. The maximumavailable amount of borrowing under the CB Facility is $20 million. The maximum amount thatcan be borrowed is subject to a borrowing base calculation of 1.5 times the trailing four quarterEBITDA. The CB Facility is unsecured. The Company shall pay an annual commitment fee ofbetween 0.25% and 0.50% calculated on the average unused portion of the $20 million CBFacility. The rate is determined by QAD’s ratio of funded debt to its 12-month trailing EBITDA.
The CB Facility provides that the Company will maintain certain financial and operatingcovenants which include, among other provisions, maintaining a minimum liquidity ratio of 1.3 to1.0, a minimum 12-month trailing EBITDA of $10 million and a minimum cash balance in theUnited States of $10 million. Borrowings under the CB Facility bear interest at a floating ratebased on LIBOR or prime, plus the corresponding applicable margins, ranging from 0.75% to1.75% for the LIBOR option or -0.25% to 0.25% for the bank’s prime option, depending on theCompany’s funded debt to 12-month trailing EBITDA ratio. There is no minimum interest rate.
Construction Loan
In connection with the construction of the Company’s new headquarters located inSummerland, California, and in accordance with the provisions of the construction loan agreementwith Santa Barbara Bank and Trust, the Company received $3.9 million to fund qualifiedexpenditures made during the six months ended July 31, 2004. Total borrowings under theconstruction loan agreement were $14.3 million. On July 28, 2004, the Company repaid theconstruction loan in full. Interest expense incurred through April 1, 2004 (the approximate datethe Company moved into the new facility) was capitalized and included in ‘‘Property andequipment, net’’ on the Company’s Consolidated Balance Sheet. Interest expense in the amountof $0.2 million which was incurred from April 1, 2004 through July 28, 2004 was expensed to‘‘Interest expense’’ on the Company’s Consolidated Income Statement.
71

QAD INC.
NOTES TO CONSOLIDATED FINANCIAL STATEMENTS (Continued)
8. INCOME TAXES
Income tax expense (benefit) is summarized as follows:
Years Ended January 31,
2005 2004 2003
(in thousands)
Current:Federal . . . . . . . . . . . . . . . . . . . . . . . . . . . . . . . . . . . . . $ 23 $ (235) $(1,151)State . . . . . . . . . . . . . . . . . . . . . . . . . . . . . . . . . . . . . . . 163 103 108Foreign . . . . . . . . . . . . . . . . . . . . . . . . . . . . . . . . . . . . . 4,070 1,800 2,081
Total . . . . . . . . . . . . . . . . . . . . . . . . . . . . . . . . . . . . . 4,256 1,668 1,038Deferred:
Federal . . . . . . . . . . . . . . . . . . . . . . . . . . . . . . . . . . . . . (5,057) — —State . . . . . . . . . . . . . . . . . . . . . . . . . . . . . . . . . . . . . . . (523) — —Foreign . . . . . . . . . . . . . . . . . . . . . . . . . . . . . . . . . . . . . (951) 1,410 262
Sub total . . . . . . . . . . . . . . . . . . . . . . . . . . . . . . . . . . . . (6,531) 1,410 262Equity . . . . . . . . . . . . . . . . . . . . . . . . . . . . . . . . . . . . . . 218 — —
Total . . . . . . . . . . . . . . . . . . . . . . . . . . . . . . . . . . . . . $(2,057) $3,078 $ 1,300
Actual income tax expense (benefit) differs from that obtained by applying the statutoryFederal income tax rate of 34% to income (loss) before income taxes and cumulative effect ofaccounting change as follows:
Years Ended January 31,
2005 2004 2003
(in thousands)
Computed expected tax expense (benefit) . . . . . . . . . . . . . $ 7,625 $ 6,594 $(1,801)State income taxes, net of Federal income tax expense . . . . 71 68 71Incremental tax expense (benefit) from foreign operations . (667) 979 (960)Foreign withholding taxes . . . . . . . . . . . . . . . . . . . . . . . . . 1,427 549 437Adjustments to deferred tax assets . . . . . . . . . . . . . . . . . . (2,298) — —Net change in valuation allowance . . . . . . . . . . . . . . . . . . (9,513) (4,916) 4,582Non-deductible expenses . . . . . . . . . . . . . . . . . . . . . . . . . 264 271 137Tax payment (refund) related to prior years . . . . . . . . . . . . 1,090 (341) (1,170)Other . . . . . . . . . . . . . . . . . . . . . . . . . . . . . . . . . . . . . . . (56) (126) 4
$(2,057) $ 3,078 $ 1,300
72

QAD INC.
NOTES TO CONSOLIDATED FINANCIAL STATEMENTS (Continued)
8. INCOME TAXES (Continued)
Consolidated U.S. income (loss) before income taxes and cumulative effect of accountingchange was $9.8 million, $11.1 million and $(7.2) million for the fiscal years ended January 31,2005, 2004 and 2003, respectively. The corresponding income before income taxes for foreignoperations was $12.6 million, $8.3 million, and $1.9 million for the fiscal years ended January 31,2005, 2004 and 2003, respectively.
Withholding and U.S. income taxes have not been provided on approximately $19.0 million ofunremitted earnings of certain non-U.S. subsidiaries because such earnings are or will bereinvested in operations or will be offset by appropriate credits for foreign income taxes paid.Such earnings would become taxable upon the sale or liquidation of these non-U.S. subsidiaries orupon the remittance of dividends. Upon remittance, certain foreign countries impose withholdingtaxes that are then available, subject to certain limitations, for use as credits against our U.S. taxliability, if any. The determination of tax associated with the $19.0 million of unremitted earningsis not practicable.
On October 22, 2004, the American Jobs Creation Act (‘‘the AJCA’’) was signed into law.The AJCA includes a tax deduction of 85% of certain foreign earnings that are repatriated, asdefined in the AJCA. The Company may elect to apply this provision to qualifying earningsrepatriations in fiscal 2006. The Company has started an evaluation of the effects of therepatriation provision; however, the Company does not expect to be able to complete thisevaluation until after Congress or the Treasury Department provide additional clarifying languageon key elements of the provision. The Company expects to complete its evaluation of the effectsof the repatriation provision within a reasonable period of time following the publication of theadditional clarifying language. The range of possible amounts that the Company is considering forrepatriation under this provision is between zero and $21.5 million. The related potential range ofincome tax, net of related AMT benefits, is between zero and $0.8 million.
73

QAD INC.
NOTES TO CONSOLIDATED FINANCIAL STATEMENTS (Continued)
8. INCOME TAXES (Continued)
Significant components of the Company’s deferred tax assets and liabilities are as follows:
January 31,
2005 2004
(in thousands)
Deferred tax assets:Allowance for doubtful accounts and sales adjustments . . . . . . . . . . . . . . $ 415 $ 868Accrued vacation . . . . . . . . . . . . . . . . . . . . . . . . . . . . . . . . . . . . . . . . . 1,040 1,185Accrued commissions . . . . . . . . . . . . . . . . . . . . . . . . . . . . . . . . . . . . . . 339 182Alternative minimum tax (AMT) credits . . . . . . . . . . . . . . . . . . . . . . . . . 443 416Research and development credits . . . . . . . . . . . . . . . . . . . . . . . . . . . . . 8,243 6,683Foreign tax credits . . . . . . . . . . . . . . . . . . . . . . . . . . . . . . . . . . . . . . . . 8 721Depreciation and amortization . . . . . . . . . . . . . . . . . . . . . . . . . . . . . . . . — 125Deferred revenue . . . . . . . . . . . . . . . . . . . . . . . . . . . . . . . . . . . . . . . . . 3,524 1,534Net operating loss carry forwards . . . . . . . . . . . . . . . . . . . . . . . . . . . . . . 26,197 28,956Other . . . . . . . . . . . . . . . . . . . . . . . . . . . . . . . . . . . . . . . . . . . . . . . . . . 1,207 1,805
Total deferred tax assets . . . . . . . . . . . . . . . . . . . . . . . . . . . . . . . . . . . 41,416 42,475Less valuation allowance . . . . . . . . . . . . . . . . . . . . . . . . . . . . . . . . . . (33,626) (41,596)
Deferred tax assets, net of valuation allowance . . . . . . . . . . . . . . . . . $ 7,790 $ 879
Deferred tax liabilities:Capitalized software development costs . . . . . . . . . . . . . . . . . . . . . . . . . $ 170 $ 424Depreciation and amortization . . . . . . . . . . . . . . . . . . . . . . . . . . . . . . . . 595 —State income taxes . . . . . . . . . . . . . . . . . . . . . . . . . . . . . . . . . . . . . . . . — 35Unrecognized capital gain . . . . . . . . . . . . . . . . . . . . . . . . . . . . . . . . . . . 941 941Other . . . . . . . . . . . . . . . . . . . . . . . . . . . . . . . . . . . . . . . . . . . . . . . . . . 90 358
Total deferred tax liabilities . . . . . . . . . . . . . . . . . . . . . . . . . . . . . . . . 1,796 1,758
Total net deferred tax asset (liability) . . . . . . . . . . . . . . . . . . . . . . . . $ 5,994 $ (879)
Current portion of deferred taxes . . . . . . . . . . . . . . . . . . . . . . . . . . . . . . . 454 $ 107Non-current portion of deferred taxes . . . . . . . . . . . . . . . . . . . . . . . . . . . . 5,540 (986)
Total net deferred tax asset (liability) . . . . . . . . . . . . . . . . . . . . . . . . $ 5,994 $ (879)
In assessing the realizability of deferred tax assets, management considers whether it is morelikely than not that some portion or all of the deferred tax assets will not be realized. Theultimate realization of deferred tax assets is dependent upon the generation of future taxableincome during the periods in which those temporary differences become deductible. At April 30,2004 and January 31, 2005, the Company performed an assessment of the recoverability of its netdeferred tax assets. Management determined that some tax benefits associated with previouslyreserved net deferred tax assets were more likely than not realizable through future taxableincome and future reversals of existing taxable temporary differences. As a result, the Companyrecorded a tax benefit of $1.2 million at April 30, 2004 and $5.3 million at January 31, 2005,resulting from the reduction of previously recorded valuation allowances against net deferred taxassets.
74

QAD INC.
NOTES TO CONSOLIDATED FINANCIAL STATEMENTS (Continued)
8. INCOME TAXES (Continued)
The Company continues to evaluate the realizability of its net deferred tax assets and theneed to record a valuation allowance. As of January 2004, the Company did not have objectiveverifiable evidence of future income and as a consequence fully valued its net deferred tax assets.As of January 2005, the Company had returned to cumulative profits in recent years. As aconsequence, the Company considered a forecast of future income as objective and verifiable,resulting in a reduction of valuation allowance (see discussion above) resulting in a net deferredtax asset in the amount of $6.0 million as of January 2005. In forecasting its future income, theCompany considers the volatility of its industry and its relatively recent return to profit bydiscounting the projection of income in future periods. SFAS 123R is likely to reduce taxableincome available for recognition of deferred tax assets when fully implemented.
The Company has net operating loss carryforwards of $86.8 million and tax creditcarryforwards of $8.6 million as of January 31, 2005. This includes U.S. federal and state netoperating loss carryforwards of $29.6 million that expire from 2011 through 2024 and foreign netoperating loss carryforwards of $57.2 million that expire from 2006 to unlimited carryover. Thisalso includes U.S. federal and state tax credit carryforwards of $8.6 million that expire from 2011through 2019 for federal and unlimited carryover for state. At January 31, 2005 and 2004, thevaluation allowance attributable to deferred tax assets was $33.6 million and $41.6 million,respectively, representing an overall decrease of $8.0 million. The decrease in the valuationallowance relates to a $9.5 million realization of benefits primarily associated with net operatinglosses and to $0.3 million of adjustments to goodwill related to the TRW ISCS acquisitioncompleted in fiscal 2003, partially offset by an increase of $1.9 million for stock option taxbenefits not deemed realizable. Of the $33.6 million valuation allowance as of January 31, 2005,$0.7 million may reduce goodwill and intangible assets should the acquired TRW ISCS deferredtax assets be recognized in a subsequent period, and $4.0 million may increase additionalpaid-in-capital should the net operating losses associated with stock options be recognized in asubsequent period.
9. EMPLOYEE BENEFIT PLANS
The Company has a defined contribution 401(k) plan which is available to U.S. employeesafter 30 days of employment. Employees may contribute up to the maximum allowable by theInternal Revenue Code. The Company matches 75% of the employees’ contributions up to thefirst four percent of the employee’s salary. In addition, the Company can make additionalcontributions at the discretion of the board of directors. Participants are immediately vested intheir employee contributions. Employer contributions vest over a five-year period. The employercontributions for fiscal 2005, 2004 and 2003 were $1.0 million, $1.1 million and $1.2 million,respectively.
Various QAD foreign subsidiaries also contribute to what can be considered definedcontribution pension plans. Employer contributions in these plans are generally based onemployee salary and range from 5% to 16%. These plans are funded at various times throughoutthe year according to plan provisions with aggregate employer contributions of $1.7 million,$1.8 million and $1.4 million during fiscal 2005, 2004 and 2003, respectively.
75
QAD INC.
NOTES TO CONSOLIDATED FINANCIAL STATEMENTS (Continued)
10. COMMITMENTS AND CONTINGENCIES
Lease Obligations
The Company leases certain office facilities, office equipment and automobiles underoperating lease agreements. Total rent expense was $7.7 million for fiscal 2005 and $7.5 millionfor both fiscal 2004 and 2003. Future minimum rental payments under non-cancelable operatinglease commitments with terms of more than one year as of January 31, 2005 are as follows:$5.8 million in fiscal 2006; $4.3 million in fiscal 2007; $2.0 million in fiscal 2008; $1.6 million infiscal 2009; $1.4 million in fiscal 2010 and $4.2 million in total thereafter.
Exit Costs
On December 1, 2004, QAD entered into a sub-lease agreement to sublease approximately60% of its leased office space in Carpinteria, California, which it vacated when the Companymoved to its new offices in Summerland, California. The sublease commenced on December 1,2004 and ends on the date QAD’s lease terminates with the lessor in August 2011. Under theterms of the sublease agreement, the sublessee shall pay QAD a monthly rental amount which isless than the current monthly lease payment QAD pays to the lessor. In accordance withFinancial Accounting Standards Board Statement No. 146, ‘‘Accounting for Costs Associated withExit or Disposal Activities’’, the Company expensed the present value of the expected loss fromthe sublease arrangement. Expense of approximately $0.6 million was incurred on December 1,2004 and an additional $0.1 million was expensed in January 2005 to account for the rent increasefrom the lessor. The expense is reflected in the Consolidated Statement of Operations during theperiod ended January 31, 2005.
Indemnifications
The Company sells software licenses and services to its customers under written agreements.Each agreement contains the relevant terms of the contractual arrangement with the customer,and generally includes certain provisions for indemnifying the customer against losses, expenses,and liabilities from damages that may be awarded against the customer in the event theCompany’s software is found to infringe upon certain intellectual property rights of a third party.The agreement generally limits the scope of and remedies for such indemnification obligations ina variety of industry-standard respects, including but not limited to certain time- and geography-based scope limitations and a right to replace an infringing product.
The Company believes its internal development processes and other policies and practiceslimit its exposure related to the indemnification provisions of the agreements. For several reasons,including the lack of prior indemnification claims and the lack of a monetary liability limit forcertain infringement cases under the agreements, the Company cannot determine the maximumamount of potential future payments, if any, related to such indemnification provisions.
Legal Actions
The Company is subject to various legal proceedings and claims, either asserted orunasserted, which arise in the ordinary course of business. While the outcome of these claimscannot be predicted with certainty, management does not believe that the outcome of any ofthese legal matters will have a material adverse effect on the Company’s consolidated results ofoperations or financial position.
76

QAD INC.
NOTES TO CONSOLIDATED FINANCIAL STATEMENTS (Continued)
11. BUSINESS SEGMENT INFORMATION
QAD operates in geographic business segments. The North America region includes theUnited States and Canada. The EMEA region includes Europe, the Middle East and Africa. TheAsia Pacific region includes Asia and Australia. The Latin America region includes SouthAmerica, Central America and Mexico.
The geographic business segments derive revenue from the sale of licenses, maintenance andservices to third party customers. License revenue is assigned to the regions based on theproportion of commission earned by each region, maintenance revenue is allocated to the regionwhere the end user customer is located and services revenue is assigned based on the regionwhere the services are performed.
Operating income (loss) attributable to each business segment is based on management’sassignment of revenue and costs. Regional cost of revenue includes the cost of goods produced byQAD manufacturing operations at the price charged to the distribution operation. Income frommanufacturing operations and research and development costs are included in the corporateoperating segment.
Identifiable assets and capital expenditures are assigned by geographic region based on thelocation of each legal entity. This is in contrast to depreciation and amortization expense, which isallocated both to corporate and the geographic regions based on management’s assignment ofcosts.
Capital expenditures within the North America region contain $6.6 million, $13.8 million and$4.3 million in fiscal 2005, 2004 and 2003, respectively, related to the construction of the newcompany headquarters. As the company headquarters are located in the United States, asignificant amount of corporate assets are assigned to the North America region.
77

QAD INC.
NOTES TO CONSOLIDATED FINANCIAL STATEMENTS (Continued)
11. BUSINESS SEGMENT INFORMATION (Continued)
Years Ended January 31,
2005 2004 2003
(in thousands)
Revenue:North America . . . . . . . . . . . . . . . . . . . . . . . . . . . . . . . . . . $ 97,726 $ 92,994 $ 84,018EMEA . . . . . . . . . . . . . . . . . . . . . . . . . . . . . . . . . . . . . . . . 85,188 88,951 67,595Asia Pacific . . . . . . . . . . . . . . . . . . . . . . . . . . . . . . . . . . . . . 34,638 35,220 30,687Latin America . . . . . . . . . . . . . . . . . . . . . . . . . . . . . . . . . . . 13,654 13,487 12,948
$231,206 $230,652 $195,248
Operating income (loss):North America . . . . . . . . . . . . . . . . . . . . . . . . . . . . . . . . . . $ 19,300 $ 19,166 $ 14,896EMEA . . . . . . . . . . . . . . . . . . . . . . . . . . . . . . . . . . . . . . . . 2,057 624 (1,658)Asia Pacific . . . . . . . . . . . . . . . . . . . . . . . . . . . . . . . . . . . . . 1,650 1,849 (4,228)Latin America . . . . . . . . . . . . . . . . . . . . . . . . . . . . . . . . . . . 79 (784) (1,144)Corporate . . . . . . . . . . . . . . . . . . . . . . . . . . . . . . . . . . . . . . 300 (3,206) (5,723)Impairment loss . . . . . . . . . . . . . . . . . . . . . . . . . . . . . . . . . . — — (151)Restructuring . . . . . . . . . . . . . . . . . . . . . . . . . . . . . . . . . . . . — 346 (5,287)
$ 23,386 $ 17,995 $ (3,295)
Depreciation and amortization:North America . . . . . . . . . . . . . . . . . . . . . . . . . . . . . . . . . . $ 460 $ 450 $ 537EMEA . . . . . . . . . . . . . . . . . . . . . . . . . . . . . . . . . . . . . . . . 1,672 2,234 2,558Asia Pacific . . . . . . . . . . . . . . . . . . . . . . . . . . . . . . . . . . . . . 648 1,287 2,037Latin America . . . . . . . . . . . . . . . . . . . . . . . . . . . . . . . . . . . 225 543 812Corporate . . . . . . . . . . . . . . . . . . . . . . . . . . . . . . . . . . . . . . 4,536 3,568 4,693
$ 7,541 $ 8,082 $ 10,637
Capital expenditures:North America . . . . . . . . . . . . . . . . . . . . . . . . . . . . . . . . . . $ 9,210 $ 16,332 $ 6,406EMEA . . . . . . . . . . . . . . . . . . . . . . . . . . . . . . . . . . . . . . . . 780 885 2,092Asia Pacific . . . . . . . . . . . . . . . . . . . . . . . . . . . . . . . . . . . . . 457 484 686Latin America . . . . . . . . . . . . . . . . . . . . . . . . . . . . . . . . . . . 130 84 77
$ 10,577 $ 17,785 $ 9,261
January 31,
2005 2004
(in thousands)
Identifiable assets:North America . . . . . . . . . . . . . . . . . . . . . . . . . . . . . . . . . . . . . . . . . . . $117,406 $104,371EMEA . . . . . . . . . . . . . . . . . . . . . . . . . . . . . . . . . . . . . . . . . . . . . . . . 62,125 57,606Asia Pacific . . . . . . . . . . . . . . . . . . . . . . . . . . . . . . . . . . . . . . . . . . . . . 20,757 21,575Latin America . . . . . . . . . . . . . . . . . . . . . . . . . . . . . . . . . . . . . . . . . . . 6,805 6,276
$207,093 $189,828
78
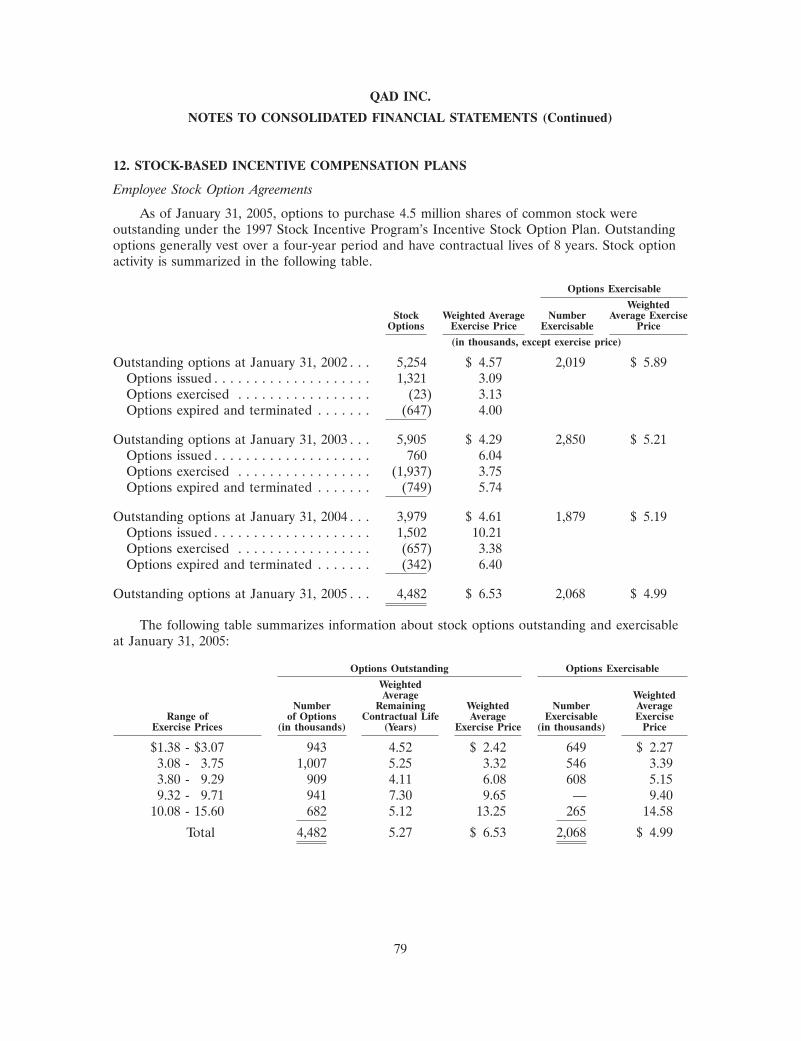
QAD INC.
NOTES TO CONSOLIDATED FINANCIAL STATEMENTS (Continued)
12. STOCK-BASED INCENTIVE COMPENSATION PLANS
Employee Stock Option Agreements
As of January 31, 2005, options to purchase 4.5 million shares of common stock wereoutstanding under the 1997 Stock Incentive Program’s Incentive Stock Option Plan. Outstandingoptions generally vest over a four-year period and have contractual lives of 8 years. Stock optionactivity is summarized in the following table.
Options Exercisable
WeightedStock Weighted Average Number Average Exercise
Options Exercise Price Exercisable Price
(in thousands, except exercise price)
Outstanding options at January 31, 2002 . . . 5,254 $ 4.57 2,019 $ 5.89Options issued . . . . . . . . . . . . . . . . . . . . 1,321 3.09Options exercised . . . . . . . . . . . . . . . . . (23) 3.13Options expired and terminated . . . . . . . (647) 4.00
Outstanding options at January 31, 2003 . . . 5,905 $ 4.29 2,850 $ 5.21Options issued . . . . . . . . . . . . . . . . . . . . 760 6.04Options exercised . . . . . . . . . . . . . . . . . (1,937) 3.75Options expired and terminated . . . . . . . (749) 5.74
Outstanding options at January 31, 2004 . . . 3,979 $ 4.61 1,879 $ 5.19Options issued . . . . . . . . . . . . . . . . . . . . 1,502 10.21Options exercised . . . . . . . . . . . . . . . . . (657) 3.38Options expired and terminated . . . . . . . (342) 6.40
Outstanding options at January 31, 2005 . . . 4,482 $ 6.53 2,068 $ 4.99
The following table summarizes information about stock options outstanding and exercisableat January 31, 2005:
Options Outstanding Options Exercisable
WeightedAverage Weighted
Number Remaining Weighted Number AverageRange of of Options Contractual Life Average Exercisable Exercise
Exercise Prices (in thousands) (Years) Exercise Price (in thousands) Price
$1.38 - $3.07 943 4.52 $ 2.42 649 $ 2.273.08 - 3.75 1,007 5.25 3.32 546 3.393.80 - 9.29 909 4.11 6.08 608 5.159.32 - 9.71 941 7.30 9.65 — 9.40
10.08 - 15.60 682 5.12 13.25 265 14.58
Total 4,482 5.27 $ 6.53 2,068 $ 4.99
79

QAD INC.
NOTES TO CONSOLIDATED FINANCIAL STATEMENTS (Continued)
12. STOCK-BASED INCENTIVE COMPENSATION PLANS (Continued)
1997 Stock Incentive Program
The Company has adopted the 1997 Stock Incentive Program, which currently consists ofseven parts:
• Incentive Stock Option Plan under which incentive stock options may be granted.
• Non-Qualified Stock Option Plan under which non-qualified stock options may be granted.
• Restricted Share Plan under which restricted shares of common stock may be granted.
• Employee Stock Purchase Plan (ESPP) that allows participating employees to purchaseshares of common stock totaling up to 10% of an employee’s compensation through payrolldeductions. The price of common stock to be purchased is 85% of the lower of the fairmarket value of the common stock on the first or last day of each calendar quarter,defined as the purchase period. During the fiscal years ended January 31, 2005, 2004 and2003, a total of 81,000 shares, 161,000 shares and 417,000 shares, respectively, were issuedunder the ESPP, generating total proceeds to the Company of $0.6 million, $0.7 millionand $0.8 million, respectively.
• Non-Employee Director Stock Option Plan under which grants of options to purchaseshares of common stock may be made to non-employee directors of QAD.
• Stock Appreciation Rights Plan under which SARs (as defined in the plan) may begranted.
• Other Stock Rights Plan under which (1) units representing the equivalent shares ofcommon stock may be granted; (2) payments of compensation in the form of shares ofcommon stock may be granted; and (3) rights to receive cash or shares of common stockbased on the value of dividends paid with respect to a share of common stock may begranted.
The maximum aggregate number of shares of common stock subject to the 1997 program is12 million shares, as approved by the shareholders. The 1997 program expires 10 years from thedate of adoption.
13. STOCKHOLDERS’ EQUITY
Stock Repurchase
On June 15, 2004, the Company’s Board of Directors approved an open market stockrepurchase program authorized for one year to buy up to one million shares of the Company’scommon stock. For the twelve months ended January 31, 2005 the Company repurchasedapproximately 742,000 shares of its common stock at an average repurchase price of $7.52 pershare, including fees. As a result, stockholders’ equity was reduced for the twelve months endedJanuary 31, 2005 by $5.6 million.
Dividends
On June 15, 2004, the Company’s Board of Directors approved a one-time special dividendof $0.10 per share of common stock payable August 10, 2004 to the Company’s shareholders of
80

QAD INC.
NOTES TO CONSOLIDATED FINANCIAL STATEMENTS (Continued)
13. STOCKHOLDERS’ EQUITY (Continued)
record at the close of business on July 19, 2004. In addition, the Company’s Board of Directorsapproved an initial quarterly cash dividend of $0.025 per share of common stock payableSeptember 20, 2004 to the Company’s shareholders of record at the close of business onAugust 23, 2004. The one-time special dividend and the initial quarterly dividend, for a total of$4.3 million, were paid during the third quarter of fiscal 2005.
On September 9, 2004, the Company’s Board of Directors approved the payment of aquarterly cash dividend of $0.025 per share of common stock to shareholders of record at theclose of business on November 22, 2004, payable December 20, 2004. This quarterly dividend of$0.8 million was paid during the fourth quarter of fiscal 2005.
On December 15, 2004, the Company’s Board of Directors approved a fiscal 2005 fourthquarter cash dividend of $0.025 per share of common stock payable on April 11, 2005 toshareholders of record at the close of business on March 14, 2005.
Total dividends declared for the year ended January 31, 2005 were $6.0 million, of which$5.1 million were paid by January 31, 2005.
Warrants
Recovery Equity Investors II, L.P. (REI) acquired a warrant in December 1999 in conjunctionwith a private placement by QAD, in which REI received 2,333,333 shares of the Company’scommon stock for net consideration of $9.6 million. The warrant included anti-dilution provisions,which were not applicable to this transaction. The warrant exercise period was set to expire inDecember 2003. In December 2003, REI exercised, in its entirety, the warrant to purchase225,000 shares of QAD common stock at an exercise price of $7.50 per share for which QADreceived $1.7 million in cash.
Tender Offer
On March 20, 2003, QAD announced a plan to purchase up to 2.6 million shares of itscommon stock (subject to its rights under the securities laws to purchase additional sharesrepresenting up to 2% of its outstanding common stock) through a ‘‘Modified Dutch Auction’’tender offer. The tender offer commenced on March 21, 2003, and consisted of an offer topurchase shares at a price between $4.75 per share and $5.25 per share, net to the seller in cash,without interest. The offer expired on April 21, 2003. Based on a final count by the depositary forthe tender offer, QAD accepted for payment 2.6 million shares and exercised its right to acceptfor payment an additional 0.3 million shares for a total of approximately 2.9 million shares, at apurchase price of $5.00 per share.
The aggregate cost, including fees and expenses associated with the tender offer, wasapproximately $15.2 million. The Company financed the tender offer from available cash. Sharesacquired pursuant to the tender offer returned to the status of authorized but unissued commonstock, and were available for issuance. Subsequent to the tender offer, common shares issued inconnection with stock option and warrant exercises, and ESPP purchases have been primarilymade from treasury.
81
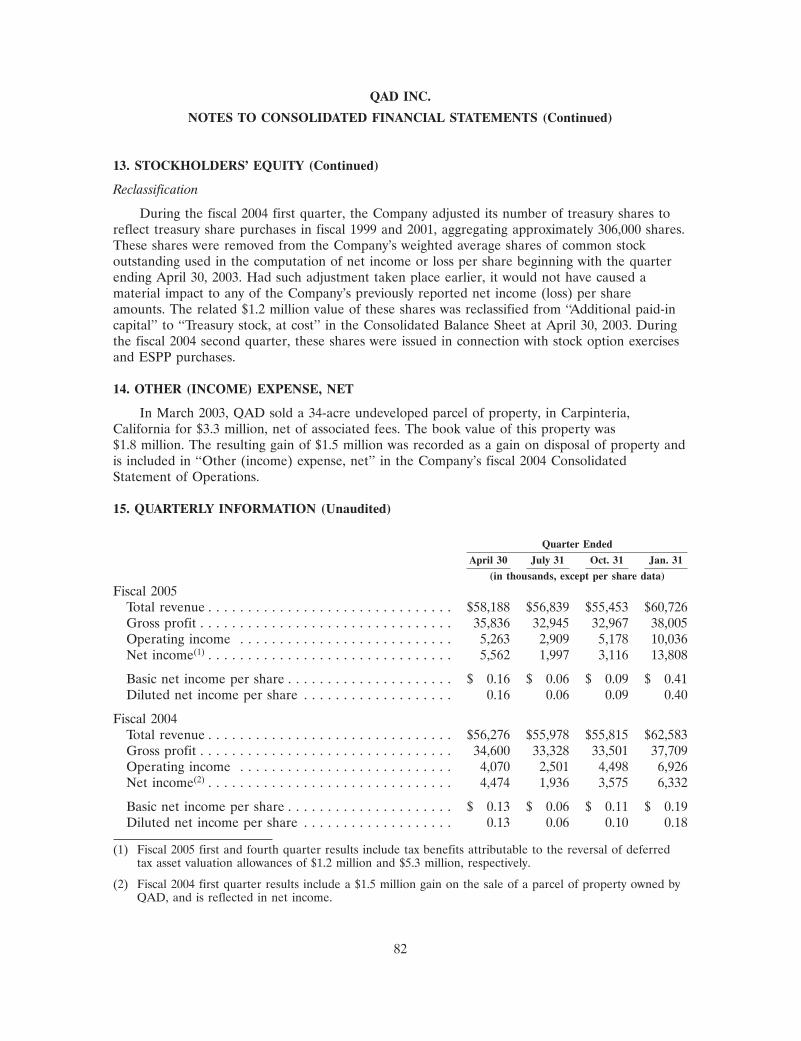
QAD INC.
NOTES TO CONSOLIDATED FINANCIAL STATEMENTS (Continued)
13. STOCKHOLDERS’ EQUITY (Continued)
Reclassification
During the fiscal 2004 first quarter, the Company adjusted its number of treasury shares toreflect treasury share purchases in fiscal 1999 and 2001, aggregating approximately 306,000 shares.These shares were removed from the Company’s weighted average shares of common stockoutstanding used in the computation of net income or loss per share beginning with the quarterending April 30, 2003. Had such adjustment taken place earlier, it would not have caused amaterial impact to any of the Company’s previously reported net income (loss) per shareamounts. The related $1.2 million value of these shares was reclassified from ‘‘Additional paid-incapital’’ to ‘‘Treasury stock, at cost’’ in the Consolidated Balance Sheet at April 30, 2003. Duringthe fiscal 2004 second quarter, these shares were issued in connection with stock option exercisesand ESPP purchases.
14. OTHER (INCOME) EXPENSE, NET
In March 2003, QAD sold a 34-acre undeveloped parcel of property, in Carpinteria,California for $3.3 million, net of associated fees. The book value of this property was$1.8 million. The resulting gain of $1.5 million was recorded as a gain on disposal of property andis included in ‘‘Other (income) expense, net’’ in the Company’s fiscal 2004 ConsolidatedStatement of Operations.
15. QUARTERLY INFORMATION (Unaudited)
Quarter Ended
April 30 July 31 Oct. 31 Jan. 31
(in thousands, except per share data)
Fiscal 2005Total revenue . . . . . . . . . . . . . . . . . . . . . . . . . . . . . . . $58,188 $56,839 $55,453 $60,726Gross profit . . . . . . . . . . . . . . . . . . . . . . . . . . . . . . . . 35,836 32,945 32,967 38,005Operating income . . . . . . . . . . . . . . . . . . . . . . . . . . . 5,263 2,909 5,178 10,036Net income(1) . . . . . . . . . . . . . . . . . . . . . . . . . . . . . . . 5,562 1,997 3,116 13,808
Basic net income per share . . . . . . . . . . . . . . . . . . . . . $ 0.16 $ 0.06 $ 0.09 $ 0.41Diluted net income per share . . . . . . . . . . . . . . . . . . . 0.16 0.06 0.09 0.40
Fiscal 2004Total revenue . . . . . . . . . . . . . . . . . . . . . . . . . . . . . . . $56,276 $55,978 $55,815 $62,583Gross profit . . . . . . . . . . . . . . . . . . . . . . . . . . . . . . . . 34,600 33,328 33,501 37,709Operating income . . . . . . . . . . . . . . . . . . . . . . . . . . . 4,070 2,501 4,498 6,926Net income(2) . . . . . . . . . . . . . . . . . . . . . . . . . . . . . . . 4,474 1,936 3,575 6,332
Basic net income per share . . . . . . . . . . . . . . . . . . . . . $ 0.13 $ 0.06 $ 0.11 $ 0.19Diluted net income per share . . . . . . . . . . . . . . . . . . . 0.13 0.06 0.10 0.18
(1) Fiscal 2005 first and fourth quarter results include tax benefits attributable to the reversal of deferredtax asset valuation allowances of $1.2 million and $5.3 million, respectively.
(2) Fiscal 2004 first quarter results include a $1.5 million gain on the sale of a parcel of property owned byQAD, and is reflected in net income.
82

QAD INC.
NOTES TO CONSOLIDATED FINANCIAL STATEMENTS (Continued)
16. SUBSEQUENT EVENTS (Unaudited)
Purchased Software
On February 11, 2005, the Company entered into an agreement with Soft Cell N.V. topurchase intellectual property comprised of certain software that is complementary to MFG/PRO.Specifically, the software purchased will enhance the Company’s existing financial modules. In thefourth quarter of fiscal 2005, the Company paid a deposit of $0.1 million. The remaining purchaseprice includes a total of $3.6 million in payments due in four phases from February 2005 throughMay 2006.
Exit Activity
On March 18, 2005, the Company moved its data center from leased office space inCarpinteria, California to its new headquarters in Summerland, California. Under SFAS 146,‘‘Accounting for Costs Associated with Exit or Disposal Activities’’, a loss must be recognized forcosts that will continue to be incurred under the lease agreement without economic benefit to theCompany. Although the Company has not secured a sublease agreement with a tenant, it expectsto do so by August 1, 2005. During the first quarter ended April 30, 2005, the Company willreport expense of approximately $0.9 million related to the present value of the estimated loss onthe lease and related asset disposal costs.
Credit Facility
On April 7, 2005, the Company entered into a credit facility with Comerica Bank. The facilityhas a commitment for three years and expires in April 2008. The maximum available amount ofborrowing under the facility is $20 million. The facility with Comerica Bank will replace theexisting Wells Fargo Foothill facility. For further details, see note 7 within these Notes toConsolidated Financial Statements.
83

SCHEDULE II
SCHEDULE OF VALUATION AND QUALIFYING ACCOUNTS
(in thousands)
Charged Impact ofBalance at (Credited) to Foreign Balance atBeginning Statement of Currency End ofof Period Operations Deletions Acquisitions Translation Period
Year ended January 31, 2003Allowance for doubtful
accounts . . . . . . . . . . . . . $2,169 $ 168 $(1,362) $981 $229 $2,185Allowance for sales
adjustments . . . . . . . . . . . 6,609 668 (3,627) — 257 3,907
Total allowances . . . . . . . . $8,778 $ 836 $(4,989) $981 $486 $6,092
Year ended January 31, 2004Allowance for doubtful
accounts . . . . . . . . . . . . . 2,185 (212) (437) — 151 1,687Allowance for sales
adjustments . . . . . . . . . . . 3,907 349 (1,276) — 278 3,258
Total allowances . . . . . . . . $6,092 $ 137 $(1,713) $ — $429 $4,945
Year ended January 31, 2005Allowance for doubtful
accounts . . . . . . . . . . . . . 1,687 (32) (625) — 63 1,093Allowance for sales
adjustments . . . . . . . . . . . 3,258 289 (1,101) — 143 2,589
Total allowances . . . . . . . . $4,945 $ 257 $(1,726) $ — $206 $3,682
84

SIGNATURES
Pursuant to the requirements of Section 13 or 15(d) of the Securities Exchange Act of 1934,the Registrant has duly caused this report to be signed on its behalf by the undersigned, thereuntoduly authorized, on April 15, 2005.
QAD INC.
By: /s/ DANIEL LENDER
Daniel LenderChief Financial Officer
Pursuant to the requirements of the Securities Exchange Act of 1934, this report has beensigned by the following persons on behalf of the Registrant and in the capacities and on the dateindicated.
Signature Title Date
/s/ PAMELA M. LOPKER Chairman of the Board, and April 15, 2005PresidentPamela M. Lopker
/s/ KARL F. LOPKER Director, Chief Executive Officer April 15, 2005(Principal Executive Officer)Karl F. Lopker
Executive Vice President and Chief/s/ DANIEL LENDERFinancial Officer (Principal April 15, 2005
Daniel Lender Financial Officer)
/s/ VALERIE J. MILLER Vice President, Corporate Controller April 15, 2005(Principal Accounting Officer)Valerie J. Miller
/s/ JEFFREY A. LIPKINDirector April 15, 2005
Jeffrey A. Lipkin
/s/ A. J. MOYERDirector April 15, 2005
A. J. Moyer
/s/ BARRY PATMOREDirector April 15, 2005
Barry Patmore
/s/ PETER R. VAN CUYLENBURGDirector April 15, 2005
Peter R. van Cuylenburg
/s/ LARRY WOLFEDirector April 15, 2005
Larry Wolfe
85

INDEX OF EXHIBITS
EXHIBITNUMBER EXHIBIT TITLE
3.1 Certificate of Incorporation of the Registrant, filed with the Delaware Secretary ofState on May 15, 1997(1)
3.2 Certificate of Amendment of Certificate of Incorporation of the Registrant, filed withthe Delaware Secretary of State on June 19, 1997(1)
3.9 Bylaws of the Registrant(1)
4.1 Specimen Stock Certificate(1)
10.1 QAD Inc. 1994 Stock Ownership Program(1)
10.2 QAD Inc. 1997 Stock Incentive Program(1)
10.3 Form of Indemnification Agreement with Directors and Executive Officers(1)
10.4 Master License Agreement between the Registrant and Progress software Corporationdated June 30, 1995(1)†
10.5 Lease Agreement between the Registrant and Matco Enterprises, Inc. for Suites I, Kand L located at 5464 Carpinteria Ave., Carpinteria, California dated November 30,1992(1)
10.6 First Amendment to Office Lease between the Registrant and Matco Enterprises, Inc.for Suites C and H located at 5464 Carpinteria Ave., Carpinteria, California datedSeptember 9, 1993(1)
10.7 Second Amendment to Office Lease between the Registrant and MatcoEnterprises, Inc. for Suite J located at 5464 Carpinteria Ave., Carpinteria, Californiadated January 14, 1994(1)
10.8 Third Amendment to Office Lease between the Registrant and Matco Enterprises, Inc.for Suites B and C located at 5464 Carpinteria Ave., Carpinteria, California datedJanuary 14, 1994(1)
10.9 Fourth Amendment to Office Lease between the Registrant and MatcoEnterprises, Inc. for Suite H located at 5464 Carpinteria Ave., Carpinteria, Californiadated February 15, 1994(1)
10.10 Fifth Amendment to Office Lease between the Registrant and Matco Enterprises, Inc.or Suites G and E located at 5464 Carpinteria Ave., Carpinteria, California datedSeptember 12, 1994(1)
10.11 Sixth Amendment to Office Lease between the Registrant and Matco Enterprises, Inc.for Suites A, B, D, F and H, and Room A located at 5464 Carpinteria Ave.,Carpinteria, California dated October 30, 1996(1)
10.12 Lease Agreement between the Registrant and William D. and Edna J. Wright dbaSouth Coast Business Park for Suites 3 through 8 located at 6430 Via Real,Carpinteria, California dated November 30, 1993(1)
10.13 Addendum to Lease between the Registrant and William D. and Edna J. Wright dbaSouth Coast Business Park for Suites 3 through 8 located at 6430 Via Real,Carpinteria, California dated November 30, 1993(1)
86

INDEX OF EXHIBITS (Continued)
EXHIBITNUMBER EXHIBIT TITLE
10.14 Lease Agreement between the Registrant and William D. and Edna J. Wright dbaSouth Coast Business Park for 6450 Via Real, Carpinteria, California datedNovember 30,1993(1)
10.15 Addendum to Lease between the Registrant and William D. and Edna J. Wright dbaSouth Coast Business Park for 6450 Via Real, Carpinteria, California datedNovember 30, 1993(1)
10.16 Lease Agreement between the Registrant and William D. and Edna J. Wright dbaSouth Coast Business Park for Suites 1 through 5 located at 6460 Via Real,Carpinteria, California dated November 30, 1993(1)
10.17 Addendum to Lease between the Registrant and William D. and Edna J. Wright dbaSouth Coast Business Park for Suites 1 through 5 located at 6460 Via Real,Carpinteria, California dated November 30, 1993(1)
10.18 Lease Agreement between the Registrant and William D. and Edna J. Wright dbaSouth Coast Business Park for Suites 7 and 8 located at 6440 Via Real, Carpinteria,California dated September 8, 1995(1)
10.19 Addendum to Lease between the Registrant and William D. and Edna J. Wright dbaSouth Coast Business Park for Suites 7 and 8 located at 6440 Via Real, Carpinteria,California dated September 8, 1995(1)
10.20 Lease Agreement between the Registrant and William D. and Edna J. Wright dbaSouth Coast Business Park for Suites 9 and 10 located at 6440 Via Real, Carpinteria,California dated September 8, 1995(1)
10.21 Addendum to Lease between the Registrant and William D. and Edna J. Wright dbaSouth Coast Business Park for Suites 9 and 10 located at 6440 Via Real, Carpinteria,California dated September 8, 1995(1)
10.22 Multi-Tenant Office Lease Agreement between the Registrant and EDB PropertyPartners, LP III, successor to Laurel Larchmont Office, Inc. located at 10,000Midlantic Drive, Mt. Laurel, New Jersey dated December 29, 1993(1)
10.23 Amendment to Multi-Tenant Office Lease Agreement between the Registrant and EDBProperty Partners, LP III, successor to Laurel Larchmont Office, Inc. located at 10,000Midlantic Drive, Mt. Laurel, New Jersey dated April 26, 1994(1)
10.24 Second Amendment to Multi-Tenant Lease Agreement between the Registrant andEDB Property Partners, LP III, dated May 30, 1995(1)
10.25 Third Amendment to Multi-Tenant Lease Agreement between the Registrant and EDBProperty Partners L.P. I dated November 30, 1995(1)
10.26 Agreement and Plan of Merger between QAD California and the Registrant datedJuly 8, 1997(1)
10.27 Standard Industrial Commercial Multi-Tenant Lease—Modified Net dated as ofDecember 29, 1997 between the Registrant and CITO Corp.(2)
87
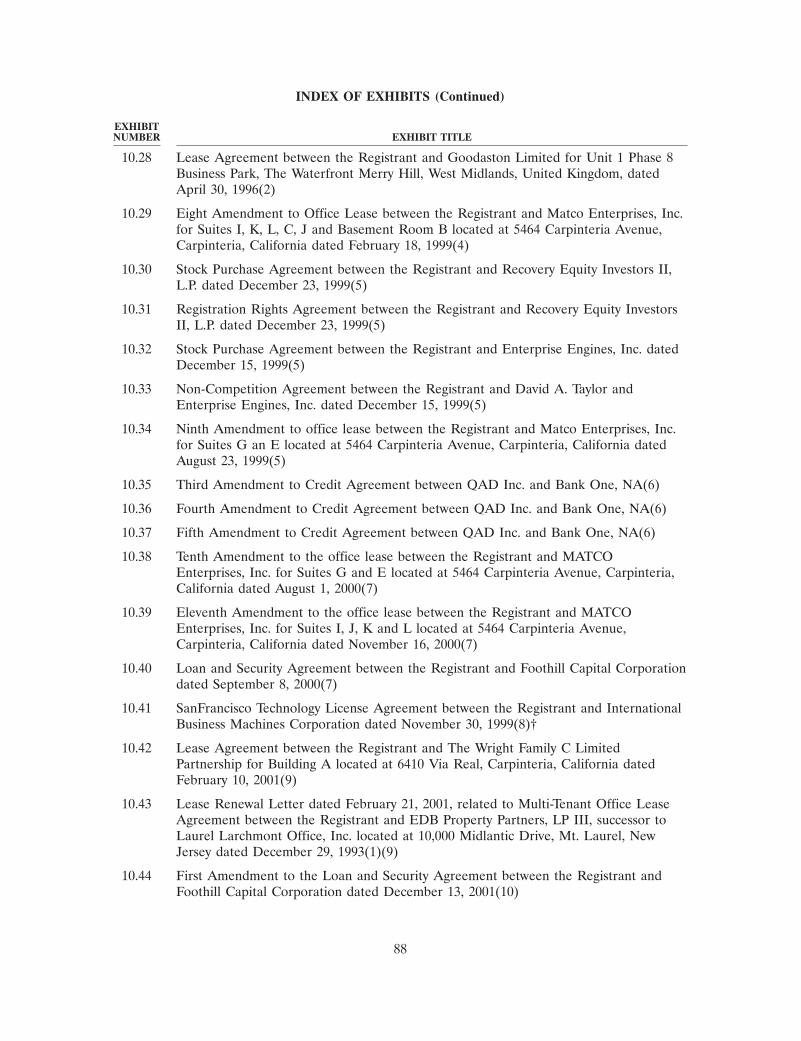
INDEX OF EXHIBITS (Continued)
EXHIBITNUMBER EXHIBIT TITLE
10.28 Lease Agreement between the Registrant and Goodaston Limited for Unit 1 Phase 8Business Park, The Waterfront Merry Hill, West Midlands, United Kingdom, datedApril 30, 1996(2)
10.29 Eight Amendment to Office Lease between the Registrant and Matco Enterprises, Inc.for Suites I, K, L, C, J and Basement Room B located at 5464 Carpinteria Avenue,Carpinteria, California dated February 18, 1999(4)
10.30 Stock Purchase Agreement between the Registrant and Recovery Equity Investors II,L.P. dated December 23, 1999(5)
10.31 Registration Rights Agreement between the Registrant and Recovery Equity InvestorsII, L.P. dated December 23, 1999(5)
10.32 Stock Purchase Agreement between the Registrant and Enterprise Engines, Inc. datedDecember 15, 1999(5)
10.33 Non-Competition Agreement between the Registrant and David A. Taylor andEnterprise Engines, Inc. dated December 15, 1999(5)
10.34 Ninth Amendment to office lease between the Registrant and Matco Enterprises, Inc.for Suites G an E located at 5464 Carpinteria Avenue, Carpinteria, California datedAugust 23, 1999(5)
10.35 Third Amendment to Credit Agreement between QAD Inc. and Bank One, NA(6)
10.36 Fourth Amendment to Credit Agreement between QAD Inc. and Bank One, NA(6)
10.37 Fifth Amendment to Credit Agreement between QAD Inc. and Bank One, NA(6)
10.38 Tenth Amendment to the office lease between the Registrant and MATCOEnterprises, Inc. for Suites G and E located at 5464 Carpinteria Avenue, Carpinteria,California dated August 1, 2000(7)
10.39 Eleventh Amendment to the office lease between the Registrant and MATCOEnterprises, Inc. for Suites I, J, K and L located at 5464 Carpinteria Avenue,Carpinteria, California dated November 16, 2000(7)
10.40 Loan and Security Agreement between the Registrant and Foothill Capital Corporationdated September 8, 2000(7)
10.41 SanFrancisco Technology License Agreement between the Registrant and InternationalBusiness Machines Corporation dated November 30, 1999(8)†
10.42 Lease Agreement between the Registrant and The Wright Family C LimitedPartnership for Building A located at 6410 Via Real, Carpinteria, California datedFebruary 10, 2001(9)
10.43 Lease Renewal Letter dated February 21, 2001, related to Multi-Tenant Office LeaseAgreement between the Registrant and EDB Property Partners, LP III, successor toLaurel Larchmont Office, Inc. located at 10,000 Midlantic Drive, Mt. Laurel, NewJersey dated December 29, 1993(1)(9)
10.44 First Amendment to the Loan and Security Agreement between the Registrant andFoothill Capital Corporation dated December 13, 2001(10)
88
INDEX OF EXHIBITS (Continued)
EXHIBITNUMBER EXHIBIT TITLE
10.45 Lease Agreement between the Registrant and Vof Forward Erenha for office spacelocated at Beechavenue 125, 1119 RB Schiphol Rijk, The Netherlands, datedDecember 24, 2001(11)
10.46 Architectural Services Agreement between the Registrant and Lenvik & MinorArchitects dated May 29, 2002(12)
10.47 Master Services Agreement between the Registrant and Equant, Inc. dated June 6,2002(†)(12)
10.48 Consulting Agreement between the Registrant and Ove Arup & Partners Californiadated June 12, 2002(12)
10.49 Second Amendment to the Loan and Security Agreement between the Registrant andFoothill Capital Corporation dated July 31, 2002(12)
10.50 Lease Termination Agreement between the Registrant and Brandywine OperatingPartnership, L.P. dated September 19, 2002(13)
10.51 Contractor agreement between the Registrant and Melchiori Construction Companydated October 30, 2002(13)
10.52 Agreement for Interior Design Services between the Registrant and DMJM Rottetdated October 30, 2002(13)
10.53 Stock and Asset Purchase Agreement by and among BDM International, Inc., TRWIntegrated Supply Chain Solutions GMBH, TRW Integrated Supply ChainSolutions, Inc. and TRW Inc. on the one hand and Pistach EMEA Holdings, B.V. andQAD Inc. on the other hand dated November 12, 2002(†)(14)
10.54 Agreement for Landscaping and Improvements between the Registrant and the Countyof Santa Barbara dated November 1, 2002(15)
10.55 Construction Loan Agreement between the Registrant and Santa Barbara Bank &Trust dated November 18, 2002(15)
10.56 Amendment to the Loan and Security Agreement between the Registrant and FoothillCapital Corporation dated March 18, 2003(15)
10.57 Amendment to the Loan and Security Agreement between the Registrant and FoothillCapital Corporation effective as of April 29, 2003(16)
10.58 Amendment to the Loan and Security Agreement between the Registrant and WellsFargo Foothill, Inc. effective as of April 28, 2004(17)
10.59 Promissory Note between the Registrant and Mid-State Bank & Trust effective as ofJuly 28, 2004(18)
10.60 Amendment to the Loan and Security Agreement between the Registrant and WellsFargo Foothill, Inc. effective as of October 31, 2004
10.61 Sublease agreement between the Registrant and Somera Communications Inc. datedNovember 29, 2004
10.62 Amendment to the Loan and Security Agreement between the Registrant and WellsFargo Foothill, Inc. effective as of March 21, 2005
89

INDEX OF EXHIBITS (Continued)
EXHIBITNUMBER EXHIBIT TITLE
10.63 Loan Agreement between the Registrant and Comerica Bank effective as of April 7,2005
10.64 Termination letter of the Loan and Security Agreement between the Registrant andWells Fargo Foothill, Inc. effective as of April 6, 2005
21.1 Subsidiaries of the Registrant
23.1 Consent of Independent Registered Public Accounting Firm
31.1 Certification by the Chief Executive Officer pursuant to Rule 13a-14(a) of theSecurities Exchange Act of 1934, as adopted pursuant to Section 302 of the Sarbanes-Oxley Act of 2002
31.2 Certification by the Chief Financial Officer pursuant to Rule 13a-14(a) of theSecurities Exchange Act of 1934, as adopted pursuant to Section 302 of the Sarbanes-Oxley Act of 2002
32.1 Certification by the Chief Executive Officer pursuant to 18 U.S.C. Section 1350, asadopted pursuant to Section 906 of the Sarbanes-Oxley Act of 2002
32.2 Certification by the Chief Financial Officer pursuant to 18 U.S.C. Section 1350, asadopted pursuant to Section 906 of the Sarbanes-Oxley Act of 2002
(1) Incorporated by reference to the Registrant’s Registration Statement on Form S-1(Commission File No. 333-28441)
(2) Incorporated by reference to the Registrant’s Annual Report on Form 10-K for the yearended January 31, 1999 filed April 30, 1999 (Commission File No. 0-22823)
(3) Incorporated by reference to the Registrant’s Quarterly Report for the quarter endedApril 30, 1999 filed June 14, 1999 (Commission No. 0-22823)
(4) Incorporated by reference to the Registrant’s Quarterly Report for the quarter ended July 31,1999 filed September 14, 1999 (Commission No. 0-22823)
(5) Incorporated by reference to the Registrant’s Annual Report on Form 10-K for the yearended January 31, 2000 (Commission No. 0-22823)
(6) Incorporated by reference to the Registrant’s Quarterly Report for the quarter endedApril 30, 2000 filed June 13, 2000 (Commission No. 0-22823)
(7) Incorporated by reference to the Registrant’s Quarterly Report for the quarter endedOctober 31, 2000 filed December 15, 2000 (Commission No. 0-22823)
(8) Incorporated by reference to the Registrant’s Annual Report on Form 10-K for the yearended January 31, 2001 (Commission No. 0-22823)
(9) Incorporated by reference to the Registrant’s Quarterly Report for the quarter endedApril 30, 2001 filed June 14, 2001 (Commission No. 0-22823)
(10) Incorporated by reference to the Registrant’s Quarterly Report for the quarter endedOctober, 31, 2001 filed December 14, 2001 (Commission No. 0-22823)
(11) Incorporated by reference to the Registrant’s Annual Report on Form 10-K for the yearended January 31, 2002 (Commission No. 0-22823)
90

INDEX OF EXHIBITS (Continued)
(12) Incorporated by reference to the Registrant’s Quarterly Report for the quarter ended July 31,2002 filed September 15, 2002 (Commission No. 0-22823)
(13) Incorporated by reference to the Registrant’s Quarterly Report for the quarter endedOctober 31, 2002 filed December 14, 2002 (Commission No. 0-22823)
(14) Incorporated by reference to the Registrant’s Current Report on Form 8-K filedNovember 27, 2002 (Commission No. 0-22823)
(15) Incorporated by reference to the Registrant’s Annual Report on Form 10-K for the yearended January 31, 2003 (Commission No. 0-22823)
(16) Incorporated by reference to the Registrant’s Quarterly Report for the quarter endedApril 30, 2003 Commission No. 0-22823)
(17) Incorporated by reference to the Registrant’s Quarterly Report for the quarter endedApril 30, 2004 (Commission No. 0-22823)
(18) Incorporated by reference to the Registrant’s Quarterly Report for the quarter ended July 31,2004 (Commission No. 0-22823)
(†) Certain portions of exhibit have been omitted based upon a request for confidentialtreatment. The omitted portions have been separately filed with the Securities and ExchangeCommission.
91

(This page has been left blank intentionally.)

EXHIBIT 23.1
CONSENT OF INDEPENDENT REGISTERED PUBLIC ACCOUNTING FIRM
The Board of DirectorsQAD Inc.:
We consent to the incorporation by reference in the registration statements (Nos. 333-66610,333-48381 and 333-35367) on Form S-8 of QAD Inc. of our reports dated April 15, 2005, withrespect to the consolidated balance sheets of QAD Inc. as of January 31, 2005 and 2004, and therelated consolidated statements of operations, stockholders’ equity and comprehensive income(loss), and cash flows for each of the years in the three-year period ended January 31, 2005, andthe related financial statement schedule II, management’s assessment of the effectiveness ofinternal control over financial reporting as of January 31, 2005 and the effectiveness of internalcontrol over financial reporting as of January 31, 2005, which reports appear in the January 31,2005 Annual Report on Form 10-K of QAD Inc.
/s/ KPMG LLP
Los Angeles, CaliforniaApril 15, 2005

(This page has been left blank intentionally.)

F i n a n c i a l H i g h l i g h t s Fiscal years ended January 31. Amounts in thousands, except per share data.
6%Latin
America
15%Asia
Pacific
42%North
America
37%Europe,
Middle East& Africa
17%ConsumerProducts/
Food &Beverage
18%Medical
30%Automotive
35%Electronics/
Industrial
35%Electronics/
Industrial 49%Maintenance
and Other
49%Maintenance
and Other
26%License26%License
25%Services25%
Services
FY05 Revenue by Region FY05 Revenue by Vertical FY05 Revenue by Type
Fiscal 2005 marked the most profitable year in QAD’s history
1 | QAD Inc Annual Report FY05
FY2005 FY2004 FY2003
Total revenue $231,206 $230,652 $195,248
Net income (loss) 24,483 16,317 (7,649)
Diluted earnings (loss) per share 0.70 0.47 (0.22)
Cash, restricted cash & marketable securities 68,289 59,784 51,204
Total debt 25,636 19,707 11,125
Cash flow from operations 22,980 19,840 13,441

© 2005 QAD Inc. All Rights ReservedItem # 73-1695H
QA
D Inc. FY
05 Annual R
epo
rt