Maturity Model for Customer-Centric Approach in Enterprise
300
Portland State University Portland State University PDXScholar PDXScholar Dissertations and Theses Dissertations and Theses 4-12-2022 Maturity Model for Customer-Centric Approach in Maturity Model for Customer-Centric Approach in Enterprise: The Case of E-commerce and Online Enterprise: The Case of E-commerce and Online Retail Industry Retail Industry Soheil Zarrin Portland State University Follow this and additional works at: https://pdxscholar.library.pdx.edu/open_access_etds Part of the Business Administration, Management, and Operations Commons, and the Marketing Commons Let us know how access to this document benefits you. Recommended Citation Recommended Citation Zarrin, Soheil, "Maturity Model for Customer-Centric Approach in Enterprise: The Case of E-commerce and Online Retail Industry" (2022). Dissertations and Theses. Paper 5925. https://doi.org/10.15760/etd.7796 This Dissertation is brought to you for free and open access. It has been accepted for inclusion in Dissertations and Theses by an authorized administrator of PDXScholar. Please contact us if we can make this document more accessible: [email protected].
-
Upload
khangminh22 -
Category
Documents
-
view
0 -
download
0
Transcript of Maturity Model for Customer-Centric Approach in Enterprise
Portland State University Portland State University
PDXScholar PDXScholar
Dissertations and Theses Dissertations and Theses
4-12-2022
Maturity Model for Customer-Centric Approach in Maturity Model for Customer-Centric Approach in
Enterprise: The Case of E-commerce and Online Enterprise: The Case of E-commerce and Online
Retail Industry Retail Industry
Soheil Zarrin Portland State University
Follow this and additional works at: https://pdxscholar.library.pdx.edu/open_access_etds
Part of the Business Administration, Management, and Operations Commons, and the Marketing
Commons
Let us know how access to this document benefits you.
Recommended Citation Recommended Citation Zarrin, Soheil, "Maturity Model for Customer-Centric Approach in Enterprise: The Case of E-commerce and Online Retail Industry" (2022). Dissertations and Theses. Paper 5925. https://doi.org/10.15760/etd.7796
This Dissertation is brought to you for free and open access. It has been accepted for inclusion in Dissertations and Theses by an authorized administrator of PDXScholar. Please contact us if we can make this document more accessible: [email protected].

Maturity Model for Customer-Centric Approach in Enterprise:
The Case of E-commerce and Online Retail Industry
by
Soheil Zarrin
A dissertation submitted in partial fulfillment of the requirements for the degree of
Doctor of Philosophy in
Technology Management
Dissertation Committee: Tugrul U. Daim, Chair
Judith A. Estep Leong Chan
Thomas Gillpatrick
Portland State University 2022
i
Abstract
The network technologies are changing the dynamics of the interaction between
customer and provider. Customers demand closer relationships and higher
investment between partners, as well as cooperation between companies to build
supporting technologies for their unique needs. [1] Customer-centricity is defined as
interaction with the customer through various touchpoints and aggregating these
relations to create a position for the customer. Each Customer has a different need
and expectation from the provider or seller, and companies need to be flexible enough
to fulfill their needs. [2] One of the reasons organizations invest less in
customer experience is that they believe they are already customer-centric
organizations. [2]
Companies need to deploy structured methods to evaluate their customer-centricity
as it is now to achieve this purpose. Also, the techniques should enable them to plan
the organization's evolution toward the customer-centric approach strategically. This
research focuses on designing a new maturity model to evaluate and plan an
organization's customer-centricity. The Hierarchical Decision Model (HDM) is used
as the primary methodology to quantify impacting factors and intensity of influence
on the ultimate outcome.
To demonstrate the proposed model in the real world, a case study is performed in
the E-commerce industry, especially B2C online retailer organizations. This industry
is selected because of the high impact of customer-centricity on the success of

ii
businesses. Also, in order to deliver the best experience, e-commerce firms need to
stay on top of cutting-edge technologies and related practices.

iii
Dedication
To my wise, kind, and supportive wife,
Shirin Yekekar, Ph.D.,
who made this journey possible.
iv
Acknowledgements
The Ph.D. studies is a journey that is impossible to accomplish without the outstanding
support and help from many people who lean in and make it possible.
First of all, I’d like to acknowledge the support of my Ph.D. advisor and dissertation
committee chair, Professor Dr. Tugrul Daim, who played a critical role, not only as the
person who provided direction and guidance all along with my Ph.D. program but also his
supports enable me to continue my education despite all the challenges that happened
during my studies.
In addition, there are a few of my research teammates who provided invaluable
contributions to my research:
Dr. Edwin Garces who spent many hours with me on research methods and provided
valuable recommendations and feedback on my Ph.D. dissertation.
Dr. Rafaa Khalifa guided this research in the early stages and helped to improve the HDM
model for the dissertation proposal.
Dr. Husam Barham who helped me with narrowing down my research topic and being
able to finalize the details and approach of the research proposal.
Dr. Farshad Madani who provided valuable suggestions to help me get a better grasp of
Technology Management research methods and concepts in the early stages of my
independent studies.

v
The Ph.D. Dissertation Committee members Dr. Judith Estep, Dr. Leong Chan, Dr. Thomas
Gillpatrick who took the time to review my method, structure, and content of the
research and provided precious feedback to make improvements along the way.
Finally, I’d like to thank all the research participants and expert panelists who shared their
knowledge, expertise, and experience during this research.

vi
Table of Contents
Abstract ..................................................................................................................... i
Dedication ................................................................................................................ iii
Acknowledgements....................................................................................................iv
List of Tables ............................................................................................................. x
List of Figures ......................................................................................................... xiii
Chapter One: Introduction ..................................................................................... 1
Research Motivation ...................................................................................................... 1
Research Scope .............................................................................................................. 7
Research Application ................................................................................................... 10
Chapter Two: Literature Review .......................................................................... 12
Customer-centricity in organization .......................................................................... 12
Product-Service Systems............................................................................................. 24
Maturity Model landscape .......................................................................................... 27
Capacity Maturity Model Integration (CMMI) .......................................................... 32
Portfolio, Program, Project Management Maturity Model (P3M3) ......................... 36
Transmission Resilience Maturity Model (TRMM) .................................................... 44
E-commerce Industry .................................................................................................. 49
Chapter Three: Research Scope ........................................................................... 57
Research Gaps ............................................................................................................... 57
Research Questions ..................................................................................................... 64
Research Goal ............................................................................................................... 64
Research Questions ..................................................................................................... 64
Chapter Four: Research Methodology ................................................................. 66
Overview of Multi-criteria Decision Models .............................................................. 66
Analytical Hierarchy Process (AHP) ........................................................................... 66
Analytic Network Process (ANP) ................................................................................ 67

vii
Preference Ranking Organization METHod for Enrichment of Evaluations
(PROMETHEE ) ........................................................................................................... 67
Technology Acceptance Model (TAM) ...................................................................... 67
Technique for Order of Preference by Similarity (TOPSIS) ........................................ 68
ELimination and Choice Expressing Reality (ELECTRE) .............................................. 68
Multi-Attribute Utility Theory (MAUT) ...................................................................... 69
AHP vs. MAUT vs. HDM ............................................................................................. 69
Hierarchical Decision Model ......................................................................................... 71
Inconsistency in Hierarchical Decision Model ........................................................... 75
Disagreement in Hierarchical Decision Model .......................................................... 80
Sensitivity Analysis in Hierarchical Decision Model .................................................. 84
Desirability Curves in Hierarchical Decision Model ................................................... 87
Calculating Customer-centricity Score ...................................................................... 90
Expert Panel Formation ............................................................................................. 92
Validation of the Decision Model .............................................................................. 94
Research Application and Case Study ........................................................................... 95
Chapter Five: Research Design ............................................................................. 98
Research Framework .................................................................................................. 98
Hierarchical Decision Model Perspectives .................................................................. 100
Technology/Data Perspective .................................................................................. 102
Customer Perspective .............................................................................................. 104
Organization Perspective ......................................................................................... 105
Policy Perspective .................................................................................................... 107
Initial HDM Model ....................................................................................................... 108
Experts Panel Design ................................................................................................... 109
Data Collection ............................................................................................................ 112
Chapter Six: Results of Model Validation and Quantification ........................... 114
Model Validation ......................................................................................................... 115
Perspective validation .............................................................................................. 115
Criteria Validation – Technology/Data .................................................................... 117
viii
Criteria Validation – Organization ........................................................................... 119
Criteria Validation – Customer ................................................................................ 122
Criteria Validation – Policy ...................................................................................... 124
Changes to the initial model .................................................................................... 125
Final HDM Model ........................................................................................................ 126
HDM Model Quantification ......................................................................................... 126
Perspective Quantification....................................................................................... 128
Criteria Quantification – Technology/Data ............................................................. 130
Criteria Quantification – Organization .................................................................... 132
Criteria Quantification – Customer .......................................................................... 134
Criteria Quantification – Policy ................................................................................ 136
Final Model Weights ................................................................................................... 138
Inconsistency and Disagreement Analysis .................................................................. 141
Desirability Curves ....................................................................................................... 142
Technology Perspective ........................................................................................... 143
Organization Perspective ......................................................................................... 148
Customer Perspective .............................................................................................. 155
Policy Perspective .................................................................................................... 159
Case Studies ................................................................................................................ 163
Company profiles ..................................................................................................... 163
Case Study 1 ................................................................................................................ 164
Company Alpha ........................................................................................................... 165
Company Beta ............................................................................................................. 168
Company Gamma ........................................................................................................ 170
Sensitivity Analysis ................................................................................................... 184
Scenario 1: Emphasis on Technology/Data Perspective .................................... 185
Scenario 2: Emphasis on Organization Perspective ............................................ 186
Scenario 3: Emphasis on Customer Perspective ................................................. 187
Scenario 4: Emphasis on Policy Perspective........................................................ 188
Case Study 2 ................................................................................................................ 190
ix
Company C1 ............................................................................................................. 190
Company C2 ............................................................................................................. 194
Score Improvement recommendations .................................................................. 203
Research Validity ......................................................................................................... 205
Chapter Seven: Contribution and future studies ............................................... 207
Research outcomes and contribution ......................................................................... 207
Research limitation ..................................................................................................... 212
References ............................................................................................................ 213
Appendix A: Expert Panel formation and correspondence .............................. 233
Email 1 – Initial Invitation to Experts ...................................................................... 234
Email 2 – Perspectives Validation ............................................................................ 238
Email 3 – Thank you notes – step 1 .......................................................................... 242
Email 4 - Criteria Validation ..................................................................................... 243
Email 5 – Thank you notes – step 2 .......................................................................... 246
Email 6 – Quantification – Leadership and organization Panels ........................... 247
Email 7 – Quantification – Technology and Policy Panels ...................................... 251
Email 8 – Quantification – Sales and Marketing Panels .......................................... 253
Email 9 - Desirability Curve ...................................................................................... 255
Appendix B: Pilot implementation of the HDM model........................................... 259
Reduced HDM model for Pilot implementation ...................................................... 260
Perspectives, Criteria and Desirability curves definitions ..................................... 263
Expert Panel Correspondence .................................................................................. 271
Pilot HDM Implementation ....................................................................................... 276
Perspective and Criteria Validation ...................................................................... 276
Desirability Curves ................................................................................................. 277
Pilot HDM Implementation Results ...................................................................... 282
Criteria Weights ..................................................................................................... 283
x
List of Tables
Table 1: Summarized view of the literature ...................................................................... 17
Table 2: Customer Experience Research Focus Trends (last 50 years) ............................ 18
Table 3: Most Adopted Maturity Models ......................................................................... 30
Table 4: CMMI Capacity and Maturity Level .................................................................. 35
Table 5: P3M3 Assessment Result Table ......................................................................... 39
Table 6: P3M3 Maturity Levels Characteristics ............................................................... 40
Table 7: Research Concepts and Gaps .............................................................................. 63
Table 8: Perspectives Definitions ................................................................................... 101
Table 9: Technology Perspective's Criteria Definition ................................................... 103
Table 10: Customer Perspective's Criteria Definition .................................................... 104
Table 11: Organization Perspective's Criteria Definition ............................................... 106
Table 12: Policy Perspective's Criteria Definition .......................................................... 107
Table 13: Expert Panel Design ....................................................................................... 109
Table 14: Perspective Validation Result ...................................................................... 115
Table 15: Perspective Validation Responses .............................................................. 116
Table 16: Criteria Validation Result – Technology ..................................................... 117
Table 17: Criteria Validation Responses - Technology .............................................. 118
Table 18: Criteria Validation Result – Organization ................................................... 119
Table 19: Criteria Validation Responses - Organization ............................................ 121
Table 20: Criteria Validation Result - Customer ......................................................... 122
Table 21: Criteria Validation Responses - Customer .................................................. 123
Table 22: Criteria Validation Result - Policy ............................................................... 124
Table 23: Criteria Validation Responses - Policy ........................................................ 125
Table 24: Perspectives Quantification ......................................................................... 128
Table 25: Criteria Quantification Result - Technology/Data ..................................... 130
Table 26: Criteria Quantification Results - Organization ........................................... 132
Table 27: Criteria Quantification Results - Customer ................................................ 134
Table 28: Criteria Quantification Results - Policy ....................................................... 136
Table 29: Local and Global Weights of HDM model ................................................... 139
Table 30: Technology Infrastructure and Integration Desirability Curve ...................... 143
Table 31: Data Distribution and Accessibility Desirability Curve ................................. 144
Table 32: Data Collection Robustness Desirability Curve Values ................................. 145
Table 33: Data Metrics Clarity Desirability Curve Values ............................................. 146
Table 34: Data Analytics Capabilities Desirability Curve Values.................................. 147
Table 35: Process Robustness Desirability Curve Values .............................................. 148
Table 36: Organizational Structure Desirability Curve Values ...................................... 149
Table 37: Cultural Strength Desirability Curve Values .................................................. 150
Table 38: Strategy Focus Desirability Curve Values ...................................................... 151
Table 39: Staff Expertise Desirability Curve Values ...................................................... 152
Table 40: Leadership Support Desirability Curve Values .............................................. 153

xi
Table 41: Financial Desirability Curve Values ............................................................... 154
Table 42: Awareness and Training Desirability Curve Values ...................................... 155
Table 43: Satisfaction Desirability Curve Values ........................................................... 156
Table 44: Expectation Desirability Curve Values .......................................................... 157
Table 45: Loyalty and commitment Desirability Curve Values ..................................... 158
Table 46: Data Privacy Compliance Desirability Curve Values .................................... 159
Table 47: Data Security Compliance Desirability Curve Values ................................... 160
Table 48: Data Ownership Desirability Curve Values ................................................... 161
Table 49: Data Governance Desirability Curve Values .................................................. 162
Table 50: customer-centricity Assessment for Company Alpha .................................... 167
Table 51: customer-centricity Assessment for Company Beta ....................................... 170
Table 52: customer-centricity Assessment for Company Gamma ................................. 173
Table 53: Company Alpha Customer-centricity Score Calculations ............................. 176
Table 54: Company Beta Customer-centricity Score Calculations ................................ 178
Table 55: Company Gamma Customer-centricity Score Calculations ........................... 180
Table 56: Sensitivity Analysis Scenario 1 ...................................................................... 185
Table 57: Sensitivity Analysis Scenario 2 ...................................................................... 186
Table 58: Sensitivity Analysis Scenario 3 ...................................................................... 187
Table 59: Sensitivity Analysis Scenario 4 ...................................................................... 188
Table 60: Sensitivity Analysis Scenarios Deviations and Range difference .................. 189
Table 61: Customer Centricity Assessment Results - Company C1............................... 193
Table 62: Customer Centricity Assessment Results - Company C2............................... 197
Table 63: Company C1 Customer-centricity Score Calculations ................................... 200
Table 64: Company C2 Customer-centricity Score Calculations ................................... 202
Table 65: Number of Experts .......................................................................................... 233
Table 66: Expertise or Titles of Experts ......................................................................... 233
Table 67: Expert Organzations ....................................................................................... 234
Table 68: Disirability Curve levels example .................................................................. 257
Table 69: Data Collection Tool for Desirability Values ................................................. 262
Table 70: Criteria under Technology for Pilot research ................................................. 267
Table 71: Criteria under Organization for Pilot research ................................................ 269
Table 72: Criteria under Customer for Pilot research ..................................................... 271
Table 73: Collected Perspective Results in Pilot Research ............................................ 276
Table 74: Collected Criteria Results in Pilot Research ................................................... 277
Table 75: Desirability Levels for Infrastructure in Pilot Research ................................. 278
Table 76: Desirability Levels for Data Distribution in Pilot Research ........................... 278
Table 77: Desirability Levels for Data Collection in Pilot Research .............................. 279
Table 78: Desirability Levels for Employee in Pilot Research ....................................... 279
Table 79: Desirability Levels for Leadership in Pilot Research ..................................... 280
Table 80: Desirability Levels for Strategy in Pilot Research ......................................... 280
Table 81: Desirability Levels for Awareness in Pilot Research ..................................... 281
Table 82: Desirability Levels for Satisfaction in Pilot Research .................................... 281

xii
Table 83: Desirability Levels for Loyalty in Pilot Research .......................................... 281
Table 84: Perspectives Weight Results in Pilot .............................................................. 282
Table 85: Criteria Weight Results in Pilot ...................................................................... 283
xiii
List of Figures
Figure 1: Customer Centric Organization Research during last two decades .................. 19
Figure 2: Google Trend Search Results for Customer ...................................................... 19
Figure 3: Maturity Level Characteristics .......................................................................... 28
Figure 4: CMMI Hierarchical Structure ........................................................................... 34
Figure 5: CMMI Maturity Level Definitions .................................................................... 35
Figure 6: P3M3 Hierarchy of factors ................................................................................ 37
Figure 7: P3M3 Implementation Steps ............................................................................. 42
Figure 8: TRMM model elements..................................................................................... 46
Figure 9: TRMM Domain, Objective and Practice relationship ....................................... 48
Figure 10: Retail ecommerce Sales Worldwide ................................................................ 50
Figure 11: Most popular online retail websites................................................................. 51
Figure 12: E-commerce sales CAGR forecast - Map ....................................................... 52
Figure 13: E-commerce sales CAGR forecast - Chart ...................................................... 52
Figure 14: Importance of Impacting factors on Customer Centricity ............................... 58
Figure 15: Paradigm Shift in Strategies of Organizations ................................................ 59
Figure 16: Research Gaps, Goals, and Questions ............................................................. 65
Figure 17: Example Desirability Curve Diagram for Data Collection Robustness .......... 89
Figure 18: Five Major Steps in Expert Panel Formation .................................................. 93
Figure 19: Model Validation Process ............................................................................... 94
Figure 20: Research Framework ....................................................................................... 98
Figure 21: HDM Initial Model ........................................................................................ 108
Figure 22: Initial HDM Model ....................................................................................... 114
Figure 23: Final HDM Model ......................................................................................... 126
Figure 24: Perspectives Weight ................................................................................... 129
Figure 25: Criteria Weight - Technology/Data ........................................................... 131
Figure 26: Criteria Weight - Organization ................................................................... 133
Figure 27: Criteria Weight - Customer ........................................................................ 135
Figure 28: Criteria Weight - Policy ............................................................................... 137
Figure 29: Global Weight of factors ............................................................................... 140
Figure 30: Technology Infrastructure and Integration Desirability Curve ..................... 143
Figure 31: Data Distribution and Accessibility Desirability Curve ................................ 144
Figure 32: Data Collection Robustness Desirability Curve ............................................ 145
Figure 33: Data Metrics Clarity Desirability Curve ....................................................... 146
Figure 34: Data Analytics Capabilities Desirability Curve ............................................ 147
Figure 35: Process Robustness Desirability Curve ......................................................... 148
Figure 36: Organizational Structure Desirability Curve ................................................. 149
Figure 37: Cultural Strength Desirability Curve ............................................................. 150
Figure 38: Strategy Focus Desirability Curve ................................................................ 151
Figure 39: Staff Expertise Desirability Curve ................................................................ 152
Figure 40: Leadership Support Desirability Curve ......................................................... 153

xiv
Figure 41: Financial Desirability Curve ......................................................................... 154
Figure 42: Awareness and Training Desirability Curve ................................................. 155
Figure 43: Satisfaction Desirability Curve ..................................................................... 156
Figure 44: Expectation Desirability Curve ..................................................................... 157
Figure 45: Loyalty and commitment Desirability Curve ................................................ 158
Figure 46: Data Privacy Compliance Desirability Curve ............................................... 159
Figure 47: Data Security Compliance Desirability Curve .............................................. 160
Figure 48: Data Ownership Desirability Curve .............................................................. 161
Figure 49: Data Governance Desirability Curve ............................................................ 162
Figure 50: Variation of Hypothetical Companies ........................................................... 164
Figure 51: Initial Model Shared with Experts................................................................. 240
Figure 52: Initial Model Shared with Experts................................................................ 245
Figure 53: HDM Example Shared with Experts ............................................................. 250
Figure 54: Scoring How-to Shared with Experts ............................................................ 251
Figure 55: Desirability Curve Example .......................................................................... 257
Figure 56: HDM Pilot Model .......................................................................................... 260
Figure 57: HDM Software Example ............................................................................... 261
1
Chapter One: Introduction
Research Motivation
Customer-centricity is defined as interacting with the customer through various
touchpoints and aggregating these relations resulting in building a position for the
customer. Each Customer has a different need and expectation from the provider or
seller, and companies need to be flexible enough to be able to fulfill their needs. [2]
As the most customer-focused organization, Amazon clearly states Customer-
centricity in the company’s mission statement: "To be Earth's most customer-centric
company." This statement shows the commitment, focus, and importance of
customer-centricity for this organization's leaders and their belief in this concept. [3]
Besides, the undeniable impact of Artificial Intelligence and the Internet of things on
the value proposition and offerings of firms drive many strategic initiatives in
organizations to design solutions that integrate products and services. In order to
create loyal customers and keep them for the long term, organizations need to build
capabilities to be more flexible and agile to provide the novel needs of the customers.
Customer expectations and behaviors have changed dramatically over the past
decade. Organizations are expected to meet customers’ needs and expectations at
every interaction in return for customer loyalty. The ability to deliver such a flexible
solution depends on how customer-centricity is embedded within every person in the
business. [4]

2
In the twenty-first century, successful companies follow and build customer-centric
capabilities to serve their customers better experiences. [2] The products' quality has
reached a certain level of saturation in various product lines, and close competition
makes the profit margin smaller and smaller every day. Selling products or services
without focusing on customer experience and their real needs shrinks the companies'
profit tremendously. [2]Long-term relationships between providers/sellers and
customers are a competitive advantage that is not easy to duplicate, understand and
implement for competitors. [1]Gartner predicts that by the year 2020, poor customer
experience will destroy 30% of digital businesses in organizations.[5]
Any customer value can be defined as a sum of product value and service value. The
percentage of service value to total customer value is growing. [6] This creates
complexity for the organizations that provide these services and the organizations
that develop the products. The two must be aligned to deliver customer value. This
co-dependency and integration are critical in emerging technology development.
[7][8][9][10]
In this decade, the companies are challenged by competitors’ products and their
capability to deliver reliable and robust services. The designers and strategists of
Product-Service Systems (PSS) dive into the products' ecosystem with inherently
embedded services that exponentially increase the complexity of such systems. In
most designs, the Products get the centerpiece, and Services are subsided and not
efficiently designed or integrated. [11]
3
According to [12], the PSSs are mostly suffering from two perspectives 1) the
customer value and product functionality do not fit together 2) the process of design
of products and services are performed in silos by different departments, which
deteriorates the final integrated outcome.
Many publications state clearly that both Product and Service designs need to start in
the early stages of the projects and in an integrated manner to deliver a proper
Product-Service solution to the customer.[13], [14]
[15] review the benefits of the Product-Service system as well as barriers that
currently exist to full adoption of it. The high dependency of the customer on the
supplier makes it harder for competitors to challenge the solutions. The customers
do not need to own the assets to have access to the products or Services. New
Services bring about more revenue for businesses, and finally, PSSs create business
sources more sustainable
On the other hand, there should be a mutual trust between customer and supplier to
convert from a transactional basis to a long-term partnership, and companies do not
have all the required expertise to design value-packed product-Service Solutions. [15]
Moreover, the dynamics of customer interaction are changing drastically. The results
of a consulting company [16]survey show that 80% of the global population will have
access to mobile technologies, and 60% of those will be smartphones or low-cost
tablets. There would be 50 billion connected devices globally by 2020, with mobile
being their primary Internet connection channel for individuals.

4
More than 60% of the operation leaders believe that customer behavior will have a
disruptive effect on their organization in the next five years. Almost 2 out of 3 of
responders in the same group state that understanding the customer value drivers
are already a challenge for their organization. Just 1 out of 4 of the survey responders
confirm that their operational capabilities are built to deliver customer value and
distinctive experience today and next three years.[17]
Capgemini reports [18] show that the dynamics of customer interaction are changing
drastically. A survey conducted by this consulting firm shows that by 2020, 80% of
the global population will have access to mobile technologies, and 60% of those will
be smartphones or low-cost tablets. There would be 50 billion connected devices
globally, with mobile devices being their primary Internet connection channel for
individuals.
This revolution in internet accessibility enables firms to have closer contact with their
customers and collect more information from customers regarding their needs,
challenges, and satisfaction level.
This research is defined based on the gaps that were identified during the literature
review. There is a lack of knowledge in quantifying the organization's customer-
centricity through maturity levels and developing a model to provide a guideline to
drive an organization from a product-centric approach to a customer-centric
approach.

5
This research contributes to the technology management body of knowledge by
covering this gap and proposing a novel quantitative method to assess an
organization's maturity level in customer-centricity. Besides, this research improves
our perception of this discipline and highlights the dynamics of the internal and
external factors impacting customer orientation projects in technology management
academic research.
On the practical and business level, this research's outcomes offer a quantitative tool
and step-by-step framework for evaluating the organizational maturity levels and
recommendations of the improvements to develop new capabilities.
Most customer-centricity challenges arise from the fact that organizations begin
focusing on customer-centricity after product or service launches to market. The
customer-centricity embeds the customer-centric approach in all products and
services from roadmapping and design stages. Therefore, the technology
management role becomes critical since all products or services (from Technology
assessment and roadmapping to product/service innovation) need to have intrinsic
customer orientation. The product-centric organizations ignore the role of customer-
centricity in their technology management practices, and this research intends to
cover this gap in academia and industry.

6
Most organizations do not have a comprehensive understanding of how much they
are customer-oriented, and the assessment of organization executives do not match
with the reality in their organization
In addition, the new advanced technologies such as IoT-based platforms and myriad
organizational systems, applications, processes, and the restrictions from the policy-
making entities build a complex system that necessitates structured assessment and
systemic measurement to conclude how much an organization is customer-centric.
In the last few decades, the customers have demanded total solutions from
organizations that fulfill their entire need (pain as they see it) without shopping from
different vendors and suppliers. The customers prefer to buy products supported
with full service and reduce the hassle of matching other products and services and
linking different vendors or suppliers. This primary trend in the market motivated
the organizations to design products and services in tandem and consider both
tangible product and intangible service dimensions of their offerings to the customer.
On the other hand, delivering offerings that include both product and service adds an
exponential complexity to new product introductions and also makes it difficult
to evaluate how much they are focused on customer needs or, in other words, "how
much they are customer-centric."
7
This research aims to propose a novel method for evaluating an organization's
customer-centricity with interweaved product and service deliverables - Product-
Service Systems or, in short, PSS. Through this research author intends to design a
new maturity model to help the organizations to 1) evaluate the level of customer-
centricity as well as 2) provide recommendations that guide them to improve the
customer orientation and enhance their level of customer-centricity maturity.
Research Scope
This research is defined based on the gaps that were identified during the literature
review. There is a lack of knowledge in quantifying the organization's customer-
centricity through maturity levels and developing a model to provide a guideline to
drive an organization from a product-centric approach to a customer-centric
approach.
This research contributes to the technology management body of knowledge by
covering this gap and proposing a novel quantitative method to assess customer-
centricity maturity. Besides, this research improves our perception of this discipline
and highlights the dynamics of the internal and external factors impacting customer
orientation projects in technology management academic research.

8
On the practical and business level, this research's outcomes offer a quantitative tool
and step-by-step framework for evaluating the organizational maturity levels and
recommendations of the improvements to develop new capabilities.
Most challenges in customer-centricity arise from the fact that organizations begin
focusing on customer-centricity after a product or service is launched to market. The
customer-centricity embeds the customer-centric approach in all products and
services from roadmapping and design stages. Therefore, the technology
management role becomes critical since all products or services (from Technology
assessment and roadmapping to product/service innovation) need to have intrinsic
customer orientation. The product-centric organizations ignore the role of customer-
centricity in their technology management practices, and this research intends to
cover this gap in academia and industry.
The ultimate goal of this research is to “develop a quantitative multi-dimensional
model to evaluate the maturity of the organization in customer-centricity approach.”
Therefore, this research intends to answer the following questions:

9
• What are the highest priorities of Challenges, gaps & barriers to adopting and
implementing a customer-centric approach in a product-centric
organization?
• What are the dynamics among influential perspectives and criteria impacting
the maturity of an organization in customer-centricity approaches?
• Is the proposed maturity model appropriate for the assessment of the
customer-centricity approach in the organization?
• Is the model generalizable to other industries and applications?
10
Research Application
When it comes to meeting customers' wants and needs, there is a significant gap
between how well companies think they perform and how well they actually do. To
understand why things happen, the overall process and underlying causes need to be
understood and not just rely on evaluating the outputs and outcomes.
The most successful companies do not just react to problems as they occur; they try
to predict and mitigate those problems before they ever happen. Customer-centricity
maturity model and score provides the organizations with an instrument to monitor
and analyze different organizational dimensions to spot opportunities for
improvement regarding their customer orientation
This research developed a decision model that includes a Customer-centricity score
and maturity model to evaluate the customer orientation level in an organization.
While the case study focuses on E-commerce, the model can easily be applied to any
organization with a digital or technological line of business. The Customer-centricity
Score can be incorporated appropriately in an assessment methodology.
This tool is a suitable candidate for evaluating the gaps in the organization and a
prerequisite for building improvement strategies in a multi-dimensional
environment.
The customer-centricity model informs the behavior of the entire organization.
Companies that create actual value through customer-centric efforts will
automatically have a competitive advantage. Simply, customers will perceive them as
11
more valuable than other options in the market. The Customer-centricity score in
each perspective reveals the weakness, which are great opportunities for improving
the organization's customer orientation.
The customer experience (which is a sub-section of customer-centricity) is the
company's overall impression from the customer’s perspective. It is made up of every
single interaction that customers have with the organization, whether it is visible to
the leadership or not. This thesis's outcome model can also enhance the customer
experience and identify the gaps in and out of the organization.

12
Chapter Two: Literature Review
Customer-centricity in organization
Customer-centricity is defined as interaction with the customer through various
touchpoints and aggregating these relations to build a position for the customer.
[2]Experienced marketers know that selling to existing customers is more profitable
than new customer acquisition and sale to new customers. The new customers are
more likely to switch to another seller or provider and take a long time to turn them
into loyal customers who will have more cost. The quality of the products has reached
a certain level of saturation in many products, and heavy competition makes the
profit margin smaller and smaller. Selling products or services without focusing on
customer experience and their real needs shrinks the companies' profit
tremendously.
[19]defines customer loyalty simply as "a consumer’s intent to stay with an
organization." the customer commits to purchase more and various products from
the same company and interact positively toward creating more success for the firm
through different tools such as recommending them to other customers. [2] Long-
term relationships lead to an increase in client confidence about what they can expect
to receive from the firm. [20]Different studies reveal that the existing loyal customer
is the most profitable ones. [21][22]
In other words, the customer commits to purchase more and various products from
the same company and interact positively toward creating more success for the firm
through different tools such as recommending them to other customers. [2] More

13
recently, scholars have begun to consider the importance of managing a firm’s
customer portfolio as the nature of customer-firm relationships changes. [23]The
customer relationship has a massive impact on how much an organization can attract
investors. [24]believes that the sum of values of customer relationship is a sign for
investors for that purpose.
A customer-centric organization understands the customer's needs and develops
capabilities in the company to cover those needs. For instance, a company with a high
focus on customer uses the expectation of customer in creating a solution from
products and services that delivers specific value to the customer [2]
Besides, Long term relationships between providers and customer is a competitive
advantage that is not easy to duplicate, understand and implement for
competitors. [1][25]This makes customer-centricity a significant competitive
advantage that prevents other organizations from entering a specific market or
moving from one company to another.
With all the benefits that customer-centricity delivers, it may seem evident that firms
will adopt it as soon as they understand the long-term value of such an approach.
However, there are multiple challenges in implementing customer-centricity in
organizations that prevent an organization's expeditious and effortless evolution
from product-centric to customer-centric.

14
The main challenge in building an enhanced customer experience is that
organizations are mostly designed based on business units, functions, and
geographical distribution rather than customer segments and needs. [2]
One of the reasons organizations invest less in customer experience is that they
believe they are already customer-centric. [2]The resistance to change in the
organization results in making the processes easier internally but making it difficult
for the customer to do business with the organization.
The customers interact with the firms through numerous channels, from brick-and-
mortar stores to online shopping and social network reviews. The customer journey
begins even before they enter the local store or log on to the shopping website, which
is a massive change for the companies to cope with. These changes require the
firms to take a new initiative to capture, analyze and deploy the customer
requirements and needs and provide them with a proper solution, which
in most cases is the result of merging different business units and even the external
partners.[26]
The integration of the business functions includes but is not limited to marketing,
human resources, logistics, IT, service operations and would also involve the
external providers and partners. All these efforts are undertaken for the design,
creation, and delivery of a positive customer experience. Therefore, the firms' level of
complexity to contain all these changes has increased tremendously [27][28], and
they need new tools and processes to adopt this enormous change. The researchers'
main focus has been on identifying the customer-company touchpoints and
15
measurement of experience that is delivered to them through each of these channels.
[29][30][31] And not much empirical work exists in the literature which directly
addresses the customer experience and customer journey. [26]
Schmitt et al. [29] state that every interaction between customer and firm regarding
the services result in new customer experiences. This is a very broad definition that
includes any customer experience regardless of their nature. It includes all
the cognitive, emotional, sensory, social, and spiritual responses to customer and
company interaction. [31][32][33]
In almost similar grouping, Schmitt categorizes the customer experiences into
sensory (sense), affective (feel), cognitive (think), physical (act), and social-identity
(relate) experiences[34].
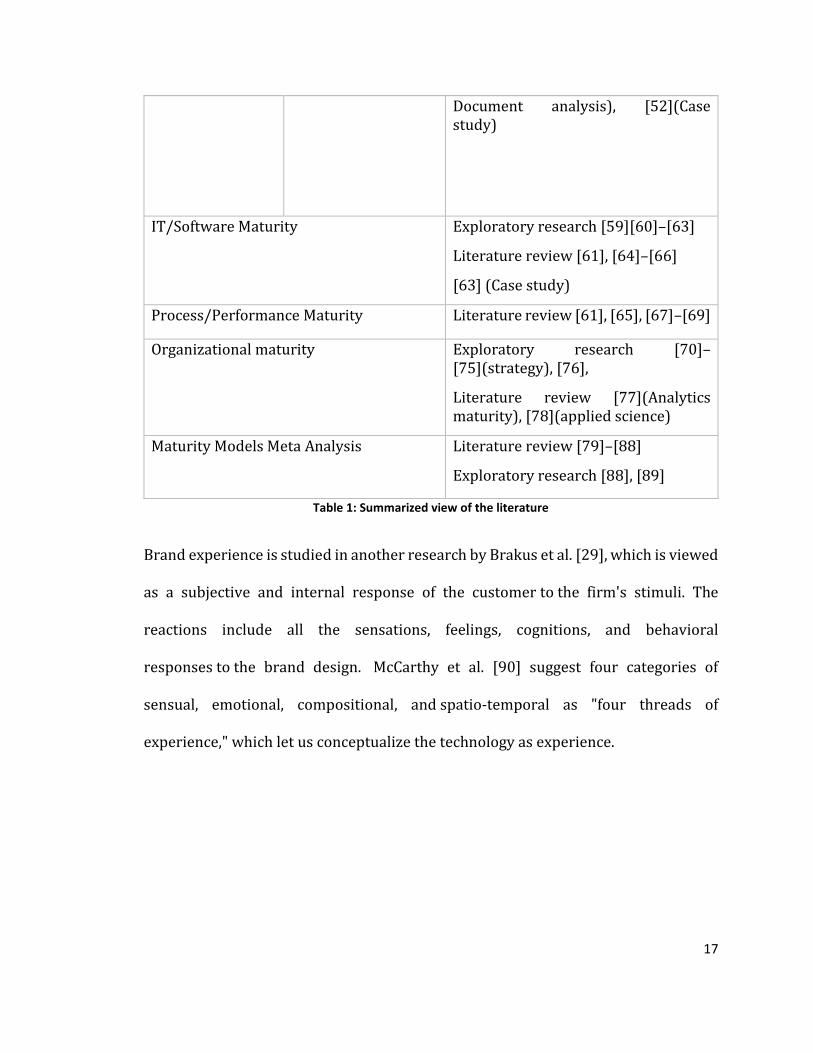
Verhoef et al. [31] define customer experience as a holistic nature that involves all the
customer's cognitive, affective, emotional, social, and physical experiences in
response to retailer services and products. The table below shows a summarized
view of the literature on customer-centricity and maturity models:

16
Customer centricity / Customer Orientation
Customer centricity - Management and business model
Exploratory research [35]
Literature Review
[36], [37] [38]–[40]
Empirical Research/Qualitative Analysis
[37] Empirical research/ qualitative analysis [38]
Case study [35]
Conceptual model [41], [42]
Customer Marketing and CRM
Exploratory research [43]
Literature review [44]
Empirical Research/Qualitative Analysis
[37](CSI) [45]–[47](SEM),[48](CFI, TLI)
Case study [35]
Empirical research/ qualitative analysis
[45], [49](Survey),
Customer Orientation - Technology Management
Exploratory research [50], [51]
Literature Review [50]–[54]
Empirical Research/Qualitative Analysis
[48], [55](Partial Least Squares), [56](SLR/TRL)
Empirical research/ qualitative analysis
[49](Survey),[50], [52], [53], [57](Survey), [51], [58](Interview,
17
Document analysis), [52](Case study)
IT/Software Maturity Exploratory research [59][60]–[63]
Literature review [61], [64]–[66]
[63] (Case study)
Process/Performance Maturity Literature review [61], [65], [67]–[69]
Organizational maturity Exploratory research [70]–[75](strategy), [76],
Literature review [77](Analytics maturity), [78](applied science)
Maturity Models Meta Analysis Literature review [79]–[88]
Exploratory research [88], [89]
Table 1: Summarized view of the literature
Brand experience is studied in another research by Brakus et al. [29], which is viewed
as a subjective and internal response of the customer to the firm's stimuli. The
reactions include all the sensations, feelings, cognitions, and behavioral
responses to the brand design. McCarthy et al. [90] suggest four categories of
sensual, emotional, compositional, and spatio-temporal as "four threads of
experience," which let us conceptualize the technology as experience.

18
The table below presents the evolution of the research focus during the last five
decades.
Customer experience research evolved in the last 50 years, and the focus of the
studies and contributions to customer experience has changed tremendously. Lemon
et al. [26] identify the subsequent developments in and contributions to customer
experience in the six eras.
1960s & 1970s: Initial steps in customer experience and purchase decision making
1970s: Assessment of customer satisfaction and loyalty
1980s: Designing customer journey and Service quality initiatives
1990s: Relationship marketing and expanding the customer experience concepts
2000s: Customer relationship management and impact of business outcomes
2000s-2010s: Business functions integration for delivering positive customer
experience
2010-present: Customer engagement and recognizing its role in the experience
Table 2: Customer Experience Research Focus Trends (last 50 years)
19
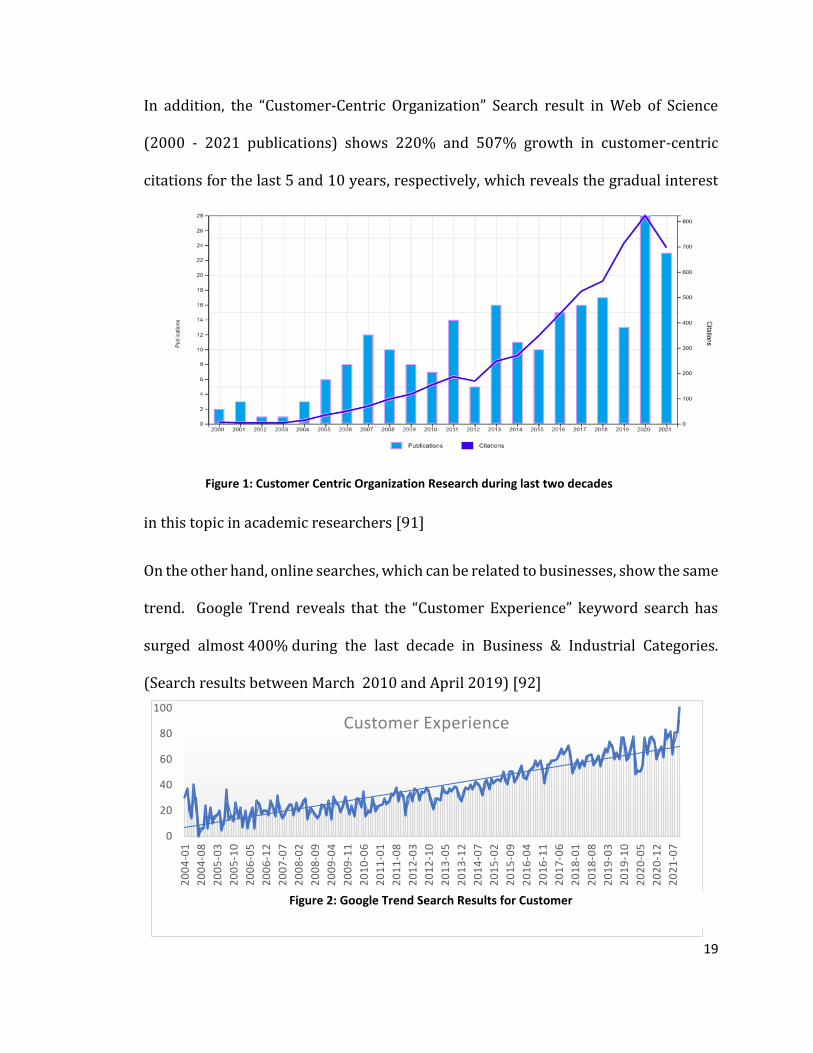
In addition, the “Customer-Centric Organization” Search result in Web of Science
(2000 - 2021 publications) shows 220% and 507% growth in customer-centric
citations for the last 5 and 10 years, respectively, which reveals the gradual interest
in this topic in academic researchers [91]
On the other hand, online searches, which can be related to businesses, show the same
trend. Google Trend reveals that the “Customer Experience” keyword search has
surged almost 400% during the last decade in Business & Industrial Categories.
(Search results between March 2010 and April 2019) [92]
Figure 1: Web of Science Search Result for Customer Centricity
0
20
40
60
80
100
20
04
-01
20
04
-08
20
05
-03
20
05
-10
20
06
-05
20
06
-12
20
07
-07
20
08
-02
20
08
-09
20
09
-04
20
09
-11
20
10
-06
20
11
-01
20
11
-08
20
12
-03
20
12
-10
20
13
-05
20
13
-12
20
14
-07
20
15
-02
20
15
-09
20
16
-04
20
16
-11
20
17
-06
20
18
-01
20
18
-08
20
19
-03
20
19
-10
20
20
-05
20
20
-12
20
21
-07
Customer Experience
Figure 2: Google Trend Search Results for Customer
Figure 1: Customer Centric Organization Research during last two decades
20
Some researchers focus on the customer experiences with technology [90], and some
others research on a brand aspect of the offerings [29], but overall there is consensus
in the academia and industry that customer experience is a multidimensional concept
that involves cognitive, emotional, behavioral, sensory and social components.
[34][31]
To define customer-centricity, describing the differences with close concepts is
beneficial. Customer Relationship Management is one of the topics that sometimes is
confused with Customer-centricity.
CRM is an acronym that stands for Customer Relationship Management. It describes
the strategy that a company uses to handle customer interactions and has become
synonymous with more focused marketing activities—using intelligence from the
database and setting targets to optimize it. However, customer-centricity allows for
the customer's empowerment; it helps her do a better job and enables the customer
to manage the business relationship, while CRM-as-a-sort-of-marketing does nothing
of that kind.
Companies are now talking about customer-centricity rather than Customer
Relationship Management (CRM). They are receptive to the idea of creating alignment
across the business to ensure consistency in the customer experience, which means
developing all the non-IT capabilities as well as the apparent customer relationship
management aspects. [93]
21
Customer Relationship Management has become synonymous with more focused
marketing activities—using intelligence from the database and setting targets to
optimize it. On the other hand, customer-centricity means how the whole
organization behaves towards customers, not just the touchpoints, the decision
points, but how the entire business is organized and optimized around the customer's
needs. [94]
Croteau and Li [95]state that deployment of CRM tools without understanding their
core benefits and the advantages they bring to customer relationships is unrealistic
business strategies, and most cases fail to deliver what is expected.
The expectation of the customers regarding how organizations meet their demands
has changed tremendously. Customers anticipate the organizations to personalize the
products and services for their specific needs and deliver them in the shortest period
with competitive quality.
Developing new customer-centric capacities in the organization is a complex problem
that requires various resources and strategic alignment. Therefore, experts and
practitioners understand that they need a guideline for making decisions regarding
new processes, deliverables, and required competencies. This research intends to
design a novel maturity model for evaluating an organization's customer-centricity
and provide recommendations to enable the companies to move from one stage to a
higher maturity model.

22
The customer-centricity approach delivers high financial and social benefits to the
organization. [96] states that most of the research in the field of customer-centricity
is driven by the assumption that customer satisfaction/dissatisfaction meaningfully
influences the re-purchase of products and services[96]
A notably large number of researches has shown that organizations are more
successful when accepting, supporting, and moving toward a customer
orientation. [97]
The customer expectation has escalated during the last few years. The customers
expect organizations to understand and deliver features, products, or services that
are not explicitly requested. They anticipate the proactive involvement of the seller
to understand their future needs and requirements. [98]
The main challenge that organizations face is moving away from existing product-
centric approaches and delivering what customers are demanding. To achieve this
goal, firms need to build new capabilities and processes in the organization. [1]
On the other hand, the research shows that organizations are negligent toward this
change in customer expectations. They underestimate, misunderstand or overlook
these expectations. [98]
[98] state that proactive customer orientation and being customer-centric are the
most consistent customer value drivers in different parts of the world.
Researchers believe that the research community has to explore barriers and issues
related to customer-centricity in organizations and suggest new insights to

23
practitioners and organizations. Shah et al. demand the researchers conduct in-depth
research on customer-centric organizations' 4 main barriers: Culture, Processes,
Structure, and financial metrics. [79]
Re-organizing a firm around the customer is burdensome for the organizations that
have succeeded by product-driven approaches for many years. They need to have
concrete evidence for their weaknesses and how they can move away from them [79].
Croteau and Li state customer focus is returning to organizations due to the
emergence of electronic business, organizational dynamics, and cultural
changes. [95]
The main challenge in building an enhanced customer experience is that
organizations are mostly designed based on business units, functions, and
geographical distribution rather than customer segments and needs. [2]
One of the reasons organizations invest less in customer experience is that they
believe they are already customer-centric. [2]The resistance to change in the
organization results in making the processes easier internally but making it difficult
for the customer to do business with the organization.

24
Product-Service Systems
Most of the tools and methodologies that are designed for Product-Service Systems
(PSS) development are typically using traditional processes and structures and do not
evaluate the actual performance of the outcomes in practice. [99][100][101][102]
The process of value delivery does not end when the product starts, and the supplier
needs to support the customer until the end of the use of the life cycle of a product
with providing further Services. Contrastingly, the engineering processes are mostly
focused on the early phases of the product/Service life cycles, and there is not much
focus on the mid and end-of-life cycle phases of a PSS. [14][103][104][105][106]–
[108]
Most methodologies that are proposed by academia for designing PSS emphasize the
importance of the development of the services but are unsuccessful in embedding
them in business models, strategies, and operations of the companies. [109], [110]
Compared to physical products, services are generally under- designed and
inefficiently developed [109]. Behara and Chase [110] state that ‘‘if we designed cars
the way we seem to design services, they would probably come with one axle and five
wheels’’. Most publications emphasize the importance of the development of services,
but they fail to provide specific assistance on how to embed these services into the
strategic and operative management of enterprises.[109], [110]
Most of the engineering processes do not have a clear customer experience
management phase in their process steps. [99] suggests a process model for the

25
development of the Product-System systems, which considers theoretical and
empirical aspects of design efforts at the same time.
[111] by means of a multiple case study investigation, provide some guidelines for
selecting the most suitable engineering process model for a PSS. [112] Manufacturing
companies are getting more interested in the role of services in their business
success
From the 1980s that [112] introduced the servitization concepts, the research has
grown steadily, which brought to light new topics and research gaps in this field in
the last four decades.
[113] categorize the services into three main groups. The base group consists of all
services that are provided for the sold goods and products. The intermediate level
group of services includes the contact center and helpdesks, which may include
maintenance and repair of the products as well. Finally, the advanced services, which
service provider provides turnkey services in an agreed level of service (SLA) and
fully take responsibility for keeping the performance of the products and services of
the customer at a certain level.
The manufacturers adopt servitization for different reasons, but mostly it is because
of creating new revenue and profit streams [114]. Other purposes for embracing
the servitization include setting barriers for competitors [115], more involvement
and loyalty of customers [111], innovation and novelty in products [114], and
betterment in responding to the customer needs and requirements [116]
26
The other categorization comes from the [117], which breaks the services into
defensive and offensive. The defensive motivation for the servitization includes cost
reduction and creating barriers from infiltration of the competitors, and offensive
incentives are business growth and new revenue streams.
There are numerous critical success factors in servitization. A better understanding
of the customer behavior and requirements, acceptance and adoption of the new
services by customers, understanding and deploying the dynamics of the value
proposition, and deep involvement of broader networks in creating the processes.
[118]
From the changes that should happen in the processes in the firms to empower them
to embrace the servitization, there are a few considerations. For designing new
strategies and capabilities, there are two main perspectives: resource-based and
dynamic capabilities. The efforts in these approaches are to find the resources and
capabilities that enable Service development and utilization. [119]
The advancement of technology introduces novel and creative methods to collect,
store and analyze customer-centric information, which will revolutionize these
concepts as a whole and in organizations. [79]
Product-service systems deliver total solutions to customers and provide a
framework for firms to implement customer-centricity capabilities as well as
empowering companies to design the organizational structure, which increases the

27
rate of success in the transition from Product-centric to Customer-centric
organization.
Maturity Model landscape
“A maturity model is a conceptual model that consists of a sequence of discrete
maturity levels for a class of processes in one or more business domains and
represents an anticipated, desired, or typical evolutionary path for these processes.”
[120]The word “Maturity” was coined by Philip Crosby and defined as "the state of
being complete, perfect or ready." The maturity model represents a skill or target and
a spectrum from initial stages to the highest maturity stage. the maturity models aim
to enable organizations to achieve the goals of the processes and organizational
excellence. [121]
As can be seen, maturity models have been proposed to address different aspects of
different areas and industries. Maturity models are applicable in many various areas
such as software, system engineering, project, program, portfolio, and technology
management, healthcare technology management, energy technology management,
and other areas with goals of improving the processes in the organization
[122][123][124][125] [126]
One of the well-known Maturity Models is Capability Maturity Model Integration,
which was developed in the 1990s in software engineering. The primary purpose of
this Maturity Model was to deliver higher quality software solutions that have been
deployed by hundreds of organizations.
28
There are also maturity models on the project management side, such as OPM3,
P3M3, and the project management maturity model (PMMM). The P3M3 and CMMI
have the same levels of maturity, except that the first step in P3M3 is awareness
instead of initial. The project management maturity model (PMMM) includes a
common language, standard processes, singular methodology, benchmarking, and
continuous improvement as its maturity levels [124]
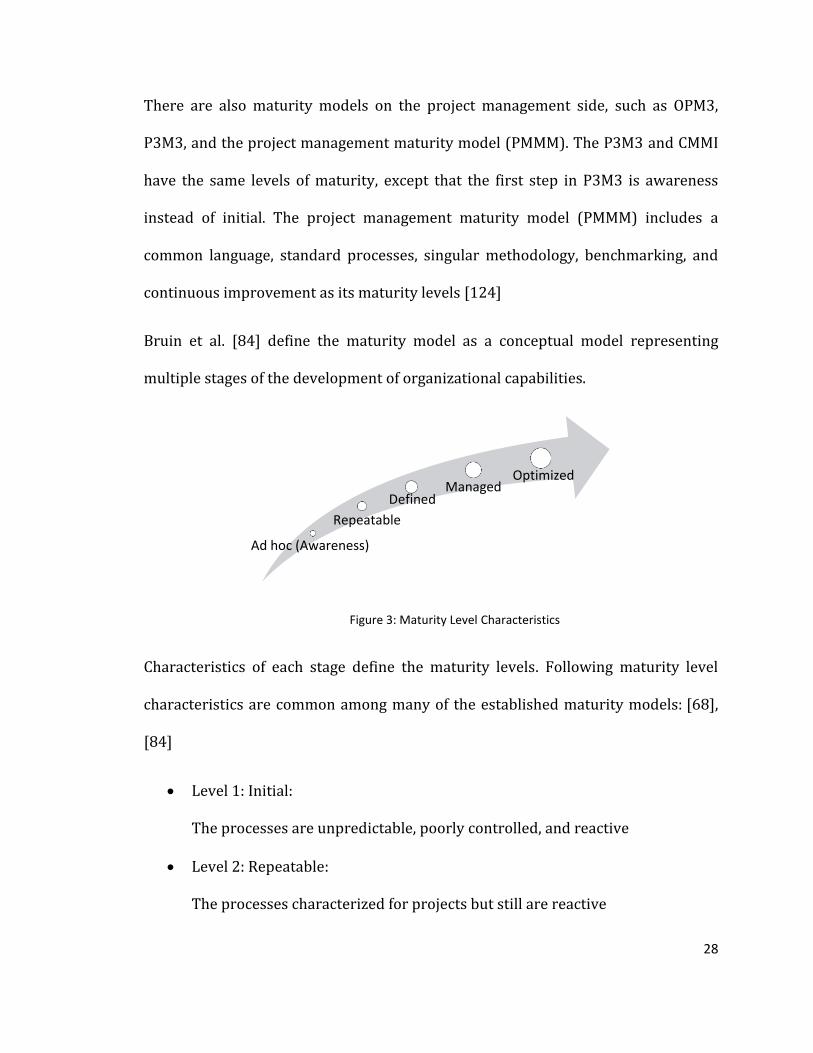
Bruin et al. [84] define the maturity model as a conceptual model representing
multiple stages of the development of organizational capabilities.
Figure 3: Maturity Level Characteristics
Characteristics of each stage define the maturity levels. Following maturity level
characteristics are common among many of the established maturity models: [68],
[84]
• Level 1: Initial:
The processes are unpredictable, poorly controlled, and reactive
• Level 2: Repeatable:
The processes characterized for projects but still are reactive
Ad hoc (Awareness)
Repeatable
DefinedManaged
Optimized

29
• Level 3: Defined:
The processes characterized for the organization are proactive. The projects
tailor their processes from the organization's standards
• Level 4: Quantitatively Managed:
The processes are measured and controlled with already defined KPIs
• Level 5: Optimizing:
The focus is on the process improvement and enhancement of organizational
performance management
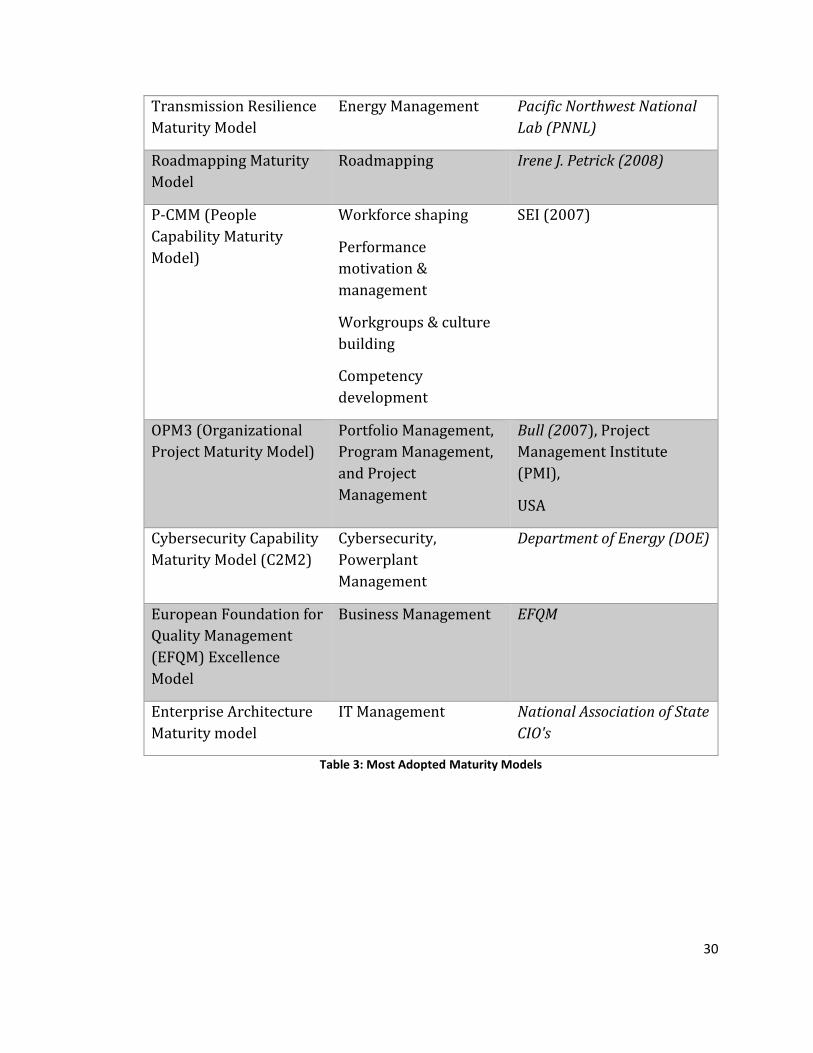
The table below summarizes the most adopted maturity models in the industry.
Maturity Model Domains Developer
CMM/CMMI Software Engineering
(CMMI-SW)
System Engineering
(CMMI-SE)
Integrated Product and
Process
Development (CMMI-
IPPD)
Supplier Sourcing
(CMMI-SS)
M. C. Paulk, et al., Software
Engineering Institute (SEI),
(1993), M. C. Paulk, et al.
(2006), M.C. Paulk (2009)
P3M3 Portfolio Management,
Program Management,
and Project
Management
Office of Government
Commerce (OGC), UK (2006)
Project Management
Maturity Model
Project Management Harold Kerzner (2001)
30
Transmission Resilience
Maturity Model
Energy Management Pacific Northwest National
Lab (PNNL)
Roadmapping Maturity
Model
Roadmapping Irene J. Petrick (2008)
P-CMM (People
Capability Maturity
Model)
Workforce shaping
Performance
motivation &
management
Workgroups & culture
building
Competency
development
SEI (2007)
OPM3 (Organizational
Project Maturity Model)
Portfolio Management,
Program Management,
and Project
Management
Bull (2007), Project
Management Institute
(PMI),
USA
Cybersecurity Capability
Maturity Model (C2M2)
Cybersecurity,
Powerplant
Management
Department of Energy (DOE)
European Foundation for
Quality Management
(EFQM) Excellence
Model
Business Management EFQM
Enterprise Architecture
Maturity model
IT Management National Association of State
CIO's
Table 3: Most Adopted Maturity Models

31
According to De Bruin et al. [84], there are three main types of maturity models based
on the purpose they serve.
• Descriptive: These models describe the current state of the organization and
let the experts come up with improvement recommendations
• Prescriptive: These models, besides the current state evaluation, offer
recommendations to improve capabilities.
• Comparative: These models include the initial assessment and relevant
recommendations, and the best practices in the sector, which enable the
experts to benchmark their organization against it. [84]
In recent years have been different attempts to build a framework for developing the
maturity models. For instance, De Bruin et al. [84]propose a framework for designing
new maturity models in different sectors. Maier et al. [85] took a structural approach
to develop a maturity model. This approach puts forward all the building blocks and
elements in designing a new maturity model in the maturity matrix format.
On the other hand, Becker et al. [86]recommend procedural activities to develop a
new maturity model mostly derived from design science guidelines.
Salviano et al. [87] suggests an empirical approach that employs the prior
accumulative experience of developing maturity models, and finally, Von
Wangenheim et al. [88] utilize the knowledge management theory to structure the
design on a new maturity model
32
What is shared among all the above approaches are the initial stages in planning the
maturity development:
They all start with the problem statement, stakeholder identification, scoping the
target state, and planning toward the goals.
At the second set of activities, they utilized one of the strategies/approaches
mentioned earlier to design the maturity models, including the critical capacities,
maturity levels, and best practices in each area. Finally, they build the measurement
tools that allow for scoring each capability and quantifying the final result.
The below section reviews three different maturity models and their implementation
methods to better understand the maturity model structure.
Capacity Maturity Model Integration (CMMI)
One of the most impactful examples of maturity models is the Capability Maturity
Model Integration (CMMI) [127], which has already been deployed in over 10,000
companies in 106 countries.[128]
The Capability Maturity Model Integration (CMMI) model focuses on essential
elements for effective processes that scientific management pioneers such as Crosby,
Deming, Juran, and Humphrey recommended. [129] [130] [131] [132]
In Version 1.3 of the CMMI model [133][134], three interest areas later were merged
in CMMI V2.0. These three areas are"
• Product and service development – CMMI for Development (CMMI-DEV),

33
• Service establishment, management, – CMMI for Services (CMMI-SVC), and
• Product and service acquisition – CMMI for Acquisition (CMMI-ACQ)
The software Engineering Institute believes that the CMMI helps organizations by
"providing best practices that enable organizations to improve performance of their
key capabilities, providing a clear roadmap for building, improving, and
benchmarking capability." [135]
In this model, the best practice for 22 process areas is addressed. [136] These areas
include but are not limited to the below-listed items:
• Measurement and Analysis (MA)
• Decision Analysis and Resolution (DAR)
• Organizational Performance Management (OPM)
• Project Planning (PP)
• Validation (VAL)
• Verification (VER)
• Quantitative Project Management (QPM)
• Requirements Development (RD)
• Requirements Management (REQM)
Each Process area has two types of goals: Generic Goals and Specific Goals

34
The Generic Goals are called "generic" as they show up under different process areas.
The Specific Goals are the target state of process maturity, unique to a specific process
area.
The third layer of structure in the CMMI is "Practices, " which includes the desired
action details to satisfy the requirements.
Finally, the 4th later of CMMI structures are sub-practices that elaborate on practices
further. [136]. The below figure illustrates the CMMI model structure.
According to the CMMI model, the levels are used to describe an evolutionary path
recommended for an organization'' process improvement. There are two types of
levels in the CMMI model; Capability Levels and Maturity Levels. [136]
The capability levels are used to evaluate and score the goals inside the process areas,
and maturity levels are utilized to describe the level of maturity on the process area
level. In other words, the maturity model represents the level of process
improvement achievement in multiple process areas.
Figure 4: CMMI Hierarchical Structure

35
The table below shows the comparison and definition of capacity and maturity levels:
Level Capacity Levels Maturity Levels
Level 0 Incomplete -
Level 1 Performed Initial
Level 2 Managed Managed
Level 3 Defined Defined
Level 4 - Quantitatively managed
Level 5 - Optimizing
Table 4: CMMI Capacity and Maturity Level
The figure below illustrates the characteristics of Maturity levels in CMMI: [136]
The CMMI tools and structure (described above) aid the experts in evaluating the
organization's current state regarding the process area maturity. In the next step,
based on the target state that is defined, the CMMI provides a long list of
recommendations for improving the organization's capacity and maturity levels.
Figure 5: CMMI Maturity Level Definitions
36
Portfolio, Program, Project Management Maturity Model (P3M3)
The P3M3 was first published in 2005 by Axelos. It was one of the earliest maturity
models in portfolio, program, and project management that has derived most of its
characteristics from the CMMI approach. [137], [138]
This model is important because of having a holistic and system perspective rather
than just focusing on the organization's processes.
This maturity model is comprised of 3 underlying models:
• Portfolio Management Maturity Model (PfM3)
• Program Management Maturity Model (PgM3)
• Project Management Maturity Model (PjM3).
Similar to the Capability Maturity Model, the P3M3 framework uses five maturity
levels.
• Level 1 – Awareness of process
• Level 2 – Repeatable process
• Level 3 – Defined process
• Level 4 – Managed process
• Level 5 – Optimized process.
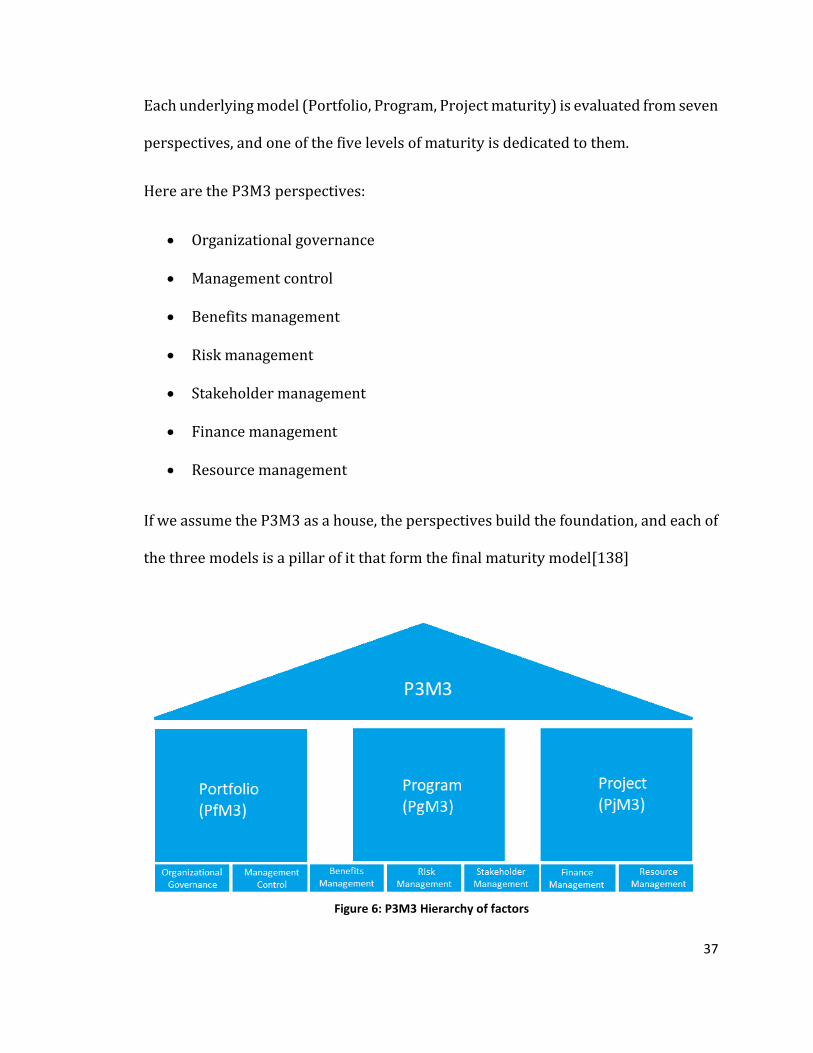
37
Each underlying model (Portfolio, Program, Project maturity) is evaluated from seven
perspectives, and one of the five levels of maturity is dedicated to them.
Here are the P3M3 perspectives:
• Organizational governance
• Management control
• Benefits management
• Risk management
• Stakeholder management
• Finance management
• Resource management
If we assume the P3M3 as a house, the perspectives build the foundation, and each of
the three models is a pillar of it that form the final maturity model[138]
Figure 6: P3M3 Hierarchy of factors

38
The P3M3 assessment result is delivered from each perspective separately based on
levels 1 through 5. Here is a sample outcome of the P3M3 assessment of an
organization

39
Level 5
Level 4
Level 3
Level 2
Level 1
Organ
izatio
nal
gov
er
nan
ce
Man
a
geme
nt
con
tr
ol
Ben
efi
ts
man
a
geme
nt
Risk
man
a
geme
nt
Stake
ho
lde
r
man
a
geme
nt
Fin
an
ce
man
a
geme
nt
Reso
u
rce
man
a
geme
nt
Table 5: P3M3 Assessment Result Table
Legend: Fully meets Partially meets Never
To elaborate on the example, a few of the scores are explained. The “organizational
governance” is on “Level 3”. In other words, this company they have defined the
governance processes, but it is not fully managed. As another example, the company
is “Level 4” in the “Stakeholder Management” perspective, which reveals that besides
defining the processes, they are managing the processes closely.
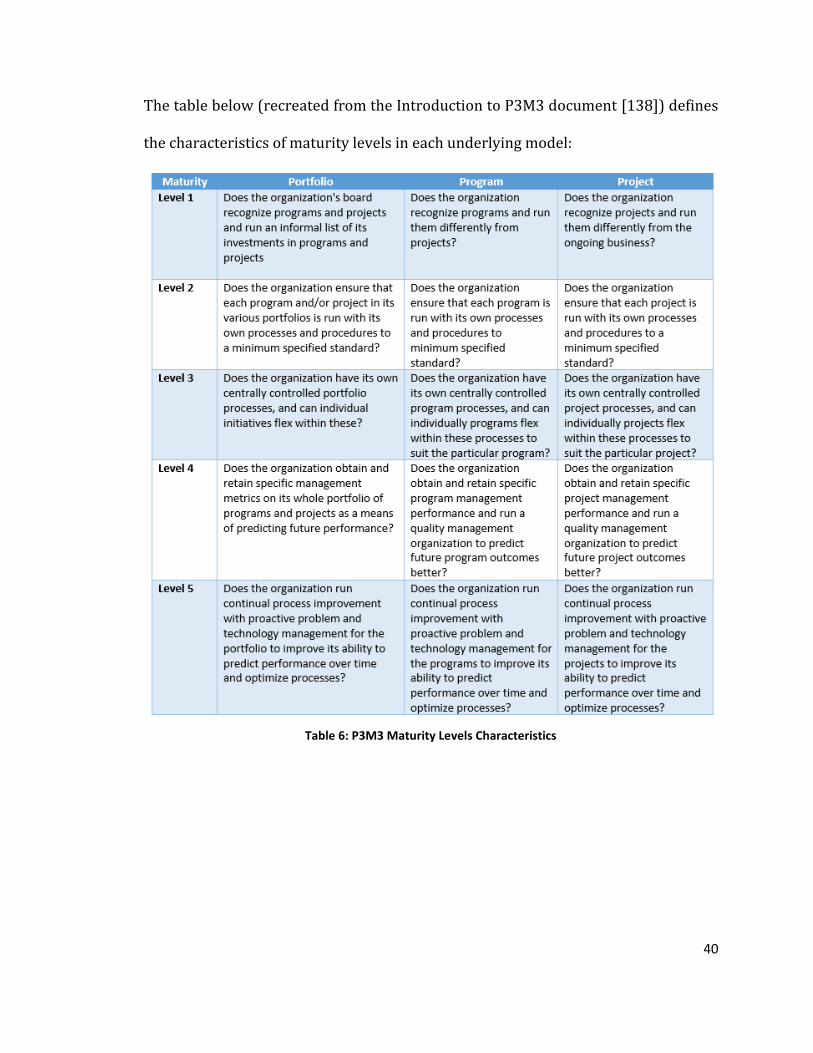
40
The table below (recreated from the Introduction to P3M3 document [138]) defines
the characteristics of maturity levels in each underlying model:
Table 6: P3M3 Maturity Levels Characteristics
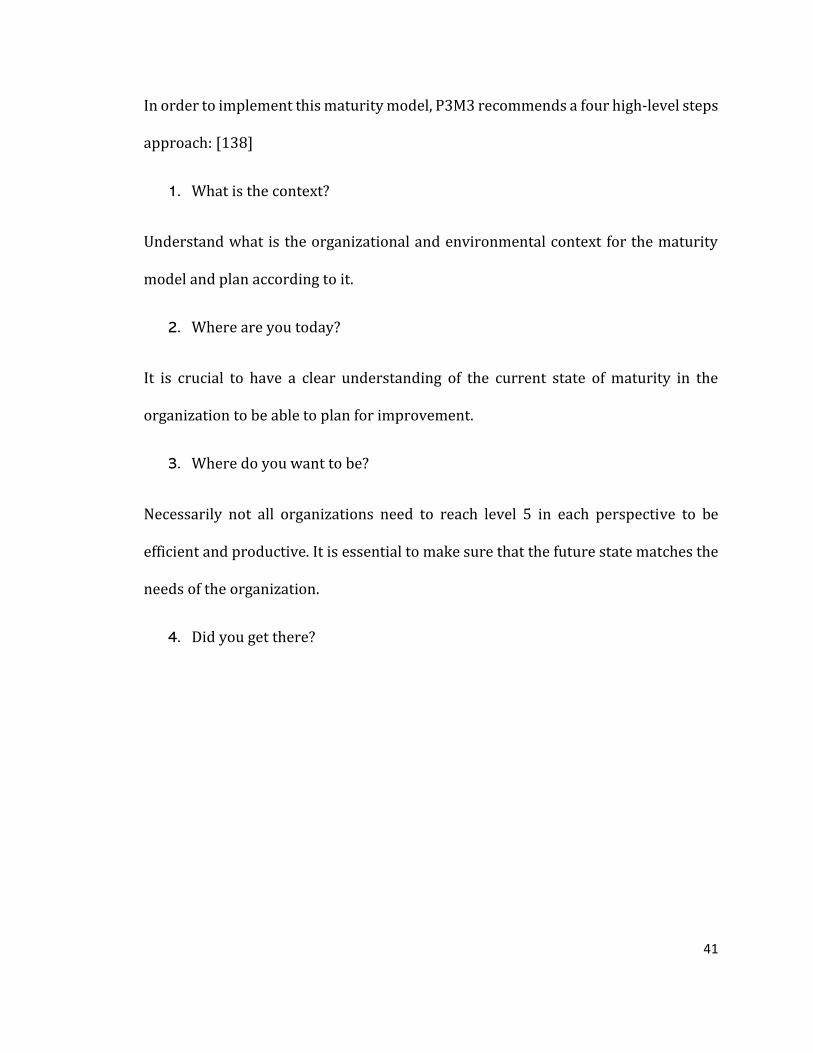
41
In order to implement this maturity model, P3M3 recommends a four high-level steps
approach: [138]
1. What is the context?
Understand what is the organizational and environmental context for the maturity
model and plan according to it.
2. Where are you today?
It is crucial to have a clear understanding of the current state of maturity in the
organization to be able to plan for improvement.
3. Where do you want to be?
Necessarily not all organizations need to reach level 5 in each perspective to be
efficient and productive. It is essential to make sure that the future state matches the
needs of the organization.
4. Did you get there?

42
The results, as outlined in step 3 need to be evaluated. The gap and divergence from
the original plan need to be determined and the next iteration of improvements
considered. This cycle continues until the desired state outlined in step 3 is achieved.
Pacific Northwest National Lab (PNNL) has devised multiple maturity models to
evaluate critical business processes in different sectors and provide
recommendations for increasing processes' effectiveness and efficiency. [139]
Here are a few examples of maturity models released by PNNL:
• Electricity Subsector Cybersecurity Capability Maturity Model (ES-C2M2)
• Buildings Cybersecurity Capability Maturity Model (B-C2M2)
• Secure design and Development Cybersecurity Capability Maturity Model
(SDD-C2M2)
• Facility Cybersecurity Framework (FCF)
• Transmission Resiliency Maturity Model (TRMM)
• Chemical Security Assessment Model (CSAM)
Figure 7: P3M3 Implementation Steps
43
Contemplating the similarities between these maturity models, one of them is
reviewed concisely in the next section to provide a better understanding of the PNNL
maturity models.
44
Transmission Resilience Maturity Model (TRMM)
According to PNNL [140], TRMM is a tool to assess the resiliency of policies,
programs, and investments in electricity transmission organizations.
This tool also provides a benchmark for the transmission organizations to evaluate
their targets and priorities against best practices in the sector and plan for
improvement and enhancement of their capabilities accordingly.
Resilience is defined as "the ability to last different kinds of shocks and survive or
readily bounce back," and TRMM focuses on the resiliency of transmission systems
and components inside the transmission organizations. This model is (some of other
PNNL maturity models) based on the Cybersecurity Capability Maturity Model
developed by the Department of Energy [141]. The TRMM evaluates resiliency from
nine different perspectives, which are called "domains" [142]
1. Resiliency Program Management
2. Risk Identification, Assessment, and Management
3. Situational Awareness
4. Event Response & Recovery
5. Resiliency Asset Management
6. Information Sharing and Communications
7. Supply Chain and Critical Entities Management
8. Transportation Management
9. Workforce Management
45
Each domain consists of one or more objectives, which together form the underlying
areas of the domains.
The lowest level of the TRMM structure is the practices, which are actionable
exercises to achieve each domain's objectives.
Unlike the CMM-based models, TRMM has three levels of maturity, which is defined
as follows:
Maturity Indicator Level 1 (MIL1)
Maturity Indicator Level 2 (MIL2)
Maturity Indicator Level 3 (MIL3)
The level of maturity defines each objective in their “Practices.” The TRMM model
provides a list of expected maturity levels in each “Practice” that is used during this
model's implementation.

46
The figure below shows the relationship of different TRMM model elements: [142]
Figure 8: TRMM model elements

47
• Here is an example of the relationship between domain, objectives, and
underlying practices:
• Domains:
Domain 1: Resiliency Program Management
o Objectives:
Objective 1. Establish and maintain a resilience governance
structure
Objective 2. Establish and maintain the resilience program
strategy
Objective 3. Sponsor resilience program activities
Objective 4. Incorporate resilience in the rate-making/cost
recovery process
▪ Practices: (Practices for Objective 1:)
Establish and maintain a resilience governance structure

48
ID Practice MIL
1.1.1 The TBU has an approach to provide program oversight for
resilience activities; even if not yet formalized, it is at least
done in an ad hoc manner.
1
1.1.2 Management’s roles, responsibilities, and accountability
for oversight of resilience activities are documented and
understood, although that information might be found in
several different documents.
2
1.1.3 The TBU’s resilience governance and program structure
are documented and readily accessible in a single
document (e.g., written charter) or a shared information
repository (e.g., a web page with links).
2
1.1.4 The TBU’s resilience program governance structure is
approved by TBU senior management and updated on an
organization-defined frequency
3
1.1.5 The governance of the TBU resilience program is part of a
larger and comprehensive enterprise-wide resilience
program (e.g., a Chief Resilience Officer or senior
management has oversight of all enterprise resilience
activities).
3
Figure 9: TRMM Domain, Objective and Practice relationship
The PNNL offers an online tool [143] for TRMM evaluation. Users can register and
input the model data and export a comprehensive 90-100 pages report with
guidelines for improvement to processes and policies. [142]
49
E-commerce Industry
The electronic data interchange (EDI) made E-commerce possible. [144] The EDI
technology was invented in the mid-1960 when companies were attempting to
reduce paper consumption, mostly in the retailer and transportation sectors. In the
early days of this technology, the EDI was limited to exchanging documents from one
computer to another.
Later on, EDI enabled the companies to exchange information, order goods, and
perform electronic fund transfers via their computers. [145]Despite ASC regulations
(Accredited Standards Committee) in the 1970s, which made this mode of business
more trustable, the adoption of EDI was very slow. As Timmers [146]reports, less
than one percent of US and European companies adopted it until the late 1990s.
The lower adoption rates were due to the high cost of connecting to EDI connections
and frequent technical problems.
The internet revolutionized the dynamics of e-commerce, which enabled the more
convenient transaction of goods and services. However, until 1991, NSFNET removed
the commercial limitations of using the internet, and the diffusion of e-commerce has
soared since then. [144]
After the 2000s, retailing shifted heavily to online and digital transactions, which
resulted in more personalized online offerings and marketing approaches, which
caused both companies and consumers to benefit from it. [96] [97]

50
The consumers benefited from the price transparency, which enabled them to
compare different goods and services fast and efficiently, which took the producer's
pricing power and put it in consumers' hands.
The Producers and retail companies, losing the pricing power, focused heavily on
fulfilling the consumers' needs and aimed their competitive efforts toward
understanding customers' needs and delivering higher value.
Almost one-third of the world (1.92 billion people) purchased online services and
goods in 2019, and it is expected that by 2023, 22% of the total global retail sales will
be completed through e-commerce. [149]
E-commerce sales in the retail sector have been soaring during the last few years,
and the forecasts reveal that there is no slowing in pace for its growth. From 2014 to
Figure 10: Retail ecommerce Sales Worldwide

51
2020, retail e-commerce has experienced a staggering 314% increase in total sales
worldwide. [150]
The most popular online retail website by unique visitors is Amazon.com, with over
5.2 billion visitors in June 2020. Amazon also leads the market cap leading consumer
internet and online services worldwide with a trillion US dollar value. [150]
It is forecasted that the highest compound annual growth rate (CAGR) of e-commerce
in the world's services and goods will be seen in Turkey, Argentina, Indonesia, India,
and South Africa. [151]
Figure 11: Most popular online retail websites
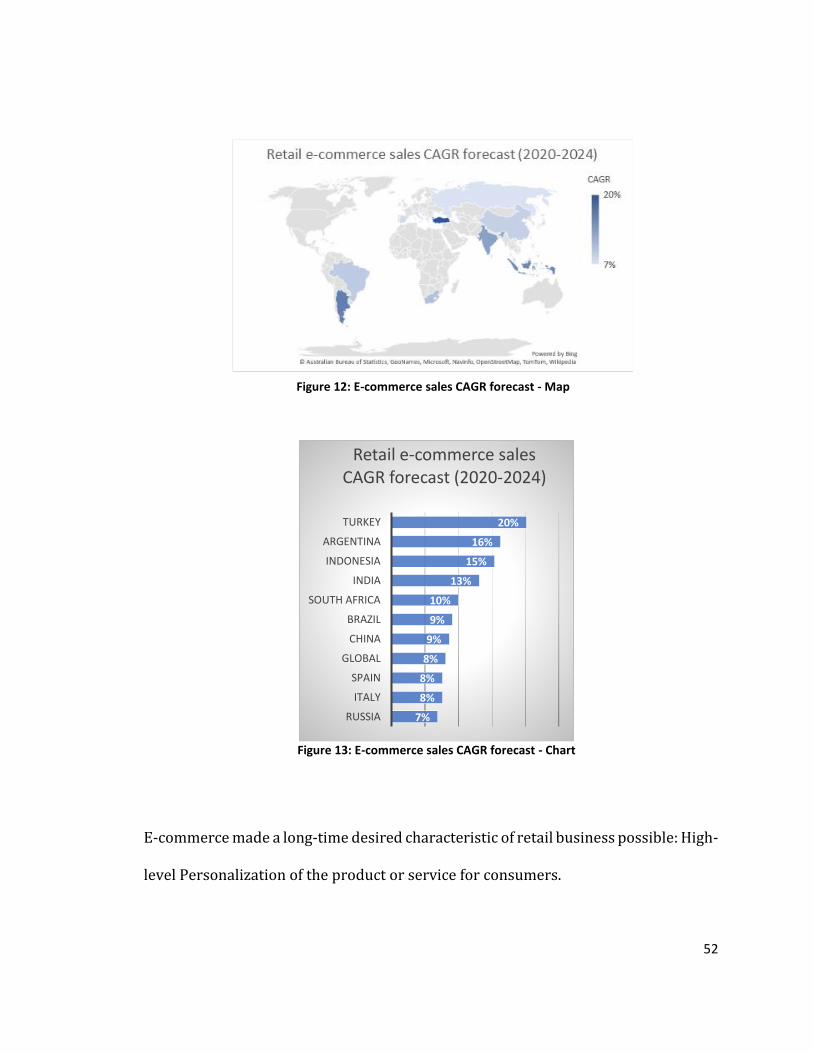
52
E-commerce made a long-time desired characteristic of retail business possible: High-
level Personalization of the product or service for consumers.
20%
16%
15%
13%
10%
9%
9%
8%
8%
8%
7%
TURKEY
ARGENTINA
INDONESIA
INDIA
SOUTH AFRICA
BRAZIL
CHINA
GLOBAL
SPAIN
ITALY
RUSSIA
Retail e-commerce sales CAGR forecast (2020-2024)
Figure 12: E-commerce sales CAGR forecast - Map
Figure 13: E-commerce sales CAGR forecast - Chart
53
In modern e-commerce strategies, personalization plays an essential role in the
success or failure of a producer. They need to build a close relationship with millions
of customers in order to understand and address customer personalities, desires, and
needs. Producers need to identify the customer, gather information about the
customer, process a vast amount of data relevant to an individual customer, and
recommend products and services that the customer is probably interested in
purchasing.
Risch [152]defines the sole aim of personalization as fulfilling a particular customer
or user requirement. According to Mulvenna et al. [153], personalization is the
process of customizing or tailoring the products, services, and information to an
individual's need. Recommender systems, customization of websites, and adaptive
content is also considered as personalization in this research
Technology plays a significant role in expanding e-commerce and will be the primary
vehicle to facilitate growth in this sector. Artificial Intelligence (AI) is one of the core
technologies that enable organizations to personalize their goods and services for
consumers. In a survey performed in 2019 from 158 respondents, 73% stated that
the future of personalization of goods and services relies heavily on AI technologies.
[154]

54
In the above literature, all the consumers - disregard the entity type- are considered
customers. However, there are five different types of dynamics between supply and
demand in e-commerce from entity types;
• business-to-business (B2B),
• business-to-consumer (B2C),
• business-to-government (B2G),
• consumer-to-consumer (C2C) and
• mobile commerce. [155]
Among these dynamics, the business-to-consumer (B2C) is the most well-known
shopping method. The consumer commonly pays for the purchase directly via the
internet and now orders the products and goods from online channels. [156]
Chen and Dubinsky [157]define customer satisfaction in two different ways:
Instant and cumulative satisfaction. Each transaction between customer and retailer
results in an instant customer experience that causes satisfaction for the customer
when desirable. Over time, the cumulative shopping experience needs to be
considered as it impacts overall customer satisfaction immensely.
Other researchers confirm the above definition of customer satisfaction by describing
it as fulfilling requirements, goals, or desires resulting in customers' attitude toward
a particular retailer or their emotional response to what they expect and what they
get. [158]

55
Beyond instant and cumulative satisfaction during the shopping interaction, Yen and
Lu [159] believe that retailers should expand their communications beyond the
financial transaction with high-quality after-sales services and maintain a good
relationship with the customer online e-commerce environment.
At the peak of customer satisfaction resides customer loyalty, which is defined as a
favorable attitude towards a specific retailer to the extent that leads to repetitive
purchases [160]
Olsen [161]believes that satisfaction and loyalty have variable relationships
dependent on customer commitment, trust, involvement, and the retail industry.
Despite the problematic nature of keeping a customer loyal in the e-commerce
environment [162], many researchers indicate loyalty as the principal success factors
in online retailing. [163][148]
Perceived value is another critical factor in customer satisfaction, which is modeled
by [155]due to the perception of the price against the perceived quality of the product
or service.
Perceived quality is emphasized in many research pieces [160], [164], which creates
more e-satisfaction and, consequently, more positive outcomes for the e-retailer.
On the other hand, customer satisfaction may be degenerated, and their loyalty is lost
due to weaknesses in providing secure, private, and timely services as well as poor
website design and using outdated technologies. [163], [165]

56
The negligence in managing or misuse of customer information has been considered
as an invasion of customers' privacy [166]
The privacy of the consumer data is a concern for customers from different
dimensions, including unsolicited marketing, price discrimination, exposure of the
personal data, identity theft and other criminal activities, and governance
surveillance [167]
In recent years, lawmakers have addressed a few privacy and security concerns with
comprehensive legislation (such as GDPR in European Union and CCPA in California).
In 2020 additional legislation was introduced to address the collection and use of
biometric or facial recognition data by e-commerce organizations. As of Jan 2021,
over 90 state-wide privacy protection acts are pending approval in 12 States of the
United States. [168]
The other factor that impacts the product/service personalization for consumers is
the low quality of the data due to careless data collection, intentional false statements,
and useless customer profiles. [169]
57
Chapter Three: Research Scope
Research Gaps
The quality of the products has reached a certain level of saturation in many products,
and heavy competition makes the profit margin smaller and smaller. Selling products
or services without focusing on customer experience and their real needs shrink the
profit of the companies tremendously [2]
The concept of customer-centricity has been around for at least 5o years, and it is not
new. In 1954, Drucker stated that “it is the customer who determines what a business
is, what it produces, and whether it will prosper.” [170] The survey result from 245
organization leaders in response to the question "Thinking about organizational
culture in the digital age, which characteristics do you think are most important in
establishing a truly digital-native culture" reveals that 58% believed that customer-
centricity ranks on top of other impacting factors. [171]
Although customer-centricity seems to be easy to discuss, organizations struggle to
build and sustain it in their large organizations [172]

58
Galbraith believes managers seem to be running product-centric firms with merely a
cosmetic gloss of customer focus sprinkled around the edges. [2]
Re-organizing a firm around the customer is burdensome for the organizations that
have succeeded by product-driven approaches for many years. They need to have
substantial evidence for their weaknesses and how they can move away from
them [79]. Croteau and Li state customer focus is returning to organizations due to
the emergence of electronic business, organizational dynamics, and cultural
changes. [95] The prominent challenge organizations face is moving away from
existing product-centric approaches and delivering what customers are demanding.
To achieve this goal, firms need to build new capabilities and processes in the
organization. [1]
Figure 14: Importance of Impacting factors on Customer Centricity

59
A paradigm shift in management approaches is discussed in different research works,
suggesting a change from product-based strategy to customer-based strategy. [173]
However, developing new organizational capacities is a complex problem that
requires various resources and strategic alignment. Therefore, experts and
practitioners understand that they need a guideline for making decisions regarding
new processes, deliverables, and required competencies. [174]
The maturity model defines skill or target and a spectrum from initial stages to the
final maturity stage. the maturity models aim to enable organizations to achieve the
goals of the processes and organizational excellence. [175]
On the other hand, [121] believes Maturity Model design methods are an emerging
topic in academic literature. Reviewing the widely used maturity models reveals that
they are based on practice and experience from previous projects completed
successfully. These methods lack a solid theoretical foundation and academic
research method. Besides, a systematic approach in building maturity models is
essential as the number of proposals and models to build them increases day by day.
Mettler and Rohner [175]Found 135 different maturity models related to information
systems and platforms. in another study, Bruin et al. found 150 different models
Product/Service
Centricity
Customer
Centricity
Figure 15: Paradigm Shift in Strategies of Organizations

60
evaluate the IT capabilities strategies alignment of innovation management, program
management, knowledge management, and enterprise architecture [84]
The methods that exist mostly focus on one or a handful of organizational dimensions.
For instance, Von Waigenheim et al., [88][176]propose a method that focuses on
knowledge management. In another study, Salviano et al. [87]offer a technique for
developing Maturity models based on the organizations' previous experience in
developing maturity models.
Garcia-Mireles et al. believe that new technologies and novel customer needs demand
changes in firms' processes and structure. Although well-known maturity models
such as CMMI and ISO/IEC 15504 are widely used in industry, they need to be
customized based on organizational needs and require long-term strategic plans to
enable them to achieve short-term goals. [121]
Shah et al. believe that the research community must explore barriers and issues
related to customer-centricity in organizations and suggest new insights to
practitioners and organizations. Shah et al. demand the researchers conduct in-depth
research on customer-centric organizations' 4 main barriers: Culture, Processes,
Structure, and financial metrics. [79]
Also, the technologies have changed tremendously, which impacts how firms interact
with customers. Mobile devices, Social media, the cloud, the internet of things, and
artificial intelligence have largely influenced firms’ customer-centricity approach
adoption. [5]

61
In most of the literature, researchers focus on one or a few areas to develop the
Maturity Model. However, this research proposes a multi-criteria maturity model for
organizations focusing on product-service systems that were not addressed before.
De Bruin states that there is little research and documentation on
developing maturity models widely accepted, reliable and sustainable [84]. In most
academic literature, researchers focus on one or a few areas to develop the maturity
model. There is inconsistency in the methods used and limited to the researcher's
experience in specific fields, and the exhaustive list of criteria was limited to the
industry and sector studied.
[177]believes in order to improve customer experience, service providers must first
be able to measure and model customer experience effectively.
Research Gap References

62
Current Maturity Models focus mostly on
Engineering Capabilities, strategic planning, and
project management, and customer-centricity was
not directly considered in the evaluation models. The
existing maturity models do not address the
measurement of customer-centric maturity level in
organizations from a multi-dimensional
perspective.
[62],[121],[88], [176],[87],
[123], [178], [179], [180],
[84],[181],[122],[182],
[79],[171]
The literature review reveals that Critical Success
Factors and dynamics of internal and external
elements are identified, reviewed, and proposed
based on the Product-Centric approaches in
organizations. Therefore, in the proposed factors, the
organizational capabilities in products and service
design received more attention than customer needs
and experiences. Besides, products-services systems
are not considered in tandem with the customer
experience and organizational capabilities, Project
Management, Strategic Planning, and new
revolutionary technologies (i.e., AI, IoT). Multiple
researchers demand the researchers conduct in-
depth research on the main barriers to transition
[1], [17], [79], [2], [5],
[18], [62],
[121], [88], [176],[87],[75],
[76], [77]
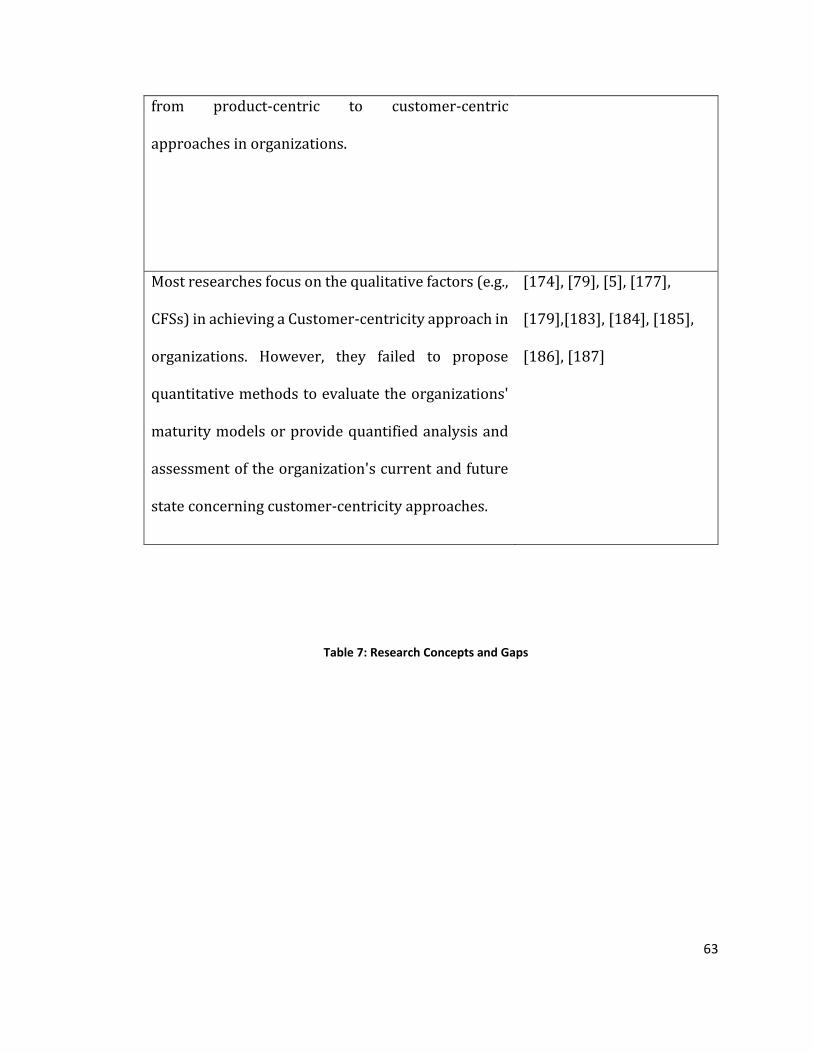
63
from product-centric to customer-centric
approaches in organizations.
Most researches focus on the qualitative factors (e.g.,
CFSs) in achieving a Customer-centricity approach in
organizations. However, they failed to propose
quantitative methods to evaluate the organizations'
maturity models or provide quantified analysis and
assessment of the organization's current and future
state concerning customer-centricity approaches.
[174], [79], [5], [177],
[179],[183], [184], [185],
[186], [187]
Table 7: Research Concepts and Gaps

64
Research Questions
Through the literature review, multiple gaps are recognized, which was presented in
the previous section. In order to cover those research gaps, the research goals and
questions are defined as follows:
Research Goal
• RG: Develop a quantitative multi-dimensional model to evaluate the maturity
of the organization concerning the customer-centric approach
Research Questions
• RQ1: What are the highest priorities of Challenges, gaps & barriers to
adopting and implementing customer-centric approaches in a product-
centric organization?
• RQ2: What are the dynamics among influential perspectives and criteria
impacting an organization's maturity in customer-centricity approaches?
• RQ3: Is the proposed maturity model appropriate for the assessment of the
customer-centricity approach in the organization?
• RQ4: Is the model generalizable to other industries and applications?

65
Figure 16: Research Gaps, Goals, and Questions

66
Chapter Four: Research Methodology
Chapter four of this research presents the methods and prerequisites for constructing
a maturity model that integrates organizational and market factors. The research's
side consideration is to provide a complete understanding of how emerging
technologies can be developed in ways that competition in both product and service
fronts is possible.
Overview of Multi-criteria Decision Models
Analytical Hierarchy Process (AHP)
AHP introduced by Thomas Saaty [188] is very similar to the HDM model basic concepts. Both
provide a model for multi-criteria decision-making through pairwise comparison. The pairwise
comparison refers to the practice that Each of the respondents has to compare the relative
importance between the two items under a specially designed questionnaire. [188]
Besides, both AHP and HDM are structured techniques for organizing and analyzing complex
decisions based on mathematics and psychology. AHP provides a comprehensive and rational
framework for 1) structuring a decision problem, 2) representing and quantifying its elements, 3)
relating those elements to overall goals, and 4) evaluating alternative solutions.
On the other hand, the main difference between HDM and AHP is that HDM uses constant-sum
calculations, and AHP applies Eigenvectors. Other than that, most steps and calculations follow a
similar practice.
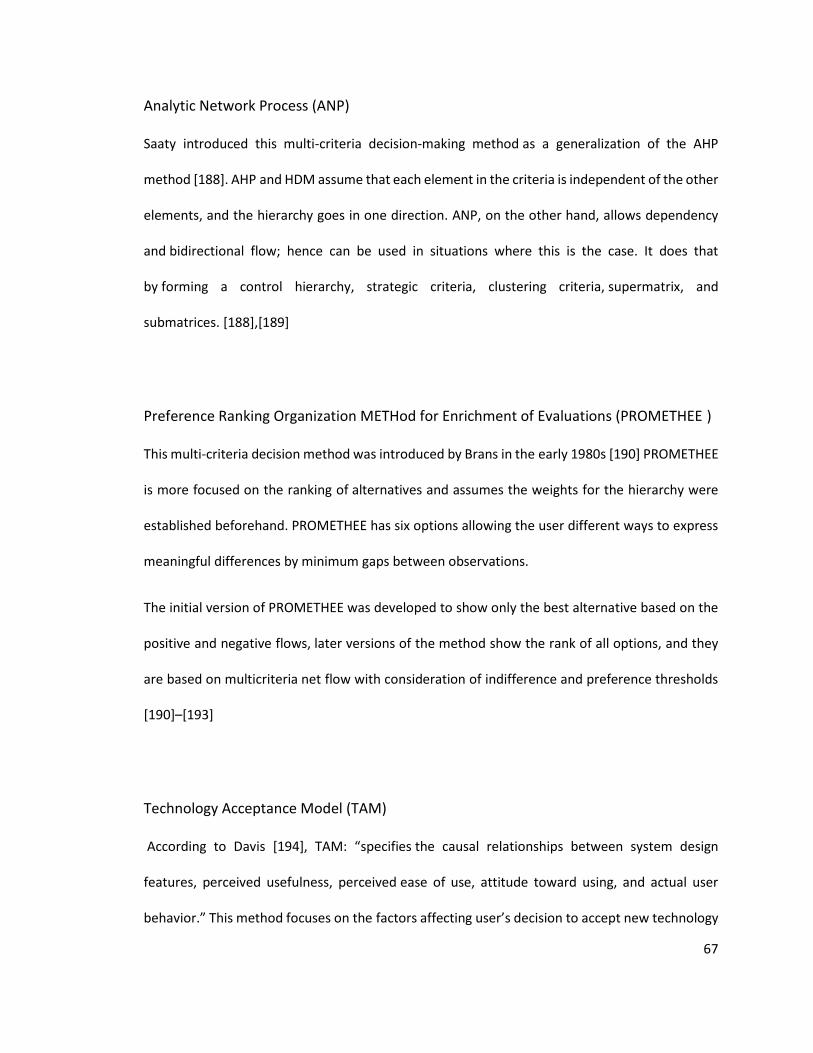
67
Analytic Network Process (ANP)
Saaty introduced this multi-criteria decision-making method as a generalization of the AHP
method [188]. AHP and HDM assume that each element in the criteria is independent of the other
elements, and the hierarchy goes in one direction. ANP, on the other hand, allows dependency
and bidirectional flow; hence can be used in situations where this is the case. It does that
by forming a control hierarchy, strategic criteria, clustering criteria, supermatrix, and
submatrices. [188],[189]
Preference Ranking Organization METHod for Enrichment of Evaluations (PROMETHEE )
This multi-criteria decision method was introduced by Brans in the early 1980s [190] PROMETHEE
is more focused on the ranking of alternatives and assumes the weights for the hierarchy were
established beforehand. PROMETHEE has six options allowing the user different ways to express
meaningful differences by minimum gaps between observations.
The initial version of PROMETHEE was developed to show only the best alternative based on the
positive and negative flows, later versions of the method show the rank of all options, and they
are based on multicriteria net flow with consideration of indifference and preference thresholds
[190]–[193]
Technology Acceptance Model (TAM)
According to Davis [194], TAM: “specifies the causal relationships between system design
features, perceived usefulness, perceived ease of use, attitude toward using, and actual user
behavior.” This method focuses on the factors affecting user’s decision to accept new technology
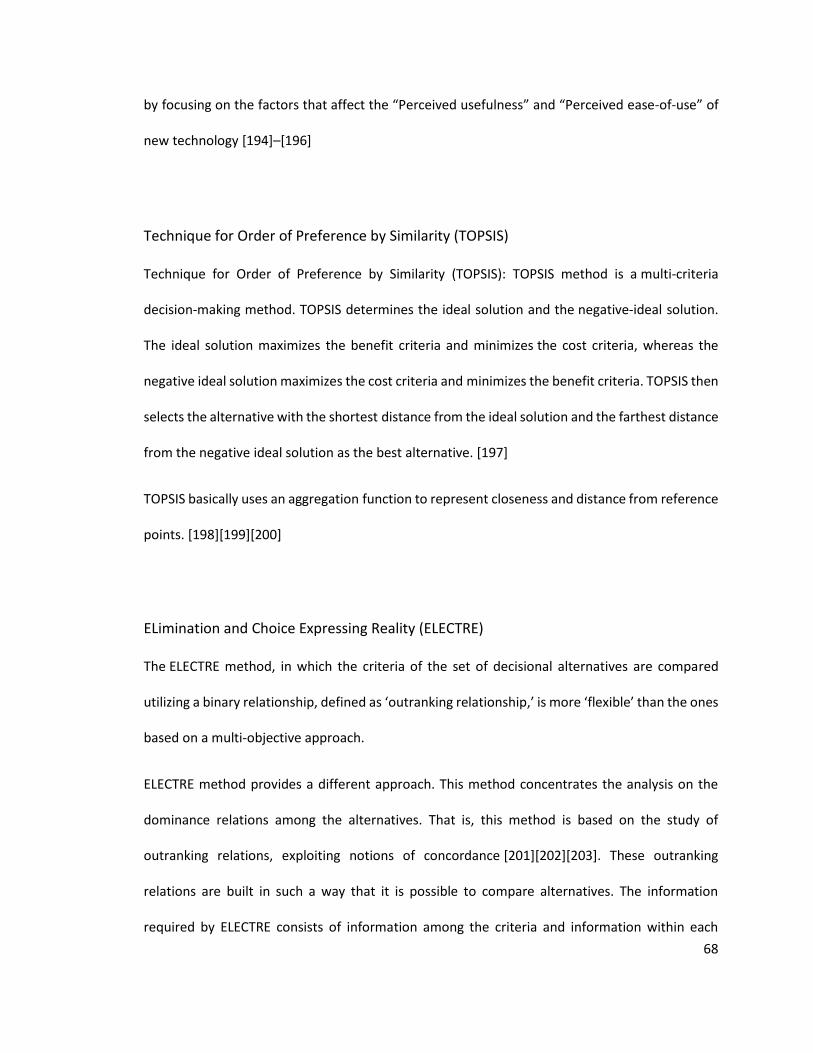
68
by focusing on the factors that affect the “Perceived usefulness” and “Perceived ease-of-use” of
new technology [194]–[196]
Technique for Order of Preference by Similarity (TOPSIS)
Technique for Order of Preference by Similarity (TOPSIS): TOPSIS method is a multi-criteria
decision-making method. TOPSIS determines the ideal solution and the negative-ideal solution.
The ideal solution maximizes the benefit criteria and minimizes the cost criteria, whereas the
negative ideal solution maximizes the cost criteria and minimizes the benefit criteria. TOPSIS then
selects the alternative with the shortest distance from the ideal solution and the farthest distance
from the negative ideal solution as the best alternative. [197]
TOPSIS basically uses an aggregation function to represent closeness and distance from reference
points. [198][199][200]
ELimination and Choice Expressing Reality (ELECTRE)
The ELECTRE method, in which the criteria of the set of decisional alternatives are compared
utilizing a binary relationship, defined as ‘outranking relationship,’ is more ‘flexible’ than the ones
based on a multi-objective approach.
ELECTRE method provides a different approach. This method concentrates the analysis on the
dominance relations among the alternatives. That is, this method is based on the study of
outranking relations, exploiting notions of concordance [201][202][203]. These outranking
relations are built in such a way that it is possible to compare alternatives. The information
required by ELECTRE consists of information among the criteria and information within each

69
criterion [201]. The method uses concordance and discordance indexes to analyze the outranking
relations among the alternatives. [202]
Multi-Attribute Utility Theory (MAUT)
MAUT allows the decision-maker to quantify and aggregate multiple objectives even when these
objectives are composed of conflicting attributes [204], [205]. The decision maker's preferences
are modeled in order to obtain a multi-attribute utility function, for instance
U(ci,ti,di)
This function aggregates utility functions for all criteria or attributes. That is, an analytical function
is obtained, which combines all criteria through a synthesis function. Each particular analytical
form for this function has preferential independence conditions to be evaluated to guarantee that
the decision maker’s preferences are [204], [206]
AHP vs. MAUT vs. HDM
Since its development three decades ago, the AHP has become a widely popular
MCDM procedure in the US and other countries. AHP provides a model for multi-criteria
decision-making through pairwise comparison. This is a structured technique for organizing and
analyzing complex decisions based on mathematics and psychology. The main benefit of AHP is
that it provides a comprehensive and rational framework for structuring a decision problem,
70
representing and quantifying its elements, relating those elements to overall goals, and evaluating
alternative solutions.
However, the data required for this method needs experience, judgment, and
knowledge to be utilized. Besides, AHP implementation does not consider the risks
and uncertainty that are inherent to decision-making models. The main weakness
that researchers debate in the AHP method is the measurement scale, rank reversal,
and preferences' transitivity. [207]
The main advantage of MAUT is that it lets the decision-maker quantify and aggregate
multiple objectives even when these objectives are composed of conflicting attributes
and form a multi-attribute utility function.
A multi-attribute utility (MAU) function is applied to illustrate an agent's preferences
about the product bundles either in situations with specific results or when there is
uncertainty involved.
The Literature continuously criticizes MAUT’s axiomatic base and related application
issues. For instance, [208]argues that “the [decision making] subject systematically
make choices that violate properties required by the expected utility.”
Also, other decision-making researchers [209], [210] state that “The conclusion is
that the justification of the practical use of expected utility decision analysis as it is
known today is weak.”

71
For the case study of e-commerce, it is essential to be able to tailor this process to
capture all nuances of technologies, products, services, and markets.
However, a clear and comprehensive set of methods is required to study this problem
in detail. Therefore, this research's key goal is to propose, explain, and implement a
set of methodologies that is appropriate for improving understanding in this area.
Hierarchical Decision Model
The hierarchical Decision Model (HDM) is a decision-making tool that ranks the
alternatives and evaluates those choices to distinguish the best among them. [211]
This is an MCDM method which was developed by Kocaoglu [212] with the same
concept as the Analytical Hierarchy Process (AHP) methodology, but using a different
pairwise comparison scale [213]and judgmental quantification technique and
enables to analyze of the complex problem through quantifying the alternatives and
also embedding the qualitative judgments into a decision model [214].
HDM uses a hierarchical disposition model to visually illustrate the impact of
perspectives, criteria, and sub-criteria on the ultimate objective. The model consists
of 5 levels: mission, Objectives, Goals, Strategies, and actions (MOGSA). These levels
are not fixed or limited but flexible to match the actual requirements of any case
under study. Determining the number of hierarchical levels depends on how simple
or complex the decision problem is. This method's application and robustness are
proven in different areas such as Risk Assessment, Investment Analysis, Resource
Allocation, Medical and Health care decisions, and Energy Choices [215], [216].

72
HDM is used frequently to capture complex and multi-criteria problems in academia
and industry. The method provides a mechanism to illustrate the relationship
between different perspectives, criteria, and ultimately decision model factors. [217]
The hierarchical Decision Model allows the researcher to collect the subject matter
experts' feedback and build a quantitative model based on a pair-wise comparison of
the impacting factors. The relative weight of the factors represents the importance of
the factor in decision making and the level of impact in selecting between alternatives.
[188]
The Hierarchical model decomposes a complex problem into its elements. Besides,
the pair-wise comparison is more comfortable to digest and understand than the
absolute impact of a single factor on a complex issue. The human brain can only
process a certain number of items simultaneously. The pair-wise comparison of the
factors allows the experts to focus only on two factors simultaneously and use their
brainpower to make a much simpler decision rather than comparing dozens of
elements simultaneously. This makes the experts more comfortable during decision-
making processes. [217]
To design a maturity model, the researcher needs to select a methodology that
enables him/her to quantify the expert judgments and conclude on the level of
maturity of an organization in certain factors. Many of the existing maturity models
are products of companies, reports, and/or whitepapers, which means they have not
been through a peer-reviewed process and, more importantly, validation. In addition,
73
creating a new maturity model is a complex and multi-dimensional activity, and the
methodology used for developing it needs to simplify this complexity.
The methodology used to address the gaps in the literature need to possess the
following attributes:
• Decomposition: Decomposition allows the researcher to break down the
problem in impacting factors that reduce its complexity.
• Quantification: the selected methodology needs to quantify the criteria
under analysis to allow building a mathematical model.
• Validation and re-usability: The method needs to equip the researcher
with some validation tools to enhance the model's accuracy. Also, the model
should be re-useable by different researchers and practitioners.
After reviewing several other models that are used in multi-criteria decision-making,
it is found that the HDM methodology can adequately tackle the gaps mentioned
above. HDM is indeed a multi-criteria decision-making method with a hierarchical
structure that enables a more complex analysis through pairwise comparing the
important factors (perspectives/criteria) in a certain problem/decision.
Furthermore, HDM captures experts’ judgments and turns them into the weights for
important factors regarding the problem.
The HDM model is used for the following purposes:

74
• Structure the impacting criteria and perspectives concerning customer-
centricity score
• Validate the impacting criteria and perspectives through an expert panel
• Quantify criteria and their level of impact on the final goal (level of the
customer-centricity)
• Reveal any disagreement or inconsistency in the judgments of the expert
panel
• Use desirability curves to quantify subjective measures and identify the level
impact of each factor on the final goal (level of customer-centricity)
• Determine the level of sensitivity of customer-centricity to each impacting
factor
This data collection can be done anonymously and individually, boosting data quality
to help the decision-maker. Different kinds of analysis, such as Inconsistency analysis
and Disagreement analysis, can be done to validate expert judgments when using
HDM.
Moreover, at each level of the hierarchy, surveys/questionnaires/interviews can be
used to validate the selected perspectives/criteria (initially found using literature
review).

75
In addition, Sensitivity Analysis provides the decision-makers with a better
understanding of the model in terms of flexibility. At the same time, it gives them a
better idea of when the model would require an update. Finally, although a heavy load
of quantification may go into the quantification, validation, and calculation of the
results, HDM results are intuitive and not difficult to use/understand by people who
have a less academic background.
HDM methodology quantifies the experts' input, and desirability curves clearly
illustrate the level of maturity in the organization. The desirability curves allow the
measurement of each criterion influential on the final result (score).
Inconsistency in Hierarchical Decision Model
In the HDM model, the disagreement among one expert’s evaluations is referred to as
Inconsistency.
Estep defines the Inconsistency as “generally, inconsistency can be defined as
disagreement within an individual’s evaluation” [218]
From another perspective, Abotah mentions that “inconsistency is a measure that
explains how reliable and homogeneous in his or her answers each expert was
through the whole questionnaire” [219]
There are two types of Inconsistency analysis: Ordinal and Cardinal.
76
The Ordinal Inconsistency reveals the logical inconsistency, and Cardinal
Inconsistency shows the magnitude of it as well. An example helps with the
elaboration of these concepts.
For instance, given three factors A, B, and C, if A is better than B and B is better than
C, A must be better than C if one is to be logically consistent if it is stated otherwise
(e.g., C is better than A) researcher concludes that there is an Ordinal Inconsistency.
Given the same three factors of A, B, and C, if A is three times better than B and B is
two times better than C, then A must be six times better than C; otherwise there is
Cardinal Inconsistency an individual’s evaluation.
According to Gibson, when subject matter experts need to make multiple decisions
and compare among different items, the research should expect inconsistency
occurrences. [220]
In HDM, inconsistency is measured by calculating the sum of the
standard deviations. Hence, inconsistency can be measured by the variance of
relative values.
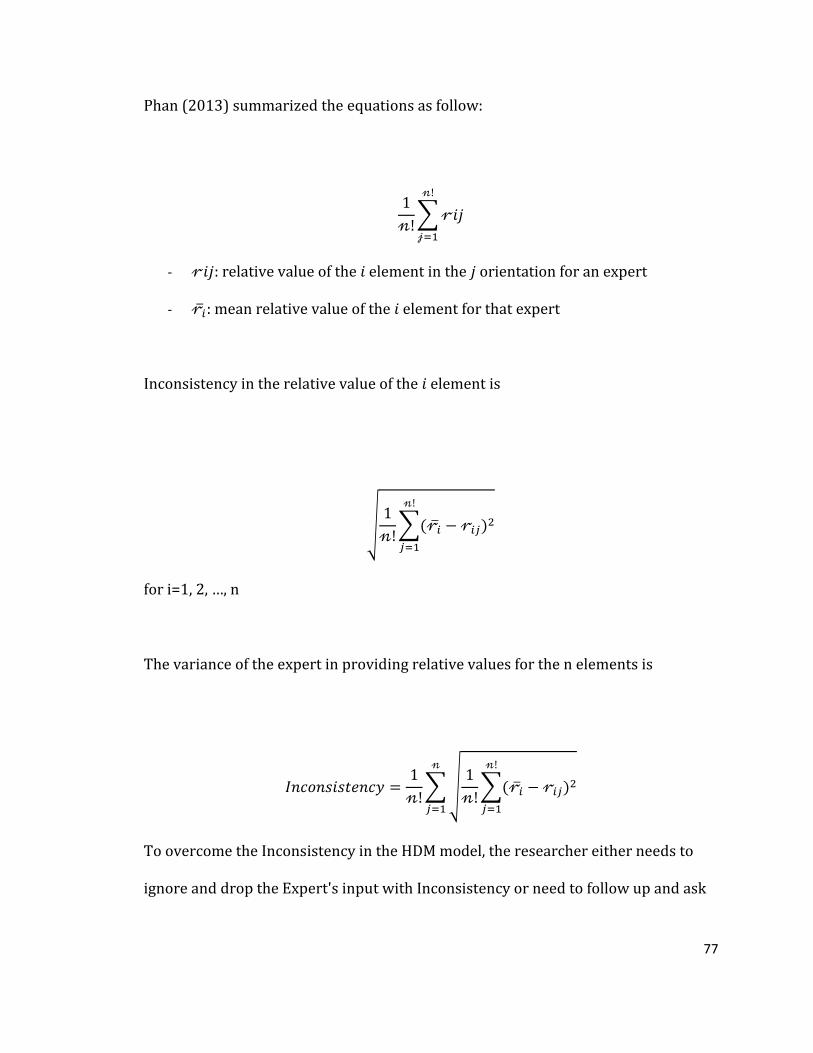
77
Phan (2013) summarized the equations as follow:
1
𝓃!∑ 𝓇𝑖𝑗
𝓃!
𝒿=1
- 𝓇𝑖𝑗: relative value of the 𝑖 element in the 𝑗 orientation for an expert
- ��𝑖: mean relative value of the 𝑖 element for that expert
Inconsistency in the relative value of the 𝑖 element is
√1
𝓃!∑(��𝑖 − 𝓇𝑖𝑗)2
𝓃!
𝑗=1
for i=1, 2, …, n
The variance of the expert in providing relative values for the n elements is
𝐼𝑛𝑐𝑜𝑛𝑠𝑖𝑠𝑡𝑒𝑛𝑐𝑦 =1
𝓃!∑ √
1
𝓃!∑(��𝑖 − 𝓇𝑖𝑗)2
𝓃!
𝑗=1
𝓃
𝑗=1
To overcome the Inconsistency in the HDM model, the researcher either needs to
ignore and drop the Expert's input with Inconsistency or need to follow up and ask
78
for further information and seek more clarity to understand if the Inconsistency is
valid and input of the Expert need to be considered.
Since the Inconsistency is expected, there should be an acceptance range to verify the
expert's input. According to Kocaoglu [212][220], the acceptable level of
Inconsistency level is 10% percent. In other words, if the Inconsistency exceeds this
level, the researcher needs to be very cautious about accepting the expert’s judgment.
In this case, the researcher needs to either discard the expert judgment or collect their
input again through repeating their pair-wise comparisons. [220]
Abbas [221] formulated a new method of calculating the Inconsistency in case the
inconsistency level is higher than recommended 10%.
He used root-sum of variances (RSV), which injects the number of pair-wise
comparisons into the inconsistency calculation. In other words, when the number of
pairwise comparisons increases, the range of inconsistency is adjusted accordingly
with his method. [221]
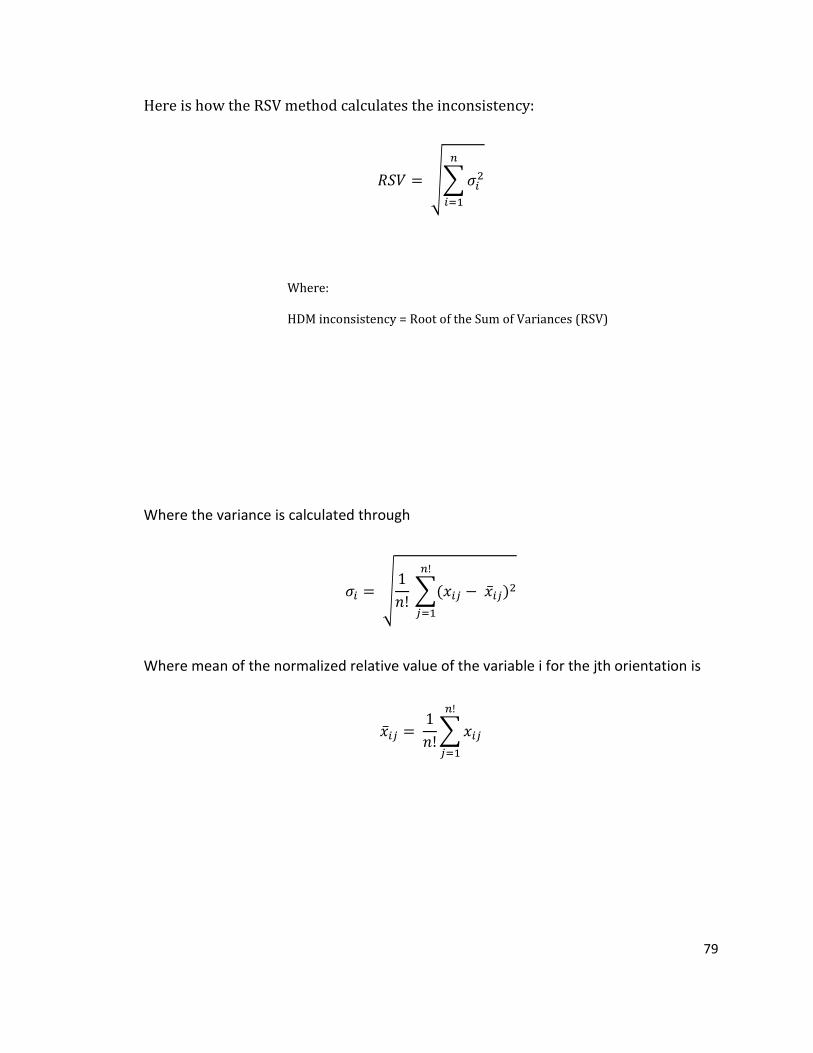
79
Here is how the RSV method calculates the inconsistency:
𝑅𝑆𝑉 = √∑ 𝜎𝑖2
𝑛
𝑖=1
Where:
HDM inconsistency = Root of the Sum of Variances (RSV)
Where the variance is calculated through
𝜎𝑖 = √1
𝑛! ∑(𝑥𝑖𝑗 − ��𝑖𝑗)2
𝑛!
𝑗=1
Where mean of the normalized relative value of the variable i for the jth orientation is
��𝑖𝑗 = 1
𝑛!∑ 𝑥𝑖𝑗
𝑛!
𝑗=1

80
Disagreement in Hierarchical Decision Model
The Disagreement in HDM occurs when the input data of experts disagree with each
other. In other words, subject matter experts evaluate the impact of factors differently
from other experts on the panel.
Abotah states, “the disagreement of experts can be understood as the deviation of
their judgments from each other” [219]
While experts are invaluable to assigning values to decision attributes, their input is
subjective, resulting in disagreement among the experts.
The Disagreement analysis is important from the model reliability perspective. With
this analysis, the researcher quantifies and reveals the disagreement among the
experts. As [219]states, if the researchers do not perform disagreement analysis on
their input data, they would face problems during the decision analysis. [219]
When a disagreement shows up in the HDM model, the researcher needs to follow up
with the experts who provided different opinions and further elaborate on their
input. The researcher needs to confirm with the expert that they have fully
understood the intention of the question correctly.
If the expert confirms and insists on their input to be correct, the researcher needs to
keep their input and explain the discrepancy in their calculation. In extreme cases,
the removal of those outliers from the pool of experts could also be contemplated.
According to Estep [218], this disagreement has roots in experts' personal and
professional experiences. Therefore, to ensure that all experts can fully understand

81
the survey questions and respond correctly, the questions need to be written without
ambiguity and in the most straightforward way.
According to Gibson [220] and Iskin [222], the disagreement is calculated as follows:
Let
m: The number of experts, k= 1 … m
n: The number of decision elements, i=1 … n
𝑟#.: The mean relative value of the i-th element for k-th expert
𝑅#: The group relative value of the i-th element for m experts is
𝑅𝑖 = 1
𝑚∑ ��𝑖𝑗
𝑚
𝑘=1
for i = 1, 2, …, n
The Disagreement among the m experts for n decision variables is:
𝑑 = √1
𝑛. 𝑚∑ ∑(𝑅𝑖 − ��𝑖𝑘)2
𝑛
𝑖=1
𝑚
𝑘=1

82
As mentioned in previous sections, the acceptable threshold for Disagreement is 10%
(or d=0.1) [218] [219] [222][220]. If the Disagreement above this threshold is
noticed, the researcher needs to take action to resolve the issue either by eliminating
the Expert or analyzing and discussing the reasons to understand the reason behind
it.
Researchers have recommended different methods for the disagreement analysis.
Iskin [222] and Gibson[220] suggest Hierarchical Agglomerative Clustering (HAC), which
iteratively puts the experts with similar opinions in a cluster. The grouping continues to
build as many clusters (groups) needed to lower each cluster's disagreement levels to an
acceptable level. In this method, the clusters inside the expert panels are illustrated with
dendrograms to reveal different groups and sub-groups of opinion.
The other method for measuring disagreement among experts is the statistical F-Test. F-
test is defined as a test for the equivalence of the variances of two experts or people
having normal distributions. It is the ratio of the variances of a sample of observations
taken from each. [223]F-test uses the null hypothesis, which indicates no association
or significant disagreement among experts [224]. The F-values and F-critical values
of the pairwise comparisons are provided readily by the HDM software supplied by
the ETM department. The F-value of a pairwise comparison procedure is calculated
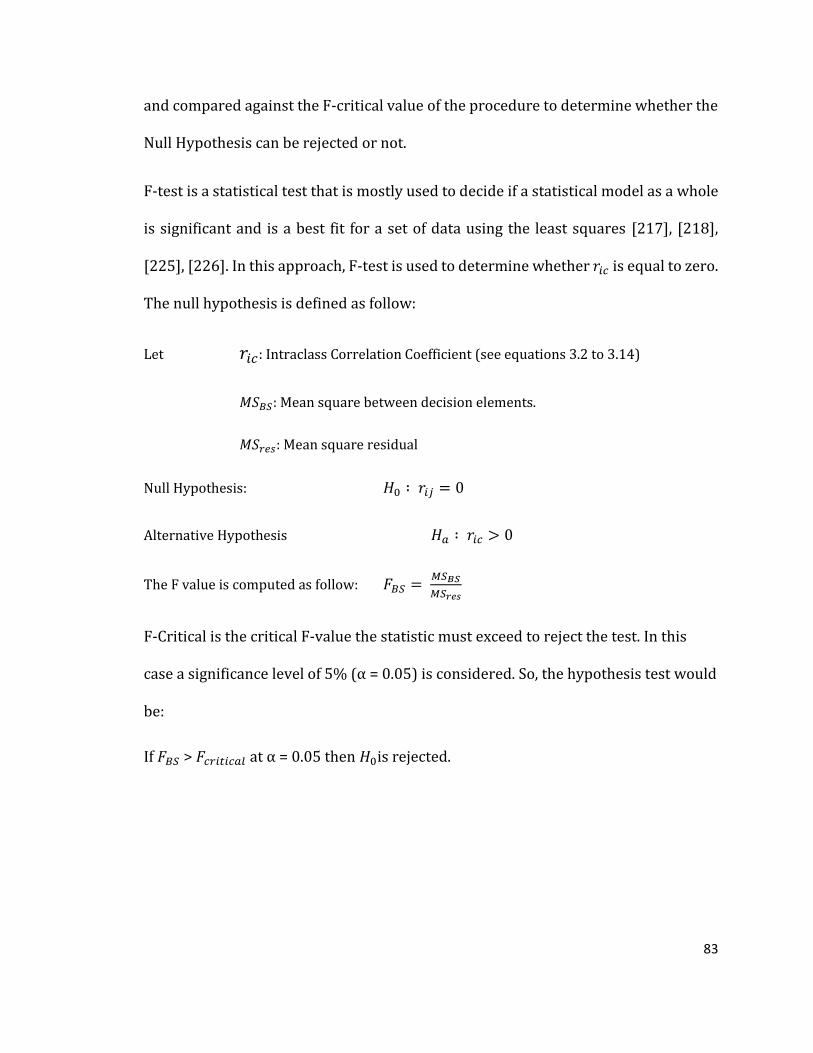
83
and compared against the F-critical value of the procedure to determine whether the
Null Hypothesis can be rejected or not.
F-test is a statistical test that is mostly used to decide if a statistical model as a whole
is significant and is a best fit for a set of data using the least squares [217], [218],
[225], [226]. In this approach, F-test is used to determine whether 𝑟𝑖𝑐 is equal to zero.
The null hypothesis is defined as follow:
Let 𝑟𝑖𝑐: Intraclass Correlation Coefficient (see equations 3.2 to 3.14)
𝑀𝑆𝐵𝑆: Mean square between decision elements.
𝑀𝑆𝑟𝑒𝑠: Mean square residual
Null Hypothesis: 𝐻0 ∶ 𝑟𝑖𝑗 = 0
Alternative Hypothesis 𝐻𝑎 ∶ 𝑟𝑖𝑐 > 0
The F value is computed as follow: 𝐹𝐵𝑆 = 𝑀𝑆𝐵𝑆
𝑀𝑆𝑟𝑒𝑠
F-Critical is the critical F‐value the statistic must exceed to reject the test. In this
case a significance level of 5% (α = 0.05) is considered. So, the hypothesis test would
be:
If 𝐹𝐵𝑆 > 𝐹𝑐𝑟𝑖𝑡𝑖𝑐𝑎𝑙 at α = 0.05 then 𝐻0is rejected.
84
Sensitivity Analysis in Hierarchical Decision Model
In order to analyze the impact of potential future changes in
HDM, Sensitivity Analysis is conducted. In simple words, Sensitivity Analysis runs
different what-if scenarios on each element and reveals how a model depends on a
specific factor or element. The main objective of performing Sensitivity Analysis is to
evaluate how the uncertainty impacts the model’s outcome and find the allowable
range at the perspective or criteria levels, called the model’s tolerance. In this manner,
the researcher can test the robustness of the HDM model.
The other use case of sensitivity analysis is to determine the impact of expert
disagreements on the final decision model. If there is disagreement in the expert
panel, sensitivity analysis can measure the significance of the disagreement and
reveal the depth of it to the researcher.
There are two approaches to applying Sensitivity Analysis, including the local
Sensitivity Analysis approach and the global Sensitivity Analysis approach. In the
local Sensitivity Analysis approach, the focus is on varying inputs one at a time
while holding the others fixed to a nominal value.
To calculate the allowable range for changes in the values that do not impact the final
outcome of the model, [215] proposed the following calculation:
85
For the perturbation 𝑝𝑖𝑐(the perturbation affecting one of the objectives) where:
−𝐶𝑙∗𝐶 ≤ 𝑝𝑙∗
𝑐 ≤ 1 − 𝐶𝑙∗𝑐
The original maturity score (ranking) will not be subject to change if:
𝜆 ≥ 𝑃𝑖𝑐. 𝜆𝑐
Where:
𝜆 = 𝐶𝑟𝐴 − 𝐶𝑟+𝑛
𝐴
And:
𝜆𝑐 = 𝐶𝑟+𝑛,𝑙∗𝐴−𝐶 − 𝐶𝑟𝑙∗
𝐴 − ∑ 𝐶𝑟+𝑛,𝑙∗𝐴−𝑐
𝐿
𝑙=1,𝑙≠𝑙∗
.𝐶𝑙
𝑐
∑ 𝐶𝑙𝑐𝐿
𝑙=1,𝑙≠𝑙∗
+ ∑𝐴𝑟𝑙
𝐴−𝑐
∑ 𝐶𝑙𝑐𝐿
𝑙=1,𝑙≠𝑙∗
𝐿
𝑙=1,𝑙=𝑙∗
The top choice will remain at the top rank if the above condition is satisfied for all r=1
and n=1, 2… I-1. The rank order of all Ai’s will not change if the above condition stands
of all r=1, 2… I-1, and n=1.
The allowance range of perturbations 𝐶𝑖𝑐 is obtained as
[𝛿𝑙−𝐶 , 𝛿𝑙+
𝐶 ]
The sensitivity coefficient is obtained as:
1
|𝛿𝑙−𝐶 − 𝛿𝑙+
𝐶 |
One of the calculation methods for Sensitivity Analysis is to use the “Boost” approach.
The Boost approach is a scenario-driven method that the analysis is done around
86
boosting one factor (at a time) to the maximum and observing the impact of that on
the result and other perspectives or criteria’s relative importance. More details of this
method of sensitivity analysis are provided after the case study analysis alongside the
research sensitivity analysis in Chapter six.

87
Desirability Curves in Hierarchical Decision Model
The concept of desirability curves is applied to calculate the Customer-centricity
score. For each of the factors in the model, the desirability of levels is determined by
collecting the inputs from the experts. The panel experts assign a desirability value
for each of those levels between 0 and 100. The 100 is the most desirable situation,
and 0 is the least desired state of that level. Then these desirability values are used to
plot the desirability curves.
According to Estep [218], “The purpose of these curves is to identify how “desirable”
or “valuable” a metric is for a decision-maker.”
For example, let us assume the researcher intends to assign desirability to different
levels of a criterion named “data collection robustness.” With the expert panels'
assistance, the researcher comes up with different states or situations for this
criterion and names them Disability levels. Here are the four levels for data collection
robustness which experts recommend:
• Level 1: The data collection methods are ineffective and do not provide reliable
and usable data
• Level 2: The data collection methods are semi-structured and provide some
usable data
88
• Level 3: The data collection methods are fully structured and provide entirely
usable data, which requires data cleaning
• Level 4: The data collection methods provide ready to use data that is
comprehensive and reliable
Then for each level, the experts determine how much it is desirable. The average of
the experts’ input is used to assign the desirability percentage to the levels.
▪ Level 1: 10%
▪ Level 2: 20%
▪ Level 3: 40%
▪ Level 4: 100%
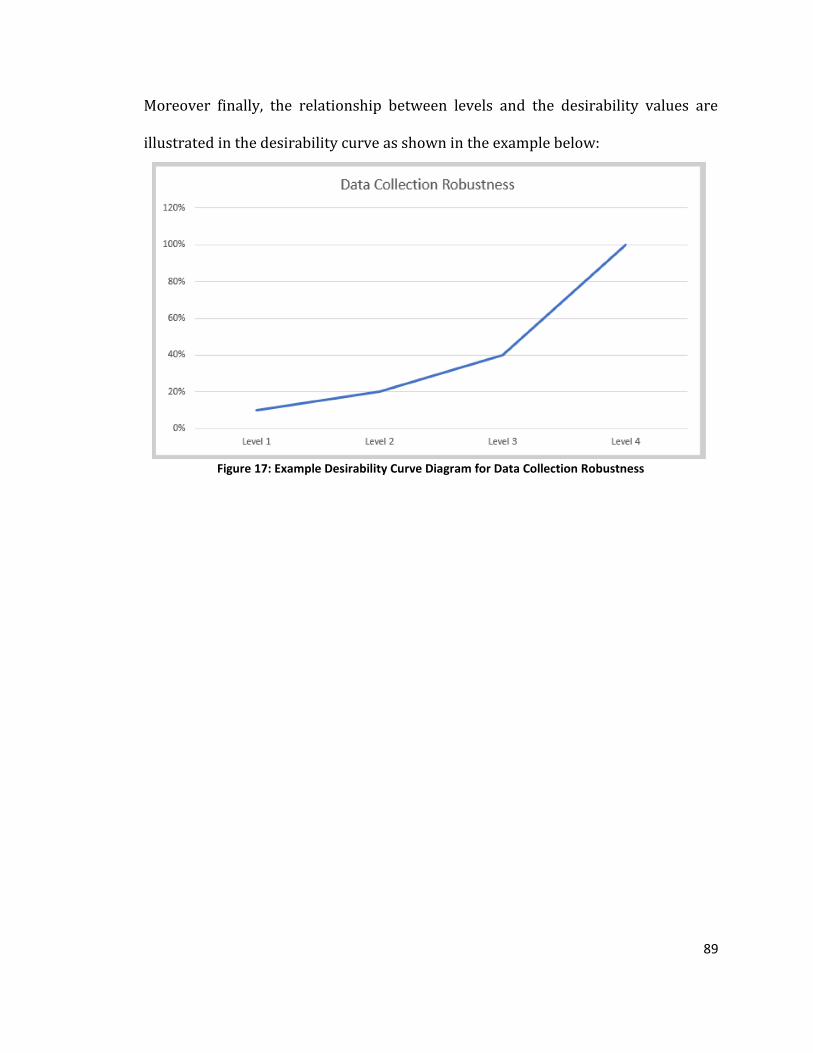
89
Moreover finally, the relationship between levels and the desirability values are
illustrated in the desirability curve as shown in the example below:
Figure 17: Example Desirability Curve Diagram for Data Collection Robustness
90
Calculating Customer-centricity Score
One of the research objectives is to develop a decision model resulting in a Customer-
centricity score that can be used to assess an organization's maturity level from the
customer orientation perspective.
Customer-centricity is a multi-dimensional characteristic of an organization. In other
words, multiple factors or criteria accumulatively determine how much an
organization is customer-centric. Therefore, evaluation of the customer-centricity of
an organization cannot be done unless the customer-centricity is broken down into
impacting factors and criteria.
Then the hierarchical decision model along with desirability curves is used to build a
re-usable model which:
• Reveals what are the impacting criteria in deciding the level of customer-
centricity
• Defines the levels of maturity for each criterion
• Quantifies the customer-centricity through a pair-wise comparison model
(HDM)
• Identifies the level of maturity of an organization

91
• Provides recommendations for improving the customer-centricity through
enhancing the areas with lower scores
The customer-centricity score is determined by the sum product of the perspective,
criteria weights, and desirability values. The mathematical expression for calculating
the customer-centricity score is presented below:
𝑆𝐶𝐶 = ∑ ∑(𝑃𝑗)(𝐶𝑖,𝑗)(𝐷𝑖,𝑗)
𝑛
𝑗=1
𝑚
𝑖=1
Where
𝑆𝐶𝐶 is the Customer-centricity Score
𝑃𝑗 is the relative value of perspective 𝑗 with respect to Customer-centricity Score
𝑤ℎ𝑒𝑟𝑒 𝑗 = 1,2, … , 𝑛
𝐶𝑖,𝑗 is the relative value of criteria 𝑖 under perspective 𝑗 with respect to Customer-
centricity Score
𝑤ℎ𝑒𝑟𝑒 𝑗 = 1,2, … , 𝑛 𝐴𝑁𝐷 𝑖 = 1,2, … , 𝑚
𝐷𝑖,𝑗 is the Desirability value of criteria 𝑖 under perspective 𝑗
𝑤ℎ𝑒𝑟𝑒 𝑗 = 1,2, … , 𝑛 𝐴𝑁𝐷 𝑖 = 1,2, … , 𝑚
The Perspective and Criteria weights, as well as Desirability values, are determined
by judgment quantifications from the experts. They are used as input to calculate the
overall customer-centricity score. In the next section, the expert panel and
consideration in the formation of such panels are discussed in detail.

92
Expert Panel Formation
In this research, literature review and expert feedback are used to identify the most
critical factors influencing customer-centricity, focusing on e-commerce and online
retail organizations.
In order the quantify and validate the model, multiple expert panels are involved. The
expert panel's judgment is crucial in this model, and the effectiveness of the model
entirely relies on it. The expert panels are formed by involving individuals in
academia and industry with backgrounds and knowledge in this field. The experts
quantified each factor's impact concerning the customer-centricity, validate if the
criteria deserve to be part of the model, suggest other criteria that are not identified
in the initial model, and finally evaluate the entire model considering all the
definitions and scores.
The HDM methodology is used to elicit expert judgment to identify the relative
importance of those factors. Besides, experts' feedback is used to identify possible
statuses an organization might have regarding each factor. The data input is made by
SME’s. As outlined in the previous section, Experts are involved in validating the
initial model and quantifying its components.
Definition of Experts and Panels gives a better understanding of these concepts in
HDM; An expert is a person who has the relevant knowledge and experience and
whose opinions are esteemed by peers in his or her field [219], [227]. An expert panel
is analyzed by [218], who mentioned the [228]: expert panels are groups of
individuals with access to current, high-quality information on a related topic.

93
Since the HDM model is based on experts' judgment and input, selecting the right
subject matter expert and forming diverse panels are critical to building a reliable
decision model. [219]
Literature suggests considering the following criteria to select the expert panel [229]
▪ Professional knowledge, background, and experience on the research topic
▪ Enough availability for participation in panels
▪ Willingness in participation in the research
▪ Lack of bias and tendency toward decision alternatives or goal
▪ Independence in Technical and professional opinion
▪ Prior experience of working in Committees and expert panels
There is a consensus that the size of the expert panels should be between 6-12
individuals to achieve the expected results [230], [231]. Very large panels could have
coordination problems, or very small panels could not be beneficial since experts
could think that it is not an obligation to participate [232]
The impact of disagreement on the decision model can be offset by selecting the right
expert panel for each level of the decision model. [218]
[229] defines five major steps in forming Expert panels, which is illustrated below:
Identify list of experts
Create experts
databaseNominate add
Group experts into panels
Send the required invitation
Figure 18: Five Major Steps in Expert Panel Formation

94
Validation of the Decision Model
Eight panels of experts are formed to validate and quantify the model. The HDM
method requires the researcher to perform validation to enhance the accuracy of the
model. Each panel represents certain expertise that is used to evaluate related parts
of the model. The primary purpose of validating the model is to confirm all impacting
elements are considered and the model structure is close to the real-world experience
of the experts.
Multiple validation stages are applied in this research to ensure all elements of the
model are valid.
Figure 19: Model Validation Process
“Content validity” is the first measure, and it is used throughout the development of
the research model. It refers to the model's ability to properly represent all relevant
aspects and elements pertaining to the research topic.
“Construct validity” is utilized after the model is developed to validate the research
approach's fitness to past and underlying theories and refers to the ability of the
model’s structure to deal with the problem at hand.
Content and Construct Validation
Perspective
Validation
Criteria
Validation

95
The “Perspective and Criteria validation” is the final stage of this process to validate
the outcomes of the research and evaluation of the model built with the real world.
For perspective and criteria validation, the experts provide feedback regarding the
final model as well as recommendations on improving the accuracy of the model.
Research Application and Case Study
In this research, the case study method is performed to demonstrate the application
of the model built during this research. The case study also provided another layer of
validation and verification for the model in the real world.
To perform a thorough case study, access to information and experts is very critical.
One of the reasons for selecting this organization for the case study was the
availability of the data to the author and direct access to the experts for SME panel
formation.
The quantified model is validated using the case study. The organization's maturity
level in the Customer-centricity approach is evaluated and scored, and used as the
baseline to enhance its overall customer orientation. During the case study, the
criteria, perspective, and desirability with lower scores are identified that is used as
the areas for improvement for the organization.

96
Since the data for perspectives and criteria used in the model are not publicly
available to illustrate the performance of the model in real-world and the researcher
do not have access to such detailed information in order to demonstrate the proposed
model at work, and following case study performed by Phan [217] hypothetical
companies in the field of the E-commerce is used to perform the case study. Each
hypothetical company is associated with alternative characteristics to differentiate
them from one another and illustrate the real situation outcome in a comparative
manner.
In other words, these hypothetical companies possess variant strengths and
weaknesses in each perspective and criteria, which is modeled in the research. Here
is a narrative introduction to these three companies.:
Company A gets high scores regarding technology stacks and data management but
lacks specific customer relationship management capabilities. Their communication
with the customers is not consistent and takes a long time to respond to any customer
support requests.
Company B is a highly structured organization with robust and established processes,
and they follow the restricted data privacy policies, but the technologies are obsolete
and non-scalable, which negatively impacts the data distribution and accessibility.
They invest heavily in customer awareness and training and attempt to acquire more
customers through marketing initiatives.

97
On the other hand, Company C is an agile and flexible start-up in utilizing the new
technologies and delivering innovative solutions to the customers. They can
customize their solution based on customer needs but do not follow well-structured
processes and policies and miss a few of the checkboxes in the privacy and security
policies.
During the case study, the perspectives and criteria are quantified for each of these
three hypothetical companies. The details of the hypothetical companies are provided
later in the research application and case chapter. (Chapter 6)
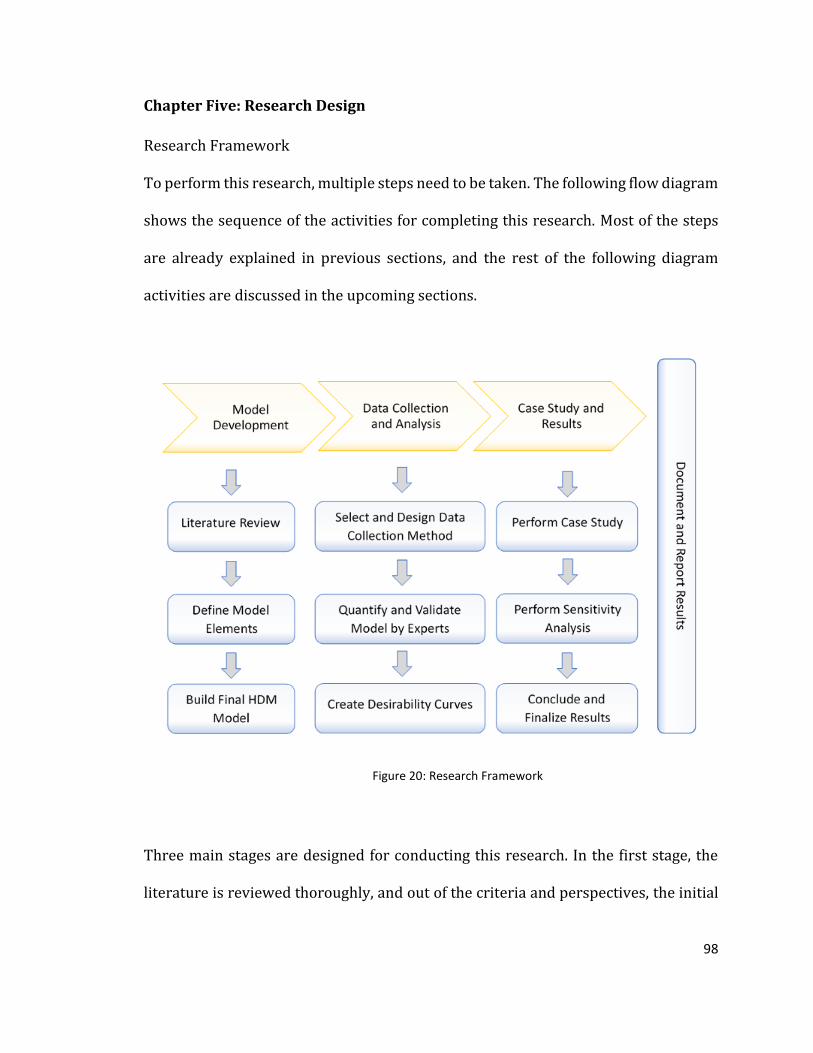
98
Chapter Five: Research Design
Research Framework
To perform this research, multiple steps need to be taken. The following flow diagram
shows the sequence of the activities for completing this research. Most of the steps
are already explained in previous sections, and the rest of the following diagram
activities are discussed in the upcoming sections.
Three main stages are designed for conducting this research. In the first stage, the
literature is reviewed thoroughly, and out of the criteria and perspectives, the initial
Figure 20: Research Framework

99
model is defined. The model is then verified and validated by the expert panel and
finalized to be used in the data collection stage. The second stage of this research
focuses on collecting related data and analyzing them methodically. First, the data
collection tool is selected, customized, and designed for this purpose, and data is
collected, respectively. The Expert panels are utilized to quantify and validate the
model, and finally, the desirability curve is created. Finally, in the last stage of this
research, the proposed model is used to perform a case study and document the
results. This model's sensitivity is analyzed and evaluated based on the impacting
factors, and research results are concluded and documented in the thesis report. This
is the initial framework that may face some updates and enhancement during the
research, as necessary.
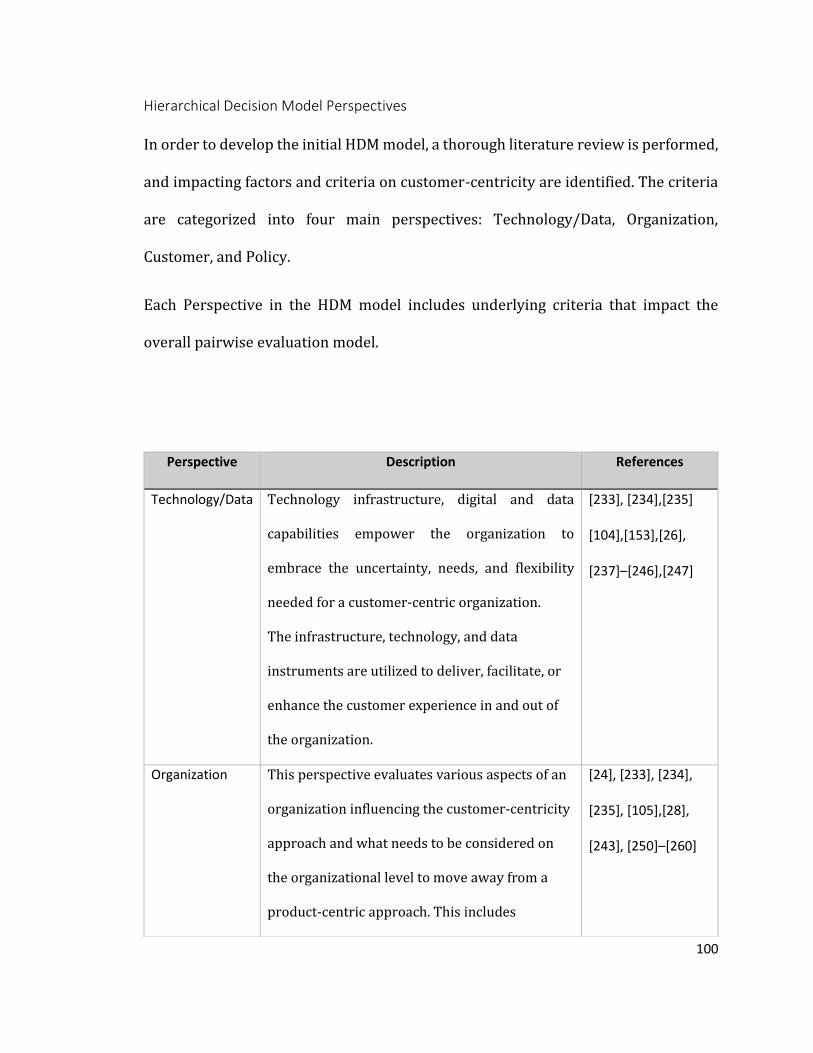
100
Hierarchical Decision Model Perspectives
In order to develop the initial HDM model, a thorough literature review is performed,
and impacting factors and criteria on customer-centricity are identified. The criteria
are categorized into four main perspectives: Technology/Data, Organization,
Customer, and Policy.
Each Perspective in the HDM model includes underlying criteria that impact the
overall pairwise evaluation model.
Perspective Description References
Technology/Data Technology infrastructure, digital and data
capabilities empower the organization to
embrace the uncertainty, needs, and flexibility
needed for a customer-centric organization.
The infrastructure, technology, and data
instruments are utilized to deliver, facilitate, or
enhance the customer experience in and out of
the organization.
[233], [234],[235]
[104],[153],[26],
[237]–[246],[247]
Organization This perspective evaluates various aspects of an
organization influencing the customer-centricity
approach and what needs to be considered on
the organizational level to move away from a
product-centric approach. This includes
[24], [233], [234],
[235], [105],[28],
[243], [250]–[260]
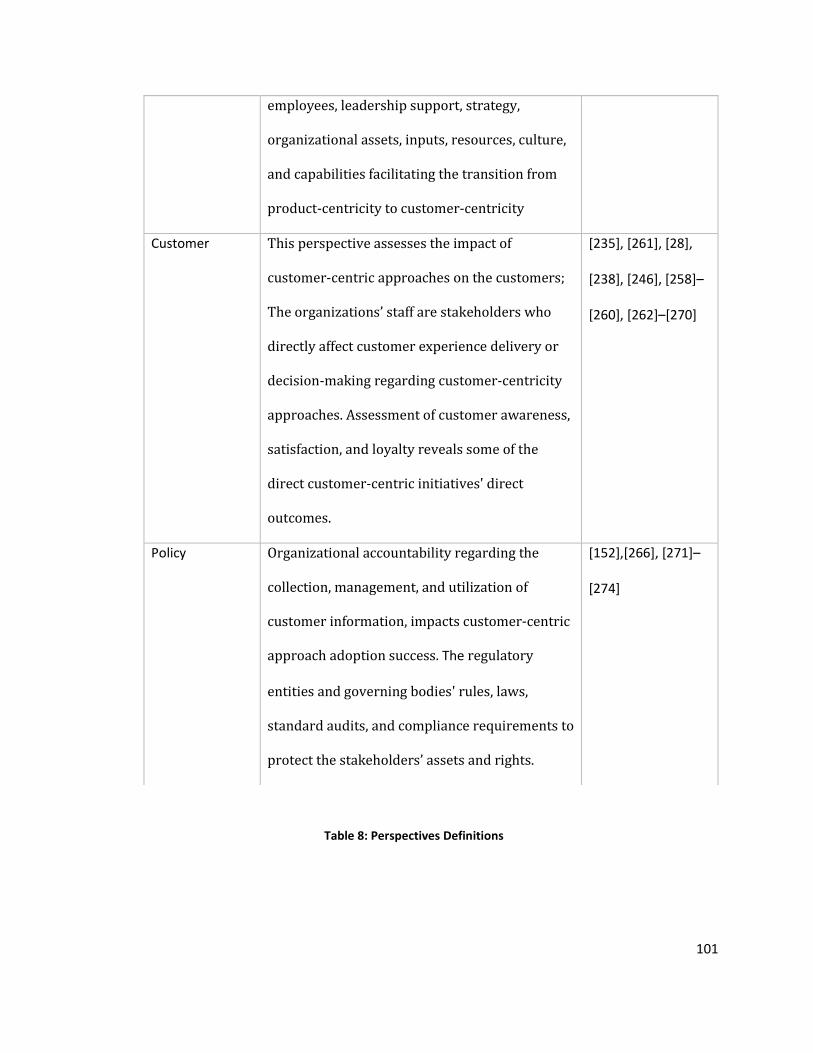
101
employees, leadership support, strategy,
organizational assets, inputs, resources, culture,
and capabilities facilitating the transition from
product-centricity to customer-centricity
Customer This perspective assesses the impact of
customer-centric approaches on the customers;
The organizations’ staff are stakeholders who
directly affect customer experience delivery or
decision-making regarding customer-centricity
approaches. Assessment of customer awareness,
satisfaction, and loyalty reveals some of the
direct customer-centric initiatives' direct
outcomes.
[235], [261], [28],
[238], [246], [258]–
[260], [262]–[270]
Policy Organizational accountability regarding the
collection, management, and utilization of
customer information, impacts customer-centric
approach adoption success. The regulatory
entities and governing bodies' rules, laws,
standard audits, and compliance requirements to
protect the stakeholders’ assets and rights.
[152],[266], [271]–
[274]
Table 8: Perspectives Definitions

102
Technology/Data Perspective
This perspective focus on technology infrastructure, digital and data capabilities,
which empower the organization to embrace the uncertainty, needs, and flexibility
needed on customer-centric organization
The category of factors related to infrastructure, technology, and data instruments is
utilized to deliver, facilitate, or enhance the customer experience. Here are the
definitions of each criterion categorized under Technology/Data Perspective:
Criterion Details References
Technology
Infrastructure
and Integration
Developing the key internal technology platforms for
Customer-centricity. Bringing visibility to customer
needs as quickly as possible. Enable the organization
to track and action the Customer needs
[237], [239]–
[242]
Data
Distribution
and
Accessibility
Data easily is accessible by the relevant users, and it
is distributed freely in the organization
[30],
[243],[244]
Data Collection
Robustness
Level of robustness in data collection methods
impacted by depth and reliability of the information
[26], [30],
[177], [243],
[244]
Data Metrics
Clarity
Clearly defined metrics and measures for evaluating
the needs and requests of the customer
[238], [243]–
[245]
Data Analytics
Capabilities
Access to insightful and actionable information
enabled by advanced analytics
[30], [243],
[244], [247]

103
Table 9: Technology Perspective's Criteria Definition
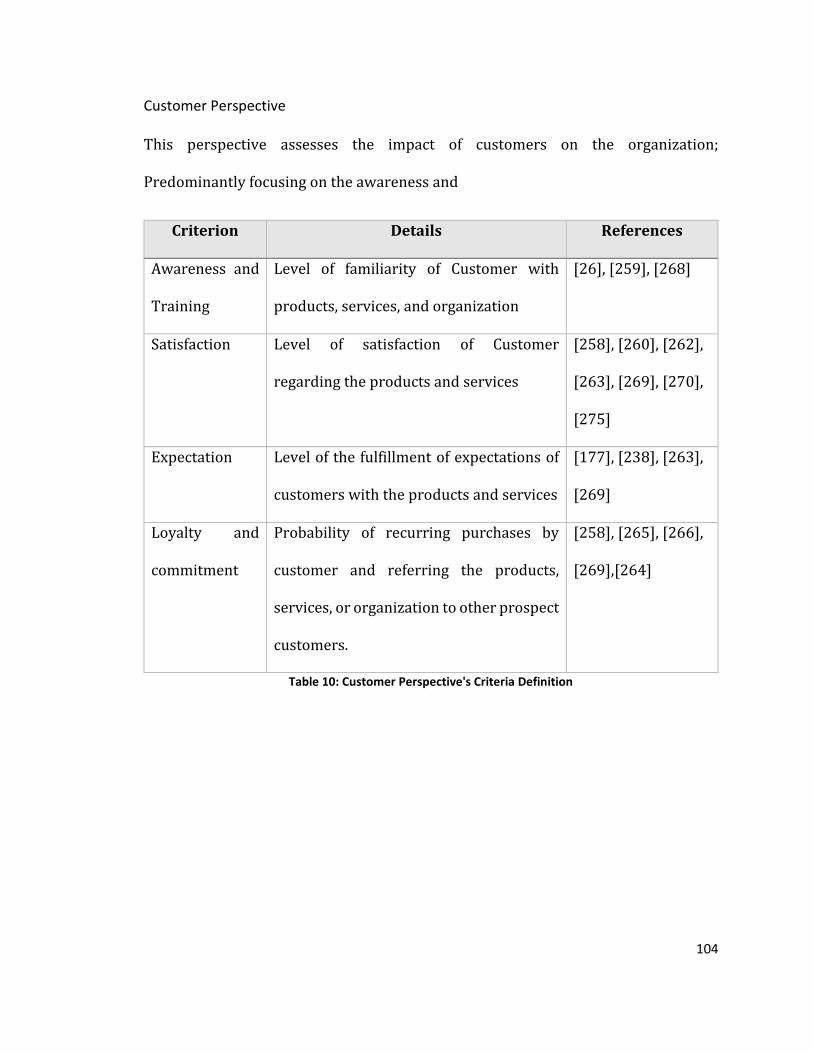
104
Customer Perspective
This perspective assesses the impact of customers on the organization;
Predominantly focusing on the awareness and
Criterion Details References
Awareness and
Training
Level of familiarity of Customer with
products, services, and organization
[26], [259], [268]
Satisfaction Level of satisfaction of Customer
regarding the products and services
[258], [260], [262],
[263], [269], [270],
[275]
Expectation Level of the fulfillment of expectations of
customers with the products and services
[177], [238], [263],
[269]
Loyalty and
commitment
Probability of recurring purchases by
customer and referring the products,
services, or organization to other prospect
customers.
[258], [265], [266],
[269],[264]
Table 10: Customer Perspective's Criteria Definition

105
Organization Perspective
This perspective is about How different aspects of an organization influence the
customer-centricity approach and what needs to be considered on the organizational
level to move away from a product-centric approach. This includes all corporate
assets, inputs, resources, culture, and capabilities facilitating the transition from
product centricity to customer-centricity. Here are the definitions of each criterion
categorized under Organization Perspective:
Criterion Details References
Process
robustness
Possession of robust processes mainly on following
domains:
• Requirement Gathering processes
• CX centric Product/Service design
• Feedback and response processes
• Customer relationship management
[243], [256],
[275],
[253]–[255]
Organizational
Structure
How the organization builds interdisciplinary
teams and level of flexibility and adaptability to re-
organize and embrace uncertainty
[257], [258]
Cultural Strength strong, sustainable, scalable organizational culture
aligned with customer needs Common definition of
customer-centricity Clarity and comprehensive
Communication Willingness to change
[257], [259],
[275]

106
Strategy focus Customer Experience driven product and service
roadmaps and Customer Data-driven product and
service design
[258], [260]
Staff Expertise Technical and inter-personal Skillset and the
attitude toward change and flexibility in processes
[250], [251],
[256]
Leadership
Support
Leadership support and sponsorship of change
management
[251], [252],
[257], [258]
Table 11: Organization Perspective's Criteria Definition

107
Policy Perspective
In this perspective, organizational accountability in the collection, management, and
utilization of customer information impacts an organization's success in customer-
centric approach adoption. The perspective focuses on regulatory entities and
governing bodies' rules, laws, standard audits, and compliance requirements to
protect the stakeholders’ assets and rights. Here are the definitions of each criterion
categorized under Policy Perspective:
Criterion Details References
Data Privacy Compliance Compliance with local, regional, and
global customer information privacy
requirements
[271], [273],[272]
Data Security Compliance Compliance with local, regional, and
global customer information Security
requirements
[266], [271],
[273], [274]
Data Ownership Level of freedom in the organization
for distributing data and analytics
collected and generated by the
organization
[273], [274]
Data Governance The management of the availability,
usability, integrity of data by the
organization
[271], [273]
Table 12: Policy Perspective's Criteria Definition

108
Initial HDM Model
The perspectives and criteria described in the previous section for a hierarchical
model are illustrated in the below figure. This initial model is used for building the
Maturity Model and evaluating the Maturity level of an enterprise. In the next section,
involving the experts in quantifying these criteria is further explained, and the next
steps of this research are outlined. This model was enhanced according to the
insightful feedback during the Comprehensive Exam.
Figure 21: HDM Initial Model
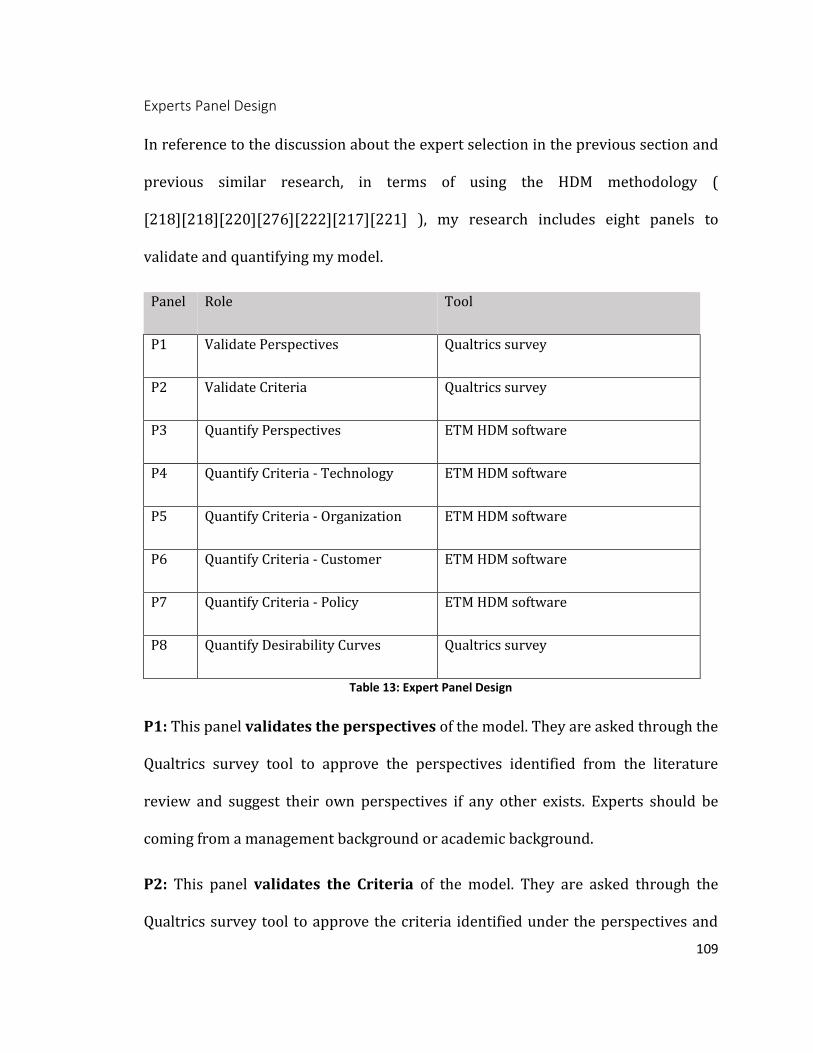
109
Experts Panel Design
In reference to the discussion about the expert selection in the previous section and
previous similar research, in terms of using the HDM methodology (
[218][218][220][276][222][217][221] ), my research includes eight panels to
validate and quantifying my model.
Panel Role Tool
P1 Validate Perspectives Qualtrics survey
P2 Validate Criteria Qualtrics survey
P3 Quantify Perspectives ETM HDM software
P4 Quantify Criteria - Technology ETM HDM software
P5 Quantify Criteria - Organization ETM HDM software
P6 Quantify Criteria - Customer ETM HDM software
P7 Quantify Criteria - Policy ETM HDM software
P8 Quantify Desirability Curves Qualtrics survey
Table 13: Expert Panel Design
P1: This panel validates the perspectives of the model. They are asked through the
Qualtrics survey tool to approve the perspectives identified from the literature
review and suggest their own perspectives if any other exists. Experts should be
coming from a management background or academic background.
P2: This panel validates the Criteria of the model. They are asked through the
Qualtrics survey tool to approve the criteria identified under the perspectives and

110
suggest their own perspectives if any other exists. Experts should be coming from a
management background or academic background.
P3: This panel is asked to quantify the perspectives by conducting pairwise
comparisons between every two perspectives, using the HDM methodology via the
ETM HDM software. Also, to quantify the related desirability curves using the
Qualtrics survey tool. Experts should be coming from technology, engineering, and
management background as well as academic backgrounds.
P4: This panel is asked to quantify the criteria under the Technology/Data
perspective by conducting pairwise comparisons between every two perspectives,
using the HDM methodology via the ETM HDM software. Also, to quantify the related
desirability curves using the Qualtrics survey tool. Experts should be coming from
technology, engineering, and management background as well as academic
backgrounds.
P5: This panel is asked to quantify the criteria under the Organization perspective
by conducting pairwise comparisons between each two perspectives, using the HDM
methodology via the ETM HDM software. Also, to quantify the related desirability
curves using the Qualtrics survey tool. Experts should be coming from technology,
engineering, and management background as well as academic backgrounds.
P6: This panel is asked to quantify the criteria under the Customer perspective by
conducting pairwise comparisons between every two perspectives, using the HDM
methodology via the ETM HDM software. Also, to quantify the related desirability
111
curves using the Qualtrics survey tool. Experts should be coming from technology,
engineering, and management background as well as academic backgrounds.
P7: This panel is asked to quantify the criteria under the Policy perspective by
conducting pairwise comparisons between each two perspectives using the HDM
methodology via the ETM HDM software. Also, to quantify the related desirability
curves using the Qualtrics survey tool. Experts should be coming from technology,
engineering, and management background as well as academic backgrounds.
P8: This panel quantifies the maturity levels based on e-commerce and online
retail sector information against the desirability curves through Qualtrics surveys.
Experts should be individuals related to the technical and management of online
retailers and e-commerce businesses and have a deep understanding of the
organization's customer-centricity.
The general selection criteria for experts regarding the assessment of maturity
levels of customer-centricity in the e-commerce sector include:
▪ Expertise in the topic.
▪ Balance biases.
▪ Diversity in terms of background, details of exposure to the research topic,
and coming, as much as possible, from different organizations to avoid bias
by influence.
Furthermore, the research instruments would be the Email, VoIP software (e.g.,
Hangout and WhatsApp), and online software tools (e.g., HDM and Qualtrics), so

112
panelists did not meet physically; hence, bias by influence and silent bystanders’
issues did not affect research quality.
Data Collection
There are numerous reasons that researchers need to collect and analyze the data
from experts and include their judgment in different stages of research, from
hypothesis generation and model development to the interpretation of the results
and research conclusion. Therefore, research needs to understand and prevent the
common issues in forming an expert panel and selecting the experts.
The value and quality of an expert’s judgment depend on; how informative the
decision is; how close it is to reality; and how certain it is. However, such
expert judgment quality can be undermined by several factors, including “bias”
and “self-serving. “ Mahoney [277]defines bias as a tendency to emphasize and
believe experiences which support one's views and to ignore or discredit others.
Another challenge that researchers who work with Expert panels face is the
availability and willingness to participate in the research, which can hinder the
researcher from collecting all the required opinions and judgments. In addition, in the
expert panels, there may be some experts that try to influence the opinions of

113
other experts if they can directly communicate with each other. Also, there are
"silent Bystanders" who would not offer proper judgment in a panel discussion.
In this research, literature review and expert feedback are used to identify the most
critical factors influencing customer-centricity, focusing on product-service systems
in e-commerce organizations. Then, through HDM methodology, expert judgment
was collected to determine the relative importance of those factors. In addition,
experts' feedback is used to identify possible statuses an organization might have
regarding each factor. The data input is made by SME’s. As outlined in the previous
section, Experts are involved in validating the initial model and quantifying its
components.
The Snowball sampling method [278] is used to identify the experts of each group,
and the following criteria are used to select through the list of the available experts:
• Relevant expertise within the research area
• Availability and willingness to participate
• Balanced perspectives and biases

114
Chapter Six: Results of Model Validation and Quantification
This chapter presents the results of conducting the research steps as outlined in the
previous chapters. During the research design step, the initial model was developed
according to the literature review findings. The Figure below illustrates the initial
hierarchical model of perspectives and criteria which during literature review were
identified as impactful on customer-centricity approach in organization
Figure 22: Initial HDM Model
After the literature review, the researcher took three major steps to finalize the
design of the HDM model; first, all the perspectives and criteria got validated, and
missing factors were identified according to the Subject Matter Experts. Second, the
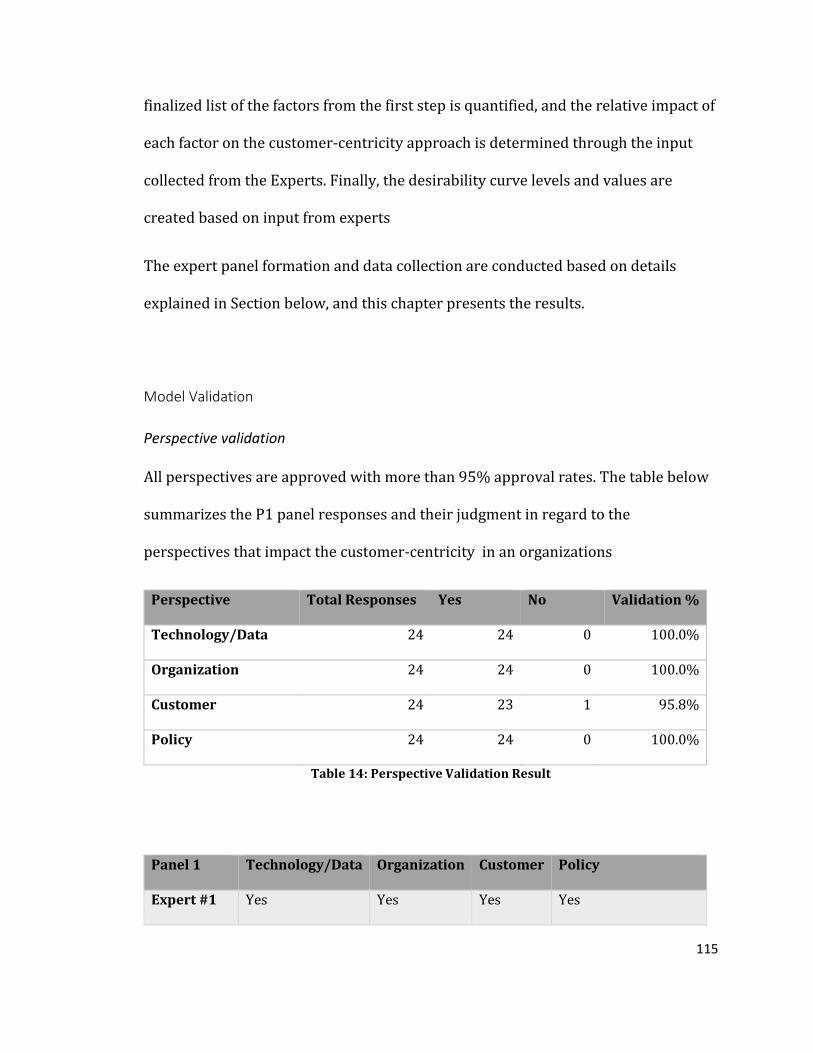
115
finalized list of the factors from the first step is quantified, and the relative impact of
each factor on the customer-centricity approach is determined through the input
collected from the Experts. Finally, the desirability curve levels and values are
created based on input from experts
The expert panel formation and data collection are conducted based on details
explained in Section below, and this chapter presents the results.
Model Validation
Perspective validation
All perspectives are approved with more than 95% approval rates. The table below
summarizes the P1 panel responses and their judgment in regard to the
perspectives that impact the customer-centricity in an organizations
Perspective Total Responses Yes No Validation %
Technology/Data 24 24 0 100.0%
Organization 24 24 0 100.0%
Customer 24 23 1 95.8%
Policy 24 24 0 100.0%
Table 14: Perspective Validation Result
Panel 1 Technology/Data Organization Customer Policy
Expert #1 Yes Yes Yes Yes

116
Expert #2 Yes Yes Yes Yes
Expert #3 Yes Yes Yes Yes
Expert #4 Yes Yes Yes Yes
Expert #5 Yes Yes Yes Yes
Expert #6 Yes Yes Yes Yes
Expert #7 Yes Yes Yes Yes
Expert #8 Yes Yes Yes Yes
Expert #9 Yes Yes Yes Yes
Expert #10 Yes Yes Yes Yes
Expert #11 Yes Yes Yes Yes
Expert #12 Yes Yes Yes Yes
Expert #13 Yes Yes Yes Yes
Expert #14 Yes Yes Yes Yes
Expert #15 Yes Yes Yes Yes
Expert #16 Yes Yes No Yes
Expert #17 Yes Yes Yes Yes
Expert #18 Yes Yes Yes Yes
Expert #19 Yes Yes Yes Yes
Expert #20 Yes Yes Yes Yes
Expert #21 Yes Yes Yes Yes
Expert #22 Yes Yes Yes Yes
Expert #23 Yes Yes Yes Yes
Expert #24 Yes Yes Yes Yes
Table 15: Perspective Validation Responses

117
Criteria Validation – Technology/Data
All criteria under the Technology/Data perspective are approved with an over 91%
approval rate. The table below summarizes the P2 panel responses and their
judgment in regards to the Criteria under Technology/Data that impact the
customer-centricity in organizations.
Criteria Total
Responses
Yes No Validation %
Technology Infrastructure and
Integration
24 22 2 91.7%
Data Distribution and Accessibility 24 23 1 95.8%
Data Collection Robustness 24 22 2 91.7%
Data Metrics Clarity 24 23 1 95.8%
Data Analytics Capabilities 24 23 1 95.8%
Table 16: Criteria Validation Result – Technology
Expert
Number
Technology
Infrastructure
and Integration
Data
Distribution
and
Accessibility
Data
Collection
Robustness
Data
Metrics
Clarity
Data
Analytics
Capabilities
Expert #1 Yes Yes Yes Yes Yes
Expert #2 Yes Yes Yes Yes Yes
Expert #3 Yes Yes Yes Yes Yes

118
Expert #4 Yes Yes Yes Yes Yes
Expert #5 Yes Yes Yes Yes Yes
Expert #6 Yes Yes Yes Yes Yes
Expert #7 Yes Yes Yes Yes Yes
Expert #8 Yes Yes Yes Yes Yes
Expert #9 Yes Yes Yes Yes Yes
Expert #10 No Yes No Yes Yes
Expert #11 No Yes Yes Yes Yes
Expert #12 Yes Yes Yes Yes Yes
Expert #13 Yes Yes Yes Yes Yes
Expert #14 Yes Yes Yes Yes Yes
Expert #15 Yes Yes Yes Yes Yes
Expert #16 Yes Yes Yes Yes Yes
Expert #17 Yes Yes Yes Yes Yes
Expert #18 Yes No No No No
Expert #19 Yes Yes Yes Yes Yes
Expert #20 Yes Yes Yes Yes Yes
Expert #21 Yes Yes Yes Yes Yes
Expert #22 Yes Yes Yes Yes Yes
Expert #23 Yes Yes Yes Yes Yes
Expert #24 Yes Yes Yes Yes Yes
Table 17: Criteria Validation Responses - Technology
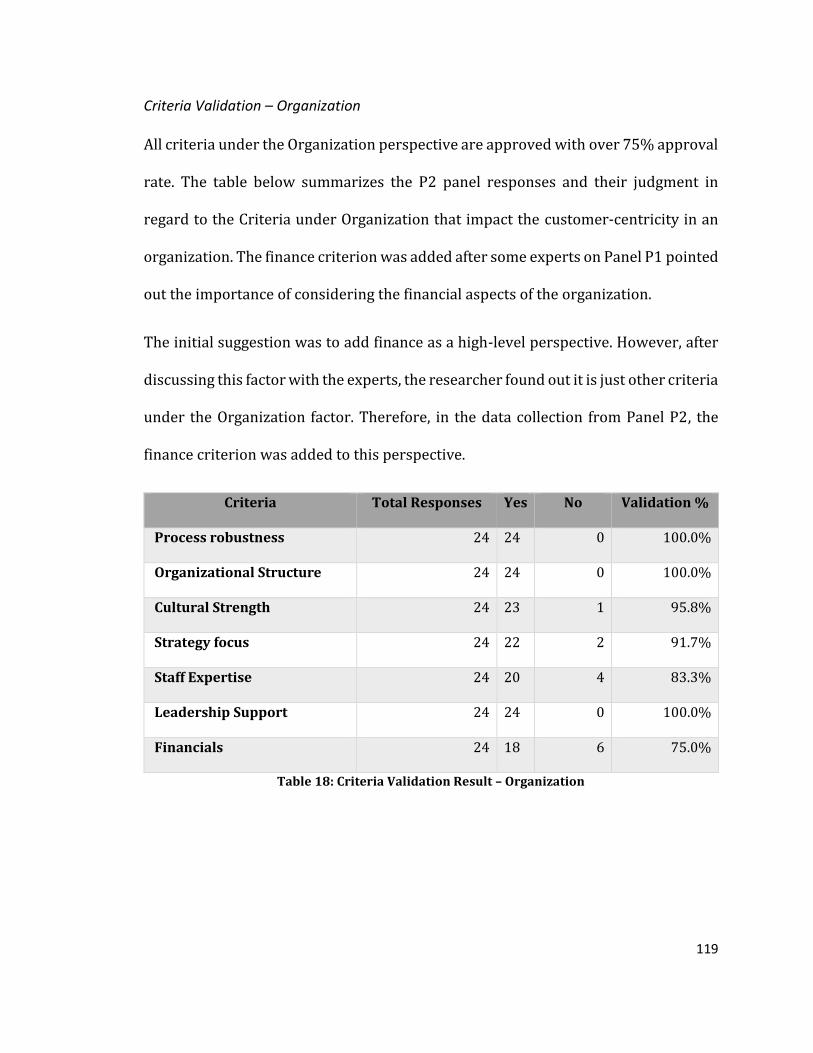
119
Criteria Validation – Organization
All criteria under the Organization perspective are approved with over 75% approval
rate. The table below summarizes the P2 panel responses and their judgment in
regard to the Criteria under Organization that impact the customer-centricity in an
organization. The finance criterion was added after some experts on Panel P1 pointed
out the importance of considering the financial aspects of the organization.
The initial suggestion was to add finance as a high-level perspective. However, after
discussing this factor with the experts, the researcher found out it is just other criteria
under the Organization factor. Therefore, in the data collection from Panel P2, the
finance criterion was added to this perspective.
Criteria Total Responses Yes No Validation %
Process robustness 24 24 0 100.0%
Organizational Structure 24 24 0 100.0%
Cultural Strength 24 23 1 95.8%
Strategy focus 24 22 2 91.7%
Staff Expertise 24 20 4 83.3%
Leadership Support 24 24 0 100.0%
Financials 24 18 6 75.0%
Table 18: Criteria Validation Result – Organization

120
Ex
pe
rt Nu
mb
er
Pro
cess ro
bu
stne
ss
Org
an
izatio
na
l
Stru
cture
Cu
ltura
l Stre
ng
th
Stra
teg
y fo
cus
Sta
ff Ex
pe
rtise
Le
ad
ersh
ip S
up
po
rt
Fin
ancials
Expert #1 Yes Yes Yes Yes No Yes No
Expert #2 Yes Yes Yes Yes Yes Yes Yes
Expert #3 Yes Yes Yes Yes No Yes No
Expert #4 Yes Yes Yes Yes No Yes Yes
Expert #5 Yes Yes Yes Yes Yes Yes Yes
Expert #6 Yes Yes Yes Yes Yes Yes Yes
Expert #7 Yes Yes Yes Yes Yes Yes Yes
Expert #8 Yes Yes Yes Yes Yes Yes No
Expert #9 Yes Yes Yes Yes Yes Yes Yes
Expert #10 Yes Yes Yes Yes Yes Yes Yes
Expert #11 Yes Yes Yes No No Yes Yes
Expert #12 Yes Yes Yes Yes Yes Yes No
Expert #13 Yes Yes Yes Yes Yes Yes Yes
Expert #14 Yes Yes Yes Yes Yes Yes Yes
Expert #15 Yes Yes Yes Yes Yes Yes Yes
Expert #16 Yes Yes Yes Yes Yes Yes No
Expert #17 Yes Yes Yes Yes Yes Yes Yes
Expert #18 Yes Yes Yes No Yes Yes Yes
Expert #19 Yes Yes No Yes Yes Yes No

121
Expert #20 Yes Yes Yes Yes Yes Yes Yes
Expert #21 Yes Yes Yes Yes Yes Yes Yes
Expert #22 Yes Yes Yes Yes Yes Yes Yes
Expert #23 Yes Yes Yes Yes Yes Yes Yes
Expert #24 Yes Yes Yes Yes Yes Yes Yes
Table 19: Criteria Validation Responses - Organization
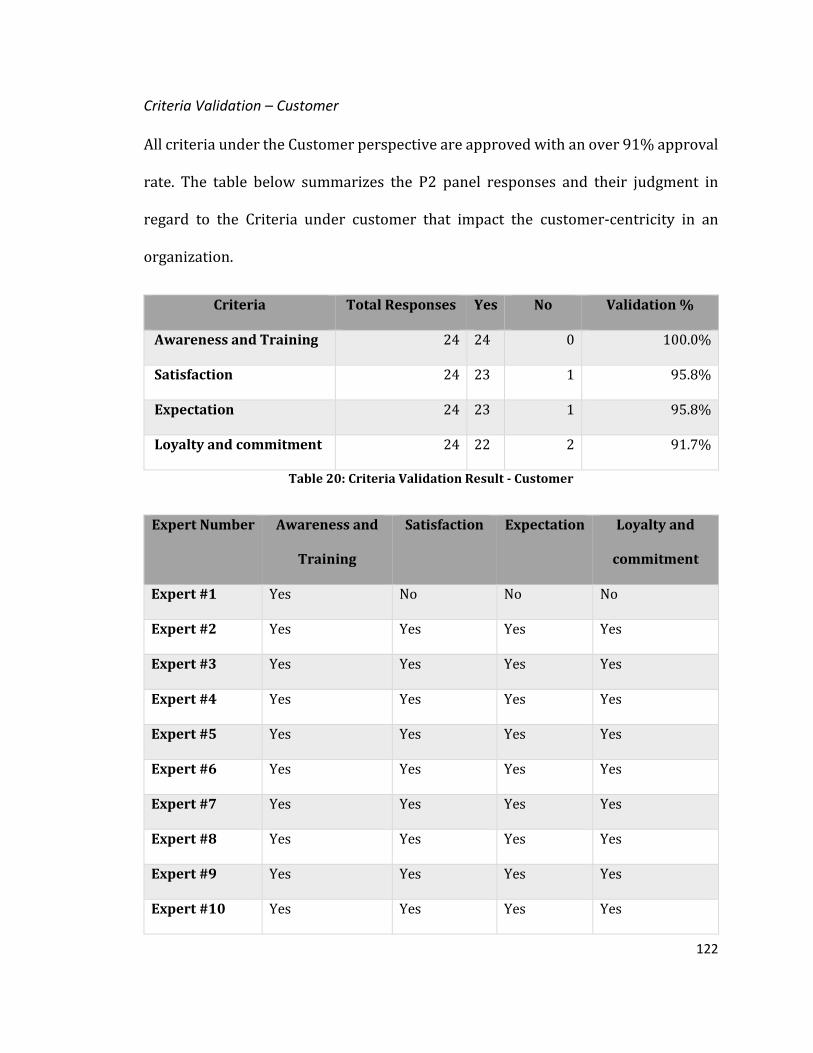
122
Criteria Validation – Customer
All criteria under the Customer perspective are approved with an over 91% approval
rate. The table below summarizes the P2 panel responses and their judgment in
regard to the Criteria under customer that impact the customer-centricity in an
organization.
Criteria Total Responses Yes No Validation %
Awareness and Training 24 24 0 100.0%
Satisfaction 24 23 1 95.8%
Expectation 24 23 1 95.8%
Loyalty and commitment 24 22 2 91.7%
Table 20: Criteria Validation Result - Customer
Expert Number Awareness and
Training
Satisfaction Expectation Loyalty and
commitment
Expert #1 Yes No No No
Expert #2 Yes Yes Yes Yes
Expert #3 Yes Yes Yes Yes
Expert #4 Yes Yes Yes Yes
Expert #5 Yes Yes Yes Yes
Expert #6 Yes Yes Yes Yes
Expert #7 Yes Yes Yes Yes
Expert #8 Yes Yes Yes Yes
Expert #9 Yes Yes Yes Yes
Expert #10 Yes Yes Yes Yes
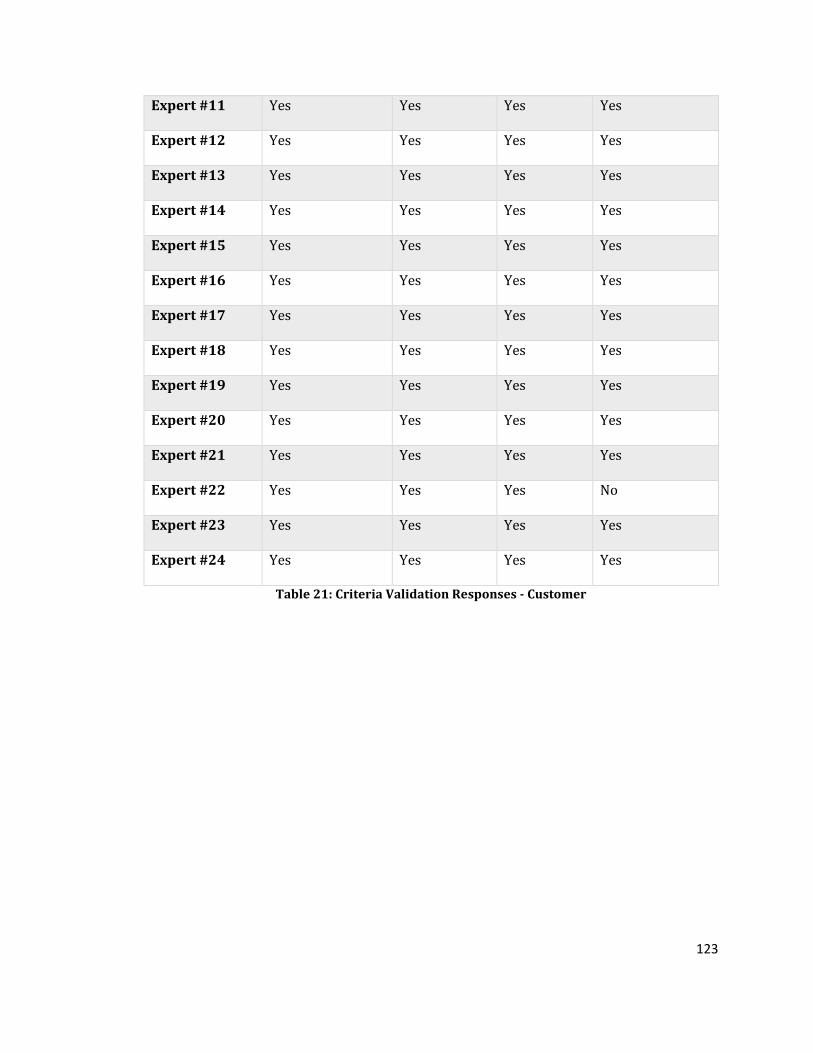
123
Expert #11 Yes Yes Yes Yes
Expert #12 Yes Yes Yes Yes
Expert #13 Yes Yes Yes Yes
Expert #14 Yes Yes Yes Yes
Expert #15 Yes Yes Yes Yes
Expert #16 Yes Yes Yes Yes
Expert #17 Yes Yes Yes Yes
Expert #18 Yes Yes Yes Yes
Expert #19 Yes Yes Yes Yes
Expert #20 Yes Yes Yes Yes
Expert #21 Yes Yes Yes Yes
Expert #22 Yes Yes Yes No
Expert #23 Yes Yes Yes Yes
Expert #24 Yes Yes Yes Yes
Table 21: Criteria Validation Responses - Customer

124
Criteria Validation – Policy
All criteria under the Policy perspective are approved with an over 91% approval
rate. The table below summarizes the P2 panel responses and their judgment in
regards to the Criteria under Policy that impact the customer-centricity in an
organization.
Criteria Total Responses Yes No Validation %
Data Privacy Compliance 24 23 1 95.8%
Data Security Compliance 24 21 3 87.5%
Data Ownership 24 20 4 83.3%
Data Governance 24 21 3 87.5%
Table 22: Criteria Validation Result - Policy
Expert Number Data Privacy
Compliance
Data Security
Compliance
Data
Ownership
Data Governance
Expert #1 No No No No
Expert #2 Yes Yes Yes Yes
Expert #3 Yes Yes Yes Yes
Expert #4 Yes Yes Yes Yes
Expert #5 Yes Yes Yes Yes
Expert #6 Yes Yes Yes Yes
Expert #7 Yes Yes Yes Yes
Expert #8 Yes Yes Yes Yes
Expert #9 Yes Yes Yes Yes
Expert #10 Yes No Yes Yes
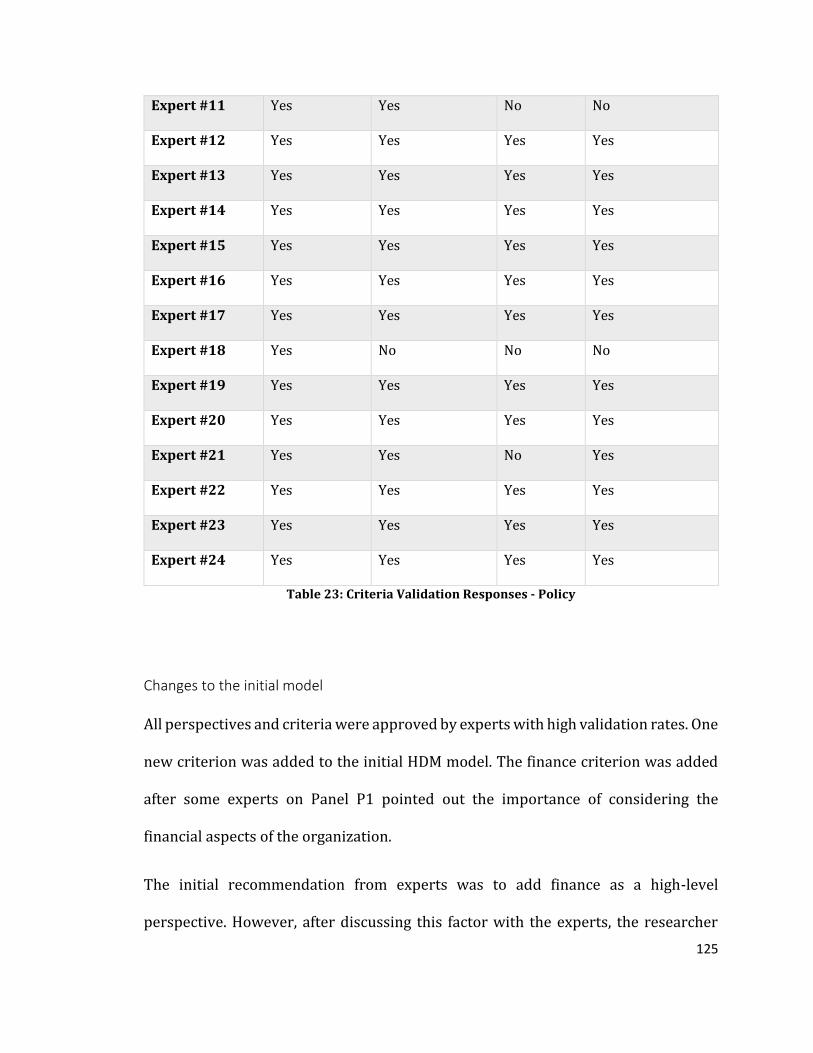
125
Expert #11 Yes Yes No No
Expert #12 Yes Yes Yes Yes
Expert #13 Yes Yes Yes Yes
Expert #14 Yes Yes Yes Yes
Expert #15 Yes Yes Yes Yes
Expert #16 Yes Yes Yes Yes
Expert #17 Yes Yes Yes Yes
Expert #18 Yes No No No
Expert #19 Yes Yes Yes Yes
Expert #20 Yes Yes Yes Yes
Expert #21 Yes Yes No Yes
Expert #22 Yes Yes Yes Yes
Expert #23 Yes Yes Yes Yes
Expert #24 Yes Yes Yes Yes
Table 23: Criteria Validation Responses - Policy
Changes to the initial model
All perspectives and criteria were approved by experts with high validation rates. One
new criterion was added to the initial HDM model. The finance criterion was added
after some experts on Panel P1 pointed out the importance of considering the
financial aspects of the organization.
The initial recommendation from experts was to add finance as a high-level
perspective. However, after discussing this factor with the experts, the researcher

126
found out it is just other criteria under the Organization factor. Therefore, in the data
collection from Panel P2, the finance criterion was added to this perspective.
Final HDM Model
The figure below illustrates the final HDM model that is used to evaluate the
customer-centricity approach of an organization.
Figure 23: Final HDM Model
HDM Model Quantification
After validation of the factors (Perspectives and Criteria), the researcher involved the
experts in the quantification of the factors. Panels P3 through P8 were formed for this
127
purpose, and experts on each panel were selected based on expertise, knowledge,
professional experience, and background.
The quantification of the model was performed through pairwise comparison of the
factors as outlined in the HDM methodology. For this purpose, ETM HDM software
was used to collect the data from experts.
The following sections represent the HDM model quantification results which are
derived from expert judgments.
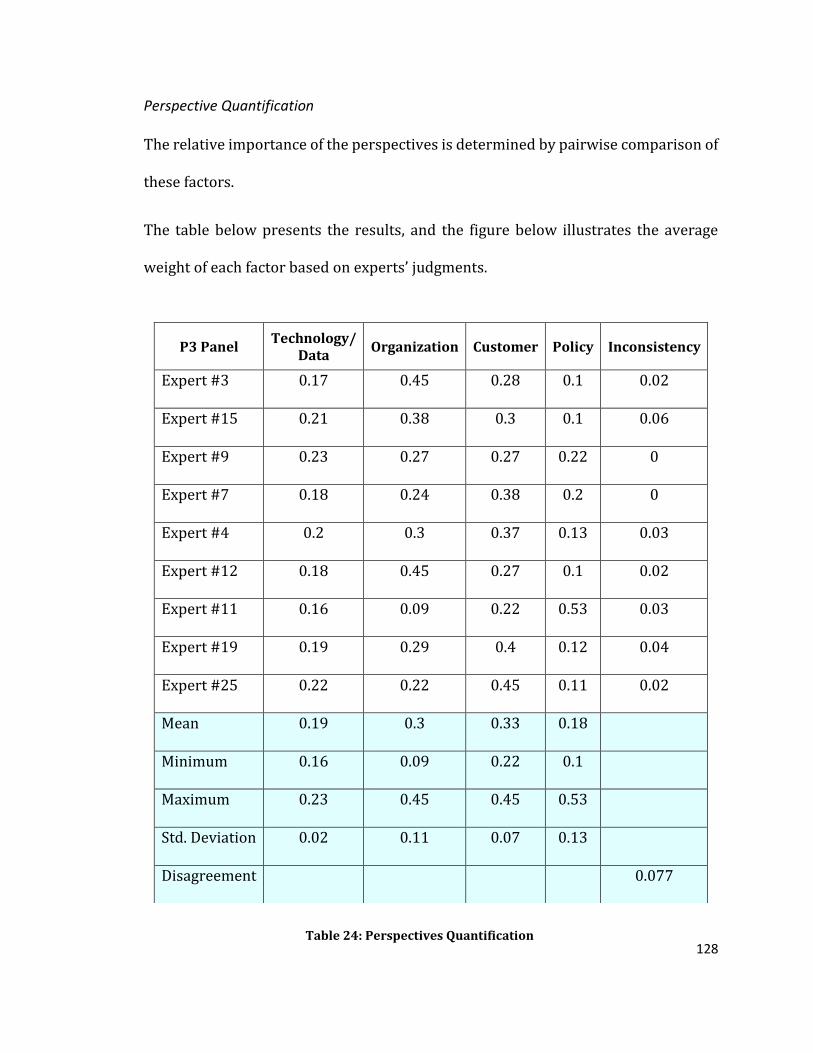
128
Perspective Quantification
The relative importance of the perspectives is determined by pairwise comparison of
these factors.
The table below presents the results, and the figure below illustrates the average
weight of each factor based on experts’ judgments.
Table 24: Perspectives Quantification
P3 Panel Technology/
Data Organization Customer Policy Inconsistency
Expert #3 0.17 0.45 0.28 0.1 0.02
Expert #15 0.21 0.38 0.3 0.1 0.06
Expert #9 0.23 0.27 0.27 0.22 0
Expert #7 0.18 0.24 0.38 0.2 0
Expert #4 0.2 0.3 0.37 0.13 0.03
Expert #12 0.18 0.45 0.27 0.1 0.02
Expert #11 0.16 0.09 0.22 0.53 0.03
Expert #19 0.19 0.29 0.4 0.12 0.04
Expert #25 0.22 0.22 0.45 0.11 0.02
Mean 0.19 0.3 0.33 0.18
Minimum 0.16 0.09 0.22 0.1
Maximum 0.23 0.45 0.45 0.53
Std. Deviation 0.02 0.11 0.07 0.13
Disagreement 0.077
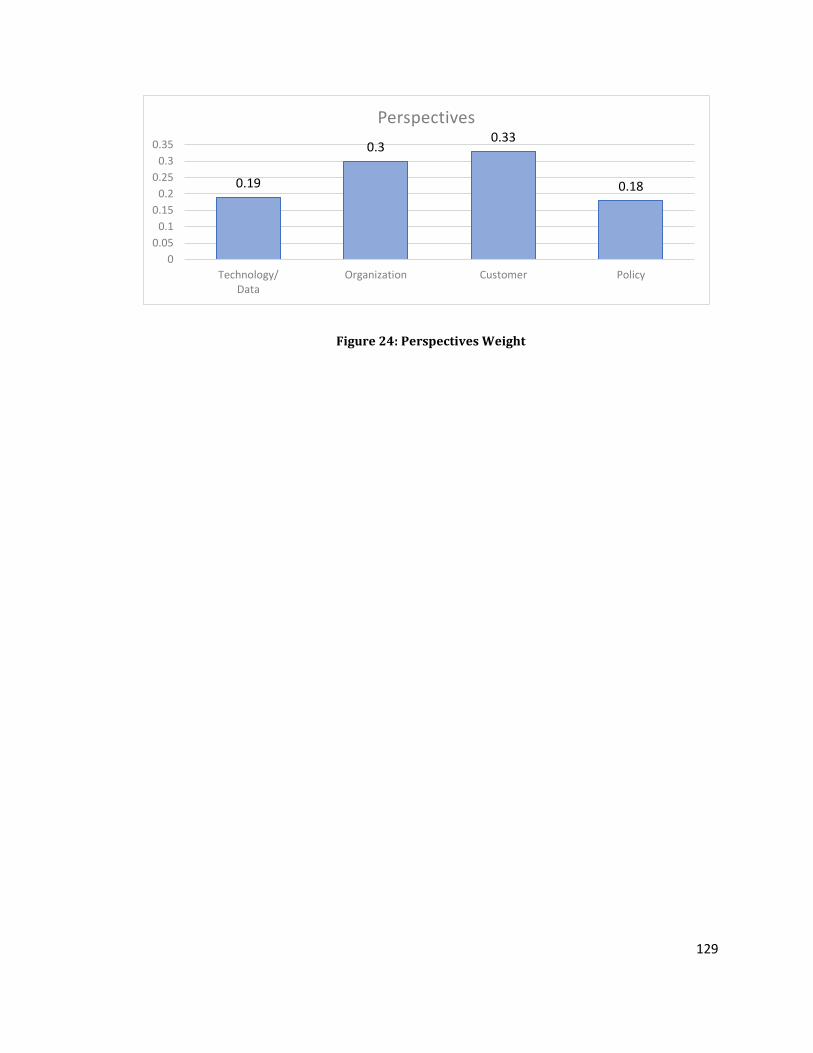
129
Figure 24: Perspectives Weight
0.19
0.30.33
0.18
0
0.05
0.1
0.15
0.2
0.25
0.3
0.35
Technology/Data
Organization Customer Policy
Perspectives

130
Criteria Quantification – Technology/Data
The relative importance of the criteria under the Technology/Data perspective is
determined by pairwise comparison of these factors. The table below presents the
results, and the figure below illustrates the average weight of each factor based on
experts’ judgments.
P4 Panel
Te
chn
olo
gy
In
frastru
cture
an
d
Inte
gra
tion
Da
ta D
istribu
tion
an
d
Acce
ssibility
Da
ta C
olle
ction
R
ob
ustn
ess
Da
ta M
etrics C
larity
Da
ta A
na
lytics
Ca
pa
bilitie
s Inconsistency
Expert #22 0.51 0.09 0.05 0.19 0.16 0.05
Expert #20 0.24 0.11 0.14 0.18 0.34 0.03
Expert #26 0.24 0.32 0.12 0.13 0.19 0.02
Expert #27 0.12 0.24 0.16 0.11 0.37 0.03
Expert #28 0.2 0.25 0.15 0.16 0.24 0.09
Expert #16 0.31 0.18 0.17 0.1 0.23 0.03
Expert #23 0.29 0.24 0.21 0.13 0.14 0.01
Mean 0.27 0.2 0.14 0.14 0.24
Minimum 0.12 0.09 0.05 0.1 0.14
Maximum 0.51 0.32 0.21 0.19 0.37
Std. Deviation 0.11 0.08 0.05 0.03 0.08
Disagreement 0.068
Table 25: Criteria Quantification Result - Technology/Data

131
Figure 25: Criteria Weight - Technology/Data
0.27
0.2
0.14 0.14
0.24
0
0.05
0.1
0.15
0.2
0.25
0.3
TechnologyInfrastructure and
Integration
Data Distributionand Accessibility
Data CollectionRobustness
Data MetricsClarity
Data AnalyticsCapabilities
Criteria - Technology/Data

132
Criteria Quantification – Organization
The relative importance of the criteria under the Organization perspective is
determined by pairwise comparison of these factors. The table below presents the
results, and the figure below illustrates the average weight of each factor based on
experts’ judgments.
P5 Panel
Pro
cess ro
bu
stne
ss
Org
an
izatio
na
l S
tructu
re
Cu
ltura
l Stre
ng
th
Stra
teg
y fo
cus
Sta
ff Ex
pe
rtise
Le
ad
ersh
ip
Su
pp
ort
Fin
an
cials
Inconsistency
Expert #3 0.07 0.08 0.22 0.16 0.08 0.22 0.17 0.07
Expert #15 0.12 0.09 0.1 0.18 0.23 0.23 0.06 0.08
Expert #9 0.12 0.16 0.12 0.15 0.15 0.14 0.17 0
Expert #7 0.14 0.12 0.15 0.22 0.1 0.18 0.09 0
Expert #4 0.11 0.08 0.24 0.1 0.11 0.25 0.11 0.09
Expert #12 0.13 0.06 0.27 0.11 0.18 0.2 0.06 0.07
Expert #11 0.09 0.13 0.26 0.16 0.11 0.2 0.07 0.04
Expert #25 0.06 0.09 0.09 0.13 0.17 0.17 0.28 0.04
Mean 0.11 0.1 0.18 0.15 0.14 0.2 0.13
Minimum 0.06 0.06 0.09 0.1 0.08 0.14 0.06
Maximum 0.14 0.16 0.27 0.22 0.23 0.25 0.28
Std. Deviation 0.03 0.03 0.07 0.04 0.05 0.03 0.07
Disagreement 0.047
Table 26: Criteria Quantification Results - Organization

133
Figure 26: Criteria Weight - Organization
0.110.1
0.18
0.150.14
0.2
0.13
0
0.05
0.1
0.15
0.2
0.25
Processrobustness
OrganizationalStructure
CulturalStrength
Strategy focus Staff Expertise LeadershipSupport
Financials
Criteria - Organization

134
Criteria Quantification – Customer
The relative importance of the criteria under the Customer perspective is determined
by pairwise comparison of these factors. The table below presents the results, and the
figure below illustrates the average weight of each factor based on experts’
judgments.
P6 Panel
Aw
are
ne
ss an
d
Tra
inin
g
Sa
tisfactio
n
Ex
pe
ctatio
n
Lo
ya
lty a
nd
co
mm
itme
nt
Inconsistency
Expert #3 0.17 0.45 0.12 0.26 0.06
Expert #15 0.06 0.38 0.38 0.18 0.03
Expert #5 0.18 0.45 0.25 0.12 0.01
Expert #8 0.21 0.36 0.16 0.26 0.01
Expert #4 0.14 0.37 0.29 0.21 0.02
Expert #12 0.22 0.06 0.64 0.08 0.01
Mean 0.16 0.35 0.31 0.19
Minimum 0.06 0.06 0.12 0.08
Maximum 0.22 0.45 0.64 0.26
Std. Deviation 0.05 0.13 0.17 0.07
Disagreement 0.097
Table 27: Criteria Quantification Results - Customer

135
Figure 27: Criteria Weight - Customer
0.16
0.35
0.31
0.19
0
0.05
0.1
0.15
0.2
0.25
0.3
0.35
0.4
Awareness and Training Satisfaction Expectation Loyalty andcommitment
Criteria - Customer

136
Criteria Quantification – Policy
The relative importance of the criteria under the Policy perspective is determined by
a pairwise comparison of these factors. The table below presents the results, and the
figure below illustrates the average weight of each factor based on experts’
judgments.
P7 Panel
Da
ta P
riva
cy
Co
mp
lian
ce
Da
ta S
ecu
rity
Co
mp
lian
ce
Da
ta O
wn
ersh
ip
Da
ta G
ov
ern
an
ce
Inconsistency
Expert #22 0.25 0.25 0.25 0.25 0
Expert #20 0.25 0.25 0.25 0.25 0
Expert #26 0.3 0.39 0.13 0.19 0.01
Expert #27 0.3 0.37 0.14 0.19 0.02
Expert #28 0.38 0.2 0.15 0.27 0.02
Expert #16 0.28 0.46 0.11 0.15 0.03
Expert #23 0.26 0.3 0.24 0.2 0
Mean 0.29 0.32 0.18 0.21
Minimum 0.25 0.2 0.11 0.15
Maximum 0.38 0.46 0.25 0.27
Std. Deviation 0.04 0.09 0.06 0.04
Disagreement 0.056
Table 28: Criteria Quantification Results - Policy
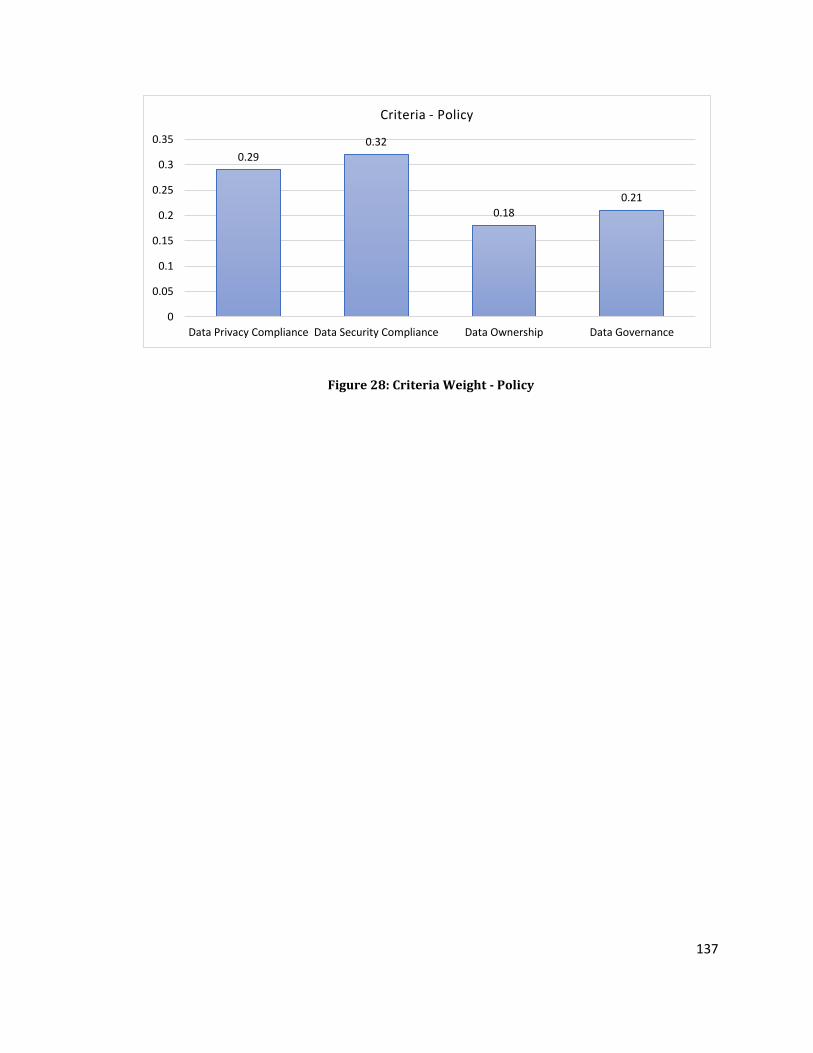
137
Figure 28: Criteria Weight - Policy
0.29
0.32
0.18
0.21
0
0.05
0.1
0.15
0.2
0.25
0.3
0.35
Data Privacy Compliance Data Security Compliance Data Ownership Data Governance
Criteria - Policy

138
Final Model Weights
The below table illustrates the final weights of the model, which is calculated based
on local perspective weight multiplied by the local weight of each criterion under that
perspective. The figure below illustrates the impact of each factor on the final
outcome of the model.
Perspective Local
Weight
Criteria Local
Weight
Global
Weight
Technology/
Data
19.0% Technology Infrastructure and
Integration
27.0% 5.1%
Technology/
Data
19.0% Data Distribution and
Accessibility
20.0% 3.8%
Technology/
Data
19.0% Data Collection Robustness 14.0% 2.7%
Technology/
Data
19.0% Data Metrics Clarity 14.0% 2.7%
Technology/
Data
19.0% Data Analytics Capabilities 24.0% 4.6%
Organization 27.0% Process robustness 11.0% 3.0%
Organization 27.0% Organizational Structure 10.0% 2.7%
Organization 27.0% Cultural Strength 18.0% 4.9%
Organization 27.0% Strategy focus 15.0% 4.1%
Organization 27.0% Staff Expertise 14.0% 3.8%
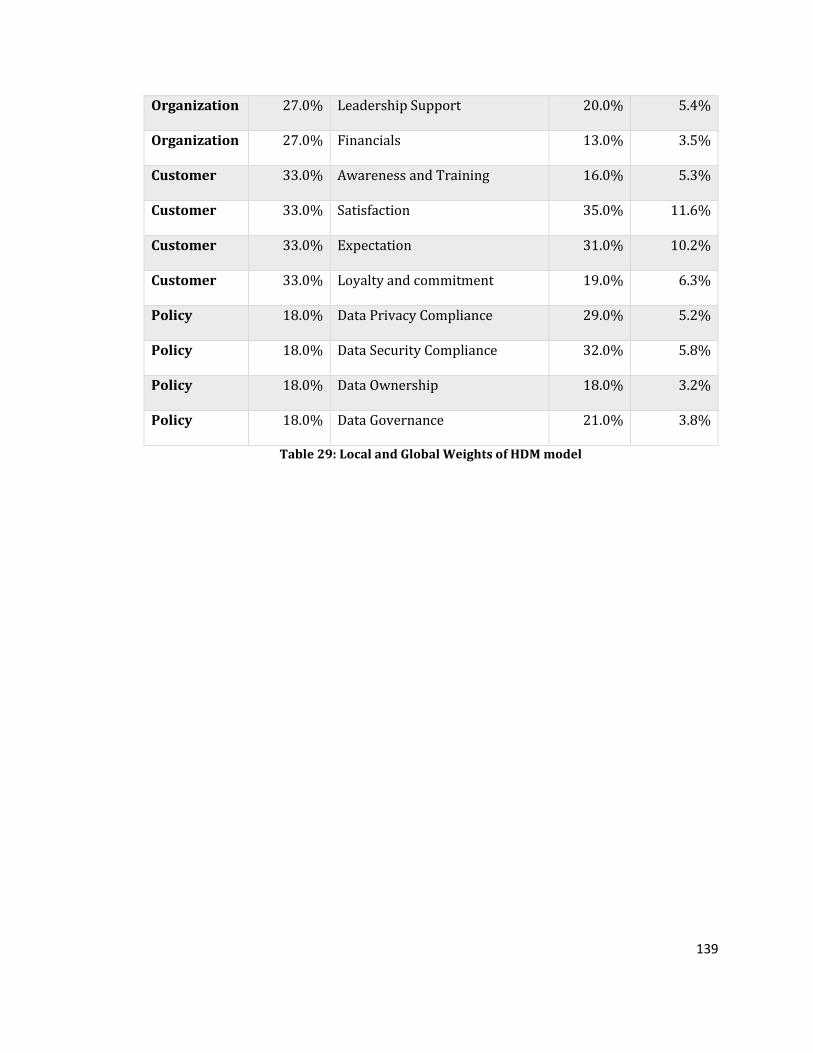
139
Organization 27.0% Leadership Support 20.0% 5.4%
Organization 27.0% Financials 13.0% 3.5%
Customer 33.0% Awareness and Training 16.0% 5.3%
Customer 33.0% Satisfaction 35.0% 11.6%
Customer 33.0% Expectation 31.0% 10.2%
Customer 33.0% Loyalty and commitment 19.0% 6.3%
Policy 18.0% Data Privacy Compliance 29.0% 5.2%
Policy 18.0% Data Security Compliance 32.0% 5.8%
Policy 18.0% Data Ownership 18.0% 3.2%
Policy 18.0% Data Governance 21.0% 3.8%
Table 29: Local and Global Weights of HDM model
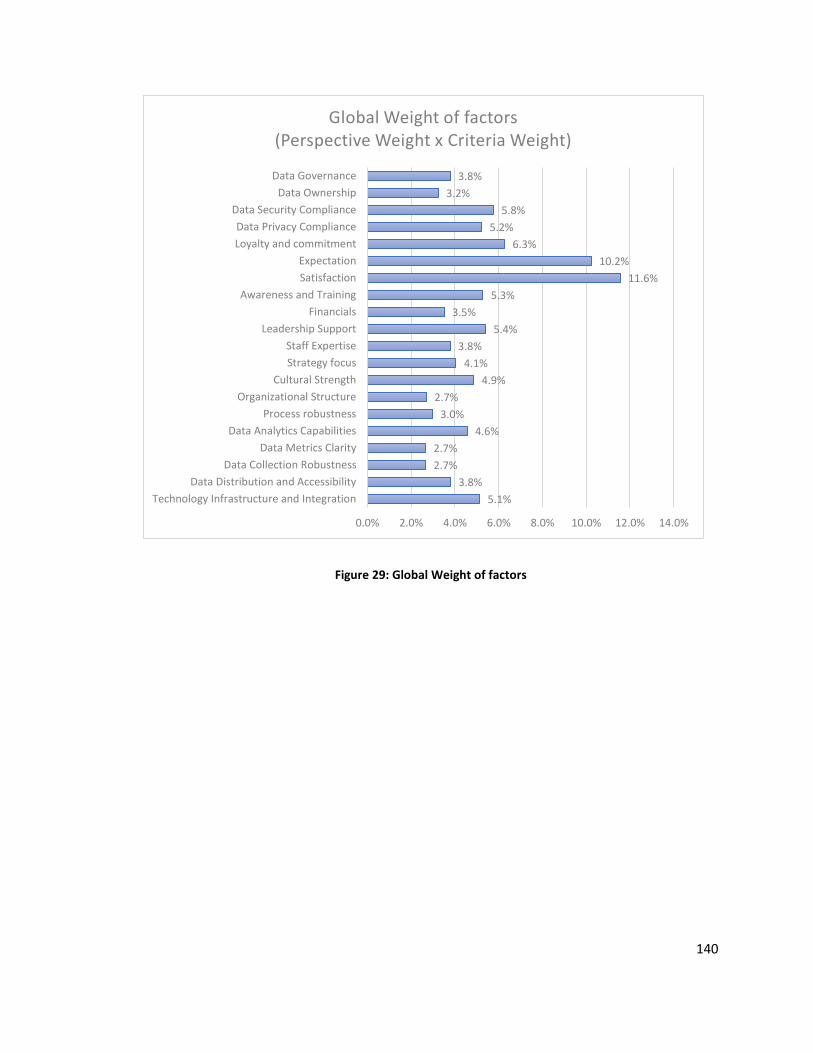
140
Figure 29: Global Weight of factors
5.1%
3.8%
2.7%
2.7%
4.6%
3.0%
2.7%
4.9%
4.1%
3.8%
5.4%
3.5%
5.3%
11.6%
10.2%
6.3%
5.2%
5.8%
3.2%
3.8%
0.0% 2.0% 4.0% 6.0% 8.0% 10.0% 12.0% 14.0%
Technology Infrastructure and Integration
Data Distribution and Accessibility
Data Collection Robustness
Data Metrics Clarity
Data Analytics Capabilities
Process robustness
Organizational Structure
Cultural Strength
Strategy focus
Staff Expertise
Leadership Support
Financials
Awareness and Training
Satisfaction
Expectation
Loyalty and commitment
Data Privacy Compliance
Data Security Compliance
Data Ownership
Data Governance
Global Weight of factors (Perspective Weight x Criteria Weight)
141
Inconsistency and Disagreement Analysis
The Inconsistency and Disagreement analysis enables the researcher to evaluate the
validation of the input collected from the subject matter experts in the HDM model.
Since in this methodology, the experts’ judgment is one of the major pillars of model
development, the reliability of the data that is collected through panels needs to be
assessed via Inconsistency and Disagreement analysis.
The mathematical calculation of the Inconsistency is discussed in chapter four. After
data collection from the experts, the inconsistency is assessed against the 10%
threshold, and any inconsistency above this value requires the researcher to take
further action. The two main action items recommended in the HDM model is the
evaluation of the expertise of the SME and making sure that they are actually expert
in this field or having a discussion with the expert and pointing out the inconsistency
in their input and asking them to correct or resubmit their input.
In this research above two actions were taken, and as illustrated in the quantification
sections, none of the judgments have major inconsistency (>10%).
The mathematical calculation of the disagreement between experts is discussed in
detail in chapter four. After data collection, no major disagreement between experts
(>10%) was observed in this research.

142
Desirability Curves
The Final panel of experts was formed to find the values for the Desirability Curves.
The following tables show the different levels that are defined for the desirability
curves based on literature review and consultation with experts. Then the experts are
asked to value each level based on their experience and judgment.
The below section illustrates the results of desirability curves based on input from
experts

143
Technology Perspective
Technology Infrastructure and Integration
Figure 30: Technology Infrastructure and Integration Desirability Curve
Level Description Desirability
Level 1 No Infrastructure or Integration 4%
Level 2 Minimum level of integration 23%
Level 3 Moderate level of integration 49%
Level 4 High level of integration 80%
Level 5 Fully integrated infrastructure 100%
Table 30: Technology Infrastructure and Integration Desirability Curve
4%
23%
49%
80%
100%
0%
10%
20%
30%
40%
50%
60%
70%
80%
90%
100%
Level 1 Level 2 Level 3 Level 4 Level 5
Technology Infrastructure and Integration

144
Data Distribution and Accessibility
Figure 31: Data Distribution and Accessibility Desirability Curve
Level Description Desirability
Level 1 Required data is not available at all 2%
Level 2 30% of required data is accessible when and where needed
within an organization
30%
Level 3 50% of required data is accessible when and where needed
within an organization
47%
Level 4 70% of required data is accessible when and where needed
within an organization
68%
Level 5 Required data is always accessible when and where needed
within an organization
100%
Table 31: Data Distribution and Accessibility Desirability Curve
2%
30%
47%
68%
100%
0%
10%
20%
30%
40%
50%
60%
70%
80%
90%
100%
Level 1 Level 2 Level 3 Level 4 Level 5
Data Distribution and Accessibility
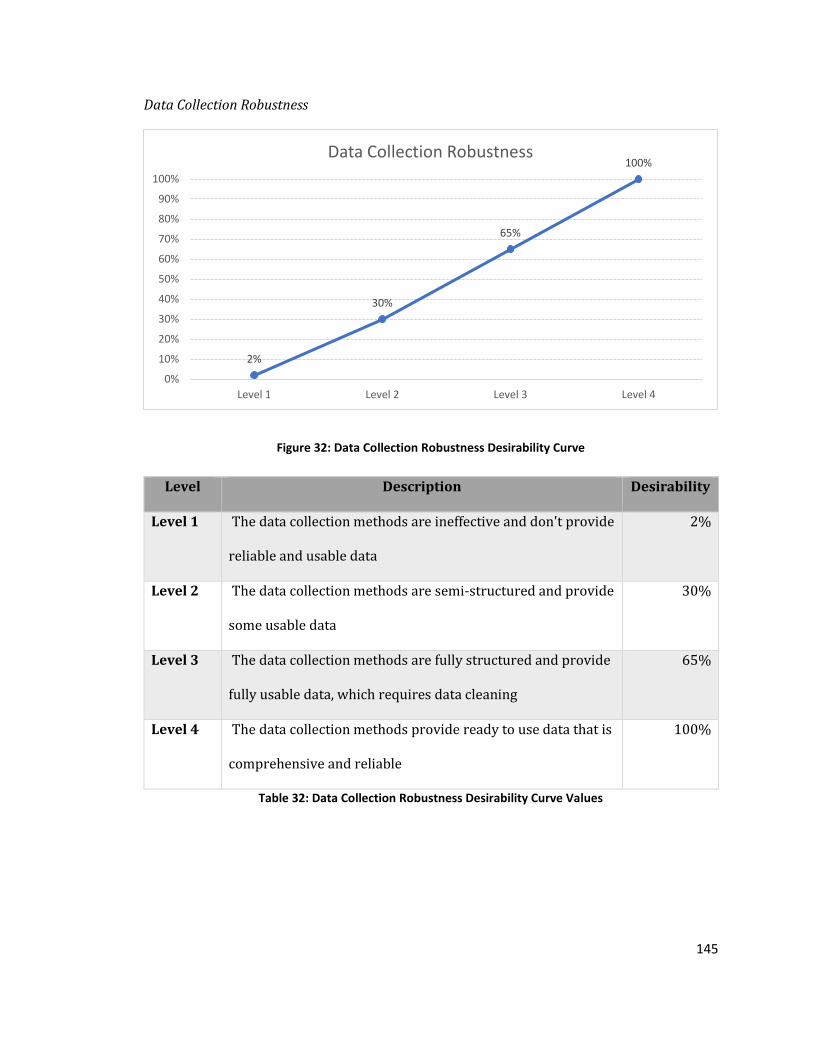
145
Data Collection Robustness
Figure 32: Data Collection Robustness Desirability Curve
Level Description Desirability
Level 1 The data collection methods are ineffective and don't provide
reliable and usable data
2%
Level 2 The data collection methods are semi-structured and provide
some usable data
30%
Level 3 The data collection methods are fully structured and provide
fully usable data, which requires data cleaning
65%
Level 4 The data collection methods provide ready to use data that is
comprehensive and reliable
100%
Table 32: Data Collection Robustness Desirability Curve Values
2%
30%
65%
100%
0%
10%
20%
30%
40%
50%
60%
70%
80%
90%
100%
Level 1 Level 2 Level 3 Level 4
Data Collection Robustness
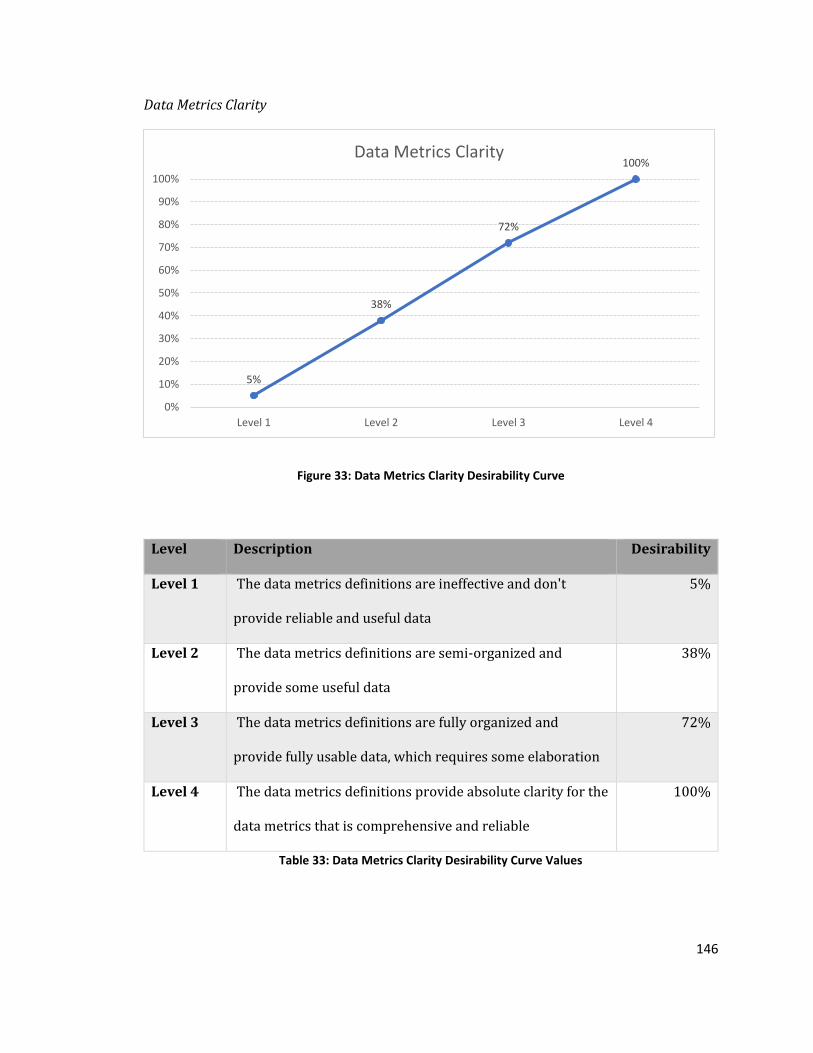
146
Data Metrics Clarity
Figure 33: Data Metrics Clarity Desirability Curve
Level Description Desirability
Level 1 The data metrics definitions are ineffective and don't
provide reliable and useful data
5%
Level 2 The data metrics definitions are semi-organized and
provide some useful data
38%
Level 3 The data metrics definitions are fully organized and
provide fully usable data, which requires some elaboration
72%
Level 4 The data metrics definitions provide absolute clarity for the
data metrics that is comprehensive and reliable
100%
Table 33: Data Metrics Clarity Desirability Curve Values
5%
38%
72%
100%
0%
10%
20%
30%
40%
50%
60%
70%
80%
90%
100%
Level 1 Level 2 Level 3 Level 4
Data Metrics Clarity
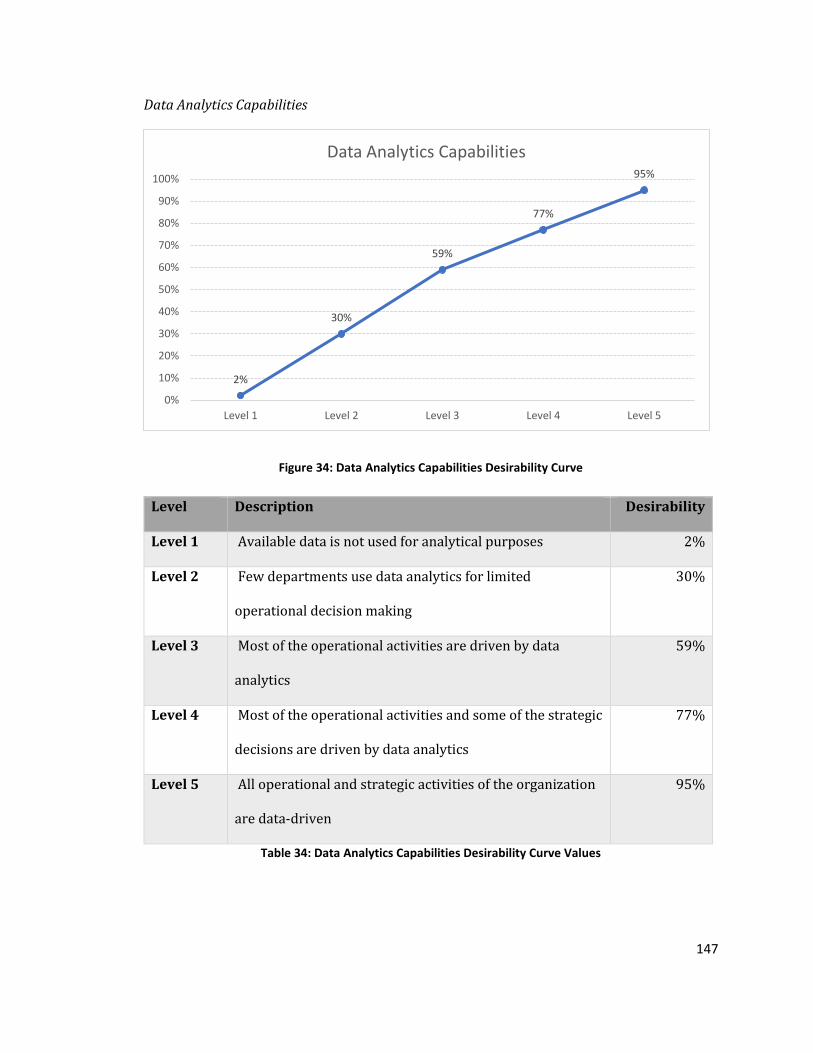
147
Data Analytics Capabilities
Figure 34: Data Analytics Capabilities Desirability Curve
Level Description Desirability
Level 1 Available data is not used for analytical purposes 2%
Level 2 Few departments use data analytics for limited
operational decision making
30%
Level 3 Most of the operational activities are driven by data
analytics
59%
Level 4 Most of the operational activities and some of the strategic
decisions are driven by data analytics
77%
Level 5 All operational and strategic activities of the organization
are data-driven
95%
Table 34: Data Analytics Capabilities Desirability Curve Values
2%
30%
59%
77%
95%
0%
10%
20%
30%
40%
50%
60%
70%
80%
90%
100%
Level 1 Level 2 Level 3 Level 4 Level 5
Data Analytics Capabilities

148
Organization Perspective
Process Robustness
Figure 35: Process Robustness Desirability Curve
Level Description Desirability
Level 1 The processes are based on efficient product/service design, and
the voice of the customer is not heard in internal teams.
8%
Level 2 The processes are developed based on efficient product/service
design with some flexibility to adjust customer needs
43%
Level 3 The processes are developed based on initial customer needs but
are not flexible enough to fulfill new customer needs in the
shortest time
62%
Level 4 The processes are developed based on customer needs and are
flexible enough to fulfill new customer needs in the shortest time
98%
Table 35: Process Robustness Desirability Curve Values
8%
43%
62%
98%
0%
10%
20%
30%
40%
50%
60%
70%
80%
90%
100%
Level 1 Level 2 Level 3 Level 4
Process Robustness

149
Organizational Structure
Figure 36: Organizational Structure Desirability Curve
Level Description Desirability
Level 1 Organizational structure is siloed based on product families,
and all new customer requests need to be channeled through
departments
11%
Level 2 Organizational structure is siloed based on product families,
and new customer requests are handled by cross-functional
teams
32%
Level 3 The organization uses a matrix structure is handled customer
needs
72%
Level 4 All departments of the organization are structured based on
customer needs
95%
Table 36: Organizational Structure Desirability Curve Values
11%
32%
72%
95%
0%
10%
20%
30%
40%
50%
60%
70%
80%
90%
100%
Level 1 Level 2 Level 3 Level 4
Organizational Structure

150
Cultural Strength
Figure 37: Cultural Strength Desirability Curve
Level Description Desirability
Level 1 The culture of the organization is fully product-centric, and
customer needs don't impact internal interactions
8%
Level 2 The culture of the organization is impacted moderately by the
needs and voices of customers
32%
Level 3 The culture of the organization is impacted Highly by the
needs and voices of customers
69%
Level 4 The culture of the organization is driven by the needs and
voices of customers
88%
Table 37: Cultural Strength Desirability Curve Values
8%
32%
69%
88%
0%
10%
20%
30%
40%
50%
60%
70%
80%
90%
100%
Level 1 Level 2 Level 3 Level 4
Cultural Strength

151
Strategy Focus
Figure 38: Strategy Focus Desirability Curve
Level Description Desirability
Level 1 The organization strategy doesn't consider customer-centric
approaches at all
2%
Level 2 The organization strategy includes some sections for
moving toward a customer-centric approach
31%
Level 3 Most of the organization strategy is designed with the
customer-centric approach in scope
67%
Level 4 The organization strategy is designed with the core of the
customer-centric approach
97%
Table 38: Strategy Focus Desirability Curve Values
2%
31%
67%
97%
0%
10%
20%
30%
40%
50%
60%
70%
80%
90%
100%
Level 1 Level 2 Level 3 Level 4
Strategy Focus

152
Staff Expertise
Figure 39: Staff Expertise Desirability Curve
Level Description Desirability
Level 1 The employees are not familiar with customer needs 1%
Level 2 The employees are familiar with customer needs but
can't take many actions to fulfill them
28%
Level 3 The employees know the customer needs and can take
action to fulfill them
68%
Level 4 The employees know the customer needs and are trained
on how to fulfill them
100%
Table 39: Staff Expertise Desirability Curve Values
1%
28%
68%
100%
0%
10%
20%
30%
40%
50%
60%
70%
80%
90%
100%
Level 1 Level 2 Level 3 Level 4
Staff Expertise
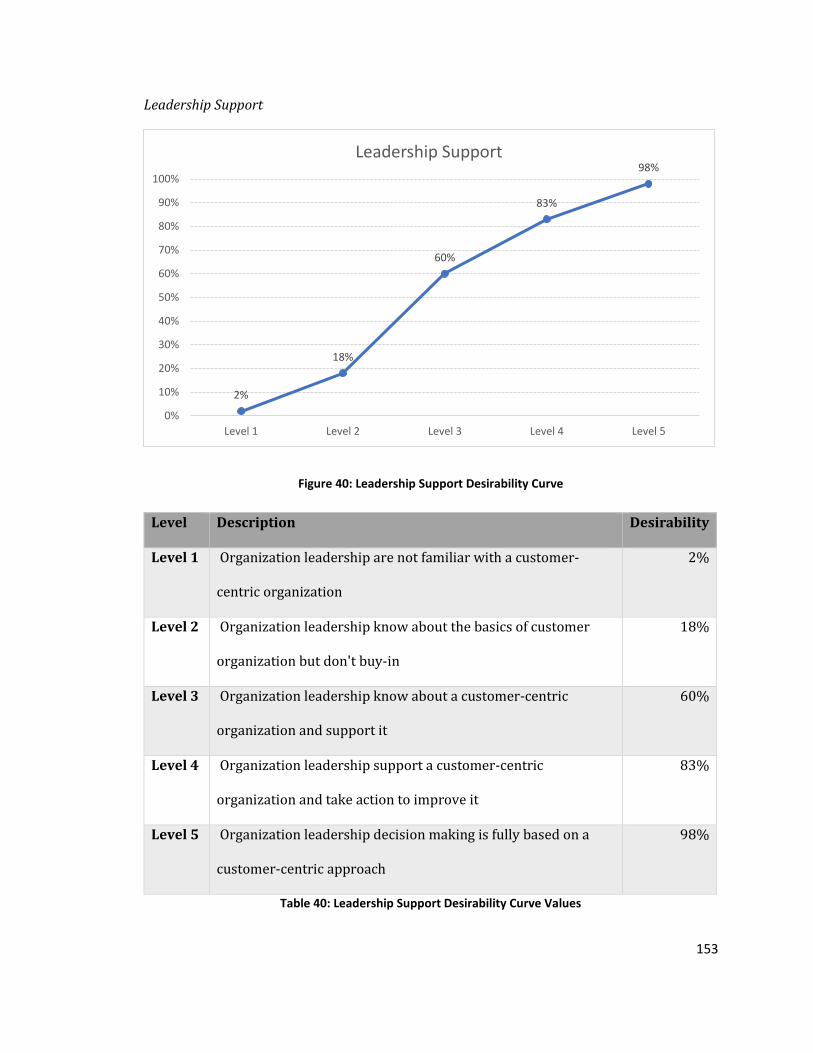
153
Leadership Support
Figure 40: Leadership Support Desirability Curve
Level Description Desirability
Level 1 Organization leadership are not familiar with a customer-
centric organization
2%
Level 2 Organization leadership know about the basics of customer
organization but don't buy-in
18%
Level 3 Organization leadership know about a customer-centric
organization and support it
60%
Level 4 Organization leadership support a customer-centric
organization and take action to improve it
83%
Level 5 Organization leadership decision making is fully based on a
customer-centric approach
98%
Table 40: Leadership Support Desirability Curve Values
2%
18%
60%
83%
98%
0%
10%
20%
30%
40%
50%
60%
70%
80%
90%
100%
Level 1 Level 2 Level 3 Level 4 Level 5
Leadership Support
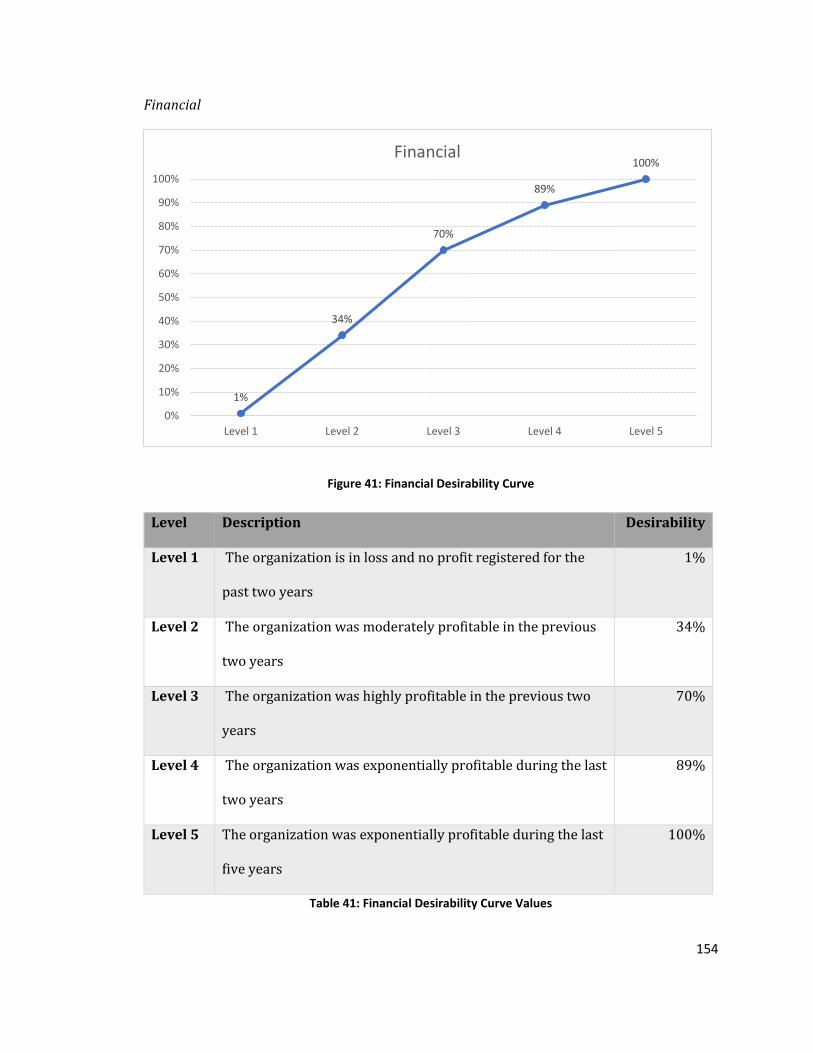
154
Financial
Figure 41: Financial Desirability Curve
Level Description Desirability
Level 1 The organization is in loss and no profit registered for the
past two years
1%
Level 2 The organization was moderately profitable in the previous
two years
34%
Level 3 The organization was highly profitable in the previous two
years
70%
Level 4 The organization was exponentially profitable during the last
two years
89%
Level 5 The organization was exponentially profitable during the last
five years
100%
Table 41: Financial Desirability Curve Values
1%
34%
70%
89%
100%
0%
10%
20%
30%
40%
50%
60%
70%
80%
90%
100%
Level 1 Level 2 Level 3 Level 4 Level 5
Financial

155
Customer Perspective
Awareness and Training
Figure 42: Awareness and Training Desirability Curve
Level Description Desirability
Level 1 Customer has not heard of any products or services of the
company
21%
Level 2 Customer has heard the name of the company but not
products or services
30%
Level 3 Customer is familiar with the company and few products or
services
51%
Level 4 Customer is familiar with the company and most products or
services
75%
Level 5 Customer is familiar with the company and has got training on
how to use products or services
90%
Table 42: Awareness and Training Desirability Curve Values
21%
30%
51%
75%
90%
0%
10%
20%
30%
40%
50%
60%
70%
80%
90%
100%
Level 1 Level 2 Level 3 Level 4 Level 5
Awareness and Training
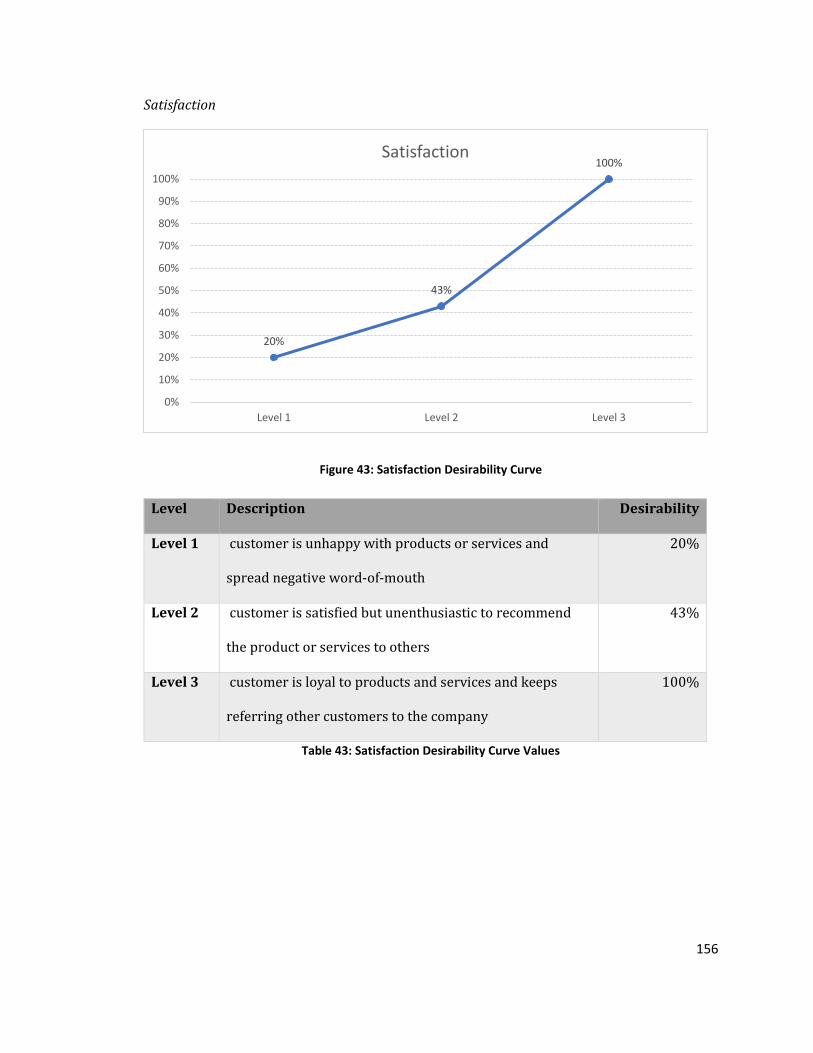
156
Satisfaction
Figure 43: Satisfaction Desirability Curve
Level Description Desirability
Level 1 customer is unhappy with products or services and
spread negative word-of-mouth
20%
Level 2 customer is satisfied but unenthusiastic to recommend
the product or services to others
43%
Level 3 customer is loyal to products and services and keeps
referring other customers to the company
100%
Table 43: Satisfaction Desirability Curve Values
20%
43%
100%
0%
10%
20%
30%
40%
50%
60%
70%
80%
90%
100%
Level 1 Level 2 Level 3
Satisfaction

157
Expectation
Figure 44: Expectation Desirability Curve
Level Description Desirability
Level 1 The products and services do not match with customer
needs
20%
Level 2 The products and services do match with some of the
customers' needs but require many changes
51%
Level 3 The products and services are designed and developed to
entirely fulfill customer expectations
100%
Table 44: Expectation Desirability Curve Values
20%
51%
100%
0%
10%
20%
30%
40%
50%
60%
70%
80%
90%
100%
Level 1 Level 2 Level 3
Expectation

158
Loyalty and commitment
Figure 45: Loyalty and commitment Desirability Curve
Level Description Desirability
Level 1 customer is never going to purchase the services or products
again
6%
Level 2 customer is going to purchase again if there are no other
competitive offerings in the market
38%
Level 3 customer is going to purchase again even if the offering of
other companies are same or even better
99%
Table 45: Loyalty and commitment Desirability Curve Values
6%
38%
99%
0%
10%
20%
30%
40%
50%
60%
70%
80%
90%
100%
Level 1 Level 2 Level 3
Loyalty and commitment

159
Policy Perspective
Data Privacy Compliance
Figure 46: Data Privacy Compliance Desirability Curve
Level Description Desirability
Level 1 The data management practices in the organization are NOT
Compliant with local, regional, and global customer
information privacy requirements
11%
Level 2 The data management practices in the organization, to some
degrees, are compliant with local, regional, and global
customer information privacy requirements
44%
Level 3 The data management practices in the organization are fully
designed in compliance with local, regional, and global
customer information privacy requirements
99%
Table 46: Data Privacy Compliance Desirability Curve Values
11%
44%
99%
0%
10%
20%
30%
40%
50%
60%
70%
80%
90%
100%
Level 1 Level 2 Level 3
Data Privacy Compliance

160
Data Security Compliance
Figure 47: Data Security Compliance Desirability Curve
Level Description Desirability
Level 1 The data management practices in the organization are NOT
Compliant with local, regional, and global customer
information security requirements
6%
Level 2 The data management practices in the organization, to some
degrees, are compliant with local, regional, and global
customer information security requirements
43%
Level 3 The data management practices in the organization are fully
designed in compliance with local, regional, and global
customer information security requirements
100%
Table 47: Data Security Compliance Desirability Curve Values
6%
43%
100%
0%
10%
20%
30%
40%
50%
60%
70%
80%
90%
100%
Level 1 Level 2 Level 3
Data Security Compliance

161
Data Ownership
Figure 48: Data Ownership Desirability Curve
Level Description Desirability
Level 1 The data ownership is not clearly assigned to particular
people, roles, departments
5%
Level 2 The data ownership is to some degree assigned to
particular people, roles, departments
45%
Level 3 The owners of each data resources are clearly defined, and
people, roles, and departments are clear about it
100%
Table 48: Data Ownership Desirability Curve Values
5%
45%
100%
0%
10%
20%
30%
40%
50%
60%
70%
80%
90%
100%
Level 1 Level 2 Level 3
Data Ownership

162
Data Governance
Figure 49: Data Governance Desirability Curve
Level Description Desirability
Level 1 The organization don't follow any specific data governance
practices
4%
Level 2 The organization follows some data governance practices
which are informally communicated with departments
21%
Level 3 The organization follows some formal data governance
practices and gradually expending them to all data resources
49%
Level 4 The organization follows formal data governance practices
that encompass all presently accessible data resources
100%
Table 49: Data Governance Desirability Curve Values
4%
21%
49%
100%
0%
10%
20%
30%
40%
50%
60%
70%
80%
90%
100%
Level 1 Level 2 Level 3 Level 4
Data Governance
163
Case Studies
In this research, the case study method is used to demonstrate the application of the
model built during this research. The case study also provides another layer of
validation and verification for the model in the real world.
To perform a thorough case study, access to information and experts is very critical.
One of the reasons for selecting this organization for the case study was the
availability of the data to the author and direct access to the experts for SME panel
formation.
The quantified model is validated using the case study. The organization's maturity
level in the Customer-centricity approach is evaluated, scored, and used as the
baseline to enhance its overall customer orientation. During the case study, the
criteria, perspective, and desirability with lower scores are identified that are used as
the areas for improvement for the organization.
Company profiles
Since the data for perspectives and criteria used in the model are not publicly
available to illustrate the performance of the model in real-world and the researcher
do not have access to such detailed information for a large organization, in order to
demonstrate the proposed model at work, two case studies are performed in this
research. In Case Study 1, three hypothetical companies are used to perform the case
study.[217] Later in this chapter, the profile of these hypothetical companies are
defined and used for case analysis. In Case Study 2, the researcher performed another

164
case study analysis based on his access to different sources, mainly through the
researcher network.
Case Study 1
For case study 1, each hypothetical company is associated with alternative
characteristics to differentiate them from one another and illustrate the real situation
outcome in a comparative manner.
In other words, these hypothetical companies possess variant strengths and
weaknesses in each perspective and criteria, which is modeled in the research.
The figure below shows the variation of the Hypothetical companies and their
strength and weaknesses in different factor groups
Figure 50: Variation of Hypothetical Companies

165
In order to elaborate on the differences between the hypothetical companies, a
narrative introduction is brought up in the below section. Further on, based on the
variation chart and narrative introduction of the companies, desirability values are
assigned to each criterion.
Company Alpha
Tech Savvy; Strategic Leadership; Customer Negligent; Policy master
Company Alpha is an online retailer firm that gets high scores regarding technology
stacks and data management but lacks specific customer relationship management
capabilities. They use robust methods to collect and distribute data in the
organization. They have built a solid and flexible infrastructure for information
technology and pursue cutting-edge technologies for data and IT management
constantly. The leadership entirely supports the customer-centricity initiatives, and
the official strategic plans of the organization include customer-centric alignment.
However, their communication with the customers is not consistent and takes a long
time to respond to any customer support requests. Customers are rarely informed of
new products or innovations of the company, and loyalty programs initiated a few
years back are not efficient and have high customer turnover. In addition, the staff is
not trained with customers in mind, and their skills are incentivized based on product
management or technical skills.
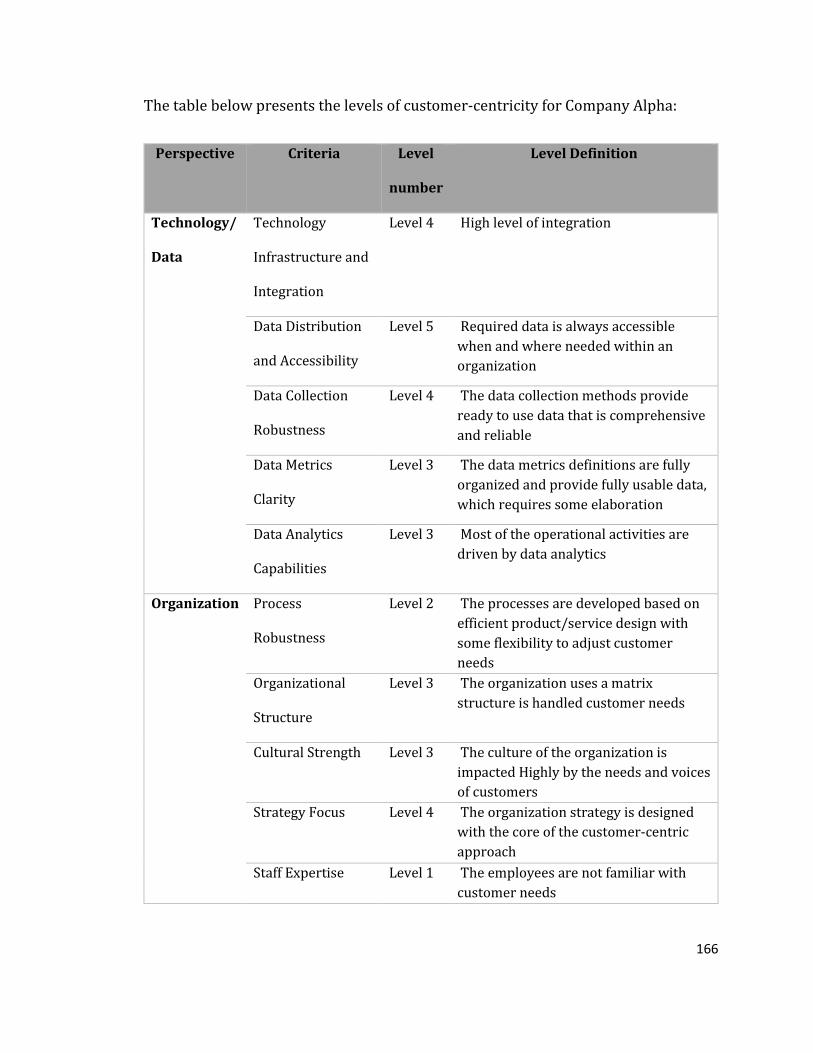
166
The table below presents the levels of customer-centricity for Company Alpha:
Perspective Criteria Level
number
Level Definition
Technology/
Data
Technology
Infrastructure and
Integration
Level 4 High level of integration
Data Distribution
and Accessibility
Level 5 Required data is always accessible
when and where needed within an
organization
Data Collection
Robustness
Level 4 The data collection methods provide
ready to use data that is comprehensive
and reliable
Data Metrics
Clarity
Level 3 The data metrics definitions are fully
organized and provide fully usable data,
which requires some elaboration
Data Analytics
Capabilities
Level 3 Most of the operational activities are
driven by data analytics
Organization Process
Robustness
Level 2 The processes are developed based on
efficient product/service design with
some flexibility to adjust customer
needs
Organizational
Structure
Level 3 The organization uses a matrix
structure is handled customer needs
Cultural Strength Level 3 The culture of the organization is
impacted Highly by the needs and voices
of customers
Strategy Focus Level 4 The organization strategy is designed
with the core of the customer-centric
approach
Staff Expertise Level 1 The employees are not familiar with
customer needs
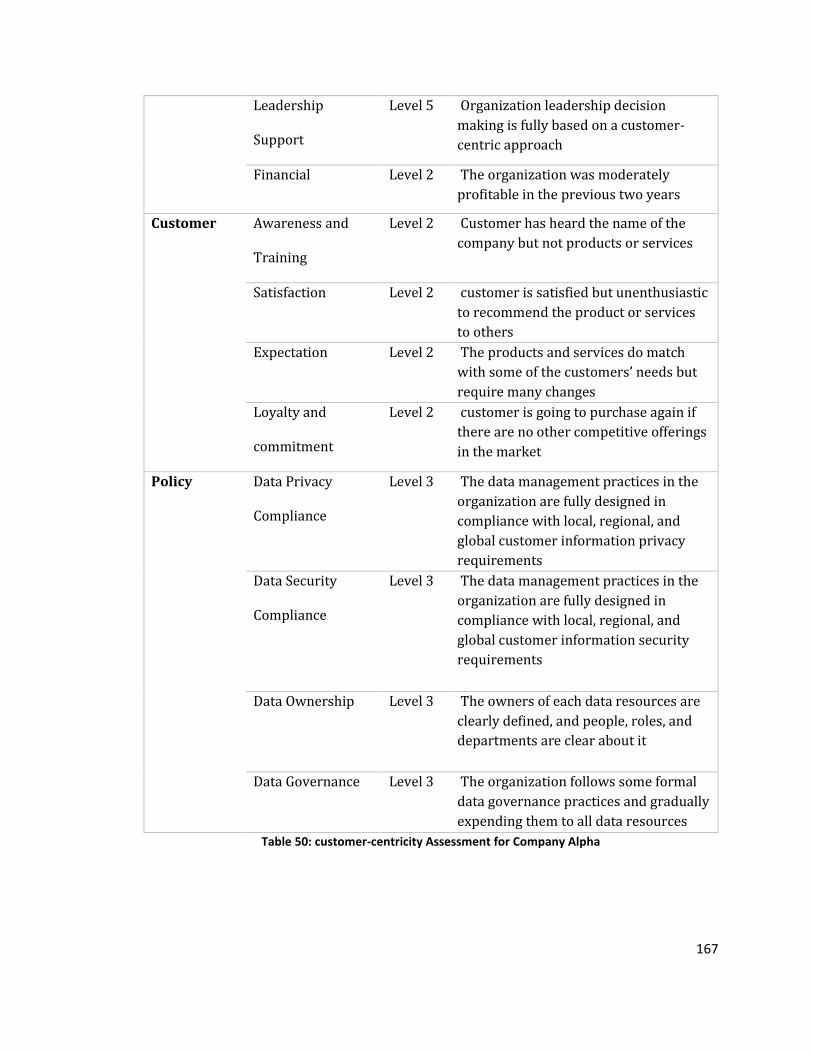
167
Leadership
Support
Level 5 Organization leadership decision
making is fully based on a customer-
centric approach
Financial Level 2 The organization was moderately
profitable in the previous two years
Customer Awareness and
Training
Level 2 Customer has heard the name of the
company but not products or services
Satisfaction Level 2 customer is satisfied but unenthusiastic
to recommend the product or services
to others
Expectation Level 2 The products and services do match
with some of the customers’ needs but
require many changes
Loyalty and
commitment
Level 2 customer is going to purchase again if
there are no other competitive offerings
in the market
Policy Data Privacy
Compliance
Level 3 The data management practices in the
organization are fully designed in
compliance with local, regional, and
global customer information privacy
requirements
Data Security
Compliance
Level 3 The data management practices in the
organization are fully designed in
compliance with local, regional, and
global customer information security
requirements
Data Ownership Level 3 The owners of each data resources are
clearly defined, and people, roles, and
departments are clear about it
Data Governance Level 3 The organization follows some formal
data governance practices and gradually
expending them to all data resources
Table 50: customer-centricity Assessment for Company Alpha
168
Company Beta
Tech Laggard; Mature Organization; Customer repeller; Policy Obedient
Company Beta is a highly structured organization with robust and established
processes, and they follow the restrictive data privacy policies, but the technologies
are obsolete and non-scalable, which negatively impacts the data distribution and
accessibility. They started an e-commerce website to market and sold their products
five years ago but struggled with attracting customers to their e-commerce website.
This is an old company with traditional siloed structures with minimum flexibility in
synergy and compounding of separate teams’ efforts. They invest heavily in customer
awareness and training and attempt to acquire more customers through marketing
initiatives, but their customer ratings are moderate, and they have difficulty in
building long-term relationships with customers. They follow the policies strictly in
order to stay away from any legal challenges and lawsuits, but data governance and
ownership initiatives lack uniform leadership and cause confusion among the
internal users.
The technology stack was upgraded 15 years ago, and digital transformation has been
a challenge since then. Therefore, the organization does not possess the modern IT
and data infrastructure needed for the delivery of customer-centric capabilities for
internal teams.
The table below presents the levels of customer-centricity from different
perspectives for Company Beta:

169
Perspective Criteria Level
number
Level Definition
Technology/
Data
Technology
Infrastructure and
Integration
Level 2 A minimum level of integration
Data Distribution
and Accessibility
Level 2 30% of required data is accessible
when and where needed within an
organization
Data Collection
Robustness
Level 1 The data collection methods are
ineffective and don't provide reliable
and usable data
Data Metrics
Clarity
Level 1 The data metrics definitions are
ineffective and don't provide reliable
and useful data
Data Analytics
Capabilities
Level 2 Few departments use data analytics for
limited operational decision making
Organization Process
Robustness
Level 2 The processes are developed based on
efficient product/service design with
some flexibility to adjust customer
needs
Organizational
Structure
Level 4 All departments of the organization are
structured based on customer needs
Cultural Strength Level 3 The culture of the organization is
impacted Highly by the needs and voices
of customers
Strategy Focus Level 3 Most of the organization strategy is
designed with the customer-centric
approach in scope
Staff Expertise Level 3 The employees know the customer
needs and can take action to fulfill them

170
Leadership
Support
Level 4 Organization leadership support a
customer-centric organization and take
action to improve it
Financial Level 5 The organization was exponentially
profitable during the last five years
Customer Awareness and
Training
Level 4 Customer is familiar with the company
and most products or services
Satisfaction Level 2 customer is satisfied but unenthusiastic
to recommend the product or services
to others
Expectation Level 2 The products and services do match
with some of the customers' needs but
require many changes
Loyalty and
commitment
Level 2 customer is going to purchase again if
there are no other competitive offerings
in the market
Policy Data Privacy
Compliance
Level 3 The data management practices in the
organization are fully designed in
compliance with local, regional, and
global customer information privacy
requirements
Data Security
Compliance
Level 3 The data management practices in the
organization are fully designed in
compliance with local, regional, and
global customer information security
requirements
Data Ownership Level 2 The data ownership is to some degree
assigned to particular people, roles,
departments
Data Governance Level 3 The organization follows some formal
data governance practices and gradually
expending them to all data resources
Table 51: customer-centricity Assessment for Company Beta
Company Gamma
Tech Master; Affluent but wasteful; Alienated Customers; Policy Ignorant

171
Company Gamma is an agile and flexible start-up that utilizes new technologies to
deliver innovative solutions to customers through its website. The customers can buy
the products directly from their e-commerce website and request customization and
delivery. Although Company Gamma can customize their solution based on customer
needs, they don’t have a strong footprint in the market, and customers are not familiar
with their products and services. They do not follow well-structured processes and
policies and miss a few of the checkboxes in the privacy and security policies. The
table below presents the levels of customer-centricity from different perspectives for
Company Gamma:
Perspective Criteria Level
number
Level Definition
Technology
/Data
Technology Infrastructure
and Integration
Level 4 High level of integration
Data Distribution and
Accessibility
Level 4 70% of required data is
accessible when and
where needed within an
organization
Data Collection Robustness Level 2 The data collection
methods are semi-
structured and provide
some usable data
Data Metrics Clarity Level 3 The data metrics
definitions are fully
organized and provide
fully usable data, which
requires some elaboration
Data Analytics Capabilities Level 4 Most of the operational
activities and some of the
strategic decisions are
driven by data analytics

172
Organization Process Robustness Level 2 The processes are
developed based on
efficient product/service
design with some
flexibility to adjust
customer needs
Organizational Structure Level 2 Organizational structure
is siloed based on product
families, and new
customer requests are
handled by cross-
functional teams
Cultural Strength Level 2 The culture of the
organization is impacted
moderately by the needs
and voices of customers
Strategy Focus Level 3 Most of the organization
strategy is designed with
the customer-centric
approach in scope
Staff Expertise Level 2 The employees are
familiar with customer
needs but can't take many
actions to fulfill them
Leadership Support Level 3 Organization leadership
know about a customer-
centric organization and
support it
Financial Level 4 The organization was
exponentially profitable
during the last two years
Customer Awareness and Training Level 1 Customer has not heard
of any products or
services of the company
Satisfaction Level 2 customer is satisfied but
unenthusiastic to
recommend the product
or services to others
Expectation Level 1 The products and
services do not match
with customer needs
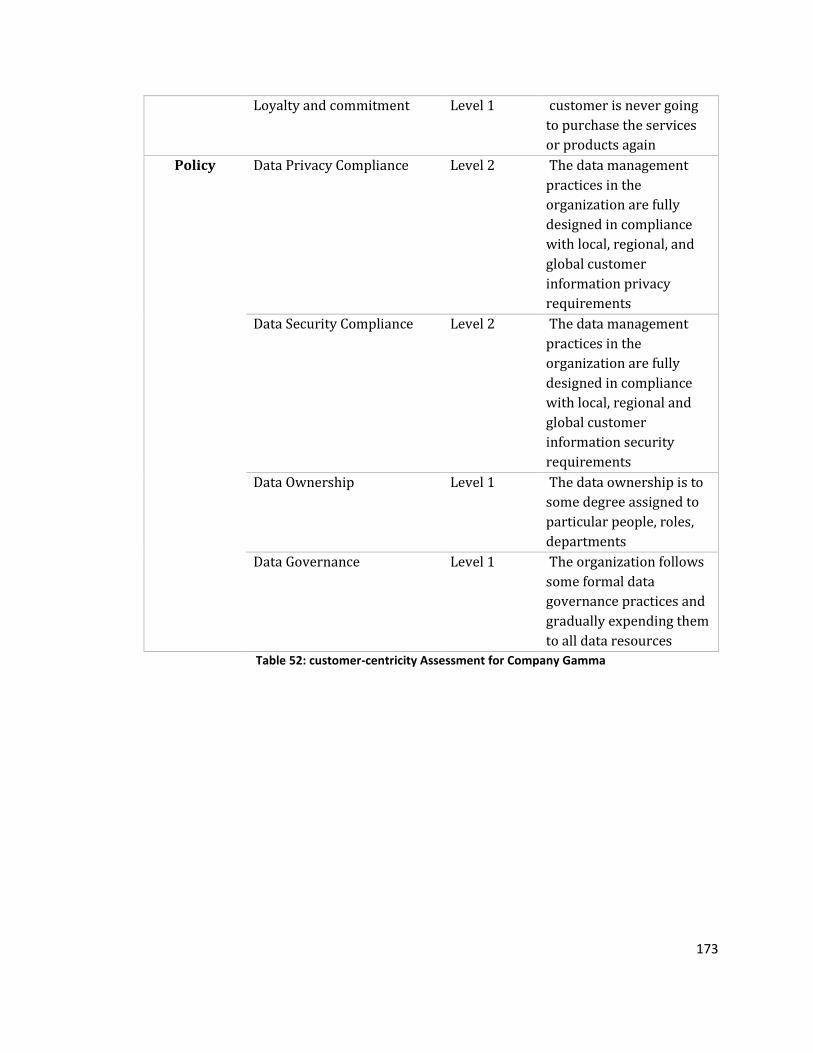
173
Loyalty and commitment Level 1 customer is never going
to purchase the services
or products again
Policy Data Privacy Compliance Level 2 The data management
practices in the
organization are fully
designed in compliance
with local, regional, and
global customer
information privacy
requirements
Data Security Compliance Level 2 The data management
practices in the
organization are fully
designed in compliance
with local, regional and
global customer
information security
requirements
Data Ownership Level 1 The data ownership is to
some degree assigned to
particular people, roles,
departments
Data Governance Level 1 The organization follows
some formal data
governance practices and
gradually expending them
to all data resources
Table 52: customer-centricity Assessment for Company Gamma

174
Case Study Analysis
The Customer-Centricity Approach for companies in the case study is calculated
through the following formula (see Chapter four for more details)
𝑆𝐶𝐶 = ∑ ∑(𝑃𝑗)(𝐶𝑖,𝑗)(𝐷𝑖,𝑗)
𝑛
𝑗=1
𝑚
𝑖=1
Where
𝑆𝐶𝐶 is the Customer-centricity Score
𝑃𝑗 is the relative value of perspective 𝑗 with respect to Customer-centricity Score
𝑤ℎ𝑒𝑟𝑒 𝑗 = 1,2, … , 𝑛
𝐶𝑖,𝑗 is the relative value of criteria 𝑖 under perspective 𝑗 with respect to Customer-
centricity Score
𝑤ℎ𝑒𝑟𝑒 𝑗 = 1,2, … , 𝑛 𝐴𝑁𝐷 𝑖 = 1,2, … , 𝑚
𝐷𝑖,𝑗 is the Desirability value of criteria 𝑖 under perspective 𝑗
𝑤ℎ𝑒𝑟𝑒 𝑗 = 1,2, … , 𝑛 𝐴𝑁𝐷 𝑖 = 1,2, … , 𝑚

175
The tables below present the detailed values for Perspectives, Criteria and
Desirability, and customer-centricity score for each company in case study 1.
Company Alpha Customer-centricity Score Calculations
Perspective Criteria Global
Weights
(GW)
Level
number
Desirability
Value (DV)
GW X
DV
Technology/
Data
Technology
Infrastructure and
Integration
5.13% Level 4 80.00% 4.10%
Data Distribution
and Accessibility
3.80% Level 5 100.00% 3.80%
Data Collection
Robustness
2.66% Level 4 100.00% 2.66%
Data Metrics Clarity 2.66% Level 3 72.00% 1.92%
Data Analytics
Capabilities
4.56% Level 3 59.00% 2.69%
Organization Process Robustness 2.97% Level 2 43.00% 1.28%
Organizational
Structure
2.70% Level 3 72.00% 1.94%
Cultural Strength 4.86% Level 3 69.00% 3.35%
Strategy Focus 4.05% Level 4 97.00% 3.93%
Staff Expertise 3.78% Level 1 1.00% 0.04%
Leadership Support 5.40% Level 5 98.00% 5.29%

176
Financial 3.51% Level 2 34.00% 1.19%
Customer Awareness and
Training
5.28% Level 2 30.00% 1.58%
Satisfaction 11.55% Level 2 43.00% 4.97%
Expectation 10.23% Level 2 51.00% 5.22%
Loyalty and
commitment
6.27% Level 2 38.00% 2.38%
Policy Data Privacy
Compliance
5.22% Level 3 99.00% 5.17%
Data Security
Compliance
5.76% Level 3 100.00% 5.76%
Data Ownership 3.24% Level 3 100.00% 3.24%
Data Governance 3.78% Level 3 49.00% 1.85%
Customer-centricity Score
62.4%
Table 53: Company Alpha Customer-centricity Score Calculations
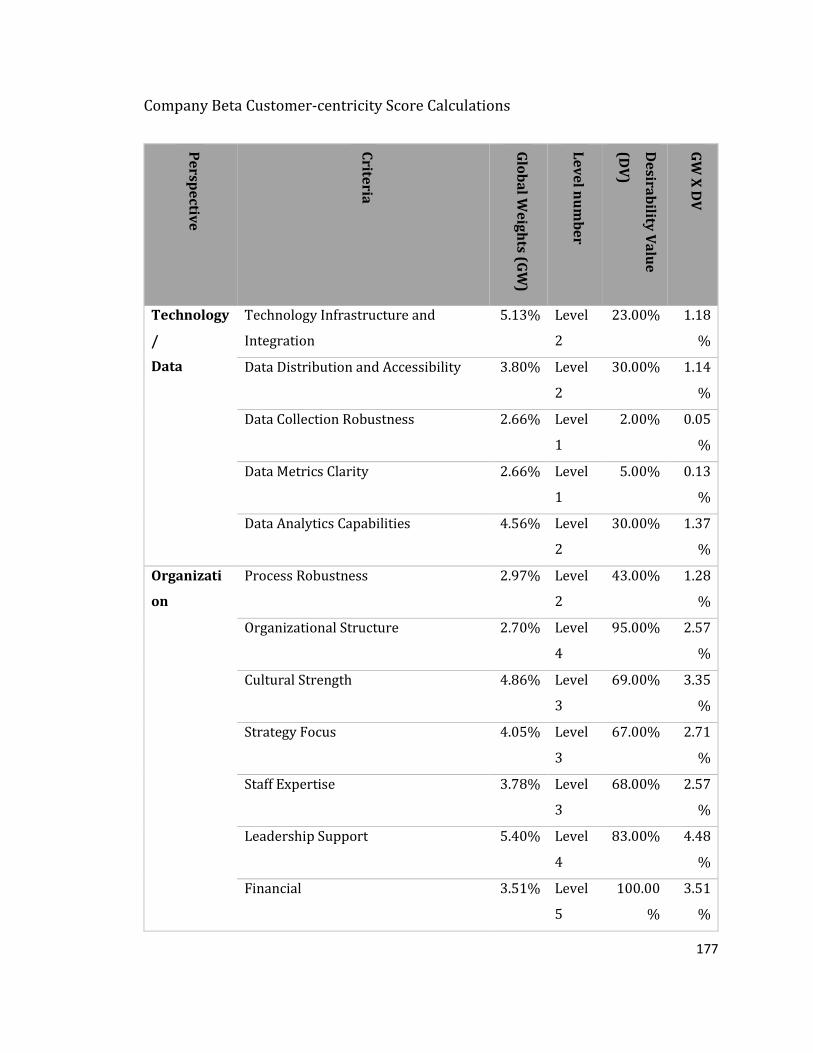
177
Company Beta Customer-centricity Score Calculations
Pe
rspe
ctive
Crite
ria
Glo
ba
l We
igh
ts (GW
)
Le
ve
l nu
mb
er
De
sirab
ility V
alu
e
(DV
)
GW
X D
V
Technology
/
Data
Technology Infrastructure and
Integration
5.13% Level
2
23.00% 1.18
%
Data Distribution and Accessibility 3.80% Level
2
30.00% 1.14
%
Data Collection Robustness 2.66% Level
1
2.00% 0.05
%
Data Metrics Clarity 2.66% Level
1
5.00% 0.13
%
Data Analytics Capabilities 4.56% Level
2
30.00% 1.37
%
Organizati
on
Process Robustness 2.97% Level
2
43.00% 1.28
%
Organizational Structure 2.70% Level
4
95.00% 2.57
%
Cultural Strength 4.86% Level
3
69.00% 3.35
%
Strategy Focus 4.05% Level
3
67.00% 2.71
%
Staff Expertise 3.78% Level
3
68.00% 2.57
%
Leadership Support 5.40% Level
4
83.00% 4.48
%
Financial 3.51% Level
5
100.00
%
3.51
%
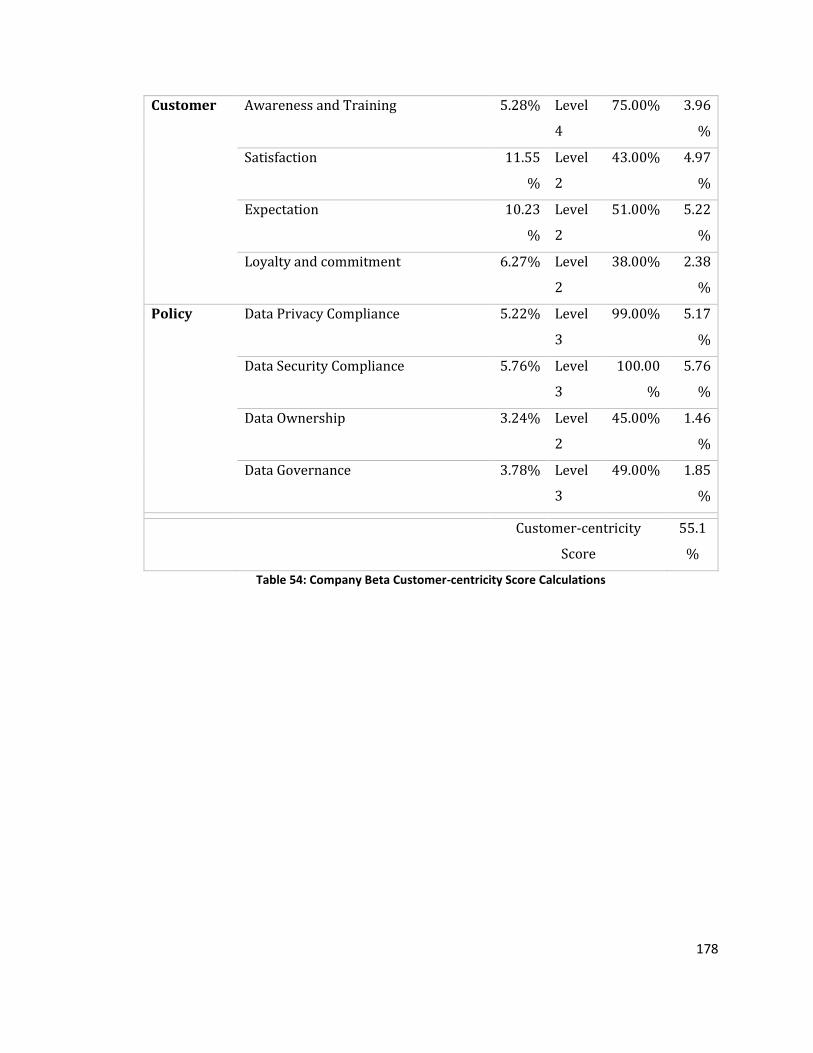
178
Customer Awareness and Training 5.28% Level
4
75.00% 3.96
%
Satisfaction 11.55
%
Level
2
43.00% 4.97
%
Expectation 10.23
%
Level
2
51.00% 5.22
%
Loyalty and commitment 6.27% Level
2
38.00% 2.38
%
Policy Data Privacy Compliance 5.22% Level
3
99.00% 5.17
%
Data Security Compliance 5.76% Level
3
100.00
%
5.76
%
Data Ownership 3.24% Level
2
45.00% 1.46
%
Data Governance 3.78% Level
3
49.00% 1.85
%
Customer-centricity
Score
55.1
%
Table 54: Company Beta Customer-centricity Score Calculations

179
Company Gamma Customer-centricity Score Calculations
Pe
rspe
ctive
Crite
ria
Glo
ba
l We
igh
ts (GW
)
Le
ve
l nu
mb
er
De
sirab
ility V
alu
e
(DV
)
GW
X D
V
Technology
/
Data
Technology Infrastructure and
Integration
5.13% Level
4
80.00
%
4.10
%
Data Distribution and Accessibility 3.80% Level
4
68.00
%
2.58
%
Data Collection Robustness 2.66% Level
2
30.00
%
0.80
%
Data Metrics Clarity 2.66% Level
3
72.00
%
1.92
%
Data Analytics Capabilities 4.56% Level
4
77.00
%
3.51
%
Organizatio
n
Process Robustness 2.97% Level
2
43.00
%
1.28
%
Organizational Structure 2.70% Level
2
32.00
%
0.86
%
Cultural Strength 4.86% Level
2
32.00
%
1.56
%
Strategy Focus 4.05% Level
3
67.00
%
2.71
%
Staff Expertise 3.78% Level
2
28.00
%
1.06
%
Leadership Support 5.40% Level
3
60.00
%
3.24
%
Financial 3.51% Level
4
89.00
%
3.12
%
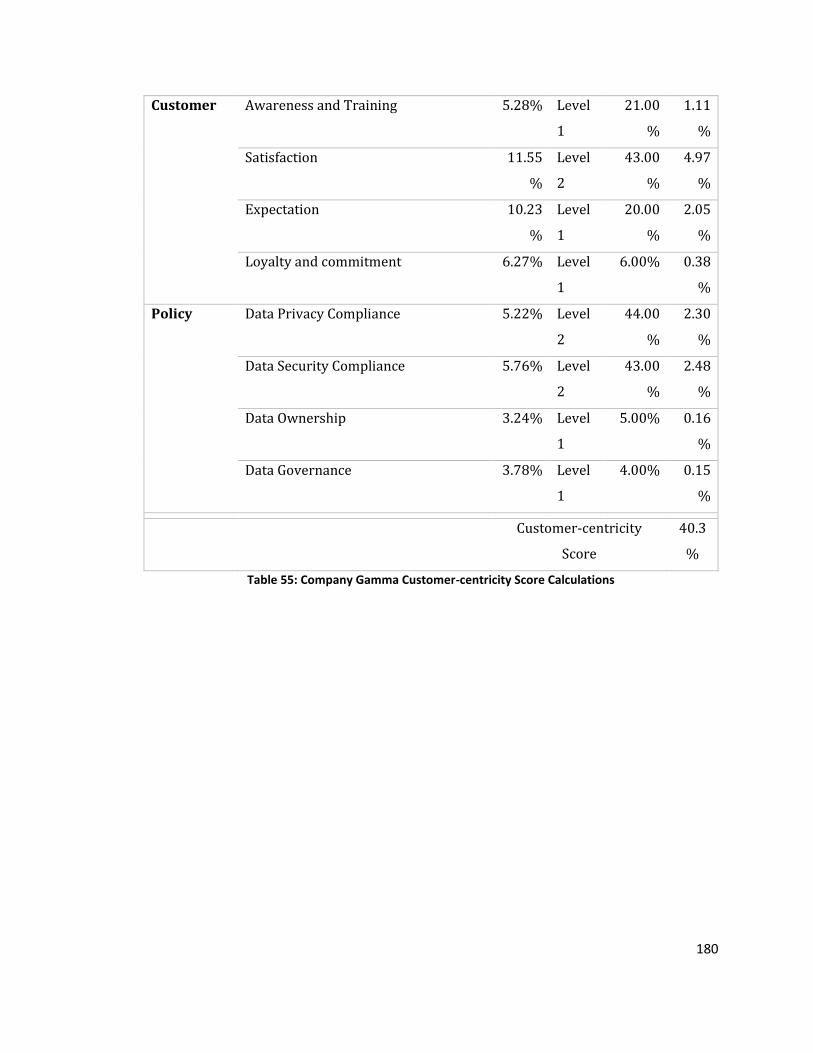
180
Customer Awareness and Training 5.28% Level
1
21.00
%
1.11
%
Satisfaction 11.55
%
Level
2
43.00
%
4.97
%
Expectation 10.23
%
Level
1
20.00
%
2.05
%
Loyalty and commitment 6.27% Level
1
6.00% 0.38
%
Policy Data Privacy Compliance 5.22% Level
2
44.00
%
2.30
%
Data Security Compliance 5.76% Level
2
43.00
%
2.48
%
Data Ownership 3.24% Level
1
5.00% 0.16
%
Data Governance 3.78% Level
1
4.00% 0.15
%
Customer-centricity
Score
40.3
%
Table 55: Company Gamma Customer-centricity Score Calculations

181
Score Improvement recommendations
In this section, the researcher provides recommendations to improve the customer-
centricity approach in companies Alpha, Beta, and Gamma according to the calculated
customer-centricity scores. The case study analysis on three hypothetical companies
shows that the customer-centricity score of the companies Alpha, Beta, and Gamma
are 62.4%, 55.1%, and 40.3%, respectively. For all three companies, there are many
opportunities to improve customer-centricity. In the following section, a few of the
gaps and improvement opportunities are discussed for each company separately.
Company Alpha
The company Alpha got the lowest score in Staff Expertise. The training of the employees and
lack of the communication skills to interact with customers is the main gap that is identified
in their customer-centricity approach. The other factors that reduced the score for company
Alpha were “customer awareness and Training” and also building “Loyalty and commitment”
among customers.
Company Alpha can improve its customer-centricity approach by designing and
implementing marketing campaigns surrounding the customers’ awareness about their
brand and products. In addition, training the employees with customer interaction skills can
improve customer-centricity in this company.
Company Beta
The company Beta got the lowest scores from the criteria under the Technology perspective.
The data collection processes of the organization are ad hoc and are not solidified based on
customer needs. The data metrics are not clearly defined, and internal employees have

182
ambiguity about data metrics and what they represent in the customer-centricity approach.
On the other hand, the technology infrastructure and data distribution are not revised for a
long time and are negatively impacting the data collection, analysis, and distribution in the
organization.
The Company Beta can improve its customer-centricity, focusing on digital transformation
and technology renovation. They need to clearly define the data metrics and how they can be
collected from reliable sources. In addition, the process for data collection and data analysis
needs to be revised in order to enhance the customer-centricity approach in the company.
Company Gamma
The company Gamma got the lowest score from the loyalty and commitment of the
customers. The company considers its customers as transactional and one-time buyers and
has not planned on returning customers to buy again and making them loyal to the brand and
products of this company. Besides that, the customers are aware of just a few flagship
products of the company, which doesn’t entirely fulfill their expectations.
On the other hand, siloed organizational structures prevent the departments from focusing
on and addressing customer needs. The staff is not well trained for customer interactions,
and there is a gap of knowledge on how to communicate and interact with the customers
among the staff.
The company Gamma can improve the customer-centricity approach, starting with a solid
loyalty program design that addresses the customer needs at every touchpoint along the
customer journey. They need to build a long-term relationship with customers to understand
their expectations. In addition, in order to deliver according to the customers’ expectations
and needs, there is a need to restructure the organization based on customer segments.

183
Centralized management of the customer needs based on target customers enables them to
customize their products faster and have a more loyal customer base.

184
Sensitivity Analysis
Sensitivity analysis measures the reliability and confidence level of the model, which
is built based on expert judgments. In other words, sensitivity analysis evaluates
different levels of values and changes that are introduced to the model and provides
the researcher with enough information about the limits of the model and different
scenarios that the model is/is not applicable.
The sensitivity analysis is important to be applied in such research as the factors
impacting the outcome may change over time which is highly probable when the
technology is one of the core components of the model. The rapid changes in the
technology may require frequent changes or updates on the model to confirm it is still
valid and relevant to the problem and outcome.
Following sensitivity analysis made by Estep[218] and Abotah[279] and after the
data collection and model development, sensitivity analysis is performed to confirm
the impact of the changes in priority in perspectives in the ultimate customer-
centricity score. In this research, scenario analysis is applied to the model to assess
the behavior of the model under extreme inputs and determine the robustness of the
model.
The following tables present the calculation of the sensitivity based on boosting each
of the perspectives (scenarios 1 through 4) and evaluating the impact on the final
customer-centricity scores in each company.

185
Scenario 1: Emphasis on Technology/Data Perspective
Table 56: Sensitivity Analysis Scenario 1
Company Alpha Company Beta Company Gamma
Base line values 0.62 0.55 0.40
Scenario 1 results 0.79 0.22 0.67
Difference 0.17 -0.33 0.27
Max difference 0.60
Std. Deviation 0.26

186
Scenario 2: Emphasis on Organization Perspective
Table 57: Sensitivity Analysis Scenario 2
Company Alpha Company Beta Company Gamma
Base line values 0.62 0.55 0.40
Scenario 2 results 0.63 0.75 0.51
Difference 0.01 0.20 0.11
Max difference 0.19
Std. Deviation 0.08

187
Scenario 3: Emphasis on Customer Perspective
Table 58: Sensitivity Analysis Scenario 3
Company Alpha Company Beta Company Gamma
Base line values 0.62 0.55 0.40
Scenario 3 results 0.44 0.50 0.26
Difference -0.18 -0.05 -0.14
Max difference 0.14
Std. Deviation 0.06

188
Scenario 4: Emphasis on Policy Perspective
Table 59: Sensitivity Analysis Scenario 4
Company Alpha Company Beta Company Gamma
Base line values 0.62 0.55 0.40
Scenario 4 results 0.88 0.78 0.53
Difference 0.26 0.23 0.13
Max difference 0.13
Std. Deviation 0.06

189
The comparison between different scenarios reveals that the highest impact among
the perspectives comes from the “Technology/Data” and criteria under it. On the
other hand, the lowest impact is observed “Policy” perspective and criteria associated
with it.
The sensitivity analysis performed in this section provides a better understanding of the
impact of each perspective on the final customer-centricity score. When the strategic
priorities changes in an organization, the overall customer-centricity approach is impacted
tremendously.
The HDM model provided us with baseline (preset) weights; however, since the technology
management area is changing rapidly, considering the impact of each perspective and
criterion on the final score enables the future researchers to obtain a better understanding of
the impact of each factor and replacing them with new factors based on the content, context,
and structure of their research.
Table 60: Sensitivity Analysis Scenarios Deviations and Range difference
190
Case Study 2
In case study 2, the data from two companies that the researcher had access to the
information was utilized to perform case analysis.
Company C1
This first company, in case study 2, is an SME in the store security products and solutions,
which run multiple e-commerce websites to offer their products to the customers. The
company was established more than 40 years ago, and the main customers are large
electronic businesses that need to secure their devices in the store. The core technologies
used in the security devices position them among the top 10 providers in this area. Besides
products, this company provides complementary services, which in recent years streamed
more or equal levels of revenue compared to product design and manufacturing.
Regarding the technologies utilized in the products, they use cutting-edge solutions;
however, the internal technologies are not completely established. The integration of
infrastructure is a huge gap in the internal technologies, and data collection methods are not
entirely solidified. The data collection challenges present a larger gap in the service business
unit than the product business unit as more people are involved in data collection, data audit,
data analysis, and data reporting.
From the organization's perspective, the organization has documented the processes;
however, the process improvement practices are not frequently used to adapt to changing
landscape of customer expectations and requirements. The frequent organizational
restructuring resulted in some issues in regard to employee retention as well as customer
loyalty. The organization is led by strong leadership with solidified vision; however, the

191
organization follows multiple strategic initiatives, which make it difficult to cascade it to
middle managers and staff. Finally, the organization financially was challenged during the last
three years, and the profitability of the organization was impacted negatively. However, no
platforms and solutions illustrate a bright future from the financial perspective.
From the Customer perspective, the customer expectation is managed moderately, and
regarding the nature of the industry and heavy competition, the loyalty of the customers is
minimal. The customer satisfaction is moderate as well since few of the new products and
services still have customer experience challenges, and it requires a few more iterations to
have fully satisfied customers.
From Policy perspective, the organization follows the required measures for the privacy of
customer and employee data. However, they have solid practices for data security, and
multiple levels of data protection are applied to make sure a safe place for the collected data.
Despite having a few processes for data governance and data ownership, there are some
ambiguities in this regard, but the organization is applying gradual improvement to its data
governance practices.
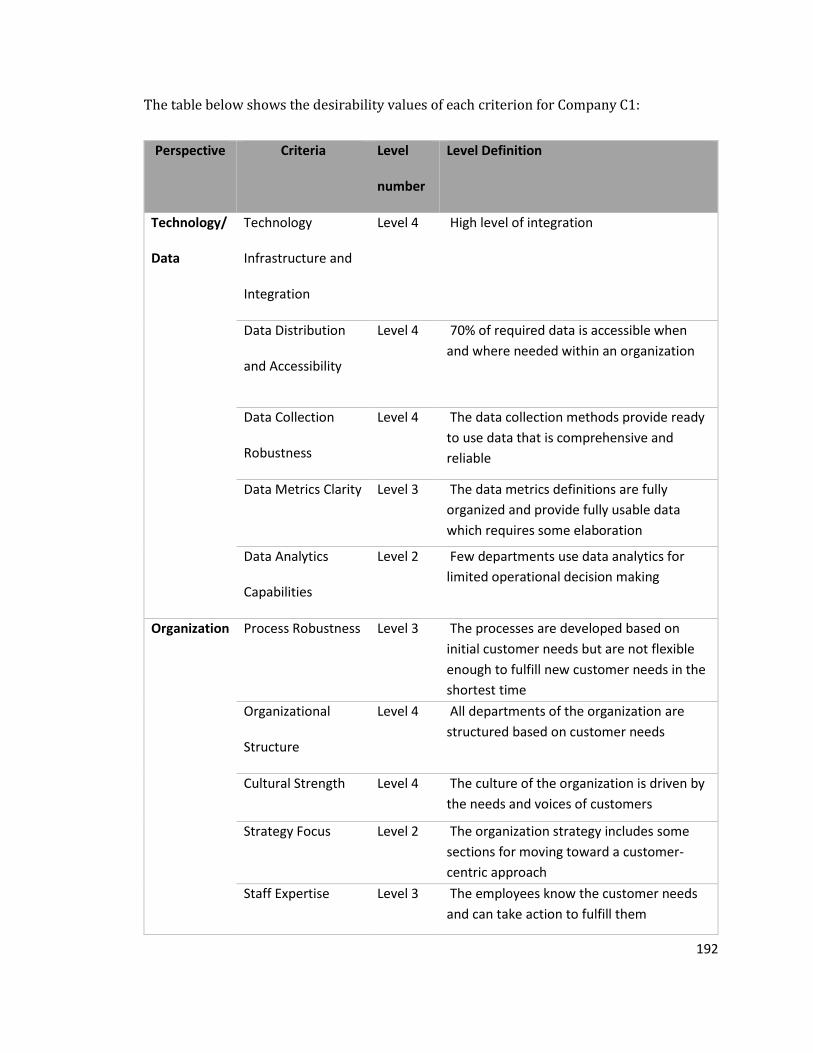
192
The table below shows the desirability values of each criterion for Company C1:
Perspective Criteria Level
number
Level Definition
Technology/
Data
Technology
Infrastructure and
Integration
Level 4 High level of integration
Data Distribution
and Accessibility
Level 4 70% of required data is accessible when
and where needed within an organization
Data Collection
Robustness
Level 4 The data collection methods provide ready
to use data that is comprehensive and
reliable
Data Metrics Clarity Level 3 The data metrics definitions are fully
organized and provide fully usable data
which requires some elaboration
Data Analytics
Capabilities
Level 2 Few departments use data analytics for
limited operational decision making
Organization Process Robustness Level 3 The processes are developed based on
initial customer needs but are not flexible
enough to fulfill new customer needs in the
shortest time
Organizational
Structure
Level 4 All departments of the organization are
structured based on customer needs
Cultural Strength Level 4 The culture of the organization is driven by
the needs and voices of customers
Strategy Focus Level 2 The organization strategy includes some
sections for moving toward a customer-
centric approach
Staff Expertise Level 3 The employees know the customer needs
and can take action to fulfill them
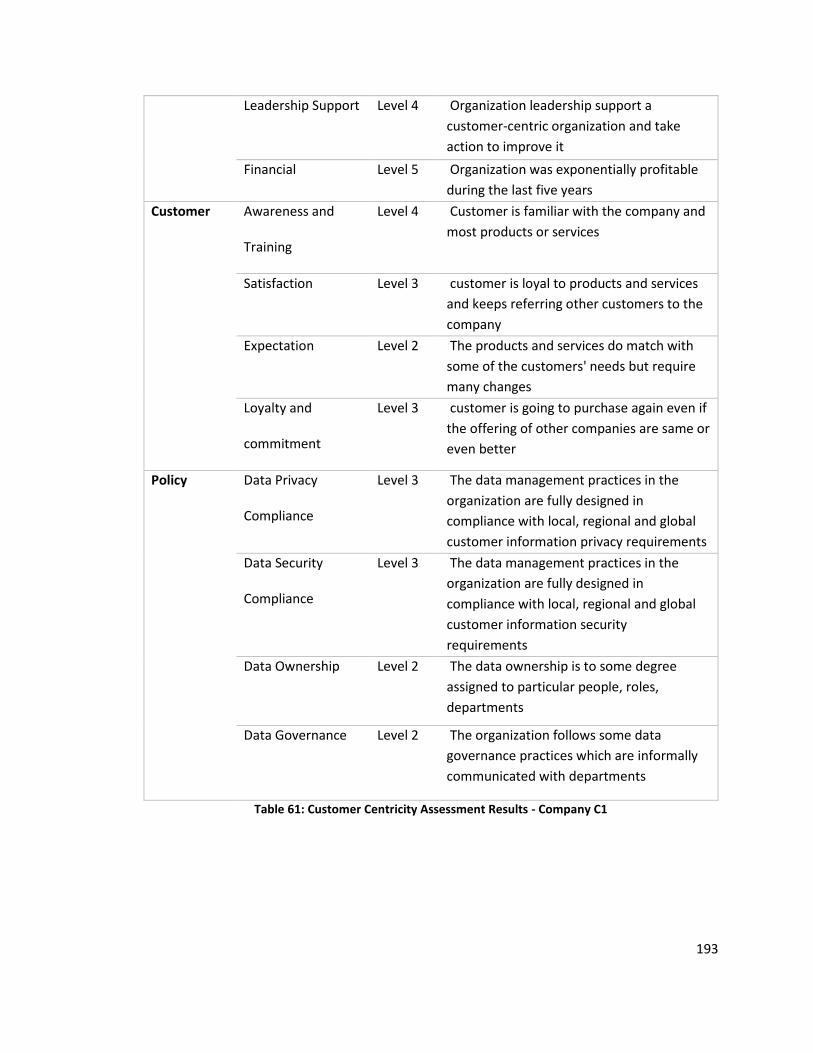
193
Leadership Support Level 4 Organization leadership support a
customer-centric organization and take
action to improve it
Financial Level 5 Organization was exponentially profitable
during the last five years
Customer Awareness and
Training
Level 4 Customer is familiar with the company and
most products or services
Satisfaction Level 3 customer is loyal to products and services
and keeps referring other customers to the
company
Expectation Level 2 The products and services do match with
some of the customers' needs but require
many changes
Loyalty and
commitment
Level 3 customer is going to purchase again even if
the offering of other companies are same or
even better
Policy Data Privacy
Compliance
Level 3 The data management practices in the
organization are fully designed in
compliance with local, regional and global
customer information privacy requirements
Data Security
Compliance
Level 3 The data management practices in the
organization are fully designed in
compliance with local, regional and global
customer information security
requirements
Data Ownership Level 2 The data ownership is to some degree
assigned to particular people, roles,
departments
Data Governance Level 2 The organization follows some data
governance practices which are informally
communicated with departments
Table 61: Customer Centricity Assessment Results - Company C1

194
Company C2
The second company of Case Study 2 is a public company in the food and beverage industry.
This is a fast-growing company with stores in different United States cities. They also have
multiple e-commerce retailer websites which offer the products of this company.
From the technology perspective, there has been a huge recent investment in data
infrastructure, data warehousing, and data analytics which has improved the underlying
systems that internal teams are using to make better decisions.
From the Organization's perspective, this company has a unique, well-established, and
cohesive culture that enables them to collaborate internally and also serve the customers
beyond their expectations. There are some gaps in the strategic alignment of departments
due to a lack of strategic focus. The employees are highly trained, and there is a huge
emphasis on the education of new employees to serve the customers. Leadership supports
new customer-oriented initiatives and has been profitable during the last five years.
From the Customer perspective, this organization has very loyal customers who return for
new products frequently. The new mobile application enables the customers to be informed
of the most recent products. The loyalty programs and campaigns have launched frequently,
which in most cases have a very high success rate.
From the Policy perspective, the company follows multiple data privacy and security and has
established processes to protect the data collected from customers and employees. There are
some gaps in data governance practices that require the organization to take more steps to
clarify the processes and ownership of systems, data, and applications.
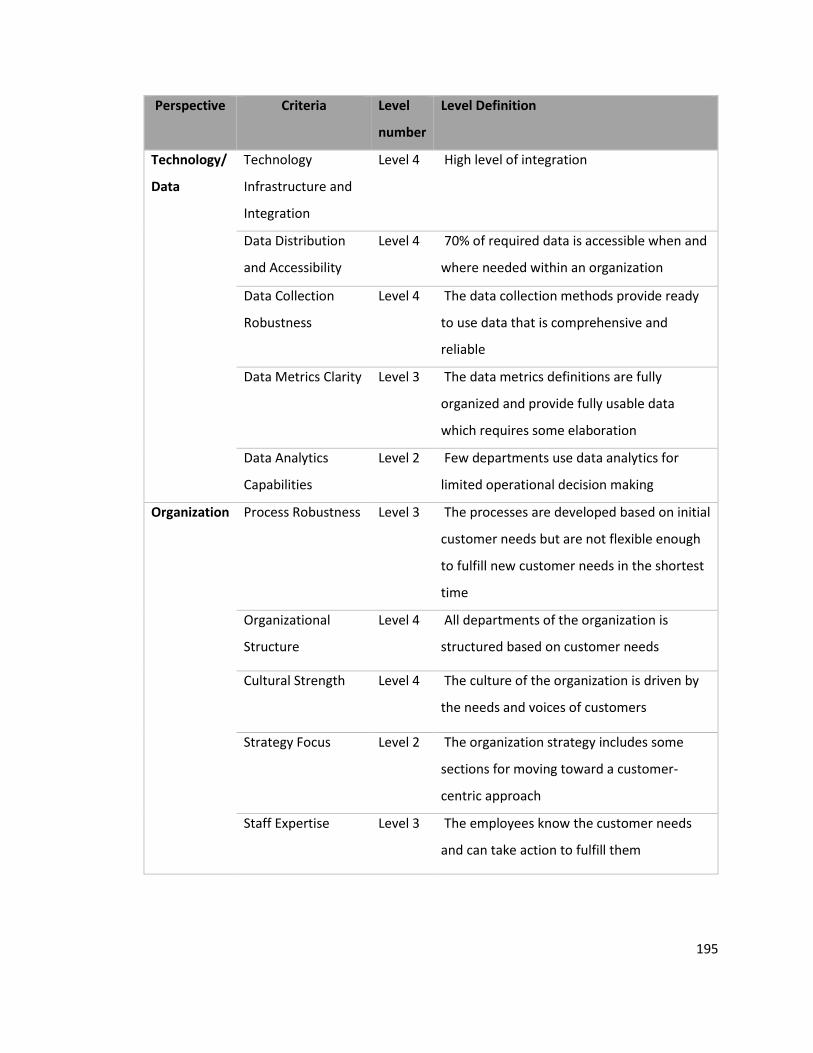
195
Perspective Criteria Level
number
Level Definition
Technology/
Data
Technology
Infrastructure and
Integration
Level 4 High level of integration
Data Distribution
and Accessibility
Level 4 70% of required data is accessible when and
where needed within an organization
Data Collection
Robustness
Level 4 The data collection methods provide ready
to use data that is comprehensive and
reliable
Data Metrics Clarity Level 3 The data metrics definitions are fully
organized and provide fully usable data
which requires some elaboration
Data Analytics
Capabilities
Level 2 Few departments use data analytics for
limited operational decision making
Organization Process Robustness Level 3 The processes are developed based on initial
customer needs but are not flexible enough
to fulfill new customer needs in the shortest
time
Organizational
Structure
Level 4 All departments of the organization is
structured based on customer needs
Cultural Strength Level 4 The culture of the organization is driven by
the needs and voices of customers
Strategy Focus Level 2 The organization strategy includes some
sections for moving toward a customer-
centric approach
Staff Expertise Level 3 The employees know the customer needs
and can take action to fulfill them

196
Leadership Support Level 4 Organization leadership support a customer-
centric organization and take action to
improve it
Financial Level 5 Organization was exponentially profitable
during the last five years
Customer Awareness and
Training
Level 4 Customer is familiar with the company and
most products or services
Satisfaction Level 3 customer is loyal to products and services
and keeps referring other customers to the
company
Expectation Level 2 The products and services do match with
some of the customers' needs but require
many changes
Loyalty and
commitment
Level 3 customer is going to purchase again even if
the offering of other companies are same or
even better
Policy Data Privacy
Compliance
Level 3 The data management practices in the
organization are fully designed in compliance
with local, regional and global customer
information privacy requirements
Data Security
Compliance
Level 3 The data management practices in the
organization are fully designed in compliance
with local, regional and global customer
information security requirements
Data Ownership Level 2 The data ownership is to some degree
assigned to particular people, roles,
departments
Data Governance Level 2 The organization follows some data
governance practices which are informally
communicated with departments

197
Table 62: Customer Centricity Assessment Results - Company C2

198
Case Study Analysis
The Customer-Centricity Approach for companies in the case study is calculated
through the following formula (see Chapter four for more details)
𝑆𝐶𝐶 = ∑ ∑(𝑃𝑗)(𝐶𝑖,𝑗)(𝐷𝑖,𝑗)
𝑛
𝑗=1
𝑚
𝑖=1
Where
𝑆𝐶𝐶 is the Customer-centricity Score
𝑃𝑗 is the relative value of perspective 𝑗 with respect to Customer-centricity Score
𝑤ℎ𝑒𝑟𝑒 𝑗 = 1,2, … , 𝑛
𝐶𝑖,𝑗 is the relative value of criteria 𝑖 under perspective 𝑗 with respect to Customer-
centricity Score
𝑤ℎ𝑒𝑟𝑒 𝑗 = 1,2, … , 𝑛 𝐴𝑁𝐷 𝑖 = 1,2, … , 𝑚
𝐷𝑖,𝑗 is the Desirability value of criteria 𝑖 under perspective 𝑗
𝑤ℎ𝑒𝑟𝑒 𝑗 = 1,2, … , 𝑛 𝐴𝑁𝐷 𝑖 = 1,2, … , 𝑚
The tables below present the detailed values for Perspectives, Criteria and
Desirability, and customer-centricity score for each company in case study 2.
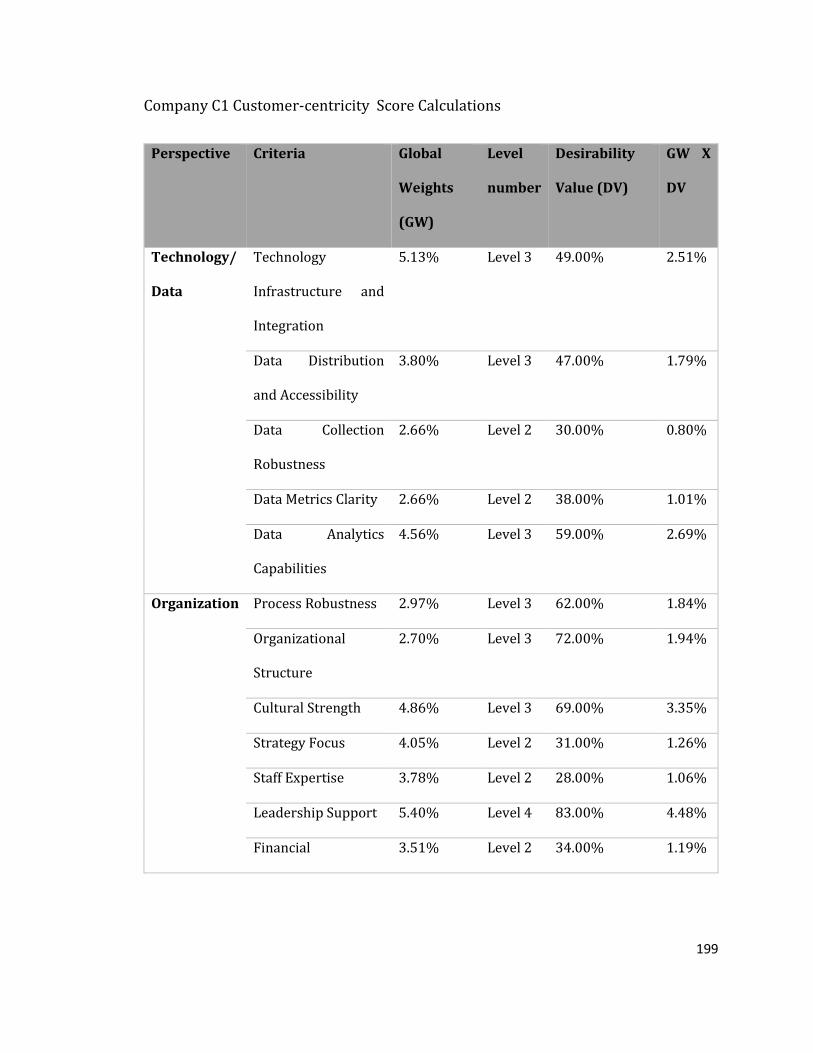
199
Company C1 Customer-centricity Score Calculations
Perspective Criteria Global
Weights
(GW)
Level
number
Desirability
Value (DV)
GW X
DV
Technology/
Data
Technology
Infrastructure and
Integration
5.13% Level 3 49.00% 2.51%
Data Distribution
and Accessibility
3.80% Level 3 47.00% 1.79%
Data Collection
Robustness
2.66% Level 2 30.00% 0.80%
Data Metrics Clarity 2.66% Level 2 38.00% 1.01%
Data Analytics
Capabilities
4.56% Level 3 59.00% 2.69%
Organization Process Robustness 2.97% Level 3 62.00% 1.84%
Organizational
Structure
2.70% Level 3 72.00% 1.94%
Cultural Strength 4.86% Level 3 69.00% 3.35%
Strategy Focus 4.05% Level 2 31.00% 1.26%
Staff Expertise 3.78% Level 2 28.00% 1.06%
Leadership Support 5.40% Level 4 83.00% 4.48%
Financial 3.51% Level 2 34.00% 1.19%
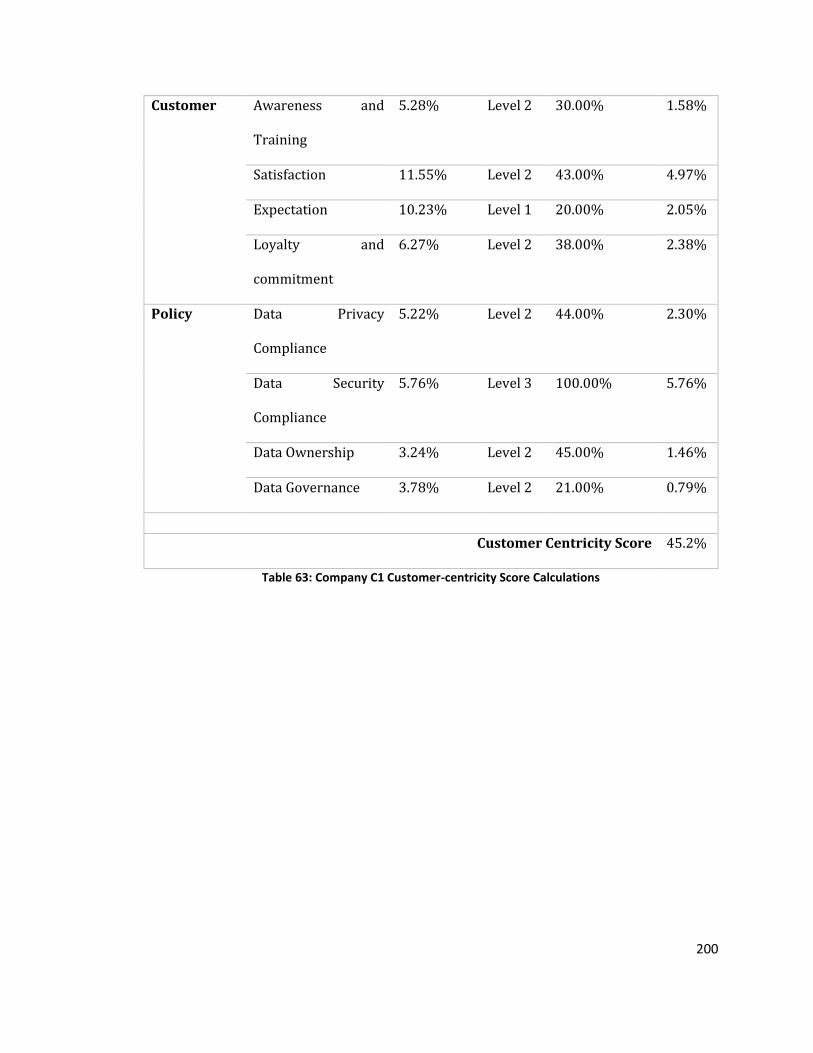
200
Customer Awareness and
Training
5.28% Level 2 30.00% 1.58%
Satisfaction 11.55% Level 2 43.00% 4.97%
Expectation 10.23% Level 1 20.00% 2.05%
Loyalty and
commitment
6.27% Level 2 38.00% 2.38%
Policy Data Privacy
Compliance
5.22% Level 2 44.00% 2.30%
Data Security
Compliance
5.76% Level 3 100.00% 5.76%
Data Ownership 3.24% Level 2 45.00% 1.46%
Data Governance 3.78% Level 2 21.00% 0.79%
Customer Centricity Score 45.2%
Table 63: Company C1 Customer-centricity Score Calculations

201
Company C2 Customer-centricity Score Calculations
Perspective Criteria Global
Weights
(GW)
Level
number
Desirability
Value (DV)
GW X
DV
Technology/
Data
Technology
Infrastructure and
Integration
5.13% Level 4 80.00% 4.10%
Data Distribution
and Accessibility
3.80% Level 4 68.00% 2.58%
Data Collection
Robustness
2.66% Level 4 100.00% 2.66%
Data Metrics
Clarity
2.66% Level 3 72.00% 1.92%
Data Analytics
Capabilities
4.56% Level 2 30.00% 1.37%
Organization Process
Robustness
2.97% Level 3 62.00% 1.84%
Organizational
Structure
2.70% Level 4 95.00% 2.57%
Cultural Strength 4.86% Level 4 88.00% 4.28%
Strategy Focus 4.05% Level 2 31.00% 1.26%
Staff Expertise 3.78% Level 3 68.00% 2.57%

202
Leadership
Support
5.40% Level 4 83.00% 4.48%
Financial 3.51% Level 5 100.00% 3.51%
Customer Awareness and
Training
5.28% Level 4 75.00% 3.96%
Satisfaction 11.55% Level 3 100.00% 11.55%
Expectation 10.23% Level 2 51.00% 5.22%
Loyalty and
commitment
6.27% Level 3 99.00% 6.21%
Policy Data Privacy
Compliance
5.22% Level 3 99.00% 5.17%
Data Security
Compliance
5.76% Level 3 100.00% 5.76%
Data Ownership 3.24% Level 2 45.00% 1.46%
Data Governance 3.78% Level 2 21.00% 0.79%
Customer
Centricity
Score
73.2%
Table 64: Company C2 Customer-centricity Score Calculations

203
Score Improvement recommendations
In this section, the researcher provides recommendations to improve the customer-
centricity approach in companies C1 and C2 according to the calculated customer-
centricity scores.
The case study analysis on three hypothetical companies shows that the customer-
centricity score of companies C1 and C2 are 45.2% and 73.2%, respectively. For both
companies, there are many opportunities to improve customer-centricity. In the
following section, a few of the gaps and improvement opportunities are discussed for
each company separately.
Company C1
Company C1 got the lowest score in Data Collection robustness and Data Governance criteria. The
organization needs to cover the gaps in data collection methods and design solid processes for
data collection, which impacts directly on the metrics clarity and data analytics criteria and would
pull those scores up as well. In addition, the practices and procedures for data governance need
to be revised and upgraded since it impacts the data ownership and data privacy at this
organization.
For improving the scores under the Organization perspective, the company needs to address two
main issues. The focus of the strategy efforts needs to be on customer-centric initiatives, and also,
the employees need to be trained in regard to customer relationship management. Overall, since
the company is benefiting from the leadership support from customer-oriented approaches, the
strategy focus change can be managed smoother.

204
Finally, Company C1 needs to invest more in customer awareness and training since it directly
impacts the expectations and loyalty of current and future customers.
Company C2
Company C2 got the lowest scores in Data Governance and strategy focus criteria.
This organization can improve its customer centricity score easily by consolidating
the strategy focuses. Although customer-centricity is one of the main drivers of the
strategy in this company, the strategy needs to be more focused on processes and
products that directly impact customers.
The Data Governance gap needs to be covered by need processes, measures, and
monitoring applications. Regarding the scale of this organization, automation of data
governance practices and processes is required to improve this score. In other words,
besides clarity of the processes, the supporting applications and systems for data
governance play an important role in improving the score in this criterion.
Despite having a robust infrastructure for data collection, data analytics requires
more efforts to turn data into insights. There are huge data sources that can be
utilized for decision-making inside the organization that is not fully exploited.
Finally, there are some opportunities to meet the customer expectations in regards to
new trends of food and beverages dietary offerings, which can improve the products
of this company.
205
Research Validity
To ensure the validity of the research and to follow previous Ph.D.
dissertations[218][279][224][222], three aspects of validity are considered while
conducting the research: Content validity, Construct validity, and Criterion validity.
Content validity is the first aspect of research validity and needs to be considered in
the entire process of the research. To validate the content of this research, expert
panels were formed during this research to ensure the perspectives and criteria
identified from the literature are valid and relevant to the purpose pursued in this
research. Also, the experts were provided with the opportunity of expanding the
content by suggesting new factors (perspectives or criteria) and improving the
content validity of this research. Through this process, a new criterion was identified
(financial) and added to the relevant content pertaining to this research topic.
Construct validity evaluates the capability and fitness of the developed model to deal
with the topic of the research. During this research, many subject matter experts,
academic faculty, and doctoral students provided feedback and recommendation in
regard to the model developed throughout this research to validate the construct of
this research. The final construct was validated through disagreement analysis which
ensures the model doesn’t have wide differences in opinions from a diverse group of
experts.
Criterion validity during and after analysis of the results of the research. In this
research, multiple academic faculty and SMEs were involved in providing feedback
on the accuracy of the outcomes of this research and validating the results and

206
recommendations suggested in this research. Besides, Hypothetical companies were
created during the case study analysis of this research to test the model.
207
Chapter Seven: Contribution and future studies
Research outcomes and contribution
There are multiple expected contributions and results from this research. The first
and foremost purpose of this research is to develop a model for evaluating an
organization's degree of maturity concerning the customer-centricity approach. This
model includes attributes that are identified through literature review and expert
inputs and relative impact on the ultimate objective of this model. From the academic
perspective, this research's contribution is in fulfilling the research gap found during
the initial literature review by developing a multi-criteria-based measuring approach
for evaluating the customer-centricity approach. On the other hand, this model assists
organizations with self-assessment and continuous improvement in their customer-
centric initiatives from a business and practical perspective. Finally, this research also
recommends improvements that can facilitate the transition from product-centric to
customer-centric.
This research is defined based on the gaps that were identified during the literature
review. There is a lack of knowledge in quantifying the customer-centricity of an
organization through maturity levels and developing a model to provide a guideline
to drive an organization from a product-centric approach to a customer-centric
approach.

208
This research contributes to the technology management body of knowledge by
covering this gap and proposing a novel quantitative method to assess an
organization's maturity level in customer-centricity.
Besides, this research improves our perception of this discipline and highlights
the dynamics of the internal and external factors impacting customer orientation
projects in technology management academic research.
The final model that is developed and applied in this study is a situational awareness
tool. Improvement of an organization's Customer orientation is not achieved directly
through the model application but is instead enabled by it. Directing the company
toward a customer-centric organization is not possible without having enough
visibility toward where they are standing and assessing the current state of
the organization, and a valuable instrument that organizational change leaders can
use to effectively understand the internal and external dynamics surrounding
customer-centricity is maturity model
This research enables the evaluation of the maturity level of customer orientation in
an organization. It allows the organization's leaders to have a thorough
understanding of the organization's current state. On the other hand, the gaps
revealed in this process empower the change management team in the organization
to build a long-term roadmap to develop and improve the required capabilities
The other contribution of this research to the industry is the criteria and metrics that
quantify the maturity level of the organization regarding Customer-centricity.
Quantification of the organization's current state with specific metrics develops a
209
common understanding of where the organization is standing in regard to customer-
centricity and equips the change management team with an instrument to
communicate the current state, gap, future state, and progression of the change
management project.
On the practical and business level, the outcome of this research offers a quantitative
tool and step-by-step framework for evaluating the organizational maturity levels
and recommendations of the improvements to develop new capabilities
The methodological foundations of this research are based on two primary
methodologies of HDM and Action Research. The expert’s practical inputs collected
through Expert input and the literature review balanced and adjusted the final HDM
model from two theoretical/academic perspectives and industry/practical
standpoints.
There is a lack of knowledge in quantifying the organization's customer-centricity
through maturity levels and developing a model to guide an organization from a
product-centric approach to a customer-centric approach.
This research contributes to the Maturity Model literature by covering this gap and
proposing a novel quantitative method to assess an organization's maturity level in
customer-centricity.
On the practical and business level, this research's outcomes offer a quantitative tool
and step-by-step framework for evaluating the organizational maturity levels and
recommendations of the improvements to develop new capabilities.
210
The research was structured based on four main research questions that during the
last chapters, comprehensive and exhaustive responses are provided. However, the
research question responses can be summarized in the following concise answers:
RQ1: What are the highest priorities of challenges, gaps & barriers to adopt and
implement customer-centric approaches in a product-centric organization?
In this research and dissertation, the main challenges and gaps in customer-centricity
in organizations are identified, and critical success factors to overcome those barriers
were introduced.
RQ2: What are the dynamics among perspectives and criteria impacting an
organization's maturity in customer-centricity approaches?
The dynamics among impacting factors on customer-centricity are modeled and
quantified through developing a hierarchical decision model which formulates
outcomes of this research into a reusable resource for future academic research as
well as industry practices
RQ3: Is the proposed maturity model appropriate for the assessment of the customer-
centricity approach in the organization?

211
The proposed maturity model was validated through expert panel judgment, case
study analysis, and sensitivity analysis which reveal that the model is appropriate for
the assessment of the customer-centricity approach.
RQ4: Is the model generalizable to other industries and applications?
The focus of this research was on the e-commerce industry, which is heavily impacted
by customer-centric approaches. However, the results of this research can be applied
and generalized in other industries and applications
As the Literature review reveals [84], there is little research and documentation on
how to develop maturity models that are widely accepted, tangible and
sustainable [84]. In most academic literature, researchers focus on one or a few areas
to develop the maturity model. There is inconsistency in the methods used and
limited to the researcher's experience in a particular field, and an exhaustive list of
criteria was limited to the industry and sector that was studied.
This research is developed based on the HDM methodology, which is widely used to
build decision models in academia and industry and explores its application in
building maturity models to evaluate its customer-centricity. This is a novel
employment of this method in assessing customer orientation capability which has
no precedence and will further reveal the strength and fit-for-use of the HDM model
for a myriad of applications and use cases. The researcher believes this research also

212
promotes this methodology's utilization and adoption across academia and industry.
In other words, the ultimate goal of this research which is “To develop a quantitative
multi-dimensional model to evaluate the maturity of the organization in customer-
centricity approach,” is completely fulfilled.
Research limitation
The authors identified three limitations in this research, which is also an opportunity for
future studies in this field.
The research case study is limited to E-commerce companies. However, the model can be
expanded to other digital businesses such as online video conferencing and chat services, AI-
driven digital assistants, or social media advertising platforms.
The model is developed based on the experts' subjective judgment, which is heavily impacted
by their biases and level of knowledge in this field. In order to mitigate such impact, the
experts need to be selected from more impartial and knowledgeable people.
The criteria weight in the model will change over time, and new perspectives and criteria may
need to be considered as new technologies and policies are introduced every day. Therefore,
to gain the most benefit from the proposed model, review and revision may be needed after
a specific period.

213
References
[1] D. J. Reibstein and D. R. Wittink, “Competitive Responsiveness,” Mark. Sci., vol. 24, no. 1, pp. 8–11, Feb. 2005.
[2] J. Galbraith, Designing the customer-centric organization: A guide to strategy, structure, and process. 2011.
[3] “Amazon.com, Inc.” https://www.amazon.jobs/en/working/working-amazon.
[4] A. Bustan, R. Hotel, D. M. Almotairi, and M. Almotairi, “CRM SUCCESS FACTORS TAXONOMY.”
[5] “Is Your Organization Customer Centric? - Smarter With Gartner,” Gartner, 2019. https://www.gartner.com/smarterwithgartner/is-your-organization-customer-centric/.
[6] W. Reim, V. Parida, and D. Örtqvist, “Product–Service Systems (PSS) business models and tactics – a systematic literature review,” J. Clean. Prod., vol. 97, pp. 61–75, Jun. 2015.
[7] B. Kamp and G. Parry, “Servitization and advanced business services as levers for competitiveness,” Ind. Mark. Manag., vol. 60, pp. 11–16, Jan. 2017.
[8] T. Baines, A. Ziaee Bigdeli, O. F. Bustinza, V. G. Shi, J. Baldwin, and K. Ridgway, “Servitization: revisiting the state-of-the-art and research priorities,” Int. J. Oper. Prod. Manag., vol. 37, no. 2, pp. 256–278, Feb. 2017.
[9] W. Coreynen, P. Matthyssens, and W. Van Bockhaven, “Boosting servitization through digitization: Pathways and dynamic resource configurations for manufacturers,” Ind. Mark. Manag., vol. 60, pp. 42–53, Jan. 2017.
[10] D. Opresnik and M. Taisch, “The value of Big Data in servitization,” Int. J. Prod. Econ., vol. 165, pp. 174–184, Jul. 2015.
[11] S. Cavalieri, G. P.-C. in industry, and undefined 2012, “Product–Service Systems Engineering: State of the art and research challenges,” Elsevier.
[12] T. Hara, T. Arai, Y. Shimomura, T. S.-C. J. of Manufacturing, and undefined 2009, “Service CAD system to integrate product and human activity for total value,” Elsevier.
[13] J. Aurich, C. Fuchs, C. W.-J. of C. Production, and undefined 2006, “Life cycle oriented design of technical Product-Service Systems,” Elsevier.
[14] T. Alonso-Rasgado and G. Thompson, “A rapid design process for Total Care Product creation,” J. Eng. Des., vol. 17, no. 6, pp. 509–531, Dec. 2006.
[15] T. Baines et al., “State-of-the-art in product service-systems,” Proc. Inst. Mech. Eng. Part B J. Eng. Manuf., vol. 221, no. Part B, pp. 1543–1552, 2007.

214
[16] “Five examples of customer-centric companies – Econsultancy.” https://econsultancy.com/examples-customer-centric-companies/.
[17] PwC, “19th Annual Global CEO Survey: Redefining business success in a changing world.”
[18] “8 in 10 Consumers willing to pay more for a better customer experience as big business falls short on expectations – Capgemini Worldwide,” Capgemini, 2017. https://www.capgemini.com/news/8-in-10-consumers-willing-to-pay-more-for-a-better-customer-experience-as-big-business-falls/.
[19] V. Zeithaml, … L. B.-J. Of, and undefined 1996, “The behavioral consequences of service quality,” journals.sagepub.com.
[20] K. Gwinner, … D. G.-J. of the academy of, and undefined 1998, “Relational benefits in services industries: the customer’s perspective,” journals.sagepub.com.
[21] F. R.-H. business review and undefined 1996, “Learning from customer defections.,” elibrary.ru.
[22] P. Seybold and R. Marshak, Customers. Com: how to create a profitable business strategy for the Internet and beyond. 1998.
[23] S. J. Bell, S. Auh, and K. Smalley, “Customer Relationship Dynamics: Service Quality and Customer Loyalty in the Context of Varying Levels of Customer Expertise and Switching Costs,” J. Acad. Mark. Sci., vol. 33, no. 2, pp. 169–183, Apr. 2005.
[24] P. B. Seybold, “Get inside the lives of your customers.,” Harv. Bus. Rev., vol. 79, no. 5, pp. 80–9, 164, May 2001.
[25] G. S. Day, “Managing Market Relationships,” J. Acad. Mark. Sci., vol. 28, no. 1, pp. 24–30, Jan. 2000.
[26] K. Lemon, P. V.-J. of Marketing, and undefined 2016, “Understanding customer experience throughout the customer journey,” journals.ama.org.
[27] D. Edelman, M. S.-H. B. Review, and undefined 2015, “Competing on customer journeys,” webscience.th-koeln.de.
[28] A. Rawson, E. Duncan, C. J.-H. B. Review, and undefined 2013, “The truth about customer experience,” sma.nl.
[29] J. Brakus, B. Schmitt, L. Z.-J. of marketing, and undefined 2009, “Brand experience: what is it? How is it measured? Does it affect loyalty?” journals.ama.org.
[30] N. Puccinelli, R. Goodstein, D. Grewal, … R. P.-J. of, and undefined 2009, “Customer experience management in retailing: understanding the buying process,” Elsevier.

215
[31] P. C. Verhoef, K. N. Lemon, A. Parasuraman, A. Roggeveen, M. Tsiros, and L. A. Schlesinger, “Customer Experience Creation: Determinants, Dynamics and Management Strategies,” J. Retail., vol. 85, no. 1, pp. 31–41, Mar. 2009.
[32] R. N. Bolton, A. Gustafsson, J. McColl-Kennedy, N. J. Sirianni, and D. K. Tse, “Small details that make big differences,” J. Serv. Manag., vol. 25, no. 2, pp. 253–274, Apr. 2014.
[33] C. Gentile, N. Spiller, G. N.-E. management journal, and undefined 2007, “How to sustain the customer experience:: An overview of experience components that co-create value with the customer,” Elsevier.
[34] B. S.-D. M. J. (Former Series) and undefined 1999, “Experiential marketing: A new framework for design and communications,” Wiley Online Libr.
[35] C. Berger, K. Möslein, F. Piller, and R. Reichwald, “Co-designing modes of cooperation at the customer interface: learning from exploratory research,” Eur. Manag. Rev., vol. 2, no. 1, pp. 70–87, Mar. 2005.
[36] E. M. Martinelli and A. Tunisini, “Customer integration into supply chains: literature review and research propositions,” J. Bus. Ind. Mark., vol. 34, no. 1, pp. 24–38, Mar. 2019.
[37] A. Garai and T. K. Roy, “Multi-objective optimization of cost-effective and customer-centric closed-loop supply chain management model in T-environment,” Soft Comput., vol. 24, no. 1, pp. 155–178, Jan. 2020.
[38] H. Kuokkanen, “Improving profitability: A conceptual model of destination-centric revenue management,” J. Revenue Pricing Manag., vol. 12, no. 4, pp. 313–319, Jul. 2013.
[39] L. V. Ngo and A. O’Cass, “Value creation architecture and engineering: A business model encompassing the firm-customer dyad,” Eur. Bus. Rev., vol. 22, no. 5, pp. 496–514, 2010.
[40] M. Grieger and A. Ludwig, “Correction to: On the move towards customer-centric business models in the automotive industry - a conceptual reference framework of shared automotive service systems (Electronic Markets, (2019), 29, 3, (473-500), 10.1007/s12525-018-0321-6),” Electron. Mark., vol. 29, no. 3, p. 501, Sep. 2019.
[41] J. Sheth, N. Sethia, S. S.-J. of the academy of marketing, and undefined 2011, “Mindful consumption: a customer-centric approach to sustainability,” Springer, 2011.
[42] M. Bogers, R. Hadar, and A. Bilberg, “Additive manufacturing for consumer-centric business models: Implications for supply chains in consumer goods manufacturing,” Technol. Forecast. Soc. Change, vol. 102, pp. 225–239, Jan. 2016.

216
[43] J. N. Sheth, R. S. Sisodia, and A. Sharma, “The antecedents and consequences of customer-centric marketing,” J. Acad. Mark. Sci., vol. 28, no. 1, pp. 55–66, 2000.
[44] Å. Finne and C. Grönroos, “Communication-in-use: customer-integrated marketing communication,” Eur. J. Mark., vol. 51, no. 3, pp. 445–463, 2017.
[45] T. T. Dang and A. D. Pham, “What makes banks’ front-line staff more customer-oriented? The role of interactional justice,” Int. J. Bank Mark., vol. 38, no. 4, pp. 777–798, Jun. 2020.
[46] C. France, D. Grace, B. Merrilees, and D. Miller, “Customer brand co-creation behavior: conceptualization and empirical validation,” Mark. Intell. Plan., vol. 36, no. 3, pp. 334–348, Apr. 2018.
[47] E. Peelen, K. van Montfort, R. Beltman, and A. Klerkx, “An empirical study into the foundations of CRM success,” J. Strateg. Mark., vol. 17, no. 6, pp. 453–471, Dec. 2009.
[48] F. M. Chuang, R. E. Morgan, and M. J. Robson, “Customer and competitor insights, new product development competence, and new product creativity: Differential, integrative, and substitution effects,” J. Prod. Innov. Manag., vol. 32, no. 2, pp. 175–182, Mar. 2015.
[49] D. Zahay, A. Griffin, and E. Fredericks, “Information use in new product development: An initial exploratory empirical investigation in the chemical industry,” J. Prod. Innov. Manag., vol. 28, no. 4, pp. 485–502, Jul. 2011.
[50] D. Walters, “Research note market centricity and producibility: An opportunity for marketing and operations management to enhance customer satisfaction,” J. Manuf. Technol. Manag., vol. 25, no. 2, pp. 299–308, 2014.
[51] P. H. Tseng and C. H. Liao, “Supply chain integration, information technology, market orientation and firm performance in container shipping firms,” Int. J. Logist. Manag., vol. 26, no. 1, pp. 82–106, May 2015.
[52] J. S. Caerteling, C. A. Di Benedetto, A. G. Dorée, J. I. M. Halman, and M. Song, “Technology development projects in road infrastructure: The relevance of government championing behavior,” Technovation, vol. 31, no. 5–6, pp. 270–283, 2011.
[53] S. H. Han, J. Lee, B. Edvardsson, and R. Verma, “Mobile technology adoption among hotels: Managerial issues and opportunities,” Tour. Manag. Perspect., vol. 38, Apr. 2021.
[54] I. Pihir, … K. T.-P.-J. of I. and, and undefined 2019, “Digital transformation playground-literature review and framework of concepts,” track.srce.hr, vol. 43, no. 1, pp. 33–48, 2019.
[55] H. L. Chang, H. E. Hsiao, Y. J. Lee, and J. Chang, “Assessing IT-business alignment in service-oriented Enterprises,” Pacific Asia J. Assoc. Inf. Syst., vol.

217
3, no. 1, p. 3, Mar. 2011.
[56] W. Tan, B. J. Sauser, and J. E. Ramirez-Marquez, “Analyzing component importance in multifunction multicapability systems developmental maturity assessment,” IEEE Trans. Eng. Manag., vol. 58, no. 2, pp. 275–294, May 2011.
[57] Pankaj Setia, Pankat Setia, Viswanath Venkatesh, and Supreet Joglekar, “Leveraging Digital Technologies: How Information Quality Leads to Localized Capabilities and Customer Service Performance on JSTOR,” MIS Quarterly Vol. 37, No. 2, 2013. https://www-jstor-org.proxy.lib.pdx.edu/stable/43825923?seq=1#metadata_info_tab_contents.
[58] P. Trkman, W. Mertens, S. Viaene, and P. Gemmel, “From business process management to customer process management,” Bus. Process Manag. J., vol. 21, no. 2, pp. 250–266, Apr. 2015.
[59] S. Ethiraj, P. Kale, … M. K.-S. management, and undefined 2005, “Where do capabilities come from and how do they matter? A study in the software services industry,” Wiley Online Libr., vol. 26, no. 1, pp. 25–45, Jan. 2005.
[60] D. E. Harter, M. S. Krishnan, and S. A. Slaughter, “Effects of process maturity on quality, cycle time, and effort in software product development,” Manage. Sci., vol. 46, no. 4, pp. 451–466, 2000.
[61] K. M.-J. of S. and Software and undefined 2016, “Revisiting software ecosystems research: A longitudinal literature study,” Elsevier.
[62] A. A. Khan, J. W. Keung, Fazal-E-Amin, and M. Abdullah-Al-Wadud, “Spiimm: Toward a model for software process improvement implementation and management in global software development,” IEEE Access, vol. 5, pp. 13720–13741, Jul. 2017.
[63] S. Ali, S. K.-J. of systems and software, and undefined 2016, “Software outsourcing partnership model: An evaluation framework for vendor organizations,” Elsevier, 2016.
[64] S. Balsamo, A. Di Marco, P. Inverardi, and M. Simeoni, “Model-based performance prediction in software development: A survey,” IEEE Trans. Softw. Eng., vol. 30, no. 5, pp. 295–310, May 2004.
[65] F. S. Silva et al., “Using CMMI together with agile software development: A systematic review,” Elsevier, vol. 58, pp. 20–43, 2015.
[66] C. Torrecilla-Salinas, J. Sedeño, … M. E.-I. and, and undefined 2016, “Agile, Web Engineering, and Capability Maturity Model Integration: A systematic literature review.,” Elsevier, 2015.
[67] M. Röglinger, J. Pöppelbuß, and J. Becker, “Maturity models in business process management,” Bus. Process Manag. J., vol. 18, no. 2, pp. 328–346, Apr. 2012.
218
[68] A. Tarhan, O. Turetken, H. R.-I., and S. Technology, and undefined 2016, “Business process maturity models: A systematic literature review,” Elsevier, 2016.
[69] A. van Looy, M. de Backer, and G. Poels, “Defining business process maturity. A journey towards excellence,” Total Qual. Manag. Bus. Excell., vol. 22, no. 11, pp. 1119–1137, 2011.
[70] J. Y. Lee, S. Sridhar, C. M. Henderson, and R. W. Palmatier, “Effect of customer-centric structure on long-term financial performance,” Mark. Sci., vol. 34, no. 2, pp. 250–268, 2015.
[71] J. Lee, S. P.-E. S. with Applications, and 2003, “Agent and data mining based decision support system and its adaptation to a new customer-centric electronic commerce,” Elsevier, 2003.
[72] J. C. Lee, C. Y. Chen, and Y. C. Shiue, “The moderating effects of organizational culture on the relationship between absorptive capacity and software process improvement success,” Inf. Technol. People, vol. 30, no. 1, pp. 47–70, 2017.
[73] F. Ahmed, L. C.-S. Q. Journal, and undefined 2010, “An organizational maturity model of software product line engineering,” Springer, vol. 18, no. 2, pp. 195–225, 2010.
[74] S. M. Wagner, K. K. R. Ullrich, and S. Transchel, “The game plan for aligning the organization,” Bus. Horiz., vol. 57, no. 2, pp. 189–201, Mar. 2014.
[75] J. Kenny, “Strategy and the learning organization: A maturity model for the formation of strategy,” Learn. Organ., vol. 13, no. 4, pp. 353–368, 2006.
[76] R. Hirschheim, A. Schwarz, P. T.-I. S. Journal, and undefined 2006, “A marketing maturity model for IT: Building a customer-centric IT organization,” ieeexplore.ieee.org, 2005.
[77] R. L. Grossman, “A framework for evaluating the analytic maturity of an organization,” Int. J. Inf. Manage., vol. 38, no. 1, pp. 45–51, Feb. 2018.
[78] I. Boughzala, G. D. V.-J. of M. Information, and undefined 2015, “Evaluating team collaboration quality: The development and field application of a collaboration maturity model,” Taylor Fr., vol. 32, no. 3, pp. 129–157, Jul. 2015.
[79] D. Shah, R. Rust, A. P.-… of service Research, and U. 2006, “The path to customer-centricity ,” journals.sagepub.com, 2006.
[80] R. B. Sadiq, N. Safie, A. H. Abd Rahman, and S. Goudarzi, “Artificial intelligence maturity model: A systematic literature review,” PeerJ Comput. Sci., vol. 7, pp. 1–27, Aug. 2021.
[81] J. B. S. dos Santos-Neto and A. P. C. S. Costa, “Enterprise maturity models: a
219
systematic literature review,” Enterp. Inf. Syst., vol. 13, no. 5, pp. 719–769, May 2019.
[82] R. Wendler, “The maturity of maturity model research: A systematic mapping study,” Inf. Softw. Technol., vol. 54, no. 12, pp. 1317–1339, Dec. 2012.
[83] R. van de Wetering and R. Batenburg, “A PACS maturity model: A systematic meta-analytic review on maturation and evolvability of PACS in the hospital enterprise,” Int. J. Med. Inform., vol. 78, no. 2, pp. 127–140, Feb. 2009.
[84] T. De Bruin, R. Freeze, U. Kaulkarni, and M. Rosemann, “Understanding the main phases of developing a maturity assessment model,” 2005.
[85] A. Maier, J. Moultrie, P. C.-4th I. C. on, and undefined 2009, “Developing maturity grids for assessing organisational capabilities: Practitioner guidance,” orbit.dtu.dk.
[86] J. Becker, R. Knackstedt, and J. Pöppelbuß, “Developing Maturity Models for IT Management,” Bus. Inf. Syst. Eng., vol. 1, no. 3, pp. 213–222, Jun. 2009.
[87] C. Salviano, A. Zoucas, … J. S.-16th E., and undefined 2009, “A method framework for engineering process capability models,” pro2pi.wdfiles.com.
[88] C. von Wangenheim, J. Hauck, … A. Z.-I., and undefined 2010, “Creating software process capability/maturity models,” ieeexplore.ieee.org.
[89] J. Poeppelbuss, B. Niehaves, A. Simons, J. Becker, and J. Pöppelbuß, “Maturity Models in Information Systems Research: Literature Search and Analysis,” Commun. Assoc. Inf. Syst., vol. 29, pp. 505–532, 2011.
[90] J. McCarthy, P. W.- interactions, and undefined 2004, “Technology as experience,” dl.acm.org.
[91] “Web of Science.” https://login.webofknowledge.com/.
[92] “Google Trends.” https://trends.google.com/trends/?geo=US.
[93] R. Ocker, S. M.-36th A. H. International, and undefined 2003, “Assessing the readiness of firms for CRM: a literature review and research model,” ieeexplore.ieee.org.
[94] W. Brenski, “Customer-centricity and satisfaction as a key aspect of CRM,” 2015.
[95] A.-M. Croteau and P. Li, “Critical Success Factors of CRM Technological Initiatives,” Can. J. Adm. Sci. / Rev. Can. des Sci. l’Administration, vol. 20, no. 1, pp. 21–34, Apr. 2009.
[96] T. Hennig-Thurau and A. Klee, “The impact of customer satisfaction and relationship quality on customer retention: A critical reassessment and model development,” Psychol. Mark., vol. 14, no. 8, pp. 737–764, 1997.

220
[97] K. N. Kennedy, J. R. Goolsby, and E. J. Arnould, “Implementing a Customer Orientation: Extension of Theory and Application,” J. Mark., vol. 67, no. 4, pp. 67–81, Oct. 2003.
[98] C. P. Blocker, D. J. Flint, M. B. Myers, and S. F. Slater, “Proactive customer orientation and its role for creating customer value in global markets,” J. Acad. Mark. Sci., vol. 39, no. 2, pp. 216–233, Apr. 2011.
[99] P. Müller, R. S.-D. 60: P. of D. 2010, undefined the, and undefined 2010, “A generic PSS development process model based on theory and an empirical study,” designsociety.org.
[100] H. Meier, … K. S.-: 15th C. I. C., and U. 2008, “Industrial Product-service-systems: Integrated Development of Products and Services,” search.informit.com.au.
[101] M. Lindahl, E. Sundin, T. Sakao, and Y. Shimomura, “An interactive design methodology for service engineering of functional sales concepts - A potential design for environment methodology,” in 13th CIRP International Conference on Life Cycle Engineering, 2006, pp. 2–7.
[102] S. Cavalieri, G. Pezzotta, D. C. Mcfarlane, and P. Wilde, “Towards a classification of service design foci, activities, phases, perspectives and participants,” p., 2009.
[103] T. Sakao, Y. S.-J. of C. Production, and undefined 2007, “Service Engineering: a novel engineering discipline for producers to increase value combining service and product,” Elsevier.
[104] H. Luczak, C. Gill, B. S.-A. in services innovations, and undefined 2007, “Architecture for service engineering—the design and development of industrial service work,” Springer.
[105] N. Morelli, “Designing Product/Service Systems: A Methodological Exploration,” Des. Issues, vol. 18, no. 3, pp. 3–17, Jul. 2002.
[106] R. Schmitt, S. H.-M. systems and technologies for the new, and undefined 2008, “Strategic servicification—a quality based approach beyond service-engineering,” Springer.
[107] K. Chai, J. Zhang, K. T.-J. of S. Research, and undefined 2005, “A TRIZ-based method for new service design,” journals.sagepub.com.
[108] H. Lee, C. Kim, Y. P.-C. & I. Engineering, and undefined 2010, “Evaluation and management of new service concepts: An ANP-based portfolio approach,” Elsevier.
[109] C. Froehle, A. Roth, R. C.-… of S. Research, and undefined 2000, “Antecedents of new service development effectiveness: an exploratory examination of strategic operations choices,” journals.sagepub.com.

221
[110] R. S. Behara and R. B. Chase, “Service quality deployment: quality service by design,” in Perspectives in Operations Management, 1993, pp. 87–99.
[111] G. Pezzotta, S. Cavalieri, P. G.-I. C. on, and undefined 2009, “Product-service engineering process: theoretical and empirical evidences,” aisberg.unibg.it.
[112] O. Bustinza, A. Bigdeli, … T. B.-R.-T., and undefined 2015, “Servitization and competitive advantage: the importance of organizational structure and value chain position,” Taylor Fr.
[113] T. Baines and H. W. Lightfoot, “Servitization of the manufacturing firm,” Int. J. Oper. Prod. Manag., vol. 34, no. 1, pp. 2–35, Dec. 2013.
[114] A. Eggert, J. Hogreve, W. Ulaga, and E. Muenkhoff, “Revenue and Profit Implications of Industrial Service Strategies,” J. Serv. Res., vol. 17, no. 1, pp. 23–39, Feb. 2014.
[115] R. Oliva, R. K.-I. journal of service industry, and undefined 2003, “Managing the transition from products to services,” emeraldinsight.com.
[116] A. L. Ostrom et al., “Moving Forward and Making a Difference: Research Priorities for the Science of Service,” J. Serv. Res., vol. 13, no. 1, pp. 4–36, Feb. 2010.
[117] T. Baines and V. G. Shi, “A Delphi study to explore the adoption of servitization in UK companies,” Prod. Plan. Control, vol. 26, no. 14–15, pp. 1171–1187, Nov. 2015.
[118] R. Roy and K. S. Cheruvu, “A competitive framework for industrial product-service systems,” Int. J. Internet Manuf. Serv., vol. 2, no. 1, p. 4, 2009.
[119] D. K.-E. management journal and undefined 2010, “Towards a service-based business model–Key aspects for future competitive advantage,” Elsevier.
[120] “Maturity model | Cyber.gov.au.” https://www.cyber.gov.au/acsc/view-all-content/glossary/maturity-model.
[121] G. A. Garcia-Mireles, M. Angeles Moraga, and F. Garcia, “Development of maturity models: a systematic literature review,” in 16th International Conference on Evaluation & Assessment in Software Engineering (EASE 2012), 2012, pp. 279–283.
[122] J. Becker, B. Niehaves, J. Poeppelbuss, and A. Simons, “Maturity Models in IS Research,” ECIS 2010 Proc., Jan. 2010.
[123] M. P.-A. S. Q. Professional and undefined 2009, “A history of the capability maturity model for software,” Citeseer.
[124] H. Kerzner, Strategic planning for project management using a project management maturity model. John Wiley, 2001.

222
[125] J. V. Carvalho, Á. Rocha, and A. Abreu, “Maturity Models of Healthcare Information Systems and Technologies: a Literature Review,” J. Med. Syst., vol. 40, no. 6, Jun. 2016.
[126] A. Shaygan and T. Daim, “Technology management maturity assessment model: An exploratory multi-criteria approach for healthcare organizations,” Aug. 2019.
[127] “Software Engineering Institute.” https://www.sei.cmu.edu/about/index.cfm.
[128] “CMMI Institute - Company.” https://cmmiinstitute.com/company.
[129] K. J.-Q. Progress and undefined 2001, “Philip B. Crosby’s mark on quality,” search.proquest.com.
[130] EW Deming, “Out of the Crisis,” Massachusetts Inst. Technol., 1986.
[131] J. Juran, “Juran on planning for quality,” 1988.
[132] W. Humphrey, “Managing the software process,” 1989.
[133] “CMMI Product Team.” https://resources.sei.cmu.edu/library/author.cfm?authorid=4781.
[134] C. Product Team, “CMMI ® for Acquisition, Version 1.3 CMMI Product Team Improving processes for acquiring better products and services,” 2010.
[135] “CMMI Institute - Home.” https://cmmiinstitute.com/.
[136] J. McClure, “CMMI for development v 1.3 by Mary Beth Chrissis, Mike Konrad and Sandy Shrum,” ACM SIGSOFT Softw. Eng. Notes, vol. 36, no. 4, pp. 34–35, Aug. 2011.
[137] “Sowden, R., D. Hinley, and S. Clarke. "Porfolio,... - Google Scholar.” https://scholar.google.com/scholar?hl=en&as_sdt=0%2C38&authuser=1&q=Sowden%2C+R.%2C+D.+Hinley%2C+and+S.+Clarke.+%22Porfolio%2C+Programme+and+Project+Management+Maturity+Model+%28P3M3%29.%22 Introduction+and+Guide+to+P3M3.+AXELOS+Limited%2C+UK %282013%29.&btnG=.
[138] “Introduction to P3M3 ®,” 2019.
[139] “PNNL Maturity Models | PNNL.” https://www.pnnl.gov/pnnl-maturity-models.
[140] “TRMM.” https://trmm.labworks.org/.
[141] “Cybersecurity Capability Maturity Model (C2M2) Program | Department of Energy.” https://www.energy.gov/ceser/energy-security/cybersecurity-capability-maturity-model-c2m2-program.
[142] “ELECTRICITY SUBSECTOR TRANSMISSION RESILIENCE MATURITY MODEL

223
(TRMM) User Guide,” 2020.
[143] “TRMM Evaluation Tool,” PNNL. https://trmm.labworks.org/Evaluation.
[144] Y. Tian and C. Stewart, “History of E-Commerce,” in Electronic Commerce, IGI Global, 2011, pp. 1–8.
[145] S. Sawabini, “EDI AND THE INTERNET,” J. Bus. Strategy, vol. 22, no. 1, pp. 41–41, Jan. 2001.
[146] P. Timmers, “Electronic commerce,” 1999.
[147] R. E. Anderson and S. S. Srinivasan, “E-Satisfaction and E-Loyalty: A Contingency Framework,” Psychol. Mark., vol. 20, no. 2, pp. 123–138, Feb. 2003.
[148] L. Cao, L. L.-J. of Retailing, and undefined 2015, “The impact of cross-channel integration on retailers’ sales growth,” Elsevier.
[149] “E-commerce worldwide - statistics & facts | Statista.” https://www.statista.com/topics/871/online-shopping/.
[150] “• Global retail e-commerce market size 2014-2023 | Statista.” https://www.statista.com/statistics/379046/worldwide-retail-e-commerce-sales/#statisticContainer.
[151] “• Retail e-commerce sales CAGR 2024 | Statista.” https://www.statista.com/statistics/220177/b2c-e-commerce-sales-cagr-forecast-for-selected-countries/.
[152] D. Risch and P. Schubert, “Customer Profiles, Personalization, and Privacy,” Citeseer, 2005. https://scholar-google-com.proxy.lib.pdx.edu/scholar?hl=en&as_sdt=0%2C38&q=Risch%2C+Daniel%2C+and+Petra+Schubert.+%22Customer+Profiles%2C+Personalization+and+Privacy.%22+%282005%29.&btnG=.
[153] M. D. Mulvenna, S. S. Anand, and A. G. Büchner, “Personalization on the Net using Web Mining,” Commun. ACM, vol. 43, no. 8, pp. 122–125, Aug. 2000.
[154] “• E-commerce companies believing AI will help business 2019 | Statista.” https://www.statista.com/statistics/1175063/ai-help-business-ecommerce-companies-worldwide/.
[155] C. Chen, M. Martin, K. M.-M. accounting research, and undefined 2014, “The effect of measurement timing on the information content of customer satisfaction measures,” Elsevier.
[156] T. Nisar, G. P.-J. of retailing and consumer services, and undefined 2017, “What factors determine e-satisfaction and consumer spending in e-commerce retailing?,” Elsevier.

224
[157] Z. Chen and A. J. Dubinsky, “A Conceptual Model of Perceived Customer Value in E-Commerce: A Preliminary Investigation,” Psychol. Mark., vol. 20, no. 4, pp. 323–347, Apr. 2003.
[158] O. C. Hansemark and M. Albinsson, “Customer satisfaction and retention: The experiences of individual employees,” Manag. Serv. Qual. An Int. J., vol. 14, no. 1, pp. 40–57, Feb. 2004.
[159] C. H. Yen and H. P. Lu, “Effects of e-service quality on loyalty intention: An empirical study in online auction,” Manag. Serv. Qual., vol. 18, no. 2, pp. 127–146, 2008.
[160] X. Luo and C. B. Bhattacharya, “Corporate Social Responsibility, Customer Satisfaction, and Market Value,” J. Mark., vol. 70, no. 4, pp. 1–18, Oct. 2006.
[161] S. O. Olsen, “Repurchase loyalty: The role of involvement and satisfaction,” Psychol. Mark., vol. 24, no. 4, pp. 315–341, Apr. 2007.
[162] M. Gommans, K. S. Krishnan, and K. B. Scheffold, “From Brand Loyalty to E-Loyalty: A Conceptual Framework,” 2001.
[163] J. Bamfield, “Retail futures 2018: Shop numbers, online and the high street: A guide to retailing in 2018,” 2013.
[164] P. K. Chintagunta, J. Chu, and J. Cebollada, “Quantifying transaction costs in online/off-line grocery channel choice,” Mark. Sci., vol. 31, no. 1, pp. 96–114, Jan. 2012.
[165] K. Pauwels, P. Leeflang, M. T.-J. of Retailing, and undefined 2011, “Does online information drive offline revenues?: only for specific products and consumer segments!,” Elsevier.
[166] F. Fui, H. Nah, and S. Davis, “HCI Research Issues in Electronic Commerce. HCI RESEARCH ISSUES IN E-COMMERCE,” 2002.
[167] C. Karat, J. Blom, and J. Karat, Designing personalized user experiences in eCommerce. 2004.
[168] “2020 Consumer Data Privacy Legislation.” https://www.ncsl.org/research/telecommunications-and-information-technology/2020-consumer-data-privacy-legislation637290470.aspx.
[169] C. Adolphs and A. Winkelmann, “PERSONALIZATION RESEARCH IN E-COMMERCE-A STATE OF THE ART REVIEW (2000-2008).”
[170] S. A. Zahra, “"The Practice of Management": Reflections on Peter F. Drucker’s Landmark Book,” The Academy of Management Executive (1993-2005), vol. 17. Academy of Management, pp. 16–23.
[171] “What are the key digital strategies for 2016? [stats] – Econsultancy.” https://econsultancy.com/what-are-the-key-digital-strategies-for-2016-
225
stats/.
[172] C. H.-M. Management and undefined 1999, “Customers are your business,” search.proquest.com.
[173] “Impact of Emerging Markets on Marketing: Rethinking Existing Perspectives and Practices,” 2011.
[174] M. Van Steenbergen, R. Bos, … S. B.-… C. on D., and undefined 2010, “The design of focus area maturity models,” Springer.
[175] T. Mettler, P. R.-P. of the 4th international conference on, and undefined 2009, “Situational maturity models as instrumental artifacts for organizational design,” dl.acm.org.
[176] J. Hauck, C. Von Wangenheim, … F. M. C.-… C. on P., and undefined 2011, “Proposing an ISO/IEC 15504-2 compliant method for process capability/maturity models customization,” Springer.
[177] J. Spiess, Y. T’Joens, … R. D.-B. labs technical, and undefined 2014, “Using big data to improve customer experience and business performance,” ieeexplore.ieee.org.
[178] M. Leppänen, “A Comparative Analysis of Agile Maturity Models,” in Information Systems Development, New York, NY: Springer New York, 2013, pp. 329–343.
[179] J. Pöppelbuß, M. R.- Ecis, and undefined 2011, “What makes a useful maturity model? a framework of general design principles for maturity models and its demonstration in business process management.,” aisel.aisnet.org.
[180] M. Röglinger, … J. P.-B. process, and undefined 2012, “Maturity models in business process management,” emeraldinsight.com.
[181] J. E. Scott, “Mobility, Business Process Management, Software Sourcing, and Maturity Model Trends: Propositions for the IS Organization of the Future,” Inf. Syst. Manag., vol. 24, no. 2, pp. 139–145, Mar. 2007.
[182] P. Gottschalk, “Maturity levels for interoperability in digital government,” Gov. Inf. Q., vol. 26, no. 1, pp. 75–81, Jan. 2009.
[183] D. Raber, R. Winter, F. W.-2012 45th Hawaii, and undefined 2012, “Using quantitative analyses to construct a capability maturity model for business intelligence,” ieeexplore.ieee.org.
[184] A. Rae, R. Alexander, J. M.-R. E. & S. Safety, and undefined 2014, “Fixing the cracks in the crystal ball: a maturity model for quantitative risk assessment,” Elsevier.
[185] G. Lahrmann, F. M. D. S. R. in I. Systems, and undefined 2010, “Systematization of maturity model extensions,” Springer.
226
[186] D. Welte, M. Y.-A. Bulletin, and undefined 1981, “Petroleum origin and accumulation in basin evolution--a quantitative model,” archives.datapages.com.
[187] J. Jacobs, J. T.-10th I. W. on, and undefined 2002, “Towards a metrics based verification and validation maturity model,” ieeexplore.ieee.org.
[188] T. Saaty, “Analytic network process Encyclopedia of Operations Research and Management Science (pp. 28-35),” 2001.
[189] J. Razmi, M. Sangari, R. G.-A. in E. Software, and undefined 2009, “Developing a practical framework for ERP readiness assessment using fuzzy analytic network process,” Elsevier.
[190] J. P. Brans and Y. De Smet, “PROMETHEE methods,” Int. Ser. Oper. Res. Manag. Sci., vol. 233, pp. 187–219, 2016.
[191] J. Brans and B. Mareschal, “PROMETHEE methods, in ‘Multiple Criteria Decision Analysis: State of the Art Surveys’. Edited by J. Figueira, S. Greco, M. Ehrgott,” 2005.
[192] V. Balali, B. Zahraie, and A. Roozbahani, “A Comparison of AHP and PROMETHEE Family Decision Making Methods for Selection of Building Structural System,” Am. J. Civ. Eng. Archit., vol. 2, no. 5, pp. 149–159, 2014.
[193] D. O.-E. J. of operational research and undefined 2001, “Comparison of three multicriteria methods to predict known outcomes,” Elsevier.
[194] F. D.-I. journal of man-machine studies and undefined 1993, “User acceptance of information technology: system characteristics, user perceptions and behavioral impacts,” Elsevier.
[195] M. C.-W. P. on I. Systems and undefined 2009, “Overview of the technology acceptance model: Origins, developments and future directions,” academia.edu.
[196] P. Legris, J. Ingham, P. C.-I. & management, and undefined 2003, “Why do people use information technology? A critical review of the technology acceptance model,” Elsevier.
[197] S. Opricovic, G. T.-E. journal of operational research, and undefined 2004, “Compromise solution by MCDM methods: A comparative analysis of VIKOR and TOPSIS,” Elsevier.
[198] A. K. Puthanpura, R. Khalifa, L. Chan, and H. Barham, “Technology Assessment: Emerging Automotive Technologies for the Future,” 2018, pp. 367–385.
[199] F. Junior, L. Osiro, L. C.-A. S. Computing, and undefined 2014, “A comparison between Fuzzy AHP and Fuzzy TOPSIS methods to supplier selection,” Elsevier.
227
[200] S.-J. Chen and C.-L. Hwang, “Fuzzy Multiple Attribute Decision Making Methods,” 1992, pp. 289–486.
[201] B. Roy, Multicriteria methodology for decision aiding. 2013.
[202] C. A. Bana e Costa and P. Vincke, “Multiple Criteria Decision Aid: An Overview,” in Readings in Multiple Criteria Decision Aid, Springer Berlin Heidelberg, 1990, pp. 3–14.
[203] V. Belton and T. Stewart, Multiple criteria decision analysis: an integrated approach. 2002.
[204] R. Keeney and H. Raiffa, Decisions with multiple objectives: preferences and value trade-offs. 1993.
[205] V. Belton and T. Stewart, Multiple criteria decision analysis: an integrated approach. 2002.
[206] A. de A.-E. J. of O. Research and undefined 2001, “Multicriteria decision making on maintenance: spares and contracts planning,” Elsevier.
[207] S. I. Gass and R. H. Smith, “Model World: The Great Debate-MAUT Versus AHP,” vol. 35, no. 4, pp. 308–312, 2005.
[208] L. R. Keller, “Properties of Utility Theories and Related Empirical Phenomena,” 1992, pp. 3–23.
[209] D. KAI-INEMAN, A. T.- Econometrica, and undefined 1979, “Prospect theory: An analysis of decision under risk,” hassler-j.iies.su.se.
[210] D. Trentesaux, “Distributed control of production systems,” Eng. Appl. Artif. Intell., vol. 22, no. 7, pp. 971–978, Oct. 2009.
[211] S. Munkongsujarit, W. Schweinfort, … I. I.-P.-2009, and undefined 2009, “Decision model for a place to live at PSU: The case of international graduate students,” ieeexplore.ieee.org.
[212] D. K.-I. T. on E. Management and undefined 1983, “A participative approach to program evaluation,” ieeexplore.ieee.org.
[213] H. Chen, J. L.-2011 P. of P. Technology, and undefined 2011, “A sensitivity analysis algorithm for the constant sum pair-wise comparison judgments in hierarchical decision models,” ieeexplore.ieee.org.
[214] K. Phan, D. K.-P. of P. Conference, and undefined 2014, “Innovation measurement framework to determine innovativeness of a company: Case of semiconductor industry,” ieeexplore.ieee.org.
[215] H. Chen, D. K.-E. J. of O. Research, and undefined 2008, “A sensitivity analysis algorithm for hierarchical decision models,” Elsevier.
228
[216] A. Mahmood, “Software implementation of hierarchical decision modeling and hierarchical decision modeling sensitivity analysis.,” 2011.
[217] K. Phan, “Innovation Measurement: a Decision Framework to Determine Innovativeness of a Company,” pp. 5–16, 2013.
[218] J. Estep, “Development of a Technology Transfer Score for Evaluating Research Proposals: Case Study of Demand Response Technologies in the Pacific Northwest,” pp. 2–13, 2017.
[219] R. Abotah, “Evaluation of Energy Policy Instruments for the Adoption of Renewable Energy : Case of Wind Energy in the Pacific Northwest,” 2014.
[220] E. Gibson, T. D.-2016 P. I. Conference, and undefined 2016, “A measurement system for science and engineering research center performance evaluation,” ieeexplore.ieee.org.
[221] M. S. Abbas, “Consistency Analysis for Judgment Quantification in Hierarchical Decision Model,” pp. 3–21, 2016.
[222] I. Iskin, “An Assessment Model for Energy Efficiency Program Planning in Electric Utilities: Case of the Pacific of Northwest U.S.A.,” pp. 6–8, 2014.
[223] J. Goodier, “ The Cambridge Dictionary of Statistics (4th edition)2011224B.S. Everitt and A. Skrondal. The Cambridge Dictionary of Statistics (4th edition) . Cambridge: Cambridge University Press 2010. ix+468 pp., ISBN: 978 0 521 76699 9 £40 $59 ,” Ref. Rev., vol. 25, no. 5, pp. 37–38, Jun. 2011.
[224] L. Chan, “Developing a Strategic Policy Choice Framework for Technological Innovation: Case of Chinese Pharmaceuticals,” Portland, OR, Jan. 2013.
[225] M. Lingga, “Developing a Hierarchical Decision Model to Evaluate Nuclear Power Plant Alternative Siting Technologies,” Portland State University, 2016.
[226] P. E. Shrout and J. L. Fleiss, “Intraclass correlations: Uses in assessing rater reliability,” Psychol. Bull., vol. 86, no. 2, pp. 420–428, Mar. 1979.
[227] D. J. Weiss and J. Shanteau, “Empirical Assessment of Expertise,” Hum. Factors J. Hum. Factors Ergon. Soc., vol. 45, no. 1, pp. 104–116, 2003.
[228] “Use of Expert Panels in Developing Land Use Forecasts.” .
[229] R. Khalifa, “Evaluating Project Assessment Techniques for High-Profile Transportation Projects Development and Delivery: Case of State Departments of Transportation (DOTs) in the United States,” Portland, OR, Jan. 2019.
[230] M. G. Morgan, “Use (and abuse) of expert elicitation in support of decision making for public policy,” Proceedings of the National Academy of Sciences of the United States of America, vol. 111, no. 20. National Academy of Sciences, pp. 7176–7184, May 20, 2014.

229
[231] G. F. Nemet, L. D. Anadon, and E. Verdolini, “Quantifying the Effects of Expert Selection and Elicitation Design on Experts’ Confidence in Their Judgments About Future Energy Technologies,” Risk Anal., vol. 37, no. 2, pp. 315–330, Feb. 2017.
[232] Q. Jones et al., “Information Overload and the Message Dynamics of Online Interaction Spaces: A Theoretical Model and Empirical Exploration,” Inf. Syst. Res., vol. 15, no. 2, pp. 194–210, Jun. 2004.
[233] B. Sohrabi, … M. H.-J. of H., and undefined 2010, “Customer relationship management maturity model (CRM3): A model for stepwise implementation,” j-humansciences.com.
[234] C. Gurău, A. Ranchhod, R. H.-I. technology and, and undefined 2003, “Customer-centric strategic planning: Integrating CRM in online business systems,” Springer.
[235] C. Gurǎu, A. R.-J. of Targeting, M. and Analysis, and undefined 2002, “Measuring customer satisfaction: a platform for calculating, predicting and increasing customer profitability,” Springer.
[236] M. C. Paulk, B. Curtis, M. B. Chrissis, and C. V. Weber, “Capability maturity model, version 1.1,” IEEE Softw., vol. 10, no. 4, pp. 18–27, Jul. 1993.
[237] R. N. Bolton et al., “Customer experience challenges: bringing together digital, physical and social realms,” J. Serv. Manag., vol. 29, no. 5, pp. 776–808, Oct. 2018.
[238] J. R. McColl-Kennedy, M. Zaki, K. N. Lemon, F. Urmetzer, and A. Neely, “Gaining Customer Experience Insights That Matter,” J. Serv. Res., vol. 22, no. 1, pp. 8–26, Feb. 2019.
[239] N. Roberts and V. Grover, “Leveraging information technology infrastructure to facilitate a firm’s customer agility and competitive activity: An empirical investigation,” in Journal of Management Information Systems, Apr. 2012, vol. 28, no. 4, pp. 231–270.
[240] R. Angeles, “Information technology infrastructure support for omnichannel retailing,” 2015.
[241] T. A. Byrd and D. E. Turner, “Measuring the flexibility of information technology infrastructure: Exploratory analysis of a construct,” J. Manag. Inf. Syst., vol. 17, no. 1, pp. 167–208, 2000.
[242] S. Shrivastava, “Digital Disruption is Redefining the Customer Experience: The Digital Transformation Approach of the Communications Service Providers.”
[243] K. Zhu, “The complementarity of information technology infrastructure and E-commerce capability: A Resource-based assessment of their business value,” J. Manag. Inf. Syst., vol. 21, no. 1, pp. 167–202, 2004.

230
[244] A. Brombacher et al., “Improving product quality and reliability with customer experience data,” Qual. Reliab. Eng. Int., vol. 28, no. 8, pp. 873–886, Dec. 2012.
[245] D. Grewal, M. Levy, and V. Kumar, “Customer Experience Management in Retailing: An Organizing Framework,” J. Retail., vol. 85, no. 1, pp. 1–14, Mar. 2009.
[246] J. Spiess, Y. T’Joens, R. Dragnea, P. Spencer, and L. Philippart, “Using big data to improve customer experience and business performance,” Bell Labs Tech. J., vol. 18, no. 4, pp. 3–17, Mar. 2014.
[247] M. Holmlund et al., “Customer experience management in the age of big data analytics: A strategic framework,” J. Bus. Res., vol. 116, pp. 356–365, Aug. 2020.
[248] J. R. GALBRAITH, “Organizing to Deliver Solutions,” Organ. Dyn., vol. 31, no. 2, pp. 194–207, Sep. 2002.
[249] O. F. Bustinza, A. Z. Bigdeli, T. Baines, and C. Elliot, “Servitization and Competitive Advantage: The Importance of Organizational Structure and Value Chain Position,” Res. Manag., vol. 58, no. 5, pp. 53–60, Sep. 2015.
[250] L. Rodrigues da Costa and S. Maria Correia Loureiro, “The Importance of Employees’ Engagement on the Organizational Success,” J. Promot. Manag., vol. 25, no. 3, pp. 328–336, Apr. 2019.
[251] V. Kumar and A. Pansari, “Competitive Advantage through Engagement,” J. Mark. Res., vol. 53, no. 4, pp. 497–514, Aug. 2016.
[252] C. Gentile, N. Spiller, and G. Noci, “How to Sustain the Customer Experience:. An Overview of Experience Components that Co-create Value With the Customer,” Eur. Manag. J., vol. 25, no. 5, pp. 395–410, Oct. 2007.
[253] R. Jain, J. Aagja, and S. Bagdare, “Customer experience – a review and research agenda,” Journal of Service Theory and Practice, vol. 27, no. 3. Emerald Group Publishing Ltd., pp. 642–662, 2017.
[254] O. A. Mascarenhas, R. Kesavan, and M. Bernacchi, “Lasting customer loyalty: A total customer experience approach,” J. Consum. Mark., vol. 23, no. 7, pp. 397–405, 2006.
[255] A. M. Kranzbühler, M. H. P. Kleijnen, R. E. Morgan, and M. Teerling, “The Multilevel Nature of Customer Experience Research: An Integrative Review and Research Agenda,” Int. J. Manag. Rev., vol. 20, no. 2, pp. 433–456, Apr. 2018.
[256] J. Kandampully, T. Zhang, and E. Jaakkola, “Customer experience management in hospitality: A literature synthesis, new understanding and research agenda,” Int. J. Contemp. Hosp. Manag., vol. 30, no. 1, pp. 21–56, 2018.
231
[257] P. P. Tallon, K. L. Kraemer, and V. Gurbaxani, “Executives’ perceptions of the business value of information technology: A process-oriented approach,” J. Manag. Inf. Syst., vol. 16, no. 4, pp. 145–173, 2000.
[258] E. W. Anderson, C. Fornell, and S. K. Mazvancheryl, “Customer Satisfaction and Shareholder Value,” J. Mark., vol. 68, no. 4, pp. 172–185, Oct. 2004.
[259] H. Majra, R. Saxena, S. Jha, and S. Jagannathan, “Structuring Technology Applications for Enhanced Customer Experience: Evidence from Indian Air Travellers,” Glob. Bus. Rev., vol. 17, no. 2, pp. 351–374, Apr. 2016.
[260] H. Chesbrough, “Bringing Open Innovation to Services,” 2011.
[261] P. Wiese, “The role of multi-level customer relationship management in satisfaction and cross-selling in the South African business-banking sector,” 2013.
[262] T. S. Gruca and L. L. Rego, “Customer Satisfaction, Cash Flow, and Shareholder Value,” J. Mark., vol. 69, no. 3, pp. 115–130, Jul. 2005.
[263] Z. S. Dimitriades, “Customer satisfaction, loyalty and commitment in service organizations: Some evidence from Greece,” Manag. Res. News, vol. 29, no. 12, pp. 782–800, Dec. 2006.
[264] M. Kangu, K. L. Wanjau, G. Kosimbei, and R. Arasa, “TECHNOLOGY INFRASTRUCTURE: A CUSTOMER RELATIONSHIP MANAGEMENT DIMENSION IN MAINTAINING CUSTOMER LOYALTY,” Int. J. Econ. Commer. Manag. United Kingdom, no. 5, 2017.
[265] M. Srivastava and D. Kaul, “Exploring the link between customer experience-loyalty-consumer spend,” J. Retail. Consum. Serv., vol. 31, pp. 277–286, Jul. 2016.
[266] H. H. Chang and S. W. Chen, “Consumer perception of interface quality, security, and loyalty in electronic commerce,” Inf. Manag., vol. 46, no. 7, pp. 411–417, Oct. 2009.
[267] K. Lemon, “Understanding Customer Experience Throughout the Customer Journey.”
[268] M. Mulder, “Customer satisfaction with training programs,” J. Eur. Ind. Train., vol. 25, no. 6, pp. 321–331, Aug. 2001.
[269] R. Hallowell, “The relationships of customer satisfaction, customer loyalty, and profitability: An empirical study,” Int. J. Serv. Ind. Manag., vol. 7, no. 4, pp. 27–42, 1996.
[270] S. Mithas, M. S. Krishnan, and C. Fornell, “Why Do Customer Relationship Management Applications Affect Customer Satisfaction?,” J. Mark., vol. 69, no. 4, pp. 201–209, Oct. 2005.
232
[271] K. D. Martin, A. Borah, and R. W. Palmatier, “Data Privacy: Effects on Customer and Firm Performance,” J. Mark., vol. 81, no. 1, pp. 36–58, Jan. 2017.
[272] K. D. Martin and P. E. Murphy, “The role of data privacy in marketing,” J. Acad. Mark. Sci., vol. 45, no. 2, pp. 135–155, Mar. 2017.
[273] R. W. Palmatier and K. D. Martin, The Intelligent Marketer’s Guide to Data Privacy. Springer International Publishing, 2019.
[274] E. Steel and A. G. Fowler, “Facebook in Privacy Breach,” 2010.
[275] A. Rawson, E. Duncan, and C. Jones, “The Truth About Customer Experience,” 2013.
[276] U. S. R. Abotah, “Evaluation of Energy Policy Instruments for the Adoption of Renewable Energy: Case of Wind Energy in the Pacific Northwest U.S.,” pp. 11–25.
[277] M. J. Mahoney, “Publication prejudices: An experimental study of confirmatory bias in the peer review system,” Cognit. Ther. Res., vol. 1, no. 2, pp. 161–175, Jun. 1977.
[278] P. Biernacki and D. Waldorf, “Snowball Sampling: Problems and Techniques of Chain Referral Sampling,” Sociol. Methods Res., vol. 10, no. 2, pp. 141–163, Nov. 1981.
[279] R. Abotah, “Evaluation of Energy Policy Instruments for the Adoption of Renewable Energy: Case of Wind Energy in the Pacific Northwest U.S.,” Portland, OR, Jan. 2015.

233
Appendix A: Expert Panel formation and correspondence
The Experts were selected from a diverse and relevant field of work and study. The
following tables show the size and background of the experts in the panel.
Size Funnel stage
128 Experts Selected in the initial stage
79 Experts Contacted based on their experience and background
9 Either Declined or informally accepted but didn’t participate in
research
41 Contacted for the data collection
28 Experts actively Participated in research
Table 65: Number of Experts
Expertise or Titles
VP/Director - Sales, Marketing, IT
System Analysts and Architects
Data Management and Governance Experts
Business Development Professionals
Project & Product Managers
Table 66: Expertise or Titles of Experts
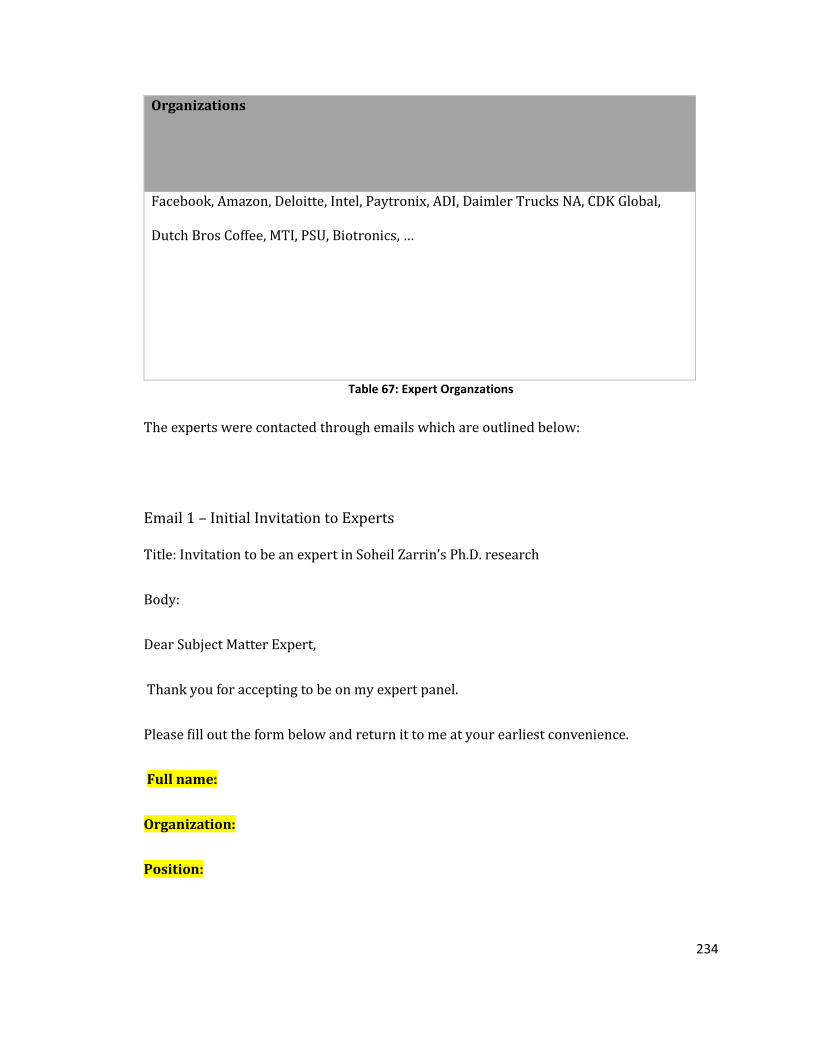
234
Organizations
Facebook, Amazon, Deloitte, Intel, Paytronix, ADI, Daimler Trucks NA, CDK Global,
Dutch Bros Coffee, MTI, PSU, Biotronics, …
Table 67: Expert Organzations
The experts were contacted through emails which are outlined below:
Email 1 – Initial Invitation to Experts
Title: Invitation to be an expert in Soheil Zarrin’s Ph.D. research
Body:
Dear Subject Matter Expert,
Thank you for accepting to be on my expert panel.
Please fill out the form below and return it to me at your earliest convenience.
Full name:
Organization:
Position:

235
I would also appreciate it significantly if you could suggest other experts who have
expertise or experience in customer-centricity approach or retail e-commerce practices as
potential expert panel members. Please fill the fields below in case you wish to suggest
other experts participate in this study:
Name: ……………………………….. Email: …………………………………….
Name: ……………………………….. Email: …………………………………….
Name: ……………………………….. Email: …………………………………….
-----------------------------------------------------------------------------------------------------------
About this research:
I am a Ph.D. candidate in the Department of Engineering and Technology Management (ETM)
at Portland State University (PSU). I am conducting research on Customer-centricity, and its
title is “Maturity Model for Customer-Centric Approach in Enterprise: The Case of E-
Commerce and Online Retail Industry.”
I am building a multi-criteria decision model to develop a customer-centricity score to
measure the organization's resources and capabilities in a customer-centric approach.
In order to properly build the model, I will use subject matter experts' (SME’s) judgments for
validation and quantification purposes.
236
I am hereby inviting you to participate in this study by being one of the SME’s
that will help me with the model validation and quantification. Your background and
expertise will be very helpful to my research.
If you accept the invitation, you will receive online survey instruments, which
will be used to collect your judgments. Below is a summary of the participation
regarding time commitment:
• Validation Phase: a maximum of 2 online surveys, ranging from 2 to 5 minutes each
• Quantification Phase: a maximum of 3 online surveys, ranging from 5 to 15 minutes
each
Desirability Curves: a survey ranging from 10-15
Please be informed that:
• Experts are going to be involved based on their experience and background. Therefore,
experts are NOT going to be participating in all surveys.
• The time period between each survey will range from a few days up to several
weeks, depending on how quickly other experts respond.
237
-----------------------------------------------------------------------------------------------------------
Research Summary:
The network technologies are changing the dynamics of the interaction between customer
and provider. Customers demand closer relationships and higher investment between
partners, as well as cooperation between companies to build supporting technologies for
their unique needs. Customer-centricity is defined as interaction with the customer through
various touchpoints and aggregating these relations to create a position for the
customer. Each customer has a different need and expectation from the provider or seller,
and companies need to be flexible enough to fulfill their needs.
One of the reasons organizations invest less in customer experience is that they believe they
are already customer-centric organizations.
Companies need to deploy structured methods to evaluate their customer-centricity as it is
now to achieve this purpose. Also, the techniques should enable them to plan the
organization's evolution toward the customer-centric approach strategically. This research
focuses on designing a new maturity model to evaluate and plan an organization's customer-
centricity. The hierarchical Decision Model (HDM) will be used as the primary methodology
to quantify impacting factors and intensity of influence on the ultimate outcome.
Please notice that the Portland State University’s Institutional Review Board (IRB) has
approved this study. Participation in this study does not involve any risks of any kind
whatsoever. Moreover, your name will be kept in total confidentiality and will not be
used in any published reports.

238
All the best,
Soheil Zarrin - PhD Candidate
Department of Engineering and Technology Management (ETM)
Portland State University (PSU)
Phone: (971) 325-7537
Email: [email protected]
-------------------------------------------------------------------------------------------
-----
Email 2 – Perspectives Validation
Title: Customer-Centricity Research - Step 1: Perspective validation
Body:
Dear Expert,
Thank you for accepting to participate in my research.

239
------------------------------------------------------------
Note:
You don't need to go through this section if you are familiar with the purpose and process of
this research
What do we want to achieve?
In simple words, the ultimate goal of this research is to find the factors that impact
customer-centricity and then quantify them.
To make sure that we identified the right factors, we group factors under Perspectives to
make them easier to work with.

240
The attached file shows the initial model that includes goal (top-level), Perspective (level 2),
Criteria (Level 3), and Outcome (bottom level)
What are the steps?
In this research, we are going to have a few steps in data collection which are
interdependent.
In summary, below lists the steps that you contribute to this research:
Step 1: Validate the Perspectives (Do these perspectives have a significant impact on
customer-centricity? Are there more?)
Step 2: Validate the Criteria - a.k.a. factors (Do these factors have a significant impact on
customer-centricity? Are there more?)
Figure 51: Initial Model Shared with Experts

241
Step 3 Quantify the Perspectives and Criteria (How much do they impact customer-
centricity?)
Step 4: Validate and quantify the desirability curves (I'll go through it later!)
(If the words sound unfamiliar, no worries, I promise they're more
understandable than what they look like!!)
------------------------------------------------------------
Let's start!
Step 1:
At this point, I ask you to help me validate the perspectives that contribute to customer-
centricity in an organization. The preliminary perspectives have been identified in the
literature and are listed on the survey instrument that I am sending herein.
Please click on the following link to access the survey instrument. (less than 5 minutes)
https://portlandstate.qualtrics.com/jfe/form/SV_07I2oSmEqZbgjvE
You will see the instructions to submit your response after you click on the link.

242
I would appreciate it if you fill out the survey before the end of the day Thursday,
7/22/2021. Subsequent steps will be sent later in other emails. Thanks again!
All the best,
Soheil Zarrin - PhD Candidate
Department of Engineering and Technology Management (ETM)
Portland State University (PSU)
Phone: (971) 325-7537
Email: [email protected]
Email 3 – Thank you notes – step 1
Title: Step 1 Results received -- Thank you!
Body:
Dear Subject Matter Expert,
Thank you for your input. I received your input for Step 1 of the customer-
centricity research.
In a few days, the Step 2 survey will be sent to you. Appreciate your participation in this
research.
243
Have a great day.
All the best,
Soheil Zarrin - PhD Candidate
Department of Engineering and Technology Management (ETM)
Portland State University (PSU)
Phone: (971) 325-7537
Email: [email protected]
Email 4 - Criteria Validation
Title: Customer-Centricity Research - Step 2: Criteria
Validation
Body:
If this is your 1st survey, no worries, each step is designed independent from each others, and
you can respond to this survey without going through step #1.
Dear Expert,
The research in step #1 was a complete success. I got a more than expected survey
returned with informative comments and notes.

244
It was amazing participation, and I appreciate your involvement in this research so much!
----------------------------------------------------------
STEP 2:
In step #2, we will dive deeper into impacting factors on Customer-centricity.
The perspectives are broken down into more granular criteria.
Please click on the following link to access the survey instrument. (between 10-15 minutes)
Step #2 Survey:
https://portlandstate.qualtrics.com/jfe/form/SV_dptNs7psbbW1kbk
You will see the instructions to submit your response after you click on the link.
I would appreciate it if you fill out the survey before the end of the day Thursday
8/12/2021. Subsequent steps will be sent later in other emails. Thanks again!
----------------------------------------------------------
Note:
You don't need to go through this section if you are familiar with the purpose and process of
this research

245
What do we want to achieve?
In simple words, the ultimate goal of this research is to find the factors that impact
customer-centricity and then quantify them.
To make sure that we identified the right factors, we group factors under Perspectives to
make them easier to work with.
The attached file shows the initial model that includes goal (top-level), Perspective (level 2),
Criteria (Level 3), and Outcome (bottom level)
Figure 52: Initial Model Shared with Experts
What are the steps?
In this research, we are going to have a few steps in data collection which are
interdependent.
In summary, below lists the steps that you contribute to this research:
Step 1: Validate the Perspectives (Do these perspectives have a significant impact on
customer-centricity? Are there more?)
246
Step 2: Validate the Criteria - a.k.a. factors (Do these factors have a significant impact on
customer-centricity? Are there more?)
Step 3 Quantify the Perspectives and Criteria (How much do they impact customer-
centricity?)
Step 4: Validate and quantify the desirability curves (I'll go through it later!)
(If the words sound unfamiliar, no worries, I promise they're more
understandable than what they look like!!)
------------------------------------------------------------
Please feel free to reach out if you have any questions.
All the best,
Soheil Zarrin - PhD Candidate
Department of Engineering and Technology Management (ETM)
Portland State University (PSU)
Phone: (971) 325-7537
Email: [email protected]
Email 5 – Thank you notes – step 2
Title: Step 2 Results received -- Thank you!

247
Body:
Dear Subject Matter Expert,
Thank you for your input. I received your input for Step 2 of the customer-
centricity research.
In a few days, the Step 3 survey will be sent to you. Appreciate your participation in this
research.
Have a great day.
All the best,
Soheil Zarrin - PhD Candidate
Department of Engineering and Technology Management (ETM)
Portland State University (PSU)
Phone: (971) 325-7537
Email: [email protected]
Email 6 – Quantification – Leadership and organization Panels
Title Customer-Centricity Research - Step 3-LC: Factors Quantification - Leadership Cohort

248
Body
Dear Subject Matter Expert,
Thank you again for participating in this research.
In this step, the factors are compared pairwise. In other words, each factor is compared
with other factors in the same group.
With the information collected from this step, the researcher determines the relative
impact/importance of each factor on Customer-centricity .
Start Step 3:
Please click on the link below to start your input.
Link 1) Comparison of Perspective (estimated time: 3-5 minutes)
http://research1.etm.pdx.edu/hdm2/expert.aspx?id=d0e02f67c7db1d6e/e7086497be33e
145!A01
Link 2) Comparison of Organization Criteria (estimated time: 7-10 minutes)
http://research1.etm.pdx.edu/hdm2/expert.aspx?id=d0e02f67c7db1d6e/e7086497be33e
145!B02
Please feel free to reach out if you have any questions.

249
I would appreciate it if you fill out the survey before the end of the day Thursday,
9/2/2021. Subsequent steps will be sent later in other emails. Thanks again!
All the best,
Soheil Zarrin - PhD Candidate
Department of Engineering and Technology Management (ETM)
Portland State University (PSU)
Phone: (971) 325-7537
Email: [email protected]
----------------------------------------------------------------------------------------------------------
NOTE: The application used in this step is user-friendly, and the below details provide
additional directions in case needed. Skip the below section if you feel you don’t need it.
More details about ETM HDM Software:
After clicking on the link(s) provided above, you will be guided to the HDM model on the
PSU website (pdx.edu)
I use ETM HDM software (Engineering and Technology Management Hierarchical Decision
Model Software) to quantify the impact of each factor on the ultimate goal (i.e., Customer-
Centricity Level)

250
Here is what you should expect in the ETM HDM software:
1) Enter your name and click on “Submit.”
2) On the new page, select the node that is assigned to you (in the example below
“Technology”)
3) Move the slider to left and right or enter the numbers in the box beside each
factor) to input your judgment. Continue this for all sliders on the screen.
Example:
(“A” is Data Distribution and Accessibility; “B” is Technology Infrastructure and
Integration)
- If “A” is three times as important as “B,” “A” gets 75 points, “B” gets 25 points
- If the importance of “A” and “B” are the same, both get 50 points.
Figure 53: HDM Example Shared with Experts

251
4) Click on “Save and Go to the Main Page” when you enter values for each slider.
(If you don’t see the button, scroll down a little bit)
5) Click on “Submit” on the main page, and it’s done!
Email 7 – Quantification – Technology and Policy Panels
Title Customer-Centricity Research - Step 3-TC: Factors Quantification - Technology
Cohort
Body
Dear Subject Matter Expert,
Thank you again for participating in this research.
Figure 54: Scoring How-to Shared with Experts

252
In this step, the factors are compared pairwise. In other words, each factor is compared
with other factors in the same group.
With the information collected from this step, the researcher determines the relative
impact/importance of each factor on Customer-centricity .
Start Step 3:
Please click on the link below to start your input.
Link 1) Comparison of Technology/Data Criteria (estimated time: 5-7 minutes)
http://research1.etm.pdx.edu/hdm2/expert.aspx?id=d0e02f67c7db1d6e/e7086497be33e
145!B01
Link 2) Comparison of Policy Criteria (estimated time: 3-5 minutes)
http://research1.etm.pdx.edu/hdm2/expert.aspx?id=d0e02f67c7db1d6e/e7086497be33e
145!B04
Please feel free to reach out if you have any questions.
I would appreciate it if you fill out the survey before the end of the day Thursday,
9/2/2021. Subsequent steps will be sent later in other emails. Thanks!
All the best,

253
Soheil Zarrin - PhD Candidate
Department of Engineering and Technology Management (ETM)
Portland State University (PSU)
Phone: (971) 325-7537
Email: [email protected]
Email 8 – Quantification – Sales and Marketing Panels
Title: Customer-Centricity Research - Step 3-SMC: Factors Quantification - Sales &
Marketing Cohort
Body:
Dear Subject Matter Expert,
Thank you again for participating in this research.
In this step, the factors are compared pairwise. In other words, each factor is compared
with other factors in the same group.
254
With the information collected from this step, the researcher determines the relative
impact/importance of each factor on Customer-centricity .
Start Step 3:
Please click on the links below to start your input.
Link 1) Comparison of Customer Criteria (estimated time: 3-5 minutes)
http://research1.etm.pdx.edu/hdm2/expert.aspx?id=d0e02f67c7db1d6e/e7086497be33e
145!B03
Link 2) Comparison of Organization Criteria (estimated time: 7-10 minutes)
http://research1.etm.pdx.edu/hdm2/expert.aspx?id=d0e02f67c7db1d6e/e7086497be33e
145!B02
Please feel free to reach out if you have any questions.
I would appreciate it if you could fill out the survey before the end of the day Thursday,
9/2/2021. Subsequent steps will be sent later in other emails. Thanks again!
All the best,
Soheil Zarrin - PhD Candidate
Department of Engineering and Technology Management (ETM)
Portland State University (PSU)
Phone: (971) 325-7537
Email: [email protected]

255
Email 9 - Desirability Curve
Title: Customer-Centricity Research - Step 4 (Final Step)
Body
Dear Subject Matter Expert,
Thank you again for participating in this research. This survey is the last survey in this
research which is sent to a very limited group of Experts with a high impact in the previous
steps.
In this last step, The SMEs help to create a Desirability Curve for the perspectives and
criteria.
----------------------------
Start Step 4:
Note: Before moving forward with the Survey, It's highly recommended to spend 3 minutes
reading about Desirability Curves in the below section.
Please click on the links below to start your input.
Quantify Desirability Curve Survey: (21 questions; estimated time: 15-25 minutes)
https://portlandstate.qualtrics.com/jfe/form/SV_cMFcrRcAosMwNw2
Please feel free to reach out if you have any questions.
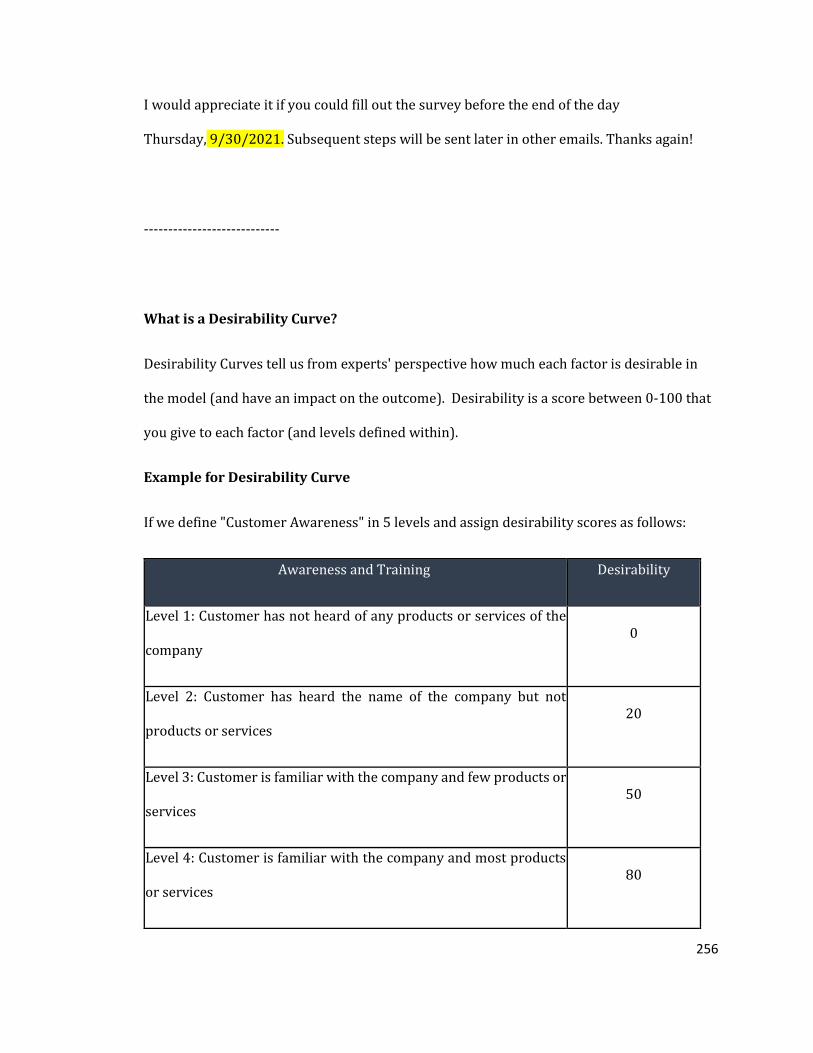
256
I would appreciate it if you could fill out the survey before the end of the day
Thursday, 9/30/2021. Subsequent steps will be sent later in other emails. Thanks again!
----------------------------
What is a Desirability Curve?
Desirability Curves tell us from experts' perspective how much each factor is desirable in
the model (and have an impact on the outcome). Desirability is a score between 0-100 that
you give to each factor (and levels defined within).
Example for Desirability Curve
If we define "Customer Awareness" in 5 levels and assign desirability scores as follows:
Awareness and Training Desirability
Level 1: Customer has not heard of any products or services of the
company 0
Level 2: Customer has heard the name of the company but not
products or services 20
Level 3: Customer is familiar with the company and few products or
services 50
Level 4: Customer is familiar with the company and most products
or services 80

257
Level 5: Customer is familiar with the company and has got training
on how to use products or services 100
Table 68: Disirability Curve levels example
We can build the below desirability curve for Awareness and Training criteria:
Figure 55: Desirability Curve Example
These curves help the researcher to build the final Hierarchical Decision Model and, for my
research, the Customer-centricity Score.
Please feel free to reach out if you need further information about the model or the request
in this step. Thank you again!!
258
----------------------------------
All the best,
Soheil Zarrin - PhD Candidate
Department of Engineering and Technology Management (ETM)
Portland State University (PSU)
Phone: (971) 325-7537
Email: [email protected]
259
Appendix B: Pilot implementation of the HDM model
The pseudo expert panel was formed with seven members that participated in the
HDM pilot implementation in the following phases:
The research structure and design will be explained in further detail in the next
sections. Initially, expert judgment is needed to validate the model in terms of
perspectives and criteria. Then, the desirability curves metrics need to be validated
and quantified by the experts. Finally, the experts need to quantify the model and
pairwise compare the decision elements in the model.
Most parts of these judgments (Validation/Quantification) are done using MS Excel
tool, and the HDM model quantification is implemented using the ETM HDM model
developed by the Engineering and Technology Management department at Portland
State University.
In the next section, the details of activities for data collection and analysis is described
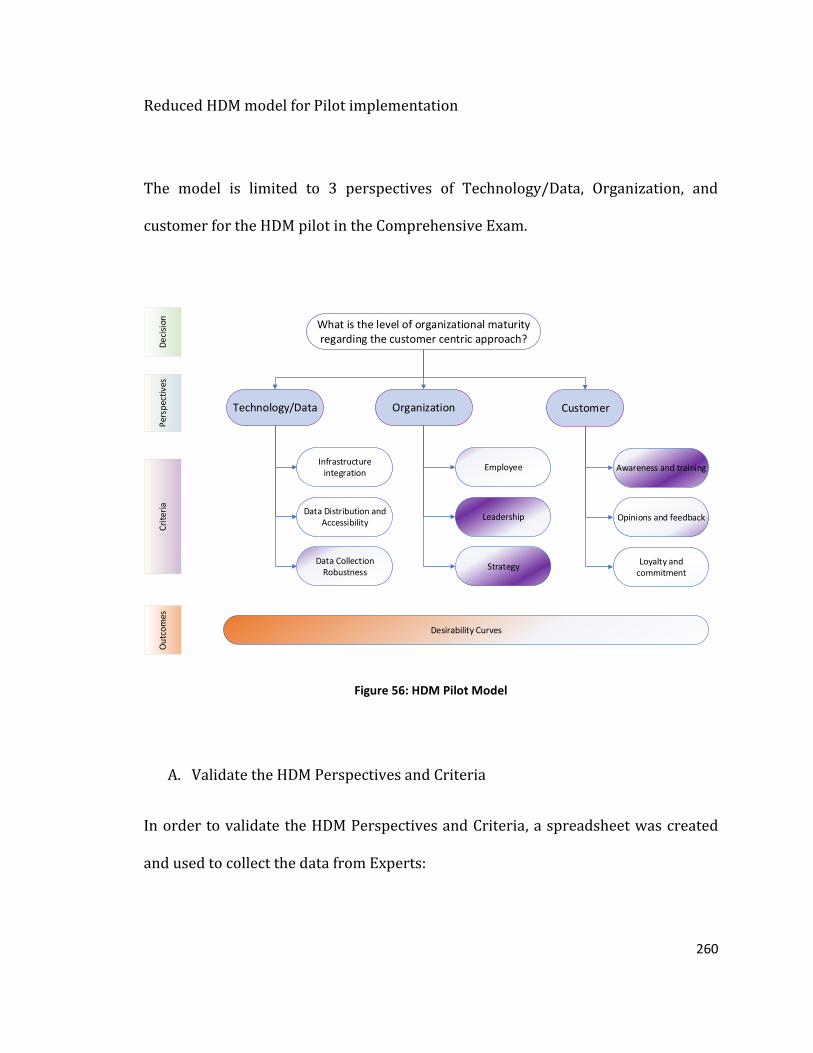
260
Reduced HDM model for Pilot implementation
The model is limited to 3 perspectives of Technology/Data, Organization, and
customer for the HDM pilot in the Comprehensive Exam.
CustomerOrganization
Awareness and training
Opinions and feedback
Loyalty and commitment
Employee
Leadership
Strategy
Technology/Data
Infrastructure integration
Data Distribution and Accessibility
Data Collection Robustness
What is the level of organizational maturity regarding the customer centric approach?
De
cisi
onP
ersp
ecti
ves
Cri
teri
aO
utc
om
es
Desirability Curves
Figure 56: HDM Pilot Model
A. Validate the HDM Perspectives and Criteria
In order to validate the HDM Perspectives and Criteria, a spreadsheet was created
and used to collect the data from Experts:

261
B. Quantification of HDM Criteria and Perspectives
In order to quantify the HDM Criteria and Perspectives, the HDM software, which was
developed by the PSU ETM department, was utilized.
Below shows Mission/Perspective/Criteria View in this research software:
Figure 57: HDM Software Example
The link to this model was sent through email to the experts to perform a pair-wise
comparison for the Perspectives and Criteria
C. Quantification of the desirability metrics
For the quantification of the Desirability levels in my HDM model, I created a
spreadsheet to collect the responses of the Experts.
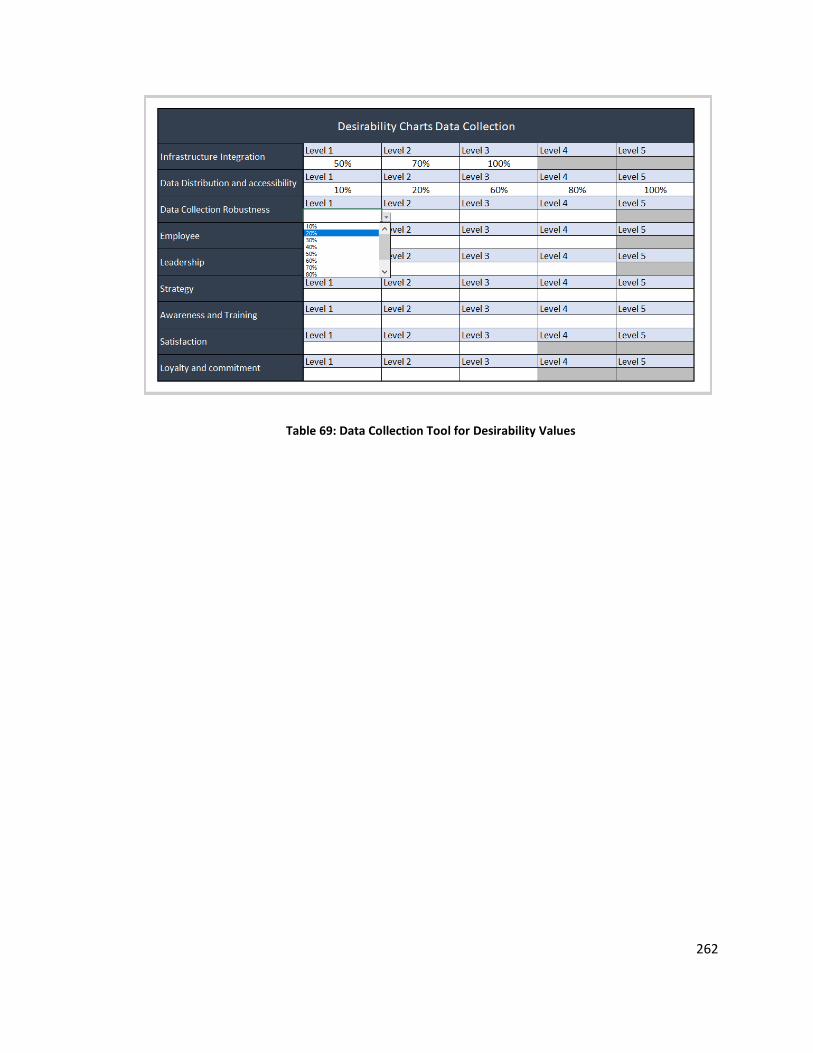
262
Table 69: Data Collection Tool for Desirability Values

263
Perspectives, Criteria and Desirability curves definitions
HDM model variables and metrics
HDM Model goal/mission
The HDM model's goal is to evaluate and quantify the level of customer-centricity in
an organization. The research is structured to answer the below question:
What is the level of organizational maturity regarding the customer-centric
organization?
HDM Perspectives
Technology/Data Perspective
Enhance the performance of the technological and data solutions; This perspective
measure the technology/data impact on customer-centricity
Criteria relevant to Technology/Data Perspective
Achieve a higher level of integration; There are different levels of integration for data
and technology in an organization. This variable measures the level of integration for
data and technologies. There are three levels of technological integration in an
organization:
• Network integration which results in connectivity

264
• Data integration which results in data sharing
• Application integration results in interoperability of solutions
Accelerate data distribution and accessibility; This variable measures how much data
is accessible in an organization and how soon the users can find the information they
are looking for.
Enhance Data collection robustness; The data collection methods impact the data
reliability, which directly influences the quality of decisions made in an organization.
This variable measures the robustness of the data collection methods and if those
methods ensure the data is comprehensive, relevant, and reliable.
Organization Perspective
Achieve organizational effectiveness and efficiency; This perspective measures how
much an organization is effective and efficient in a customer-centric approach.
Criteria relevant to Organization Perspective
Identify employees' impact on customer-centricity; This variable measures the
success of the employees in delivering customer-centric products and services.
Maximize leadership support; This variable measures how much the leadership of the
organization supports the implementation of customer-centric approaches in the
organization

265
Identify organizational strategy impact; This variable measures how much the
organizational strategy aligns with the customer-centric organization.
Customer Perspective
Enhance customer experience; This perspective measures the customer perspective
on customer-centric approach success in an organization.
Criteria relevant to Customer Perspective
Enhance customer awareness and training; This variable measures how much
customers are familiar with the products and services of an organization to benefit
the most from their offerings.
Achieve positive opinion and feedback of customer; This variable measures how
positive the customer feedback is and how likely it is to recommend the organization
and its products and services to others.
Achieve loyalty and commitment of customer; This variable measure how likely is the
customer to return for new or further purchases.

266
In order to quantify the desirability of Criteria under Technology following levels
and metrics are defined
Tec
hn
olo
gy/D
ata
Infrastructure Integration
Level 1: Network integration is implemented which resulted in
hardware connectivity
Level 2: Data Integration is implemented which resulted in
improved data sharing
Level 3: Application integration is implemented which resulted in
interoperability of solutions
Data Distribution and accessibility
Level 1: Required data is not available at all
Level 2: 30% of required data is accessible when and where needed
within an organization
Level 3: 50% of required data is accessible when and where needed
within an organization
Level 4: 70% of required data is accessible when and where needed
within an organization
Level 5: Required data is always accessible when and where
needed within an organization
Data Collection Robustness

267
Level 1: The data collection methods are ineffective and don't
provide reliable and usable data
Level 2: The data collection methods are semi-structured and
provide some usable data
Level 3: The data collection methods are fully structured and
provide fully usable data which requires data cleaning
Level 4: The data collection methods provide ready to use data
which is comprehensive and reliable
Table 70: Criteria under Technology for Pilot research

268
In order to quantify the desirability of Criteria under Organization following levels
and metrics are defined
Org
aniz
atio
n
Employee
Level 1: The employees are not familiar with customer needs
Level 2: The employees are familiar with customer needs but can't
take much action to fulfil them
Level 3: The employees know the customer needs and can take
action to fulfill them
Level 4: The employees know the customer needs and are trained
how to fulfil them
Leadership
Level 1: Organization leadership are not familiar with customer-
centric organization
Level 2: Organization leadership know about basics of customer
organization but don't buy-in
Level 3: Organization leadership know about customer-centric
organization and support it
Level 4: Organization leadership support customer-centric
organization and take action to improve it
Level 5: Organization leadership decision making is fully based on
customer-centric approach
Strategy
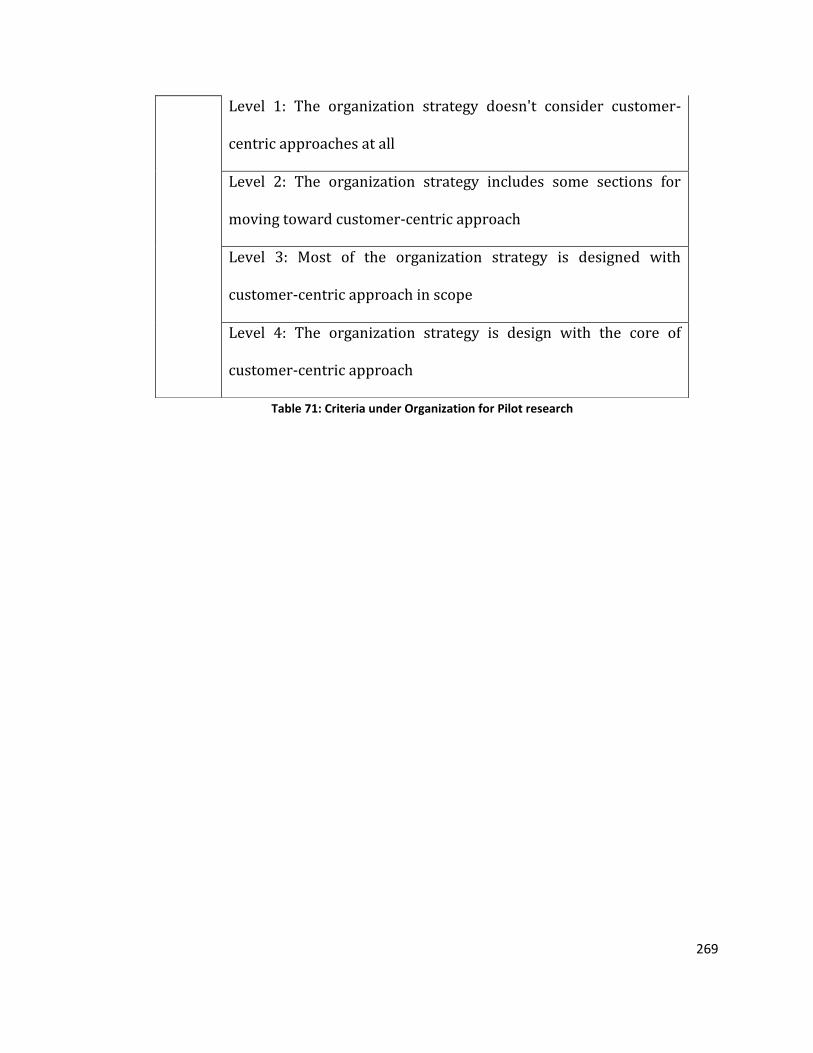
269
Level 1: The organization strategy doesn't consider customer-
centric approaches at all
Level 2: The organization strategy includes some sections for
moving toward customer-centric approach
Level 3: Most of the organization strategy is designed with
customer-centric approach in scope
Level 4: The organization strategy is design with the core of
customer-centric approach
Table 71: Criteria under Organization for Pilot research

270
In order to quantify the desirability of Criteria under Customer following levels and
metrics are defined
Cu
sto
mer
Awareness and Training
Level 1: Customer has not heard of the any products or services of
company
Level 2: Customer has heard the name of the company but not
products or services
Level 3: Customer is familiar with company and few products or
services
Level 4: Customer is familiar with company and most products or
services
Level 6: Customer is familiar with company and has got training on
how to use products or services
Satisfaction
Level 1: customer is unhappy with products or services and spread
negative word-of-mouth
Level 2: customer is satisfied but unenthusiastic to recommend the
product or services to others
Level 3: customer is loyal to products and services and keep
referring other customers to the company
Loyalty and commitment
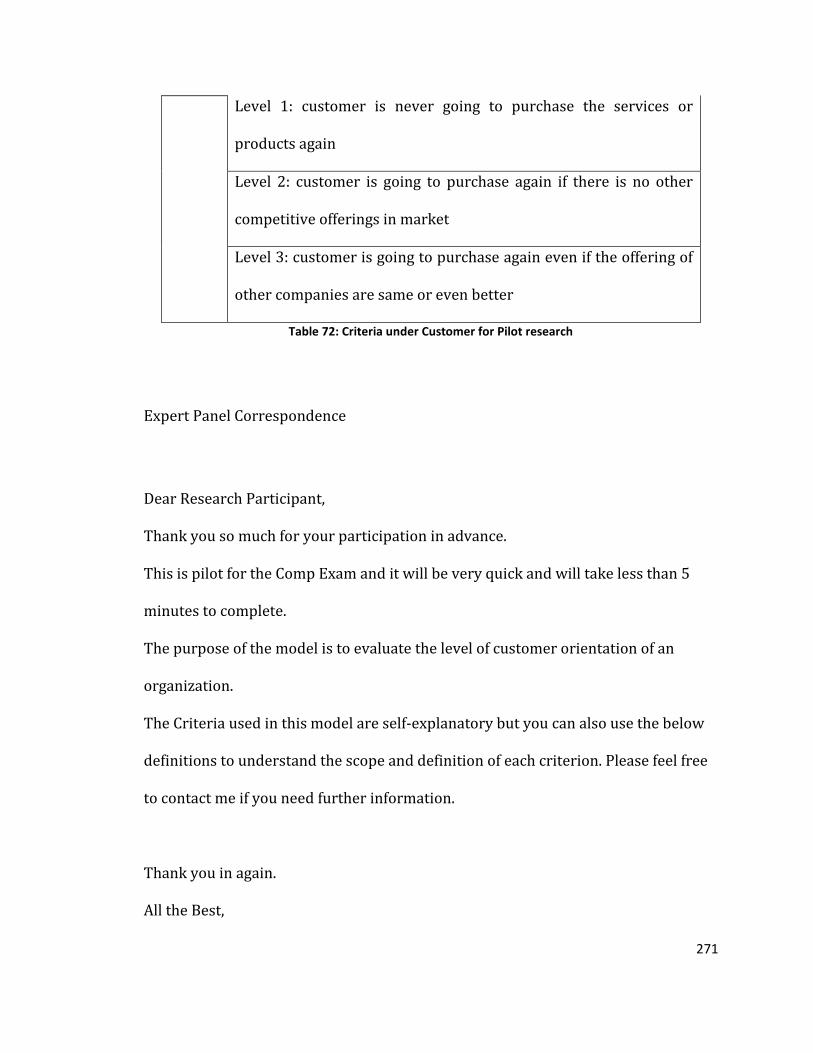
271
Level 1: customer is never going to purchase the services or
products again
Level 2: customer is going to purchase again if there is no other
competitive offerings in market
Level 3: customer is going to purchase again even if the offering of
other companies are same or even better
Table 72: Criteria under Customer for Pilot research
Expert Panel Correspondence
Dear Research Participant,
Thank you so much for your participation in advance.
This is pilot for the Comp Exam and it will be very quick and will take less than 5
minutes to complete.
The purpose of the model is to evaluate the level of customer orientation of an
organization.
The Criteria used in this model are self-explanatory but you can also use the below
definitions to understand the scope and definition of each criterion. Please feel free
to contact me if you need further information.
Thank you in again.
All the Best,

272
Soheil
--------------------------------------------------------------------------------------------
Link to HDM Model:
http://research1.etm.pdx.edu/HDM2/expert.aspx?id=d0e02f67c7db1d6e/f94b3e1
3b7943f14
--------------------------------------------------------------------------------------------
HDM Perspectives
----------------
[Technology/Data]:
Enhance the performance of the technological and data solutions; This perspective
measure the technology/data impact on customer-centricity
[Organization]:
Achieve organizational effectiveness and efficiency; This perspective measures how
much an organization is effective and efficient in a customer-centric approach
[customer]:
Enhance customer experience; This perspective measures the customer perspective
on customer-centric approach success in an organization.

273
HDM sub-criteria – Technology/Data
----------------------------------
[Infrastructure Integration]:
Achieve a higher level of integration; There are different levels of integration for
data and technology in an organization. This variable measures the level of
integration for data and technologies. There are three levels of technological
integration in an organization:
Network integration which results in connectivity
Data integration which results in data sharing
Application integration which results in interoperability of solutions
[Data Distribution and accessibility]:
Accelerate data distribution and accessibility; This variable measures how much
data is accessible in an organization and how soon the users can find the
information they are looking for.
[Data Collection Robustness]:
Enhance Data collection robustness; The data collection methods impact the data
274
reliability which directly influences the quality of decisions made in an organization.
This variable measures the robustness of the data collection methods and if those
methods ensure the data is comprehensive, relevant and reliable.
HDM sub-criteria – Organization
-------------------------------
[Employee]:
Identify employees' impact on customer-centricity; This variable measures the
success of the employees in delivering customer-centric products and services.
[Leadership]:
Maximize leadership support; This variable measures how much the leadership of
the organization supports the implementation of customer-centric approaches in
organization
[Strategy]:
Identify organizational strategy impact; This variable measures how much the
organizational strategy aligns with the customer-centric organization.
HDM sub-criteria – Customer
---------------------------

275
[Awareness and Training]:
Enhance customer awareness and training; This variable measures how much
customers are familiar with the products and services of an organization to benefit
the most from their offerings.
[Options and feedback]:
Achieve positive opinion and feedback of customer; This variable measures how
positive the customer feedback is and how likely is to recommend the organization
and its products and services to others.
[Loyalty and commitment]:
Achieve loyalty and commitment of customers; This variable measures how likely is
the customer to return for new or further purchases.
------------
Please feel free to contact me if you have any questions or you need more information.
Thank you
All the Best,
Soheil Zarrin
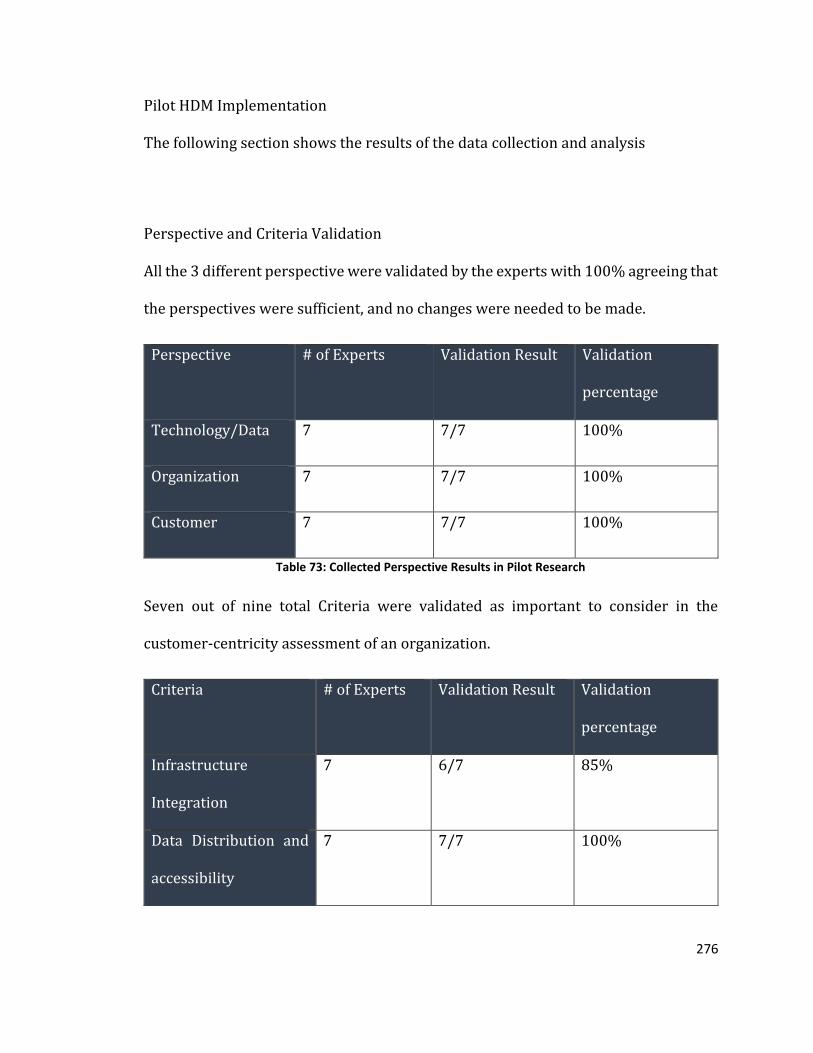
276
Pilot HDM Implementation
The following section shows the results of the data collection and analysis
Perspective and Criteria Validation
All the 3 different perspective were validated by the experts with 100% agreeing that
the perspectives were sufficient, and no changes were needed to be made.
Perspective # of Experts Validation Result Validation
percentage
Technology/Data 7 7/7 100%
Organization 7 7/7 100%
Customer 7 7/7 100%
Table 73: Collected Perspective Results in Pilot Research
Seven out of nine total Criteria were validated as important to consider in the
customer-centricity assessment of an organization.
Criteria # of Experts Validation Result Validation
percentage
Infrastructure
Integration
7 6/7 85%
Data Distribution and
accessibility
7 7/7 100%
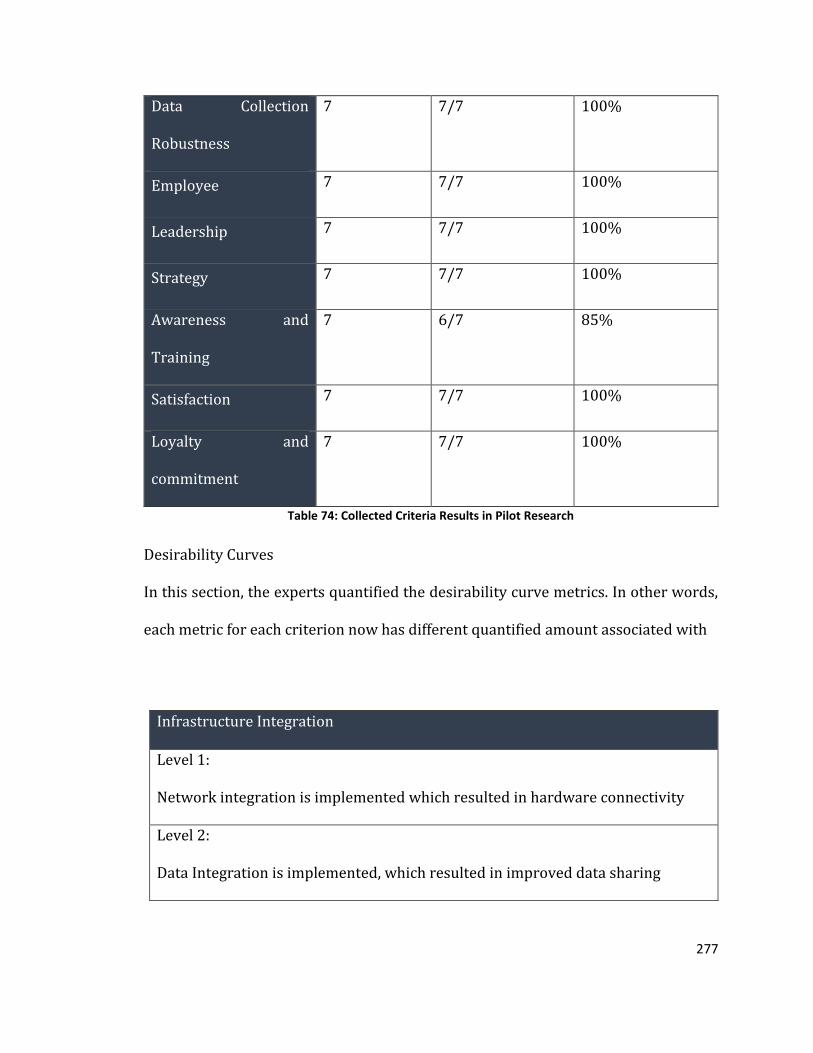
277
Data Collection
Robustness
7 7/7 100%
Employee 7 7/7 100%
Leadership 7 7/7 100%
Strategy 7 7/7 100%
Awareness and
Training
7 6/7 85%
Satisfaction 7 7/7 100%
Loyalty and
commitment
7 7/7 100%
Table 74: Collected Criteria Results in Pilot Research
Desirability Curves
In this section, the experts quantified the desirability curve metrics. In other words,
each metric for each criterion now has different quantified amount associated with
Infrastructure Integration
Level 1:
Network integration is implemented which resulted in hardware connectivity
Level 2:
Data Integration is implemented, which resulted in improved data sharing

278
Level 3: Application integration is implemented, which resulted in interoperability
of solutions
Table 75: Desirability Levels for Infrastructure in Pilot Research
Data Distribution and accessibility
Level 1: Required data is not available at all
Level 2: 30% of required data is accessible when and where needed within an
organization
Level 3: 50% of required data is accessible when and where needed within an
organization
Level 4: 70% of required data is accessible when and where needed within an
organization
Level 5: Required data is always accessible when and where needed within an
organization
Table 76: Desirability Levels for Data Distribution in Pilot Research
Data Collection Robustness
Level 1: The data collection methods are ineffective and don't provide reliable and
usable data
Level 2: The data collection methods are semi-structured and provide some usable
data
Level 3: The data collection methods are fully structured and provide fully usable
data, which requires data cleaning

279
Level 4: The data collection methods provide ready to use data that is
comprehensive and reliable
Table 77: Desirability Levels for Data Collection in Pilot Research
Employee
Level 1: The employees are not familiar with customer needs
Level 2: The employees are familiar with customer needs but can't take many
actions to fulfill them
Level 3: The employees know the customer needs and can take action to fulfill
them
Level 4: The employees know the customer needs and are trained on how to fulfill
them
Table 78: Desirability Levels for Employee in Pilot Research
Leadership
Level 1: Organization leadership are not familiar with a customer-centric
organization
Level 2: Organization leadership know about the basics of customer organization
but don't buy-in
Level 3: Organization leadership know about the customer-centric organization
and support it
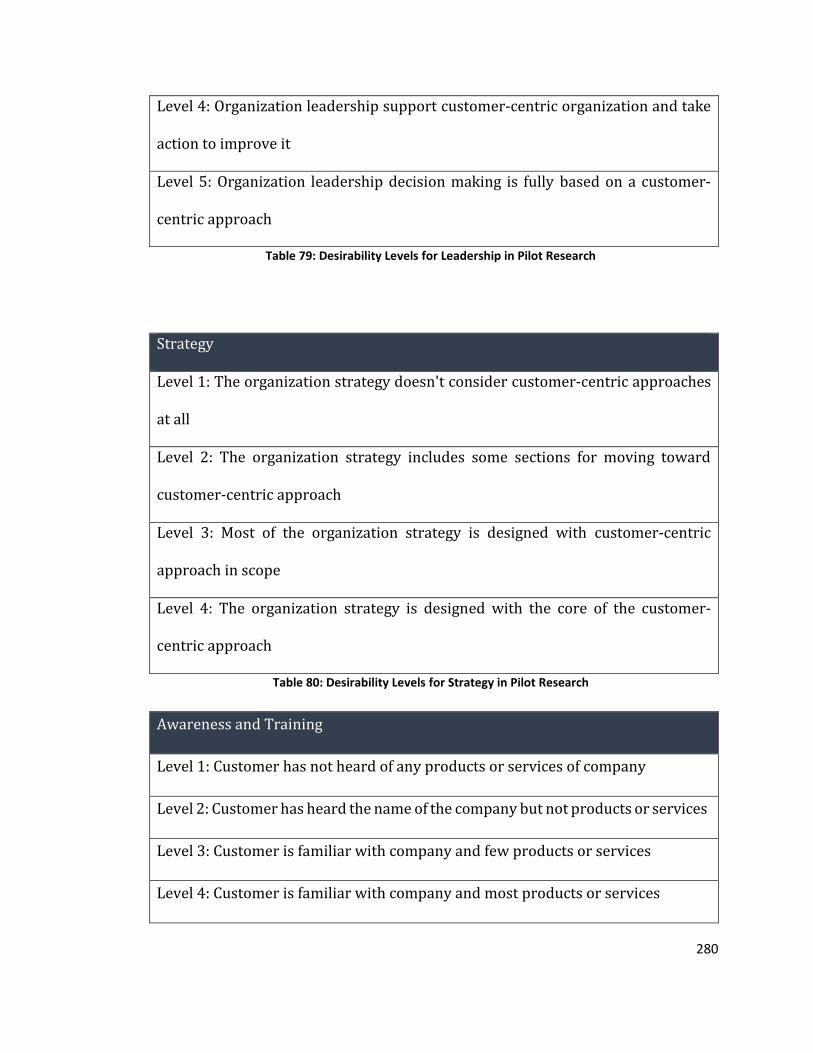
280
Level 4: Organization leadership support customer-centric organization and take
action to improve it
Level 5: Organization leadership decision making is fully based on a customer-
centric approach
Table 79: Desirability Levels for Leadership in Pilot Research
Strategy
Level 1: The organization strategy doesn't consider customer-centric approaches
at all
Level 2: The organization strategy includes some sections for moving toward
customer-centric approach
Level 3: Most of the organization strategy is designed with customer-centric
approach in scope
Level 4: The organization strategy is designed with the core of the customer-
centric approach
Table 80: Desirability Levels for Strategy in Pilot Research
Awareness and Training
Level 1: Customer has not heard of any products or services of company
Level 2: Customer has heard the name of the company but not products or services
Level 3: Customer is familiar with company and few products or services
Level 4: Customer is familiar with company and most products or services
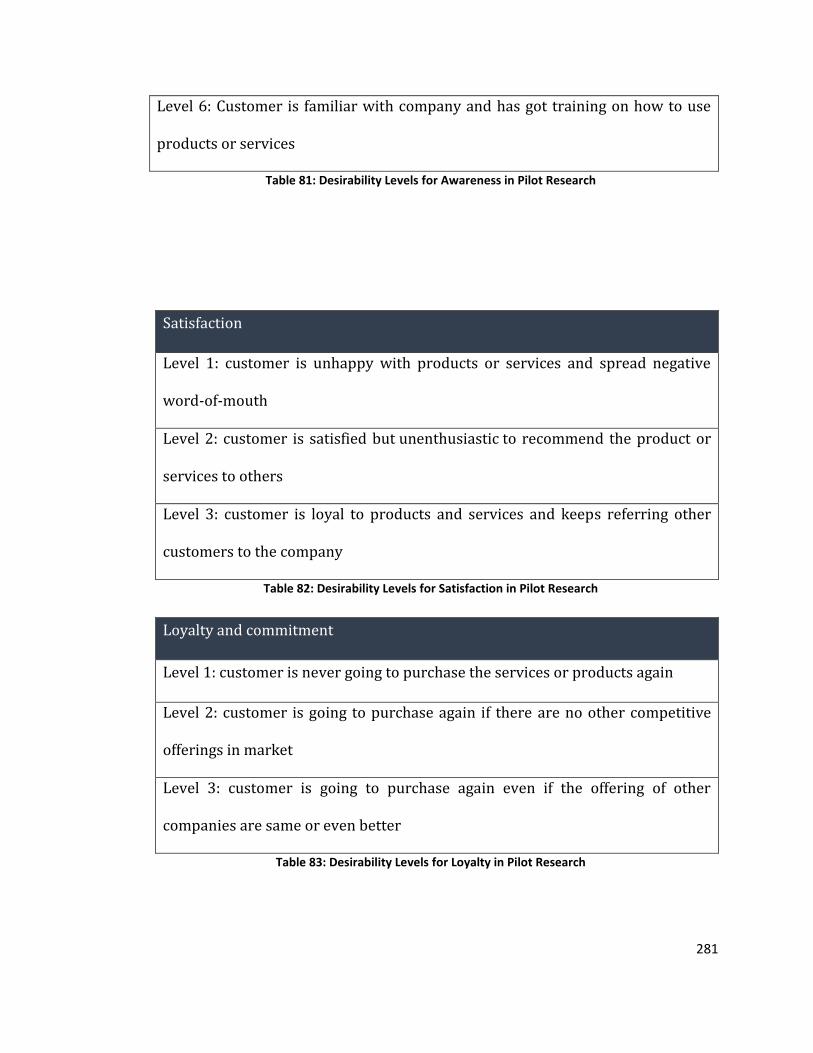
281
Level 6: Customer is familiar with company and has got training on how to use
products or services
Table 81: Desirability Levels for Awareness in Pilot Research
Satisfaction
Level 1: customer is unhappy with products or services and spread negative
word-of-mouth
Level 2: customer is satisfied but unenthusiastic to recommend the product or
services to others
Level 3: customer is loyal to products and services and keeps referring other
customers to the company
Table 82: Desirability Levels for Satisfaction in Pilot Research
Loyalty and commitment
Level 1: customer is never going to purchase the services or products again
Level 2: customer is going to purchase again if there are no other competitive
offerings in market
Level 3: customer is going to purchase again even if the offering of other
companies are same or even better
Table 83: Desirability Levels for Loyalty in Pilot Research
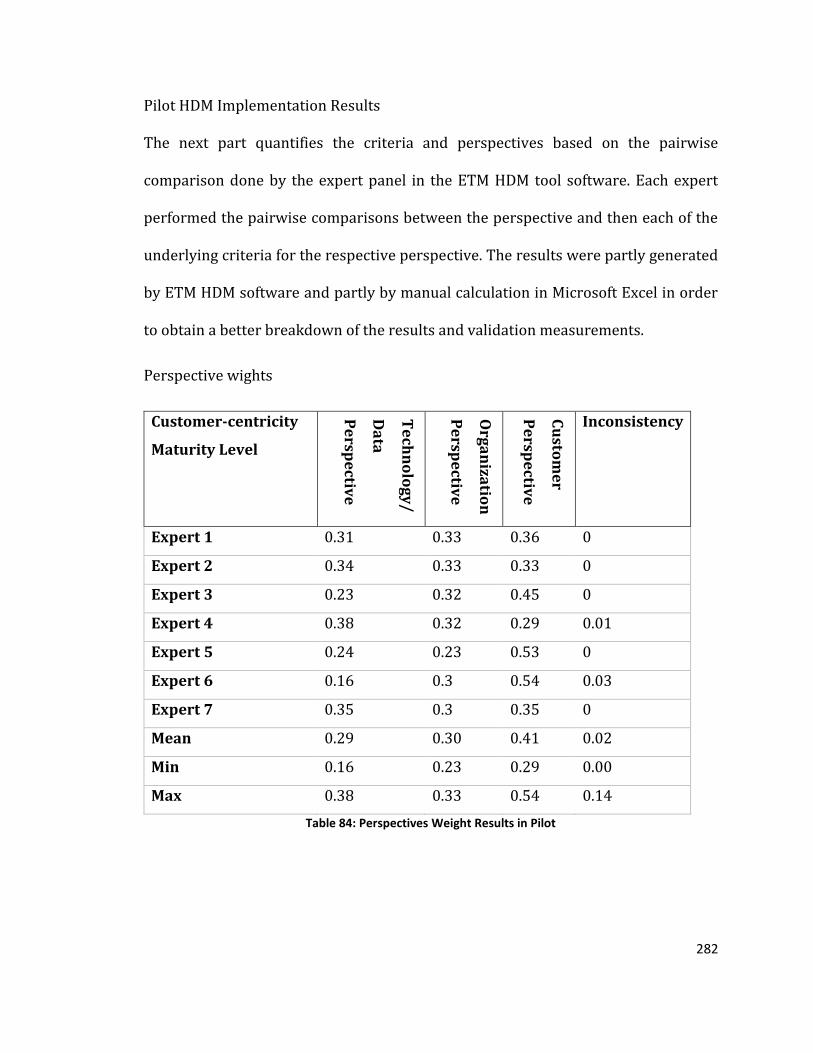
282
Pilot HDM Implementation Results
The next part quantifies the criteria and perspectives based on the pairwise
comparison done by the expert panel in the ETM HDM tool software. Each expert
performed the pairwise comparisons between the perspective and then each of the
underlying criteria for the respective perspective. The results were partly generated
by ETM HDM software and partly by manual calculation in Microsoft Excel in order
to obtain a better breakdown of the results and validation measurements.
Perspective wights
Customer-centricity
Maturity Level
Te
chn
olo
gy
/
Da
ta
Pe
rspe
ctive
Org
an
izatio
n
Pe
rspe
ctive
Cu
stom
er
Pe
rspe
ctive
Inconsistency
Expert 1 0.31 0.33 0.36 0
Expert 2 0.34 0.33 0.33 0
Expert 3 0.23 0.32 0.45 0
Expert 4 0.38 0.32 0.29 0.01
Expert 5 0.24 0.23 0.53 0
Expert 6 0.16 0.3 0.54 0.03
Expert 7 0.35 0.3 0.35 0
Mean 0.29 0.30 0.41 0.02
Min 0.16 0.23 0.29 0.00
Max 0.38 0.33 0.54 0.14
Table 84: Perspectives Weight Results in Pilot

283
Criteria Weights
Customer-centricity Maturity Level
Infra
structu
re In
teg
ratio
n
Da
ta D
istribu
tion
an
d a
ccessib
ility
Da
ta C
olle
ction
Ro
bu
stne
ss
Em
plo
ye
e
Le
ad
ersh
ip
Stra
teg
y
Aw
are
ne
ss an
d T
rain
ing
Op
tion
s an
d fe
ed
ba
ck
Lo
ya
lty a
nd
com
mitm
en
t
Inco
nsiste
ncy
Expert 1 0.12 0.09 0.1 0.1 0.11 0.12 0.15 0.1 0.11 0
Expert 2 0.1 0.11 0.13 0.09 0.08 0.16 0.1 0.07 0.16 0
Expert 3 0.05 0.08 0.1 0.07 0.11 0.14 0.11 0.18 0.16 0
Expert 4 0.11 0.11 0.16 0.12 0.12 0.08 0.08 0.07 0.14 0.01
Expert 5 0.08 0.08 0.08 0.13 0.05 0.05 0.15 0.15 0.23 0
Expert 6 0.05 0.07 0.04 0.05 0.09 0.16 0.11 0.15 0.28 0.01
Expert 7 0.32 0.01 0.02 0.02 0.22 0.06 0.34 0.01 0 0.14
Mean 0.12 0.08 0.09 0.08 0.11 0.11 0.15 0.1 0.15
Minimum 0.05 0.01 0.02 0.02 0.05 0.05 0.08 0.01 0
Maximum 0.32 0.11 0.16 0.13 0.22 0.16 0.34 0.18 0.28
Std. Deviation 0.09 0.03 0.05 0.04 0.05 0.04 0.08 0.05 0.08
Disagreement 0.051
Table 85: Criteria Weight Results in Pilot

284
As it can be seen from the table above, the inconsistency for both perspective and
criteria are in the acceptable ratio and are below 10% except for Expert #7 that
Criteria Inconsistency is above the threshold introduced by Kocaoglu in 1983,
In addition, the Disagreement is below the 10% threshold and within the acceptable
range with being 0.051 in the HDM model pilot implementation for the
Comprehensive exam
The weight of each element is calculated by aggregating (averaging) experts’ results.
These weights are called local weights; they, in turn, are multiplied by their parent
element (or parent elements in case of several levels) weight(s) to obtain the global
weight of each element.