Materials and Design - MPG.PuRe
10
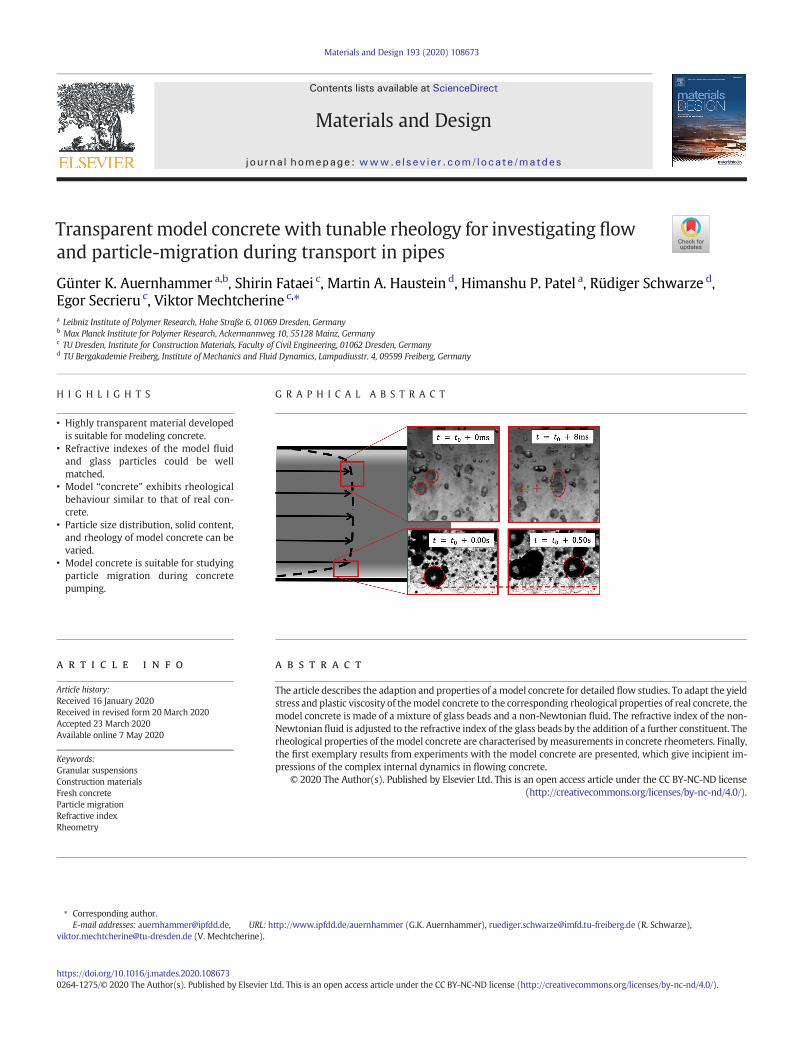
Transparent model concrete with tunable rheology for investigating flow and particle-migration during transport in pipes Günter K. Auernhammer a,b , Shirin Fataei c , Martin A. Haustein d , Himanshu P. Patel a , Rüdiger Schwarze d , Egor Secrieru c , Viktor Mechtcherine c, ⁎ a Leibniz Institute of Polymer Research, Hohe Straße 6, 01069 Dresden, Germany b Max Planck Institute for Polymer Research, Ackermannweg 10, 55128 Mainz, Germany c TU Dresden, Institute for Construction Materials, Faculty of Civil Engineering, 01062 Dresden, Germany d TU Bergakademie Freiberg, Institute of Mechanics and Fluid Dynamics, Lampadiusstr. 4, 09599 Freiberg, Germany HIGHLIGHTS • Highly transparent material developed is suitable for modeling concrete. • Refractive indexes of the model fluid and glass particles could be well matched. • Model “concrete” exhibits rheological behaviour similar to that of real con- crete. • Particle size distribution, solid content, and rheology of model concrete can be varied. • Model concrete is suitable for studying particle migration during concrete pumping. GRAPHICAL ABSTRACT abstract article info Article history: Received 16 January 2020 Received in revised form 20 March 2020 Accepted 23 March 2020 Available online 7 May 2020 Keywords: Granular suspensions Construction materials Fresh concrete Particle migration Refractive index Rheometry The article describes the adaption and properties of a model concrete for detailed flow studies. To adapt the yield stress and plastic viscosity of the model concrete to the corresponding rheological properties of real concrete, the model concrete is made of a mixture of glass beads and a non-Newtonian fluid. The refractive index of the non- Newtonian fluid is adjusted to the refractive index of the glass beads by the addition of a further constituent. The rheological properties of the model concrete are characterised by measurements in concrete rheometers. Finally, the first exemplary results from experiments with the model concrete are presented, which give incipient im- pressions of the complex internal dynamics in flowing concrete. © 2020 The Author(s). Published by Elsevier Ltd. This is an open access article under the CC BY-NC-ND license (http://creativecommons.org/licenses/by-nc-nd/4.0/). Materials and Design 193 (2020) 108673 ⁎ Corresponding author. E-mail addresses: [email protected], URL: http://www.ipfdd.de/auernhammer (G.K. Auernhammer), [email protected] (R. Schwarze), [email protected] (V. Mechtcherine). https://doi.org/10.1016/j.matdes.2020.108673 0264-1275/© 2020 The Author(s). Published by Elsevier Ltd. This is an open access article under the CC BY-NC-ND license (http://creativecommons.org/licenses/by-nc-nd/4.0/). Contents lists available at ScienceDirect Materials and Design journal homepage: www.elsevier.com/locate/matdes
-
Upload
khangminh22 -
Category
Documents
-
view
0 -
download
0
Transcript of Materials and Design - MPG.PuRe
Materials and Design 193 (2020) 108673
Contents lists available at ScienceDirect
Materials and Design
j ourna l homepage: www.e lsev ie r .com/ locate /matdes
Transparent model concrete with tunable rheology for investigating flowand particle-migration during transport in pipes
Günter K. Auernhammer a,b, Shirin Fataei c, Martin A. Haustein d, Himanshu P. Patel a, Rüdiger Schwarze d,Egor Secrieru c, Viktor Mechtcherine c,⁎a Leibniz Institute of Polymer Research, Hohe Straße 6, 01069 Dresden, Germanyb Max Planck Institute for Polymer Research, Ackermannweg 10, 55128 Mainz, Germanyc TU Dresden, Institute for Construction Materials, Faculty of Civil Engineering, 01062 Dresden, Germanyd TU Bergakademie Freiberg, Institute of Mechanics and Fluid Dynamics, Lampadiusstr. 4, 09599 Freiberg, Germany
H I G H L I G H T S G R A P H I C A L A B S T R A C T
• Highly transparent material developedis suitable for modeling concrete.
• Refractive indexes of the model fluidand glass particles could be wellmatched.
• Model “concrete” exhibits rheologicalbehaviour similar to that of real con-crete.
• Particle size distribution, solid content,and rheology of model concrete can bevaried.
• Model concrete is suitable for studyingparticle migration during concretepumping.
⁎ Corresponding author.E-mail addresses: [email protected], URL: h
[email protected] (V. Mechtcherine).
https://doi.org/10.1016/j.matdes.2020.1086730264-1275/© 2020 The Author(s). Published by Elsevier L
a b s t r a c t
a r t i c l e i n f oArticle history:Received 16 January 2020Received in revised form 20 March 2020Accepted 23 March 2020Available online 7 May 2020
Keywords:Granular suspensionsConstruction materialsFresh concreteParticle migrationRefractive indexRheometry
The article describes the adaption and properties of a model concrete for detailed flow studies. To adapt the yieldstress and plastic viscosity of themodel concrete to the corresponding rheological properties of real concrete, themodel concrete is made of a mixture of glass beads and a non-Newtonian fluid. The refractive index of the non-Newtonian fluid is adjusted to the refractive index of the glass beads by the addition of a further constituent. Therheological properties of themodel concrete are characterised bymeasurements in concrete rheometers. Finally,the first exemplary results from experiments with the model concrete are presented, which give incipient im-pressions of the complex internal dynamics in flowing concrete.
© 2020 The Author(s). Published by Elsevier Ltd. This is an open access article under the CC BY-NC-ND license(http://creativecommons.org/licenses/by-nc-nd/4.0/).
ttp://www.ipfdd.de/auernhammer (G.K. Auernhammer), [email protected] (R. Schwarze),
td. This is an open access article under the CC BY-NC-ND license (http://creativecommons.org/licenses/by-nc-nd/4.0/).
2 G.K. Auernhammer et al. / Materials and Design 193 (2020) 108673
1. Introduction
Concrete is a very versatile building material used in a great varietyof construction applications; in general it is also by far the most oftenused man-made material. From the scientific perspective, concrete is amultiphase, multiscale composite material consisting of mineralbinders, water, sand, coarse aggregates, chemical admixtures andsome air. In its fresh state, concrete exhibits many similarities to othervery wet granular materials or very dense granular suspensions [1,12].
Processing fresh concrete is one of the keystones of modern con-struction technologies. In particular, the pumping of concrete is ofhigh relevance since it is widely used for conveying concrete both on-site and, increasingly, also in precast plants. Furthermore, pumping isa central technological step in such emerging technologies as 3D-concrete-printing. Mastering the pumping of concrete and other pro-cessing stages demands a thorough understanding of concrete rheology.In this article the authors address pumping as a representative produc-tion step. Usually rheological behaviour of fresh concrete is describedbased on the Bingham model. While the determination of the model'sparameters – yield stress and plastic viscosity – is not at all trivial forsuch a complex material as fresh concrete, it is even more challengingto characterise and eventually to predict its response under typical pro-cessing conditions; here, it means simply: during pumping. The mainreasons for these difficulties are complex phenomena including shear-induced particle migration, segregation and the formation of a lubricat-ing layer at the walls of the pumping pipeline [2,7,16,18]. These phe-nomena exert a major influence on processing performance; hence,their deeper understanding is of great importance to the further devel-opment of advanced concrete technologies. In general, the rheology ofdense suspensions is very complex, which is shown in the excellent re-view of Morris et al. [21]. Unfortunately, real concrete cannot be inves-tigated directly with common optical flow measurement techniquesdue to the opacity of fresh concrete.
In the last decade, transparentmodel materials have been suggestedto monitor and analyze internal phenomena in detail during the pro-cessing of fresh concrete [3,4,17,22,24]. For example, Boulekbacheet al. [4] investigated the movement of fibres in polyacrylic acid(Carbopol®) solution, which was applied as a model materialrepresenting fresh concrete. Spangenberg et al. [24] performed modelexperiments in order to investigate particle migration during a typicalcasting operation. Their model concrete was a mixture of a Carbopol®solution,whichmimicked finemortar, and glass beads of somemillime-ters in diameter representing coarse aggregates. Further, Bian et al. [3]demonstrated that model concretes made of Carbopol® and glassbeads exhibited similar rheological behaviour and flow morphology asreal fresh concrete. Additionally, Koch et al. [17] showed that suchmodel concretes are also able to represent rheological behaviour ofreal fresh concrete under vibrational agitation.
Refractive index matching (RIM) is a well-established technique foranalyzing high-concentrated suspensions [9,25–27]. However, there arevery few studies on refractive index matching for suspensions based onnon-Newtonian liquids. Zade et al. recently proposed an interesting ap-proach with RIM for soft particles dispersed in a Carbopol gel with vol-ume fractions up to 10% [28]. However, thismodelmaterial is not suitedto model a real concrete, because of the significantly higher solid-fraction of hard particles in concrete. Note that collisions of the non-deformable particles play an important role in segregation and migra-tion processes.
The aim of the work at hand is to extend markedly the features oftransparent model concretes made of Carbopol® and glass beads. Inparticular, in contrast to previous investigations, an approachwhich en-ables a quantitative characterisation of flow is suggested. It allows theseparate quantification of the internal flow fields of both main concreteconstituents – the binder paste or finemortar and the aggregates – sep-arately. For this purpose, the refractive indices of all materials in themodel concrete and the boundary geometries, i.e., Carbopol®, glass
beads and pipeline walls must be matched in addition to their rheolog-ical properties. Proper index matching makes the complete systemtransparent, allowing the investigator to follow the motion of tracerparticles even far away from the pipe walls.
The outline of the paper is as follows: In Section 2, the materialsemployed and the methods for tuning the material parameters of themodel concrete are given. Section 3 explains specific requirementswith respect to the optical accessibility of the concrete flow region. Fi-nally, the first experimental results obtained using pumping and flowsetups are presented in Section 4.
2. Background
A model cement paste and a model concrete should meet the rele-vant rheological features of real fresh cement and fresh concrete,e.g., their non-Newtonian flow behaviour, as accurately as possible. Inthe study at hand these model systems should also allow for optical ac-cess to the near-wall and bulk flow regions without any distortion. Thisfeature is necessary for local non-intrusive flow measurements, e.g.employing particle image velocimetry or particle tracking for the evalu-ation of segregation and other internal flow phenomena in thematerials.
A key challenge in formulation of the model's materials is imposedby chemical reactions and hydration, both of which take place in thereal materials. These processes introduce, among others, thixotropicflow behaviour of the cement and concrete. Such complex chemical re-actions cannot be precisely reproduced in transparent model materials.Therefore, the rheological properties are considered time-independentfor this study. Note that the time independence of model materials istheir great advantage in comparison to real concrete since it enablesmeasurements under well-controlled conditions. Such measurementscan also deliver a data basis for calibration of numerical models for sim-ulating of concrete.
With the assumption of time-independent properties, the formula-tion of the model materials is as follows: First, the rheological data of aspecific real cement paste or fine mortar and a specific real concreteare analyzed in detail. Second, a composition of transparent model ma-terials is designed, which gives enough flexibility in the formulation toreproduce the needed optical and relevant rheological properties,e.g., index matching and Bingham or Herschel-Buckley flow behaviour.The composition is then properly tuned in order to mirror the rheolog-ical data of the selected real materials. The additives needed for theindex matching in the liquid part of the model system have a pro-nounced influence on the rheological properties. For this reason the sec-ond step includes the fine-tuning of the refractive index and therheological properties in a combined optimization procedure. In thefinal step the rheological data of themodel cement paste or finemortarand model concrete are measured in detail. The comparison of the datafrom both the real and the model materials must provide proof of theproper choice of the model material formulations.
The goal here is not to copy all the rheological properties of real con-crete in a transparentmodel system. Instead, we design amodel systemthat shows the essential features of real concrete, e.g., a Bingham fluidwith yield stress and plastic viscosity. Such a system allows the studyof the basicmechanisms dominating the concreteflowbehaviour by op-tical observation of the single-particle motion.
3. Designing the model concrete
Concrete is a dense polydisperse suspension, composed of water, ce-ment and other fines, admixtures, fine sand, and coarse aggregates. Toreduce the complexity that arises due to the broad particle size distribu-tion, the particles finer than a specific threshold, e.g., 0.4 mm, are con-sidered part of the homogenous carrier fluid in this investigation, andthe particles coarser than the specific threshold are the suspendedsolid phase representing aggregates. Thus, possible flow-induced

3G.K. Auernhammer et al. / Materials and Design 193 (2020) 108673
redistribution and migration for particles finer than the specific thresh-old are neglected in our approach. To study the concrete flowbehaviourand flow-induced migration of particles coarser than the specificthreshold, e.g., 0.4 mm, a transparent non-Newtonian model concretewith tunable rheological properties is designed. The model concreteconsists of a selected set of large transparent particles and a transparentnon-Newtonian model fluid with the same refractive index as of theglass beads. i.e., the refractive index of model fluid is increased tomatch that of glass beads. Furthermore, translucent tracer particleswith non-matching refractive index are added for tracking the flow inthe model concrete. The authors use transparent glass particles of vari-ous diameters, representing the fine sand and coarse aggregates. Thesize range of the particles generally depends on the geometry of thetesting setup. Themodel fluid should be designed tomimic the rheolog-ical properties of cementitious mortar with a maximum particle sizesmaller than the selected glass particles. This procedure implies thatthe rheological properties of the model fluids are a function of the sizeof the glass particles used.
3.1. Materials and mixture design for concrete
As described above, the main objective of this work is to design atunable model concrete consisting of a transparent non-Newtonianmodel fluid and index-matched spherical glass particles that exhibitsrheological properties similar to cementitious concrete. Three mixturesof conventional vibrated concrete (CVC) containing different volumefractions of coarse aggregates, i.e., larger than 1 mm, were designedand tested by the TUD group [10]. Table 1 presents the compositionsof the target concretes and the required dosages of the constituents inkg for producing 1 m3 of concrete. CEM III/A 42.5 N is the cement typeaccording to DIN EN 197-4. The sand and gravel are differentiatedusing the minimum and maximum grain size in mm, according to DINEN 12620. The concrete mixtures are limited to CVC with consistencyclass between F3 and F6, according to DIN EN 206-1. The class F6 refersto concrete mixtures with very flowable consistency (not yet self-compacting).
In the labelling of the samples, “C” represents concrete mixture andthe following number indicates the volume fraction of coarse aggre-gates, N1 mm; for example, C42 corresponds to the concrete containing42 vol% coarse aggregates. The volume fraction of each aggregate group,including quartz powder and fine sands, was chosen so that all togetherthe aggregates matched the middle grading curve, according to DIN1045-2. For simplicity, the constitutive finemortarwith amaximumag-gregate size of 1 mm and the coarse aggregates larger than 1 mm are
Table 1Concrete constituents and their dosage for production of 1 m3 of concrete [10]. Cementtype and grains' fractions are, according to DIN EN 197-4 and DIN EN 12620, respectively.
Materials Density[kg/m3]
Dosage [kg]
C42 C47 C52
Constit.mortar
CEM III/A 42.5 N 2990 425 388 351Quartz powder 2680 57 52 47Quartz sand0.06–0.2
2650 57 52 47
Quartz sand 0–1 2650 456 416 376Water 1000 211 192 173Superplasticizer 1056 3.48 3.18 2.87
Aggregate Quartz sand 1–2 2650 210 235 260Quartz sand 2–4 2650 210 235 260Quartz gravel 4–8 2650 290 325 360Quartz gravel 8–16 2650 403 451 500
w/b [–] 0.50 0.50 0.50SP % bwoc 0.72 0.72 0.72Vol. agg. (N1 mm) [%] 42 47 52Concrete flow table [mm] 640 545 450Mortar flow table [mm] 260 260 240
referred to as “mortar” and “aggregates”, respectively. After mixing,the constitutive mortar was sieved out of concrete using a mesh open-ing size of 1 mm. The flow table tests were performed both on concrete(DIN EN 12350-5) and constitutive mortar (DIN EN 459-2), simulta-neously with the rheological measurements. For flow table tests, a con-crete/mortar cone is positioned on the center of the testing plate and itis filled in two successive layers to ensure full-filling of the cone. Theupper radius/lower radius/height of the cones for concrete and mortarare 130/200/200 mm and 70/100/60 mm, respectively. 30 s after thecone is filled, it is lifted up and the concrete/mortar spreads dependingon its rheological properties. Then, 15 strokes are applied to the sampleby lifting and releasing the testing plate. The height of each stroke is40 mm for concrete and 10 mm for mortar. Finally, the maximum andminimum radii that of the spread concrete/mortar are measured andthe average is reported as the result, see Table 1.
3.2. Rheological parameters for mortar and concrete
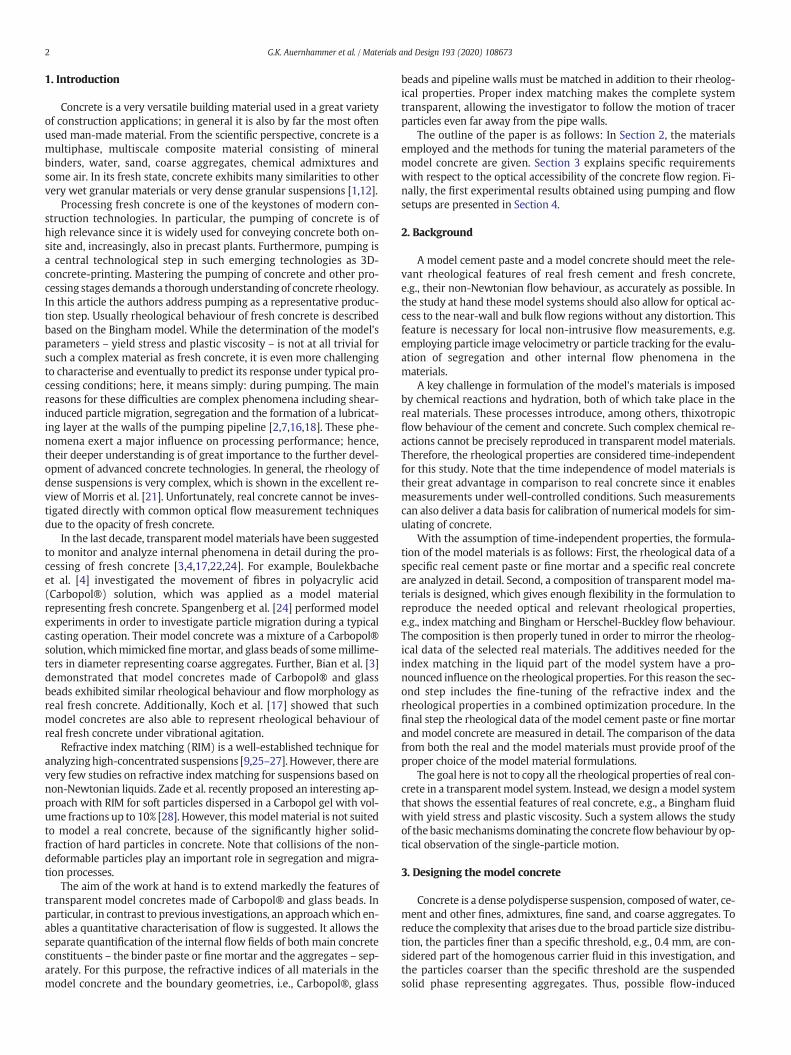
The rheological properties of concrete bulk were determined usingthe wide coaxial gap concentric cylinder viscometer ConTec 5 (ConTec,Iceland [15]): see Fig. 1a.
The constitutive mortar that was obtained from concrete by sievingmethod is considered as the homogeneous fluid that carries the coarsesolid particles, i.e., sand and aggregates in the concrete suspension.The HAAKE MARS II rheometer (Thermo Fisher Scientific, Germany[20]) was used to determine the rheological parameters of the mortarwith a special measuring cell for building materials [20]; see Fig. 1b.The testing protocol consisted of a rate-controlled hysteresis loop withthe maximum rotational velocity of 0.624 and 0.523 rps for ConTec 5and HAAKE MARS II, respectively. The rotational velocity changedstep-wise and in each step the torsional moment is recorded when astationary value is reached.
Fig. 2 illustrates the flow curves obtained for conventional mortarand concrete. The output data of these devices is the torsional momentinduced by the material vs. the rotational/angular velocities (N). In thecase of Bingham-type flow curves for the ConTec 5 viscometer, theReiner-Riwlin equations could be used to derive yield stress and plasticviscosity [11,14,23].
T ¼ Gþ H � N
τ0 ¼ G4πh
1
R2i
−1
R20
!1
ln R0=Rið Þ
μ ¼ H8π2h
1
R2i
−1
R20
!
where G (Nm) and H (Nm/rps) are the intercept and slope of the T-Ncurves. Ri and R0 denote the inner and outer radii of the sampling celland h marks the height of the tested sample. In the case of the HAAKEMARS II rheometer, the device is calibrated using a Newtonian calibra-tion oil. This method is called Affine-Translation (AT) and it is used forarbitrary geometry without analytical solutions [13]. Table 2 summa-rizes the rheological parameters, yield stress and plastic viscosity, ap-proximated for mortar and concrete by fitting the data to the Binghammodel.
3.3. Materials and mixture design for model fluid and model concrete
The three institutes involved in this study used different testingsetups to investigate particle migration in the model concrete duringflow through a pipe: TU Dresden (TUD), TU Bergakademie Freiberg(TUBAF) and Leibniz Institute of Polymer Research in Dresden (IPF).These setups differ in pipe diameter and type of flow. The sliding piperheometer at TUD represents the real-scale case [19]. This device uses
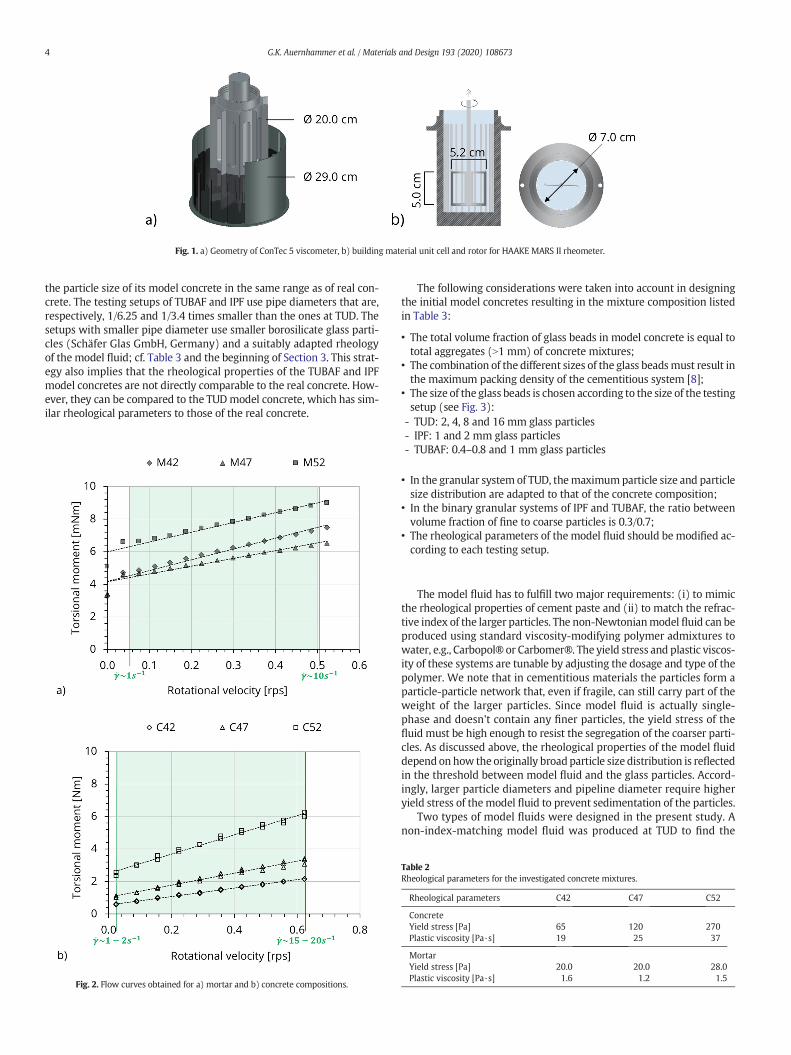
Fig. 1. a) Geometry of ConTec 5 viscometer, b) building material unit cell and rotor for HAAKE MARS II rheometer.
4 G.K. Auernhammer et al. / Materials and Design 193 (2020) 108673
the particle size of its model concrete in the same range as of real con-crete. The testing setups of TUBAF and IPF use pipe diameters that are,respectively, 1/6.25 and 1/3.4 times smaller than the ones at TUD. Thesetups with smaller pipe diameter use smaller borosilicate glass parti-cles (Schäfer Glas GmbH, Germany) and a suitably adapted rheologyof the model fluid; cf. Table 3 and the beginning of Section 3. This strat-egy also implies that the rheological properties of the TUBAF and IPFmodel concretes are not directly comparable to the real concrete. How-ever, they can be compared to the TUDmodel concrete, which has sim-ilar rheological parameters to those of the real concrete.
Fig. 2. Flow curves obtained for a) mortar and b) concrete compositions.
The following considerations were taken into account in designingthe initial model concretes resulting in the mixture composition listedin Table 3:
• The total volume fraction of glass beads in model concrete is equal tototal aggregates (N1 mm) of concrete mixtures;
• The combination of the different sizes of the glass beadsmust result inthe maximum packing density of the cementitious system [8];
• The size of the glass beads is chosen according to the size of the testingsetup (see Fig. 3):
- TUD: 2, 4, 8 and 16 mm glass particles- IPF: 1 and 2 mm glass particles- TUBAF: 0.4–0.8 and 1 mm glass particles
• In the granular system of TUD, themaximumparticle size and particlesize distribution are adapted to that of the concrete composition;
• In the binary granular systems of IPF and TUBAF, the ratio betweenvolume fraction of fine to coarse particles is 0.3/0.7;
• The rheological parameters of the model fluid should be modified ac-cording to each testing setup.
The model fluid has to fulfill two major requirements: (i) to mimicthe rheological properties of cement paste and (ii) to match the refrac-tive index of the larger particles. The non-Newtonianmodel fluid can beproduced using standard viscosity-modifying polymer admixtures towater, e.g., Carbopol® or Carbomer®. The yield stress and plastic viscos-ity of these systems are tunable by adjusting the dosage and type of thepolymer. We note that in cementitious materials the particles form aparticle-particle network that, even if fragile, can still carry part of theweight of the larger particles. Since model fluid is actually single-phase and doesn't contain any finer particles, the yield stress of thefluid must be high enough to resist the segregation of the coarser parti-cles. As discussed above, the rheological properties of the model fluiddepend onhow the originally broadparticle size distribution is reflectedin the threshold between model fluid and the glass particles. Accord-ingly, larger particle diameters and pipeline diameter require higheryield stress of themodel fluid to prevent sedimentation of the particles.
Two types of model fluids were designed in the present study. Anon-index-matching model fluid was produced at TUD to find the
Table 2Rheological parameters for the investigated concrete mixtures.
Rheological parameters C42 C47 C52
ConcreteYield stress [Pa] 65 120 270Plastic viscosity [Pa·s] 19 25 37
MortarYield stress [Pa] 20.0 20.0 28.0Plastic viscosity [Pa·s] 1.6 1.2 1.5
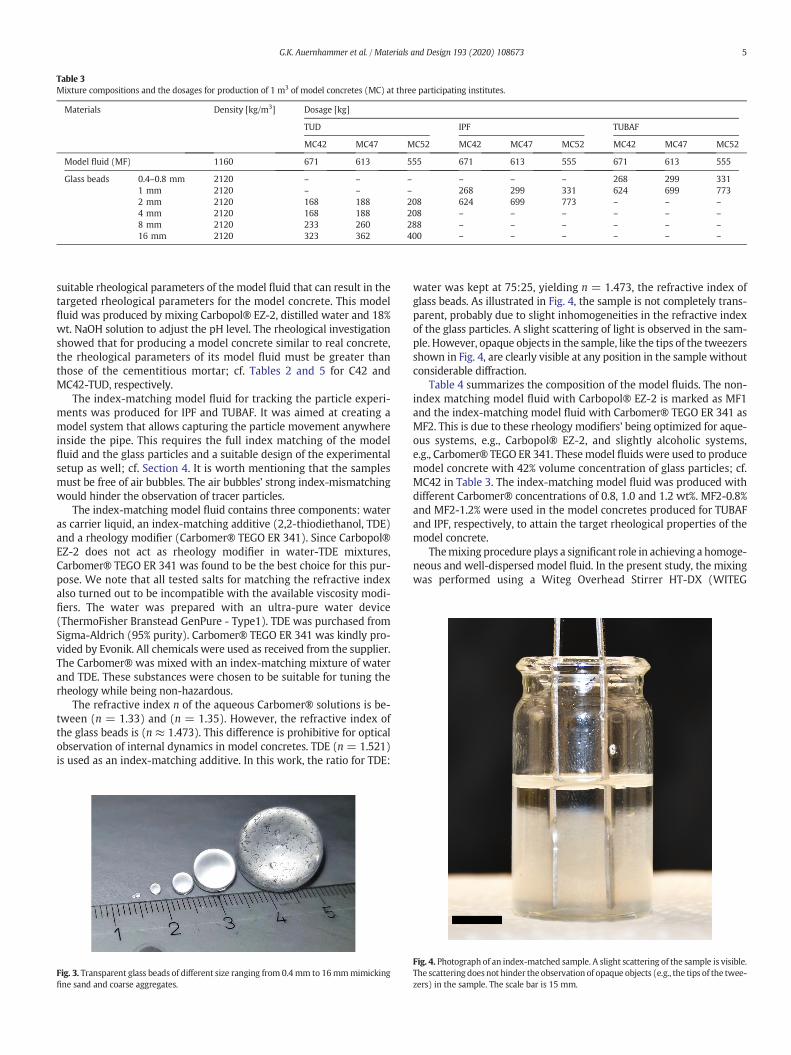
Table 3Mixture compositions and the dosages for production of 1 m3 of model concretes (MC) at three participating institutes.
Materials Density [kg/m3] Dosage [kg]
TUD IPF TUBAF
MC42 MC47 MC52 MC42 MC47 MC52 MC42 MC47 MC52
Model fluid (MF) 1160 671 613 555 671 613 555 671 613 555
Glass beads 0.4–0.8 mm 2120 – – – – – – 268 299 3311 mm 2120 – – – 268 299 331 624 699 7732 mm 2120 168 188 208 624 699 773 – – –4 mm 2120 168 188 208 – – – – – –8 mm 2120 233 260 288 – – – – – –16 mm 2120 323 362 400 – – – – – –
5G.K. Auernhammer et al. / Materials and Design 193 (2020) 108673
suitable rheological parameters of the model fluid that can result in thetargeted rheological parameters for the model concrete. This modelfluid was produced by mixing Carbopol® EZ-2, distilled water and 18%wt. NaOH solution to adjust the pH level. The rheological investigationshowed that for producing a model concrete similar to real concrete,the rheological parameters of its model fluid must be greater thanthose of the cementitious mortar; cf. Tables 2 and 5 for C42 andMC42-TUD, respectively.
The index-matching model fluid for tracking the particle experi-ments was produced for IPF and TUBAF. It was aimed at creating amodel system that allows capturing the particle movement anywhereinside the pipe. This requires the full index matching of the modelfluid and the glass particles and a suitable design of the experimentalsetup as well; cf. Section 4. It is worth mentioning that the samplesmust be free of air bubbles. The air bubbles' strong index-mismatchingwould hinder the observation of tracer particles.
The index-matching model fluid contains three components: wateras carrier liquid, an index-matching additive (2,2-thiodiethanol, TDE)and a rheology modifier (Carbomer® TEGO ER 341). Since Carbopol®EZ-2 does not act as rheology modifier in water-TDE mixtures,Carbomer® TEGO ER 341 was found to be the best choice for this pur-pose. We note that all tested salts for matching the refractive indexalso turned out to be incompatible with the available viscosity modi-fiers. The water was prepared with an ultra-pure water device(ThermoFisher Branstead GenPure - Type1). TDE was purchased fromSigma-Aldrich (95% purity). Carbomer® TEGO ER 341 was kindly pro-vided by Evonik. All chemicals were used as received from the supplier.The Carbomer® was mixed with an index-matching mixture of waterand TDE. These substances were chosen to be suitable for tuning therheology while being non-hazardous.
The refractive index n of the aqueous Carbomer® solutions is be-tween (n = 1.33) and (n = 1.35). However, the refractive index ofthe glass beads is (n ≈ 1.473). This difference is prohibitive for opticalobservation of internal dynamics in model concretes. TDE (n = 1.521)is used as an index-matching additive. In this work, the ratio for TDE:
Fig. 3. Transparent glass beads of different size ranging from 0.4mm to 16mmmimickingfine sand and coarse aggregates.
water was kept at 75:25, yielding n = 1.473, the refractive index ofglass beads. As illustrated in Fig. 4, the sample is not completely trans-parent, probably due to slight inhomogeneities in the refractive indexof the glass particles. A slight scattering of light is observed in the sam-ple. However, opaque objects in the sample, like the tips of the tweezersshown in Fig. 4, are clearly visible at any position in the sample withoutconsiderable diffraction.
Table 4 summarizes the composition of the model fluids. The non-index matching model fluid with Carbopol® EZ-2 is marked as MF1and the index-matching model fluid with Carbomer® TEGO ER 341 asMF2. This is due to these rheology modifiers' being optimized for aque-ous systems, e.g., Carbopol® EZ-2, and slightly alcoholic systems,e.g., Carbomer® TEGO ER 341. Thesemodel fluids were used to producemodel concrete with 42% volume concentration of glass particles; cf.MC42 in Table 3. The index-matching model fluid was produced withdifferent Carbomer® concentrations of 0.8, 1.0 and 1.2 wt%. MF2-0.8%and MF2-1.2% were used in the model concretes produced for TUBAFand IPF, respectively, to attain the target rheological properties of themodel concrete.
Themixing procedure plays a significant role in achieving a homoge-neous and well-dispersed model fluid. In the present study, the mixingwas performed using a Witeg Overhead Stirrer HT-DX (WITEG
Fig. 4. Photograph of an index-matched sample. A slight scattering of the sample is visible.The scattering doesnot hinder the observation of opaque objects (e.g., the tips of the twee-zers) in the sample. The scale bar is 15 mm.
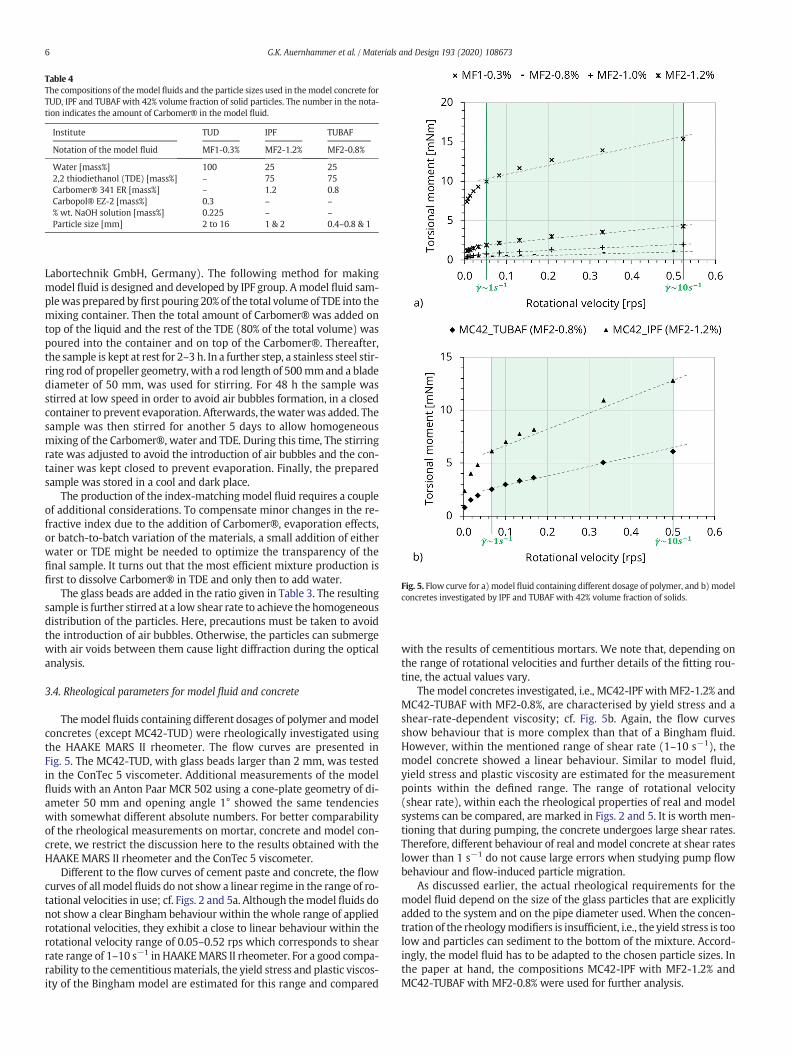
Table 4The compositions of themodel fluids and the particle sizes used in themodel concrete forTUD, IPF and TUBAF with 42% volume fraction of solid particles. The number in the nota-tion indicates the amount of Carbomer® in the model fluid.
Institute TUD IPF TUBAF
Notation of the model fluid MF1-0.3% MF2-1.2% MF2-0.8%
Water [mass%] 100 25 252,2 thiodiethanol (TDE) [mass%] – 75 75Carbomer® 341 ER [mass%] – 1.2 0.8Carbopol® EZ-2 [mass%] 0.3 – –% wt. NaOH solution [mass%] 0.225 – –Particle size [mm] 2 to 16 1 & 2 0.4–0.8 & 1
Fig. 5. Flow curve for a) model fluid containing different dosage of polymer, and b) modelconcretes investigated by IPF and TUBAF with 42% volume fraction of solids.
6 G.K. Auernhammer et al. / Materials and Design 193 (2020) 108673
Labortechnik GmbH, Germany). The following method for makingmodel fluid is designed and developed by IPF group. Amodel fluid sam-plewas prepared by first pouring 20% of the total volume of TDE into themixing container. Then the total amount of Carbomer® was added ontop of the liquid and the rest of the TDE (80% of the total volume) waspoured into the container and on top of the Carbomer®. Thereafter,the sample is kept at rest for 2–3 h. In a further step, a stainless steel stir-ring rod of propeller geometry, with a rod length of 500mmand a bladediameter of 50 mm, was used for stirring. For 48 h the sample wasstirred at low speed in order to avoid air bubbles formation, in a closedcontainer to prevent evaporation. Afterwards, thewaterwas added. Thesample was then stirred for another 5 days to allow homogeneousmixing of the Carbomer®, water and TDE. During this time, The stirringrate was adjusted to avoid the introduction of air bubbles and the con-tainer was kept closed to prevent evaporation. Finally, the preparedsample was stored in a cool and dark place.
The production of the index-matchingmodel fluid requires a coupleof additional considerations. To compensate minor changes in the re-fractive index due to the addition of Carbomer®, evaporation effects,or batch-to-batch variation of the materials, a small addition of eitherwater or TDE might be needed to optimize the transparency of thefinal sample. It turns out that the most efficient mixture production isfirst to dissolve Carbomer® in TDE and only then to add water.
The glass beads are added in the ratio given in Table 3. The resultingsample is further stirred at a low shear rate to achieve the homogeneousdistribution of the particles. Here, precautions must be taken to avoidthe introduction of air bubbles. Otherwise, the particles can submergewith air voids between them cause light diffraction during the opticalanalysis.
3.4. Rheological parameters for model fluid and concrete
Themodel fluids containing different dosages of polymer andmodelconcretes (except MC42-TUD) were rheologically investigated usingthe HAAKE MARS II rheometer. The flow curves are presented inFig. 5. The MC42-TUD, with glass beads larger than 2 mm, was testedin the ConTec 5 viscometer. Additional measurements of the modelfluids with an Anton Paar MCR 502 using a cone-plate geometry of di-ameter 50 mm and opening angle 1° showed the same tendencieswith somewhat different absolute numbers. For better comparabilityof the rheological measurements on mortar, concrete and model con-crete, we restrict the discussion here to the results obtained with theHAAKE MARS II rheometer and the ConTec 5 viscometer.
Different to the flow curves of cement paste and concrete, the flowcurves of all model fluids do not show a linear regime in the range of ro-tational velocities in use; cf. Figs. 2 and 5a. Although themodel fluids donot show a clear Bingham behaviour within the whole range of appliedrotational velocities, they exhibit a close to linear behaviour within therotational velocity range of 0.05–0.52 rps which corresponds to shearrate range of 1–10 s−1 in HAAKEMARS II rheometer. For a good compa-rability to the cementitiousmaterials, the yield stress and plastic viscos-ity of the Bingham model are estimated for this range and compared
with the results of cementitious mortars. We note that, depending onthe range of rotational velocities and further details of the fitting rou-tine, the actual values vary.
Themodel concretes investigated, i.e., MC42-IPF with MF2-1.2% andMC42-TUBAF with MF2-0.8%, are characterised by yield stress and ashear-rate-dependent viscosity; cf. Fig. 5b. Again, the flow curvesshow behaviour that is more complex than that of a Bingham fluid.However, within the mentioned range of shear rate (1–10 s−1), themodel concrete showed a linear behaviour. Similar to model fluid,yield stress and plastic viscosity are estimated for the measurementpoints within the defined range. The range of rotational velocity(shear rate), within each the rheological properties of real and modelsystems can be compared, are marked in Figs. 2 and 5. It is worth men-tioning that during pumping, the concrete undergoes large shear rates.Therefore, different behaviour of real andmodel concrete at shear rateslower than 1 s−1 do not cause large errors when studying pump flowbehaviour and flow-induced particle migration.
As discussed earlier, the actual rheological requirements for themodel fluid depend on the size of the glass particles that are explicitlyadded to the system and on the pipe diameter used. When the concen-tration of the rheologymodifiers is insufficient, i.e., the yield stress is toolow and particles can sediment to the bottom of the mixture. Accord-ingly, the model fluid has to be adapted to the chosen particle sizes. Inthe paper at hand, the compositions MC42-IPF with MF2-1.2% andMC42-TUBAF with MF2-0.8% were used for further analysis.

Fig. 6. Comparison between the Bingham parameters of a) mortar and model fluid,b) concrete and model concrete. The yield stress and plastic viscosity are marked on theright and left axis, respectively. Due to the differences in the smallest explicitly addedparticles to the different model concretes, some differences between the model systemsand the real system are expected; see main text for details.
7G.K. Auernhammer et al. / Materials and Design 193 (2020) 108673
Similar to real concrete and mortar, the Bingham model is used toderive the rheological parameters of themodel fluid and themodel con-crete within the shear rate range of 1–10 s−1. The estimates for theBingham parameters – yield stress and plastic viscosity – for modelfluids and (non-segregating) model concretes are summarized inTable 5. These values are compared with the Bingham parameters forcementitious mortar and real concrete; cf. Fig. 6a and b. Thus, in orderto attain a target value for yield stress and plastic viscosity in the samerange of concrete MC42-TUD, the model fluid requires higher valuesof yield stress and plastic viscosity in comparison to the cementitiousmortar. Certainly, the rheology of the model fluids that replaces themortar in real concrete depends on the smallest size of the added parti-cles. Since the three model concretes differ in the smallest particle size,the corresponding model fluids accordingly show different rheologicalproperties. A comparison between C42 and MC42-TUD in Tables 2 and5 reveals similar rheological behaviour for real and model concreteswhen the model fluid has twice the yield stress and plastic viscosity ofmortar. Due to the granular nature of constitutive mortar, i.e., cement,fines and fine sands, the segregation is less pronounced in cementitiousconcretes. However, the model systems presented here show enoughflexibility in their rheological properties to mimic the essential rheolog-ical properties of concrete, i.e., yield stress and shear-rate-dependentviscosity.
3.5. Similarity of real and model concrete
In order to judge the performance of the new model concrete, it isuseful to check the important dimensionless numbers. Approximatingthe model concrete similar to the real concrete as a yield stress (Bing-ham) suspension, the macroscopic behaviour is scaled with the Bing-ham Reynolds number ReB and the Hedstrom number He [6].
ReB ¼ ρeff ULμpl
He ¼ ρeff τ0L2
μ2pl
with the effective density of the suspension ρeff, themean velocityU, thecharacteristicmacroscopic length scale of theflow L, the plastic viscosityμpl and the yield stress τ0. If concrete C47 is pumped with U= 0.5 m/sthrough a pipeline of diameter D = 0.1 m, the dimensionless numbersare ReB
C47 = 5 and HeC47 = 5. If the pumping process is modelled withmodel concrete MC42-TUBAF in a pipeline with diameter D = 0.02 mand U = 0.5 m/s (compare Fig. 10), the values ReBMC42 = 11 and He-MC42 = 3 are found.
On the other hand, themicroscopic behaviour of individual particlessuspended in a Bingham liquid is characterised by the yield number Yand the particle Bingham number Bip.
Y ¼ τ0ρp−ρl
� �gd
Bip ¼ τ0dμplU
with the particle diameter d, the particle density ρp and the liquid den-sity ρl, respectively. In a flow of the real concrete with mean velocityU = 0.5 m/s, vanishing density difference between cement paste andcoarser aggregates, cement plastic viscosity μpl = 1.2 Pa ⋅ s and yield
Table 5The Bingham parameters of the model fluid and model concrete for TUD, IPF and TUBAF.
Model fluid MF1-0.3% MF2-1.2% MF2-0.8%
Yield stress [Pa] 41.01 6.85 1.82Plas. viscosity [Pa·s] 3.71 1.51 0.31
Model concrete MC42-TUD MC42-IPF MC42-TUBAF
Yield stress [Pa] 70.00 26.00 10.30Plas. viscosity [Pa·s] 22.00 2.65 1.51
stress τ0 = 20 Pa, a very large yield number Y N 1 and a Bingham num-berBi ≃ 0.03 is found for particleswith diameter d=1 mm. For theflowof the model concrete with the same mean velocity, density differencebetween model cement and glass beads ρp − ρl ≃ 1100 kg/m3, modelcement plastic viscosity μpl = 0.3 Pa ⋅ s and yield stress τ0 = 1.8 Pa, ayield number Y = 0.16 and a Bingham number Bi ≃ 0.01 is found for
Fig. 7. Flow configurations for measurements with the new model concrete. The flowdirection is marked by arrows and the regions of interest are shown in red rectangles.
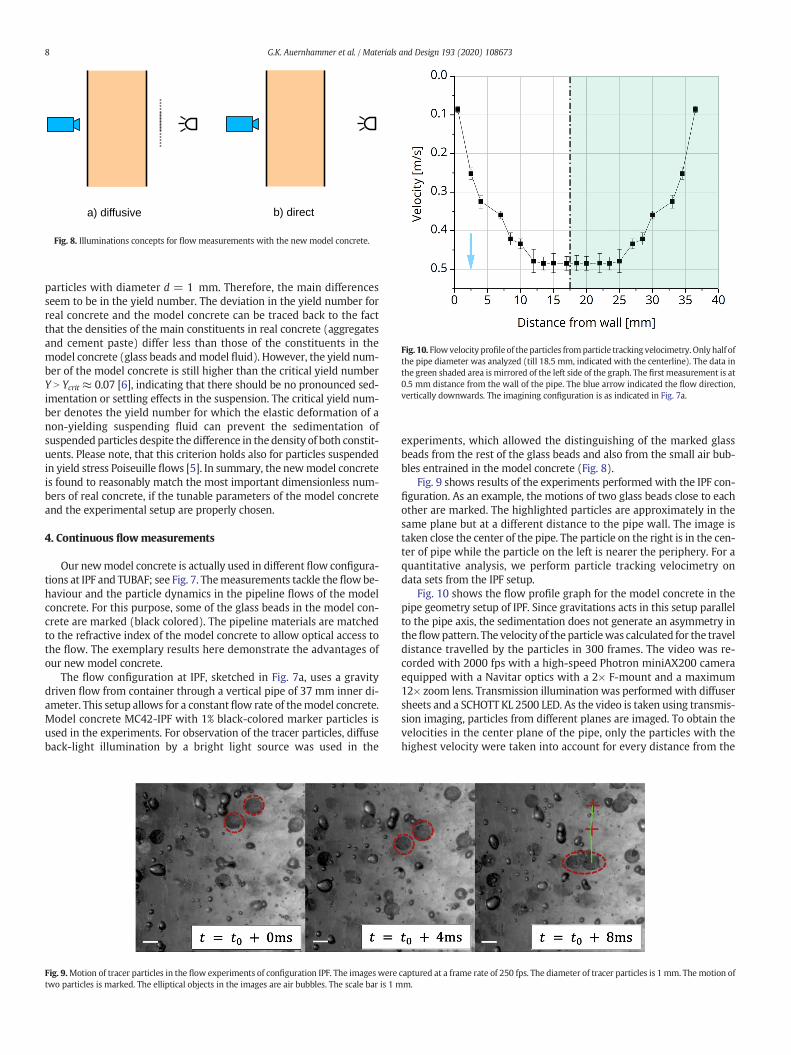
Fig. 10. Flowvelocity profile of the particles fromparticle tracking velocimetry. Only half ofthe pipe diameter was analyzed (till 18.5 mm, indicated with the centerline). The data inthe green shaded area is mirrored of the left side of the graph. The first measurement is at0.5 mm distance from the wall of the pipe. The blue arrow indicated the flow direction,vertically downwards. The imagining configuration is as indicated in Fig. 7a.
Fig. 8. Illuminations concepts for flowmeasurements with the new model concrete.
8 G.K. Auernhammer et al. / Materials and Design 193 (2020) 108673
particles with diameter d = 1 mm. Therefore, the main differencesseem to be in the yield number. The deviation in the yield number forreal concrete and the model concrete can be traced back to the factthat the densities of the main constituents in real concrete (aggregatesand cement paste) differ less than those of the constituents in themodel concrete (glass beads andmodel fluid). However, the yield num-ber of the model concrete is still higher than the critical yield numberY N Ycrit ≈ 0.07 [6], indicating that there should be no pronounced sed-imentation or settling effects in the suspension. The critical yield num-ber denotes the yield number for which the elastic deformation of anon-yielding suspending fluid can prevent the sedimentation ofsuspended particles despite the difference in the density of both constit-uents. Please note, that this criterion holds also for particles suspendedin yield stress Poiseuille flows [5]. In summary, the newmodel concreteis found to reasonably match the most important dimensionless num-bers of real concrete, if the tunable parameters of the model concreteand the experimental setup are properly chosen.
4. Continuous flowmeasurements
Our newmodel concrete is actually used in different flow configura-tions at IPF and TUBAF; see Fig. 7. Themeasurements tackle the flowbe-haviour and the particle dynamics in the pipeline flows of the modelconcrete. For this purpose, some of the glass beads in the model con-crete are marked (black colored). The pipeline materials are matchedto the refractive index of the model concrete to allow optical access tothe flow. The exemplary results here demonstrate the advantages ofour new model concrete.
The flow configuration at IPF, sketched in Fig. 7a, uses a gravitydriven flow from container through a vertical pipe of 37 mm inner di-ameter. This setup allows for a constant flow rate of themodel concrete.Model concrete MC42-IPF with 1% black-colored marker particles isused in the experiments. For observation of the tracer particles, diffuseback-light illumination by a bright light source was used in the
Fig. 9.Motion of tracer particles in the flow experiments of configuration IPF. The imagesweretwo particles is marked. The elliptical objects in the images are air bubbles. The scale bar is 1 m
experiments, which allowed the distinguishing of the marked glassbeads from the rest of the glass beads and also from the small air bub-bles entrained in the model concrete (Fig. 8).
Fig. 9 shows results of the experiments performed with the IPF con-figuration. As an example, the motions of two glass beads close to eachother are marked. The highlighted particles are approximately in thesame plane but at a different distance to the pipe wall. The image istaken close the center of the pipe. The particle on the right is in the cen-ter of pipe while the particle on the left is nearer the periphery. For aquantitative analysis, we perform particle tracking velocimetry ondata sets from the IPF setup.
Fig. 10 shows the flow profile graph for the model concrete in thepipe geometry setup of IPF. Since gravitations acts in this setup parallelto the pipe axis, the sedimentation does not generate an asymmetry intheflowpattern. The velocity of the particlewas calculated for the traveldistance travelled by the particles in 300 frames. The video was re-corded with 2000 fps with a high-speed Photron miniAX200 cameraequipped with a Navitar optics with a 2× F-mount and a maximum12× zoom lens. Transmission illumination was performed with diffusersheets and a SCHOTT KL 2500 LED. As the video is taken using transmis-sion imaging, particles from different planes are imaged. To obtain thevelocities in the center plane of the pipe, only the particles with thehighest velocity were taken into account for every distance from the
captured at a frame rate of 250 fps. The diameter of tracer particles is 1 mm. Themotion ofm.
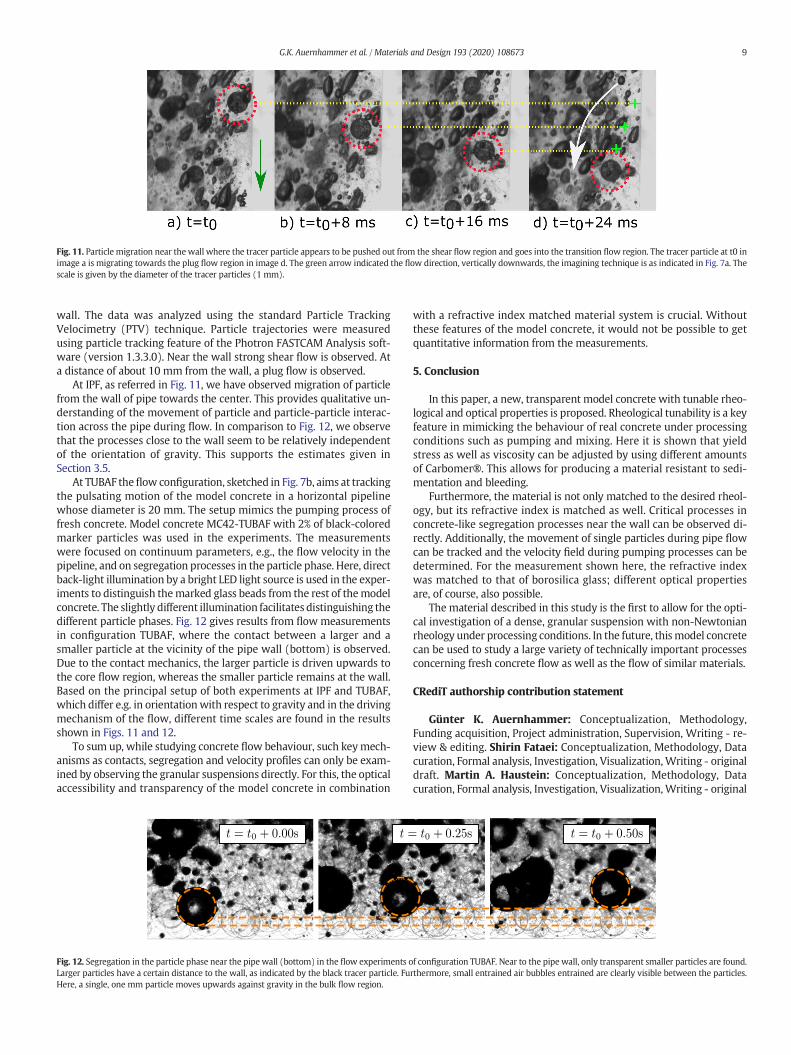
Fig. 11. Particle migration near the wall where the tracer particle appears to be pushed out from the shear flow region and goes into the transition flow region. The tracer particle at t0 inimage a is migrating towards the plug flow region in image d. The green arrow indicated the flow direction, vertically downwards, the imagining technique is as indicated in Fig. 7a. Thescale is given by the diameter of the tracer particles (1 mm).
9G.K. Auernhammer et al. / Materials and Design 193 (2020) 108673
wall. The data was analyzed using the standard Particle TrackingVelocimetry (PTV) technique. Particle trajectories were measuredusing particle tracking feature of the Photron FASTCAM Analysis soft-ware (version 1.3.3.0). Near the wall strong shear flow is observed. Ata distance of about 10 mm from the wall, a plug flow is observed.
At IPF, as referred in Fig. 11, we have observed migration of particlefrom the wall of pipe towards the center. This provides qualitative un-derstanding of the movement of particle and particle-particle interac-tion across the pipe during flow. In comparison to Fig. 12, we observethat the processes close to the wall seem to be relatively independentof the orientation of gravity. This supports the estimates given inSection 3.5.
At TUBAF theflow configuration, sketched in Fig. 7b, aims at trackingthe pulsating motion of the model concrete in a horizontal pipelinewhose diameter is 20 mm. The setup mimics the pumping process offresh concrete. Model concrete MC42-TUBAF with 2% of black-coloredmarker particles was used in the experiments. The measurementswere focused on continuum parameters, e.g., the flow velocity in thepipeline, and on segregation processes in the particle phase. Here, directback-light illumination by a bright LED light source is used in the exper-iments to distinguish themarked glass beads from the rest of themodelconcrete. The slightly different illumination facilitates distinguishing thedifferent particle phases. Fig. 12 gives results from flow measurementsin configuration TUBAF, where the contact between a larger and asmaller particle at the vicinity of the pipe wall (bottom) is observed.Due to the contact mechanics, the larger particle is driven upwards tothe core flow region, whereas the smaller particle remains at the wall.Based on the principal setup of both experiments at IPF and TUBAF,which differ e.g. in orientationwith respect to gravity and in the drivingmechanism of the flow, different time scales are found in the resultsshown in Figs. 11 and 12.
To sum up, while studying concrete flow behaviour, such keymech-anisms as contacts, segregation and velocity profiles can only be exam-ined by observing the granular suspensions directly. For this, the opticalaccessibility and transparency of the model concrete in combination
Fig. 12. Segregation in the particle phase near the pipe wall (bottom) in the flow experiments oLarger particles have a certain distance to the wall, as indicated by the black tracer particle. FuHere, a single, one mm particle moves upwards against gravity in the bulk flow region.
with a refractive index matched material system is crucial. Withoutthese features of the model concrete, it would not be possible to getquantitative information from the measurements.
5. Conclusion
In this paper, a new, transparent model concrete with tunable rheo-logical and optical properties is proposed. Rheological tunability is a keyfeature in mimicking the behaviour of real concrete under processingconditions such as pumping and mixing. Here it is shown that yieldstress as well as viscosity can be adjusted by using different amountsof Carbomer®. This allows for producing a material resistant to sedi-mentation and bleeding.
Furthermore, the material is not only matched to the desired rheol-ogy, but its refractive index is matched as well. Critical processes inconcrete-like segregation processes near the wall can be observed di-rectly. Additionally, the movement of single particles during pipe flowcan be tracked and the velocity field during pumping processes can bedetermined. For the measurement shown here, the refractive indexwas matched to that of borosilica glass; different optical propertiesare, of course, also possible.
The material described in this study is the first to allow for the opti-cal investigation of a dense, granular suspension with non-Newtonianrheology under processing conditions. In the future, thismodel concretecan be used to study a large variety of technically important processesconcerning fresh concrete flow as well as the flow of similar materials.
CRediT authorship contribution statement
Günter K. Auernhammer: Conceptualization, Methodology,Funding acquisition, Project administration, Supervision, Writing - re-view & editing. Shirin Fataei: Conceptualization, Methodology, Datacuration, Formal analysis, Investigation, Visualization,Writing - originaldraft. Martin A. Haustein: Conceptualization, Methodology, Datacuration, Formal analysis, Investigation, Visualization,Writing - original
f configuration TUBAF. Near to the pipe wall, only transparent smaller particles are found.rthermore, small entrained air bubbles entrained are clearly visible between the particles.
10 G.K. Auernhammer et al. / Materials and Design 193 (2020) 108673
draft. Himanshu P. Patel: Conceptualization, Methodology, Datacuration, Formal analysis, Investigation, Visualization,Writing - originaldraft. Rüdiger Schwarze: Conceptualization, Methodology, Funding ac-quisition, Project administration, Supervision, Writing - review &editing. Egor Secrieru: Conceptualization, Methodology, Investigation,Project administration, Supervision, Visualization, Writing - originaldraft, Writing - review & editing. Viktor Mechtcherine: Conceptualiza-tion, Methodology, Funding acquisition, Project administration,Writing- review & editing, Supervision.
Declaration of competing interest
The authors declare that they have no known competing financialinterests or personal relationships that could have appeared to influ-ence the work reported in this paper.
Acknowledgments
Gefördert durch die Deutsche Forschungsgemeinschaft (DFG) –Projektnummern 387100398, 387065607, 387095311, 387153567. Dievier Projekte wurden im Rahmen vom Schwerpunktprogram “OpusFluidum Futurum – Rheologie reaktiver, multiskaliger, mehrphasigerBaustoffsysteme” (SPP 2005) gefördert; funded by the DeutscheForschungsgemeinschaft (DFG, German Research Foundation) – projectnumbers 387100398, 387065607, 387095311, 387153567. The fourprojects were funded within the framework of the Priority Program“Opus Fluidum Futurum – Rheology of reactive, multiscale, multiphaseconstruction materials” (SPP 2005).
The authors gratefully acknowledge the supply of binder byHeidelbergCement AG and admixtures by BASF. The used Carbomer®was kindly provided by Evonik.
References
[1] B. Andreotti, Y. Forterre, O. Pouliquen, Granular Media: Between Fluid and Solid,Cambridge University Press, Cambridge, 2013.
[2] H. Bauer, Über das Pumpen von Beton durch Rohre mit kleinen Durchmessern,Baumaschine und Bautechnik 7 (1971) 277–281.
[3] C. Bian, Z. Tian, X. Li, J. Xiang, Approach on rheology of ordinary concrete, Earth andSpace 2016: Engineering for Extreme Environments , Orlando 2016, pp. 915–925.
[4] B. Boulekbache, M. Hamrat, M. Chemrouk, S. Amziane, Flowability of fibre-reinforced concrete and its effect on the mechanical properties of the material,Constr. Build. Mater. 24 (2010) 1664–1671, https://doi.org/10.1016/j.conbuildmat.2010.02.025.
[5] E. Chaparian, O. Tammisola, Stability of particles inside yield-stress fluid Poiseuilleflows, J. Fluid Mech. 885 (2020) A45, https://doi.org/10.1017/jfm.2019.1038.
[6] R. Chhabra, Bubbles, Drops, and Particles in Non-Newtonian Fluids, 2 ed. CRC Press,2006https://doi.org/10.1201/9781420015386.
[7] M. Choi, N. Roussel, Y. Kim, J. Kim, Lubrication layer properties during concretepumping, Cem. Concr. Res. 45 (2013) 69–78, https://doi.org/10.1016/j.cemconres.2012.11.001.
[8] F. De Larrard, Concrete Mixture Proportioning: A Scientific Approach, Taylor &Francis Ltd, 1999.
[9] J.A. Dijksman, F. Rietz, K.A. Lörincz, M. van Hecke, W. Losert, Refractive indexmatched scanning of dense granular materials, Rev. Sci. Instrum. 83 (2012),011301. https://doi.org/10.1063/1.3674173.
[10] S. Fataei, E. Secrieru, V. Mechtcherine, Influence of aggregate volume fraction onconcrete pumping behaviour, Rheology and Processing of Construction Materials,Springer, Cham 2019, pp. 303–310.
[11] H. Giesekus, Phänomenologische Rheologie, Springer-Verlag, Berlin HeidelbergGmbH, 1994.
[12] É. Guazzelli, O. Pouliquen, Rheology of dense granular suspensions, J. Fluid Mech.852 (2018)https://doi.org/10.1017/jfm.2018.548.
[13] M. Haist, J. Link, D. Nicia, S. Leinitz, C. Baumert, T. von Bronk, D. Cotardo, M.E.Pirharati, S. Fataei, H. Garrecht, C. Gehlen, I. Hauschildt, I. Ivanova, S. Jesinghausen,C. Klein, H.W. Krauss, L. Lohaus, D. Lowke, O. Mazanec, U. Pott, N.W. Radebe, J.J.Riedmiller, H.J. Schmid, W. Schmidt, E. Secrieru, D. Stephan, M. Thiedeitz, M.Wilhelm, V. Mechtcherine, Interlaboratory study on rheological properties of ce-ment pastes and reference substances – comparability of measurements performedwith different rheometers and measurement geometries, Mater. Struct. 53 (2020)https://doi.org/10.1617/s11527-020-01477-w (in press).
[14] G. Heirman, R. Hendrickx, L. Vandewalle, D. Van Gemert, D. Feys, G. De Schutter, B.Desmet, J. Vantomme, Integration approach of the Couette inverse problem of pow-der type self-compacting concrete in a wide-gap concentric cylinder rheometer,Cem. Concr. Res. 39 (2009) 171–181, https://doi.org/10.1016/j.cemconres.2008.12.006.
[15] G. Heirman, L. Vandewalle, D. Van Gemert, Ó.H. Wallevik, Integration approach ofthe Couette inverse problem of powder type self-compacting concrete in a wide-gap concentric cylinder rheometer, J. Non-Newtonian Fluid Mech. 150 (2008)93–103.
[16] D. Kaplan, F. de Larrard, T. Sedran, Design of concrete pumping circuit, ACI Mater. J.102 (2005) 110–117.
[17] J.A. Koch, D.I. Castaneda, R.H. Ewoldt, D.A. Lange, Vibration of fresh concrete under-stood through the paradigmof granular physics, Cem. Concr. Res. 115 (2019) 31–42,https://doi.org/10.1016/j.cemconres.2018.09.005.
[18] H.D. Le, E.H. Kadri, S. Aggoun, J. Vierendeels, P. Troch, G.D. Schutter, Effect of lubrica-tion layer on velocity profile of concrete in a pumping pipe, Mater. Struct. 48 (2015)3991–4003, https://doi.org/10.1617/s11527-014-0458-5.
[19] V. Mechtcherine, V.N. Nerella, K. Kasten, Testing pumpability of concrete using Slid-ing Pipe Rheometer, Constr. Build. Mater. 53 (2014) 312–323, https://doi.org/10.1016/j.conbuildmat.2013.11.037.
[20] V. Mechtcherine, E. Secrieru, C. Schröfl, Effect of superabsorbent polymers (SAPs) onrheological properties of fresh cement-based mortars— development of yield stressand plastic viscosity over time, Cem. Concr. Res. 67 (2015) 52–65, https://doi.org/10.1016/j.cemconres.2014.07.003.
[21] J.F. Morris, Shear thickening of concentrated suspensions: recent developments andrelation to other phenomena, Annu. Rev. Fluid Mech. 52 (2020) 121–144, https://doi.org/10.1146/annurev-fluid-010816-060128.
[22] P. Poullain, Etude copmarative de l’ecoulement d’un fluide viscoplastique dans unemaquette de malaxeur pour bétons: PIV, IRM et simulation numérique, Ph.D. thesis(in French) Ecole polytechnique de l’Université de Nantes, 2003.
[23] M. Reiner, R. Riwlin, Die theorie der Strömung einer elastischen Flüssigkeit imCouette Apparat, Kolloid-Zeitschrift 43 (1927) 1–5.
[24] J. Spangenberg, N. Roussel, J.H. Hattel, H. Stang, J. Skocek, M.R. Geiker, Flow inducedparticle migration in fresh concrete: theoretical frame, numerical simulations andexperimental results on model fluids, Cem. Concr. Res. 42 (2012) 633–641,https://doi.org/10.1016/j.cemconres.2012.01.007.
[25] E.R. Weeks, J.C. Crocker, A.C. Levitt, A. Schofield, D.A. Weitz, Three-dimensional di-rect imaging of structural relaxation near the colloidal glass transition, Science287 (2000) 627–631.
[26] J.Wenzl, R. Seto, M. Roth, H.J. Butt, G. Auernhammer, Measurement of rotation of in-dividual spherical particles in cohesive granulates, Granul. Matter 15 (2013)391–400, https://doi.org/10.1007/s10035-012-0383-7.
[27] S. Wiederseiner, N. Andreini, G. Epely-Chauvin, C. Ancey, Refractive-index and den-sity matching in concentrated particle suspensions: a review, Exp. Fluids 50 (2011)1183–1206, https://doi.org/10.1007/s00348-010-0996-8.
[28] S. Zade, T.J. Shamu, F. Lundell, L. Brandt, Finite-size spherical particles in a squareduct flow of an elastoviscoplastic fluid: an experimental study, J. Fluid Mech. 883(2020) A6, https://doi.org/10.1017/jfm.2019.868.