University of Twente Enrolment Regulation, 2017-2018 - ITC.nl
Upload
khangminh22Category
view
1download
0
Master Thesis
VERTICAL LIMITS
“The effects of Verticality Cues and a Quality claim
on Consumer Responses to Coffee ad-displays”
Date: March 2018
Study: Master Marketing Communication
2
ABSTRACT When in the shopping environment consumers are exposed to a considerable amount of marketing
communication tactics, such as packaging design and ad-displays, assigned to influence consumers in
the decision-making process. Brands face the question how to visualize luxury perceptions through
packaging and advertising design. Nowadays, more than ever, consumers buy conspicuously and are
getting more and more materialistic. However, there is a lack of research concerning the use of visuals
to manipulate luxury impressions in relation to the level of consumer materialism. Inspired by theories
of symbolic meaning portrayal and quality claim usage, this paper discusses the use of verticality
perceptions and a quality claim as visual cues to affect luxury perceptions and consumer evaluations.
The present research aims to test the influence of verticality perceptions (vertical vs. horizontal) and a
quality claim (high quality claim vs. regular quality claim) on consumer responses as a function of their
level of materialism. During a taste panel at a coffee café the use of verticality perceptions in an ad-
display influenced a more positive taste experience, quality perception and purchase intention.
However, there was no influence of consumer materialism noticeable. These findings add to current
knowledge about symbolic meaning portrayal in ad-displays. Moreover, a high-quality claim has shown
to affect a more positive quality perception. In addition, congruity between verticality perceptions and a
quality claim influence a higher quality perception of the coffee among participants. The results of this
study can contribute to future research and visual brand management.
KEYWORDS: Verticality cues, Quality claim, Taste experience, Quality perception, Purchase intention, Materialism.
3
1. Introduction
Imagine you are in the supermarket; you are confronted with a plethora of visual information used by
marketers to create meaning and aesthetic appeal. The question is what do you choose? For brands it
becomes increasingly more difficult to fight the competitive advertising clutter and make you choose
their product. By using an aesthetic package design brands try to visualize product attributes and create
positive associations in the minds of consumers (Silayoi & Speece, 2007). Because consumers extract
meaning and base choices on the visualization of a package design it is a prominent research topic in
consumer psychology. However, to create a visual appearance that increases a products’ chance of
success remains a difficult task. The appearance of a product needs to be understandable and
meaningful to consumers to achieve advertising success and create competitive advantage (Blijlevens,
Creusen & Schoormans, 2009; Van Rompay et al., 2012).
Due to an increasing demand of luxury goods a growing number of brands pursue a more
‘luxury’ positioning strategy (D'Arpizio, Levato, Zito & de Montgolfier, 2015). The question arises how
marketers, in addition to usage of traditional advertising elements such as a quality claims and textual
expressions, visuals should be used to strengthen luxury appeal.
Furthermore, a quality claim is seen as a more explicit way to signal luxury. For instance,
seeing a specific quality claim like ‘Premium Quality’ explicitly implies luxury, but can also induce
scepticism (Fenko, Kersten & Bialkova, 2016; Ooijen, Fransen, Verlegh & Smit, 2016). Although on the
other hand, basic visual elements are also known to carry intrinsic symbolic meanings (Van Rompay et
al., 2012). Therefore, besides more traditional advertising elements (e.g. quality claims) to visualize
luxury, marketers constantly try to innovate and find new ways in expressing meaning. Think of the use
of colours, objects and shapes (Becker, Van Rompay, Schifferstein & Galetzka, 2011). What these basic
visual elements have in common is that they heavily rely on the concept of symbolism (DeRosa, 2008).
For example, a product that wants to symbolize masculinity, should accentuate these characteristics
(e.g. angular forms, shapes and colours) to let the product be perceived as such (Van Rompay & Pruyn,
2011).
Of special relevance to the domain of visualizing luxury and power is the ‘verticality-
schema’ (van Rompay et al., 2012). For instance, we talk about luxury in terms of ‘uptown’ and ‘upscale’
or the powerful ones ‘looking down’ and having control ‘over’ the less powerful ones. These are vertical related terms used in language to indicate abstract luxury and/or power related concepts (Van Rompay,
de Vries, Bontekoe & Dijkstra, 2012; Machiels & Orth, 2017). However, research indicates that verticality
can also guide meaning attributions through visual scenes or stimuli. Previous studies referred to this phenomenon as ‘verticality cues’ (Van Rompay, de Vries, Bontekoe & Dijkstra, 2012; Machiels & Orth,
2017). These visual-spatial factors can be used on package designs to symbolize power and luxury
(Peracchio & Meyers-Levy, 2005). For instance, a study of Van Rompay et al. (2012) manipulated the
background of a lipstick advertisement with vertical orientations in the form of skyscrapers. As a result,
consumer responses increased positively because the product comes across as more luxurious.
A product were consumers tend to rely on its visual appearance is coffee; the visual
characteristics often determine the acceptance or rejection of the product (Borém et al., 2013). Imagine
drinking a coffee that looks luxurious in an advertisement, likely the coffee tastes delightful. However,
when tasting the same coffee presented in a less luxurious form it will be evaluated as less tasty. The
luxury appearance of the coffee affected your perception and taste experience. This has to do with crossmodal associations between visual attributes and taste/flavour (Spence, 2011).
A coffee brand that uses verticality as a luxury-signalling cue is Nespresso (2018), where
skyscrapers are used to commend their new ‘Citiz Nespresso coffee Machine’. However, the feeling of
luxury could be due to people’s association with the background image (i.e. a skyscraper) as standing
symbol for glamour and city life (Van Rompay et al., 2012). Another study manipulated a mascara
advertisement with non-figurative stimuli (i.e. stimuli free of association), where vertical lines in the ad-
background were used, to which consumers susceptible to power cues (consumers high on ‘trait
dominance’) positively respond (Van Rompay et al., 2012). Hence, showing the effect of verticality as a
4
power-signalling cue. Because verticality has an association with power, it also conveys a form of luxury,
think of verticality-related terms that connote forms of luxury, such as, ‘high class’ and ‘uptown’
(Schubert, 2005; Van Rompay et al., 2012). In short, in this study non-figurative verticality perceptions
and a quality claim are used to influence product evaluations and sensory impressions of consumers.
Where it is expected that congruity between visual and textual cues are of importance to obtain positive
evaluations of consumers (van Rompay & Pruyn, 2011).
Nonetheless, besides manipulating package or ad designs to make them appear luxurious,
consumer responses are also influenced by another important element. Namely the consumers’
individual values and need for luxury. Perhaps now more than ever consumers let their materialistic
values influence their buying behaviour. More and more consumers try to distinguish themselves by
being more conspicuous (Kapferer & Bastien, 2009). Thus, people that are more materialistic often buy
more luxury products that reflect a certain social status; it provides owners with a way to display
wealth. (Kastanakis & Balabanis, 2012). The personal values of the consumer determine whether these
benefits will be decisive in choosing for a (non-) luxury product, where materialism is seen as a critical
value for luxury consumers (Audrin, Brosch and Sander, 2017).
For instance, Audrin, Brosch and Sander (2017) tested the effect of materialism by
exposing people to the names of eight fashion brands (four luxurious and four non-luxurious) linked to
eight random fashion products. In this case materialistic consumers prefer products displayed with a
luxury brand, as opposed to non-materialistic consumers who do not seem sensitive to brand
information. Hence, materialism can moderate the way in which product cues are processed. However, not much research has been conducted into the influence of ‘verticality cues’ and ‘quality claims’
connected to the level of consumer materialism.
The novelty aspect of this research lies within the use of visual cues (i.e. verticality and a quality claim) in an ad-display in combination with a taste panel. The multi-sensory aspect of being
exposed to an ad display, manipulated with verticality perceptions and a quality claim, and tasting and
evaluating the actual product. As mentioned, consumers tend to rely on visual appearances when
evaluating coffee, making it the product to use during the taste panel. In the light of this focus the
following research question has been formulated:
“What is the influence of verticality cues and a quality claim on taste experience, quality
perception and purchase intention on consumers with different levels of materialism?”
To determine this influence this research uses a 2 x 2 x 2 experimental design with the moderator
materialism. This design has four possible combinations that provide either congruent or incongruent
stimuli. In a congruent situation a vertical display and a high-quality claim are displayed together. Then
again, in a non-congruent circumstance, verticality cues are displayed with a regular quality claim.
Driven by the assumption that materialistic consumers are more susceptible to luxury it is hypothesized
that materialistic and non-materialistic consumers process the experimental conditions differently.
5
2. Theoretical framework
The theoretical framework illustrates the influence of verticality perceptions and quality claims on taste
experience, quality perception and purchase intention. Furthermore, the possible moderating effect of
materialism will be explained.
2.1 Influence of verticality cues
Retail environments contain loads of visual information, coming from products, shelves, and ad displays,
demanding retailers and marketers to develop packages and displays to grasp consumer attention. They
spend a considerable amount of money on marketing to create positive associations in the minds of
consumers (Aaker & Keller, 1990). As such they include associations of luxury and/or power. Think of a
certain typeface or colour (e.g. gold) that embodies luxury.
Of special relevance to the concept of luxury/power is the verticality schema. As stated
by Lakoff and Johnson (1980): “Power is inextricably intertwined with the vertical dimension”. In the
consumer’s domain verticality can be used to influence product evaluations of consumers (Aaker, 1997;
Giessner, Ryan, Schubert, & van Quaquebeke, 2011; van Rompay et al., 2012). The abstract concept of
luxury can be linguistically represented through vertical forms. For instance, if we speak about ‘rising to the top’ or ‘looking down’ on someone as figures of speech that indicate power and luxury related
concepts (Machiels & Orth, 2017). These are common phrases used in everyday life where verticality
related terms are used to comprehend situations, objects or persons.
However, besides the linguistic phenomenon, meaning attributions can also be guided
by visual displays, where objects, shapes and lines are perceived as more powerful and luxurious when
placed in a vertical position as opposed to a low and/or horizontal position (Schubert, 2005; van
Rompay et al., 2012). For instance, a study of van Rompay, Fransen and Borgelink (2014) manipulated a
package design of washing powder with spiralling movement displays (upward vs. downward), where
an upward movement was evaluated as more attractive and beautiful, rather than downward.
Furthermore, van Rompay et al. (2014) also showed that the purchase intention of the washing powder
product was higher when imagery was presented in the top-left, rather than the bottom-right region of the display. These examples illustrate how basic visual-spatial aspects can be used to positively induce
consumer responses and make a product appear more beautiful, or even powerful and luxurious.
The expression of power and luxury in verticality is supported in other studies. For example, seeing an object from a low angle, when people look up, aids in consumers’ allocation of power,
like seeing a tall building from a bottom-up perspective (Mignault & Chaudhuri, 2003). Or when
powerful brands want to be perceived as leaders, marketers place the brand visually above consumers (Huang, Li & Zhang, 2013), think of brands as Apple and Starbucks who benefit from placing the logo
high on the package/advertising, whereas placing the logo low benefits less powerful brands (Sundar &
Noseworthy, 2014)
Moreover, other relevant studies named more examples of luxury embodiment by
verticality in visual displays. For instance, Machiels & Orth (2017) found that the positioning of a
product label (high vs. low), as a verticality cue, influences perceptions of power and luxury in the
domain of food. In addition, Sunder and Noseworthy (2014) demonstrated, that placing a label up high with powerful or luxury types of brands have beneficial effects. Consequently, for a brand type with less
power, or luxury, placing the label in the lower part of the package/advertising has the most positive
responses from consumers. Furthermore, a study of van Rompay et al. (2005) showed that products of
great height, as opposed to products of lesser height, are perceived as more dominant and impressive.
However, not all findings of previous conducted studies are forthright. Therefore, it is
important to conduct more research into the influence of spatial positioning to understand the cognition
process of consumers. The use of verticality (non-figurative), to manipulate luxury perceptions in ad
displays, is central to this research. Particularly, the effect of luxury visualization on consumers’ taste
6
experience. Because luxury products often rely on more positive consumer responses the following
hypotheses have been formulated:
H1a : A vertically oriented ad-display, as opposed to a horizontal oriented ad-display,
positively influences perceptions of taste luxury.
H1b : A vertically oriented ad-display, as opposed to a horizontal oriented ad-display,
positively influences the taste intensity.
H1c : A vertically oriented ad-display, as opposed to a horizontal oriented ad-display,
positively influences the taste liking.
H2 : A vertically oriented ad-display, as opposed to a horizontal oriented ad-display,
positively influences quality perception.
H3 : A vertically oriented ad-display, as opposed to a horizontal oriented ad-display,
positively influences purchase intention.
2.2 Influence of quality claims
The use of ad displays as vehicles of communication take on a prominent role in marketing
communication, and often contain strategic messages about product attributes (Silayoi & Speece, 2007). For example, claims that communicate attributes of the product, like product quality or performance.
Think of claims as ‘New best formula’ or ‘Best choice’ (Ooijen et al. 2016). These may be claims about the
product, but can be rather subjective, or have no informative value. However, the influence of
advertising claims has been demonstrated in previous studies. For instance, a product is evaluated as tastier when a claim about taste (e.g. 100% tastefulness) is displayed (Grabenhorst, Schulte, Maderwald
& Brand, 2013). However, when health claims are shown, like ‘reduced fat/sugar’ people perceive the
product as healthier (Bialkova, Sasse & Fenko, 2016). Accordingly, this proves that consumers are
already evaluating product attributes when they are confronted with quality claims on ad displays or
package labels. As stated by Caswell and Padberg (1992): “Product labels are a part of the information
set used by consumers in making product selections” (p. 460). It is used to interpret and define a
product, where consumers read and process a simple message from a label element and extract a deeper
meaning from it (Tonkin, Meyer, Conveney, Webb & Wilson, 2016).
Furthermore, a study of Grossman (1981) has shown that consumers believe that
brands will make the most favourable claims about their products without lying. Brands, which are
capable of making a quality claim, will do as such, and consumers make the assumption that
manufacturers not making quality claims will have poor quality products. It is noteworthy to mention
that not all claims are persuasive and can even be misleading; Chen & Chang (2013) brand this phenomenon as ‘Green washing’. Nevertheless, when people use heuristics to process product
information the presence of quality claims may affect product evaluations and subsequently elicit
consumer responses (Ooijen et al., 2016). Therefore, the following hypotheses have been formulated:
H4a : An ad-display with a high-quality claim, as opposed to an ad-display with a
regular quality claim, will positively influence perceptions of taste luxury.
H4b : An ad-display with a high-quality claim, as opposed to an ad-display with a
regular quality claim, will positively influence taste intensity.
H4c : An ad-display with a high-quality claim, as opposed to an ad-display with a
regular quality claim, will positively influence taste liking
7
H5 : An ad-display with a high-quality claim, as opposed to an ad-display with a
regular quality claim, will positively influence quality perception.
H6 : An ad-display with a high-quality claim, as opposed to an ad-display with a
regular quality claim, will positively influence purchase intention
2.3 Congruity
Previous research has shown that congruence among visual elements in ads or product packaging may
likewise increase consumer responses (e.g., Van Rompay, De Vries, & Van Venrooij, 2010; Van Rompay &
Pruyn, 2011). For example, van Rompay et al. (2010) showed that congruence between image portrayal
and textual descriptions in an online hotel advertisement (i.e. a description of a cosy room accompanied
by a cosy image) had more positive attitude ratings, as opposed to mismatches between text
descriptions and image portrayal. Another study of van Rompay and Pruyn (2008) tested two shape variants and two typeface variants (either connoting luxury or casualness) on a fictitious brand of
bottled water. Cross-pairing the two shapes with the two typefaces resulted in congruent and
incongruent variants, where congruence among symbolic qualities induced more positive brand
perceptions.
These examples show that when consumers see cues that are in coherence they
perceive a greater preference towards the product (Malhotra, 1981), and positive consumer responses
are imminent (Mandler, 1982; d'Astous & Seguin, 1999; Moore et al., 2005; Russell, 2002). In contrast,
incongruent product cues lead to more negative brand evaluations because they are not meaningful in
eyes of the consumer (d’Astous & Seguin, 1999).
In this study the congruity theory is used because it is predictive in how consumers
evaluate products (Sirgy, Johar, Samli, & Claiborne, 1991). Congruence among elements impact
processing fluency (i.e. the ease with which information is processed), in turn boosting favourable
product evaluations (van Rompay et al., 2010). Therefore, it is expected that when there is a match, as
opposed to a mismatch, between symbolic connotations conveyed by vertical orientations and a quality
claim more positive product evaluations will be made. Hence, the following hypothesis has been
formulated:
H7 : Congruent combinations between verticality cues and quality claims are
perceived more positively on taste experience, quality perception and purchase
intention, as opposed to incongruent ones.
2.4 Taste experience
How we experience ‘taste’ is dependent on our gustatory system, which allows us to identify between
five sorts of food constituents, namely; salt, sweet, sour, bitter and umami (i.e. pleasant taste) (Briand &
Salles, 2016). However, what flavours consumers taste and how they evaluate the product is also reliant
on how the product is presented (Mantonakis, Cardwell, Beckett, Newman & Garry, 2014). For instance,
roundness and angularity appears to play a pivotal role in associations between tastes and shapes.
Examples are that people seem to match dark chocolate with angular shapes and milk chocolate with rounded shapes (Ngo, Misra & Spence, 2011). Furthermore, Spence and Gallace (2011) showed that
people match carbonated water with angular shapes and still water with round shapes.
These examples can be attributed to the concept of cross modal correspondences
where shape symbolism operates at an implicit, subconscious level. This concept describes that people
match information across the senses (Velasco, Woods, Deroy & Spence, 2015). Think of cross-modal
metaphors present in language or textual claims (e.g. ‘a sharp taste’). The use of these adjectives
influences the intuitive associations consumers make (Spence, 2012; Piqueras-Fiszman & Spence, 2015).
8
The textual claim on a package design functions as an extrinsic product cue and
cannot change the way the food product interacts with the consumer’s taste buds to produce a taste
experience. However, Hagtvedt and Patrick (2008) claim that package designs and labels have a positive
impact on consumer’s perceptions. For instance, seeing a product claim (e.g. extra tasty) on a package
design makes people perceive the product as tastier (Grabenhorst et al., 2013), or people think the
product is healthier when health labels are shown (Bialkova et al., 2016). Another example is when an
orange juice is labelled as ‘organic’ users judge it to taste better compared to a normal juice (Fillion &
Arazi, 2002). All before mentioned studies addressed the influence of textual claims on taste experience.
But how does this hold for visuals on packages or ad displays in relation to taste?
For instance, when consumers see the most taste-giving ingredient they perceive the
product as more pure and natural, as opposed to not using visuals (Smith, Barratt & Sørensen, 2015).
Additionally, a study of Schuldt & Hannahan (2013) shows that taste was perceived as purer when
visuals of unprocessed food (e.g. vegetables and fruits) were presented on the package, as opposed to
processed food. In this case unprocessed food symbolizes freshness and indicates that a product is more
pure. Collectively, these studies show influences of visuals on taste experience. However, the visuals that
are used in these studies are rather explicit. But what happens when abstract (i.e., non-figurative)
visuals are placed on a package or ad design to influence taste experience?
In this specific study visuals are used in the form of ‘verticality’ to symbolize product
luxury because they have shown to be more effective than rhetoric (McQuarrie & Mick, 2003). It is
expected that more abstract visual-spatial structures (verticality) positively influence taste experience as well. Since verticality perceptions are associated with luxury and luxury is associated with good
quality, it is likely that consumers have a more positive taste experience when exposed to these product
indicators.
2.5 Quality perception
When consumers are in the shopping environment they cannot make judgements about the quality of
for instance product ingredients or taste. Therefore, they make use of product attributes that signal
quality at the point of purchase. Consequently, through consumption consumers make an evaluation of
the product based on expected quality and taste experience, which confirms or rejects their previously
formed expectations (Acebrón & Dopico, 2000). This process happens subjectively. Thereby, making it
even arguable if objective quality perception exists because everyone perceives differently (Zeithaml,
1988). Zeithaml (1988) describes quality perception as the consumer’s judgement about a product’s
overall superiority or excellence. However, when consumers are shopping there is normally no
opportunity to taste a product. Therefore, consumers simplify their decision-making process by taking a
decision based on a certain package or ad design they are confronted with (Ooijen, 2016).
For example, design elements such as shape and colour influence the quality
perception. Even when the actual product content is the same. Previous studies demonstrated that
based on colours and shapes consumers perceived food products differently in taste panels (Becker et al., 2011; Gordon et al., 1994). If we look at the influence of verticality on quality perception Machiels
and Orth (2017) demonstrated that verticality in label positioning (high vs. low) induces perceived
product quality, illustrating the influence of vertical label positioning as a sign of good quality in the minds of consumers. Although label positioning influences quality perception, the influence of non-
figurative vertical orientations on quality perception of food products still has to be determined.
Furthermore, Olson and Jacoby (1972) claim that quality perception is closely related
to purchasing behaviour. Therefore, it is expected that a positive taste experience and quality perception
lead to a higher purchase intention of the product. Hence, the following hypotheses have been
formulated:
H8a : The taste experience predicts the effects of the verticality cues and quality claim
and positively influences the final purchase intention.
9
H8b : The quality perception predicts the effects of the verticality cues and quality
claim and positively influences the final purchase intention.
2.6 Materialism
In present-day society luxury has become rather commonplace. People are doing better, and
conspicuous consumption is no exclusivity anymore. Besides the upper class, with high social status and
purchasing power, more and more people are buying luxury goods (Lin & Wang, 2010). It is no secret
that in the past decade people have become more materialistic due to a growing offer of products and
marketing tactics. Richins and Dawson (1992) define materialism as: “The importance a person places
on possessions and their acquisition as a necessary or desirable form of conduct to reach desired end
states, including happiness” (p. 307). To increase their self-appeal people tend to buy more costly
merchandise and move towards luxury brands (Mead, Baumeister, Stillman, Rawn, & Vohs, 2011).
As mentioned, Audrin, Brosch and Sander (2017) claim the following: “luxury conveys
symbolic aspects that provide personal and interpersonal benefits to the consumer”. It provides
materialistic consumers with a way of displaying status. By seeing such symbolic/intangible attributes
(e.g. quality claims and verticality cues) on ad displays, consumers evaluate products because these
attributes are quality related (Audrin et al., 2017). If we focus on materialistic consumers, they can have life values like ‘social recognition’, and by choosing for a product that resembles a certain quality to
them they hope to receive respect and admiration.
Previous research has shown that people with materialistic values like luxury and worldly possessions (Belk, 1985). However, previous research has mainly focussed on expensive
consumer goods, and high involvement products (e.g. cars, watches and computers). Where it is
expected that consumer materialism can be of influence with low involvement products (e.g. food) as
well, a product domain that has not been stressed yet. Therefore, an interesting question emerges. Are materialistic consumers more
susceptible to verticality cues and quality claims in ad displays of food products, as opposed to non-
materialistic consumers? For that reason, it is possible that there may be differences in the processing of
ad displays of food products for consumers with different levels of materialism. Due to their need for
luxury it is expected that materialistic consumers are more easily influenced by quality and luxury
related cues, as opposed to consumers with lower levels of materialism. In spite of that the following
hypothesis has been formulated:
H9 : Effects of verticality cues on consumer responses are more pronounced for
shoppers high in materialism.
10
Background orientation
Vertical vs. horizontal
Quality claim
High vs. regular
3. Method
The purpose of this study is to investigate the effect of vertical orientations and a quality claim on taste
experience, quality perception and purchase intention and if this is moderated by consumer
materialism. This section of the paper elaborates the research design and accountability of the stimulus
material used in this research.
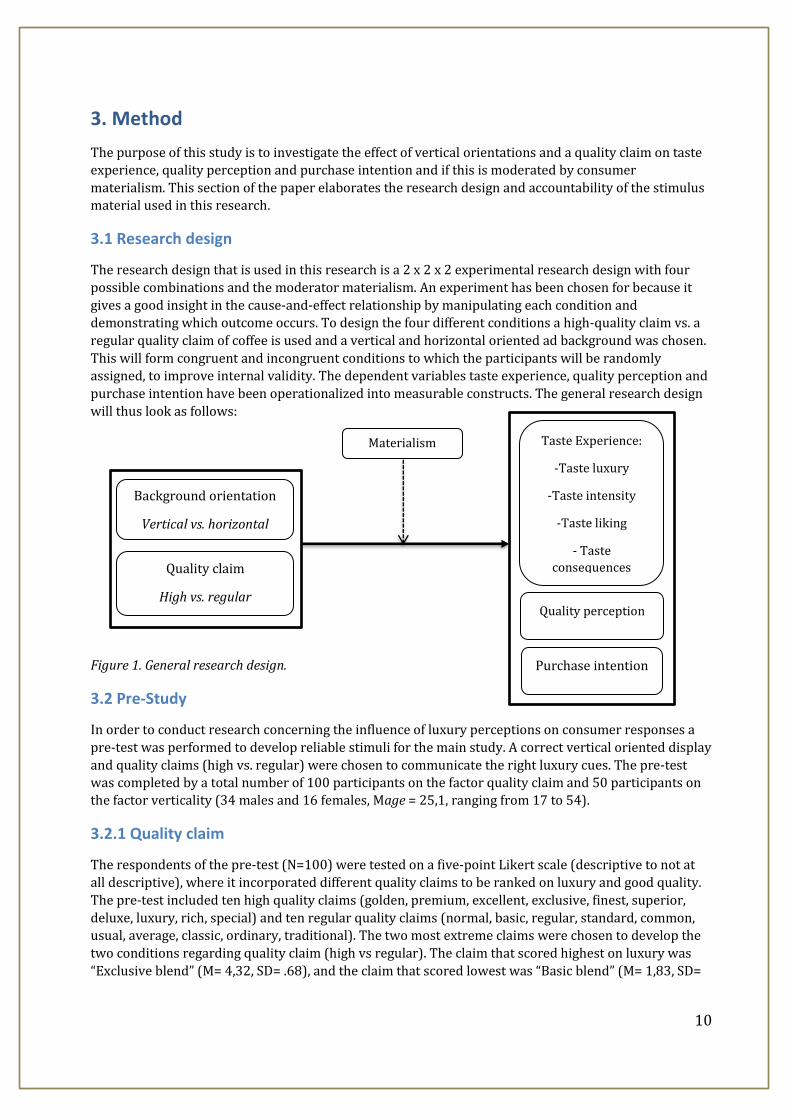
3.1 Research design
The research design that is used in this research is a 2 x 2 x 2 experimental research design with four
possible combinations and the moderator materialism. An experiment has been chosen for because it
gives a good insight in the cause-and-effect relationship by manipulating each condition and
demonstrating which outcome occurs. To design the four different conditions a high-quality claim vs. a
regular quality claim of coffee is used and a vertical and horizontal oriented ad background was chosen.
This will form congruent and incongruent conditions to which the participants will be randomly
assigned, to improve internal validity. The dependent variables taste experience, quality perception and
purchase intention have been operationalized into measurable constructs. The general research design
will thus look as follows:
Figure 1. General research design.
3.2 Pre-Study
In order to conduct research concerning the influence of luxury perceptions on consumer responses a
pre-test was performed to develop reliable stimuli for the main study. A correct vertical oriented display
and quality claims (high vs. regular) were chosen to communicate the right luxury cues. The pre-test
was completed by a total number of 100 participants on the factor quality claim and 50 participants on the factor verticality (34 males and 16 females, Mage = 25,1, ranging from 17 to 54).
3.2.1 Quality claim
The respondents of the pre-test (N=100) were tested on a five-point Likert scale (descriptive to not at
all descriptive), where it incorporated different quality claims to be ranked on luxury and good quality.
The pre-test included ten high quality claims (golden, premium, excellent, exclusive, finest, superior,
deluxe, luxury, rich, special) and ten regular quality claims (normal, basic, regular, standard, common,
usual, average, classic, ordinary, traditional). The two most extreme claims were chosen to develop the
two conditions regarding quality claim (high vs regular). The claim that scored highest on luxury was
“Exclusive blend” (M= 4,32, SD= .68), and the claim that scored lowest was “Basic blend” (M= 1,83, SD=
Purchase intention
Taste Experience:
-Taste luxury
-Taste intensity
-Taste liking
- Taste
consequences
t
Materialism
Quality perception
11
.81). These two claims were developed into a label/sticker (see figure 2) that was put on the ad-displays
based on the four experimental conditions.
Figure 2. Quality claim designs.
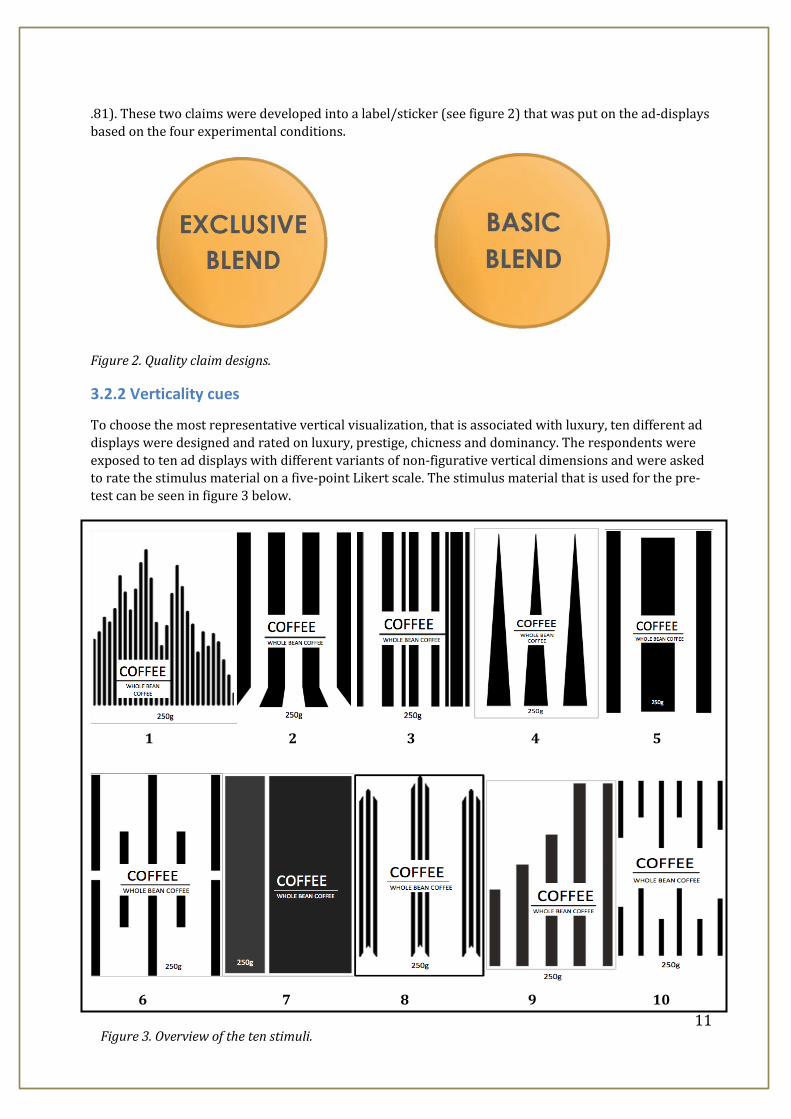
3.2.2 Verticality cues
To choose the most representative vertical visualization, that is associated with luxury, ten different ad
displays were designed and rated on luxury, prestige, chicness and dominancy. The respondents were
exposed to ten ad displays with different variants of non-figurative vertical dimensions and were asked to rate the stimulus material on a five-point Likert scale. The stimulus material that is used for the pre-
test can be seen in figure 3 below.
1 2 3 4 5
6 7 8 9 10
Figure 3. Overview of the ten stimuli.
12
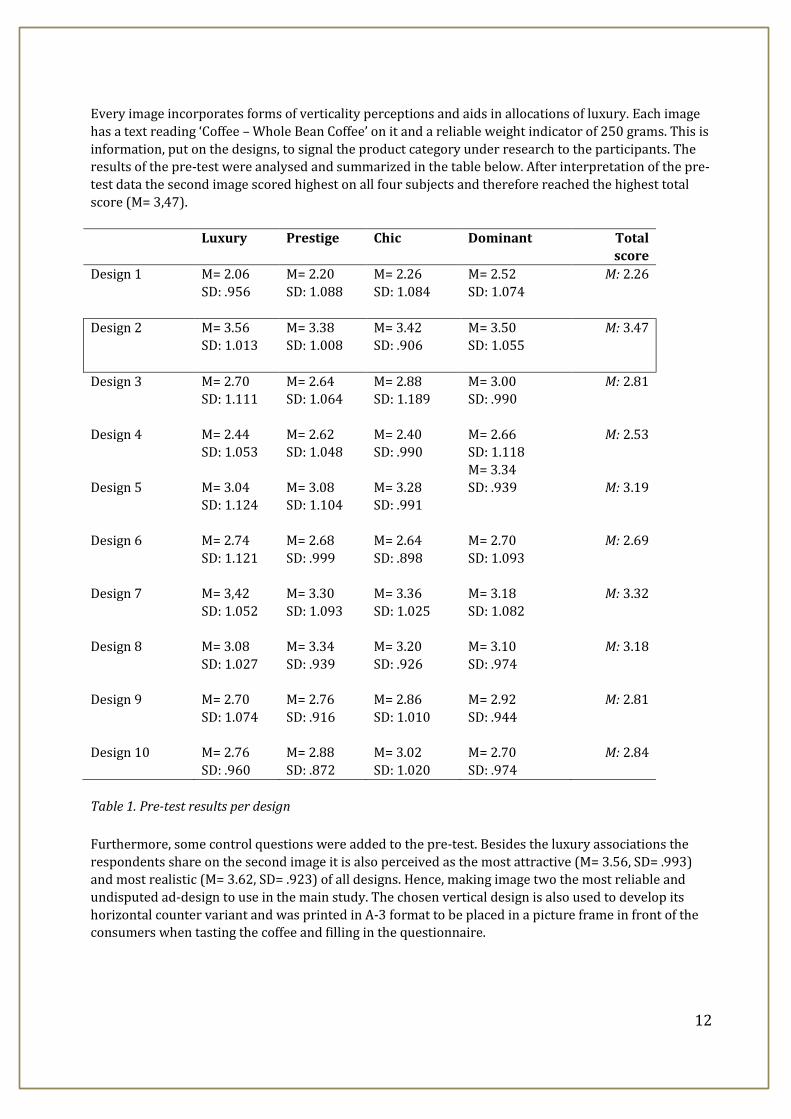
Every image incorporates forms of verticality perceptions and aids in allocations of luxury. Each image
has a text reading ‘Coffee – Whole Bean Coffee’ on it and a reliable weight indicator of 250 grams. This is
information, put on the designs, to signal the product category under research to the participants. The
results of the pre-test were analysed and summarized in the table below. After interpretation of the pre-
test data the second image scored highest on all four subjects and therefore reached the highest total
score (M= 3,47).
Luxury Prestige Chic Dominant Total
score
Design 1 M= 2.06
SD: .956
M= 2.20
SD: 1.088
M= 2.26
SD: 1.084
M= 2.52
SD: 1.074
M: 2.26
Design 2 M= 3.56
SD: 1.013
M= 3.38
SD: 1.008
M= 3.42
SD: .906
M= 3.50
SD: 1.055
M: 3.47
Design 3 M= 2.70
SD: 1.111
M= 2.64
SD: 1.064
M= 2.88
SD: 1.189
M= 3.00
SD: .990
M: 2.81
Design 4 M= 2.44 SD: 1.053
M= 2.62 SD: 1.048
M= 2.40 SD: .990
M= 2.66 SD: 1.118
M= 3.34
SD: .939
M: 2.53
Design 5 M= 3.04 SD: 1.124
M= 3.08 SD: 1.104
M= 3.28 SD: .991
M: 3.19
Design 6 M= 2.74
SD: 1.121
M= 2.68
SD: .999
M= 2.64
SD: .898
M= 2.70
SD: 1.093
M: 2.69
Design 7 M= 3,42
SD: 1.052
M= 3.30
SD: 1.093
M= 3.36
SD: 1.025
M= 3.18
SD: 1.082
M: 3.32
Design 8 M= 3.08
SD: 1.027
M= 3.34
SD: .939
M= 3.20
SD: .926
M= 3.10
SD: .974
M: 3.18
Design 9 M= 2.70
SD: 1.074
M= 2.76
SD: .916
M= 2.86
SD: 1.010
M= 2.92
SD: .944
M: 2.81
Design 10 M= 2.76
SD: .960
M= 2.88
SD: .872
M= 3.02
SD: 1.020
M= 2.70
SD: .974
M: 2.84
Table 1. Pre-test results per design
Furthermore, some control questions were added to the pre-test. Besides the luxury associations the
respondents share on the second image it is also perceived as the most attractive (M= 3.56, SD= .993)
and most realistic (M= 3.62, SD= .923) of all designs. Hence, making image two the most reliable and
undisputed ad-design to use in the main study. The chosen vertical design is also used to develop its
horizontal counter variant and was printed in A-3 format to be placed in a picture frame in front of the
consumers when tasting the coffee and filling in the questionnaire.
13
4. Main study
The main study of this research tests how the use of a quality claim and verticality cues influence the
luxury perception and product evaluation of consumers. The respondents were recruited at a coffee café
and asked to take a quick look at the ad-display that belonged to the coffee. Subsequently, they were
asked to taste the coffee and give an honest evaluation by using the survey.
4.1 Procedure
The survey was developed using Qualtrics, as in the pre-test. At the coffee place the participants were
approached and were told that a new start-up of the university was trying out a new type of coffee. The
people were asked if they wanted to join a taste panel and give their honest opinion about the coffee
product. If agreed the participants were handed a tablet, in which the survey had already been set-up,
starting with an introduction. The introduction of the survey contained a brief explanation of what was
expected of the participants, while a cup of coffee was poured in a small blank espresso cup; to avoid disruption by factors as brand name, images, texture or shape.
In consultation with the baristas at the coffee place the participants were given a regular type of coffee,
not too strong or mild, to avoid other factors of influence during the taste panel. The coffee type and
temperature were kept the same in all conditions. The participants were asked to drink the unknown
coffee and were told that the coffee belonged to the ad-display that was placed in front of them (based
on the four experimental conditions). After that the potential participant was asked to participate in the
research, followed by scales measuring the dependent variables and a materialism scale. Subsequently,
the participants were asked about their gender, age and level of education they followed to inspect the
samples’ demographic characteristics. Finally, the respondents were asked about their daily coffee
consumption and how they like to drink their coffee (black, with milk/sugar etc.). These control
questions were added because they can have a predictive effect of the outcome under study and can be a direct confounding or interacting variable.
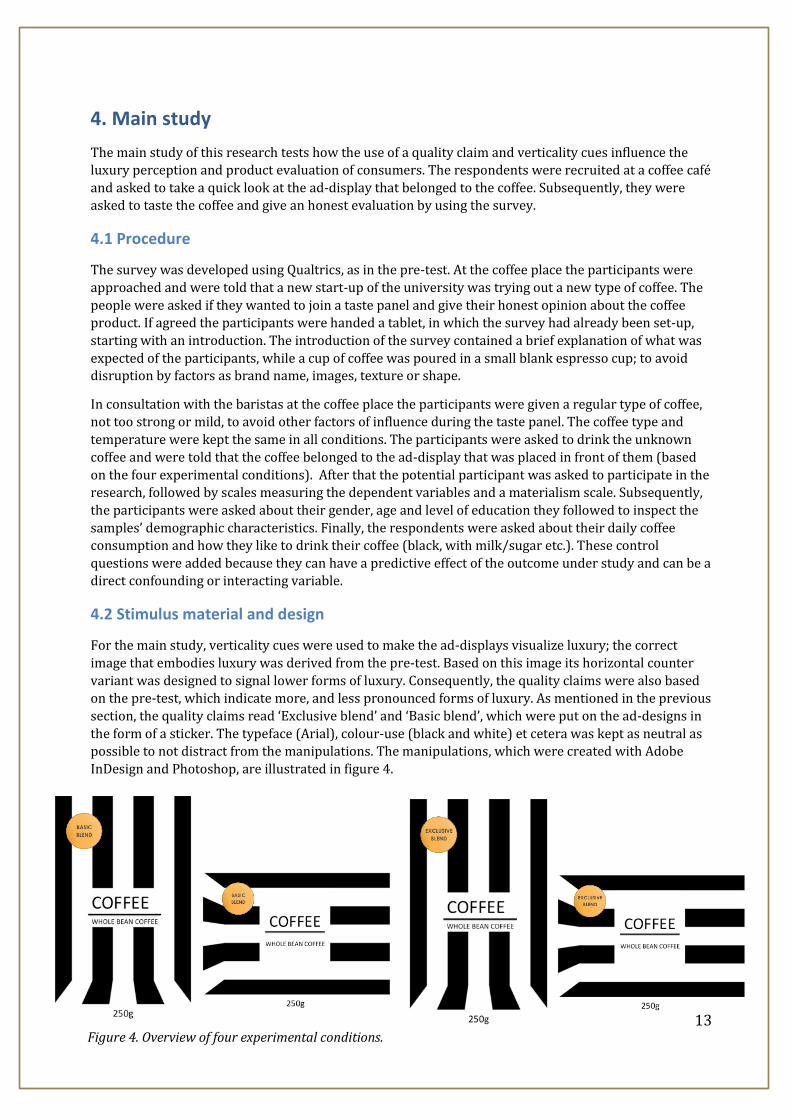
4.2 Stimulus material and design
For the main study, verticality cues were used to make the ad-displays visualize luxury; the correct
image that embodies luxury was derived from the pre-test. Based on this image its horizontal counter
variant was designed to signal lower forms of luxury. Consequently, the quality claims were also based
on the pre-test, which indicate more, and less pronounced forms of luxury. As mentioned in the previous
section, the quality claims read ‘Exclusive blend’ and ‘Basic blend’, which were put on the ad-designs in
the form of a sticker. The typeface (Arial), colour-use (black and white) et cetera was kept as neutral as
possible to not distract from the manipulations. The manipulations, which were created with Adobe
InDesign and Photoshop, are illustrated in figure 4.
Figure 4. Overview of four experimental conditions.
14
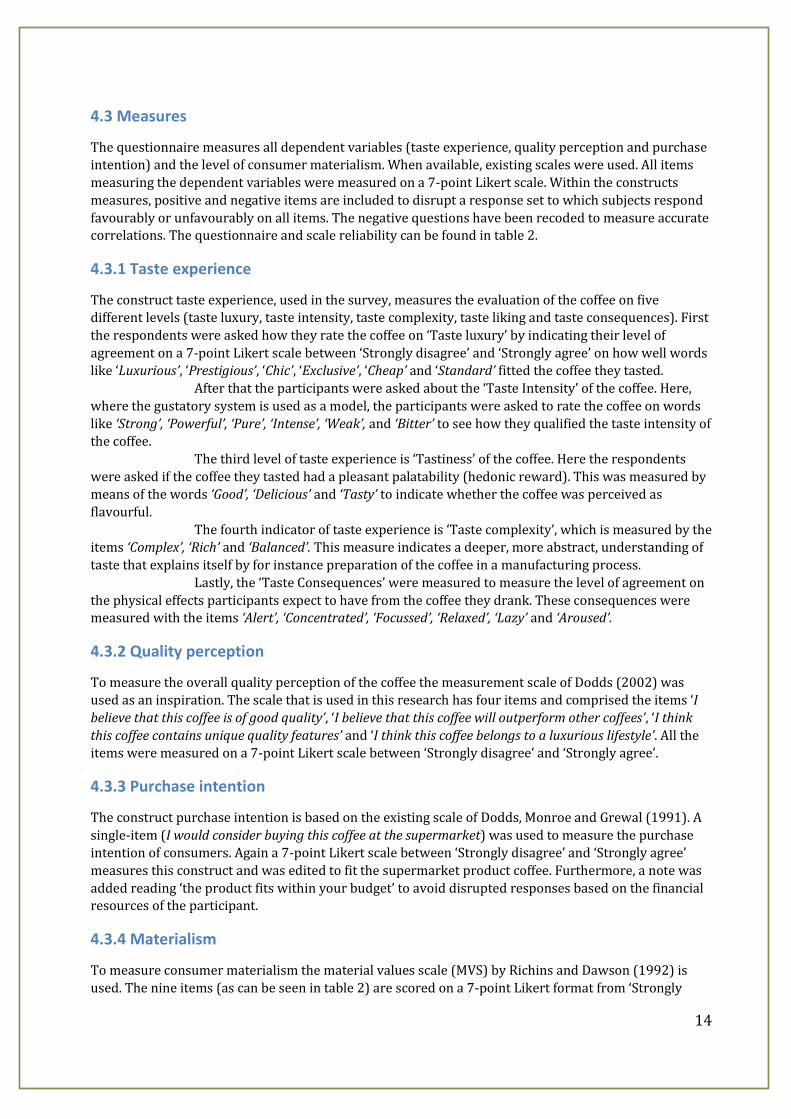
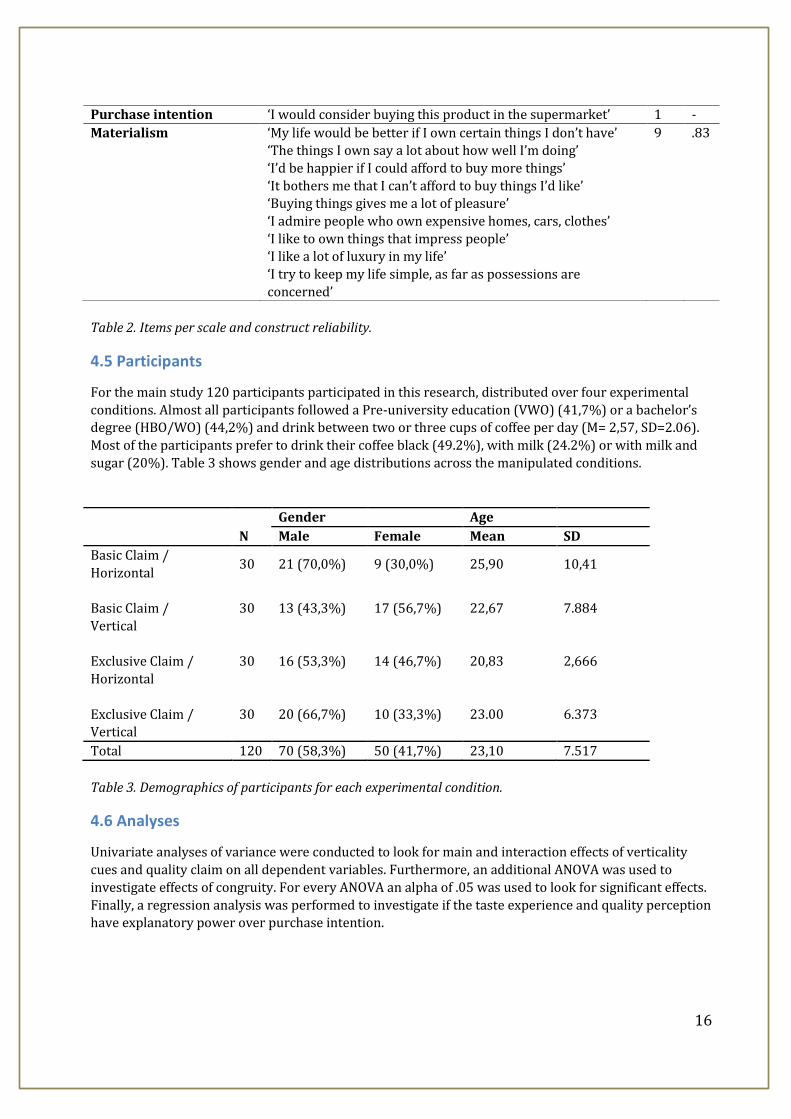
4.3 Measures
The questionnaire measures all dependent variables (taste experience, quality perception and purchase
intention) and the level of consumer materialism. When available, existing scales were used. All items
measuring the dependent variables were measured on a 7-point Likert scale. Within the constructs
measures, positive and negative items are included to disrupt a response set to which subjects respond
favourably or unfavourably on all items. The negative questions have been recoded to measure accurate correlations. The questionnaire and scale reliability can be found in table 2.
4.3.1 Taste experience
The construct taste experience, used in the survey, measures the evaluation of the coffee on five
different levels (taste luxury, taste intensity, taste complexity, taste liking and taste consequences). First
the respondents were asked how they rate the coffee on ‘Taste luxury’ by indicating their level of
agreement on a 7-point Likert scale between ‘Strongly disagree’ and ‘Strongly agree’ on how well words
like ‘Luxurious’, ‘Prestigious’, ‘Chic’, ‘Exclusive’, ‘Cheap’ and ‘Standard’ fitted the coffee they tasted.
After that the participants were asked about the ‘Taste Intensity’ of the coffee. Here,
where the gustatory system is used as a model, the participants were asked to rate the coffee on words
like ‘Strong’, ‘Powerful’, ‘Pure’, ‘Intense’, ‘Weak’, and ‘Bitter’ to see how they qualified the taste intensity of the coffee.
The third level of taste experience is ‘Tastiness’ of the coffee. Here the respondents
were asked if the coffee they tasted had a pleasant palatability (hedonic reward). This was measured by means of the words ‘Good’, ‘Delicious’ and ‘Tasty’ to indicate whether the coffee was perceived as
flavourful.
The fourth indicator of taste experience is ‘Taste complexity’, which is measured by the
items ‘Complex’, ‘Rich’ and ‘Balanced’. This measure indicates a deeper, more abstract, understanding of
taste that explains itself by for instance preparation of the coffee in a manufacturing process.
Lastly, the ‘Taste Consequences’ were measured to measure the level of agreement on
the physical effects participants expect to have from the coffee they drank. These consequences were measured with the items ‘Alert’, ‘Concentrated’, ‘Focussed’, ‘Relaxed’, ‘Lazy’ and ‘Aroused’.
4.3.2 Quality perception
To measure the overall quality perception of the coffee the measurement scale of Dodds (2002) was
used as an inspiration. The scale that is used in this research has four items and comprised the items ‘I
believe that this coffee is of good quality’, ‘I believe that this coffee will outperform other coffees’, ‘I think
this coffee contains unique quality features’ and ‘I think this coffee belongs to a luxurious lifestyle’. All the items were measured on a 7-point Likert scale between ‘Strongly disagree’ and ‘Strongly agree’.
4.3.3 Purchase intention
The construct purchase intention is based on the existing scale of Dodds, Monroe and Grewal (1991). A
single-item (I would consider buying this coffee at the supermarket) was used to measure the purchase
intention of consumers. Again a 7-point Likert scale between ‘Strongly disagree’ and ‘Strongly agree’
measures this construct and was edited to fit the supermarket product coffee. Furthermore, a note was
added reading ‘the product fits within your budget’ to avoid disrupted responses based on the financial resources of the participant.
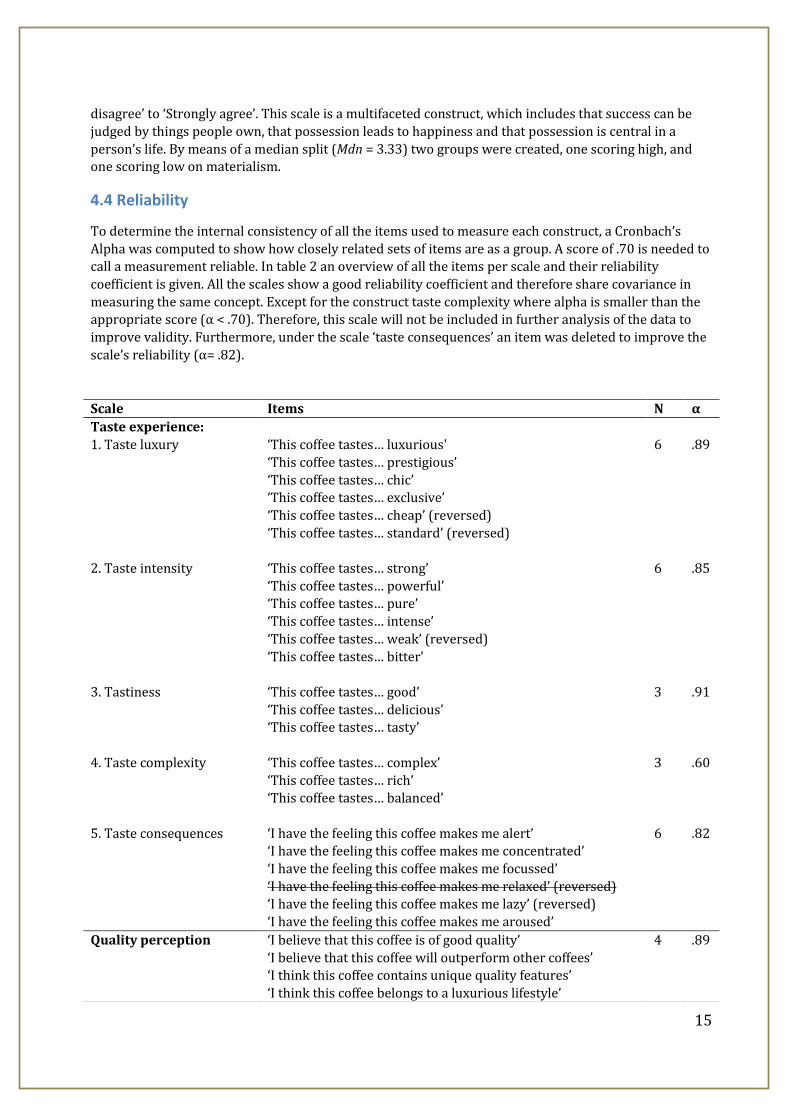
4.3.4 Materialism
To measure consumer materialism the material values scale (MVS) by Richins and Dawson (1992) is
used. The nine items (as can be seen in table 2) are scored on a 7-point Likert format from ‘Strongly
15
disagree’ to ‘Strongly agree’. This scale is a multifaceted construct, which includes that success can be
judged by things people own, that possession leads to happiness and that possession is central in a
person’s life. By means of a median split (Mdn = 3.33) two groups were created, one scoring high, and one scoring low on materialism.
4.4 Reliability
To determine the internal consistency of all the items used to measure each construct, a Cronbach’s
Alpha was computed to show how closely related sets of items are as a group. A score of .70 is needed to
call a measurement reliable. In table 2 an overview of all the items per scale and their reliability
coefficient is given. All the scales show a good reliability coefficient and therefore share covariance in
measuring the same concept. Except for the construct taste complexity where alpha is smaller than the
appropriate score (α < .70). Therefore, this scale will not be included in further analysis of the data to
improve validity. Furthermore, under the scale ‘taste consequences’ an item was deleted to improve the
scale’s reliability (α= .82).
Scale Items N α
Taste experience:
1. Taste luxury
2. Taste intensity
3. Tastiness
4. Taste complexity
5. Taste consequences
‘This coffee tastes… luxurious'
‘This coffee tastes… prestigious’
‘This coffee tastes… chic’
‘This coffee tastes… exclusive’
‘This coffee tastes… cheap’ (reversed)
‘This coffee tastes… standard’ (reversed)
‘This coffee tastes… strong’
‘This coffee tastes… powerful’
‘This coffee tastes… pure’
‘This coffee tastes… intense’
‘This coffee tastes… weak’ (reversed)
‘This coffee tastes… bitter’
‘This coffee tastes… good’
‘This coffee tastes… delicious’
‘This coffee tastes… tasty’
‘This coffee tastes… complex’
‘This coffee tastes… rich’
‘This coffee tastes… balanced’
‘I have the feeling this coffee makes me alert’
‘I have the feeling this coffee makes me concentrated’
‘I have the feeling this coffee makes me focussed’
‘I have the feeling this coffee makes me relaxed’ (reversed)
‘I have the feeling this coffee makes me lazy’ (reversed)
‘I have the feeling this coffee makes me aroused’
6
6
3
3
6
.89
.85
.91
.60
.82
Quality perception ‘I believe that this coffee is of good quality’
‘I believe that this coffee will outperform other coffees’
‘I think this coffee contains unique quality features’
‘I think this coffee belongs to a luxurious lifestyle’
4 .89
16
Table 2. Items per scale and construct reliability.
4.5 Participants
For the main study 120 participants participated in this research, distributed over four experimental
conditions. Almost all participants followed a Pre-university education (VWO) (41,7%) or a bachelor’s
degree (HBO/WO) (44,2%) and drink between two or three cups of coffee per day (M= 2,57, SD=2.06).
Most of the participants prefer to drink their coffee black (49.2%), with milk (24.2%) or with milk and
sugar (20%). Table 3 shows gender and age distributions across the manipulated conditions.
Gender Age
N Male Female Mean SD
Basic Claim /
Horizontal 30 21 (70,0%) 9 (30,0%) 25,90 10,41
Basic Claim /
Vertical
30 13 (43,3%) 17 (56,7%) 22,67 7.884
Exclusive Claim /
Horizontal
30 16 (53,3%) 14 (46,7%) 20,83 2,666
Exclusive Claim /
Vertical
30 20 (66,7%) 10 (33,3%) 23.00 6.373
Total 120 70 (58,3%) 50 (41,7%) 23,10 7.517
Table 3. Demographics of participants for each experimental condition.
4.6 Analyses
Univariate analyses of variance were conducted to look for main and interaction effects of verticality
cues and quality claim on all dependent variables. Furthermore, an additional ANOVA was used to
investigate effects of congruity. For every ANOVA an alpha of .05 was used to look for significant effects.
Finally, a regression analysis was performed to investigate if the taste experience and quality perception
have explanatory power over purchase intention.
Purchase intention ‘I would consider buying this product in the supermarket’ 1 -
Materialism ‘My life would be better if I own certain things I don’t have’ ‘The things I own say a lot about how well I’m doing’
‘I’d be happier if I could afford to buy more things’
‘It bothers me that I can’t afford to buy things I’d like’
‘Buying things gives me a lot of pleasure’
‘I admire people who own expensive homes, cars, clothes’
‘I like to own things that impress people’
‘I like a lot of luxury in my life’
‘I try to keep my life simple, as far as possessions are
concerned’
9 .83
17
5. Results
The present study tests the influence of vertical orientations and a quality claim on taste experience,
quality perception and purchase intention. This research uses a 2 x 2 x 2 between subjects design with
consumer materialism as a moderator. All observable results are discussed in this section, the
corresponding tables can be found in appendix D.
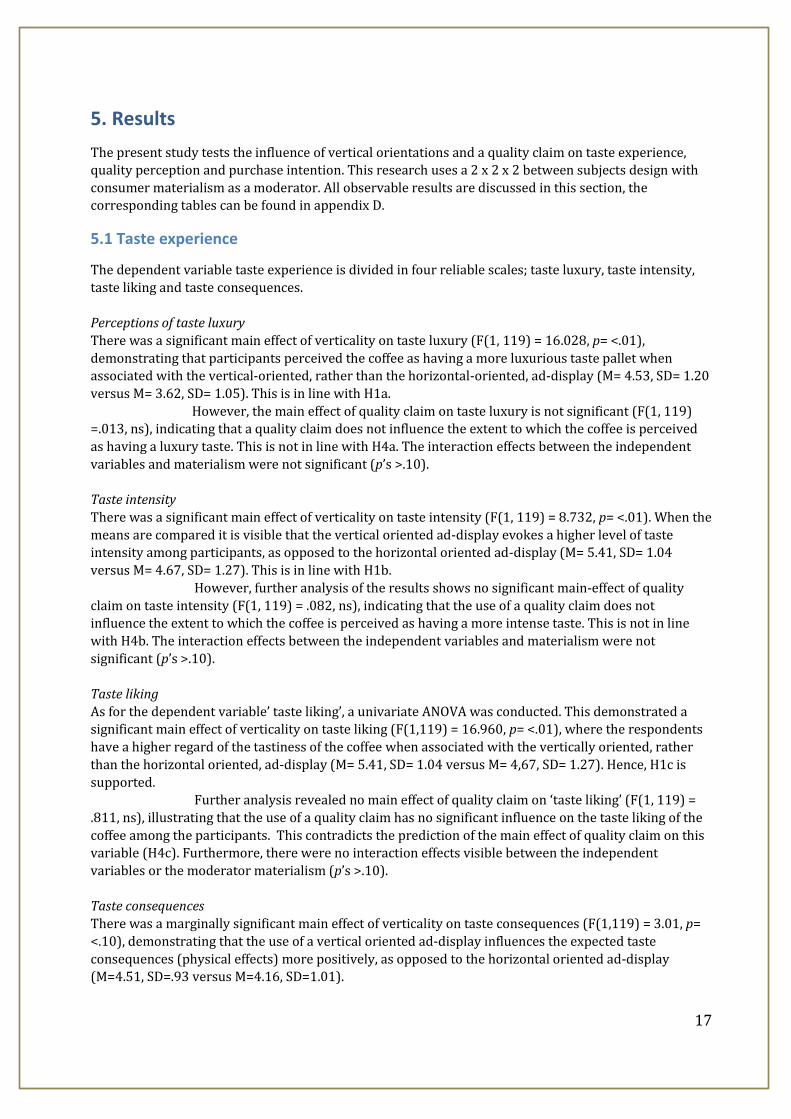
5.1 Taste experience
The dependent variable taste experience is divided in four reliable scales; taste luxury, taste intensity,
taste liking and taste consequences.
Perceptions of taste luxury
There was a significant main effect of verticality on taste luxury (F(1, 119) = 16.028, p= <.01),
demonstrating that participants perceived the coffee as having a more luxurious taste pallet when
associated with the vertical-oriented, rather than the horizontal-oriented, ad-display (M= 4.53, SD= 1.20
versus M= 3.62, SD= 1.05). This is in line with H1a.
However, the main effect of quality claim on taste luxury is not significant (F(1, 119) =.013, ns), indicating that a quality claim does not influence the extent to which the coffee is perceived
as having a luxury taste. This is not in line with H4a. The interaction effects between the independent
variables and materialism were not significant (p’s >.10).
Taste intensity
There was a significant main effect of verticality on taste intensity (F(1, 119) = 8.732, p= <.01). When the
means are compared it is visible that the vertical oriented ad-display evokes a higher level of taste
intensity among participants, as opposed to the horizontal oriented ad-display (M= 5.41, SD= 1.04
versus M= 4.67, SD= 1.27). This is in line with H1b.
However, further analysis of the results shows no significant main-effect of quality
claim on taste intensity (F(1, 119) = .082, ns), indicating that the use of a quality claim does not influence the extent to which the coffee is perceived as having a more intense taste. This is not in line
with H4b. The interaction effects between the independent variables and materialism were not
significant (p’s >.10).
Taste liking
As for the dependent variable’ taste liking’, a univariate ANOVA was conducted. This demonstrated a significant main effect of verticality on taste liking (F(1,119) = 16.960, p= <.01), where the respondents
have a higher regard of the tastiness of the coffee when associated with the vertically oriented, rather
than the horizontal oriented, ad-display (M= 5.41, SD= 1.04 versus M= 4,67, SD= 1.27). Hence, H1c is
supported.
Further analysis revealed no main effect of quality claim on ‘taste liking’ (F(1, 119) =
.811, ns), illustrating that the use of a quality claim has no significant influence on the taste liking of the
coffee among the participants. This contradicts the prediction of the main effect of quality claim on this variable (H4c). Furthermore, there were no interaction effects visible between the independent
variables or the moderator materialism (p’s >.10).
Taste consequences
There was a marginally significant main effect of verticality on taste consequences (F(1,119) = 3.01, p=
<.10), demonstrating that the use of a vertical oriented ad-display influences the expected taste
consequences (physical effects) more positively, as opposed to the horizontal oriented ad-display
(M=4.51, SD=.93 versus M=4.16, SD=1.01).

18
Furthermore, there was no significant main effect of quality claim on taste
consequences (F(1,119) = .176, ns), illustrating that the use of a quality claim on an ad-display with
coffee has no significant effects on the expected taste consequences of the participants. Furthermore, no
interaction effects were found between the independent variables or the moderator materialism (p’s >.10).
5.2 Quality perception
There was a significant main effect of verticality on quality perception (F(1, 119) = 19.087, p= <.01). The
results show that the use of a vertical oriented ad-display influences the quality perception of the coffee
in a more positive manner, as opposed to the horizontal oriented ad-display (M= 4.60, SD= 1.29 versus
M= 3.54, SD= 1.36. This is in line with H2.
Further analysis revealed a marginally significant main effect of quality claim on
quality perception (F(1, 119) = 2.851, p= .09). The results show that the use of the quality claim
‘Exclusive blend’ evokes a higher quality perception (M= 4.30, SD= 1.26), as opposed to the quality claim
‘Basic blend’ (M= 3.85, SD= 1.36). This indicates that the use of a high-quality claim, in this case
‘Exclusive blend’, has a positive effect on the quality perception of the coffee. Hence, supporting H5.
Furthermore, no interaction effects were found between the independent variables or the moderator
materialism (p’s >.10).
5.3 Purchase intention
There was a significant main effect of the factor verticality on purchase intention (F(1, 119) = 6.778, p=
<.05). The descriptive statistics show that the use of a vertical oriented ad-display evokes higher levels
of purchase intention (M= 4.60, SD= 1.29), as opposed to the horizontal oriented ad-display (M= 3.54,
SD= 1.15). This demonstrates that the use of vertical orientations in an ad-display with coffee increases
the intention of the participants to go to the supermarket and buy the coffee in question. Hence,
supporting H3.
Furthermore, there was no significant main effect noticeable of the factor quality claim
on the purchase intention of the participants (F(1, 119) = .001, ns), demonstrating that the use of a
quality claim on an ad-display with coffee, has no significant effect on the purchase intention of the
participants. This contradicts the hypothesis regarding the effects of a quality claim on purchase
intention (H6). Furthermore, the interaction between one of the independent variables or the moderator materialism did not reach significance (p’s >.10).
5.4 Additional analyses
To inspect if congruent combinations (claim-orientation) in the ad-display have a more positive effect
than incongruent combinations additional analyses were performed to look for discrepancies. To test
for significant differences between the congruent and incongruent conditions a univariate ANOVA with
congruity as fixed factor (congruent – incongruent) was performed. These additional congruence
analyses reveal a significant main effect for congruity on quality perception (F(1, 59) = 4.968, p= <.05),
demonstrating that congruity between verticality and claim is perceived more positively, as opposed to
incongruity (M= 4.96, SD= 1.04 versus M= 4.24, SD= 1.42). This is in line with H7, claiming that
congruent combinations are perceived more positively than incongruent. Even though there are more
discrepancies visible between the congruent/incongruent conditions (see appendix D), they did not
reach significance (p’s >.10).
19
NS
NS
β = .45
β = .32
Adj. R2of .51
NS
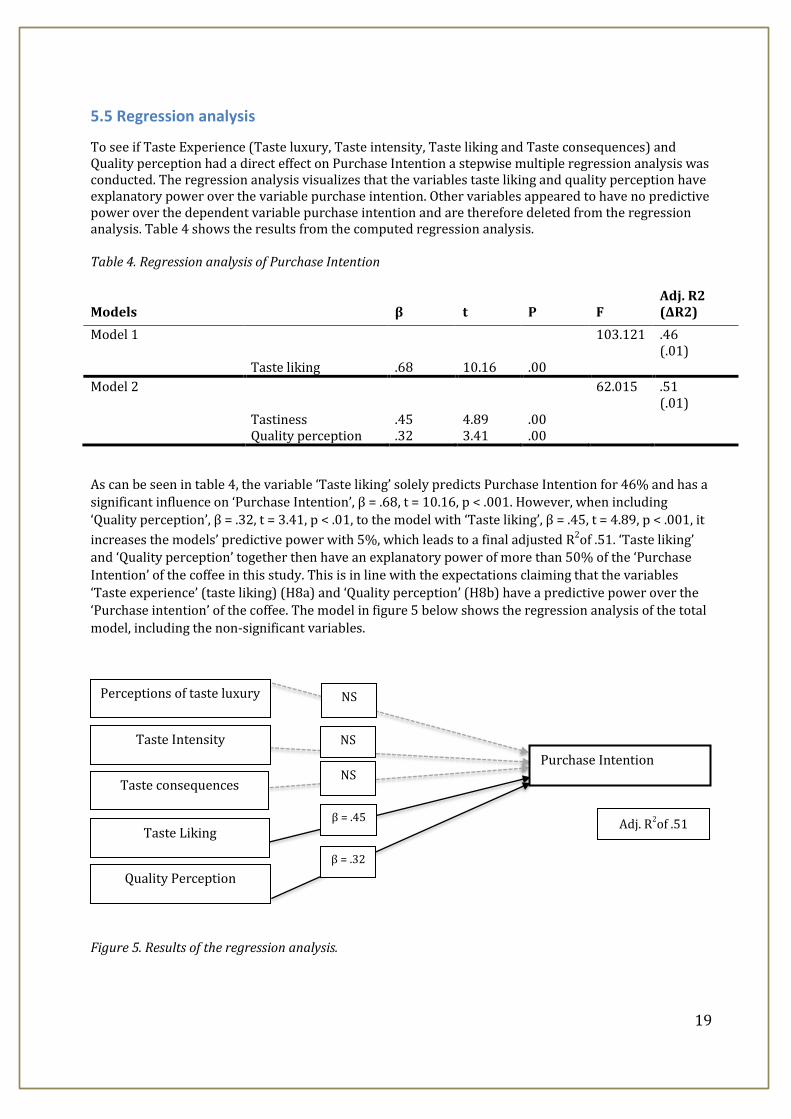
5.5 Regression analysis
To see if Taste Experience (Taste luxury, Taste intensity, Taste liking and Taste consequences) and Quality perception had a direct effect on Purchase Intention a stepwise multiple regression analysis was conducted. The regression analysis visualizes that the variables taste liking and quality perception have explanatory power over the variable purchase intention. Other variables appeared to have no predictive power over the dependent variable purchase intention and are therefore deleted from the regression analysis. Table 4 shows the results from the computed regression analysis. Table 4. Regression analysis of Purchase Intention
Models
β
t
P
F
Adj. R2 (ΔR2)
Model 1 Taste liking
.68
10.16
.00
103.121 .46 (.01)
Model 2 Tastiness Quality perception
.45 .32
4.89 3.41
.00 .00
62.015 .51 (.01)
As can be seen in table 4, the variable ‘Taste liking’ solely predicts Purchase Intention for 46% and has a significant influence on ‘Purchase Intention’, β = .68, t = 10.16, p < .001. However, when including
‘Quality perception’, β = .32, t = 3.41, p < .01, to the model with ‘Taste liking’, β = .45, t = 4.89, p < .001, it
increases the models’ predictive power with 5%, which leads to a final adjusted R2of .51. ‘Taste liking’
and ‘Quality perception’ together then have an explanatory power of more than 50% of the ‘Purchase
Intention’ of the coffee in this study. This is in line with the expectations claiming that the variables
‘Taste experience’ (taste liking) (H8a) and ‘Quality perception’ (H8b) have a predictive power over the ‘Purchase intention’ of the coffee. The model in figure 5 below shows the regression analysis of the total
model, including the non-significant variables.
Figure 5. Results of the regression analysis.
Perceptions of taste luxury
Quality Perception
Taste Intensity
Taste Liking
Purchase Intention
Taste consequences
20
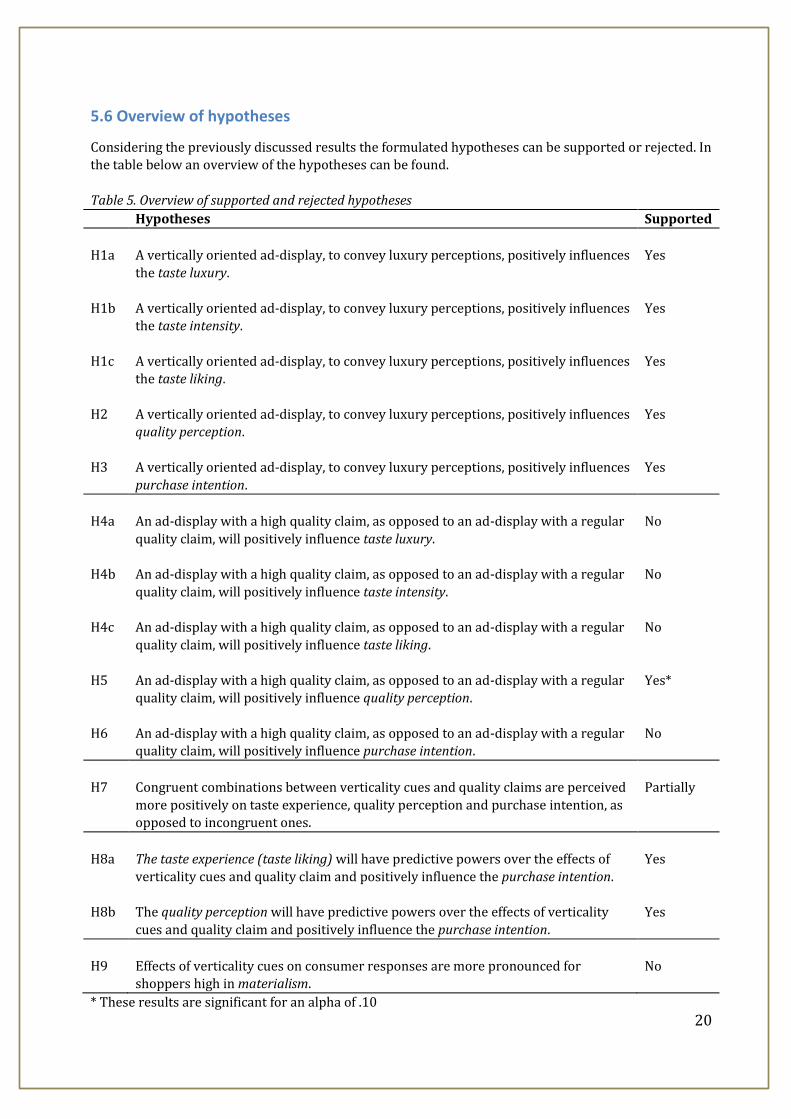
5.6 Overview of hypotheses
Considering the previously discussed results the formulated hypotheses can be supported or rejected. In
the table below an overview of the hypotheses can be found.
Table 5. Overview of supported and rejected hypotheses
Hypotheses Supported
H1a
H1b
H1c
H2
H3
A vertically oriented ad-display, to convey luxury perceptions, positively influences
the taste luxury.
A vertically oriented ad-display, to convey luxury perceptions, positively influences the taste intensity.
A vertically oriented ad-display, to convey luxury perceptions, positively influences the taste liking.
A vertically oriented ad-display, to convey luxury perceptions, positively influences
quality perception.
A vertically oriented ad-display, to convey luxury perceptions, positively influences
purchase intention.
Yes
Yes
Yes
Yes
Yes
H4a
H4b
H4c
H5
H6
An ad-display with a high quality claim, as opposed to an ad-display with a regular
quality claim, will positively influence taste luxury.
An ad-display with a high quality claim, as opposed to an ad-display with a regular
quality claim, will positively influence taste intensity.
An ad-display with a high quality claim, as opposed to an ad-display with a regular
quality claim, will positively influence taste liking.
An ad-display with a high quality claim, as opposed to an ad-display with a regular
quality claim, will positively influence quality perception.
An ad-display with a high quality claim, as opposed to an ad-display with a regular
quality claim, will positively influence purchase intention.
No
No
No
Yes*
No
H7
Congruent combinations between verticality cues and quality claims are perceived
more positively on taste experience, quality perception and purchase intention, as
opposed to incongruent ones.
Partially
H8a
H8b
The taste experience (taste liking) will have predictive powers over the effects of
verticality cues and quality claim and positively influence the purchase intention.
The quality perception will have predictive powers over the effects of verticality
cues and quality claim and positively influence the purchase intention.
Yes
Yes
H9
Effects of verticality cues on consumer responses are more pronounced for shoppers high in materialism.
No
* These results are significant for an alpha of .10
21
6. Discussion and conclusion
In this section of the report the results and conclusions of the conducted research will be discussed. Subsequently the implications and limitations of this research will be elaborated.
6.1 The interplay between verticality and quality claim
The focus of this research lies within the influence of verticality cues and quality claims as visual cues to evoke luxury impressions. In addition, the impact of these phenomena on taste experience, quality
perception and purchase intention. In the last years previous research claimed that abstract concepts
such as luxury and power can be guided through visual displays. Where objects, shapes and lines are
perceived as more luxurious or powerful when placed in the vertical dimension, thereby influencing the
way consumers evaluate products (Schubert, 2005; van Rompay et. al., 2012).
This study confirms the influence of verticality cues on the evaluation of taste, quality
and purchase intention of the coffee that is used in this research. The use of verticality cues was found
successful in communicating a luxurious taste. This is in harmony with the claim of McQuarrie & Mick
(2003) that symbolization (vertical orientations) of product luxury is shown to be more effective than
rhetoric. The participants in this study rated the coffee as having a more luxurious taste when verticality cues were present. Hence, it can be concluded that verticality cues influence the taste-luxury perception
of the participants.
In addition to taste luxury, the taste intensity of the coffee was perceived as heavier
when verticality cues were present. Even though, the coffee was the same in every condition and not
particularly strong, consumers perceived it as having a more powerful and intense taste pallet. This
study confirms that the participants derive meaning attributions in forms of power, in this case as the
coffee having a powerful/intense taste, from the vertical oriented ad-display. This is in line with findings
from previous research where verticality evoked perceptions of power (Schubert, 2005, van Rompay et
al., 2012, Machiels & Orth, 2017).
Furthermore, a significant effect was found of verticality cues on the taste liking of the
coffee. By using verticality cues participants evaluated the coffee as having a more delicious taste. This study confirms Spence’s (2012) cross-modal correspondences theory between vision and gustation.
Seeing verticality cues influences the luxury perception and, in this case, makes intuitive associations
with good taste. Furthermore, a marginally significant effect of verticality on taste consequences was found. Thus, participants had the feeling the coffee made them more awake, focussed and concentrated
when exposed to vertical orientations, as opposed to horizontal. It is plausible that the participants did
not feel a very noticeable effect when consuming the coffee product. The effect of caffeine in the coffee can be noticeable but not at the point of consumption. This could have been measured at a later point in
time.
The use of vertical orientations is also found successful in communicating quality.
There is a significant influence visible of verticality on the quality perception of the respondents. Ad-
displays that were manipulated with verticality cues enjoyed higher ratings on quality, unique product
features, luxury and made participants think that the coffee they tasted outperforms other coffees.
Therefore, this study confirms previous findings, which state that the use of verticality as a high-quality signalling cue influences the quality perception of consumers in the decision-making process
(Anselmsson, Johansson & Persson, 2007; Machiels & Orth, 2017).
Previous research stated that quality perception is an important stipulation of
purchase intention. This study made it evident that purchase intention, besides quality perception, is
also directly influenced by the factor verticality. There is a significant effect noticeable under the
conditions during which vertical orientations were present. The participants felt a higher need to buy
this type of coffee in the supermarket. Therefore, it can be concluded that verticality cues influence the
purchase intention of the participants, which is in line with the findings of previous studies where
purchase intention was also influenced by verticality (van Rompay et al., 2012; Ooijen et al., 2016;
22
Machiels & Orth, 2017). Furthermore, taste experience (taste liking) and quality perception together
have a predictive power of 51% on the purchase intention of the coffee. However, still 49% of the
purchase intention is determined by other factors, not measured in this study, that will remain
unknown.
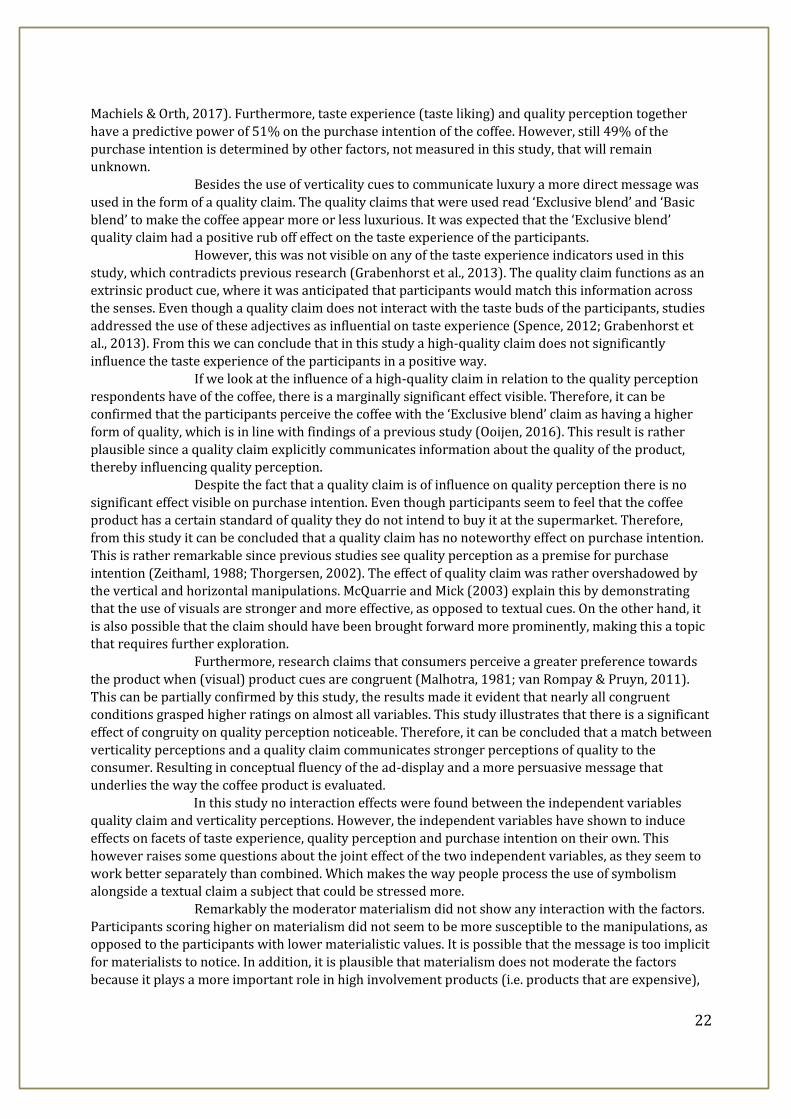
Besides the use of verticality cues to communicate luxury a more direct message was
used in the form of a quality claim. The quality claims that were used read ‘Exclusive blend’ and ‘Basic
blend’ to make the coffee appear more or less luxurious. It was expected that the ‘Exclusive blend’
quality claim had a positive rub off effect on the taste experience of the participants.
However, this was not visible on any of the taste experience indicators used in this
study, which contradicts previous research (Grabenhorst et al., 2013). The quality claim functions as an
extrinsic product cue, where it was anticipated that participants would match this information across
the senses. Even though a quality claim does not interact with the taste buds of the participants, studies
addressed the use of these adjectives as influential on taste experience (Spence, 2012; Grabenhorst et
al., 2013). From this we can conclude that in this study a high-quality claim does not significantly
influence the taste experience of the participants in a positive way.
If we look at the influence of a high-quality claim in relation to the quality perception
respondents have of the coffee, there is a marginally significant effect visible. Therefore, it can be
confirmed that the participants perceive the coffee with the ‘Exclusive blend’ claim as having a higher
form of quality, which is in line with findings of a previous study (Ooijen, 2016). This result is rather
plausible since a quality claim explicitly communicates information about the quality of the product, thereby influencing quality perception.
Despite the fact that a quality claim is of influence on quality perception there is no
significant effect visible on purchase intention. Even though participants seem to feel that the coffee product has a certain standard of quality they do not intend to buy it at the supermarket. Therefore,
from this study it can be concluded that a quality claim has no noteworthy effect on purchase intention.
This is rather remarkable since previous studies see quality perception as a premise for purchase
intention (Zeithaml, 1988; Thorgersen, 2002). The effect of quality claim was rather overshadowed by
the vertical and horizontal manipulations. McQuarrie and Mick (2003) explain this by demonstrating
that the use of visuals are stronger and more effective, as opposed to textual cues. On the other hand, it
is also possible that the claim should have been brought forward more prominently, making this a topic
that requires further exploration.
Furthermore, research claims that consumers perceive a greater preference towards
the product when (visual) product cues are congruent (Malhotra, 1981; van Rompay & Pruyn, 2011).
This can be partially confirmed by this study, the results made it evident that nearly all congruent
conditions grasped higher ratings on almost all variables. This study illustrates that there is a significant
effect of congruity on quality perception noticeable. Therefore, it can be concluded that a match between
verticality perceptions and a quality claim communicates stronger perceptions of quality to the
consumer. Resulting in conceptual fluency of the ad-display and a more persuasive message that
underlies the way the coffee product is evaluated.
In this study no interaction effects were found between the independent variables quality claim and verticality perceptions. However, the independent variables have shown to induce
effects on facets of taste experience, quality perception and purchase intention on their own. This
however raises some questions about the joint effect of the two independent variables, as they seem to
work better separately than combined. Which makes the way people process the use of symbolism
alongside a textual claim a subject that could be stressed more.
Remarkably the moderator materialism did not show any interaction with the factors.
Participants scoring higher on materialism did not seem to be more susceptible to the manipulations, as
opposed to the participants with lower materialistic values. It is possible that the message is too implicit
for materialists to notice. In addition, it is plausible that materialism does not moderate the factors
because it plays a more important role in high involvement products (i.e. products that are expensive),
23
like cars, watches and designer clothes, as opposed to products that are not that expensive (e.g. coffee).
The moderating effect of materialism on low involvement products requires further exploration.
6.2 Practical and theoretical implications
Previous research already shows the important role of packaging design and ad-displays on the way
consumers evaluate products (van Rompay et al., 2012; van Rompay et al. 2014; Fenko et al. 2016).
Therefore, a good design based on the knowledge of which effects different aspects can have on
consumer responses can be critical. Brands do not only want to attract attention but also want to create
the right associations in order to reach advertising success. This study demonstrates that the use of
basic visual elements can influence the way a product is evaluated. Thereby, illustrating that an abstract
concept as luxury can be represented by means of vertical orientations in the background of ad-displays.
The use of verticality can have a positive effect on the way consumers experience the taste (e.g. coffee is
perceived as more luxurious/powerful/delicious) and quality of the product. Furthermore, the findings
made it evident that this evaluation resulted in a higher intention to purchase the product, which is of
specific managerial importance as it increases sales.
The use of verticality is quite new and not applied by many brands yet. However,
findings from this study stress the importance of these visual-spatial factors to influence luxury impressions. Since consumers are moving towards luxury products and brands (Ko, Phau & Aiello,
2016) the factors underlying luxury impressions are getting increasingly important for brands,
marketers and manufacturers. In addition, it is expected that the use of verticality will generally benefit product types that can more easily be associated with luxury or where luxury is a salient attribute. In
contrast to low-budget products where praising the product with luxury impressions are not suitable
and possibly induce scepticism.
Furthermore, less is known about luxury being category specific. What we do know is that verticality can be used to signal luxury for quite a range of products such as make-up (van Rompay
et al., 2012), wine (Machiels & Orth, 2017) and coffee (this study). Other not investigated products may
be even more susceptible to verticality effects on luxury (e.g. watches and jewellery).
For future research it is interesting to test if the results also apply for other products
or daily shopping goods. But it can also be interesting to test for other cross-modal correspondences,
where for instance verticality in combination with a scent experience is tested (i.e. by using verticality
products get a more powerful scent). Another suggestion could be to test verticality in store design (i.e.
vertically oriented shelves evoke luxury perceptions of the products on it).
Therefore, the use of verticality, to foster perceptions of product luxury/power, leave
room for further exploration within different advertising design factors and product categories.
Furthermore, this study is rather new in the field of consumer research because the
use of visual-spatial elements and a quality claim in combination with a taste panel has not been
researched before. However, this research supports previous studies concerning the influence of visual cues on how people evaluate products, making the findings more valid.
6.3 Limitations
This study has presented some interesting results that can be useful for future researches. Nevertheless,
this study knows some limitations that are noteworthy. First, the sample size of this study is rather
small; this provides limited data. Stronger conclusions can be made when more data are collected and
analysed, making it a more valid study. Furthermore, the use of a coffee location can lead to bias because of some disadvantages; there is much noise, participants try to talk to each other and there is a risk of
less concentrated or distracted participants. Most of the participants were recruited at lunch and coffee
breaks; these were the busiest times during the day. Because of the crowdedness and time schedule of
the participants responses could have been disrupted because people have not much time to participate
24
in the research. Therefore, not taking their time to carefully taste the coffee and thoughtfully fill in the
questionnaire.
In addition, the coffee location was at a university, with highly educated participants,
making the results harder to generalize. Therefore, in order to generalize the results to a larger group
the study should have involved a larger group of participants at different levels.
Furthermore, the use of a questionnaire is an easy way of measuring relevant
constructs. However, this does not explain the thoughts of the participants and the deeper unconscious
process has not been taken into account. A possible method can be a focus group or interviews to
investigate the underlying reason why people like or dislike an ad design and to understand which
advertising elements are important to them.
Additionally, this study could have suffered from using samples that were not
completely balanced on gender in all experimental conditions. Future research should overcome these
limitations to further investigate (gender) effects regarding verticality (Cf. Machiels & Orth, 2017).
Finally, the general coffee preference of the participants also has an influence on how
the coffee is perceived; almost half of the participants like milk, sugar or both in their coffee and tasted a
regular black coffee. This can affect their responses, since participants might think the coffee is too
strong and bitter and were never offered to drink the coffee the way they liked it.
Nevertheless, being aware and observant of the reproducibility of this research, the
findings are considered to be in line with previous research on this topic (Perrachion & Meyers-Levi,
2005; van Rompay et al., 2012; Sunday & Noseworthy, 2014).
25
References
Aaker, J.L. (1997). Dimensions of brand personality. Journal of market research. 34 (3), 347.
Aaker, D. A., & Keller, K. L. (1990). Consumer evaluations of brand extensions. Journal of
Marketing, 54, 27-41.
Acebrón, L. B., & Dopico, D. C. (2000). The importance of intrinsic and extrinsic cues to expected and
experienced quality: an empirical application for beef. Food quality and preference, 11(3), 229-238.
Anselmsson, J., Johansson, U., & Persson, N. (2007). Understanding price premium for grocery products:
A conceptual model of customer based equity. Journal of Product & Brand Management, 16(6), 401-414.
Audrin, C., Brosch, T., Chanal, J., & Sander, D. (2017). When symbolism overtakes quality: Materialists
consumers disregard product quality when faced with luxury brands. Journal of Economic Psychology.
Becker, L., van Rompay, T.J.L., Schifferstein, H.N., Galetzka, M., (2011). Tough package,
strong taste: the influence of packaging design on taste impressions and product
evaluations. Food Quality Preference, 22 (1), 17–23.
Belk, R. W. (1985). Materialism: Trait aspects of living in the material world.
Journal of Consumer Research, 12(3), 265–280.
Bialkova, S., Sasse, L., & Fenko, A. (2016). The role of nutrition labels and advertising claims in altering
consumers' evaluation and choice. Appetite, 96, 38-46.
Blijlevens, J., Creusen, M. E., & Schoormans, J. P. (2009). How consumers perceive product appearance:
The identification of three product appearance attributes. International Journal of design, 3(3).
Borém, F. M., Ribeiro, F. C., Figueiredo, L. P., Giomo, G. S., Fortunato, V. A., & Isquierdo, E. P. (2013). Evaluation of the sensory and color quality of coffee beans stored in hermetic packaging. Journal of stored products research, 52, 1-6.
Briand, L., & Salles, C. (2016). Taste perception and integration. Flavor. From food to behaviors, wellbeing
and health. A volume in Woodhead Publishing Series in Food Science, Technology and Nutrition, 101-119.
Caswell, J. A., & Padberg, D. I. (1992). Toward a more comprehensive theory of food labels. American
journal of agricultural economics, 74(2), 460-468.
Chen, Y. S., & Chang, C. H. (2013). Greenwash and green trust: The mediation effects of green consumer
confusion and green perceived risk. Journal of Business Ethics, 114(3), 489–500.
D'Arpizio, C., Levato, F., Zito, D., & de Montgolfier, J. (2015). Luxury goods worldwide
market study. Bain & Company.
D’Astous, A., Séguin, N. (1999). Consumer reactions to product placement strategies in television
sponsorship, European Journal of Marketing, 33, 896–910
DeRosia, E. D. (2008). The effectiveness of nonverbal symbolic signs and metaphors in advertisements: An experimental inquiry. Psychology & Marketing, 25, 298–316.
26
Dodds, W. B. 2002. The Effects of perceived and objective market cues on consumers’ product
evaluations. Marketing bulletin 13 (2), 1-14
Dodds, W. B., Monroe, K. B., & Grewal, D. (1991), Effect of price, brand and store information on buyers’
product evaluations. Journal of Marketing Research, 28(3), 307-319.
Fenko, A., Kersten, L., & Bialkova, S. (2016). Overcoming consumer scepticism toward food labels: The
role of multisensory experience. Food quality and preference, 48, 81-92.
Giessner, S.R., Ryan, M.K., Schubert, T.W., van Quaquebeke, N., 2011. The power of
pictures: vertical picture angles in power pictures. Media Psychology, 14 (4), 442–464.
Gordon, A., Finlay, K., & Watts, T. (1994). The psychological effects of colour in consumer product
packaging. Canadian Journal of Marketing Research, 13(3), 3–11.
Grabenhorst, F., Schulte, F. P., Maderwald, S., & Brand, M. (2013). Food labels promote
healthy choices by a decision bias in the amygdala. NeuroImage, 74, 152-163
Grunert, K.G. (1997) What's in a steak? A cross-cultural study on the quality perception of beef. Food
Quality and Preference, 8 (3). 157-174
Hagtvedt, H., & Patrick, V. (2008). Art infustion: The influence of visual art on the perception and
evaluation of consumer products. Journal of Marketing Research, 45 (3), 379-389.
Huang, X., Li, X., Zhang, M. (2013). “Seeing” the social roles of brands: how physical
positioning influences brand evaluation. Journal of consumer psychology, 23 (4), 509–514.
Kapferer, J.N., & Bastien, V. (2009). The luxury strategy: Break the rules of marketing to build luxury
brands. London: Kogan Page Ltd.
Kastanakis, M.N., & Balabanis, G. (2012). Between the mass and the class: Antecedents of the
“bandwagon” luxury consumer behaviour. Journal of Business Research, 65(10), 1399–1407.
Ko, E., Phau, I., & Aiello, G. (2016). Luxury brand strategies and customer experiences: Contributions to
theory and practice. Journal of Business Research, 69(12), 5749-5752.
Lakoff, G., Johnson, M., (1980). Metaphors we live by. The University of Chicago Press,
Chicago, IL.
Lin, X., & Wang, C. L. (2010). The heterogeneity of Chinese consumer values: A dual structure explanation. Cross-Cultural Management: An International Journal, 17(3), 244–256.
Machiels, C.J.A., Orth, U.R. (2017). Verticality in product labels and shelves as a metaphorical cue to
quality. Journal of Retailing and Consumer Services. 37, 195-203
Machiels, C. J., & Karnal, N. (2016). See how tasty it is? Effects of symbolic cues on product evaluation
and taste. Food Quality and Preference, 52, 195-202.
Mandler, G. (1982). The structure of Value: Accounting for taste. University of California, San Diego.
Center for Human Information Processing. 3–36.
27
Mantonakis, A., Cardwell, B., Beckett, R., Newman, E., & Garry, M. (2014). The mere presence of a photo
on a product label can change taste perception. Conference Proceedings of the 8th International
Conference of the Academy of Wine Business Research, 609-614.
McQuarrie, E. F., & Mick, D. G. (2003). Visual and verbal rhetorical figures under directed processing
versus incidental exposure to advertising. Journal of Consumer Research, 29(4), 579–587
Mead, N.L., Baumeister, R.F., Stillman, T.F., Rawn, C.D., & Vohs, K.D. (2011). Social exclusion causes
people to spend and consume strategically in the service of affiliation. Journal of Consumer Research, 37,
902–919.
Mignault, A., Chaudhuri, A. (2003). The many faces of a neutral face: head tilt and
perception of dominance and emotion. Journal of nonverbal behaviour. 27 (2), 111–132.
Moore, R. S., Stammerjohan, C. A., Coulter, R. A. (2005). Banner advertiser-web site context congruity
and color effects on attention and attitudes. Journal of Advertising, 34, 71-84.
Ngo, M., Misra, R., & Spence, C. (2011). Assessing the shapes and speech sounds that
people associate with chocolate samples varying in cocoa content. Food Quality
& Preference, 22, 567–572.
Olson, J.C., Jacoby, J (1972). Cue utilization in the quality perception process. Proc. of the third annual
conference of the association for consumer research, 167-179
Ooijen, I., Fransen, M.L., Verlegh, P.W.J., Smit, E.G. (2016). Atypical food packaging affects the persuasive
impact of product claims. Food Quality and Preference, 48, 33-40
Peracchio, L.A., Meyers‐Levy, J., (2005). Using stylistic properties of ad pictures to
communicate with consumers. Journal of consumer research 32 (1), 29–40.
Piqueras-Fiszman, B., Spence C. (2015) Sensory expectations based on product extrinsic
food cues: an interdisciplinary review of the empirical evidence and theoretical accounts. Food Quality
Preference, 40. 165–79.
Richins, M.L., & Dawson, S. (1992). A consumer values orientation for materialism and its
measurement: Scale development and validation. Journal of Consumer Research, 19,
303–316.
Schubert, T.W., (2005). Your highness: vertical positions as perceptual symbols of power.
Journal of personality and social psychology, 89 (1), 1–21
Schuldt, J. P., & Hannahan, M. (2013). When good deeds leave a bad taste. Negative
inferences from ethical food claims. Appetite, 62, 76–83.
Silayoi, P., & Speece, M. (2007). The importance of packaging attributes: A conjoint analysis approach.
European Journal of Marketing, 41(11/12), 1495-1517.
Silverstein, M. J., & Fiske, N. (2003). Trading up: The new American luxury. New York: Penguin.
Sirgy, M. J., Johar, J. S., Samli, A. C., & Claiborne, C. B. (1991). Self-congruity versus functional congruity: Predictors of consumer behaviour. Journal of the Academy of
28
Marketing Science, 19(4), 363–375.
Smith, V., Barratt, D., & Sørensen, H. S. (2015). Do natural pictures mean natural
tastes? Assessing visual semantics experimentally. Cognitive Semiotics, 8(1).
Spence, C. (2012). Managing sensory expectations concerning products and brands: Capitalizing on the
potential of sound and shape symbolism. Journal of Consumer Psychology, 22(1), 37–54.
Spence, C., & Gallace, A. (2011). Tasting shapes and words. Food Quality and
Preference, 22, 290–295.
Thorgersen, J. (2002). Promoting “green” consumer behavior with eco-labels. In Dietz, T and Stern, PC.
(Eds), New Tools for Environmental Protection, National Academy Press, Washington, DC.
Tonkin, E., Meyer, S.B., Coveney, J., Webb, T., Wilson, A.B. (2016). The process of making trust related
judgements through interaction with food labeling. Food Policy 63, 1–11
Van Rompay, T. J., De Vries, P. W., Bontekoe, F., & Tanja‐Dijkstra, K. (2012). Embodied product
perception: Effects of verticality cues in advertising and packaging design on consumer impressions and
price expectations. Psychology & Marketing, 29(12), 919-928.
van Rompay, T.J.L., Pruyn, A.T.H., (2011). When visual product features speak the same
language: effects of shape-typeface congruence on brand perception and price expectations. Journal of product innovation management 28 (4), 599–610.
Van Rompay, T. J., Fransen, M. L., & Borgelink, B. G. (2014). Light as a feather: Effects of
packaging imagery on sensory product impressions and brand evaluation. Marketing
letters, 25(4), 397-407.
Velasco, C., Woods, A. T., Deroy, O., & Spence, C. (2015). Hedonic mediation of the crossmodal
correspondence between taste and shape. Food Quality and Preference, 41, 151-158.
29
Appendices
Appendix A – Questions pre-study
Appendix B – Setting main study
Appendix C – Questions main study
Appendix D – Additional tables
30
Appendix
Appendix A – Questions pre-study
Note: All questions were asked in Dutch and the images that were used can be found in the method section.
Part 1 – Introduction
Beste respondent,
Allereerst wil ik u hartelijk danken voor uw deelname aan dit onderzoek. In het kader van mijn
masteropleiding Marketing Communication aan de Universiteit Twente doe ik onderzoek naar de
invloed van productverpakking op product evaluaties waarbij het product koffie centraal staat. In deze
korte enquête ziet u een aantal uitdrukkingen en afbeeldingen waar enkele vragen over gesteld
worden.
Het onderzoek zal ongeveer 5 minuten van uw tijd in beslag nemen. Er zal vertrouwelijk met uw
gegevens worden omgegaan en de resultaten worden geheel anoniem verwerkt.
Mocht u nog vragen of opmerkingen hebben over het onderzoek of interesse in de resultaten, neem dan contact met mij op via [email protected]
Nogmaals hartelijk dank voor uw deelname aan dit onderzoek.
Met vriendelijke groet,
Jens
Part 2 – Demographic questions
Q1 Wat is uw geslacht?
o Man
o Vrouw
Q2 Wat is uw leeftijd?
________________________________________________________________
Q3 Hoeveel koppen koffie drinkt u gemiddeld per dag?
(Als u geen koffie drinkt vul dan 0 in)
________________________________________________________________
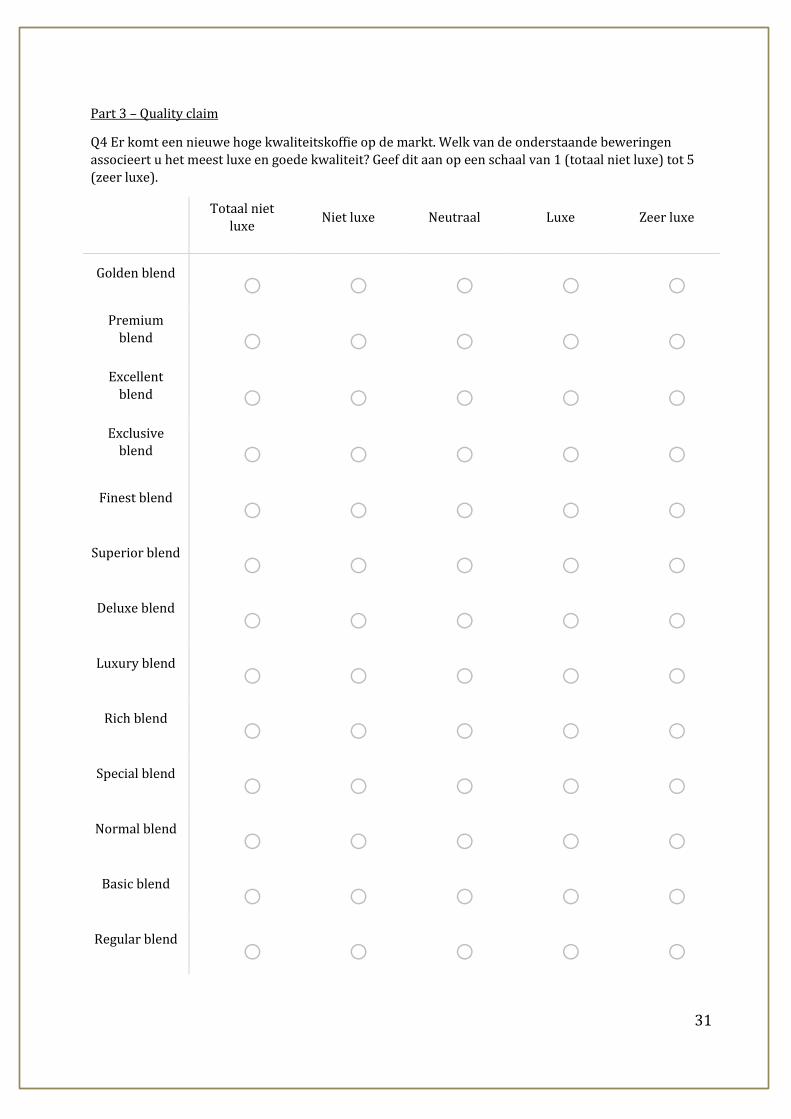
31
Part 3 – Quality claim
Q4 Er komt een nieuwe hoge kwaliteitskoffie op de markt. Welk van de onderstaande beweringen
associeert u het meest luxe en goede kwaliteit? Geef dit aan op een schaal van 1 (totaal niet luxe) tot 5
(zeer luxe).
Totaal niet
luxe Niet luxe Neutraal Luxe Zeer luxe
Golden blend o o o o o
Premium blend o o o o o
Excellent
blend o o o o o Exclusive
blend o o o o o Finest blend
o o o o o Superior blend
o o o o o Deluxe blend
o o o o o Luxury blend
o o o o o Rich blend
o o o o o Special blend
o o o o o Normal blend
o o o o o Basic blend
o o o o o Regular blend
o o o o o
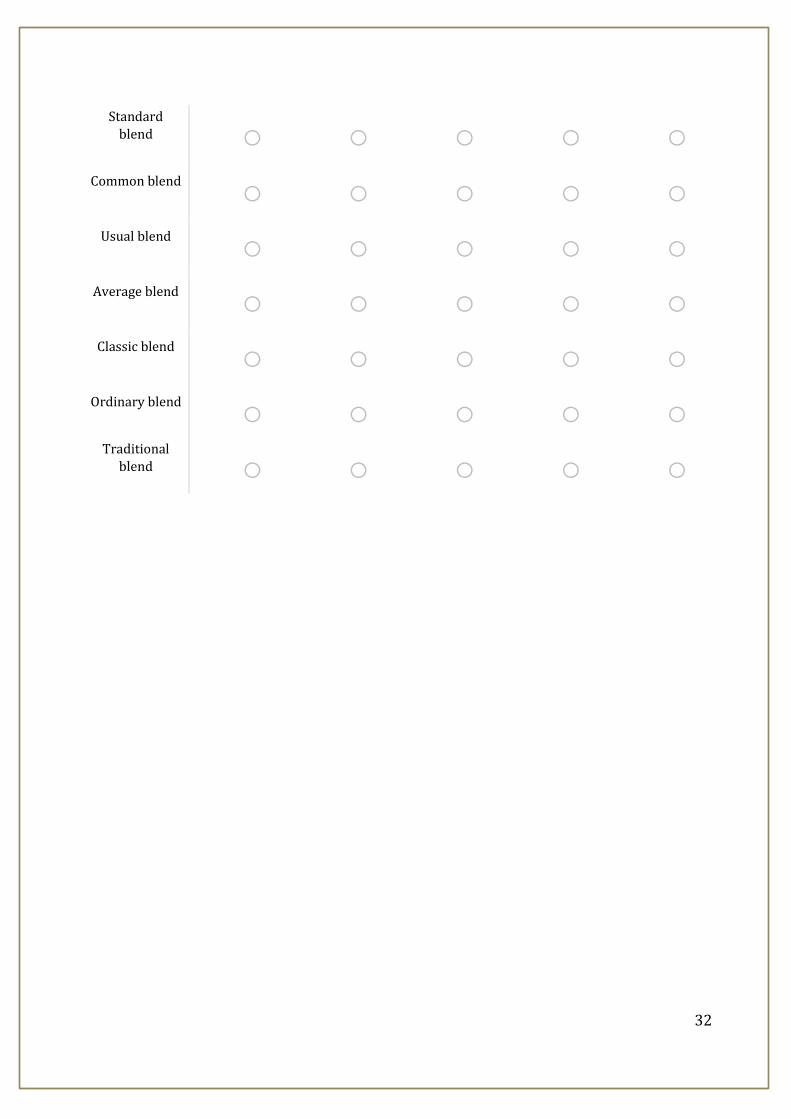
32
Standard
blend o o o o o Common blend
o o o o o Usual blend
o o o o o Average blend
o o o o o Classic blend
o o o o o Ordinary blend
o o o o o Traditional
blend o o o o o
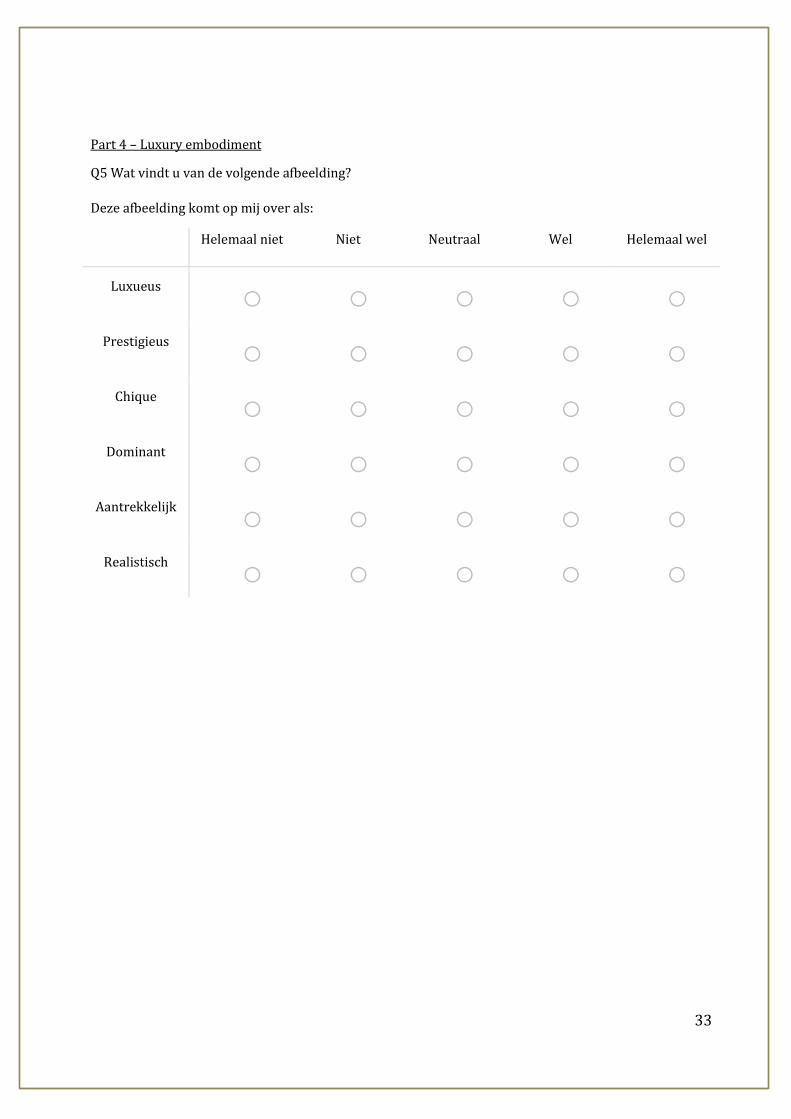
33
Part 4 – Luxury embodiment
Q5 Wat vindt u van de volgende afbeelding?
Deze afbeelding komt op mij over als:
Helemaal niet Niet Neutraal Wel Helemaal wel
Luxueus o o o o o
Prestigieus o o o o o
Chique o o o o o
Dominant o o o o o
Aantrekkelijk o o o o o
Realistisch o o o o o
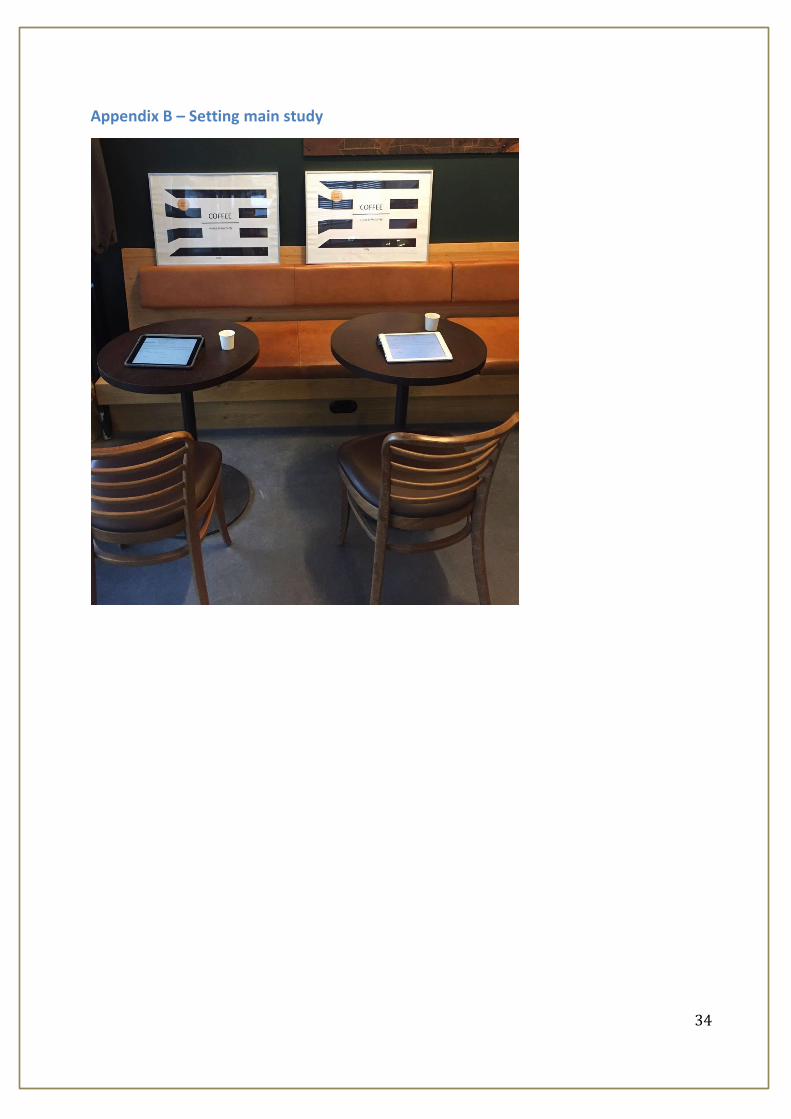
34
Appendix B – Setting main study

35
Appendix C – Questions main study
Part 1 - Introduction
Dear coffee lover,
First of all, thank you for your time and your efforts to taste and grade this possible new coffee.
Feel free to share your true opinions; both positive and negative. Your opinion is of great value for our
company to evaluate the possible success of this new coffee.
Are you ready to judge the coffee? Tick the 'next' button and you will see the questions about the coffee
package presented to you and the coffee you are enjoying now.
Q2 Declaration of participation.
o I hereby agree to participate in this study and declare that I am at least 18 years old.
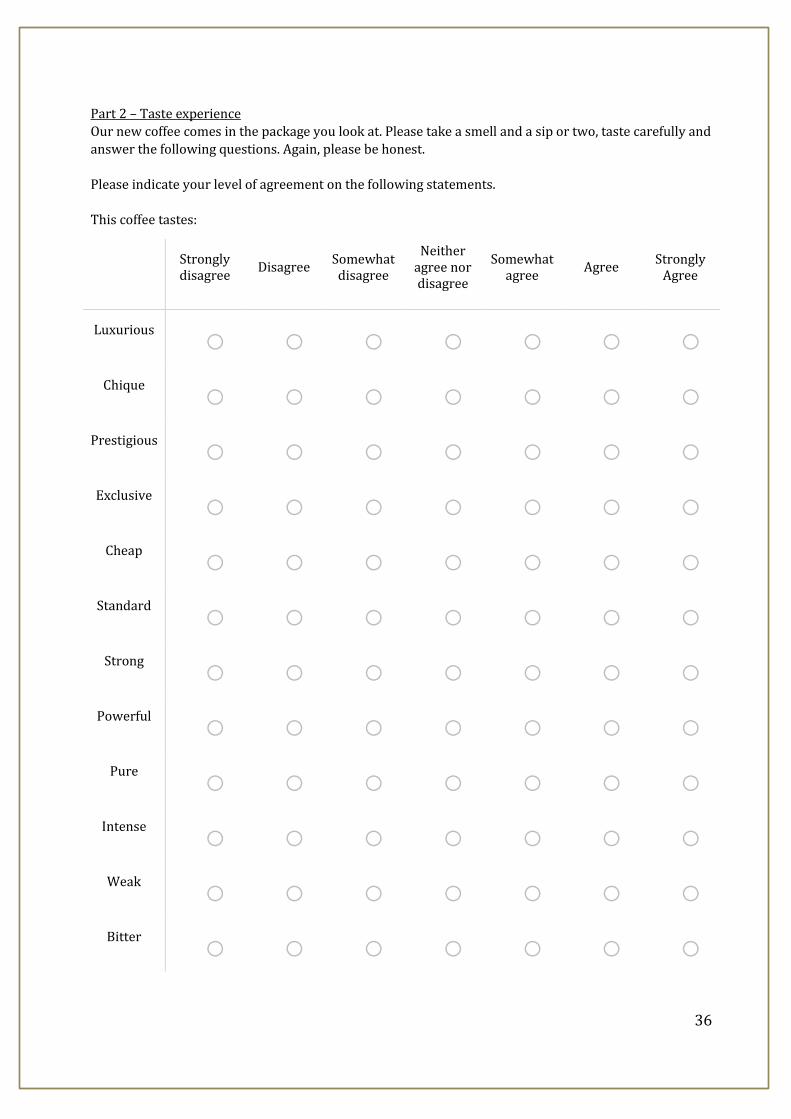
36
Part 2 – Taste experience
Our new coffee comes in the package you look at. Please take a smell and a sip or two, taste carefully and
answer the following questions. Again, please be honest.
Please indicate your level of agreement on the following statements.
This coffee tastes:
Strongly disagree
Disagree Somewhat disagree
Neither agree nor disagree
Somewhat agree
Agree Strongly
Agree
Luxurious o o o o o o o
Chique o o o o o o o
Prestigious o o o o o o o
Exclusive o o o o o o o
Cheap o o o o o o o
Standard o o o o o o o
Strong o o o o o o o
Powerful o o o o o o o
Pure o o o o o o o
Intense o o o o o o o
Weak o o o o o o o
Bitter o o o o o o o
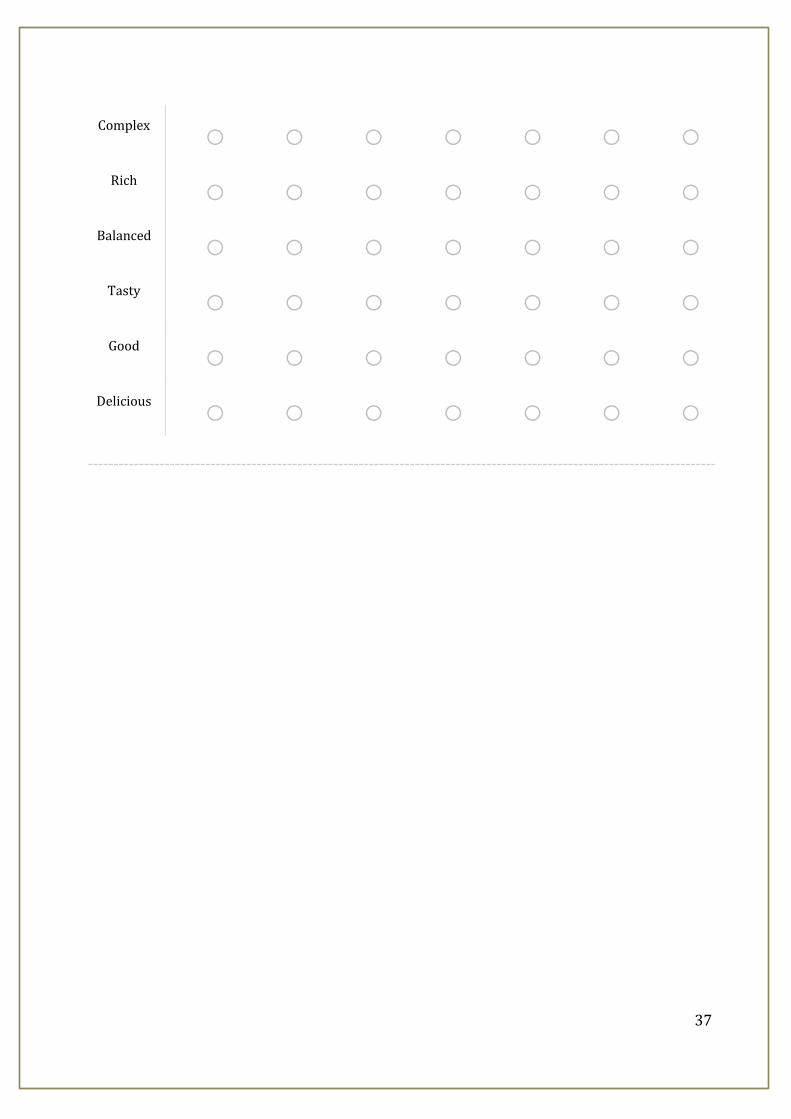
37
Complex o o o o o o o
Rich o o o o o o o
Balanced o o o o o o o
Tasty o o o o o o o
Good o o o o o o o
Delicious o o o o o o o

38
Please indicate your level of agreement on the following statements:
I have the feeling that this coffee makes me:
Strongly disagree
Disagree Somewhat disagree
Neither agree nor disagree
Somewhat agree
agree Strongly
agree
Alert o o o o o o o
Concentrated o o o o o o o
Focussed o o o o o o o
Lazy o o o o o o o
Aroused o o o o o o o
Relaxed o o o o o o o
Powerful o o o o o o o
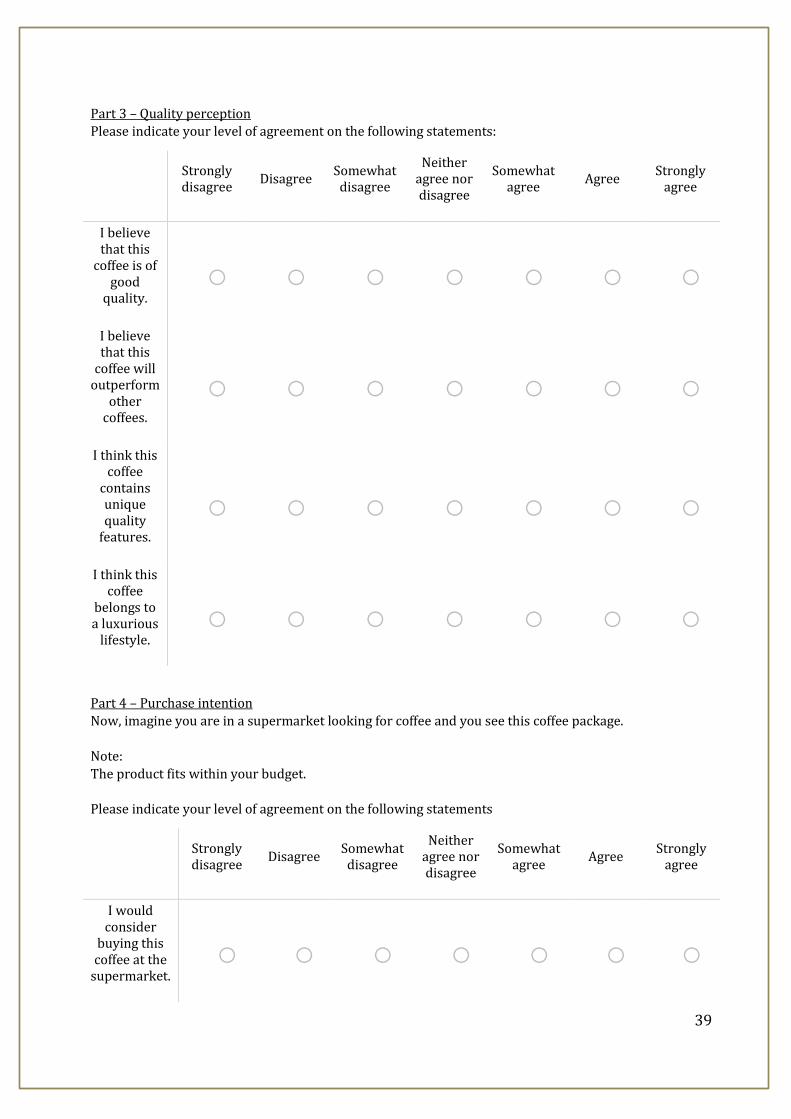
39
Part 3 – Quality perception
Please indicate your level of agreement on the following statements:
Strongly disagree
Disagree Somewhat disagree
Neither agree nor disagree
Somewhat agree
Agree Strongly
agree
I believe that this
coffee is of good
quality.
o o o o o o o
I believe that this
coffee will outperform
other coffees.
o o o o o o o
I think this coffee
contains unique quality
features.
o o o o o o o
I think this coffee
belongs to a luxurious
lifestyle.
o o o o o o o
Part 4 – Purchase intention
Now, imagine you are in a supermarket looking for coffee and you see this coffee package.
Note:
The product fits within your budget.
Please indicate your level of agreement on the following statements
Strongly disagree
Disagree Somewhat disagree
Neither agree nor disagree
Somewhat agree
Agree Strongly
agree
I would consider
buying this coffee at the
supermarket.
o o o o o o o
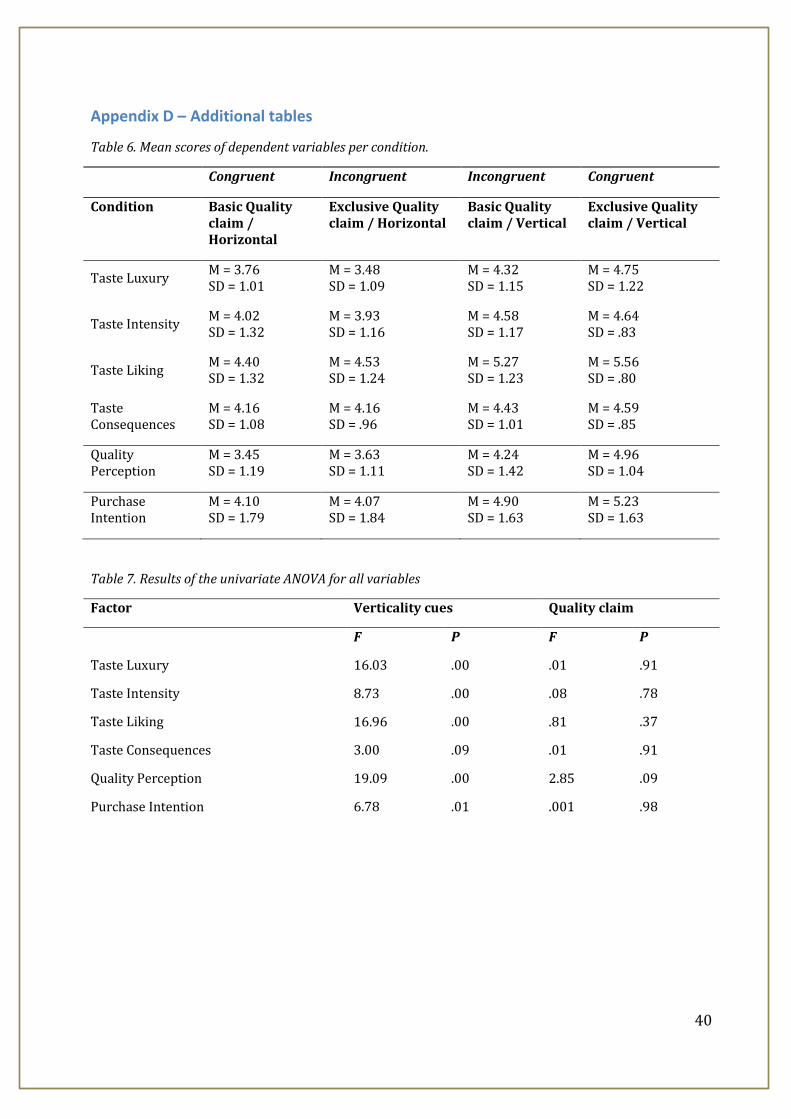
40
Appendix D – Additional tables
Table 6. Mean scores of dependent variables per condition.
Congruent Incongruent Incongruent Congruent
Condition Basic Quality claim / Horizontal
Exclusive Quality claim / Horizontal
Basic Quality claim / Vertical
Exclusive Quality claim / Vertical
Taste Luxury M = 3.76 SD = 1.01
M = 3.48 SD = 1.09
M = 4.32 SD = 1.15
M = 4.75 SD = 1.22
Taste Intensity M = 4.02 SD = 1.32
M = 3.93 SD = 1.16
M = 4.58 SD = 1.17
M = 4.64 SD = .83
Taste Liking M = 4.40 SD = 1.32
M = 4.53 SD = 1.24
M = 5.27 SD = 1.23
M = 5.56 SD = .80
Taste Consequences
M = 4.16 SD = 1.08
M = 4.16 SD = .96
M = 4.43 SD = 1.01
M = 4.59 SD = .85
Quality Perception
M = 3.45 SD = 1.19
M = 3.63 SD = 1.11
M = 4.24 SD = 1.42
M = 4.96 SD = 1.04
Purchase Intention
M = 4.10 SD = 1.79
M = 4.07 SD = 1.84
M = 4.90 SD = 1.63
M = 5.23 SD = 1.63
Table 7. Results of the univariate ANOVA for all variables
Factor Verticality cues Quality claim
F P F P
Taste Luxury 16.03 .00 .01 .91
Taste Intensity 8.73 .00 .08 .78
Taste Liking 16.96 .00 .81 .37
Taste Consequences 3.00 .09 .01 .91
Quality Perception 19.09 .00 2.85 .09
Purchase Intention 6.78 .01 .001 .98
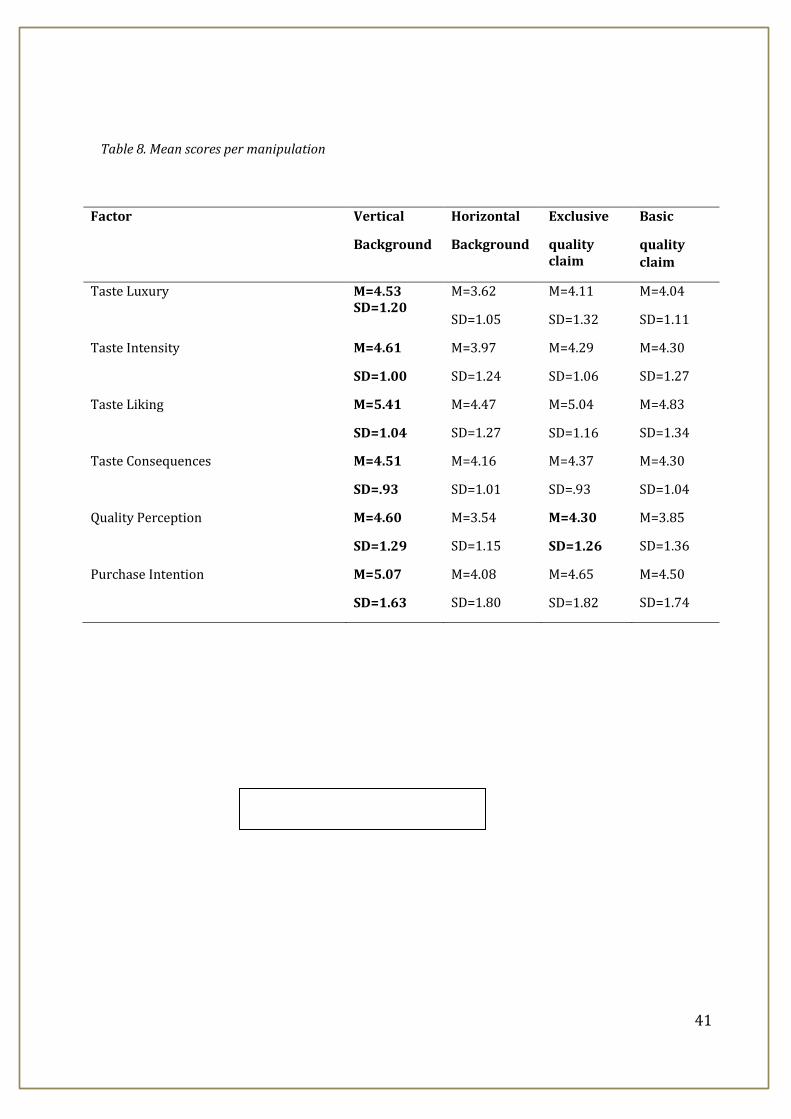
41
Factor Vertical
Background
Horizontal
Background
Exclusive
quality claim
Basic
quality claim
Taste Luxury M=4.53 SD=1.20
M=3.62
SD=1.05
M=4.11
SD=1.32
M=4.04
SD=1.11
Taste Intensity M=4.61
SD=1.00
M=3.97
SD=1.24
M=4.29
SD=1.06
M=4.30
SD=1.27
Taste Liking M=5.41
SD=1.04
M=4.47
SD=1.27
M=5.04
SD=1.16
M=4.83
SD=1.34
Taste Consequences M=4.51
SD=.93
M=4.16
SD=1.01
M=4.37
SD=.93
M=4.30
SD=1.04
Quality Perception M=4.60
SD=1.29
M=3.54
SD=1.15
M=4.30
SD=1.26
M=3.85
SD=1.36
Purchase Intention M=5.07
SD=1.63
M=4.08
SD=1.80
M=4.65
SD=1.82
M=4.50
SD=1.74
Table 8. Mean scores per manipulation
Copyright © 2022 FDOKUMEN