Market analysis of the point of sale systems through value ...
112
MARKET ANALYSIS OF THE POINT OF SALE SYSTEMS THROUGH VALUE PROPOSITIONS Naveed Jivani Bachelor of Economics, I998 University of California at Berkeley PROJECT SUBMITTED IN PARTIAL FULFILLMENT OF THE REQUIREMENTS FOR THE DEGREE OF MASTER OF BUSINESS ADMINISTRATION In the Faculty of Business Administration ONaveed JivaniZOO4 SIMON FRASER UNIVERSITY August 2004 All rights reserved. This work may not be reproduced in whole or in part, by photocopy or other means, without permission of the author
-
Upload
khangminh22 -
Category
Documents
-
view
0 -
download
0
Transcript of Market analysis of the point of sale systems through value ...
MARKET ANALYSIS OF THE POINT OF SALE SYSTEMS THROUGH VALUE PROPOSITIONS
Naveed Jivani Bachelor of Economics, I998
University of California at Berkeley
PROJECT SUBMITTED IN PARTIAL FULFILLMENT OF THE REQUIREMENTS FOR THE DEGREE OF
MASTER OF BUSINESS ADMINISTRATION
In the Faculty of
Business Administration
ONaveed JivaniZOO4
SIMON FRASER UNIVERSITY
August 2004
All rights reserved. This work may not be reproduced in whole or in part, by photocopy
or other means, without permission of the author
Approval
Name: Naveed Jivani
Degree: Master of Business Administration
Title of Project: Market Analysis of the Point of Sale Systems Through Value Propositions
Supervisory Committee:
Chair: Dr. Gary Mauser First Reader Professor Faculty of Business Administration Simon Fraser University
Dr. Bert Schoner Second Reader Professor Emeritus Faculty of Business Administration Simon Fraser University
Date Approved:
Partial Copyright Licence
The author, whose copyright is declared on the title page of this work, has
granted to Simon Fraser University the right to lend this thesis, project or
extended essay to users of the Simon Fraser University Library, and to
make partial or single copies only for such users or in response to a
request from the library of any other university, or other educational
institution, on its own behalf or for one of its users.
The author has further agreed that permission for multiple copying of this
work for scholarly purposes may be granted by either the author or the
Dean of Graduate Studies.
It is understood that copying or publication of this work for financial gain
shall not be allowed without the author's written permission.
The original Partial Copyright Licence attesting to these terms, and signed
by this author, may be found in the original bound copy of this work,
retained in the Simon Fraser University Archive.
Bennett Library Simon Fraser University
Burnaby, BC, Canada
ABSTRACT
The goal of this paper is to determine which companies are the market leaders in
the POS market, and speculate about why. In addition, what differentiation factors
should a company have to be the forerunner of the industry? For the purpose of privacy,
all the competitor names have been altered and the client will be referred to as
POSuccess Systems.
In order to discover which companies are leading the industry, we need to first
determine what attributes does their company have that the customers appreciate? This
leads us to first investigate what attributes of a POS system are important for the
customers? Second, it determines which companies are leading in those attributes,
judged to be important? Third, it determines in which attributes is this company currently
leading in? Fourth, based on the company's leading attributes, what target market
should the company be focusing on?
The results show that customers perceive system reliability, ease of use,
hardware support, and return on investment to be the most important attributes.
POSuccess Systems is perceived to have a POS system that is easy to use and reliable
as well as having a good software upgrade agreement. The two powerful competitors of
POSuccess Systems are Hello Technologies and Macros Systems. Macros was found
to have the largest market share among all of the companies.

DEDICATION
I would like to dedicate this project to my family Noorali, Parveen, Nadeem, and
my loving wife Khairunissa for being extremely supportive throughout my MBA.
ACKNOWLEDGEMENTS
I would like to thank Professor Bert Schoner and Professor Gary Mauser for their
guidance and insightful feedback in every step of the SIPS Project.
I am also grateful to Jennifer, Rob, Seema, and their colleagues for providing
information and help to expedite our process.
I am also thankful to Khairunissa Jivani and Helen Lin for their dedication and
assistance in collecting quality data for the survey.
TABLE OF CONTENTS . .
Approval ........................................................................................................................ 11 ...
Abstract ........................................................................................................................ 111
Dedication ..................................................................................................................... iv
Acknowledgements ....................................................................................................... v
Table of contents .......................................................................................................... vi
List of Tables ............................................................................................................... ix
List of Figures ................................................................................................................ ...
Glossary Of Terms ..................................................................................................... XIII
I INTRODUCTION ......................................................................................................... 1 . 1 Brief introduction of this study ...................................................................... I 1.2 POSuccess Systems. Inc ............................................................................. 2
1.2.1 History ..................................................................................................... 2 ..................................................................... 1.2.2 POSuccess Systems Today 3
............................. 1.2.3 Important Attributes of POSuccess' Value Proposition 3 ............................................................................ 1.2.3.1 Real time application 4
1.2.3.2 Ergonomically designed POS system ................................................... 4 1.2.3.3 The 24 hours a day I 7 days a week call centre .................................... 4 1.2.3.4 Hardware support ................................................................................. 4 1.2.3.5 Custom integration and analysis ........................................................... 4 1.2.3.6 Software Upgrade agreement ............................................................... 5 1.2.3.7 System Reliability ................................................................................. 5
.......................................................................................... 1.2.3.8 Ease of use 5 ................................................................................... 1.2.3.9 Easy to upgrade 5
...................................................................................... 1.2.3.10 Brand name 6 ........................................................................ 1.2.3.1 1 Styling 1 Appearance 6 ....................................................................... 1.2.3.12 Return on investment 6
2 POS Overview ........................................................................................................... 7 ............................................................................................ 2.1 POS Terminals 7
2.1.1 Uses of POS System ............................................................................... 7 .......................................... 2.1.2 What to look for in purchasing a POS system 8
.......................................................................... 2.1.3 Wireless POS Systems I 0 .................................................... 2.2 POS Market Structure In North America I I
3 POS Market ............................................................................................................. 12 ......................................... 3.1 POSuccess' Target Market In The POS Market 12
3.2 Manufacturers of POS Terminals ............................................................... 12 ...................................................................................................... 3.2.1 Hello 12 .................................................................................................... 3.2.2 ITBMl 1 3
................................................................................................ 3.2.3 InfoPOS 1 3
3.2.4 Macros Systems. Inc .............................................................................. 13 ....................................................................................................... 3.2.5 KCN 14
............................................................................................... 3.2.6 SonicCap 14 .............................................................................................. 3.2.7 Peterpoint 14
................................................................................................. 3.2.8 KTouch 1 4 3.3 POSuccess' Competitors ........................................................................... 15
4 Market Research of the target market ................................................................ 16 ..................................................................... 4.1 Sources of Market Research 16
4.2 Market Size ................................................................................................ 16 .............................................................................................. 4.3 Methodology 17
5 Market Analysis ...................................................................................................... 20 5.1 Descriptive Analysis of current customers ................................................. 20
5.1.1 POS system used by respondents ......................................................... 20 5.1.2 Duration of POS system purchased ....................................................... 21
........................................ 5.1.3 Ratings of current POS system manufacturer 22 ............................................................................. 5.1.3.1 Overall Experience 22
5.1.3.2 Overall Ratings ................................................................................... 23 .................................................................................. 5.1.3.3 Service Ratings 24
............................................................................. 5.1.3.4 Recommendation i. 25 5.1.3.5 Likelihood of Re-Purchase ................................................................. 26 5.1.3.6 Satisfaction with Amount of Contact ................................................... 27
............................................................. 5.1.3.7 Quality of Sales Organization 28 Price for 4-terminal POS system ............................................................ 29
............................................. Preference in contacting customer service 30 More then One POS system .................................................................. 31 Likelihood of Purchasing or Upgrading a POS system in the next three years ............................................................................................. 32
......... Likelihood of Switching POS manufacturer in the next three years 33 Descriptive Analysis of the Value Propositions .......................................... 34
Important Attributes according to Customers ......................................... 34 Descriptive Analysis of Competitors ........................................................... 35
Un-Aided and Aided Recall on POS System manufacturers ................... 35 Analysis of Competitors ratings based on Attributes .............................. 37
......... Analysis of the Competitor Ratings based on "Agree" Statements 38 Descriptive Analysis of Marketing Services ................................................ 46 Inferential Analysis ..................................................................................... 47
Correlation Matrix ................................................................................... 47 Multiple Regression Analysis ................................................................. 49 Two Step Cluster Analysis ..................................................................... 50
....................................................... POSuccess Systems VS . Competition 52 ......................................................................................... SWOT Analysis 53
............................................................................................... Strengths 53 ................................................................. Weaknesses + Opportunities 54
.................................................................................................. Threats 54 Porter's Forces .......................................................................................... 55
Potential Competitors ............................................................................. 55 Rivalry in the industry ............................................................................. 55 Closeness of Substitute ......................................................................... 55
6 Implications ............................................................................................................. 56
vii
7 Conclusion .............................................................................................................. 58
APPENDIX A ................................................................................................................ 59 Questionnaire ............................................................................................................ 59
Appendix B .................................................................................................................. 65 Script 65
Appendix C .................................................................................................................. 67 Fall Back Questions Guide ......................................................................................... 67
Appendix D .................................................................................................................. 69
Appendix E .................................................................................................................. 83
Appendix F ................................................................................................................... 84
Appendix G .................................................................................................................. 92
Reference list ............................................................................................................... 97
viii
LIST OF TABLES
Table 1 Table 2 Table 3 Table 4. Table 5 Table 6 Table 7 Table 8 Table 9 Table 10 Table 11 Table 12 Table 13 Table 14 Table 15 Table 16 Table 17 Table 18 Table 19 Table 20 Table 21 Table 22 Table 23 Table 24
............................................................................................ Correlation Matrix 48 Multiple Regression: Coefficients Table ........................................................... 49 Distribution of 3 Clusters .................................................................................. 50 POS Systems used by Respondents ............................................................... 69
............................................................ Current Company Satisfaction Ratings 70 Average Duration from the Purchase of the Last POS System ....................... 71
.......................................................................... Overall Company Experience 72 ................................................................................................ Overall Ratings 73
Service Ratings ............................................................................................... 74 .......................................................................................... Recommendation 75
Likelihood of Re-Purchase from Current Company ........................................ 76 Satisfaction with the Amount of Contacts ....................................................... 77 Satisfaction with the Quality of Sales Organization ........................................ 78 Price for a 4-terminal POS System ................................................................ 79 Preference in Contacting Customer Service .................................................. 80 Usage of more then One POS System .......................................................... 80 Likelihood of BuyingIUpgrading in next 3 Years ............................................. 81 Likelihood of Switching POS Manufacturer in Next 3 Years ........................... 82 Important Attributes ....................................................................................... 83
...................................................................... Attribute Importance by Cluster 83 Un-aided Recall of Companies ...................................................................... 84 Company Aided Recall .................................................................................. 84 Agree on Statement . Very Good Real Time Application ............................... 85 Agree on Statement . Very Good Ergonomically Designed POS
.......................................................................................................... System 85 ....................................... . Table 25 Agree on Statement Very Good 24x7 Call Centre 86
....................................................... . Table 26 Agree on Statement Hardware Support 86 .............. . Table 27 Agree on Statement Very Good Custom Integration and Analysis 87
Table 28 Agree on Statement . Very Good Software Upgrade Agreement .................. 87 ............................ . Table 29 Agree on Statement Very Good Reliability of the System 88
. ......................................................... Table 30 Agree on Statement Very Easy to Use 88 ................................................. . Table 31 Agree on Statement Very Easy to Upgrade 89
................................................................................ Table 32 Very Good Brand Name 89 .................................. Table 33 Agree on Statement . Very Good StylingIAppearance 90
Table 34 Agree on Statement . Very Good ROI ............................................................ 90
Table 35 Preference in Receiving Information ............................................................... 91 Table 36 Regression Model Summary with R Square ................................................... 92 Table 37 Distribution of 2 Clusters ................................................................................. 93 Table 38 Distribution of 4 Clusters ................................................................................. 93 Table 39 Distribution of 5 Clusters ................................................................................. 93 Table 40 Number of Respondents per Company within Attribute Clusters 1. 2.
and 3 ............................................................................................................. 94 ............................................................................................ Table 41 Oneway ANOVA 95
LIST OF FIGURES
Figure 1 All Companies . Estimated Market Share based on POS System Used by Respondents . Source: Jivani. 2004 ......................................................... 20
Figure 2 Current Customer -Duration from last purchase of POS System purchased over more then 11 years . Source: Jivani. 2004 ........................... 22
Figure 3 Current Customer - Overall Past Experience with Current Company . Source: Jivani. 2004 ...................................................................................... 23
Figure 4 Current Customer - Overall Company Satisfaction Rating . Source: Jivani. 2004 ................................................................................................... 24
Figure 5 Current Customer - Service Satisfaction Rating . Source: Jivani. 2004 .......... 25 Figure 6 Current Customer - Recommendation to Others . Source: Jivani. 2004 ......... 26 Figure 7 Current Customer - Likelihood of Re.Purchase . Source: Jivani. 2004 ........... 27 Figure 8 Current Customer - Satisfaction (Satisfied + Very Satisfied) with the
Amount of Contact . Source: Jivani. 2004 ..................................................... 28 Figure 9 Current Customer - Quality of Sales Organization . Source: Jivani.
2004 .............................................................................................................. 29 Figure 10 Current Customer - Price for a 4-terminal POS System . Source:
Jivani. 2004 ................................................................................................... 30 Figure 11 Current Customer - Preference in Contacting Customer Service .
Source: Jivani. 2004 ...................................................................................... 31 Figure 12 All Companies - Average Usage of more than 1 POS System .
Source: Jivani. 2004 ...................................................................................... 32 Figure 13 Current Customers.. Likelihood of Purchasing or Upgrading a POS
System in the Next 3 Years . Source: Jivani. 2004 ........................................ 33 Figure 14 All Companies -Average Likelihood of Replacing POS Manufacturer
in Next 3 Years . Source: Jivani. 2004 ........................................................... 34 Figure 15 lmportant Attributes (Vitally lmportant + Important) . Source: Jivani.
2004 .............................................................................................................. 35 Figure 16 Un-Aided Recall of Companies . Source: Jivani. 2004 .................................. 36 Figure 17 Aided Recall of Companies . Source: Jivani. 2004 ........................................ 37 Figure 18 Agree on Statement . Very Good Real Time Application . Source:
Jivani. 2004 ................................................................................................... 39 Figure 19 Agree on Statement . Very Good Ergonomically Designed POS
....................................................................... System . Source: Jivani. 2004 39 Figure 20 Agree on Statement . Very Good 24 / 7 Call Centre . Source: Jivani.
2004 .............................................................................................................. 40 Figure 21 Agree on Statement . Very Good Hardware Support . Source: Jivani.
2004 .............................................................................................................. 41 Figure 22 Agree on Statement . Very Good Custom Integration and Analysis .
Source: Jivani. 2004 ...................................................................................... 41
xi
Figure 23 Agree on Statement . Very Good Software Upgrade Agreement . Source: Jivani. 2004 ...................................................................................... 42
Figure 24 Agree on Statement . Very Good System Reliability . Source: Jivani. 2004 .............................................................................................................. 43
Figure 25 Agree on Statement . Very Easy to Use . Source: Jivani. 2004 .................... 43 Figure 26 Agree on Statement . Very Easy to Upgrade . Source: Jivani. 2004 ............. 44 Figure 27 Agree on Statement . Very Good Brand Name . Source: Jivani. 2004 .......... 45 Figure 28 Agree on Statement . Very Good Styling or Appearance . Source:
Jivani. 2004 ................................................................................................... 45 Figure 29 Agree on Statement . Very Good ROI . Source: Jivani. 2004 ....................... 46 Figure 30 Preference in Receiving Information .............................................................. 47 Figure 31 Attribute Importance by Cluster . Source: Jivani. 2004 ................................. 51 Figure 32 Average Duration from the Purchase of the Last POS System ..................... 71 Figure 33 Average Overall Experience ......................................................................... 72 Figure 34 Average Overall Ratings ............................................................................... 73 Figure 35 Average Service Ratings .............................................................................. 74 Figure 36 Recommendations ....................................................................................... 75 Figure 37 Likelihood of Re-Purchase ............................................................................ 76 Figure 38 Satisfaction with the Amount of Contacts ...................................................... 77 Figure 39 Quality of Sales Organization ....................................................................... 78 Figure 40 Price Willingness for a 4-Terminal POS System ........................................ 79 Figure 41 All Companies - Average Likelihood of Purchasinglupgrading POS
System in Next 3 Years ................................................................................. 81 Figure 42 All Companies -Average Likelihood of Replacing POS Manufacturer
in Next 3 Years ............................................................................................. 82 Figure 43 P-P Plot of Regression on the Dependent Variable Purchase ...................... 92
GLOSSARY OF TERMS
Customers Customers of the POS industry that are serviced by a variety of competitors.
POS Point-of-Sale
RO I Return On Investment
SWOT Strengths, Weakness, Opportunities, and Threats
xiii
INTRODUCTION
1.1 Brief introduction of this study
More then two decades ago, the sole purpose of a cash register was to either
keep the money in an organized manner or provide change. In the last ten years, the
point-of-sale (POS) systems have evolved in an astonishing manner. Today, the POS
system not only conducts the transaction, but it also, among its many features, collects
the customer's data in a CRM system, sends the customer information and the real time
transactions to corporate headquarters, and provides touch screen technology to make
the customer service turn around time more rapidly. This provided an extremely
lucrative market for POS systems, inviting competition in masses to this industry. With
the existence of enormous competition, it becomes essential for POS companies to be
extremely customer focused while developing an estate of the art, differentiated product
for the customer.
The paper conducts a market analysis for this company, exploring the current
trends in the POS market that demonstrate some of the significant discoveries in the
existing research. In addition, the paper examines the key attributes that are important
to the POS customers, observing which attributes are geared towards a particular target
market, analyzes them against the current value propositions of the company. Then it
performs a competitor analysis to determine which companies in the market lead in the
important customer attributes that are critical for the purchase of a POS system.
The paper then provides a set of recommendations which discusses the value
propositions of the company and provides suggestions that would set off an increase in
market share of the company.
This research study is being conducted to determine the customers' perspective
of Point-of-sales systems (POS), their attitude towards their current POS systems
company, and to determine how their overall experience with that company is. The
study also finds how the respondents rate the importance of various attributes of a POS
system, and how that leads to their ratings of specific POS system manufacturers.
Finally, there is a competitor analysis conducted to explore the current status of
POSuccess Systems, our company in interest, among its immediate competitors in the
industry.
Through the use of different measurement scales and graphical representations
of data, I will be describing the results of each question, analyzing the responses to
illustrate relationships, showing the status of POSuccess Systems among its competitors
in the industry and discussing the implications of the survey in this report.
1.2 POSuccess Systems, Inc.
1.2.1 History
POSuccess is a leading provider of innovative technology solutions for the
worldwide foodservice industry. The company claims to have the easiest restaurant
point-of-sale system to learn, and use. POSuccess pioneered the touch-screen
technology to the foodservice industry in 1985 and it has maintained a respectable
market share over the last two decades.
1.2.2 POSuccess Systems Today
POSuccess currently services approximately 10,000 restaurants, hotels & clubs
installed world-wide. The company's install-base includes more than 50,000 point of
sale workstations. Some of the leading restaurant chains like the Keg, Chevy's,
O'Charleyls, Chi Chi's, McCormick & Schmick, Houlihan's and many others have
standardized on POSuccess as their in-store management solution. Its current products
and services are available from the corporate offices in Atlanta, Chicago, Hong Kong,
London, Los Angeles, San Francisco, Singapore, Sydney, and Vancouver as well as
over hundred authorized business partners in the Americas, EMEA and AsiaIPacific.
1.2.3 Important Attributes of POSuccess' Value Proposition
POSuccess prides itself by providing some of the key value propositions that are
beneficial to customers. By providing some of the top of the line systems, POSuccess
combines the powerful Windows and SQL Server software platform from Microsoft with
the POSuccess commitment that provides a point of sale system which is dramatically
easier to use and customized to meet each restaurateur's unique desires. The designs
of the user interface are based upon advanced human factors engineering making the
system truly simple, intuitive and natural to use requiring substantially less training then
some of the other systems in the market.
POSuccess provides this difference to its customers through twelve key value
propositions. These propositions are not only the differentiating factor of POSuccess but
the basis for all the products the company develops. These value propositions are
described as follows:
1.2.3.1 Real time application
Real time application can produce up-to-the-minute customized reports in real-
time both to corporate and the restaurant, and allows multiple users to operate other
software programs while the system is in use.
1.2.3.2 Ergonomically designed POS system
The POSuccess POS systems are designed on the concept of human
engineering which deals with designing and arranging systems that people use to be
safe and efficient.
1.2.3.3 The 24 hours a day 1 7 days a week call centre
The POSuccess Solution Centre which is a 24 hours a day, seven days a week
centrally staffed help desk service, is available to support all customers regardless of
where they are located in North America. The POSuccess Customer Care services are
fully integrated with the network of Corporate and Business service offices which are
dispatched whenever a local service call is necessary to ensure continued satisfaction.
1.2.3.4 Hardware support
POSuccess offers numerous hardware maintenance plans which include parts
and labour to maintain all or part of the hardware equipment. The plans are designed to
include shipping of the parts to a support site near the customer as well as on-site repair,
maintenance, and upgrade protocols.
1.2.3.5 Custom integration and analysis
Designed by hospitality specialists, the POSuccess POS systems are designed
keeping the approach in mind that you can configure its features to fit your specific
needs. In addition, the sales and the technical staff can design a system for the
customer, which would cater towards their specific usage.
1.2.3.6 Software Upgrade agreement
A software upgrade agreement provides the customers with the peace of mind of
not having to worry about paying for and installing software upgrades. By managing this
task for its customers, POSuccess leaves the customer worry-free and focused on the
business itself.
1.2.3.7 System Reliability
The POSuccess POS systems have been designed to last. The use of solid-
state components and passive cooling eliminates the mechanical devices most prone to
failure, hard drives and fans. The result is a device with an expected life span far in
excess of a typical PC based workstations. Great care has been taken to ensure the
finest components have been used to utilize components with proven superior in
performance and reliability.
1.2.3.8 Ease of use
The systems at POSuccess are designed to be user-friendly, exciting, and easy
to use. The systems are designed to provide a quick training to new employees, which
can result in an efficient operation by them.
1.2.3.9 Easy to upgrade
The systems are designed so that they have the capability to get upgraded
easily. This saves the customer both time and money on minor upgrades.
1.2.3.1 0 Brand name
POSuccess' brand name is one of the key assets that company owns. Being the
pioneer of the touch screen systems, POSuccess' name is internationally recognized as
one of the leading global brands in the POS market.
1.2.3.1 1 Styling I Appearance
The appearance and styles is an important part of POSuccess' value proposition
because of two reasons. First, the styling provides an identity for the restaurant chain to
differentiate itself from others. Second, the style of the POS system, which is mostly
visible to the diners at these restaurants, portrays an image and sends out a message
regarding the image of the restaurant, and to a POS expert, an image of POSuccess.
1.2.3.12 Return on investment
Every business that purchases any equipment, acquires it for its beneficial value
and to attain a positively lucrative return on investment. This is the reason POSuccess
develops every product keeping all of its differentiating factors in mind, while keeping it
cost-effective to provide the best value for its customers.
POS OVERVIEW
2.1 POS Terminals
2.1 .I Uses of POS System
POS systems help get customers out the door and on their way faster, and at the
same time allow the operator to run businesses smoothly, efficiently, and with more
tables turned. What was once a machine used solely to ring up orders and keep track of
cash going in and out of operation, POS system technology has changed the way those
in the foodservice industry run their businesses. According to a recent survey of POS
systems and their use, it's rare to find a POS system that does not communicate with a
corporate or main office workstation. Advancements in technology have been a driving
force in how POS systems are used in day-to-day operations. They allow operators to
easily track profits, control menus and analyze traffic trends down to the hour of service
("Point of Returns", 2004).
Some POS systems can customize menus, itemize products that make or lose
money, and control inventory. Employee time-keeping and payroll records including
automatic calculation of tips are functions of the new POS technologies. New systems
allow operators to instantly deploy changes to every terminal throughout the enterprise
without having to replace any previously purchased equipment. A lot of chains run on
different POS systems. They start a new concept and buy a new model of POS. Then
they acquire another chain, one already running another POS system, and it's unfeasible
logistically and economically to get a full life cycle without replacing cash registers
("Point of Returns", 2004). Users look for software that provides detailed information for
better margin analysis, and a product that would house all such reports at a centralized
location. With the help of technology, now these operations are viable.
2.1.2 What to look for in purchasing a POS system
Which POS system is best for your operation depends on immediate needs and
future plans. Knowing the challenges your business faces and how you would like to
improve your operation goes a long way toward determining which system is best for
you (Kaschyk, 2003). Another important consideration is the vendor itself. Your choice
of a manufacturer should result in a business relationship that lasts for years. When
selecting a POS system, two performance factors are of utmost importance: reliability
and speed. The POS can be thought of as the transaction engine inside your business
("Powering the Point of Sale", 2000). This makes it the logical place at which to attach
all the other components. The other factors have become so dynamic that what people
are really talking about now is not interface among various systems but complete
integration. When people talk POS today, they are actually weighing the single system
that locks down the desktop, payroll, food stuffs, inventory, administrative reports -- and
POS. This is an indication of how the technology and adaptable design have driven
down the costs of even the most sophisticated POS systems, making them affordable to
both large and small companies. Moreover, the vendors maintain that the systems pay
for themselves because of the way they can be utilized. The data collected at the POS
alone can be translated quickly into marketing opportunities for savvy operators. Many
systems now contain the built-in capability to sign up customers for frequent dining
benefits; generate mailing lists for birthdays; create special reservation services; allow
the human server, based on the order entered, to offer an appetizer or dessert that fits
the entree or the customer profile; and provide a customized "comeback" coupon at
checkout. It is a major marketing without the maintenance. Restaurants must select the
POS system that contains the capabilities for customer profiling, coupon intelligence, .
loyalty rewards and other frequent-dining offerings. But marketing is just the tip of the
iceberg. Instant reporting, employee training and delivery services are some additional
areas POS technology can help bolster productivity for operators ("Powering the Point of
Sale", 2000).
Receiving information quickly at the corporate level is paramount to success, and
getting instant reporting from a POS system can make a huge difference to the
operators. The CEO can look over the reports from the previous day over coffee before
his 9 a.m. meeting. He can see what sold, what outlets are lagging, what innovations
are moving ahead. For multi-outlet restaurants, this efficiency is only possible through a
POS married to all the other services and systems. Unquestionably, this is an
advantage of the modern POS back-end reporting, offering a range of reporting
capabilities out of which each company can pick what they really want to know. For the
multi-store model, this use of the Internet allows centralized sharing with corporate
headquarters in a quick and convenient way we didn't have before.
POS systems even can be employed in the training of new workers which
addresses a major issue for foodservice operators faced with the turnover of personnel
and high-training costs.
Let's pretend that a restaurant got a new bartender who does not know how to
make a Singapore Sling. It's right there in the computer, step by step. The staff can
employ the POS system to remind them of methods and policies, identify which tables
need to be covered, track the progress of kitchen orders and show which members of
the staff are checked in or out ("Powering the Point of Sale", 2000).
2.1.3 Wireless POS Systems
The latest technology in point-of-sale systems cannot be found dangling at the
end of a wire. The biggest and latest solution is wireless POS systems. Servers can
take the order on a handheld device at the table. It saves time, labour and improves
table-turn times. Non-wireless servers write down an order, walk to a POS station and
re-enter the order on the touch-screen terminal. Repeat that for each time a meal
segment is ordered and the time adds up. One particular provider of wireless computing
solutions, offers hand-held Symbol products that are co-branded by both companies.
The software runs the hand-held unit and links to various POS systems. There is still a
fixed touch screen, but you may need fewer of them. Hand-held units cost about $2,000
each, while fixed POS systems cost about $4,000 each (Adams, 2000). Macros
Systems and Hypercom Corporation also offer stand-alone or wireless POS solutions
that can tie into a hotel's banquet room. It is a wireless, Internet-enabled, point-of-sale
terminal using the newest operating system for restaurants that wants to bring the
payment system to the diner. The graphical interface and open development platforms
provides greater flexibility to use custom and third-party applications, increasing revenue
and streamlining operations (Adams, 2000). The bottom line is that wireless POS
systems help restaurants save time and labour and improve table-turn times, and hand-
held POS systems cost about half of what is charged for fixed systems.
2.2 POS Market Structure in North America
Within roughly three years, global shipments of POS application software will
approach the $1 billion mark, according to a report by Venture Development Corp.
(VDC). That figure is based on a 9.8% compound annual growth rate between 2003 and
2008 ("Market for POS Application Software Nearing $1 Billion", 2004).
The increase in POS spending is due to a number of factors, VDC says,
including compliance standards such as Sunrise 2005 and mandates from retail
powerhouses like Wal-Mart and Target ("Market for POS Application Software Nearing
$1 Billion", 2004). POS tops ClO's list of investment priorities in 2004. As economic
recovery begins to take hold, one of the first places retail IT shops plan to invest their
increased funds is the POS. Traditionally a high-priority investment because of its direct
impact upon the customer experience, POS spending is especially poised to break out in
2004, after several years of delaying POS investments (Scheraga, 2004).
There's a great deal of pent-up demand for new POS systems. That's been the
story for several years now, but this year should finally see some spending, according to
the Retail Industry Leaders Association (RILA). There are a lot of POS units out there
that have outlived their lives as useful assets, and now they're becoming a pain point for
some (Scheraga, 2004).
POS MARKET
3.1 POSuccess' Target Market In The POS Market
Upon interviewing the senior management of POSuccess systems, it was
determined that the target market (sweet spot) for POSuccess is the small to medium
sized, franchised, dining restaurants. These restaurants included casual dining, and fine
dining franchises that required a table service. These chains were categorized in three
tiers, with tier one having two to five locations, tier two with six to fifty locations, and tier
three with more then fifty locations, respectively. With the data available from the Chain
Store Guide ("Market Study of Food Service Technology", 2003), POSuccess
determined that there are roughly about 3,000 chains in the market place and roughly
ten percent of this market should be in a POS purchase mode. This point requires
validation from the market study which will be further discussed in the analysis.
3.2 Manufacturers of POS Terminals
Within the next three year period, the global shipments of POS application
software will approach the $1 billion mark ("Market for POS Application Software
Nearing $1 Billion", 2004). In this lucrative industry, there are a few key players that are
leading the industry. Following are some of the companies in this industry.
3.2.1 Hello
Hello POS systems is part of Sunny Systems Inc., which provides store
technology for the hospitality, petroleum and convenience store, and cinema industries.
The company was founded in 1985 and is headquartered in Atlanta, Georgia. Sunny
has deployed its solutions in more than 50,000 sites worldwide.
3.2.2 ITBMl
ITBMI, formerly known as JKTR, was first established in 1888. Today, it is the
world's largest information technology company. The POS systems by ITBMl are sold
through its Retail Store Solutions which is part of ITBMl's Personal Systems Group
(PSG). ITBMl has more than 1.7 million point-of-sale systems installed around the
world, and the greatest number of patents and inventions in the industry. ITBMl retail
solutions are installed in more than 60 of the world's top 100 retailers.
3.2.3 InfoPOS
The InfoPOS POS solution is designed for table service restaurants, hotels,
resorts, casinos, cruise ships, and institutional foodservice. They market their products
through a direct sales force in the United States and Canada and through authorized
resellers and business partners around the world. Founded in 1986 in Santa Barbara,
California, InfoPOS maintains its revenue growth by keeping it a privately held
corporation.
3.2.4 Macros Systems, Inc
Macros Systems, Inc., established in 1977, is one of the leading developer of
enterprise applications serving the hospitality and retail industries exclusively. Macros
serves table service and quick service restaurants, hotels, the leisure and entertainment
industry, and specialty retail stores. Macros' global network consists of over 3,000
employees, 43 subsidiaries in major markets, and 93 distributors in 40 countries.
Macros is also one of the leading POS providers in the restaurant industry with more
than 150,000 installations worldwide.
3.2.5 KCN
Founded in 1884, the KCN is one of the key providers in supplying relationship
technology solutions. KCN was the first to introduce bar code scanning to retail, the first
to deliver an integrated keyboard and display for POS, and the first to offer a fully
integrated wireless ESL solution.
3.2.6 SonicCap
Founded in 191 8, SonicCap is one of the key providers of the POS systems by
operation. Within the hospitality industry it controls front counter, kitchen, drive-thru,
manager's office, and remote offices.
3.2.7 PeterPoint
Established in 1992, PeterPoint has been committed to providing reliable,
flexible, and easy-to-use point of sale software for restaurants. It has installations in
North America and internationally, covering almost every major economic centre
worldwide.
3.2.8 KTouch
KTouch is a Windows based hospitality industries point of sale (POS) application
for table service, quick service, hotels, country clubs, delivery and stadiumslarena use.
Their POS system has been installed in excess of 12,000 locations. Established in
1982, the company products are sold in US, Canada, South America, Europe, and Far
East.
3.3 POSuccess' Competitors
Among the POS manufacturers described above, there are two major and three
minor competitors of POSuccess Systems. The two major ones are Macros, and Hello,
where as the three minor ones include InfoPOS, Peterpoint, and KTouch. Since these
are the companies of concern, the competitor analysis conducts the market study on
each one of the companies, and provides a detailed analysis for each of the major
players in the industry.
MARKET RESEARCH OF THE TARGET MARKET
4.1 Sources of Market Research
In order to determine the goals of conducting a marketing research, a few
meetings were set with the executives of POSuccess Systems to determine the primary
information they are searching for. After determining their focus for the marketing study,
a literature review was conducted to draw from some of the existing research on POS
systems. Even though the information retrieved was fairly insightful, it did not answer all
of the questions that the executives were seeking. Thus, a primary study of a telephone
survey was created to be conducted on the current users of a POS system.
4.2 Market Size
In order to create a random sample, a mechanism was created to pull random
companies from the Chain Store Guide that belonged to a table-service market. The
table-service market included only table-service customers that belong to casual dining,
fine dining, and family restaurant chains, and strictly excluded any fast food, quick
serves, or vending companies. The mechanism was designed to distribute a fair number
of customers from tier two and three, as there were no customers in the database that
belonged to tier one. It was also designed to include an industry reflected fair share of
respondents from each of the major competitors. This mechanism helped create a list of
over 700 potential respondents out of the 3,000 different customers that belong to this
market.
Methodology
In order to accomplish the success of this marketing study, Lavrakas' (Lavrakas,
1987) basic steps in the telephone survey process were utilized. First, a sampling
design mechanism was created by randomly opening the Chain Store Guide and picking
the first or last company on the left or right page, alternating each time. If the first
customer did not meet the table service requirements, then a search was conducted on
the same page to find the first one that fit the target market. If none of the customers on
that page fit the target market requirement, then the page number was noted down to
avoid repetition, and another random opening of the Guide was conducted. There was
sufficient random sample created to ensure that the qualifying 700 potential respondents
on the list had a fair share of respondents from a variety of competitors and from the
tiers two and three.
Second, a questionnaire (Appendix A) was developed that would fulfil the
purpose of primary market research for POSuccess Systems. After going through
multiple drafts and having the questionnaire reviewed by the executives at POSuccess,
a final version was produced. This questionnaire consisted of five major parts. Part A
was designed to determine which company are they currently with, and whether they are
satisfied with their current company whether it is POSuccess or a competitor. Part B
was to determine what percentage of the market is planning to purchase or upgrade in
the next 3 yrs and for how much. Part C was designed to see which value propositions
are important for the customers. Part D, then based on the more important value
propositions, conducted a competitor analysis to determine which competitors currently
fulfil the important attributes of the customers. And finally part E was to determine what
form of advertising or marketing methods do the customers prefer.
Third, a file was created to keep track of all of the numbers that were called and
to store the results in the comments section whether there was a positive or a negative
response or even a non-response. This way it would be easy to track the number of
responses and call backs.
Fourth, a script (Appendix B) was developed to be used by interviewers to assist
them in conducting this study as well as to maintain a consistency for the responses. In
addition, there was a fall-back statements sheet (Appendix C) that was created to
provide the interviewers with the tools of reducing the number of negative responses
from the customers.
Fifth, since the respondents are mainly chief executives either in operations,
information systems, or POS system department, their time is extremely valuable. To
encourage these respondents to participate in the survey, they were offered incentives
which included entering the respondents in a lottery to win a $US300 American Express
gift certificate, and a small thank you gift. In addition, the script included an awareness
statement that provided a built-in value of the set of questions themselves, which are
what they should be asking at the time of searching for a POS system.
Sixth, an email advertisement was sent out on the undergraduate business
students' list to hire external interviewers for the market study. The reason for hiring
external interviewers is to avoid any bias towards POSuccess from the interviewer or the
interviewee. After conducting the preliminary resume screening, two rounds of
interviews, and the time limitations, three individuals were hired on a contract basis at an
industry based hourly rate.
Seventh, a pilot-testing session was conducted to validate or revise the survey
instruments. By determining which part of the questionnaire required a revision or re-
formatting, the pilot testing benefited the questionnaire by making it a successful one.
.&
Eighth, the interviewers were provided with two training sessions. The training
topics included what makes a good telephone interviewer, interviewer productivity,
payments, and specifics about the survey. These specifics about the survey included an
explanation of the purpose of the survey, the call sheet, the use of script and fallback
statements, and a detailed explanation of the questionnaire. A decent portion of these
training sessions was also spent on practice interviewing to make the interviewers more
comfortable with the content.
Ninth, all of the respondent data that was collected was then inputted onto an
Excel file and reviewed carefully to avoid any miscoding or typing errors. At this point,
the data was run both in Excel and SPSS to prepare the analysis that assists in
understanding the customers and competitive nature of the POS industry.
5 MARKET ANALYSIS
5.1 Descriptive Analysis of current customers
5.1 .I POS system used by respondents
This question was established to determine the market distribution of the
competitors of POS systems within the table service sector of the hospitality industry.
The 153 respondents belonged to 26 different competitors in the industry (See Figure 1).
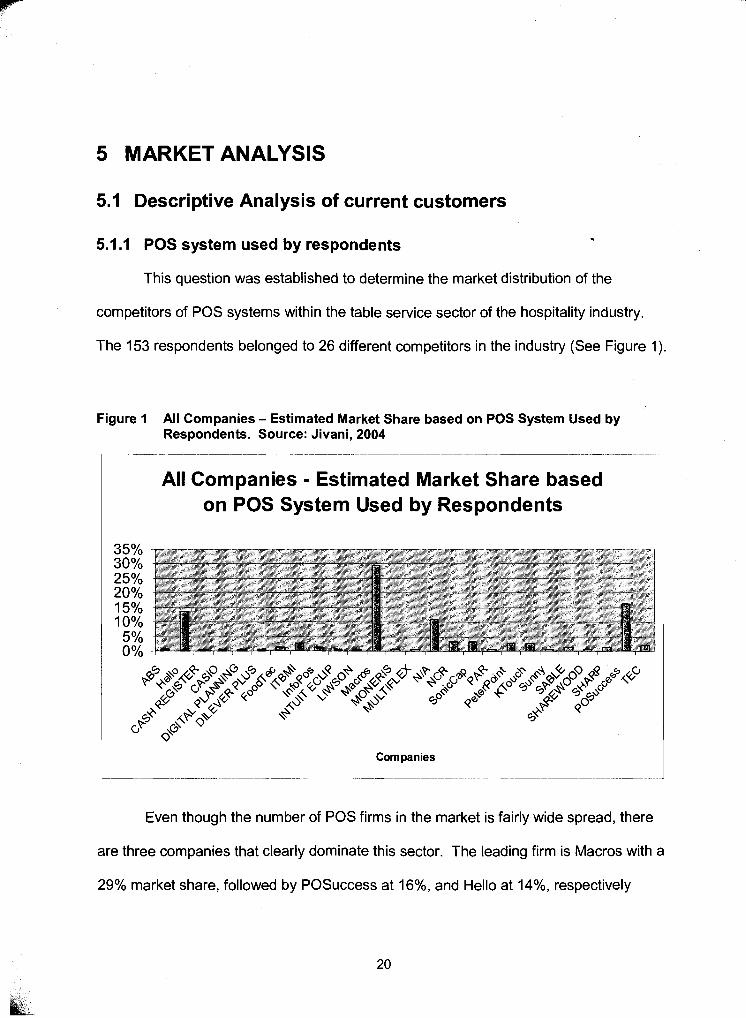
Figure 1 All Companies - Estimated Market Share based on POS System Used by Respondents. Source: Jivani, 2004
All Companies - Estimated Market Share based on POS System Used by Respondents
~ Companies
Even though the number of POS firms in the market is fairly wide spread, there
are three companies that clearly dominate this sector. The leading firm is Macros with a
29% market share, followed by POSuccess at 16%, and Hello at 14%, respectively
(Appendix D, Table 4). Maitre d' was not reported by any of the 153 respondents.
Among the respondents, 17 hesitated to report their POS systems.
The descriptive analysis of current customers with their POS provider that follows
includes the data of all the competitors in this market. In order to provide POSuccess
with a further thorough analysis, each current customer analysis is supplemented with
the distribution of satisfaction analysis by the three top leaders in the industry.
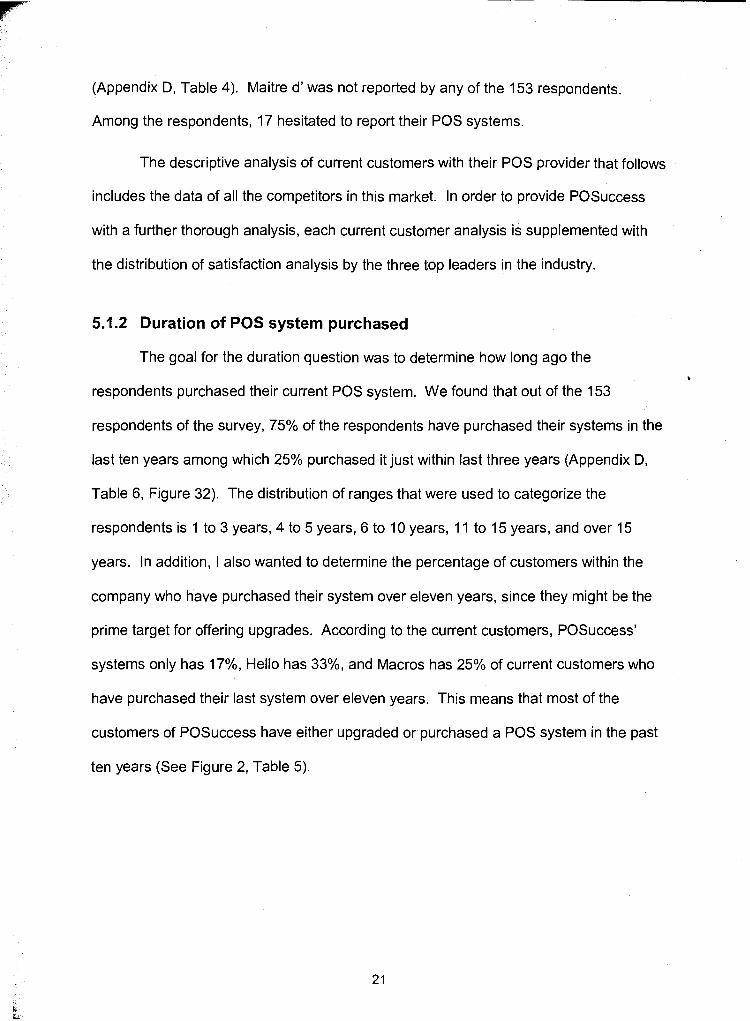
5.1.2 Duration of POS system purchased
The goal for the duration question was to determine how long ago the 'r
respondents purchased their current POS system. We found that out of the 153
respondents of the survey, 75% of the respondents have purchased their systems in the
last ten years among which 25% purchased it just within last three years (Appendix D,
Table 6, Figure 32). The distribution of ranges that were used to categorize the
respondents is 1 to 3 years, 4 to 5 years, 6 to 10 years, 11 to 15 years, and over 15
years. In addition, I also wanted to determine the percentage of customers within the
company who have purchased their system over eleven years, since they might be the
prime target for offering upgrades. According to the current customers, POSuccess'
systems only has 17%, Hello has 33%, and Macros has 25% of current customers who
have purchased their last system over eleven years. This means that most of the
customers of POSuccess have either upgraded or purchased a POS system in the past
ten years (See Figure 2, Table 5).
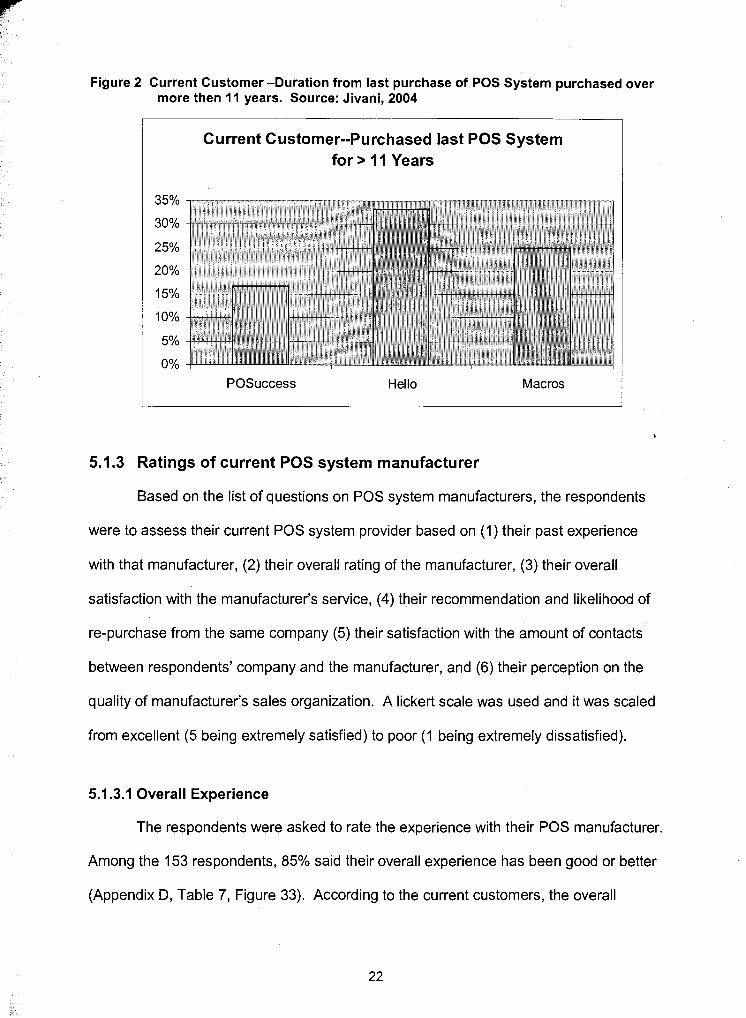
Figure 2 Current Customer -Duration from last purchase of POS System purchased over more then 11 years. Source: Jivani, 2004
Current Customer--Purchased last POS System for > 11 Years
POSuccess Hello Macros
5.1.3 Ratings of current POS system manufacturer
Based on the list of questions on POS system manufacturers, the respondents
were to assess their current POS system provider based on ( I ) their past experience
with that manufacturer, (2) their overall rating of the manufacturer, (3) their overall
satisfaction with the manufacturer's service, (4) their recommendation and likelihood of
re-purchase from the same company (5) their satisfaction with the amount of contacts
between respondents' company and the manufacturer, and (6) their perception on the
quality of manufacturer's sales organization. A lickert scale was used and it was scaled
from excellent (5 being extremely satisfied) to poor ( I being extremely dissatisfied).
5.1 .XI Overall Experience
The respondents were asked to rate the experience with their POS manufacturer.
Among the 153 respondents, 85% said their overall experience has been good or better
(Appendix D, Table 7, Figure 33). According to the current customers, the overall
company experience of Macros' customers has been a bit higher then that of Hello and
POSuccess (See Figure 3, Appendix D, Table 5).
Figure 3 Current Customer - Overall Past Experience with Current Company. Source: Jivani, 2004
Current Customer--Overall Company Experience
I POSuccess Hello Macros
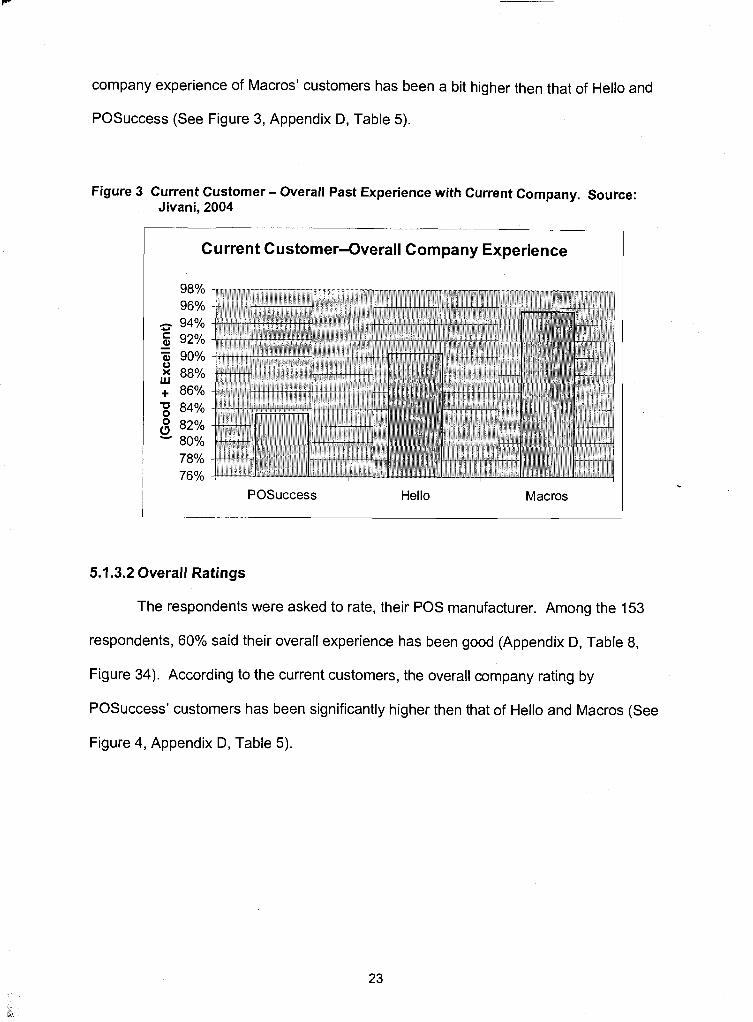
5.1.3.2 Overall Ratings
The respondents were asked to rate, their POS manufacturer. Among the 153
respondents, 60% said their overall experience has been good (Appendix D, Table 8,
Figure 34). According to the current customers, the overall company rating by
POSuccess' customers has been significantly higher then that of Hello and Macros (See
Figure 4, Appendix D, Table 5).
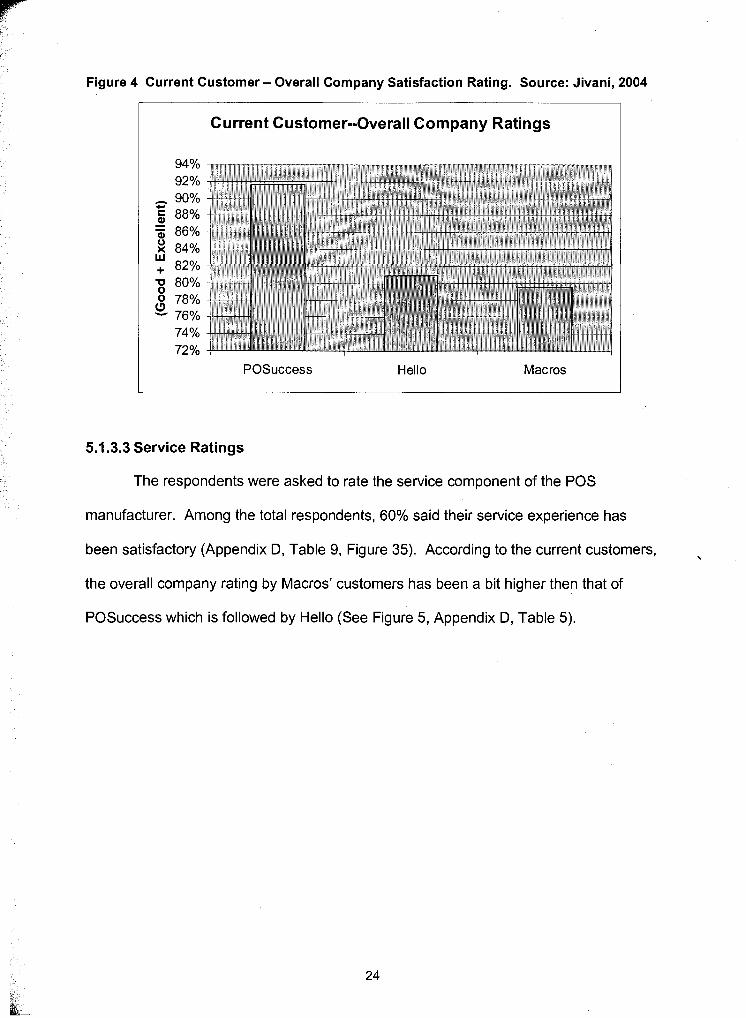
Figure 4 Current Customer - Overall Company Satisfaction Rating. Source: Jivani, 2004
Current Customer--Overall Company Ratings
POSuccess Hello Macros
5.1.3.3 Service Ratings
The respondents were asked to rate the service component of the POS
manufacturer. Among the total respondents, 60% said their service experience has
been satisfactory (Appendix D, Table 9, Figure 35). According to the current customers, %
the overall company rating by Macros' customers has been a bit higher then that of
POSuccess which is followed by Hello (See Figure 5, Appendix D, Table 5).
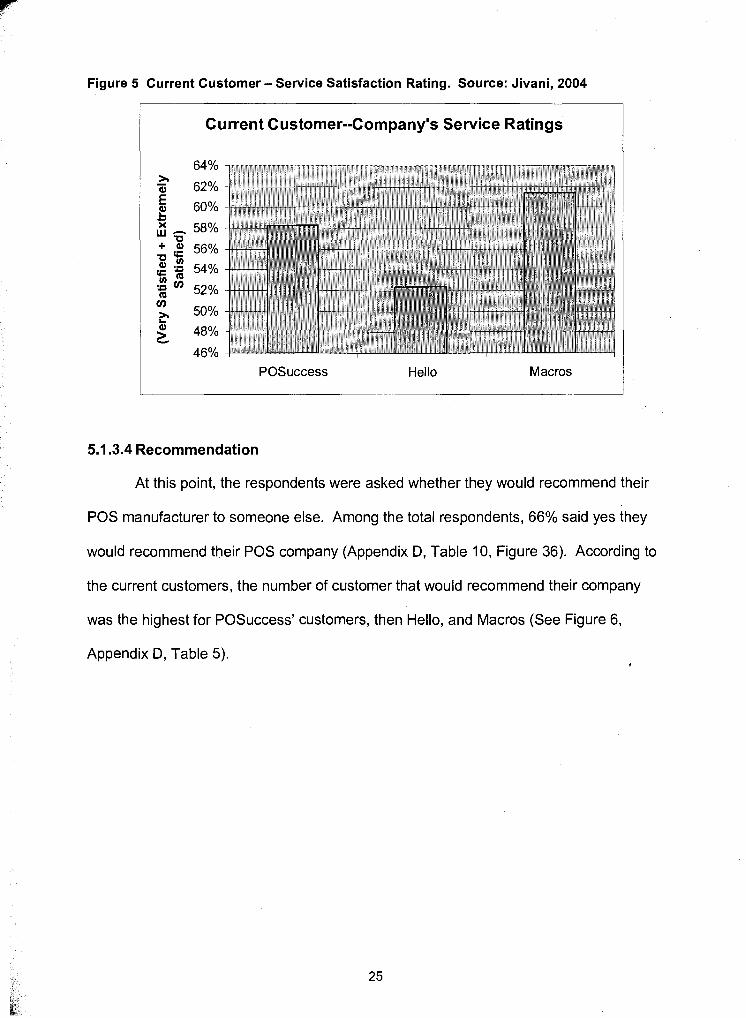
Figure 5 Current Customer - Service Satisfaction Rating. Source: Jivani, 2004
Current Customer--Company's Service Ratings
POSuccess Hello Macros
5.1.3.4 Recommendation
At this point, the respondents were asked whether they would recommend their
POS manufacturer to someone else. Among the total respondents, 66% said yes they
would recommend their POS company (Appendix D, Table 10, Figure 36). According to
the current customers, the number of customer that would recommend their company
was the highest for POSuccess' customers, then Hello, and Macros (See Figure 6,
Appendix D, Table 5). d
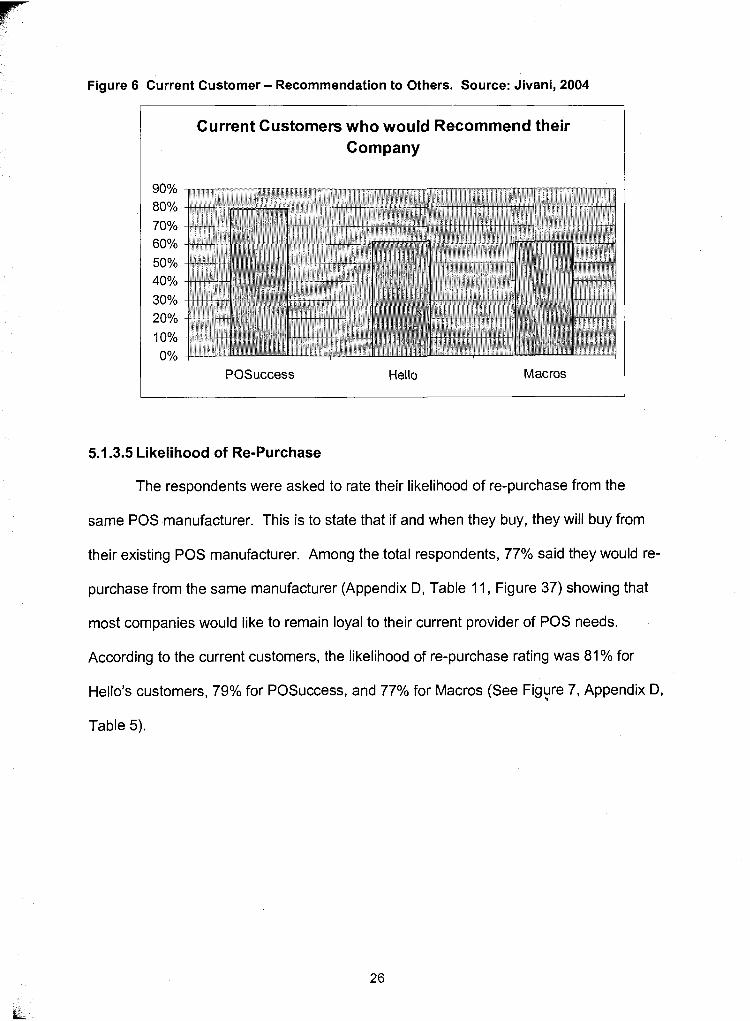
Figure 6 Current Customer - Recommendation to Others. Source: Jivani, 2004
Current Customers who would Recommend their Company
POSuccess Hello Macros
5.1.3.5 Likelihood of Re-Purchase
The respondents were asked to rate their likelihood of re-purchase from the
same POS manufacturer. This is to state that if and when they buy, they will buy from
their existing POS manufacturer. Among the total respondents, 77% said they would re-
purchase from the same manufacturer (Appendix D, Table 11, Figure 37) showing that
most companies would like to remain loyal to their current provider of POS needs.
According to the current customers, the likelihood of re-purchase rating was 81% for
Hello's customers, 79% for POSuccess, and 77% for Macros (See Figure 7, Appendix D,
Table 5).
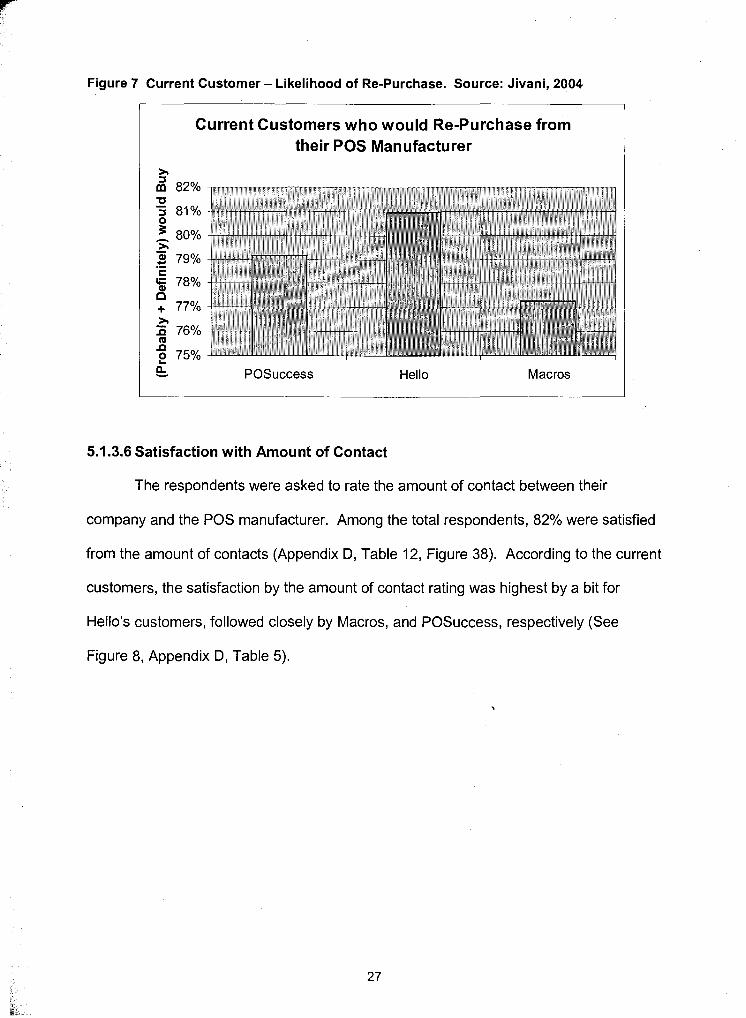
Figure 7 Current Customer - Likelihood of Re-Purchase. Source: Jivani, 2004
Current Customers who would Re-Purchase from their POS Manufacturer
POSuccess Hello Macros
5.1.3.6 Satisfaction with Amount of Contact
The respondents were asked to rate the amount of contact between their
company and the POS manufacturer. Among the total respondents, 82% were satisfied
from the amount of contacts (Appendix D, Table 12, Figure 38). According to the current
customers, the satisfaction by the amount of contact rating was highest by a bit for
Hello's customers, followed closely by Macros, and POSuccess, respectively (See
Figure 8, Appendix D, Table 5).
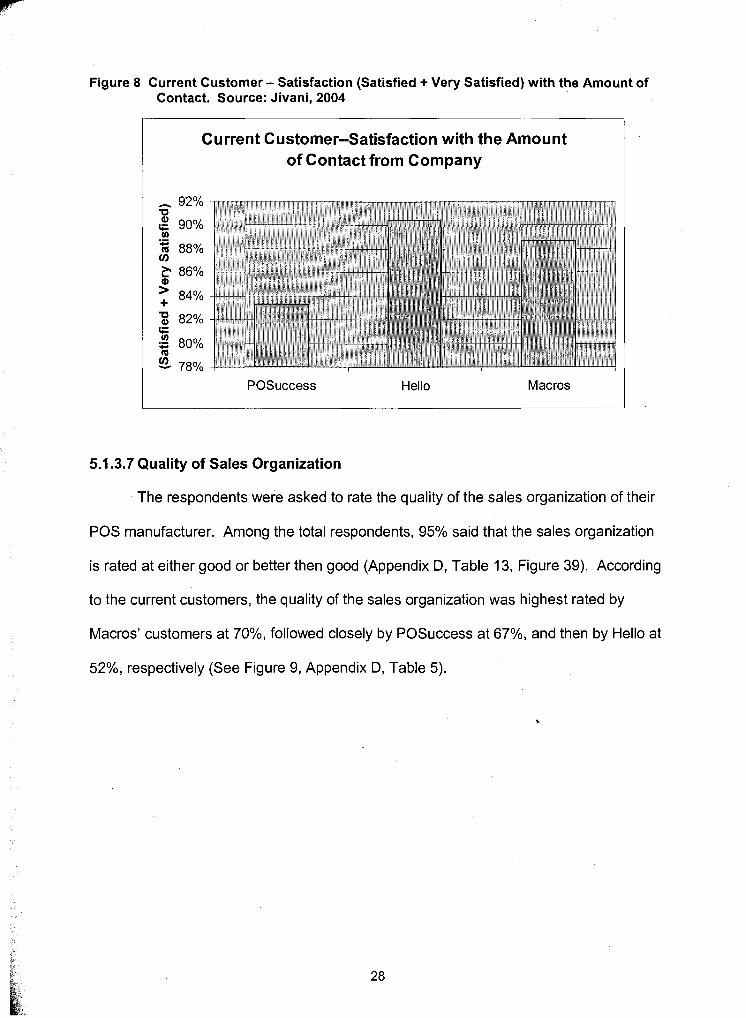
Figure 8 Current Customer - Satisfaction (Satisfied + Very Satisfied) with the Amount of Contact. Source: Jivani, 2004
Current Customer--Satisfaction with the Amount of Contact from Company
POSuccess Hello Macros
5.1.3.7 Quality of Sales Organization
The respondents were asked to rate the quality of the sales organization of their
POS manufacturer. Among the total respondents, 95% said that the sales organization
is rated at either good or better then good (Appendix D, Table 13, Figure 39). According
to the current customers, the quality of the sales organization was highest rated by
Macros' customers at 70%, followed closely by POSuccess at 67%, and then by Hello at
52%, respectively (See Figure 9, Appendix D, Table 5).
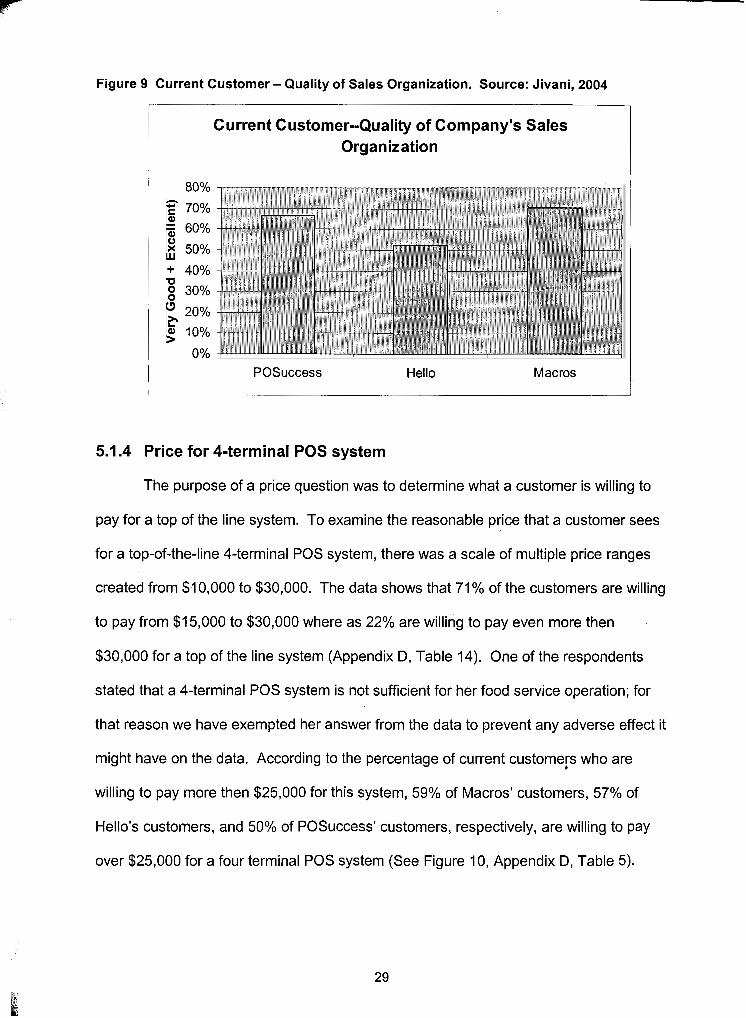
Figure 9 Current Customer - Quality of Sales Organization. Source: Jivani, 2004
Current Customer--Quality of Company's Sales Organization
POSuccess Hello Macros
5.1.4 Price for 4-terminal POS system
The purpose of a price question was to determine what a customer is willing to
pay for a top of the line system. To examine the reasonable price that a customer sees
for a top-of-the-line 4-terminal POS system, there was a scale of multiple price ranges
created from $1 0,000 to $30,000. The data shows that 71 % of the customers are willing
to pay from $15,000 to $30,000 where as 22% are willing to pay even more then
$30,000 for a top of the line system (Appendix D, Table 14). One of the respondents
stated that a 4-terminal POS system is not sufficient for her food service operation; for
that reason we have exempted her answer from the data to prevent any adverse effect it
might have on the data. According to the percentage of current customers who are
willing to pay more then $25,000 for this system, 59% of Macros' customers, 57% of
Hello's customers, and 50% of POSuccess' customers, respectively, are willing to pay
over $25,000 for a four terminal POS system (See Figure 10, Appendix D, Table 5).
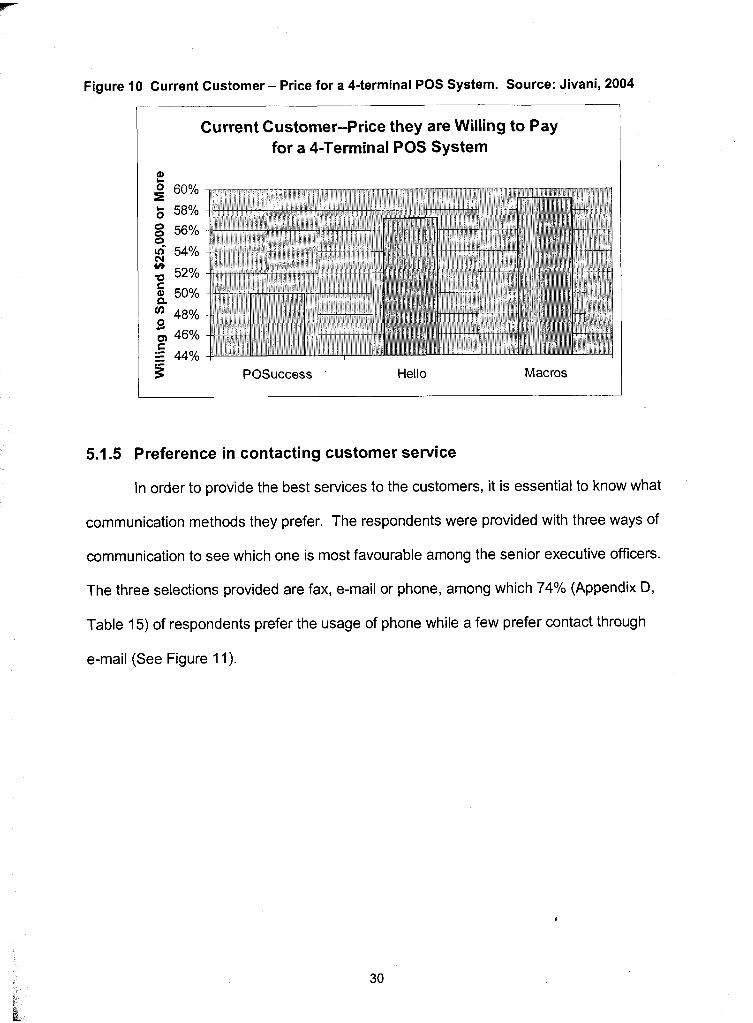
Figure 10 Current Customer - Price for a 4-terminal POS System. Source: Jivani, 2004
Current Customer--Price they are Willing to Pay for a 4-Terminal POS System
POSuccess Hello Macros
5.1.5 Preference in contacting customer service
In order to provide the best services to the customers, it is essential to know what
communication methods they prefer. The respondents were provided with three ways of
communication to see which one is most favourable among the senior executive officers.
The three selections provided are fax, e-mail or phone, among which 74% (Appendix 0,
Table 15) of respondents prefer the usage of phone while a few prefer contact through
e-mail (See Figure 11).
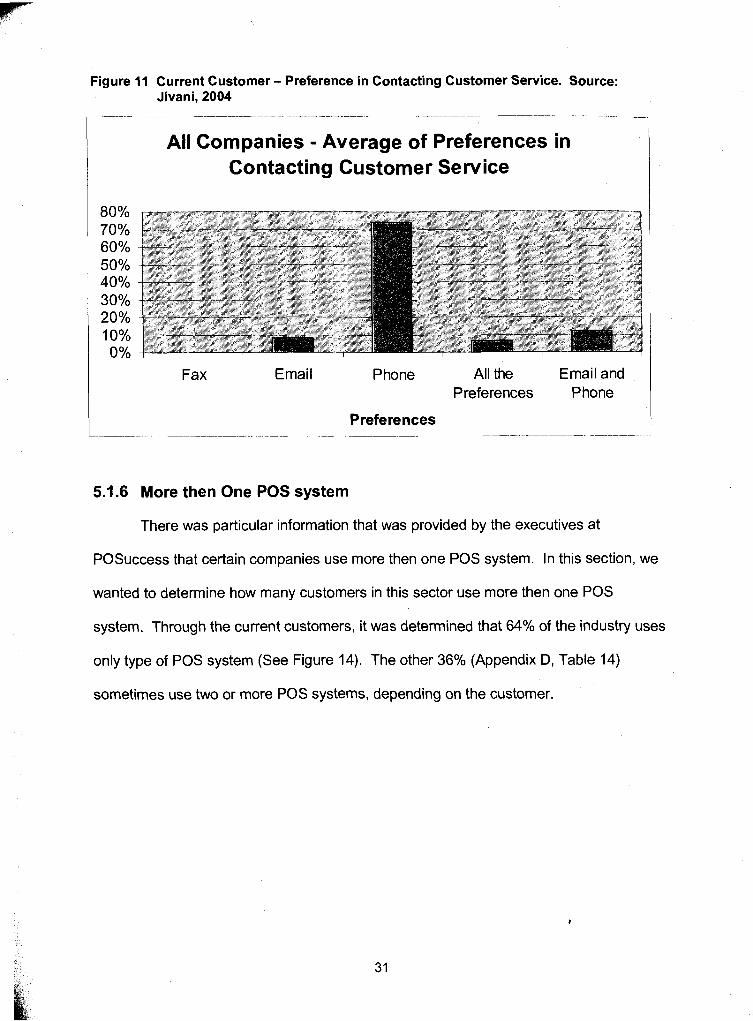
Figure 11 Current Customer - Preference in Contacting Customer Service. Source: Jivani, 2004
~ - - -- -- - - - - -- -- - - - - -
All Companies - Average of Preferences in Contacting Customer Service
Fax Email Phone All the Email and Preferences Phone
I Preferences ~ . ~ ~. ... - .. .- .. -
5.1.6 More then One POS system
There was particular information that was provided by the executives at
POSuccess that certain companies use more then one POS system. In this section, we
wanted to determine how many customers in this sector use more then one POS
system. Through the current customers, it was determined that 64% of the industry uses
only type of POS system (See Figure 14). The other 36% (Appendix D, Table 14)
sometimes use two or more POS systems, depending on the customer.
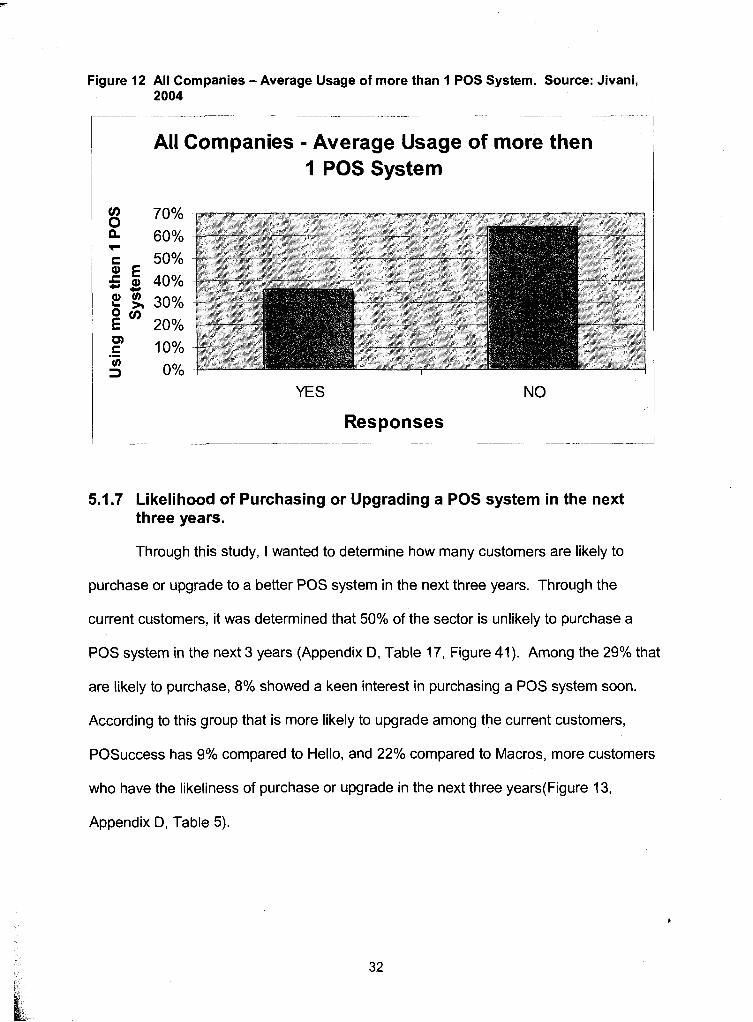
Figure 12 All Companies -Average Usage of more than 1 POS System. Source: Jivani,
All Companies - Average Usage of more then 1 POS System
YES NO
Responses
5.1.7 Likelihood of Purchasing or Upgrading a POS system in the next three years.
Through this study, I wanted to determine how many customers are likely to
purchase or upgrade to a better POS system in the next three years. Through the
current customers, it was determined that 50% of the sector is unlikely to purchase a
POS system in the next 3 years (Appendix D, Table 17, Figure 41). Among the 29% that
are likely to purchase, 8% showed a keen interest in purchasing a POS system soon.
According to this group that is more likely to upgrade among the current customers,
POSuccess has 9% compared to Hello, and 22% compared to Macros, more customers
who have the likeliness of purchase or upgrade in the next three years(Figure 13,
Appendix D, Table 5).
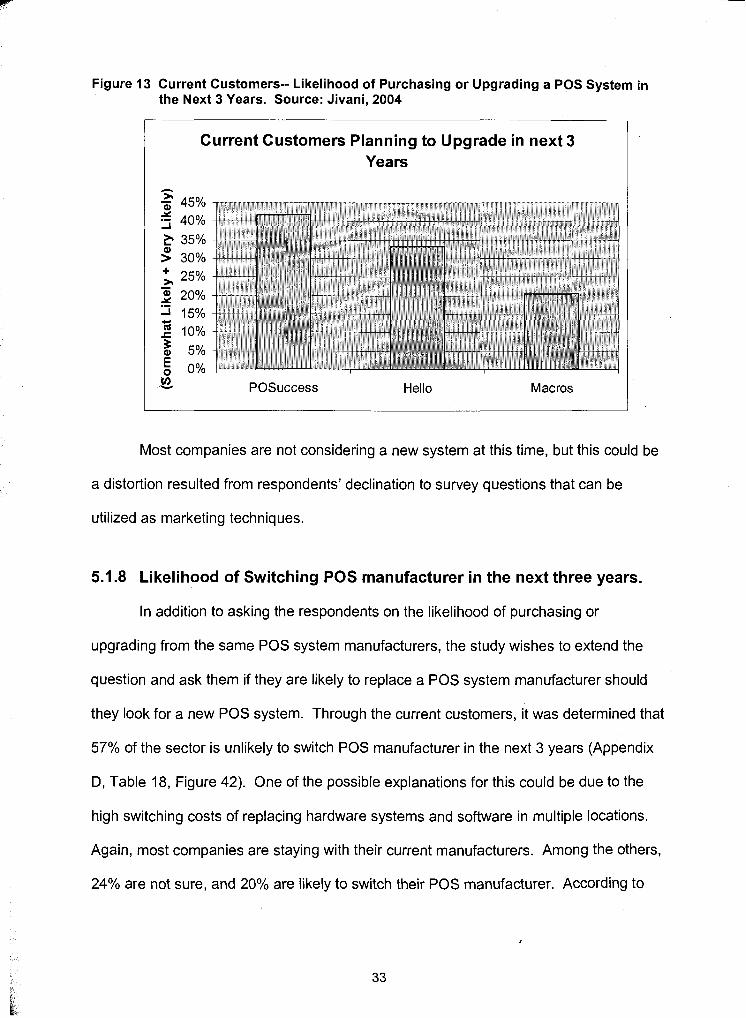
Figure 13 Current Customers-- Likelihood of Purchasing or Upgrading a POS System in the Next 3 Years. Source: Jivani, 2004
Current Customers Planning to Upgrade in next 3 Years
POSuccess Hello Macros
Most companies are not considering a new system at this time, but this could be
a distortion resulted from respondents' declination to survey questions that can be
utilized as marketing techniques.
5.1.8 Likelihood of Switching POS manufacturer in the next three years.
In addition to asking the respondents on the likelihood of purchasing or
upgrading from the same POS system manufacturers, the study wishes to extend the
question and ask them if they are likely to replace a POS system manufacturer should
they look for a new POS system. Through the current customers, it was determined that
57% of the sector is unlikely to switch POS manufacturer in the next 3 years (Appendix
D, Table 18, Figure 42). One of the possible explanations for this could be due to the
high switching costs of replacing hardware systems and software in multiple locations.
Again, most companies are staying with their current manufacturers. Among the others,
24% are not sure, and 20% are likely to switch their POS manufacturer. According to
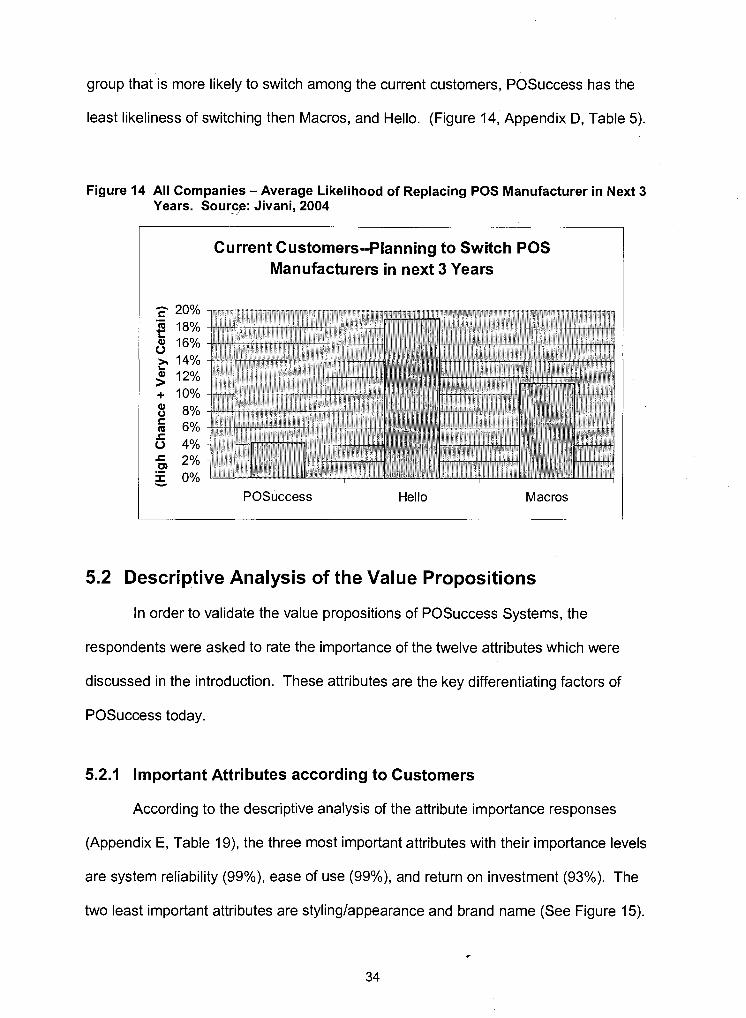
group that is more likely to switch among the current customers, POSuccess has the
least likeliness of switching then Macros, and Hello. (Figure 14, Appendix D, Table 5).
Figure 14 All Companies -Average Likelihood of Replacing POS Manufacturer in Next 3 Years. Sourp: Jivani, 2004
1 Current Customers--Planning to Switch POS I Manufacturers in next 3 Years
POSuccess Hello Macros
5.2 Descriptive Analysis of the Value Propositions
In order to validate the value propositions of POSuccess Systems, the
respondents were asked to rate the importance of the twelve attributes which were
discussed in the introduction. These attributes are the key differentiating factors of
POSuccess today.
5.2.1 Important Attributes according to Customers
According to the descriptive analysis of the attribute importance responses
(Appendix E, Table 19), the three most important attributes with their importance levels
are system reliability (99%), ease of use (99%), and return on investment (93%). The
two least important attributes are stylinglappearance and brand name (See Figure 15).
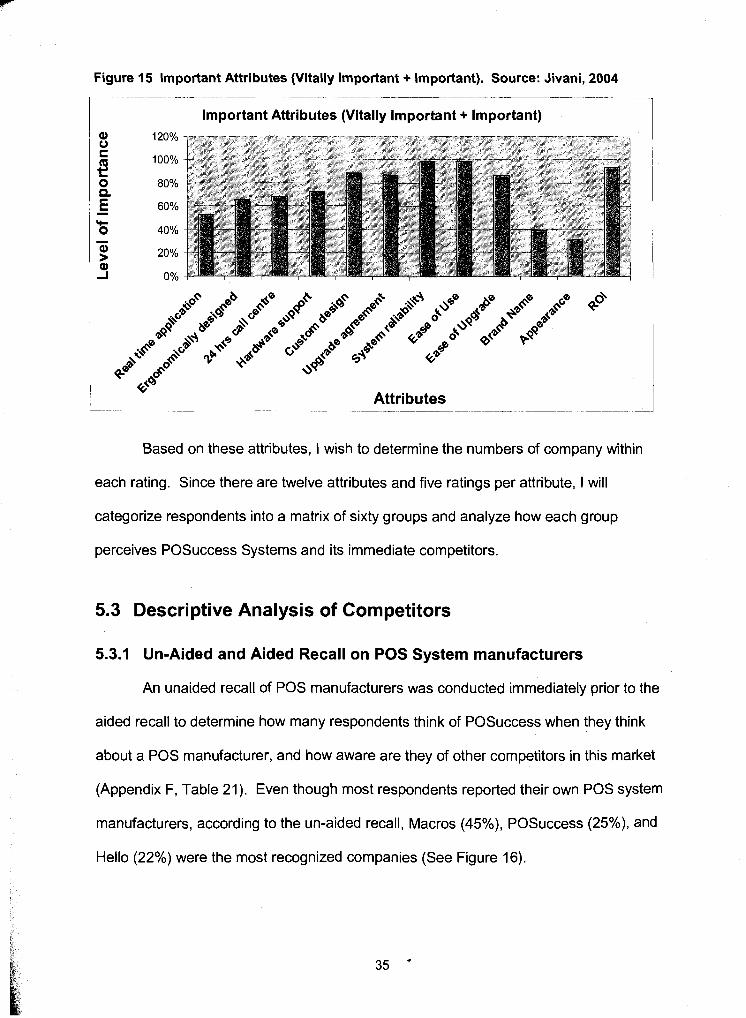
Figure 15 lmportant Attributes (Vitally lmportant + Important). Source: Jivani, 2004
I lmportant Attributes (Vitally lmportant + Important)
Based on these attributes, I wish to determine the numbers of company within
each rating. Since there are twelve attributes and five ratings per attribute, I will
categorize respondents into a matrix of sixty groups and analyze how each group
perceives POSuccess Systems and its immediate competitors.
5.3 Descriptive Analysis of Competitors
5.3.1 Un-Aided and Aided Recall on POS System manufacturers
An unaided recall of POS manufacturers was conducted immediately prior to the
aided recall to determine how many respondents think of POSuccess when they think
about a POS manufacturer, and how aware are they of other competitors in this market
(Appendix F, Table 21). Even though most respondents reported their own POS system
manufacturers, according to the un-aided recall, Macros (45%), POSuccess (25%), and
Hello (22%) were the most recognized companies (See Figure 16).
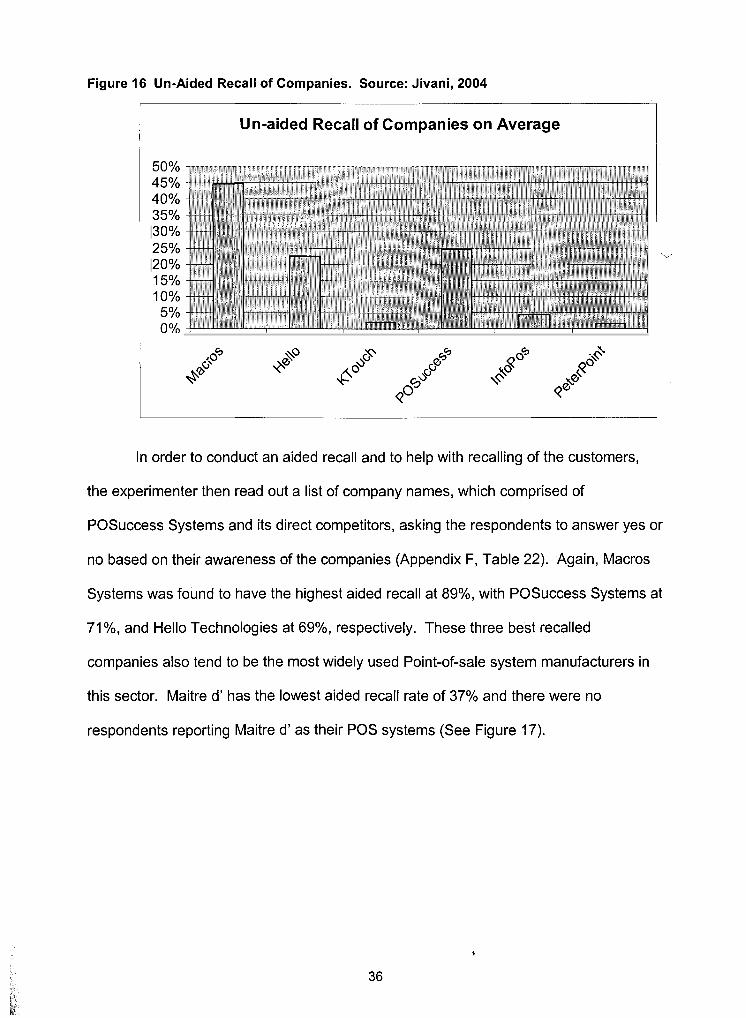
Figure 16 Un-Aided Recall of Companies. Source: Jivani, 2004
I Un-aided Recall of Companies on Average
In order to conduct an aided recall and to help with recalling of the customers,
the experimenter then read out a list of company names, which comprised of
POSuccess Systems and its direct competitors, asking the respondents to answer yes or
no based on their awareness of the companies (Appendix F, Table 22). Again, Macros
Systems was found to have the highest aided recall at 89%, with POSuccess Systems at
71 %, and Hello Technologies at 69%, respectively. These three best recalled
companies also tend to be the most widely used Point-of-sale system manufacturers in
this sector. Maitre d' has the lowest aided recall rate of 37% and there were no
respondents reporting Maitre d' as their POS systems (See Figure 17).
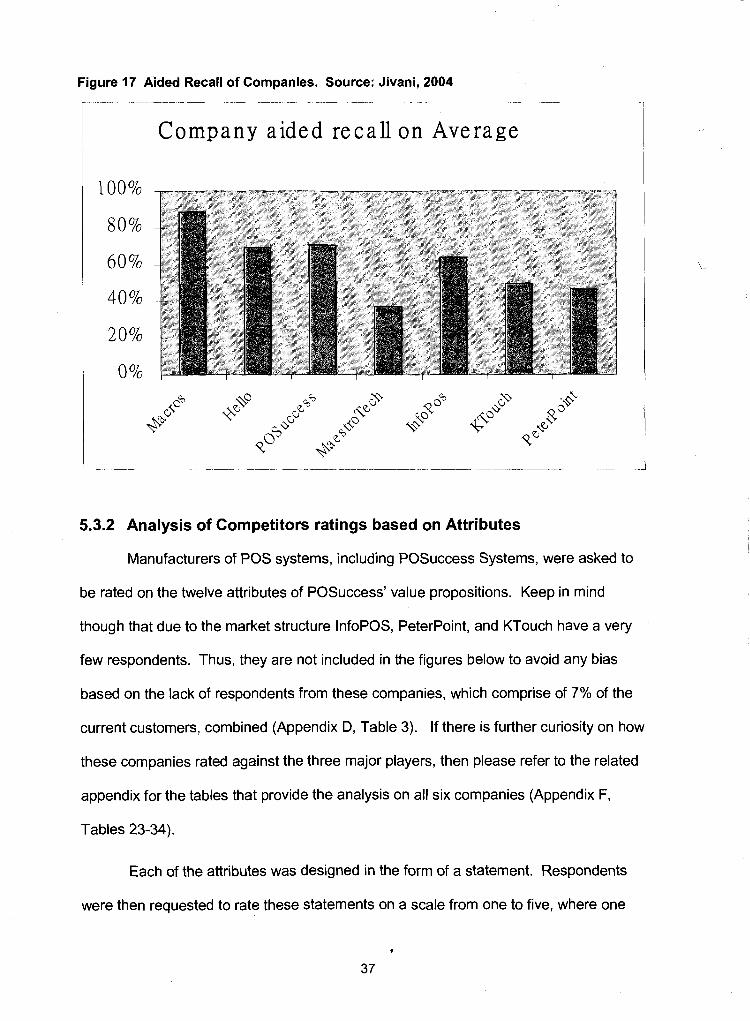
Figure 17 Aided Recall of Companies. Source: Jivani, 2004
Company aided recall on Average
5.3.2 Analysis of Competitors ratings based on Attributes
Manufacturers of POS systems, including POSuccess Systems, were asked to
be rated on the twelve attributes of POSuccess' value propositions. Keep in mind
though that due to the market structure InfoPOS, Peterpoint, and KTouch have a very
few respondents. Thus, they are not included in the figures below to avoid any bias
based on the lack of respondents from these companies, which comprise of 7% of the
current customers, combined (Appendix D, Table 3). If there is further curiosity on how
these companies rated against the three major players, then please refer to the related
appendix for the tables that provide the analysis on all six companies (Appendix F,
Tables 23-34).
Each of the attributes was designed in the form of a statement. Respondents
were then requested to rate these statements on a scale from one to five, where one
means disagree totally and five means agree totally. For an example, please refer to the
questionnaire (Appendix A). The data was collected for Macros Systems, Hello
Technologies, POSuccess Systems, InfoPos, KTouch, and Peterpoint. Maitre d' was
not included in this section, because no respondent mentioned the usage of this POS
system.
The total respondents were 143 from the top six companies. Out of these
respondents, a certain number of people agreed and totally agreed. The important
calculation for this part was to determine how many people agree or apree totally to the
statements for each company. Since the question was based on a scale of one to five, I
took the number of people who either agreed or totally agreed to the statements,
determined what percent were they for each company out of the total respondents from
the top six competing companies, and combined them together to get a total number of
respondents who agreed to the value proposition statements for that company.
5.3.3 Analysis of the Competitor Ratings based on "Agree" Statements
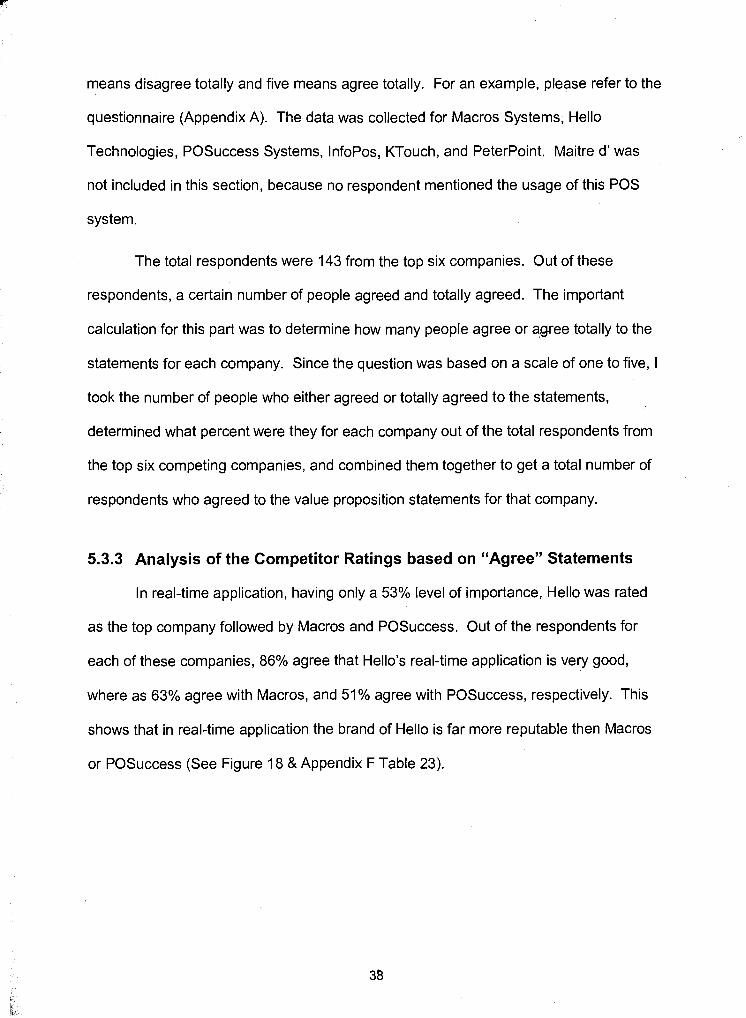
In real-time application, having only a 53% level of importance, Hello was rated
as the top company followed by Macros and POSuccess. Out of the respondents for
each of these companies, 86% agree that Hello's real-time application is very good,
where as 63% agree with Macros, and 51 % agree with POSuccess, respectively. This
shows that in real-time application the brand of Hello is far more reputable then Macros
or POSuccess (See Figure 18 & Appendix F Table 23).
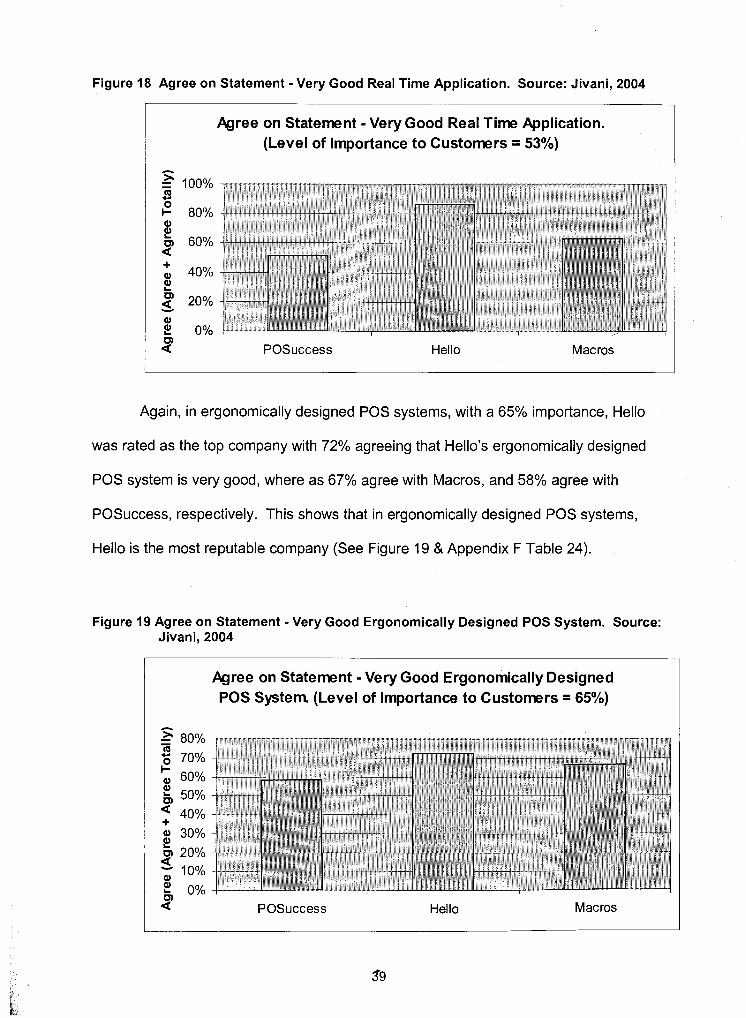
Figure 18 Agree on Statement -Very Good Real Time Application. Source: Jivani, 2004
Agree on Statement - Very Good Real Time Application. (Level of Importance to Customers = 53%)
I POSuccess Hello Macros
Again, in ergonomically designed POS systems, with a 65% importance, Hello
was rated as the top company with 72% agreeing that Hello's ergonomically designed
POS system is very good, where as 67% agree with Macros, and 58% agree with
POSuccess, respectively. This shows that in ergonomically designed POS systems,
Hello is the most reputable company (See Figure 19 & Appendix F Table 24).
Figure 19 Agree on Statement - Very Good Ergonomically Designed POS System. Source: Jivani, 2004
Agree on Statement - Very Good Ergonomically Designed POS System. (Level of Importance to Customers = 65%)
POSuccess Hello Macros
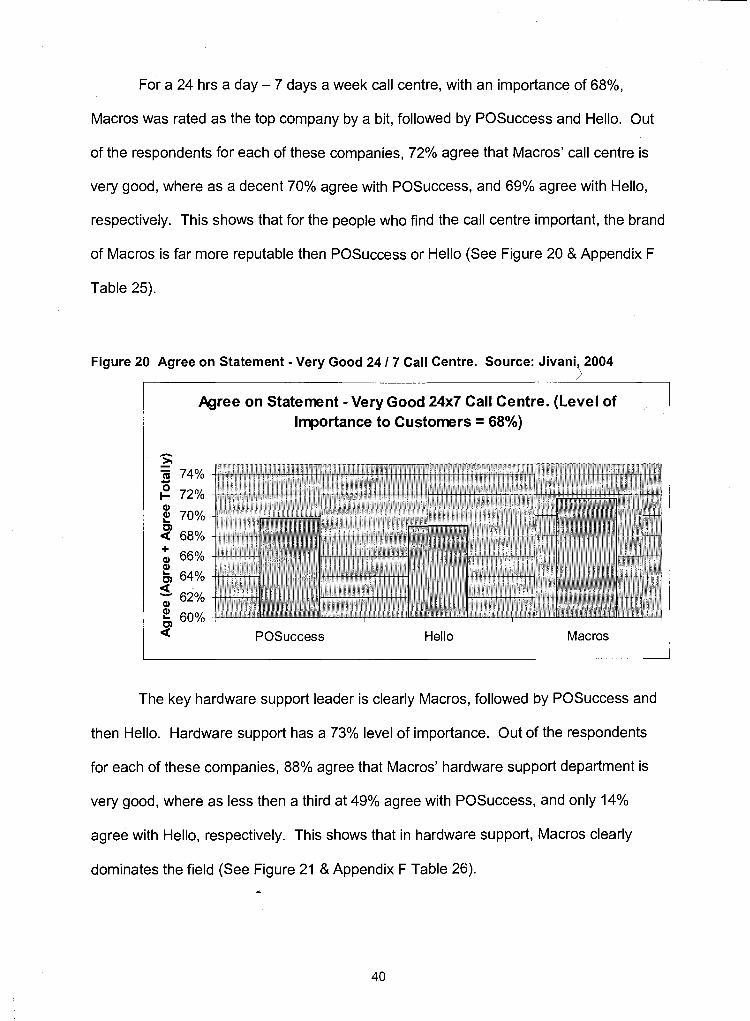
For a 24 hrs a day - 7 days a week call centre, with an importance of 68%,
Macros was rated as the top company by a bit, followed by POSuccess and Hello. Out
of the respondents for each of these companies, 72% agree that Macros' call centre is
very good, where as a decent 70% agree with POSuccess, and 69% agree with Hello,
respectively. This shows that for the people who find the call centre important, the brand
of Macros is far more reputable then POSuccess or Hello (See Figure 20 & Appendix F
Table 25).
Figure 20 Agree on Statement - Very Good 24 17 Call Centre. Source: Jivani, 2004
Agree on Statement -Very Good 24x7 Call Centre. (Level of Importance to Customers = 68%)
POSuccess Hello Macros
The key hardware support leader is clearly Macros, followed by POSuccess and
then Hello. Hardware support has a 73% level of importance. Out of the respondents
for each of these companies, 88% agree that Macros' hardware support department is
very good, where as less then a third at 49% agree with POSuccess, and only 14%
agree with Hello, respectively. This shows that in hardware support, Macros clearly
dominates the field (See Figure 21 & Appendix F Table 26). *
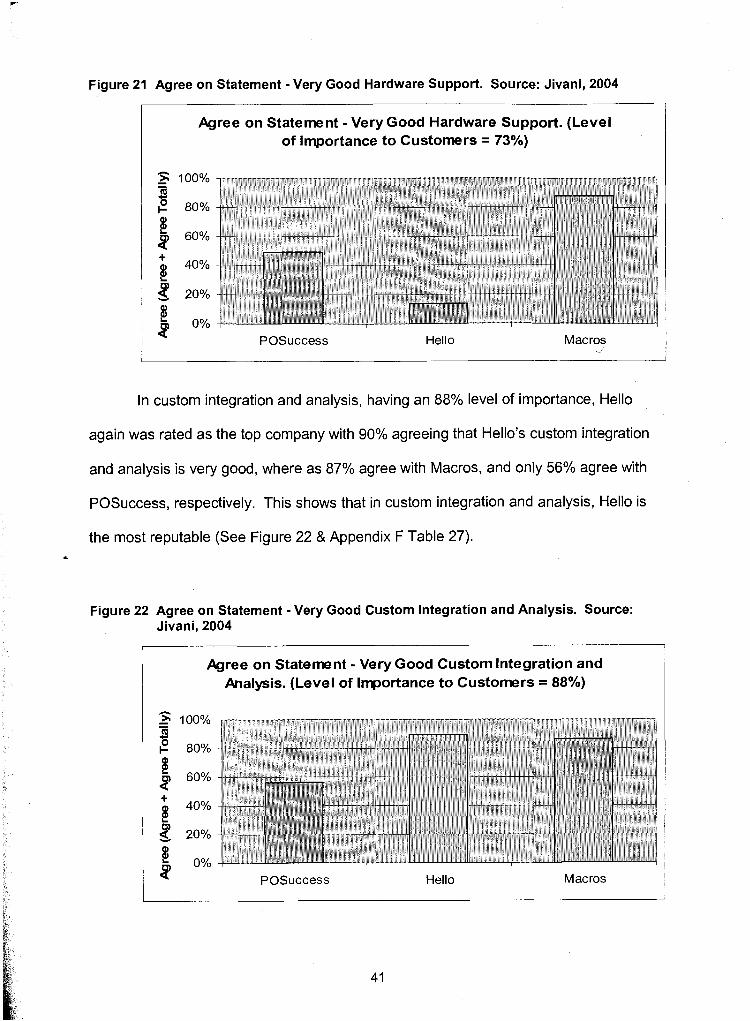
Figure 21 Agree on Statement -Very Good Hardware Support. Source: Jivani, 2004
Agree on Statement - Very Good Hardware Support. (Level of lmportance to Customers = 73%)
I POSuccess Hello Macros
In custom integration and analysis, having an 88% level of importance, Hello
again was rated as the top company with 90% agreeing that Hello's custom integration
and analysis is very good, where as 87% agree with Macros, and only 56% agree with
POSuccess, respectively. This shows that in custom integration and analysis, Hello is
the most reputable (See Figure 22 &Appendix F Table 27).
Figure 22 Agree on Statement -Very Good Custom lntegration and Analysis. Source: Jivani, 2004
Agree on Statement - Very Good Custom lntegration and Analysis. (Level of Importance to Customers = 88%)
POSuccess Hello Macros
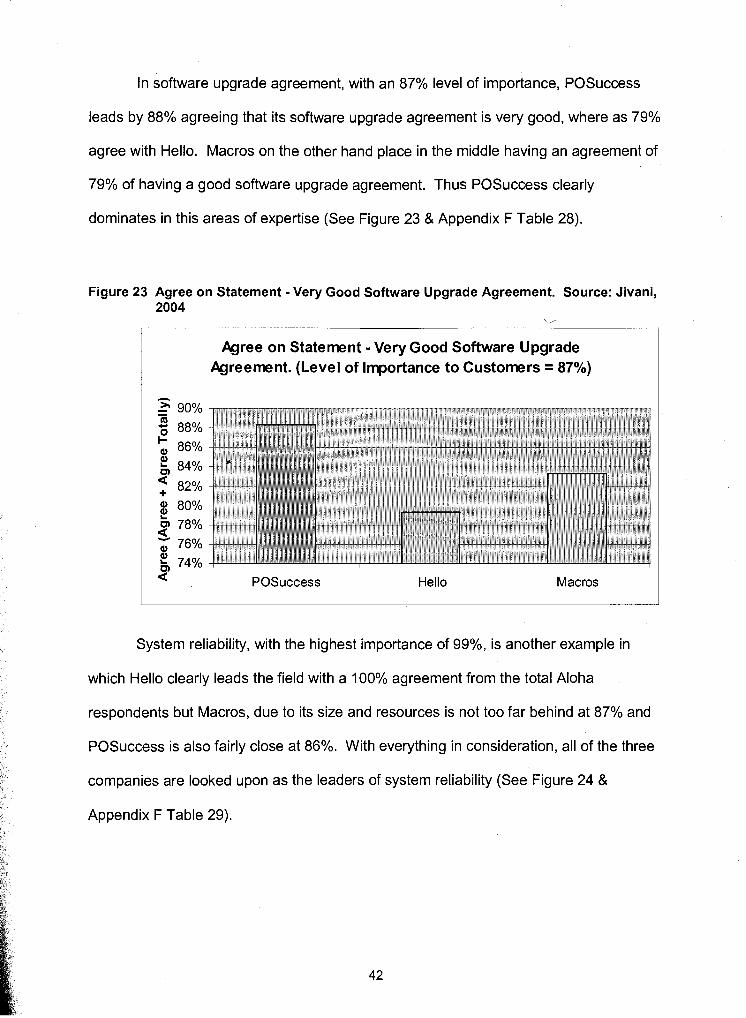
In software upgrade agreement, with an 87% level of importance, POSuccess
leads by 88% agreeing that its software upgrade agreement is very good, where as 79%
agree with Hello. Macros on the other hand place in the middle having an agreement of
79% of having a good software upgrade agreement. Thus POSuccess clearly
dominates in this areas of expertise (See Figure 23 & Appendix F Table 28).
Figure 23 Agree on Statement -Very Good Software Upgrade Agreement. Source: Jivani,
Agree on Statement - Very Good Software Upgrade Agreement. (Level of Importance to Customers = 87%)
POSuccess Hello Macros
System reliability, with the highest importance of 99%, is another example in
which Hello clearly leads the field with a 100% agreement from the total Aloha
respondents but Macros, due to its size and resources is not too far behind at 87% and
POSuccess is also fairly close at 86%. With everything in consideration, all of the three
companies are looked upon as the leaders of system reliability (See Figure 24 &
Appendix F Table 29).
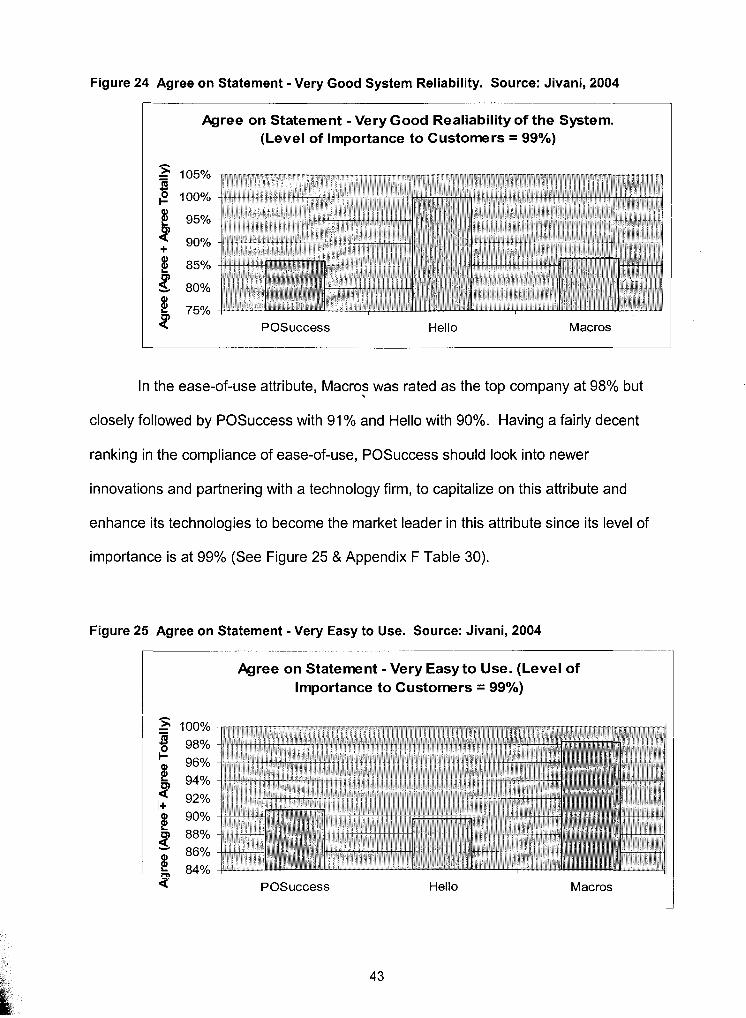
Figure 24 Agree on Statement -Very Good System Reliability. Source: Jivani, 2004
Agree on Statement - Very Good Realiability of the System. (Level of lmportance to Customers = 99%)
POSuccess Hello Macros
In the ease-of-use attribute, Macros was rated as the top company at 98% but 3
closely followed by POSuccess with 91 % and Hello with 90%. Having a fairly decent
ranking in the compliance of ease-of-use, POSuccess should look into newer
innovations and partnering with a technology firm, to capitalize on this attribute and
enhance its technologies to become the market leader in this attribute since its level of
importance is at 99% (See Figure 25 & Appendix F Table 30).
Figure 25 Agree on Statement -Very Easy to Use. Source: Jivani, 2004
Agree on Statement - Very Easy to Use. (Level of lmportance to Customers = 99%)
POSuccess Hello Macros
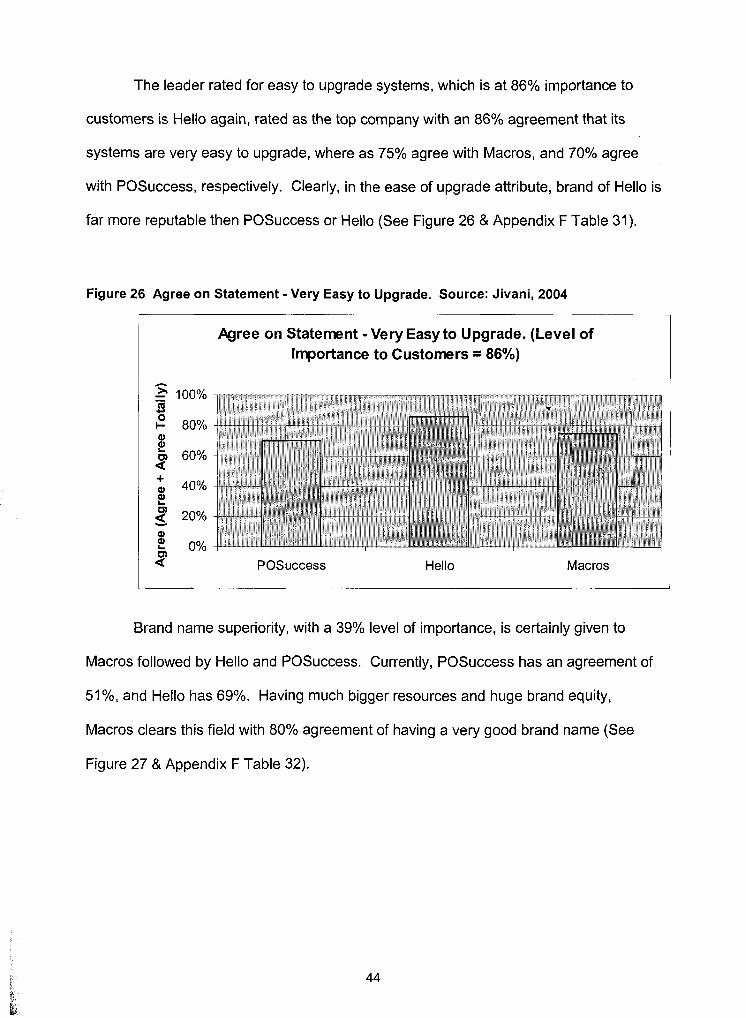
The leader rated for easy to upgrade systems, which is at 86% importance to
customers is Hello again, rated as the top company with an 86% agreement that its
systems are very easy to upgrade, where as 75% agree with Macros, and 70% agree
with POSuccess, respectively. Clearly, in the ease of upgrade attribute, brand of Hello is
far more reputable then POSuccess or Hello (See Figure 26 & Appendix F Table 31).
Figure 26 Agree on Statement -Very Easy to Upgrade. Source: Jivani, 2004
Agree on Statement - Very Easy to Upgrade. (Level of Importance to Customers = 86%)
POSuccess Hello Macros
Brand name superiority, with a 39% level of importance, is certainly given to
Macros followed by Hello and POSuccess. Currently, POSuccess has an agreement of
51 %, and Hello has 69%. Having much bigger resources and huge brand equity,
Macros clears this field with 80% agreement of having a very good brand name (See
Figure 27 & Appendix F Table 32).
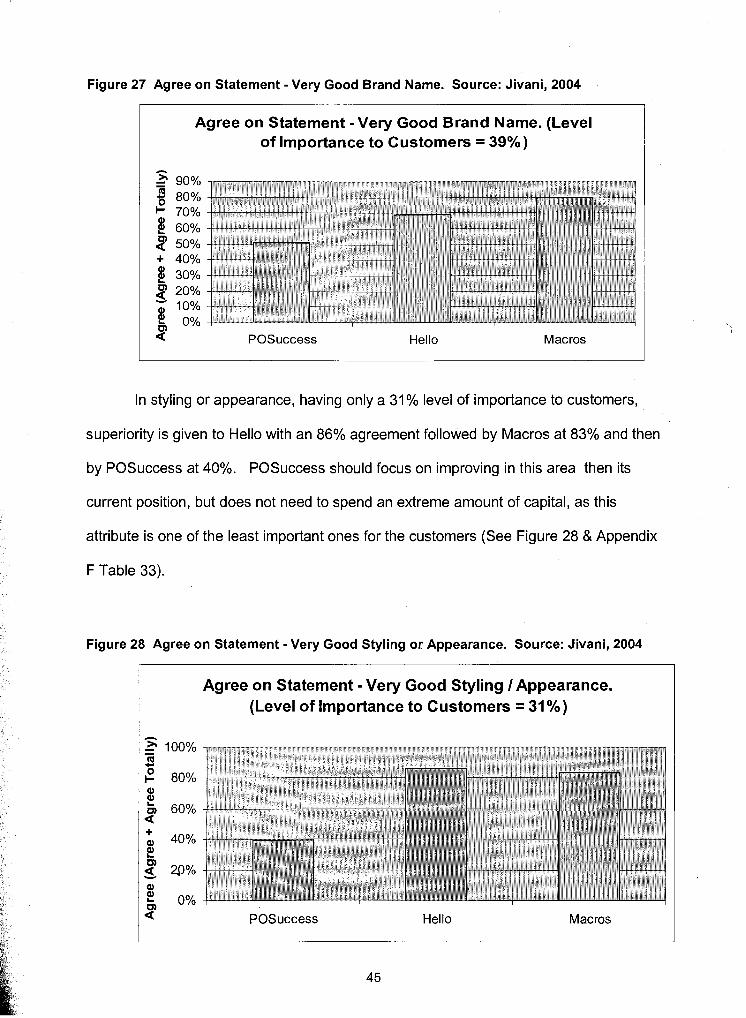
Figure 27 Agree on Statement - Very Good Brand Name. Source: Jivani, 2004
Agree on Statement -Very Good Brand Name. (Level of lmportance to Customers = 39%)
I < POSuccess Hello Macros
In styling or appearance, having only a 31 % level of importance to customers,
superiority is given to Hello with an 86% agreement followed by Macros at 83% and then
by POSuccess at 40%. POSuccess should focus on improving in this area then its
current position, but does not need to spend an extreme amount of capital, as this
attribute is one of the least important ones for the customers (See Figure 28 & Appendix
F Table 33).
Figure 28 Agree on Statement -Very Good Styling or Appearance. Source: Jivani, 2004 --- -
Agree on Statement - Very Good Styling I Appearance. (Level of Importance to Customers = 31%)
POSuccess Hello Macros
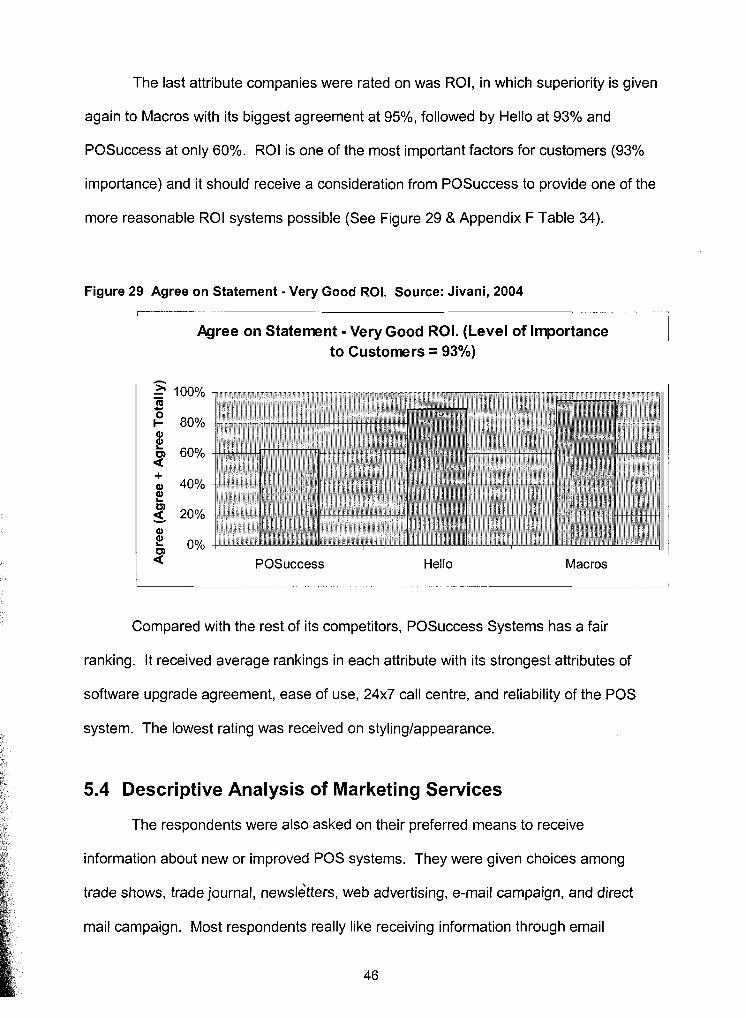
The last attribute companies were rated on was ROI, in which superiority is given
again to Macros with its biggest agreement at 95%, followed by Hello at 93% and
POSuccess at only 60%. ROI is one of the most important factors for customers (93%
importance) and it should receive a consideration from POSuccess to provide one of the
more reasonable ROI systems possible (See Figure 29 & Appendix F Table 34).
Figure 29 Agree on Statement -Very Good ROI. Source: Jivani, 2004
I Agree on Statement - Very Good ROI. (Level of Importance to Customers = 93%) I -
POSuccess Hello Macros I Compared with the rest of its competitors, POSuccess Systems has a fair
ranking. It received average rankings in each attribute with its strongest attributes of
software upgrade agreement, ease of use, 24x7 call centre, and reliability of the POS
system. The lowest rating was received on stylinglappearance.
5.4 Descriptive Analysis of Marketing Services
The respondents were also asked on their preferred means to receive
information about new or improved POS systems. They were given choices among
trade shows, trade journal, newsl&ters, web advertising, e-mail campaign, and direct
mail campaign. Most respondents really like receiving information through email
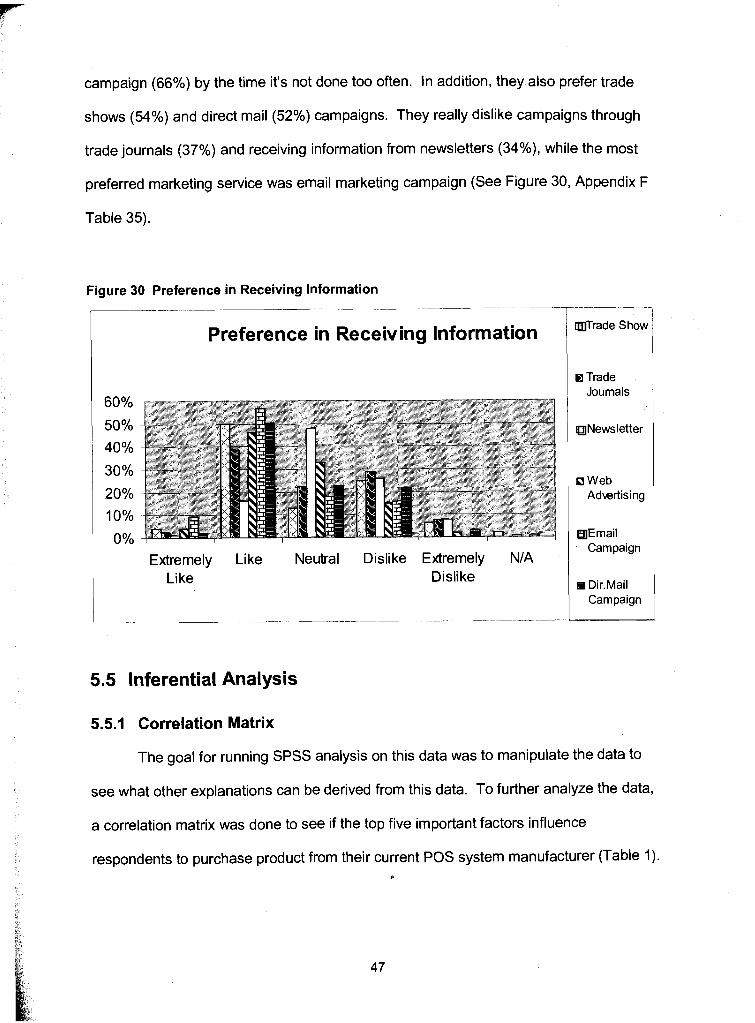
campaign (66%) by the time it's not done too often. In addition, they also prefer trade
shows (54%) and direct mail (52%) campaigns. They really dislike campaigns through
trade journals (37%) and receiving information from newsletters (34%), while the most
preferred marketing service was email marketing campaign (See Figure 30, Appendix F
Table 35).
Figure 30 Preference in Receiving lnformation
Extremely Like Neutral Dislike Extremely NIA Like Dislike
Trade Show
EI Trade Joumals
Newsletter
0 Web Adwrtising
Email Campaign
es Dir.Mail Campaign
5.5 Inferential Analysis
5.5.1 Correlation Matrix
The goal for running SPSS analysis on this data was to manipulate the data to
see what other explanations can be derived from this data. To further analyze the data,
a correlation matrix was done to see if the top five important factors influence
respondents to purchase product from their current POS system manufacturer (Table 1). *
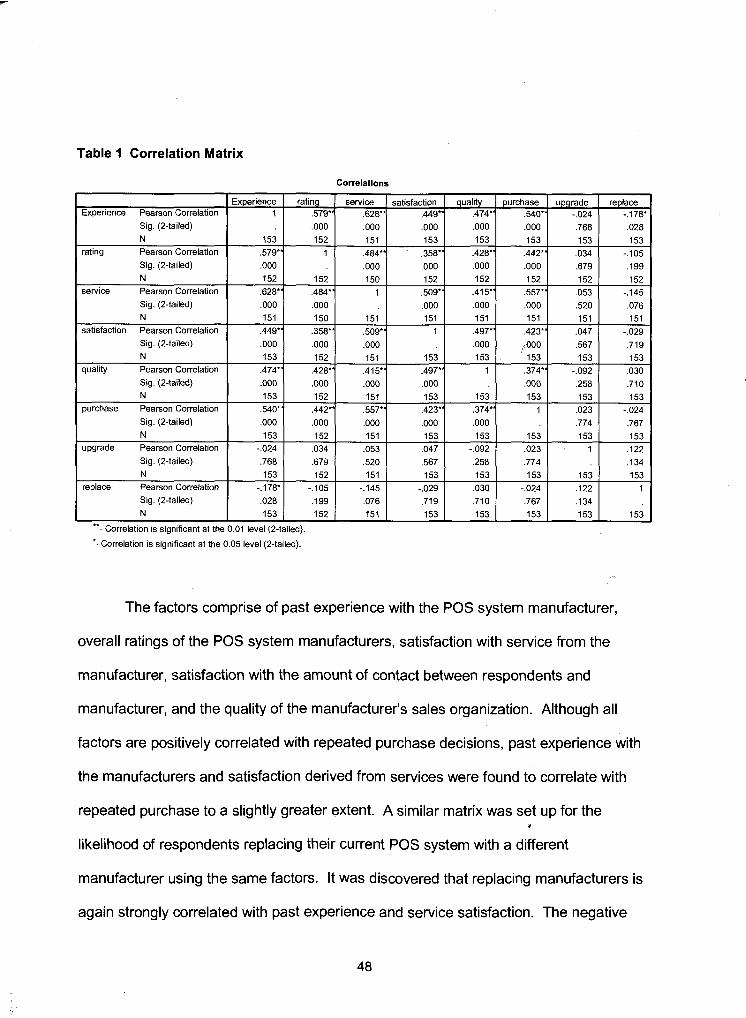
Table 1 Correlation Matrix
Correlations
*. Correlation is significant at the 0.05 level (2-tailed).
Experience Pearson Correlation Sig. (2-tailed) N
rating Pearson Correlation Sig. (2-tailed) N
service Pearson Correlation Sig. (2-tailed) N
satisfaction Pearson Correlation Sig. (2-tailed) N
quality Pearson Correlation Sig. (2-tailed) N
purchase Pearson Correlation Sig. (2-tailed) N
upgrade Pearson Correlation Sig. (2-tailed) N
replace Pearson Correlation Sig. (2-tailed) N
.* . Correlation is significant at the
The factors comprise of past experience with the POS system manufacturer,
overall ratings of the POS system manufacturers, satisfaction with service from the
Experience 1
153 .579** .OOO 152
628" ,000 151
.449*^ ,000 153
.474" ,000 153 .540** .OOO
153 -.024 ,768 153
-.178' ,028 153
0.01 level
manufacturer, satisfaction with the amount of contact between respondents and
manufacturer, and the quality of the manufacturer's sales organization. Although all
rating ,579" .OOO 152
1
152 .484*" ,000 150
.358** ,000 152
.428^* ,000 152
.442** ,000 152
,034 ,679 152
-.I05 .I99 152
(2-tailed).
factors are positively correlated with repeated purchase decisions, past experience with
the manufacturers and satisfaction derived from services were found to correlate with
repeated purchase to a slightly greater extent. A similar matrix was set up for the #
likelihood of respondents replacing their current POS system with a different
service .628** ,000 151
,484'' ,000 150
1
151 .509** ,000 151 .415** ,000 151
,557" ,000 151
.053 ,520 151
-. 145 ,076 151
manufacturer using the same factors. It was discovered that replacing manufacturers is
quality .47P ,000 153
.428** ,000 152
.415"
.OOO 151 ,497" .OOO 153
1
153 .374*' ,000 153
-.092 .258 153
,030 ,710 153
satisfaction .449" ,000 153 ,358" ,000 152
,509" ,000 151
1
153 ,497- .OOO 153 ,423'' .OOO
153 ,047 ,567 153
-.029 ,719 153
again strongly correlated with past experience and service satisfaction. The negative
replace -.178' ,028 153
-.I05 .I99 152
-.I45 ,076 151
-.029 ,719 153
.030
.710 153
-.024- .767 153 ,122 ,134 153
1
153
purchase 540" ,000 153 .442*" .OOO 152 ,557- ,000 151
.423*'
(000 153
,374'' ,000 153
1
153 ,023 .774 153
-.024 .767 153
upgrade -.024 ,768 153
,034 ,679 152
.053 ,520 151
.047 ,567 153
-.092 .258 153 ,023 ,774 153
1
153 .I22 .I34 153
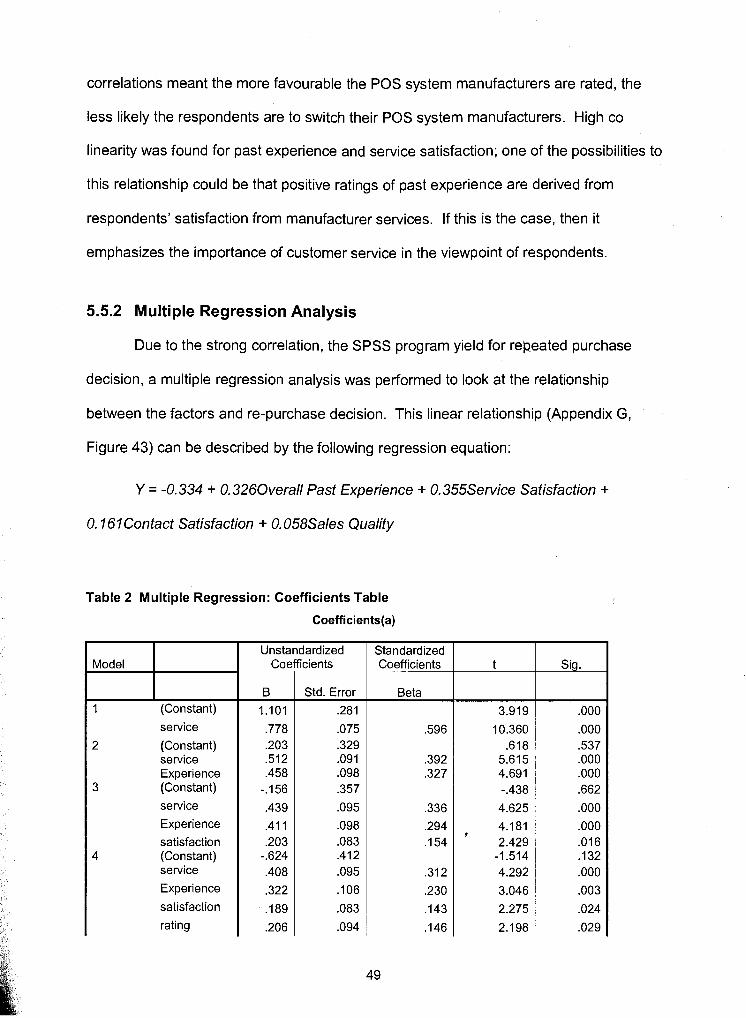
correlations meant the more favourable the POS system manufacturers are rated, the
less likely the respondents are to switch their POS system manufacturers. High co
linearity was found for past experience and service satisfaction; one of the possibilities to
this relationship could be that positive ratings of past experience are derived from
respondents' satisfaction from manufacturer services. If this is the case, then it
emphasizes the importance of customer service in the viewpoint of respondents.
5.5.2 Multiple Regression Analysis
Due to the strong correlation, the SPSS program yield for reheated purchase
decision, a multiple regression analysis was performed to look at the relationship
between the factors and re-purchase decision. This linear relationship (Appendix G,
Figure 43) can be described by the following regression equation:
Y = -0.334 + 0.3260verall Past Experience + 0.355Service Satisfaction +
0. I 61 Contact Satisfaction + 0.058Sales Quality
Table 2 Multiple Regression: Coefficients Table
Model + 1 (Constant)
service
2 (Constant) service Experience
3 (Constant)
service
Experience
satisfaction 4 (Constant)
service
Experience
satisfaction
rating
Unstandardized Coe
B
1.101
.778
.203 512 .458
-.I56
.439
.411
.203 -.624 .408
.322
.I89
,206
cients
Std. Error
.281
,075 .329 .091 .098 .357
.095
.098
.083
.412 ,095
.I06
.083
,094
Standardized Coefficients
Beta
Sig.
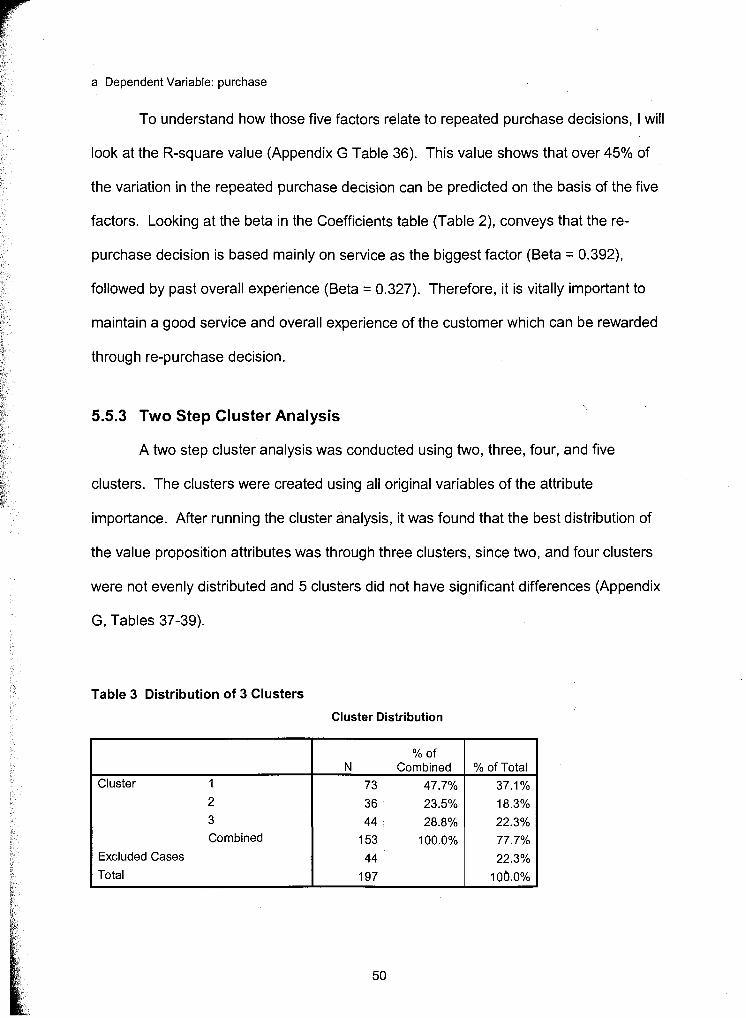
a Dependent Variable: purchase
To understand how those five factors relate to repeated purchase decisions, I will
look at the R-square value (Appendix G Table 36). This value shows that over 45% of
the variation in the repeated purchase decision can be predicted on the basis of the five
factors. Looking at the beta in the Coefficients table (Table 2), conveys that the re-
purchase decision is based mainly on service as the biggest factor (Beta = 0.392),
followed by past overall experience (Beta = 0.327). Therefore, it is vitally important to
maintain a good service and overall experience of the customer which can be rewarded
through re-purchase decision.
i 5.5.3 Two Step Cluster Analysis
A two step cluster analysis was conducted using two, three, four, and five
clusters. The clusters were created using all original variables of the attribute
importance. After running the cluster analysis, it was found that the best distribution of
the value proposition attributes was through three clusters, since two, and four clusters
were not evenly distributed and 5 clusters did not have significant differences (Appendix
G, Tables 37-39).
Table 3 Distribution of 3 Clusters
Cluster Distribution
Cluster 1
2
3
Combined
Excluded Cases
Total
% of Total - 37.1%
18.3%
22.3%
77.7%
22.3%
1 06.0%
Combined
73
36
44
153
44
197
47.7%
23.5%
28.8%
100.0%
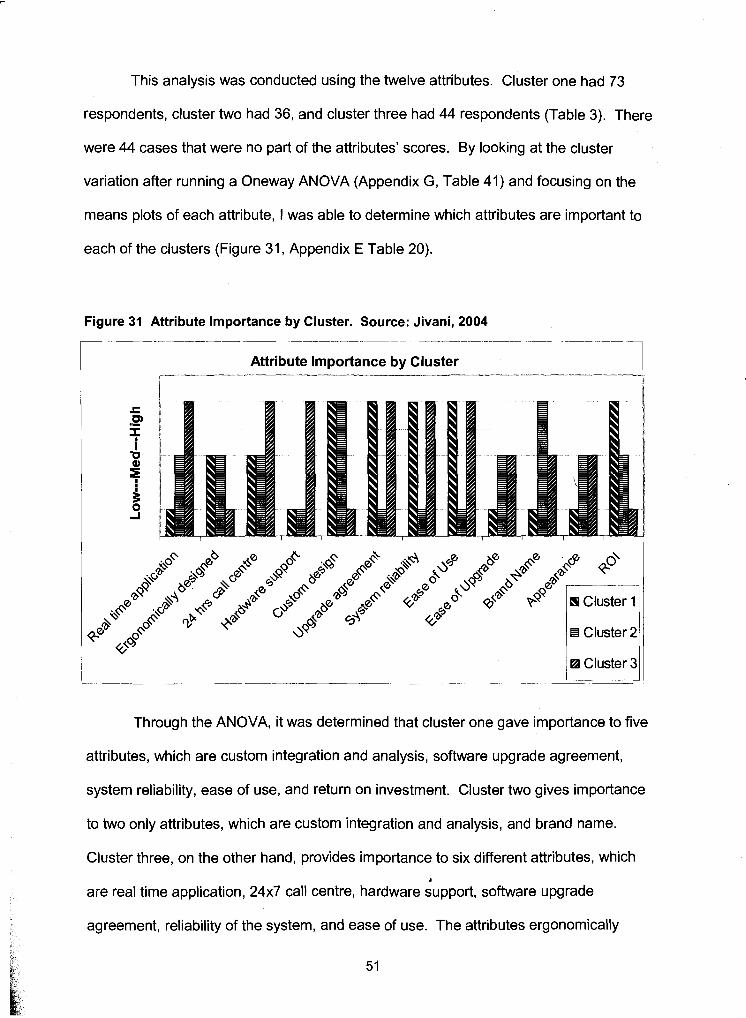
This analysis was conducted using the twelve attributes. Cluster one had 73
respondents, cluster two had 36, and cluster three had 44 respondents (Table 3). There
were 44 cases that were no part of the attributes' scores. By looking at the cluster
variation after running a Oneway ANOVA (Appendix G, Table 41) and focusing on the
means plots of each attribute, I was able to determine which attributes are important to
each of the clusters (Figure 31, Appendix E Table 20).
Figure 31 Attribute lmportance by Cluster. Source: Jivani, 2004
Attribute Importance by Cluster 1
Through the ANOVA, it was determined that cluster one gave importance to five
attributes, which are custom integration and analysis, software upgrade agreement,
system reliability, ease of use, and return on investment. Cluster two gives importance
to two only attributes, which are custom integration and analysis, and brand name.
Cluster three, on the other hand, provides importance to six different attributes, which b
are real time application, 24x7 call centre, hardware support, software upgrade
agreement, reliability of the system, and ease of use. The attributes ergonomically
designed POS system and stylinglappearance were not considered a high priority for
any of the clusters. The attribute tables for cluster one, two, and three which has each
company's distribution in the three clusters, is provided in the appendix (Appendix G,
Table 40), where company 1 is Macros, 2 is Hello, and 3 is POSuccess.
5.6 POSuccess Systems VS. Competition
The immediate competitors of POSuccess Systems consist of Macros Systems,
Hello Technologies, Maitre d', InfoPos, KTouch, and PeterPoint. Maitre d' was removed
from this comparison because no report was found on Maitre d' among the respondents,
and the rest of the three due to insufficient market share. In the remaining three
companies, based on this research, POSuccess Systems has the second largest market
share next to Macros Systems in the lead. POSuccess Systems received the highest
overall company rating. Macros Systems had been rated favourably on hardware
support, easy to use, and its brand name. They were given a low average score on their
software upgrade agreement and system reliability. Hello Technologies was next as
they are being perceived to have good real time application, custom integration and
analysis, very good reliability of the system, easy to upgrade, very good styling and ROI.
One of their poor ratings was on their hardware support. In addition to these immediate
competitors that are being recognized, a few other companies were reported commonly
by respondents. Those companies include TEC, a sales subsidiary to Toshiba TEC
Corporation, KCN, ITBMI, and SonicCap. Those companies carve up similar market
share in our sample of respondents as PeterPoint and KTouch.
Data was retrieved from tier 2 and tier 3 companies, because the food service
directory only provided database on the two tiers. According to this existing market %
share data, 15% of tier 2 companies were using POSuccess Systems, and they are the
second largest POS system provider next to Macros Systems at roughly 70%. Similar
statistics were found for tier 3 companies. POSuccess Systems has a gain with a
market share of 13% in tier 3 market, while Macros Systems declined to 63%. Again,
POSuccess Systems was captivating the second largest share. These comparisons
were conducted between the immediate competitors of POSuccess Systems within all
hospitality sectors of the POS systems for North America.
In addition, by understanding the distribution of the current customers of the
leading companies in the two clusters (Appendix G, Table 44); POSuccess is in a better
position to decide on its distribution of resources, by allocating them in the most efficient
manner.
5.7 SWOT Analysis
5.7.1 Strengths
POSuccess Systems has set up strategic partnerships with companies providing
electronic payments or software development. By doing so, POSuccess Systems is able
to provide customers with an end product that combines innovative and most up-to-date
technologies. Consequently, it allows POSuccess Systems to achieve superior quality.
Being the innovator of touch screen POS systems, POSuccess Systems has gained
brand loyalty with some large restaurant chains such as The Keg.
POSuccess Systems achieves competitive advantage by providing customized
POS systems for customers and developing easy to use and easy to learn POS
systems. To ensure customer satisfaction, POSuccess Systems has established a 24
hours a day 17days a week solution centre to resolve customer inquiries. In addition to
these strengths, this research study discovered that customers perceive POSuccess I
Systems to have an easy to use, reliable POS system, with a good software upgrade
agreement, and a 24x7 call centre.
5.7.2 Weaknesses + Opportunities
POSuccess Systems was rated poorly on its performance in custom integration
and analysis, real time application of POS system, stylelappearance of the POS system,
ease of upgrade, brand name, and R01. Instead of letting these attributes weaken
POSuccess Systems' status in the market; POSuccess can make improvements by
boosting the real time application function of POS system, expanding its hardware
support department, and enhancing the stylelappearance of its systems. The first
priority for POSuccess should be to focus on the two important attributes to customers,
which are ease of upgrade and ROI, in which this company has been rated low. Food
service and hospitality industries have recognized the importance of advance technology
in their business operations. With the growing demand of POS systems to help
restaurants function more efficiently, it provides POSuccess with a definite opportunity to
gain a fair market share. POSuccess should focus on cluster one and three companies
that give importance to 24x7 call centre, software upgrade agreement, system reliability,
and ease of use, since POSuccess is perceived to lead in these four attributes. Further
expansion can be reached with proper marketing strategies.
5.7.3 Threats
A big threat to POSuccess Systems is the strong market position of Macros
Systems, which is a publicly traded company targeting the same market segment as
POSuccess Systems. From the collected data, more than half of the market share is
captivated by Macros Systems. Another threat is associated with the growing demands
of POS systems, because it attracts potential competitors to enter into the industry. This
leads us to the discussion of Porter's first force, the risk of potential competitors, in our
next section.
5.8 Porter's Forces
5.8.1 Potential Competitors
Potential competitors are companies currently in different industries, but have the
ability to enter the POS systems industry given its lucrative status. During one of our
surveys, a respondent has replied that they make their own POS system. Big
companies in the food service and hospitality industries can enter into the POS systems
industry by manufacturing the systems internally. These companies are knowledgeable
about their needs, and could threaten to take away customers from POSuccess
Systems. Other potential competitors are technology companies, since they have the
basic technology to manufacture POS systems; an example is ITBMI, which has been
already offering POS systems and related products.
5.8.2 Rivalry in the industry
Rivalry is intense in the POS systems industry. During the survey, over twenty
POS system company names were mentioned. As previously mentioned, Macros
Systems is leading competitor among all of the companies. Most companies offer
similar products and services in order to survive competition in the same market
segment.
5.8.3 Closeness of Substitute
A substitute for POS systems is simple cash registers. They do not have a fancy
design or anything more then a basic computer system. However, it is sufficient and
affordable for smaller restaurant chains, such as those in the tier 1 with lesser resources
available. With the ease of use of POS systems, restaurants will be looking forward to
replace cash registers if there are models available for a comparable price.
IMPLICATIONS
The implication of this research was to validate the importance of the value
proposition that POSuccess offers. In addition, my goal was to pinpoint some of the
strengths and weaknesses of POSuccess Systems by conducting an industry analysis
with its competitors. Through these findings, I will be able to better understand the POS
system manufacturers from the customer's stand point.
I have found that 2 strong competitors of POSuccess Systems are Hello
Technologies and Macros Systems. Their presence is taking away significant market
share away from POSuccess Systems. POSuccess Systems could improve its standing
among the competitors by enhancing its marketing strategy to gain more prevalence in
the segment by making them aware of POSuccess' value propositions and make
improvements on the above mentioned key areas of weaknesses. Based on the
responses from the survey, e-mail campaigns, and direct mail campaigns can be utilized
to help promoting POSuccess Systems' products and services to a broader customer
base. In addition, POSuccess' booth at trade shows is certainly a preferred method of
advertisement based on our respondents.
Past experience with manufacturers and the satisfaction derived from service
seem to be two of the most important determinants in the repeated purchase decision.
Since the cost to retain customer is lower than the cost to cultivate a new group of
customers, POSuccess Systems should focus their attention in gaining competitive
advantage through high level of customer responsiveness, thereby increasing the
possibility of future sales and reducing the likelihood of customers switching POS
manufacturers.
On the basis of the POS system manufacturer's ratings, POSuccess Systems is
weak in its ease of upgrade, ROI, real time application, hardware support, and
stylinglappearance attributes. Within the six attributes, ROI, ease of upgrade, and
hardware support have been rated more important. POSuccess Systems can search for
cost-effective measures to reduce its costs, providing a better product and service to the
customer, resulting in the increase of the ROI of its products. It could also take
measures to make the upgrade function simple, and improve its hardware support,
which could include offering proper on-site POS systems training, and reducing
resolution time.
One of POSuccess Systems' competitive advantages is its solution centre, which
offers 24 hours a day and 7 days a week help desk service is to support customers.
However, competition have followed and added this service to their offerings. To
differentiate itself from competitors, POSuccess Systems needs to strengthen or expand
its current customer support. An easy access, quick, and convenient way to provide
support is through the use of virtual solution centre, instead of call transfer and indefinite
wait. Online support service can reduce the irritation for existing customers.
One of the possible explanations for Macros Systems to seize such a
substantial market share is their impression of reliability and financial stability through its
public stock offerings and because of being a remarkable leader in the two important
attributes perceived by respondents were the reliability of the POS system and the ease
of POS system use. Further studies could be implemented to find out about the
determinants of those attributes.
7 CONCLUSION
This paper not only provides the information of what is important to the
customers, but it also states who is leading the field among those attributes, and why.
The company should focus on the cluster one and three companies that give importance
to 24x7 call centre, software upgrades, and ease of use since POSuccess is perceived
to lead in these three attributes. POSuccess Systems could improve its standing among
the competitors by enhancing its marketing strategy to gain more prevalence in the
segment by making them aware of POSuccess' value propositions and make
improvements on areas of weaknesses. Based on the customer preferences, they
should be promoted through e-mail campaigns, trade shows, and direct mail campaigns.
With the information provided, POSuccess Systems will be in the position to provide its
customers the difference that makes a difference.
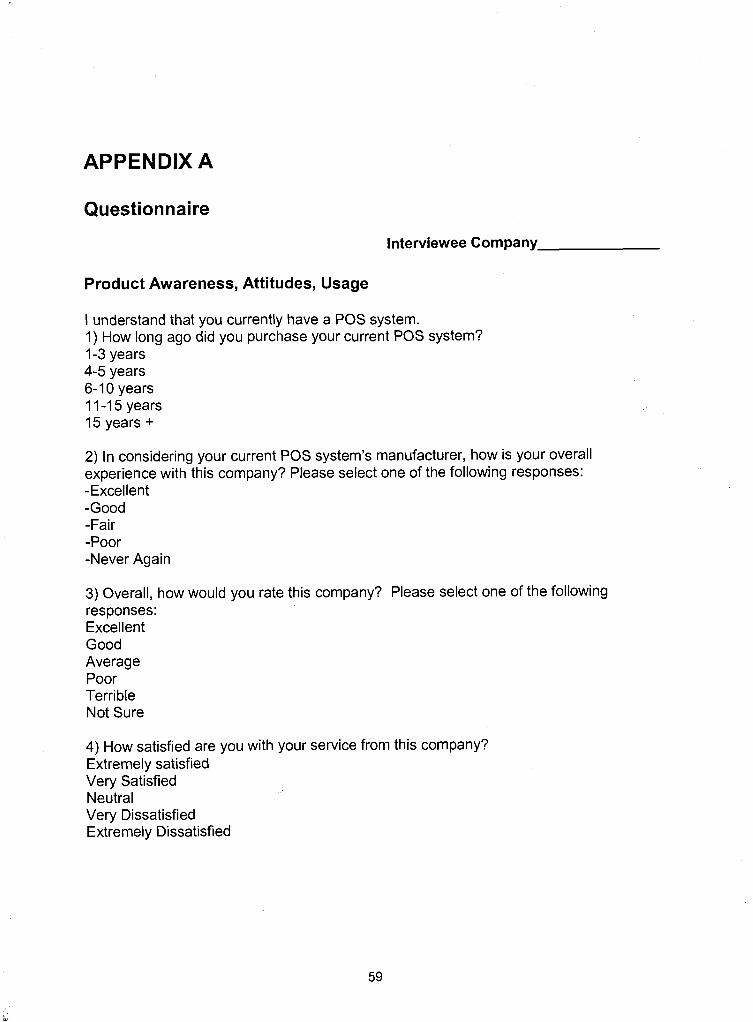
APPENDIX A
Questionnaire
Interviewee Company
Product Awareness, Attitudes, Usage
I understand that you currently have a POS system. 1) How long ago did you purchase your current POS system? 1-3 years 4-5 years 6-1 0 years 1 1-1 5 years 15 years +
2) In considering your current POS system's manufacturer, how is your overall experience with this company? Please select one of the following responses: -Excellent -Good -Fair -Poor -Never Again
3) Overall, how would you rate this company? Please select one of the following responses: Excellent Good Average Poor Terrible Not Sure
4) How satisfied are you with your service from this company? Extremely satisfied Very Satisfied Neutral Very Dissatisfied Extremely Dissatisfied
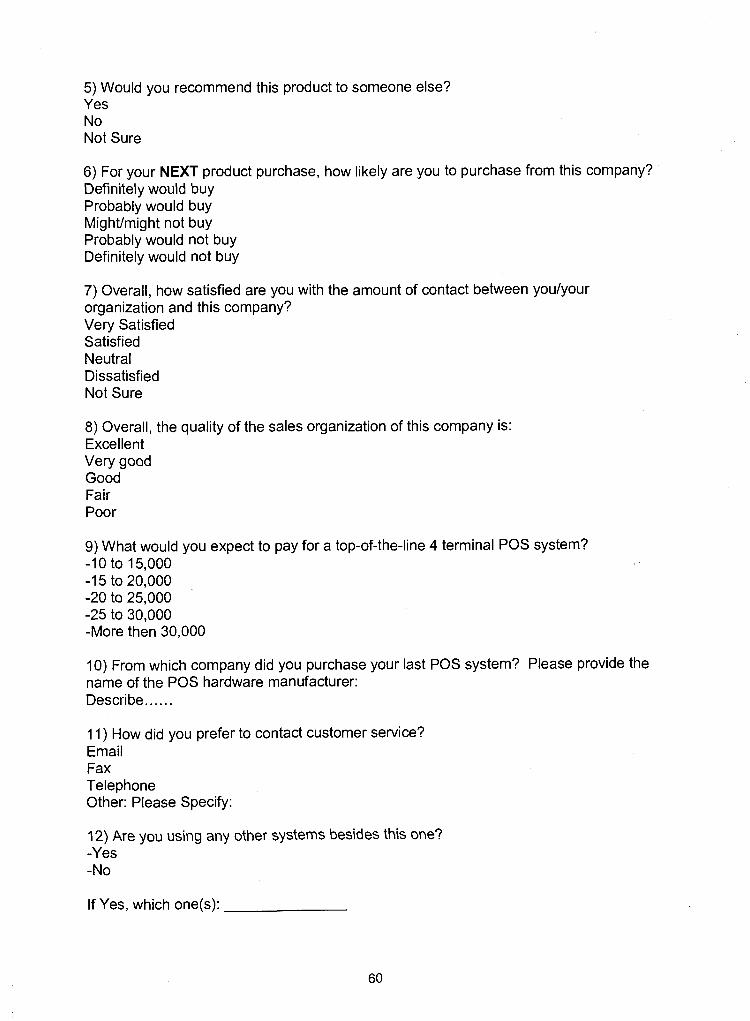
5) Would you recommend this product to someone else? Yes No Not Sure
6) For your NEXT product purchase, how likely are you to purchase from this company? Definitely would buy Probably would buy Mightlmight not buy Probably would not buy Definitely would not buy
7) Overall, how satisfied are you with the amount of contact between youlyour organization and this company? Very Satisfied Satisfied Neutral Dissatisfied Not Sure
8) Overall, the quality of the sales organization of this company is: Excellent Very good Good Fair Poor
9) What would you expect to pay for a top-of-the-line 4 terminal POS system? -1 0 to 15,000 -1 5 to 20,000 -20 to 25,000 -25 to 30,000 -More then 30,000
10) From which company did you purchase your last POS system? Please provide the name of the POS hardware manufacturer: Describe.. . . . .
11) How did you prefer to contact customer service? Email Fax Telephone Other: Please Specify:
12) Are you using any other systems besides this one? -Yes -No
If Yes, which one(s):
13) How likely are you to buy or upgrade in the next 3 yrs? Very unlikely somewhat unlikely not sure somewhat likely very likely
14) How likely are you to replace your POS system with a different manufacturer over the next 3 years? -Very Certain -High Chance -Low Chance -No Chance -Not Sure
Product Purchase Decisions: I am going to ask you some questions about the attributes of POS systems.
15) How important are these Attributes to you when choosing to purchase a POS system: Please describe each of the following item based on the scale of 1-5, 1 being Not - important at all, 2 being Not so important, 3 being Neutral, 4 being Important, and 5 being Vitally Important. So, based on the scale of 1 to 5, how do you perceive: -Real Time Application -Ergonomically designed POS system -24 hours a day, 7 days a week, call centre -Hardware Support -Custom Integration and Analysis -Software Upgrade Agreement -Reliability of the system -Ease of Use -Easy to Upgrade -Brand name -Styling/Appearance -RO I
16) For the next question, please tell me the significant Point Of Sale company names that come to your mind. Please tell me the company names: 1 > 2) 3) Note: Write down as many un-aided recalled company names, but conduct the survey on only the first three on the list.
Competitor Analvsis: 17) Please tell me if you have heard of each of the following by saying Yes or NO: (Note: Exclude the company names that were listed in question 16, & randomize them) Micros Aloha Squirrel Maitre d' Info Genesis PosiTouch Pixelpoint
NOTE: List the top 3 company names they have mentioned in questions 16 and 17 based on the method provided in the training. If Squirrel is one of the companies mentioned in questions 16 or 17, include that as one of the three companies for questions 18-20.
COMMENT: Now I will be asking you some questions on three of the companies with respect to their POS systems. Based on the following attributes, please tell us according to your experience or image of this company, how you perceive the products from this company. Please base your answers on a scale from 1 to 5, where 1 means disagree totally and 5 means agree totally.
18) Company: -Very good Real Time Application -Very good Ergonomically designed POS system -24 hours a day, 7 days a week, call centre -Very good Hardware Support -Very good Custom Integration and Analysis -Very good Software Upgrade Agreement -Very good Reliability of the system -Very good Ease of Use -Very Easy to Upgrade -Very good Brand name -Very good StylinglAppearance -Very good ROI Any other comments regarding ?
19) The second company I'd like to ask you about is . Again, please base your answers on a scale of 1 to 5, where 1 means disagree totally, and 5 means agree totally. -Very good Real Time Application -Very good Ergonomically designed POS system -24 hours a day, 7 days a week, call centre -Very good Hardware Support -Very good Custom Integration and Analysis -Very good Software Upgrade Agreement -Very good Reliability of the system -Very good Ease of Use -Very Easy to Upgrade -Very good Brand name -Very good StylinglAppearance -Very good ROI Any other comments regarding ?
20) The third company I'd like to ask you about is . Again, please base your answers on a scale of 1 to 5, where 1 means disagree totally, and 5 means agree totally. -Very good Real Time Application -Very good Ergonomically designed POS system -24 hours a day, 7 days a week, call centre -Very good Hardware Support -Very good Custom lntegration and Analysis -Very good Software Upgrade Agreement -Very good Reliability of the system -Very good Ease of Use -Very Easy to Upgrade -Very good Brand name -Very good StylinglAppearance -Very good ROI Any other comments regarding ?
Evaluation of use of marketing services COMMENT: This brings us to our last question.
21) For each of the following advertising, sales and marketing services listed, please tell us which communication method does your company prefer in receiving information about new and improved POS systems? Extremely Like, Like, Neutral, Dislike, Extremely Dislike
-Trade Shows -Trade Journals -Newsletters -Web Advertising -Email marketing campaign -Direct mail campaign
Do you have any additional questions or comments regarding this marketing study?
-AT THE END OF THE SURVEY, STATE:
Thank you very much for your valuable time Mr./Ms. . You have been extremely helpful. I will now enter your name in the lottery to win that gift certificate and will also be sending you a gift which you will receive within a two week period. For any questions or concerns regarding this marketing study, please contact Mr. Naveed Jivani. Thanks again, and have a great day. Bye.
Script
AUTOMATED SYSTEM:
If you receive an automated system, locate the person by their last name and ring their
extension and go to the RESPONDENT script directly. If you come across an assistant,
go to the ASSISTANT script followed by the RESPONDENT script.
ASSISTANT:
Hello, this is . May I speak with Mr./Ms. . Thank you.
(If enquired upon where you are calling from, let them know, you're calling from SFU).
RESPONDENT:
Hello Mr./Ms. , how are you. This is . l am
phoning you on behalf of Mr. Naveed Jivani, an MBA student fulfilling program
requirements by conducting a survey on Point of Sale systems. This valuable research
study, which could be of interest to you, is being conducted on behalf of one of the
leading firms manufacturing the POS &terns. The survey will only take a few minutes,
and at the end of it I will not only enter your name in a lottery to win a 300 US dollars
American Express gift certificate, but will also be sending you a valuable gift, which you
will receive within next two weeks, as a gesture of our appreciation for your valuable
time.
To understand the needs that the point of sale system fulfils from a customer stand
point, do I have your permission to ask you some questions that will only take a few
minutes?
If YES, say THANK YOU and begin the survey.
If NO, refer to the FALLBACK QUESTIONS GUIDE.
APPENDIX C
Fall Back Questions Guide
Q: I am busy right now.
R: Not a problem sirlmadam. I completely understand. What will be a better time for
you so I can obtain your valuable perspective on POS systems.
Q: If assistant asks, the purpose for the call?
R: This is , and I need to speak to someone in the point-of-sale
purchasing department.
Q: Who is the sponsoring company?
R: In order not to prejudice your response, I cannot tell you their name before nor during
the survey, but I can certain tell you their name afterwards.
Q: At which university is the person finishing their MBA?
R: Simon Fraser University in Vancouver, British Columbia, Canada
Q: How long will the survey take?
R: Nine minutes
Q: What is a Real-time Application?
R: This is the application by which any data that is entered at any of the terminals in
your restaurant chain, can be viewed in real-time at the head office. For example, by
entering the last food order, the system at the local restaurant determines a particular
product is running low in the inventory, it will immediately send a page in real-time to the
head office to fulfil that inventory need.
Q: How may I contact the person conducting the marketing study?
R: Please contact Mr. Naveed Jivani at (604) 307-3923 or by email n i i~an i~s fu .ca
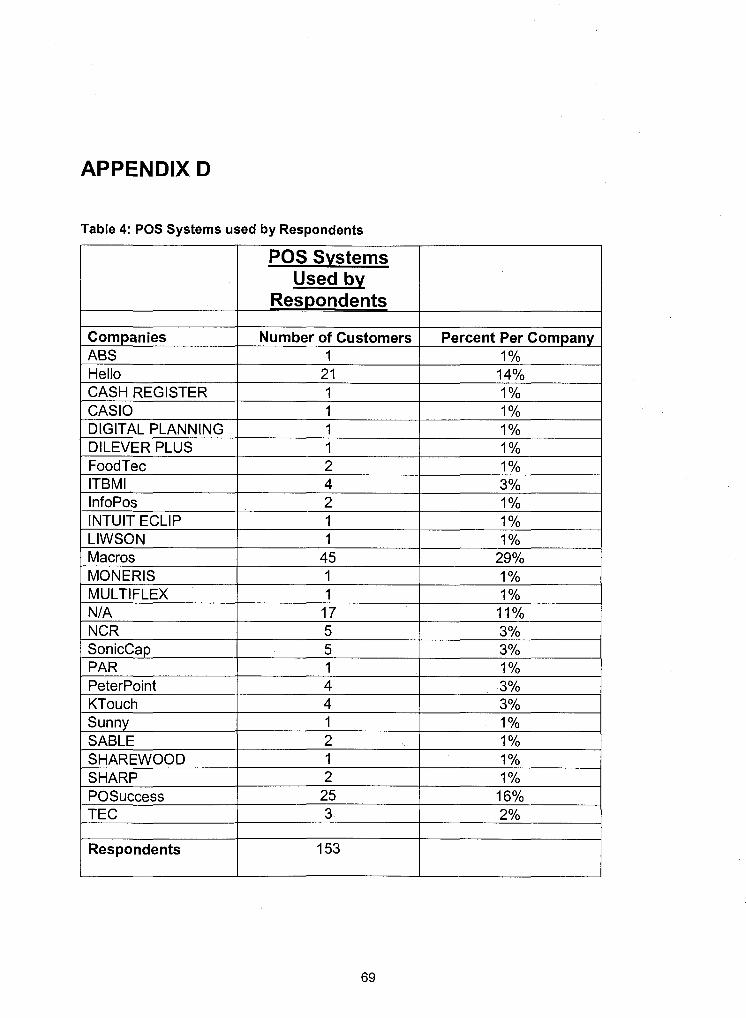
APPENDIX D
Table 4: POS Systems used by Respondents
POS Systems Used by
Respondents
Companies ABS Hello CASH REGISTER CAS I 0 DIGITAL PLANNING DILEVER PLUS FoodTec ITBMl
Number of Customers 1
InfoPos INTUIT ECLlP LIWSON Macros
Percent Per Company 1 O/o
2 1 1 1 1 1 2 4
MULTIFLEX NIA NCR SonicCap PAR
14% 1% 1% 1% 1% 1% 3%
2 1 1
45
Peterpoint KTouch
1% 1% 1%
29%
1 17 5 5 1
Sunny SABLE SHAREWOOD SHARP
1% 11% 3% 3% 1%
4 4
POSuccess TEC
3% 3%
1 2 1 2
I I
1% 1% 1% 1%
25 3
Respondents
16% 2%
153
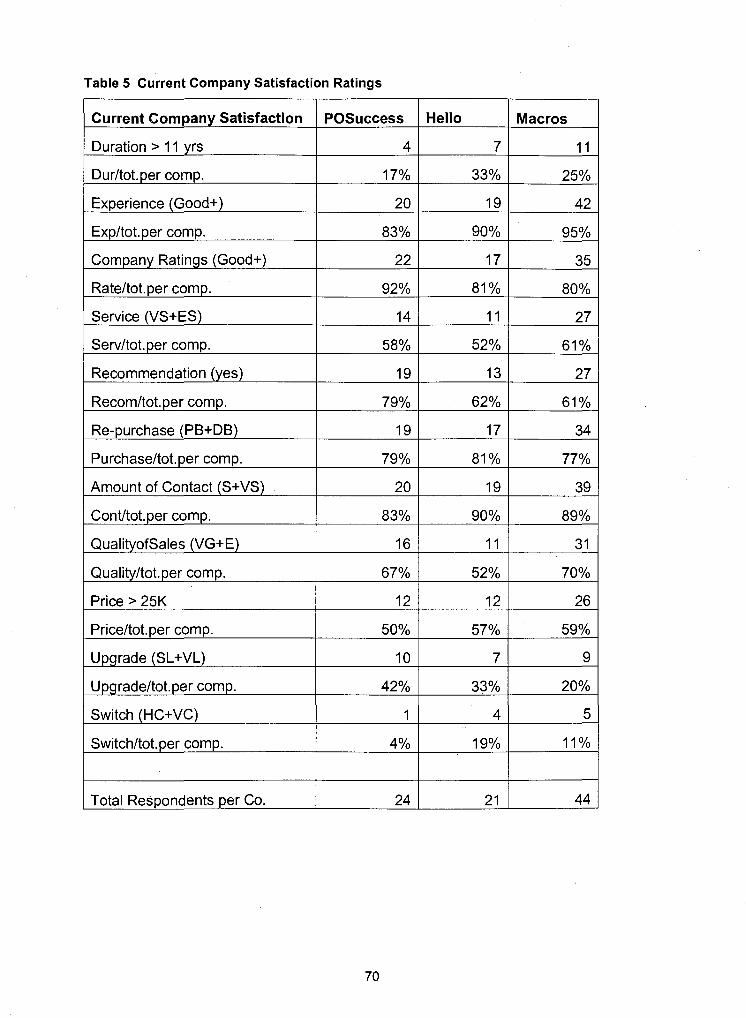
Table 5 Current Company Satisfaction Ratings
Current Com~anv Satisfaction I POSuccess Hello Macros
11 Duration > 11 yrs 4
Durltot. per comp.
Experience (Good+)
17%
20
Expltot.per comp.
Company Ratings (Good+)
Rateltot.per comp.
Service (VS+ES)
Serv1tot.per comp.
Recommendation (yes)
83%
22
92%
14
58%
19
Recomltot.per comp. 79%
Re-purchase (PB+DB)
Purchaseltot.per comp.
19
79%
Amount of Contact (S+VS) 20
Cont/tot.per comp. 83%
Quality1tot.per comp.
Price > 25K
I
67%
12
Switch (HC+VC)
Total Res~ondents Der Co.
1
Switchltot.per comp. 4%
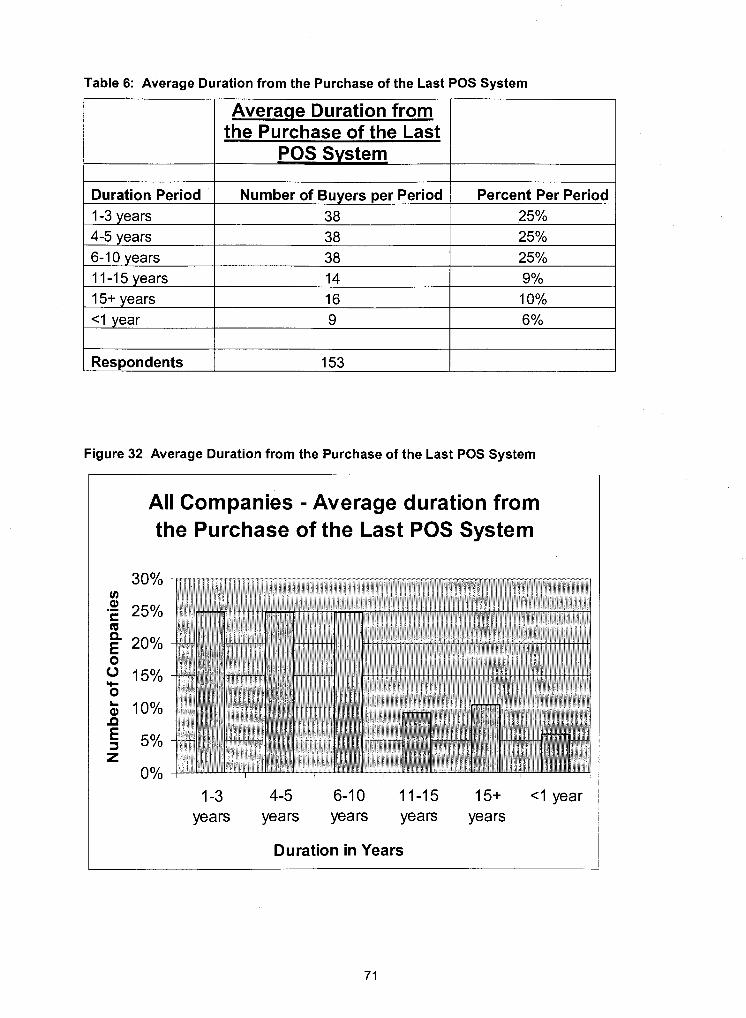
Table 6: Average Duration from the Purchase of the Last POS System
Average Duration from the Purchase of the Last
PO-
Duration Period 1-3 years 4-5 years 6-1 0 years 1 1-1 5 years 15+ years <I year
Figure 32 Average Duration from the Purchase of the Last POS System
Number of Buyers per Period 38 38 38 14 16
All Companies - Average duration from the Purchase of the Last POS System
Percent Per Period 25% 25% 25% 9% 10%
9
1 I Respondents
1-3 4-5 6-10 11-15 15+ <Iyear years years years years years
6%
153
Duration in Years
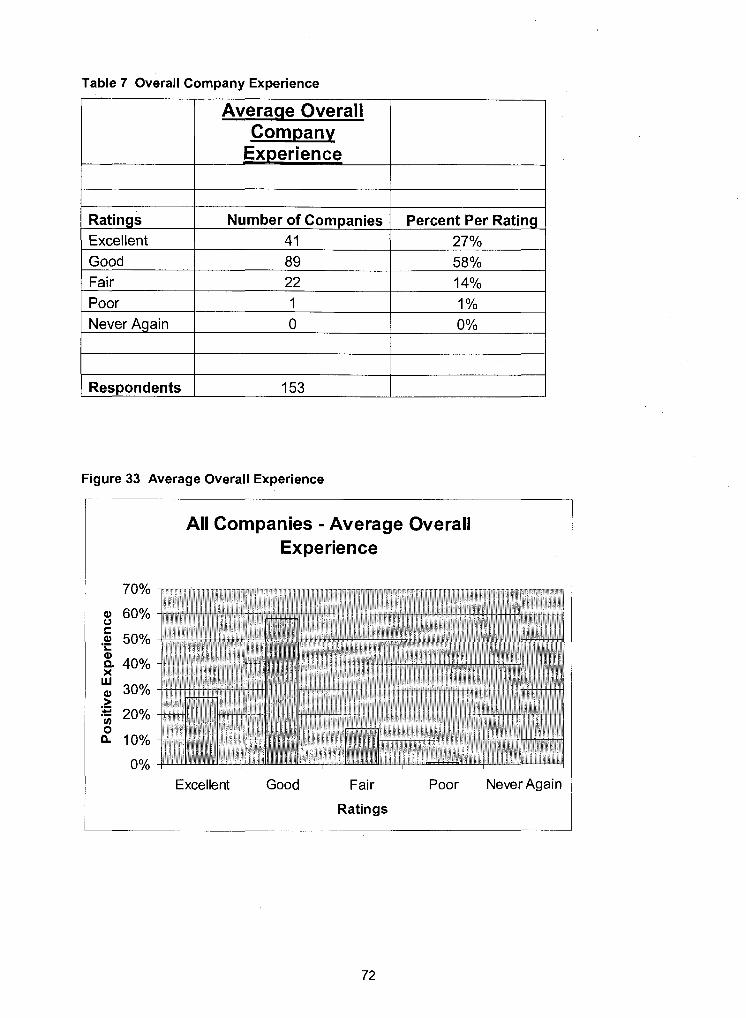
Table 7 Overall Company Experience
Ratings Number of Companies Percent Per Rating Excellent 41 27%
I Good 89 58% Fair 22 14% Poor 1 1% Never Again 0 0%
1 Respondents I 153
Figure 33 Average Overall Experience
All Companies - Average Overall Experience
Excellent Good Fair Poor Never Again
Ratings
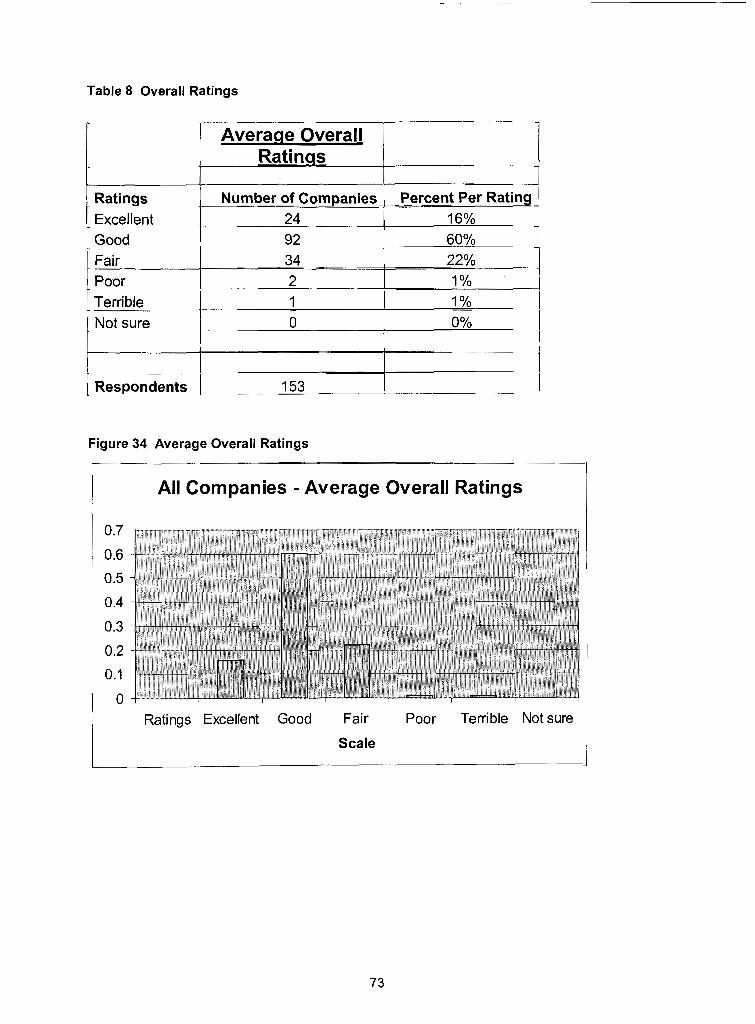
Table 8 Overall Ratings
Average Overall Ratinqs
Ratings I Number of Companies 1 Percent Per Rating Excellent Good
Poor 2 1% I
24
Fair
16% 92
I I
Respondents I 153
6 0 O/O
34
Terrible Not sure
Figure 34 Average Overall Ratings
22%
All Companies - Average Overall Ratings
1 0
Ratings Excellent Good Fair Poor Terrible Not sure
Scale
1% 0%
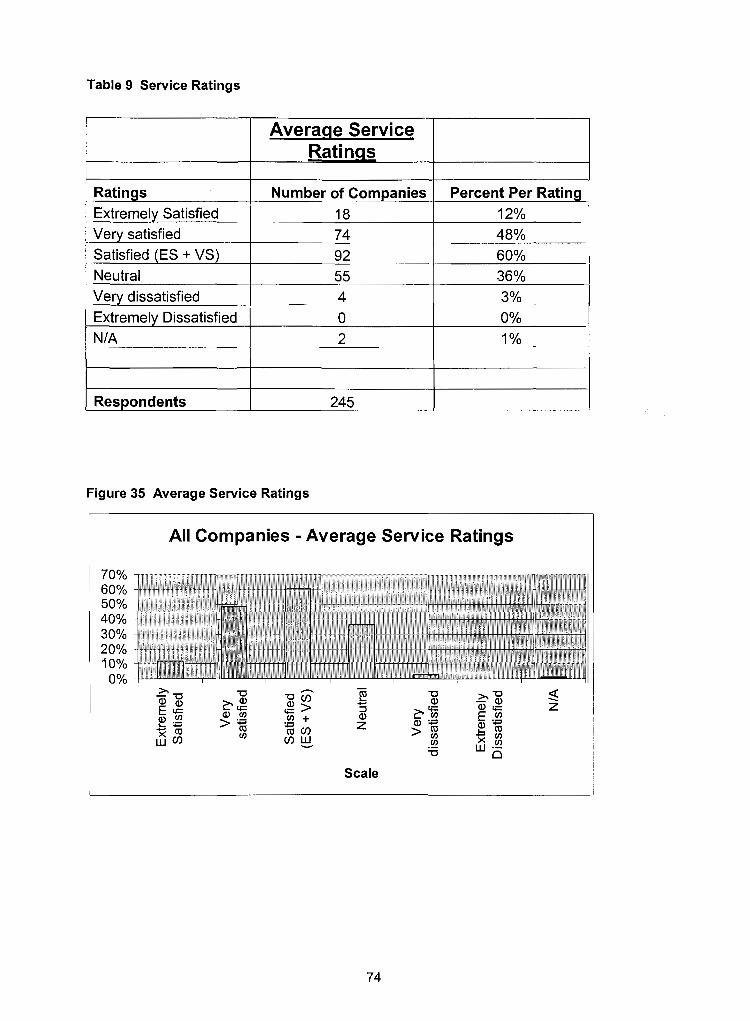
Table 9 Service Ratings
Averaqe Service
I Extremely Dissatisfied / 0 0%
1 Ratings Extremely Satisfied Very satisfied Satisfied (ES + VS) Neutral Very dissatisfied
Number of Companies 18 74 92 55 4
NIA
Figure 35 Average Service Ratings
Percent Per Rating 12% 48% 60% 36% 3%
I Respondents
All Companies - Average Service Ratings
2
245
Scale
1%
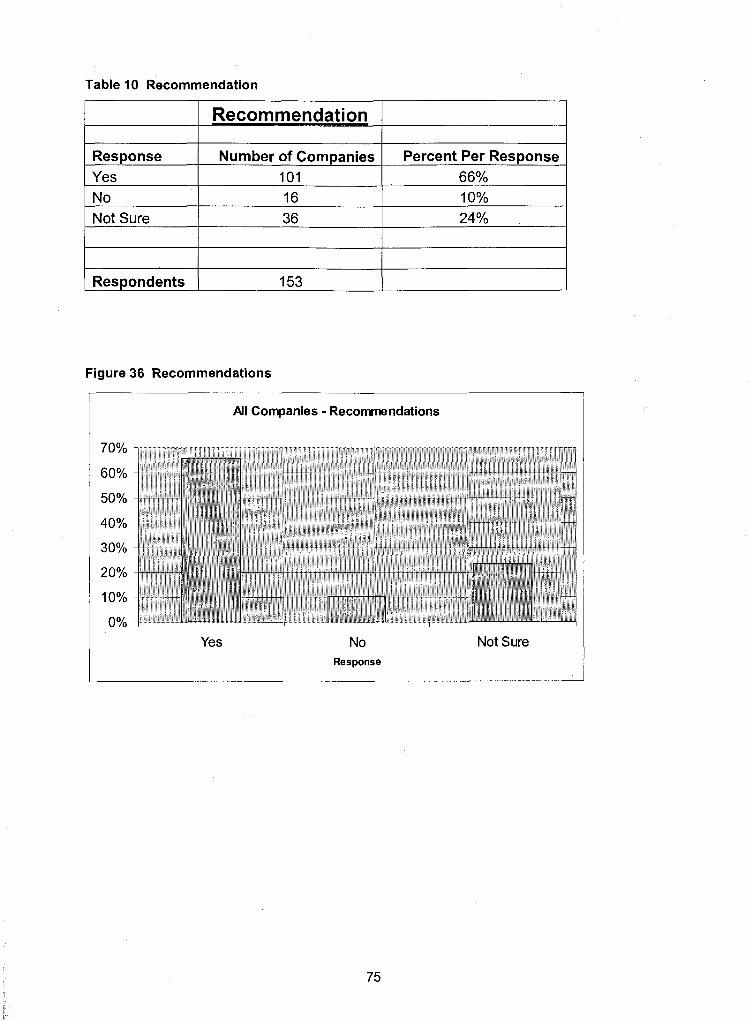
Table 10 Recommendation
Figure 36 Recommendations
I
Respondents
All Companies - Recommendations
153
Yes No Response
Not Sure
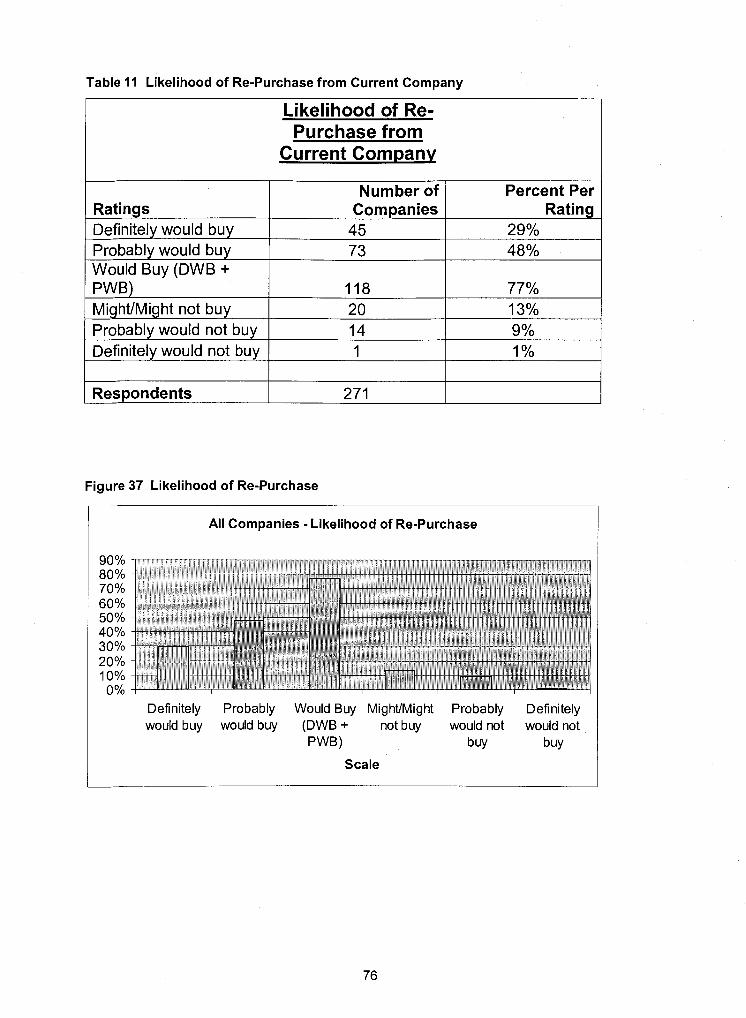
Table 11 Likelihood of Re-Purchase from Current Company
Likelihood of Re- Purchase from
Current Company
Ratings Definitely would buy Probably would buy Would Buy (DWB + PWB) MightIMight not buy Probably would not buy I 14
Number of Companies
45 73
118 20
9% Definitely would not buy
Figure 37 Likelihood of Re-Purchase
Percent Per Rating
29% 48%
77% 13%
I I
All Companies - Likelihood of Re-Purchase
1
Respondents
Definitely Probably Would Buy MightIMight Probably Definitely would buy would buy (DWB + not buy would not would not
PWB) buy buy
1%
271
Scale
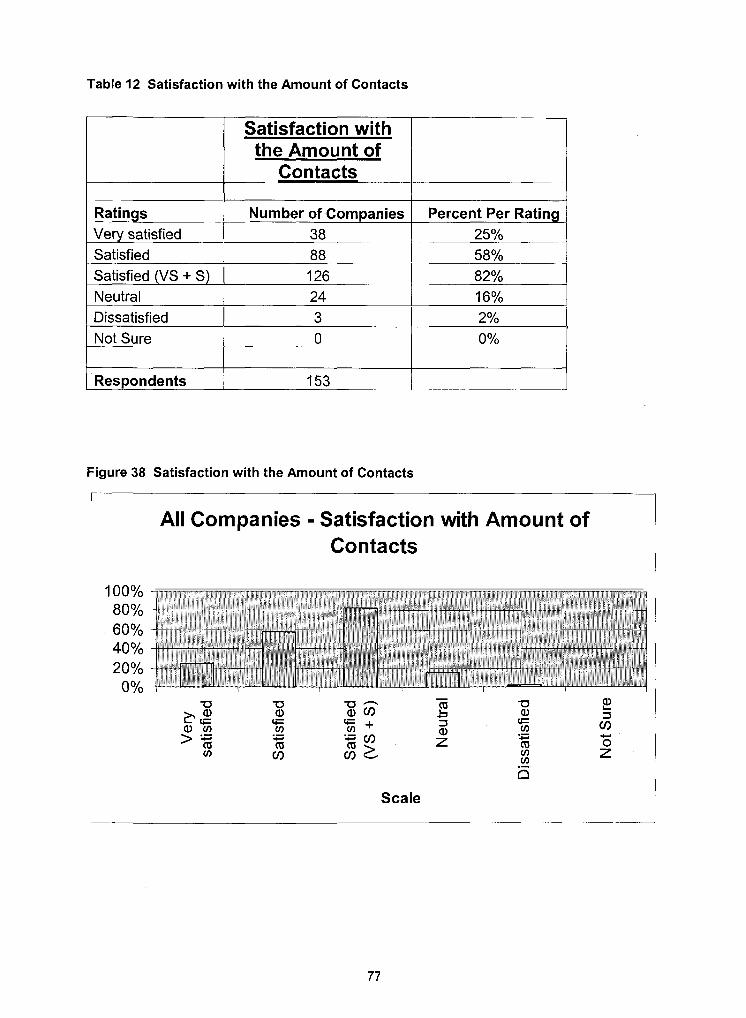
Table 12 Satisfaction with the Amount of Contacts
Satisfaction with 1 the Amount of Contacts
I I I
Ratings , Very satisfied
Number of Companies I Percent Per Rating
Satisfied 38
Satisfied (VS + S) I 126
Dissatisfied I 3 1 2 O/O I
25% 88
82% Neutral
58%
24
Not Sure
Figure 38
16%
I Respondents
Satisfaction with the Amount of Contacts
0
153
All Companies - Satisfaction with Amount of
0%
Contacts
Scale
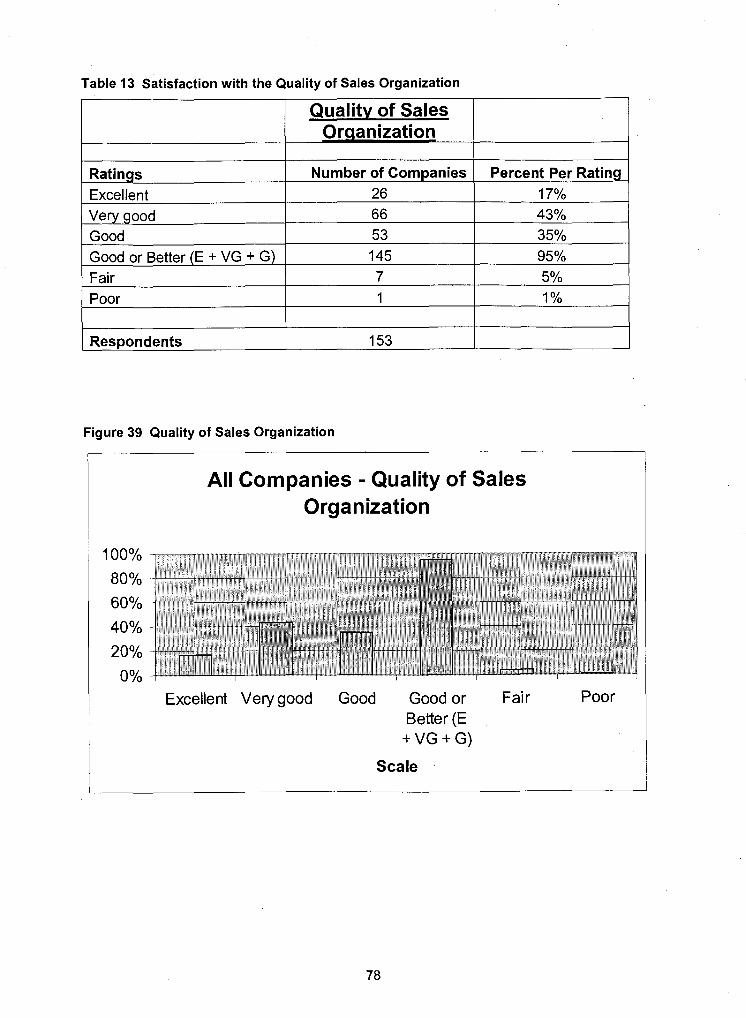
Table 13 Satisfaction with the Quality of Sales Organization
I Quality of Sales / Organization
I I
1 Good 53 35%
Ratings Excellent Very good
Number of Companies 26 66
Good or Better (E + VG + G) Fair
Percent Per Rating 17% 43%
Poor
Figure 39 Quality of Sales Organization
145 7
I I
All Companies - Quality of Sales Organization
95% 5%
1
Respondents
Excellent Very good Good Good or Fair Better (E +VG+G)
1%
153
Scale
Poor
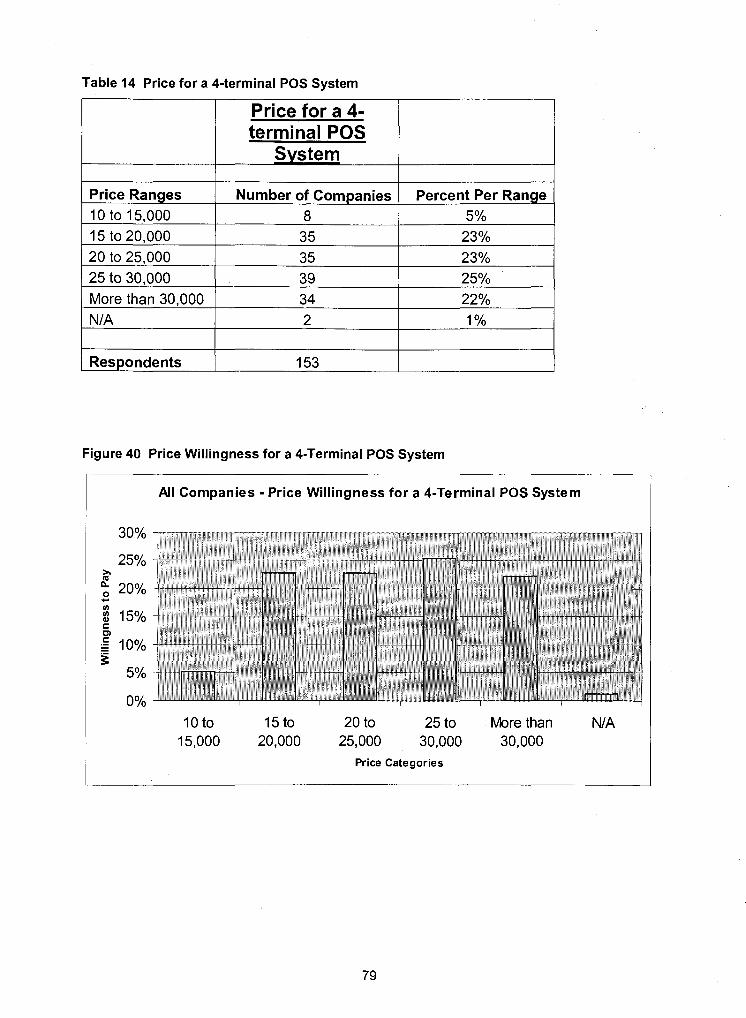
Table 14 Price for a 4-terminal POS System
Price for a 4- terminal POS
System
Price Ranges
10 to 15,000 15 to 20,000 20 to 25,000 25 to 30,000 More than 30,000 NIA
Figure 40 Price Willingness for a 4-Terminal POS System
Number of Companies 8
1 Respondents
All Companies - Price Willingness for a 4-Terminal POS System
Percent Per Range
5% 35 35 39 34 2
153
10 to 15 to 20 to 25 to More than NIA 15,000 20,000 25,000 30,000 30,000
23% 23% 2 5 O/O
22% 1%
Price Categories
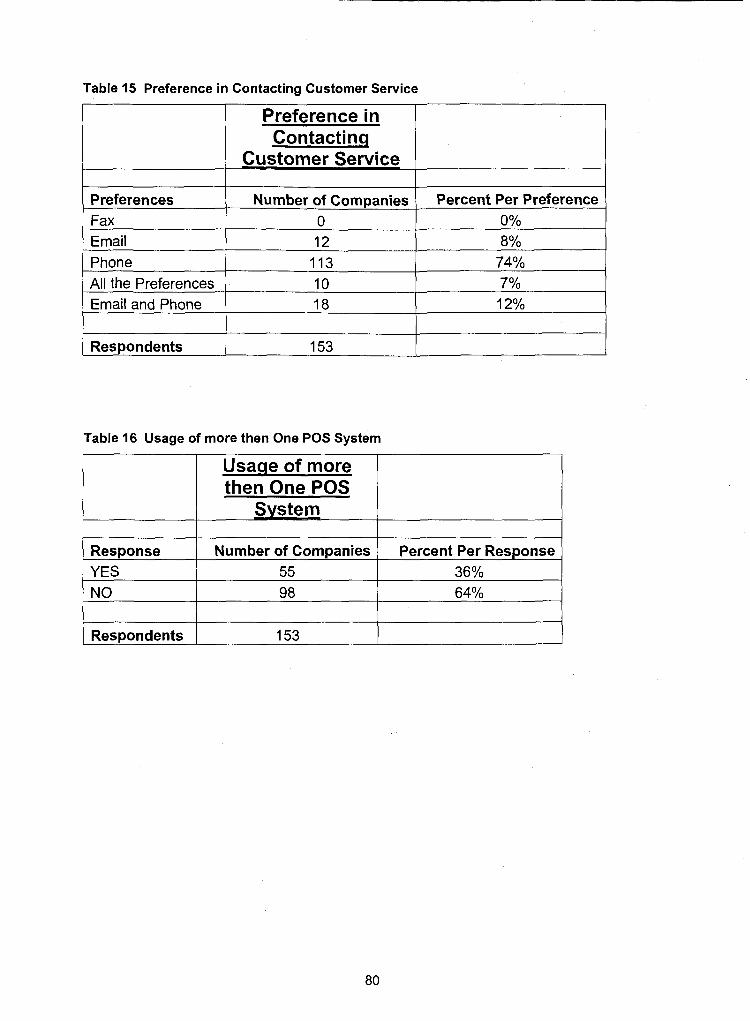
Table 15 Preference in Contacting Customer Service
I Preference in ( Contacting
Customer Service
Preferences Fax Email Phone All the Preferences Email and Phone
Table 16 Usage of more then One POS System
Number of Companies 0 12
I I
U s a ~ e of more then One POS
System
Percent Per Preference 0% 8%
1 13 10 18
Respondents
74% 7% 12%
153
I I
Respondents 1 153
Response YES NO
Number of Companies 55 98
Percent Per Response 36% 64%
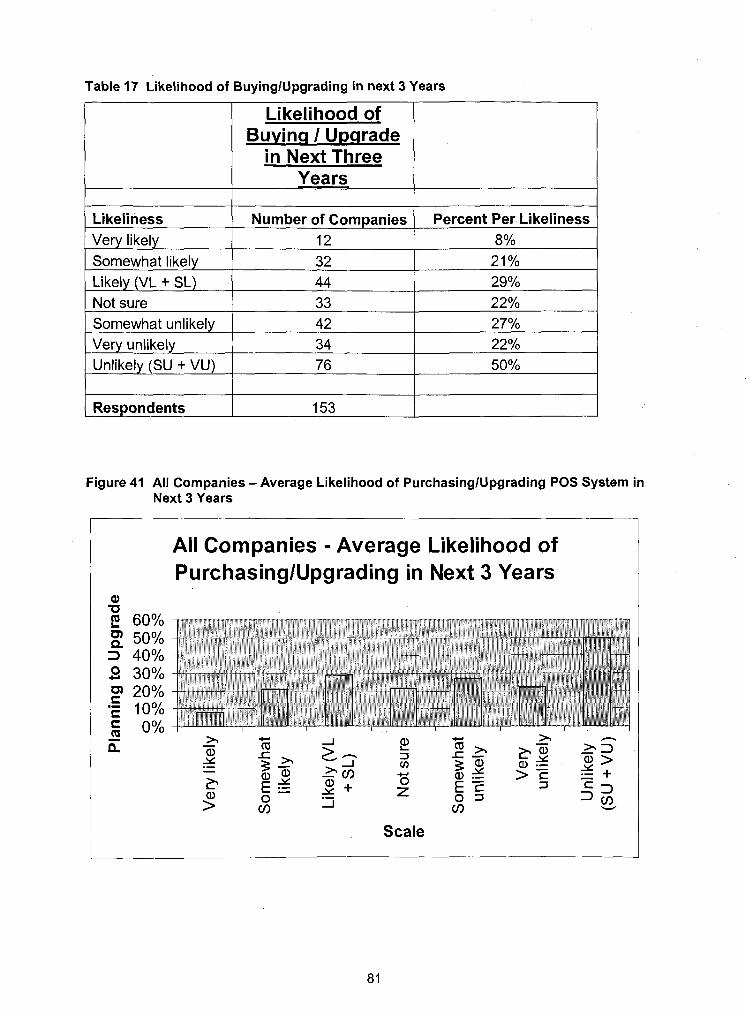
Table 17 Likelihood of BuyinglUpgrading in next 3 Years
Likelihood of Buying 1 Upgrade
in Next Three Years
I I
Likeliness Very likely Somewhat likely Likely (VL + SL) Not sure Somewhat unlikely Very unlikely Unlikely (SU + VU)
Figure 41 All Companies - Average Likelihood of PurchasinglUpgrading POS System in
I I
Next 3 Years
Number of Companies 12 32 44 33 42 34 76
Respondents
All Companies - Average Likelihood of PurchasingIUpgrading in Next 3 Years
Percent Per Likeliness 8% 21 % 2 9 O/O
22% 27% 22% 50%
153
Scale
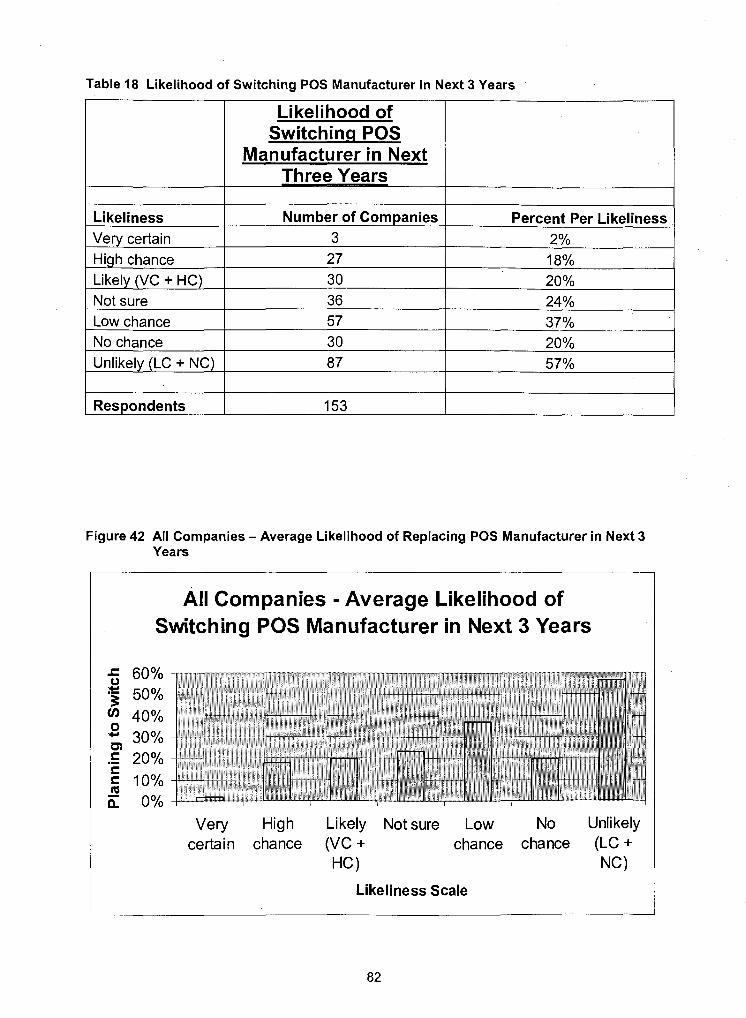
Table 18 Likelihood of Switching POS Manufacturer in Next 3 Years
Likelihood of Switching POS
Manufacturer in Next Three Years
/ No chance 30 20%
Likeliness Very certain High chance Likely (VC + HC) Not sure Low chance
I Unlikely (LC + NC) 1 87 57%
Number of Companies 3
27 30 36 57
Figure 42 All Companies - Average Likelihood of Replacing POS Manufacturer in Next 3
Percent Per Likeliness 2% 18% 20% 24% 37%
/ Respondents
Years
153
All Companies - Average Likelihood of Switching POS Manufacturer in Next 3 Years
Very High Likely Not sure Low No Unlikely certain chance (VC + chance chance (LC+
HC) NC)
Likeliness Scale
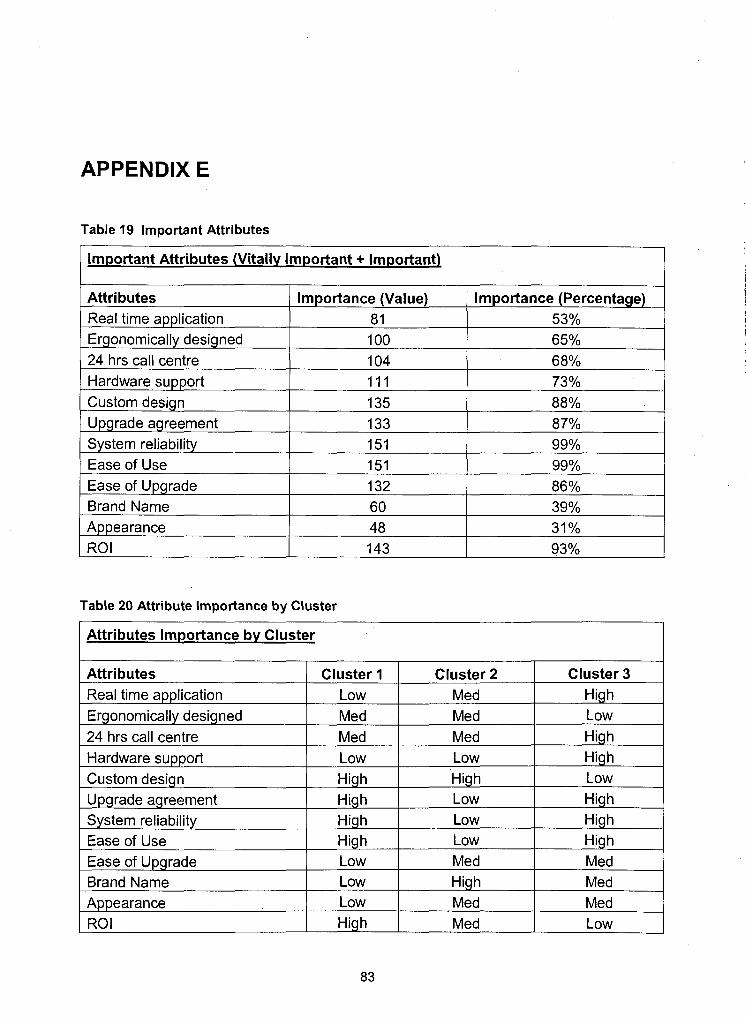
APPENDIX E
Table 19 lmportant Attributes
lmportant Attributes (Vitally lmportant + Important)
Attributes Real time application Ergonomically designed 24 hrs call centre Hardware support Custom design Upgrade agreement System reliability Ease of Use Ease of Upgrade Brand Name
Table 20 Attribute lmportance by Cluster
Importance (Value) 8 1 100 104 111
Appearance RO I
I Attributes Importance by Cluster I
Importance (Percentage) 53% 65% 68% 73%
135 133 151 151 132 60
88% 87% 99% 99% 86% 39%
48 143
31 % 93%
Attributes Real time application Ergonomically designed 24 hrs call centre Hardware support Custom design Upgrade agreement
Cluster 1 Low Med
System reliability
Med Low High High
Ease of Use Ease of Upgrade Brand Name
Cluster 2 Med Med
High
Appearance RO I
Cluster 3 High Low
Med Low High Low
High Low Low
High High Low High
Low
Low High
High Low Med High
High Med Med
Med Med
Med Low
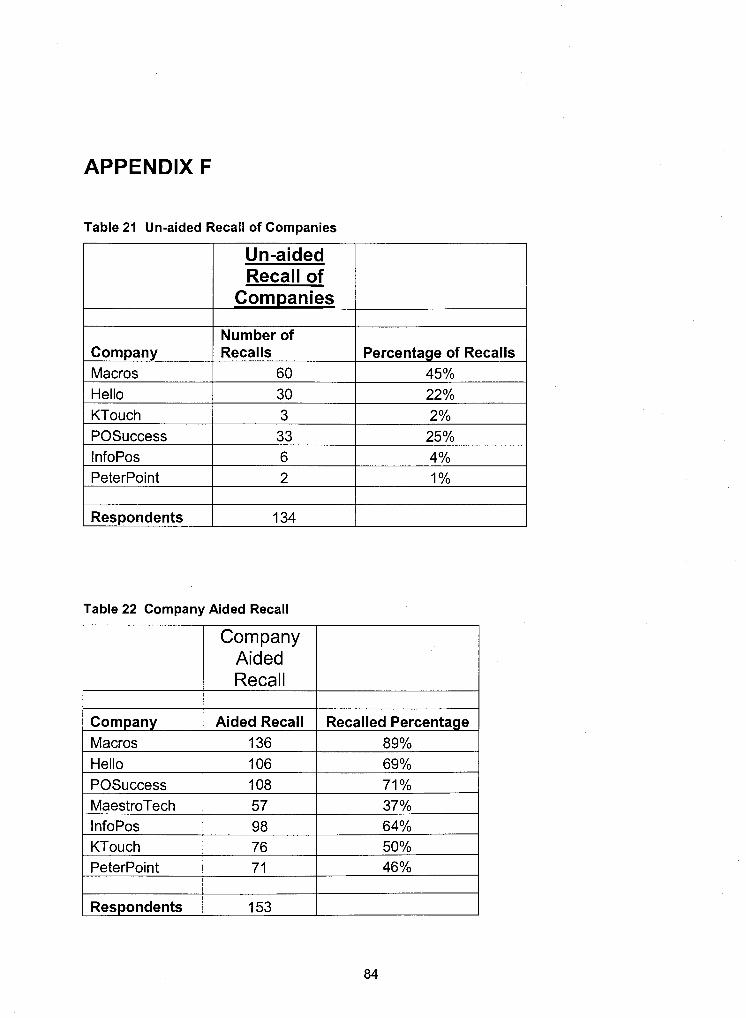
APPENDIX F
Table 21 Un-aided Recall of Companies
Recall of
I Hello I 30
Company Macros
KTouch I 3
Number of Recalls
60
POSuccess InfoPos PeterPoint
Table 22 Company Aided Recall
I
Company Aided Recall
Respondents 1 34
Company Macros Hello POSuccess
Aided Recall 136 106
MaestroTech l nfoPos
Respondents 1 153
Recalled Percentage 89% 69%
108
KTouch Peterpoint
71 % 57 98
37% 64%
76 71
50% 46%
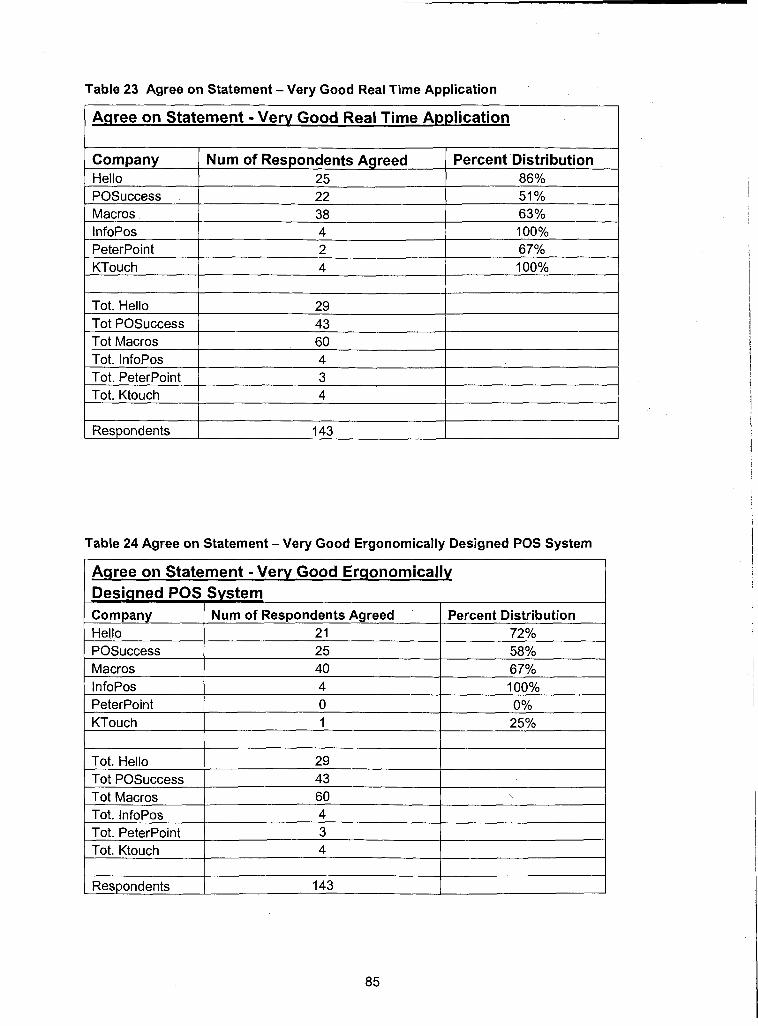
Table 23 Agree on Statement -Very Good Real Time Application
Agree on Statement -Very Good Real Time Application
Company Hello POSuccess Macros InfoPos Peterpoint KTouch
Num of Respondents Agreed 25
Tot. Hello Tot POSuccess Tot Macros Tot. InfoPos Tot. Peterpoint Tot. Ktouch
Table 24 Agree on Statement -Very Good Ergonomically Designed POS System
Percent Distribution 86%
22 38 4 2 4
29 43 60 4 3 4
I I
51 % 63% 100% 67% 100%
Respondents
( POSuccess 25 58%
143
Agree on Statement - Very Good Ergonomically Designed POS System
I Macros 40 67%
-
Company Hello
Num of Respondents Agreed 2 1
Peterpoint KTouch
Percent Distribution 72 %
Tot. Hello Tot POSuccess Tot Macros Tot. InfoPos Tot. Peterpoint Tot. Ktouch
0 1
29 43 60 4 3 4
1 Respondents
0% 25%
143
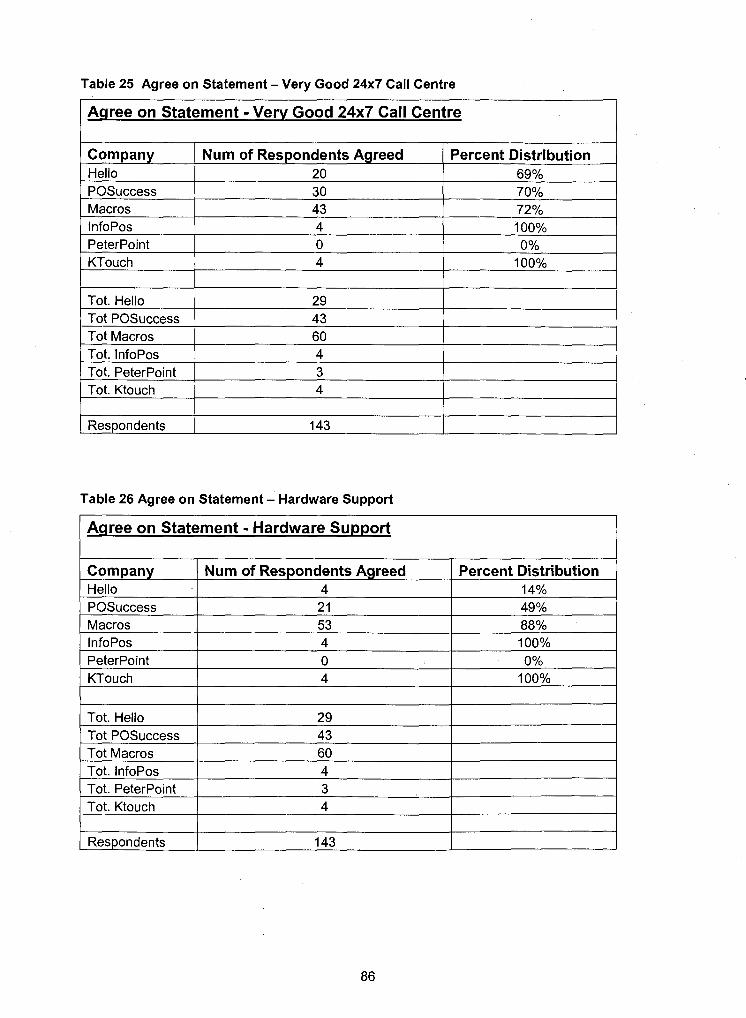
Table 25 Agree on Statement - Very Good 24x7 Call Centre
Aaree on Statement - Ven/ Good 24x7 Call Centre
Company Hello POSuccess Macros InfoPos Peterpoint KTouch
Tot. Hello
Num of Respondents Agreed 20 30 43 4 0 4
29 Tot POSuccess Tot Macros Tot. lnfoPos
Percent Distribution 69% 70% 72% 100% 0%
100%
43 60 4
Tot. Peterpoint 1 3
Table 26 Agree on Statement - Hardware Support
Tot. Ktouch
I Respondents
Agree on Statement - Hardware Support
4
143
Company Hello
( Peterpoint 0 0%
POSuccess Macros InfoPos
Num of Respondents Agreed 4
Percent Distribution 14%
2 1 53 4
KTouch
49% 88% 100%
Tot. Hello Tot POSuccess Tot Macros Tot. InfoPos Tot. Peterpoint Tot. Ktouch
4
29 43 60 4 3 4
1 Respondents
100%
143
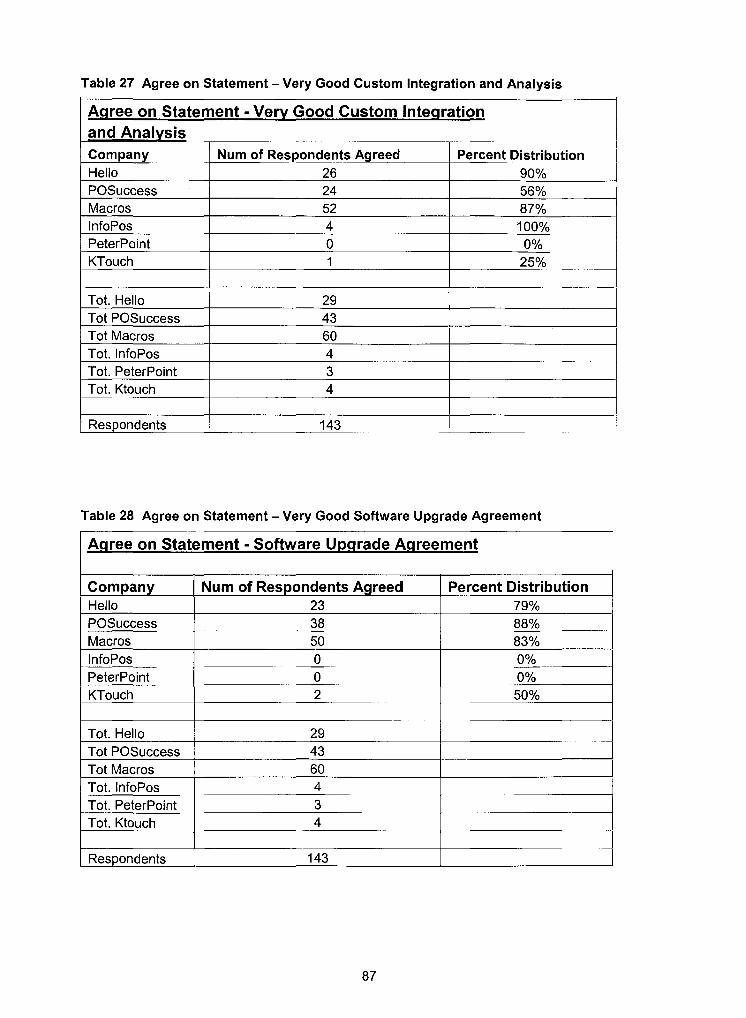
Table 27 Agree on Statement - Very Good Custom Integration and Analysis
I POSuccess 24 56 %
Agree on Statement - Very Good Custom Integration and Analysis
I Macros I 52 I 8794 I
Company Hello
Num of Respondents Agreed 26
InfoPos Peterpoint KTouch
I Tot POSuccess 43
Percent Distribution 9 0 oh
I I
I Tot Macros I 60 I I
4 0 1
Tot. Hello
I Tot. InfoPos 4
100% 0%
25%
29
Tot. Peterpoint Tot. Ktouch
Table 28 Agree on Statement - Very Good Software Upgrade Agreement I
3 4
I Respondents
Agree on Statement - Software Upgrade Agreement
143
Company Hello POSuccess Macros InfoPos Peterpoint KTouch
Tot. Hello Tot POSuccess Tot Macros Tot. InfoPos Tot. Peterpoint Tot. Ktouch
Num of Respondents Agreed 23 38 50 0 0 2
29 43 60 4 3 4
Respondents
Percent Distribution 79% 88% 83% 0% 0% 50 %
143
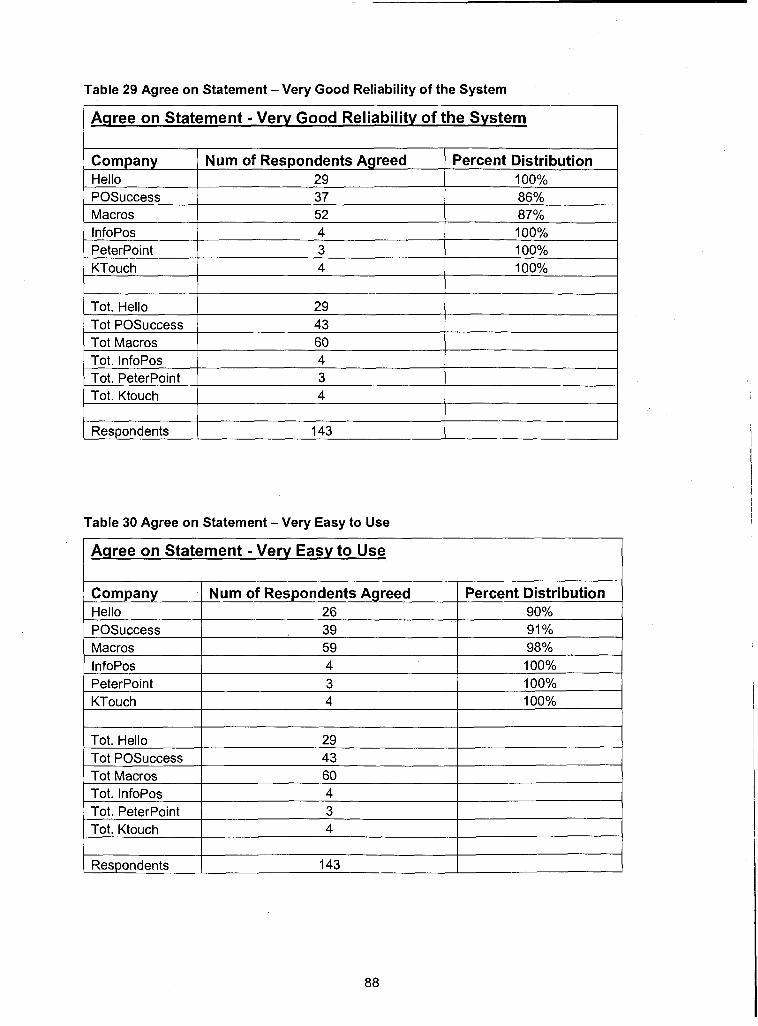
Table 29 Agree on Statement -Very Good Reliability of the System
1 Agree on statement - Very Good Reliability of the System
Company - Hello POSuccess Macros InfoPos Peterpoint KTouch
Table 30 Agree on Statement - Very Easy to Use
Tot. Hello Tot POSuccess Tot Macros Tot. InfoPos Tot. Peterpoint Tot. Ktouch
Agree on Statement - Very Easy to Use
Num of Respondents Agreed 29 37 52 4 3 4
29 43 60 4 3 4
Percent Distribution 100% 86% 87% 100% 100% 100%
Company Hello POSuccess Macros InfoPos Peterpoint KTouch
Tot. Hello Tot POSuccess Tot Macros Tot. InfoPos Tot. Peterpoint Tot. Ktouch
Num of Respondents Agreed 26 39 59 4 3 4
29 43 60 4 3 4
Respondents
Percent Distribution 90% 91 % 98% 100% 100% 100%
143
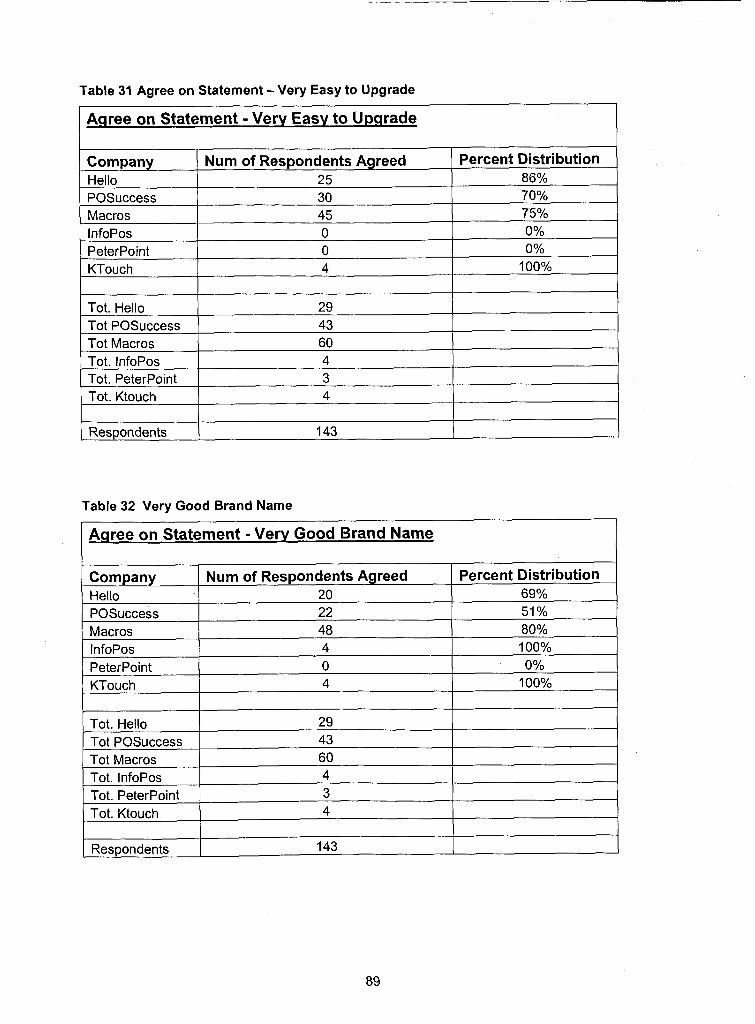
Table 31 Agree on Statement -Very Easy to Upgrade
Agree on Statement - Very Easy to Upgrade
Company Hello POSuccess Macros InfoPos Peterpoint KTouch
Tot. Hello Tot POSuccess Tot Macros Tot. InfoPos Tot. Peterpoint Tot. Ktouch
Table 32 Very Good Brand Name
Agree on Statement - Very Good Brand Name
Num of Respondents Agreed 25 30 45 0 0 4
29 43 60 4 3 4
I Respondents
Percent Distribution 86% 70% 75% 0% 0%
100%
143
Company Hello POSuccess Macros InfoPos Peterpoint KTouch
Tot. Hello Tot POSuccess Tot Macros Tot. InfoPos Tot. Peterpoint Tot. Ktouch
Num of Respondents Agreed 20 22 48 4 0 4
29 43 60 4 3 4
I I
Percent Distribution 69 % 51 % 80% 100% 0%
100%
Respondents 143
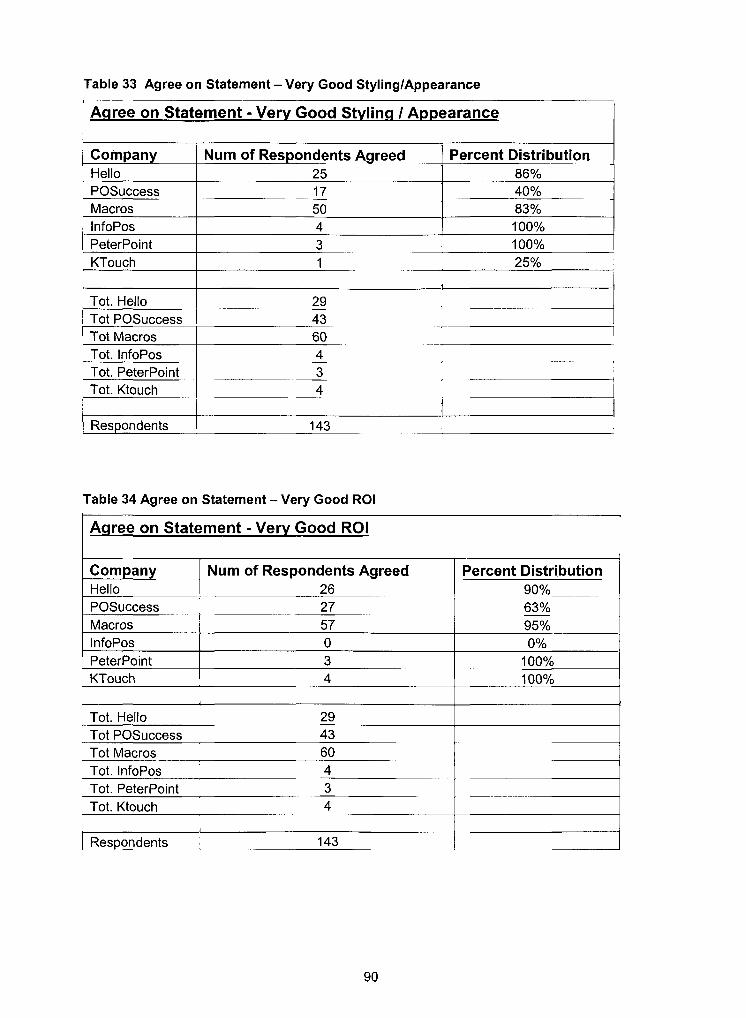
Table 33 Agree on Statement -Very Good StylinglAppearance I
Agree on Statement - Very Good Styling I Appearance
Company Hello POSuccess Macros
Peterpoint KTouch
Num of Respondents Agreed 25 17 50
Tot. Hello Tot POSuccess
Percent Distribution 86% 40% 83%
3 1
29 43
Tot Macros Tot. InfoPos Tot. Peterpoint Tot. Ktouch
Table 34 Agree on Statement - Very Good ROI
100% 25%
60 4 3 4
1 Respondents
Agree on Statement - Very Good ROI
143
Company Hello POSuccess Macros InfoPos
Num of Respondents Agreed 26
Peterpoint KTouch
Percent Distribution 90%
27 57 0
Tot. Hello Tot POSuccess Tot Macros Tot. InfoPos Tot. Peterpoint Tot. Ktouch
63% 95% 0%
3 4
29 43 60 4 3 4
I Respondents
100% 100%
143
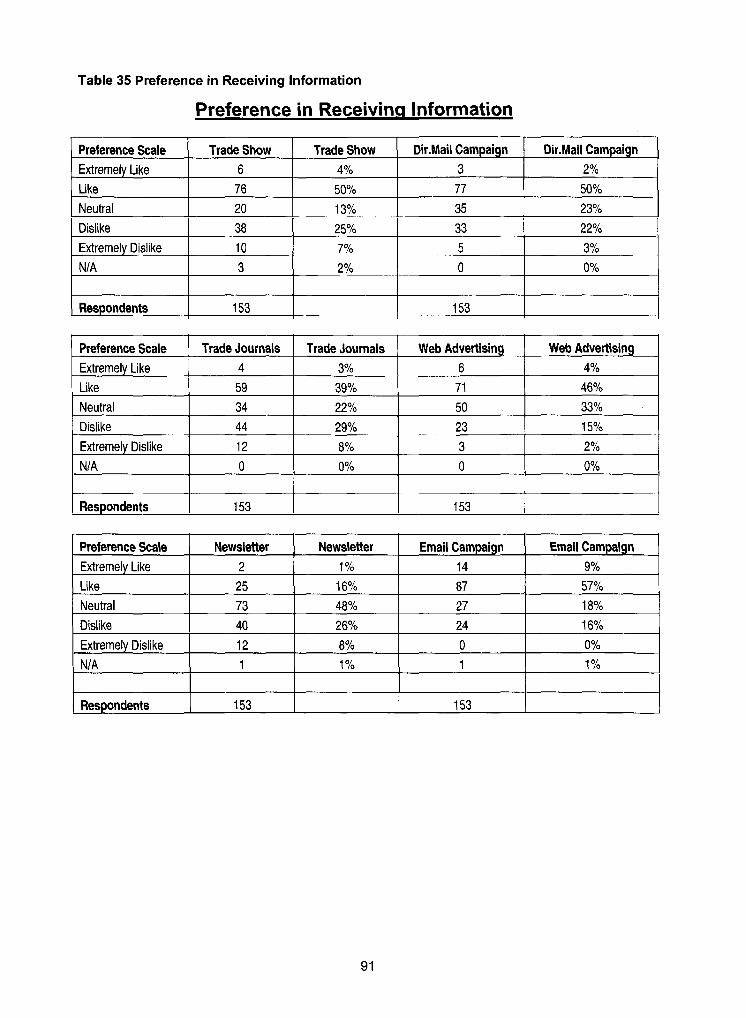
Table 35 Preference in Receiving lnformation
Preference in Receivin~ lnformation
I Preference Scale I Trade Show I Trade Show ( Mr.Mail Campaign I Dir.Mail Campaign I I Extremely Like 6 4% 3 2%
Like
Neutral Dislike
76
20
Extremely Dislike
NI A
38
( Respondents
I Neutral I 34 I 22% I 50 I 33% I
50%
13%
10
3
25%
153
Preference Scale Extremely Like Like
77
35
7%
2%
153
Trade Journals 4
59
Dislike Extremely Dislike
NIA
50%
23%
33
Web Advertising 4%
46%
Trade Journals 3% 39%
Respondents
22%
5
0
Web Advertising 6 71
44
12
0
Preference Scale Extremely Like Like
3%
0%
153
Neutral Dislike
Extremely Dislike
29%
8% 0%
153
Newsletter 2
25
NIA
73
40
12
Respondents
23
3
0
Newsletter 1 %
16%
1
15%
2%
0%
48%
26%
8%
153
Email Campaign 14
87
1 %
1 53
Email Campaign 9% 57%
27
24
0
18%
16%
0%
1 1 Yo
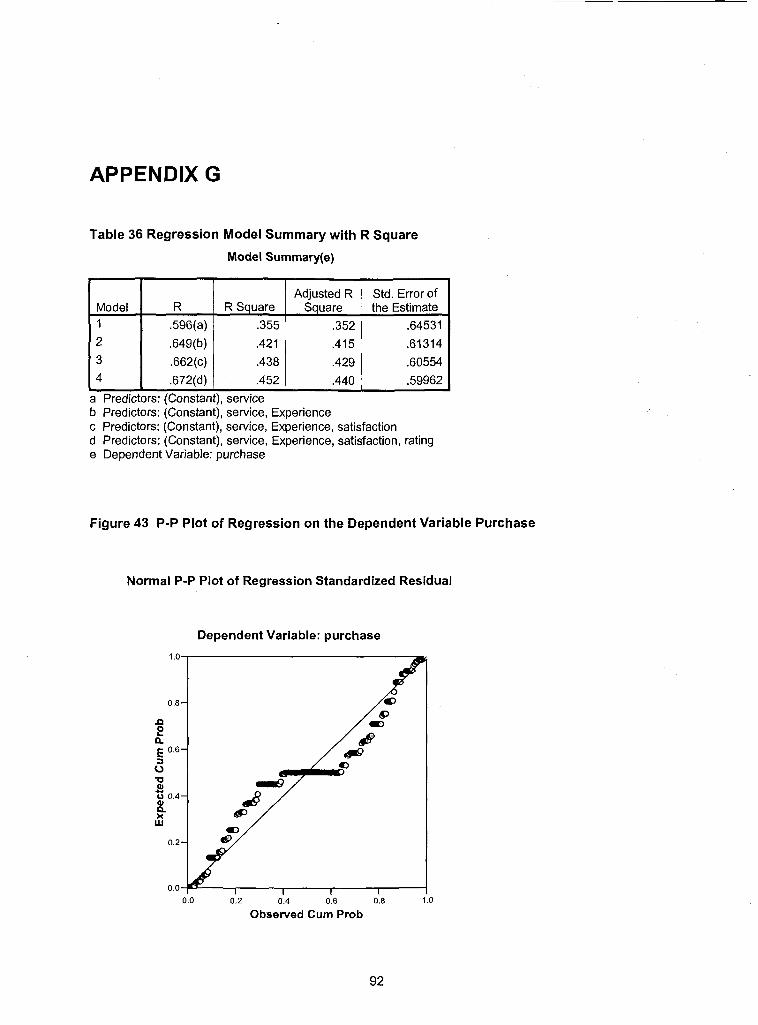
APPENDIX G
Table 36 Regression Model Summary with R Square
Model Summary(e)
I I I 1 Adiusted R 1 Std. Error of Model 1
Figure 43 P-P Plot of Regression on the Dependent Variable Purchase
4 I .672(d)
Normal P-P Plot of Regression Standardized Residual
R
.596(a)
Dependent Variable: purchase
a Predictors: (Constant), service b Predictors: (Constant), service, Experience c Predictors: (Constant), service, Experience, satisfaction d Predictors: (Constant), service, Experience, satisfaction, rating e Dependent Variable: purchase
.452
0.0 0.2 0.4 0.6 0.8
Observed Cum Prob
R Square
.355
.440
square
.352
.59962
the Estimate .64531
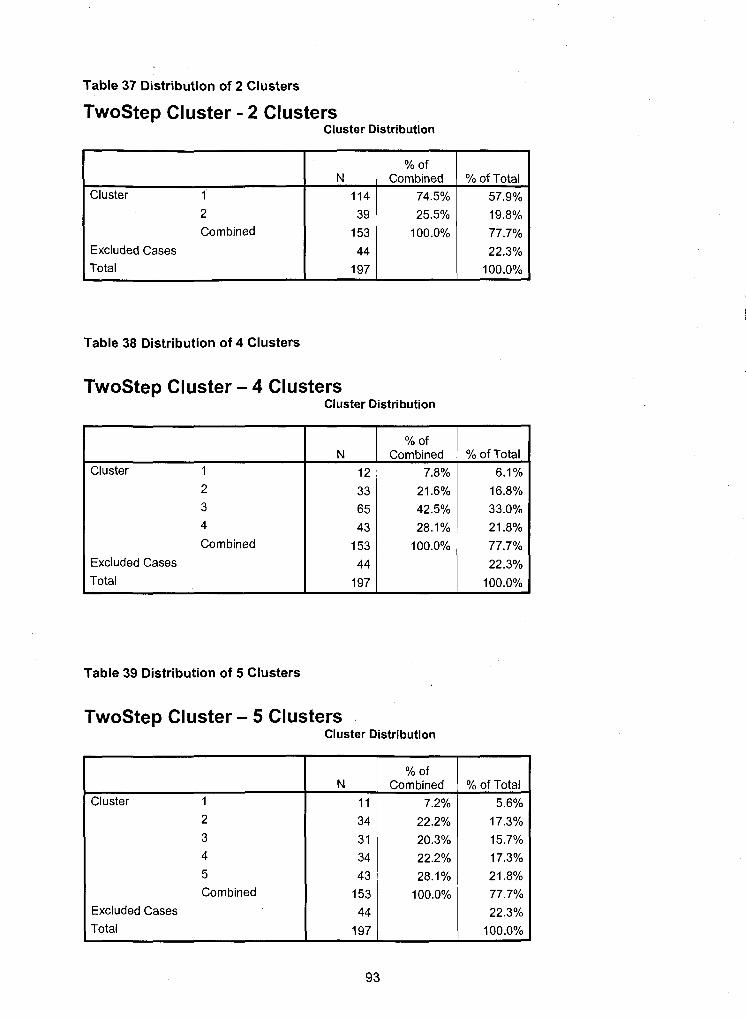
Table 37 Distribution of 2 Clusters
TwoStep Cluster - 2 Clusters Cluster Distribution
Cluster 1
Table 38 Distribution of 4 Clusters
TwoStep Cluster - 4 Clusters
2
Combined
Excluded Cases Total
Cluster Distribution
N 1 14
Cluster 1
2
3
4
Combined
Excluded Cases
Total
39
153
44
197
N 2 Combined - % of Total 12 7.8% 6.1%
Combined 74.5%
Table 39 Distribution of 5 Clusters
TwoStep Cluster - 5 Clusters
O/O of Total
57.9%
25.5%
100.0%
Cluster Distribution
19.8%
77.7%
22.3%
100.0%
2
3 4
5
Combined
Excluded Cases
Total
Cluster 1 N
11 Combined
7.2%
% of Total
5.6%
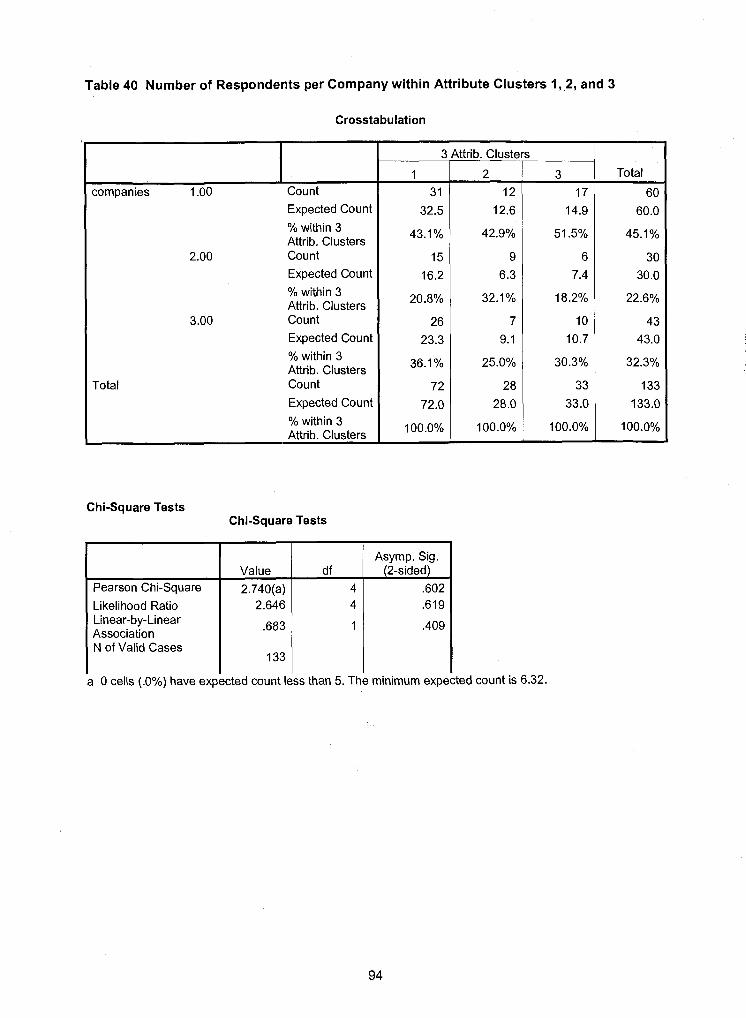
Table 40 Number of Respondents per Company within Attribute Clusters 1,2, and 3
Crosstabulation
companies 1 .OO Count Expected Count
% within 3 Attrib. Clusters
2.00 Count Expected Count
% within 3 Attrib. Clusters
3.00 Count Expected Count
% within 3 Attrib. Clusters
Total Count Expected Count
% within 3 Attrib. Clusters
Chi-square Tests
Pearson Chi-square
Likelihood Ratio Linear-by-Linear Association N of Valid Cases
Chi-square Tests
Asymp. Sig. 1 df 1 (2-side!Ao2 Value
2.740(a) 2.646 619
583 .409
dtrib. Cluste
2 12
12.6
42.9%
9
6.3
32.1%
7 9.1
25.0%
28
28.0
100.0%
3 17
14.9
51.5%
6
7.4
18.2O/0
10
10.7
30.3%
33
33.0
100.0%
Total
60
60.0
45.1%
30 30.0
22.6%
43 43.0
32.3%
133
133.0
100.0%
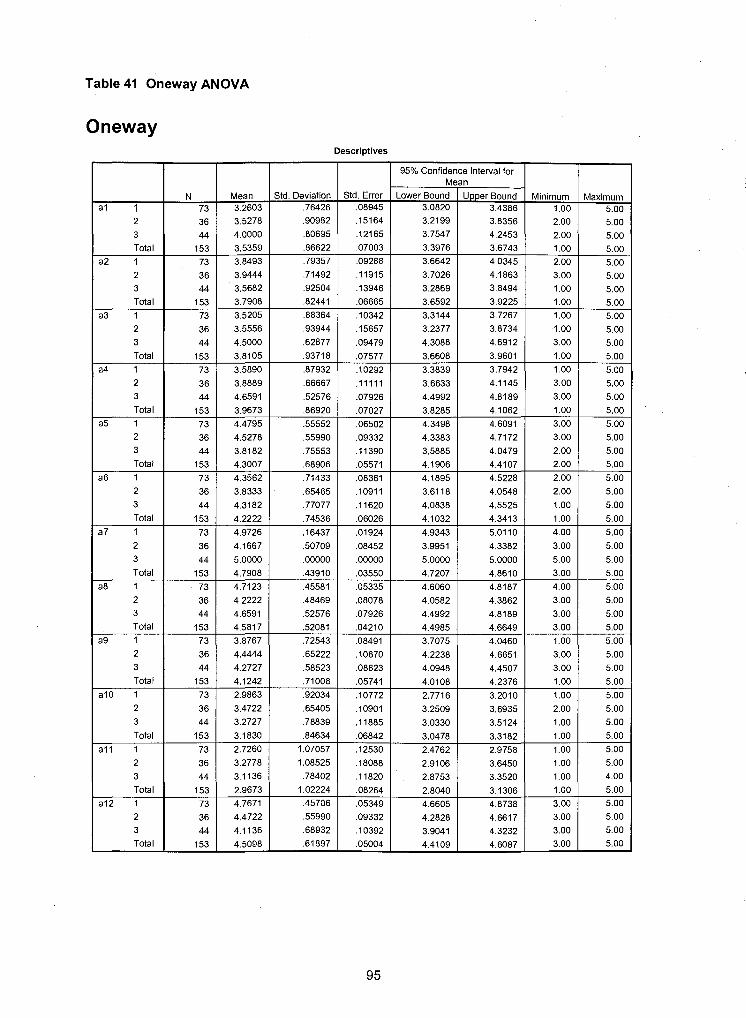
Table 41 Oneway ANOVA
Oneway Descriptives
2 3
Total
a6 1 2 3
Total
a7 1 2 3
Total
a8 1 2 3
a1 1
2 3 Total
a2 1 2 3
Total a3 1
2 3
Total a4 1
2 3
Total a5 1
Total
a9 1
N 73 36 44
153 73 36 44
153 73
36 44
153 73
36 44
153
73
2
3
Total
a10 1 2
3
Total
a l l 1 2
3 Total
a12 1 2 3 Total
Mean - 3.2603 3.5278
4.0000 3.5359 3.8493 3.9444 3.5682
3.7908 3.5205 3.5556 4.5000
3.8105
3.5890 3.8889
4.6591 3.9673 4.4795 4.5278
3.81 82 4.3007
4.3562 3.8333
4.3182
4.2222 4.9726
4.1667
5.0000 4.7908 4.7123
4.2222 4.6591 4.581 7 3.8767 4.4444
4.2727 4.1242
2.9863
3.4722 3.2727 3.1830
2.7260
3.2778 3.1136
2.9673
4.7671 4.4722 4.1136
4.5098
3d. Deviation ,76426 ,90982 ,80695 ,86622 ,79357
,71492 ,92504 ,82441
,88364 ,93944
,62877 ,93718
,87932
,66667
,52576 ,86920
,55552 ,55990
,75553 ,68906 ,71433
,65465 ,77077
,74536
,16437
,50709 .ooooo ,43910
,45581 ,48469 ,52576
,52081 ,72543 ,65222
,58523 ,71008
.92034
.65405
,78839 ,84634
1.07057 1.08525 ,78402
1.02224
,45706 ,55990 ,68932 ,61897
1 95% Confidence Interval for
Minimum 1 .oo 2.00 2.00 1 .oo 2.00 3.00 1 .oo 1 .oo 1 .oo 1 .oo 3.00
1 .oo 1 .oo
3.00 3.00 1 .oo
3.00 3.00
2.00 2.00 2.00
2.00
1 .oo 1 .oo
4.00
3.00
5.00 3.00
4.00 3.00
3.00 3.00 1 .oo
3.00
3.00 1 .oo
1 .oo 2.00
1 .oo 1 .oo 1 .oo 1 .oo 1 .oo 1 .oo 3.00 3.00 3.00 3.00
Maximum 5.00 5.00 5.00 5.00 5.00 5.00 5.00 5.00 5.00 5.00 5.00 5.00 5.00
5.00 5.00
5.00 5.00 5.00 5.00 5.00
5.00 5.00
5.00
5.00
5.00 5.00
5.00 5.00
5.00 5.00
5.00 5.00 5.00
5.00 5.00
5.00
5.00 5.00 5.00 5.00
5.00 5.00
4.00 5.00 5.00 5.00 5.00 5.00
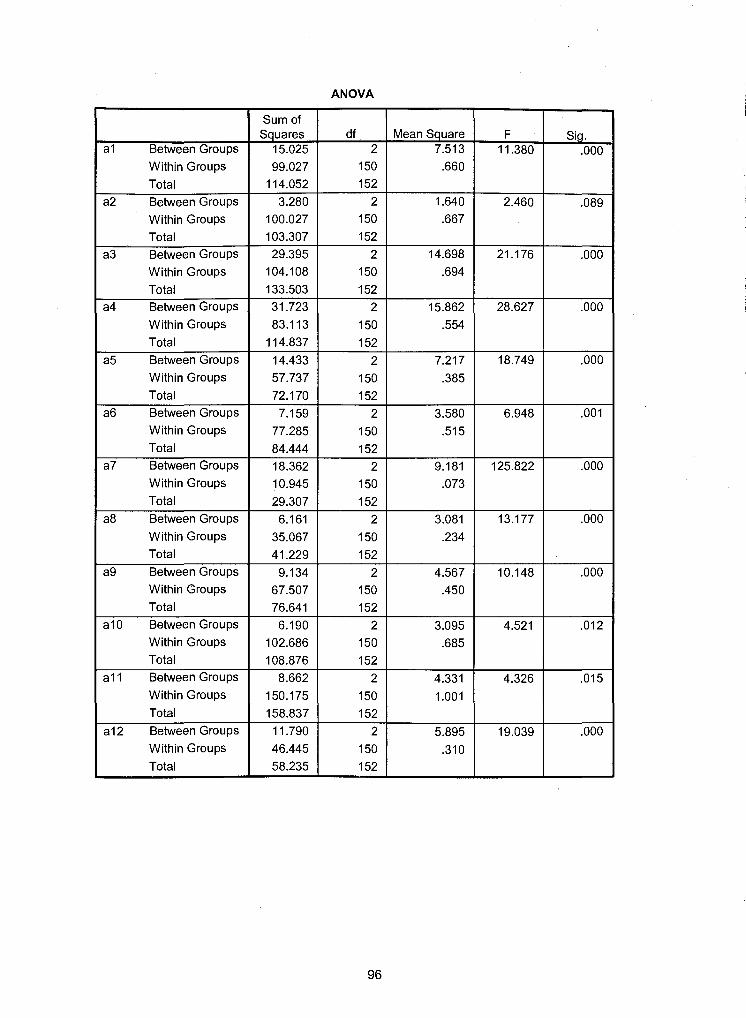
ANOVA
a1 Between Groups Within Groups Total
a2 Between Groups Within Groups Total
a3 Between Groups Within Groups Total
a4 Between Groups Within Groups Total
a5 Between Groups Within Groups Total
a6 Between Groups Within Groups Total
a7 Between Groups Within Groups Total
Sum of Squares
15.025 99.027
114.052 3.280
100.027 103.307 29.395
104.108 133.503 31.723 83.113
1 14.837 14.433 57.737 72.1 70 7.159
77.285 84.444 18.362 10.945 29.307
a8 Between Groups Within Groups Total
a9 Between Groups Within Groups Total
a10 Between Groups Within Groups Total
a1 I Between Groups Within Groups Total
a1 2 Between Groups Within Groups Total
Mean Square 7.51 3
.660
1.640 .667
REFERENCE LIST
Adams, Bruce. "Wireless point-of-sale option offers speed, flexibility". Hotel & Motel Management, 0611 912000, Vol. 21 5 lssue 1 1, p82
Allegon, Jeff. "New Frontiers in POS". Lodging Hospitality, 5/15/2004, Vol. 60 Issue 7, p78, 314p
Bertagnoli, Lisa. "POS-itively Remarkable". Restaurants & Institutions, 811 5/95, Vol. 105 lssue 20, p114
Greengard, Samuel. "Wireless Point of Sale". Internet World, Nov2001, Vol. 7 lssue 19, ~ 4 8
Kaschyk, Howard. "A Survey of Systems on The Show Floor". American Drycleaner, Sep2003, Vol. 70 lssue 6, p32
Lavrakas, Paul J. "Telephone Survey Methods - Sampling, Selection, and Supervision", Sage Publications, Inc., c. 1987, pp 18-1 9, 1 1 1, 11 7.
"Market for POS Application Software Nearing $1 Billion". Jul. 13, 2004, Chain Store Age Online, Payment Systems,Technology
"Point of Returns". Restaurants & Institutions, 1/15/2004, Vol. 114 lssue 2, p20, 2/3p
"Powering the Point of Sale". Nation's Restaurant News, 05/22/2000, Vol. 34 lssue 21, TECH TRENDS p16, 4p Romanow, Kara. "Bringing POS Data into Focus". Food Logistics, Mar2004 lssue 66, p46
Scheraga, Dan. "Positively POS". May. 1, 2004, Chain Store Age, Focus On, Page: IOA-I 1A
Websites:
~.ssui r re lsvstems.com (Accessed May 10, 2004)
www.rnicros.com (Accessed May 23, 2004)
www.aIohapos.com (Accessed July 01,2004)
www.ibm.com (Accessed July 1 1, 2004)
www.infoqenesis.com (Accessed July 12, 2004)
www.ncr.com (Accessed July 1 5,2004)
www.panasonic.com (Accessed July 15, 2004)
www.pixel~ointpos.com (Accessed July 16, 2004)
www.positouch.com (Accessed July 16, 2004)