Marine aerosol production: a review of the current knowledge
22
Marine aerosol production: a review of the current knowledge BY COLIN D. O’DOWD 1, * AND GERRIT DE LEEUW 2,3 1 Department of Experimental Physics and Environmental Change Institute, National University of Ireland, Galway University Road, Galway, Ireland 2 Climate and Global Change Unit, Research and Development, Finnish Meteorological Institute, 00560 Helsinki, Finland 3 TNO, PO Box 96864, 2509 JG, The Hague, The Netherlands The current knowledge in primary and secondary marine aerosol formation is reviewed. For primary marine aerosol source functions, recent source functions have demonstrated a significant flux of submicrometre particles down to radii of 20 nm. Moreover, the source functions derived from different techniques up to 10 mm have come within a factor of two of each other. For secondary marine aerosol formation, recent advances have identified iodine oxides and isoprene oxidation products, in addition to sulphuric acid, as contributing to formation and growth, although the exact roles remains to be determined. While a multistep process seems to be required, isoprene oxidation products are more likely to participate in growth and sulphuric acid is more likely to participate in nucleation. Iodine oxides are likely to participate in both nucleation and growth. Keywords: marine aerosol; particle formation; nucleation; sea spray; sea salt 1. Introduction The marine aerosol constitutes one of the most important natural aerosol systems globally. It contributes significantly to the Earth’s radiative budget, biogeo- chemical cycling, impacts on ecosystems and even to regional air quality. The marine aerosol comprises primary and secondary aerosol components. The primary aerosol production results from the interaction of wind stress at the ocean surface and results in the mechanical production of sea-spray aerosol (sea spray being the combination of inorganic sea salt and organic matter). Sea spray is produced via the bubble-bursting process typically resulting from whitecap generation, producing film and jet drops, resulting in sea-spray particles in the range of the submicrometre size and up to a few micrometres. It is estimated that whitecap formation onset occurs at wind speeds of 4 m s K1 . At higher wind speeds, the direct tearing of wave crests can result if spume droplet formation occurs at sizes from tens to hundreds of micrometres. Globally, in terms of sea-salt production, the mass flux is estimated to be 1–3!10 16 g yr K1 ( Erickson & Duce 1988; Phil. Trans. R. Soc. A (2007) 365, 1753–1774 doi:10.1098/rsta.2007.2043 Published online 18 May 2007 One contribution of 18 to a Discussion Meeting Issue ‘Trace gas biogeochemistry and global change’. * Author for correspondence ([email protected]). 1753 This journal is q 2007 The Royal Society on February 29, 2016 http://rsta.royalsocietypublishing.org/ Downloaded from
Transcript of Marine aerosol production: a review of the current knowledge
on February 29, 2016http://rsta.royalsocietypublishing.org/Downloaded from
Marine aerosol production: a review ofthe current knowledge
BY COLIN D. O’DOWD1,* AND GERRIT DE LEEUW
2,3
1Department of Experimental Physics and Environmental Change Institute,National University of Ireland, Galway University Road, Galway, Ireland
2Climate and Global Change Unit, Research and Development,Finnish Meteorological Institute, 00560 Helsinki, Finland
3TNO, PO Box 96864, 2509 JG, The Hague, The Netherlands
The current knowledge in primary and secondary marine aerosol formation is reviewed.For primary marine aerosol source functions, recent source functions have demonstrateda significant flux of submicrometre particles down to radii of 20 nm. Moreover, the sourcefunctions derived from different techniques up to 10 mm have come within a factor of twoof each other. For secondary marine aerosol formation, recent advances have identifiediodine oxides and isoprene oxidation products, in addition to sulphuric acid, ascontributing to formation and growth, although the exact roles remains to bedetermined. While a multistep process seems to be required, isoprene oxidation productsare more likely to participate in growth and sulphuric acid is more likely to participate innucleation. Iodine oxides are likely to participate in both nucleation and growth.
Keywords: marine aerosol; particle formation; nucleation; sea spray; sea salt
Oncha
*A
1. Introduction
The marine aerosol constitutes one of the most important natural aerosol systemsglobally. It contributes significantly to the Earth’s radiative budget, biogeo-chemical cycling, impacts on ecosystems and even to regional air quality.The marine aerosol comprises primary and secondary aerosol components. Theprimary aerosol production results from the interaction of wind stress at the oceansurface and results in the mechanical production of sea-spray aerosol (sea spraybeing the combination of inorganic sea salt and organic matter). Sea spray isproduced via the bubble-bursting process typically resulting from whitecapgeneration, producing film and jet drops, resulting in sea-spray particles in therange of the submicrometre size and up to a few micrometres. It is estimated thatwhitecap formation onset occurs at wind speeds of 4 m sK1. At higher wind speeds,the direct tearing of wave crests can result if spume droplet formation occurs atsizes from tens to hundreds of micrometres. Globally, in terms of sea-saltproduction, themassflux is estimated tobe1–3!1016 g yrK1 (Erickson&Duce1988;
Phil. Trans. R. Soc. A (2007) 365, 1753–1774
doi:10.1098/rsta.2007.2043
Published online 18 May 2007
e contribution of 18 to a Discussion Meeting Issue ‘Trace gas biogeochemistry and globalnge’.
uthor for correspondence ([email protected]).
1753 This journal is q 2007 The Royal Society

radius (µm)10–2 10–1 1 10 102
dF/d
log(
r) (
m–2
s–1
)
1
10
102
103
104
105
106
107
108
MonahanMonahan extrapol.M rtenssonVignatiGongClarkede Leeuw 2000de Leeuw 2003Reid
Figure 1. Compilation of sea-spray source functions published since 1998. Flux values are for awind speed of 8 m sK1.
C. D. O’Dowd and G. de Leeuw1754
on February 29, 2016http://rsta.royalsocietypublishing.org/Downloaded from
Gong et al. 2002). Thirty-two per cent of the global flux comes from the NorthernHemisphere and 92% of the mass flux is attributed to the supermicrometre sizerange (i.e. rO0.5 mm). Increase in sea-salt mass is primarily associated withincreasing wind speeds with mass concentrations being measured up to1000 mg mK3 at wind speeds of 15–20 m sK1 (Lewis & Schwartz 2004). Althoughmass loadings can be high, marine aerosol number concentrations are typicallylow, of the order of 300–600 cmK3 (O’Dowd et al. 1997; Yoon et al. 2007), ofwhich up to 50–150 cmK3 can be sea-salt particles under high wind conditions(O’Dowd & Smith 1993; Kreidenweis et al. 1998).
The interest in sea-spray aerosol has traditionally been focused on largeparticles (O1 mm) owing to their influence, at high wind speeds, on sea–airtransfer of water vapour and latent heat (e.g. Andreas 1998). The overview ofsea-spray source fluxes presented by Andreas (2002), which includes most of thecommon source functions presented until 1998, shows a variation ofapproximately six orders of magnitude. A critical analysis of the source functionspresented in Andreas (2002) is discussed in Schulz et al. (2004).
More recently, the interest in sea spray has been shifted to other applicationssuch as its role in chemical reactions (for coupled nitric acid–sea salt see Sorensenet al. (2005); for coupled sulphate–sea salt cycles see O’Dowd et al. (1999a,2000)) and, in particular, its role in climate change (IPCC 2001). Sea salt is thedominant submicrometre scatterer in most ocean regions (e.g. Kleefeld et al.2002; Bates et al. 2006) and dominates the marine boundary layer (MBL)particulate mass concentration in remote oceanic regions, with a significantfraction occurring in the submicrometre size range (IPCC 2001). Sea saltcontributes 44% to the global aerosol optical depth. Estimates for top-of-atmosphere, global-annual radiative forcing due to sea salt are K1.51 andK5.03 W mK2 for low and high emission values, respectively (IPCC 2001). Sea
Phil. Trans. R. Soc. A (2007)

1755Marine aerosol production
on February 29, 2016http://rsta.royalsocietypublishing.org/Downloaded from
spray not only affects climate by scattering of solar radiation, but also the sprayparticles act as cloud condensation nuclei and thus contribute to the indirectaerosol effect (O’Dowd et al. 1999b). Sea salt has also been linked to the MBLcycle through the activation of halogens, leading to ozone depletion (Vogt et al.1996; McFiggens et al. 2000). For primary marine aerosol (PMA), a historicaland detailed review of sea-salt production and resulting concentrations isdiscussed in Lewis & Schwartz (2005).
In terms of secondary marine aerosol production (i.e. particle productionresulting from gas-to-particle conversion processes), historically, it has beenthought that sulphur species have been the primary chemical componentinvolved (Shaw 1983; Charlson et al. 1987). Secondary aerosol production occursin the following two ways: (i) new particle formation occurs via the nucleation ofstable clusters of the order of 0.5–1 nm in sizes (these clusters, once formed, cangrow to larger sizes via condensation processes) and (ii) they also can grow viaheterogeneous reactions and aqueous phase oxidation of dissolved gases inexisting aerosol particles. In terms of the sulphur cycle, dimethylsulphide(DMS), a waste produced by phytoplankton, is released from the ocean into theatmosphere where it undergoes oxidation by the OH radical to form SO2, whichis further oxidized to form H2SO4 (see Charlson et al. (1987) for full discussion).H2SO4 is thought to participate in binary homogeneous nucleation with H2O,and more recently, in ternary nucleation with H2O and NH3. While Clarke et al.(1998) found evidence for particle production linked to high DMS emissions inthe Pacific, a more robust analysis of particle production from H2SO4 by Pirjolaet al. (2000) pointed out that while binary nucleation was likely to occur in thepolar regions, and ternary nucleation likely to occur in many other marineenvironments, there is typically insufficient H2SO4 vapour to contribute togrowth of stable clusters into aerosol particles (operationally defined as particleswith DO3 nm). O’Dowd et al. (2002a) demonstrated that unless newly formedstable clusters can grow sufficiently fast, the clusters are scavenged by the pre-existing aerosol coagulation sink. For example, a 1 nm particle, under typicalH2SO4 concentrations, will grow by condensation of H2SO4 vapour at a rate of0.5!10K4 nm sK1. This is compared with a coagulation loss rate of 2!10K3 sK1,that is, there is a very low probability of survival for 1 nm particles. If, however,the source rate of condensable vapours is increased significantly above that forH2SO4, and the particle can grow rapidly to 3 nm, the coagulation loss ratereduces by an order of magnitude, and at 6 nm, the lost rate is reduced further byanother order of magnitude. Thus, it is essential for new clusters to undergorapid condensation growth immediately after formation if they are to have areasonable probability for survival. The difficulty is that H2SO4 concentrationsare insufficient to lead to the required growth rate for a significant number ofnucleated embryos to survive into aerosol particles.
Recent studies in the coastal zone, where regular and significant particlenucleation events have been observed (O’Dowd et al. 1998, 1999c, 2002b), show thatiodine oxides have been found to drive the nucleation and growth (O’Dowd et al.2002b). This has raised the question whether or not iodine oxides can explain theproduction of newaerosol particles over the open ocean.Other issues to consider arethat nucleation events over the ocean appear to be relatively infrequent andassociatedwith significantwashout after heavyprecipitation events.Twoquestionsyet to be answered are (i) is secondary particle production dominated by
Phil. Trans. R. Soc. A (2007)
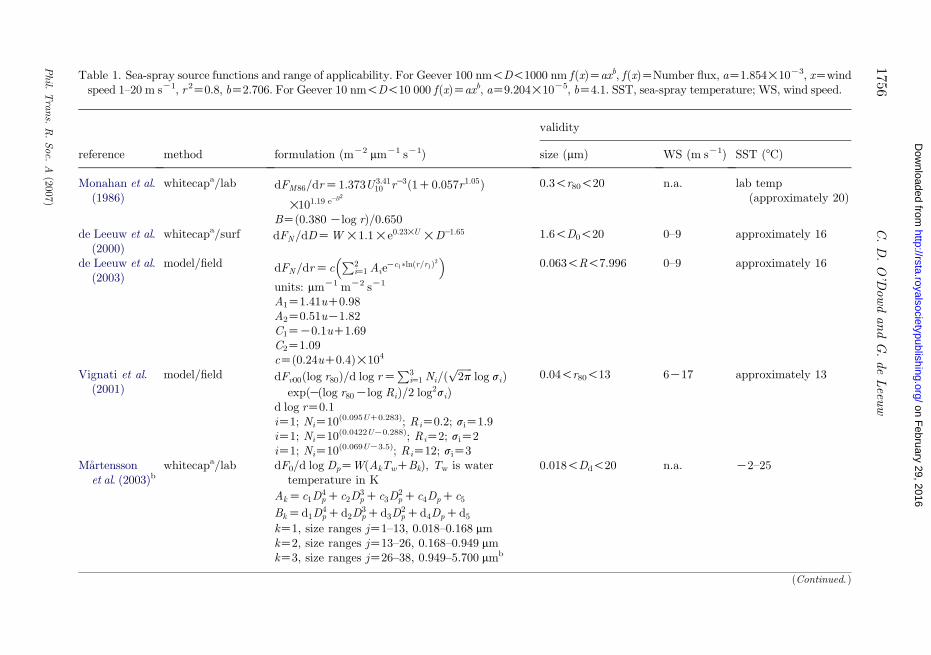
Table 1. Sea-spray source functions and range of applicability. For Geever 100 nm!D!1000 nm f(x)Zaxb, f(x)ZNumber flux, aZ1.854!10K3, xZwindspeed 1–20 m sK1, r 2Z0.8, bZ2.706. For Geever 10 nm!D!10 000 f(x)Zaxb, aZ9.204!10K5, bZ4.1. SST, sea-spray temperature; WS, wind speed.
reference method formulation (mK2 mmK1 sK1)
validity
size (mm) WS (m sK1) SST (8C)
Monahan et al.(1986)
whitecapa/lab dFM86=drZ1:373U 3:4110 rK3ð1C0:057r1:05Þ
!101:19 eKB2
0.3!r80!20 n.a. lab temp(approximately 20)
BZ(0.380Klog r)/0.650de Leeuw et al.
(2000)whitecapa/surf dFN=dDZW!1:1!e0:23!U !DK1:65 1.6!D0!20 0–9 approximately 16
de Leeuw et al.(2003)
model/field dFN=drZcP2
iZ1 AieKc1�lnðr=r1Þ2
� �0.063!R!7.996 0–9 approximately 16
units: mmK1 mK2 sK1
A1Z1.41uC0.98A2Z0.51uK1.82C1ZK0.1uC1.69C2Z1.09cZ(0.24uC0.4)!104
Vignati et al.(2001)
model/field dFv00ðlog r80Þ=d log rZP3
iZ1 Ni=ðffiffiffiffiffiffi2p
plog siÞ
expðKðlog r80Klog RiÞ=2 log2siÞ0.04!r80!13 6K17 approximately 13
d log rZ0.1iZ1; NiZ10(0.095UC0.283); RiZ0.2; siZ1.9iZ1; NiZ10(0.0422UK0.288); RiZ2; siZ2iZ1; NiZ10(0.069UK3.5); RiZ12; siZ3
Martenssonet al. (2003)b
whitecapa/lab dF0/d log DpZW(AkTwCBk), Tw is watertemperature in K
0.018!Dd!20 n.a. K2–25
AkZc1D4pCc2D
3pCc3D
2pCc4DpCc5
BkZd1D4pCd2D
3pCd3D
2pCd4DpCd5
kZ1, size ranges jZ1–13, 0.018–0.168 mmkZ2, size ranges jZ13–26, 0.168–0.949 mmkZ3, size ranges jZ26–38, 0.949–5.700 mmb
(Continued. )
C.D.O’D
owdandG.deLeeu
w1756
Phil.
Trans.
R.Soc.
A(2007)
on February 29, 2016
http://rsta.royalsocietypublishing.org/D
ownloaded from

Table 1 (Continued.)
reference method formulation (mK2 mmK1 sK1)
validity
size (mm) WS (m sK1) SST (8C)
Gong (2003) modifiedMonahan/lab
dFM86=drZ1:373U 3:4110 rKAð1C0:057r3:45Þ
!101:19eKB2
0.07!r80!200.04!rd n.a. see Monahan et al.(1986)
AZ4:7ð1CqrÞK0:017rK1:44
BZð0:433Klog rÞ=0:433Clarke et al.
(2006)cwhitecapa/surf ðdFN=d log DpÞZw
P3iZ1 Ai
0.01!Dp!8 n.a. approximately 25
AiZb0Cb1DpCb2DpCb3DpCb4DpCb5Dpc
aWhitecap cover is most commonly formulated as (Monahan & O’Muircheartaigh 1980): W(U10)Z3.84!10K6 U 3:4110 , where U10 (m sK1) is the wind
speed at 10 m.bSee table 2 for values of the constants.cSee table 3 for values of the constants.
1757
Marin
eaero
solproductio
n
Phil.
Trans.
R.Soc.
A(2007)
on February 29, 2016
http://rsta.royalsocietypublishing.org/D
ownloaded from

C. D. O’Dowd and G. de Leeuw1758
on February 29, 2016http://rsta.royalsocietypublishing.org/Downloaded from
entrainment of sulphate clusters/particles from the free troposphere?And (ii) is thebackground particle concentration maintained by a slow source rate of secondaryparticles which are below the detection limit of current-day aerosol instrumenta-tion?While we do not aim to answer these questions in this review, we provide themost current summary of recent advances in elucidating the marine secondaryaerosol formation process based on current knowledge.
2. Primary marine aerosol source functions
The PMA source function describes the surface flux (typically at 10 m above theocean) of sea-spray aerosol, i.e. the number of droplets produced per unit surfacearea and per unit of time. Measurements may provide total fluxes, i.e. the totalnumber of particles in a given size interval or spectral fluxes. The latter areexpressed in number of droplets for a range of size intervals, i.e. mmK1 mK2 sK1.It is noted that the particle radius may be given as dry radius (rdry), i.e. theradius the sea-salt particle would have at relative humidity RHZ0%, as theradius the particle would have when normalized to RHZ80% (r80) or asthe radius at formation (r0). The latter would be understood as a particle withthe composition of seawater in an environment with the equilibrium RH overseawater (RHZ97%). The formulation depends on the way the source functionhas been derived. As a rule of thumb, r0z2r80z4rdry. Often the particlediameter is used instead of radius. In this review, we focus on a selection of sourcefunctions which span both submicrometre and supermicrometre sizes, withparticular emphasis on the submicrometre flux.
The selected source functions are shown in figure 1 for a wind speed of 8 m sK1.The associated parametrizations are listed in table 1 along with their range ofapplicability. Mostly, the source functions are presented as power-law functionsand hence, at higher wind speeds, the source of sea spray increases in greaterproportions than the wind speed increase. These include Monahan et al. (1986)who used the whitecap method that is based on combining the parametrization ofthe whitecap cover using field experimental data and the production of sea-sprayaerosol per unit whitecap area determined from laboratory experiments. Thisparametrization applies to particle diameters in the range 0.3–10 mm, which isthe range of the particle counter used in their laboratory experiments.Monahan’s parametrization has also been extrapolated down to 20 nm sizes, asshown in the figure; however, there is no scientific rationale associated with thisextrapolation. It should be noted that although not included here, Hoppel et al.(2002) recommend a combined source function using Monahan et al. (1986) and amodified version of Smith et al. (1993). Gong (2003) modified Monahan’s sourcefunction to account for the observed decrease in the particle concentrations forparticles smaller than 0.1 mm radius (O’Dowd et al. 1997) although the results atthe smallest sizes are likely to be questionable. Vignati et al. (2001) used anapproach based on inverse modelling and also used the observations of O’Dowdet al. (1997).
de Leeuw et al. (2000) based their parametrization on surf zone experimentswhile Reid et al. (2001) used a concentration build-up method using aircraftmeasurements in an evolving internal boundary layer. A more recent schemedeveloped by de Leeuw et al. (2003) used the Vignati method for data collected in
Phil. Trans. R. Soc. A (2007)

Table 2. Values of constants used in Martensson et al. (2003).
size interval(mm) c1 c2 c3 c4 c5
0.018–0.168 K2.87!1028 K1.30!1022 1.94!1015 K1.00!108 7.46!10K1
0.168–0.949 K4.57!1024 1.30!1019 K1.34!1013 5.76!106 K7.15!10K1
0.949–5.700 K1.09!1021 1.64!1016 K8.43!1010 1.59!105 K5.53!10K2
d1 d 2 d3 d4 d5
0.018–0.168 K8.37!1030 3.81!1024 K5.74!1017 3.01!1010 K2.21!102
0.168–0.949 1.25!1027 K3.62!1021 3.81!1015 K1.67!109 2.17!102
0.949–5.700 2.93!1023 K4.44!1018 2.29!1013 K4.32!107 1.52!101
Table 3. Values of constants used in Clarke et al. (2006). (Percentage values of constants inClarke et al. (2006).)
coefficient
Dp range (mm)
0.01–0.132 0.132–1.2 1.2–8.0
b0 K5.001!103 3.854!103 4.498!102
b1 0.808!106 1.168!104 0.839!103
b2 K1.980!107 K6.572!104 K5.394!102
b3 2.188!108 1.003!105 1.218!102
b4 K1.144!109 K6.407!104 K1.213!101
b5 2.290!109 1.493!104 4.514!10K1
1759Marine aerosol production
on February 29, 2016http://rsta.royalsocietypublishing.org/Downloaded from
the Pacific near Hawaii. Martensson et al. (2003) determined their sourcefunction from bubble-mediated laboratory studies to determine the flux as afunction of whitecap coverage and then incorporated Monahan’s wind speed andwhitecap relationship to produce flux estimates. Their parametrization alsoincludes temperature effects, finding that at lower temperatures, the dry size ofthe spray droplet reduced in size with reducing sea surface temperature. Clarkeet al. (2006) determined the production over the surf zone and related that toopen ocean production using whitecap cover, similar to de Leeuw, but extendingthe valid interval to the range 0.01–8 mm dry radius (table 3).
The data in figure 1 show that the discrepancy between different formulationsis much reduced with respect to the situation when Andreas did his review. Thesource functions shown in figure 1 were obtained using different methods andphysical principles but leading to consistent results. Comparison of theformulations by Clarke et al. (2006), a representative expression for the ‘whitecapmethod’, de Leeuw, Monahan and Reid and collegues show that they lie withinapproximately a factor of 2 (Clarke et al. 2006). In addition, Clarke et al.compares very well with the Martensson et al.’s (2003) laboratory-basedparametrization. This provides the level of confidence in PMA source functionsover sizes from 0.01 to approximately 10 mm (Clarke et al. 2006; table 3).
Phil. Trans. R. Soc. A (2007)

108
107
106
105
104
103
numbersurface areavolume
radius (µm)
dF/d
log(
r) µ
m2 ,
µm
3 m
–2 s
–1
102
10–2 10–1 1 10 102
Figure 2. Number, surface area and volume source functions at 18 m sK1 using the source functionfrom Clarke et al. (2006).
C. D. O’Dowd and G. de Leeuw1760
on February 29, 2016http://rsta.royalsocietypublishing.org/Downloaded from
It is useful to also look at the higher order moments of the sea-spray sourcefunction distribution to estimate the sea-spray surface area and volume flux sincethese fluxes are important for chemical reactions and scattering processes.Figure 2 illustrates the number, surface area and volume flux at 18 m sK1 for theClarke et al. (2006) parametrization (corresponding to a water temperature of288C). It can be clearly seen that while the number is dominated bysubmicrometre sizes, and in particular, sizes as small as 20 nm, the surfacearea flux is dominated by modes at 300 nm and 2–3 mm. Volume is dominated bythe 3 mm mode also; however, the trend indicates that the actual volume mode isat sizes greater than 10 mm. This is consistent with the volume mode reported byO’Dowd et al. (1997).
The PMA source functions discussed above are based on indirect methodsrelying on measurements of particle concentrations, which in most cases canreliably be assumed to be sea spray (refractory measurements and profiles overthe surf zone). Direct measurements of sea-spray fluxes are provided by the eddycovariance (EC) method that was first attempted by Nilsson et al. (2001) in theArctic Ocean using an ultrasonic anemometer (Sonic) and a condensationparticle counter (CPC) to measure the total number flux of particles larger than10 nm. The advantage of this method, as opposed to the whitecap method, is thatall particles within the detectable size range may be measured, and hence there isno restriction for bubble-mediated production. The technique was also used at acoastal station over the North East Atlantic by Geever et al. (2005). In the latterstudy, fluxes were quantified for total number concentration larger than 10 nmusing a CPC, and larger than 100 nm using a particle measuring system activescattering aerosol spectrometer probe (ASASP-X). The data were carefullyfiltered to remove any potential surf zone effect and they demonstrated that thepeak in the flux footprint for the filtered data was clearly 1–2 km offshore. Geeveret al. (2005) found that approximately 50% of the number flux occurred into theAitken mode (10–100 nm) and 50% into the accumulation mode (100–1000 nm).
Phil. Trans. R. Soc. A (2007)

(a) (b)
108
106
104
wind speed (ms–1)
M rtenssonGeever
num
ber
flux
(m
–2s–1
)
102
10
107
106
105
104
103
1020 5 10 15 20
M rtensson at 13˚CGeever
accumulation mode source function
wind speed (ms–1)
0 5 10 15 20
aitken mode source function
Figure 3. (a) Parametrized source function of total number concentration from Martensson andGeever for sizes larger than 10 nm. (b) Parametrized source function of total number concentrationfrom Martensson and Geever for sizes larger than 100 nm. Martensson parametrization is derivedfor a sea surface temperature of 138C.
1761Marine aerosol production
on February 29, 2016http://rsta.royalsocietypublishing.org/Downloaded from
They reported measurements up to 18 m sK1. Figure 3 compares the Geeverintegrated number with that derived fromMartensson at sizes DO10 and 100 nm.For sizes DO10 nm, the two parametrizations exhibit close agreement, while theagreement is not as close, but still reasonable for sizes larger than 100 nm.
3. Submicrometre size distribution structure
Over the last few years, three detailed studies on laboratory-generated sea-sprayproduction were conducted. Martensson et al. (2003) conducted experimentsusing artificial seawater (using aquarium-grade sea salt) for four different watertemperatures and three different salinities. At 258C, there was a distinct mode atapproximately 100 nm and a secondary mode at approximately 40 nm(diameter). Both modes appeared to shift to smaller sizes as the temperaturewas reduced to 58C with an increasing amplitude for the smaller mode and adecreasing amplitude for the larger mode.
Sellegri et al. (2006) conducted experiments on artificial seawater alone andartificial seawater with added synthetic surfactant (SDS). At 238C, the aerosoldistribution resulting from the use of surfactant-free seawater comprised threemodes (figure 4): (i) a dominant accumulationmode at 110 nm, (ii) anAitkenmodeat 45 nm, and (iii) a thirdmode at 300 nm, resulting from forcedbursting of bubbles.The forced bursting occurs when bubbles fail to burst upon reaching the surface andare later shattered by splashing associated with breaking waves and/or windpressure at the surface. At 48C, the accumulation mode diameter was reduced to85 nm, the Aitken mode diameter was reduced to less than 30 nm and the 300 nmmode diameter was reduced to 200 nm. With the addition of SDS, the relativeimportance of the mode resulting from forced bursting increased dramatically.
Tyree et al. (in press) also conducted submicrometre aerosol measurementsfrom controlled bubble-mediated production in the laboratory. They also found,for inorganic seawater, a dominant mode at 100 nm. They found that a reductionin salinity reduced the net flux of particles and also reduced the dominant mode
Phil. Trans. R. Soc. A (2007)

20
15
10
norm
aliz
ed d
n/d
log
Dp (
×10
–3)
5
0
0.01
inorganic mode1inorganic mode2inorganic mode3inorganic sum modessurfactant mode1surfactant mode2surfactant mode3surfactant sum modes
5 6 7 89 2 3 4 5 6 7 89 2 3 4 5 6 7 8 9
0.1
Dp(µm) Dp(µm)
1.0
1614121086420
inorganic mode1inorganic mode2inorganic mode3inorganic sum modessurfactant mode1surfactant mode2surfactant mode3surfactant sum modes
0.015 6 7 89 2 3 4 5 6 7 89 2 3 4 5 6 7 8 9
0.1 1.0
(a) (b)
Figure 4. (a) Resulting size distribution for small sintered gas bubble system (mean bubble size160 mm) for inorganic seawater and with added surfactant. (b) Same as (a) except for weir-generated bubbles with a mean size of 70 mm. Reproduced with permission from AmericanGeophysical Union (Sellegri et al. 2007; doi:10.1029/2005JD006658). Copyright q AmericanGeophysical Union.
C. D. O’Dowd and G. de Leeuw1762
on February 29, 2016http://rsta.royalsocietypublishing.org/Downloaded from
size from 100 nm at a salinity of 70% to 90 nm at a salinity of 10%. This changein salinity reduced the number concentration by a factor of 2. In addition, theyfound that the addition of natural organic matter increased the droplet flux by afactor of 1.5.
These preliminary studies indicate a more complex submicrometre spectralstructure that is significantly affected by salinity, temperature and surfactantconcentration and suggest that more detailed studies are required for laboratory-generated sea-spray aerosol.
4. Chemical composition
Although the dominant mass fraction of sea-spray aerosol is inorganic sea salt,organic matter can also contribute to the overall mass and it has long beenknown that marine aerosols contain organic material (i.e. Blanchard 1964;Hoffman & Duce 1976). Recent field measurements clearly document thepresence of organic matter in individual particles (Middlebrook et al. 1998) and arelevant contribution of organic species to fine aerosol mass in the unperturbedMBL (Putaud et al. 2000). However, the role of organic compounds in the remotemarine aerosol, although recognized as potentially important (Matsumoto et al.1997; Novakov et al. 1997), remains largely uncertain, mainly due to the lack ofquantitative measurements of their size-dependent composition. Further, despitea large number of studies on the occurrence of individual compounds or classes ofcompounds, e.g. carboxylic acids (Kawamura & Sakaguchi 1999; Mochida et al.2003), a comprehensive characterization of the chemical nature of organic matterin marine aerosols is currently not available.
The most comprehensive study to date on the organic fraction of sea-sprayaerosol has been conducted by Cavalli et al. (2004) and O’Dowd et al. (2004). Theyfound a significant and dominating fraction of organic matter in submicrometresizes, while the supermicrometre size range was predominately inorganic sea salt.However, it should be noted that the absolute magnitudes of organic mass in thesub- and supermicrometre size ranges were equivalent and it was their relative
Phil. Trans. R. Soc. A (2007)
1763Marine aerosol production
on February 29, 2016http://rsta.royalsocietypublishing.org/Downloaded from
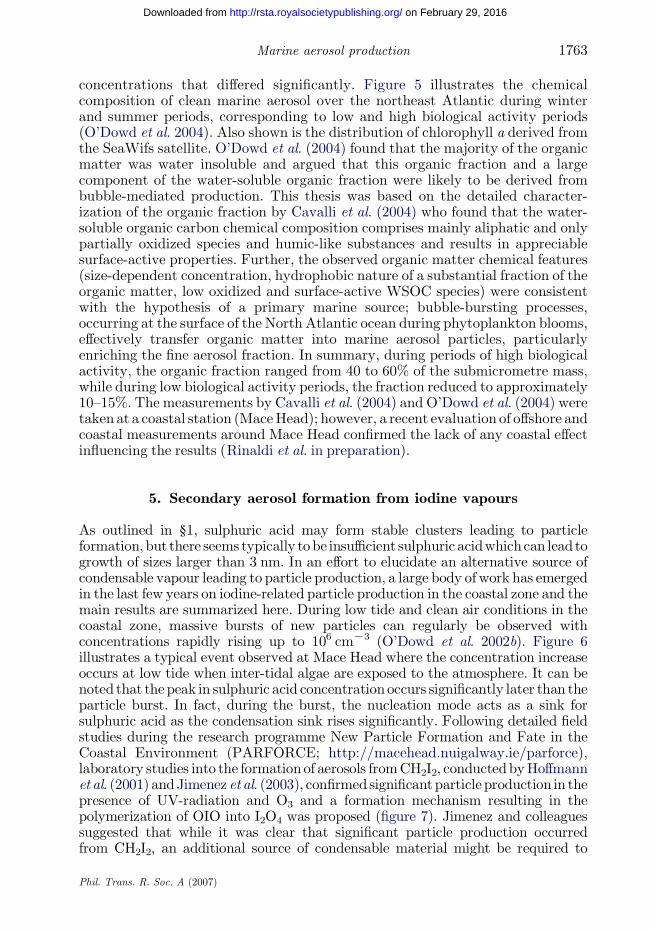
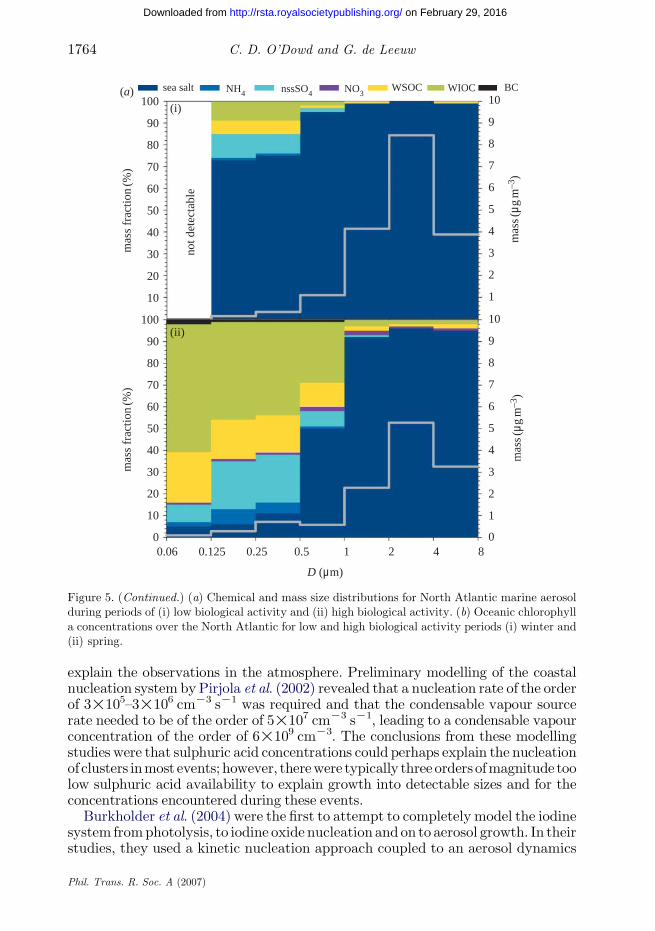
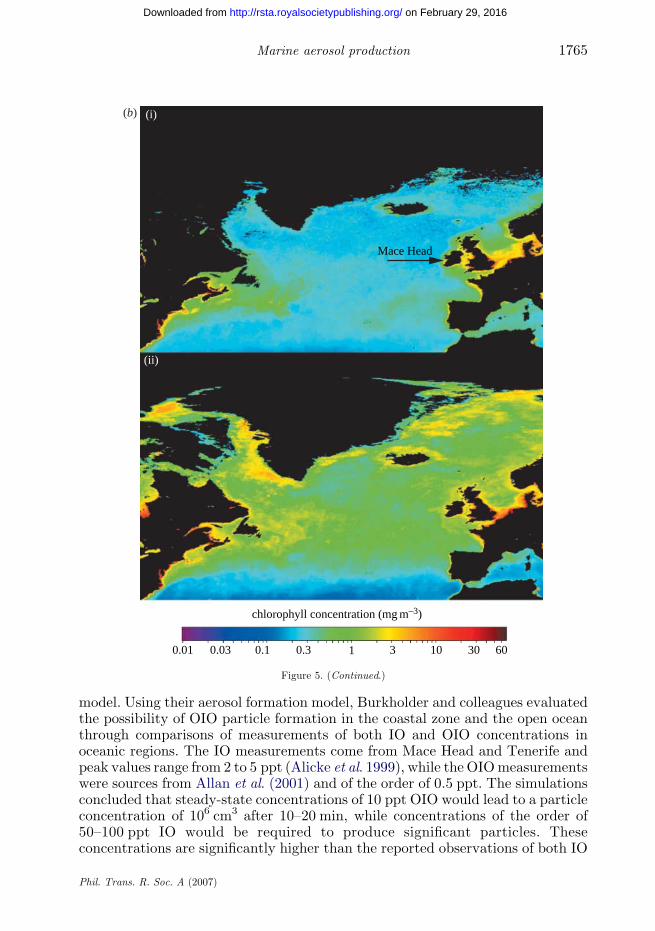
concentrations that differed significantly. Figure 5 illustrates the chemicalcomposition of clean marine aerosol over the northeast Atlantic during winterand summer periods, corresponding to low and high biological activity periods(O’Dowd et al. 2004). Also shown is the distribution of chlorophyll a derived fromthe SeaWifs satellite. O’Dowd et al. (2004) found that the majority of the organicmatter was water insoluble and argued that this organic fraction and a largecomponent of the water-soluble organic fraction were likely to be derived frombubble-mediated production. This thesis was based on the detailed character-ization of the organic fraction by Cavalli et al. (2004) who found that the water-soluble organic carbon chemical composition comprises mainly aliphatic and onlypartially oxidized species and humic-like substances and results in appreciablesurface-active properties. Further, the observed organic matter chemical features(size-dependent concentration, hydrophobic nature of a substantial fraction of theorganic matter, low oxidized and surface-active WSOC species) were consistentwith the hypothesis of a primary marine source; bubble-bursting processes,occurring at the surface of the North Atlantic ocean during phytoplankton blooms,effectively transfer organic matter into marine aerosol particles, particularlyenriching the fine aerosol fraction. In summary, during periods of high biologicalactivity, the organic fraction ranged from 40 to 60% of the submicrometre mass,while during low biological activity periods, the fraction reduced to approximately10–15%. The measurements by Cavalli et al. (2004) and O’Dowd et al. (2004) weretaken at a coastal station (MaceHead); however, a recent evaluation of offshore andcoastal measurements around Mace Head confirmed the lack of any coastal effectinfluencing the results (Rinaldi et al. in preparation).
5. Secondary aerosol formation from iodine vapours
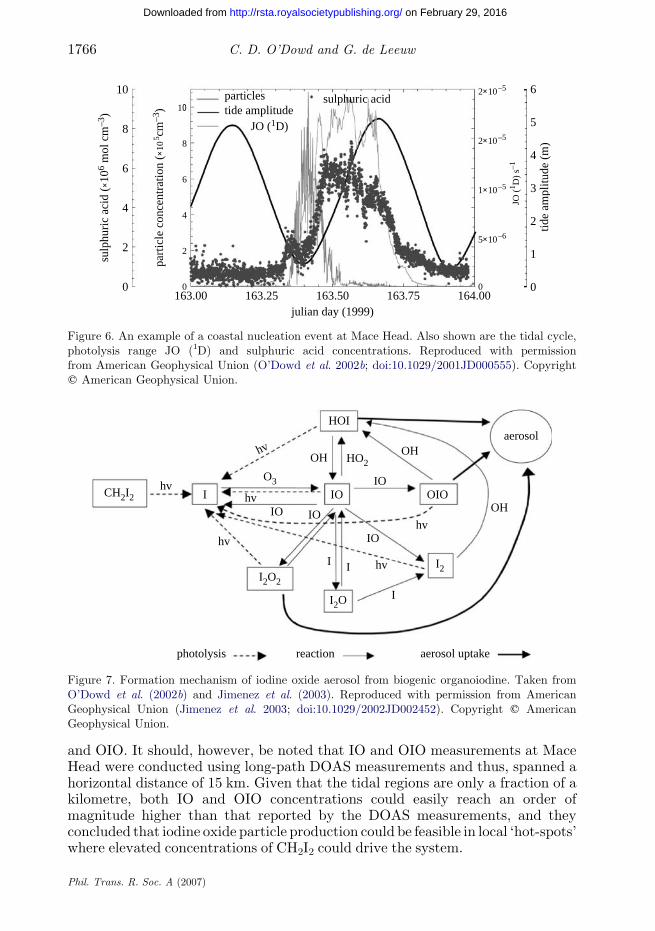
As outlined in §1, sulphuric acid may form stable clusters leading to particleformation, but there seems typically tobe insufficient sulphuric acidwhichcan lead togrowth of sizes larger than 3 nm. In an effort to elucidate an alternative source ofcondensable vapour leading to particle production, a large body of work has emergedin the last few years on iodine-related particle production in the coastal zone and themain results are summarized here. During low tide and clean air conditions in thecoastal zone, massive bursts of new particles can regularly be observed withconcentrations rapidly rising up to 106 cmK3 (O’Dowd et al. 2002b). Figure 6illustrates a typical event observed at Mace Head where the concentration increaseoccurs at low tide when inter-tidal algae are exposed to the atmosphere. It can benoted that thepeak in sulphuric acid concentration occurs significantly later than theparticle burst. In fact, during the burst, the nucleation mode acts as a sink forsulphuric acid as the condensation sink rises significantly. Following detailed fieldstudies during the research programme New Particle Formation and Fate in theCoastal Environment (PARFORCE; http://macehead.nuigalway.ie/parforce),laboratory studies into the formation of aerosols fromCH2I2, conductedbyHoffmannet al. (2001) andJimenez et al. (2003), confirmed significant particle production in thepresence of UV-radiation and O3 and a formation mechanism resulting in thepolymerization of OIO into I2O4 was proposed (figure 7). Jimenez and colleaguessuggested that while it was clear that significant particle production occurredfrom CH2I2, an additional source of condensable material might be required to
Phil. Trans. R. Soc. A (2007)
100sea salt NH4 NO3nssSO4
WSOC WIOC BC
mas
s fr
actio
n(%
)
not d
etec
tabl
e
mas
s fr
actio
n(%
)90
80
70
60
50
40
30
20
10
10
9
8
7
6
5
4
3
2
1
10
9
8
7
mas
s(µg
m–3
)m
ass(
µgm
–3)
6
5
4
3
2
1
0
100
90
80
70
60
50
40
30
20
10
00.06 0.125 0.25 0.5
D (µm)
(ii)
(i)
1 2 4 8
(a)
Figure 5. (Continued.) (a) Chemical and mass size distributions for North Atlantic marine aerosolduring periods of (i) low biological activity and (ii) high biological activity. (b) Oceanic chlorophylla concentrations over the North Atlantic for low and high biological activity periods (i) winter and(ii) spring.
C. D. O’Dowd and G. de Leeuw1764
on February 29, 2016http://rsta.royalsocietypublishing.org/Downloaded from
explain the observations in the atmosphere. Preliminary modelling of the coastalnucleation system byPirjola et al. (2002) revealed that a nucleation rate of the orderof 3!105–3!106 cmK3 sK1 was required and that the condensable vapour sourcerate needed to be of the order of 5!107 cmK3 sK1, leading to a condensable vapourconcentration of the order of 6!109 cmK3. The conclusions from these modellingstudies were that sulphuric acid concentrations could perhaps explain the nucleationof clusters inmost events; however, therewere typically three ordersofmagnitude toolow sulphuric acid availability to explain growth into detectable sizes and for theconcentrations encountered during these events.
Burkholder et al. (2004) were the first to attempt to completely model the iodinesystem fromphotolysis, to iodine oxide nucleation and on to aerosol growth. In theirstudies, they used a kinetic nucleation approach coupled to an aerosol dynamics
Phil. Trans. R. Soc. A (2007)
(i)
(ii)
Mace Head
chlorophyll concentration (mg m–3)
0.01 0.03 0.1 0.3 1 3 10 30 60
(b)
Figure 5. (Continued.)
1765Marine aerosol production
on February 29, 2016http://rsta.royalsocietypublishing.org/Downloaded from
model. Using their aerosol formation model, Burkholder and colleagues evaluatedthe possibility of OIO particle formation in the coastal zone and the open oceanthrough comparisons of measurements of both IO and OIO concentrations inoceanic regions. The IO measurements come from Mace Head and Tenerife andpeak values range from 2 to 5 ppt (Alicke et al. 1999), while the OIOmeasurementswere sources from Allan et al. (2001) and of the order of 0.5 ppt. The simulationsconcluded that steady-state concentrations of 10 ppt OIO would lead to a particleconcentration of 106 cm3 after 10–20 min, while concentrations of the order of50–100 ppt IO would be required to produce significant particles. Theseconcentrations are significantly higher than the reported observations of both IO
Phil. Trans. R. Soc. A (2007)
tide amplitudeJO (1D)
julian day (1999)163.00 163.25 163.50 163.75 164.00
tide
ampl
itude
(m
)
part
icle
con
cent
ratio
n ( ×
10 5 c
m–3
)
sulp
huri
c ac
id (
×106
mol
cm
–3)
sulphuric acidparticles10
10
8
6
4
2
2×10 –5
2×10 –5
1×10 –5
5×10 –6
00
6
5
4
3
2
1
0
8
6
4
2
0
JO (
1 D)
s–1
Figure 6. An example of a coastal nucleation event at Mace Head. Also shown are the tidal cycle,photolysis range JO (1D) and sulphuric acid concentrations. Reproduced with permissionfrom American Geophysical Union (O’Dowd et al. 2002b; doi:10.1029/2001JD000555). Copyrightq American Geophysical Union.
photolysis
hv
hv
hvIO IO
OH
IO
IO
OH
I
II
hv
hv
hv
CH2I2
I2O2
I2O
HO2
O3
I2
I IO
OH
HOI
OIO
reaction aerosol uptake
aerosol
Figure 7. Formation mechanism of iodine oxide aerosol from biogenic organoiodine. Taken fromO’Dowd et al. (2002b) and Jimenez et al. (2003). Reproduced with permission from AmericanGeophysical Union (Jimenez et al. 2003; doi:10.1029/2002JD002452). Copyright q AmericanGeophysical Union.
C. D. O’Dowd and G. de Leeuw1766
on February 29, 2016http://rsta.royalsocietypublishing.org/Downloaded from
and OIO. It should, however, be noted that IO and OIO measurements at MaceHead were conducted using long-path DOAS measurements and thus, spanned ahorizontal distance of 15 km. Given that the tidal regions are only a fraction of akilometre, both IO and OIO concentrations could easily reach an order ofmagnitude higher than that reported by the DOAS measurements, and theyconcluded that iodine oxide particle production could be feasible in local ‘hot-spots’where elevated concentrations of CH2I2 could drive the system.
Phil. Trans. R. Soc. A (2007)

3 – 3.4 nm particlestotal no. of particles
part
icle
con
cent
ratio
n (×
106 c
m–3
) 8
6
4
2
0
100 200l2 (ppt)
300
R2
400
= 0.975a = 70 900 ± 8×10⁴
b = 2770 ± 315
Figure 8. Relationship between particle concentrations as a function of molecular iodine(Sellegri et al. 2005).
1767Marine aerosol production
on February 29, 2016http://rsta.royalsocietypublishing.org/Downloaded from
While initially, CH2I2 appeared promising as themain source of coastal nucleationevents, it became clear that its source rate was still insufficient to explain theobservations. Subsequently, McFiggans et al. (2004) found that the iodine flux frommolecular iodine was three orders of magnitude greater than that from CH2I2. Thishigh source ofmolecular iodinewas able to explain the observed levels of OIO (3 ppt)and was supported by observations of I2 ranging from 20 ppt in the daytime to morethan 80 ppt at night (Saiz-Lopez et al. 2004, 2005). As a consequence, moleculariodine seemedthemostprobable precursor of theobservednucleationevents.Aroundthe same time, Sellegri et al. (2005) conducted chamber experiments on inter-tidalalgae (Fucus and Laminaria). The experiments were designed to be as close toatmospheric conditions as possible and were conducted in a 2 mK3 perspex flow-through chamber with 50%UV transmission efficiency. Natural sunlight was used todrive the photochemistry and clean ambient air, filtered of background aerosol butnot scrubbedof ozone,was usedas theflowcarrier.Themain results revealeda strongcorrelation between I2 concentrations and seaweed biomass. Further, theconcentration of particles produced, both the total particle concentration and theconcentration of particles between 3 and 3.4 nm, were linearly correlated with I2concentrations (figure 8). Peak I2 concentrations of 400 ppt produced approximately2!106 particles cmK3 in the 3–3.4 nm size range and approximately 107 particlescmK3 as a total particle concentration. For a seaweedmass of 2.5 kg mK3, the flux
of 3–3.4 nm particles was of the order of 1.5!1010 mK2 sK1, which compared wellwith direct eddy-covariance flux measurements (Flanagan et al. 2005). Modelsimulations of the chamber experiments (Pirjola et al. 2005) derived a range of I2fluxes from 5!108 to 1.5!109 cmK3 sK1. The calculations showed that for thelower I2 flux, I2 reached a steady-state concentration of 3.2!109 cmK3 and for thehigher flux, a concentration of 1!1010 cmK3, which were in very close agreementwith the observations.
Phil. Trans. R. Soc. A (2007)

C. D. O’Dowd and G. de Leeuw1768
on February 29, 2016http://rsta.royalsocietypublishing.org/Downloaded from
Although it was clear that iodine oxides, most probably predominant from I2emissions were producing the observed nucleation events, there was somedebate on the actual form of the iodine oxide. In particular, Saunders & Plane(2005) argued on the basis of ab initio modelling studies and elemental analysisof iodine oxide particles produced in laboratory chamber experiments that theform was more like I2O5 rather than I2O4, requiring I2O4 to undergo a furtherreaction with O3 to produce I2O5. While the results clearly suggest theformation of I2O5 under laboratory conditions, this is not necessarily the case inthe atmosphere. Vakeva et al. (2002) conducted measurements into nucleationmode aerosol uptake of water (i.e. hygroscopic growth) and found that undertypical coastal particle production conditions, the new particles possessed verylow hygroscopicity—an observation inconsistent with the proposed dominanceof I2O5, which is very water soluble in comparison to the non-water-solublecharacteristics of I2O4.
In terms of open ocean particle production, the situation is less clear, mainlydue to the significantly lower biogenic emissions when compared with the coastalzone and also the less frequent observations of nucleation events to study.Studies have clearly linked iodocarbon production to phytoplanktonic processes(Yamamoto et al. 2001) suggesting that over the open ocean, there is likely to bean unaccounted and significant source of biogenic iodine which could perhapscontribute to particle production. In addition, there are also inorganic sources ofiodine. For example, the direct photochemical oxidation if iodide at the sea–airinterface (Miyake & Tsunogai 1963) is likely to be an important source as is theoxidation by ozone of seawater iodide, followed by the release of I2 into the gasphase (Vrbka et al. 2004). The latter mechanism depends on ozone deposition atthe ocean surface and the production of I2 must take place at the air–sea interfacefor volatilization to occur.
Since the aforementioned processes have only been recently hypothesized asparticipating in open ocean particle production, there is little evidence gatheredto date to evaluate the role of either organic or inorganic iodine in process.Future experiments should be designed to evaluate the sources and the role ofiodine in open ocean particle production. As mentioned in the §1, the sourcestrengths of precursors over the open ocean are quite low and often difficult todetect, particularly for iodine species which are very short lived, thus presentingsignificant challenges associated with addressing these hypotheses.
6. Secondary organic aerosol formation
The work by O’Dowd et al. (2004), and references therein, point to a significantsource of both water-soluble and water-insoluble organic carbon in marineaerosol. They concluded that both classifications, and in particular, the water-insoluble organic carbon was most likely resulting from bubble-mediated primaryproduction. However, it is possible that a notable fraction of the oxidized andwater-soluble organic carbon could be produced via Secondary organic aerosol(SOA) formation processes. If this was indeed the case, some evidence of SOAcomposition should be visible in at least coastal nucleation mode particles. Suchevidence was provided by Vaattovaara et al. (2006) for coastal nucleation eventsat Mace Head. They used a novel experimental system to examine organic
Phil. Trans. R. Soc. A (2007)
volatile iodinecompoundse.g.I2
volatile organiccompoundse.g. isoprene
primary particles (CCN)mainly organics and sea salt
changed properties ofprimary particles(e.g. primary and secondaryorganics + sea salt +nssSO4
2–)
further
further
growth
growth
CCN(e.g. OC + nssSO4
2–
+ iodine oxides)
marine biotabiosynthesis
sea salt
biosynthesis
condensation
coagulation
condensation
bubble bursting
cond
ensa
tion
condensation
DMS
hv
hv, H+
OH, I, O3
O3
(e.g. phytoplankton, cyanobacteria, seaweeds)
condensableiodine compoundse.g. I2O4, I2O5
condensableorganiccompoundse.g. methyltetrols
nucleation~1 nm
~3–4 nm
> 5 nm
particles/clusters
mainly iodine oxideparticles
iodine oxides+organiccompounds (OC)
nssSO42– (TSC)
e.g. nssSO42– (a catalyst H+TSC)
> 50 nm
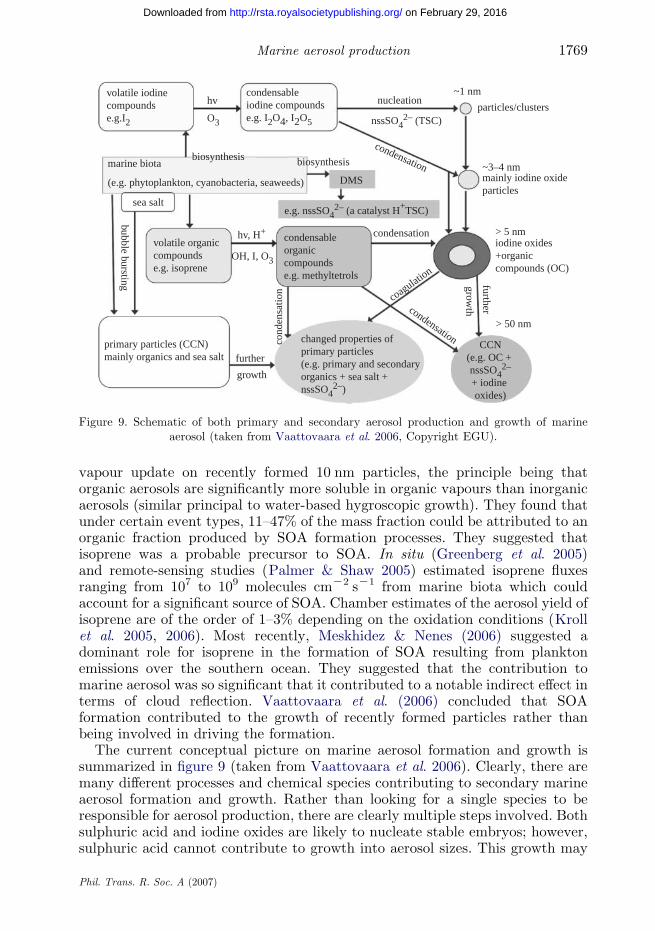
Figure 9. Schematic of both primary and secondary aerosol production and growth of marineaerosol (taken from Vaattovaara et al. 2006, Copyright EGU).
1769Marine aerosol production
on February 29, 2016http://rsta.royalsocietypublishing.org/Downloaded from
vapour update on recently formed 10 nm particles, the principle being thatorganic aerosols are significantly more soluble in organic vapours than inorganicaerosols (similar principal to water-based hygroscopic growth). They found thatunder certain event types, 11–47% of the mass fraction could be attributed to anorganic fraction produced by SOA formation processes. They suggested thatisoprene was a probable precursor to SOA. In situ (Greenberg et al. 2005)and remote-sensing studies (Palmer & Shaw 2005) estimated isoprene fluxesranging from 107 to 109 molecules cmK2 sK1 from marine biota which couldaccount for a significant source of SOA. Chamber estimates of the aerosol yield ofisoprene are of the order of 1–3% depending on the oxidation conditions (Krollet al. 2005, 2006). Most recently, Meskhidez & Nenes (2006) suggested adominant role for isoprene in the formation of SOA resulting from planktonemissions over the southern ocean. They suggested that the contribution tomarine aerosol was so significant that it contributed to a notable indirect effect interms of cloud reflection. Vaattovaara et al. (2006) concluded that SOAformation contributed to the growth of recently formed particles rather thanbeing involved in driving the formation.
The current conceptual picture on marine aerosol formation and growth issummarized in figure 9 (taken from Vaattovaara et al. 2006). Clearly, there aremany different processes and chemical species contributing to secondary marineaerosol formation and growth. Rather than looking for a single species to beresponsible for aerosol production, there are clearly multiple steps involved. Bothsulphuric acid and iodine oxides are likely to nucleate stable embryos; however,sulphuric acid cannot contribute to growth into aerosol sizes. This growth may
Phil. Trans. R. Soc. A (2007)

C. D. O’Dowd and G. de Leeuw1770
on February 29, 2016http://rsta.royalsocietypublishing.org/Downloaded from
be supported by iodine oxide and isoprene oxidation products. An alternative isthat iodine oxides nucleate and growth is accelerated by sulphuric acid andisoprene products. Both the above options are equally probable at different timesdue to sulphur and iodine species being emitted by different plankton speciesand/or different parts of the plankton life cycle.
In any event, it is unlikely that isoprene products are responsible fornucleation, but clearly can contribute to growth.
7. Conclusions
Considerable advances have been made in the last 5 years in terms of betterunderstanding of both primary and marine aerosol formation. In terms of PMA,a number of studies have confirmed a significant flux of submicrometre sea-spray particles, even down to 10 nm sizes. Furthermore, the estimates of thesea-spray flux in submicrometre and micrometre size ranges exhibit closeagreement despite the variety of methods used to derive the fluxes. While it isunclear if one flux scheme should be recommended over another, it is clear thatlike wind speed, sea surface temperature also affects the physical sea-spraysource function, so future improvements on the source function should alsoaccount for sea surface temperature. In addition to the physical source function,the chemical source function also needs to be developed as there is a growingbody of evidence that primary organic matter contributes significantly to thesea-spray source flux, and at times, can dominate in submicrometre sizes. As astrong recommendation, the chemical component must also be incorporatedinto the source function also, although this presents a challenge as it involvedincorporating a biogenic factor into what has traditionally been a dynamic orphysical source function.
In terms of secondary marine aerosol formation, significant advances havebeen made in identifying particle production, at least in coastal zones whereiodine oxides are considered the dominant species leading to particle production(O’Dowd & Hoffmann 2005). Contributing to growth can also be SOA species(i.e. isoprene oxidation products) and sulphuric acids. Further, sulphuric acidand iodine oxides are perhaps equally likely to form stable clusters from the gasphase (i.e. nucleation); however, sulphuric acid on its own does not appearcapable of growing the stable clusters to detectable sizes of 3 nm and larger. Atthat stage, iodine oxides and organic vapours are more likely to drive aerosolgrowth. The difficulty in truly elucidating this process relates to the very lowlevels of short-lived precursor gases over the ocean, combined with the difficultyassociated with detection of low production rates of new particles, given currentday aerosol instrumentation, and these difficulties present us with a considerablechallenge in terms of really identifying the dominant processes and species andthe source rate of new particles, formed in situ, in the MBL. On a more positivefront, if the rate of instrumentation and analytical methods continue to developas they have recently, along with the increased scientific focus on gas and aerosolemissions from the marine environment, the outlook for considerable advances isactually quite positive.
Phil. Trans. R. Soc. A (2007)

1771Marine aerosol production
on February 29, 2016http://rsta.royalsocietypublishing.org/Downloaded from
References
Alicke, B., Hebestreit, K., Stutz, J. & Platt, U. 1999 Iodine oxide in the marine boundary layer.
Nature 397, 572–573. (doi:10.1038/17508)
Allan, B. J., Plane, J. M. C. & McFiggans, G. 2001 Observations of OIO in the remote marine
boundary layer. Geophys. Res. Lett. 28, 1945–1948. (doi:10.1029/2000GL012468)Andreas, E. L. 1998 A new sea spray generation function for wind speeds up to 32 m sK1. J. Phys.
Oceanogr. 28, 2175–2184. (doi:10.1175/1520-0485(1998)028!2175:ANSSGFO2.0.CO;2)
Andreas, E. L. 2002 A review of the sea spray generation function for the open ocean. In
Atmosphere–ocean interactions, vol. 1 (eds W. A. Perrie), pp. 1–46. Southampton, UK: WIT
Press.Bates, T. S., et al. 2006 Aerosol direct radiative effects over the northwest Atlantic, northwest
Pacific, North Indian Oceans: estimates based on in-situ chemical and optical measurements
and chemical transport modeling, pp. 1657–1732. SRef-ID: 1680-7324/acp/2006-6-1657.
Blanchard, D. C. 1964 Sea to air transport of surface active material. Science 146, 396–397. (doi:10.
1126/science.146.3642.396)
Burkholder, J. B., Curtius, J., Ravishankara, A. R. & Lovejoy, E. R. 2004 Laboratory studies of
the homogeneous nucleation of iodine oxides. Atmos. Chem. Phys. 4, 19–34.
Cavalli, F. et al. 2004 Advances in characterization of size resolved organic matter in marine
aerosol over the North Atlantic. J. Geophys. Res. 109. (doi:10.1029/2004JD0051377)
Charlson, R. J., Lovelock, J. E., Andreae, M. O. & Warren, S. G. 1987 Oceanic phytoplankton,
atmospheric sulfur, cloud albedo and climate. Nature 326, 655–661. (doi:10.1038/326655a0)
Clarke, A. D. et al. 1998 Particle nucleation in the tropical boundary layer and its coupling to
marine sulfur sources. Science 282, 89–91. (doi:10.1126/science.282.5386.89)
Clarke, A. D., Owens, S. R. & Zhou, J. 2006 An ultrafine sea-salt flux from breaking waves:
implications for cloud condensation nuclei in the remote marine atmosphere. J. Geophys. Res.
111, D06202. (doi:10.1029/2005JD006565)De Leeuw, G., Neele, F. P., Hill, M., Smith, M. H. & Vignati, E. 2000 Sea spray aerosol production
by waves breaking in the surf zone. J. Geophys. Res. 105, 29 397–29 409. (doi:10.1029/
2000JD900549)
De Leeuw, G., Moerman, M., Cohen, L., Brooks, B., Smith, M. & Vignati, E. 2003 Aerosols,
bubbles and sea spray production studies during the RED experiments. In Proc. AMS
Conference, Long Beach, CA, 9–13 Feb.
Erickson, D. J. & Duce, R. A. 1988 On the global flux of atmospheric sea salt. J. Geophys. Res. 93,
14 079–14 088.Flanagan, R. J., Geever, M. & O’Dowd, C. D. 2005 Direct measurements of new-particle fluxes in
the coastal environment. Environ. Chem. 2, 256–259. (doi:10.1071/EN05069)
Geever, M., O’Dowd, C., van Ekeren, S., Flanagan, R., Nilsson, D., de Leeuw, G. & Rannik, U.
2005 Sub-micron sea-spray fluxes. Geophys. Res. Lett. 32, L15810. (doi:10.1029/2005GL023081)Gong, S. L. 2003 A paramterization of sea-salt aerosol source function for sub- and super-micron
particles. J. Geophys. Res. 17, 1097. (doi:10.1029/2003GB002079)
Gong, S. L., Barrie, L. A. & Lazare, M. 2002 Canadian aerosol module (CAM): a size-segregated
simulation of atmospheric aerosol processes for climate and air quality models 2. Global sea-salt
aerosol and its budgets. J. Geophys. Res. 107, 4779. (doi:10.1029/2001JD002004)Greenberg, J. P., Gunther, A. B. & Turnipseed, A. 2005 Marine organic halide and isoprene
emissions near Mace Head, Ireland. Environ. Chem. 2, 291–294. (doi:10.1071/EN05072)
Hoffman, E. J. & Duce, R. A. 1976 Factor influencing the organic carbon content of marine
aerosols: a laboratory study. J. Geophys. Res. 81, 3667–3670.Hoffmann, T., O’Dowd, C. D. & Seinfeld, J. H. 2001 Iodine oxides and new particle formation.
Geophys. Res. Lett. 28, 1949–1952. (doi:10.1029/2000GL012399)
Hoppel, W. A., Frick, G. M. & Fitzgerald, J. W. 2002 Surface source function for sea-salt aerosol
and aerosol dry deposition to the ocean surface. J. Geophys. Res. 107, 4382. (doi:10.1029/
2001JD002014)
Phil. Trans. R. Soc. A (2007)

C. D. O’Dowd and G. de Leeuw1772
on February 29, 2016http://rsta.royalsocietypublishing.org/Downloaded from
Intergovernmental Panel on Climate Change (IPCC) 2001 In Climate change 2001: the scientific
basis (eds J. T. Houghton, Y. Ding, D. J. Griggs, M. Noguer, P. J. van der Linden & D. Xiaosu),New York, NY: Cambridge University Press.
Jimenez, J. L., Bahreini, R., Cocker III, D. R., Zhuang, H., Varutbangkul, V., Flagan, R. C.,Seinfeld, J. H., O’Dowd, C. D. & Hoffmann, T. 2003 New particle formation from
photooxidation of diiodomethane (CH2I2). J. Geophys. Res. 108, 4318. (doi:10.1029/2002JD002452)
Kawamura, K. & Sakaguchi, F. 1999 Molecular distributions of water-soluble dicarboxylic acids inmarine aerosols over the Pacific Ocean including tropics. J. Geophys. Res. 104, 3501–3509.(doi:10.1029/1998JD100041)
Kleefeld, Ch., O’Dowd, C. D., O’Riely, S., Jennings, S. G., Aalto, P., Becker, E., Kunz, G. & deLeeuw, G. 2002 The relative scattering of sub and super micron particles to aerosol light
scattering in the marine boundary layer (MBL). J. Geophys. Res. 107. (doi:10.1029/2000D000262)
Kreidenweis, S. M., McInnes, L. M. & Brechtel, F. J. 1998 Observations of aerosol volatility andelemental composition at Macquarie Island during the first aerosol characterisation experiment
(ACE 1). J. Geophys. Res. 103, 16 511–16 524. (doi:10.1029/98JD00800)Kroll, J. H., Ng, N. L., Murphy, S. M., Flagan, R. C. & Seinfeld, J. H. 2005 Secondary organic
aerosol formation from isoprene photo oxidation under high-NOx conditions. Geophys. Res.Lett. 32, L18808. (doi:10.1029/2005GL023637)
Kroll, J. H., Ng, N. L., Murphy, S. M., Flagan, R. C. & Seinfeld, J. H. 2006 Secondary organicaerosol formation from isoprene photooxidation. Environ. Sci. Technol. 40, 1869–1877. (doi:10.1021/es0524301)
Lewis, E. R. & Schwartz, S. E. 2004 Sea salt aerosol production. Mechanisms, methods,measurements, and models. Washington, DC: American Geophysical Union.
Martensson, M., Nilsson, E. D., de Leeuw, G., Cohen, L. H. & Hansson, H.-C. 2003 Laboratorysimulations of the primary marine aerosol generated by bubble bursting. J. Geophys. Res.
Atmos. 108, 4297. (doi:10.1029/2002JD002263)Matsumoto, K., Tanaka, H., Nagao, I. & Ishizaha, Y. 1997 Contribution of particulate sulfate and
organic carbon to cloud condensation nuclei in marine atmosphere. Geophys. Res. Lett. 24,655–658. (doi:10.1029/97GL00541)
McFiggens, G., Plane, J. M. C., Allan, B. J., Carpenter, L. J., Coe, H. & O’Dowd, C. D. 2000 Amodel study of Iodine chemistry in the marine boundary layer. J. Geophys. Res. 105,
14 371–14 386. (doi:10.1029/1999JD901187)McFiggans, G. et al. 2004 Direct evidence for coastal iodine particles from Laminaria macroalgae—
linkage to emissions of molecular iodine. Atmos. Chem. Phys. 4, 701–713.Meskhidez, N. & Nenes, A. 2006 Phytoplankton and cloudiness in the southern ocean. Science 1,
1419–1423. (doi:10.1126/science.1131779)Middlebrook, A. M., Murphy, D. M. & Thomson, D. S. 1998 Observation of organic material
in individual particles at Cape Grim during the First Aerosol Characterization Experiment(ACE 1). J. Geophys. Res. 103, 16 475–16 483. (doi:10.1029/97JD03719)
Miyake, Y. & Tsunogai, S. 1963 Emission of iodine from the ocean. J. Geophys. Res. 68, 3989–3993.Mochida, M., Kawabata, A., Kawamura, K., Hatsushika, H. & Yamazaki, K. 2003 Seasonal
variation and origins of dicarboxylic acids in the marine atmosphere over the western NorthPacific. J. Geophys. Res. 108, AAC7-1–AAC7-11.
Monahan, E. C. & O’Muircheartaigh, I. 1980 Optimal power-law description of oceanic white capcoverage dependence on wind speed. J. Phys. Oceanogr. 10, 2094–2099.
Monahan, E. C., Spiel, D. E. & Davidson, K. L. 1986 A model of marine aerosol generation via
whitecaps and wave disruption. InOceanic whitecaps and their role in air-sea exchange processes(eds E. C. Monahan & G. MacNiocaill), pp. 167–174. Dordrecht, The Netherlands: Reidel.
Nilsson, E. D., Rannik, U., Swietlicki, E., Leck, C., Aalto, P. P., Zhou, J. & Norman, M. 2001Turbulent aerosol fluxes over the Arctic Ocean. 2. Wind-driven sources from the sea.J. Geophys. Res. 106, 32 139–32 154. (doi:10.1029/2000JD900747)
Phil. Trans. R. Soc. A (2007)

1773Marine aerosol production
on February 29, 2016http://rsta.royalsocietypublishing.org/Downloaded from
Novakov, T. C. E., Corrigan, C. E., Penner, J. E., Chuang, C. C., Rosario, O. & Mayol Bracero,
O. L. 1997 Organic aerosols in the Caribbean trade winds: a natural source? J. Geophys. Res.
102, 21 307–21 313. (doi:10.1029/97JD01487)
O’Dowd, C. D. & Hoffmann, T. 2005 Coastal new particle formation: a review of the current state-
of-the-art. Environ. Chem. 2, 245–255. (doi:10.1071/EN05077)
O’Dowd, C. D. & Smith, M. H. 1993 Physico-chemical properties of aerosol over the North East
Atlantic: evidence for wind speed related sub-micron sea-salt aerosol production. J. Geophys.
Res. 98, 1137–1149.
O’Dowd, C. D., Smith, M. H., Consterdine, I. E. & Lowe, J. A. 1997 Marine aerosol, sea salt, and
the marine sulphur cycle: a short review. Atmos. Environ. 31, 73–80. (doi:10.1016/S1352-
2310(96)00106-9)
O’Dowd, C. D., Geever, M., Hill, M. K., Jennings, S. G. & Smith, M. H. 1998 New particle
formation: spatial scales and nucleation rates in the coastal environment. Geophys. Res. Lett.
25, 1661–1664. (doi:10.1029/98GL01005)
O’Dowd, C. D., Lowe, J. A. & Smith, M. H. 1999a Coupling sea-salt and sulphate interactions and
its impact on predicting cloud droplet concentrations. Geophys. Res. Lett. 26, 1311–1314.
(doi:10.1029/1999GL900231)
O’Dowd, C. D., Lowe, J., Smith, M. H. & Kaye, A. D. 1999b The relative importance of sea-salt
and nss-sulphate aerosol to the marine CCN population: an improved multi-component aerosol-
droplet parameterisation. Q. J. R. Met. Soc. 125, 1295–1313. (doi:10.1256/smsqj.55609)
O’Dowd, C. D. et al. 1999c On the photochemical production of new particles in the coastal
boundary layer. Geophys. Res. Lett. 26, 1707–1710. (doi:10.1029/1999GL900335)
O’Dowd, C. D., Lowe, J. A., Clegg, N., Clegg, S. L. & Smith, M. H. 2000 Modelling heterogeneous
sulphate production in maritime stratiform clouds. J. Geophys. Res. 105, 7143–7160. (doi:10.
1029/1999JD900915)
O’Dowd, C. D. et al. 2002a Marine aerosol formation from biogenic iodine emissions. Nature 417,
632–636. (doi:10.1038/nature00775)
O’Dowd, C. D. et al. 2002b A dedicated study of new particle formation and fate in the coastal
environment (PARFORCE): overview of objectives and initial achievements. J. Geophys. Res.
107, 8108. (doi:10.1029/2001JD000555)
O’Dowd, C. D., Facchini, M. C., Cavalli, F., Ceburnis, D., Mircea, M., Decesari, S., Fuzzi, S.,
Yoon, Y. J. & Putaud, J. P. 2004 Biogenically-driven organic contribution to marine aerosol.
Nature 431, 676–780. (doi:10.1038/nature02959)
Palmer, P. I. & Shaw, S. L. 2005 Quantifying global marine isoprene fluxes using MODIS
chlorophyll observations. Geophys. Res. Lett. 32, L09805. (doi:10.1029/2005GL022592)
Pirjola, L., O’Dowd, C. D., Brooks, I. M. & Kulmala, M. 2000 Can new particle formation occur in
the clean marine boundary layer? J. Geophys. Res. 105, 531–546. (doi:10.1029/2000JD900310)
Pirjola, L., O’Dowd, C. D., Yoon, Y. J. & Sellegri, K. 2005 Modelling iodine particle formation and
growth from seaweed in a chamber. Environ. Chem. 2, 271–281. (doi:10.1071/EN05075)
Pirjola, L., O’Dowd, C. D. & Kulmala, M. 2002 A model prediction of the yield of CCN from
coastal nucleation events. J. Geophys. Res. 107. (doi:10.1126/science.1131779)
Putaud, J.-P. et al. 2000 Chemical mass closure and assessment of the origin of the submicron
aerosol in the marine boundary layer and the free troposphere at Tenerife during ACE-2.
Tellus B 52, 141–168. (doi:10.1034/j.1600-0889.2000.00056.x)
Reid, J. S., Jonsson, H. H., Smith, M. H. & Smirnov, A. 2001 Evolution of the vertical profile and
flux of large sea-salt particles in the coastal zone. J. Geophys. Res. 106, 12 039–12 053. (doi:10.
1029/2000JD900848)
Rinaldi, M., Facchini, M. C., Carbone, C., Finessi, E., Decesari, S., Mircea, M., Fuzzi, S.,
Ceburnis, D. & O’Dowd, C. D. In preparation. Similarity between aerosol physico-chemical
properties at a coastal station and open ocean over the North Atlantic (eds C. D. O’Dowd &
P. E. Wagner). Proc. 17th Int. Conf. on Nucleation & Atmospheric Aerosol. Berlin, Germany:
Springer.
Phil. Trans. R. Soc. A (2007)

C. D. O’Dowd and G. de Leeuw1774
on February 29, 2016http://rsta.royalsocietypublishing.org/Downloaded from
Saiz-Lopez, A., Saunders, R. W., Joseph, D. M., Ashworth, S. H. & Plane, J. M. C. 2004 Absoluteabsorption cross-section and photolysis rate of I2. Atmos. Chem. Phys. 4, 1443–1450.
Saiz-Lopez, A., Plane, J. M. C., McFiggans, G., Williams, P. I., Ball, S. M., Bitter, M., Jones,R. L., Hongwei, C. & Hoffmann, T. 2005 Modelling molecular iodine emissions in the coastalmarine environment: the link to new particle formation. Atmos. Chem. Phys. 5, 5405–5439.
Saunders, R. W. & Plane, J. M. C. 2005 Formation pathways and composition of iodine oxideultra-fine particles. Environ. Chem. 2, 199–303. (doi:10.1071/EN05079)
Schulz, M., de Leeuw, G. & Balkanski, Y. 2004 Sea-salt aerosol source functions and emissions. InEmissions of atmospheric trace compounds (eds C. Granier, P. Artaxo & C. Reeves), pp. 333–359.Dordecht, The Netherlands: Kluwer.
Sellegri, K., Yoon, Y. J., Jennings, S. G., Pirjola, L., Cautenet, S. & O’Dowd, C. D. 2005Quantification of coastal new ultra-fine particles formation from in-situ and chambermeasurements during the BIOFLUX campaign. Environ. Chem. 2, 260–270. (doi:10.1071/EN05074)
Sellegri, K., O’Dowd, C. D., Yoon, Y. J., Jennings, S. G. & de Leeuw, G. 2006 Surfactantsand submicron sea spray generation. J. Geophys. Res. 111, D22215. (doi:10.1029/2005JD006658)
Shaw, G. 1983 Bio-controlled thermostasis involving the sulfur cycle. Clim. Change 5, 297–303.(doi:10.1007/BF02423524)
Smith, M. H., Park, P. M. & Consterdine, I. E. 1993 Marine aerosol concentrations and estimatedfluxes over the sea. Q. J. R. Meteorol. Soc. 119, 809–824. (doi:10.1002/qj.49711951211)
Sørensen, L. L., Pryor, S., de Leeuw, G. & Schulz, M. 2005 Flux divergence for nitric acid in themarine atmospheric surface layer. J. Geophys. Res. 110, D15306. (doi:10.1029/2004JD005403)
Tyree, C. A., Hellion, V. M., Alexandrova, O. A. & Allen, J. O. In press. Foam droplets generatedfrom natural and artificial seawaters. J. Geophys. Res.
Vaattovaara, P., Huttunen, P. E., Yoon, Y. J., Joutsensaari, J., Lehtinen, K. E. J., O’Dowd, C. D.& Laaksonen, A. 2006 The composition of nucleation and Aitken modes particles during coastalnucleation events: evidence for marine secondary organic contribution. Atmos. Chem. Phys. 6,4601–4616.
Vakeva, M., Hameri, K. & Aalto, P. 2002 Hygroscopic properties of nucleation mode and Aitkenmode particles during nucleation bursts and in background air on the west coast of Ireland.J. Geophys. 107. (doi:10.1126/science.1131779)
Vignati, E., de Leeuw, G. & Berkowicz, R. 2001 Modeling coastal aerosol transport and effects ofsurf-produced aerosols on processes in the marine atmospheric boundary layer. J. Geophys. Res.Atmos. 106, 20 225–20 238. (doi:10.1029/2000JD000025)
Vogt, R., Crutzen, P. J. & Sander, R. 1996 A mechanism for halogen release from sea salt aerosol inthe remote marine boundary layer. Nature 383, 327–330. (doi:10.1038/383327a0)
Vrbka, L., Mucha, M., Minofar, B., Jungwirth, P., Brown, E. & Tobias, D. 2004 Propensity of softions for the air/water interface. Curr. Opin. Colloid. Interface Sci. 9, 67–73. (doi:10.1016/j.cocis.2004.05.028)
Yamamoto, H., Yokouchi, Y., Otsuki, A. & Itoh, H. 2001 Depth profiles of volatile halogenatedhydrocarbons in seawater in the Bay of Bengal. Chemosphere 45, 371–377. (doi:10.1016/S0045-6535(00)00541-5)
Yoon, Y. J. et al. 2007 Seasonal characteristics of the physico-chemical properties of North Atlanticmarine atmospheric aerosols. J. Geophys. Res. 112, D04206. (doi:10.1029/2005JD007044)
Phil. Trans. R. Soc. A (2007)