Mapping of penetrometer resistance in relation to tractor traffic using multivariate geostatistics
14
Mapping of penetrometer resistance in relation to tractor traffic using multivariate geostatistics M. Carrara a , A. Castrignanò b,1 , A. Comparetti a, ⁎ , P. Febo a , S. Orlando a a Dipartimento I.T.A.F., Università di Palermo, Viale delle Scienze, Building 4, 90128, Palermo, Italy b CRA — Istituto Sperimentale Agronomico, Via Celso Ulpiani, 5, 70125, Bari, Italy Received 9 June 2006; received in revised form 30 March 2007; accepted 22 August 2007 Available online 1 October 2007 Abstract The traffic of agricultural machines can cause soil compaction and high variability of soil structure, both along normal lines and along those parallel to the field plane. The aim of this work was to investigate the potential of an electronic penetrometer, a GPS, a GIS and geostatistical techniques for mapping soil compaction. In July 2003 soil cone penetrometer resistance was measured using a semi-automatic electronic penetrometer in a sandy-silt soil (Vertic Xerochrept) of inland Sicily where a three-year rotation wheat (Triticum durum Desf.)–wheat–tomato (Solanum lycopersicum L.) was practiced. The measurements were carried out along three parallel 3-m long transects, from the soil surface to a depth of 0.70 m. A multivariate geostatistical approach, including exploratory analysis, variography, stochastic simulation and post-processing of simulations, was applied to produce thematic maps of penetrometer resistance and probability exceeding a critical value, in correspondence of a different number of tractor passes. Penetrometer resistance variation resulted erratic at the surface but showed high spatial correlation between data measured at different depths. The probabilistic maps of compaction risk showed that the soil volume, exceeding the penetrometer resistance of 2.5 MPa, critical for root growth, at the probability level of p N 0.40 increased from 20% to 40% after five tractor passes. © 2007 Elsevier B.V. All rights reserved. Keywords: Soil compaction mapping; Cone penetrometer resistance; Multivariate geostatistics; Joint stochastic simulation 1. Introduction The implementation of intensive agricultural production systems has led to the use of heavy machines with high working capacity requiring high traction forces. The traffic of these machines can cause soil compaction and general structural degradation, reducing porosity and creating obstacles to air, water, nutrient movements and root penetration (Carrara et al., 2003; Febo and Pessina, 2002). Soil compaction can result in an increase of natural soil density even at shallow depth (at 0– 0.50 m), where the elongated pores distributed along lines parallel to the field plane are prevalent on those distributed normally to the field plane itself, which are relevant for water drainage (Febo et al., 1998). Repeated passes on the field can then cause pans, having a low permeability to water and nutrients and a high resistance to root penetration. Plant root characteristics, such as diameter, elongation and morphology, are negatively affected by high values of soil cone penetrometer resistance caused by soil compaction (Atwell, 1990) and there are several examples of the negative effect of soil compaction on crop production (Taylor et al., 1966; Heinonen et al., 2002). When erroneous field management causes soil compaction, a reduction of crop yield is observed during both the current crop season and the subsequent ones (Oussible et al., 1992). To understand whether a field is subjected or not to soil compaction, the farmer should reply to questions about intensity, extension, spatial and temporal variation, depth, thickness and time of compaction, which require a site-specific investigation across the field itself. Only a proper local survey Available online at www.sciencedirect.com Geoderma 142 (2007) 294 – 307 www.elsevier.com/locate/geoderma ⁎ Corresponding author. Fax: +39 091 484035. E-mail addresses: [email protected] (M. Carrara), [email protected] (A. Castrignanò), [email protected] (A. Comparetti), [email protected] (P. Febo), [email protected] (S. Orlando). 1 Tel.: +39 080 5475023. 0016-7061/$ - see front matter © 2007 Elsevier B.V. All rights reserved. doi:10.1016/j.geoderma.2007.08.020
-
Upload
independent -
Category
Documents
-
view
0 -
download
0
Transcript of Mapping of penetrometer resistance in relation to tractor traffic using multivariate geostatistics

Available online at www.sciencedirect.com
07) 294–307www.elsevier.com/locate/geoderma
Geoderma 142 (20
Mapping of penetrometer resistance in relation to tractor trafficusing multivariate geostatistics
M. Carrara a, A. Castrignanò b,1, A. Comparetti a,⁎, P. Febo a, S. Orlando a
a Dipartimento I.T.A.F., Università di Palermo, Viale delle Scienze, Building 4, 90128, Palermo, Italyb CRA — Istituto Sperimentale Agronomico, Via Celso Ulpiani, 5, 70125, Bari, Italy
Received 9 June 2006; received in revised form 30 March 2007; accepted 22 August 2007Available online 1 October 2007
Abstract
The traffic of agricultural machines can cause soil compaction and high variability of soil structure, both along normal lines and along thoseparallel to the field plane. The aim of this work was to investigate the potential of an electronic penetrometer, a GPS, a GIS and geostatisticaltechniques for mapping soil compaction.
In July 2003 soil cone penetrometer resistance was measured using a semi-automatic electronic penetrometer in a sandy-silt soil (VerticXerochrept) of inland Sicily where a three-year rotation wheat (Triticum durum Desf.)–wheat–tomato (Solanum lycopersicum L.) was practiced.The measurements were carried out along three parallel 3-m long transects, from the soil surface to a depth of 0.70 m.
A multivariate geostatistical approach, including exploratory analysis, variography, stochastic simulation and post-processing of simulations,was applied to produce thematic maps of penetrometer resistance and probability exceeding a critical value, in correspondence of a differentnumber of tractor passes. Penetrometer resistance variation resulted erratic at the surface but showed high spatial correlation between datameasured at different depths. The probabilistic maps of compaction risk showed that the soil volume, exceeding the penetrometer resistance of2.5 MPa, critical for root growth, at the probability level of pN0.40 increased from 20% to 40% after five tractor passes.© 2007 Elsevier B.V. All rights reserved.
Keywords: Soil compaction mapping; Cone penetrometer resistance; Multivariate geostatistics; Joint stochastic simulation
1. Introduction
The implementation of intensive agricultural productionsystems has led to the use of heavy machines with high workingcapacity requiring high traction forces. The traffic of thesemachines can cause soil compaction and general structuraldegradation, reducing porosity and creating obstacles to air,water, nutrient movements and root penetration (Carrara et al.,2003; Febo and Pessina, 2002). Soil compaction can result in anincrease of natural soil density even at shallow depth (at 0–0.50 m), where the elongated pores distributed along lines
⁎ Corresponding author. Fax: +39 091 484035.E-mail addresses: [email protected] (M. Carrara),
[email protected] (A. Castrignanò), [email protected](A. Comparetti), [email protected] (P. Febo), [email protected](S. Orlando).1 Tel.: +39 080 5475023.
0016-7061/$ - see front matter © 2007 Elsevier B.V. All rights reserved.doi:10.1016/j.geoderma.2007.08.020
parallel to the field plane are prevalent on those distributednormally to the field plane itself, which are relevant for waterdrainage (Febo et al., 1998). Repeated passes on the field canthen cause pans, having a low permeability to water andnutrients and a high resistance to root penetration. Plant rootcharacteristics, such as diameter, elongation and morphology,are negatively affected by high values of soil cone penetrometerresistance caused by soil compaction (Atwell, 1990) and thereare several examples of the negative effect of soil compactionon crop production (Taylor et al., 1966; Heinonen et al., 2002).When erroneous field management causes soil compaction, areduction of crop yield is observed during both the current cropseason and the subsequent ones (Oussible et al., 1992).
To understand whether a field is subjected or not to soilcompaction, the farmer should reply to questions aboutintensity, extension, spatial and temporal variation, depth,thickness and time of compaction, which require a site-specificinvestigation across the field itself. Only a proper local survey

Fig. 1. The system for the geo-referenced measurement of soil conepenetrometer resistance used during the tests.
295M. Carrara et al. / Geoderma 142 (2007) 294–307
and an adequate mapping of the compacted areas enablesuccessful soil tillage, because the tillage depth can beoptimised according to the compaction depth. Variable depthtillage could be applied by working just beneath the compactedlayer and only where it is necessary (Basso et al., 2003).Therefore, fuel, labour, equipment wear and tear could be savedby farmers.
The measurement of cone penetrometer resistance is an easy,quick and cheap empirical method, widely used for monitoringand assessing soil compaction (Pagliai et al., 2000; Castrignanòet al., 2002a). Bengough and Mullins (1990) assumed that thesoil strength measured by a penetrometer is equal to the pressureencountered by roots during growth. Other authors (Bennie,1991; Bathke et al., 1992) verified that root elongation stoppedwhere cone penetrometer resistance values range from 0.8 to5 MPa. Therefore, readings up to 5 MPa can be assumed as anindication of compacted soils, which impede root growth andnegatively affect crop yield. In the past hand held penetrometershave been primarily used for trouble shooting. The accuracy ofthe measurement is highly related to the ability to push thepenetrometer probe into the surveyed soil layer at a constantspeed, even if it is almost impossible. Moreover, collectingenough data across a whole field, so that geo-referenced mapsof soil compaction can be produced, takes a long time, isexpensive and often not convenient. Nowadays it is possible tomap the within-field soil compaction by using an electronicpenetrometer. It is constituted by a rod, ending with a cone,pushed into the soil by a hydraulic cylinder, a load cellmeasuring the applied force and a displacement detectormeasuring the penetration depth. The collected data, togetherwith the related positions, sensed by a GPS, can be transferredto a PC, where a Geographic Information System (GIS)processes them, in order to produce soil compaction maps.Thus the farmer can observe how soil compaction is variable atdifferent depths and across the field. The soil compaction mapscan provide two types of information: the values of soil conepenetrometer resistance; the field areas and the depth whereeventually soil compaction occurs.
The intensity and distribution of the traffic of agriculturalmachines may actually cause a high 3D variability of soilstructure, even in soils characterised by spatial homogeneity ofphysical properties (Castrignanò et al., 2001; Mouazen et al.,2001). Spatial variability of soil cone penetrometer resistance issignificantly affected by machine traffic, which generatescompacted soil volumes located under the wheel tracks(Richard et al., 1999) and, therefore, generally causes hetero-geneity of soil physical properties (Castrignanò et al., 2002a,2003). As the traffic effect is spatially variable, it is necessary tocarry out geo-referenced soil cone penetrometer resistancemeasurements, in order to describe the spatial variation of soilcompaction and its evolution over time as a consequence ofsuccessive machine passes. One approach is that of producinginterpolated maps of cone penetrometer resistance valuesmeasured at different times, using the geostatistical techniqueof (co)kriging and then comparing the maps to each other, inorder to detect the persistence or changes in spatial patterns overtime (Goovaerts and Chiang, 1993; Castrignanò et al., 2002a).
Theoretically, (co)kriging provides the best estimates in theleast square sense, because local error variance is minimal.However, this method usually overestimates low values andunderestimates high values (Goovaerts, 1997) and providesestimation variance depending only on data configuration(homoskedasticity of variance) but not on the actual valuesof data. On the contrary, stochastic simulation allows theproduction of maps showing the spatial variability withoutsmoothing (Deutsch and Journel, 1998; Castrignanò et al.,2002b). In each location the simulation algorithms calculatemany values, which can then be used to obtain expectedpredictions and variances. Moreover, the variances very oftenchange over space, depending not only on data configurationbut also on data values (heteroskedasticity of variance) and,therefore, (co)kriging variance cannot be used to adequatelyassess local uncertainty. This last estimation is quite critical indecision making aimed at site-specific field management:defining a soil as a compacted one and, therefore, carryingout the appropriate action of recovery implies a set of problems,because any estimate of soil properties is affected by uncertainty(Goovaerts, 2001). Geostatistical simulation is an advancedmethodology for quantifying spatial distribution of soil conepenetrometer resistance and the related uncertainty in assessingsoil compaction. From the set of alternative equally probableoutcomes at each node of the simulation grid the localdistribution function of soil cone penetrometer resistance canbe obtained and then the probability of exceeding a certaincritical threshold for rooting can be computed. The latter can beconsidered as a probabilistic measurement of compaction riskat any location. The measurements carried out by using the

Fig. 2. Map showing the three parallel 3-m long transects of soil conepenetrometer resistance measurements and the tractor wheel tracks. Measure-ments were taken after zero (P0), one (P1) and five (P5) passes of the tractor.
296 M. Carrara et al. / Geoderma 142 (2007) 294–307
electronic penetrometer, combined with advanced geostatisticalmethods, may then provide farmers with information about boththe compacted areas and the soil compaction depth, in order toapply recovery measures only in those areas and, therefore,minimise their cost.
The aim of this research was to investigate the potential of anelectronic penetrometer, a GPS, a GIS and the application ofgeostatistical techniques, in order to map and assess the spatialvariability of soil compaction caused by repeated passes ofagricultural machines.
2. Materials and methods
2.1. Measurement equipment
During the tests a system for the geo-referenced measure-ment of soil cone penetrometer resistance mounted on a trackedminitransporter, Rotair Rampicar R-600, was used (Carraraet al., 2005). It consisted of the following instruments (Fig. 1):
– an electronic penetrometer, Eijkelkamp Penetrologger 06.15,consisting of a load cell, an ultrasonic depth sensor, a datalogger and a probing rod, ending with a cone of 200-mm2
base area (according to the ASAE standard 313.1); thisinstrument can measure a penetration force ranging from 0 to1000 N (with a resolution of 1 N) up to a maximum depth of0.80 m (with a resolution of 10 mm) and display conepenetrometer resistance data;
Table 1Basic statistics of soil cone penetrometer resistance (MPa) measured after zero (P0)
Variable Count Minimum Maximum Mean Medi
P0 2378 0.090 5.00 1.93 1.61P1 2098 0.10 5.00 1.88 1.50P5 2238 0.15 3.96 2.40 1.95
– an L1/L2 DGPS mobile receiver, Scorpio 6502 MK fromDSNP (now Thales Navigation), connected to a data logger,Husky MP2500, with a built-in UHF radio receiver, forreceiving in real time the differential correction signals froma UHF radio transmitter, connected to a base station, DSNPScorpio 6502 SK.
In order to lower or lift the penetrometer at a constant speed,it was mounted onto a hydraulic cylinder, which was fitted to aspecifically built metal frame, joined to the minitransporter. Itwas possible to adjust the inclination of this frame by means ofanother hydraulic cylinder, so that the force applied by thepenetrometer to the soil and the penetration direction werenormal to the field plane.
This system, requiring only one operator and able to climbover sloping ground, has a total mass of 400 kg, a total contactsurface of 0.288 m2, a soil ground pressure of 0.013 MPa, alength of 1.5 m and a width of 0.80 m and, therefore, a smallturning space. With respect to manual penetrometers, this sys-tem provides the following advantages: it highly decreasesmeasurement time, keeps a constant penetration speed, applies aforce normal to the field plane and allows the measurement andrecording of geo-referenced cone penetrometer resistance data.
2.2. Area description
In July 2003 the measurement tests were carried out in a fieldlocated at Alia (Palermo, Italy, latitude 37°46′18’’ N, longitude13°42′29’’ E, altitude 860 m above s.l. ca., annual mean tem-perature 14.5 °C and annual mean precipitation 450 mm), wherea three-year rotation wheat (Triticum durum Desf.)–wheat–tomato (Solanum lycopersicum L.) was practiced (2003 was thethird year). The soil is a Vertic Xerochrept (USDA, 1998), witha sandy-silt texture (clay 8%, silt 33.7% and sand 58.3%) and amoisture of 4.9% (constant during the whole testing day).
Before the tests the soil was ploughed at a depth of 0.35-m(in August 2002) and harrowed at 0.10-m depth (in October2002, February and April 2003).
2.3. Methods for measuring geo-referenced soil cone pen-etrometer resistance
As the testing field was mostly flat, the field plane wasperpendicular to the vertical line, so that only a toric level wasneeded to ensure that the penetrometer was vertical and, there-fore, normal to the field plane. Thus, the relative positioningwas maintained along the whole penetration. Geo-referencedsoil cone penetrometer resistance was measured from the soil
, one (P1) and five (P5) passes of the tractor
an Standard deviation Variance Skewness Kurtosis
1.57 2.45 0.95 3.051.52 2.31 1.11 3.371.69 2.86 0.64 2.30
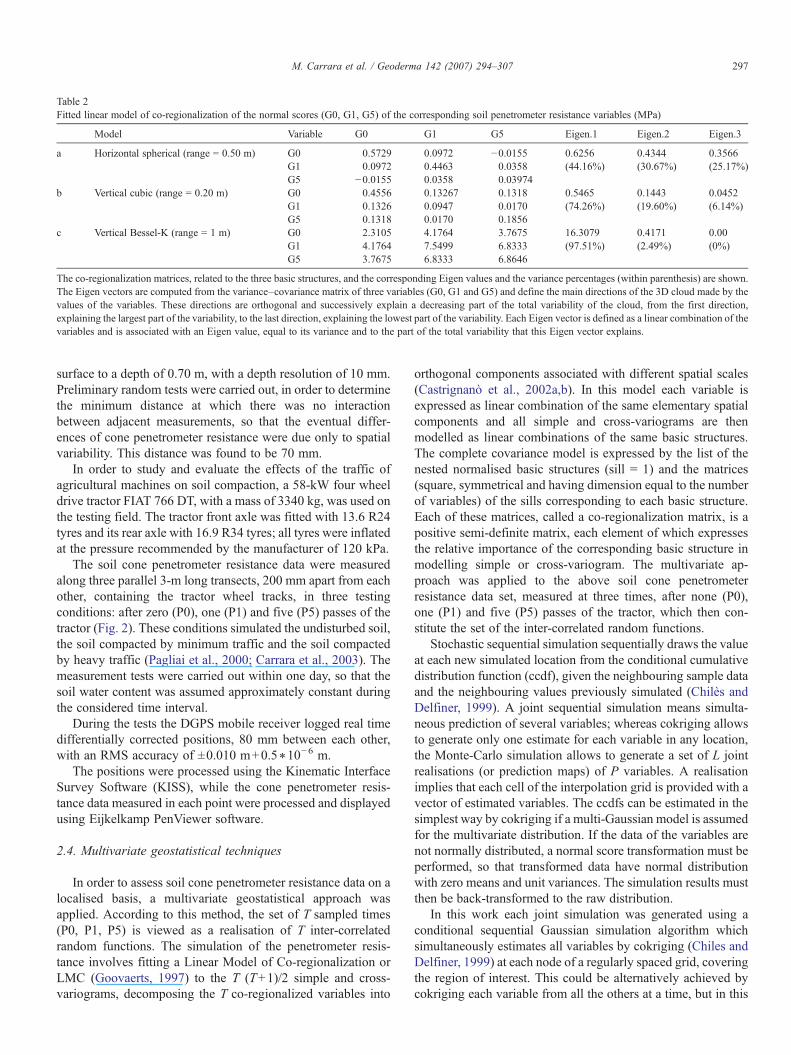
Table 2Fitted linear model of co-regionalization of the normal scores (G0, G1, G5) of the corresponding soil penetrometer resistance variables (MPa)
Model Variable G0 G1 G5 Eigen.1 Eigen.2 Eigen.3
a Horizontal spherical (range = 0.50 m) G0 0.5729 0.0972 −0.0155 0.6256 0.4344 0.3566G1 0.0972 0.4463 0.0358 (44.16%) (30.67%) (25.17%)G5 −0.0155 0.0358 0.03974
b Vertical cubic (range = 0.20 m) G0 0.4556 0.13267 0.1318 0.5465 0.1443 0.0452G1 0.1326 0.0947 0.0170 (74.26%) (19.60%) (6.14%)G5 0.1318 0.0170 0.1856
c Vertical Bessel-K (range = 1 m) G0 2.3105 4.1764 3.7675 16.3079 0.4171 0.00G1 4.1764 7.5499 6.8333 (97.51%) (2.49%) (0%)G5 3.7675 6.8333 6.8646
The co-regionalization matrices, related to the three basic structures, and the corresponding Eigen values and the variance percentages (within parenthesis) are shown.The Eigen vectors are computed from the variance–covariance matrix of three variables (G0, G1 and G5) and define the main directions of the 3D cloud made by thevalues of the variables. These directions are orthogonal and successively explain a decreasing part of the total variability of the cloud, from the first direction,explaining the largest part of the variability, to the last direction, explaining the lowest part of the variability. Each Eigen vector is defined as a linear combination of thevariables and is associated with an Eigen value, equal to its variance and to the part of the total variability that this Eigen vector explains.
297M. Carrara et al. / Geoderma 142 (2007) 294–307
surface to a depth of 0.70 m, with a depth resolution of 10 mm.Preliminary random tests were carried out, in order to determinethe minimum distance at which there was no interactionbetween adjacent measurements, so that the eventual differ-ences of cone penetrometer resistance were due only to spatialvariability. This distance was found to be 70 mm.
In order to study and evaluate the effects of the traffic ofagricultural machines on soil compaction, a 58-kW four wheeldrive tractor FIAT 766 DT, with a mass of 3340 kg, was used onthe testing field. The tractor front axle was fitted with 13.6 R24tyres and its rear axle with 16.9 R34 tyres; all tyres were inflatedat the pressure recommended by the manufacturer of 120 kPa.
The soil cone penetrometer resistance data were measuredalong three parallel 3-m long transects, 200 mm apart from eachother, containing the tractor wheel tracks, in three testingconditions: after zero (P0), one (P1) and five (P5) passes of thetractor (Fig. 2). These conditions simulated the undisturbed soil,the soil compacted by minimum traffic and the soil compactedby heavy traffic (Pagliai et al., 2000; Carrara et al., 2003). Themeasurement tests were carried out within one day, so that thesoil water content was assumed approximately constant duringthe considered time interval.
During the tests the DGPS mobile receiver logged real timedifferentially corrected positions, 80 mm between each other,with an RMS accuracy of ±0.010 m+0.5⁎10−6 m.
The positions were processed using the Kinematic InterfaceSurvey Software (KISS), while the cone penetrometer resis-tance data measured in each point were processed and displayedusing Eijkelkamp PenViewer software.
2.4. Multivariate geostatistical techniques
In order to assess soil cone penetrometer resistance data on alocalised basis, a multivariate geostatistical approach wasapplied. According to this method, the set of T sampled times(P0, P1, P5) is viewed as a realisation of T inter-correlatedrandom functions. The simulation of the penetrometer resis-tance involves fitting a Linear Model of Co-regionalization orLMC (Goovaerts, 1997) to the T (T+1)/2 simple and cross-variograms, decomposing the T co-regionalized variables into
orthogonal components associated with different spatial scales(Castrignanò et al., 2002a,b). In this model each variable isexpressed as linear combination of the same elementary spatialcomponents and all simple and cross-variograms are thenmodelled as linear combinations of the same basic structures.The complete covariance model is expressed by the list of thenested normalised basic structures (sill = 1) and the matrices(square, symmetrical and having dimension equal to the numberof variables) of the sills corresponding to each basic structure.Each of these matrices, called a co-regionalization matrix, is apositive semi-definite matrix, each element of which expressesthe relative importance of the corresponding basic structure inmodelling simple or cross-variogram. The multivariate ap-proach was applied to the above soil cone penetrometerresistance data set, measured at three times, after none (P0),one (P1) and five (P5) passes of the tractor, which then con-stitute the set of the inter-correlated random functions.
Stochastic sequential simulation sequentially draws the valueat each new simulated location from the conditional cumulativedistribution function (ccdf), given the neighbouring sample dataand the neighbouring values previously simulated (Chilès andDelfiner, 1999). A joint sequential simulation means simulta-neous prediction of several variables; whereas cokriging allowsto generate only one estimate for each variable in any location,the Monte-Carlo simulation allows to generate a set of L jointrealisations (or prediction maps) of P variables. A realisationimplies that each cell of the interpolation grid is provided with avector of estimated variables. The ccdfs can be estimated in thesimplest way by cokriging if a multi-Gaussian model is assumedfor the multivariate distribution. If the data of the variables arenot normally distributed, a normal score transformation must beperformed, so that transformed data have normal distributionwith zero means and unit variances. The simulation results mustthen be back-transformed to the raw distribution.
In this work each joint simulation was generated using aconditional sequential Gaussian simulation algorithm whichsimultaneously estimates all variables by cokriging (Chiles andDelfiner, 1999) at each node of a regularly spaced grid, coveringthe region of interest. This could be alternatively achieved bycokriging each variable from all the others at a time, but in this

298 M. Carrara et al. / Geoderma 142 (2007) 294–307
way a lot of CPU time would have been needed. A moreefficient algorithm, used in this work, performed all calculationsat a once and solved one linear system with P right-hand sidesrather than P linear systems with one right-hand side (Chilèsand Delfiner, 1999).
A random path through the grid was defined so that eachnode was visited only once (Deutsch and Journel, 1998;Castrignanò et al., 2002b). At each grid node to be visited,normal score transformed data values were used to determinethe mean and variance of the conditional distribution function ofeach variable, given the neighbouring sample data and previousestimates, using cokriging. A value was drawn randomly fromthat distribution as a possible simulation in that location for eachvariable and this value was added to the conditioning data set;the calculation proceeded for the remaining variables and thenshifted to the next node along the whole random path throughthe grid. Several simulations, virtually identical in their sta-tistical character and differing only in the random-number seedused for initiating the simulation process, can be produced.However, the number of simulations needs to be determined. Inthis study 500 simulation runs were used, because this numbermade the global variance estimation stable. Joint sequentialsimulation was performed, using as co-variables the conepenetrometer resistance data measured after zero, one and fivetractor passes.
Different types of statistical information were extracted fromthe set of back-transformed simulated images for each variable:
1) averaging the values for each pixel and producing the map ofthe “expected” value at any considered location (E-type orExpected-value estimate) (Journel, 1983), which, for a largeenough number of realisations, can become similar tocokriging estimates;
2) calculating the standard deviation of the realizations for eachpixel and producing the corresponding map, which was usedas a measurement of uncertainty. Differently from the pointone, this determination can sensibly differ from the cokrigingstandard deviation;
3) counting the number of times that each pixel exceeded acritical threshold value and converting the sum to a pro-portion, in order to produce a probability map of compactionrisk; in our research the threshold value of 2.5 MPa wasselected, because this value was considered critical for rootgrowth (Taylor et al., 1966).
3. Results and discussion
A preliminary explorative analysis of the soil conepenetrometer resistance measurements, based on the calcula-tions of the traditional descriptive statistics, is presented inTable 1. The soil cone penetrometer resistance spatially variedfrom a minimum of 0.09 MPa to a maximum of 5 MPa, which isthe maximum pressure measurable by the used penetrometermounting the cone of 200-mm2 base area. The maximum values
Fig. 3. Linear Model of Co-regionalization (LMC), related to zero (G0), one (G1) anfield plane; b) component along the direction orthogonal to the field plane.
were measured after five passes of the tractor. Also the spatialvariance followed the same temporal pattern, even if it was lesssensitive to the traffic effect. The χ2 test for normality wasrejected for all testing conditions at a probability level lowerthan 0.05 and it was also confirmed by the highly positivevalues of the skewness parameter and the median values lowerthan the means. The kurtosis parameter showed a shift fromnormality (value of 3) only for the P5 distribution.
In order to highlight some significant persistence in soilcompaction after successive tractor passes, the correlationcoefficient between the measurements corresponding to thedifferent testing conditions was used. The correlations (P0–P1=0.560; P0–P5=0.632; P1–P5=0.64) were always signif-icant at probability level pb0.01 and tended to slightly increaseas the number of the tractor passes increased. This mightsuggest that the soil tended to maintain its structure within atleast five tractor passes, even if this assumption should beverified by more direct measurements on pore and aggregatedistributions.
The above statistical parameters were calculated assumingthat all soil cone penetrometer resistance measurements aremutually independent. However, measurements of soil conepenetrometer resistance which are made close to each other arefrequently more similar than those made further apart (Burgessand Webster, 1980) and, therefore, provide expected values ofsoil cone penetrometer resistance which are spatially dependent(O'Sullivan et al., 1987). Spatial dependence was then takeninto account by calculating the experimental simple and cross-variograms of the normal scores (G0, G1, G5) of the datarecorded by the penetrometer at the same points in the threetesting conditions (P0, P1, P5). Since in each testing conditionall measurements lie on the surface within a narrow bandincluding the three parallel transects, the directional variogramswere calculated only along two main directions: 1) the transectdirection on the field plane (X axis); 2) the direction orthogonalto the field plane (Z axis). The number of lags used to calculatethe variograms was ten for both directions but the lag lengthwas different: 0.15 m for X axis and 0.03 m for Z axis, due tothe different resolution of the measurements along the twoaxes. A tolerance on direction of 15° along both axes, due tothe small support volume of penetrometer measurements, wasselected.
A Linear Model of Co-regionalization (LMC) was then fittedto both simple and cross-variograms in a semi-automatic way:only the final tuning of the corresponding sills was automat-ically performed. The number, type, range and anisotropy of thebasic spatial structures were previously chosen relying on theshape of the experimental variograms. The automatic sill fittingprocedures aimed at minimising the distance between the ex-perimental value of a variogram and the corresponding value ofthe model. Such a minimisation was performed giving differentweights to different lags, so that the weight of each lag isdirectly proportional to the number of observation pairs andinversely proportional to the average distance of the lag, under
d five passes (G5) of the tractor: a) component along the direction parallel to the

299M. Carrara et al. / Geoderma 142 (2007) 294–307

Fig. 4. 3D mean maps of the three back-transformed variables, related to zero (a), one (b) and five passes (c) of the tractor.
300 M. Carrara et al. / Geoderma 142 (2007) 294–307

Fig. 5. 3D standard deviation maps of the three back-transformed variables, related to zero (a), one (b) and five passes (c) of the tractor.
301M. Carrara et al. / Geoderma 142 (2007) 294–307

Fig. 6. 3D maps showing the probability of exceeding the threshold of soil cone penetrometer resistance, related to zero (a), one (b) and five passes (c) of the tractor.
302 M. Carrara et al. / Geoderma 142 (2007) 294–307

303M. Carrara et al. / Geoderma 142 (2007) 294–307
the constraints that each co-regionalization matrix is definitepositive (Lajaunie and Béhaxétéguy, 1989).
The following three basic structures were used:
1. a directional spherical model, with a range of 0.50 m alongthe transect direction;
2. a directional cubic model, with a range of 0.20 m along thedirection orthogonal to the field plane;
3. a bounded Bessel-k model (Chiles and Delfiner, 1999, pp.638–639), with a range of 1.00 m and a parameter equal to 1along the direction orthogonal to the field plane.
The multivariate model is presented in Table 2a, b, c, wherethe co-regionalization matrix is shown for each of the threebasic structures, together with the corresponding Eigen values.These values show that most of spatial variability is related tothe higher range variation along the direction orthogonal to thefield plane (Bessel-k model). Moreover, using this spatial scalethe three soil cone penetrometer resistance data sets resultedhighly correlated, because the first Eigen value accounted formore than 97% of the total variance. This result means that thespatial structure tends to be conservative at higher depths.
If the diagonal values (variances) of the three co-regional-ization matrices are considered, it is possible to observe that, asregards the short range variation, G0 shows the highestvariance, both along the transect direction and the directionorthogonal to the field plane (Table 2 a, b); on the contrary, asregards the high range variation, G1 and G5 show the highestvariances along the direction orthogonal to the field plane(Table 2c). These results may suggest a progressive soil strati-fication, caused by the successive passes of the tractor.
The above results (Table 2c) show that the sills of thevariogram models along the direction orthogonal to the fieldplane, having the higher range, do not reach the unit value; thisfact seems to contradict the assumption that the transformeddata have a standard Gaussian distribution with a unit variance.These results might be due, firstly, to stationarity defects, even ifstationarity is a concept that depends on scale: the data can bestationary at a large scale, whereas at a small scale they look likenon-stationary (Wackernagel, 2003, page 285). The variogramvalues show a spatial “trend” along the direction orthogonal tothe field plane, owing to the limited surveyed soil depth. In thiscase the empirical distribution of the data set may differ from itstheoretical distribution, related to its marginal distribution in aninfinite domain. Since the depth of the sampled domain(0.70 m) is lower than the range of the variogram model(1 m), the dispersion or empirical variance is smaller than thevariogram sill (“a priori” variance). Such an inequality is aconsequence of Krige's relationship, according to which thedispersion or variance is lower than the theoretical one when thesampled field is not infinite (Chilès and Delfiner, 1999).Applying Gaussian anamorphosis, the empirical variance of thetransformed data was set to one, whereas the “a priori” varianceof the component along the direction orthogonal to the fieldplane with the longer range is greater. The spatial correlationsbetween the samples located in a small surveyed domain mayproduce an apparent “trend”, although they stem from a
stochastic stationary process, involving a much higher volume(Chiles and Delfiner, 1999). In assessing the theoretical LMCvariogram a first solution was tried by providing all sills withunit value. Yet, this solution contradicted the positive semi-definite condition of the co-regionalization matrices. Therefore,the adopted solution was to consider the variogram model up toa unit sill, since all the experimental values lie below thisthreshold (Fig. 3). Thus, all the stochastic images wereconstructed up to the maximum surveyed depth of 0.70 m andno extrapolation was tried.
The directional variogram models are shown in Fig. 3a, b(continuous lines): the simple variograms along the transect(Fig. 3a) generally show an erratic behaviour; the randomcharacter of the component of the spatial variance along thetransect also explains the missing or light cross-correlationbetween the horizontal components corresponding to the dif-ferent testing conditions (cross-variograms). On the contrary,the computed cross-variograms of the vertical components ofthe spatial variance (Fig. 3b) are quite close to the upper dashedlines, which represent the maximum positive correlation. Thesimple variograms of the component plane of G0 and G1 alongthe direction orthogonal to the field look like unbounded, evenif, for the above considerations, all the simple variograms wereassumed bounded in the Linear Model of Co-regionalization,although at a range higher than the maximum depth surveyed.The apparent different behaviour of the G5 variogram, whichlooks like bounded, might suggest some ongoing change in soilstructure. Successive passes of tractor might have disruptedmost soil aggregates, causing spatial correlation length todecrease. In some cases the Linear Model of Co-regionalizationis a raw approximation, because it assumes that the same basicstructures can be fitted to the whole set of simple and cross-variograms. However, the assumption that for the consideredsoil no irreversible modification of structure occurred withinfive passes of tractor seems reasonable.
The above results suggest that the soil cone penetrometerresistance variation on layers parallel to the field plane is erraticand spatially correlated within very short distances (less than0.50 m). Therefore, measurements made more than 1 m apartfrom each other can be actually considered independent fromeach other. On the contrary, the soil cone penetrometer resis-tance data measured at different depths are spatially wellstructured and dependent on each other up to the highestsurveyed depth (0.70 m).
Fig. 4a, b, c shows a way of treating the set of the simulatedimages of the three back-transformed variables, by calculatingthe mean of the 500 simulations produced at each grid node and,then, mapping the results for each variable. Because of thegeometry of the surveyed soil volume, the Y axis was distortedon the horizontal plane by a factor of 10, in order to allow abetter readability. The simulated 3D mean maps show that mostvariations were of an erratic type, with a slight stratificationalong the direction orthogonal to the field plane. The aboveresults also reveal some differences between the eastern half ofthe surveyed soil volume and the western one, generallycharacterised by higher cone penetrometer resistance values,probably due to the intrinsic soil variation. The persistence of a

304 M. Carrara et al. / Geoderma 142 (2007) 294–307
compacted zone at a depth equal or lower than 0.40 m is visible,probably also due to the traditional tillage made every year atthe same depth (ploughing pan). The three maps do not showclear differences in the spatial dependence structures; yet, alarger extension of the areas characterised by the highest valuesof soil cone penetrometer resistance can be detected in the lastmap. These maps give high density information of soil conepenetrometer resistance which, if combined with more sparselydata of other soil properties, could be efficiently used to assesssoil compaction. However, the only mean maps are notsufficient to evaluate the soil compaction risk in site-specificmanagement, because any estimate is inevitably affected bylocal uncertainty. Actually, the higher is the variation of localestimates of soil cone penetrometer resistance values the higheris the risk of planning soil tillage management relying only onsoil compaction estimates. If the soil cone penetrometerresistance measurements were repeated on a grid, including aset of both longitudinal and transverse transects, the risk of soilcompaction could be assessed in the whole field.
In Fig. 5a, b, c the standard deviation maps of soil conepenetrometer resistance corresponding to the different testingconditions are shown. These maps show a proportional effectbetween means and variances of the local distributions of simu-lated values, symptomatic of heteroskedastic soil cone penetrom-eter resistance variance, which confirms the uselessness, in thiscase, of cokriging variance as a measure of uncertainty.
Alternatively, the soil compaction risk can be expressed inprobabilistic terms, calculating the probability of exceeding thecritical value of soil cone penetrometer resistance (2.5 MPa).The probability maps, corresponding to the different testingconditions (Fig. 6), were obtained by post-processing the 500joint-simulated images of soil cone penetrometer resistancedata and look like consistent with the mean maps (Fig. 4).Given a probability level, for example 0.40, it is possible fromthe previous probability maps to identify the areas where theprobability of exceeding the soil cone penetrometer resistanceof 2.5 MPa is higher than this critical level. Fig. 7a, b showsthese areas, respectively, after zero and one pass of the tractor:they are similar to each other and soil compaction distributionis characterised by some randomly distributed hot spots. Thespatial pattern slightly changes after five tractor passes(Fig. 7c), due to an intensification and localisation of soilcompaction, preferably along the western side of the transect.Since the 3D maps were produced in a GIS environment, itwas also possible to calculate the portion of the surveyed soilat compaction risk after successive tractor passes, in order toproduce a global indicator of soil compaction. The amount ofsoil at compaction risk was about 20% of the total soil volumeat the beginning, remained approximately constant after onepass, but increased up to about 40% of the total after fivepasses.
The above results show that the traffic intensity may affectsoil compaction and cause soil deformations, which worsenwith an increasing number of tractor passes, as confirmed by
Fig. 7. 3D maps showing the areas where the probability of exceeding the threshold o(a), one (b) and five passes (c) of the tractor.
several other authors (Bakker and Davis, 1995; Jorajuria andDraghi, 2000; Balbuena et al., 2000; Seker and Isildar, 2000).The main difficulty of the proposed approach for identifyingcompacted soil areas is to choose an appropriate probabilitythreshold above which remedial action must be undertaken.Decision making is straightforward for the areas with a veryhigh or very low probability, while it is much more difficult forthe areas with intermediate probabilities, in the range [0.30–0.70] (Goovaerts, 1999). Therefore, the choice of a probabilitythreshold remains mainly subjective, mostly affected by landuse and available financial resources. A more practical way offacing the problem is to assess the financial costs which mightresult from a wrong decision in tillage management and analysedifferent cost-effective solutions, also using simulation models.
4. Conclusions
This research has demonstrated the usefulness of anelectronic penetrometer, used with a GPS, for sensing thedepth and degree of the soil cone penetrometer resistance, asindex of soil compaction, in the various surveyed positions of afield, and, then, producing 3D maps, by using a GIS software.These maps, showing the within-field spatial variability of soilcompaction, can allow the managers and users of agricultural,forestry, environmental and ecological systems to assess the soilcompaction itself and identify areas where site-specific soilmanagement should be implemented. In fact, within these areas,the soil management practices could be varied, implementing,for example, no tillage or minimum tillage (subsoiling, etc.) ortraditional tillage (ploughing and harrowing) with a variableworking depth. Moreover, this research has proved that thedecision process aimed at selecting the tillage system in anyfield area should be based not only on smooth interpolatedmaps, which might lead to a severe underestimation of soilcompaction uncertainty and, therefore, of its economical andenvironmental impacts, but also on stochastic simulation. Infact, this geostatistical method allows to produce several mapsshowing the spatial variability of soil compaction, which can beused in order to assess the uncertainty in estimating soil com-paction itself and its evolution as affected by the traffic ofagricultural machines. The effect of such an uncertainty on theprediction of tillage costs could be evaluated using simulationmodels.
Another geostatistical method for assessing spatial uncer-tainty is to calculate the probability of exceeding some criticalthreshold of soil cone penetrometer resistance. The resultingprobability maps can be used for assessing the soil compactionrisk.
Indeed all the statistical and geostatistical methods used inthis work are promising in the fields where the soil spatialvariability suggests a soil management system on a localisedbasis, according to the principles of precision agriculture and,however, in all the fields, aiming at the soil conservation,according to the principles of sustainable agriculture.
f soil cone penetrometer resistance is higher than the critical level, related to zero

305M. Carrara et al. / Geoderma 142 (2007) 294–307

306 M. Carrara et al. / Geoderma 142 (2007) 294–307
Recently new electronic penetrometers have been designed,in order to map also other soil characteristics such as soiltexture, moisture, bulk electric conductivity and even real timesubsurface imagery (Rooney and Lowery, 2000; Rooney et al.,2000; Drummond et al., 2000). These advanced electronicpenetrometers with a built-in GPS, used together with a GIS andgeostatistical methods, could allow an easy and efficient realtime mapping of soil characteristics. Moreover, these instru-ments could allow the measurement of soil characteristicsaffected by an error estimated by using previous calibrationfunctions, in order to correctly map these characteristics.
The successful combination of an electronic penetrometer, aGPS, a GIS and geostatistical methods allows to rapidly “map”the soil compaction and associate it with other spatially fun-damental information such as those deriving from yield maps orremote sensing images.
Acknowledgements
The authors gratefully acknowledge the financial support ofthe Italian Ministry of Instruction, University and Researchthrough the PRIN 2002–2003 fund, coordinated by Prof. Febo,and ex 60% fund, coordinated by Prof. Carrara.
References
Atwell, B.J., 1990. The effect of compaction on wheat during early tillering: I.Growth, development and root structure. New Phytologist 115, 29–35.
Bakker, D.M., Davis, R.J., 1995. Soil deformation observations in a Vertisolunder field traffic. Australian Journal of Soil Research 33, 817–832.
Balbuena, R.H., Terminiello, A.M., Claverie, J.A., Casado, J.P., Marlats, R.,2000. Soil compaction by forestry harvester operation. Evolution of physicalproperties. Revista Brasileira de Engenharia Agricola e Ambiental 4,453–459.
Basso, B., Sartori, L., Bertocco, M., Oliviero, G., 2003. Evaluation of variabledepth tillage: economic aspect and simulation of long term effects onsoil organic matter and soil physical properties. In: Stafford, J., Werner, A.(Eds.), Precision Agriculture. Wageningen Academic Publishers, pp. 61–67.
Bathke, G.R., Cassel, D.K., Hargrove, W.L., Porter, P.M., 1992. Subsurfacecompaction reduces the root and shoot growth and grain yield of wheat. SoilScience 154, 316–328.
Bengough, A.G., Mullins, C.E., 1990. Mechanical impedance to root growth: areview of experimental techniques and root growth responses. Journal ofSoil Science 41, 341–358.
Bennie, A.T.P., 1991. Growth and mechanical impedance. In: Waisel, Y., Eshel,A., Kafkafi, U. (Eds.), Plant Roots: The Hidden Half, (1st edition). MarcelDekker, New York, NY, USA.
Burgess, T.M., Webster, R., 1980. Optimal interpolation and isarithmic mappingof soil properties. I. The semi-variogram and punctual kriging. Journal ofSoil Science 31, 315–331.
Carrara, M., Comparetti, A., Febo, P., Morello, G., Orlando, S., 2003. Mappingsoil compaction measuring cone penetrometer resistance. In: Werner, A., Jarfe,A. (Eds.), Book of Abstracts of the 4th European Conference on PrecisionAgriculture. 15–19 June, Berlin, Germany.Wageningen Academic Publishers,The Netherlands, p. 176.
Carrara, M., Castrignanò, A., Comparetti, A., Febo, P., Orlando, S., 2005.Multivariate geostatistics for assessing and predicting soil compaction.Proceedings of the 5th European Conference on Precision Agriculture. 9–12June, Uppsala, Sweden, pp. 723–730.
Castrignanò, A., Maiorana, M., Fornaro, F., 2003. Using regionalised variablesto assess field-scale spatiotemporal variability of soil impedance for differenttillage management. Biosystems Engineering 85 (3), 381–392.
Castrignanò, A., Maiorana, M., Fornaro, F., Lopez, N., 2001. Mapping spatialand temporal variability of cone resistance data in an Italian field cropped todurum wheat. In: Grenier, G., Blackmore, S. (Eds.), Proceedings of the 3rdEuropean Conference on Precision Agriculture. 18–21 June, Montpellier,France, Agro Montpellier, Ecole de Nationale Supérieure AgronomiqueMontpellier, pp. 355–359.
Castrignanò, A., Maiorana, M., Fornaro, F., Lopez, N., 2002a. Spatial andtemporal variability of soil strength and its change over time in a durumwheat field in Southern Italy. Soil & Tillage Research 65 (1), 95–108.
Castrignanò, A., Lopez, N., Prudenzano, M., Steduto, P., 2002b. Estimation orstochastic simulation in soil science? In: Zdruli, P., Steduto, P., Kapur, S.(Eds.), Selected Papers of the 7th International Meeting on Soils withMediterranean Type of Climate. September 2001, Bari, Italy. OptionMéditerranéennes, Series A: Mediterranean Seminars, vol. 50. CIHEAM,Paris, France, pp. 167–182.
Chiles, J.P., Delfiner, P., 1999. Geostatistics. Modelling Spatial Uncertainty. AWiley-Interscience Publication, New York, NY, USA.
Deutsch, C.V., Journel, A.G., 1998. GSLIB: Geostatistical Software Library andUser's Guide. Oxford University Press, New York, NY, USA.
Drummond, P.E., Christy, C.D., Lund, E.D., 2000. Using an automatedpenetrometer and soil EC probe to characterise the rooting zone.Proceedings of the 5th International Conference on Precision Agriculture.20–24 July 2000, Bloominghton, MN, USA. ASA-CSSA-SSSA, Madison,WI, USA.
Febo, P., Pessina, D., 2002. Ground pressures exerted by agricultural machines.In: Pagliai, M., Jones, R. (Eds.), Sustainable Land Management —Environmental Protection: A Soil Physical Approach. Catena VerlagGmbh, Reiskirchen, Germany, pp. 339–350.
Febo, P., Pagliai, M., Pessina, D., 1998. Occurrence, experiences and researchon soil compaction in Italy. Proceedings of the 1st Workshop of theConcerted Action on Subsoil Compaction “Experiences with the Impact andPrevention of Subsoil Compaction in the European Community”. Wagenin-gen, The Netherlands, pp. 96–107.
Goovaerts, P., 1997. Geostatistics for Natural Resources Evaluation. OxfordUniversity Press, New York, NY, USA.
Goovaerts, P., 1999. Geostatistics in soil science: state-of-the-art andperspectives. Geoderma 89, 1–45.
Goovaerts, P., 2001. Geostatistical modelling of uncertainty in soil science.Geoderma 103 (1–2), 3–26.
Goovaerts, P., Chiang, C., 1993. Temporal persistence of spatial patterns formineralizable nitrogen and selected soil properties. Soil Science Society ofAmerica Journal 57 (2), 372–381.
Heinonen, M., Alakukku, L., Aura, E., 2002. Effects of reduced tillage and lighttractor traffic on the growth and yield of oats (Avena sativa). In: Pagliai, M.,Jones, R. (Eds.), Sustainable Land Management — EnvironmentalProtection: A Soil Physical Approach. Catena Verlag Gmbh, Reiskirchen,Germany, pp. 367–378.
Jorajuria, D., Draghi, L., 2000. Sobrecompactacion del suelo agricola. Parte I:influencia diferencial del peso y del numero de pasadas. Revista Brasileirade Engenharia Agricola e Ambiental 4, 445–452.
Journel, A.G., 1983. Non-parametric estimation of spatial distribution.Mathematical Geology 15, 445–468.
Lajaunie, C., Béhaxétéguy, J.P., 1989. Elaboration d’un programme d’ajuste-ment semi-automatique d’un modèle de coregionalisation — Théorie.Technical report N21/89/G. ENSMP, Paris, France, pp. 6.
Mouazen, A.M., Ramon, H., De Baerdemaeker, J., 2001. On-line detection ofsoil compaction distribution based on finite element modelling procedure.Proceedings of the 3rd European Conference on Precision Agriculture.18–21 June, Montpellier, France, Agro Montpellier, Ecole NationaleSupérieure Agronomique de Montpellier, pp. 455–460.
O’Sullivan, M.F., Dikson, J.W., Campbell, D.J., 1987. Interpretation andpresentation of cone resistance data in tillage and traffic studies. Journal ofSoil Science 38, 137–148.
Oussible, M., Crookston, R.K., Larson, W.E., 1992. Subsurface compactionreduces the root and shoot growth and grain yield of wheat. AgronomyJournal 84, 34–38.
Pagliai, M., Marsili, A., Servadio, P., Vignozzi, N., Pellegrini, S., 2000.Changes of some physical properties of a clay soil following the passage of

307M. Carrara et al. / Geoderma 142 (2007) 294–307
rubber tracked and wheeled tractors of medium power. In: Arvidsson, J.,van den Akker, J.J.H., Horn, R. (Eds.), Experiences with the impact andprevention of subsoil compaction in the European Community. SLUREPRO 2000, pp. 131–144.
Richard, G., Boizard, H., Roger-Estrade, J., Boiffin, J., Guérif, J., 1999. Fieldstudy of soil compaction due to traffic in Northern France: pore space andmorphological analysis of the compacted zone. Soil & Tillage Research 51,151–160.
Rooney, D.J., Lowery, B., 2000. A profile cone penetrometer for mapping soilhorizons. Soil Science Society of America Journal 64, 2136–2139.
Rooney, D.J., Lieberman, S.H., Norman, J.M., Scarpace, F.L., 2000. Imagingthe colour characteristics of the soil environment. Proceedings of AmericanSociety of Photogrammetry and Remote Sensing. May, Washington, DC,USA.
Seker, C., Isildar, A.A., 2000. Effects of wheel traffic porosity and compactionof soil. Turkish Journal of Agriculture and Forestry 24, 71–77.
Taylor, H.M., Robertson, G.M., Parker Jr., J.J., 1966. Soil strength-rootpenetration relations for medium-to-coarse-textured soil materials. SoilScience 102, 18–22.
USDA, 1998. Soil taxonomy: Keys to Soil Taxonomy, Sixth Edition.Wackernagel, H., 2003. Multivariate Geostatistics: an introduction with
Applications. Springer-Verlag, Berlin.