Mapping immigrant minority languages in multicultural cities
20
In Barni, M. & Extra, G. (eds.) (2008), Mapping Linguistic Diversity in Multicultural Contexts, 139-162, Berlin/New York: Mouton de Gruyter. Mapping immigrant minority languages in multicultural cities 1 Guus Extra and Kutlay Yağmur 1. Rationale and goals of the study Given the overwhelming focus on mainstream second language acquisition by immigrant minority (henceforward IM) groups, there is much less evidence of the status and use of IM languages across European nation-states. In contrast to regional minority (henceforward RM) languages, IM languages have no established status in terms of period and area of residence. Obviously, typological differences between IM languages across EU nation-states do exist, e.g., in terms of the status of IM languages as EU languages or non-EU languages, or as languages of former colonies. Taken from the latter perspective, e.g., Indian languages are prominent in the United Kingdom, Arabic languages in France, Congolese languages in Belgium, and Surinamese languages in the Netherlands. Tosi (1984) offers an early case study on Italian as an IM language in England. Most studies of IM languages in Europe have focused on a spectrum of IM languages at the level of one particular multilingual city (Kroon 1990; Baker and Eversley 2000), one particular nation-state (LMP 1985, Alladina and Edwards 1991; Extra and Verhoeven 1993a; Extra and De Ruiter 2001; Caubet, Chaker and Sibille 2002; Extra et al. 2002), or one particular IM language at the nation-state or European level (Tilmatine 1997 and Obdeijn and De Ruiter 1998 on Arabic in Europe, or Jørgensen 2003 on Turkish in Europe). A number of studies have taken both a cross- national and a cross-linguistic perspective on the status and use of IM languages in Europe (e.g., Husén and Opper 1983; Jaspaert and Kroon 1991; Extra and Verhoeven 1993b, 1998; Extra and Gorter 2001). Churchill (1986) has offered an early cross-national perspective on the education of IM children in the OECD countries, whereas Reid and Reich (1992) have carried out a cross-national evaluative study of 15 pilot projects on the education of IM children supported by the European Commission. Here, we present the rationale, methodology, and kernel outcomes of the Multilingual Cities Project (henceforward MCP), a co-ordinated multiple survey study in six major multicultural cities in different EU nation-states. The project was carried out under the auspices of the European Cultural Foundation, established in Amsterdam, and it was coordinated by a research team at Babylon, Centre for Studies of the Multicultural Society, at Tilburg University in the Netherlands, in cooperation with universities and educational authorities in all participating cities. The aims of the MCP were to gather, analyse, and compare multiple data on the status of IM languages at home and at school, taken from cross-national and cross-linguistics perspectives. In the participating cities, ranging from Northern to Southern Europe, Germanic or Romance languages have a dominant status in public life. Figure 1 gives an outline of the project. 1 This is an adated and extended version of an earlier text in International Journal of the Sociology of Language 175/176 (2005): 17–40.
-
Upload
independent -
Category
Documents
-
view
0 -
download
0
Transcript of Mapping immigrant minority languages in multicultural cities

In Barni, M. & Extra, G. (eds.) (2008), Mapping Linguistic Diversity in Multicultural Contexts, 139-162, Berlin/New York:
Mouton de Gruyter.
Mapping immigrant minority languages in multicultural cities1
Guus Extra and Kutlay Yağmur
1. Rationale and goals of the study
Given the overwhelming focus on mainstream second language acquisition by immigrant
minority (henceforward IM) groups, there is much less evidence of the status and use of IM
languages across European nation-states. In contrast to regional minority (henceforward RM)
languages, IM languages have no established status in terms of period and area of residence.
Obviously, typological differences between IM languages across EU nation-states do exist, e.g.,
in terms of the status of IM languages as EU languages or non-EU languages, or as languages of
former colonies. Taken from the latter perspective, e.g., Indian languages are prominent in the
United Kingdom, Arabic languages in France, Congolese languages in Belgium, and
Surinamese languages in the Netherlands.
Tosi (1984) offers an early case study on Italian as an IM language in England. Most studies
of IM languages in Europe have focused on a spectrum of IM languages at the level of one
particular multilingual city (Kroon 1990; Baker and Eversley 2000), one particular nation-state
(LMP 1985, Alladina and Edwards 1991; Extra and Verhoeven 1993a; Extra and De Ruiter
2001; Caubet, Chaker and Sibille 2002; Extra et al. 2002), or one particular IM language at the
nation-state or European level (Tilmatine 1997 and Obdeijn and De Ruiter 1998 on Arabic in
Europe, or Jørgensen 2003 on Turkish in Europe). A number of studies have taken both a cross-
national and a cross-linguistic perspective on the status and use of IM languages in Europe
(e.g., Husén and Opper 1983; Jaspaert and Kroon 1991; Extra and Verhoeven 1993b, 1998;
Extra and Gorter 2001). Churchill (1986) has offered an early cross-national perspective on the
education of IM children in the OECD countries, whereas Reid and Reich (1992) have carried
out a cross-national evaluative study of 15 pilot projects on the education of IM children
supported by the European Commission.
Here, we present the rationale, methodology, and kernel outcomes of the Multilingual Cities Project (henceforward MCP), a co-ordinated multiple survey study in six major multicultural
cities in different EU nation-states. The project was carried out under the auspices of the
European Cultural Foundation, established in Amsterdam, and it was coordinated by a research
team at Babylon, Centre for Studies of the Multicultural Society, at Tilburg University in the
Netherlands, in cooperation with universities and educational authorities in all participating
cities. The aims of the MCP were to gather, analyse, and compare multiple data on the status of
IM languages at home and at school, taken from cross-national and cross-linguistics
perspectives. In the participating cities, ranging from Northern to Southern Europe, Germanic
or Romance languages have a dominant status in public life. Figure 1 gives an outline of the
project.
1 This is an adated and extended version of an earlier text in International Journal of the Sociology of
Language 175/176 (2005): 17–40.

2 Guus Extra and Kutlay Yağmur
Figure 1. Outline of the Multilingual Cities Project (MCP)
The criteria for selecting a city to participate in this multinational study were that it should
be prototypical for a multicultural environment with a great variety of IM groups, and that it
should offer a university-based research facility that would be able to handle the local data
gathering and local data analysis, and the final reporting of the local results. Given the
increasing role of municipalities as educational authorities in all partner cities, the project was
carried out in close cooperation between researchers at local universities and local educational
authorities. In each partner city, this cooperation proved to be of essential value. In sum, the
rationale for collecting, analysing and comparing multiple home language data on multicultural
school populations derives from three different perspectives:
• taken from a demographic perspective, home language data play a crucial role in the
definition and identification of multicultural school populations;
• taken from a sociolinguistic perspective, home language data offer valuable insights into
both the distribution and vitality of home languages across different population groups, and
thus raise the public awareness of multilingualism;
• taken from an educational perspective, home language data are indispensable tools for
educational planning and policies;
• taken from an economic perspective, home language data offer latent resources that can be
built upon and developed in terms of economic chances.
Local reports about the participating cities have been made available for Göteborg (Nygren-
Junkin and Extra 2003), Hamburg (Fürstenau, Gogolin and Yağmur 2003), The Hague (Extra,
Aarts, Van der Avoird, Broeder and Yağmur 2001), Brussels (Verlot, Delrue, Extra and
Yağmur 2003), Lyon (Akinci, De Ruiter and Sanagustin 2004), and Madrid (Broeder and
Mijares 2003). For the final cross-national report we refer to Extra and Yağmur (2004).
2. Method of research Design of the questionnaire
Except in Scandinavian countries, there is no European tradition of collecting home
language statistics on multicultural (school) population groups. In fact, collecting home
language data in some countries is even in conflict with present language legislation. This holds
in particular for Belgium, where traditional language borders have been allocated and legalised
in terms of Dutch and/or French.
Our method of carrying out home language surveys amongst primary school children in each
of the six participating cities has profited from experiences in non-European English-dominant
Dominant Germanic Mixed form Dominant Romance
Swedish German Dutch French Spanish
Göteborg Hamburg The Hague Brussels Lyon Madrid

Mapping immigrant minority languages in multicultural cities 3
immigration countries with nationwide population surveys in which commonly single questions
on home language use were asked. In contrast to such questionnaires, our survey was based on
multiple rather than single questions on home language use and on cross-nationally equivalent
questions. In doing this, we aimed at describing and comparing multiple language profiles of
major IM communities in each of the cities under consideration.
The questionnaire for data collection was designed after ample study and evaluation of
language-related questions in nationwide or large-scale population research in a variety of
countries with a longer history of migration and minorisation processes. The design of the
questionnaire also derived from extensive empirical experiences gained in carrying out
municipal home language surveys amongst pupils in both primary and secondary schools in the
Netherlands (Broeder and Extra 1995; 1998 and Extra et al. 2001; 2002).
A number of conditions for the design of the questionnaire needed to be met. The first
prerequisite was that the questionnaire should be appropriate for all children and should include
a built-in screening question for distinguishing between children in whose homes only the
mainstream language is used and children in whose homes one or more other languages next to
or instead of this language are used. In the latter case, a home language profile has to be
specified.
The second prerequisite of the questionnaire was that it should be both short and powerful.
It should be short in order to minimise the time needed by teachers and children to answer it
during school hours, and it should be powerful in that it should have an appropriate and
transparent set of questions which should be answered by all children individually, if needed –
in particular with younger children – in cooperation with the teacher, after an explanation of the
goals and design of the questionnaire in class. The survey consisted of 20 questions which were
made available to schools in a double-sided printed format.
The third prerequisite of the questionnaire was that the answers given by the children should
be controlled, scanned, interpreted, and verified as automatically as possible, given the large
size of the resulting database. In order to fulfil this demand, both hardware and software
conditions had to be met.
Table 1 gives an outline of the questionnaire. An English version is made available in the
Appendix.
Table 1. Outline of the MCP questionnaire
Questions Focus
1–3 Personal information (name, age, gender)
4–8 School information (city, district, name, type, grade)
9–11 Birth country of the pupil, father and mother
12 Selective screening question (Are any other languages than X ever used in your home?
If yes, complete all the questions; if no, continue with questions 18–20)
13–17 Language repertoire, language proficiency, language choice, language dominance, and
language preference
18–20 Languages learnt at/outside school and demanded from school
In compliance with privacy legislation in different nation-states, the resulting database
contains language data at the levels of districts, schools, and grades only; no data have been
processed that can be traced back to individuals. The answers to questions 9–12 make it

4 Guus Extra and Kutlay Yağmur
possible to compare the status of birth country data and home language data as demographic
criteria. The countries and languages explicitly mentioned in questions 9–12 were determined
on the basis of the most recent municipal statistics about IM children at primary schools. Thus,
the list of prespecified languages for, e.g., Hamburg was quite different from the one used in
Madrid. The selective screening question 12 (see also Appendix) was aimed at a maximal scope
from three different perspectives, i.e., by the passive construction are used instead of do you use, by the modal adverb ever, and by asking for use instead of one of the four language skills.
The language profile, specified by questions 13–17, consists of the following dimensions:
• language repertoire: the number and type of (co-)occurring home languages next to or
instead of the mainstream language;
• language proficiency: the extent to which the pupil can understand/speak/read/write the
home language;
• language choice: the extent to which the home language is commonly spoken with the
mother, father, younger and older brothers/sisters, and best friends;
• language dominance: the extent to which the home language is spoken best;
• language preference: the extent to which the home language is preferably spoken.
Taken together, the four dimensions of language proficiency, choice, dominance, and
preference result in a language vitality index (see Section 4). On the basis of questions 18–20, a
school language profile can be specified. This profile provides information about the available
language education in and outside school, as well as the expressed interest in learning other
languages. The agreed-upon questionnaire was translated into equivalent versions in Dutch,
French, German, Spanish, and Swedish. These versions were tested in at least one primary
school in each partner city. On the basis of the suggestions of local educational authorities and
researchers, the phrasing and wording of the questionnaires were further adapted. All six cities
had the same questions, but one additional question on “nationality” was added to the German
questionnaire. This question was not included in any of the other cities.
Data collection The local questionnaires were printed in multiple copies. Due to the requirements of
automatic processing, it was essential that printed rather than photocopied questionnaires were
used. Uniformity, both in terms of content and form, was a prerequisite for data processing.
Local educational authorities sent out letters of permission to schools and/or parents so that
their children could participate in the survey. In each city, the printed questionnaires were
distributed to school directors. Both for classroom teachers and for data collection assistants, a
manual in the local language was prepared to facilitate interaction with the pupils.
The completed questionnaires were delivered by the schools to the researchers at the
participating universities. After checks of the total set of questionnaires per school had been
made, all delivered questionnaires were sent to Tilburg University in the Netherlands for data
processing.
Data processing Data processing was centrally done in Tilburg by Babylon researchers. Given the large size
of the database, an automatic processing technique based on specially developed software
(Teleform) and available hardware was developed and utilised. By means of these tools about
5000 forms could be scanned per day. Because some questionnaire items were filled-out in
handwriting, additional verification of these items had to be done using character recognition
software; in this way, around 4000 forms could be processed per day. After scanning and
verification had been completed, the database for each city was analysed by using the SPSS

Mapping immigrant minority languages in multicultural cities 5
program. Table 2 gives an overview of the resulting database, derived from the reports of
primary school children in an age range of 4–12 years (only in The Hague were data also
collected at secondary schools). The total cross-national sample consists of more than 160,000
pupils.
Table 2. Overview of the MCP database
(a Dutch-medium schools only;
b Reseau d’Education Prioritaire only)
City Total
of schools
Total of schools
in the survey
Total of pupils
in schools
Total of pupils
in the survey
Age range
of pupils
Brussels 117a 110
a 11,500 10,300 6–12
Göteborg 170 122 36,100 21,300 6–12
Hamburg 231 public 218 public 54,900 46,000 6–11
17 catholic 14 catholic
Lyon 173b 42
b 60,000 11,650 6–11
Madrid 708 public 133 public 202,000 30,000 5–12
411 catholic 21 catholic 99,000
The Hague 142 primary 109 primary 41,170 27,900 4–12
30 secondary 26 secondary 19,000 13,700 12–17
In order to carry out systematic analyses on the data set, a SPSS syntax file which was
developed step-by-step was used in the preparation stage. In the analysis stage, another SPSS
syntax file was used in order to achieve uniformity of the findings. The last stage of data
processing was transmitting the outcomes of the analyses in a readable format. Given the fact
that the research results should be presented in the same format in all six participating cities in
the project, a cross-nationally uniform format was set up. In presenting the results, Excel Worksheets and Microsoft Graphics within Word for Windows were used. Both the worksheets
and the templates for figures within Microsoft Graphics were predefined. In this way, a uniform
format for all the tables and figures could be achieved, which then needed to be interpreted.
3. Distribution of languages
The local language surveys amongst primary school children have delivered a wealth of yet
unknown cross-national evidence on the distribution and vitality of IM languages at home.
Apart from selecting one or more of the prespecified languages in each of the local surveys,
pupils could also opt for self-references to other home languages by filling-out in hand-writing
the boxes provided for this objective (see Appendix).
The resulting database consists of a huge variety of self-references (types) and their
frequencies of mentioning (tokens). In most cases, the pupils referred to entities that could be
(re)traced as existing languages. In this context, the regularly updated database of The Ethnologue (www.sil.org/ethnologue; Grimes 1996) on languages of the world proved to be
very helpful. In cases of doubt or lacking information, other resources were used, such as
Comrie et al. (2003), Campbell (2000), Dalby (1999/2000), Giacalone Ramat and Ramat
(1998), and Crystal (1997). Apart from self-references to known and unknown languages, the
pupils also made references to countries that could not reasonably be traced back to languages
or to other/unknown categories. In general, however, the resolution level of the language

6 Guus Extra and Kutlay Yağmur
question in the survey was very high, and relatively few references could not be traced back to
languages. Table 3 gives a cross-national overview of the data under consideration.
Table 3. References made by pupils in terms of types and tokens (x = not specified)
Reference
to languages
Reference
to countries
Other/unknown
references
Municipality Types Tokens Types Tokens Types Tokens
Göteborg 75 7,598 8 40 10 20
Hamburg 90 16,639 12 229 10 92
The Hague 88 23,435 13 788 17 24
Brussels 54 12,737 9 186 7 11
Lyon 66 6,106 17 130 – –
Madrid 56 2,619 x x x x
Based on the overview of types and tokens of (re)traced home languages, the distribution of
these home languages was specified in a ranked order of decreasing frequency. A common
phenomenon in all participating cities was that few languages (types) were referred to often
(tokens), and that many languages (types) were referred to rarely (tokens). Therefore, the most
frequently mentioned home languages represent a very high proportion of the total number of
occurrences/tokens in all cities.
Apart from Madrid, late-comer amongst our focal cities in respect of immigration, the
proportion of primary school children in whose homes other languages were used next to or
instead of the mainstream language ranged between one third and more than a half. The total
number of languages other than Swedish/German/Dutch (The Hague/Brussels)/French/ Spanish
ranged per city between 50 and 90. The figures were 36% of the total student population in
Göteborg, 35% in Hamburg, 49% in The Hague, 82% in Brussels, 54% in Lyon, and 10% in
Madrid.
The outcomes of the local surveys were aggregated in one cross-national database. On the
basis of the number of references made to home languages, the top 20 of the most frequently
mentioned languages in each city were identified. Forty-nine languages were in the group of the
top 20 list in the six cities. Out of these 49 languages, 19 languages were represented in 3–
6 cities and 30 languages in only 1–2 cities. There were also unique references in the top 20 per
city; most of these languages were either languages of neighbouring countries, languages of
former colonies, or RM languages. For purposes of cross-national and cross-linguistic analyses,
20 of the most frequently mentioned languages in these cities were chosen.
Two criteria were used to select these 20 languages from the list of 49 languages. Each
language should be represented by at least three cities, and each city should be represented in
the cross-national database by at least 30 pupils in the age range of 6–11 years. Our focus on
this age range was motivated by comparability considerations: This range was represented in
the local databases of all participating cities (see Table 2). Romani/Sinte was included in the
cross-national analyses because of its special status in our list of 20 languages as a language
without territorial status. Two languages had an exceptional status: English “invaded” the local
databases as a language of international prestige, and Romani/Sinte was solidly represented in
Hamburg and Göteborg only. The concept of language group was based on the pupils’ answers
to the question whether and, if so, which other languages were used at home instead of or next
to the mainstream language (see Appendix, question 13). On the basis of their answer patterns,
pupils may belong to more than one language group. Table 4 gives an overview of the resulting
database.
Mapping immigrant minority languages in multicultural cities 7
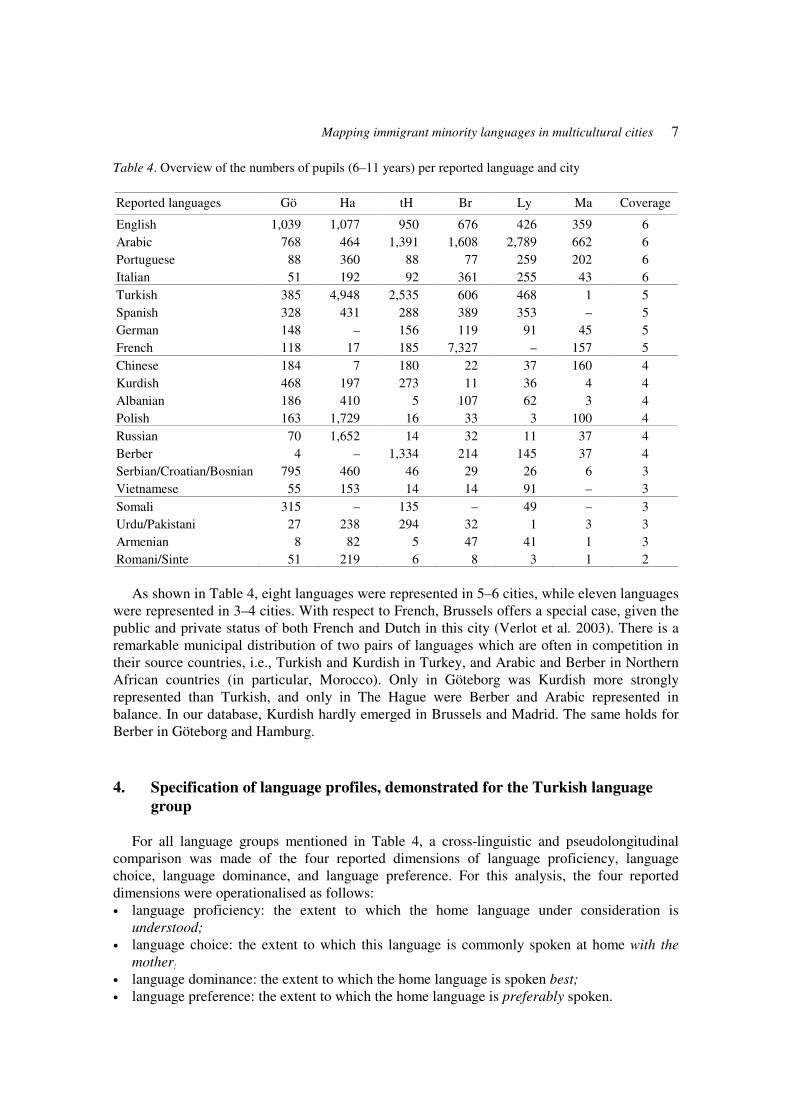
Table 4. Overview of the numbers of pupils (6–11 years) per reported language and city
Reported languages Gö Ha tH Br Ly Ma Coverage
English 1,039 1,077 950 676 426 359 6
Arabic 768 464 1,391 1,608 2,789 662 6
Portuguese 88 360 88 77 259 202 6
Italian 51 192 92 361 255 43 6
Turkish 385 4,948 2,535 606 468 1 5
Spanish 328 431 288 389 353 – 5
German 148 – 156 119 91 45 5
French 118 17 185 7,327 – 157 5
Chinese 184 7 180 22 37 160 4
Kurdish 468 197 273 11 36 4 4
Albanian 186 410 5 107 62 3 4
Polish 163 1,729 16 33 3 100 4
Russian 70 1,652 14 32 11 37 4
Berber 4 – 1,334 214 145 37 4
Serbian/Croatian/Bosnian 795 460 46 29 26 6 3
Vietnamese 55 153 14 14 91 – 3
Somali 315 – 135 – 49 – 3
Urdu/Pakistani 27 238 294 32 1 3 3
Armenian 8 82 5 47 41 1 3
Romani/Sinte 51 219 6 8 3 1 2
As shown in Table 4, eight languages were represented in 5–6 cities, while eleven languages
were represented in 3–4 cities. With respect to French, Brussels offers a special case, given the
public and private status of both French and Dutch in this city (Verlot et al. 2003). There is a
remarkable municipal distribution of two pairs of languages which are often in competition in
their source countries, i.e., Turkish and Kurdish in Turkey, and Arabic and Berber in Northern
African countries (in particular, Morocco). Only in Göteborg was Kurdish more strongly
represented than Turkish, and only in The Hague were Berber and Arabic represented in
balance. In our database, Kurdish hardly emerged in Brussels and Madrid. The same holds for
Berber in Göteborg and Hamburg.
4. Specification of language profiles, demonstrated for the Turkish language
group
For all language groups mentioned in Table 4, a cross-linguistic and pseudolongitudinal
comparison was made of the four reported dimensions of language proficiency, language
choice, language dominance, and language preference. For this analysis, the four reported
dimensions were operationalised as follows:
• language proficiency: the extent to which the home language under consideration is
understood; • language choice: the extent to which this language is commonly spoken at home with the
mother; • language dominance: the extent to which the home language is spoken best; • language preference: the extent to which the home language is preferably spoken.

8 Guus Extra and Kutlay Yağmur
The operationalisation of the first and second dimension (language proficiency and language
choice) was aimed at a maximal scope for tracing language vitality. Language understanding is
generally the least demanding of the four language skills involved, and the mother acts
generally as the major gatekeeper for intergenerational language transmission (Clyne 2003).
The final aim was the construction of a language vitality index (henceforward LVI), based
on the outcomes of the four dimensions presented above. Since Giles et al. (1977) introduced
the concept of ethnolinguistic vitality, the focus has been on its determinants rather than on its
operationalisation. Determinants have been proposed in terms of lists of factors, clustered in
status factors, demographic factors, and institutional support factors, e.g. by Giles et al. (1977),
or in additional factors such as cultural (dis)similarity, e.g., by Appel and Muysken (1987: 32–
38). The proposed lists of factors suffer from various shortcomings that cannot be solved easily:
• the lists of factors are neither exhaustive nor mutually exclusive;
• different factors contribute in different ways to (lack of) vitality and may even neutralise
each other;
• some of these factors are personal characteristics (e.g., age, gender, or educational level),
whereas other factors are group characteristics (e.g., group size or group spread);
• moreover, a distinction has been proposed and found between the objective status of these
factors and their subjective perception by minority and/or majority groups (Bourhis et al.
1981, Van der Avoird 2001).
In our research project, we took a different approach by focusing on the operationalisation
of language vitality rather than on its determinants. The operationalisation of language vitality
was derived from the construction of language profiles, based on self-reports. In the analyses,
the four above-mentioned language dimensions were compared as proportional scores, i.e., the
mean proportion of pupils per language group that indicated a positive response to the relevant
questions. The LVI is, in turn, the mean value of these four proportional scores. This LVI is by
definition a value-driven index, in the sense that the chosen dimensions with the chosen
operationalisations are equally weighted.
In this context, it should be mentioned that, from a conceptual point of view, the chosen
dimensions are more closely related than in many other large-scale attempts to operationalise
multiple human properties in terms of an index. An interesting case in point is the widely used
Human Development Index (HDI), proposed by the United Nations in its annual UNDP reports.
The HDI measures the overall achievements in a particular country in three basic dimensions of
human development, i.e., life expectancy, educational achievement, and income per capita. For
each of these dimensions, an index based on multiple values has been created. The ultimate
HDI is based on the average of the three indices mentioned. In this case also, the chosen
dimensions with the chosen operationalisations are equally weighted (for details see UNDP
2002).
For all 20 language groups, language profiles were specified based on tabulated and graphic
information. Tabulated information was provided on the number of pupils and the language
vitality (index) per age group and per generation. For all language groups, three age groups and
three generations were distinguished. The age groups consisted of children aged 6/7, 8/9, and
10/11 years old. The three generations were operationalised as follows:
• G1: pupil + father + mother born abroad;
• G2: pupil born in country of residence, father and/or mother born abroad;
• G3: pupil + father + mother born in country of residence.

Mapping immigrant minority languages in multicultural cities 9
On the basis of this categorisation, intergenerational shift can be estimated. In addition,
graphic information was provided on the pseudolongitudinal outcomes per age group on the
four dimensions of language proficiency, language choice, language dominance, and language
preference. In all cases, the total population of age groups was always larger than the total
population of generations. This discrepancy is the result of a predictably larger number of
missing values (i.e., non-responses) for generation than for age. In the former case, references
have to be made to the countries of birth of the pupil, the father, and the mother; in the latter
case, reference has to be made only to the age of the pupil. Language vitality indices for age
and generation were calculated only if at least 5 children were represented in a particular group.
Given the possible non-responses of children to any of the questions represented in figures and
tables, all figures and tables were presented and interpreted in proportional values. In Table 5,
we demonstrate the provided cross-national and pseudolongitudinal information on the Turkish
language group (see Table 4 for the absence of Madrid).
Table 5. Turkish language group: cross-national numbers of pupils and LVI per age group and per
generation
Age groups
Population Vitality
Cities 6/7 8/9 10/11 Total 6/7 8/9 10/11 Mean
Göteborg 124 115 146 385 69 67 66 67
Hamburg 1,384 2,381 1,183 4,948 66 62 65 64
The Hague 833 853 849 2,535 75 68 65 69
Brussels 225 213 168 606 73 75 71 73
Lyon 146 176 146 468 65 63 68 65
Total / Mean 2,712 3,738 2,492 8,942 70 67 67 68
Generations
Population Vitality
Cities G1 G2 G3 Total G1 G2 G3 Mean
Göteborg 51 308 10 369 67 68 43 59
Hamburg 627 3,676 205 4,508 69 64 49 61
The Hague 539 1,842 46 2,427 73 68 62 68
Brussels 75 417 42 534 74 74 70 73
Lyon 78 308 24 410 70 64 65 66
Total / Mean 1,370 6,551 327 8,248 71 68 58 65

10 Guus Extra and Kutlay Yağmur
Pseudolongitudinal profile of the Turkish language group Figure 2a. Language proficiency in Turkish
Figure 2b. Language choice for Turkish
Figure 2c. Language dominance of Turkish and/or mainstream language
Figure 2d. Language preference for Turkish and/or mainstream language
0102030405060708090
100
6/7 8/9 10/11
Understand
Speak
Read
Write
0102030405060708090
100
6/7 8/9 10/11
Mother
Father
Younger b/s
Older b/s
Best friends
0102030405060708090
100
6/7 8/9 10/11
Turkish
Mainstream
Tur./Mainstr.
0102030405060708090
100
6/7 8/9 10/11
Turkish
Mainstream
Tur./Mainstr.

Mapping immigrant minority languages in multicultural cities 11
Language proficiency (Fig. 2a). For all age groups, reported understanding (96–97%) and
speaking skills (94%) in Turkish are higher than reported reading (38–80%) and writing skills
(33–73%), but the differences narrow as children get older.
Language choice (Fig. 2b). At home, 77-82% of the children reported commonly speaking
Turkish with their mothers, 70–76% with their fathers, 38–43% with their younger siblings, 27–
36% with their older siblings, and 30–36% with their best friends.
Language dominance (Fig. 2c). The reported dominance of Turkish decreases as children
get older (44%, 33%, and 31%, respectively). The reported dominance of the mainstream
language increases across age groups (45%, 54%, and 53%, respectively). A slight increase in
balanced bilingualism was reported across age groups (6–11%).
Language preference (Fig. 2d). Similar to dominance, the reported preference for Turkish
decreases as children get older (43%, 35%, and 30%, respectively). In a complementary pattern,
an increasing preference for the mainstream language was reported across age groups (44%,
50%, and 50%, respectively). No preference was reported by an increasing 7–12% of all
children.
Language vitality across age groups and generations (Table 5). The Turkish language group
is the largest group in the overall research population (except for Madrid). Turkish is spoken in
the homes of 8,942 children across the age groups in 5 cities. A great majority of the Turkish-
speaking pupils was traced in Hamburg and The Hague, followed by Brussels, Lyon, and
Göteborg. In terms of intergenerational differences, first-generation children born abroad
reported the highest language vitality (71%), followed by second- and third-generation children
(68–58%). In Brussels, there is almost no difference between the 3 generations. Turkish has the
highest vitality in Brussels (73%) for all age groups, and the average vitality of Turkish for all
cities in the given age groups is 68%.
Languages other than Turkish. Next to Turkish, a number of other languages were reported
as home languages. French (381), Kurdish (375), English (133), Arabic (96), German (29),
Albanian (17), and Spanish (17) were the major languages reported.
5. Cross-linguistic perspectives on language vitality
In this section, we present a cumulative language vitality index (LVI) for all 20 language
groups on the basis of the obtained proportional scores for language proficiency
(understanding), language choice (with mother), language dominance, and language preference.
As mentioned before, the LVI is based on the mean value of the obtained scores for each of the
four language dimensions referred to. Table 6 gives a cross-linguistic and pseudolongitudinal
overview of the LVI per language group and age group. LVI calculations have only been made
if at least 5 children were represented in a particular age group and generation.

12 Guus Extra and Kutlay Yağmur
Table 6. Language vitality per language group and age group (in %, LVI in cumulative %)
Language group Total pupils 6/7 years 8/9 years 10/11 years Average
Romani/Sinte 270 76 71 64 70
Urdu/Pakistani 564 65 70 69 68
Turkish 8,942 70 67 67 68
Armenian 170 64 59 65 63
Russian 1,791 66 58 57 60
Serbian/Croatian/Bosnian 1,285 60 58 59 59
Albanian 765 63 56 58 59
Vietnamese 299 57 60 58 58
Chinese 561 56 58 60 58
Arabic 7,682 59 58 58 58
Polish 1,925 57 59 53 56
Somali 499 58 54 53 55
Portuguese 1,074 54 54 54 54
Berber 1,730 51 54 51 52
Kurdish 974 54 47 51 51
Spanish 1,789 47 49 47 48
French 7,787 47 40 44 44
Italian 994 39 40 39 39
English 4,527 37 33 39 36
German 559 35 31 32 33
Considering its non-territorial status, it is not surprising that Romani/Sinte emerged with the
highest language vitality. English and German ended up in bottom positions given the fact that
they often had a higher status at school than at home. When the average scores of the youngest
and oldest age groups were compared, 11 language groups showed the highest scores for the
former and 5 language groups for the latter. The largest interval between the scores emerged for
Romani/Sinte. Strong maintenance of language vitality across the youngest and oldest age
groups, with intervals of -1/0/+1 only, emerged for 8 out of the 20 language groups.
A different cross-linguistic and pseudolongitudinal perspective is provided in Table 7, in
terms of generations.

Mapping immigrant minority languages in multicultural cities 13
Table 7. Inter-generational distribution (in %) and inter-generational language vitality (LVI in cumulative
%) per language group
Inter-generational
distribution
Inter-generational
language vitality
Language group
Total
pupils G1 G2 G3 G1 G2 G3
Albanian 675 39 56 5 72 51 34
Arabic 7,002 21 73 6 64 57 35
Armenian 153 49 42 9 69 55 –
Berber 1,656 20 78 2 59 50 45
Chinese 523 22 74 4 72 59 –
English 4,045 16 42 41 43 41 28
French 7,090 7 45 48 55 43 30
German 506 18 45 38 43 35 22
Italian 916 12 60 28 49 43 29
Kurdish 900 50 49 2 61 43 33
Polish 1,837 14 82 4 73 59 31
Portuguese 1,004 27 66 8 63 52 33
Romani/Sinte 231 35 41 23 76 66 65
Russian 1,616 81 16 3 64 – –
Serbian/Croatian/Bosnian 1,191 38 58 4 71 50 –
Somali 464 38 58 5 70 50 –
Spanish 1,570 18 61 21 63 47 30
Turkish 8,248 17 79 4 71 68 58
Urdu/Pakistani 534 25 72 3 70 67 –
Vietnamese 270 12 85 3 60 57 –
Table 7 reveals significant differences between language groups in the distribution of pupils
across different generations. In most language groups, second-generation pupils were most-
represented and third-generation pupils least. Remarkable exceptions to this rule were
Armenian and in particular Russian, with mainly first-generation pupils. Third-generation
pupils were relatively well represented (>20%) for English, French, German, Italian,
Romani/Sinte, and Spanish. In conformity with expectations, Table 7 shows a stronger decrease
of language vitality across generations than Table 6 shows across age groups. All language
groups show more or less decreasing language vitality across generations. The strongest inter-
generational shift between G1 and G3 emerged for Polish (42%), Albanian (38%), Spanish
(33%), and Portuguese (30%), whereas the strongest inter-generational maintenance of
language vitality occurred for Romani/ Sinte and Turkish.
The top position for language vitality of Romani/Sinte across age groups in Table 6, and its
relatively strong maintenance across generations in Table 7, were also observed in earlier and
similar research in the Netherlands (Broeder and Extra 1998: 70). The high vitality of
Romani/Sinte was also confirmed by other studies on this language community (Acton and
Mundy 1999; Kyuchukov 2002). One reason why language vitality is a core value for the Roma
across Europe is the absence of source country references as alternative markers of identity – in
contrast to almost all other language groups presented in Tables 6 and 7.

14 Guus Extra and Kutlay Yağmur
6. Conclusions
The findings of the Multilingual Cities Project have delivered a wealth of hidden evidence
on the distribution and vitality of IM languages at home across European cities and nation-
states. Apart from Madrid, late-comer amongst our focal cities in respect of immigration, the
proportion of primary school children in whose homes other languages were used next to or
instead of the mainstream language ranged per city between one third and more than a half. The
total number of traced “other” languages ranged per city between 50 and 90; the common
pattern was that a limited set of languages were often referred to by the children and that many
languages were referred to only a few times.
The findings show that making use of more than one language is a way of life for an
increasing number of children across Europe. Mainstream and non-mainstream languages
should not be conceived in terms of competition. Rather, the data show that these languages are
used as alternatives, depending on such factors as type of context and interlocutor. The data
also reveal that the use of other languages at home does not occur at the cost of competence in
the mainstream language. Many children who addressed their parents in another language
reported to be dominant in the mainstream language.
Among the major 20 non-national languages in the participating cities, 10 languages are of
European origin and 10 languages stem from abroad. These findings clearly show that the
traditional concept of language diversity in Europe should be reconsidered and extended. The
outcomes of the local language surveys also demonstrate the high status of English among
primary school pupils across Europe. Its intrusion in the children's homes is apparent from the
position of English in the top 5 of languages referred to by the children in all of the cities
(Table 4). This outcome cannot be explained as an effect of migration and minorisation only.
The children's reference to English also derives from the status of English as the international
language of power and prestige. English has invaded the repertoire of all of the national
languages under consideration. Moreover, children have access to English through a variety of
media, and English is commonly taught in particular grades at primary schools.
In addition, children in all participating cities expressed a desire to learn a variety of
languages that are not taught at school. The results of the local language surveys also show that
children who took part in instruction in particular non-mainstream languages at school reported
higher levels of literacy in these languages than children who did not take part in such
instruction. Both the reported reading proficiency and the reported writing proficiency profited
strongly from language instruction. The differences between participants and non-participants
in language instruction were significant for both forms of literacy skills and for all the 20
language groups. In this domain in particular, the added value of language instruction for
language maintenance and development is clear. Owing to the monolingual habitus (Gogolin
1994) of primary schooling across Europe, there is an increasing mismatch between language
practices at home and at school. The findings on multilingualism at home and those on
language needs and language instruction reported by the children should be taken into account
by both national and local educational authorities in any type of language policy.

Mapping immigrant minority languages in multicultural cities 15
Appendix
English version of the language survey questionnaire
Anchorage points
Software and processing of the filled-out questionnaires are discussed in Extra & Yağmur
(2004: 116–118). The bottom-line texts on the first and second page of the questionnaire
function as anchorage points for data base recognition before the process of data scanning can
start.
Questions 9/10/11
• C 1 = country of residence (in casu Sweden, Germany, the Netherlands, Belgium, France or
Spain);
• C 2–20 = alphabetical list of countries most frequently represented in a particular city (in casu Göteborg, Hamburg, The Hague, Brussels, Lyon or Madrid, respectively), derived from
local municipal statistics.
Questions 12/13
• xxx = mainstream language of country of residence (in casu Swedish, German, Dutch,
French or Spanish, respectively).
Questions 13-20
• L 1 = mainstream language of country of residence;
• L 2–20 = alphabetical list of languages most frequently represented in a particular city,
derived from assumptions on countries 2–20.

16 Guus Extra and Kutlay Yağmur

Mapping immigrant minority languages in multicultural cities 17

18 Guus Extra and Kutlay Yağmur
References
Acton, T. & G. Mundy (eds.) 1999 Romani Culture and Gypsy Identity. Hatfield: University of
Hertfordshire Press.
Akinci, M-A., J.J. de Ruiter and F. Sanagustin 2004 Le Plurilinguisme à Lyon. Le Statut des Langues à la Maison et à l’École. Paris: L’Harmattan.
Alladina, S. and V. Edwards (eds.) 1991 Multilingualism in the British Isles (Vol. 1: The older mother
tongues and Europe; Vol. 2: Africa, the Middle East and Asia). London: Longman.
Alladina, S. 1993 South Asian languages in Britain. In: G. Extra and L. Verhoeven (eds.),
Immigrant Languages in Europe, 55–65. Clevedon: Multilingual Matters.
Appel, R. and P. Muysken 1987 Language Contact and Bilingualism. London: Edward Arnold.
Baker, P. and J. Eversley (eds.) 2000 Multilingual Capital. The Languages of London’s Schoolchildren and their Relevance to Economic, Social and Educational Policies. London: Battlebridge
Publications.
Bourhis, R., H. Giles and D. Rosenthal 1981 Notes on the construction of a ‘Subjective Vitality
Questionnaire’ for ethnolinguistic groups. Journal of Multilingual and Multicultural Development 2: 145–
155.
Broeder, P. and G. Extra 1995 Minderheidsgroepen en Minderheidstalen. Den Haag: VNG
Uitgeverij.
Broeder, P. and G. Extra 1998 Language, Ethnicity and Education. Case Studies on Immigrant Minority Groups and Immigrant Minority Languages. Clevedon: Multilingual Matters.
Broeder, P. and L. Mijares 2003 Plurilingüismo en Madrid. Las Lenguas de los Alumnos de Origin Inmigrante en Primaria. Madrid: Centro de Investigación y Documentación Educativa.
Campbell,. G. 2000 Compendium of the World’s Languages (Volume 1 & 2). London: Routledge.
Caubet, D., S. Chaker and J. Sibille (eds.) 2002 Codification des Langues de France. Paris:
l’Harmattan.
Churchill, S. 1986 The Education of Linguistic and Cultural Minorities in the OECD Countries. Clevedon: Multilingual Matters.
Clyne, M. 2003 Dynamics of Language Contact. Cambridge: Cambridge University Press.
Comrie, B., S. Matthews and M. Polinsky 2003 The Atlas of Languages. Revised Edition. London:
Eurospan Group.
Crystal, D. 1997 The Cambridge Encyclopedia of Language. Cambridge: Cambridge University
Press.
Dalby, D. 1999/2000 The Linguasphere Register of the World’s Languages and Speech Communities (Volume 1 & 2). Wales-Hebron: Linguasphere Press.

Mapping immigrant minority languages in multicultural cities 19
Extra, G., R. Aarts, T. van der Avoird, P. Broeder and K. Yağmur 2001 Meertaligheid in Den Haag. De Status van Allochtone Talen Thuis en op School. Amsterdam: European Cultural Foundation.
Extra, G., R. Aarts, T. van der Avoird, P. Broeder and K. Yağmur 2002 De Andere Talen van Nederland. Muiderberg: Coutinho.
Extra, G. and D. Gorter (eds.) 2001 The Other Languages of Europe. Demographic, Sociolinguistic and Educational Perspectives. Clevedon: Multilingual Matters.
Extra, G. and J.J. de Ruiter (eds.) 2001 Babylon aan de Noordzee. Nieuwe Talen in Nederland.
Amsterdam: Bulaaq.
Extra, G. and L. Verhoeven (eds.) 1993a Community Languages in the Netherlands. Amsterdam:
Swets and Zeitlinger.
Extra, G. and L. Verhoeven (eds.) 1993b Immigrant Languages in Europe. Clevedon: Multilingual
Matters.
Extra, G. and L. Verhoeven (eds.) 1998 Bilingualism and Migration. Berlin/New York: Mouton De
Gruyter.
Extra, G. and K. Yağmur (eds.) 2004 Urban Multilingualism in Europe: Immigrant Minority Languages at Home and School. Clevedon: Multilingual Matters.
Fürstenau, S., I. Gogolin and K. Yağmur (Hrsg.) 2003 Mehrsprachigkeit in Hamburg. Ergebnisse einer Sprachenerhebung an den Grundschulen in Hamburg. Münster/New York: Waxmann.
Giacalone Ramat, A. and P. Ramat 1998 The Indo-European Languages. London: Routledge.
Giles, H., R. Bourhis and D. Taylor 1977 Towards a theory of language in ethnic group
relations. In: H. Giles (ed.), Language, Ethnicity, and Intergroup Relations, 307–348. London: Academic
Press.
Gogolin, I. 1994 Der Monolinguale Habitus der Multilingualen Schule. Milnster: Waxmann.
Grimes, B. (ed.) 1996 Ethnologue. Languages of the world (13th
Edition). Dallas: Summer Institute of
Linguistics (www.sil.org/ethnologue).
Husén, T. and S. Opper (eds.) 1983 Multicultural and Multilingual Education in Immigrant Countries. Oxford: Pergamon Press.
Jaspaert, K. and S. Kroon (eds.) 1991 Ethnic Minority Languages and Education. Amsterdam/Lisse: Swets and Zeitlinger.
Jørgensen, J. (ed.) 2003 Turkish Speakers in North Western Europe. Clevedon: Multilingual
Matters.
Kroon, S. 1990 Opportunities and Constraints of Community Language Teaching. Münster/New York:
Waxmann.
Kyuchukov, H. (ed.) 2002) New Aspects of Roma Children Education. Sofia: Ictus.

20 Guus Extra and Kutlay Yağmur
Linguistic Minorities Project 1985 The Other Languages of England. London: Routledge and
Kegan.
Nygren-Junkin, L. and G. Extra 2003 Multilingualism in Göteborg. The Status of Immigrant Minority Languages at Home and at School. Amsterdam: European Cultural Foundation.
Obdeijn, H. and J.J. de Ruiter (eds.) 1998 Le Maroc au Coeur de l’Europe. L’Enseignement de la Langue et Culture d'Origine (ELCO) aux Éleves marocains dans cinq Pays Europeens. Tilburg:
Tilburg University Press, Syntax Datura.
Reid, E. and H. Reich 1992 Breaking the Boundaries. Migrant Workers’ Children in the EC.
Clevedon: Multilingual Matters.
Tilmatine, M. (ed.) 1997 Enseignment des Langues d’Origine et Immigration Nord-Africaine en Europe: Langue Maternelle ou Langue d’Etat? Paris: Inalco/Cedrea-Crb.
Tosi, A. (1984). Immigration and bilingual education. A case study of movement of population, language change and education within the EEC. Oxford: Pergamon Press.
UNDP 2002 www.hdr.undp.org/reports/global/2002/en/pdf/backone.pdf and _backtwo.pdf.
Van der Avoird, T. 2001 Determining language vitality. The language use of Hindu communities in the Netherlands and the United Kingdom. Dissertation, Tilburg University.
Verlot, M., K. Delrue, G. Extra and K. Yağmur 2003 Meertaligheid in Brussel. De Status van Allochtone Talen Thuis en op School. Amsterdam: European Cultural Foundation.